Australian CEO Remuneration*
38
UWA Research Publication Heaney, R., Tawani, V. and Goodwin, J. (2010), Australian CEO Remuneration. Economic Papers: A journal of applied economics and policy, 29: 109–127. ©2010 The Economic Society of Australia This is the accepted version of the following article: Heaney, R., Tawani, V. and Goodwin, J. (2010), Australian CEO Remuneration. Economic Papers: A journal of applied economics and policy, 29: 109–127, which has been published in final form at https://dx.doi.org/10.1111/j.1759-3441.2010.00060.x. In addition, authors may also transmit, print and share copies with colleagues, provided that there is no systematic distribution of the submitted version, e.g. posting on a listserve, network or automated delivery. This version was made available in the UWA Research Repository the 5 th of November 2014, in compliance with the publisher’s policies on archiving in institutional repositories.
-
Upload
independent -
Category
Documents
-
view
2 -
download
0
Transcript of Australian CEO Remuneration*
UWA Research Publication
Heaney, R., Tawani, V. and Goodwin, J. (2010), Australian CEO Remuneration. Economic Papers: A journal of applied economics and policy, 29: 109–127. ©2010 The Economic Society of Australia This is the accepted version of the following article: Heaney, R., Tawani, V. and Goodwin, J. (2010), Australian CEO Remuneration. Economic Papers: A journal of applied economics and policy, 29: 109–127, which has been published in final form at https://dx.doi.org/10.1111/j.1759-3441.2010.00060.x. In addition, authors may also transmit, print and share copies with colleagues, provided that there is no systematic distribution of the submitted version, e.g. posting on a listserve, network or automated delivery. This version was made available in the UWA Research Repository the 5th of November 2014, in compliance with the publisher’s policies on archiving in institutional repositories.
1 3/11/201422/04/201021/04/2010
Australian CEO Remuneration
Richard Heaney# and Vineet Tawani* and John Goodwin+
Abstract
Cross-sectional analysis of the remuneration paid by a sample of 1144 listed
Australian companies in 2006 to their CEOs highlights the variation in the level and
composition of remuneration both within and across industries. Average annual CEO
remuneration for 2006 is $730,000 with 79% short-term, 14% long-term and 7% post-
employment remuneration. These components of remuneration structure, company
size and corporate governance measures provide insight into the variation in CEO
remuneration. There is no evidence of a positive relation between current year CEO
remuneration and following year performance.
JEL Classification: G34
Keywords: CEO remuneration; performance sensitive remuneration; industry and
company effects; board composition and size.
Acknowledgements
We thank Binesh Seetanah for his research assistance in the manual collection of
remuneration, board of directors and shareholder data from annual reports and
AspectHuntley for access to other accounting numbers used in the study.
JEL Classification: G34
Keywords: CEO remuneration; performance sensitive remuneration; industry and
company effects; board composition and size.
Contact Details
#Richard Heaney, School of Economics, Finance and Marketing, RMIT University,
Level 12, 239 Bourke Street, Melbourne, Victoria, 3000. Australia.
Tel.: +61 3 9925 5905; Fax.: 61 3 9925 5986
E-mail address: [email protected]
* School of Economics, Finance and Marketing, RMIT University, Level 12, 239
Bourke Street, Melbourne, Victoria, 3000. Australia.
Email Address: [email protected]
+ School of Accounting and Finance, M715, Li Ka Shing Tower, The Hong Kong
Polytechnic University, Hung Hom, Kowloon, Hong Kong
Email Address: [email protected]
2 3/11/201422/04/201021/04/2010
1. Introduction
There has been considerable growth in CEO remuneration in recent years. For
example, the increase in total remuneration for the top 100 Australian companies for
the seven years from 2002 to 2008 inclusive averaged 12% per annum.1 Discussion
in the Australian press points to a concern about this rapid growth in CEO
remuneration.2 A question arises as to what is an appropriate level of remuneration
and what determines variation in remuneration across companies? Concerns about
excessive CEO remuneration have been forcefully expressed in the past, (Fels 2004;
Saulwick & Coorey 2009) although a recent productivity commission report
(Productivity Commission 2009) takes a somewhat more tempered view, with support
for the Commission’s recommendations appearing in the press (Swan 2010). While
we can provide little insight into whether the level of remuneration is appropriate, this
study provides an examination of the cross sectional variation in CEO remuneration
for a large sample of listed Australian companies for the year 2006.
The CEO is responsible for the management of the company and, given the
separation of management and ownership, agency conflicts can lead to divergence
between CEO objectives and those of the shareholders (Jensen & Meckling 1976;
Jensen & Murphy 1990). Commentators often ignore the scarcity of superior
management skills, yet failure to secure a trustworthy and effective CEO can have
1 Total CEO remuneration includes options and shares. This information was obtained from a series of
research papers entitled “CEO pay in the top 100 companies” available from the Australian Council of
Superannuation Investors web site (http://www.acsi.org.au/). The actual % change in total CEO
compensation for the top 100 firms was 22% for 2001-2002, -2% for 2002-2003, 24% for 2003-2004,
6% for 2004-2005, 21% for 2005-2006, 21% for 2006-2007 and -7% for 2007-2008. 2 More recent examples include articles by Jane Cadzow (Outrageous Fortune, Good Weekend, The
Sydney Morning Herald, 13 February 2010) and Adele Ferguson and Scott Murdoch (Market split
over exec pay, Finance, The Australian, 1 October 2009).
3 3/11/201422/04/201021/04/2010
deleterious effects on company performance.3 Even with an effective CEO, it is still
necessary to ensure that remuneration agreements and monitoring align CEO and
shareholder objectives, (Kole 1997) and that appropriate shareholder returns are
achieved.4 There are two approaches used to explain CEO remuneration, optimal
contracting and managerial power, and both approaches provide considerable insight
into the CEO remuneration problem (Bebchuk & Fried 2003; Edmuns & Gabaix
2009). Indeed, recent increases in CEO remuneration can be explained by more
complex optimal contracting models as well as by management power arguments
(Edmuns & Gabaix 2009).
We focus on the remuneration paid by Australian listed companies to their
CEOs as reported in their annual reports for the year ending in 2006 using a sample of
1,144 listed Australian companies. The year 2006 is chosen as it follows the
Australian adoption of the international accounting standards (IFRS), which resulted
in a considerable improvement in the quality of corporate remuneration disclosure.
Average annual CEO remuneration for the year ending in 2006 is $730,000 with 79%
short-term remuneration, 14% long-term remuneration and 7% post-employment
remuneration. CEO remuneration is measured in total dollars paid as well as
remuneration relative to industry average and while there is limited evidence of a
statistically significant link between CEO remuneration and company performance,
there is evidence of size, governance, growth options and remuneration structure
effects on both CEO remuneration and company performance in this study. The
following section reviews the literature, with data description provided in Section 3.
3 Comparison of founder/CEOs like Bill Gates at Microsoft and Kenneth Lay at Enron provide some
insight into the impact of CEO quality on long-term survival and performance of a corporation.
Choice and oversight of the CEO are crucial tasks for the board of directors. 4 A particularly striking example of the failure to achieve alignment is evident in the Ralston Purina
Company case (Campbell & Wasley 1999). Further, there is some question about the actual link that
might exist between compensation and performance (Baker et al. 1988).
4 3/11/201422/04/201021/04/2010
Results are discussed in Section 4 and Section 5 concludes the paper.
2. Literature Review and Hypothesis Development
While it is expected that CEO remuneration will compensate for past
performance, optimal contracting suggests that the board of directors, acting in the
interests of the shareholders, choose remuneration contracts that best align the
incentives of the CEO with those of the shareholders to maximise company value.
Yet, managerial power could bias the remuneration decision in favour of the CEO
(Bebchuk & Fried 2003). This has implications both for CEO remuneration decisions
and for the link that can exist between CEO remuneration and company performance
2.1 CEO remuneration
Prior company performance, the shareholders and the board of directors each
play a role in CEO remuneration decisions. A substantial shareholder, whether or not
represented on the board, has incentive to closely monitor CEO remuneration (Bhagat
& Bolton 2008; Del Guercio et al. 2008). Yet, a large board dominated by executive
directors may feel less constrained in granting excessive remuneration to a CEO who
is also chairman of the board. Ultimately, the CEO remuneration package should
reward the CEO for superior performance, taking into account the level of task
complexity as well as controlling for the costs arising from shirking and negative
NPV investment. But, managerial power could lead to remuneration levels that are
inconsistent with those expected under the traditional optimal contracting model of
the company.
2.1.1 Prior or present performance
5 3/11/201422/04/201021/04/2010
It is expected that CEO remuneration should reflect current and past
performance, but Australian research into the relation between CEO remuneration and
performance is inconclusive. A large body of overseas evidence has examined
whether CEO remuneration is explained by performance (Murphy 1985; Core et al.
1999; Bertrand & Mullainathan 2001; Hermalin & Wallace 2001; Garvey & Milbourn
2006; Leone et al. 2006; Rajgopal et al. 2006). Early Australian research into the link
between CEO remuneration and performance found no statistically significant
relationship (Izan et al. 1998), although more recent research identifies a link between
company performance, both past and present, and CEO remuneration (Merhebi et al.
2006). In these studies, CEO remuneration is regressed on various performance
measures as well as control variables including company size. Given that it can be
difficult to disentangle performance and remuneration reported for the same period,
prior period performance is used as an instrument for performance in the analysis that
follows. This gives rise to the first hypothesis; that performance is positively related
to CEO remuneration.
Hypothesis 1
1. Prior period return on assets and market to book ratio are positively related to total
CEO remuneration.
2.1.2 The Components of the CEO remuneration package
Longer-term incentives can be created through the use of stock options,
restricted shares and long-term performance plans, based on growth in earnings over a
number of years (Kole 1997) but the difficulty for the board of directors is in selecting
the most appropriate remuneration strategy for their company. If poorly designed,
equity based remuneration contracts need not result in superior performance
(Campbell & Wasley 1999). Yet, the early literature supported the use of market
based remuneration as a means of aligning CEO and shareholder objectives (Jensen &

6 3/11/201422/04/201021/04/2010
Murphy 1990). Thus it is important that, where share or option grants are considered,
the board ensures the scheme actually aligns CEO and shareholder objectives
(Aggarwal & Samwick 1999; Ross 2004). If a risk-averse CEO is faced with an easy
target or a target that can be manipulated then there is a tendency for the CEO to
maintain the status quo or manipulate the target and thus avoid unnecessary risk5.
Further, a poorly diversified risk averse CEO will tend to value share and option
grants somewhat less than the market might value these securities (Hall & Murphy
2000a; Hall & Murphy 2000b; Hall & Murphy 2002, 2003). Finally, an expensive
though poorly constructed market based incentive scheme could result in reduced
rather than superior performance (Ryan and Wiggins, 2001).
The level of growth options, equity agency costs and CEO power are likely to
effect the final remuneration package offered to the CEO. For example, companies
with high levels of growth options may prefer longer term remuneration, including
share and option based incentive plans, more than companies with low levels of
growth options (Baber et al. 1996; Ryan & Wiggins 2001). Indeed, growth
companies often pose special problems for the board of directors as the board may not
have the expertise to effectively monitor a highly qualified CEO in charge of a
complex business. Market based remuneration can help to align CEO and shareholder
objectives in these circumstances. Alternatively, with a large company operating in a
stable low tech industry, the board may be able to monitor CEO behaviour more
accurately and so CEO remuneration packages for this type of company could rely
less on longer term remuneration and more on shorter term remuneration like fixed
salary and bonus payments. Thus, ignoring managerial power, the components used
5 Changing the terms of executive stock options provides one example of target manipulation (Brenner
et al. 2000) which can result in considerable ex post gain for a CEO.
7 3/11/201422/04/201021/04/2010
in CEO remuneration should reflect characteristics of the company including its size,
growth options and agency costs.
Hypothesis 2 is concerned with the determinants of the CEO remuneration
package. There has been considerable growth in the level of CEO remuneration,
particularly in large companies, as well as growing reliance on market based
remuneration within the CEO remuneration package.
The preference for market based remuneration may arise from increasing
managerial power. It is possible that market based remuneration could disguise the
actual cost to the firm of the CEO’s remuneration package. Further, in Australia,
personal taxes could have a part to play in the choices made by a risk averse CEO.
There is a personal tax advantage to receiving remuneration in the form of equity and
option grants rather than cash. For example the capital gains tax on shares is 50% of
the personal tax rate and dividend imputation reduces the personal tax on dividends
by the amount of franking credits attached to the dividends. Where a cash payment is
received the CEO must pay personal tax at their marginal personal tax rate, which
would exceed the tax paid on market-based remuneration by a considerable margin
for most resident Australian CEOs. While we do not argue that a risk averse CEO
will choose to plunge into a remuneration package that consists of either 100% equity
or 100% cash there are good reasons for the CEO to want to hold both asset classes in
their compensation package.
Managerial power could explain a preference for equity but there are strong
arguments supporting the incentive alignment benefits of equity based remuneration.
Given the incentive alignment potential of market based remuneration it is predicted
that the proportion of long term CEO remuneration will be increasing in the level of
growth options and company size. While market based remuneration may increase
8 3/11/201422/04/201021/04/2010
shareholder value if the remuneration scheme results in successfully aligning
shareholder and CEO incentives, it may also dilute shareholder interest in the
company where it is paid out of newly issued shares and so there is no clear prediction
as to how shareholder value will relate to market based remuneration. Similarly, for
board structure, there is no clear prediction as to how board structure will affect the
structure of the CEO remuneration contract. Yet, if the board is captured by the CEO
then not only will the CEO pay themselves more but they may prefer a greater
proportion of market based remuneration because of the favourable personal tax
treatment of market based remuneration in Australia under a dividend imputation tax
system.
Hypothesis 2
2a. Proportion of market based (cash based) CEO remuneration is positively
(negatively) correlated with size and growth options
2b. Total CEO remuneration is positively (negatively) correlated with the percentage
of remuneration that is market based (cash based).
2c. CEO remuneration relative to industry average is positively (negatively)
correlated with the percentage of remuneration that is market based (cash based).
2.1.3 Shareholder structure
The ownership structure of the company has implications for CEO remuneration.
There is a link between shareholder characteristics and CEO remuneration,
particularly where active shareholders are openly critical of excessive or unwarranted
CEO remuneration levels. For example, there is evidence that shareholder activism
can have considerable influence over CEO excesses, with improvements in company
performance and increased CEO oversight by the board (Bebchuk & Fried 2003; Del
Guercio et al. 2008).6 CEOs are sensitive to shareholder concerns as there are costs
for the CEO including damaged reputation and reduced shareholder support during
6 Institutional shareholding appears to be particularly important in the US (Hartzell & Starks 2003)
though the extensive use of nominee shareholders by investors in Australian firms make accurate
identification of institutional shareholding extremely difficult and error prone at best.
9 3/11/201422/04/201021/04/2010
takeover bids or proxy contests. Thus, the more powerful and better organised the
shareholder group the less outrageous the CEO behaviour (Bebchuk & Fried 2003).7
This leads to the third set of hypotheses. It concerns the relation between the level of
CEO remuneration and three measures of shareholder concentration, shareholding of
the top 20 shareholders, total shareholding of the block-holders (shareholders with
more than 5%), and the shareholding of the largest shareholder. It is predicted that
the more concentrated the shareholding, the better organised the shareholder group
with the result that excessive CEO remuneration payments are curbed.
Hypothesis 3
3a. Percentage of shares held by the top 20 shareholders is negatively related with
CEO remuneration.
3b. Percentage of shares held by blockholders is negatively related with CEO
remuneration.
3c. Percentage of shares held by the largest shareholder is negatively related with
CEO remuneration.
It should be noted that with very small firms it is possible that the CEO is also
the majority shareholder in the company. In this case, the CEO remuneration policy
will be based on the individual circumstances of the CEO and so there may be no
correlation between shareholding and CEO remuneration.8
2.1.4 CEO power and the board of directors
A board that is captured by the CEO may take a different view of CEO remuneration
to that taken by a board controlled by non-executive directors. A powerful CEO9
could use his remuneration contract to transfer wealth from the shareholders to
7 In particular, the impact of one large shareholder has been noted in the literature (Shleifer & Vishny
1986; Core et al. 1999). 8 We thank one of the reviewers for identifying this possibility.
9 Choe et al (2009) define CEO power along three dimensions, board characteristics, shareholder rights
and ownership structure with a range of variables used to capture these characteristics. It is argued that
CEO power is positively associated with poor governance and a lack of oversight by board or
shareholders.
10 3/11/201422/04/201021/04/2010
himself (Bertrand & Mullainathan 2000, 2001; Bebchuk & Fried 2003; Choe et al.
2009). For example, this could be achieved through increased equity based
incentives, particularly where earnings management is possible (Bergstresser &
Philippon 2006). There is evidence of a positive relation between CEO power and
total CEO remuneration (Core et al. 1999; Choe et al. 2009) although the relation
between CEO power and equity based remuneration is less clear (Bebchuk & Fried
2003; Hartzell & Starks 2003; Choe et al. 2009). Given the nature of the CEO
remuneration decision we select specific proxies for CEO power rather than rely on
the more general governance indices reported in the literature and there is some
support for this approach (Bhagat & Bolton 2008). It is expected that CEO power
would be most apparent in large boards (Lipton & Lorsch 1992; Eisenberg et al.
1998; Jensen 2001) with high levels of executive directors (Ryan & Wiggins 2001)
and where the CEO is also the chair of the board (Core et al. 1999; Ryan & Wiggins
2001; Bhagat & Bolton 2008) and so our proxies for CEO power include board size,
proportion of non-executive directors on the board and chairman/CEO duality. It is
hypothesised that the greater the CEO power, the greater the level of CEO
remuneration and this gives rise to the next hypothesis.
Hypothesis 4
4a. Board size is positively related with CEO remuneration.
4b. Proportion of non-executive directors on the board is negatively related with CEO
remuneration.
4c. Existence of dual chairman/CEO is positively related with CEO remuneration.
2.1.5 Growth options and task complexity
CEO task complexity tends to increase with company size (Rose & Shepard 1997;
Core et al. 1999). CEO remuneration should reflect complexity and so it is expected
11 3/11/201422/04/201021/04/2010
that there will be a positive relation between the level of CEO remuneration and the
size of the company. We also expect a positive relation between the size of the
investment opportunity set available to the company and CEO remuneration (Smith &
Watts 1992; Baber et al. 1996). Further, the greater the level of growth options in the
company the more difficult it is to monitor the CEO and the greater the risk that the
CEO will not perform as required. It is hypothesized that there is a positive relation
between CEO remuneration and growth opportunities and between CEO remuneration
and size. The variable used to proxy for growth options is R&D to total assets and so
hypothesis 5 is written as follows:
Hypothesis 5
5. R&D to total assets and size are positively related to CEO remuneration.
2.1.6 Monitoring by lenders
Monitoring by lenders, such as banks and financial institutions, may also have
an impact on CEO remuneration, with greater levels of debt being associated with the
possibility of greater levels of outside monitoring including the monitoring of the
CEO remuneration package. Leverage is included in the study as a control variable to
capture the impact of lender monitoring. It is expected that greater leverage is
associated with lower CEO remuneration. Lenders are expected to monitor highly
levered companies more closely and so may be more sensitive to excessive CEO
remuneration where company leverage is high.
Hypothesis 6
6. Debt to assets is negatively related to CEO remuneration.
2.2 Company performance
Higher remuneration levels should tend to attract superior CEOs, and so if
incentives are correctly set up, current CEO remuneration will be positively correlated
12 3/11/201422/04/201021/04/2010
with future performance. The relation between future performance and CEO
remuneration is necessarily stochastic and so it is possible that there will be states of
the world where a positive relation is not evident. Nevertherless, we expect that a
positive relation will hold on average across our sample of firms.
Market based incentives can better align CEO and shareholder expectations as
both benefit from company value increases. Thus, in lieu of managerial power, the
level of CEO equity based remuneration is, on average, positively related with future
firm performance. Cash or bonus based remuneration is not linked to future
performance in a direct manner like market based remuneration and so this element of
remuneration may be used to reward past performance as well as to retain a valuable
CEO. Thus the form of the remuneration, cash or equity, could be important in
aligning CEO remuneration with future performance.
The literature provides little analysis of the relation between CEO
remuneration and future performance though Core et al. use a CEO remuneration
model to estimate excess remuneration and find that their excess remuneration
measure is negatively related to performance (Core et al. 1999). The result is
interpreted as supporting the argument that management entrenchment can generate
negative future performance.
Hypothesis 7 deals with the relation between future performance and current
CEO remuneration and its components where future performance is measured using a
short-term accounting measure, return on total assets, and a long-term market based
performance measure, market to book value of total assets. The hypothesis relates
both to total remuneration and total remuneration relative to the industry average.
The latter measure adjusts for broad industry effects in the determination of CEO
remuneration. Analysis also focuses on the components of the remuneration package,
13 3/11/201422/04/201021/04/2010
to guage the impact of cash based remuneration relative to equity based remuneration
on the performance of the firm.
Hypothesis 7
7a. Market to book value of assets (or ROA) is positively related with CEO
remuneration in the previous year.
7b. Market to book value of assets (or ROA) is positively related with the proportion
of market based remuneration paid to the CEO in the previous year.
3. Data
We conduct a cross-sectional analysis of CEO remuneration for 1144
companies listed on the Australian stock exchange in 2006. The year 2006 was
chosen for analysis because of the change in financial reporting requirements that
occurred with the introduction of the Australian equivalent to the International
Financial Reporting Standards (A-IFRS) in 2005.10
It has been argued that there was
a considerable improvement in the remuneration disclosure practices after
introduction of AIFRS accounting standards though there were still some gaps,
particularly for the very small listed companies that form part of this sample.
Our sample of 1144 Australian companies is identified from the Aspect
Huntley data base.11
Shareholder information, board characteristics and director
remuneration information is manually collected from pdf copies of the annual reports
for the companies in the sample. The initial list of companies obtained from Aspect
Huntley numbered 1696 but this was reduced where there was: no annual report
available (44 companies); no clearly identified CEO (95 companies); no remuneration
section in the annual report (59 companies); no remuneration paid to the CEO (39
companies); no remuneration data reported (15); no Aspect Huntley accounting data
10
Publication of CEO remuneration was rather patchy prior to 2006 with some firms providing
comprehensive disclosure, while other firms reported little or no CEO remuneration data. 11
http://aspectfinancial.com.au/
14 3/11/201422/04/201021/04/2010
for the company in 2006 (108 companies); no data for market value of assets or book
value of assets (119 companies) and; missing shareholder or board of directors
information (73). This gives 552 exclusions from the original list of 1696, leaving
1144 companies for analysis.
Variables are collected for each of the companies to capture the level and
composition of CEO remuneration with total CEO remuneration and CEO
remuneration relative to industry average used as measures of CEO remuneration.
The natural logarithm of these variables is used in regression analysis due to the non-
normal distribution of these variables. This gives rise to the two dependent variables
used in analysis, the logarithm of total CEO remuneration (LntotCEOrem) and the
logarithm of CEO remuneration relative to industry average (IndreltotCEOrem).
Information is also collected on the composition of the CEO remuneration package
including the proportion of CEO remuneration devoted to short-term (Stpay), long-
term (Ltpay) and post-employment components (Pepay). The short-term elements of
CEO remuneration include salaries, fees, commissions, short-term cash or profit
sharing payouts, other short-term bonuses, short-term non-monetary benefits and any
other benefits of a short-term nature that the CEO receives as part of their
remuneration agreement. The long-term elements of CEO remuneration include
long-term incentive plans, shares, options and other benefits of a long term nature.
The post-employment elements of CEO remuneration include superannuation,
pension benefits and other post-employment benefits made available to the CEO.
Governance variables cover both shareholder and board of director
characteristics. Shareholder variables include the percentage of equity held by the top
20 shareholders (Top20shrhldrs), the percentage of equity held by the largest
shareholder (Topshrholdr) and the percentage of equity held by blockholders, being
15 3/11/201422/04/201021/04/2010
those shareholders with more than 5% of the equity in the company (Block-holding).
The number of directors on the board (BoardSize), the percentage of non-executive
directors on the board (Nonex) and a dummy variable indicating whether the
chairman of the board is also the CEO are used to capture the impact of board
characteristics on CEO remuneration (Chairman/CEO).
Return on assets and market to book value of total assets are used to measure
company performance The return on assets variables include the average return on
assets for 2004 and 2005 (avROA45) as well as return on assets for 2006 and for 2007
(ROA6 and ROA7). Market to book value of total assets is collected for the years
2005, 2006 and 2007 (Mkt/bvasset5, Mkt/bvasset6 and Mkt/bvasset7). These
variables are commonly used to capture company performance in the literature and so
analysis is conducted separately for the return on assets based performance measures
which tend to be short term in nature and the market to book based performance
measures which tend to take a longer term focus.
The proxy for growth options, or the investment opportunity set, is research
and development costs (Rd/asset6) and this is calculated using the ratio of R&D
expenses over the year to total assets at the beginning of the year. Long-term debt to
total assets (Ltd/assets6) is used to capture leverage. Finally, the log of the market
value of assets, where the market value of assets is defined as the sum of the book
value of liabilities and the market value of equity, is used as a proxy for size effects
(Lnmktasset6), including the impact of complexity.
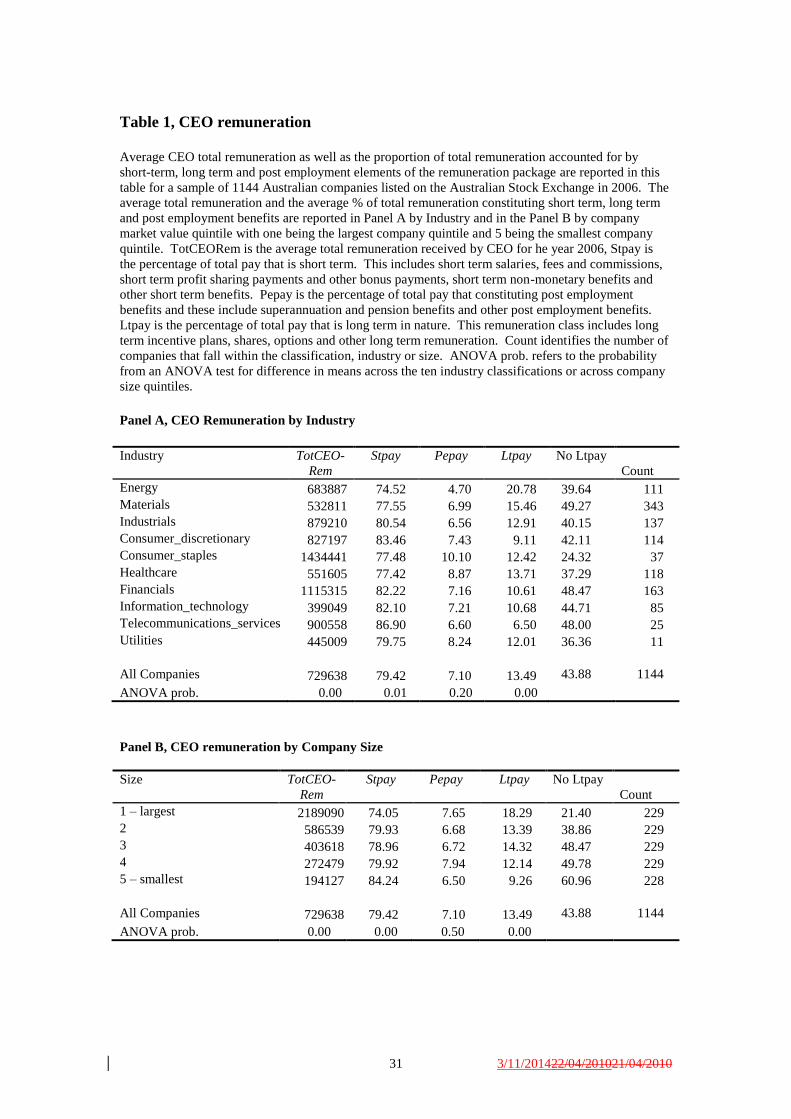
CEO remuneration data is described in Table 1 with average total CEO
remuneration ranging from $1.4 million in the consumer staples sector to $0.4 million
in information technology (Panel A of Table 1). The CEOs in the energy sector
exhibited the lowest proportion of short term remuneration on average (74.5%) and
16 3/11/201422/04/201021/04/2010
highest proportion of long-term remuneration (20.8%) while the Telecommunications
services sector provide the highest average short term component (86.9%) and the
least long-term component on average (6.5%). Analysis of variance (ANOVA) tests
for difference in the mean across the industries shows that there is statistically
significant variation across the industries in average total CEO remuneration as well
as for short-term and long term components of remuneration. The average post
employment component of CEO remuneration is fairly stable across industries with
an average of 7.1% for the sample.12
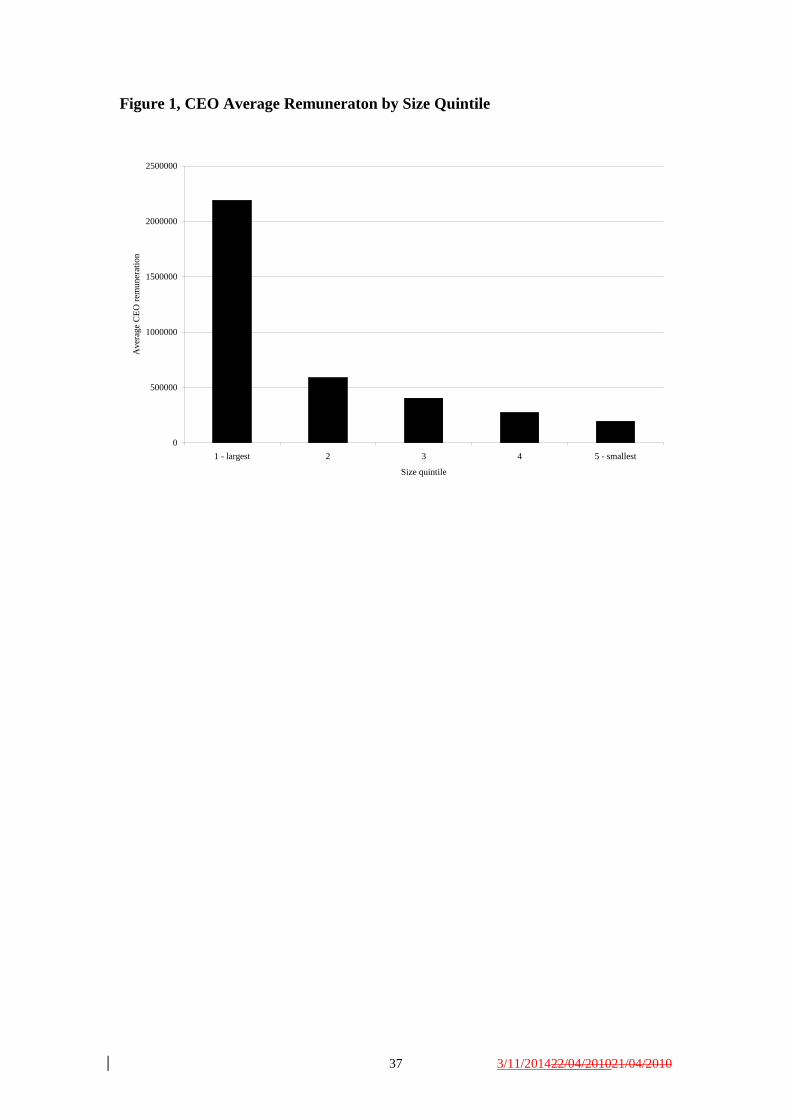
Descriptive statistics for remuneration by
company size quintiles are reported in Panel B of Table 1. Size quintiles are based on
the book value of the total assets held by the firm with a value of 1 referring to the
largest firm quintile and a value of 5 referring to the smallest firm quintile. While
there is a considerable difference in the average CEO remuneration for the largest
companies ($2.2 million) compared with the smallest companies ($0.2 million) there
is also some variation in the proportions allocated to long-term and short-term
components of the remuneration package with greater incidence of short-term
remuneration in the smaller companies.13
[Insert Table1 and Figure 1 about here]
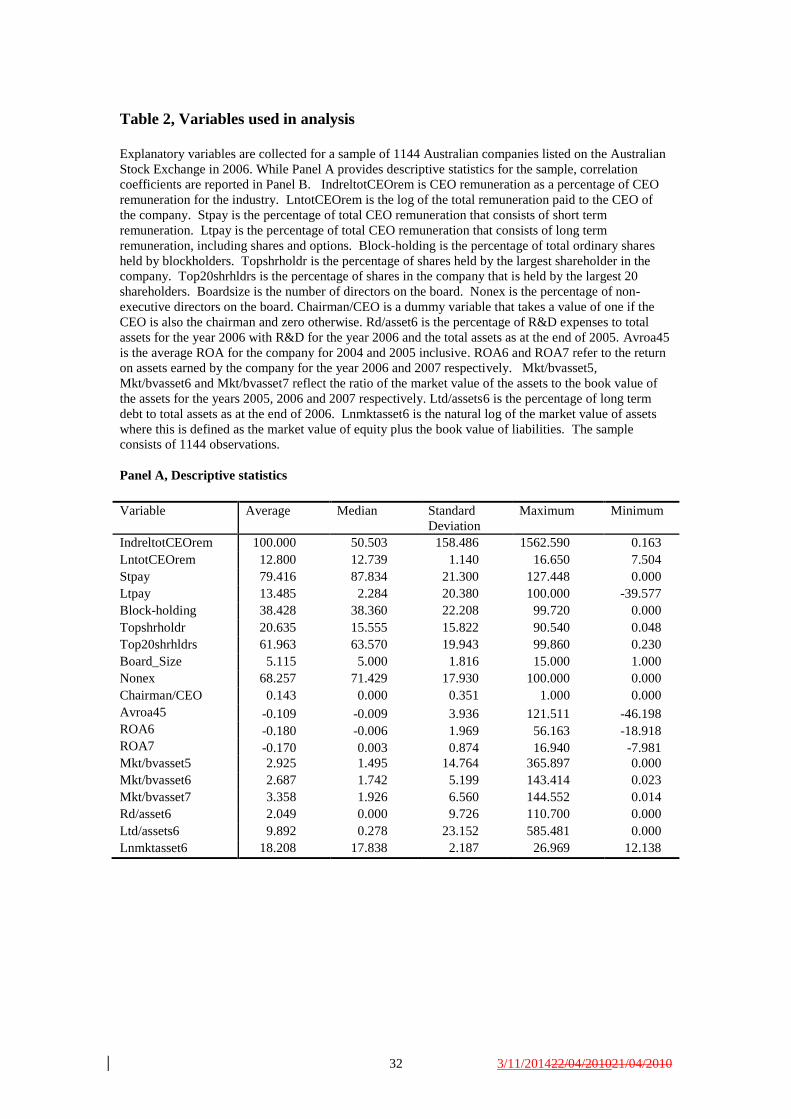
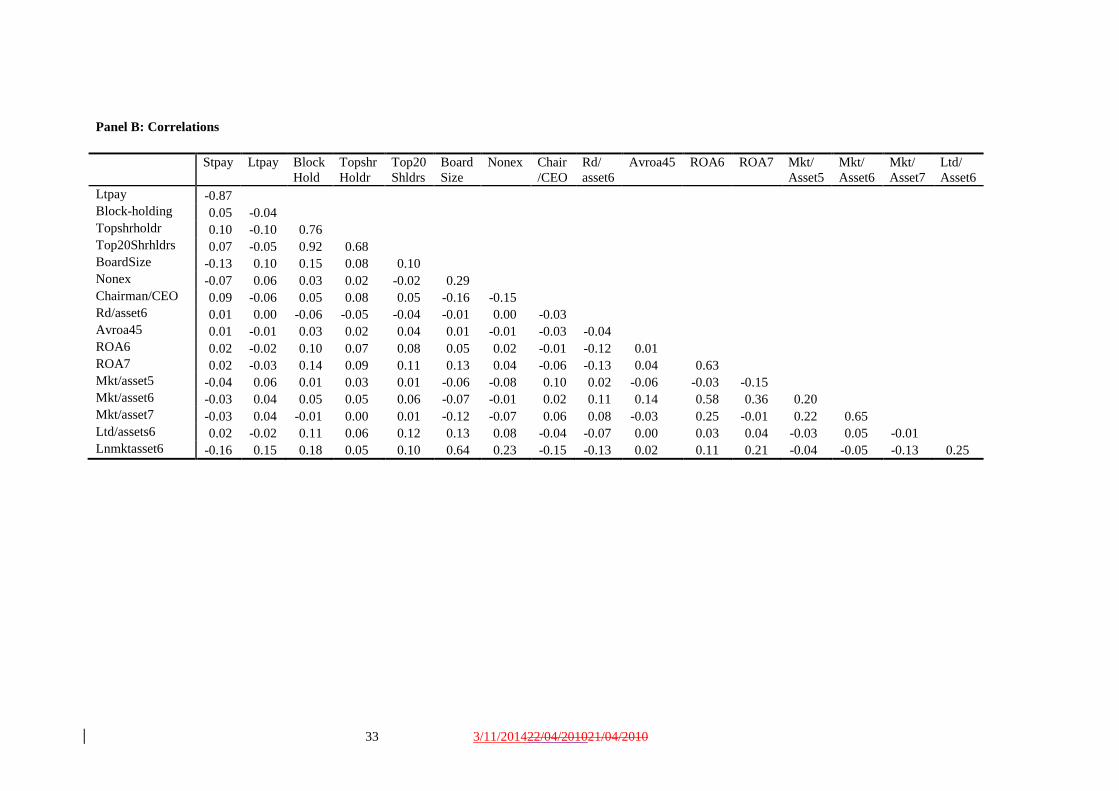
Descriptive statistics are reported for the explanatory variables in Panel A of
Table 2, with correlation coefficients for these variables appearing in Panel B of Table
2. While there are some large correlation coefficients, particularly for shareholder
12
The ANOVA test failed to reject the null of no difference in the mean post employment component
of total remuneration. 13
ANOVA tests show that mean differences are statistically significant for total remuneration as well
as for the short-term and long-term proportions. Again, the ANOVA test for difference in post
employment proportion of remuneration across the industries fails to reject the null of no statistically
significant difference.
17 3/11/201422/04/201021/04/2010
variables, company size, and the book to market value of assets, the remainder of the
estimated correlation coefficients are small.
[Insert Table 2 about here]
4. Analysis
We analyse both total CEO remuneration and the proportion of CEO
remuneration to the average for its industry using ordinary least squares regression,
with robust standard errors. A set of nine industry dummy variables are included in
the model to control for the impact of industry effects (Inddummies) on CEO
remuneration.
4.1 CEO remuneration
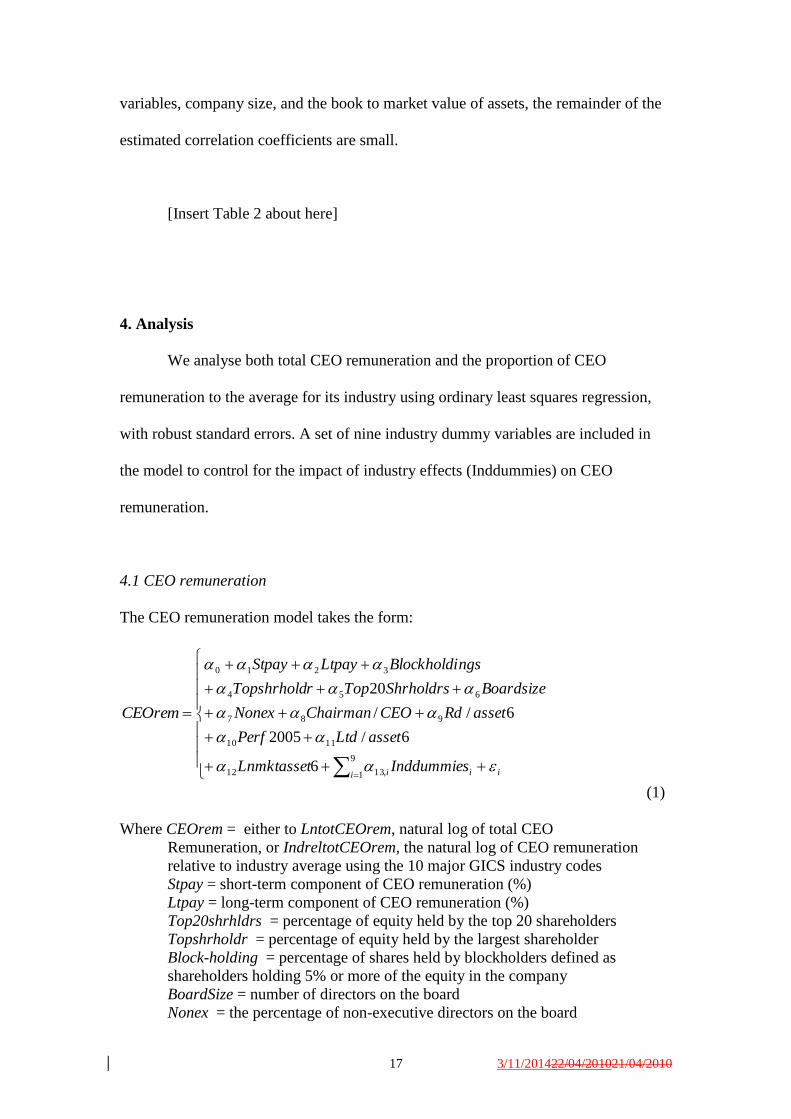
The CEO remuneration model takes the form:
CEOrem
ii ii InddummiesLnmktasset
assetLtdPerf
assetRdCEOChairmanNonex
BoardsizeShrholdrsToprTopshrhold
ngsBlockholdiLtpayStpay
9
1 ,1312
1110
987
654
3210
6
6/2005
6//
20
(1)
Where CEOrem = either to LntotCEOrem, natural log of total CEO
Remuneration, or IndreltotCEOrem, the natural log of CEO remuneration
relative to industry average using the 10 major GICS industry codes
Stpay = short-term component of CEO remuneration (%)
Ltpay = long-term component of CEO remuneration (%)
Top20shrhldrs = percentage of equity held by the top 20 shareholders
Topshrholdr = percentage of equity held by the largest shareholder
Block-holding = percentage of shares held by blockholders defined as
shareholders holding 5% or more of the equity in the company
BoardSize = number of directors on the board
Nonex = the percentage of non-executive directors on the board

18 3/11/201422/04/201021/04/2010
Chairman/CEO = a dummy variable indicating whether the chairman of the
board is also the CEO
Perf = either avROA45, average return on assets for 2004 and 2005, or
Mkt/bvasset5, the market to book value of total assets calculated for 2005
Rd/asset6 = ratio of R&D expenses over the year to total assets at the
beginning of the year
Ltd/assets6 = long-term debt to total assets
Lnmktasset6 = natural log of the market value of assets
Inddummies = a set of dummy variable used to capture industry effects
.
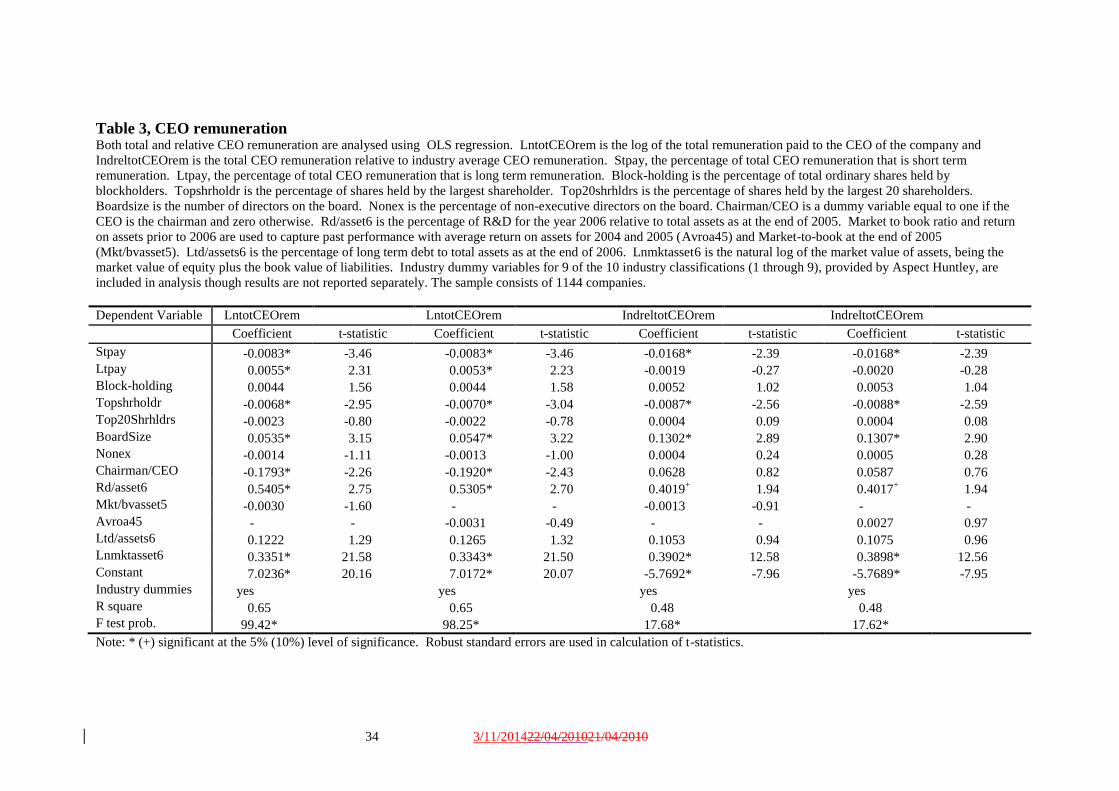
The results from estimating this model are reported in Table 3 with separate
models estimated for the two measures of CEO remuneration and for the two
performance measures, return on assets and the ratio of market value to book value of
assets. The estimated models are statistically significant with an R square of 0.65 for
the total CEO remuneration regression and 0.48 for the CEO remuneration relative to
the industry average.
[Insert Table 3 about here]
There is no support for Hypothesis 1 as neither of the performance measure
coefficients is statistically significant. Past performance has no statistically
significant explanatory power over cross-sectional variation in either total CEO
remuneration or CEO remuneration relative to industry average for our sample of
Australian listed companies. While this result is consistent with Izan et al. (1998) it is
not consistent with the more recent time series analysis of Merhebi et al.(2006).
The components of the remuneration package are found to be important in
explaining cross-sectional variation in total CEO remuneration and CEO
remuneration relative to industry average. There is a statistically significant negative
relation between the two CEO remuneration measures and the proportion of

19 3/11/201422/04/201021/04/2010
remuneration that is short-term (cash) in nature. Further, there is a statistically
significant positive relation between total CEO remuneration and the proportion of
remuneration that is long-term (market based) in nature. These results are consistent
with hypothesis 2, although the lack of a statistically significant relation between
market based remuneration (Ltpay) and CEO remuneration relative to the industry
average should be noted. Thus, total remuneration paid to a CEO tends to be larger
the greater the proportion of equity and the lower the proportion of cash that is
included in the package. The negative (positive) relation between the short-term
(long-term) component of CEO remuneration and total remuneration could be
explained by large complex firms paying their CEOs more in total while favouring
equity-based remuneration because of its ability to better align CEO and shareholder
interests. An alternative managerial power based explanation is that market based
remuneration is chosen to cloak the true cost to the firm of the CEO’s remuneration
package, particularly in the rising market that occurred from 2004 through to 2006
Only one of the three shareholder characteristics is found to be important in
this analysis with percentage of shareholding controlled by the largest shareholder
being statistically significant and negatively related with CEO remuneration,
consistent with Hypothesis 3c. It seems that the existence of a very large shareholder
is sufficient to temper the level of CEO remuneration both in an absolute sense and
relative to the industry average. The coefficients for the shareholding of blockholders
as a group and for shareholder concentration (shareholding of the top 20 shareholders)
are not statistically significant at the 5% level and thus there is no support for
hypotheses 3a and 3b. This result casts doubt on the ability of block-holders, as
distinct from the largest shareholder, to temper excessive CEO remuneration claims.
20 3/11/201422/04/201021/04/2010
The structure of the board of directors could affect CEO remuneration either
through CEO capture of the board (Lipton & Lorsch 1992; Jensen 2001) or through
the board structure mitigating CEO capture. Consistent with hypothesis 4a, board size
is positive and statistically significantly related with CEO remuneration. Greater
levels of remuneration earned by CEOs may simply reflect the greater control that
CEOs have over the board of directors. Yet, in this sample, a CEO who is also chair
of the board tends to earn lower levels of pay on average than a CEO who does not
hold both positions. This is inconsistent with hypothesis 4c and the managerial power
explanation. Finally, the proportion of non-executive directors on the board is not
statistically significantly related with CEO remuneration and so there is no support for
hypothesis 4b. In effect, the monitoring aspect of this group of directors does not
appear to be important with respect to the CEO remuneration decision. While the
positive link between board size and CEO remuneration and the lack of a non-
executive director effect on remuneration suggests board capture, it is interesting to
note that CEOs who also chair the board earn lower levels of remuneration. The
sample used in this study is quite unusual in its coverage of all available listed
companies and so it is possible that small companies with small boards that are
controlled by a dominant shareholder could be driving this CEO/chair of the board
duality effect.
Consistent with hypothesis 5, coefficients for both R&D and size are positive
and statistically significant either at the 5% level or at the 10% level of significance.
This suggests that growth options and task complexity are important determinants of
CEO remuneration. It appears that higher levels of remuneration are paid to CEOs
who face a more complex task; where they are responsible for dealing with large
complex companies and/or companies with considerable growth options. There is no
21 3/11/201422/04/201021/04/2010
support for hypothesis 6 with respect to monitoring by lenders. The coefficients are
positive thought not statistically significant in Table 3.
4.2 Components of CEO remuneration
CEO remuneration is broken down into three components, short term remuneration
(Stpay), long term remuneration (Ltpay) and post employment benefits (Pepay).
Given the lack of variation in post employment benefits evident in Table 1, the cross-
sectional analysis focuses on remaining two elements, the short-term and the long-
term components of CEO remuneration. Results of the analysis are reported in Table
4. The explanatory variables are similar to those included in Equation (1) above with
statistically significant coefficients reported for the largest shareholder and size at the
5% level of significance and for long term debt to assets and for market to book
coefficients (Stpay only).
[Insert Table 4 about here]
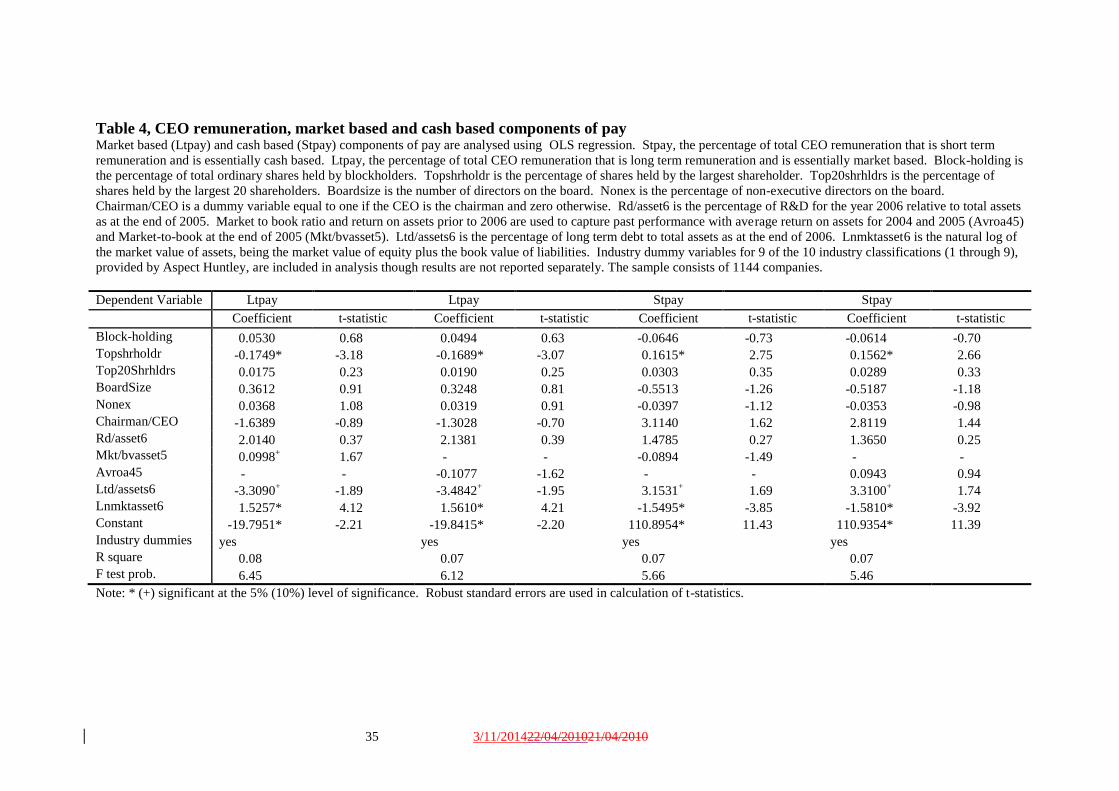
The market sensitive component of CEO remuneration (Ltpay) is negatively
related to the shareholding of the largest shareholder while cash based remuneration
(Stpay) is positively related to the shareholding of the largest shareholder. This
suggests that large powerful shareholders monitor CEO remuneration and tend to be
associated with firms that pay their CEOs relatively more cash based remuneration
and relatively less equity based remuneration. It is also found that the larger the
company the greater the proportion of market sensitive remuneration and the lower
22 3/11/201422/04/201021/04/2010
the proportion of cash based remuneration there is in the CEO’s remuneration
package, consistent with hypothesis 2a.
These results highlight the problems facing boards of directors in large
companies. Large listed companies are rarely controlled by one shareholder. While
the board of a large company rarely faces the intense monitoring that occurs where
one shareholder holds a very large percentage of the company’s shares, large
companies also face an internationally competitive market for CEOs. These
companies must pay a competitive salary to attract and hold a suitable CEO (Oyer
2004; Rajgopal et al. 2006). Yet, there is always the question of whether the CEO is
being paid for luck or for skill (Bertrand & Mullainathan 2001; Garvey & Milbourn
2006) and whether the remuneration package deals with poor performance in a
responsible manner (Brenner et al. 2000). In this sample larger companies show a
preference for market based remuneration and this is consistent with optimal
contracting theory (Jensen & Meckling 1976).
The coefficients estimated for lender monitoring suggest that lenders have
some impact on the structure of CEO remuneration with high levels of debt being
associated with lower levels of market sensitive remuneration and greater reliance on
cash based remuneration. While there was no evidence of lender monitoring affecting
total remuneration, there is evidence of a preference for cash remuneration as leverage
increases.
There is also a positive relation between market sensitive remuneration and
the long term performance measure, market to book ratio, in the prior year. It seems
that strong market to book based performance in 2005 was rewarded with increased
levels of market sensitive remuneration in 2006. This result is not robust to
23 3/11/201422/04/201021/04/2010
performance measure choice because the coefficient estimated for the short-term
performance measure, return on assets, is not statistically significant.
In sum, while there is a strong positive size effect on the proportion of market
based CEO remuneration there is no evidence of a growth options effect (R&D) and
so there is only partial support for Hypothesis 2c. The other variables provide a more
interesting explanation, particularly the importance of the largest shareholder and the
level of debt. Both of these variables can proxy for monitoring and they suggest that
higher levels of monitoring are associated with lower levels of market sensitive
remuneration and higher levels of cash based remuneration.
4.3 Company performance and CEO remuneration
The results from regressing future company performance measures on remuneration,
using performance data from 2007, and control variables drawn from 2006 are
reported in Table 5. The estimated coefficients differ considerably with performance
measure choice.
[Insert Table 5 about here]
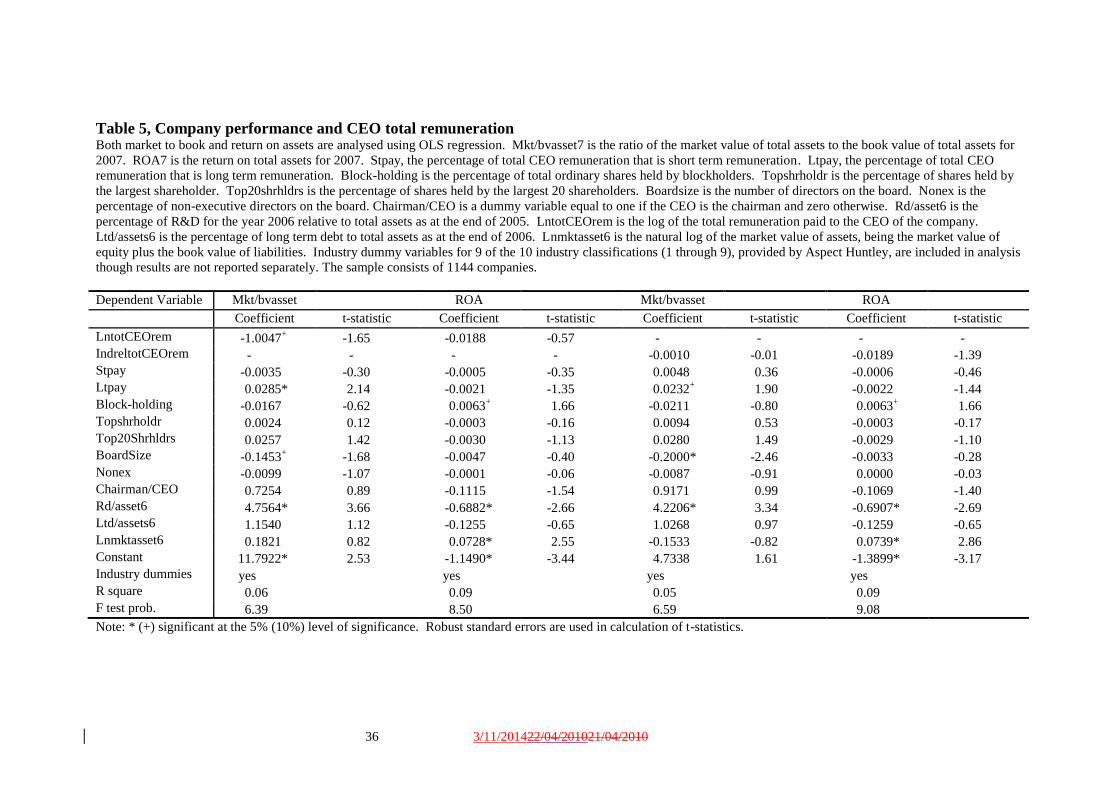
When using market to book value of assets there is a negative relation between
performance in 2007 and total CEO remuneration in 2006. This result is consistent
with entrenchment such that the greater the CEO power the greater the CEOs ability
to control the remuneration process while not being held accountable for poor
performance. Yet, this result is not supported strongly in the return on asset based
analysis where the coefficient is not statistically significant. CEO remuneration
relative to the industry average has no explanatory effect regardless of the
24 3/11/201422/04/201021/04/2010
performance measure used. These results are inconsistent with hypothesis 7a, which
relies on optimal contracting arguments. It would seem that optimal contracting
arguments do not capture the essence of the relation that exists between future
performance and current CEO remuneration in this data set.
The impact of the market sensitive (Ltpay) and cash based (Stpay)
components of CEO remuneration indicate that is the results are sensitive to the
performance measure chosen. There is a statistically significant positive relation
between the market sensitive component of CEO remuneration in 2006 and market to
book value of assets at the end of 2007. Thus, the results from the market to book
based performance measure are consistent with hypothesis 7b although this
hypothesis is not supported when using the short term performance measure, return on
assets.
Further, when using the market to book performance measure, it is evident that
larger boards in 2006 result in lower market to book ratio in 2007 and that greater
levels of R&D in 2006 are associated with greater market to book ratios in 2007.
These results are not replicated when the short-term performance measure, return on
assets, is used. Indeed, there is a positive block-holding effect, a negative R&D effect
and a positive size effect
Market to book and return on assets appear to capture different aspects of
company performance, particularly given the nature of these two measures. The
return on assets measure used in this analysis focuses on the performance that
occurred during the financial year ending in 2007 while market to book value of
assets measured as at the end of 2007 likely captures performance from the end of
2007 onwards. Thus, it is not surprising that the coefficients for R&D differ markedly
between the two measures of performance as growth options tend to pay off in the
25 3/11/201422/04/201021/04/2010
longer-term. Further, the lack of a market sensitive CEO remuneration component
effect in the return on assets analysis is also not surprising given that this performance
measure only focuses on performance over the next 12 months whereas this
remuneration component is expected to have a longer term impact on CEO behaviour.
5. Conclusions
The determination of CEO remuneration is an important responsibility for the
board of directors who are charged with the responsibility to hire, fire and remunerate
CEOs. Using a sample of 1,144 Australian listed companies for 2006, we find that
total CEO remuneration is positively associated with the size of the long-term
component of CEO remuneration, company size, board size and the level of a
company's growth options and negatively associated with the short-term component
of CEO remuneration, the percentage shareholding of the largest shareholder and the
existence of a CEO who is also chair of the board.
It is important to note that the shareholding of the largest shareholder, and not
the proportion of shares held by blockholders or the proportion of non-executive
directors on the board, explains variation in CEO remuneration. The largest
shareholder in a company appears to be able to dampen CEO remuneration claims.
Perhaps this result is not surprising because the greater the investment, the greater the
ability of the shareholder to affect remuneration decisions and the greater the loss that
the shareholder suffers when funds are wasted on inappropriate CEO remuneration.
This result has policy implications because it highlights the importance of investors
whose incentives are closely aligned with the value of the company. The larger the
investor's stake in the company the more sensitive the investor is to decisions like
CEO remuneration.
26 3/11/201422/04/201021/04/2010
Although it is commonly argued that non-executive directors improve
corporate governance, we find that the proportion of executive directors on the board
has no impact on CEO remuneration levels or CEO remuneration relative to the
industry average. This result is important because it casts doubt on the ability of, or
the incentive for, non executive directors to reign in excessive CEO remuneration.
While the non-executive directors can be captured by the CEO there is also little
direct incentive for this group to control CEO remuneration. Given the importance of
reputation costs to this group, corporate strategy and avoidance of bankruptcy may
rank more highly than the generally immaterial costs arising from the CEO
remuneration decision.14
When the company is doing well it is unlikely that non-
executive directors will question CEO remuneration and this contention is supported
when directors of large corporations choose to ignore shareholder criticism of CEO
remuneration levels.
Further, large shareholders (blockholders) are often cited in the finance
literature as an important group in the company governance, yet this group also seems
to have little impact on CEO remuneration in our sample. In Australia, blockholders
would generally include insurance companies, superannuation, other mutual funds
and other financial institutions.
It is also argued that CEO remuneration should drive company performance
but the literature is inconsistent on this point. While not measured with much
precision (10% level of significance) there is evidence that total compensation is
negatively related with longer term measures of performance (market to book).
Increased levels of remuneration in 2006 may have actually reduced long-term
performance as estimated at the end of 2007. Possible future research could extend
14
It could be argued that a million dollar payout to a CEO is an immaterial amount for a trillion dollar
company.

27 3/11/201422/04/201021/04/2010
the period of study while maintaining the focus on all available companies rather than
just focusing on the larger companies, which is the case for much of the recent
literature.
28 3/11/201422/04/201021/04/2010
References
Aggarwal, R.K., Samwick, A.A., 1999. The other side of the trade-off: The impact of
risk on executive compensation. Journal of Political Economy 107, 65-105
Baber, W.R., Janakiraman, S.N., Kang, S.-H., 1996. Investment opportunities and the
structure of executive compensation. Journal of Accounting and Economics
21, 297-318
Baker, G.P., C., J.M., J., M.K., 1988. Compensation and Incentives: Practice vs.
theory. The Journal of Finance 63, 593-616
Bebchuk, L.A., Fried, J.M., 2003. Executive compensation as an agency problem.
journal of Economic Perspectives 17, 71-92
Bergstresser, D., Philippon, T., 2006. CEO Incentives and earnings management.
Journal of Financial Economics 80, 511-529
Bertrand, M., Mullainathan, S., 2000. Agents with and without principals. American
Economic Review 90, 203-208
Bertrand, M., Mullainathan, S., 2001. Are CEOs rewarded for luck? The ones without
principals are. Quarterly Journal of Economics 116, 901-932
Bhagat, S., Bolton, B., 2008. Corporate governance and firm performance. Journal of
Corporate Finance 14, 257-273
Brenner, M., Sundaram, R.K., Yermack, D., 2000. Altering the terms of executive
stock options. Journal of Financial Economics 57, 103-128
Campbell, C.J., Wasley, C.E., 1999. Stock-based incentive contracts and managerial
performance: The case of Ralston Purina Company. Journal of Financial
Economics 51, 195-217
Choe, C., Tian, G., Yin, X., 2009. Managerial Power, stock-based compensation, and
firm performance: Theory and evidence. In: Available at SSRN:
http://ssrn.com/abstract=1361327, pp. 1-55
Core, J.E., Holthausen, R.W., Larcker, D.F., 1999. Corporate governance, chief
executive officer compensation, and firm performance. Journal of Financial
Economics 51, 371-406
Del Guercio, D., Seery, L., Woidtke, T., 2008. Do boards pay attention when
institutional investor activists "just vote no"? Journal of Financial Economics
90, 84-103
Edmuns, A., Gabaix, X., 2009. Is CEO pay really inefficient? A survey of new
optimal contracting theories. European Financial Management 15, 486-496
Eisenberg, T., Sundgren, S., Wells, M.T., 1998. Larger board size and decreasing firm
value in small firms. Journal of Financial Economics 48, 35-54
Fels, A., 2004. CEO's pay out of whack. In: Australian Financial Review, Sydney
Garvey, G., T., Milbourn, T., T., 2006. Asymmetric benchmarking in compensation:
Executives are rewarded for good luck but not penalised for bad. Journal of
Financial Economics 82, 197-225
Hall, B.J., Murphy, K.J., 2000a. Optimal exercise prices for executive stock options.
American Economic Review 90, 209-214
Hall, B.J., Murphy, K.J., 2000b. Stock options for undiversified executives? , pp. 1-
63, California
Hall, B.J., Murphy, K.J., 2002. Stock options for undiversified executives. Journal of
Accounting and Economics 33, 3-42
29 3/11/201422/04/201021/04/2010
Hall, B.J., Murphy, K.J., 2003. The trouble with stock options. The Journal of
Economic Perspectives 17, 49-70
Hartzell, J.C., Starks, L.T., 2003. Institutional investors and executive compensation.
Journal of Finance 58
Hermalin, B.E., Wallace, N.E., 2001. Firm performance and executive compensation
in the savings and loan industry. Journal of Financial Economics 61, 139-170
Izan, H.Y., Sidhu, B., Taylor, S., 1998. Does CEO pay reflect performance? Some
Australian evidence. Corporate Governance 6, 39-47
Jensen, M.C., 2001. Value maximization, stakeholder theory, and the corporate
objective function. Journal of Applied Corporate Finance 14, 8-21
Jensen, M.C., Meckling, W.H., 1976. Theory of the firm: Managerial behavior,
agency costs and ownership structure. Journal of Financial Economics 3, 305-
360
Jensen, M.C., Murphy, K.J., 1990. Performance pay and top-management incentives.
The Journal of Political Economy 98, 225-264
Kole, S.R., 1997. The complexity of compensation contracts. Journal of Financial
Economics 43, 79-104
Leone, A.J., Wu, J.S., Zimmerman, J.L., 2006. Asymmetric sensitivity of CEO cash
compensation to stock returns. Journal of Accounting and Economics 42, 167-
192
Lipton, M., Lorsch, J.W., 1992. A modest proposal for improved corporate
governance. Business Lawyer 48, 59-77
Merhebi, R., Pattenden, K., Swan, P.L., Zhou, X., 2006. Australian chief executive
officer remuneration: Pay and performance. Accounting and Finance 46, 481-
497
Murphy, K.J., 1985. Corporate performance and managerial remuneration An
empirical analysis. Journal of Accounting and Economics 7, 11-42
Oyer, P., 2004. Why do firms use incentives that have no incentive effects? Journal of
Finance 59, 1619-1649
Productivity Commission, 2009. Executive remuneration in Australia. In: Report No.
49 Final Inquiry Report, Melbourne
Rajgopal, S., Shevlin, T., Zamora, V., 2006. CEOs' outside employment opportunities
and the lack of relative performance evaluation in compensation contracts.
Journal of Finance 61, 1813-1844
Rose, N.L., Shepard, A., 1997. Firm diversification and CEO compensation :
Managerial ability or executive entrenchment? RAND Journal of Economics
28, 489-514
Ross, S.A., 2004. Compensation, incentives and the duality of risk aversion and
riskiness. The Journal of Finance 59, 207-225
Ryan, H.E., Wiggins, R.A.I., 2001. The influences of firm- and manager-specific
characteristics on the structure of executive compensation. Journal of
Corporate Finance 7, 101-123
Saulwick, J., Coorey, P., 2009. Rudd takes action on bosses' pay. In: Sydney Morning
Herald, 19 March, Sydney
Shleifer, A., Vishny, R., 1986. Large shareholders and corporate control. Journal of
Political Economy 94, 461-488
Smith, C.W., Watts, R.L., 1992. The investment opportunity set and corporate
financing, dividend, and compensation policies. Journal of Financial
Economics 32, 263-292
30 3/11/201422/04/201021/04/2010
Swan, P.L., 2010. The case fo curbing CEO pay is based on political hyperbole. In:
The Australian, 11 january, Sydney
31 3/11/201422/04/201021/04/2010
Table 1, CEO remuneration
Average CEO total remuneration as well as the proportion of total remuneration accounted for by
short-term, long term and post employment elements of the remuneration package are reported in this
table for a sample of 1144 Australian companies listed on the Australian Stock Exchange in 2006. The
average total remuneration and the average % of total remuneration constituting short term, long term
and post employment benefits are reported in Panel A by Industry and in the Panel B by company
market value quintile with one being the largest company quintile and 5 being the smallest company
quintile. TotCEORem is the average total remuneration received by CEO for he year 2006, Stpay is
the percentage of total pay that is short term. This includes short term salaries, fees and commissions,
short term profit sharing payments and other bonus payments, short term non-monetary benefits and
other short term benefits. Pepay is the percentage of total pay that constituting post employment
benefits and these include superannuation and pension benefits and other post employment benefits.
Ltpay is the percentage of total pay that is long term in nature. This remuneration class includes long
term incentive plans, shares, options and other long term remuneration. Count identifies the number of
companies that fall within the classification, industry or size. ANOVA prob. refers to the probability
from an ANOVA test for difference in means across the ten industry classifications or across company
size quintiles.
Panel A, CEO Remuneration by Industry
Industry TotCEO-
Rem
Stpay Pepay Ltpay No Ltpay
Count
Energy 683887 74.52 4.70 20.78 39.64 111
Materials 532811 77.55 6.99 15.46 49.27 343
Industrials 879210 80.54 6.56 12.91 40.15 137
Consumer_discretionary 827197 83.46 7.43 9.11 42.11 114
Consumer_staples 1434441 77.48 10.10 12.42 24.32 37
Healthcare 551605 77.42 8.87 13.71 37.29 118
Financials 1115315 82.22 7.16 10.61 48.47 163
Information_technology 399049 82.10 7.21 10.68 44.71 85
Telecommunications_services 900558 86.90 6.60 6.50 48.00 25
Utilities 445009 79.75 8.24 12.01 36.36 11
All Companies 729638 79.42 7.10 13.49 43.88 1144
ANOVA prob. 0.00 0.01 0.20 0.00
Panel B, CEO remuneration by Company Size
Size TotCEO-
Rem
Stpay Pepay Ltpay No Ltpay
Count
1 – largest 2189090 74.05 7.65 18.29 21.40 229
2 586539 79.93 6.68 13.39 38.86 229
3 403618 78.96 6.72 14.32 48.47 229
4 272479 79.92 7.94 12.14 49.78 229
5 – smallest 194127 84.24 6.50 9.26 60.96 228
All Companies 729638 79.42 7.10 13.49 43.88 1144
ANOVA prob. 0.00 0.00 0.50 0.00
32 3/11/201422/04/201021/04/2010
Table 2, Variables used in analysis
Explanatory variables are collected for a sample of 1144 Australian companies listed on the Australian
Stock Exchange in 2006. While Panel A provides descriptive statistics for the sample, correlation
coefficients are reported in Panel B. IndreltotCEOrem is CEO remuneration as a percentage of CEO
remuneration for the industry. LntotCEOrem is the log of the total remuneration paid to the CEO of
the company. Stpay is the percentage of total CEO remuneration that consists of short term
remuneration. Ltpay is the percentage of total CEO remuneration that consists of long term
remuneration, including shares and options. Block-holding is the percentage of total ordinary shares
held by blockholders. Topshrholdr is the percentage of shares held by the largest shareholder in the
company. Top20shrhldrs is the percentage of shares in the company that is held by the largest 20
shareholders. Boardsize is the number of directors on the board. Nonex is the percentage of non-
executive directors on the board. Chairman/CEO is a dummy variable that takes a value of one if the
CEO is also the chairman and zero otherwise. Rd/asset6 is the percentage of R&D expenses to total
assets for the year 2006 with R&D for the year 2006 and the total assets as at the end of 2005. Avroa45
is the average ROA for the company for 2004 and 2005 inclusive. ROA6 and ROA7 refer to the return
on assets earned by the company for the year 2006 and 2007 respectively. Mkt/bvasset5,
Mkt/bvasset6 and Mkt/bvasset7 reflect the ratio of the market value of the assets to the book value of
the assets for the years 2005, 2006 and 2007 respectively. Ltd/assets6 is the percentage of long term
debt to total assets as at the end of 2006. Lnmktasset6 is the natural log of the market value of assets
where this is defined as the market value of equity plus the book value of liabilities. The sample
consists of 1144 observations.
Panel A, Descriptive statistics
Variable Average Median Standard
Deviation
Maximum Minimum
IndreltotCEOrem 100.000 50.503 158.486 1562.590 0.163
LntotCEOrem 12.800 12.739 1.140 16.650 7.504
Stpay 79.416 87.834 21.300 127.448 0.000
Ltpay 13.485 2.284 20.380 100.000 -39.577
Block-holding 38.428 38.360 22.208 99.720 0.000
Topshrholdr 20.635 15.555 15.822 90.540 0.048
Top20shrhldrs 61.963 63.570 19.943 99.860 0.230
Board_Size 5.115 5.000 1.816 15.000 1.000
Nonex 68.257 71.429 17.930 100.000 0.000
Chairman/CEO 0.143 0.000 0.351 1.000 0.000
Avroa45 -0.109 -0.009 3.936 121.511 -46.198
ROA6 -0.180 -0.006 1.969 56.163 -18.918
ROA7 -0.170 0.003 0.874 16.940 -7.981
Mkt/bvasset5 2.925 1.495 14.764 365.897 0.000
Mkt/bvasset6 2.687 1.742 5.199 143.414 0.023
Mkt/bvasset7 3.358 1.926 6.560 144.552 0.014
Rd/asset6 2.049 0.000 9.726 110.700 0.000
Ltd/assets6 9.892 0.278 23.152 585.481 0.000
Lnmktasset6 18.208 17.838 2.187 26.969 12.138
33 3/11/201422/04/201021/04/2010
Panel B: Correlations
Stpay Ltpay Block
Hold
Topshr
Holdr
Top20
Shldrs
Board
Size
Nonex Chair
/CEO
Rd/
asset6
Avroa45 ROA6 ROA7 Mkt/
Asset5
Mkt/
Asset6
Mkt/
Asset7
Ltd/
Asset6
Ltpay -0.87
Block-holding 0.05 -0.04
Topshrholdr 0.10 -0.10 0.76
Top20Shrhldrs 0.07 -0.05 0.92 0.68
BoardSize -0.13 0.10 0.15 0.08 0.10
Nonex -0.07 0.06 0.03 0.02 -0.02 0.29
Chairman/CEO 0.09 -0.06 0.05 0.08 0.05 -0.16 -0.15
Rd/asset6 0.01 0.00 -0.06 -0.05 -0.04 -0.01 0.00 -0.03
Avroa45 0.01 -0.01 0.03 0.02 0.04 0.01 -0.01 -0.03 -0.04
ROA6 0.02 -0.02 0.10 0.07 0.08 0.05 0.02 -0.01 -0.12 0.01
ROA7 0.02 -0.03 0.14 0.09 0.11 0.13 0.04 -0.06 -0.13 0.04 0.63
Mkt/asset5 -0.04 0.06 0.01 0.03 0.01 -0.06 -0.08 0.10 0.02 -0.06 -0.03 -0.15
Mkt/asset6 -0.03 0.04 0.05 0.05 0.06 -0.07 -0.01 0.02 0.11 0.14 0.58 0.36 0.20
Mkt/asset7 -0.03 0.04 -0.01 0.00 0.01 -0.12 -0.07 0.06 0.08 -0.03 0.25 -0.01 0.22 0.65
Ltd/assets6 0.02 -0.02 0.11 0.06 0.12 0.13 0.08 -0.04 -0.07 0.00 0.03 0.04 -0.03 0.05 -0.01
Lnmktasset6 -0.16 0.15 0.18 0.05 0.10 0.64 0.23 -0.15 -0.13 0.02 0.11 0.21 -0.04 -0.05 -0.13 0.25
34 3/11/201422/04/201021/04/2010
Table 3, CEO remuneration Both total and relative CEO remuneration are analysed using OLS regression. LntotCEOrem is the log of the total remuneration paid to the CEO of the company and
IndreltotCEOrem is the total CEO remuneration relative to industry average CEO remuneration. Stpay, the percentage of total CEO remuneration that is short term
remuneration. Ltpay, the percentage of total CEO remuneration that is long term remuneration. Block-holding is the percentage of total ordinary shares held by
blockholders. Topshrholdr is the percentage of shares held by the largest shareholder. Top20shrhldrs is the percentage of shares held by the largest 20 shareholders.
Boardsize is the number of directors on the board. Nonex is the percentage of non-executive directors on the board. Chairman/CEO is a dummy variable equal to one if the
CEO is the chairman and zero otherwise. Rd/asset6 is the percentage of R&D for the year 2006 relative to total assets as at the end of 2005. Market to book ratio and return
on assets prior to 2006 are used to capture past performance with average return on assets for 2004 and 2005 (Avroa45) and Market-to-book at the end of 2005
(Mkt/bvasset5). Ltd/assets6 is the percentage of long term debt to total assets as at the end of 2006. Lnmktasset6 is the natural log of the market value of assets, being the
market value of equity plus the book value of liabilities. Industry dummy variables for 9 of the 10 industry classifications (1 through 9), provided by Aspect Huntley, are
included in analysis though results are not reported separately. The sample consists of 1144 companies.
Dependent Variable LntotCEOrem LntotCEOrem IndreltotCEOrem IndreltotCEOrem
Coefficient t-statistic Coefficient t-statistic Coefficient t-statistic Coefficient t-statistic
Stpay -0.0083* -3.46 -0.0083* -3.46 -0.0168* -2.39 -0.0168* -2.39
Ltpay 0.0055* 2.31 0.0053* 2.23 -0.0019 -0.27 -0.0020 -0.28
Block-holding 0.0044 1.56 0.0044 1.58 0.0052 1.02 0.0053 1.04
Topshrholdr -0.0068* -2.95 -0.0070* -3.04 -0.0087* -2.56 -0.0088* -2.59
Top20Shrhldrs -0.0023 -0.80 -0.0022 -0.78 0.0004 0.09 0.0004 0.08
BoardSize 0.0535* 3.15 0.0547* 3.22 0.1302* 2.89 0.1307* 2.90
Nonex -0.0014 -1.11 -0.0013 -1.00 0.0004 0.24 0.0005 0.28
Chairman/CEO -0.1793* -2.26 -0.1920* -2.43 0.0628 0.82 0.0587 0.76
Rd/asset6 0.5405* 2.75 0.5305* 2.70 0.4019+ 1.94 0.4017
+ 1.94
Mkt/bvasset5 -0.0030 -1.60 - - -0.0013 -0.91 - -
Avroa45 - - -0.0031 -0.49 - - 0.0027 0.97
Ltd/assets6 0.1222 1.29 0.1265 1.32 0.1053 0.94 0.1075 0.96
Lnmktasset6 0.3351* 21.58 0.3343* 21.50 0.3902* 12.58 0.3898* 12.56
Constant 7.0236* 20.16 7.0172* 20.07 -5.7692* -7.96 -5.7689* -7.95
Industry dummies yes yes yes yes
R square 0.65 0.65 0.48 0.48
F test prob. 99.42* 98.25* 17.68* 17.62*
Note: * (+) significant at the 5% (10%) level of significance. Robust standard errors are used in calculation of t-statistics.
35 3/11/201422/04/201021/04/2010
Table 4, CEO remuneration, market based and cash based components of pay Market based (Ltpay) and cash based (Stpay) components of pay are analysed using OLS regression. Stpay, the percentage of total CEO remuneration that is short term
remuneration and is essentially cash based. Ltpay, the percentage of total CEO remuneration that is long term remuneration and is essentially market based. Block-holding is
the percentage of total ordinary shares held by blockholders. Topshrholdr is the percentage of shares held by the largest shareholder. Top20shrhldrs is the percentage of
shares held by the largest 20 shareholders. Boardsize is the number of directors on the board. Nonex is the percentage of non-executive directors on the board.
Chairman/CEO is a dummy variable equal to one if the CEO is the chairman and zero otherwise. Rd/asset6 is the percentage of R&D for the year 2006 relative to total assets
as at the end of 2005. Market to book ratio and return on assets prior to 2006 are used to capture past performance with average return on assets for 2004 and 2005 (Avroa45)
and Market-to-book at the end of 2005 (Mkt/bvasset5). Ltd/assets6 is the percentage of long term debt to total assets as at the end of 2006. Lnmktasset6 is the natural log of
the market value of assets, being the market value of equity plus the book value of liabilities. Industry dummy variables for 9 of the 10 industry classifications (1 through 9),
provided by Aspect Huntley, are included in analysis though results are not reported separately. The sample consists of 1144 companies.
Dependent Variable Ltpay Ltpay Stpay Stpay
Coefficient t-statistic Coefficient t-statistic Coefficient t-statistic Coefficient t-statistic
Block-holding 0.0530 0.68 0.0494 0.63 -0.0646 -0.73 -0.0614 -0.70
Topshrholdr -0.1749* -3.18 -0.1689* -3.07 0.1615* 2.75 0.1562* 2.66
Top20Shrhldrs 0.0175 0.23 0.0190 0.25 0.0303 0.35 0.0289 0.33
BoardSize 0.3612 0.91 0.3248 0.81 -0.5513 -1.26 -0.5187 -1.18
Nonex 0.0368 1.08 0.0319 0.91 -0.0397 -1.12 -0.0353 -0.98
Chairman/CEO -1.6389 -0.89 -1.3028 -0.70 3.1140 1.62 2.8119 1.44
Rd/asset6 2.0140 0.37 2.1381 0.39 1.4785 0.27 1.3650 0.25
Mkt/bvasset5 0.0998+ 1.67 - - -0.0894 -1.49 - -
Avroa45 - - -0.1077 -1.62 - - 0.0943 0.94
Ltd/assets6 -3.3090+ -1.89 -3.4842
+ -1.95 3.1531
+ 1.69 3.3100
+ 1.74
Lnmktasset6 1.5257* 4.12 1.5610* 4.21 -1.5495* -3.85 -1.5810* -3.92
Constant -19.7951* -2.21 -19.8415* -2.20 110.8954* 11.43 110.9354* 11.39
Industry dummies yes yes yes yes
R square 0.08 0.07 0.07 0.07
F test prob. 6.45 6.12 5.66 5.46
Note: * (+) significant at the 5% (10%) level of significance. Robust standard errors are used in calculation of t-statistics.
36 3/11/201422/04/201021/04/2010
Table 5, Company performance and CEO total remuneration Both market to book and return on assets are analysed using OLS regression. Mkt/bvasset7 is the ratio of the market value of total assets to the book value of total assets for
2007. ROA7 is the return on total assets for 2007. Stpay, the percentage of total CEO remuneration that is short term remuneration. Ltpay, the percentage of total CEO
remuneration that is long term remuneration. Block-holding is the percentage of total ordinary shares held by blockholders. Topshrholdr is the percentage of shares held by
the largest shareholder. Top20shrhldrs is the percentage of shares held by the largest 20 shareholders. Boardsize is the number of directors on the board. Nonex is the
percentage of non-executive directors on the board. Chairman/CEO is a dummy variable equal to one if the CEO is the chairman and zero otherwise. Rd/asset6 is the
percentage of R&D for the year 2006 relative to total assets as at the end of 2005. LntotCEOrem is the log of the total remuneration paid to the CEO of the company.
Ltd/assets6 is the percentage of long term debt to total assets as at the end of 2006. Lnmktasset6 is the natural log of the market value of assets, being the market value of
equity plus the book value of liabilities. Industry dummy variables for 9 of the 10 industry classifications (1 through 9), provided by Aspect Huntley, are included in analysis
though results are not reported separately. The sample consists of 1144 companies.
Dependent Variable Mkt/bvasset ROA Mkt/bvasset ROA
Coefficient t-statistic Coefficient t-statistic Coefficient t-statistic Coefficient t-statistic
LntotCEOrem -1.0047+ -1.65 -0.0188 -0.57 - - - -
IndreltotCEOrem - - - - -0.0010 -0.01 -0.0189 -1.39
Stpay -0.0035 -0.30 -0.0005 -0.35 0.0048 0.36 -0.0006 -0.46
Ltpay 0.0285* 2.14 -0.0021 -1.35 0.0232+ 1.90 -0.0022 -1.44
Block-holding -0.0167 -0.62 0.0063+ 1.66 -0.0211 -0.80 0.0063
+ 1.66
Topshrholdr 0.0024 0.12 -0.0003 -0.16 0.0094 0.53 -0.0003 -0.17
Top20Shrhldrs 0.0257 1.42 -0.0030 -1.13 0.0280 1.49 -0.0029 -1.10
BoardSize -0.1453+ -1.68 -0.0047 -0.40 -0.2000* -2.46 -0.0033 -0.28
Nonex -0.0099 -1.07 -0.0001 -0.06 -0.0087 -0.91 0.0000 -0.03
Chairman/CEO 0.7254 0.89 -0.1115 -1.54 0.9171 0.99 -0.1069 -1.40
Rd/asset6 4.7564* 3.66 -0.6882* -2.66 4.2206* 3.34 -0.6907* -2.69
Ltd/assets6 1.1540 1.12 -0.1255 -0.65 1.0268 0.97 -0.1259 -0.65
Lnmktasset6 0.1821 0.82 0.0728* 2.55 -0.1533 -0.82 0.0739* 2.86
Constant 11.7922* 2.53 -1.1490* -3.44 4.7338 1.61 -1.3899* -3.17
Industry dummies yes yes yes yes
R square 0.06 0.09 0.05 0.09
F test prob. 6.39 8.50 6.59 9.08
Note: * (+) significant at the 5% (10%) level of significance. Robust standard errors are used in calculation of t-statistics.
37 3/11/201422/04/201021/04/2010
Figure 1, CEO Average Remuneraton by Size Quintile
0
500000
1000000
1500000
2000000
2500000
1 - largest 2 3 4 5 - smallest
Size quintile
Av
erag
e C
EO
rem
un
erat
ion