STEAM REFORMING OF LOWER ALKANES AND THE W
208
INVESTIGATION OF ACTIVE SITES AND REACTION NETWORKS IN CATALYTIC HYDROGEN PRODUCTION: STEAM REFORMING OF LOWER ALKANES AND THE WATER-GAS SHIFT REACTION DISSERTATION Presented in Partial Fulfillment of the Requirements for the Degree Doctor of Philosophy in the Graduate School of The Ohio State University By Sittichai Natesakhawat, M.S. * * * * * The Ohio State University 2005 Dissertation Committee: Approved by Professor Umit S. Ozkan, Adviser Professor Jeffrey J. Chalmers Professor David L. Tomasko _________________________ Professor Heather Davis Adviser Graduate Program in Chemical Engineering
-
Upload
khangminh22 -
Category
Documents
-
view
4 -
download
0
Transcript of STEAM REFORMING OF LOWER ALKANES AND THE W

INVESTIGATION OF ACTIVE SITES AND REACTION NETWORKS IN CATALYTIC HYDROGEN PRODUCTION: STEAM REFORMING OF LOWER
ALKANES AND THE WATER-GAS SHIFT REACTION
DISSERTATION
Presented in Partial Fulfillment of the Requirements for
the Degree Doctor of Philosophy in the Graduate
School of The Ohio State University
By
Sittichai Natesakhawat, M.S.
* * * * *
The Ohio State University 2005
Dissertation Committee: Approved by Professor Umit S. Ozkan, Adviser Professor Jeffrey J. Chalmers Professor David L. Tomasko _________________________ Professor Heather Davis Adviser Graduate Program in
Chemical Engineering

ii
ABSTRACT
Steam reforming (SR) of hydrocarbons and water-gas shift (WGS) are of
importance in hydrogen generation technologies due to recent attention focusing on fuel
cells. Current research efforts have focused on catalyst development to improve activity,
selectivity, and stability under a realistic range of operating conditions. Although coke
formation is a major concern for Ni-based catalysts when used for hydrocarbon steam
reforming, their low cost and long-proven performance warrants further investigation.
Moreover, hydrogen and fuel cell technologies will greatly benefit from innovative high-
temperature shift (HTS) catalyst formulations that can overcome some serious drawbacks
(i.e., low activity at low temperatures, sintering of magnetite (Fe3O4), a pyrophoric
nature, and the harmful effects of Cr6+ on human health).
In this Ph.D. study, lanthanide-promoted Ni/Al2O3 catalysts and Fe-based
catalysts promoted with first row transition metals were synthesized by a modified sol-gel
technique and a coprecipitation method, respectively. The effect of synthesis variables
on the catalyst properties (i.e., BET surface area, reducibility, crystallite size, crystal
structure, oxidation states, adsorption/desorption behavior, and surface intermediates
during the reaction) and, in turn, on the catalytic performance in SR of lower alkanes and

iii
the WGS reaction has been investigated. Catalysts were characterized by BET surface
area and pore size distribution measurements, temperature-programmed
desorption/reduction/oxidation (TPD/TPR/TPO), X-ray diffraction (XRD), X-ray
photoelectron spectroscopy (XPS), diffuse reflectance infrared Fourier transform
spectroscopy (DRIFTS), static chemisorption, transmission electron microscopy (TEM),
thermogravimetric analysis (TGA).
The introduction of small amounts (2 wt%) of Ce and Yb in sol-gel Ni/Al2O3
catalysts improves SR activity significantly by enhancing Ni surface area, reducibility of
Ni species, and Ni sintering resistance. In addition, the incorporation of Ce in Ni/Al2O3
catalysts results in the reduction of carbon dissolution/diffusion through nickel
crystallites, thus preventing catalyst deactivation by coke formation. Formulations of
highly active and Cr-free HTS catalysts can be achieved by adding both Al and Cu. The
activity of Fe-based catalysts is strongly related to catalyst reducibility, magnetite
crystallite size, and redox characteristics. More detailed characterization has provided
additional insights into phase transformations, surface intermediates, and
reaction/deactivation mechanisms, giving further evidence of the modification of the
properties and performance of catalysts through optimized synthesis.

iv
Dedicated to my mother, Wannaporn Natesakhawat

v
ACKNOWLEDGMENTS
This dissertation is more than the product of the last four years and a half of my
research. It represents contributions and influences from everyone who has taught me,
inspired me, challenged me, or supported me throughout the process.
First and foremost, I wish to thank my research adviser, Dr. Umit S. Ozkan, who
not only guided my research but also served as a role model. This dissertation would not
have been possible without her support and dedication.
I was also fortunate enough to know and work with many past and present
members of the Heterogeneous Catalysis Research Group. I would like to thank Dr.
Okan Oktar, Dr. Xueqin Wang, Dr. Rick B. Watson, and Lingzhi Zhang for their help
and stimulating discussion about research issues. From this group, I would like to
especially thank Rick for his friendship and guidance.
My biggest thanks go to my family especially my mother, Wannaporn
Natesakhawat, for their love, support, and encouragement throughout not only the course
of my Ph.D. studies, but throughout my entire life. Nothing in a simple paragraph can
express the love and gratitude I have for them.
I also wish to thank the Royal Thai Government for providing me financial
support for my graduate studies.
This research was supported by a grant from Honda Research Institute, USA Inc.
and the Ohio Coal Development Office.

vi
VITA
September 8, 1973………………………..Born – Nakorn Pathom, Thailand
1994………………………………………B.E. Chemical Engineering, Kasetsart University
1998………………………………………M.S. Chemical Engineering, Colorado School of Mines
2000-present……………………………...Graduate Research Associate, The Ohio State University
PUBLICATIONS
Research Publication
1. J.G. Goodwin, Jr., S. Natesakhawat, A.A. Nikolopoulos, S.Y. Kim, “Etherification on Zeolites: MTBE Synthesis” Catal. Rev. 44 (2002) 287.
2. S. Natesakhawat, O. Oktar, U.S. Ozkan, “Lanthanide-Promoted Ni-Based
Catalysts for Steam Reforming of Propane” Prepr. Pap.-Am. Chem. Soc., Div. Fuel Chem. 48 (2003) 852.
FIELD OF STUDY
Major Field: Chemical Engineering

vii
TABLE OF CONTENTS
Page
Abstract ............................................................................................................................... ii Dedication .......................................................................................................................... iv Acknowledgments................................................................................................................v Vita..................................................................................................................................... vi List of Tables ..................................................................................................................... ix List of Figures .................................................................................................................... xi
Chapters:
1. Introduction......................................................................................................................1
2. Literature review............................................................................................................10
2.1 Steam reforming of hydrocarbons ........................................................................10 2.1.1 Methane steam reforming ....................................................................11
2.1.2 Steam reforming of higher hydrocarbons ............................................18 2.1.3 Catalyst deactivation by coke formation..............................................25
2.2 The water-gas shift reaction..................................................................................31 2.2.1 Precious metal catalysts .......................................................................31 2.2.2 Non- precious metal catalysts ..............................................................33
3. Experimental ..................................................................................................................42
3.1 Catalyst synthesis..................................................................................................42 3.1.1 Ni-based catalysts ...............................................................................42 3.1.2 Fe-based catalysts ...............................................................................43 3.2 Catalyst characterization.......................................................................................44 3.2.1 BET surface area measurement ..........................................................46 3.2.2 X-ray diffraction (XRD) .....................................................................46
3.2.3 Temperature-programmed desorption/reduction/oxidation (TPD/TPR/TPO) .................................................................................47 3.2.4 X-ray photoelectron spectroscopy (XPS) ...........................................50 3.2.5 Diffuse reflectance infrared Fourier transform spectroscopy (DRIFTS) ......................................................................51 3.2.6 Chemisorption.....................................................................................53
viii
3.2.7 Transmission electron microscopy (TEM) .........................................54 3.2.8 Thermogravimetric analysis (TGA)....................................................55
3.3 Steady-state reactions............................................................................................56
4. Effect of lanthanide promotion on catalytic performance of sol-gel Ni/Al2O3 catalysts
in steam reforming of propane....................................................................................62
4.1 Introduction...........................................................................................................62 4.2 Physical properties of sol-gel catalysts .................................................................64 4.3 Promotion effect on catalyst reducibility and nickel surface area ........................67 4.4 Reaction performance in propane steam reforming..............................................78 4.5 DRIFTS studies.....................................................................................................92 4.6 Summary .............................................................................................................103
5. Deactivation characteristics of lanthanide-promoted sol-gel Ni/Al2O3 catalysts in propane steam reforming .........................................................................................104
5.1 Introduction.........................................................................................................104 5.2 Catalytic activity and stability for propane steam reforming..............................106 5.3 Deactivation characteristics of sol-gel catalysts..................................................112 5.4 Summary .............................................................................................................137 6. Chromium-free iron-based catalysts: preparation, characterization, and catalytic performance in the high-temperature water-gas shift catalysts ...................................138
6.1 Introduction.........................................................................................................138 6.2 Reaction experiments for the high-temperature water-gas shift reaction ...........141 6.3 Change in catalyst reducibility............................................................................151 6.4 Change in crystallinity and phase transformations during reduction..................153 6.5 Investigation of active sites and oxidation states................................................158 6.6 DRIFTS studies...................................................................................................166 6.7 Summary .............................................................................................................174 7. Recommendations........................................................................................................175
Bibliography ....................................................................................................................178
Sample calculations .........................................................................................................189

ix
LIST OF TABLES
Table Page
3.1 GC temperature program ...................................................................................60
3.2 GC valve-switching program.............................................................................60
4.1 BET surface area of various sol-gel Ni/Al2O3 catalysts ....................................66
4.2 BET surface area of lanthanide-promoted sol-gel Ni/Al2O3 catalysts calcined at 450 °C ..............................................................................................67
4.3 H2 chemisorption data on various lanthanide-promoted sol-gel Ni/Al2O3 catalysts reduced under H2 at 600 °C for 2 h .....................................................73
4.4 Effect of calcination (Tcal) and reduction (Tred) temperatures on nickel dispersion and nickel surface area .....................................................................74
4.5 Comparison of the ANi0/(ANi
0+ANi2+) XPS ratio of the catalysts
after reduction at 600 °C....................................................................................77
4.6 Propane steam reforming reaction data obtained with sol-gel Ni/Al2O3 catalysts – effect of synthesis parameters ..........................................................80
4.7 Reaction comparison for propane steam reforming (dilution experiments) at 500 °C ............................................................................................................82
4.8 Reaction comparison for propane steam reforming (dilution experiments) at 550 °C ............................................................................................................83
4.9 Reaction comparison for propane steam reforming (neat experiments) ............85
4.10 Effect of reaction temperature on turnover frequency.......................................89
5.1 Comparison of the ratio of XPS peak areas ANi0/(ANi
0+ANi2+) of
the catalysts before and after 20-h propane steam reforming ..........................114

x
Table Page 5.2 Effect of reduction temperature on nickel crystallite diameter (nm) of lanthanide-promoted sol-gel 20% Ni/Al2O3 catalysts......................................117
5.3 Effect of steam/carbon ratio on coking initiation temperature ........................127
6.1 BET surface area measurements and % CO conversion over Fe-based catalysts ............................................................................................143 6.2 Reaction comparison for the high-temperature water-gas shift reaction- effect of synthesis variables .............................................................................146
6.3 Effect of calcination temperature on hematite crystallite diameter of Fe-based catalysts ............................................................................................155
6.4 Major peaks in the XRD patterns of identified phases during in situ reduction of Fe-based catalysts ........................................................................................156
6.5 Phase transformations in Fe-based catalysts as a function of reduction temperature ......................................................................................159 6.6 Effect of reduction temperature on magnetite crystallite diameter of
Fe-based catalysts ............................................................................................160
6.7 Effect of the pre-reduction step on catalytic performance of Fe-Al and Fe-Al-Cu catalysts ...........................................................................................164

xi
LIST OF FIGURES
Figure Page
1.1 WGS integrated in the IGCC system for H2 Production................................... ..4
1.2 Equilibrium compositions in steam reforming of propane at T = 400-1000 oC and H2O/C3H8 = 4....................................................................7
1.3 CO conversion as a function of T and H2O/CO molar ratio in the WGS reaction.................................................................................................9
3.1 Schematic of TPD/TPR/TPO system.................................................................49
3.2 Schematic of DRIFTS system............................................................................52
3.3 Schematic of SR-WGS reactor system ..............................................................58
3.4 The arrangement of columns and six-port valves for product separation.............................................................................................59
4.1 XRD patterns of (a) sol-gel Al2O3 calcined at 450 °C (b) 20% Ni-2%Ce/Al2O3 catalyst calcined at 450 °C (c) 20% Ni-2% Ce/Al2O3 catalyst reduced at 600 °C .................................................................................69
4.2 TPR profiles of various sol-gel 20% Ni/Al2O3 catalysts promoted with 2 wt% lanthanide elements (calcined at 450 °C). The effect of calcination temperature on reducibility of 20% Ni-2% Ce/Al2O3 catalysts is shown as an inset ............70
4.3 Ni 2p X-ray photoelectron spectra of lanthanide-promoted sol-gel 20% Ni/Al2O3 catalysts reduced at 600 °C ................................................................76
4.4 Effect of reaction temperature on catalytic performance of lanthanide-promoted sol-gel 20% Ni/Al2O3 catalysts........................................81
4.5 Effect of calcination and reduction temperatures on catalytic performance in propane steam reforming ...............................................................................87
4.6 Effect of GHSV on H2 yield at 500-550 °C and H2O/C = 2 in propane steam reforming over 20% Ni/Al2O3 and 20% Ni-2% Ce/Al2O3 catalysts ..................88

xii
Figure Page
4.7 Variation of product selectivities with C3H8 conversion ...................................90
4.8 DRIFT spectra taken over reduced 20% Ni-2% Ce/Al2O3 catalysts after C3H8 adsorption .........................................................................................93
4.9 DRIFT spectra taken over reduced 20% Ni-2% Ce/Al2O3 catalysts after C3H6 adsorption at room temperature ................................................................96 4.10 DRIFT spectra taken over reduced 20% Ni-2% Ce/Al2O3 catalysts after CO2 adsorption at room temperature .................................................................97 4.11 DRIFT spectra taken over reduced 20% Ni-2% Ce/Al2O3 catalysts after consecutive adsorption of C3H8 and H2O ........................................................101 4.12 Mechanistic steps during propane steam reforming over reduced Ni-Ce/Al2O3 catalyst as observed using in situ DRIFTS ......................................................102 5.1 C3H8 conversion as a function of time on stream observed with various
catalysts............................................................................................................108
5.2 Effect of H2O/C ratio on catalytic activity and stability of 20% Ni/Al2O3 and 20% Ni-2% Ce/Al2O3 catalysts in propane steam reforming....................109
5.3 H2 formation rate at 550 °C as a function of time on stream observed at differing H2O/C ratios......................................................................................111
5.4 Ni 2p spectra of reduced catalysts after being exposed to the propane steam reforming atmosphere at 500 °C for 20 h ..............................................113
5.5 In situ XRD patterns of 20% Ni-2% Yb/Al2O3 catalysts during reduction under 5% H2/N2................................................................................................116 5.6 Comparison of XRD patterns of 20% Ni/Al2O3 and 20% Ni-2% Ce/Al2O3
catalysts reduced at 700 °C..............................................................................120
5.7 TPO profiles of carbon deposited on 20% Ni/Al2O3 and 20% Ni-2% Ce/Al2O3 catalysts............................................................................................................123

xiii
Figure Page
5.8 TEM images of carbon deposited on catalysts after 20 h propane steam reforming over 20% Ni/Al2O3 and 20% Ni-2% Ce/Al2O3 catalysts...............124 5.9 The morphology of carbonaceous species on 20% Ni/Al2O3 and 20% Ni-2% Ce/Al2O3 catalysts after propane steam reforming ......................125 5.10 Effect of steam ratio on the coking initiation temperature during propane steam reforming .................................................................................128 5.11 Changes in the concentrations of various carbon-containing species as a function of time on stream in propane decomposition at 500 °C..................131 5.12 TPGasification profiles of carbon deposited following propane decomposition ....................................................................................132 5.13 TPH profiles of carbon following TPGasification...........................................133 5.14 Coking models during propane steam reforming over Ni/Al2O3 and Ni-Ce/Al2O3 catalysts ......................................................................................136 6.1 Effect of reduction temperature on WGS activity of Fe-based catalysts.........147
6.2 Effect of reaction temperature on WGS activity of Fe-based catalysts ...........148
6.3 Effect of GHSV on CO conversion at 400 °C of Fe-based catalysts...............150
6.4 TPR profiles of various Fe-based catalysts calcined at 450 °C .......................152
6.5 XRD patterns of various Fe-based catalysts calcined at 450 °C......................154
6.6 In situ XRD patterns during reduction of Fe-Al and Fe-Al-Cu catalysts ........157
6.7 Fe 2p X-ray photoelectron spectra of various Fe-based catalysts....................161
6.8 Cr 2p spectra of calcined and reduced Fe-Cr catalysts ....................................162
6.9 Cu 2p spectra of calcined and reduced Fe-Al-Cu catalysts .............................163

xiv
Figure Page
6.10 Comparison of pre- and post-reaction XPS of Fe-Al-Cu catalysts without the pre-reduction step .........................................................................165 6.11 CO-TPD DRIFT spectra of reduced Fe-only and Fe-Al-Cu catalysts.............167
6.12 CO+H2O-TPReaction DRIFT spectra of the reduced Fe-Al-Cu catalyst ........168
6.13 Comparison of CO+H2O-TPReaction DRIFT spectra taken under
CO flow of Fe-only and Fe-Al-Cu catalysts ....................................................170
6.14 Redox mechanism of the WGS reaction over Fe-based catalysts....................173

1
CHAPTER 1
INTRODUCTION
Hydrogen is the ultimate clean energy carrier. When it is combusted, heat and
water are the only products. The use of hydrogen as a fuel for fuel cell-powered vehicles
can greatly reduce green house gas emissions from internal combustion engines.
Moreover, development of affordable hydrogen fuel cells will help reduce our nation’s
dependence on foreign oil, leading to an increased national energy security. Thus,
hydrogen offers a potentially non-polluting, inexhaustible, efficient, and cost attractive
fuel for today’s rising energy demands [1]. Currently, steam reforming of natural gas,
which is composed mainly of methane, is used to produce most of hydrogen in the U.S.
and about half of the world’s hydrogen supply. Naphtha fractions with a final boiling
point of less than 220 °C are also considered as suitable feedstocks [2]. However,
supported Ni catalysts suffer from catalyst deactivation by coke formation more severely
when higher hydrocarbons are reformed at low steam/carbon ratios. Although supported
precious metals such Pd, Pt, and Rh have been reported to be active and stable for steam
reforming of hydrocarbons, cost of the precious metals is still a major issue. The low-
cost and long-proven performance of Ni-based catalysts, therefore, warrant the efforts to
optimize these catalysts for more demanding steam reforming applications. On-board

2
steam reforming of hydrocarbons for proton exchange membrane (PEM) fuel cell-
powered vehicles has attracted much attention. Widespread applications of fuel cells in
transportation will depend on the development of an effective and efficient fuel
processing technology from existing liquid fuels such as gasoline and diesel especially
during transition to hydrogen economy. Therefore, development of novel Ni-based
catalysts with superior performance and stability for the steam reforming process is
essential.
A potential alternative that makes use of our nation’s most abundant fossil fuel
resource, coal, to produce hydrogen is an attractive prospect. In fact, coal gasification
may be one of the best ways to produce clean-burning hydrogen for tomorrow’s
automobiles and power-generating fuel cells [www.fossil.energy.gov]. It is a process that
converts coal from a solid to a gaseous fuel through partial oxidation [3]. Depending on
operating conditions, processes, and coal rank, the raw coal gas from a gasifier consists
primarily of CO, H2, CO2, CH4, H2O, H2S, COS, and nitrogen compounds. The gas is
further purified to remove impurities for the final use.
The Department of Energy (DOE) has demonstrated Integrated Gasification
Combined-Cycle (IGCC) operation to produce power, fuels, and chemicals from coal.
This advanced technology is proposed to be one of the most efficient and cleanest
available technologies for coal-based power generation, with emissions comparable to
those of natural gas-based power production as indicated in the U.S. DOE Topical
Report# 21 [4]. At present, IGCC processes are aimed at direct combustion of synthesis
gas after particulate and H2S removal. Production of chemicals such as methanol and
diesel-grade hydrocarbons from syngas is also an important market worldwide [5].

3
However, wide applications of the IGCC technique will require significant advances in
some of the steps that follow gasification. Especially developing efficient processes for
hydrogen production from syngas will bridge the gap between coal utilization and fuel
cell technology.
In hydrogen production, the WGS reaction remains as a technology that would
benefit from innovative approaches such as development of highly active, sulfur-tolerant,
and Cr-free catalytic systems. Additionally, DOE’s Clean Coal Technology (CCT)
program highlights the need for advanced water-gas shift reactors using sulfur-tolerant
catalysts to produce hydrogen from synthesis gas at lower cost. [www.fe.doe.gov].
Figure 1.1 demonstrates a conceptual process where gasified coal is converted to
hydrogen rather than being directly combusted. The sulfur in the gasified stream is in the
form of H2S, which is much easier to separate by scrubbing than SO2. The sensible heat
of the effluent gas from the gasifier can also be used through a heat exchanger to heat
steam or the effluent from the scrubber. If the activity of WGS catalysts is high enough,
high CO conversion levels can be achieved at lower temperatures. If hydrogen
production is desired for PEM fuel cell operation, further purification or separation of
hydrogen would be needed. However, if it is targeted for Solid Oxide Fuel Cells (SOFC),
hydrogen can be used without any further purification. For stationary power generation,
solid oxide fuel cell applications are much more relevant.

4
Figure 1.1: WGS integrated in the IGCC system for H2 Production

5
Generally, the steam reforming process involves the reaction of hydrocarbons
with steam (Reactions 1 and 2) on supported Ni catalysts at 500-950 °C. It is
accompanied by the water-gas shift (WGS, Reaction 3) and methanation reactions
(Reaction 4) as follows:
CnH2n+2 + nH2O ⇔ nCO + (2n+1)H2 (1)
CnH2n+2 + 2nH2O ⇔ nCO2 + (3n+1)H2 (2)
CO + H2O ⇔ CO2 + H2 (3) , ∆H (298 K) = -41.2 kJ/mol
CO + 3H2 ⇔ CH4 + H2O (4) , ∆H (298 K) = -206.2 kJ/mol
Both WGS and methanation reactions are exothermic and become significant at
lower temperatures. In general, the overall reaction enthalpy of alkane steam reforming
is still positive and heat needs to be supplied. The equilibrium composition of gaseous
products depends on temperature, pressure, and the molar ratio of water to alkane. In
practice, steam reforming of hydrocarbons is performed at high temperature and low
pressure. However, the high temperature required may also favor several routes to
carbon products (Reactions 5-8) such as the Boudouard reaction and
methane/hydrocarbon decomposition.
2CO ⇔ C + CO2 (5)
CH4 ⇔ C + 2H2 (6)
CO + H2 ⇔ C + H2O (7)
CnH2n+2 ⇔ nC + (n+1)H2 (8)
Further comprehensive reviews on thermodynamics of alkane steam reforming
can be found in the literature [2, 6-8]. The equilibrium composition of the products can

6
be calculated at different ratios of steam to carbon and operating conditions using
published thermodynamic data in the literature [6, 8]. For example, Figure 1.2 shows the
equilibrium compositions of propane steam reforming at H2O/C3H8 = 4 where significant
carbon formation is below 700 °C. The main products of propane steam reforming at
higher temperatures are H2 and CO with small amounts of CO2. On the other hand,
methane-rich gases are produced at lower temperatures. It should be noted that, however,
these calculations only predict the equilibrium concentrations and do not provide any
information about the kinetic rates of various reaction steps involved in the network.
In practice, it is the kinetics rates that determine the concentration of various
reaction products. As a result, coking is encountered at higher steam-to-carbon
conditions than what thermodynamics predicts. In addition, carbon observed under
actual reaction conditions may be in various forms of gas-phase and surface-grown with
properties quite different than those of graphite [9]. Therefore, thermodynamic data can
only give an initial starting point and kinetics of the many constituents representing
different molecular weights and aromaticity present in liquid fuels must be considered in
the experimental determination of coking characteristics. Generally, excess steam/carbon
ratios of 3.5-4.5 are used to prevent coke formation but minimal water input needs to be
considered to provide a higher H2 concentration.

7
Figure 1.2: Equilibrium compositions in steam reforming of propane at T = 400-1000 °C
and H2O/C3H8 = 4

8
The WGS reaction (Reaction 3) is an important step in the production of H2,
where CO, which is produced from steam reforming or coal gasification, is reacted with
water to give H2 and CO2. The water-gas shift reaction is exothermic and
thermodynamically limited at high temperatures. The thermodynamic equilibrium
constant, Kp, as defined by Kp = PH2 PCO2/PCOPH2O. The exothermic nature of the reaction
makes the activity of the catalyst at lower temperatures very important since at higher
temperatures conversion is limited by thermodynamic equilibrium, as seen in Figure 1.3,
which is constructed for three different ratios of CO and H2O in the feed mixture. The
equilibrium conversion is independent of pressure for this reaction. In addition to their
activity, another consideration for WGS catalysts is their selectivity, since methanation
(Reaction 4) is a competing reaction that can lower the selectivity.
Key challenges for development of novel catalytic systems include carbonaceous
deposit formation particularly at lower steam/carbon ratios, short lifetimes due to loss of
active surface area and metal agglomeration under steam reforming and WGS conditions,
sulfur tolerance, and resistance to other poisons found in the feed stream. Current
research focuses on synthesis, formulations, and characterization of catalysts designed to
meet these challenges. Solving the hydrogen generation problems will ultimately help
drive advancements in fuel cell technology, which brings a hydrogen energy future much
closer to reality.

9
Figure 1.3: CO conversion as a function of T and H2O/CO molar ratio in the WGS
reaction

10
CHAPTER 2
LITERATURE REVIEW
2.1 Steam reforming of hydrocarbons
Hydrocarbon steam reforming has been a process of major importance for
production of hydrogen, synthesis gas, and town gas for several decades. Classical steam
reforming is the process by which methane, and other hydrocarbons in natural gas, is
converted into hydrogen and carbon monoxide by reaction with steam over a nickel
catalyst on a ceramic support. The hydrogen and carbon monoxide are used as feedstock
for many other industrial processes. Generally, Ni-based catalysts are industrially used in
hydrocarbon steam reforming due to their fast turnover rates, long-term stability, and low
cost [2, 8]. However, in practice, the process industry of steam reforming faces many
challenges. The major concern is catalyst deactivation by coke formation and, to a lesser
extent, thermal sintering at high operating temperatures. Supports and promoters play an
important role on the prevention of coke formation. Alkalis such as K2O and CaO are
introduced into Ni-based catalysts to enhance carbon gasification and suppress olefin
adsorption, which leads to carbon deposition. Basic supports such as MgAl2O4, CaAl2O4,
BaAl2O4, and Al2O3 containing lanthanide elements have gained wide interest since they
were reported to be successful in steam reforming of C2-C4 [7, 8]. The introduction of

11
certain additives such as lanthanides (i.e., uranium, lanthanum, and cerium) into nickel
catalysts has also shown an improvement in resistance to coking. Therefore, innovative
approaches to catalyst promotion, which can minimize catalyst coking but maintain their
activity, are of great importance.
This chapter provides an overview of catalytic hydrogen production from steam
reforming of hydrocarbons and the water-gas shift reaction. Catalyst deactivation by
coke formation during steam reforming, different approaches to control coking, and the
role of promoters or supports on coke minimization are also discussed. Further detailed
reviews on steam reforming of hydrocarbons and the WGS reaction can be found
elsewhere [1, 2, 7, 8, 10-19].
2.1.1 Methane Steam Reforming
Thermodynamics
The reversible steam reforming reaction of methane (∆H°298 = 206 kJ/mol) is
highly endothermic. The forward reaction is favored at high temperature and low
pressure. On the other hand, the WGS reaction (∆H°298 = -41.2 kJ/mol) is exothermic
and becomes significant at lower temperature. In general, the overall reaction enthalpy of
methane steam reforming is still positive and heat needs to be supplied. The main
products of the steam reforming reaction at higher temperatures are CO and H2. In
contrast, methane-rich gases are produced at lower temperatures. The equilibrium
composition of gaseous products depends on temperature, pressure, and the molar ratio of

12
water to methane. Further comprehensive reviews on thermodynamics of methane steam
reforming can be found in the literature [2, 6-8].
Kinetics
The kinetics of methane steam reforming on nickel catalysts has been extensively
studied [2, 8, 20-22]. It is widely accepted that the reaction is first order with respect to
methane concentration. However, the values of the activation energies were reported to
be in a wide range of 20-160 kJ/mol, depending on the influence of pore diffusion and
heat transfer limitations.
Bodrov et al. [20] studied the kinetics of methane steam reforming on nickel foil
at 800-900 °C and atmospheric pressure using a circulation-flow reactor. The rate of
methane decomposition was found as follows:
r = kPCH4/[1+a(PH2O/PH2) + bPCO]
At 800 °C, a and b were 0.5 and 2.0 atm-1 and at 900 °C, a and b were 0.2 and 0
atm-1, respectively. The activation energy of the reaction was 130 kJ/mol. It was
concluded that the reaction of methane with steam was much faster than the
decomposition of methane to carbon on the nickel surface, which was the rate-
determining step. Al-Ubaid et al. [21] investigated the kinetics of catalytic steam
reforming of methane over nickel on supports with different acidities at 450-550 °C. The
order of decreasing acidity of supports is Y-zeolite > Ni aluminate > (Ni, Ca) aluminate.
The positive “effective” order of methane steam reforming with respect to steam was
observed for the most acidic support (Y-zeolite). A dual-site mechanism, in which steam
and methane were adsorbed on different active sites, was suggested. On the other hand,

13
negative “effective” reaction order with respect to steam was found for the less acidic
support. It was suggested that steam and methane were competitively adsorbed on the
same active sites (single-site mechanism), thus giving a non-monotonic dependence of
the rate of reaction on reactant concentration.
Luna and Becerra [22] studied the kinetics of methane steam reforming on a
commercial Ni on alumina-titania catalyst at 500-600 °C. A Hougen-Watson kinetic
model was proposed and was in good agreement with the experimental rates. In addition,
the results supported the mechanism of methane steam reforming proposed by Rostrup-
Nielsen [8], that is, steam simultaneously adsorbs on both the nickel surface and the
support and oxygen subsequently spills over to the nickel.
Catalysts
As mentioned earlier, supported nickel catalysts are preferred for most
commercial steam reforming applications. However, other catalysts such as ZrO2-
supported metals and supported Pd, Pt, and Rh catalysts have also been reported to be
active and stable for methane steam reforming and are discussed in the following section.
Supported Nickel Catalysts
The introduction of certain additives such as potassium and oxides of rare earth
metals (i.e., uranium, lanthanum, and cerium) into nickel catalysts has shown an
improvement on their resistance to coking. Although potassium-promoted catalysts,
widely used in industry, can prevent catalyst coking, their activity decreases during steam
reforming. Borowiecki and Golebiowski [23] investigated the influence of molybdenum

14
and tungsten additives on the properties of nickel steam reforming catalysts. A Ni/Al2O3
catalyst containing 0.5 wt% WO3 or MoO3 was found to retain its catalytic activity in
methane steam reforming as opposed to the potassium-promoted nickel catalyst.
However, the beneficial effect of the molybdenum addition is still unclear since Ni/Al2O3
catalyst (3 wt% MoO3) was also reported to increase the rate of carbon deposition in CO
methanation by one order of magnitude. Moreover, it is known that the morphology and
mechanism of the formation of carbon deposits in steam reforming of hydrocarbons and
CO methanation are quite similar [24].
Borowiecki et al. [25] further investigated the effects of small MoO3 additions on
the properties of nickel catalysts for steam reforming of hydrocarbons. It is interesting
that an introduction of small amounts of molybdenum compounds (≤0.1 wt% MoO3)
considerably reduced the rate of carbon deposition but increased the activity of methane
steam reforming. Furthermore, with higher amounts of MoO3, the activity decreased
more slowly than the reduction of the coking rate. The authors also stated that the
activity of Ni-Mo/Al2O3 catalysts depended on the ratio of hydrogen to steam in the
reaction mixture; the maximum in activity moved towards higher H2 contents when the
amounts of molybdenum increased.
Zhuang et al. [26] investigated the effect of cerium oxide as a promoter in
supported nickel catalysts for methane steam reforming. It showed a positive effect by
decreasing the rate of carbon deposition, thus maintaining the catalytic activity during the
induction period and in the constant carbon deposition region. Su and Guo [27] also
reported a significant improvement in the stability and the high temperature steam
resistance of Ni/Al2O3 catalysts doped with rare earth oxides. The growth of Ni particle,

15
the oxidation of active component Ni, and the formation of NiAl2O4 were suppressed by
the addition of rare earth oxides, thus significantly reducing the catalyst deactivation.
Also, the heavy rare earth oxides had a more distinct effect than the light ones.
The advantages of magnesia as a support for nickel steam reforming catalysts
were examined [28]. Compared to nickel supported on alumina, nickel-magnesia
catalysts showed similar initial specific activities but considerably minimized coke
formation. It is believed that magnesia enhances coke gasification on the catalyst
surface, thereby preserving the active sites for steam reforming.
The deactivation of Ni/Al2O3 catalysts by sintering during methane steam
reforming at 500 and 800 °C was studied [29]. High temperature, the presence of steam,
and nature of solid phases upon sintering of nickel crystallites were found to be the
important parameters. The authors concluded that the combined action of steam and high
temperature enhanced the rate of sintering of small nickel crystallites, particularly for
narrow initial crystallite size distributions and high initial dispersions. The beneficial
effect of lanthanum as a promoter is suggested to be inhibiting the metal crystallite
growth under reduction and reaction conditions. The effect of hydrogen on catalyst
deactivation by sintering was also reported [30]. An introduction of 2 vol% H2 in the
feed gas mixture at 589 °C had a negative impact on the activity of a Ni/Al2O3 catalyst
due to continuous and irreversible deactivation by sintering of Ni particles. At 744 °C, a
decrease in activity was still observed but was stabilized over 130 h and then recovered
by stopping the H2 addition.
The coupled methane oxidative conversion and steam reforming (CMOCSR)
process was performed over a NiO-CaO catalyst to develop the methane-to-syngas

16
conversion [31]. The catalyst was chosen due to its high activity, selectivity, and
productivity in the oxidative conversion of methane to CO and H2. The benefit of this
process was that little or no external energy is needed since the process is mildly
exothermic. However, the effect of process variables on oxygen conversion and CO
selectivity is quite complex. Choudhary et al. [32] further investigated simultaneous
steam and CO2 reforming of methane to syngas over supported NiO/MgO in the presence
and absence of oxygen. This study emphasized the importance of the afore-mentioned
CMOCSR process in that it can be efficient and safe by manipulating the reaction
temperature and/or the concentration of O2 in the feed. Furthermore, methane can be
converted to syngas with desirable H2/CO ratio (close to 2.0) by controlling the relative
concentrations of steam and CO2 in the feed.
To produce CO-free hydrogen for fuel cells and other processes that are sensitive
to CO poisoning, stepwise methane steam reforming has been developed. The two-step
process, which involves the catalytic decomposition of methane to produce CO-free
hydrogen (step I) followed by the steam gasification of the surface carbon on Ni/zirconia
catalysts (step II), has been proposed [33]. It was concluded that no CO was observed in
the products from step II and that this process, which was operated in cycles, could
provide an excellent source of hydrogen. Subsequently, Choudhary and Goodman [34]
continued their work by optimizing the reaction conditions of this process such as
temperature and carbon coverage. High temperatures were found to have a detrimental
effect on step II while an increase in the coverage of surface carbon had a negative
impact on its removal. As a result, the optimum temperatures and carbon surface

17
coverage were found to be of 375-400 °C and of 0.10-0.20 monolayer equivalents
(MLEs), respectively.
Other Catalysts
Although nickel catalysts have many advantages as mentioned earlier, they are
not resistant to carbon formation, causing a major drawback in their industrial use.
Therefore, it is essential to develop alternative catalysts, which are active but more coke-
resistant. York et al. [35] developed molybdenum and tungsten carbides as catalysts for
methane steam reforming using stoichiometric feedstocks at slightly elevated pressures.
Surprisingly, the catalysts were extremely active and stable for more than 72 h.
Furthermore, no carbon deposition was observed.
In addition, zirconia-supported catalysts have been reported to be effective in
many processes such as CO2 reforming of methane, partial oxidation of methane, and
combined steam and CO2 reforming. Catalysts containing 1 wt% of Co, Cu, Fe, Ni, Pd,
and Pt supported on zirconia were tested for methane steam reforming at 400-800 °C
[36]. The Pt, Pd, and Ni catalysts showed highest activity but only the Pt catalyst
remained stable at 800 °C due to higher resistance to carbon deposition. The Pt/ZrO2
catalyst was also found to be active and stable for both CO2 reforming and partial
oxidation of methane.
Porous metal/ceramic catalysts based on powdered aluminum and lanthanum
nickelate mixture were also reported to be active and stable. Tikhov et al. [37] studied
the impact on the specific catalytic activity of pore structure formation of porous
composite materials based on Al/Al2O3. The phase composition of the active component

18
precursor was found to be the most important parameter for high activity; the catalysts
containing ceramic perovskite as a precursor showed much higher activity and CO
selectivity than those prepared by a plasma thermolysis technique.
2.1.2 Steam reforming of higher hydrocarbons
Thermodynamics
The overall steam reforming of hydrocarbons is generally endothermic since Eq.
(1) is strongly endothermic (∆H°298 = 1,108 kJ/mol for n-heptane). Like methane steam
reforming, it is desirable to perform steam reforming of hydrocarbons at a high
temperature and low pressure. As a result, the water-gas shift reaction is inhibited by
high temperature but largely unaffected by pressure [2]. The equilibrium composition of
the products can be calculated at different ratios of steam to carbon and operating
conditions using published thermodynamic data in the literature [7, 8].
It is known that energy requirements for steam reforming of higher hydrocarbons
is very flexible depending on the reaction conditions [16]. By manipulating temperature
and molar ratios of steam to hydrocarbon, the overall reaction enthalpy may be positive
or negative. For example, the overall process is exothermic (∆H°298 = -47.9 kJ/mol) at a
relatively low temperature of 450 °C and a steam/naphtha ratio of 2.0. On the other hand,
the process becomes endothermic (∆H°298 = 102.9 kJ/mol) at higher temperatures and
higher steam/naphtha ratios (i.e., 800 °C and 3.0, respectively).
However, carbon formation is of greater concern in steam reforming of
hydrocarbons. In practice, excess steam/carbon ratios of 3.5-4.5 are used to favor the

19
reforming reaction. Furthermore, methanation begins to dominate at low steam/carbon
ratios and the overall reaction can be exothermic under certain process conditions of
temperature and pressure [2].
Kinetics
Rostrup-Nielsen [38] studied the kinetics of ethane steam reforming at
atmospheric pressure and 500 °C over various catalysts. A difference in the kinetics of
the reaction was influenced by steam partial pressure, which was related to the catalyst
composition. Magnesia-supported and alkali-promoted catalysts were found to enhance
steam adsorption. For a Ni/MgO catalyst, the following rate expression was obtained:
r = 20pC2H6/[1 + 30pC2H6pH2/pH2O + 1.26 x 10⁻² pH2O/ pH2] 2
where r [=] mol/m2 (Ni) h and p [=] Mpa.
In addition, a mechanism for steam reforming of hydrocarbons was proposed in
the same study. It was assumed that hydrocarbon was adsorbed on a dual active site,
followed by successive α-scission of the C-C bonds. The resulting C1 species
subsequently reacted with adsorbed steam to yield CO and H2.
Tottrup [39] investigated the macrokinetics of steam reforming of n-heptane on a
commercial Ni/MgO catalyst at 450-550 °C and 5-30 bar. The rate of reaction was
strongly influenced by internal diffusion and was found to be:
r = ka (pC7H16)0.6(pH2O)-0.1(PH2)0.2
where ka was the apparent rate constant and the apparent activation energy was 38.3
kJ/mol.

20
Phillips et al. [40] investigated the kinetics and mechanism of steam reforming of
n-hexane and n-heptane over a nickel-alumina catalyst at 360-450 °C and 200 psig. The
reaction rate was found to be proportional to (pC6H14 or pC7H16)0.3 and the activation
energy for the reaction was 21±1 kcal/mol. A Langmuir model was applied to the kinetic
data and the relative reaction rates were strongly influenced by the relative adsorption
coefficients of the reactants. Muraki and Fujitani [41] studied the kinetics of steam
reforming of n-heptane over a Rh/MgAl2O4 catalyst at 400-500 °C. The observed initial
reaction rate was best expressed by a Langmuir-type equation with the adsorption
equilibrium constant for n-heptane and water of 111 and 0.712 atm-1, respectively.
Furthermore, the reaction between n-heptane adsorbed on rhodium metal and adsorbed
steam on the spinel surface was found to be the rate-determining step. CO was a primary
product whereas both CO2 and CH4 were secondary products. More kinetic studies for
steam reforming of hydrocarbons can be found elsewhere [7, 8].
Catalysts
Supported Nickel Catalysts
The introduction of MgO to Al2O3 in Ni catalysts has been known to improve the
catalytic properties such as activity, stability, and resistance to coking. However, the role
of MgO on enhancement in reaction performance is unknown. Borowiecki [42]
investigated the effects of calcination and reduction conditions on the phase composition
and the resistance to coking of the Ni/MgO-NiO-Al2O3 catalysts for steam reforming of
n-butane. Calcination and reduction temperatures were found to strongly affect the
nickel crystallite sizes and the phase composition of the catalysts. A phase of solid

21
solution rich in NiO was observed with a rise in calcination temperatures but a fall in the
degree of NiO reduction. In addition, higher reduction temperatures were found to
increase the degree of NiO reduction. It was concluded that the optimum calcination and
reduction temperatures were 400 and 500 °C, respectively. Furthermore, a phase of solid
solution MgO-NiO (rich in MgO) and a MgO phase suppressed the rate of carbon
deposition of the catalyst while that of solid solution NiO/MgO (rich in NiO) enhanced
coking.
Borowiecki [43] further examined direct and indirect factors affecting the
coking rate. Nickel dispersion and phase composition of the support were found to have
the direct effect on the coking rate. On the other hand, other variables connected with
preparation procedures such as catalyst composition and preparation conditions indirectly
affected the catalyst coking. The structure of carbon deposits on Ni/Al2O3 and Ni/MgO
catalysts during steam reforming of n-butane at 400-680 °C was subsequently studied
[44]. The similar carbon structures, which were true filaments, tubes, and shells, were
observed on both catalysts. The dependence of temperature on the created forms and
their degree of graphitization was also observed. Moreover, the arrangement of the
carbon layers in the deposits was strongly affected by the shape of the nickel particles. It
was suggested that rate of catalyst coking did not affect the morphology of carbon
deposits formed.
The introduction of small amounts of molybdenum (≤ 1.0 wt%) into the Ni-Mo
catalysts has shown the increase in their resistance to coking [45-47]. This was likely due
to lower rates of carbon deposit formation caused by the addition of molybdenum as a
promoter [45]. In addition, the gasification of carbonaceous deposits on the catalyst

22
surface was found to depend on the composition of the reaction mixture. The presence of
N2 in steam showed highest rate of the deposit removal whereas the lowest rate was
obtained with further addition of H2 (H2O: H2 = 1:1). However, the rate of gasification
was unaffected by the presence of molybdenum in the H2 + N2 mixture.
Kepinski et al. [47] investigated carbon deposition on Ni/Al2O3 and Ni-Mo/Al2O3
catalysts during steam reforming of n-butane. Ni-Mo/Al2O3 catalyst showed a
remarkable reduction in coke deposition with much lower numbers of Ni particles
observed in the carbon filaments growth. Furthermore, the morphology of carbon was
found to be similar on both catalysts.
A beneficial effect of small amounts of molybdenum in the Ni catalysts was
examined during steam reforming of n-heptane [46]. The mechanism of improved
coking resistance of catalysts promoted with molybdenum was proposed as follows:
Mo+n on the nickel surface was initially oxidized to Mo+(n+2), which then reacted with
adsorbed Ni-C or Ni-CHx yielding CO and H2, and was finally reduced back to Mo+n. It
was believed that only a few atoms of Mo+n could significantly increase the oxidation of
adsorbed Ni-C or Ni-CHx, thus preventing the accumulation of carbon on the nickel
surface.
As mentioned earlier, magnesia as a support has been known to reduce catalyst
coking via the enhancement of gasification by steam. The benefits of magnesia for nickel
steam reforming of ethane and propane were established by O. Sidjabat and D.L. Trimm
[28]. Ni/MgO catalysts were found to deactivate much slower than Ni/Al2O3 catalysts
and performed even better with the presence of H2. Also, the preparation method for
magnesia did not strongly affect the catalytic activity and coking rate.
23
Hydrogen generation for PEM fuel cell-powered vehicles from heavy and more
complex hydrocarbon fuels such as gasoline and diesel has gained much attention. Coke
formation and sulfur poisoning over Ni-based catalysts become even more serious when
heavy hydrocarbons are steam reformed. Moon et al. [48] investigated POX reforming
(or autothermal reforming, ATR) of iso-octane with/without 100 ppm sulfur and of
reformulated naphtha over a commercial ICI naphtha reforming catalyst (NRC). The
NRC catalyst did not show coke deposition at 700 °C, H2O/C = 3, and O/C =1 over 24 h.
However, the NRC catalyst deactivated from sulfur poisoning when 100 ppm sulfur
(thiophene) was introduced into the iso-octane feed. The authors concluded that a
preferential partial oxidation (PROX) reactor for CO conversion and highly coke- and
sulfur-resistant catalysts are needed to successfully develop a gasoline fuel processor.
Hydrogen production by partial oxidation and steam reforming (POSR) of n-octane over
alumina-supported Ni catalysts has been reported [49, 50]. n-Octane conversion and H2
selectivity were strongly affected by Ni loading and reaction parameters such as reaction
temperature and O2/C8H18 ratio [50]. An increase in these parameters resulted in an
increase in n-octane conversion and H2 selectivity at H2O/C = 3.0. However, 5 wt%
Ni/γ-Al2O3 catalysts deactivated rapidly at 750 °C mainly due to carbon deposition. The
presence of Pd in the Ni-based catalysts significantly improved the catalytic performance
and stability. However, SEM and TGA results did not show any differences between the
fresh and deactivated catalysts.
While scarce literature exists on the use of catalyst systems for hydrogen
production from gasoline and diesel fuels, additional insight into the performance of Ni-
based catalysts for heavy feedstocks can be obtained from examining the literature related
24
to the steam reforming of oils. Wang et al. [51, 52] investigated the production of H2
from biomass by catalytic steam reforming of fast pyrolysis oils over commercial Ni-
based catalysts. Hydrogen yields as high as 85% of the stoichiometric value were
achieved from steam reforming of poplar oil aqueous fraction at 750 °C. Furthermore,
the catalysts were easily regenerated by steam or CO2 gasification of carbonaceous
deposits at 800 °C for 12 h. A variety of research and commercial Ni-based catalysts
were tested in the catalytic steam reforming of bio-oils derived from pyrolysis of biomass
[53]. It appeared that Ni-Co and Ni-Cr catalysts supported on MgO-La2O3-Al2O3 were
the best performing catalysts. The addition of Co or Cr was believed to modify the
existing nickel metal sites by forming alloys that led to smaller crystallite size.
Marquevich et al. [54-56] studied steam reforming of sunflower oil for hydrogen
production over a commercial Ni-based catalyst. Although the catalyst showed some
deactivation, the activity was restored after gasification of the carbon deposits.
Other Catalysts
It has been known that rhodium and ruthenium catalysts are more active than
nickel catalysts for steam reforming of ethane and n-heptane. Thus, in many studies,
they are used at higher space velocities. Kikuchi et al. [57] investigated the effect of the
rhodium dispersion on catalytic activity of rhodium supported on γ-alumina for steam
reforming of n-heptane. The specific activity was found to strongly depend on the
dispersion of rhodium, that is, the activity decreased when the dispersion of rhodium
increased. It was suggested that the proportion of active face atoms, as opposed to corner
and edge atoms, decreased with an increase in the rhodium dispersion.

25
Barbier and Duprez [58] studied steam reforming of propane with and without
oxygen over Pt-Rh catalysts supported on CeO2/Al2O3. The Pt (1 wt%)-Rh (0.2 wt%)
catalyst was found to be the most active. The catalyst was initially active and deactivated
completely after 12 h time-on-stream. The authors concluded that platinum, which was
intrinsically inactive, significantly increased the activity of rhodium in the bimetallics,
hence showing a synergistic effect. Moreover, CeO2/Al2O3-supported catalysts showed
much higher activity than those supported only on ceria. In addition, the catalysts were
more stable during the reforming reaction with the presence of oxygen in the reactant
mixture. Maillet et al. [59] further investigated oxy-steam reforming of propane on a
Pd/Al2O3 catalyst. Pd was found to be more thermally resistant than Pt and Rh. It was
suggested that the addition of steam in propane oxidation was not necessary due to its
inhibition effect. However, steam protected an active PdOx species from reduction into a
less active phase, Pd0, below 400 °C.
2.1.3 Catalyst Deactivation by Coke Formation
Due to high operating temperatures during alkane steam reforming, catalyst
deactivation by coke formation cannot be avoided. As a result, understanding the
mechanism of coke formation and exploring any measures to control coking are
considerably significant. Studies of coke formation on supported nickel catalysts have
been of interest for the last two decades [23-28, 42-47, 60-69].
Although more studies have reported on the positive effect of promoters or
supports on coke minimization, still more studies need to be conducted. The following

26
section reviews the important aspects of carbon and coke formation (i.e., mechanism,
carbon morphology, thermodynamics, kinetics) and discusses different approaches to
control coking and the role of promoters or supports on coke minimization.
Carbon and Coke Formation
Mechanism and Morphology
Carbon is described as a product of CO disproportionation or the Boudouard
reaction [reaction (5)] while coke is produced by decomposition or condensation of
hydrocarbons on metals [24]. At high temperatures, coke formation via reactions (6) and
(7) become insignificant whereas reactions (5) and (8) are favored. Also, the rate of
carbon formation depends on the nature of the feed. Furthermore, the different routes to
carbon formation affect the morphology of the carbon and how easily it may be gasified.
The most common types of carbon observed in steam reforming are whisker-like,
encapsulating, and pyrolytic [8]. Whisker-like carbon is formed at temperatures
approximately greater than 450 °C. Basically, its formation is involved with the diffusion
of carbon through Ni crystals and the nucleation and whisker growth with Ni crystals at
the top. However, whisker carbon does not deactivate the catalyst but it will eventually
break the catalyst surface down and increase the pressure drop. Unlike whisker-like
carbon, encapsulating carbon films are formed by slow polymerization of CnHm radicals
on Ni surface at temperatures below 500 °C. The catalyst is then deactivated
continuously. Pyrolytic carbon originates from thermal cracking of hydrocarbons. It
subsequently deposits on the catalyst surface and encapsulates the catalyst particles. Not
surprisingly, its effects are catalyst deactivation and an increase in pressure drop.

27
Moreover, carbon deposits via CO decomposition can be further divided into five forms,
depending on their reactivity and temperature of formation: adsorbed atomic carbon (Cα),
amorphous carbon (Cβ), vermicular carbon (Cv), bulk Ni carbide (Cγ), and crystalline,
graphitic carbon (Cc) [24].
Thermodynamics
Calculations based on thermodynamic data can be used to estimate the amount of
carbon formed in equilibrium with gaseous products at any specific values of O/H ratio,
temperature, and pressure. Nonetheless, any deviations from the calculation at
equilibrium can occur. For example, although the equilibrium composition is predicted
to form no carbon, it may be formed due to poor activity or selectivity of the catalyst
under steady-state condition [24]. Likewise, based on the bulk gas temperature, no
carbon formation is predicted when the temperature of the catalyst surface is higher than
that of the bulk gas.
In addition, the effects of temperature, pressure, composition, and carbon type on
equilibrium carbon deposition isotherms were investigated [24]. It was found that carbon
fraction had the most impact on the carbon-forming boundary. The tendency to form
carbon decreased when water or hydrogen was added. At moderate temperatures and
high pressures, amorphous carbon could be produced from H2/CO mixtures. On the other
hand, H2O/CH4 mixtures could form graphitic carbon at low pressures and very high
temperatures.
It is noted that thermodynamics of carbon formation is independent of catalyst
composition, promoters, and supports whereas its kinetics is strongly influenced by these

28
factors. Furthermore, since graphitic carbon is mainly formed in steam reforming at the
typical operating conditions, thermodynamic data for graphite are more applicable to this
process over the catalysts containing relatively large metal particles. However, any
deviation needs to be considered when amount of carbon is predicted from the
thermodynamic data for small crystallite catalyst systems.
Kinetics
Although carbon is largely deposited by CO disproportionation, little information
on its kinetics is known. More detail on two comprehensive kinetic studies can be found
in [24]. In general, the forward reaction is favored at temperatures below 700 °C. The
catalytic activity of carbon formation depends on metals in the following order: Fe > Co
> Ni. Also, the temperature-dependent rate of carbon formation was found to be zero to
first order in the concentration of CO.
Adsorbed atomic carbon (Cα) is so highly reactive that most can be further
gasified to reduce coking with a suitable ratio of steam/carbon in the feedstock.
However, some of Cα can be converted to less active amorphous carbon (Cβ) via
polymerization and rearrangement of Cα. Subsequently, Cβ may be gasified or converted
to different carbon forms by encapsulation of the catalyst surface and dissolution into the
nickel crystallite. Therefore, understanding of the kinetics of the various reactions of Cα
and Cβ is of significance since it can be used to predict the extent of coking.

29
Coke Minimization
Different Approaches to Control Coking
Two different approaches to control coking have been proposed and explained in
terms of the mechanism of coke formation: the ensemble size control and the prevention
of carbide formation [66, 67].
The concept of the ensemble size control is to minimize coking by controlling the
number of surface sites required for coke formation. It is known that coke formation is
involved with a carbonaceous intermediate, which is produced from reactions (5)-(8).
Therefore, coke minimization could be accomplished by controlling the selectivity of the
reaction that favors steam reforming rather than coke formation [67]. Furthermore, it is
suggested that coke formation demands more surface sites than steam reforming. The
benefit of this approach has been emphasized by adding traces of sulfur in the feed to
create correct size ensembles. When suitable amounts of sulfur are adsorbed on the
catalyst surface, coke formation could be prevented at the expense of catalytic activity.
Consequently, careful control of sulfur levels in the feed is of great concern to avoid
poisoning the catalyst surface.
On the other hand, the prevention of carbide formation could also suppress coke
formation since carbide was suggested to be an essential intermediate in carbon
dissolution and precipitation. Doping with small amounts of metals to form an alloy on
the catalyst surface could possibly reduce carbide formation, thus significantly reducing
coke formation. However, although surface segregation may occur, formation of the

30
alloy with a dopant does not necessarily follow [67]. Moreover, the impact of nickel
carbide formation on coke formation is still unknown.
It is known that a catalyst may lose its activity to some extent when alkali or
alkali-earth elements are added as promoters to suppress carbon deposition [8].
However, cerium oxide-containing nickel catalysts were found to suppress the rate of
carbon deposition but maintain their activity during the induction period and in the
constant carbon deposition region [26]. The promoting effect of cerium oxide was
suggested to occur via a redox mechanism. Cerium oxide may dissociatively adsorb
water and enhance the reaction of steam with adsorbed species on the nickel surface to
quickly yield the products. A significant improvement in the stability and high
temperature steam resistance of rare earth oxide-promoted Ni/α-Al2O3 catalysts were
confirmed by the work of Su and Gao [27]. It was found that the presence of rare earth
oxides retarded the growth of Ni particle size and the transformation of active
components to unreducible NiO and NiAl2O4, thus suppressing the catalyst deactivation.
Trimm [67] further explored the kinetics of steam reforming and carbon
formation over supported nickel catalysts doped with various amounts of tin. It was
concluded that small amounts of tin (less than 1.75 wt% Sn) had a minor effect on steam
reforming while coke formation was greatly reduced even with 0.5 wt% of tin addition.
Also, the supported nickel catalyst with 1.75 wt% Sn was the best performing catalyst
showing the highest rate of steam reforming compared to that of coke formation among
various metal-doped catalysts examined.

31
2.2 The water-gas shift (WGS) reaction
There has been renewed interest in the WGS reaction in recent years because of
its necessity in conjunction with fuel cell power generation. The high-temperature shift
(HTS) reaction is performed at 320-450 °C using Fe-Cr oxides catalysts, while the low-
temperature shift (LTS) reaction is conducted at 200-250 °C. The LTS catalysts
commonly used are Cu/ZnO/Al2O3 and precious metal-based catalysts. The WGS reactor
currently represents the largest volume of any catalyst in a fuel processor due to slow
kinetics at temperatures where the equilibrium is favorable [70]. In the absence of a
catalyst, the reaction is very slow at accessible industrial temperatures [71]. Two main
categories of WGS catalytic systems, which have been studied in recent years, can be
summarized as follows:
2.2.1 Precious metal catalysts
Ceria-supported precious metals have gained much interest as potential candidates
for low-temperature water-gas shift catalysts in the past years. Their enhanced activity is
attributed to higher oxygen storage capacity and improved reducibility. Gorte and
coworkers [72-74] have proposed that the mechanism of the WGS reaction over ceria-
supported precious metals involves a redox process, with reduced ceria being oxidized by
water and then transferring oxygen to the precious metal to react with adsorbed CO.
Interestingly, ceria-supported Pd, Pt, and Rh catalysts were found to show similar WGS
activity and they were even more active than alumina-supported catalysts. Work

32
performed at NexTech Materials on the development of Pt/ceria catalysts showed that
hydrothermal synthesis methods for dispersed suspension of nanoscale ceria and ceria-
zirconia gave more active WGS catalysts compared to a commercial Süd-Chemie Cu-
based catalyst at 300–400 °C [75]. Johnson Matthey has also developed new WGS
catalysts including non-pyrophoric platinum group metals (PGM) formulations with
improved durability and no methanation activity at 200-500 °C [76]. However, the
deactivation mechanisms of Pt/ceria and Pd/ceria catalysts for the water-gas shift reaction
are still under debate. Wang et al. [77] have suggested that the deactivation of these
catalysts is due to the growth of metal particles in the presence of CO based on
accelerated aging tests. On the other hand, Zalc et al. [78] have claimed that Pt/ceria
catalysts deactivate rapidly with the presence of H2 in the feed due to the irreversible
over-reduction of ceria. The authors further implied that these ceria-supported precious
metals could not be practical for automotive fuel processing. Therefore, better
understanding of deactivation mechanisms of these catalysts for the WGS reaction will
definitely play a crucial role on the success of their transportation applications.
Gold-containing catalysts are known for high activity at low temperatures for CO
oxidation and methane oxidation. As a result, they have been increasingly studied for
low-temperature water-gas shift reaction in recent years. An increase in catalytic activity
of gold-containing catalysts could be due to synergism between the gold and metal oxide
supports, which strongly depends on catalyst preparation conditions. Andreev et al. [79]
reported that a Au/α-Fe2O3 catalyst prepared by deposition-precipitation (DP) method
showed much higher catalytic WGS activity and stability than a co-precipitated (CP)
sample at 120-200 °C. It was found that highly dispersed gold particles (avg. 2 nm) and

33
more uniform gold particle size distribution on α-Fe2O3 were detected on the DP sample.
Later, the authors concluded that the catalytic activity of gold catalysts supported on
metal oxides depended not only on the dispersion of gold particles but also on the nature
and structure of the supports [80]. Gold catalysts on well-crystallized supports such as
Fe2O3 and ZrO2 were more active and stable than those on amorphous supports (i.e.,
ZnO, ZrO2, Fe2O3-ZnO, and Fe2O3-ZrO2). As mentioned earlier, ceria can promote Pd,
Pt, and Rh for the water-gas shift reaction. Fu et al. [81] and Andreeva et al. [82]
investigated the role of ceria as a support on the catalytic behavior of gold catalysts.
Their enhanced activity has been related to much improved Ce reducibility, that is, the
surface oxygen of ceria was substantially weakened by the presence of gold particles. In
addition, the catalytic behavior of gold catalysts supported on titania has been
investigated [83, 84]. Sakurai et al. [83] presented that TiO2-supported gold catalysts
prepared by a deposition-precipitation method exhibited very high WGS activity,
comparable with that of a conventional Cu/ZnO/Al2O3 catalyst for forward and reverse
WGS reactions. The activity was found to increase with increasing gold loading (3.4-10
at% Au).
2.2.2 Non-precious metal catalysts
The development of low-cost non-precious metal catalysts is of great significance
for WGS reaction for fuel cell applications. However, this still poses major challenges
since non-precious metal catalysts possess lower WGS catalytic activity at low
temperatures compared to PGM or gold catalysts. Li et al. [85] reported that Cu or Ni (2

34
wt%) supported on Ce (La)Ox prepared by a urea precipitation-gelation method gave high
WGS activity at high space velocities. Hydrogen addition (40% in the feed) did not
suppress the reaction over the Cu-containing sample. The enhanced activity was related
to improved ceria reducibility with the addition of Cu or Ni. Saito et al. [86] investigated
the effect of ZnO on the specific activity of Cu-based catalysts supported on Al2O3, ZrO2,
or SiO2 for various reactions including the water-gas shift reaction. The specific activity
was defined as the reaction rate per unit of Cu surface area of the spent catalyst.
Interestingly, the addition of ZnO did not improve the specific activity of the supported
Cu-based catalysts for methanol steam reforming and the WGS reaction but for methanol
synthesis and the reverse WGS reaction. Therefore, the development of high-
performance Cu-based catalysts can be achieved by increasing Cu surface area. The
authors also found that catalyst preparation methods play a major role on Cu surface area
of Cu-based catalysts. A co-precipitated Cu/ZnO catalyst displayed much larger Cu
surface area than an impregnated Cu/ZnO catalyst. Not only the presence of ZnO in Cu-
based catalysts can improve activity and selectivity in the WGS reaction, but it enhances
the catalyst life by adsorbing sulfur poisons as discussed by Spencer [87].
Tanaka et al. [88] studied the WGS reaction over various Cu-based mixed oxides
under severe conditions including a large amount of H2O (25% vol.) in the reformed
fuels. It was found that CuMn2O4 showed similar WGS activity over 300 oC compared to
Cu/ZnO/Al2O3. CuFe2O4 and CuAl2O4 also showed a moderate activity. The effect of
reduction treatment on the WGS activity was also investigated. The catalytic activity
after reduction in 10% H2/N2 at 225 °C decreased as follows:
CuMn2O4 > CuFe2O4 > CuY2O5 > CuAl2O4 > CuLa2O4 > CuCr2O4

35
Furthermore, without reduction, CuMn2O4 became even more active at 200-350 °C. It
was concluded that excessive reduction led to the sintering of Cu particles, thus resulting
in a decrease in WGS activity
Additionally, superior tolerance to contaminants in the feed such as H2S and
chlorine must be considered for non-precious metal WGS formulations used for fuel
processing. It is reported that alkali promoters can increase sulfur tolerance of Co-
Mo/Al2O3 catalysts in the WGS reaction. However, little is known for the effect of alkali
promotion on the structure of Co-Mo/Al2O3 catalysts. Xie et al. [89] examined the
influence of potassium on the structure of Co-Mo/Al2O3 catalysts. The presence of
potassium was found to enhance not only the reducibility but also the sulfidation ability
of the catalysts. XRD and XPS results indicated that potassium was well dispersed on the
surface in both oxidic and sulfided states. The authors further concluded that the WGS
activity of K-promoted Co-Mo/Al2O3 was affected by the potassium content. Mellor et
al. [90] investigated the influence of sulfur present in coal-derived process gas on the
performance of novel cobalt-based WGS catalysts. Both Co-MnO and CoCr2O4 catalysts
were found to be active under the feed containing sulfur up to 220 ppm. However, they
suffered from sulfur poisoning in the WGS reaction of coal-derived process gas
containing 0.25-0.3 mol% sulfur. Interestingly, the activity and stability of the CoCr2O4
catalyst were improved when it was pre-sulfided in a gas mixture of H2S, H2, and N2
before use. The sulfided CoCr2O4 catalyst exhibited the highest activity in a sulfur-rich
feed (0.91 mol% sulfur) at 400 °C.
Andreev et al. [79] studied the active components in non-promoted and K-
promoted NiMo-sulfided catalysts for the WGS reaction. Water vapor in the feed caused

36
hydrolysis of the sulfide phase to yield an oxysulfide phase which also showed catalytic
activity. An increase in the Mo4+ content was also observed in the more active K-
promoted samples. Lanieeki et al. [91] studied the influence of three different oxide
supports (γ-Al2O3, TiO2, ZrO2) on NiMo-sulfided catalysts on the catalytic activity in the
WGS reaction with sulfided feed. The best performing catalyst was 3 wt% Ni-6 wt%
Mo/TiO2 [precursor = Mo(CO)6]. High activity of TiO2-supported catalysts was due to
better homogeneity in the coordination of Mo species on titania than on alumina and
zirconia. Moreover, the authors have currently investigated the effect of different surface
properties of alumina and zirconia modified with different ions (i.e., SO42-, PO4
3-, F-, or
Na+) on the WGS activity. However, literature on the active forms of sulfided WGS
catalysts is very limited. Mo carbide catalysts are known for good tolerance to sulfur
poisons for many catalytic reactions. Patt et al. [92] reported that, with the absence of
methanation, high surface area Mo2C was more active than a commercial Cu-Zn-Al
catalyst in the WGS reaction of a synthetic steam reformer exhaust at 220-295 oC.
It is known that the activation process can play an important role on the activity
and stability of catalysts. Rethwisch et al. [93] investigated the effect of reducing agents
(CO/CO2 and H2/H2O gas mixtures) on WGS activity at 390 °C over a 16.8 wt% Fe3O4
supported on graphite. It was found that the pre-reduction of the catalyst in CO/CO2 at
390 °C increased the catalytic activity. In contrast, reducing in H2/H2O caused the
growth of magnetite particles, leading to a decrease in the catalytic activity. Gonzalez et
al. [94] studied the influence of thermal treatments and reduction process on HTS activity
of Fe-Cr catalysts. The active phase, Fe3O4, can be obtained from partial reduction of
Fe2O3. However, over-reduction to form metallic Fe should be avoided. Moreover,

37
metallic Fe is believed to enhance methanation and carbon formation reactions. It was
found that the surface area of Fe-Cr catalysts decreased with increasing calcination
temperature from 360 to 500 °C under both N2 and N2/H2O. The presence of steam led to
an even more pronounced decrease in the surface area. The effect of reducing agents on
the catalyst reduction was further examined. The reducing agents tested were N2/H2,
CO/N2, and N2/H2/H2O. TPR results indicated that, compared to the sample reduced
under N2/H2, the reduction peak maxima shifted toward higher temperatures when steam
was added in the reducing mixture. On the other hand, CO/N2 enhanced the reducibility
significantly, which may lead to the formation of inactive metallic Fe. The authors
concluded that reduction under either N2/H2 or CO/N2/H2/H2O at temperatures below 500
°C should be performed to obtain higher activity without over-reduction of Fe2O3.
Tsagaroyannis et al. [95] investigated the effect of preparation conditions (i.e.,
Gd/Fe atomic ratio, atmosphere, and firing temperature) on catalytic behavior of
gadolinium-iron ferrites in the WGS reaction. All the catalysts were prepared by a co-
precipitation method followed by thermal treatment in air or Ar. The optimum catalyst
preparation variables giving the best reaction performance were as follows: at% Gd:Fe =
3:5, firing temperature = 800 °C in air. An improved catalytic activity of ferrite catalysts
over pure Fe3O4 was attributed to the presence of punctual defects in their crystal lattice
associated with their n- or p- semiconductivity. However, all ferrite catalysts showed
lower activity than a commercial catalyst.
Hakkarainen et al. [96] studied the WGS activity of a commercial Co-Mo oxide
catalyst with transient respond experiments in a gradientless spinning basket reactor at
350-400 °C. The Co-Mo oxide catalyst exhibited WGS activity above 350 °C. The

38
reaction mechanism was further proposed based on transient response experiments and
chemisorption studies. It involved water adsorption and decomposition to form hydroxyl
groups. The surface hydroxyl groups subsequently reacted with CO producing H2 and
CO2. In addition, hydrogen formation was found to be faster than that of CO2. It was
suggested that surface reaction and CO2 desorption were rate-determining steps. Rhodes
et al. [97] discussed the mechanism of the WGS reaction for both Cu/ZnO/Al2O3 and
Fe3O4/Cr2O3 catalysts. The mechanism of the WGS reaction over Cu/ZnO/Al2O3
catalysts is still under debate due to lack of data under reaction conditions. Two possible
mechanisms over Cu/ZnO/Al2O3 catalysts have been proposed: associative and
regenerative. The associative mechanism involves CO and H2O adsorption on the
catalyst surface forming an unknown intermediate that decomposes later to CO2 and H2;
formate species could be the possible reaction intermediate. On the other hand, the
regenerative (redox) mechanism involves cyclic reduction-oxidation reactions on the
catalyst surface.
For Fe3O4/Cr2O3 catalysts, there is strong evidence supporting the WGS reaction
proceeds via the regenerative mechanism. The dissociative adsorption of H2O leads to
the oxidation of Fe2+ to Fe3+ and production of H2. The Fe3+ ion could be further reduced
by CO, thus making CO2. Interestingly, the authors also suggested that the presence of
Cu could modify the electronic properties of Fe3O4/Cr2O3 catalysts, which results in an
improvement in catalytic activity. Hu et al. [98] examined the reductive behavior of iron-
based shift catalysts promoted by cerium oxide to explain high activity, selectivity, and
stability under the WGS reaction conditions. It was confirmed that the mechanism of the
WGS reaction on ceria-promoted Fe-Cr catalysts occurs through a redox process. H2O

39
can adsorb dissociatively to produce H2 and adsorbed hydroxyl groups. Subsequently,
CO reacts with hydroxyl groups to form H2 and CO2 simultaneously. TPR results
showed that there were two reduction peaks observed around 250 and 400 °C on the
ceria-promoted Fe-Cr catalyst. A low-temperature peak was assigned to the reduction of
surface oxygen species whereas a high-temperature peak was due to the bulk reduction of
Fe2O3. It appeared that the presence of ceria enhanced the catalyst reducibility. The
optimum reduction of ceria-promoted Fe-Cr catalyst should be 200-450 °C to avoid over-
reduction of Fe2O3.
Development of Fe-Cr catalysts to improve their activity and stability has been
pursued in the last two decades. Andreev et al. [99] studied the effect of the addition of
CuO, CoO, and ZnO (5 wt%) on the activity of Fe-Cr catalysts. The unpromoted sample
showed lower WGS activity than the promoted samples; the Cu-promoted sample was the
most active at 380 °C. Although Fe-Cr oxide catalysts have been widely used in high-
temperature WGS reaction, the role of the Cr2O3 addition on the stabilization of the
catalyst structure is still unclear. Edwards et al. [100] reported a detailed microstructural
comparison of Fe3O4/Cr2O3 and Cu-promoted Fe3O4/Cr2O3 co-precipitated catalysts to
identify the location and distribution of the chromia structural stabilizer and the Cu
promoter. The authors suggested that a model for a high stabilizing effect of chromium is
proposed whereby a shell of chromium enriched material is formed on each catalyst
grain, which stabilizes the catalysts. They also concluded that Cu seemed to preferentially
segregate toward the surface layers of the spinel structure, but the mechanism by which
promotion occurs is still uncertain. Kappen et al. [101] studied the state of Cu promoter
(0.17-1.5 wt%) in Fe-Cr catalysts by in situ fluorescence XAFS combined with on-line

40
gas analysis. It was found that Cu was in a metallic phase under the WGS reaction
conditions. However, it reoxidized easily when exposed to the atmosphere. The
reduction of Cu (II) to Cu (I), occurred at 120-150 °C, was not much affected by Cu
concentration. On the other hand, further reduction of Cu (I) to metallic Cu was
significantly enhanced at low Cu concentrations. Rhodes et al. [102] examined the
promotion of Fe3O4/Cr2O3 high-temperature water-gas shift catalysts with 2 wt% B, Cu,
Ba, Pb, Hg, and Ag. It was found that the WGS activity at 350-440 °C decreased in the
following order:
Hg > Ag, Ba > Cu > Pb > unpromoted > B
A beneficial effect of adding Hg, Ag, or Ba could be due to their different ionic sizes
compared to that of Fe2+, influencing the electronic structure of the active Fe3+ center.
Despite its best WGS activity, it is unlikely that toxic Hg-promoted catalysts will be
considered as a commercial HTS catalyst.
Even though chromium oxide has been used as a stabilizer in industrial HTS
catalysts, development of non-toxic catalytic systems is needed due to environmental
concerns related to chromium. Araujo and Rangel [103] investigated the catalytic
performance of aluminum-doped iron-based catalyst with small amounts of copper (%wt
Cu ≈ 3) in the HTS reaction. The aluminum and copper-doped catalyst showed similar
catalytic activity compared to a commercial Fe-Cr catalyst even at more severe
conditions (H2O/CO = 0.4, 350 °C). However, there was no information about the
stability of the aluminum and copper-doped catalyst under industrial conditions. Costa et
al.[104] subsequently examined the use of thorium instead of chromium in iron- and
copper-based catalysts for the HTS reaction. It was found that the thorium and copper-

41
doped catalyst was more active than a commercial Fe-Cr catalyst at H2O/CO = 0.6 and
370 °C. Its high activity was attributed to an increase in surface area by thorium. The
authors concluded that a non-toxic thorium and copper-doped catalyst is a promising
HTS catalyst. A review of the state of the art makes it clear that alternatives to Fe-Cr
catalysts that can overcome the drawbacks such as low activity at low temperatures,
sintering, poisoning by sulfur and chlorine, pyrophoric nature, fragmentation with water
and harmful effects of Cr6+ would have an impact in many processes that target hydrogen
production.

42
CHAPTER 3
EXPERIMENTAL
3.1 Catalysts synthesis
3.1.1 Ni-based catalysts for steam reforming of lower alkanes
Catalysts were prepared using a modified sol-gel technique. Nickel and
lanthanide precursors (Aldrich) used were in nitrate form. For the aluminum precursor,
aluminum tri-sec-butoxide (ATB; Aldrich) was used. Ethanol (Alfa Aesar; 130 cm3) was
used as the solvent. The following sol-gel variables were controlled during the synthesis:
nickel content = 20 wt%, lanthanide content = 2-5 wt%, H2O/ATB molar ratio = 3.6, and
pH of the resulting gels = 4.8. Initially, ATB was placed in ethanol and stirred to form a
white suspension. The aqueous solutions with the desired amounts of nickel and
lanthanide were added dropwise into the suspension using a syringe pump at the flow rate
of 0.5 cm3/min. It is noted that the aqueous lanthanide nitrate solution was added first
followed by that of nickel. The pH of the resulting green gels was measured and adjusted
by adding HNO3 (Fisher) or NH4OH (Fisher). The gels were stirred for an additional 15
min. and were kept at room temperature for 30 min. The samples were then dried
overnight in the oven at 110 °C to remove the remaining water and ethanol. The dry

43
samples were ground to a fine powder and were calcined under O2 at 450-600 °C (ramp
rate = 10 °C/min) for 4 h. For simplicity, all the catalysts prepared were denoted to
indicate compositions and calcination temperature: for example, 20Ni2CeAl(450)
represents 20%Ni-2%Ce/Al2O3 catalyst calcined at 450 °C.
3.1.2 Fe-based catalysts for the HTS reaction
Catalysts were prepared using a coprecipitation method. All metal precursors
(Aldrich) used were in nitrate form. Ammonium hydroxide (29.63 vol%, Fisher
Scientific) was used as the precipitating agent. Initially, 0.5 M aqueous solutions of
metal nitrates were prepared and mixed in a beaker in appropriate proportion to yield the
desired Fe/promoter molar ratio. NH4OH was subsequently added drop-wise to the
mixed solution until the desired pH was reached. The resulting dark brown solution was
stirred vigorously for an additional 30 min. The precipitate was washed with
demineralized distilled water and filtered several times to remove ammonium ions. The
remaining solid was then dried overnight in an oven at 110 °C. The dry samples were
ground to a fine powder and were calcined under air at 350-500 °C (ramp rate =
2.5°C/min) for 4 h. For catalysts promoted with first-row transition metals (Cu, Co, Zn),
they were synthesized by a coprecipitation-impregnation method. Before drying, the
precipitate obtained after washing was further impregnated with a calculated amount of
0.5 M aqueous solution of the first row transition metal and stirred for 30 min.

44
3.2 Catalyst characterization
Various characterization techniques were incorporated into this research to
determine the physical, chemical, and structural properties of the catalysts and the role of
different preparation variables. Among the techniques which will be regularly used for
catalyst characterization are BET surface area measurements, pore size distribution
measurements, temperature-programmed desorption/reduction/oxidation
(TPD/TPR/TPO), X-ray diffraction (XRD), X-ray photoelectron spectroscopy (XPS),
diffuse reflectance infrared Fourier transform spectroscopy (DRIFTS), H2 chemisorption,
transmission electron microscopy (TEM), and thermogravimetric analysis (TGA)
Important catalytic properties of the synthesized catalysts are the catalyst composition,
the BET surface area and pore size distribution, metal dispersion, reducibility, crystal
structure, surface morphology, and oxidation state of the metals. For Ni-based catalysts,
metallic Ni is generally known as an active site for steam reforming of hydrocarbons.
The activity is, therefore, correlated to the nickel surface area, which increases with Ni
content. However, the Ni dispersion decreases with increasing Ni content. Furthermore,
the ease of reduction of to metallic Ni is also expected to influence the Ni surface area.
For example, nickel aluminate (NiAl2O4) formation may result in inactive nickel species
which require higher reduction temperatures to obtain similar catalytic activity. For Fe-
based catalysts, magnetite (Fe3O4), which is produced by the partial reduction of hematite
(Fe2O3), is reported to be the active phase for high-temperature water-gas shift reaction in
Fe-based catalysts. Over-reduction of Fe2O3 to form either inactive FeO or metallic Fe
needs to be avoided to prevent sintering. Calcination/reduction temperatures and
reducing agents therefore strongly affect the catalytic activity, selectivity, and stability of

45
these catalysts. BET surface areas of catalysts were measured to investigate the surface
change upon the promotion. As mentioned earlier, the addition of lanthanide elements in
Ni-based catalysts has been reported to inhibit nickel crystallite growth under reduction
and reaction conditions. On the other hand, the presence of Al or Cr in HTS Fe-based
catalysts can prevent the growth of magnetite crystallites. TPR helped elucidate the
nature of active sites and interaction of active and promoter/support species and examine
the catalyst reducibility. TPD of adsorbed reactants was used to investigate the
heterogeneity of active site strengths present on the catalysts. X-ray diffraction (XRD)
equipped with atmosphere and temperature control capabilities (up to 1200 °C) was used
to study changes in catalyst crystallinity and phase transformation during calcination and
reduction steps. H2 chemisorption was used to measure Ni dispersion and metallic
surface area.
Furthermore, XPS provided useful information on surface chemical states (i.e.,
oxidation state, coordination environment, and nature of catalytic active sites). In situ
DRIFTS combined with TPD and TPReaction was conducted to identify the important
surface species under the reaction conditions. Post-reaction characterization techniques
using controlled-atmosphere sample handling capability of the surface and bulk
characterization systems available such as XPS, and TEM were used to examine phase
transformation, deactivation mechanisms, and change in microstructure of these catalysts.
Additionally, TPO and TGA were performed to characterize carbonaceous species
formed on catalyst surface during steam reforming of lower alkanes. Information
acquired from all the characterization techniques above will offer a more complete
picture of the characteristics of both Ni-based and Fe-based catalysts.

46
3.2.1 BET surface area measurement
The most common method of measuring surface area is the BET method
developed by Brunauer, Emmett, and Teller. They proposed the following linearized
BET isotherm, which is derived by equating the rate of condensation to the rate of
evaporation as follows:
ommo CPVPC
CVPPVP )1(1
)(−+=
−
where V is the volume of gas adsorbed at pressure P, Vm is the volume of gas adsorbed in
monolayer, Po is the saturation pressure of adsorbate gas at the experimental temperature,
and C is a constant. Plotting P/V(Po-P) vs P/Po results in a straight line whose slope and
intercept can be used to determine Vm. With a knowledge of cross sectional area of
adsorbing gas, the surface area of the catalyst can be calculated from Vm [12].
BET surface areas of calcined catalysts were measured by N2 adsorption-
desorption at 77 K using a Micromeritics ASAP 2010 instrument. Before measurements,
samples were degassed under vacuum at 130 °C overnight.
3.2.2 X-ray diffraction (XRD)
Determination of the crystal structure and identification of phases can be achieved
using X-ray diffraction (XRD). XRD is particularly useful for the determination of
change in crystallinity and phase transformation of species present in steam reforming
and HTS catalysts during calcination and reduction steps. When electromagnetic
radiation (X-rays) is incident upon a periodic array of scattering centers (lattice atoms),
there are certain discrete directions for the incident ray that result in strong reflections.

47
This is because of constructive interference of the radiation scattered from each of the
centers. The directions for which these strong reflections occur are related through
Braggs law to the geometry of the arrangement. Therefore, measurements of the angles
and intensities of the Bragg reflections can be used to deduce the arrangement and
spacing of the scatterers. Additionally, line broadening of XRD peaks are inversely
proportional to crystallite size and therefore can be used to estimate crystallite size in the
range ~5-50nm using the Scherrer equation [105] as follows:
d (nm) = 0.9λ/Bcosθ
where λ is wavelength usually 1.54056 Å for Cu Kα radiation , B is width of diffraction
line at half of its maximum intensity, and θ in radian is angle at the maximum intensity.
X-ray diffraction patterns of catalysts were obtained with a Scintag XDS
diffractometer using Cu Kα radiation operated at 45 kV and 20 mA. In situ XRD during
reduction of the catalysts pre-calcined at 450 °C was performed using a Bruker D8
Advance X-ray diffractometer equipped with atmosphere and temperature control stage
and using Cu Kα radiation operated at 40 kV and 50 mA. In these experiments, XRD
patterns were recorded every 50 °C with the ramp rate of 10 °C/min up to 800 °C under
5% H2/N2.
3.2.3 Temperature-programmed desorption/reduction/oxidation(TPD/TPR/TPO)
Temperature-programmed techniques have been one of the most widely used
methods for studying interactions between reactants and the catalyst surface. The
methods involve the measurement of the rate of desorption (of adsorbed molecules),
reduction, or oxidation as a function of temperature (linear temperature ramp). TPD can

48
provide information on the number of catalytic sites, the strength of adsorption bonds,
and the nature of exposed sites. TPR can be used to determine the reducibility,
distribution of reducible states, and the effect of metal catalyst modification by supports.
TPO can be used to qualitatively and quantitatively characterize carbonaceous species
formed on catalyst surface during hydrocarbon steam reforming.
TPD/TPR/TPO of catalysts was conducted using a laboratory-made gas flow
system as shown in Figure 3.1. For TPR experiments, 50 mg of catalysts was initially
placed in a 1/4 in. O.D. quartz U-tube reactor. The catalysts were then re-calcined under
10% O2/He at 450 °C for 1 h followed by cooling to room temperature under Ar. The
reduction was performed with 10% H2/Ar (40 cm3/min). The temperature of the catalysts
was raised using a ramp rate of 10 °C/min to 900 °C and held for 10 min. The effluent
from the reactor was passed through a silica gel water trap to remove moisture formed
during reduction. H2 consumption was measured using a thermal conductivity detector
(TCD) connected to a data-acquisition computer. TPO was performed with 50 mg of
samples which were placed in a 1/4 in. O.D. quartz U-tube reactor and heated under He
(40 cm3/min) at 200 °C for 30 min. to remove moisture followed by cooling to room
temperature.

49
Figure 3.1: Schematic of TPD/TPR/TPO system

50
Subsequently, the temperature of the catalysts was raised under 1% O2/He (40 cm3/min)
with a ramp rate of 10 °C/min to 800 °C and held for 5 min. The desorbed species from
the catalyst surface were monitored using a mass spectrometer (HP5890 GC-MS) under
He carrier gas.
Sequential temperature-programmed coking/gasification/hydrogenation of
catalysts was conducted with a Shimadzu GC-MS QP-5050. Prior to spectra collection,
the catalysts were reduced in situ under 20% H2/N2 at 600 °C for 2 h. The coking was
then performed by exposing the catalysts with 2% C3H8/He at 500 °C for 1 h followed by
cooling to room temperature under He. Temperature-programmed gasification
(TPGasification) experiments were initiated by raising the catalyst temperature under 2%
H2O/He with a ramp rate of 10 °C/min to 800 °C. Following cooling to room
temperature, temperature-programmed hydrogenation (TPH) experiments were
performed with 10% H2/He. TPH profiles were collected while heating the catalysts with
a ramp rate of 10 °C/min to 800 °C.
3.2.4 X-ray photoelectron spectroscopy (XPS)
XPS is a technique employed for chemical analysis of solid surfaces. This
technique offers information on surfaces such as distribution, concentration, and chemical
states for all elements. In XPS, a sample is irradiated by monochromatic X-rays under
ultrahigh-vacuum conditions. Photoelectrons are ejected from various atomic shells with
characteristic kinetic energy, which gives their binding energy according to the following
equation: KE=hγ-BE-φSP

51
where KE is the kinetic energy, hγ is the incident X-ray energy, BE is the binding energy,
and φSP is the spectrometer work function. The binding energy is characteristic of the
atomic number of the element. The chemical environment in which they exist affects the
binding energies of elements. These changes in binding energies are called the “chemical
shift” that gives information on the oxidation states of elements on the surface.
In this study, X-ray photoelectron spectra were used to determine the oxidation
states of the components present in catalysts. XPS of reduced and post-reaction catalysts
was performed with an AXIS Ultra XPS spectrometer with an Al anode operated at 14
kV and 10 mA. All samples were transferred to an XPS chamber using an inert glove
box without exposing them to the atmosphere. Spectra were corrected using the C 1s
signal located at 284.5 eV.
3.2.5 Diffuse reflectance infrared Fourier transform spectroscopy (DRIFTS)
DRIFTS is a surface sensitive technique for the analysis of trace quantities of
materials. Unlike traditional solid sampling FTIR techniques, a sample does not need to
be pelletized with KBr. Diffuse reflectance occurs when light impinges on the surface of
a material and is partially reflected and transmitted. Light that passes into the material
may be absorbed or reflected out again. Therefore, the radiation that reflects from an
absorbing material is composed of surface-reflected and bulk re-emitted components,
which summed are the diffuse reflectance of the sample. Figure 3.2 shows a DRIFTS
system schematic used in this study.

52
Figure 3.2: Schematic of DRIFTS system
Gas Inlets
MFC 1
MFC 2
MFC 3
Vent
Vacuum Pump
Diffusion Pump
Pirani GaugeVent
Bruker FTIR Spectrophotometer
Data Acquisition Computer
Inlet Manifold

53
DRIFTS experiments were performed using a Bruker IFS66 instrument equipped
with an MCT detector and a KBr beamsplitter. Catalysts were in situ reduced and then
were placed in a sample cup inside a Spectratech diffuse reflectance cell equipped with
KBr windows and a thermocouple that allowed direct measurements of the surface
temperature. Spectra for each experiment were averaged over 1000 scans in the mid-IR
range (400-4000 cm-1) to a nominal 3 cm-1 resolution. Lanthanide-promoted sol-gel
Ni/Al2O3 catalysts were reduced under 20% H2/N2 at 600 oC for 2 h. Prior to the
collection of spectra, the catalysts were re-reduced in situ under 20% H2/He at 450 °C for
1 h. The background spectra were taken at different temperature intervals under He. The
adsorption of C3H8 was performed at room temperature for 1 h followed by flushing
under He for 30 min. The spectra were subsequently collected at different temperatures
up to 450 °C.
Fe-based catalysts were reduced in situ under 20% H2/He at 350 °C for 2 h
followed by flushing under He for 30 min. Spectra for CO-TPD DRIFTS experiments
were subsequently collected under CO by heating in steps up to 400 °C. For CO+H2O-
TPReaction experiments, spectra were taken under He before CO and H2O were
introduced at 400 °C.
3.2.6 Chemisorption
Chemisorption is a method for measuring metal surface area, dispersion, and
crystallite size. By measuring the amount of gas adsorbed and knowing its stoichiometry
of adsorption on the surface, one can calculate the metal dispersion. The metal dispersion
54
is the percentage of the active metal available for interaction with the adsorbate expressed
as follows:
%D = (Volume adsorbed)(SF)(atomic wt. of metal)/22400 x 100
(%wt of metal in the catalyst)
where SF is the stoichiometry factor. In general, the 1:1 stoichiometry is widely accepted
for H2 adsorption on nickel; each surface Ni atom chemisorbs one hydrogen atom
through the dissociation of a H2 molecule. Moreover, the metal surface area can be
estimated if an effective area of a metal atom is known.
Metal surface area (m2/g) = (Volume adsorbed)(SF) (Navg)(effective area of metal)/22400
where Navg is Avogadro’s number.
H2 chemisorption of catalysts was conducted using a Micromeritics ASAP 2010
Chemisorption System. Prior to adsorption measurements, approximately 0.2 g of
calcined samples was reduced under H2 at the desired reduction temperature for 2 h.
Subsequently, the samples were cooled down to 35 °C followed by evacuation to 10-5
mmHg. The adsorption isotherms were measured at equilibrium pressures between 50-
500 mmHg.
3.2.7 Transmission electron microscopy (TEM)
Transmission electron microscopy (TEM) is dedicated to micro structural analysis
of solid materials down to the sub-nanometer scale. TEM is analogous to optical
microscopy in that the photons are replaced by high-energy (>100 keV) electrons and the
glass lenses replaced by electromagnetic lenses. The electron beam passes an electron-
transparent sample and an enlarged image is formed using a set of lenses. Since electrons

55
interact strongly with matter, electrons are attenuated as they pass through a solid
requiring the samples to be prepared in very thin sections. The image is projected onto a
Charged Coupled Device (CCD) camera for imaging. Image contrast is obtained by the
interaction of the electron beam with the sample: a part of the electrons will be diffracted.
By means of an aperture, one or more diffracted beams are selected for the formation of
the image. In this way, one can distinguish between different materials, as well as image
individual crystals and crystal defects. TEM images of post-reaction catalysts were taken
with a Tecnai TF-20 operated at 100 kV. Samples were ultrasonically dispersed in
ethanol, and a couple drops of the suspension were deposited on a standard 3 mm copper
grid covered with a holey carbon film.
3.2.8 Thermogravimetric analysis (TGA)
TGA is a quantitative technique that measures the weight change of a catalyst
placed in a quartz basket hung on the balance arm in a flow reactor where it contacts
gaseous reactants. By using this method, carbon deposition during hydrocarbon steam
reforming can be monitored continuously and the weight changes of catalysts can then be
measured. When applied with temperature-programmed techniques, the minimal
temperature at which the formation of carbon deposits starts can also be determined.
TGA-TPReaction experiments were performed in a Perkin-Elmer TGA7. Catalysts were
reduced in situ under 20% H2/N2 at 600 °C for 2 h followed by cooling to 250 °C under
N2. The reaction mixture (C3H8/H2O/N2, 30 cm3/min) with varied H2O/C molar ratios of
0.167-0.333 was subsequently introduced to the reduced catalysts. The temperature

56
program was as follows: 1 min. at 250 °C, 10 °C/min ramp rate to 750 °C, and 5 min. at
750 °C.
3.3 Steady-state reactions
The catalysts synthesized and characterized as described in the previous sections
were tested for their catalytic performance in steam reforming of lower alkanes and the
HTS reaction. Figure 3.3 shows the reactor system for steady-state reaction experiments
for steam reforming of lower alkanes and the WGS reaction. It consists of three main
components: reactor, feed system, and analytical system. The reactor is made of 304
stainless steel with an outside diameter of 1/4 in. The catalyst was loaded into the reactor
with a small amount of quartz wool placed at both ends of the bed. An Omega
thermocouple was inserted into the catalyst bed to monitor the reaction temperature. The
reactor was subsequently kept inside a laboratory-made furnace where the reaction
temperature was controlled by a Dwyer temperature controller. The lines before and after
the reactor were kept constant at 130 °C in order to prevent any condensation from the
gas stream.
The gas feed system consists of various gas cylinders (Ar, H2, N2, CO, CO2, and
C3H8). The delivery pressure of each gas cylinder was kept constant at 50 psi. Each gas
stream was passed through an Alltech gas purifier packed with Drierite and 5A molecular
sieve to remove moisture, traces of hydrocarbons and organics. The flow rates of all
gases were subsequently controlled by Brooks mass flow controllers. The pressure of the
feed stream was measured using a Noshok pressure gauge. In addition, steam was

57
introduced into the feed via a 300-cm3 Parker CPI stainless steel bubbler. To achieve the
desired concentration of steam in the feed, the bubbler temperature was determined from
the total gas flow rate and the H2O/C molar ratio. The effluent gas was analyzed using an
automated Shimadzu gas chromatograph (GC-14A) equipped with a thermal conductivity
detector (TCD) using Ar (17 cm3/min) as the carrier gas. Both detector and injector
were kept constant at 200 °C. The TCD current was set at 50 mA. A 1-cm3 sample loop
was heated to 200 °C using a VICI temperature controller. Samples were injected into
the GC via both VICI six-port valves controlled by automatic air-actuator switches. As
shown in Figure 3.4, separations were performed using the TCD with two columns:
Porapak Q (12 ft x 1/8 in. SS, 80/100 mesh) and Molecular Sieve 13X (5 ft x 1/8 in. SS,
60/80 mesh). A GOW-MAC 069-50 ruthenium methanizer operated at 350 °C was used
with the FID for the sensitive determination of CO as low as 10 ppm. The light gases
such as H2 and N2 were “isolated” in the molecular sieve column and were separated
from the heavier ones in Porapak Q column. The temperature and the valve-switching
programs for the GC are shown in Tables 3.1 and 3.2, respectively.
The Shimadzu CLASS-VP chromatography automated software system was
employed to control the chromatograph, acquire data and analyze the acquired data.
Generally, it is used to perform an integration analysis graphically on data to find,
identify, and quantify peaks as well as to set up and run automated acquisition sequences.

58
Figure 3.3: Schematic of SR-WGS reactor system

59
Figure 3.4: The arrangement of columns and six-port valves for product separation

60
Parameter Setting Value
Initial temperature (°C) 80
Initial time (min.) 3.5
Ramp rate (°C/min) 10
Final temperature (°C) 120
Final time (min.) 17.5
Table 3.1: GC temperature program.
Time (min.) Valve Number Valve Position
0.0 1 Inject
0.5 1 Load
3.15 2 Load
13.5 2 Inject
Table 3.2: GC valve-switching program.

61
The steady-state reaction experiments were performed using a fixed-bed flow
stainless steel reactor (1/4 in. OD). The reaction conditions for propane steam reforming
(dilution experiments) were as follows: 400-550 °C, H2O/C = 1.3-2.7, and GHSV =
124,000-248,000 h-1. Unless otherwise noted, lanthanide-promoted sol-gel Ni/Al2O3
catalysts were reduced in situ under 20% H2/N2 (50 cm3/min) at 600 °C for 2 h prior to
the reaction. “Neat” experiments were also performed without N2 dilution using 1/2 in.
O.D. stainless steel flow reactor to avoid high pressure drop at 500-550 °C, 56,000 h-1.
The H2O/C ratio was kept constant at 4. Demineralized distilled water was delivered by
an Eldex metering pump (Model: A-10-S) connected with a 40 psi back pressure
regulator and subsequently vaporized in a preheater which was operated above 150 °C.
A column packed with ceramic beads was installed after the preheater to help C3H8 and
steam mix effectively. The WGS reaction conditions were as follows: 300-400 °C,
atmospheric pressure, H2O/CO = 1, FCO = 10 cm3/min, FTOT = 100 cm3/min, GHSV =
3,200-9,500 h-1. Fe-based catalysts were pre-reduced in situ under 20% H2/N2 (50
cm3/min) at 350 °C for 2 h.

62
CHAPTER 4
EFFECT OF LANTHANIDE PROMOTION ON CATALYTIC PERFORMANCE OF
SOL-GEL Ni/Al2O3 CATALYSTS IN STEAM REFORMING OF PROPANE
4.1 Introduction
Hydrogen is the ultimate clean energy carrier. When it is combusted, heat and
water are the only products. When it is used as a fuel for fuel cells, then it has the
potential of providing much higher efficiencies compared to combustion. Thus,
hydrogen offers a potentially non-polluting and efficient fuel for today’s rising energy
demands [1]. However, in the transition period before renewable sources of hydrogen
can be developed, production of hydrogen from fossil fuels remains an important
technology. Currently, steam reforming of natural gas, which is composed mainly of
methane, is used to produce most of hydrogen in the U.S. and about half of the world’s
hydrogen supply. Naphtha fractions with a final boiling point of less than 220 °C are
also considered as suitable feedstocks [2] for hydrogen production. However, current Ni-
based catalysts, which are used for natural gas steam reforming processes, suffer from
catalyst deactivation by coke formation more severely when higher hydrocarbons are
reformed at low steam/carbon ratios.

63
Although supported precious metals such as Pd, Pt, and Rh have been reported to
be active and stable for steam reforming of hydrocarbons [106-111], the cost of the
precious metals is still a major drawback. The low-cost and long-proven performance of
Ni-based catalysts, therefore, warrant the effort to optimize these catalysts for steam
reforming applications, particularly fuel processing technology from existing liquid fuels
such as gasoline and diesel.
There is evidence in the literature pointing to an improvement in catalytic activity
of Ni-based catalysts in hydrocarbon steam reforming with the addition of lanthanide
elements [26, 27, 112]. Zhuang et al. [26] investigated the effect of cerium oxide as a
promoter in supported Ni catalysts for methane steam reforming. It showed a beneficial
effect by not only decreasing the carbon deposition rate, but also increasing the steam
reforming activity. The authors believed that cerium oxide accelerated the reaction of
steam with adsorbed species on the nickel surface, thus decreasing the carbon deposition
as well as increasing or maintaining the catalytic activity. Su and Guo [27] also
reported an improvement in catalytic activity and resistance to Ni sintering of Ni/Al2O3
catalysts doped with rare earth oxides in methane steam reforming. The growth of Ni
particles and the formation of inactive NiO and NiAl2O4 phases were suppressed by the
addition of rare earth oxides. Moreover, the oxides of heavy rare earth elements (Gd, Er,
Dy) exhibited a more pronounced effect than those of the light ones (La, Pr, Nd).
The use of lanthanide-promoted Ni/Al2O3 catalysts in dry reforming of methane
[113-116] and benzene hydrogenation [117] has also been reported. The effects of the
addition of lanthanide oxides (La2O3 and CeO2) and preparation procedures were
investigated in the reforming of methane with carbon dioxide over impregnated Ni/Al2O3

64
catalysts [113]. When lanthanides were impregnated prior to nickel, an enhanced
reducibility of nickel and a decrease in nickel particle size were observed. However, the
reforming activity was not affected to a large extent by the impregnation order of nickel
and lanthanides. The presence of CeO2 (1-5 wt%) in impregnated Ni/γ-Al2O3 catalysts
was found to reduce the chemical interaction between nickel and the alumina support,
resulting in an increase in reducibility and higher nickel dispersion [114, 115].
Moreover, carbon deposition was greatly suppressed due to the oxygen storage capacity
of CeO2. The catalytic activity, sulfur tolerance, and thermal stability were remarkably
improved after adding La, Sm, and Yb into Ni-B/Al2O3 catalysts for benzene
hydrogenation [117]. The positive effect of lanthanide promotion was associated with
easier reduction of nickel oxides, smaller nickel particles, and larger surface area of
active nickel.
In this study, Ni/Al2O3 catalysts promoted with lanthanide elements (La, Ce, and
Yb) were prepared by a modified sol-gel technique and were examined in propane steam
reforming. Characterization was performed using the BET N2 adsorption method, X-ray
diffraction (XRD), temperature-programmed reduction (TPR), X-ray photoelectron
spectroscopy (XPS), and H2 chemisorption. In situ DRIFTS studies were also conducted
to identify adsorbed species under C3H8 and C3H8 + H2O flows as well as to elucidate the
reaction pathways for propane steam reforming.
4.2 Physical properties of sol-gel catalysts
The effect of synthesis parameters on the physical properties of sol-gel Ni/Al2O3
catalysts is reported in Table 4.1. Parameters that were varied during the synthesis

65
included Ni content, pH of the resulting gels, and H2O/ATB molar ratio. BET surface
area of sol-gel Ni/Al2O3 catalysts is seen to decrease with increasing Ni contents possibly
due to nickel aggregation to form larger particles on the Al2O3 support surface during
thermal treatment. The decrease in surface area is even more pronounced at higher Ni
contents. Furthermore, an increase in pH and H2O/ATB ratio results in a decrease in
surface area of 20 wt% Ni/Al2O3 catalysts. It is noted that a decrease in the pore diameter
from 10.5 nm to 7.4 nm occurs when H2O/ATB ratio is increased from 3.6 to 5.0. This
phenomenon is related to an increase in cross-linking as a result of an increase in the
extent of hydrolysis at high H2O/ATB ratios [118].
BET surface areas of lanthanide-promoted sol-gel Ni/Al2O3 catalysts prepared at
different lanthanide contents are listed in Table 4.2. In general, catalysts have a lower
surface area than the pure support. At lower loading levels, the lanthanide-promoted
catalysts exhibit a higher surface area than the unpromoted catalyst, but a loss in surface
area with higher lanthanide content is observed with Ni-Ce/Al2O3 and Ni-Yb/Al2O3
catalysts possibly due to pore blockage by excess metal. In addition, an increase in
calcination temperature from 450 °C to 600 °C causes a decrease in surface area of Ni-
Ce/Al2O3 catalysts. The surface area of the catalyst calcined at 600 °C is 261 m2/g
compared to 304 m2/g for the catalyst calcined at 450 °C.
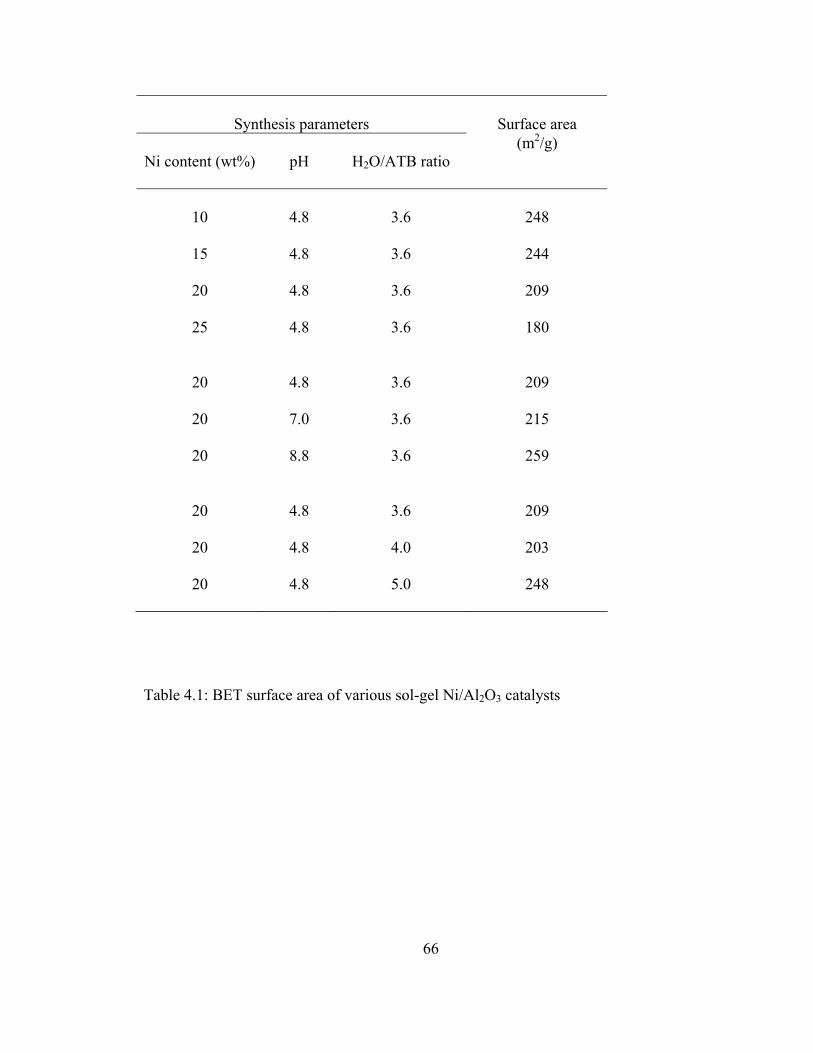
66
Synthesis parameters
Surface area
Ni content (wt%)
pH
H2O/ATB ratio
(m2/g)
10
4.8
3.6
248
15
4.8
3.6
244
20
4.8
3.6
209
25
4.8
3.6
180
20 4.8 3.6 209
20 7.0 3.6 215
20 8.8 3.6 259
20
4.8
3.6
209
20
4.8
4.0
203
20
4.8
5.0
248
Table 4.1: BET surface area of various sol-gel Ni/Al2O3 catalysts

67
Catalyst
Surface area (m2/g)
20% Ni/Al2O3
209
20% Ni-2% La/Al2O3 286
20% Ni-5% La/Al2O3 300
20% Ni-2% Ce/Al2O3 304
20% Ni-5% Ce/Al2O3 228
20% Ni-2% Yb/Al2O3 278
20% Ni-5% Yb/Al2O3 234
Al2O3 342
Table 4.2: BET surface area of lanthanide-promoted sol-gel Ni/Al2O3 catalysts calcined
at 450 °C
4.3 Promotion effect on catalyst reducibility and nickel surface area
X-ray diffraction. The XRD patterns of calcined and reduced 20% Ni-2%
Ce/Al2O3 catalysts are compared in Figure 4.1. The support calcined at 450 °C is
relatively amorphous as evidenced by broad peaks that correspond to γ-Al2O3 (Figure
4.1(a)). The possible crystalline phases over the catalyst calcined at 450 °C are NiO,
NiAl2O4, and γ-Al2O3 (Figure 4.1(b)). However, XRD results are not conclusive about

68
the presence of NiAl2O4. No cerium-related crystalline phases could be detected,
suggesting that cerium species could be well dispersed on the alumina support
undetectable by XRD. After in situ reduction under 5% H2/N2 at 600 °C, significant
amounts of metallic nickel were formed as confirmed by the diffraction lines of a metallic
nickel phase [(111), (200), (220)] at 2θ = 44.5°, 51.8°, and 76.4°, respectively (Figure
4.1(c)).
Temperature-programmed reduction. TPR experiments on lanthanide-promoted
sol-gel Ni/Al2O3 catalysts were performed using 10% H2/Ar as a reducing agent. As
shown in Figure 4.2, the TPR profiles exhibit two peaks, representing two different
reduction sites on all catalysts. A small low-temperature (LT) reduction peak around 400
°C could be attributed to the reduction of a well-dispersed and possibly amorphous NiO
phase on the alumina support surface. On the other hand, a broad high-temperature (HT)
reduction peak above 570 °C could be due to the bulk reduction of Ni in NiAl2O4 phase
[119-121]. TPR results suggest that nickel species may exist in the form of NiAl2O4 as a
result of the sol-gel preparation where nickel is incorporated into the alumina support
network during gelation. For lanthanide-promoted catalysts calcined at 450 °C, the
position of the HT peak maximum shifts toward lower temperatures compared to that of
the unpromoted catalyst. This suggests that the presence of lanthanide elements helps
facilitate the reduction of nickel species; the promotion effect is most evident on the Ni-
Ce/Al2O3 catalyst. It is noted that the introduction of lanthanides to nickel catalysts
showed no additional reduction peak under these conditions.

69
Figure 4.1: XRD patterns of:(a) sol-gel Al2O3 calcined at 450 °C (b)20% Ni-2%Ce/Al2O3
catalyst calcined at 450 °C (c) 20% Ni-2% Ce/Al2O3 catalyst reduced at 600 °C.

70
Figure 4.2: TPR profiles of various sol-gel 20% Ni/Al2O3 catalysts promoted with 2 wt%
lanthanide elements (calcined at 450 °C). The effect of calcination temperature on
reducibility of 20% Ni-2% Ce/Al2O3 catalysts is shown as an inset.

71
In general, calcination temperature plays a major role on the strength of metal
oxide and support interaction for supported metal catalysts, which in turn strongly affects
the degree of reduction. The effect of calcination temperature on the catalyst reducibility
of Ni-Ce/Al2O3 was also investigated. An increase in calcination temperature from 450
to 600 °C results in a shift of the HT peak maximum to a higher temperature around 680
°C. TPR results show that the interaction of Ni species with the alumina support
becomes stronger at higher calcination temperatures, thereby suppressing the reduction of
Ni species to metallic Ni [122, 123]. This could also be indicative of the formation of a
nickel aluminate spinel at higher calcination temperatures.
H2 chemisorption. H2 chemisorption was performed to determine nickel
dispersion and nickel surface area of the catalysts. Unless otherwise noted, the reduction
was conducted under H2 (UHP, 99.999%) at 600 °C for 2 h. The catalysts were then
evacuated at 610 °C to remove adsorbed hydrogen from the surface and cooled to 35 °C.
The first analysis was performed to measure both strong and weak sorption in
combination whereas a repeat analysis was conducted to measure only weak (reversible)
H2 uptake. The chemisorption isotherm was obtained by plotting the difference in the
volume of hydrogen adsorbed from the first and repeat analyses versus the hydrogen
pressure and by extrapolating to zero pressure to obtain hydrogen uptake due to
chemisorption on nickel. The nickel dispersion and nickel surface area were calculated
assuming that one hydrogen atom is adsorbed on one surface nickel atom [18, 124, 125].
72
As listed in Table 4.3, the nickel dispersion is observed to be quite poor (2.3-
6.4%) for all catalysts. The apparent low nickel dispersion on the high surface area of
sol-gel alumina could be due to the formation of NiAl2O4, which is rather difficult to
reduce and therefore is not available for H2 chemisorption [126, 127]. The amount of H2
chemisorbed on pure sol-gel alumina is negligibly small, thus no correction on H2 uptake
values was made. Furthermore, the method of dispersion calculations may not be quite
applicable for these catalysts, since these calculation methods assume the supported metal
to be present primarily on the surface (as a result of an impregnation process), whereas
our catalysts are prepared by a modified sol-gel technique where some of the nickel metal
can be in the alumina support matrix. The nickel dispersion and nickel surface area
increase in the following order:
20% Ni-2% La/Al2O3 < 20% Ni/Al2O3 ≈ 20% Ni-2% Yb/Al2O3 < 20% Ni-2% Ce/Al2O3
Additionally, the nickel dispersion and nickel surface area are seen to decrease at higher
lanthanide content; a decrease is more pronounced with Ni-Ce/Al2O3 and Ni-Yb/Al2O3
catalysts. This implies that higher amounts of lanthanides could cover or block nickel
sites for hydrogen adsorption.
The effect of calcination and reduction temperatures on the nickel dispersion and
nickel surface area of Ni/Al2O3 and Ni-Ce/Al2O3 catalysts is further examined. As
reported in Table 4.4, there are three major exhibited by the H2 chemisorption data: (i)
For the catalysts calcined at 450 °C, the nickel dispersion and nickel surface area increase
with increasing reduction temperature and reach a maximum at 600 °C. Further increase
in reduction temperature to 700 °C leads to a decrease in both parameters. It is
conceivable that growth of nickel crystallites becomes more prominent with higher

73
reduction temperatures, (ii) The nickel dispersion and nickel surface area increase with
increasing reduction temperature for the catalysts calcined at 600 °C. In addition, the
catalysts exhibit higher nickel dispersion and larger nickel surface area at the reduction
temperature of 700 °C compared to those calcined at 450 °C. (iii) Regardless of
calcination and reduction temperatures, Ni-Ce/Al2O3 catalysts possess higher nickel
dispersion and larger nickel surface area than Ni/Al2O3 catalysts.
Catalyst
%Da
MSA (m2/g)b
20% Ni/Al2O3
4.95
6.59
20% Ni-2% La/Al2O3
3.67
4.88
20% Ni-5% La/Al2O3
3.35
4.46
20% Ni-2% Ce/Al2O3
6.37
8.48
20% Ni-5% Ce/Al2O3
2.35
3.13
20% Ni-2% Yb/Al2O3
4.97
6.62
20% Ni-5% Yb/Al2O3
2.85
3.80
a % nickel dispersion.
b Nickel surface area, m2/g.
Table 4.3: H2 chemisorption data on various lanthanide-promoted sol-gel Ni/Al2O3
catalysts reduced under H2 at 600 °C for 2 h.

74
Catalyst
Tcal (°C)
Tred (°C)
%Da
MSA (m2/g)b
20% Ni/Al2O3
450
500
3.72
4.96
600 4.95 6.59
700 4.82 6.42
600
500
3.32
4.42
600
5.25
6.99
700
5.40
7.19
20% Ni- 2% Ce/Al2O3
450
500
5.17
6.89
600
6.37
8.48
700
6.22
8.28
600
500
3.77
5.02
600
6.20
8.25
700
6.72
8.95
a % nickel dispersion.
b Nickel surface area, m2/g.
Table 4.4: Effect of calcination (Tcal) and reduction (Tred) temperatures on nickel
dispersion and surface area of sol-gel 20% Ni/Al2O3 and 20% Ni- 2% Ce/Al2O3 catalysts.

75
X-ray Photoelectron Spectroscopy. XPS analysis was conducted to study the
nature of surface nickel species over the catalysts after reduction under 20% H2/N2 at 600
°C for 2 h. The catalysts were transferred to the XPS chamber without exposing them to
the atmosphere. The Ni 2p XPS spectra of reduced lanthanide-promoted catalysts are
shown in Figure 4.3. The Ni 2p XPS spectra of the catalysts exhibit features that are
assigned to Ni2+ with Ni 2p3/2 and Ni 2p1/2 binding energies at 855.8 and 873.3 eV,
respectively and Ni0 with Ni 2p3/2 and Ni 2p1/2 binding energies at 852.7 and 870.2 eV,
respectively [128-131]. The signal of Ni2+ species is likely to be due to NiAl2O4 although
the possibility of a NiO phase cannot be excluded since the Ni 2p binding energies for
these two species are very close together. The Ni 2p3/2 signal corresponding to Ni2+ is
accompanied by a broader peak located at 860.8 eV due to a strong shake-up process
[132]. Ni 2p XPS spectra imply that the reduction of nickel species to the metallic state
in the sol-gel catalysts was not complete due to a strong interaction of nickel oxide with
the alumina support. In addition, all catalysts show similar Ni 2p XPS spectra,
suggesting that nickel species in these catalysts exist in a similar coordination
environment. Deconvolution of the Ni 2p XPS spectra was performed by Gaussian-
Lorentzian curve-fitting method to determine the peak areas for obtaining relative surface
concentrations of nickel species. The ratio of peak areas ANi0/(ANi
0+ANi2+) is used to
illustrate the degree of reducibility.

76
Figure 4.3: Ni 2p XPS spectra of lanthanide-promoted sol-gel 20% Ni/Al2O3 catalysts
reduced at 600 °C.

77
As displayed in Table 4.5, a significant increase in the ANi0/(ANi
0+ANi2+) ratio for
lanthanide-promoted Ni/Al2O3 catalysts is seen after reduction compared to that of the
unpromoted catalyst, indicative of an enhancement in the catalyst reducibility with
lanthanide promotion. This is in agreement with TPR results obtained with the
lanthanide-promoted catalysts, which have shown a shift in the maximum of the high-
temperature peak corresponding to the reduction of Ni in NiAl2O4 toward lower
temperatures. For reduced Ni/Al2O3, only 27% of surface nickel is found in zero state
while 73% is in the +2 state. In contrast, 68-89% of surface nickel is found in the
metallic phase with 11-32% remaining in the oxide phase for reduced lanthanide-
promoted catalysts.
Catalyst
ANi
0/(ANi0+ANi
2+)
20% Ni/Al2O3
0.37
20% Ni-2% La/Al2O3
0.62
20% Ni-2% Ce/Al2O3
0.64
20% Ni-2% Yb/Al2O3
0.60
Table 4.5: Comparison of the ANi0/(ANi
0+ANi2+) XPS ratio of the catalysts after reduction
at 600 °C.

78
4.4 Reaction performance in propane steam reforming
Effect of synthesis parameters. The effect of catalyst synthesis parameters on the
catalytic activity of sol-gel Ni/Al2O3 catalysts at 500 oC and H2O/C = 1.3 is shown in
Table 4.6. The parameters examined are Ni content, pH and H2O/ATB ratio. It is noted
that H2 yield is defined as (2 x moles of H2 produced/total moles of hydrogen in the feed).
As reported in Table 4.6, C3H8 conversion and H2 yield are seen to increase with
increasing Ni content and reach a maximum at 20 wt%, with C3H8 conversion and H2
yield at 53% and 37%, respectively. Further increase in Ni content to 25 wt% leads to a
decline in catalytic activity. Moreover, the variations of pH and H2O/ATB ratio also
have a pronounced effect on catalytic activity of 20% Ni/Al2O3 catalysts. The
selectivities to C-containing products are also shown in Table 4.6. The C-containing
products from propane steam reforming are CO, CO2, and CH4 with CO2 being the main
one. CO2 selectivity is seen to increase with a decrease in CH4 selectivity at lower C3H8
conversions. No CH4 formation is observed at 10 wt%.
Effect of lanthanide promotion. Several sol-gel 20% Ni/Al2O3 catalysts promoted
with lanthanide elements (La, Ce, Yb) were subsequently prepared at pH = 4.8 and
H2O/ATB = 3.6. The influence of lanthanide promotion (2 wt%) on catalytic
performance at differing reaction temperatures is shown in Figure 4.4. C3H8 conversion
(Figure 4.4(a)) and H2 yield (Figure 4.4(b)) are seen to increase with increasing reaction
temperature on all catalysts. Hydrogen yield that would be obtained at equilibrium is
also included for comparison. 20% Ni-2% Ce/Al2O3 and 20% Ni-2% Yb/Al2O3 catalysts
show an improvement in C3H8 conversion and H2 yield compared to 20% Ni/Al2O3

79
catalyst. Although 20% Ni-2% La/Al2O3 catalyst exhibits similar C3H8 conversion to
20% Ni/Al2O3 catalyst, it still shows an increased H2 yield above 450 °C. At 500 °C, the
highest C3H8 conversion (84%) and H2 yield (50%) are achieved with 20% Ni-2%
Yb/Al2O3 catalyst. The effect of lanthanide promotion is more evident at higher reaction
temperatures. Moreover, heavier lanthanides exhibit a more pronounced effect than
lighter ones; the catalytic activity at 500 °C increases in the following order: La < Ce <
Yb.
When the performances in propane steam reforming at different lanthanide
contents are compared at 500 °C (Table 4.7), reaction data show that C3H8 conversion
and H2 yield decrease with increasing lanthanide content from 2 wt% to 5 wt%. H2
chemisorption data have also shown a decreasing trend of nickel surface area at higher
lanthanide content. This indicates that the catalytic activity of lanthanide-promoted sol-
gel Ni/Al2O3 catalysts is strongly related to nickel surface area. Thus, loss of activity
with higher lanthanide content is due to the blockage of active sites by excess amounts of
lanthanides introduced in the catalysts. It is noted that the distribution of C-containing
products is not much affected by an increase in lanthanide content.

80
Synthesis parameters
C3H8 conversion
H2 yield
Selectivity (%)
Ni content (wt%)
pH
H2O/ATB ratio
(%)
(%)
CO2
CH4
CO
10
4.8
3.6
16
21
85
0
15
15
4.8
3.6
27
33
73
19
8
20
4.8
3.6
53
37
54
36
10
25
4.8
3.6
43
29
52
31
17
20 4.8 3.6 53 37 54 36 10
20 7.0 3.6 31 28 61 20 19
20 8.8 3.6 27 26 68 20 12
20
4.8
3.6
53
37
54
36
10
20
4.8
4.0
43
30
63
30
7
20
4.8
5.0
23
23
77
15
8
Table 4.6: Propane steam reforming reaction data obtained with sol-gel Ni/Al2O3
catalysts – effect of synthesis parameters.

81
Figure 4.4: Effect of reaction temperature on catalytic performance of lanthanide-
promoted sol-gel 20% Ni/Al2O3 catalysts in propane steam reforming: (a) C3H8
conversion (b) H2 yield [Reaction conditions: 400-500 °C, C3H8/H2O/N2 = 1/4/95, feed
flow rate = 300 cm3/min, equal surface area reactions (9 m2)].

82
Catalyst
C3H8 conversion (%)
H2 yield (%)
Selectivity (%)
CO2
CH4
CO
20% Ni/Al2O3
53
37
54
36
10
20% Ni-2%La/Al2O3
51
40
59
28
13
20% Ni-5%La/Al2O3
29
29
55
29
16
20% Ni-2%Ce/Al2O3
72
46
50
38
12
20% Ni-5%Ce/Al2O3
53
38
56
33
11
20% Ni-2%Yb/Al2O3
84
50
46
38
16
20% Ni-5%Yb/Al2O3
65
44
50
35
15
Table 4.7: Reaction comparison for propane steam reforming (dilution experiments) at
500 °C [Reaction conditions: 500 °C, C3H8/H2O/N2 = 1/4/95, feed flow rate = 300
cm3/min, equal surface area reactions (9 m2)].
To further investigate catalytic performance at higher reaction temperature,
steady-state reaction experiments were conducted at 550 °C. However, the feed flow rate
was raised to 400 cm3/min to avoid complete C3H8 conversion. Interestingly, the highest
C3H8 conversion (80%) and H2 yield (52%) are obtained with 20% Ni-2% Ce/Al2O3
catalyst at 550 °C (Table 4.8). Furthermore, 20% Ni-2% La/Al2O3 catalyst also shows a

83
significant improvement in steam reforming activity compared to 20% Ni/Al2O3 catalyst
under these reaction conditions.
Catalyst
C3H8 conversion (%)
H2 yield (%)
Selectivity (%)
CO2
CH4
CO
20% Ni/Al2O3
48
36
48
21
31
20% Ni-2%La/Al2O3
66
52
38
25
37
20% Ni-2%Ce/Al2O3
80
52
31
32
37
20% Ni-2%Yb/Al2O3
70
50
33
30
37
Table 4.8: Reaction comparison for propane steam reforming (dilution experiments) at
550 °C.
“Neat” experiments were performed with 20% Ni/Al2O3, 20% Ni-2% Ce/Al2O3,
and 20% Ni-2% Yb/Al2O3 catalysts in propane steam reforming without N2 dilution at the
following conditions: 500-550 °C, H2O/C = 4, total feed rate = 270 cm3/min, equal
surface area reaction (18 m2). Demineralized distilled water was delivered by an Eldex
metering pump (Model: A-10-S) connected with a 40 psi back pressure regulator and

84
subsequently vaporized in a preheater which was operated above 150 °C. A column
packed with ceramic beads was installed after the preheater to help C3H8 and steam mix
effectively. The steady-state reaction experiments were performed using 1/2 in. O.D.
stainless steel flow reactor to avoid high pressure drop due to higher amounts of catalysts
loaded in the reactor. Consistent with reaction data obtained from dilution experiments,
20% Ni-2% Yb/Al2O3 catalyst is seen to give the highest C3H8 conversion and H2 yield at
500 °C (Table 4.9). On the other hand, at 550 °C, 20% Ni-2% Ce/Al2O3 catalyst exhibits
higher C3H8 conversion and H2 yield compared to 20% Ni-2% Yb/Al2O3 catalyst.
Moreover, an increase in CO selectivity is observed at higher reaction temperature. This
suggests an increased contribution from the reverse water-gas shift reaction (CO2 + H2 →
CO + H2O) to the overall reaction network. Another possible explanation is that at higher
conversion, water becomes the limiting reactant, and leading to an increased formation of
CO as opposed to CO2 from the steam reforming reaction. Increased coking on the
surface at higher temperatures could also lead to higher CO formation through the
gasification of surface carbon.

85
Catalyst
T (°C)
C3H8 conversion (%)
H2 yield (%)
Selectivity (%)
CO2
CH4
CO
20% Ni/Al2O3
500
35
14
68
25
7
550
43
18
69
20
11
20% Ni-2%Ce/Al2O3
500
43
15
65
28
7
550
95
31
58
28
14
20% Ni-2%Yb/Al2O3
500
59
19
60
32
8
550
83
27
58
30
12
Table 4.9: Reaction comparison for propane steam reforming (neat experiments).
Effect of calcination and reduction temperatures. Upon calcination at 450 °C,
20% Ni-2% Ce/Al2O3 catalyst exhibits higher H2 yield compared to 20% Ni/Al2O3
catalyst at the reduction temperatures ranging from 500-700 °C (Figure 4.5(a)). An
improvement in H2 yield with cerium promotion is more evident at higher reduction
temperature. Furthermore, the catalytic activity of both catalysts calcined at 450 °C is
seen to go through a maximum at the reduction temperature of 600 °C and decreases at
higher reduction temperature. By comparing the performance of 20% Ni-2% Ce/Al2O3
catalysts calcined at 450 and 600 °C, we see that the reduction temperature affects H2
yield in a similar fashion (Figure 4.5(b)). The optimum reduction temperature is 600 °C
regardless of calcination temperature. However, higher calcination temperature causes a
decline in catalytic activity. This observation is in agreement with TPR and H2

86
chemisorption results. When Ni-Ce/Al2O3 catalysts are calcined at higher temperature
(600 °C), NiO interacts with Al2O3 to form a very stable NiAl2O4 spinel which is more
difficult to reduce [133-137]. Our in-situ X-ray diffraction studies performed to observe
the phase changes during reduction have shown incomplete reduction at lower
temperatures while sintering of Ni was observed at higher temperatures [138].
Effect of gas hourly space velocity (GHSV). The catalytic performance of 20%
Ni/Al2O3 and 20% Ni-2% Ce/Al2O3 catalysts in propane steam reforming was further
investigated at various space velocities. The reaction conditions for these experiments
were as follows: 500-550 °C, H2O/C = 2. The variation of GHSV was performed by
adjusting both the amount of the catalyst (10-20 mg) and the feed flow rate (200-400
cm3/min).

87
Figure 4.5: Effect of calcination and reduction temperatures on catalytic performance in
propane steam reforming: [Reaction conditions: 550 °C, H2O/C = 2, GHSV = 248,000 h-
1]: (a) Comparison between 20% Ni/Al2O3 and 20% Ni-2% Ce/Al2O3 catalysts calcined at
450 °C (b) Effect of calcination temperature on 20% Ni-2% Ce/Al2O3 catalysts.

88
Figure 4.6: Effect of GHSV on H2 yield at 500-550 °C and H2O/C = 2 in propane steam
reforming over 20% Ni/Al2O3 and 20% Ni-2% Ce/Al2O3 catalysts.

89
As expected, H2 yield increases with decreasing GHSV from 496,000 to 124,000
h-1 over both catalysts (Figure 4.6). At 500 °C, the beneficial effect of cerium promotion
becomes much more pronounced at lower GHSVs. At 550 °C, an improvement in H2
yield with the addition of cerium is more evident for the whole range of GHSVs
examined. The highest H2 yield (50%) observed is achieved with 20% Ni-2% Ce/Al2O3
catalyst at 550 °C and 124,000 h-1. C3H8 conversion rates at steady state were further
normalized to surface nickel atoms, measured by H2 chemisorption at 35 °C, in the form
of turnover frequencies (TOFs). Table 4.10 compares average TOFs obtained with 20%
Ni/Al2O3 and 20% Ni-2% Ce/Al2O3 catalysts at 500 and 550 °C. TOF is seen to increase
with increasing reaction temperature. The increase is more pronounced with 20% Ni-2%
Ce/Al2O3 catalyst. Furthermore, the higher activity of promoted catalysts is clearly seen
when TOF values are compared for the 20% Ni-2% Ce/Al2O3 and 20% Ni/Al2O3
catalysts.
Catalyst
TOF (s-1)
500 °C
550 °C
20% Ni/Al2O3
0.35
0.65
20% Ni-2%Ce/Al2O3
0.50
1.20
Table 4.10: Effect of reaction temperature on turnover frequency.

90
The variation of product selectivities with C3H8 conversion over 20% Ni/Al2O3
and 20% Ni-2% Ce/Al2O3 catalysts is shown in Figure 4.7(a-d). In this study, CO2
selectivity is defined as the ratio of moles of CO2 produced to the total moles of C-
containing products (i.e., CO2, CO, and CH4) whereas H2 selectivity is defined as 2 x
moles of H2 produced/total moles of hydrogen in the H-containing products, which are H2
and CH4. Interestingly, CH4 selectivity is seen to increase at the expense of both H2 and
CO2 selectivities at lower GHSVs, i.e., higher conversions. This suggests that CO2
methanation (CO2 + 4H2 → CH4 + 2H2O) becomes more appreciable at when residence
time is increased, leading to an increased CH4 selectivity. CO selectivity, on the other
hand, is not much affected by the variation of C3H8 conversion over either catalyst.

91
Figure 4.7: Variation with C3H8 conversion of product selectivity over: (a) 20% Ni/Al2O3
at 500 °C (b) 20% Ni/Al2O3 at 550 °C (c) 20% Ni-2% Ce/Al2O3 at 500 °C (d) 20% Ni-2%
Ce/Al2O3 at 550 °C.

92
4.5 DRIFTS studies
C3H8-TPD/TPReaction. TPD/TPReaction experiments with DRIFTS were
performed over reduced 20% Ni-2% Ce/Al2O3 catalyst, where strongly adsorbed propane
was allowed to react with water. Adsorption of propane was carried out at room
temperature for 1 h. The system was subsequently purged and heated under He and
spectra were collected in steps under He flow up to 450 °C. The introduction of H2O was
performed at 450 °C for different times on stream (i.e., 5, 10, and 15 min.) followed by
He flushing before spectra were taken.
Figure 4.8 shows DRIFT spectra taken at 25, 100, 200, 250, 300, and 450 °C
under He after C3H8 adsorption over reduced 20% Ni-2% Ce/Al2O3 catalyst. After
propane adsorption and He flushing, bands remained at 2940, 2932 (shoulder), 2824,
1630, 1476, 1435 (shoulder), 1373, 1189, and 1103 cm-1 at room temperature. The band
at 1630 cm-1 could be attributed to an olefinic C=C vibration [139, 140] and has been
observed in a separate propylene adsorption/desorption DRIFTS experiment performed in
our laboratory (Figure 4.9). However, bands typical of olefinic C=C stretching present
above 3000 cm-1 were not observed after propane adsorption which leads us to assume
that the band at 1630 cm-1 could be assigned as the O-H bending frequency of water as
observed by Gates and co-workers [141]. The remaining bands are characteristic of
adsorbed propylidyne [139, 142] and are rather equivalent to resultant spectra of propane
adsorbed on a reduced Ir/Al2O3 catalyst [141]. In addition, a negative peak at 3750 cm-1,
which is characteristics of surface hydroxyl groups on the alumina support, was observed
[143, 144].
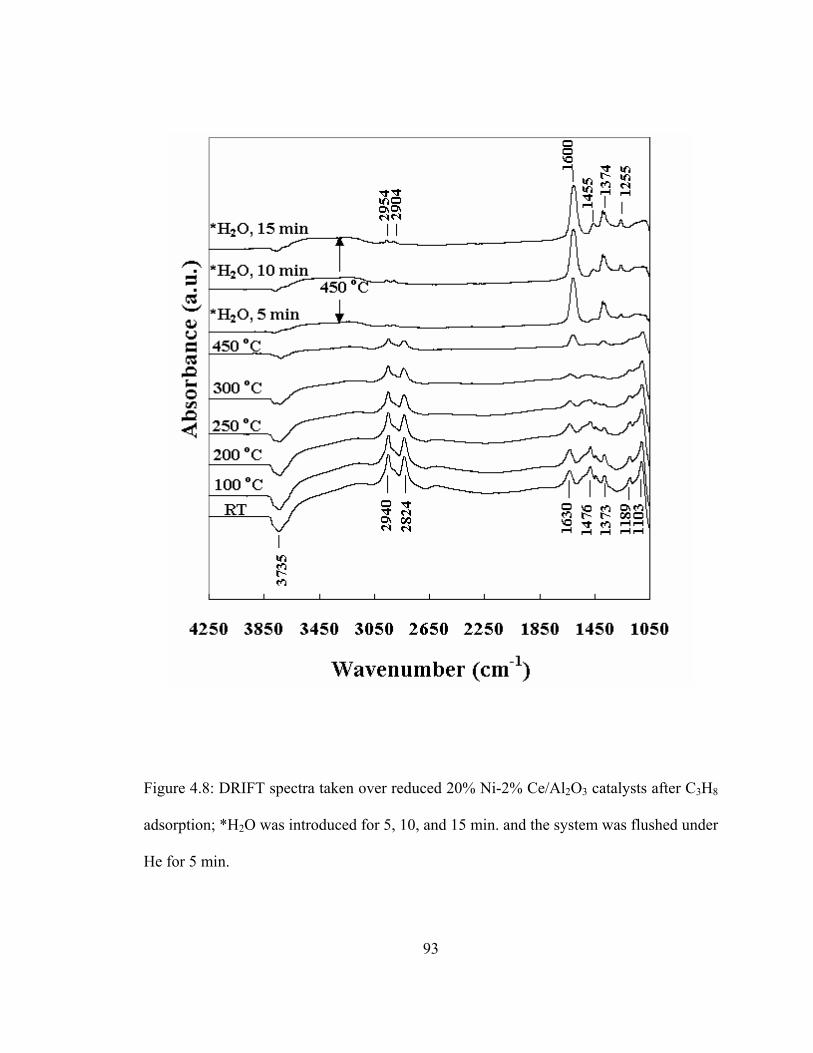
93
Figure 4.8: DRIFT spectra taken over reduced 20% Ni-2% Ce/Al2O3 catalysts after C3H8
adsorption; *H2O was introduced for 5, 10, and 15 min. and the system was flushed under
He for 5 min.

94
This indicates that the surface hydroxyl groups either interacted with propane or
were consumed upon the adsorption of propane. Although the intensities of the bands at
2940 and 2824 cm-1 decreased at higher temperatures, they were thermally stable up to
450 °C. The features at 2940 and 2932 cm-1 are assigned to asymmetric CH3 stretching
[νas(CH3)] and asymmetric CH2 stretching [νas(CH2)], respectively [139, 142, 145-147].
The feature at 2824 cm-1 could be attributed to either symmetric CH2 stretching [νs(CH2)]
or symmetric CH3 stretching [νs(CH3)] [142, 148]. The features at 2940, 2824, 1476,
1437, 1373, 1189, 1103 cm-1 decreased in intensity with temperature and subsequently
almost disappeared at 300 oC. These features could be associated with adsorbed
ethylidyne/propylidyne species that were depleted upon the reaction with H2O. At 450
°C and before the introduction of water, new bands at 1600 and 1374 cm-1 were present
accompanied by two small C-H stretching bands at 2954 and 2904 cm-1. Although it is
conceivable that new CH3 groups could be forming due to desorption/re-adsorption
processes, a more likely explanation is that the features at 2954, 2904, 1600, and 1374
cm-1 are due to formate species [149, 150]. With the introduction of water at 450 °C, the
bands associated with the formate species grew much stronger and were seen in higher
intensity with time on stream. In the course of propane steam reforming, formate species
are probably produced by the reaction of CO with the water introduced. In the absence of
water, surface hydroxyl groups can serve as a source of oxygen to form formate species.
Our formate band assignments are consistent with those which arise from adsorption of
CO on 1% Au/ceria and 1% Pt/ceria catalysts [151]. Two additional features at 1455 and
1255 cm-1, which could be attributed to carbonate species, were also observed after H2O
exposure at 450 °C [149, 150].

95
In order to help in the band assignments for the C3H8-TPD/TPReaction
experiment, propylene, water-only, and CO2 adsorption with DRIFTS were also
performed. Figure 4.9 shows DRIFT spectra taken at 25, 250, and 450 °C under He flow
over reduced 20% Ni-2% Ce/Al2O3 catalyst during the C3H6-TPD experiment. The
strong presence of the band at 1630 cm-1 on the catalyst surface following propylene
adsorption signals the C=C stretching vibration. Presence of olefinic C-H vibrations that
would be expected above 3000 cm-1 cannot be discerned from this spectrum due to a very
broad feature in that region. It is possible that adsorbed propylene could be
dehydrogenated on the surface, giving rise to water (surface hydroxyl groups), which
would show an IR band around 1630 cm-1 as well as a broad feature above 3000 cm-1.
The feature at 1373 cm-1, which was quite prominent following propane adsorption, could
not be observed after propylene adsorption. This observation supports the assignment of
the band at 1373 cm-1 to symmetric CH3 bending [δs(CH3)] of propylidyne. This
assignment is in agreement with what is reported by Shahid and Sheppard [142]. In
addition, the feature at 2824 cm-1 was absent, and the 2940 cm-1 band was much weaker
and disappeared very quickly at higher temperatures. The band at 1476 cm-1, which was
quite strong following propane adsorption was barely noticeable (~1456 cm-1) after
propylene adsorption. This observation makes us believe that this feature could be due to
a methyl group, which may have a different orientation in species resulting from
propylene adsorption. This explanation would also be consistent with our earlier
assertion that propylidyne species are the predominant hydrocarbon derivatives on the
surface following propane adsorption, but this is not necessarily the case following
propylene adsorption.

96
Figure 4.9: DRIFT spectra taken over reduced 20% Ni-2% Ce/Al2O3 catalysts after C3H6
adsorption at room temperature.

97
Figure 4.10: DRIFT spectra taken over reduced 20% Ni-2% Ce/Al2O3 catalysts after CO2
adsorption at room temperature.

98
From DRIFT spectra of CO2-TPD over the reduced 20% Ni-2% Ce/Al2O3
catalyst, bands at 3619, 2355, 2325, 1643, 1543 (shoulder), 1438, 1387 (shoulder), 1229,
and 1084 cm-1 are seen at room temperature (Figure 4.10). The bands at 3619, 1643,
1438, and 1229 cm-1 are assigned to bicarbonate species and decrease in intensity
significantly at 250 °C [149, 150, 152]. Conversely, carbonate species are characterized
by the shoulder bands at 1543, and 1387 cm-1 as well as the 1084 cm-1 band [149, 150,
152]. In addition, the only other feature observed is a doublet at 2355 and 2325 cm-1,
which corresponds to adsorbed CO2 [153, 154]. The disappearance of carbonate and
bicarbonate species at higher temperatures leads us to believe that formate and carbonate
species observed from the C3H8-TPD/TPReaction experiment are the result of the surface
transformation of propylidyne species rather than from the re-adsorption of CO2.
C3H8 + H2O-TPReaction. C3H8 + H2O-TPReaction with DRIFTS was also
performed over reduced 20% Ni-2% Ce/Al2O3 catalyst. C3H8 was adsorbed at room
temperature for 1 h. The system was then purged under He for 30 min. and H2O was
subsequently introduced for 5 min. at room temperature followed by He flushing for 5
min. The system was heated and DRIFT spectra were collected in steps under He flow
up to 450 °C. It is noted that H2O was re-introduced at each temperature for 5 min.
followed by He flushing before taking spectra.
After C3H8 and H2O introduction at room temperature, bands remained at 3750-
3500 (very broad), 2940, 2824, 2055, 1630, 1435 (weak), 1373 (weak), and 1255 (weak)
cm-1 (Figure 4.11). The broad band around 3750-3500 cm-1 is characteristic of the OH
stretching region while the feature at 2055 cm-1 is assigned as linearly adsorbed CO on
99
the catalyst surface and disappeared above 200 °C [155-157]. Compared to the DRIFT
spectrum after C3H8 adsorption at room temperature, the intensity of the band located at
1630 cm-1 increased significantly when H2O was introduced at room temperature. In a
separate water-TPD experiment performed in our laboratory (not shown), a large band at
1630 cm-1 was attributed to adsorbed water. This band decreased in intensity at higher
temperatures and eventually shifted to 1600 cm-1 at 450 °C. It is intuitive that the band at
1600 cm-1 could be a surface species which is produced from the reaction of C3H8 with
H2O and a formate species is a likely possibility. The features at 2940 and 2824 cm-1
were seen in much lower intensity and disappeared above 250 °C whereas the bands at
2954 and 1455 cm-1 started to appear at 200 °C and grew stronger at higher temperatures.
Furthermore, two additional bands at 2904 and 1374 were seen at 450 °C. It is evident
that most surface species such as formate and carbonate ions are formed upon the
reaction of adsorbed C3H8 and H2O above 250 °C.
Based on the observed surface specie transformations from in situ DRIFTS
studies, the major reaction pathways for adsorbed propane in the presence of steam over
reduced sol-gel Ni-Ce/Al2O3 catalysts are proposed and are illustrated in Figure 4.12.
The first step is believed to be adsorption of propane on metallic nickel sites to form
propylidyne. To a lesser degree, adsorbed propane can further decompose into
hydrocarbon fragments (i.e., CHx) and even carbon oxides in the presence of adsorbed
water. Carbon deposition, especially at higher temperatures, also is a possibility as seen
through our coking studies [138]. During this step, it is likely that the formation of
carbon monoxide could be occurring on nickel sites. Adsorbed water from the catalyst
can combine with adsorbed hydrocarbon fragments or adsorbed carbon monoxide to form

100
formate species. It is also possible that adsorbed hydrocarbon fragments could react with
other sources of oxygen (hydroxyls, ceria) to form formates in the absence of water, as
observed at 450 oC (Figure 4.8). Additionally, it is possible that water can dissociatively
adsorb to produce gaseous hydrogen and surface oxygen species. These surface oxygen
species have been found to react with methane to form CO and hydrogen in methane
steam reforming over various oxide supports, including ceria [158-160]. Unfortunately,
we cannot obtain information pointing to the dissociative adsorption of water to form
hydrogen from the DRIFTS experiments. However, the contribution from hydroxyls
created from adsorbed water is expected to be much higher than that from surface
oxygen. The thermal decomposition of adsorbed formates can result in the formation of
carbon dioxide and hydrogen, or the formation of carbon monoxide and hydroxyl groups
[150]. Moreover, the fraction of the formate remaining adsorbed could react with
hydroxyl groups arising from adsorbed water to form carbonates and hydrogen at higher
temperatures. While the DRIFTS experiments do not specifically indicate the
participation of other surface intermediates, it could be possible that adsorbed species
such as oxygen atoms, hydrogen atoms, and hydroxyl groups could also be spilling over
to the nickel surface from the alumina support or ceria, thus enhancing the overall
adsorption and participation of water.
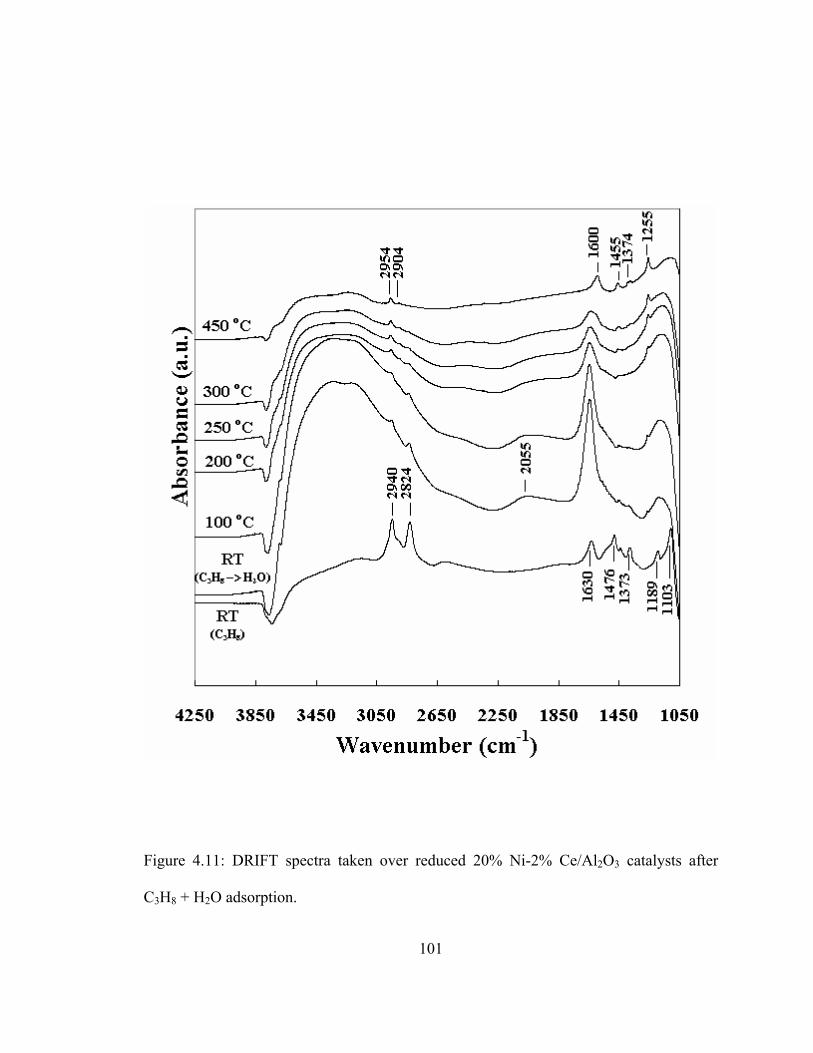
101
Figure 4.11: DRIFT spectra taken over reduced 20% Ni-2% Ce/Al2O3 catalysts after
C3H8 + H2O adsorption.

102
Figure 4.12: Mechanistic steps during propane steam reforming over reduced Ni-
Ce/Al2O3 catalyst as observed using in situ DRIFTS.

103
4.6 Summary
Sol-gel 20% Ni/Al2O3 catalysts promoted with lanthanide elements (La, Ce, and
Yb) were studied with regard to their activity for the steam reforming of propane. The
beneficial effect is induced upon low-content lanthanide promotion (2 wt%) of Ni/Al2O3
catalysts in catalytic performance under reaction conditions with and without N2 dilution.
Among the lanthanide elements examined, cerium is found to be very effective in
improving the steam reforming activity. The better catalytic performance of lanthanide-
promoted catalysts is partially attributed to easier reduction of nickel species to a metallic
state. The pretreatment conditions (i.e., calcination and reduction temperatures) also
markedly affect nickel surface area. High calcination temperature retards the catalyst
reducibility due to a strong interaction of NiO and the Al2O3 support. Regardless of
calcination temperature, the optimum reduction temperature is found to be 600 °C to
obtain the best catalytic performance with respect to C3H8 conversion and H2 yield.
Furthermore, an increase in nickel surface area measured by H2 chemisorption at 35 °C is
apparently observed with the incorporation of cerium. In situ DRIFTS results show that
ethylidyne/propylidyne species are formed after C3H8 adsorption at room temperature and
are depleted upon the reaction with H2O at 450 °C. Adsorbed species on Ni0 sites under
C3H8 + H2O flow are formate and carbonate ions which further decompose to CO, CO2,
and H2.

104
CHAPTER 5
DEACTIVATION CHARACTERISTICS OF LATHANIDE-PROMOTED SOL-GEL
Ni/Al2O3 CATALYSTS IN PROPANE STEAM REFORMING
5.1 Introduction
Steam reforming (SR) of hydrocarbons has seen increasing interest due to the
necessity of efficient and cost-effective reforming technologies for hydrogen production
for fuel cell applications. In practice, SR of hydrocarbons, especially that of methane, is
performed at high temperature and low pressure over Ni-based catalysts. However, the
high temperature required may favor several routes to the formation of carbon deposits
such as the Boudouard reaction and methane/hydrocarbon decomposition. Additionally,
Ni catalysts tend to agglomerate and then lose their active surface area under steam
reforming conditions, resulting in short catalyst lifetimes. Therefore, novel preparation
and promotion techniques that could resist rapid catalyst deactivation by coking and
sintering are essential.
Much effort has been placed on development of Ni catalysts with improved
resistance to coke formation by adding promoters. Alkali metals such as K2O and CaO
have been shown to improve coking resistance by enhancing carbon gasification but with
the expense of a reduction in catalytic activity [2, 8]. The introduction of small amounts

105
of molybdenum or tungsten (0.5 wt% MoO3 or WO3) into Ni catalysts has shown to
increase the coking resistance without a decrease in catalytic activity [23, 25, 45, 46,
161]. The mechanism of coke minimization on molybdenum-promoted Ni catalysts was
proposed as follows: Mo+n on the nickel surface is first oxidized to Mo+(n+2), which then
reacts with adsorbed Ni-C or Ni-CHx yielding CO and H2, and is finally reduced back to
Mo+n [46].
Alternatively, lanthanides appear to be promising promoters since they can inhibit
coke formation without sacrificing the catalytic activity [26, 112, 114]. Zhuang et al.
[26] investigated the effect of cerium oxide as the promoter in MgAl2O4-supported Ni
catalysts for methane steam reforming at 550 °C. Cerium promotion showed a beneficial
effect by not only decreasing the rate of carbon deposition but also increasing the
catalytic activity. Wang and Lu [114] stated that the addition of CeO2 into Ni/γ-Al2O3
catalysts enhanced the nickel dispersion and reactivities of carbon deposits, leading to an
improvement in the catalytic activity and stability in carbon dioxide reforming of
methane. An increase in sintering resistance by adding lanthanides into supported Ni
catalysts was also reported [27, 162]. Incorporation of lanthanides (4 wt%) suppressed
the growth of Ni crystallites and the formation of inactive NiO and NiAl2O4 phases [27].
Furthermore, oxides of heavier lanthanides (Gd, Er, and Dy) exhibited a more
pronounced effect than those of lighter ones (La, Pr, Nd). Teixeira and Giudici [162]
suggested that the sintering rate of small nickel crystallites, particularly for narrow initial
crystallite size distributions and high initial dispersions in coprecipitated Ni/Al2O3, was
facilitated at high temperatures when steam was present. However, the growth of nickel
106
crystallites under reduction and reaction conditions could be inhibited by lanthanum
promotion.
In this study, lanthanide-promoted Ni/Al2O3 catalysts were prepared and
evaluated with regard to their activity and stability for the steam reforming of propane.
Characterization was performed using X-ray photoelectron spectroscopy (XPS), in situ
X-ray diffraction (XRD), temperature-programmed oxidation (TPO), transmission
electron microscopy (TEM), thermogravimetric analysis-temperature-programmed
reaction (TGA-TPReaction), and sequential temperature-programmed
coking/gasification/hydrogenation. Using the information obtained, possible deactivation
mechanisms of lanthanide-promoted sol-gel Ni/Al2O3 catalysts in propane steam
reforming are discussed.
5.2 Catalytic activity and stability for propane steam reforming
Effect of lanthanide addition. Lanthanide-promoted sol-gel 20% Ni/Al2O3
catalysts were evaluated with regard to activity and stability in propane steam reforming
at 500-550 °C. Propane conversion and % activity loss data (inset) are presented in
Figure 5.1. The feed percentages of these experiments were C3H8/H2O/N2 = 1/4/95. To
ensure that steady-state reaction conditions do not allow the system to approach
equilibrium-limited regime, GHSV was increased at higher temperatures. As shown in
Figure 5.1(a), at 500 °C and 124,000 h-1, 20% Ni-2% Ce/Al2O3 and 20% Ni-2%
Yb/Al2O3 catalysts exhibits an increase in propane conversion whereas 20% Ni-2%
La/Al2O3 catalyst shows similar steam reforming activity compared to 20% Ni/Al2O3

107
catalyst. More importantly, the addition of lanthanide elements leads to a significant
improvement in catalyst stability as evidenced by a smaller percentage of activity loss.
At 500 °C, the loss of catalytic activity increases in the following order:
Ni-Yb/Al2O3 (7%) < Ni-Ce/Al2O3 (12%) < Ni-La/Al2O3 (19%) < Ni/Al2O3 (23%)
However, an increase in activity loss becomes more evident with increasing reaction
temperature possibly due to more severe catalyst deactivation by sintering and coke
formation as shown in Figure 5.1(b). Interestingly, the highest propane conversion is
achieved with 20% Ni-2% Yb/Al2O3 catalyst at 500 °C while 20% Ni-2% Ce/Al2O3
catalyst is the best-performing catalyst with regard to catalytic activity and stability at
550 °C. It is conceivable that a beneficial effect of cerium promotion on improvement in
coking resistance is more pronounced at elevated temperatures, thus resulting in more
stable catalysts. An enhancement in stability of cerium-containing Ni-based catalysts as
a result of a reduction in carbon deposition during reforming processes has been reported
earlier [26, 115, 163].
Effect of H2O/C ratio. The effect of H2O/C ratio on catalytic performance of 20%
Ni/Al2O3 and 20% Ni-2% Ce/Al2O3 catalysts in propane steam reforming was
investigated at 550 °C and 248,000 h-1. The H2O/C ratio was varied in the range of 1.3-
2.7 by keeping the propane flow rate constant at 6 cm3(STP)/min. As shown in Figure
5.2(a), C3H8 conversion is seen to increase with increasing H2O/C ratio. An increase in
catalytic activity is more evident with 20% Ni-2% Ce/Al2O3 catalyst; 47% and 99% C3H8
conversion were obtained at H2O/C ratios = 1.3 and 2.7, respectively. A significant
improvement in catalyst stability is apparent at higher H2O/C ratios when cerium is
present in the catalysts [Figure 5.2(b)].

108
Figure 5.1: C3H8 conversion as a function of time on stream observed with various
catalysts under the reaction conditions: (a) T = 500 °C, H2O/C = 1.3, GHSV =124,000 h-1
(b) T = 550 °C, H2O/C = 1.3, GHSV = 186,000 h-1. The activity loss of the same set of
catalysts is shown as insets.
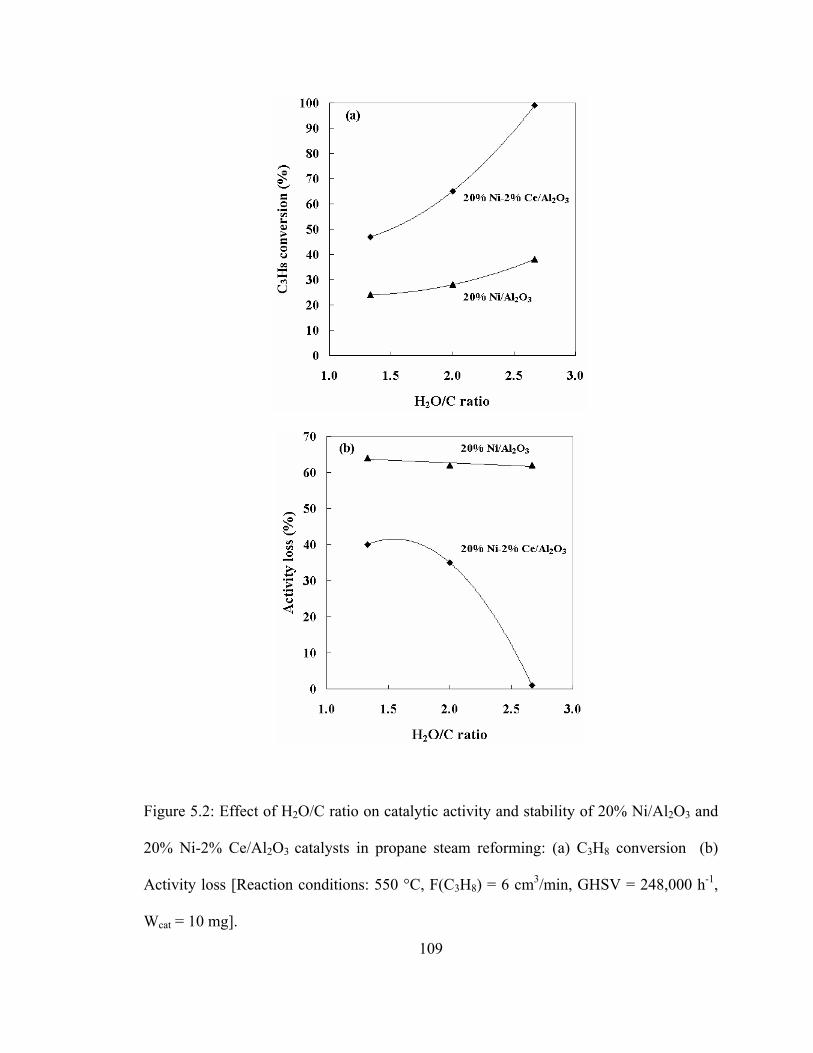
109
Figure 5.2: Effect of H2O/C ratio on catalytic activity and stability of 20% Ni/Al2O3 and
20% Ni-2% Ce/Al2O3 catalysts in propane steam reforming: (a) C3H8 conversion (b)
Activity loss [Reaction conditions: 550 °C, F(C3H8) = 6 cm3/min, GHSV = 248,000 h-1,
Wcat = 10 mg].

110
On the other hand, an improvement in the catalyst stability of 20% Ni/Al2O3
catalysts is barely noticeable with increasing H2O/C ratios. At 550 °C and H2O/C = 2.7,
20% Ni-2% Ce/Al2O3 catalyst lost only 1% of its initial activity (TOS = 1 h) after steady
state was reached while 20% Ni/Al2O3 catalyst gave 62% activity loss. Fig. 5.3 shows
plots of H2 formation rate at 550 °C as a function of time on stream observed with 20%
Ni/Al2O3 and 20% Ni-2% Ce/Al2O3 catalysts at different H2O/C ratios. A decline in H2
formation rate is seen over both catalysts at lower H2O/C ratios possibly due to catalyst
deactivation by coke formation. At H2O/C = 2.7, 20% Ni/Al2O3 catalyst still exhibits a
pronounced reduction in H2 formation rate in the first 15 hours whereas the Ni-Ce
catalyst shows a very stable performance. Reaction results indicate that a high H2O/C
ratio coupled with cerium promotion is very effective in enhancing catalytic activity as
well as preventing the activity loss.

111
Figure 5.3: H2 formation rate at 550 °C as a function of time on stream observed at
differing H2O/C ratios over 20% Ni/Al2O3 and 20% Ni-2% Ce/Al2O3 catalysts.

112
5.3 Deactivation characteristics of sol-gel catalysts
Re-oxidation of metallic nickel sites. Figure 5.4 shows the Ni 2p region of the
XPS spectra of sol-gel 20% Ni/Al2O3 catalysts promoted with 2 wt% La, Ce, and Yb
after being exposed to the propane steam reforming reaction medium at 500 °C for 20 h.
The Ni 2p XPS spectra of the catalysts exhibit features that are assigned to Ni2+ with Ni
2p3/2 and Ni 2p1/2 binding energies at 855.8 and 873.3 eV, respectively and Ni0 with Ni
2p3/2 and Ni 2p1/2 binding energies at 852.7 and 870.2 eV, respectively [128-131]. The
signal of Ni2+ species is likely to be due to NiAl2O4 although the possibility of a NiO
phase cannot be excluded since the Ni 2p binding energies for these two species are very
close together. The Ni 2p3/2 signal corresponding to Ni2+ is accompanied by a broader
peak located at 860.8 eV due to a strong shake-up process [132]. Deconvolution of the
Ni 2p XPS spectra was performed by Gaussian-Lorentzian curve-fitting method to
determine the peak areas for obtaining relative surface concentrations of nickel species.
The ratio of peak areas ANi0/(ANi
0+ANi2+) is used to illustrate the degree of reduction
before and after reaction. As displayed in Table 5.1, a decrease in the ANi0/(ANi
0+ANi2+)
ratio is seen after being exposed to the propane steam reforming atmosphere compared to
freshly reduced pre-reaction catalysts. This suggests a partial oxidation of metallic nickel
sites during the reaction. Since the Ni 2p binding energies for NiAl2O4 and NiO are very
close together, it is not possible to determine if the re-oxidation to +2 state leads to the
formation of NiO species. In addition, 20% Ni-2% La/Al2O3 and 20% Ni-2% Ce/Al2O3
catalysts contain more of the Ni species in a metallic phase (~50%) compared to 20%
Ni/Al2O3 catalyst (32%) after being subjected to the propane steam reforming
atmosphere.

113
Figure 5.4: Ni 2p XPS spectra of reduced catalysts after being exposed to the propane
steam reforming atmosphere at 500 °C for 20 h.

114
Catalyst
ANi0/(ANi
0+ANi2+)
Pre-reaction (reduction)
Post-reaction
20% Ni/Al2O3
0.37 0.32
20% Ni-2% La/Al2O3
0.62 0.51
20% Ni-2% Ce/Al2O3
0.64 0.50
20% Ni-2% Yb/Al2O3
0.60 0.33
Table 5.1: Comparison of the ratio of XPS peak areas ANi0/(ANi
0+ANi2+) of the catalysts
before and after 20-h propane steam reforming
Ni sintering. The sintering of Ni crystallites in lanthanide-promoted sol-gel 20%
Ni/Al2O3 catalysts during reduction was studied from a determination of the mean Ni
crystallite size by in situ XRD. The XRD patterns of 20% Ni-2% Yb/Al2O3 catalyst
during reduction under 5% H2/N2 are shown in Figure 5.5. The pre-calcined catalyst is
relatively amorphous as evidenced by broad peaks at room temperature. The possible
crystalline phases are NiO, NiAl2O4, and γ-Al2O3. No ytterbium-related crystalline
phases could be detected, suggesting that Yb species could be well dispersed on the
alumina support undetectable by XRD. As the reduction temperature was increased to
450 °C, a metallic Ni phase starts to appear. The diffraction lines of Ni (111), (200), and
(220) are seen to grow in intensity with further increase in reduction temperature up to

115
700 °C. In situ XRD results indicate that high reduction temperatures (above 500°C)
necessary to reduce nickel species to a metallic state due to a strong interaction of nickel
oxide with the alumina support. Nickel crystallite diameters of different lanthanide-
promoted 20% Ni/Al2O3 catalysts were calculated from line broadening of Ni (111)
diffraction line using the Scherrer equation [105] and are listed in Table 5.2. Ni
crystallite diameter of the catalysts is found to increase with increasing reduction
temperature. Compared to unpromoted catalyst, Ni crystallites are much smaller in
lanthanide-promoted samples at all reduction temperatures. This suggests that the
presence of lanthanide elements in sol-gel Ni/Al2O3 catalysts helps improve the sintering
resistance of nickel crystallites during reduction.

116
Figure 5.5: XRD patterns of 20% Ni-2% Yb/Al2O3 catalysts during in situ reduction
under 5% H2/N2.

117
Catalyst Reduction temperature (°C)
500 600 700
20% Ni/Al2O3 29 30 32
20% Ni-2% La/Al2O3 16 20 24
20% Ni-2% Ce/Al2O3 16 19 20
20% Ni-2% Yb/Al2O3 12 15 16
Table 5.2: Effect of reduction temperature on nickel crystallite diameter (nm) of
lanthanide-promoted sol-gel 20% Ni/Al2O3 catalysts.
The stabilizing effect of lanthanides to prevent Ni sintering is associated with a
surface phenomenon in which lanthanides, located mostly on the catalyst surface, could
act as a spacer by separating Ni crystallites after reduction. BET surface area
measurements show that the addition of lanthanides results in an increase in surface area.
The BET surface area of a freshly calcined 20% Ni/Al2O3 catalyst is 209 m2/g whereas
catalysts promoted with 2% lanthanides possess the BET surface area of 278-304 m2/g.
It is also possible that a substantial fraction of lanthanides could be present inside the
nickel crystallites. Topsoe et al. [164] reported that the existence of strain created by the
occluded Al2O3 phase in the iron lattice led to a shift of the equilibrium iron particle size
toward smaller particles. As a result, the presence of alumina in ammonia-synthesis iron

118
catalysts inhibited the growth of iron particles. Similarly, lanthanides could also cause
strain in the nickel lattice and this is subsequently responsible for the formation of
smaller nickel crystallites after reduction. Figure 5.6 displays the XRD patterns of 20%
Ni/Al2O3 and 20% Ni-2% Ce/Al2O3 catalysts reduced at 700 °C. α-Al2O3 was used as
an internal standard to investigate a change in the lattice parameter of the metallic Ni
phase when cerium is added in sol-gel 20% Ni/Al2O3 catalysts. The peak maxima of
Ni(111) and (200) diffraction lines of 20% Ni-2% Ce/Al2O3 catalyst shift to lower
diffraction angles (2θ) compared to those of the unpromoted sample. The calculated
lattice parameters are 3.5239 and 3.5278 Å in 20% Ni/Al2O3 and 20% Ni-2% Ce/Al2O3
catalysts reduced at 700 °C, respectively. It is noted that the lattice parameter of pure
nickel, obtained from ICDD PDF database (PDF 4-850), is 3.5238 Å. This suggests that
cerium could be embedded in the nickel lattice, thus preventing the growth of Ni
crystallites.
It is known that sintering is an important cause of deactivation of Ni-based
catalysts under steam reforming conditions. The sintering process can be affected by
many parameters including temperature, chemical environment, catalyst composition and
structure, and support morphology [165-167]. The sintering rate of Ni crystallites was
considerably enhanced by high temperature and the presence of water in the feed gas
[162, 168]. Moreover, sintering of the catalysts with a lower Ni loading was found to be
slower and they exhibited a greater loss in Ni surface area compared to those with a
higher Ni loading [165]. Type of support also plays a role on the thermal stability of
active metal phase, thus affecting the sintering process. Nickel was found to be much

119
more stable on alumina compared to silica in a hydrogen atmosphere at 700 °C, partially
due to a stronger metal-support interaction for Ni/Al2O3 catalysts [168].
Coke formation. Our reaction results indicate that the introduction of
lanthanide elements in sol-gel 20% Ni/Al2O3 catalysts enhances steam reforming activity
and stability significantly. It is likely that lanthanide promotion strongly affects the
coking process under steam reforming conditions, thus improving the catalyst resistance
to coking. To investigate the nature and amount of carbonaceous species formed on the
surface during reaction, TPO and TEM were performed with 20% Ni/Al2O3 and 20% Ni-
2% Ce/Al2O3 catalysts after 20 h propane steam reforming. TGA-TPReaction
experiments were conducted to determine the temperature of coking initiation. In
addition, coking studies were performed using sequential temperature-programmed
coking/gasification/hydrogenation experiments.

120
Figure 5.6: Comparison of XRD patterns of 20% Ni/Al2O3 and 20% Ni-2% Ce/Al2O3
catalysts reduced at 700 °C: (a) 2θ = 42-46° (b) 2θ = 50-54°.

121
TPO experiments. TPO profiles of carbon deposited on 20% Ni/Al2O3 and 20%
Ni-2% Ce/Al2O3 catalysts after 20 h propane steam reforming at 500 °C, H2O/C = 1.3 are
shown in Figure 5.7. TPO profiles of carbon deposited on both catalysts are similar.
There are mainly two peaks observed, indicative of two types of carbonaceous species
having different reactivity toward oxidation. A low-temperature peak at 360 °C could be
assigned to amorphous carbon, which is highly reactive and easily oxidized from the
catalyst surface [26, 115, 169-171]. A larger peak at 640 °C could be due to graphitic
carbon, which is more stable and oxidized at higher temperature. Although the
temperatures at which the CO2 is eluted from the surface are identical for the two
catalysts, the amount of CO2 evolution from the oxidation of carbon deposited on 20%
Ni/Al2O3 catalyst is much higher compared to 20% Ni-2% Ce/Al2O3 catalyst, suggesting
a much larger amount of carbon deposited on Ni-only catalyst. As displayed in the inset,
the amounts of carbon deposited, obtained by integrating the TPO curves, are 1.7 and 0.2
mg /m2 on 20% Ni/Al2O3 and 20% Ni-2% Ce/Al2O3 catalysts, respectively. The amount
of carbon deposited on the catalyst is reduced by approximately 90% upon cerium
promotion. Furthermore, the formation of graphitic carbon is markedly suppressed when
cerium is present as indicated by a smaller value of the ratio of the high-temperature (640
°C) peak area to the low-temperature (360 °C) peak area.
The effect of cerium as a promoter on coke minimization can be attributed to
its unique properties as an oxygen carrier. The redox properties of ceria and the high
lability of lattice oxygen are among the most important factors which contribute to the
catalytic reactivity of CeO2 in oxidation reactions [172]. Under steam reforming
conditions, the presence of cerium could accelerate the reaction of steam with adsorbed

122
species on the nickel surface [26]. Subsequently, surface carbon species are quickly
converted to products, decreasing the accumulation of carbon deposited on the catalysts.
TEM experiments. TEM was conducted to further characterize the structure of
carbon deposited on 20% Ni/Al2O3 and 20% Ni-2% Ce/Al2O3 catalysts after 20 h
propane steam reforming at 500 °C. As shown in Figure 5.8, there is clear evidence of
significant amounts of carbon filaments covering nickel particles on unpromoted catalyst.
Most of them exhibit some degree of curvature possibly due to an unequal diffusion of
graphitic carbon through nickel particles [173]. Conversely, no carbon filaments are seen
on post-reaction 20% Ni-2% Ce/Al2O3 catalyst. This indicates that carbon deposition and
fiber growth are greatly suppressed due to the addition of cerium in Ni/Al2O3 catalysts.
The nickel particles remained relatively small with a diameter ranging between 10 and 15
nm and homogeneously distributed. The morphology of a filament obtained with 20%
Ni/Al2O3 catalyst is shown in Figure 5.9. A nickel particle is seen at the tip of the carbon
filament. Upon the carbon filament formation, the deformation of the nickel particle
occurred, resulting in the appearance of a pear shape [116, 174]. Moreover, the diameter
of the carbon filament formed on the unpromoted sample is about 50 nm which is
roughly the same as that of the Ni particle at the tip of the carbon filament. This suggests
that the size of nickel particles determines the width of carbon filaments. The growth of
carbon filaments has been observed previously with nickel particle sizes in the range of
10-60 nm [169].

123
Figure 5.7: TPO profiles of carbon deposited on 20% Ni/Al2O3 and 20% Ni-2% Ce/Al2O3
catalysts. Calculated carbon formation rates and ratios of 360 °C and 640 °C peak areas
are shown as insets.

124
Figure 5.8: TEM images of carbon deposited on catalysts after 20 h propane steam
reforming over 20% Ni/Al2O3 and 20% Ni-2% Ce/Al2O3 catalysts.

125
Figure 5.9: The morphology of carbonaceous species on 20% Ni/Al2O3 and 20% Ni-2%
Ce/Al2O3 catalysts after propane steam reforming.

126
It is intuitive that larger nickel particles located at the filament tips could
remain immobile and cannot contribute for steam reforming activity, causing rapid
catalyst deactivation as observed on 20% Ni/Al2O3 catalyst. In contrast to carbon
filaments formed on unpromoted catalyst, the morphology of carbon deposited on 20%
Ni-2% Ce/Al2O3 catalyst is quite different. Carbon appears to be “extruded” while the
nickel particle remains on the alumina support surface.
TGA-TPReaction experiments. As previously discussed, TPO and TEM
results clearly indicate that addition of cerium to sol-gel 20% Ni/Al2O3 catalysts
considerably improves resistance to coking. A temperature-programmed reaction
technique (i.e., steam reforming of hydrocarbons) coupled with thermogravimetric
analysis was also performed to investigate the coking resistance of Ni-based catalysts.
The introduction of small amounts of MoO3 (0.5-2 wt%) [175, 176] or K2O [177] into
Ni-based catalysts was reported to increase the coking initiation temperature when steam
ratio was increased, which implies an improvement in coking resistance.
The effect of H2O/C ratio on the weight changes on reduced 20% Ni/Al2O3 and
20% Ni-2% Ce/Al2O3 catalysts during the TPReaction of propane with steam is shown in
Figure 5.10. An increase in weight due to coke formation during propane steam
reforming on 20% Ni-2% Ce/Al2O3 catalyst is less pronounced compared to 20%
Ni/Al2O3 catalyst at all steam ratios. At H2O/C ratio = 0.1, 77% weight increase is
obtained with 20% Ni-2% Ce/Al2O3 catalyst at 750 °C whereas the weight increase
reaches 102% on unpromoted catalyst. The amount of carbon deposited decreases with
increasing steam ratio, suggesting that more coke is gasified at higher concentrations of

127
steam on both catalysts. Furthermore, an increase in steam ratio causes an increase in the
temperature of coking initiation. As listed in Table 5.3, a pronounced increase in coking
initiation temperature is clearly seen when cerium is present in sol-gel Ni/Al2O3 catalysts.
Additionally, the beneficial effect of cerium promotion is more evident at higher steam
ratios.
Catalyst H2O/C ratio
0.1 0.2 0.3
20% Ni/Al2O3 430 465 485
20% Ni-2% Ce/Al2O3 486 557 598
Table 5.3: Effect of steam/carbon ratio on coking initiation temperature on 20% Ni/Al2O3
and 20% Ni-2% Ce/Al2O3 catalysts.

128
Figure 5.10: Effect of steam ratio on the temperature of coking initiation during propane
steam reforming over 20% Ni/Al2O3 and 20% Ni-2% Ce/Al2O3 catalysts.

129
Sequential temperature-programmed coking/gasification/hydrogenation.
Propane decomposition with 2% C3H8/He at 500 °C and subsequent TPGasification of
carbon deposited with 2% H2O/He followed by TPH with 10% H2/He were performed
with reduced 20% Ni/Al2O3 and 20% Ni-2% Ce/Al2O3 catalysts. Figure 5.11 shows the
changes in the concentrations of various carbon-containing species in propane
decomposition. Compared to 20% Ni/Al2O3 catalyst, the intensity of propane increases
with time on stream more noticeably over 20% Ni-2% Ce/Al2O3 catalyst. This suggests
that there are markedly smaller amounts of carbon-containing products formed as a result
of propane decomposition on 20% Ni-2% Ce/Al2O3 catalyst. Moreover, the formation of
CH4 and C2 species is seen to start approximately at 3 min. and increases rapidly as the
time progresses. However, after 6 min., the formation of CH4 decreases with time on
stream while C2 species signal increases. It is conceivable that the formation of C2
species is enhanced with time on stream due to the recombination of CH4 molecules.
Additionally, CO, CO2, and H2O were not detected within 1 h of propane decomposition
at 500 °C.
TPGasification profiles of carbon deposited following propane decomposition
are shown in Figure 5.12. It is seen that gasification of carbon deposited with 2%
H2O/He results in the formation of CO and CO2. A decline in H2O concentration is
accompanied by CO and CO2 evolution. The combined peak area under the CO and
CO2 evolution curves of 20% Ni-2% Ce/Al2O3 catalyst is considerably smaller compared
to that of 20% Ni/Al2O3 catalyst. This shows that there is much less accumulation of
carbon species from propane decomposition when cerium is present in sol-gel Ni/Al2O3
catalysts. The gasification mechanism of carbon deposited on nickel has been proposed

130
to be controlled by the diffusion of carbon through the metal [178-180]. Since the
gasification reaction proceeds at the same rate as the diffusion of carbon through nickel,
back diffusion of carbon to the nickel surface becomes the rate-determining step [64]. In
case of steam gasification, H2O is believed to dissociatively adsorb on the surface of
nickel particles to form mobile surface oxygen species, which further react with carbon
atoms to form CO and CO2. Our TPGasification profiles show that 20% Ni-2% Ce/Al2O3
catalyst exhibits a higher gasification temperature (570 °C) compared to 20% Ni/Al2O3
catalyst (535 °C). This suggests that the carbon diffusion rate could be retarded due to a
decrease in mobility of carbonaceous species upon the incorporation of cerium in nickel
particles.
Following TPGasification experiments, the catalysts were cooled down to
room temperature under He. TPH experiments were then conducted with 10% H2/He to
further characterize deposited carbon left on the catalyst surface after steam gasification.
As displayed in Figure 5.13, TPH profiles show a peak of CH4 and C2 species over both
catalysts, indicating that there was some carbon that could not be completely gasified.
The hydrogenation of this “residual” carbon deposited starts approximately at 550 °C and
is complete at 800 °C on both catalysts. The peak maxima of CH4 and C2 species appear
at 650 and 770 °C, respectively. Furthermore, the peak area integrated under the curves
of CH4 and C2 species is lower with 20% Ni-2% Ce/Al2O3 catalyst compared to 20%
Ni/Al2O3 catalyst. This suggests that a higher amount of carbon deposited is removed
from the surface of 20% Ni-2% Ce/Al2O3 catalyst after steam gasification. Cerium
promotion could also enhance gasification of carbonaceous species due to high mobility
of its lattice oxygen.

131
Figure 5.11: Changes in the concentrations of various carbon-containing species as a
function of time on stream in propane decomposition at 500 °C over 20% Ni/Al2O3 and
20% Ni-2% Ce/Al2O3 catalysts.

132
Figure 5.12: TPGasification profiles of carbon deposited following propane
decomposition.

133
Figure 5.13: TPH profiles of carbon deposited left after H2O gasification. The inset
shows the comparison of the peak area of CH4 and C2 species formed during TPH over
20% Ni/Al2O3 and 20% Ni-2% Ce/Al2O3 catalysts.

134
Coking models during steam reforming. Based on information obtained from
characterization results, coking models during propane steam reforming over sol-gel
Ni/Al2O3 and Ni-Ce/Al2O3 catalysts are proposed similar to that reported by Baker et al.
[181] and Snoeck et al. [174, 182]. For Ni/Al2O3 catalyst, the formation of carbon
filaments is believed to cause rapid catalyst deactivation. The mechanism of carbon
filament growth for propane steam reforming on nickel involves various steps (i.e.,
surface reactions, dissolution/segregation, carbon diffusion through nickel, and
precipitation) [174, 181-183]. The decomposition of propane to hydrocarbon fragments
(i.e., CHx and carbon atoms) originally occurs on the nickel surface as illustrated in
Figure 5.14. Carbonaceous species further dissolve and diffuse through the nickel
particle accompanied by the precipitation at the rear of the nickel particle with formation
of a carbon filament. As the carbon filament begins to grow, the deformation of the
nickel particle takes place. The appearance of a distorted nickel particle is affected by
the relative rates of nucleation of carbon filaments and of carbon diffusion through nickel
as well as the difference in diffusional path lengths on the metal/carbon interface. A
pear-shaped nickel particle as observed from TEM studies could be due to a much faster
nucleation rate with high diffusional path lengths at elevated temperature. Snoeck et al.
[174] reported that the metal/support interaction must be overcome to lift the particle at
places where there is no carbon excretion. Consequently, the formation of a pear shape
takes place as the nickel particle is lifted strongly far from the support near the gas/metal
interface.
In contrast, the addition of cerium enhances the adsorption of water, resulting
in higher concentrations of active surface oxygen. The gasification of adsorbed carbon

135
from hydrocarbon fragments on the nickel surface is so efficient that the surface carbon
species can be quickly converted to products and therefore the accumulation rate of
carbon deposited is reduced [26]. Additionally, dissolution and diffusion of carbon
species through nickel particles are greatly inhibited by the incorporation of cerium. The
nucleation process to form carbon filaments is therefore retarded due to decreased
mobility of carbon. TEM studies have shown that there were no carbon filaments
detected over Ni-Ce/Al2O3 catalyst after 20 h propane steam reforming. Unlike Ni/Al2O3
catalyst, nickel particles on Ni-Ce/Al2O3 catalyst still remain on the alumina support
rather than being strongly lifted far from it. Indeed, a small amount of carbon species
spreading out around nickel particles is seen with the presence of cerium instead of
carbon filaments having the same diameter as nickel particles.

136
Figure 5.14: Coking models during propane steam reforming over Ni/Al2O3 and Ni-
Ce/Al2O3 catalysts.

137
5.4 Summary
This study has examined the effect of lanthanide promotion on catalytic
performance of sol-gel nickel catalysts supported on alumina in steam reforming of
propane. The presence of lanthanide elements (i.e., La, Ce, and Yb) is found to enhance
the catalytic activity and stability significantly. This is partially due to the fact that
lanthanides help retard the growth of nickel crystallites as well as the re-oxidation of
metallic nickel sites during the reaction. Coke formation is likely a major cause of
catalyst deactivation as suggested by an improvement in the reaction performance at
higher steam/carbon ratios. In particular, the catalysts promoted with cerium remain
highly active and stable for 20 h when excess steam is introduced into the feed. It
appears that cerium promotion greatly inhibits carbon deposition due to enhanced water
adsorption and effective gasification. As evidenced by TEM studies, the incorporation of
cerium prevents the formation of carbon filaments by reducing the dissolution and
diffusion of carbonaceous species through nickel particles.

138
CHAPTER 6
CHROMIUM-FREE IRON-BASED CATALYSTS: PREPARATION,
CHARACTERIZATION, AND CATALYTIC PERFORMANCE IN THE HIGH-
TEMPERATURE WATER-GAS SHIFT REACTION
6.1 Introduction
The water-gas shift (WGS) reaction is an important step in the production of H2,
where CO, which is produced from hydrocarbon steam reforming or coal gasification, is
reacted with water to give H2 and CO2. The water–gas shift reaction is exothermic and
thermodynamically limited at high temperatures:
CO (g) + H2O (g) ⇔ CO2 (g) +H2 (g), ∆H (298 K) = -41.2 kJ/mol.
There has been renewed interest in the WGS reaction in recent years because of
its necessity in conjunction with fuel cell power generation. The high-temperature shift
(HTS) reaction is industrially performed at 320-450 °C using Fe-Cr oxide catalysts, while
the low-temperature shift (LTS) reaction is conducted at 200-250 °C. The LTS catalysts
commonly used are Cu/ZnO/Al2O3 or precious metal-based catalysts. The WGS reactor
currently represents the largest volume of any catalyst in a fuel processor due to the slow
kinetics at temperatures where the equilibrium is favorable [70].
Development of Fe-Cr catalysts with improved activity and stability has been
pursued in the last two decades [94, 98-102, 184-192]. However, existing WGS catalyst

139
formulations are not yet commercially viable for use in coal-based fuel processors for
fuel cell applications due to many disadvantages such as their sensitivity to air and low
activity of Fe-Cr catalysts, which dictates higher temperature of operation. Thus,
development of novel WGS catalysts with superior performance and low cost will have
an impact on the widespread applications of fuel cell systems. Andreev et al. [99] studied
the effect of the addition of CuO, CoO, and ZnO (5 wt%) on the activity of Fe-Cr
catalysts. The Cu-promoted sample was found to be the most active at 380 °C. Kappen
et al. [101] investigated the state of the Cu promoter (0.17-1.5 wt%) in Fe-Cr catalysts. It
was found that Cu was in the metallic phase under the WGS reaction conditions.
However, it reoxidized easily when exposed to the atmosphere. Rhodes et al. [102]
examined the promotion of Fe-Cr catalysts with 2 wt% B, Cu, Ba, Pb, Hg, and Ag. A
beneficial effect of adding Hg, Ag, or Ba was observed between 350-440 °C. This could
be due to their different ionic sizes compared to that of Fe2+, influencing the electronic
structure of the active Fe3+ center. Despite its high WGS activity, it is unlikely that the
toxic Hg-promoted catalyst will be considered as a commercial HTS catalyst. Although
Fe-Cr catalysts have been widely used in the HTS reaction, the role of the Cr2O3 addition
on the stabilization of the catalyst structure is still unclear. Edwards et al. [100] proposed
a model for the high stabilizing effect of chromium whereby a shell of chromium
enriched material is formed on each catalyst grain, but the mechanism by which
promotion occurs is still uncertain.
It is known that the activation process can play an important role on the activity
and stability of catalysts. Rethwisch et al. [93] investigated the effect of catalyst
treatment on catalytic activity over 16.8 wt% Fe3O4 supported on graphite. It was found

140
that the treatment of the catalyst in CO/CO2 at 390 °C prior to the reaction increased the
WGS activity. In contrast, the catalyst treatment in H2/H2O caused the growth of
magnetite particles, leading to a decrease in catalytic activity. Gonzalez et al. [94]
studied the influence of thermal treatments and reduction processes on the WGS activity
of Fe-Cr catalysts. The active phase, Fe3O4, can be obtained from partial reduction of
Fe2O3. However, over-reduction to form metallic Fe should be avoided since it results in
a loss of catalytic activity. The authors concluded that reduction under either H2/N2 or
CO/N2/H2/H2O at temperatures below 500 °C should be performed to obtain higher
activity without over-reduction of Fe2O3.
Even though chromium oxide has been used as a stabilizer in industrial HTS
catalysts, its replacement with more benign components is highly desirable due to
environmental concerns related to chromium. Araujo and Rangel [103] investigated the
catalytic performance of Al-doped Fe-based catalyst with small amounts of copper (%wt
Cu ≈ 3) in the HTS reaction. The aluminum and copper-doped catalyst showed similar
catalytic activity compared to the commercial Fe-Cr catalyst even at more severe
conditions (H2O/CO = 0.4, 350 °C). Costa et al. [104] subsequently examined the use of
thorium instead of chromium in iron- and copper-based catalysts for the HTS reaction. It
was found that the thorium and copper-doped catalyst was more active than the
commercial Fe-Cr catalyst at H2O/CO = 0.6 and 370 °C. Its high activity was attributed
to an increase in surface area by thorium. The authors concluded that the non-toxic
thorium and copper-doped catalyst is a promising HTS catalyst.
Consequently, it is apparent that innovative chromium-free iron-based catalysts
that can overcome these drawbacks (i.e., low activity at low temperatures, sintering,

141
sulfur poisoning, and pyrophoric nature) will have a significant impact in many
processes, in particular those that target hydrogen production from coal. In this study, we
examine the effect of various catalyst preparation variables on catalytic performance in
the HTS reaction to develop chromium-free iron-based catalysts that are highly active
and stable. Catalyst characterization was performed using BET surface area
measurements, temperature-programmed reduction (TPR), X-ray diffraction (XRD), X-
ray photoelectron spectroscopy (XPS), and diffuse reflectance infrared Fourier transform
spectroscopy (DRIFTS). The reaction mechanism of the HTS reaction over Fe-based
catalysts is also discussed.
6.2 Reaction experiments for the high-temperature water-gas shift reaction
Effect of promoters. It is believed that the function of chromium in commercial
HTS formulations is to stabilize magnetite from sintering, thus enhancing the activity and
stability of iron catalysts [2, 193]. However, the use of chromium poses additional
complications due to harmful effects of Cr6+ on human health such as cancer risk and
lung damage [194]. Therefore, development of chromium-free catalytic system is
necessary. Generally speaking, it is conceivable that any metal that has a similar ionic
radius to Fe3+ (0.69 Å) could easily incorporate into the hematite lattice to form a solid
solution instead of segregating into another phase. Based on this concept, aluminum,
manganese, and gallium were chosen to replace chromium. The ionic radii of metals
investigated in this study are as follows: Al3+ (0.675 Å), Mn3+ (0.72 Å), Cr3+ (0.755 Å),
Ga3+ (0.76 Å) [195]. The addition of manganese and gallium causes a decrease in WGS
activity whereas the presence of aluminum results in an improvement in WGS activity of

142
Fe catalysts as shown in Table 6.1. However, the CO conversion achieved with Fe-Al
catalyst is still lower than that obtained over Fe-Cr catalyst. Fe-Al catalysts promoted
with first-row transition metals (copper, cobalt, zinc) were subsequently prepared using a
coprecipitation-impregnation method by keeping the Fe/promoter ratio constant at 20. As
shown in Table 6.1, although addition of Zn does not provide any higher activity
compared to Fe-Al catalyst, promotion with Co and Cu leads to significantly higher CO
conversion, with Fe-Al-Cu catalyst giving the highest activity. More importantly, Fe-Al-
Cu catalyst not only matches the activity of Fe-Cr catalyst, but surpasses it. The
promotion of Fe catalysts is seen to increase the surface area (Table 1), although it is
clear that the change in activity with the promoters cannot be explained solely by the
variation in surface area.
The effect of various synthesis variables (i.e., Fe/Al molar ratio, Fe/Cu molar
ratio, pH of precipitation medium, calcination and reduction temperatures) on the activity
and stability of the catalysts was examined to improve the catalytic performance of Fe-
Al-Cu catalysts.

143
Catalysta
Surface area (m2/g)
CO conversion (%)
Fe-only
19
20
Fe-Ga
31 12
Fe-Mn
64 16
Fe-Cr
54 43
Fe-Al
61 25
Fe-Al-Zn
78 19
Fe-Al-Co
84 34
Fe-Al-Cu
88 46
Table 6.1: BET surface area measurements and % CO conversion over Fe-based
catalysts.
Effect of Fe/Al molar ratio. A first series of Fe-Al catalysts was prepared at
differing Fe/Al molar ratios from 5 to 20. The pH of precipitation medium and
calcination temperature were kept constant at 9 and 450 °C, respectively. Table 6.2
shows that the WGS activity of Fe-Al catalysts increases with decreasing Fe/Al molar
ratio (or at higher Al contents) and reaches a maximum at Fe/Al = 10. Further addition of
Al (Fe/Al = 5) causes a significant drop in WGS activity, possibly due to segregation of
aluminum into another phase.

144
Effect of pH of precipitation medium. A second series of Fe-Al catalysts was
subsequently prepared at various pH values of the precipitation medium. The Fe/Al
molar ratio and calcination temperature were kept constant at 10 and 450 °C,
respectively. pH is the major factor to control the precipitation rate of different species in
the mixture of catalyst precursors. Lower pH values of the precipitation medium could
favor the precipitation of aluminum species whereas the precipitation rate of iron species
becomes faster at higher pH values. Reaction results indicate that the optimum pH value
of the precipitation medium is 9 for forming the solid solution of aluminum species in
iron precipitates
Effect of calcination temperature. A third series of Fe-Al catalysts was therefore
synthesized at Fe/Al = 10 and pH = 9. CO conversion of Fe-Al catalysts prepared at
various calcination temperature ranging from 350-500 °C is also listed in Table 6.2. The
catalytic activity of Fe-Al catalysts is seen to go through a maximum at 450 °C. Higher
calcination temperature results in a decrease in WGS activity possibly due to loss of
surface area caused by sintering. It is concluded that the best-performing Fe-Al catalyst
with regard to WGS activity can be prepared at the following conditions: Fe/Al molar
ratio = 10, pH = 9, and calcination temperature = 450 °C.
Effect of Fe/Cu molar ratio. As displayed in Table 6.2, the WGS activity of Fe-
Al-Cu catalysts increases with decreasing Fe/Cu molar ratio (or at higher Cu contents)
until it reaches a maximum at Fe/Al = 20. A further decrease in Fe/Cu molar ratio causes
a drop in WGS activity.

145
Effect of reduction temperature. Generally, pretreatment conditions such as
reduction temperature and reducing atmosphere strongly affect the active form of a
catalyst, which in turn, influence its catalytic performance. The effect of reduction
temperature on WGS activity of Fe-based catalysts was examined with 20% H2/N2 as a
reducing agent. As shown in Figure 6.1, the WGS activity of all catalysts is seen to go
through a maximum and drops at higher reduction temperatures, possibly due to over-
reduction of magnetite at higher temperatures.
Although Fe-Al catalyst shows similar activity to Fe-only catalyst at reduction
temperature below 300 °C, it shows an improvement in catalytic activity at higher
reduction temperatures, with Fe-only catalyst showing almost negligible WGS activity
when it is reduced at 450 °C. This indicates the beneficial effect of aluminum on
stabilizing the magnetite phase. Although all three catalysts exhibit a maximum in
activity with increasing reduction temperature, the maximum for the Fe-Al-Cu catalyst
takes place at a much lower reduction temperature (250 °C) compared to Fe-only and Fe-
Al catalysts (350 °C). It appears that a reduction temperature of 250 °C is not high
enough to convert all of hematite to magnetite in Fe-only and Fe-Al catalysts whereas it
is sufficient for Fe-Al-Cu catalyst. Moreover, the Fe-Al-Cu catalyst reduced at 350 °C
rapidly deactivates during the first 10 h as shown in the inset of Figure 6.1. However, the
loss of activity can be prevented for a larger extent by reducing the catalyst at a lower
catalyst (250 °C) as CO conversion is seen to decrease more slowly and remains constant
for 20 h.

146
Catalyst
Fe/Al
Fe/Cu
pH
Tcal (°C)
CO conversion (%)
Fe-Al
5
-
9
450
14
10 - 9 450 25 15 - 9 450 18 20 - 9 450 16 10 - 8 450 13 10 - 9 450 25 10 - 10 450 20 10 - 11 450 15 10 - 9 350 16 10 - 9 400 19 10 - 9 450 25 10 - 9 500 22 Fe-Al-Cu 10 10 9 450 40 10 20 9 450 46 10 30 9 450 42 10 40 9 450 37
Table 6.2: Reaction comparison for the high-temperature water-gas shift reaction- effect
of synthesis variables [Reaction conditions: 400 °C, CO/H2O/N2 = 1/1/8, feed flow rate =
100 cm3/min, equal weight reactions (0.1 g), in situ reduction at 350 °C under 20% H2/N2
for 2 h].
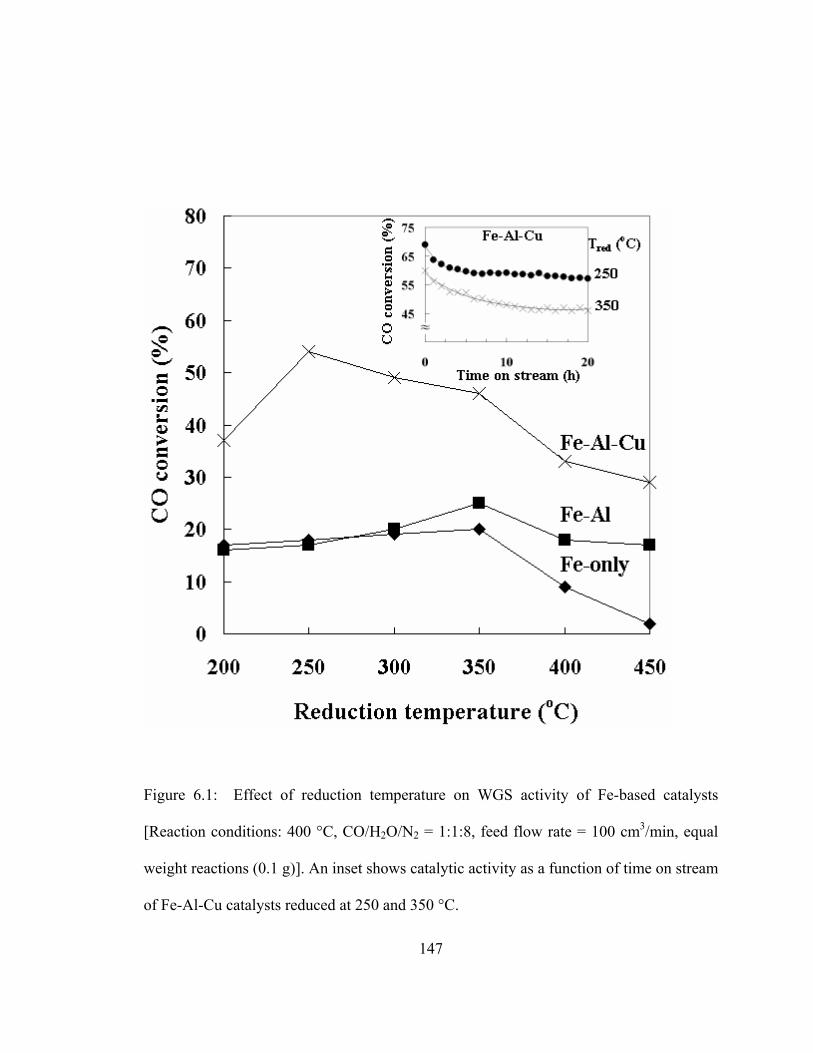
147
Figure 6.1: Effect of reduction temperature on WGS activity of Fe-based catalysts
[Reaction conditions: 400 °C, CO/H2O/N2 = 1:1:8, feed flow rate = 100 cm3/min, equal
weight reactions (0.1 g)]. An inset shows catalytic activity as a function of time on stream
of Fe-Al-Cu catalysts reduced at 250 and 350 °C.

148
Figure 6.2: Effect of reaction temperature on WGS activity of Fe-based catalysts.
149
Effect of reaction temperature. Fe-based catalysts were compared in the HTS
reaction at 300-400 °C and H2O/CO = 1. The effect of reaction temperature on WGS
activity of Fe-based catalysts in the HTS reaction is shown in Figure 6.2. Compared to
Fe-only catalyst, all promoted catalysts exhibit higher WGS activity for the whole range
of reaction temperature investigated. The WGS activity of all catalysts is seen to increase
with increasing reaction temperature. Furthermore, the beneficial effect of Cu promotion
on activity enhancement is more pronounced at lower reaction temperatures. It is noted
that H2 and CO2 are the only products from these reaction experiments; no CH4 formation
is detected.
Effect of gas hourly space velocity (GHSV). The effect of GHSV on CO
conversion in the HTS reaction at 400 °C over Fe-based catalysts reduced at 250 °C is
shown in Figure 6.3. As the space velocity is decreased, CO conversion increases. At
the highest space velocity studied (9500 h-1), Fe-only and Fe-Al catalysts exhibits similar
WGS activity. CO conversions are 17%, 39%, and 54% over Fe-Al, Fe-Cr, and Fe-Al-
Cu catalysts, respectively. At lower space velocities, Fe-Al catalyst gives slightly higher
CO conversion than Fe-only catalyst whereas the equilibrium CO conversion (78%) is
obtained over Fe-Al-Cu catalyst. Within the range of GHSV investigated, the WGS
activity of Fe-based catalysts increases in the following order: Fe-only ≤ Fe-Al << Fe-Cr
< Fe-Al-Cu.

150
Figure 6.3: Effect of GHSV on CO conversion at 400 °C of Fe-based catalysts.

151
6.3 Change in catalyst reducibility
To further examine the change in catalyst reducibility with promotion, TPR was
performed with 10% H2/Ar over various Fe-based catalysts calcined at 450 °C. As
depicted in Figure 6.4, there are two main reduction peaks observed above 300 °C. A
low-temperature (LT) reduction peak is assigned to the reduction of hematite (Fe2O3) to
magnetite (Fe3O4). A broad high-temperature (HT) reduction peak is attributed to the
reduction of magnetite (Fe3O4) to FeO. The HT reduction peak has a shoulder possibly
due to the reduction of the outer layers of FeO particles forming metallic Fe. The
addition of Al and Cr into Fe catalysts leads to a shift of the HT peak maximum to higher
temperatures. This suggests that the addition of Al and Cr stabilizes magnetite and
prevents its further reduction to undesirable FeO or metallic Fe. An additional reduction
peak, assigned to the reduction of Cr6+ to Cr3+, is seen at 270 °C for Fe-Cr catalyst [94].
Upon Cu promotion, the position of the LT peak maximum shifts toward much lower
temperature, around 300 °C, suggesting that Cu facilitates the formation of magnetite.
An additional reduction peak is also seen on Fe-Al-Cu catalyst at 220 °C. This could be
due to the reduction of Cu2+ to metallic Cu [103, 104]. It is noted that the formation of
magnetite is slightly enhanced by the presence of Co and Zn.

152
Figure 6.4: TPR profiles of various Fe-based catalysts calcined at 450 °C.

153
6.4 Change in crystallinity and phase transformations during reduction
Calcined catalysts. The XRD patterns of catalysts calcined at 450 °C are
displayed in Figure 6.5. Hematite (Fe2O3) is the only crystalline phase detected. No
separate Al- and Cr-containing crystalline phases are observed on the calcined samples,
suggesting that Al and Cr could exist in solid solution within the hematite lattice upon the
catalyst preparation. XRD peaks of all promoted catalysts are much broader than Fe-only
catalyst, suggesting that hematite crystallites in these catalysts are significantly smaller.
The crystallite sizes of hematite were further calculated from line broadening of Fe2O3
(104) diffraction line using the Scherrer equation [105]. As shown in Table 6.3, the
addition of Al and Cr in Fe catalysts helps improve the sintering resistance of hematite as
confirmed by much smaller crystallite sizes of hematite at all calcination temperatures.
In addition, the effect of calcination temperature on crystallinity of Fe-Al catalysts in
shown in an inset. The catalyst calcined at 350 °C is relatively amorphous. As the
calcination temperature is increased, Fe-Al catalysts become more crystalline.
Reduced catalysts. Phase transformations that took place during the reduction in
Fe-based catalysts were further investigated by an in situ XRD technique. The
corresponding d spacings and (hkl) values for the diffraction lines of iron-containing
species using the International Centre for Diffraction Data (ICDD) PDF database are
given in Table 6.4. No phase transformation occurs in Fe-Al catalyst below 250 °C; the
only crystalline phase observed is hematite (Figure 6.6). At 300 °C, hematite begins to
reduce to magnetite (Fe3O4), which is further reduced to inactive FeO above 600 °C. In
contrast, the Fe-Al-Cu calcined at 450 °C is amorphous.

154
Figure 6.5: XRD patterns of various Fe-based catalysts calcined at 450 °C. The effect of
calcination temperature on crystallinity of Fe-Al catalysts is shown as an inset.

155
Catalyst
d (nm)
Calcination temperature (°C)
350
400
450
500
Fe
34
36
47
55
Fe-Al n.d.a 26 31 34
Fe-Cr n.d.a 23 25 37
n.d.a = not determined since Fe2O3(104) diffraction line was not well resolved.
Table 6.3: Effect of calcination temperature on hematite crystallite diameter of Fe-based
catalysts.

156
Phase
d (Å)
2θ
(hkl)
Fe2O3 3.684 24.14 (012)
2.700 33.15 (104) 2.519 35.61 (110) 2.207 40.85 (113) 1.841 49.48 (024) 1.694 54.09 (116) 1.599 57.59 (018) 1.486 62.45 (214) 1.454 63.99 (300) 1.306 72.26 (119)
Fe3O4 2.967 30.09 (220) 2.532 35.42 (311) 2.099 43.05 (400) 1.715 53.39 (422) 1.616 56.94 (511) 1.485 62.51 (440)
FeO 2.490 36.04 (111) 2.153 41.92 (200) 1.523 60.76 (220) 1.299 72.73 (311) 1.243 76.58 (222)
Fe 2.027 44.67 (110) 1.433 65.02 (200)
Table 6.4: Major peaks in the XRD patterns of identified phases during in situ reduction
of Fe-based catalysts.

157
Figure 6.6: In situ XRD patterns during reduction of Fe-Al and Fe-Al-Cu catalysts.

158
Magnetite is observed at much lower temperature (200 °C) in Fe-Al-Cu catalyst
and it is subsequently reduced to metallic Fe at 450 °C. This implies that the presence of
Cu in Fe-based catalysts enhances the reduction of magnetite to metallic Fe considerably.
Table 6.5 summarizes the reduction temperature at which each crystalline iron-containing
phase is detected in various Fe-based catalysts. Compared to Fe-Al and Fe-Cr catalysts,
FeO is detected at lower reduction temperature (500 °C) for the Fe-only catalyst. This is
in good agreement with TPR results. The presence of Al and Cr in Fe catalysts stabilizes
the magnetite phase and prevents its further reduction to FeO. This also indicates that
the HT reduction peak observed with Fe-Al-Cu catalyst is due to the reduction of
magnetite to metallic Fe. The crystallite sizes of various Fe-based catalysts reduced at
differing temperatures (300-450 °C) were also calculated from line broadening of Fe3O4
(311) diffraction line and are listed in Table 6.6. It can be seen that magnetite crystallite
sizes increase with increasing reduction temperature. The presence of Al and Cr
significantly inhibits the growth of magnetite crystallites.
6.5 Investigation of active sites and oxidation states
Pre-reaction XPS. In order to investigate the nature of active sites and oxidation
states of species upon promotion, XPS was performed with calcined and reduced
catalysts. Figure 6.7(a) shows Fe 2p X-ray photoelectron spectrum of calcined Fe-only
catalysts. Hematite (710.9 eV) is the only iron species observed on the surface of
calcined catalysts. After reduction at 350 °C, magnetite (710.3 eV) is the major species
detected. Metallic (706.3 eV) phase is clearly seen on reduced Fe-only (Figure 6.7b) and
Fe-Al-Cu (Figure 6.7e) while it is markedly suppressed on both Fe-Cr (Figure 6.7c) and

159
Fe-Al (Figure 6.7d). Consistent with TPR and in situ XRD results, the addition of Al and
Cr in Fe catalysts helps stabilize the magnetite phase. Compared to Fe-Al-Cu catalyst
reduced at 350 °C, there is no metallic Fe observed after reduction at 250 °C (Figure
6.7f). This is in good agreement with reaction results; Fe-Al-Cu catalyst becomes less
stable when reduced at 350 °C due to over-reduction of magnetite to metallic Fe.
Catalyst
Reduction temperature (°C)
Fe3O4
FeO
Fe
Fe
300
500
n.d.a
Fe-Al 300 600 n.d.a
Fe-Cr 300 700 n.d.a
Fe-Al-Cu 200 n.d.a 450
n.d.a = not detected.
Table 6.5: Phase transformations in Fe-based catalysts as a function of reduction
temperature.

160
Catalyst
d (nm)
Reduction temperature (°C)
300
350
400
450
Fe
49
62
63
70
Fe-Al 32 46 47 53
Fe-Cr 32 51 54 54
Fe-Al-Cu 25 32 37 37
Table 6.6: Effect of reduction temperature on magnetite crystallite diameter of Fe-based
catalysts.
As shown in Figure 6.8, Cr is found to have two oxidation states in the calcined
sample: Cr+6 (579.3 eV) and Cr+3 (576.5 eV) with Cr+6 being the main phase. After
reduction at 350 °C, Cr+6 is reduced to Cr+3, which is also observed in the TPR profile of
Fe-Cr catalyst. Cu is found in the +2 state in the calcined sample (Figure 6.9). After
reduction at 350 °C, all copper oxide is converted to a metallic Cu phase (932.2 eV). It
is noted that aluminum is found to exist in +3 state in calcined Fe-Al catalyst and no
notable change is observed after reduction.

161
Figure 6.7: Fe 2p X-ray photoelectron spectra of various Fe-based catalysts: (a) calcined
Fe-only (b) reduced Fe-only (c) reduced Fe-Cr (d) reduced Fe-Al (e) Fe-Al-Cu reduced at
350 °C (f) Fe-Al-Cu reduced at 250 °C.

162
Figure 6.8: Cr 2p spectra of calcined and reduced Fe-Cr catalysts.

163
Figure 6.9: Cu 2p spectra of calcined and reduced Fe-Al-Cu catalysts.

164
Post-reaction XPS without the pre-reduction step. Post-reaction XPS
characterization shows that hematite is converted primarily to magnetite and a lesser
extent to FeO as shown in Figure 6.10 (a). Additionally, CuO is seen to reduce to
metallic Cu on the post-reaction catalyst (Figure 6.10b). This indicates that catalysts are
reduced under the reaction medium; however, the presence of FeO suggests that they may
be “over-reduced”. To further examine the impact of the pre-reduction step on the
catalytic performance, steady-state reaction experiments at 400 °C were performed with
Fe-Al and Fe-Al-Cu catalysts. Although catalysts that are not pre-reduced still exhibit
WGS activity, they are less active than pre-reduced catalysts (250 °C, 20% H2/N2) as
compared in Table 6.7. A significant increase in catalytic activity is observed with Fe-
Al-Cu catalysts.
Catalyst
Pretreatment
CO conversion (%)
Fe-Al
No pre-reduction
15
Reduction at 350 °C, 2 h 25 Fe-Al-Cu No pre-reduction 40 Reduction at 250 °C, 2 h
54
Table 6.7: Effect of the pre-reduction step on catalytic performance of Fe-Al and Fe-Al-
Cu catalysts.

165
3
Figure 6.10: Comparison of pre- and post-reaction XPS of Fe-Al-Cu catalysts without the
pre-reduction step: (a) Fe 2p (b) Cu 2p.

166
6.6 DRIFTS studies
Surface species formed as a result of CO adsorption over reduced catalysts were
examined using DRIFTS. Figure 6.11 shows DRIFT spectra under CO flow taken at
various temperatures up to 400 °C over reduced Fe-only and Fe-Al-Cu catalysts. At
room temperature, bands at 2173, 2110, 1608, 1391, and 1215 cm-1 are observed under
CO flow. The bands at 2173 and 2110 cm-1 are assigned to gas-phase CO and weakly
adsorbed CO, respectively [150, 196, 197]. It is plausible that the oxidation of adsorbed
CO and/or the Boudouard reaction could produce CO2. The features at 1608, 1391, and
1215 cm-1 are attributed to bicarbonate species, which are formed upon the adsorption of
CO2 [149, 150]. Bicarbonate bands are much more intense on reduced Fe-Al-Cu catalyst
compared to those observed on reduced Fe-only catalyst. Subsequent heating under He
results in an appearance of a doublet at 2358 and 2327 cm-1, which signals the formation
of CO2 [153, 154]. These bands grow much stronger with increasing temperature up to
400 °C. Moreover, they are seen at much lower temperature (75 °C) over reduced Fe-Al-
Cu catalyst, suggesting that the presence of Al and Cu helps reduce the energy barrier of
CO2 formation.
DRIFTS experiments of the CO+H2O TPReaction were further conducted to
investigate adsorbed species during the WGS reaction and to elucidate the reaction
mechanism. Figure 6.12 displays CO+H2O TPReaction DRIFT spectra over reduced Fe-
Al-Cu catalyst. The bands at 2173 cm-1 (gas-phase CO) and 2110 cm-1 (weakly-adsorbed
CO) are seen under CO flow at room temperature. Under He flow, the band at 2173 cm-1
disappears completely at room temperature.

167
Figure 6.11: CO-TPD DRIFT spectra of reduced Fe-only and Fe-Al-Cu catalysts.

168
Figure 6.12: CO+H2O-TPReaction DRIFT spectra of the reduced Fe-Al-Cu catalyst.

169
In addition, the intensity of the band at 2110 cm-1 decreases gradually with increasing
temperature. At 400 °C, no adsorbed species are observed under He flow.
After CO is re-introduced at 400 °C for 10 min., a doublet, characterized the
formation of CO2, at 2358 and 2327 cm-1 appears. The intensity of these bands decreases
whereas that of the CO bands (2173 and 2110 cm-1) increases with time on stream,
suggesting that surface oxygen is being depleted during the reaction. After H2O
introduction at 400 °C, the catalyst is re-oxidized by oxygen, which is produced from the
dissociation of H2O. Interestingly, the bands at 2358-2327 cm-1 re-appear after H2O
exposure with much higher intensity compared to those before introducing water.
However, their intensity continues to decrease with time on stream as previously
observed. Most importantly, these bands grow much strongly on reduced Fe-Al-Cu
catalyst after H2O exposure compared to reduced Fe-only catalyst as shown in Figure
6.13. This suggests that activity difference observed over the two catalysts could be due
to the more rapid regeneration of the active sites over the Cu-promoted catalysts.
Two possible reaction mechanisms of the HTS reaction on Fe-based catalysts
have been proposed: associative and regenerative (redox) [97]. The associative
mechanism involves the adsorption of CO and H2O on the catalyst surface, therefore
leading to the formation of an intermediate (i.e., formate), which further decomposes to
CO2 and H2. The redox mechanism can be visualized as a cyclic change in the oxidation
state of magnetite upon the adsorption of CO and H2O. The redox mechanism seems to
be the predominant reaction pathway due to the unique capabilities of magnetite to
exchange an electron between Fe2+ and Fe3+ rapidly.

170
Figure 6.13: Comparison of CO+H2O-TPReaction DRIFT spectra taken under CO flow
of Fe-only and Fe-Al-Cu catalysts.

171
Magnetite is known to have an inverse spinel structure [198, 199]. It consists of
Fe3+ located in tetrahedral sites with Fe2+ and Fe3+ equally occupying octahedral sites
while the oxygen atoms form a face-centered cubic lattice (fcc) within a spinel. The
arrangements of iron and oxygen atoms in magnetite can be written as Fe3+ (A) Fe3+(B)
Fe2+(B)(O2-)4, where A and B refer to tetrahedral and octahedral sites, respectively. Fast
electron hopping between Fe2+ and Fe3+ locating in octahedral sites in magnetite has been
confirmed by Mössbauer spectroscopy [164, 200] and isotopic labeling studies [201].
Furthermore, the water-gas shift reaction over Fe-Cr catalysts was well described by the
kinetics of surface oxygen removal by CO and H2 and surface oxygen incorporation from
CO2 and H2O, indicating that the redox mechanism is a primary pathway for the water-
gas shift reaction over magnetite [202, 203]. Our in situ DRIFTS results also indicate
that the WGS reaction over Fe-based catalysts occurs via the redox mechanism as
depicted in Figure 6.14. The catalyst surface undergoes successive reduction and
oxidation cycles by CO and H2O to produce CO2 and H2, respectively, with Fe3+ and Fe2+
occupying the octahedral sites in the magnetite structure constituting a “redox” pair.
The role of copper in HTS catalysts for the water-gas shift reaction is still
uncertain. Rhodes et al. [192] reported that copper enhanced the WGS activity by
modifying the electronic properties of coprecipitated Fe-Cr catalysts. Their TPR studies
using 5% H2/Ar and 5% CO/He showed that no additional feature was observed with
coprecipitated Fe-Cr-Cu catalyst, suggesting that CuO and Cr2O3 could exist in solid
solution within the magnetite structure. Moreover, no discrete Cr2O3 or CuO phase was
observed in the reduced sample while CuO was found to segregate on the surface of the
post-reaction sample [100]. However, it is also possible that under the WGS reaction

172
atmosphere copper could provide new active sites similar to those in Cu/ZnO/Al2O3
catalysts, which are extensively used for the LTS reaction, methanol synthesis, and
methanol steam reforming. Andreev et al. [99] reported that the addition of 5 wt% CuO
and CoO in coprecipitated Fe-Cr catalysts enhanced the reaction rate and shifted the
maximum of the conversion curve to lower temperatures compared to unpromoted
samples.
It is worth noting that our Fe-Al-Cu catalysts were prepared by a coprecipitation-
impregnation method by which the catalyst surface could be enriched in copper upon the
impregnation step. As previously discussed, TPR, in situ XRD, and XPS results clearly
indicate that copper is in a metallic form after reduction. The sintering of metallic Cu
could also contribute to loss of the WGS activity when catalysts are reduced at higher
temperatures. In situ DRIFTS results suggests that the differences in catalytic
performance can be due to rate differences in redox steps of the WGS reaction over Fe-
based catalysts. Moreover, a two-fold increase in WGS activity of Fe-Al catalysts due to
Cu promotion makes us suspect that Cu could also provide additional active sites for the
water-gas shift reaction (Table 6.7). Thus, it is possible that the combination of
magnetite and metallic copper could contribute to high activity of Fe-Al-Cu catalysts.
The effect of catalyst preparation methods (i.e., coprecipitation, 1-step vs coprecipitation-
impregnation, 2-step) and the role of copper promoter are being further investigated to
clarify this issue.
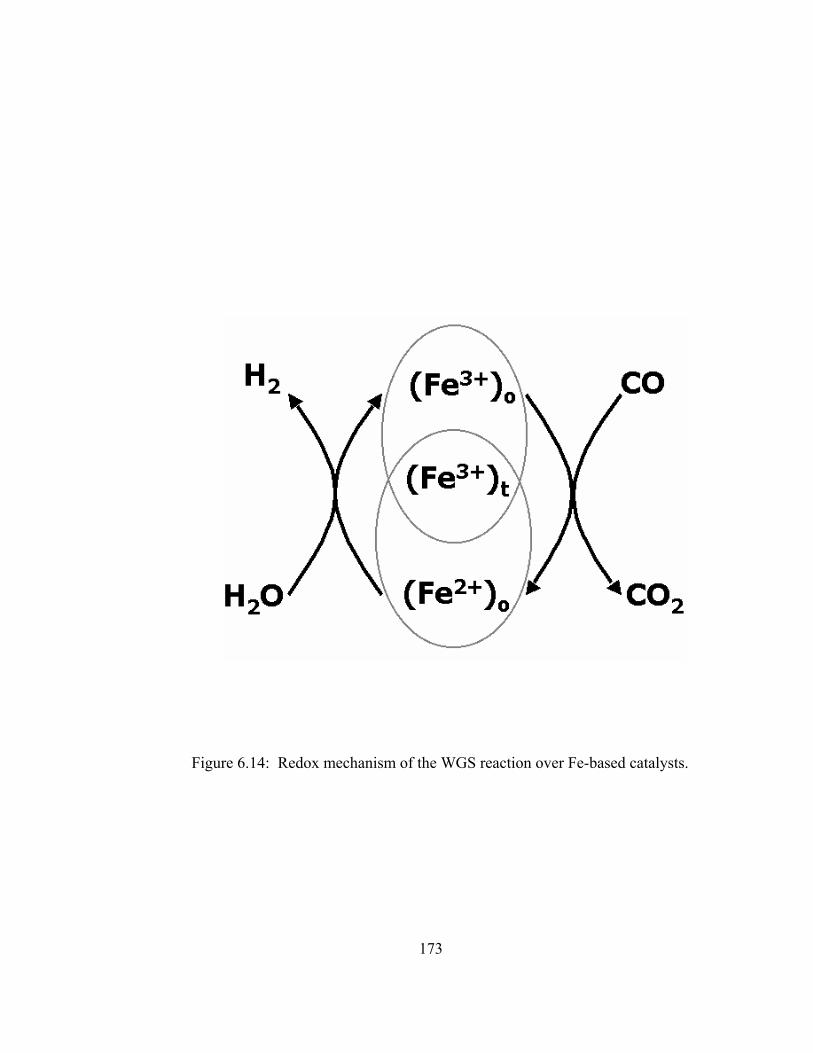
173
Figure 6.14: Redox mechanism of the WGS reaction over Fe-based catalysts.

174
6.7 Summary
Chromium-free iron-based HTS catalysts that are highly active and stable were
prepared by adding both aluminum and copper using a coprecipitation-impregnation
method. Many catalysts synthesis variables, including Fe/promoter ratio, pH of the
precipitation medium, calcination temperature, and reduction temperature, have been
shown to affect the catalyst performance significantly. Steady-state reaction experiments
have shown that the effect of Cu promotion on the activity enhancement is much more
pronounced at low reaction temperatures. Over-reduction of Fe-based catalysts to form
metallic Fe is seen to lead to a drastic decrease in catalytic activity. Characterization
results using BET, TPR, XRD, and XPS strongly indicate that aluminum, which is a
promising chromium replacement, acts as a textural promoter by stabilizing magnetite
and retarding its further reduction to FeO or metallic Fe. Copper, which is believed to be
a structural promoter, improves the WGS activity by enhancing the reduction of hematite
to magnetite markedly. Its promotional effect due to formation of additional active sites
is also a strong possibility. Moreover, strong evidence gained from in situ DRIFTS
studies (coupled with TPReaction experiments) suggests that the WGS reaction on iron-
based catalysts occurs through a redox process. It is conceivable that Cu may promote the
WGS activity by enhancing the rate of the re-oxidation step.

175
RECOMMENDATIONS
Novel approaches to catalyst promotion for additional activity, selectivity, and
stability of nickel-based catalysts should be developed to achieve high nickel
surface area, increased carbon gasification rates, and nickel-metal alloys to inhibit
coking and sintering. In this study, addition of lanthanides (i.e., lanthanum,
cerium, and ytterbium) has shown a significant improvement in catalytic activity.
In particular, sol-gel Ni-Ce/Al2O3 catalysts were found to remarkably suppress the
rate of carbon deposition but maintain their activity in steam reforming of
propane. However, little is known for the role of enhanced steam adsorption on
cerium-promoted catalysts. A beneficial effect was also reported with the
promotion of molybdenum and tin. Studies on multi-promoter catalytic systems
that provide optimal metal dispersion and resistance to coking and sulfur are still
limited. The introduction of small amounts of molybdenum or tin on mixed oxide
supports (i.e., alumina-ceria) could be a promising approach to tackle the coking
problem. In addition, metals aimed specifically to either alloy or electronically
interact with nickel to improve sulfur tolerance should be explored. Potential
candidates include rhenium and iron since they have been reported to enhance
sulfur tolerance of supported nickel catalysts.

176
The effect of sol-gel parameters such as type of metallic precursor and solvent,
gelation time and temperature, as well as pretreatment conditions should be
further studied to improve catalytic performance. We should keep in mind that
precise control of the size, structure, and location of domains within a catalyst is
necessary. Therefore, new methods of catalyst synthesis should be developed to
establish molecular control over the structure, location, and promoter distribution
of catalysts to give optimum activity, selectivity, and stability. Innovative
preparation methods based on Layered Double Hydroxides (LDHs) or
hydrotalcite-like compounds, which posses versatile acid-base and redox
properties where metal-support interaction can be carefully fine-tuned during
synthesis, should be examined for their effects on coking and sulfur resistance.
Evaluation of catalyst durability (>100 h time-on-stream) under realistic steam
reforming conditions with the presence of olefins/aromatics and sulfur
compounds should be attempted. Fundamental chemical interactions that
contribute to deactivation by coking and sulfur should be identified using
characterization techniques such as controlled-atmosphere XPS, in situ DRIFTS,
TPO, TGA, DSC, and TEM.
Steady-state and transient isotopic labeling studies using 13C3H8 and D2O should
be performed to obtain kinetic parameters such as abundance of adsorbed surface
intermediates, surface coverage, and reactivity distribution, thus gaining insights
into the reaction mechanism of hydrocarbon steam reforming over nickel-based
catalysts.

177
With the success of replacing toxic chromium in high-temperature shift iron-
based catalysts with aluminum, there is incentive to further develop these
catalysts for the water-gas shift reaction of coal-derived synthesis gas. Although
many synthesis variables have been optimized in this work, namely,
iron/promoter molar ratio, pH of the precipitation medium, calcination and
reduction temperatures, other catalyst preparation parameters such as type of iron
precursor and precipitating agent as well as aging time should also be examined.
Considerable effort is needed to elucidate the role of copper promoter on activity
enhancement. Microcalorimetry techniques can be employed to measure heat of
adsorption of adsorbed reactants on the catalyst surface and could open up surface
thermodynamics to molecular level studies. Mössbauer spectroscopy, which has
been widely applied to studies of iron-containing catalysts, provides valuable
information on oxidation states, magnetic fields, lattice symmetry, and lattice
vibrations of iron-based catalysts. This capability is extremely important because
it can reveal the identity of iron phases in a catalyst after different treatments and
phase transformations upon promotion. It is also employed to follow the kinetics
of bulk reactions and to determine sizes of iron particles in applied magnetic field,
giving a complete picture of the structure of catalysts.

178
BIBLIOGRAPHY
[1] J.N. Armor, Appl. Catal. A 176 (1999) 159. [2] D.E. Ridler, M.V. Twigg, in: Catalyst Handbook, M.V. Twigg (Eds.), Wolfe,
London,1989, p. 225. [3] S.C. Stultz, J.B. Kitto, STEAM: Its Generation and Use, 40th ed., Babcock &
Wilcox,1992. [4] U.S. DOE Topical Report # 21, Clean Coal Technology: Coproduction of Power,
Fuels, and Chemicals, p., September 2001. [5] U.S. DOE Topical Report # 19, Clean Coal Technology: Tampa Electric
Integrated Gasification Combined-Cycle Project - An Update, p., July 2000. [6] J.P.V. Hook, Catal. Rev. Sci. Eng. 21 (1980) 1. [7] G.W. Bridger, Catalysis, The Chemical Society, London, Vol. 3,1978. [8] J.R. Rostrup-Nielsen, in: Catalysis: Science and Technology, J.R. Anderson, M.
Boudart (Eds.), Springer, New York, Vol. 5,1984, p. 3. [9] M.F. Stephanopoulos, G.E. Voecks, Int. J. Hydrogen Energy 8 (1983) 539. [10] J.R.H. Ross, Catalysis, The Chemical Society, London, Vol. 7,1983. [11] J.R. Rostrup-Nielsen, Catal Today 63 (2000) 159. [12] C.N. Satterfield, Heterogeneous Catalysis in Industrial Practice, 2nd ed., Krieger
Publishing Company, Florida,1996. [13] A.M. Aitani, Int. J. Hydrogen Energy 21 (1996) 267. [14] A.L. Dicks, J. Power Sources 61 (1996) 113. [15] A.L. Dicks, J. Power Sources 71 (1998) 111.

179
[16] K. Kochloefl, in: Handbook of Heterogeneous Catalysis, G. Ertl, H. Knozinger, J. Weitkamp (Eds.), VCH, Germany, Vol. 4,1997, p. 1819.
[17] S.H. Clarke, A.L. Dicks, K. Pointon, T.A. Smith, A. Swann, Catal. Today 38
(1997) 411. [18] R.J. Farrauto, C.H. Bartholomew, Fundamentals of Industrial Catalytic Processes,
Blackie Academic & Professional, London,1997. [19] J.R. Rostrup-Nielsen, I. Alstrup, Catal Today 53 (1999) 311. [20] N.M. Bodrov, L.O. Apel'baum, M.I. Temkin, Kinet. Catal. 5 (1964) 614. [21] A.S. Al-Ubaid, S.S.E.H. Elnashaie, M.E.E. Abbashar, in: Methane Conversion,
D.M. Bibby, C.D. Chang, R.F. Howe, S. Yurchak (Eds.), Elsevier, Amsterdam,1988, p. 83.
[22] A.E.C. Luna, A.M. Becerra, React. Kinet. Catal. Lett. 61 (1997) 369. [23] T. Borowiecki, A. Golebiowski, Catal. Lett. 25 (1994) 309. [24] C.H. Bartholomew, Catal. Rev. Sci. Eng. 24 (1982) 67. [25] T. Borowiecki, A. Golebiowski, B. Stasinska, Appl. Catal. A 153 (1997) 141. [26] Q. Zhuang, Y. Qin, L. Chang, Appl. Catal. 70 (1991) 1. [27] B.L. Su, S.D. Guo, in: Catalyst Deactivation, B. Delmon, G.F. Froment (Eds.),
Elsevier, Amsterdam,1999, p. 325. [28] O. Sidjabat, D.L. Trimm, Topics in Catal. 11 (2000) 279. [29] A. Carlos, S.C. Teixeira, R. Giudici, Chem. Engng. Sci. 54 (1999) 3609. [30] T. Numaguchi, K. Shoji, S. Yoshida, Appl. Catal. A 133 (1995) 241. [31] V.R. Choudhary, A.M. Rajput, B. Prabhakar, in: Proceedings of American
Chemical Society Symposium on Methane and Alkane Conversion Chemistry, M.M. Bhasin, D.W. Slocum (Eds.), San Diego,1994, p. 305.
[32] V.R. Choudhary, B.S. Uphade, A.S. Mamman, Appl. Catal. A 168 (1998) 33. [33] T.V. Choudhary, D.W. Goodman, Catal. Lett. 59 (1999) 93. [34] T.V. Choudhary, D.W. Goodman, J. Catal. 192 (2000) 316.

180
[35] A.P.E. York, J.B. Claridge, A.J. Brungs, S.C. Tsang, M.L.H. Green, Chem.
Commun. 39 (1997). [36] M.E.S. Hegarty, A.M. O'Connor, J.R.H. Ross, Catal. Today 42 (1998) 225. [37] S.F. Tikhov, V.A. Sadykov, A.N. Salanov, Y.A. Potapov, G.S. Litvak, S.V.
Tsybulya, S.N. Pavlova, in: Recent Advances in Catalytic Materials, S.L.S. N.M. Rodriguez, J. Hrbek (Eds.), Vol. 497,1998, p. 121.
[38] J.R. Rostrup-Nielsen, J. Catal. 31 (1973) 173. [39] P.B. Tottrup, Appl. Catal. 4 (1982) 377. [40] T.R. Phillips, J. Mulhall, G.E. Turner, J. Catal. 15 (1969) 233. [41] H. Muraki, Y. Fujitan, Appl. Catal. 47 (1989) 75. [42] T. Borowiecki, Appl. Catal. 10 (1984) 273. [43] T. Borowiecki, Appl. Catal. 31 (1987) 207. [44] E. Tracz, R. Scholz, T. Borowiecki, Appl. Catal. 66 (1990) 133. [45] B. Stasinska, A. Golebiowski, T. Borowiecki, in: Catalyst Deactivation, B.
Delmon, G.F. Froment (Eds.), Elsevier, Amsterdam,1999, p. 431. [46] T. Borowiecki, A. Machocki, in: Catalyst Deactivation, B. Delmon, G.F. Froment
(Eds.), ElsevierAmsterdam, Amsterdam,1999, p. 435. [47] L. Kepinski, B. Stasinska, T. Borowiecki, Carbon 38 (2000) 1845. [48] D.J. Moon, K. Sreekumar, S.D. Lee, B.G. Lee, H.S. Kim, Appl. Catal. A 215
(2001) 1. [49] W. Yanhui, W. Diyong, Int. J. Hydrogen Energy 26 (2001) 795. [50] J. Zhang, Y. Wang, R. Ma, D. Wu, Appl. Catal. A 243 (2003) 251. [51] D. Wang, S. Czernik, D. Montane, M. Mann, E. Chornet, Ind. Eng. Chem. Res.
36 (1997) 1507. [52] D. Wang, S. Czernik, D. Montane, E. Chornet, Energy Fuels 12 (1998) 19. [53] L. Garcia, R. French, S. Czernik, E. Chornet, Appl. Catal. A 201 (2000) 225.
181
[54] M. Marquevich, R. Coll, D. Montane, Ind. Eng. Chem. Res. 39 (2000) 2140. [55] M. Marquevich, F. Medina, D. Montane, Catal. Comm. 2 (2001) 119. [56] M. Marquevich, X. Farriol, F. Medina, D. Montane, Ind. Eng. Chem. Res. 40
(2001) 4757. [57] E. Kikuchi, K. Ito, T. Ino, Y. Morita, J. Catal. 46 (1977) 382. [58] J. Barbier, D. Duprez, Appl. Catal. B 3 (1993) 61. [59] T. Maillet, J. Barbier, D. Duprez, Appl. Catal. B 9 (1996) 251. [60] J.R. Rostrup-Nielsen, J. Catal. 48 (1977) 155. [61] J.R. Rostrup-Nielsen, Chem. Eng. Prog. (1977) 87. [62] J.R. Rostrup-Nielsen, in: Proceedings of the NATO Advanced Study Institute on
Catalyst Deactivation, J.L. Figueiredo (Eds.), Algarve, Portugal,1981, p. 127. [63] J.R. Rostrup-Nielsen, Catal Today 37 (1997) 225. [64] D.L. Trimm, Catal. Rev. Sci. Eng. 16 (1977) 155. [65] D.L. Trimm, Appl. Catal. 5 (1983) 263. [66] D.L. Trimm, Catal. Today 37 (1997) 233. [67] D.L. Trimm, Catal. Today 49 (1999) 3. [68] R.A. Hadden, in: Proceedings of the First Tokyo Conference on Advanced
Catalytic Science and Technology, S. Yoshida, N. Takezawa, T. Ono (Eds.), Tokyo,1990, p. 317.
[69] A. Jess, O. Hein, C. Kern, in: Catalyst Deactivation, B. Delmon, G.F. Froment
(Eds.), Elsevier, Amsterdam,1999, p. 81. [70] N.A. Koryabkina, A.A. Phatak, W.F. Ruettinger, R.J. Farrauto, F.H. Ribeiro, J.
Catal. 217 (2003) 233. [71] S.F. Rice, R.R. Steeper, J.D. Aiken, J. Phys. Chem. A 102 (1998) 2673. [72] T. Bunluesin, R.J. Gorte, G.W. Graham, Appl. Catal. B 15 (1998) 107.

182
[73] S. Hilaire, X. Wang, T. Luo, R.J. Gorte, J. Wagner, Appl. Catal. A 215 (2001) 271.
[74] L. Yang, O. Kresnawahjuesa, R.J. Gorte, Catal. Lett. 72 (2001) 33. [75] S.L. Swartz, M.M. Seabaugh, C.T. Holt, W.J. Dawson, Fuel Cell Bull. 4 (2001)
7. [76] A.F. Ghenciu, Curr. Opin. Solid State Mater. Sci. 6 (2002) 389. [77] X. Wang, R.J. Gorte, J. Wagner, J. Catal. 212 (2002) 225. [78] J.M. Zalc, V. Sokolovskii, D.G. Loffler, J. Catal. 206 (2002) 169. [79] A.A. Andreev, V.J. Kafedjiysky, R.M.E. Kardjieva, Appl. Catal. A 179 (1999)
223. [80] T. Tabakova, V. Idakiev, D. Andreeva, I. Mitov, Appl. Catal. A 202 (2000) 91. [81] Q. Fu, A. Weber, M.F. Stephanopoulos, Catal. Lett. 77 (2001) 87. [82] D. Andreeva, V. Idakiev, T. Tabakova, L. Ilieva, P. Falaras, A. Bourlinos, A.
Travlos, Catal. Today 72 (2002) 51. [83] H. Sakurai, A. Ueda, T. Kobayashi, M. Haruta, Chem. Commun. (1997) 271. [84] F. Boccuzzi, A. Chiorino, M. Manzoli, D. Andreeva, T. Tabakova, L. Ilieva,
V. Iadakiev, Catal. Today 75 (2002) 169. [85] Y. Li, Q. Fu, M.F. Stephanopoulos, Appl. Catal. B 27 (2000) 179. [86] M. Saito, J. Wu, K. Tomoda, I. Takahara, K. Murata, Catal. Lett. 83 (2002) 1. [87] M.S. Spencer, Topics in Catal. 8 (1999) 259. [88] Y. Tanaka, T. Utaka, R. Kikuchi, K. Sasaki, K. Eguchi, Appl. Catal. A 242
(2003) 287. [89] X. Xie, H. Yin, B. Dou, J. Huo, App. Catal. 77 (1991) 187. [90] J.R. Mellor, R.G. Copperthwaite, N.J. Coville, Appl. Catal. A 164 (1997) 69. [91] M. Lanieeki, M. Malecka-Gryez, F. Domka, Appl. Catal. A 196 (2000) 293. [92] J. Patt, D.J. Moon, C. Philips, L. Thompson, Catal. Lett. 65 (2000) 193.

183
[93] D.G. Rethwisch, J. Phillips, Y. Chen, T.F. Hayden, J.A. Dumesic, J. Catal. 91
(1985) 167. [94] J.C. Gonzalez, M.G. Gonzalez, M.A. Laborde, N. Moreno, Appl. Catal. 20
(1986) 3. [95] J. Tsagaroyannis, K.J. Haralambous, Z. Loizos, G. Petroutsos, N. Spyrellis,
Mat. Lett. 28 (1996) 393. [96] R. Hakkarainen, T. Salmi, Appl. Catal. A 99 (1993) 195. [97] C. Rhodes, G. Hutchings, A.M. Ward, Catal. Today 23 (1995) 43. [98] Y. Hu, H. Jin, J. Liu, D. Hao, Chem. Eng. J. 78 (2000) 147. [99] A. Andreev, V. Idakiev, D. Mihajlova, D. Shopov, Appl. Catal. 22 (1986) 385. [100] M.A. Edwards, D.M. Whittle, C. Rhodes, A.M. Ward, D. Rohan, M.D.
Shannon, G.J. Hutchings, C.J. Kiely, Phys. Chem. Chem. Phys. 4 (2002) 3902. [101] P. Kappen, J.D. Grunwaldt, B.S. Hammershoi, L. Troger, B.S. Clausen, J. Catal.
198 (2001) 56. [102] C. Rhodes, B.P. Willaims, F. King, G. Hutchings, Catal. Commun. 3 (2002) 381. [103] G.C. Araujo, M.C. Rangel, Catal. Today 62 (2000) 201. [104] J.L.R. Costa, G.S. Marchetti, M.C. Rangel, Catal. Today 77 (2002) 205. [105] B.D. Cullity, Elements of X-Ray Diffraction, 2nd ed., Addison-Wesley,
Massachusetts,1978. [106] J.T. Richardson, S.A. Paripatyadar, Appl. Catal. A 61 (1990) 293. [107] A. Igarashi, T. Ohtaka, S. Motoki, Catal. Lett. 13 (1991) 189. [108] J.R. Rostrup-Nielsen, J.H. Hansen, J. Catal. 144 (1993) 38. [109] D. Qin, J. Lapszewicz, Catal. Today 21 (1994) 551. [110] R. Craciun, B. Shereck, R.J. Gorte, Catal. Lett. 51 (1998). [111] X. Wang, R.J. Gorte, Catal. Lett. 73 (2001) 15.

184
[112] R.M. Sambrook, J.R.H. Ross, US Patent 4 469 815, 1984. [113] Z. Cheng, Q. Wu, J. Li, Q. Zhu, Catal. Today 30 (1996) 147. [114] S. Wang, G.Q. Lu, Appl. Catal. B 19 (1998) 267. [115] S. Wang, G.Q. Lu, J. Chem. Technol. Biotechnol. 75 (2000) 589. [116] J.A. Montoya, E.R. Pascual, C. Gimon, P.D. Angel, A. Monzon, Catal. Today
63 (2000) 71. [117] R. Zhang, F. Li, Q. Shi, L. Luo, Appl. Catal. A 205 (2001) 279. [118] R.D. Gonzalez, T. Lopez, R. Gomez, Catal. Today 35 (1997) 293. [119] M.L. Jacono, M. Schiavello, A. Cimino, J. Phys. Chem. A 75 (1971) 1044. [120] J.L. Brito, J. Laine, J. Catal. 139 (1993) 540. [121] Z.X. Cheng, X.G. Zhao, J.L. Li, Q.M. Zhu, Appl. Catal. A 205 (2001) 31. [122] Y.G. Chen, J. Ren, Catal. Lett. 29 (1994) 39. [123] C.E. Quincoces, S. Dicundo, A.M. Alvarez, M.G. Gonzalez, Mater. Lett. 50
(2001) 21. [124] C.H. Bartholomew, R.J. Farrauto, J. Catal. 45 (1976) 41. [125] C.H. Bartholomew, R.B. Pannell, J. Catal. 65 (1980) 390. [126] Z. Zhang, X.E. Verykios, Appl. Catal. A 138 (1996) 109. [127] R.G. Ding, Z.F. Yan, Catal. Today 68 (2001) 135. [128] Y.J. Huang, J.A. Schwarz, J.R. Diehl, J.P. Baltrus, Appl. Catal. 36 (1988) 163. [129] K.T. Ng, D.M. Hercules, J. Phys. Chem. A 80 (1976) 2094. [130] J.F. Moulder, W.F. Stickle, P.E. Sobol, K.D. Bomben, in: Handbook of X-ray
Photoelectron Spectroscopy, J. Chastain (Eds.), Perkin-Elmer, Minnesota,1992. [131] A. Velon, I. Olefjord, Oxid. Met. 56 (2001) 415. [132] X. Wang, U.S. Ozkan, J. Phys. Chem. B (2005) (in press).

185
[133] J.R.H. Ross, M.C.F. Steel, A. Zeini-Isfahani, J. Catal. 52 (1978) 280. [134] J. Zielinski, J. Mol. Catal. 83 (1993) 197. [135] J. Zielinski, Appl. Catal. A 94 (1993) 107. [136] C. Li, Y.W. Chen, Thermo. Acta 256 (1995) 457. [137] B. Vos, E. Poels, A. Bliek, J. Catal. 198 (2001) 77. [138] S. Natesakhawat, R.B. Watson, X. Wang, U.S. Ozkan, submitted for publication. [139] F. Solymosi, R. Nemeth, L.Ovari, L. Egri, J. Catal. 195 (2000) 316. [140] M.A. Chesters, C.D.L. Cruz, P. Gardner, E.M. McCash, P. Pudney, G. Shahid,
N. Sheppard, J. Chem. Soc. Faraday Trans. 86 (1990) 2757. [141] A.M. Argo, J.F. Goellner, B.L. Philips, G.A. Panjabi, B.C. Gates, J. Am. Chem.
Soc. 123 (2001) 2275. [142] G. Shahid, N. Sheppard, Spectrochimica Acta 46A (1990) 999. [143] D.H. Lee, R.A.Condrate, Mater. Lett. 23 (1995) 241. [144] A. Hinz, M. Skoglundh, E. Fridell, A. Andersson, J. Catal. 201 (2001) 247. [145] N. Sheppard, C.D.L. Cruz, Adv. Catal. 41 (1996) 1. [146] P.D. Holmes, G.S. McDougall, I.C. Wilcock, Catal. Today 9 (1991) 15. [147] K. Nakamoto, Infrared and Raman Spectra of Inorganic and Coordination
Compounds, 3rd ed., John Wiley & Sons,1978. [148] F.C. Tompkins, Chemisorption of Gases on Metals, Acedamic Press,1978. [149] V.F. Kiselev, O.V. Krylov, Adsorption and Catalysis on Transition Metals and Their Oxides, Berlin, Vol. 9,1989. [150] D. Bianchi, T. Chafik, M. Khalfallah, S. Jean, Appl. Catal. A 105 (1993) 223. [151] G. Jacobs, P.M. Patterson, L. Williams, E. Chenu, D. Sparks, G. Thomas, B.H.
Davis, Appl. Catal. A 262 (2004) 177. [152] R. Philip, K. Fujimoto, J. Phys. Chem. A 96 (1992) 9035.

186
[153] M.A. Bollinger, M.A. Vannice, Appl. Catal. B 8 (1996) 417. [154] V. Ermini, E. Finocchio, S. Sechi, G. Busca, S. Rossini, Appl. Catal. A 190
(2000) 157. [155] S.I. Fujita, M. Nakamura, T. Doi, N. Takezawa, Appl. Catal. A 104 (1993) 87. [156] J. Ryczkowski, Catal. Today 68 (2001) 263. [157] D. Liu, G.H. Que, Z.X. Wang, Z.F. Yan, Catal. Today 68 (2001) 155. [158] K. Hou, R. Hughes, Chem. Eng. J. 82 (2001) 311. [159] Y. Matsumura, T. Nakamori, Appl. Catal. A 258 (2004) 107. [160] E. Ramirez-Cabrera, A. Atkinson, D. Chadwick, Appl. Catal. B 47 (2004) 127. [161] T. Borowiecki, G. Giecko, M. Panczyk, Appl. Catal. A 230 (2002) 85. [162] A.C.S.C. Teixeira, R. Giudici, Chem. Eng. Sci. 54 (1999) 3609. [163] W.S. Dong, H.S. Roh, K.W. Jun, S.E. Park, Y.S. Oh, Appl. Catal. A 226 (2002)
63. [164] H. Topsoe, J.A. Dumesic, M. Boudart, J. Catal. 28 (1973) 477. [165] J. Sehested, A. Carlsson, T.V.W. Janssens, P.L. Hansen, A.K. Datye, J. Catal.
197 (2001) 200. [166] J.R. Rostrup-Nielsen, J. Sehested, Adv. Catal. 47 (2002) 65. [167] J. Sehested, J. Catal. 217 (2003) 417. [168] C.H. Bartholomew, W.L. Sorensen, J. Catal. 81 (1983) 131. [169] P. Wang, E. Tanebe, K. Ito, J. Jia, H. Morioka, T. Shishido, K. Takehira, Appl.
Catal. A 231 (2002) 35. [170] Z. Hou, O. Yokota, T. Tanaka, T. Yashima, Catal. Lett. 89 (2003) 121. [171] S. Wang, G.Q. Lu, Appl. Catal. A 169 (1998) 271. [172] A. Trovarelli, Catal. Rev. Sci. Eng. 38 (1996) 439. [173] C. Park, M.A. Keane, J. Catal. 221 (2004) 386.

187
[174] J.W. Snoeck, G.F. Froment, M. Fowles, J. Catal. 169 (1997) 240. [175] T. Borowiecki, W. Grzegorczyk, A. Denis, A. Golebiowski, Catal. Lett. 79
(2002) 119. [176] T. Borowiecki, A. Denis, W. Grzegorczyk, A. Golebiowski, React. Kinet. Catal.
Lett. 77 (2002) 163. [177] A. Golebiowski, K. Stolecki, U. Prokop, A. Kusmierowska, T. Borowiecki, A.
Denis, C. Sikorska, React. Kinet. Catal. Lett. 82 (2004) 179. [178] J.L. Figueiredo, D.L. Trimm, J. Catal. 40 (1975) 154. [179] J.L. Figueiredo, Carbon 19 (1981) 146. [180] J.L. Figueiredo, Materials and Corrosion 49 (1998) 373. [181] R.T.K. Baker, M.A. Barber, F.S. Feates, P.S. Harris, R.J. Waite, J. Catal. 26
(1972) 26. [182] J.W. Snoeck, G.F. Froment, M. Fowles, J. Catal. 169 (1997) 250. [183] J.L. Figueiredo, C.A. Bernardo, J.J.C. Jr., R.T.K. Baker, J. Catal. 110 (1988)
127. [184] G.C. Chinchen, R.H. Logan, M.S. Spenser, Appl. Catal. 12 (1984) 89. [185] G. Doppler, A.X. Trautwein, H.M. Ziethen, E. Ambach, R. Lehnert, M.J.
Sprague, U. Gonser, Appl. Catal. 40 (1988) 119. [186] R.L. Keiski, T. Salmi, Appl. Catal. A 87 (1992) 185. [187] M.C. Rangel, R.M. Sassaki, F. Galembeck, Catal. Lett. 33 (1995) 237. [188] Y. Li, L. Chang, Ind. Eng. Chem. Res. 35 (1996) 4050. [189] R.L. Keiski, T. Salmi, P. Niemisto, J. Ainassaari, V.J. Pohjola, Appl. Catal. A
137 (1996) 349. [190] L.S. Chen, G.L. Lu, J. Mater. Sci. 34 (1999) 4193. [191] E.B. Quado, M.L.R. Dias, A.M.M. Amorim, M.C. Rangel, J. Braz. Chem. Soc.
10 (1999) 51.
188
[192] C. Rhodes, G.J. Hutchings, Phys. Chem. Chem. Phys. 5 (2003) 2719. [193] D.S. Newsome, Catal. Rev. Sci. Eng. 21 (1980) 275. [194] Agency for Toxic Substances and Disease Registry, Toxicological Profile for
Chromium,TP-92/08. ATSDR, Atlanta, GA, p. 227, 1993. [195] J.E. Huheey, E.A. Keiter, R.L. Keiter, Inorganic Chemistry: Principle of
Structure and Reactivity, 4th ed., Harper Collins, New York, NY,1993. [196] A. Erdohelyi, K. Fodor, S. Suru, Appl. Catal. A 139 (1996) 131. [197] H. Kusama, K.K. Bando, K. Okabe, H. Arakawa, Appl. Catal. A 197 (2000) 255. [198] R.W. Grimes, A.B. Anderson, A.H. Heuer, J.Am. Chem. Soc. 111 (1989) 1. [199] G.R. Lumpkin, Prog. Nucl. Energy 38 (2001) 447. [200] D.G. Rethwisch, J.A. Dumesic, Appl. Catal. 21 (1986) 97. [201] M. Tinkle, J.A. Dumesic, J. Catal. 103 (1987) 65. [202] J.E. Kubsh, J.A. Dumesic, AIChE J. 28 (1982) 793. [203] C.R. Lund, J.E. Kubsh, J.A. Dumesic, in: Solid State Chemistry in Catalysis,
R.K. Grasselli, J.F. Brazdil (Eds.), American Chemical Society, Washington D.C., Vol. 279,1985, p. 19.
189
APPENDIX
SAMPLE CALCULATIONS
Definition of Relative Response Factor (Dilution experiments): Xi = component i [C3H8, H2O, CO2, H2, CH4, CO], AXi = peak area of component i RF(Xi/N2) = (moles of Xi/ AXi) (moles of N2/ AN2) mol% Xi = RF(Xi/N2)(AXi) x 100 ∑ RF(Xi/N2)(AXi) Feed Stream Analysis (FN2,feed = 285 cm3(STP)/min): ∑ RF(Xi/N2)(peak area of Xi) = RF(C3H8/N2)(AC3H8) + RF(H2O/N2)(AH2O) + AN2 = (0.567)(10524) + (0.474)(50821) + 520913 = 550969 mol% C3H8,feed = 5967/550969 x 100 = 1.1%
mol% H2O,feed = 24089/550969 x 100 = 4.4% mol% N2,feed = 100-1.1-4.4 = 94.5%
then gives,
FC3H8,feed = (1.1)(285)/94.5 = 3.3 cm3(STP)/min FH2O,feed = (4.4)(285)/94.5 = 13.3 cm3(STP)/min

190
Product Stream Analysis @ Steady-State:
∑ RF(Xi/N2)(peak area of Xi) = RF(C3H8/N2)(AC3H8) + RF(H2O/N2)(AH2O) + AN2 + RF(H2/N2)(AH2) + RF(CO2/N2)(ACO2) + RF(CO/N2)(ACO) + RF(CH4/N2)(ACH4) =(0.567)(2496)+(0.474)(19649)+508498+(0.070)(310000)+(1.797)(3750)+(0.943)(1595)
+(0.314)(15882)
= 554157
mol% C3H8,prod = 1415/554157 x 100 = 0.2%
Similarly,
mol% H2O,prod = 1.7%
mol% N2,prod = 91.8%
mol% H2 = 3.9%
mol% CO2 = 1.2%
mol% CO = 0.3%
mol% CH4 = 0.9%
N2-balance:
FN2,prod = 285/0.918 = 310.4 cm3(STP)/min
which gives
FC3H8,prod = 0.6 cm3(STP)/min
FH2O,prod = 5.3 cm3(STP)/min
FH2 = 12.1 cm3(STP)/min
FCO2 = 3.7 cm3(STP)/min
FCO = 0.9 cm3(STP)/min
FCH4 = 2.8 cm3(STP)/min

191
% C3H8 Conversion = (moles of carbon converted / total moles of carbon in the feed)x 100
= (3.3-0.6)/3.3 x 100
= 81.8%
% H2O Conversion = (moles of H2O converted / moles of H2O in the feed)x 100
= (13.3-5.3)/13.3 x 100
= 60.1%
% H2 Yield = (2*moles of H2 produced / total moles of H in the feed) x 100
= (2)(12.1)/ [(8)(3.3)+(2)(13.3)] x 100
= 45.7%
% H2 Selectivity = (2*moles of H2 produced / total moles of H in H2 and CH4) x 100
= (2)(12.1)/ [(2)(12.1)+(4)(2.8)] x 100
= 68.4%
% CO2 Selectivity = (moles of carbon in CO2 / total moles of carbon in CO2, CH4, and CO) x 100
= (3.7)/(3.7+2.8+0.9) x 100
= 50%
% C Balance = (total moles of carbon in the products / total moles of carbon in the feed)x 100
= [(3)(0.6)+3.7 +2.8+0.9]/[(3)(3.3)] x 100
= 93%
% H Balance = (total moles of hydrogen in the products / total moles of hydrogen in the feed)x 100
= [(8)(0.6)+(2)(5.3)+(2)(12.1)+(4)(2.8)]/[(8)(3.3)+(2)(13.3)] x 100
= 96%

192
Definition of Relative Response Factor (Neat experiments): Xi = component i [H2O, CO2, H2, CH4, CO], AXi = peak area of component i RF(Xi/C3H8) = RF(Xi/N2) RF(C3H8/N2) mol% Xi = RF(Xi/C3H8)(AXi) x 100 ∑ RF(Xi/C3H8)(AXi) Feed Stream Analysis (FC3H8 = 20.8 cm3(STP)/min): ∑ RF(Xi/C3H8)(peak area of Xi) = RF(H2O/C3H8)(AH2O) + AC3H8 = (0.837)(788188) + 54119 = 713832 mol% C3H8,feed = 54119/713832 x 100
= 7.6% mol% H2O,feed = 100-7.6 = 92.4%
FH2O,feed = (92.4)(20.8)/ 7.6
= 252.9 cm3(STP)/min
Product Stream Analysis @ Steady-State:
∑ RF(Xi/N2)(peak area of Xi) = AC3H8 + RF(H2O/C3H8)(AH2O) + RF(H2/C3H8)(AH2) + RF(CO2/C3H8)(ACO2) + RF(CO/C3H8)(ACO) + RF(CH4/C3H8)(ACH4) = 8581+(0.836)(565623)+(0.123)(1699041)+(3.171)(21007)+(1.665)(6036)+
(0.554)(59016)
= 799782
mol% C3H8,prod = 8581/799782 x 100
= 1.1%

193
Similarly,
mol% H2O,prod = 59.1%
mol% H2 = 26.1
mol% CO2 = 8.3
mol% CO = 1.2
mol% CH4 = 4.2
O-balance:
252.9 = [0.591+(0.083)(2)+0.012]Fprod
Fprod = 329 cm3(STP)/min
FC3H8, prod = 3.6 cm3(STP)/min
FH2O,prod = 194.4 cm3(STP)/min FH2 = 85.9 cm3(STP)/min
FCO2 = 27.3 cm3(STP)/min
FCO = 3.9 cm3(STP)/min
FCH4 = 13.8 cm3(STP)/min
% C3H8 Conversion = (moles of carbon converted / total moles of carbon in the feed)x 100
= (20.8-3.6)/ 20.8 x 100
= 82.7%
% H2O Conversion = (moles of H2O converted / moles of H2O in the feed)x 100
= (252.9-194.4)/ 252.9 x 100
= 23.1%

194
% H2 Yield = (2*moles of H2 produced / total moles of H in the feed) x 100
= (2)(85.9)/ [(8)(20.8)+(2)(252.9)] x 100
= 25.6%
% H2 Selectivity = (2*moles of H2 produced / total moles of H in H2 and CH4) x 100
= (2)(85.9)/ [(2)(85.9)+(4)(13.8)] x 100
= 75.7%
% CO2 Selectivity = (moles of carbon in CO2 / total moles of carbon in CO2, CH4, and CO) x 100
= (27.3)/(27.3+13.8+3.9) x 100
= 60.7%
% C Balance = (total moles of carbon in the products / total moles of carbon in the feed)x 100
= [(3)(3.6)+27.3+13.8+3.9]/[(3)(20.8)] x 100
= 90%
% H Balance = (total moles of hydrogen in the products / total moles of hydrogen in the feed)x 100
= [(8)(3.6)+(2)(194.4)+(2)(85.9)+(4)(13.8)]/[(8)(20.8)+(2)(252.9)] x 100
= 96%