
Comparison of fluidized bed flow regimes for steam methane reforming in membrane reactors: A...
16
Chemical Engineering Science 64 (2009) 3598--3613 Contents lists available at ScienceDirect Chemical Engineering Science journal homepage: www.elsevier.com/locate/ces Comparison of fluidized bed flow regimes for steam methane reforming in membrane reactors: A simulation study Andrés Mahecha-Botero a, ∗ , Zhongxiang Chen a , John R. Grace a , S.S.E.H. Elnashaie b , C. Jim Lim a , Mohammad Rakib a , Isamu Yasuda c , Yoshinori Shirasaki c a Department of Chemical and Biological Engineering, University of British Columbia, 2360 East Mall, Vancouver, Canada V6T 1Z3 b College of Engineering, Misr University for Science and Technology (MUST), Distinguished District, 6th of October Province, Egypt c Tokyo Gas Co., Ltd., Hydrogen System Team, Technology Research Institute, 1-7-7, Suehiro-cho, Tsurumi-ku, Yokohama City, Kanagawa 230-0045, Japan ARTICLE INFO ABSTRACT Article history: Received 14 June 2008 Received in revised form 14 April 2009 Accepted 29 April 2009 Available online 9 May 2009 Keywords: Fluidized bed Hydrogen production Fluidization regimes Mathematical modelling Membranes Multiphase reactors Reaction engineering Simulation An important decision in the design of fluidized bed reactors is which of several flow regimes to choose. Almost all fluidized bed reactor models are restricted to a single flow regime, making comparison difficult, especially near the regime boundaries. This paper examines the performance of fluidized bed methane reformers with three models—a simple equilibrium model and two kinetic distributed models, based on different assumptions of varying sophistication. Membranes are incorporated to improve reactor perfor- mance. Eighteen cases are simulated for different flow regimes and membrane configurations. Predictions for the fast fluidization and turbulent flow regimes show that the rate-controlling step is permeation through the membranes. Bubbling regime simulations predict somewhat less hydrogen production than for turbulent and fast fluidization, due to the effects of interphase crossflow and mass transfer. Overall reactor performance is predicted to be best under turbulent fluidization operation. Practical considera- tions also affect the advantages, shortcomings and ultimate choice of flow regime. © 2009 Elsevier Ltd. All rights reserved. 1. Introduction Hydrogen is one of the most important industrial chemicals, re- quired for example in petroleum refining (Shu-Ren, 1998), as well as in other chemical processes such as hydrogenation of fats and oils, hydrocracking, hydrodealkylation, hydrodesulphurization and the production of methanol and ammonia. Moreover, it could be- come an important energy carrier (Crabtree et al., 2004). World pro- duction is currently ∼ 5 × 10 11 Nm 3 per annum (Ewan and Allen, 2005), and demand is increasing rapidly. Pure hydrogen is required for fuel cells (e.g. proton exchange fuel cells) to produce electricity with an efficiency of 45–55% and with reduced acid gas emissions (Borroni-Bird, 1996; Brown, 2001). 1.1. Steam methane reforming Steam methane reforming (SMR) is the dominant process for hy- drogen production (Twigg, 1989; Scholz, 1993; Koroneos et al., 2004), and it is expected to play a major role during the initial stages of a ∗ Corresponding author. Tel.: +1 604 827 3174; fax: +1 604 822 6003. E-mail addresses: [email protected], [email protected] (A. Mahecha-Botero). 0009-2509/$ - see front matter © 2009 Elsevier Ltd. All rights reserved. doi:10.1016/j.ces.2009.04.044 hydrogen economy (Ogden, 2001). For a comprehensive review on reforming technologies, see Ferreira-Aparicio et al. (2005). SMR is a reversible, endothermic process, usually carried out in fixed bed reactors at 700–900 ◦ C and 15–30 × 10 5 Pa, using nickel-on-alumina catalyst pellets. Despite its industrial importance, conventional SMR, carried out in parallel vertical fixed bed catalyst tubes suspended within huge high temperature furnaces, coupled with purification by pressure swing adsorption (PSA), suffers from several significant limitations: • The reversibility of the reforming reactions constrains hydrogen production to thermodynamic equilibrium values (Twigg, 1989; Elnashaie and Elshishini, 1993). • In fixed bed reformers, the flow rate is high enough that exter- nal diffusional resistances can be neglected. However, intraparticle resistances are high, giving rise to low catalyst effectiveness fac- tors (typically 10 −3 –10 −2 )(Rostrup-Nielsen, 1977; De Deken et al., 1982; Soliman et al., 1988). • Carbon formation can deactivate reforming catalysts, reducing ef- ficiency (Twigg, 1989; Bartholomew, 2001; Sehested, 2006). • Because of the endothermic nature of steam reforming, conven- tional SMR is operated at high temperature with a large demand for external heat. Only ∼50% of the heat of combustion is used di- rectly for the steam reforming reactions (Armor, 1999). In addition,
-
Upload
independent -
Category
Documents
-
view
0 -
download
0
Transcript of Comparison of fluidized bed flow regimes for steam methane reforming in membrane reactors: A...
Chemical Engineering Science 64 (2009) 3598 -- 3613
Contents lists available at ScienceDirect
Chemical Engineering Science
journal homepage: www.e lsev ier .com/ locate /ces
Comparison of fluidized bed flow regimes for steammethane reforming inmembranereactors: A simulation study
Andrés Mahecha-Boteroa,∗, Zhongxiang Chena, John R. Gracea, S.S.E.H. Elnashaieb, C. Jim Lima,Mohammad Rakiba, Isamu Yasudac, Yoshinori ShirasakicaDepartment of Chemical and Biological Engineering, University of British Columbia, 2360 East Mall, Vancouver, Canada V6T 1Z3bCollege of Engineering, Misr University for Science and Technology (MUST), Distinguished District, 6th of October Province, EgyptcTokyo Gas Co., Ltd., Hydrogen System Team, Technology Research Institute, 1-7-7, Suehiro-cho, Tsurumi-ku, Yokohama City, Kanagawa 230-0045, Japan
A R T I C L E I N F O A B S T R A C T
Article history:Received 14 June 2008Received in revised form 14 April 2009Accepted 29 April 2009Available online 9 May 2009
Keywords:Fluidized bedHydrogen productionFluidization regimesMathematical modellingMembranesMultiphase reactorsReaction engineeringSimulation
An important decision in the design of fluidized bed reactors is which of several flow regimes to choose.Almost all fluidized bed reactor models are restricted to a single flow regime, making comparison difficult,especially near the regime boundaries. This paper examines the performance of fluidized bed methanereformers with three models—a simple equilibrium model and two kinetic distributed models, based ondifferent assumptions of varying sophistication. Membranes are incorporated to improve reactor perfor-mance. Eighteen cases are simulated for different flow regimes and membrane configurations. Predictionsfor the fast fluidization and turbulent flow regimes show that the rate-controlling step is permeationthrough the membranes. Bubbling regime simulations predict somewhat less hydrogen production thanfor turbulent and fast fluidization, due to the effects of interphase crossflow and mass transfer. Overallreactor performance is predicted to be best under turbulent fluidization operation. Practical considera-tions also affect the advantages, shortcomings and ultimate choice of flow regime.
© 2009 Elsevier Ltd. All rights reserved.
1. Introduction
Hydrogen is one of the most important industrial chemicals, re-quired for example in petroleum refining (Shu-Ren, 1998), as wellas in other chemical processes such as hydrogenation of fats andoils, hydrocracking, hydrodealkylation, hydrodesulphurization andthe production of methanol and ammonia. Moreover, it could be-come an important energy carrier (Crabtree et al., 2004). World pro-duction is currently ∼ 5 × 10¹¹ Nm3 per annum (Ewan and Allen,2005), and demand is increasing rapidly. Pure hydrogen is requiredfor fuel cells (e.g. proton exchange fuel cells) to produce electricitywith an efficiency of 45–55% and with reduced acid gas emissions(Borroni-Bird, 1996; Brown, 2001).
1.1. Steam methane reforming
Steam methane reforming (SMR) is the dominant process for hy-drogen production (Twigg, 1989; Scholz, 1993; Koroneos et al., 2004),and it is expected to play a major role during the initial stages of a
∗ Corresponding author. Tel.: +16048273174; fax: +16048226003.E-mail addresses: [email protected], [email protected]
(A. Mahecha-Botero).
0009-2509/$ - see front matter © 2009 Elsevier Ltd. All rights reserved.doi:10.1016/j.ces.2009.04.044
hydrogen economy (Ogden, 2001). For a comprehensive review onreforming technologies, see Ferreira-Aparicio et al. (2005). SMR isa reversible, endothermic process, usually carried out in fixed bedreactors at 700–900 ◦C and 15–30×105 Pa, using nickel-on-aluminacatalyst pellets. Despite its industrial importance, conventional SMR,carried out in parallel vertical fixed bed catalyst tubes suspendedwithin huge high temperature furnaces, coupled with purificationby pressure swing adsorption (PSA), suffers from several significantlimitations:
• The reversibility of the reforming reactions constrains hydrogenproduction to thermodynamic equilibrium values (Twigg, 1989;Elnashaie and Elshishini, 1993).
• In fixed bed reformers, the flow rate is high enough that exter-nal diffusional resistances can be neglected. However, intraparticleresistances are high, giving rise to low catalyst effectiveness fac-tors (typically 10−3–10−2) (Rostrup-Nielsen, 1977; De Deken et al.,1982; Soliman et al., 1988).
• Carbon formation can deactivate reforming catalysts, reducing ef-ficiency (Twigg, 1989; Bartholomew, 2001; Sehested, 2006).
• Because of the endothermic nature of steam reforming, conven-tional SMR is operated at high temperature with a large demandfor external heat. Only ∼50% of the heat of combustion is used di-rectly for the steam reforming reactions (Armor, 1999). In addition,
A. Mahecha-Botero et al. / Chemical Engineering Science 64 (2009) 3598 -- 3613 3599
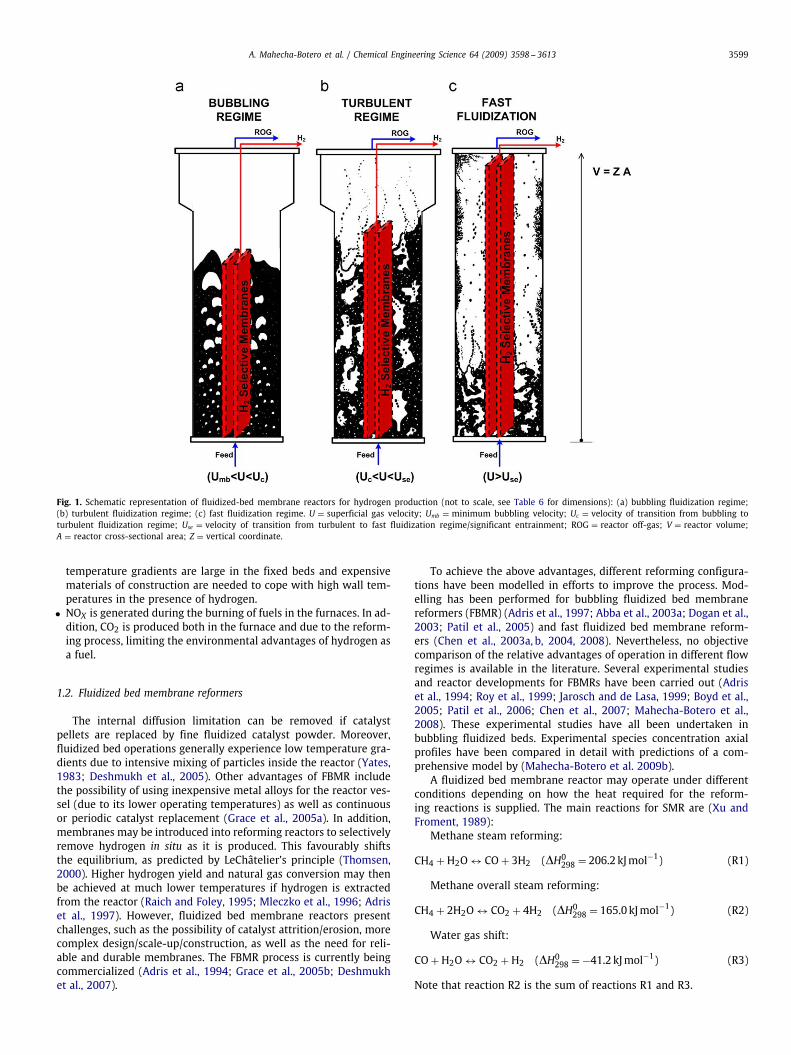
Fig. 1. Schematic representation of fluidized-bed membrane reactors for hydrogen production (not to scale, see Table 6 for dimensions): (a) bubbling fluidization regime;(b) turbulent fluidization regime; (c) fast fluidization regime. U = superficial gas velocity; Umb = minimum bubbling velocity; Uc = velocity of transition from bubbling toturbulent fluidization regime; Use = velocity of transition from turbulent to fast fluidization regime/significant entrainment; ROG = reactor off-gas; V = reactor volume;A = reactor cross-sectional area; Z = vertical coordinate.
temperature gradients are large in the fixed beds and expensivematerials of construction are needed to cope with high wall tem-peratures in the presence of hydrogen.
• NOX is generated during the burning of fuels in the furnaces. In ad-dition, CO2 is produced both in the furnace and due to the reform-ing process, limiting the environmental advantages of hydrogen asa fuel.
1.2. Fluidized bed membrane reformers
The internal diffusion limitation can be removed if catalystpellets are replaced by fine fluidized catalyst powder. Moreover,fluidized bed operations generally experience low temperature gra-dients due to intensive mixing of particles inside the reactor (Yates,1983; Deshmukh et al., 2005). Other advantages of FBMR includethe possibility of using inexpensive metal alloys for the reactor ves-sel (due to its lower operating temperatures) as well as continuousor periodic catalyst replacement (Grace et al., 2005a). In addition,membranes may be introduced into reforming reactors to selectivelyremove hydrogen in situ as it is produced. This favourably shiftsthe equilibrium, as predicted by LeChâtelier's principle (Thomsen,2000). Higher hydrogen yield and natural gas conversion may thenbe achieved at much lower temperatures if hydrogen is extractedfrom the reactor (Raich and Foley, 1995; Mleczko et al., 1996; Adriset al., 1997). However, fluidized bed membrane reactors presentchallenges, such as the possibility of catalyst attrition/erosion, morecomplex design/scale-up/construction, as well as the need for reli-able and durable membranes. The FBMR process is currently beingcommercialized (Adris et al., 1994; Grace et al., 2005b; Deshmukhet al., 2007).
To achieve the above advantages, different reforming configura-tions have been modelled in efforts to improve the process. Mod-elling has been performed for bubbling fluidized bed membranereformers (FBMR) (Adris et al., 1997; Abba et al., 2003a; Dogan et al.,2003; Patil et al., 2005) and fast fluidized bed membrane reform-ers (Chen et al., 2003a, b, 2004, 2008). Nevertheless, no objectivecomparison of the relative advantages of operation in different flowregimes is available in the literature. Several experimental studiesand reactor developments for FBMRs have been carried out (Adriset al., 1994; Roy et al., 1999; Jarosch and de Lasa, 1999; Boyd et al.,2005; Patil et al., 2006; Chen et al., 2007; Mahecha-Botero et al.,2008). These experimental studies have all been undertaken inbubbling fluidized beds. Experimental species concentration axialprofiles have been compared in detail with predictions of a com-prehensive model by (Mahecha-Botero et al. 2009b).
A fluidized bed membrane reactor may operate under differentconditions depending on how the heat required for the reform-ing reactions is supplied. The main reactions for SMR are (Xu andFroment, 1989):
Methane steam reforming:
CH4 + H2O ↔ CO + 3H2 (�H0298 = 206.2 kJmol−1) (R1)
Methane overall steam reforming:
CH4 + 2H2O ↔ CO2 + 4H2 (�H0298 = 165.0 kJmol−1) (R2)
Water gas shift:
CO + H2O ↔ CO2 + H2 (�H0298 = −41.2 kJmol−1) (R3)
Note that reaction R2 is the sum of reactions R1 and R3.

3600 A. Mahecha-Botero et al. / Chemical Engineering Science 64 (2009) 3598 -- 3613
For autothermal reforming (ATR) conditions, oxygen is supplied tothe reactor to oxidize combustibles, thereby generating the requiredheat (Roy et al., 1999; Hoang and Chan, 2004). Reforming reactionsR1–R3, as well as methane combustion, occur simultaneously duringautothermal reforming of methane.
FBMRs can be operated in several different flow regimes asrepresented schematically in Fig. 1. In this paper we investigatethe relative merits of different fluidization hydrodynamic regimes—bubbling, turbulent and fast fluidization. In addition, we study theinfluence of operating variables, such as reactor pressure and tem-perature, and of key equipment variables, such as the palladiumalloy coating membrane thickness and membrane surface area perunit volume of reactor.
2. Description of reactor models
Gas-fluidized bed reactors may operate in several different flowregimes—bubbling, slugging, turbulent, fast fluidization, or densesuspension upflow. Choosing the flow regime is a key question inthe design of the reactors. While there have been many attemptsto model gas-fluidized bed reactors, addressing the essential inher-ent two-phase flow issues, almost all of these models are specificto one of these flow regimes (Abba et al., 2003c; Mahecha-Botero,2009a). This makes it very difficult to compare the flow regimes,especially near the regime boundaries, where the regime-specificmodels predict abrupt changes at the regime boundaries, whereasexperimental evidence (Sun and Grace, 1990) show that the transi-tions are smooth and gradual.
In this paper, three reactor models are developed to investigatethe performance of fluidized bed membrane methane reformers. Thesimplest, Model 1, is a single-stage Gibbs reactor model which, af-ter removing the desired hydrogen generation from the abundancesof the various species, assumes that the remaining mixture reacheschemical equilibrium, given the rapid kinetics. Model 2 incorporatesthe chemical kinetics of the reforming and water gas shift reactions,as well as, when applicable, the oxidation reactions caused by addi-tion of air to provide autothermal reforming. It adopts a very simpleplug flow, no-slip representation of the hydrodynamics and mixing,as a first approximation to what might occur in a riser (fast-fluidizedbed) reactor. The model accounts for possible regeneration of cata-lyst by burning in the return loop any coke formed on the catalystsurface during reforming. Model 3 is the most sophisticated of themodels. It implements the two-phase theory of fluidization, as wellas probabilistic averaging of hydrodynamic parameters, so that thevarious flow regimes of fluidization can be compared. It also accountsfor such factors as the increase in volumetric flow due to the changein the number of moles due to reaction, interphase crossflow, with-drawal of hydrogen through membrane surfaces, and mass and heattransfer resistances. Key features of the three models are comparedin Table 1.
Simulations were carried out both for steam methane reformingwith external heat transfer and for autothermal reforming with airintroduced to provide the endothermic heat absorbed by the reform-ing reactions. For comparison, some cases are considered withoutpermselective membranes. Additionally, the models were used un-der isothermal conditions for ease of comparison. Thermodynamicequilibrium analyses were carried out for the base case with andwithout membranes based on Model 1. The different models gavevery similar results when applied to the same operating and equip-ment conditions, demonstrating their compatibility and consistency.
Mechanistic simulations are carried out using two kinetic mod-els, Models 2 and 3, to test the influence of fluidization flowregime on the reactor performance. The three most common flowregimes of fluidization—bubbling, turbulent fluidization and fastfluidization—are compared. The superficial gas velocity is first
chosen to maximize the probability of being in the turbulent flowregime according to Model 3, with probabilities estimated as out-lined by Abba et al. (2003b). Operating conditions for the bubblingand fast fluidization flow regimes are then chosen to match that(high) probability (0.971) of being in turn in each of these flowregimes. Simplifications introduced to the kinetic models for easeof direct comparison are:
(1) Steady-state operation (i.e. dynamic terms are turned off forModel 3).
(2) The palladium-based membranes are 100% selective for the per-meation of hydrogen.
(3) The performance of the membranes is unaffected by carbon de-position.
(4) The membrane permeation flux is calculated with a membraneefficiency factor of 0.7 (i.e. the membrane permeability is takenas 70% of that measured in the permeation rig without particlesand only gas present).
(5) The membranes are assumed to begin at the bottom and extendwithout interruption to the top of the reactor.
(6) Isothermal operation (i.e. energy balance turned off for Models2 and 3).
2.1. Single-stage equilibrium model (Model 1)
For operating conditions of interest (i.e., temperature 550–900 ◦Cand absolute pressure 5×10⁵–30×105 Pa), the steam reforming andwater gas shift reactions in the presence of catalyst are fast enoughthat the production of hydrogen closely approaches the equilibriumvalues. As a result, thermodynamic equilibrium analysis provides asimple and direct basis for practical applications. At the equilibriumstate, the second steam methane reforming reaction (R2) is just thesummation of reactions R1 and R3. Hence it is sufficient to includeany two of the above three reactions in the thermodynamic equilib-rium analysis.
When air is introduced into the reformer, its oxygen is consideredto be used up rapidly and irreversibly, supplying the exothermic heatof reaction balancing the endothermic steam reforming. For example,partial oxidation of methane can be represented by the irreversiblereaction:
Methane partial oxidation:
CH4 + 0.5O2 → CO + 2H2 �H0 = −36.0 kJmol−1
Equilibrium constants for the reversible steam methane re-forming reaction R1 and water gas shift reaction R3 are calculated(Elnashaie and Elshishini, 1993) by:
K1 =P3H2
PCOPCH4PH2O
= 10000e−(26 830/T)+30.114 (kPa2) (1)
K2 = PCO2PH2
PCOPH2O= e(4400/T)−4.036 (2)
A Microsoft Excel spreadsheet program has been developed forthe thermodynamic equilibrium analysis. Details are summarizedin Table 1 in comparison with the other three models. Model 1 isused to simulate autothermal reforming with and without hydrogenmembranes.
2.2. Plug flow reactor model with complete conversion regenerator(Model 2)
This model considers a circulating fluidized bed membrane reac-tor modeled as a plug flow reactor with a constant solid fraction andslip between the solid and gas neglected, because fine catalyst par-ticles (mean diameter of ∼ 100�m) are used (Patience et al., 1992).

A. Mahecha-Botero et al. / Chemical Engineering Science 64 (2009) 3598 -- 3613 3601
Table 1Summary of reactor models.
Model characteristic (1) (2) (3)Single-stage model Plug-flow reactor model with
complete conversion regeneratorGeneric reactor model
Software used Microsoft Excel Fortran Matlab 7.5
Number of independent variables(lumped or distributed model)
Lumped One independent variable (1-D dis-tributed model)
One independent variable (1-D dis-tributed model)
Number of pseudo-phases One pseudo-phase One pseudo-phase Two pseudo-phases (i.e. high andlow density)
Kinetic or equilibrium model Equilibrium model Kinetic model Kinetic model
Accounts for change in number ofmoles
Yes Yes Yes
Can account for the heat capacity ofthe gases and solids
N/A (isothermal) Yes Yes
Includes a pressure balance No No Yes
Accounts for hydrodynamics No Yes (fast fluidization only) Yes (i.e. for bubbling, turbulent andfast fluidization)
Accounts for voidage profiles No No Yes
Accounts for mass transfer betweenphases
N/A N/A Yes
Uses probabilistic averaging of hy-drodynamic parameters
No No Yes (i.e. for bubbling, turbulent andfast fluidization)
Includes hydrogen removal Yes (net H2 removal) Yes (differential H2 removal) Yes (differential H2 removal)
Allows for carbon formation No Yes No
Allows for catalyst recirculation No Yes (external) No
Assumes ideal regeneration N/A Yes N/A
Numerical technique adopted formodel solution
Empirical iterations DGEAR subroutines for solving stiffdifferential equations. ftom algo-rithm for two point boundary valueproblem
ODE15s routine for accurately solv-ing stiff differential equations
Design/operating parameters Reactor input conditions: mole frac-tions, temperature, pressure, gasvelocity; membrane characteris-tics and input conditions; reactordimensions
Reactor input conditions: mole frac-tions, temperature, pressure, gasvelocity; membrane characteris-tics and input conditions; reactordimensions
Reactor input conditions: mole frac-tions, temperature, pressure, gasvelocity; Membrane characteris-tics and input conditions; Reactordimensions
Required chemical kinetics N/A SMR kinetics from Xu and Froment(1989); Coking Kinetics fromTottrup (1976) and Snoeck et al.(1997); Coke gasification from Chenet al. (2000)
SMR Kinetics from Xu and Froment(1989); oxidation kinetics from Jinet al. (2000)
Physico-chemical parameters Equilibrium constants from Xu andFroment (1989); van't Hoff equationfor heats of reaction
Heat capacity correlations and pa-rameters; heats of reaction; catalystproperties: particle size and den-sity; species properties: molecularweight
Regime correlations; heats of re-action; catalyst properties: particlesize and density; species properties:heat capacity, viscosity and diffu-sivity correlations and parameters;molecular weight
Equations of state Ideal Ideal IdealModel output Exit molar flows, temperature, con-
version and H2 yieldMolar flows, temperature, velocity,conversion and H2 yield profilesalong the reactor length
Profiles along reactor length for:molar flows of all species in bothphases; phase volumetric flowrates;flow regime probabilities; effec-tive mass transfer coefficients forall species; gas density; minimumfluidization velocity; hydrogen re-moval from each pseudo-phase; vol-umetric cross-flow between phases,bubble diameter; phase voidage;temperature; velocity; pressure;conversion and H2 yield. Hy-drodynamic parameters show theweighted contribution from eachflow regime
Suitable applications of the model Reactors not controlled by kinetics Coking environments, fast fluidiza-tion, reactor-regenerator systems
Bubbling, turbulent and fast flu-idized beds
3602 A. Mahecha-Botero et al. / Chemical Engineering Science 64 (2009) 3598 -- 3613
Table 2Reaction kinetics applied to membrane reformer.
Reaction Reaction Heat (kJ/mol) Kinetic rate equation Reference
CH4 + H2O ⇔ CO + 3H2 −206.2 r1 = k1
(PCH4
PH2O
P2.5H2
−PCOP0.5H2
K2
)/DEN2 Xu and Froment (1989)
CO + H2O ⇔ CO2 + H2 −41.2 r2 = k2
(PCOPH2O
PH2− PCO2
K3
)/DEN2 Xu and Froment (1989)
CH4 + 2H2O ⇔ CO2 + 4H2 165.0 r3 = k3
(PCH4
P2H2O
P3.5H2
−PCO2
P0.5H2K2 ·K3
)/DEN2 Xu and Froment (1989)
CH4 + 2O2 → CO2 + 2H2O −802.6 r4 = k4PCH4PO2 Jin et al. (2000)
CH4 + CO2 ⇔ 2CO + 2H2 247.0 r5 = k5PCH4PCO2
(1 −
P2COP2H2K5PCH4
PCO2
)Jin et al. (2000)
CH4 ⇔ C + 2H2 74.6 r6 =k6KCH4
⎛⎜⎝PCH4
−P2H2K6a
⎞⎟⎠
⎛⎜⎝1+
P1.5H2K6b
+KCH4PCH4
⎞⎟⎠2 Snoeck et al. (1997)
2CO → C + CO2 −172.4 r7 = k7PCO(1+K7aPCO+K7b
PCO2PCO
)2 Tottrup (1976)
C + H2O → CO + H2 131.3 r8 = k8P0.5H2O
Chen et al. (2000)
C + 0.5O2 → CO −110.5 r9 = k9P0.5O2
Chen et al. (2000)
C + CO2 → 2CO 172.4 r10 = k10P0.5CO2
Chen et al. (2000)
DEN = 1 + KCOPCO + KH2PH2 + KCH4PCH4 + KH2OPH2O/PH2
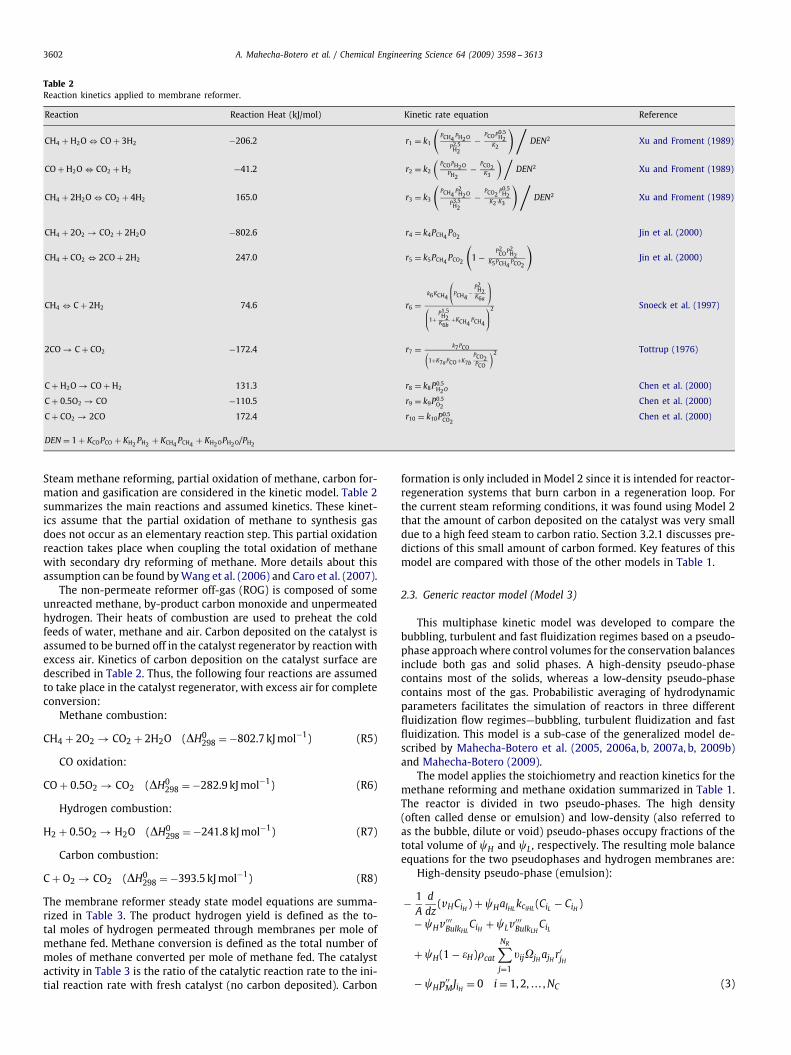
Steam methane reforming, partial oxidation of methane, carbon for-mation and gasification are considered in the kinetic model. Table 2summarizes the main reactions and assumed kinetics. These kinet-ics assume that the partial oxidation of methane to synthesis gasdoes not occur as an elementary reaction step. This partial oxidationreaction takes place when coupling the total oxidation of methanewith secondary dry reforming of methane. More details about thisassumption can be found byWang et al. (2006) and Caro et al. (2007).
The non-permeate reformer off-gas (ROG) is composed of someunreacted methane, by-product carbon monoxide and unpermeatedhydrogen. Their heats of combustion are used to preheat the coldfeeds of water, methane and air. Carbon deposited on the catalyst isassumed to be burned off in the catalyst regenerator by reaction withexcess air. Kinetics of carbon deposition on the catalyst surface aredescribed in Table 2. Thus, the following four reactions are assumedto take place in the catalyst regenerator, with excess air for completeconversion:
Methane combustion:
CH4 + 2O2 → CO2 + 2H2O (�H0298 = −802.7 kJmol−1) (R5)
CO oxidation:
CO + 0.5O2 → CO2 (�H0298 = −282.9 kJmol−1) (R6)
Hydrogen combustion:
H2 + 0.5O2 → H2O (�H0298 = −241.8 kJmol−1) (R7)
Carbon combustion:
C + O2 → CO2 (�H0298 = −393.5 kJmol−1) (R8)
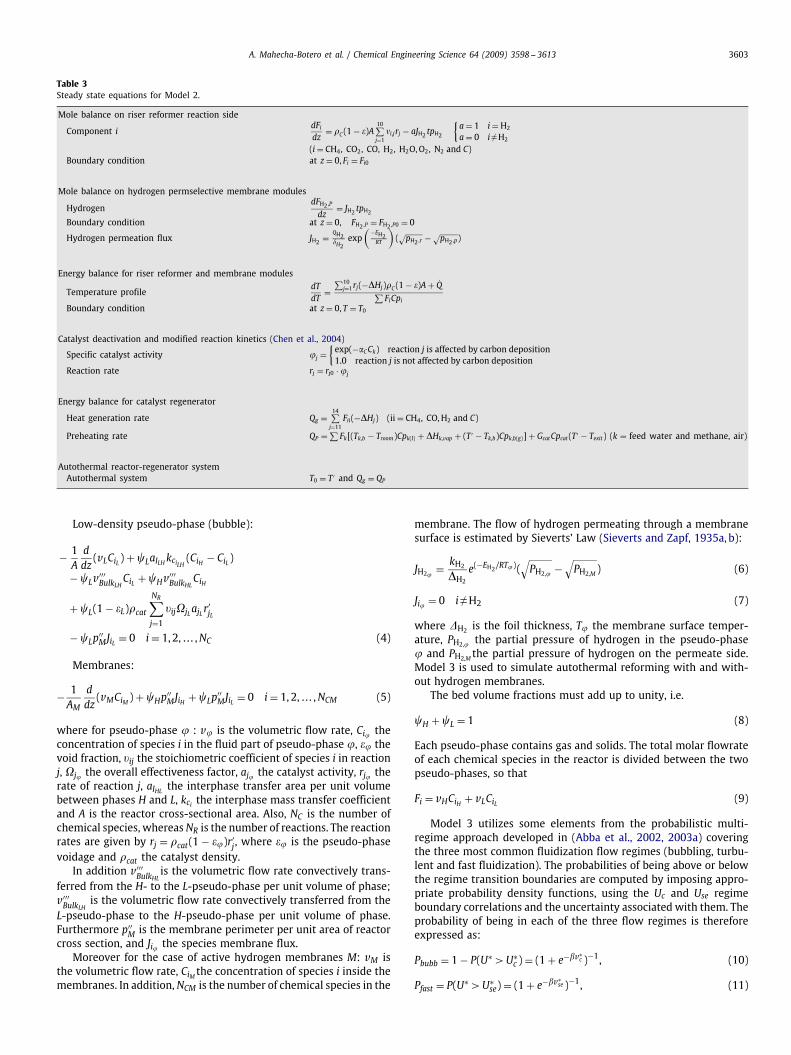
The membrane reformer steady state model equations are summa-rized in Table 3. The product hydrogen yield is defined as the to-tal moles of hydrogen permeated through membranes per mole ofmethane fed. Methane conversion is defined as the total number ofmoles of methane converted per mole of methane fed. The catalystactivity in Table 3 is the ratio of the catalytic reaction rate to the ini-tial reaction rate with fresh catalyst (no carbon deposited). Carbon
formation is only included in Model 2 since it is intended for reactor-regeneration systems that burn carbon in a regeneration loop. Forthe current steam reforming conditions, it was found using Model 2that the amount of carbon deposited on the catalyst was very smalldue to a high feed steam to carbon ratio. Section 3.2.1 discusses pre-dictions of this small amount of carbon formed. Key features of thismodel are compared with those of the other models in Table 1.
2.3. Generic reactor model (Model 3)
This multiphase kinetic model was developed to compare thebubbling, turbulent and fast fluidization regimes based on a pseudo-phase approachwhere control volumes for the conservation balancesinclude both gas and solid phases. A high-density pseudo-phasecontains most of the solids, whereas a low-density pseudo-phasecontains most of the gas. Probabilistic averaging of hydrodynamicparameters facilitates the simulation of reactors in three differentfluidization flow regimes—bubbling, turbulent fluidization and fastfluidization. This model is a sub-case of the generalized model de-scribed by Mahecha-Botero et al. (2005, 2006a, b, 2007a, b, 2009b)and Mahecha-Botero (2009).
The model applies the stoichiometry and reaction kinetics for themethane reforming and methane oxidation summarized in Table 1.The reactor is divided in two pseudo-phases. The high density(often called dense or emulsion) and low-density (also referred toas the bubble, dilute or void) pseudo-phases occupy fractions of thetotal volume of �H and �L, respectively. The resulting mole balanceequations for the two pseudophases and hydrogen membranes are:
High-density pseudo-phase (emulsion):
− 1A
ddz
(vHCiH ) + �HaIHLkciHL (CiL − CiH )
− �Hv′′′BulkHL
CiH + �Lv′′′BulkLH
CiL
+ �H(1 − �H)�cat
NR∑j=1
�ij�jH ajH r′jH
− �Hp′′MJiH = 0 i = 1, 2, . . . ,NC (3)
A. Mahecha-Botero et al. / Chemical Engineering Science 64 (2009) 3598 -- 3613 3603
Table 3Steady state equations for Model 2.
Mole balance on riser reformer reaction side
Component idFidz
= �C(1 − �)A10∑j=1
�i,jrj − aJH2 tpH2
{a = 1 i = H2
a = 0 i�H2
(i = CH4, CO2, CO, H2, H2O,O2, N2 and C)Boundary condition at z = 0, Fi = Fi0
Mole balance on hydrogen permselective membrane modules
HydrogendFH2,Pdz
= JH2 tpH2
Boundary condition at z = 0, FH2,P = FH2,P0 = 0
Hydrogen permeation flux JH2 = QH2�H2
exp(
−EH2RT
)(√pH2,r −√
pH2,p)
Energy balance for riser reformer and membrane modules
Temperature profiledTdT
=∑10
j=1rj(−�Hj)�C(1 − �)A + Q∑FiCpi
Boundary condition at z = 0, T = T0
Catalyst deactivation and modified reaction kinetics (Chen et al., 2004)
Specific catalyst activity j ={exp(−CCk) reaction j is affected by carbon deposition1.0 reaction j is not affected by carbon deposition
Reaction rate rj = rj0 · j
Energy balance for catalyst regenerator
Heat generation rate Qg =14∑
j=11Fii(−�Hj) (ii = CH4, CO,H2 and C)
Preheating rate QP =∑Fk[(Tk,b − Troom)Cpk(l) + �Hk,vap + (T ′ − Tk,b)Cpk,b(g)] + GcatCpcat(T ′ − Texit) (k = feed water and methane, air)
Autothermal reactor-regenerator systemAutothermal system T0 = T ′ and Qg = QP
Low-density pseudo-phase (bubble):
− 1A
ddz
(vLCiL ) + �LaILH kciLH (CiH − CiL )
− �Lv′′′BulkLH
CiL + �Hv′′′BulkHL
CiH
+ �L(1 − �L)�cat
NR∑j=1
�ij�jL ajL r′jL
− �Lp′′MJiL = 0 i = 1, 2, . . . ,NC (4)
Membranes:
− 1AM
ddz
(vMCiM ) + �Hp′′MJiH + �Lp
′′MJiL = 0 i = 1, 2, . . . ,NCM (5)
where for pseudo-phase : v is the volumetric flow rate, Ci theconcentration of species i in the fluid part of pseudo-phase , � thevoid fraction, �ij the stoichiometric coefficient of species i in reactionj, �j the overall effectiveness factor, aj the catalyst activity, rj therate of reaction j, aIHL the interphase transfer area per unit volumebetween phases H and L, kci the interphase mass transfer coefficientand A is the reactor cross-sectional area. Also, NC is the number ofchemical species, whereasNR is the number of reactions. The reactionrates are given by rj = �cat(1 − �)r′j , where � is the pseudo-phasevoidage and �cat the catalyst density.
In addition v′′′BulkHL
is the volumetric flow rate convectively trans-ferred from the H- to the L-pseudo-phase per unit volume of phase;v′′′BulkLH
is the volumetric flow rate convectively transferred from theL-pseudo-phase to the H-pseudo-phase per unit volume of phase.Furthermore p′′
M is the membrane perimeter per unit area of reactorcross section, and Ji the species membrane flux.
Moreover for the case of active hydrogen membranes M: vM isthe volumetric flow rate, CiM the concentration of species i inside themembranes. In addition,NCM is the number of chemical species in the
membrane. The flow of hydrogen permeating through a membranesurface is estimated by Sieverts' Law (Sieverts and Zapf, 1935a, b):
JH2= kH2
�H2
e(−EH2 /RT)(√PH2, −
√PH2,M ) (6)
Ji = 0 i�H2 (7)
where �H2 is the foil thickness, T the membrane surface temper-ature, PH2, the partial pressure of hydrogen in the pseudo-phase and PH2,M the partial pressure of hydrogen on the permeate side.Model 3 is used to simulate autothermal reforming with and with-out hydrogen membranes.
The bed volume fractions must add up to unity, i.e.
�H + �L = 1 (8)
Each pseudo-phase contains gas and solids. The total molar flowrateof each chemical species in the reactor is divided between the twopseudo-phases, so that
Fi = vHCiH + vLCiL (9)
Model 3 utilizes some elements from the probabilistic multi-regime approach developed in (Abba et al., 2002, 2003a) coveringthe three most common fluidization flow regimes (bubbling, turbu-lent and fast fluidization). The probabilities of being above or belowthe regime transition boundaries are computed by imposing appro-priate probability density functions, using the Uc and Use regimeboundary correlations and the uncertainty associated with them. Theprobability of being in each of the three flow regimes is thereforeexpressed as:
Pbubb = 1 − P(U∗ >U∗c ) = (1 + e−�v∗
c )−1, (10)
Pfast = P(U∗ >U∗se) = (1 + e−�v∗
se )−1, (11)
3604 A. Mahecha-Botero et al. / Chemical Engineering Science 64 (2009) 3598 -- 3613
In the transition zones the system may present characteristics foundin more than one flow regime following the summation rule:
Pturb = 1 − Pfast − Pbubb, (12)
where
v∗c = (U∗ − U∗
min) − U∗c
∗c
, v∗se = U∗ − U∗
se
∗se
,
U∗ = ReAr1/3
, U∗min = Remin
Ar1/3,
U∗c = Rec
Ar1/3, U∗
se = ReseAr1/3
,
Rec = 0.74 · Ar0.426, Rese = 1.68 · Ar0.469,
∗2se = 1
n − 1
n∑j=1
(U∗se,exp,j − U∗
se(Ar)j)2,
∗2c = 1
n − 1
n∑j=1
(U∗c,exp,j − U∗
c (Ar)j)2.
Once the probabilities of being in each flow regime have beenestimated, these probabilities are employed as weighting factorsto obtain point approximations of the hydrodynamic parameters.The model parameters (coefficients in the mole and energy balanceequations for each separate fluidization regime), are then weightedaccording to:
� =3∑
r=1
�rPr , (13)
where �r is the value of � for regime r, and Pr is the probability ofbeing in regime r. Bubbling fluidization corresponds to r = 1, whereasr = 2 for turbulent fluidization (Bi et al., 2000), and r = 3 for fastfluidization. Themajor assumptions for themodel (Abba et al., 2003c)are:
• U>Umb, i.e. the gas velocity is at least sufficient to initiate bub-bling;
• Large or shallow enough column and/or small enough particles thatslug flow conditions are avoided over the entire operating rangeof interest;
• U<UDSU to ensure that the system is not operating in the densesuspension upflow regime (Grace et al., 1999), with the boundarybetween fast fluidization and dense suspension upflow estimatedusing the correlation proposed by Kim et al. (2004).
3. Flow regimes of fluidization
3.1. Introduction
The FBMR process could be operated in several different flowregimes. In this section, we consider which flow regime is most ap-propriate for the FBMR SMR process. Both kinetic models (Models2 and 3 described in Section 2) are developed, assuming isothermalconditions for identical inputs in order to compare the reactor vol-umes required to achieve a specified hydrogen yield. The results arethen compared, and other factors are also factored into a discussionof which flow regime is most appropriate.
3.2. Simulations and discussion
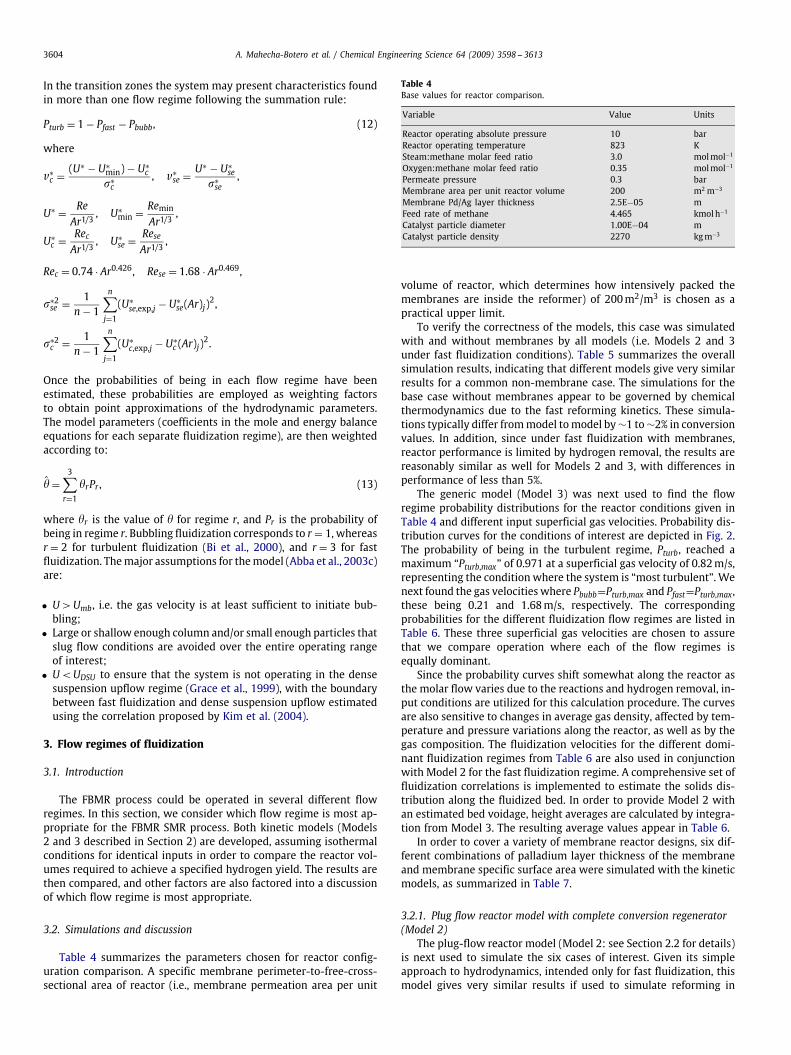
Table 4 summarizes the parameters chosen for reactor config-uration comparison. A specific membrane perimeter-to-free-cross-sectional area of reactor (i.e., membrane permeation area per unit
Table 4Base values for reactor comparison.
Variable Value Units
Reactor operating absolute pressure 10 barReactor operating temperature 823 KSteam:methane molar feed ratio 3.0 molmol−1
Oxygen:methane molar feed ratio 0.35 molmol−1
Permeate pressure 0.3 barMembrane area per unit reactor volume 200 m2 m−3
Membrane Pd/Ag layer thickness 2.5E−05 mFeed rate of methane 4.465 kmolh−1
Catalyst particle diameter 1.00E−04 mCatalyst particle density 2270 kgm−3
volume of reactor, which determines how intensively packed themembranes are inside the reformer) of 200m2/m3 is chosen as apractical upper limit.
To verify the correctness of the models, this case was simulatedwith and without membranes by all models (i.e. Models 2 and 3under fast fluidization conditions). Table 5 summarizes the overallsimulation results, indicating that different models give very similarresults for a common non-membrane case. The simulations for thebase case without membranes appear to be governed by chemicalthermodynamics due to the fast reforming kinetics. These simula-tions typically differ frommodel tomodel by∼1 to∼2% in conversionvalues. In addition, since under fast fluidization with membranes,reactor performance is limited by hydrogen removal, the results arereasonably similar as well for Models 2 and 3, with differences inperformance of less than 5%.
The generic model (Model 3) was next used to find the flowregime probability distributions for the reactor conditions given inTable 4 and different input superficial gas velocities. Probability dis-tribution curves for the conditions of interest are depicted in Fig. 2.The probability of being in the turbulent regime, Pturb, reached amaximum “Pturb,max” of 0.971 at a superficial gas velocity of 0.82m/s,representing the condition where the system is “most turbulent”. Wenext found the gas velocities where Pbubb=Pturb,max and Pfast=Pturb,max,these being 0.21 and 1.68m/s, respectively. The correspondingprobabilities for the different fluidization flow regimes are listed inTable 6. These three superficial gas velocities are chosen to assurethat we compare operation where each of the flow regimes isequally dominant.
Since the probability curves shift somewhat along the reactor asthe molar flow varies due to the reactions and hydrogen removal, in-put conditions are utilized for this calculation procedure. The curvesare also sensitive to changes in average gas density, affected by tem-perature and pressure variations along the reactor, as well as by thegas composition. The fluidization velocities for the different domi-nant fluidization regimes from Table 6 are also used in conjunctionwith Model 2 for the fast fluidization regime. A comprehensive set offluidization correlations is implemented to estimate the solids dis-tribution along the fluidized bed. In order to provide Model 2 withan estimated bed voidage, height averages are calculated by integra-tion from Model 3. The resulting average values appear in Table 6.
In order to cover a variety of membrane reactor designs, six dif-ferent combinations of palladium layer thickness of the membraneand membrane specific surface area were simulated with the kineticmodels, as summarized in Table 7.
3.2.1. Plug flow reactor model with complete conversion regenerator(Model 2)
The plug-flow reactor model (Model 2: see Section 2.2 for details)is next used to simulate the six cases of interest. Given its simpleapproach to hydrodynamics, intended only for fast fluidization, thismodel gives very similar results if used to simulate reforming in

A. Mahecha-Botero et al. / Chemical Engineering Science 64 (2009) 3598 -- 3613 3605
Table 5Comparison of simulation results for base case (as specified in Table 4) for different models.
Without H2 selective membranes With H2 selective membranes
Model 1 Model 2 Model 3 Model 1 Model 2 Model 3Fluidization regime NA Fast Fast NA Fast Fast
ROG dry compositionCH4 mol% 16.3% 16.1% 6.8% 11.4% 11.5% 11.2%H2O – – – – – – –CO mol% 1.2% 1.2% 1.3% 1.6% 1.6% 1.8%H2 mol% 31.6% 31.8% 33.0% 24.7% 24.0% 25.2%CO2 mol% 12.1% 12.2% 12.6% 19.6% 19.8% 21.3%O2 mol% 0.0% 0.0% 0.0% 0.0% 0.0% 0.0%N2 mol% 38.7% 38.7% 36.3% 42.6% 43.1% 40.5%
Total mol% 100.0% 100.0% 100.0% 100.0% 100.0% 100.0%CH4 conversion – 45.0% 45.8% 43.6% 65.1% 65.2% 65.1%Total H2 yield mol H2 mol CH−1
4 1.1 1.0 1.0 1.9 1.8 1.9Pure H2 yield mol H2 mol CH−1
4 NA NA NA 1.1 1.1 1.1Thickness of membrane �m NA. NA NA 25.0 25.0 25.0Membrane effectiveness factor – NA NA NA 0.7 0.7 0.7Superficial gas velocity (ms−1) 1.7 1.7 1.7 1.7 1.7 1.7
Fig. 2. Probability distribution for bubbling, turbulent and fast fluidization flow regimes.
Table 6Parameters for different fluidization flow regimes.
Flow regime Model Gas velocity (ms−1) Pbubb (–) Pturb (–) Pfast (–) Voidage (−) Free cross-sectionalarea (m2)
Reactor height (m)
Bubbling Model 3 0.21 0.971 0.028 9.2×10⁻⁵ 0.587 0.206 0.549a
Turbulent Model 3 0.82 0.0096 0.971 0.019 0.721 0.0579 1.954a
Fast fluidization Models 2 and 3 1.68 9.71×10⁻⁸ 0.028 0.971 0.95 0.0279 4.056
aDense bed height.
Table 7Configurations for reactor simulations.
Configuration Membrane palladium layerthickness (�m)
Specific membrane surfacearea (m2 m−3)
(1) 50 200(2) Base case 25 200(3) 15 200(4) 5 200(5) 1 200(6) 25 1000
different flow regimes. Since Model 2 does not allow for regimespecific correlations and assumes single-phase plug-flow, it is usedexclusively for fast fluidization simulations. When the results fromModel 2 were compared to those from Model 3 under fast fluidiza-tion conditions, differences were very small (typically ∼2 to ∼5%),suggesting correctness in the model implementation. It is shownthat hydrogen permeation is the rate-limiting step in the membranereformer operations for fast fluidization. Decreasing membranethickness and/or increasing the membrane permeation area per unitvolume of reactor enhance the hydrogen production.

3606 A. Mahecha-Botero et al. / Chemical Engineering Science 64 (2009) 3598 -- 3613
Fig. 3. (a) Comparison of pure hydrogen production rates; (b) methane conver-sion for different membrane thicknesses, different permeation area per unit vol-ume of reactor and for different fluidization flow regimes based on Model 2for fast fluidization. Overlap is observed for Config. 4 and 6. For conditions seeTables 4 and 5.
Figs. 3a and b show the predicted pure hydrogen production rateand methane conversion respectively as a function of reactor volumefor the different configurations outlined in Table 7. The pure hydro-gen production rate increases significantly with decreasing mem-brane thickness, resulting in quick increases followed by levellingoff, for thinner membranes. A similar trend is found for the methaneconversion, where we observe how the reformer could achieve com-plete conversion for very thin membranes. Therefore, for thinnermembranes, the reactor height could be significantly decreased, orless surface area would be required. Increasing the membrane per-meation area per unit volume of reactor could in principle increasethe hydrogen production rate. For current membranes, a more com-pact reformer with a higher density of membranes could, if this werepossible, also increase the pure hydrogen production capacity. Theresults for cases 4 and 6 in Fig. 3 also indicate that for the same ra-tio of membrane permeation area per unit volume of reactor to themembrane thickness, the reactor performance is virtually the samesince the hydrogen permeation flux would be virtually the same.For comparison, detailed reformer simulation results are shown inFigs. 4 and 5 below. The products of the reactor height and freecross-sectional area, listed in Table 6, give the corresponding reactorvolumes.
As shown in Fig. 4, methane conversion is predicted to increasequickly at first in the base case (25�m, 200m2/m3 configuration),
and then more slowly as the resistance to permeation becomes rate-controlling. More hydrogen is generated as hydrogen is withdrawnthrough the membranes. The total flowrate of hydrogen (i.e. insidethe membranes plus inside the reactor) is seen to increase mono-tonically over the reactor height. Reactor (non-permeate) hydrogenflowrate reaches a maximum after quick initial reaction and then de-creases due to membrane removal. The superficial gas velocity in thereactor increases at first because of the increase in molar flowrate(via reactions R1 and R3), but then declines gradually as hydrogen iswithdrawn. Based on the model, the carbon content of the catalystgrows quickly and then maintains a constant value.
When thinner membranes are simulated, the hydrogen pro-duction rate and methane conversion increase much more quicklythan for the base case (Fig. 3). Thinner membranes allow the con-centrations of CH4 and H2O to drop much more quickly. The CO2concentration rises more steeply with the thinner membranes but,because of the promotion of the water gas shift reaction by H2removal, the CO concentration remains very low along the entirereactor. The oxygen profiles are not shown in these figures as theoxygen partial pressure falls very quickly to essentially zero sincethe oxidation reactions proceed even faster than the reformingreactions.
3.2.2. Generic reactor model (Model 3)Model 3 was employed to address other issues of the multiphase
behaviour. With the parameters in Tables 4 and 6, six reactor con-figurations (See Table 7) were simulated for all three flow regimes,giving a total of eighteen cases (Figs. 6–11).
Figs. 6a, b and c depict the pure hydrogen production rate for thesix configurations in Table 7 for the bubbling, turbulent and fast flu-idization regimes, respectively. Although the turbulent regime hasa very small edge in performance (less than 1%) in the simulations,these results are very similar to those for the fast fluidization sim-ulations, giving almost the same overall pure hydrogen productionfor all configurations. The bubbling regime is predicted to produce22–24% less hydrogen than for the turbulent regime for all config-urations where the membrane area is limiting (i.e. for cases wherenot all available hydrogen is removed).
Configurations 1 and 2 show that the pure hydrogen (permeate)production rate increases almost linearly with reactor volume (orheight) for all three flow regimes. Comparison of the different config-urations shows that thinner membranes greatly accelerate the pro-duction of hydrogen. For instance, Configurations 4, 5 and 6 achievecomplete hydrogen removal. After a quick increase in permeate hy-drogen, hydrogen production stops. Clearly for the operating con-ditions considered, those configurations are overdesigned, since ashorter reactor would lead to virtually the same overall performance.From a reactor design point of view for the reforming conditionsunder scrutiny, Configuration 3 appears to use the installed mem-brane area in a more optimal way. The results for Configurations4 and 6 are indistinguishable as already shown in Fig. 3 based onModel 2.
Figs. 6 and 7 compare the methane conversion for the differ-ent flow regimes. It is observed that the turbulent regime results inthe fastest conversion in the region directly above the distributor.The methane conversion curves for turbulent and fast fluidizationsimulations then overlap over most of the reactor height. Again thebubbling regime simulations achieve smaller conversion values foreach case. The positive impact of reducing membrane thickness onreactor performance is again demonstrated. Three stages can be ob-served for the reforming system: (1) A very quick increase in con-version due to very fast chemical kinetics. This stage occurs duringthe initial ∼0.005m3 of reactor for turbulent/fast fluidization and∼0.01m3 for bubbling fluidization (with these values depending onthe gas residence time inside the reactor). (2) A gradual increase in

A. Mahecha-Botero et al. / Chemical Engineering Science 64 (2009) 3598 -- 3613 3607
Fig. 4. Predicted axial profiles of key variables for base case (i.e. Configuration 2). Simulations using Model 2 for fast fluidization. For conditions see Tables 4 and 5.
Fig. 5. Predicted axial profiles of species molar flowrates for base case (i.e. Con-figuration 2). Simulations using Model 2 under fast fluidization. For conditions seeTables 4 and 5.
conversion due to the continuous hydrogen removal that shifts theequilibrium forward. (3) The reactor achieves complete conversion(i.e. ∼0.999+%) and the conversion profiles become flat. This latterstage is only achieved for very thin membranes (e.g. Configurations4, 5 and 6 in Table 7).
Figs. 9–11 plot concentration profiles of the different species inthe high-density and low-density phases for the three flow regimesand the base case. An important finding is that the concentrationsin the H- and L-phases are predicted to be very similar for the high-velocity flow regimes (turbulent and fast fluidization), as shown inFigs. 9b and c, 10b and c and 11b and c. For these two flow regimesthe concentration profiles in the high- and low-density pseudo-phases are virtually indistinguishable due to fast mass transfer be-tween the phases. Furthermore, since the SMR kinetics are fast andthe low-density phase contains significant proportions of catalystparticles by volume, significant conversion is predicted to occur inthe low-density phase, yielding similar concentrations to the high-density phase.
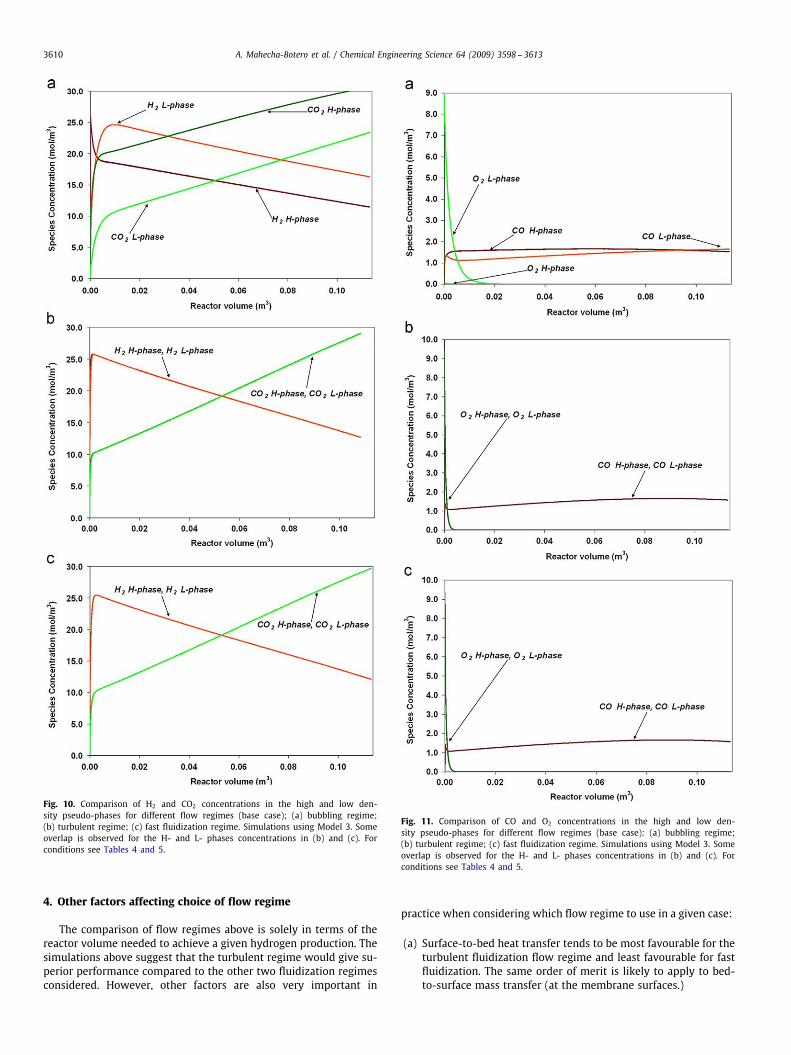
Figs. 9a, 10a and 11a show the predicted species concentrations inthe bubbling regime. The CO concentration profile in Fig. 11a showsinteresting non-monotonic behaviour, passing through a maximumas it is produced during the initial rapid kinetically-controlled reac-tion near the bottom of the reactor, and then being consumed due tothe water gas shift reaction, promoted by withdrawal of hydrogen.
3608 A. Mahecha-Botero et al. / Chemical Engineering Science 64 (2009) 3598 -- 3613
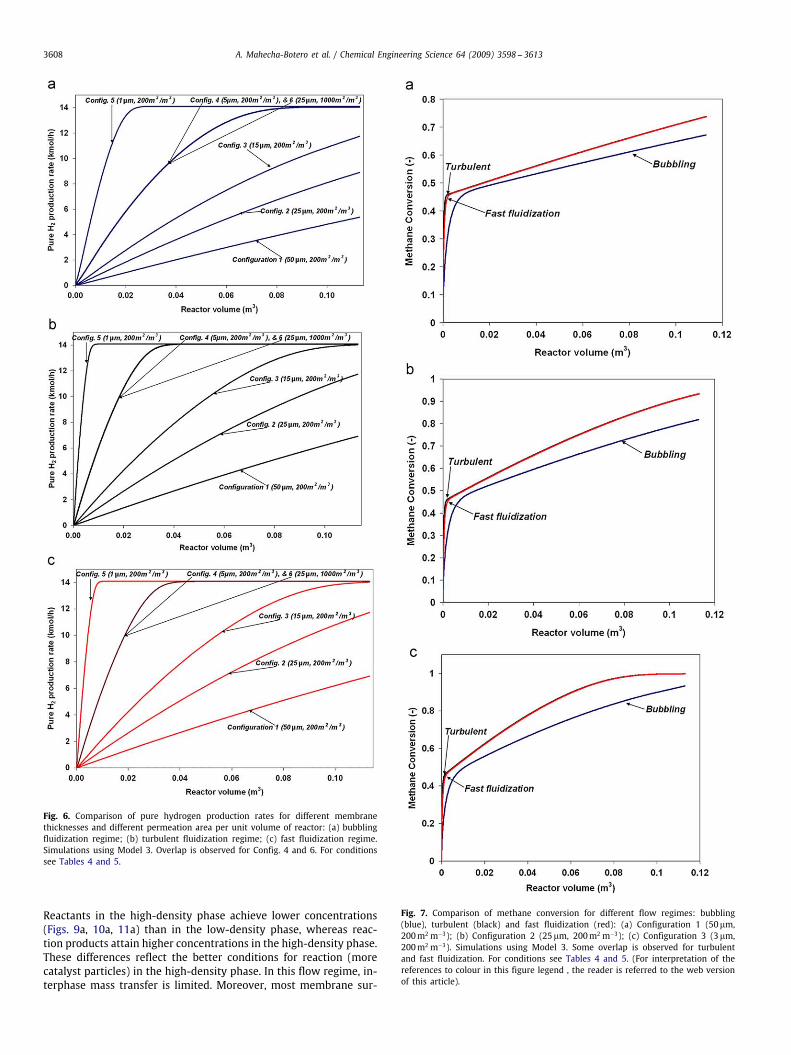
Fig. 6. Comparison of pure hydrogen production rates for different membranethicknesses and different permeation area per unit volume of reactor: (a) bubblingfluidization regime; (b) turbulent fluidization regime; (c) fast fluidization regime.Simulations using Model 3. Overlap is observed for Config. 4 and 6. For conditionssee Tables 4 and 5.
Reactants in the high-density phase achieve lower concentrations(Figs. 9a, 10a, 11a) than in the low-density phase, whereas reac-tion products attain higher concentrations in the high-density phase.These differences reflect the better conditions for reaction (morecatalyst particles) in the high-density phase. In this flow regime, in-terphase mass transfer is limited. Moreover, most membrane sur-
Fig. 7. Comparison of methane conversion for different flow regimes: bubbling(blue), turbulent (black) and fast fluidization (red): (a) Configuration 1 (50�m,200m2 m−3); (b) Configuration 2 (25�m, 200m2 m−3); (c) Configuration 3 (3�m,200m2 m−3). Simulations using Model 3. Some overlap is observed for turbulentand fast fluidization. For conditions see Tables 4 and 5. (For interpretation of thereferences to colour in this figure legend , the reader is referred to the web versionof this article).
A. Mahecha-Botero et al. / Chemical Engineering Science 64 (2009) 3598 -- 3613 3609
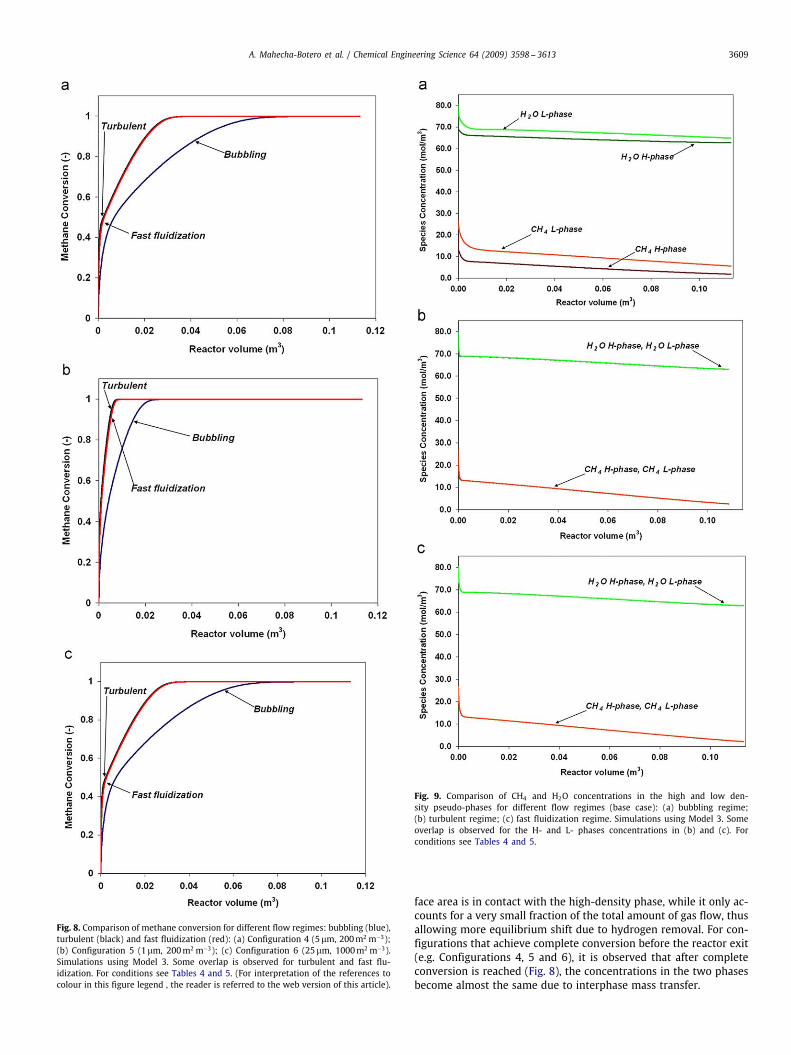
Fig. 8. Comparison of methane conversion for different flow regimes: bubbling (blue),turbulent (black) and fast fluidization (red): (a) Configuration 4 (5�m, 200m2 m−3);(b) Configuration 5 (1�m, 200m2 m−3); (c) Configuration 6 (25�m, 1000m2 m−3).Simulations using Model 3. Some overlap is observed for turbulent and fast flu-idization. For conditions see Tables 4 and 5. (For interpretation of the references tocolour in this figure legend , the reader is referred to the web version of this article).
Fig. 9. Comparison of CH4 and H2O concentrations in the high and low den-sity pseudo-phases for different flow regimes (base case): (a) bubbling regime;(b) turbulent regime; (c) fast fluidization regime. Simulations using Model 3. Someoverlap is observed for the H- and L- phases concentrations in (b) and (c). Forconditions see Tables 4 and 5.
face area is in contact with the high-density phase, while it only ac-counts for a very small fraction of the total amount of gas flow, thusallowing more equilibrium shift due to hydrogen removal. For con-figurations that achieve complete conversion before the reactor exit(e.g. Configurations 4, 5 and 6), it is observed that after completeconversion is reached (Fig. 8), the concentrations in the two phasesbecome almost the same due to interphase mass transfer.
3610 A. Mahecha-Botero et al. / Chemical Engineering Science 64 (2009) 3598 -- 3613
Fig. 10. Comparison of H2 and CO2 concentrations in the high and low den-sity pseudo-phases for different flow regimes (base case); (a) bubbling regime;(b) turbulent regime; (c) fast fluidization regime. Simulations using Model 3. Someoverlap is observed for the H- and L- phases concentrations in (b) and (c). Forconditions see Tables 4 and 5.
4. Other factors affecting choice of flow regime
The comparison of flow regimes above is solely in terms of thereactor volume needed to achieve a given hydrogen production. Thesimulations above suggest that the turbulent regime would give su-perior performance compared to the other two fluidization regimesconsidered. However, other factors are also very important in
Fig. 11. Comparison of CO and O2 concentrations in the high and low den-sity pseudo-phases for different flow regimes (base case): (a) bubbling regime;(b) turbulent regime; (c) fast fluidization regime. Simulations using Model 3. Someoverlap is observed for the H- and L- phases concentrations in (b) and (c). Forconditions see Tables 4 and 5.
practice when considering which flow regime to use in a given case:
(a) Surface-to-bed heat transfer tends to be most favourable for theturbulent fluidization flow regime and least favourable for fastfluidization. The same order of merit is likely to apply to bed-to-surface mass transfer (at the membrane surfaces.)
A. Mahecha-Botero et al. / Chemical Engineering Science 64 (2009) 3598 -- 3613 3611
(b) In practice, axial dispersion of both gas and solids is likely to begreatest for bubbling fluidization, and least for fast fluidization.
(c) Wear of surfaces tends to be greatest in the fast fluidization flowregime given the higher particle velocities.
(d) Losses of catalyst due to entrainment are likely to be greatestin the fast fluidization flow regime and least in the bubblingregime.
(e) Extra reactor volume will be needed for the turbulent and bub-bling flow regimes to provide a freeboard region. The disadvan-tage of having a freeboard could be offset, at least in part, byextending the membrane surfaces into the freeboard region.
(f) Vertical and radial temperature gradients tend to be greatest inthe fast fluidization flow regime, but they can also be significantin the freeboard region above turbulent and bubbling fluidizedbeds. This is an important consideration for the SMR process asthe reforming reactions will reverse in the presence of catalystif the temperature drops significantly.
(g) The height-to-diameter ratio for fast-fluidization tends to bemuch greater than for bubbling beds, with the turbulent regimecase showing intermediate values. In practice, this means thatfast fluidization is unlikely to be practical for small-scale sys-tems, whereas bubbling beds are less likely to be viable for largecommercial systems.
Given these factors, it is impossible to unambiguously choose asingle flow regime for all cases. In each case in practice, it is necessaryto weigh the competing factors. It is also important to rememberthat experimental FBMR results have so far been obtained only forthe bubbling flow regime, whereas most industrial catalytic fluidizedbed reactors operate in the turbulent fluidization flow regime.
5. Conclusions
Incorporation of permselective membranes provides an innova-tive means of overcoming the equilibrium barrier in the productionof hydrogen, while also decreasing the adverse effect of pressureand providing in situ hydrogen purification. However, with currentlyavailable membranes, the removal of hydrogen via permeation is rel-atively slow, requiring tall membranes and high reactors, or a verycongested arrangement of membrane surfaces in the reformer. Theresistance to permeation through the membrane surfaces is the rate-controlling factor for currently available membranes. The overridingimportance of the membrane permeability means that the future ofmembrane reactor technology is critically dependent on develop-ing thinner pinhole-free membrane foil or coatings, which are alsorobust.
An important issue which has received little attention, is thechoice of the flow regime in which the reactor operates. The simula-tion predictions for the three flow regimes show that the turbulentregime is capable of yielding higher hydrogen production for a givenconfiguration, compared to bubbling and fast fluidization. Model 1,an equilibrium model is a useful tool for overall estimation. Two ki-netic reactor models are also used to simulate the conditions of anisothermal fluidized bed membrane reactor for steam methane re-forming. A simple reactor model (Model 2) gives predictions verysimilar to those for a more comprehensive probabilistic Model 3 forthe fast fluidization regime. The latter is especially useful for settingthe conditions where the three flow regime can be compared andto provide insights on reactor characteristics such as mass trans-fer and phase concentrations. For turbulent and fast fluidization,Model 3 estimates virtually the same volume requirement for a givenproduction rate of pure hydrogen, and almost the same retentate(non-permeate stream) gas composition for a given reactor vol-ume for the same membranes and membrane packing density. Froma practical point of view, low-velocity fluidization is likely to be
preferred for at least the next few years because of the gentler en-vironment it provides for the membranes, in addition to decreasedentrainment.
Overall, modelling is shown to be a useful tool for simulatingcomplex processes like FBMR steam methane reforming. The mod-elling demonstrates the considerable promise of the technology andthe pre-eminent need for material science to provide thin robustpinhole-free membranes to make the process economically viable.
Notation
a control index for the membranes flux of hydrogen,dimensionless
aj catalyst activity (associated with catalyst deactiva-tion), dimensionless
aIn interphase transfer area per unit volume betweenphases and n, m−1
A reactor cross sectional area, m2
AM membrane cross-sectional area, m2
Ar Archimedes number, dimensionlessCi molar concentration of component i, mol/m3
Ck concentration of deposited coke on catalyst,g/gcatalyst
Ci concentration of species i in pseudo-phase ,molm−3
Ceq,i molar concentration of component i at equilibriumstate, molm−3
Cpi specific heat of component i, Jmol−1 K−1
Cpcat specific heat of solid catalyst, J gcatalyst−1 K−1
DEN DEN term, in SMR kinetics equationsEH2 activation energy for hydrogen permeation, Jmol−1
Fi molar flow rate of component i, mol s−1
Fi molar flow rate of species i in pseudo-phase ,mol s−1
Fcat mass flow rate of catalysts, kg s−1
FH2,P molar flow rate of hydrogen in hydrogen permse-lective membranes, mol s−1
Fi0 molar feed flow rate of component i at entrance ofreformer, mol s−1
GS net solids circulation rate, kgm−2 s−1
Gcat mass flow rate of catalyst, g s−1
�H2 thickness of hydrogen membranes, m�Hj heat of reaction for jth reaction, Jmol−1
�Hvap heat of vaporization, Jmol−1
�H0 enthalpy change, Jmol−1
�H0C heat of combustion, Jmol−1
JH2 permeation fluxes of hydrogen, molm−2 s−1
Ji permeation flux of component i in pseudo-phase ,molm−2 s−1
kcininterphase mass transfer coefficient of component ibetween phases and n, m/s
kj generalized reaction rate constant for jth reaction,various units
Ki absorption constant for component i, various unitsKj reaction equilibrium constant for jth reaction, vari-
ous unitsNC total number of chemical species, dimensionlessNR total number of reactions, dimensionlessNCM total number of chemical species inside the mem-
brane, dimensionlessp′′M membrane perimeter per unit area of reactor cross
section, m−1
Pi partial pressure of component i, kPaPr probability of being in regime r, dimensionless

3612 A. Mahecha-Botero et al. / Chemical Engineering Science 64 (2009) 3598 -- 3613
PH2,P , PH2,M partial pressure of hydrogen in hydrogen permse-lective membranes, kPa
PH2,r ,PH2, partial pressure of hydrogen in reformer reactionside, kPa
Q rate of heating along the reactor length, Jm−1 s−1
Qg heat generation rate, J s−1
QH2 , kH2 pre-exponential factor for hydrogen permeationflux, molm−1 s−1 Pa−0.5
QP preheating rate, J s−1
rj generalized reaction rates, mol gcatalyst−1 s−1
rj rate of production by chemical reaction j in pseudo-phase , mol kg−1 s−1
r′j rate of production by chemical reaction j in pseudo-phase (mol (m of pseudo-phase )−3 s−1)
rj0 generalized reaction rates with fresh catalyst,mol gcatalyst−1 s−1
R gas constant, 8.314 Jmol−1KRec Reynolds number at the transition from bubbling to
turbulent regime, dimensionlessRese Reynolds number at the transition from turbulent to
fast fluidization regime, dimensionlesst time, stpH2 total perimeter of hydrogen membranes, mT temperature, KTexit riser reformer exit temperature, KTk,b boiling temperature of component k, KT0 autothermal feed temperature, KT′ mixing temperature of steam and recycled catalyst
after preheating, KTroom room temperature, KT membrane surface temperature, KU superficial gas velocity, m/sU∗ dimensionless superficial gas velocity, U(�2
g /�g(�p −�g))
1/3, ms−1
Uc transition velocity from bubbling to turbulent flu-idization, ms−1
UDSU onset of dense suspension upflow, ms−1
Umb minimum bubbling velocity, ms−1
Use transition gas superficial velocity from turbulent tofast fluidization regime, ms−1
vM membrane volumetric flow rate, m3 s−1
vt terminal velocity, m/sv volumetric flow rate of pseudo-phase , m3/sv′′′BulkHL
volumetric flow rate convectively transferred fromthe (H)-pseudo-phase to the (L)-pseudo-phase perunit volume of phase (s−1)
v′′′BulkLH
volumetric flow rate convectively transferred fromthe (L)-pseudo-phase to the (H)-pseudo-phase perunit volume of phase (s−1)
XCaO conversion of CaO sorbent, dimensionlessz height or length coordinate, m
Greek letters
C deactivation constant, gcatalyst gcoke−1
� fitting parameter in logistic regression function,dimensionless
� void fraction, v v−1
� voidage in pseudo-phase , dimensionless�S solid fraction, v v−1
� averaged value dependent on operating conditionsand physical properties
�c density of catalyst, kgm−3
�g density of gas, kgm−3
�p density of particles, kgm−3
�ij stoichiometric coefficient of species i in reaction j,dimensionless
� catalyst activity function, dimensionless� volume fraction of pseudo-phase , dimensionless�j overall effectiveness factor of reaction j in pseudo-
phase , dimensionless
Subscripts
c transition from bubbling to turbulent fluidizationregime
o initial state or at entrance of reformer or membranetube
bubb bubbling flow regimecat catalystexp experimentfast fast fluidization flow regimeH high-density pseudo-phasei reactants or products (i = CH4, CO2, CO,
H2, H2O, O2, C)j reaction indexL low-density pseudo-phasemax maximump hydrogen membrane permeation sider reaction sidese transition from turbulent to fast fluidization regimeturb turbulent flow regime
Superscripts
* dimensionless
Abbreviations
ATR autothermal reformingFBMR fluidized bed membrane reformer (reactor)ICFBMR internally circulating fluidized bed membrane
reactorMRT Membrane Reactor Technology, Ltd.NEDO New Energy and Industrial Technology Development
Organization, JapanROG reactor (reformer) off-gas (non-permeate)SMR steam methane reforming
Acknowledgements
The authors thank the “New Energy and Industrial TechnologyDevelopment Organization” (NEDO), Japan for providing funding un-der Contract no: 05003135-0. The authors also gratefully acknowl-edge input from Dr. Tony Boyd of Membrane Reactor Technologies(MRT) Ltd, Vancouver.
References
Abba, I.A., Grace, J.R., Bi, H.T., 2002. Variable-gas-density fluidized bed reactor modelfor catalytic processes. Chem. Eng. Sci. 57, 4797–4807.
Abba, I.A., Grace, J.R., Bi, H.T., 2003a. Application of the generic fluidized-bedreactor model to the fluidized-bed membrane reactor process for steam methanereforming with oxygen input. Ind. Eng. Chem. Res. 42, 2736–2745.
Abba, I.A., Grace, J.R., Bi, H.T., Thompson, M.L., 2003b. Spanning the flow regimes:a generic fluidized bed reactor model. A.I.Ch.E. J. 49, 1838–1848.
Abba, I.A., Grace, J.R., Bi, H.T., Thompson, M.L., 2003c. Spanning the flow regimes: ageneric fluidized bed reactor model. A.I.Ch.E. J. 49, 1838–1848.
A. Mahecha-Botero et al. / Chemical Engineering Science 64 (2009) 3598 -- 3613 3613
Adris, A.M., Grace, J.R., Lim, C.J., Elnashaie, S.S.E.H., 1994. Fluidized bed reactionsystem for steam/hydrocarbon gas reforming to produce hydrogen. USA Patentnumber 5326550.
Adris, A.M., Lim, C.J., Grace, J.R., 1997. The fluidized bed membrane reactor for steammethane reforming: model verification and parametric study. Chem. Eng. Sci.52, 1609–1622.
Armor, J.N., 1999. Review: the multiple roles for catalysis in the production of H2.Appl. Catal. A Gen. 176, 159–176.
Bartholomew, C.H., 2001. Mechanisms of catalyst deactivation. Appl. Catal. A Gen.212, 17–60.
Bi, H.T., Ellis, N., Abba, I.A., Grace, J.R., 2000. A state of the art review of gas–solidturbulent fluidization. Chem. Eng. Sci. 55, 4789–4825.
Borroni-Bird, C.E., 1996. Fuel cell commercialization issues for light-duty vehicleapplications. J. Power Sources 61, 33–48.
Boyd, T., Grace, J.R., Lim, C.J., Adris, A., 2005. Hydrogen from an internally circulatingfluidized bed membrane reactor. Int. J. Chem. React. Eng. 3, A58.
Brown, L.F., 2001. A comparitive study of fuels for onboard hydrogen productionfor fuel Cell powered automobiles. Int. J. Hydrogen Energy 26, 381–397.
Caro, J., Caspary, K.J., Hamel, C., Hoting, B., Kolsch, P., Langanke, B., Nassauer, K.,Schiestel, T., Schmidt, A., Schomacker, R., Seidel-Morgenstern, A., Tsotsas, E.,Voigt, I., Wang, H., Warsitz, R., Werth, S., Wolf, A., 2007. Catalytic membranereactors for partial oxidation using perovskite hollow fiber membranes and forpartial hydrogenation using a catalytic membrane contactor. Ind. Eng. Chem.Res. 46, 2286–2294.
Chen, C.X., Horio, M., Kojima, T., 2000. Numerical simulation of entrained flow coalgasifiers. Part I: Modeling of coal gasification in an entrained flow gasifier. Chem.Eng. Sci. 55, 3861–3874.
Chen, Z., Grace, J.R., Lim, C.J., Li, A., 2007. Experimental studies of pure hydrogenproduction in a commercialized fluidized-bed membrane reactor with SMR andATR catalysts. Int. J. Hydrogen Energy 32, 2359–2366.
Chen, Z., Po, F., Grace, J.R., Lim, C.J., Elnashaie, S.S.E.H., Mahecha-Botero, A., Rakib,M., Shirasaki, Y., Yasuda, I., 2008. Sorbent enhanced/membrane-assisted steammethane reforming. Chem. Eng. Sci. 63, 170–182.
Chen, Z., Prasad, P., Yan, Y., Elnashaie, S.S.E.H., 2003a. Simulation for steam-reformingof natural gas with oxygen input in a novel membrane reformer. Fuel Process.Tech. 83, 235–252.
Chen, Z., Yan, Y., Elnashaie, S.S.E.H., 2003b. Modeling and optimization of a novelmembrane reformer for higher hydrocarbons. A.I.Ch.E. J. 49, 1250–1265.
Chen, Z., Yan, Y., Elnashaie, S.S.E.H., 2004. Catalyst deactivation and engineeringcontrol for steam-reforming of higher hydrocarbons in a novel membranereformer. Chem. Eng. Sci. 59, 1965–1978.
Crabtree, G.W., Dresselhaus, M.S., Buchanan, M.V., 2004. The hydrogen economy.Phys. Today 57, 39–45.
De Deken, J.C., Devos, E.F., Froment, G.F., 1982. Steam reforming of natural gas.Chem. React. Eng. Am. Chem. Soc. Symp. Ser., Washington, DC, 181–197.
Deshmukh, S.A.R.K., Heinricha, S., Morl, L., van Sint Annaland, M., Kuipers, J.A.M.,2007. Membrane assisted fluidized bed reactors: potentials and hurdles. Chem.Eng. Sci. 62, 416–436.
Deshmukh, S.A.R.K., Laverman, J.A., van Sint Annaland, M., Kuipers, J.A.M., 2005.Development of a membrane-assisted fluidized bed reactor. 2. Experimentaldemonstration and modeling for the partial oxidation of methanol. Ind. Eng.Chem. Res. 44, 5966–5976.
Dogan, M., Posarac, D., Grace, J.R., Adris, A.M., Lim, C.J., 2003. Modeling of autothermalsteam methane reforming in a fluidized bed membrane reactor. Int. J. Chem.React. Eng. 1, A2.
Elnashaie, S.S.E.H., Elshishini, S.S., 1993. Modelling, Simulation and Optimization ofIndustrial Fixed-bed Catalytic Reactors. Gordon and Breach Science Publishers,Amsterdam.
Ewan, B.C.R., Allen, R.W.K., 2005. A figure of merit assessment of the routes tohydrogen. Int. J. Hydrogen Energy 30, 809–819.
Ferreira-Aparicio, P., Benito, M.J., Sanz, J.L., 2005. New trends in reformingtechnologies: from hydrogen industrial plants to multifuel microreformers. Catal.Rev. 47, 491–588.
Grace, J.R., Abba, I.A., Bi, H.T., Thompson, M.L., 1999. Fluidized bed catalytic reactormodeling across the flow regimes. Can. J. Chem. Eng. 77, 305–311.
Grace, J.R., Elnashaie, S.S.E.H., Lim, C.J., 2005a. Hydrogen production in fluidized bedswith in-situ membranes. Int. J. Chem. React. Eng. 3, A41.
Grace, J.R., Lim, C.J., Adris, A.M., Xie, D., Boyd, T., Wolfs, W.M., Brereton, C.M.H., 2005b.Internally circulating fluidized bed membrane reactor system for autothermaloperations. US Patent Application Publ. 12pp. CODEN: USXXCO US 2005036940A1 20050217. Application: US 2003-637639 20030811.
Hoang, D.L., Chan, S.H., 2004. Modeling of a catalytic autothermal methane reformerfor fuel cell applications. Appl. Catal. A Gen. 268, 207–216.
Jarosch, K., de Lasa, H.I., 1999. Novel riser simulator for methane reforming usinghigh temperature membranes. Chem. Eng. Sci. 54, 1455–1460.
Jin, W., Gu, X., Li, S., Huang, P., Xu, N., Shi, J., 2000. Experimental and simulationstudy on a catalyst packed tubular dense membrane reactor for partial oxidationof methane to syngas. Chem. Eng. Sci. 55, 2617–2625.
Kim, S.W., Kirbas, G., Bi, H.T., Lim, C.J., Grace, J.R., 2004. Flow behavior and regimetransition in a high-density circulating fluidized bed riser. Chem. Eng. Sci. 59,3955–3963.
Koroneos, C., Dompros, A., Roumbas, G., Moussiopoulos, N., 2004. Life cycleassessment of hydrogen fuel production processes. Int. J. Hydrogen Energy 29,1443–1450.
Mahecha-Botero, A., 2009. Comprehensive modelling and its application tosimulation of fluidized-bed reactors for efficient production of hydrogen andother hydrocarbon processes. Ph.D. Thesis. Chemical and Biological EngineeringDepartment, University of British Columbia, Vancouver.
Mahecha-Botero, A., Boyd, T., Gulamhusein, A., Comyn, N., Lim, C.J., Grace, J.R.,Shirasaki, Y., Yasuda, I.., 2008. Pure hydrogen generation in a fluidized bedmembrane reactor: experimental findings. Chem. Eng. Sci. 63, 2752–2762.
Mahecha-Botero, A., Grace, J.R., Elnashaie, S.S.E.H., Lim, C.J., 2005. FEMLAB simulationsusing a comprehensive model for gas fluidized-bed reactors. In: COMSOLMultiphysics (FEMLAB) Conference Proceedings, Boston, USA. 〈http://cds.comsol.com/access/dl/papers/1179/Mahecha-Botero_paper.pdf〉.
Mahecha-Botero, A., Grace, J.R., Elnashaie, S.S.E.H., Lim, C.J., 2006a. Comprehensivemodelling of gas fluidized-bed reactors allowing for transients, multiple flowregimes and selective removal of species. Int. J. Chem. React. Eng. 4, A11.
Mahecha-Botero, A., Grace, J.R., Elnashaie, S.S.E.H., Lim, C.J., 2006b. A generalizeddynamic model for fluidized-bed reactors and its application to the production ofpure hydrogen. In: Asian Pacific Confederation of Chemical Engineering Congress.Kuala Lumpur, Malaysia.
Mahecha-Botero, A., Grace, J.R., Elnashaie, S.S.E.H., Lim, C.J., 2007a. A comprehensiveapproach to reaction engineering. Int. J. Chem. Reactor Eng. 5, A17.
Mahecha-Botero, A., Grace, J.R., Elnashaie, S.S.E.H., Lim, C.J., 2007b. Time scaleanalysis of a fluidized-bed reactor based on a generalized dynamic model. In:Bi, X.T., Berruti, F., Pugsley, T. (Eds.), Fluidization XII. Harrison Hot Springs,BC, Canada, ECI Symposium Series. United Engineering Conferences, Brooklyn.〈http://services.bepress.com/eci/fluidization_xii/76〉, pp. 623–630, ISSN 978-0-918902-57-3.
Mahecha-Botero, A., Grace, J.R., Elnashaie, S.S.E.H., Lim, C.J., 2009a. Advances inmodelling of fluidized-bed catalytic reactors: A comprehensive review. Chem.Eng. Commun., in press.
Mahecha-Botero, A., Grace, J.R., Lim, C.J., Elnashaie, S.S.E.H., Boyd, T., Gulamhusein,A., 2009b. Pure hydrogen generation in a fluidized bed membrane reactor:application of the generalized comprehensive reactor model. Chem. Eng. Sci., inpress, doi:10.1016/j.ces.2009.05.025.
Mleczko, L., Ostrowski, T., Wurzel, T., 1996. A fluidized-bed membrane reactor forthe catalytic partial oxidation of methane to synthesis gas. Chem. Eng. Sci. 51,3187–3192.
Ogden, J.M., 2001. Review of small stationary reformers for hydrogen production. AReport for the International Energy Agency Agreement on the Production andUtilization of Hydrogen. Hydrogen from Carbon-containing Materials.
Patience, G.S., Chaouki, J., Berruti, F., Wong, R., 1992. Scaling considerations forcirculating fluidized bed risers. Powder Technol. 72, 31–37.
Patil, C.S., van Sint Annaland, M., Kuipers, J.A.M., 2005. Design of a novelautothermal membrane-assisted fluidized-bed reactor for the production ofultrapure hydrogen from methane. Ind. Eng. Chem. Res. 44, 9502–9512.
Patil, C.S., van Sint Annaland, M., Kuipers, J.A.M., 2006. Experimental study of amembrane assisted fluidized bed reactor for H2 production by steam reformingof CH4. Chem. Eng. Res. Des. 84, 399–404.
Raich, B.A., Foley, H.C., 1995. Supra-equilibrium conversion in palladium membranereactors: kinetic sensitivity and time dependence. Appl. Catal. A 129, 167–188.
Rostrup-Nielsen, J.R., 1977. Hydrogen via steam reforming of naphtha. Chem. Eng.Prog. 9, 87.
Roy, S., Pruden, B.B., Adris, A., Grace, J.R., Lim, C.J., 1999. Fluidized-bedsteam–methane reforming with oxygen input. Chem. Eng. Sci. 54, 2095–2102.
Scholz, W.H., 1993. Processes for industrial production of hydrogen and associatedenvironmental effects. Gas Sep. Purif. 7, 131–139.
Sehested, J., 2006. Four challenges for nickel steam-reforming catalysts. Catal. Today111, 103–110.
Shu-Ren, H., 1998. Hydrocarbon steam-reforming process: feedstock and catalystsfor hydrogen production in China. Int. J. Hydrogen Energy 23, 315–319.
Sieverts, A., Zapf, G., 1935a. Iron and nitrogen. Zeitschrift fur Physikalische Chemie172, 314–315.
Sieverts, A., Zapf, G., 1935b. The solubility of deuterium and hydrogen in solidpalladium. Zeitschrift fur Physikalische Chemie 174, 359–364.
Snoeck, J.W., Froment, G.F., Fowles, M., 1997. Kinetic study of the carbon filamentformation by methane cracking on a nickel catalyst. J. Catal. 169, 250–262.
Soliman, M.A., Elnashaie, S.S.E.H., Al-Ubaid, A.S., Adris, A., 1988. Simulation of steamreformers for methane. Chem. Eng. Sci. 43, 1801–1806.
Sun, G., Grace, J.R., 1990. Effect of particle size distribution on the performance offluidized bed reactors. Chem. Eng. Sci. 45, 2187–2194.
Thomsen, V.B.E., 2000. LeChâtelier's principle in the sciences. J. Chem. Edu. 77.Tottrup, P.B., 1976. Kinetics of decomposition of carbon monoxide on a supported
nickel catalyst. J. Catal. , 42, 29–36.Twigg, M.V., 1989. Catalyst Handbook. second ed. Wolfe Publishing Ltd, London,
England.Wang, H., Tablet, C., Schiestel, T., Werth, S., Caro, J., 2006. Partial oxidation of methane
to syngas in a perovskite hollow fiber membrane reactor. Catal. Commun. 7,907–912.
Xu, J., Froment, G.F., 1989. Methane steam reforming, methanation and water–gasshift: parts I and II. A.I.Ch.E. J. 35, 88–103.
Yates, J.G., 1983. Fundamentals of Fluidized-bed Chemical Processes. Butterworth-Heinemann, London.