Performance of Fluidized Bed Biofilm Reactor for Nitrate Removal
Upload
khangminh22Category
view
0download
0
-mscmt-sv, 37-/03 - ...NT^SyNP—^
VT
Pressurized fluidized bed combustion and gasification
power systems
VALTION TEKNILLINEN TUTKIMUSKESKUS STATENS TEKNISKA FORSKNINGSCENTRAL
TECHNICAL RESEARCH CENTRE OF FINLAND ESPOO 1988
8ISIR1BUTI0N OF THIS DOCUMENT IS UNLIMITED FOREIGN SALES PROHIBITED

DISCLAIMER
This report was prepared as an account of work sponsored by an agency of the United States Government. Neither the United States Government nor any agency thereof, nor any of their employees, makes any warranty, express or implied, or assumes any legal liability or responsibility for the accuracy, completeness, or usefulness of any information, apparatus, product, or process disclosed, or represents that its use would not infringe privately owned rights. Reference herein to any specific commercial product, process, or service by trade name, trademark, manufacturer, or otherwise does not necessarily constitute or imply its endorsement, recommendation, or favoring by the United States Government or any agency thereof. The views and opinions of authors expressed herein do not necessarily state or reflect those of the United States Government or any agency thereof.
DISCLAIM ER
Portions of this document may be illegible in electronic image
products. Images are produced from the best available
original document.
UDK 662.74:662.76:66.096.5
Keywords:combustion, fluidized bed processors, pressurizing, gasification, coal, peat, electric power plants
VTT SYMPOSIUM 83
VTT-SYMP—83
DE89 766970
rr ]
Pressurized fluidized bed combustion and gasification power systems
Espoo, 23.-24.11.1987
Editor: Maija KorhonenTJ£.
Organizers:Helsinki University of Technology,Laboratory of Energy Economics and Power Plants Technical Research Centre of Finland,Laboratory of Fuel Processing and Lubrication Technology Imatran Voima Oy
MASTERVALTION TEKNILLINEN TUTKIMUSKESKUS STATENS TEKNISKA FORSKNINGSCENTRAL TECHNICAL RESEARCH CENTRE OF FINLAND Espoo 1988
BtSTRiBUTION GF THIS DOCUMENT IS UNLIMITEDFOREIGN SALES PROHIBITED

ISSN 0357-9387Copyright © Valtion teknillinen tutkimuskeskus (VTT) 1988
JULKAISIJA - UTGIVARE - PUBLISHER
Valtion teknillinen tutkimuskeskus (VTT), Vuorimiehentie 5, 02150 Espoopuh. vaihde (90) 4561, teleksi 122972 vttha sf r j
L . . _v4.
Statens tekniska forskningscentral (VTT), Bergsmansvagen 5, 02150 Esbo tel. vaxel (90) 4561, telex 122972 vttha sf
Technical Research Centre of Finland (VTT), Vuorimiehentie 5, SF—02150 Espoo, Finland phone intemat. + 358 0 4561, telex 122972 vttha sf
r r
VTT, Polttoainejalostus-ja voitelutekniikan laboratorio, Biologinkuja 3-5,02150 Espoo puh. vaihde (90) 4561
VTT, Laboratoriet for bransleforadlings- och smoijteknik, Biologgranden 3-5, 02150 Esbo tel. vaxel (90) 4561
VTT, Laboratory of Fuel Processing and Lubrication Technology, Biologinkuja 3—5, SF—02150 Espoo, Finland
I l
VTT OFFSET?AINO, ESPOO 1988

- 3 -
FOREWORD
Antero Jahkola, Prof.Helslnlcf University of Technology Espoo, Finland
The application of fluidized bed combustion to energy production Is
cornnerclally established and Its Importance Internationally recognized.
So far It has based on atmospheric combustion technology (AFBC).
Pressurized fluidized bed combustion (PFBC) has not yet been applied to
commercial energy production 1n any country. However, test plants have
been constructed, extensive research projects carried out and the pilot
plant stage has already been reached.
In Finland, research Into pressurized fluidized bed combustion was
initiated In 1985, at first by studying thoroughly research results
obtained in other countries and by evaluating the advantages of
fluidized bed combustion and gasification technology within the context
of Finland's energy economy. The preliminary studies warranted the ini
tiation of experimental research and the construction of test equipment
for pressurized fluidized bed combustion and gasification. A research
project of several years' duration was Initiated In 1986 as a joint
project between the Helsinki University of Technology, the Technical
Research Centre of Finland, and Imatran Voima Oy. The first pressurized
combustion experiments with peat were carried out In summer 1987. The
work 1s funded mainly by the Finnish Ministry of Trade and Industry.
It is also of crucial Importance to the progress of the research work,
to Increase the level of expertise of our researchers and hence inter
national cooperation and Interchange of views. International seminars
and conferences are especially well suited for this purpose. The PFGC/G
Seminar organized in Otanleml on November 23 - 24, 1987, was the first
attempt towards this goal. The Seminar was planned and organized by the
executive group of the BFBC/G research project.
I _T J
r r̂__ i

- 4 -
The foreign lecturers Invited to the Seminar represent the highest
international expertise. They reviewed the present results and level
of international research and development in the field of pressurized .
fluidized bed combustion and gasification, and problems that require
further research. The aim of the Finnish lecturers was to inform about
the research work, its aims and results.
The first PFBC/G seminar aroused gratifyingly, extensive interest
in Finland and also in the other Nordic countries. The seminar was
attended by 75 participants, mainly specialists and researchers in
the field.
I wish to extend iqy best thanks to the participants, organizers, and
lecturers, in particular to the foreign guests, for the successful
seminar.
Espoo, January 1988
C r
i .i
T f
Antero Jahkola
Chairman of the Organizing Committee

CONTENTS
FOREWORD 3
Antero Jahkola
OPENING ADDRESS 7
Seppo Hannus
RESEARCH INTO PFBC IN FINLAND
POWER AND HEAT GENERATING PFBC COMBI PROCESSES AND 9
THEIR POTENTIAL MARKETS IN FINLAND
Antero Jahkola, Seppo Hulkkonen S Karl Savlharju
GASIFICATION COMBINED CYCLE POWER GENERATION - 37
PROCESS ALTERNATIVES
Esa Kurkela
THE OTANIEMI PFBC/G TEST RIG AND RESEARCH PROJECT 53
Seppo Hulkkonen, Antero Jahkola & Esa Kurkela
PRESSURIZED COMBUSTION TECHNOLOGY
PFBC RESEARCH AND DEVELOPMENT - BRITISH EXPERIENCES
H. Raymond Hoy 59
PRESENT STATUS AND FURTHER DEVELOPMENT OF PFBC 99
COMBINED-CYCLE PLANT
Krishna K. Pillai
- 5 -
PRESSURIZED FLUIDIZED BED COMBUSTION OF PEAT
Andras Horvath
121
- 6 -
GASIFICATION COMBINED CYCLE POWER GENERATION
NEW COAL TECHNOLOGIES 133
Rainer Muller
THE RHEINBRAUN HTW-GASIFICATION TECHNOLOGY FOR 161
COMBINED CYCLE POWER GENERATION
Eberhard Nitschke
THE PRESSURIZED BED PEAT GASIFICATION PLANT OF 193
KEMIRA OY IN OULU
Kalevi Kuorelahti
TECHNO-ECONOMIC EVALUATION OF DIFFERENT GASIFICATION 199
COMBINED CYCLE PROCESSES
Yrjo Solantausta
l _E _
HOT GAS CLEANUP
HOT GAS CLEANUP: THE STATE-OF-THE-ART, AND PROSPECTS 213
FOR THE FUTURE
Roland Clift
DIDIER HOT GAS FILTER SYSTEMS 237
Ulrich Weidner
PARTICLE MEASUREMENTS AT THE bTAHlE^I PFBC/G TEST RIG 251
Seppo Hulkkonen
THERMODYNAMIC STUDY OF ALKALI METALS RELEASE IN PRESSURISED 263
FLUIDISED-BED COMBUSTION AND GASIFICATION OF PEAT
Wahab Mojtahedi & Rainer Backman
APPENDIX
[ I .
E l.
11
\

- 7 -
OPENING ADDRESS
Seppo Hannus, Dr.
Ministry of Trade and Industry
Energy Department
00131 Helsinki, Finland
On behalf of the Ministry of Trade and Industry and its Energy Depart
ment I have the prlvlledge to open this seminar on pressurized
fluidized bed combustion and gasification power systems.
The subject of this seminar has a high priority both Internationally
and here in Finland. There are several reasons for this and they origi
nate from the present situation in the world energy scene. With the
continuying growth of energy consumption and. In particular, electrici
ty consumption more energy production capacity is needed. This Is true
both in the near and long term future. At the same time the available
energy sources are few. The present trends indicate that a large part
of the additional energy needs will or have to be satisfied with solid
fuels, especially coal. And these prospects are not problem-free. En
vironmental concern already plays a major role in energy policy, and in
a situation with growing coal consumption the concern is likely to
become more acute.
Looking beyond the year 2000 we can see the present electricity capaci
ty becoming old and needing replacement. In Finland like In many other
industrialized countries a large part of the electricity capacity has
been constructed In the 1970s and will have to be replaced in the first
or second decade of the next century. Much more decisions on the con
struction of new capacity will have to be made In the 1990s than has
been necessary In the 1980s. In this situation the first priority 1s to
maximize the electricity capacity in combined heat and power genera
tion. Since solid fuels will, most probably, play a significant role In
future power systems extensions we have to be prepared to meet high
environmental emission standards, too.
r
- 8 -
These prospects and concerns are the main motivation why the Ministry
of Trade and Industry has set a high priority on combustion research
and development work. The information available to the Ministry indi
cates that there is a considerable long-term technological potential
for developing better energy production and combustion processes. It
has also been estimated that the Finnish technological and scientific
expertise in this field has the possibility for becoming competitive on
the international level. And thus we could be able to develop our own
technologies instead of being totally dependent on technology transfer
from other countries. This, however, implies active cooperation with
other countries carrying out similar research activities. The future
will show whether we have been realistic in estimating our resources
and capacities.
In practical terms, the Ministry has decided to launch an extensive
long-term research programme on advanced combustion technologies. It
has been estimated that the total cost of this five-year programme
would be in the order of FIM 100 million, of which about one half would
come from the public energy research funds and the other half would be
draw from other sources. This project is called Liekki (which is Fin
nish and means flame).
Like all the participants of the Seminar well know the most promising
new combustion technologies are related to pressurized fluidized bed
combustion and gasification power systems which are the subject of this
seminar. I will not now go into the technical substance of these topics
but on behalf of the Ministry of Trade and Industry wish the best suc
cess to this Seminar.
r
L T
w T£. ^1.
Wl
\

- 9 -
POWER AND HEAT GENERATING PFBC COMBI PROCESSES AND THEIR POTENTIAL MARKET IN FINLAND
A. Jahkola, Prof., S. Hulkkonen, M.Sc.(Eng.) K. Savlharju, M.Sc.(Eng.)*Helsinki University of Technology and Technical Research Centre of Finland* Otaniemi, Espoo, Finland
Abstract
Pressurized fluidized bed combustion/gasification makes it possible to construct gas turbine power plants based on solid fuels. By connecting, after the gas turbine, a steam-generator and a back-pressure turbine we/obtain a combined process, which has a good thermal efficiency and a two-threefold power to heat ratio compared with conventional back-pressure power plants utilizing solid fuels. The ratio, however, decisively depends on the allowable inlet temperature of the gas turbine. Low calorific value fuels are also suitable for such a power plant. The PFBC combined processes are of special interest from the Finnish point of view, as the growth of heat load is saturating in industry and in cities while the demand of electric power is growing further rapidly.
In the report alternative combined PFBC-cogeneration power processes are compared. The best power to heat ratio can be obtained by means of a partial gasification process equipped with an after-burning combustor. In case of a cogeneration power process the power to heat ratio is 1.0-1.3 whilst it is only 0.5 for conventional cogeneration power plants.
rk. a1
l l
10 -
According to the results of a market study summarized in the report nearly 3000 megawatts of PFBC combined cogeneration power plant capacity can be built in industrial or municipal power plants, of which 1400 megawatts are the increase in the capacity of conventional back-pressure power plants.
According to preliminary profitability calculations the economic competitiveness of the PFBC-cogeneration processes also seems to be fairly good compared to that of the conventional power plants.
1 INTRODUCTION
Pressurized fluidized bed combustion has some advantages compared with the conventional combustion methods and also with atmospheric fluidized-bed combustion. In a fluidized bed boiler it is possible to use a great variety of fuels, including low-grade fuels, efficiently and with low emissions. Due to high pressure and efficient heat transfer the pressurized fluidized bed boiler is small-sized.
Pressurized combustion makes it possible to construct gas turbine plants based on solid fuels. The gas turbine process preceding a conventional steam power plant process improves the efficiency of a condensing power plant and the power to heat ratio of a cogeneration power plant.
2 CHARACTERISTIC PROPERTIES OF PFBC COMBINED CYCLE PROCESSES
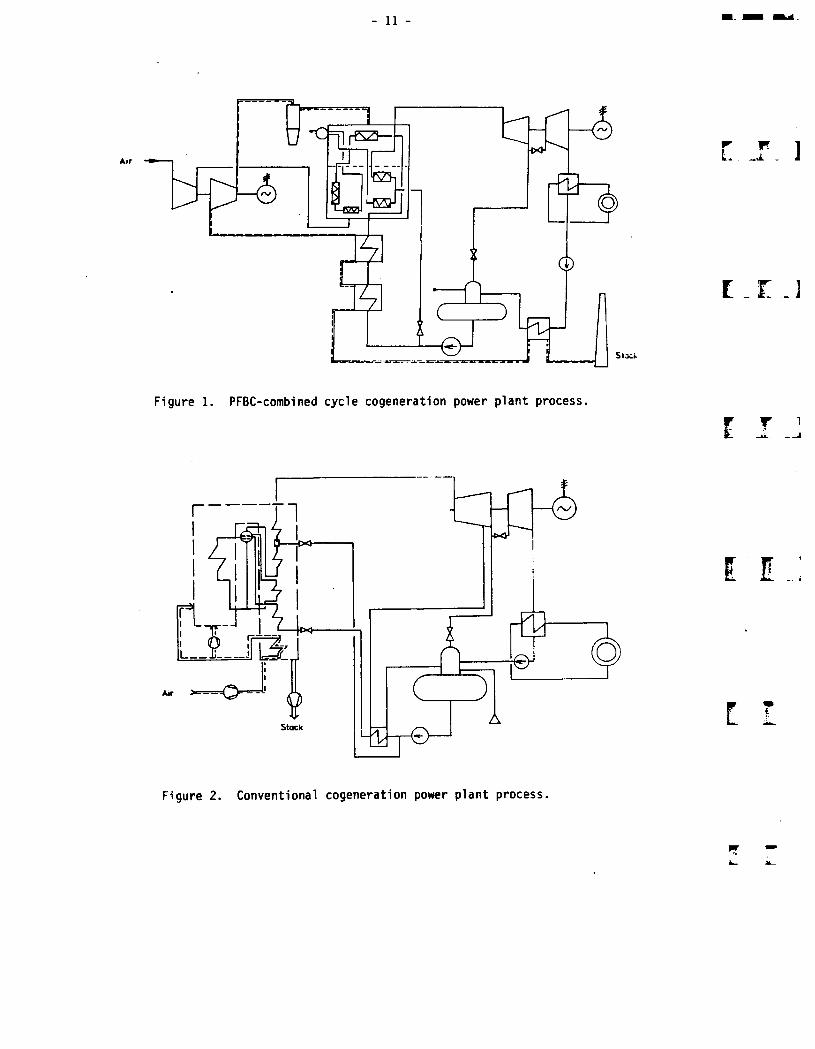
Figure 1 shows a process scheme of a small-scale PFBC district heating power plant based on steam-cooled combined cycle system.
r rU _ _.i
l I
l I
l l
11
Air
Stack
Figure 1. PFBC-combined cycle cogeneration power plant process.
r. r . i
Figure 2. Conventional cogeneration power plant process.

12 -
The combustion chamber of the steam generator is pressurized to an operating pressure of 6 - 12 bar. After cleaning in a hot gas dust filter, the flue gases expand through the gas turbine.The heat remaining in the flue gases is transferred to the feed water of the steam cycle. The generated steam is used to drive a steam turbine and finally to generate district heat.
The fuel (peat) input of the power plant is 50 MW, resulting in 28 MW district heat and 15 MW electric power. Approximately 30% of the electric output is generated in the gas turbine.
The power to heat ratio is a very characteristic feature in case of cogeneration power plants. It is defined as the output of electricity in relation to the output of district heat.
The effect of the gas turbine inlet temperature on the power to heat ratio can be clearly seen in figure 3 where the compressor pressure ratio is 8:1. The power to heat ratio is growing sharply when the gas turbine inlet temperature is increased.
The effect of the compressor pressure ratio on the power to heat ratio is shown in figure 4. At higher pressures the power to heat ratio could be improved by using intercooling in the compressor.
The effect of the moisture content of peat on the power to heat ratio is shown in figure 5, when the pressure ratio of the compressor is 8:1.
I r
r r
i r

13 -
Ot
W :S0%
1000 tec) 4
FlgunS. The aftoct of gas turblnt Infat twnptratum Figure 4. The effect of the compressor pressure(t) on the power lo heet retio (a)- ratio (x) on the power to heat ratio (a).
Moisture o( peat w - 50%; Pressure ratio x - 8:1
port
oc.
70 w(%)
Figures. The effect of the moisture contentfw) of Figures. Overall thermal effiency ft) as a function peat on the power to heat ratio (a). of the moisture content of peat (w).Gas turbine Inlet temperature as parameter
E.XJ
SI.
14 -
The gas turbine inlet temperature is used as the third parameter. The power to heat ratio increases when the moisture content of the fuel is increased. This is due to a large amount of water vapour in the flue gases which has a positive effect on turbine output. It should, however, be noted that the gas turbine inlet temperature also increases, when the moisture content is decreased.
The effect of the fuel moisture on the overall thermal efficiency is shown in figure 6. The thermal efficiency decreases when the moisture content of the fuel is increased. The reduction in efficiency is due to increased flue gas losses.
3 THE MOST ATTRACTIVE PROCESS ALTERNATIVES OF PFBC COMBINED CYCLE POWER PLANTS
For extensive utilization of combined cycle power plant processes in Finnish conditions one of the basic requirements is the capability of cogeneration of power and heat. It is advantageous if hereby the power to heat ratio is as high as possible. In addition, it should be possible to use indigenous low-grade fuels as the main fuels.
Principally, there is quite a number of process alternatives applicable to PFBC combined cycle power plants. In the following only the most attractive ones will be reviewed.
For the small-scale cogeneration power plants the PFBC process alternative given in figure 1 is rather attractive. It has steam cooling of the fluidized bed, and, therefore, a simple process scheme. It is suitable for low-grade fuels of high moisture content. However, due to the moderate inlet temperature of the gas turbine the power to heat ratio is relatively low as seen in figures 3-5.
z z ;;
T r
\

15 -
For the larger scale cogeneration power plants the following four process alternatives can be seen as the most. attractive ones. They are suitable for the thermal output of appr. 200 MW.
3.1 Steam-cooled process
Figure 7 shows a PFBC combined cycle cogeneration power plant process where the bed is cooled with a water/steam coil (supercharged boiler cycle).
The bed temperature at 100% load is 850°C, and the flue gas temperature before the stack 150°C. The pressure ratio is 12:1 and the air coefficient 1.25.The steam turbine is provided with reheating. The district heat output of the plant is 105 MW, divided almost equally between two heat exchangers. The electric power output of the steam turbine is 49 MW and of the gas turbine 24 MW, the power to heat ratio being 0.693 for the whole plant. The temperature of the district heating water leaving the plant is 120 °C in the case reviewed. A higher power to heat ratio could be obtained with a lower water temperature.
3.2 Air-cooled process
Figure 8 shows an air-cooled PFBC cogeneration power plant process. In this case some of the by compressor pressurized air is conducted into the heat exchanger to cool the fluidized bed (air heater), and the rest is used for combustion in the fluid bed. After the gas cleaning the air and gas flows are combined and fed into the gas turbine.The fluidized bed combustor is pressurized to 12 bar. Approximately 1/3 of the compressed air goes into combustion and 2/3 are conducted through the cooling coils of the bed.
in

16 -
Process-values at dimensioning point
Steam cycle Gas cyclem P t h m p t h
kg/s bar •c kJ/kg kg/s bar •c kJ/kg1 46.3 160 565 3475 1 97.5 1 15 163 46.3 42 565 3590 2 97.5 12 351 3714 1.84 4.5 315 3090 4 118 11.5 850 10506 21.4 0.6 135 2758 5 118 1 450 541
16 46.3 160 330 1530 7 118 1 150 17017 358 5019 358 120
0f -200 MW 0dh - 105.3 MWpot - 24.0 MW Pst - 49,0 MW
a - 0.693
w TL. L
Figure 7. Steam-cooled PFBC cogeneration power process.
w

17 -
i.WT I
r ;t i
Process values at dimensioning point
Steam cycle Gas cyclem P t h m P t hkg's bar *€ kJ/kg kg/s bar °C kJ/kg
1 48.3 160 565 3475 1 97.5 1 15 163 48.3 42 565 3590 2 97.5 12 351 3714 1.8 4.5 315 3090 4 43.7 11.5 850 10506 22.3 0.6 135 2758 5 105.1 11.5 850 1050
16 48.3 160 330 1530 6 105.1 1 460 54117 375 50 7 118 1 473 55619 375 120 9 118 1 150 170
11 61.3 11.5 850 1050
0, = 200 MW (tot) ®dh = 110.2 MWpgt!= 17.2 MW Pst = 51.4 MW
a = 0.628
Figure 8. Air-cooled PFBC cogeneration power process.In exhaust-gas boiler supporting burning.
WL
18 -
The air coefficient for combustion is 1.25. The bed temperature is 850 °C, and the temperature of flue gases before the stack 150 0C.Steam is produced in an exhaust-gas boiler equipped with additional combustion. Approximately 2/3 of the total fuel input of the plant are fired in the exhaust-gas boiler. An atmospheric fluidized bed boiler can be used as the exhaust-gas boiler.
The district heat output of the plant is 110 MW, which is divided almost equally between two heat exchangers. The electric power output generated by the steam turbine is 51 MW, and that of the gas turbine 17 MW. This gives a power to heat ratio of 0.628.
3.3 Steam-cooled process with partial gasification of fuel
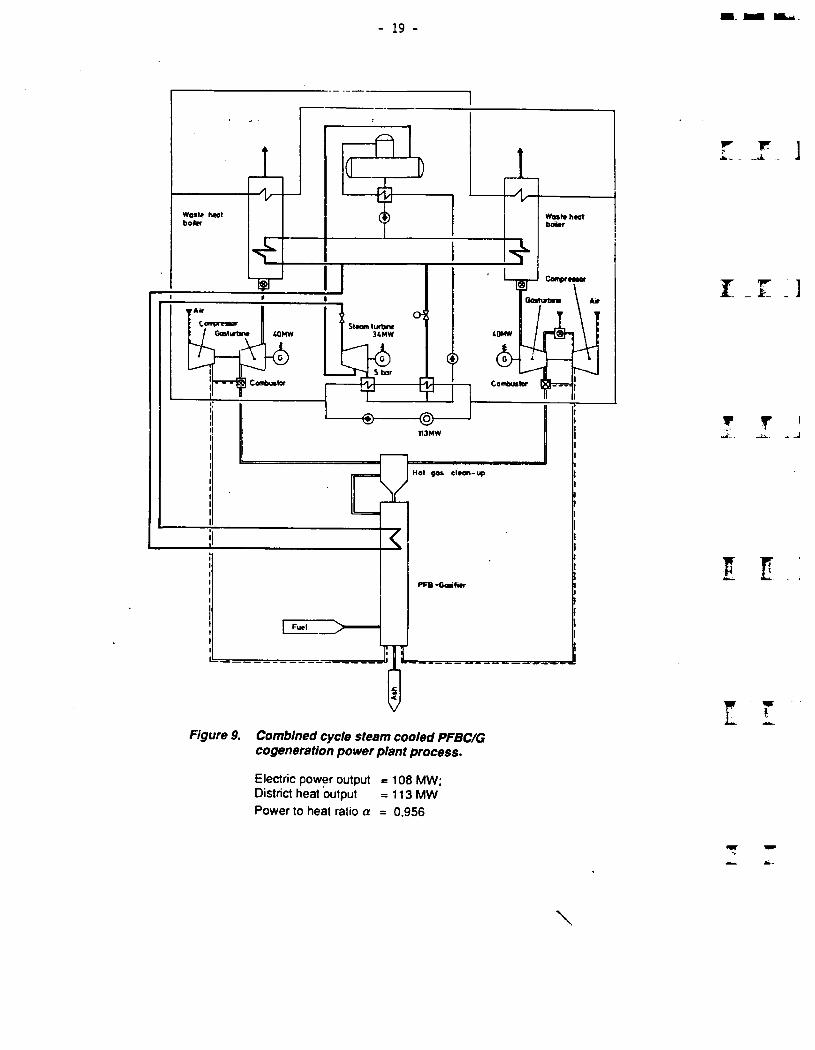
Figure 9 shows a steam-cooled combined cycle cogeneration power scheme, where a PFB-reactor is used as a pyrolysing gasifier operating with understoichiometric air. The gasifier is cooled by superheated steam. The gas turbine inlet temperature is 1100 °C. Hot product gases are cleaned by a clean-up system and conducted into the combustors of two parallel gas-turbine units. The temperature of product hot gases is kept relatively low (600 °C). After the gas turbine flue gases are conducted into two exhaust gas boilers which produce steam for a back-pressure steam turbine. The boilers are also used as additional heaters of the district heating water. The gas turbines generate 2 x 40 MW electric power and the steam turbine 34 MW. The total net electric power output is 108 MW. The respective district heat output is 113 MW. The power to heat ratio is thus 0.956.
r r
f
fcaU fc-J
19 -
boiler boiler
113MW
Hot go& clean-up
Figure 9. Combined cycle steam cooled PFBC/G cogeneration power plant process.
Electric power output = 108 MW;District heat output =113 MW Power to heat ratio a = 0,956
r f•ib 4
3
i _ i: ]
\

- 20 -
3.4 Air-cooled process with partial gasification of fuel
A scheme of an air-cooled process provided with partial gasification is given in figure 10. The fuel is fed into the gasifier in which, due to the prevailing temperature, partial gasification takes place. The remaining combustible char is separated in the cyclone, and conducted into the air-cooled PFB-boiler. Some of the flue gases formed in the boiler are conducted into the gasifier, and the remainder is combined with the heated cooling. The gas released from the gasifier is burned together with the air/flue gas mixture in the after-burner before the gas turbine. The temperature of the fluidized bed is 850-900 °C, from where the gas temperature is raised in the after-burner to 1090 °C before the gas turbine. The quantity of pressurized air conducted into the process is considerably larger than the air flow of preceding processes. The total air coefficient used in this case is about 2.4. Steam is produced in the exhaust-gas boiler.The district heat output of the plant is 73 MW, the electric power output generated by the steam turbine is 34 MW and by the gas turbine 57 MW, which is considerably higher than in other alternatives. The power to heat ratio of the plant is thus 1.25.
3.5 Comparison between processes
The clearly highest power to heat ratio among the processes under comparison is obtained with the processes provided with partial gasification. Thus the proportion of electric power output generated by the gas turbine is fairly large due to the high inlet temperature of the gas turbine. Due to the high temperature level the temperature of flue gases after the gas turbine is also sufficient for generating high-standard steam.

- 21 -
Process values at dimensioning point
Steam cyclem P t hkg/s bar ‘C kJ/kg
1 32.0 160 565 34753 32.0 42 565 35904 1.2 4.5 315 30906 14.8 0.6 135 2758
16 32.0 160 330 153017 248 5019 248 120
0f = 200 MWPgt = 57.2 MW
a =1.25
Gas cyclem P t hkg/s bar *0 kJ/kg
1 183.7 1 15 152 183.7 12 351 3715 204.2 11.5 1090 13136 204.2 1 610 6987 204.2 1 302 3199 204.2 1 150 170
°dh = 73,0 MW
Pst = 33.8 MW
I E
Figure 10. Air-cooled PFBC cogeneration power process with partial
gasification.

- 22 -
The highest power to heat ratio can be achieved by the air-cooled process, but due to the large quantity of flue gases the flue gas losses of the process are greater than those of other alternatives. As a consequence, the overall efficiency of energy production is somewhat lower. As a whole, the air-cooled process is quite complex, and according to a reference /3/ it is less economic than the other alternatives. It should, however, be borne in mind that the significance of the high power to heat ratio of cogeneration has not been properly considered in this comparison. As a more attractive alternative, however, can be considered a steam-cooled process provided with partial gasification.
The power to heat ratio of the process based on air-cooled fluidized bed is relatively low, 0.628. A mere 25 % of the total electric power output is generated by the gas turbine." The process has the advantage that the amount of flue gases to be cleaned is small. In addition, it is possible to select a higher ratio of the gas turbine than in a conventional air-cooled process since the operation of the exhaust-gas boiler is enhanced by additional combustion. A weakness of the process principle is that additional combustion passes the first part of the overall process. For this reason the process is neither economic with natural gas.
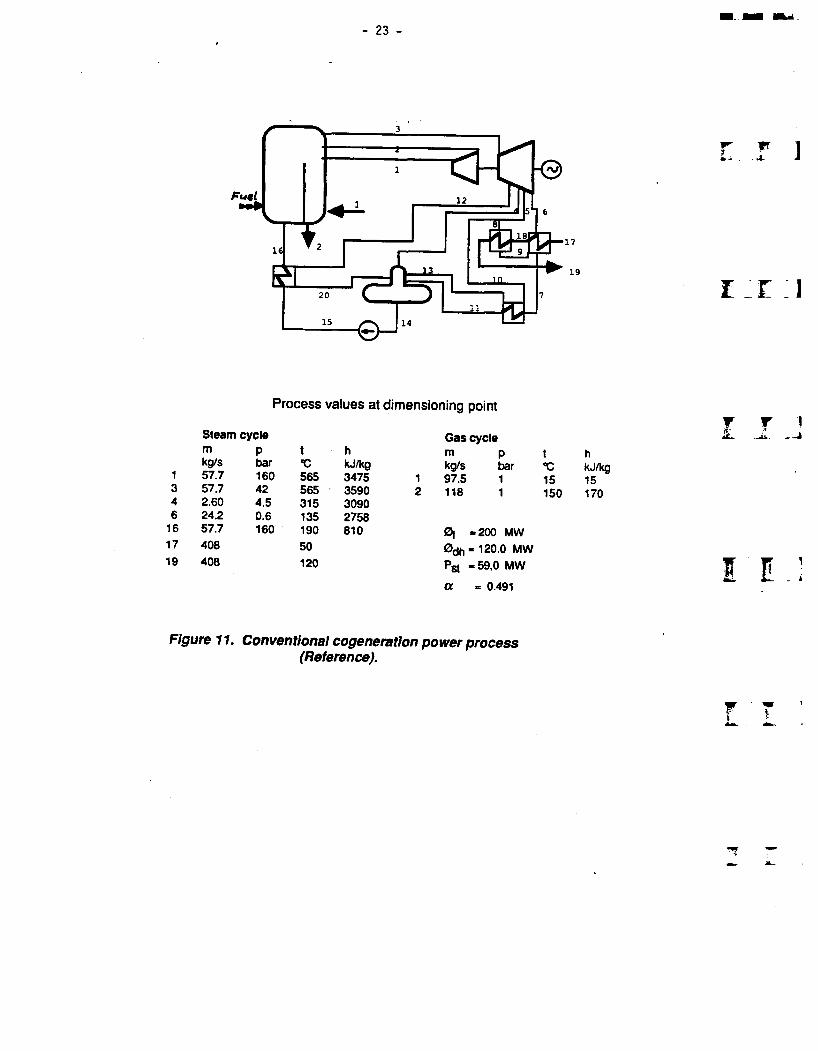
For comparison of the advantages achievable with pressurized combustion and combined-cycle processes a respective conventional cogeneration process was also evaluated. The scheme and essential process values of this process are given in figure 11. The process follows a similar principle as the steam cycles of PFBC-processes.
—i
r r
- 23 -
•17
19i _r :i
Process values at dimensioning point
Steam cycle Gas cyclem P t h m p t hkg/s bar ’C kJ/kg kg/s bar *C kJ/kg
1 57.7 160 565 3475 1 97.5 1 15 153 57.7 42 565 3590 2 118 1 150 1704 2.60 4.5 315 30906 24.2 0.6 135 2758
16 57.7 160 190 810 0f -200 MW17 408 50 0dh - 120.0 MW19 408 120 Pst * 59,0 MW
a = 0.491
r r i
Figure 11. Conventional cogeneration power process (Reference).

- 24 -
The electric power output generated by the plant is 59 MW, and the district heating output 120 MW. This gives a power to heat ratio of 0.491. The overall thermal efficiency of the process is about 89 %.
4 THE ECONOMIC PROFITABILITY OF PFBC COMBINED CYCLE PROCESSES
From the utility point of view various PFBC processes have been compared with a conventional district heating process both in small and medium-size plants. It is assumed that the compared process alternatives satisfy the same heat demand, whilst the electric power output varies depending on the process scheme used.
4.1 Profitability of small PFBC-district heatingcogeneration plants
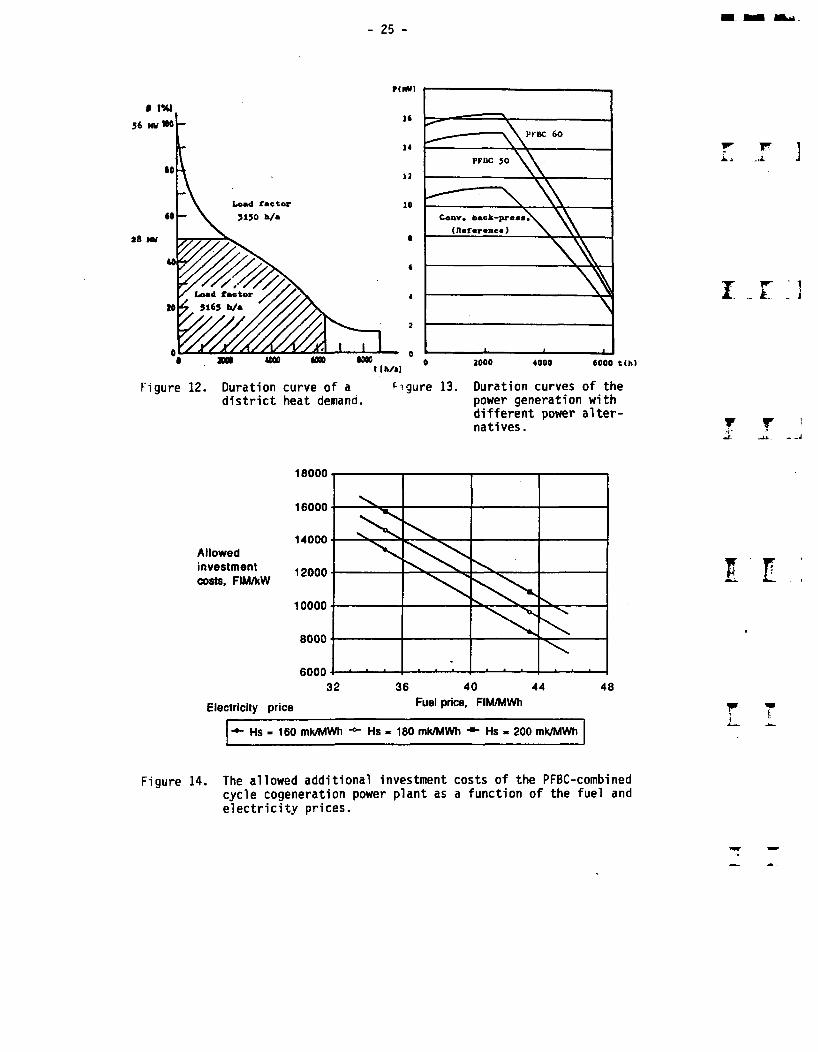
The process scheme of the compared small-scale PFBC-district heating plant is shown in figure 1. The profitability of the PFBC combined cycle process is compared with a conventional back-pressure power plant process, shown in figure 2. Its fuel input is of the order of 50 MW in all cases.Based on the duration curve of figure 12 the total energy generated over the year is calculated. The generated district heating output and energy are the same for all the compared alternatives: the maximum output 28 MW and the produced annual energy 146 GWh/a. The maximum electric power output of the conventional cogeneration process is 11 MW, and the produced annual energy is 53 GWh/a. The respective values for the PFBC-combined cycle processes are 14 - 16 MW and 70 - 75 GWh/a. The duration curves of the electric power generation with respective process alternatives are shown in figure 13.
r "" rr
i: r ;
f Tjik. -Al.
- 25 -
56 MfWOPKBC 60
PFBC 50
Load factor3150 h/m Conv. back-pr
<Ref«r«nc»)28 MW
Lead factor
4000 6000 t(h>
Figure 12. Duration curve of a figure 13. Duration curves of the district heat demand. power generation with
different power alternatives.
Allowed investment costs, FIM/kW
Electricity price
18000
16000
14000
12000
10000
8000
6000
Fuel price, FIM/MWh
Hs = 160 mk/MWh -°- Hs - 180 mk/MWh * Hs - 200 mk/MWh
]
I .1 1i
r rjt _ii. . _j
Figure 14. The allowed additional investment costs of the PFBC-combined cycle cogeneration power plant as a function of the fuel and electricity prices.
- 26 -
The supposed fuel is peat with a moisture content of either 50% or 60% alternatively. In the case of 50% peat (PFBC 50) the process is dimensioned for peat of 50% moisture content. The electric power output is 15.1 MW with the power to heat ratio of 0.53. The overall thermal efficiency is 86% and the fuel input is 50 MW.
In the case of a 60% moisture content (PFBC 60) the rated electric power output is 16.3 MW with the power to heat ratio of 0.58. The overall thermal efficiency is 85% and the fuel input 52 MW.
The highest output of electric power is generated by the PFBC 60 process, the power output of which is 16.3 MW and the annual energy 76 GWh/a. The respective values for the reference plant are 11.3 MW and 49 GWh/a.
The economic comparison of the different alternatives is shown in table 1.
The fuel price is depending on the moisture of peat.The price of generated surplus electric power has been assumed to be the medium price of electricity at the Finnish national grid, in 1986 approximately 160 FIM/MWh.
The biggest profit can be achieved by the PFBC 60 alternative, in which the price of the 60% moist peat is 35 FIM/MWh. The total profit over the year is approximately FIM 6 million/a compared with the reference plant. The annual profit of the PFBC 50 alternative is FIM 2.2 million/a.
The allowed cost for the additional investment of the PFBC 60 plant is FIM 1075/kW ‘a when the fuel price is FIM 35/MWh. The corresponding cost for the PFBC 50 alternative is FIM 505/ kW‘a.
i t :
t rJL
IE
- 27 -
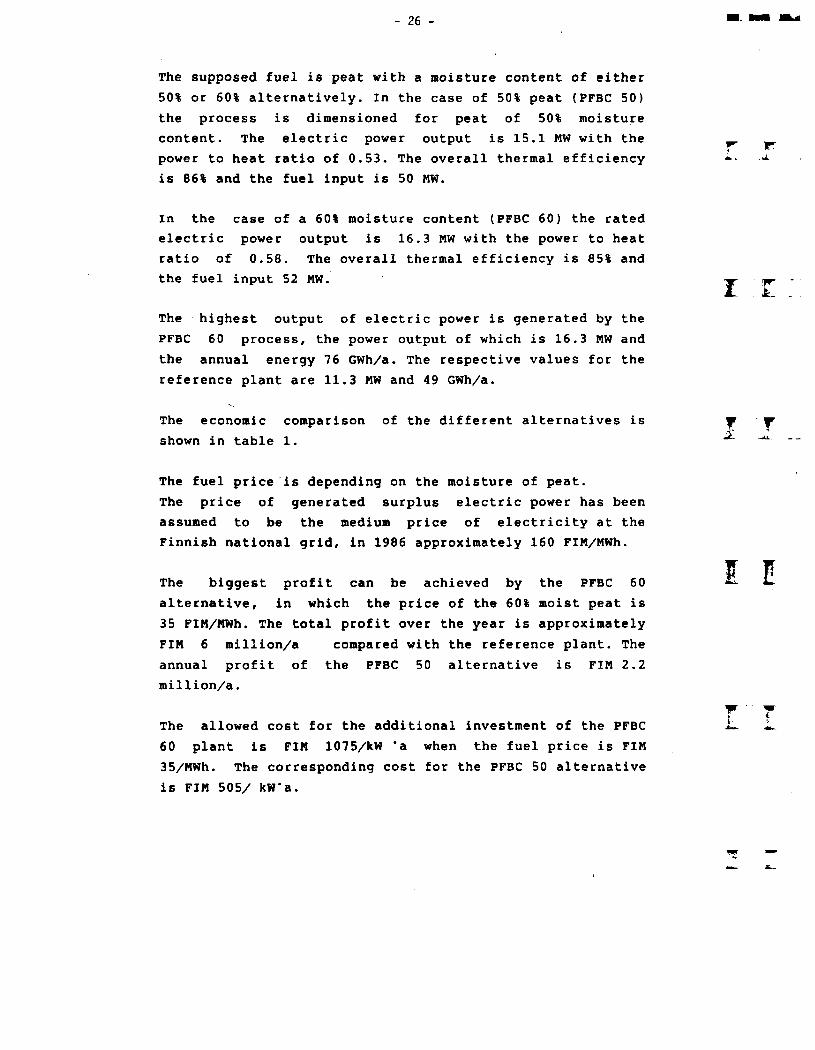
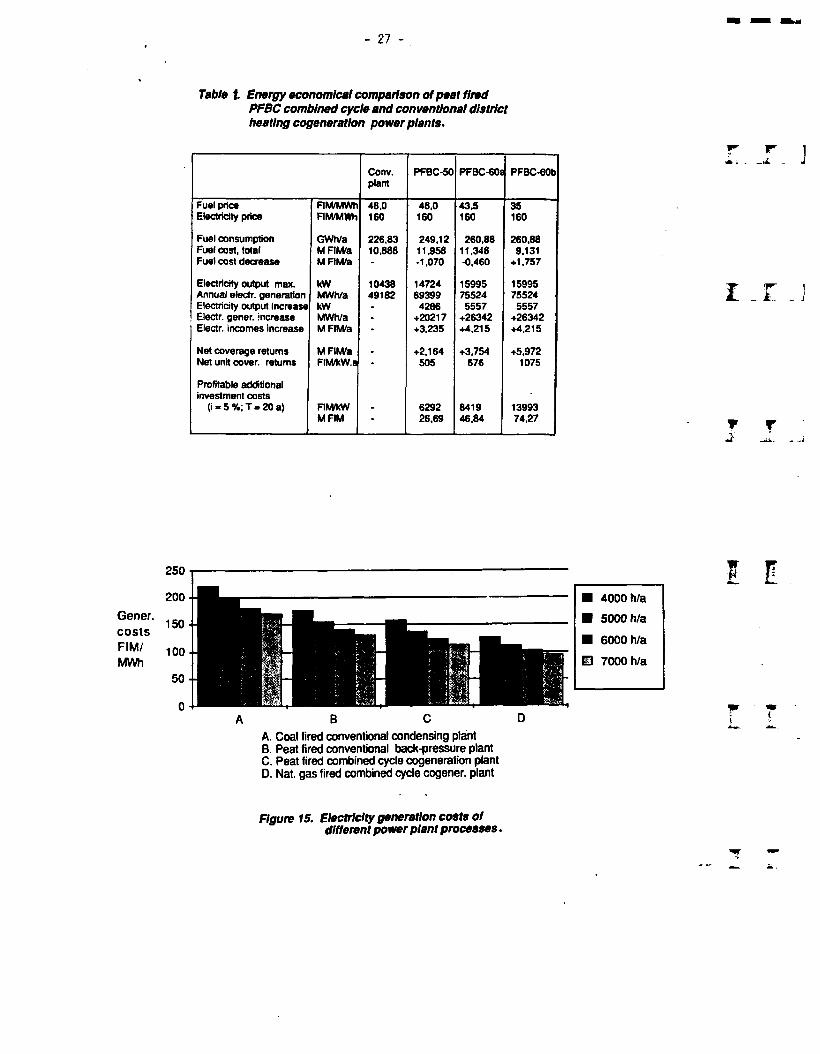
Table l Energy economical comparison of peat firedPFBC combined cycle and conventional district heating cogeneration power plants.
Conv.plant
PFBC-50 PFBC-60S PFBC-60b
Fuel price FIM/MWh 48,0 48,0 43.5 35Electricity price FIM/MWh 160 160 160 160
Fuel consumption GWh/a 226,83 249,12 260,88 260,88Fuel cost, total MFIM/a 10,668 11,958 11,348 9,131Fuel cost decrease MFIM/a - -1,070 -0,460 +1,757
Electricity output max. KW 10438 14724 15995 15995Annual electr. generation MWh/a 49182 69399 75524 75524Electricity output increase kW - 4286 5557 5557Electr. gener. increase MWh/a - +20217 +26342 +26342Electr. incomes increase MFIM/a * +3,235 +4,215 +4,215
Net coverage returns MFIM/a . +2,164 +3,754 +5,972Net unit cover, returns FIM/kW.a - 505 676 1075
Profitable additional investment costs
(i = 5%;T«20a) FIM/kW 6292 8419 13993MFIM * 26,69 46,84 74,27
250
Gener.costsFIM/MWh
A. Coal fired conventional condensing plantB. Peat fired conventional back-pressure plantC. Peat fired combined cycle cogeneration plantD. Nat. gas fired combined cycle cogener. plant
Flgun 15. Electricity genentlon costs ofdlffennt power plant processes.

- 28 -
Figure 14 shows the allowed investment costs as a function of the price of peat with 60% moisture content using the electricity price as a parameter. The assumed operating time is 20 years and the rate of interest 5%. The strong effect of the electricity price on the allowed investment costs is visible.
4,2 Profitability of medium-size district heating powerplants
The profitability of medium-size (200 MW) combined cycle cogeneration plants was evaluated for the case of a steam- cooled PFBC with partial gasifier (figure 9).
A cost estimate for the peat-fuelled cogeneration power plant is shown in table 2, The compared process alternatives are a 500 MW coal-fired condensing power plant with desulphurization, a conventional 60/120 MW peat-fired cogeneration power plant, and a natural gas fuelled combined cycle cogeneration system. The annual costs of electricity generation with different power plant alternatives are illustrated in figure 15.
According to the comparison in table 2 and in figure 15 the combined cycle power plant fuelled with milled peat is clearly more economic than the coal-fired condensing power plant, and generates electric power at about the same price as the conventional peat-fired cogeneration power plant with equal heat output. If we consider the higher electric power output of the plant with pressurized combustion, and the difference has to be covered by condensing power, the pressurized combustion, instead, makes it possible to get 10-15% lower overall production costs.A natural gas fuelled combined cycle power plant is, however, the most economic at current gas prices.
I T

29
Table 2. Comparison of power and heat production costsbased on different process alternatives.
ProcessFuel
Steam turbine plant Gas/steam turbine plantHard coal Milled beat Milled oeat Natural oas
Plant capacity- electric power output MW 500 60 107 104- district heat output MW 0 120 114 108
Process efficiency- electric power % 40,3 81,3 76,9 78,1• district heat % 0.0 87,0 89,3 90,9- demand of supp. fuel % 3.0 8,0 0,0 0.0
Investment costs- machineries MFM 1289,7 186,8 363,2 185,5• buildings MFM 241,6 63,9 63,4 61,8• other costs MFM 561,6 91.1 154,7 89,9Total investment MFM 2092,9 341,8 581,3 337,2- Sales tax compens. MFM 0,0 •36,9 -63,2 -36,4Capital demand MFM 2092,9 304,9 518,1 300,8
Energy production costsAnnua/ fixed costs- capital costs MFIM/a 148,5 21,6 41,6 24,1-other fixed M FIM/a 90,3 13,2 16,1 11.8Total fixed, actual MRM/a 238,8 34,8 57,7 35,9- from it heat gener. MFIM/a 0.0 13,5 5.4 5.4- from it power gener. MFIM/a 238,8 21,3 52,3 30,5Fixed costs, comparable- heat generation MFIM/a 0.0 13,5 12,8 5,4- power generation MFIM/a 238,8 21,3 44,9 30,5Fixed unit costs, comparable- district heal FIM/kW.a 0,0 112,5 112,5 50,0- electric power FIM/kW.a 477,6 408,9 419,4 293,3
Variable costs -Fuel price-main fuel FIM/MWh 39,0 40,0 40,0 47,0- supporting fuel FIM/MWh 47.0 47.0Variable unit costs, actual- district heat FIM/MWh 0,0 48,4 46,6 46,7- electric power FIM/MWh 102,1 51,7 54,1 54,4Variable unit costs, comparable- district heat FIM/MWh 0,0 46,6 46,6 46,6- electric power FIM/MWh 102,1 73.8 54,1 54,4
Comparable energy production c ostsDistrict heat FIM/MWh Lf-4000 h/a 75 75 59
Lf-5000 h/a 69 69 57Lf-6000 h/a 65 65 55Lf-7000 h/a 63 63 54
Electric power FIM/MWh Lf-4000 h/a 222 176 159 128Lf-5000 h/a 198 156 138 113Lf-6000 h/a 182 142 124 103Lf-7000 h/a 170 132 114 96
r i i
t I . 3
f r i-U.. - -i
\
- 30 -
4.3 Profitability of industrial cogeneration power plants
The competitiveness of small industrial PFBC power plants is considerably better than the figures above, due to a higher relative growth of the power to heat ratio.
By complementing an existing industrial back-pressure power plant with a preceding PFBC boiler and gas turbine the achievable additional electricity output will cost FIM 6400/kW in investment.The average cost of generated electricity will be FIM 60/MWh with 5% interest and 20 years' operating time. If a reinvestment or new capacity are concerned, the additional need for capital drops down to 3 000 FIM/kW, corresponding to 28 FIM/MWh.
r w
I T
5 MARKET POTENTIAL OF PFBC IN FINLAND
New fuels for combined cycle power plants, being of interest in Finnish conditions, are wood waste and black liquor in the pulp and paper industry, peat at heating power plants and peat or coal at condensing power plants. When natural gas is available, the process based on pressurized combustion of solid fuels is not yet competitive, in the next 10 years, excepting the use of process fuels (waste wood and liquors).
In the long term, the combined cycle power plant processes using solid fuels seem to be competitive even in Finland. However, it is still feasible to build natural gas combined cycle technology, if a gas net is available. By replacing natural gas with eg. gas produced from coal a significant proportion of the savings obtained from the above price difference can be put into investments.
? r•V~ .■*

- 31 -
In the short and medium terms possible objects o£ use include the wood waste boilers of the pulp and paper industry and the district heating power plants outside the natural gas network. Possible objects of use in the long term are all the base load power plants with a thermal output of 50 MW or more.According to the Finnish energy statistics the industry consumed in 1985 1.7 million toe of waste liquors, i.e. 19 TWh, which is equal to 1070 MW of fuel input.
Until the year 2000-2010 the fuel input obtained with black liquor will rise up to 2700 MW and that obtained with wood waste up to 1200 MW, if the annual production of chemical and mechanical pulp will grow in accordance with development programs for the pulp and paper industry.
Along with the rationalization of the pulp and paper industry the production of chemical pulp will be concentrated on estimated 12-14 plants. The average waste wood and black liquor input per plant will be about 300 MW. At the moment the average size of recovery boilers is less than 100 MW. The possible fuel input of the largest industrial power plant would be as high as 650 MW.
It is possible to build a maximum of 12-15 plants with a fuel input of 20-60 MW in conjunction with paper mills using mechanical pulp. The overall thermal output can rise in the largest units up to 100 MW.
]
T T - -j
EE
In Finland, in 1983, the total thermal capacity of boilers with over 50 MW was 19 GW. Of this, the proportion of base load power was perhaps 12-14 GW. In the long term, thisbase load capacity and the thermal capacity of newcondensing power produced with fossil fuels is thepotential to which the pressurized combustion can beapplied.

- 32 -
The theoretical electric power generation capacity of the industrial back-pressure power plants is today about 1500 MW of which about 1000 MW is premium capacity. The figures indicate about 5000 MW to process heat output. This figure will not grow to a decisive degree. The back-pressure power output of the district heating power plants is about 1700 MW corresponding to about 3500 MW of district heat output. Until the year 2000 the output will grow to 4300-4500 MW. The thermal output of the back-pressure power plants will be 9-10 GW on the level of the year 2000.
As the combined cycle power plant involves a notable rise in the power to heat ratio, the theoretical additional capacities of back-pressure power until the years 2000-2010, compared with the conventional steam power plants, will be as follows:1) industrial back-pressure power plants 2000 MW2) municipal cogeneration power plants 2500 MW
In reality, construction activities are decisively affected by
1) ageing of existing units,2) additional need of capacity, and3) competing fuels (natural gas).
Pressurized combustion based on peat would become topical in 2000-2010 in twelve towns in northern and central Finland.Coal-fired power plants based on pressurized combustion could be considered in three towns on the western coast of Finland.
L
r r i*L -u..

33 -
By including the process fuels of the pulp and paper industry in the possible potential of the year 2010 and the fuels outside the natural gas network as well as the municipal power stations within the same area, pressurized combustion makes it possible, in principle, to increase power production according to table 3 by the year 2000-2010. The figures include the hypothesis that, by the year 2010, 3/4 of the pulp mills utilize the process fuels in a gas turbine process, i.e. ageing of the plants has been criteria for classification.
Hence, it is in theory possible to produce about 1400 MW more cogeneration power with pressurized combustion compared to conventional solutions.Thus the electric power capacity produced by pressurized combustion would be 2950 MW.In the production of condensing power the pressurized combustion may also be a competitive alternative in 2000-2010.
6 CONCLUSIONS
In the future, the pressurized combustion will offer a competitive method of energy production which is suitable for the environmentally beneficial utilization of low-grade fuels with a good overall efficiency. In addition, by utilizing pressurized technology it is possible to improve considerably the power to heat ratio of cogeneration power plants, which, again, makes this type of plants well-suited for an alternative form of future energy production also in Finland.
The most characteristic techno-economic advantages of combined cycle processes in comparison with respective steam processes are shown in table 4.
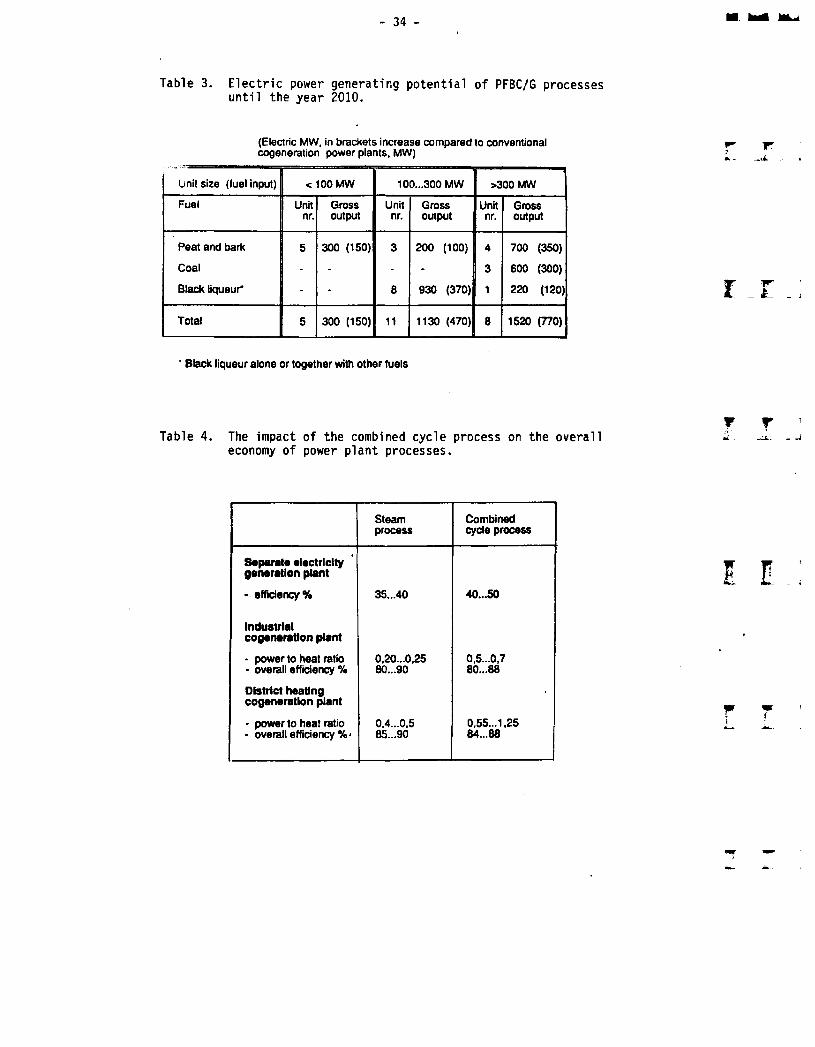
34 -
Table 3. Electric power generating potential of PFBC/G processes until the year 2010.
(Electric MW, in brackets increase compared to conventional cogeneration power plants, MW)
Unit size (fuel input) < 100 MW 100...300MW >300 MW
Fuel Unitnr.
Grossoutput
Unitnr.
Grossoutput
Unitnr.
Grossoutput
•Peat and bark 5 300 (150) 3 200 (100) 4 700 (350)
Coal - - - - 3 600 (300)
Black liqueur* - - 8 930 (370) 1 220 (120)
Total 5 300 (150) 11 1130 (470) 8 1520 (770)
' Black liqueur alone or together with other fuels
Table 4. The impact of the combined cycle process on the overall economy of power plant processes.
Steamprocess
Combined cycle process
Separate electricity generation plant
- efficiency % 35...40 40...50
Industrial cogenaratlon plant
• power to heat ratio - overall efficiency %
0,20...0,2580...90
0,5...0,780...88
District heating cogeneration plant
- power to heat ratio- overall efficiency %<
0,4...0,585...90
0,55...1,2584...88
35 -
The power to heat ratio of a PFBC cogeneration power plant is considerably higher than that of a conventional one. An increase of the gas turbine inlet temperature or the pressure ratio has a positive effect on the power to heat ratio. Additionally, an increase in the power to heat ratio can be achieved by using wet fuels.In a comparison of different combined cycle cogeneration power plant processes utilizing pressurized fluidized bed technology it was found that air-cooled partial gasification and a steam-cooled PFBC-process with partial gasification are the most economic in particular if the thermal capacity of the plant is at least 200 MW. The power to heat ratio achievable with a partial gasification process is 1.25 resp. 1.0, whereas with an air- or water-cooled PFBC-process without afterburning it is less than 0.7.
According to economic calculations the fixed unit costs of additional electric power generating capacity achieved by pressurized combustion are less than those of coal-fired condensing plants, although the fuel consumption in the cogeneration process drops to half. The economic competitiveness of pressurized combined cycle power plants is also good if compared with conventional cogeneration power plants.
According to the conducted market survey, it will be theoretically possible, by the year 2010, to build about 1400 ’ MW more cogeneration power capacity using the pressurized combustion compared with the conventional solutions. A prerequisite is, however, that the process operates technically with various types of fuel. Thus the electric power capacity of power plants operating on pressurized technology would be 3000 MW. The PFBC combined cycle power plants can also be a competitive alternative in the production of condensing power after the year 2000.

36 -
REFERENCES
1. Hulkkonen, S., Makela, J., & Jahkola, A.: The properties and economy of the 50 MW peat burning PFBC district heating power plant. TKK/EVO 1986.
2. Olesen, C., et al.: The commercial status of ASEA-PFBC technology. 8th Int. Conf. on Fluidized Bed Combustion. Houston, Texas, 1985.
3. Huber, D. A. & Costello, R. M. : Conceptual desing andeconomic evaluation of various fluidized bed power plant concepts. Pressurized Fluidized Bed Combustion Technology Exchange Workshop. DOE Conf-7906157, 1980.
4. Jahkola, A., Hulkkonen, S., Horvath, A., Boij, J., Kurkela, E., Mojtahedi, W., Saviharju, K.: Development of pressurized fluidized bed combustion. Research Report Otaniemi 1987. Helsinki University of Technology, Department of Energy Engineering. Report 22, 213 p (In Finnish)
i r
T rJL. -ji. -
I l
W " 7
I
\

- 37 -
GASIFICATION COMBINED CYCLE POWER GENERATION - PROCESS ALTERNATIVES
Esa Kurkela, M.Sc., Senior Research Scientist
Technical Research Centre of Finland
Laboratory of Fuel Processing and Lubrication Technology
02150 Espoo, Finland
Abstract
Interest in Integrated Gasification Combined Cycle (IGCC) power plants
has recently increased also in Finland. The IGCC systems offer the
potential of superior efficiency and environmental performance over
conventional pulverized coal or peat fired boilers. Potential applica
tions are both large-scale electricity production from coal and medium-
scale combined heat and electricity production. In the latter case, the
gasification process should also be applicable to peat and wood.
Several IGCC processes have been developed in USA and in Europe. These
processes differ from each other in many respects. Nearest to commer
cialization are processes, which employ oxygen gasification and cold
gas cleanup. The Cool Water plant, which was brought into operation in
1984 in USA, has demonstrated the feasibility of an IGCC system using
Texaco entrained-bed gasifier. Several pressurized fluidized-bed and
fixed-bed gasification processes have also reached a pilot or de
monstration stage with a wide variety of coals from lignite to hard
coal. Pressurized fluidized-bed gasification of peat (Rheinbraun-HTW-
process) will also be demonstrated at the peat ammonia plant of Kemira
Oy, which will be commissioned in 1988 in Oulu, Finland. Oxygen gasifi
cation and cold gas cleanup are, however, economically viable only in
large-scale applications. Technology is being developed to simplify the
IGCC system, in order to reduce its capital costs and increase its
efficiency. Air gasification combined with hot gas cleanup seems to
have a great potential of improving the competitiveness of the IGCC
system.
r r iil. _-is. _Jl

38 -
1 GENERAL
The use of solid fuels in gas turbine processes is based either on
pressurized combustion or on gasification. Combined processes are also
under developement. Pressurized fluidized-bed combustion (PFBC) has
been considered the best alternative of the combustion methods and
other combustion methods have hardly developed at all, whilst the deve
lopment of processes based on gasification includes several alter
natives of different type. The aim of ventures underway in the United
States and Europe is most often the production of electricity in large
(> 300 MWe) coal-fired power plants. Advantages of the gasification
combined cycle processes are primarily smaller emissions and higher
efficiency than those of the conventional power plants. In addition to
base load electricity generation from coal, co-generation of electri
city and heat in the size class of < 200 MWg is of special interest in
Finland. The gasification process should also be capable of using indi
genous fuels, such as peat, wood and different waste fuels.
The Gasification combined cycle plants have advanced closer to a com
mercial level than those based on fluidized-bed combustion. A plant
based on air gasification operated in Liinen, F.R.G. in the years 1973 -
1982, and an industrial-scale demonstration plant based on oxygen gasi
fication was put into operation by Texaco in Cool Water, U.S.A., in
1984. However, the advancement of the gasification combined cycle pro
cess to a level that is more profitable than the other electricity
production alternatives still requires the development of both gasifi
cation processes and gas turbines.
I . I
T r
2 THE IGCC SYSTEM
2.1 Process alternatives wi
In conventional power plants (Figure 1) the solid fuel is combusted
under atmospheric pressure and steam is generated; electricity is pro
duced at an overall efficiency of 36 - 39 % and the flue gas is cleaned
\

- 39 -
AtmosphericCombustion
Pressurised Fluidised Bed Combustion
Gasification Combined Cycle
Air/Oxygen Solid fuelAir Solid fuelAir Solid fuel
Steam turbine
Gasturbine Steam
turbineSteamturbine
Flue gas CondenserFlue gas CondenserFlue gas
GasCleaning
HeatRecovery
HeatRecovery
PressurisedGasification
Pressurised.Combustiorv
GasCleaning
AtmosphericCombustion
HeatRecovery
GasCleaning
Boiler
i r i
Figure 1. Schematic diagrams of a conventional power plant and ofpressurised fluidised-bed combustion (PFBC) and integrated gasification combined-cycle (IGCC) power generation schemes.
at about 150 °C to protect the environment. In an Integrated Gasifi
cation Combined Cycle (IGCC) power generation scheme the solid fuel is
first gasified under pressure. The produced fuel gas is first cleaned
and burned in the combustion chamber and then expanded in the gas
turbine.
The main subsystems of the IGCC system are gasifier, heat exchanger,
gas clean-up, gas turbine generator set, heat recovery boiler, and
steam turbine generator set. To maximize the efficiency of the plant,
these subsystems should be carefully integrated.
The IGCC plant can be constructed in many different ways, which deviate
from each other in details (Figure 2). The most significant factors
I I . ]
7 T

- 40 -
DEGREE OF REACTOR METHOD OFGASIFICATION TYPE HEATING
V-A.-
OXYGEN
INDIRECTHEATING
FLUIDIZEDBED
ENTRAINEDBED
FIXEDBED
OTHERTYPES
TOTALGASIFICATION
PARTIALGASIFICATION
IE
Figure 2. Gasification methods in IGCC systemsT-i; r
affecting the efficiency of the whole process and its economy are:
degree of gasification: total and partial gasification,
method of heating: air gasification, oxygen gasification and
indirect heating,
reactor type: fixed-bed, fluidized-bed, entrained-bed,
gas clean-up: cold and hot clean-up,
properties of the gas turbine,
properties of steam process.
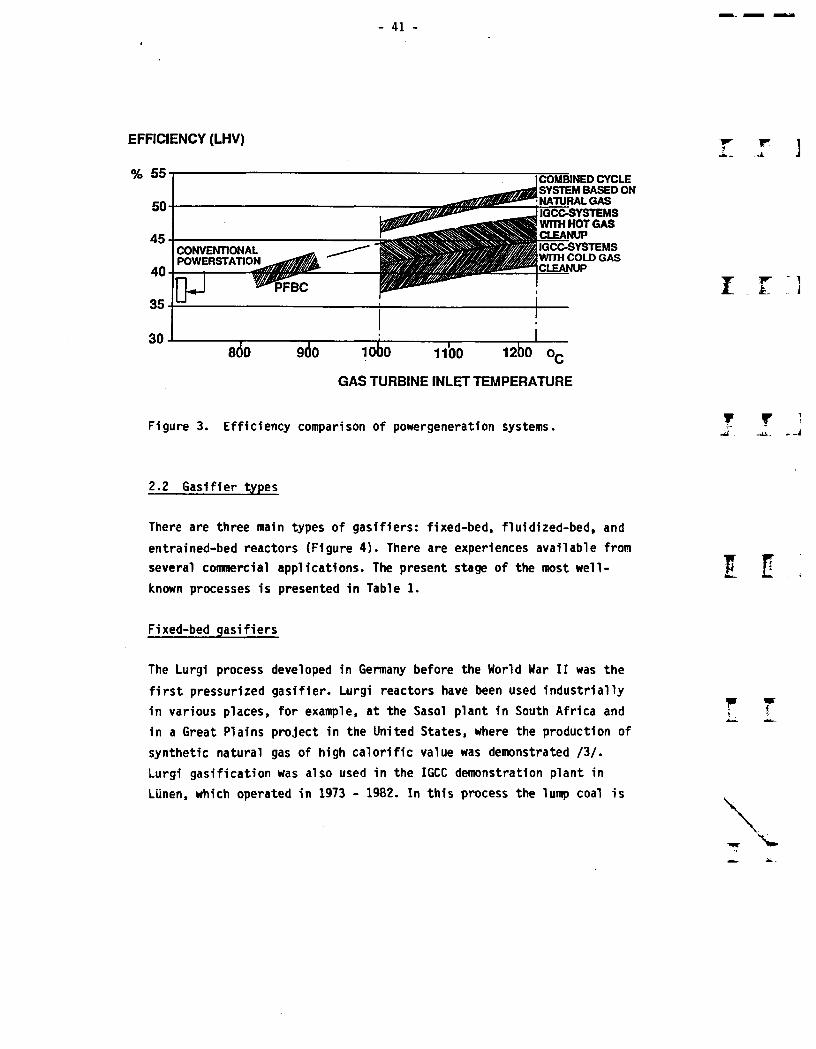
Estimates of the efficiency of the PFBC and IGCC systems presented in
various references /4, 12, 13, 14/ are shown in Figure 3. The turbine
inlet temperature has a fairly crucial effect on the efficiency of the
IGCC plant. The superiority of hot gas clean-up to cold one is based on
the fact that the efficiency available from the gas turbine process
increases, as it is not necessary to cool the gas.
I'l.
- 41 -
EFFICIENCY (LHV)
% 55
50
45
40
35
30
COMBINED CYCLE SYSTEM BASED ON NATURAL GAS IGCC-SYSTEMS WITH HOT GAS CLEANUP IGCC-SYSTEMS WITH COLD GAS CLEANUP
I I ]
GAS TURBINE INLET TEMPERATURE
Figure 3. Efficiency comparison of powergeneration systems.T r -j
2.2 Gasifier types
There are three main types of gasifiers: fixed-bed, fluidized-bed, and
entrained-bed reactors (Figure 4). There are experiences available from
several commercial applications. The present stage of the most well-
known processes is presented in Table 1.
Fixed-bed gasifiers
The Lurgi process developed in Germany before the World War II was the
first pressurized gasifier. Lurgi reactors have been used industrially
in various places, for example, at the Sasol plant in South Africa and
in a Great Plains project in the United States, where the production of
synthetic natural gas of high calorific value was demonstrated /3/.
Lurgi gasification was also used in the IGCC demonstration plant in
Liinen, which operated in 1973 - 1982. In this process the lump coal is

- 42
FIXED BED FLUIDIZED BED ENTRAINED FLOWPRESSURE 100 bar 25 bar AO barCAS TEMPERATURE 700 - 1100 C600 C 1000 - 1500 C
(5 - 50 (0-5 inn)
FINES FINES
0,+ STEAMAIR/O.
HT-HINKLERU-GASKRU
TEXACOPRENFLOSHELLVEW
PROCESSES LURGI (dry ash) BGC-LURGI
Figure 4. Gasifier types and processesf r■r- _j
Table 1. Gasification processes: stage of development.
PROCESS development statusPILOT DEMO-PLANT COMMERCIAL
FIXED BEDLurgi, dry ashBritish Gas - Lurgi Hestfleld,CB(500t/h>
SASOL(S.Africa,44000t/d)
FLUIDIZED BEDHT - HinklerKRHU - GasMINO
Hachtberg,FRG(20t/d) Waltz Mill.USA(200t/d)Ch1cage,USA(20t/d>Studsvik,SHE(12t/d)
Berrenrath,FRG(720t/d) Kemira,FIN(650t/d)
ENTRAINED FL(H(Texaco
Prennflo
Montebel1o,USA(20t/d)
Furstenhausen,FRG(48t/d)
Oberhausen,FRG(150T/d) Tennessee,USA('83)UBE,Japan!’84)Cool Hater,USA<’84) etc.
Shell Amsterdam,Netherl. Hous ton,USA(150t/h)VEW Herne,FRG(12t/d) Herne,FRG(240t/d)
ri

- 43 -
pressurized in a multiphase lock hopper and fed to the upper zone of
the reactor. The mixture of air or oxygen and steam is fed to the lower
zone of the gasifier. The fuel flows slowly downwards through drying,
pyrolysis, reduction and combustion zones. As a consequence of the
counter current flow of the gasification material and the gases, the
temperature of the gas is low (< 600 °C for coal, < 200 °C for peat)
and the major part of energy is obtained as chemical energy.
However, an abundance of condensing tars are developed in the process,
and therefore, cold gas clean-up and related waste water treatment
would be a complicated operation. On the other hand, the particle and
alkali content of the gas can be fairly low, and hence, the alternative
of hot gas clean-up is an interesting potential.
The most wellknown fixed-bed process designed for combined cycle appli
cations is British Gas Slagging Lurgi, where the temperature of the
lower gasifier zone is kept above the ash melting temperature. The
process may be suitable, in addition for coal gasification, also for
piece-shaped peat products, although tar separation would be more
troublesome. The aim of British Gas is to apply this process in the
size class of > 200 MWe and to use o*ygen/steam gasification and cold
gas clean-up.
Entrained-bed gasifiers
In these gasifiers finely pulverized coal and air or oxygen are led to
a reactor, where gasification takes place at > 1 200 °C temperature.
The residence time is extremely short. As a consequence of the high
temperature the CO and H2 contents of gas are high and tar content
insignificant. The ash is removed molten. The high carbon conversion
requires dry and finely pulverized fuel. The fuel is fed as slurry to
the pressurized reactor in most processes. The pressurized entrained-
bed gasifiers do not suit particularly well for gasifying biomass or
peat, as these fuels require pretreatment to a considerable extent and
the feed causes problems. Due to the high temperature of gas, the major
t. I. 1
I T.l
T r i.iL _ -j

- 44 -
part of the fuel energy is obtained as sensible heat of the gas. Hence,
the chemical efficiency is lower than in fixed-bed processes.
The most significant commercial or developing entrained-bed gasifica
tion processes suggested for combined cycle power plant applications
are Texaco, Prenflo, Shell and VEW. The last-mentioned one is a partial
gasification process. For the time being, the process of Texaco, based
on slurry feed and multiphase gas cooling and heat recovery, has been
the most successful one. Before the construction of the Cool Water com
bined cycle power plant, experiences had already been obtained from a
number of synthesis gas plants. The slurry feed, which decreases effi
ciency and increases oxygen consumption, and expensive heat recovery
equipment can be considered to be disadvantages of the Texaco process.
The Prenflo process of Krupp-Koppers /3, 5/ was developed from the
unpressurized commercial Koppers-Totzek process. Development work was
done in 1974 - 1981 in co-operation with Shell at a 150 t/d pilot plant
in Harburg, F.R.G. Krupp-Koppers has continued to develop the process
by constructing a new 48 t/d demonstration plant in Furstenhausen. In
this process, dry coal is fed pneumatically to the reactor.
Fluidized-bed gasifiers
In these reactors the fuel, particle size 0 - 10 mm, is typically gasi
fied at 750 - 1 000 °C. The method suits in particular for reactive
fuels, such as lignite, biomass and peat.
The most wellknown pressurized fluidized-bed processes are the High
Temperature Winkler (HTW) developed by Rheinische Braunkohlenwerke AG
and Uhde GmbH, F.R.G., the U-gas process developed by the Institute of
Gas Technology, U.S.A., and the KRW process originally developed by
Westinghouse, U.S.A. All these processe employ bubbling bed reactors.
Lurgi and A. Ahlstrdm Oy have developed circulating fluidized beds,
using a higher rate of flow. However, Lurgi and Ahlstrom have so far no
pressurized equipment. The difference between the slow bubbling
fluidized bed and the circulating fluidized bed is apparently becoming

- 45 -
smaller, as there are solids recirculating systems in all these pro
cesses, and the tendency is to change over to higher fluidizing veloci
ties also in HTW and U-gas processes.
A special feature of the U-Gas and KRW processes is agglomeration based
on partial melting of ash. The methods were developed in particular for
fuels with a high ash content, when good carbon conversion requires an
efficient separation of ash and residual carbon. The U-Gas process has
been proved to operate also with peat in pilot-scale experiments /8/.
The U-Gas and KRW processes have not been demonstrated commercially so
far.
2.3 Partial gasification
In total gasification the aim is to convert the fuel totally to gas.
The gasification consists of pyrolysis by heat and of reactions of the
residual carbon with gasification gases. The last-mentioned stage re
quires oxygen inlet into the process, usually as air, pure oxygen or
steam. As the gasification of the residual carbon is a rather slow
reaction, it is difficult to secure sufficient conversion of carbon in
certain gasification methods, especially in such fluidized-bed re
actors, in which agglomerated ash removal is not applied.
Partial gasification is a process, where part of fuel energy is re
covered as residual carbon from the reactor. The degree of gasification
can in principle range from slight pyrolysis (part of volatiles is
removed) to total gasification. The heat of endothermic drying and
pyrolysis stage can also be introduced in many different ways. In
combined cycle power production, the simplest way of oxygen input is
partial gasification by air. Compared to total gasification, the only
difference is that carbon conversion is not maximized.
Two different integrations of partial gasification to a power plant are
shown in Figure 5. In alternative a) the bottom ash from a pressurized
fluidized-bed gasifier and the fly ash separated in cyclones are fed to
- 46 -
AIR/OXYGEN FUEL
1___ LAIR
PRESSURIZEDGASIFICATION
ASH +
DUST
FUEL GAS CLEANING
AIR FUEL GAS COMBUSTION
rATMOSPHERICCOMBUSTION
ASH
FLUEGASCLEANING
FLUE GAS
a
GASTURBINE
HEAT T-n- RECOVERY ,
FLUEGAS
©
STEAMTURBINE
CONDENSER
FUEL b
ASH +
CHAR
GASTURBINE
STEAMTURBINE
FLUEGAS
CONDENSER
HEATRECOVERY
FUEL GAS COMBUSTION
PFBC
HOT GAS CLEANUP
GASCLEANUP
PARTIALGASIFICATION
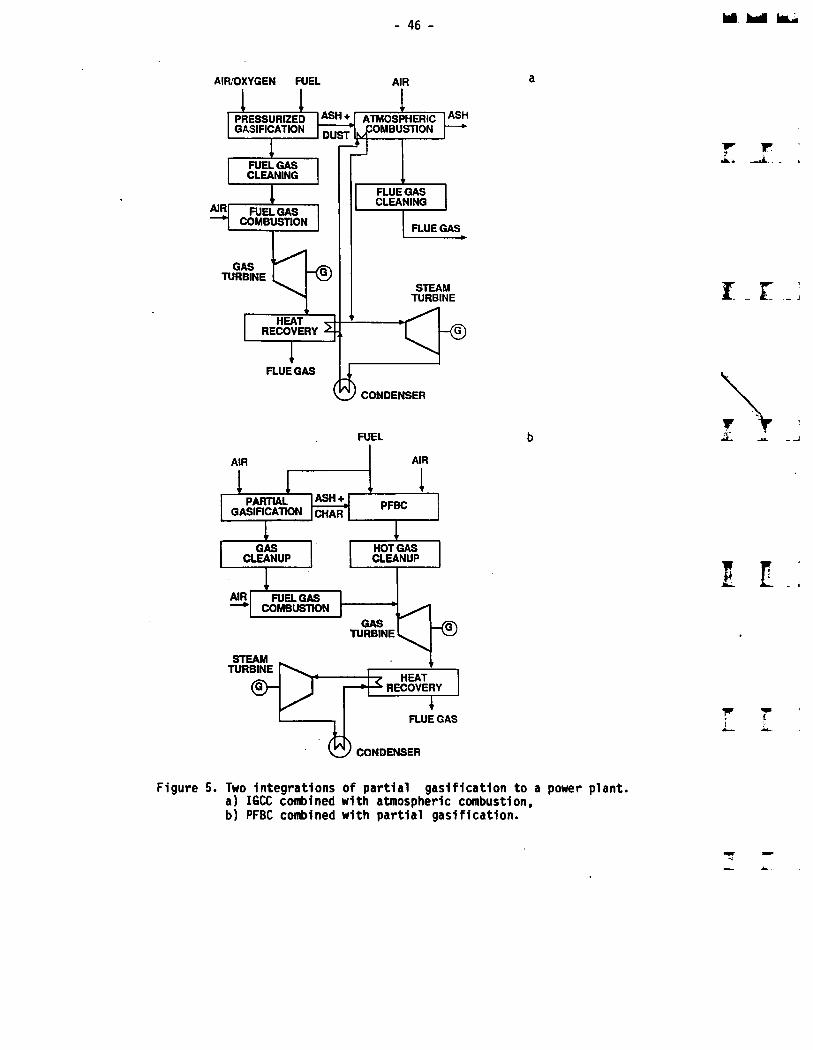
Figure 5. Two Integrations of partial gasification to a power plant.a) IGCC combined with atmospheric combustion,b) PFBC combined with partial gasification.
- 47 -
an atmospheric fluidized-bed boiler, where combustion is completed.
Alternative b) is based on that weakness of the PFBC process that the
inlet temperature of the turbine cannot be higher than that of ash
deformation. This restricts the available efficiency. As part of the
fuel is gasified, the inlet temperature of the turbine can be raised to
the allowed maximum temperature by combusting the fuel gas.
3 EXPERIENCES FROM THE COOL WATER DEMONSTRATION PLANT
The Cool Water coal gasification demonstration plant was commissioned
in 1984. A five-year demonstration project is underway, the following
enterprises participating in the work: Texaco Inc., Southern California
Edison Company, General Electric, Bechtel Power Corporation, Electric
Power Research Institute (EPRI), and Japan CWP. A simplified block
diagram of the CWCG process is shown in Figure 6.
The system uses an oxygen-blown Texaco entrained-bed gasifier. Radiant
and convective heat exchangers cool the gas for cold gas clean-up and
raise saturated steam for superheat in a heat recovery steam generator
(HRSG). Particulates are scrubbed and the gas is cooled further for
sulphur removal by the Selexol process. The gas is then reheated and
saturated for combustion and expansion in a 65 MW General Electric
Frame 7F combustion gas turbine. Remaining energy is recovered in a
HRSG to produce superheated steam for a 55 MW steam turbine.
The reports on the performance of the Cool Water plant have been ex
ceptionally good /l, 3, 10, 15/. The environmental performance has in
particular exceeded all targets. The measured emissions of the CWCG
plant compared to U.S. New Source Performance Standards for Coal-fired
Utility Plants are shown in Figure 7.

48
OEttINfftAUZED WATER
STACKGAS
IFWSYSTEM
COAL RECEIPT STEAMPUNT TURGINEIS.*.)
EXHAUSTSTEAMSTEAM
CLEANSYNGAS
CLEANSYNGAS
SULPUR SYNGASSYNGASCOOLING SATURATIONCOOLING
SOUR jACIO SATURATOR■LOWOOWN
STACK
ASH 4 WATER GAS
PUSH SULPUR
recycleT
TO DISPOSALHANOLING
EFPLUENTWATER
TREATING
QtfcSEL (ALT FUEL)
Figure 6. Cool Water coal gasification program, bloc flow diagramnot.
i r
y Tj
S02 (3 % wt S) S02 (0.5JS wt S) PARTICULATES
(X I U S - N S P S E3 COOL WATER
I E 1
wt
^' iure 7. Environmental performance of the Cool Water demonstrt.; plant /3, 10/.

- 49 -
4 ADVANCED IGCC SYSTEMS
The Cool Water Program has succesfully demonstrated on a commercial
scale an IGCC system, which 1s based on oxygen gasification and conven
tional cold gas clean-up. Oxygen gasification and cold gas clean-up
are, however, economically viable only in large-scale applications.
Cooling and scrubbing the fuel gas also means a reduction of efficiency
compared to hot gas clean-up systems. So, technology is being developed
to simplify the IGCC system, in order to reduce its capital costs and
to increase its efficiency. Air gasification combined with hot gas
clean-up seems to have a great potential of improving the competiti
veness of the IGCC system (Figure 8).
Advantages of hot gas clean-up compared to the conventional IGCC con
cept are:
higher thermal efficiency,
simpler process,
no waste water production,
low investment costs in medium-size power plants.
However, there are still a number of unsolved technical problems
related to hot gas clean-up. Development work is required at least in
the following subjects:
temperature and corrosion resistant filter materials (for parti
culate removal),
in-bed desulphurization and/or hot sulphur removal processes,
alkali control methods,
N0x control methods.
It is possible to remove about 70 - 85 % of sulphur in the fluidized-
bed gasifier by using dolomite. This has been demonstrated by experi
ments carried out at the KRW fluidized-bed pilot plant in Waltz Mill,
Pennsylvania, U.S.A. /!/. However, if the aim is to reach the same
level as in conventional scrubbing processes (> 90 % desulphurization),
the H2S content of the fuel gas should be reduced further in separate
desulphurization equipment. Possible sorbents are, for example, iron
I
IT]
r ' T ’■ *

tflo
■q.jre 8. Comparison of eMSt'Ing and advanced IGCC sr—em-
f 4
t i rz* H
NM

- 51 -
oxide and zinkferrite (ZnFe204), the use of which has been studied at
the Morgantown Energy Technology Center /l, 12/.
Particulate removal and alkali control at high temperature is discussed
more closely in other papers of this publication. The major part of
fuel nitrogen is transformed into NH3 in gasification. This cannot be
removed in hot gas clean-up. Ammonia has a tendency of develop fuel N0x
in combustion. Hence, special design of combustion chambers may be
required to keep the N0x emissions low.
LITERATURE
1. Wieber, P. R. & Halow, J. S. Advanced IGCC power systems for the
United States. Energy Progress 7(1987)2, p. 119 - 125.
2. Thompson, B. H. et al. Conversion of coal to electricy by gasifi
cation combined cycle systems - overview of GCC developments in
Europe. AICHE Nat. Meeting, Boston, 24.-27.8.1986. 25 p.
3. Conn, A. L. The integrated gasification combined cycle power
plant - power from coal with minimum environmental problems - an
American view. Energy World (1986) December, p. 5 - 12.
4. Nitschke, E. Combined-cycle power generation - a promising alter
native for the generation of electric power from coal. Symp. on
Coal Gas - a Clean and Efficient Alternative for the Generation of
Electric Power, Stockholm 18.9.1986. 23 p.
5. Pohl, H. C. & Rohm, J. K. Pressurized entrained flow gasification
and its application to combined-cycle power plants. Palo Alto
1985, Electric Power Research Institute, EPRI AP-4257-SR, Vol. 1,
Section 20. 38 p.
6. Davies, H. S. et al. Application of the British Ga/Lurgi Slagging
gasifier for combined-cycle power generation. Palo Alto 1985,
Electric Power Research Institute, EPRI AP-4257-SR, Vol. 1,
Section 13. 32 p.
W ]
I T ]
T f 1JZ.

52 -
7. Weinzierl, K. Combined cycle with integrated coal gasification
VEW coal conversion process. Palo Alto 1985, Electric Power
Research Institute, EPRI AP-4257-SR, Vol. 1, Section 22. 25 p.
8. Kurkela, E. et al. Synthesis gas production from Finnish peat by
fluid-bed gasification. Energy from Biomass and Wastes X, April
7-10, 1986, Washington, D.C. Chicago 1986, Institute of Gas Tech
nology. 15 p.
9. Corman, J. C. & Horner, M. W. Simplified IGCC attracts clean coal
cash. Modern Power Systems 1986: October, p. 37 - 41.
10. Clark, W. N. et al. Cool Water: performance & economics. Energy
Progress 7(1987)2, p. 99 - 104.
11. Salvador, L. A. Clean coal money staked on Applachian IGCC.
Modern Powpr Systems 1986: November, p. 33 - 37.
12. Finckh, H. H. & Muller, R. The development of integrated coal-
gasification power plants with clean combustion in Germany. New
York 1985, the American Society of Mechanical Engineers,
85-IGT-47. 75 p.
13. Vessonen, K. Kahden kivihiilta kayttavan kombivoimalaitossuunni-
telman analyysi (Analysis of two concepts of coal-fired combined-
cycle power plants). Diploma thesis. Espoo 1987, Helsinki Univer
sity of Technology, Department of Mechanical Engineering. 75 p.
14. Solantausta, Y. Techno-economic evaluation of different gasifi
cation-combined cycle processes. Espoo 1988, Technical Research
Centre of Finland, VTT Symposium 83. P. 199-21.2.
15. Keller, J. Development of coal gasification technology applicable
for combined-cycle power generation. Symp. on Coal Gas - a Clean
and Efficient Alternative for the Generation of Electric Power,
Stockholm 18.9.1986. 24 p.
IFk. i __
I F
t rSL -A.
IE
m

- 53 -
THE OTANIEMIPFBC/G TEST RIG AND RESEACH PROJECT
Seppo Hulkkonen M.Sc.(Eng), Antero Jahkola Prof., Esa Kurkela M.Sc.(Eng)*
Helsinki University of Technology
Technical Research Centre of Finland *
Otaniemi, 02150 Espoo, Finland
IT-A. ]
1 INTRODUCTION
The reseach project "Experimental Research of Pressurized Fluidized Bed Technology and
its Application to Combined Power and Heat Generation" was started in 1986. The project
is carried out in co-operation between Helsinki University of Technology (TKK), Technical
Research Centre of Finland (VTT) and Imatran Voima (TVO). The project is scheduled for
years 1986-1989 and is mainly financed by the Ministry of Trade and Industry (KTM).
The total costs of the project are 10 million FIM including the test facilities. The objective
of the project is to create knowledge of the basics of pressurized fluidized bed combustion/
gasification and their applications. The fuel of main interest is peat. The research is
realised partly theoretically based on literature studies and computer runs but primarily by
experimental measurements carried out using the PFBC/G test rig.
I
T T 1Jt. - -J
2 PFBC/G TEST RIG
The project was started by designing and building a PFBC/G test rig operating at pressures
up to 10 bar. The test rig was commissioned in summer 1987 and is located in Otaniemi in
VTT/POV Laboratory. The test rig can be used for combustion and gasification research
with thermal input of 130 kW and 400 kW, respectively. A general flow diagram of the rig
is shown in Figure 1.
The main part of the facility is reactor which is a 6 m tall vessel of 60 cm diameter.
Refractory lining brings the inside diameter down to 15 cm in bed and 25 cm in freeboard.
The bed height is 1.2 m and freeboard height is 2.3 m. The bed is cooled by vertically
oriented watertubes immersed in the bed. Hot gases leave the freeboard and pass through a
two-stage cyclone collector and then along high temperature ducting in which are located
the dust sampling system and main gas sampling points. The hot gases are then cooled in a
heat exchanger before pressure let-down valve which also controls the pressure in reactor.
I
WI
54 -
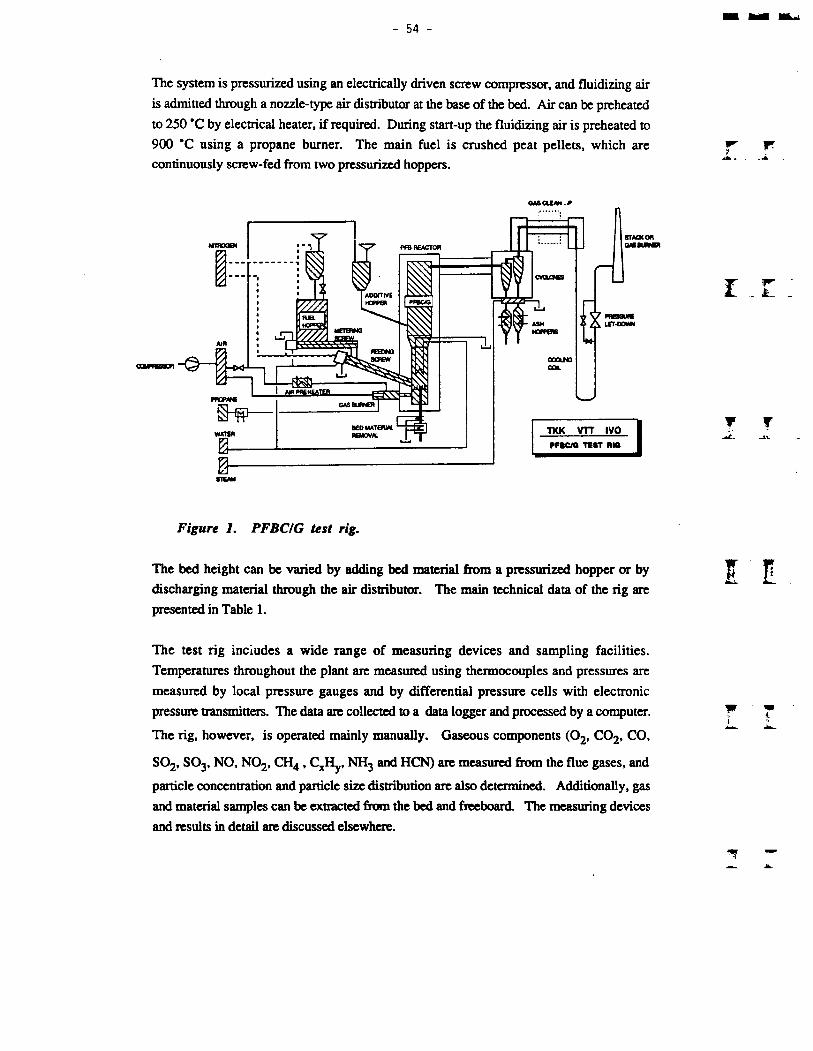
The system is pressurized using an electrically driven screw compressor, and fluidizing air
is admitted through a nozzle-type air distributor at the base of the bed. Air can be preheated
to 250 *C by electrical heater, if required. During start-up the fluidizing air is preheated to
900 *C using a propane burner. The main fuel is crushed peat pellets, which are continuously screw-fed from two pressurized hoppers.
GAS CLEAN .-P
LET-DOWNHOPPER
TKK VTT IVOPFftC/Q TEST RIG
STEAM
V.A
i r ;
T r
Figure 1. PFBC/G test rig.
The bed height can be varied by adding bed material from a pressurized hopper or by
discharging material through the air distributor. The main technical data of the rig are
presented in Table 1.
The test rig includes a wide range of measuring devices and sampling facilities.
Temperatures throughout the plant are measured using thermocouples and pressures are
measured by local pressure gauges and by differential pressure cells with electronic
pressure transmitters. The data are collected to a data logger and processed by a computer.
The rig, however, is operated mainly manually. Gaseous components (02, C02, CO,
S02, S03, NO, N02, CH4 , CxHy, NH3 and HCN) are measured from the flue gases, and
particle concentration and particle size distribution are also determined. Additionally, gas
and material samples can be extracted from the bed and freeboard. The measuring devices
and results in detail are discussed elsewhere.
- 55 -
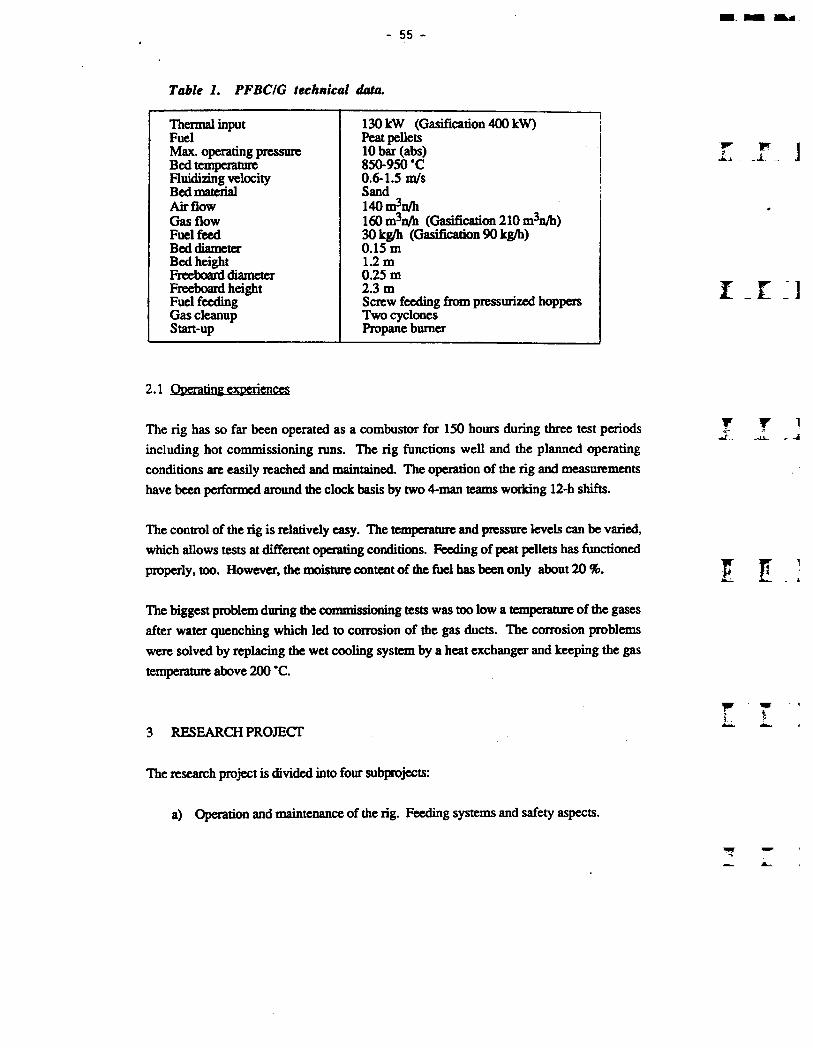
Table 1. PFBC/G technical data.
Thermal input 130 kW (Gasification 400 kW)Fuel Peat pelletsMax. operating pressure 10 bar (abs)Bed temperature 850-950 'CFluidizing velocity 0.6-1.5 m/sBed material SandAirflow 140 m3n/hGas flow 160 m3n/h (Gasification 210 m3n/h)Fuel feed 30kg/h (Gasification 90 kg/h)Bed diameter 0.15 mBed height 1.2 mFreeboard diameter 0.25 mFreeboard height 2.3 mFuel feeding Screw feeding from pressurized hoppersGas cleanup Two cyclonesStart-up Propane burner
2.1 Operating experiences
The rig has so far been operated as a combustor for 150 hours during three test periods
including hot commissioning runs. The rig functions well and the planned operating
conditions are easily reached and maintained. The operation of the rig and measurements
have been performed around the clock basis by two 4-man teams working 12-h shifts.
The control of the rig is relatively easy. The temperature and pressure levels can be varied, which allows tests at different operating conditions. Feeding of peat pellets has functioned
properly, too. However, the moisture content of the fuel has been only about 20 %.
The biggest problem during the commissioning tests was too low a temperature of the gases
after water quenching which led to corrosion of the gas ducts. The corrosion problems
were solved by replacing the wet cooling system by a heat exchanger and keeping the gas
temperature above 200 *C.
3 RESEARCH PROJECT
T J
I l
The research project is divided into four subprojects:
a) Operation and maintenance of the rig. Feeding systems and safety aspects.

56 -
b) Pressurized fluidized bed combustion and hot gas clean-up.
c) Pressurized fluidized bed gasification and gas cleaning
d) Power plant processes and turbine technology
The responsibility for the subprojects a) and c) is taken by VTT, for b) by TKK, and for d)
by IVO. The project organisation is illustrated also in Figure 2.
EXPERIMENTAL RESEARCH OF PFB - TECHNOLOGY AND ITS APPLICATION TO COMBINED POWER AND HEAT GENERATION
IMATRAN VOIMA
MINISTRY OF TRADE AND INDUSTRY
TECHNICAL RESEARCHCENTRE OF FINLAND
HELSINKI UNIVERSITY OF TECHNOLOGY
(TKK)
D) POWER PLANT PROCESSES AND TURBINE TECHNOLOGY
B) PRESSURIZED FLUIDIZED BED COMBUSTION ANDHOT GAS CLEAN-UP
O PRESSURIZED FLUIDIZED BED GASIFICATION AND GAS CLEANING
A) OPERATION AND MAINTENANCE OF THE RIG. FEEDING SYSTEMS AND SAFETY ASPECTS
Figure 2. Project organisation and subprojects.
Subproject a) includes, besides operation and maintenance of the rig, also studies of fuel
feeding systems. Feeding systems will be reviewed using literature, and laboratory- scale
experiments with different fuels will be carried out. Pressurized fluidized bed combustion
research (b) includes studies of combustion and gaseous emissions at different pressures
using different fuels, and also studies of fluid bed hydrodynamics. Additionally, particle
elutriation is measured and some hot gas cleanup devices will be tested. Cyclone tests will
f f

57 -
probably be continued by ceramic filter tests. Pressurized gasification research (c)
includes, among others, basic research of gasification at high pressures and also
development of alkaline monitoring systems. Subproject d) includes computer modelling
of PFBC/G processes and also reviews of turbine technology.
The rig is planned to be used annually 6 monthts as a combustor and 6 months as a gasifier.
A general timeschedule of the project is shown in Figure 3. After the first combustion and
gasification test periods the rig will be completed by some secondary hot gas cleanup
device. The fuel in the first runs has been peat but coal will also be tested.
IKK VII ivn
PFBC/G
TIME SCHEDULE OF THEPFBC/G PROJECT
PLANNING OF THE RIG
BUILDING OF THE RIG
COMMISSIONING
COMBUSTION TESTS
GASIFICATION TESTS
i: i. i
r r j_ -i
Figure 3. Project timeschedule.

r :c;
r tS. A
I I
w1

- 59 -
PFBC RESEARCH AND DEVELOPMENT - BRITISH EXPERIENCES
H. Raymond Hoy, Director T’' WHoy Associates Ltd ^
Leatherhead, England
Abstract
The UK involvement in the development of PFBC is outlined with parti
cular reference to the period up to the end of 1984.
1 BACKGROUND
The main motivation for developing PFBC is its potential for enabling
coal to be used in combined cycle power generating plant, thereby in
creasing power generating efficiency, and at the same time meeting at
mospheric emission regulations as regards sulphur and nitrogen oxides.
As is well known, a gas turbine converts heat into power at a higher
temperature than is practicable in conventional steam power plant. The
steam plant however rejects heat at a lower temperature, and hence
combining the two extends the range of temperature over which heat is
converted into power and hence increases power generating efficiency.
Combined cycle plant burning clean gas or liquid fuels are now being
used by a few power utilities, but for this system to be widely applied
the fuel will need to be coal.
Interest in the possibility of using coal as the fuel for power plant
involving gas turbines was first shown in the UK in 1947, and a number
of R A D programmes were intiated by the UK Ministry of Fuel and Power,
and by the Department of Scientific and Industrial Research.
Two direct combustion systems were investigated. In the first pulve
rized fuels (75 - 80 % smaller than 76 microns), were burned and the
r r i
v r '
E
intent was to keep the combustion temperatures below those at which the
ash was molten. In the second, crushed coal was burned in a cyclone
combustor at temperatures at which the ash from the fuel was molten,
and from which over 80 °k of the ash was discharged as liquid slag.
The first route was followed at a number of establishments in the UK,
USA, and Australia, and following upon a 2000 hour test run at the US
Department of Energy's Morgantown research station in 1964 work was
discontinued. The turbine blades suffered from both erosion and accumu
lation of ash deposits on the blades. The higher temperatures prevail
ing in the cyclone combustion system resulted in greater volatilisation
of the coal ash and when in the early 1950s the English Electric Com
pany operated a gas turbine at Rugby with this type of combustor, the
passageways through the turbine blades became choked with cohesive ash
after only a few hours operation. This approach was discontinued in the
late 1950s, and the author and his colleagues concluded that direct
firing of coal for gas turbines could not be seriously considered until
there was a radical new development in combustor technology.
This possibility arose with the evolution of fluidised bed combustion
in 1963 - 1964, which had the potential of achieving high combustion
efficiency at combustor temperatures below those likely to sinter the
ash and cause major volatilisation of alkalis, together with providing
a more compact heat exchange system, and the possibility of meeting the
anticipated limitations on emissions of S0X and N0X.
In the latter part of 1967 my colleagues and I inspired by the late
Prof. Douglas Elliott set about obtaining the necessary support to
build a pressurised combustor at the British Coal Utilisation Research
Association's laboratory in Leatherhead. The type of cycle envisaged is
shown in Figure 1.
The philosophy was to build the largest combustor with a rectangular
cross section that could be contained within an existing 1.8 m diameter
pressure vessel. The result was a combustor, Figure 2, with a cross
section of 1 200 mm x 600 mm. The maximum operating pressure for the
vessel was 6 bar.
r r
j r--i

61 -
Goa Clean up
ViSteam Turbine*
Fluidised bed boiler
_y
Condenser
I Gas to J.ta'k
Economiser
Ash
AirCompressor
]
i. i; i
Figure 1. Supercharged boiler combined cycle. Main application is for electric power plant larger than about 200 MWe. 20 - 30 % of total power would be provided by the gas turbine. Designs envisaged: 60 - 70 MWg gas turbine; pressure ratio 10:1 to 16:1; inlet temperature initially 800 - 850 °C; steam turbine pressure 170 - 240 bar; 538 °C superheat and reheat.
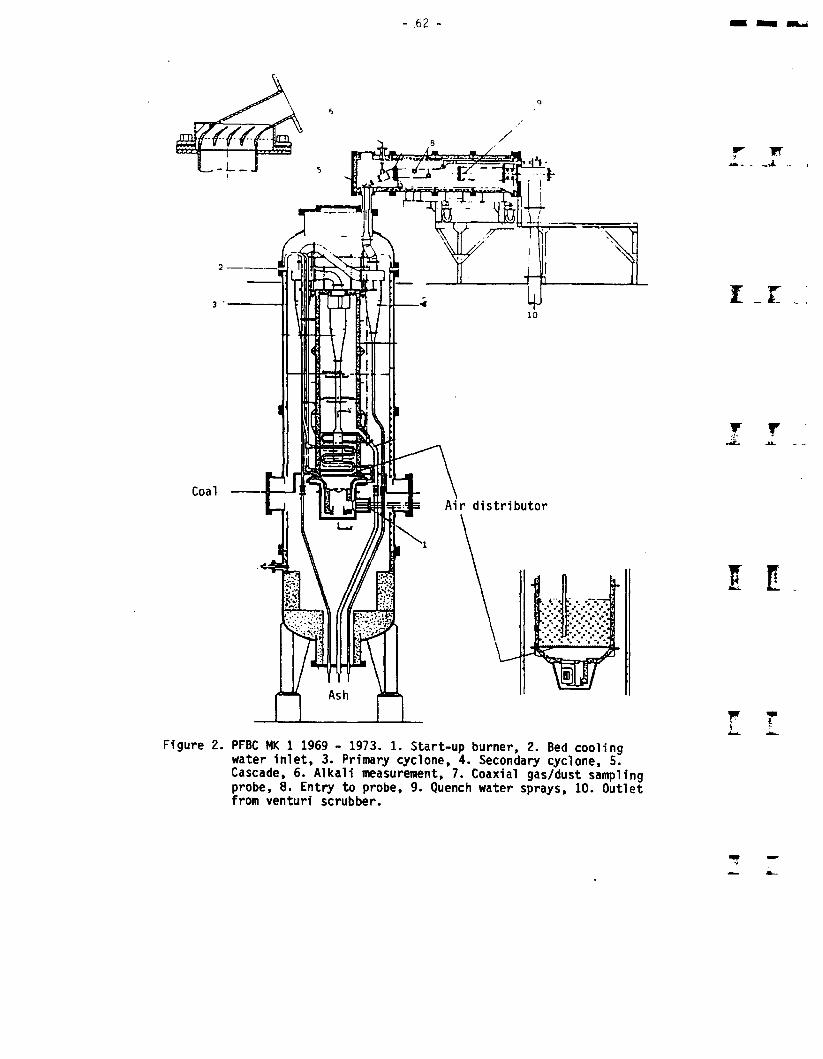
- 62 -
Figure 2. PFBC MK 1 1969 - 1973. 1. Start-up burner, 2. Bed cooling water inlet, 3. Primary cyclone, 4. Secondary cyclone, 5. Cascade, 6. Alkali measurement, 7. Coaxial gas/dust sampling probe, 8. Entry to probe, 9. Quench water sprays, 10. Outlet from venturi scrubber.

- 63 -
The primary purpose of the combustor was to obtain an indication as to
whether the combustion gases could, after cleaning in cyclones, be
expanded through a cascade of turbine blades without causing serious
erosion, or deposition that would adversely affect the aerodynamics of
the blades. A plant with the highest practicable gas flow was therefore
needed, and a combustor with a relatively large cross section was also
needed in order to obtain meaningful data for scaling up.
The test programme began in 1969, and in the period 1972 - 1981 several
other versions of the combustor were tested in the course of programmes
that were mainly sponsored by the US Department of Energy or their
predecessors, but which sometimes also involved such organisations as
Electric Power Research Institute (EPRI), General Electric, American
Electric Power, Stal-laval, British Columbia Hydro, Fluidised Com
bustion Contractors Limited, and the Grimethorpe PFBC Project.
In a total of over 2000 hours operation information was obtained on
factors affecting, combustion and sulphur retention efficiences, N0x
emissions, heat transfer, combustor shape, and on the effect of the
coiribustion gases on the surfaces of static turbine blades and targets
downstream of them. The effects on performance of alternative methods
of load changing were also investigated.
The experience obtained has provided guidance for the design and opera
tion of the Grimethorpe combustor. Figure 3. This has a cross-section
of 2 m x 2 m, and typically operated at pressures up to 12 bar, with
thermal inputs around 50 MW. This project was jointly financed by the
governments of the United States, the United Kingdom, and the Federal
Republic of Germany, and was operated under the auspices of the Inter
national Energy Agency.
The test programme began in 1981 and continued until 1984 during which
period the combustor was operated for about 4000 hours.
Operation subsequently to 1984 has mainly been financed by the UK
Central Electricity Generating Board, and British Coal. The USDOE and
I
I. t.. ]
Y Y s
, -i
W
\
* .
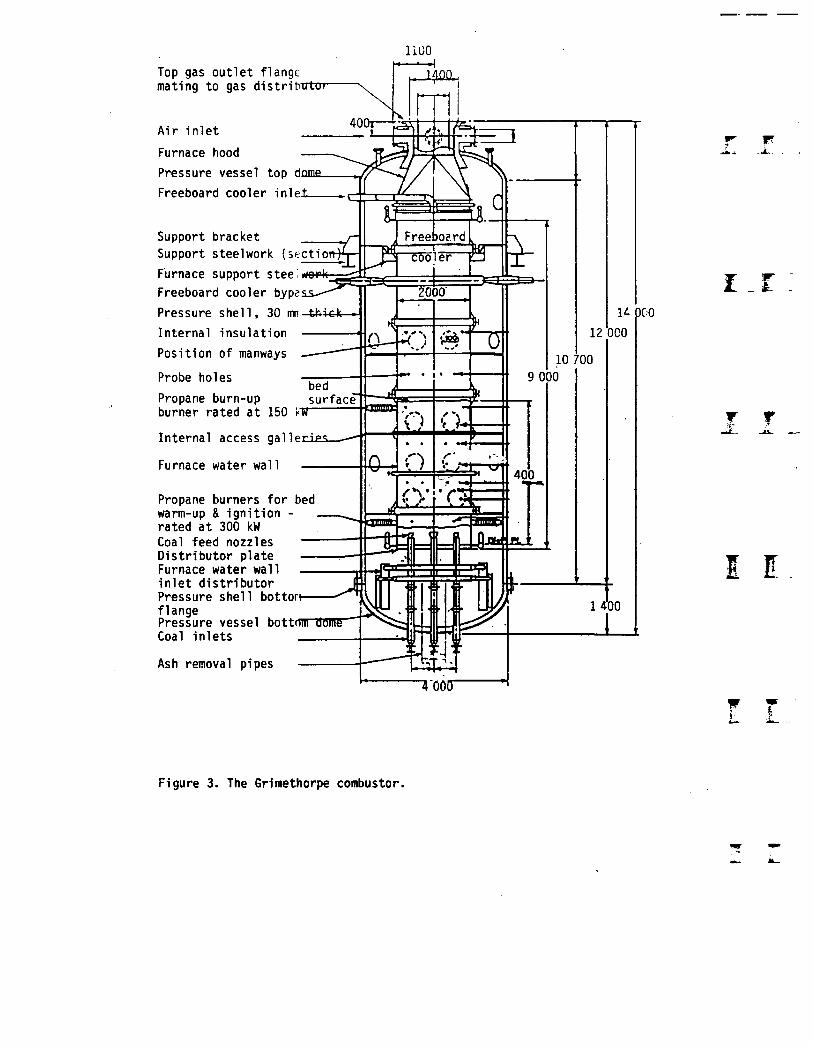
1100Top gas outlet flange mating to gas distributor
Air inlet
Furnace hood
Pressure vessel top dome.
Freeboard cooler inlet
Support bracket Support steelwork (secti
Furnace support stee.work
Freeboard cooler bype
Pressure shell, 30 mn
Internal insulation
Position of manways
Probe holesbed
Propane burn-up surfaceburner rated at 150 rff
Internal access galleries
Furnace water wall
Propane burners for bed warm-up & ignition - rated at 300 kW Coal feed nozzles Distributor plate Furnace water wall inlet distributor Pressure shell bottom flangePressure vessel bottom dome1 Coal inlets
Ash removal pipes
TOOff
Figure 3. The Grimethorpe combustor.

- 65 -
have funded the provision of equipment respectively, for operation on
coal-water mixtures, and for investigating hot gas filtration, and have
contributed to the cost of testing these items.
In order to investigate the effect on combustion and sulphur retention
performance of operating over a wider pressure range than was feasible
in the foregoing rigs, a combustor with a cross-section of 300 x 300 mm
capable of operating at pressures up to 20 bar. Figure 4, was built at
Leatherhead at the end of 1981. The construction was funded jointly by
EPRI, AEP/Stal-Laval/Deutsche Babcock, Swedish NE, and the NCB-CURL.
]
I iij
Coal Itom 6olfn storage vessel
Coal lockhopper
Waterquench
VenturiCyclone vessel"
scrubberCoal teeder hopperTo pressure
let-down
filter Rotary valvesCombustor
Waterseparator Coal sampler
Slurry
Bed removal screw Bed lock hopper
bagtiller
r r* -J
\
Figure 4. General layout of 20 atmosphere rig.

Tests totalling over 2 000 hours were carried out, including over 300
hours burning coal-water mixtures containing 70 % coal. The costs of
operating the combustor were mainly met by the USDOE.
During over 9 000 hours operation in the three combustors and their
variants, data were obtained for the following ranges of conditions:
Pressure
Bed temperature
Fluidising velocity
Excess air
Thermal input
Bed depth
Coals
5 - 20 bar
720 - 950 °C
0.7 - 2.5 m/s
25 - 100 1o0.5-59 MWt
1.2 - 4.2 m
Sub-bit > bituminous
10 - 44 %
12 - 36 %
Dolomite, limestone
ash content adb
volatiles "
Sorbents
The test programmes varied in their objectives. Some were planned to
methodically explore the effects on performance of systematically
changing process variables, whilst others were aimed at resolving spe
cific design and operating issues raised by those engaged in design
studies for commercial plant.
2 SOME FEATURES OF THE COMBUSTORS AT LEATHERHEAD
The ensuing paragraphs are intended to highlight the major features of
the various combustors that were operated at Leatherhead, to point out
their merits, and some of the things that we would not recommend others
to do.
2.1 Combustors for pressures up to 6 bar
The containment for the various versions of the several combustors thathad plan cross-sections of 1 200 mm x 600 mm, or 900 mm x 600 mm, was avertical pressure vessel 6.7 m tall, and 1.8 m diameter. It was pro-
- 67 -
tected from risk of local overhezting by a water cooled liner; this was
the legacy from an earlier programme and was never a necessary provi
sion. The rectangular combustor shafts were fabricated from carbon
steel and were lined with insulating refractory with a total thickness
of 75 mm which had an inner layer of higher abrasion resistance than
the outer layer. The combustion air sweeping down from the inlet at the
top of the pressure vessel provided a measure of cooling for the
casings.
In all but one version of the combustor heat absorption in the bed has
been by horizontal water cooled tube plattens. The configuration of the
tube plattens chosen results from the start up procedure adopted. The
problem was to raise the temperature of a bed that was cooled suffi
ciently for operation at high pressure, before the pressure has risen
far enough for the appropriate quantity of fuel to be burned.
This problem was overcome on the early combustors by delaying admission
of the cooling water until the appropriate level of heat input had been
reached. The admission of water into tubes oeprating at bed temperature
was not conducive to long tube life, but in contrast to vertical plat
tens, horizontal plattens kept their shape under these circumstances.
Tubes inserted into the bed for assessing corrosion behaviour were of
course cooled to the appropriate temperature all the time.
Fluidising air was fed into the combustor through closely spaced stand
pipes welded to a heat resisting steel baseplate in the first build of
the combustor. Figure 2, and gas was burned in the air to preheat the
bed. This was a slow process and resulted in distortion of the distri
butor plate. In subsequent builds, a carbon steel sandwich type distri
butor plate was used, but the standpipes were still made from heat re
sisting steel. For heating up the bed, propane was fed into the stand
pipes from the compartment between the plates, initially into zones
that were being heated to the propane ignition temperature by above or
in-bed burners. This enabled the bed to be heated up much more rapidly
and in the event of there being an interruption to fuel feeding, bed
temperature could be maintained for a short while.
I
i r i
T T 1JL -a.. - -i
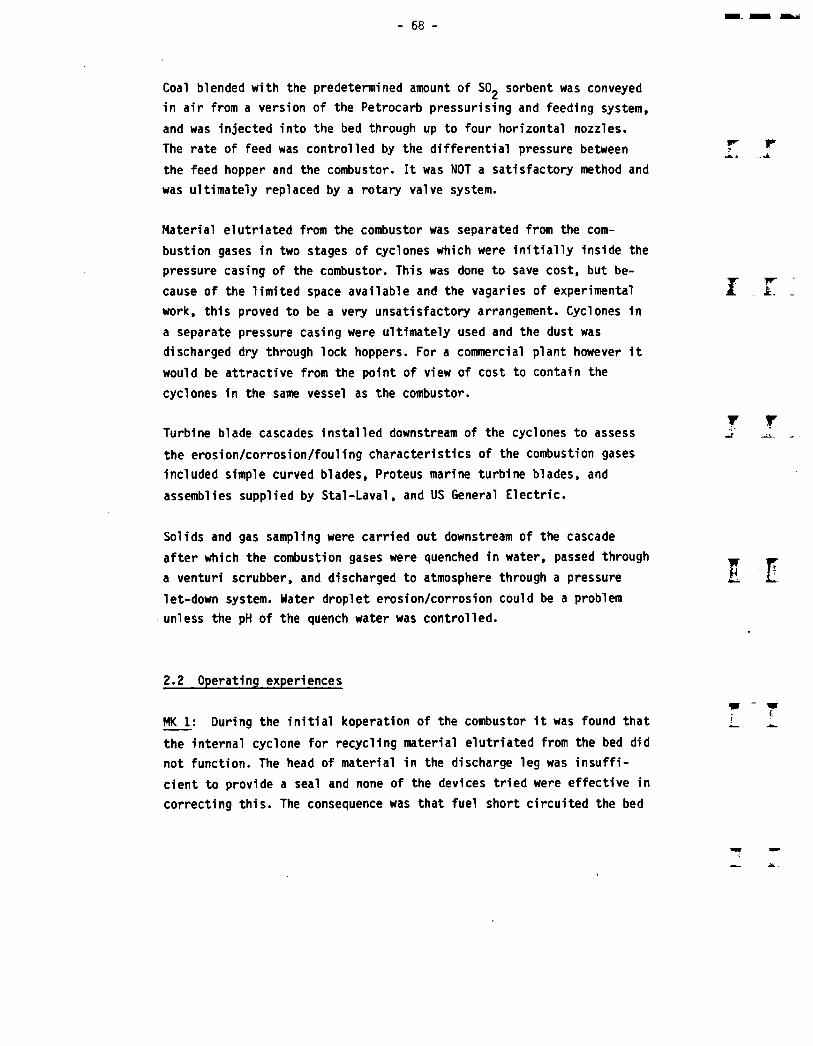
68 -
Coal blended with the predetermined amount of S02 sorbent was conveyed
in air from a version of the Petrocarb pressurising and feeding system,
and was injected into the bed through up to four horizontal nozzles.
The rate of feed was controlled by the differential pressure between
the feed hopper and the combustor. It was NOT a satisfactory method and
was ultimately replaced by a rotary valve system.
Material elutriated from the combustor was separated from the com
bustion gases in two stages of cyclones which were initially inside the
pressure casing of the combustor. This was done to save cost, but be
cause of the limited space available and the vagaries of experimental
work, this proved to be a very unsatisfactory arrangement. Cyclones in
a separate pressure casing were ultimately used and the dust was
discharged dry through lock hoppers. For a commercial plant however it
would be attractive from the point of view of cost to contain the
cyclones in the same vessel as the combustor.
Turbine blade cascades installed downstream of the cyclones to assess
the erosion/corrosion/fouling characteristics of the combustion gases
included simple curved blades, Proteus marine turbine blades, and
assemblies supplied by Stal-Laval, and US General Electric.
Solids and gas sampling were carried out downstream of the cascade
after which the combustion gases were quenched in water, passed through
a venturi scrubber, and discharged to atmosphere through a pressure
let-down system. Water droplet erosion/corrosion could be a problem
unless the pH of the quench water was controlled.
T 1*
i r
F T
I E
2.2 Operating experiences
MK 1: During the initial koperation of the combustor it was found that
the internal cyclone for recycling material elutriated from the bed did
not function. The head of material in the discharge leg was insuffi
cient to provide a seal and none of the devices tried were effective in
correcting this. The consequence was that fuel short circuited the bed
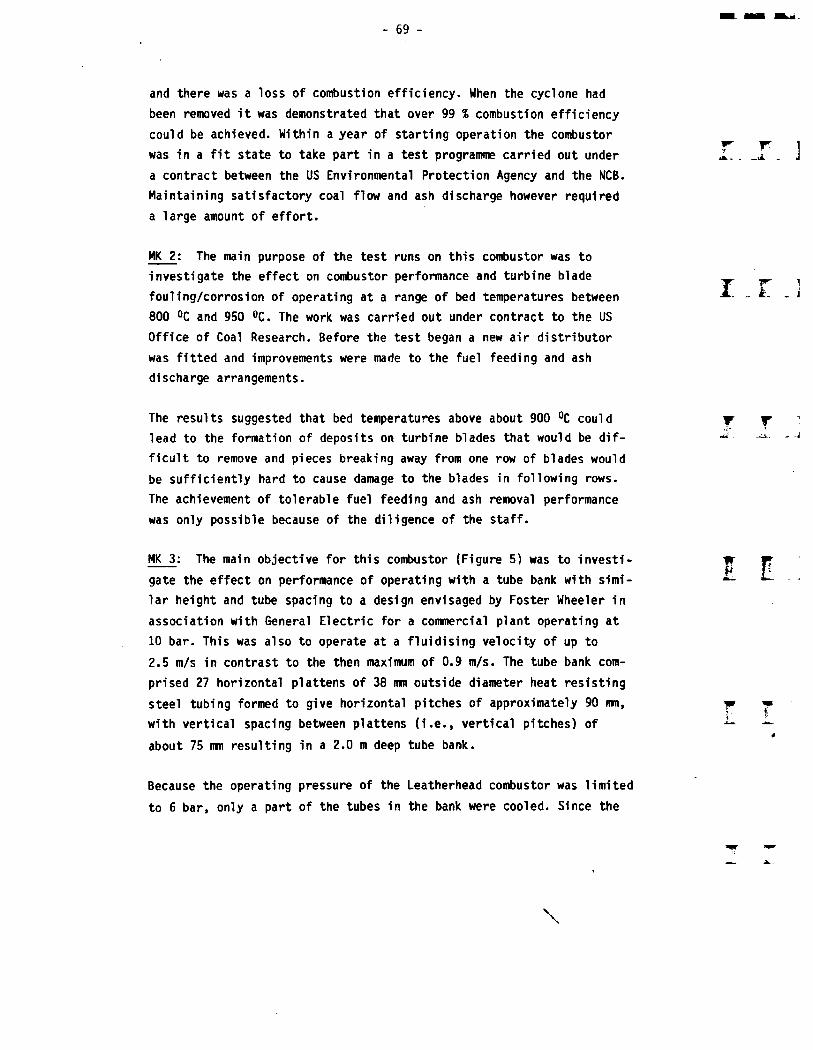
- 69 -
and there was a loss of combustion efficiency. When the cyclone had
been removed it was demonstrated that over 99 % combustion efficiency
could be achieved. Within a year of starting operation the combustor
was in a fit state to take part in a test programme carried out under
a contract between the US Environmental Protection Agency and the NCB.
Maintaining satisfactory coal flow and ash discharge however required
a large amount of effort.
MK 2: The main purpose of the test runs on this combustor was to
investigate the effect on combustor performance and turbine blade
fouling/corrosion of operating at a range of bed temperatures between
800 °C and 950 °C. The work was carried out under contract to the US
Office of Coal Research. Before the test began a new air distributor
was fitted and improvements were made to the fuel feeding and ash
discharge arrangements.
The results suggested that bed temperatures above about 900 °C could
lead to the formation of deposits on turbine blades that would be dif
ficult to remove and pieces breaking away from one row of blades would
be sufficiently hard to cause damage to the blades in following rows.
The achievement of tolerable fuel feeding and ash removal performance
was only possible because of the diligence of the staff.
MK 3: The main objective for this combustor (Figure 5) was to investi
gate the effect on performance of operating with a tube bank with simi
lar height and tube spacing to a design envisaged by Foster Wheeler in
association with General Electric for a commercial plant operating at
10 bar. This was also to operate at a fluidising velocity of up to
2.5 m/s in contrast to the then maximum of 0.9 m/s. The tube bank com
prised 27 horizontal plattens of 38 mm outside diameter heat resisting
steel tubing formed to give horizontal pitches of approximately 90 nm,
with vertical spacing between plattens (i.e., vertical pitches) of
about 75 mm resulting in a 2.0 m deep tube bank.
Because the operating pressure of the Leatherhead combustor was limited
to 6 bar, only a part of the tubes in the bank were cooled. Since the
r r
\
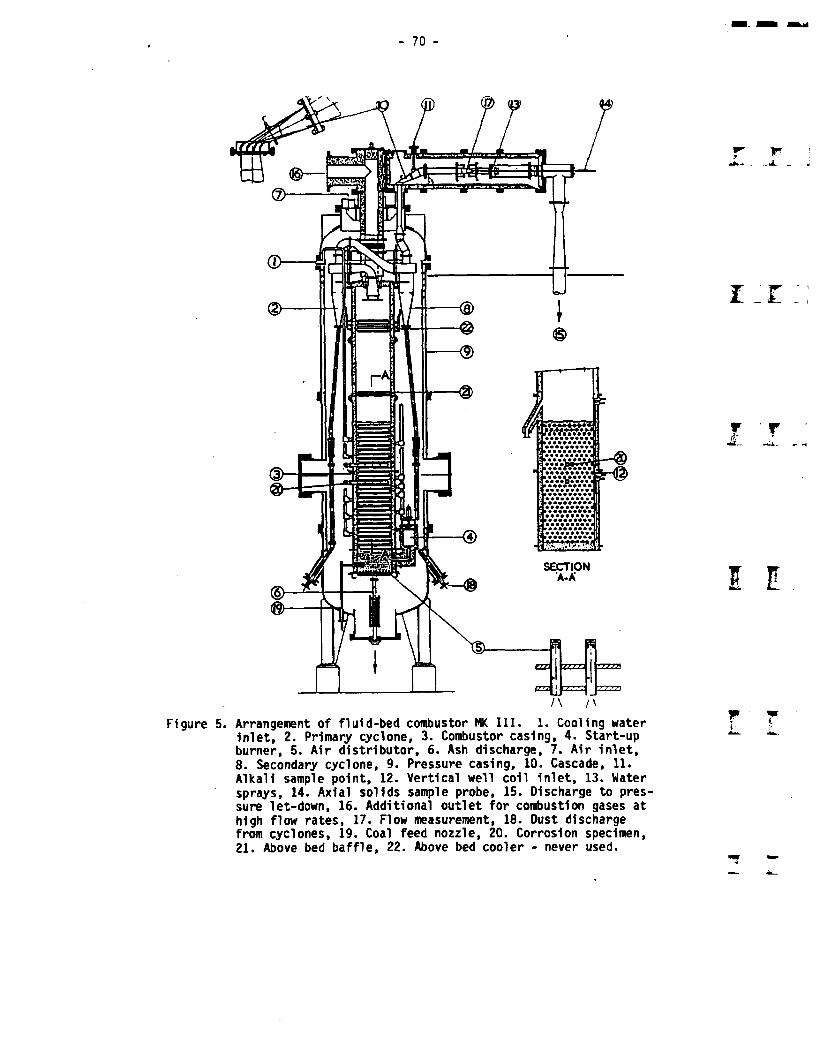
- 70 -
SECTION
Figure 5. Arrangement of fluid-bed combustor MK III. 1. Cooling water inlet, 2. Primary cyclone, 3. Combustor casing, 4. Start-up burner, 5. Air distributor, 6. Ash discharge, 7. Air inlet,8. Secondary cyclone, 9. Pressure casing, 10. Cascade, 11. Alkali sample point, 12. Vertical well coil inlet, 13. Water sprays, 14. Axial solids sample probe, 15. Discharge to pressure let-down, 16. Additional outlet for combustion gases at high flow rates, 17. Flow measurement, 18. Dust discharge from cyclones, 19. Coal feed nozzle, 20. Corrosion specimen, 21. Above bed baffle, 22. Above bed cooler - never used.
I... c ;;
W ' TJL X

71 -
investigations also included exploring performance at fluidising velo
cities between 0.9 and 2.2 m/s, the proportion of cooled tubes in the
bed was varied over a wide range. The grouping of the cooled tubes over
the height of the combustor did not appear to have a significant effect
on performance. Owing to administrative delays, performance data for
operation at the highest fluidising velocity were not available at the
time the range of operating conditions for the Grimethorpe combustor
were chosen. The inferior performance achieved as regards sulphur
retention and combustion efficiency at 2 m/s compared with that at
0.9 m/s led GE under their contract with the ERDA to sponsor tests at
a fluidising velocity of around 1.4 m/s. The performance obtained was
considered to be sufficiently good for this fluidising velocity to be
chosen for the design study for the commercial plant, and for the
design of the tube bank used after the first series of rebuild of the
Grimethorpe combustor.
MK 4: Operation of this combustor. Figure 6, was a major deviation
from the development programme for the supercharged boiler combined
cycle. Curtiss-Wright had been successful in obtaining from the USDOE
a contract to develop the Air-Cycle. In this the bed temperature is
controlled by passing air instead of steam through tubes immersed in
the bed, and the hot air produced is mixed with the products of com
bustion from the bed after these have been cleaned. Since in the air-
cycle tubes can operate at temperatures approaching the bed temper
ature, change of load and start-up are simplified.
The surface area of in-bed tubing required however is greater than in
the steam cycle, the tubing is more expensive, and none of the esti
mates of power costs made so far have shown the Air-Cycle to be
superior to conventional power plant.
The main objective of the test was to assess the behaviour of per
formance of this type of tube bank and the performance of a bed with
vertical tubes and an unusual type of air distribution system. The
performance in all respects was better than we had anticipated, but
the tubes appeared to be very sensitive to imperfections in the
w ir 3
I - E . J
TJL

72 -
Propane.
i r
IT3 -
Figure 6. Arrangement of fluid bed combustor MK IV 1977 - 1978.

distribution of the cooling air. Subsequent work by Curtiss-Wright in
the USA culminated in a successful 1 000 hour test run, but good as the
results were, they could not outweigh the unfavourable economics of the
air-cycle approach.
MK 5: This version was the outcome of a design study carried out by
Americal Electric Power, Stal-laval (now ASEA-PFBC), and Fluidised
Combustion Contractors Limited, for a 176 MWe demonstration plant in
the USA. The design of the combustor was carried out by that group, and
they met the cost of construction and operation. There were two phases
of operation, one without tubes in the bed, and the second with the
tube arrangement shown in Figure 7.
This was the first PfBC to have a tapered bed. A tapered bed has many
potential merits. These include:
lower cost for the air distributor,
fewer coal nozzles,
fewer ash offtakes,
less fuel for initial heating of the bed.
The geometry of the combustor was wholly unsuccessful as regards com
bustion efficiency and sulphur retention. The larger than usual pres
sure pulsations resulted in even more unsatisfactory fuel feeding than
had prevailed previously, and this combined with the higher carbon led
to grievous problems with the very poor ash discharge system from the
primary cyclone.
The faults of MK 5 combustor basically added up to:
Taper angle too wide, bottom/top bed area ratio too large, tube
bank to distributor distance too large, tube bank tube spacings
wrong.
The lessons well and truly learned as regards the test rig were:
Feed rate control must not be solely dependent upon the pressure
differential between the feed hopper and the combustor.

- 74 -
Figure 7. Arrangement of fluid bed combustor MK V. 1. Cooling water inlets, 2. Primary cyclone, 3. Main bed cooling coils, 4. Start-up burners, 5. Air distributor, 6. Ash discharge leg, 7. Main air inlet, 8. Secondary cyclone, 9. Pressure casing, 10. Two-stage cascade, 11. Water jets, 12. Venturi scrubber, 13. Additional outlet, 14. Lower bed cooling coils, 15. Baffle tubes, 16. Above bed cooler, 17. Ash leg discharge 18. Coal nozzle.
r r

- 75 -
Ash discharge legs need to follow an essentially straight path,
and to be well above the acid dew point temperature before com
mencing to burn a hydrogen containing fuel.
HK 6: The MK 6 combustor. Figure 8, was built to demonstrate that good
performance as regards combustion efficiency, sulphur retention, ash
removal by cyclones, and freedom from erosion, and fouling of turbine
blade cascades could be maintained over an operating period of 1 000
hours. The thermal input was 2.5 MW.
The lower part was manufactured by Babcock UK in accordance with de
signs evolved at Leatherhead, and Combustion Systems Ltd., met the cost
of both the combustor and the cold model work involved in its design.
Babcock, under contract to EPRI, also provided assemblies of super
heater tube metal specimens, tube hanger materials, and a variety of
other specimens for a major programme of corrosion investigations.
Stal-Laval, and GE provided cascades of turbine blades, and in addition
the latter provided a cyclone designed to investigate the possibility
of improving performance by electrostatic charging of the particles.
American Electric Power provided the coal and dolomite, and the USDOE
met the full cost of operating the rig. The layout of the test equip
ment is shown in Figure 9.
Some ten years after operating the first version of the combustor we
had at last been able to provide ourselves with a reliable coal feeding
system, and the external cyclones provided relatively troublefree ash
removal.
The freedom from deterioration of the cascades, and generally good
performance achieved in this rig was a landmark in the development of
PFBC as it provided confidence as to the viability of the technology.
MK 7; The principle objective of the programme for this combustor was
to investigate the performance that might be achieved when using change
of bed level as the means for changing load. For this purpose we

76 -
\
Figure 8. Arrangement of fluid bed combustor MK VI 1979
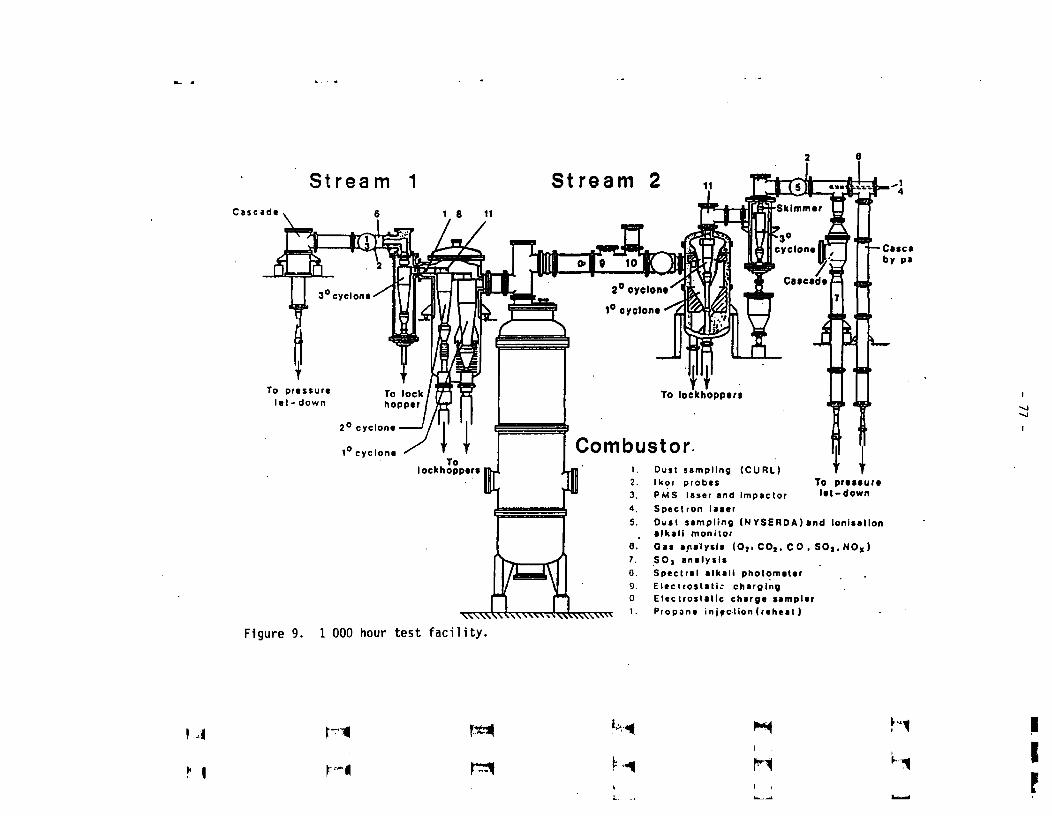
2 6
Strea m Stream 2Cascade
To pressure let - down
To pressure let-down
Figure 9. 1 000 hour test facility.
Dust sampling (CURL)Ikor probes
PMS laser and impactor Speclron laserDust sampling (NYSERDA)and ionisation alkali monitorGas a/ialysis (O,. CO,, C 0 , SOj , NOx ) SO, analysisSpectral alkali photometer Electrostatic charging Electrostatic charge sampler Propane in jpc-tion (reheat )
i-j
l i r* Mi
hi
r i r**t
M

- 78 -
reverted to the use of a parallel sided combustor. Figure 10, largely
because the tapered combustor had been dismembered for rigorous exami
nation following upon the 1 000 hour run.
The results of the tests showed that reduction of load to 50 - 60 * of
mcr by reducing bed level resulted in a lesser penalty on combustion
W_
1.
2.3.4.5.6.7.8. 9.
High temperature | Kamyr valve Conveying air •. T Purge nitrogen Fluidising distributor Adjustable tube Preheater Gas offtake Quench water Venturi scrubber
I T.
II-
Figure 10. MK Vll combustor with bed transfer facility.

- 79 -
efficiency and sulphur retention than when the same reduction was
achieved by reducing bed temperature, and that by combining the two
methods together with by-passing of air around the combustor, operation
at loads down to 30 - 40 % mcr should be feasible. The results indi
cated that rates of load change of 3 - 5 % per minute should be
achievable.
The inferior performance achieved at low loads indicated that where
this type of operation formed a significant part of the operating life
of a plant, it would be necessary to consider recycling the fines sepa
rated from the first stage of the hot gas cleanup system. It can be
deduced from experience on AFBC systems that this would result in a
significant improvement in performance, but as yet there are no defi
nitive data for operation of a PFBC using recycle.
MK 8: The function of the tests on this combustor (Figure 11) was to
provide a link between the results achieved at Leatherhead and those
achieved by the much larger Grimethorpe combustor, which at that time
(April 1980) was hortly to begin hot commissioning. A new tube bank
installed in the MK VII combustor which had the same diameter tubes
(34 mm), and the same horizontal (89 mm) and vertical (65 mm) pitches
as the Grimethorpe tube bank, but the overall height of the bank was
about 1 m lower, and the distance between the bottom of the bank and
the air distributor was 450 mm as compared with 900 mm at Grimethorpe.
The combustor was operated at a fluidising velocity of 2 m/s and with
35 % excess air which resulted in both higher combustion and heat ab
sorption intensities than hitherto experienced in the tests at Leather
head. However, because of the lower pressure in the Leatherhead rig
(6 atm, as compared with 10 atm), the intensities were lower than was
to apply at Grimethorpe.
The results were some cause for alarm, as a bed temperature gradient of
60 °C between the top and the bottom of the bed was found, and this
would clearly be greater in the Grimethorpe combustor. Design work on a
new tube bank for Grimethorpe was therefore initiated, and because we
T
V
\
'•4

- 80 -
Figure 11. Arrangement of fluid bed combustor MK VIII 1980

- 81 -
had already shown that performance at a fluidising velocity of 2 m/s
was inferior to that at 1.5 m/s, it was designed for the lower veloci
ty. This concluded operations for the 6 atm rig.
2.3 The 20 atm combustor
As mentioned previously this was designed to investigate performance at
pressures above those attainable in the Grimethorpe rig. Its design
incorporated a number of features that experience suggested to us were
desirable in future commercial combustor designs. The small cross-
section, 300 inn x 300 mm was dictated by cost considerations.
The layout of the equipment is shown in Figure 2, and some details are
shown in Figure 12. It was designed, built and commissioned in 9 months
and came into operation at the end of 1981. Before it was dismantled
and transferred to the British Coal Research Establishment at Stoke
Orchard in August 1984 it had been operated for over 2 000 hours.
The combustor consisted of a refractory-lined vessel, the fluidised bed
and freeboard together occupied a height of about 4.8 m. The tube bank
comprised up to 119, 25 mm diameter cooled and uncooled tubes in 34
horizontal rows, on 75 inn horizontal and 64 mm vertical pitches. Air
was admitted through a sparge-type distributor consisting of four
headers containing 16 stand-pipes arranged on a 70 mm square pitch.
Differences in thermal input were met by changing the ratio of cooled
to uncooled elements, and the pattern in which they were inserted.
Surplus bed material descends through the distributor and is cooled in
passing between cooling coils below it en-route to arotary valve which
controlled the rate of outflow to the lock hopper for depressurising.
The valve was replaced by a screw in a later edition.
For most of the tests dry coal was used. This was fed from a lock
hopper system at a rate controlled by a rotary valve into a pneumatic
3
113
t r

82
transport line that was already carrying the S02 sorbent. This had also
been fed through a lock hopper system. The coal nozzle was a plain pipe
with a dispersion baffle on the end.
Special provisions were made for in-bed measurements. Traversing probes
were installed at 1.1 m and 2.3 m above the distributor to enable the
Figure 12 20 atm rig: arrangement of distributor and tube bank.

- 83 -
solids and the gases (using conventional on-line instrumentation) to
be sampled at various positions across the bed. Fixed probes were also
installed in the bed to carry out measurements of bubble size and velo
city (by capacitance measurements); oxygen potentials (using zirconia
electrolytic cells) and gas composition (by on-line mass spectrometry).
These special investigations were planned and carried out by staff from
Chalmers University of Technology (Sweden) and formed part of the pro
gramme supoorted by the Swedish Department of Energy (NE). The major
part of the cost involved in manufacturing and isntalling the traver
sing and fixed probes was met by Chalmers University.
For over 300 hours of the operating period, the coal was fed as a coal-
water mixture. This was produced on site, and mainly contained 70 - 73
* of 1 mm -0 coal by weight. In some tests the sorbent was mixed with
the coal. Both US and UK coal were used. With the US coal (caking),
combustion efficiency was maintained at a higher level when bed tem
perature was reduced than applied with dry burning (Figure 13).
The investigation also included tests with two-stage air admission with
the intent of further reducing N0x emission. This made only a small
improvement but sulphur retention was greater improved. We do not think
however that two-stage air admission is practicable in a pressurised
bubbling bed combustion system.
The main conclusion from the programme was that operation at pressures
in the range 12 - 20 atm was unlikely to result in problems that would
discourage operation of commercial plant in this pressure range.
IT.]
f w 1
I E
3 FEATURES OF THE IEA GRIMETHORPE COMBUSTOR
W3.1 The facility ^
The decision to build the Grimethorpe Test Facility was taken at the
end of 1975. The objective was to have a flexible facility capable of
investigating a wide range of operating conditions on behalf of the

- 84 -
COMBUSTIONEFFIENCV
%
COMBUSTIONEFFICIENCY
%
HIGH VOLATILE COAL EXCESS AIR >30%
BED TEMPERATURE °C
i r.
MEDIUM VOLATILE COAL BED TEMPERATURE C. 850°C
EXCESS AIR %
CWM
DRY COAL
{{
0-16 atm. • • 10 atm. A - 16 atm. ▲ • 10 atm.
GAS RESIDENCE TIME IN BED C. 3 SECS
r t
\
Figure 13. Combustion efficiency: CWM V dry feeding.

- 85 -
sponsors. As mentioned previously owing to delays in funding some key
test programmes at Leatherhead, important information affecting the
choice of operating conditions was not available at the time the design
of the facility was frozen.
The overall flow diagram for the form of the rig used for the activi
ties subsequently to the first test series is shown in Figure 14. The
most significant changes that were made to the test rig after the first
period included the installation of rotary valves for controlling coal
feed, major revision of the coal preparation equipment, and the instal
lation of comprehensive research Instrumentation and data processing
equipment. The facility was and still is the largest PFBC installation
in existence. During the IEA phase the coal was burned for around 4 000
hours, and subsequently for over 2 000 hours in the course of which
coal-water mixtures with high solids content have been burned success
fully for several hundred hours.
3.2 The combustor
The combustor which has a plan cross section within the refractory
lining of the water wall tubes of 1.9 m x 1.9 m is contained in a 4 m
diameter, 14 m high pressure vessel.
The first tube bank, 'A', was designed for heat loads up to 30 MW. The
tube bank was 3.5 m high and began about 0.9 m above the air distri
butor. The tubes were on triangular pitches, 89 mm horizontal and 65 mm
vertical. Operated at 10 bar, with a bed temperature of 850 °C and a
fluidising velocity of 2.6 m/s, the vertical bed temperature gradient
was typically 170 °C. It was accordingly difficult to get meaningful
performance data.
The replacement tube bank 'C was designed for a fluidising velocity of
1.5 m/s, a bed height of 4.5 m to give a longer residence time, and
because the tube bank had now only to accept heat loads of up to 18 MW,
it had a much more open structure (Figure 15).
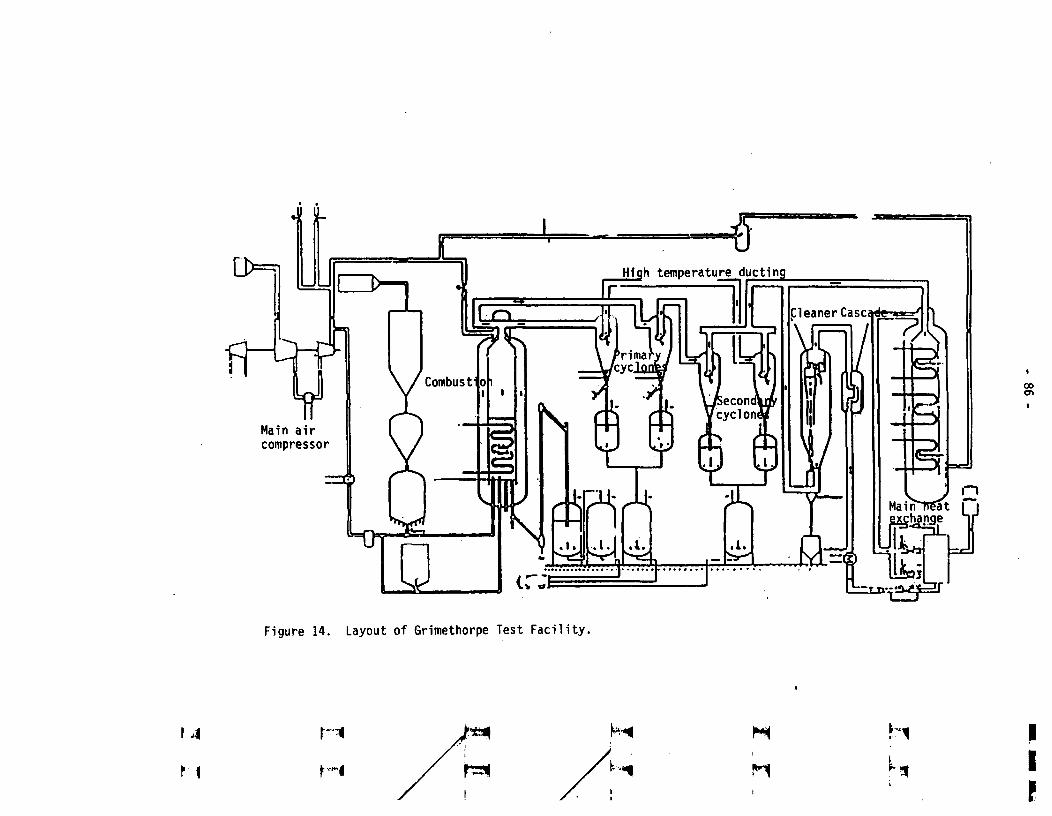
High temperature ducting
pi eaner Cascade
Combust oi
Main air compressor
Figure 14. Layout of Grimethorpe Test Facility.
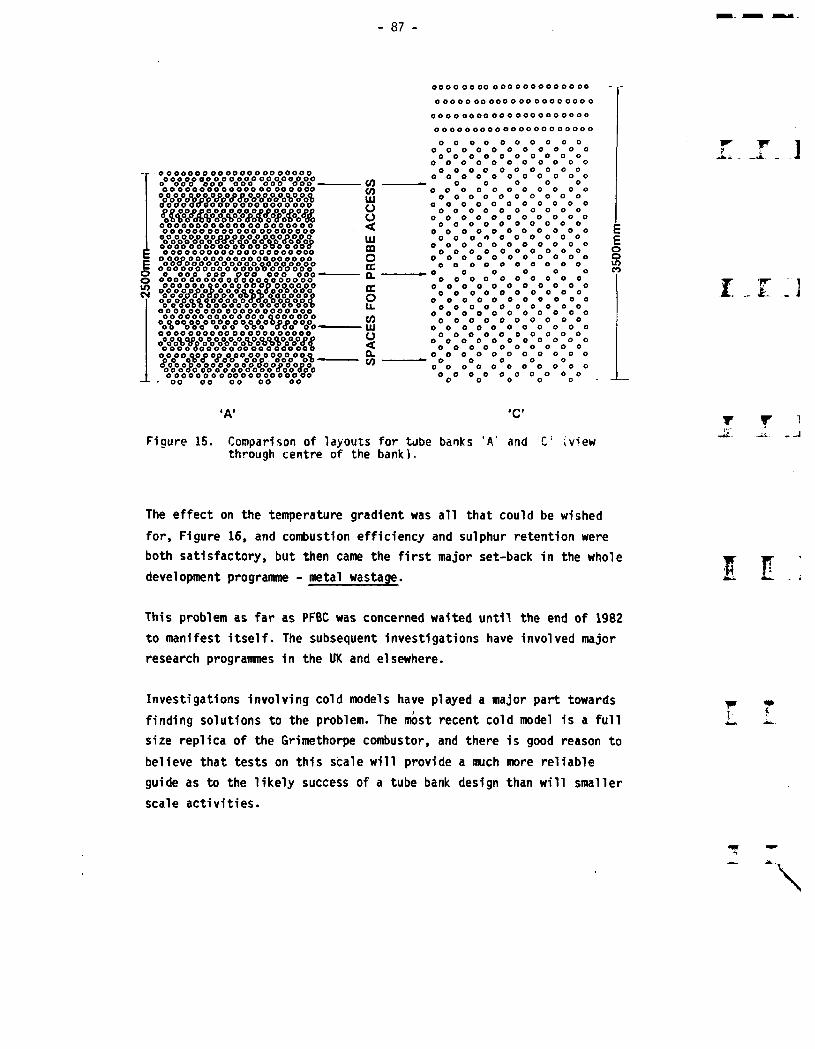
2500
m rr
v
- 87
ooooooooooooooooooooo oooop poop oooooooooooo o ooo ooo ooo ooo ooo - ooooooooooooo oo ooo ooo
oooooooooooooo ooooooo ooooooooooooo oo ooo ooooooooooooooooo ooooooo ooooooooooooooooooooo ooooooooooooooooooooo o oooooooooooooooooooo ooooooooooooooooooooo o ooo ooo poo OOO OOOmOOOOOOOOOOOO----------------------------oooooor----*VoW ‘ooooo0oo<o o o o o o o oo o o o~o o o ooo ooo oooooooooooooo ooooooooo%00oVo° Wo0 Wo° Wo0 °o0o - OOOOOOOO00ooooooooooooVoWpVoWoWomvoWoooooooooooooooooo oooW°oW VAP°oWWo0%% - VoWoVo0oVo0oVoVoWo0«Po°o
<0c/>uioo<Uimoccaccou.(0UIo<CLV)
oooooooo oooooooooooooooooooooooooooooooooooooo oooo ooo ooooooooooooooooooooooooooooooooooooooooo ooooooooooo oooooooooo ooooooooooo oooo oooooo ooooooooooo o o o o o ooooooooooo oooooooooo ooooooooooo oooooooooo ooooooooooo oooooooooo ooooooooooo oo oooooooo ooooooooooo oooooooooo ooooooooooo oo ooooooooOOOOOOoooo oooooo ooooooooooo oooooooooo ooooooooooo oooooooooo ooooooooooo o ooooooo oo ooooooooooo oooooooooo ooooooooooo oooooooooo ooooooooooo o o o o o ooooooooooo oooo oooo oo 0 0 0 0 0
EEoom
CO
f.. ]
i _ e .: ]
‘A’ ‘C’
Figure 15. Comparison of layouts for tube banks 'A' and C through centre of the bank).
i view
T ' T 1-44. «. -J
The effect on the temperature gradient was all that could be wished
for. Figure 16, and combustion efficiency and sulphur retention were
both satisfactory, but then came the first major set-back in the whole
development programme - metal wastage.
This problem as far as PFBC was concerned waited until the end of 1982
to manifest itself. The subsequent investigations have involved major
research programmes in the UK and elsewhere.
Investigations involving cold models have played a major part towards
finding solutions to the problem. The most recent cold model is a full
size replica of the Grimethorpe combustor, and there is good reason to
believe that tests on this scale will provide a much more reliable
guide as to the likely success of a tube bank design than will smaller
scale activities.
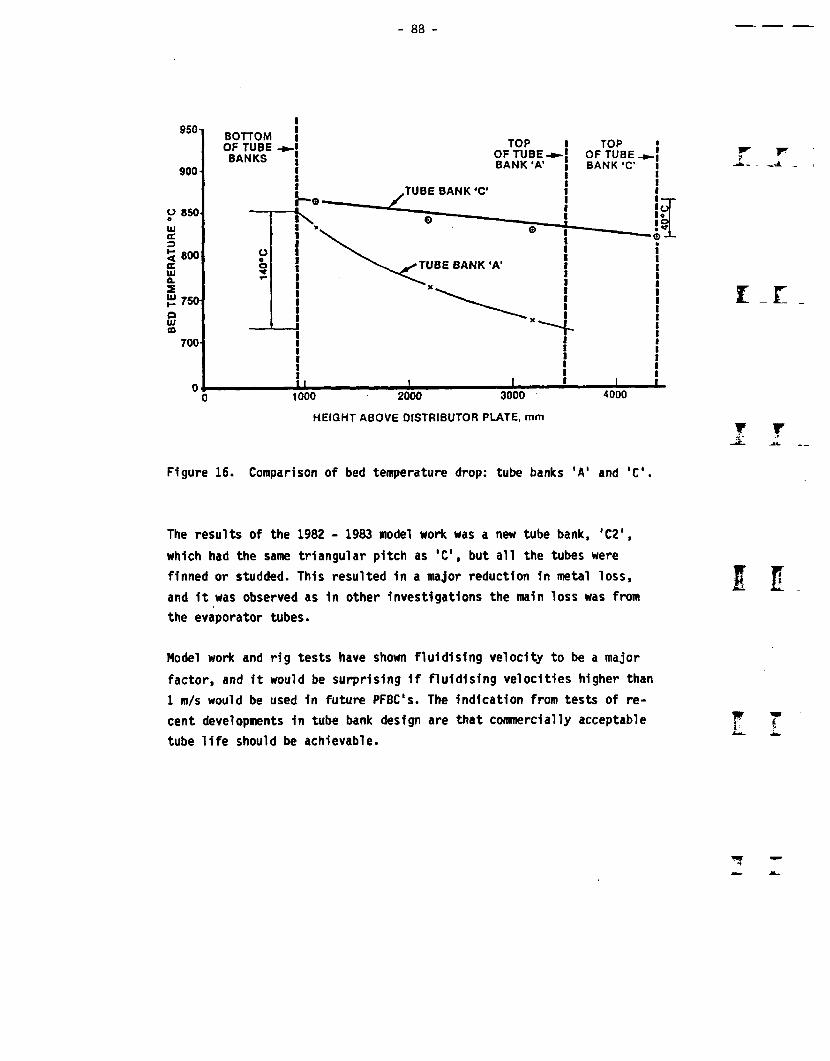
- 88 -
r _£
y
Figure 16. Comparison of bed temperature drop: tube banks 'A1 and 'C.
The results of the 1982 - 1983 model work was a new tube bank, ,C2I,
which had the same triangular pitch as 'C, but all the tubes were
finned or studded. This resulted in a major reduction in metal loss,
and it was observed as in other investigations the main loss was from
the evaporator tubes.
Model work and rig tests have shown fluidising velocity to be a major
factor, and it would be surprising if fluidising velocities higher than
1 m/s would be used in future PFBC's. The indication from tests of re
cent developments in tube bank design are that commercially acceptable
tube life should be achievable.
wl
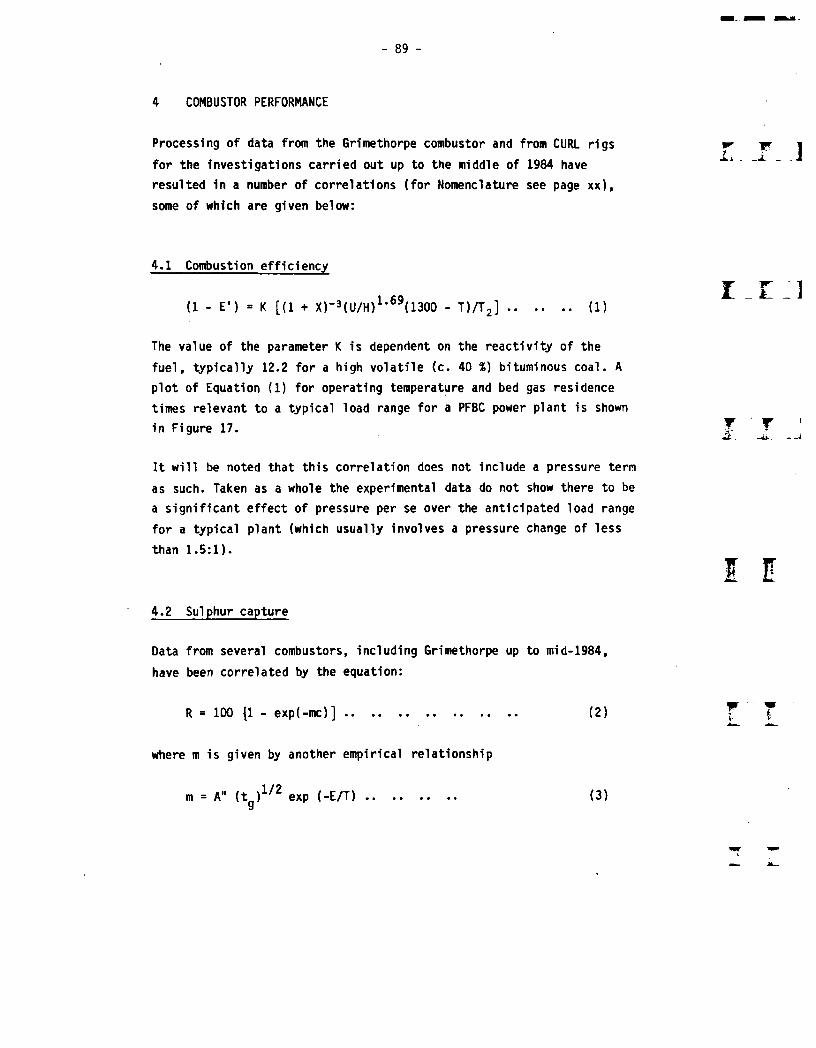
- 89 -
4 COMBUSTOR PERFORMANCE
Processing of data from the Grimethorpe combustor and from CURL rigs -w-for the investigations carried out up to the middle of 1984 have ^
resulted in a number of correlations (for Nomenclature see page xx),
some of which are given below:
4.1 Combustion efficiency
(1 - E') = K [{1 + X)_3(U/H)1*69(1300 - T)/T2] ....................... (1)
The value of the parameter K is dependent on the reactivity of the
fuel, typically 12.2 for a high volatile (c. 40 %) bituminous coal. A
plot of Equation (1) for operating temperature and bed gas residence
times relevant to a typical load range for a PFBC power plant is shown
in Figure 17.
It will be noted that this correlation does not include a pressure term
as such. Taken as a whole the experimental data do not show there to be
a significant effect of pressure per se over the anticipated load range
for a typical plant (which usually involves a pressure change of less
than 1.5:1).
4.2 Sulphur capture
Data from several combustors, including Grimethorpe up to mid-1984,
have been correlated by the equation:
R = 100 {1 - exp(-mc)]............................................................... (2)
where m is given by another empirical relationship
m = A" (tg)1/2 exp (-E/T)
i _e :i
T ' r 1
I I
(3)

- 90 -
/ //
Temperature :°C
------ Gee reeldence time in bed —4e•t •> •> n •> —2s•» •• it ii •• —te
Numbers adjacent to curves are percent excess air.
Figure 17. Effect of part-load parameters on combustion efficiency.
I E
T T
I l
The value of A" is mainly dependent on the sorbent characteristics and
variations between 10 and 50 have been found.
A polot of these equations for a reactive dolomite (Plum Run) where A"
= 50 (mm/s)^ and E = 4 650 K is shown in Figure 18. At full load,
the Ca/S ratio for 90 % retention is about 1.4, rising to 1.6 to 2.0 at
60 % load and to greater than 3 at loads below 40 %.
Over the above load range sulphur retention appears to be independent
of pressure and excess air.

- 91 -
Ca/S mol ratio
for 90% sulphur
retention
Residence time in bed, s Sorbent : Plum Run dolomite
Particle size : 1mm
Figure 18* Effect of pa^t-load parameters on sorbent requirements.
4.3 NO^ emissions
Data from the Grimethorpe plant (pre-June 1984, Figure 19) and the CURL
rigs can be correlated by the expression:
NO = 0.028 N (02 + 0.5) Ib/million Btu................................. (4)x
(0.6 lb per million Btu = 720 mg/m3).j
There is now much experimental evidence to suggest that, although
pressure has a significant effect over the range 1 to 6 bar, it has no
effect above about 6 bar. Likewise, no effect of bed temperature in the
range 750 to 950 °C has been observed.
]
T r i-
I E

- 92 -
■ TEST SERIES 2.1Q TEST SERIES 2.2O TEST SERIES 2.3A• TEST SERIES 2.3B
FRO STANDARD
U.S. EPA STANDARD
400-
O
cf ■200-
O, IN OFF-GAS, PERCENT BY VOLUME
oz
oElE -oz
Figure 19. N0x emission data from tests on the Grimethorpe rig.
Thus at full load (30 %> excess air), the N0x emissions with a 1.4 % N
coal would be about 240 mg/m3 rising to c. 400 mg/m3 at 60 % load when
the excess air level would typically have increased to 60 %. These
values are well within the U.S. emission standard of 720 mg/m3. If, or
when, the standard is made more rigorous than can be met without opera
ting at excess air values that in current practice entail loss of com
bustion efficiency, performance could be restored by recycling fines.
T r-
r r
T T
4.4 Heat transfer
Examination of the CURL data, and of the Grimethorpe data for operation
with plain tubes (Tube Bank C) has resulted in the following correla-
ti on:
Nu0.183 (Ar)
0.265
Ev0.7
W
\
(5)
- 93 -
where Nu is Nusselt Nubmer (based on a particle diameter),
Ar Archimedes Number, and
E Bed Voidage.
Convective heat transfer coefficient predicted by the above expression
agreed with measured values to within 95 % confidence limits of ± 14 %.
For the Grimethorpe data alone, the limits were ± 8 %, or about ± 20
W/m2 K. This compares with limits of ± 35 W/m2 K for the correlation
presented In the final Grimethorpe report. When using the correlation
it is important to calculate voidage and bed density by the procedures
that were used when the correlation was derived.
5 FUTURE DEVELOPMENTS
Two ways in which power generating efficiency of the PFBC combined
cycle system might be increased are:
1. by upgrading the steam system to operate at high supercritical
pressure with two stages of reheat. This could increase efficiency
by up to 2.5 percentage points,
2. by adding a pyrolysis/gasification stage ahead of the PFBC. The
gas produced in this stage would be burned in the stream of com
bustion gases from the FBC raising the temperature to c. 1 100 °C.
This cycle, the After Burner Cycle (Figure 20) combined with the
advanced steam system has the potential to Increase power generating
efficiency to around 45 %.
The main uncertainty is in the design of the combustion chamber. Even
if the gases from both stages are cleaned in filters the gases will
contain some dust. Designing a combustion chamber that will remain, free
from any deposits in the mixing zones will tax the ingenuity of the
most accomplished team. Lack of success will mean disaster for the
blades of the high temperature turbine.
I l
T

- 94 -
800-850°CReheat chamber1000-
1100°C CombustionGasification
Stack
Steam j I turbine | I power plant I | and heat j i recovery ^ I____system |
Coal 8 dolomite
Wasteheatrecovery
. -A. _
r .i.
Figure 20. After-burner cycle scheme i.
6 CONCLUDING REMARKS
7 7J:'. J.
Consequent upon around 10 000 hours operation in the UK alone, there is
now a very considerable amount of data on the operation and performance
of PFBC systems, and on the associated activities of hot gas cleaning,
fuel and sorbent feeding, and ash removal.
I lIt can be concluded that:
High combustion efficiency, high sulphur retention and low N0x
emissions can be obtained when burning high-medium volatile coals
over a wide range of operating conditions.
The system is likely to have adequate load following capabilities ; *■
for most utility power plant applications.
The design bases for fuel feeding and ash removal systems have
been established.

- 95 -
Sufficient know-how has been obtained to enable tube banks having
acceptable lives as regards metal wastage to be designed with a
reasonable degree of confidence.
The results of exposing cascades of turbine blades or similar
devices to the combustion gases have been sufficiently promising
to have confidence that adequate protection of turbine blades from
particulate erosion will be provided by two stages of cyclones.
Thanks to the very considerable efforts of ASEA PfBC there is the
prospect of having several combined cycle power plants in operation
within the next three years.
Major contributions to the development of the technology have been made
at Grimethorpe, but despite all the foregoing endeavours and the in
vestment of many tens of millions of pounds, and other currencies, no
one has yet run an industrial gas turbine on the combustion gases from
a PFBC. This factor alone dictates the need for major back-up activi
ties, e.g. on hot-gas cleaning and on more detailed examination of the
effects on the dust loading and constituents of the combustion gases on
turbine blades.
There is a powerful justification even now for operating a gas turbine.
The unique facilities and the proven and highly accomplished team at
Grimethorpe make this a logical choice of venue for a major back-up
programme.
There is also need:
to develop an understanding of the mechanisms involved in tube
metal wastage, and experience has also shown the need to have
available large ‘cold1 rigs in which models of tube banks can be
tested,
to establish reliable laboratory procedures for predicting the
sintering behaviour of material fed to fluidised beds.
r _T: j
T T 1-ii.__j
I l
w

- 96 -
to ascertain the reasons for there still being a considerable
scatter in the data on sulphur retention,
to provide the background for reducing even further N0x emission,
e.g. by operating at much lower excess air levels, and by using
recycle to restore high combustion efficiency,
to develope reliable and safely applicable 'on-line' techniques
for detecting significant changes in dust loading and size con
sistency of the gas stream ahead of the gas turbine. It is essen
tial to have means available to detect malfunction of hot-gas
clean-up equipment before serious turbine operation begins.
Many of the foregoing activities involve operation of large scale plant
but there is still considerable scope for work on small units. In addi
tion to contributing to the development of the technology and measuring
techniques, these have a vital function in providing basic training for
PfBC engineers for the considerable number of plants that we shall hope
to see in the future.
r' r
f
ACKNOWLEGEMENTS
Firstly, I would like to thank the organisers for Inviting me to this
meeting.
I would also like to acknowledge the major contribution that Scandi
navia has made to the promotion and development of the technology. The
former began early in 1970 when Henrik Harboe of Stal-Laval having seen
the activities at Leatherhead set about promoting interest in PFBC
technology at every possibly opportunity.
Thanks are also due to all those who have seen the wisdom in contri
buting to the development of PFBC technology, particularly in the UK.
These include U.S. Department of Energy, EPRI, Stal-Laval, Swedish NE,
American Electric Power, General Electric, Combustion Systems Ltd.,
Wf
- 97 -
the Governments of U.K., U.S.A., and F.R.G. in their support of
Grimethorpe, Combustion Systems Ltd. and Babcokc U.K. and U.S.A.
In paying tribute to those who have striven to get the technology to
its present state of development, often against non-technical rather
than technical problems, I would also wish to remember those who are
sadly no longer available to see its success, in particular, Douglas
Elliott and George Sparham.
f J
NOMENCLATURE i :i
A" "Sorbent reactivity index" in Equation (3), (irm/s)1/2 A Total submerged heat transfer areaAr Archimedes Number = g Zpr (s-r)/u2C Ca/S molar ratioCb Specific heat of bed materialeg Specific heat of gasD Particle size (e.g. surface mean dia.), mm in equ (3),and m in equ (5)E' Fractional combustion efficiency in Equation (1)E Constant related to the apparent activation energy for
the sulphur capture reactions in Equation (3), K Ev Fractional bed voidage (typically 0.7) in Equation (5) H Bed height, mh Convective heat transfer coefficient, W/m^Kho Overall heat transfer coefficient from bed to water or steamK Constant; representing fuel reactivity,in Equation (1)k Mean gas conductivity in film, W/raK% Bed weightMg Gas mass flow ratem A "sulphur capture parameter", dimensionlessN Nitrogen content of coal, wt. % d.a.f.Nu Nusselt Number & hD/k02 Oxygen content of the dry gas, mol % p' Partial pressure of oxygen, barR Sulphur capture, %r Mean gas density in film, kg/m^ «s Mean particle density (usually taken to be 2500 kg/m^T Absolute bed temperature, Kt Gas residence time in off-gas system, stg Gas residence time in bed, sU Fluidising velocity, m/su Mean viscosity in film, kg/msX Fractional excess air level.
T f l
-u..------ J
I l

98 -
SOME REFERENCES
Leatherhead Combustors ^ TFTMk 1/Mk 2BCURA Laboratories, Fluidised Combustion of Coal at High Pressures, AIChE Symposium Series, Vol. 68, No. 126, p.225.Mk 3NRDC Contract No. 14-32-001-1511. "Pressurised Fluidised Bed Cambustion”, R & D Report No. 85, Interim No. 1, 1974.Mk 6Coal Utilisation Research Laboratory, "investigations on the Leatherhead Pressurised Facility". Proceedings of the 6th International Conference on Fluidised Bed Combustion, April 1980, Atlanta, Georgia.Mk 7Coal Utilisation Research Laboratory. "Final report on tEst 3, 1980, in the Leatherhead fluidised bed facility". Report No. IE-14129-5 to the U.S. Department of Energy, March 1981.Mk 8NCB (IEA Grimethorpe) Limited. "Report on the Leatherhead Link Tests." Report No. GEF/U/81/4, December 1981. Also published by NTIS as Report No. DOE/MEPC-83-63.20 Atmosphere RigGoal Utilisation Research Laboratory. "Performance of a snail combustor at pressures up to 20 atm". Paper to the 7th International Conference on Fluidized Bed Cambustion, Philadelphia, October 1982.Grimethorpe Rig"Grimethorpe Pressurised Fluidised Bed Combustion Project: Overall Project Review". IEA Grimethorpe GEF/U/84/21, Mayl985.
I L
¥ f
wL
99 -
PRESENT STATUS AND FURTHER DEVELOPMENT OF PFBC COMBINED-CYCLE PLANT
Krishna K. Pillai Manager Market Development ASEA PFBC ABS-612 20 Finspong, Sweden
Abstract
?FBC plants are under construction in Sweden, Spain and the US. This paper summarises these projects and describes the technology they are based upon. The PFBC concept is described together with the advances which have brought this technology into the start of its commercial phase.
The role of the Component Test Facility (CTF) in the development of pressurised fluidised bed combustion (PFBC) technology is described together with an update of the further development in progress. An Important feature of PFBC technology is not only that current "Clean Coal" requirements can be met effectively but also that clear development paths can be identified for the future. The 10-15Z saving on fuel consumption available today can be reduced by a further 15-25Z over the next 25 years. The potential available for the Improvement of emissions performance means that current regulations can be met and continue to be met as more and more stringent requirements are placed on power generation systems.
Whereas efficiency and environmental requirements determine the entry of a new technology into the market place and also provide the driving force for development efforts, plant availability and investment costs are the criteria which will determine its acceptance.
In retrofit applications, the combined cycle provided by the PFBC leads to significant efficiency improvements together with an
]
i _t :i
Y TJi— -iv. —j
I E
\
100 -
uprating of power production. This Is combined with the ability to use high-sulphur or low-grade coals In an environmentally acceptable manner. The low footprint area required for this pressurised process also makes constrained sites feasible.
1 STATUS OF CURRENT PFBC PROJECTS
1.1 General
PFBC plants are under construction in the US, Spain and Sweden. These plants will be taken Into operation through 1990. Tables 1, 2 and 3 provide a summary of these projects.
Table 1. PFBC Projects - Summary.
SITE ESCATRON TIDD VARTAN
Utility Endesa OPCo SEPSupplier ASEA PFBC + BWE ASEA Babcock PFBC ASEA PFBCPurpose PFBC Demo PFBC Demo CogenerationOutput 79 MWe 70 MWe 130 MWe +
210 MWtUnit lxP200 lxP200 2xP200Steam turbine Existing Existing New turbineStart-up date Mid 1990 Mid 1990 51 Late -89
52 Early ’90
1.2 Sweden
Stockholm Energi, the main producer of district heat for the city of Stockholm, with an annual heat-production of about 4,000 GWh, has decided to injtall a PFBC cogeneration plant at VMrtan in the centre of Stockholm.
Like most cities in Sweden, Stockholm is, to a great extent, served by a district heating system. This system is rapidly expanding and is targetted to supply most of the city's heat demand in the 1990s.
II
t-'l

- 101 -
The largest heating plant is VUrtan with a capacity for supplying nearly 1,000 MW heat, based on oil fired boilers and heat pumps.
Table 2. PFBC Projects - Technical Data.
PROJECT Escatron Tidd VSrtan
Coal type Lignite Ohio PolishCoal-S 7Z 4% 1%Ash 36Z 10% 15%Coal feed Dry Paste PasteSorbent feed Dry Dry Mixed as pasteSorbent Limestone Dolomite Limestone, DolomiteFeed points 16 6 6CyclonesSteam data:
9x2 7x2 7x2
Pressure 95 bar 90 bar 140 barTemperature 510°C 496°C 540°C
Excess air 15% 25% 25%Fluidising velocity 0.9 m/s 0.9 m/s 0.9 m/sBed height 3.5 m 3.5 m 3.5 mPressure 12 bar 12 bar 12 barCoal feed rate 18.0 kg/s 7.2 kg/s 2x8.0 kg/sSorbent feed rate 7.0 kg/s 2.3 kg/s 2x0.75 kg/sSteam flow 60.0 kg/s 56.0 kg/s 114.0 kg/s
Table 3. PFBC Projects - Emissions Data.
PROJECT Escatron Tidd Vartan
Sulphurremoval 90% 90% c.85%Emission <50 mg/MJ
«0.12 Ib/MBtu)Ca/S ratio NOx
1.8 1.6 c.1.3
emissions 150 mg/MJ (250 mg/MJ) 70 mg/MJ(0.35 Ib/MBtu) 0.5 Ib/MBtu (0.15 Ib/MBtu)
W i
l I
T T
In Sweden there is an extensive program to reduce oil dependence and to utilize all possible heat demands for the combined production of heat and electricity. Thus the introduction of a coal-fired cogeneration unit at Vartan has been considered for a long time. However, for environmental reasons, a decision has been difficult to reach.
102 -
The decision was finally taken to use PFBC technology for Vartan based on Its economic and environmental advantages compared to other alternatives.
The authorities Impose very stringent emission standards on this city plant. It is also subject to special restrictions concerning dust and noise as there are residential areas directly adjacent to the plant.
The PFBC concept lends itself very well to this site where a minimum of space is available. Compactness is a feature of the pressurized combustion system.
The change-over to coal-fired PFBC boilers having low specific emissions of SC^ and NO^ gives Stockholm Energi a higher production capacity with no additional environmental impact.
The new cogeneration installation consists of two PFBC modules of 200 MW thermal input each (P200)t and is designed for base load operation.
ASEA PFBC has turnkey responsibility for the VMrtan plant. Site construction is in progress and most major equipment has beer, ordered. The first unit will be started up in late 1989.
1.3 USA
American Electric Power (AEP) has decided to install one PFBC module of 200 MW thermal input (P200) for the repowering of its Tidd Power Plant at Brilliant, Ohio, as a demonstration plant for PFBC combined-cycle technology.
AEP is one of the largest electric utilities and coal consumers in the United States. They consume over 40 millions tons of coal annually to produce some 85% of their electricity generation.
r r
wJt..

- 103 -
AEP's commitment to clean coal technologies which generate electricity in an economic and environmentally compatible manner has led to Interest in the development of PFBC combined-cycle technology, especially for the use of vast high-sulphur coal reserves In the states of Ohio and Indiana.
AEP and ASEA PFBC (then STAL-LAVAL) began a study of PFBC in late 1976. The encouraging results of this study led to further cooperation between the two companies. Combustion tests at Leatherhead, England and further test programs at ASEA PFBC's Component Test Facility (CTF) in Sweden confirmed the technical and economic advantages of PFBC technology over conventional pulverized coal plants with flue gas desulphurization systems and even over other coal technologies.
The ultimate goal of the Tidd PFBC demonstration plant is to establish this technology as a viable alternative for generating electricity using coal.
Both the U.S. Department of Energy and the State of Ohio Coal Development Office have selected this program for funding in their respective Clean Coal Technology Programs.
In the United States, ASEA PFBC cooperates with the Babcock & Wilcox Company. In late 1985, B&W and ASEA PFBC formed a business partnership, ASEA Babcock PFBC, to commercialize PFBC technology in the United States and Canada. This company is the main contractor for Tidd P200.
Site work is due to start in April 1988. The pressure vessel for the PFBC is now virtually complete and the boiler is being fabricated. All major equipment has been or is in the process of being ordered. Start-up is scheduled for summer 1990.

104 -
1.4 Spain
Empresa Naclonal de Electrlcidad S.A. (ENDESA) is the Spanish stateowned utility producing about 25% of Spain's electricity mainly fromcoal and lignite. The black lignite reserves in the Aragon provincetotal more than 1000 M tonnes with known recoverable reserves ofmore than 400 M tonnes. These coals contain 4-8% sulphur, 25-45% ashand about 20% moisture. The annual consumption was 5 M tonnes in1985 and it is Intended to be increased to 10 M tonnes per annum
*corresponding to about 2000 MWe.
After a thorough investigation of different technologies, ENDESA has chosen the PFBC system of ASEA PFBC design as the most promising technology for burning this type of coal especially considering its potential for future larger plants of 350 MWe size.
ENDESA has, therefore, decided to install one PFBC module of 200 MW thermal input (P200) for repowering the existing unit No. 4 in the Escatron Power Plant as a commercial demonstration plant for Spanish black lignite with high ash and high sulphur content. This is the first step in commercializing PFBC technology in Spain.
The PFBC unit will be delivered in cooperation between ASEA PFBC AB and Babcock & Wilcox Espanola S.A. About 60% will be manufactured in Spain.
Site work is due to start in February 1988 and procurement of equipment has started. This unit will start-up in spring 1990.
1.5 The Gas Turbine GT 35P
rra.
l:z:
Y T
All the four units ordered so far will utilise the 17 MW^ GT 35 gas Wturbine specially modified for PFBC use. The first GT 35P machine has now been constructed and is being installed on a specially designed full-scale, oil-fired test stand in ASEA STAL's workshops

105 -
in Flnspong, Sweden. The comprehensive test program for this machine will begin in December 1987. All GT 35P machines will be factorytested upto full load before being transported to site. w ^
2 THE CURRENT PFBC CONCEPT
2.1 Concept
Today, PFBC represents a coal-fired combined cycle process which incorporates a pressurised bubbling fluidised bed and a gas turbine operating at a conservative turbine entry temperature. The deep (c. 4 m) fluidised bed together with the relatively low fluidising velocity (1 m/s) gives excellent sulphur capture and combustion efficiency data without having to resort to recycle arrangements. Recycling of fines is only called for when dealing with very unreactive fuels (anthracite or petroleum coke for example) or when particularly low values of minimum load are required (c. 20% mcr).
The basic cycle is illustrated in figure 1. Some design features worth noting are:o Separation of temperature and pressure barriers o A two-shaft gas turbine with a small intercooler between the
LP and HP compressors to limit pressure vessel temperature o Mild steel as material for the pressure vessel o All hot parts surrounded by higher pressure, compressed airo Absence of moving parts within the pressure vesselo Absence of refractory linings through the gas patho Hot gas cleaning (cyclones) and load changing system within
the same pressure vessel as the fluidised bed o A ruggedised. Industrial gas turbineo Bed temperature below 880°Co Gas turbine entry temperature of 830°C
o Integral gas-air ducting and isolation valves between the combustor and the gas turbine
i :t :i
YJl
l E
t

PRESSURIZED FLUIDISED BED BOILER
Figure 1. Pressurized fluidized bed boiler, Asea PFBC.
I
* f ^ ■■-'i
hi M
I
I
I
Kf
106

- 107 -
The combustor layout Is Illustrated In figure 2 and shows some of these features.
2.2 Coal Feeding
Two methods of coal feeding are available. For coals with ash contents of less than about 25Z which have a relatively high heating value, pumping of a coal-water-paste is used. The paste has a total water content of between 20 and 25Z. At this level of water content, net efficiency is virtually unchanged compared to dry coal feeding since:(a) part of the evaporative loss is recovered as additional mass
flow through the gas turbine,(b) coal drying is eliminated,(c) lock hopper pressurisatlon and inertisation is eliminated.
For coals with high ash contents and/or low heating values, the efficiency penalty became unacceptable when feeding as a paste and pneumatic feeding via a lock hopper is used instead.
If a low-sulphur coal is used (< 1.5% S) then the sorbent material material (limestone or dolomite) can be mixed directly into the coal-water-paste. For higher-sulphur coals, pneumatic feeding is used. (See figure 3)
2.3 Steam Generation
F_A- I
r t i
I F 1
The gas turbine exhaust gas is used for feed water heating but represents only about 10-15Z of the heat transferred to the steam cycle. The remainder, including all steam generation, superheating and reheating (if applicable), comes from the in-bed tube bundle. Intensive development of tube bundle design has taken place in three areas:(a) Design of bed and tube bundle geometry together with
fluidisation studies to minimise the erosion potential within the fluidised bed.
V\

108 -
Combustor C 25 for PFBC 200
i
Figure 2. The layout of Combustor C 25 for PFBC 200.
r r
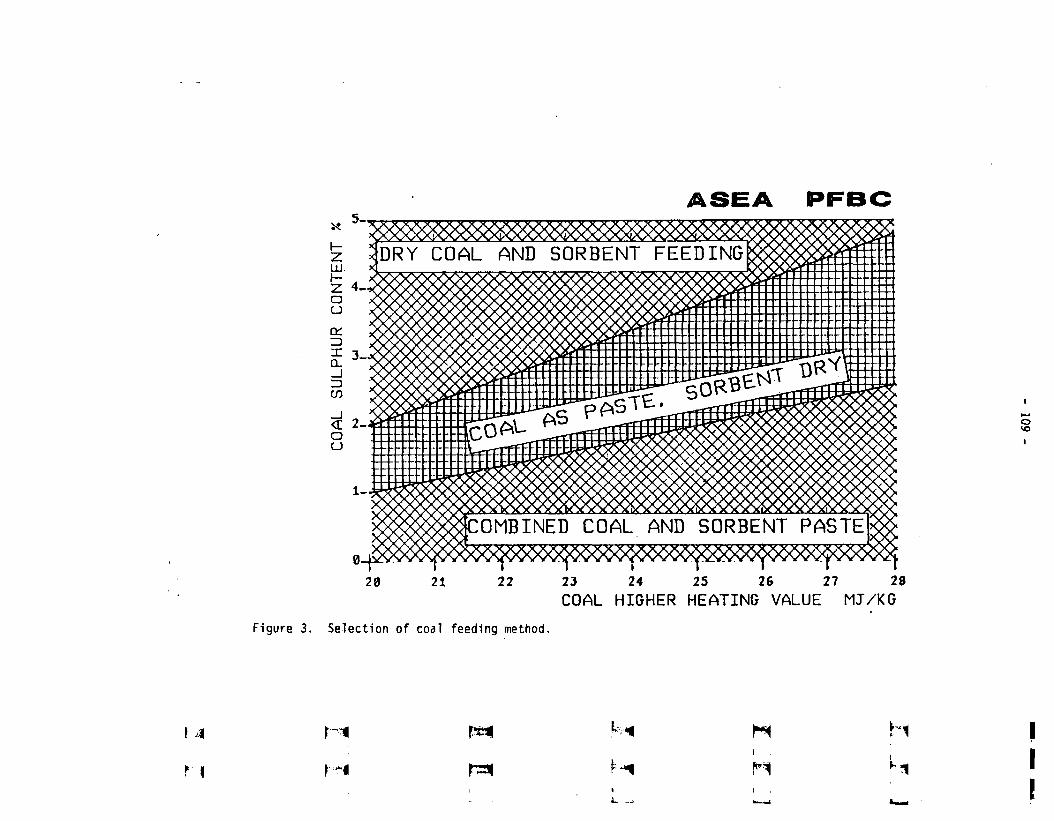
Figure 3. Selection of coal feeding method.
It—»0 to
1
f 4M N N i
r i r-i r
L.
1
»
i i
!
110 -
(b) Testing and choice of tube materials, and(c) Tube bundle design and construction to enable rapid service or
tube-changes to be carried out.
This development has led to design values of tube bundle life of over 50,000 hours for all tubes. In addition the design philosophy allows rapid repair or. If necessary, rapid replacement of entire tube sections. Materials under Investigation promise over 100,000 hrs life.
The once-through boiler concept is normally used though a drumboller could also be used.
At the steam conditions currently being used (160 bar, 565°C/5650C)
corrosion does not limit tube bank design. Present materials are suitable for perhaps upto 600°C. However at these higher
temperatures and consequently high steam pressures, the high heat fluxes in a fluid bed lead to material limitations from the viewpoint of thermal stresses.
2.4 Gas Cleaning
We judge that hot gas cleaning Is not yet commercially mature and thus, for the present concept, we use a two-step gas cleaning process. The first step - with two stages of high efficiency cyclones - performs the gas turbine protection function. For clean air requirements however, a back-end filter at conventional pressures and temperatures is used.
2.5 Gas Turbine
The available gas cleaning techniques today together with the ruggedisatlon of our gas turbines for PFBC use give a design life for the first stage rotor blades in excess of 20,000 hours. Here too the design problem has been attacked from two converging directions.
I .
v r.ill .tt

Ill -
Much effort has been expended in obtaining a truly modularised design such that rapid replacement of modules is possible, with the module removed being then refurbished to provide the new spare.
2.6 Load Changing
Bed level alteration at constant bed temperature is used for load changing. Bed storage vessels are placed within the pressure vessel and bed material is transported pneumatically between the storage vessel and the fluidised bed. When bed material is removed, in-bed tubes are exposed in the freeboard. This leads to both steam generation and the gas turbine entry temperature being reduced. The two-shaft gas turbine with its free-wheeling low pressure shaft gives a constant volume flow over much of the load range. This in turn leads to fluidising velocity, cyclone velocity and excess air remaining constant over much of the load range.
Load changing rates are around 4% per minute and minimum load is typically 30% mcr. A cold-start takes 5-6 hours while a warm start can be achieved in around 2 hours.
3 CURRENT PFBC PLANT SIZES AND THEIR PERFORMANCE
PFBC module sizes are determined by the chosen gas turbine which, in turn determine the air flow delivered. Table 4 indicates the module sizes available based on the gas turbines adapted for PFBC application.
Table 4. PFBC Modules.
DESIGNATION P200 P800
Gas Turbine GT 35P GT 140PNet Power MWe 80 350Gross Power MWe 84 366GT Power MWe 17 80ST Power MWe 67 286Net Efficiency % 42.5 44Heat input MWt (LHV) 188 795

112 -
One or more PFBC modules can be coupled to a single steam turbine.As shown in Table 5 the current configurations span the range from 80 MWe upto 700 MWe. Table 4 also gives the plant efficiencies. It should be noted that the larger module exhibits a higher efficiency due to the absence of the gas turbine gear, the slightly higher pressure ratio (16:1 instead of 12:1) and the economies of scale for auxiliary power. Both module sizes exhibit a small efficiency increase when coupled in pairs to a larger steam turbine.
Table 5. Current PFBC Plant Sizes and Efficiency.
Plant Size No. of PFBC Steam Gas Net(net) MWe modules turbine turbines efficiency
MWe MWe % LHV
80 lxP200 67 1x17 42.5162 2xP200 135 2x17 42.9243 3xP200 202 3x17 43.0
350 IxPSOO 286 1x80 43.8705 2xP800 573 2x80 44.1
Currently coals ranging from lignite to low-volatile bituminous can be accepted. Anthracite is acceptable but needs some fines recycle if high combustion efficiency is to be maintained (> 9SZ). Excess air levels are at around 20% (15% for lignite). Carbon monoxide levels are usually negligible (< 20 ppm).
Sulphur capture levels of upto 98% can be achieved if sufficient sorbent can be fed. With limestones of "average" reactivity a Ca/S ratio of around 2.0 is needed for 90% retention. With dolomites the corresponding Ca/S ratio is about 1.5. Sulphur levels of upto 8% can be accepted provided that feed systems and ash removal systems can be designed to cope.
Ash levels of 40-50% (depending upon how much sorbent must be fed too) are acceptable.

113 -
NO^ emissions are typically around 100 mg/MJ at these excess air levels, and, with special reduction procedures (but not catalytic converters) can be reduced to around 60 mg/MJ. Note that with PFBC, unlike atmospheric fluidised beds, NO^, S0x and CO are very weakly linked. Thus 60 mg/MJ NO can be achieved simultaneously with around 50 mg/MJ SO^ (or lower) and less than 10 mg/MJ of CO.
The ash produced contains a mixture of partially sulphated sorbent and coal ash. Virtually no free lime (CaO) exists and sulphites or sulphides are also negligible. After setting with water the heavy metals in the coal ash are non-leachable but of course sulphate content is high. Strengths are comparable to concrete and may even exceed those of concrete if small quantities of a binder (cement) are added. One disadvantage when using dolomite as sorbent is that the slow hydration of MgO causes the strength to deteriorate. Limestone based ash is much more stable. Development efforts have concentrated on, and succeeded in, testing and identifying potential uses of this material. The material has been found suitable:(a) as road building material(b) for manufacture of synthetic gravel(c) for manufacture of "formed" bricks or tiles(d) as general building material, and(e) as roofing or flooring material for tips containing hazardous
material.
An entrepreneurial phase now remains to find sales outlets for this material. It thus seems highly probable that ash disposal costs - which are currently being used in the economic evaluation of PFBC plants - will give way first to a zero cost disposal (free to user who will transport material away from the site) scenario and then to a credit for the sale of such material.
- 114 -
4 HIGH FERFOBMANCE AND SECOND GENERATION PFBC'S
4.1 High Performance PFBC's
With no change to the current concept and with much the same gas turbine entry temperature as present (830-870°C), significant
improvements can be made to PFBC plant performance. Plants ordered over the next 3 or 4 years will exhibit these improvements to an increasing degree.
Since superheat and reheat surface requirements in a PFBC are only between 10 and 20Z of that required in a conventional pulverised boiler, the techno-economic optimal steam conditions for a PFBC are different to those of a boiler relying mainly on convective heat transfer surface. In general, the optimum lies at higher temperatures and lower pressures than for a conventional boiler. The steam pressure value is partly limited by thermal stresses arising from the high but evenly distributed heat fluxes in the PFBC. This in turn leads to optimum reheat temperatures somewhat higher than main steam temperatures.
The materials available today are suitable for upto 565°C from the
erosion, corrosion and strength viewpoints. Materials already developed (using powder metallurgy) and currently being tested will soon allow steam temperatures to be raised to around 600°C. The
efficiency of the current PFBC concept can be Increased by about 1 percentage point by this means alone.
For simplicity the gas turbine exhaust gases are used only for feed water heating. Some efficiency gains are possible with the added complexity of a heat recovery steam generator. However this is unlikely to be economic till higher gas turbine exit temperatures are attained.
r r
r r

- 115 -
Emissions performance is also improving. The effectiveness of the NO^ reduction techniques currently being used Involve:(a) modifying combustion patterns within the bed> and(b) the use of in-bed or gas path additive injection (though
without any catalyst)and are not, as yet, well understood. Nevertheless, NO^ emissions currently can be held to around 60 mg/MJ (independantly of SO^ or CO emissions) and results from our test plant show that much lower emissions are possible. The next PFBC ordered (l.e. within 2 years) will be designed for NO^ emissions of less than 40-50 mg/MJ.
While S0^ emissions themselves pose no significant limitations, there is a strong incentive to reduce sorbent consumption to a minimum. The use of limestone rather than dolomites in PFBC is relatively recent, but it is clear that the original fears that high pressure operation would inhibit calcination and consequently sulphur capture (based on theoretical analyses in the US) are mlsfounded. Within 3-5 years therefore the High Performance PFBC (HP-PFBC) will need a Ca/S mol ratio of around 1.5-1.6 with limestone for 90Z sulphur capture. Optimisation of size distribution and recycle of streams containing unused calcium are the main lines of development here.
For dust control it is anticipated that the HP-PFBC will still use cyclones for turbine protection and a bag filter for clean air requirements. The expected tolerable dust emission levels of 5-10 mg/MJ will probably exclude the use of electrostatic precipitators for final clean-up, especially if regulations regarding sub-micron particles begin to come into force.
A summary of the development potential for PFBC is given in Table 6.
4.2 Second Generation PFBC's
e . r . ]
r rJl
Continued development of PFBC then requires that some means be found for increasing gas turbine entry temperature. Since the bed temperature is limited to be under 900°C this implies the use of an

Table 6 Development Potential with PFBC Combined Cycle Plant
Possible Order Date
Plant Description Steam Data Gas Turbine Data
ExpectedEmissions
Efficiency Net (LHV) !
Today "Conventional" PFBC 180 bar 5650C/565°C830°C TBT Cyclone Gas Cleaning
NOx: 60 mg/MJSOx: 90Z at Ca/S-2 Dust: 5 mg/MJCO: 10 mg/MJ
44.1
1989-92 "Conventional" PFBC 190 bar565°C/600°C850°C TBT Cyclone Gaa Cleaning -
HOx: 50SOx: 90Z at 1.8 Duat^ 5CO: 10
44.6
1990-93 "Conventional" PFBC High Performance Version
180 bar 600°C/600OC870°C TBT Cyclone Gaa Cleaning
NOx: 40SOx: 90Z at 1.6 Dust: 5CO: 10
45.0
1992-96 Hybrid PFBC + Pyrolyser f8r temp.topping
c.210 bar 600oC/625°C950°C TBTHot gaa cleaning
NOx: 30SOx: 90Z at 1.3 Dust: 5CO: 10
46.5
1995-98 Hybrid PFBC + Pyrolyser for temp.topping
c.220 bar 625oC/650°C1050°C TBTHot gaa cleaning
NOx: 25SOx: 90Z at 1.3 Dust: 5CO: 10
47.6
1998-2000 Hybrid PFBC + Pyrolyser for temp.topping
c.240 bar 650oC/650°C1150°C TBT Advanced hot gaa cleaning
NOx: 20SOx: 90Z at 1.2 Dust: 5CO: 10
48.8
2010 Hybrid PFBC + air blown gasifier for temp.topping
c.3Q0 bar650 C/700°C1500°C TBT Very advanced hot gas cleaning
NOx:<20SOx: 90Z«><1.2 Dust: 5CO: 5
e. 52.o
M r* r** N H i
h-f psai\ i
t

117 -
after-burning process. Here well-known processes for pyrolysis or partial coal gasification could come into play, to produce the gas for turbine temperature topping. The PFBC must be retained for combustion of fresh coal and the residues from the pyrolysis or partial gasification process. These hybrid schemes have the big advantage that the PFBC Is available not only for steam generation but as the sink for partially utilised coal and for heat losses from the partial gasification stage.
Pyrolysis, depending upon coal type, permits gas turbine entry temperatures to be increased to between 1100 and 1200°C. To raise
temperature further would need the use of steam, though an air-blown process is sufficient, in a partial gasification stage. Here, of course, fuel gas and PFBC exhaust gas would still be at temperatures below 900°C but would need rigorous cleaning before the temperature
topping process.
Hot gas cleaning is therefore necessary for this development and must be suitable for both oxidising as well as reducing atmospheres. The level of cleaning required is intimately connected to the final gas turbine entry temperature and a staged development as shown In Table 6 is possible.
Gas turbine development beyond today's state-of-the-art will be required once temperatures exceed about 1200°C. It should be noted
however, that the hybrid-PFBC always needs a turbine temperature some 300-400°C lower than a pure gasification process for power
generation to attain the same efficiency. (See figure 40
Emissions performance will be largely determined by the PFBC and the after-burning process for NO^ and by the pyrolyser/PFBC for SO^.
I l 1
r r

Efficiency, % 55 -------
50
45
40
PFBC 180/565/565
PC 240/565/565 PC 180/565/565
35
30 ■— 600
J_ _ _ I__ L700 800 900
1
Gas turbine Inlet tempera-
J__________ ture, °C
1000 1100 1200
i
i
Hgure 4. Efficiency comparison for power generation systems.
i N h i
iM
i
I
118

119 -
5 CONCLUSIONS
Without good plant availability, performance can be worthless. A basic requirement while working on performance development is therefore that engineering development proceeds in parallel to ensure and then improve plant availability. The techniques developed during the Swedish nuclear program are being used to identify critical plant systems and components and these are the focus of efforts to simplify and Improve.
From the performance viewpoint, PFBC, as a newly commercial technology, offers not only the boost needed today but also clear lines of development for the future. Fuel consumption savings of 10-152 are available now and a further 15-252 is available in the future. The emissions potential means that a "Clean Coal Technology" today maintains its ability to meet the more and more stringent requirements anticipated over the next 20-30 years.
BIBLIOGRAPHY
1. Pillai K. K., WickstrSm B., and Tjellander G., The Influence of Gas Turbine Technology on the P200 Power Plant, in Proceedings 2nd Biennial PFBC Power Plants Untility Conference, Milwaukee 1986.
2. Menendez-Peres E. et al, Escatron - A PFBC Combined Cycle Demonstration Plant for High Ash and Sulphur Coals, in Proceedings 2nd Biennial PFBC Power Plants Utility Conference, Milwaukee 1986.
3. Almqvist P., The PFBC Plant in Vartan, Stockholm, in Proceedings 9th International Conference on FBC, Boston 1987.
4. Mudd M J and Bauer D A, Tidd PFBC Demonstration Plant, in Proceedings 9th International Conference on FBC, Boston 1987.
]
i :i
T T
l l

T
r r
IE

121 -
PRESSURIZED FLUIDIZED BED COMBUSTION OF PEAT
Andras Horvath, M.Sc.(Eng)
Helsinki University of Technology
Laboratory of Energy Economics and Power Plant Engineering
02150 Espoo, Finland
Abstract
Combustion and emission properties of peat (a fuel of high volatile and low ash content)
were investigated under the special conditions of pressurized fluidized bed combustion.
At the Otaniemi PFBC/G test rig, during a total of 150 hours of test runs crushed peat
pellets of about 20 % moisture were burnt. Natural silica sand was used as the bed
material. The bed height was 0.6... 1.2 m depending on operating pressure and thermal
input. The pressure levels of operation were 5,7 and 10 bar (abs.). The amount of excess
air was varied between 10 and 50 %. The flue gas composition was monitored
continuously after the two stage cyclone collector, using pressure reduction and double
sampling system. Gas samples were also taken from the bed, freeboard and downstream
of the cyclones. Bed material and fly-ash samples were analysed in respect of fuel bum out.
Combustion efficiency was over 99 %. The losses caused by unbumt carbon in fly-ash
were very low. Carbon monoxide emission was always below 90 mg/MJ, effected by the
bed temperature. The emitted amount of sulphur dioxide was smaller than 160 mg/MJ
(peat has. a low sulphur content of 0.2 %wt, d.b.). Sulphur trioxide was found in the flue
gases and due to that rigorous low temperature corrosion appeared. NOx-emission was in
the range of 10 to 100 mg/MJ strongly influenced by excess air. The effect of pressure on
NO-formation appeared to be moderate. Compared to atmospheric fluidized bed burning
of peat, slightly better combustion and emission performance were experienced in the
pressurized fluidized bed combustor.
I
w
F
w}

122 -
1 INTRODUCTION
Combined cycle power generation, using pressurized fluidized bed combustion (PFBC),
has the potential of increasing power generation efficiency and at the same time fulfilling
environmental requirements, especially on S02 and NOx emissions. There is quite a lot of
informadon available on the pressurized fluidized bed burning of coal, as a result of
intensive research activity all over the world. In Finland peat is the only indigenous fuel,
thus it is burnt widely in conventional PF, AFB and CFB boilers. Within the joint project
of Helsinki University of Technology, Technical Research Center of Finland and Imatran
Voima Oy, a PFBC/G test rig was built in Otaniemi, Espoo. Peat is the fuel of main
interest during the first phase of the research project. The test rig has been in operation
for 150 hours in the autumn of 1987. The investigation focused on the combustion and
emission properties of peat corresponding to pressurized fluidized bed burning
conditions.
2 THE FACILITY AND MEASURING SYSTEMS
The Otaniemi PFBC/G test rig has a 1.2 m high bed area of 0.15 m diameter and a 2.5 m
high freeboard area of 0.25 m diameter. The electrically preheated air flows through the
nozzle type air distributor in to the water cooled (vertical cooling coils) fluidized bed. The
flue gases leaving the freeboard pass through a two stage cyclone collector and heat
exchanger to the pressure let down valve (Figure 1). Fuel is fed into the bed. The system
pressure can be increased up to 10 bar, the thermal input can reach the 130 kW level.
Figure 1. The flow diagram of the PFBC/G test rig.
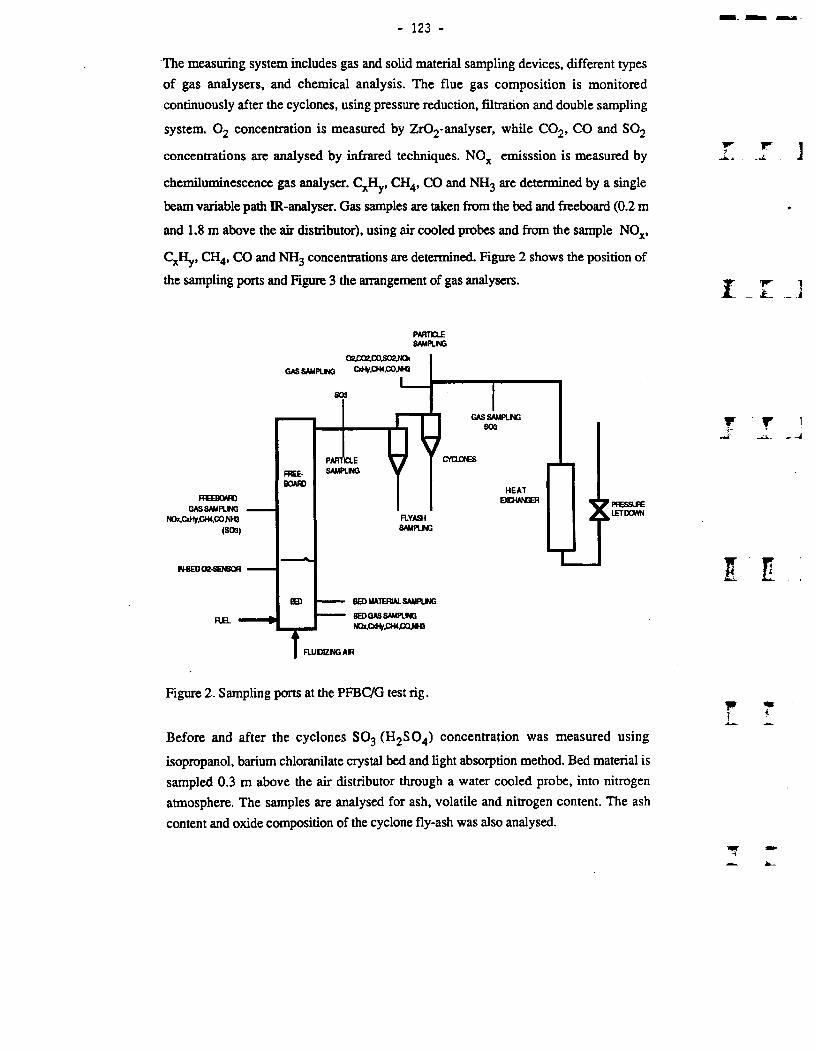
- 123 -
The measuring system includes gas and solid material sampling devices, different types
of gas analysers, and chemical analysis. The flue gas composition is monitored
continuously after the cyclones, using pressure reduction, filtration and double sampling
system. 02 concentration is measured by Zr02-analyser, while C02, CO and S02
concentrations are analysed by infrared techniques. NOx emisssion is measured by
chemiluminescence gas analyser. CxHy, CH4, CO and NH3 are determined by a single
beam variable path IR-analyser. Gas samples are taken from the bed and freeboard (0.2 m
and 1.8 m above the air distributor), using air cooled probes and from the sample NOx,
CxHy, CH4, CO and NH3 concentrations are determined. Figure 2 shows the position of
the sampling ports and Figure 3 the arrangement of gas analysers.
3
I _ I ‘ 1
PAHTCLE SAM PLUG
’ PRESSURE t LETDOWN
l E
Figure 2. Sampling ports at the PFBC/G test rig.
Before and after the cyclones S03 (H2S04) concentration was measured using
isopropanol, barium chloranilate crystal bed and light absorption method. Bed material is
sampled 0.3 m above the air distributor through a water cooled probe, into nitrogen
atmosphere. The samples are analysed for ash, volatile and nitrogen content. The ash
content and oxide composition of the cyclone fly-ash was also analysed.

124 -
RUE CMS , FROM REACTOR I
-CX}-HEATMQ
MTROQB4RME
ir^
WzTzzzzzmmzzn
G3
ZZZZZZZZZZZZ2 ZZZZZ2
BBCKMZFQ 02
EXCESS OKSOUTlfT
rjfi ■■ O IZ3□ y HEATMQ
n
KAA/j' HEATMQ 1
3__C—1
■I 0
StaMAOOO NOxJtO
TOGASAMAIYZEW
LET DOWN
BEOSXMniia CEMiCFLIBI
-cx- -tx-
MSBUraaSG 802
Figure 3. Arrangement of gas analysers at the PFBC/G test rig.
3 PROPERTIES OF PEAT AND BED MATERIAL
Peat is a fuel of high volatile (about 69 %, d.b.) and low ash content (about 4 %, d.b.). It
has a high moisture ccmtent when harvested. During the experiments at the PFBC test rig
crushed peat pellets of about 20 % moisture were burnt The mass mean particle size of
die fuel is 4.83 mm (33 % larger than 6 mm and 10 % smaller than 1 mm). The proximate
and ultimate analyses of peat arc presented in Table 1. Regarding emissions it can be
noted, that the sulphur content of peat is lower (about 0.2 %wt, d.b.) and the nitrogen
content is somewhat higher (1.4 %wt, d.b.) than in coal.
Natural silica sand was used as bed material. The mean particle size of the bed material
was 0.73 mm before the test and it decreased to 0.33 mm (32 % smaller than 0.3 mm)
during the tests, because of attrition and the effect of fine ash particles.
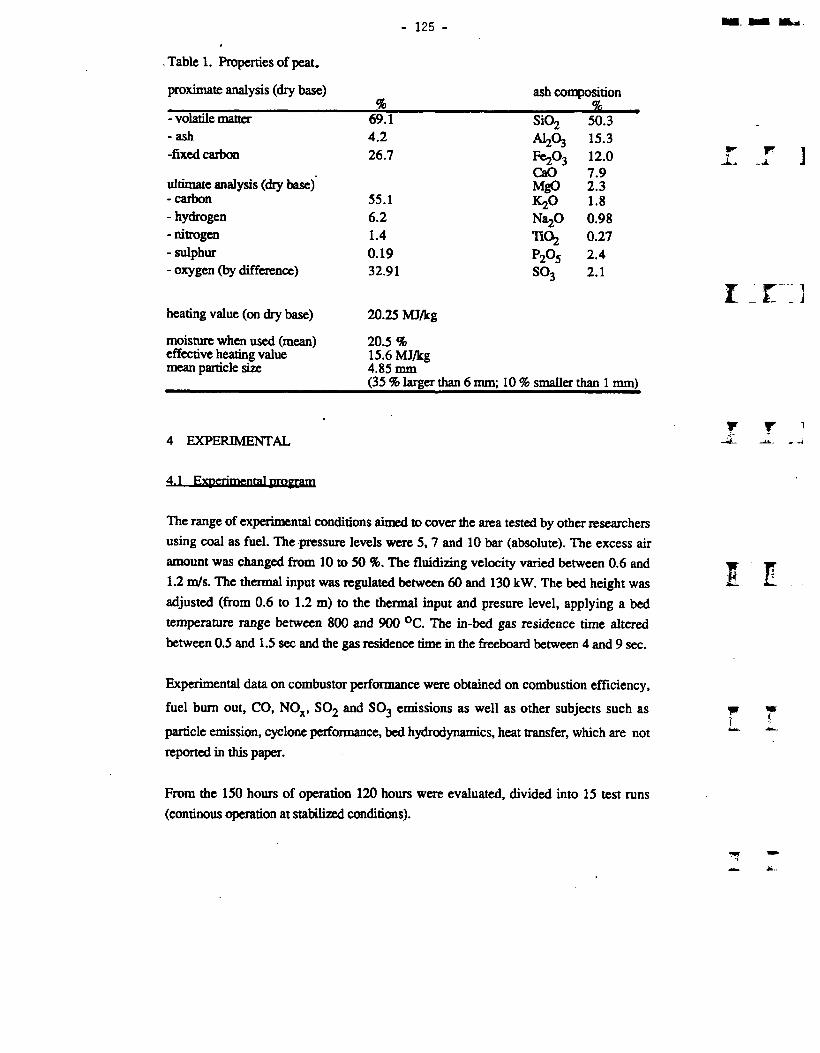
- 125 -
. Table 1. Properties of peat.
proximate analysis (dry base)%
ash composition %
- volatile matter 69.1 Si02 50.3- ash 4.2 AI2O3 15.3-fixed carbon 26.7 Fe^ 12.0
CaO 7.9ultimate analysis (dry base) MgO 2.3- carbon 55.1 K20 1.8
- hydrogen 6.2 NajO 0.98-nitrogen 1.4 TiOz 0.27- sulphur 0.19 P2O5 2.4- oxygen (by difference) 32.91 SO3 2.1
heating value (on dry base)
moisture when used (mean) effective heating value mean particle size
20.25 MJ/kg
20.5 %15.6 MJ/kg4.85 mm(35 % larger than 6 mm; 10 % smaller than 1 mm)
i: r ]
4 EXPERIMENTAL
4.1 Experimental propram
The range of experimental conditions aimed to cover the area tested by other researchers
using coal as fuel. The pressure levels were 5, 7 and 10 bar (absolute). The excess air
amount was changed from 10 to 50 %. The fluidizing velocity varied between 0.6 and1.2 m/s. The thermal input was regulated between 60 and 130 kW. The bed height was
adjusted (from 0.6 to 1.2 m) to the thermal input and presure level, applying a bed
temperature range between 800 and 900 °C. The in-bed gas residence time altered
between 0.5 and 1.5 sec and the gas residence time in the freeboard between 4 and 9 sec.
Experimental data on combustor performance were obtained on combustion efficiency,
fuel bum out, CO, NOx, SO2 and SO3 emissions as well as other subjects such as
particle emission, cyclone performance, bed hydrodynamics, heat transfer, which are not
reported in this paper.
From the 150 hours of operation 120 hours were evaluated, divided into 15 test runs
(continous operation at stabilized conditions).

126 -
4.2 Experimental results
4.2.1 Combustion efficiency, char bum out, CO-emission
The combustion efficiency was generally higher than 99 %. The maximum value of combustion efficiency achieved was 99.6 %, when bed temperature was above 850 °C
and the gas residence time in the reactor was longer than 10 sec. The high combustion
efficiency is due to the high volatile content of peat. About 2 % of the total combustion
losses can be atributed to the unbumt content of fly-ash which is a very low value. Combustion losses were caused mainly by the carbon monoxide emission. It was found
that the combustion efficiency (T|cff %) could be correlated by the following empirical
equation, using multiparameter linear regression:
neff = 96.01+ 0.004 tb + 0.165 x - 0.021 02 (i2 = 0.844)
I L
The influence of bed temperature (tb ,°C ) - the strongest parameter in that correlation -
upon combustion efficiency is shown in Figure 4. The increasing residence time (x, sec)
in the bed increases combustion efficiency. The effect of oxygen concentration (02, %)
seems to be a contradictory, because of the combined effect of bed temperature and
excess air. After reduction of number of parameters the bed temperature and residence
time remained as determining parameters. Further measurements are needed for more
reliable regression analysis of combustion efficiency.
100.0
99.8
99.6comb eff. %
99.4
99.2
99.0800 810 820 830 840 850 860 870 880 890 900
bed temperature, °C
□Li
♦
I T
Figure 4. Combustion efficiency as a function of bed temperature.
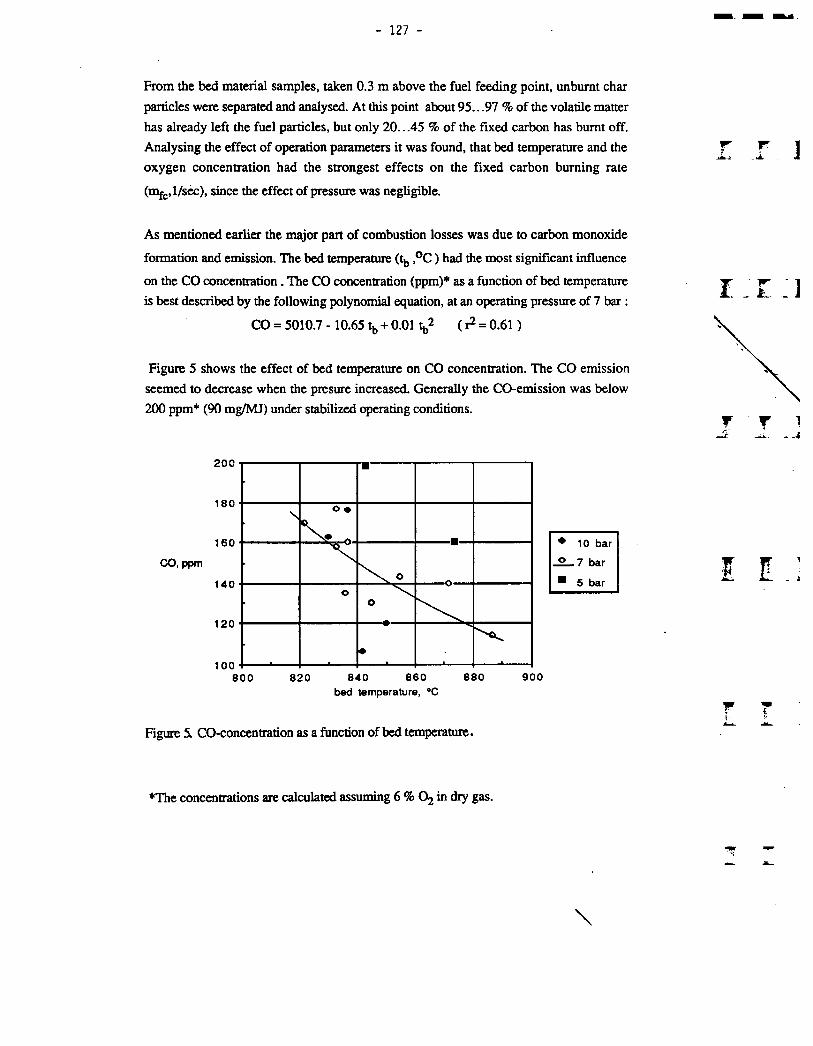
127 -
From the bed material samples, taken 0.3 m above the fuel feeding point, unbumt char
particles were separated and analysed. At this point about 95.. .97 % of the volatile matter
has already left the fuel particles, but only 20.. .45 % of the fixed carbon has burnt off.
Analysing the effect of operation parameters it was found, that bed temperature and the
oxygen concentration had the strongest effects on the fixed carbon burning rate
(mfc,l/sec), since the effect of pressure was negligible.
As mentioned earlier the major part of combustion losses was due to carbon monoxide
formation and emission. The bed temperature (tb ,°C) had the most significant influence
on the CO concentration . The CO concentration (ppm)* as a function of bed temperature
is best described by the following polynomial equation, at an operating pressure of 7 bar :
CO = 5010.7 - 10.65 tb + 0.01 (i2 = 0.61)
Figure 5 shows the effect of bed temperature on CO concentration. The CO emission
seemed to decrease when the presure increased. Generally the CO-emission was below
200 ppm* (90 mg/MJ) under stabilized operating conditions.
bed temperature, °C
Figure S CO-concentration as a function of bed temperature.
]
\
♦The concentrations are calculated assuming 6 % O2 in dry gas.

128 -
4.2.2 NOx-emission
The emission of NOx was in the range of 20 to 130 ppm* (10 to 100 mg/MJ calculated as
N02). Less than 13 % of the fuel bound nitrogen appeared as NOx, assuming that all the
NOx was originated from the fuel. Such low conversion is typical when burning peat in a
fluidized bed. The effects of operation parameters on NOx formation were analyzed, with
respect to pressure (p, bar) and oxygen concentration (02, %).
The following expression was found to describe their influence:
NOx = -9.548 + 27.424 02 - 2.627 p (i2 = 0.958 )
NOx-emission decreases when the system pressure increases, but the effect of pressure is
moderate. As has been reported (1., 2.), the main infuencing parameter on
NOx-formation was the excess air level (02 concentration of the flue gas), as shown in
Figure 6 and characterized by the following linear equation of correlation:
NOx = -27.937 + 27.03 02 (i^^^SO)
0.0 0.5 1.0 1.5 2.0 2.5 3.0 3.5 4.0 4.5 5.0 5.5 6.0 Oxygen concentration, %
Figure 6. NOx-emission as a function of oxygen concentration.
i r
T r
♦The concentrations are calculated assuming 6 % 02 in dry gas.

129 -
The effect of oxygen concentration on NO-formation can be explained by the in-situ
reduction of NO in the fluidized bed by reactive pyrolysis products like CxHy, CH4 and
CO. Using a high excess air level those compounds bum off and therefore NO-emission
increases. In the case of peat pyrolysis significant amounts of ammonia (NH3) appears .
as an important intermediate compound, reducing nitric oxide. These gas components
were measured in the fluidized bed, freeboard, and after the cyclones (Figures 7 and 8).
after cyclones
top of reactor
freeboard
bed
1 10 100 1000 10000 concentration, ppm
Figure 7. Distribution of gas components, p=7 bar, 02=1.9 %.
after cyclones
top of reactor
freeboard
bed
1 10 100 1000 10000 concentration, ppm
Figure 8. Distribution of gas components, p=7 bar, 02=5.9 %.
i f :i
V f 1JL __i
VI

130 -
The gas distributions in Figures 7 and 8 are measured at the same pressure (7 bar) and at
different excess air levels. Each point of the distribution curves represents concentrations
at the local oxygen concentration. The concentration of both NO and reductive
compounds decrease downstream from the feeding point, having the highest
concentrations near the feeding point. About 40.. .50 % of fuel nitrogen was found to be
bound to the char particles separated from the bed material sample (sampled 0.3 m from
the feeding point).
4.2.3 SO2 and SO3 measurements
Peat has a low sulphur content (below 0.2 %wt. d.b.), thus the level ofsulphur dioxide
emission, even without using sorbents, does not exceed the limits of environmental
regulations. When burning peat in the pressurized fluidized bed the SC>2*emission was
below 200 ppm* (160 mg/MJ). The operating pressure had no effect on the
S (^-emission, but at the bed temperature above 840 °C, sulphur dioxide emission
slightly increases with temperature. At the temperature and pressure levels used in
pressurized fluidized bed combustors, S02 can be oxidized to SO3. During the trials a
strong evidence of S03 (H2SO4) presence was observed in the form of rigorous
low-temperature corrosion. Sulphur trioxide was measured in the freeboard, before and
after the cyclones. The SO3 concentration was found to be in the range of 4...6 ppm,
when system pressure was 10 bar. The effect of operating parameters on sulphur trioxide
formation will be studied later. Counter measures were taken to prevent low-temperature corrosion, keeping the flue gas temperature above 200 °C (above the acid dewpoint)
before pressure letdown.
t r■*- *
I l
5 CONCLUSIONS
Some of the results of the 120 hour peat combustion experiments at the Otaniemi
PFBC/G test rig can be summarized as follows:
- Combustion efficiency was above 99 %. The losses due to unbumt carbon in the fly-ash
were very low. Carbon monoxide emission was always below 90 mg/MJ, effected by the
bed temperature.
♦The concentrations are calculated assuming 6 % 02 in dry gas.
Wi
•SI
\

131
- NOx-emissions were in the range of 10 to 100 mg/MJ, strongly influenced by excess
air, since the effect of pressure on NO-formation appeared to be moderate.
- The emitted amount of sulphur dioxide was smaller than 160 mg/MJ (peat has low
sulphur content). Sulphur trioxide was found in the flue gases and low temperature
corrosion appeared on the flue gas duct.- Compared to atmospheric fluidized bed burning of peat slightly better combustion and
emission performance was experienced in the pressurized fluidized bed combustor.
References:
1. Hoy, HJi., Roberts, A.G.& Scott, RL. Operation of a small combustor on dry coal
and on cwm at pressure up to 20 atm. Proc. of 8th Conf. on FBC. Houston 1985
2. Grimethorpe pressurized fuidized bed combustion project. Overall project review.
CEF/U84/21, 19853. Horvath, A. Jahkola, A.& Virtanen, M. Combustion and emission of the pyrolysis
products of peat in fluidized bed. Finnish "Flame Days" Conference, Otaniemi 1986.
r r ]
r r !
r r
I l
F

IT-A
11

- 133 -
NEW COAL TECHNOLOGIES
Rainer Muller, Dr.-Eng., Deputy Director
Siemens AG, KWU Group
D-8520 Erlangen, F.R.G.
Abstract
Combined cycle power plants with integrated coal gasification (IGCC) are a good alternative for coal-based power generation in the nineties. Coal gasification can reduce emissions (SO^, N0x, dust) to significantly lower levels than other technologies and can also contribute to minimize waste disposal problems. Besides environmental reasons achievable degrees of efficiency and economic data let expect an advantage for IGCC systems in the future.
There are a large number of advanced coal gasification processes at various stages of development. Each of the processes has its own distinctive characteristics, preferred feed coals, applications, and operating experiences. Most of them still require successful operation of large-scale units before confirmed test results are available.
Based on power-plant-specific requirement criteria and on available information a comparing assessment of selected gasification systems was performed, and results of IGCC system studies were summarized in the form of simplified energy balances. Calculations were performed for three types of gasifiers in a large-scale IGCC power plant, assuming identical boundary conditions for all systems to rule out any influence which might be use of different types of coal and configurations .
]j
I T
V 'T

134 -1 INTRODUCTION
The environmental problems caused by thermal power plants stem above all from the pollutants liberated in the course of combustion and their dispersion in the atmosphere. Whereas a start was made with effective dust separation some time ago in the Sixties with the installation of electrostatic precipitators, retention technologies for sulfur or, as the next step, for nitrogen oxides have only been developed in recent years.
The retrofitting of existing power plants ist going ahead in full swing following the requirements of new ordinances that are coming into force. The emphasis of the engineering and economic efforts is on desulfurization and denitrogeni- zation plant to remove pollutants from flue gas.
FT 1—A. . j
2 COAL TECHNOLOGIES
In principle, there are a number preventing the pollutants bonded leased from the vent stack (Fig.
of possible methods for with coal from being re- 1) .
2.1 Coal Beneficiation
Following the path on the way to electricity generation, the first stage is coal treatment. The coal is first milled, screened and then treated chemically or physically. The objective of this process is to separate rock and minerals from the coal and furthermore, to reduce the sulfur content. While chemical treatment, which entails elaborate decomposition processes, hitherto has only rarely found application, physical methods of beneficiation have become industrial practice. These methods exploit differences in density, surface tension, magnetic or electric properties of the coal constituents for the purpose of separation. They permit considerable reductions of the ash content and of the inorganically bound, that is pyritic sulfur content.
f T-li.----- i
I
wi
•i
\
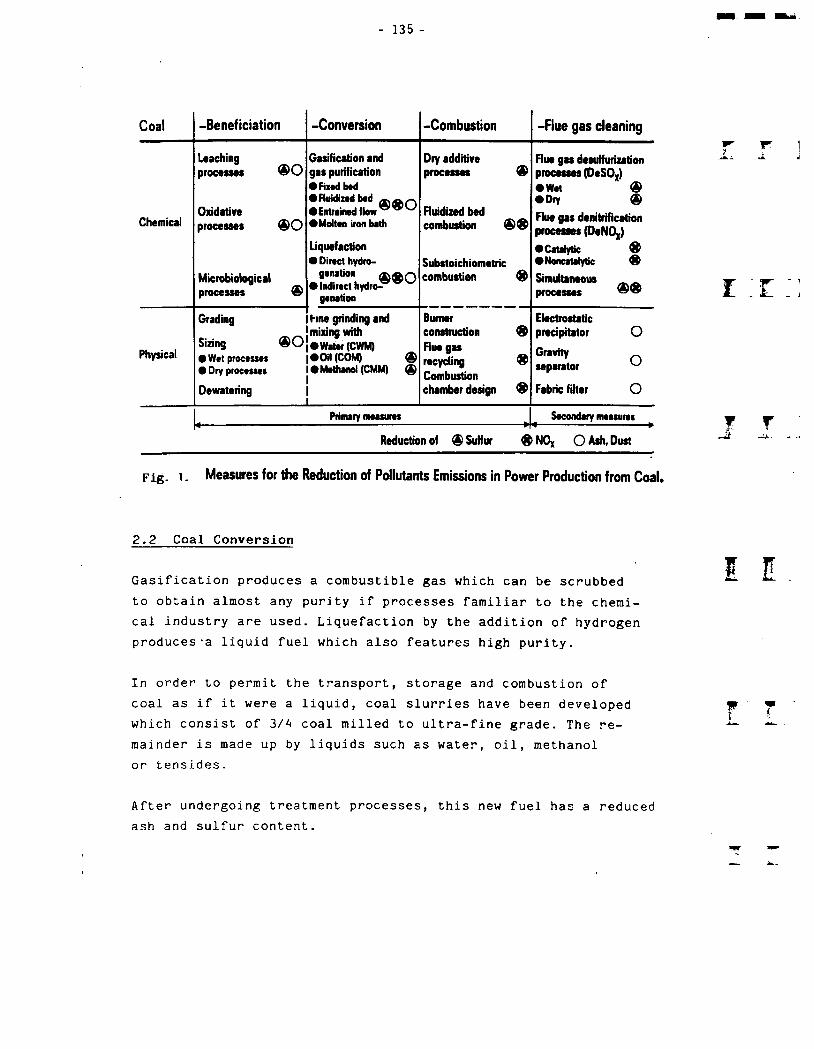
- 135 -
Coal -Beneficiation -Conversion -Combustion -Flue gas cleaning
Chemical
Leachingprocesses ®0
Oxidativeprocesses ®0
Microbiological processes ®
Gasification and gas purification• Fixed bed•Fluidized bed •Entrained flow w•Molten iron bath
Liquefaction• Direct hydro
genation• Indirect hydro^
genation
Dry additive processes ®
Fluidized bed combustion ®®
Substoichiometric combustion ®
r ^ iHue gas desulfurization •*- Jprocesses (DeSOx)• Wet ®• Dry ®Flue gas denitrification processes (DeNOg)•Catalytic ®•Noneatalytic ®Simultaneous _ _ iprocesses 1 .. I .
Physical
Grading
Sizing ®0• Wet processes• Dry processes
Dewatering
Fine grinding and mixing with •Water (CWM)•Oil (COM) ®• Methanol (CMM) @
_____________
Burnerconstruction ®Hue gasrecycling ®Combustion chamber design ®
Electrostatic precipitator O
Gravityseparator ^
Fabric filter O
Primary measures4------------------------------------------------- -1—--------------------------------------------------H Secondary measures y
Reduction of ® Sulfur ® NOx O Ash, Dust
Fig. i. Measures for the Reduction of Pollutants Emissions in Power Production from Coal.
2.2 Coal Conversion
Gasification produces a combustible gas which can be scrubbed to obtain almost any purity if processes familiar to the chemical industry are used. Liquefaction by the addition of hydrogen produces-a liquid fuel which also features high purity.
In order to permit the transport, storage and combustion of coal as if it were a liquid, coal slurries have been developed which consist of 3/A coal milled to ultra-fine grade. The remainder is made up by liquids such as water, oil, methanol or tensides.
After undergoing treatment processes, this new fuel has a reduced ash and sulfur content.
WI

- 136 -
2.3 Coal Combustion
During coal combustion itself, it is possible to bond sulfur within the ash in the form of calcium sulfite or sulfate by adding limestone, for example. The same principle is applied successfully in fluidized-bed combustion. Different kinds of this technology are summarized in Fig. 2.
Since N0x are only to a small extent formed from the nitrogen bonded with the fuel, attention had to centre above all on the prevention of the formation of nitrogen oxides from atmospheric nitrogen at high temperatures. In this context, the extremely low combustion temperatures of about 850°C used in fluidized-bed combustion are of benefit.
Conventional combustion techniques can be significantly improved in respect of N0x emissions by employing substoichiometric combustion, which can be achieved by means of suitable burner designs (e.g. 2-stage burner) or burning chambers.
FBC principle
FBC boiler schematic
Bubblinggf1
CA
irculatingFBC jajwmn
BubUiog
Main features: • Combustion of poor fuels and waste materials possible• Sulphur rstentlon In the combustor by moans
of Hmestono (no necessity of FCO)• Low NOx omission duo to low combustion temperature
Special features: • Simple plant concept
• Wear of heating surfaces
• Sophisticated plant concept
• Lower NOx emission due to staged combustion
• Better part-load bohaviour
• Compact components• Shop fabrication• Development problems - Hot gas cleaning -Gas turbine
for dustladen and corrosive gases
Comparison of technical data:VelocityHeat release Combustion efficiencyN0X emissionCa/S molar ratio (90 % S retention)
up to 2.5 m/s1 to2 NlWg/m2
90 to 95 %
200 to 400 ppm2.5 to 3.5
up to 7.0 m/s4 to 6 MWft/m2
90 to 99 %
100 to 300 ppm1.5
up to 2.5 m/s1 to20 MWft/m2
90 to 99 %
100 to 200 ppm1 to 1.5
Fig. 2. Compartson of Fluidized-Bed Combustion (FBC) Principles

137 -
2.4 Flue Gas Purification
The final link in the coal-to-power conversion chain is flue gas cleaning. This is the most suitable of the methods that can be implemented at present in response to the exacting legal environmental requirements imposed on existing power plants. With other methods either the pollutant separation efficiency is inadequate or technical and economic requirements of power plant operation cannot be met.
Is there then no choice but first to dilute the pollutants in coal to 10.000 times their volume in order then to collect them again laboriously in the flue gas?
In this respect coal conversion can be considered a genuine alternative since the progress that has been made in the development of coal gasification systems permits the prediction that this technology will be ready for commercial use in power plants by the end of the retrofitting period in West Germany - that is, by 1993.
2.5 Coal Gasification
Integration of coal gasification systems into combined cycle power plants, the flow chart of which is shown in Fig. 3, results in specific requirements which can be summarized in the form of assessment criteria (Fig. 4). What is needed is a gasification system which can be used with a wide variety of coals, contains tried and tested key components and is flexible in operation. Less sophisticated technical equipment should be sufficient for gas and by-product processing and cost-effective operation of the gasifier should be possible while maintaining a high degree of efficiency.
To achieve a high plant efficiency, the gasification pressure has to be matched to the gasturbine inlet pressure. Furthermore, the produced fuel gas must fulfill the purity
r r
r _r
r r
I l
\

Steam turbinepower plant
WHB_____1 Flua Gai
Fig. 3. Simplified Flow Sheet of a Combined CyclePower Plant with Pressurized Coal Gasificalieation.
f 1
► \ \ -i
No limitation by • Coal type• Particle alze• Ash content• Caking behavior
[ Gasifier technique )Solved problems concerning
[ Environment
Extensive reduction of
f EconomicsResulting from
• Coal feed• Ash removal• Heat recovery• Gasifier pressure!* <»•* turbin* pmtura)• Availability• Transient behavior d0Wn’
• Scale up9 Manufacturing experience
• Dust• Sulfur, NOx• By-products, auxiliary materials• Waste water• Space requirement• Overall height
• Low Investment cost• Low O 4- M cost• High efficiency
Fig. Requirements for Gasification ProcessesIntegrated within Combined Cycle Power Plants.
M M M
. 1^ 1

139 -
requirements of the gas turbine to prevent blade erosion and corrosion. At the same time the allowable emission limits must be observed, if possible with an adequate margin since legal requirements may become even more stringent in future depending on the state of the art of emission controls.
2.5.1 Advanced Coal Gasification Systems and Assessment thereof
A distinction is generally made between three basic types of coal gasifiers, i.e. fixed-bed, fluidized-bed and entrained- flow gasifiers. Another type available is the molten-iron-bath gasification system which cannot directly be assigned to one of the "classical" basic types. The schematic diagrams appertaining to the different types of coal gasification processes are shown in Fig. 5.
r r ]
Fixed bed800 -1000 "C, 10 -100 bar
Coal
Aah
Fluidized bed800 -1000 °C. 10 - 25 bar
Gas
Ash
Entrained flow1500 -1900 °C. 25 - 40 bar
Stag
Molten iron bath- 1500 °C, 1 -3bar
Gaa
Slag♦
Sulfur
Processes Processes Processes Processes
Fig. 5. Basic Types of Coal Gasification Processes.
T r 1
- 140 -
2.5.1-1 Fixed-bed gasifier
Lump coal is use, in the fixed-bed gasifier. In countercurrent flow to the rising gas, it is initially dried, carburized and finally gasified and partly burned, respectively. Depending on the method used, the ash is removed either in a solid or molten state. The technique with dry ash removal is known as Lurgi Pressurized Gasification and has been used for the production of synthesis gas and fuel gas for many years.At the 170-MW-plant in Lunen (FRG), the world's first combined-cycle power plant with coal gasification, this type of gasifier using an air/steam mixture as gasifying agent has been installed /6/. Further development of the Lurgi gasifier led to the BGC/Lurgi slagging gasifier of whichseve ral sizes have been tested at We stf ie Id (Scotland) n / .It i s characterized by the use of a wider variety of c oals,inc r eased operational flexibility, a high carbon conve rsionrate , reduced steam requirement and a low CO^ content i nthe raw gas /8/. To date, an oxygen/ steam mixture has beenused exclusively as gasifying agent by th e slagging ga sifier
The KILnGAS process developed in the USA is also a fix ed-bedsystem. In East Alton (Illinois), a demonstration plant is in operation /9/. Gasification takes place in a ported rotary kiln; since air is used as gasifying agent, the carbon cannot be converted completely and this has adverse effects on thermal efficiency. If the KILnGAS gasifier is integrated into an IGCC power plant, the low operating pressure means that the produced gas has to be further compressed to the gas turbine inlet pressure. Since the gasification temperature is relatively low, tars and oils are produced as by-products as is the case in all systems with partial carburization of the coal. It is possible to return them to the gasifier but the required waste water treatment then becomes considerably more complex and the necessary equipment has to be more sophisticated than for the fluidized-bed and entrained-flow gasifier.
L.L
\
- 141 -
2.5. 1.2 Fluidized-bed gasifier
In the fluidized-bed gasifier, fine-grained and hardly caking coal is used which is converted in a fluidized-bed using an oxygen/steam or air/steam mixture as the gasifying agent.The gasification temperature ist limited to the range below the ash softening point. Lignite and highly reactive hard coal are particularly suitable for this type of gasifier.This system was operated at atmospheric pressure on an industrial scale as Winkler gasifier, preferably for the coals mentioned above. Further development of this process towards the pressurized High-Temperature Winkler (HTW) gasifier led to improved carbon conversion, gas quality and specific power.A commercial HTW plant for the production of synthesis gas has been put in operation in Berrenrath (FRG) about a year ago. An oxygen/steam mixture is used as gasifying agent.Further development activities are planned which will raise the gasifying pressure to the level required by the gas turbine so that it can be used in combined cycle plants /10/.
The fluidized-bed gasification process prevents the production of tars and oils as by-products, however, incomplete carbon conversion results in the accumulation of residual char, the chemically-bound energy of which cannot be utilized in the gas turbine process. Attempts are beeing made to solve this problem in the KRW gasifier being tested at the pilot plant in Waltz Mill (Pennsylvania) by a process providing for the return of entrained char and separate steam injection into the upper fluidized-bed zone. This should permit gasification of a large portion of the accumulated residual char even when hard coal is used. A prerequisite for this, however, is a very high separation efficiency of the recycle cyclones provided for the entrained char. Both oxygen and air can be used as a gasifying agent / 11 /, / 12 /.

142 -
Similar goals are being pursued with the U-Gas process which also has an ash agglomerating zone. A pilot plant is in operation in Southwest Chicago / 13 /.
The CGT experimental plant for hard-coal gasification in Hiinxe (FRG) uses a two-stage process in which residual char from the fluidized-bed is utilized in an entrained-flow stage / 15 /. It is intended to develop the system further especially for application in power plants using air and steam as gasifying agents. The entrained-flow section operated with oxygen is not to be used in future.
2.5.1.3 Entrained flow gasifier
In the entrained-flow gasifier, very finegrained coal ist converted using oxygen and a small quantity of steam at a high reaction temperature into a by-product-free gas mainly containing CO and Most of the ash is removed in a molten state. This process has been used for years on a large scale for the production of synthesis gas at atmospheric pressure under the name of Koppers-Totzek process. Further development of the process towards pressurized operation led to the PRENFLO gasifier via the Shell/-Koppers gasifier which was tested in Hamburg-Harburg (FRG). An experimental plant is in operation in Furstenhausen (FRG) / 16 /. The development work conducted independently by Shell led to the construction of a demonstration plant.in Houston (Texas) /17/. This system is characterized by high carbon conversion rate and dry coal • dust feeding. Furthermore, all types of coal can be used irrespective of their caking characteristics, their inerts and sulfur contents. High ash contents, however, cause an increase in oxygen consumption which has a negative effect on thermal efficiency and the cost-effectiveness of the overall process.
The GSP gasifier is another entrained-flow system with dry coal feeding. A large-scale experimental facility using
¥
I z
¥ T
wI
143 -
pulverized lignite is in operation at the VEB Gas Combine "Schwarze Pumpe" (GDR) / 18 /.
In the Texaco gasifier, coal slurry is entrained which requires less sophisticated systems and control equipment. The attainable proportion of coal in suspension, however, is limited.In addition, the proportion of water in the slurry leads to higher oxygen consumption and a lower heating value of the produced gas. The Texaco process is the only advanced hard coal gasification process being used for the production of synthesis gas on an industrial scale in several plants.In the "Cool Water" plant near Daggett (California), theuse of this gasifier type for fuel gas production for a 100 MWIGCC power plant is currently being tested / 20 /.
Another slurry-fed entrained-flow system is the DOW gasifier of which several sizes were tested in Plaquemine (Louisiana).A commercial gasifier for the production of fuel gas for an existing combined cycle power plant is currently being commissioned.
In the DOW system, the hot raw gases are cooled in a first stage by injecting coal slurry and this reduces oxygen consumption and improves gas quality / 21 /, / 22 /.
The VEW gasifier is the only entrained-flow system with partial gasification using air. This process was specially developed for use in combined-cycle plants. The residual char is burned in a separate boiler. A demonstration plant of the VEW gasifier is in operation at Gersteinwerk (FRG) /23/.
2.5.1.A Molten iron bath gasifier
The molten iron bath gasifier was a further development of steel converter technology. Coal is fed into the molten iron bath together with limestone and oxygen. The carbon contained
r ... c _ ]
y r

in the iron is converted into CO and ash and sulfur arechemically bonded in the slag. If this process is developed further towards a process operating continuously at elevated pressure, its main field of application will be in the combined steel and electricity production in connection with new steel production technologies / 2k /.
Fig. 6 contains a table of advanced gasification plants under construction or in operation.
Process Company Leeatien Coal Capacity (M) ■tatiM Product
BGOLur* British Gas Westfield. Soottend sso MOperaMon Fuel Gee. Dsdric Power
KILnGAS AMs Chalmers East Alton, Moots 600 In Operation Fust Gee tor Boder
HTW RhoWschs BraunhoMsworite Ornenmth. FRG 720 In Operation Chernies/ rseddocfc
HTW KemiraOy Oulu. FinrSend 690 Under Cenakrudion Chemieel FeedMoch
KRW KRW Energy SyWems Wahz MB. Pennsylvania 90 In Operation Fuel Gas
KRW ... China 720 Under Canetrudion ...U4es MfeuM of Gas Technology Southwssl Chicago 90 In Operation FustG*
U-Gm ChMbonnogo «• Franco Mahngarhe, France 200 Under Design Fust Gee. Chemical Fsedst.
COT B^ooek HQnse.FRG •6 In Operation Fuel Gas
gaiflnorf Flam
PRENFLO KnniKen»n Fflmtenhauaen, FRG 46 In Operation Fuel Get
Shei Shol CM Company Deer Parik. Texaa 290 Undor Construction Fuel Get
GSP VEBGasCambinoSchwarz# Pianpe
GOR 720 hi Operation Fuel Gas. Chemieel
Teiaoo Tennsoote Easmen King^iBit. Tiwiumi eo tnOparaHsn Chemical FdedModt
Tesaoo Cost WWsr Pn(scl Osggn. CeMnnde sto taOpsiMian Electric Power
Teuco Ubo hnilriss UbeCfey. Japan I960 biOpenataa Chemtoei FsedMocfc
T— RuhrehomWRuhriuMs Osf und Gas FRG
720 to Operation Chemical Fsaddodt
Tesaoo ... Lu Nan. China 960 Under Construction Chemical Feadslcdt
Tesaoo NynAs Energy Chsniicals Camples (NEX)
Nyntohamn, Sereden 4700 Under Design Chemical Feedslodt.Fuel Gaa
VEW VamWgis EtmatTlWrOr Osrms>iesriL.FRQ 240 ■nOpermton Fuel Qaa tor Bator
MattsoJtta
MP MNoa Uriea. Swedsn 240 In Operation Fuel Gaa
KMdtnerIliiimRsnshflns
Suhbacii • ReaarWerg, FRG
•0 Under ComtrutSion Fuel Gaa
Fig. 6. Advanced Gasification Systems Application In Commercial and Demonstration Plants.

145 -
2.5.2 Efficiency and Energy Balance of IGCC Systems
Since different processes are used for the gasification systems presented, the process temperature, gasifying agent requirement and the quality of the produced gas vary. From the energy point of view, processes which make it possible to use a considerable proportion of the coal energy input in the gas turbine in the form of chemically bound energy should preferably be envisaged for integration into combined cycle plants. For high-temperature processes such as entrained-flow gasification, the production of high-pressuresteam during raw gas heat recovery is an essential factor
/in the reduction of exergy losses. The quantity of oxygen and air required for gasification influences the (electrical) auxiliary power requirement of the overall plant via the required compressor drive power.
The simplified flow diagrams of the IGCC power plants are shown in Figs. 7 to 10 for the chosen types of gasifier. Compared to other systems, the combined cycle power plant equipped with the PRENFLO gasifier (Fig. 9) has certain special features in terms of gasifying agent supply and the concept for N0x reduction. The air separation plant operated at elevated pressure is supplied with air taken from the gas turbine air compressor. In addition to the oxygen used for gasification, the produced nitrogen is also utilized.A large proportion of the nitrogen is added to the clean gas; this reduces N0x emissions in the gas turbine and increases power due to the increased mass flow. The other systems, however, are designed for independent compression of separation air and saturation of the clean gas with water or steam injection to reduce NO in the gas turbine.
I
I
\
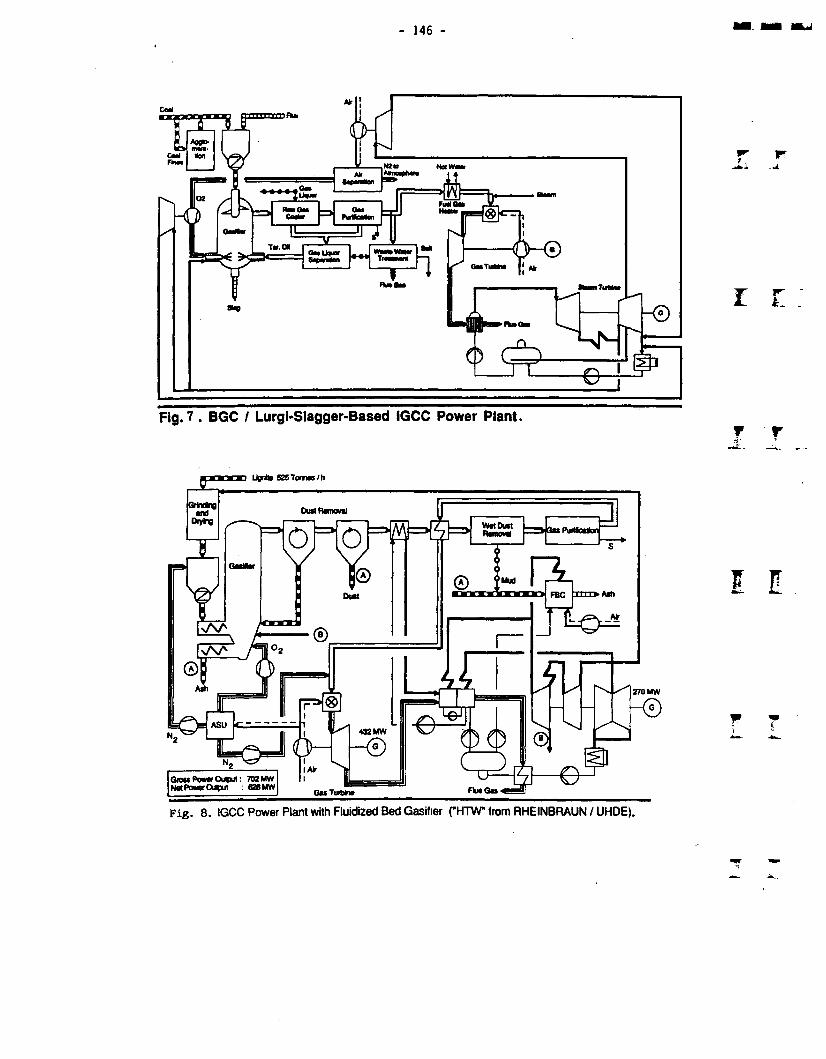
]46 -
Fig. 7 . BGC / Lurgf-Slagger-Based IGCC Power Plant.
Lignte S2S Tonnes/h
Grinding
270 MW
ASU C432 MW
Qroes Power OMpul : 702 MWNet Power Outxit : 628 MW
I I
w r
Fig. 8. IGCC Power Plant with Fluidized Bed Gasitier ("HTW from RHEINBRAUN / UHDE).

- 147 -
Waste Heat Fuel Gas
Grinding
Gas Purificabor
Waste
HI - Combustion
Gas Turbine
Fig. 9. PRENFLOBased IGCC Power Plant.
i . r _ ]
T r i
Fig. 10. Texaco-Based IGCC Power Plant.
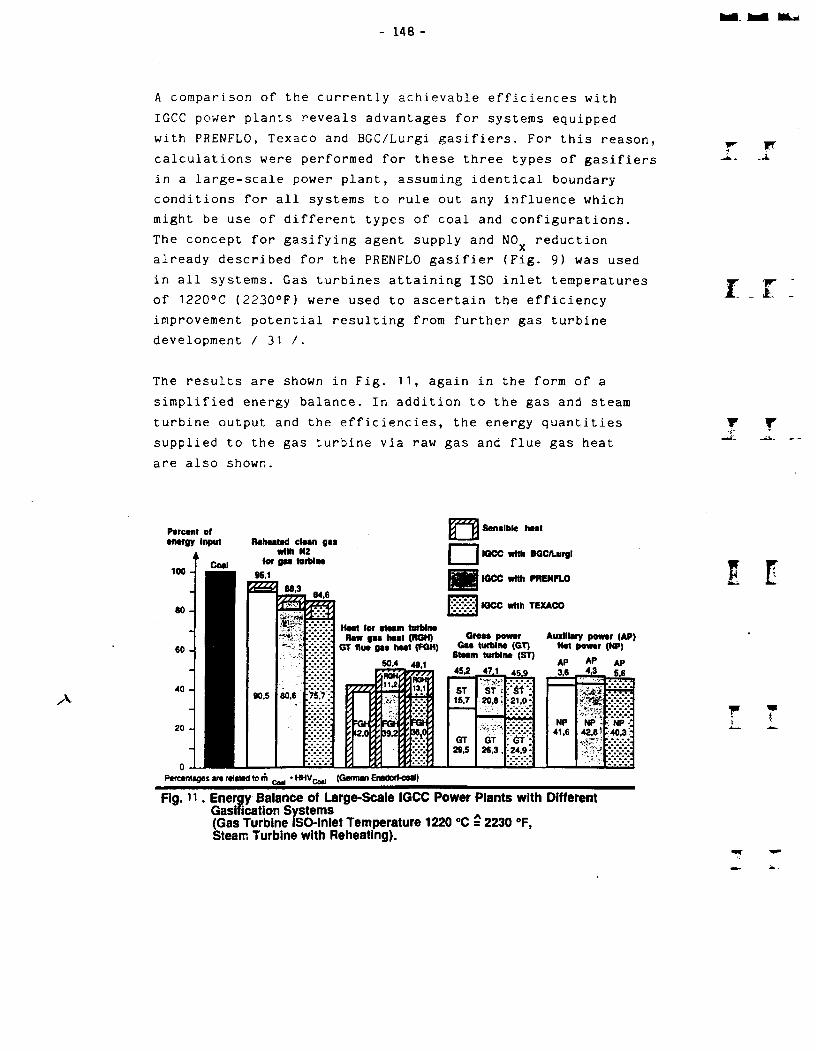
148 -
A comparison of the currently achievable efficiences with IGCC power plants reveals advantages for systems equipped with PRENFLO, Texaco and BGC/Lurgi gasifiers. For this reason, calculations were performed for these three types of gasifiers in a large-scale power plant, assuming identical boundary conditions for all systems to rule out any influence which might be use of different types of coal and configurations.The concept for gasifying agent supply and N0x reduction already described for the PRENFLO gasifier (Fig. 9) was used in all systems. Gas turbines attaining ISO inlet temperatures of 1220°C (2230°F) were used to ascertain the efficiency improvement potential resulting from further gas turbine development / 31 /.
The results are shown in Fig. 11, again in the form of a simplified energy balance. In addition to the gas and steam turbine output and the efficiencies, the energy quantities supplied to the gas turbine via raw gas and flue gas heat are also shown.
A
Parcant el anargy input
AReheated clean gaa
with N2 lor gaa turbine
95.1' SB,3
I
90.5 75,7 > VZZL
=gh: : i2.o
ffi:.
392$ 3^0;
| Sensible heat
□ IGCC with BGC/Uirgl
IGCC with PRENFLO
•Xl IGCC with TEXACO
Heat lor ataam turbine Raw gaa heat (RGH)
GT flue gaa heat (FGH)
50.4 49.1
Grose power Gas turbine (GT)
Steam turbine (ST)
Auxiliary Nat power
45,2 47.1 45.9
ST ST^15.7 20.8. ’21,0;
GT GT ; 6t;29.5 26.3.
AP3,6
AP4.3
mNP np *;
41.6 42.8*•••
<AP) (HP)
AP5.6
np" l •: Tip
Percentages are related tom Coi| • HHVCatl (German Enadorl-coal)
Fig. 11. Energy Balance of Large-Scale IGCC Power Plants with Different Gasification Systems(Gas Turbine ISO-Inlet Temperature 1220 °C = 2230 °F,Steam Turbine with Reheating).
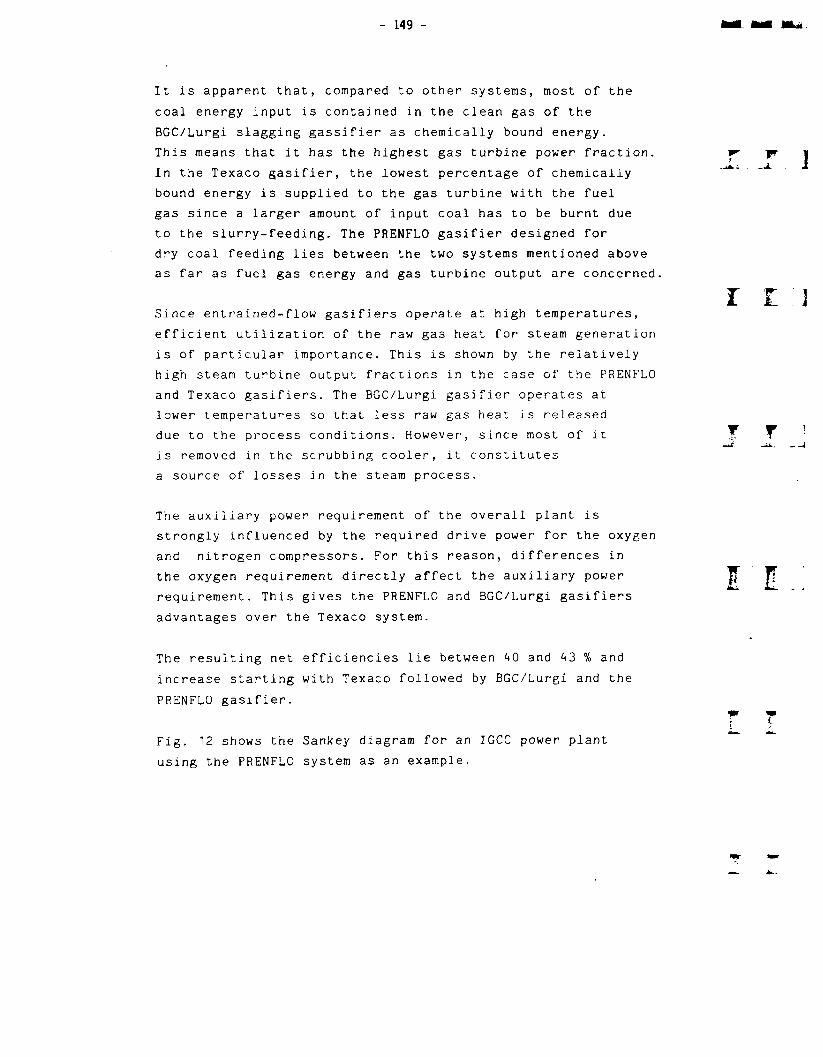
149 -
It is apparent that, compared to other systems, most of the coal energy input is contained in the clean gas of the BGC/Lurgi slagging gassifier as chemically bound energy.This means that it has the highest gas turbine power fraction. In the Texaco gasifier, the lowest percentage of chemically bound energy is supplied to the gas turbine with the fuel gas since a larger amount of input coal has to be burnt due to the slurry-feeding. The PRENFLO gasifier designed for dry coal feeding lies between the two systems mentioned above as far as fuel gas energy and gas turbine output are concerned
Since entrained-flow gasifiers operate at high temperatures, efficient utilization of the raw gas heat for steam generation is of particular importance. This is shown by the relatively high steam turbine output fractions in the case of the PRENFLO and Texaco gasifiers. The BGC/Lurgi gasifier operates at lower temperatures so that less raw gas heat is released due to the process conditions. However, since most of it is removed in the scrubbing cooler, it constitutes a source of losses in the steam process.
The auxiliary power requirement of the overall plant i strongly influenced by the required drive power for th and nitrogen compressors. For this reason, difference the oxygen requirement directly affect the auxiliary p requirement. This gives the PRENFLO and BGC/Lurgi gasi advantages over the Texaco system.
se oxygen s in ower f iers
The resulting net efficiencies lie between 40 and 43 % and increase starting with Texaco followed by BGC/Lurgi and the PRENFLO gasifier.
Fig.using
2 shows the Sankey the PRENFLO system
diagram for an as an example.
IGCC power plant
I I ]
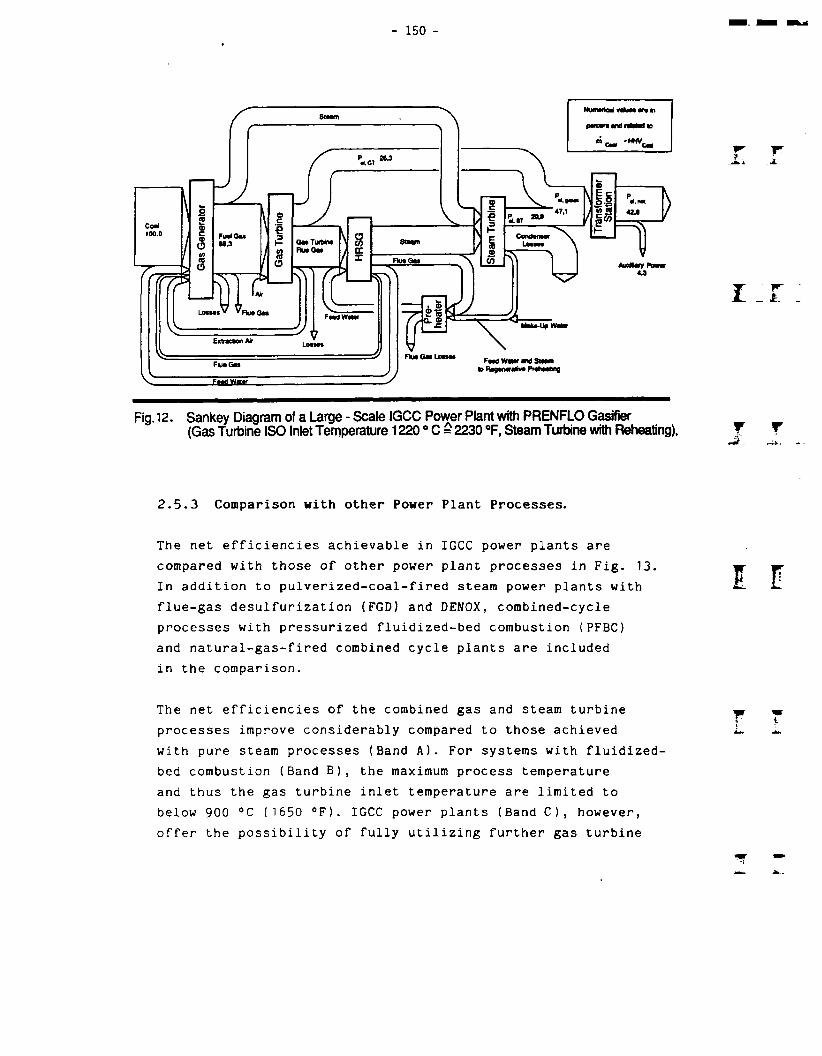
150 -
Fig. 12. Sankey Diagram of a Large - Scale IGCC Power Plant with PRENFLO Gasifier(Gas Turbine ISO Inlet Temperature 1220 ° C = 2230 °F, Steam Turbine with Reheating).
2.5.3 Comparison with other Power Plant Processes.
The net efficiencies achievable in IGCC power plants are compared with those of other power plant processes in Fig. 13. In addition to pulverized-coal-fired steam power plants with flue-gas desulfurization (FGD) and DENOX, combined-cycle processes with pressurized fluidized-bed combustion (PFBC) and natural-gas-fired combined cycle plants are included in the comparison.
The net efficiencies of the combined gas and steam turbine processes improve considerably compared to those achieved with pure steam processes (Band A). For systems with fluidized- bed combustion (Band B), the maximum process temperature and thus the gas turbine inlet temperature are limited to below 900 °C (1650 °F). IGCC power plants (Band C), however, offer the possibility of fully utilizing further gas turbine
- 15.1 -
development towards higher inlet temperatures. Conversionlosses and the increased auxiliary power requirement associatedwith coal gasification, however, cause a drop in efficiency- in comparison with natural-gas-fired combined-cycle plants(Band D) - by 5 to 10 percentage points. The range is fairly ^ ^wide since the efficiencies attainable in IGCC power plantsnot only depend on the gasification process used and itsauxiliary power requirement, but also on the configurationand the chosen gas purification system.
Net efficiency (HHV-related)
Pulverized coal-fired power plants with FGD and DENOX
Combined cycle power plants with natural gas firing
•PRENFLOCombined cycle power plants with pressurized
fluldlzed-bed combustionPRENFLO
BGC/Lurgi
•Texaco
Texaco1Combined cycle
power plants with Integrated coal
gasification (IGCC)
Gas turbine Inlet temperature (ISO)
—I------------------------------ 1------------------------------1------------------------------ 1-----------—"1600 1800 2000 2200 t’FJ
Fig. 13. Comparison of Station Efficiencies for Different Types of Combined Cycle Processes and Pulverized Hard-Coal-Fired Power Plants.
i r
t r
I l
Coal gasification power plants with two or more gasification trains and gas turbines also attain high efficiency during part-load operation. They are therefore not only suitable for operation in the base-load range, but also in the intermediate-load range which is the most cost-effective operating range for hard-coal-fired power plants in the Federal Republic of Germany.

152 -
2.5.A Environmental and Economic Aspects
Combined-cycle plants with coal gasification will become a valid alternative to conventional technologies only if they prove advantageous from the point of view of cost or emissions in addition to the higher efficiencies attained. For this reason, these two aspects are briefly discussed in the following.
Fig. 14 shows the supply and disposal flows, and the emission values of a conventional hard-coal-fired power plant with FGD and DENOX and of an IGCC power plant. The power plants with coal gasification are not only advantageous as far as SO^, N0x and CO2 emissions are concerned, but also with respect to the disposal of solid residues.
In a conventional power plant, a considerable amount of gypsum is produced due to the use of lime for FGD purposes; utilization of the gypsum will become increasingly difficult in the future. The IGCC power plant, on the other hand, requires no additional absorbent as the sulfur is bonded in the form of
with regenerable scrubbing fluids. Marketable elemental sulfur produced from this can be sold in a concentrated form.
For the use of hard coal, Fig. 15 provides a comparison of the cost structures of pulverized-coal-fired power plants with FGD and DENOX and IGCC power plants. It is particularly noticeable that the actual power generating equipment accounts for less than half of the total costs of an IGCC plant, whereas it accounts for 3/4 of the total investment in a pulverized- coal- fired steam power plant. The reason for this is the extremely low specific cost of the gas turbine in comparison with the steam turbine cycle. Total investment is expected to be about the same for both power plant types within the
W„JL.
I T
Y Y
\

153 -
Coal (6366)
n159 wagons J I
‘O
Umasiona (217)
_i gr^-i090 090 £90 090 090 090
0
SO, :22,4
NO. :1U iz_Hi±jUo c
Convantlonal Power Plant ( ^ -36%)
0 0 0
100 m
Coal (5376)
£t>C30C3 134 waoons
0dally amcunta(metric tons)
P~[> so2 :«
o “NO, :6.6
IQCC-Powar Plant ( t) -43%) *)0 0 0 0C3CJCTC3 C3C3CTC3 C3 CTCT C3 C3CJC3C3
Ash (637)
coco earneammoaoa oo oa ooOQ oo 00 ooGypsum (315)
C3C3CT C3 aQ
C02 SLJ W IwJ Fine DustC3C0C3 W
CD
Sutlerco, s
(17000) =| C3CJC3
Sag (488)
(63) (14400) =
*) based on PRENFLO-GasificationFig. 14. Comparison of Supply and Disposal Flow in Hard Coal Power Plants
(700 MW(et); 73 % C; 1,2 % S; 10 % Ash; HHV w 26500 kj / kg; IGCC: 98 % Desulfurization; Conventional Power Plant: 400 mg S02 / m3 Dry Hue Gas).
[%] |100 -
80 -
60 -
40 -
20 -
Electrostatic precipitatorDENOXFGD25%
Steam generator Civil works
34%
Mechanical equipment Electrical equipment
Others41 %
Steam turbine 12%
Wet dust removal 6 %Desulfurization
7%Gasifier9%
Waste heat boiler 11 %
Air separation 14%
doal preparation8%
Combined cycle unit45%
Pulverized coal-fired power plant with FGD and DENOX
IGCC power plant
Fig. 15 . Cost Structures of Pulverized Hard-Coal-Fired Power Plants with FGD and DENOX Compared to Combined Cycle Power Plants with Integrated Coal Gasification (IGCC).
]
IT.]
t r
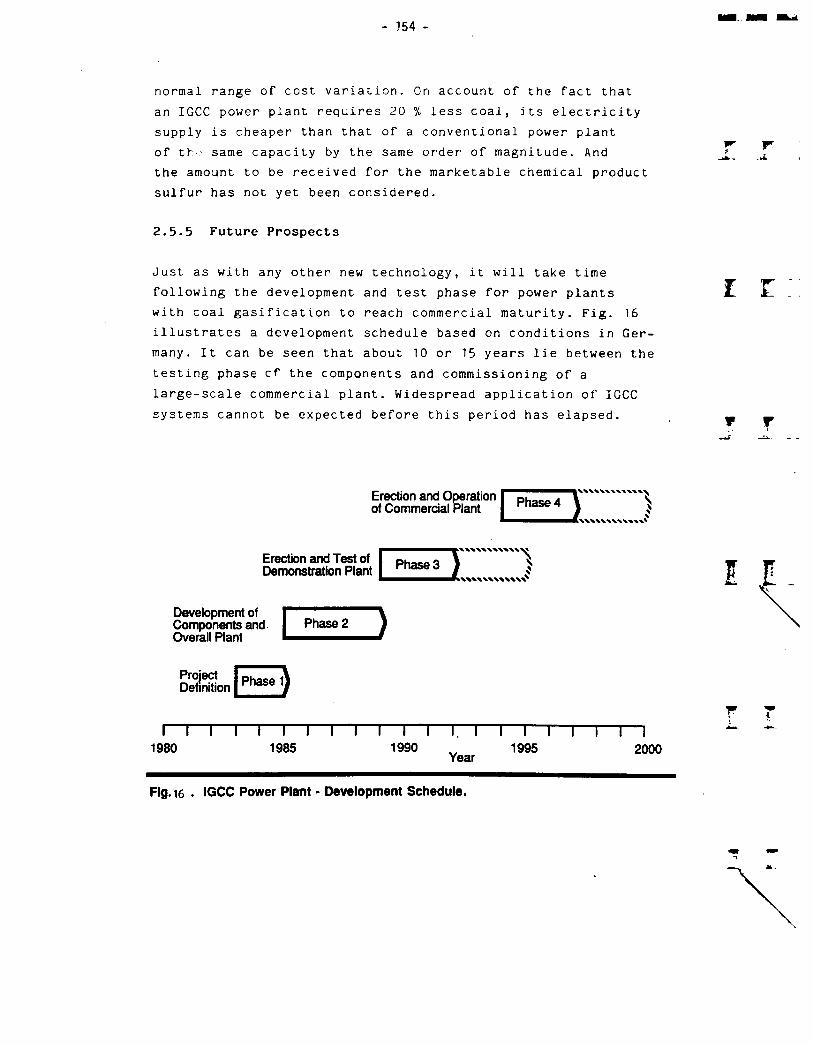
154 -
normal range of cost variation. On account of the fact that an IGCC power plant requires 20 % less coal, its electricity supply is cheaper than that of a conventional power plant of th-' same capacity by the same order of magnitude. And the amount to be received for the marketable chemical product sulfur has not yet been considered.
2.5.5 Future Prospects
Just as with any other new technology, it will take time following the development and test phase for power plants with coal gasification to reach commercial maturity. Fig. 16 illustrates a development schedule based on conditions in Germany. It can be seen that about 10 or 15 years lie between the testing phase cf the components and commissioning of a large-scale commercial plant. Widespread application of IGCC systems cannot be expected before this period has elapsed.
r r
I T
T T
Erection and Operation of Commercial Plant Phase 4 ]
Erection and Test of Demonstration Plant Phased ]
.XXXXXXXXXXXV1)^xxxxxxxxxxxx*
Development of Components and Overall Plant
Phase 2
ProjectDefinition Phase 1
r ri—i—i—i—i—i—i—i—i—i—i—i—n—i—i—i—i—i—i—i - -
1980 1985 1990 w 1995 2000Year
Fig. i6 . IGCC Power Plant • Development Schedule.

- 155 -
The fact, that so many different gasification systems are currently being developed means that it will be necessary in the nineties when confirmed test results are available to start a selection process among the systems suitable for application in power plants. If the power-plant-specific requirements defined in Fig. k are used as selection criteria, it is expected that only a small number of processes will be suitable for commercial application.
3 CONCLUSIONS
In principle, all advanced types of gasifier operating under pressure are suitable for use in a power plant. The power- plant- specific requirements, however, are fulfilled in different ways by the various systems. In addition, a comparison of the basic types of gasifiers has shown that they can be assigned to special fields of application in which they have specific advantages over other systems. For example, fixed-bed gasifiers are particularly suitable for plant concepts providing physical separation of the gasifying unit and the power plant, and fluidized-bed gasifiers are more suitable for highly reactive types of coal. Entrained-flow gasifiers are universally applicable and particularly suitable for concepts with a high degree of thermal integration.
Integration of coal gasification systems into combined gas and steam turbine power plants is technically feasible and provides a high potential for improvement in efficiency as against conventional coal-fired power plants. In addition, IGCC power plants are economically and ecologically superior to conventional technologies.
Although further development work is necessary for certain components such as gasifier, heat recovery boiler and high- temperature gas turbine, the results obtained to date give

- 156 -
confidence that this technology will be ready for commercial application in the nineties. This IGCC technology also allows better adaptation of power generation to the increase in power consumption by way of phased construction and the avoidance of excess capacities which is of particular interest from the economic point of view. In addition, gasification is suitable far retrofitting of existing steam or combined gas and steam turbine power plants to IGCC systems.
A ACKNOWLEDGEMENT
The work described in this paper was performed by Siemens AG, KWU Group, sponsored by the German Federal Ministry for Research and Technology.
REFERENCES
/I/ Frewer, H.: Strukturwandel in der Technik fossilbeheiz-ter Kraftwerke in der Bundesrepublik Deutschland.VGB Kraftwerkstechnik 1986, 66(1), 303 - 326.
/2/ Breucker, H., and Stadie, L.: SteinkohlebefeuerteDampferzeuger fur Kraftwerke mit hohen Dampfzustanden. VGB Kraftwerkstechnik 1983, 63(1), 29 - 37.
73/ .Ewald, J., Haase, H., and Zorner, W.: DampfturbinenfUr Kraftwerke mit hohen Dampfzustanden. VGB Kraftwerkstechnik 1983, 63(1), 37 - 45.
/A/ Giovanni, D. V., and Armor, A. F.: Die Verbesserungdes thermischen Wirkungsgrades konventioneller Kraftwerke. VGB Kraftwerkstechnik 1982, 62(2), 78 - 89.
75/ Schiffers, U., and Stocksmeier, H.: Kombiniertes Gas-Dampfturbinenkraftwerk mit Kohlevergasung, Projektde- finition (Phase 1).BMFT-Report-FB-T86-036, February 1986.
T lpr
i r
t r
157 -
/6/ Dorstewitz, U., and Wien, H.: KDV-Anlage Liinen.Report TB 201 of the VGB Conference "Kohlevergasung in der Energietechnik".
77/ Davies, H. S., Lacey, J. A., Scott,J.E., Herbert, P.K.,and Vierrath, H. E.: Application of the British Gas/Lurgi Slagging Gasifier for Combined Cycle Power Generation. Symposium on Coal Gasification and Synthetic Fuels for Power Generation, San Francisco, April 16, 1985.
78/ Thomas, K. M.: Some Scientific Aspects of the Development of Slagging Gasifier. NATO ASI Ser., Ser. E, 105 (Carbon Coal Gasification), A39-53.
79/ Garside, P. G.: KILnGAS Process for Producing CleanGas from High-Sulfur Coal; Major Technical Accomplishment and Plans. Energy Progress 1986, 6 (1), 5-11.
710/ Fabianek, G., Adloch, W, and Wischnewski,R.: Standdes Rheinbraun HTW-Verfahrens. Haus der Technik Conference "Die Projektierung von Kohleveredelungsanlagen und deren Veredelungsbetriebe." Essen, November 6-7, 1986.
711/ Haldipur, G. B., Cherish, P., Lewandowski, D. A.,and Pavel, J.: Hot Gas Cleanup Using the KRW Gasifier. Fifth Annual EPRI Contractor's Conference on Coal Gasification. Palo Alto, California, October 30-31,1985-
712/ Salvador, L. A.: The Appalachian Project: Clean Power from Coal. West Virginia Conference on Clean Coal Technology. Morgantown, June 19, 1986.
713/ Patel, J. G., and Schora, F. C.: The U-Gas-Process:Clean Fuel Gas from Coal. Urja 1986, 19 (A), 283-91-
Palat, P., Schora, F. C., and Patel, J. G-: U-Gas Process CdF. Urja 1984, 17(3), 187-94.
7 14/
158 -
/ 1 5/
/ 16/
/ 17/
/ 18/
/1 9/
/20/
/2 1/
/22/
/23/
Carbon Gas Technology GmbH: CGT-Kohlevergasung.Company Brochure.
Pohl, H. C.: Commissioning of the PRENFLO Test Unit.Sixth Annual EPRI Contractors's Conference on Coal Gasification. Palo Alto, California, October 15-16, 1986.
Heitz, W.L., and Nager, M.: Status of the Shell Gasification Process (SCGP). Fifth Annual EPRI Contractor's Conference on Coal Gasification. Palo Alto, California, October 30-31, 1985.
Schingnitz, M., Brandt, H., Berger, F., Gohler, P. and Kretschmer, H.: GSP-Verfahren: Druckvergasung von Braunkohlenstaub. Erdol und Kohle, Erdgas, Petrochemie vereinigt mit Brennstoff-Chemie 1987, A0(2), 76-80.
Ruhrkohle Oel und Gas: Business Report 1985.
Spencer, D. F., Alpert, S. B., and Gilman, H. H.:Cool Water: Demonstration of Clean and Efficient New Technology. Science 1986, 232 (2), 609-12.
Borneman, G. A., and Sundstrom, D. G.: Commercialization of the DOW Gasification Process. American Chemical Society, Div. Fuel. Chem. 1986, 31(2), 270-73.
Fisackerly, R. H., and Sundstrom, D. G.: The DOW Syngas Project Overview and Status Report.
Weinzierl, K.: Combined Cycle Process with Integrated Coal Gasification; VEW-Coal Conversion Process. Symposium Advanced Coal Power Technology. Malmo, November 6-7, 1985.

I2kl
/25/
726/
727/
728/
729/
730/
731/
Henrich, G., Pook, H. and Waldhecker, H.D.: Kohlevergasung im Eisenbad nach dem MIP-Proze/3. Energie 1986, 38(10), 39-41.
Simbeck, D. R., and Dickenson, R.L.: Integrated Gasification, Combined Cycle for Acid Rain Control. Chemical Engineering Progress 1986, 82(10), 28-33.
Coal Gasification Systems: A Guide to Status, Application and Economics. EPRI-Report AP-3109, June 1983.
Cost and Performance for Commercial Applications of Texaco-Based Gasification-Combined-Cycle Plants. EPRI-Report AP-3A86, April 1984.
Evaluation of the British Gas Corporation/Lurgi Slagging Gasifier in Gasification-Combined-Cycle Power Generation. EPRI-Report AP-3980, March 1985-
Cost and Performance of Kellogg Rust Westinghouse-Based Gasification-Combined-Cycle Plants. EPRI-Report AP-4018, June 1985-
Petersen, G. T.: KILnGAS Coal Gasification Process- Status. Coal Gasification and Synthetic Fuels for Power Generation Conference. San Francisco, California, April 14 - 16, 1985.
Muller R., Karg J.: Assessment of Coal Gasification Systems for Combined Cycle Power Plants. Jt.ASME/IEEE Power Generation Conference Miami Beach, Florida,October 4-8, 1987. The American Society of Mechanical Engineers, New York, October 1987.
r-X
II
\

- 161 -
THE RHEINBRAUN HTW-GASIFICATION TECHNOLOGY FOR COMBINED CYCLE POWER
GENERATION
Eberhard Nitschke, Dr.
UHDE GmbH
Dortmund, FRG
Abstract
One of the most advanced coal gasification processes is the Rheinbraun
HTW-fluidized bed gasification. The process has been developed by
Rheinische Braunkohlenwerke AG, Cologne, in close cooperation with Uhde
GmbH as the engineering partner.
In 1978 a pilot plant (capacity up to 30 t/d) was put into operation.
The influence of different gasification parameters on the performance
of the plant was studied. Also Finnish peat and Australian lignite with
a high sulphur and salt content were tested. Based on the results a
commercial scale demonstration plant with a capacity of 720 t/d dried
lignite was built and is successful in operation since 1986.
Together with Rheinbraun and Kraftwerk-Union Uhde has performed as
study for an IGCC-plant (600 MW), based on HTW-process. The concept has
great advantages with respect to efficiency. Also emissions from the
power station can be drastically reduced.
1 INTRODUCTION
The Rheinische Braunkohlenwerke AG (Rheinbraun) which has economically
mineable brown coal deposits of more than 35 000 million tons, is also
engaged in the development of new coal beneficiation processes. Besides
coal liquefaction, the coal gasification is the most important and
promising route.

162 -
The experience gained in the fifties from the Winkler gasification
process at Union Kraftstoff a Rheinbraun subsidiary in Wesseling was
the basis for the development of the high-temperature Winkler (HTW)
process for the production of synthesis gas or low-BTU gas.
Rheinbraun signed an agreement with the engineering company Uhde GmbH,
Dortmund, in order to cooperate in the development of the Rheinbraun
HTW process. Uhde is the engineering partner of Rheinbraun and, conse
quently, it was responsible for the engineering, erection and start-up
of the Wachtberg pilot plant as well as for the commercial-scale Ber-
renrath plant. Uhde is also the contractor for the peat gasification
plant in Finland.
r
i r:
2 DEVELOPMENT OF THE HTW PROCESS
The HTW process has been developed on the basis of the wellknown
Winkler process in which coal or coke is gasified with the aid of air
or oxygen/steam mixtures in a fluidized bed. The first step of the
development aimed at the production of a reducing gas for the direct
reduction of iron ore "in an in-line heat". Therefore a high gasifi
cation temperature - which is now used to designate this process - had
priority over a high gasification pressure which was initially planned
to be 5 bar.
During the technological development, the interest concentrated upon
the production of gas for chemical synthesis and in order to obtain a
high gasifier performance, it was decided to use a process pressure of
10 bar.
A further step is currently under consideration, i.e. the use of the
process potentials in a combined gas and steam turbine process with a
pressure of over 20 bar.
The development work on the HTW process, therefore, mainly concentrates
on the improvement of the gasifier output with the aid of higher
T T
W ~I

- 163 -
operating pressures and on the solution of all problems related to
process engineering and operation.
3 THERMODYNAMIC AND REACTION-KINETIC FUNDAMENTALS
Reactive carbon carriers such as wood, peat, brown coals, lignites and
subbituminous coals have a high content of volatile matter, i.e. in the
presense of heat they tend to decompose rapidly to form gaseous and
liquid fractions and char. In a Winkler-type fluidized-bed gasifier,
the so-called carbonization or devolatilization process can be
controlled in such a way that gaseous products and reactive char are
only obtained as intermediates which further react in the gasifier.
Since the a.m. carbonization or devolatilization is an endothermal pro
cess, reaction heat has to be introduced by burning part of the inter
mediates. Thus, each feedstock used in the fluidized bed of a Winkler
gasifier involves a specific temperature at which - with a constant bed
depth - a steady state is reached between the required quantity of
feedstock and the heat consumed by its endothermal devolatilization or
gasification, on the other hand, and the heat obtained by burning the
feedstock or its intermediates, on the other hand. Table 1 shows that a
higher volatile content leads to a lower temperature in the fluidized
bed. Said specific temperature is also crucial for the composition of
the gas from the fluidized bed. Feedstock with a low degree of coalifi-
cation such as wood yields also liquid carbonization products which may
cause problems in the downstream gas treatment units.
In order to prevent such problems, it is necessary to raise the tem
perature in the so-called freeboard above the fluidized bed by in
jecting additional oxygen or air to such an extent that unwanted by
products are converted into useful gases. This is possible because the
only substances that are present in this zone are small quantities of
higher hydrocarbons and the entrained degassed char particles. They are
contained in the gas stream in relatively low concentrations so that
the endothermal reactions are impeded.

164 -
Table 1. Comparison of performance data from different feedstocks used in the HTW process development unit.
wood peatRhenish
brown coalLignite
subbit uminoui
coal
degree of coallication 0-0.07 0.18 - 0.36 045 - 0.48 0.52 058 - 059
votetle content % t 82-87 61-73 49 - 55 46 32 - 35
char reactivity with COg at 900*Cand 30% conversion
cm3/g.s 10- 15 5- 10 4- 8 3 - 4 05 - 0.7
gasification temperaturein the IMdteed bed
•C 550 - 650 700 - 750 750 - 800 760- 810 800 - 850
specific input t. maf/m2.h 1.12 0.69 0.73 0.52 0.35
specific synthesis gas yield
m3(STP)/t/naf 1020 1170 1370 1590 1650
specific synthesis gas output
m3<STP)/m2.h 1U0 1040 1000 630 650
gasification pressure: 1 bar energy loss: 10% carbon conversion: 95%
r r-
I I
T r
A mean content of volatile matter permits an increase in the heating
value of the gas by reducing the oxygen quantity fed to the freeboard.
This prevents the conversion of a major portion of the primary
methane produced in the fluidized bed into CO + H at high temperatures.
This method is particularly effective at higher pressures as shown in
Figures 1 and 2. When, for instance, a pressure of 20 bar is used and when the temperature drops from 950 to 850 °C, the methane content in
the raw gas increases from about 4 % to 10 % (calculated in terms of
thermodynamics).
W
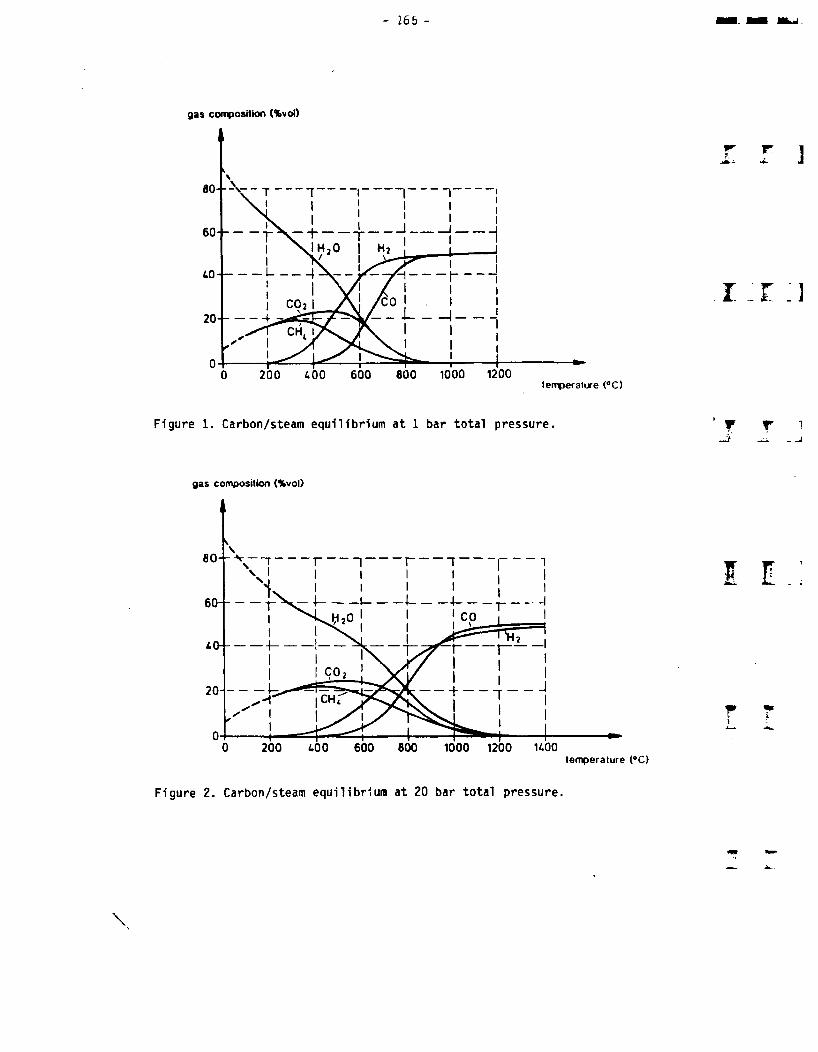
165 -
gas composition (%voi)
80---y
___ 1____60---- - +--------+ -
--1- --------- 1
C_ J- - - - - - - 1- - - - -20-------4
temperature (°C)
Figure 1. Carbon/steam equilibrium at 1 bar total pressure.
gas composition (Sbvol)
- -I----------- 1-----------\----------- 1------60-------------r
---------- r_
1000 1200temperature (°C)
Figure 2. Carbon/steam equilibrium at 20 bar total pressure.
I 5 3
i r i
W T l
W
\

166 -
4 THE HTW PROCESS DEVELOPMENT UNIT
In the seventies, the development of the HTW process was starting by
building a process development unit at the Aachen Technical University
with a solids input capacity of about 50 kg/h. In this plant operating
under atmospheric conditions, the influence of an increase in temper
ature on the performance parameters was investigated, i.e. carbon con
version, gas yield and specific gas output. This plant is still being
used for testing the suitability of different feedstocks for the HTW
process. Table 1 reflects the main results of said tests which show
that a higher rate of coalification - from wood to subbituminous coal -
causes a significant decrease in the solids input due to lower reacti
vity, while the yield of useable gases such as synthesis gas signifi
cantly increases due to the lower oxygen content and the higher heating
value. The slight decline in the synthesis gas output, however, can be
partly set off by a higher oxygen supply and, consequently, a temper
ature rise in the freeboard.
The verification of such performance data in continuous operation also
depends on the quantity of inorganic matter such as ash in the
respective feedstock and the ash fusibility.
Table 2 reflects to feedstocks with different ash composition. Type I
is an "acid" ash with a particularly favourable fusibility as, for
instance, in the case of hard or subbituminous coal. Type III is a
feedstock with a poor ash fusibility. This applies, for instance, to
some American lignites. This "basic" ash, however, is also found in
coals with a significantly better ash fusibility, as is the case with
Rhenish brown coal which contains more alkaline earth oxides but has a
lower alkali content (Type II). In general, wood has a very low ash
content.
Since the conversion temperatures are relatively low in the fluidized
bed and also in the freeboard as mentioned above, there will be no
serious trouble due to agglomeration of inorganic matter.

Table 2. Ash melting behaviour and ash composition.
ash melting behaviour(reducing atmosphere)
I 11 III
initial deformation point 1520 1265 1180
hemispherical point °C 1570 1315 1210
flow point 1580 1375 1230
ash compositionsio2 49,3 74 29,7
ai2o3 39,0 2.7 9.1
Fe203 3.4 144 14.5
CaO 2,3 42,4 15,9
MgO Xwt 2,0 9,3 5.1
Ti02 1.3 0.4
Na20 1,1 1.3 6,8
KjO 0,3 0.3 0.6
Mn304 ^O.l - 0.6SOj 14 22,2 17.9
In the case of a subbituminous coal with lower reactivity, however,
comparatively high temperatures are required in the gasifier in order
to obtain sufficient yields. These temperatures may even be as high as
the ash sintering temperature or the initial deformation point causing
ash agglomeration and/or gasifier choking, particularly in oxygen or
air injection zones where the reaction heat cannot rapidly dissipate
due to endothermal reactions. Consequently, peak temperatures may
occur. To avoid these problems, subbituminous coal with a high ash
fusion point should only be gasified.

:68 -
5 THE HTW PILOT PLANT
After the tests in the a.m. process development unit, a pilot plant for
the gasification of Rhenish dry brown coal using the HTW process went
on stream in 1978 on the site of the Rheinbraun brown-coal upgrading
plant in Wachtberg near Cologne (Figures 3 and 4). The engineering for
this plant, i.e. design, construction and start-up, were performed by
Uhde GmbH, Dortmund. The objective of the test operation was to
optimize the synthesis gas production.
The feedstock is dry brown coal with a moisture content of 18 % which
is also used for briquetting. Depending on the test target, the
moisture content of the coal can be reduced to 10 - 12 % by means of a
pneumatic conveyor for drying. In the downstream lock-hopper system,
the coal is subjected to the gasification pressure and fed by a screw
conveyor to the gasifier which has a refractory lining.
gasification agents oxygen/steam or ai pressure up to 10 bar
throughput (browncoal ) up to 1800 kg/h. raw gas output up to 4000 inVh.temperature up to 1100 °C .
I _C
Figure 3. Flow sheet HTW pilot plant.

The gasifier Is divided Into two rones. The gas leaves the fluidlred
bed where the solids concentration is relatively high, entraining a
considerable amount of char particles. In the second zone, the so-
called freeboard or post gasification zone where the solids density is
lower, additional oxygen and steam are injected in order to ensure a
carbon conversion at temperature of approx. 1 000 °C and in order to
adjust the gas composition such that the specification is met, parti
cularly with regard to the lowest methane content that can be obtained.
The raw gas flows from the gasifier outlet via a short refractory-1ined
pipe directly into the first cyclone in which the coarser dust
170 -
particles are separated and recycled to the gasifier. In the second
cyclone, the major part of the remaining fine dust particles is removed
from the raw gas and - as is the case with the ash withdrawn from the
gasifier bottom - discharged via a cooling screw conveyor and depressu
rized in a lock-hopper system. The purified raw gas is then cooled in a
waste heat boiler and burnt in an adjacent power plant.
During the first years, certain problems had to be solved in the HTW
pilot plant. The plant availability was significantly reduced by ash
agglomeration, particularly in the section of the oxygen injection
nozzle. Meanwhile, a high plant availability has been reached by means
of an adequate nozzle arrangement in the gasifier and a new configura
tion of the raw gas outlet to the cyclones, the dust recycling system,
waste heat boiler, water scrubber and bottom product (residual char)
discharge. The longest period of continuous operation was seven weeks.
In late June 1985, the plant was shut down because the operating expe
rience and the process engineering data regarding the investigated
10-bar mode were conclusive. Since the start-up, the plant had been in
operation for almost 38 000 hours, i.e. 27 400 hours under gasification
conditions. During this period, more than 21 100 t of Rhenish brown
coal plus approx. 200 t of Finnish peat were processed within the scope
of various test programs.
In December 1986 and January 1987, additional tests were performed with
South Australian brown coal having a high sulphur and salt content (see
chapter 7.2).
Table 3 shows a comparison of the operating results of the HTW pilot
plant and the conventional Winkler gasifiers using an oxygen/steam
mixture for gasification. As can be seen, the carbon conversion rate
increased from 91 % to 96 % and, consequently, the synthesis gas yield
per ton of brown coal was Improved accordingly.
A typical raw gas contains the following: CO 33 % by vol., H2 26 % by
vol., CH,, 3 % by vol., C02 19 % by vol. and H20 19 % by vol. On a wet
I I
T T
I E
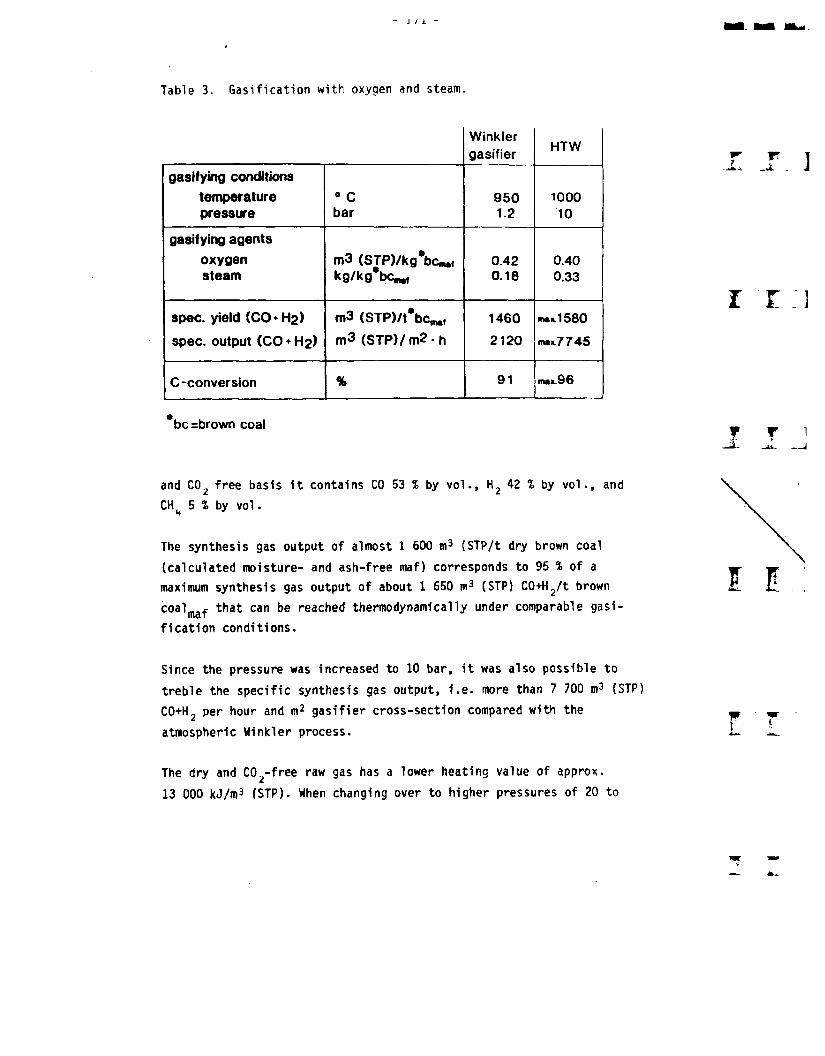
J /1
Table 3. Gasification with oxygen and steam.
Winklergasifier HTW
gasifying conditionstemperature 0 C 950 1000pressure bar 1.2 10
gasifying agentsm3 (STP)/kg*bCm,ioxygen 0.42 0.40
steam kg/kg’bc*., 0.18 0.33
spec, yield (CO»H2) m3 (STP)/t*bcm., 1460 maul 580
spec, output (CO + H2) m3 (STP)/ m2 • h 2120 •naK.7 745
C-conversion % 91 max. 9 6
be =brown coal
and C02 free basis it contains CO 53 % by vol., H2 42 % by vol., and
CH4 5 % by vol.
The synthesis gas output of almost 1 600 m3 (STP/t dry brown coal
(calculated moisture- and ash-free maf) corresponds to 95 % of a
maximum synthesis gas output of about 1 650 m3 (STP) C0+H2/t brown
coalmaf that can be reached thermodynamically under comparable gasi
fication conditions.
Since the pressure was increased to 10 bar, it was also possible to
treble the specific synthesis gas output, i.e. more than 7 700 m3 (STP)
C0+H2 per hour and m2 gasifier cross-section compared with the
atmospheric Winkler process.
The dry and C02-free raw gas has a lower heating value of approx.
13 000 kJ/m3 (STP). When changing over to higher pressures of 20 to
W-X ]
i t : i
T T 1-JL __ I
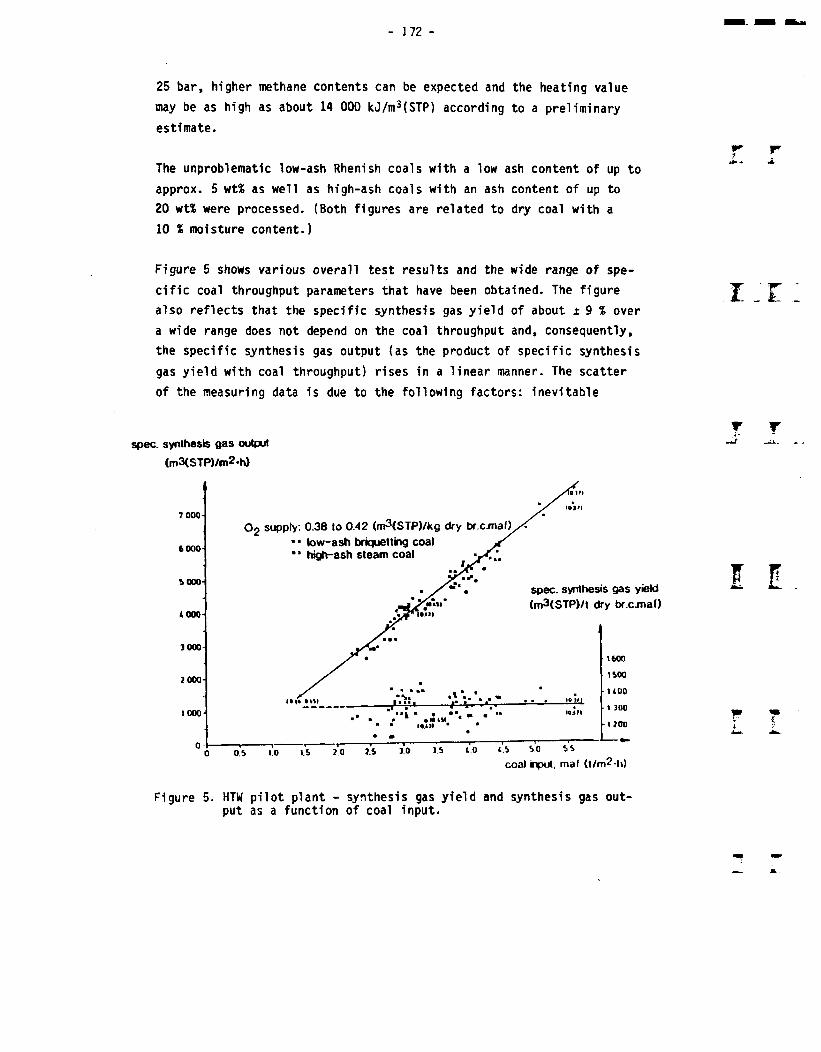
172 -
25 bar, higher methane contents can be expected and the heating value
may be as high as about 14 000 kJ/m3(STP) according to a preliminary
estimate.
The unproblematic low-ash Rhenish coals with a low ash content of up to
approx. 5 wti as well as high-ash coals with an ash content of up to
20 wt% were processed. (Both figures are related to dry coal with a
10 % moisture content.)
Figure 5 shows various overall test results and the wide range of spe
cific coal throughput parameters that have been obtained. The figure
also reflects that the specific synthesis gas yield of about ± 9 % over
a wide range does not depend on the coal throughput and, consequently,
the specific synthesis gas output (as the product of specific synthesis
gas yield with coal throughput) rises in a linear manner. The scatter
of the measuring data is due to the following factors: inevitable
spec, synthesis gas output
(m3(STP)/in2.h)
02 supply: 0.38 to 0.42 (m3(STP)/kg dry br.c.mat)
■ ■ low-ash briquetting coal • * high-ash steam coal
spec, synthesis gas yield (m3(STP)/t dry br.c.maU
coal input, mal (t/m2-h)
f T
Figure 5. HTW pilot plant - synthesis gas yield and synthesis gas output as a function of coal input.

- 173 -
measuring errors in analytics and mass flow measurement and varying
distribution of the gasification agent injected into the gasifier, on
one hand, and normal variations of the reactivity of the utilized brown
coal, on the other hand. In the Rhenish brown-coal district, 14 diffe
rent so-called litho-based brown coals have been found so far. While
their reactivity varies considerably depending on the gasification
agents used in the HTW process such as steam and carbon dioxide, their
distribution related to the coal is almost stable when large equipment
is employed in opencast mining.
Figure 5 also shows that the mean output figures for the processing of
high-ash coals are lower than those for low-ash coals but are still
within the a.m. range. Considering the fact that, when processing high-
ash coals, an inert material portion of up to 15 wt% (mostly silica
sands) has also to be heated and that, together with the bottom dis
charge of this inorganic material, carbon losses cannot be avoided in
the process, the result can be regarded as very satisfactory.
Figure 6 shows a comparison of the synthesis gas output initially ex
pected in the case of a pressure increase to 10 bar and the test re
sults. It was possible to exceed the expected figure of 6 000 m3 consi
derably: almost 8 000 m3(STP)/m2 were reached. Compared with the atmo
spheric Winkler gasifier, this increase corresponds to an uprating
index of about 0.6, previously 0.5. From these positive results it is
concluded that a further increase in pressure will also improve the
output. In this connection, the fluid mechanics have to be considered
as well. The above specific synthesis gas outputs were reached at
superficial velocities of about 1.6 m/s in the freeboard. Extrapolation
of these conditions to higher pressures indicates even higher perform
ance parameters than can be expected, i.e. in excess of the pressure
uprating index of 0.6. Exact figures, however, can only be obtained by
testing.
The objective of the HTW process development is to use higher pres
sures. Therefore, it has been decided to use the former pilot plant for
hydrogasification of brown coal at the Rheinbraun subsidiary in Wesse
ling as new HTW pilot plant.
?.W ]
I T ]
T r 1
wi,
'•*1
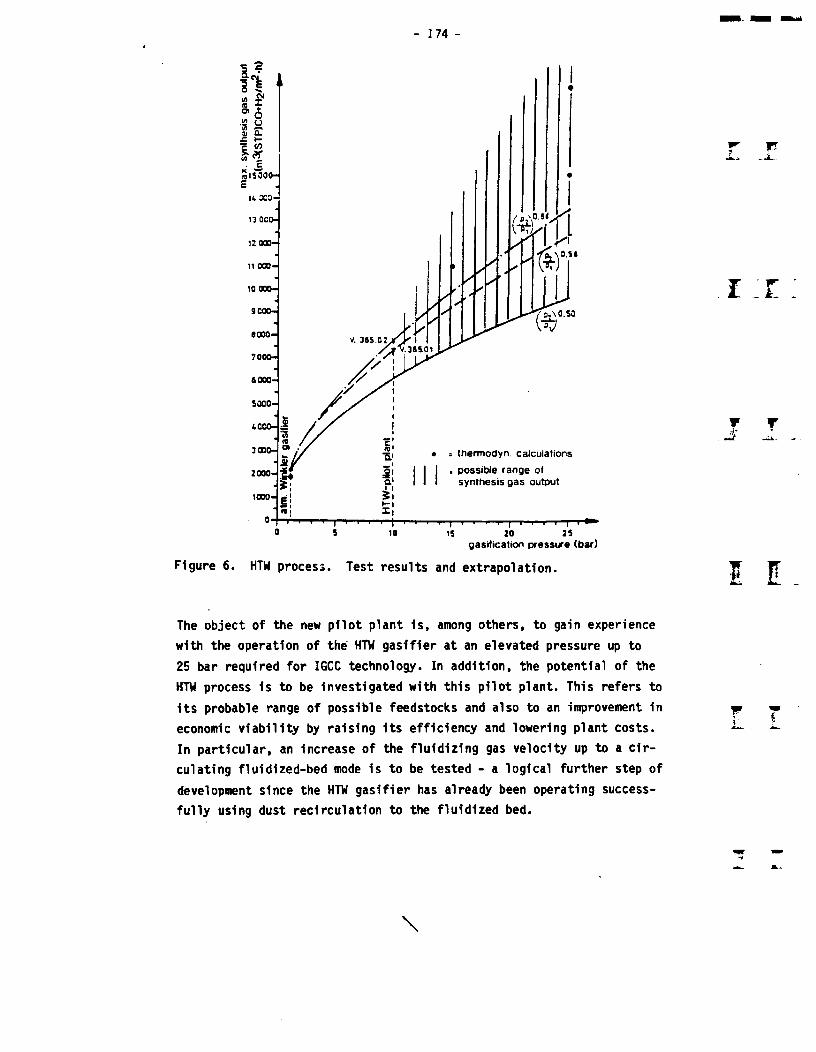
174 -
Jnisooo-
13 0 CO-
12 OOO-
11 000-
V. 365.02
7000-
6000-
5000-
3 000- = thermodyn calculations< possible range of
synthesis gas output2000-
gasification pressure (bar)
Figure 6. HTW process. Test results and extrapolation.
The object of the new pilot plant is, among others, to gain experience
with the operation of the HTW gasifier at an elevated pressure up to
25 bar required for IGCC technology. In addition, the potential of the
HTW process is to be investigated with this pilot plant. This refers to
its probable range of possible feedstocks and also to an improvement in
economic viability by raising its efficiency and lowering plant costs.
In particular, an increase of the fluidizing gas velocity up to a cir
culating fluidized-bed mode is to be tested - a logical further step of
development since the HTW gasifier has already been operating success
fully using dust recirculation to the fluidized bed.
\

1 /o
As the fluidized-bed pilot plant an existing and currently mothballed
pilot plant and its infrastructural installations can be used, the
necessary refitting of which is scheduled to be completed by mid-1989.
During the last weeks the first orders for the new plant were placed.
The refitted pilot plant will have a throughput of 6.5 t of dry lignite
per hour. The design allows for gasification both with 02/steam and
air/steam. In addition to gasifier testing, it is planned to investi
gate also the problems of a hot gas clean-up system.
6 THE HTW DEMONSTRATION PLANT
On the basis of the HTW pilot plant experience, Rheinbraun has built a
HTW demonstration plant for converting dry brown coal into synthesis
gas. The engineering was performed by Uhde GmbH, Dortmund. This demon
stration plant is located on the site of the Rheinbraun coal upgrading
facilities in Berrenrath near Cologne and includes one HTW gasifier and
all downstream units for further gas treatment required to produce
syngas.
The demonstration plant represents the last step of the HTW process
development towards the construction of a commercial-scale synthesis
gas unit. It is required to demonstrate the complete process line from
the coal to the final product and offers a new and reliable technology
for future applications.
The synthesis gas from this plant is piped to the Union Kraftstoff
plant in Wesseling where it is used in the existing methanol synthesis
gas system in order to replace the synthesis gas still produced from
residual oil.
With regard to the coal preparation, process steam/power plant and
off-sites for waste water disposal, the demonstration plant is inte
grated into the existing infrastructure of the Berrenrath complex of
Rheinbraun (Figures 7 and 8).

176 -
The flow sheet shows that a particularly favourable gas treatment train
was chosen for the process line in order to reduce energy losses: a hot
water scrubbing system has been installed directly behind the raw gas
cooler and has two simultaneous functions, i.e. solids removal and gas
saturation with steam. These process steps could be linked because the
catalyst used in the CO-shift conversion is sulphur-resistant and
operates at relatively low steam-to-gas ratios and low pressures.
Said water scrubbing system has three stages: After passing the hot
water quench, the gas is further purified by removing finest dust
particles in a Venturi scrubber and a water scrubbing tower. The gas
enters the shift conversion at a temperature of about 220 °C and is
adjusted to a C0/H2 ratio of 1:2.4 required for the methanol synthesis.
When the gas has cooled, it is compressed from about 8 to 37 bar and
then piped to a one-step non-selective H2S/C02 scrubber. In this so-
called Recti sol unit, the sulphur compounds are almost completely re
moved at temperatures below 0 °C using methanol as a solvent. The C02
content is simultaneously reduced to 3 % in order to meet the methanol
synthesis requirements.
The acid gas separated in the H2/C02 scrubber is fed to the sulphur
recovery unit. Due to the low sulphur content in the coal, the total
sulphur content in the acid gas is as low as approximately 1 %. The
installed Stretford plant is capable of regenerating such low sulphur
contents at conversion rates of > 99 % without an upstream concentra
tion step. Thus the sulphur emissions are extremely low. The H2S is
converted into salable elementary sulphur. A part stream of the puri
fied C02 is compressed and used for pressurizing the coal, ash and dust
lock-hopper systems.
The coal consumption of the HTW demonstration plant amounts to approx.
30 t/h. This corresponds to about 37 000 m3/h methanol synthesis gas to
specification. The erection of the plant was completed in autumn 1985.
From March 1986 to the end of October 1987, the HTW demonstration plant
was run for about 6 100 hours in seven periods of operation. About
t r

- 177 -
Waste heat boilerGasifier, lock hopper
Coalhopper Dust
refflovalsystems W< ter
si rubbe
Shiftconversi
Ash lock hopper
Synthesis gas
Sulphur
Sulphur recovery
COg/HgS scrubbingWaste water
Ash, dust
1
III
Figure 7. HTW pilot plant - synthesis gas yield and synthesis gas output as a function of coal input.
t r—C- —U.. - -J
Figure 8. Demonstration plant Berrenrath.
4834

178 -
130 000 t of dry brown coal were converted. Since the beginning of June
1986, nearly 138 million m3 synthesis gas have been produced.
Table 4 compares the most important test results with the design. The
C-conversion design data of 91 % have been exceeded. Further positive
results are: the oxygen consumption is lower and the specific synthesis
gas yield is higher than the expected figures. This is due to the im
proved heat balance of the demonstration plant compared with the pilot
plant and to the extended post gasification zone. The lower oxygen
consumption is also substantiated by the design/as-measured comparison
of the raw gas analysis. Owing to the low C02 formation, the product
gas content (CO + H2) in the raw gas is as high as about 75 % by vol.
while 70 % was expected.
The a.m. operating data show that the gasifier reaches or even exceeds
the design figures. Nevertheless, the experience from said plant in the
field of process engineering such as nozzle charging of gasifying
agents, will lead to improved operating conditions. Technical improve
ments are still required, particularly in the field of solids hand
ling.
Table 4. Results of the Demoplant.
r t
DESIGN ACTUAL
Synthesis gas CO+Hj m3/h 35 500 35 500
Coal (dry) t/h 30.5 28.0
Raw gas composition VoIX
h2 31.3 36.0
CO 39.2 39.6
COj 25.7 20.1
ch4 2.7 3.6
h2s 0.16 0.05
Carbon conversion X 91 96
Oxygen consumption m3/t coal maf 430 400

- 179 -
The plant units in which the raw gas is converted into synthesis gas
suitable for the methanol synthesis loop have been working more or less
troublefree after solving the usual start-up problems.
The design values for the gas throughput of the sulphur recovery unit
(Stretford process) have not yet been reached. In order to optimize the
Stretford plant operation, a test programme has been prepared and part
ly been carried out. In close co-operation with engineering firms, we
have elaborated adequate means to improve the performance and said
measures will be implemented on a step-to-step basis.
7 APPLICATION OF THE RHEINBRAUN HTW PROCESS
As has already been mentioned in the previous chapter, the commis
sioning of the Berrenrath demonstration plant is a significant stage in
the development of the Rheinbraun HTW process. The operational results
of the Wachtberg pilot plant were confirmed to a large extent. Various
interesting process applications will be available.
7.1 Synthesis gas
The primary aim of the process development scheme was to generate syn
thesis gas for the production of methanol, ammonia, etc. The gas gene
rated in the Berrenrath demonstration plant is used as feedstock for a
methanol synthesis plant.
It is also possible to use a synthesis gas unit for the production of
lignite-based ammonia. Figure 9 shows the configuration of such an
ammonia plant with a capacity of 1 350 t/d. In this case, the lignite
is first ground, dried to a moisture content of 12 % and then fed to
two parallel gasifiers. A third gasifier is required as standby unit.
Saturated steam of 120 bar is generated in the raw gas cooler. In a
water scrubber, the dust is removed and the gas is simultaenously satu
rated with water. The major part of the carbon monoxide contained in
the gas is converted into hydrogen in a two-stage CO-shift conversion
]
I .C .]
T f
Wl
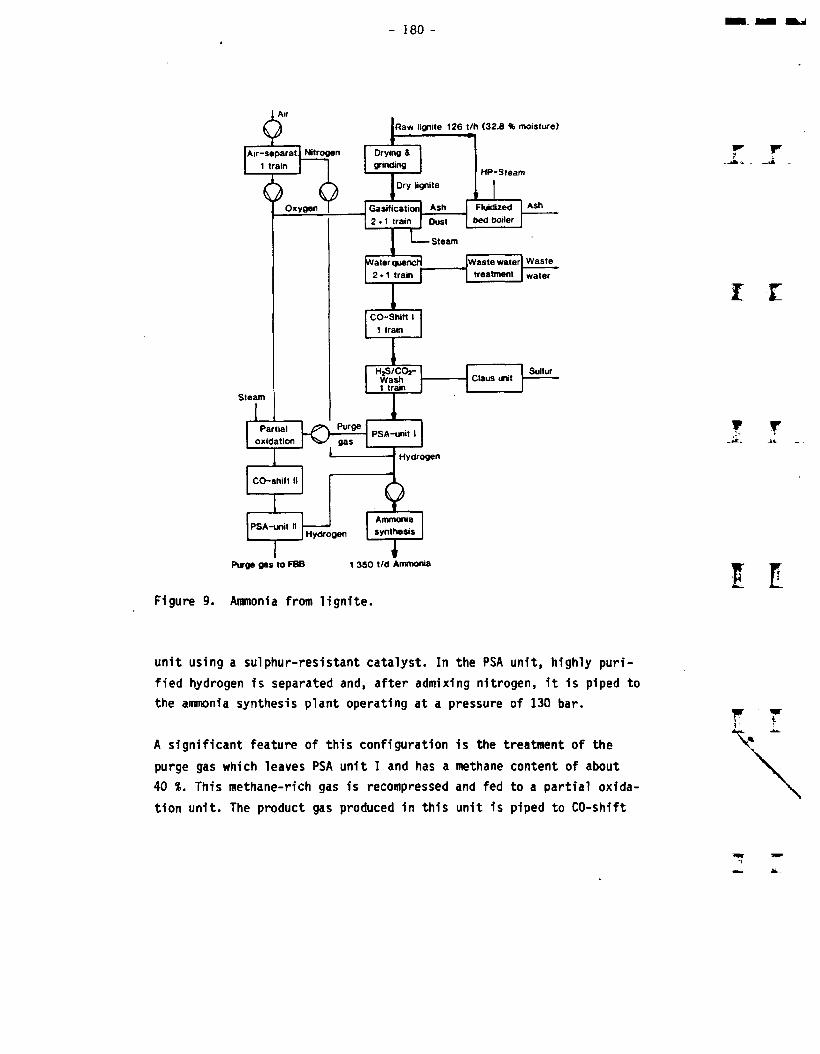
180 -
Raw lignite 126 t/h (32.8 % moisture)
NitrogenHP-Steam
Dry lignite
SteamWastewater
Sulfur
Steam
Purge
Hydrogen
Hydrogen
Partialoxidation PSA-unit I
2*1 train
HjS/COj- Wash 1 train
PSA-unit II
Fluidized bed boiler
Waste water treatment
CO-Shift I1 train
CO-shilt II
Claus unit
Air-separat. 1 train
Gasification 2 * 1 train
Drying & grinding
Ammoniasynthesis
Purge gas to FBB 1 350 t/d Ammonia
Figure 9. Ammonia from lignite.
I I
T f
unit using a sulphur-resistant catalyst. In the PSA unit, highly puri
fied hydrogen is separated and, after admixing nitrogen, it is piped to
the ammonia synthesis plant operating at a pressure of 130 bar.T 7
A significant feature of this configuration is the treatment of the
purge gas which leaves PSA unit I and has a methane content of about
40 *. This methane-rich gas is recompressed and fed to a partial oxida
tion unit. The product gas produced in this unit is piped to CO-shift

181
conversion unit II and PSA unit II. This permits a considerable in
crease in the hydrogen recovery rate. Another significant feature is
that the carbon-laden ash is fed to the fluidized-bed combustion
section where it is incinerated with additional lignite in order to
produce high-pressure steam required for driving the large compressors.
The additional electric energy is rather low (approx. 5.7 MWh/h) and is
only required for small plant consumers.
Tests with Finnish peat had also been performed in the Wachtberg pilot
plant. Since the test results were good, Uhde was awarded a contract in
early 1986 by Kemira Oy for the design and construction of a gasifica
tion plant using Finnish peat as feedstock. The technical data of this
plant are indicated below:
Feedstock rate: 30 t/h peat (dry)
Gasification pressure: 13.5 bar max.
Gasification temperature: 900 °C
Synthesis gas yield: 1.110 kmol C0+H2/h.
This synthesis gas yield permits a production of 240 t/d ammonia.
The peat is first moulded in extruders to form large pellets. The dried
pellets are ground in order to obtain the grain size distribution re
quired for the gasification process. The synthesis gas produced in this
unit is treated in the existing downstream synthesis gas scrubbing
section (Ami sol. Recti sol, liquid nitrogen scrubber) and fed to the
ammonia synthesis unit. The gasifier dimensions are similar to those of
the gasifier in the Berrenrath demonstration plant.
When considering the Berrenrath demonstration plant as reference unit,
it was necessary to determine the scale-up factor for the envisaged
ammonia synthesis unit with a capacity of 1 400 t/d (which is the
standard size at present) or a methanol plant with a capacity of 2 500
t/d. Commercial facilities using natural gas are already in operation.
Uhde has also designed and constructed such plants. Several gasifiers
are required for this plant size, i.e. three gasifiers for a 2 500 tpd
rw \_ . i
I l
- 182 -
methanol plant. Compared with the Berrenrath gasifier capacity, each of
said gasifiers has double the throughput which can be obtained without
major dimensional modifications to the Berrenrath gasifier. The gasifi
cation pressure is increased and permits a higher specific gasifier
throughput. In view of the sophisticated technology of the coal gasifi
cation unit (compared with natural-gas steam reforming), provision
should be made for a reserve capacity to improve the on-stream factor,
for Instance by means of a stand-by gasifier.
7.2 Combined-cycle power plants
The classical configuration of the power plants using fossil fuels is
based on the combustion technology. The combustion heat is utilized for
the generation of steam driving a steam turbine coupled to the gene
rator. For thermodynamic reasons, the efficiency of such a plant is not
very high. When fuel gas is burned and the flue gas is fed to a gas
turbine directly coupled to the generator, the energy conversion takes
place at a higher temperature and will improve the thermodynamic condi
tions provided the waste heat of the gas leaving the turbine is re
covered. The combination of gas turbine and steam turbine is called
combined-cycle power plant. Natural gas-fired combined-cycle power
plants are being successfully operated in many parts of the world.
When coal is used as feedstock, it has first to be gasified. The over
all efficiency of such an integrated gasification combined-cycle power
plant (IGCC plant) is considerably higher than that of a conventional
solid-fuel power plant, i.e. in excess of 40 %. The efficiency largely
depends
- on the selected type of gas turbine and the inlet temperature,
- the selected type of coal gasification,
- the waste heat recovery system,
- the mode of gas purification.
Uhde and Rheinbraun, in cooperation with Kraftwerk Union, have deve
loped a concept for a 600 MW combined-cycle power plant on the basis of
the HTW process.
i :i
II
V rL 1
\
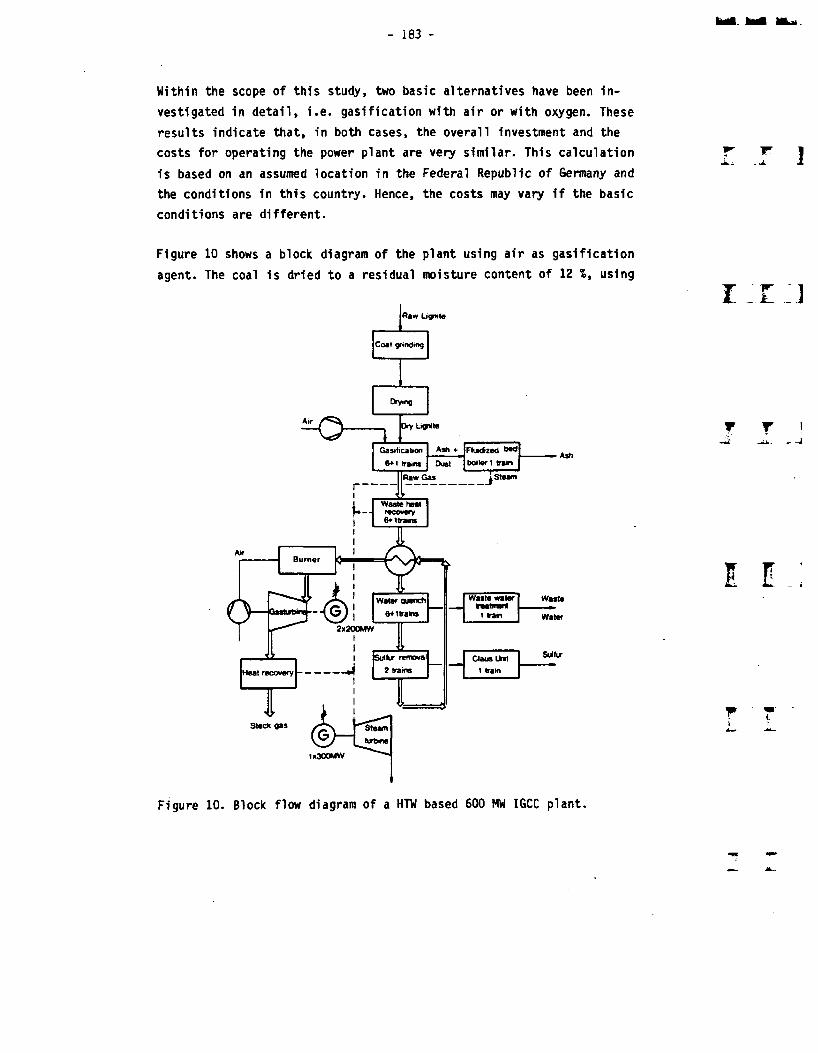
- 183 -
Within the scope of this stu<iyf two basic alternatives have been in
vestigated in detail, i.e. gasification with air or with oxygen. These
results indicate that, in both cases, the overall investment and the
costs for operating the power plant are very similar. This calculation
is based on an assumed location in the Federal Republic of Germany and
the conditions in this country. Hence, the costs may vary if the basic
conditions are different.
Figure 10 shows a block diagram of the plant using air as gasification
agent. The coal is dried to a residual moisture content of 12 %, using
1
i _t :j
T T 1
F
Figure 10. Block flow diagram of a HTW based 600 MW IGCC plant.

- 184 -
back-pressure steam. The dried coal is fed to the gasifier. The gasifi
cation process takes place in six parallel gasification lines, while an
additional gasifier is required as stand-by unit. In case of an oxygen
blown gasifier four parallel lines would be needed.
The hot raw gas is first fed to a cyclone in which the coarser dust
particles are removed. Then it is cooled in a waste heat boiler, high-
pressure steam being generated simultaneously. In a down-stream heat
exchanger, the raw gas is cooled further with the aid of the purified
gas. The remaining fine dust particles are removed in a wet scrubber.
After passing a further cooling step, the gas is fed to a gas scrubber
in which hydrogen sulphide is separated, thus obtaining a low sulphur
content without difficulty. The acid gas is treated in a Claus plant
which comprises downstream tail gas treatment facilities and a final
incinerator.
The purified gas is reheated in a heat exchanger with the raw gas and
then fed to the combustion chamber of the gas turbine, i.e. two 200 MW
gas turbines with an ISO inlet temperature of 1 200 °C will be instal
led. The thermal potential of the turbine exhaust gas is utilized in
waste heat boilers generating high-pressure and low-pressure steam. The
high-pressure steam from the raw-gas waste-heat boilers is superheated
in these boilers. Additional high-pressure steam is generated in
boilers with a circulating fluidized-bed combustion system using the
residual char from HTW gasification. The steam turbine capacity amounts
to 300 MW. Thus, the overall power output of the HTW combined-cycle
power plant is 700 MW, the net value being 630 MW.
The maximum overall efficiency (LHV-basis) of this plant configuration
is 46 *. If the gas turbine temperature decreases to 1 000 OC, the
efficiency drops to about 42 %. Compared with a conventional power
plant, the fuel saved at an efficiency rate of 46 % amounts to 35 %
(see Figure 11).
The combined-cycle power plant with integrated coal gasification, the
concept of which is illustrated here, uses proven process technologies
T f

185 -
Ligniteconsumption
GT.LT.(ISO)
1 120°C 1220°C
GT.LT.(ISO)
I UQ't 1 220°C100X
Conventional IGCC oxygen IGCC airpower plant gasification gasification
(LHV) 3SX 43.S 45.6 44.4 46.7
(HHV) 30 X 36.8 38.6 37.6 39.6
Basis: 600 MW HTW gasification Integrated combined cycle system Location: FRG Feedstock: Rhenish lignite
Figure 11. Comparison of power generation efficiencies.
for the gas treatment and gas/steam turbine processes. The technology
of hot-gas desulphurization and hot-dust removal from the hot gas may
become an alternative in the field of gas treatment when these process
steps have been developed further and proved to be reliable. A hot gas
clean-up would further improve the overall efficiency.
In 1986, Uhde signed a contract for an engineering study of a 2 x 300
MW combined-cycle power plant in South Australia using the HTW process
and South Australian brown coal. Preliminary tests have been performed
in the Aachen test facilities with South Australian brown coal, which
has a high salt and sulphur content, and they have shown that this type

- 186 -
of coal is suitable for the HTW process. Further larger-scale tests
have been performed in the HTW pilot plant in Wachtberg. The test
results indicate that it is possible to gasify also problematic coals
without serious problems. At present, a feasibility study is being
elaborated on the basis of the above experience.
Figure 12 shows a model of the envisaged combind-cycle power plant in
South Australia.
Figure 12. Combined cycle power station. South Australia (artist view).
8 ENVIRONMENTAL ASPECTS
Over the years, we have become ever more aware of the fact that some
thing has to be done to effectively reduce the pollution of the atmo
sphere. Emission from power stations is of primary interest in this
case. There are stringent requirements in the USA, Japan and the in
dustrial countries of Western Europe (especially in the Federal Re
public of Germany) to limit the emissions of sulphur dioxide, nitrogen
oxides, and dust. For a conventional power station this means that a

187 -
desulphurization unit and a DeNox unit have to be added and highly
efficient dust filters have to be installed. The investment costs of
these facilities nowadays constitute 25 % of the total investment costs
for a power station.
In the case of a combined-cycle power station, gaseous waste and
effluents, e.g. the waste water from the gasification plant, must be
taken into consideration. In addition, there is solid waste in the form
of ash and dust.
8.1 Gaseous waste
In a combined-cycle power station, gas purification constitutes an
essential part of gas treatment and is relatively simple. For compa
rison, here are some figures which make this clear.
In a conventional 600 MW lignite-fired power station, the amount of
flue gas obtained is 2.4 million, mn3 per hour, whereas in a combined-
cycle power station, as outlined before, the amount of raw gas to be
purified is approx. 360 000 mn3 per hour, this being less than 20 % of
the flue gas. This does not take into consideration the fact that, in
the combined-cycle power station, the gas to be treated is under pres
sure. If the comparison is related to the volume, the ratio is 100:1.
It should be mentioned that the sulphur compounds contained in the gas
are not present in the form of S02 but in the form of hydrogen sul
phide, which is much easier to remove from the gas and which can be
converted directly to elemental sulphur in a Claus unit. The sulphur
dioxide obtained in the flue gas treatment processes presently being
used in conventional power stations is converted to gypsum (calcium
sulphate). However, it is obvious that this will no longer be possible
in the near future due to disposal problems, considering the amounts of
gypsum obtained.
The formation of nitrogen oxides in the flue gas of a power station can
be traced to two sources. Firstly, nitrogen oxides are formed during
the combustion of nitrogen-bearing compounds contained in the coal and,
IT)
I .1
\
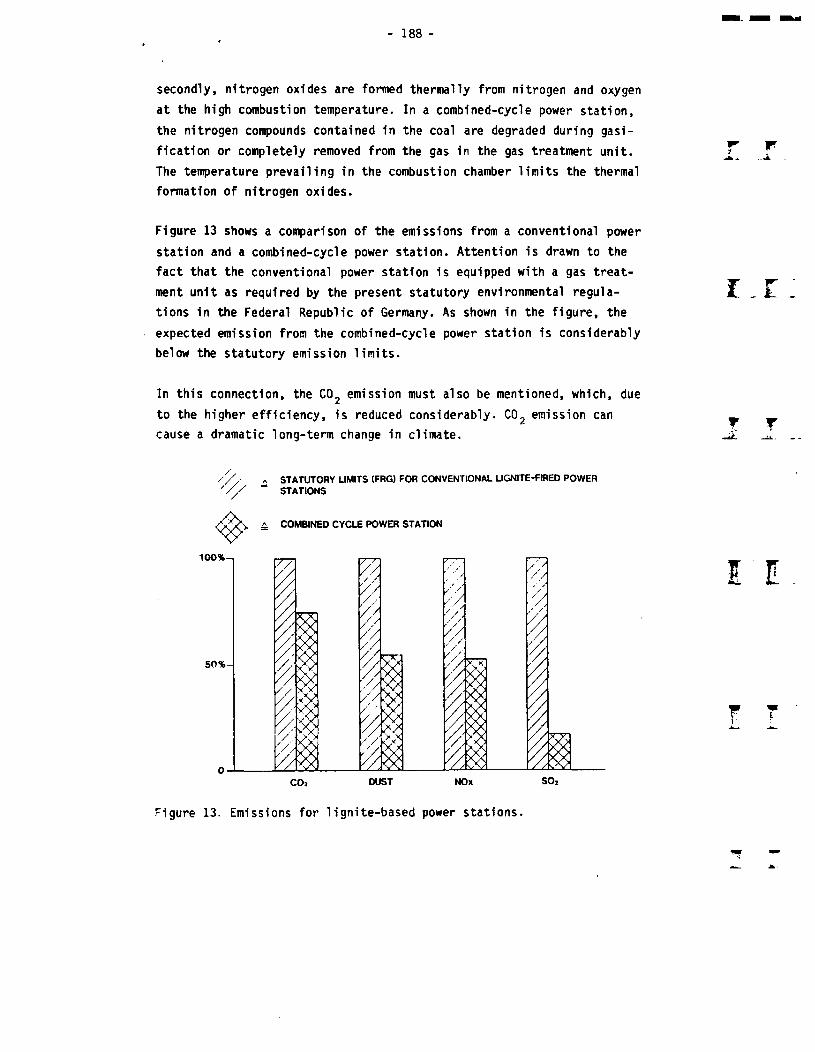
188 -
secondly, nitrogen oxides are formed thermally from nitrogen and oxygen
at the high combustion temperature. In a combined-cycle power station,
the nitrogen compounds contained in the coal are degraded during gasi
fication or completely removed from the gas in the gas treatment unit.
The temperature prevailing in the combustion chamber limits the thermal
formation of nitrogen oxides.
Figure 13 shows a comparison of the emissions from a conventional power
station and a combined-cycle power station. Attention is drawn to the
fact that the conventional power station is equipped with a gas treat
ment unit as required by the present statutory environmental regula
tions in the Federal Republic of Germany. As shown in the figure, the
expected emission from the combined-cycle power station is considerably
below the statutory emission limits.
In this connection, the C02 emission must also be mentioned, which, due
to the higher efficiency, is reduced considerably. C02 emission can
cause a dramatic long-term change in climate.
'V'V A STATUTORY LIMITS (FRG) FOR CONVENTIONAL LIGNITE-FIRED POWER “ STATIONS
A COMBINED CYCLE POWER STATION
1i~'“
Figure 13. Emissions for lignite-based power stations.

8.2 Effluents
Waste water is obtained in the coal gasification process. Figure 14
shows the basic configuration of a wet purification unit as used in the
Berrenrath plant mentioned earlier. The treatment consists of three
steps, i.e. quench, Venturi scrubber and scrubbing column. This con
figuration permits effective removal of the dust from the gas. The
water stream containing solids is fed to the downstream separator
(filter or settling tank). The treated water from the separator can be
returned to the cycle. Depending on the water-soluble constitutents of
the coal, a certain amount of waste water must, however, be withdrawn
from the cycle in order to prevent salt enrichment in the cycle, as this might cause extensive corrosion. The quantity to be withdrawn is
thus primarily determined by the salt content of the coal. It goes
without saying that the waste water stream also contains gases which
are dissolved in the water, in particular C02, H2S and NH3, but also
water-soluble organic constituents whose point of condensation is below
the temperature of the water cycle. The dissoTved gases are removed 'n
Scrubber Clean gas
QuenchFresh waterVenturi
Raw gasSeparator
Sludge
Dissolved gas
Stripper
Waste waterRecycle
Figure 14. Dust removal and water scrubbing system.

190 -
a down-stream stripper and fed to the sour gas treatment unit. A sepa
rate treatment step may be required in order to recover the valuable
substances, such as ammonia, in concentrated form from the waste water.
The water stream leaving the stripper is of significance with a view to
environmental pollution. It contains traces of inorganic and organic
substances. The salt content is determined to a large extent by the
composition of the mineral constitutents of the coal. The content of
organic substances depends on the gasification process used. In the HTW
process as well, where the gasification temperature is relatively low
(900 - 1 000 °C), a considerable decrease in hydrocarbons is achieved
by the special two-step process in the gasifier. The content of aroma
tic hydrocarbons is in the ppm range only. The waste water can thus be
discharged directly into the general waste water system without any
further treatment or conveyed to a biological waste water plant, de
pending on the applicable local regulations.
In this connection, it must be mentioned that the cooling water re
quirement of a combined-cycle power station is considerably lower than
that of a conventional power station. This is not only a consequence of
the higher efficiency, which indicates that less heat is dissipated to
the environment, i.e. to the atmosphere and to the cooling water. The
saying in cooling water is also due to the fact that only part of the
total power output is made up by the steam turbines, which again re
sults in a decrease of the cooling water consumption. Referred to the
entire plant, about 50 * less cooling water is required.
8.3 Solid waste
The solids leaving the power station consist of ash and dust. In the
HTW process, which operates at temperatures below the ash melting
point, there is a risk that, particularly in the case of highly basic
ash, part of the sulphur contained in the coal is combined in the form
of sulphide as a result of the reducing conditions in the gasifier.
There is, of course, the risk that these sulphides may be released
whenever there is any contact with water. The concept therefore
I I
W f
\
191
provides for final combustion of the ash and dust. Apart from the addi
tional energy that is generated, sulphide compounds are converted into
sulphates in the combustion process in the presence of an excess of
oxygen. The ash obtained after combustion can then be dumped under the
same conditions as the ash from a corresponding lignite-fired power
station.
In sumnfery, it can be said that environmental pollution is drastically
reduced by a combined-cycle power station as compared with all other
types of fossil-fuel-fired power station.
9 COMBINED-CYCLE POWER STATION WITH CO-PRODUCTION
The main distadvantage of electric power generation is the fact that
electricity cannot be stored. Compared with a chemical plant, the load
factor of a power station is relatively low. This particularly applies
to power stations which operate in the medium-load range. In this case,
there are interesting possibilities for varying the concept of a comb
ined-cycle power station.
These variants are based on the assumption that the gasification
section including the gas treatment unit continues to operate at maxi
mum load and that the generated gas is used for the production of, for
instance, ammonia or methanol. However, it then becomes necessary to
provide a further gas treatment stage in order to adapt the generated
raw gas to the conditions prevailing in the synthesis unit. Moreover,
it is necessary to design the gasification section for a certain excess
capacity in order to permit continuous operation of the chemical plant
even during maximum load operation of the power station, thus reducing
the problem of capacity adaptation.
Conversion to methanol is of special interest since it can easily be
stored and burnt as additional fuel in the turbine if required for
peak-load operation. In this special case, no specific demands are made
on the methanol produced and the synthesis unit can be kept relatively
simple. Distillation of the methanol is not necessary.
i i :i
r r
192 -
10 ECONOMY
A number of investigations performed by us have shown that the invest
ment costs for a combined-cycle power station are identical with those
for a conventional power station. In view of the higher efficiency, of a
combined-cycle power station, it is to be expected that the operating
costs will be appreciatively lower. This, of course, depends on the.
energy production costs, i.e. the price per kWh will therefore be
lower. An exact calculation will only be possible when comparing alter
natives for the same location.
11 SUMMARY AND PERSPECTIVES
By the development of the Rheinbraun HTW process in three steps
- PDU-plant at Aachen,
- pilot plant in Wachtberg,
- demonstration plant at Brrenrath,
a large field of investigation was covered:
- comprehensive investigation of process principles was performed,
- a number of different feedstocks was tested,
- the influence of various process parameters on the gasifier per
formance was investigated over several years,
- commercial experience from the operation of the Berrenrath plant
was gained.
The results obtained will give a reliable and proven basis for design
of large plants. The process can be used for different applications:
The prod'iction of synthesis gas to be used
- in the chemical industry or
- for the production of fuel gas for a combined cycle power
station.
The concept of such power station with integrated coal gasification
does show not only a high efficiency but also drastical reduced emis
sions.
Wp are sure that this concept will be the basis for plants to be built
in the future.
\
- 193 -
THE PRESSURIZED BED PEAT GASIFICATION PLANT OF KEMIRA OY IN OULU
Kalevi Kuorelahti, Manager of Energy Unit Kemira Oy Oulu Works Box 171SF-90101 Oulu, Finland
Abstract
Kemira, the largest chemical enterprise in Finland, is building a pressurized bed peat gasification for producing synthesis gas. The gas will be used for ammonia and other chemicals. The ammonia production will be 80,000 tons/year. The investment costs amount to 225 million FIM. The production is to be started in spring 1988.
1 HOW TO GASIFY PEAT
For the time being Kemira operates in Oulu a minor ammonia plant based on the gasification of heavy fuel oil. The ammonia production in Oulu was started in 1952 on the basis of coal gasification. In order to establish an ammonia production resting on domestic raw material a research program aiming at the gasification of peat was started in the middle of the 1970's. Peat is the only realistic domestic raw material for synthesis gas in Finland.
1.1 Gasification Process
In chemical and physical properties peat resembles lignite. That's why the experimental work was started at a research institute for lignite gasification in Aachen. However, the treatment of peat proved to be quite problematic.
The volume weight of peat is very small ranging from 0.2 kg/m^ to 0.45 kg/m^. The moisture content is to 40 - 60 % and the type, composition
and ash content of peat vary very much. Moreover, the Finnish peat contains fibres, wood and stones. Due to these factors peat is difficult to treat with the feeding equipment of a gasifier.

194 -
In order to study the feasibility of peat for gasification and to build a suitable gasifier for this purpose, tests with crushed peat pellets were made with the German HTW-gasifier in Berrenrath near Cologne as well as with the Swedish Mino-process in Sweden. The American IGT-process was tested using dried and crushed sod peat. On the basis of these test runs the HTW fluidized bed gasifier was chosen.
1.2 Peat pretreatment studies
Because either milled peat or sod peat dried by sun and drawn from the peat production were not without some processing suitable to be fed into the gasifier, the study of alternative pretreatment processes was started in cooperation with The Finnish Technical Research Institute.
The drying, pelletizing and crushing of milled peat resulted in good crumbs as to physical properties, but the treatment had an injurious effect on the reactivity. Moreover, the pelletizing process is not very easy to perform on a large scale.
The crushing and drying of sod peat proved to be a more interesting alternative. The reactivity of the crumbs is clearly better, even if the physical properties do not match crushed pellets. The moisture content of sod peat is 30 - 40 %, that of milled peat instead 45 - 55 %. This is an important advantage in view of the drying.
That's why the study was concentrated on the crushing technology and drying equipment as well as on the research of sod peat properties in order to master these pretreatment processes as well as possible from the very beginning.
i r
T r
2 PEAT GASIFICATION PLANT
The gasification plant being under construction includes as intergrated individual processes: peat transfer, screening, crushing, drying, pressurized HTW fluidized bed gasification, soot removal, raw gas compression and three-stage gas purification. The existing Pyroflow boiler plant serves for energy supply and waste incinerator for the gasification.

195 -
2.1 Conveyors and screening equipment
Sod peat is transported to the plant by lorries. The loads are dipped into unloading pockets, from which peat is passed by belt conveyors to the screening. A two-deck disc screen separates the oversized wood material as well as the fine peat powder, which are led into the power plant to be burnt. The screened sod peat is carried into the 2,000 m^
storage silo of the gasifier.
2.2 Crushing
From the storage silo sod peat is fed at a rate of 42 t/h to the crushing. Crushing takes place in a three-screw biomass crusher with a bottom screen. The granulometric composition of the material coming from the crushing is 0.5 - 10 mm. After that the crushed product having a moisture content of 30 - 40 % is passed into the feeding silo of the drier.
2.3 Drying
Peat must be dried to a moisture content of 15 %. This is made by a counter-pressure steam drier designed by Modo Chemetics. Crushed peat is fed by means of a lock hopper and a screw into the drier, where superheated steam is flowing at a pressure of 4 bar. Steam with peat flows through a set of heat exchangers. Additional steam at a pressure of 11 bar is introduced into the heat exchangers. This evaporates further the water in peat and superheats the steam. The dried peat is then separated by a cyclone and passed into the two feeding silos of the gasifier. From the cyclone part of steam is recycled to the inlet of the drier, the rest to the heat exchangers to be condensed by condensing waters of the plant. The resulting steam of 2,5 bar can be used in the steam system, which makes the plant thermal economy quite profitable. Uncondensed smell gases resulting from drying are burnt at the power plapt.
2.4 Gasification
Dried peat is fed through two lock hopper feeding lines and screw feeders into the fluidized bed reactor having a pressure of 10 bar. Oxygen and 35 bar water vapour serving as reaction and fluidization gas are introduced into the reactor through nozzle systems.
\

- 196 -
The result is a gas mixture containing 70 - 90 % of utility gas (H2 + CO) and various contaminants, e.g. CO2, CH4, H2S, NH3, HCN, CgHg, H2
etc. Ash is removed from the bottom of the reactor and with two dust cyclones from the gas flow. Raw gas is cooled with gas coolers generating steam of 2.5 and 35 bar. The carbon residual in gasifier ash is burnt in the dust recycle reactor of the power plant.
2.5 Soot removal
Soot is removed from raw gas by a scrubber. Precipitate is separated by a centrifuge, the ammonia dissolved in water distilled and passed into the power plant to be burnt in the dust recycle reactor.
2.6 Compression and conversion
The raw gas is pressurized to 35 bar by means of a compressor and passed to the CO-conversion, where CO reacts with water vapour to carbon dioxide (CO2) and hydrogen (H2).
2.7 Amisol wash
The amisol wash removes carbon dioxide (CO2) and hydrogen sulphide (H2S). The hydrogen sulphide gas is led into the dust recycle reactor to be burnt. Part of the produced sulphur dioxide (SO2) is absorbed in lime and the resulting gypsum mixed up with ash. Moreover, the amisol wash produces benzene, which is burnt as well.
2.8 Methanol and nitrogen washes
Methane (CH4) and carbon monoxide (CO) are removed by methanol and nitrogen washes. The result is pure hydrogen gas (H2) for the synthesis. The discharge gas is used as fuel gas at the power plant.
2.9 Power plant
The power plant has a 55 MW steam boiler fired by the dust recycle reactor and a 55 MW gas boiler, which generate steam and counter pressure electricity for the needs of the plant.
The emissions of gasification, e.g. ash, ammonia, hydrogen sulphide, hydro cyanic acid, benzene, naphthalene and smell gases, which may be iangerous to the environment, are burnt in the dust recycle reactor.
_x _ .
I I
rJtL

- 197 -
The resulting sulphur dioxide is partly absorbed in lime and mixed up with ash. The discharge gas containing methane and carbon monoxide is burnt in the gas boiler.
Moreover, the water for the district heating is used for cooling in the gasification unit, which improves the thermal efficiency of the plant.
3 SUMMARY
The gasification plant being under construction will give us interesting operation experiences about most components of a complexed cycle power station, i.e.:
- Treatment of fuel- Drying of biomass- Pressurized oxygen operated fluidized bed gasification- Cold gas purification- Steam boiler fired by a dust recycle reactor- Steam turbine process- Burning of remaining coke of gasification- S0X, and C0X removal as well as burning of smell gases
In fact, the only missing individual process is the gas turbine process.
w ]
IT]
T f 1
I l

i x;
T 's.
IE
w\

- iys -
TECHNO-ECONOMIC EVALUATION OF DIFFERENT GASIFICATION COMBINED CYCLE PROCESSES
YrJB Solantausta, M.Sc., Senior Research Scientist Technical Research Centre o-f Finland 02150 Espoo, Finland
Abstract
The economic and technical potential o-f Integrated Gasi-fication Combined Cycle (IGCC) with peat was studied in order to
— compare presently available IGCC to conventional power production, and
- to assess the -future potential of a developed IGCC.
The features typical of peat-based IGCC were assessed. The effects of the most significant process variables on the overall efficiency were studied. Three process concepts were compiled and their material and energy balances were calculated.
Investment and operating costs were estimated, and power production costs for condensing power at 150 MW were compared. The production price of electricity with the present IGCC is competitive with that of conventional power plants. However, its efficiency is higher, 43 X compared to 37 7. (LHV-based). The emissions'from the IGCC are only a fraction of those from a pulverized fuel boiler. The future IGCC concept proved to be very promising. The efficiency would be as high as 50 X and the production cost of electricity close to FIM 150/kWh, compared to FIM IBO/kWh for the conventional technology.

- 200 -
1 INTRODUCTION
The steady increase in the electricity consumption of Finland necessitates decisions concerning the construction of several condensing power plants. At the same time more attention is paid to the environmental effects of the plants. Although one peat based condensing power plant is under construction in Haapavesi, it is generally accepted that without the energy tax reform peat could not compete with coal as a fuel for condensing power production /!/.
During this decade power production from coal with Integrated Gasification Combined Cycle (IGCC) has been maturing to become an increasingly promising technology for the future /2/, /3/. While synthesis gas production from peat has been developing towards a commercial reality /4/, a peat based IGCC is also becoming a technical alternative. A cooperation work to study pressurized power production processes experimentally was started in Finland during 1986, when IVO Oy, HTKK and VTT, together with the Ministry of Trade and Industry, initiated an experimental program.
I Z
w r4- i
However, no economic studies are available concerning the competitiveness of a peat-fired IGCC compared to the more conventional schemes. Power production cost estimates areneeded to compare the new technology to the old one, the W
L.technical and economic potential of peat IGCC has to be ^assessed, and finally experimental work has to be supportedby economic studies. This paper summarizes the results ofthe first part of a techno-economic study that is underwayat VTT. Power production from peat with condensing IGCC isiiscussed in this paper.
\
- 201 -
2 THE APPLICATION OF IBCC FOR PEAT
2.1 Bamis for tha assessment
After the process concepts were compiled and the status of technology was assessed, material and energy balances were calculated with a spreadsheet program. The effects of some process parameters were studied (chapter 2.3). The investment and operating costs were estimated based on the data given by major unit process licensors and companies utilizing the present technology. Minor details had to be estimated from published literature, especially /!/. The aim was to compile the power production cost so that they could be compared to the numbers of a previous study of Ekono Oy /!/. The accuracy of the investment for the case utilizing oxygen blown gasifier (present technology) is estimated to be within • 20 X. There is more uncertainty in the third concept employing future technology.
r r ;
T ]- -j
2.2 Process concepts
Three process concepts were compiled. The first one employs an oxygen blown HTW gasifier with cold gas clean-up (water quench with further physical gas scrubbing) and a gas turbine with a firing temperature of 1100 *C. This concept is referred as IGCC-present. The second case utilizes an air blown fluid-bed gasifier with water quench and chemical gas scrubbing (IGCC-air). The third concept is based on an air blown fluid-bed gasifier with in bed desulfurization and hot gas clean-up. The firing temperature was 1200 *C (IGCC-future). The block flow diagram of the first concept is presented in figure 1.

202 -
SEPARATION
PEATDRVMG
OXYGEN U [COMPRESSOR
GASnCATION
20 2)s 20 22 24WHO
QUENCH GAS SULFURCLEANMG RECOVERY SULPUR
30 MAIR
COMPRESSOROAS
TURBME
HRSG
~l----
FLUE
STEAMTURBME
i r .
Figure 1. The block flow diagram of the peat-fired IGCCW r
?.3 The effect of eome parameters on the efficiency of the IGCC
The most important single factor typical of peat delivered to the plant is the relatively high moisture content» usually about 50 X. The effect of the moisture content on the plant overall thermal efficiency is shown in figure 2 (IGCC-present).
Gasification pressure is one of the key process parameters. Figure 3 depicts the efficiency of the IGCC-present for gasification pressures ranging 1.0-3.5 MPa. A similar presentation can be used together with other factors (gas turbine characteristics, investment and operating costs etc.) to find the optimum gasification pressure. In the present case it should be around 2.0 MPa.

203 -
MOISTirnC CONTENT OF PEAT * O HHV BASED * LHV BASED
w I
r r i
Figure 2. The ef-fect of the moisture content on the plant overall thermal efficiency. r r i- -A
0.1?
0.17 -
0.16
0.14
PRESSURE OF GASIFICATION MPa
w
. The effect of the gasification pressure on the plant internal power consumption.
\
Figure 3
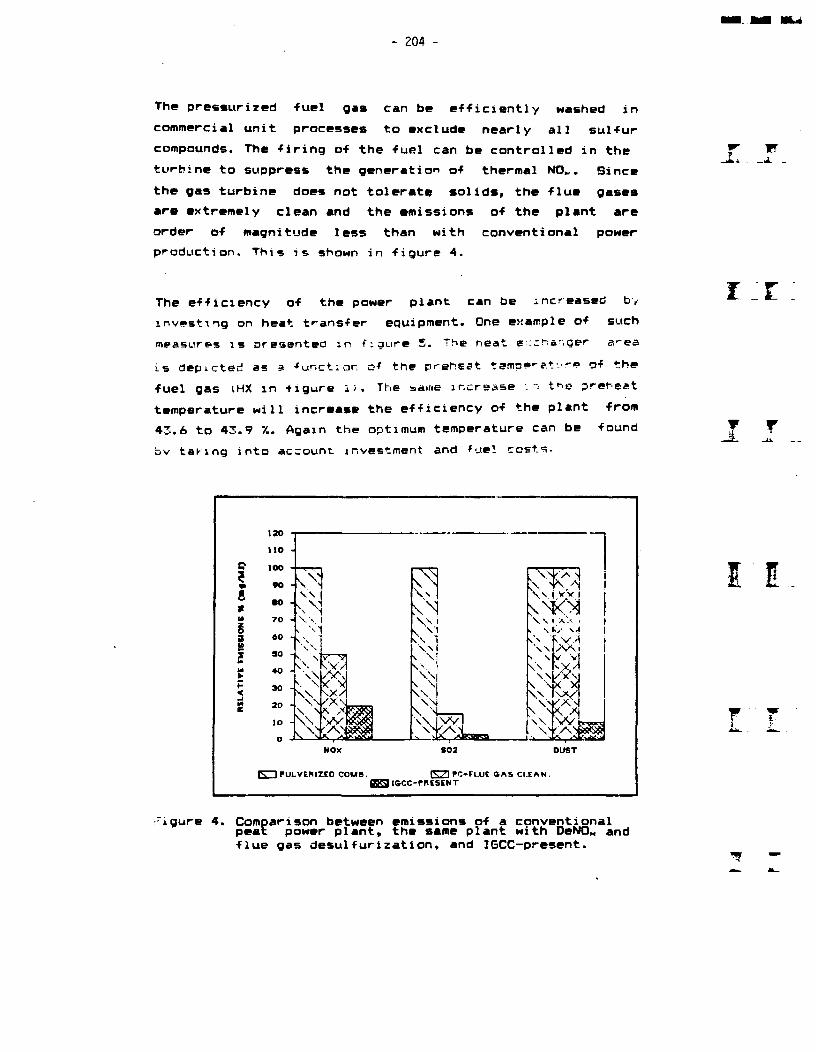
- 204 -
The pressurized fuel gas can be efficiently washed in commercial unit processes to exclude nearly all sulfur compounds. The firing of the fuel can be controlled in the turbine to suppress the generation of thermal NO„. Since the gas turbine does not tolerate solids, the flue gases are extremely clean and the emissions of the plant are order of magnitude less than with conventional power production. This is shown in figure 4.
The efficiency of the power plant can be increased by investing on heat transfer equipment. One example of such measures is presented in figure 5. The neat exchanger a^ea is depicted as a ■‘unction of the preheat temoe-'at’.re of the fuel gas (HX in figure i>. The same increase ." tne preheat temperature will increase the efficiency of the plant from 43.6 to 43.9 7.. Again the optimum temperature can be found bv taking into account, investment and fuel costs.
r f
r i
r rJL ^1.
p
*a V\ i Xlv •
1
\ \ \
-\\TwDUST
rr~l PULVERIZED COMB. ____ hTTI BC»Fi.UE ®AS Cl.EAN.BSlttCC-PBESENT
-'igure 4. Comparison between emissions of a conventionalpeat power plant, the same plant with DeNO„ and flue gas desulfurization, and IGCC-present.
II
VI

PREHEAT TFMFERATURE OF THE FUEL &AS OC HAS ♦ 6790 kmol/h (.NTP)
Figure 5. The e-f-fect o-f the -fuel gas preheater temperature on the heat exchanger area.
One o-f the key -features of the gas turbine technology under development is the allowed firing temperature. It is generally accepted that the firing temperature of 1100 *C should be available by the beginning of next decade. The effect of the temperature on the plant efficiency is shown in figure 6. For the future concept in this study the firing temperature of 1200 *C was selected.
3 MATERIAL AND ENERGY BALANCES OF THE CONCEPTS
A summary of balances of the concepts is presented in table1. The overall efficiency of power production with IGCC is estimated to range from 42 to 90 X based on lower heats of combustion. This can be compared to the efficiency of 37 X of a pulverized boiler plant.
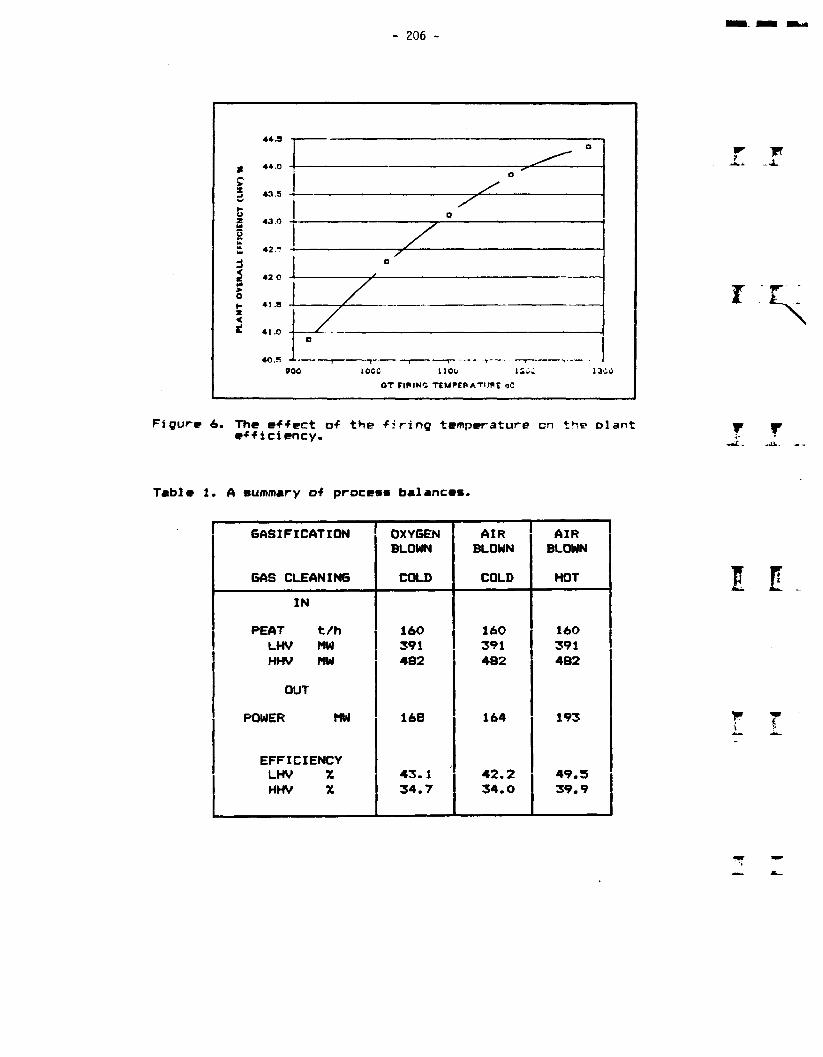
206 -
43.5
43.0
42 0
41 .9
41.0--------
110010GC
GT PIPING TfMPEBA*nip£ 0C
r
Figuf# h. The e-f-fect o-f the -firing temperature on the plant e-f-f iciency. r r
Table 1. A summary o-f process balances.
GASIFICATION OXYGEN AIR AIRBLOMN BLOMN BLOMN
GAS CLEANING COLD COLD HOTIN
PEAT t/h 160 160 160LHV MM 391 391 391HHV MM 462 482 482
OUT
P0MER MM 168 164 193
EFFICIENCYLHV X 43.1 42.2 49.5HHV X 34.7 34.0 39.9

207 -
vnergy flows of two of the concepts <IGCC-air and IGCC future) are compared in figure 7. The hot gas clean up (which is carried out at 650 *C) considerably increases the power produced by the gas turbine and thus the efficiency T"
_u.of the plant.
A summary of the energy flows of a plant consuming 160 t/h of 50 % moist peat is presented in table 2.
I
DRYING
100.0100.0
51.4
POWER
STEAMTURBINE
STEAMTURBINE
GASIFICATION
WASTE HEAT BOILER
GASTURBINE
DRYING
HRSG
GASCLEANING
GASIFICATION
WASTE HEAT BOILER
GASTURBINE
HRSG
T r
PRESENT FUTURE
Figure 7. Relative energy flows of process concepts.
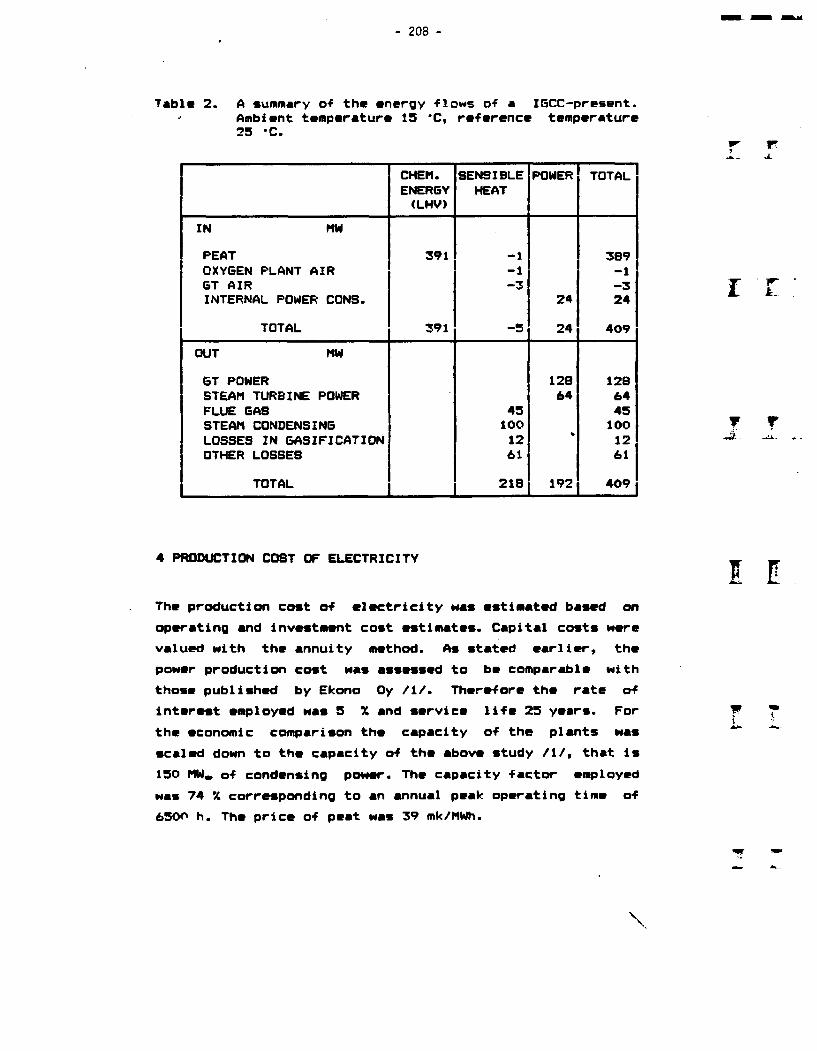
- 208 -
Table 2. A summary o-f the energy -flows of a IGCC-present. ^ Ambient temperature 15 *C, reference temperature
25 *C.
CHEM.ENERGY(LHV)
SENSIBLEHEAT
POWER TOTAL
IN MWPEAT 391 -1 389OXYGEN PLANT AIR -1 -1GT AIR -3 -3INTERNAL POWER CONS. 24 24
TOTAL 391 -5 24 409OUT MW
GT POWER 12B 128STEAM TURBINE POWER 64 64FLUE GAS 45 45STEAM CONDENSING 100 100LOSSES IN GASIFICATION 12 12OTHER LOSSES 61 61
TOTAL 218 192 409
T
4 PRODUCTION COST OF ELECTRICITY
The production cost of electricity was estimated based on operating and investment cost estimates. Capital costs were valued with the annuity method. As stated earlier, the power production cost was assessed to be comparable with those published by Ekono Oy /!/. Therefore the rate of interest employed was 5 X and service life 25 years. For the economic comparison the capacity of the plants was scaled down to the capacity of the above study /!/, that is 150 MW* of condensing power. The capacity factor employed was 74 X corresponding to an annual peak operating time of 6500 h. The price of peat was 39 mk/flWh.
\
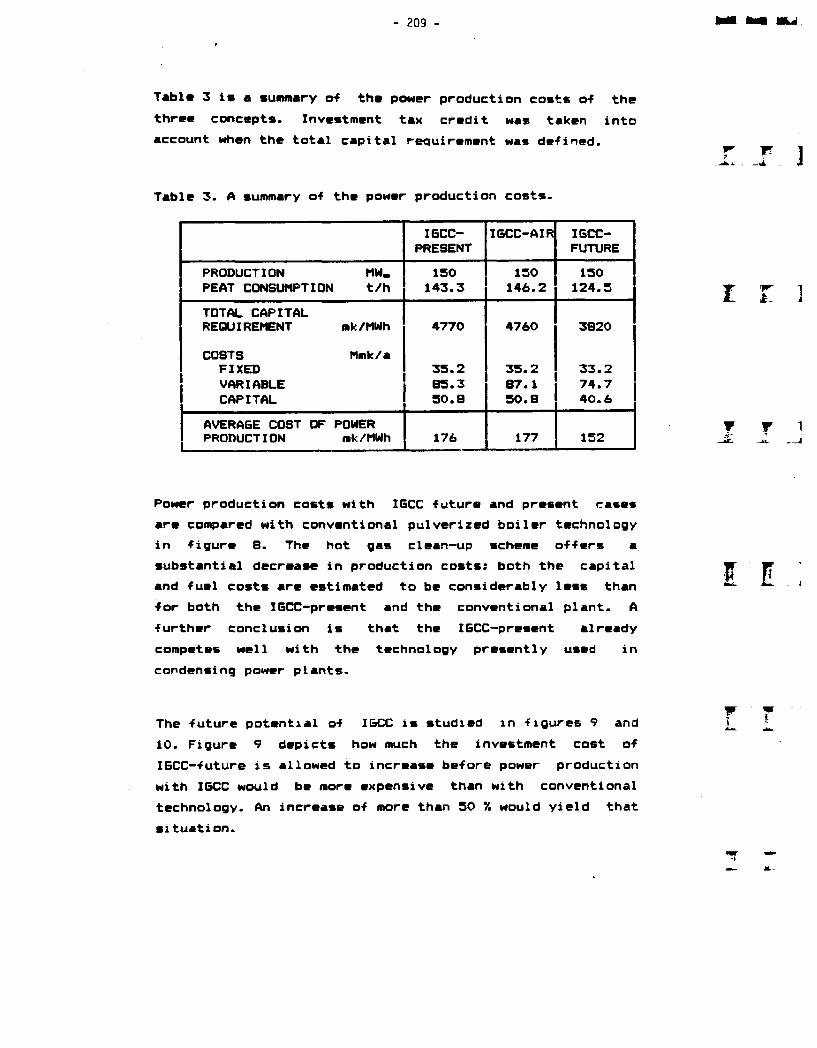
- 209 -
T*bl» 3 is a summary o-f the power production costs of the three concepts. Investment tax credit was taken into account when the total capital requirement was defined.
Table 3. A summary of the power production costs.
IGCC-PRESENT
IGCC—AIR IGCC-FUTURE
PRODUCTION MW. 150 150 150PEAT CONSUMPTION t/h 143.3 146.2 124.5TOTAL CAPITALREQUIREMENT mk/MWh 4770 4760 3820
COSTSFIXED
Mmk/a35.2 35.2 33.2
VARIABLE 85.3 87.1 74.7CAPITAL 50.8 50.8 40.6
AVERAGE COST OF PRODUCTION
POWERmk/MWh 176 177 152
Power production costs with IGCC future and present cases are compared with conventional pulverized boiler technology in figure 8. The hot gas clean-up scheme offers a substantial decrease in production costs: both the capital and fuel costs are estimated to be considerably less than for both the IGCC-present and the conventional plant. A further conclusion is that the IGCC-present already competes well with the technology presently used in condensing power plants.
The future potential of IGCC is studied in figures 9 and 10. Figure 9 depicts how much the investment cost of IGCC-future is allowed to increase before power production with IGCC would be more expensive than with conventional technology. An increase of more than 50 % would yield that situation.
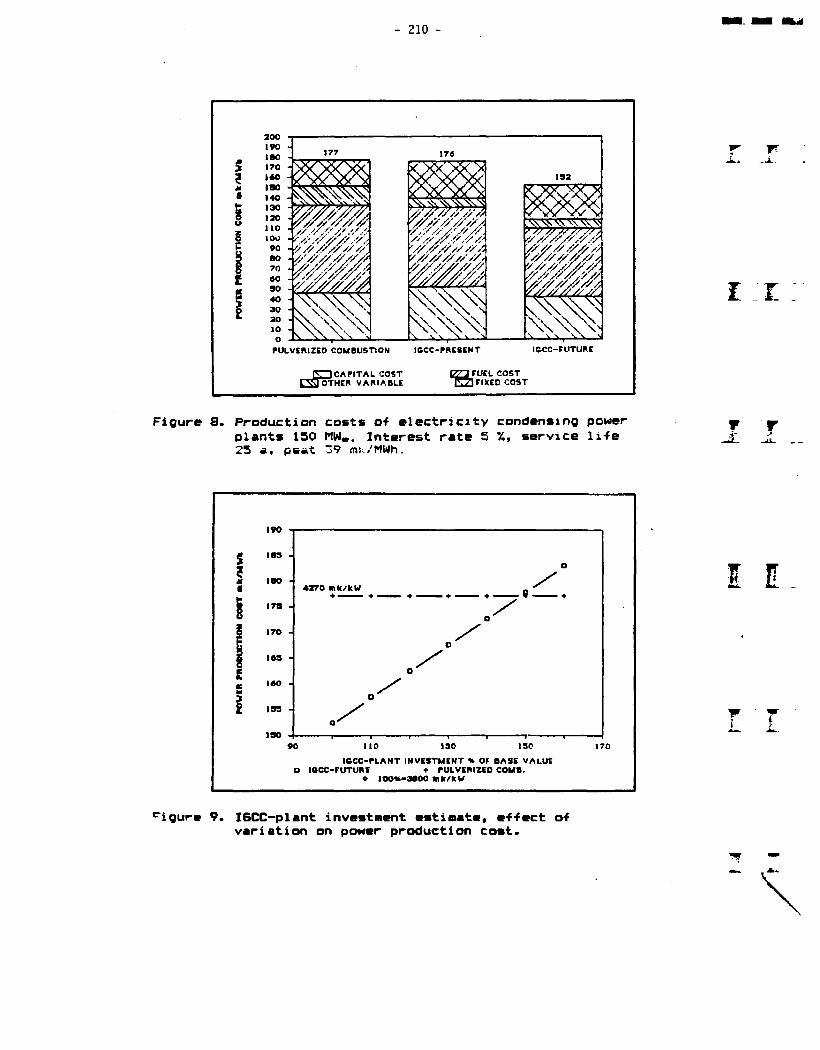
210 -
- '/ // /s// // //'-t'/y/A
w \\ N \\
IOCC-FUTUREl&CC-PBESENTPULVERIZED COMBUSTION
FUEL COST ] FIXED COST
ZD CAPITAL COST OTHER VARIABLE
Figure 8. Production costs of electricity condensing power jpplants 150 MW». Interest rate 5 %, service life 25 a, peat 39 mi./MWh.
s?it■
5S
i
IBS -
4270 mk/kW
170 -
160 •
193 •
ICCC-PLANT INVESTMENT « OF BASE VALUE O IOCC—FUTURE ♦ PULVERIZED COMB.
• IOO«>3BOO mk/kW
I l
wI L
figure 9. IGCC-plant investment estimate, effect of variation on power production cost.

- 211 -
Figur* 10 dapicts th» ••ffact o-f th» 16CC •f-ficiancy on powar production cost. The estimated efficiency of close to SO X of the IGCC-future concept could decrease to below 40 X before the production cost would exceed those of conventional technology.
I7S -
193 -
EFFICIENCY OF THE ICCC-FUTUBE CLHVJ «* O PULVERIZED COMB. + ICCC
Figure lO.Efficiency of the future IGCC, effect on power production cost.
I .1
f T 1
5 ACKNOWLEDGMENT
The author would like to thank Ms. Virve Tulenheimo and Mr. Esa Kurkela for their help in preparing this work.
212 -
REFERENCES
1. Kotimaisten polttoaineiden kiIpailukyky 1986. Kauppa- Ja taol1isuusministeriB, anergiaosasto, sarja Bs62. Helsinki 1986.
2. Clark, W. at al. Cool Water: Per-formance & economics. AIChE National Meeting, Boston, MA, August 24-27, 1986.
3. Leibson, 1. Comparative Economics for Alternative Fuels and Power Technologies, Energy Progress 7(1987)2,63-71.
4. Koljonen, J. & SBderwall, T. Turve synteesikaasun raaka-aineena. Kemia-Kemi 14(1987)10, p.829-832.

- 213 -
HOT GAS CLEANUP: THE STATE-OF-THE-ART AND PROSPECTS FOR THE FUTURE
Roland Clift, Prof.
University of Surrey
Department of Chemical and Process Engineering
Guildford, Surrey, U.K.
Abstract
In addition to sulphur compounds, turbine expansion gases in PFBC and
gasification cycles contain particulates, alkali salts and HC1. Gas
cleaning is most economic if carried out hot. During periods of steady
operation, cyclones can reduce particle loading in PFBC plant to a
level acceptable to a gas turbine. However, periodic upsets in cyclone
performance could destroy a turbine. Moreover, cyclone performance in
gasification plant is less well investigated. Therefore, in either
application, some form of tertiary gas cleanup is needed. Wet scrubbing
is not feasible, and sonic agglomeration is questionable. Electrostatic
precipitation is potentially usable but unproven for PfBC, and very
doubtful for gasification. Metal and ceramic fabric filters are not
sufficiently durable. Rigid ceramic barrier filters appear to be the
best developed option for tertiary cleaning, either as candles or
crossflow monoliths. Granular bed filters need further evaluation, but
offer potential advantages of steady operation and compact design, with
the possibility of collecting gases and particulates in one device. The
extent to which alkali salts represent a problem depends on chlorine
levels in the coal: high-chlorine coals are subject to more alkali
release, and the alkalis are harder to remove by "gettering".
1 INTRODUCTION
This review paper presents an overview of the various possible techno
logies for cleaning gases derived from coal by combustion or gasifica
tion. Most of the processes and cycles currently under development
r r ]
T r !- .j

214 -
involve expanding the gases through a turbine. In Pressurised Fluidised
Bed Combustion cycles, turbine entry conditions are typically 10 to 20
bar and 1 100 to 1 150 K (825 to 875 °C). Gasification cycles are more
variable in their turbine entry conditions, but 10 to 20 bar and 1 170
to 1 270 K (900 to 1 000 °C) are typical /!/. In view of the Increased
overall efficiencies available if turbine inlet temperatures can be
increased, there is an incentive to go to higher temperatures still.
This is possible with some gasification cycles, and may become feasible
with the introduction of new materials, such as ceramic composites, for
construction of turbomachinery. In any of these processes, there is a
clear economic advantage in cleaning the gases hot rather than cooling,
cleaning, and reheating /2/.
Four general classes of harmful contaminants are present:
a) particulates: fly ash in a combustion process; coal char with
various ash and tar content (here termed "gasification fines" in
gasification;
b) sulphur compounds: oxides and sulphates for a combustion cycle,
sulphides in gasification;
c) alkali compounds: predominantly sulphates in combustion and
chlorides in gasification/3/;
d) hydrogen chloride: probably significant in gasification, and in
combustion of fuels high in chlorine /4/.
This review is concerned primarily with particulates. Sulphur compounds
are a matter more of environmental than of process concern, and are not
covered here. The problems associated with alkalis and hydrogen
chloride are closely associated /4/, and will be considered briefly.
In addition to the difference in turbine inlet temperatures, there are
other significant differences between the gas cleaning problems which
arise in combustion and gasification processes. PfBC fly ash is typi
cally highly cohesive and moderately resistive, whereas gasifier fines
are highly conductive and generally uncohesive /5/. These differences
ensure that the two types of particle behave quite differently in any
collection process. Moreover, the four classes of contaminant Interact.
r r
i z
T ' T

- 215 -
Interparticle forces are affected by sulphur and alkali compounds.
Hydrogen chloride concentration has a strong influence on the pro
portion of the alkalis present as condensed sulphates /3, 4/, and thus
influences both the cohesion of the particles and the extent to which
the alkalis are removed by collecting the particles and any aerosol
present. For these reasons, "modelH studies using redispersed particles
or simulated gases can be misleading, and tests of gas cleaning equip
ment on pilot- or full-scale plant are essential.
It is also worth remembering that the viscosity of a gas mixture in
creases with temperature but, to a first approximation, is independent
of pressure. Because we are concerned with removal of fine particles,
Reynolds numbers are very low and so fluid-particle drag is determined
by viscosity not gas density /6/. Therefore, in laboratory or pilot
testing of particle arresting devices, it is more important to match
the process temperature than the pressure.
Rubow et al. /7/ have carried out a detailed technical and economic
comparison of ten particulate collection devices for PFBC. This review
draws on that study, but is concerned with fundamental and technical
considerations rather than economics, with some different gas cleaning
devices, and with gasification as well as combustion. 2
I
I T. ]
2 INERTIAL SEPARATORS
2.1 Reverse flow cyclones
Cyclones are the commonest form of inertial device for recovering
particles from gases. In general, the performance of a cyclone is sa
tisfactory for coarse particles but deteriorates very rapidly when
particle size decreases below about 10 jim /48/. Because they are com
pact, simple to construct and operate, and generally capable of hand
ling high throughputs, cyclones are the most suitable inertial separa
tors for use at high temperatures and pressures. They are therefore
natural contenders for the first stage or stages of particle collection

216 -
and have been investigated for this type of duty since early work on
coal-fired turbines for locomotive propulsion /see 9/.
In general, at low solid loadings the efficiency of collection (n) of a
particle of diameter dp and pp by a cyclone of diameter D follows, from
simple dimensional analysis /10/, as:
n
d2p Qf"-
pD3 pD(1)
where Q is the volumetric throughput of gas of density p^ and visco
sity p. The functional relationship in equation (1) depends on the geo
metrical design of the cyclone. The first independent variable is a
form of particle Stokes number (St) while the second can be regarded as
the cyclone Reynolds number (Re); thus St is a dimensionless measure of
particle inertia, while Re relates to the gas flow within the cyclone.
The more significant variable is St. Because of the increase of p with
T, St for given dp decreases as the temperature increases; i.e. cy
clonic separation becomes less effective. Using a more mechanisfic
analysis, derived from the worm of Muschelknautz /ll/ and Mothes and
Loffler /l2/, Abrahamson and Allen /13/ have shown that high-tempera-
ture cyclone performance is predictable from results at conditions
closer to ambient, so that there is no obvious difficulty in selecting
or designing cyclones for PfBC or gasification plant. This conclusion
is confirmed by the work of Wheel don et al. /14/, who reported on tests
at the Grimethorpe PfBC facility with cyclones similar but not identi
cal to the standard high-efficiency Stairmand design /8/. Much of the
earlier work on cyclone performance at high temperatures and pressures
/see e.g. 9/ had been obscured by problems in measuring particle char
acteristics and cyclone efficiency. Thus the work of Abrahamson and
Allen and of Wheeldon et al. provides a welcome, even if expected,
confirmation of familiar design approaches.
The general overall conclusion of cyclone testing on PFBC duty is that
two or three stages of cyclone can reduce particle loading to a level
acceptable to a gas turbine, but only provided that the operation
r it^. -i.
i r
f t

- 217 -
remains steady. Periodic upsets, caused by pidleg blockage for example,
can generate particle loadings sufficient to wreck a turbine in a few
minutes. Furthermore, in gasification plant where the higher turbine
inlet temperatures demand lower particles loadings, the suitability of ^JL' _i
cyclones remains to be verified. In either type of system, therefore,
some form of tertiary cleaning is essential. Possible approaches are
discussed below.
2.2 Other cyclone designs
Various attempts to improve the performance of gas cyclones have also
been reported. Syred and his colleagues at University College Cardiff
have tested a range of different geometries, one of which is shown in
Figure 1. The Cardiff cyclones feature "Vortex Collector Pockets" (VCP)
which remove part of the dust burden, and also use a "Vortex Weir" to
ensure smooth gas entry into the main cell (which is essentially a
Stairmand cyclone). It is claimed /e.g. 9) that these design features
III
f r i
FJ
Figure 1. Cardiff cyclone separator.

- 218 -
improve the collection efficiency for smaller particles. However, it
could turn out that the main advantages of this more complex design are
reduced height and pressure drop for any given duty.
The General Electric Co. has investigated two other variants /e.g. 16,
17/. The "gas-shielded" cyclone uses an annular vortex "shield" gas
flow between the dirty gas inlet and the exit tube, to reduce entrain
ment of dirty gas and turbulent radial dispersion of particles. It is
far from clear that the increased complexity in design and operation
results in significant improvement in performance. Another variant is
the "electrocyclone", which has an electrode mounted along the axis of
the cyclone. When a potential is applied to this electrode a corona
discharge is set up, while an electric field is established between the
electrode and the cyclone body. The device therefore attempts to com
bine by inertial separation with electrostatic precipitation: particles
are charged by the corona, and migrate towards the walls in the elec
tric field. However, any resulting gain in efficiency is offset by the
reduction in efficiency of cyclonic removal caused by the presence of
the central electrode. The electrocyclone was not recommended by Rubow
/7/ for further investigation.
Further possible variants include cyclones in which part of the device
is driven to enchange rotation of suppress turbulence /18, 19/. There
is little indication that the increase in complexity, which is enormous
for operation at high temperature and pressure, is justified by im
provement in performance.
Rotary flow cyclones use axial stationary vanes rather than tangential
inlet to impart "swirl" to the gas: see Figure 2. Fairly extensive
testing /e.g. 20, 21/ gives no indication that, for high temperature
high pressure duty, this type of cyclone has any advantage over conven
tional reverse-flow cyclones.
r r
T TJi. -J..
\
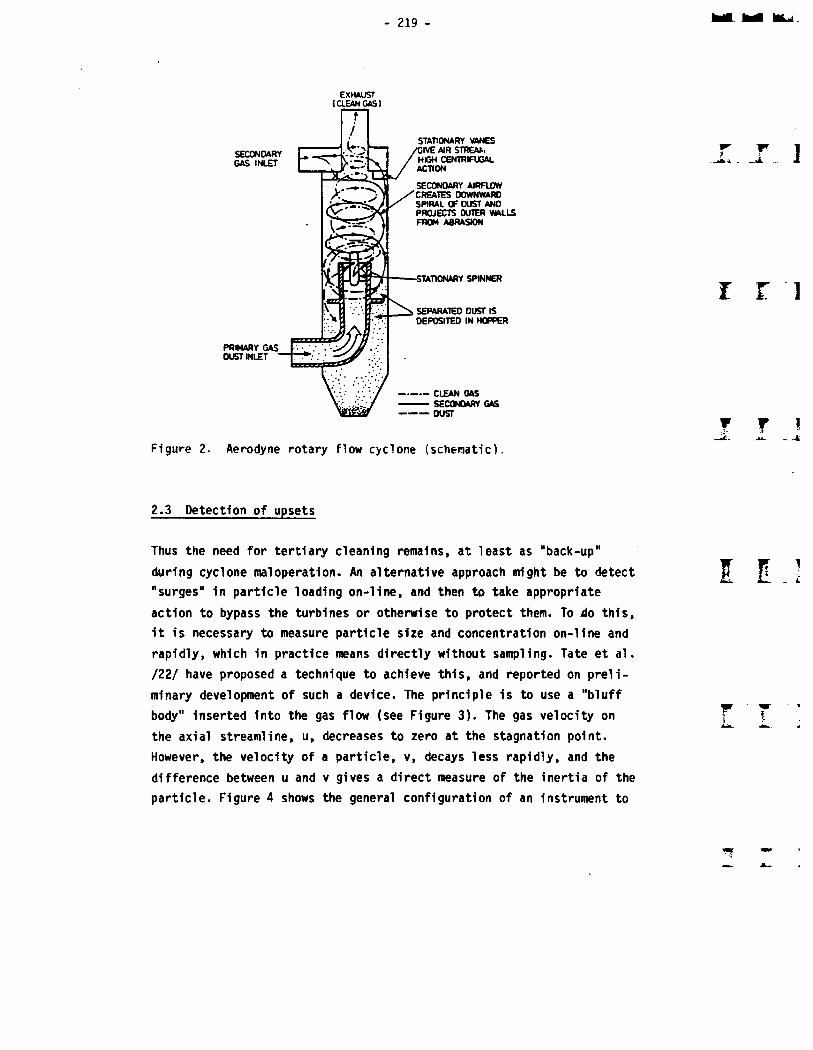
- 219 -
EXHAUST (CLEAN GAS)
STATIONARY VANES 'GIVE AIR STREAA. HIGH CENTRIFUGAL ACTION
SECONDARY GAS INLET
SECONDARY AIRFLOW CREATES DOWNWARD SPIRAL OF OUST AND PROJECTS OUTER WALLS FROM ABRASION
-STATIONARY SPINNER
SEPARATED DUST ISDEPOSITED IN HOPPER
PRIMARY GAS DUST INLET *
CLEAN GAS SECONDARY GAS
---- DUST
]
I E l
t r i4- .'t
Figure 2. Aerodyne rotary flow cyclone ischematic).
2.3 Detection of upsets
Thus the need for tertiary cleaning remains, at least as "back-up"
during cyclone maloperation. An alternative approach might be to detect
"surges" in particle loading on-line, and then to take appropriate
action to bypass the turbines or otherwise to protect them. To do this,
it is necessary to measure particle size and concentration on-line and
rapidly, which in practice means directly without sampling. Tate et al.
/22/ have proposed a technique to achieve this, and reported on preli
minary development of such a device. The principle is to use a "bluff
body" inserted into the gas flow (see Figure 3). The gas velocity on
the axial streamline, u, decreases to zero at the stagnation point.
However, the velocity of a particle, v, decays less rapidly, and the
difference between u and v gives a direct measure of the inertia of the
particle. Figure 4 shows the general configuration of an instrument to
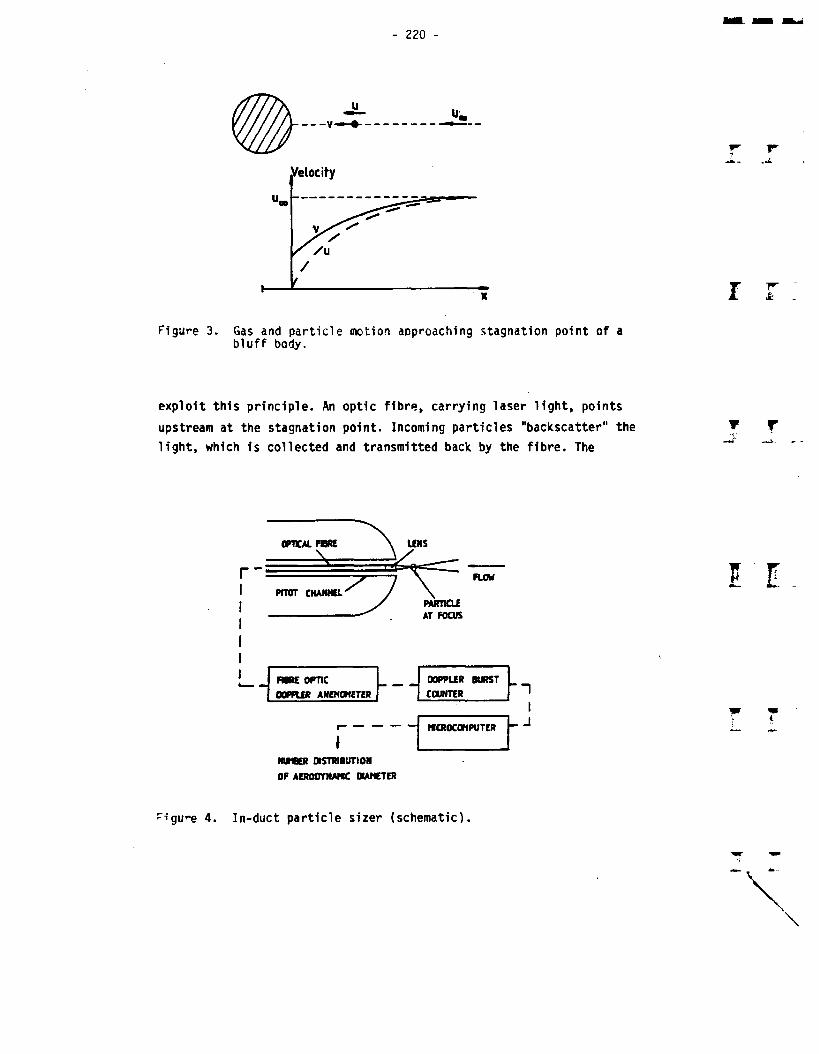
220 -
r r :Figure 3. Gas and particle motion approaching stagnation point of a
bluff body.
exploit this principle. An optic fibre, carrying laser light, points
upstream at the stagnation point. Incoming particles "backscatter" the ▼ Tlight, which is collected and transmitted back by the fibre. The
OPTICAL FORE \ LENS
HCROCONPUTER
DOPPLER BURST COUNTER
FIBRE OPTIC DOPPLER ANEMOMETER
NUMBER DISTRIBUTION OF AERODYNAMIC DIAMETER
\
r-igu'-e 4. In-duct particle sizer (schematic).

- 221 -
Doppler shift of this returning light gives the particle velocity. The
frequencies of many "Doppler-bursts" are measured and the individual
measurements are used to build up the particle size distribution. Be
cause the technique uses Doppler frequency and not light intensity, it
is free from the obscuration problems which bias diffraction or scat
tering measurements in "dirty" process environments. Because the sens
ing head is connected to the delicate photodiode and electronic compo
nents only by a length of optic fibre, this technique is well suited to
on-line applications such as detecting cyclone upsets.
3 TERTIARY PARTICLE REMOVAL
Variants on most of the conventional gas cleaning techniques have been
tested for PFBC and gasification duty. Wet scrubbing can be eliminated
immediately, for lack of a suitable scrubbing liquid. Molten tin and
molten salts have been considered and tested /e.g. 23, 24/, but are
ruled out in practice and no alternative liquid has been proposed.
Sonic agglomeration reappears periodically as a way of pretreating
particle-laden gases to enhance the efficiency of more conventional
devices such as cyclones. While significant changes in particle size
distribution have been achieved in bench-scale tests at ambient condi
tions /see 7/, there are major problems in both the science and the
technology of applying sonic agglomeration on a large scale at high
temperature and pressure.
I T ']
w
I I
3.1 Electrostatic precipitation
From the information then available, Rubow et al. /7/ identified elec
trostatic precipitation as the most attractive tertiary cleaning tech
nique. Subsequent experience has not so far lived up to this expecta-
tion, partly but not entirely as a result of operating problems in the ^
various test facilities. Tassicker /25/ has recently reviewed the test
programme under way in the U.S.A.

222 -
Electrostatic precipitation (ESP) involves three processes:
a) charging of suspended particles by corona discharge;
b) migration and deposition of the charged particles under the in
fluence of an applied electric field;
c) detachment and recovery of deposited material from the collecting
electrode.
Stages a) and b) are usually combined, because the electrostatic field
also produces the corona discharge. For ESP to be viable, the field
strength necessary to establish a corona must be smaller than that at
which "sparkover" occurs between the electrodes. Therefore ESP cannot
be used at temperatures above 800 °C and ambient pressure. Increasing
pressure increases the sparkover voltage sharply while the corona
voltage increases more gradually /26, 27/. The pressure at which the
two become equal is called the "critical pressure". Negative corona
gives more stable operation. The critical pressure depends on electrode
geometry, but is typically a few bar for PFBC duty. Because of the
variation of corona and sparkover voltages with pressure and tempera
ture, it is possible in principel to use higher voltages for high-pres
sure high-temperature duty than at less extreme conditions /27/. Thus,
in principle, higher electrophoretic forces can be imposed, to offset
the higher drag resulting from the higher gas viscosity at elevated
temperatures.
The most extensive test programme, using the Curtiss-Wright PFBC faci
lity in the USA, was beset by so many problems of maloperation that it
is far from clear what real conclusions can be drawn /28/. Smaller
scale tests at Denver Research Institue /29/ and the University of
Essen /30/ suggest that good collection efficiencies can be achieved.
However, the current densities needed appear to be high, even with the
best electrode geometries yet conceived. Furthermore, construction
materials to maintain the necessary electrical insulation between the
electrodes are needed; the Research-Cottrell preciptator used at
Curtiss-Wright, for example, used high-purity alumina which still had
to be cooled to about 800 K.
Thus it remains uncertain whether electrostatic precipitation can be
used for PFBC plant without unacceptable power consumption. Major
I
t r

- 223 -
difficulties can also be foreseen in applying ESP to gasification. It
is very uncertain whether it will be possible to maintain stable corona
discharge in the dirty reducing gases obtained from coal gasification.
Moreover, because the particles are so uncohesive, they are unlikely to
form a stable cake on the collecting electrode and very likely to re
disperse. A build-up of conducting particles in the precipitator would
in turn destabilise the corona. Overall, electrostatic precipitation
remains potentially usable but unproven for PfBC plant, and very doubt
ful for use in gasification cycles.
3.2 Barrier filtration
The term "barrier filter" is used here to mean a device using a rigid
or flexible filter medium, fixed in place within the filter housing and
functioning largely by interception of the dust particles. Such filters
must be cleaned in situ by some mechanical process such as vibration or
reverse pressure pulse or reverse gas flow. Particularly for high-tem-
perature high-pressure duty, where the cleaning action is difficult to
apply, cleanability is of as much concern as filter efficiency. The
durability of the filter medium is also of prime concern, and rules out
the use of metal filters.
Two general types of barrier filter have been investigated, both made
from suitable ceramic materials: they are woven or felted fabrics, and
rigid sintered or bonded elements. Fabrics are formed into cylindrical
bags, as used for conventional fabric filters. Table 1, after Chang et
al. /31/ summarises the differences between woven and felted media.
Ceramic fabrics have been widely tested, notably at Acurex Corp. /32/,
Westinghouse /33/ and the University of Essen /34/. Substantial diffi
culties have been encountered, notably associated with embrittlemenet
of the ceramic fibres. Because these media are required to flex for
cleaning, embrittlement can lead to loss of mechanical integrity. This
is particularly serious with woven media, for which a relatively small
crack or tear leads to catastrophic loss of filter efficiency. In the
author's view, rigid ceramic filter media hold more promise.

224 -
Table 1. Comparison of woven and felted fabrics.
Felted Woven
Very high collection efficiencies High collection efficiencies(> 99.9 %) (> 99 %)
High face veolocity Low face velocity(up to 0.1 m/s) (0.005 to 0.03 m/s)
Requires high cleaning energy. Low energy cleaning, by pulsing.usually by pulse shaking, or reverse flow
Rigid ceramic media have been tested fairly extensively in two forms;
"candles", which are hollow cylinders with closed ends, much like con
ventional filter bags; and "crossflow" filters, which take the form of
blocks containing many small gas channels (see below). Candles have
been tested at Westinghouse /33/, University of Essen /34/, and by
British Coal and the University of Surrey /35/. Types of candle include
sintered granules, granule and fibre mixtures, bonded fibres, and gra
nular substrates with a fine surface layer on the "dirty" face of the
filter. It appears possible to find formulations, for both PFBC and
gasification duties, which will maintain their strength and integrity
over extended periods. However, a more serious operating problem is
long-term rise in the resistance of the medium, due to "blinding" with
particles not removed by cleaning or to fouling with some other type of
deposit. Current developments therefore concentrate on finding media
and appropriate cleaning cycles to reduce "blinding". Because the be
haviour of a dust cake depends on interparticle forces, which are in
turn very dependent on the chemical environment, it is likely that
media and cleaning strategies will differ between different applica
tions. It appears that, for PFBC fly ash, pulse cleaning causes less
redispersion than does reverse flow cleaning /35/. However, redisper
sion is likely to be more of a problem in gasification, because of the
low cohesiveness of gasifier fines.
The other geometry, the "crossflow" filter, is shown in Figure 5. This
type of filter has been tested most extensively by Westinghouse /36/,
i r
r r
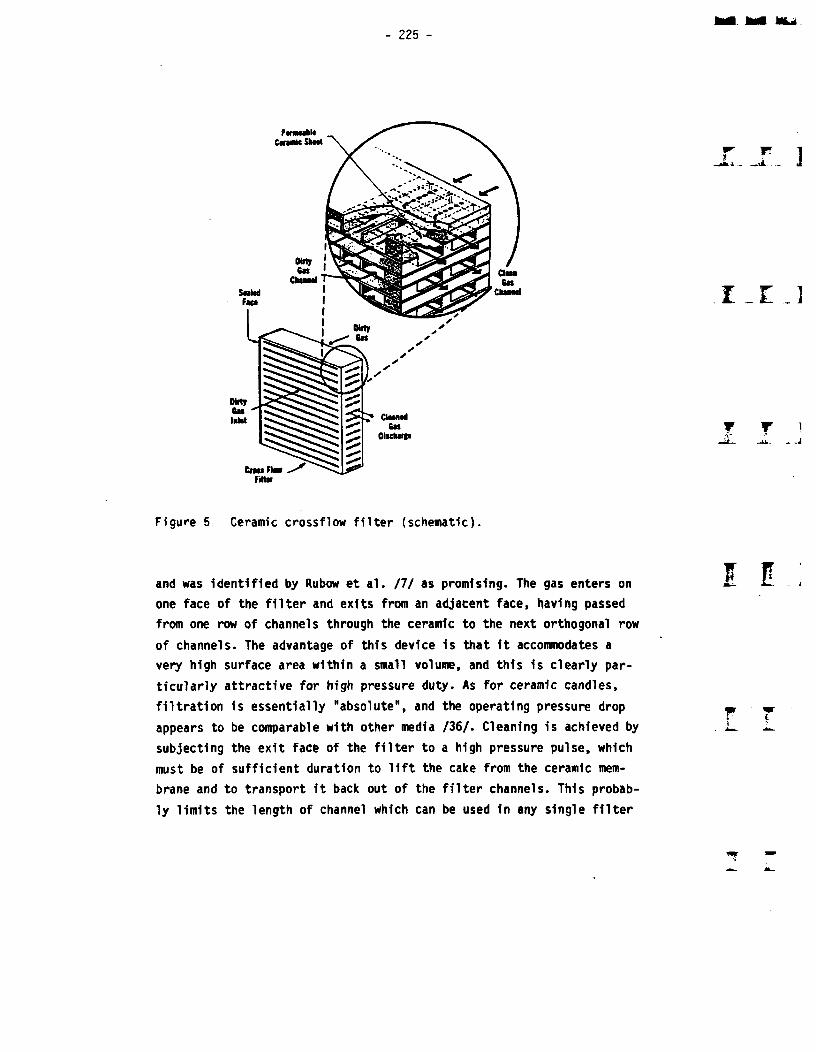
- 225 -
Figure 5. Ceramic crossflow filter (schematic).
and was identified by Rubow et al. /7/ as promising. The gas enters on
one face of the filter and exits from an adjacent face, having passed
from one row of channels through the ceramic to the next orthogonal row
of channels. The advantage of this device is that it accommodates a
very high surface area within a small volume, and this is clearly par
ticularly attractive for high pressure duty. As for ceramic candles,
filtration is essentially "absolute", and the operating pressure drop
appears to be comparable with other media /36/. Cleaning is achieved by
subjecting the exit face of the filter to a high pressure pulse, which
must be of sufficient duration to lift the cake from the ceramic mem
brane and to transport it back out of the filter channels. This probab
ly limits the length of channel which can be used in any single filter
I E
F
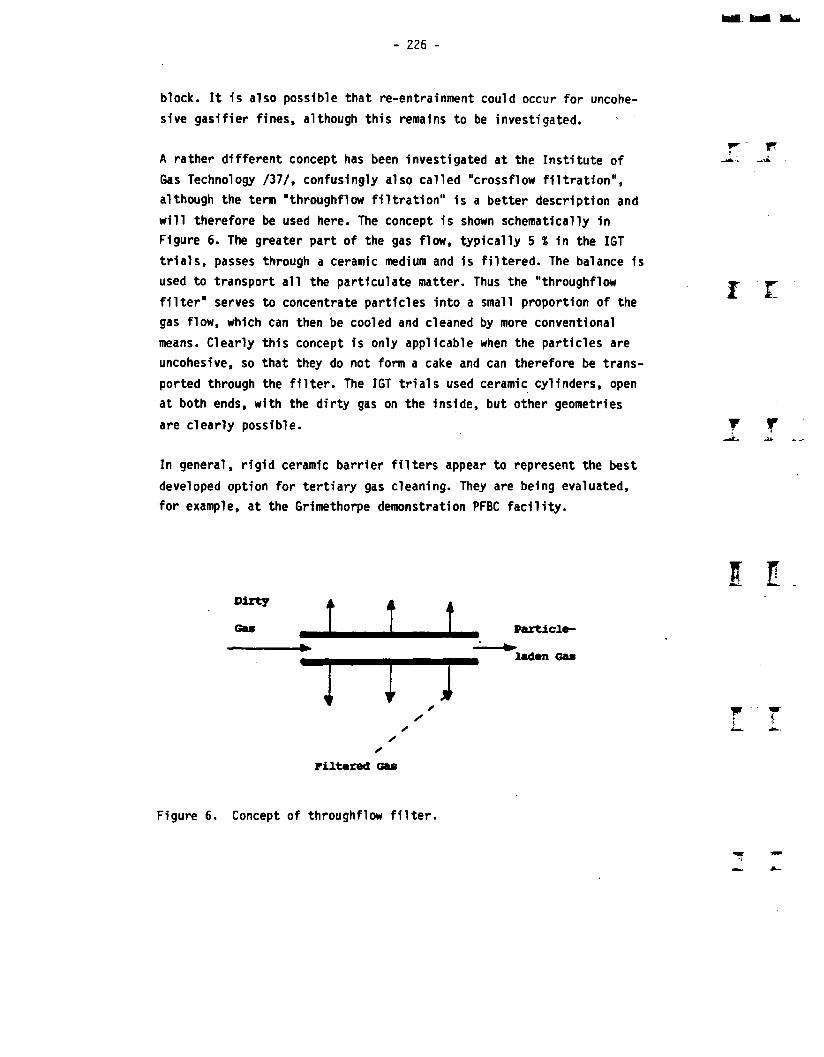
- 226 -
block. It is also possible that re-entrainment could occur for uncohe-
sive gasifier fines, although this remains to be investigated.
A rather different concept has been investigated at the Institute of
Gas Technology /37/, confusingly also called "crossflow filtration",
although the term "throughflow filtration" is a better description and
will therefore be used here. The concept is shown schematically in
Figure 6. The greater part of the gas flow, typically 5 * in the IGT
trials, passes through a ceramic medium and is filtered. The balance is
used to transport all the particulate matter. Thus the "throughflow
filter" serves to concentrate particles into a small proportion of the
gas flow, which can then be cooled and cleaned by more conventional
means. Clearly this concept is only applicable when the particles are
uncohesive, so that they do not form a cake and can therefore be trans
ported through the filter. The IGT trials used ceramic cylinders, open
at both ends, with the dirty gas on the inside, but other geometries
are clearly possible.
In general, rigid ceramic barrier filters appear to represent the best
developed option for tertiary gas cleaning. They are being evaluated,
for example, at the Grimethorpe demonstration PFBC facility.
r' r-
I I
r
Dirty
Gas t t
1 fn
*/sss
Filtered Gas
Particle
laden Gas
Figure 6. Concept of throughflow filter.

3.3 Granular bed filters
By contrast with barrier filters, granular beds use unbonded filter
elements. The filter may be cleaned in situ as for a barrier filter;
examples of this practice are the Lurgi "twist layer" filter /38/ and
the Ducon filter /39/. However, this type of design retains the diffi
culties of intermittent cleaning which arise with barrier filters. The
potential advantages of granular bed filters include continuous opera
tion, whith the medium passing continuously through the filter zone,
and cleaned elsewhere to be recycled or passed to disposal or pro
cessing. This general type of device may have additional advantages for
simultaneous removal of particulates and vapours, such as sulphur
oxides or alkali salts. We therefore concentrate here on two types of
granular bed filter which embody this advantage: the Moving Granular
Bed Filter developed by Combustion Power Company (CPC) and given a
positive assessment by Rubow et al. /?/, and the Fluidised Bed Filter,
developed by the University of Surrey with British Coal /40/ and not
evaluated by Rubow.
Granular bed filters differ from membrane filters in a further im
portant respect. The passages carrying gas through the filter are much
larger than the dust particles, so that "absolute" filtration is not
expected (unless the dust forms a "cake" on the upstream face of the
filter, and this cannot occur with moving or fluidised beds). In the
filtration process, dust must be brought into contact with the filter
granules. For the range of particle sizes of interest for turbine ex
pansion. gases, the most important mechanism is inertial impaction /41/.
The dust must then adhere to the collector, without rebounding or being
re-entrained. This depends on a balance between the kinetic energy of
the impacting particle and the adhesion between the particle and the
collector /41/. For cohesive fly ash particles, retention can be good
provided that the filtration velocity is not too high /5, 41/. For
cohesive gasifier fines, there may be very little retention of the dust
in the filter, and efficiency is typically low.
The basic concept of the CPC Moving Granular Bed Filter is shown in
Figure 7. The dirty gas passes upward through a bed of filter granules,
I l
wi

- 228 -
MEOW RETURN LEG x. GAS INLET
'GAS OUTLET
INTERNAL MEDIA RESERVOIR
8 EQUALLY SPACED MEDIA FEED LEGS
INNER MEDIA FLOW ANNULUS
I DIRTY i MEDIA
Figure 7. CPC moving granular bed filter (schematic).
which are particles of gravel or alumina a few millimetres In diameter
/42/. The filter granules are drawn off at the base of the filter, and
raised In a high-velocity pneumatic conveying line to a fluidised bed,
from which they are returned to the filter. It appears that the depo
sited particles are dislodged In the conveying line, and entrained off
from the fluidised bed. Thus the filter operates by transferring
particles from the process stream to the cooler air flow passing off
from the fluidised bed holding vessel, and probably by agglomerating
them in the process so that they are easier to collect in a cyclone.
Overall particle collection efficiencies above 90 % have been reported
for cohesive fly ash, with less than 1 kg of dust collected per 100 kg
of collector circulated /7, 43/.
i r
r ' t
I l
W
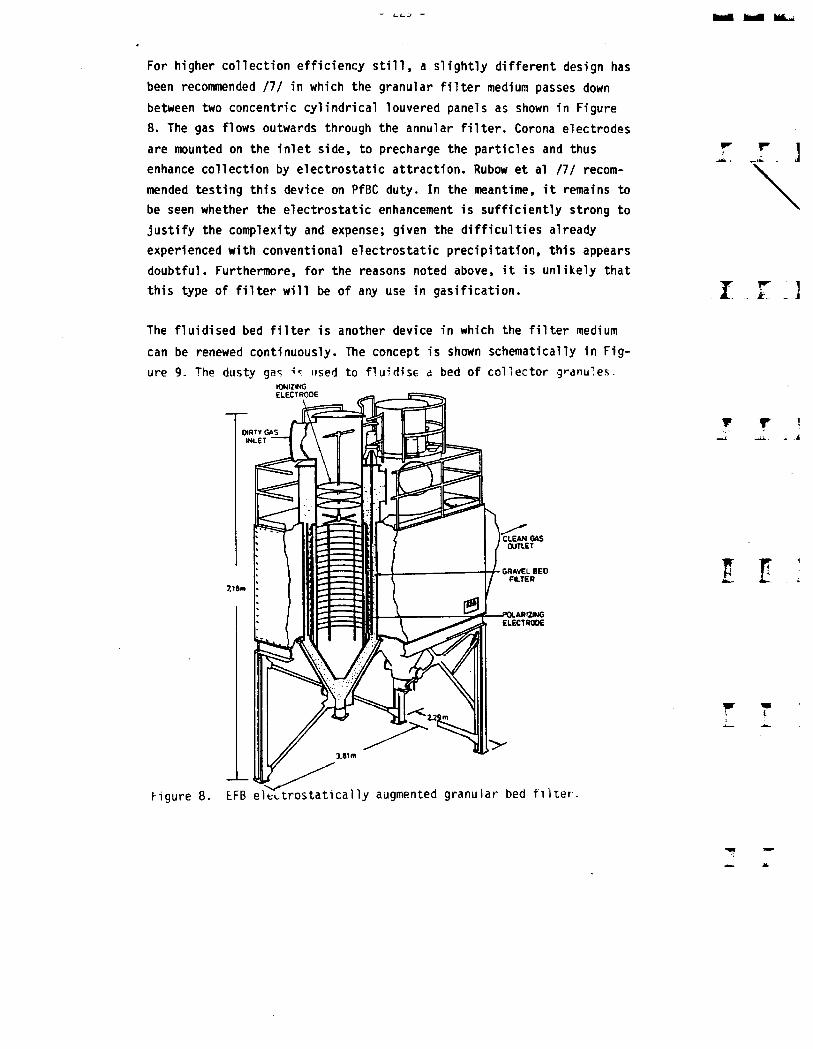
i_ i_
For higher collection efficiency still, a slightly different design has
been recommended /7/ in which the granular filter medium passes down
between two concentric cylindrical louvered panels as shown in Figure
8. The gas flows outwards through the annular filter. Corona electrodes
are mounted on the inlet side, to precharge the particles and thus
enhance collection by electrostatic attraction. Rubow et al /7/ recom
mended testing this device on PfBC duty. In the meantime, it remains to
be seen whether the electrostatic enhancement is sufficiently strong to
justify the complexity and expense; given the difficulties already
experienced with conventional electrostatic precipitation, this appears
doubtful. Furthermore, for the reasons noted above, it is unlikely that
this type of filter will be of any use in gasification.
The fluidised bed filter is another device in which the filter medium
can be renewed continuously. The concept is shown schematically in Fig
ure 9. The dusty gas is used to fluidise a bed of collector granules.IONIZWG
DIRTY GAS INLET —
CLEAN GAS OUTLET
GRAVEL BED FA.TER
Mgure 8. EFB electrostatically augmented granular bed filter.

- 230
FRESH FILTER MEDIUM
GAS ENTRY
SPENT FILTER MEDIUM
i r
Figure 9. Fluidised bed filter (schematic;.
Filtration occurs predominantly by inertial impaction in the jets which
form above the ofifices in the distributor plate through which the gas
enters the bed. The function of the bed itself is then to immerse these
jets so that filter granules are continuously entrained into them; thus
a bed only a few centimeters deep is needed. In some respects, the
fluidised bed filter is analogous to the "dry plate scrubber" developed
by Air Pollution Technology Inc. /46/. However, by using a fully
fluidised bed, it becomes possible to introduce means to enhance the
retention of dust by the filter /40/. For fly ash, for example, a che
mical additive may be injected to the bed to reduce the sintering point
of the ash and so ensure retention. For gasifier fines, it is possible
to spray, a heavy fuel oil into the bed. The oil "cracks" to leave a
tarry residue which binds the particles to the bed granules. Thus the
device can be operated as an agglomerating filter, fed with seed
particles and producing as product agglomerates of dust onto "seed"
cores. Alternatively, such a device can be used as pre-agglomerator
before a cyclone separator /40, 47/.
The fluidised bed filter has yet to be tested on either PfBC or gasi
fier duty. However, it has clearly reached a stage of development where
this is poortune, particularly in view of its advantages of compact
design and continuous operation.
7 7
l l
r-'i

Z3L
4 COLLECTION OF ALKALI SALTS
The extent to which it is necessary to remove alkali salts from the
gases derived from coal remains to be determined. It is clear that it
will be very difficult indeed to satisfy the tolerances on alkali level
set by most turbine manufacturers, but it is far from clear whether
these tolerances are actually required by the turbomachinery. Sodium
and potassium compounds are the main concern. In gross terms, sodium
and potassium chlorides are volatile at the temperatures of concern
here, whereas the sulphates are very much less volatile /3/. Thus if
the alkalis form as sulphates, they *i11 be removed to some extent with
the particulate matter. In PFBC gases, sulphates form by reactions like
2NaCl + H20 + S02 + 1/2 02 Na2S04 + 2HCL (2)
Thus sulphate condensation may be suppressed if the gases contain
significant levels of HC1.
This demonstrates a particular difficulty in assessing the release and
effects of alkali compounds: they are strongly dependent on the chlo
rine level in the coal. It appears /4/ that high HC1 levels encourage
release of alkalis from minerals in the coal by reactions like that
with feldspar:
Na20*Al 203*2Si02 + 2HC1 2NaCl + Al 203*2Si02 + H20 (3)
and then inhibit sulphate condensation by reactions like (2). Most work
on alkali collection /e.g. 48/ has concentrated on absorbing or re
acting the chlorides with mineral "getters". The getters could form a
bed through which the gases are passed, or might conceivably be added
directly to the combustor or gasifier along with the limestone used for
sulphur collection. An example of a "getter" is kaolin, in which case
the "gettering" reaction for sodium chloride is the reverse of reaction
B. Thus this reaction also serves to demonstrate why HC1 also reduces
the possible effectiveness of getters, by displacing thermodynamic
equilibrium to leave more alkali as chloride vapour.
i r !
r r i
I l

232
North American coals are typically low in chlorine. British, and some
other European, coals are high in chlorine. This difference explains
why the chlorine problem has been regarded rather differently on the
two sides of the Atlantic. Low-chlorine American coals are subject to
less alkali release, and "gettering" appears to be a feasible way to
reduce alkalis to acceptable levels /48/. The indications, at present
based largely on thermodynamic estimates /4/, are that known getters
will not achieve acceptable alkali levels for PfBC plant using high
chlorine coals unless the gases are cooled slightly.
For gasification the position is potentially more serious, because
sulphate condensation by reaction A cannot occur in a reducing environ
ment. It appears that "gettering" can effect some reduction in alkali
levels, but to achieve acceptable levels it may be necessary either to
cool the gases or to remove HC1 /4/.
REFERENCES
1. Robson, B. Energy Research 1, 157 (1977).
2. Reed, G. P. "FilTech" Confce. London 1983, Filt. Soc. P. 384.
3. Scandrett, L. A. & Clift, R. J. Inst. Energy 57, 391 (1984).
4. Singh, A. et al. IChemE Symp. Ser. 99, 167 (1986).
5. Coury, J. R., Reed, G. P. 4 Clift. R. To be published.
6. Clift, R., Grace, J. R. 4 Weber, M. E. Pubbles, drops and
particles. New York 1978, Academic Press.
7. Rubow, L. N. et al. Technical and economic evaluation of ten high
temperature, high pressure particulate cleanup systems for pressu
rized fluidized bed combustion. Rept. D0E/MC/19196-1654 (1984).
I L
rJL
8. Stairmand, C. J. Trans IChemE 29, 356 (1951).
9. Henry, R. F. & Podolski, W. F. Cyclone performance estimates for
pressurized fluidized bed combustion. Rept. ANL/CEN/FE-81-4
(1981).
10. Clift, R. et al. Textbook of particle technology. London,
Elsevier Applied Science Publishers. To be published.
11. Muschelknautz, E. VDI Berichte 363, 49 (1980).
12. Mothes, H. S Loffler, F. Chem. Eng. Process. 18, 323 (1984).
13. Abrahamson, J. & Allen, R. W. K. IChemE Symp. Ser. 99, 31
(1986).
14. Wheeldon, J. M. et al. IChemE Symp. Ser. 99, 45 (1986).
15. Syred, N. et al. IChemE Symp. Ser. n:o 99, 17 (1986).
16. General Electric, US DOE Rept. FE-2357-70 (1980.
17. Giles, W. B. High performance cyclone development. 3rd Symp. on
Transfer and Utilisation of Particulate Control Technology,
Orlanda, FA, C0NF-810319-1 (1981).
18. McCabe, J. T. EPA/DOE Symp. on High-Temperature High-Pressure
Particulate Control. EPA-600/9-78-004, C0NF-770970, p. 55 (1977).
19. Paul, D. D., Razgaitis, R. & Jordan, H. IChemE Symp. Ser. 99, 1
(1986).
20. Ciliberti, D. F. & Lancaster, B. W. Chem. Eng. Sci 31, 499
(1976).
I _£ _]
w
21. General Electric, US DOE Rept. FE-2357-39A (1980).

234 -
22. Tate, A. H. J. et al. IChemE Symp. Ser. 99, 89 (1986).
23. McCreight, L. R. Proc. High-Temperature High-Pressure Particulate
and Alkali Control in Coal Combustion Process Streams. US DOE
Contractors' Meeting, C0NF-810249, p. 583 (1981).
24. Weber, E. et al. Environment International 6, 349 (1981).
25. Tassicker, 0. J. IChemE Symp. Ser. 99, 331 (1986).
26. Robinson, M. Electrostatic precipitation. In: Strauss, W. (ed.)
Air pollution control. Part 1. Wiley-Interscience 1971.
27. Bush, J. R., Feldman, P. L. & Robinson, M. JAPCA 29, 365 (1979).
28. Kumar, K. S. DOE Contractors' Meeting (1983).
29. Rinard, G. IChemE Symp. Ser. 99, 315 (1986).
30. Riepe, T. & Wiggers, H. IChemE Symp. Ser. 99, 297 (1986).
31. Chang, R. et al. 3rd Annual Contractors' Meeting on Contaminant
Control in Hot Coal-Derived Gas Streams. US/DOE/METC/84-6 (1983).
32. Chang, R. et al. IChenC Symp. Ser. 99, 177 (1986).
33. Lippert, T. E. et al. IChemE Symp. Ser. 99, 215 (1986).
34. Schmidt, D., Schulz, R. A Bender, J. IChemE Symp. Ser. 99, 245
(1986).
35. Cheung, W. et al. To be published.
36. Ciliberti, D. F. & Lippert, T. E. IChemE Symp. Ser. 99, 193
(1986).
IT
i r
f T•J1;. -ii.

235 -
37. Rush, W. F. et al. An exploratory study of a combined sonic
agglomeration and cross-flow filtration system for hot gas
clean-up. AIChE Conf., Chicago, Nov. 1980.
38. Use of gravel filter beds for dust removal from the exhaust air of
clinker coolers. Lurgi Apparate-Technik GmbH, 1977.
39. Kalen, B. & Zenz, F. A. AIChE Symp. Ser. 137, 397 (1974).
40. Ghadiri, M., Seville, J. P. K. A Clift, R. IChemE Symp. Ser. 99,
351 (1986).
41. Coury, J. R., Thambimuthu, K. V. & Clift, R. Powder Tech. 50, 253
(1987).
42. Guillory, J. L., Placer, F. M. A Grace, D. S. Environment
International 6, 387 (1981).
43. Moresco, L. L. A Cooper, J. L. US DOE Contractors' Meeting.
C0NF-810249, p. 507 (1981).
44. Doganogly, Y. et al. Trans. IChemE 56, 239 (1978).
45. Clift, R., Ghadiri, M. A Thambimuthu, K. V. in: Wakeman, R. J.
(ed.) Progress in filtration and separation, Vol. 2. London 1981,
Elsevier.
46. Calvert, S. et al. EPA Symp. on Transfer and Utilisation of
Particulate Control Technology, Vol. 3. EPA-600/7-79-044C, p. 405
(1979).
47. Barone, L. et al. Powder and Bulk Solids Tech. 1, 15 (1983).
48. Lee, S. H. D. A Myles, K. M. IChemE Symp. Ser. 99, 149 (1986).
W ]
I _ E _ ]
f T 1
r t
Fj

237 -
DIDER HOT GAS FILTER SYSTEMS
Weidner UlrichDidier filtertechnikD 6719 Eisenberg / Pfalz, FRG
1 INTRODUCTION
Didier, founded in 1834, is one of the biggest and most renown companies in refactory field, solving high-temperature problems up to 2 000 °C
Didier filtertechnik (DF) founded by Wilhelm Schuler in 1887 and acquired by Didier in 1957, is a leading manufacturer of filter material (porous ceramics), gas and liquid filters as well as of fine-bubble diffusers for sewage aeration.
For 20 years DF has been planning and constructing high-efficient hot gas filter system fot the direct, dry cleaning of hot gases at temperature ranges up to 1 000 °C. According to this process, in which the filter is located immediately after the firing systems, that is heat exchangers are installed behind the separators, corrosion problems are thus prevented - as no cases arise in which the temperature falls below the dewpoint Optimum heat recovery is also provided.
In the flue gas dust precipitation and product recovery the limiting temperature of application fin* ceramic candle filters - depending on the material of filter media - was for a long time approximately 400 °Gto 600 °G
In 1970 / 71 DF developed for the first time refactory-lined filters on a commersial scale for continuous temperatures 800 °C to 900 °C.
In 1981 / 82 a complete pilot plant was constructed by DF for Japanese licence, for
working temperatures of 1000 °C.
I I J
Y r, .j

- 238 -
The filters mentioned so far operate at atmospheric conditions. On the basis of developments in the Didier Group with regard to special high-tech tube-sheets, refactory- lined and high-temperature insulated pressure vessels, complete high-temperature high- pressure (HTHP) filters are designed since 1980. They are achieving excellent clean gas values (e.g. residual dust content in clean gas <1 mg/nm3) and thus satisfy the conditions required in pressurised fluidised bed combustion and gasification - based (PFBC/G) combined cycle applications before the gas turbines.
2 HOT GAS FILTER ELEMENTS
DF manufactures high efficient filter elements of alumina silicate and silicon carbide mateial, fired at temperatures around 1 400 °C. They are made in different shapes (1):
2J Cylindric hollow-todies;
Filter cylinders, open at both ends; filter candles, closed at one end with flange at the open end.
In hot gas filtration mainly flanged candles are used; the new hemispherical flange design(2) was developed in the 1970's, improving the backblowing behaviour of candles.
22"Cross-flow" (31 elements
DF makes "Kanalsteine" (4) among others. When using such type of filter elements the filtering surface can be increased in a given space.
W ]. J
r r
f r-Ji. -jjl. - ~J
I E
3 HOT GAS FILTERS FOR ATMOSPHERIC CONDITIONS
Highlights:From 1966 to 1969 DF developed hot gas pilot filters for temperatures up to 600 °C to 700 °C (5). In 1971 DF constructed for the first time scaled-up hot gas filters for a continuous operating temperature of 800 °C to 900 °C with refactory-lining and 91 - later on: 85 - pieces of flanged candles per unit (6).
In 1974 / 75 a complete DF pilot filter unit, consist of hot gas filter, blower, backblowing gas receiver, piping and measuring device, was tested with best results (7).
From 1980 larger hot gas filter units with elements of 1 500 mm length were commisioned
DF designed and constructed for the first time a complete pilot filter plant, operating at temperatures of 1 000 °C, with integral heat recovery system (8).
4 HTHP FILTERS
The use of combined cycle generation systems incorporating a gas turbine ahead of the syeam cycle is seen as a promising technology for raising the efficiency of electric power generation. For the protection of a gas turbine - operating with high entry temperatures - a paticle loading of 4 mg/nm3 will be tolerated. Conventionally the particle cleaning system would be wet scrubber. Hot gas filtration would raise the efficiency of PFBC as well as of gasification-based process (9).
DF development on HTHP filter was started in 1980. Already in 1981, some filters could be commissioned for designed pressure of 120 bars and a design temperature of 350 °C
(10).
In 1985/86 scaled-up filter units were designed, meeting the tubesheet and sealing problems (11).
Characteristics:Large filter units with a number of filter elements will be constructed in order to
minimize costs of filter vessel, valves and pipes.Special tubesheet of high-tech material are arranged in a big support plate in order
to meet tubesheet problems, especially the manufacturing costs and the dimension
(diameter) limitations.An optimal sealing of filter elements, gaskets, tubesheet and support plate will be
achiebed - and raw gas leakage will be prevented - by using ceramic materials only with
same thermal expansion.

- 240 -
References:
(1) Didier Filtertechnik, "Porous Ceramic Filter Media", Technical documentation no V 2.20 E, November 1983.
(2) Didier Filtertechnik, Sketch No. G/Wr, March 1985.
(3) Ciliberti D.F., and Lippert T.E.: "Ceramic Cross Flow Filters for Hot Gas Cleaning", September 1986.
(4) Hofbeck R., Kafla H., and Weidner U.: "Filtereinrichtung zur Russpartikel- filtration", October 1985.
(5) Hempelmann W., and Krause H.: " behandlung der festen radioaktiven AbfKlle im Kemforschungszentrum Karlsruhe", September 1970.
(6) Dirks F., and Hempelmann W.: "The Incineration Plant of the Karlsruhe Nuclear Research Center - a Regional Solution", 1984.
(7) David A., and Wittenmeier F.: "Filtration heissen Rauchgase iiber 600 °C", May 1976.
(8) Didier Filtertechnik, Sketch No. 4S -1101, May 1982
(9) Reed G.P.: "The Economics of Hot Gas Cleaning for Coal Gasification Combined Cycle Power Generation", September 1983
(10) Didier Filtertechnik, Sketch No. 4S - 1058, December 1980
(11) Weidner U.: "High-Temperature High-Pressure Ceramic Candle Filters for Pressurised Fluidised Bed Combustion and Gasification - Based on Combined Cycle applications", September 1986
Enclosed:Drawing and sketches of DF hot gas filter material, non-pressure filters and HTHP filters
(figures 1 to 18).
r r
I T
T T
\

h //
VV*?*.*** It*.V.*« I’•^,***:r»*.\"»** I -A 1• ”6 ^ZL±
w ]
Figure 1. Filter cylinders are open at both ends (outside diameter x inside diameter x length).
I _£ .1
Tfi
: ■TW.- •.-v.i' .••Tvi.O * i
t r i
Figure 2. Filter candles are closed at one end (outside diameter x inside diameter x length overall).
Figure 3. Flanged filter candles have a flange at the open end(outside diameter x inside diameter x length overall, Wwith outside diameter x height of the flange). ]_

242 -
Figure 4. Flanged candle with hemispherical shape. DF hot gas filter material: cylindric hollow bodies.
\

- 243 -
E22X3 Reingaskonole Raw aas channels
I I Rohgaskanolp Clean gas channels
Figure 5. DIDIER cross-flow filter.
m ]
i x: j
w r i
Figure 6. DIDIER "Kanalstein" ("channel tile"). DF hot gas filter material: cross-flow filter (patented).
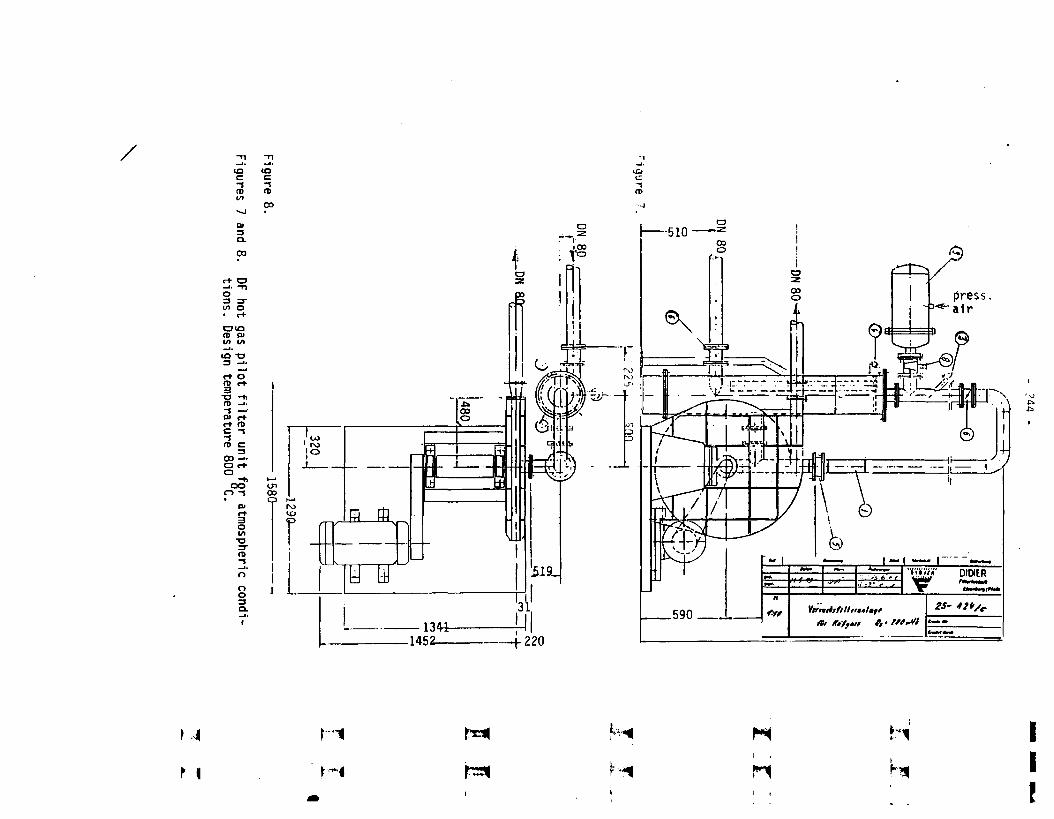
?44
-......DN SO
-^-E
•igu
re
DN 80
1290------------
Fig
ure
8
r
wr •.
i
r ;t
t r
Fig
ures
7
and 8
. DF
ho
t gas
pilo
t filte
r u
nit
for
atm
osp
heric
con
di
tion
s.
Desig
n
tem
pera
ture
800 °C
.

© © ©
©£LEGENDE
SENDREKUPERATORRECUPERATOR
VORABSCHEIDERPRE-SEPARATOR
GASFILTERGAS FILTER
KUHLER MIT INTEGRIERTEM DRUCKERZEUGER F RUCK- ■BLASUNGCOOLER FOR BACK WASHING WITH PRESSURE PRODUCER
GEBLASEBLOWER
tn<
O
EXHAUST GAS
REINGAS1 frii reaf n ft
4©t--------»
GAS FLOW RATE METERDURCHFLMENGENMESSER
Hgure 9. DF hot gas pilot filter unit for atmospheric conditions, with heat recovery. Design temperature 1 000
ro.rscnI
Jc.
1 4 Mh K
Mm
* i rz*i \i i
m__

- 246 -
I E
Figure 12. Hot gas filter unit, fully-automatically controlled. Design temperature 600 °C. Scaled-up DF hot gas filters for atmospheric conditions: single-chamber filters.
\
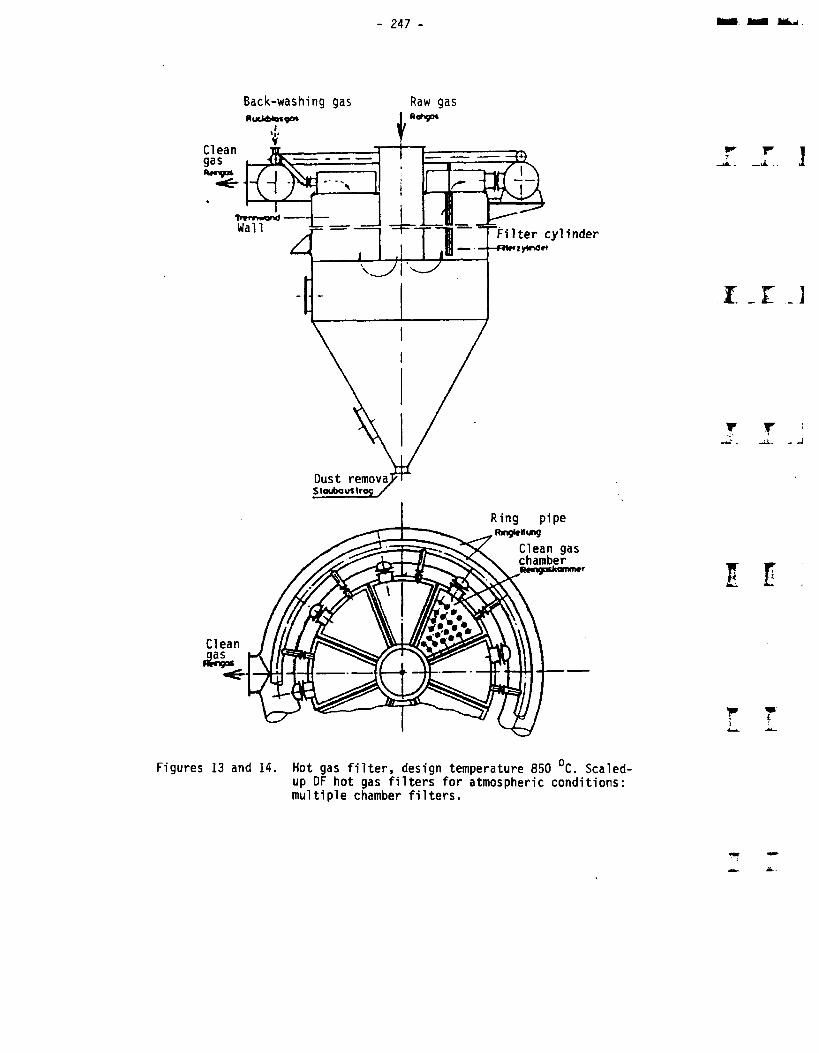
247 -
Back-washing gas Raw gas
I. J... ]
_ L J
T T. -J
l l
W!
Figures 13 and 14. Hot gas filter, design temperature 850 °C. Scaled- up DF hot gas filters for atmospheric conditions: multiple chamber filters.

248 -
Filter elcinem
Figures 15 and 16. Hot gas filter, design temperature 600 C. Scaled-up DF hot gas filters for atmospheric conditions: multiple chamber filters.
r z
wJl
I E
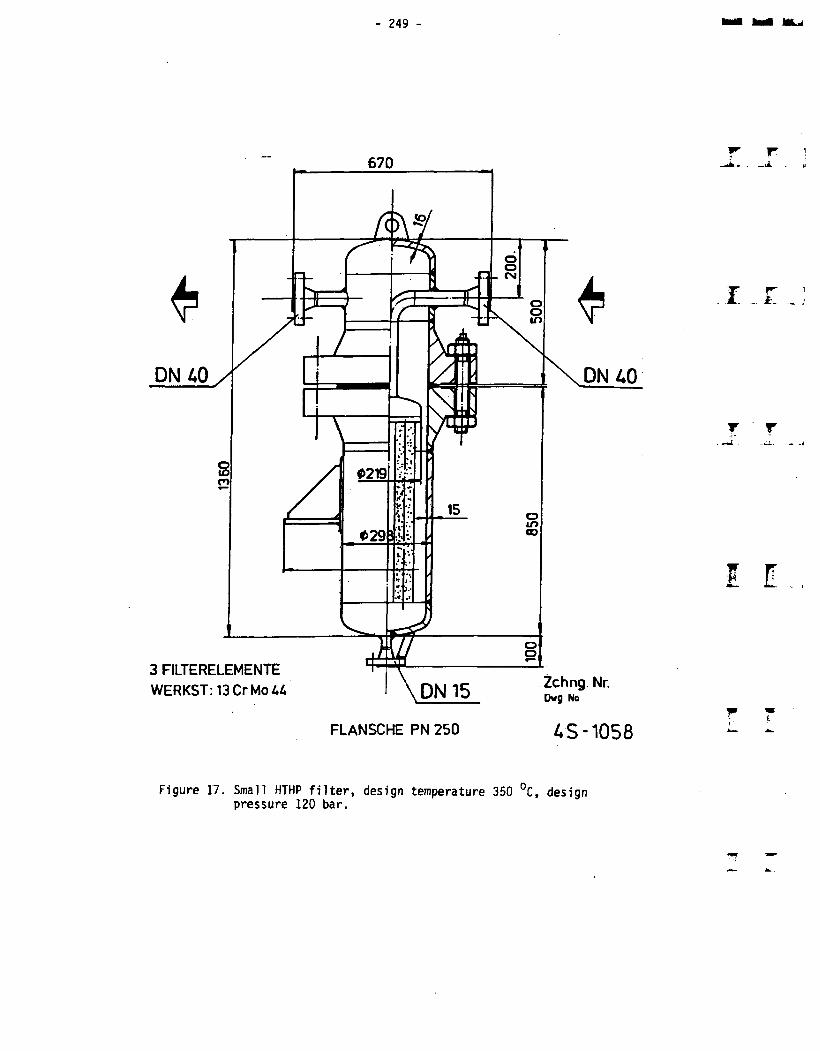
DN 40 / DN 40
3 FILTERELEMENTE WERKST: 13 Cr Mo 44 Zchng Nr.DN 15
FLANSCHE PN 250 4S-1058
.A
i r
r ' r
l E
Figure 17. Small HTHP filter, design temperature 350 °C, design pressure 120 bar.
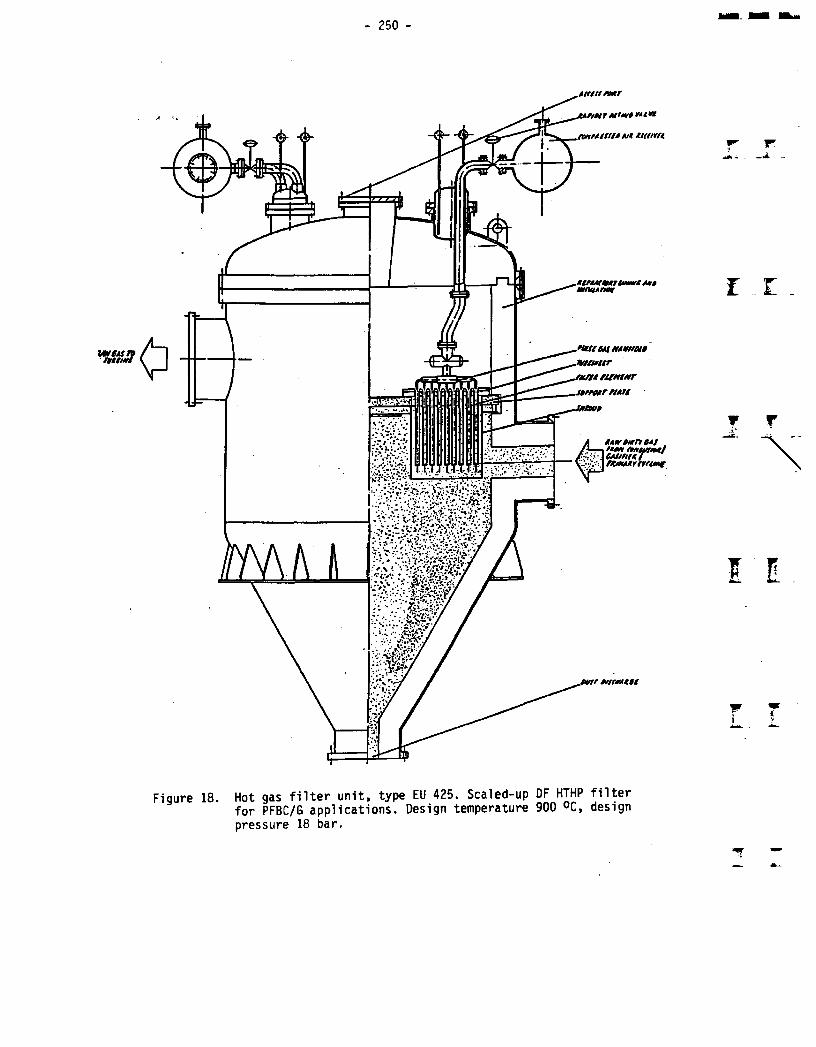
v*eun■ ttuml
- 250
unit n*r
't-nttr Atrm$ m* mittttwM uttnn
,*tr*Mionunt*t m»
StuttNMtmnu.n/fiuitr ,rx/fK nrnttur .wmrrtMt
A mao' ettn e*i
,P¥tr MUTAKCt
Figure 18. Hot gas filter unit, type EU 425. Scaled-up DF HTHP filter for PFBC/G applications. Design temperature 900 °C, design
pressure 18 bar.
r _t
F TJii ^

- 251 -
PARTICLE MEASUREMENTS AT THE OTANIEMI PFBC/G TEST RIG
Seppo Hulkkonen, M.Sc.(Eng)Helsinki University of Technology ]
Laboratory of Energy Economics and Power Plant Engineering 02150 Espoo, Finland
Abstract
One of the most difficult problems in the commercialization of PFBC technology is hot gas cleanup. Hot and compressed gases have to be cleaned effectively enough before the gas turbine to ensure a reasonable gas turbine life time. At the PFBC/G test rig combustion gases are cleaned in a two-stage cyclone collector. The efficiency of the Erst cyclone is quite low and it is considered as a pre-collector. The secondary cyclone is similar but not identical to the standard high efficiency Stairmand design. The diameter of the secondary cyclone is 103 mm.
Particle measurements are based on isokinetic sampling. Isokinetic sample flow is extracted before and after the two cyclones. The particle concentration is measured using a total filter which is electrically heated to maintain the temperature at 200 *C. The system operates at plant pressure. The filter papers used are of 90 mm in diameter and made of glass or quartz fibres. The size distribution is determined from total filter samples using Coulter Counter analysis and also using a virtual impactor. The impactor is a four-stage cascade centripeter made by Bird&Tole (UK). The centripeter is used at atmospheric pressure and 140 *C temperature. The isokinetic sample flow is expanded through a critical nozzle and diluted using heated clean air before impactor measurement. The performance of the cyclones is determined from the exit dust sample and the samples taken from the captured dusts.
The first measurements were made at pressures in the 5 to 10 bar range at different excess air levels using crushed peat pellets as fuel. The elutriation from the reactor was 2000- 4000 mg/m3n and the cyclone system reduced the concentration of particles to 70-150 mg/m3n at the secondary cyclone outlet. The overall collection efficiency of the secondary cyclone was about 90 %. The mass mean diameter of the elutriated particles was about 30 |xm and at the outlet the mass mean diameter was 2-4 |im. Size distribution analysis by Coulter Counter agreed quite well with impactor measurements.
i. r . ]
w w-u.. -
I l.
\

252 -
1 INTRODUCTION
The purpose of this paper is to present particle measuring systems and the first results obtained at the pressurized fluidized bed combustion/gasification test facility in Otaniemi. The tests in autumn 1987 were carried out using crushed peat pellets as fuel at pressures in the S to 10 bar range. Particle concentration was measured using a total filter system and particle size distribution was determined using a virtual impactor and also by Coulter Counter analyses. The performance of the two cyclones was calculated based on the mass balance techniques.
2 EXPERIMENTAL EQUIPMENT AND PROCEDURES
The PFBC/G test rig used in this study consists of a combustor vessel lined to an inside bed diameter of 15 cm. The expanded bed height is 1.2 m. The diameter of the freeboard is 0.25 m and the height of the freeboard is 2.3 m. Vertically oriented watercooling coils are immersed in the bed. Crushed peat pellets as fuel are screw-fed into the bed through a lock hopper system. The feeding port is about 12 cm above the nozzles of the air distributor. The maximum solid feed rate is about 30 kg/h. The combustor is capable of operating at pressures up to 10 bar (abs), at temperatures up to 950 *C, and at superficial gas velocities up to 1.5 m/s with expanded beds up to 1.2 m. The bed height can be controlled by adding material from a pressurized hopper or by discharging material through the air distributor. Flue gas exiting from the combustor passes through two cyclone separators. Solids collected in cyclones are removed through lock hoppers. A schematic layout of the combustor and off-gas path is shown in Figure 1.
The cyclones are made of heat-resistant steel and they are located in a large pressure vessel. The first cyclone is a low efficiency pre-collector and the secondary cyclone is similar but not identical to the standard high efficiency Stairmand design. The barrel diameter of the secondary cyclone is 103 mm. The details of the secondary cyclone are
given in Table 1.

- 253 -
CONCENTRATION AND SEE DISTRIBUTION MEASUREMENT
CONCENTRATIONMEASUREMENT
ASH HOPPERS
TKK VTT IVQ
PFBC/G TEST RIG
Figure 1. PFBC/G test rig.
I
T
Table 1. The dimensions of the secondary cyclone.
Dimensions relative to barrel diameter DPFBC/G Secondary Cyclone
Standard High EfficiencyStairmand
Height of inlet A/D 0.51 0.5Width of inlet B 1/D 0.205 0.2Gas outlet diam. Dl/D 0.54 0.5Outlet pipe insertion length S/D 0.57 0.5Height of cylindrical section Hl/D 1.52 1.5Total cyclone height H/D 4.04 4.0Dust outlet diam. B/D 0.40 0.375
The measurements were made during six tests of 5 to 15 hours duration giving the total time of about 60 h. The operating conditions of the combustor are given in Table 2.

- 254 -
Table 2. Combustor operating conditions.
TestNo.
Thermal input [kW]
Pressure[bar]
Bed temperaturera
Fluid, velocity [m/s]
Excess air [02-%]
6A 131 7.0 860 1.16 1.86 72 7.0 850 0.64 1.71 110 10.0 830 0.65 1.63 100 10.0 840 0.84 5.857A 67 5.0 870 0.83 1.59A 60 5.0 840 0.92 5.2
Natural silica sand is used as bed material. The mass mean diameter of the bed materialincluding also some fuel ash is 520 |im. The fuel properties are given in Table 3. The Y ITmass mean diameter of the crushed peat pellets is 4.85 mm.
Table 3. Fuel properties.
Effective heating value 15.6 MJ/kgMoisture content 20 J %Ash content (on dry base) 4.2%Particle size 4.85 mm (35 % >6 mm. 10 % < 1 mm)
2.1 Measuring procedures
Particle measurements are based on isokinetic sampling. Isokinetic sample flow is extracted before and after the two cyclones. The probes in use are null-type probes of 6 mm in diameter. The isokinetic conditions are maintained by keeping the static pressures inside and outside of the probe head equal. Additionally, the isokinetic flow is calculated from measured process values by means of a computer. The probes are air-cooled to reduce the temperature to 250 - 300 *C.
Particle concentration is measured using a total filter system. The filter papers are of 90 mm in diameter and the filter housing is electrically heated to keep the temperature above 200 *C. The filter materials in use are quarz and glass fibres (Munktell MK360 and Munktell MG160). Following the filter, the gas pressure is reduced across a flow control valve, the flow rate being controlled such that the sample is extracted isokinetically. Depending upon the dust loading in the duct, the sampling period can be of up to 90 minutes duration. The collected amount of dust is in the range from 100 mg to 2000 mg. After cooling and drying in an icebath condenser the gases pass through a dry gas meter. A schematic diagram of the sampling system is shown in Figure 2.
f T
l E

MEASUREMENT OF PARTICLE CONCENTRATION
... ..Nitrogen
AIRCOOLINGAIRCOOLING
Cooling, drying
TOTAL FILTER
DRY GAS METER
Rotameter
Figure 2. Concentration measurement.
Particle size distribution at the secondary cyclone outlet is determined by a virtual
impactor and by making Coulter Counter analysis of the total filter samples.
The virtual impactor is a four stage cascade centripeter made by Bird&Tole (UK). The
cascade centripeter separates the particles to size ranges according to their aerodynamic
sizes. A sectional view of the cascade centripeter is shown in Figure 3.
The particles are collected on a filter paper (Whatman GF/A) backing each nozzle. About
3 % of the total sample flow is taken through the filter thus helping the separation of small
particles.
The impactor is used at atmospheric pressure and at 140 *C temperature but it is calibrated
at ambient temperature. The corrected cut sizes for the stages at higher temperatures can
be calculated from equation
d(T) = d(293) (1)
where d is particle size, T) is viscosity of the flue gas, and T is temperature (K). The cut
sizes at 140 *C are 14.5,4.4, and 1.6 |im from first to third stage. The last stage collects
all particles below 1.6 |im (aerodynamic diameter).

- 256 -
STAGE I
STAGE 2
STAGE 3
STAGE 4
Stage! stage iSTAGE 3
£ I 60
£ 40
IO 20PARTICLE DIAMETER - MICRONS
CALIBRATION OF CENTRIPETER FOR SPHERICAL PARTICLES
OF UNIT DENSITY
SECTION THROUGH A
CENTRIPETER STAGE
SHOWING AIR FLOW LINES
SECTIONAL VIEW WEIGHT > NETT. -82 Kj.C I lb 13ot ) GROSS -91 K}.C 2 lb >
Figure 3. Cascade centripeter (Bird&Tole, UK) 131.
The isokinetic sample flow is expanded to atmospheric pressure through a critical nozzle
and diluted using clean air before impactor sampling. The flow can be varied by changing
the nozzle diameter. The nozzles in use are of 0.5 - 0.9 mm in diameter. Following the
impactor the sampled gases flow through a condenser unit to a leakless vacuum pump and
on through a dry gas meter. The sampling time is up to 2 h. The measuring facility is
presented in Figure 4.
The Coulter Counter analyses are performed of the dust samples captured on the total
filter. The dust cake on the filter is carefully scraped off and subjected to ultrasonic
dispersion for 5 minutes before Coulter Counting. This is done to brake the agglomerates
as the dust collected from pressurized fluidized bed combustor is known to agglomerate
once sampled. The electrolyte used is waterbased with 6 % NaCl. Particle size

- 257 -
distributions on a weight basis are obtained assuming that all observed particles were
spheres of equal density.
MEASUREMENT OF SIZE DISTRIBUTION
Nitrogen
Ancooting
Probe
Air heater
Rotameter
DRY GAS METERDILUTION AIR
Figure 4. Impactor measurement.
Additionally the size distribution of the dust captured by the cyclones is determined using
Coulter Counter. The material has a wide size range from 0 up to 200 pm and so the
analysis is completed in two stages; Erst the entire sample is air-sieved (Alpine) to
determine the distribution of the particles over 11 pm and then the size distribution of the
fine particles is determined using Coulter Counter. The grade efficiency of the cyclones is
then calculated from the mass balances.
i. r j
f r i■iifr, — _j
3 RESULTS AND DISCUSSION
3.1 Elutriation and emissions f 7
The elutriation from the reactor varies in the range 2000 - 3000 mg/m3n (1700 - 2600
ppmw, by weight) and the cyclones reduce the concentration of particles down to 70 -150 mg/m3n (60 -130 ppmw) at the secondary cyclone outlet. Typical particle loading curves
are shown in Figure 5. The curves are based on Coulter Counter analyses.
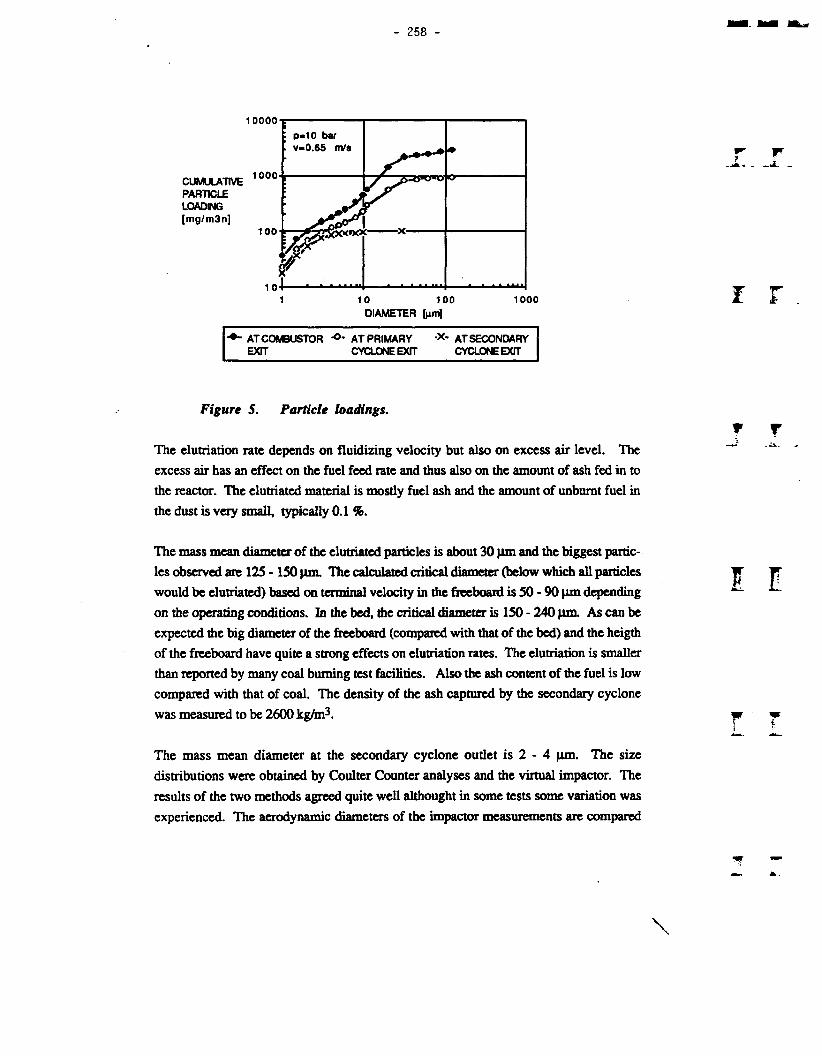
258 -
CUMULATIVEPARTICLELOADING[mg/m3n]
10000D-10 bar
1000
1000DIAMETER [nm]
i rAT COMBUSTOR •O- at PRIMARY •X* AT SECONDARYEXIT CYCLONE EXIT CYCLONE EXIT
Figure 5. Particle loadings.
The elutriation rate depends on fluidizing velocity but also on excess air level. The
excess air has an effect on the fuel feed rate and thus also on the amount of ash fed in to
the reactor. The elutriated material is mostly fuel ash and the amount of unbumt fuel in
the dust is very small, typically 0.1 %.
The mass mean diameter of the elutriated particles is about 30 pm and the biggest partic
les observed are 123 - ISO pm. The calculated critical diameter (below which all particles
would be elutriated) based on terminal velocity in the freeboard is 30 - 90 pm depending
on the operating conditions. In the bed, die critical diameter is 130 - 240 pm. As can be
expected the big diameter of the freeboard (compared with that of the bed) and the heigth
of the freeboard have quite a strong effects on elutriation rates. The elutriation is smaller
than reported by many coal burning test facilities. Also the ash content of the fuel is low
compared with that of coal. The density of the ash captured by the secondary cyclone was measured to be 2600 kg/m3.
The mass mean diameter at the secondary cyclone outlet is 2 - 4 pm. The size
distributions were obtained by Coulter Counter analyses and the virtual impactor. The
results of the two methods agreed quite well although! in some tests some variation was
experienced. The aerodynamic diameters of the impactor measurements are compared
1 l
\

- 259 -
with the mass (volume) distribution determined by Coulter Counter. Data are reported in
terms of physical diameter. Following definition is used:
dp = dpa(C’pp)-M (2)
where dp is the physical diameter, dpa is the aerodynamic diameter, C is the slip correction factor, and pp is particle density.
Typical curves of size distribution at the secondary cyclone outlet determined by both techniques are shown in Figure 6.
SIZE DISTRIBUTION AT THE SECONDARY CYCLONE OUTLET
I £ _]
CUMULATIVE 60 MASS [%]
p m 10 baiv - 0.65 m/s
10DIAMETER [pm]
COULTER ■*- COULTER ■©• IMPACTOR 1 IMPACTOR 2 COUNTER 1 COUNTER 2
¥ T )
Figure 6. Size distribution at the secondary cyclone outlet.
Figure 6 shows two independent Coulter and impactor measurements made during one
test of IS hours duration. The impactor measurements tend to show slightly higher
concentration of very fine particles. FI
3.2 Cyclone performance
About 95 % of the particles in flue gases leaving the reactor are removed in passage
through two cyclones. The material captured by the primary cyclone has a mass mean
- 260 -
diameter of 26 - 37 pm. The overall efficiency of this cyclone is only about 66 % and it
is considered as a pre-collector. The material captured by the secondary cyclone has a
mass mean diameter of 20 - 26 pm and an overall efficiency of 90 %. Particleconcentration in the flue gases leaving the secondary cyclone is generally 70 - 150 ]prmg/m3n. The operating parameters of the cyclones are presented in Table 4. The inlet
velocity of the cyclones is quite low, being normally 11-12 m/s.
Table 4. Operating conditions of the cyclones.
Inlet velocity [m/s] 10-20Pressure [bar] 5-10Temperature [*C] 600-700Pressure drop [kPa] 0.6-2.1Particle concentration 1 [mg/m3n] 2000-3000Particle concentration 2 [mg/m3n] 570-1100Gas flow [kg/h] 100-190Primary cyclone catch [g/h] 130-270Secondary cyclone catch [g/h] 60-110Exhaust dust flow fe/hl 8-14
The grade efficiency curves for the secondary cyclone are also prepared. Grade
efficiencies were calculated for each test period based on the exit dust sample and the
samples taken from the captured dusts. Figure 7 shows a typical grade efficiency curve
obtained and also the predicted grade efficiency determined by Leicht&Iicht model. The
overall collection efficiences are 1 - 3 units of percentage lower than predicted by the
model The measured cut sizes (50 % collection efficiency) of the secondary cyclone are
3.5 - 4.2 pm. The predicted cut sizes are in the range from 1.3 to 1.7 pm.
What is typical of all determined grade efficiency curves is the sudden improvement in
collection efficiency when the particle diameter is below 1,5-2 pm. Similar phenomena
have also been detected by other workers /l, 2/. This is probably caused by particle
aggregation promoted within the cyclone whereby fine particles, which would otherwise
pass through the cyclone uncollected, adhere to bigger particles and are then consequently
collected. However, the agglomerates are broken down and re-dispersed during the
particle size analysis. Also the fine particles can agglomerate with other small particles
thus forming big particles which are then captured by the cyclones. It seems that the
behaviour of small particles at high pressures cannot be predicted by the Leicht&Licht
model.
r r
T ' r
T
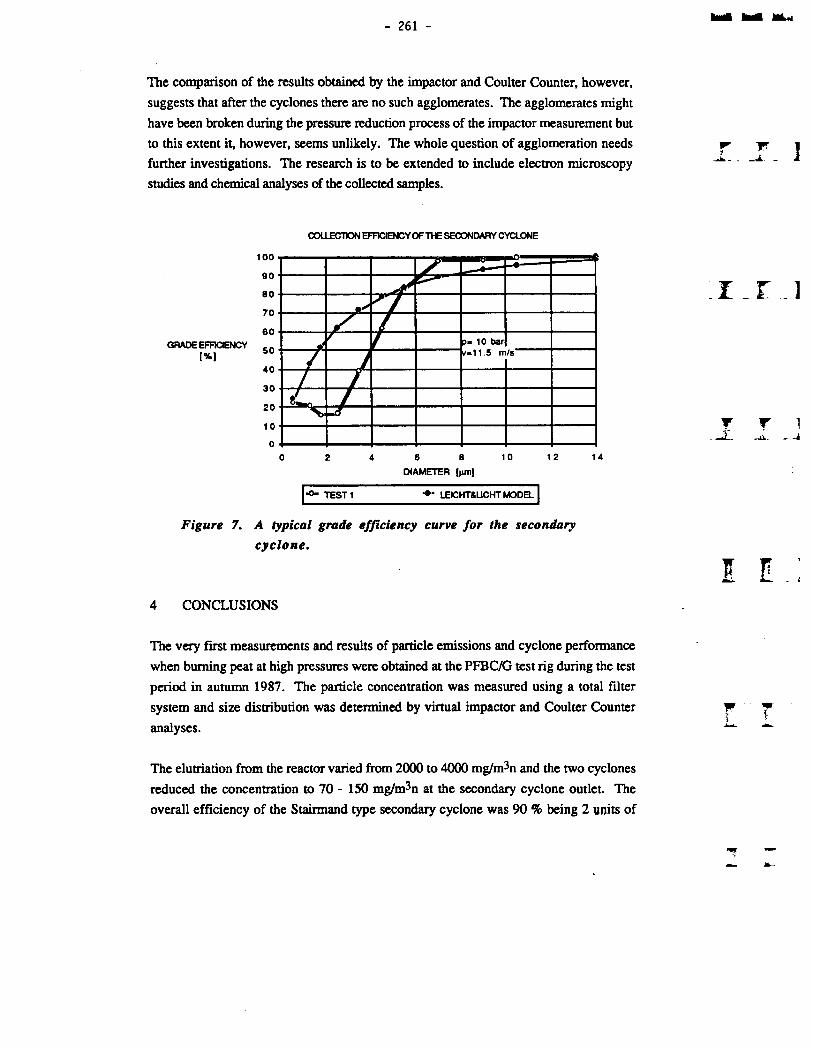
- 261 -
The comparison of the results obtained by the impactor and Coulter Counter, however,
suggests that after the cyclones there are no such agglomerates. The agglomerates might
have been broken during the pressure reduction process of the impactor measurement but
to this extent it, however, seems unlikely. The whole question of agglomeration needs w rr
further investigations. The research is to be extended to include electron microscopy
studies and chemical analyses of the collected samples.
COLLECTION EFFICIENCY OF THE SECONDARY CYCLONE
GRADE EFFICIENCY [%1
p- 10 barv-11.5 m/s'
-o- TEST 1 LEICHT&LICHT MODEL
Figure 7. A typical grade efficiency curve for the secondary
cyclone.
4 CONCLUSIONS
The very first measurements and results of particle emissions and cyclone performance
when burning peat at high pressures were obtained at the PFBC/G test rig during the test
period in autumn 1987. The particle concentration was measured using a total filter
system and size distribution was determined by virtual impactor and Coulter Counter
analyses.
The elutriation from the reactor varied from 2000 to 4000 mg/m^n and the two cyclones
reduced the concentration to 70 - 150 mg/m3n at the secondary cyclone outlet. The
overall efficiency of the Stairmand type secondary cyclone was 90 % being 2 units of
I _E 1
T T 1_ -it- -ii. ~ -i
I
w
- 262 -
percentage lower than predicted by the Leicht&Licht model. The results, however,
showed that the Leicht&Licht model appears to be insufficient for predicting the
behaviour of very fine particles. Further investigation of agglomeration of fine particles isneeded. Electron microscopy studies of the particles collected will be undertaken. f" Jr
References:
1. Pillai KX., Wood MA., Emissions from a pressurized fluidized bed coal
combustor. Journal of the Institute of Energy. December 1980. p 159-175.
2. Wheeldon J.M.,etxil., The performance of cyclones in the off-gas path of a
pressurized fluidized bed combustor. IChemE Symposium Series No.99. 1986.
3. Air pollution measurement, Bird&Tole brochure.
T T
S l

- 263 -
THERMODYNAMIC STUDY OF ALKALI METALS RELEASE IN PRESSURISED
FLUIDISED-BED COMBUSTION AND GASIFICATION OF PEAT
Wahab Mojtahedi* & Rainer Backman **
* Laboratory of Fuel Processing and Lubrication Technology
Technical Research Centre of Finland
Espoo, Finland.
** Department of Chemical Engineering
Abo Akademi
Turku, Finland.
ABSTRACT
A combined-cycle power generation system incorporating pressurised
fluidised-bed combustion (PFBC) or gasification is considered a promi
sing approach for electricity generation using solid fuels such as
peat. In these systems, the high-pressure hot flue gas is expanded in a
gas turbine. Peat contains sodium and potassium which are released in
combustion and gasification. These are corrosive elements that can
cause severe damage to the turbine blades if not suppressed.
Multicomponent, multiphase equilibrium calculations were carried out
for atmospheric and pressurised fluidised-bed operating conditions to
determine the relative distribution of the two metals (Na and K) in the
gas and condensed phases. Dependence of the alkali volatilisation on
the operating temperature, pressure, the chlorine-content and the total
alkali-content of the feedstock was studied. The results show that the
alkali release in the vapour-phase could be much higher than acceptable
to a gas turbine, particularly under gasification conditions. Hence the
necessity to remove the volatilised alkali-metal compounds is more
acute in gasification than in combustion.
Both sodium and potassium are present as chlorides and to a lesser
extent as hydroxides in the gas phase in both modes of operation (i.e.
combustion and gasification). However, whereas under combustion
conditions both metals seem to condense as sulphates (Na2S04 and
]
I r 1
wi

264 -
K2S04), in gasification, chlorides and carbonates dominate in the
condensed phase. The alkali-metals volatilisation shows strong de
pendence on the operating pressure of the system as well as on the
chlorine-content of the feedstock. It decreases markedly with the
former but increases sharply with the latter.
1 INTRODUCTION
Fluidised-bed gasification of peat to produce a low calorific value
fuel gas for use in a combined-cycle power generation scheme, provides
a great potential for improved thermal conversion efficiency. Similar
ly, in a pressurised fluidised-bed combustion/gas turbine combined-
cycle system, the high temperature, high-pressure flue gas generated
from the PFB combustor is expanded through a gas turbine to recover
energy for improved overall thermal cycle efficiency.
The major obstacle remaining in the utilisation of solid fuels such as
coal and peat in such systems, is the high-temperature high-pressure
gas cleanup necessary before the flue gas can be admitted to the gas
turbine. The principal contaminants include
(I) fine particulates (small ash, sorbent and unburnt carbon
particles),
(II) alkali-metal compounds (principally sodium and potassium
chlorides and sodium and potassium sulphates), and
(III) sulphur dioxide and sulphur trioxide.
The contaminants are not effectively removed from the hot gases by
conventional hot gas cleaning methods (mainly cyclones) either because
of their very small size or because they exist in the vapour phase. The
fine particulates in the hot gas streams cause most of the erosion and
fouling that occurs in gas turbines. The major causes of hot corrosion
are the alkali-metal compounds. These compounds generally corrode the
turbine blades by attacking and destroying the protective oxide layer
normally present on the metal at high temperatures. The different tem
perature ranges in which accelerated corrosion takes place can be rela
ted to the different melting temperatures of various alkali compounds.
Manufacturers' specifications for acceptable levels of alkali in tur
bine expansion gases vary reflecting a real lack of experience in the
effect of alkalis on turbomachinary /!/. The current industrial gas-
turbine specification limit for alkali-metal compounds in the com
bustion gas entering a turbine is equivalent to 0.024 ppm (v) /2/.
Singh et al. /3/ reporting on alkali removal from hot coal-derived
gases, state that "conventional standards for turbomachinery require
alkali levels equivalent to typically 0.1 ppm (w) in a gaseous fuel".
As a result of the catastrophic erosion and corrosion of gas turbine
hardware, it is imperative to find a method to clean up gasifier pro
duct gas and combustor flue gas before combined-cycle power generation
can be operated successfully. The removal of particulates and alkali-
metal compounds at high temperatures is investigated in the Laboratory
of Fuel Processing and Lubrication Technology of the Technical Research
Centre of Finland. This article deals with some theoretical considera
tions concerning alkali release from fluidised- bed combustion and
gasification of peat.
2 THERMODYNAMIC EQUILIBRIUM CALCULATIONS
A theoretical distribution of sodium and potassium in combustion and
gasification products was studied assuming equilibrium conditions.
The equilibrium composition was established by minimising the total
Gibbs free energy of the system. This was done by using a computer
model developed by G. Eriksson /4/. Altogether 65 chemical species (45
gaseous and 20 condensed) were considered. These are listed in Table
(1). Thermodynamic data for the species were taken from references /5 -
8/. The notations used in Table 1 (and in this paper) are as follows:
- name-g gaseous
- name-1 1iquid
- name-s solid
condensed (i.e. solid or liquid)name-c

Table 1. Chemical species considered in the equilibrium calculations
1 6 10 bar
A: 0.3 & 1.2 bar
500-1000‘C
200-600 ppm
190-5700 ppmK+Na=
Gaseous phase: co2, h2o, o2, n2, oh. h2, CH^ HCO, H, 0. N.
HCN, C, NH3, HC1, Cl, C12, S03, S02, S, S2,H2S, COS, HS, CS, CS2, S20, H2S0l4, Ma, Na2,
NaCl, Na2Cl2, NaOH, NaH, NaO, Na2S0„, K, K2,
kci, k2ci2, koh, kh, ko
Liquid phase: Na2C03, Na2S04, Na2S, NaCl, NaOH, K2C03,
K2S0^, k2s, KCI, KOH
Solid phases: Na2 C03, Na2S04, Na2S, NaCl, NaOH, K2C03,
K2s°4, K2S, KCI, KOH
1 i r...i 1 hi
r i h-« M

267
In the results presented here, equilibrium compositions are calculated
assuming that gas mixtures are ideal and that all solid condensed
phases are immiscible. The first assumption is not a significant
limitation for the moderate pressures of interest here. Mixtures of
condensed liquid phases, however, have been considered except in the
case of sodium and potassium sulphates and carbonates.
The calculations were carried out to predict the form in which alkali
metals are released from xombustion or gasification of peat. It is of
interest to know whether the compounds of sodium and potassium will be
present in the aerosol or the vapour phase in the hot flue gas.
According to the vapour pressure data for sodium sulphate, if the
alkalis are present as sulphates in the hot gas streams, they are most
likely to be in the aerosol phase. If they are present primarily as
chlorides, they will be in the vapour phase. The actual form will have
a serious effect on the ultimate design of an industrial-sized hot gas
alkali removal system.
Table 2 lists the composition of the fuel used for the equilibrium
calculations. These were taken from reference /9/.
i r
r r.A
Table 2. Feedstock composition.
Element mol/1000 mol of C t/t of dry solid
C 1000.0 0.55H 1191.6 0.0550 444.98 0.326N 26.512 0.017S 1.363 0.002h2o* 808.54 0.667
El ement Minimum Maximummg/kg of peat mg/kg of peat
Cl 200 600K 140 2210Na 50 790
* The value for H20 corresponds to 40 % water-content in peat.

- 268 -
3 COMBUSTION
Equilibrium calculations were carried out for atmospheric as well as
pressurised fluidised-bed combustion (AFBC and PFBC) conditions. An air
ratio of 1.2.(i.e. 20 % in excess of the stoichiometric requirement)
with both operating pressures (of 1 and 10 bar) were employed. Some
calculations were also carried out to simulate isothermal fluidised-bed
combustion of peat. In this case, a temperature of 850 °c was employed
which represents a typical fluidised-bed combustion operation.
The calculations were repeated for three different fuel compositions
with regard to the chlorine content of the fuel (200, 400 and 600 mgAg
of peat) and again, for three alkali-metal contents in the feedstock.
Figures 1-5 show the results of some of these calculations. Figure 1
presents the distribution of the two metals in the three different
phases at 500 - 1000 °C temperature range. A chlorine content of 400
mg/kg and alkali content of 500 mg/kg (K = 400 and Na s 100 mg/kg),
used in these calculations, correspond to a "mean" peat composition
with regard to these elements.
The maximum of 100 % on the Y-axes corresponds to the total amount of
the element in question, in the system. Table 2, (e.g. 100 mg/Kg of dry
peat for Na). The composition of the gas can be read from Figure 2,
which shows the variation of the partial pressure of the gaseous alkali
and chlorine compounds with temperature. The bulk of both metals are
present in the form of chloride and to a lesser extent hydroxide in the
volatilised phase.
The liquid phase (Figure 1) consists almost entirely of the sulphates
of sodium and potassium (Na2S04-1 and K2S04-1). Solid sodium sulphate
seems to form below 740 °C but K2S04-s could be present at even 900 °C.
The concentration of both metals in the flue gas can be read from Table
3, which shows that the total alkali content in the vapour phase never
exceeds 0.05 ppm (v), (Na = 0.1, K = 0.04) at 800 °C under PFBC condi
tions with a chlorine-content of 400 mg/kg and alkali-content of 500
mg/kg in the feedstock. This value represents about 0.06 * of the
JL
r r
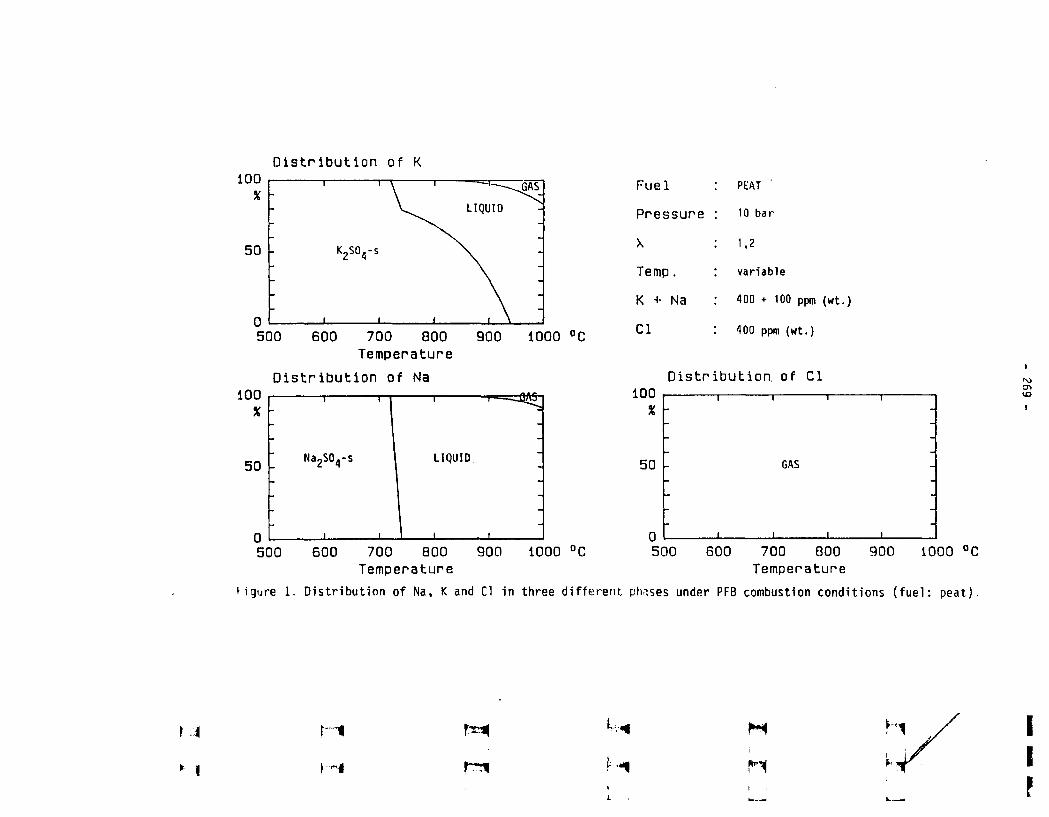
Distribution of K
LIQUID
500 600 700 000 900 1000 °C
Temperature
Distribution of Na
Fuel
Pressure
X
Temp.
K + Na
Cl
PEAT
10 bar
1.2
variable
400 + 100 ppm (wt.)
400 ppm (wt.)
Distribution of Cl
LIQUID
500 600 700 800 900 1000 °C 500 600 700 GOO 900 1000 °C
Temperature Temperature
Hgure 1. Distribution of Na, K and Cl in three different, phases under PFB combustion conditions (fuel: peat).

270 -
sodium and 0.12 % of the potassium in the system. The corresponding figure for 900 °C shows a value of 0.67 ppm (v) for the total volati
lised alkali (Na = 0.13, K = 0.5), an increase of almost 10-fold.
This figure represents about 1.0 %> of the total sodium and 1.9 % of
the total potassium entering the system.
GASEOUS K-, Na- and Cl-species
-0.001
900 1000 °C700 BOO Temperature
i r
f TJL A
IE
Figure 2. Variation of the partial pressure of the gaseous alkalispecies with temperature under PFB combustion conditions(fuel: peat).
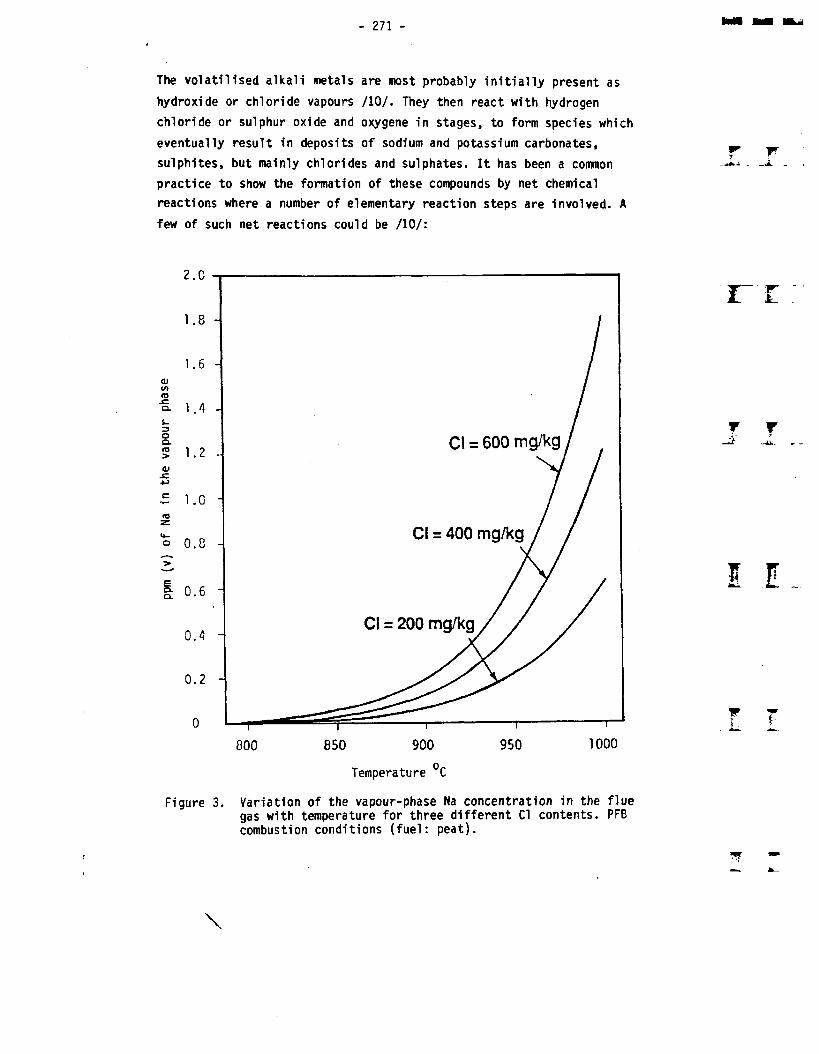
- 271 -
The volatilised alkali metals are most probably initially present as
hydroxide or chloride vapours /10/. They then react with hydrogen
chloride or sulphur oxide and o*ygene in stages, to form species which
eventually result in deposits of sodium and potassium carbonates,
sulphites, but mainly chlorides and sulphates. It has been a common
practice to show the formation of these compounds by net chemical
reactions where a number of elementary reaction steps are involved. A
few of such net reactions could be /10/:
Cl = 600 mg/kg
Cl = 400 mg/kg
Cl = 200 mg/kg
Temperature C
Figure 3. Variation of the vapour-phase Na concentration in the fluegas with temperature for three different Cl contents. PFBcombustion conditions (fuel: peat).
r r
v rJL -J.
\

ppm
(v) K i
n the v
apou
r phas
e
272 -
KOH (g) + HC1 (g) - KCI (g) + H20 (g) (1)
2 NaCl (g) + H20 (g) + S02 (g) + 1/2 02 (g) -
Na2S04 (c,g) + 2 HC1 (g) (2)
2 NaOH (g) + S02 (g) + 1/2 02 (g)
Na2 SO^ (c,g) + H20 (g) (3)
C! = 600 mg/kg
Cl = 400 mg/kg
Cl = 200 mg/kg
800 850 900 950 1000
Temperature °C
Figure 4. Variation of the vapour-phase K concentration in the fluegas with temperature for three different Cl contents. PFBcombustion conditions (fuel: peat).
W- _
I E .
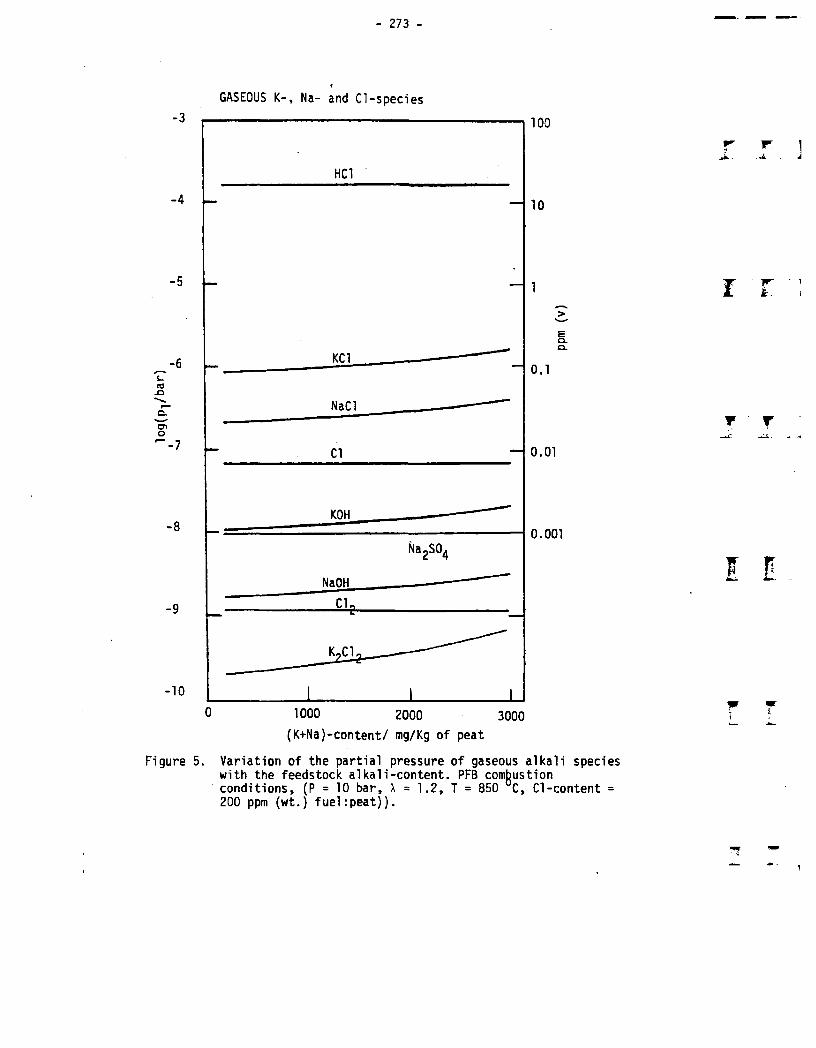
- 273 -
GASEOUS K-, Na- and Cl-species
100
10
1
>
EQ.CL
0.1
0.01
0.001
o 1000 2000 3000
(K+Na)-content/ mg/Kg of peat
Figure 5. Variation of the partial pressure of gaseous alkali species with the feedstock alkali-content. PFB combustion conditions, (P = 10 bar, X = 1.2, T = 850 °C, Cl-content = 200 ppm (wt.) fuel:peat)).
r r i- _*4 J
I T 1i
T fp
F

274 -
Table 3. Sodium and potassium concentrations 1n the vapour phase In the flue gas under combustion conditions (x = 1.2) at 1 and 10 bar pressures. (Fuel : peat. Cl-content = 400 mg/kg).
Temperature(°C)
P = 1 bar P = 10 bar
Na(ppm v)
K(ppm v)
Na + K (ppm v)
Na(ppm v)
K(ppm v)
Na + K (ppm v)
800 0.12 0.56 0.68 0.01 0.04 0.05810 0.16 0.75 0.91 0.01 0.05 0.06820 0.22 1.00 1.22 0.01 0.06 0.07830 0.29 1.32 1.61 0.02 0.09 0.11840 0.39 1.72 2.11 0.03 0.11 0.14850 0.51 2.23 2.74 0.03 0.15 0.18860 0.66 2.85 3.51 0.04 0.19 0.23870 0.85 3.61 4.46 0.06 0.25 0.31880 1.08 4.51 5.59 0.08 0.33 0.41890 1.36 5.56 6.92 0.10 0.42 0.52900 1.68 6.74 8.42 0.13 0.54 0.67910 2.05 8.06 10.11 0.17 r\ c -\.: - . 0.86920 2.46 9.48 11.94 0.21 1.09930 2.92 10.97 13.89 0.2? -ii 1.38940 3.41 12.51 15.92 0.34 1.39 1.73950 3.92 14.06 17.98 0.43 1.73 2.16960 4.47 15.61 20.08 0.53 2.14 2.67970 5.04 17.13 22.17 0.66 2.62 3.28980 5.63 18.64 24.27 0.82 3.20 4.02990 6.26 20.15 26.41 1.00 3.87 4.87
1000 6.95 21.64 28.64 1.21 4.64 5.85
However, in thermodynamic equilibrium analyses such as those reported
in this paper, it is more appropriate to consider the chemical system
as a whole rather than single reactions. Hence, the compounds which can
exist at equilibrium under given conditions of temperature, pressure
and composition are considered in our analyses and not these reactions.
This study shows that both sulphates of sodium and potassium are likely
to be found in the condensed phase under the conditions prevalent in
PFBC systems. (Na2S04-g concentration never exceeds 0.01 ppmv even at
950 °C). Scandrett /10/ studying the possible forms of the alkali-metal
compounds in pressurised fluidised-bed combustion of coal, also
reported that both sodium sulphate and potassium sulphate are most
likely to be present in the condensed phase.
S l

- 275 -
The saturation concentrations of the chlorides of sodium and potassium
at 900 °C and a pressure of 10 bar are reported to be of the order of
10"3 bar in a flue gas with similar composition to that considered here
/10/. Our calculations show the concentrations of NaCl-g and KCL-g to
be well below the saturation levels (of the order of 10"5 for both
chlorides). Therefore, if the alkalis are present as chloride or
hydroxide, they will be present in the vapour phase. However, the
estimated vapour saturation concentrations for the sulphates are below
their concentrations in the flue gas. This suggests that, if the
alkalis are present as sulphates, they will be present predominantly as
condensed phase.
It is interesting to note the effect of the chlorine-content of the
fuel on the relative distribution of the two metals in the gas and
condensed phases. Most of the fuel-bound chlorine is present as HCl-g
in the flue gas. Figure 2. Because the HCl-g concentration is much
higher than that of the alkali chlorides, its formation has negligible
effect upon the chloride concentration in the gas. However, Figures 3
and 4 show the volatilisation of both sodium and potassium to be
strongly dependent on the chlorine-content of the in-going fuel. The
higher the Cl-content the higher the vapour-phase alkali chlorides in
the flue gas. This indicates the relative importance of the peat compo
sition used as fuel in pressurised fluidised-bed combustion process.
The flue gas composition with respect to the volatilised alkali com
pounds (principally chlorides), the necessity to remove these com
pounds, and the removal mechanism selected, (should it be required),
would depend to some extent on the type of peat combusted, (i.e. the
initial feedstock composition).
Calculations similar to those reported above, were carried out for
operating conditions corresponding to fluidised-bed combustion of peat
at normal pressure; the operating conditions were identical except for
pressure which is one bar. Again, the higher chlorine content of the
fuel enhances alkali metals volatilisation (in the form of vapour-phase
chlorides). A comparison of the results obtained at P = 1 bar with
r t
t r
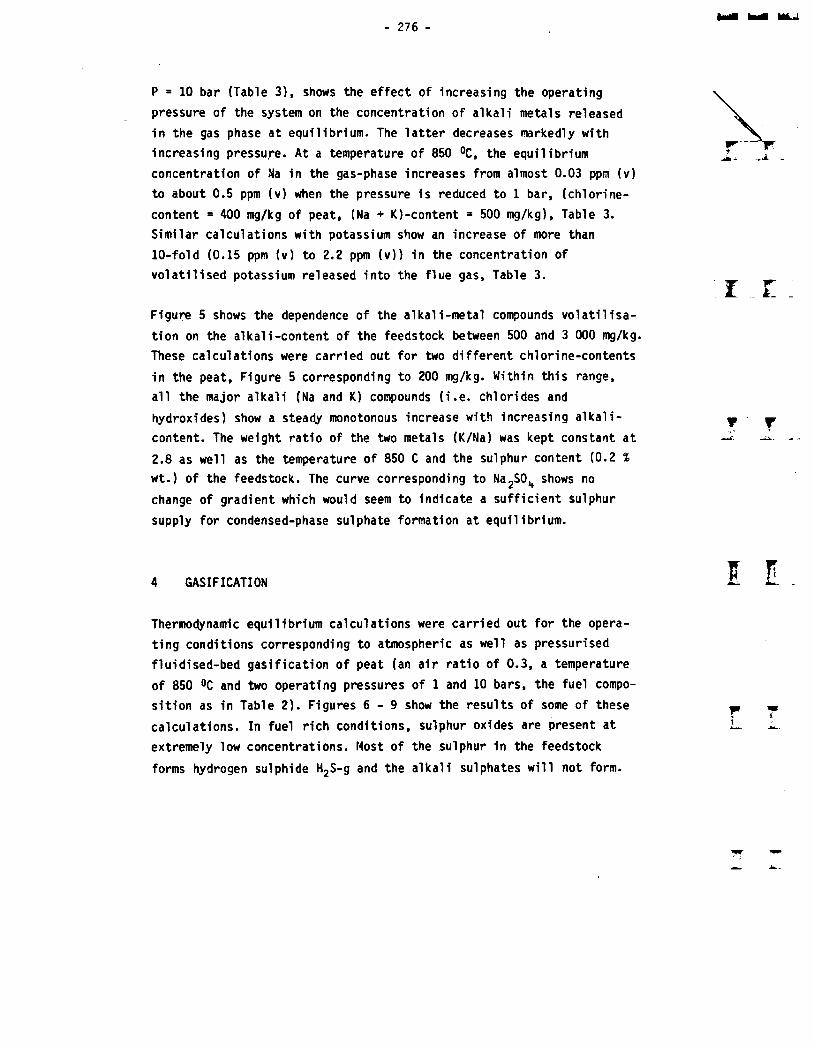
- 276 -
P = 10 bar (Table 3), shows the effect of increasing the operating
pressure of the system on the concentration of alkali metals released
in the gas phase at equilibrium. The latter decreases markedly with
increasing pressure. At a temperature of 850 °C, the equilibrium
concentration of Na in the gas-phase increases from almost 0.03 ppm (v)
to about 0.5 ppm (v) when the pressure is reduced to 1 bar, (chlorine-
content = 400 mg/kg of peat, (Na + K)-content = 500 mg/kg). Table 3.
Similar calculations with potassium show an increase of more than
10-fold (0.15 ppm (v) to 2.2 ppm (v)) in the concentration of
volatilised potassium released into the flue gas. Table 3.
Figure 5 shows the dependence of the alkali-metal compounds volatilisa
tion on the alkali-content of the feedstock between 500 and 3 000 mg/kg.
These calculations were carried out for two different chlorine-contents
in the peat. Figure 5 corresponding to 200 mg/kg. Within this range,
all the major alkali (Na and K) compounds (i.e. chlorides and
hydroxides) show a steady monotonous increase with increasing alkali-
content. The weight ratio of the two metals (K/Na) was kept constant at
2.8 as well as the temperature of 850 C and the sulphur content (0.2 % wt.) of the feedstock. The curve corresponding to NajSO^ shows no
change of gradient which would seem to indicate a sufficient sulphur
supply for condensed-phase sulphate formation at equilibrium.
4 GASIFICATION
Thermodynamic equilibrium calculations were carried out for the opera
ting conditions corresponding to atmospheric as well as pressurised
fluidised-bed gasification of peat (an air ratio of 0.3, a temperature
of 850 °C and two operating pressures of 1 and 10 bars, the fuel compo
sition as in Table 2). Figures 6-9 show the results of some of these
calculations. In fuel rich conditions, sulphur oxides are present at
extremely low concentrations. Most of the sulphur in the feedstock
forms hydrogen sulphide H2S-g and the alkali sulphates will not form.
II
T ' T
- 277 -
Compared to fluidised-bed combustion, a much greaterproportion of both
metals (Na, K) are present in the vapour phase at 700 - 900 °C tempe
rature range (Figures 1 and 6). The volatilised phase consists prima
rily of chlorides and hydroxides of sodium and potassium. Whereas in
F-B combustion the condensed phase consists almost entirely of the
sulphates of the two metals, in F-B gasification both metals condense
as chlorides and carbonates. KC1-1 is the dominant compound of potassium in the condensed phase above 600 °C. Below this temperature, the
solid phase forms and KCl-s is the dominant compound of potassium. A
relative distribution of potassium between KC1-1 and K2C03-1 was cal
culated and the results show the concentration of the former to be al
most an order of magnitude greater than the latter. This pattern prevails up to almost 920 °C, above which no condensed phase is revealed.
A similar pattern is revealed with sodium in that, at equilibrium, this metal will condense as NaCl-1 and NagCO^-l at 600 - 900 °C tempe
rature range. However, the relative distribution of sodium in these
two compounds varies as the temperature increases. Most of the metal is bound as NaCl-1 at about 700 °C but the carbonate percentage becomes
significant above 850 °C.
Figure 7 shows that the chlorides (KCl-g and NaCl-g) and to a lesser
extent hydroxides (KOH-g and NaOH-g) are the dominant volatilised al
kali compounds. Diehlorides of both metals (I^Clg-g and Na2Cl2-g) are
also formed but by almost an order of magnitude less than monochlorides.
The concentrations of the volatilised alkali metals in the flue gas at various temperatures are tabulated in Table 4. Even at 700 °C a rela
tively significant concentration (at ppm level) of both metals is re
leased in the vapour phase in the flue gas (7.5 ppm (v), with Na =
0.6 ppm (v) and K = 6.9 ppm(v)), Table 4.
Our analyses show that, depending on the alkali and chlorine content
in the feedstock, as much as 20 % of total sodium and 70 % of total potassium in the fuel could be present in the vapour phase at 800 °C,
under gasification conditions. Figure 8. Again, the higher chlorine
content in the fuel seems to enhance the alkali-metal volatilisation.
TF-L. - ]
T J
El
wi
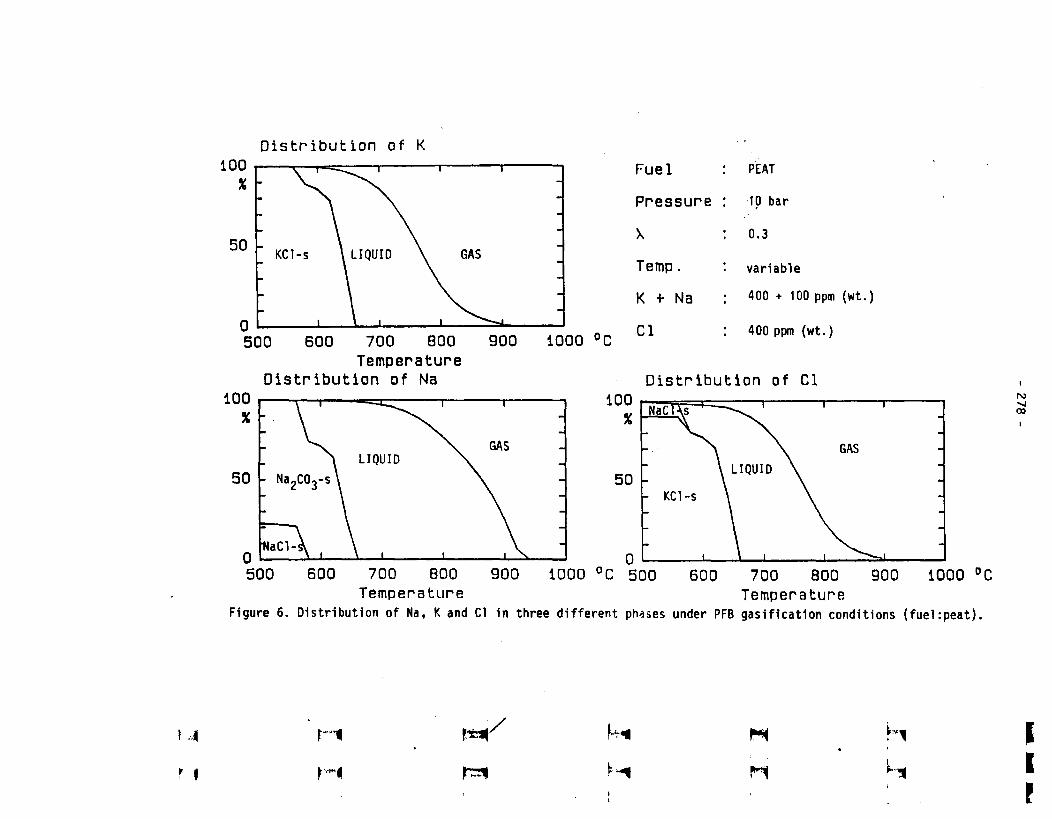
Distribution of K
KCI-s LIQUID
900 1000Temperature
Distribution of Na
Fuel
Pressure
X
Temp.
K + Na
Cl
PEAT
10 bar
0.3
variable
400 + 100 ppm (wt.)
400 ppm (wt.)
Distribution of Cl
1000 °C: 500 600 700 800 900Temperature
Figure 6. Distribution of Na, K and Cl in three different phases under PFB gasification conditions (fuelrpeat).
I
I
\ 4 lx*/ Mi N hi•
r I H 1
\ t
I
I
P
278
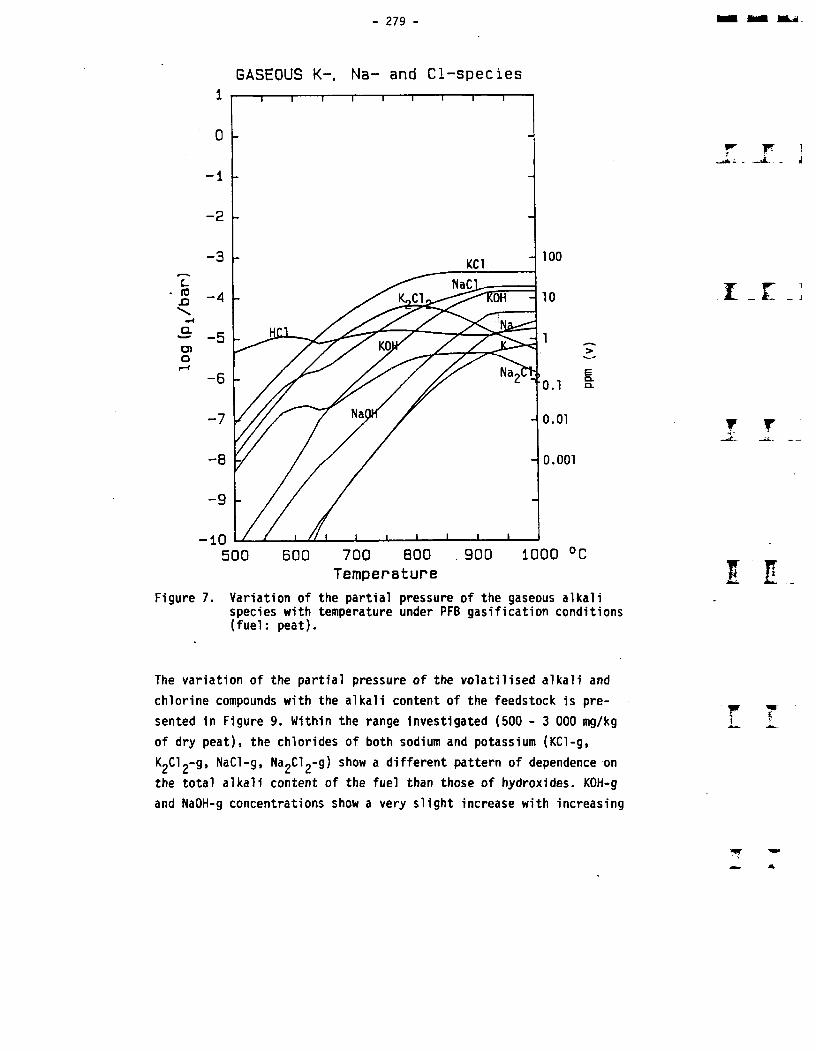
- 279 -
GASEOUS K-, Na- and Cl-species
100
10
1
0.1
o.oi
o.ooi
>
CLCL
500 500 700 800 900 1000 °CTemperature
Figure 7. Variation of the partial pressure of the gaseous alkalispecies with temperature under PFB gasification conditions (fuel: peat).
r w i___j. . j
i _£
T T
The variation of the partial pressure of the volatilised alkali and
chlorine compounds with the alkali content of the feedstock is pre-w
sented in Figure 9. Within the range investigated (500 - 3 000 mg/kg ]_
of dry peat), the chlorides of both sodium and potassium (KCl-g,
K2Cl2-g, NaCl-g, Na2Cl2-g) show a different pattern of dependence on
the total alkali content of the fuel than those of hydroxides. KOH-g
and NaOH-g concentrations show a very slight increase with increasing

Potassium
in v
apour
Cl-content: 200 g/t ds.400BOO
1 Pressure - 10 bar X - 0.3
Potasslum
> 60
1000 °C 1000 °CTemperature Temperature
Figure 8. Percent of total Na and K in the vapour phase for three different Cl contents in the feedstock. PFB gasification conditions (P - 10 bar, x - 0.3, fuel: peat).
WA
I £
wJL
r
(Na + K) content after a threshold value of about 500 mg/kg, or remain
constant. The chloride concentrations on the other hand, show the oppo
site trend of steady decline with increasing (Na + K) content after
the threshold value of about 500 mg/kg. In these calculations the K/Na
weight ratio of 2.8, the sulphur content of peat (0.2 % wt.), the
chlorine content of the feedstock (of 200 mg/kg) and the operating
temperature of 850 °C are kept constant. Similar calculations with a
higher chlorine content (of 600 mg/kg in the feedstock) show very
little change in the overall pattern seen in Figure 9. This seems to
indicate that above a certain minimum requirement of total alkali
presence in the system (necessary for the chloride and hydroxide
formation), the concentrations of the volatilised alkali compounds
are not significantly affected by an increase in the total (Na + K)
content of peat, within the range investigated.

- 281 -
GASEOUS K-, Na- AND Cl-species
Figure 9. Variation of the partial pressure of gaseous alkali species with the feedstock alkali-content.PFB gasification conditions (P = 10 bar, X = 0.3,T = 850 °C, Cl-content = 200 ppm (wt.) fuel:peat ).
4
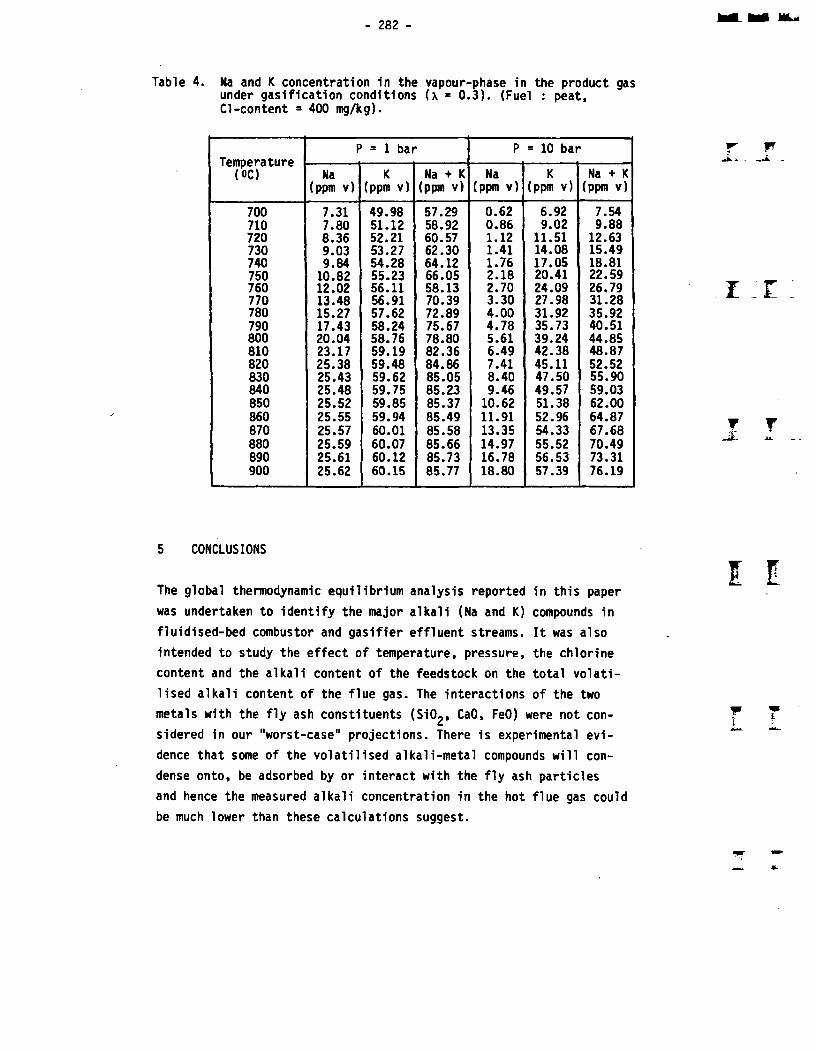
- 282 -
Table 4. Na and K concentration In the vapour-phase In the product gas under gasification conditions (\ = 0.3). (Fuel : peat, Cl-content s 400 mg/kg).
Temperature(°C)
P = 1 bar P = 10 bar
Na(ppm v)
K(ppm v)
Na K (ppm v)
Na(ppm v)
K(ppm v)
Na + K (ppm v)
700 7.31 49.98 57.29 0.62 6.92 7.54710 7.80 51.12 58.92 0.86 9.02 9.88720 8.36 52.21 60.57 1.12 11.51 12.63730 9.03 53.27 62.30 1.41 14.08 15.49740 9.84 54.28 64.12 1.76 17.05 18.81750 10.82 55.23 66.05 2.18 20.41 22.59760 12.02 56.11 58.13 2.70 24.09 26.79770 13.48 56.91 70.39 3.30 27.98 31.28780 15.27 57.62 72.89 4.00 31.92 35.92790 17.43 58.24 75.67 4.78 35.73 40.51800 20.04 58.76 78.80 5.61 39.24 44.85810 23.17 59.19 82.36 6.49 42.38 48.87820 25.38 59.48 84.86 7.41 45.11 52.52830 25.43 59.62 85.05 8.40 47.50 55.90840 25.48 59.75 85.23 9.46 49.57 59.03850 25.52 59.85 85.37 10.62 51.38 62.00860 25.55 59.94 85.49 11.91 52.96 64.87870 25.57 60.01 85.58 13.35 54.33 67.68880 25.59 60.07 85.66 14.97 55.52 70.49890 25.61 60.12 85.73 16.78 56.53 73.31900 25.62 60.15 85.77 18.80 57.39 76.19
CONCLUSIONS
The global thermodynamic equilibrium analysis reported in this paper
was undertaken to identify the major alkali (Na and K) compounds in
fluidised-bed combustor and gasifier effluent streams. It was also
intended to study the effect of temperature, pressure, the chlorine
content and the alkali content of the feedstock on the total volati
lised alkali content of the flue gas. The interactions of the two
metals with the fly ash constituents (S102, CaO, FeO) were not con
sidered in our "worst-case" projections. There is experimental evi
dence that some of the volatilised alkali-metal compounds will con
dense onto, be adsorbed by or interact with the fly ash particles
and hence the measured alkali concentration in the hot flue gas could
be much lower than these calculations suggest.

- 283 -
The removal of the alkali-metal compounds from the hot flue gas will
depend to some extent on the form in which these species will exit
from the reactor in the gas stream. In other words, the necessity to
remove these compounds and the choice of the removal device will de
pend on the form in which the alkali metals exist in the hot flue gas.
It was shown that the alkali metals will be present predominantly in
the vapour phase, should they form chlorides or hydroxides, but as
aerosols, if present as sulphates.
Our analyses of the alkali-metal release under conditions prevalent
in fluidised-bed combustion and gasification of peat show that:
The concentration of the vapour-phase alkali-metal compounds in the
flue gas is strongly dependent on the operating temperature and
pressure. It increases sharply with increasing temperature but
decreases markedly with an increase in the total pressure of the
system. In the temperature range of interest (700 - 1 000 °C), the
dominant species of both sodium and potassium are chlorides
(NaCl-g), KCl-g) and hydroxides, (NaOH-g and KOH-g). Whereas in
combustion conditions, the condensed phase consists almost entirely
of sulphates (Na2S04-c and K2S04-c), under gasification conditions
chlorides (NaCl-c and KCl-c) and carbonates (Na2C03-c and K2C03-c)
prevail.
Relatively, a greater percentage of both metals are released in the
vapour phase in gasification than in combustion. Hence, gettering
(to remove the volatilised alkalis) is more relevant to
gasification than combustion.
A strong dependence on the chlorine-content of the peat is also
revealed. Relatively higher concentrations of volatilised alkali-
metal compounds are revealed with higher chlorine-content in the
feedstock. This holds for both modes of operation (i.e. combustion
and gasification).
The total alkali-content of peat does not seem to affect the alkali
metals volatilisation greatly. Above a certain minimum requirement
- 284 -
(necessary for the alkali' compounds formation) the presence of
additional Na and K simply results in a slight increase in the
volatilised alkali-metal compounds under PFBC conditions, the
chlorine-content and the sulphur-content of the fuel being suffi- _
cient to form the chlorides (of Na and K) as well as the condensed —a
phase sulphates. However, under PFB gasification conditions, the
reverse obtains and the alkali chloride concentrations decline with
increasing (Na + K) content above this threshold value.
REFERENCES
1. Scandrett, L. A. & Clift, R. Thermodynamics of alkali removal from
coal-derived gases. Journal of the Inst, of Energy (1984) Dec., p.
391 - 397.
2. Lee, S. H. D. & Miles, K. Measurement of alkali vapour in PFBC
flue gas and its control by a fixed granular bed of activated
bauxite. Proc. Symp. on Gas Cleaning at High Temperatures, 16 - 18
Sept, 1986, p. 149 - 166.
3. Singh, A. et al. Thermodynamic calculations of the effects of
chlorine on alkali removal from hot coal-derived gases. Proc. Symp.
on Gas Cleaning at High Temperatures, 16 - 18 Sept. 1986, p. 167 -
176.
4. Eriksson, G. Thermodynamic studies of high temperature equilibria.
Chemica Scripta (1975)8, p. 100 - 103.
5. Barin, I. & Knacke, 0. Thermochemical properties of inorganic
substances. Berlin 1973, Springer-Verlag. 921 p.
6. Barin, I., Knacke, 0. & Kubaschewski, 0. Thermochemical properties
of Inorganic substances. Supplement. Berlin 1977, Springer-Verlag.
861 p.
I l
r r
w{
- 285 -
7. JANAF thermochemical tables with supplements. Washington, D.C.,
1971 - 1978, National Bureau of Standards of the U.S. Department of
Commerce. 1 141 p.
8. Pejryd, L. & Hupa, M. Bed and furnace gas composition in recovery
boilers. Paper presented at the 1984 Tappi Pulping Conf., November
12 - 14, San Francisco, U.S.A., 12 s.
9. Lappi, M. Branntorvmyrarnas fbrbranningstekniska och kemiska egen-
skaper samt asksammansattning (Combustion-technical and chemical
• characteristics of mires used for fuel peat production, and the
composition of ash). Esbo 1985, Technical Research Centre of Fin
land, NE 1460 76 SVEFIN TORV, Properties of industrialpeat and
their test methods. Sub-report 2. 63 p.
10. Scandrett, L. A. The removal of alkali compounds from gases at
high temperatures. Ph. 0. thesis. Cambridge 1983, University of
Cambridge.
i _r
w\

r r
I E
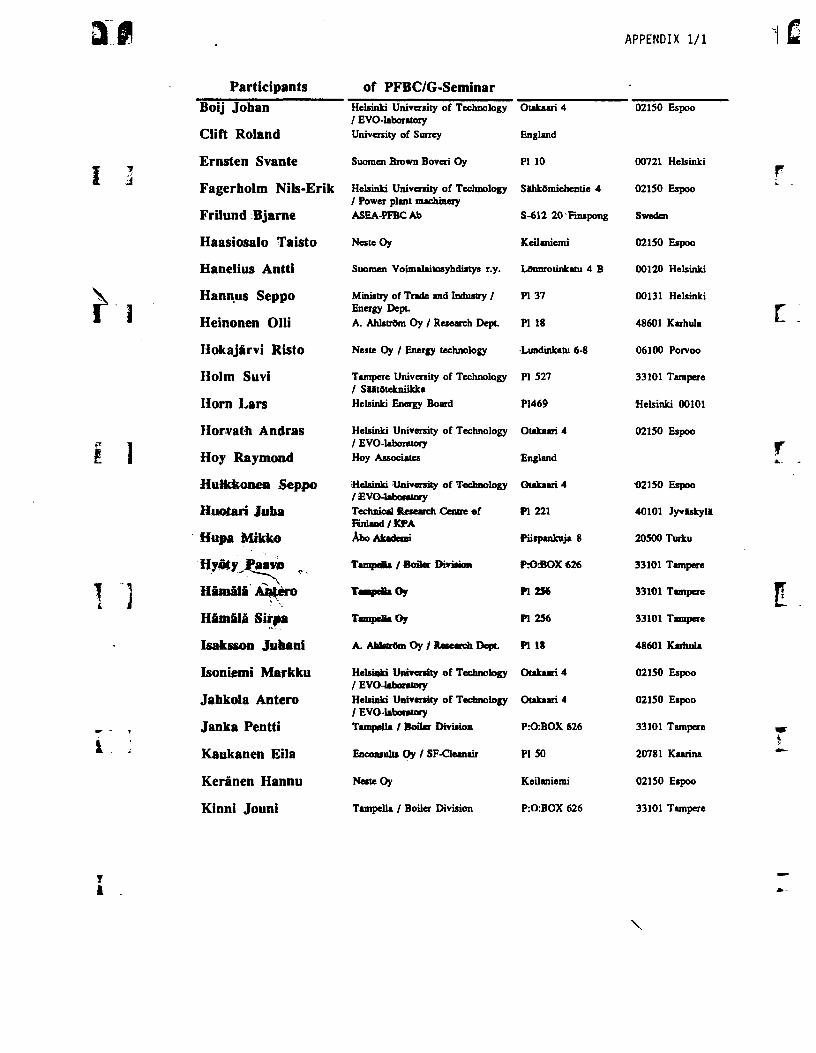
APPENDIX 1/1
1 I
l" 1
t ]
! 1
i
Participants of PFBC/G-SeminarBoij Johan Helsinki University of Technology
/ EVO-laboraioryOtakaari 4 02150 Espoo
Clift Roland University of Surrey England
Ernsten Svante Suomen Brown Boveri Oy PI 10 00721 Helsinki
Fagerholm Nils-Erik Helsinki University of Technology / Power plant machinery
SihkOmiehemie 4 02150 Espoo
Frilund Bjarne ASEA-PFBC Ab S-612 20 'Finspong Sweden
Haasiosalo Taisto Neste Oy Keilaniemi 02150 Espoo
Hanelius Antti Suomen Voimalaitosyhdistys r.y. LOnnrotinkatu 4 B 00120 Helsinki
Hannus Seppo Ministry of Trade and Industry / Energy Dept.
PI 37 00131 Helsinki
Heinonen Olli A. AhlstrOm Oy / Research Dept PI 18 48601 Karhula
Hokajarvi Risto Neste Oy / Energy technology Lundinkatu 6-8 06100 Porvoo
Holm Suvi Tampere University of Technology / SMtOtekniikka
PI 527 33101 Tampere
Horn Lars Helsinki Energy Board P1469 Helsinki 00101
Horvath Andras Helsinki University of Technology / EVO-laboratory
Otakaari 4 02150 Espoo
Hoy Raymond Hoy Associates England
HuHdconen Seppo Helsinki University of Technology / EVO-laboratory
Otakaari 4 02150 Espoo
HwMtari Juba Technical Research Centre ef Finland / KPA
PI 221 40101 JyviskyU
Hupa Mikko Abo Akedrmi Piispankuja 8 20500 Turku
HyntyJJaav® ^ Tampdia / Boiler Division PO:BOX 626 33101 Tampere
Hamali Ap^ero Taaapeiia Oy PI 256 33101 Tampere
Hamala Sirpa Tampella Oy PI 256 33101 Tampere
Isaksson Juhani A. AUstrtm Oy / Research Dept PI 18 48601 Karhula
Isoniemi Markku Helsinki University of Technology / EVO-Uboralory
Otakaari 4 02150 Espoo
Jahkola Antero Helsinki University of Technology / EVO-laboratory
Otakaari 4 02150 Espoo
Janka Pentti Tampella / Boiler Division P:0:B0X 626 33101 Tampere
Kaukanen Eila Enconsults Oy / SF-Cleanair PI 50 20781 Kaarina
Keranen Hannu Neste Oy Keilaniemi 02150 Espoo
Kinni Jouni Tampella / Boiler Division P:0:B0X 626 33101 Tampere
C
f
N
Ji

APPENDIX 1/2
Participants of PFBC/G-SeminarKiukaanniemi Eino Oulu University of Technology Lirmamnaa 90570 Oulu
Korkiakoski Martti Ministry of Trade and Industry / Pohjoinen 00130 HelsinkiEnergy Dept. Makasiinikatu 6
Kuorelahti Kalevi Kemirm Oy
Kurkela Esa Technical Research Centre of Finland / POV
Biologinkuja S 02150 Espoo
Kurki-Suonio Ilmari Helsinki University of Technology Otakaari 4 02150 Espoo
Kurppa Erkki Limpdvoima Oy Mertaniemi 53920 Lappeenranta
Lehtonen Olof Tampella / Boiler Division P:0:B0X 626 33101 Tampere
LVK / Jarmo Tervo Helsinki University of Technology / EVO-laboratory
Otakaari 4 02150 Espoo
Maskuniitty Hannu Ekono Oy PL 27 00131 Helsinki
McKeough Paterson Technical Research Centre of Finland / POV
Biologinkuja S 02150 Espoo
Mikkanen Pirita Helsinki University of Technology / EVO-laboratory
Otakaari 4 02150 Espoo
Mojtahedi Wahab Technical Research Centre of Finland/POV
Muller Rainer KWU West Germany
Nieminen Jorma A. AhlstrOm Oy / Boiler division PI 184 78201 Varicaus
Nieminen Matti Technical Research Centre of Finland/POV
Biologirikuja S 02150 Espoo
Nitschke Eberhard UHDEGmbH West Germany
Nurmi Jari Eknnalik Oy Vihiheikkilintie 37 20810 Turku. . 3 ^
Olsen Aksel Risoe National Laboratory 4000 Roskilde Demhink
Orjaia Markku Technical Research Centre of Finland/KPA
PI 221 40101 JyviskyU
Pesonen Pekka Technical Research Centre ofFinland / KPA
PI 221 40l01 JyviskyU
Pikku-Pyhilto Raija Ministry of Trade and Industry / Pohjoinen 00130 HelsinkiEnergy Dept Makasiinikatu 6
Pillai Krisna ASEA-PFBC Ab Sweden
Raiko Markku Imatran Voima Oy PI 138 00101 Helsinki
Raiko Risto Tampere University of Technology PI 527 33101 Tampere
Riala Pekka Imatran Voima Oy PI 138 00101 Helsinki
Rinne Risto University of Oulu / Energy laboratory
90570 Oulu
Salmi Jorma Jaakko FOyry Oy Kanpintie 3, PI 16 00441 Helsinki
X

APPENDIX 1/3
Participants of PFBC/G-SeminarSalminen Pekka Imatran Voima Oy PI 138 00101 Hebinki
Salo Kari YTT - Yhtymft Oy Hlmeenlinna workshop
PI 537 13111 Hlmeenlinna
Salo-Asikainen Sirpa Ministry of Environment PI 399 00121 Hebinki
Saviharju Kari Technical Research Centre ofFinland / POV
Seppa Matti Helsinki Energy Board PI 469 00101 Hebinki
Sihvola Ali Imatran Voima Oy PI 138 00101 Hebinki
Sipila Kai Technical Research Centre ofFinland / POV
Biologinkuja 3-5 02200 Espoo
Sipilp Kari Technical Research Centre ofFinland / SAH
Otakaari 5 i 02150 Espoo
Solantausta Yrjo Technical Research Centre ofFinland / POV
Suokas Mervi Tampella Oy PI 256 33101 Tampere
Thun Rabbe Technical Research Centre ofFinland / POV
Biologinkuja 5 02150 Espoo
Vainio Pirjo-Liisa Ministry of Trade and Industry / Pohjoinen 00130 HebinkiEnergy Dept. Makasiinikatu 6
Vessonen Kari Imatran Voima Oy PI 138 00101 Hebinki
Vilppunen Pekka University of Oulu / Energy laboratory
90570 Oulu
Virta Kari A. AhlstrOm Oy / Termoflow P.O. BOX 15 20781 Kaarina
Wallman Henrik Chalmers University of Technology Institutionen for S-41296 GOteborg,energiteknik Sweden
Weidner Ulrich Didier Filtertechnik Konrad-Adenauer-Str. 4 D-6719 Ebenberg, FRG
Wilin Carl Technical Research Centre ofFinland/POV
Biologinkuja 5 02150 Espoo
Ylhaisi Mikko Ministry of Trade and Industry / PI 37 00131 Hebinki
Astrdm LeifEnergy Dept.Outokumpu Oy / Engineering PtOtBOX 86 02201 Espoo
Xijalfi Martti Imatran Voima Oy PI 138 00101 Hebinki

i
* r
T
T
1
*i
X
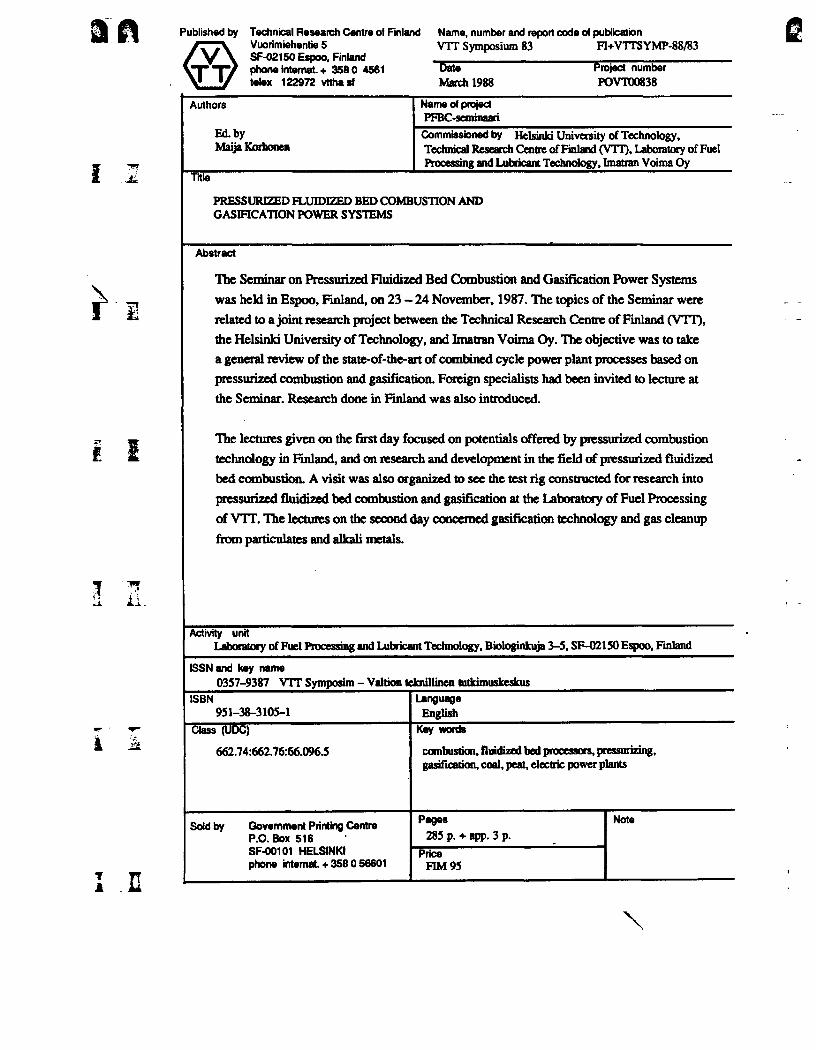
Published by Technical Research Centre of Finland Vuorimiehentie 5 SF-02150 Espoo, Finland
IT TV phone internal. + 358 0 4561 \l */ telex 122972 vtthasf
Name, number and report code of publicationVTT Symposium 83 FI+VTTSYMP-88/83
DateMarch 1988
Project numberPOVT00838
Authors Name of projectPFBC-seminaari
Ed. byMaija Korhonen
Commissioned by Helsinki University of Technology,Technical Research Centre of Finland (VTT), Laboratory of Fuel Processing and Lubricant Technology, Imatran Voima Oy
Title
PRESSURIZED FLUIDIZED BED COMBUSTION ANDGASIFICATION POWER SYSTEMS
Abstract
The Seminar on Pressurized Fluidized Bed Combustion and Gasification Power Systems was held in Espoo, Finland, on 23 - 24 November, 1987. The topics of the Seminar were related to a joint research project between die Technical Research Centre of Finland (VTT), the Helsinki University of Technology, and Imatran Voima Oy. The objective was to take a general review of the state-of-the-art of combined cycle power plant processes based chi pressurized combustion and gasification. Foreign specialists had been invited to lecture at the Seminar. Research done in Finland was also introduced.
The lectures given on the first day focused on potentials offered by pressurized combustion technology in Finland, and on research and development in the field of pressurized fluidized bed combustion. A visit was also organized to see die test rig constructed for research into pressurized fluidized bed combustion and gasification at the Laboratory of Fuel Processing of VTT. The lectures on the second day concerned gasification technology and gas cleanup from particulates and alkali metals.
Activity unitLaboratory of Fuel Processing and Lubricant Technology, Biologinkuja 3-5, SF-02150 Espoo, Finland
ISSN and key name0357-9387 VTT Symposim - Valtion teknillinen tutkimuskeskus
ISBN951-38-3105-1
LanguageEnglish
Class (UDC)
662.74:662.76:66.096.5
Key words
combustion, fluidized bed processors, pressurizing, gasification, coal, peat, electric power plants
Sold by Government Printing Centre P.O. Box 516 SF-00101 HELSINKI phone internal. + 358 0 56601
Pages
285 p. + app. 3 p.
PriceFIM95
Note

i
l I
Is r.
I ISii.
A
i nX

VTT:N JULKAISUSARJATValtion teknillisen tutkimuskes-kuksen julkaisusarjat ovat
• Technical Research Centre of Finland Publications
• Valtion teknillinen tutkimus- keskus Tutkimuksia —Statens tekniska forsknings- central Forskningsrapporter — Technical Research Centre of Finland Research Reports
• Valtion teknillinen tutkimuskeskus Tiedotteita —Statens tekniska forsknings- central Meddelanden — Technical Research Centre of Finland Research Notes
• VTT Symposium
VTT’S PUBLIKATIONS- SERIERStatens tekniska forskningscentra-lens (VTT) publikationsserier ar
• Technical Research Centre of Finland Publications
• Valtion teknillinen tutkimuskeskus Tutkimuksia —Statens tekniska forsknings- central Forskningsrapporter — Technical Research Centre of Finland Research Reports
• Valtion teknillinen tutkimuskeskus Tiedotteita —Statens tekniska forsknings- centrai Meddelanden — Technical Research Centre of Finland Research Notes
• VTT Symposium
PUBLICATION SERIES OF VTTThe publication series of theTechnical Research Centre ofFinland (VTT) are
• Technical Research Centre of Finland Publications
• Valtion teknillinen tutkimuskeskus Tutkimuksia —Statens tekniska forsknings- central Forskningsrapporter — Technical Research Centre of Finland Research Reports
• Valtion teknillinen tutkimuskeskus Tiedotteita —Statens tekniska forsknings- central Meddelanden — Technical Research Centre of Finland Research Notes
• VTT Symposium
VTT:N JULKAISUSAR- JOJEN HANKINTAVTT:n julkaispja myy Valtion painatuskeskus.
Postimyynti:Valtion painatuskeskus PL 51600101 Helsinki vaihde (90)56601 teleksi 123458 vapksf telekopio (90)5660374
Kiijakaupat Helsingissa: Annankatu 44 vaihde (90) 17341
Etelaespianadi 4 puh. (90)662801
ANSKAFFNING AV VTT’S PUBLIKATIONERVTT’s publikationer saljes av Statens tryckericentral.
Postfbrsaljning:Statens tryckericentral PB 51600101 Helsingfors vaxel (90)56601 telex 123458 vapk sf telefax (90)5660374
Bokhandlar i Helsingfors: Annegatan 44 vaxel (90) 17341
Siidra esplanaden 4 puh. (90)662801
HOW TO OBTAIN VTT’S PUBLICATIONSVTT’s publications are sold by Government Printing Centre.
Mail orders:Government Printing Centre P.O. Box 516 SF-00101 Helsinki phone internal. +358 0 56601 telex 123458 vapk sf telefax + 35805660374
Bookshops in Helsinki: Annankatu 44
Etelaespianadi 4
Kolmea vuotta vanhemmat julkaisut toimitetaan kopioina VTT:n informaatiopalvelu- laitoksesta:
VTTInformaatiopalvelulaitos Vuorimiehentie 5 02150 Espoo puh. (90)4564402 teleksi 125175 vttin sf teleteksi 1000418 vttinf telekopio (90)462382 (HI ryhma)
Tre 4r aldre publikationer le- vereras som kopior frikn VTTs Informa tionstjanst:
VTTInformationstjanst Bergsmansvagen 5 02150 Esbo tel. (90)4564402 telex 125175 vttin sf teletex 1000418 vttinf telefax (90)462382 (III grupp)
Publications published more than three years ago are delivered as copies from the Information Service at VTT:
VTTInformation Service Vuorimiehentie 5 SF—02150 Espoo phone internat. + 358 0 456 4402
telex 125175 vttin sf teletex 1000418 vttinf telefax +3580462382 (III group)
VTT SYMPOSIUM
64. Murtumismekaniikan soveltaminen rakenteiden lujuustarkastelussa. Tampere, 4.—5.6.1985. Toim. Kim Wallin, Kari Torronen ja Heikki Kotilainen. Espoo 1986. 155 s.
65. Turve-ja humussymposiumi. Turku, 2.-3-9-1985. Toim. Jarmo Hallikas. Espoo 1986. 211 s.66. Reparation av betongkonstruktioner. Nordiskt miniseminarium, Esbo den 15. maj 1985. Red. Kalle
Tanskanen och Asko Saija. Esbo 1986. 161 s.67. Manniskan i komplexa industriella processer. Nordisk manniska-maskinkonferens. Mariehamn, Aland
15—17 april 1986. Red. Monica Stockmann och Bjorn Wahlstrom. Esbo 1986. 439 s.68. The 4th Marine Technology Symposium. Ship Vibration, Noise & Hydrodynamics. Espoo, January
13—14, 1986. Espoo 1986. 296 p.69. Korvaavien moottoripolttoaineiden kayttotutkimus Suomessa. Espoo, 6.2.1986. Espoo 1986. 85 s.70. POLARTECH ’86. Internationa) Offshore and Navigation Conference and Exhibition. Volume 1.
Helsinki, Finland, 27—30 October 1986. Espoo 1986. 527 p.71. POLARTECH ’86. International Offshore and Navigation Conference and Exhibition. Volume 2.
Helsinki, Finland, 27—30 October 1986. Espoo 1986. 641 p.72. Industrial planning, engineering and construction under extreme circumstances. VII International
Symposium. Espoo, Fimand, May 19—23, 1986. Ed. by Markku Salmi and Pirkko Tuomela. Espoo 1986. 351 p. + app. 5 p.
73. POLARTECH ’86. International Offshore and Navigation Conference and Exhibition. Volume 3. Helsinki, Finland, 27—30 October 1986. Espoo 1986. 332 p.
74. Mittaustekniikan seminaari. 3.—4.9.1986, Hameenlinna. Toim. Vaino Kelha. Espoo 1987. 175 s.75. Biomassan uusia jalostusmahdollisuuksia 1990-luvulla. Helsinki, 21.10.1986. Espoo 1987. 119 s.76. Betongkonstruktioner under tv&ngsbelastning Nordiskt miniseminarium. Esbo den 21. oktober 1986.
Red. Heli Koukkari. Esbo 1987. 112 s.77. Die wissenschaftlich-technische Zusammenarbeit zwischen der DDR und Finland auf dem Gebiet des
industriellen Bauens im Zeitraum 1986 bis 1990. Orientierungsseminar in Dessau, DDR am 18. Marz 1986 Arbeitsseminar in Espoo, Filmland am 16. Oktober 1986. Red. Asko Saija, Pekka Leppanen und Juha Ratvio. Espoo 1987. 116 S.
78. Advances in Man-Machine Interactions. The Joint Finnish-Soviet Symposium on Man-Machine Interface, Control Rooms, and Expert Systems. Espoo, Finland, October 21—23, 1986. Ed. by Pentti Uuspaa. Espoo 1987. 297 p. + app. 1 p.
79. Status of reactor calculations in the Nordic countries. Helsinki, 31 March — 1 April 1987. Ed. by Randolph Hoglund. Espoo 1987. 276 p. + app. 4 p.
80. Numeeriset simulointimallit. Jyvaskyla 24.—25.11.1986. Toim. Jarmo Hallikas, Maija-Leena Kaner- virta & Pekka Neittaanmaki. Espoo 1987. 260 s.
81. Biobranslen och torv i Nordens energiekonomi &r 2000. Jyvaskyla 4.—5.8.1987. Red. Maija-Leena Ka- nervirta. Esbo 1987. 120 s. + bil. 4 s.
82. Nykyaikainen valmistustekniikka. Espoo, 14.—15.10.1987. Toim. Martti Vilpas. Espoo 1988. 198 s.83. Pressurized fluidized bed combustion and gasification power systems. Espoo, 23.-24.11.1987. Ed. by
Maija Korhonen. Espoo 1988. 285 p. + app. 3 p.
Tata julkaisua myy
VALTIONPAINATUSKESKUS
POSTIMYYNTI PI 516
00101 Helsinki Puh. (90) 566 0266 Vaihde (90) 56601
Teleksi 123458 vapk sf
KIRJAKAUPAT HELSINGISSA
Annankatu 44 (Et. Rautatiekadun kuima)
Vaihde (90) 173 4396 Etelaespianadi 4 Puh. (90) 662 801
Denna pubiikation sdljs av
STATENSTRYCKERICENTRAL
POSTFORSAUNINGEN PB 516
00101 Helsingfors Tel. (90) 5660266 Voxel (90) 56601
Telex 123458 vapk sf
BOKHANDLARNA I HELSINGFORS
Annegatan 44 (I hornet av S. Jdrnv.g.)Vaxel (90) 173 4396 Sodra esplanaden 4
Tel. (90) 662 801
This publication is available from
GOVERNMENT PRINTING CENTRE
MAIL ORDERS P.O.B. 516 .
SF-00101 Helsinki Finland Phone internal.+ 358 0 56601
Telex 123458 vapk sf
BOOKSHOPS IN HELSINKI
Annankatu 44 Phone (90) 173 4396
Etelaespianadi 4 Phone (90)662 801
ISBN 951-38-3105-1 ISSN 0357-9387 UDC 662.74:662.76:
66.096.5
Copyright © 2022 FDOKUMEN