
CFD Internet Operación Fiscal o CFD Internet PAC Tecnología CFD Internet Servicio Gratuito
Upload
khangminh22Category
view
0download
0
Applying the Fundamentals
Considerations for Simulating Fluidized Beds
Ray Cocco, Casey LaMarche, S.B. Reddy Karri, Ben Freireich
CPFD-Software User Group MeetingApril 9th, 2018

Applying the Fundamentals
Abo
ut P
SRI

Applying the Fundamentals
FCC Fluidized Bed Regenerator
Barracuda®Barracuda®

Applying the Fundamentals
FCC Fluidized Bed Regenerator
Barracuda®Barracuda®

Applying the Fundamentals
FCC Fluidized
Bed Regenerator
Barracuda®
Barracuda®

Applying the Fundamentals
FCC Fluidized
Bed Regenerator
Barracuda®
Barracuda®

Applying the Fundamentals
Status of CFD Modeling of Fluidized Beds
• Today’s CFD (CPFD) models are• Capturing macro-scaled hydrodynamics• Simulating large-scale, commercial equipment
• CFD models used for fluidized bed simulations are at the point that other factors need to be strongly considered• Accurate boundary conditions• Actual particle properties• Relevant drag model• Actual steady state
Steady State ???
Steady State ???

Applying the Fundamentals
Accurate Boundary Conditions
• In the world of fluidized bed, it is unlikely your boundary condition is uniform
• Boundary conditions either need to• Reflect the actual non uniform spacial and temporal of
boundary in the fluidized bed, or• Be position such that the boundary condition has a
minimal effect on the solution
Barracuda®

Applying the Fundamentals
Case Study: How Does Aeration Help Standpipe Flow
OutletOutlet
Angle
d Tra
nsiti
on
Pressure Taps
Aeration Taps
4’ (1.2 m) ID x 70’ (21 m) Standpipe
30’ (9.1 m) ID Fluidized Bed
400% Open Area Cone
Slide Valve
10’ (3 m) ID Mixing Pot
5’ (1.5 m) ID Riser
Pout = 101 KPa
Even though we only cared about the standpipe, the whole loop was simulated
UOP RxCat
PSRI Experimental Data
Applying the Fundamentals
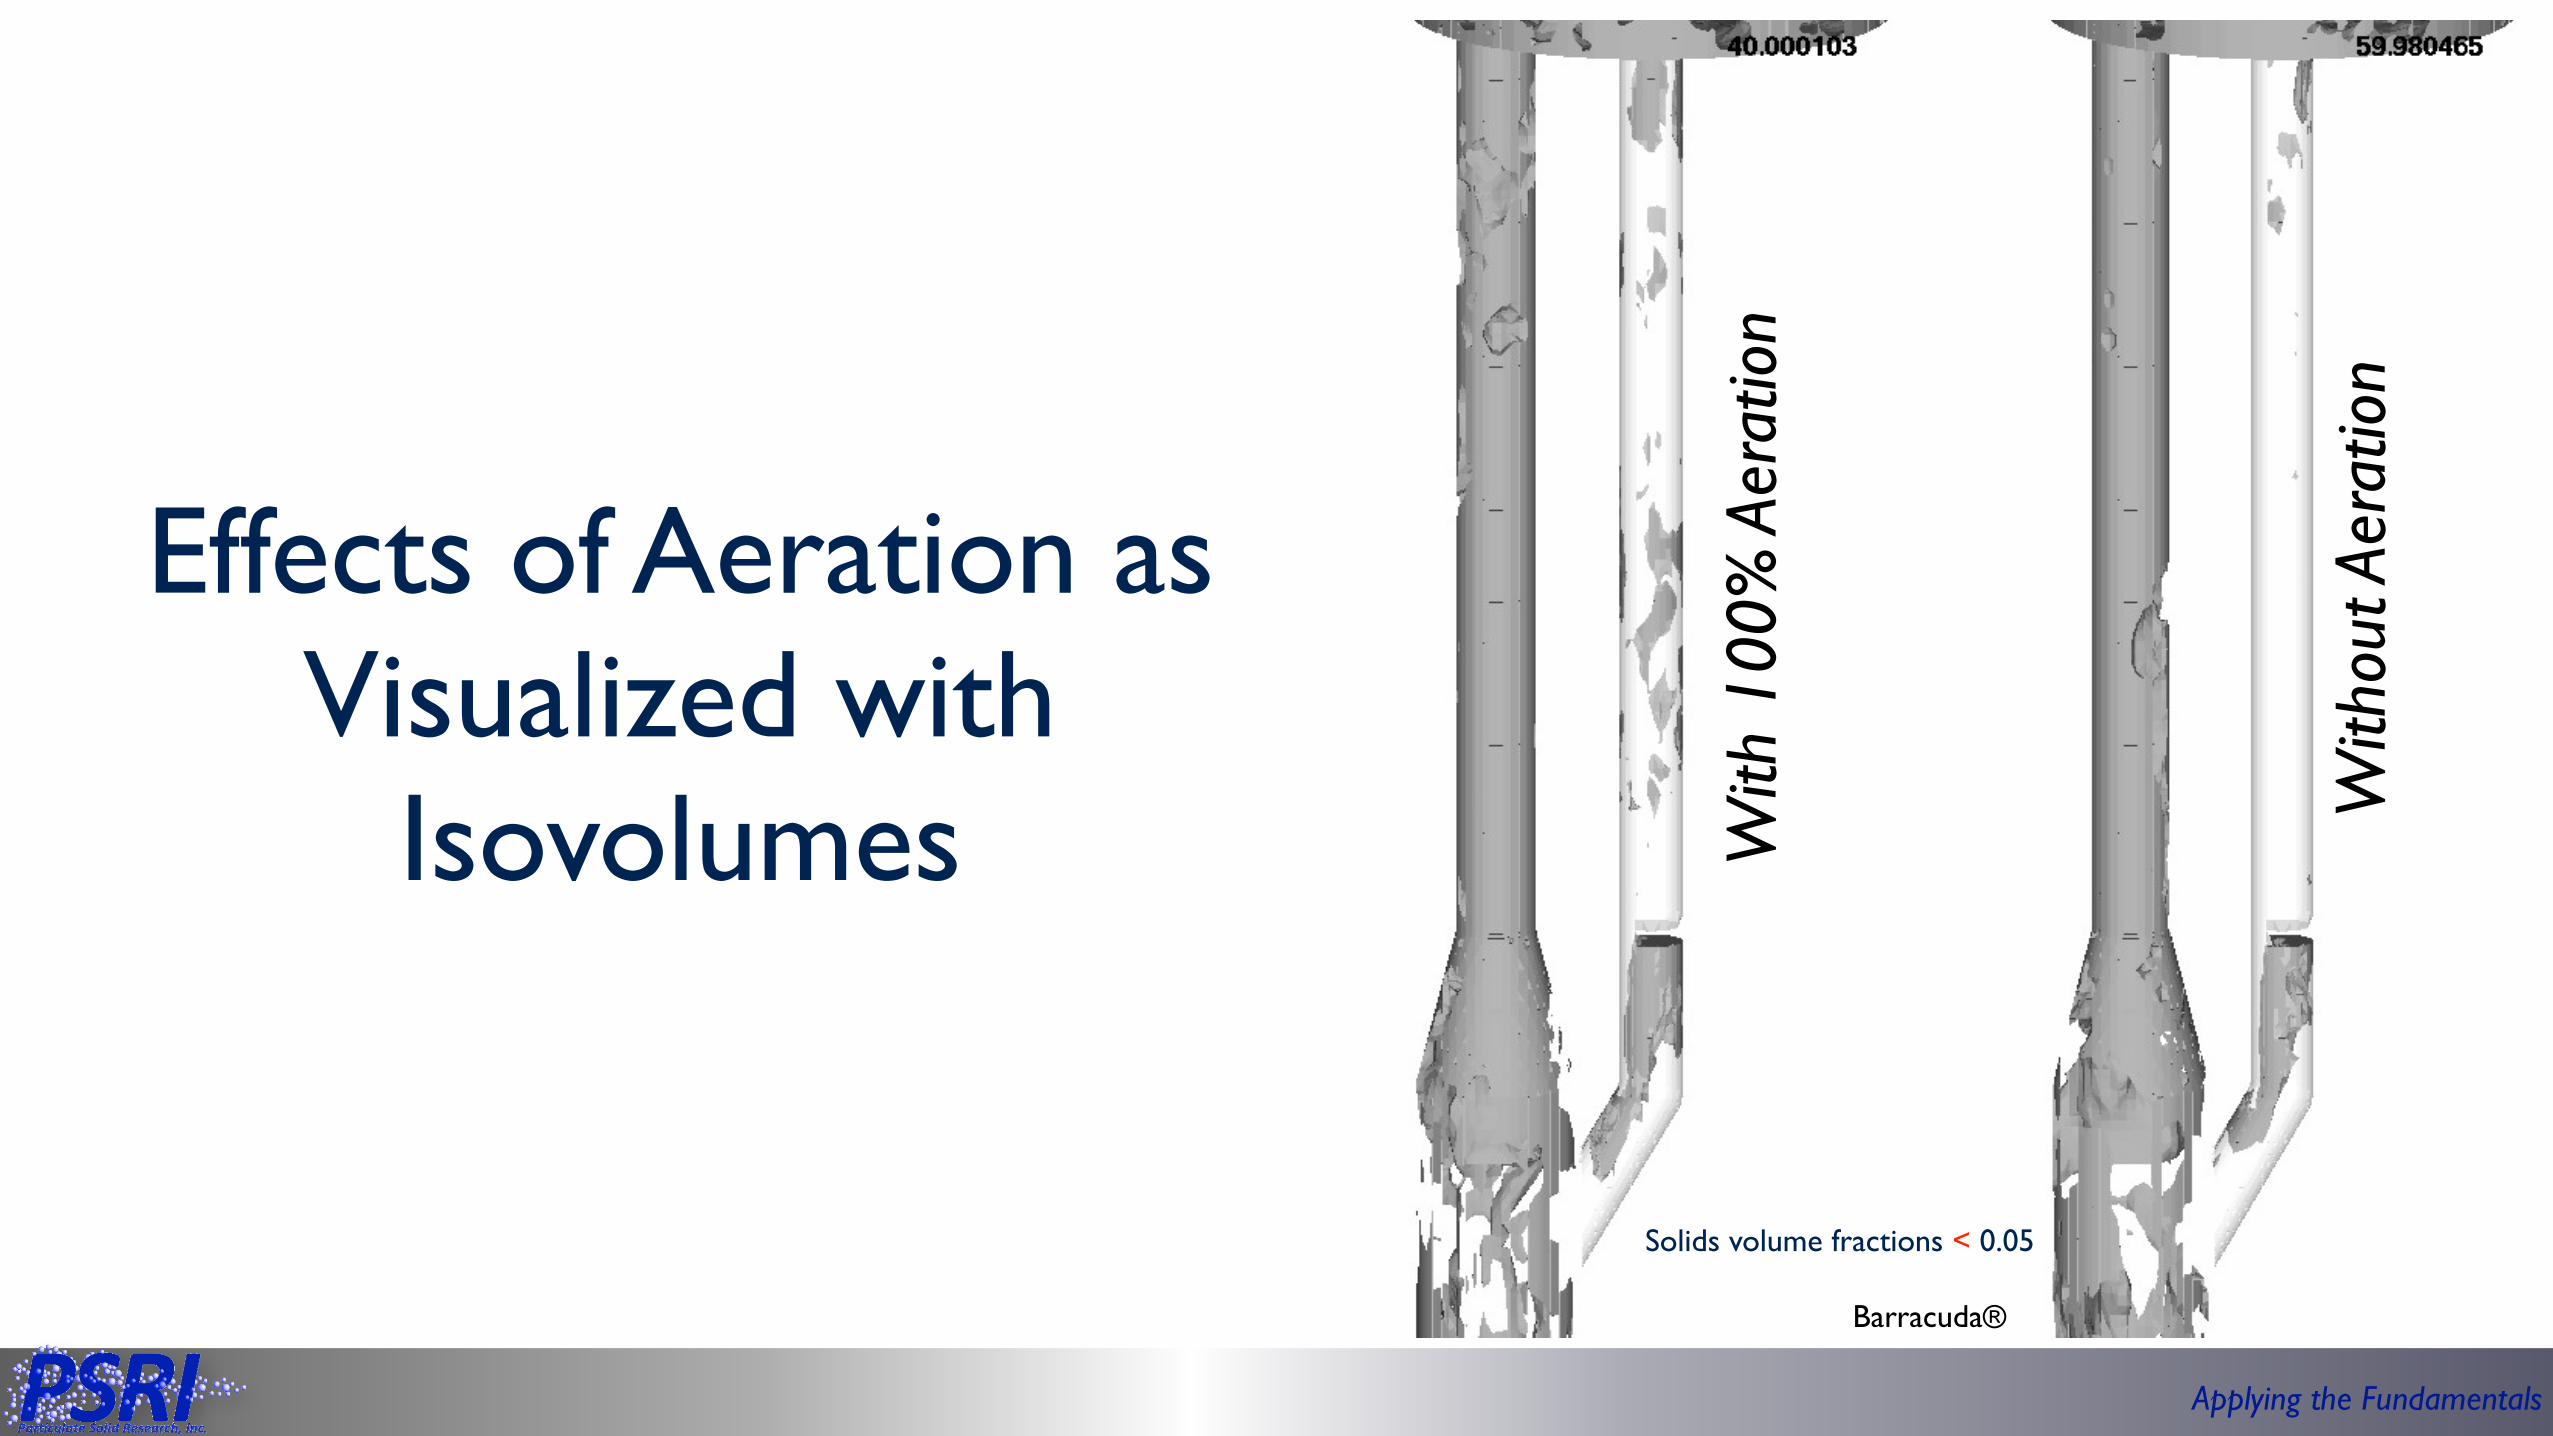
Effects of Aeration as Visualized with
Isovolumes With
100
% A
erat
ion
With
out A
erat
ion
Barracuda®
Solids volume fractions < 0.05

Applying the Fundamentals
Effects of Aeration as Visualized with
Isovolumes With
100
% A
erat
ion
With
out A
erat
ion
Barracuda®
Solids volume fractions < 0.05

Applying the Fundamentals
Symmetric Asymmetric
Fluidized Bed
Outlets
Vert
ical
Sta
ndpi
pe
Cone Inlet
Ris
er
Mixing Pot
Ang
led
Stan
dpip
e
Slide Valve @ 25%
Barracuda®
Outlets
Barracuda®
Symmetric vs. Asymmetric
Aeration

Applying the Fundamentals
Symmetric Asymmetric
Fluidized Bed
Outlets
Vert
ical
Sta
ndpi
pe
Cone Inlet
Ris
er
Mixing Pot
Ang
led
Stan
dpip
e
Slide Valve @ 25%
Barracuda®
Outlets
Barracuda®
Symmetric vs. Asymmetric
Aeration

Applying the Fundamentals
‡‡‡
‡
‡
‡
‡
‡‡‡‡
‡ ‡‡‡‡‡‡
‡‡‡‡‡‡
‡‡‡‡
‡‡‡‡‡
‡‡
‡‡
‡
‡
‡
‡
‡‡‡
‡
‡
···
·
·
·
·
····
· ············
····
·····
··
··
·
·
·
·
···
·
·
0 20000 40000 60000 800000
10
20
30
40
Pressure Drop, Pa
Height,m
‡‡‡
‡
‡
‡
‡
‡‡‡
‡‡‡‡
‡‡‡‡‡‡‡‡‡‡
‡‡‡‡
‡‡‡‡‡
‡‡
‡‡
‡
‡
‡
‡
‡‡‡
‡
‡
···
·
·
·
·
····
· ····
····
····
····
·····
··
··
·
·
·
·
···
·
·
0 2 4 6 8 100
20
40
60
80
100
120
140
Pressure Drop, psi
Height,ft
Symmetric
Asymmetric‡‡‡‡
‡
‡
‡
‡‡‡‡
‡ ‡‡‡‡
‡‡‡‡
‡‡‡‡
‡‡‡‡
‡‡‡‡‡
‡‡
‡‡
‡
‡
‡
‡
‡‡‡
‡
‡
····
·
·
·
····
· ············
····
·····
··
··
·
·
·
·
···
·
·
0 2 4 6 8 10 120
20
40
60
80
100
120
140
Pressure Drop, psi
Height,ft
Symmetric vs. Asymmetric Aeration

Applying the Fundamentals
Case Study: How Do Vent Holes Improve Stripping
Catalyst Catalyst
Steam Steam
ÊÊ Ê Ê Ê Ê ÊÊÊ
ÊÊ
ÊÊÊ
‡ ‡ ‡ ‡ ‡‡ ‡‡ ‡ ‡ ‡‡ ‡‡ ‡‡ ‡
‡
Ê Without Vents
‡ With Vents
0 5 10 15 2010
20
30
40
50
Solids Flux from Circulation, lbmêft2-sBedDensity,lbmêft3
0.5 ft/sec Superficial Gas VelocityFCC eCat
2-ft Dia x 9-ft Tall Stripper6 Disk and Donut Trays

Applying the Fundamentals
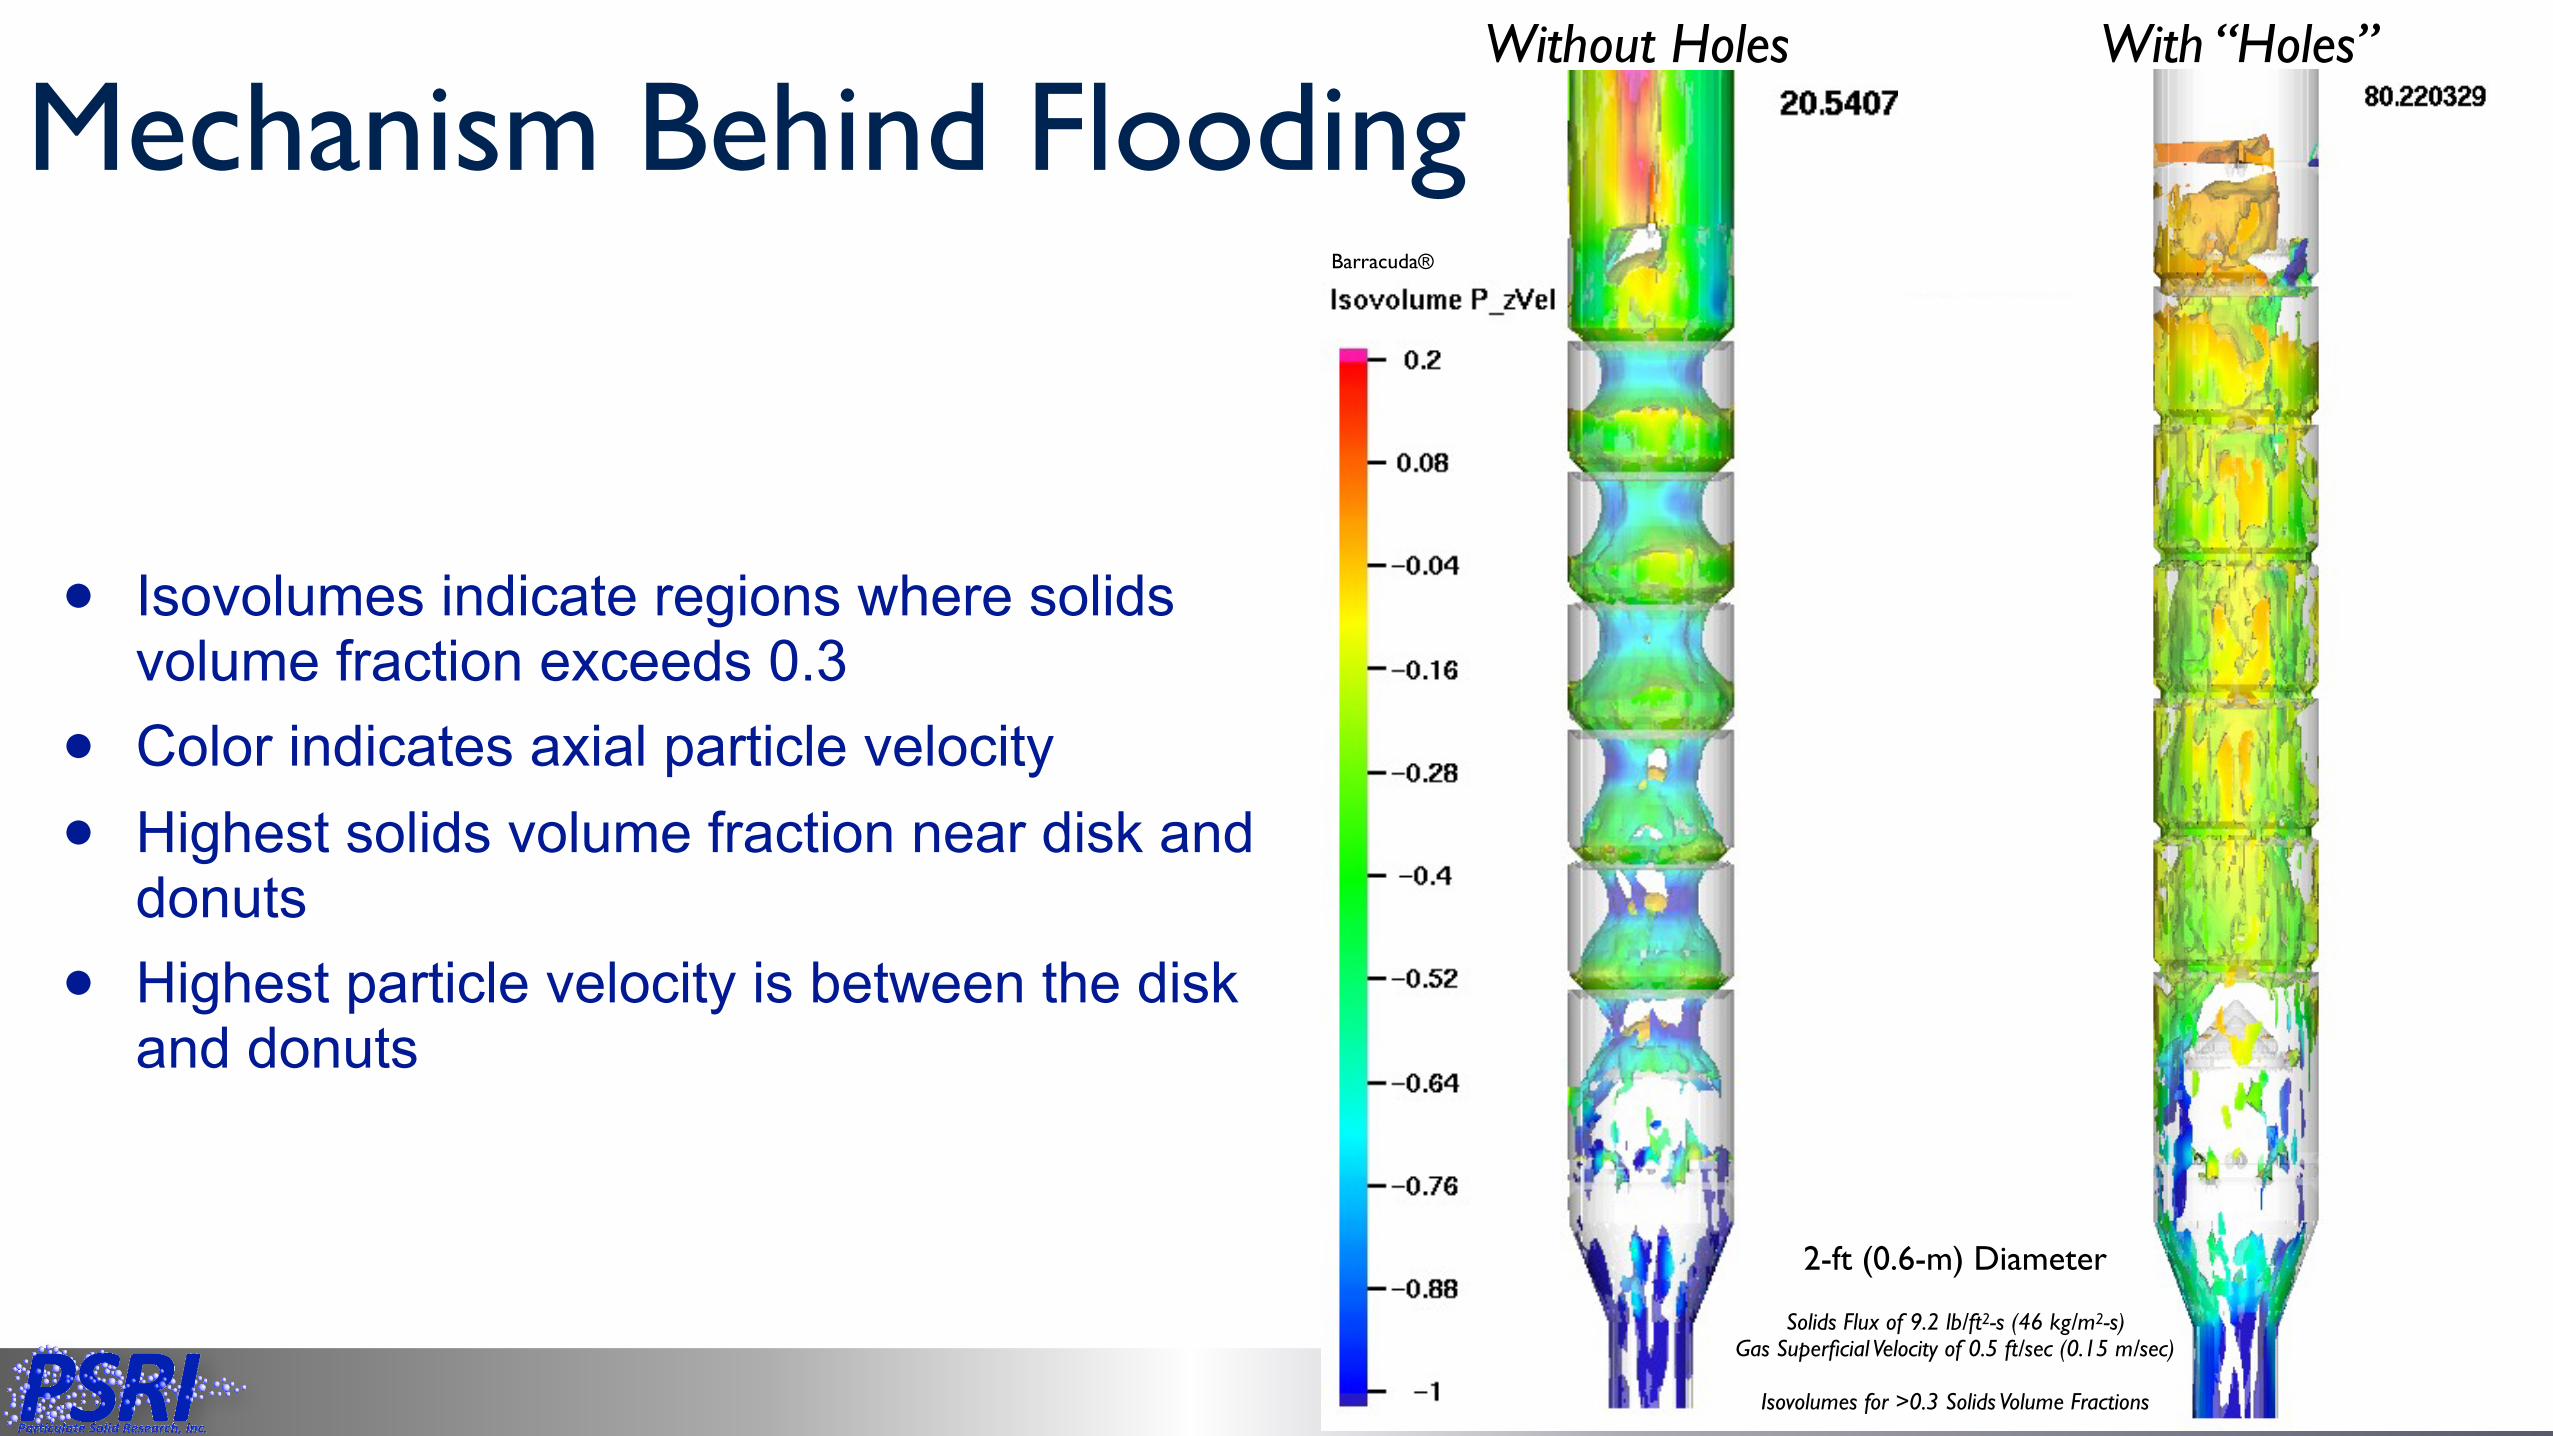
• Isovolumes indicate regions where solids volume fraction exceeds 0.3
• Color indicates axial particle velocity
• Highest solids volume fraction near disk and donuts
• Highest particle velocity is between the disk and donuts
Without Holes With “Holes”
Barracuda®
2-ft (0.6-m) Diameter
Mechanism Behind Flooding
Solids Flux of 9.2 lb/ft2-s (46 kg/m2-s)Gas Superficial Velocity of 0.5 ft/sec (0.15 m/sec)
Isovolumes for >0.3 Solids Volume Fractions
Applying the Fundamentals
• Isovolumes indicate regions where solids volume fraction exceeds 0.3
• Color indicates axial particle velocity
• Highest solids volume fraction near disk and donuts
• Highest particle velocity is between the disk and donuts
Without Holes With “Holes”
Barracuda®
2-ft (0.6-m) Diameter
Mechanism Behind Flooding
Solids Flux of 9.2 lb/ft2-s (46 kg/m2-s)Gas Superficial Velocity of 0.5 ft/sec (0.15 m/sec)
Isovolumes for >0.3 Solids Volume Fractions

Applying the Fundamentals
ÊÊ
ÊÊ
ÊÊ
ÊÊÊ
Ê
Ê
Ê
Ê
ÊÊ
‡‡‡
‡‡‡‡‡‡
‡
‡
‡
‡
‡‡
ÁÁ
Á
Á
Á
···
·
·
0 100 200 300 400 500 600 7000
2
4
6
8
DPêL, kgêm^3
Height,meters
Ê 0.15 ftêsec & 45 kgêm2-sec CFD‡ 0.3 mêsec & 45 kgêm2-sec CFDÁ 0.15 mêsec & 52 kgêm2-sec Expermental· 0.3 mêsec & 46 kgêm2-sec Expermental
Bed Density Validation
Comparing bed densities at similar superficial gas velocities and at near flooding conditions
Flooding in the Experimental unit corresponded to a solids flux of 14 lbm/ft2-sec (68 kg/m2-sec) but in the CFD simulations it was at 9.2 lbm/ft2-sec
(45 kg/m2-sec).
2-ft (0.6-m) Diameter

Applying the Fundamentals
A Better Way: Barracuda’s New BC Options
• Pressure Boundary Condition (BC) • Allows gas and entrained particles to exit
• Flow BC on cyclone dipleg face • Returns entrained particles via BC Connector • For cases with non-zero solids flux, this BC is also used to return bottom exit particles to the system • Interstitial gas also enters the domain
• Local injection BCs at gas distributor nozzles
• Flow BC at bottom of vessel • Only present for cases with non-zero solids flux • Particle out flow with “Particle Exit Control” • Desired solids flux is specified
Subway grating baffles are included in the
geometry as real CAD elements, and captured
by the computational mesh.
Simulation Boundary Conditions

Applying the Fundamentals
Ug = 1.0 ft/s
With BC Flux
Control

Applying the Fundamentals
Ug = 1.0 ft/s
With BC Flux
Control

Applying the Fundamentals
Relevant Particle Properties
Particles are rarely perfectly round, smooth or mono dispersed
■■
■ ■■ ■ ■ ■ ■ ■ ■ ■ ■ ■ ■ ■ ■ ■ ■
▲ ▲▲ ▲▲ ▲▲ ▲▲
▲
● ●● ●● ●
● ● ●●
▼▼▼ ▼▼ ▼▼ ▼
▼ ▼▼
0.0 0.2 0.4 0.6 0.8 1.0 1.2
200
300
400
500
600
700
800
Superficial Gas Velocity, m/sec
BedDensity,kg/m3
12% Fines
8% Fines
6% Fines
4% Fines
PSRI Data of FCC Catalyst in a 0.9-m Diameter Fluidized Bed
PSRI Experimental Data

Applying the Fundamentals
Effects of Particle Size
0"
50"
100"
150"
200"
250"
1" 2" 3" 4"
dP#m
ean,#kg/m
3#
sampling#point#
mean#across#en5re#bed#
exptl"
sim"
0"
5"
10"
15"
20"
25"
1" 2" 3" 4"
dP#stde
v,#kg/m
3#
sampling#point#
Stdev#across#en5re#bed#
exptl"
sim"
0"
10"
20"
30"
40"
50"
1" 2" 3" 4"
dP#m
ean,#kg/m
3#
sampling#point#
mean#across#61#cm#
exptl"
sim"
0"
5"
10"
15"
20"
25"
30"
1" 2" 3" 4"
dP#stde
v,#kg/m
3#
sampling#point#
Stdev#across#61#cm#
exptl"
sim"
0.0"
1.0"
2.0"
3.0"
4.0"
5.0"
6.0"
0" 200" 400" 600" 800" 1000"
H,#m
#
dP/dL,#kg/m3#
mono"
exptl"
0.0#
1.0#
2.0#
3.0#
4.0#
5.0#
6.0#
0# 200# 400# 600# 800# 1000#
H,#m
#
dP/dL,#kg/m3#
exptl#
PB#
rev#PB#
175#180#185#190#195#200#205#210#215#220#
1# 2# 3# 4#
dP#m
ean,#kg/m
3#
sampling#point#
mean#across#en7re#bed#
exptl#
sim#
0#
5#
10#
15#
20#
25#
30#
1# 2# 3# 4#
dP#stde
v,#kg/m
3#
sampling#point#
Stdev#across#en7re#bed#
exptl#
sim#
0#
10#
20#
30#
40#
50#
1# 2# 3# 4#
dP#m
ean,#kg/m
3#
sampling#point#
mean#across#61#cm#
exptl#
sim#
0#
5#
10#
15#
20#
25#
30#
1# 2# 3# 4#
dP#stde
v,#kg/m
3#
sampling#point#
Stdev#across#61#cm#
exptl#
sim#
DQMOM

Applying the Fundamentals
Gas Bypassing in Fluidized Beds
4
3
2
1
0Max
Bed
Hei
ght w
/o B
ypas
sing
, m
1412108642% Fines (< 44 µm)
0.3 meters Column DiaLight FCC Powder
Ug = 0.46 m/sec Ug = 0.61 m/sec

Applying the Fundamentals
Gas Bypassing in Fluidized Beds
4
3
2
1
0Max
Bed
Hei
ght w
/o B
ypas
sing
, m
1412108642% Fines (< 44 µm)
0.3 meters Column DiaLight FCC Powder
Ug = 0.46 m/sec Ug = 0.61 m/sec

Applying the Fundamentals
Gas Bypassing in Fluidized Beds
4
3
2
1
0Max
Bed
Hei
ght w
/o B
ypas
sing
, m
1412108642% Fines (< 44 µm)
0.3 meters Column DiaLight FCC Powder
Ug = 0.46 m/sec Ug = 0.61 m/sec

Applying the Fundamentals
PSDs Matter with CFD
Simulations of Fluidized Beds
3% Fines, No Flux 9% Fines, No Flux 3% Fines with Flux 9% Fines with Flux
SolidsVolumeFraction
2 ft/sec (0.6 m/sec) Superficial Gas Velocity
Barracuda™

Applying the Fundamentals
PSDs Matter with CFD
Simulations of Fluidized Beds
3% Fines, No Flux 9% Fines, No Flux 3% Fines with Flux 9% Fines with Flux
SolidsVolumeFraction
2 ft/sec (0.6 m/sec) Superficial Gas Velocity
Barracuda™

Applying the Fundamentals
ÊÊÊÊÊÊÊÊÊÊÊ
Ê
Ê
ÊÊ
Ê
Ê
ÊÊ
ÊÊÊ
ÊÊ
ÊÊÊ
ÊÊ
ÊÊ
ÊÊ
ÊÊÊÊÊÊÊÊÊÊÊÊÊÊÊÊÊ
Ê
Ê
Ê
Ê
Ê
ÊÊ
ÊÊ
Ê
ÊÊÊ
Ê
ÊÊ
ÊÊÊ
ÊÊÊÊÊ
ÊÊÊÊÊ Ê
0 50 100 150 2000
2
4
6
8
dp, um
Diffwt%
9 wt%
3 wt%
Reported dp50, μm % Fines, (< 44 μm)
3 wt% 80.4 μm 2.7%
8 wt% 81.0 μm 8.6%
• Significant difference in hydrodynamics due to fines level, not median particle size.
• Fines are the driver for moving gas in and out of the emulsion phase• Higher mobility in dense bed• Higher surface to volume
ratio• There may be a lot more
fines in your particles than you think• 9 wt% = 33 num%
• If using one representative particle size, which one do you use?
Fines Matter!
3% Fines with Flux 9% Fines with Flux
SolidsVolumeFraction
Barracuda™

Applying the Fundamentals
Effect of Drag on Fluidized Bed Simulations
• Drag dominates in fluidized beds and yet our drag laws are limited
Esmaili and Mahinpey (2011) Adv Eng Software
Experimental Data Various drag model predictions

Applying the Fundamentals
Effects of Drag with
Fluidized Bed Simulations
Wen Yu x 0.63
Case 3 Case 5 Case 6 Case 7
Wen Yu x 0.8 Wen Yu x 1 Wen Yu x 1.5

Applying the Fundamentals
Effects of Drag with
Fluidized Bed Simulations
Wen Yu x 0.63
Case 3 Case 5 Case 6 Case 7
Wen Yu x 0.8 Wen Yu x 1 Wen Yu x 1.5

Applying the Fundamentals
● ● ●●●●●
●●●●●●●●●
●●●
○○
○○
○○○○ ○○○
○○○
○○○○
● CFD○ Data
0 200 400 600 8000
1
2
3
4
5
6
ΔL/lg, kg/m3
HeightAboveGrid,m
Bed Density (Ave from 34.9997 to 39.9997 Seconds)
Bed Density at High Velocity for Wen & Yu Drag
Model
Wen & Yu x 0.63Case 3B
Case 5B
Case 6B
Case 7B
Wen & Yu x 1
Wen & Yu x 0.8 Wen & Yu x 1.5
● ● ●●●●
●●●●●●●●●●
●●
●
○○
○○
○○○○ ○○○
○○○
○○○○
● CFD○ Data
0 200 400 600 8000
1
2
3
4
5
6
ΔL/lg, kg/m3
HeightAboveGrid,m
Bed Density (Ave from 34.9996 to 39.9996 Seconds)
● ●●●●●
●●●●●●●●●
●●
●●
○○
○○
○○○○ ○○○
○○○
○○○○
● CFD○ Data
0 200 400 600 8000
1
2
3
4
5
6
ΔL/lg, kg/m3
HeightAboveGrid,m
Bed Density (Ave from 35. to 40. Seconds)
●●●●●●●●●●●
●●●●●
●●
●
○○
○○
○○○○ ○○○
○○○
○○○○
● CFD○ Data
0 100 200 300 400 500 600 7000
1
2
3
4
5
6
ΔL/lg, kg/m3
HeightAboveGrid,m
Bed Density (Ave from 34.9994 to 39.9994 Seconds)
3-ft (0.9-m) Bed Diameter0.75 ft/sec (0.23 m/sec) Superficial Gas Velocity
BC at Sparger Exit

Applying the Fundamentals
● ● ●●●●●
●●●●●●●●●
●●●
○○
○○
○○○○ ○○○
○○○
○○○○
● CFD○ Data
0 200 400 600 8000
1
2
3
4
5
6
ΔL/lg, kg/m3
HeightAboveGrid,m
Bed Density (Ave from 34.9997 to 39.9997 Seconds)
Bed Density at High Velocity for
EMMS Drag Model
Wen & Yu x 0.63Case 3B
Case 8B
EMMS x 1
Case 9B
EMMS x 0.5Case 10B
EMMS x 1.5
●●●●●●●●
●●●●●●●
●●
●●
○○
○○
○○○○ ○○○
○○○
○○○○
● CFD○ Data
0 100 200 300 400 500 600 7000
1
2
3
4
5
6
ΔL/lg, kg/m3
HeightAboveGrid,m
Bed Density (Ave from 34.9996 to 39.9996 Seconds)
●●●●
●●●●●●
●●●●●
●●●●
○○
○○
○○○○ ○○○
○○○
○○○○
● CFD○ Data
0 200 400 600 8000
1
2
3
4
5
6
ΔL/lg, kg/m3
HeightAboveGrid,m
Bed Density (Ave from 34.9997 to 39.9997 Seconds)
● ●● ●●● ●●●●●●●
●●●
●●
●
○○
○○
○○○○ ○○○
○○○
○○○○
● CFD○ Data
0 100 200 300 400 500 600 7000
1
2
3
4
5
6
ΔL/lg, kg/m3
HeightAboveGrid,m
Bed Density (Ave from 34.9999 to 39.9999 Seconds)
3-ft (0.9-m) Bed Diameter0.75 ft/sec (0.23 m/sec) Superficial Gas Velocity
BC at Sparger Exit

Applying the Fundamentals
Well Established Drag Law Limits
Confident in single particle and packed bed drag laws, but not at intermediate Re and 𝜙 which is relevant to fluidized bed simulations
0 0.2 0.4 0.6100
102
104
106
Re
0 0.2 0.4 0.6100
102
104
106
Re
Carman-Kozeny Fd(Loading → Loading, Re → 0)
Single Particle Drag Fd(loading → 0, Re) Ergun Fd(loading → loadingmax, Re)
Fluidized Beds

Applying the Fundamentals
Uncertainty in Drag Coefficient, CD
Uncertainty in CD measurements high at low Re
Fd(loading, Re) = C,D,single(Re) loadingn
What Do We Do?

Applying the Fundamentals
Uncertainty in Drag Coefficient, CD
Uncertainty in CD measurements high at low Re
Fd(loading, Re) = C,D,single(Re) loadingn
Range of interest
What Do We Do?

Applying the Fundamentals
Parameter Estimation using Umf/Umb Data
Wen Yu x 0.8Wen Yu x 1
ÊÊÊ
Ê
Ê
Ê
Ê
Ê
Ê
Ê
ÊÊÊ ÊÊ Ê ÊÊ ÊÊ ÊÊÊÊÊ ÊÊÊÊÊ ÊÊ ÊÊÊ
‡‡‡ ‡‡‡ ‡‡ ‡ ‡‡‡
‡‡‡‡‡‡ ‡‡ ‡ ‡
‡‡‡ ‡ ‡ ‡‡ ‡ ‡ ‡ ‡‡‡
0.005 0.010 0.015 0.020 0.025 0.030 0.0350
10
20
30
40
50
60
16.16.517.17.518.18.519.19.520.
Superficial Gas Velocity, ftêsec
BedDensity,lbêft2
BedHeight,in
PSRI Umf/Umb Test Unit
We are basically fitting the drag model to the Umf/Umb data

Applying the Fundamentals
It’s Not Just About Bed Density
• Column dimensions• 3 ft (0.9-m) diameter• 20 ft (6.1-m) tall
• 4 ft (1.2-m) static bed height• Entrainment rate determined from rate of fill in
primary cyclone dipleg• Heavy FCC catalyst• 70 micron dp50
• 1500 kg/m3 density○
○
○
○
○
0.5 0.6 0.7 0.8 0.9 1.00.0
0.1
0.2
0.3
0.4
0.5
0.6
0.7
Superficial Gas Velocity, m/sec
EntrainmentFlux,kg
/m2-sec
Experimental Data
Particle Entrainment
For Geldart Group A Particles, Drag Models Over Predict the Entrainment Rates

Applying the Fundamentals
Entrainment Fluxes
��� �/��� ���� ������� ����������� ����� ��/��-������ ��������� ������������ ��������� ������������ �������� ������������ ��������� ����������� ��������� ���������
PSRI Cluster Size + Entrainment Flux
●
●
●
●
●
△△▽ ▽
▽ ▽
▲
▲ ▲▲
★
★
★
★★
0.5 0.6 0.7 0.8 0.9 1.0 1.1
0.5
1
5
10
Superficial Gas Velocity, m/sec
EntrainmentFlux,kg
/m2-sec
● Data
△ CPFD 0.8 Wen Yu
▽ CPFD 1.0 Wen Yu
▲ PSRI Drag
★ PSRI Correlation

Applying the Fundamentals
Its Not Just CFD
Entrainment rate calculations based on FCC catalyst powder with 9% fines in a 3-meters ID x 12-meters tall fluidized bed with a bed height of 6 meters and superficial gas velocity of 1 m/sec at
room temperature
Stojkovski, V., Kostic’, Z., Thermal Science, 7 (2003) 43-58.Zenz, P.A., Weil, N.A., AIChE J., 4 (1958) 472-479.Lin, L, Sears, J.T., Wen, C.Y., Powder Technology, 27 (1980) 105-115.
M. Colakyan, N. Catipovic, G. Jovanovic, T.J. Fitzgerald, AIChE Symp. Ser. 77 (1981) 66.Colakyan, M., Levenspiel, O., Powder Technology, 38 (1984), pp. 223-232
Geldart, D., Cullinan, J., Georghiades, S., Gilvray, D., Pope, D.J., Trans. Inst. Chem. Eng., 57 (1979) 269-277.

Applying the Fundamentals
This is a Fines Problem
‡ ‡ ‡‡
‡
‡‡
‡
‡
Ê Ê ÊÊ
ÊÊÊÊÊÊÊÊÊ
Ê
Ê
Ê
0.2 0.4 0.6 0.8 1.0 1.2 1.40
2
4
6
8
Superficial Gas Velocity, mêsec
EntrainmentFlux,kgêm
2 -sec
‡‡
‡‡
‡
‡
‡
ÊÊ
ÊÊÊÊÊ
Ê
Ê
0.6 0.8 1.0 1.2 1.40.0
0.5
1.0
1.5
2.0
2.5
3.0
Superficial Gas Velocity, mêsec
EntrainmentFlux,kgêm
2 -sec
Geldart Group B Cokeρp=1600 kg/m3
dp50 (Initial) =150 μmColumn Dia. = 0.3 mStatic Bed Height (Initial) = 0.76 m
With Baffles
Without Baffles
With Baffles
Without Baffles
Geldart Group A FCC Catalyst Powderρp=1490 kg/m3
dp50 (Initial) =90 μmColumn Dia. = 0.15 mStatic Bed Height (Initial) = 0.76 mBaffles at 0.5 and 0.76 m

Applying the Fundamentals
Particle Drag and
Entrainment
Fluid FlowFluid Flow
����������� ��� ��������� �/��� ������� �������� ������� �������� ��/�� ������������ �������� ��/�� ��������������� ��/�-��� ���������
Fluid Flow
dp = 50 microns dp = 100 microns dp,cluster = 100 micronsdp = 30 microns
0 50 100 150 200 250
100
200
500
1000
2000
Particle Size, microns
DragForce,N
eCat in a Bubbling Fluidized Bed

Applying the Fundamentals
FCC Catalyst Particle Clusters in Freeboard
• 30% of the material in the freeboard was observed as clusters
• Average cluster size was equivalent to 11 particles of dp50 size
Phantom V7.1 @ 4000 fps, 20 μs exposure (NETL)
FCC powder with dp50 of 72 microns in 6-in (15-cm) ID
fluidized bed with superficial gas velocity of 1 ft/sec (0.3 m/
sec)
←200 μm Diameter

Applying the Fundamentals
FCC Catalyst Clusters in the Fluidized Bed
• Cluster observed near bubble region
• Can not distinguished if clusters are in the emulsion phase or not
Phantom V7.1 @ 4000 fps, 20 μs exposure (NETL)FCC powder with dp50 of 72 microns in 6-in (15-cm) ID fluidized bed with superficial gas
velocity of 1 ft/sec (0.3 m/sec)
←50 μm Diameter

Applying the Fundamentals
FCC Catalyst Clusters in the Fluidized Bed
• Cluster observed near bubble region
• Can not distinguished if clusters are in the emulsion phase or not
Phantom V7.1 @ 4000 fps, 20 μs exposure (NETL)FCC powder with dp50 of 72 microns in 6-in (15-cm) ID fluidized bed with superficial gas
velocity of 1 ft/sec (0.3 m/sec)
←50 μm Diameter←50 μm Diameter

Applying the Fundamentals
Surface Morphology Driven
Royer, J.R., Evans, D.J., Oyarte, L., Guo, Q., Kapit, E., Möbius, M.E., Waitukaitis, S.R., Jaeger, H.M., High-Speed Tracking of Rupture and Clustering in Freely Falling Granular Streams, Nature 459 (2009) 1110-1113.
Glass Beads Copper Powder

Applying the Fundamentals
Surface Morphology Driven
Royer, J.R., Evans, D.J., Oyarte, L., Guo, Q., Kapit, E., Möbius, M.E., Waitukaitis, S.R., Jaeger, H.M., High-Speed Tracking of Rupture and Clustering in Freely Falling Granular Streams, Nature 459 (2009) 1110-1113.
Glass Beads Copper Powder
Applying the Fundamentals
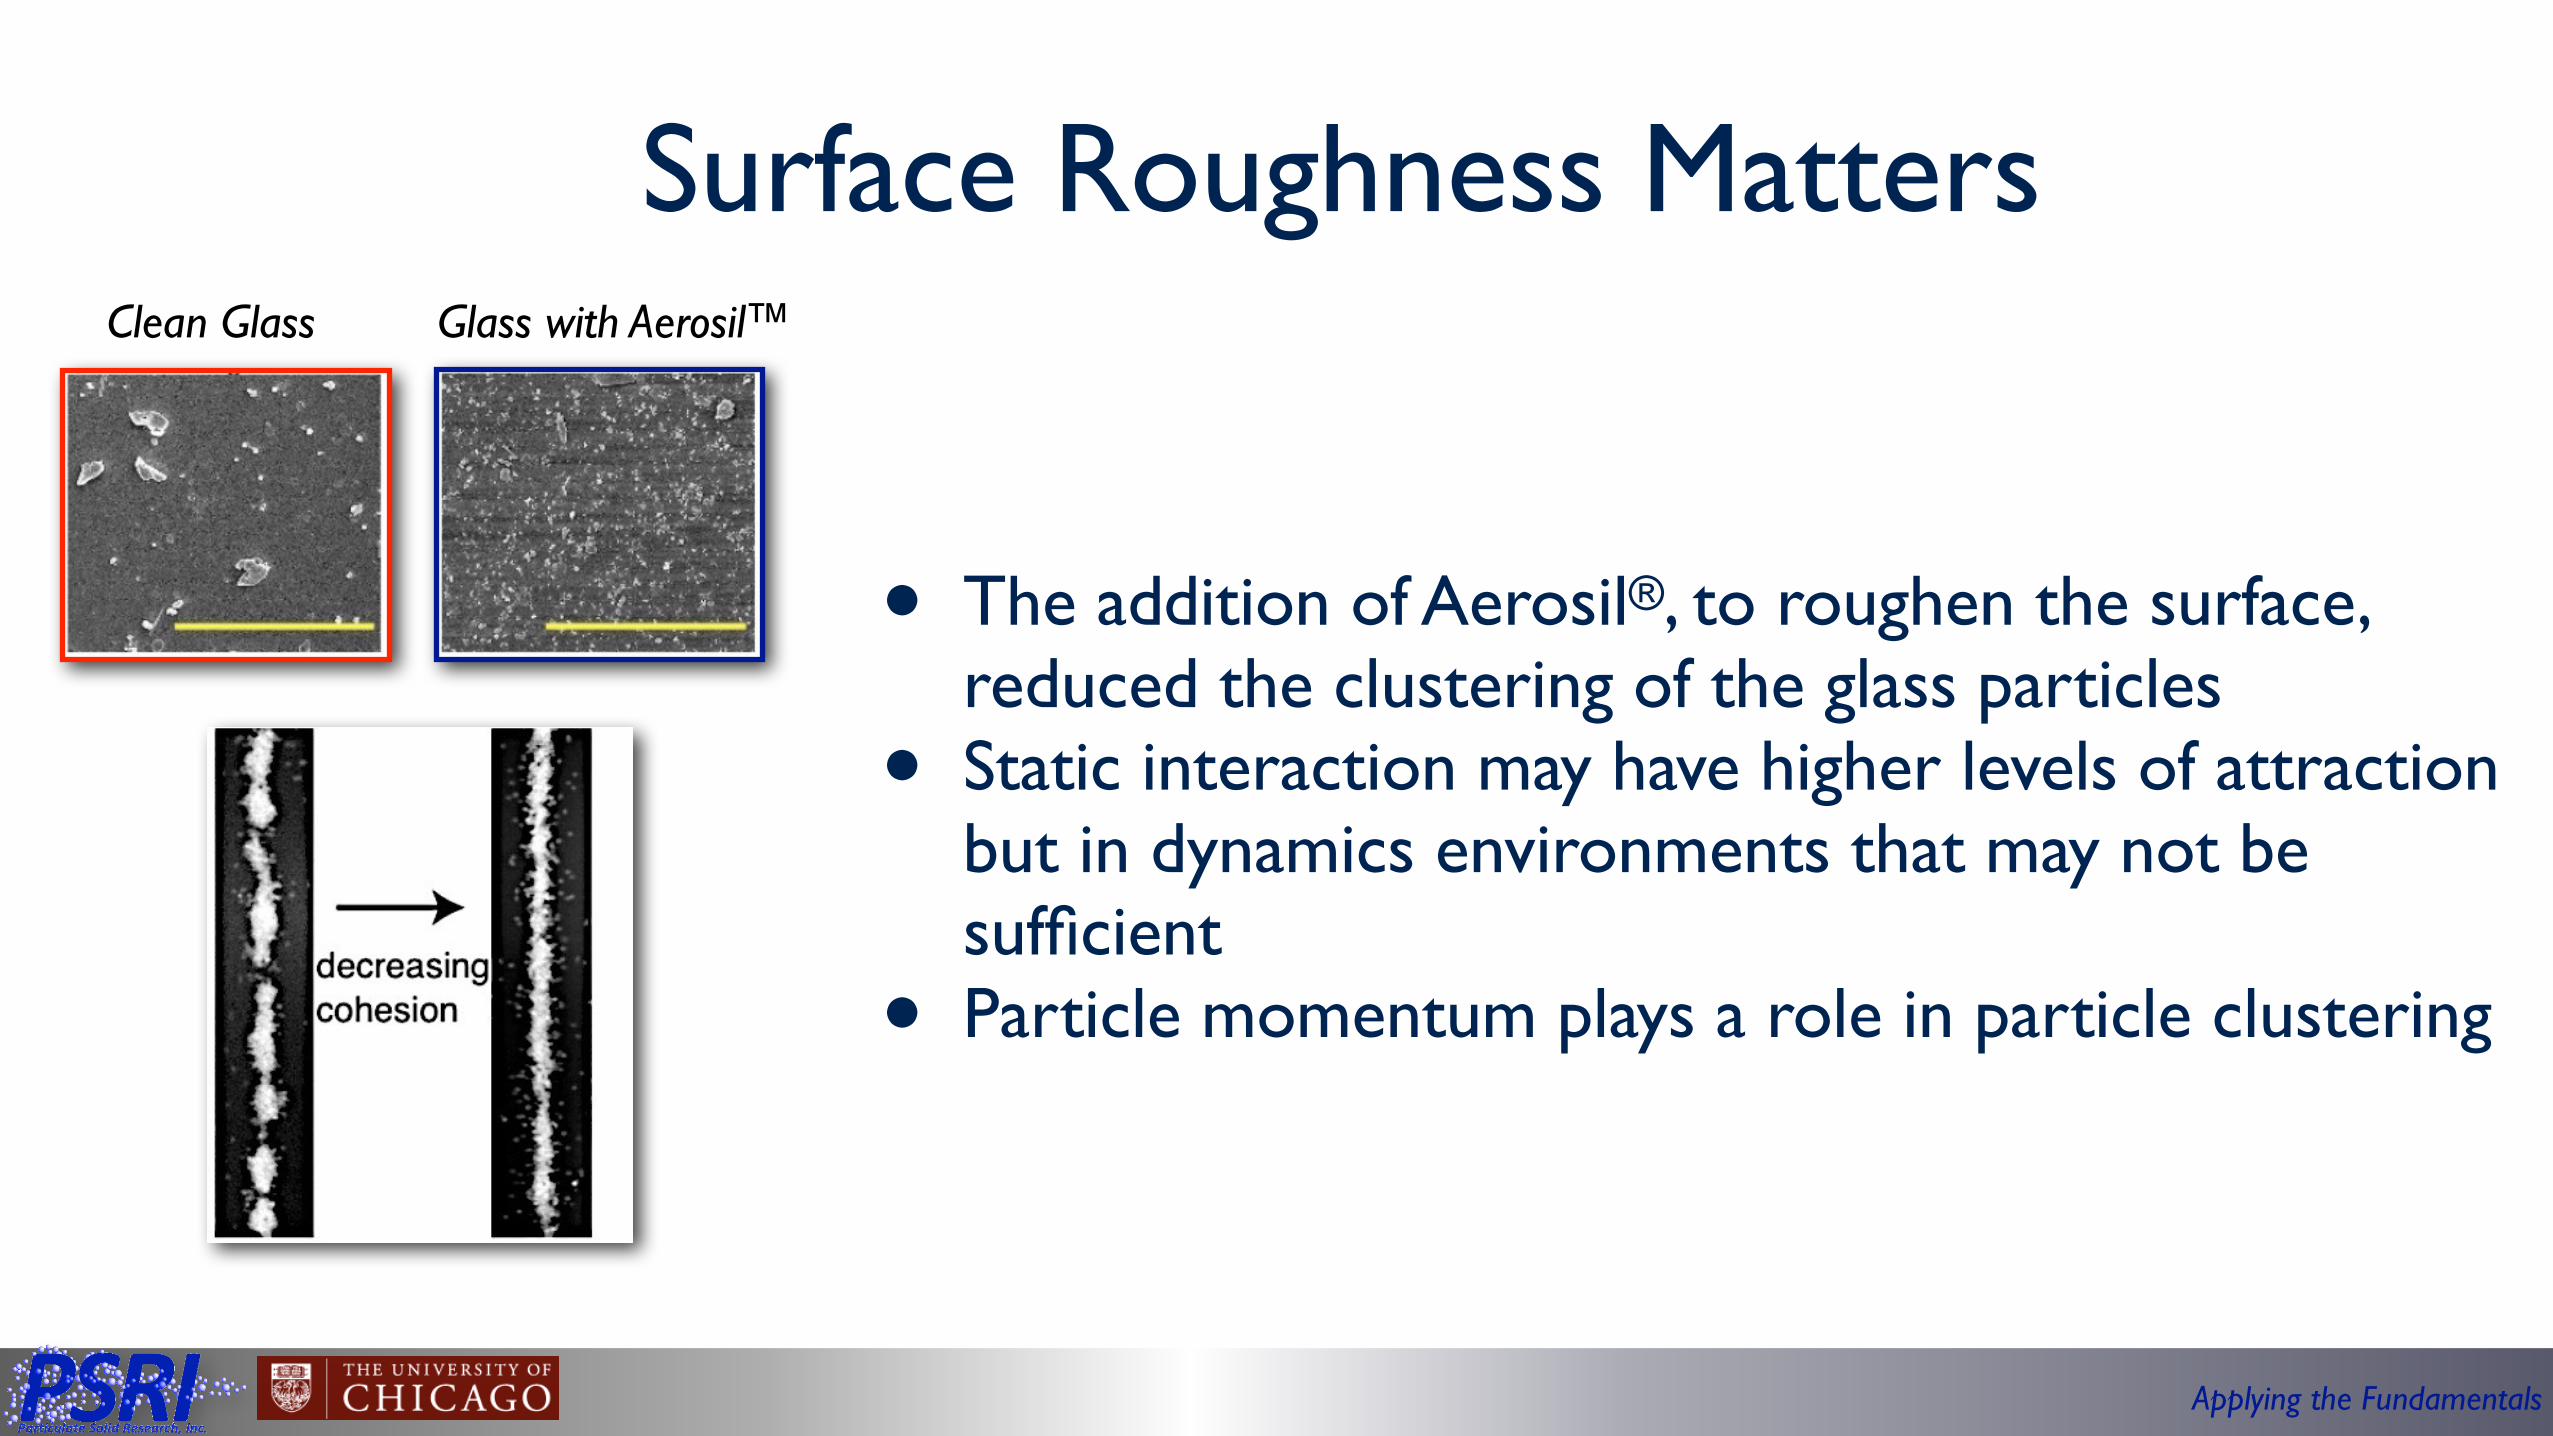
Surface Roughness Matters
• The addition of Aerosil®, to roughen the surface, reduced the clustering of the glass particles
• Static interaction may have higher levels of attraction but in dynamics environments that may not be sufficient
• Particle momentum plays a role in particle clustering
Clean Glass Glass with Aerosil™

Applying the Fundamentals
Electronic and Ionic Exchange
• \
V. Lee, S.R. Waitukaitis, M.Z. Miskin, H.M. Jaeger, Direct observation of particle interactions and clustering in charged granular streams, Nat Phys. 11 (2015) 733–737.
Large Particles
Small Particles
80% of the larger particles were positively charged while 95% of the smaller particles where negatively charged
S.R. Waitukaitis, V. Lee, J.M. Pierson, S.L. Forman, H.M. Jaeger, Size-Dependent Same-Material Tribocharging in Insulating Grains, Physical Review Letters. 112 (2014) 218001–5

Applying the Fundamentals
Electronic and Ionic Exchange
S.R. Waitukaitis, V. Lee, J.M. Pierson, S.L. Forman, H.M. Jaeger, Size-Dependent Same-Material Tribocharging in Insulating Grains, Physical Review Letters. 112 (2014) 218001–5
Thermoluminescence Measurements
σ~1x10⁻⁴ um-2
Surface charge density, σ, is 5X lower than needed to explain the particle
mobility in the drop tube. Ionic exchange, such as OH-, may be
responsible with the glass beads
No Excitation
12 hrs Visible
12 hrs UV

Applying the Fundamentals
Hydroxyl Ion and Clustering
• Pence et al. (1994) and McCarty et al. (2008) have noted the importance of water, and with it OH- ions, on the surface of particles for contact charging.
• Unless one prepares surfaces under ultra-high vacuum conditions, thin water layers are generally unavoidable.
• Indeed, even in a vacuum at 10-6 Torr, a molecularly thin layer of water adsorbs in one second, which is the definition of a Langmuir.
• On a zeolite, water is present on the surface at temperature exceeding 700°C

Applying the Fundamentals
Particle Clusters in Freefall
Lee, V., Waitukaitis, S.R., Miskin, M.Z., Jaeger, H,M., Direct observations of particle interactions and clustering in charged granular streams, Nature Physics, 11, (2015) 733-737.

Applying the Fundamentals
Particle Clusters in Freefall
Lee, V., Waitukaitis, S.R., Miskin, M.Z., Jaeger, H,M., Direct observations of particle interactions and clustering in charged granular streams, Nature Physics, 11, (2015) 733-737.

Applying the Fundamentals
Momentum Exchange is Important Too
Near Capture Repulsion Rotational to Translational
Lee, V., Waitukaitis, S.R., Miskin, M.Z., Jaeger, H,M., Direct observations of particle interactions and clustering in charged granular streams, Nature Physics, 11, (2015) 733-737.

Applying the Fundamentals
Momentum Exchange is Important Too
Near Capture Repulsion Rotational to Translational
Lee, V., Waitukaitis, S.R., Miskin, M.Z., Jaeger, H,M., Direct observations of particle interactions and clustering in charged granular streams, Nature Physics, 11, (2015) 733-737.

Applying the Fundamentals
Hypothesis on Particle Clustering
+
-OH-
H+
OH-
H+
OH-H+
Long Range Attraction
Collision
Short Range Attraction
Collision and Collisional Cooling
Short Range Attraction
Clustering
+
-OH-
H+
Long Range Attraction
Collision
Rotational Momentum ➔Translational Momentum
Clustering Unlikely+
-
Long Range Attraction

Applying the Fundamentals
Sub-grid Drag Models: Filtered
Filtered drag models based on simulations using homogenous drag models (mostly Wen and Yu)
Ultra-fine mesh simulations
Filtering regions
∆* ∆*
Developed filtered drag model

Applying the Fundamentals
Heterogeneous (Sub-grid or Filtered) Models
Course mesh[1] Ultrafine mesh
Agrawal et al. (2001) J Fluid Mech
Homogenous drag: ultra-fine mesh required to resolve solids gradients of
instabilities
experimental data
sub-grid drag
homogenous drag
Sub-grid drag model improves upon (course-grid) homogenous drag model which over-predicts drag
Wang et al. (2010) Chem Eng Sci
However, clustering may not start with the drag

Applying the Fundamentals
Sub-grid Drag Models: EMMSFlow separated into three phases
(phase c)
(phase d)
(phase cl)
Drag determined on each phase separately
Total power (F·u), minimized to close all unknowns introduced

Applying the Fundamentals
Sub-grid Drag Models: EMMS
Drag force computed within each phase based on homogenous Wen and Yu drag model
Flow separated into three phases
Wen and Yu drag for each phase
(phase c)
(phase d)
(phase cl)
Drag determined on each phase separately
Total power (F·u), minimized to close all unknowns introduced

Applying the Fundamentals
Sub-grid Drag Model Experimental Validation: EMMS
0 1 2 3
0
1
2
3
0
1
2
3
0123
0
1
2
3
0
1
2
3
< >Gs,loc
Gs,all
Bub P/ x
Yang et al. (2003)Shah et al. (2011) (low flux)Shah et al. (2011) (high flux)Shah et al. (2011)Wang (2010)Lu et al. (2011) (group A)Lu et al. (2011) (group B)Hong et al. (2016)Chen et al. (2016)Qui et al. (2017)Song et al. (2016)Li et al. (2012)Qui et al. (2015)
For Entrainment, the drag needs to be fitted to the entrainment rate data

Applying the Fundamentals
Sub-grid Drag Model Experimental Validation: EMMS
0 1 2 3
0
1
2
3
0
1
2
3
0123
0
1
2
3
0
1
2
3
< >Gs,loc
Gs,all
Bub P/ x
Yang et al. (2003)Shah et al. (2011) (low flux)Shah et al. (2011) (high flux)Shah et al. (2011)Wang (2010)Lu et al. (2011) (group A)Lu et al. (2011) (group B)Hong et al. (2016)Chen et al. (2016)Qui et al. (2017)Song et al. (2016)Li et al. (2012)Qui et al. (2015)
Fully validated
0 = 😣
1 = 🙁
2 = 😀
3 = 🤘
For Entrainment, the drag needs to be fitted to the entrainment rate data

Applying the Fundamentals
Entrainment Fluxes
��� �/��� ���� ������� ����������� ����� ��/��-������ ��������� ������������ ��������� ������������ �������� ������������ ��������� ����������� ��������� ���������
����������� ��� ��������� �/��� ������ ������� ����� ���������� ������������ ������������ ����������� ����������� ���������
PSRI Cluster Size + Entrainment Flux CFD Fitted to a Cluster Size
●
●
●
●
●
△△▽ ▽
▽ ▽
▲
▲ ▲▲
★
★
★
★★
0.5 0.6 0.7 0.8 0.9 1.0 1.1
0.5
1
5
10
Superficial Gas Velocity, m/sec
EntrainmentFlux,kg
/m2-sec
Dp Correction
● Data
△ CPFD 0.8 Wen Yu
▽ CPFD 1.0 Wen Yu
▲ PSRI Drag
★ PSRI Correlation
Fitting Cluster Size

Applying the Fundamentals
Concluding Remarks
• Boundary conditions need to be realistic or have a minimal dependance on the solution
• Particle properties need to go beyond the median particles size and particle density
• PSD, Shape, Adsorbate, Roughness!• Drag models are dragging down the capabilities of today’s CFD models for
fluidized bed simulations• All CFD models are limited for Geldart Group A and AC materials due to
particle clustering• This is not an issue for larger particles where clustering is unlike to happen
• With such limitations, calibration with experimental data is recommended• For fluidized beds, fitting drag to Umf/Umb and bed density data is a good start
Copyright © 2022 FDOKUMEN