Catalytic Coal Gasification Process Simulation with Alkaline ...
18
Energies 2019, 12, 1367; doi:10.3390/en12071367 www.mdpi.com/journal/energies Article Catalytic Coal Gasification Process Simulation with Alkaline Organic Wastewater in a Fluidized Bed Reactor Using Aspen Plus Xianbin Xiao, Xueying Wang, Zongming Zheng *, Wu Qin and Yumengqiu Zhou National Engineering Laboratory for Biomass Power Generation Equipment, North China Electric Power University, Beijing 102206, China; [email protected] (X.X.); [email protected] (X.W.); [email protected] (W.Q.); [email protected] (Y.Z.) * Correspondence: [email protected]; Tel.: +86‐010‐61772304 Received: 26 February 2019; Accepted: 4 April 2019; Published: 9 April 2019 Abstract: A co‐gasification process was proposed both for treating alkaline organic wastewater and to promote coal gasification by the alkaline substances in situ. A catalytic gasification model was developed by introducing a catalytic correction factor to describe the catalytic effects quantitatively. An integrated process simulation was carried out using Aspen Plus equipped with FORTRAN subroutines. The model was verified using the root mean square error between the simulation results and experimental data from the literature. Syngas composition, cold gas efficiency, and carbon conversion efficiency were analyzed with respect to different operating conditions (reaction temperature, steam/coal ratio, and equivalence ratio). The optimal conditions are summarized based on a self‐sufficient system by using sensitivity analysis: Gasification temperature of 700 °C, steam/coal ratio = 1.0, and equivalence ratio = 0.4. Keywords: Coal; Gasification; Alkaline organic wastewater; Catalytic correction factors; ASPEN PLUS 1. Introduction The energy crisis and environmental pollution are becoming increasingly serious due to rapid industrialization. In China, large amounts of alkaline organic wastewater are created by the paper‐ making, chemical, pharmaceutical, and textile industries, as a special source of bioenergy [1], which significantly damages the environment because of the presence of metal ions and complex organic compounds. Hence, how to dispose of this massive volume of wastewater in an environmentally friendly and cost‐effective manner is becoming an attractive research issue for scientists. Some researchers have proposed methods to handle organic wastewater, such as physicochemical, electrical, and biological processes [2]. Incineration is the most common technique for highly toxic organic wastewater with complex compositions, and combustion efficiency is usually 99% [3,4]. Incinerating wastewater containing alkali metal ions and organic compounds leads to agglomeration and coking in the fluidized bed [5,6]. There are two major causes for agglomeration and coking: (i) The alkali metal compounds in wastewater (Na2CO3, NaCl, Na2SO4, and other sodium‐ based salts) turn to melted ash because the temperature inside the incinerator is higher than their melting point (melting points of NaCl, Na2SO4, and Na2CO3 are 801, 884, and 851 °C, respectively). Then, the molten liquid sodium salts flow along with the flue gas, contact the surface of the fluidized bed, and eventually condense to form coke and slag. (ii) The alkali elements in wastewater, particularly Na and K, react with bed materials, and SiO2 forms sodium silicates, which melt under the high temperature [5].
-
Upload
khangminh22 -
Category
Documents
-
view
6 -
download
0
Transcript of Catalytic Coal Gasification Process Simulation with Alkaline ...

Energies 2019, 12, 1367; doi:10.3390/en12071367 www.mdpi.com/journal/energies
Article
Catalytic Coal Gasification Process Simulation with
Alkaline Organic Wastewater in a Fluidized Bed
Reactor Using Aspen Plus
Xianbin Xiao, Xueying Wang, Zongming Zheng *, Wu Qin and Yumengqiu Zhou
National Engineering Laboratory for Biomass Power Generation Equipment, North China Electric Power
University, Beijing 102206, China; [email protected] (X.X.); [email protected] (X.W.);
[email protected] (W.Q.); [email protected] (Y.Z.)
* Correspondence: [email protected]; Tel.: +86‐010‐61772304
Received: 26 February 2019; Accepted: 4 April 2019; Published: 9 April 2019
Abstract: A co‐gasification process was proposed both for treating alkaline organic wastewater and
to promote coal gasification by the alkaline substances in situ. A catalytic gasification model was
developed by introducing a catalytic correction factor to describe the catalytic effects quantitatively.
An integrated process simulation was carried out using Aspen Plus equipped with FORTRAN
subroutines. The model was verified using the root mean square error between the simulation
results and experimental data from the literature. Syngas composition, cold gas efficiency, and
carbon conversion efficiency were analyzed with respect to different operating conditions (reaction
temperature, steam/coal ratio, and equivalence ratio). The optimal conditions are summarized
based on a self‐sufficient system by using sensitivity analysis: Gasification temperature of 700 °C,
steam/coal ratio = 1.0, and equivalence ratio = 0.4.
Keywords: Coal; Gasification; Alkaline organic wastewater; Catalytic correction factors; ASPEN PLUS
1. Introduction
The energy crisis and environmental pollution are becoming increasingly serious due to rapid
industrialization. In China, large amounts of alkaline organic wastewater are created by the paper‐
making, chemical, pharmaceutical, and textile industries, as a special source of bioenergy [1], which
significantly damages the environment because of the presence of metal ions and complex organic
compounds. Hence, how to dispose of this massive volume of wastewater in an environmentally
friendly and cost‐effective manner is becoming an attractive research issue for scientists.
Some researchers have proposed methods to handle organic wastewater, such as
physicochemical, electrical, and biological processes [2]. Incineration is the most common technique
for highly toxic organic wastewater with complex compositions, and combustion efficiency is usually
99% [3,4]. Incinerating wastewater containing alkali metal ions and organic compounds leads to
agglomeration and coking in the fluidized bed [5,6]. There are two major causes for agglomeration
and coking: (i) The alkali metal compounds in wastewater (Na2CO3, NaCl, Na2SO4, and other sodium‐
based salts) turn to melted ash because the temperature inside the incinerator is higher than their
melting point (melting points of NaCl, Na2SO4, and Na2CO3 are 801, 884, and 851 °C, respectively).
Then, the molten liquid sodium salts flow along with the flue gas, contact the surface of the fluidized
bed, and eventually condense to form coke and slag. (ii) The alkali elements in wastewater,
particularly Na and K, react with bed materials, and SiO2 forms sodium silicates, which melt under
the high temperature [5].

Energies 2019, 12, 1367 2 of 18
A process of gasification combined with combustion is proposed in Figure 1 to thoroughly
decompose the alkaline organic wastewater and avoid agglomeration. The entire process can be
divided into four stages: (i) Coal and wastewater are mixed to form metal‐ion‐exchanged coal. (ii)
Metal‐ion‐exchanged coal and wastewater are co‐gasified in the fluidized bed, where steam is
introduced into the system as a gasifying agent. The gasification temperature must be controlled
below the ash melting point. (iii) Separation of the mixed products. (iv) The gaseous products serve
as a fuel to undergo further combustion to produce energy and heat, while the fly ash remains static
and can be separated and recovered in a solid state.
Figure 1. Gasification combined with combustion process.
Some researchers have established a two‐stage system to avoid agglomeration and coking [7,8].
However, they mainly focused on controlling the temperature of the first stage without exploiting
the catalytic effects of metal ions in the wastewater.
The catalytic effects of alkali and alkaline earth metallic species on coal gasification have been
proved since the 1980s [9–11]. The co‐gasification of wastewater and coal has been preliminarily
studied, which demonstrated the feasibility of using wastewater as a catalyst for coal gasification.
Zhang et al. [12–16] evaluated the performance of black/viscose liquor and organic sodium as the
catalyst during anthracite steam gasification at temperatures of 850–950 °C. The experimental results
showed the remarkable catalytic effect of alkaline organic wastewater, and the saturation of adding
alkali metal compounds is about 8–10 wt%. Wastewater increases surface activity as well as decreases
the activation energy of gasification when mixed with coal. Kuang et al. [17,18] investigated the
catalytic gasification of a coal black liquor slurry (CBLS) and found that many mesopores and
micropores exist on the surface of CBLS coke, which play a crucial role in catalytic gasification.
Beyond the catalytic function of alkali metals, the lignin and cellulose contained in the wastewater
also enhance the heat value of the syngas. However, previous researches mainly focused on the
catalytic effect of alkali metals at temperatures >800 °C, which deviates from the gasification
temperature required by our proposed process. Efforts should be made to expand studies of
gasification characteristics in a relatively low temperature range.

Energies 2019, 12, 1367 3 of 18
ASPEN PLUS has been used to simulate the gasification process of different raw materials, such
as coal, biomass, and solid waste, in different reactors (fixed bed/fluidized bed/entrained‐flow bed)
for the past decade [19–24]. There are two ways for the simulation of coal gasification in a fluidized
bed to occur, i.e., the equilibrium method and the kinetic method. The equilibrium models mainly
use the RYield and RGibbs modules to describe the pyrolysis and gasification process [21], while
kinetic models adopt RCSTR to represent the fluidized bed [22]. The equilibrium model is more
accurate when applied to complete equilibrium states and is more suitable to describe equilibrium of
the gasification reaction, especially when the gasification temperature is relatively high. The kinetic
model is much more complex and relies on experimental data, but is more precise and adaptable than
the equilibrium model. Jorge et al. [25] and Che et al. [26] simulated biomass and coal co‐gasification
in a fluidized bed at temperatures of 700–900 °C. The results showed that the simulation results were
highly accurate with a maximum deviation of about 7.23%. Accuracy was favored by gasification
temperatures >800 °C. In particular, a catalytic coal gasification model was developed by Jang et al.
who added catalytic effects of K2CO3 to a fixed bed model, where kinetic values were calculated from
the experimental data, and the maximum error of the syngas component was 6% [27]. However, few
literature can be found in regard to the simulation of co‐gasification of coal and wastewater with
catalytic effects in a fluidized bed.
The objective of our study was to develop a catalytic gasification model of coal and alkaline
organic wastewater in a fluidized bed using Aspen Plus. We used the model to clarify the effects of
operating parameters including gasification temperature, the steam/coal (S/C) ratio, and equivalence
ratio (ER) on carbon conversion efficiency, gas yield, and composition. An energy analysis based on
sensitivity was conducted to obtain optimal operation conditions.
2. Method Description
2.1. Process Assumptions
The following assumptions were applied to the comprehensive model:
Gasification temperature remains stable.
The raw material particles are mixed with the gasifying agents in the furnace quickly and
uniformly.
H, O, N, and S in the coal all changed into the gas phase, and C was assumed to be incompletely
transformed according to the reaction.
The char contains only fixed carbon and ash.
Ash in coal is inert and does not participate in chemical reactions.
The syngas consists of H2, CO, CO2, CH4, H2O, N2, and C6H6.
The fluidized bed was divided into dense and dilute phases.
The composition of the gas phase under the simulation conditions is regarded as an ideal gas, and
it is applicable to the physical properties, methods, and models in the software.
The catalytic effect was introduced into the gasification model of the fluidized bed using a
correction factor.
2.2. Reactions
The following reactions (1)–(7) were considered during the pyrolysis, char gasification, and
combustion processes and all the reaction rates are shown in Table 1 [28].
Pyrolysis:
Coal → CO + H� + CO� + H�O + H�S + N � + CH� + C�H� + Char (1)
Solid‐gas reactions:
C +Z + 2
2Z + 2O� →
Z
Z + 1CO +
1
Z + 1CO� (2)
C + H�O → CO + H� (3)

Energies 2019, 12, 1367 4 of 18
C + CO� → 2CO (4)
C + 2H� → CH� (5)
CO + H�O → CO� + H� (6)
H� + 0.5O� → H�O (7)
Table 1. Reaction rates for reactions (2)–(7) [28].
Reaction Reaction Rate Remarks
2
���
1�����
+1
����
����� = 0.0292 × 4.26 ×(
�1800)�.��
���
���� = ����� ∙ ���.� ∙
��������������
1 −�����
���������
3 )(][930 22
*T1.987
45000
OHOH PPCe
T
COHOH
e
PPP
1633029.17
* 2
2
4 )(][930 22
*T1.987
45000
COCO PPCe
T
COCO
e
PP
2028092.20
2*
2
5 )(][ 22
*T
8078-087.7-
HH PPCe
5.0
1010043.13-
* 4
2
T
CHH
e
PP
6
T
P
wgs
HCO
OHCO
w
e
Pk
xxxx
eF
t
555391.8
2505.0
1.987/T
277605
)(
10877.2
22
2
Twgs ek
8.1
7234689.3
7 22
4
T8.315
109.976-
51083.8 OH CCe
‐
2.3. Process Modeling
Based on the above hypothesis, a mixed air‐stream gasification model was established in the
fluidized bed (Figure 2). The model consists of nine unit operation modules and seventeen material
streams. A brief introduction to the model is given in Table 2.
Figure 2. Flowsheet of the gasification process in Aspen Plus.

Energies 2019, 12, 1367 5 of 18
Table 2. Block descriptions.
Block Name Block Description
DRYER RYield Simulate coal drying based on the water content value in
proximate analysis of coal
PYROLYS RYield Simulate coal pyrolysis based on pyrolysis experiment
CHAR‐DEC RStoic Decompose char into C, H2, O2, N2, S, and ash
GASIFI‐1/2 RCSTR Simulate char gasification
MX MIXER Mix the feed‐in streams
SEP SEP Separate the gas and solid
2.3.1. Component Definitions and Method
In the global setting, we set the streams and defined the component parameters and physical
properties. All components involved in the coal gasification process were divided into conventional
components and non‐conventional components (NC). Conventional components refer to
conventional chemical compounds with definite molecular formulas, such as O2, N2, H2, CO, CH4,
and CO2. The physical properties of the conventional components were specified directly through
the physical database of the Aspen Plus system, whereas the non‐conventional components, such as
coal, could not be defined by the system’s database. The char and ash generated in the reactions were
defined as NC components. NC components was never involved in the calculation of phase
equilibrium and chemical equilibrium during the simulation, and they worked as inert substances [29].
Thus, it was necessary to use the HCOALGEN and DCOALIGT models to calculate their density and
enthalpy based on proximate and ultimate analyses.
The choice of physical properties affects the accuracy of the simulation results. Property
methods, such as RKS‐BM, RK‐SOAVE, or PR‐BM, are selected when gasification occurs at high
temperature, high pressure, and the components consist mostly of light gas. The IDEAL property
method can be considered when the gas components are H2O, N2, and O2 on a low‐pressure condition
[29]. This study used RK‐SOAVE to calculate the physical properties of the components in the
simulation.
2.3.2. Process Description
We selected the appropriate blocks and established the process flow (Figure 2). The full‐flow
reactor (RCSTR) was selected as the key fluidized bed gasification reactor model, as it can handle
both equilibrium and kinetic control reactions simultaneously [30]. The entire coal gasification
process consisted of drying, pyrolysis, decomposition of the char and gasification.
(1) Drying: A stream of coal, with a mass flow, was fed into the DRYER reactor in which the physical
moisture bound was released completely into the gas phase. The amount of vaporized water was
determined by the proximate analysis of the coal. We assumed that coal drying was instantaneous
compared with that of the coal gasification process. Water content for the specific coal we used
was set to x%, according to the proximate analysis. As a result the yield of dried coal was set to 1
− x%. The output was separated by a gas–solids separator called SEP‐1.
(2) Pyrolysis: The output of the drying process was called DRY‐COAL, whereafter it entered the
PYROLYS block. Pyrolysis is a complex thermochemical process that occurs during coal
gasification which is difficult to simulate accurately using the database of Aspen Plus. Two ways
are available to simulate coal pyrolysis. One is based on experiments and the other is to use
functional group models based on a theoretical method [19]. Using experimental results will be
simpler compared with using a functional group. Thus, the pyrolysis experimental data for a
specific coal species was used to specify every component of the PYROLYS block. In this block,
dried coal was broken down into CO, H2, CH4, CO2, N2, H2O, C6H6, and char. The gas–solids
separator SEP‐2 block separated the upstream product into two streams, namely CHAR and
PYRO‐GAS. This reaction was also considered instantaneous.

Energies 2019, 12, 1367 6 of 18
(3) Decomposition: CHAR was downstream of the CHAR‐DEC block. CHAR, as a NC component,
must be transformed to participate in the gasification reaction. In this study, block RStoic was
chosen to simulate the decomposition process. CHAR was decomposed into C, H2, O2, N2, S, and
ash for the solid–gas reactions. The stoichiometric coefficients of the elements mentioned above
were determined automatically according to char’s ultimate analysis in the CALCULATOR block.
The output was separated by the gas–solids separator SEP‐3 block into two streams of CHAR‐GAS
(including H2, O2, and N2) and CHAR‐SLD.
(4) Gasification: The air, steam and the stream CHAR‐GAS gaseous products, were mixed in MIX‐
GASIN. Then, the stream CHAR‐SLD together with MIX‐GASIN and the stream PYRO‐GAS from
the upper block PYROLYS was reacted in the RCSTR reactor, named as block GASIF‐1/2. We used
two RCSTR reactors to simulate the dense and the dilute regions of the fluidized bed. The
uncatalyzed kinetic parameters are shown in Table 1, which were written in an external FORTRAN
subroutine and was linked to the simulation. The gaseous outputs were mainly CO2, CO, H2, CH4,
and C6H6.
(5) Catalytic effects: In fact, catalysts, such as alkali metals, will respectively increase the reaction rates
of the chemical Equations (2)–(7), mentioned in Section 2.2, during the gasification process. Adding
catalytic effects into the gasification model requires correcting of the kinetic parameters compared
with the uncatalyzed simulation. We assumed that alkali metals merely increase the rate of the
carbon‐steam reaction (3), which is the step‐determining step in the steam/air gasification process
after the char is decomposed [31]. A correction factor is introduced based on the kinetics of catalytic
coal gasification with alkaline organic wastewater in the fluidized bed. The correction factor was
obtained via the following method: it equaled the ratio of kexp to kn, where kexp is the reaction rate
constant from the catalytic gasification experiment, and kn is the reaction rate constant without
catalytic effects calculated from Table 1 as used in Equation (8).
nk
kf
exp
(8)
2.4. Characteristics of Feed Coal and Operation Parameters
We selected Yongding Fujian anthracite as the raw material, using steam/air as gasification
agents with catalytic effect correction factors of 10% waste alkali in Sections 3.2–3.3. The results of
proximate and ultimate analyses along with the operation parameters are shown in Tables 3 and 4,
respectively. While the validation of models was carried out on the basis of previous literature in
Section 3.1, the characteristics of feed coal and the reaction conditions can be seen experimentally in
their researches [32,33].
Table 3. Proximate and ultimate analyses of Yongding Fujian anthracite [31].
Proximate Analysis Ultimate Analysis (d)
Mad Ad Vd C H N S O a
5.69 72.04 17.88 75.86 1.26 1.33 1.78 0.77 a by difference.
Table 4. Operation parameters used in the simulation.
Types of Coal Yongding Fujian Anthracite
Coal‐feeding flow rate 0.6 kg/h
Steam flow rate Steam/coal = 0 to 5
Air flow rate ER = 0 to 1
Gasification temperature 550 to 900 °C
Pressure 0.1 MPa
Fluidized bed volume 0.001 + 0.001
Void fraction 0.25 to 0.65 (dense phase and dilute phase)

Energies 2019, 12, 1367 7 of 18
2.5. Calculation of CCG, CGE, and LHV Values
The carbon conversion efficiency (CCE), cold gas efficiency (CGE), and the lower heating value
(LHV) are chosen as quality indicators of syngas. CCE, CGE, and LHV are defined and calculated as
follows [34,35]:
CCG =carbon content in the syngas × syngas flow rate
carbon content in the feed coal × coal flow rate× 100% (9)
CGE =LHV of syngas × syngas flow rate
LHV of the feed coal × coal flow rate× 100% (10)
LHV(MJ/Nm�)=10.79n��
+ 12.63n�� + 35.818n���
100 (11)
3. Results and Discussion
3.1. Model Validation
3.1.1. Validation of Fluidized Bed Model without Catalytic Effect
Experimental data from two lab scale gasifiers were used and named as cases 1 and 2 [32,33].
Both experimental and simulation results under same operation conditions are compared in Figures 3
and 4. In case 1, the agents for bituminous coal were steam and air, and the gasification temperature
was set to 840–910 °C. The results show that the CO content during the simulation was a bit lower
than the experiment value. In case 2, air/oxygen was employed for the gasification agents. The
gasification temperature was about 860 °C in the dense phase zone, which decreased to 760 °C in the
dilute phase zone. The results show that CO content was over‐predicted paralleled with the
experimental data, while H2 and CO2 were lower. The largest absolute error occurred in nitrogen
content with a deviation of 5.7%. In summary, the model outcomes were reasonably close to what
were seen experimentally.
Figure 3. Syngas distribution comparison in case 1 (Steam: 0.76 kg/h, Air: 2.18 m3/h).

Energies 2019, 12, 1367 8 of 18
Figure 4. Syngas distribution comparison in case 2 (Air: 5 Nm3/h, Oxygen: 1.2 Nm3/h).
3.1.2. Validation of the Fluidized Bed Model with a Catalytic Effect
We introduced the catalytic effects to update the original model. The apparent kinetics of
catalytic anthracite gasification with 10% industrial alkaline organic wastewater have been studied
by Lin et al. [31]. The kinetic parameters obtained in their study describe the overall gasification
process, in which all chemical reactions are involved. A simplification in that only the carbon‐steam
reaction is promoted in our simulation is made based on the assumption mentioned in Section 2.3.2.
The correction factor was calculated using Equation (8) as shown in Table 5. We acquired a fitting
formula between reaction temperatures and correction factors through the curve‐fitting method in
Origin program and it was linked to the model by user‐defined subroutine.
� = 2.55 × 10� × ���.���� (12)
where f is the correction factor, and T is the gasification temperature.
Table 5. Catalytic correction factors.
Temp. (K) ���� f
1023 0.0216 1593
1073 0.0266 699
1123 0.037 380
1173 0.0416 180
Predicted trends for every component were also compared to those gained experimentally with
rising steam/air ratio in Figure 5 [31]. The H2 yield increased while CO2 and CO decreased when the
steam/air ratio was increased. The largest deviation, of 8.6%, occurred in H2 and CH4 contents at a
ratio of 1.4. The deviation demonstrated that the catalytic effect played a role in other reactions, such
as the water‐shift reaction (6), and H2 will affect the methanation reaction (7). Another possible reason
for the seemingly high error of CH4 is that pyrolysis is the determining factor for CH4 yield and the
experimental data we used to simulate pyrolysis process was one specific coal type with similar
pyrolysis characteristics [36].

Energies 2019, 12, 1367 9 of 18
Figure 5. Syngas distribution comparison under different steam‐to‐air ratios.
The experimental data of CCE (50–80%), CGE (79.22–85.73%), and LHV (5.31–6.03 MJ/m3) were
collected under a gasification temperature range of 750–900 °C [31]. From Figure 6, CCG and CGE
values were reasonably matching with those observed experimentally. While lower LHV values
occurred because of the lower CH4 content in the syngas. To sum up, the simulation results showed
a good agreement with what can be seen experimentally.
Figure 6. CCE, CGE, and LHV values in validation.

Energies 2019, 12, 1367 10 of 18
3.1.3. Calculation of Root Mean Square Error (RMSE)
To quantify the accuracy of the model, the simulation results were compared with all experimental
data using the sum squared deviation method. We calculated the RMSE of syngas composition, such
as CO, H2, CO2, CH4, and N2, for 12 sets of experimental data through Equation (13) [37].
Root Mean Square Error (RMSE)= �1
�� �
��� − ���
����
��
���
(13)
where yie and yip are experimental and simulation compositions of the gasification product gas.
As shown in Table 6, the distribution of errors was 0.07–0.29. N2 showed the lowest error, while
CH4 showed the largest error of 0.2883. The deviation in this simulation is reasonable and the
correction factors were available for catalytic gasification.
Table 6. Results of sum squared deviation method.
Composition CO H2 CO2 CH4 N2
RMSE 0.2714 0.1667 0.1526 0.2883 0.0728
3.2. Influence of Operating Conditions on Gasification Performance
3.2.1. Effect of Gasification Temperature
The effect of gasification temperature on the simulation results is presented in Figures 7 and 8.
Figure 7 shows H2 content was increased with higher gasification temperature, while CO content
increased first and then decreased when the gasification temperature raised gradually, with a turning
point of 650 °C. CO2 content presented with the opposite trend of CO and CH4 content declined
slightly. These phenomena are explained by the endothermic steam gasification reaction (3) and the
Boudouard reaction (4) and were motivated with ascending temperature. In addition, lower
temperature was beneficial to the exothermic methanation reaction (5).
Figure 7. Effect of gasification temperature on syngas composition (Simulation, ER = 0.2, S/C = 2).

Energies 2019, 12, 1367 11 of 18
Figure 8. Effect of gasification temperature on CCE, CGE, and LHV (Simulation, ER = 0.2, S/C = 2).
The contents of the effective gas components (CO + H2 + CH4) were relatively high, above 700
°C. As shown in Figure 8, CCE (44.8–78.0%), CGE (41.9–81.4%), and the LHV (4.97–6.26 MJ/Nm3) are
all improved with elevated gasification temperature. More syngas can be obtained at gasification
temperatures >700 °C. Higher gasification temperatures were more favorable for the overall
gasification process. Moreover, an appreciable carbon conversion of 65–70% was achieved due to the
catalytic effect at a low temperature range of 650–750 °C.
3.2.2. Effect of the Steam to Coal (S/C) Ratio
The effect of the steam to coal ratio on the simulation results is presented in Figure 9. As
expected, H2 increased rapidly in the S/C range of 0–5.0. The steam‐carbon reaction (2) was the largest
contributor to H2 yield, which was accelerated tremendously with adequate steam source and
catalytic effects. CO content decreased while CO2 content showed a completely opposite tendency
with the rise in S/C, indicating that the steam enhanced the water–gas shift reaction (6), which
generated H2 and CO2, while consumed CO. The steam did not have a great impact on CH4, which
remained almost immobile.
Figure 9. Effect of the steam to coal ratio on syngas composition (Simulation, ER = 0.2, T = 700 °C).

Energies 2019, 12, 1367 12 of 18
CCE (44.5%–72.7%), CGE (39.6%–83.1%), and LHV (5.13%–6.63 MJ/Nm3) were all improved with
larger S/C ratio (Figure 10). Adding extra steam to the system helps enlarge the volume of wastewater
that needs to be treated but it also requires additional energy input [38], which is one of the constraint
conditions according to the technological economics. The effects of operating parameters on energy
consumption will be discussed in detail in Section 3.3.
Figure 10. Effect of the S/C ratio on CCE, CGE, and LHV (Simulation, ER = 0.2, T = 700 °C).
3.2.3. Effect of the ER ratio
The effect of the ER ratio on the distribution of syngas component is presented in Figure 11. H2
content dropped sharply as ER increased, while CO and CO2 contents decreased slightly. It is
apparent that the equivalence ratio had two opposing effects on the gasification process. Adding air
to the system promoted the combustion reaction but increased the gasification temperature, which is
helpful to improve the composition of effective gases as mentioned in Section 3.2.1. But the
combustion of carbon and the oxidation of reducing gas (such as H2, CO) will be dominant in the
gasification process if excessive air is added.
Figure 11. Effect of ER on syngas composition (Simulation, S/C = 2, T = 700 °C).

Energies 2019, 12, 1367 13 of 18
Figure 12 shows that CGE and LHV decreased with ascendant ER ratio which declared the
effective gas contents were transformed by extra O2. The maximum of CGE was 84.05% when the ER
ratio was >0.4, CGE was <64.72%, which diverged from the desired value. LHV was 10.45–2.17
MJ/Nm3, which could reach and even surpass the maximum values in previous statement when the
ER ratio was less than 0.2. And it is not difficult to understand why CCE increased with the rise in
the ER ratio resulted in a highest CCE of 84.98% at a ratio of 1.0. The ideal gasification process
emphasizes high CCG, CGE, and LHV at the same time. Thus, the ER ratio should be <0.4 to ensure
syngas quality.
Figure 12. Effect of ER on CCE, CGE, and LHV (Simulation, S/C = 2, T = 700 °C).
3.3. Energy Analysis
Energy consumption is one of the limiting conditions for system optimization, as we mentioned
in Section 3.2.2. Figure 13 is a heat transfer flow chart of the coal catalytic gasification system. Based
on the model we established, heat from each reactor (Q‐DRY, Q‐PYRO, Q‐DECOM, Q‐GASI1, and Q‐
GASI2) was introduced and summed in the Q‐TOTAL stream, which is the total heat released by the
system. The Q‐TOTAL value should be greater than or equal to zero in Equation (14) to guarantee
that the gasification system maintains self‐sufficiency.
Figure 13. Heat transfer flow chart in the model.
Energies 2019, 12, 1367 14 of 18
TOTALGASIGASIDECOMPYRODRY QQQQQQ 21- (14)
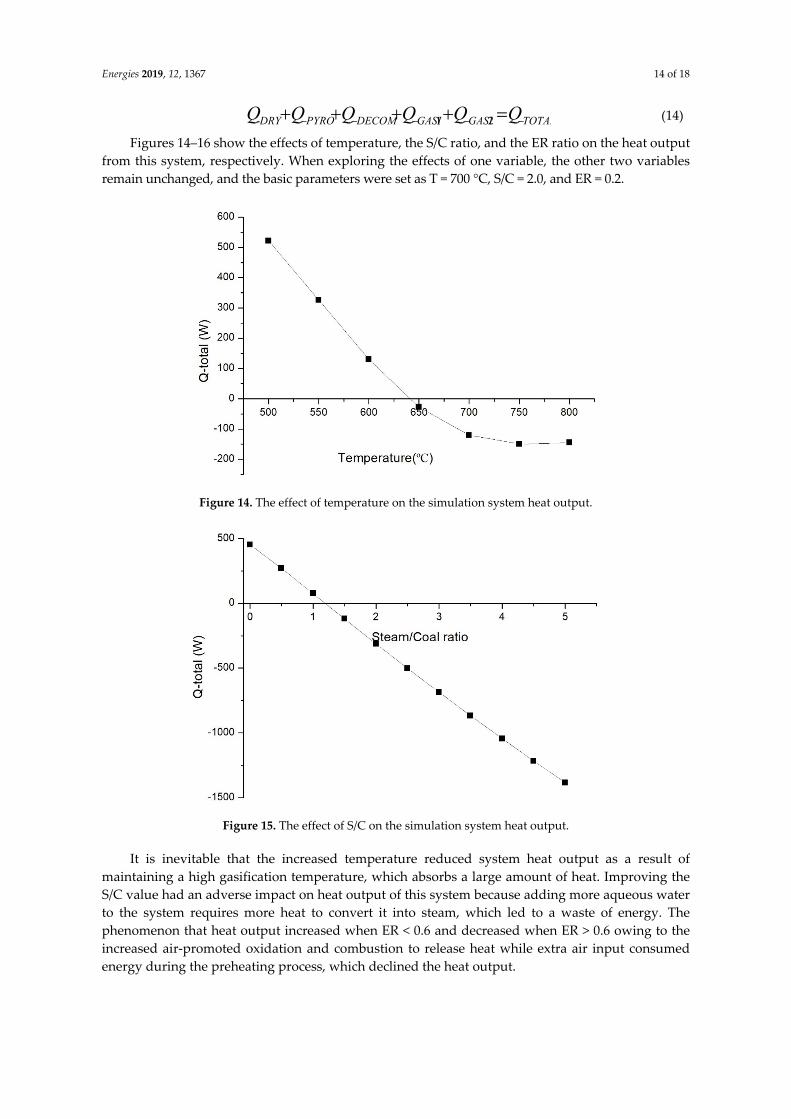
Figures 14–16 show the effects of temperature, the S/C ratio, and the ER ratio on the heat output
from this system, respectively. When exploring the effects of one variable, the other two variables
remain unchanged, and the basic parameters were set as T = 700 °C, S/C = 2.0, and ER = 0.2.
Figure 14. The effect of temperature on the simulation system heat output.
Figure 15. The effect of S/C on the simulation system heat output.
It is inevitable that the increased temperature reduced system heat output as a result of
maintaining a high gasification temperature, which absorbs a large amount of heat. Improving the
S/C value had an adverse impact on heat output of this system because adding more aqueous water
to the system requires more heat to convert it into steam, which led to a waste of energy. The
phenomenon that heat output increased when ER < 0.6 and decreased when ER > 0.6 owing to the
increased air‐promoted oxidation and combustion to release heat while extra air input consumed
energy during the preheating process, which declined the heat output.
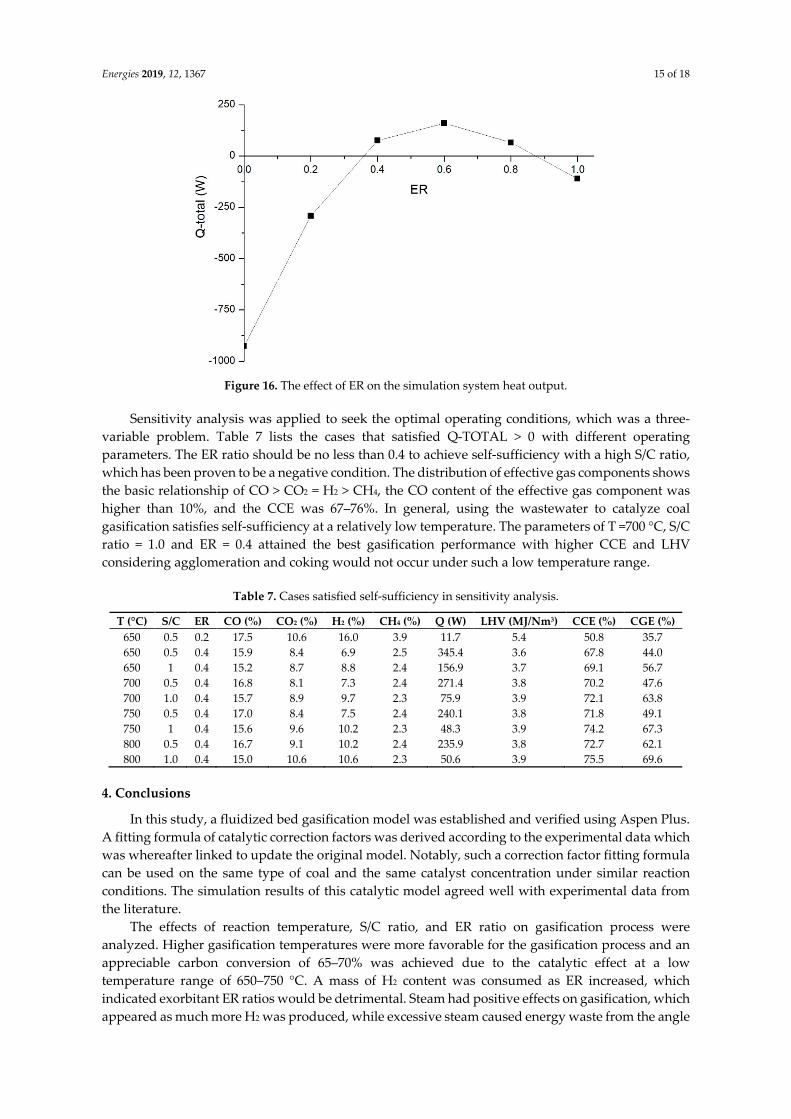
Energies 2019, 12, 1367 15 of 18
Figure 16. The effect of ER on the simulation system heat output.
Sensitivity analysis was applied to seek the optimal operating conditions, which was a three‐
variable problem. Table 7 lists the cases that satisfied Q‐TOTAL > 0 with different operating
parameters. The ER ratio should be no less than 0.4 to achieve self‐sufficiency with a high S/C ratio,
which has been proven to be a negative condition. The distribution of effective gas components shows
the basic relationship of CO > CO2 = H2 > CH4, the CO content of the effective gas component was
higher than 10%, and the CCE was 67–76%. In general, using the wastewater to catalyze coal
gasification satisfies self‐sufficiency at a relatively low temperature. The parameters of T =700 °C, S/C
ratio = 1.0 and ER = 0.4 attained the best gasification performance with higher CCE and LHV
considering agglomeration and coking would not occur under such a low temperature range.
Table 7. Cases satisfied self‐sufficiency in sensitivity analysis.
T (°C) S/C ER CO (%) CO2 (%) H2 (%) CH4 (%) Q (W) LHV (MJ/Nm3) CCE (%) CGE (%)
650 0.5 0.2 17.5 10.6 16.0 3.9 11.7 5.4 50.8 35.7
650 0.5 0.4 15.9 8.4 6.9 2.5 345.4 3.6 67.8 44.0
650 1 0.4 15.2 8.7 8.8 2.4 156.9 3.7 69.1 56.7
700 0.5 0.4 16.8 8.1 7.3 2.4 271.4 3.8 70.2 47.6
700 1.0 0.4 15.7 8.9 9.7 2.3 75.9 3.9 72.1 63.8
750 0.5 0.4 17.0 8.4 7.5 2.4 240.1 3.8 71.8 49.1
750 1 0.4 15.6 9.6 10.2 2.3 48.3 3.9 74.2 67.3
800 0.5 0.4 16.7 9.1 10.2 2.4 235.9 3.8 72.7 62.1
800 1.0 0.4 15.0 10.6 10.6 2.3 50.6 3.9 75.5 69.6
4. Conclusions
In this study, a fluidized bed gasification model was established and verified using Aspen Plus.
A fitting formula of catalytic correction factors was derived according to the experimental data which
was whereafter linked to update the original model. Notably, such a correction factor fitting formula
can be used on the same type of coal and the same catalyst concentration under similar reaction
conditions. The simulation results of this catalytic model agreed well with experimental data from
the literature.
The effects of reaction temperature, S/C ratio, and ER ratio on gasification process were
analyzed. Higher gasification temperatures were more favorable for the gasification process and an
appreciable carbon conversion of 65–70% was achieved due to the catalytic effect at a low
temperature range of 650–750 °C. A mass of H2 content was consumed as ER increased, which
indicated exorbitant ER ratios would be detrimental. Steam had positive effects on gasification, which
appeared as much more H2 was produced, while excessive steam caused energy waste from the angle

Energies 2019, 12, 1367 16 of 18
of technological economics. The optimal conditions are summarized based on a self‐sufficient system
via sensitivity analysis: gasification temperature of 700 °C, S/C = 1.0, and ER = 0.4.
We will use additional catalytic experimental data and the same method to enhance the
adaptability and robustness of this model in future work by deriving the function relationship
concerning catalyst concentration.
Author Contributions: conceptualization, X.X. and X.W.; methodology, Z.Z. and W.Q.; software, W.Q.;
validation, X.W. and Y.Z.; formal analysis, Z.Z.; investigation, X.X. and X.W.; data curation, Z.Z. and W.Q.;
writing—original draft preparation, Y.Z.; writing—review and editing, X.W.; visualization, Y.Z.; supervision,
X.X.; project administration, X.X.; funding acquisition, X.X.
Funding: This research was funded by National Natural Science Foundation of China (Grant No. 5177060739)
and the Fundamental Research Funds for the Central Universities (Grant No. 2017MS023).
Acknowledgments: The authors gratefully acknowledge the financial support by National Natural Science
Foundation of China (Grant No. 5177060739) and the Fundamental Research Funds for the Central Universities
(Grant No. 2017MS023).
Conflicts of Interest: The authors declare no conflict of interest.
Nomenclature
Mad moisture of the coal sample under air dry basis (%)
Vd volatiles of the coal sample under dry basis (%)
Ad ash of the coal sample under dry basis (%)
T reaction temperature (K)
����� mass transfer coefficient for gas film diffusion (gm‐mole/cm3·sec·atm)
���� mass transfer coefficient for ash diffusion (gm‐mole/cm3·sec·atm)
�� porosity of ash
����� average radius of shrinking unreacted coal particles (cm)
��������� average radius of feed coal (cm)
[C] concentration of char
C mole concentration of the subscripted substance (mol/m3)
P partial pressure of the subscripted substance (atm)
P* back reaction equilibrium pressure of the subscripted substance (atm)
� mole fraction of the subscripted substance (%)
�� ash correction factor
���� equilibrium constant of the water–gas shift reaction
References
1. Emamitaba, L.; Irfan, M.F.; Mohd, A.W.D.W.; Chakrabarti, M.H. Fuel blending effects on the co‐gasification
of coal and biomass—A review. Biomass Bioenergy 2013, 57, 249–263.
2. Na, S.H.; Shon, H.K.; Kim, J.B.; JuPark, H.; Kim, J.‐H. Preparation and characterization of titania
nanoparticle produced from Ti‐flocculated sludge with paper mill wastewater. J. Ind. Eng. Chem. 2011, 17,
277–281.
3. Poulsen, T.G.; Hansen, J.A. Assessing the impacts of changes in treatment technology on energy and
greenhouse gas balances for organic waste and wastewater treatment using historical data. Waste Manag.
Res. J. Int. Solid Wastes Public Clean. Assoc. Iswa 2009, 27, 861.
4. Mu, L.; Cai, J.; Chen, J.; Ying, P.; Li, A.; Yin, H. Further Study on Ash Deposits in a Large‐Scale Wastewater
Incineration Plant: Ash Fusion Characteristics and Kinetics. Energy Fuels 2016, 29, 1812–1822.
5. Ma, J.; Liu, D.; Chen, Z.; Chen, X. Agglomeration characteristics during fluidized bed combustion of salty
wastewater. Powder Technol. 2014, 253, 537–547.
6. Bie, R.; Zhao, Y.; Chen, Z.; Lu, J.; Yang, L. Formation Mechanism of Agglomeration Caused by Burning
NSSC Black Liquor in a Fluidized Bed Incinerator. Energy Fuels 2009, 23, 683–689.
7. Li, S.Y. Study on Incineration of Organic Wastewater with High Concentration in Fluidized Bed. Doctoral
Dissertation, Harbin Institute of Technology, Harbin, China, 2006.
8. Zhao, J.; Ma, Z.; Chen, Y. Migration of alkali metal salts of high salinity organic wastewater in fluidized
bed combustion. Energy Eng. 2016, 4, 51–55.

Energies 2019, 12, 1367 17 of 18
9. Veraa, M.J.; Bell, A.T. Effect of alkali metal catalysts on gasification of coal char. Fuel 1978, 57, 194–200.
10. Tay, H.L.; Kajitani, S.; Wang, S.; Li, C.‐Z. A preliminary Raman spectroscopic perspective for the roles of
catalysts during char gasification. Fuel 2014, 121, 165–172.
11. Chen, Z.; Dun, Q.; Shi, Y.; Lai, D.; Zhou, Y.; Gao, S.; Xu, G. High quality syngas production from catalytic
coal gasification using disposable Ca(OH)2, catalyst. Chem. Eng. J. 2017, 316, 842–849.
12. Gul‐e‐Rana, J.; Zhang, J.Y. Catalytic Activity of the Black Liquor and Calcium Mixture in CO2 Gasification
of Fujian Anthracite. Cheminform 2007, 15, 670–679.
13. Jiang, Y.H.; Chen, Y.; Lin, C.; Zhang, J.‐Y. Kinetics of catalytic gasification of anthracite by using organic
sodium as catalysts. J. Combust. Sci. Technol. 2012, 18, 539–544.
14. Lin, J.; Zhang, J.Y.; Zhong, X.Q. Kinetics and compensation effects during steam gasification of Fujian
anthracite using viscose liquor as catalyst. J. Fuel Chem. Technol. 2009, 37, 398–404.
15. Lin, J.; Zhang, J.Y.; Zhong, X.Q. Kinetics and compensation effects of steam gasification of Fujian anthracite
using black liquor as catalyst. J. Chem. Ind. Eng. Soc. China 2009, 284, 15750–15761.
16. Chen, Y.; Zhang, J.Y.; Feng, Y.F. Effects of dispersion of sodium ions on catalytic Fujian anthracite
gasification. J. Fuel Chem. Technol. 2014, 11, 1302–1308.
17. Kuang, J.P.; Zhou, J.H.; Zhou, Z.J.; Liu, J.‐Z.; Cen, K. Research on alkali‐catalyzed gasification of coal black
liquor slurry cokes made up by five different coals. Asia-Pac. J. Chem. Eng. 2010, 2, 152–157.
18. Kuang, J.P.; Zhou, J.H.; Zhou, Z.J.; Liu, J.‐Z.; Cen, K. Catalytic mechanism of sodium compounds in black
liquor during gasification of coal black liquor slurry. Energy Convers. Manag. 2008, 49, 247–256.
19. Beheshti, S.M.; Ghassemi, H.; Shahsavan‐Markadeh, R. Process simulation of biomass gasification in a
bubbling fluidized bed reactor. Energy Convers. Manag. 2015, 94, 345–352.
20. Kong, X.D.; Zhong, W.M.; Du, W.L.; Qian, F. Three Stage Equilibrium Model for Coal Gasification in
Entrained Flow Gasifiers Based on Aspen Plus. Chin. J. Chem. Eng. 2013, 21, 79–84.
21. Qiu, X.; Yan, W.P.; Sun, J.W.; Dong, J.L. Simulation of fluidized bed gasification of biomass based on
minimization of gibbs free energy. Renew. Energy Resour. 2011, 29, 32–39.
22. Begum, S.; Rasul, M.G.; Akbar, D.; Cork, D. An Experimental and Numerical Investigation of Fluidized
Bed Gasification of Solid Waste. Energies 2013, 7, 43–61.
23. Tian, Y.; Zhou, X.; Lin, S.; Ji, X.; Bai, J.; Xu, M. Syngas production from air‐steam gasification of biomass
with natural catalysts. Sci. Total Environ. 2018, 645, 518–523.
24. Wan, W.; Engvall, K.; Yang, W. Model investigation of condensation behaviors of alkalis during syngas
treatment of pressurized biomass gasification. Chem. Eng. Process. Process Intensif. 2018, 129, 28–36.
25. Preciado, J.E.; Ortizmartinez, J.J.; Gonzalezrivera, J.C.; Sierra‐Ramirez, R.; Gordillo, G. Simulation of
Synthesis Gas Production from Steam Oxygen Gasification of Colombian Coal Using Aspen Plus. Energies
2012, 5, 4924–4940.
26. Che, D.Y.; Han, N.N.; Li, S.H.; Liu, H. Simulation Study on Influence of Steam on Co‐gasification of Biomass
and Coal in a Fluidized Bed. Proc. CSEE 2013, 33, 40–45.
27. Jang, D.H.; Kim, H.T.; Chan, L.; Kim, S.H. Kinetic analysis of catalytic coal gasification process in fixed bed
condition using Aspen Plus. Int. J. Hydrogen Energy 2013, 38, 6021–6026.
28. Wen, C.Y.; Chen, H.; Onozaki, M. User’s Manual for Computer Simulation and Design of the Moving-Bed Coal
Gasifier; Final Report; Deptement of Chemical Engineering, West Virginia University: Morgantown, WV,
USA, 1982.
29. Plus, A. Getting Started Modeling Processes with Solids; Aspen Technology, Inc.: Bedford, MA, USA, 2000.
30. Xiong, J.M.; Yang, S.H. Instance Tutorial of Aspen Plus; Chemical Industry Press: Beijing, China, 2012.
31. Lin, J.; Zhang, J.Y.; Zeng, C.; Zhu, Y.‐Z. Apparent kinetics of catalytic gasification on pulverized Fujian
anthracite with mixing gas in fluidized Beds. J. Fuel Chem. Technol. 2000, 28, 485–491.
32. Lu, X.A.; Yan, W.P. Influence of blending ratios on fluidized bed co‐gasification of biomass and coal. J.
Power Eng. 2009, 29, 977–983.
33. Wang, J.Q. System Integration Research on Coal Partial Gasification and Semicoke Combustion. Doctoral
Dissertation, Zhejiang University, Hangzhou, China, 2008.
34. Ding, L.; Yoshikawa, K.; Fukuhara, M.; Kowata, Y.; Nakamura, S.; Xin, D.; Muhan, L. Development of an
ultra‐small biomass gasification and power generation system: Part 2. Gasification characteristics of
carbonized pellets/briquettes in a pilot‐scale updraft fixed bed gasifier. Fuel 2018, 220, 210–219.
35. Fernandez‐Lopez, M.; Pedroche, J.; Valverde, J.L.; Sanchez‐Silva, L. Simulation of the gasification of animal
wastes in a dual gasifier using Aspen Plus®. Energy Convers. Manag. 2017, 140, 211–217.

Energies 2019, 12, 1367 18 of 18
36. Pauls, J.H.; Mahinpey, N.; Mostafavi, E. Simulation of air‐steam gasification of woody biomass in a
bubbling fluidized bed using Aspen Plus: A comprehensive model including pyrolysis, hydrodynamics
and tar production. Biomass Bioenergy 2016, 95, 157–166.
37. Li, G.; Liu, Z.; Li, J.; Fang, Y.; Liu, T.; Mei, Y.; Wang, Z. Application of general regression neural network
to model a novel integrated fluidized bed gasifier. Int. J. Hydrogen Energy 2018, 43, 5512–5521.
38. Pala, L.P.R.; Wang, Q.; Kolb, G.; Hessel, V. Steam gasification of biomass with subsequent syngas
adjustment using shift reaction for syngas production: An Aspen Plus model. Renew. Energy 2017, 101, 484–492.
© 2019 by the authors. Licensee MDPI, Basel, Switzerland. This article is an open access
article distributed under the terms and conditions of the Creative Commons
Attribution (CC BY) license (http://creativecommons.org/licenses/by/4.0/).