Overview of DOE's Gasification Program
150
Gasification Systems Overview v3.0 July 12, 2012 Jenny B. Tennant Technology Manager - Gasification Gasification Systems Program – Slide Library
-
Upload
khangminh22 -
Category
Documents
-
view
1 -
download
0
Transcript of Overview of DOE's Gasification Program
Gasification Systems Overview v3.0 July 12, 2012
Jenny B. Tennant Technology Manager - Gasification
Gasification Systems Program – Slide Library
2
Slide Library Table of Contents
Gasification 101 Program Slides Energy Outlook Active DOE Cooperative Agreements NETL In-House R&D (ORD-RUA) Congressionally Directed Projects DOE Supported Gasification Demonstration Projects Systems Analysis – Gasification Systems Program – Bituminous Baseline Study – Bituminous IGCC Pathway Study – Low Rank Coal Baseline Study: IGCC Cases – Low Rank Coal IGCC Pathway Study
Conventional IGCC Compared to PC and NGCC Commercial IGCC Plants Worldwide Gasification Database Closing
3
Gasification 101
4
What is Gasification?
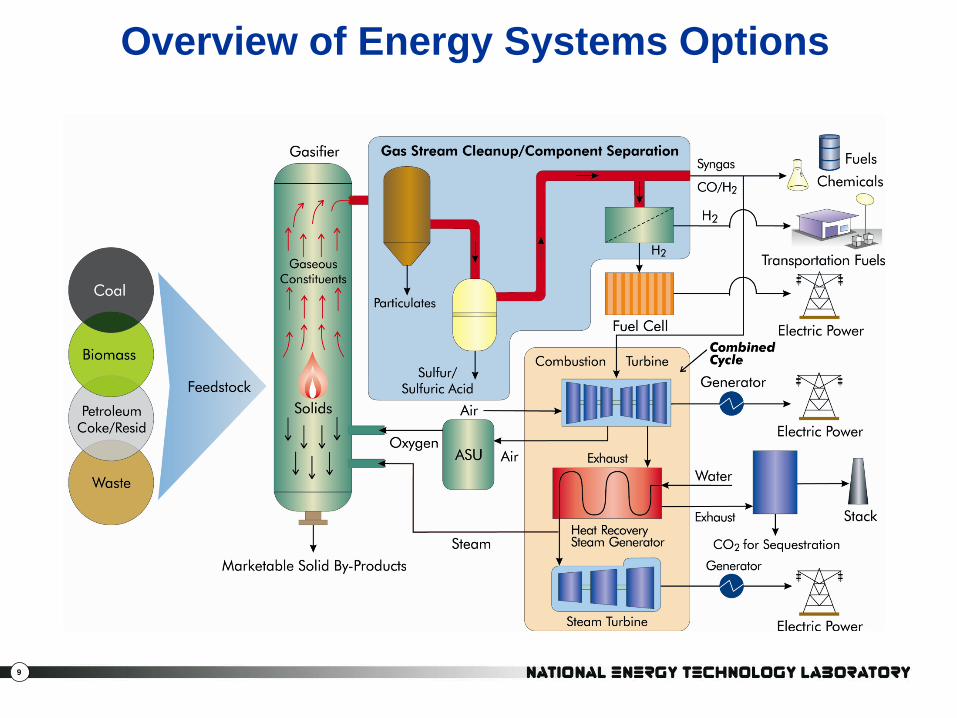
Gasification converts any carbon-containing material into synthesis gas, composed primarily of carbon monoxide and hydrogen (referred to as syngas)
Syngas can be used as a fuel to generate electricity or steam, as a basic chemical building block for a large number of uses in the petrochemical and refining industries, and for the production of hydrogen
Gasification adds value to low- or negative-value feedstocks by converting them to marketable fuels and products
5
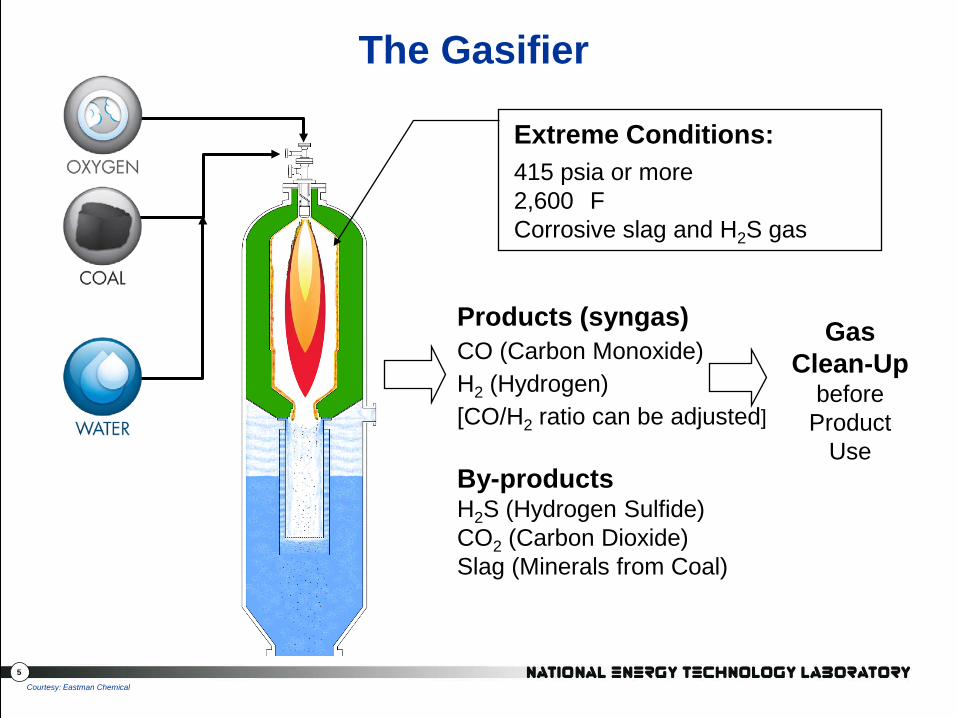
Extreme Conditions: 415 psia or more 2,600 F Corrosive slag and H2S gas
Products (syngas) CO (Carbon Monoxide) H2 (Hydrogen) [CO/H2 ratio can be adjusted] By-products H2S (Hydrogen Sulfide) CO2 (Carbon Dioxide) Slag (Minerals from Coal)
Gas Clean-Up
before Product
Use
The Gasifier
Courtesy: Eastman Chemical
6
Gasification – Differences from Combustion
Add water and high pressure Use less air or oxygen Gasification exit gases are at high pressure, so smaller volume, smaller reactors Combustion makes heat + CO2 + H2O Gasification makes less heat + carbon monoxide + hydrogen (CO + H2); called Syngas
7
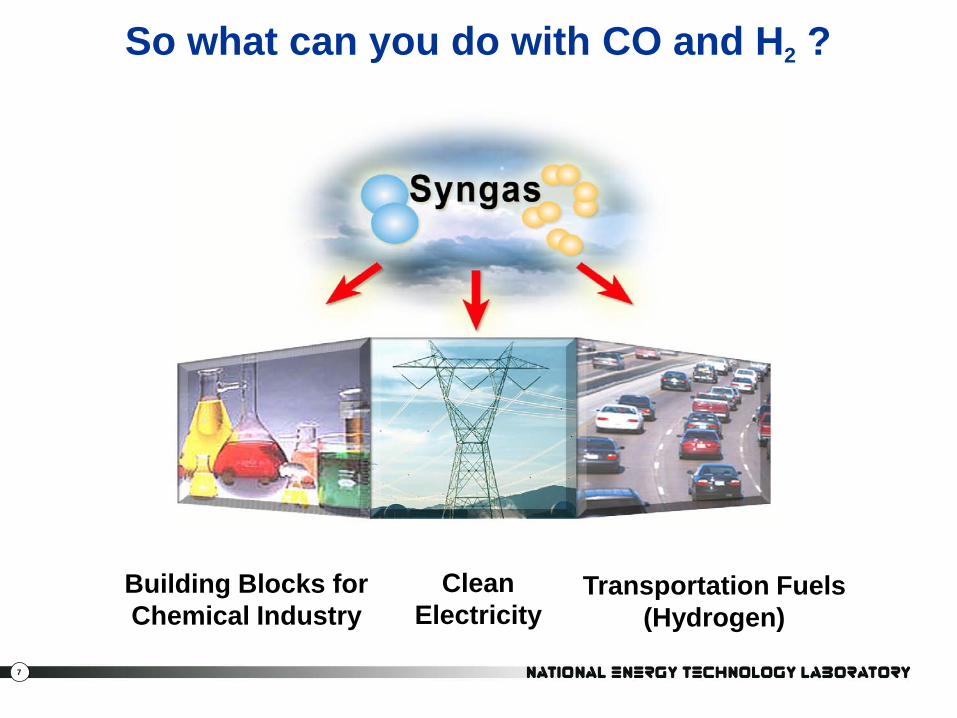
So what can you do with CO and H2 ?
Clean Electricity
Transportation Fuels (Hydrogen)
Building Blocks for Chemical Industry

8
Water-Gas-Shift (WGS) Reaction
Dry syngas is ~ 40% CO + 50% H2
– For each CO molecule the WGS reaction creates one H2 molecule and one CO2 molecule
CO + H2O + catalyst CO2 + H2
After the WGS reaction, the CO2 and H2 can be separated High pressure CO2 results in lower cost sequestration Hydrogen can be burned to make power
2H2 + O2 2H2O
9
Overview of Energy Systems Options
10
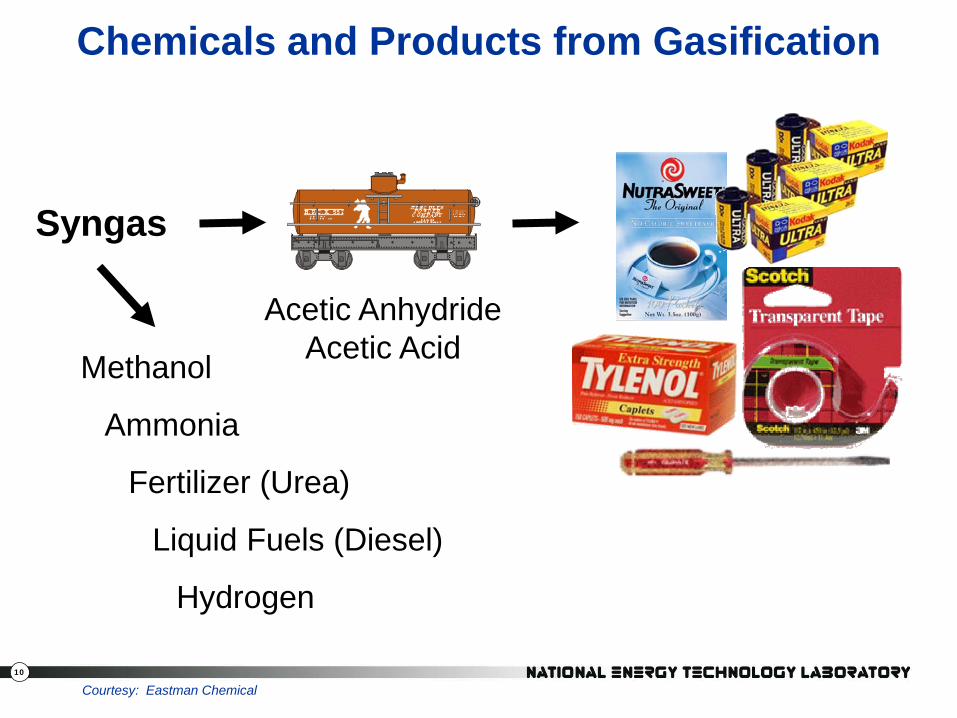
Chemicals and Products from Gasification
Acetic Anhydride Acetic Acid
Courtesy: Eastman Chemical
Methanol
Ammonia
Fertilizer (Urea)
Liquid Fuels (Diesel)
Hydrogen
Syngas
11
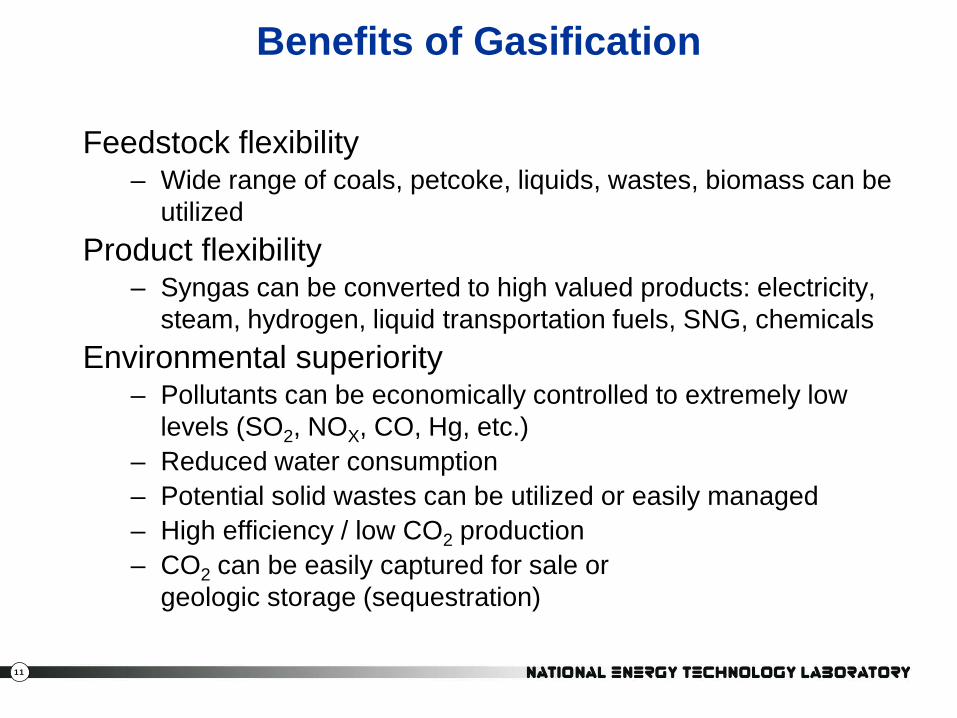
Benefits of Gasification
Feedstock flexibility – Wide range of coals, petcoke, liquids, wastes, biomass can be
utilized Product flexibility
– Syngas can be converted to high valued products: electricity, steam, hydrogen, liquid transportation fuels, SNG, chemicals
Environmental superiority – Pollutants can be economically controlled to extremely low
levels (SO2, NOX, CO, Hg, etc.) – Reduced water consumption – Potential solid wastes can be utilized or easily managed – High efficiency / low CO2 production – CO2 can be easily captured for sale or
geologic storage (sequestration)

12
Program Slides
13
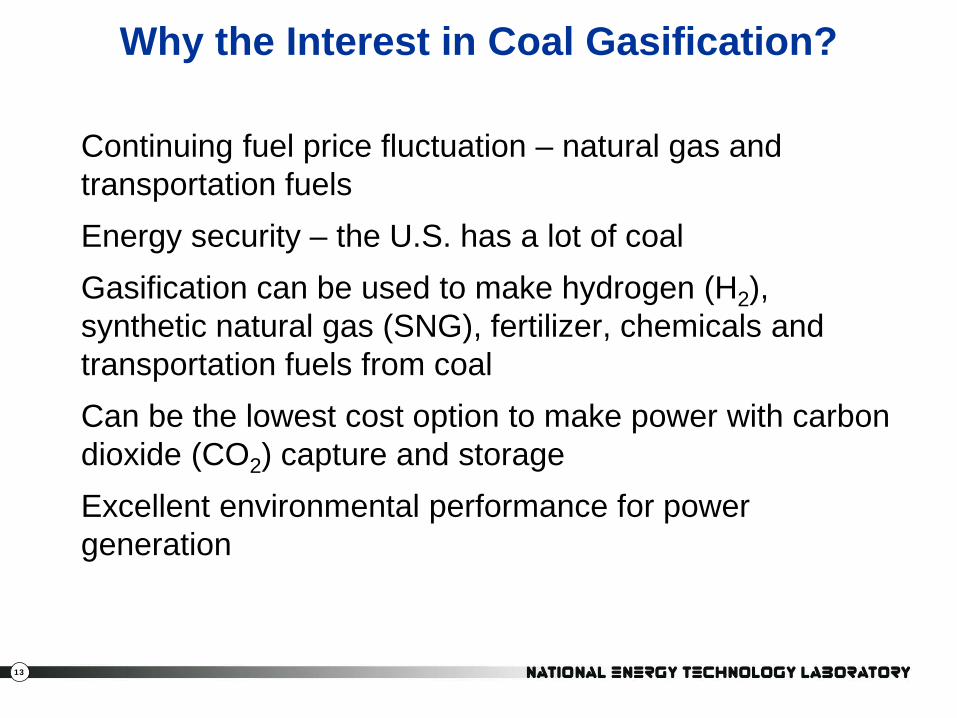
Why the Interest in Coal Gasification?
Continuing fuel price fluctuation – natural gas and transportation fuels Energy security – the U.S. has a lot of coal Gasification can be used to make hydrogen (H2), synthetic natural gas (SNG), fertilizer, chemicals and transportation fuels from coal Can be the lowest cost option to make power with carbon dioxide (CO2) capture and storage Excellent environmental performance for power generation
14
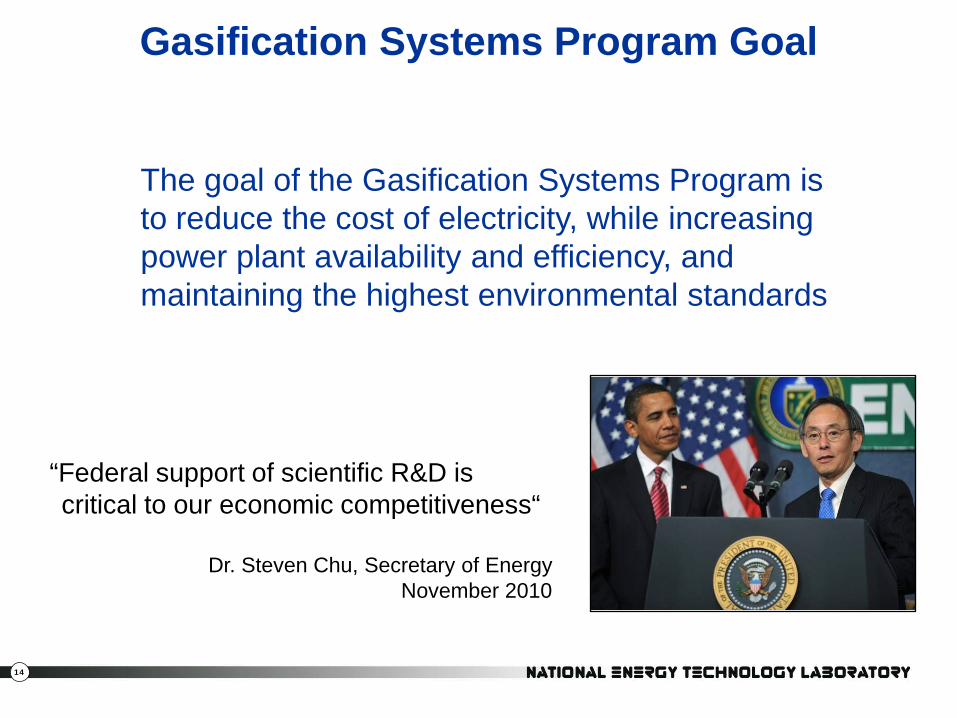
Gasification Systems Program Goal
“Federal support of scientific R&D is critical to our economic competitiveness“
Dr. Steven Chu, Secretary of Energy
November 2010
The goal of the Gasification Systems Program is to reduce the cost of electricity, while increasing power plant availability and efficiency, and maintaining the highest environmental standards

15
Gasification Systems Program
Focus to reduce the cost of gasification, while increasing plant availability and efficiency, and maintaining the highest environmental standards
FE Program Target: IGCC with CSS that has less than 10% increase in COE and 90% capture Increasing focus on low rank coal (LRC) gasification – EIA forecasts significant growth in western coal production; low
rank western coal cost per Btu will stay at about half that of eastern coal
– Industry interest in cost-sharing LRC R&D
– Potential for economic boost to U.S. regions with LRC reserves
16
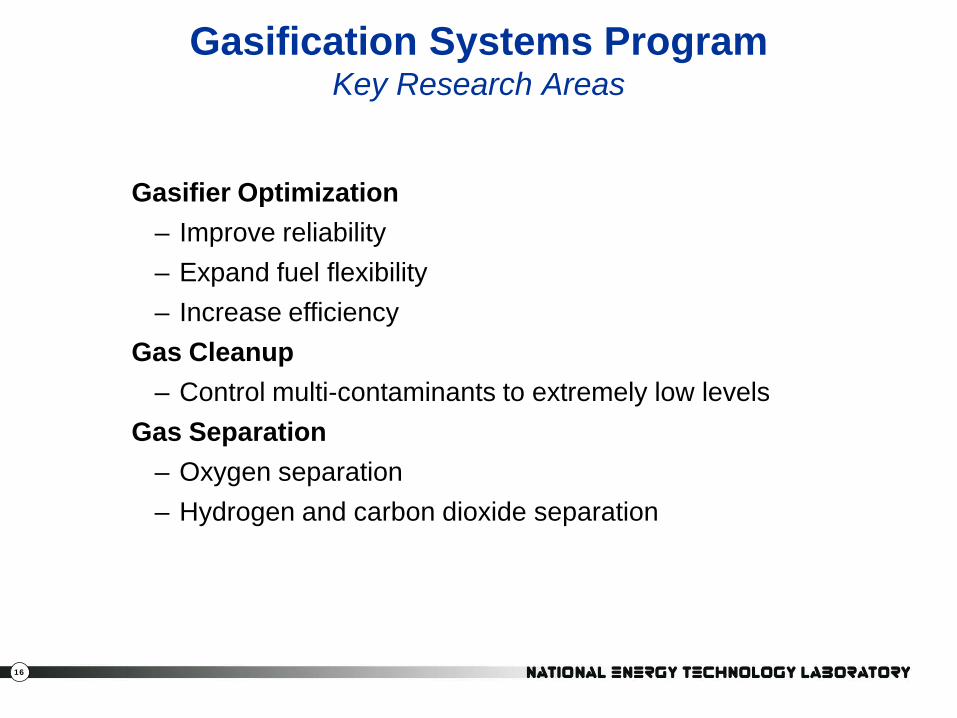
Gasification Systems Program Key Research Areas
Gasifier Optimization – Improve reliability – Expand fuel flexibility – Increase efficiency
Gas Cleanup – Control multi-contaminants to extremely low levels
Gas Separation – Oxygen separation – Hydrogen and carbon dioxide separation
17
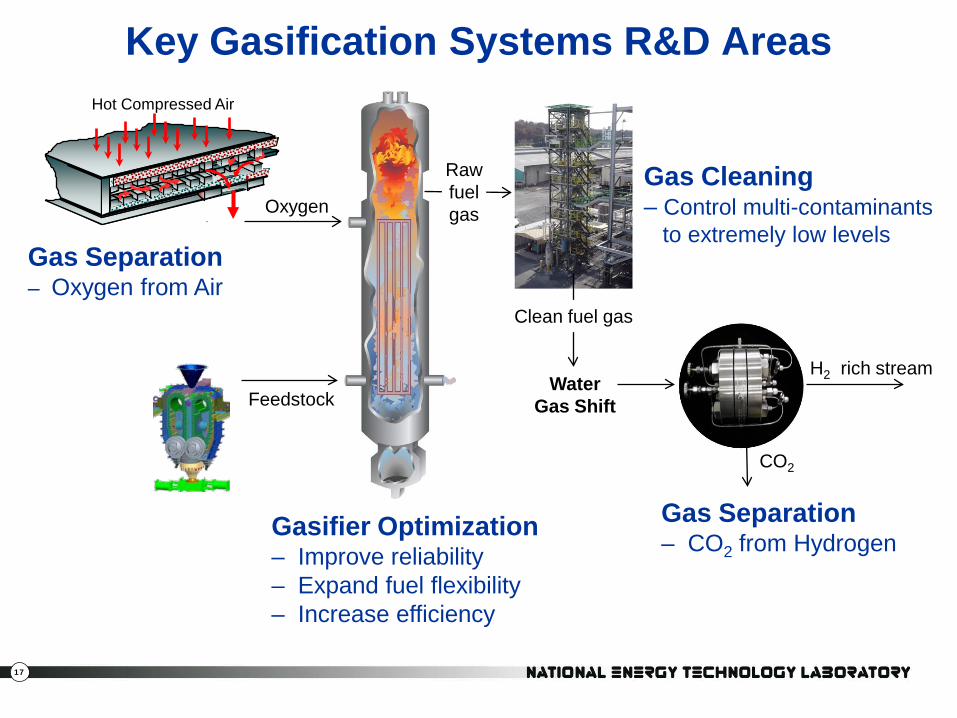
Gas Separation – Oxygen from Air
Gas Cleaning – Control multi-contaminants to extremely low levels
Oxygen
CO2
H2 rich stream Water
Gas Shift
Key Gasification Systems R&D Areas Hot Compressed Air
Feedstock
Clean fuel gas
Gasifier Optimization – Improve reliability – Expand fuel flexibility – Increase efficiency
Raw fuel gas
Gas Separation – CO2 from Hydrogen
18
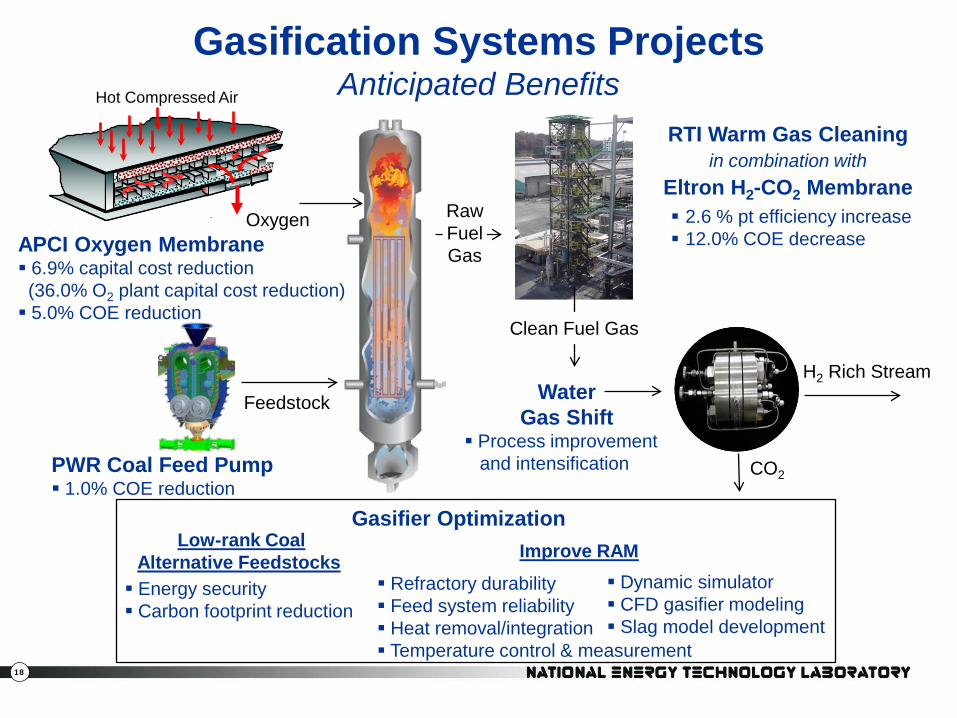
APCI Oxygen Membrane 6.9% capital cost reduction (36.0% O2 plant capital cost reduction) 5.0% COE reduction
Oxygen
CO2
H2 Rich Stream Water
Gas Shift Process improvement and intensification
Gasification Systems Projects Anticipated Benefits Hot Compressed Air
PWR Coal Feed Pump 1.0% COE reduction
Feedstock
Clean Fuel Gas
Raw Fuel Gas
Gasifier Optimization Low-rank Coal
Alternative Feedstocks Energy security Carbon footprint reduction
Improve RAM
Refractory durability Feed system reliability Heat removal/integration Temperature control & measurement
Dynamic simulator CFD gasifier modeling Slag model development
RTI Warm Gas Cleaning in combination with
Eltron H2-CO2 Membrane 2.6 % pt efficiency increase 12.0% COE decrease

19
APCI Oxygen Membrane 6.9% capital cost reduction (36.0% O2 plant capital cost reduction) 5.0% COE reduction
Oxygen
CO2
H2 Rich Stream Water
Gas Shift
Gasification Systems Project Benefits Hot Compressed Air
PWR Coal Feed Pump 1.0% COE reduction
Feedstock
Clean Fuel Gas
Raw Fuel Gas
ORD Pd Sorbent
RTI Warm Gas Cleaning in combination with
Eltron H2-CO2 Membrane 2.6 % pt efficiency increase 12.0% COE decrease
NCCC WGS Optimization
Gasifier Optimization Low-rank Coal
Alternative Feedstocks Goal is competitive use of LRC
Improve RAM Goal is 10% Improvement
20
Low Rank Coal Program Pathway Why It’s the Right Time
Gasification industry interviews show interest in low rank coal – Most projects are cost shared with industry – Industry use is objective of Gasification Program R&D
Low rank coals present unique challenges and opportunities for gasification and IGCC
– High inherent moisture, high in alkali metals (Na, K, Ca) – High oxygen content, high reactivity, low sulfur and Low Cost
NETL systems analysis has shown low rank coal gasification has the potential to be economically competitive
– Altitude vs Shipping – Limited gasifier types
About half of world, and U.S., coal reserves are low rank -- a global market opportunity for advanced IGCC technology
21
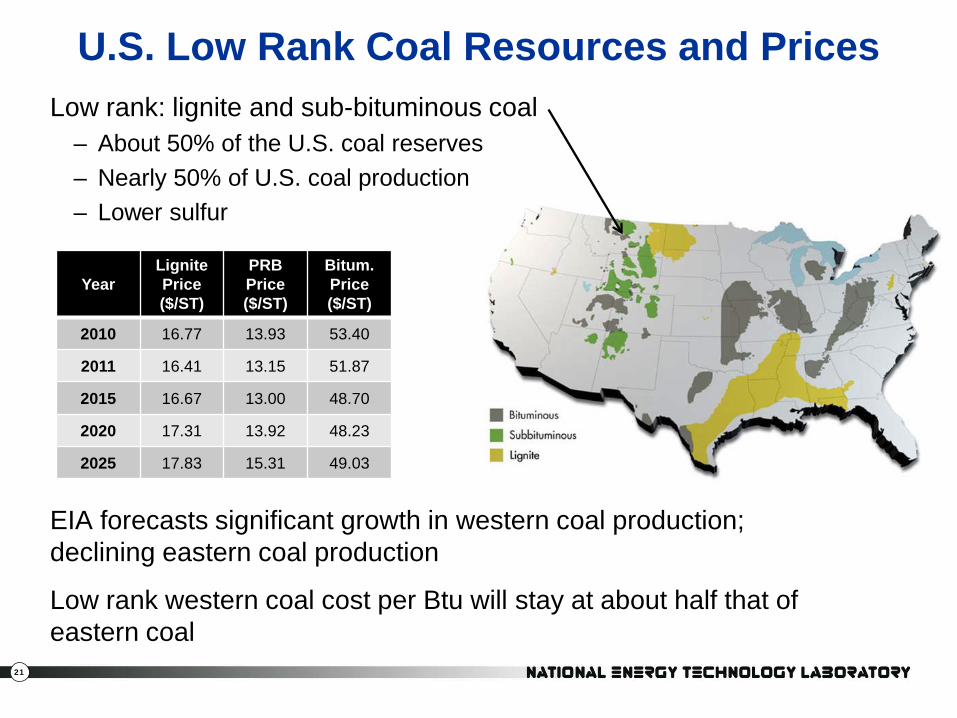
Low rank: lignite and sub-bituminous coal – About 50% of the U.S. coal reserves – Nearly 50% of U.S. coal production – Lower sulfur
EIA forecasts significant growth in western coal production; declining eastern coal production
Low rank western coal cost per Btu will stay at about half that of eastern coal
U.S. Low Rank Coal Resources and Prices
Year Lignite Price ($/ST)
PRB Price ($/ST)
Bitum. Price ($/ST)
2010 16.77 13.93 53.40
2011 16.41 13.15 51.87
2015 16.67 13.00 48.70
2020 17.31 13.92 48.23
2025 17.83 15.31 49.03
22
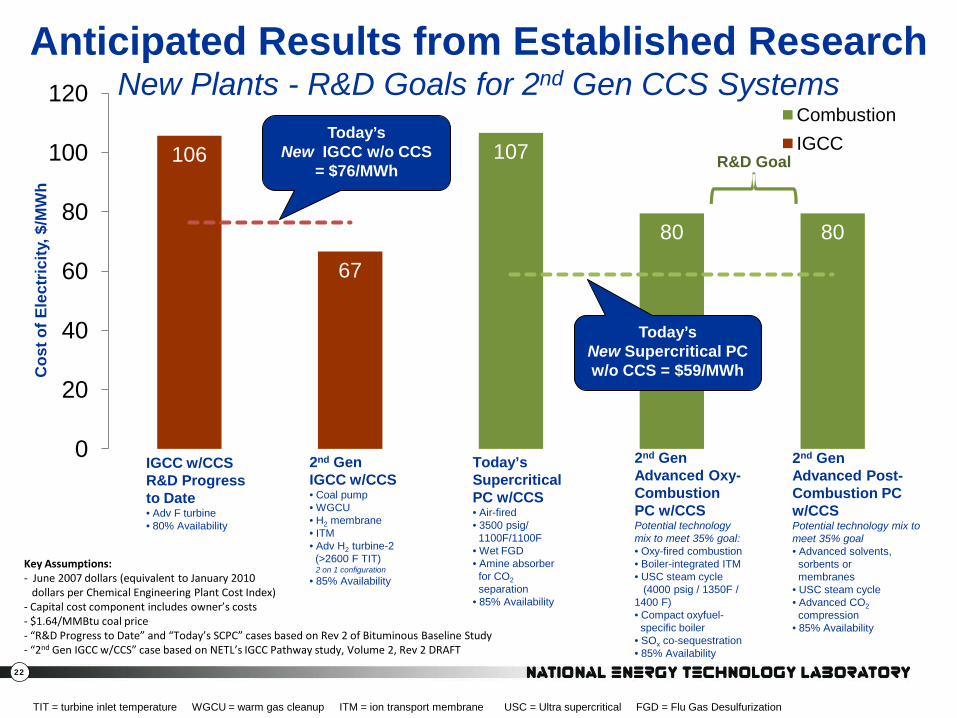
Anticipated Results from Established Research New Plants - R&D Goals for 2nd Gen CCS Systems
106
67
107
80 80
0
20
40
60
80
100
120 Combustion IGCC
Cos
t of E
lect
ricity
, $/M
Wh
Key Assumptions: - June 2007 dollars (equivalent to January 2010 dollars per Chemical Engineering Plant Cost Index) - Capital cost component includes owner’s costs - $1.64/MMBtu coal price - “R&D Progress to Date” and “Today’s SCPC” cases based on Rev 2 of Bituminous Baseline Study - “2nd Gen IGCC w/CCS” case based on NETL’s IGCC Pathway study, Volume 2, Rev 2 DRAFT
IGCC w/CCS R&D Progress to Date • Adv F turbine • 80% Availability
2nd Gen IGCC w/CCS • Coal pump • WGCU • H2 membrane • ITM • Adv H2 turbine-2 (>2600 F TIT) 2 on 1 configuration • 85% Availability
Today’s Supercritical PC w/CCS • Air-fired • 3500 psig/ 1100F/1100F • Wet FGD • Amine absorber for CO2 separation • 85% Availability
2nd Gen Advanced Oxy-Combustion PC w/CCS Potential technology mix to meet 35% goal: • Oxy-fired combustion • Boiler-integrated ITM • USC steam cycle (4000 psig / 1350F / 1400 F) • Compact oxyfuel- specific boiler • SOx co-sequestration • 85% Availability
2nd Gen Advanced Post-Combustion PC w/CCS Potential technology mix to meet 35% goal • Advanced solvents, sorbents or membranes • USC steam cycle • Advanced CO2 compression • 85% Availability
TIT = turbine inlet temperature WGCU = warm gas cleanup ITM = ion transport membrane USC = Ultra supercritical FGD = Flu Gas Desulfurization
Today’s New Supercritical PC w/o CCS = $59/MWh
Today’s New IGCC w/o CCS
= $76/MWh R&D Goal

23
Energy Outlook
24
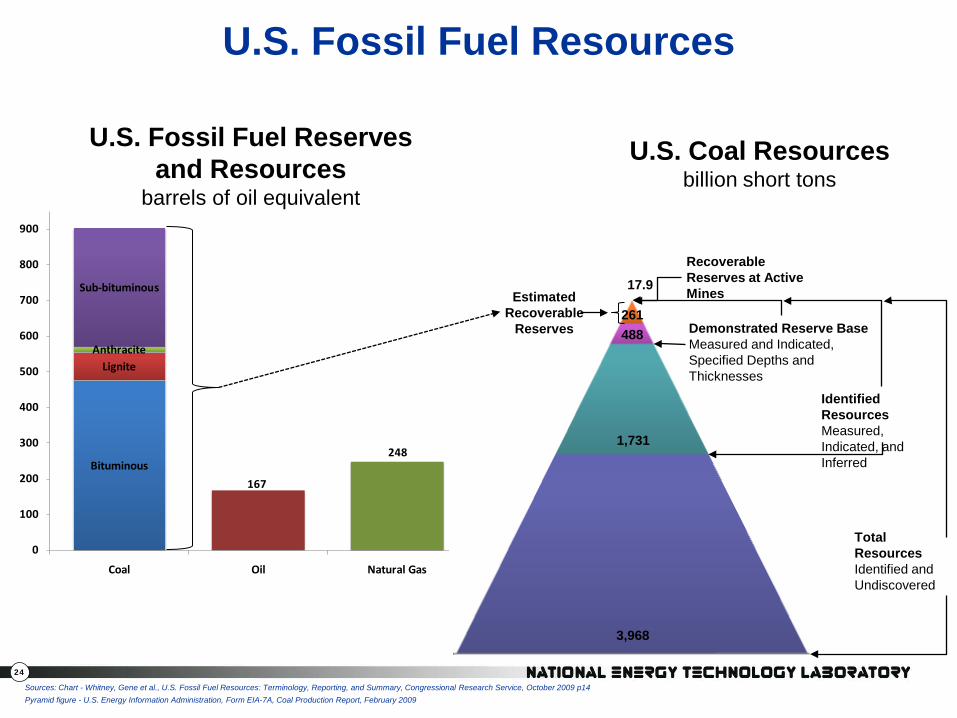
Bituminous
167
248
LigniteAnthracite
Sub-bituminous
0
100
200
300
400
500
600
700
800
900
Coal Oil Natural Gas
Recoverable Reserves at Active Mines
3,968
1,731
Identified Resources Measured, Indicated, and Inferred
488 Demonstrated Reserve Base Measured and Indicated, Specified Depths and Thicknesses
Estimated Recoverable
Reserves
Total Resources Identified and Undiscovered
261
17.9
U.S. Coal Resources billion short tons
U.S. Fossil Fuel Reserves and Resources
barrels of oil equivalent
Sources: Chart - Whitney, Gene et al., U.S. Fossil Fuel Resources: Terminology, Reporting, and Summary, Congressional Research Service, October 2009 p14 Pyramid figure - U.S. Energy Information Administration, Form EIA-7A, Coal Production Report, February 2009
U.S. Fossil Fuel Resources
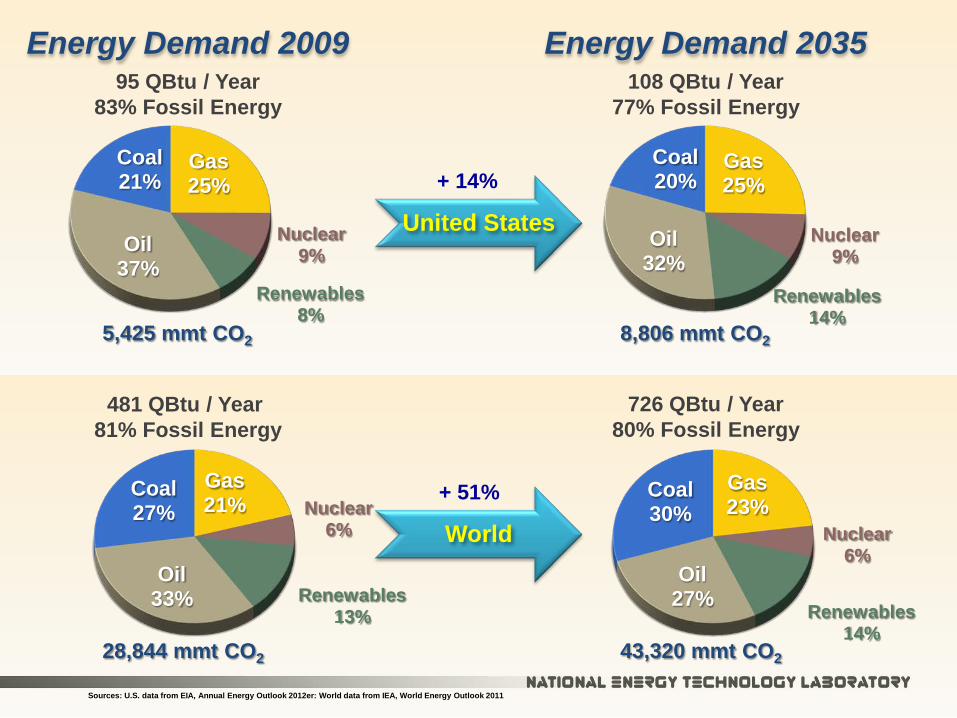
Gas 23%
Nuclear 6%
Renewables 14%
Oil 27%
Coal 30%
Gas 25%
Nuclear 9%
Renewables 14%
Oil 32%
Coal 20%
Gas 21% Nuclear
6%
Renewables 13%
Oil 33%
Coal 27%
Gas 25%
Nuclear 9%
Renewables 8%
Oil 37%
Coal 21%
Sources: U.S. data from EIA, Annual Energy Outlook 2012er: World data from IEA, World Energy Outlook 2011
726 QBtu / Year 80% Fossil Energy
108 QBtu / Year 77% Fossil Energy
+ 14%
Energy Demand 2009 95 QBtu / Year
83% Fossil Energy
481 QBtu / Year 81% Fossil Energy
28,844 mmt CO2 43,320 mmt CO2
5,425 mmt CO2 8,806 mmt CO2
Energy Demand 2035
United States
World
+ 51%
26
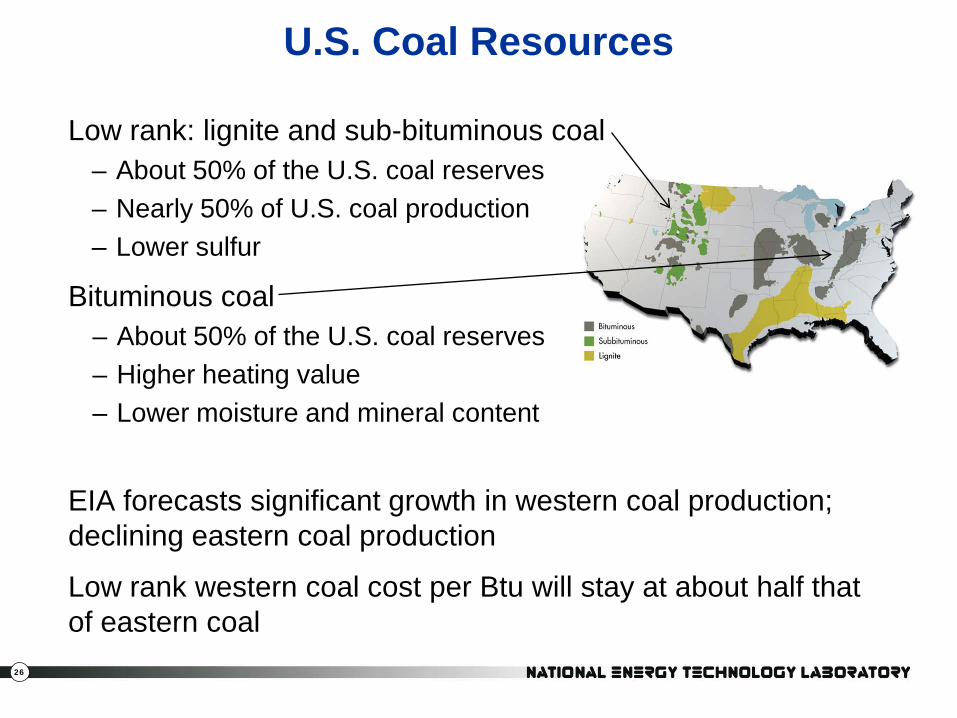
U.S. Coal Resources
Low rank: lignite and sub-bituminous coal – About 50% of the U.S. coal reserves – Nearly 50% of U.S. coal production – Lower sulfur
Bituminous coal – About 50% of the U.S. coal reserves – Higher heating value – Lower moisture and mineral content
EIA forecasts significant growth in western coal production; declining eastern coal production
Low rank western coal cost per Btu will stay at about half that of eastern coal
27
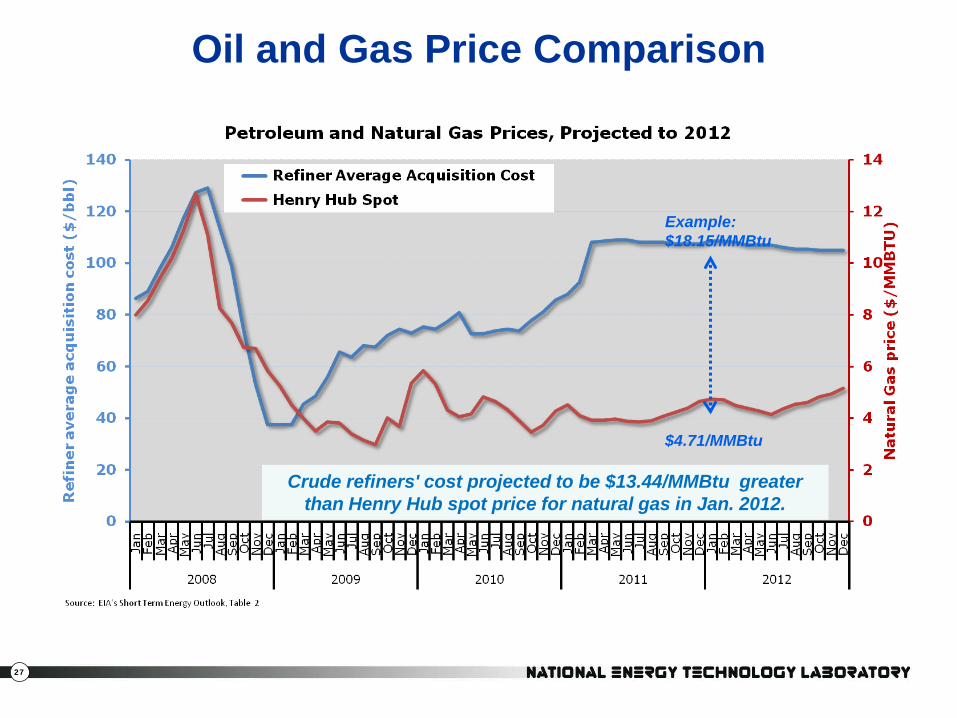
Oil and Gas Price Comparison
Crude refiners' cost projected to be $13.44/MMBtu greater than Henry Hub spot price for natural gas in Jan. 2012.
Example: $18.15/MMBtu
$4.71/MMBtu

28
Average World Oil Price Projections
0
50
100
150
200
250
2010
$/B
arre
l
Reference Case
High Oil Price Case
Low Oil Price Case
Projection Historical
Source: EIA AEO 2012 (early release), Figure 5
29
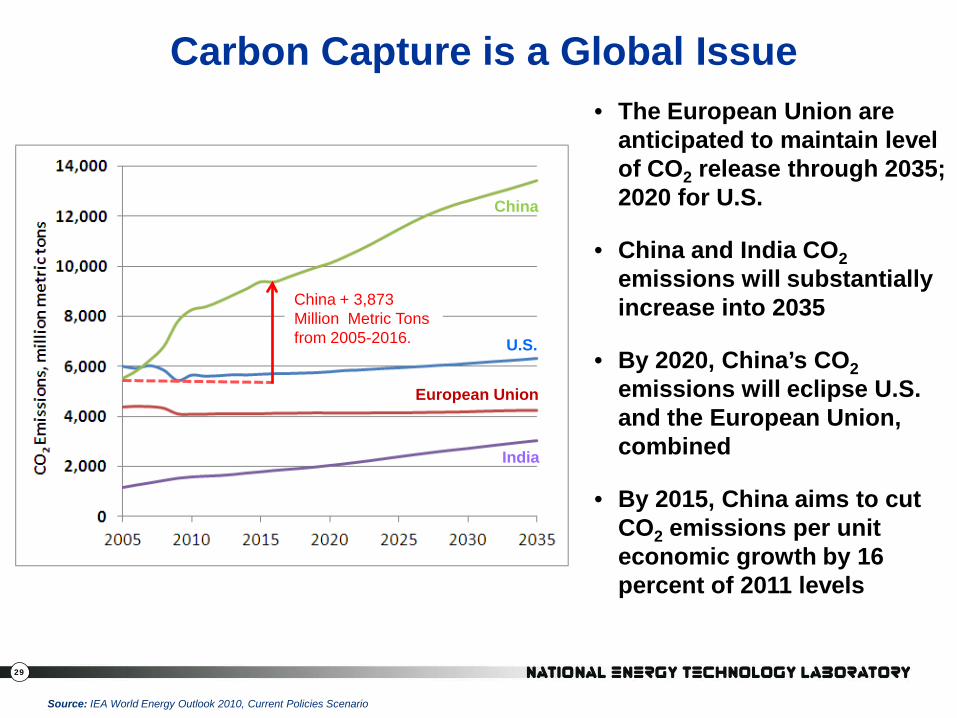
Source: IEA World Energy Outlook 2010, Current Policies Scenario
Carbon Capture is a Global Issue
China + 3,873 Million Metric Tons from 2005-2016.
China
U.S.
India
European Union
• The European Union are anticipated to maintain level of CO2 release through 2035; 2020 for U.S.
• China and India CO2 emissions will substantially increase into 2035
• By 2020, China’s CO2 emissions will eclipse U.S. and the European Union, combined
• By 2015, China aims to cut CO2 emissions per unit economic growth by 16 percent of 2011 levels
30
Active DOE Cooperative Agreements
31
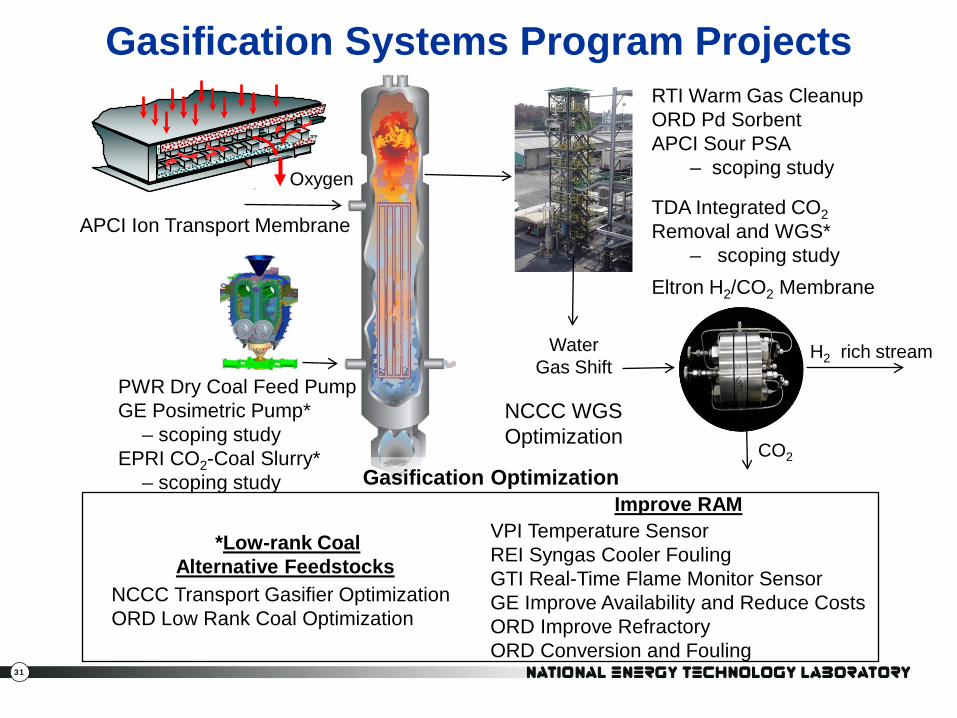
APCI Ion Transport Membrane
RTI Warm Gas Cleanup ORD Pd Sorbent APCI Sour PSA
– scoping study
TDA Integrated CO2 Removal and WGS*
– scoping study Eltron H2/CO2 Membrane
Oxygen
CO2
H2 rich stream Water Gas Shift
Gasification Systems Program Projects
PWR Dry Coal Feed Pump GE Posimetric Pump* – scoping study EPRI CO2-Coal Slurry* – scoping study
NCCC WGS Optimization
Gasification Optimization
*Low-rank Coal Alternative Feedstocks
NCCC Transport Gasifier Optimization ORD Low Rank Coal Optimization
Improve RAM VPI Temperature Sensor REI Syngas Cooler Fouling GTI Real-Time Flame Monitor Sensor GE Improve Availability and Reduce Costs ORD Improve Refractory ORD Conversion and Fouling

32
National Carbon Capture Center at the Power Systems Development Facility (PSDF)
Southern Company Services
Location: Wilsonville, AL Subcontractors
– American Electric Power – Arch Coal – Electric Power Research Institute – Luminant – NRG – Peabody Energy – Rio Tinto
Development and commercial scale-up of modular industrial scale gasification-based processes and components
33
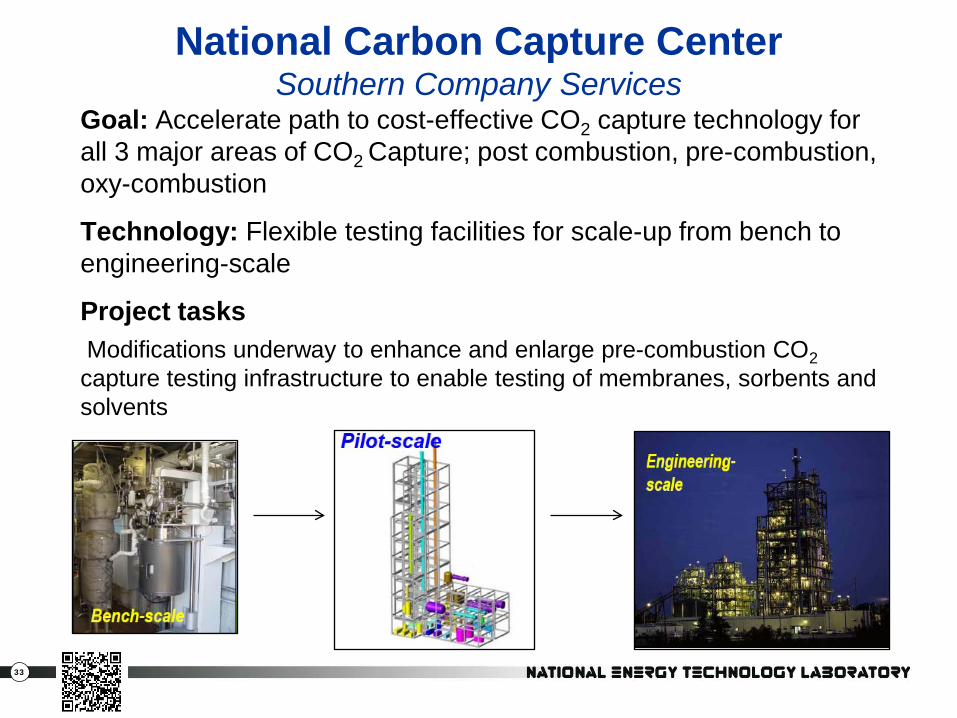
National Carbon Capture Center Southern Company Services
Goal: Accelerate path to cost-effective CO2 capture technology for all 3 major areas of CO2 Capture; post combustion, pre-combustion, oxy-combustion
Technology: Flexible testing facilities for scale-up from bench to engineering-scale
Project tasks Modifications underway to enhance and enlarge pre-combustion CO2 capture testing infrastructure to enable testing of membranes, sorbents and solvents
34
National Carbon Capture Center (NCCC) Advanced Gasification and H2 Separation
Fuel flexibility, filter materials, sensor development - 1000 hour gasification test using PRB coal ‒ Evaluated new gasifier temperature control scheme ‒ Continued long-term evaluation of hot gas filter elements ‒ Conducted sensor development involving sapphire thermowell for gasifier
service, coal-flow measurement device, and vibration type level detector ‒ 996 hour test of PRB sub-bituminous coal completed through Dec. 2011
Carbon capture - Modifications continue to enhance and enlarge pre-combustion CO2 capture testing infrastructure to enable testing of membranes, sorbents, and solvents. Conducted evaluations of: ‒ Hydrogen and CO2 membranes ‒ High-temperature palladium-based mercury sorbent ‒ CO2 capture testing with new solvents ‒ Water-gas shift catalyst performance
35
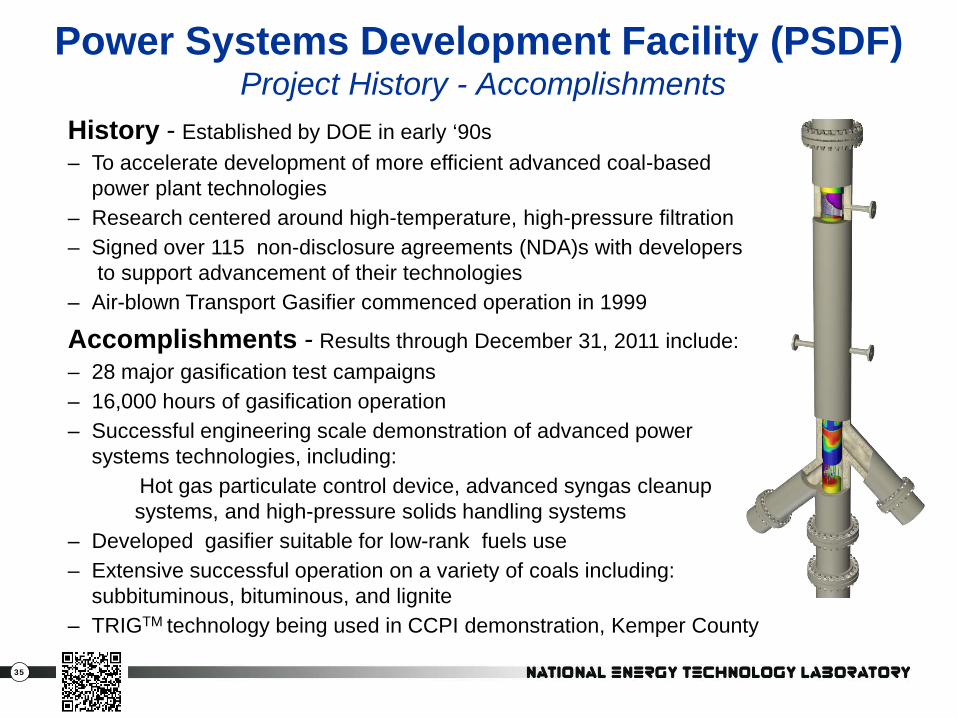
Power Systems Development Facility (PSDF) Project History - Accomplishments
History - Established by DOE in early ‘90s – To accelerate development of more efficient advanced coal-based power plant technologies – Research centered around high-temperature, high-pressure filtration – Signed over 115 non-disclosure agreements (NDA)s with developers to support advancement of their technologies – Air-blown Transport Gasifier commenced operation in 1999
Accomplishments - Results through December 31, 2011 include: – 28 major gasification test campaigns – 16,000 hours of gasification operation – Successful engineering scale demonstration of advanced power systems technologies, including:
Hot gas particulate control device, advanced syngas cleanup systems, and high-pressure solids handling systems
– Developed gasifier suitable for low-rank fuels use – Extensive successful operation on a variety of coals including: subbituminous, bituminous, and lignite – TRIGTM technology being used in CCPI demonstration, Kemper County
36
Ion Transport Membrane (ITM) Air Products and Chemicals, Inc. (APCI)
Goal: Low cost oxygen production
Technology: O2 separation from air utilizing peroskovite ceramic membrane technology
Project tasks (planned completion date 9/30/2015) – Perform module testing utilizing the 5 TPD Test System to evaluate lifetime performance against target values, and obtain membrane module performance data (complete) – Construct ~100 TPD pilot system to demonstrate integrated operability and performance of ITM system, (construction continuing) – Construct and start-up the ceramic wafer and module manufacturing [commercial scale] facility (equipment orders placed) – Conduct process modeling and conceptual design of 2,000 TPD ITM oxygen production plant
37
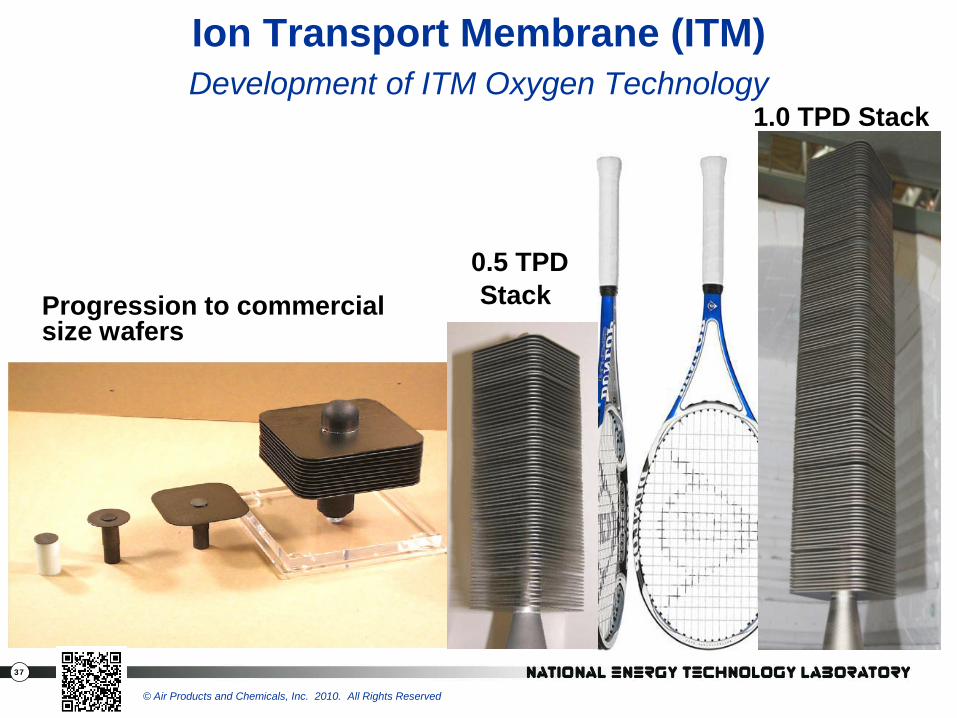
Ion Transport Membrane (ITM) Development of ITM Oxygen Technology
0.5 TPD Stack Progression to commercial
size wafers
1.0 TPD Stack
© Air Products and Chemicals, Inc. 2010. All Rights Reserved
38
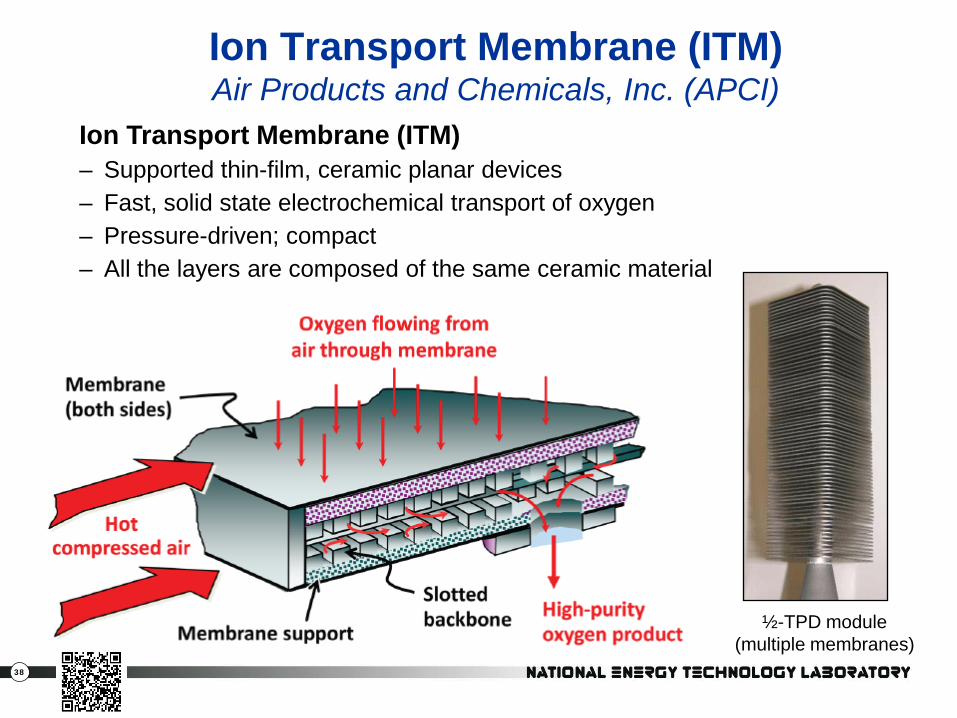
Ion Transport Membrane (ITM) – Supported thin-film, ceramic planar devices – Fast, solid state electrochemical transport of oxygen – Pressure-driven; compact – All the layers are composed of the same ceramic material
½-TPD module (multiple membranes)
Ion Transport Membrane (ITM) Air Products and Chemicals, Inc. (APCI)
39
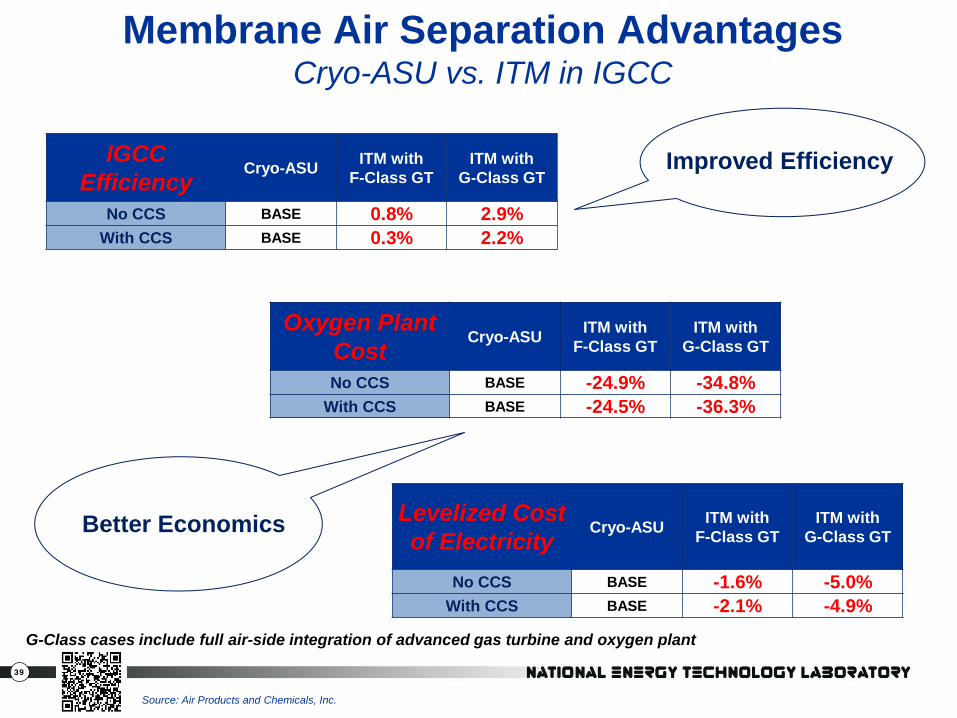
Membrane Air Separation Advantages Cryo-ASU vs. ITM in IGCC
G-Class cases include full air-side integration of advanced gas turbine and oxygen plant
Improved Efficiency
Better Economics
Source: Air Products and Chemicals, Inc.
IGCC Efficiency
Cryo-ASU ITM with F-Class GT
ITM with G-Class GT
No CCS BASE 0.8% 2.9% With CCS BASE 0.3% 2.2%
Oxygen Plant Cost
Cryo-ASU ITM with F-Class GT
ITM with G-Class GT
No CCS BASE -24.9% -34.8% With CCS BASE -24.5% -36.3%
Levelized Cost of Electricity
Cryo-ASU ITM with F-Class GT
ITM with G-Class GT
No CCS BASE -1.6% -5.0% With CCS BASE -2.1% -4.9%
40
High Pressure Solids Pump Pratt & Whitney Rocketdyne
Goal: Reliable and consistent dry feed for high pressure IGCC leading to lower cost
Technology: Bulk solids form multiple stable “bridges” between parallel moving walls to feed dry solids across 1,000+ psi pressure gradient Project tasks (planned completion date 12/31/2012)
– Complete performance and durability tests – Perform pump cost benefit analysis
41
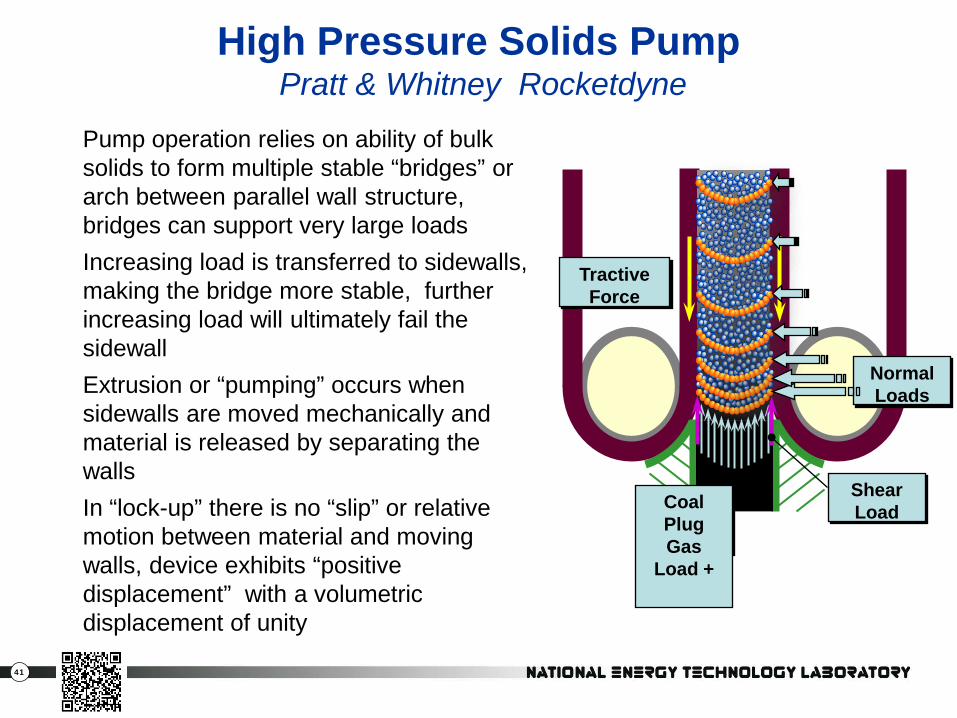
High Pressure Solids Pump Pratt & Whitney Rocketdyne
Pump operation relies on ability of bulk solids to form multiple stable “bridges” or arch between parallel wall structure, bridges can support very large loads Increasing load is transferred to sidewalls, making the bridge more stable, further increasing load will ultimately fail the sidewall Extrusion or “pumping” occurs when sidewalls are moved mechanically and material is released by separating the walls In “lock-up” there is no “slip” or relative motion between material and moving walls, device exhibits “positive displacement” with a volumetric displacement of unity
Normal Loads
Normal Loads
Coal Plug
Load + Friction
Coal Plug Gas
Load +
Normal Loads Shear Load
Normal Loads
Tractive Force

42
Single Point Sapphire Temperature Sensor Virginia Polytechnic Institute
Future Work – Validate sensor design for flexible but robust packaging for in situ gasifier monitoring – Complete bench scale testing sensor probe for combustion turbine monitoring
A temperature measurement system based using a sapphire optical sensor that is accurate and reliable for use in the extreme harsh environment of a coal gasifier Accomplishments – Accurate readings up to 1600 °C – Full-scale testing at TECO – 7 months of operation
43
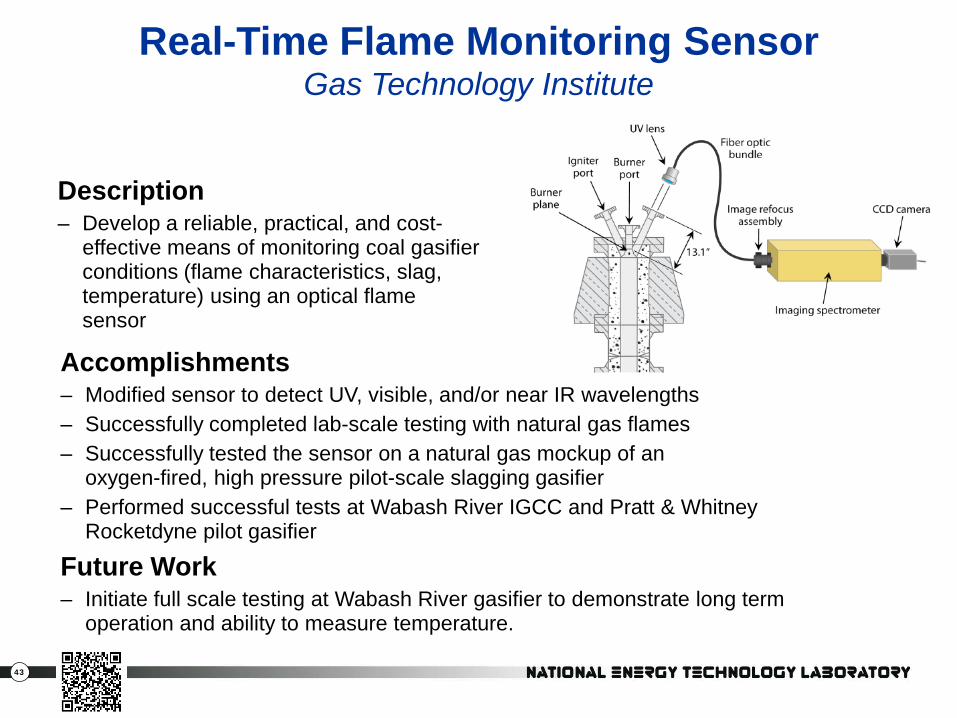
Real-Time Flame Monitoring Sensor Gas Technology Institute
Description – Develop a reliable, practical, and cost-
effective means of monitoring coal gasifier conditions (flame characteristics, slag, temperature) using an optical flame sensor
Accomplishments – Modified sensor to detect UV, visible, and/or near IR wavelengths – Successfully completed lab-scale testing with natural gas flames – Successfully tested the sensor on a natural gas mockup of an
oxygen-fired, high pressure pilot-scale slagging gasifier – Performed successful tests at Wabash River IGCC and Pratt & Whitney
Rocketdyne pilot gasifier
Future Work – Initiate full scale testing at Wabash River gasifier to demonstrate long term
operation and ability to measure temperature.
44
Goal: Develop an advanced model-based optimal sensor network to monitor the condition of the gasification section in an IGCC plant, focusing on gasifier refractory degradation and radiant syngas cooler fouling
Technology: Combination of model-based nonlinear estimation and optimization software
Project tasks (planned completion date 12/31/2012)
– Develop systematic model-based computational approach for optimal sensor placement
– Computer simulation demonstration on gasifier and radiant syngas cooler
Model Based Optimal Sensor Network Design General Electric Global Research
45
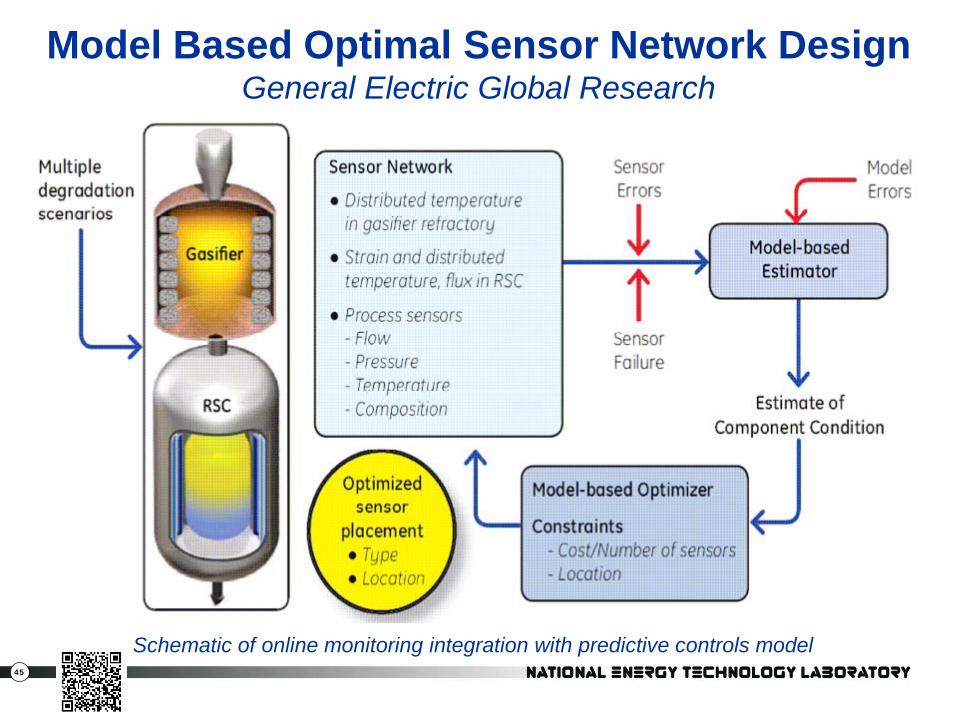
Model Based Optimal Sensor Network Design General Electric Global Research
Schematic of online monitoring integration with predictive controls model
46
Warm Gas Cleanup Research Triangle Institute (RTI)
Goal: Higher efficiency, ultra clean syngas cleanup
Technology: Highly reactive sorbent in integrated transport reactor system
Project tasks (planned completion date 9/30/2015) – Design and construct a 50 MWe prototype system
(FEED completed) – Operate at commercial conditions – Optimize water gas shift – Capture 90% carbon in syngas, up to 300,000 TPY CO2, via
integration of water-gas shift (WGS) and aMDEA into process – Perform CO2 sequestration with monitoring and verification
47
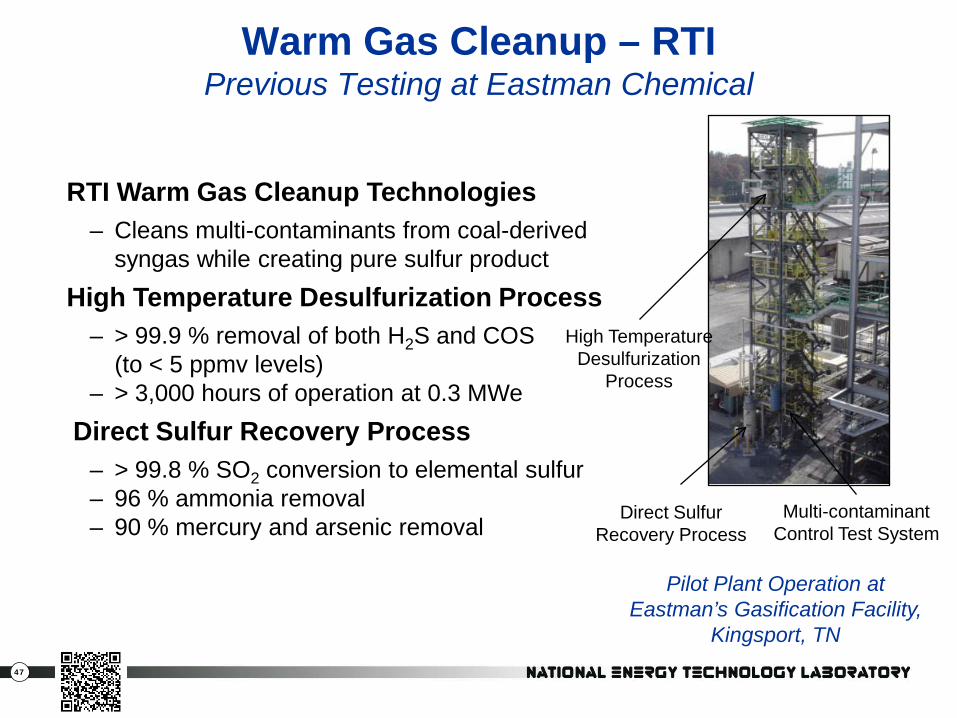
Warm Gas Cleanup – RTI Previous Testing at Eastman Chemical
RTI Warm Gas Cleanup Technologies – Cleans multi-contaminants from coal-derived
syngas while creating pure sulfur product High Temperature Desulfurization Process
– > 99.9 % removal of both H2S and COS (to < 5 ppmv levels)
– > 3,000 hours of operation at 0.3 MWe Direct Sulfur Recovery Process
– > 99.8 % SO2 conversion to elemental sulfur – 96 % ammonia removal – 90 % mercury and arsenic removal
Pilot Plant Operation at
Eastman’s Gasification Facility, Kingsport, TN
High Temperature Desulfurization
Process
Direct Sulfur Recovery Process
Multi-contaminant Control Test System

48
Goal: Lower cost H2 separation and CO2 capture for IGCC
Technology: Dense metal membrane to separate H2 from shifted syngas, leaving CO2 at high pressure
Project tasks (planned completion date 9/30/2015) – Complete testing of lab- and bench-scale units at Eltron (ongoing) – Complete testing of 5-12 lb/day H2 production unit
using real coal-derived synthesis gas (ongoing) – Design, construct, and evaluate performance of nominally 250 lb/day
prototype development unit – Design, construct and test a nominally 4-10 TPD pre-commercial
module
Hydrogen Transport Membrane (HTM) Eltron Research, Inc.
49
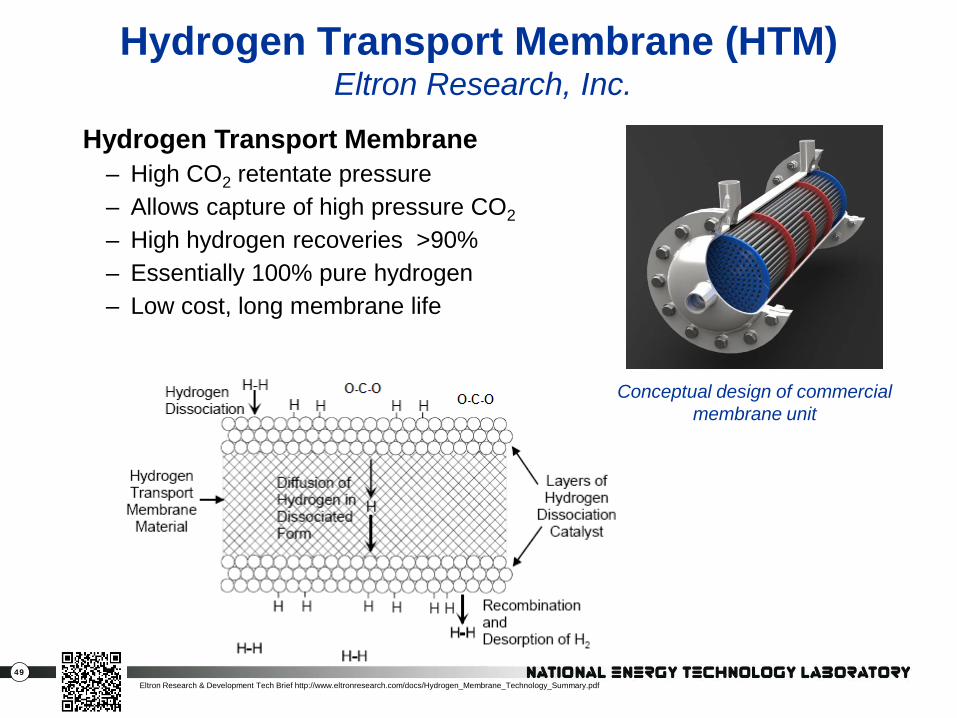
Hydrogen Transport Membrane (HTM) Eltron Research, Inc.
Conceptual design of commercial membrane unit
Eltron Research & Development Tech Brief http://www.eltronresearch.com/docs/Hydrogen_Membrane_Technology_Summary.pdf
Hydrogen Transport Membrane – High CO2 retentate pressure – Allows capture of high pressure CO2 – High hydrogen recoveries >90% – Essentially 100% pure hydrogen – Low cost, long membrane life
50
Low Rank Coal R&D Recently Awarded Projects
Liquid CO2 Slurry for Feeding Low Rank Coal (LRC) Gasifiers (Electric Power Research Institute, Inc.)
– Measurements of rheological properties including viscosity and solids loading with three low rank coals for both LCO2 and water slurries
– Preliminary design and cost estimate of mixing system
Advanced CO2 Capture Technology for LRC IGCC Systems (TDA Research) Demonstrate technical/economic potential for integrated CO2 scrubber/water gas shift (WGS) catalyst by:
– Optimizing sorbent/catalyst and process design – Assessing integrated system in bench-scale & slipstream field demonstration
Scoping Studies to Evaluate the Benefits of an Advanced Dry Feed System on the Use of LRC in IGCC Technologies (GE)
– Completing techno-economic studies of IGCC – with and without dry feeder
Sour PSA for Separation of CO2,Sulfur, and Impurities from LRC (Air Products and Chemicals, Inc.)
– Extensive testing in PSA and TSA modes – Using experimental results to generate a high-level pilot process design – Techno-economic assessment of applicability for low-rank coal use

51
CO2 Slurry Feed Electric Power Research Institute, Inc. (EPRI)
Liquid CO2 Slurry for Feeding Low Rank Coal (LRC) Gasifiers Study potential advantages of CO2 slurries of low-rank coal by: – Conducting plant-wide technical and economic simulations – Developing a preliminary design and cost estimate of a slurry preparation
and mixing system – Performing laboratory tests of rheological properties of liquid CO2/LRC
slurry and maximum solids loading capability for 3 coals Project Duration: 12 months Team Members: – Electric Power Research Institute – Dooher Institute of Physics and Energy – Worley Parsons Group, Inc. – Columbia University
52
Integrated CO2 Scrubber and Water Gas Shift TDA Research, Inc
Advanced CO2 Capture Technology for Low Rank Coal IGCC Systems Demonstrate technical and economic potential for an integrated CO2 scrubber/ water gas shift catalyst by: – Optimizing sorbent/catalyst and process design – Assessing integrated system, in bench-scale & slipstream field
demonstration using actual coal-derived synthesis gas – Use results to feed a techno-economic analysis Project Duration: 12 months Team Members: – TDA Research, Inc. – University of California at Irvine – Southern Company – ConocoPhillips
53
Benefits of Dry Feed System General Electric Company
Scoping Studies to Evaluate the Benefits of an Advanced Dry Feed System on the Use of Low Rank Coal in IGCC Technologies
Evaluate and demonstrate the benefits of novel dry-feed technologies to effectively, reliably, and economically feed low-rank coal into commercial IGCC systems by: – Completing comparative techno-economic studies of two IGCC power
plant cases, (with and without advanced dry feed technologies)
Project Duration: 12 months
Team Members: – General Electric Company – Eastman Chemical Company

54
Advanced Acid Gas Separation Technology for the Utilization of Low Rank Coals
Air Products and Chemicals, Inc. (APCI) Sour Pressure Swing Adsorption (PSA) for Separation of CO2, Sulfur, and Impurities from Low Rank Coals Objective: – Test performance of APCI Sour PSA on syngas produced from
gasification low rank coals – Achieve resulting cost reduction of >10% in capital scope at
90% CO2 capture and >95% CO2 purity – Determine the ability of adsorbents in handling impurities resulting
from the gasification of low rank coals Scope of Work: – Extensive testing in PSA and temperature swing adsorption (TSA) modes – Using experimental results to generate a high-level pilot process design – Preparing techno-economic assessment of applicability for low-rank coal use
Project Team: – Air Products and Chemicals, Inc. (APCI) – University of North Dakota Energy and Environmental Research Center (EERC)
55
Reliability, Availability & Maintainability R&D Recently Awarded Projects
Mitigation of Syngas Cooler Plugging and Fouling (Reaction Engineering International) – Experimental Testing: Deposit bond strength and characterization – Modeling: Investigate deposit behavior in the syngas cooler section,
evaluate process conditions and equipment designs for mitigation of syngas cooler plugging and fouling
– Field Test: Validate specific means to implement mitigation methods
Feasibility Studies to Improve Plant Availability and Reduce Total Installed Cost in IGCC Plants (GE) Work on tasks, with broad applicability to the IGCC industry – Integrated operations philosophy – Modularization of gasification/IGCC plant – Active fouling removal – Improved slag handling

56
Mitigation of Syngas Cooler Plugging & Fouling Reaction Engineering International
Objective: – Improve the availability of IGCC plants through improving the performance of
the Syngas Cooler (SC) through reduced plugging and fouling by: • Gaining a better understanding of ash deposition onto refractory and metal
surfaces associated with SC • Evaluating fouling and plugging of SC designs • Evaluate and develop methods to mitigate SC fouling and plugging • Validate defined SC mitigation technology through field tests
Scope Of Work: – Experimental Testing – deposit bond strength and characterization – Modeling – investigate deposit behavior in the SC section, evaluate process
conditions and equipment designs for mitigation of SC plugging/fouling – Field Test – Validate specific means to implement mitigation methods
Team Members: – Reaction Engineering International, Salt Lake City – University of Utah, Salt Lake City
57
IGCC Affordability and Availability General Electric Company
Feasibility Studies to Improve Plant Availability and Reduce Total Installed Cost in IGCC Plants
Objective: Work on tasks, with broad applicability to the IGCC industry – Integrated operations philosophy – Modularization of gasification/IGCC plant – Active fouling removal – Improved slag handling
Project Duration: 36 months Team Members: – General Electric Company – Eastman Chemical Company
58
NETL In-House R&D (ORD-RUA)
59
NETL Office of Research & Development Gasification Projects
Refractory Improvement – Develop improved performance refractory liners that are carbon
feedstock flexible (coal, western coal, petcoke) – Model gasifier slag for refractory interactions, downstream phases
and material interactions (syngas coolers) – Manage slag viscosity and refractory wear, evaluate additives
Conversion and Fouling
– In slagging gasifiers using coal, petcoke or mixtures of them to: • Improve the carbon conversion efficiency to syngas • Reduce convective syngas cooler fouling
– Collaborate with industry to ensure proper technology development and transfer
60
NETL Office of Research & Development Gasification Projects
Low-Rank Coal Optimization – Pretreatment and kinetic co-feed experimental efforts to support
and validate the development of a hierarchy of device scale gasifier models with uncertainty quantification (UQ).
– Demonstrate the models with UQ for the NCCC/TRIG under co-feed conditions and optimize co-feed performance.
Warm Syngas Cleanup – Conduct both lab and pilot-scale R&D for cost efficient sorbents for
trace contaminant capture of high efficiency coal gasification plant
Advanced Virtual Energy Simulation Training And Research (AVESTARTM) Center
– Training Center: 3D virtual simulation of IGCC plant – Establish the world-class center for addressing key operational and
control challenges arising in IGCC plants with carbon capture.
61
Refractory Development for Mixed Feedstock Use – Determine mechanisms of wear in NETL refractory materials
under development. – Determine refractory corrosion mechanisms in current generation
commercial refractory liner materials exposed to coal slag, important for understanding how to overcome limitations in current refractory liner materials.
Slag Management (Current Emphasis)
– Determine critical information needed for slag management in gasifiers, which will be tracked in commercial gasifiers and predicted in models to increase gasifier RAM.
Refractory Improvement NETL Office of Research and Development
62
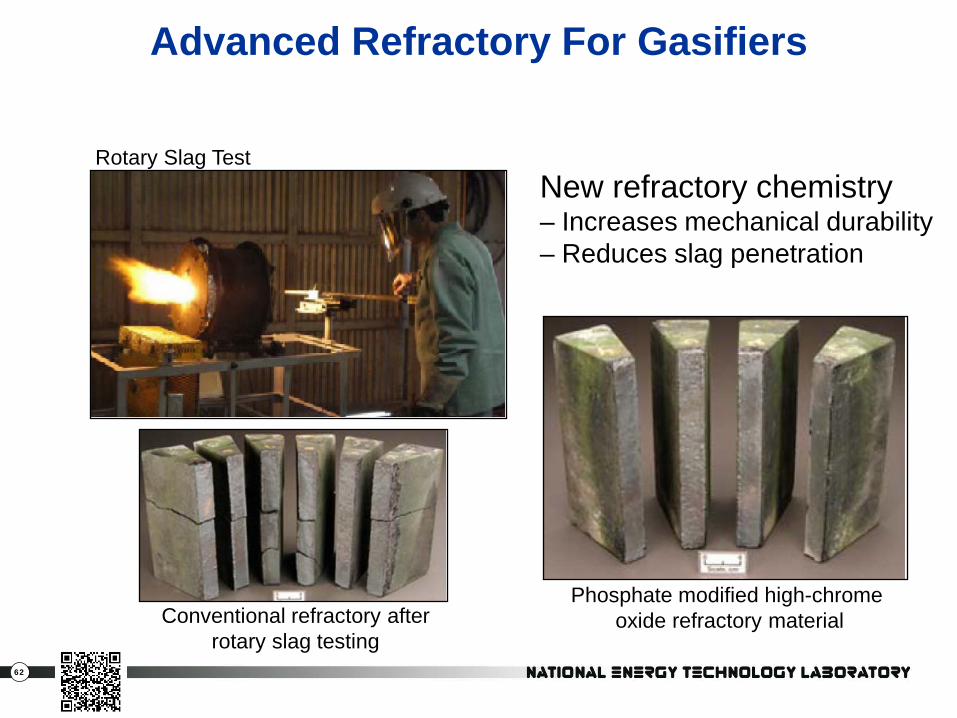
Advanced Refractory For Gasifiers
New refractory chemistry – Increases mechanical durability – Reduces slag penetration
Phosphate modified high-chrome oxide refractory material Conventional refractory after
rotary slag testing
Rotary Slag Test
63
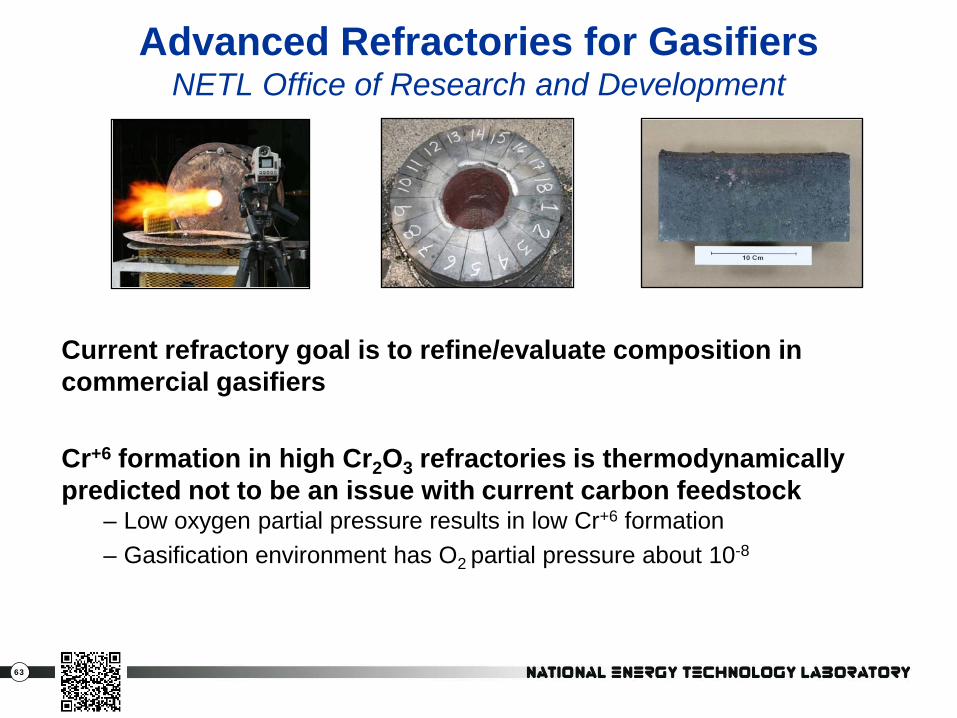
Current refractory goal is to refine/evaluate composition in commercial gasifiers Cr+6 formation in high Cr2O3 refractories is thermodynamically predicted not to be an issue with current carbon feedstock
– Low oxygen partial pressure results in low Cr+6 formation – Gasification environment has O2 partial pressure about 10-8
Advanced Refractories for Gasifiers NETL Office of Research and Development
64
Modeling – Evaluate and validate sub-models for particle-slag interaction,
particle fragmentation, and mineral matter chemistry (sulfur release) and implement into CFD model
– Develop and evaluate reduced order model to predict mineral matter split between slag and fly ash for entrained-flow gasifier
Convective Syngas Cooler Fouling – Literature survey of deposition models – Investigate gasifier ash deposits to determine problematic ash
characteristics Kinetics
– Effect of pressure on pyrolysis kinetics – Preliminary gasification kinetics at high pressure
Slag Characterization – Continue to characterize coal and petcoke blends, characterize ash
and slag, begin studies of FeS and VOx behavior in slag
Conversion and Fouling NETL Office of Research and Development

65
Control of Ash in IGCC Regional University Alliance
Goal: Solutions to IGCC Ash Management Problems
– Unconverted carbon in gasification flyash – Syngas cooler fouling
Development of Models and Techniques to improve IGCC plant operations
– Adaption of “Particle Population Model” used for predicting CFB ash splits
– Inorganic transformations and char/slag interactions
– Particle trajectories and deposition modeling – Gasification kinetics
Coordinate and leverage R&D in 3 universities (PSU, CMU and WVU) and NETL
1. Particles contact and coalesce with slag
2. Particles do not contact slag 3. Particles contact but do not
coalesce with slag
Fuel Oxygen Water
Syngas + Flyash
1
2 3
66
Kinetics – Development of NETL’s Carbonaceous Chemistry for
Computational Modeling (C3M) software to bridge coal kinetics software (PCCL, CPD, etc) and available kinetic experiments with CFD software (MFIX, Fluent, Barracuda), other models
– Provide modelers and experimentalist with a virtual kinetic laboratory
Fuel Pretreatment – Expand and further test the grinding laws developed in FY11 – Correlate the NETL lab scale results with large scale grinding
energies Multiphase Models
– NETL’s open source suite of multiphase solvers such as MFIX-DEM, MFIX continuum, MFIX-PIC and multiphase Reduced Order Models will be used to aid in the design and optimization of operating conditions and establishing performance trends in the NCCC/TRIG with uncertainty quantification
Low Rank Coal Optimization NETL Office of Research and Development
67
Elevated temperatures results in higher IGCC thermal efficiency Palladium-based sorbents are currently among the most promising candidates for high-temperature capture of mercury, arsenic, selenium, phosphorus and the other trace elements Progress:
– 2007 - License agreement between the NETL and sorbent manufacturer Johnson Matthey
– 2008 - The technology received the R&D 100 award – 2009 to present - Over 99% removal of mercury, arsenic, and
selenium from dirty syngas slipstreams at 550oF over several weeks testing at the National Carbon Capture Center
– Present - Identifying an optimum form of the palladium sorbent (loading, support, alloy)
Warm Syngas Cleanup NETL Office of Research and Development
68
Advanced Virtual Energy Simulation Training And Research (AVESTAR™)
Center
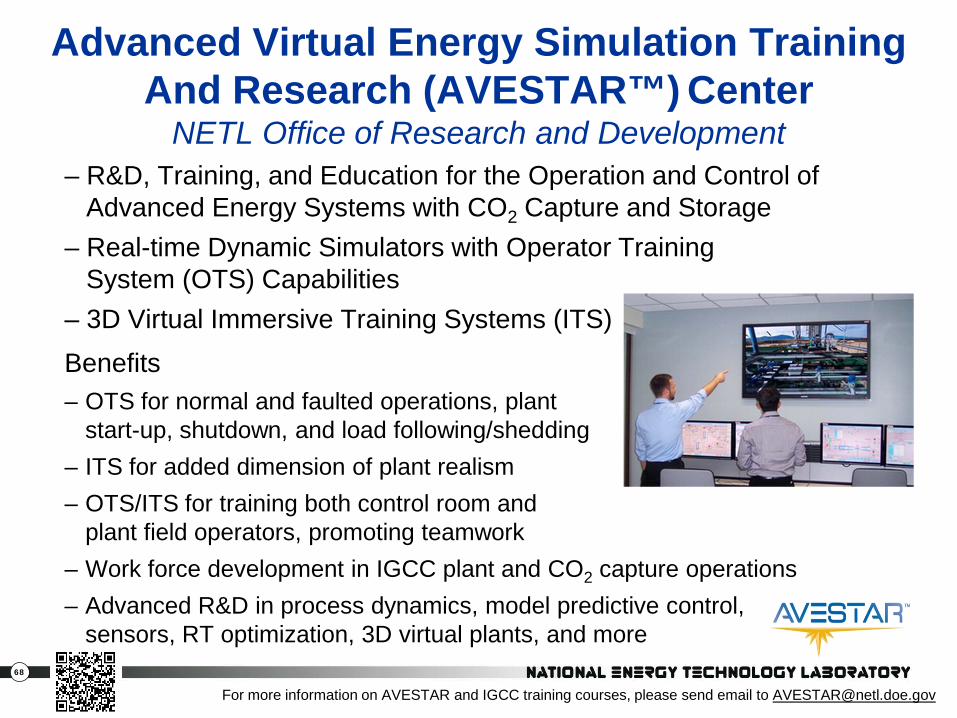
NETL Office of Research and Development – R&D, Training, and Education for the Operation and Control of Advanced Energy Systems with CO2 Capture and Storage – Real-time Dynamic Simulators with Operator Training System (OTS) Capabilities – 3D Virtual Immersive Training Systems (ITS) Benefits – OTS for normal and faulted operations, plant
start-up, shutdown, and load following/shedding – ITS for added dimension of plant realism – OTS/ITS for training both control room and
plant field operators, promoting teamwork – Work force development in IGCC plant and CO2 capture operations – Advanced R&D in process dynamics, model predictive control,
sensors, RT optimization, 3D virtual plants, and more
For more information on AVESTAR and IGCC training courses, please send email to [email protected]
69
Congressionally Directed Projects
70
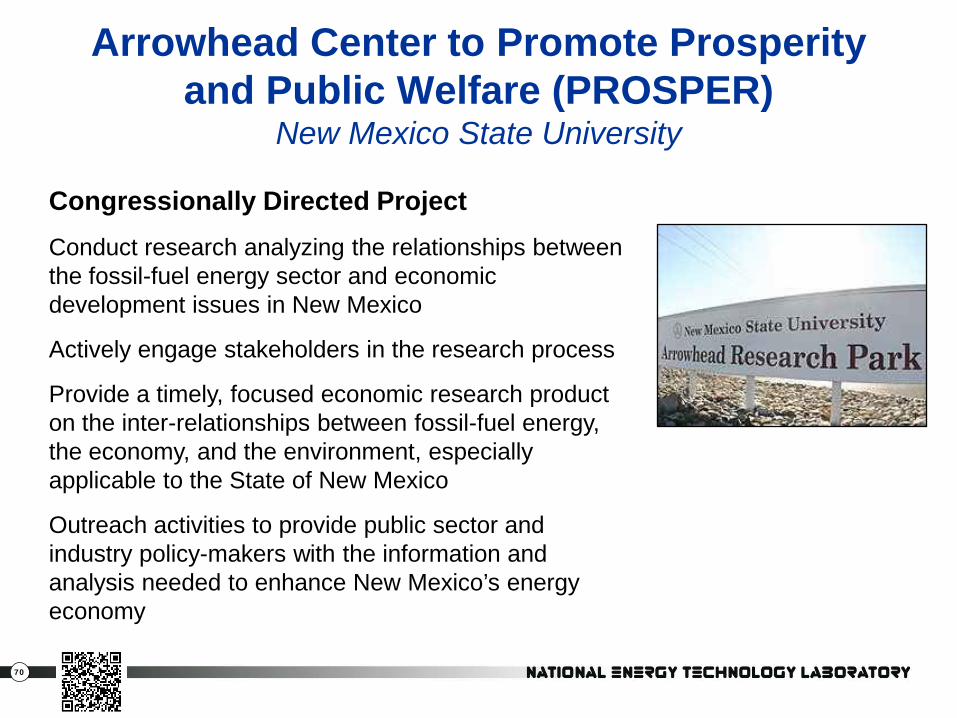
Arrowhead Center to Promote Prosperity and Public Welfare (PROSPER)
New Mexico State University
Congressionally Directed Project Conduct research analyzing the relationships between the fossil-fuel energy sector and economic development issues in New Mexico
Actively engage stakeholders in the research process
Provide a timely, focused economic research product on the inter-relationships between fossil-fuel energy, the economy, and the environment, especially applicable to the State of New Mexico
Outreach activities to provide public sector and industry policy-makers with the information and analysis needed to enhance New Mexico’s energy economy
71
DOE Supported Gasification
Demonstration Projects
72
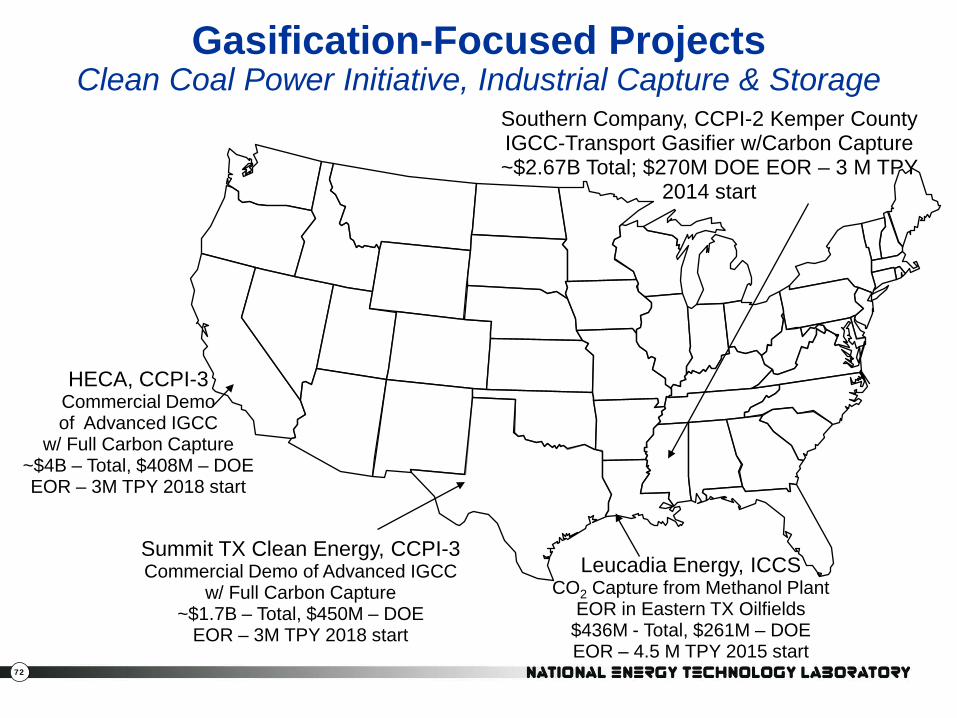
Southern Company, CCPI-2 Kemper County IGCC-Transport Gasifier w/Carbon Capture ~$2.67B Total; $270M DOE EOR – 3 M TPY
2014 start
Summit TX Clean Energy, CCPI-3 Commercial Demo of Advanced IGCC
w/ Full Carbon Capture ~$1.7B – Total, $450M – DOE
EOR – 3M TPY 2018 start
HECA, CCPI-3 Commercial Demo of Advanced IGCC
w/ Full Carbon Capture ~$4B – Total, $408M – DOE EOR – 3M TPY 2018 start
Leucadia Energy, ICCS CO2 Capture from Methanol Plant
EOR in Eastern TX Oilfields $436M - Total, $261M – DOE EOR – 4.5 M TPY 2015 start
Gasification-Focused Projects Clean Coal Power Initiative, Industrial Capture & Storage
73
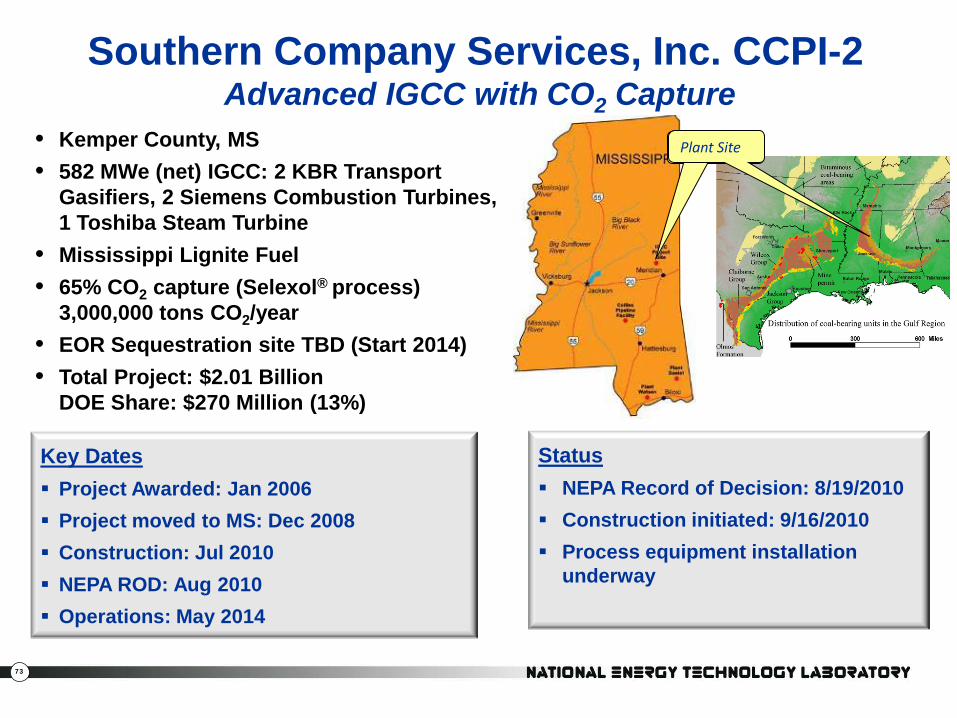
Southern Company Services, Inc. CCPI-2 Advanced IGCC with CO2 Capture
Plant Site Plant Site
Status NEPA Record of Decision: 8/19/2010 Construction initiated: 9/16/2010 Process equipment installation
underway
Key Dates Project Awarded: Jan 2006 Project moved to MS: Dec 2008 Construction: Jul 2010 NEPA ROD: Aug 2010 Operations: May 2014
• Kemper County, MS • 582 MWe (net) IGCC: 2 KBR Transport
Gasifiers, 2 Siemens Combustion Turbines, 1 Toshiba Steam Turbine
• Mississippi Lignite Fuel • 65% CO2 capture (Selexol® process)
3,000,000 tons CO2/year • EOR Sequestration site TBD (Start 2014) • Total Project: $2.01 Billion
DOE Share: $270 Million (13%)
74
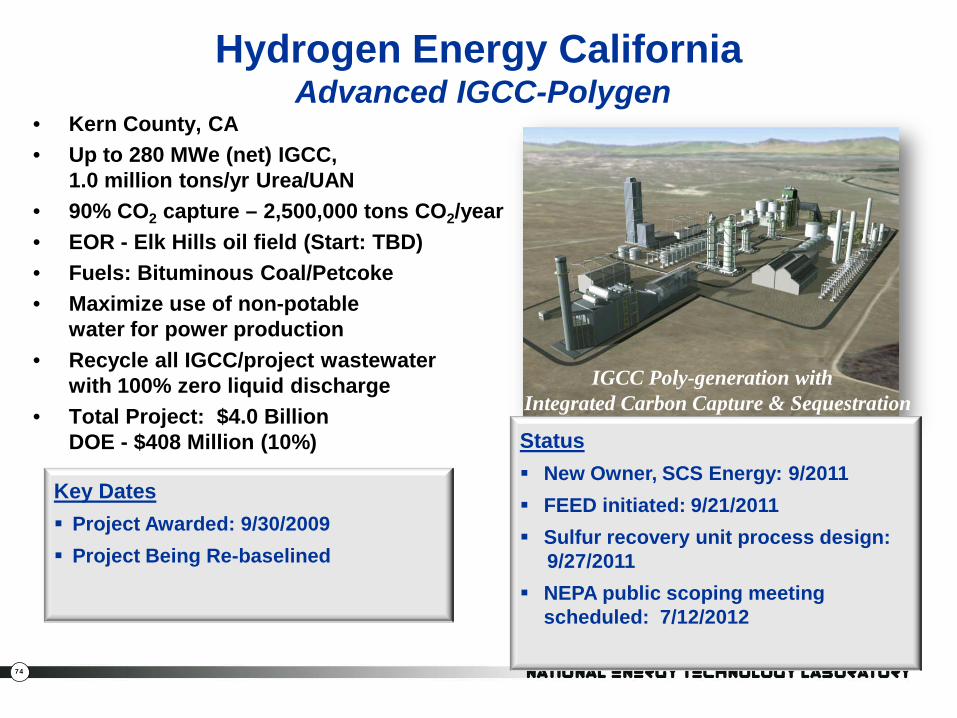
Hydrogen Energy California Advanced IGCC-Polygen
• Kern County, CA • Up to 280 MWe (net) IGCC,
1.0 million tons/yr Urea/UAN • 90% CO2 capture – 2,500,000 tons CO2/year • EOR - Elk Hills oil field (Start: TBD) • Fuels: Bituminous Coal/Petcoke • Maximize use of non-potable
water for power production • Recycle all IGCC/project wastewater
with 100% zero liquid discharge • Total Project: $4.0 Billion
DOE - $408 Million (10%)
IGCC Poly-generation with Integrated Carbon Capture & Sequestration
Key Dates Project Awarded: 9/30/2009 Project Being Re-baselined
Status New Owner, SCS Energy: 9/2011 FEED initiated: 9/21/2011 Sulfur recovery unit process design: 9/27/2011 NEPA public scoping meeting
scheduled: 7/12/2012
75
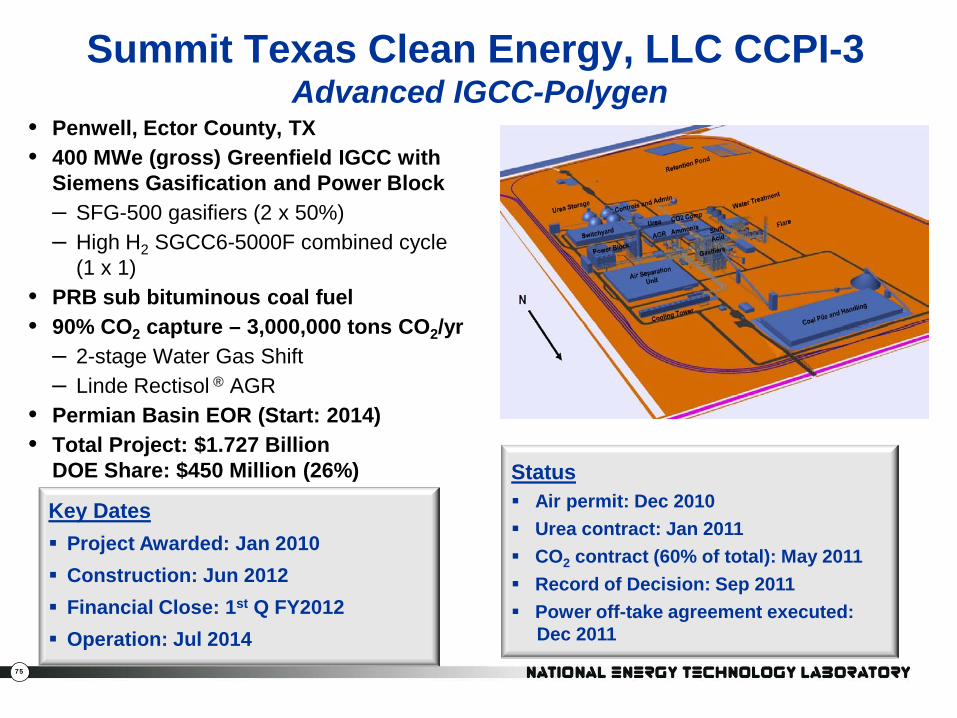
Summit Texas Clean Energy, LLC CCPI-3 Advanced IGCC-Polygen
• Penwell, Ector County, TX • 400 MWe (gross) Greenfield IGCC with
Siemens Gasification and Power Block – SFG-500 gasifiers (2 x 50%) – High H2 SGCC6-5000F combined cycle
(1 x 1) • PRB sub bituminous coal fuel • 90% CO2 capture – 3,000,000 tons CO2/yr
– 2-stage Water Gas Shift – Linde Rectisol ® AGR
• Permian Basin EOR (Start: 2014) • Total Project: $1.727 Billion
DOE Share: $450 Million (26%)
Key Dates Project Awarded: Jan 2010 Construction: Jun 2012 Financial Close: 1st Q FY2012 Operation: Jul 2014
Status Air permit: Dec 2010 Urea contract: Jan 2011 CO2 contract (60% of total): May 2011 Record of Decision: Sep 2011 Power off-take agreement executed: Dec 2011
76
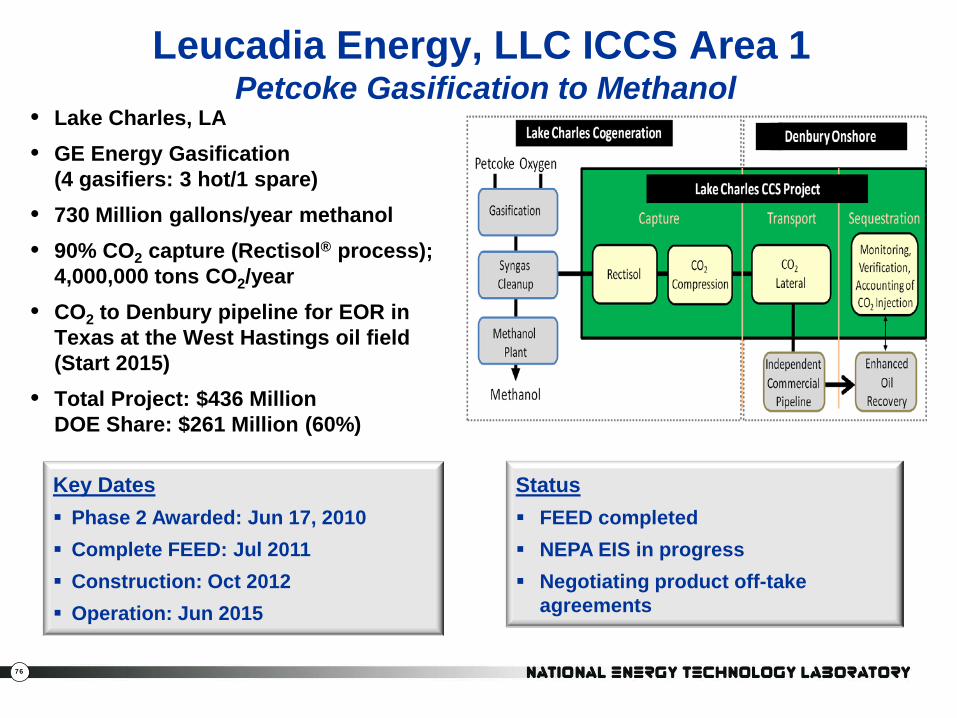
Leucadia Energy, LLC ICCS Area 1 Petcoke Gasification to Methanol
• Lake Charles, LA • GE Energy Gasification
(4 gasifiers: 3 hot/1 spare) • 730 Million gallons/year methanol • 90% CO2 capture (Rectisol® process);
4,000,000 tons CO2/year • CO2 to Denbury pipeline for EOR in
Texas at the West Hastings oil field (Start 2015)
• Total Project: $436 Million DOE Share: $261 Million (60%)
Key Dates Phase 2 Awarded: Jun 17, 2010 Complete FEED: Jul 2011 Construction: Oct 2012 Operation: Jun 2015
Status FEED completed NEPA EIS in progress Negotiating product off-take
agreements
77
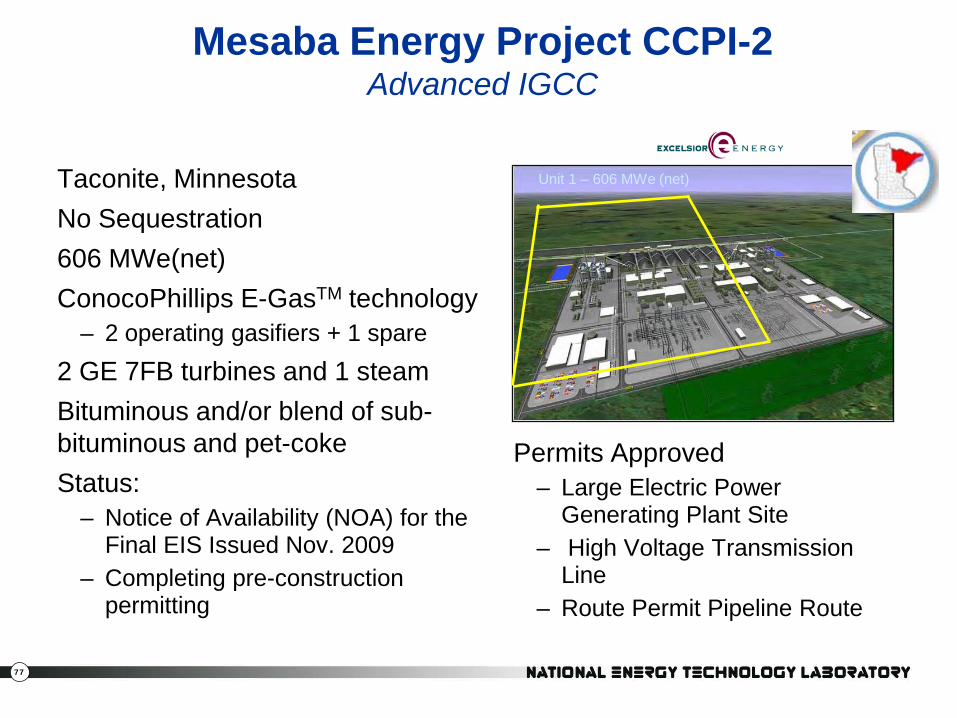
Taconite, Minnesota No Sequestration 606 MWe(net) ConocoPhillips E-GasTM technology
– 2 operating gasifiers + 1 spare 2 GE 7FB turbines and 1 steam Bituminous and/or blend of sub-bituminous and pet-coke Status:
– Notice of Availability (NOA) for the Final EIS Issued Nov. 2009
– Completing pre-construction permitting
Mesaba Energy Project CCPI-2 Advanced IGCC
Unit 1 – 606 MWe (net)
Permits Approved – Large Electric Power
Generating Plant Site – High Voltage Transmission
Line – Route Permit Pipeline Route
78
Systems Analysis
Gasification Systems Program

79
NETL’s Program Analysis Support On-going and Planned Gasification Studies
Low Rank Coal: Parallel screening studies for Gasification FY11 awards Cost and Performance Baseline for TRIG™ – PRB and ND Lignite Air Blown IGCC – Texas Lignite Air and Oxygen Blown IGCC
Co-feeding of biomass to meet 90% equivalent CCS IGCC with CCS Pathway Study: Low Rank Coal Co-production assessments Altitude versus shipping sensitivity analysis
IGCC availability studies: Identifying gaps for conventional technologies Setting targets for advanced technologies
General advanced technology assessments:
IGCC with CCS Pathway: Bituminous Coal, Updates – DOE IGCC portfolio + PWR compact gasifier assessment – Pressure sensitivity analysis Updated WGCU assessment - learnings from TECO design
80
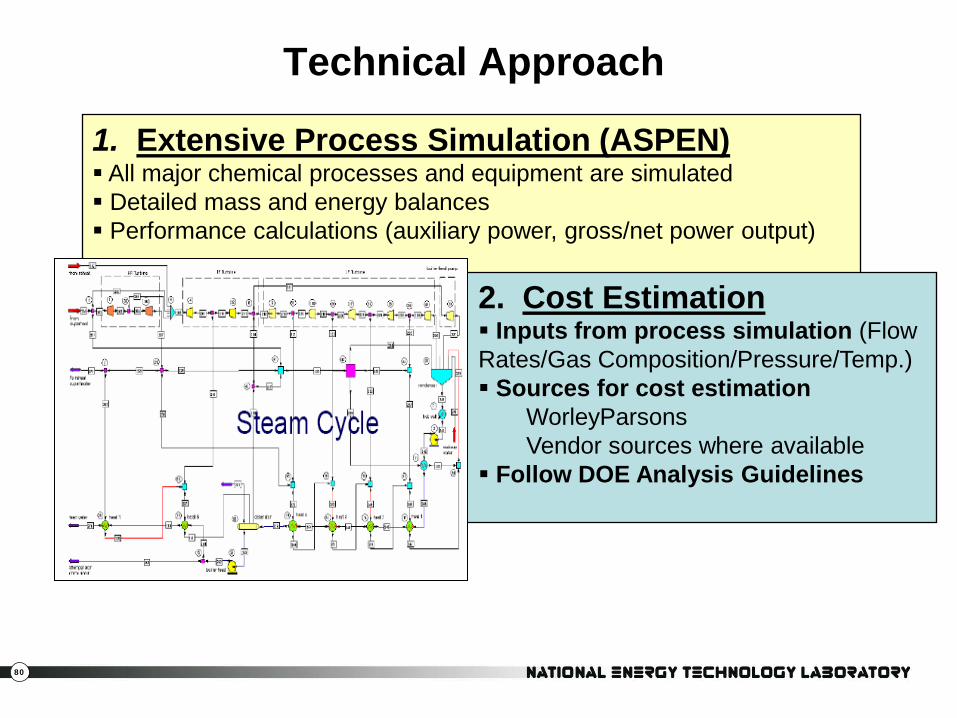
Technical Approach
1. Extensive Process Simulation (ASPEN) All major chemical processes and equipment are simulated Detailed mass and energy balances Performance calculations (auxiliary power, gross/net power output) 2. Cost Estimation
Inputs from process simulation (Flow Rates/Gas Composition/Pressure/Temp.) Sources for cost estimation
WorleyParsons Vendor sources where available
Follow DOE Analysis Guidelines
81
Systems Analysis
Bituminous Baseline Study
Full presentation available at: http://www.netl.doe.gov/energy-analyses/baseline_studies.html
82
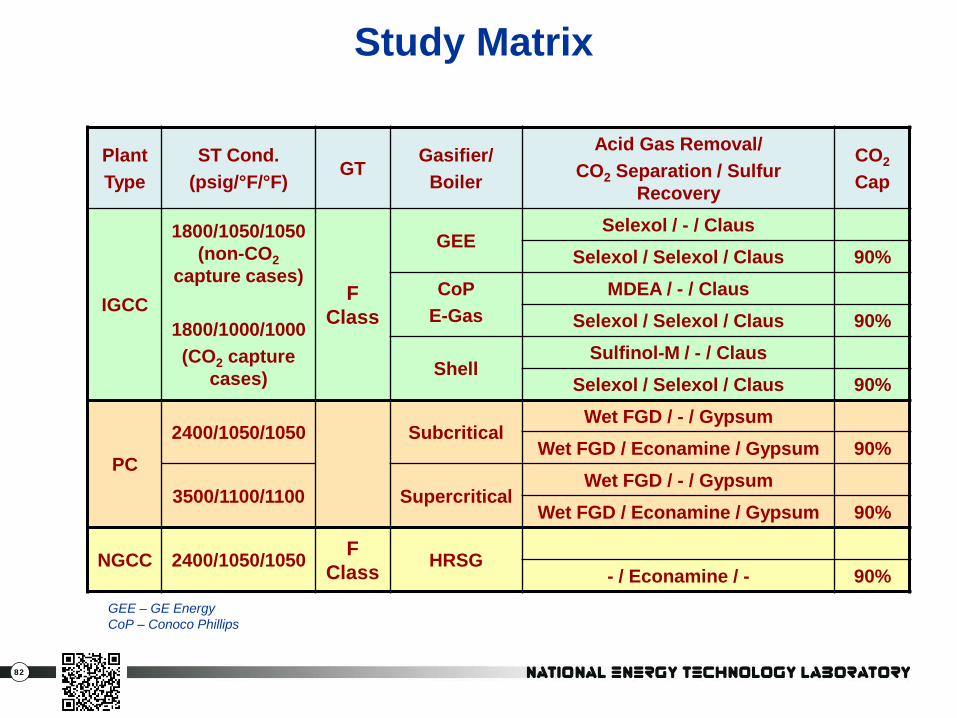
Study Matrix
Plant Type
ST Cond. (psig/°F/°F)
GT Gasifier/
Boiler
Acid Gas Removal/ CO2 Separation / Sulfur
Recovery
CO2
Cap
IGCC
1800/1050/1050 (non-CO2
capture cases)
1800/1000/1000 (CO2 capture
cases)
F Class
GEE Selexol / - / Claus
Selexol / Selexol / Claus 90% CoP
E-Gas MDEA / - / Claus
Selexol / Selexol / Claus 90%
Shell Sulfinol-M / - / Claus
Selexol / Selexol / Claus 90%
PC 2400/1050/1050 Subcritical
Wet FGD / - / Gypsum Wet FGD / Econamine / Gypsum 90%
3500/1100/1100 Supercritical Wet FGD / - / Gypsum
Wet FGD / Econamine / Gypsum 90%
NGCC 2400/1050/1050 F Class HRSG
- / Econamine / - 90% GEE – GE Energy CoP – Conoco Phillips
83
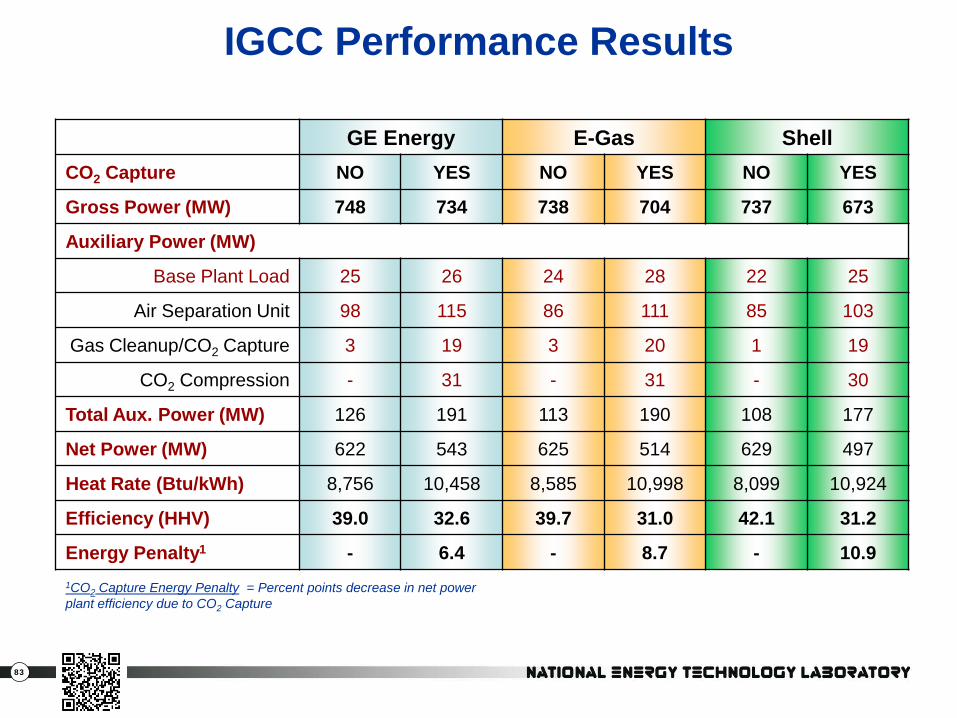
IGCC Performance Results
GE Energy E-Gas Shell CO2 Capture NO YES NO YES NO YES
Gross Power (MW) 748 734 738 704 737 673
Auxiliary Power (MW)
Base Plant Load 25 26 24 28 22 25
Air Separation Unit 98 115 86 111 85 103
Gas Cleanup/CO2 Capture 3 19 3 20 1 19
CO2 Compression - 31 - 31 - 30
Total Aux. Power (MW) 126 191 113 190 108 177
Net Power (MW) 622 543 625 514 629 497
Heat Rate (Btu/kWh) 8,756 10,458 8,585 10,998 8,099 10,924
Efficiency (HHV) 39.0 32.6 39.7 31.0 42.1 31.2
Energy Penalty1 - 6.4 - 8.7 - 10.9 1CO2 Capture Energy Penalty = Percent points decrease in net power plant efficiency due to CO2 Capture
84
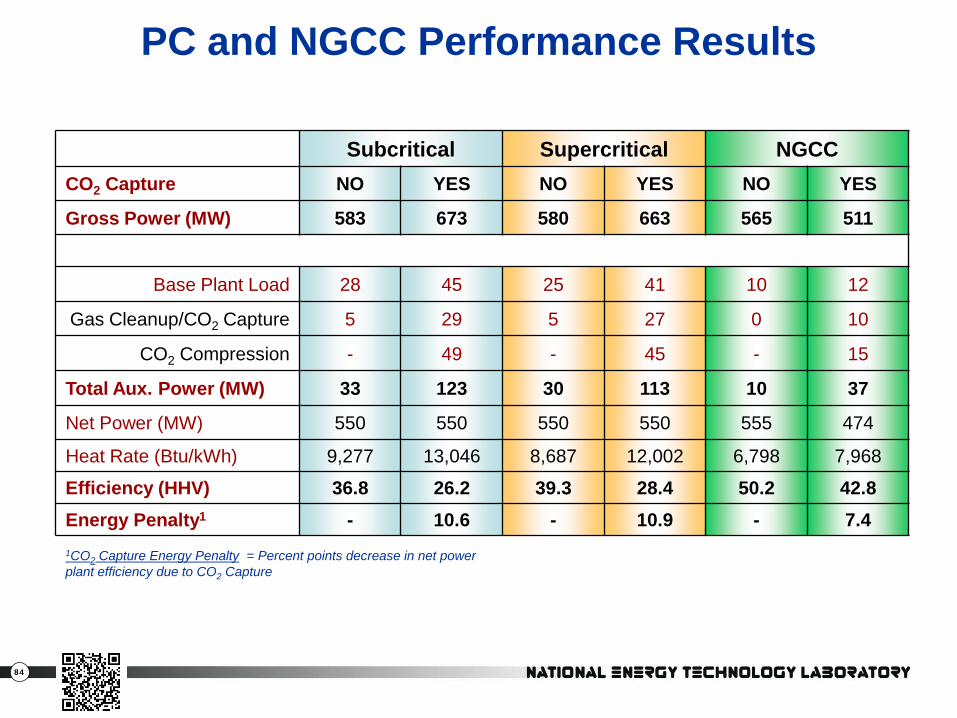
PC and NGCC Performance Results
Subcritical Supercritical NGCC CO2 Capture NO YES NO YES NO YES
Gross Power (MW) 583 673 580 663 565 511
Base Plant Load 28 45 25 41 10 12
Gas Cleanup/CO2 Capture 5 29 5 27 0 10
CO2 Compression - 49 - 45 - 15
Total Aux. Power (MW) 33 123 30 113 10 37
Net Power (MW) 550 550 550 550 555 474
Heat Rate (Btu/kWh) 9,277 13,046 8,687 12,002 6,798 7,968
Efficiency (HHV) 36.8 26.2 39.3 28.4 50.2 42.8 Energy Penalty1 - 10.6 - 10.9 - 7.4 1CO2 Capture Energy Penalty = Percent points decrease in net power plant efficiency due to CO2 Capture
85
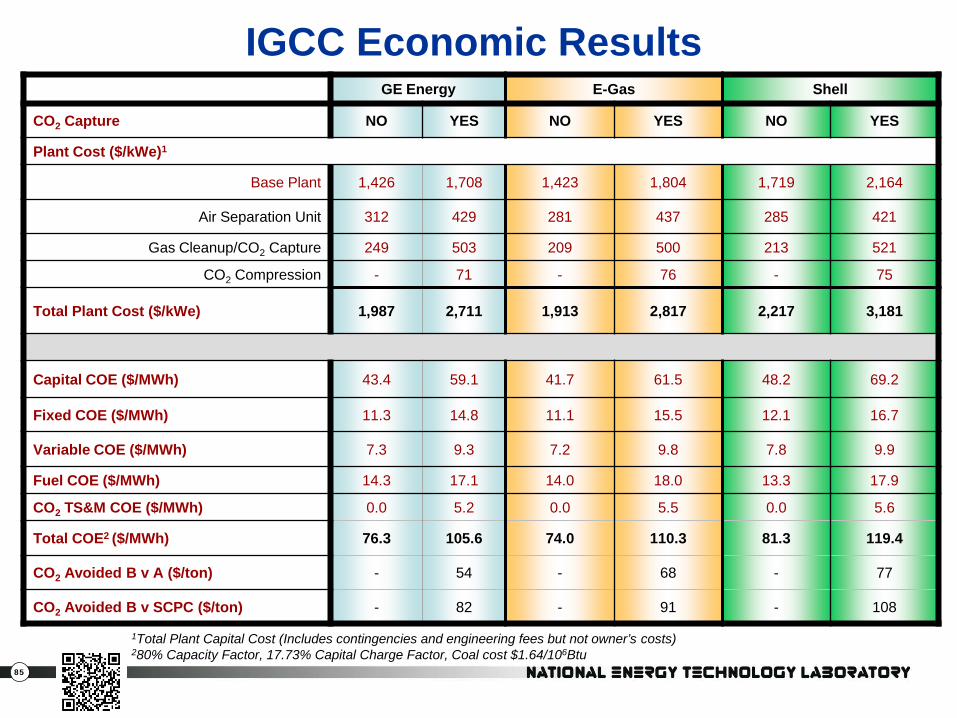
IGCC Economic Results GE Energy E-Gas Shell
CO2 Capture NO YES NO YES NO YES
Plant Cost ($/kWe)1
Base Plant 1,426 1,708 1,423 1,804 1,719 2,164
Air Separation Unit 312 429 281 437 285 421
Gas Cleanup/CO2 Capture 249 503 209 500 213 521
CO2 Compression - 71 - 76 - 75
Total Plant Cost ($/kWe) 1,987 2,711 1,913 2,817 2,217 3,181
Capital COE ($/MWh) 43.4 59.1 41.7 61.5 48.2 69.2
Fixed COE ($/MWh) 11.3 14.8 11.1 15.5 12.1 16.7
Variable COE ($/MWh) 7.3 9.3 7.2 9.8 7.8 9.9
Fuel COE ($/MWh) 14.3 17.1 14.0 18.0 13.3 17.9
CO2 TS&M COE ($/MWh) 0.0 5.2 0.0 5.5 0.0 5.6
Total COE2 ($/MWh) 76.3 105.6 74.0 110.3 81.3 119.4
CO2 Avoided B v A ($/ton) - 54 - 68 - 77
CO2 Avoided B v SCPC ($/ton) - 82 - 91 - 108
1Total Plant Capital Cost (Includes contingencies and engineering fees but not owner’s costs) 280% Capacity Factor, 17.73% Capital Charge Factor, Coal cost $1.64/106Btu
86
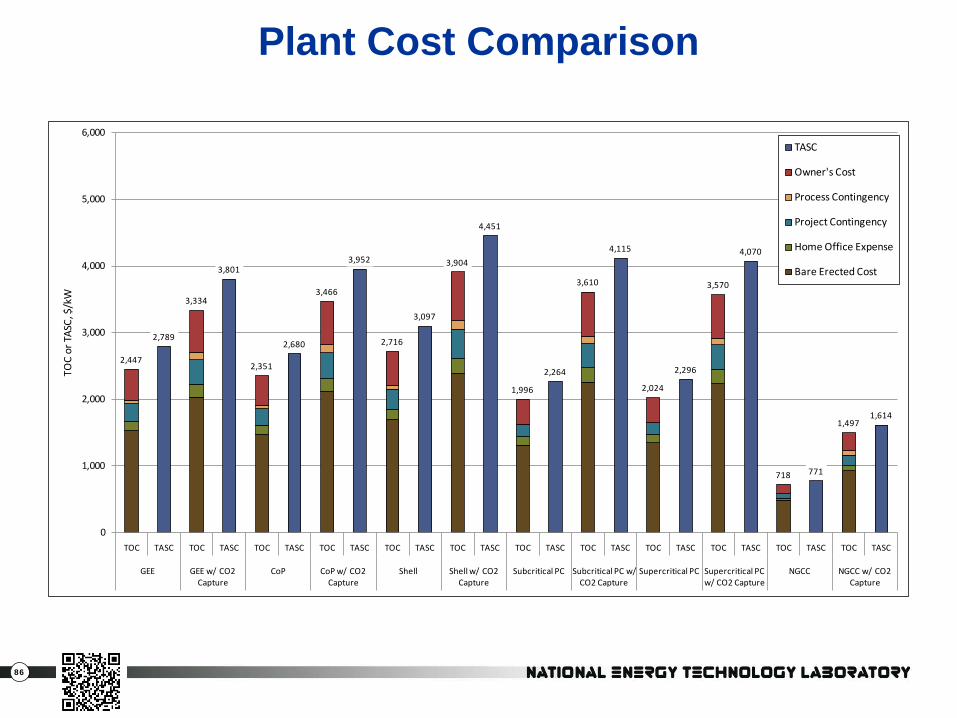
Plant Cost Comparison
2,447
3,334
2,351
3,466
2,716
3,904
1,996
3,610
2,024
3,570
718
1,497
2,789
3,801
2,680
3,952
3,097
4,451
2,264
4,115
2,296
4,070
771
1,614
0
1,000
2,000
3,000
4,000
5,000
6,000
TOC TASC TOC TASC TOC TASC TOC TASC TOC TASC TOC TASC TOC TASC TOC TASC TOC TASC TOC TASC TOC TASC TOC TASC
GEE GEE w/ CO2 Capture
CoP CoP w/ CO2 Capture
Shell Shell w/ CO2 Capture
Subcritical PC Subcritical PC w/ CO2 Capture
Supercritical PC Supercritical PC w/ CO2 Capture
NGCC NGCC w/ CO2 Capture
TOC
or T
ASC,
$/k
W
TASC
Owner's Cost
Process Contingency
Project Contingency
Home Office Expense
Bare Erected Cost
87
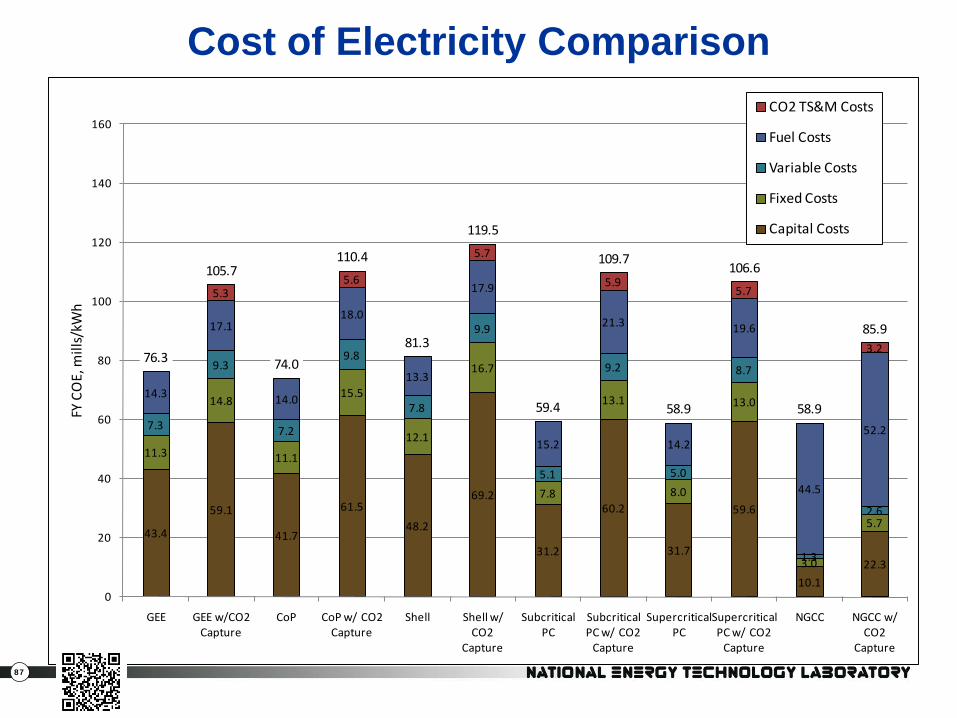
Cost of Electricity Comparison
Coal cost $1.64/106Btu, Gas cost $6.55/106Btu
43.4
59.1
41.7
61.5
48.2
69.2
31.2
60.2
31.7
59.6
10.1
22.3
11.3
14.8
11.1
15.5
12.1
16.7
7.8
13.1
8.0
13.0
3.0
5.7
7.3
9.3
7.2
9.8
7.8
9.9
5.1
9.2
5.0
8.7
1.3
2.6
14.3
17.1
14.0
18.0
13.3
17.9
15.2
21.3
14.2
19.6
44.5
52.2
5.35.6
5.7
5.95.7
3.276.3
105.7
74.0
110.4
81.3
119.5
59.4
109.7
58.9
106.6
58.9
85.9
0
20
40
60
80
100
120
140
160
GEE GEE w/CO2 Capture
CoP CoP w/ CO2 Capture
Shell Shell w/ CO2
Capture
Subcritical PC
Subcritical PC w/ CO2
Capture
Supercritical PC
Supercritical PC w/ CO2
Capture
NGCC NGCC w/ CO2
Capture
FY C
OE,
mill
s/kW
h
CO2 TS&M Costs
Fuel Costs
Variable Costs
Fixed Costs
Capital Costs

88
CO2 Avoided Costs
43
54
61
68 69
84
66
73
86
75
69
36
0
10
20
30
40
50
60
70
80
90
100
GEE CoP Shell Subcritical PC Supercritical PC NGCC
Firs
t Yea
r CO
2Av
oide
d Co
st, $
/ton
ne
Avoided Cost (Analogous Technology w/o Capture Reference)
Avoided Cost (SC PC w/o Capture Reference)
89
Systems Analysis
Bituminous IGCC Pathway Study
90
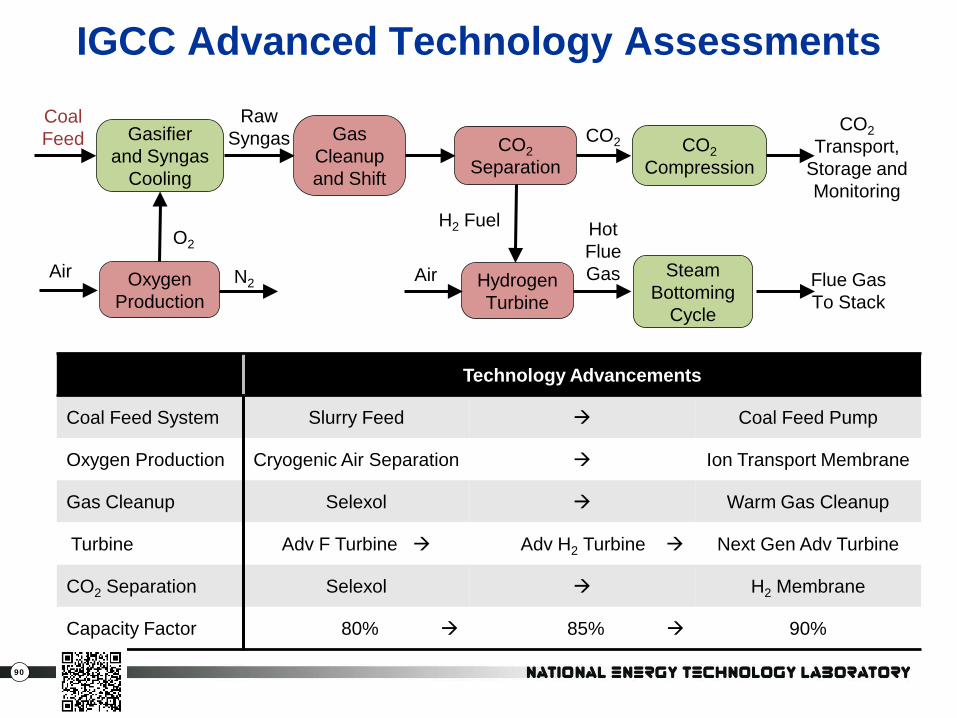
IGCC Advanced Technology Assessments
Technology Advancements
Coal Feed System Slurry Feed Coal Feed Pump
Oxygen Production Cryogenic Air Separation Ion Transport Membrane
Gas Cleanup Selexol Warm Gas Cleanup
Turbine Adv F Turbine Adv H2 Turbine Next Gen Adv Turbine
CO2 Separation Selexol H2 Membrane
Capacity Factor 80% 85% 90%
Steam Bottoming
Cycle
Oxygen Production
Hydrogen Turbine
Flue Gas To Stack
Hot Flue Gas
H2 Fuel
N2
O2
Air Air
Gasifier and Syngas
Cooling
Gas Cleanup and Shift
CO2 Separation
CO2 Compression
Coal Feed
Raw Syngas
CO2 Transport,
Storage and Monitoring
CO2
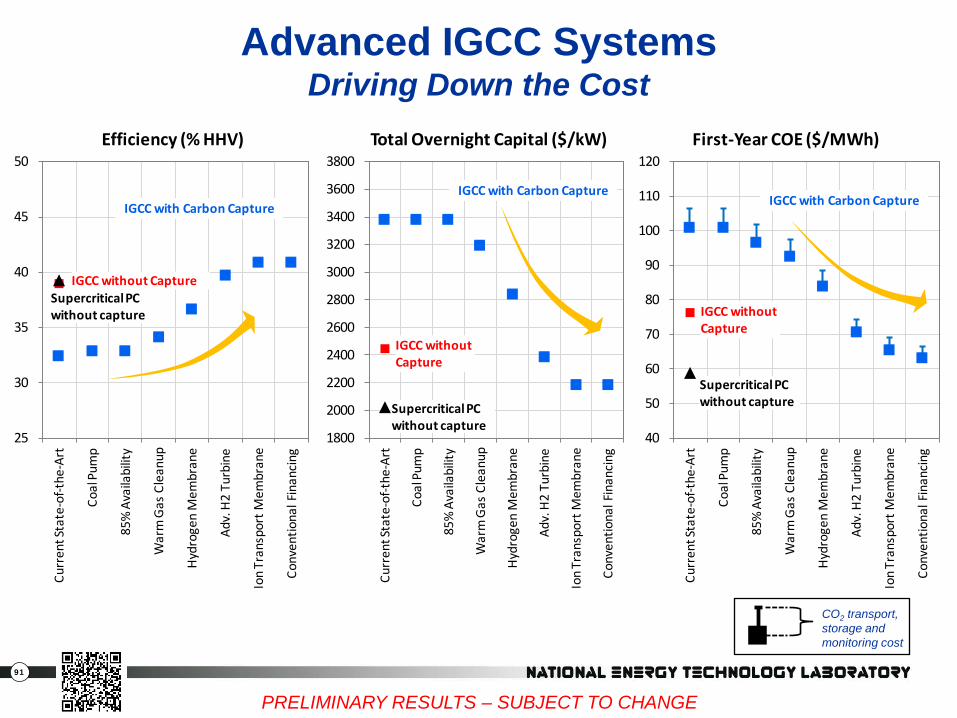
91
CO2 transport, storage and monitoring cost
Advanced IGCC Systems Driving Down the Cost
25
30
35
40
45
50
Curr
ent S
tate
-of-t
he-A
rt
Coal
Pum
p
85%
Ava
ilabi
lity
War
m G
as C
lean
up
Hyd
roge
n M
embr
ane
Adv.
H2
Turb
ine
Ion
Tran
spor
t Mem
bran
e
Conv
entio
nal F
inan
cing
Efficiency (% HHV)
Supercritical PC without capture
IGCC with Carbon Capture
IGCC without Capture
1800
2000
2200
2400
2600
2800
3000
3200
3400
3600
3800
Curr
ent S
tate
-of-t
he-A
rt
Coal
Pum
p
85%
Ava
ilabi
lity
War
m G
as C
lean
up
Hyd
roge
n M
embr
ane
Adv.
H2
Turb
ine
Ion
Tran
spor
t Mem
bran
e
Conv
entio
nal F
inan
cing
Total Overnight Capital ($/kW)
Supercritical PC without capture
IGCC with Carbon Capture
IGCC withoutCapture
40
50
60
70
80
90
100
110
120
Curr
ent S
tate
-of-t
he-A
rt
Coal
Pum
p
85%
Ava
ilabi
lity
War
m G
as C
lean
up
Hyd
roge
n M
embr
ane
Adv.
H2
Turb
ine
Ion
Tran
spor
t Mem
bran
e
Conv
entio
nal F
inan
cing
First-Year COE ($/MWh)
Supercritical PC without capture
IGCC with Carbon Capture
IGCC withoutCapture
PRELIMINARY RESULTS – SUBJECT TO CHANGE
92
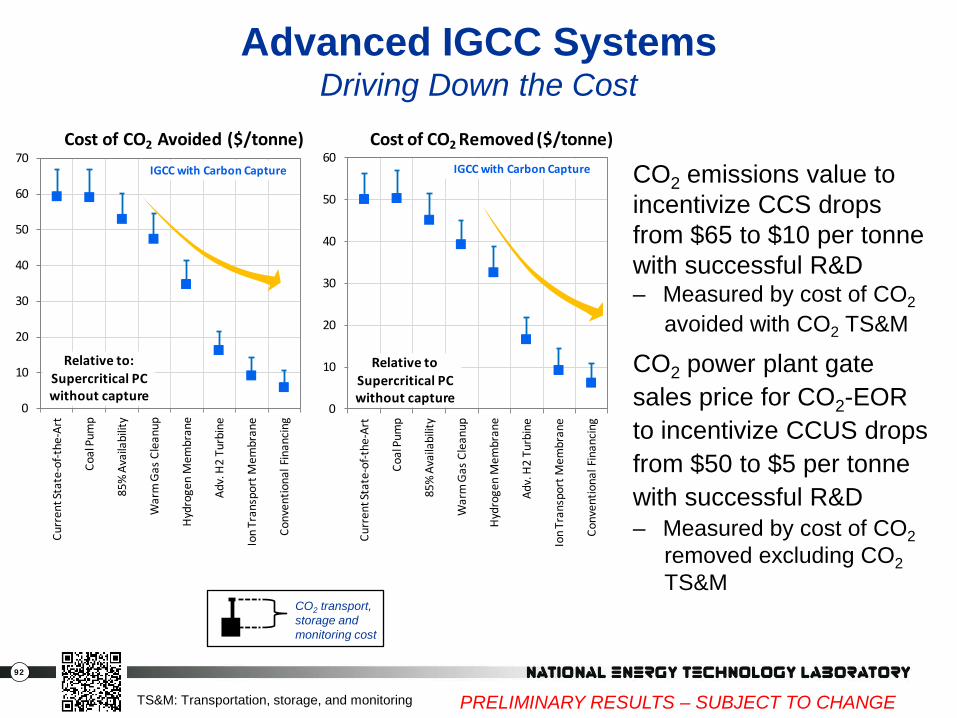
CO2 emissions value to incentivize CCS drops from $65 to $10 per tonne with successful R&D – Measured by cost of CO2 avoided with CO2 TS&M
CO2 power plant gate sales price for CO2-EOR to incentivize CCUS drops from $50 to $5 per tonne with successful R&D – Measured by cost of CO2 removed excluding CO2 TS&M
CO2 transport, storage and monitoring cost
Advanced IGCC Systems Driving Down the Cost
0
10
20
30
40
50
60
70
Curr
ent S
tate
-of-t
he-A
rt
Coal
Pum
p
85%
Ava
ilabi
lity
War
m G
as C
lean
up
Hyd
roge
n M
embr
ane
Adv.
H2
Turb
ine
Ion
Tran
spor
t Mem
bran
e
Conv
entio
nal F
inan
cing
Cost of CO2 Avoided ($/tonne)
Relative to: Supercritical PC without capture
IGCC with Carbon Capture
0
10
20
30
40
50
60
Curr
ent S
tate
-of-t
he-A
rt
Coal
Pum
p
85%
Ava
ilabi
lity
War
m G
as C
lean
up
Hyd
roge
n M
embr
ane
Adv.
H2
Turb
ine
Ion
Tran
spor
t Mem
bran
e
Conv
entio
nal F
inan
cing
Cost of CO2 Removed ($/tonne)
Relative to Supercritical PC without capture
IGCC with Carbon Capture
PRELIMINARY RESULTS – SUBJECT TO CHANGE TS&M: Transportation, storage, and monitoring
93
0
2
4
6
8
10
12
14
0 10 20 30 40 50 60 70 80 90 100 110
Nat
ural
Gas
Pri
ce, $
/MM
Btu
CO2 Emissions Price, $/tonne
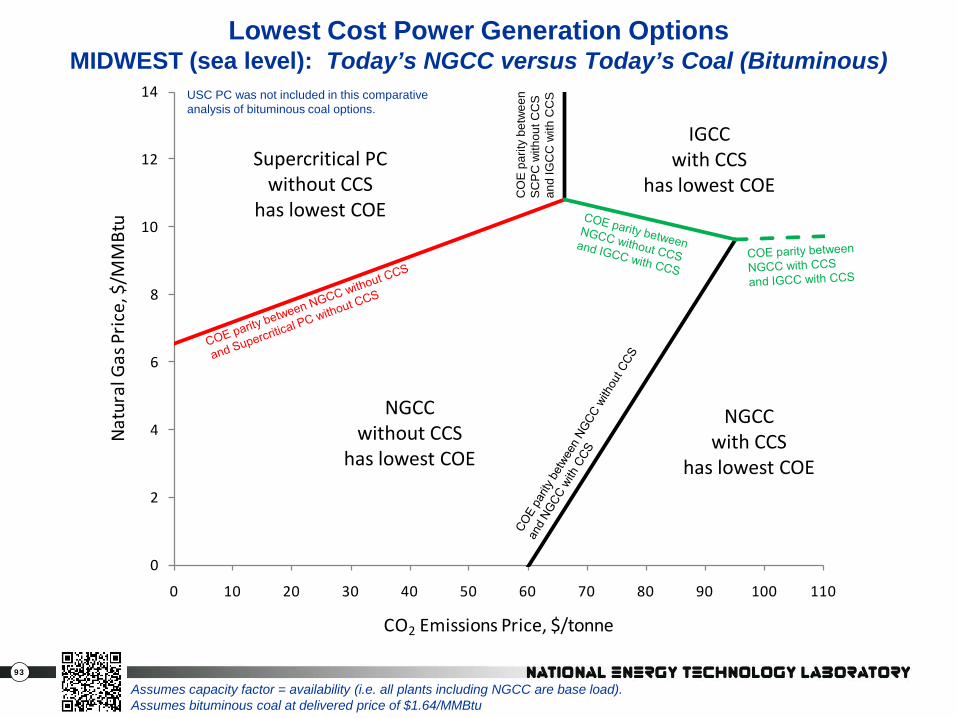
Lowest Cost Power Generation Options MIDWEST (sea level): Today’s NGCC versus Today’s Coal (Bituminous)
CO
E p
arity
bet
wee
n S
CP
C w
ithou
t CC
S an
d IG
CC
with
CC
S
NGCC with CCS
has lowest COE
IGCC with CCS
has lowest COE
NGCC without CCS
has lowest COE
Assumes capacity factor = availability (i.e. all plants including NGCC are base load). Assumes bituminous coal at delivered price of $1.64/MMBtu
Supercritical PC without CCS
has lowest COE
USC PC was not included in this comparative analysis of bituminous coal options.
94
0
2
4
6
8
10
12
14
0 10 20 30 40 50 60 70 80 90 100 110
Nat
ural
Gas
Pri
ce, $
/MM
Btu
CO2 Emissions Price, $/tonne
COE parity between NGCC with CCS and 2nd Gen IGCC with CCS
2nd Gen PC without
CCS has lowest
COE
NGCC with CCS
has lowest COE
2nd Gen IGCC with CCS
has lowest COE
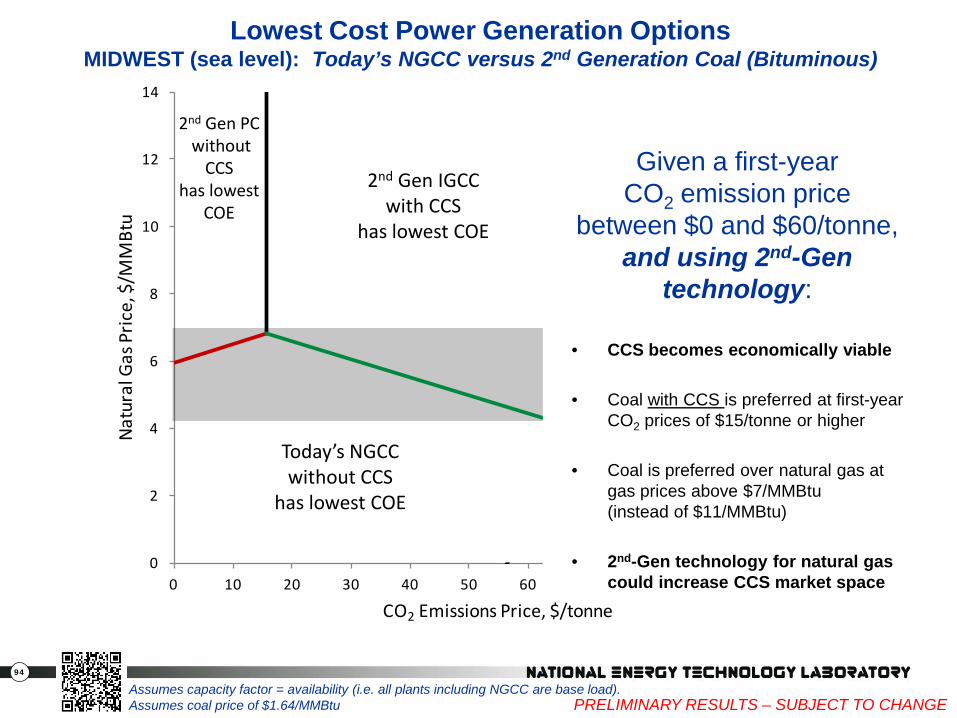
Lowest Cost Power Generation Options MIDWEST (sea level): Today’s NGCC versus 2nd Generation Coal (Bituminous)
Assumes capacity factor = availability (i.e. all plants including NGCC are base load). Assumes coal price of $1.64/MMBtu
Today’s NGCC without CCS
has lowest COE
Given a first-year
CO2 emission price between $0 and $60/tonne,
and using 2nd-Gen technology:
• CCS becomes economically viable
• Coal with CCS is preferred at first-year
CO2 prices of $15/tonne or higher
• Coal is preferred over natural gas at gas prices above $7/MMBtu (instead of $11/MMBtu)
• 2nd-Gen technology for natural gas could increase CCS market space
PRELIMINARY RESULTS – SUBJECT TO CHANGE
95
Systems Analysis Low Rank Coal Baseline Study:
IGCC Cases
Full presentation available at: http://www.netl.doe.gov/energy-analyses/baseline_studies.html
96
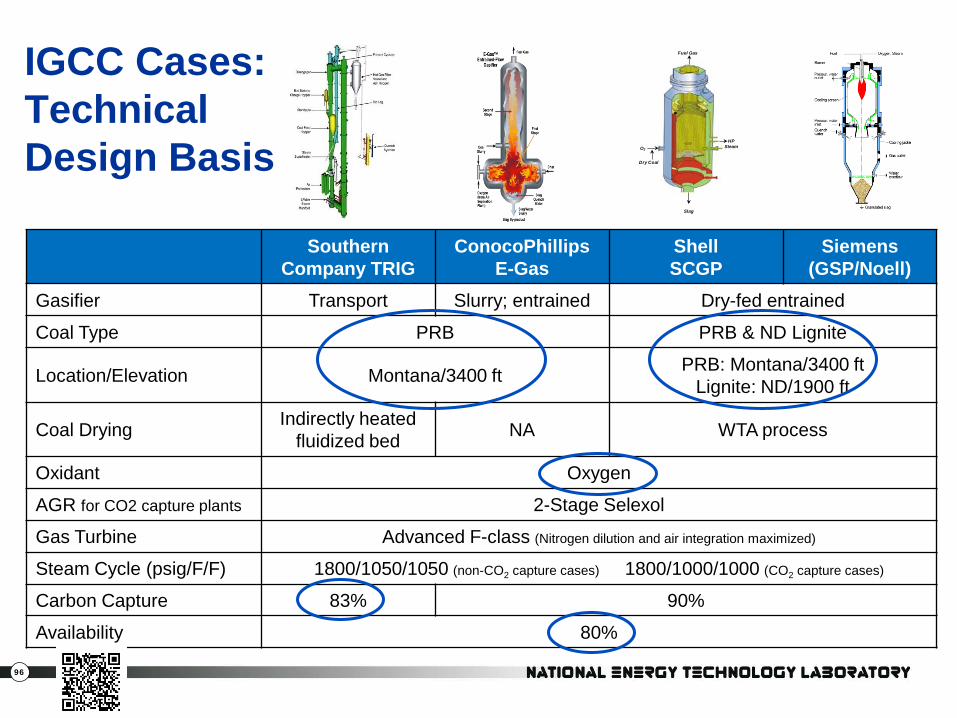
IGCC Cases: Technical Design Basis
Southern Company TRIG
ConocoPhillips E-Gas
Shell SCGP
Siemens (GSP/Noell)
Gasifier Transport Slurry; entrained Dry-fed entrained
Coal Type PRB PRB & ND Lignite
Location/Elevation Montana/3400 ft PRB: Montana/3400 ft Lignite: ND/1900 ft
Coal Drying Indirectly heated fluidized bed NA WTA process
Oxidant Oxygen
AGR for CO2 capture plants 2-Stage Selexol
Gas Turbine Advanced F-class (Nitrogen dilution and air integration maximized)
Steam Cycle (psig/F/F) 1800/1050/1050 (non-CO2 capture cases) 1800/1000/1000 (CO2 capture cases)
Carbon Capture 83% 90%
Availability 80%
Slag
Fuel Gas
Dry Coal
O2
HP Steam
97
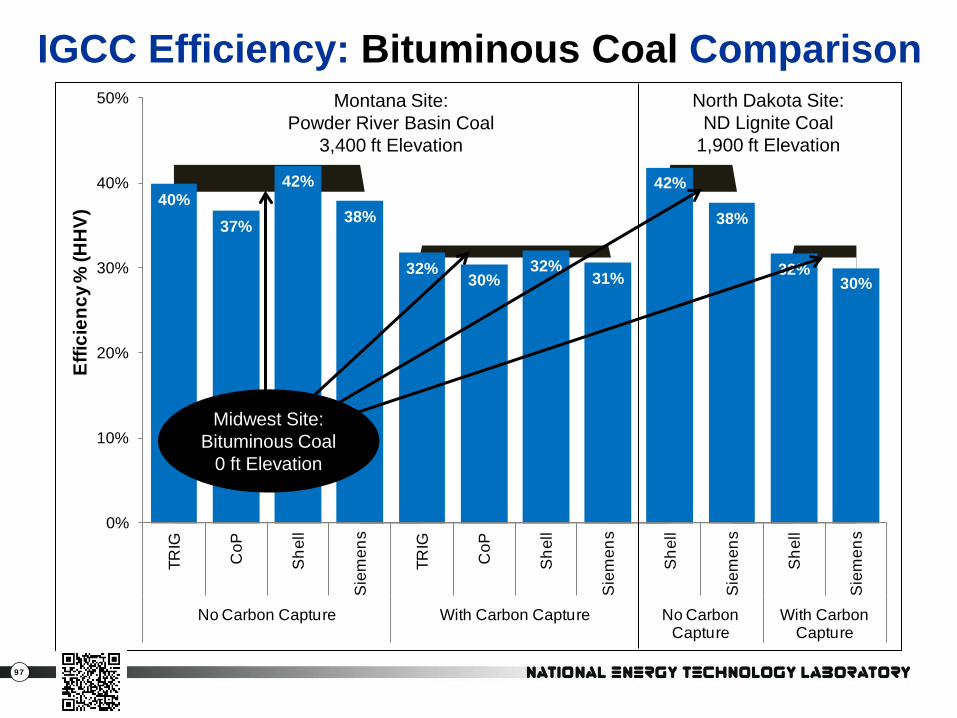
40%37%
42%
38%
32%30%
32%31%
42%
38%
32%30%
0%
10%
20%
30%
40%
50%
TRIG
CoP
She
ll
Sie
men
s
TRIG
CoP
She
ll
Sie
men
s
She
ll
Sie
men
s
She
ll
Sie
men
s
No Carbon Capture With Carbon Capture No Carbon Capture
With Carbon Capture
Effic
ienc
y % (H
HV)
IGCC Efficiency: Bituminous Coal Comparison Montana Site:
Powder River Basin Coal 3,400 ft Elevation
North Dakota Site: ND Lignite Coal
1,900 ft Elevation
Midwest Site: Bituminous Coal
0 ft Elevation
98
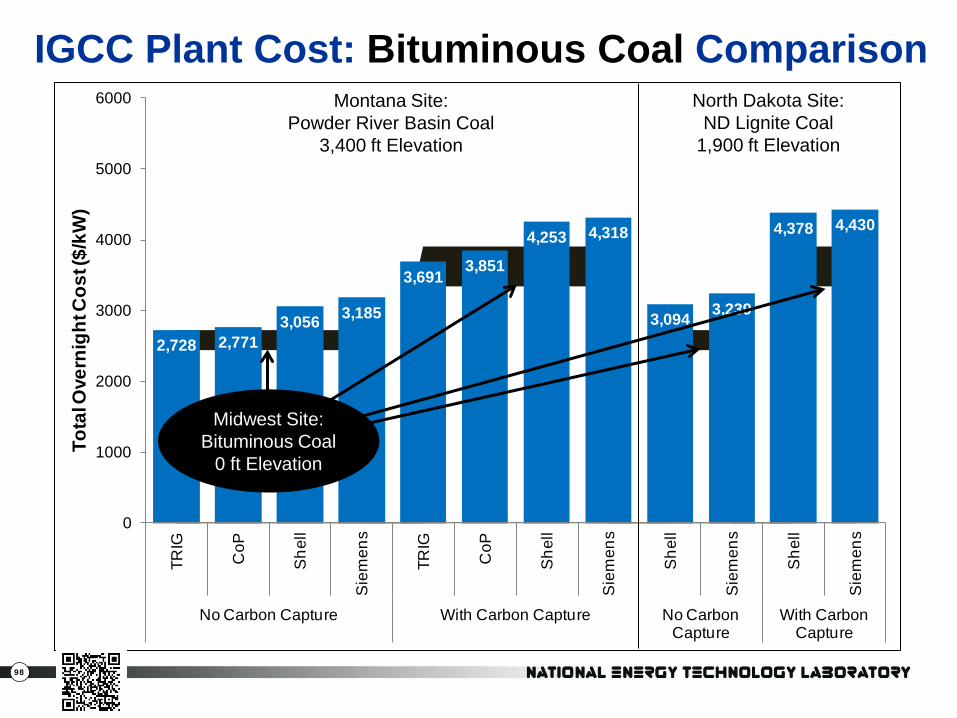
2,728 2,7713,056 3,185
3,6913,851
4,253 4,318
3,094 3,239
4,378 4,430
0
1000
2000
3000
4000
5000
6000
TRIG
CoP
She
ll
Sie
men
s
TRIG
CoP
She
ll
Sie
men
s
She
ll
Sie
men
s
She
ll
Sie
men
s
No Carbon Capture With Carbon Capture No Carbon Capture
With Carbon Capture
Tota
l Ove
rnig
ht C
ost (
$/kW
)IGCC Plant Cost: Bituminous Coal Comparison
Montana Site: Powder River Basin Coal
3,400 ft Elevation
North Dakota Site: ND Lignite Coal
1,900 ft Elevation
Midwest Site: Bituminous Coal
0 ft Elevation
99
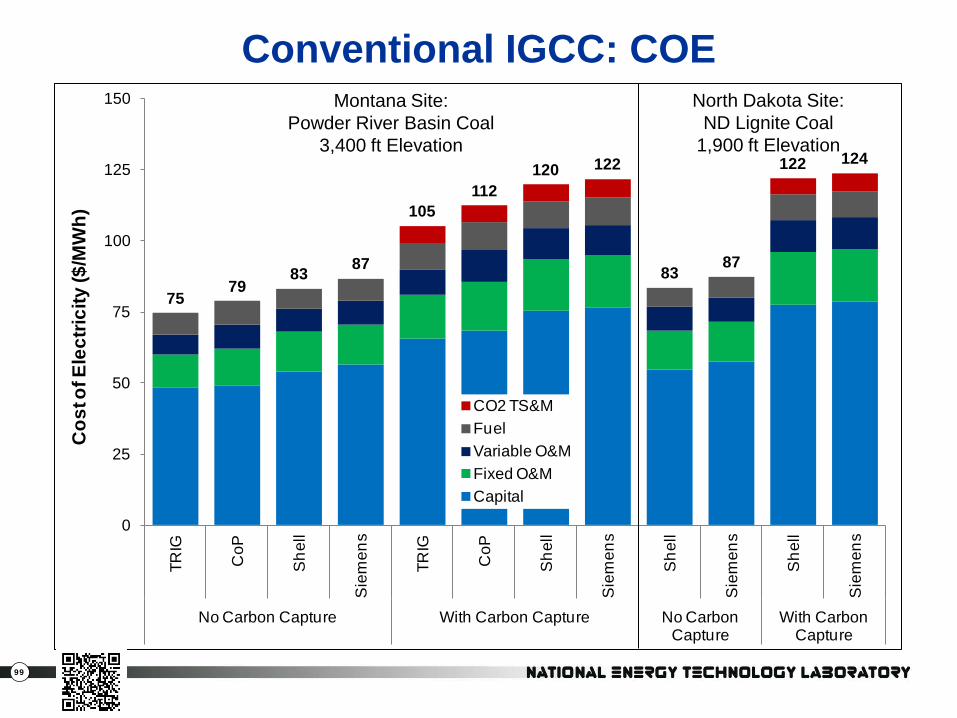
7579
83 87
105112
120 122
83 87
122 124
0
25
50
75
100
125
150
TRIG
CoP
She
ll
Sie
men
s
TRIG
CoP
She
ll
Sie
men
s
She
ll
Sie
men
s
She
ll
Sie
men
s
No Carbon Capture With Carbon Capture No Carbon Capture
With Carbon Capture
Cos
t of E
lect
ricity
($/M
Wh)
CO2 TS&MFuelVariable O&MFixed O&MCapital
Conventional IGCC: COE Montana Site:
Powder River Basin Coal 3,400 ft Elevation
North Dakota Site: ND Lignite Coal
1,900 ft Elevation
100
7579
83 87
105112
120 122
83 87
122 124
0
25
50
75
100
125
150
TRIG
CoP
She
ll
Sie
men
s
TRIG
CoP
She
ll
Sie
men
s
She
ll
Sie
men
s
She
ll
Sie
men
s
No Carbon Capture With Carbon Capture No Carbon Capture
With Carbon Capture
Cos
t of E
lect
ricity
($/M
Wh)
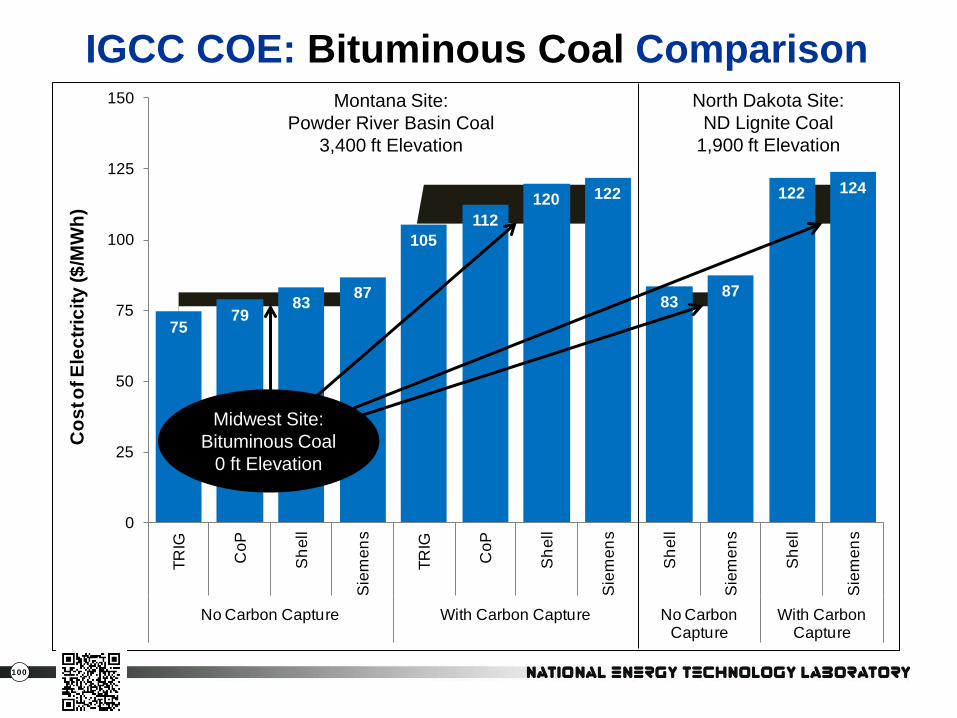
IGCC COE: Bituminous Coal Comparison Montana Site:
Powder River Basin Coal 3,400 ft Elevation
North Dakota Site: ND Lignite Coal
1,900 ft Elevation
Midwest Site: Bituminous Coal
0 ft Elevation
101
7579
83 87
105112
120 122
83 87
122 124
0
25
50
75
100
125
150
TRIG
CoP
She
ll
Sie
men
s
TRIG
CoP
She
ll
Sie
men
s
She
ll
Sie
men
s
She
ll
Sie
men
s
No Carbon Capture With Carbon Capture No Carbon Capture
With Carbon Capture
Cos
t of E
lect
ricity
($/M
Wh)
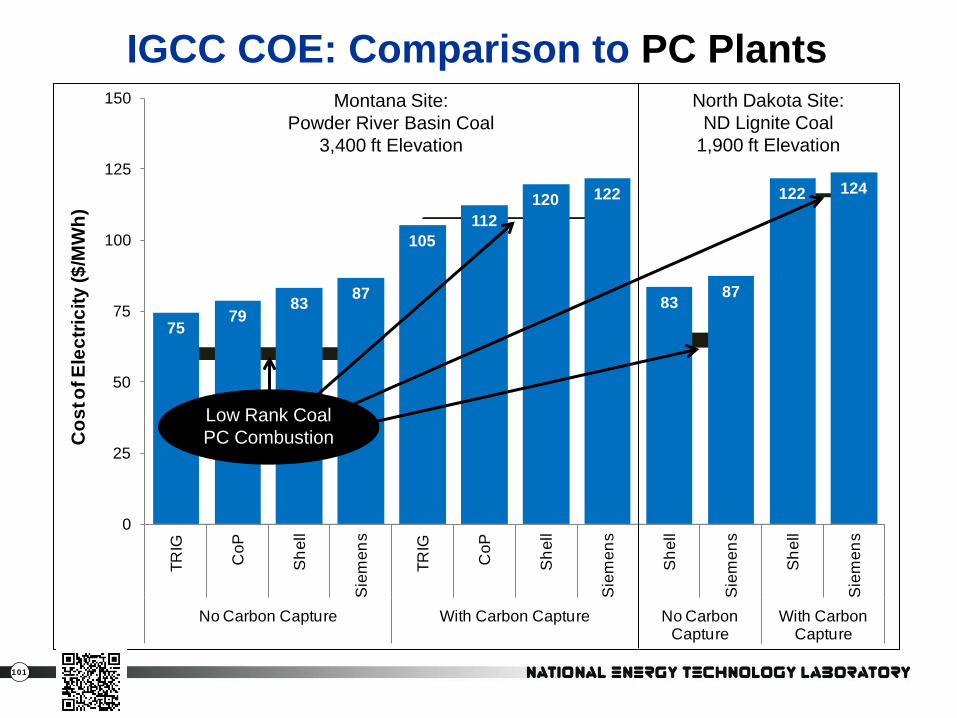
IGCC COE: Comparison to PC Plants Montana Site:
Powder River Basin Coal 3,400 ft Elevation
North Dakota Site: ND Lignite Coal
1,900 ft Elevation
Low Rank Coal PC Combustion
102
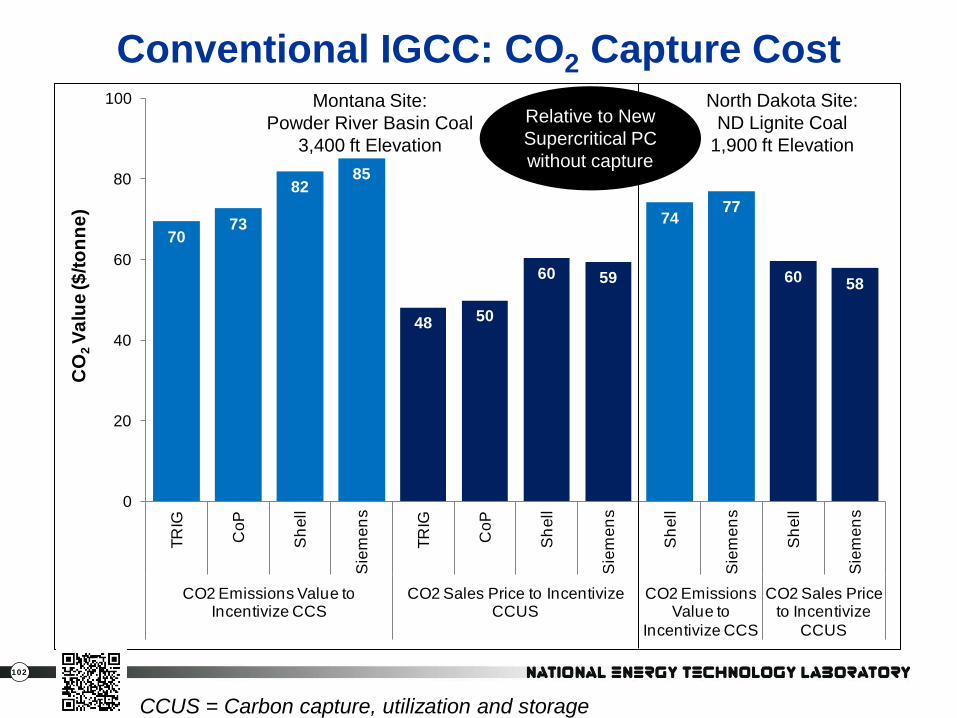
7073
8285
7477
48 50
60 59 60 58
0
20
40
60
80
100
TRIG
CoP
She
ll
Sie
men
s
TRIG
CoP
She
ll
Sie
men
s
She
ll
Sie
men
s
She
ll
Sie
men
s
CO2 Emissions Value to Incentivize CCS
CO2 Sales Price to Incentivize CCUS
CO2 Emissions Value to
Incentivize CCS
CO2 Sales Price to Incentivize
CCUS
CO
2Va
lue
($/to
nne)
Conventional IGCC: CO2 Capture Cost Montana Site:
Powder River Basin Coal 3,400 ft Elevation
North Dakota Site: ND Lignite Coal
1,900 ft Elevation Relative to New Supercritical PC without capture
CCUS = Carbon capture, utilization and storage
103
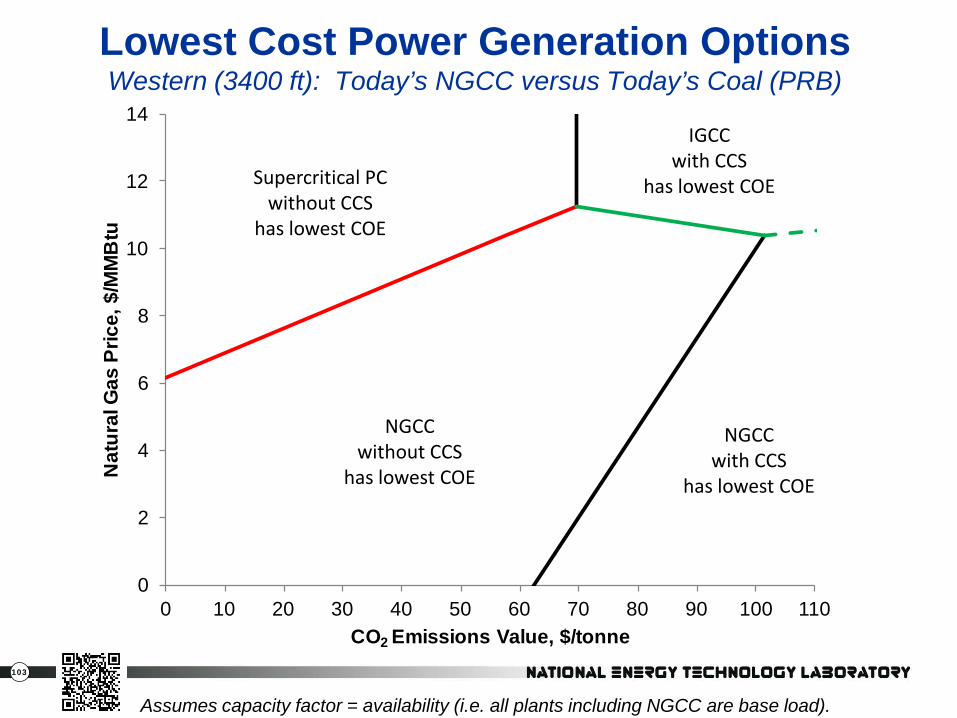
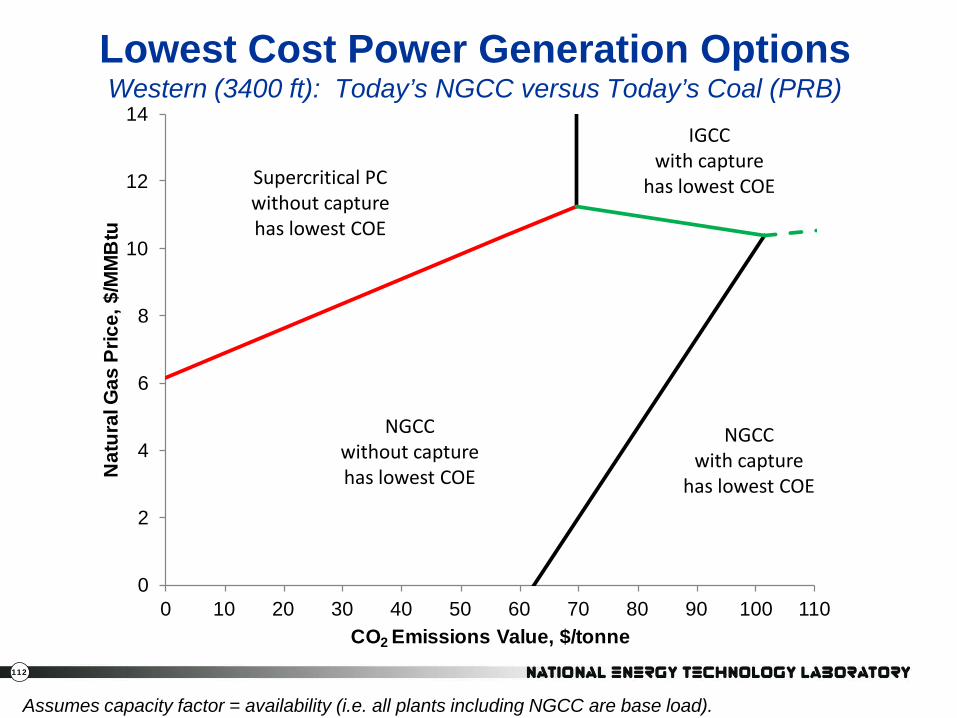
Lowest Cost Power Generation Options Western (3400 ft): Today’s NGCC versus Today’s Coal (PRB)
0
2
4
6
8
10
12
14
0 10 20 30 40 50 60 70 80 90 100 110
Nat
ural
Gas
Pric
e, $
/MM
Btu
CO2 Emissions Value, $/tonne
NGCC with CCS
has lowest COE
IGCC with CCS
has lowest COE
NGCC without CCS
has lowest COE
Assumes capacity factor = availability (i.e. all plants including NGCC are base load).
Supercritical PC without CCS
has lowest COE
104
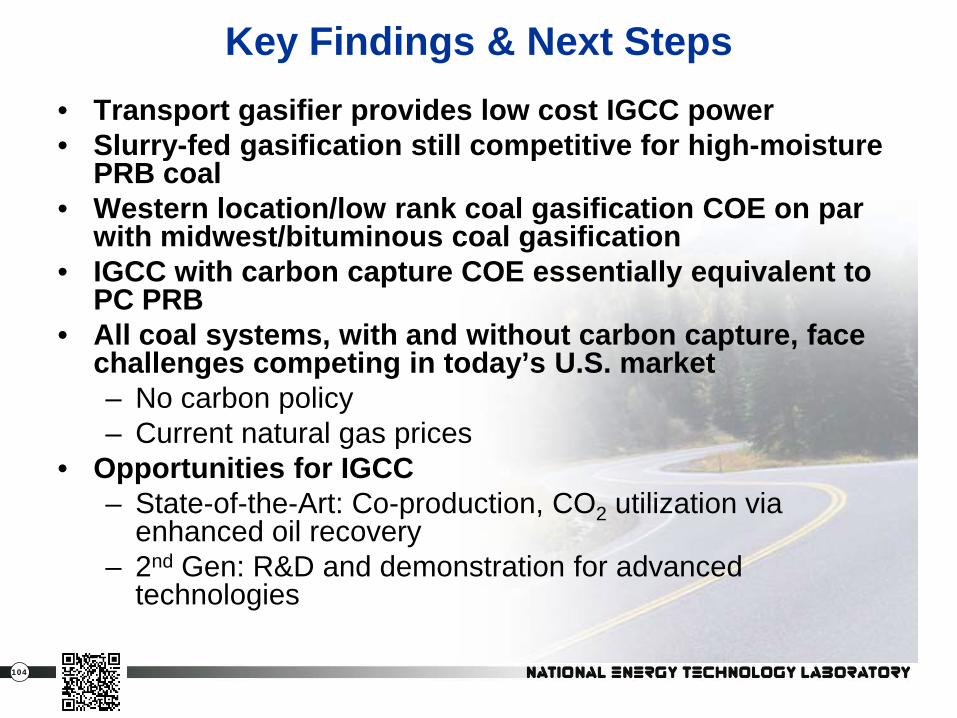
Key Findings & Next Steps • Transport gasifier provides low cost IGCC power • Slurry-fed gasification still competitive for high-moisture
PRB coal • Western location/low rank coal gasification COE on par
with midwest/bituminous coal gasification • IGCC with carbon capture COE essentially equivalent to
PC PRB • All coal systems, with and without carbon capture, face
challenges competing in today’s U.S. market – No carbon policy – Current natural gas prices
• Opportunities for IGCC – State-of-the-Art: Co-production, CO2 utilization via
enhanced oil recovery – 2nd Gen: R&D and demonstration for advanced
technologies
105
Systems Analysis Low Rank Coal IGCC
Pathway Study
106
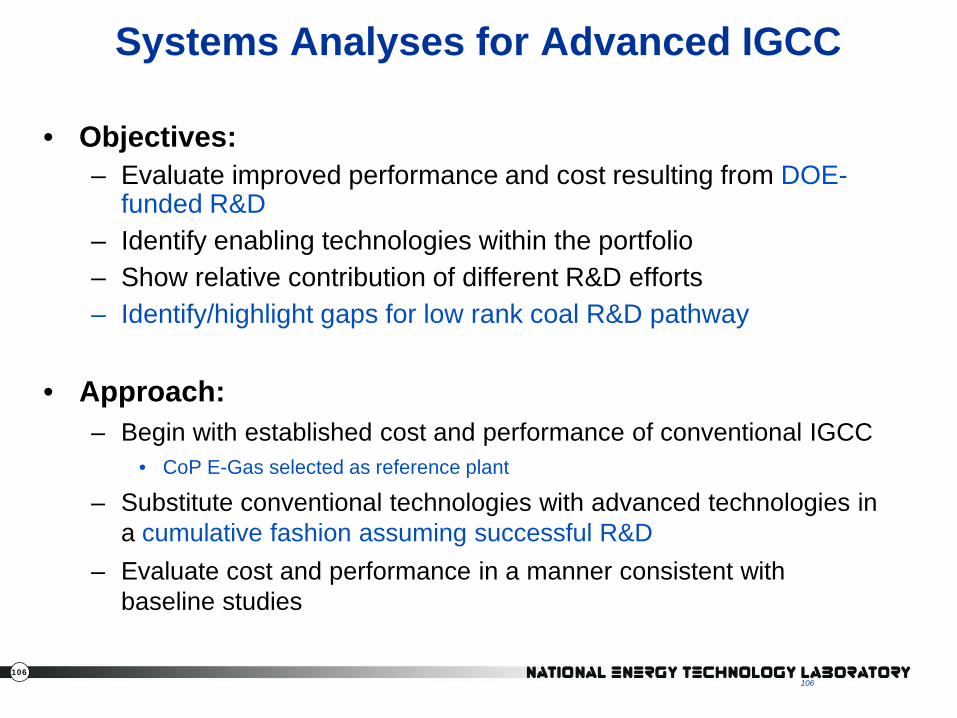
Systems Analyses for Advanced IGCC
• Objectives: – Evaluate improved performance and cost resulting from DOE-
funded R&D – Identify enabling technologies within the portfolio – Show relative contribution of different R&D efforts – Identify/highlight gaps for low rank coal R&D pathway
• Approach:
– Begin with established cost and performance of conventional IGCC • CoP E-Gas selected as reference plant
– Substitute conventional technologies with advanced technologies in a cumulative fashion assuming successful R&D
– Evaluate cost and performance in a manner consistent with baseline studies
106
107
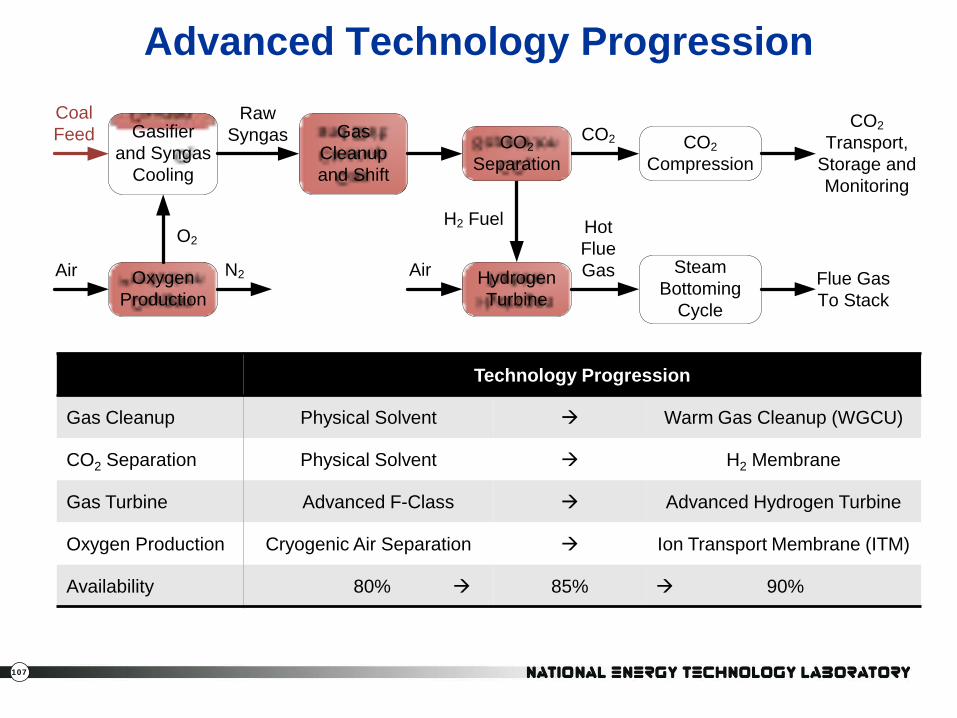
Advanced Technology Progression
Technology Progression
Gas Cleanup Physical Solvent Warm Gas Cleanup (WGCU)
CO2 Separation Physical Solvent H2 Membrane
Gas Turbine Advanced F-Class Advanced Hydrogen Turbine
Oxygen Production Cryogenic Air Separation Ion Transport Membrane (ITM)
Availability 80% 85% 90%
Oxygen Production
Gasifier and Syngas
Cooling
Gas Cleanup and Shift
Hydrogen Turbine
Steam Bottoming
Cycle
Coal Feed
RawSyngas
O2
Air Air
Hot FlueGas Flue Gas
To Stack
H2 Fuel
N2
CO2 Compression
CO2CO2 Separation
CO2 Transport,
Storage and Monitoring
108
CO2 transport, storage and monitoring cost
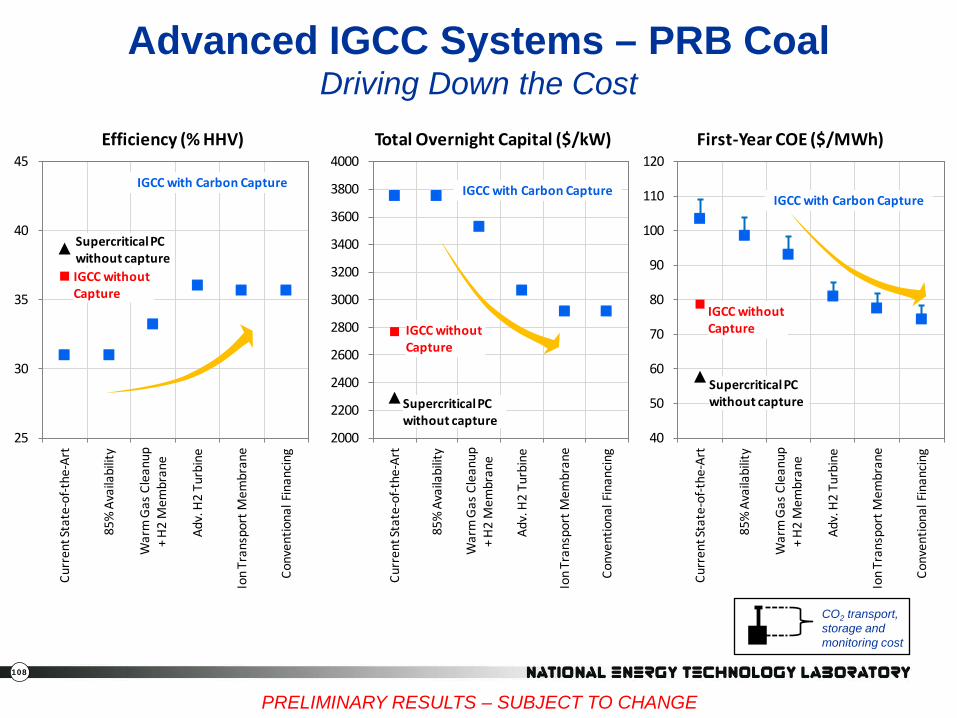
Advanced IGCC Systems – PRB Coal Driving Down the Cost
PRELIMINARY RESULTS – SUBJECT TO CHANGE
40
50
60
70
80
90
100
110
120
Curr
ent S
tate
-of-t
he-A
rt
85%
Ava
ilabi
lity
War
m G
as C
lean
up
+ H
2 M
embr
ane
Adv.
H2
Turb
ine
Ion
Tran
spor
t Mem
bran
e
Conv
entio
nal F
inan
cing
First-Year COE ($/MWh)
Supercritical PC without capture
IGCC with Carbon Capture
IGCC withoutCapture
2000
2200
2400
2600
2800
3000
3200
3400
3600
3800
4000
Curr
ent S
tate
-of-t
he-A
rt
85%
Ava
ilabi
lity
War
m G
as C
lean
up
+ H
2 M
embr
ane
Adv.
H2
Turb
ine
Ion
Tran
spor
t Mem
bran
e
Conv
entio
nal F
inan
cing
Total Overnight Capital ($/kW)
Supercritical PC without capture
IGCC with Carbon Capture
IGCC withoutCapture
25
30
35
40
45
Curr
ent S
tate
-of-t
he-A
rt
85%
Ava
ilabi
lity
War
m G
as C
lean
up
+ H
2 M
embr
ane
Adv.
H2
Turb
ine
Ion
Tran
spor
t Mem
bran
e
Conv
entio
nal F
inan
cing
Efficiency (% HHV)
Supercritical PC without capture
IGCC with Carbon Capture
IGCC withoutCapture
109
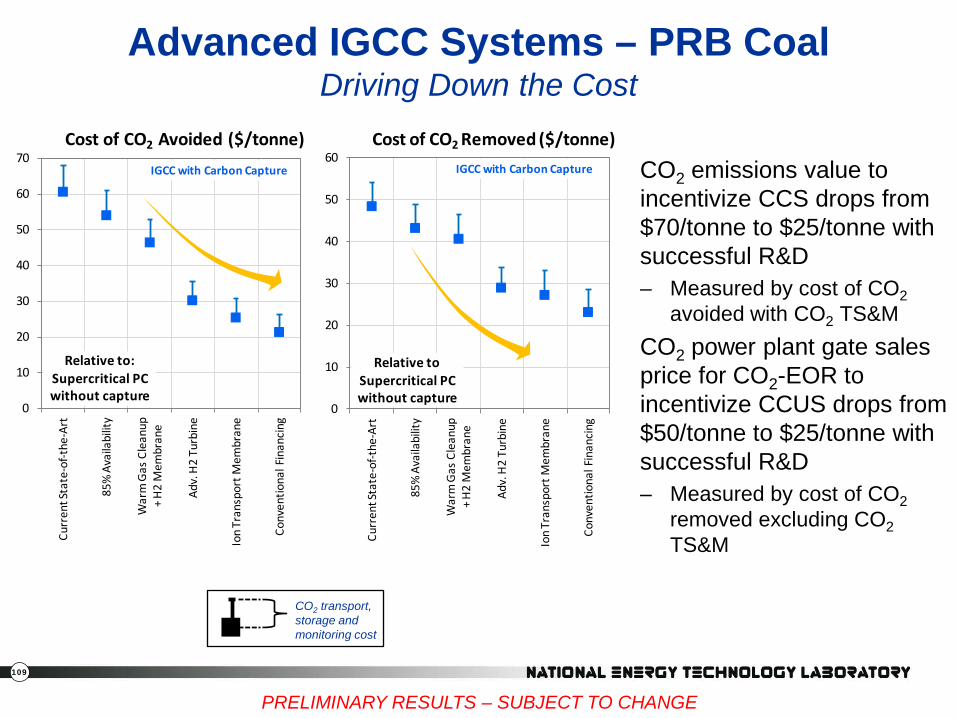
CO2 emissions value to incentivize CCS drops from $70/tonne to $25/tonne with successful R&D – Measured by cost of CO2
avoided with CO2 TS&M CO2 power plant gate sales price for CO2-EOR to incentivize CCUS drops from $50/tonne to $25/tonne with successful R&D – Measured by cost of CO2
removed excluding CO2 TS&M
CO2 transport, storage and monitoring cost
Advanced IGCC Systems – PRB Coal Driving Down the Cost
PRELIMINARY RESULTS – SUBJECT TO CHANGE
0
10
20
30
40
50
60
70
Curr
ent S
tate
-of-t
he-A
rt
85%
Ava
ilabi
lity
War
m G
as C
lean
up
+ H
2 M
embr
ane
Adv.
H2
Turb
ine
Ion
Tran
spor
t Mem
bran
e
Conv
entio
nal F
inan
cing
Cost of CO2 Avoided ($/tonne)
Relative to: Supercritical PC without capture
IGCC with Carbon Capture
0
10
20
30
40
50
60
Curr
ent S
tate
-of-t
he-A
rt
85%
Ava
ilabi
lity
War
m G
as C
lean
up
+ H
2 M
embr
ane
Adv.
H2
Turb
ine
Ion
Tran
spor
t Mem
bran
e
Conv
entio
nal F
inan
cing
Cost of CO2 Removed ($/tonne)
Relative to Supercritical PC without capture
IGCC with Carbon Capture
110
CO2 transport, storage and monitoring cost
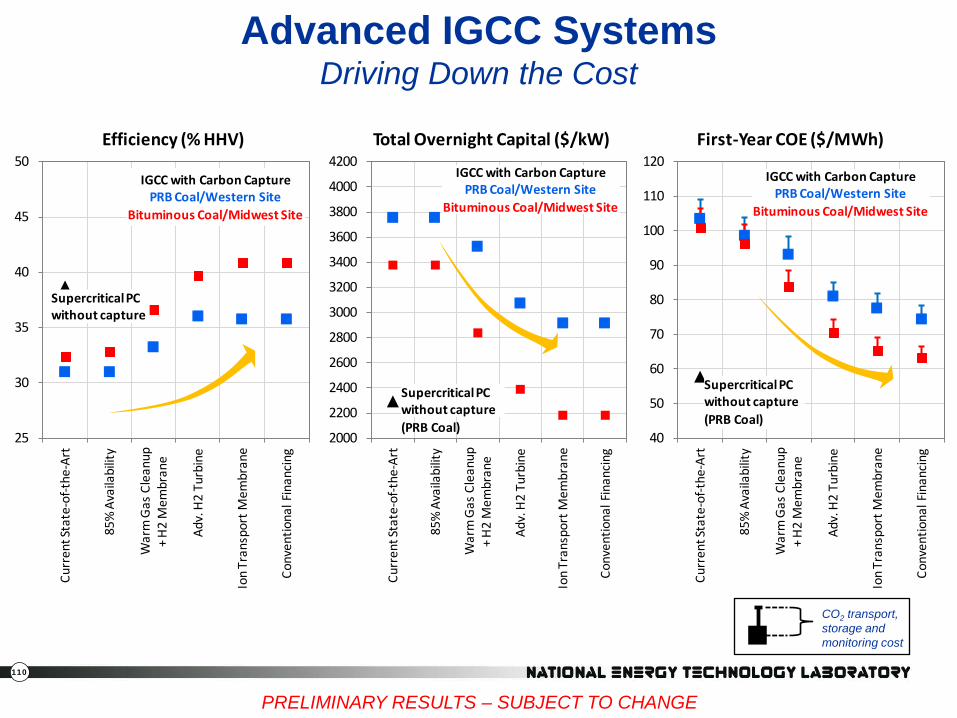
Advanced IGCC Systems Driving Down the Cost
PRELIMINARY RESULTS – SUBJECT TO CHANGE
40
50
60
70
80
90
100
110
120
Curr
ent S
tate
-of-t
he-A
rt
85%
Ava
ilabi
lity
War
m G
as C
lean
up
+ H
2 M
embr
ane
Adv.
H2
Turb
ine
Ion
Tran
spor
t Mem
bran
e
Conv
entio
nal F
inan
cing
First-Year COE ($/MWh)
Supercritical PC without capture (PRB Coal)
IGCC with Carbon CapturePRB Coal/Western Site
Bituminous Coal/Midwest Site
2000
2200
2400
2600
2800
3000
3200
3400
3600
3800
4000
4200
Curr
ent S
tate
-of-t
he-A
rt
85%
Ava
ilabi
lity
War
m G
as C
lean
up
+ H
2 M
embr
ane
Adv.
H2
Turb
ine
Ion
Tran
spor
t Mem
bran
e
Conv
entio
nal F
inan
cing
Total Overnight Capital ($/kW)
Supercritical PC without capture(PRB Coal)
IGCC with Carbon CapturePRB Coal/Western Site
Bituminous Coal/Midwest Site
25
30
35
40
45
50
Curr
ent S
tate
-of-t
he-A
rt
85%
Ava
ilabi
lity
War
m G
as C
lean
up
+ H
2 M
embr
ane
Adv.
H2
Turb
ine
Ion
Tran
spor
t Mem
bran
e
Conv
entio
nal F
inan
cing
Efficiency (% HHV)
Supercritical PC without capture
IGCC with Carbon CapturePRB Coal/Western Site
Bituminous Coal/Midwest Site

111
CO2 emissions value to incentivize CCS drops from $70/tonne to $10-25/tonne with successful R&D – Measured by cost of CO2
avoided with CO2 TS&M
CO2 power plant gate sales price for CO2-EOR to incentivize CCUS drops from $50/tonne to $10-25/tonne with successful R&D – Measured by cost of CO2
removed excluding CO2 TS&M
CO2 transport, storage and monitoring cost
Advanced IGCC Systems Driving Down the Cost
PRELIMINARY RESULTS – SUBJECT TO CHANGE
0
10
20
30
40
50
60
70
Curr
ent S
tate
-of-t
he-A
rt
85%
Ava
ilabi
lity
War
m G
as C
lean
up
+ H
2 M
embr
ane
Adv.
H2
Turb
ine
Ion
Tran
spor
t Mem
bran
e
Conv
entio
nal F
inan
cing
Cost of CO2 Avoided ($/tonne)
Relative to: Supercritical PC without capture
IGCC with Carbon CapturePRB Coal/Western Site
Bituminous Coal/Midwest Site
0
10
20
30
40
50
60
Curr
ent S
tate
-of-t
he-A
rt
85%
Ava
ilabi
lity
War
m G
as C
lean
up
+ H
2 M
embr
ane
Adv.
H2
Turb
ine
Ion
Tran
spor
t Mem
bran
e
Conv
entio
nal F
inan
cing
Cost of CO2 Removed ($/tonne)
Relative to Supercritical PC without capture
IGCC with Carbon CapturePRB Coal/Western Site
Bituminous Coal/Midwest Site
112
Lowest Cost Power Generation Options Western (3400 ft): Today’s NGCC versus Today’s Coal (PRB)
0
2
4
6
8
10
12
14
0 10 20 30 40 50 60 70 80 90 100 110
Nat
ural
Gas
Pric
e, $
/MM
Btu
CO2 Emissions Value, $/tonne
NGCC with capture
has lowest COE
IGCC with capture
has lowest COE
NGCC without capture has lowest COE
Assumes capacity factor = availability (i.e. all plants including NGCC are base load).
Supercritical PC without capture has lowest COE
113
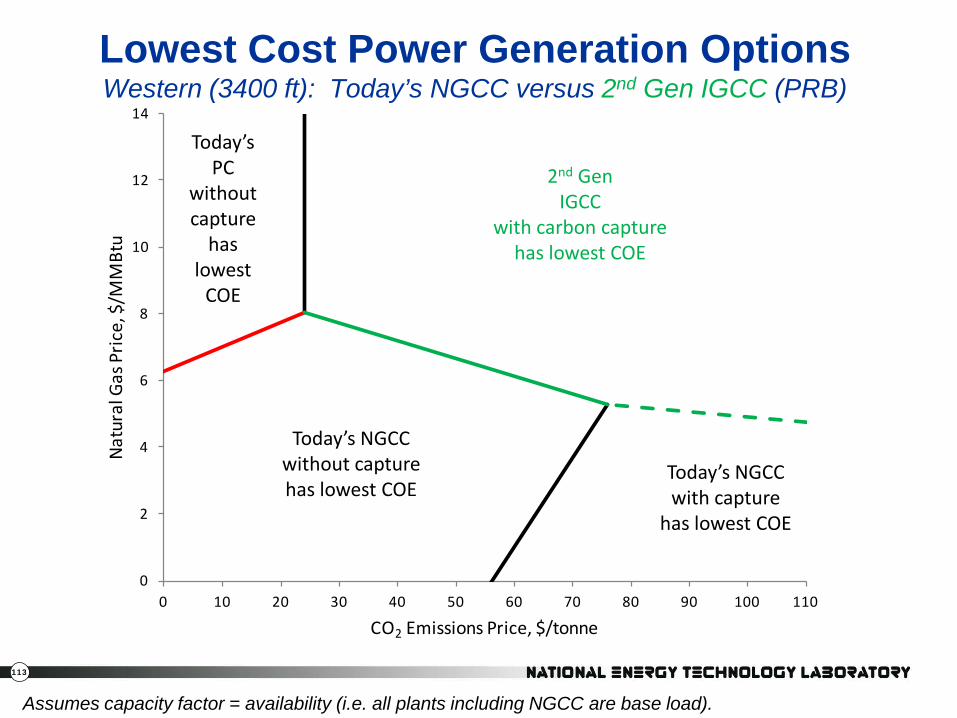
Lowest Cost Power Generation Options Western (3400 ft): Today’s NGCC versus 2nd Gen IGCC (PRB)
Today’s NGCC with capture
has lowest COE
2nd Gen IGCC
with carbon capture has lowest COE
Today’s NGCC without capture has lowest COE
Assumes capacity factor = availability (i.e. all plants including NGCC are base load).
Today’s PC
without capture
has lowest
COE
0
2
4
6
8
10
12
14
0 10 20 30 40 50 60 70 80 90 100 110
Nat
ural
Gas
Pri
ce, $
/MM
Btu
CO2 Emissions Price, $/tonne
114
Findings of Study and Gaps
• Current DOE portfolio provides 5 points efficiency gain, 30% reduction in COE relative to today’s IGCC with CCS
• High pressure gasification may be needed to enable advanced technologies in current R&D portfolio – Managing WGCU pressure drop, hydrogen membrane
driving force, meeting fuel gas pressure needs for advanced hydrogen turbine
• Evaluation of alternatives to slurry-fed gasification for 2nd Gen IGCC recommended
115
Conventional IGCC Compared
to PC and NGCC
116
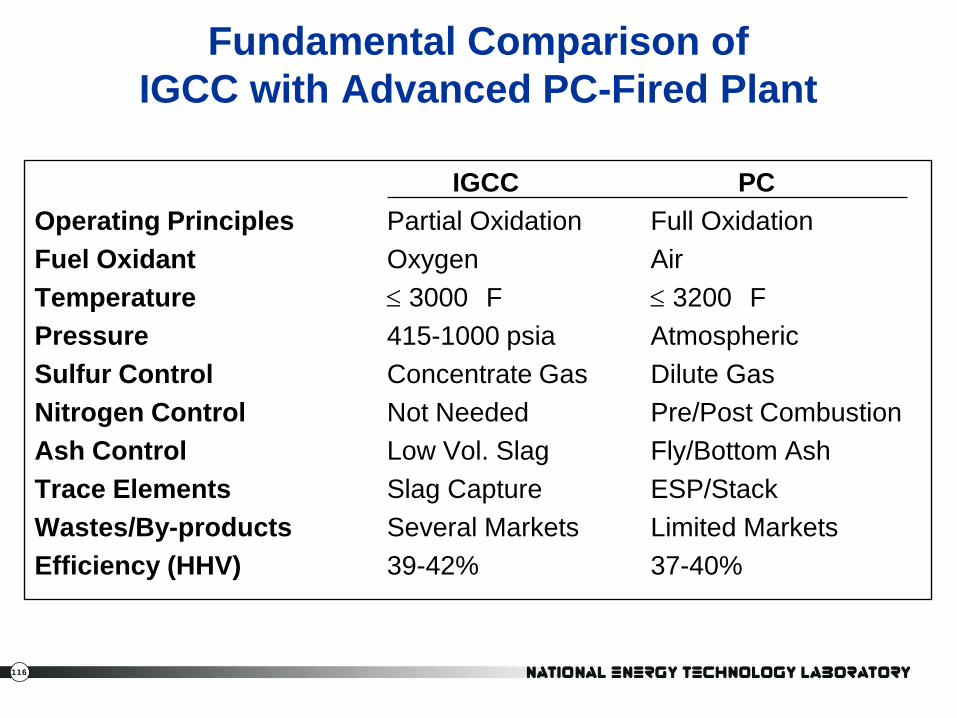
Fundamental Comparison of IGCC with Advanced PC-Fired Plant
IGCC PC Operating Principles Partial Oxidation Full Oxidation Fuel Oxidant Oxygen Air Temperature ≤ 3000 F ≤ 3200 F Pressure 415-1000 psia Atmospheric Sulfur Control Concentrate Gas Dilute Gas Nitrogen Control Not Needed Pre/Post Combustion Ash Control Low Vol. Slag Fly/Bottom Ash Trace Elements Slag Capture ESP/Stack Wastes/By-products Several Markets Limited Markets Efficiency (HHV) 39-42% 37-40%
117
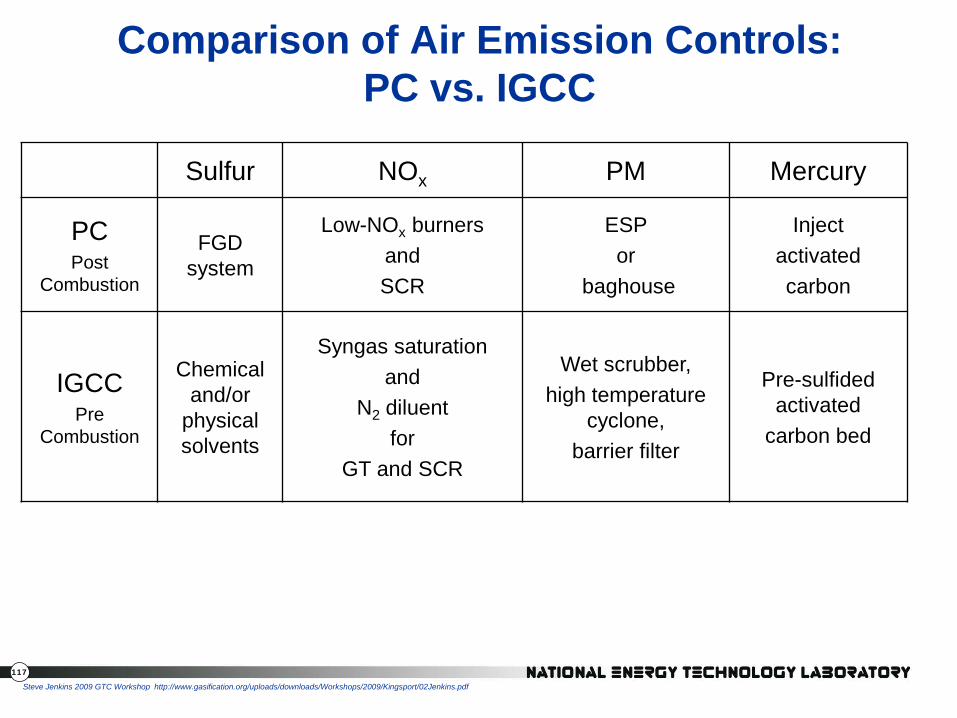
Comparison of Air Emission Controls: PC vs. IGCC
Sulfur NOx PM Mercury
PC Post
Combustion
FGD system
Low-NOx burners and SCR
ESP or
baghouse
Inject activated carbon
IGCC Pre
Combustion
Chemical and/or
physical solvents
Syngas saturation and
N2 diluent for
GT and SCR
Wet scrubber, high temperature
cyclone, barrier filter
Pre-sulfided activated
carbon bed
Steve Jenkins 2009 GTC Workshop http://www.gasification.org/uploads/downloads/Workshops/2009/Kingsport/02Jenkins.pdf
118
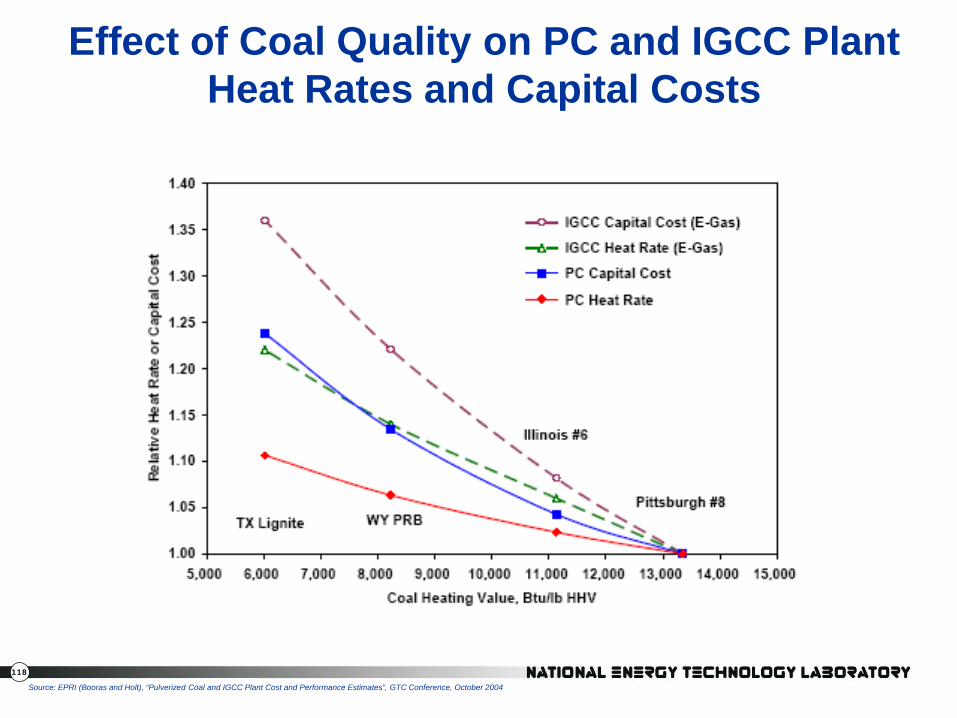
Effect of Coal Quality on PC and IGCC Plant Heat Rates and Capital Costs
Source: EPRI (Booras and Holt), “Pulverized Coal and IGCC Plant Cost and Performance Estimates”, GTC Conference, October 2004
119
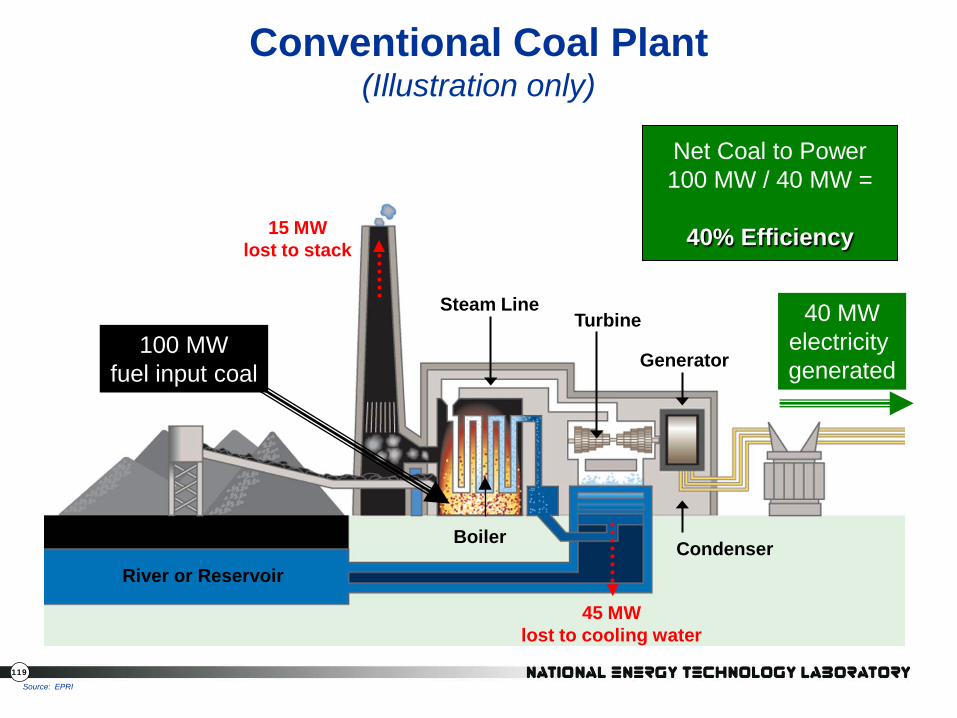
Conventional Coal Plant (Illustration only)
Source: EPRI
River or Reservoir
Boiler Condenser
Generator
Turbine Steam Line 40 MW
electricity generated
15 MW lost to stack
45 MW lost to cooling water
Net Coal to Power 100 MW / 40 MW =
40% Efficiency
100 MW fuel input coal
120
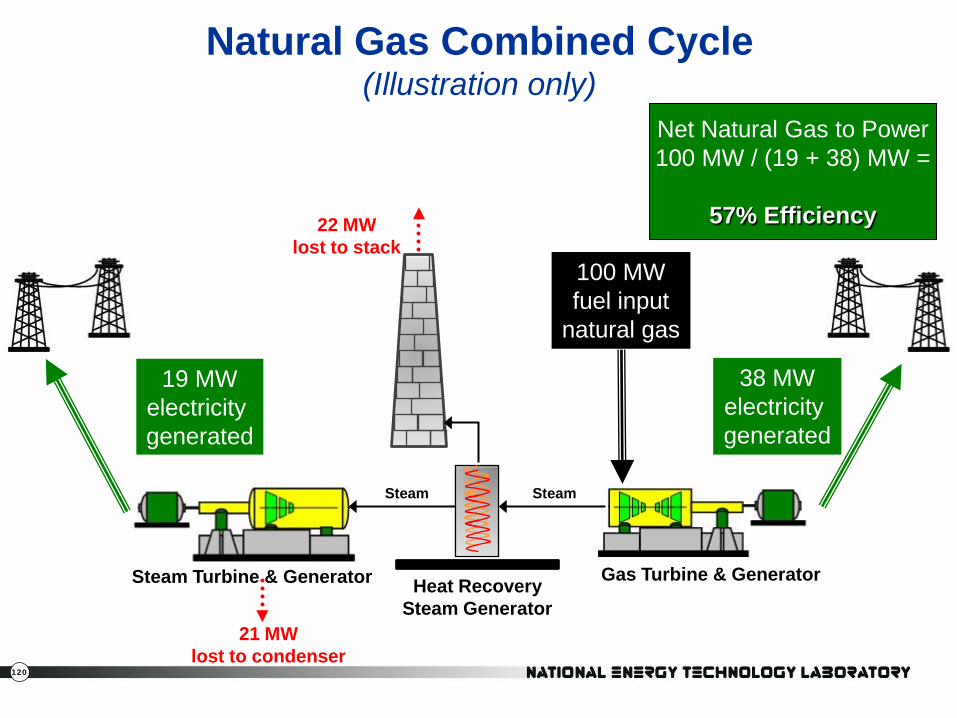
Net Natural Gas to Power 100 MW / (19 + 38) MW =
57% Efficiency 22 MW
lost to stack
Heat Recovery Steam Generator
21 MW lost to condenser
Gas Turbine & Generator
19 MW electricity generated
Steam Steam
38 MW electricity generated
Natural Gas Combined Cycle (Illustration only)
100 MW fuel input
natural gas
Steam Turbine & Generator
121
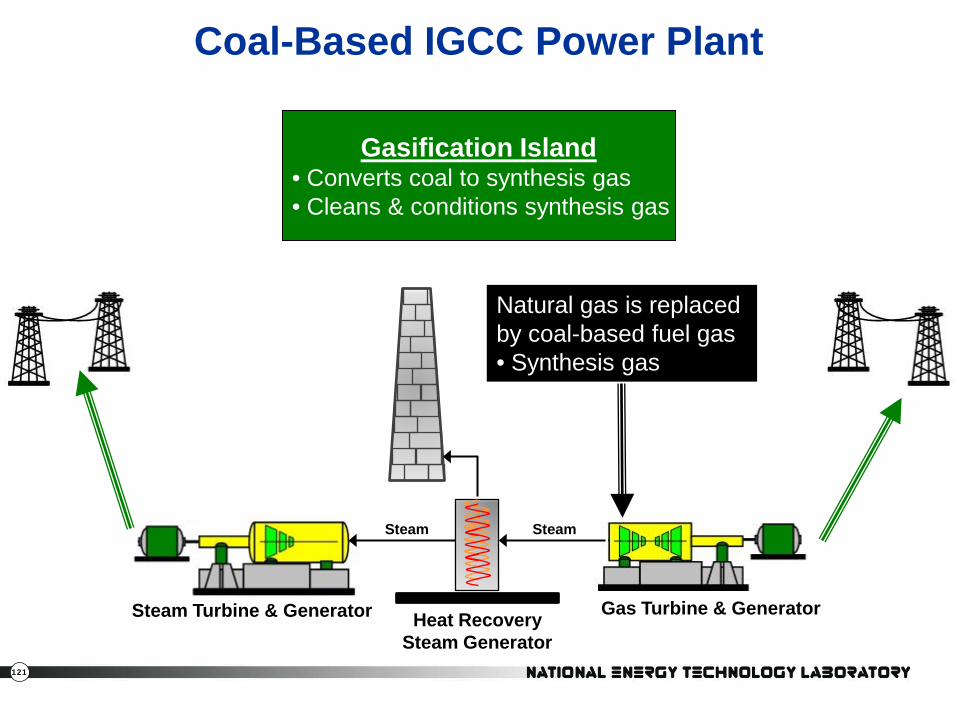
Steam Turbine & Generator
Gasification Island • Converts coal to synthesis gas • Cleans & conditions synthesis gas
Heat Recovery Steam Generator
Gas Turbine & Generator
Steam Steam
Natural gas is replaced by coal-based fuel gas • Synthesis gas
Coal-Based IGCC Power Plant

122
Coal-Based IGCC Power Plant
Steam Turbine & Generator Heat Recovery
Steam Generator Gas Turbine & Generator
Steam Steam
Slag By-product
Net Coal to Power 100 MW / (30 + 21 – 10) MW =
41% Efficiency
Steam
18 MW lost to stack
10 MW electricity to ASU
100 MW fuel input coal
Synthesis gas 21 MW
electricity generated
30 MW electricity generated
26 MW lost to
condenser
123
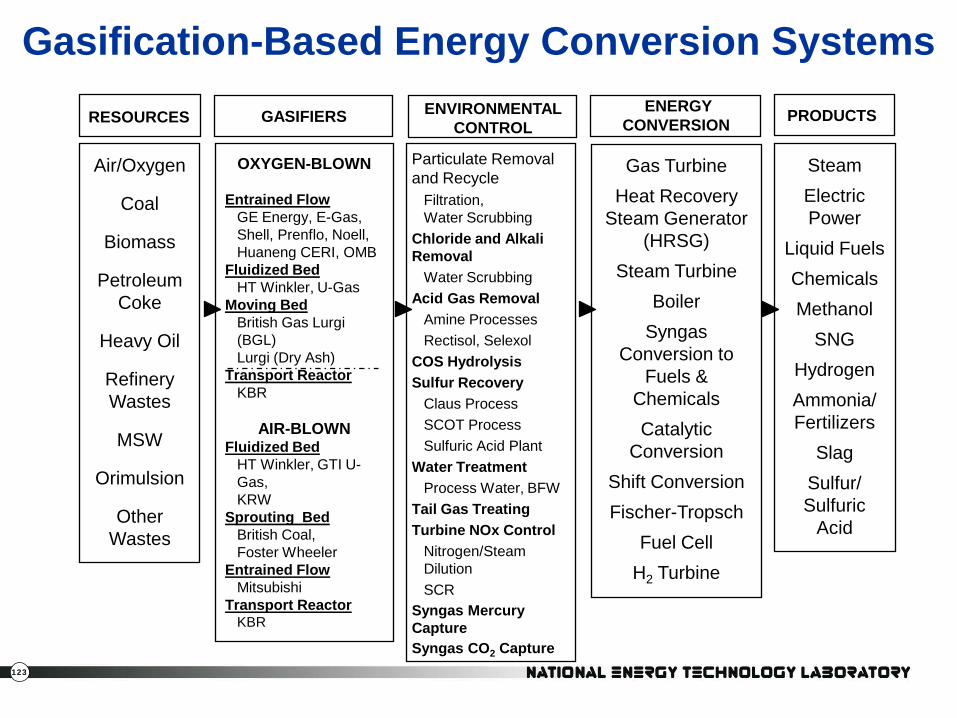
Gasification-Based Energy Conversion Systems RESOURCES GASIFIERS ENVIRONMENTAL
CONTROL ENERGY
CONVERSION PRODUCTS
Steam Electric Power
Liquid Fuels Chemicals Methanol
SNG Hydrogen Ammonia/ Fertilizers
Slag Sulfur/ Sulfuric
Acid
Gas Turbine Heat Recovery
Steam Generator (HRSG)
Steam Turbine Boiler
Syngas Conversion to
Fuels & Chemicals Catalytic
Conversion Shift Conversion Fischer-Tropsch
Fuel Cell H2 Turbine
Particulate Removal and Recycle
Filtration, Water Scrubbing
Chloride and Alkali Removal
Water Scrubbing Acid Gas Removal
Amine Processes Rectisol, Selexol
COS Hydrolysis Sulfur Recovery
Claus Process SCOT Process Sulfuric Acid Plant
Water Treatment Process Water, BFW
Tail Gas Treating Turbine NOx Control
Nitrogen/Steam Dilution SCR
Syngas Mercury Capture Syngas CO2 Capture
OXYGEN-BLOWN
Entrained Flow GE Energy, E-Gas, Shell, Prenflo, Noell, Huaneng CERI, OMB
Fluidized Bed HT Winkler, U-Gas
Moving Bed British Gas Lurgi (BGL) Lurgi (Dry Ash)
Transport Reactor KBR
AIR-BLOWN
Fluidized Bed HT Winkler, GTI U-Gas, KRW
Sprouting Bed British Coal, Foster Wheeler
Entrained Flow Mitsubishi
Transport Reactor KBR
Air/Oxygen
Coal
Biomass
Petroleum Coke
Heavy Oil
Refinery Wastes
MSW
Orimulsion
Other Wastes
124
Commercial IGCC Plants
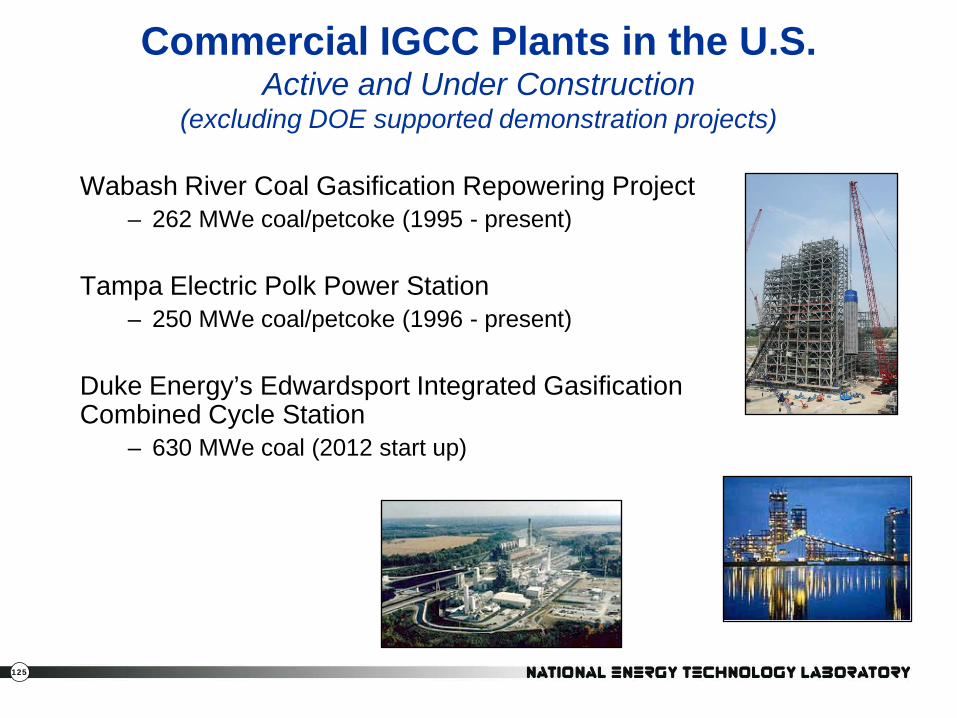
125
Commercial IGCC Plants in the U.S. Active and Under Construction
(excluding DOE supported demonstration projects)
Wabash River Coal Gasification Repowering Project – 262 MWe coal/petcoke (1995 - present)
Tampa Electric Polk Power Station – 250 MWe coal/petcoke (1996 - present)
Duke Energy’s Edwardsport Integrated Gasification Combined Cycle Station
– 630 MWe coal (2012 start up)
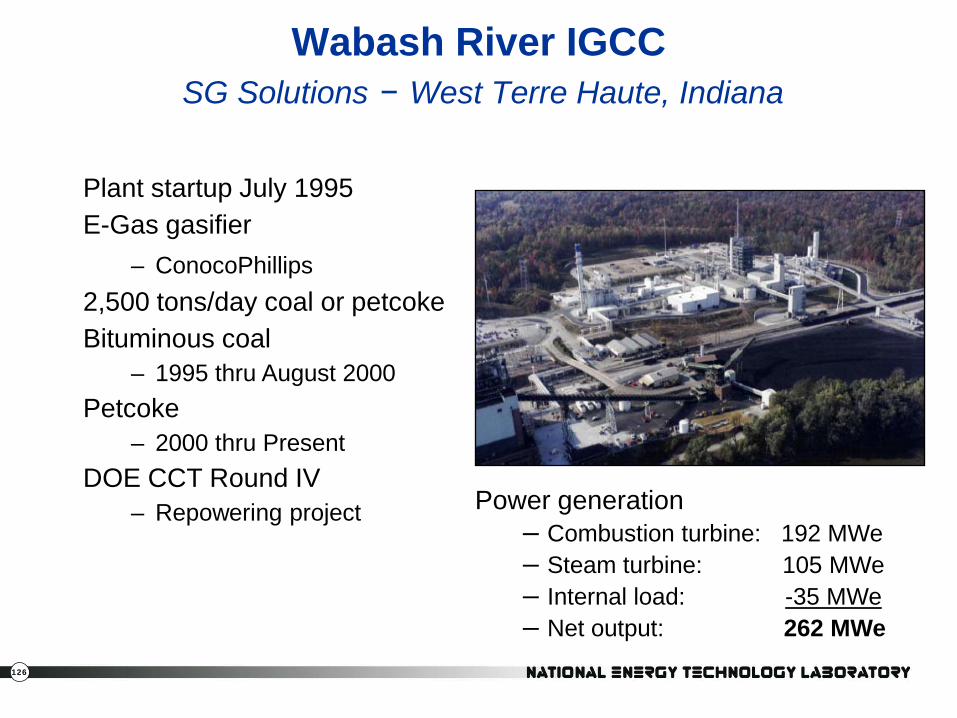
126
Wabash River IGCC SG Solutions − West Terre Haute, Indiana
Power generation – Combustion turbine: 192 MWe – Steam turbine: 105 MWe – Internal load: -35 MWe – Net output: 262 MWe
Plant startup July 1995 E-Gas gasifier
– ConocoPhillips 2,500 tons/day coal or petcoke Bituminous coal
– 1995 thru August 2000 Petcoke
– 2000 thru Present DOE CCT Round IV
– Repowering project
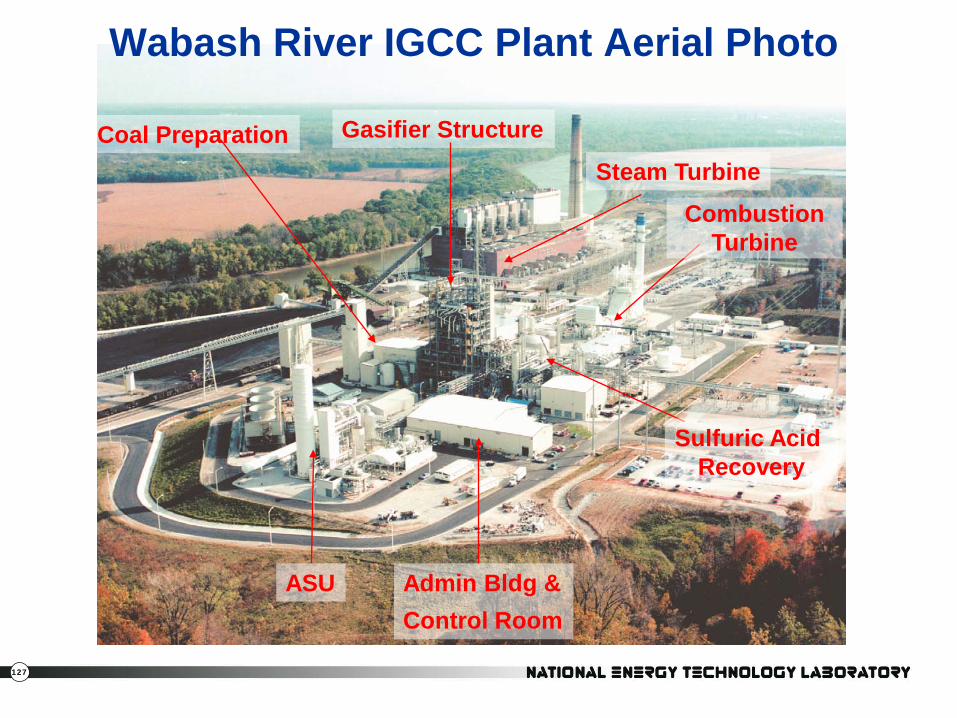
127
Gasifier Structure
Combustion Turbine
Steam Turbine
Sulfuric Acid Recovery
ASU
Coal Preparation
Admin Bldg & Control Room
Wabash River IGCC Plant Aerial Photo
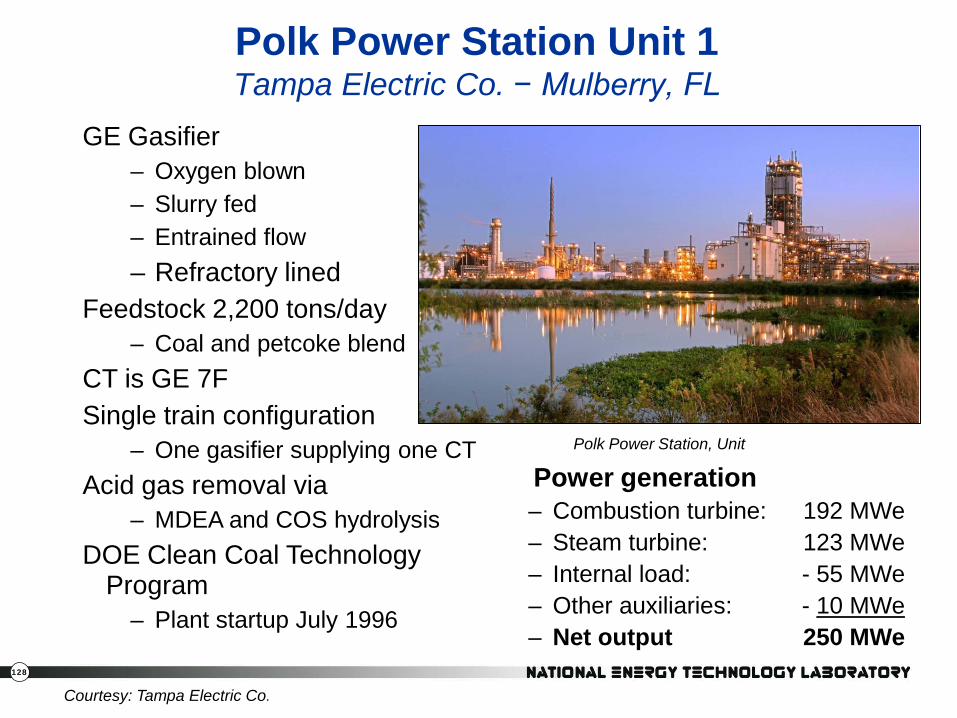
128
Polk Power Station Unit 1 Tampa Electric Co. − Mulberry, FL
GE Gasifier – Oxygen blown – Slurry fed – Entrained flow – Refractory lined
Feedstock 2,200 tons/day – Coal and petcoke blend
CT is GE 7F Single train configuration
– One gasifier supplying one CT Acid gas removal via
– MDEA and COS hydrolysis DOE Clean Coal Technology
Program – Plant startup July 1996
Polk Power Station, Unit
Power generation – Combustion turbine: 192 MWe – Steam turbine: 123 MWe – Internal load: - 55 MWe – Other auxiliaries: - 10 MWe – Net output 250 MWe
Courtesy: Tampa Electric Co.
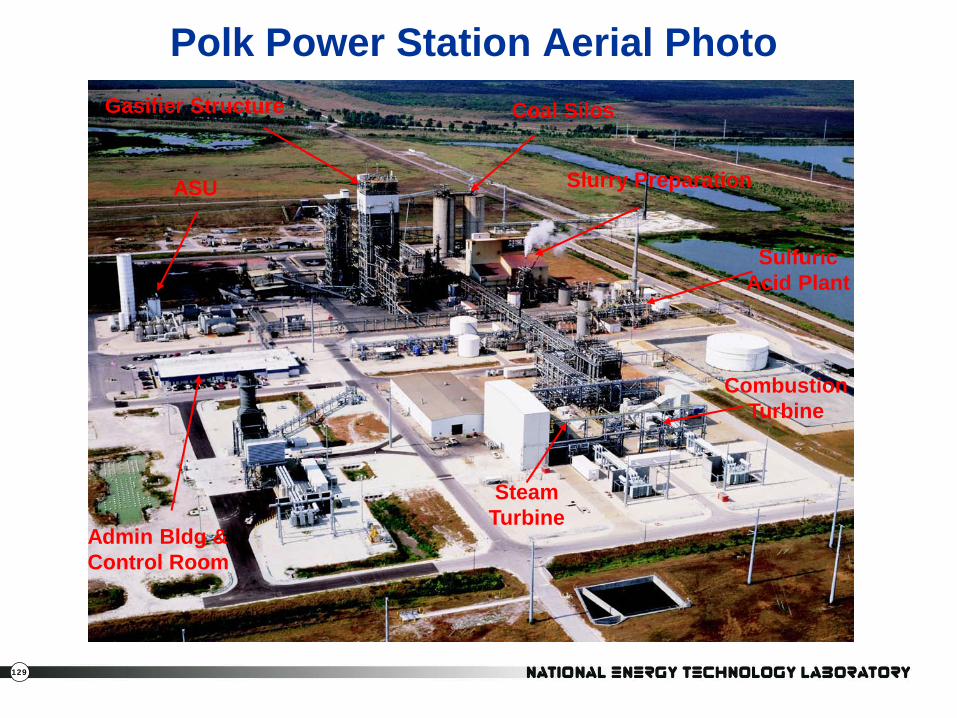
129
Polk Power Station Aerial Photo Gasifier Structure
ASU
Coal Silos
Combustion Turbine
Steam Turbine
Sulfuric Acid Plant
Admin Bldg & Control Room
Slurry Preparation
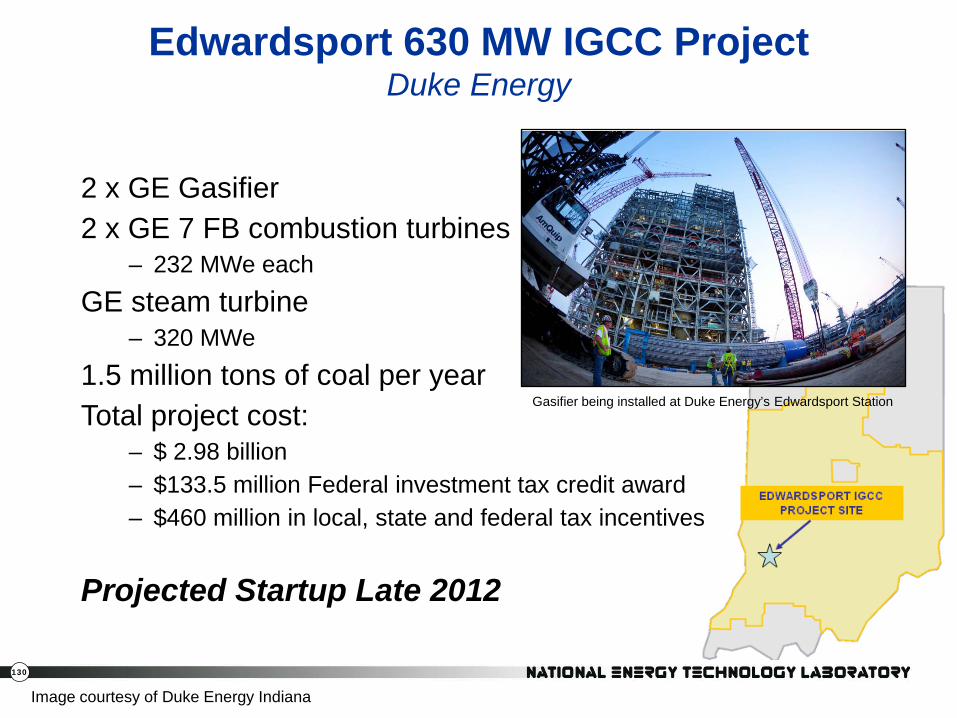
130
Edwardsport 630 MW IGCC Project Duke Energy
2 x GE Gasifier 2 x GE 7 FB combustion turbines
– 232 MWe each GE steam turbine
– 320 MWe 1.5 million tons of coal per year Total project cost:
– $ 2.98 billion – $133.5 million Federal investment tax credit award – $460 million in local, state and federal tax incentives
Projected Startup Late 2012
Gasifier being installed at Duke Energy’s Edwardsport Station
Image courtesy of Duke Energy Indiana
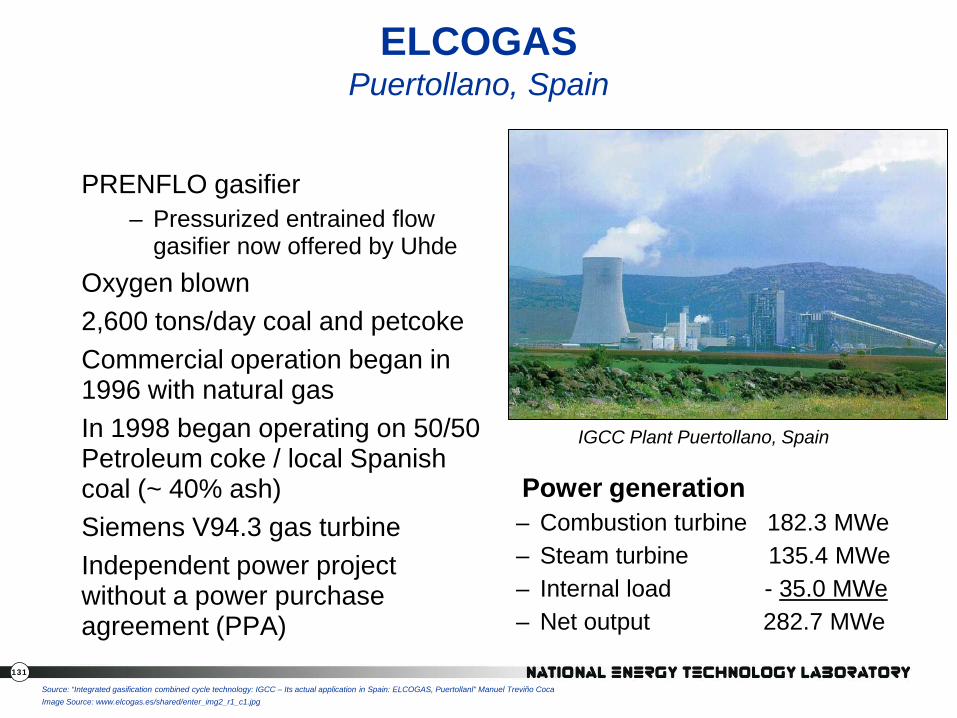
131
ELCOGAS Puertollano, Spain
PRENFLO gasifier – Pressurized entrained flow
gasifier now offered by Uhde Oxygen blown 2,600 tons/day coal and petcoke Commercial operation began in 1996 with natural gas In 1998 began operating on 50/50 Petroleum coke / local Spanish coal (~ 40% ash) Siemens V94.3 gas turbine Independent power project without a power purchase agreement (PPA)
IGCC Plant Puertollano, Spain
Power generation – Combustion turbine 182.3 MWe – Steam turbine 135.4 MWe – Internal load - 35.0 MWe – Net output 282.7 MWe
Source: “Integrated gasification combined cycle technology: IGCC – Its actual application in Spain: ELCOGAS, Puertollanl” Manuel Treviño Coca Image Source: www.elcogas.es/shared/enter_img2_r1_c1.jpg
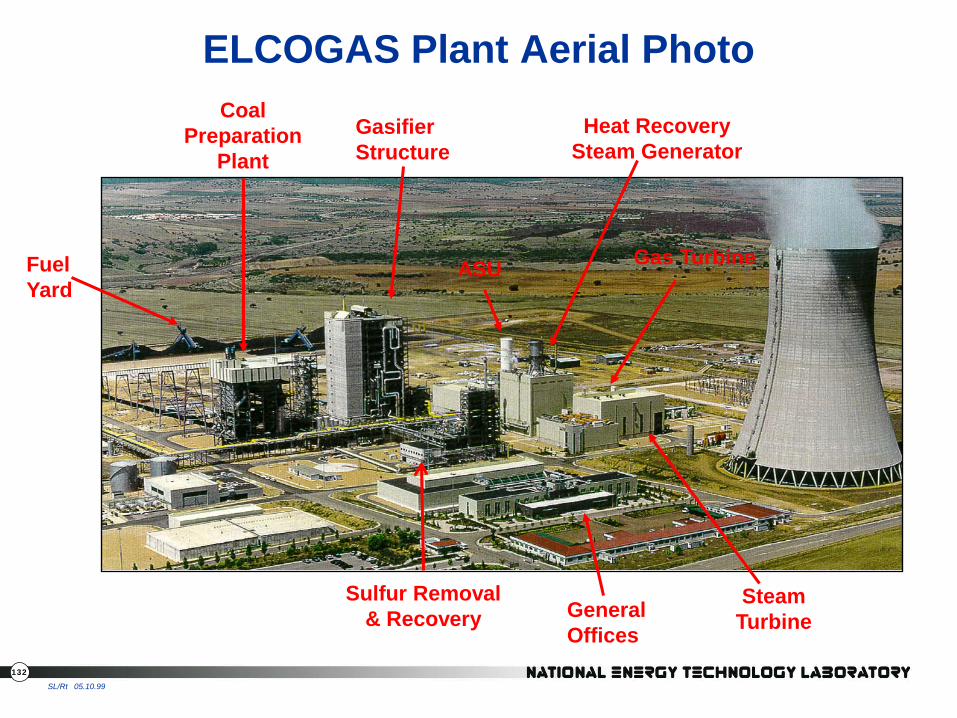
132
SL/Rt 05.10.99
ELCOGAS Plant Aerial Photo
Gasifier Structure
ASU Fuel Yard
Gas Turbine
Steam Turbine
Heat Recovery Steam Generator
Coal Preparation
Plant
Sulfur Removal & Recovery General
Offices

133 http://www.gasification.org/Docs/2005_Papers/05CHHO.pdf
Vresova IGCC Power Plant Vřesová, Czech Republic
1970 Town Gas Production 1996 Converted to IGCC 26 Lurgi Gasifiers – Entrained flow
– Dry coal feed - Lignite 1 Siemens SFG-200 – Entrained
– Added 2007 – Oxygen blown – Full quench ‒ Feedstock: Phenols, tars,
petrol, etc. created during gasification
2 GE Combustion turbines – FRAME 9 E (9171 E)
ABB ES Steam turbine
Power generation – Combustion turbine: 309 MWe – Steam turbine: 114 MWe – Internal load: - 25 MWe – Net output: 398 MWe
Vřesová IGCC Plant, Czech Republic
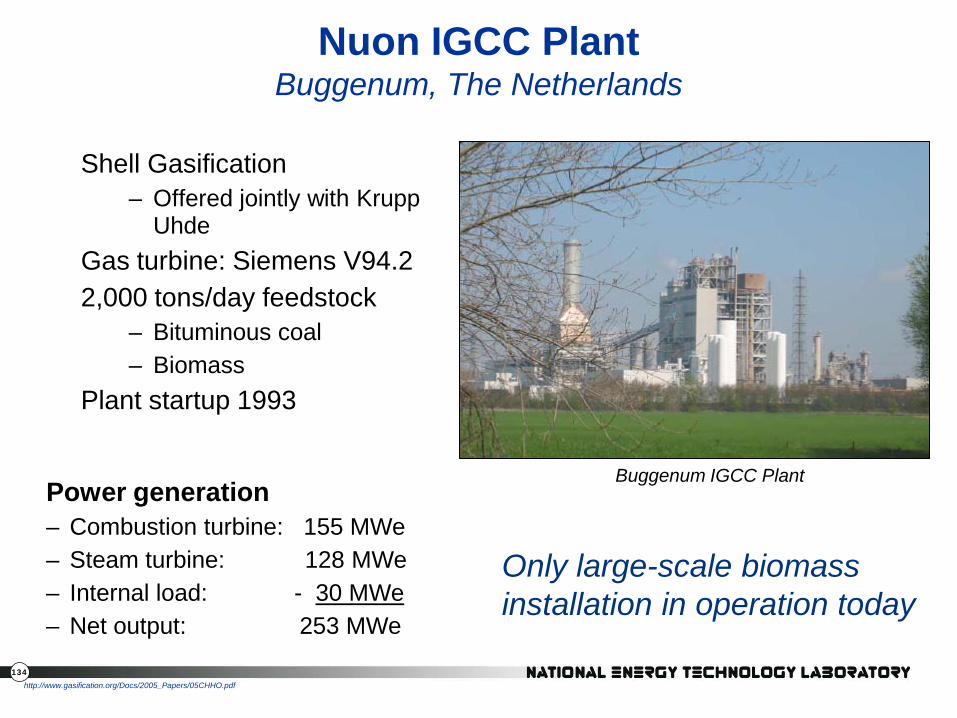
134
Nuon IGCC Plant Buggenum, The Netherlands
Shell Gasification – Offered jointly with Krupp
Uhde Gas turbine: Siemens V94.2 2,000 tons/day feedstock
– Bituminous coal – Biomass
Plant startup 1993
Buggenum IGCC Plant
http://www.gasification.org/Docs/2005_Papers/05CHHO.pdf
Power generation – Combustion turbine: 155 MWe – Steam turbine: 128 MWe – Internal load: - 30 MWe – Net output: 253 MWe
Only large-scale biomass installation in operation today
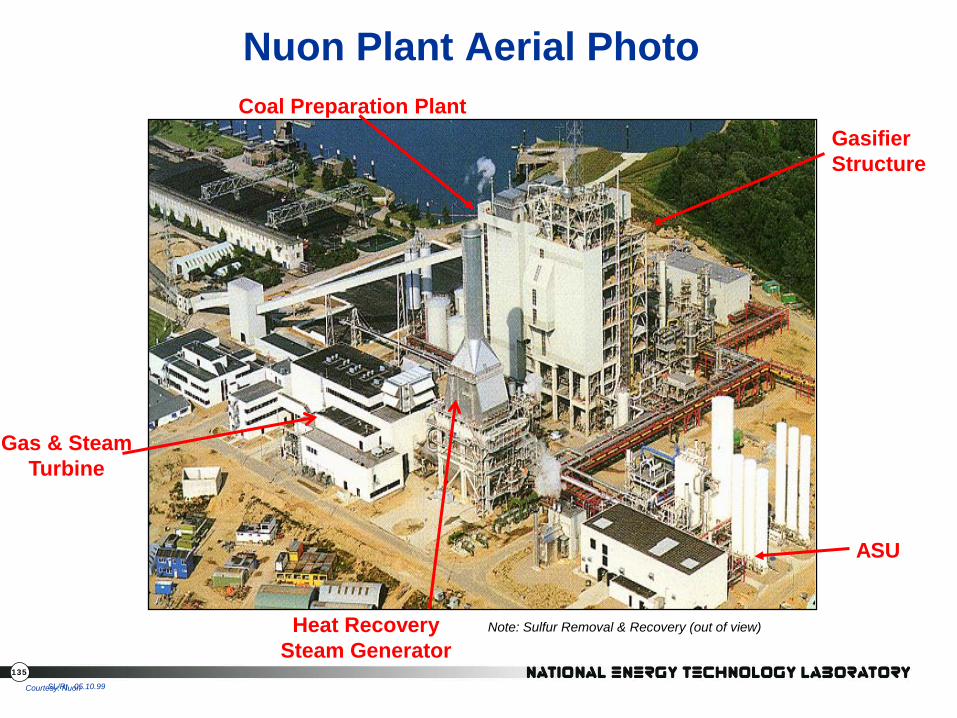
135
SL/Rt 05.10.99
Nuon Plant Aerial Photo
Gasifier Structure
ASU
Gas & Steam Turbine
Heat Recovery Steam Generator
Coal Preparation Plant
Note: Sulfur Removal & Recovery (out of view)
Courtesy: Nuon
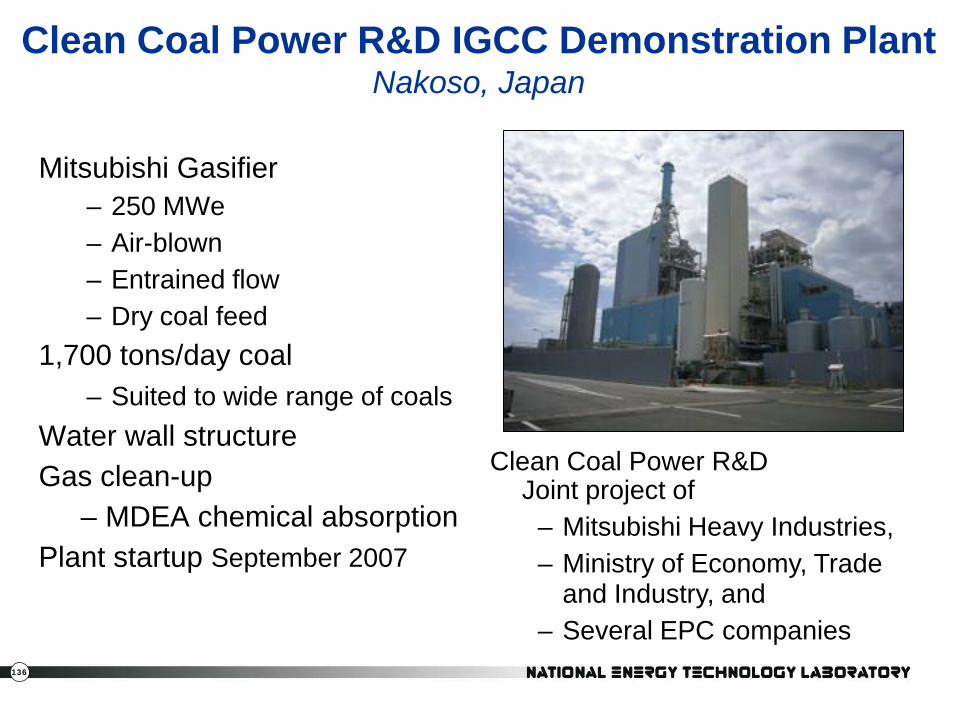
136
Clean Coal Power R&D IGCC Demonstration Plant Nakoso, Japan
Mitsubishi Gasifier – 250 MWe – Air-blown – Entrained flow – Dry coal feed
1,700 tons/day coal – Suited to wide range of coals
Water wall structure Gas clean-up
– MDEA chemical absorption Plant startup September 2007
Clean Coal Power R&D Joint project of
– Mitsubishi Heavy Industries, – Ministry of Economy, Trade
and Industry, and – Several EPC companies
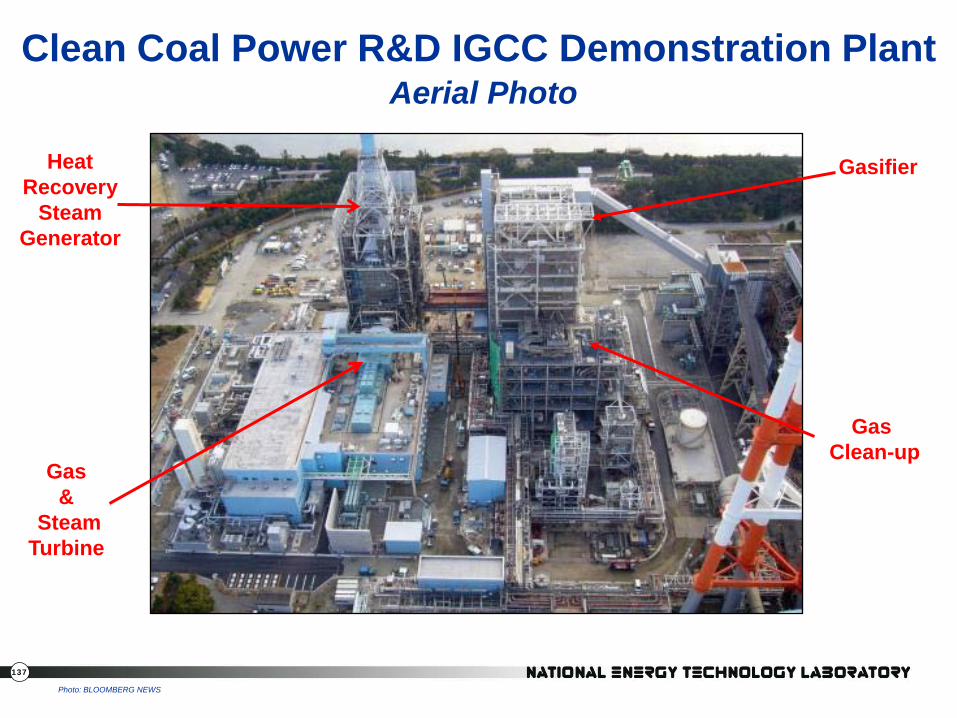
137
Clean Coal Power R&D IGCC Demonstration Plant Aerial Photo
Gasifier
Gas &
Steam Turbine
Heat Recovery
Steam Generator
Gas Clean-up
Photo: BLOOMBERG NEWS
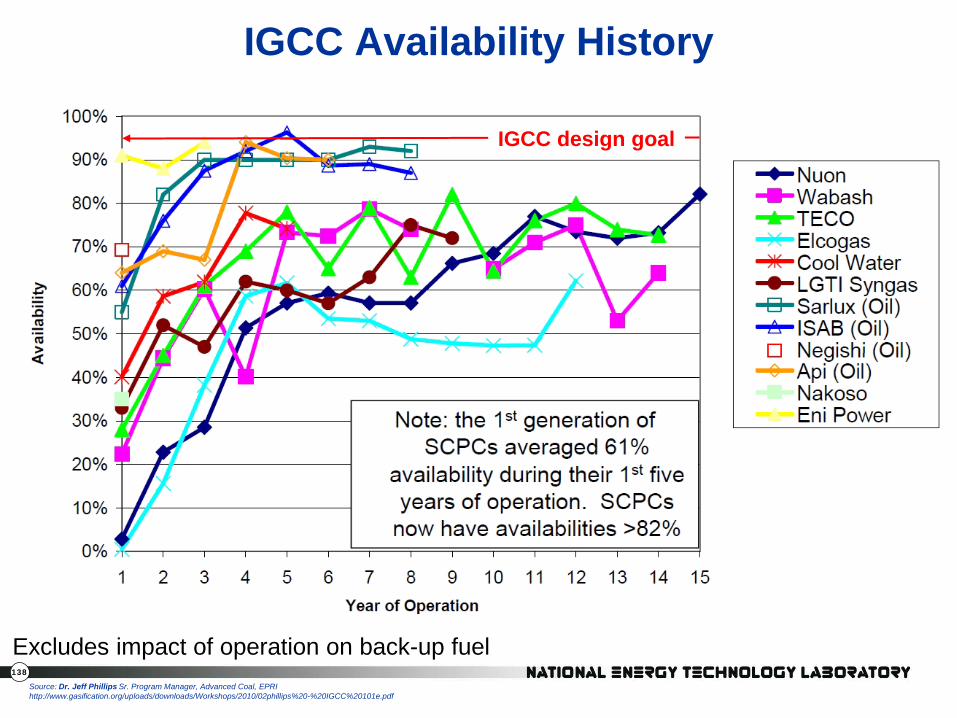
138
IGCC Availability History
Source: Dr. Jeff Phillips Sr. Program Manager, Advanced Coal, EPRI http://www.gasification.org/uploads/downloads/Workshops/2010/02phillips%20-%20IGCC%20101e.pdf
Excludes impact of operation on back-up fuel
IGCC design goal
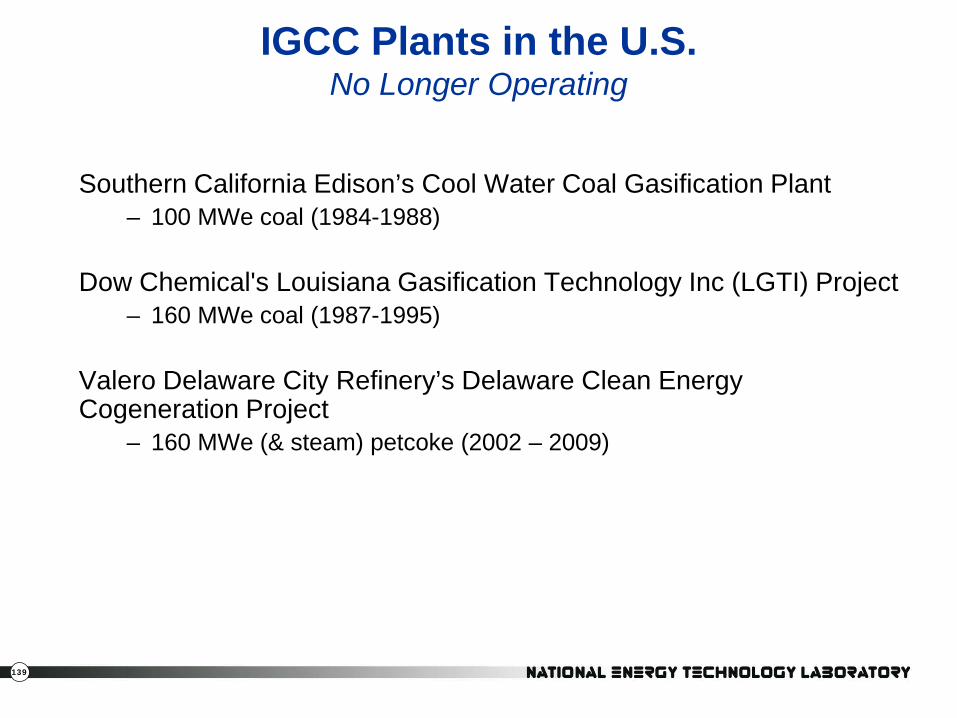
139
IGCC Plants in the U.S. No Longer Operating
Southern California Edison’s Cool Water Coal Gasification Plant – 100 MWe coal (1984-1988)
Dow Chemical's Louisiana Gasification Technology Inc (LGTI) Project – 160 MWe coal (1987-1995)
Valero Delaware City Refinery’s Delaware Clean Energy Cogeneration Project
– 160 MWe (& steam) petcoke (2002 – 2009)
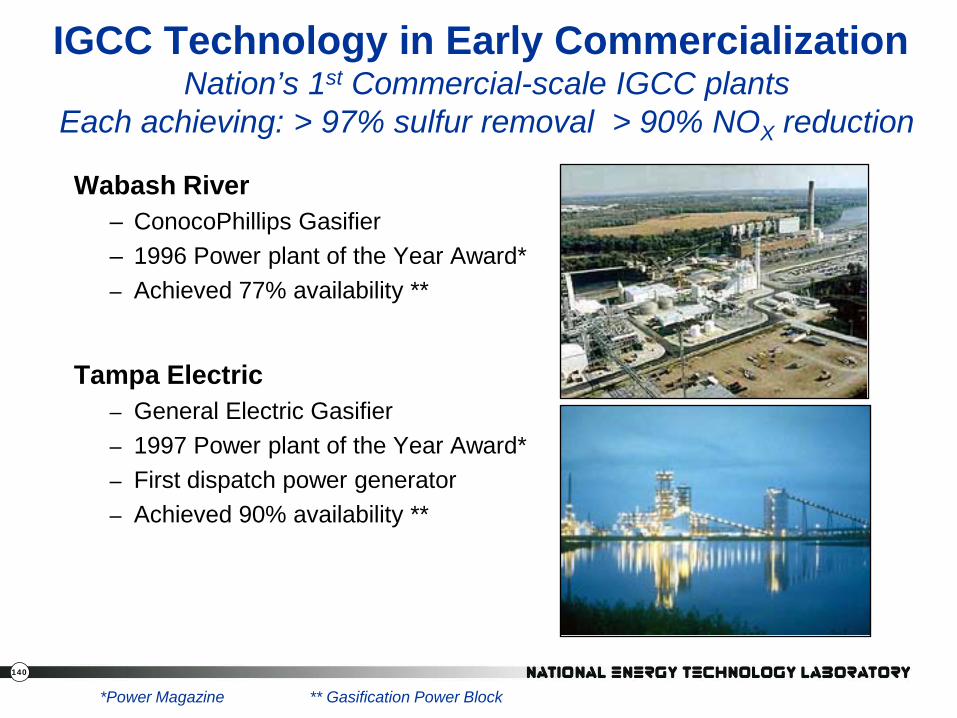
140
IGCC Technology in Early Commercialization Nation’s 1st Commercial-scale IGCC plants
Each achieving: > 97% sulfur removal > 90% NOX reduction
Wabash River – ConocoPhillips Gasifier – 1996 Power plant of the Year Award* – Achieved 77% availability **
Tampa Electric – General Electric Gasifier – 1997 Power plant of the Year Award* – First dispatch power generator – Achieved 90% availability **
*Power Magazine ** Gasification Power Block
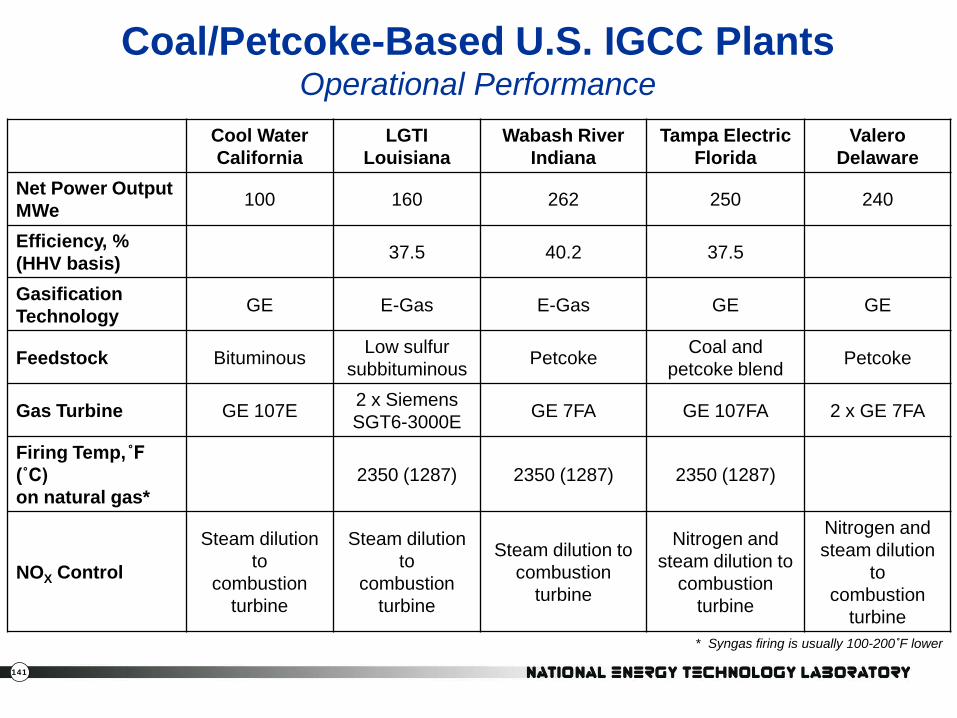
141
Coal/Petcoke-Based U.S. IGCC Plants Operational Performance
* Syngas firing is usually 100-200˚F lower
Cool Water California
LGTI Louisiana
Wabash River Indiana
Tampa Electric Florida
Valero Delaware
Net Power Output MWe 100 160 262 250 240
Efficiency, % (HHV basis) 37.5 40.2 37.5
Gasification Technology GE E-Gas E-Gas GE GE
Feedstock Bituminous Low sulfur subbituminous Petcoke Coal and
petcoke blend Petcoke
Gas Turbine GE 107E 2 x Siemens SGT6-3000E GE 7FA GE 107FA 2 x GE 7FA
Firing Temp,˚F (˚C) on natural gas*
2350 (1287) 2350 (1287) 2350 (1287)
NOX Control
Steam dilution to
combustion turbine
Steam dilution to
combustion turbine
Steam dilution to combustion
turbine
Nitrogen and steam dilution to
combustion turbine
Nitrogen and steam dilution
to combustion
turbine
142
Worldwide Gasification Database
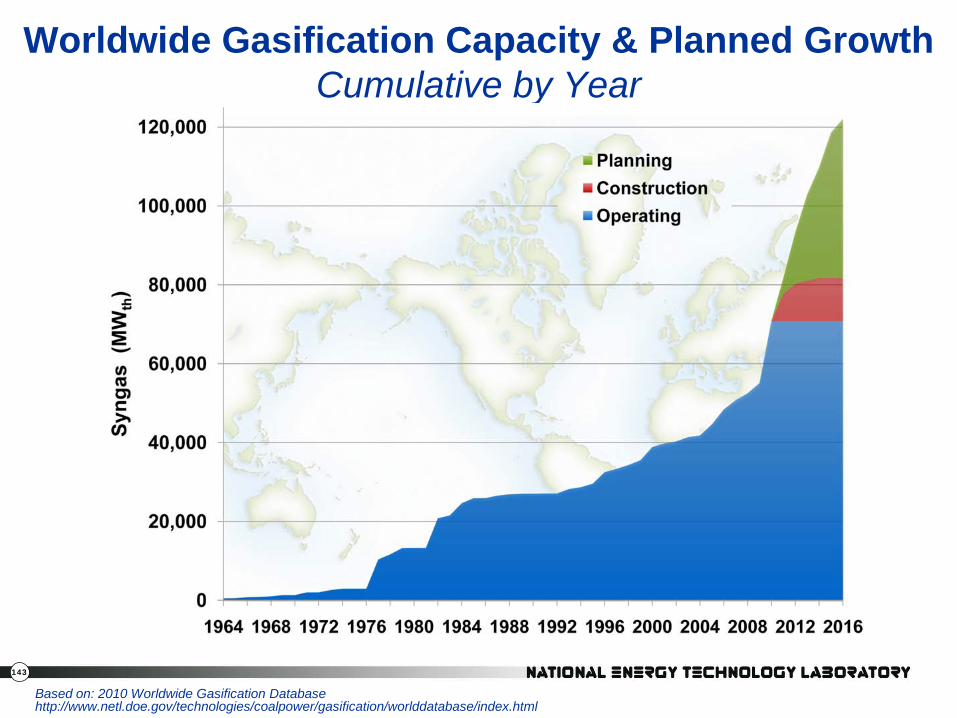
143
Worldwide Gasification Capacity & Planned Growth Cumulative by Year
Based on: 2010 Worldwide Gasification Database http://www.netl.doe.gov/technologies/coalpower/gasification/worlddatabase/index.html
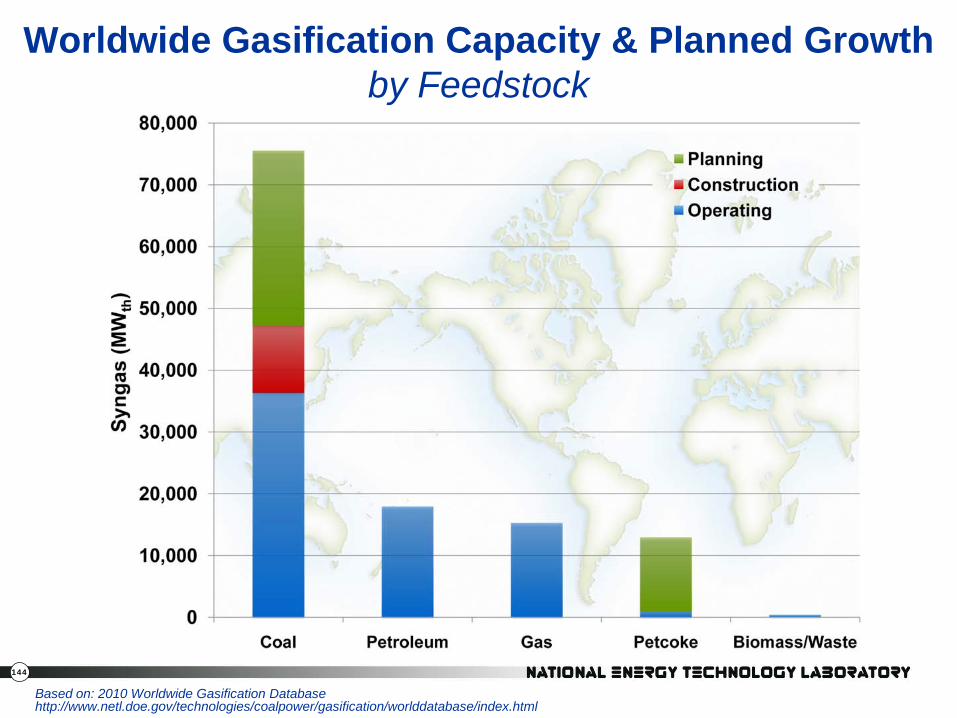
144
Worldwide Gasification Capacity & Planned Growth by Feedstock
Based on: 2010 Worldwide Gasification Database http://www.netl.doe.gov/technologies/coalpower/gasification/worlddatabase/index.html
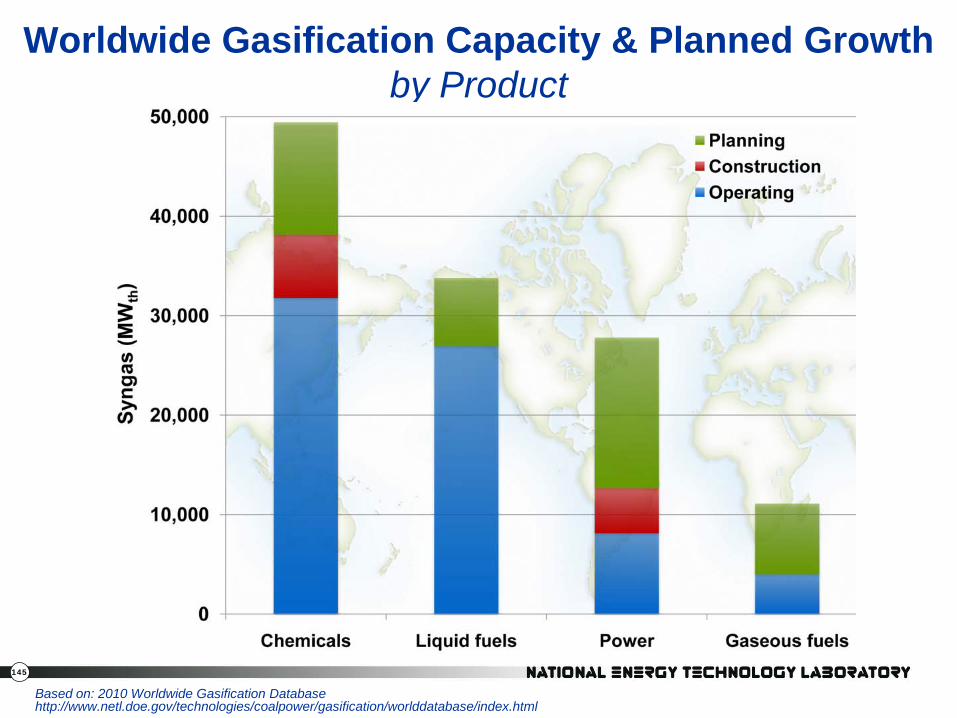
145
Worldwide Gasification Capacity & Planned Growth by Product
Based on: 2010 Worldwide Gasification Database http://www.netl.doe.gov/technologies/coalpower/gasification/worlddatabase/index.html
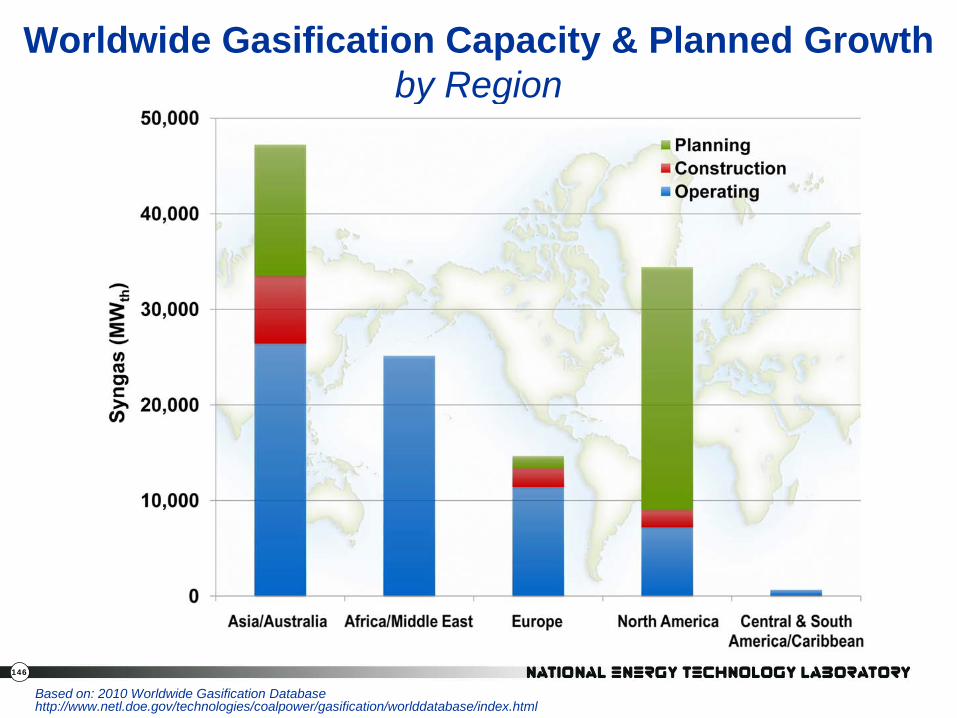
146
Worldwide Gasification Capacity & Planned Growth by Region
Based on: 2010 Worldwide Gasification Database http://www.netl.doe.gov/technologies/coalpower/gasification/worlddatabase/index.html
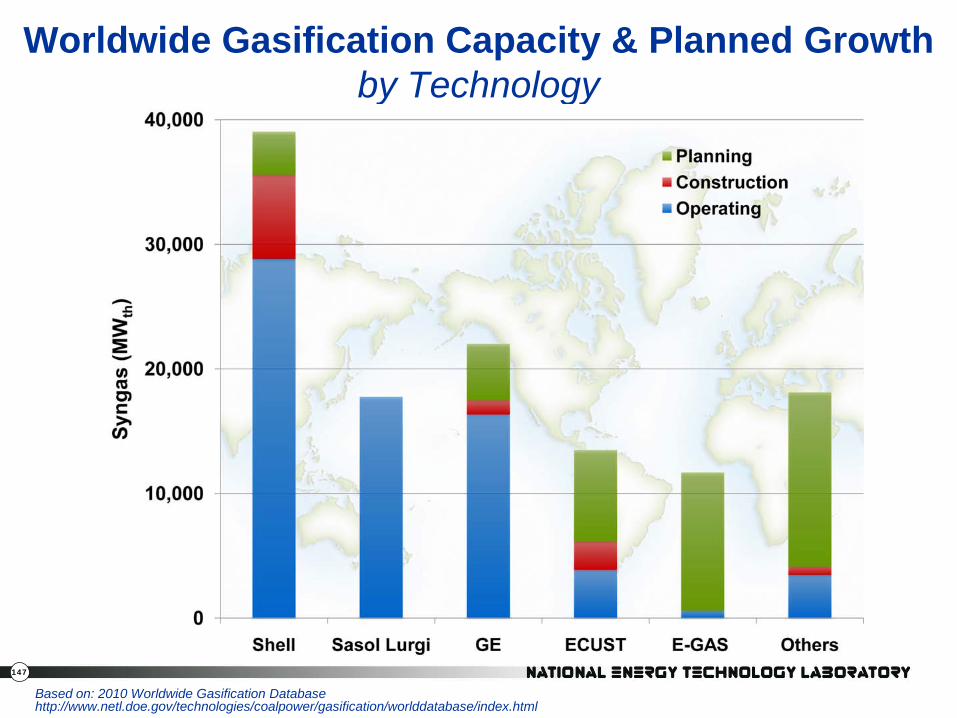
147
Worldwide Gasification Capacity & Planned Growth by Technology
Based on: 2010 Worldwide Gasification Database http://www.netl.doe.gov/technologies/coalpower/gasification/worlddatabase/index.html
148
Closing

149
… the Benefits
GASIFICATION – Stable, affordable, high-efficiency energy supply with a minimal environmental impact – Feedstock Flexibility/Product Flexibility – Flexible applications for new power generation, as well as for repowering older coal-fired plants BIG PICTURE – Energy Security -- Maintain coal as a significant component in the
U.S. energy mix – A Cleaner Environment (reduced emissions of pollutants) – The most economical technology for CO2 capture – Ultra-clean Liquids from Coal -- Early Source of Hydrogen
150
Visit NETL Gasification Website www.netl.doe.gov/gasification-portal.html
Google the term “Gasifipedia”