Products of wood gasification - GovInfo.gov
120
NBS PUBLICATIONS NATL INST. OF STAND & TECH A11107 31D13S NBSIR 85-3127 Products of Wood Gasification T.J. Ohlemiller T. Kashiwagi K. Werner U.S. DEPARTMENT OF COMMERCE National Bureau of Standards National Engineering Laboratory Center for Fire Research Gaithersburg, MD 20899 April 1985 Sponsored by: QC U.S. Department of Energy 100 Washington, DC 20585 U 56 85-3127 1985 C. 2
-
Upload
khangminh22 -
Category
Documents
-
view
1 -
download
0
Transcript of Products of wood gasification - GovInfo.gov

NBS
PUBLICATIONS
NATL INST. OF STAND & TECH
A11107 31D13S
NBSIR 85-3127
Products of Wood Gasification
T.J. Ohlemiller
T. Kashiwagi
K. Werner
U.S. DEPARTMENT OF COMMERCENational Bureau of Standards
National Engineering Laboratory
Center for Fire Research
Gaithersburg, MD 20899
April 1985
Sponsored by:
QC U.S. Department of Energy
100 Washington, DC 20585
U 5 6
85-3127
1985
C. 2

/

NBSIR 85-3127
PRODUCTS OF WOOD GASIFICATION
T.J. Ohlemiller
T. Kashiwagi
K. Werner
U S. DEPARTMENT OF COMMERCENational Bureau of Standards
National Engineering Laboratory
Center for Fire Research
Gaithersburg, MD 20899
April 1985
Sponsored by:
U.S. Department of Energy
Washington, DC 20585
U.S. DEPARTMENT OF COMMERCE, Malcolm Baldrige, Secretary
NATIONAL BUREAU OF STANDARDS, Ernest Ambler, Director


TABLE OF CONTENTS
Page
List of Figures iv
Abstract 1
1. INTRODUCTION 1
2. EXPERIMENTAL APPARATUS AND PROCEDURE 3
2.1 Radiant Heating Apparatus 3
2.2 Product Collection 4
2.3 Test Procedure 6
2.4 Chromatographic Analyses
3. RESULTS AND DISCUSSION 10
3.1 Time-Dependent Behavior 11
3.2 Time-Integrated Behavior 15
3.3 Characterization of the Solid Residue 24
3.4 Total Hydrocarbon (THC) Composition 28
3.5 Chemical Composition of the Organic Condensate (Tar) 29
3.6 Variability of the Organic Condensate (Tar) 32
3.7 Other Fingerprinting Techniques for the Organic Condensate 37
3.8 Comparison with Wood Stove Organic Condensate 42
4. CONCLUSIONS 44
5. ACKNOWLEDGMENTS 4 6
6. REFERENCES 46
-iii-

LIST OF FIGURES
Page
Figure 1. Schematic of apparatus showing details of radiationsource and sample chamber 49
Figure 2. Schematic of apparatus showing details of productmonitoring 50
Figure 3(a). Temperature vs time from five thermocouples in a whitepine sample; base case conditions except N
2atmosphere ... 51
Figure 3(b). Temperature vs depth and time; cross -plotted fromFig. 3(a) 52
Figure 4(a). Surface mass flux vs time; white pine at base caseconditions except N
2atmosphere 53
Figure 4(b). Composition of evolved products; white pine at base caseconditions except N
2atmosphere 54
Figure 5(a). Temperature vs time from five thermocouples in a whitepine sample; base case conditions except air atmosphere .. 55
Figure 5(b). Temperature vs depth and time; cross-plotted fromFig. 5(a) 56
Figure 6(a). Surface mass flux vs time; white pine at base caseconditions except air atmosphere 57
Figure 6(b). Composition of evolved products; white pine at base caseconditions except air atmosphere 58
Figure 7(a). Reproducibility of integrated product composition andweight loss for white pine at base case conditions 59
Figure 7(b). Reproducibility of integrated product composition andweight loss for red oak at base case conditions 60
Figure 8(a). Integrated product mass and composition as a functionof exposure time; white pine at base case conditionsexcept for exposure time 61
Figure 8(b). Integrated product mass and composition as a functionof exposure time; red oak at base case conditions exceptfor exposure time 62
Figure 9(a). Integrated product mass and composition as a functionof sample thickness; white pine at base case conditionsexcept for thickness 63
Figure 9(b). Surface mass flux vs time; white pine at base caseconditions except sample thickness is halved 64
-iv-

LIST OF FIGURES (continued)
Page
Figure 9(c). Composition of evolved products; white pine at basecase conditions except sample thickness is halved 65
Figure 10(a). Integrated product mass and composition as a functionof wood grain orientation; white pine at base case
conditions 66
Figure 10(b). Integrated product mass and composition as a function of
wood grain orientation; red oak at base case conditions .. 67
Figure 11(a). Integrated product mass and composition as a functionof sample moisture content; white pine otherwise at
base case conditions 68
Figure 11(b). Integrated product mass and composition for wet whitepine as a function of exposure time 69
Figure 12(a). Temperature vs time from five theromcouples in a whitepine sample; base case conditions except for moisturecontent 70
Figure 12(b). Temperature vs depth and time; cross-plotted fromFig. 12(a) 71
Figure 12(c). Temperature vs depth and time; white pine base caseconditions 72
Figure 13(a). Integrated product mass and composition as a functionof ambient oxygen percentage; white pine at otherwisebase case conditions 73
Figure 13(b). Integrated product mass and composition as a functionof ambient oxygen percentage; red oak at otherwisebase case conditions 74
Figure 14(a). Integrated product mass and composition as a functionof incident radiant flux; white pine at otherwise basecase conditions 75
Figure 14(b). Integrated product mass and composition as a functionof incident radiant flux; red oak at otherwise basecase conditions 76
Figure 15. Integrated product mass and composition as a functionof wood type; all at base case conditions
Figure 16(a). B.E.T. surface area vs depth for white pine in threeatmospheres; otherwise base case conditions
-v-

LIST OF FIGURES (continued)
Page
Figure 16(b). B.E.T. surface area vs depth for white pine of threemoisture levels; otherwise base case conditions 79
1 OFigure 17(a). C-NMR spectra vs depth; white pine at base case
conditions 80
Figure 17(b). C-NMR spectra vs depth; white pine at base caseconditions except exposed in nitrogen 81
Figure 18(a). Capillary GC fingerprint of tar from white pine at basecase conditions 82
Figure 18(b). Identification of peaks in base case capillary GCfingerprint 83
Figure 19. Reproducibility of capillary GC fingerprint; tar fromtwo separate tests on white pine at same base caseconditions 84
Figure 20. Capillary GC fingerprints of tar as a function ofexposure time; white pine at base case conditions except:(a) 1-1/2 min, (b) 2-1/2 min, (c) 6 min, (d) 12 min,
(e) 24 min exposure 85
Figure 21. Capillary GC fingerprints of tar as a function of ambientoxygen level; white pine (a) 0% 0
2 , pure N2 ;
(b) 10-1/2% 02 ; (c) 21% 0
2 87
Figure 22. Capillary GC fingerprints of tar as a function of
incident radiant flux; white pine base case conditionsexcept: (a) 2-1/2 W/cm2
; (b) 4 W/cm2; (c) 6.9 W/cm2 ;
(d) 7.85 W/cm2 88
Figure 23. Capillary GC fingerprints of tar as a function ofsample thickness; white pine at base case conditions (a)
and half thickness (b) 90
Figure 24. Capillary GC fingerprints of tar as a function of
sample grain orientation; white pine at base case
conditions (a) and with perpendicular grain (b) 91
Figure 25. Capillary GC fingerprints of tar as a function ofsample moisture content; white pine at base caseconditions except: (a) 0%; (b) 5%; (c) 33%; (d) 33%
water and 24 min exposure 92
Figure 26. Capillary GC fingerprints of tar as a function of
wood type; base case conditions: (a) white pine;(b) red oak; (c) yellow pine 93
-vi-

LIST OF FIGURES (continued)
Page
Figure 27(a). Gel permeation chromatogram of tar from white pineat base case conditions except in N
2atmosphere 94
Figure 27(b). Gel permeation chromatogram of tar from white pineat base case conditions except in air atmosphere 95
Figure 28(a). Fast atom bombardment mass spectrum of tar from whitepine at base case conditions except in N
2atmosphere 96
Figure 28(b). Fast atom bombardment mass spectrum of tar from whitepine at base case conditions except in air atmosphere .... 97
Figure 29. High pressure liquid chromatography results for tarfrom white pine at base case conditions except:(a) N
2atmoshpere: (b) air atmosphere 98
Figure 30. Capillary GC fingerprints of tar from: (a) red oakirradiated at base case conditions, (b) mixed oak burnedin a wDod stove at “overnight burn" conditions 99
Figure 31. Capillary GC fingerprints of tar from: (a) yellow pineirradiated at base case conditions, (b) yellow pineburned in a wood stove at "overnight burn" conditions .... 100
-vii-


PRODUCTS OF WOOD GASIFICATION
T.J. Ohlemiller, T. Kashiwagi, and K. Werner
Abstract
The increasing problem of pollution from wood-burning stoves has prompted
this examination of the basic gasification process of wood under conditions
encompassing those in stoves. The emphasis is on the products generated when
wood is heated, without flaming, in atmospheres of varying oxygen concentra-
tion (0 to 21% C>2 in N2). Small wood samples (typically 4 x 4 cm face, 2-4 cm
thick; white pine, red oak, plus two tests with yellow pine) were subjected to
9uniform radiative heat fluxes (2 to 7.8 W/cm ) on one face. Other variables
were sample grain orientation, thickness, exposure time and moisture content.
Sample weight was followed in some tests; sample temperature (5 thermocouples)
was followed in others. In all tests, all evolved products were either
monitored (1^0, CO, CO2 , total hydrocarbons not condensible at -40°C) or
trapped and analyzed (condensible organic species) by gas chromatography and
mass spectroscopy. Many of the trends of the major products (CO, CO2 , ^0,
THC, total organic condensible or tar) are qualitatively intelligible in terras
of the expected impact of varying temperature or oxygen level, for example.
The extent of change in these major products is rather limited (factor of two
to four) over the range of variables explored here. The organic condensate
was difficult to analyze; it is estimated that only 20% of it was chromato-
graphable. More than forty species in this chromatographable portion were
positively or tentatively identified and quantified. Chromatographic finger-
prints of the organic condensate indicated that its composition does not vary
a great deal for the conditions examined here. The fingerprints from the
radiative heating tests bear a strong resemblance to those of the smoke
condensate from a wood stove.
1 . INTRODUCTION
Wood burning stoves have become a common means for homeowners to lessen
their heating bills. However, the popularity of these devices has brought
with it an air pollution threat [1]. There are numerous facets to this
problem of pollution from wood burning stoves [2]; that addressed here
- 1 -

concerns basic aspects of how the wood gasifies in a stove and what it is
converted to in this process. This is part of a larger study under DOE
Project No. 133A, DE-A01-76PR06010 aimed at clarifying the generation and fate
of pollutants in wood burning devices.
In the first stage of the overall study, the fate of the combustion
products in the stack of a wood burning stove was investigated [3], Permanent
gases (CO, CO2 , O
2 ) and condensibles (phenolic fraction) were monitored at the
bottom and top of a 3 meter stack during an "overnight burn" condition. This
type of burn condition, also used (as well as simulated) in the present work,
represents a severe case with regard to pollution. The air supply to the
stove is choked down to the point where a single load of wood will burn for a
period of the order of eight hours. As a result of the severely limited air
supply flaming is largely or totally absent and the wood combustion process
is basically one of smoldering (surface oxidation of the wood char). A
further consequence of this low rate, oxygen-starved burning is a low stack
temperature (80-150°C). Consequently one might expect little chemical altera-
tion of the smoke in passing up the stack; this is in fact the case [3]. The
only changes found were consistent with the physical process of material
exchange to and from the walls of the stack ( condensation/ evaporation)
.
Keeping in mind the severe "overnight burn" condition that is the focus
here, one sees that the place of origin of the pollutants that emerge from the
stack is shifted by the above result to the firebox itself or to the wood. In
the present study we focus on the products emerging from the wood. In addi-
tion, some comparisons of these products are made with those emerging from the
firebox of a stove; we are seeking an indication of the extent of product
alteration between the wood surface and the firebox exit. A further goal is
the identification of typical major species emerging from the wood so that, in
the next stage of this work, we can quantify the necessary conditions (time,
temperature, C>2 concentration) required to convert such species to CO2
and
h2o.
The environment in a wood stove (temperature, heat flux, local oxygen
concentration) is variable both from point to point and with time [4], This
makes the wood stove a poor device with which to do detailed studies of the
-2-

wood gasification process. In the present work, the wood was instead placed
in a precisely-controlled environment where the variables affecting the gasi-
fication process could be individually controlled and their effects examined.
The wood was subjected to a purely radiative heat source and the effects of
heat flux level, exposure time, ambient oxygen, wood type, grain orientation,
sample thickness and sample moisture content were examined. All products
evolved from the wood were collected with permanent gases being monitored in a
time-dependent fashion. The organic condensibles are exceedingly complex.
They have been fingerprinted by capillary gas chromatography and to a limited
extent, identified.
2. EXPERIMENTAL APPARATUS AND PROCEDURE
2.1 Radiant Heating Apparatus
Figures 1 and 2 illustrate the nature of the radiative heating apparatus
and the associated flow system. The radiation source is an electrically-
heated graphite plate contained in an argon-purged box. The plate is heated
to about 1250°C, thus it is essentially a gray body with an emission peak near
two micrometers in the infrared. Radiation emitted from the front of the
plate is collected and transferred out of the box by a square light pipe.
Essentially all of the spectral content of the radiation is transmitted
through the two infrared windows in the system. Until the start of an experi-
ment, the radiation is intercepted by a water-cooled shutter; its removal
marks the beginning of the constant flux irradiation process used throughout
this work. The flux level is varied from test to test by simply moving the
sample chamber relative to the end of the light pipe. The apparatus can
generate fluxes up to about 8 W/ cm ; the flux is uniform to within about 5%
over the 4 cm x 4 cm face of a typical sample.
The wood samples (2 to 4 cm thick in this study) are placed on top of an
electronic balance for continuous weight recording (1 mg sensitivity).
Thermocouples can be placed on the sample surface or within holes drilled into
the sample but when this is done the thermocouple lead wires preclude useful
weight measurements so thermocouple measurements were made in separate expert
ments. This assembly is placed inside of the sample chamber in which the
-3-

gaseous environment can be controlled. The chamber walls are water cooled to
prevent their temperature from rising during a test. The atmosphere in the
chamber is continually replenished by a slow upward flow (< 1 cm/ s) coming
through the porous plate in the base. In the present test series, this atmo-
sphere was varied from pure nitrogen to 10-1/2% 02/89-1/2% to 21% 02/79% N2
in separate tests.
The pressure in the sample chamber during a test was monitored largely
for safety reasons; the CaF2window in the front of the chamber was not
designed to withstand much stress. The pressure normally started at about
1/2 psig (relative to atmospheric pressure) due to the flow resistance of the
aerosol filter and the various gas flow lines. During a few of the tests the
pressure in the chamber rose as high as 2-1/2 psig at which point the test was
stopped. The increased flow resistance was usually due to accumulation of
products on the aerosol filter but was also caused by ice build-up in the cold
trap in tests with high moisture content samples. The increased pressure is
believed to have only a small affect on the wood gasification process.
2.2 Product Collection
The ambient purge gas plus all products (gas and aerosol) emitted by the
irradiated wood sample were collected by the funnel above the sample. In some
tests that involved an exceptionally rapid product emission in the first few
minutes , there was some spillover of products from the funnel into the bulk of
the sample chamber volume. This spillover was subsequently swept out of the
chamber as the test continued. The net result is some (generally small)
distortion of the product time histories (e.g., CO, C02). Even though spill-
over introduced aerosol into the radiation path (between the front window and
the sample surface), the attenuation was found to be negligible (a water-
cooled flux gage next to the sample monitored the level during each test).
All parts of the sample product collection system likely to be in contact
with condensible portions of the products were cleaned and weighed before each
test. No attempt was made to keep material from condensing in the lines down-
stream of the sample chamber. (The water line in Fig. 2 was an exception; it
was heated to 60 °C to prevent water condensation prior to the hygrometer
-4-

sensor. This line diverted only 5% of the flow.) Some small amounts of the
condensible organics deposited in the funnel, more condensed in the glass line
leading to the cold trap. Water and most of the condensible organics ended up
in the cold trap (cooled by a CaC^/^O slush at -35 to -45°C). The cold trap
was designed to be more than adequate in length to assure that the gases
passing through it were cooled to the trap temperature. However, aerosol
particles formed in various parts of the system were not efficiently caught in
the cold trap; this prompted the placing of a glass fiber filter immediately
downstream of the cold trap (Gelman type A/E, > 99.9% retention for particles
greater than 0.3 ym) . This system for trapping condensibles is not perfect
since it lets some semi-volatile components of the aerosol caught in the
filter escape downstream; however, the gas (plus particles) impinging on the
filter was near -40 °C so this effect should be quite small. The trap, filter,
lines and funnel were weighed to the nearest 0.01 g after each test and the
weight gain was recorded as condensible products. Methanol was used to remove
all condensate in the trap, filter, lines and funnel for subsequent analysis.
The flow of permanent gases (plus the chamber purge gas) left by the trap
system was split into a series of parallel lines for analysis. Note that the
flow in all of the lines was measured by calibrated rotameters or, in the case
of the bypass line, by an electronic mass flowmeter. The latter device
indicated relative flow variations during a test, assumed valid for all of the
lines. This information plus the initial flows and the measured gas concen-
trations integrated over time give the total mass of CO, CO2
and gaseous
hydrocarbons. The time-dependent CO and CO2
concentrations in the present
tests were measured by an Infrared Industries non-dispersive infrared
analyzer; the time-dependent gaseous hydrocarbons were measured by a Beckman
flame-ionization instrument. Both instruments were calibrated routinely as
per the manufacturer's instructions. Hydrogen was not measured since no
suitable instrument was available. Some hydrogen was very likely present [5]
but its low molecular weight means that it would account for a small fraction
of the mass of the permanent gases.
In order to adequately describe equipment, it is occasionally necessary to
identify commercial products by manufacturer's name. In no instance doessuch identification imply endorsement by the National Bureau of Standards . r
does it imply that the particular equipment is necessarily the best avail iM.-
for that purpose.
-5-

Measuring the time-dependent water evolution from the wood samples proved
to be quite problematical. Even though the manufacturer’s literature empha-
sizes the insensitivity of the hygrometer probe to chemical interferences, it
ultimately became apparent that the probe was changing its calibration with
each exposure to the numerous organic components of the wood smoke. Repeated
re-calibrations were ultimately fruitless. The data obtained on the time-
dependent evolution of water are qualitatively valid but quantitatively
inaccurate. The total water (integral over time) evolved from each sample was
obtained separately by chromatographic analysis of the condensate in the cold
trap.
2.3 Test Procedure
Samples (usually from a single large piece of kiln-dried lumber) were cut
to size and conditioned for at least two months at 50 ± 5% relative humidity
and 21-24°C. If thermocouples were to be used in a given test, holes 0.5 to
0.6 mm diameter were drilled halfway through the wood blocks at carefully
spaced distances back from the face to be irradiated (e.g. , 5, 10, 15 mm).
Chromel/alumel thermocouples with a 0.025 cm diameter stainless steel sheath
were inserted to the bottoms of these holes and glued in place (glue at the
outer edge of the hole only). Surface thermocouples (0.005 cm diameter
chromel/alumel wire on front surface; 0.0075 cm diameter on rear surface) on
pine samples were mounted by the technique developed by Attreya [6]; the
junction was held near the center of the surface by a very small amount of
general purpose glue (Elmer's Glue-All). For red oak samples the lead wires
were fed through the pores of the wood and the junction itself was again glued
in place. These mounting techniques generally succeeded in keeping the
thermocouple junction in contact with the surface (despite shrinkage) until
rather late in a test exposure.
The sample was placed on top of the electronic balance and its top
surface was covered with aluminum foil (omitted in a few tests) to prevent
excessive heating of the top by radiation reflected from the collector cone.
After the sample and balance assembly were sealed in the chamber, it was
purged for several minutes to assure complete replacement of air by the
environmental test gas. This was done before connecting the cold trap into
-6-

the exhaust line so that no moisture originally in the chamber would deposit
in the cold trap. The radiant source was run for a few minutes to stabilize
its temperature. At time zero, the shutter was dropped to begin the irradia-
tion of the front surface of the wood sample; at the same time data recording
from the various instruments was initiated by a computer. Data were recorded
at intervals of the order of 2-4 seconds. One operator monitored the radiant
flux level during a test and adjusted the source power input to hold it
constant; the other operator monitored the behavior of the sample.
Because of problems with thermal shock breakage of the infrared window on
the chamber, the irradiation was ended not by closing the shutter (except in
some of the earlier tests) but rather by turning off the source power. As a
result, the radiation on the sample decayed over one to two minutes. The
computer, however, stopped taking data as the source power was cut and the
cold trap was pulled from the exhaust line at this point as well. One conse-
quence of the slow radiation decay was that the sample continued to lose some
weight so that its weight after the test was not a precise measure of the
weight loss during the constant flux exposure. In tests where thermocouples
were used, and the electronic balance could therefore not be used, the sample
weight loss reported here includes the additional loss during the radiation
decay.
The cold trap, aerosol filter and glass lines with condensate were
weighed immediately after the test and then extracted with methanol. The
methanol contained 0.2% of triphenyl methane as a free radical trap; this was
an attempt to inhibit apparent long term changes in early condensate samples.
The methanol solutions were kept refrigerated (0°C) until analyzed.
2.4 Chromatographic Analyses
Gas chromatography was used for three purposes: to analyze the water
content of the cold trap, to analyze the mixture of hydrocarbon gases going to
the total hydrocarbon (THC) analyzer and to separate and fingerprint the
organic condensate collected from the cold trap, lines and aerosol filter.
-7-

The water content of the cold trap condensate was analyzed on a Carle
Model 311 using a Porapak QS packed column at 120°C and a thermal conductivity
detector. It proved necessary to homogenize the trap condensate/methanol
solution in an ultrasonic bath prior to sampling because two phases were
present in many of the samples. Quantitation was done against a calibration
curve with known concentration of water and anhydrous methanol. The hydro-
carbon analyses were done on a Hewlett-Packard Model 5710 using a Carbosieve-B
packed column at 275°C and a flame ionization detector. The gas samples for
this purpose were obtained by grab sampling with a syringe downstream of the
aerosol filter. Identification was done by retention time comparison with a
known mixture of to hydrocarbons. The principal purpose here was to
obtain an estimate of the mean molecular weight of the gases going to the
Beckman hydrocarbon analyzer; that estimate (MW « 20 g/mole) was used in
deducing the overall mass of permanent gas hydrocarbons.
The organic condensate separations and fingerprints were done on a
Hewlett-Packard Model 5793, primarily using a J&W DB-1701 capillary column
(30 m) programmed at 2°C/min from 27 °C to 280°C and a flame ionization
detector. A J&W inlet splitter with a split ratio of about 75:1 was used.
The injection port was normally at 280 °C; a few runs at 230 °C did not yield
qualitatively different results.
Not all of the organic condensate was able to be chromatographed. Some
of it never left the injection port and some stayed on the GC column after
injection. The quantity remaining in the injection port was estimated by
making 50 successive injections into the GC injection port after placing a
clean, pre-weighed glass liner in it; the results showed that one third of the
injected material was non-volatile and remained in the injection port. The
fraction of injected material which actually reached the detector was esti-
mated as follows. Flame ionization response factors were computed for the
forty or so species identified and an effective overall response factor was
calculated from a mass-weighted average of these. This result (0.65) was
applied to the total peak area reported by the chromatograph integrator to
estimate the total mass emerging from the column. The use of an average
response factor is, of course, crude but there was no realistic alternative.
The result was a rough estimate that only 20% of the organic condensate
-8-

injected into the chromatograph is actually coming through the chromatograph.
This, coupled with the previous result, implies that about 50% is staying
permanently on the capillary column. Gradual discoloration of the front end
of the column confirmed that some material was indeed retained there. It
should be borne in mind, then, that the organic condensate fingerprints and
analyses discussed below do not represent the total amount of material
produced and the loss is selective, i.e., the lost material represents some
set of species different than those that are seen. This situation is not
really satisfactory but it is, in fact, similar to that in previous studies on
wood combustion products that have used more elaborate analysis schemes [7].
An attempt has been made to identify the major peaks in the chromato-
graphable portion of the organic condensate. Selected samples were sent to
the Hass Spectroscopy Center at West Virginia University. These samples were
chromatographed under essentially identical conditions to those used for the
fingerprinting and the output peaks subjected to mass spectral analysis.
Pattern searches were done against a library of 31,000 compounds. The output
of this search (comparing the mass spectrum obtained at the apex of each GC
peak with the library) is a listing of the five most probable compounds from
the library based on statistical measures of the closeness of fit. Nearly all
of these reported fits were ambiguous with two or three compounds (usually
completely different chemically) being suggested as equally good fits. In the
case of several other major peaks, the library search produced no good
statistical fit with a known compound. Biller-Bieman enhancement of the
resolution between successively eluting chromatograph peaks failed to improve
the mass spectral identification process [8]. The cause of these difficulties
is almost certainly the co-elution of two or more chemical species from the
capillary column even for "clean" looking peaks; in spite of the very high
resolution of such columns, it is inadequate for the present purpose. Some
sort of pre-separation (solvent partitioning, liquid chromatography) would be
needed to improve the effective final separation capability of the capillary
GC column. Such resources were not available in this study and, indeed, it
was not the goal here to identify the majority of the species in the organic
condensate
.
-9-

Some sixty-two pure compounds suggested by the mass spectral analysis
have been compared with the unknown peaks on both the DB-1701 column and on a
Supelco-wax 10 column (30 m capillary, programmed from 50 °C to 270 °C at
2°C/min). Retention time agreement between known and unknown on both columns
established the identity of twenty-nine compounds in the organic condensate;
about fifteen others were less-certainly identified.
3. RESULTS AND DISCUSSION
As noted previously, the wood gasification process may depend on heat
flux level, ambient oxygen level, exposure time, wood type, grain orientation,
sample thickness and sample moisture content. In view of this large number of
parameters, it was necessary to restrict the experimental plan to individual
parametric variations on a base case. The case about which each of the para-O
meters was singly perturbed was as follows: heat flux of 4 W/cm,ambient
oxygen level of 10-1/2% (balance N2 ),
exposure time of 12-15 min., grain
(longitudinal wood pores) perpendicular to exposed surface, sample thickness
of 3.9 cm (2.9 cm in the case of red oak), and sample moisture content
dictated by equilibration with 50% relative humidity at 24 °C. This base case
and perturbations about it were run for both white pine and red oak; the base
case condition was also done with yellow pine.
The choice of the base case conditions was a result of several considera-o
tions. The flux level of 4 W/cm was estimated to be a mid-level value to be
expected as a result of blackbody radiation from smoldering wood surfaces in
the 600-700°C range; the results from Batelle [4] confirmed this. The oxygen
level of 10-1/2% was suggested by our previous wood stove stack measurements
[3]; again the Batelle results confirmed this [4]. The exposure time of 12-15
min. was considered to be long enough to reveal the range of wood behavior.
Sample thickness was largely limited by the 50 gram upper limit on the elec-
tronic balance that followed the sample weight. The perpendicular grain
orientation was chosen so that the high wood permeability in the direction
perpendicular to the exposed surface would facilitate product evolution and
minimize irregular splitting which could cause data scatter.
-10-

3 . 1 Time-Dependent Behavior
Consider first the behavior of a wood sample in an inert environment,
nitrogen. While the incoming radiation is the ultimate forcing function in
the wood gasification, it is the temperature within the sample which directly
dictates its degradation behavior. Figure 3(a) shows a typical set of temper-
ature versus time plots for the five thermocouples at various depths in a
sample of white pine. Inspection of Fig. 3(a) prior to 60 seconds indicates
a minor problem in the tests: some of the radiation going into the sample
chamber was finding its way to the back surface of the sample (even though the
chamber walls were painted black and were water cooled). This is a deviation
from ideal behavior but it is not likely to have any significant effect on the
results.
The slowing in the rate of temperature rise near 100 °C apparent in all
but the front surface thermocouple record is due to water evaporation. This
effect is much more pronounced in the high water content cases, as will be
seen.
It is apparent that after about five minutes or so the surface
temperature is nearly constant (due to re-radiation) and the major change is
continuing inward movement of the thermal wave. This inward movement is more
easily seen in Fig. 3(b) which is a crossplot of the data from Fig. 3(a). The
reversal in curvature evident in Fig. 3(b) for long times is most likely an
artifact. The surface is actually regressing (with the thermocouple attached)
and has moved backward about 1-1/2 - 2 mm by the end of the test. If the last
"zero" point is moved to the right this distance, the reversal in curvature
disappears. Lee, et al [9] made a similar point.
It should be noted that in the first minute or so (up to ^ 400°C), the frontsurface thermocouple record in all tests is not necessarily an exactdepiction of the behavior of the entire front of the sample; the small filmof glue in the area of the thermocouple junction always darkened faster thanthe wood surface itself (initial reflectance = 30-35% for radiation usedhere) so that it doubtless heated somewhat faster. By 400°C the wood wasequally dark and this discrepancy disappears.
- 11 -

Under therraogravimetric (TG) conditions (constant heating rate
- 5°C/min “ 0.08°C/s), white pine begins to gasify rapidly at about 300°C. At
the higher heating rates (see Fig. 3(a)) in the wood sample, this could be
pushed up to perhaps 350°C. With a possible band of 300-350°C for the initia-
tion of rapid gasification, it is apparent from Fig. 3(b) that by the end of
the test, the wood gasification process has penetrated about 10 mm into the
37 mm depth of the sample. On the other hand, the drying process (up to
100-110°C) appears to have penetrated the full depth of the sample.
Although the thermal wave appears in Fig. 3(b) to make rather steady
progress inward, the resultant mass efflux (Fig. 4(a)) varies considerably
with time. The mass flux is deduced from the recorded weight-time history by
numerical differentiation and subsequent smoothing. When the irradiation
starts , the sample begins to lose mass virtually immediately. The rate of
mass loss accelerates rapidly as the front surface temperature climbs; succes-
sive portions of the wood inward from the surface are first dried and then
raised to the 300-350 °C range where rapid pyrolysis begins. Since the
principal components of wood (cellulose, hemi-celluloses , lignin) have
differing thermal stabilities, there will, in the first few tens of seconds of
degradation, be a tendency for selective product generation. That is, hemi-
celluloses with their lesser thermal stability will dominate the first instant
of gaseous product production, then cellulose products will begin evolving
followed finally by lignin degradation products [10]. This varying stability
of the wood components could be an important consideration in the piloted
ignition of wood but here it is quickly overridden by the continuing rise in
temperature. This causes all three components to degrade (at their own rates)
first at the sample surface and then in increasing depth; the evolved products
at the surface are a summation over this distributed pyrolysis zone.
Since water can move both forward and backward as the thermal wavepenetrates from the front, some water probably came out the back of thesamples near the end of a test such as that in Fig. 3. In a thicker samplethis backward moving water would not have escaped. Similarly, volatilepyrolysis products can presumably move forward and backward [10], but sincethe pyrolysis wave penetrates only about one quarter of the sample depth, noescape of such products from the back is expected. The sample collectionsystem used here captures all products regardless of what surface theyemerge from.
-12-

A product of the degradation of all three components (especially lignin)
is a carbon-enriched solid or char. This solid comprises about 35% of the
original mass of the wood under TG conditions. In the present situation, this
char accumulates progressively from the front surface of the sample; during
this process it tends to shrink slightly and crack to a limited extent. In
this experiment, as in a wood stove, the heat flux from the outside is
absorbed on the front surface of the char. The char is not completely inert
but, in the absence of oxygen, it is much more resistant to pyrolysis than is
the original wood. A major role of the char then is that it forms a rather
poorly conductive barrier between the incoming heat flux and the inward propa-
gating pyrolysis zone (and water vaporization zone). Some of the incoming
radiation is re-emitted from the char surface while a progressively decreasing
portion penetrates the thickening char by conduction and radiative transfer.
The rate of gasification must therefore decrease; Fig. 4(a) shows that the
rate decreases by more than a factor of three over a 12 minute exposure. This
type of behavior was previously observed by Lee, et al [9] and Attreya [6]; it
is predicted by the wood gasification models of Rung [11] and Kansa, et al
[12], both of which use only a single step reaction to represent the complex
pyrolysis
.
In the present work, we have resolved the composition of the evolved
products underlying the mass efflux pattern of Fig. 4(a); the result is shown
in Fig. 4(b). The tar (organic condensibles) evolution pattern was not
directly measured but was inferred from the other measured curves by differ-
ence (the summation of CO, CO2 , ^0, THC and tar should equal 100% of the
products in pure pyrolysis). The tar curve is not quantitatively accurate for
three reasons. First, the mass balance for this run showed only 92% recovery,
not 100%. Second, the THC curve as shown does not include the small ( - 25%)
upward correction to its mass percentage due to the non-methane components
(see below). Third, as previously noted, the hygrometer used to follow water
evolution frequently exhibited a shifted sensitivity (generally downward) due
to interferences from some of the volatile organic constituents of the smoke;
in Fig. 4(b) the hygrometer output looks much more credible with regard to
absolute water percentage than it did for many other tests. The net result,
however, is that the indicated tar percentages as a function of time are
high. Nevertheless, the basic shape should be correct.
-13-

Figure 4(b) indicates, as one would expect, that the initial mass
evolution from the sample is essentially pure water. However, the water is
quickly followed by a large efflux of organic condensibles (tar) which dilute
the water. In Fig. 3(a) this is seen to correspond approximately to the
surface region passing upward through the 300-400 °C range. The permanent
gases (CO, CO2 , THC) rise somewhat more slowly at about the same time.
The more interesting feature of Fig. 4(b) is the downward turn in the tar
evolution. Comparing the flux of tar at 120 s to that at 600 s for example,o
one gets (using Fig. 4(a) and Fig. 4(b)) 0.35 mg/cm s for the former and
0.04 mg/cm s for the latter. Thus the tar flux drops off more than twice as
much as does the mass flux over this interval. This is consistent with, but
not proof of, the idea that the pyrolytic tars are altered as they pass
through the accumulating char on the front of the sample. It has been
suggested that these tars may undergo cracking to small hydrocarbons and/or
polymerization to a char [13, 14]. Figure 4 does not give clear evidence as
to the fate of the tars as they pass through the char. It does not appear
consistent with the idea that they are converted largely to hydrocarbons since
THC does not rise nearly as much as tar falls. Figure 4 seems to suggest that
the tars are converted to water. This cannot literally be true but water
could be a product of a char formation process.
In the presence of ambient oxygen, the only new qualitative feature is
oxidation of the surface char. Under TG conditions (5°C/min in air), the char
oxidation process occurs between 400 and 500 °C; at the higher heating rates
here this could shift upward somewhat. In the present configuration, the only
clear-cut indication of the onset of char oxidation is the appearance on the
front surface of gray ash left when the local char is fully consumed. (There
is also some increase in the rate of surface temperature rise between 400 and
450°C possibly indicating the outset of the char oxidation exotherm; see Fig.
5(a).) Typically the gray ash appears along the lower edge of the sample (and
sometimes along one of the vertical side edges). Even though the heating
process on the face of the sample is essentially uniform, the oxygen supply is
inherently two-dimensional; thus oxidation progresses most rapidly along the
lower portions of the sample face where the buoyant boundary layer is
thinnest.
-14-

Inspection of Figures 5 and 6 confirms the qualitative similarity when
ambient oxygen is present; all conditions are the same as in Fig. 3 and 4
except that air is the environmental gas. Quantitative comparisons reveal
some significant differences, however. The peak surface temperature is
100-150°C hotter in the presence of air due to the char oxidation process.
(The surface temperature indicated in Fig. 5(a) drops suddenly at about 600 s
because the thermocouple broke away from the surface.) Comparison of Fig.
6(a) with Fig. 4(a) shows that the peak mass flux is nearly twice as high in
air as in nitrogen and this ratio persists throughout the exposure. This is a
consequence of char oxidation which has two effects: (1) it directly
increases the rate of mass loss since the char is also being gasified, (2) it
indirectly raises the heat flux into the pyrolysis zone since the char oxida-
tion heat supplements the external radiation.
Note that in Fig. 6(b) the tar percentage curve is not shown. Unlike the
inert atmosphere case, here we cannot assume that the summation of the five
gasification "products" adds up to 100%. Some of the oxygen in the CO, CO2
and H2O has come from the atmosphere in this case and our analytical approach
cannot distinguish how much. Note that by 600 s the summation of the four
products shown approaches 150%. It appears from the low height of the early
water peak that the hygrometer was probably reading 30-50% low during this
test; thus the water curve should be higher and the other curves lower.
Nevertheless, it is apparent that there is much more CO and CO2
in this case
than in nitrogen; again this is an expected consequence of char oxidation.
The hydrocarbon gases (THC) appear essentially unchanged by the presence of
oxygen. Although we cannot infer any semi-quantitative tar percentage
history, it appears probable that it would qualitatively resemble that in
Fig. 4(b).
3.2 Time-Integrated Behavior
Although time-dependent data of the above type were obtained in all of
the radiative heating tests, it is much easier to compare parameter effects
using the time-integrated data on product evolution. All of the time-
dependent data were qualitatively similar so the previous discussion suffices
to clarify the major trends; time-dependent data will be referred to below
only when they support some point to be made with the time-integrated data.
- 15-

Inspection of Fig. 4(b) and 6(b) indicates that the product compositions
evolving from the wood are still changing at 12 minutes, though relatively
slowly compared to the first five minutes or so of the heat exposure. Thus
the time-integrated numbers discussed below are not completely unique; they
would change somewhat if longer exposures were used. This should be borne in
mind. It Is most pertinent to comparisons in which the parameter varied
might, in some part of its range, substantially prolong the early, stronger
transient phase of gasification (e.g., very low heat fluxes or very high water
content in the wood).
Consider first the reproducibility of the product compositions integrated
over the constant flux exposure time. Figure 7(a) shows the results of four
tests on white pine at the same conditions; Fig. 7(b) shows the results of two
tests on red oak at the same conditions. Reproducibility of the permanent
gases and the total weight loss appears good. (The weight values shown dashed
are expected to be higher because the shutter was not closed at the end of the
exposure and they include weight loss during the cool-down period, as
explained previously.) Only the condensibles, tar and water, show significant
scatter and this is only with white pine. Note that a high value for water
produces a low value for tar and vice versa; this is because the condensibles
consist only of these two constituents and the total quantity of condensibles
was very reproducible. It appears that the scatter in these percentages is
more a result of scatter in the analytical technique rather than in the real
tar and water proportions.
From Figure 8 onward, the emphasis is on the effects of the experimental
parameters on the integrated product compositions. Table I gives all of these
results in tabular form. Note that the figures show both the total mass of
all products and the percentage breakdown of that total. On this type of
plot, a linear increase in total amount of product with an unchanging composi-
tion would result in the dashed lines all being straight and fanning outward
from a common intercept on the vertical axis.
Consider first the effect of total exposure time (Fig. 8). It was stated
previously that in selecting a base case exposure time of 12 to 15 minutes, it
was expected that all of the basic behavior of the wood would be seen. This
- 16 -

is not completely true since there is a unique transient, not seen here, when
the pyrolysis zone hits the rear of the sample (see below). However, it is
apparent from Fig. 8 that there are only weak quantitative changes in product
composition over the exposure times examined. The only really prominent
trends here are the decaying percentage of tar in the products with increasing
exposure time and the increasing percentage of CC^. This trend mirrors the
tar behavior shown in Fig. 4(b); again, the former trend evidently results
from partial destruction of the tar fraction of the wood pyrolysate as it
passes through the increasingly thick char layer. For white pine, in the
presence of oxygen here, the product that appears to replace the destroyed tar
is CO2
(consistent with Fig. 6(b)); this cannot be the sole product of tar
destruction but it is one feasible product. For red oak CO2
again grows the
most but H2O and CO show significant increases as well. Note that all of
these products are probably also growing in relative amount due to increasing
char oxidation as well as due possibly to tar degradation. In any event, it
should be noted that after the first five minutes or so, no component changes
its percentage of the total product by more than two and one half times.
Figure 9(a) shows the effect of halving the wood sample thickness. The
principle impact derives from the fact that the pyrolysis zone reaches the
rear surface of the sample when the thickness is halved. Because of the
comparatively adiabatic behavior of the rear surface, the sample behaves as if
it was increasingly pre-heated as the thermal wave reaches the back. The
result is a late stage acceleration of the mass loss rate as shown in Fig.
9(b). Note the second maximum in the mass flux; it is probable that by this
point this mass flux is coming in part from the rear surface as well as the
front surface of the sample. The thermal wave is not very parallel to the
rear surface by this stage so the intersection with the rear surface is
smeared out in time widening the second mass flux peak. Figure 9(c) shows
that this all has a significant impact on the instantaneous product composi-
tions. The impact is greatest on CO2
right at the end, probably because the
pre-heating effect is greatly accelerating the char oxidation rate (and
pyrolysis is nearly completed throughout the sample).
It is interesting to note that the tar content of the products from the
thinner samples is about twice as high as that of the normal thickness sample.
- 17 -

This may be the result (in part) of pyrolyzate escape from the rear of the
sample where it is not forced to pass through a hot char layer.
The effect of wood grain orientation is shown in Fig. 10. The
designation "parallel" means here that the longitudinal pores in the wood were
parallel to the incoming flux, i.e., these pores came straight out of the
irradiated face of the sample. The designation "perpendicular" means that
these pores were perpendicular to incoming flux, i.e., they ran parallel to
the irradiated face. Most wood in a stove, being in log form, burns in the
orientation designated perpendicular here. Figure 10(b) indicates that with
red oak at the base case conditions, grain orientation has no significant
impact at all on the evolved product composition. Figure 10(a) shows a small
but significant effect of grain orientation for white pine on total product
mass; nearly all of the added product mass in the perpendicular orientation is
tar whose percentage of the total product is doubled in this case. It is not
apparent why these two woods should differ with regard to grain orientation
effects nor is it apparent what causes the factor of two differences in tar
outputs for the two grain orientations of white pine. There are, of course,
enormous differences in the gas permeabilities of woods between flow along and
across the longitudinal pores [10]. Roberts, however, reports that cross-pore
flow resistance decreases rapidly just above 300°C [10]. Presumably, then it
is mainly water movement across the pores and not pyrolysis product movement
that is influenced by sample grain orientation. Even this effect should be
short-circuited here because of the finite sample width. Water vapor unable
to move straight out through the irradiated surface in the perpendicular grain
orientation can instead move sideways out of the sample along the pores. This
would eliminate the convective cooling effect of the water normally found when
it passes out through the heated zone in front of the water vaporization
zone. There is not much water in the base case samples, however, and it is
not clear if this diversion of a small water flux could influence the tar
generation or destruction process.
Grain orientation also has a rather large effect on the thermal
conductivity of wood. The conductivity in the parallel orientation (along the
longitudinal pores) is roughly 2-1/2 times greater than that in the perpendic-
ular orientation for most woods [15]. A higher conductivity tends to improve
-18-

heat flow into the bulk of the wood from the surface where the incoming radia-
tion is absorbed. For a fixed radiation flux, this means that the sample with
a higher conductivity (parallel orientation) will exhibit a lower rate of
surface temperature rise; when re-radiation begins to dominate the surface
temperature, conductivity effects become diminished. Below the surface,
however, the effect continues to be felt. At any depth, the higher
conductivity sample at first increases more rapidly in temperature but, after
some minutes (increasing time with increasing depth), the local temperature
lags that in the lower conductivity sample because the incoming heat is being
transferred more quickly to still greater depths. The net effect of the grain
orientation difference on the thermal wave depth at the end of the test or on
the mass flux history is surprisingly small (~ 10%) for both white pine and
red oak. One cannot assess the role of conductivity as the source of the
differences in Fig. 10(a) (and the lack of differences in Fig. 10(b)) without
a detailed model of the gasification process.
The effect of water content in the wood is shown in Fig. 11(a). Note
that the high water content samples were made from the same wood as was used
in all of the other tests; the wood was soaked in distilled water to increase
its water content. Note also that the total product mass for the sample
containing 30% water is somewhat high since it is based on the pre- and post-
test weight, not just the constant flux exposure period.
The trends in Fig. 11(a) are somewhat more complex than those seen
previously, e.g., here the variation of tar percentage is not a monotonic
function. Water as a gasification product more than doubles its percentage as
one would expect; CO and CO2
decrease considerably which is not expected.
This effect on CO and CO2
is a result of the limited exposure time. This
exposure time was quite adequate for all other samples, as discussed
previously. However, the need to vaporize the large amount of water in the
high moisture samples considerably slows the progress of the wood gasifica-
tion. In the sample with 53% water there was no ash on the surface at the end
of the test implying little or no oxidation of the char had as yet occurred;
hence the low CO and CO2
values.
-19-
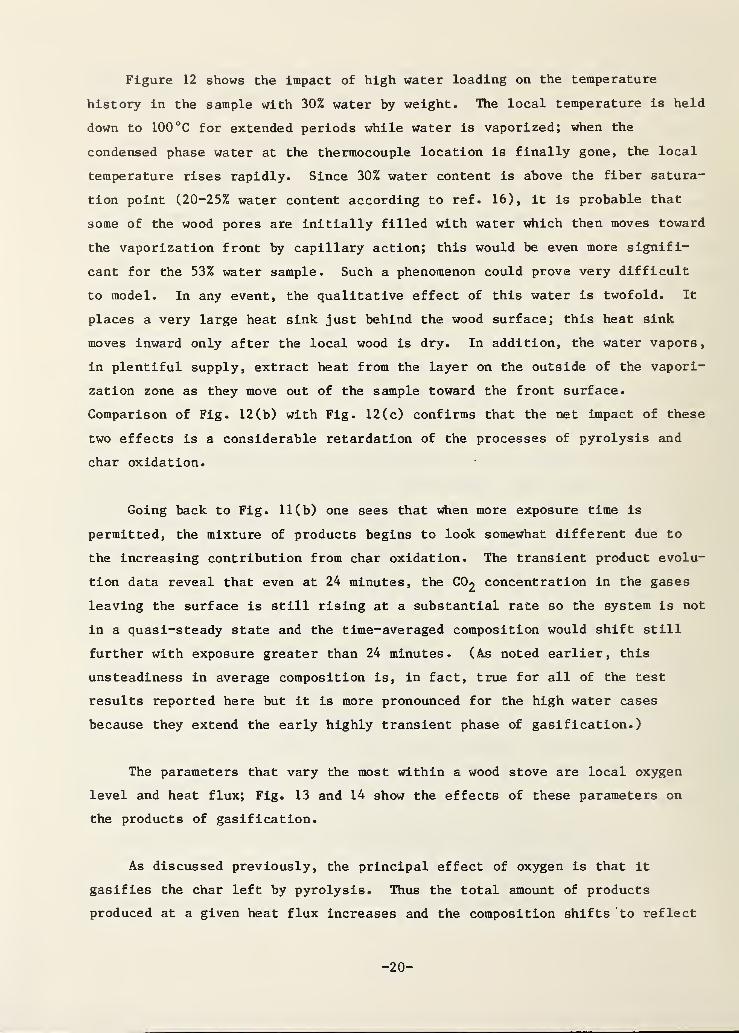
Figure 12 shows the impact of high water loading on the temperature
history in the sample with 30% water by weight. The local temperature is held
down to 100 °C for extended periods while water is vaporized; when the
condensed phase water at the thermocouple location is finally gone, the local
temperature rises rapidly. Since 30% water content is above the fiber satura-
tion point (20-25% water content according to ref. 16), it is probable that
some of the wood pores are initially filled with water which then moves toward
the vaporization front by capillary action; this would be even more signifi-
cant for the 53% water sample. Such a phenomenon could prove very difficult
to model. In any event, the qualitative effect of this water is twofold. It
places a very large heat sink just behind the wood surface; this heat sink
moves inward only after the local wood is dry. In addition, the water vapors,
in plentiful supply, extract heat from the layer on the outside of the vapori-
zation zone as they move out of the sample toward the front surface.
Comparison of Fig. 12(b) with Fig. 12(c) confirms that the net impact of these
two effects is a considerable retardation of the processes of pyrolysis and
char oxidation.
Going back to Fig. 11(b) one sees that when more exposure time is
permitted, the mixture of products begins to look somewhat different due to
the increasing contribution from char oxidation. The transient product evolu-
tion data reveal that even at 24 minutes, the CO2
concentration in the gases
leaving the surface is still rising at a substantial rate so the system is not
in a quasi-steady state and the time-averaged composition would shift still
further with exposure greater than 24 minutes. (As noted earlier, this
unsteadiness in average composition is, in fact, true for all of the test
results reported here but it is more pronounced for the high water cases
because they extend the early highly transient phase of gasification.)
The parameters that vary the most within a wood stove are local oxygen
level and heat flux; Fig. 13 and 14 show the effects of these parameters on
the products of gasification.
As discussed previously, the principal effect of oxygen is that it
gasifies the char left by pyrolysis. Thus the total amount of products
produced at a given heat flux increases and the composition shifts to reflect
-20-

much greater amounts of CO and CC^* This effect is apparent for white pine
and red oak in Fig. 13. It is interesting to note that the combustion of the
char has practically no effect on the fraction of combustible materials
(CO + THC + tar) in the products; for both pine and oak it is never more than
1/4 to 1/3, a surprisingly small fraction.
Comparison of Fig. 13(a) and 13(b) shows that the impact of increased
oxygen level on tar seems to vary with wood type, at least at high O2
levels.
(Because tar measurements showed greater scatter than other product measure-
ments, one should be cautious about apparent trends based on relatively small
changes.) Even though for both woods more solid is gasified in 21% O2
than in
10-1/2% O2 , the percentage of tar and the absolute amount of tar goes down
with increased O2
in the case of white pine and up in the case of red oak.
Comparing Fig. 5(b) with Fig. 3(b) confirms that the pyrolysis zone penetrates
more virgin wood in the high O2
case so that more primary tar is being
generated. The peak surface temperatures for both woods are comparable in
equivalent atmospheres (ca. 620°C in 10-1/2% O2 ; ca. 670-680°C in 21% O
2 ) so
this does not appear to be a factor In explaining apparent differences between
wood types in the survival of the amount of primary tar that emerges as the
tar actually collected. One can speculate that since oak appears to yield a
more open structured char than pine (i.e., the scale of the pores and cracks
is larger) , more primary tar passes through but this cannot be proven at this
point.
Figure 14 shows that the effect of increased heat flux is quite
comparable for both wood types. For the exposure times used here, a flux of
22 W/ cm is just above the threshold of significant weight loss. (For longer
oexposures, this threshold moves downward; for example 1 W/cm will cause wood
in air to smolder if sustained for 45 min. or more.) Increased flux, above
the threshold level, has two principal effects. It increases the heat flux
reaching the pyrolysis zone through the char thus increasing the rate of
pyrolytic gasification. In addition, at low fluxes, it undoubtedly acceler-
ates char oxidation by raising the char temperature. However at high fluxes
the char oxidation rate most probably becomes fully limited by the oxygen
supply rate in spite of further temperature increases; thus this contribution
becomes "saturated". (Referring back to Fig. 13, one sees no such
-21 -

"saturation" with increased O2
level since (>2 supply rate is proportional to
C>2 level.) The combination of these two effects probably accounts for the
decreasing slope of the total product weight with increasing flux in Fig. 14o
for fluxes up to about 7 W/cm . The upturn at the higher flux is based on one
experiment only (the CaF2window broke at this high flux). It is possible
that the upturn represents an additional gasification pathway, e.g., pyrolysis
of the char or gasification by CO2
and l^O, but this cannot be proven at this
point.
Comparison of time-integrated data at a constant time exposure as flux is
varied widely is potentially deceptive. As was noted previously, the product
compositions are still changing at the end of the exposure. Furthermore, for
a fixed integration time, the thermal wave induced by the highest flux will
have progressed deeply into sample whereas the lowest flux case may be just
getting started. This latter situation appears to be the case at 2 W/cm but
by 2-1/2 W/cm the sample is well past the early rapid transient stage in its
12-15 min. exposure. The problem of being misled by time-dependent results is
thus not too bad here but it should be kept in mind.
2 2Comparing fluxes of 4 W/cm and ca. 6-1/2 W/cm , one sees in Fig. 14 that
at the higher flux level both woods appear to yield lesser percentages and
absolute amounts of tar. (The 7.8 W/cm case, based on single test, is
anomalous with regard to tar.) These higher fluxes have a substantial impact
on the char temperature near the surface; the surface temperature is raised by
100°C or more at ca. 6-1/2 W/cm compared to the base cases (4 W/cm ). One
would expect this to increase fragmentation reactions in heavy tar molecules
passing through the char. The amount of total hydrocarbons (THC) is not
obviously enhanced by any such reactions; their percentage is essentially
unchanged compared to the base case. Carbon monoxide does increase but this
could come from degradation of oxygenated tar species or from CC>2 reduction on
the char
.
The effect of wood type has been alluded to somewhat in the previous
discussion. It is shown in (a) versus (b) comparisons of the previous
figures. It is also shown explicitly for three woods in Fig. 15. The most
striking effect of wood type in all of the figures is on the total amount of
-22-

products evolved. It is always much greater with red oak than with white
pine; yellow pine is seen in Fig. 15 to be intermediate between the two.
There are two processes responsible for the total weight loss - pyrolysis and
char oxidation. The pyrolysis weight loss is proportional to the penetration
depth of the pyrolysis zone. For the conditions of Fig. 15, this is about
10 mm (depth of 325 °C isotherm) for red oak and about 15 mm for white pine
(both measured after 15 min. of constant heating). With the assumption of
equal char fractions for these two woods (25-30%), the mass pyrolyzed from
these depths is proportional to the initial density of the wood. The initial
wood densities are as follows: white pine, 0.36 g/cc; yellow pine, 0.66 g/cc;
red oak, 0.74 g/cc. From this one infers that the mass loss of red oak due to
pyrolysis alone is 1.37 times that for white pine. The actual ratio of total
mass losses is 1.55 so the difference is evidently due to a slightly higher
degree of char oxidation in the case of red oak. Without a detailed model of
the wood gasification process one cannot be more precise as to the cause of
these variations due to wood type; existing models in the literature have not
been applied to such questions.
The effect of wood type on the composition of the gasified products is
not large; this is apparent from Fig. 15 and from (a) versus (b) comparisons
of the earlier figures. Red oak and white pine do not differ greatly in gross
composition. The following data are from ref. 17:
Northern EasternRed Oak White Pine
Total carbohydrates 69% 68%Alpha cellulose 46% 45%Klason lignin 24% 27%Ethanol/ benzene extractives 5% 6%
On the other hand, the chemical nature of the hemi-cellulose portion of
the carbohydrates does differ significantly between a hardwood like oak and a
softwood like pine; the lignins differ also, but to a lesser degree [18].
These detailed chemical differences appear to impact the production of
The total product mass for white pine in Fig. 15 is for a 12 min. exposurewhereas that for the other two woods is 15 min.; Fig. 8(a) shows that whit*'
pine would lose 7.8 g at 15 min.
-23 -

specific compounds within the tar such as certain types of phenols, for
example (see below), but they obviously do not greatly affect the gross
product distribution.
3.3 Characterization of the Solid Residue
As is apparent from the previous discussion, one of the products of
incomplete wood gasification is a solid sample with a continuous gradient
(front to back) in its degree of degradation. It is of interest to examine
this material to see what it may reveal about the overall gasification
process. Samples were sliced with a fine saw into a series of layers
(typically 3-5 mm thick) as parallel as possible to the pyrolysis front. This
front was not flat in some cases nor was it necessarily parallel to the rear
surface of the sample (in spite of the fact that the outer 6 mm of each of the
four side faces was first removed and discarded to minimize edge effects). As
a consequence the effective position of each slice relative to the exposed
surface of the wood is uncertain to about ± 2 mm. The slices were character-
ized in two ways: the internal surface area was measured and the chemical
functional groups were characterized by NMR spectroscopy.
The internal surface area of a solid is a factor of prime importance in
its reactivity with oxygen. Here that area was measured by one point B.E.T.
experiments using nitrogen at -196 °C and a Quantasorb Surface Area Analyzer.
(A check showed that multi-point B.E.T. measurements did not give appreciably
different results.) Figure 16 shows the results. Note first that the intactO
wood deep within the sample starts with a surface area of about 0.4 m /g (the
same as one finds on an unheated sample of this white pine). This area is
essentially that due to the walls of the longitudinal pores in the wood. In
Fig. 16(a) where only the ambient atmosphere was varied, one sees a slight
increase in surface area about 1 cm below the exposed face of the sample;
thereafter the increase is substantial. However up to about 4 mm (or less)
below the surface, the increase is essentially independent of ambient O2
level. At shallower depths the intermediate O2
level (10-1/2% O2 ) yields much
more internal surface area near the exposed face of the sample. Interestingly,
the high O2
case (air) is back down to a surface area comparable to the zero O2
(pure N2 ) case.
-24-

When oxygen attacks a carbonaceous material it tends to bore holes into
the solid, especially in locations where catalytic metal atoms exist [19].
This phenomenon, which leads to a variable surface area, has been studied
extensively for coal chars [20]; the surface area typically increases and then
decreases as the char approaches full consumption. Evidently what one has in
the surface layer of the char here is a similarly oxygen-modified material.
In the 10-1/2% O2
case, oxygen has been reacting at a moderate rate when it
encounters the char so that it penetrates to some significant depth (Zone II
behavior in ref. 19). Because of the slicing technique used here one cannot
say for certain what this penetration depth is except that it is <_ 4 mm. In
the 21% O2
case, the boost in temperature accompanying the faster O2
transport
rate speeds up the local char/02 reaction rate and decreases the oxygen pene-
tration depth (Zone III behavior). In the limit (ideal) no oxygen penetrates
the sample face because it is consumed at the front surface; then the internal
area behind the front face is undisturbed from the no oxygen case. This
description, adapted from the coal char literature, appears appropriate here.
In Fig. 16(b), the O2
level is the same in all three cases; only the
water level in the sample varied. Water can participate in carbonaceous char
gasification (yielding CO and H2 ) but it reacts rather slowly unless heavily
catalyzed [19]; its direct influence here is probably secondary since the
temperature of the char is below 650 °C. Given the rather rough nature of the
sample slicing process, one should not take the extrapolations to zero depth
in Fig. 16(b) too seriously; thus it is not clear whether differences greater
than the measured factor of two in internal surface area exist in these three
cases. One expected effect is clearly present: the 50% water case with its
greatly compressed thermal wave (above 100°C) shows also a greatly compressed
region of increased surface area.
Some of the same sample slices as were used for the surface area analyses
1
3
were also characterized by C-NMR. The solid-state, proton-decoupled spectra
were acquired at 15.08 MHZ with cross-polarization and magic angle spinning
techniques on a home-built instrument. The spectra shown in Fig. 17 are the
result of approximately 20,000 scans with 1024 data points for scan at a dwell
time of 50 ps . The time between scans was 3 s and the spinning frequency was
2300 HZ. The chemical shifts (ppm along the abscissa) are relative to tetra-
methylsilane.
-25-

Figure 17(a) shows successive slices from a white pine sample exposed to
4 W/cm in 10-1/2 ©2
* The lowest spectrum is for the unheated wood. Note
that the carbohydrate portion of the wood provides a series of fairly sharp
peaks (^60 to 110 ppm); the lignin, however, contains a variety of carbon
atoms with overlapping resonances that yield a less sharply defined portion of
the spectrum (110-160 ppm). The material from slice 3, centered about 7 mm
below the exposed surface, varied in color from black to a medium brown.
Figure 17(a) shows that despite this considerable discoloration, the carbo-
hydrate portion of the spectrum still dominates (the relative amount of a
given carbon atom in the spectrum is proportional to the area under its peak)
.
These peaks appear even sharper in some cases, probably reflecting the
disappearance (by destruction or re-arrangement) of less-ordered areas of the
carbohydrate chains. The fact that the specific surface area is up by about
4x (Fig. 16(a)) implies substantial disruption of the physical structure of
the wood. The temperature- time history for this condition indicates that at
this position in the wood the temperature just reached about 410°C at the end
of the exposure (but the gradient from back to front of the slice was nearly
100°C). Earl [21] found roughly comparable changes in oak above about 310°C
but his samples were exposed to this temperature for 4-5 minutes; the present
material (slice 3) progressed from 300 to 410°C over a period of about 5-1/2
minutes
.
There are other significant changes in the slice 3 material (Fig. 17(a)).
The broad peak between 110 and 140 ppm has grown indicating an increase in
aromatic species (substituted and unsubstituted). There is also a low, broad
peak below 50 ppm indicative of a range of aliphatic carbons.
Slice 2 (Fig. 17(a)) centered about 4 mm below the exposed surface is
drastically different than the material immediately below it. The surface
area is increased about 2x (Fig. 16(a)) indicating some further physical
disruption but the chemical nature has changed enormously. Essentially all of
the carbohydrate structure is gone and the spectrum is completely dominated by
a broad aromatic peak. (The abruptness of the change in chemical structure is
consistent with thermoanalytical data showing rapid pyrolysis of such carbo-
hydrates as cellulose in a narrow temperature range around 300°C at 5°C/min.)
Most of the persisting peak is due to unsubstituted and carbon-substituted
-26-

benzene ring structures. There is a weak shoulder at 150 ppm corresponding to
oxygen-substituted aromatics; these could be due to the persistence of methoxy
groups attached to aromatic rings which are present in the original lignin
structure. Earl [21] found these groups to be persistent up to at least 390°C
(5 min. exposure) in both oak and spruce. Here there is also some hint of
persistent aliphatic carbons.
In slice 1 (Fig. 17(a)) the structure of the charred wood at and just
below the sample surface (centered at about 2 mm) is further simplified,
probably as a consequence of further heating. The slight aliphatic peak is
gone and the oxygen-substituted shoulder on the aromatic peak is reduced to a
mere hint. Recall that this is the slice that showed indications of oxygen
attack in its large surface area. This spectrum implies that very little of
that oxygen stays in the structure of the solid; evidently it extracts carbon
in the form of CO or CO2
and leaves.
2Figure 17(b) shows comparable spectra for white pine exposed at 4 W/ cm
in nitrogen. The deepest sample, centered about 16 mm below the exposed
surface has no change in its surface area (Fig. 16(a)) and no substantial
changes in its chemical structure. Figure 3(b) indicates that the 16 mm region
reaches less than 250°C by the end of twelve minutes. Slice 2 (Fig. 17(b)) is
centered at about 9 mm below the exposed face and reached about 350 °C at the
end of the exposure; it is quite similar in appearance to slice 3 from Fig.
17(a) even though that slice reached significantly higher temperatures (on
average) . The same chemical changes apply apparently.
The material in the next spectrum of Fig. 17(b), denoted as being between
slices 1 and 2, was collected separately because it appeared to be physically
homogeneous. It constituted the black frangible char-like material easily
scraped off the sample leaving an intact, tough, more wood- like (though
blackened) material beneath it. The NMR spectrum indicates it is in a state
of transition with what appears to be some of the carbohydrate structure still
present. Thus it seems that the abrupt physical transition in the sample
(found also in all other sectional samples) from a woody structure to a fran-
gible char coincides with the rapid pyrolysis of the carbohydrate portion of
the wood. Even though the internal surface area undergoes no abrupt change In
-27 -

this region, it seems probable that the gas flow resistance of the wood may go
down rapidly in this region. Roberts [10] reported the onset of a perme-
ability increase at 310°C (heating conditions not described). The material
here has reached more than 400 °C (on average), but it is most likely the
coolest region of this slice (~ 350°C) that contributed the carbohydrate
structure
.
The top spectrum in Fig. 17(b) bears a strong resemblance to slice 2 in
Fig. 17(a) and presumably represents the same chemical structure. The peak
surface temperature in the N£ atmosphere (550 °C) is about 100 °C less than that
in 10-1/2 percent 02* The lower temperature thus probably accounts for the
persistence of the 02~substituted aromatic shoulder on the main peak of this
surface layer material.
3.4 Total Hydrocarbon (THC) Composition
The permanent gases passing through the cold trap were grab-sampled with
a syringe and analyzed by gas chromatography. Identification was done by
comparison with a known mixture of gases on one GC column only. The known
mixture contained methane, acetylene, ethylene, ethane, propyne, propylene,
propane and butane so it was these gases whose presence or absence could be
sensed in the test samples. In no case were acetylene, propylene or butane
seen; the other five gases were seen in varying proportions. The apparent
presence of propyne is unexpected. The peak identified as this gas was seen
with both white pine and red oak but it did not show up consistently (e.g., it
was seen with red oak at 2-1/2 W/ cm and 6.2 W/cm but not at 4 W/cm or
6.9 W/cm ) . This raises the possibility that the peak was some kind of
artifact, even though, when it did show, it was large (30-60% by weight of the
measured hydrocarbons).
The measured compositions sometimes seemed to vary smoothly and weakly
with some parameter, such as ambient O2
level, then in other tests they were
substantially different. It is difficult to give a typical composition other
than the following. Methane was always present, usually comprising ca. 50% of
the measured hydrocarbons but it varied from 20% to 80% in some cases;
ethylene varied from 0 to 50% of the measured hydrocarbons from red oak but
-28-

was usually 0-10% from white pine; ethane varied from 0 to 30% from both
woods; propane was seen in only one test (with white pine) in which it
comprised 10-20% of the measured hydrocarbons.
3.5 Chemical Composition of the Organic Condensate (Tar)
The composition of the tar was investigated by means of capillary gas
chromatography coupled with mass spectroscopy. Recall that our best estimate
is that the chromatograms or fingerprints represent only about 20 percent of
the mass of the tar injected; the remaining 80 percent stayed either in the
injection port or in the column. Where possible, specific components of the
tar which did pass through the chromatograph were identified. Figure 18(a)o
shows a capillary chromatogram for the base case with white pine (4 w/ cm,
10-1/2 percent oxygen, 3.8 cm thick, wood pores perpendicular to irradiated
face of sample, normal water content, 12 minute exposure). The original
chromatogram which is about five feet long was recast into the form shown.
For any component, the vertical ordinate is proportional to the total peak
area; the abscissa is the retention time of that peak. All subsequent finger-
prints like this have been normalized to the same total amount of tar as was
present in Figure 18(a). The 60 or so peaks shown were those that emerged
above a rather arbitrarily chosen threshold. They represent the "major” peaks
present (few percent by area to a few hundredths of a percent coming through
the chromatograph of the tar). A large number of minor peaks has thus been
dropped.
The weight percentages reported in Fig. 18(b) are based on calculated FID
correction factors. They are percentages of the material coming through the
gas chromatograph; since this is only about 20% of the injected tar, their
percentage of the original tar is one-fifth of that shown.
The species identifications noted in Figure 18(b) fall into two differing
levels of certainty. The higher level (with no parenthetic T after the
species name) were for the most part tentatively identified by mass spectro-
scopy and then confirmed by matching known and unknown retention times on two
different capillary columns (DB-1701 and Supelcowax 10). The lower level
(with a parenthetic T after the species name) emerged from the mass spectro-
-29-

scopic library search with very good scores for matching to the library
spectrum. Their identification must be regarded as tentative since they have
not been checked with regard to chromatographic retention time.
Nearly all of the compounds listed in Figure 18(b) have been previously
found in pyrolysis or combustion products of cellulose, lignin or wood. For
example, 22 of the first 31 compounds are products of cellulose pyrolysis
[22]. These include a variety of small acids (plus methyl esters possibly
resulting from the methanol solvent though some small fraction of the methanol
is also a pyrolysis product), aldehydes and furan derivatives; a curious
feature is the nearly total lack of ketones. Some of the phenolic compounds
(up to peak 31) can also be produced by cellulose pyrolysis but are more
readily produced from lignin [22, 23]. Levoglucosan (peak no. 40) is a
primary product of cellulose pyrolysis [22]; its decomposition may be a source
of several of the smaller oxygenated species. The levoglucosan peak was
always present and virtually always one of the most abundant species in the
tar. However, the appearance of the peak varied considerably and it sometimes
was treated by the chromatograph integrator as a series of small peaks or
occasionally the integrator was fooled by its gentle leading slope and it
reported only a small area value. The "pure" known compound also gave a
rather complex peak of similar shape suggesting that the levoglucosan may
typically be accompanied by lesser amounts of similar anhyro-sugars . Some of
the more complex phenols (eugenol, isoeugenol, vanillin) have been isolated
from wood decomposition products [24, 25] and are readily relatable to the
There are three scores used in the matching process. Purity is a measure of
the similarity between the unknown and the library mass spectrum; a score of
1,000 means the two spectra are linearly proportional to each other. Fit is
a measure of the degree to which the peaks in the library spectrum arecontained in the unknown spectrum; a perfect fit yields a score of 1,000.Reverse fit is a measure of the degree to which the peaks in the unknownspectrum are contained in the library spectrum; again a perfect score is
1,000. Since the species leaving the capillary columns are virtually neverfully separated and 100 percent pure, scores of 1,000 are not achieved butscores above 800 (criterion used here) are highly suggestive of a speciesidentity. Nevertheless, the identification must be scrutinized for generalplausibility in light of the nature of wood and its elemental composition;e.g., species which received high scores in the library search but containednitrogen were rejected. Compounds having other structural featuresseemingly incompatible with the circumstances of the experiment (e.g., a
four carbon ring) were also rejected.
-30-

structure of lignin [26]. Compounds 41 to 46 (except no. 42 which was added
to help stabilize the tar) appear to be derived from the extractives present
in vrood [26],
Some of the compounds in Figure 18(b) (nos. 18, 20, 22, and 23) were not
reported in the preceding references nor in a large compilation of compounds
isolated from wood distillation [27], Of course these sources, while fairly
comprehensive, are not exhaustive. Furthermore, the gasification techniques
used in all of these sources differed from that used here. Nevertheless, this
does add a note of caution about the tentative identification of peaks
numbered 18, 20, 22, and 23.
Inspection of the compounds listed in Figure 18(b) reveals that nearly
all are fairly small molecules; only the last half dozen are rather large.
The only polycyclic compound on the list (no. 46) could well be derived from
the resin acids in the extractive portion of the wood [26]. There is no other
representative of the numerous polycyclics (benzofurans , naphthalenes,
anthracenes, pyrenes, etc.) that have received so much attention in wood stove
emissions [7, 25]. For the chromatographic conditions used here, one would
expect that many of these compounds will be eluted though those without polar
functional groups attached may not be well separated. In fact, the presence
of about eight compounds in this category is suggested by the mass spectro-
scopic library search. They were not included in Figure 18(b) either because
they fell below the threshold level (approximately 0.1 percent of the tar) or
because their scores for matching the library spectrum did not meet the
criterion used here (at least 800 for all three measures of matching). All of
the following scored at least 900 with regard to fit between the unknown peak
and the library spectrum (although their other scores were below 800 except as
noted): naphthalene, 2, 3-dihydrobenzofuran (scores for methyl benzaldehyde
were as good for this peak), 7-methyl benzofuran (scores for 3-phenyl, 2-
propenal were somewhat better for this peak) , 1 or 2-methyl naphthalene (other
scores also above 900), 3-methoxy, 2-naphthalenol (other scores were above
850), phenanthrene with extensive aliphatic substitutions (C^gf^^) and tetra-
methyl phenanthrene (3, 4, 5, 6- or 2, 4, 5, 7-). Phenanthrene itself and
another highly substituted derivative also received fit scores between 800 and
900 for two other peaks. All of this suggests that a variety of polycyclic
-31 -

compounds can be evolved directly from wood when it is gasified. It is
possible that other bigger polycyclics are present but fall below the detec-
tion limits for the techniques used here. The threshold level for Figure 18
corresponds to about 100 mg of a given species per kilogram of wood gasified.
Formation of this much of a given polycyclic during wood combustion (in a
stove) is evidently highly unlikely; typical levels appear to be one or two
orders of magnitude less [25].
3.6 Variability of the Organic Condensate (Tar)
In the discussion of Figures 7 to 15, all of the condensible organic
materials were lumped into a single category called tar. The amount of this
tar varies only by a factor of four over all of the parameter ranges
indicated; most of the parameters altered total tar quantity by a factor of
two or less. Thus, tar would appear to be no more variable than the other
major constituents. On the other hand, when one considers the origin of the
tar in the pyrolytic break-up of cellulose, hemicelluloses and lignin coupled
with the harsh environment through which it must pass on leaving the wood (hot
char sometimes containing hot oxygen), one anticipates a greater variability
in at least some of the constituents of the tar. Since they comprise the
products of a large number of parallel degradation reactions, their relative
amounts should vary with the heating rate of the wood. Furthermore, some
species should be more thermally or oxidatively labile than others.
First it should be noted that the fingerprint for the tar from a given
test was found to be reproducible but this reproducibility required certain
precautions. As noted previously, the methanol solution of the tar frequently
yielded two liquid phases. These had to be uniformly interdispersed before
they could be reliably sampled with a syringe. An ultrasonic bath was used for
this purpose.
The reproducibility of a tar fingerprint for separate samples of the same
wood exposed to the same gasification conditions was good though not nearly as
good as that just noted above. Figure 19 shows an example. The qualitative
reproducibility is very good; it is even better than it appears because most
of the peaks missing from Figure 19(b) are present in the original chromato-
-32-

gram but fell below the threshold for Inclusion. One peak seems to be
genuinely absent (or too small for detection) in Figure 19(b), that between
peaks 26 and 27 in Figure 18(a). Presumably the missing peak is a phenolic
compound.
The quantitative reproducibility is not as good as the qualitative
reproducibility. Some of the variation in relative peak areas is due to
variability in the amounts of minor species that, in effect, confused the
chromatograph integrator as to when larger peaks were beginning and ending.
However, some of the peak areas vary by a factor of two between Figure 19(a)
and 19(b); e.g., the group including peak no. 16 (furaldehyde) ,peak 17
(furfuryl alcohol), peak 22 (tentatively, 1-acetyl cyclohexene), and peak 32
(cresol). Peaks missing from Figure 19(b) that are greater than two relative
area units in Figure 18(a) (and conversely) also must have varied by a factor
of two or more. The reason for this kind of relative peak size variability
must lie in the wood and/or the gasification process itself.^ Probably the
most variable feature of the latter is the pattern of cracks in the char. The
larger cracks provide cooler pathways out through the hot char for pyrolysis
products generated behind the char. The proportion of products going this way
versus through the finer pores in the char where they would be heated to the
char temperature depends on the statistical variability of the crack pattern.
Such a mechanism could lead to a random variation in the concentrations of
those tar species most subject to thermal degradation (and, conversely, in the
products of such degradations).
There are some systematic differences in retention times of equivalent peaksthat result mainly from small variations in column carrier gas flow rate.Comparisons discussed below are all based on superimposing two fingerprintsand aligning characteristic patterns of peaks irrespective of retentiontimes which can vary by a few minutes
.
^ There is also significant scatter in the absolute size of all peaks in thefingerprint as a whole. It was noted previously that all of the
fingerprints have been normalized to the same amount of tar as that injectedfor Figure 18(a). However the absolute tar determinations are subject to an
uncertainty of about ± 30 percent on average since the tar was the minorcomponent in a mixture with methanol and water and could only be determinedby difference.
-33-

Figure 20 shows the effect of exposure time to the thermal radiation for
otherwise base case conditions; the wood is white pine. The first two finger-
prints in the series (1-1/2 minutes, 2-1/2 minutes) show differences that
appear to be significant (greater than the sample-to-s ample variability). In
the following discussion, the retention times are those for the base case
(Figure 20(d)). The acetic acid peak (#13, ca. 8 minutes) is greatly
suppressed. The group of small to medium peaks between 12 and 16 minutes,
including #14 and #15 (tentatively, ethyl benzene and propionic acid,
respectively) is suppressed (all are present in trace amounts). The group of
peaks between 20 and 24 minutes is strongly suppressed except that #17
(furfuryl alcohol) is present just below the threshold. Essentially all of
the other differences represent changes in relative proportions rather than
total suppression of a peak since all peaks in the base case are present at
least at the trace level. From exposure times of 6 minutes to 24 minutes, the
differences are less and less significant, with corresponding peaks falling
mostly within a factor of two with regard to absolute or relative size.
The reasons for the differing fingerprints at short times are at least
twofold. First, the surface temperature is still climbing significantly: it
is 525 °C at 1-1/2 minutes, 580°C at 2-1/2 minutes, and it then rises only
another 40°C to 620°C by 6 minutes. This means that in the first few minutes,
the relative proportions of products arising from the different wood constit-
uents is changing more rapidly than it does after the thermal wave becomes
more "quasi-steady", penetrating inward with a nearly fixed peak temperature.
Relative thermal stability of the wood constituents counts more with regard to
gaseous product emissions in these first few minutes than it does subsequent-
ly. Second, there is no char layer initially so any reactions in such a layer
are suppressed. Unfortunately, in the absence of more specific information on
degradation rates and products, we cannot discern which of these mechanisms is
primarily responsible for the product variations noted above.
Figure 21 shows the effect of ambient oxygen level on the fingerprints of
the tar from white pine. The fingerprints from pure nitrogen and from 10-1/2
percent O2
are extremely similar (as good as the reproducibility of a finger-
print from one sample to the next) . The fingerprint from the ambient air case
has all of the same peaks (though several fall below the threshold). However,
-34-

there are substantial differences in the sizes of most of the peaks with the
air case yielding peaks half the size of those in 10-1/2 percent O2
. Given
the uncertainties here, this difference is on the borderline of being signifi-
cant so it is difficult to assign a meaningful interpretation.
Figure 22 shows the effect of incident heat flux varied about the base
case (4 w/cm ) for white pine. In this series, virtually all of the same
peaks are present; those that appear to be missing fell below the threshold
for inclusion. Most of the relative peak height variations fall near or just
outside a factor of two and therefore cannot be judged to be significant. One
apparent exception is compound number 32 (cresol) which shows peak height
variations of a factor of four among the various cases. In fact, the very
large cresol peak for the base case (Figure 22(b)) is exceptional; other base
case runs show this peak reduced by about a factor of two relative to the
other peaks present. Red oak showed a similar lack of significant effects due
to flux level.
Sample thickness and grain orientation had a similar mild impact on the
tar fingerprints. Figures 23 and 24 are included for completeness.
Figure 25 shows the tar fingerprints obtained with white pine where only
the water content of the wood was varied about the base case value. The
difference between the oven dry case and the base case is not significant;
this is not surprising since the base case water content was only about 5
percent. The presence of 30 percent or more of water in the wood has a signi-
ficant impact on the tar composition. Comparison of Figures 25(b) and (c)
shows that the higher water case yields a fingerprint where many of the peaks
are suppressed. Note that the phenols are less suppressed (the decreases are
of borderline significance) than the numerous oxygenated species probably
arising in large part from the carbohydrate portion of the wood (cellulose and
hemi-celluloses) . Most, if not all of these latter degradation products are
in fact present but their relative quantities are decreased by factors of 4 to
10. About half dozen of them re-emerge above the threshold in the case with
ca. 50 percent water (Figure 25(e)).
-35-

It was noted earlier that the base case 12-15 minute exposure times may
have been too short in some cases such as with high water content because the
early transient is distended. The case of ca. 30 percent water was repeated
with a 24 minute exposure (Figure 25(d)) and it shows essentially no signifi-
cant changes in the tar fingerprint as a result of this longer time even
though greater char oxidation was clearly evident in the test. Thus,
relatively short exposure time is not the cause of these fingerprints
differing from the base case.
The peak surface temperature (ca. 650 °C) is about the same for 33 percent
water and for the base case. Furthermore, in the extended exposure case just
mentioned, the char layer is ultimately comparable to the base case as well.
Thus, there would appear to be no reason to expect differing degrees of tar
alteration upon passage through the char. However, there are some differences
here that may count in this regard. Recall that most of the tar is evolved in
the first few minutes (Figure 4(b)). During this time, the high water content
does indeed keep the char substantially cooler as a comparison of surface
temperature histories shows:
. Base Case 33% WaterTime (min) Surface Temp.(°C) Surface Temp.(°C)
2 575 325
4 600 495
6 625 590
8 630 620
In addition there is a physical difference in the chars that may well
yield differing degrees of thermal contact; the char in the high water cases
always was perforated by a fairly regular array of cracks (1-2 mm wide). This
yielded 2-3x more large crack area for sub-surface volatile escape than was
seen in low water cases (all cases are for the wood pores perpendicular to the
irradiated sample face).
It is tempting to infer that it is levoglucosan degradation (or the lack
thereof) that accounts for the bulk of the differences in the high water/low
water tar fingerprints. While some of the high water cases do indeed show
high levoglucosan levels, there is not a consistent significant trend.
-36-

One expects some significant differences in the tar fingerprints when
different types of wood are compared, particularly hard wood versus soft
wood. Figure 26 compares base case fingerprints for white pine, yellow pine
and red oak. Hard wood lignin contains many more dimethoxy phenolic moieties
than does soft wood lignin [28]. The hemi-cellulose constituents also differ
significantly [26]. The degradation products from the latter probably cover a
very large spectrum of species and may not yield distinctive differences
between hard and soft woods. The lignin, on the other hand, is the major
precursor of the various phenols so one anticipates significant changes in the
range of such species in the tar. Figure 26 does show some significant
changes in the phenolic make-up between the two types of pine and red oak but
the changes are not very dramatic. Once again, peaks not shown are present
below the threshold. The biggest identified change is in the quantity of
species no. 39 (vanillin). Contrary to expectation, since this is mono-
methoxy phenol, the red oak yields significantly more than either type of
pine. The other large change is the tall peak at about 59-1/2 min in the red
oak fingerprint. This is a complex peak and it is unclear whether the bulk of
it is due to compound no. 36 (eugenol) or to eugenol plus some other species
(likely another phenol in this region of the chromatogram). In any event it
is surprising to note that no dimethoxy phenol is definitely identified in the
red oak fingerprint. The other differences among wood species are of border-
line significance.
In summary, the preceding results imply that, except for the case of wet
wood or of normal wood exposed only briefly, the chromatographable portion of
the organic condensate does not vary in the relative concentrations of most of
its constituent species by more than a factor of two or three.
3.7 Other Fingerprinting Techniques for the Organic Condensate
The preceding result is more than a little surprising given the wide
range of conditions under which the tars were generated. Recall that the
capillary GC fingerprints only represent about one-fifth of the tar. This
being the case, it is highly desirable to attempt to confirm this apparent
invariance by some other technique that does not select a portion of the tar
in the same way as does the gas chromatograph. Three further techniques wer<*
-37 -

tried, gel permeation chromatography, fast atom bombardment mass spectrometry
and liquid chromatography. Neither of the first two techniques is very satis-
factory in that the fingerprint is relatively featureless. Both look essen-
tially at the distribution of molecular sizes in the tar and not at functional
groups on the molecules. The third technique produces a detailed fingerprint
but it has other limitations.
Gel permeation chromatography (GPC) is a form of liquid chromatography
that separates molecules based on their effective size in a given solvent.
The stationary phase, in this case Waters Micros tyragel , has a graded micro-
porosity that retards the forward motion of molecules through the column to
varying degrees as a function of the molecules size-dependent ability to
penetrate the pores. The injected sample thus elutes from the column as a
function of time with the smaller molecules exiting last. The concentration
of the eluting molecules is measured by a differential refractometer. The
calibration of elution time with molecular weight is done with known
compounds. In the present case this calibration was done with narrow molec-
ular weight fractions of polystyrene so the calibration is not exact; it could
easily be off by a factor of two but that is not crucial for the present
purpose
.
Figure 27 shows GPC results for the organic condensate from two white
pine samples exposed differently, one in nitrogen (Fig. 27(a)) and the other
in air; other exposure conditions are those of the base case. These two cases
were chosen because one might expect significant differences in the composi-
tion of the condensate; inspection of Fig. 3 and Fig. 5 indicates that the
peak sample surface temperatures differ by more than 100°C. Both spectra are
qualitatively quite similar showing a main peak at MW - 220-250; both also
show a significant number of molecules of MW > 1000. (Recall, however, that
the absolute molecular weight calibration is approximate here.) Both GPC
chromatograms have been truncated at just below MW=100 because the water and
methanol present cause a large negative peak. It should be noted also that
about 15% of the height of the lower molecular weight peak is due to solvent
impurities. Quantitative differences between the two cases can be seen but
they are probably not significant; they fall within the spread of results seen
when condensate from two different wood samples , exposed identically, is
-38-

subjected to GPC analysis. The same ambiguity about the significance of
quantitative differences also was found with condensate from samples exposed
2 2at very low and very high radiant fluxes (2-1/2 W/ cm vs. 7.8 W/cm )
.
Fast atom bombardment (FAB) mass spectroscopy provides a measure of the
molecular weight distribution of a sample as well. The sample is coated on a
metal surface (along with some glycerol) and bombarded with fast neutral atoms
(cesium in the present case) which both vaporize and ionize the molecules.
The ions (positive or negative) are then sorted according to mass/charge ratio
as in normal mass spectroscopy. Fragmentation of the molecules is relatively
small but it does yield some distortion of the molecular weight distribution,
biasing it toward smaller sizes.
Figure 28 shows FAB mass spectra of the organic condensate from the same
two white pine samples as were used for Fig. 27. Figure 28 does not show a
significant difference in the FAB spectra. Both samples yield a broad flat
distribution of ions extending to 1000 amu and beyond (note that the inset
graphs provide magnified views of the high end of the mass unit scale). The
tall peaks at 93 and 185 amu are due to the glycerol; the peak at 133 amu is
due to cesium ions; the peak at 43 amu is a common hydrocarbon fragment that
could arise from many different parent molecules.
An interesting feature here, as with the GPC chromatograms, is the
indication of an appreciable amount of high molecular weight material. The
capillary gas chromatograms did not reveal material heavier than about
200 amu. Figure 28 implies that perhaps 40-50% of the organic condensate mass
lies above this value. (Figure 27 implies a high molecular weight portion
more like 25-30%.) One might at first infer that such material is largely
polycyclic organic material. While some of it undoubtedly is, it seems
unlikely that the majority is. Polycyclic aromatic hydrocarbons become
rapidly less volatile with increasing size; coronene (M.W.=300) has a boiling
point of 525 °C. Unlike the wood stove situation in the radiative heating
experiments such molecules cannot form in the gas phase away from the wood.
They must form in the wood sample and then leave; the temperatures are not
adequate for the requisite vaporization in most of the sample.
-39 -

A more probable explanation of these large molecules is that they are
polymers (oligomers) of some of the smaller species. The furans, phenols and
aldehydes are capable of reacting together to form condensation polymers
[29], Such polymerization of the organic condensate from wood gasification
has been previously reported [24,30]; acid or base catalysis can be involved.
Such large molecules would be equally unlikely to vaporize from the wood
during radiative heating. They could conceivably form in the aerosol droplets
as the cooler temperatures away from the wood surface allow condensation; in
this case they would not be artifacts. The alternative is that they are
artifacts which formed in the sampling system or during sample storage. The
capillary GC chromatograms have not changed systematically with age over many
months; this implies that any such polymerization would have to go essentially
to completion fairly soon after sample generation, perhaps during the process
of being extracted from the cold trap (the samples spend up to two hours at
room temperature). Unfortunately, we do not have enough information to
resolve this issue.
Liquid chromatography, based on a solute's chemical interaction with a
stationary phase (rather than a physical interaction as in GPC), can produce a
more detailed fingerprint. In the form used here (reverse phase), the tar
/
solvent sample is injected on the head end of a high pressure liquid chromato-
graphic column (HPLC) where it is subjected to a flow of an eluting solvent
whose composition is slowly changed. An important advantage here is the lack
of any sample heating such as occurs in gas chromatography; this method is
non-destructive so the losses that occurred in the capillary GC inlet are
absent here. The HPLC column was a Vydac 201 TP C^g column; the eluting
solvent was initially 10% methanol in water and it was programmed to 100%
methanol over a 30 min. period. The net solvent polarity thus decreased with
time so the first eluted components are the most polar. Since 100% methanol
is still fairly polar, non-polar constituents of the sample would not be
eluted; it is not expected that any great amount of totally non-polar species
is present anyway.
A difficulty with HPLC is the lack of a highly sensitive universal
detector. A refractive index detector, such as that used in the GPC studies,
is universal but here it showed only two or three peaks (probably solvents
-40-

present). An ultraviolet absorption detector (254 ran) was used to generateQ /
the fingerprints in Figure 29. Such a detector is 10-10 times more sensi-
tive but it is selective for species absorbing at the wavelength chosen.
Generally this means species with conjugated double bonds or aromatic
resonance. This could include, for example, the various phenols, furans,
polycyclic aromatics and carbonyl compounds with 6 unsaturation. Since ultra-
violet absorbance peaks are quite broad, many compounds whose absorbance does
not peak very near 254 nm will be seen anyway but the apparent peak height
will be relatively suppressed.
What this means is that HPLC with an ultraviolet detector should
definitely produce a fingerprint with a differing set of biases from those in
gas chromatography. Since it relies on solubility and not volatility, it
seems reasonable to expect that it also will elute nearly all of the sample,
i.e., the higher molecular weight species (at least those soluble in methanol,
which appear to be a majority) should elute as well as the smaller species.
Figure 29 presents HPLC fingerprints for two of the same samples as were
used in the other techniques. It is clear that HPLC lacks the resolution of
capillary gas chromatography, however, the fingerprint has a good deal of
detail. Comparison of the fingerprints for the condensate obtained from two
substantially differing gasification conditions (white pine in air and in
nitrogen) shows very little difference. As with the other techniques, the
most obvious differences (which are few) are in relative peak heights only.
These additional fingerprinting techniques tend to confirm the borderline
significance of variations in the composition of the organic condensate as the
conditions of its generation are varied. The first two indicate that the bulk
of the material missing from the capillary GC fingerprints is of high molec-
ular weight (MW >_ 200)
,
most likely polymers of some of the smaller molecules.
If these (presumed) polymers were prevented from forming, the capillary GC
fingerprints would look different because some of the furan, aldehyde and
phenol peaks would be enlarged (we cannot say which at this point). However,
since the amount of high molecular weight material apparently does not varv
greatly with the conditions of condensate formation, we can only infer at this
point that the fingerprints with polymerization suppressed would not vary "inch
-41 -

differently with sample exposure conditions from those obtained here. The
mechanism for such comparative invariance of the condensible organic species
remains unclear.
3.8 Comparison with Wood Stove Organic Condensate
It is of interest to see to what degree the fingerprints of the tar from
the radiative heating tests correspond to those for similar woods burned in a
wood stove. The stove used for this purpose was airtight and non-baffled with
a firebrick lining; it had a glass window on one side that allowed limited
viewing of the combustion of the wood load. Duplicate runs with two kinds of
wood were made under the "overnight burn" conditions mentioned earlier, i.e.,
the air supply was choked down to the point that flaming was absent more than
95% of the burn time. The resultant stack temperature (about two feet from
the stove exit) was in the range 100-115°C. The stove was filled to about
two-thirds of full capacity after a bed of coals was first established. Smoke
from the stack centerline (about two feet from the stove exit) was sampled
continuously during the next 5-1/2 to 6 hours of burning. The stove air vents
were adjusted manually during this time to keep the stack temperature in the
range indicated. The sampling system was essentially identical to the cold
trap and aerosol filter used in the radiative heating tests except that a
second spiral cold trap was added In series with the first to preclude break-
through at long times; this proved to be unnecessary. The sampling rate was
kept low (500 cc/min) so as not to warm up the cold traps excessively at long
times. About 5 g of material was collected over the test duration.
Extraction and fingerprinting techniques were identical to those for the
radiative heating tests. Two runs were made with mixed oak wood (red, white
and pin oak) and two were made with yellow pine. The logs were split pieces
with a minimum thickness dimension in the range of one to three inches; bark
was included in the oak but not the yellow pine tests. Moisture content of
the wood, checked with an impedance meter, was 8-10%.
Figure 30 shows the fingerprint of the organic condensate from a stove
burn with mixed oak and that of the condensate from radiative heating of red
oak at the base case conditions. It should be noted that the heating rate and
ambient oxygen history around the wood in the stove most probably differ
-42-

substantially from point to point in the stove and also, of course, they
differ from that seen by the red oak sample in the base case radiative heating
test. However, the preceding discussion of the fingerprints from the radia-
tive heating tests implies that these differences will not have a major impact
on the condensate composition. In fact Fig. 30 shows that the fingerprint
from the stove is generally quite similar to that from the radiative heating
apparatus. At the same time there are a few differences that are more
definite than those existing among the radiative heating fingerprints.
Several of the peaks in the retention time range of 14 to 17 min (Fig. 30(a))
are present only at trace levels in the stove fingerprint. The peaks at 28.14
(tentatively, solketal) and 28.35 min (3 or 5-methyl furan 2-aldehyde) (Fig.
30(a)) are completely absent in the stove fingerprint. The peak at 55.8 min
(2-tert butyl phenol) (Fig. 30(a)) is suppressed by an order of magnitude.
Three or four other peaks due to unidentified products are similarly
suppressed by an order of magnitude. Levoglucosan (79-80 min) is present in
substantially reduced amounts though this compound varied widely in the radia-
tive heating tests. The reasons for the absences noted is not clear.
Presumably these compounds were generated in the wood but were preferentially
degraded as the smoke underwent recirculation through the smoldering bed of
wood before leaving the stove.
Figure 31 shows a similar comparison for yellow pine. Again the two
fingerprints are largely alike although here the stove case has a few both
added and subtracted peaks. For the identified species the major differences
are as follows. The peak at 28.41 min (3 or 5 methyl furan 2-aldehyde) (Fig.
31(a)) is much less in the stove as it was for oak above. The peak at 29.58
min (butyrol lactone) (not shown in Fig. 31(a) because it is below the
threshold) is an order of magnitude bigger in the stove. The peak at 59.34
min (eugenol) (again below the threshold in Fig. 31(a)) is about 5x bigger in
the stove. Contrary to the oak case, the levoglucosan peak (79-80 min) is
somewhat bigger in the stove than in the radiative heating situation. There
are about half a dozen other unidentified peaks which differ in size by a
factor of 5 to 10 between the two heating situations.
The major implication of this result is that, in this "overnight burn"
condition, the majority of the products leaving the wood stove (and becoming
-43-

air pollutants) arise directly from the wood surface during its self-sustained
smoldering process. Passage through the stove for the most part involves
dilution and cooling of the wood gasification products. Some recirculation
through the smoldering bed of wood is inevitable and this causes some re-
contact with the hot wood surfaces but the net alteration is comparatively
small. It is possible that the differences between the stove and radiative
heating fingerprints seen here have more to do with the differences in the
mode of wood gasification rather than any further reactions in the stove.
This point will be checked in future experiments on two-dimensional, self-
sustained smolder of wood.
4. CONCLUSIONS
The products of the gasification of wood have been extensively
characterized for a wide range of conditions incorporating those in wood
burning stoves. The major products (CO, CO2 , water, tar, THC) vary rapidly
with time only in the first two or three minutes but their rate of emission
continues to vary more slowly with prolonged heat exposure. When time-
averaged major product compositions are compared as a function of the condi-
tions of wood gasification (varying heat flux, ambient oxygen, sample thick-
ness , grain orientation, exposure time, water content and wood type, one
variable at a time about a base case), they are found to change by no more
than a factor of four for all conditions examined; in many cases the variation
is within a factor of two.
The organic condensate or tar is extremely complex In composition,
probably exceeding two hundred constituents above trace levels in the
chromatographable portion alone. Twenty-nine species were positively identi-
fied by a combination of gas chromatography and mass spectroscopy. An
additional fifteen species were tentatively identified by the same techniques.
Nearly all of these species have been previously seen in other types of wood
and/or wood component gasification processes. Except in the cases of very
short time exposures or high water content in the wood, the relative levels of
the main constituents in the chromatographable portion of the tar (ca. 20% of
the mass) varied by no more than a factor of two or three despite the wide
variations in sample exposure conditions . In the former two cases , there was
-44-

some hint (but no definitive evidence) that the significant differences could
be due to lesser degradation of primary tar components in the hot char through
which they must pass in order to leave the gasifying wood.
An interesting finding is the general similarity between the fingerprints
from the radiative heating experiments and those from "overnight burning" of
the same woods in a stove. This implies that, for this type of burn condi-
tion, most pollutants issuing from a woodstove are coming directly from the
smoldering wood.
The results of this study (and others preceding it) imply that predicting
even the major components (CO, CO2 , ^0, tar, THC) of wood gasification in the
presence of oxygen requires a chemically complex model. Kinetic descriptions
are needed for the temperature (and possibly oxygen) dependent rate of gasifi-
cation of the three major component classes (cellulose, hemi-celluloses
,
lignin). For ignition studies where the most volatile components count
heavily, the extractives may also be important. Strictly speaking each of
these major wood components requires a multi-step description of the degrada-
tion and gasification in order to be broadly applicable and this still
neglects any interactions among the basic wood constituents. A complete
description of the stoichiometry of major product formation from each wood
component is also necessary. The char oxidation process may be fairly simple
chemically but it has physical complications inherent in it; the char is
porous and it goes through large changes in internal surface area as it is
consumed. Some description of this is needed. Secondary gasification
reactions (CO2 , H
2 , H2O attack) complicate the char behavior at temperatures
above about 650°C. Finally there is the ambiguous issue of reactions between
primary tar products and the hot char (forming either smaller molecules or
more char). More direct evidence on this is needed. Presumably the same
experiments which could provide the direct evidence could also provide some
empirical rate information. Secondary tar reactions are also coupled to the
physical state of the char - the degree to which it contacts the primary tar
passing through or largely bypasses material through cracks. Prediction of
char cracking patterns is a fundamentally intractable problem so some appro-
priate empirical description of this process would be required.
-45-

5 . ACKNOWLEDGMENTS
Mr. William Wooden and Dr. Arvind Attreya helped extensively in carrying
out the radiative heating experiments. Dr. Attreya also provided extensive
assistance in the tedious job of installing the fine surface thermocouples.
1
3
Dr. William Manders ran the C-NMR experiments on the wood residue and
interpreted the spectra.
Mr. Robert Smith of the West Virginia University Mass Spectroscopy Center
performed all of the mass spectral analyses.
Mr. James Brown ran the gel permeation chromatograms on the organic
condensate. Dr. Michael Welch ran the Fast Atom Bombardment mass spectral
analyses. Dr. Stephen Wise ran the liquid chromatography analyses. Mr. Frank
Guenther provided helpful advice from time-to-time on the capillary gas
chromatographic analyses.
6. REFERENCES
[1] Cooper, J. and Malek, D.,Residential Solid Fuels; Environmental Impacts
and Solutions, (Proceedings of the 1981 International Conference,
Portland, Oregon), published by Oregon Graduate Center, Beaverton,Oregon, 1982.
[2] Bendersky, C. , "Results of the Residential Wood Program Emissions ThinkShop", Pyros Inc. Report 1011. Rl, August 1980.
[3] Gann, R.,"Comparison of Principal Combustion Products from a Wood Stove
as a Function of Height in the Chimney", Final Report for FY 1982 on DOEProject No. 133A, DE-AOI-76PR06010 from the National Bureau of Standards(October 1982).
[4] Murphy, M. , Allen, J. and Longanbach, J. ,"Residential Heating with
Solid Fuels, Task 2: Characterization of Wood Charge Utilization inWoodstoves"
, Final Report to USDOE from Batelle Columbus Laboratories,Columbus, Ohio (April 1984).
[5] Dyer, D. , et al., "Improving the Efficiency, Safety and Utility ofWoodburning Units", Quarterly Report WB-4, Vol. II on ERDA ContractEC-77-S -05-5552
, Auburn Univ. Dept, of Mech. Eng., September 1978.
[6] Attreya, A., "Pyrolysis, Ignition and Fire Spread on Horizontal Surfacesof Wood", Ph.D. Thesis, Harvard University (1983).
-46 -

[7] DeAngelis , D.,Ruffin, D. and Reznik, R. , "Preliminary Characterization
of Emissions from Wood-Fire Residential Combustion Equipment",Environmental Protection Agency Rept., EPA-600/7 -80-040 , March 1980.
[8] Rose, M. and Johnstone, R., Mass Spectroscopy for Chemists and
Biochemists,Cambridge University Press, Cambridge, England, 1982,
p. 54 ff.
[9] Lee, C. , Chaiken, R. and Singer, J. ,"Charring Pyrolysis of Wood in
Fires by Laser Simulation", Sixteenth Symposium (International) onCombustion , The Combustion Institute, Pittsburgh, PA (1976), p. 1459.
[10] Roberts, A.F., "A Review of Kinetics Data for the Pyrolysis of Wood and
Related Substances", Combust. Flame 14 , p. 261 (1970).
[11] Kung, A.C., "A Mathematical Model of Wood Pyrolysis", Combust. Flame 18,
p. 185 (1972).
[12] Kansa, E. ,
Perlee, H.E. and Chaiken, R. , "Mathematical Model of WoodPyrolysis Including Internal Forced Convection", Combust. Flame 29
,
No. 3, p. 311 (1977).
[13] Madorsky, S.,Thermal Degradation of Organic Polymers , Inter science , New
York (1964) p. 238.
[14] Kanury, M. and Blackshear, K. , "Some Considerations Pertaining to the
Problem of Wood Burning", Comb. Sci. Technol. 1 , (1970) p. 339.
[15] Summitt, R. and Sliker , A. (eds.), CRC Handbook of Materials Science ,
Vol. IV, Wood , CRC Press, Boca Raton, Florida, 1980, p. 38.
[16] ibid , p. 26.
[17] Rowell, R. (ed.). The Chemistry of Solid Wood , ACS Advances in ChemistrySeries No. 207, American Chemical Society, Washington, DC, 1984,
p. 78 ff.
[18] ibid, p. 62 ff.
[19] McKee, D. , "The Catalyzed Gasification Reactions of Carbon", Chemistryand Physics of Carbon, Vol. 16 (P. Walker and P. Thrower, eds.), Dekker
,
New York (1981), pp. 1-118.
[20] Laurendeau, N. , "Heterogeneous Kinetics of Coal Char Gasification and
Combustion", Prog. Energy Combust. Sci. 4 , (1978), p. 221-270.
[21] Earl, W. , "An Investigation of Wood Pyrolysis Using Solid State ^CNuclear Magnetic Resonance", in Residential Solid Fuels , op. cit.,
p. 772.
[22] Molten, P. and Demmitt, T. , "Reaction Mechanisms in Cellulose Pyrolysis:A Literature Review", Batelle Pacific Northwest Laboratories ReportBNWL-2297, Richland, Washington, 1977.
-47 -

[23] Milne, T. , "Pyrolysis - The Thermal Behavior of Biomass Below 600°C" in
"A Survey of Biomass Gasification, Vol. II - Principles ofGasification", Solar Energy Research Institute SERI/TR-33-239, Vol. II,
July 1979.
[24] Goos, A., as quoted in Jahnsen, V., "The Chemical Composition ofHardwood Smoke", Ph.D Thesis, Purdue University, 1961.
[25] Hubble, B. , et al., "Experimental Measurements of Emissions fromResidential Wood-Burning Stoves" in Residential Solid Fuels;Environmental Impacts and Solutions , op. cit. p. 79.
[26] Sjostrum, E., Wood Chemistry; Fundamentals and Applications , AcademicPress, New York, 1981, Chap. 4 and 5.
[27] Hawley, L., "Combustion of Wood" in Wood Chemistry, Vol. 2 (2nd ed.),L. Wise and E. Jahn (eds.). Reinhold, New York, 1952, pp. 846-850.
[28] Rowell, R. (ed.), op. cit., p. 66.
[29] Roberts, J. and Caserio, M. , Basic Principles of Organic Chemistry ,
W.A. Benjamin, New York (1965) pp. 1102-1103.
[30] Polk, M. and Phingbodhippakkiya , M. , "Development of Methods for the
Stabilization of Pyrolytic Oils", EPA Report EPA-600/2-81-201 , AtlantaUniversity, Atlanta, Georgia, September 1981.
-48-
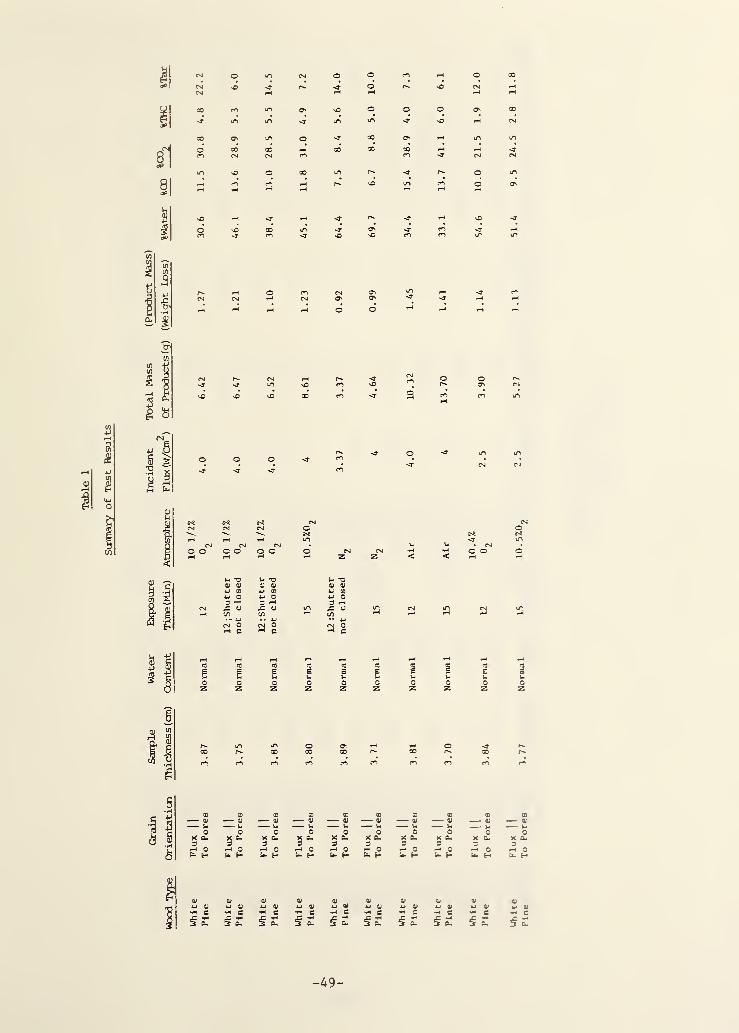
§1
§1
ss
(Vu
I&
CO
—— >-
oX 0-3^ o
fs- E-
OX 3-3
H C
5 £
0)— uo
X &.3•H Ou. H
0)
•H 3
OX 0-3
*-< OU. H
0)
Uo
X cu3
Ou. H
S 5 S §-« C «H C
oX 0-3
r-« Ou. t-
c
§ £
49

liable
1
(Continued)
II
§1
St
£&
u O3 rHxl uCO
o o o o
3§ o uco 4-i
<0
<? 3
co d>CO 4-1
03
c> 3
.5 1rtf +3
^ §
CD— <y— w.
o
rH Oft- H
CD
<U
ox ft3rH Oft- H
CD
0)
Vj
oX ft3rH Oft- H
<U— uo
X ft3rH Oft- H
co
<y— ft
x <£3rH Oft- H
(1)
ft
OX ft3rH Oft- H
CO— <u— po
X ft3^ G
ft- H
CD
<U
J-
OX ft.
3rH Oft- E-»
Uo
X ft3rH Oft- H
OX ft3
•H C
^ ft
(1)
U 0)•H C
0)
U 0)•H C •H C
a) 0)
u 0J u 0)
•H C *H C
£2
-50-

i\
§i
m
I a
ISM
U
i
U -o0) 0)
4J CO
4-» O3 r-l
J= OC/3• - *J
CM OrH C
0)
1 >H
oX o.3
f-H OP- H
d)— uo
X CL,
3rH OP- H
x a.3^ CP« 6-
X P-3rH OP« H
0)
Wi
Ox a3rH OP. H
0)— w<
oX o-3rH OP- E-
0)— uo
X Oh3rH OP- H
0)
ui OJ
•H C •H C
0)
4J <UH C *3 .*U qOC O
51
Table
1
(Continued)
qH•h tq
(TJ -P
8 §
3
3°* 3
(1)
1 Uo
X CL3rH OH
T3 ^(V «J
Pd OX3 Jd0) «0
fid OT3 -XQJ (0
o2 o-o ^a> to
oS oT3 .X0) CO
OS O-3aj co
« o*o ^<U CO
c2 o"O ^ T3 ^0) co 0) 03
cfi O PS o
52
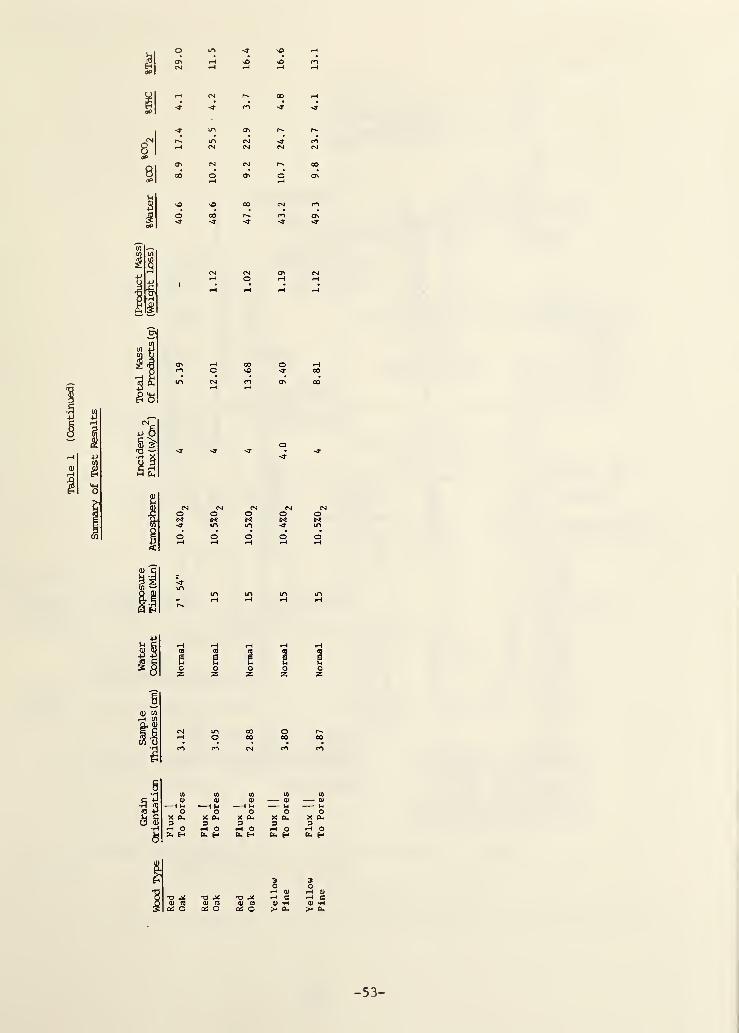
II
oONCM
rH
2
24-4
<N
^ ro
in on
m cmCM CM
CM CM
O ONrH
SO 00
oo r-*
<r -d-
00 rH
<4* -d
<r roCM CM
r>» oo
C O'rH
CM CO
CO ON<r <r
o*d-
ON
o»d- 'd* • -d-
<r
CMomo
CMomo
CMOSs#«d-
o
CMoin
o
•P
HQ *o .xQ a) td
3 an O
goz
goz
m coo oo
CO CM
05
V1 UO
X fa3rH Ofa H
<U
1 Wi
oX fa3rH Ofa H
-O ^ T3 .X05 CO QJ CO
fa O O
CO
sMOz
o00
CO
05
0)
Po
X fa3fH Ofa H
rH <UrH C<D tH>- fa
oZ
n-oo
CO
05
0)— uo
X fa3rH Ofa H
5OrH 0)rH C05 tH>* fa
53

COco2
THC
Aerosolfilter
Graphiteplate
10x13 cm1 250°C
r-*-
3
Pyrexcold trap
(-40°C)
ArgonExhaust
i_
Pyrextransfer
line
Gasif. products
CaF2
Ar purgegas—
-
Detector
window
\UCollectorcone
Q)c
o03nu<D
0[JL
NaCIwindow-*-
T/
TC*^ Sample
I
Shutter Balance
f f1 1
—
—i
Power supplyin:440V 60Aout: 12V 2000A
Square light pipe
(gold coated inside wall)
9x9 cm
Porousmetalplate
Testgas
Figure 1. Schematic of apparatus showing details of radiationsource and sample chamber
-54-

0c
T304—1
as
0szc
Aerosolfilter
Trap(-40°C)
CO
C02
Bypass
THC
Purge
0— m(t) -
Figure 2. Schematic of apparatus showing details of product monir.riv
-55-

(Oo) 3fciniVH3dW31
-56-
Figure
3(a).
Temperature
vs
time
from
five
thermocouples
in
a
white
pine
sample;
base
case
conditions
except
atmosphere

700
o
CDCO
CMCO
CDCM
CM
OCM
CD
CM
CD
O
o O O o oo O O o oCD LO CO CM
(Oo) 3UniVU3dW31
o oo
SI
u.
57 -
DEPTH
BELOW
ORIGINAL
SURFACE
(mm)

(s • 3 iuo/6iu) Xflld SSVI4I
-58-
TIME
(seconds)
Figure
4(a).
Surface
mass
flux
vs
time;
white
pine
at
base
case
conditions
except
N~
atmosphere
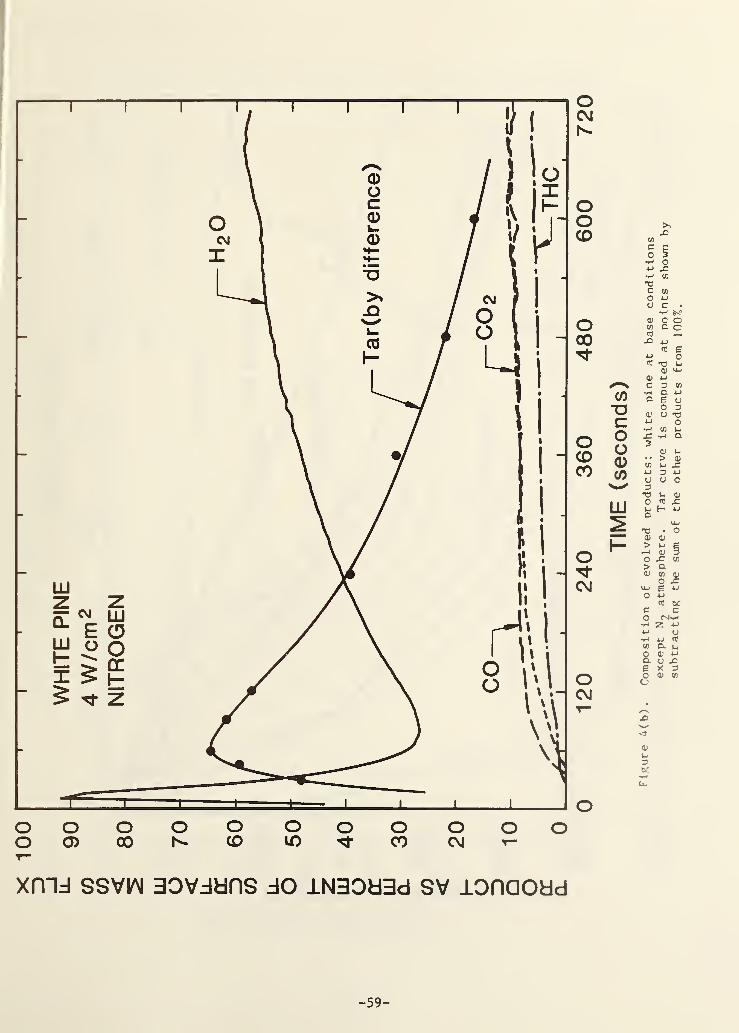
xmd ssvw aovddns do iNaoaad sv lonaoad
-59 -
TIME
(seconds)
Figure
4(b).
Composition
of
evolved
products;
white
pine
at
base
conditions
except
N2
atmosphere.
Tar
curve
is
computed
at
points
shown
by
subtracting
the
sum
of
the
other
products
from
100%.

o00
-60-
TIME
(seconds)
Figure
5(a).
Temperature
vs
time
from
five
thermocouples
in
a
white
pine
sample;
base
case
conditions
except
air
atmosphere
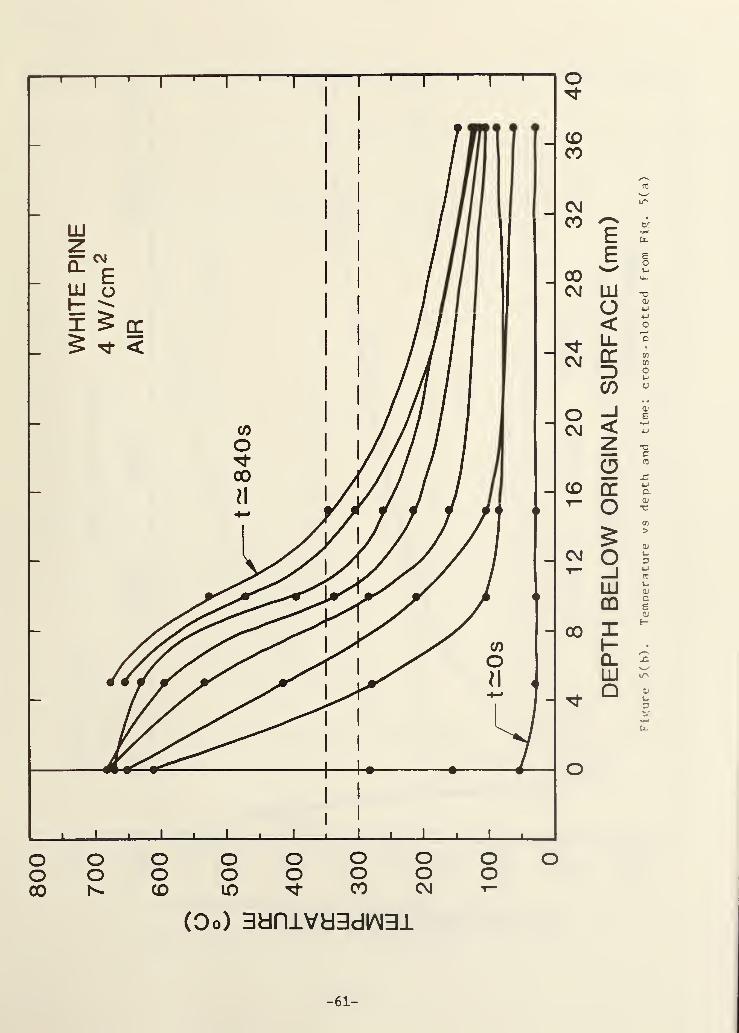
(Do) 3an±VH3dW31
3bf
u.
-61-
DEPTH
BELOW
ORIGINAL
SURFACE
(mm)
*e
5(h).
Temperature
vs
depth
and
time;
cross-plotted
from
Fig.
5(a)

WHITE
PINE
4
W/cm
2
AIR
(s- jUJO/Buj) Xflld SSVI/M
OC\J
N-
OOCO
O00
CO
"Oco
o oCO CD
00 w
oCVJ
oCVJ
-62-
Figure
6(a).
Surface
mass
flux
vs
time;
white
nine
at
base
case
conditions
except
air
atmosphere

xrru ssvw aovdbnsdo ±N30H3d sv lonaodd
-63-
120
240
360
480
600
720
TIME
(seconds)
Figure
6(h).
Conposi
tion
of
evolved
products:
<vh
ite
nine
nt
hasp
cese

100
O00 O
(6) sscn 10M 1V101
CO CM
<HOh-
oZDO HO Icc g0- LLI
Li- 5
>it <
g o
geo°?cc %CL ^LLI Ocr o
cELO
^ 7CM
CM
o
CM
co OOx.EU-»CM
ie
x
o00
oCO
sionaoad adidisvo do iNaoadd iom
-64-
WGT.
LOSS
Figure
7(a).
Reproducibility
of
integrated
product
composition
and
weight
loss
for
white
pine
at
base
case
conditions.
Dashed
weight
loss
is
based
on
pre-
and
post-test
weights,
not
iust
weight
loss
during
constant
heat
flux
period.

oC\J
CD O
(6
) SS01 ‘10M 1V101
CO
&5
oXI-
oo
CNJ
oo
<l-
oX
sionaoud adidisvo do iNdOddd -iom
c\jCO
oo
oCO
oCD
O oCNJ
-65 -
Htfure
7(h).
Reproducibility
of
Integrated
product
composition
and
weight
loss
for
red
oak
at
base
case
conditions

TOTAL
MASS
OF
PRODUCT
(g)
EXPOSURE TIME (min.)Figure 8(a). Integrated product mass and composition as a function of
exposure time; white nine at base case conditions excent forexposure time
-66-

TOTAL
MASS
OF
PRODUCT
(g)
EXPOSURE TIME (min)Figure 8(h). Integrated product mass and composition as a function >f
exposure time, red oak at base case conditions extent forexDosure time
-67-

TOTAL
MASS
OF
PRODUCT
(g)
Figure
14
12
10
8
6
4
2
00 1 2 3 4 5
SAMPLE THICKNESS (cm)9(a). Integrated product mass and composition as a Function of sample
thickness: white pine at base case conditions except forthickness
-68-

WHITE
PINE
4
W/cm
2
10-1/2%
02;
1/2
THK.
o
(s gOio/Bui) xnu ssvw
o00
OC\J
N-
OOCD
c
o
"Oc
O00
oo0CO
LU
O HCD00
O''t
C\J
oC\J
-69 -
Figure
9(h).
Surface
mass
flux
vs
time:
white
pine
at
base
case
conditions
except
samnle
thickness
is
halved
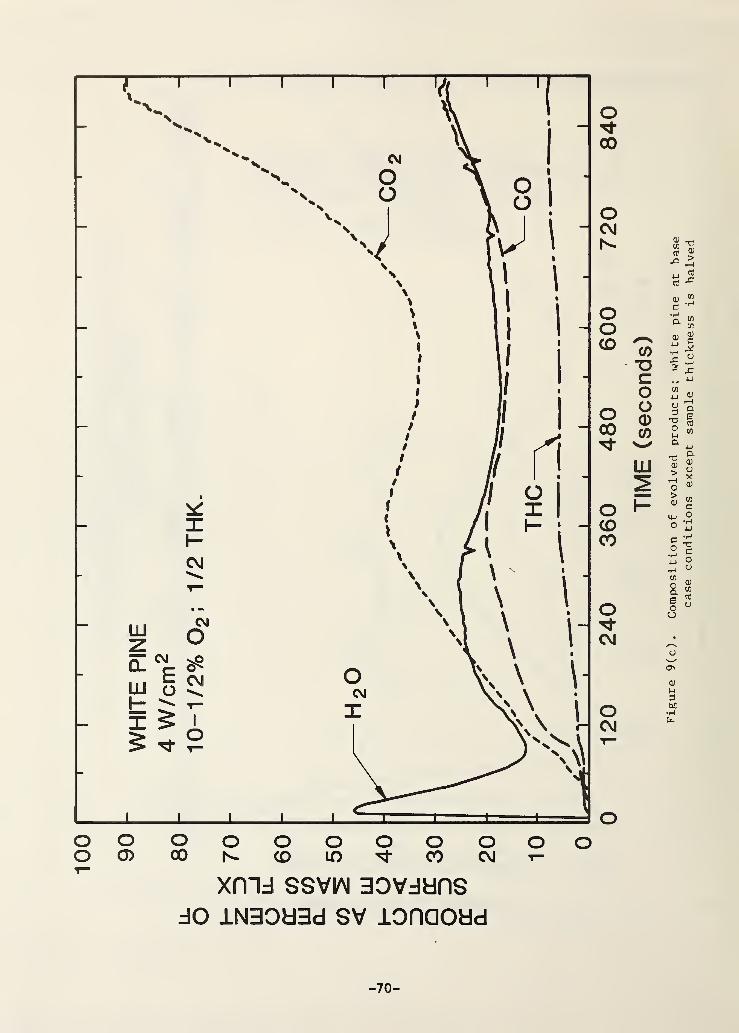
do lNaoudd sv lonaoad
ooo
oCM1^
OoCO
o00M-
oCD00
OCM
OCM
O
-70-
Figure
9(c).
Composition
of
evolved
products;
white
pine
at
base
case
conditions
except
sample
thickness
is
halved

TOTAL
MASS
OF
PRODUCT
(g)
Figure 10(a). Integrated product mass and composition as a r uncti )
grain orientation; white pine at base case condirLi;
-71-

TOTAL
MASS
OF
PRODUCT
(g)
GRAIN ORIENTATIONFigure 10(b). Integrated product mass and composition as a function of
wood grain orientation: red oak at base case conditions
-72-
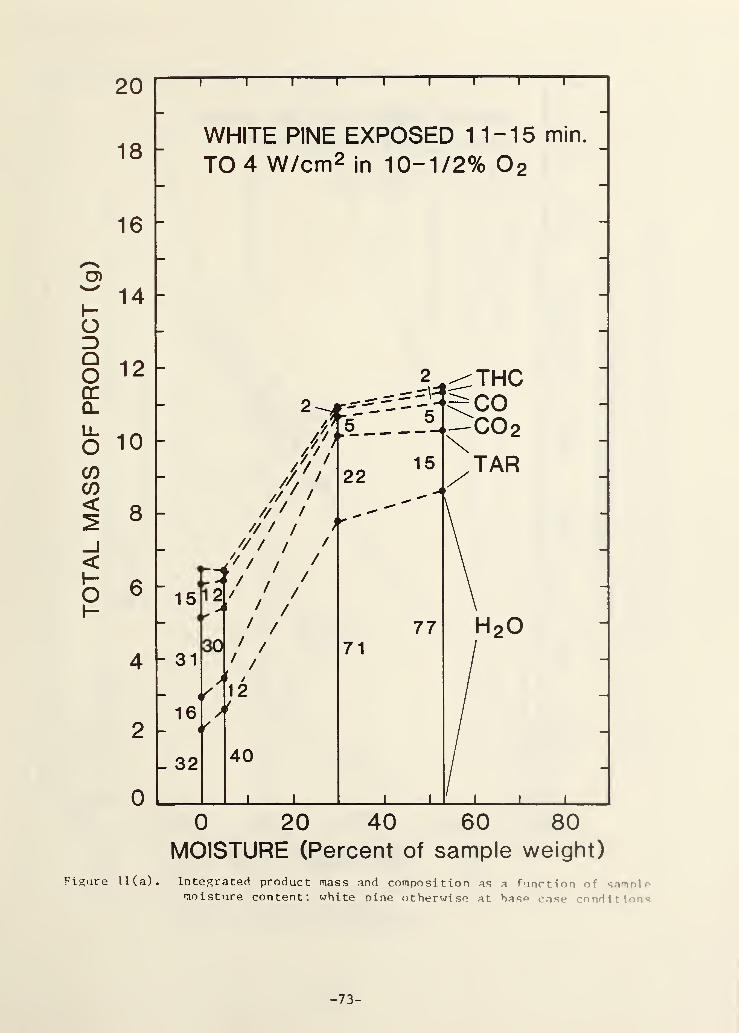
20
18
16
14
12
10
8
6
4
2
0
1 1 ( a
T1 1 1 1 1 1
T1
WHITE PINE EXPOSED 11-15 min.
TO 4 W/cm 2in 10-1/2% 0 2
15
31
16
32
12A
//'J, •
/// '
/// /
/// //
fit ,'
/ /
• /
//
£'l
22
130
jK l
71
12
/
40
0 20 40 60 80MOISTURE (Percent of sample weight)
Integrated product mass and composition as a function of „ir '
moisture content; white nine otherwise at hasp case conditions
-73-

20
18
16
14
12
10
8
6
4
2
0
F
1 1 1
WHITE PINE (30-33% water)
EXPOSED TO 4 W/cm 2
IN 10-1/2% 02
68
i i i ii
5 10 15 20 25
EXPOSURE TIME (min)
e 11(b). Integrated product mass and composition for wet white
nine as a function of exnosure time
,e
/> .-4
V'
A/' /V /
COco 2
TAR
5 .
r'
22
/
//
/
//
/
-74-

CO
TDCooCDCO
cr
v-/
cs>
0u
U.
(Oo) 3aniva3dW3i
-75-
Temperature
vs
time
from
five
theromcouples
In
a
white
nine
sample:
base
case
conditions
except
for
moisture
content

(Oo) 3UniVU3dYM31
-76-
DEPTH
BELOW
ORIGINAL
SURFACE
(mm)
Figure
12(b).
Temperature
vs
depth
and
time;
cross
-plotted
from
Fig.
12(a)

o
COCO
cr
cc
(NCO
COCN
<N
OC\J
CO
C\J
00
0)
u
o
o o o o o o o o oo o o o o o o o00 CO ID CO C\J T-
(Oo) 3amva3dW3i
-77-
DEPTH
BELOW
ORIGINAL
SURFACE
(mm)

TOTAL
MASS
OF
PRODUCT
(g)
Figure 13(a). Integrated product mass and composition as a function ofambient oxygen percentage: white pine at otherwise base caseconditions
-78-

TOTAL
MASS
OF
PRODUCT
(g)
J I U I l_l I
0 5 10 15 20 25
PERCENT OXYGENFigure 13(b). Integrated product mass and comnosition as a function ‘
ambient oxvgen percentage: red oak at otherwise has* r.i
conditions
-79 -

10
9
8
7
6
5
4
3
2
1
0
re 1.
RADIANT HEAT FLUX (W/cm 2)
a). Integrated product mess and composition as a function ofincident radiant flux: white pine at otherwise base caseconditions
-80-

18
16
14
12
10
8
6
4
2
0
RADIANT HEAT FLUX (W/cm 2)
. Integrated product mass and composition as a function f
incident radiant flux; red oak at otherwise hasp ca
conditions
-81-
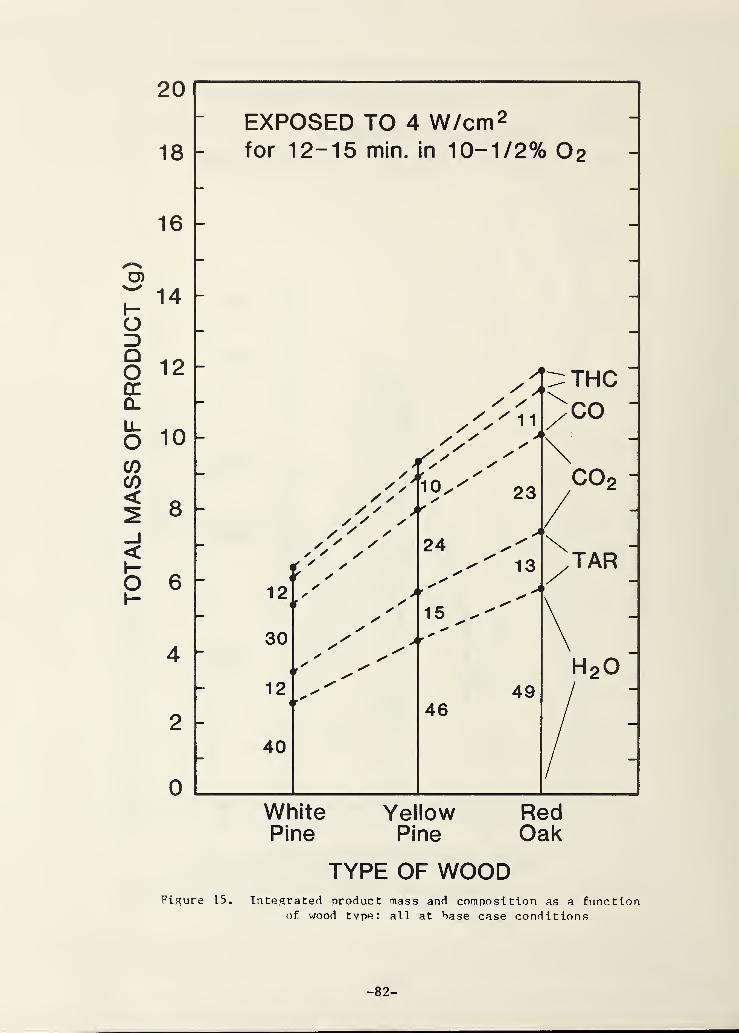
20
18
16
14
12
10
8
6
4
2
0
Figi
EXPOSED TO 4 W/cm 2
for 12-15 min. in 10-1/2% O 2
12
30
12t
40
// /
,y
'
S.' '
jr 's
*
'M./
T/ >>
^11*
/
10^
24
23
13
THCCO
C02 -
TAR"
White Yellow RedPine Pine Oak
TYPE OF WOOD15. Integrated product mass and composition as a function
of wood tvpe: all at base case conditions
-82-

SURFACE
AREA
(m2/g)
DISTANCE FROM EXPOSED SURFACE (cm)Figure 16(a). B.F.T. surface area vs depth for whit** nine in r' r. ,
atmospheres: otherwise base case rondi t t >n ;
-83-

SURFACE
AREA
(m2/g)
DISTANCE FROM EXPOSED FACE (cm)Figure 16(b). R.E.T. surface area vs depth for white pine of three
moisture levels: otherwise base case conditions
-84-

CHEMICAL SHIFT (ppm)
13Figure 17(a). C—NMR sDectra vs depth; white pine at base case conditions
-85-

I 3Figure 17(h). C-NMR spectra vs depth: white pine at base case
conditions except exposed in nitrogen
-86-

CVJ
oo
oCO
oCO
o
oCVJ
oGO CO ^ CVJ OV3HV >JV3d 3AI1V13H
LU
1K
HZLUI—LUOC
87
Figure
18(a).
Capillary
CC
fingerprint
of
tar
from
white
nine
at
base
ease
conditions;
areas
not
corrected
for
FID
response
factors;
neartv
all
of
peak
#2
is
the
methanol
solvent:
peak
(trinhenvl
methane)
was
added
as
a
stabilizer.

Fig.
18(b)
Identified
peaks
in
base
case
capillary
GC
fingerprint
of
white
pine;
(T)
means
identification
is
tentative.
Percentages
are
based
on
amount
of
material
that
passed
through
chromatograph;
all
are
corrected
for
calculated
FID
response
factor.
ug0)
ou<D
Pm
x00•HG3
LO ON rH CN vO CN vO VO CN o CN <r mo CO o vO •<r 00 <1- rH ON in r^. oo 00
o 1—
1
rH o o o o CN o o rH o o rH o <r
<D
COI
GaG
GCG4-> ""sg H H HG V-/ /—NCU G Ho rH rH rH rH G 'w'rH o O o •H O rH COCJ g G G a G O o X)rO i—
1
rH 0) 0) rH i—
i
a; <3 0) rH G G a •HO O O X JP o o rH rH ^G rH O CD •H G Ocj rH co Pm Pm CO Cfi o X o Pm o •H 00 rH rH <3
CN G o g a; at co X •H e X G rH 00•H g u rH rH H Vj o O rH a) a; *H o O
r CO 0) CJ X X CJ u 0) H X oo CL) o G > •HCO 0 X,
i JP X i i H G •u 3 G CO G G Opp o Pm o H 4-1 e cu CJ CN Pm G w (1) pH > GCJ 0) 0) PQ N G
1 a £ c aCO •H •H 4-4 0) 0)
n Q H CQ X** G G
PC CO m H CN XO * r. •N CD1 CN CN CN rH X
CN
O
G0)
Pm
CNLO vOCN CN
r^* ooCN CN
ON Ocn co
r—I CNCO CO
co <rco co
LO vOco co
ooco co
on oco
gGCJ
HGP*
X00•H0)
oo 00 m O VO ON 00 o <fr o CN CN <ro vO o o CN CO o CO o m vO •<r
o rH o o CN o o o o o 00 o o o rH rH o
H'w' d)
CH /TV c ^ CO
<u H CO H X /—
v
H4-1 V4 4-1 H N^r
1—
1
CU cfl 3 w —
r
o<v -a G C G [H CU X) Xu tn U O G XI X <u •H oCO X G •H <u H rH fH X c O o r—S
e CU 4H O. T3 G Ph X o X 0) c (U rH Hc X G O PH Pm U3 CU X *H N X <5 S-M*
o tH a u X 4H X) 4J CJ c o tHbr rH c CO <3 PH 01 rH a> rH CU < 0) •H X rH rH
O iH C T3 X e CO 6 <u 03 C CU >r GrH c <u O rH iH rH X •H c •H o c o X u 4J
tn co rH •H X >» CO 4H Q o Q •H <u rH *H rH 3 G.c x o D. X X 4-1 G 4J 4-1 3 tH a CO M—
C
u w H O JJ 4J a) £ '.n O rH G r—
1
rC 0 l-l H rHa> CU O H G CU o r> H rs CJ O U H 3 3 0S s C PH s S <c CN CN U rH < H W Ph tH iH CO
O
G0)
P<
rH CN co m vo oo on vOr^CO^OrHCNCOrHrHrHrHCNCNCNCN
88
5
Methyl
Furan
2
Aldehyde
1.90
42
Triphenyl
Methane
3
Methyl
Furan
2
Aldehyde
43
Methyl
10
Octadecenoate
(T)
0.37
Butyrolactone
1.59
44
Methyl
9
Octadecenoate
(T)
1
Acetyl
Cyclohexene
(T)
1.17
45
Methyl
Linoleate
0.19
Benzyl
Alcohol
(T)
0.43
46
Phenanthrene
Carboxylic
Acid
0.25

V3dV >iV3d 3AI±V~13d
o
V3dV ><V3d 3AllV“l3d
cE
LU
1
zO
LUt-1
LUDC
89
Figure
19.
Reproducibility
of
capillary
GC
fingerorlnt;
tar
from
two
separate
teats
on
white
pine
at
same
base
case
conditions

RELATIVE
PEAK
AREA
RELATIVE
PEAK
AREA
RELATIVE
PEAK
AREA
RETENTION TIME (min.)
Figure 20. Capillary GC fingerprints of tar as a function of exposure time;white pine at base case conditions except: (a) 1-1/2 min,( b) 2-1/2 rain, (c) 6 min, (d) 12 min, (e) 24 min exposure
90

V3UV *V3d 3AI±V~13H V3dV >JV3d 3AI1V13H
-91
RETENTION
TIME
(min.)

RELATIVE
PEAK
AREA
RELATIVE
PEAK
AREA
RELATIVE
PEAK
AREA
8
6
4
2
0
t f f I I t I I V t t T ?’ '"I T ' >
*
I I I I
WHITE PINE BASE CASEEXCEPT IN PURE N 2
1— *f I
1
40
r 1
1-
i ) T"A
20 60 80
RETENTION TIME (min.)
100 120
—
i
1 iii—r—i1 i 1 r i i » i i i i i i
WHITE PINE BASE CASE 4 W/cm 2,10-1/2% 0 2
I I I l
8
6
4
2
0
2 '12
123
\
26
27 31
282 9'
>\43/
B -
46
20 40 60 80
RETENTION TIME (min.)
100 120
20 40 60 80
RETENTION TIME (min.)
100 120
Figure 21. Capillary 0C fingerprints of tar as a function of ambient oxygenlevel: white nine (a) 0% 0 2% pure N
2: (b) 10-1/2% 0
2: (c) 21% 0
2
-92-

00 CD Tt CM oV3HV >1V3d 3AllV13a
00 CD Tt CM OV3HV >IV3d 3AllV~13d
c ••
C CM— ec u
u 3
<5
X3
U.
93
RETENTION
TIME
(min.)

EE
LU
2
HZ111
HwEE
CO CD rt CM OV3dV >IV3d 3AI1V13U
CO CD Tj- CM OV3dV >iV3d 3AI±V~l3d
94 -
RETENTION
TIME
(min.)

CO CD rf C\J OV3UV >IV3d 3AI1V13H
c
zHII—LLJ
cc
oCM
COCOLUz*01
oo
<IHCL111
OXLU
LUCO<0LUCO<DO
LUZCL
LUH1£
OCO
oCO
oTj-
oCM
b ..w
:i i x T~" '
I
00 CO Tt CM OV3HV MV3d 3AI1V13H
95
RETENTION
TIME
(min.)

oCM
OO
O00
oCD
o"t
oCM
O00 CD CM OV3HV >W3d 3AI1VI3U
cE
LU
II-
Oh-zLUI—LUCC
00 CD Tj- CM OV3dV >lV3d 3AllV“l3d
-96-
Figure
24.
Capillary
GC
fingerprints
of
tar
as
a
function
of
sample
grain
orientation;
white
nine
at
base
case
conditions
(a)
and
with
perpendicular
grain
(b)

V3UV >IV3d 3AI1V13U
co
CM
O
CM
I
O
CM
Eo
IUCO<0LUCO<CO
HIz0-
LLI
H1
CO o-.? ,/T-
oCM
OO
OCO
OCD
O
oCM
00 CO rt CM OV3dV *V3d 3AI1V13H
Hi> ..
97
RETENTION
TIME
(min.)

i—i—i—i—i—i—
r
ocLUI-<£oCOCO
I-Q.LUOXLU
LUCO<oLUCO<m
_ LU
KLUHX
u
oCM
oho
o00
00 CO Tt CM ovaav wad aAiivnaa
cE
yj
o<o
o
zLU\—LUDC
OCM
ui |uj OLU XCO LU
LO.ELUCO<CD
CM
mgZ L—0L <m ^x *^ CO
J I I L J I I L
oCM
OO
O00
oCO
o''t
oCM
00 CO Tt CM ovaav wad aAiivnaa
RETENTION
TIME
(min.)

RELATIVE
PEAK
AREA
RELATIVE
PEAK
AREA
RELATIVE
PEAK
AREA
tt 1 1 1 1 1—i r -i 1 r—i—
r
-p1 1 r-
WHITE PINE BASE CASE 4 W/cm 2,10-1/2% 0 2
8 h
6
4
2
0 I
1 9 &20
23^
27 3 1
30
4 3 /
A -
II I I
1
I1—T-i i
20 40 60 80
RETENTION TIME (min.)
100 120
8
6
4
2
00 20 40 60 80 100 120
RETENTION TIME (min.)
-\ 1 1 1 1
I
1 1 1 11 1 1 1 1 1 1 1 1 r-
RED OAK BASE CASE 4 W/cm 2 10-1/2% 0 2
i r
-i 1 1 1 r
—I—i1 1 1 1—I—i r—i—i
1 1 1 1 1 1—i1 1 r
YELLOW PINE BASE CASE 4 W/cm 2 10-1/2% 0 2
“i—i—i—i—i—
r
8
6
4
0C -
v—“i—i
"r i r i
f I I f i r t' i i r—i t i i ' r—
—
0 20 40 60 80 100 120
RETENTION TIME (min.)
Figure 26. Capillary GC fingerprints of tar as a function of wood type h* ..
case conditions: (a) white pine; (b) red oak : (c) vellow pine
-99-

NOI1VU1N3DNOO 3AI1V13U
-100-
1800
1280
900
620
435
310
200
150
105
APPROXIMATE
MOLECULAR
WEIGHT
Figure
27(a).
Gel
permeation
chromatogram
of
tar
from
white
nine
at
base
case
conditions
except
in
N0
atmosnhere

T
00C\J
oooo
CD 00 D- COLOTf 00 CM
NOIlVdlNBONOO 3AI1V13H
- 101-
D
900
620
435
310
200
150
105
APPROXIMATE
MOLECULAR
WEIGHT
(VI
narmoa
tton
chroma
tovtrnm
oF
tar
From
whi
tp
pina
at
hasp
caso
conditions
i»xcept
In
air
atmosnhore

Oia) iNBuano noi 3Aiiviaa
-102-
200
400
600
800
1000
1200
MOLECULAR
WEIGHT
(amu)
Figure
28(a).
Fast
atom
bomhardment
mass
spectrum
of
tar
from
white
nine
at
base
case
conditions
except
in
atmosphere
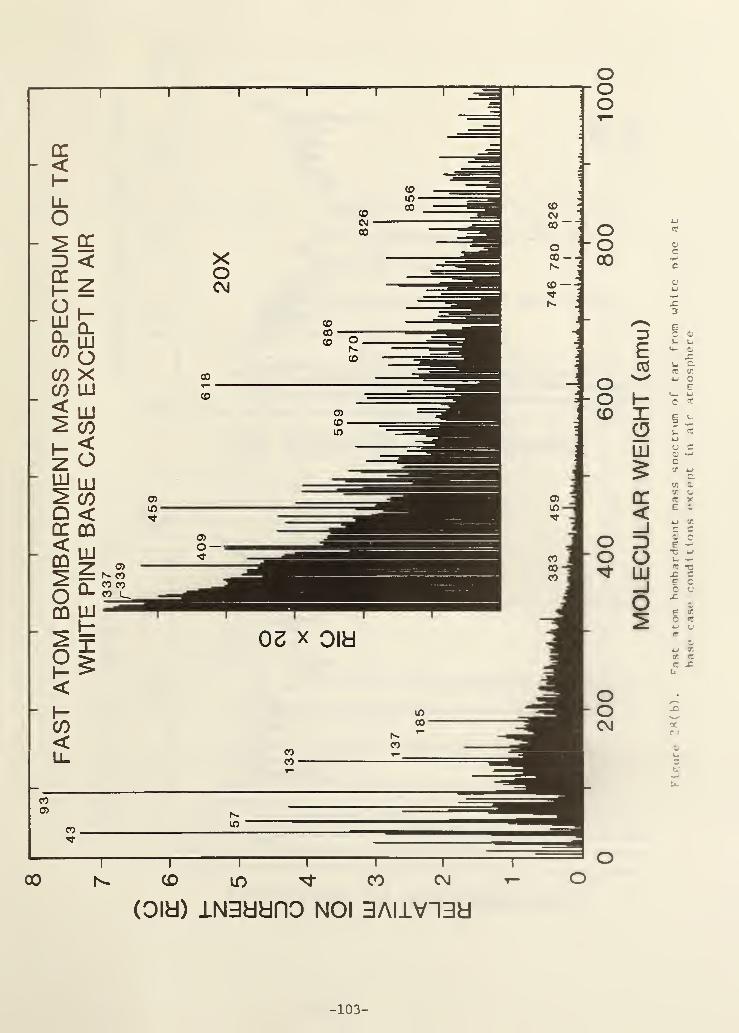
x3
D eo a;
Eu uu- a;
XCO u a
ct cr
o w ±-> oe
o H U_ 4-1
C *
CD I g ^O C *i >
LU u c0)
5cO' 4_l
c.
ccT. U<C X
< e a;
_J4-> CT.
c C
O 3 0J ce —
O o T3 JJu —
LUW T3jc c
—1 e co V
o £.9!
C <C
LJ T05 C3
rr Xb
Xac
u.
co in co c\j
Oia) iNgaano noi aAiiviaa
-103-

1-0
oaoNvaaosav An aMivnaa
oaoNvaaosav An aAiivnaa
-104-
RETENTION
TIME
(min)
RETENTION
TIME
(min)

CM
oseC\J
i
oCM
Eo
LUCO<oLUCO<CO
*<ooLUCC
"i 1 1 r T“
<
OCM
OhO
O00
cE
LU
oCO
.o
LUH-LUoc
oCM
00 CO CM OV3EIV >IV3d 3AI±V"13d
00 CO Tt C\l OV3dV >IV3d 3AI1V13H
-105-
RETENTION
TIME
(min.)

RELATIVE
PEAK
AREA
RELATIVE
PEAK
AREA
Figure 31. Canillary GC fingerprints of tar from: (a) yellow pine irradiatedat base case conditions, (b) yellow pine burned in a wood stoveat "overnight burn" conditions
-106-

U.S. DEPT. OF COMM.
BIBLIOGRAPHIC DATA
1. PUBLICATION ORREPORT NO.
2. Performing Organ. Report No. 3. Publ ication Date
SHEET (See instructions) NBSIR-85-3127 February 1985
4. TITLE AND SUBTITLE
Products of Wood Gasification
5. AUTHOR(S)Thomas J. Ohlemiller, Takashi Kashiwagi, Kathleen E. Werner
6. PERFORMING ORGANIZATION (If joint or other than NBS, see instructions)
NATIONAL BUREAU OF STANDARDSDEPARTMENT OF COMMERCE)»®SttUffiXHKXHXXXXKKX Gaithersburg, MD 20899
7. Contract/Grant No.
8. Type of Report & Period Covered
9.
SPONSORING ORGANIZATION NAME AND COMPLETE ADDRESS (Street. City, State. ZIP)
U. S. Dept, of EnergyWashington, D.C. 20585
10.
SUPPLEMENTARY NOTES
| |
Document describes a computer program; SF-185, FIPS Software Summary, is attached.
11.
ABSTRACT (A 200-word or less factual summary of most significant information. If document includes a significantbi bliography or literature survey, mention it here)
The increasing problem of pollution from wood-burning stoves has prompted this exam-ination of the basic gasification process of wood under conditions encompassing thosein stoves. The emphasis is on the products generated when wood is heated, withoutflaming, in atmospheres of varying oxygen concentration (0 to 21% 0
2in . Small
wood samples (typically 4 x 4 cm face, 2-4 cm thick; white pine, red oak, plus two^te^ts with yellow pine) were subjected to uniform radiative heat fluxes (2 to 7.8 W/
cm ) on one face. Other variables were sample grain orientation, thickness, exposuretime and moisture content. Sample weight was followed in some tests; sample tempera-ture (5 thermocouples) was followed in others. In all tests, all evolved productswere either monitored (1^0, CO, CO
2, total hydrocarbons not condensible at -40°C) or
trapped and analyzed (condensible organic species) by gas chromatography and massspectroscopy. The extent of change in these major products is rather limited (factorof two to four) over the range of variables explored here. The organic condensatewas difficult to analyze; it is estimated that only 20% of it was chromatographable
.
More than forty species in this chromatographable portion were positively or tenta-tively identified and quantified. Chromatographic fingerprints of the organic conden-sate indicated that its composition does not vary a great deal for the conditionsexamined here. The fingerprints from the radiative heating tests bear a strong resem-blance to those of the smoke condensate from a wood stove.
12.
KEY WORDS (Six to twelve entries; alphabetical order; capitalize only proper names; and separate key words by ier :-
5
air pollution; gasification; radiative heat; stoves; smoldering combustion;thermal degradation
13.
AVAILABILITY
[X] Unlimited
| |
For Official Distribution. Do Not Release to NTIS
Order From Superintendent of Documents, U.S. Government Printing Office, Washington, D.C.20402.
fXl Order From National Technical Information Service (NTIS), Springfield, VA. 22161
14. NO. OFPRINTEO PAGES
114
IS. Price
$13
UlCOuU'OC 4)»l


T