Structural tests of a wood framed housing module - Govinfo.gov
118
NBSIR 73-121 Structural Tests of a Wood Framed Housing Module C. W. Yancey and N. F. Somes Center for Building Technology Institute for Applied Technology National Bureau of Standards Washington, D. C. 20234 113 I March 26, 1973 Final Report Prepared for Office of Research and Technoiog/ Department of Housing and Urban Development Washington, D. C. 20410
-
Upload
khangminh22 -
Category
Documents
-
view
0 -
download
0
Transcript of Structural tests of a wood framed housing module - Govinfo.gov
NBSIR 73-121
Structural Tests of a Wood
Framed Housing Module
C. W. Yancey and N. F. Somes
Center for Building Technology
Institute for Applied Technology
National Bureau of Standards
Washington, D. C. 20234
113 I
March 26, 1973
Final Report
Prepared for
Office of Research and Technoiog/
Department of Housing and Urban Development
Washington, D. C. 20410

NBSIR 73-121
STRUCTURAL TESTS OF A WOOD FRAMED
HOUSING MODULE
C. W. Yancey and N. F. Somes
Center for Building Technology
Institute for Applied Technology
National Bureau of Standards
Washington, D. C. 20234
March 26, 1973
Final Report
Prepared for
Office of Research and Technology
Department of Housing and Urban Development
Washington, D. C. 20410
U. S. DEPARTMENT OF COMMERCE. Frederick B. Dent, Secretary
NATIONAL BUREAU OF STANDARDS, Richard W. Roberts. Director

i.
Contents
Page
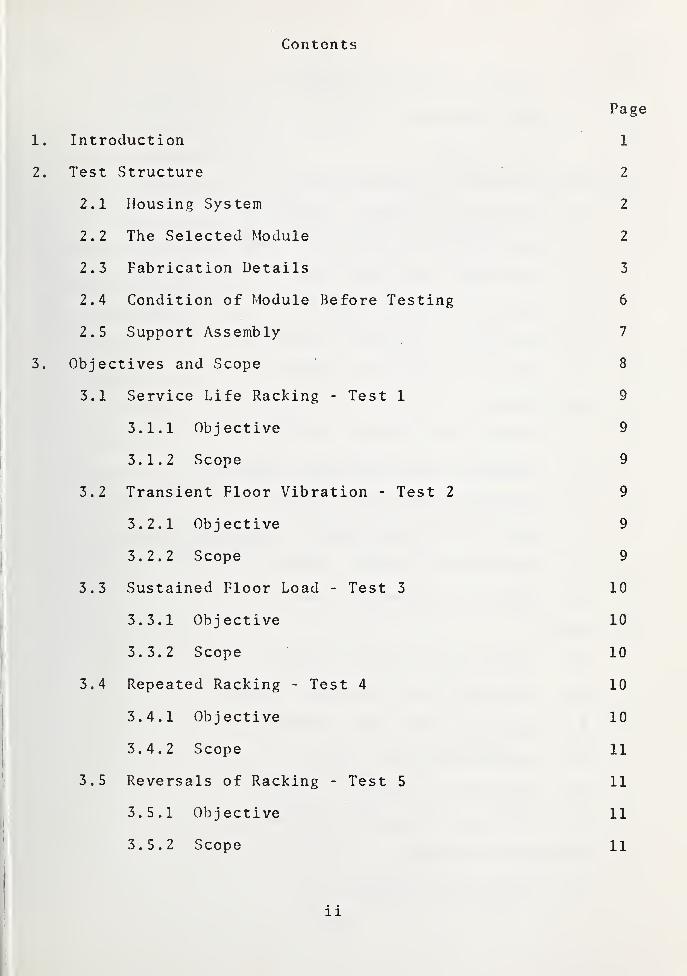
1. Introduction 1
2. Test Structure 2
2.1 Housing System 2
2.2 The Selected Module 2
2.3 Fabrication Details 3
2.4 Condition of Module Before Testing 6
2.5 Support Assembly 7
3. Objectives and Scope 8
3.1 Service Life Racking - Test 1 9
3.1.1 Objective 9
3.1.2 Scope 9
3.2 Transient Floor Vibration - Test 2 9
3.2.1 Objective 9
3.2.2 Scope 9
3.3 Sustained Floor Load - Test 3 10
3.3.1 Objective 10
3.3.2 Scope 10
3.4 Repeated Racking - Test 4 10
3.4.1 Objective 10
3.4.2 Scope 11
3.5 Reversals of Racking - Test 5 11
3.5.1 Ob j ective 11
3.5.2 Scope 11
ii
Page
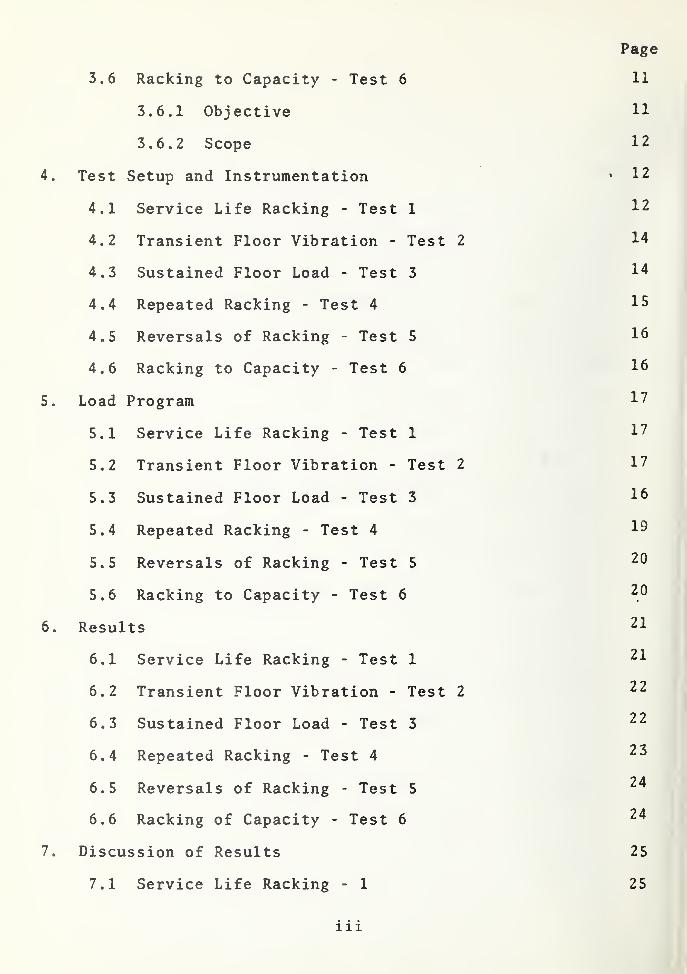
3.6 Racking to Capacity - Test 6 11
3.6.1 Objective 11
3.6.2 Scope 12
4. Test Setup and Instrumentation • 12
4.1 Service Life Racking - Test 1 12
4.2 Transient Floor Vibration - Test 2 14
4.3 Sustained Floor Load - Test 3 1^
4.4 Repeated Racking - Test 4 15
4.5 Reversals of Racking - Test 5 16
4.6 Racking to Capacity - Test 6 16
5. Load Program 17
5.1 Service Life Racking - Test 1 17
5.2 Transient Floor Vibration - Test 2 17
5.3 Sustained Floor Load - Test 3 16
5.4 Repeated Racking - Test 4 19
5.5 Reversals of Racking - Test 5 20
5.6 Racking to Capacity - Test 6 2^
6. Results 21
6.1 Service Life Racking - Test 1 21
6.2 Transient Floor Vibration - Test 2 22
6.3 Sustained Floor Load - Test 3 22
6.4 Repeated Racking - Test 4
6.5 Reversals of Racking - Test 5
6.6 Racking of Capacity - Test 6 24
7. Discussion of Results 25
7,1 Service Life Racking - 1 25
iii
Page
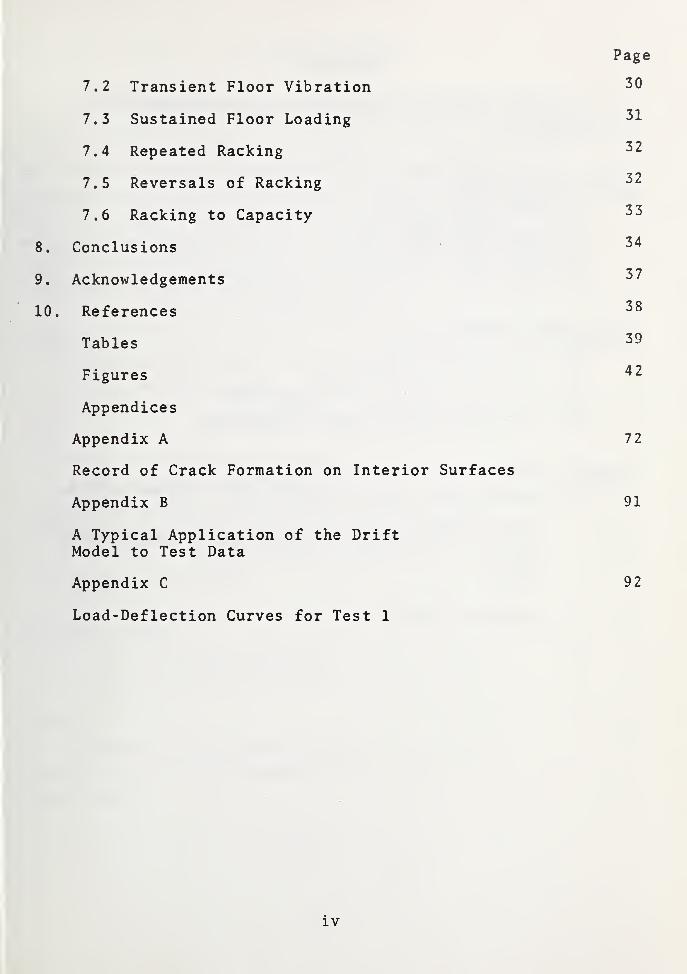
7.2 Transient Floor Vibration 30
7.3 Sustained Floor Loading
7.4 Repeated Racking ^2
7.5 Reversals of Racking ^2
7.6 Racking to Capacity
8. Conclusions
9. Acknowledgements
10. References ^
Tables 39
Figures ^2
Appendices
Appendix A 72
Record of Crack Formation on Interior Surfaces
Appendix B 91
A Typical Application of the DriftModel to Test Data
Appendix C 92
Load-Deflection Curves for Test 1
iv
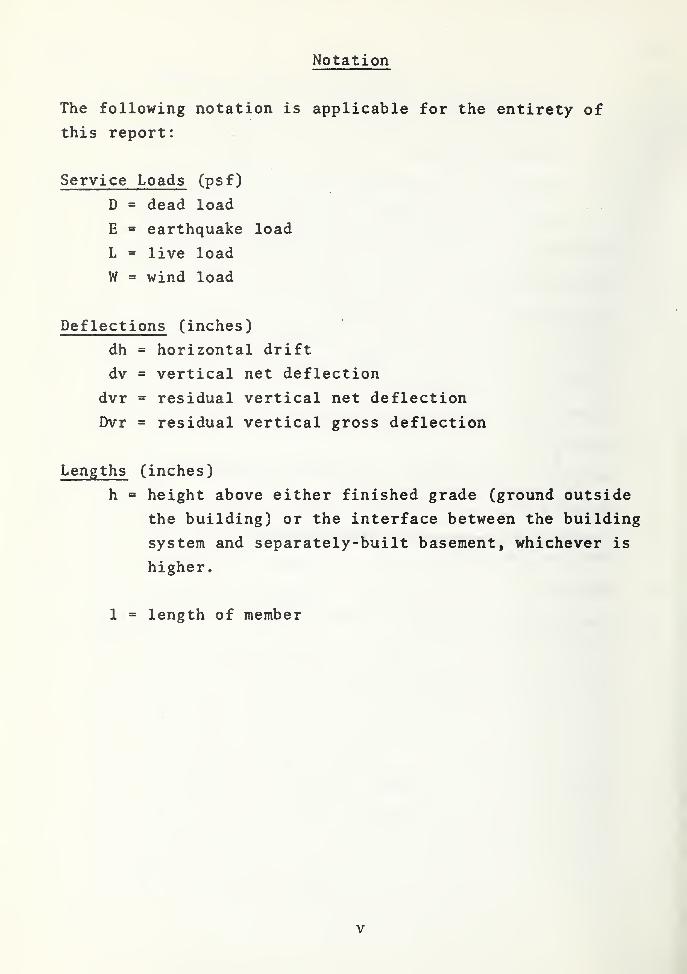
Notation
The following notation is applicable for the entirety of
this report:
Service Loads (psf)
D = dead load
E = earthquake load
L = live load
W = wind load
Deflections (inches)
dh = horizontal drift
dv = vertical net deflection
dvr = residual vertical net deflection
Dvr = residual vertical gross deflection
Lengths (inches)
h = height above either finished grade (ground outside
the building) or the interface between the building
system and separately-built basement, whichever is
higher.
1 = length of member
V
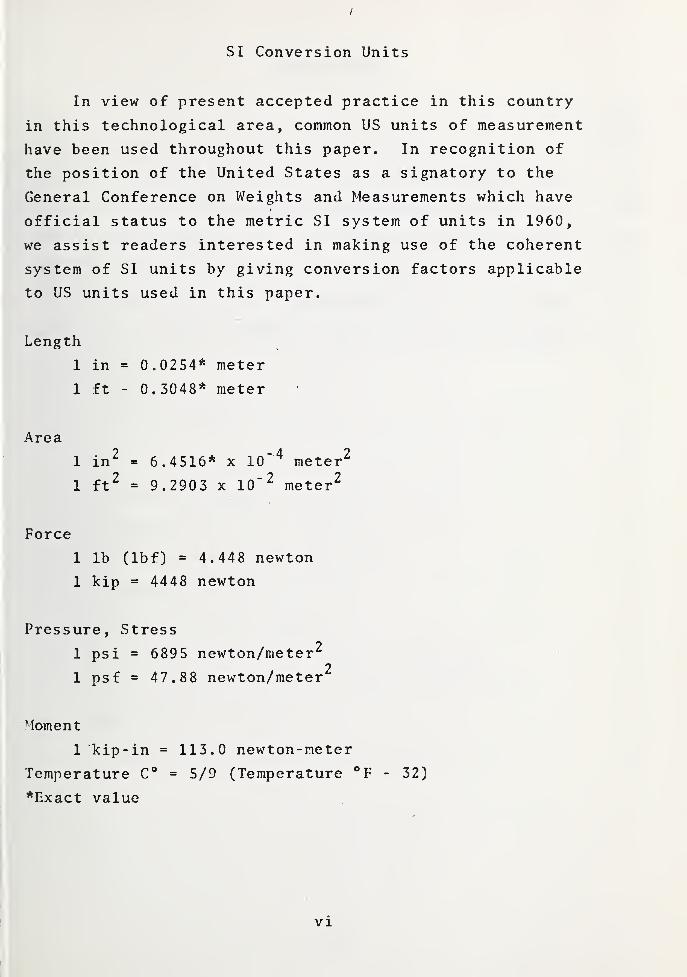
SI Conversion Units
In view of present accepted practice in this country
in this technological area, common US units of measurement
have been used throughout this paper. In recognition of
the position of the United States as a signatory to the
General Conference on Weights and Measurements which have
official status to the metric SI system of units in 1960,
we assist readers interested in making use of the coherent
system of SI units by giving conversion factors applicable
to US units used in this paper.
Length
1 in = 0.0254* meter
1 ft - 0.3048* meter
Area
1 in^ = 6.4516* x 10"^ meter^
1 ft^ = 9.2903 X 10"^ meter^
lb (Ibf) = 4.448 newton
kip = 4448 newton
Pressure, Stress
1 psi = 6895 newton/meter'^2
1 psf = 47.88 newton/meter
Moment
1 kip-in = 113.0 newton-meter
Temperature C° = 5/9 (Temperature - 32)
*Exact value
Force
1
1
vi
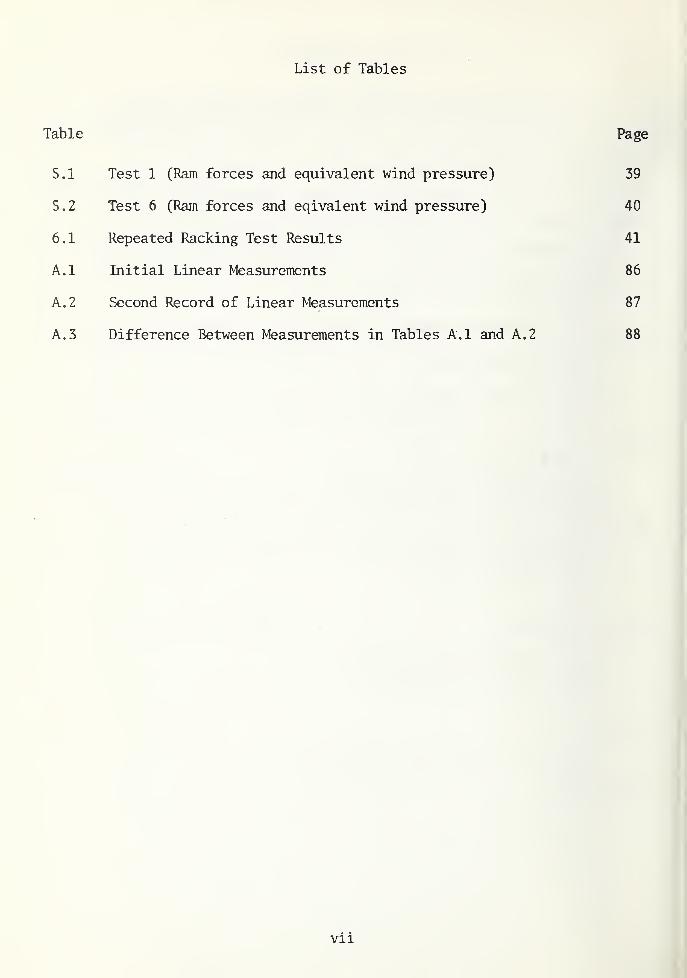
List of Tables
Table Page
5.1 Test 1 (Ram forces and equivalent wind pressure) 39
5.2 Test 6 (Ram forces and eqivalent wind pressure) 40
6.1 Repeated Racking Test Results 41
A.l Initial Linear Measurements 86
A. 2 Second Record of Linear Measurements 87
A. 3 Difference Between Nteasurements in Tables A.l and A. 2 88
vii
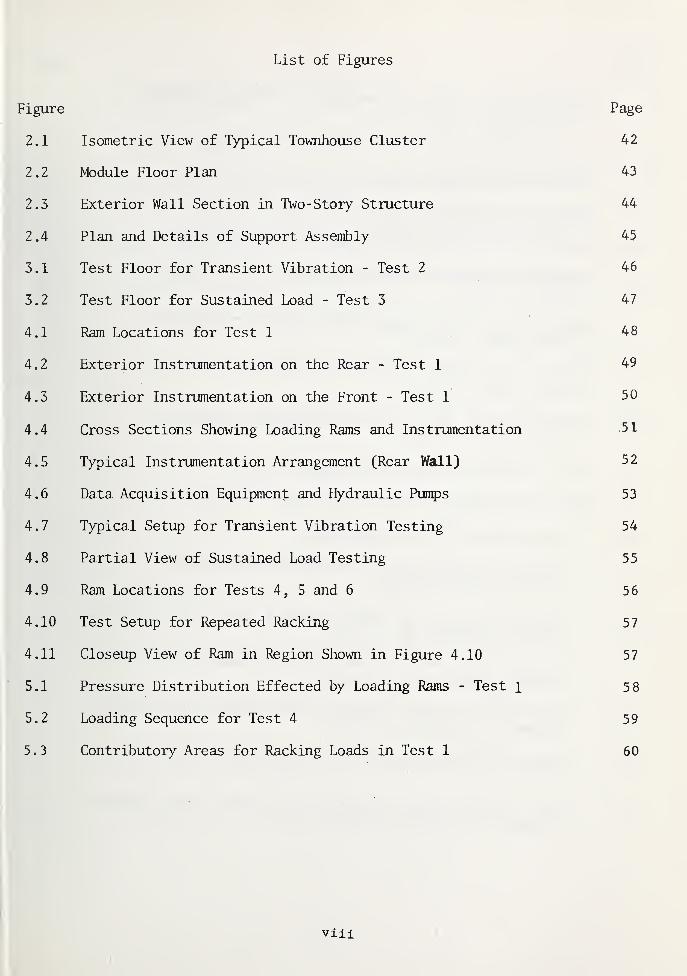
List of Figures
Figure Page
2.1 Isometric View of Typical Townhouse Cluster 42
2.2 Module Floor Plan 43
2.3 Exterior Wall Section in Two-Story Structure 44
2.4 Plan and Details of Support Assembly 45
3.1 Test Floor for Transient Vibration - Test 2 46
3.2 Test Floor for Sustained Load - Test 3 47
4.1 Ram Locations for Test 1 ^84.2 Exterior Instrumentation on the Rear - Test 1 49
4.3 Exterior Instrumentation on the Front - Test 1,
50
4.4 Cross Sections Showing Loading Rams and Instrumentation 51
4.5 Typical Instrumentation Arr<'mgement (Rear Wall) 52
4.6 Data Acquisition Equipment and Hydraulic Pumps 53
4.7 Typical Setup for Transient Vibration Testing 54
4.8 Partial View of Sustained Load Testing 55
4.9 Ram Locations for Tests 4, 5 and 6 56
4.10 Test Setup for Repeated Racking 57
4.11 Closeup View of Ram in Region Shown in Figure 4.10 57
5.1 Pressure Distribution Effected by Loading Rams - Test i 5 8
5.2 Loading Sequence for Test 4 59
5.3 Contributory Areas for Racking Loads in Test 1 60
viii
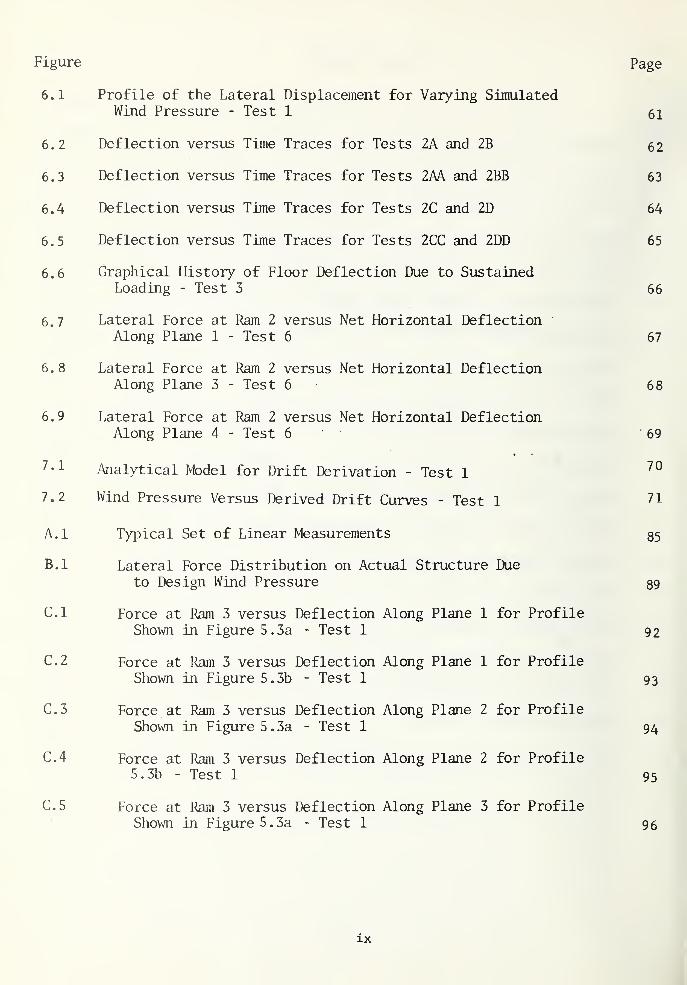
Figure Page
6.1 Profile of the Lateral Displacement for Varying SimulatedWind Pressure - Test 1 61
6.2 Deflection versus Time Traces for Tests 2A and 2B 62
6.3 Deflection versus Time Traces for Tests 2AA and 2BB 63
6.4 Deflection versus Time Traces for Tests 2C and 2D 64
6.5 Deflection versus Time Traces for Tests 2CC and 2DD 65
6.6 Graphical History of Floor Deflection Due to SustainedLoading - Test 3 66
6.7 Lateral Force at Ram 2 versus Net Horizontal DeflectionAlong Plane 1 - Test 6 67
6.8 Lateral Force at Ram 2 versus Net Horizontal DeflectionAlong Plane 3 - Test 6 68
6.9 Lateral Force at Ram 2 versus Net Horizontal DeflectionAlong Plane 4 - Test 6 '69
7-1 Analytical Model for Drift Derivation - Test 1
7.2 Wind Pressure Versus Derived Drift Curves - Test 1 71
A. l Typical Set of Linear Measurements 85
B. l Lateral Force Distribution on Actual Structure Dueto Design Wind Pressure 89
C. l Force at Ram 3 versus Deflection Along Plane 1 for ProfileShown in Figure 5.3a - Test 1 92
C.2 Force at Ram 3 versus Deflection Along Plane 1 for ProfileShown in Figure 5.3b - Test 1 93
C.3 Force at Ram 3 versus Deflection Along Plane 2 for ProfileShown in Figure 5 . 3a - Test 1 94
C.4 Force at Ram 3 versus Deflection Along Plane 2 for Profile5.3b - Test 1 95
C.5 Force at Ram 3 versus Deflection Along Plane 3 for ProfileShown in Figure 5.3a - Test 1 96
ix
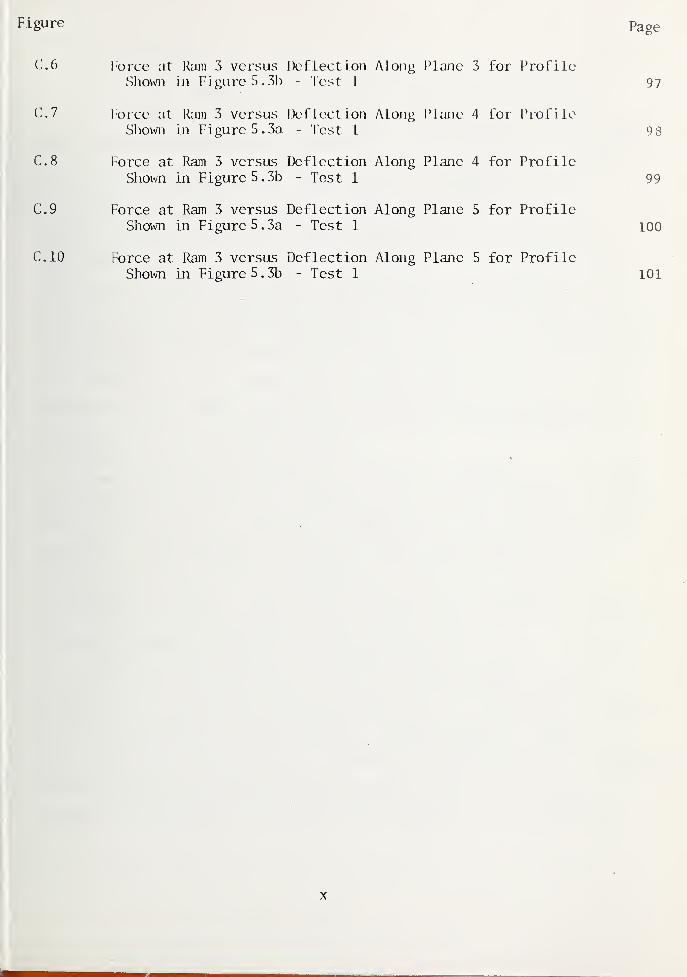
I'orcc at Rajii 3 versus Deflection Along Plane 3 for ProfileShown in rigurc5.3h - Test 1
I'orce at R^iiii 3 versus Deflection Alojig I'lane 4 for ProfileShowi in Figure 5.3a - Test 1
Force at Ram 3 versus Deflection Along Plane 4 for ProfileShown in Figure 5.3b - Test 1
Force at Ram 3 versus Deflection Along Plaiie 5 for ProfileShown in Figure 5 . 3a - Test 1
Force at Ram 3 versus Deflection Along Plane 5 for ProfileShown in Figure 5 . 3b - Test 1

1. Introduction
This paper reports the results of tests to determine
the structural strength and stiffness characteristics of a
wood framed volumetric housing module. The series of structural
tests was performed subsequent to a series of tests relating
to transportation by rail. The entire test program was
conducted in conjunction with the HUD- sponsored industrial
housing program, Operation BREAKTHROUGH. An integral part of
the transportation study was the shipment of the module, over
850 miles of rail track, from its point of manufacture to the
National Bureau of Standards (NBS) Structures Laboratory at
Gaithersburg,Maryland. This report refers to the transportation
only inasmuch as it concerns the module, and, in particular,
its condition at the start of the structural tests. The total
sequence of the tests closely simulated the experience of an
actual module as it undergoes manufacture , transportation,
erection, and in-service loading.
The concept of fabricating volumetric modules in a factory
and assembling them on the housing site to form complete dwelling
units is one that is growing in popularity within the building
industry. Such modules can have a width and length ranging
up to 12 ft and 60 ft, respectively, while their height is
approximately 10 ft. The feasibility of this concept hinges. •
on the economics of transporting the units from a central point
of manufacture to distant construction sites.
Of the many factors to be considered in regard to trans-
portation, its effect on the subsequent performance of the
module, as a component of the living unit, is of primary concern.
Cost considerations require damage incurred during regular
rail shipment to be held to a minimum. For the system in question,
transportation was particularly critical since the initial
production of modules would have to withstand rail shipment
1
for a distance exceeding 2000 miles. An experimental shipment
was therefore conceived, using a full-scale prototype module
of a configuration considered to be most critical for transportatior-'*
2. Test Structure l!^
2.1 Housing System ifit
The housing system represented in this study is characterized
by wood framed modules joined into clusters at the building
site to form units. The isometric view presented in figure
2.1, illustrates three such townhouses,arranged in a staggered
pattern. The exterior envelope and the interior partitions n
are common throughout the system and are described in paragraph -ia
2.3. i%
As structural integrals, modular units such as the test i
specimen are connected in various arrangements to resist l«i
gravity live loads, environmental forces (i.e., earthquake, :!i
snow and wind forces) and occupant loads (i.e. impact). The i\
arrangement utilized in this system is a four-module combination
which results in a two-story house. i,i
2.2 The Selected Module
The interface between adjacent modular units provides
a natural boundary in the selection of a test specimen. The
full-scale module selected for the transportation study and
the subsequent structural testing is designated as a second-
story front unit. The bold outline in figure 2.1 denotes
the boundary of the test module in relation to the remaining
three segments. Although its selection was predicated upon
choosing a module critical for transportation, the construction
of the module was thought to be representative of the systemin general.
As erected in the laboratory, the module was 59 ft-4
1/2 in long x 11 ft-9 1/2 in wide x 15 ft-7 1/2 in high.
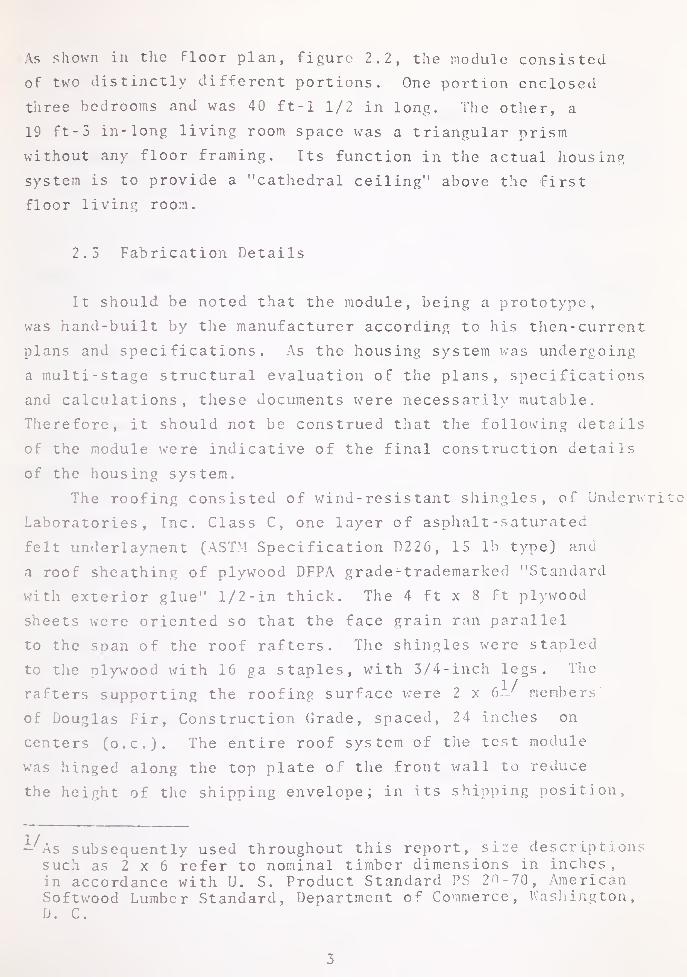
As shown ill the Floor plan, figure 2.2, the module consisted
of two tlistinctly different portions. One portion enclosed
three bedrooms and was 40 ft-i 1/2 in long. The other, a
19 ft- 5 in- long living room space was a triangular prism
without any floor framing. Its function in the actual liousing
system is to provide a "cathedral ceiling" above the first
floor living room.
2.5 Fabrication Details
It should be noted that the module, being a prototype,
was hand-built by the manufacturer according to his tlien- current
plans and specifications. As the housing system v/as undergoing
a multi-stage structural evaluation of the plans, specifications
and calculations, these documents were necessarily mutable.
Therefore, it should not be construed that t)ie following details
of the module were indicative of the final construction details
of the housing system.
The roofing consisted of v;ind- resis tant shingles, of Underwrite
Laboratories, Inc. Class C, one layer of asplial t -s atur ated
felt underlayment (ASTM Specification D226, 15 lb type) and
a roof sheathing of plywood DFPA grade - trademarkcd "Standard
with exterior glue" 1/2-in thick. The 4 ft x 8 ft plywood
sheets were oriented so that the face grain ran parallel
to the snan of the roof rafters. The shingles were stapled
to the plywood with 16 ga staples, with 3/4-inch legs. The
rafters supporting the roofing surface xvere 2 x 6—^ members
of Douglas Fir, Construction Grade, spaced, 24 inches on
centers (o.c). The entire roof system of tiie test module
was hinged along the top plate of tlie front wall to reduce
the height of tlie shipping envelope; in its shipping position,
-As subsequently used throughout this report, size descriptionssuch as 2 x 6 refer to nominal timber dimensions in inches,in accordance with U. S. Product Standard PS 20-70, AmericanSoftwood Lumber Standard, Department of Commerce, Wasliington,D. C.
3
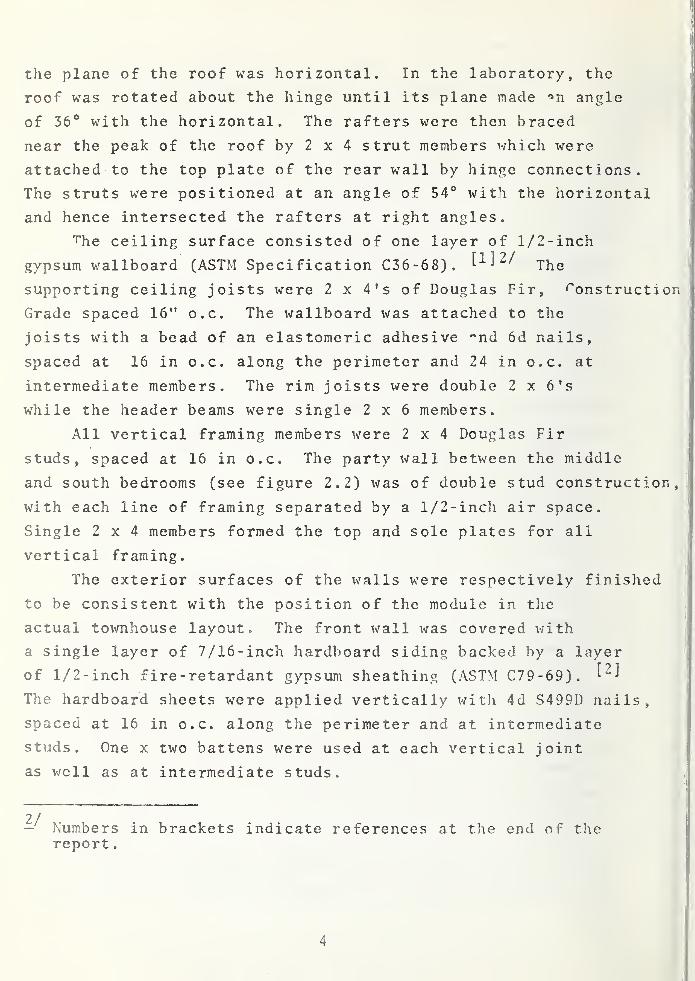
the plane of the roof was horizontal. In the laboratory, the
roof was rotated about the hinge until its plane made ^n angle
of 36° with the horizontal. The rafters were then braced
near the peak of the roof by 2 x 4 strut members which were
attached to the top plate of the rear wall by hinge connections.
The struts were positioned at an angle of 54° with the horizontal
and hence intersected the rafters at right angles.
"T^he ceiling surface consisted of one layer of 1/2-inch
gypsum wallboard (ASTM Specification C36-68). ^^^2/ ^-^^
supporting ceiling joists were 2 x 4's of Douglas Fir, 'Construction
Grade spaced 16" o.c. The wallboard was attached to the
joists with a bead of an elastomeric adhesive "nd 6d nails,
spaced at 16 in o.c. along the perimeter and 24 in o.c. at
intermediate members. The rim joists were double 2 x 6's
while the header beams were single 2x6 members.
All vertical framing members were 2x4 Douglas Fir
studs, spaced at 16 in o.c. The party wall between the middle
and south bedrooms (see figure 2.2) was of double stud construction,
with each line of framing separated by a 1/2-inch air space.
Single 2x4 members formed the top and sole plates for all
vertical framing.
The exterior surfaces of the walls were respectively finished
to be consistent with the position of the module in the
actual townhouse layout. The front wall was covered with
a single layer of 7/16-inch hardboard siding backed by a layer
of 1/2-inch fire-retardant gypsum sheathing (ASTM C79-69). ^"-^
The hardboard sheets were applied vertically witli 4d S499D nails,
spaced at 16 in o.c. along the perimeter and at intermediate
studs. One x two battens were used at each vertical joint
as well as at intermediate studs.
— Numbers in brackets indicate references at the end of tlie
report
.
4
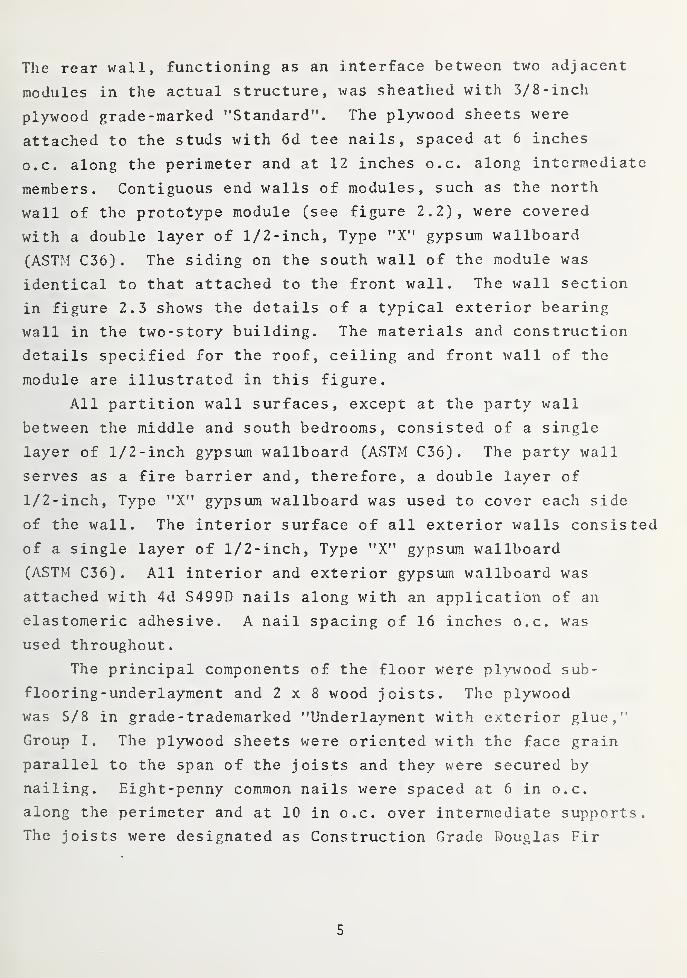
The rear wall, functioning as an interface between two adjacent
modules in the actual structure, was sheathed with 5/8-incli
plywood grade-marked "Standard". The plywood sheets were
attached to the studs with 6d tee nails, spaced at 6 inches
o.c. along the perimeter and at 12 inches o.c. along intermediate
members. Contiguous end walls of modules, such as the north
wall of the prototype module (see figure 2.2), were covered
with a double layer of 1/2-inch, Type "X" gypsum wallboard
(ASTM C36). The siding on the south wall of the module was
identical to that attached to the front wall. The wall section
in figure 2.3 shows the details of a typical exterior bearing
wall in the two-story building. The materials and construction
details specified for the roof, ceiling and front wall of the
module are illustrated in this figure.
All partition wall surfaces, except at the party wall
between the middle and south bedrooms, consisted of a single
layer of 1/2-inch gypsum wallboard (ASTM C36) . The party wall
serves as a fire barrier and, therefore, a double layer of
1/2-inch, Type "X" gypsum wallboard was used to cover each side
of the wall. The interior surface of all exterior walls consisted
of a single layer of 1/2-inch, Type "X" gypsum wallboard
(ASTM C36) . All interior and exterior gypsum wallboard was
attached with 4d S499D nails along with an application of an
elastomeric adhesive. A nail spacing of 16 inches o.c. was
used throughout.
The principal components of the floor were plywood sub-
flooring-underlayment and 2x8 wood joists. The plywood
was 5/8 in grade- trademarked "Underlayment with exterior glue,"
Group I. The plywood sheets were oriented with the face grain
parallel to the span of the joists and they were secured by
nailing. Eight-penny common nails were spaced at 6 in o.c.
along the perimeter and at 10 in o.c. over intermediate supports.
The joists were designated as Construction Grade Douglas Fir
5
and their clear span measured 11 ft- 3 1/2 in. Conventional
16-inch joist spacing was used. Both the rim joists and header
beams were double members, consisting of a 2 x 10 nailed to a
2 X 12, tlie 2 X 10 being outermost.
Wall-to-wall nylon carpet, with foam padding, was installed
in the factory in all three bedrooms. Pre-assembled push-out
bay window assemblies were installed in the laboratory in the
north and middle bedrooms according to the plans (see figures
2.1 and 2.2). Bi-fold metal doors in closet openings were
installed at the factory.
2.4 Condition of the Module Before Testing
The module was visually inspected for damage or other
evidence of structural distress, upon its arrival at the laboratory.
All cracks in wallboard and other forms of local damage were
systematically documented. Prior to lifting and transporting
from the factory, reference points had been established on
the interior and exterior wall surfaces and linear measurements
were made between the reference points. These measurements
were repeated in the laboratory, so as to determine any dimensional
changes in the module caused by the handling and shipping
operations
.
It was observed that the interior surfaces incurred
two types of damage as a result of lifting and transportation:
The first type was hairline cracking on the surface of the
gypsum wallboard. These fine cracks were located mostly near
doorways, closet openings and window frames. There was no
apparent damage to the structural framing associated with
this cracking. In the second type, the wallboard tape, applied
to the joint between two adjacent panels of wallboard, was
torn at several locations, reflecting relative motion between
the panels. Most of the tearing occurred along the horizontal
6
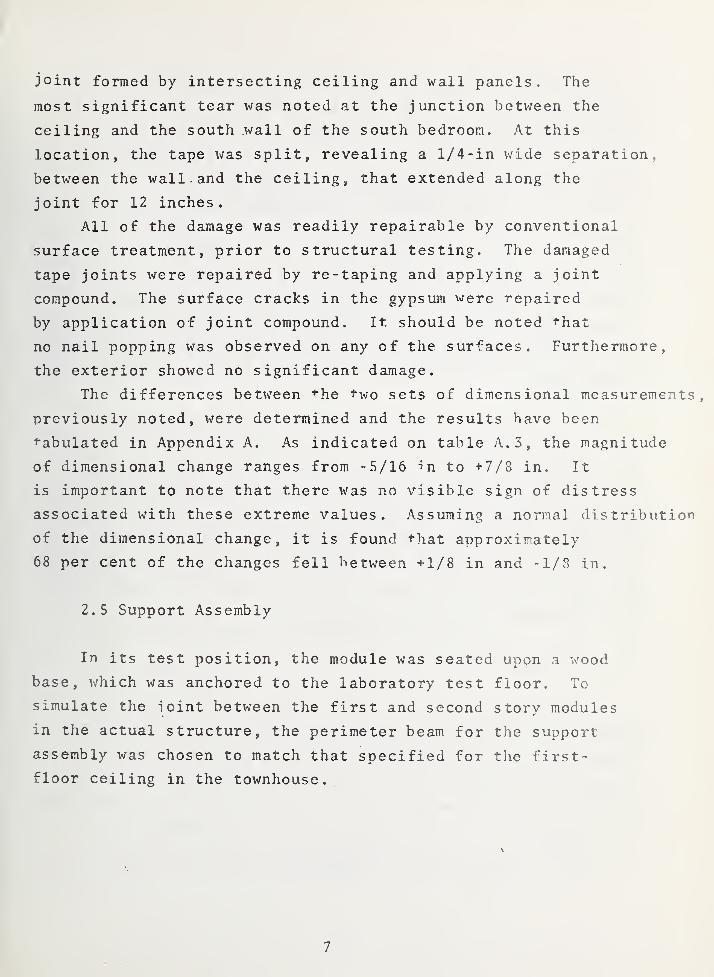
joint formed by intersecting ceiling and wall panels. The
most significant tear was noted at the junction between the
ceiling and the south wall of the south bedroom. At this
location, the tape was split, revealing a 1/4-in wide separation,
between the wall. and the ceiling, that extended along the
joint for 12 inches.
All of the damage was readily repairable by conventional
surface treatment, prior to structural testing. The damaged
tape joints were repaired by re-taping and applying a joint
compound. The surface cracks in the gypsum were repaired
by application of joint compound. It should be noted '•hat
no nail popping was observed on any of the surfaces. Furthermore,
the exterior showed no significant damage.
The differences between "^he two sets of dimensional measurements,
previously noted, were determined and the results have been
tabulated in Appendix A. As indicated on table A. 3, the magnitude
of dimensional change ranges from -5/16 in to -s-y/S in. It
is important to note that there was no visible sign of distress
associated with these extreme values. Assuming a normal distribution
of the dimensional change, it is found that approximately
68 per cent of the changes fell between +1/8 in and -1/8 in.
2.5 Support Assembly
In its test position, the module was seated upon a wood
base, which was anchored to the laboratory test floor. To
simulate the ioint between the first and second story modules
in the actual structure, the perimeter beam for the support
assembly was chosen to match that specified for tlie first-
floor ceiling in the townhouse.
7
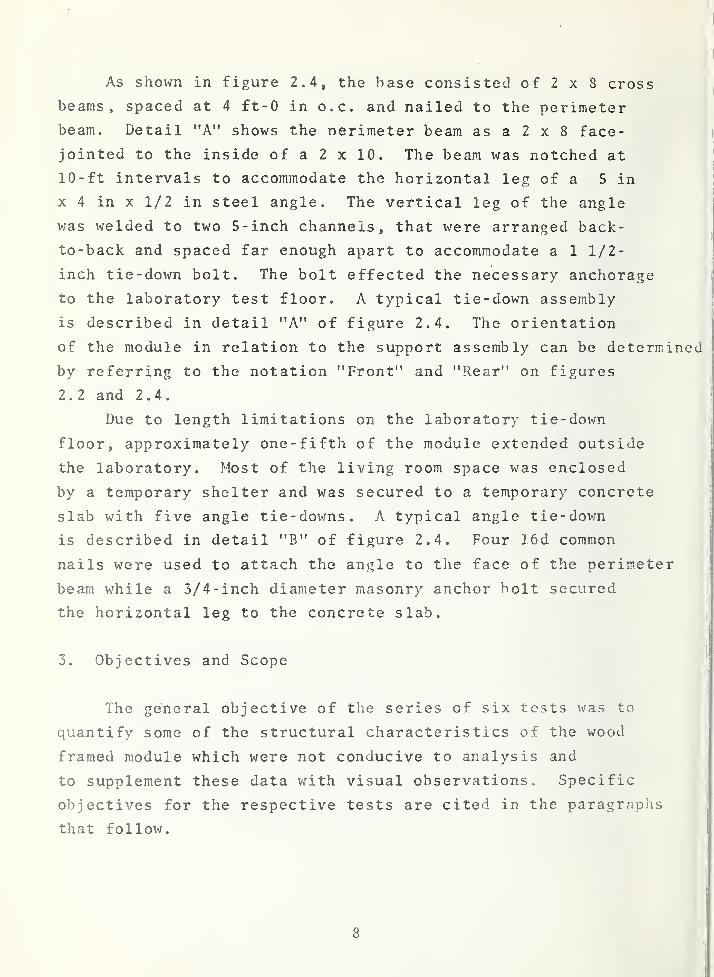
As shown in figure 2.4, the base consisted of 2 x 8 cross
beams, spaced at 4 ft-0 in o.c. and nailed to the perimeter
beam. Detail "A" shows the nerimeter beam as a 2 x 8 face-
jointed to the inside of a 2 x 10. The beam was notched at
10-ft intervals to accommodate the horizontal leg of a 5 in
X 4 in X 1/2 in steel angle. The vertical leg of the angle
was welded to two 5-inch channels, that were arranged back-
to-back and spaced far enough apart to accommodate a 1 1/2-
inch tie-down bolt. The bolt effected the necessary anchorage
to the laboratory test floor. A typical tie-down assembly
is described in detail "A" of figure 2.4. The orientation
of the module in relation to the support assembly can be determined
by referring to the notation "Front" and "Rear" on figures
2 . 2 and 2.4.
Due to length limitations on the laboratory tie-down
floor, approximately one-fifth of the module extended outside
the laboratory. Most of the living room space was enclosed
by a temporary shelter and was secured to a temporary concrete
slab with five angle tie-downs. A typical angle tie-down
is described in detail "B" of figure 2.4. Four 16d common
nails were used to attach the angle to tlie face of the perimeter
beam while a 3/4-inch diameter masonry anchor bolt secured
the horizontal leg to the concrete slab.
3. Objectives and Scope
The general objective of the series of six tests was to
quantify some of the structural characteristics of the wood
framed module which were not conducive to analysis and
to supplement these data with visual observations. Specific
objectives for the respective tests are cited in the paragraplis
that follow.
8
In the following chronological sequence of tests, the
racking tests were designed so that each test would be more
critical to the structural integrity of the module than the
one that preceded it.
3.1 Service Life Racking - Test 1
3.1.1 Objective
To determine the stiffness of the module with respect
to lateral load and to estimate the drift, at the second-
floor level in the actual building when it is subjected to
wind forces.
3.1.2 Scope
The module was subjected to static concentrated loads
simulating wind forces normal to the front face of the building
and the resulting horizontal and vertical deflections of selected
points were measured. No attempt was made to consider variations
of loading distribution or the module's response as a function
of time.
3.2 Transient Floor Vibrations - Test 2
3.2.1 Objective
To determine the damping behavior of the floor when subjected
to vibrations of relatively short duration, such as those
induced by human activities
.
3.2.2 Scope
This test recorded the decay of the amplitude of floor
displacement, with time, following a single impulse excitation.
9
The same procedure was performed for each of four combinations
of the point of delivery of impulse and the point of measurement
of displacement. This was done in order to observe the difference
in readings resulting from varying the combination. The
floor in the largest room, the north bedroom, was selected
for testing and its location is shown in figure 3.1.
3.3 Sustained Floor Load - Test 3
3.3.1 Objective
To determine the deflection of the floor, at critical
locations, both under a uniformly distributed load and subsequent
to its removal.
3.3.2 Scope
This was a two-day test performed on the south bedroom
floor, the location of which is shown in figure 3.2. Since
the floor construction was identical in all three rooms,
it was considered necessary to test only one floor.
Following this test, the triangular-shaped living room
space was completely severed from the bedroom portion and
all further testing was conducted on the remaining 40-ft -
1 1/2 in long module. It was concluded that this alteration
would result in a closer representation of lower-story construction
in the actual building.
3.4 Repeated Racking - Test 4
3.4.1 Objective
To document any detectable decrease in serviceability
and to determine if a reduction in lateral stiffness resulted
10
upon the module being subjected to repeated applications of
lateral loading.
3.4.2 Scope
One thousands cycles of simulated wind force were applied
at right angles to the front face of the module. Horizontal
and vertical deflections of selected points were measured.
Qualitative assessment of the structure's response was accomplished
by visually examining those areas identified as potential points
of distress.
3.5 Reversals of Racking - Test 5
3.5.1 Objective
To describe qualitatively the extent of distress and
damage to all visible connections and exposed components as
the module was subjected to loading that, in magnitude, corresponded
to earthquake design provisions in the Uniform Building Code
[3].
3.5.2 Scope
Five cycles of reversed lateral load were applied at
right angles to the front face of the module. The structure
was visually examined for evidence of distress or failure
at the conclusion of testing.
3.6 Racking to Capacity - Test 6
3.6.1 Objective
To quantify the maximum lateral load which the module
could withstand.
11
3.6.2 Scope
Static lateral force was applied in increasing magnitude,
at right angles to the front face of the module until failure
occurred. Deflection data were periodically recorded and
the module was visually examined for signs of distress and
damage.
4. Test Setup and Instrumentation
4.1 Service Life Racking - Test 1
The five 10-ton hydraulic rams schematically located
in figure 4.1, were actuated through a dual manifold system.
Rams 1, 2 and 5 were branched from one manifold, while rams
3 and 4 were connected to a second line. In order to measure
the magnitude of force in the hydraulic systems, a load cell
was attached to one ram in each system. Hydraulic pressure,
corresponding to a particular jacking force, was monitored
visually from two single-channel strain indicator boxes.
A pressure transducer located in each manifold provided the
electrical input to the indicator boxes. The centerline of
each ram was measured to be 9 ft-9 in above the laboratory
test floor.
The rams were attached to reaction frames constructed
of rolled steel sections. The principal parts of a typical
frame consisted of a wide-flange column, 10 ft high, and a
diagonal member consisting of two angles placed back-to-back.
The column was braced at mid-height by the diagonal member
and both elements were bolted to the laboratory floor. The
design capacity of each frame was 10 kip applied horizonallyat the top of column. Several reaction frames are shown in
figure 4.10.
12
A total of 40 linear variable differential transducers
(LVDTs) was used to measure displacement of the nodule. The
relative location of 28 of the transducers is shown in figures
4.2 and 4.3. The isometric view in figure 4.2 locates the
14 horizontal and 5 vertical transducers along the rear of
the module. An input signal was supplied to two X-Y recorders
by LVDTs no. 5 and 17. Thus, the combined signals of the
load cells and LVDTs enabled a load-deflection curve to be
plotted for all cycles of loading.
Nine LVDTs were attached to the front of the module (see
figure 4.3). Several dial gages with f range of + 1 inch
and graduated to 0.001 inch were employed along the front
to provide a check against the LVDT recordings.
One face of two shear wall panels was instrumented with
6 LVDTs. Schematic drawings of the rectangles formed by the
transducers are shown in figure 4.4 against the background
of the two wall panels, Plane 1 and Plane 3. Transducers
23 through 34 measured wall racking deformation. Figure 4.5
shows the detail of a typical support of LVDTs positioned
along the rear of the module.
Calibration of load cells, pressure transducers and deflec-
tion transducers was performed prior to all racking tests.
All data for this test, as well as most of the data for the
remaining racking tests, was acquired through the use of a
computer-controlled automatic scanner and a digital voltmeter.
The capability of the system was 200 channels. The voltmeter
readings were recorded for the designated load levels, on
magnetic tape and also on a teletype console printout. The
entire array of data acquisition equipment is illustrated
in figure 4.6. The output data, as recorded on tape, was
later converted to engineering units and the results were
printed in tabular and graphical form by an electronic computer.
13
4.2 Transient Floor Vibration - Test 2
The test arrangement, as shown in figure 4.7, consisted
of a weighted leather bag, a bag-release mechanism, a tripod
for support and a linear variable differential transducer
(LVDT) for deflection measurement.
Lead shot was placed in the bag to increase its weight
to 25 lb. It was established that the potential energy ofi
the bag (weight of bag times height of drop) of 75 ft-lb was
sufficient to induce a measurable excitation of wood-joist
floors. Consequently, the bag was suspended 3 ft above the
finished floor.
The LVDT had a gage length of + 1.0 in and was calibrated
to measure increments of +_ 0.0001 in. A beam of adjustable
length, to which the LVDT was attached, is shown in the background
of figure 4.7. The beam spanned approximately 15 ft -6 in
between the north and south walls of the North Bedroom. To
insure that the response of the LVDT was in phase with that
of the floor at the point of observation, the plunger was
secured to the surface of the plywood underlayment -subfloor
.
An oscillograph, equipped with a galvanometer of 600 Hz response,
was used to record the LVDT output. A trace of the floor
response was printed on oscillograph recording paper.
4.3 Sustained Floor Load - Test 3
A total of five instruments were used to measure deflection.
Two were LVDTs and the remaining three were dial gages . Four
of these instruments are visible in figure 4.8.
The LVDTs were of +^ 1 inch gage length and were calibrated
to read increments of + 0.0001 in. The dial gages had a range
of + 1 inch and were graduated 0.001 inch. A strip-chart
recorder continuously recorded the output of the LVDTs, while
the dial gages were read periodically with the aid of a
14
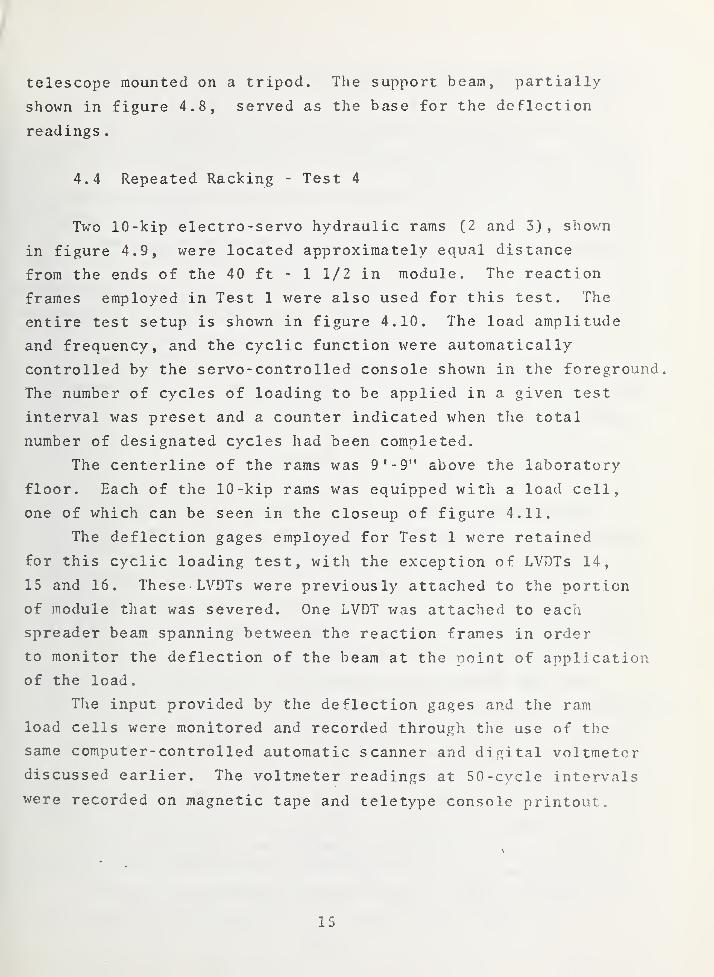
telescope mounted on a tripod. The support beam, partially-
shown in figure 4.8, served as the base for the deflection
readings
.
4.4 Repeated Racking - Test 4
Two 10 -kip electro-servo hydraulic rams (2 and 3) , shovm
in figure 4.9, were located approximately equal distance
from the ends of the 40 ft - 1 1/2 in module. The reaction
frames employed in Test 1 were also used for this test. The
entire test setup is shown in figure 4.10. The load amplitude
and frequency, and the cyclic function were automatically
controlled by the servo- controlled console shown in the foreground.
The number of cycles of loading to be applied in a given test
interval was preset and a counter indicated when the total
number of designated cycles had been completed.
The centerline of the rams was 9 '-9" above the laboratory
floor. Each of the 10-kip rams was equipped with a load cell,
one of which can be seen in the closeup of figure 4.11.
The deflection gages employed for Test 1 were retained
for this cyclic loading test, with the exception of LVDTs 14,
15 and 16. These LVDTs were previously attached to the portion
of module that was severed. One LVDT was attached to each
spreader beam spanning between the reaction frames in order
to monitor the deflection of the beam at the point of application
of the load.
The input provided by the deflection gages and the ram
load cells were monitored and recorded through the use of tlie
same computer- controlled automatic scanner and digital voltmeter
discussed earlier. The voltmeter readings at 50-cycle intervals
were recorded on magnetic tape and teletype console printout.
15
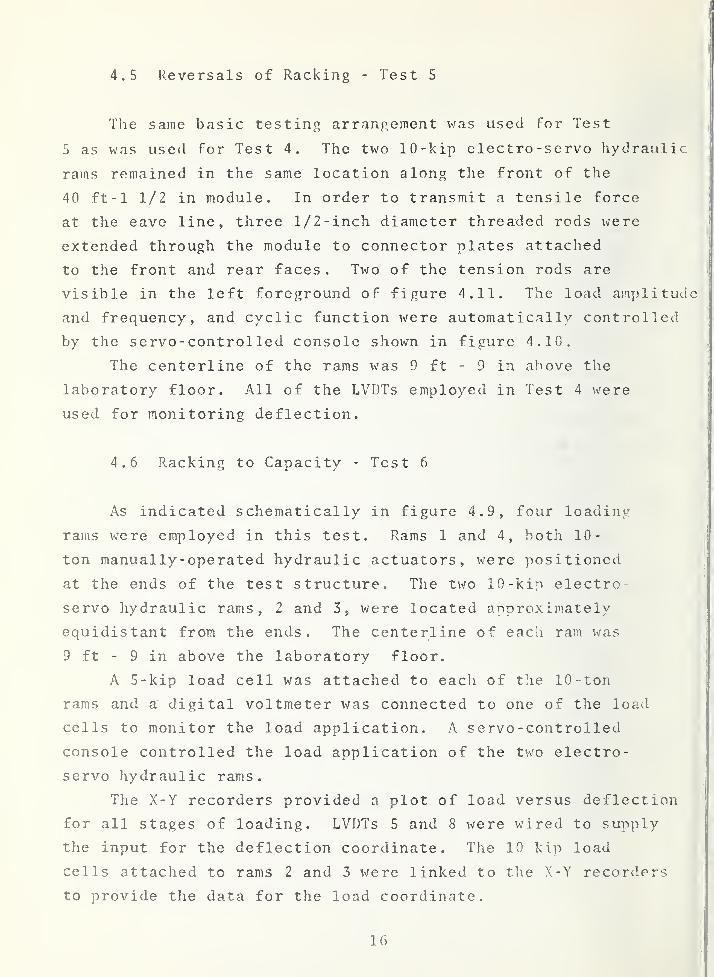
4.5 Reversals of Racking - Test 5
The same basic testinj^ arrangement was used for Test
5 as was used for Test 4. The two 10 -kip electro -servo hydrauli
rams remained in the same location along the front of the
40 ft-1 1/2 in module. In order to transmit a tensile force
at the eave line, three 1/2-inch diameter threaded rods were
extended through the module to connector plates attached
to the front and rear faces. Two of the tension rods are
visible in the left foreground of figure 4.11. The load anplitu
and frequency, and cyclic function were automatically controlled
by the servo - control led console shown in figure 4.10.
The centerline of the rams was 9 ft - 9 in above tlie
laboratory floor. All of the LVDTs employed in Test 4 were
used for monitoring deflection.
4.6 Racking to Capacity - Test 6
As indicated schematically in figure 4.9, four loading
rams were employed in this test. Rams 1 and 4, both 10-
ton manually-operated hydraulic actuators, were positioned
at the ends of the test structure. The two 10-kip electro-
servo hydraulic rams, 2 and 3, were located approximately
equidistant from the ends. The centerline of each ram was
9 ft - 9 in above the laboratory floor.
A 5-kip load cell was attached to each of the 10 -ton
rams and a digital voltmeter was connected to one of the load
cells to monitor the load application. A servo -controlled
console controlled the load application of the two electro-
servo hydraulic rams.
The X-Y recorders provided a plot of load versus deflection
for all stages of loading. LVDTs 5 and 8 were wired to supply
the input for the deflection coordinate. The 10 kip load
cells attached to rams 2 and 3 were linked to the X-Y recorders
to provide the data for the load coordinate.
16
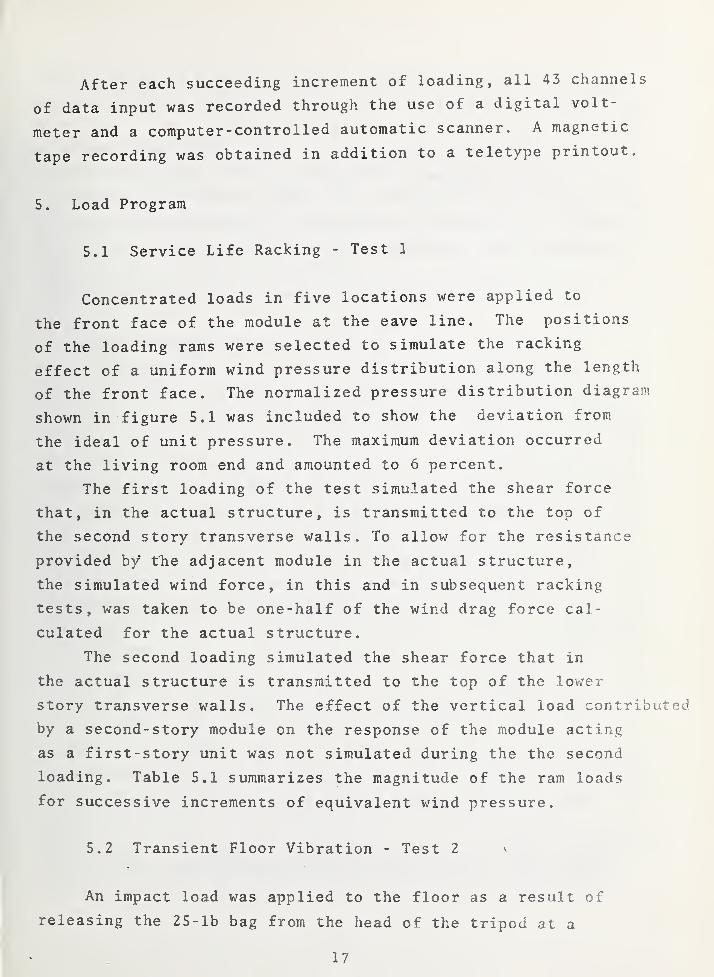
After each succeeding increment of loading, all 43 channels
of data input was recorded through the use of a digital volt-
meter and a computer- controlled automatic scanner. A magnetic
tape recording was obtained in addition to a teletype printout.
5. Load Program
5.1 Service Life Racking - Test 1
Concentrated loads in five locations were applied to
the front face of the module at the eave line. The positions
of the loading rams were selected to simulate the racking
effect of a uniform wind pressure distribution along the length
of the front face. The normalized pressure distribution diagram
shown in figure 5.1 was included to show the deviation from
the ideal of unit pressure. The maximum deviation occurred
at the living room end and amounted to 6 percent.
The first loading of the test simulated the shear force
that, in the actual structure, is transmitted to the top of
the second story transverse walls. To allow for the resistance
provided by the adjacent module in the actual structure,
the simulated wind force, in this and in subsequent racking
tests, was taken to be one-half of the wind drag force cal-
culated for the actual structure.
The second loading simulated the shear force that in
the actual structure is transmitted to the top of the lower
story transverse walls. The effect of the vertical load contributec
by a second-story module on the response of the module acting
as a first-story unit was not simulated during the the second
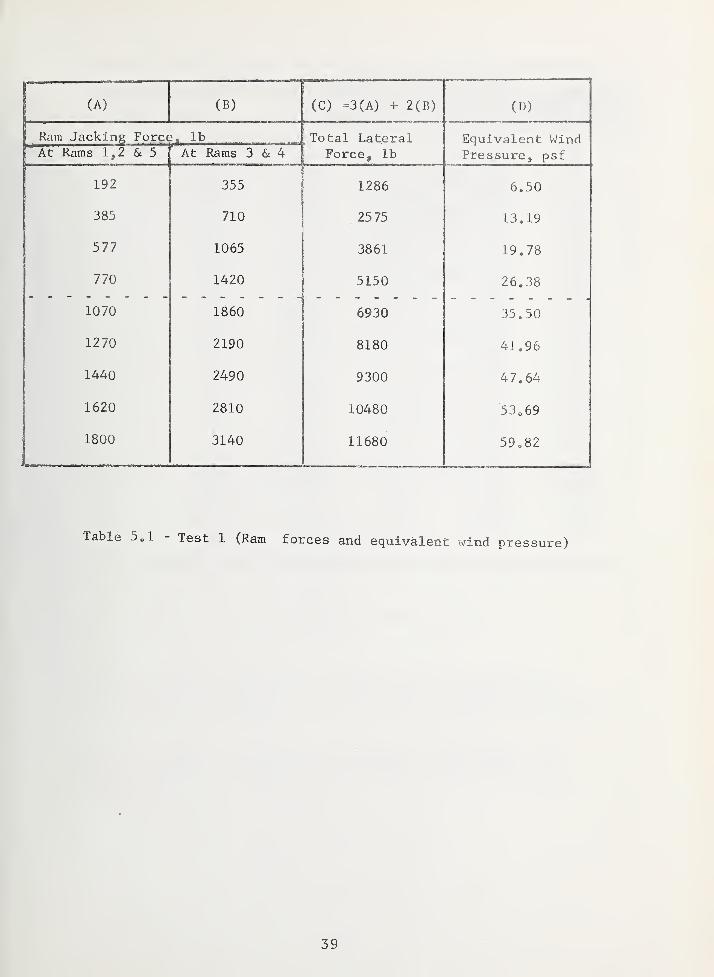
loading. Table 5.1 summarizes the magnitude of the ram loads
for successive increments of equivalent wind pressure.
5.2 Transient Floor Vibration - Test 2 v
An impact load was applied to the floor as a result of
releasing the 25-lb bag from the head of the tripod at a
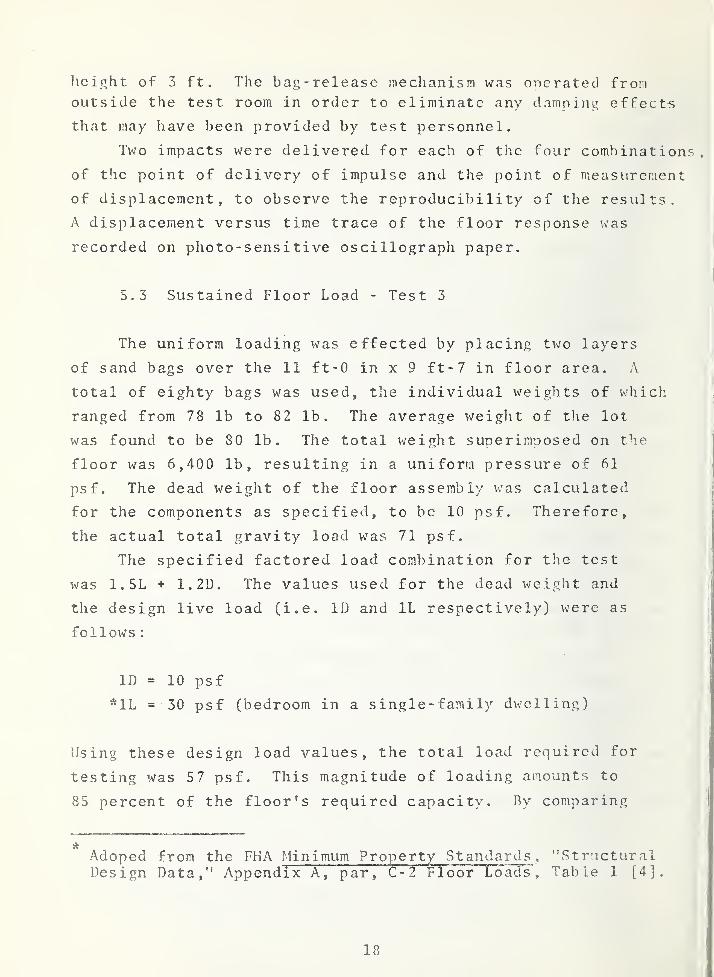
hcifjht of 3 ft. The bag-release mechanism was onerated fromoutside the test room in order to eliminate any damping effects
that may have been provided by test personnel.
Two impacts were delivered for each of the four combinations,
of the point of delivery of impulse and the point of measurement
of displacement, to observe the reproducibility of the results.
A displacement versus tine trace of the floor response was
recorded on photo-sensitive oscillograph paper.
5.3 Sustained Floor Load - Test 3
The uniform loading was effected by placing t\\ro layers
of sand bags over the 11 ft-0 in x 9 ft-7 in floor area. A
total of eighty bags was used, the individual weights of which
ranged from 78 lb to 82 lb. The average weight of the lot
was found to be 80 lb. The total weight superimposed on the
floor was 6,400 lb, resulting in a uniform pressure of 61
psf. The dead weight of the floor assembly was calculated
for the components as specified, to be 10 psf. Therefore,
the actual total gravity load was 71 psf.
The specified factored load combination for the test
was 1.5L + 1.2D. The values used for the dead weight and
the design live load (i.e. ID and IL respectively) were as
follows:
ID = 10 psf
*1L = 30 psf (bedroom in a s ingle - fami ly dwelling)
Using these design load values, the total load required for
testing was 57 psf. This magnitude of loading amounts to
85 percent of the floor's required capacity. By comparing
Adoped from the FHA Minimum Property Standards , "StructuralDesign Data," Appendix A, par, C-2 Floor Loads, Table 1 [4].
18
the actual test load with the specified load value, it is
seen that a 24,5 percent greater load was applied than was
required.
Vertical deflection of five points was recorded immediately-
after the full load was applied and several times during
the subsequent 24 hours. The ability of the floor to return
to its initial position was quantified by recording the deflection
at the same points, upon unloading the floor. Measurements
were obtained immediately after the load was removed and at
several intervals during the subsequent 24 hours.
5.4 Repeated Racking - Test 4
Concentrated loads were applied at the eave line of the
front face of the module at two locations. These loads varied
with time in accordance with a half-sine wave. This test
involved 1000 cycles of loading from ID to (ID + 0 . 5W) . The
magnitude of the horizontal forces was determined by considering
the contributory area shown in figure 5.3b, minus the 19 ft-
3 in long living room space which had been severed from the
remaining bedroom portion. The loading used was considered
capable of closely representing the loading experience of the
actual structure during its service life. The design wind
pressure (i.e. IW) was taken to be 20 psf.
The 1000 cycles of loading were applied automatically
by the hydraulic rams and the load control was preset such
that 50 cycles of loading would be applied at a frequency
of 1 Hz. The maximum amplitude of loading during each cycle
was 2.5 kips per ram. Twenty blocks of these 50 cycles of
loading were required to complete the test loading. In addition,
there were two manually- controlled cycles of loading, one
preceding the first 50-cycle block and one following the
lOpOth cycle. The entire sequence of loading is shown schematically
in figure 5.2. The manually controlled cycles are denoted
as "static" cycles in the figure. Note that the abscissa is
19
intermittently labeled with a letter to establisli the terminals
of the 50-cycle blocks, as well as the points of zero and
peak load for tlie static cycles. The horizontal and vertical
displacements of selected points were measured at the terminals
of the 50-cycle blocks and residual deflection measurements
were obtained 24 hours after the 1,000th cycle.
5.5 Reversals of Racking - Test 5
The application of 5 cycles of lateral load, reversing
from +11: to -IE, was intended to provide a simulation of the
fatigue experience that the structure could undergo during
a major earthquake. Since there is no known requirement
for deflection limitation of a structure subjected to such
loading, the main consideration was the effect on t]ie visible
joints in the test structure and the change in stiffness of
the structure.
The magnitude of the test load was calculated in accordance
with the seismic provisions for two-story structures in the
1967 edition of the Uniform Building Code.^^-' Tlie weight calculatio
was based upon a two-story, wood- frame structure 40 ft-1 1/2
in long X 12 ft wide.
A sinusoidal forcing function was applied to the front
of the test module The frequency of the forcing function
was varied to observe any resulting differences in the characteris-
tics of response. The three selected frequencies were 0,1
Hz, 0.5 Hz and 0.75 Hz.
5.6 Racking to Capacity - Test 6
It was discovered in Test 1 that no measurable increase
in residual deflection occurred after three cycles of loading
had been applied. In order to effect this "shake-down" condi-
tion prior to beginning the test, three cycles of loading
were performed by ram nos . 2 and 3. Figure 4.9 sliows the
20
location of the rams. The peak load in each cycle was approximately
100 lb per ram. Zero load readings were obtained before and
after the three cycles.
The racking test was begun with a load of 500 lb on each
of rams 2 and 3 and 250 lb on each of rams 1 and 4. This
2:1 ratio was maintained throughout the test in order to effect
uniform load distribution. The structure v/as then subjected
to monotonic loading and horizontal deflection at two points
was recorded using two X-Y recorders. Loads on rams 2 and
3 were generally increased in increments of 500 11) except
that in the early stages of the test the load level was increased
directly from 1000 lb per ram to 2000 lb per ram. At the
predetermined load levels, interior and exterior surfaces
were examined for signs of distress. Closet doors and the
three exterior windows were also checked for malfunction.
6. Results
Four tests involved racking response and two tests were
concerned with floor performance. Generally, the ^lata acquired
from the four racking tests had to be transformed •^o 'Engineering
units through the use of ^n electronic computer. In the case
of tests 1 and 6, curves relating applied load to resulting
deflection (i.e. P-A curves") were subsequently plotted automatically
for all deflection transducer channels. As a means '^f ronfirming
the reliability of the readout from the automatic -^^ata acquisition
equipment, X-Y recorders plotted ^-A curves for the response
at "^wo critical locations. A <?econdary check was accomplished
by using the readings of six mechanical dial gages at -"^arious
""ocations along the front of the test structure.
6.1 Service Life Racking - Test 1
A series of curves of applied load versus net horizontal
displacement are presented in figures A. 3 through A. 12.
21
The values on the abscissa were obtajnea by calculating
the tlifference between the horizontal deflection at tlie ton
of the rear wall and that at the ton of the sunnort assembly.
No attempt has been made to separate the f^ross horizontal
deflection at a point into its three components, i.e. deflection
due to 1.) rinid body rotation, 2.) curvature and rackin^^.
Five curves depictin.r the lateral displaccnent profile
are sliown in figure 6.1. These curves, corresponding, to
equivalent wind pressures of 13.19, 26.38, 35.50, 41.96
and 47.63 psf, illustrate the deformation behavior of the
test module relative to its oric^inal position.
6.2 Transient Floor Vibration - Test 2
The response of the test floor to the impact loading,
is presented in figures 6.2 through 6.5 in the form of deflection
amplitude versus time curves. There were t\.'0 trials for
eacli of the four setups (see ripht side of figure 6.2 and
6.3) and lience there are eight traces presented.
The response for the first trial within a given sctun
is denoted by the number 2 followed by a single letter (i.e.
2A) . The seconrl trial for the same setup is identified by
tlic number 2 followed by tA\'o letters (i.e. 2A.^) . In all
cases, the positive side of the trace corrosnonds to the
downward motion of the floor.
It sliould be noted that in three of the four test setups
tiie initial amplitude trace is truncated rather t!\an possessinr;
a vertex similar to the remaining amplitudes. This anor.ialy
was due to the limited outjnit of the amplifier in the os c i 1 1 o;'.rn'^h
recorder. The positive half of the first cvclc has been
extrapolated by dashed lines to indicate the probable initial
amplitude
.
6.3 Sustained Floor Load - Test 3
T]ie deflections recorded by a LYDT nlace l at the ccr;t';^r
of the south bedroom are presented in figure 6.6, v;hero tliev
22
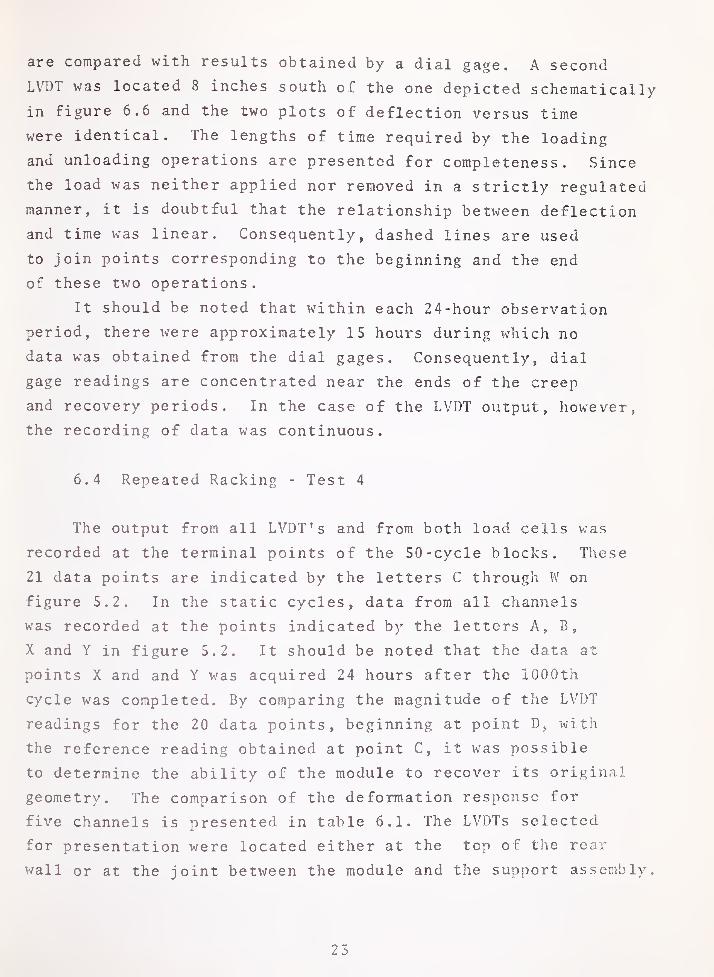
are compared with results obtained by a dial gage. A second
LVDT was located 8 inches south of the one depicted schematically
in figure 6.6 and the two plots of deflection versus time
were identical. The lengths of time required by the loading
and unloading operations are presented for completeness. Since
the load was neither applied nor removed in a strictly regulated
manner, it is doubtful that the relationship between deflection
and time was linear. Consequently, dashed lines are used
to join points corresponding to the beginning and the end
of these two operations.
It should be noted that within each 24-hour observation
period, there were approximately 15 hours during which no
data was obtained from the dial gages. Consequently, dial
gage readings are concentrated near the ends of the creep
and recovery periods. In the case of the LVDT output, however,
the recording of data was continuous.
6.4 Repeated Racking - Test 4
The output from all LVDT's and from both load cells was
recorded at the terminal points of the 50 -cycle blocks. These
21 data points are indicated by the letters C through W on
figure 5.2. In the static cycles, data from all channels
was recorded at the points indicated by the letters A, B,
X and Y in figure 5.2. It should be noted that the data at
points X and and Y was acquired 24 hours after the 1000th
cycle was completed. By comparing the magnitude of the LVDT
readings for the 20 data points, beginning at point D, with
the reference reading obtained at point C, it was possible
to determine the ability of the module to recover its original
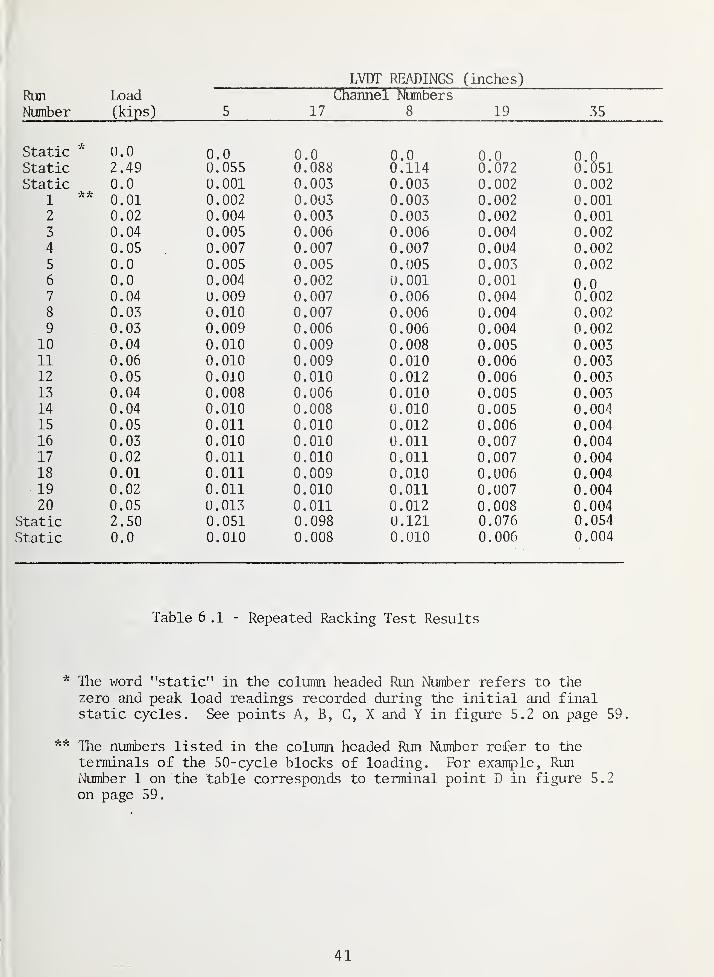
geometry. The comparison of the deformation response for
five channels is presented in table 6.1. The LVDTs selected
for presentation were located either at the top of the rear
wall or at the joint between the module and the support assembly.
23
Visual examination of the interior and exterior of the module
at each terminal point did not lead to the discovery of any
new damage or distress.
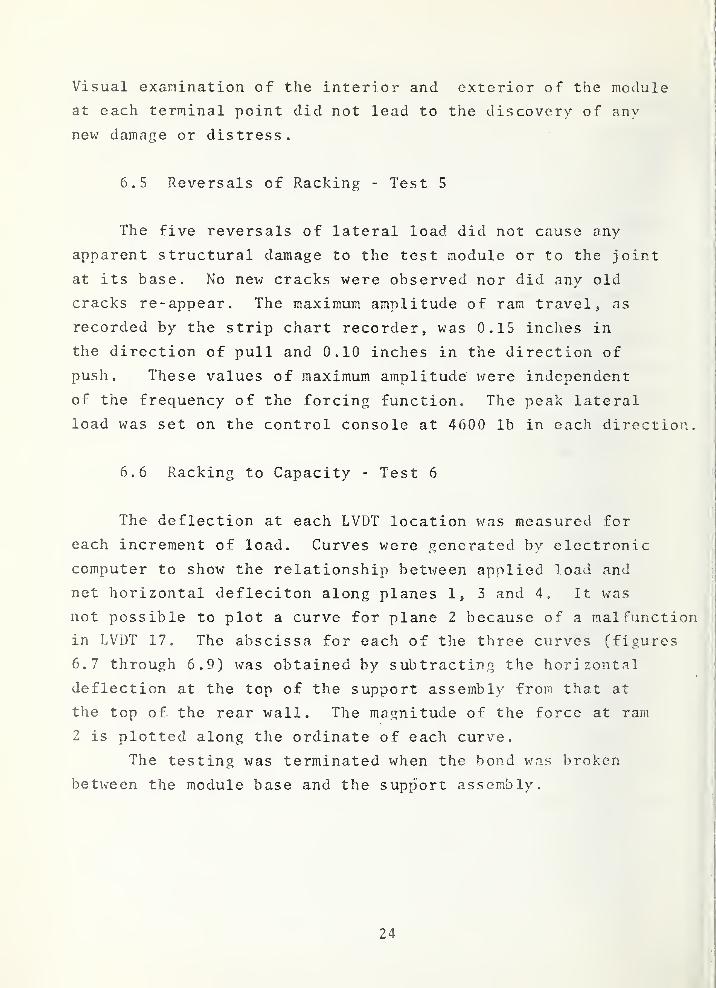
6.5 Reversals of Racking - Test 5
The five reversals of lateral load did not cause any
apparent structural damage to the test module or to the joint
at its base. No new cracks were observed nor did any old
cracks re -appear. The maximum amplitude of ram travel, as
recorded by the strip chart recorder, was 0.15 inclies in
the direction of pull and 0.10 inches in the direction of
push. These values of maximum amplitude i^ere independent
of the frequency of the forcing function. The peak lateral
load was set on the control console at 4600 lb in each direction.
6.6 Racking to Capacity - Test 6
The deflection at each LVDT location was measured for
each increment of load. Curves were generated by electronic
computer to show the relationship between applied load and
net horizontal defleciton along planes 1, 3 and 4. It was
not possible to plot a curve for plane 2 because of a malfunction
in LVDT 17. The abscissa for each of the three curves (figures
6.7 through 6.9) \\ras obtained by subtracting the horizontal
deflection at the top of the support assembly froin that at
the top of the rear wall. The magnitude of the force at ram
2 is plotted along the ordinate of each curve.
The testing was terminated when the bond was broken
between the module base and the support assembly.
24
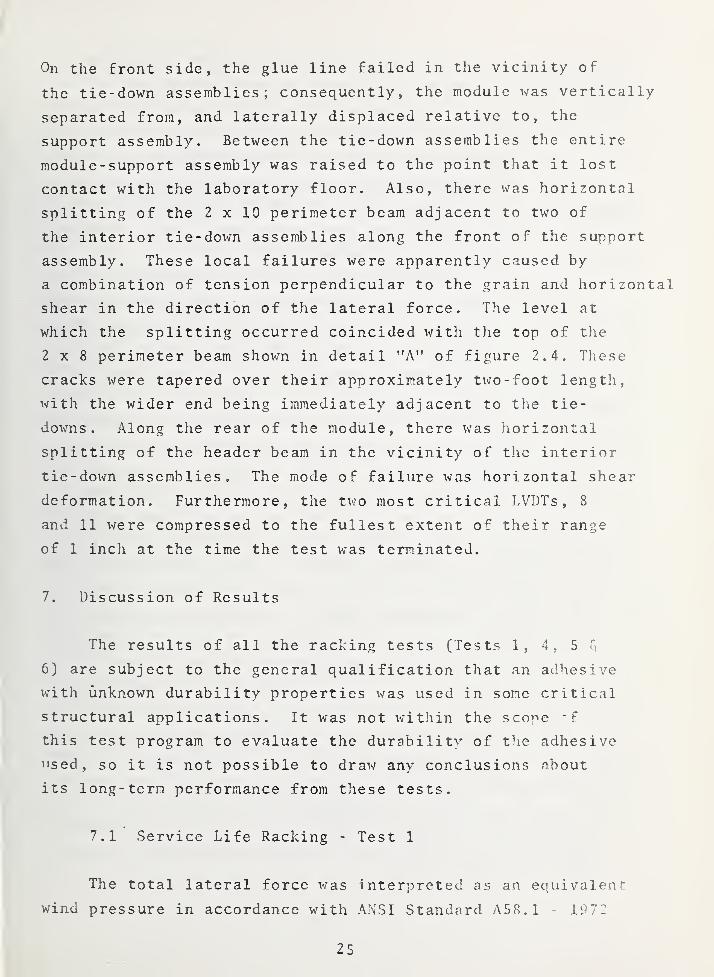
On the front side, the glue line failed in tlie vicinity of
the tie-down assemblies; consequently, the module was vertically
separated from, and laterally displaced relative to, the
support assembly. Between the tie-down assemblies the entire
module- support assembly was raised to the point that it lost
contact with the laboratory floor. Also, there was horizontal
splitting of the 2 x 10 perimeter beam adjacent to two of
the interior tie-down assemblies along the front of the support
assembly. These local failures were apparently caused by
a combination of tension perpendicular to the grain and horizontal
shear in the direction of the lateral force. The level at
which the splitting occurred coincided with the top of the
2x8 perimeter beam shown in detail "A" of figure 2.4. Tliese
cracks were tapered over their approximately two-foot length,
with the wider end being immediately adjacent to the tie-
downs. Along the rear of the module, there was horizontal
splitting of the header beam in the vicinity of tlie interior
tie-down assemblies. The mode of failure was horizontal shear
deformation. Furthermore, the two most critical LVDTs , 8
and 11 were compressed to the fullest extent of their range
of 1 inch at the time the test was terminated.
7. Discussion of Results
The results of all the racking tests (Tests 1, 4, 5 G
6) are subject to the general qualification that an adhesive
with unknown durability properties was used in some critical
structural applications. It was not witliin the scope 'f
this test program to evaluate the durabilitv of tlie adhesive
"sed, so it is not possible to draw any conclusions about
its long-term performance from these tests.
7.1 Service Life Racking - Test 1
The total lateral force was interpreted as an equivalent
wind pressure in accordance with ANSI Standard A58.1 - 1972
25
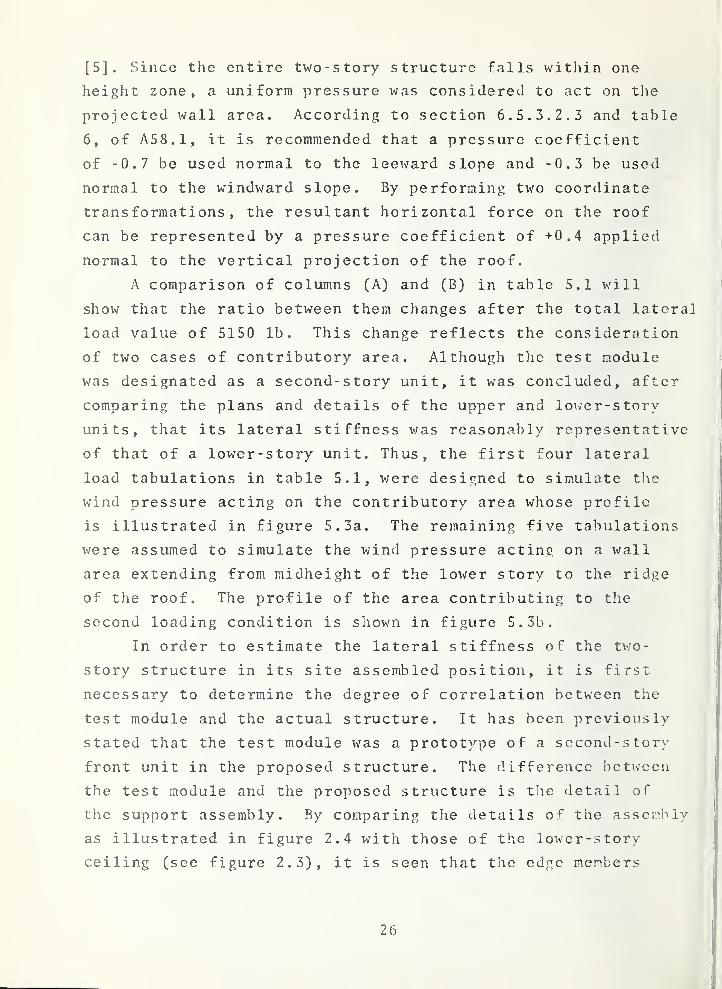
[5]. Since the entire two-story structure falls within one
height zone, a uniform pressure was considered to act on the
projected wall area. According to section 6.5.3.2.3 and table
6, of A58.1, it is recommended that a pressure coefficient
of -0.7 be used normal to the leeward slope and -0.3 be used
normal to the windward slope. By performing two coordinate
transformations, the resultant horizontal force on the roof
can be represented by a pressure coefficient of +0.4 applied
normal to the vertical projection of the roof.
A comparison of columns (A) and (B) in table 5.1 will
show that the ratio between them changes after the total lateral
load value of 5150 lb. This change reflects the consideration
of two cases of contributory area. Although the test module
was designated as a second-story unit, it was concluded, after
comparing the plans and details of the upper and lower-story
units, that its lateral stiffness was reasonably representative
of that of a lower-story unit. Thus, the first four lateral
load tabulations in table 5.1, were designed to simulate the
wind pressure acting on the contributory area whose profile
is illustrated in figure 5.3a. The remaining five tabulations
were assumed to simulate the wind pressure acting on a wall
area extending from midheight of the lo\\fer story to the ridge
of the roof. The profile of the area contributing to the
second loading condition is shown in figure 5.3b.
In order to estimate the lateral stiffness of the tv/o-
story structure in its site assembled position, it is first
necessary to determine the degree of correlation between the
test module and the actual structure. It has been previously
stated that the test module was a prototype of a second-story
front unit in the proposed structure. Tlie difference between
the test module and the proposed structure is the detail of
the support assembly. By comparing the details of the asser.il->ly
as illustrated in figure 2.4 with those of the lower-story
ceiling (see figure 2.3), it is seen that tlie edge members
26
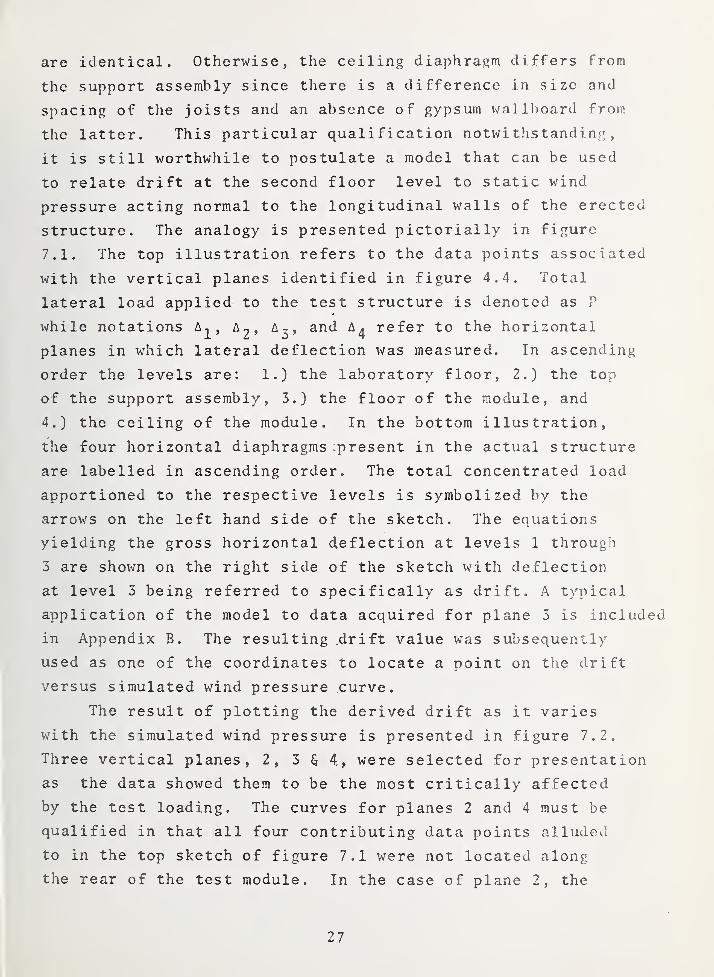
are identical. Otherwise, the ceiling diaphragm differs from
the support assembly since there is a difference in size and
spacing of the joists and an absence of gypsum wallboard from
the latter. This particular qualification notwithstanding,
it is still worthwhile to postulate a model that can be used
to relate drift at the second floor level to static wind
pressure acting normal to the longitudinal walls of the erected
structure. The analogy is presented pictorially in figure
7.1. The top illustration refers to the data points associated
with the vertical planes identified in figure 4.4. Total
lateral load applied to the test structure is denoted as P
while notations A^^, a^, and refer to the horizontal
planes in which lateral deflection was measured. In ascending
order the levels are: 1.) the laboratory floor, 2.) the top
of the support assembly, 3.) the floor of the module, and
4.) the ceiling of the module. In the bottom illustration,
the four horizontal diaphragms ^present in the actual structure
are labelled in ascending order. The total concentrated load
apportioned to the respective levels is symbolized by the
arrows on the left hand side of the sketch. The equations
yielding the gross horizontal deflection at levels 1 through
3 are shown on the right side of the sketch with deflection
at level 3 being referred to specifically as drift. A typical
application of the model to data acquired for plane 3 is included
in Appendix B. The resulting drift value was subsequently
used as one of the coordinates to locate a point on the drift
versus simulated wind pressure curve.
The result of plotting the derived drift as it varies
with the simulated wind pressure is presented in figure 7.2.
Three vertical planes, 2, 3^4., were selected for presentation
as the data showed them to be the most critically affected
by the test loading. The curves for planes 2 and 4 must be
qualified in that all four contributing data points alluded
to in the top sketch of figure 7.1 were not located along
the rear of the test module. In the case of plane 2, the
27
data forA^i^
and provided by LVDTs 39 and 38 respectively,
both of which were located on the front and offset approximately
3 ft from plane 2. In order to provide values for along
plane 4, the output from LVDT 22 was used. This transducer
was also located on the front and offset 8 1/2 in from plane
4. The primary assumption underlying this improvisation is
that the support assembly acted as a diaphragm subjected to
in-plane flexure. Therefore, it can be reasonably assumed
that the deflection measured at a point on the front of the
assembly is the same as that occurring directly in line with
that point on the rear.
It is also necessary to qualify the curve of drift versus
simulated pressure for the fact that the effect of the vertical
load provided by a second-story module was not simulated during
the loading.
The dashed vertical line in figure 7.2 coincides with
the conventionally accepted maximum allowable drift. This
value, h/500, where h is the height as defined in the Notation
section, is normally used in the design of medium and high-
rise buildings, and is associated with a w^ind having a 50-
year mean recurrence interval. Using the point of intersection
of this line with the curve derived for plane 4, it is concluded
tliat the maximum pressure at which the system would satisfy
this drift limitation is 21 psf.
The diagonal transducers that were installed on the walls
denoted as planes 1 and 3 (see figure 4.4) were expected to
afford a correlation between the deformation measured at
the wall surfaces and the lateral deflection measured at
the ceiling level of the test module. However, the test data
showed the change in length along the diagonals to be
an order of magnitude less than the corresponding horizontal
deflection. From this it is apparent that either the ceiling
diaphragm did not transfer a significant amount of the lateral
load to these two planes, or there was relative movement
28
between the wall framing and the gypsum wallboard surface.
Since compatibility must be satisfied between the ceiling
diaphragm and the transverse walls, it is reasonable to conclude
that resistance was provided by the transverse walls and that
relative movement occurred between the framing and the surface.
Figure 6.1 shows a set of profiles for lateral deflection
along the top of the rear wall. The five deflection transducers
from which the data were obtained, are numbered and shown
in their respective positions in the plan view at the top
of the figure. The curve between successive points is approximated
by straight lines. The shape of the profiles indicates that
the ceiling assembly underwent in-plane deformation while
transferring load to the <;hear walls. It is observed that
the maximum measured lateral displacement occurred in planes
3 and 4
.
It should be noted that the total wind drag applicable
to the actual structure was divided by a factor nf 2 to account
for the stiffness orovided by the second module. The construction
details indicated that the two modules were bolted together
near the top and bottom of their common wall with 3/8 inch
diameter through bolts. This mechanical connection '-'ould
presumably cause the two modules to deflect laterally in a
compatible manner. Given two beams with identical properties,
when one is placed upon the other, the given load s shared
equally by the beams and the beams are compatible in deflection.
In a similar manner, two identical modules bolted in the manner
described above, could be expected to be compatible in deflection
and to participate equally in resisting lateral forces. However,
given that the transverse walls in the rear module may not
be distributed the same as those in the front module, the
distribution of the lateral deflection in the actual structure
may differ from that shown in figure 6.1. This qualification
to the profile curves is acknowledged.
29
There are ten curves presented in Appendix C, fij^ures
C.l through C.IO, which describe the measured net horizontal
deflection in the five previously identified pianos. Two
plots are presented for each plane, one for each of the contributor)
areas (see figure 5.3) on which the ram loads were based.
A study of figures C.l through C.IO reveals a coinmon behavior
with respect to deflection. There was a residual deflection
at the end of the first cycle of loading, but subsequent cycling
to the same maximum load did not result in a substantial increase
in this deflection. V/hen the maximum load level was increased,
there was likewise an increase in the residual deflection.
Furtlier cycling to the same peak load caused little increase
in residual deflection. This behavior may be attributed to
the removal of slackness in the connections. Once this slackness
was removed, the system behaved in a reasonably clastic manner
and the response was reproducible.
7.2 Transient Floor Vibration - Test 2
It is seen from figures 6.2 througli 6.5 tliat the impact
load v</as sufficient to create a measurable response in tJie
floor assembly. This study was concerned with damped free
vibration caused by a short - durat ion load and hence it is
necessary to account for the period of response (hiring which
tlie forcing function was on the floor system. This effect
is believed to be accounted for by neglectinp tlie first cvclc
of response because it is judged that the duration of the
load was no greater than the natural period of the subsystem.
The gain in amplitude observed between the time of 0.35 and
0.4 seconds suggests that at this point the bag made a second
contact with the floor. The range of the natural frequency
derived from the response curves extends from 23 IIz to 26
IIz.
There was SO-6 success in reproducing the results of the
first trial in the two-trial sets. Tests 2B3 and 201) correlatedclosely with the initial trials, 2B and 2D respectively. Butthe results of tests 2A and 2C were not reproduced during
30
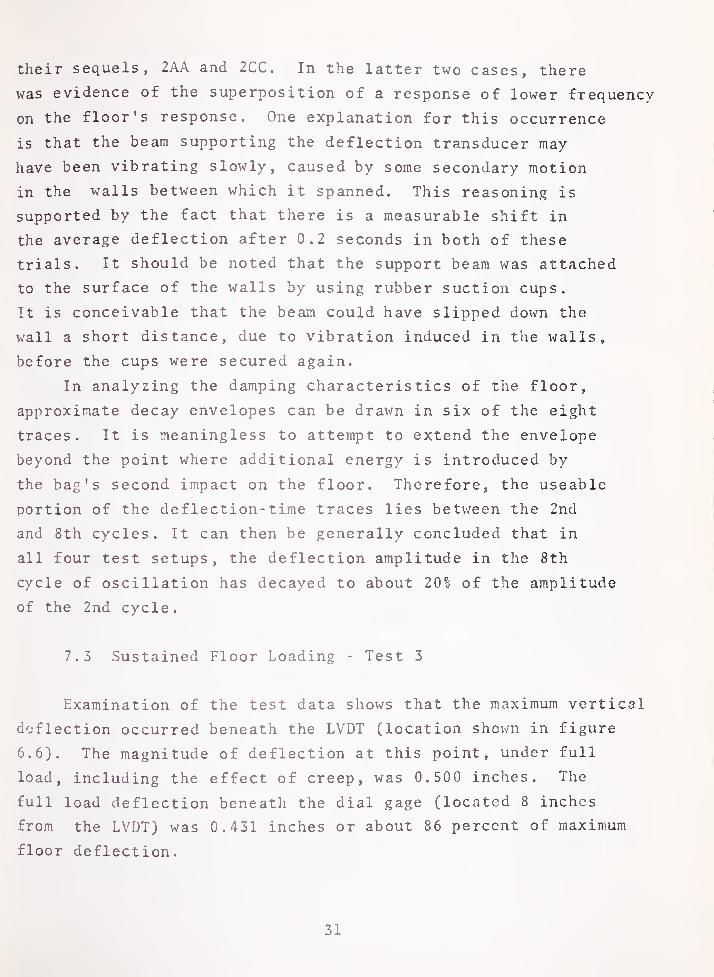
their sequels, 2AA and 2CC. In the latter two cases, there
was evidence of the superposition of a response of lower frequency
on the floor's response. One explanation for this occurrence
is that the beam supporting the deflection transducer may-
have been vibrating slowly, caused by some secondary motion
in the walls between which it spanned. This reasoning is
supported by the fact that there is a measurable shift in
the average deflection after 0.2 seconds in both of these
trials. It should be noted that the support beam was attached
to the surface of the walls by using rubber suction cups.
It is conceivable that the beam could have slipped down the
wall a short distance, due to vibration induced in the walls,
before the cups were secured again.
In analyzing the damping characteristics of the floor,
approximate decay envelopes can be drawn in six of the eight
traces. It is meaningless to attempt to extend the envelope
beyond the point where additional energy is introduced by
the bag's second impact on the floor. Therefore, the useable
portion of the deflection- time traces lies between the 2nd
and 8th cycles. It can then be generally concluded that in
all four test setups, the deflection amplitude in the 8th
cycle of oscillation has decayed to about 20% of the amplitude
of the 2nd cycle.
7.3 Sustained Floor Loading - Test 3
Examination of the test data shows that the maximum vertical
deflection occurred beneath the LVDT (location shown in figure
6.6). The magnitude of deflection at this point, under full
load, including the effect of creep, was 0.500 inches. The
full load deflection beneath the dial gage (located 8 inches
from the LVDT) was 0.431 inches or about 86 percent of maximum
floor deflection.
31
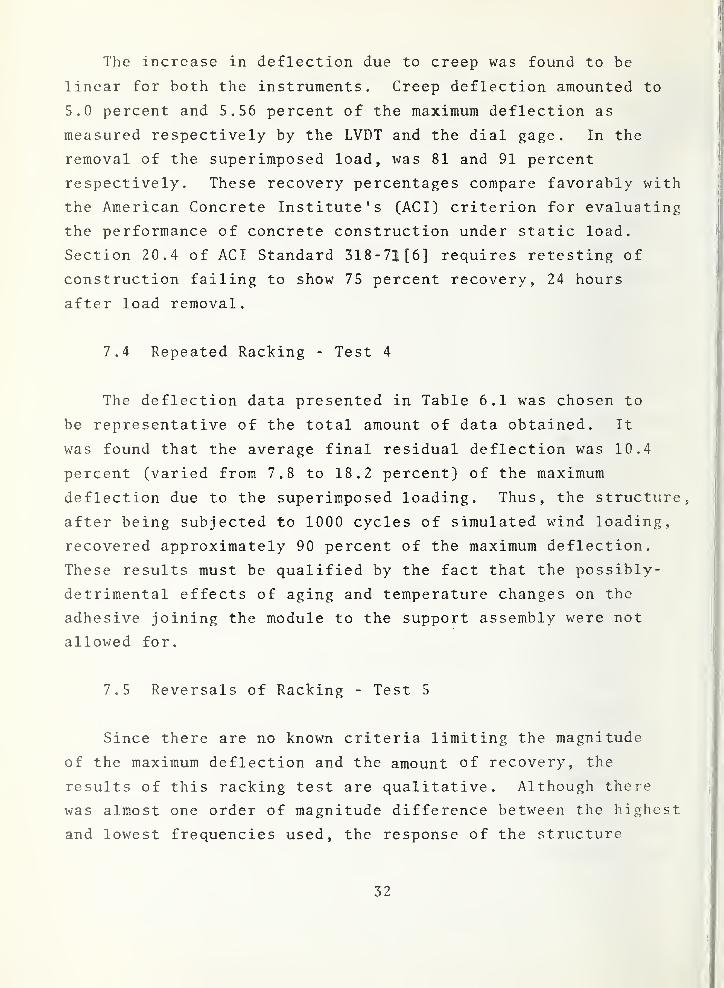
The increase in deflection due to creep was found to be
linear for both the instruments. Creep deflection amounted to
5.0 percent and 5.56 percent of the maximum deflection as
measured respectively by the LVDT and the dial gage. In the
removal of the superimposed load, was 81 and 91 percent
respectively. These recovery percentages compare favorably with
the American Concrete Institute's (ACI) criterion for evaluating
the performance of concrete construction under static load.
Section 20.4 of ACI Standard 318-71 [6] requires retesting of
construction failing to show 75 percent recovery, 24 hours
after load removal.
7.4 Repeated Racking - Test 4
The deflection data presented in Table 6.1 was chosen to
be representative of the total amount of data obtained. It
was found that the average final residual deflection was 10.4
percent (varied from 7.8 to 18.2 percent) of the maximum
deflection due to the superimposed loading. Thus, the structure,
after being subjected to 1000 cycles of simulated wind loading,
recovered approximately 90 percent of the maximum deflection.
These results must be qualified by the fact that the possibly-
detrimental effects of aging and temperature changes on the
adhesive joining the module to the support assembly were not
allowed for.
7.5 Reversals of Racking - Test 5
Since there are no known criteria limiting the magnitude
of the maximum deflection and the amount of recovery, the
results of this racking test are qualitative. Although there
was almost one order of magnitude difference between the highest
and lowest frequencies used, the response of the structure
32
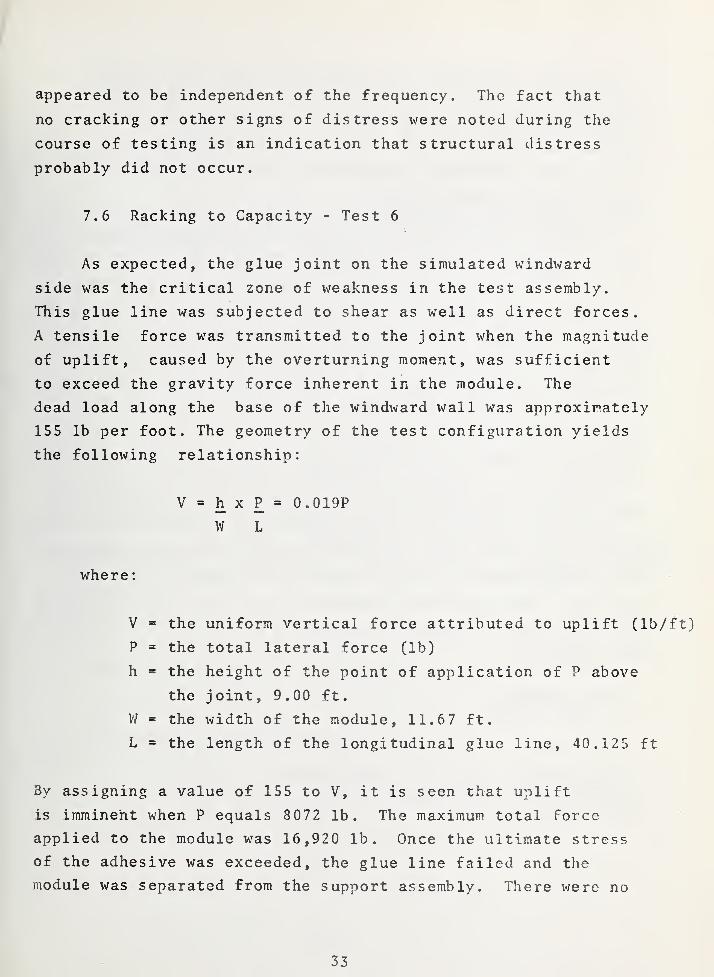
appeared to be independent of the frequency. The fact that
no cracking or other signs of distress were noted during the
course of testing is an indication that structural distress
probably did not occur.
7.6 Racking to Capacity - Test 6
As expected, the glue joint on the simulated windward
side was the critical zone of weakness in the test assembly.
This glue line was subjected to shear as well as direct forces.
A tensile force was transmitted to the joint when the magnitude
of uplift, caused by the overturning moment, was sufficient
to exceed the gravity force inherent in the module. The
dead load along the base of the windward wall was approximately
155 lb per foot. The geometry of the test configuration yields
the following relationship:
V = h X P = 0.019P
W L
where:
V = the uniform vertical force attributed to uplift (lb/ft)
P = the total lateral force (lb)
h = the height of the point of application of P above
the joint, 9.00 ft.
W = the width of the module, 11.67 ft.
L = the length of the longitudinal glue line, 40.125 ft
By assigning a value of 155 to V, it is seen that uplift
is imminent when P equals 8072 lb. The maximum total force
applied to the module was 16,920 lb. Once the ultimate stress
of the adhesive was exceeded, the glue line failed and the
module was separated from the support assembly. There were no
33
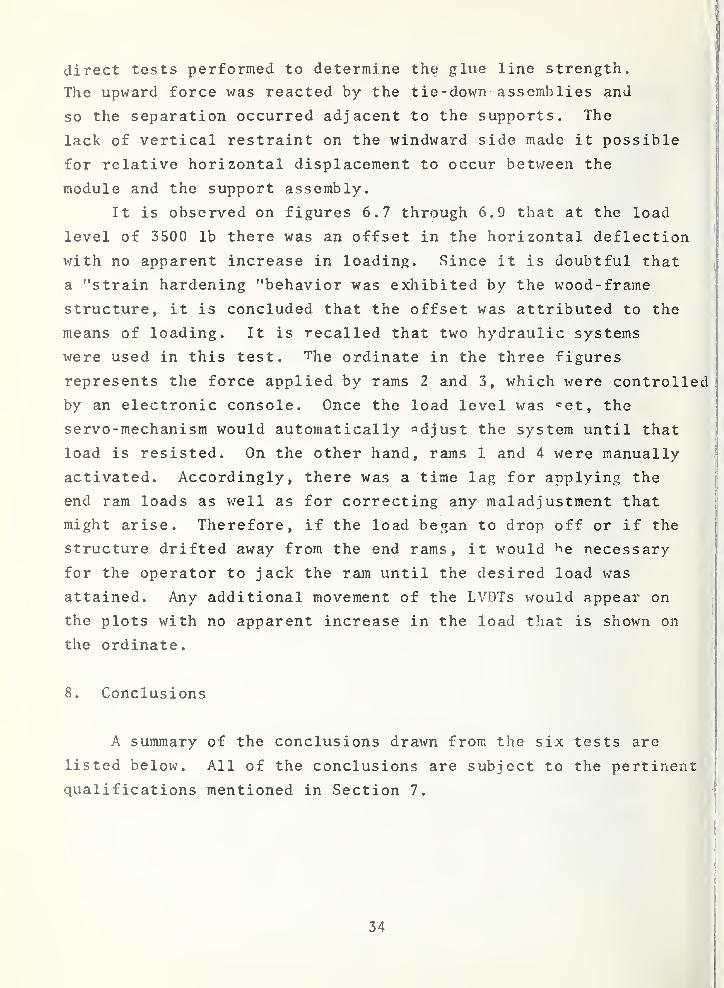
direct tests performed to determine the glue line strength.
The upward force was reacted by the tie-down assemblies and
so the separation occurred adjacent to the supports. The
lack of vertical restraint on the windward side made it possible
for relative horizontal displacement to occur between the
module and the support assembly.
It is observed on figures 6.7 through 6.9 that at the load
level of 3500 lb there was an offset in the horizontal deflection
with no apparent increase in loading. Since it is doubtful that
a "strain hardening "behavior was exhibited by the v\rood-frame
structure, it is concluded that the offset was attributed to the
means of loading. It is recalled that two hydraulic systems
were used in this test, ^he ordinate in the three figures
represents the force applied by rams 2 and 3, which were controlled
by an electronic console. Once the load level was -^et, the
servo-mechanism would automatically adjust the system until that
load is resisted. On the other hand, rams 1 and 4 were manually
activated. Accordingly, there was a time lag for applying the
end ram loads as well as for correcting any maladjustment that
might arise. Therefore, if the load began to drop off or if the
structure drifted away from the end rams, it would ^e necessary
for the operator to jack the ram until the desired load was
attained. Any additional movement of the LVDTs would appear on
the plots with no apparent increase in the load that is shown on
the ordinate
.
8. Conclusions
A summary of the conclusions drawn from the six tests are
listed below. All of the conclusions are subject to the pertinent
qualifications mentioned in Section 7.
34
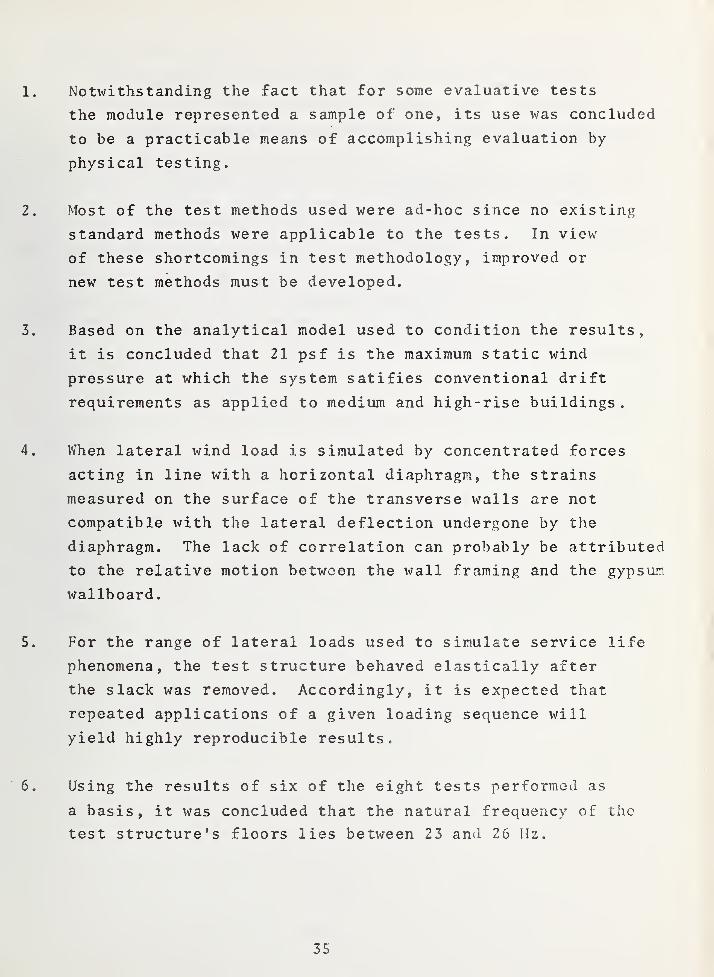
1. Notwithstanding the fact that for some evaluative tests
the module represented a sample of one, its use was concluded
to be a practicable means of accomplishing evaluation by-
physical testing.
2. Most of the test methods used were ad-hoc since no existing
standard methods were applicable to the tests. In view
of these shortcomings in test methodology, improved or
new test methods must be developed.
3. Based on the analytical model used to condition the results,
it is concluded that 21 psf is the maximum static wind
pressure at which the system satifies conventional drift
requirements as applied to medium and high-rise buildings.
4. When lateral wind load is simulated by concentrated forces
acting in line with a horizontal diaphragm, the strains
measured on the surface of the transverse walls are not
compatible with the lateral deflection undergone by the
diaphragm. The lack of correlation can probably be attributed
to the relative motion between the wall framing and the gypsum
wallboard.
5. For the range of lateral loads used to simulate service life
phenomena, the test structure behaved elastically after
the slack was removed. Accordingly, it is expected that
repeated applications of a given loading sequence will
yield highly reproducible results.
6. Using the results of six of the eight tests performed as
a basis, it was concluded that the natural frequency of the
test structure's floors lies between 23 and 26 Hz.
35
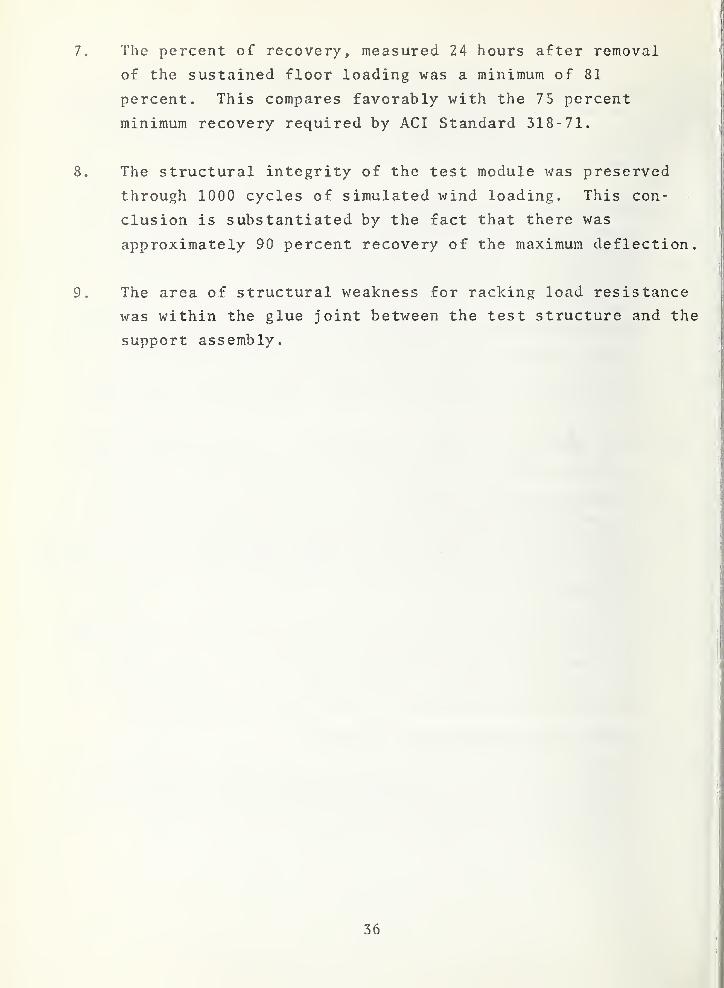
7. The percent of recovery, measured 24 hours after removal
of the sustained floor loading was a minimum of 81
percent. This compares favorably with the 75 percent
minimum recovery required by ACI Standard 318-71.
8. The structural integrity of the test module was preserved
through 1000 cycles of simulated wind loading. This con-
clusion is substantiated by the fact that there was
approximately 90 percent recovery of the maximum deflection.
9. The area of structural weakness for racking load resistance
was within the glue joint between the test structure and the
support assembly.
36
9. Acknowledgements
The authors acknowledge the contributions of the following
NBS staff and laboratory personnel:
Frank A. Rankin, Supervisory Technician, was in charge
of all laboratory handling, placement and dismantling of the
test structure. He also supervised the erection of the reaction
frames and the operation of mechanical equipment.
James Raines, Engineering Technician was responsible for
the placement of the electronic instrumentation and the
operation of the data acquisition equipment.
Randolph Williams, Physicist, was in charge of the advanced
stages of the electronic data processing.
Charles Bulik, Electronics Engineer, was responsible for the
coordination of the instrumentation and data acquisition
activities.
Felix Y. Yokel, Structural Research Engineer, contributed
many helpful suggestions and comments pertaining to the planning
and execution of the test program and to the preparation of the
report
.
Lymus Payton, Edward Tuma, James Warfield and James Seller,
Technicians, participated in the handling, placement and testing
of the test structure.
Cathy Glaze, Clerk Stenographer, performed the typing of
the several drafts of this report.
The technical review and helpful suggestions contributed
by Wayne C. Lewis, Research Specialist, Forest Products
Laboratory, are gratefully acknowledged.
37
10. References
[1] ASTfl C36-68 , Standard Specifications for Cynsum IVall-
board, 1970 Annual Book of ASTM Standards, Cement, Lime,
Gypsum, Part 9, November 19 70, pp. 34-36.
[2] ASTM C79-67 , Standard Specifications for Gypsum Slieath-
:, ing Board, 1970 Annual Book of ASTM Standards, Cement,
Lime, Gypsum, Part 9, November 1970, pp. 60-61.
[3] Uniform Building Code, 1967 Fdition, Volume I,
International Conference of Building Officials.
[ 4 ] FHA Minimum Property Standards For Multifam ily Housin.g,
FHA No. 2600, US Department of Housing and Urban Develop-
ment, Federal Housing Administration, Washington, D.C.
20410 , June 1969
.
[S] A58. 1-1972, American National Standards Institute,
Building Code Requirements for Minimum Design Loads in
Building and Other Structure s, National Bureau of
Standards, 19 72.
[6] ACT Standard 318-71, American Concrete Institute, Building
Code Requirements for Reinforced Concrete, 1971.
38
(A) (B) (C) =3(A) H- 2(B) (D)
Ram Jacking Forces lb _J
Total Lateral Equivalent WindAt Rams i,Z & 3 At Rams J & 4 JC UX, L-ti « i U Pressure, psf
192r~
—~
b , jU
TOR /lO
R 7 7 iUoj 3861 1 Q 7ft
1 IK) /.D.Jo
1070 1860 6Q30\JZJ .J\J ^s snJ -J , J u
1270 2190 81 80 Hi . y O
1440 2490 9300 47.64
1620 2810 10480 53„69
1800 3140 11680 59.82
Table 5„1 - Test 1 (Ram forces and equivalent wind pressure)
39
(A) (B)
Ram Jacking Force, lb
At Rams 1 & 4 At Rams 2 & 3
(C) = 2(A) + 2(B)r
Total LateralForce, lb
(D)
Equivalent WindPressure, psf
250
500
1000
1250
1500
1750
2000
2250
2500
2725
2820
500
1000
2000
2500
3000
3500
4000
4500
5000
5450
5640
1500
3000
6000
7500
9000
10500
12000
13500
15000
16350
16920
10.28
20.56
41.12
51.40
61.68
71.96
82.24
92.52
102,80
112.05
115.95
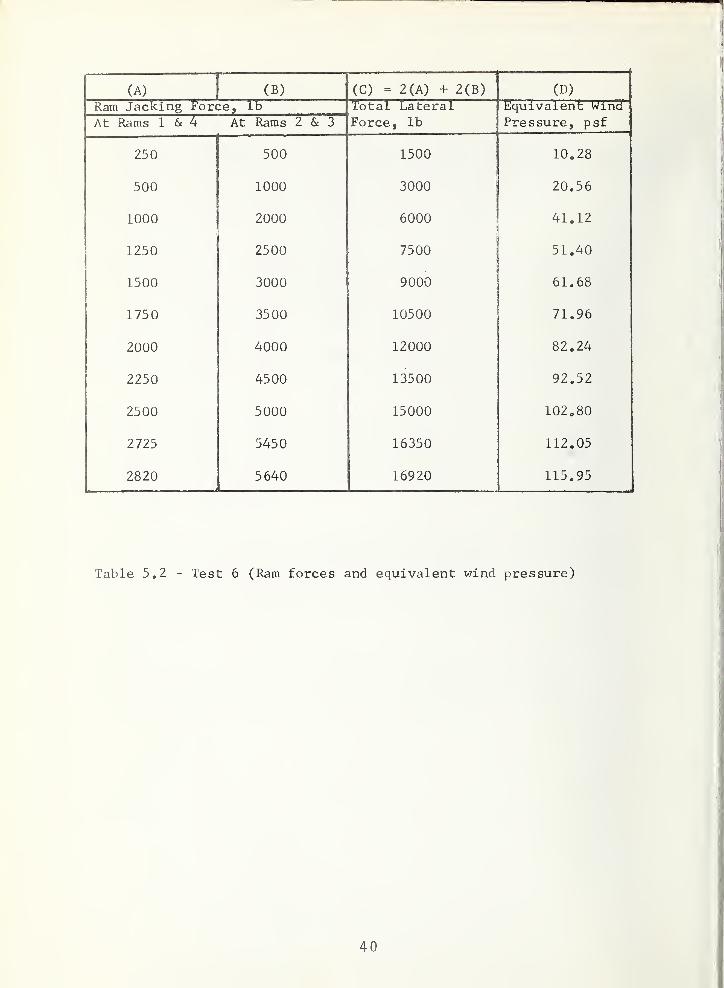
Table 5.2 - Test 6 (Ram forces and equivalent wind pressure)
40
LVDT READINGS (inches)
RunNumber
Load(kips) 5
Ch17
annel Numbers8 19 35
n n 0.0 0.0 0.0 0.0 O.Qu « uo J 0 Oft«U . UoO 0 11/1U . Xlf 0 077U , U / / 0 Ot^lU . UOl
n nu . u u . uux 0 00"^u . uuo 0 007u . uuo 0 007u . uu/ 0 007u . uu/
X n mu . ux n nn7u . uu^ 0 Oii"^u . uuo 0 00'^u . uuo 0 007U . UU/i, 0 001u . uux
L fl 07 U . UUH 0 00*^u . uuo 0 00'^u . uuo 0 007u . uu/ 0 001u . uuxo U . Uf u . uuo u . uuo 0 OOAu . uuu 0 OOAU . UUf 0 007u . uu/A U . UJ u . uu / 0 007u . uu / 0 007u . uu /
0 OllAU . UUf 0 007u . uu/CD n nu . u 0 00"^u . uuo 0 ooc;u . uuo 0 fioi;u . uuo 0 oo'j;U . UUO 0 007u . uu/AD u . u 0 00/1U . UU4- 0 007u . uu/. n 001u , uu± 0 001U . UU± 0.07 U . UM- 1 1 OOQu . uuy 0 007U . UU /
0 OOAU . UUD 0 00/1U . UUf 0 007u . uu/QO 0 0"^u . uo 0 01 0u . uxu 0 007u . uu /
0 00f\U . UUD 0 00/1U . UU4 0 007u . uu/Q 0 OOQu . uuy 0 OOfiu . uuo 0 00^^U . UUD 0 OOAU . UUM- 0 007u . uu/
1 n n HA 0 01 0u . u±u 0 OOQu . uuy 0 00ftU . UUO 0 ooc;U . UUO 0 00"?u . uuo1
1
U . UD 0 01 0U . UxU 0 OOQu . uuy 0 01 0U . U±U 0 oo^^U . UUD 0 00*^u . uuo1 7 U . Uo 0 01 0u . uxu 0 01 0U . UxU 0 01 7U . Ux/ 0 00^U . UUD 0 00"^u . uuoJ.J 0 DA 0 OORu . uuo U . UUD 0 01 0U . UlU 0 OOQu . uuo 0 ooxu . uuo
D DA 0 01 0u . ux
u
0 OORU . UUO 0 01 0u . uxu 0 OOc,u . uuo 0 00/^U . UUS
xo u . uo 0 onu . uxx 0 01 0u . uxu 0 01 7u . ux/ U . UUD 0 00/1U . UU'f
ID u . uo 0 01 0U . UJ.U 0 01 0U . u±U (1 01
1
U . Ulx 0 007U . UU /0 00/1U . UU4
1 7J. /
n 07 0 01
1
u . ux± 0 01 0u . UxU 0 ni 1U . Uil 0 007u . uu /n nn/1U . UU4
18 0.01 0.011 0.009 0.010 0.006 0.00419 0.02 0.011 0.010 0.011 0.007 0.00420 0.05 0.013 0.011 0.012 0.008 0.004
Static 2.50 0.051 0.098 U.121 0.076 0.054
Static 0.0 0.010 0.008 0.010 0.006 0.004
Table 6.1- Repeated Racking Test Results
Tlie word "static" in the column headed Run Number refers to thezero and peak load readings recorded during the initial and finalstatic cycles. See points A, B, C, X and Y in figure 5.2 on page 59.
Tlie numbers listed in the column headed Run Number refer to theterminals of the 50-cycle blocks of loading. For example, RunNumber 1 on the table corresponds to terminal point D in figure 5.2
on page 59.
41
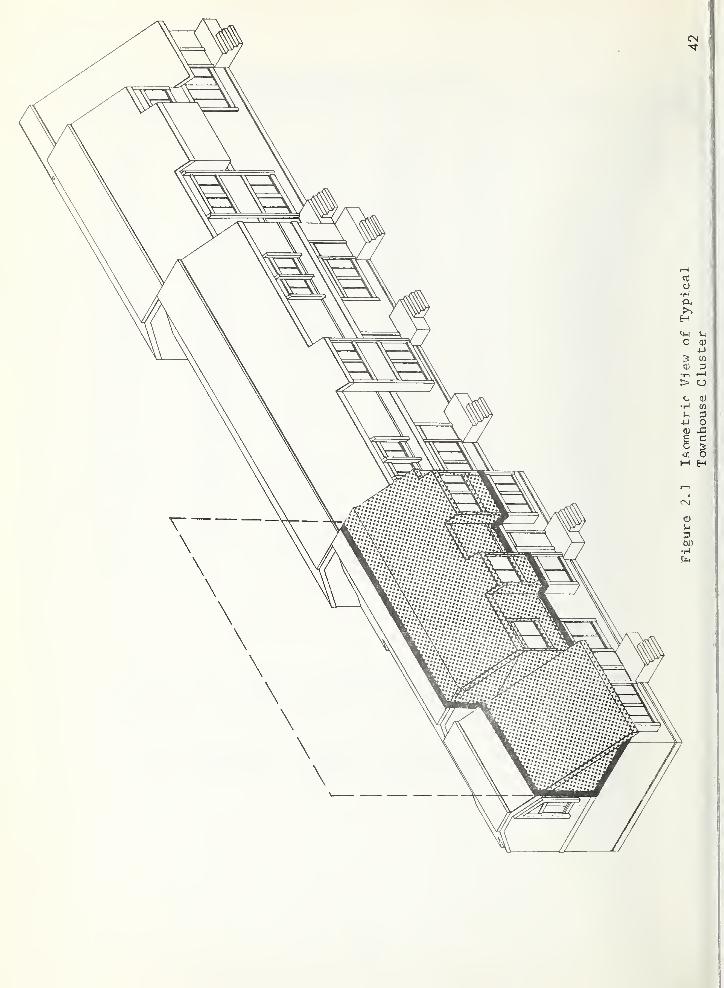
CN
o
a.
M-i >-i
C (U
3 cn
<D 3•l-i r-l
> u
^- a-U O
E C
a OM H
•Hfx,
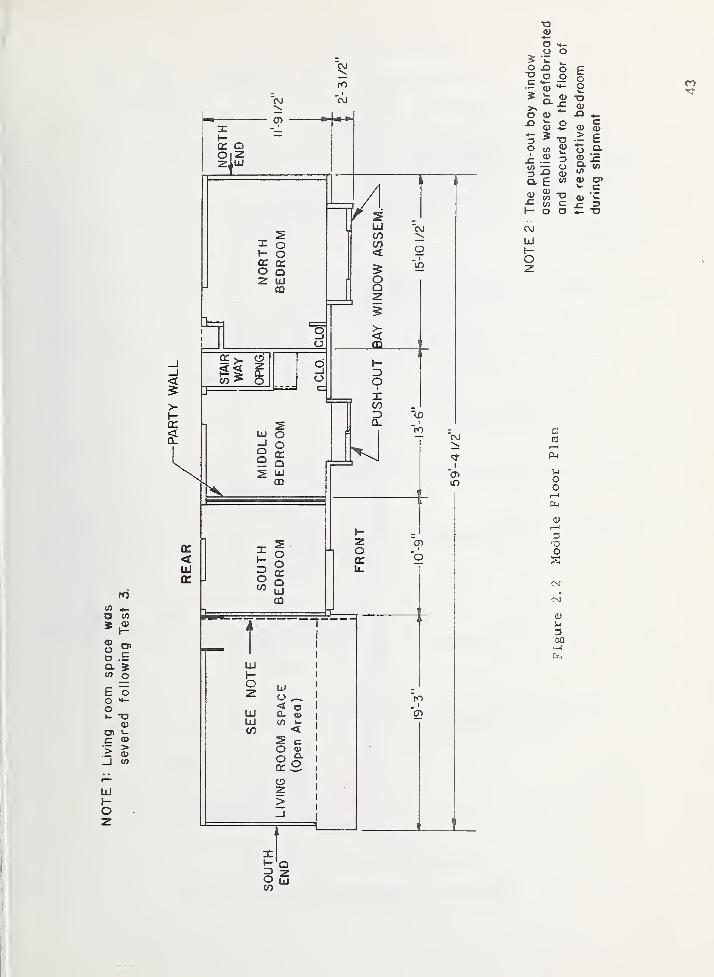
to
</)
Te
ace'ing
CL $W> oE "oo <*-
oTJa>
o» i_
c <i>
> >_J
liJ
h-OZ
(U
oo
? zo ^-o oc <*-._
J
O 0)
O 0)
Qu e
o
o £oo
0) T3<UX3
o c
o 6w. o Q.
ecCL«/>
10 0)w c•CJ a> *wc JZ Z3o T3
CJ
UJ
cCO(—1
oo1—
»
3
o
0)
•I-l
CO
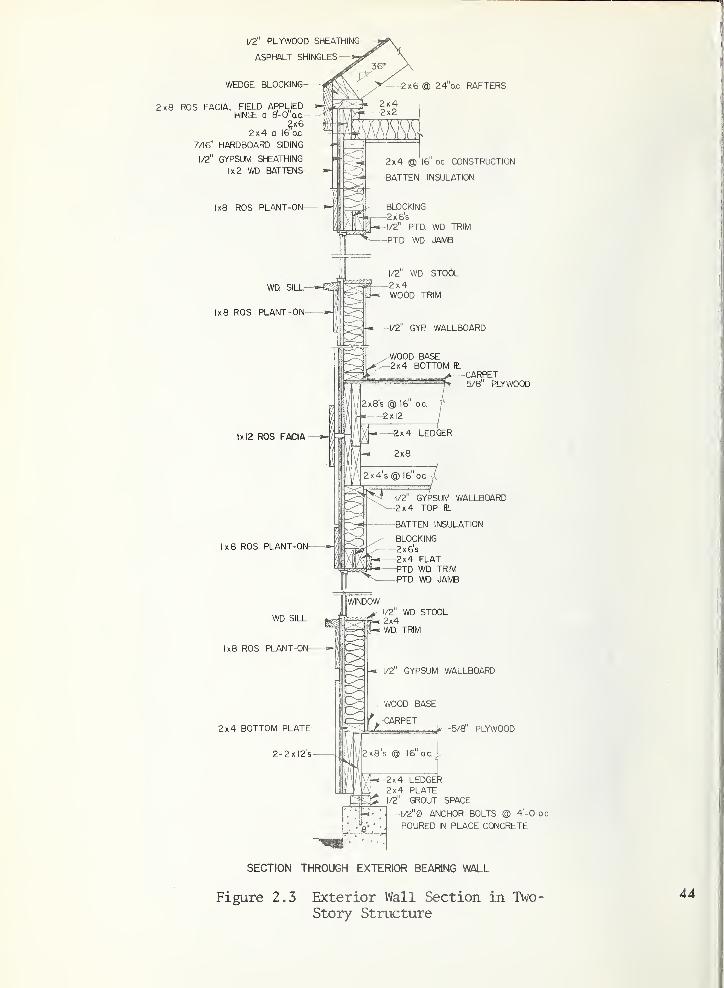
1/2" PLYWOOD SHEATHING
ASPHALT SHINGLES—
:
WEDGE BLOCKING-
2x8 ROS FACIA, FIELD APPLIED-— ^HINGE a 8^-0 O.C.--
2x62x4 a I6 0.C
7/16" HARDBOARD SIDING
1/2" GYPSUM SHEATHING
1x2 WD BATTENS
1x8 ROS PLANT-ON-
24"o.c. RAFTERS
WD SILL-
1x8 ROS PLANT-ON—
1x12 ROS FACIA—
-
US ROS PLANT-ON
2x4 (3)16" oc CONSTRUCTION
BATTEN INSULATION
-BLOCKING-2x6's-1/2" PTD WD TRIM
PTD WD JAMB
1/2" WD STOdL2x4WOOD TRIM
1/2 GYP WALLBOARD
•WOOD BASE-2x4 BOTTOM Ft
--CARPET-5/8" PLYWOOD
/2 GYPSUM WALLBOARD2x4 TOP S.
BATTEN INSULATION
BLOCKING2x6's2x4 FLAT—PTD WD TRIM
—PTD WD. JAMB
WD SILL-
1x8 ROS PLANT-ON
2x4 BOTTOM PLATE
—
2-2xl2's—
WINDOW
2x8's ® 16" oc
1/2 WD STOOL: 2x41 WD TRIM
-« 1/2" GYPSUM WALLBOARD
, WOOD BASE
-CARPETA^-ssi^s^ss^t^^/^ PLYWOOD
3-* 2x4 LEDGER
i . 2x4 PLATE1/2" GROUT SPACE
-l/2"0 ANCHOR BOLTS @ 4'-0 oc
POURED IN PLACE CONCRETE
SECTION THROUGH EXTERIOR BEARING WALL
Figure 2.3 Exterior Wall Section in Two-Story Structure
44
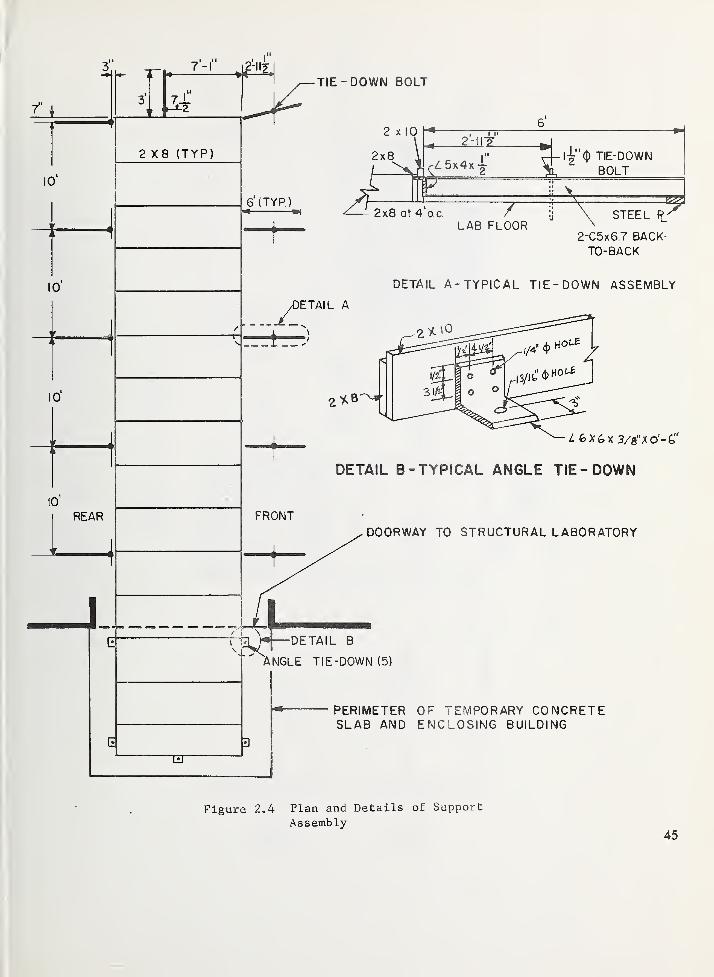
11^ 7-1".
r
10'
10'
10'
10
REAR
J
.7XM-2
TIE -DOWN BOLT
2X8 (TYP)
6 (TYP)
2 X 10
2x8 \
"*
- 2-lltfc.
^
-|-^"(() TIE-DOWN
1, BOLTIq/^5x4x-^'
J- 2x8 at ^roc. /
LAB FLOOR
\j \ STEEL^
2-C5x6.7 BACK-
TO-BACK
DETAIL A- TYPICAL TIE- DOWN ASSEMBLY
^^ETAIL A
—
FRONT
Z fcXfcX 3/8"/0'-&"
DETAIL B-TYPICAL ANGLE TIE- DOWN
DOORWAY TO STRUCTURAL LABORATORY
DETAIL B
/^NGLE TIE-DOWN (5)
PERIMETER OF TEMPORARY CONCRETESLAB AND ENCLOSING BUILDING
Figure 2.4 Plan and Details of Support
Assembly45
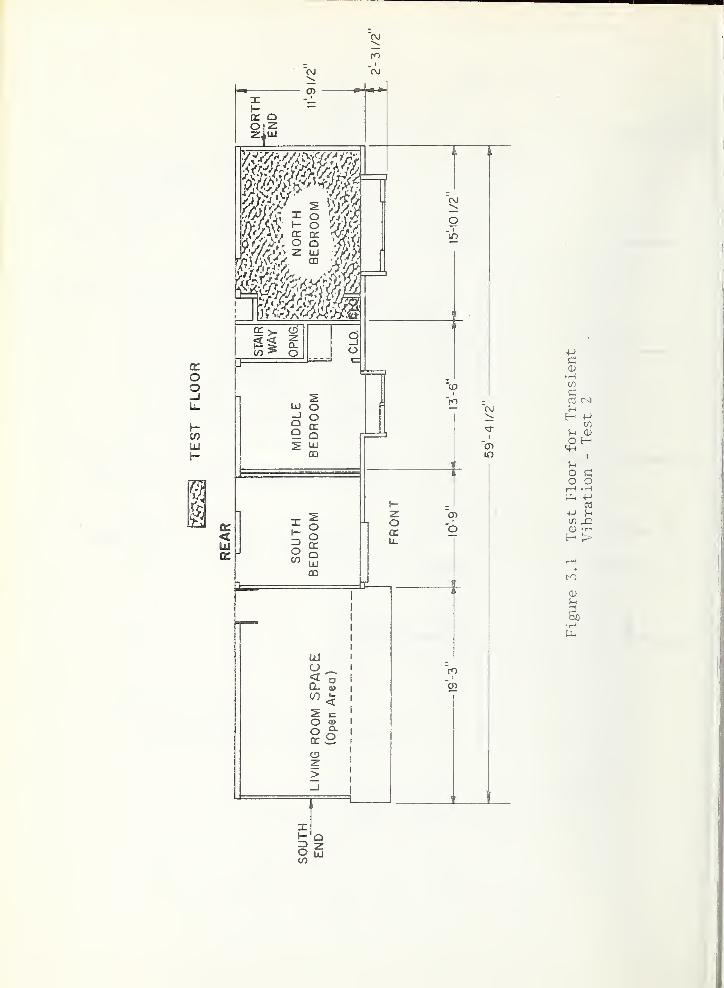
cCD•H
g
f-H CD
O H
OOrH
05M 5-1
to ^H >
CD5h
•H
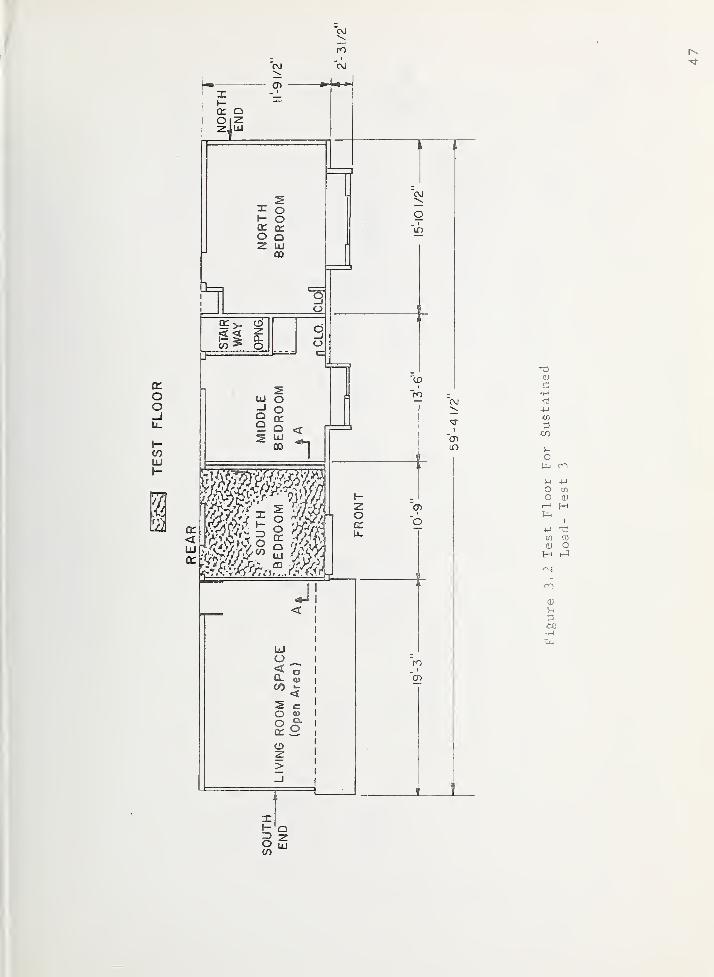
q:oo
0)
c
-U
•CO
(-1
o[xj on
(1) o
0)
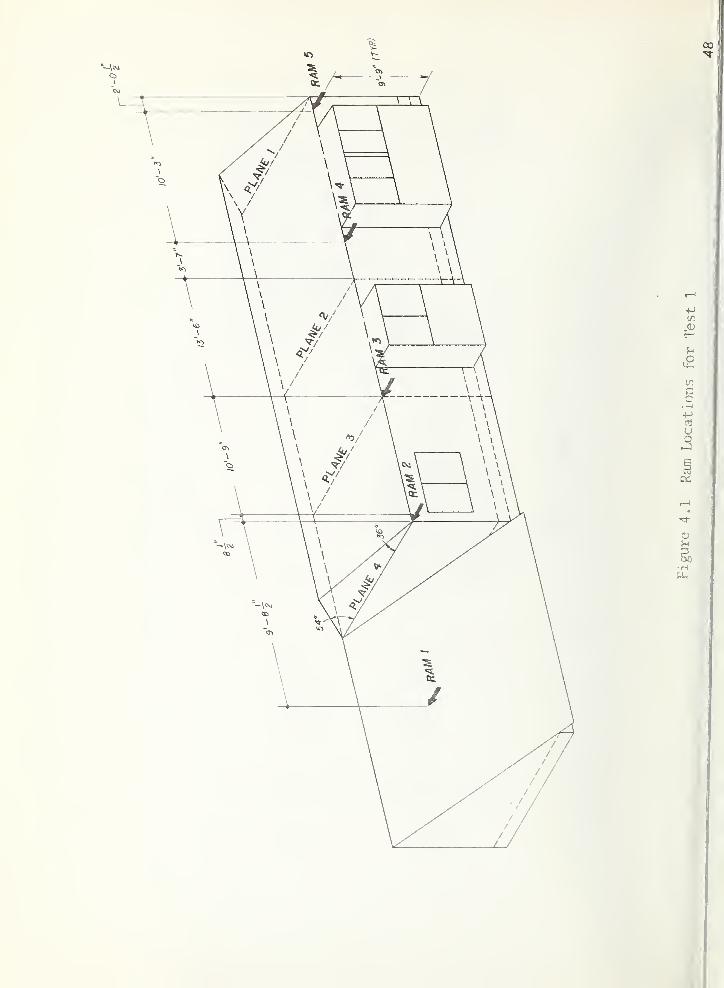
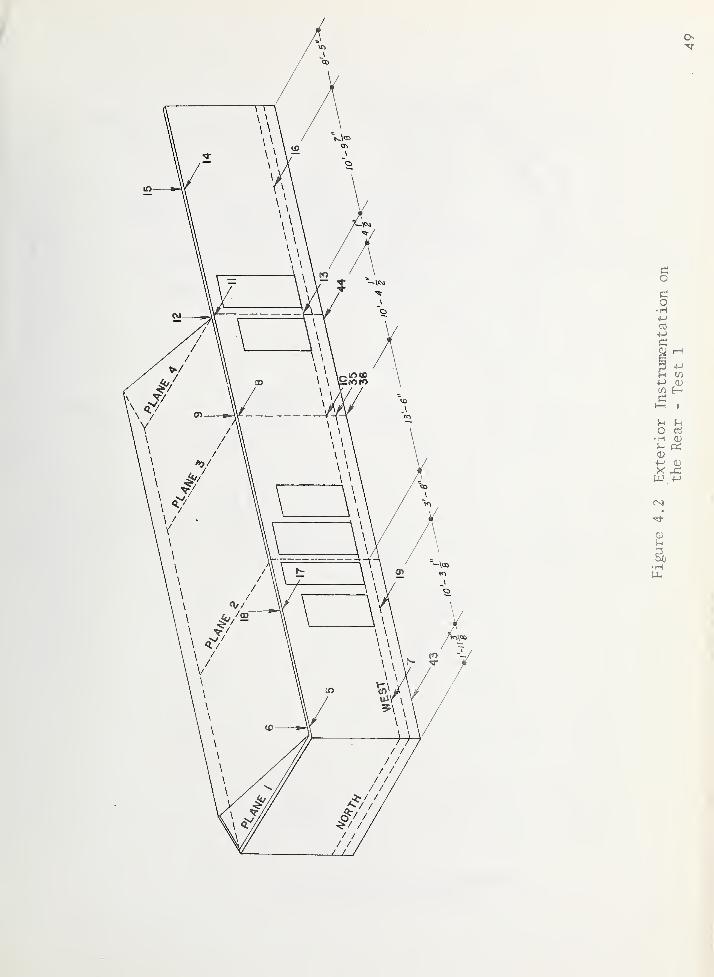
oco•H+->
cS-M
H t/)
»->, 0)
O CT3
•H (U^ IX
+-I CD
W -P
eg
5-
•Hp..
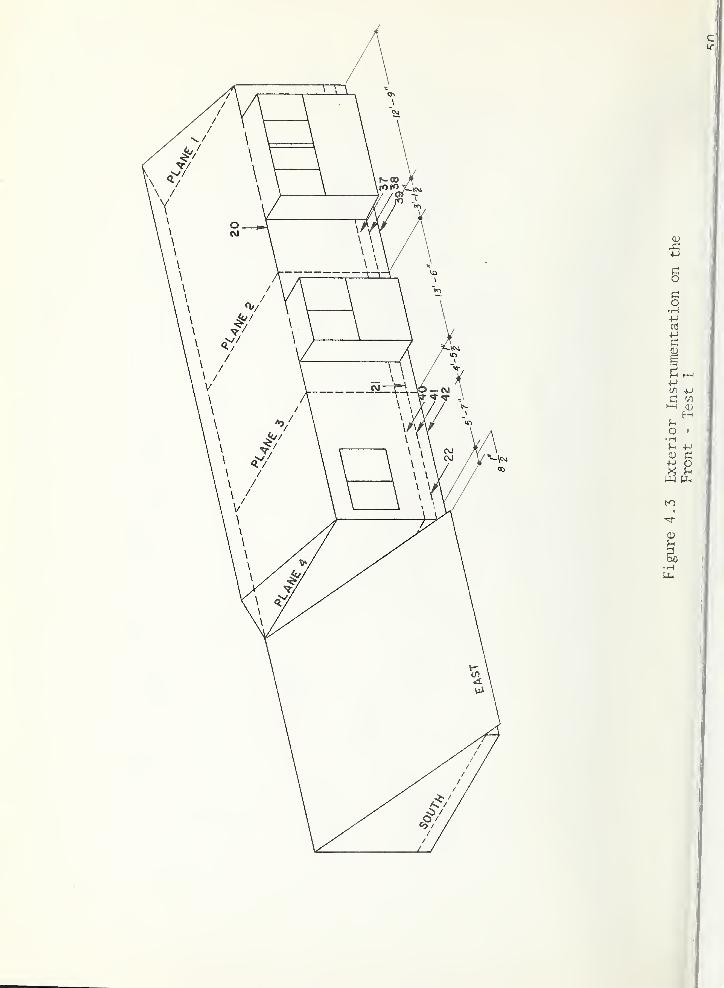
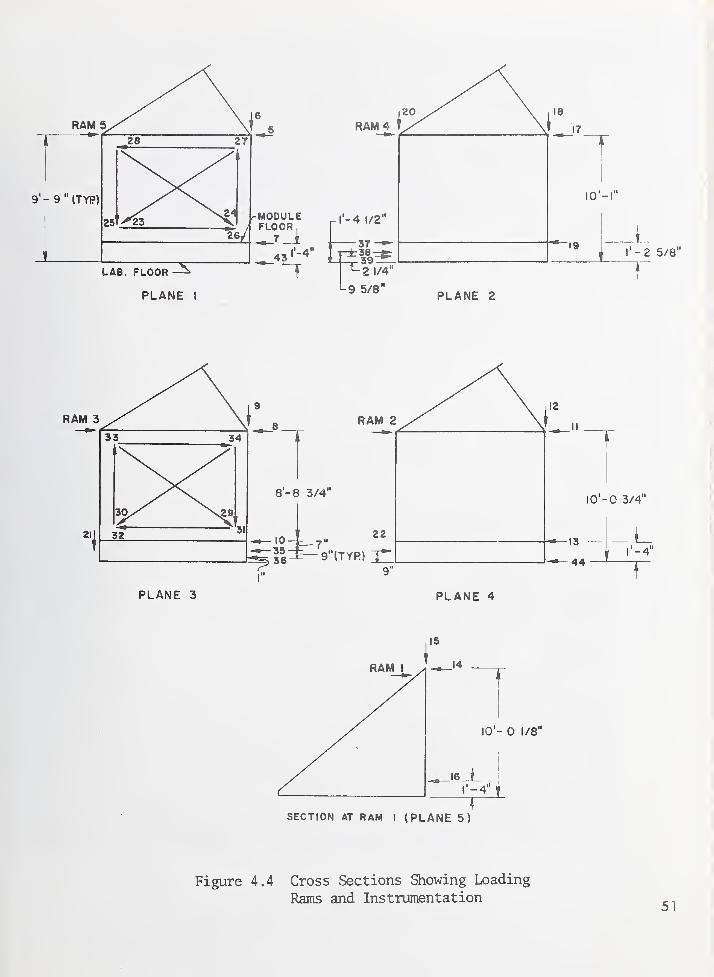
PLANE I^ PLANE 2
SECTION AT RAM I (PLANE 5)
Figure 4.4 Cross Sections Showing Loading
Rams and Instrumentation51
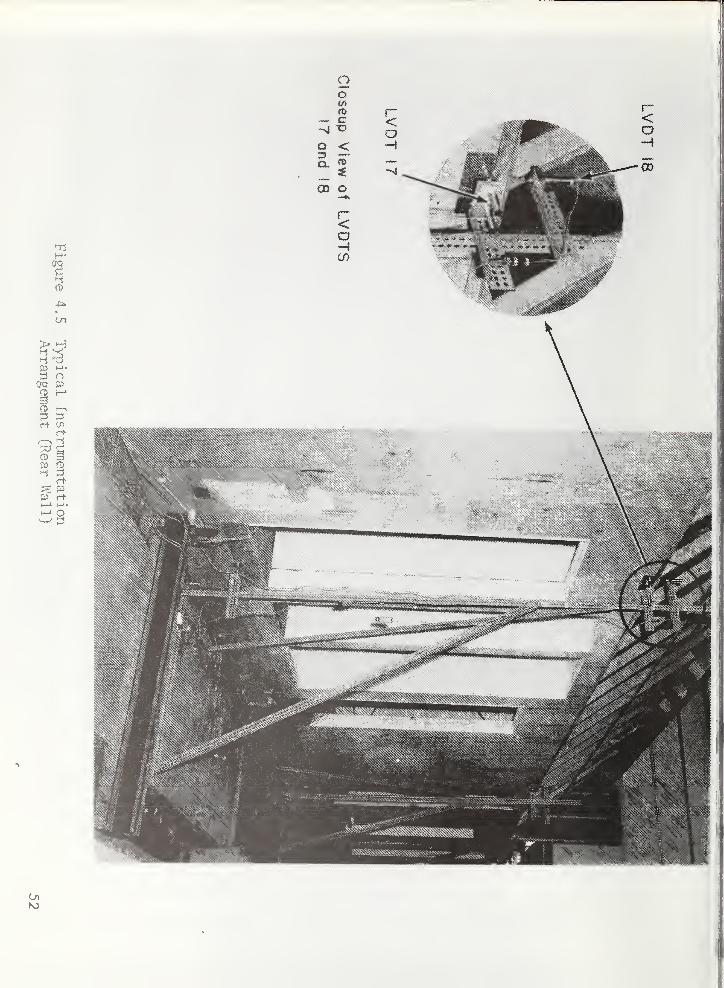
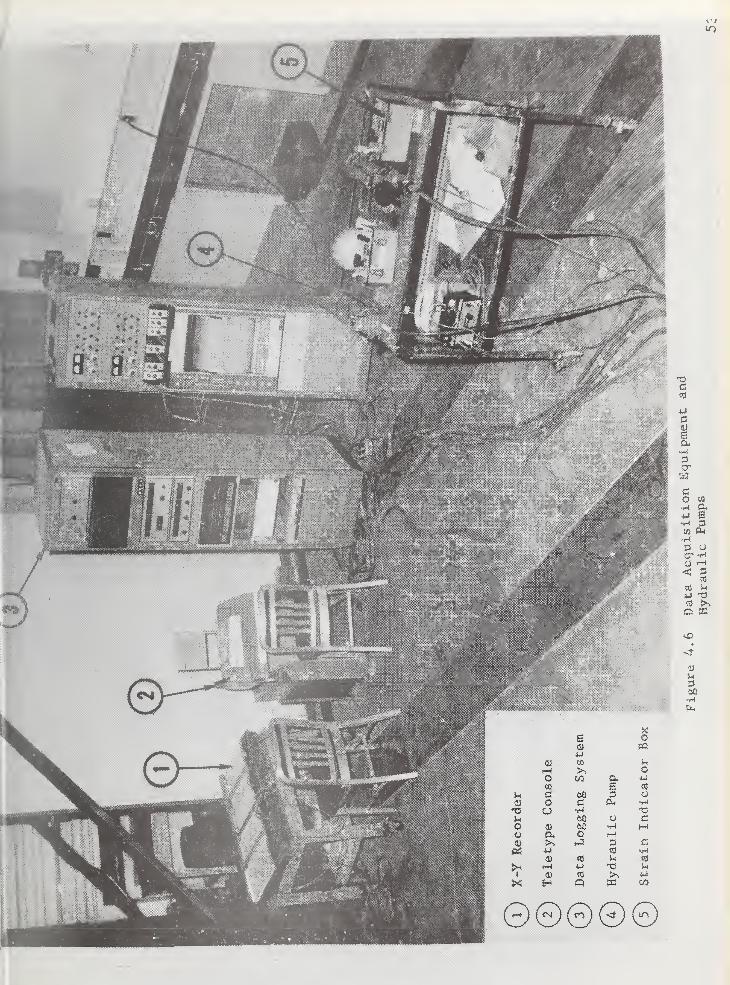
S4J «ij
ar-f oo CO a.m eC OC D oo d 'H
•xs uu ao u do Q> 6C •H Mo O. o r-f
CU cpi u C8
!h «8
>< x;li) t« >^H
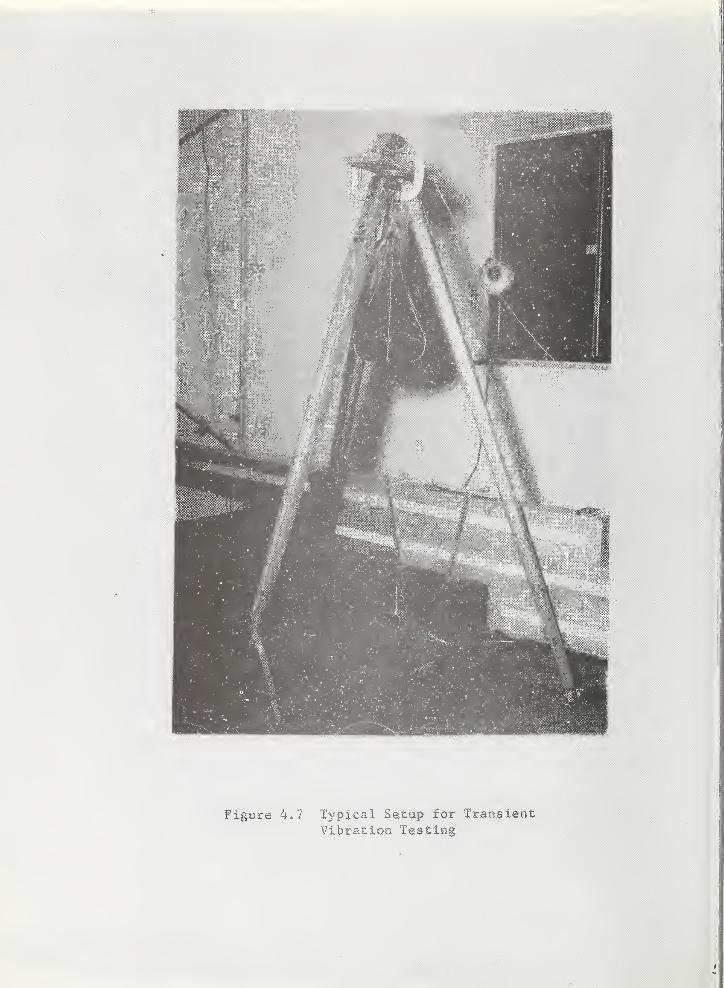
Figure 4.7 Typical Setup for TransientVibration Testing
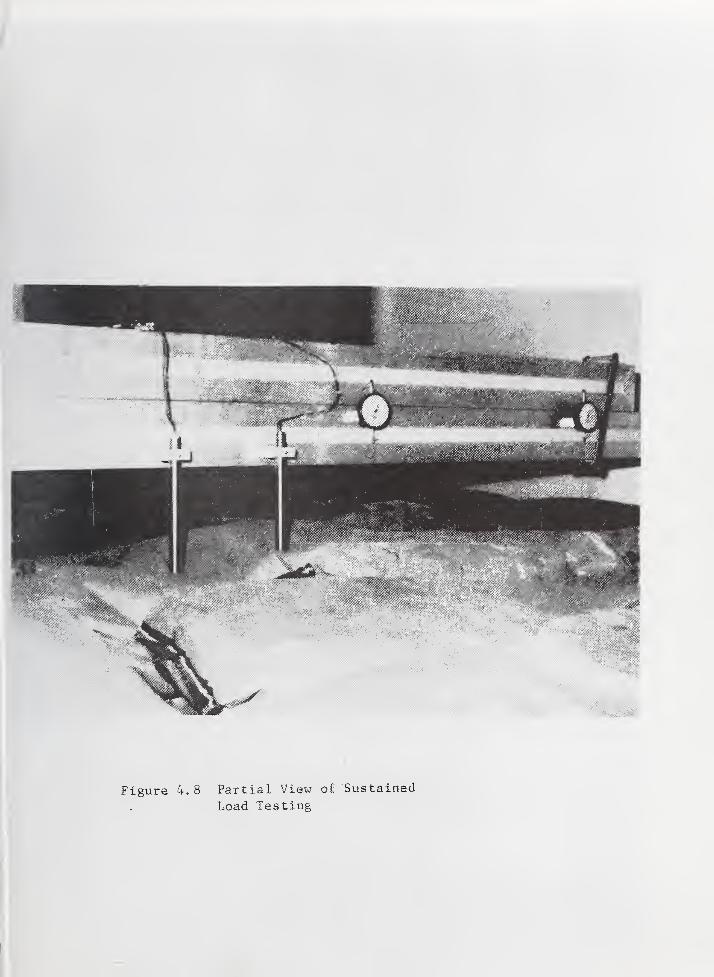
Figure 4.8 Partial View of Sustained
Load Testing
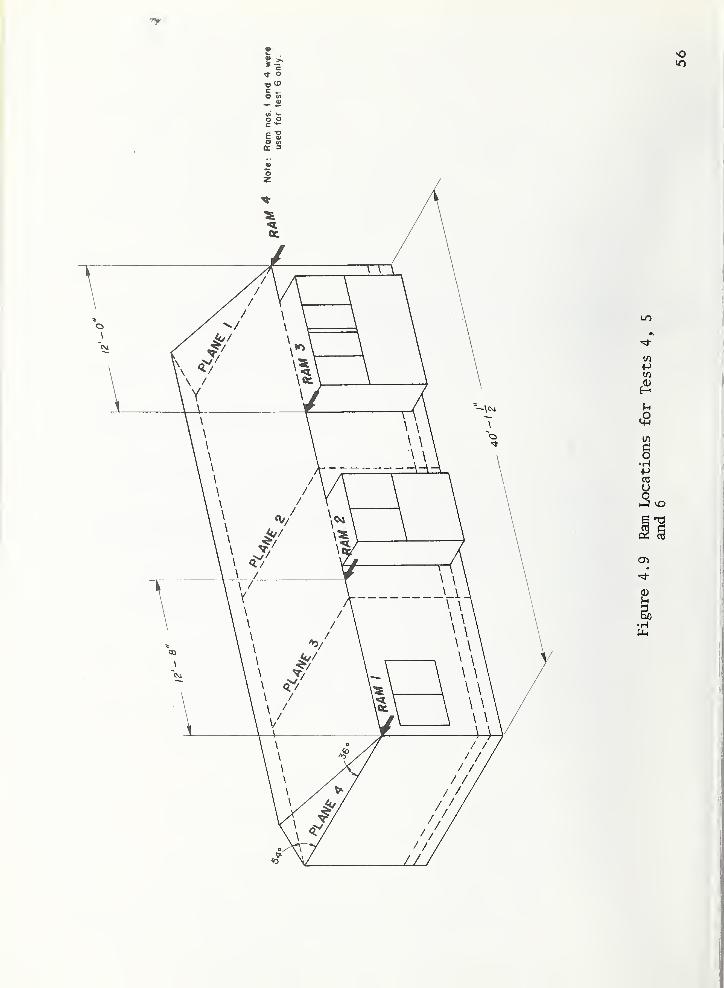
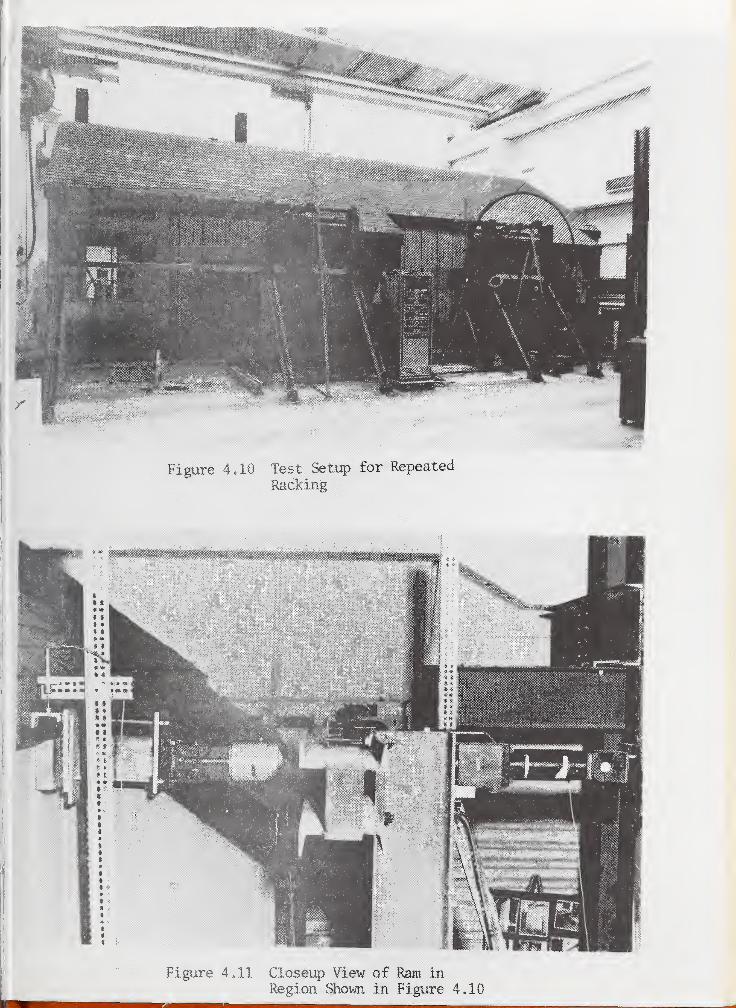
Figure 4.10 Test Setup for Repeated
Racking
Figure 4.11 Closeup View of Ram inRegion Shown in Figure 4.10
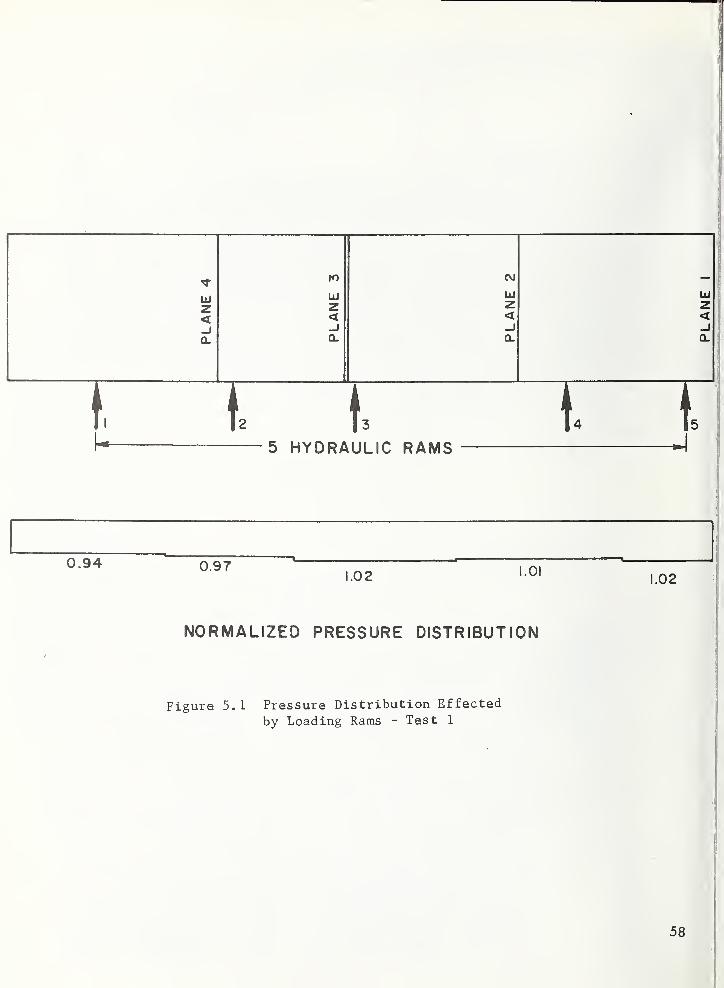
UJz<a.
ro
UJz<
I5 HYDRAULIC RAMS
1.02 1.02
NORMALIZED PRESSURE DISTRIBUTION
Figure 5.1 Pressure Distribution Effected
by Loading Rams - Test 1
58
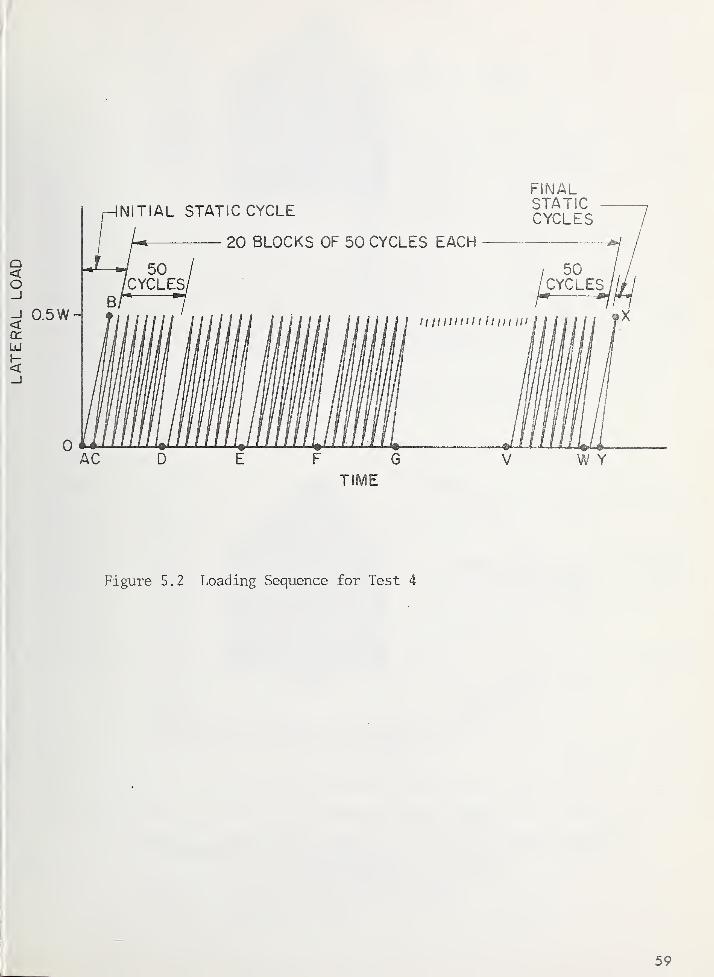
FINAL
TIME
Figure 5.2 Loading Sequence for Test 4
59
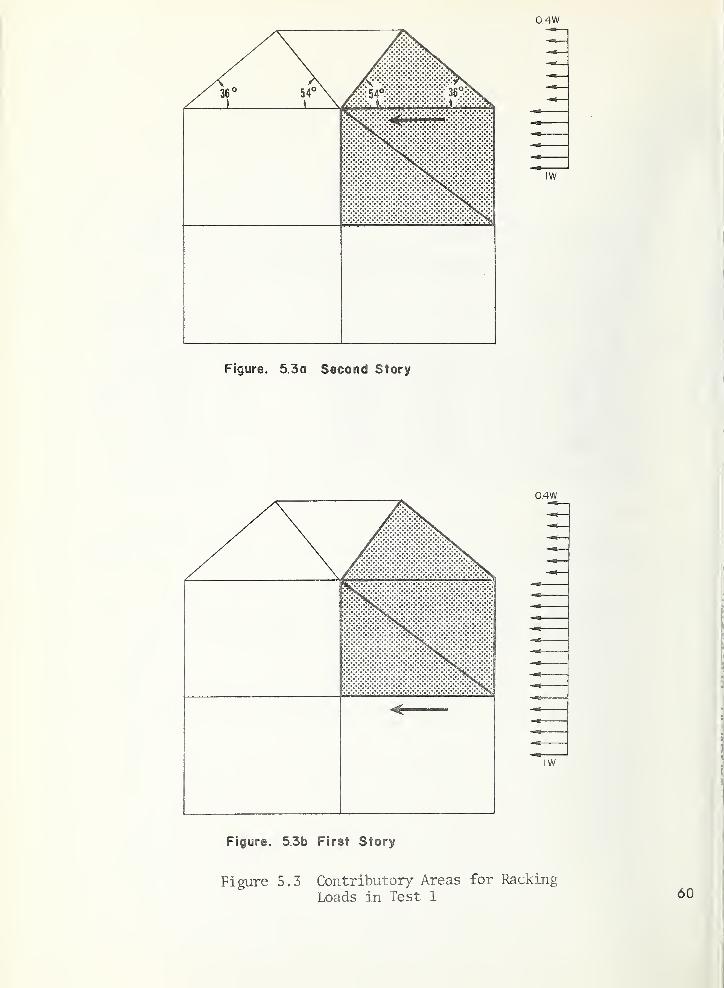
Figure. 5.3a Second Story
0.4W
9
i
IJ
IW ]
I
?
Figure. 5.3b First Story
Figure 5.3 Contributory Areas for Racking
Loads in Test 1

14
LVDTS
17
CO
UJ UJ LiJ UJ
z z z z< < < <
_l
0. Q. Q. Q.
TRAMS
PLAN OF RAMS AND HORIZONTAL TRANSDUCERS
LATERAL DISPLACEMENT PROFILE ALONG TOP REAR OF MODULE
Figure 6.1 Profile o£ the Lateral Displace-
ment for Varying Simulated Wind
Pressures - Test 1
61
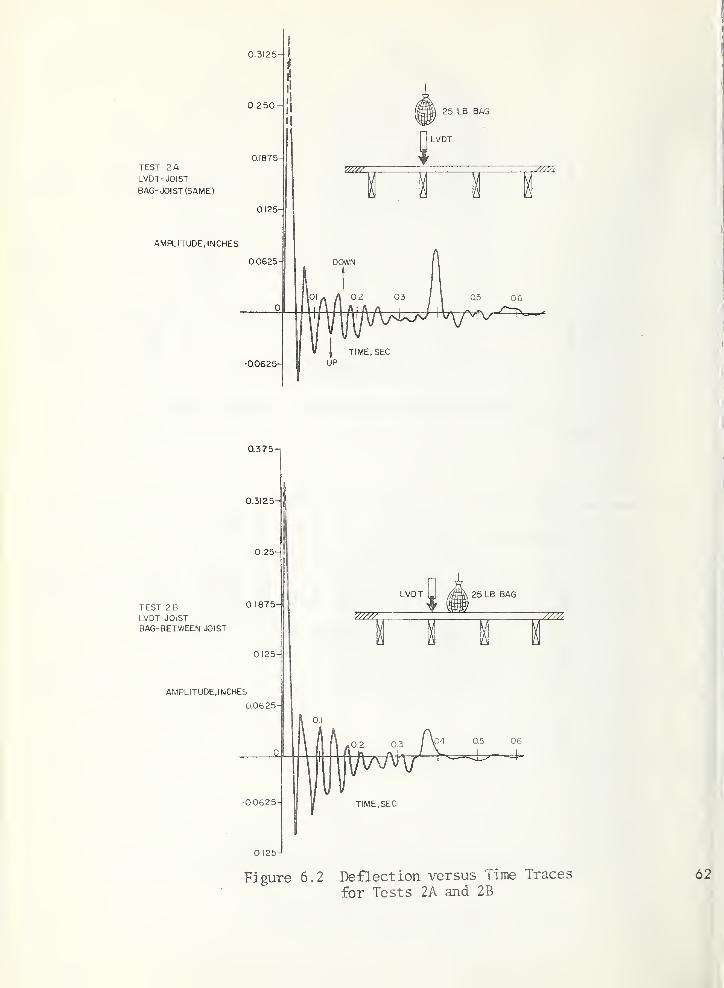
0.3125-
0.250-
TEST 2 A
LVDT- JOIST
BAG-JOIST(SAME)
AMPLITUDE, INCHES
-0.0625
TEST 2BLVDT-JOISTBAG- BETWEEN JOIST
0.375-1
0.3125-
0.25-
0 1875-
0125-
AMPLITUDE.INCHES
0,0625-
0,0625-
0 125
LVDT U /M\ 25 LB BAG
i i i
.04 0.5 06
TIME, SEC
Figure 6.2 Deflection versus Time Traces
for Tests 2A and 2B
62
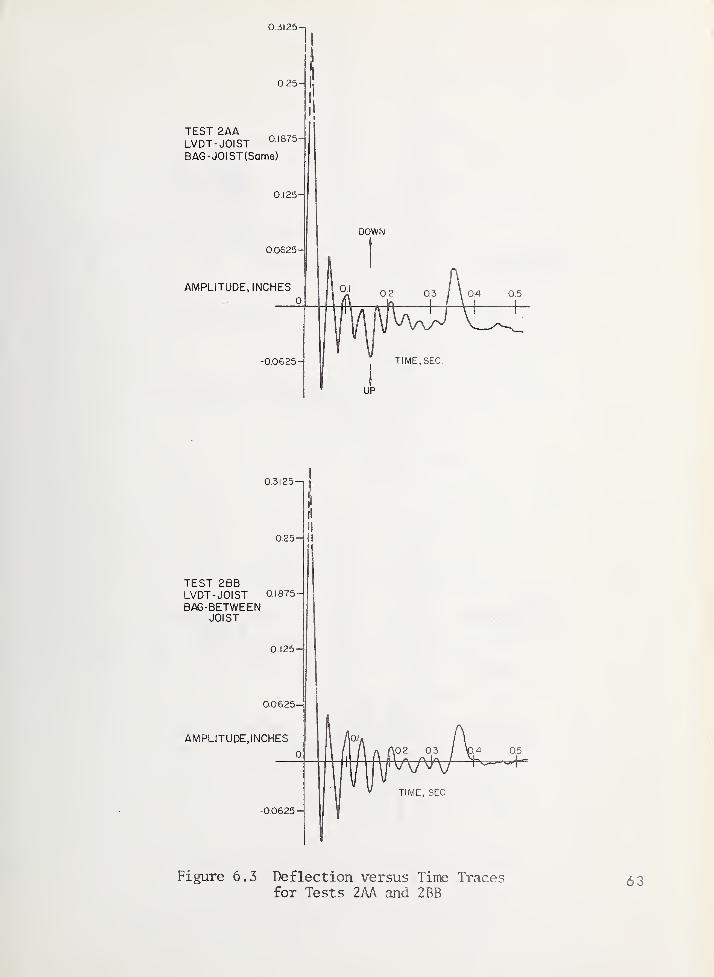
03125-1
025-
TEST 2AALVDT-JOISTBAG-JOIST(Same)
0.1875-
0.0625-
AMPLITUDE, INCHES
-0.0625-
03125-1
TEST 2BBLVDT-JOIST 0.1875
BAG-BETWEENJOIST
0.125-
AMPLITUDE.INCHES
-0.0625
0.0625-
Figure 6.3 Deflection versus Time Tracesfor Tests 2AA and 2BB
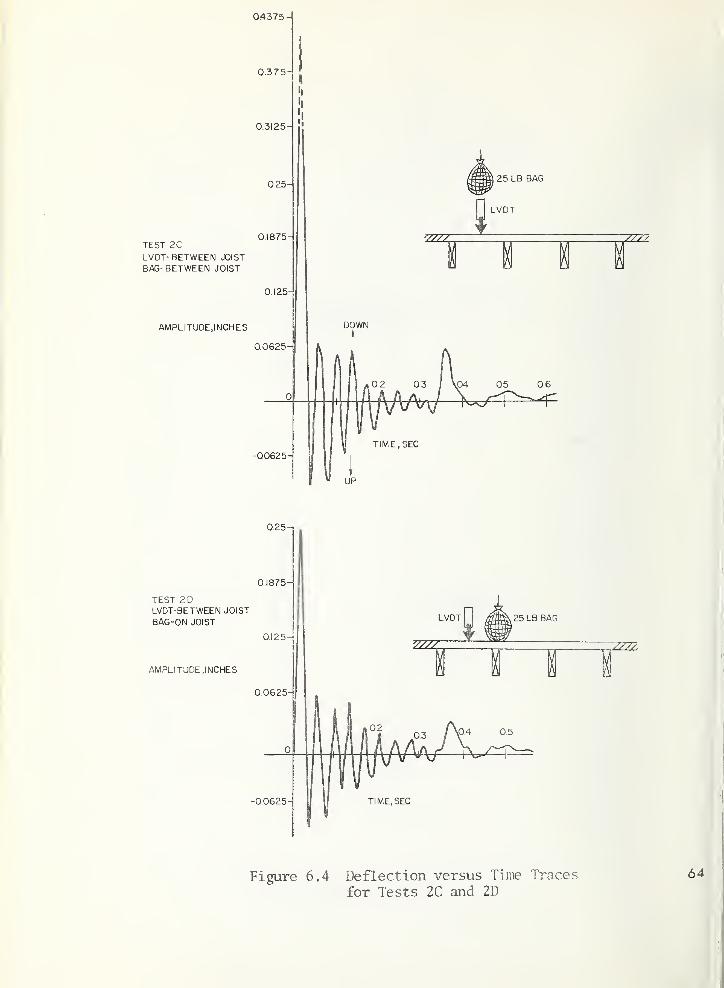
04375-
0.375-
0.3125-
Q25-
TEST 2CLVDT- BETWEEN JOIST
BAG- BETWEEN JOIST
AMPLITUDE,INCHES
01875-
0.I25-'
00625-
-00625-
1 25 LB BAG
LVDT
777?
TEST 2DLVDT-BETWEEN JOIST
BAG-ON JOIST
0.25
OI875-
0125-
AMPLITUDE .INCHES
0.0625
-00625
Figure 6.4 Deflection versus Time Traces
for Tests 2C and 2D
64
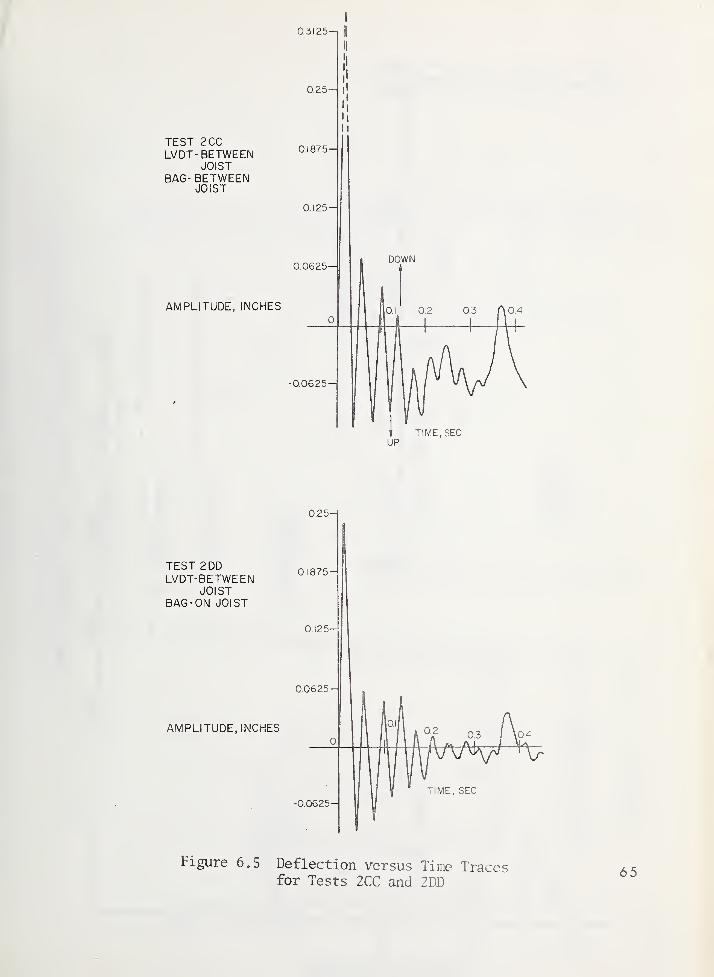
TEST 2CCLVDT- BETWEEN
JOISTBAG- BETWEEN
JOIST
I
Q3I25-, i
0.25-
0.1875
0.125-
AMPLITUDE, INCHES
0.0625-
-0.0625
TIME, SEC
TEST 2DDLVDT-BETWEEN
JOISTBAG-ON JOIST
0,25-
0.1875-
0.125-
AMPLITUDE, INCHES
Figure 6.5 Deflection versus Time Tracesfor Tests 2CC and 2DD
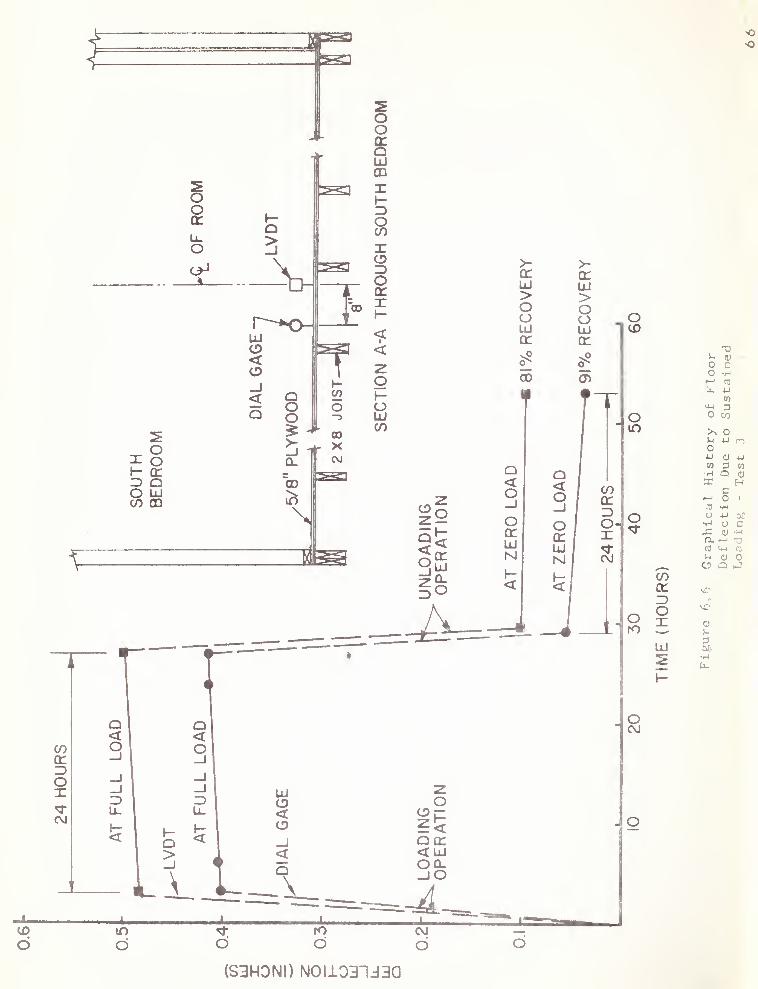
JL
d bro
d d
o
o
o
oro
CO
OXUJ
oCVJ
CO
O CO
>, o
O
wHX
•U r-)
D 03
Q (D
H
o(!)
Cr-l O.1} t-(
O
x:
Cfl U-i (13
0) OO Q iJ
0)
00
(S3H0NI) NOI1331d3a
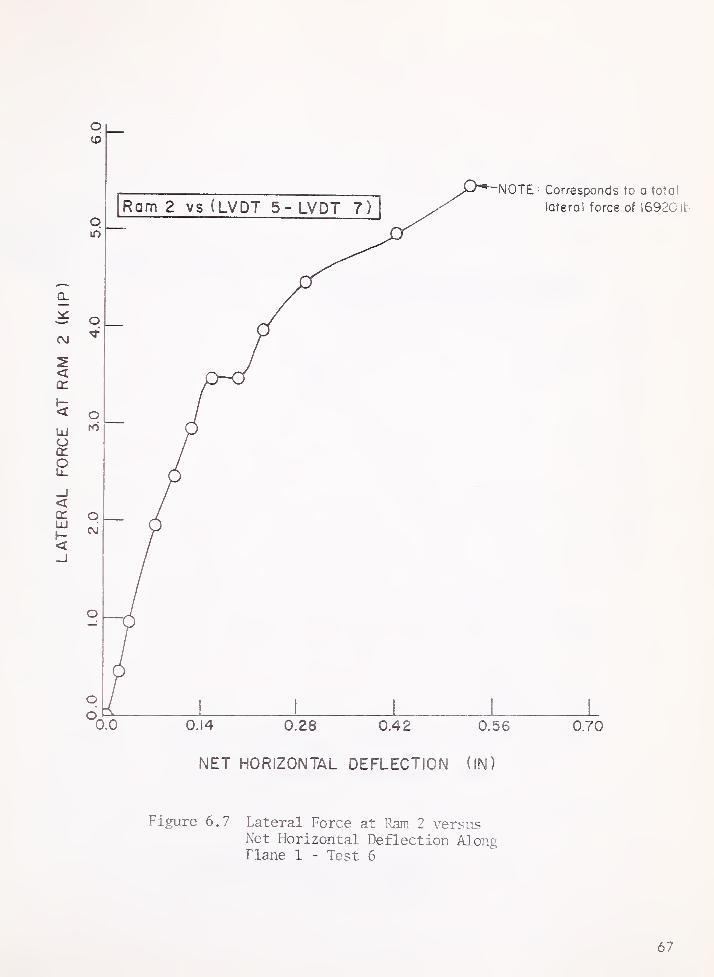
o
NET HORIZONTAL DEFLECTION (IN)
Figure 6.7 Lateral Force at Ram. 2 versusNet Horizontal Deflection AlongFlane 1 - Test 6
67
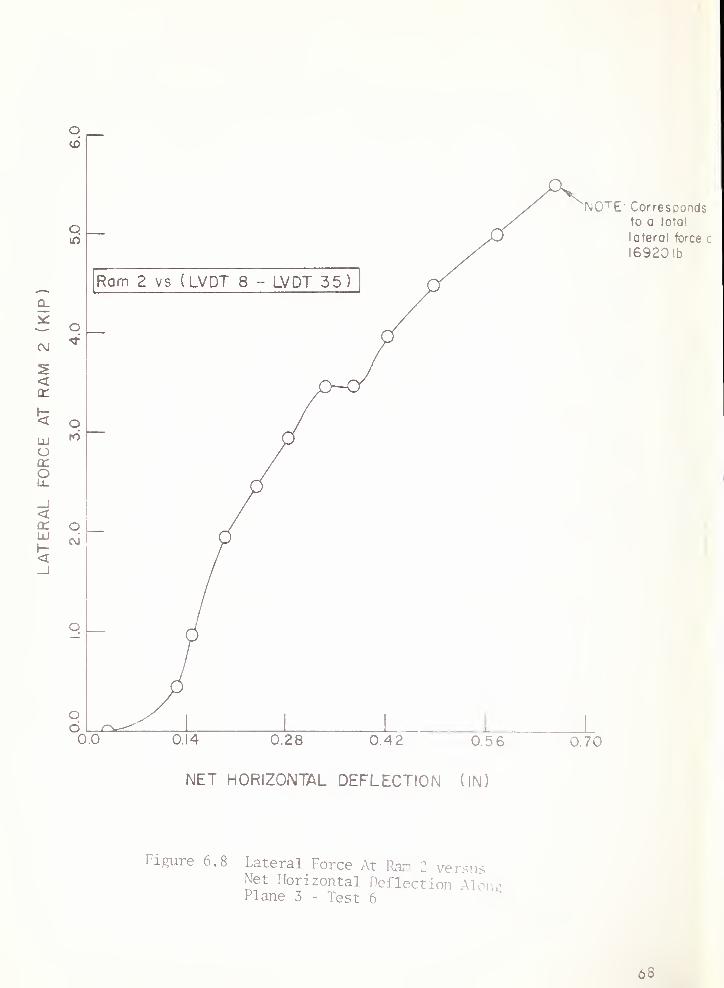
o^6
Q
Ram 2 vs (LVDT 8 - LVDT 35)
5 o
o
NOTE- Correspondsto a [oral
lateral force c
169201b
0.14 0.28 0.42 0.5 6 0.70
NET HORIZONTAL DEFLECTION (IN)
Figure 6.8 Lateral Force At Rain 2 versusNet Horizontal Deflection AlonePlane 3 - Test 6
68
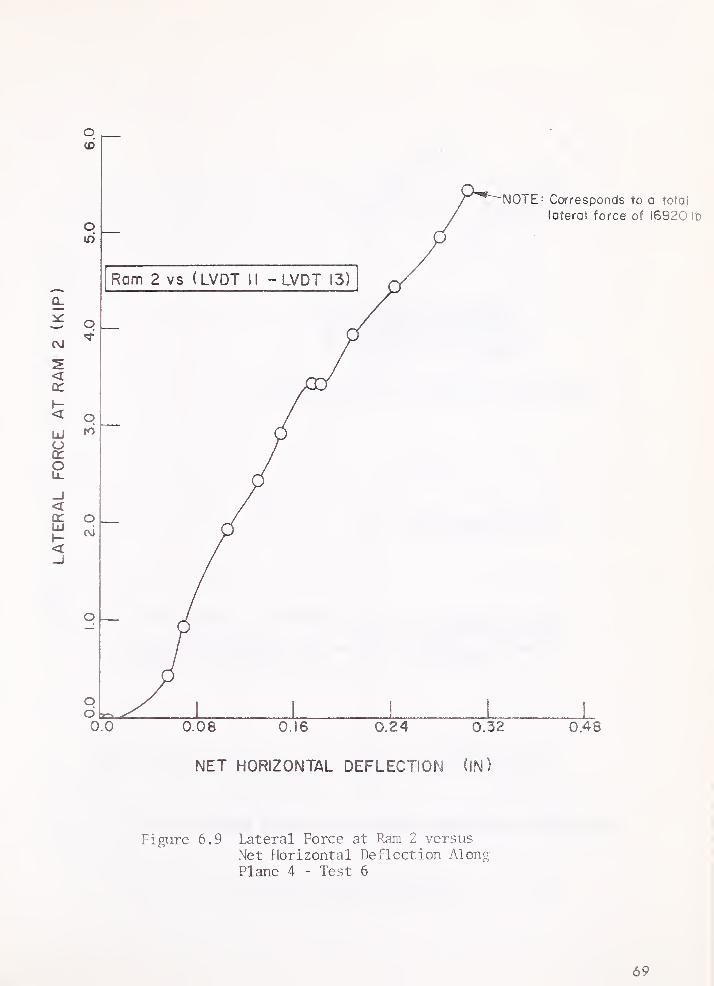
q
CVJ
<
<LLi
OITo
<UJ
oin
Ram 2 vs (LVDT II - LVDT 13)
o
q
o
od
NOTE: Corresponds to a total
lateral force of 16920 lb
0.0 0.08 0.16 0.24 0.32 0.48
NET HORIZONTAL DEFLECTION
Figure 6.9 Lateral Force at Ram 2 versusNet Horizontal Deflection AlongPlane 4 - Test 6
69
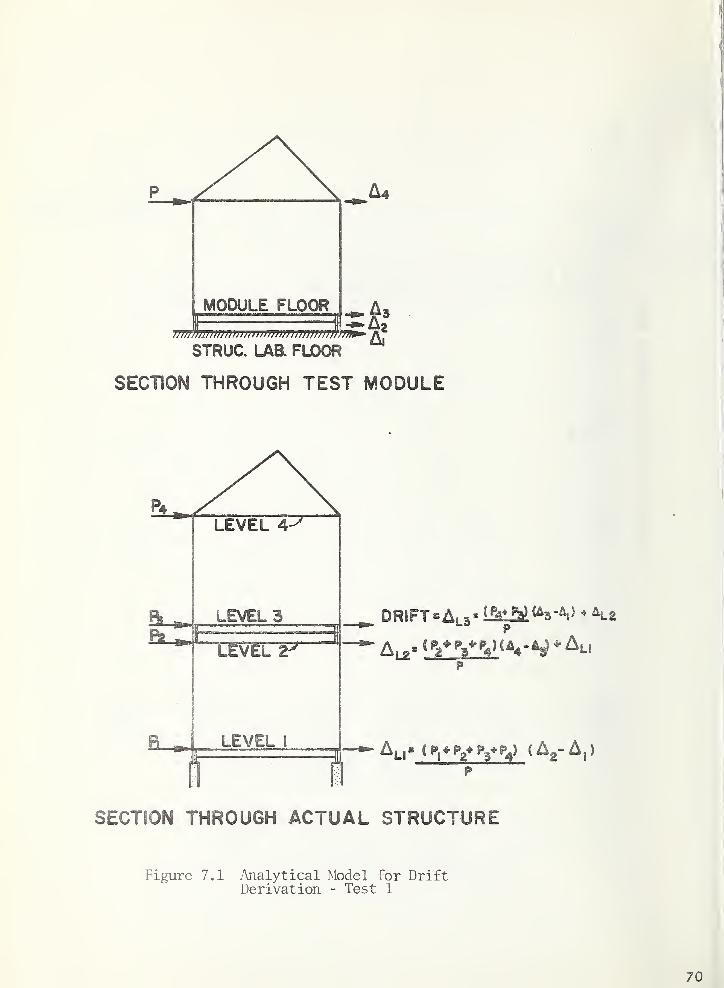
A4
MODULE FLOOR
)))))m}n}}))W)}})})U}n)))))W)}))n
STRUG. LAa FLOOR
SECTION THROUGH TEST MODULE
a. LEVEL 3
lEvETF^
LEVEL I
p
SECTION THROUGH ACTUAL STRUCTURE
Figure 7.1 Analytical Model for DriftDerivation - Test 1
70
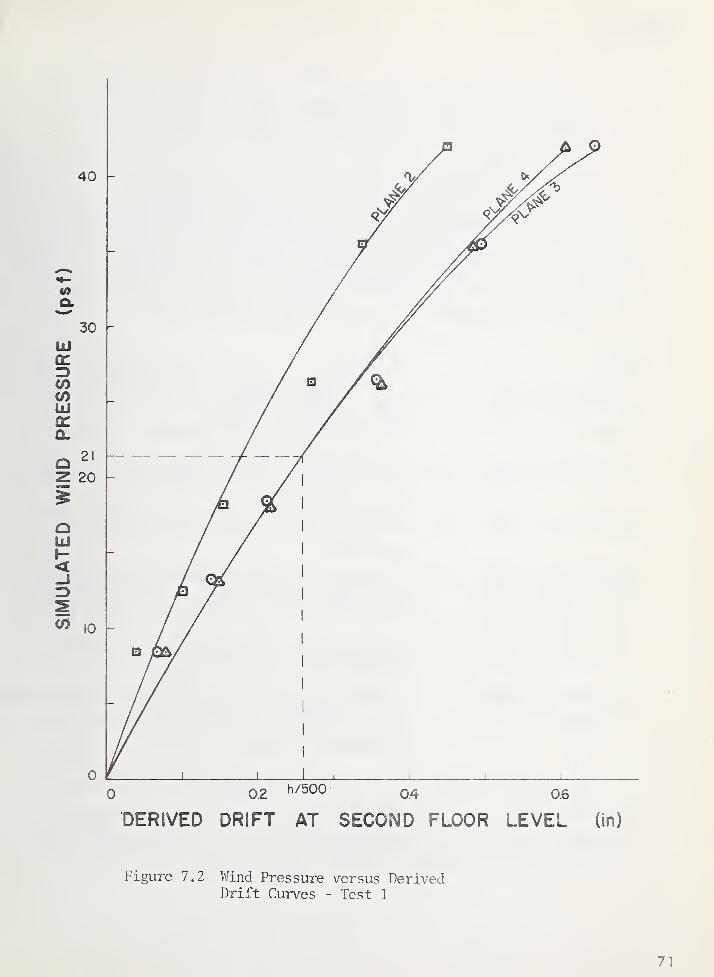
0 0.2 h/5000.4 0.6
DERIVED DRIFT AT SECOND FLOOR LEVEL (in)
Figure 7.2 Wind Pressure versus DerivedDrift Curves - Test 1
71
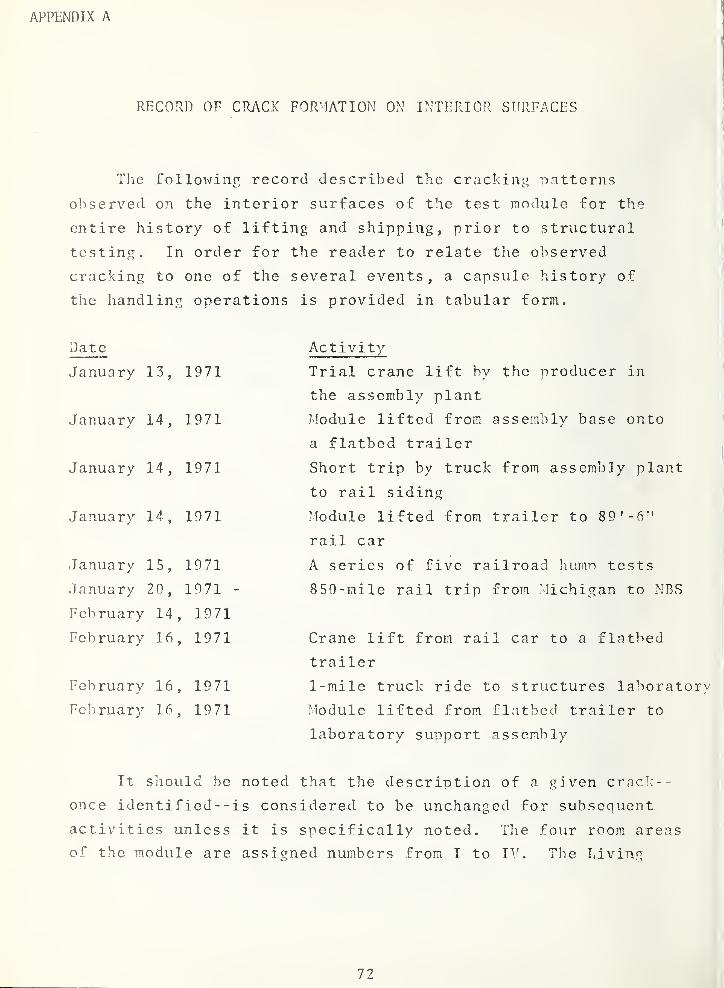
APPENDIX A
RECORD OV CRACK FORMATION ON INTERIOR SURFACES
Tlio followinr record described the cracking patterns
observed on the interior surfaces of the test module for the
entire history of lifting and shipping, prior to structural
testing. In order for the reader to relate the observed
cracking to one of the several events, a capsule history of
the handling operations is provided in tabular form.
Date '
January 13, 1971
January 14, 1971
January 14, 1971
January 14, 19 71
January 15, 1971
January 20, 1971
February 14, 1971
February 16, 1971
February 16, 1971
February 16, 19 71
Activity
Trial crane lift by the producer in
the assembly plant
Module lifted from assembly base onto
a flatbed trailer
Short trip by truck from assemi)ly plant
to rail siding
Module lifted from trailer to 89 '-6''
rail car
A series of five railroad humn tests
8 50 -mile rail trip from Michigan to NBS
Crane lift from rail car to a flatbed
trailer
1-mile truck ride to structures laboratory
Module lifted from flatbed trailer to
laboratory support assembly
It siiould be noted that the description of a given cracl;--
once identified- - is considered to be unchanged for subsequent
activities unless it is specifically noted. Tlie four room areas
of the module are assigned numbers from I to IV. Tlie Livin^:
72
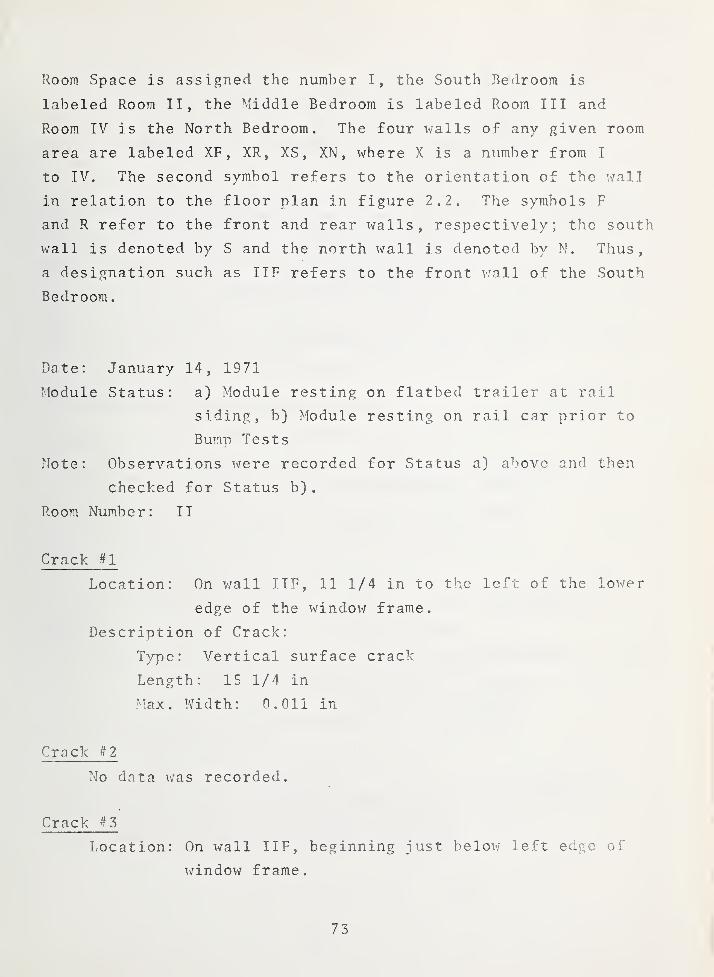
Room Space is assigned the number I, the South Bedroom is
labeled Room II, the Middle Bedroom is labeled Room III and
Room IV is the North Bedroom. The four walls of any given room
area are labeled XF,XR, XS , XN , where X is a number from I
to IV. The second symbol refers to the orientation of the wall
in relation to the floor plan in figure 2.2. The symbols F
and R refer to the front and rear walls, respectively; the south
wall is denoted by S and the north wall is denoted by N. Thus,
a designation such as IIF refers to the front v/all of the South
Bedroom.
Date: January 14, 1971
Module Status: a) Module resting on flatbed trailer at rail
siding, b) Module resting on rail car prior to
Bump Tests
Note: Observations were recorded for Status a) above and then
checked for Status b)
.
Room Number: II
Crack #1
Location: On v;all IIF, 11 1/4 in to the left of the lovjer
edge of the window frame.
Description of Crack:
Type: Vertical surface crack
Length: 15 1/4 in
Max. Width: 0.011 in
Crack #2
No data was recorded.
Crack #5
Location: On wall IIF, beginning just belov/ left edge of
window frame.
73
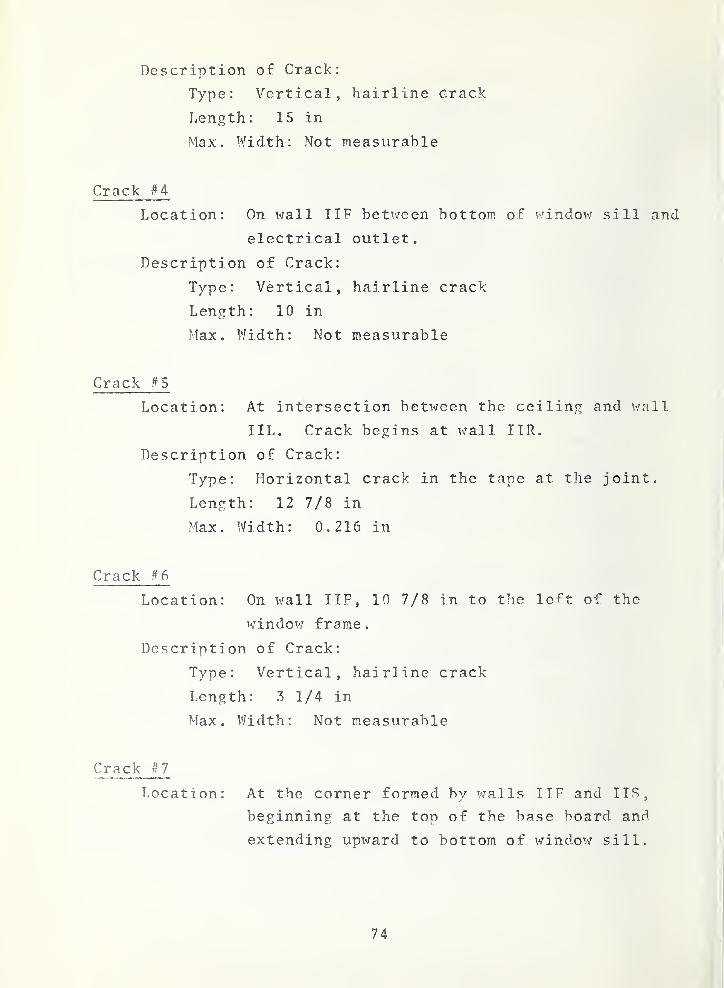
Description of Crack:
Type: Vertical, hairline Grack
Length : 15 in
Max. Width: Not measurable
Crack #4
Location: On wall IIF between bottom of v/indow sill and
electrical outlet.
Description of Crack:
Type: Vertical, hairline crack
Length: 10 in
Max. Width: Not measurable
Crack #5
Location: At intersection between the ceiling and wall
TIL. Crack begins at wall IIR.
Description of Crack:
Type: Horizontal crack in the tape at the joint.
Length: 12 7/8 in
Max. Width: 0. 216 in
Crack #6
Location: On wall IIF, 10 7/8 in to the left of the
windov/ frame
.
Description of Crack:
Type: Vertical, hairline crack
Length: 3 1/4 in
Max. Width: Not measurable
Crack #7
Location: At the corner formed by walls IIF and IIS,
beginning at the top of the base board and
extending upward to bottom of window sill.
74

Description of Crack:
Type: Vertical tear in the tape joint
Length: No data recorded
Max. Width: 0.060 in
Date: January 15, 1971
Module Status: Module resting on rail car ririor to Bumn Tests
Note: Module's interior was scrutinized prior to lifting from
trailer to rail car, but no data was recorded due to the
time element. However, it was generally observed that
all the cracks documented below were previously observed
when the module was resting on the trailer.
Room Number: III
Crack #1
Location: On wall IIIF, immediately to the right of the
header above the push -out bay v;indoH'.
Description of Crack:
Type: Horizontal, hairline crack
Length: 3 in
Max. Width: Not measurable
Crack #2
Location: On wall IIIF, extending the entire length between
the right hand corner of the push-out window
frame and the top of the baseboard.
Description of Crack:
Type: Vertical, hairline crack
Length: Approximately 20 in (not measured)
Max. Width: Not measurable
75
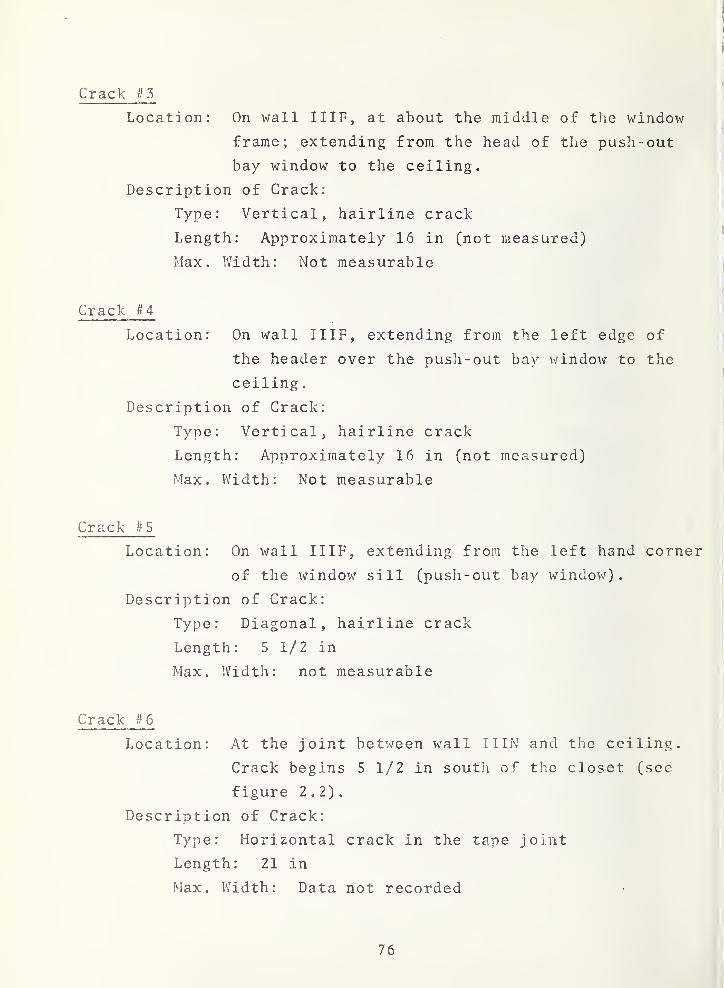
Crack #5
Location: On wall IIIF, at about the middle of the window
frame; extending from the head of the push-out
bay window to the ceiling.
Description of Crack:
Type: Vertical, hairline crack
Length: Approximately 16 in (not measured)
Max. Width: Not measurable
Crack #4
Location: On wall IIIF, extending from the left edge of
the header over the push-out bay window to the
ceiling
.
Description of Crack:
Type: Vertical, hairline crack
Length: Approximately 16 in (not measured)
Max. Width: Not measurable
Crack #5
Location: On wall IIIF, extending from the left hand corner
of the xvindow sill (push-out bay window) .
Description of Crack:
Type: Diagonal, hairline crack
Length: 5 1/2 in
Max. Width: not measurable
Crack #6
Location: At the joint between wall IIIN and the ceiling.
Crack begins 5 1/2 in south of the closet (see
figure 2.2).
Description of Crack:
Type: Horizontal crack in the tape joint
Length: 21 in
Max. Width: Data not recorded
76
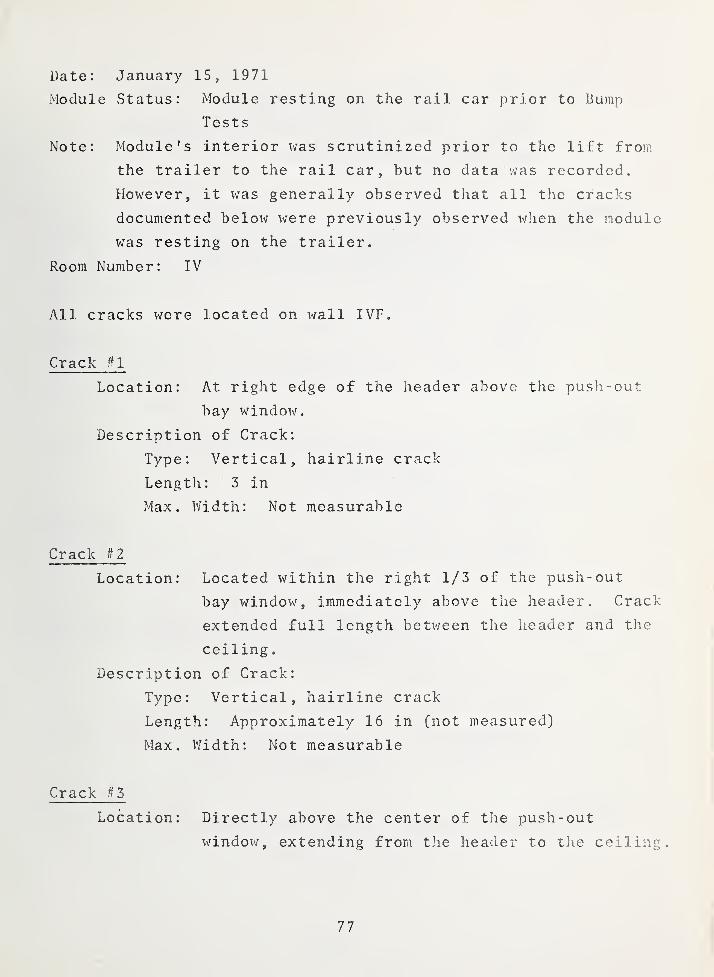
Date: January 15, 1971
Module Status: Module resting on the rail car prior to Bump
Tests
Note: Module's interior \^as scrutinized prior to the lift from
the trailer to the rail car, but no data was recorded.
However, it was generally observed that all the cracks
documented below were previously observed when the module
was resting on the trailer.
Room Number: IV
All cracks were located on wall IVF.
Crack #1
Location: At right edge of the header above the pusli-out
bay windov/.
Description of Crack:
Type: Vertical, hairline crack
Length: 3 in
Max. Width: Not measurable
Crack #2
Location: Located within the right 1/3 of the push-out
bay window, immediately above the header. Crack
extended full length between the header and the
ceiling.
Description of Crack:
Type: Vertical, hairline crack
Length: Approximately 16 in (not measured)
Max. Width: Not measurable
Crack #3
Location: Directly above the center of the push-out
v\?indow, extending from the header to t]\e ceiling.
77

Description of Crack:
Type: Vertical, hairline crack
Length: Approximately 16 in (not measured)
Max. Width: Not measurable
Crack #4
Location: Above the header o£ the push-out window; the
center of the crack was located 4 ft to the
south of the left side of the window frame.
Description of Crack:
Type: Vertical, hairline crack
Length: 4 in
Max. IVidth: Not measurable
Crack /f 5
Location: Projecting from directly above the left edge of
the window header.
Description of Crack:
Type: Vertical, hairline crack
Length: 2 in
Max. Width: Not measurable
Crack #6
Location: Situated between the bottom of the window sill
and the electrical outlet.
Description of Crack;
Type: Vertical, hairline crack
.Length: 7 in
Max. Width: Not measurable
Crack #7
Location: Situated between the electrical outlet and the
top of the baseboard.
78
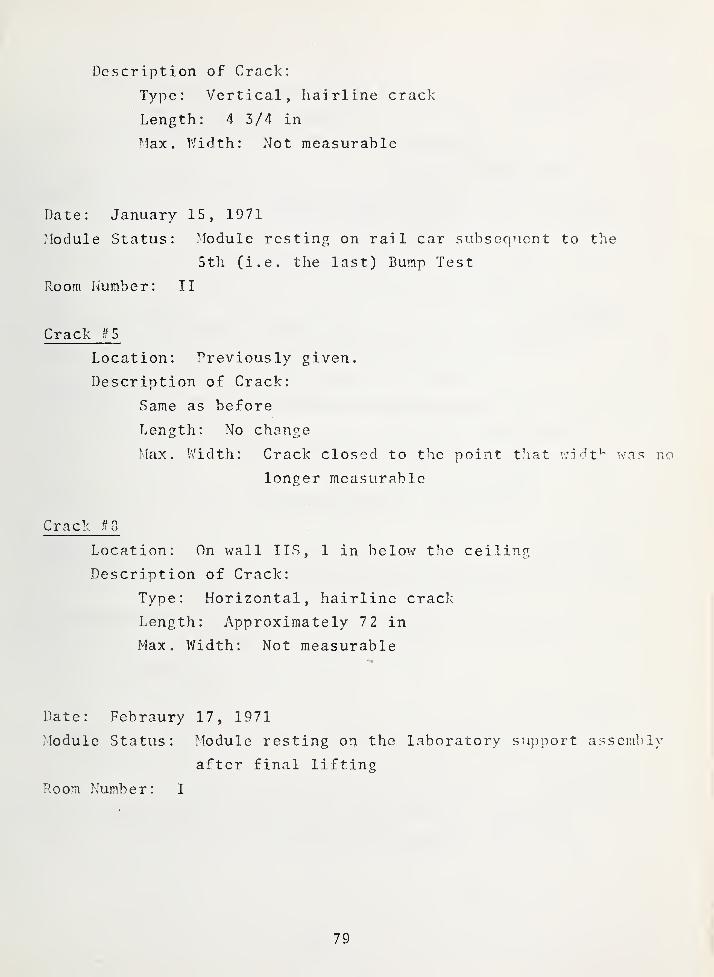
Description of Crack:
Type: Vertical, liairline crack
Length: 4 3/4 in
Max. VJidth: Not measurable
Date: January 15, 1971
Module Status: Module resting on rail car subscqncnt to the
5th (i.e. the last) Bump Test
Room IJumber: II
Crack #5
Location: Previously given.
Description of Crack:
Same as before
Length: No change
Max. Width: Crack closed to the point t;iat vn'dt^: was no
longer measurable
Crack ff?>
Location: On wall IIS, 1 in below the ceiling
Description of Crack:
Type: Horizontal, hairline crack
Length: Approximately 7 2 in
Max. Width: Not measurable
Date: Febraury 17, 1971
Module Status: Module resting on the laboratory su])port assembly
after final lifting
Room Number: I
79
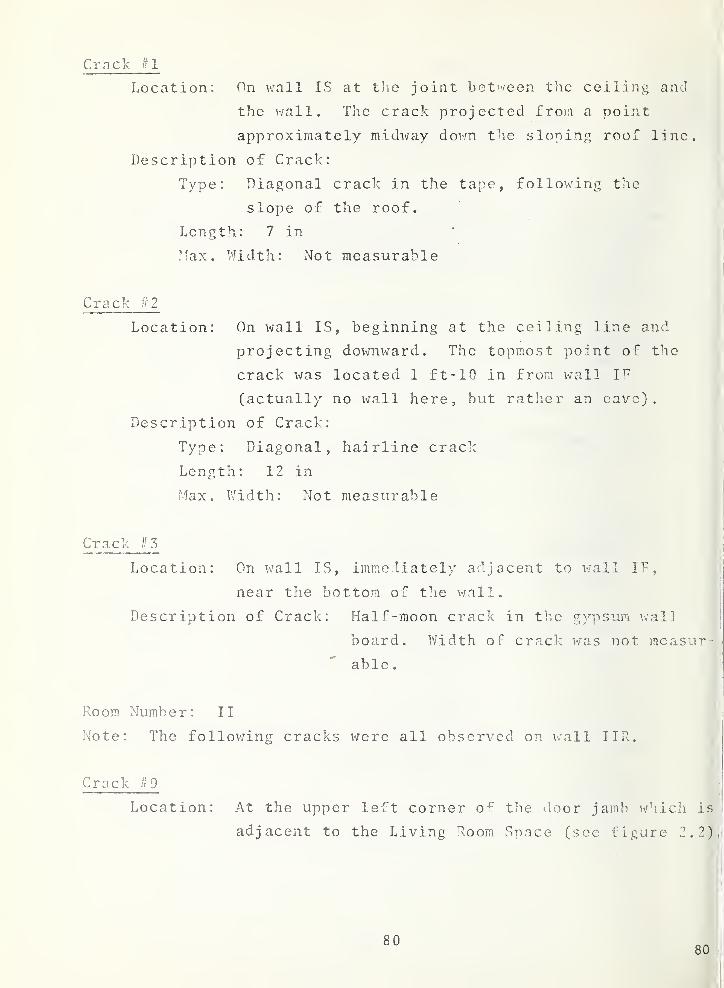
Crack III
Location: On wall IS at the joint betiveen the ceiling and
the v/all. Tiio crack projected rro):i a point
approximately midway dovm the sloping roof line.
Description of Crack:
Type: Diagonal crack in the tape, following the
slope of the roof.
' • Length: 7 in
Ilax. Widtli: Not measurable
Crack #2
Location: On wall IS, beginning at the ceiling line and
projecting downward. The topmost point of the
crack was located 1 ft- 10 in from wall I^
(actually no wall here, but ratlier an eave) .
Description of Crack:
Type: Diagonal, hairline crack
Length: 12 in
Max. V/idth: Not measurable
Crack ffZ
Location: On ivall IS, immediately adjacent to v/all IF,
near the bottom of th.e wall.
Description of Crack: Half -moon crack in the gypsum wall
board. Width of cracl: was not measur-' able.
Room Number: II
Note: The following cracks were all observed on wall IIR.
Crack #9
Location: At the upper left corner the <loor jamb wbiich is
adjacent to the Living Room Space (see figure 2.2),
8080
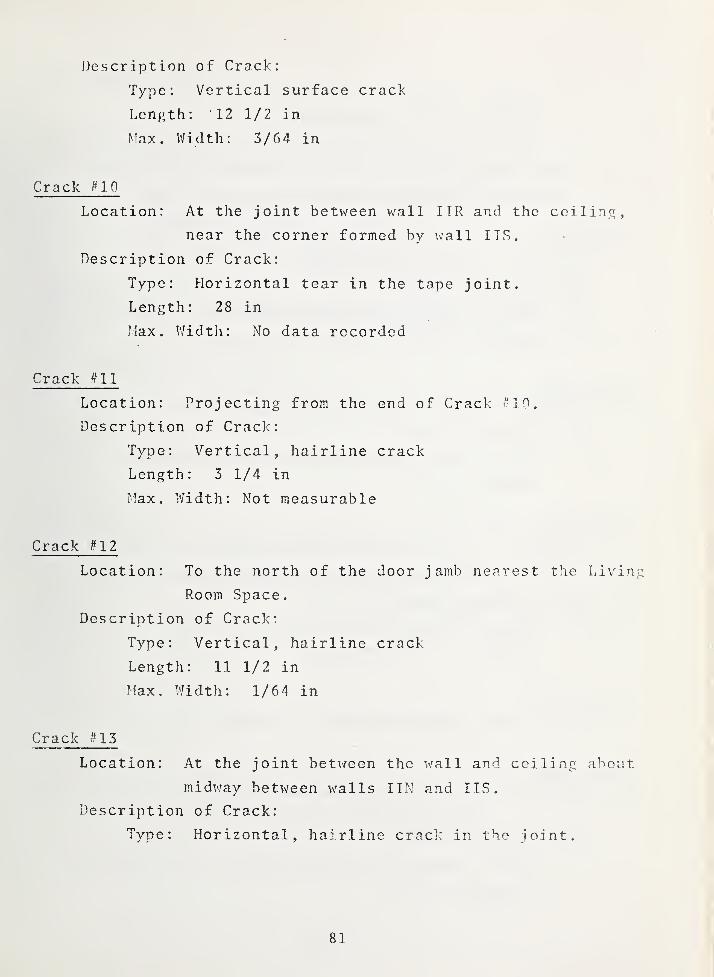
Description of Crack:
Type: Vertical surface crack
Lenjith: 12 1/2 in
Max. Width: 3/64 in
Crack noLocation: At the joint between v/all ITR and the ceiling,
near the corner formed by wall IIS.
Description of Crack:
Type: Horizontal tear in the tape joint.
Length: 28 in
Max. Width: No data recorded
Crack #11
Location: Projecting from the end of Crack .^10.
Description of Crack:
Type: Vertical, hairline crack
Length: 3 1/4 in
Max. Width: Not measurable
Crack #12
Location: To the north of the door jamb nearest the Living
Room Space.
Description of Crack:
Type: Vertical, hairline crack
Length: 11 1/2 in
Max. Width: 1/64 in
Crack #13
Location: At the joint between the wall and ceiling about
midway between walls UN and IIS.
Description of Crack:
Type: Horizontal, hairline crack in the joint.
81
LGngtli: 3 7 in
Max. Width: Not measurable
Note: The following cracks were all observed on v;all IIP and
their width was not measurable.
Crack #14
Location: Around vn.ndow frame.
Description of Crack:
Type: Vertical, hairline crack
Length : 4 1/4 in
Crack #15
Location: Above window frame at the ceiling line.
Description of Crack:
Type: Horizontal, hairline crack in the tape joint
Length: 9 1/2 in
Crack #16
Location: At the corner formed by walls ITF and IIS, begin-
ning just above the end of Crack #7.
Description of Crack:
Type: Vertical tear in the tape joint
Length: 23 1/2 in
C rack #17
Data is too incomprehensible to report
Crack #18
Location: At the corner formed by walls IT^^ and IIS, near
the ceiling.
Description of Crack:
Type: Vertical, hairline crack in the tane joint.
Length: 2 1/2 in
82
Room Number: III
Crnck #7
Location: On \vall IIIR, at left edge of the door jamb.
Description of Crack:
Type: Vertical, hairline crack
Length: 9 1/2 in
Max. Width: Not measurable
Crack #8
Location: Along the joint between wall IIIR and the
ceiling, beginning 1 1/2 in from wall HIS.
Description of Crack:
Type: Horizontal tear in the tane joint, barely
visible in some places.
Length: 12 1/2 in
Hax. Width: Not measurable
Crack #9
Location: Inside the closet at the joint between the
ceiling and the walls.
Description of Crack: Hairline crack in the tape, extend-
ing completely around the perimeter
of the closet. The width was not
measurable
.
Room Number: IV
Crack #8
Location: Center of the crack was 2 in belov/ the ceiling
on wall IVN; crack began 4 '-6" from v;all corner
formed by wall IVR.
83
De.scriDt ion of Crack:
Type: Horizontal, hairline crack
Length : 48 in
Max. Width: Not measurable
Crack #9
Location: On viall IVN, beginning 1 in below the ceiling.
Description of Crack:
Type: Vertical, hairline crack
Length: 3 in
Max. Width: Not measurable
84
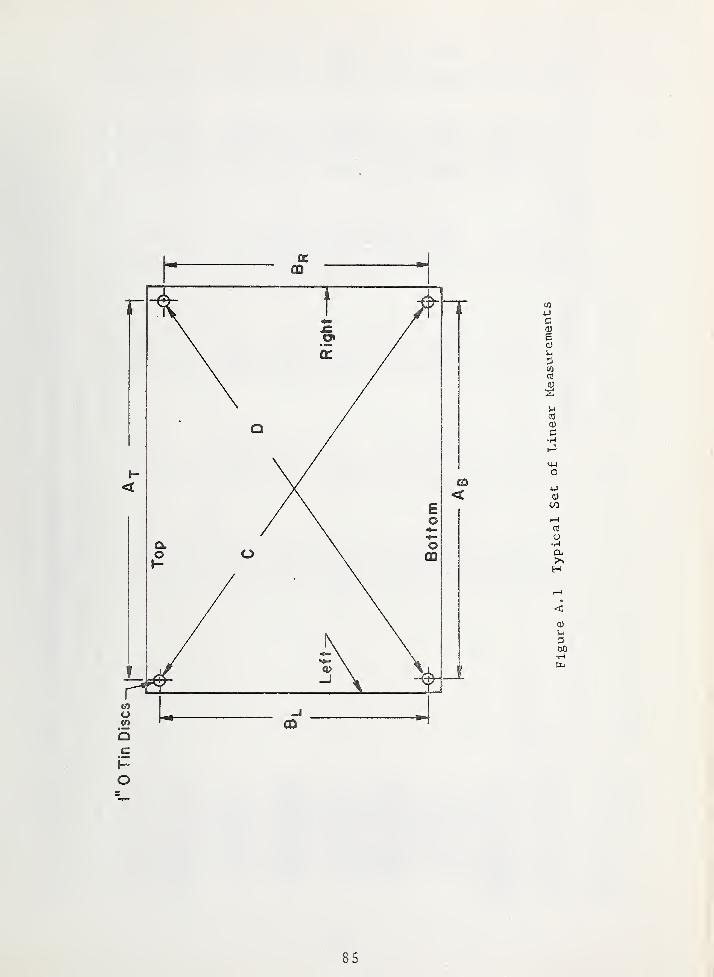
85
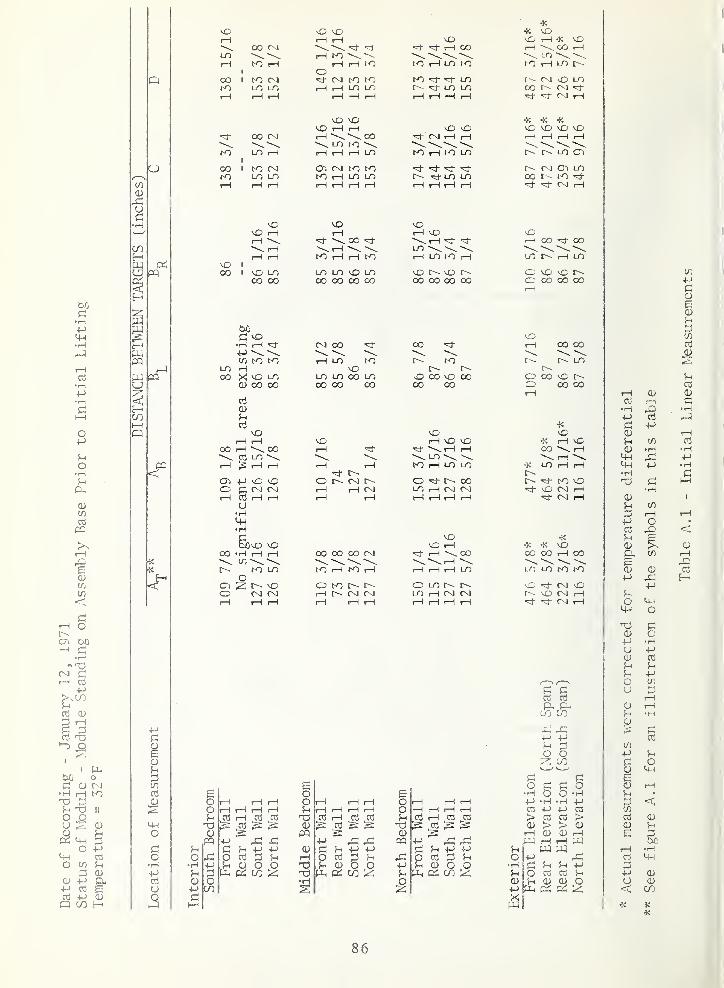
1 IJh
o(D rj
•H rH K)
II
Oo (D
urDC mO Mm
o t/) ?-i
0) -P+-> 03
4->
O CO H
Pi
0)
o
o•H-MnJ
UO
00 C-J
K> i-H
oo toro,—
1
OO
tn LO .—
1
oo <N]
K) un LOI-H I—
1
^ 1—
I
\0 I
OO I vO LOOO OO
•H ,—I -vt
t/l irO toun Hoo X vo un
<D oo oo
0)fH
!—I I-HCO t—I \ oo
1—I ;S I-H T-H
cr> +J vD ^I—I TO t—I rH
u•Hm•H
OO -H rH I—
I
OcTi ;z; !>- vDO (NJ CM
i-H I—i iH rHrH TO Cti
e ^ ^M^ bO Oj>H CU otin Pi CO iz;
rH rH
iH to --^
rH rH 1^)Orsi to to
rH tH LO LTj
vO rH iHrH "^^^ OO\ LO torH rH rH LD
cr> (Ni to toto rH LO LO
rH\ 30 'd-
tO rH rH to
LD LO LOOO 00 00 oo
<N! OO
iH LO to
LO LO oo LO00 OO oo
o cNi
rH iH OJ
00 OO CO 04
to rH to rH
O to t--~ !>-
rH CSI CsJ
oo5h
(UPQ
(UrH
•H
rH 03 Oj
^ ^Cti n !h
0) o op., Di; CO :2
rH oo
to rH LO to
to LOLO LO
rH rH •H rH
rH iH
to rH to LO
':d-LO LOrH iH rH rH
rH vO"^-^ iH 'ct
rH LO to rH
vO r-- vO r--
OO oo OO OO
oo "=d-
to
O oo VO 00oo oo
tH vO vO-^rH rH
to rH LO LO
O OOLO rH CNl OJ
VOrH
vO
,OO
rH rH rH LO
O LO !>-LO rH
1o
CD
o3 iH o5 o3
& ^ is ^
fH !-> 4->
O 03 p J-i
fi <D O OPh OO :z
K vOvO rH -K vDrH CO rH
to rH LO
r - r-i O LOCO t-~- c^i M-
ro ,H
•K -K *\C> \o \o \o
i>- r-- LO en
r-- rj cn LOCO to^ -"^ CNl rH
rH OO OO
LO r-- rH LD
o vD vo r--O CO oo 00
vOrH 00 OO
r-- LO
o oo voO oo 00
VO^ rH VCoo rH
•K LO iH rH
r-- to vDvO CvJ rH^ CNl rH
4C
•K -K vOCO oo rH oo
!-0 LO to to
vD CNl vOr-- vO Csl rH^ rsl rH
nj 03
L/0 CO
2 CO
o•H
p
o•H-M03
>(0rH
Po
c oo O -H
•H -H PP -P OiOS 03 >> >CD CD
CD
^-^ 5-< P03 o3
<D CD OPi Pi :z
CD
CDMh
CD
P03
(D
CDPJ
t--
OMh
njCDpuCD
PPOOCD
PCD
c/1
4-J
fi:
CD
CD
p;3
o3CD
c-S
PO<
pCD
CHp>
rHCO•H •H
PP •H
1—
1
H1
CO
rH rHo
<CD
m rH
CD
P<POc;o•HP)03
PPto
rHrHM
0}
Po
86
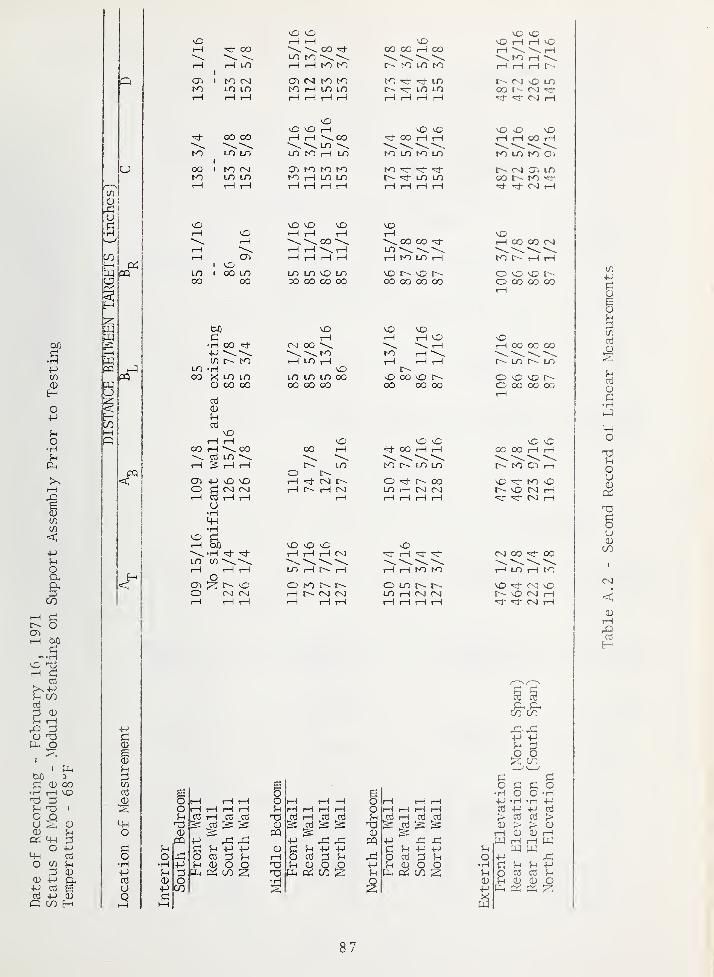
vOoo OO oo (X) rH oo
r-- ro LT)
\0 VD\0 t—I rH
to
toI to (XI
LO unCTl CSl to toto rH LO LO
to ^ LOt-~- '>^^ LO LO
r-- r-i \o LOoo r-- cNi -^d-^ CNl tH
to
ooto
oo oo
LO LO
I to (Nl
LO LO
\0 t—
1
rH 1—I \00LO to rH LO
cn to to toto t—I LO LO
O \0oo rH rH
to LO to LO
to "^t"Tt LO LO
o -o >orH rH oo rH
to LO to Oi
r-- CTi LOoo r-- to -^t
rj- rsj ,-H
vO
LOOO
VO
cnI vOI oo LO
oo
VO vO vO
. oo
LO LO vO LO20 oo oo 00
VOt—
I
^ 00 00
rH to LO rH
VO l>- vO00 00 CO 00
VOr-H CO 00 CNJ
to rH rH
O VO vO t~-o 00 00 00
ISO
•H 00 "^f
W l>- toLO -H00 X LO LO
CD CO 00
<D
03VO
pH rH00 iH \ 00\ OJ LO ^rH ;S rH rH
cn -M O VOO C (Nl CNJ
I—I TO rH rHo•Hm
vD1—1
(xj 00\ toI—I LO rH
vOLO LO LO 0000 00 00
00VOrH
LO
rH CNI
I—I t-- rH (Nl
vD
to
vOvD
•O 00 vD O-00 00 00
vD O00 rH rH
to I>- LO LO
O "^S- 00LO I—I CNi (NJ
VDrH CO (30 00
r-- LO LO
O vO vOo 00 00 00
O vDOC 00 rH rH
I\ to 01 rH
VC ^ to vOr-- vO CN] rH^ CNl r—
I
VD
ocji VDO (NI CNJ
vO vD vDrH r—I rH (Nl
LO rH rH
O to t-- t>-!—1 r-- (Nl (Nl
VOrH '=d-
to to
o LOLO r-H <NJ (N!
(NJ CO 00
rH LO t—I to
vD "=:j- CN! vOl>- vD (Nl r—
I
^ CNl rH
4->
(U
03
modoH+Jo3
Uo
o5-1
CD
PQ
o3 I—I 03 o3.03
Pi CO
+->
o
ouCD
CDrH1313
H t-H I—
I
—I rH r—I rH03 r—I 03 03
& ^ ^ &
O o3 :3fH (D O OPL, Cr:; CO iz:
oo13CD
rd
f-t
o2
03
.03
03
O cti
Jd+-> -M
O O
cyo CO
rd ^M +->
o o2^
g d•H O4-J -H05 +->
> CT3
(D >CD
O•H
CD
O -Hr-i 4-)
cti >> CD(D
O o3
J-4 CD03 !U
CD OPL, K S
87
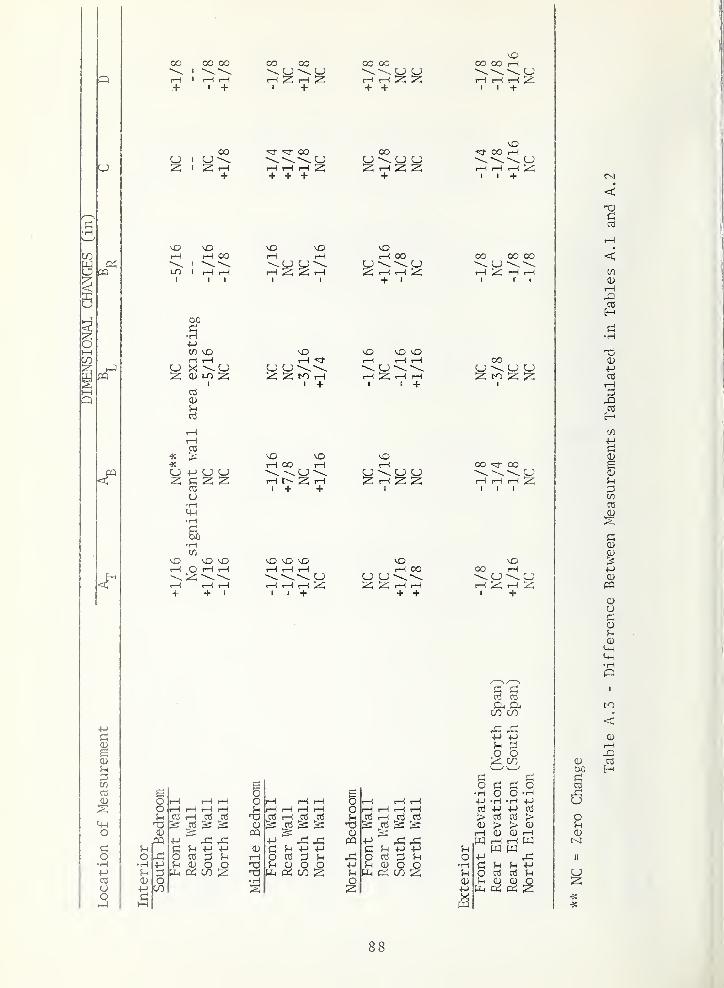
CO
I—
I
+
oo oo
.—I t—
I
I +
CO oo
t-i 2 rH iz;I +
oo oo
+ +
oo oo T—
I
r—I rH I—
I
I I +
2;
00
+
OO
!-l r-< rH Z+ + +
OO
;z t-H ;z: iz;
+
«5t- oo rH
I—I t—I I—
I
I I +
PQ
oo ^y y^i-H 2: rH
vOiH 00
Iz; iH rH :z;
+ •
oo OO OO
rH rH rHI r I
OI—
I
CO^-3
pq
•H+->
(/) ^H rH
<D LO izI
CO
a;
iH -^^j-
IZ K) rH• +
iH rH rH
iH IZ rH iHI I +
OO
^ 2
<u2;
y "-^2 2o•H
•H
aH(/)
rH _0 jH rH
VO vOiH OO iH
iH ;z; tHI + +
vO vO vD
VOiH
y y u:z: .H 2 :z:
vOiH OO
IZ IZ: >H r-l
+ +
oo CO
rH r-l rH IZI I I
VOoo rH
rH 2; rH 2I +
(->
!=;
to03
MhO
O•H4->
Oj
Oo
ot3
pq
.CO
M ^b -y
O 03 35h (U O
Pi CO
eoo
pq
<DrH
•H
oS 1—I o3 o3:s ^ & is
+-> X ^O oj ^3 ^^ 0) o oUh cc; CO ^
o
<Dpq
X,4->
O2
rH rH rH rH03 1—I o3 o3s oj ^ :s
O 03U CD o p
CO 2:
9* 9^CO CO
•p •(->
o oZ CO
o•H
•H OP -H0} P> ^5(0 >rH 0)W rHW-P
O 03
O -H•H PP 03
J? >> CUcu rHrH W
03 ^(U O
88
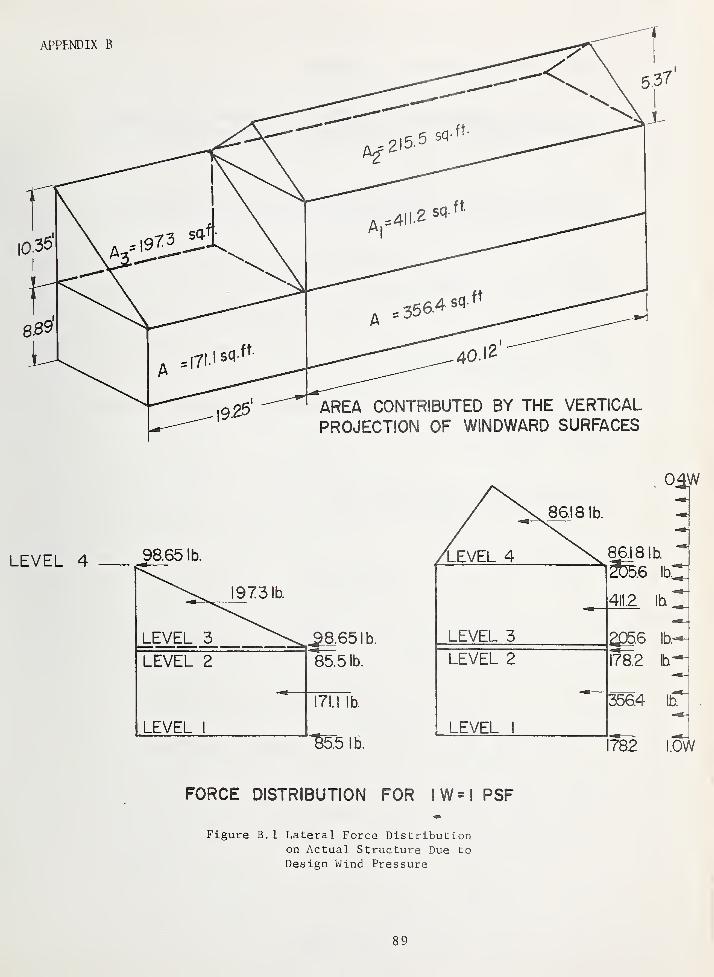
19.25 AREA CONTRIBUTED BY THE VERTICAL
PROJECTION OF WINDWARD SURFACES
98.65 lb.
19731b.
j^EVB^^_____\. ^.65 1 b. LEVEL 3
LEVEL 2
LEVEL
86.181b.
04W
86.181b
?65.6 lb.:
411.2 lb
2^.6 lb.--
178.2 Ib^
3564 lb
782 LOW
FORCE DISTRIBUTION FOR IW=I PSF
Figure B. 1 Lateral Force Distributionon Actual Structure Due to
Design Wind Pressure
89
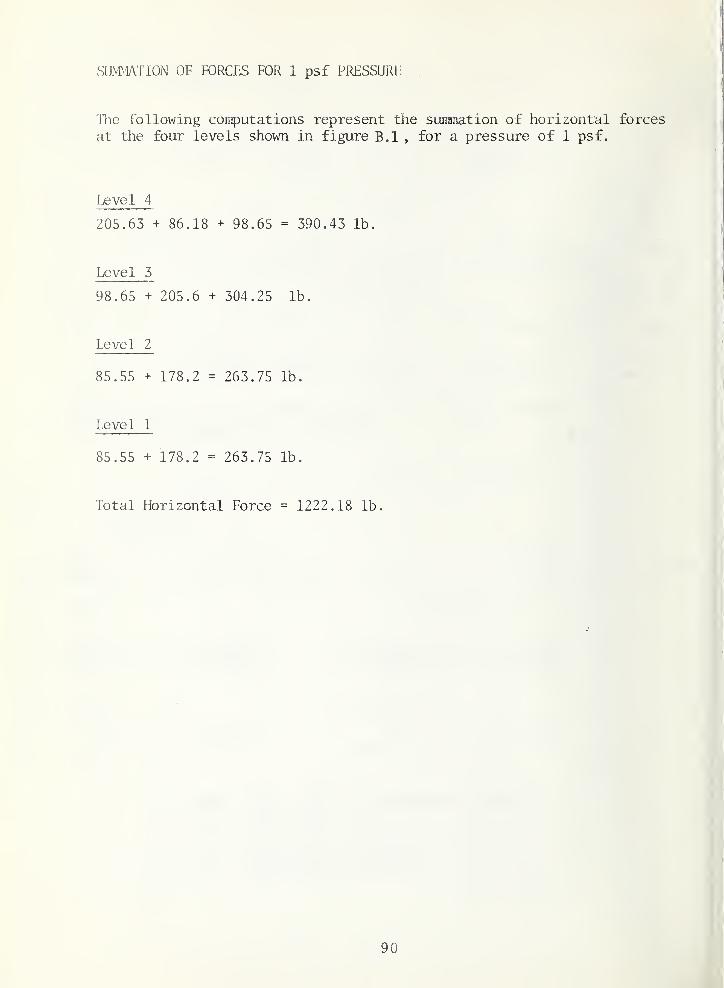
SLM>1ATI0N OF FORCES FOR 1 psf PRESSURli.
llie following confutations represent the summation of horizontal forces
at the four levels shown in figure B.l , for a pressure of 1 psf.
Level 4 .
,
205.63 + 86.18 + 98.65 = 390.43 lb.
Level 3
98.65 + 205.6 + 304.25 lb.
Level 2
85.55 + 178.2 = 263.75 lb.
Level 1
85.55 + 178.2 = 263.75 lb.
Total Horizontal Force = 1222.18 lb.
90
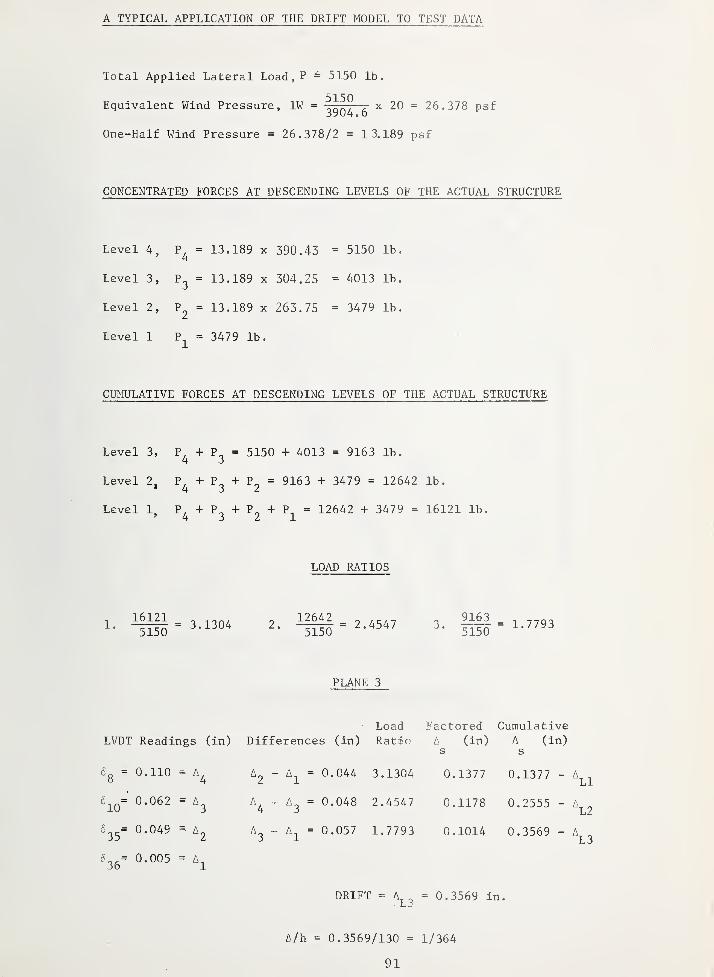
A TYPICAL APPLICATION OF THE DRIFT MODEL TO TEST DATA
Total Applied Lateral Load,P ^ 5150 lb.
Equivalent Wind Pressure, IW =^^^^ ^
x 20 = 26.378 psf
One-Half Wind Pressure = 26.378/2 = 1 3.189 psf
CONCENTRATED FORCES AT DESCENDING LEVELS OF THE ACTUAL STRUCTURE
Level 4, P = 13.189 x 390.43 = 5150 lb.
Level 3, P^ = 13.189 x 304.25 = 4013 lb.
Level 2, P^ = 13.189 x 263.75 = 3479 lb.
Level 1 P^ = 3479 lb.
CUMULATIVE FORCES AT DESCENDING LEVELS OF THE ACTUAL STRUCTURE
Level 3, P, + P^ = 5150 + 4013 = 9163 lb.4 J
Level 2, P, + P^ + P^ = 9163 + 3479 = 12642 lb.'432Level 1 P, + P, + P, + P = 12642 + 3479 = 16121 lb.
' 4 3 2 1
LOAD RATIOS
16121 12642 _ 9163 _ -,
^- ^150 ^^-^^'^ 2. -^= 2.4547 3. -^- 1.7793
PLANE 3
Load Factored CumulativeLTOT Readings (in) Differences (in) P.atio A (in) A (in)
s s
6g = 0.110 = A^ - = 0.044 3.1304 0.1377 0.1377 - A^^^
£^Q= 0.062 = - = 0.048 2.4547 0.1178 0.2555 - A^^
6^^= 0.049 - A2 A^ - A^ = 0.057 1.7793 0.1014 0.3569 - A^^
6= 0.005 = A,36 1
DRIFT = A^^ = 0.3569 in.
A/h = 0.3569/130 = 1/364
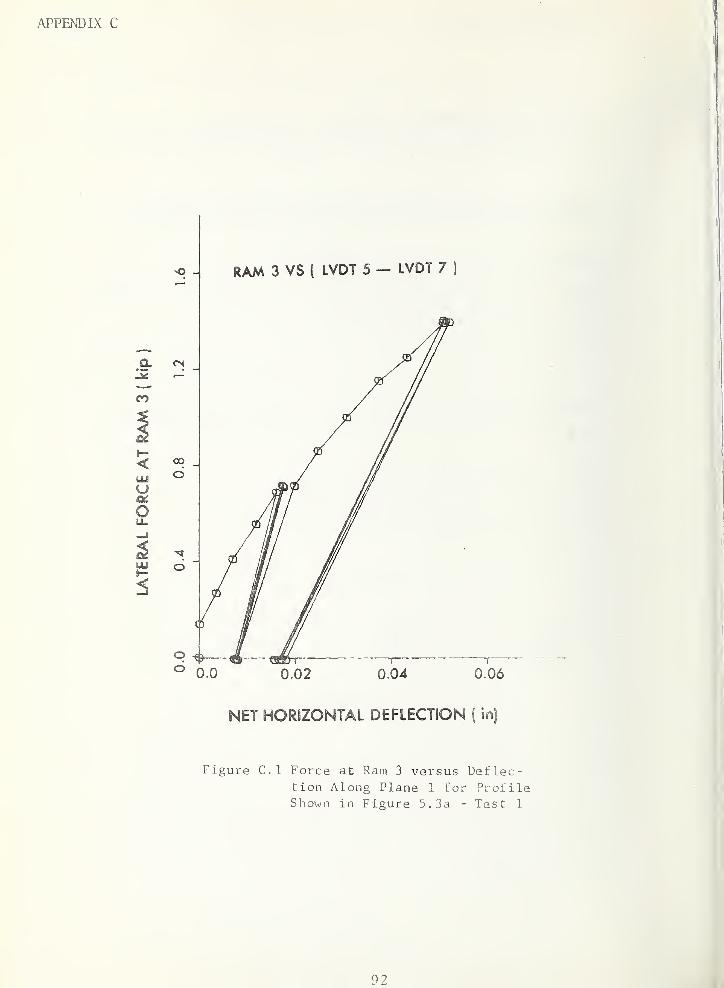
APPENDIX C
RAM 3 VS ( LVDT 5 - LVDT 7 )
Q. CN
CO
U
uu
0.02 0.04
NET HORIZONTAL DEFLECTION ( in)
Figure C.l Force at Ram 3 versus Deflec-tion Along Plane 1 for ProfileShown in Figure 5.3a - Test 1
92
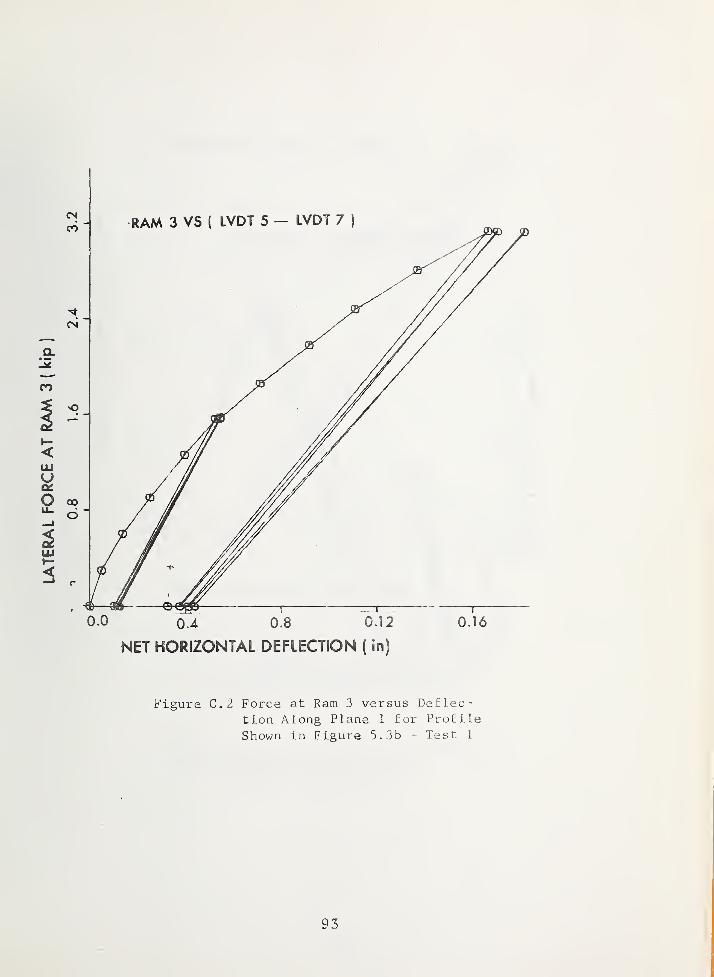
NET HORIZONTAL DEFLECTION ( in)
Figure C.2 Force at Ram 3 versus Deflec-tion Along Plane 1 for Profile
Shown in Figure 5.3b - Test 1
93
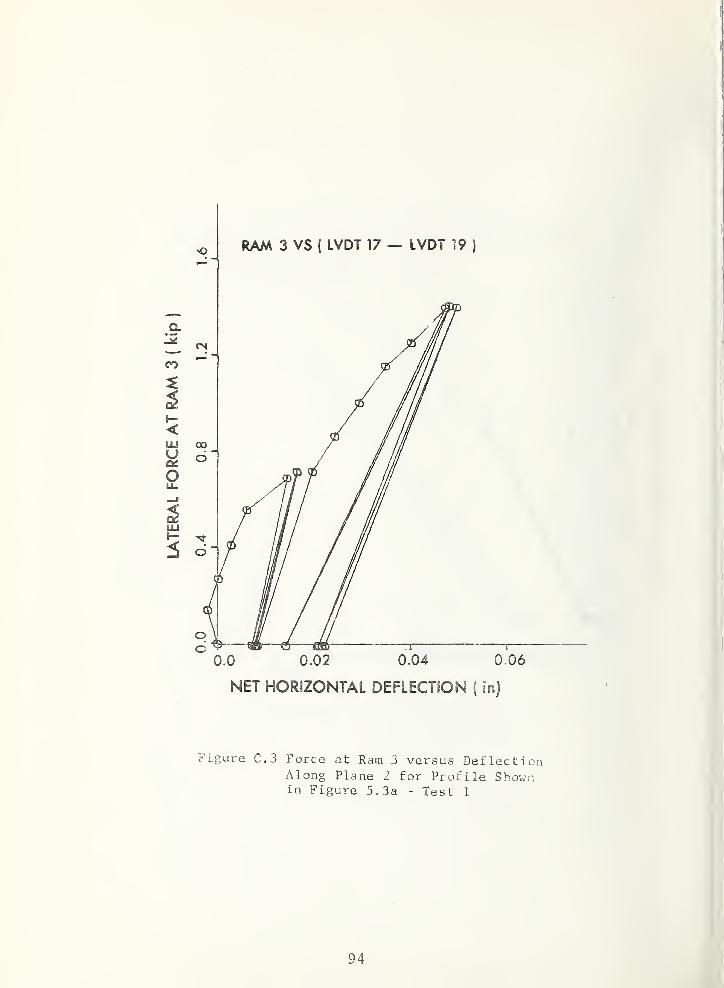
RAM 3 VS { LVDT 17 — LVDT 19)
0.06
NET HORIZONTAL DEFLECTiON(in)
Figure C.3 Force at Ram 3 versus DeflectionAlong Plane 2 for Profile Shownin Figure 5.3a - Test 1
94
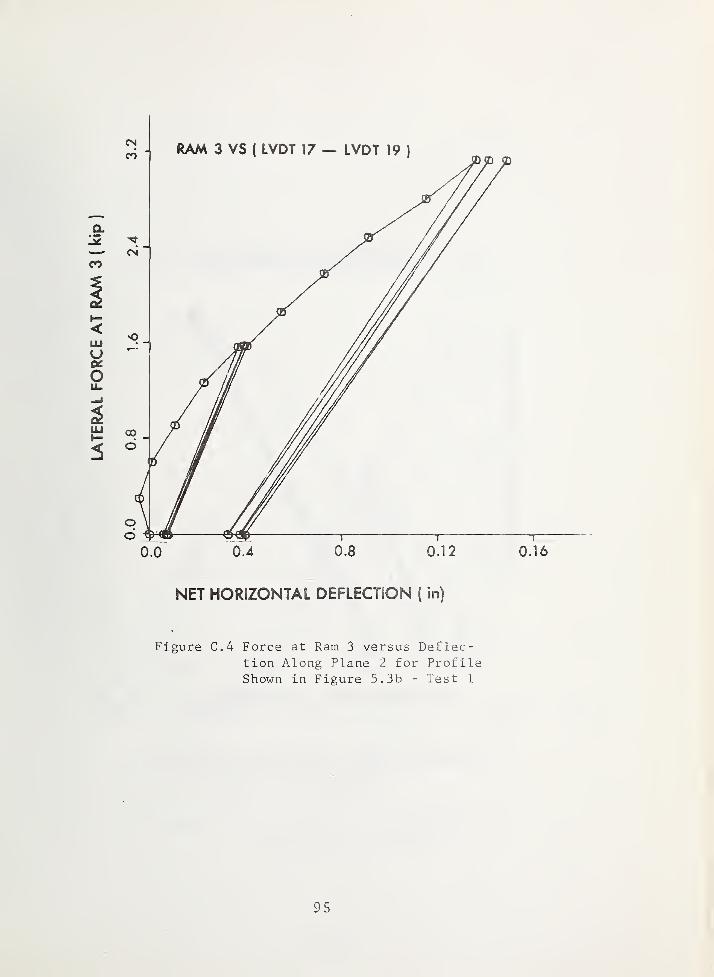
NET HORIZONTAL DEFLECTSON ( in)
Figure C.4 Force at Ram 3 versus Deflec-tion Along Plane 2 for ProfileShown in Figure 5.3b - Test 1
95
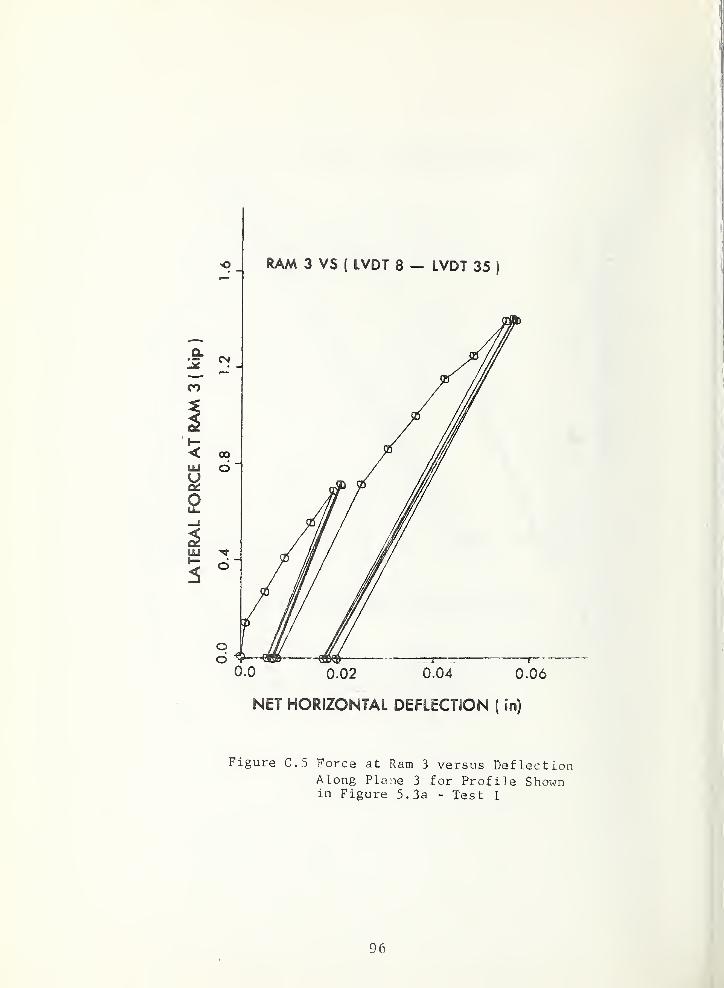
RAM 3 VS ( LVDT 8 — LVDT 35)
NET HORIZONTAL DEFLECTSON(in)
Figure C.5 Force at Ram 3 versus DeflectionAlong Plane 3 for Profile Shownin Figure 5. 3a - Test 1
96
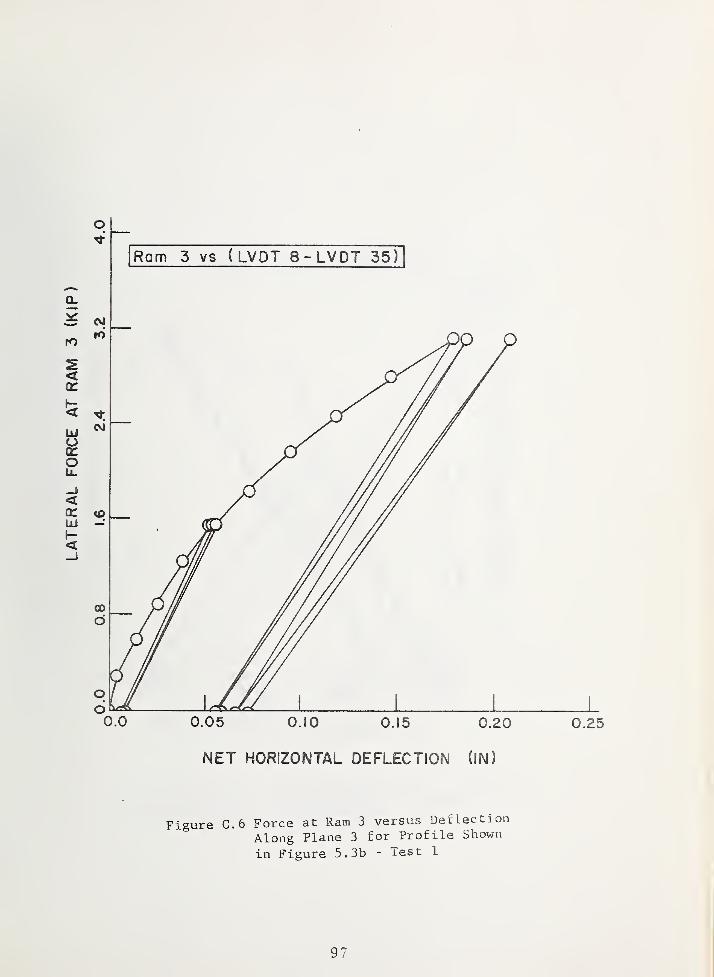
NET HORIZONTAL DEFLECTION (iN)
Figure C.6 Force at Ram 3 versus Deflection
Along Plane 3 for Profile Shown
in Figure 5.3b - Test 1
I
97
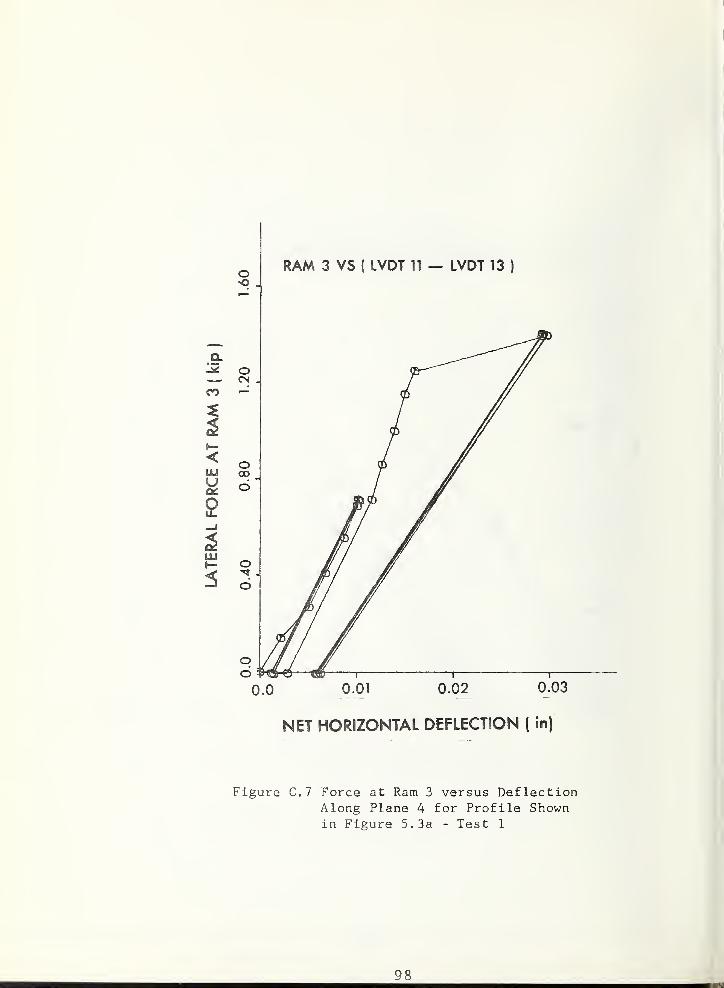
o RAM 3 VS ( LVDT 11 — LVDT 13)
0.0 0.01 0.02 0.03
NET HORIZONTAL DEFLECTION ( in)
Figure C.7 Force at Ram 3 versus DeflectionAlong Plane 4 for Profile Shownin Figure 5.3a - Test 1
98
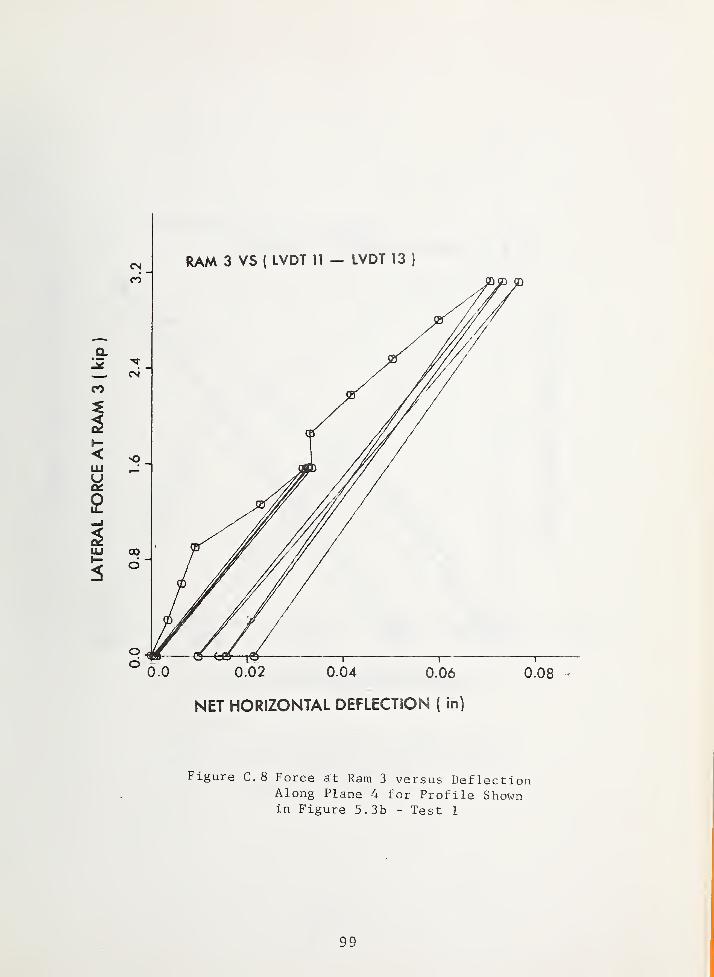
0.02 0.04 0.06
NET HORIZONTAL DEFLECTION (in)
0.08
Figure C. 8 Force at Ram 3 versus DeflectionAlong Plane 4 for Profile Shownin Figure 5.3b - Test 1
99

RAM 3 VS( LVDT 14 — LVDT 16
)
0.0 0.02 0.04 0.06 0.08
NET HORIZONTAL DEFLECTION ( in)
Figure C.9 Force at Ram 3 versus DeflectionAlong Plane 5 for Profile Shown
in Figure 5.3a - Test 1
100
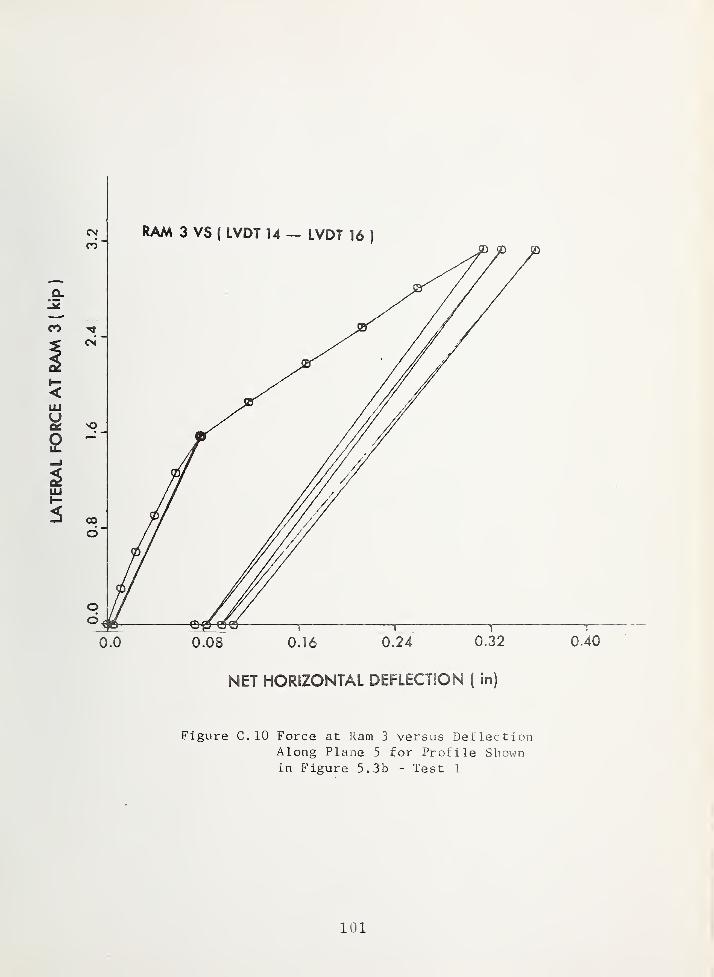
Figure C. 10 Force at Ram 3 versus DeflectionAlong Plane 5 for Profile Shownin Figure 5.3b - Test 1
101