Polystyrenes - Govinfo.gov
92
REFERENCE NBS PUBLICATIONS AlllDB MaM63b NAFL INST OF STANDARDS & jECH R. .0. A1 11 02484836 _ ?ar«.'s'm»c*.'SSirpu»- 5-3277 Polystyrenes: A Review of the Literature on the Products of Thermal Decomposition and Toxicity Joshua L. Gurman Laura Baler Barbara C. Levin March 1986 Sponsored in part by: U.S. Consumer Product Safety Commission Bethesda, MD 20207 ~QC 100 .056 85-5277 1986
-
Upload
khangminh22 -
Category
Documents
-
view
4 -
download
0
Transcript of Polystyrenes - Govinfo.gov
REFERENCENBS
PUBLICATIONSAlllDB MaM63b
NAFL INST OF STANDARDS & jECH R. .0.
A1 11 02484836 _?ar«.'s'm»c*.'SSirpu»- 5-3277
Polystyrenes: A Review of the Literature
on the Products of Thermal Decompositionand Toxicity
Joshua L. GurmanLaura Baler
Barbara C. Levin
March 1986
Sponsored in part by:
U.S. Consumer Product Safety CommissionBethesda, MD 20207
~QC
100
.056
85-5277
1986

tras
RES2AECH IITFOUMATIONCENTER
NBSIR 85-3277
POLYSTYRENES: A REVIEW OF THE LITERATUREON THE PRODUCTS OF THERMAL DECOMPOSITIONAND TOXICITY
^
Joshua L. GurmanLaura Baler
Barbara C. Levin
March 1 986
Sponsored in part by:
U.S. Consumer Product Safety CommissionBethesda, MD 20207
U.S. DEPARTMENT OF COMMERCE, Malcolm Baldrige, Secretary
NATIONAL BUREAU OF STANDARDS. Ernest Ambler, Director

Table of ContentsPage
List of Tables iv
List of Figures vi
Abstract 1
1. Introduction 2
2. Chemistry 3
2.1 Polymerization 3
2.2 Thermal Decomposition Processes 4
2.3 Thermal Degradation Products 4
2.3.1 Vacuum Degradation 6
2.3.2 Degradation in Inert Atmospheres 6
2.3.4 Summary on Thermal Degradation Products 17
3. Toxicity of Thermal Decomposition Products 17
3.1 The Cup Furnace 19
3.1.1 Dow Chemical Company Test Method 19
3.1.2 The National Bureau of Standards Toxicity Test Method . 21
3.1.3 The University of Utah Test Method 23
3.2 Tube Furnace Combustion Systems 24
3.2.1 DIN 53436 Toxicity Test Protocol 24
3.2.2 FAA/CAMI Toxicity Protocol 29
3.2.3 NASA/USF Toxicity Protocol 30
3.2.4 Japanese Toxicity Test Protocols 34
3.3 Combustion Ovens 39
3.3.1 University of Pittsburgh Toxicity Protocol 39
3.3.2 Harvard Medical School Toxicity Test Method 43
3.3.3 General Electric/Southern Research Institute TestMethod 45
3.3.4 University of Michigan Toxicity Protocol 47
4.0 Conclusions 49
5.0 Acknowledgements 50
References 52
iii

List of Tables
Page
Table 1. Volatile Combustion Products of Polystyrenes Under VaryingExperimental Conditions 58
Table 2. Flash Pyrolysis of Polystyrene at Different Temperatures inNitrogen Atmospheres 61
Table 3. The Low-Boiling Point Volatile Products from Radiant Pyrolysisof a Polystyrene in Nitrogen or Air Atmosphere 62
Table A. Styrene Evolution During Thermal Decomposition ofPolystyrenes 63
Table 5. Summary of Toxicity Protocols 64
Table 6. Results from the Dow Chemical Co. Test 65
Table 7 . Results from the NBS Test 66
Table 8. Results from the University of Utah Test 67
Table 9. Results from the DIN 53436 Test 68
Table 10. Concentration-Response Data from a Polystyrene Decomposedvia the NASA/USF Toxicity Test Method 69
Table 11. Toxicity of Pyrolysis Gases from a Polystyrene Rigid FoamInsulation Decomposed Under the NASA/USF Toxicity TestMethod 70
Table 12. Toxicity of Pyrolysis Gases from a Polystyrene Foam DecomposedUnder the NASA/USF Toxicity Test Method 71
Table 13. Relative Toxicological Comparisons of a Polystyrene Foamand Other Materials in the Test of Kishitani and Yusa .... 72
Table 14. Results from the Nishimaru Test 73
Table 15. Comparison of Various Materials Under the Nishimaru Test ... 74
Table 16. Toxicological Evaluation of GM 47 and GM 49 Polystyrene FoamsUnder the University of Pittsburgh Toxicity Test method ... 75
Table 17. Results from Polystyrene Television Cabinets Tested Under theHarvard Medical School Tests 76
Table 18. Analysis of Gases in the Animal Chamber from ThermalDecomposition of Polystyrene in the Harvard MedicalSchool Test 77
iv
List of Tables (continued)
Page
Table 19. Amount of Material Necessary to Produce Mortality in 50% of theRats Under the GE/SRI Test 78
Table 20. Results from the University of Michigan Test 79
V
List of Figures
Figure 1. Structure of Styrene and Polystyrene
Page
80
Vi
POLYSTYRENES: A REVIEW OF THE LITERATURE ON THEPRODUCTS OF THERMAL DECOMPOSITION AND TOXICITY
By
Joshua L. Gurman , Laura Baier and Barbara C. Levin
Abstract
The current English literature through 1984 on the productsof pyrolysis and combustion from polystyrenes and the toxicity of
those products is reviewed. Among 57 compounds detected bychemical analyses of the thermal decomposition products producedunder various atmospheric conditions (vacuum, inert, andoxidative), the main volatile component is the styrene monomer.Evidence is provided that the mass fraction of styrene increaseswith furnace temperatures at least through 500°C. At 800“C andabove, the concentration of styrene decreases. In oxidativeatmospheres, carbon monoxide (CO), carbon dioxide (COj) andoxidative hydrocarbons are formed. The concentrations of CO andCOo are a function of temperature and combustion conditions, i.e.,
greater amounts are produced in the flaming than in the non- flamingmode. Eleven different test procedures were used to evaluate thetoxicity of the pyrolysis and combustion atmospheres of
polystyrenes. The more toxic environments produced under flamingconditions appear to be mainly attributable to CO and COj.Incapacitating effects observed during exposures to non-flamingeffluents are not due to CO and COj but rather to some othertoxicant, probably the styrene monomer. When compared to othercommon materials used in buildings and residences, polystyrenes, in
general, are among the least toxic.
Keywords: Combustion products; fire data; literature reviews; polystyrene;pyrolysis products; test methods; toxicity.
NBS Research Associate, American Iron and Steel Institute
NBS Guest Worker, University of Pittsburgh Graduate School of PublicHealth
1
1. Introduction
Polystyrenes, which constitute one of the major classes of synthetic
polymers in use today, have a variety of applications, ranging from food and
medical packaging to home insulation. They have also been commonly used to
simulate wood for decorative purposes. Polystyrene is a generic term, which
denotes a nximber of forms, e.g., crystal, impact or expandable. Improvements
designed to enhance the physical properties of this class of polymers have been
in the areas of impact resistance, gloss levels, resistance to stress-cracking
by fats and oils, flame resistance and purity. These improvements in material
characteristics and the ease with which polystyrenes are processed have made
commercial use of this synthetic material economically favorable [1,2]^.
Enhancing the physical properties of polystyrenes has not been the only
concern facing manufacturers and consumers. For many years researchers have
investigated the effects of heating polystyrenes under various conditions [3].
The nature of the gaseous products produced when polystyrenes degrade during
industrial processing and in fire situations and the toxicity of these gases
have been a primary focus of many research studies. In this report, the
English literature published through 1984 on the volatile pyrolysis and
combustion products of polystyrene and the toxicity of these products is
reviewed.
^ Numbers in brackets refer to the literature references listed at the
end of this report.
2
2. Chemistry
2.1 Polymerization
Polystyrenes are amorphous, high molecular weight linear polymers.
Unless modified with special additives, they are constituted of covalently
bound units of the styrene monomer, which is composed solely of carbon and
hydrogen and contains a benzene ring in its structure (Fig. 1) [2,4].
Not all forms of polystyrenes, however, are simply homogeneous polymers
of the styrene monomer. In order to enhance its physical properties, specific
additives are incorporated into the polymer. For example, commercial impact
polystyrenes have an elastomer, generally polybutadiene, incorporated as a
block copolymer into the matrices in order to strengthen their mechanical
properties [1,5]. Expandable polystyrene beads or foams may contain 3-7% of a
volatile blowing agent (e.g., pentane) which is used in processing this
product. Fire resistant polystyrenes usually contain halogenated additives
and antimony oxide which are incorporated during polymerization [1,5].
The polymerization of the styrene monomer is a thermodynamically favored
reaction [2]. Most styrene-containing plastics are polymerized by a free
radical mechanism, where polymerization of the styrene monomer is initiated
either thermally or through the use of catalysts.
3
2.2 Thermal Decomposition Processes
The thermal degradation of various polystyrenes has been studied under a
wide range of temperatures. The temperatures quoted are those of the furnace
or heating device and not necessarily the temperature of the polystyrenes being
heated. In most cases, the temperature of the furnace increases faster than
that of the material studied. The evolved products may or may not be directly
related to the furnace temperature depending on the apparatus design.
Michal [6] studied the thermooxidative degradation of a polystyrene
(standard polystyrene, Krasten 127) between 400 and 800°C. Parikh [7]
calculated from his studies that no degradation of a pure polystyrene would
occur below 227°C, while 100 percent would decompose at 332“C when the material
was exposed for 2 hours. The mean temperature at which a sample of polystyrene
(GM51 [8]) spontaneously ignites was found by three laboratories who partici-
pated in an interlaboratory evaluation of the National Bureau of Standards
(NBS) Toxicity Test Method to be 520 + 62°C [9].
While still not completely understood, the mechanism of the thermal
degradation of polystyrenes is considered to be a radical chain reaction [10].
This process is essentially a reverse of the polymerization process.
2.3 Thermal Degradation Products
Thermal decomposition of polystyrenes has been conducted under a variety
of different atmospheric conditions, e.g., vacuum, inert and oxidative. It is
4
generally agreed that the major volatile component produced from the thermal
degradation of polystyrenes under these atmospheres is the styrene monomer
[3,11-19,21-23]. Other commonly detected products are oligomers of styrene,
such as the dimer and trimer [13,15-17,19,20], toluene, benzene, ethylbenzene
and a-methylstyrene and, under oxidative conditions, species such as
benzaldehyde and benzoic acid [11-19]. Butadiene has also been identified as a
degradation product of polystyrenes containing polybutadiene [18,21]. A
summary list of the identified degradation products is provided in table 1.
Many problems were encountered in the evaluation of the literature on
polystyrenes. First, a large variety of experimental systems and conditions
has been used to degrade polystyrenes. Second, many types of polystyrenes,
with and without additives, have been studied without adequate specification of
the formulations. Third, tests have been run at temperatures ranging from
those used for industrial processing (150 to 320°C) [17,22] to those used to
simulate fire scenarios (as high as 1200°C) [3]. The following sections will
discuss the thermal degradation products that have been detected and identified
when polystyrenes have been decomposed under the three different atmospheric
environments: vacuum, inert, and oxidative.^
^ Examination of materials under oxygen-free conditions does not simulatereal fire situations. However, such studies provide information on the genera-tion of thermal decomposition products under controlled experimental conditionsand possible effects of vitiated atmospheres which are common in fires. In
actuality, many of the products produced under inert atmospheres were alsodetected in oxidative environments.
5
2.3.1 Vacuum Degradation
Straus and Madorsky [23] studied the decomposition of specially prepared
laboratory samples of polystyrene under vacuum. These samples were either
heated for 30 minutes at AOO and SOO^C, or for five minutes at 800 and 1200®C
in a platinum tube surrounded by a preheated moveable furnace. Ninety-eight
percent or greater volatilization of the samples occurred regardless of the
temperature. Using mass spectrometry, they identified styrene as the major
decomposition product, but noted that the fractional percent yield varied with
temperature. An average of 48.3 and 53.9 weight percent of the total volatiles
was styrene at 400 and 500°C, respectively, whereas, at 800 and 1200°C, an
average of 47.5 and 41.6 weight percent of the total volatiles was styrene.
Straus and Madorsky noted an increased fragmentation of the degradation
products at 800 and 1200°C over that found at 400 and 500°C; this was probably
due to secondary decomposition of the initial decomposition products. In other
words, greater amounts of low molecular weight hydrocarbons (C 3 and below) and
benzene were observed at the higher temperatures.
2.3.2 Degradation in Inert Atmospheres
The thermal degradation of polystyrenes under inert atmospheres has been
examined by a number of investigators [3,11-13,15-21,23-25,27]. VThile nitrogen
(Nj) was the gas most widely used to study polystyrene degradation under inert
conditions [11,15,17-21,24,25], helium (He) and argon (Ar) atmospheres were
also used [3,12,13,16,23,27]. Different degradation systems as well as a
variety of analytical techniques were employed; for example, pyrolysis-gas
6
chromatography (pyrolysis-GC) , thermogravimetric analysis-gas chromatography
(TGA-GC), gas chromatography-mass spectrometry (GC-MS), and thermogravimetric
analysis-gas chromatography-high resolution mass spectrometry ( TGA-GC-HEMS )
.
Many researchers have concentrated their efforts on measuring the styrene
monomer even though many other gaseous components have also been detected and
identified (Table 1).
Using pyrolysis-GC, Knight [11] investigated the influence of varying
both sample size and pyrolysis temperature on the decomposition of a laboratory
polymerized polystyrene. It is important to note that the flash pyrolysis of
the ultrathin, low mass samples needed for pyrolysis-GC may not be totally
indicative of the decomposition of larger mass samples. (This comparison is
discussed later and shown in table 4.) These studies by Knight, plus others
using this technique [12,18,20], were designed as an initial attempt to
determine the primary products and mechanism(s) of decomposition. Knight
determined from the flash pyrolysis of 1 to 5 yg samples at 550, 600, 650, and
700°C under a Nj flow rate of .030 2,/min, that styrene was the major
decomposition product and that the styrene yield increased with increasing
temperature (Table 2). Results from studies on 1 to 3 mg samples were
compared to those with the 1 to 5 yg samples and demonstrated that at 700 °C,
the smaller sample size produced a larger percent of styrene (Table 2).
Fuchs and Szepesy [12] also used pyrolysis-GC to examine the thermal
decomposition products from various polymers, including several different
polystyrenes. These polystyrene samples (0.1 mg) were initially dissolved in
benzene which was evaporated before the sample was subjected to flash pyrolysis
7
in an argon atmosphere (flow rate; 25 m2./min) for 0-15 seconds. The resulting
pyrograms contained four major peaks which were identified as styrene, toluene,
benzene and other light hydrocarbons. Styrene was the primary thermal decompo-
sition product, constituting 97.3 percent of the total peak areas. Fuchs and
Szepesy concluded from their study that only the styrene concentration could be
accurately determined since the relative peak areas of the other pyrolysis
products were not consistent or totally reproducible.
Two different samples of polystyrenes (Krasten 127, a standard poly-
styrene, and Krasten 336, a polystyrene with an unspecified percent of
polybutadiene) were degraded in a nitrogen atmosphere (flow rate of 0.25
mH/min) at 510°C by Pacakova et al. [18]. Pyrolysis-GC was used for the
degradation and analysis of products in this study. Monomeric styrene
comprised 73.5 and 79.1 percent of the total volatiles produced from the
polystyrenes with and without polybutadiene, respectively. Butadiene monomers
and dimers, as well as vinyl-cyclohexene were also found in the degradation
gases of the polybutadiene-containing polystyrene samples. A number of other
saturated and unsaturated hydrocarbons were also detected.
Trojer [20] also used pyrolysis-GC to examine the decomposition products
and the evolution of hydrogen from a special laboratory formulated polystyrene.
The polystyrene samples were pyrolyzed under nitrogen atmospheres at
temperatures which ranged from 510 to 980°C. The hydrogen yield was observed
to increase with increasing temperature and pyrolysis time. The values ranged
from 0.8 to 26 percent.
8
A number of other investigations of the thermal decomposition of polysty-
renes in inert atmospheres were performed under more realistic degradation
conditions, i.e., at slower pyrolysis rates and using larger masses. These
studies are described below.
The research efforts of Bouster et al. [16] concentrated on the kinetics
of decomposition of a commercial, expanded polystyrene sample. A qualitative
identification of the thermal degradation products was made when this poly-
styrene was degraded in helium at temperatures ranging from 300 to 370°C.
Styrene, toluene, ethylbenzene, and a-methylstyrene were identified. Similar
to the results of Knight, an increase in styrene evolution with an increase in
temperature was noted.
A combustion system composed of a Pyrex^ tube with a movable furnace was
used by Hoff et al. [17]. This apparatus permitted the degradation of small
samples and the maintenance of a continuous flow of gas through the furnace.
Two commercial polystyrenes and two impact polystyrenes in pellet form
(additives unknown) were thermally degraded at temperatures within the
industrial processing range (240-260°C) in nitrogen at flow rates of 20 to 30
m2-/min. At these temperatures, only about 0.2 to 1.2% of the total sample mass
was actually degraded. The gaseous products were analyzed by GC-MS. Styrene
was identified as the main volatile product. The yields of styrene were 9.1
-’Certain commercial equipment, instruments, or materials are identified in
this paper in order to adequately specify the experimental procedure. In nocase does such identification imply recommendation or endorsement by theNational Bureau of Standards, nor does it imply that the equipment or materialidentified is necessarily the best available for the purpose.
9
and 13 percent by weight of the conmercial polystyrene samples volatilized and
3.1 and 3.3 percent by weight of the impact polystyrene volatilized.
Brauman [15] heated 50 mg samples of a polystyrene at 350 and 450®C in a
tube furnace under a dried nitrogen flow of 75 cc/min. Using GC analysis, she
found that 18 to 19% of the total mass volatilized at 350°C was styrene,
whereas, at A50°C, styrene constituted 50 to 51% of the total mass volatilized.
A 700 mg sample degraded at 350°C produced approximately 37 percent monomeric
styrene; thus, at the same temperature, an increase in sample size resulted in
an increase in the percent monomer production. Although this result disagrees
with that obtained by Knight [11] who found that increasing the sample size
decreased the yield of styrene, this difference may be related to the different
decomposition conditions, namely, flash pyrolysis vs. a slower thermal degrada-
tion method.
To determine the extent to which the addition of a fire retardant would
affect volatiles generated, Brauman [15] analyzed the products from 700 mg
samples of a polystyrene with and without antimony trioxide and a chlorinated
wax. When the fire retarded polystyrene was heated at 350°C in nitrogen, the
organic volatiles contained 1.5 percent monomeric styrene, whereas the non-fire
retarded polystyrene sample produced 37 percent. In a similar fashion, an
overall reduction of other volatile organics (benzene, toluene, and
ethylbenzene) was observed for the fire retarded polystyrene sample. In
contrast, the total tar content from the fire retarded s£imple was approximately
5 times greater than that from the non-fire retarded polystyrene.
10
Using a radiant heating system in order to achieve a linear rate of
degradation of a long polystyrene rod, Brauman et al. [19] examined the
pyrolysis products of this rod decomposed under a controlled nitrogen flow of
15 8,/min and a flux level of 56 kW/m^. Low boiling point volatiles were
analyzed by GC. Once again, styrene was found to be the major product,
comprising 33.2 + 3.1% of the total volatiles recovered (Table 3).
A decrease in styrene yield with an increase in temperature was found by
Straus and Madorsky [23] when a thermally prepared polystyrene was decomposed
in a helium atmosphere. This result appears to disagree with those of Knight
[11] and Booster et al. [16], as discussed previously. However, the highest
temperatures examined in either of these investigations was 700°C, whereas
Straus and Madorsky used temperatures as high as 1200°C. In the work by Straus
and Madorsky, polystyrene samples, ranging in mass from 13.4 to 20.4 mg, were
heated either for 30 minutes at 500°C or for five minutes at 800°C or 1200°C.
Ninety-five percent or greater volatilization of the sample occurred at all
temperatures. With MS, an average of 50.9 weight percent of the total
volatiles was detected as the styrene monomer at 500°C, while only an average
of 10.7 and 0.6 weight percent styrene monomer was detected at 800 and 1200“C,
respectively. As previously mentioned, under vacuum pyrolysis, Straus and
Madorsky detected an average of 53.9, 47.5 and 41.6 weight percent styrene at
500, 800 and 1200°C, respectively. Straus and Madorsky attributed this
finding to a greater degree of fragmentation of the polystyrene decomposition
products which occur at high temperatures in a helium atmosphere.
11
Chang and Mead [13] did an extensive high-resolution mass spectrometry
study designed to analyze and identify the products of thermal decomposition
produced from a polystyrene foam degraded in an inert atmosphere. The authors
heated 3 mg samples of the polystyrene foam, in helium, starting at 200°C and
increasing the temperature at a rate of 15°C/min up to 500°C. In addition to
the decomposition products identified and listed in table 1, the authors
detected several aromatic and aliphatic components which they were unable to
identify. Although Chang and Mead conducted their experiments in an inert
environment, three gaseous compounds containing oxygen were detected: CO 2 ,
CgHgO, and CgHgO. The authors concluded that these compounds may have resulted
from oxygen leakage into the degradation or analysis systems or from oxygen
that was trapped or adsorbed in the polystyrene foam during processing.
Morikawa [25] investigated the effect of water vapor on the thermal
decomposition of a polystyrene in an inert atmosphere. In particular, he was
concerned whether CO could be produced from the reaction of the water vapor
with the polystyrene. Polystyrene samples of 0.5 g were heated in a tube
furnace at temperatures ranging from 600 to 1000°C. Morikawa, using GC
analysis, detected small amounts of CO when polystyrene was decomposed at
1000°C in the presence of water vapor. He hypothesized that CO evolution from
the polystyrene in an inert atmosphere containing water vapor probably occurred
as a result of one of the following two reactions:
(1) C + HjO > CO + H 2
12
(2) Cj^H2n+2 + m'HjO --> C„jH2ni+2 m'CO + 2m'H2
where m + m' = n.
2.3.3 Thermal Decomposition in an Oxidative Environment
Many investigators [6,17,19,22,25,28,29,30] studied the thermal
decomposition of polystyrene in air or other oxidative atmospheres. These
studies have been conducted in a variety of combustion systems, e.g., tube
furnaces, crucible furnaces and radiant furnaces. Although most of the studies
were very methodically performed, it is difficult to compare the results
because each investigator attempted to model what he believed to be the most
relevant combustion scenario and thermooxidative decomposition encompasses
everything from simple oxidative pyrolysis to fully involved flaming
combustion. Since polystyrene contains no oxygen in its molecular formulation,
it is only in oxidative degradation that one would expect to find appreciable
quantities of oxidized decomposition products, such as benzaldehyde, styrene
oxide, CO, and CO 2 .
Hoff et al. [17], Morikawa [25], and Morimoto et al. [28] used tube
furnaces to study the thermooxidative decomposition of polystyrenes. Hoff et
al., using temperatures within the industrial processing range, heated
pellet-shaped samples of two commercial polystyrenes and two impact poly-
styrenes (additives unknown) for ten minutes in a dry air flow of 0.025 to
0.030 2,/min. Using GC and GC/MS techniques, 21 volatile products were
identified from the degradation of the polystyrenes at 240 and 250°C. Twenty-
two compounds were detected and identified in the gaseous products of the
13
impact polystyrenes. Benzyl alcohol and cinnamaldehyde were identified as
decomposition products of the polystyrene but were not detected among the
decomposition products of impact polystyrenes. Methyl phenol, ethanol, and
acrolein were also detected among the volatiles produced by the impact poly-
styrenes, but were not found among the polystyrene degradation products.
The thermal degradation apparatus used by Pfaffli et al. [22] consisted
of a J-shaped glass tube inserted into a laboratory oven. Polystyrene samples
without additives were heated at 200, 350, and 500°C under a slight air flow
rate (0.7 2,/min). This experimental procedure was designed to simulate
industrial processing conditions. High pressure liquid chromatography (HPLC),
GC, GC-MS, and gas indicator tubes^ were used to identify the degradation
products. At 200 °C, trace amounts of styrene, ethylbenzene and cumene were
detected. Experiments conducted at 350 and 500°C produced about the same
amounts of styrene, but the concentrations of the aromatic and aliphatic
hydrocarbons and oxidized hydrocarbons were greater at 350“C than at 500°C.
Pfaffli et al. hypothesized that the reason for these results was that at the
higher temperature, a more rapid degradation and therefore, less effective
oxidation occurred. However, a greater amount of CO was evolved at 500 °C
(2.1%) than at 350 °C (0.4%). The authors concluded that the most important
thermal degradation products generated by this polystyrene from an industrial
hygiene point of view were the styrene monomer and oxidized aromatic compounds,
such as benzaldehyde, styrene oxide, acetophenone, and 1-phenylethanol.
^ The use of colorimetric tubes, such as Draeger tubes providesunreliable and, at best, semiquantitative results [69].
14
Morikawa [25] examined the effect of water vapor and air supply rate on
the evolution of CO. A 500 mg sample of a commercial polystyrene was heated at
600°C with air flow rates from 0.5 to 1.5 2,/min. At each air flow rate, tests
were run with or without water vapor. In all cases, the evolution of CO
increased as the water vapor supply rate increased.
Morimoto et al. [28] used a quartz degradation tube placed vertically in
an electric furnace rather than horizontally (as in the conventional tube
furnace). The main gaseous hydrocarbons produced from 0.1 g samples of a
polystyrene under flaming combustion at 700°C with an air flow rate of 0.83 or
1.8 2,/min were methane, ethylene and acetylene. These compounds were
identified by infrared spectrophotometry. The quantity of acetylene increased
with the increase in air flow rate. In other experiments, Morimoto et
al. showed that acetylene could be produced from the combustion of methane and
ethylene. Therefore, they hypothesized that the acetylene in these polystyrene
decomposition experiments was probably due to the further combustion of methane
and ethylene. Among the oxidative products, CO and COj were identified as
major gaseous components.
Using a crucible furnace in the bottom of a 4.2 liter combustion chcimber,
Michal [29] degraded 20 to 25 mg samples of a polystyrene foam (Krasten 336)
under a limited supply of oxygen. These experiments were designed to closely
simulate actual fire conditions in which the oxygen supply may become
depleted. Carbon monoxide, the main concern of the author in these studies,
was analyzed by GC. The average weight percent of CO, which evolved during the
vitiated flaming combustion of the polystyrene samples, was 9.86 + 4.40%. From
15
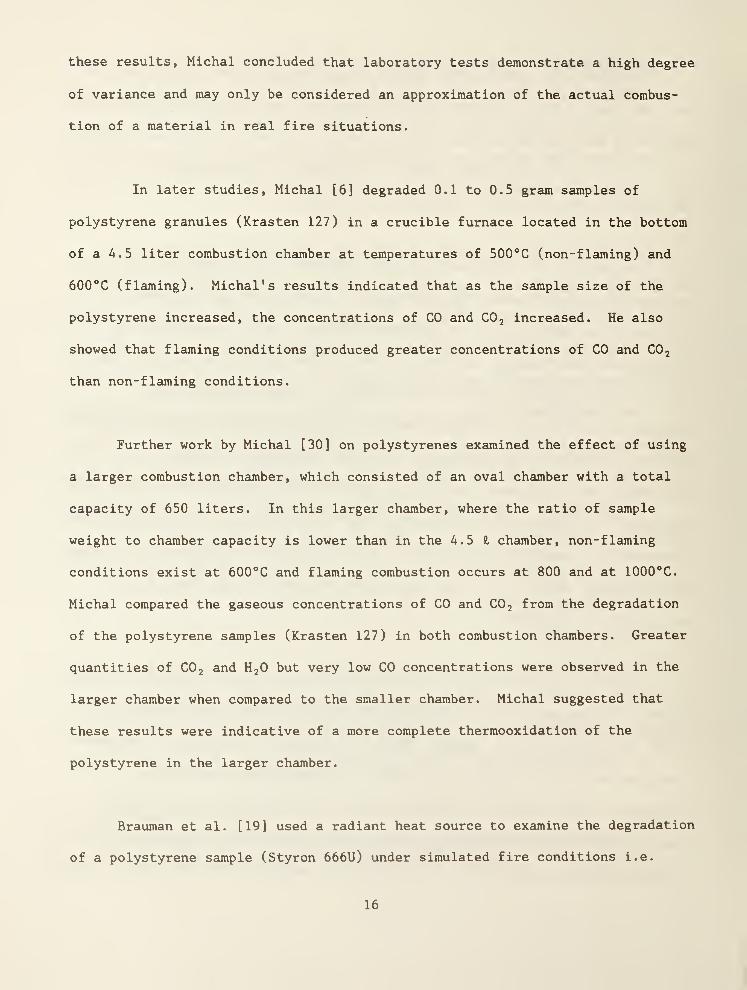
these results, Michal concluded that laboratory tests demonstrate a high degree
of variance and may only be considered an approximation of the actual combus-
tion of a material in real fire situations.
In later studies, Michal [6] degraded 0.1 to 0.5 gram samples of
polystyrene granules (Krasten 127) in a crucible furnace located in the bottom
of a 4.5 liter combustion chamber at temperatures of 500°C (non-flaming) and
600°C (flaming). Michal' s results indicated that as the sample size of the
polystyrene increased, the concentrations of CO and COj increased. He also
showed that flaming conditions produced greater concentrations of CO and COj
than non-flaming conditions.
Further work by Michal [30] on polystyrenes examined the effect of using
a larger combustion chamber, which consisted of an oval chamber with a total
capacity of 650 liters. In this larger chamber, where the ratio of sample
weight to chamber capacity is lower than in the 4.5 £. chamber, non-flaming
conditions exist at 600°C and flaming combustion occurs at 800 and at 1000°C.
Michal compared the gaseous concentrations of CO and COj from the degradation
of the polystyrene samples (Krasten 127) in both combustion chambers. Greater
quantities of COj and HjO but very low CO concentrations were observed in the
larger chamber when compared to the smaller chamber. Michal suggested that
these results were indicative of a more complete thermooxidation of the
polystyrene in the larger chamber.
Brauman et al. [19] used a radiant heat source to examine the degradation
of a polystyrene sample (Styron 666U) under simulated fire conditions i.e.
16
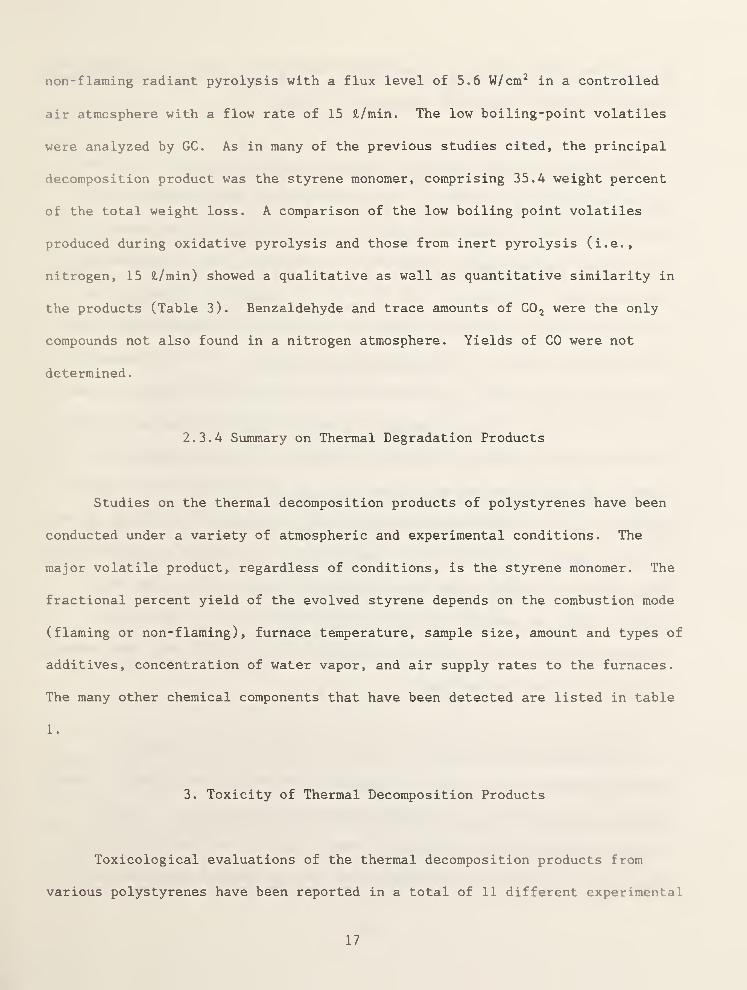
non-flaming radiant pyrolysis with a flux level of 5.6 W/cm^ in a controlled
air atmosphere with a flow rate of 15 2./min. The low boiling-point volatiles
were analyzed by GC. As in many of the previous studies cited, the principal
decomposition product was the styrene monomer, comprising 35.4 weight percent
of the total weight loss. A comparison of the low boiling point volatiles
produced during oxidative pyrolysis and those from inert pyrolysis (i.e.,
nitrogen, 15 2,/min) showed a qualitative as well as quantitative similarity in
the products (Table 3). Benzaldehyde and trace amounts of COj were the only
compounds not also found in a nitrogen atmosphere. Yields of CO were not
determined.
2.3.4 Summary on Thermal Degradation Products
Studies on the thermal decomposition products of polystyrenes have been
conducted under a variety of atmospheric and experimental conditions. The
major volatile product, regardless of conditions, is the styrene monomer. The
fractional percent yield of the evolved styrene depends on the combustion mode
(flaming or non-f Iciming) , furnace temperature, sample size, amount and types of
additives, concentration of water vapor, and air supply rates to the furnaces.
The many other chemical components that have been detected are listed in table
1 .
3. Toxicity of Thermal Decomposition Products
Toxicological evaluations of the thermal decomposition products from
various polystyrenes have been reported in a total of 11 different experimental
17
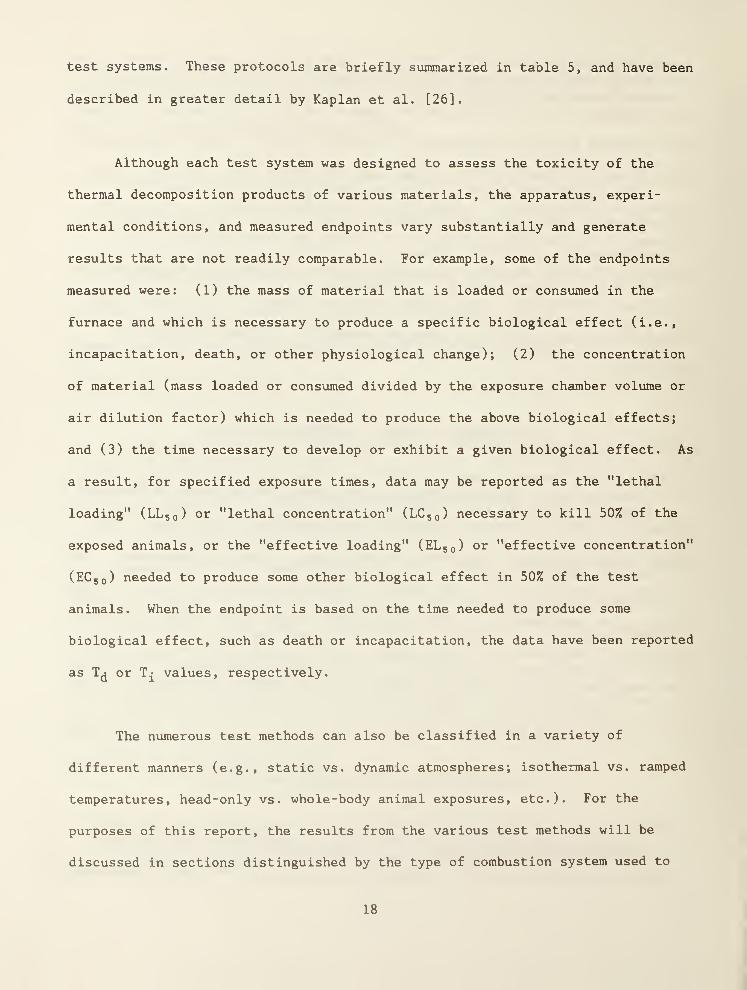
test systems. These protocols are briefly summarized in table 5, and have been
described in greater detail by Kaplan et al. [26].
Although each test system was designed to assess the toxicity of the
thermal decomposition products of various materials, the apparatus, experi-
mental conditions, and measured endpoints vary substantially and generate
results that are not readily comparable. For example, some of the endpoints
measured were: ( 1 ) the mass of material that is loaded or consumed in the
furnace and which is necessary to produce a specific biological effect (i.e.,
incapacitation, death, or other physiological change); ( 2 ) the concentration
of material (mass loaded or consumed divided by the exposure chamber volume or
air dilution factor) which is needed to produce the above biological effects;
and (3) the time necessary to develop or exhibit a given biological effect. As
a result, for specified exposure times, data may be reported as the "lethal
loading" (LL 50 ) or "lethal concentration" (LCgg) necessary to kill 50% of the
exposed animals, or the "effective loading" (EL 50 ) or "effective concentration"
(EC 50 ) needed to produce some other biological effect in 50% of the test
animals. When the endpoint is based on the time needed to produce some
biological effect, such as death or incapacitation, the data have been reported
as Tjj or values, respectively.
The numerous test methods can also be classified in a variety of
different manners (e.g., static vs. dynamic atmospheres; isothermal vs. rsimped
temperatures, head-only vs. whole-body animal exposures, etc.). For the
purposes of this report, the results from the various test methods will be
discussed in sections distinguished by the type of combustion system used to
18
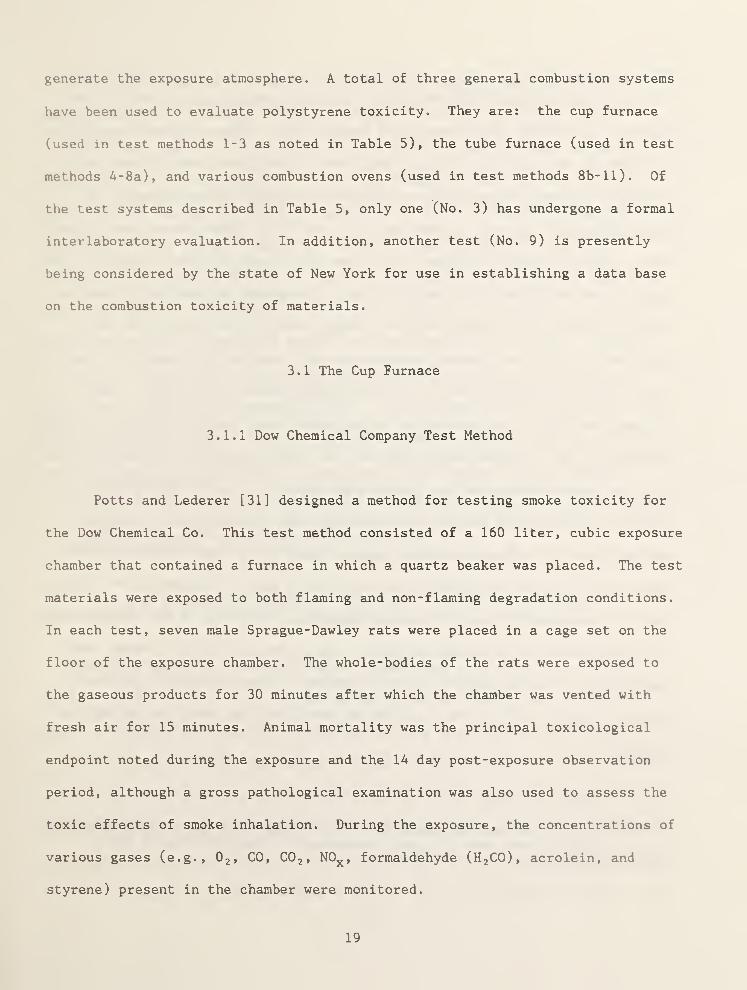
generate the exposure atmosphere. A total of three general combustion systems
have been used to evaluate polystyrene toxicity. They are: the cup furnace
(used in test methods 1-3 as noted in Table 5), the tube furnace (used in test
methods 4-8a), and various combustion ovens (used in test methods 8b-ll). Of
the test systems described in Table 5, only one (No. 3) has undergone a formal
inter laboratory evaluation. In addition, another test (No. 9) is presently
being considered by the state of New York for use in establishing a data base
on the combustion toxicity of materials.
3.1 The Cup Furnace
3.1.1 Dow Chemical Company Test Method
Potts and Lederer [31] designed a method for testing smoke toxicity for
the Dow Chemical Co. This test method consisted of a 160 liter, cubic exposure
chamber that contained a furnace in which a quartz beaker was placed. The test
materials were exposed to both flaming and non-flaming degradation conditions.
In each test, seven male Sprague-Dawley rats were placed in a cage set on the
floor of the exposure chamber. The whole-bodies of the rats were exposed to
the gaseous products for 30 minutes after which the chamber was vented with
fresh air for 15 minutes. Animal mortality was the principal toxicological
endpoint noted during the exposure and the lA day post-exposure observation
period, although a gross pathological examination was also used to assess the
toxic effects of smoke inhalation. During the exposure, the concentrations of
various gases (e.g., Oj, CO, COj, NO^^, formaldehyde (HjCO), acrolein, and
styrene) present in the chamber were monitored.
19
Potts and Lederer evaluated the toxicity of many synthetic and natural
materials, including polystyrenes and Douglas fir^. Three different samples of
polystyrenes were tested: (1) a polystyrene without additives (Styron 492U),
(2) a polystyrene with an additive designed to reduce flaming tendency and
decrease ease of ignition (Styron 6021.01), and (3) a polystyrene foam (Styro-
foam) . Table 6 lists the animal fatalities and levels of gases present in the
chamber when approximately 40 mg/ 2, of the polystyrenes or Douglas fir samples
were degraded in the flaming and non-flaming modes in this test. The data
presented by Potts and Lederer demonstrate that these polystyrenes were less
toxic than wood (Douglas fir) in the non-flaming mode in this test. Under
flaming conditions, the toxicities of the polystyrene samples and the wood were
comparable. Of the gases monitored, CO, COj, HjCO, acrolein, and styrene were
noted to evolve during the non-flaming degradation of Styron 492 and Styron
6021.01, while only CO and COj were detected from the Styrofoam. Flaming
degradation of all the polystyrene samples resulted in significantly greater
quantities of CO and COj than in the non-flaming mode. Low quantities of NOj^
were also produced during the flaming exposures, whereas HjCO was produced from
the polystyrenes in both modes except for Styrofoam in the non- flaming mode.
Degradation of Styron 6021.01, which contained a flame retardant, produced
greater amounts of CO in both combustion modes than the other two polystyrene
samples
.
^ Douglas fir data are shown to allow a comparison of relative toxicity
within a test system. Wood is not a substitute for polystyrene in most
commercial products.
20
All deaths from polystyrene occurred during exposure and only from the
flaming combustion products. Due to the high concentrations of CO (>2700
ppm), Potts and Lederer concluded that the dominant cause of death in the
flaming mode was CO intoxication. They also suggested that the low O 2 (<15%)
levels produced during the flaming combustion of Styron 492U and Styrofoam SM
contributed to the cause of the lethalities. Recent results by Levin et
al. [32] indicate that 4600 ppm of CO in air are necessary to produce death in
rats in 30 minutes. Examination of Potts and Lederer 's data show that only the
flaming Styron 6021.01 produced enough CO to account for the deaths. However,
other data by Levin et al. have shown that COj will potentiate the toxicity of
the CO, such that in the presence of 5% CO^ (50,000 ppm), the animals will die
from 2500 ppm of CO [32]. Thus, the data in table 6 indicate that the combina-
tion of CO and COj is sufficient to account for the deaths that occurred. A
pathological examination of animals exposed to the non-flaming gaseous products
of polystyrene showed no specific adverse effects.
3.1.2 The National Bureau of Standards Toxicity Test Method
The development and interlaboratory comparison of the National Bureau of
Standards (NBS) Toxicity Test Method was described by Levin et al. [9,33].
Natural and synthetic materials, including a rigid polystyrene foam (GM51),
were examined by different laboratories using the NBS protocol. This toxicity
test method consists of a combustion system, an animal exposure chamber, and a
chemical analytical system. Materials are thermally decomposed, at both non-
flaming and flaming temperatures, in a quartz beaker inserted into a cup
furnace located below a 2002. exposure chamber. All of the gaseous products are
21
circulated through analytical equipment, which continuously monitors CO, COj
and O 2 , and back to the exposure chamber. In each test, the heads of six rats
are exposed to the gaseous combustion products for 30 minutes, at which time
the surviving animals are withdrawn and held for lA days of observation. LC 50
values, based on deaths which occur during the 30 minute exposures plus the 14
day post-exposure period, are currently used as the biological endpoint for the
NBS protocol. However, incapacitation based on 30 minute EC 50 values and blood
carboxyhemoglobin (COHb) levels are also monitored and used to evaluate the
toxicity of a material.
The results for the toxicity of a polystyrene and Douglas fir obtained
from three of the laboratories who participated in the interlaboratory evalua-
tion of the NBS test method, are listed in table 7. As reported by Levin
et al. , the polystyrene tested appeared to be more toxic in the fl2iming mode
than in the non-flaming mode [9]. EC 50 and LC 50 values for the flaming mode
were less than those values for the non-flaming mode. The CO concentration for
flaming polystyrene combustion at the 30 minute LC 50 was much greater than that
for non- flaming conditions and, consequently, the percent COHb at the 30 minute
LC 50 value was much greater for the flaming mode (67-78%) than the non-flaming
mode (at the highest concentration tested, 50 mg/ 2., the COHb was 6%). Based
on pure CO- in-air studies at NBS, the concentration of CO in the flaming mode
was still too low to solely account for the deaths that occurred [9]. Since
CO 2 potentiates the toxic effect of CO, as mentioned earlier, the COj may have
played a role in these deaths. However, the COj concentrations were not
provided in reference 9.
22
3.1.3 The University of Utah Test Method
The NBS Test Method was based to a large extent upon the University of
Utah Test Method [26]. The main differences between the two test protocols are
as follows: (1) In the University of Utah test method, a polytetraf luoro-
ethylene (PTFE) covered aluminum cone is placed over the mouth of the cup
furnace in the belief that it will shield the animals from the generated
radiant heat and aid in the distribution and mixing of the combustion products;
(2) the University of Utah uses a 60 8, exposure chamber, not the 200 8, chamber
described in the NBS test method; (3) four rats are exposed in the head-only
mode instead of the six rats exposed in the NBS procedure; and (4) in the
University of Utah test method, all animal deaths that occur during the 30
minute exposures and the first thirty minutes following exposure are recorded
as within-exposure deaths. In the NBS protocol, any deaths occurring after the
thirty minute exposure were considered post-exposure deaths.
Farrar et al. [34], using the University of Utah test method, assessed
the toxicities of the combustion products from fifteen plastics and compared
the results to that of Douglas fir (used as a reference material in this test
method). Among these materials were three samples of polystyrene foam. Farrar
et al. reported that the toxicity of the polystyrene foams was very low for the
non-flaming mode of combustion. EC 50 and LC 50 (30 minutes plus 14 days)
values, percent COHb, and CO concentrations in both the non-flaming and flaming
modes for the tested polystyrene focims are presented in table 8 . Low CO levels
(<360 ppm) and low COHb levels (<7%) were observed in the non-flaming mode.
Farrar et al. stated that incapacitation under the non-flaming conditions could
23
not be attributed to CO, but may be due to the presence of styrene in the
exposure atmospheres.
The flaming combustion of polystyrene was shown to be more toxic than the
non-flaming mode. The flaming EC 50 and LC 50 values for the polystyrene
materials were comparable to those of Douglas fir. Higher CO and COHb levels
were observed for the flaming mode than for the non- flaming mode for both the
polystyrenes and the wood. Farrar et al. state that CO is probably the lethal
agent in the flaming combustion of the polystyrene foams since high COHb levels
(66-75%) were observed at death. However, work at NBS on CO in air has shown
that COHb levels exceeded 80% before deaths occurred from 30 minute exposures
to CO alone [32].
One of the polystyrene foam samples, GM49, contained a fire retardant.
Farrar et al. did not find any significant difference in the measured toxicity
parameters which could be attributed to the fire retardant.
3.2 Tube Furnace Combustion Systems
3.2.1 DIN 53A36 Toxicity Test Protocol
The DIN 53436 test method was developed in the Federal Republic of
Germany. In this system, a moving horizontal tube furnace thermally decomposes
the sample in a flowing air stream to provide a "steady-state" concentration of
combustion products. The combustion air stream is diluted with room air prior
to introduction into the animal exposure chamber. The diluted effluent is
24
drawn past the animals and exhausted from the exposure chamber. Materials,
thermally decomposed in this system, are toxicologically evaluated based on
either an equal specimen volume or an equal mass per unit length.
Hofmann and Oettel [35] evaluated the toxicity of a variety of synthetic
as well as natural products, including seven different cellular polystyrenes
(i.e., Styropors P, F200, F210, KR2180, KR2180/1, KR2180/2 and F220). In each
test, the noses of six rats were exposed to the thermal decomposition products
of the polystyrenes for a total of 30 minutes. In order to compare material
results, tests were conducted using either samples of equal mass (5 grams) or
equal volume (300 mm x 15 mm x 10 mm). Thermal decomposition of the samples
was conducted at several isothermal furnace temperatures, ranging in 100 degree
increments from 300 to 600°C. In these experiments, the furnace traveled at a
rate of 10 mm/min over the tube containing the sample, while an airflow of 100
2,/hr was directed counter- current to the motion of the furnace through the
tube. The decomposition gases were subsequently diluted with an additional
airflow of 100 2,/hr before entering the animal exposure chamber. Experimental
results for the various polystyrenes and pine wood, including average levels of
COHb developed in the blood of test animals, along with corresponding death
ratios, are presented in table 9. Experiments conducted with 5 gram scimples (a
nominal exposure concentration of 50 mg/2,) showed low COHb levels (<15%) in
animals exposed to the polystyrenes decomposed at or below 400°C. These
results would suggest that little if any CO was produced at these temperatures.
For Styropor P, little CO was observed even at temperatures of 500°C. Styropor
P did not ignite and undergo open burning until the samples were heated at
600°C. At this temperature, CO concentrations were reported to reach levels
25
ranging from 5,000 to 10,000 ppm. These exposures produced an average 92%
mortality. In general, for these polystyrenes, when ignition and open burning
did not occur, comparatively little CO was produced (<100 ppm) and all animals
survived. In those tests where the material ignited, high COHb levels (>70%)
were observed and animals died. At temperatures below the autoignition point
of the samples (<500°C), little CO (<100 ppm) was measured, COHb levels were
observed to be low (<15%), and no lethality was observed. At and above the
autoignition temperature (generally about 500°C for most of these polystyrene
samples), the specimens burned, large quantities of CO were produced (>2000
ppm), the COHb levels were greater than 70%, and deaths occurred.
For those experiments performed using equal volumes of test material
(i.e., 300 mm X 15 mm X 10 mm), autoignition of the polystyrene samples was not
observed below 600°C. Although greater quantities of CO were produced in the
flaming mode than in the non-flaming mode, COHb levels did not exceed 41% and
no mortalities were observed. This low toxicity was attributed to the small
polystyrene sample mass actually charged in the tube furnace (i.e., approxi-
mately 1 gram, resulting in nominal exposure concentrations ranging from 16 to
27.7 mg/t). Conclusions reached from these tests, run with samples of equal
volume were:
1. This size polystyrene samples did not ignite below 600°C.
2. COHb levels were elevated only after exposure to the flaming
combustion products, and
26
3. No mortalities were observed because of the low sample mass
concentration tested.
Hofmann and Sand [36] examined the toxicity of the thermal decomposition
products of a number of synthetic materials, including a rigid expanded and a
non-cellular polystyrene. The test conditions were similar to those previously
described by Hofmann and Oettel. The results found with the rigid expanded
polystyrene closely paralleled that previously reported by Hofmann and Oettel
for Styropor P. In addition, the atmospheres produced by both polystyrenes,
when decomposed under similar non-flaming conditions, at temperatures not
exceeding 500°C, caused no animal deaths and low COHb (<15%) blood levels. At
600°C, where ignition and flaming was observed for both polystyrenes, the COHb
levels were substantially elevated (rigid expanded polystyrene: 80%; non-
cellular polystyrene: 75%) and 92 to 100% of the animals died.
Herpol and Minne [37] used the DIN apparatus to evaluate the toxicity of
15 different synthetic and natural materials. Two different expanded
polystyrene samples (normal and self-extinguishing) were evaluated. In each
experiment, the whole bodies of six Wistar rats (3 males and 3 females) were
exposed for 30 minutes to the thermal decomposition products from two gram
samples placed in the tube furnace and heated to 600°C. The furnace was
adjusted to move over the sample in 30 minutes. Airflow through the combustion
system and the dilution air were adjusted to 200 H/hr producing a nominal
exposure concentration of 10 mg/ 8,. No animal deaths were observed in any of
these experiments. These findings are, however, consistent with those observed
by Hofmann and Oettel for the polystyrene samples tested at equivalent volumes.
27
Herpol [38] evaluated the acute toxic effects of exposures to the thermal
decomposition products of 35 materials, of which one was a sheet-type,
chlorinated fire-retarded polystyrene. Ten gram samples were evaluated at
furnace temperatures of 400, 600 and 800°C. Animals were monitored for changes
in respiratory rate (monitored for 30 seconds at 6 minute intervals), COHb
levels, and lethality. Carbon monoxide concentrations in the exposure
atmosphere were also measured. Flaming combustion of the polystyrene samples
was observed at 600 and 800°C. At 400°C, no lethalities were observed, COHb
concentrations did not exceed background levels (i.e.,<15%), and the respira-
tory rate was only slightly perturbed, (i.e., it gradually decreased 20% during
the first 18 minutes but then increased such that there was only a 10% decrease
by the end of the exposure). At 600°C, all the exposed animals died, the
average COHb level was 68 + 1.8%, and the respiratory rate decreased almost
linearly to zero by the end of the 30 minute exposure period. At 800°C, only
72% of the exposed animals died and the average COHb levels obtained were 50 +
6.9% (surviving animals) and 53 + 5% (dead animals). In contrast with the
experiments run at the lower temperatures, the respiratory rates initially
increased slightly, i.e., about 10% above pre-exposure rates; however, by 14
minutes, the rates had started to decrease reaching 50% of the control rate by
the end of the exposure period. These toxicological findings are consistent
with the average CO concentrations observed at 600 (''^8000 ppm) and 800°C (''-2500
ppm)
.
Herpol and Vandevelde [39,40] also tested polystyrenes according to the
procedure outlined above for Herpol [38]. They did not report their raw data.
28
but only gave results corresponding to their own "Toxicity Index." The
"index" values calculated using this approach range from TX = 0, when all
animals survive the exposure, to TX = 100, when all animals die within the
first six minutes of exposure. To compare materials, the highest TX values
obtained for each material were used, irrespective of the temperature of
decomposition. The toxicity "index" value calculated for the sheet-type
chlorinated fire retarded polystyrene was 56.7 and when compared to the other
materials tested by Herpol, indicated that this polystyrene was one of the top
four toxic materials, only surpassed by a polyamide-polyester blend carpet with
foam backing, a plasticized PVC cable, and a 100% acryl-type jacquard
upholstery material. No direct correlation was made by the authors between the
level of CO produced and the extent of toxic effects.
3.2.2 FAA/CAMI Toxicity Protocol
Crane et al. [41] at the Federal Aviation Administration's Civil Aero-
medical Institute (FAA/CAMI) developed a laboratory small-scale inhalation test
which used rats to assess the toxicity of commercial materials designed for
aircraft interiors. In this test system, 750 mg samples of materials are
thermally decomposed in a tube furnace at an isothermal temperature of 600°C.
The combustion atmosphere is recirculated at a rate of 4 2,/min through the
combustion and animal exposure chamber (total chamber volume equals 12.6 £.).
In each experiment, three Sprague-Dawley rats are placed in separate motorized
rotary cages and exposed in the whole-body mode to the decomposition products
for a maximum of 30 minutes. This mass loading is equivalent to a nominal
exposure concentration of approximately 60 mg/2,. Times-to-incapacitation (T^)
29
(the time which animals were unable to walk in the rotary cages) and times-to-
death (T^) were monitored and recorded.
Using the FAA/CAMI test method, Hilado et al. [42,43] evaluated the
toxicity of four different synthetic materials, one of which was a polystyrene
(Styron 402 D). The thermal decomposition atmosphere generated from this
polystyrene did not incapacitate or kill any of the test animals. Compared to
the combustion atmospheres generated from the other three materials, the
decomposition products from this polystyrene were the least toxic.
3.2.3 NASA/USF Toxicity Protocol
The NASA/USF toxicity protocol was developed by Hilado at the University
of San Francisco (USF) [44] for the National Aeronautic and Space Adminis-
tration (NASA). In this test, four Swiss-Webster male mice are allowed to move
freely in a 4.2 liter chamber while being exposed to thermal degradation
products from 1 gram samples of materials heated in a horizontal tube furnace.
The exposure chamber is connected to the furnace by a glass tube. Materials
are decomposed in the furnace set at either a fixed temperature or ramped at a
rate of 40°C/min. The system is designed such that either static or dynamic
combustion conditions may be generated. In the static mode, movement of the
combustion products into the exposure chamber is primarily due to thermal
expansion, while in the dynamic mode, a pump moves the decomposition products
through the system at flow rates of either 1 or 3 il/min. The nominal
calculated chamber concentration, based on a 1 gram mass loading and 30 minute
30
exposure, would be 2A0 mg/ 2, in the static mode and 33 or 11 mg/ 2, in the dynamic
mode depending of whether the air flow is 1 or 3 2,/min.
Hilado and his coworkers primarily centered their efforts on measuring
the exposure time necessary to produce a specific biological effect, such as
incapacitation (T^^) or death (T^j). These values were examined as a function
of the total amount of material consumed.
Hilado and coworkers in a series of studies [42,45-48] evaluated the
toxicity of several different commercially available polystyrene materials
(i.e., styrofoam pellets, rigid foam slabs, solid transparent sheet). Using
static flow conditions and ramped furnace temperatures (200 to 800°C at
40°C/min), they found that the decomposition products from these polystyrenes
caused mean times to incapacitation, (based on the observed times of staggering
by the animals) ranging from 13.6 to 20.7 minutes and mean times to death
ranging from 20.0 to 27.5 minutes.
Hilado and Huttlinger [49] also attempted to determine the quantity of a
polystyrene (Styron 402 D) which when thermally decomposed produced 50%
lethality in the exposed animals. Using the static flow conditions and the
ramped temperature mode, 0.1 to 5 gram samples were decomposed in the furnace.
In all experiments better than 99% of the mass charged in the furnace was
pyrolyzed. No correlation, however, was obtained between sample mass
decomposed and percent lethality or time-to-death (Table 10). Concentrations
of CO and CH 4 also did not show any correlation with the mass of sample loaded
31
in the furnace or with death. These experiments highlight the variability in
results obtained with this test method.
Hilado and coworkers [42,45,46,47,50] also investigated the effect
temperature and heating rate had upon the toxicity of the thermal decomposition
products of various types of polystyrenes. Results from tests performed
isothermally at 800°C were compared with those from thermally ramped tests.
Mean for the polystyrene materials ranged from 6.0 to 12.5 minutes and the
mean death ranged from 15.4 to 22.1 minutes. The thermal degradation
products from the polystyrene decomposed at the higher isothermal conditions
resulted in shorter mean times to incapacitation and death. These results were
attributed to a more rapid and higher generation of CO at 800°C.
Hilado and coworkers [42,47,51] also examined the effects of air flow
rates through the furnace. Hilado and Huttlinger [51] tested a rigid poly-
styrene foam under both ramped and isothermal temperature conditions (800°C)
and under both static and dynamic chamber conditions (airflow rate of 1 2,/min).
Results under the various test conditions are presented in Table 11. Regard-
less of whether air flowed through the chamber or not, the mean times to effect
were shorter when the polystyrene was decomposed isothermally at 800°C than
under the ramped furnace conditions. The experiments conducted with an airflow
of 1 2,/min did, however, produce slightly shorter mean times to incapacitation
than those without any airflow. However, the main difference between the
static and dynamic exposure modes was that no animal deaths were observed under
the dynamic conditions. It is unclear why no deaths occurred when there
appears to be sufficient toxicant(s) generated under the dynamic exposure
32
conditions to produce incapacitation even earlier than under the static
conditions
.
The toxicity of the thermal decomposition products from a polystyrene
foam was examined along with that of three other materials (i.e., ABS, poly-
carbonate and polyethylene) under ramped temperature conditions (200-800°C at
A0°C/min) and under both static and dynamic exposure chamber conditions
(airflow rates of 1 and 3 2,/min) [42]. A summary of the mean times to
incapacitation and death, along with their standard deviations, and percent
mortality obtained under these various conditions are presented in table 12.
The results obtained with no air flow suggest that the effluent produced by
polystyrene at the isothermal temperatures of 600 and 800°C was more incapaci-
tating than that produced by the ramped temperature condition. The effluents
at 800°C were more toxic than at 600°C. Only slight differences in the mean
time to death were seen for polystyrene under static conditions regardless of
the temperature of decomposition. Mortality, on the other hand, was lower at
600°C. With air flow through the system, at 600°C, times to incapacitation and
death were lower than with no air flow. At 800°C, times to incapacitation were
lower than in the static mode, but no deaths were observed. In the majority of
cases, polystyrene appeared to be slightly less toxic than ABS, polycarbonate
and polyethylene. Considering the large difference in exposure concentrations
tested (11, 33, and 240 mg/H), remarkably little differences in the mean times
to incapacitation or death were observed.
These observations were supported by results reported by Hilado and
coworkers [52,53] for tests where a polystyrene, as well as six other materials
33
(i.e., polyethylene, polycarbonate, polyoxymethylene, polyether sulfone and
Douglas fir), were decomposed isothermally from 200 to 800°C, at 100°C
intervals under static as well as dynamic air flow conditions (1 2,/min). For
all seven materials under the static chamber conditions, increasing furnace
temperature generally resulted in increased CO concentration, shorter mean
times to death and increased mortality. For polystyrene, no deaths were
observed below 400°C, whereas at 800°C, 95% of the animals died. With an air
flow of 1 2,/min, mortalities were only observed when the polystyrene was
decomposed at 600°C and 700°C. No deaths were seen below 600°C or at 800°C.
The authors concluded that, at lower temperatures, insufficient amounts of
toxicants were produced to cause death. While, at higher temperatures, the
toxicants were apparently produced so rapidly that they were not present in the
exposure atmosphere long enough to cause death.
3.2.4 Japanese Toxicity Test Protocols
Japanese researchers have developed several different methods to evaluate
and compare the toxicity of combustion products from building and furnishing
materials. Three different studies have been reported [54-56] in which the
toxicities of the thermal degradation products of rigid polystyrene foams were
compared to those of other commonly used materials. In all three studies,
neither the exact type nor the supplier of the materials was specified.
Although the experimental protocols were different, some similarities were
noted. The sample materials were heated in a quartz tube under dynamic airflow
conditions. In all cases, mice were exposed in a separate chamber through
which the gaseous effluents passed.
34
Kishitani [54] studied the toxicity of the thermal decomposition products
of ten building materials, including two different polystyrene foams. Three
grams of the foams were heated in a tube furnace in which the temperature was
raised from ambient to 740°C in 15 minutes. The heating rate was selected to
simulate the temperature increase expected in the initial stages of a fire.
Heat was provided to the test material by four propane burners placed under the
quartz tube through which air flowed at a rate 2 8,/min. For each material, a
total of 5 mice were exposed, one at a time, in a 56 8, glass chamber for 15
minutes. Measurements of T^j, COHb, three-day post-exposure observation of
surviving animals, electrocardiograms (EGG), and necropsy examinations of the
mice exposed to the polystyrene combustion products were recorded.
No mice died either during the exposures or the post-exposure observation
periods. However, the combustion products of these polystyrene foams were not
totally innocuous. Carboxyhemoglobin levels ranged from 17.5 to 34.5% and the
mucous membranes of the eyes and nasal passages of some of the mice were
injured. In addition, irregular pulses were observed in the ECGs. Kishitani
concluded that one or more irritant gases were present in the thermal
decomposition products of these polystyrenes and were responsible for the
effect on the ECGs and the mucous membranes of the animals. No attempt was
made to identify or speculate on the nature of the noxious gas(es).
Kishitani and Yusa [55] evaluated the toxicity of the thermal degradation
products of 15 different materials, one of which was a rigid polystyrene foam.
This study differed from the one of Kishitani, described above, in that the
35
mice were exposed to the combustion effluents produced when the materials were
isothermally heated at either 550 or 850°C. The test apparatus consisted of a
quartz combustion tube which was suspended in an electrically heated tubular
furnace and connected to a 55 8, glass exposure chamber. A 5 cm layer of
alumina marbles was placed in the combustion tube in order to dry the air and
increase gas dispersion. An airflow of A 2,/min supplied through the combustion
tube went into the exposure chamber. Temperatures in the exposure chamber did
not increase more than 2°C above ambient. The mass of material placed in the
tube furnace, was varied in order to obtain a concentration-response
relationship. The problem of loading a large enough sample of foam in the tube
furnace to produce incapacitation was overcome by thermally preconditioning the
samples in an oven at 150°C for 20 minutes to reduce their volumes and increase
their densities. The weight reduction, 7.4%, was attributed to the loss of
blowing agent and was not believed by the authors to effect the resultant
composition or toxicity of the combustion products. The toxicologic endpoint,
incapacitation, was based on the time necessary for collapse of the animals.
The exposure chamber contained five revolving cages which electrically
monitored the activity of each mouse. Routine visual observations were also
made. The time when a mouse could no longer make the cage revolve was
considered the time of incapacitation. The total test exposure was 15 minutes.
Kishitani and Yusa attempted to develop a relationship between the sample
mass loaded in the tube furnace and the average Tj^ obtained in each test. The
following empirical formula was derived:
W = k T^P
36
where W = sample mass in grams, = time to incapacitation in minutes, and k
and p are empirically derived regression coefficients. Various materials were
compared by ranking the total mass of material, W, which when heated in the
tube furnace produced an average collapse time of between 2.5 to 3.5 minutes
(Table 13). With the exception of polyvinyl chloride-A (PVC-A), polystyrene
produced combustion products which were less toxic than those of any other
material tested. (The unexpectedly low toxicity rating for PVC-A was suggested
by the authors to be due to the extremely large amount of inorganic filler used
in its formulation.)
Nishimaru et al. [56] evaluated the relative acute toxicities produced by
the inhalation of smoke and gases from pyrolyzing or burning plastics used for
insulation. Five different foams, two of which were polystyrenes, and a wood
(lauan) sample were tested at four different temperatures; 350, 450, 550, and
750°C. Temperatures were selected to simulate the early stages of fire
development. The test specimen was placed into a quartz tube and heated in an
electric furnace. Dry air flowed through the tube furnace and into the animal
exposure chamber at a rate of 5 2,/min. In most tests, eight male mice were
placed in individual revolving activity wheels, which were rotated solely by
the movement of the mice and were electronically monitored. The time to
incapacitation (T^^), i.e., the time at which the mouse stopped rotating the
cage, was then used as the measure of acute toxicity. Each test ended when all
the animals had collapsed. In a few experiments, materials were heated at
550°C for 10 minutes and a hybrid, male rabbit was exposed to the thermal
37
decomposition products along with the six mice. Measurements performed on the
rabbits included ECG's and respiratory tracings.
Gas concentrations (CO, CO 2 , and Oj) in the exposure chamber and the
incapacitation times calculated for both polystyrene foams at each temperature
are presented in Table 14. The greatest toxicity, as indicated by the shortest
average time to incapacitation, occurred at 550°C for both polystyrenes. This
temperature produced the highest concentration of both CO and CO 2 and the
lowest concentration of O 2 . The flaming which occurred at 550°C was also
longer than that at the other temperatures and it was noted that polystyrene
was more toxic in the flauning mode.
When compared to the other three foams (i.e., PVC, urea resin, and
polyurethane) and lauan wood decomposed at 550°C, the thermal decomposition
products from polystyrene foam appeared to be the least toxic (Table 15)
especially since a larger mass loading of polystyrene foam was degraded than
for any of the other foams. More animals were incapacitated and at shorter
times from the decomposition products of the lauan wood, which was the only
material with a mass loading equivalent to that of the polystyrene. However,
abnormalities were observed in the ECG wave patterns and the pneumatograms of
a rabbit exposed to the polystyrene combustion products. In particular, anoxia
with deep breathing was evident.
Since the polystyrene, when decomposed in the non- flaming modes, produced
relatively low levels of CO and CO 2 , the incapacitating effects are probably
caused by something other than CO and CO 2 . Styrene, one of the major pyrolysis
38
products of polystyrene and a knovm irritant, was considered by the authors to
be a likely cause.
3.3 Combustion Ovens
3.3.1 University of Pittsburgh Toxicity Protocol
Prior to the establishment of the current version of the University of
Pittsburgh Test Method (to be described later), Alarie et al. [57] developed a
test procedure to evaluate the degree of sensory irritation evoked by exposure
to plastic decomposition products. In a 12 8, combustion chamber, a known
amount of material was ignited with a bunsen burner, which was removed after
ignition so that the continued combustion was self -propagating. Samples were
configured so as to burn like tapers from the top down. A constant airflow of
17 2,/min was maintained through the combustion chamber. The thermal decomposi-
tion products were further diluted by mixing them with varying amounts of fresh
air (i.e., 0, 17, 51, and 96 2,/min) to produce different exposure
concentrations of gaseous products in order to develop a concentration-response
relationship. In each test, four mice were placed in individual body-
plethysmographs such that only their heads were exposed to the various
dilutions of the gaseous effluents which were directed through the 2.3 2, glass
exposure chamber. Since sensory irritation was correlated with a reduction in
respiratory rate [58], Alarie et al. determined the concentration of the
gaseous products which reduced the respiratory rate by 50%; that concentration
was designated the RD 50 . The respiratory rates of the mice were monitored
before each test (control rates), during the three minute exposures to the
39
combustion products, and following the exposures to establish recovery times.
Concentration-response relationships were developed based on the amount of
material loaded in the combustion chamber and the total exposure airflow (i.e.,
combustion air and dilution air).
Two polystyrene materials (i.e., a sheet and a foam) were evaluated by
this procedure and compared to a polycarbonate sheet [ 57 ]. The calculated RD50
values for the polystyrene sheet was 6.0 mg/ 2, and that for the polystyrene foam
was 9.6 mg/ 2,. These RD50 values indicated that the irritant potencies of the
combustion products of these materials were as follows: polystyrene sheet >
polystyrene foam > polycarbonate sheet. The authors concluded that the sensory
irritancy was not due to the elevated CO or COj or decreased Oj, but was
probably due to small amounts of styrene monomer or some other styrene deriva-
tives produced during combustion.
The current version of the University of Pittsburgh toxicity test method
is a dynamic flow-through system that uses a Lindberg furnace which is pro-
grammed to heat the sample at a ramped heating rate of 20 °C/min. Air and
combustion products are flushed through the oven and diluted with cooled air,
such that a total airflow of 20 2,/min passes through the animal exposure
chamber. In each experiment, four male mice are exposed in the head-only mode.
AO
Typical endpoints are the LLjo^, the amount of material loaded in the furnace
that kills 50% of the animals during a fixed exposure time (usually 30
minutes); the LT 50 , the time needed to kill 50% of the animals when exposed to
the LL 50 ; and the RD 50 , the loading of material in the furnace that reduces the
average respiratory rate of the animals to 50% of their pre-exposure control
values. Although continuous mass loss is measured throughout the experiments
in the University of Pittsburgh method, all biologic end-points are based on
the mass of material initially loaded in the furnace, not the total mass
consumed.
Alarie and Barrow [60] used respiratory rate depression (i.e., RD 50 ) as a
measurement endpoint to assess the relative toxicity of the thermal decomposi-
tion products of polymeric materials, including polystyrene. The RD 50 level
reported for the oxidative pyrolysis of a polystyrene was 0.18 mg/ 2, with 95%
confidence limits of 0.08-0.42 mg/Z,. This value may be compared to the RD 50
value (6.0 mg/ 2, with a 95% confidence limit of 4. 4-8. 4 mg/ 2,) for the same
material examined with the earlier method under flaming combustion. The
conclusion made by these investigators was that biologically significant
differences existed between the irritant effects produced by non-flaming
oxidative pyrolysis and open-flaming of polystyrene.
^The published literature uses the term LC 50 rather than LL 50 . Theauthors of this review, however, have decided to use LL 50 to point out that in
this test method the endpoint is actually based on the amount of materialloaded into the furnace and is not the exposure concentration which has to
include some measure of atmospheric volume. In fact, it is somewhat difficultto determine the actual exposure concentration over time, which depends on themass loss rate and dispersion of thermal decomposition products in the airflowthrough the oven.
41
Anderson and Alarie [61] evaluated the toxicity of the thermal decomposi-
tion products of three different polystyrenes, two of which were specially
formulated rigid polystyrene foams (GM47 and GM49 [ 8 ]) and one was a
commercially available polystyrene film. The formulations of GM47 and GM49
were alike except that GM49 contained an undefined fire retardant. The LLgo
values for these polystyrenes were 5.8, 9.8, and 10.0 grams, respectively.
Although Alarie provided values based only on the mass loading, a nominal LC 50
value in mg/ 2, may be estimated based on the exposure duration (30 minutes) and
the flow rate of the dilution air (20 2,/min) through the animal exposure
chamber. These nominal LC 50 values for GM47, GM49, and the polystyrene film
would be 9.7, 16.3, and 16.7 mg/ 2,, respectively. Although this is a possible
way to define a nominal LCgg, a more valid approach in a dynamic system, when
materials undergo rapid thermal decomposition, is to actually account for the
gas concentration which passes by the animals and the time period that the
animals are exposed. This latter time period is related to the time of total
mass loss. Based upon the information provided by Alarie and Anderson [62]
GM47 totally decomposed in approximately 6 minutes and GM49 took 8 minutes.
The LC 50 values based on the times of total mass loss for each sample would
then be 48.3 mg/ 2, for GM47 and 62.5 mg/ 2, for GM49. These LC 50 values are
approximately 4 to 5 times larger than those calculated based on the assumption
that decomposition occurred uniformly over the total exposure period and more
nearly resemble values reported with other test methods.
In addition to the LL 50 values, Alarie and Anderson [62,63] also measured
and calculated LT 50 (the time necessary to kill 50% of the animals exposed to
the 30 minute LL 50 ), LLT 50 (i.e., LL 50 times LT 50 ) and RD 50 values for GM47 and
42
GM49 (Table 16). Along with this toxicity data, the authors also provided
information on the mass loss and the CO production that occurred during the
decomposition of the polystyrenes. Both polystyrenes, i.e., GMA7 and GM49,
decomposed rapidly with the initial mass loss starting to occur at about 300°C
and the major portion of the mass being lost between 400°C and 500°C. Although
CO was released by both GM47 and GM49, the concentration produced by the fire-
retarded sample, GM49, was substantially greater (about 5000 ppm) than that
produced by GM47 (about 1500 ppm). The toxicity of the various materials
evaluated was compared with that of Douglas fir. Regardless of the endpoint
used for comparison, these polystyrenes, i.e., GM47 and GM49, were ranked by
the authors as more toxic than wood. (This test method is one of a few in
which polystyrene products are ranked as being more toxic than wood.)
3.3.2 Harvard Medical School Toxicity Test Method
This test method was developed and used by Dressier [64] in the evalua-
tion of the toxicity of combustion effluents from consximer products. In this
method, the combustion system consists of a modified self -cleaning oven and is
connected to an animal exposure chamber which contains ten revolving, animal
exercise wheels. The time-of -useful-function (TUF) is the biological endpoint
and is defined as the time from the start of exposure to when the animal is
unable to voluntarily move in the exercise wheel. The combustion products are
recirculated through the furnace and exposure chamber.
With this test procedure, Robinson et al. [65] assessed the acute
toxicity of the combustion products from three polymeric materials commonly
43
used to manufacture television cabinets. These materials consisted of two
different polystyrenes, one of which was designated PS-SB-BR and contained a
brominated flame retardant and the other, designated PS, was not flame
retarded. The third material was a polyphenylene oxide (PPOP). Two sample
loadings were tested; the first (128 mg/e,) was considered equivalent to the
concentration produced by an 8 pound television cabinet being burned in a 100
cubic foot room. This mass loading was heated at 350, 400 and 450°C. The
second loading was equivalent to a nominal animal exposure concentration of 32
mg/e, and was only tested at 450°C. In each test, a total of 28 rats (i.e., 10
in exercise wheels, 18 in wire-mesh cages) were placed inside the exposure
chamber and exposed to the pyrolysis products from these materials for 20 min.
Both the TUF and the number of animal deaths were recorded during each experi-
ment. Surviving animals were observed for 21 days to determine if the thermal
decomposition products resulted in post-exposure deaths.
The results of the mortality study are presented in table 17. When fuel
loads equivalent to 32 mg/ 8, were decomposed at 450°C, the flame retarded
materials produced no mortalities, while the non-flame retarded polystyrene
caused 10% of the animals to die. At the 128 mg/ 8, loadings, no deaths were
noted at 350°C, 0 and 82% deaths were observed when the flame retarded and non-
flame retarded materials were heated at 400°C, respectively; whereas at 450°C,
51 and 93% of the animals died from exposure to the thermal decomposition
products from the flame retarded and non-flame retarded polystyrenes,
respectively. These results indicate that the non-flame retarded polystyrene
was more toxic than the flame retarded one. Additional results presented by
the authors showed that the flame retarded polystyrene was more toxic under
44
non- flaming decomposition at 450°C than when flaming occurred. These findings
are contradictory to the already discussed polystyrene results in which the
flaming mode of combustion was observed to be more toxic.
The results of the TUF measurements showed the same trend as the
mortality data (Table 17). Animals exposed to the higher concentration of non-
flame retarded smoke produced at both 400 °C and 450 °C had the shortest TUF, 2
and 5 minutes, respectively. Compared to the other television cabinet
material, polyphenylene oxide, polystyrene appeared to be more toxic at the
higher loading.
The average concentrations of CO, COj and Oj generated in the exposure
chamber when the flame retarded and non-fl 2ime retarded polystyrenes were
decomposed at 450°C are displayed in table 18 for the 3 and 12 minute
exposures. The lowest oxygen and highest CO and COj levels were obtained when
the non- fire retarded polystyrene sample was decomposed. These findings appear
to be consistent with the higher mortality and more rapid incapacitation caused
by exposure to this polystyrene.
3.3.3 General Electric/Southern Research Institute Test Method
Nelson, Hixson and Denine developed a test procedure to determine the
relative acute toxicities of the thermal degradation products from a variety of
materials [66]. In this method, different mass loadings of materials are
placed in a combustion furnace (i.e., a nominal 10 t Electric Multiple Unit
Furnace, type 66, or Lindberg Model 51442-S Box Furnace) and decomposed at
45
temperatures which varied between 805 and 880°C. The smoke generated in the
combustion furnace was drawn through a laminated rubber tube into a 740 2,
acrylic animal exposure chamber by an exhaust fan. As the smoke started to
fill the exposure chamber, the exhaust fan was turned off and the exhaust port
was sealed. Additional gaseous products and smoke were then transported and
mixed in the exposure chamber by natural convection. When the thermal degrada-
tion of the material was complete (as determined by visual observation of the
sample), the furnace was disconnected and the animal chamber was sealed. In
each test, ten Sprague-Dawley rats (5 males and 5 females) were placed into 5
cages located inside the animal exposure chamber and exposed to the gaseous
atmosphere produced. The timed animal exposure of 120 minutes officially began
when the combustion furnace was disconnected and the exposure chamber was
sealed. The apparent lethal concentrations (ALCgo) (i.e., the amount of test
material which, when decomposed under the specified test conditions, produced
mortality in 50% of the exposed animals) were determined for twelve synthetic,
including one high impact polystyrene sample, and two natural materials. The
concentrations of CO, COj, and Oj in the exposure chamber were analyzed and the
blood COHb levels of a minimum of four animals per test were measured following
removal of the animals from the exposure chamber. The ALC 50 data, which are
based either on the amount of material loaded or the amount of material
actually consumed, are presented in table 19. These values are presented
(based on the ALC 50 values for the amount of material loaded in the furnace)
from the most toxic to the least toxic. When the ALC 50 values of all 14
materials were compared, the high impact polystyrene was determined to be the
second most toxic material with an ALC 50 of 12.0 mg/2,. However, none of the
ALC 50 values differed by more than a factor of 6 (based on the amount of sample
46
loaded) and the high impact polystyrene was determined to be about twice as
toxic as red oak.
Table 19 lists the concentrations of CO and CO 2 in the exposure chamber
atmospheres at the ALC 50 values for each material. The COj levels were noted
to increase during the exposure period; this can be attributed to the respira-
tion of the animals. The authors concluded that with the exception of wool, CO
in conjunction with the elevated CO 2 levels, was the primary cause of the
observed toxicities produced by these materials. All animals that died within
the two hour exposure period (except those exposed to wool products) were found
to have blood COHb levels in excess of 60%, mostly in the 70-80% range.
Surviving animals also exhibited elevated COHb levels, which, in some
instances, approached levels of 60%.
3.3.4 University of Michigan Toxicity Protocol
Two different test procedures, one static and the other dynamic, were
developed at the University of Michigan to study the toxicity of thermal
decomposition products of various combustible materials [67]. In the static
method, the test sample is rapidly decomposed by heating at 700°C in a Vycor
tube wrapped with resistance wiring for a period of 6 to 10 minutes. In each
test, a group of Sprague-Dawley rats (usually 15 per test) is exposed for a
period of 4 hours to the combustion products which are generated directly into
a 1500 liter stainless steel chamber.
47
The dynamic method involves slowly heating a sample material placed in a
furnace programmed to increase the temperature at a rate of either 3 or
5°C/min. An airstream of 1 S,/min flows through the furnace and is cooled and
further diluted with air flowing at a rate of 2 l/mln prior to passage through
the animal exposure system. After lAO minutes, the furnace temperatures
reaches about 700 to 800®C and the decomposition process is considered
essentially complete. At this time, all exposed animals are removed. In each
test, five rats are exposed to the thermal decomposition products from
different mass loadings. The chamber used for exposing the rats to the thermal
degradation products is a Pyrex glass column with side tubes attached so that
only the rats noses extend into the decomposition effluent airstream.
In both test methods, the primary biological endpoint is lethality. The
LL 50 values determined for the various materials tested are presented in Table
20. The LL 50 value for the polystyrene sample decomposed under static condi-
tions was 29 grams; whereas, under the dynamic conditions, it was 4.3 grams.
In the static mode, polystyrene ranked as the sixth most toxic material among
eleven evaluated materials; while in the dynamic mode, it seemed to be the
least toxic material. The nominally calculated LCgg value for polystyrene in
the static exposure tests was 19.3 mg/ 8,, while in the dynamic exposure tests,
it was 10.2 mg/ 2,.
Cornish et al. [ 68 ] also investigated whether different animal species
would respond differently to thermal decomposition products from various
materials. Both rats and rabbits were exposed to the thermal decomposition
effluents generated when 20 grams of a material were decomposed under static
48
conditions. The results of this study were inconclusive with regard to
polystyrene since no mortalities were observed in either rats or rabbits at
this loading.
The two exposure systems described above are obviously quite different.
Under the static conditions, the animals are exposed to the total products
resulting from the thermal degradation for a period of 4 hours. In the dynamic
system, animals are exposed to the thermal decomposition products only during
the time in which they are being generated. Thus, in the dynamic system,
animals are exposed to specific decomposition products for only relatively
short times. Based on the actual LCgg values calculated, this polystyrene
appeared to be more toxic under dynamic than under the static exposure
conditions. This observation, that the LC 50 values are lower under dynamic
than under static conditions (i.e., more toxic) was also noted for the other
test materials. On the other hand, under the dynamic conditions, the
polystyrene was the least toxic of all the tested materials.
4.0 Conclusions
• In general, the main volatile product regardless of atmospheric
conditions is the styrene monomer. The concentrations ranged from 0.6 to
100% of the mass evolved.
• The composition and quantity of other evolved products depend greatly
upon the chemical formulations (mostly unspecified) and experimental
conditions
.
49
• The evolution of styrene is temperature dependent - increasing with
furnace temperatures up to 500“C and decreasing above 800“C.
• In oxidative atmospheres, CO and COj were formed and appeared to be
responsible for the animal deaths that occurred during the flaming
decomposition of polystyrenes.
• Effluents produced during flaming degradation of polystyrenes were
generally found to be more toxic than those produced under non-flaming
conditions.
• Animal incapacitation occurred during non-flaming decomposition of
polystyrenes and could not be attributed to CO and COj since their
concentrations were too low. Some other toxicant, perhaps styrene, was
responsible.
• When compared to other common natural and synthetic building materials,
the thermal decomposition products of polystyrene appear to be among the
least toxic.
5.0 Acknowledgements
The authors gratefully acknowledge the helpful discussions with
Ms. Maya Paabo and the assistance of Ms. N. Jason, Ms. M. Diephaus, and
50
Ms. A. Durham and Ms. C. S. Bailey who performed the literature search and
compiled the references.
This work was performed under Contract CPSC-IAG-74-25, Task Order 84-8
from the U. S. Consumer Product Safety Commission, Dr. Rita Orzel, Project
Officer. The opinions expressed herein are those of the authors and not those
of CPSC.
51
References
1. Gilmore, H. S. and Hoge, A. R. , Polystyrene. In "Modern PlasticsEncyclopedia," J. Agranoff, ed., Volxime 61, Number lOA, McGraw-Hill,Inc., New York, 1984, pp. 82-84.
2. Styrene Plastics. Enclyclopedia of Chemical Technology. Third Edition,Vol. 21. John Wiley and Sons, Inc., New York, 1983, pp. 801-847.
3. Madorsky, S. L. , Thermal Degradation of Organic Polymers, IntersciencePublishers, John Wiley & Sons, Inc., New York, New York, 1964, p. 26-92.
4. Choudhry, G. G. , and Hutzinger, 0., Mechanistic aspects of the thermalformation of halogenated organic compounds including polychlorinateddibenzo-p-dioxin. Part III; Thermodegradation of organometallics andpolymers. Tox. & Environ. Chem. 5:97-151 (1982).
5. Swett, R. M. , Polystyrene. In "Modern Plastics Encyclopedia,"J. Agranoff, ed., Vol. 60, Number lOA, McGraw-Hill, Inc., New York, 1983,
pp. 72-74.
6. Michal, J., Combustion products of polymeric materials. 1. Test chamberCAB 4.5. Fire & Matls. 7:163-168.
7. Parikh, P. F., Thermal degradation of high polymers. J. Colour Soc.,July-Sept. 1970, p. 1-5.
8. Products Research Committee. Materials bank compendium of fire propertydata. Nat. Bur. Stand. (U. S.), [Washington, DC] February 1980, p. 130-
160.
9. Levin, B. C., Paabo, M. , and Birky, M. M. , An interlaboratory evaluationof the 1980 version of the National Bureau of Standards test method for
assessing the acute inhalation toxicity of combustion products.Nat. Bur. Stand. (U. S.) NBSIR 83-2678, April 1983, 82 p.
10. Wegner, J., and Patat, F., Thermal degradation of polystyrene.J. Poly. Sci. Part C 31:121-135 (1970).
11. Knight, G. T. , Thermal degradation of polystyrene. J. Poly. Sci.,
Polym. Lett. Ed. 5:855-857 (1967).
12. Fuchs, P., and Szepesy, C., Pyrolyse-gas-chromatographie, analyse de
polystyrene et de resines allies par chromatographie pyrolytiques en
phase gazeuse. Chromatographia 1^:310-314 (1968).
13. Chang. T., and Mead, T. E. , Tandem thermogravimetric analyzer-gaschromatograph-high resolution mass spectrometer system.
Anal. Chem. 43:534-538 (1971).
52
lA. Boettner, E. A., Ball, G. L., and Weiss, B., Combustion products from the
incineration of plastics. Report # EPA-670/2-73-049 prepared under Grantif EP-00386 for the Office of Research and Development, U. S. Environ-
mental Protection Agency, Washington, DC by the University of Michigan,Ann Arbor, Michigan, July 1973, p. 90-93.
15. Brauman, S. K. , Sb203 - Halogen fire retardance in polymers. III.
Retardant-polymer substrate interactions. J. Fire Ret. Chem. 3:138-163(1976).
16. Booster, C., Vermande, P. , and Veron, J., Study of the pyrolysis of
polystyrenes I. Kinetics of thermal decomposition. J. Anal. &
Appl. Pyrolysis jL:297-313 (1980).
17. Hoff, A., Jacobsson, S., Pfaffli, P., Zitting, A., and Frostling, H.
,
Degradation products of plastics. Scand. J. of Work, Environ. & Health8:1-60 (1982).
18. Pacakova, V., Nogatz, M. , and Novak, V., The pyrolysis capillary gaschromatography of some polymeric materials. Collect. Czech. Chem.Commun. ^:509-517 (1982).
19. Brauman, S. K. , Chen I. J., and Matzinger, D. P. , Polystyrene degradationduring combustion. J. Poly. Sci: Poly. Chem. Ed. 21_: 1831-1845 (1983).
20. Trojer, L., Hydrogen formation during pyrolysis of polystyrene.J. Anal. Sc Appl. Pyrol. 2:353-359 (1980/1981).
21. Noble, W. , Wheals, B. B., and Whitehouse, M. J., The characterisation of
adhesives by pyrolysis gas chromatography and infrared spectroscopy.Forensic Sci. 3:163-174 (1974).
22. Pfaffli, P. , Zitting, A., and Vainio, H. , Thermal degradation products of
homopolymer polystyrene in air. Scand. J. Work, Environ. Sc Health 4:22-27(1978).
23. Straus, S, and Madorsky, S. L., Pyrolysis of some polyvinyl polymers at
temperatures up to 1,200°C. J. Research Nat. Bur. Stand. 66A : 401-406(1962).
24. Morikawa, T., Acrolein, formaldehyde, and volatile fatty acids fromsmoldering combustion. J. Comb. Tox. 3:135-150 (1976).
25. Morikawa, T., Effects of water vapor on evolution of carbon monoxide in
combustion and pyrolysis. J. Comb. Tox. 9:85-96 (1982).
26. Kaplan, H. L., Grand, A. F., and Hartzell, G. E., Combustion Toxicology,Principles and Test Methods. Technomic Publishing Co., Inc., Lancaster,PA 1983.
27. Madorsky, S. L. , and Straus, S., Thermal degradation of polymers at hightemperatures. J. Res. Nat. Bur. Stand. 63A : 261-268 (1959).
53

28. Morimoto, T., Takeyama, K. , and Konishi, F., Composition of gaseouscombustion products of polymers. J. Appl. Poly. Sci. 20; 1967-1976(1976).
29. Michal, J., Determination of carbon monoxide in thermal degradationproducts of polymeric materials. Fire & Matls. 5:149-152 (1981).
30. Michal, J., Combustion products of polymeric materials. 2. Test chamberCAB 650. Fire & Matls. 7:169-172 (1983).
31. Potts, W. J. and Lederer, T. S., A method for comparative testing ofsmoke toxicity. J. Comb. Tox. 4:114-162 (1977).
32. Levin, B. C., Paabo, M. , Bailey, C., Harris, S. E. , and Gurman, J. L.
,
Toxicological effects of the interactions of fire gases and their use ina toxic hazard assessment computer model. The Toxicologist 5:127 (1985).
33. Levin, B. C., Fowell, A. J., Birky, M. M. , Paabo, M. , Stolte, A., andMalek, D. , Further development of a test method for the assessment of theacute inhalation toxicity of combustion products. Nat. Bur. Stand.(U. S.) NBSIR 82-2532, June 1982.
34. Farrar, D. G. , Hartzell, G. E. , Blank, T. L. , and Galster, W. A.,
Development of a protocol for the assessment of the toxicity of combus-tion products resulting from the burning of cellular plastics. FinalReport to the Products Research Committee. University of Utah, Salt LakeCity, Utah, Vol. 1, September 1979.
35. Hofmann, H. Th. and Oettel, H. , Comparative toxicity of thermaldecomposition products. Modern Plastics 94- 100 (1969).
36. Hofmann, H. Th. and Sand, H. , Further investigations into the relativetoxicity of decomposition products given off from smouldering plastics.JFF/Comb. Tox. 1:250-258 (1974).
37. Herpol, C. and Minne, R. , Biological evaluation of the toxicity of gases
produced under fire conditions by synthetic materials. Part 2:
Behaviour of synthetic materials in definite combustion conditions as
compared to the behaviour of traditional materials in same conditions.
Comb. Sci. & Tech. 1^:229-244 (1976).
38. Herpol, C., Biological evaluation of toxicity caused by combustion of
building materials. Fire & Matls. 4:127-143 (1980).
39. Herpol, C. and Vandevelde, P., Calculation of a toxicity index for
materials, based on a biological evaluation method. Fire & Matls. 2:7-
10 (1978).
54

40. Herpol, C. and Vandevelde, P., Note on the non-existence of correlationbetween toxicity and other reaction to fire characteristics of materials.J. Comb. Tox. 2:135-142 (1981).
41. Crane, C. R. , Sanders, D. C., Endecott, B. R. , Abbott, J. K. , and Smith,
P. W., Inhalation Toxicology: I. Design of a small animal test system.
II. Determination of the relative toxic hazard of 75 aircraft cabinmaterials. Report No. FAA-AM-77-9, Department of Transportation, FederalAviation Administration, Office of Aviation Medicine, Washington, DC
(1977).
42. Hilado, C. J., Cumming, H. J., Machado, A. M. , Schneider, J. E., Crane,C. R. , Sanders, D.C., Endecott, B. R. , and Abbott, J. K. , Comparison of
animals responses to the combustion products generated by two testprocedures, the USF/NASA methodology and the FAA/CAMI system. J. Comb.
Tox. 4:325-359 (1977).
43. Hilado, C. J. and Cumming, H. J., Evaluation of some materials using theFAA-CAMI method. Proceedings of the California Conference on FireToxicity, San Francisco, CA, August 1979.
44. Hilado, C. J., Evaluation of the NASA animal exposure chamber as a
potential chamber for fire toxicity screening tests. J. Comb. Tox.
2:298-314 (1975).
45. Hilado, C. J., Soriano, J. A., and Kosola, K. L. , Effect of heating rateon toxicity of pyrolysis gases from some synthetic polymers. J. Comb.
Tox. 4:533-555 (1977).
46. Hilado, C. J. and Machado, A. M. , Effect of char yield and specifictoxicants on toxicity of pyrolysis gases from synthetic polymers. FireTech. M-.51-62 (1979).
47. Hilado, C. J. and Huttlinger, P. A., Toxicity of off-gases from thermalinsulation. J. Therm. Insul. 4:276-287 (1981).
48. Hilado, C. J., Huttlinger, P. A., and Shabdue, C. L., Smoke and toxicgases from materials in healthcare facilities. J. Cons. Prod. Flamm.8:65-76 (1981).
49. Hilado, C. J. and Huttlinger, N. V., Concentration-response data ontoxicity of pyrolysis gases from six synthetic polymers. J. Comb. Tox.5:81-100 (1978).
50. Hilado, C. J. and Brauer, D. P. Concentration-time data on toxicity testsand resulting relationships. J. Comb. Tox. 6:136-148 (1979).
51. Hilado, C. J. and Huttlinger, N. V., Toxicity of pyrolysis gases fromphenolic, isocyanurate, and polystyrene rigid foam insulation. J. Therm.Insul. 2:40-47 (1978).
55
52. Hllado,C. J., Olcomendy, E. M. , and Bauer, P. B., Effect of pyrolysistemperature and air flow on toxicity of gases from a polystyrene polymer.J. Comb. Tox. 6:13-19 (1979).
53. Hilado, C. J., Gumming, H. J., and Schneider, J. E. , Relative toxicity ofpyrolysis gases from materials: effects of temperature, air flow andcriteria. Fire & Matls. 3:183-187 (1979).
54. Kishitani, K. , Study of injurious properties of combustion products ofbuilding materials in initial stage of fire. J. of the Faculty ofEngineering, University of Tokyo(B) 31^:1-35 (1979).
55. Kishitani, K. , and Yusa, S., Study on evaluation of relative toxicitiesof combustion products of various materials. J. of the Faculty ofEngineering, The University of Tokyo, 35:1-17 (1979).
56. Nishimaru, Y. , Saito, F., Nakamura, K, Morikawa, T., and Yusa, S.,
Evaluation of acute toxicity of smoke and gases from smoldering andburning plastic foams. Fourth Joint Meeting U.S. -Japan Panel on FireResearch and Safety, UJNR, Tokyo, pp. 567-586, 1979.
57. Alarie, Y., Lin, C. K. , and Geary, D. L. , Sensory irritation evoked byplastic decomposition products. Am. Indus. Hyg. Asoc. J. 35:654-668(1974).
58. Alarie, Y., Irritating properties of airborne materials to the upperrespiratory tract. Arch. Environ. Health, J3::433-441 (1966).
59. Alarie, Y. and Barrow, C. S., Toxicity of plastic combustion products.Toxicological methodologies to assess the relative hazards of thermaldecomposition products from polymeric materials. Nat. Bur. Stand. (U.S.)
NBS-GCR-77-85 (1976-1977).
60. Barrow, C.S., Alarie, Y., and Stock, M. F., Sensory irritation andincapacitation evoked by thermal decomposition products of polymers andcomparisons with known sensory irritants. Arch, of Environ. Health^'.79-88 (1978).
61. Anderson, R. C. and Alarie, Y. C. E., An attempt to translate toxicity of
polymer thermal decomposition products into a toxicological hazard index
and discussion on the approaches selected. J. Comb. Tox. 5:476-484
(1978).
62. Alarie, Y. C. and Anderson, R. C., Toxicologic and acute lethal hazardevaluation of thermal decomposition products of synthetic and naturalpolymers. Tox. & Appl. Pharm. ^:341-362 (1979).
63. Alarie, Y. and Anderson, R. C., Toxicologic classification of thermaldecomposition products of synthetic and natural polymers. Tox. & Appl.
Pharm. 57:181-188 (1981).
56
64. Dressier, D. P., Smoke toxicity of common consumer products. Report toConsumer Product Safety Commission, Contract No. CPSC-C-74-212 (1975).
65. Robinson, R. S., Dressier, D. P., Dugger, D. L., and Cukor, P., Smoketoxicity of fire-retardant television cabinets. J. Comb. Tox. 4:435-453(1977).
66. Nelson, G. L. , Hixson, E. J., and Denine, E. P., Combustion producttoxicity studies of engineering plastics. J. Comb. Tox. 5:222-238(1978).
67. Cornish, H. , Toxicity of thermal-degradation products of plastics. In:
Products of Combustion of (Plastics) Building Materials. Armstrong CorkCo., Lancaster , PA, March 1973, p. 30.
68. Cornish, H. H. , Barth, M. L. and Hahn, K. L., Comparative toxicology of
plastics during thermodecomposition, presented at the InternationalSymposium on Toxicology and Physiology of Combustion Products, Universityof Utah, March 22-26, 1976.
69. Standard Guide for Measurement of Gases Present or Generated DuringFires. ASTM E800-81, American Society for Testing Materials,Philadelphia, PA (1984).
57
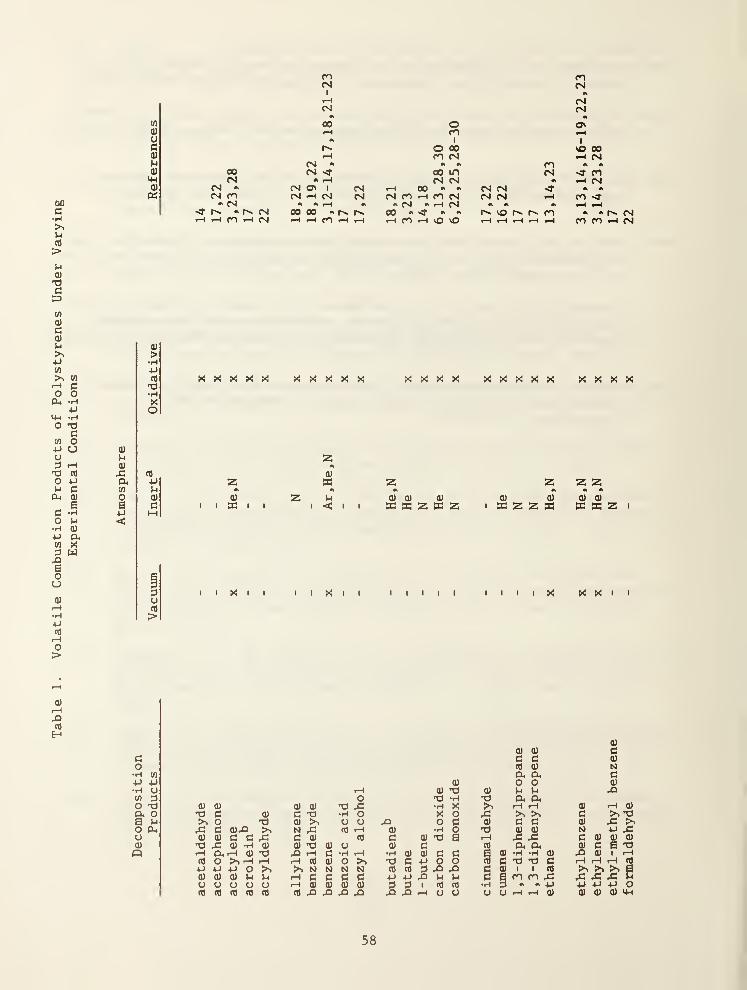
Table
1.
Volatile
Combustion
Products
of
Polystyrenes
Under
Varying
Experimental
Conditions
mCNI
I
CM
00 orH m
1
o 00n CMCM 0k 0k m
00 CM <T 00 ID CMCM A fH CM CM 0k
cs A CS C3N 1 CN ^H 00 A A CM CM<N ro (S CM CM CM m rH cn CM CM CM rH
•* CM rH A #1 CM A CM m, A 0k
A CNJ oo 00 • 00 •h 0k •t vO cnrH m *-H CN rH m rH 1-H m vO VO r-H i-H rH
3otfl
>
X X X X X X X X X X X X X X
ua)
x:a,(fl
cC
4JM
z
z0k
0)
m zo CU oT 2 >H CU CU (U
6PC
CM 1 1 33 t '< * 33 33 N H N
X I I I I X
X X X X X
0) (1)
K Z Z K
3 3c C Co 3 3•iH Cfl CX CX4-1 4-1 CU O O•r4 O rH CU •3 3 Xi HUl 3 o X) •H X3 cx cxo t3 CU 0) CU CU 43 •H X >» I-H I—
1
a, o c (U C 73 •r4 o X o 43 >v >vB >. o X) CU 5>s o O 43 o 3 3 13 C3
o 04 43 c (U40 M 43 cfl I-H CU •H O ”3 3 3o 0) CU c C 43 c CU cU c CU •3 B rH 43 43(U •o 43 CU •H (U CU t3 CU O CU (3 3 CX CXQ rH CX rH (U Ta x> rH c •H rH •H CU CU C C i 3 •H 'H 3
(0 o >> r-l rH rH Cfl (U o -o C3 4-1 o o Cfl (3 -3 -3 C4J 4-1 4-1 o >> >> N N N N cfl cfl 3 43 43 3 3 1 1 3(U 0) 0) IH M f—
1
(3 c c c 4-1 4J 43 P 3 3 B m cn 43u u O u O rH CU CU 0) CU 3 3 1 Cfl 3 •H p A A 4->
cU CU cfl cfl Cfl 43 4i 43 43 ^H CJ 3 o 3 rH rH 3
58
ethylbenzene
x
He,N
x
3,13,14,16-19,22,23
ethylene
x
He,N
x
3,14,23,28
ethyl-methyl
benzene
-
N
x
17
formaldehyde
-
-
x
22
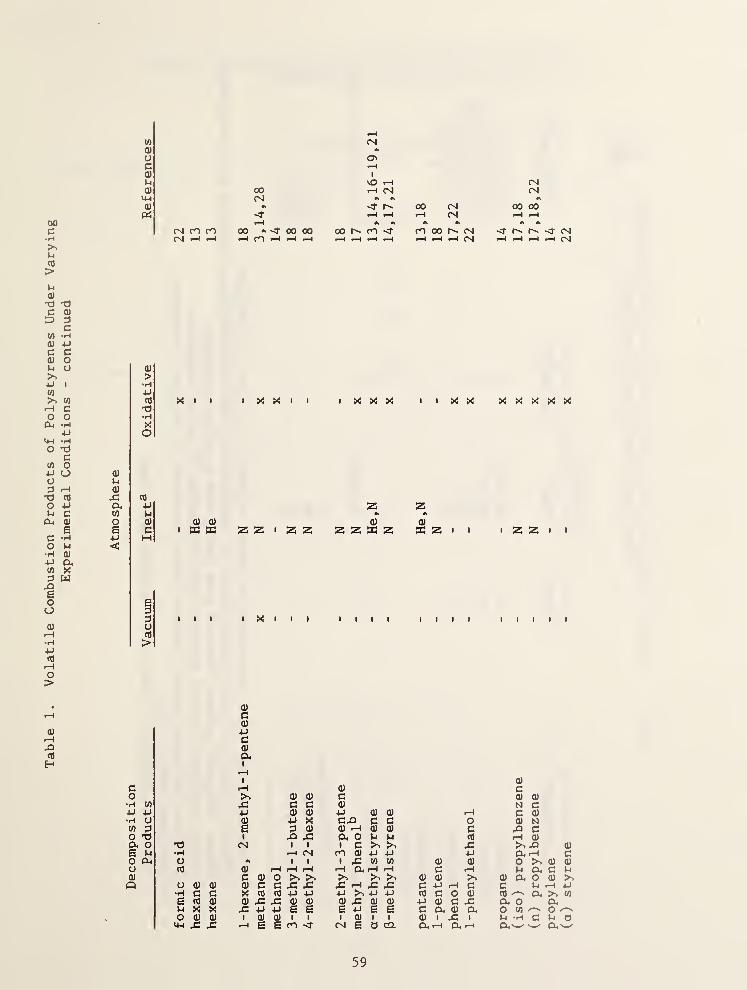
Table
1.
Volatile
Combustion
Products
of
Polystyrenes
Under
Varying
Experimental
Conditions
-
continued
cn
(U
CJ
c0)
0)i4-(
0)
«
00CNI
CM
cn
I
VOcs
r>- 00 cs
cNimm 00 *>'3’ooooCN| I—I »—1 t-H C'O »“H 1-H »-h
oor^m<- moorxcsT—t I—I T—H t—( f— t—( T—H (Vj
CNCM
00 00
<j- CMT—H *-H t-H t—
H
(U
>'H4JnJ
t3•HXo
(U
p0)
cO
CX PM Po (U
a cp M<
3oCO
>
X I I I X X I I
0) 0)
I s S Z Z I z z
XIII
I X X X
0)
z z n; z
X X
0)
w z I
X X X X X
I Z Z I I
0)
pc(Ua1
c1
rH (U
o >> (U 0) c•H CO 42 c c 0)
p p P 0) (U p 0) 0)•H o (U p X C343 C3 S3(0 3 a 3J O) 0) P (U oo t3 43 43 a o P pcx o CM 1 1 1 ca p •H CM ro 0) P po PL| CJ A 1 1 43 w (0
o CO (U rH rW rp »H Qn| rH rH0) c 0) o >> >. >> >.Q O 0) 0) 0) c c 43 43 43 p 43 43H c c X CO cO P P p p P
a CO 0) (U 43 43 CD (U 0) 43 0) 0)
p X X 43 P P a a a p a ao 0) 0) 1 0) 0) 1 1 1 (U 1 1p 4= 4= 1—
H
a a cn CM B 0 CQ.
0)
c0) (U
C -P(0 cP 0) c j::
c a 0) cu0) I ^
•—I D< '
I
O (UN c
rH C (U
o 0) Nc 43 CcO P 0)
43 >»43P CX P0) o 0)iH P cx c
Q} a. o 0)
C P(0 ^ a.cu o D.O OT OM -H c P OCL,s^ w' cii—
'
59
styrene
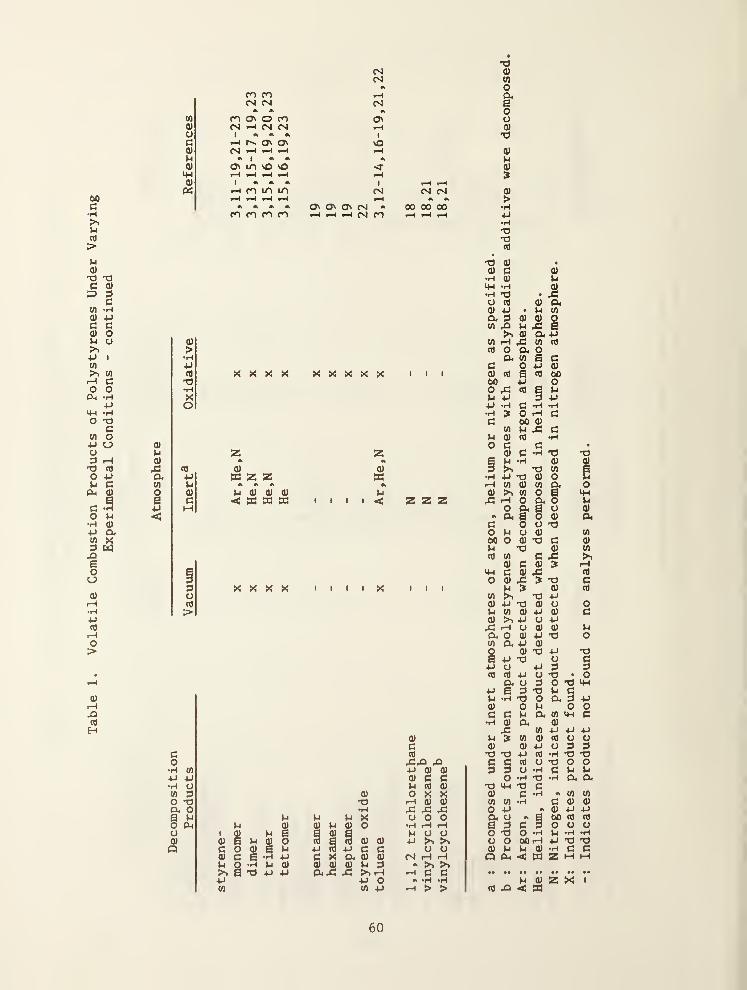
Table
1.
Volatile
Combustion
Products
of
Polystyrenes
Under
Varying
Experimental
Conditions
-
continued
CScs
m mCNi CM CM
0k 0k 0k
w m as o m as0) (S CM CMo 1 0k 0k 1
c rH rv as as vO0> <sp 0k * 0k
0) as oCP rH0) 1 * A 1
a rH m m in (M CM CMrH rH 0 0
* 0k o^ a\ ON cs 0 00 00 00ro CO cn cn 1—
<
•H (N| m
a)
(0
o
i*ou0)
0)
M0)
0)
>•H•P
'O
n)
0)
M0}
rCP4Ui
o
B<
cd
P0)
C
>i X >i X X X X X!
0)
s z zA AM 0) 0) 0)
c a z » I I I I
0)
a0k
h<
X X X X I I I I X
z z z
0)
c(d
axiP 0) 0)
0) c(d 0)
w 3 cu o X Xo a a rH (U (U
cx o •H a a aa p p p p X o o oo a p cu (U p (U o •H rH iHu 1 cu p a a (U a o o0) 0) a p cu o Cd a Cd 0) 0) +J >» >>Q c O 0) a p P cd P c c u o
0) c a •H p C X cx (U 0) CM iH rHp o -3 p 0) 0) cu (U p 3 A 5>^ >.s a a p p Pua a s rH fH C Cp p o A •H «Hw w p > >
a cu •
(U c 0)•H cu p
•H 0)•H a • ao cd (U a0) p • P wcx 3 0) 0) o
V)
cd
cQ)
00OPP
u a0) aHaw
o a oaweo Pepcd
B
cd cd
•H ?
W0)
c0)
p
pw>>
C -HO -HOO (U
p acd
cC -H•Haa 0)
0) w
Q. B6 O
bO O 0) ap acd w c: <
cu c: cup C (U
0 (u a 9p ^
w >k a0) p a (U
p w cu pcu >> p CJ
a iH CJ (U
(X o (U Pw cx P CU
o (U aBp a(j p
cd cd P CJ
cx u 3P a ap •H a o0) o pc C P cx•H cu cxa wp ? w cu
(U (U pa a p cd
c c cd CJ
3 CJ •HO *H aa p a c
(U c •HW cn -Ho p 0cx CJ •> Pa 3 C 3o a o •Hu O OOrH0) p p (U
o cxi <; n
p 0)
cd a < a
C0)
00opp•Hc
c•H
a0)
wo
ou0)a
s
a0)
po0)
p0)
Po3aopcx
w0)
pcd
o•H'Oc
•> w wCOO)QJ p p60 cd Cd
o o oP *H *Hp a a•H c cZ M M
60
product
found.
product
not
found
or
no
analyses
performed.
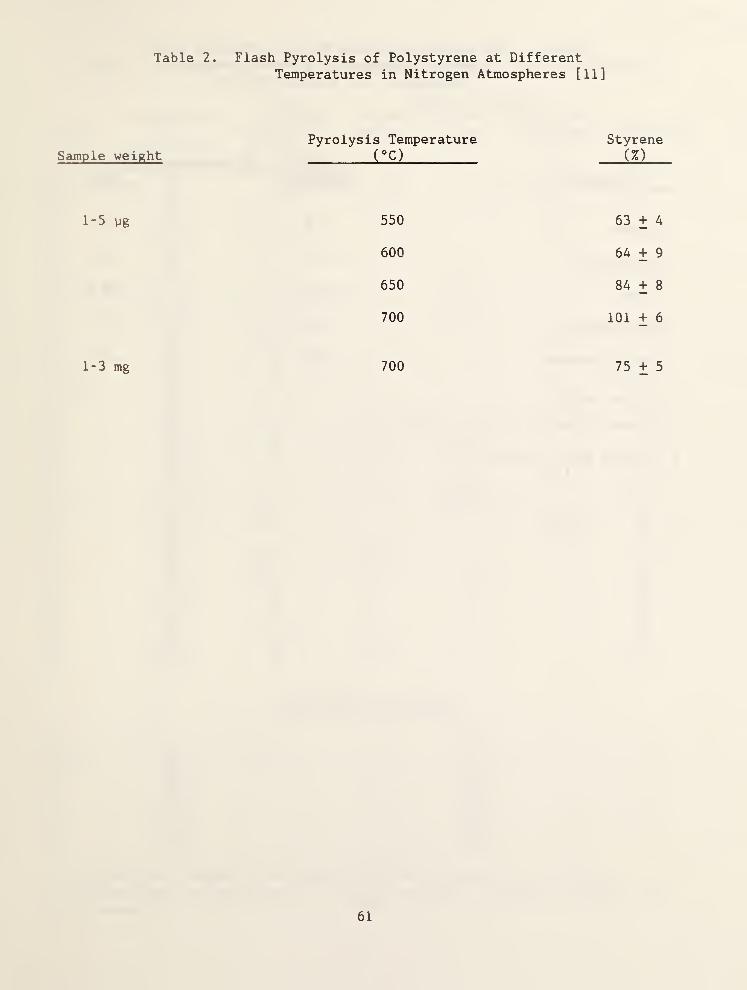
Table 2. Flash Pyrolysis of Polystyrene at DifferentTemperatures in Nitrogen Atmospheres [11]
Pyrolysis Temperature StyreneSample weight ( °C) (%)
1-5 yg 550 63+4
600 64+9
650 84+8
700 101 + 6
1-3 mg 700 75+5
61
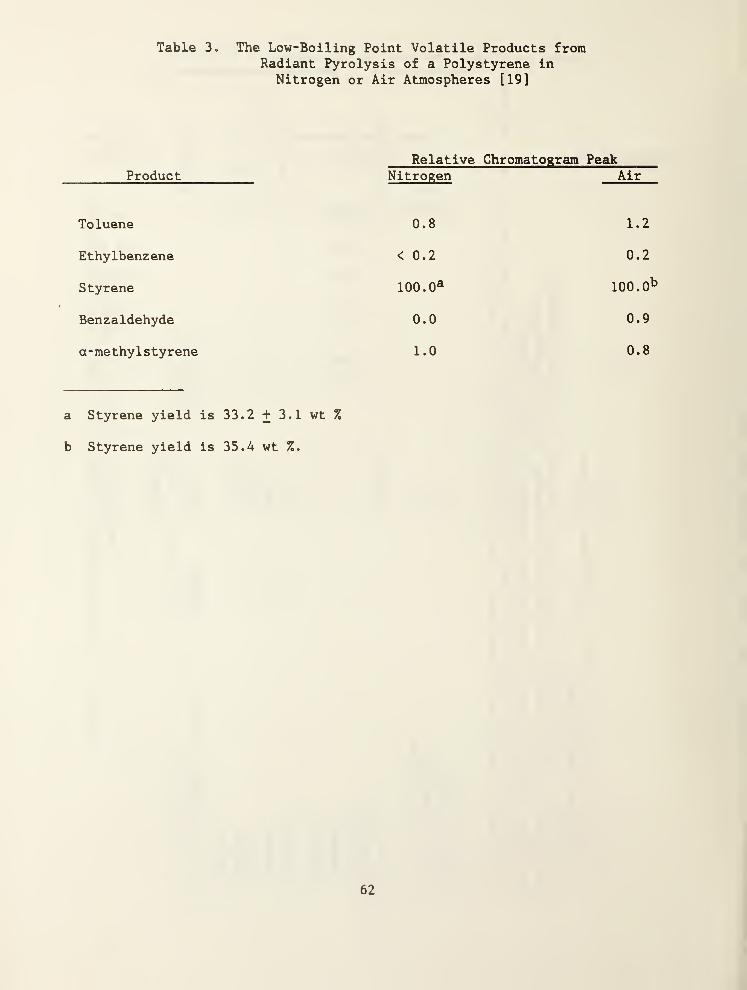
Table 3. The Low-Boiling Point Volatile Products fromRadiant Pyrolysis of a Polystyrene in
Nitrogen or Air Atmospheres [19]
Relative Chromatogram PeakProduct Nitrogen Air
Toluene 0.8 1.2
Ethylbenzene < 0.2 0.2
Styrene 100.0^ 100.0
Benzaldehyde 0.0 0.9
a-methylstyrene 1.0 0.8
a Styrene yield is 33.2 + 3.1 wt %
b Styrene yield is 35.4 wt %.
62
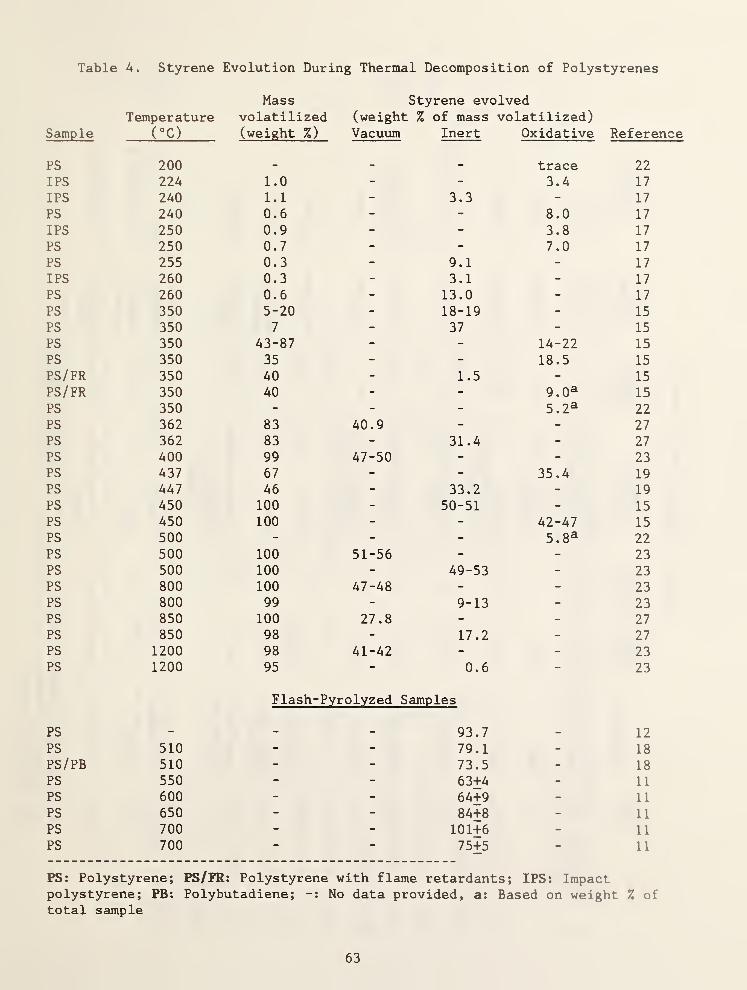
Table A. Styrene Evolution During Thermal Decomposition of Polystyrenes
SampleTemperature
(°c)
Massvolatilized(weight %)
Styrene evolved(weight % of mass volatilized)Vacuum Inert Oxidative Reference
PS 200 _ _ trace 22
IPS 224 1.0 - - 3.4 17
IPS 240 1.1 - 3.3 - 17
PS 240 0.6 - - 8.0 17
IPS 250 0.9 - - 3.8 17
PS 250 0.7 - - 7.0 17
PS 255 0.3 - 9.1 - 17
IPS 260 0.3 - 3.1 - 17
PS 260 0.6 - 13.0 - 17
PS 350 5-20 - 18-19 - 15
PS 350 7 - 37 - 15
PS 350 43-87 - - 14-22 15
PS 350 35 - - 18.5 15
PS/FR 350 40 - 1.5 - 15
PS/FR 350 40 - - 9.0^ 15
PS 350 - - - 5.2^ 22PS 362 83 40.9 - - 27PS 362 83 - 31.4 - 27
PS 400 99 47-50 - - 23PS 437 67 - - 35.4 19
PS 447 46 - 33.2 - 19
PS 450 100 - 50-51 - 15
PS 450 100 - - 42-47 15
PS 500 - - - 5.8^ 22PS 500 100 51-56 - - 23PS 500 100 - 49-53 - 23PS 800 100 47-48 - - 23PS 800 99 - 9-13 - 23PS 850 100 27.8 - - 27
PS 850 98 - 17.2 - 27
PS 1200 98 41-42 - - 23PS 1200 95 - 0.6
Flash-Pyrolyzed Samples
23
PS - - - 93.7 - 12
PS 510 - - 79.1 - 18
PS/PB 510 - - 73.5 - 18
PS 550 - - 63+4 - 11
PS 600 - - 64+9 - 11
PS 650 - - 84+8 - 11
PS 700 - - 101+6 - 11
PS 700 - - 75+5 - 11
PS: Polystyrene; PS/FR: Polystyrene with flame retardants; IPS: Impactpolystyrene; PB: Polybutadiene; -: No data provided, a: Based on weight 7, oftotal sample
63
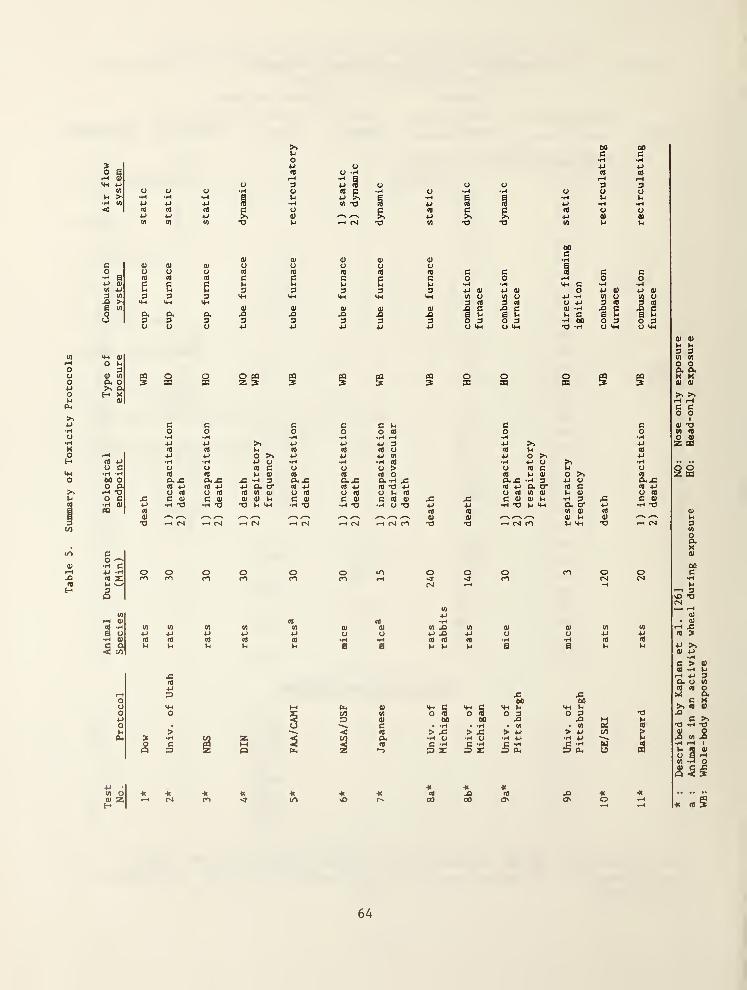
Table
5.
Summary
of
Toxicity
Protocols
(A
U ><
'T3
Uo
U -H
§
W 'O
'TS *T3 *o
C00c
4JCA
:3 (A
Xi >B (A
OO
0) O 0) O 0)0) 0) O u O o U U ao u u CO CO CO CO CO c c c(0 CO CO c 3 c C c O o i-H oc 3 c u u C M •H •H V4H C •Hu U 3 3 3 3 3 4J 0) o 4J 0)
3 3 3 Mh UH H-4 4H (A O M U 4-» -H (A U
a.3u
au
0)
D
Q>
Xx34^
0)
3
0)
XX3
3 CO
§ EO 3U 4-(
&
M-t 0)
O M3
0) (A
&gH X0)
os oX oz g g 5ow o
S3oW
c c C c c u 3 3o o o o O (0 O 0•H •H •H •H •H rH •H •H4J u 4J 4J 4-» 3 4J >> 4JCO (0 CO CO (0 CJ CO U 3
fH 4J 4J o >» 4J 4J 4J (A 4J O 4JCO 4J •H •H 4J u *H •H •H CO •H 4J u •HO c U u CO c U u u > U CO 3 L U•H •H CO CO U 0) CO CO CO O CO 0) o >> 3GO o cl4x: o,x: x: •H 3 <xx: 0« *H .3 O.Xi •H 3 4J u 0.4SO a CO 4J CO 4J 4J o* O' CO CO 4J CO 73 4J CO 4J CL* O’ CO 3 3 4J
U <0 U CO CO (A 0) O CO U (0 U U cO o CO (A 0) 3 U 3O c .c C 0) c o 0) 0» C 0) C 0) C CO 0) .3 c Q> <U 1.4 •H 3 3 0)•H 0) 4J H »o V4 Cm *H T3 •H *0 •H o T3 4J •H *3 CM a O’ 4J •HPQ CO CO CO (A 0 3
0) \ /-*s /.“N /-«s 0) 0) 3 u 0)rH rM -H CN CN •M CN r-H (N rH <N m T3 •3 rH (N m u CM *3 *H (N
oro
ra
V)
4-1
ra
Wi
3
o mm ^ o o omCN »-«
CO
0) 0)
u u•H *He a
(A
4J•H
CA ^ (A
4J ^ 4J<0 cO CO
U U M
0)
U•Ha
mooCM rs
0) (A (A
U U U•H <0 cO
B u U
X 42GO GO
Pu 0) CM 3 CM C CM CM 1-t
C/i (A 0 3 0 3 0 3 O 3 •3
35 0) GO 00 X X sM
3 • .H • *H • (A • (A 3< 3 > .3 > 42 > > 4J (/)
a •H O •H O •H M •H M3 3 *H C *H M jsZ »-) 35 £ 5 £ 5 04 £ 04 O P2
4J •
(A O -K «0) Z ^ CN
4Cm « •K
»n sOCO
00 GO
ic
CO
O'.oO' o
•K CO S
64
Described
by
Kaplan
et
al.
[26]
NO:
Nose
only
exposure
Animals
in
an
activity
wheel
during
exposure
HO;
Head-only
exposure
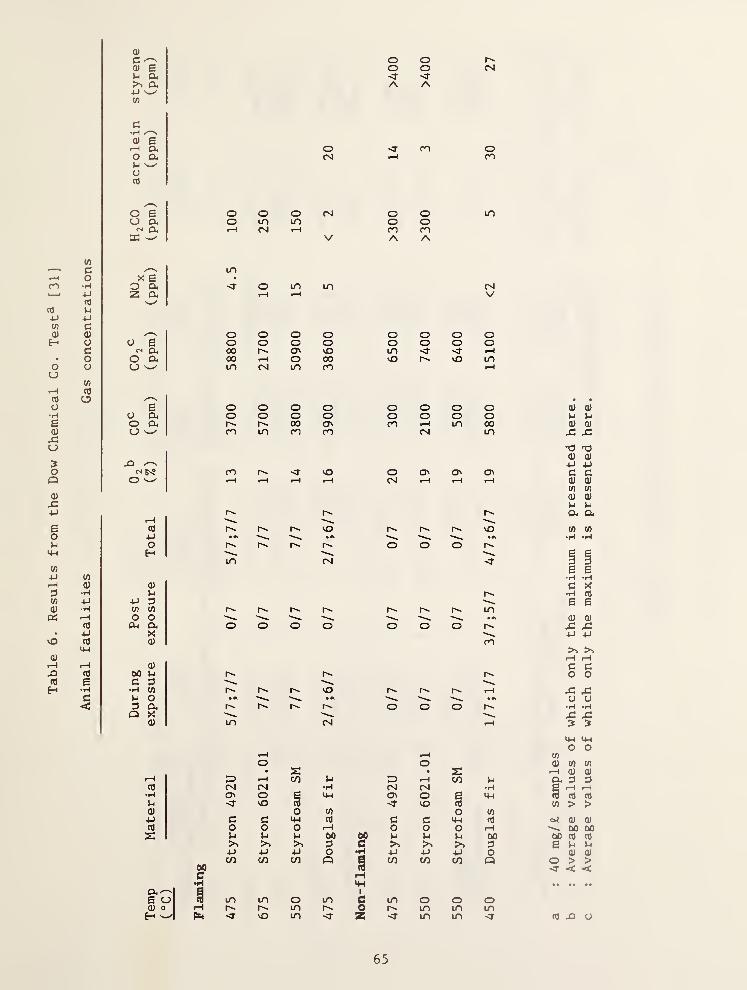
Table
6.
Results
from
the
Dow
Chemical
Co.
Test^
[31]
0)
c ^ o o0) e o o CM
a, <o.
t-i w A Aw
c•H0) eI—1 Ol< o '3" m oo cx>-l 'w'o(T3
CN m
O 6 o o o CM O o mo ex o m m o oCM 0< pH CN| m m
33 w' V A A
in
C —
\
mo X e >
•H o ex <3" o m LO CMu z a f—
H
VcO '
t-i
4J
C0) O o o o o O o oo o S O o o o o o o oc CM cx 00 O' so in <r -cj-
o o ex 00 o 00 VO vO mo o ^ m CNI m CO
in
ctJ
O£ o o o o o o O o
o ex o o o o o o O oo cx 00 O' CO mH m 00O w ro m on CO CN| m
CM Js® m 'O o o^ <yy a\O W 1-H t-H CM rH tH
nj
ufO
co
B•Hc<
cO
4JoH
0)
XtJ 0in in
o oex ex
X0)
0)
00 Xi
c 0•H to
X o0 exQ X
0)
0) (1)
U Vj
(U 0)
.C rC
t3 T30) 0)
4Jc ca) 0)
in in
<u 0)
<x a
toO o tu CO to• z • Z f-l 0) cu
i-H 33 f-H t/3 Xi 33 CO Xi ex d dto CM CM •H CM CM •H £ rH•H CJc O p O P p td CtJ cdXi '3- SO <T vO fu to > >tu o CO O toXI c: c p cd C B p CtJ o< 0) 0)(0 o O O rH o O o rH 00 00z X Xi Xi 00 Xi Xi Xi 00 00 cd cd
>> 0 B >> >, >M d e X Xip p p O •H p P P o 0) 0)
M CO CO CO Q a CO cn cn Q o > >•^T < <
B rH»p
ex-^e o m LO o m B in o o oa) o m 0 in m inH w '3' lO m <r Z in m (d P u
65
of
which
only
the
minimum
is
of
which
only
the
maximum
is
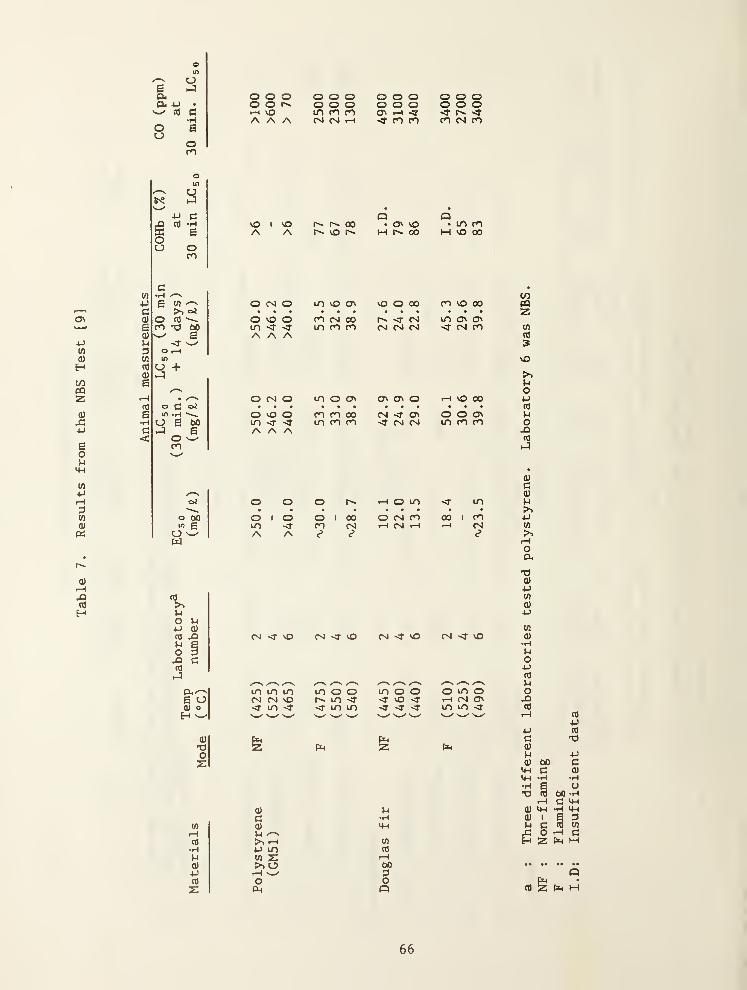
Table
7.
Results
from
the
NBS
Test
[9]
^ oaCUp^ jj •w cd c
•Ho au on
o o o o o o o o o o o oo o o o o o o o o o op NO m m m ON rd d •d dA A A rd rd i-d •d m m m rd m
ohJ
u cXJ C6 *HK aoo o
cn
C•Ha w
ojo (dm -o too
aO ,—
I
U)
O +t-J
C oi•Ha Mom
otoo
a
cd
t>^
uo vj4J 0)
td wQ^ ao 3XI ccd
X)
a oa) oH
vOA A
O CN O
00VO
m vo ov
ON NOr>. 00
NO O 00
in mNO 00
m NO 00
O NO O CO Cv) 00m 'd' <• m m cnAAA
O (S o in o ON
-<r (NCN (N <N
ON ON O
in ON ON< cN m
r-l NO 00
O NO oin 'd- 'd'AAA
O I Oin -d"
A A
cN -d- NO
in m inrd cs vo-d m -d-
m n 00in m fo
ocn
I 00CN
rd -d- vo
moom <r<t in m
1*1
rd dT ONd rd cs
o O ONm m cn
rH o mo m COr-H Cd >—
I
m00 I m.-I Cd
rd d" NO
mood NO -dd d d
rd d NO
o m of-H rd ONm m d
CO«2wn)
»
NO
>N}-l
OPCd
poXcd
hJ
0)
c0)
u>>4-)
>>rHocx
0)
Pu(U
pV)
0)•HpOpcd
PoXcd
Pc0)
p0) tooip cIH -H
0) PC •H
C/l 0) 4d1—
1
p ^cd 5n --d cn
•rd P m cd
P w X 1—
1
0) >> O too
p rd V—
'
0cd O oX Pd Q
73 cd too
rd C(U P *H0) I gP O cd
jfi O rdH Z P-d
PP
66
I.D:
Insufficient
data
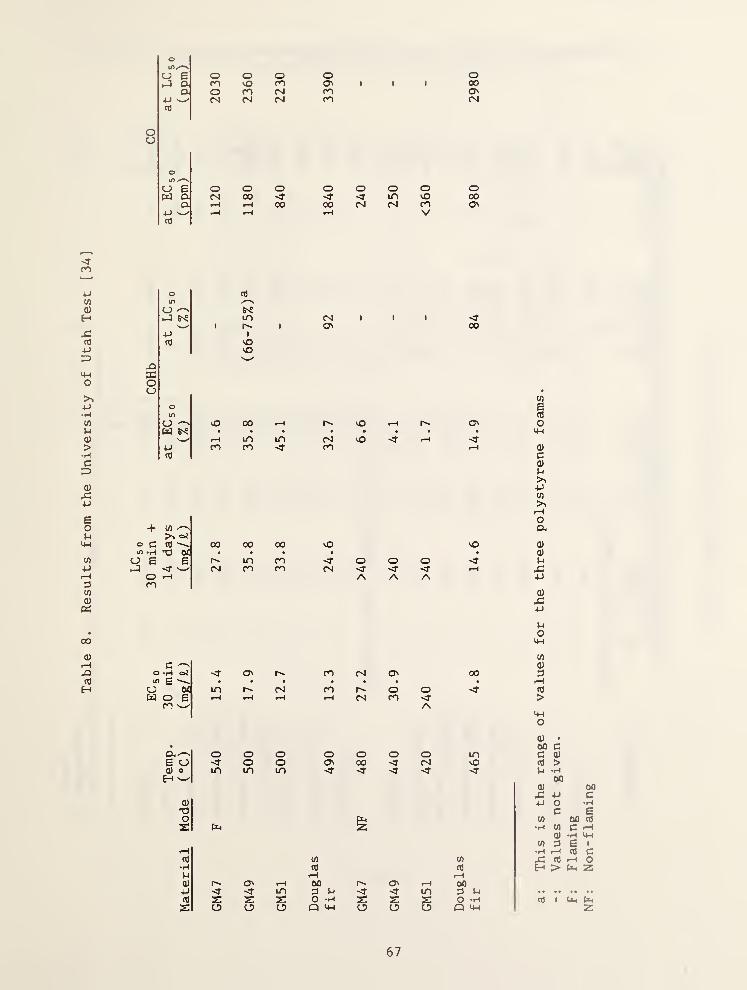
Table
8.
Results
from
the
University
of
Utah
Test
[3A]
O 6 o o o O oW & m vO m 1 1 1 00
a o ro CM m o4J w (N CNl (N m CN
o e o o o o o o o ow a 00 in vO 00
a 00 00 cs rvi m CJ»
4-1 'w' t-H V
o COmO S'?m
V 1
4-) 1
(TJ vOvO
o ^W Bn?
4-1
> c>
e
om
W /—V
>>trJ —t3 wj
e
(No> 00
vO 00 \o rH Ov
u
o14-4
m LD CM VO 'O' i-H <rro m 'T m (1)
c(Ui-i
U)w
oft
00 00 00 vO vO 0)• • • • • 0)m m o O O -cl- V4
CN m n CN •4f -O’ XA A A 4-1
0)
X4-1
uo
co tH o4m £ '
—
u 04WOEro —'
d,^e O0) oH
W wz
OV ro cs cyi 00 3• • • • • • • 1—
1
in CNl cn o o <r cO»—
4
1-H CN m 'O’A >
»4H
o
0) •
00 co o o o o o O in c 0)
<r o o ON 00 < CN vO CO >m in m N- 'T <r 'O’ 'O’ J-4 *H00
CT> rH 00 C3V 00'O’ 'O’ in 0 u 'O’ 'O’ m d >-i
s: z Z O -H s z Z O -H cO 1 U-i Oli
o o o Q IH o o o Q M-I z
0)
X4-1
V)
X (0
H >
67
Flaming
Non-flaming
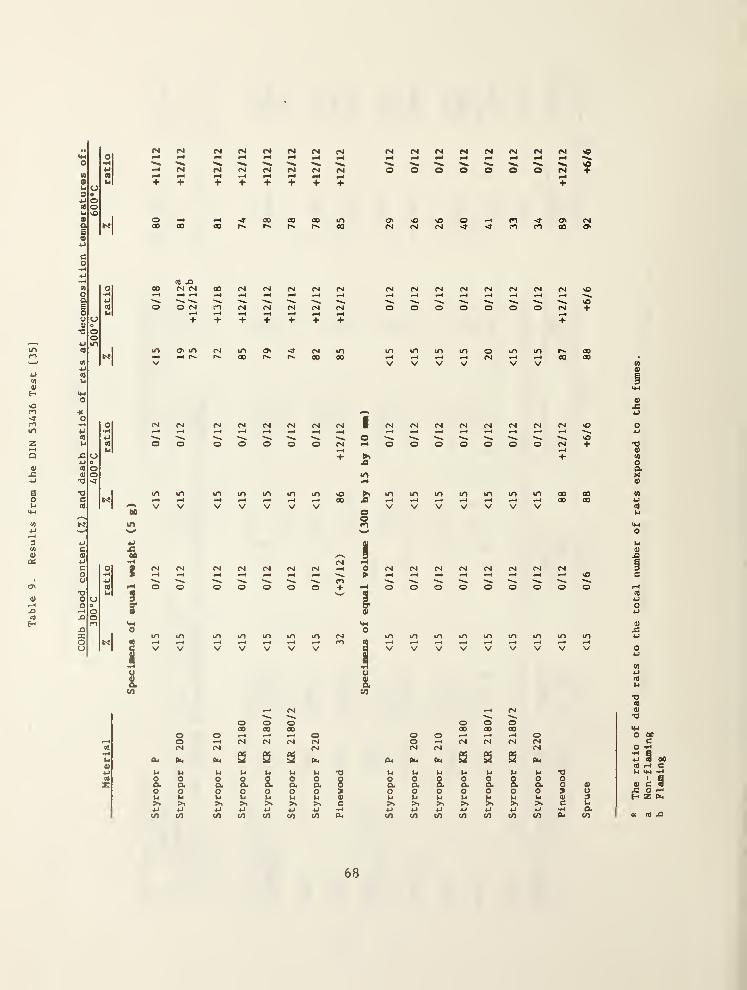
COHb
blood
content
(Z)
and
death
ratio*
of
rats
at
decomposition
temperatures
of;
300°C
A00°C
500°C
600*0
Material
Z
ratio
%
ratio
Z
ratio
Z
ratio
<s CM CM CM <M N CM CM CM N CM CM CM CM «
CM CM CM CM CM CM CM O O O o O o O CM ++ + + 4- + •f + +
O -0“ 00 00 00 in O' >o O cn O' (M00 00 00 r*. r- r**. 00 CM CM CM en <n 00 O'
CO ^r4 cs
O' lO (N iD-H r-t r>. 00V
O'rv r>.
CM00
in00
mV
mV
in in o in mr-H 0*4
V V V Vr*>
000000
x m A
68
The
ratio
of
dead
rats
to
the
total
number
of
rats
exposed
to
the
fumes.
Non-flaming
Flaming

Table 10. Concentration-Response Data from a Polystyrene Decomposed viathe NASA/USF Toxicity Test Method^ [A9]
MassLoaded
(r)
Numberof
Tests
Time toDeath(.min)
Mortality(%)
CO(ppm)
CH^(ppm)
0.1 1 26.6 + A.l 75 900
0.2 1 25.2 + 2.
A
100 AOOO
0.5 2 28.1 + 1.2 38 + 18 A600 + 1130
1.0 5 27.5 + 1.3 100 + 0 6900 + 2000 760 + 160
2.0 A 28.0 + A.
5
62 + A3 A650 + 2250 1A50 + 7A0
5.0 2 2A.8 + 6.5 100 + 0 3500
a: Rising temperature program (200-800°C at A0°C/min)
69
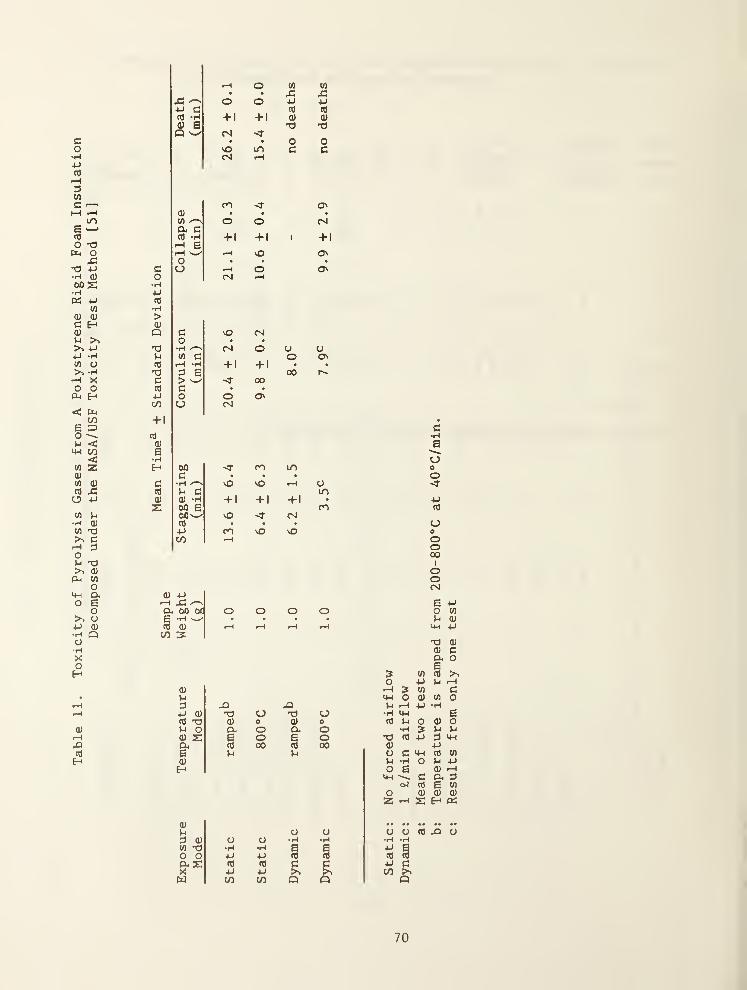
Table
11.
Toxicity
of
Pyrolysis
Gases
from
A
Polystyrene
Rigid
Foam
Insulation
Decomposed
under
the
NASA/USF
Toxicity
Test
Method
[51]
co•H4J
•H>0)
Q
W
TJcCO
-uC/D
CCO
0)
o w u• . X 42
N o o 4J Uc
+1 +1CO cO
•H o; 0)
e ts tjfM
• • 0 0vO to c ccs fH
0)
w ^a cCO *H'—I srH w-oa
co•HW C
C/D
mo+ 1
r™H
CNI
o+1
vO
O
O'
cs
+1
O'
C3'
vO CN• .
CNi o O oO ON+1 +1 • •
00'O' CXD
o O'CN
c•Ha
ooo 'O' m to 0c . • • o•H vO o u -O'
C in0) -H + 1 -H +1 • 4J00 a
vO CMm CO
cO . . • a4-> m vO SO 0C/D f-H Oo
(X)
ooCN
4-1
42 ^ a 4-4
00 0( o O o o o to
•H • » • • >-l (U
0) rH t-H rH rH >H 4-)
:s73 (U
0) ca o
5 V) >>o 4J V4 rH
0) (0 c>-i iw O 0) (0 o0 43 43 V4 r-i 4-1 •H
a4J 0) 'O o 73 O •H >4-4
CO XJ (U 0 a) 0 cO V4 o 0) ou o (X o a. o •H ? >-l
0) S o P o x3 cO 4-* d >4-1
a. (X) 00 (U 4-J
a u O c >4-4 CO CO
(D V4 •H O V4 4-1
H o a 0) rH>4-1 c o. d
o? cO a CO
o 0) 0) 0)
z rH s H OS
(U
V4 o u o CJ CO 4D CJ
d 0) o o •H H •H •H« -o •H •H P p 4J Po o 4-1 4-J CD (v CO
CO 10 c 4J4-1 4-» s C/D
C/D C/D Q Q a
70
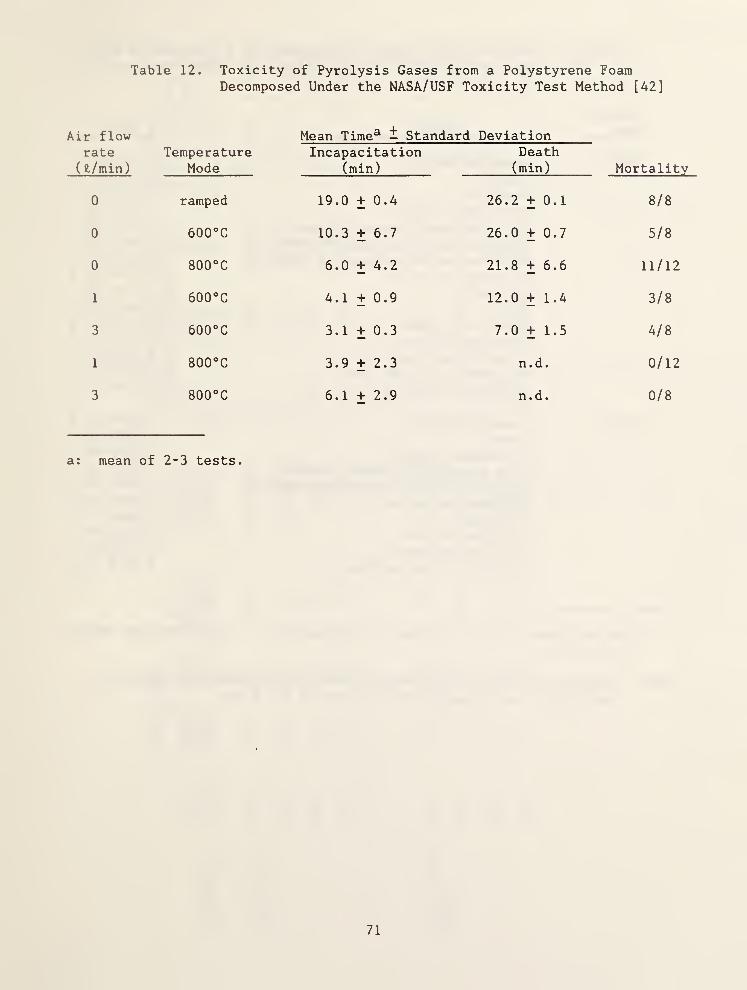
Table 12. Toxicity of Pyrolysis Gases from a Polystyrene FoamDecomposed Under the NASA/USF Toxicity Test Method [42]
Air flow Mean Time^ — Standard Deviationrate
( 2,/min)Temperature
ModeIncapacitation
(min)
Death(min) Mortality
0 ramped 19.0 + 0.4 26.2 + 0.1 8/8
0 600°C 10.3 + 6.7 26.0 + 0.7 5/8
0 800°C 6.0 + 4.2 21.8 + 6.6 11/12
1 600°C 4.1 + 0.9 12.0 + 1.4 3/8
3 600°C 3.1 + 0.3 7.0 + 1.5 4/8
1 800°C 3.9 + 2.3 n. d. 0/12
3 800°C 6.1 + 2.9 n.d. 0/8
a : mean of 2-3 tests.
71
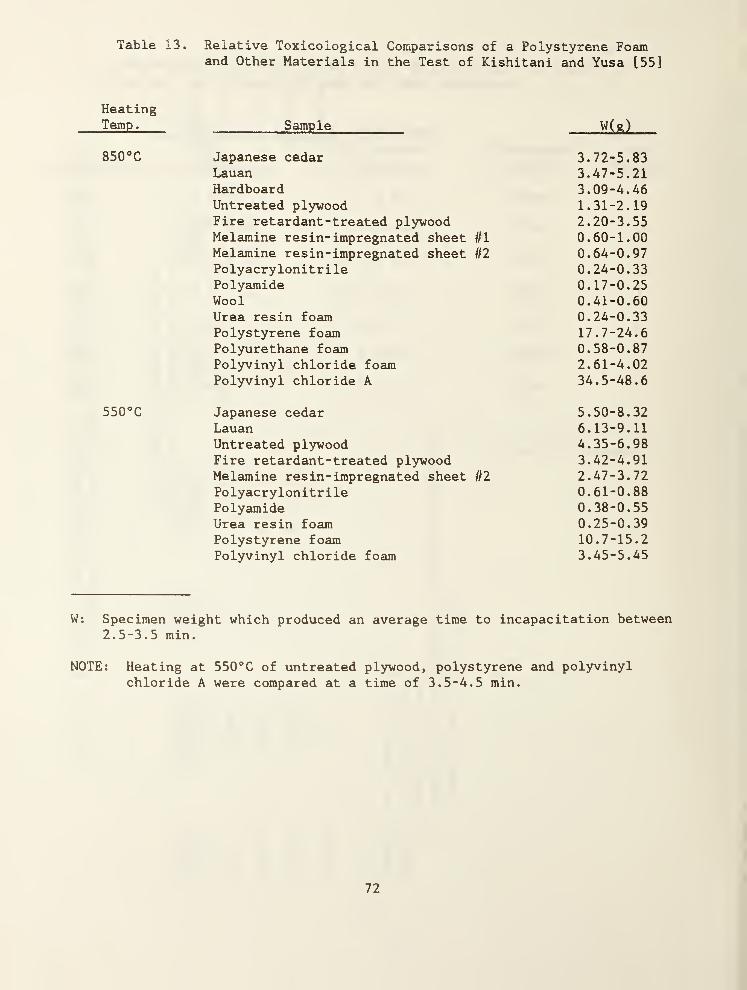
Table 13. Relative Toxicological Comparisons of a Polystyrene Foamand Other Materials in the Test of Kishitani and Yusa [55]
HeatingTemp. Sample W(g)
850°C Japanese cedarLauanHardboardUntreated plywoodFire retardant-treated plywoodMelamine resin- impregnated sheet //I
Melamine resin- impregnated sheet ifl
PolyacrylonitrilePolyamideWoolUrea resin foamPolystyrene foamPolyurethane foamPolyvinyl chloride foamPolyvinyl chloride A
3.72-5.833.47-5.213.09-4.461.31-2.192.20-3.550.60-1.000.64-0.970.24-0.330.17-0.250.41-0.600.24-0.3317.7-24.60.58-0.872.61-4.0234.5-48.6
550°C Japanese cedarLauanUntreated plywoodFire retardant-treated plywoodMelamine resin- impregnated sheet iHPolyacrylonitrilePolyamideUrea resin foamPolystyrene foamPolyvinyl chloride foam
5.50-8.326.13-9.114.35-6.983.42-4.912.47-3.720.61-0.880.38-0.550.25-0.3910.7-15.23.45-5.45
W: Specimen weight which produced an average time to incapacitation between2. 5-3.
5
min.
NOTE: Heating at 550°C of untreated plywood, polystyrene and polyvinylchloride A were compared at a time of 3. 5-4.
5
min.
72
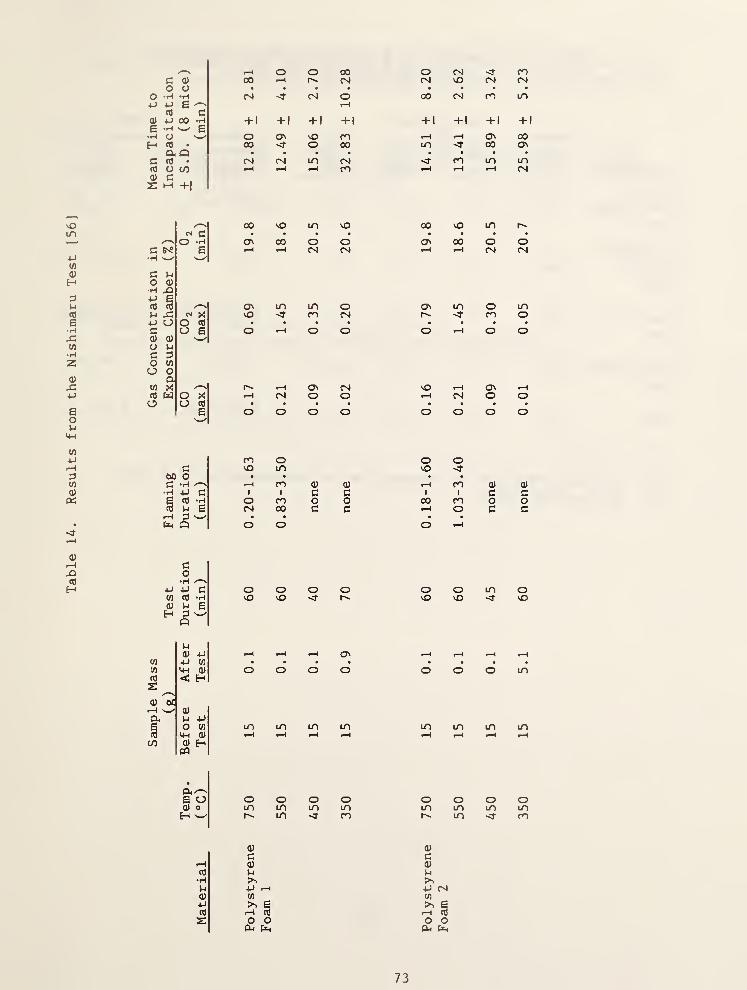
Table
14.
Results
from
the
Nishimaru
Test
[56]
/~s o o 00 o CN 'O' mc 0) 00 CN. CNI CN| NO CN| CNl
o o . • . . • 9 •
o •H •H cs < CNI o 00 CNI cn in4-1 4-) e
CO c0) 4-1 OO -H +1 + 1 + 1 +1 + 1 + 1 + 1 +e •H 6•H o ' / o ON NO m t-H 1-H ON 00H CO . 00 40- o 00 m <• 00 ON
a Q • « • • • • • •
C CO • CNJ CNI in CNl 'O' cn in incO o CO 1—
C
f—
c
cn .-H t-H cs0) cS M +1
/-—
s
00 NO in NO 00 o m fNC^ C . • • . . • . .
O -H ON 00 o o CJN 00 o oc S'? e f—
(
t-H cs CN 1-H rH cs cs•H V—
^
Vw'
c V4
o 0)*H 434J EnJ CO C3N m m O C3N in o in
4= cj X NO cn CNI f'- cn o4-1 O O CO . . . . . • . •
c o e o f—
c
o o O t-H o o0) 0)
o uc0 «o o
aw X .-H C3N CN| NO rH C3N f-H
M O X .-H CNI O o CM o oo O CO . . . • • • . .
s o o o o o O o o•w'
m o o oc vO m NO
bO o . • . •
C •H /—
^
.-4 m o 0) f-H m 0) 0)•H 4-) C 1 1 c c 1 1 c cP cO *H o m o o 00 cn o oc3 ^4 e CNI 00 c c o c c
• • • •
Q o o o f—
H
co•H
44 44 C o o o o o o in ow CO 'H NO NO Nf C" NO NO 'O' NO0) l-i EH ^ wQ
l-i
0) 44 r*H t-H C3N rH rHC/1 44 W • • • . • • •
M 14-1 (U o o o o o o o mCO < HS
/-
—
s
(U ur—1
'—
^
01
O.
§
|4 44O W in in m m m in m mIH 0) rH iH tH rH
cn 0) HPQ
s o o o o o o o o o0> 0 m m m m m m m mH w C'. m 'O' cn C'- m 'O' cn
0) 0)
c ci—i 0) 0)
cO u i-i
•r4 >N inM 44 44 CM0) cn cn
44 >N P >N PCO rH Co rH Cu
s o O o O04 04 IH
73
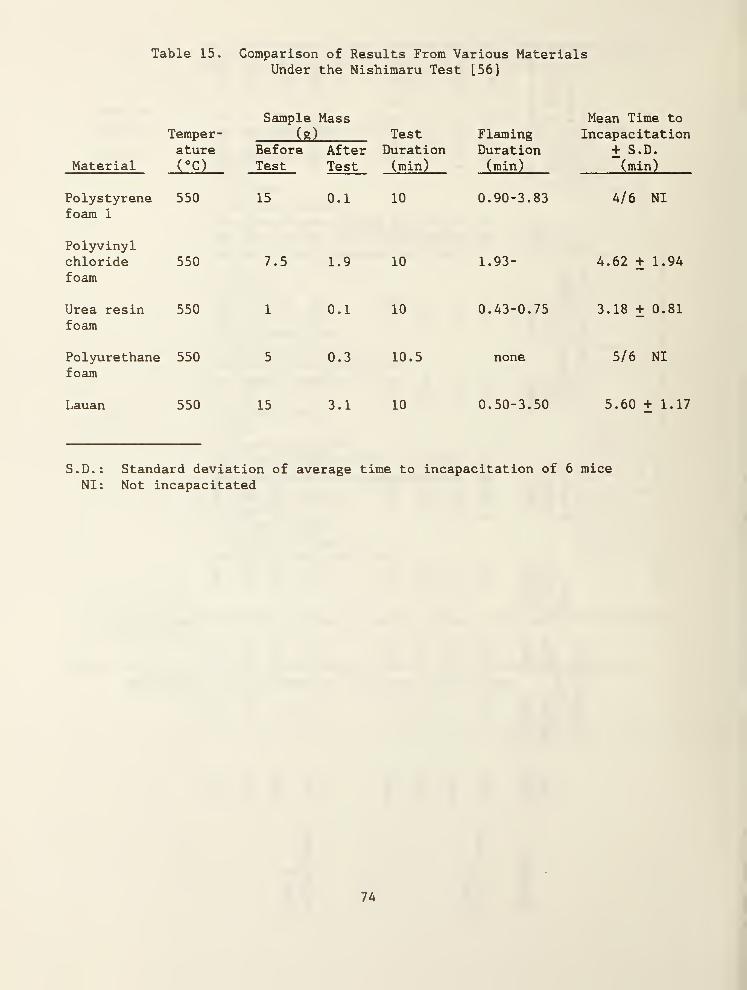
Table 15. Comparison of Results From Various MaterialsUnder the Nishimaru Test [56]
Material
Temper-ature(°c)
Sample Mass
(8)Before AfterTest Test
TestDuration(min)
FlamingDuration(min)
Mean Time to
Incapacitation+ S .D.
(min)
Polystyrenefoam 1
Polyvinyl
550 15 0.1 10 0.90-3.83 4/6 NI
chloridefoam
550 7.5 1.9 10 1.93- 4.62 + 1.94
Urea resinfoam
550 1 0.1 10 0.43-0.75 3.18 + 0.81
Polyurethanefoam
550 5 0.3 10.5 none 5/6 NI
Lauan 550 15 3.1 10 0.50-3.50 5.60 + 1.17
S.D.: Standard deviation of average time to incapacitation of 6 miceNI: Not incapacitated
7A
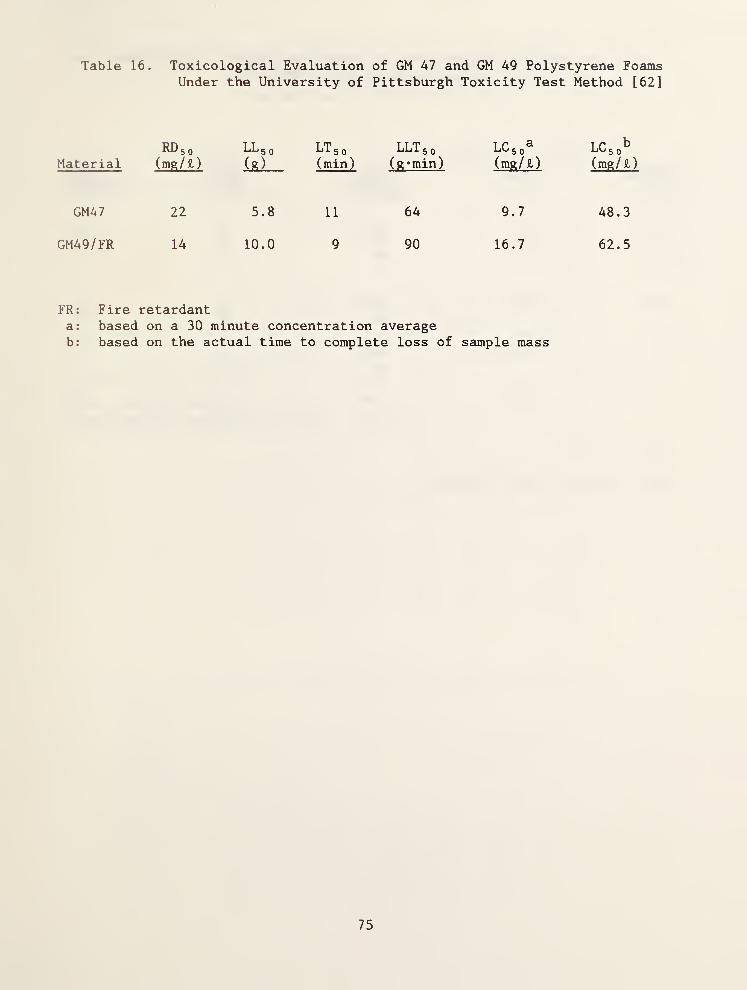
Table 16. Toxicological Evaluation of GM 47 and GM 49 Polystyrene FoamsUnder the University of Pittsburgh Toxicity Test Method [62]
^5 0 LLg 0 LTso LLTso TP ^^'^5 0
TP ^'-‘^5 0
Material (mg/ 2.) i&) (min) (g*min) (mg/ Z) (mg/ 2,)
GM47 22 5.8 11 64 9.7 48.3
GM49/FR 14 10.0 9 90 16.7 62.5
FR: Firea: basedb; based
retardanton a 30 minute concentration averageon the actual time to complete loss of sample mass
75
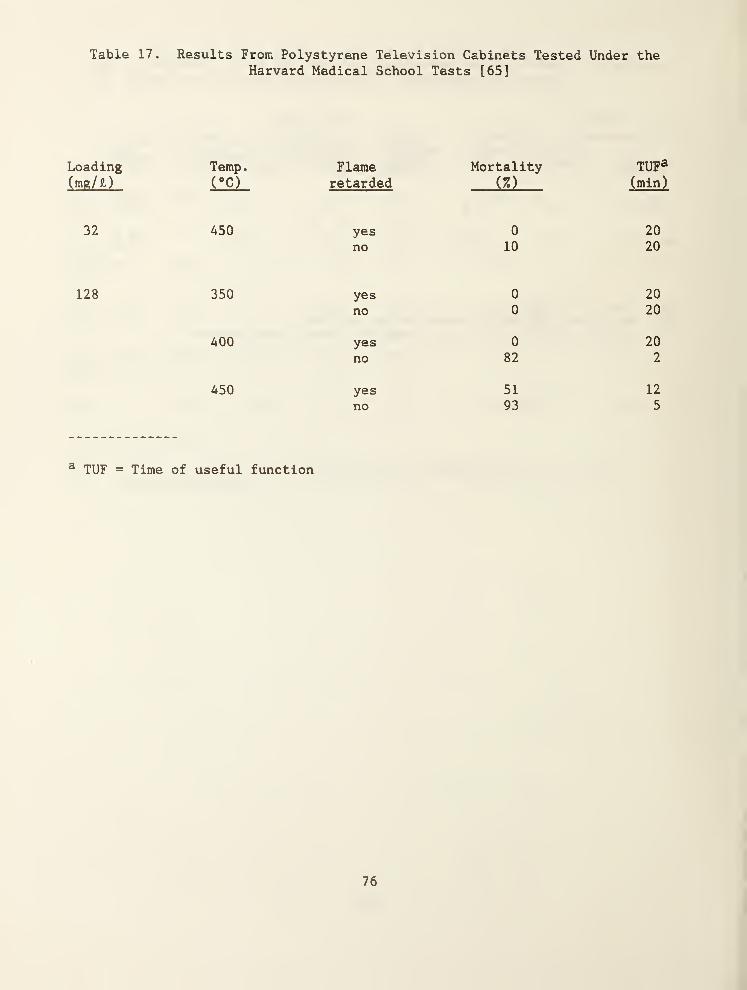
Table
Loading(mg/ £,)
32
128
3 TUF =
17. Results From Polystyrene Television Cabinets Tested Under theHarvard Medical School Tests [65]
Temp. Flame Mortality Tupa
retarded (%) (min)
450 yes 0 20
no 10 20
350 yes 0 20
no 0 20
400 yes 0 20
no 82 2
450 yes 51 12
no 93 5
Time of useful function
76
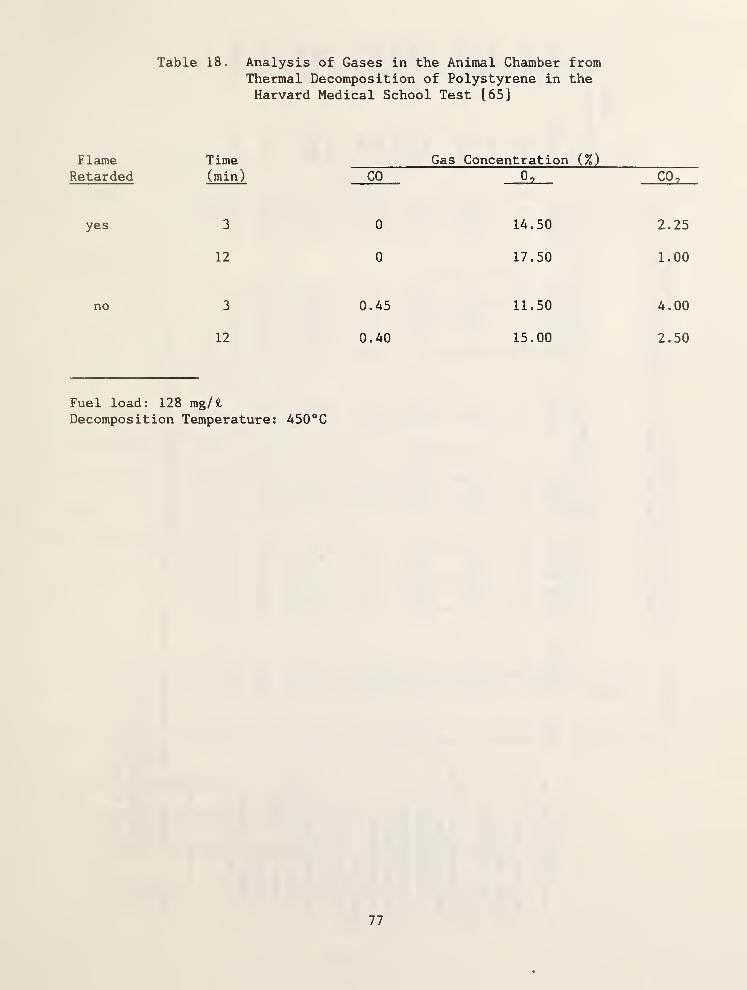
Table 18. Analysis of Gases in the Animal Chamber fromThermal Decomposition of Polystyrene in theHarvard Medical School Test [65]
Flame Time Gas Concentration (%)
Retarded (min) CO 0, CO,
yes 3 0 14.50 2.25
12 0 17.50 1.00
no 3 0.45 11.50 4.00
12 0.40 15.00 2.50
Fuel load: 128 mg/ 8,
Decomposition Temperature: 450 °C
77
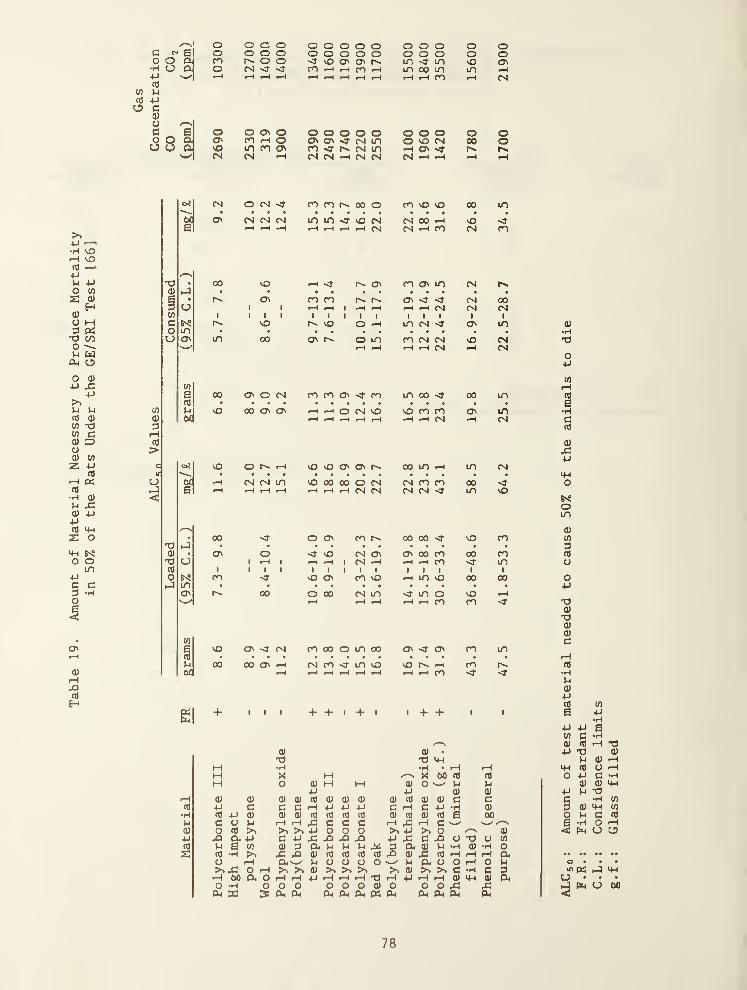
Table
19
.
Amount
of
Material
Necessary
to
Produce
Mortality
in
50
%of
the
Rats
Under
the
GE/SRI
Test
166
]
0 0 0 0 0 0 0 0 0 0 0 0 0c CM E 0 0 0 0 0 0 0 0 0 0 0 0 0 00 0 a cn r-^ 0 0 vO ON ON LTi <f in NO ON•H 0 a 0 CJ <3
" m rH »H n in 00 in m rH•U 1^ rH rH rH rH rH f-H m 1 CM
0 0 ON 0 0 0 0 0 0 0 0 0 0ON n rH 0 ON ON CM m 0 NO CM 00NO m m ON m r> CM m ON p>.
CM CM rH CM CM rH CM CM 1-H tH rH
oo
CNl
o^
O fS
CS CM <N
ro m 00 oLO m vc cs
1-H .—4 CN
m NO NO 00 mCM 00 NOCM rH m CM m
• 00 NO rH sr CJN ro CJN m CM r>.
hJ • •
• ON cn ro r>. ON ^r CM 000j j
rH ' rH rH rH rH CM CM CM
NO NO'
0 rH m CM CJN min « • • • • • • • • •
C3N m 00 ON 0 m ro CM CM NO CMs—
^
rH rH rH rH CM rH CM
(fl
00 ON 0 CN m m CJN m in 00 00 mu NO 00 ON C3N tH rH 0 CM NO NO m ro CJN moc rH rH rH rH rH rH rH CM tH CM
NO 0 rH NO NO CJN CJN 00 in rH in CM
eUc rH CM CsJ m NO 00 00 0 CM CM m m 0061 rH rH rH rH rH t—
H
rH CM CM CM CM < m NO
* 00 0 C3N m 00 00 '3- NO ro
• «
• C3N 0 NO CM CJN CJN 00 ro 00 rou 1 1 rH rH CM rH rH rH m in
cn NO CJN m NO rH in NO 00 00in • « • • • • • • «
C?N 00 0 00 CM m m 0 NO rHN—/ rH rH rH rH rH ro ro '3
-
C/1
iNO CJN 4- CM ro 00 0 in 00 CJN '3- CJN ro in
00 00 C3N rH CN m m NO NO r>. rH rocud rH rH rH rH rH iH rH rH ro '3' 'O-
t + i
'O l4-(
M •H •rM • rH rHM X M X 00 C3 c3
M 0 cu M M CU 0 >M U4-J 4-» 0) 0)
f—
c
0) (U CU (U (3 CU CU CU 0) (3 (U (U C GfO 4-1 c C C rH 4J 4-» 4J c rH S3 44 .H 0)•H (3 4-1 0) CU CU (3 c3 c3 C3 (U c3 (U (3 6 00Vu C a rH rH ^ C C C iH X tH S3 ' '—
^
cu 0 (3 So So >. 4J 0 0 0 -p So 0 CU4-1 Xi (X 4-) C 4-1 43 X> X X 4-1 43 S3 43 0 0 CO
n) V4 6 w cu 0 Or u V4 u M a O. (U P *H 0) •H 0S c3 •H So .a (U i3 c3 c3 c3 X 0) 43 c3 tH iH rH PM
0 rH O.W M 0 0 0 0 s—
'
V4 PM 0 0 fH 0 M>n 4= 0 r-i So So (U So >> So So CU SO SO S3 •H c S3r-H 00 a. 0 rH rH 4-* rH rH rH •a tH 44 tH tH 3) M-l cu CM0 •H 0 0 0 0 0 0 0) 0 0 0 43 43P4 ca 3 Ph Pli PM P4 PM pp P4 P4 PM PM PM
78
I.C50:
Amount
of
test
material
needed
to
cause
50
%of
the
animals
to
die
F.R.:
Fire
retardant
C.L.
:
Confidence
limits
g.f.:
Glass
filled

Table 20. Results from the University of Michigan Test [67]
Static Chamber^RelativeToxicity
Dynamic 1Chamber‘d
Material LL 5 0
(g)
LCg 0
(mg/ 2,)
Ranking Material LL 5 0
(g)
LCg 0
(mg/e,)
Polyurethanefoam (FR) 18 12.0 1 Polypropylene 1.0 2.4
ABS 18 12.0 2 Polyurethanefoam (FR)
1.4 3.3
ABS (FR) 20 13.3 3 Polyurethane foam 1.5 3.6
SAN 760 23 15.3 4 PVC 1.7 4.1
Polypropylene 26 17.3 5 ABS 1.7 4.1
Polystyrene 29 19.3 6 SAN 760 2.1 5.0
Nylon knit 33 22.0 7 ABS (FR) 2.2 5.2
Nylon 43 28.7 8 Nylon 2.6 6.2
Polyurethane foam 44 29.3 9 Nylon knit 3.0 7.1
Nylon Yarn 47 31.3 10 Nylon yarn 4.3 10.2
PVC 54 36.0 11 Polystyrene 4.3 10.2
LL 50 : Amount of material loaded in the furnace that causes 50% of the rats todie in 4 hours in the static system and 140 minutes in the dynamicsystem.
LC 50 : The LL 50 divided by the volume of the exposure chamber or the total airflow.
FR: Fire retarded,
a: Temperature approximately 700°C
b: Temperature ramped from ambient to 700-800°C at 3-5°C/min.
79
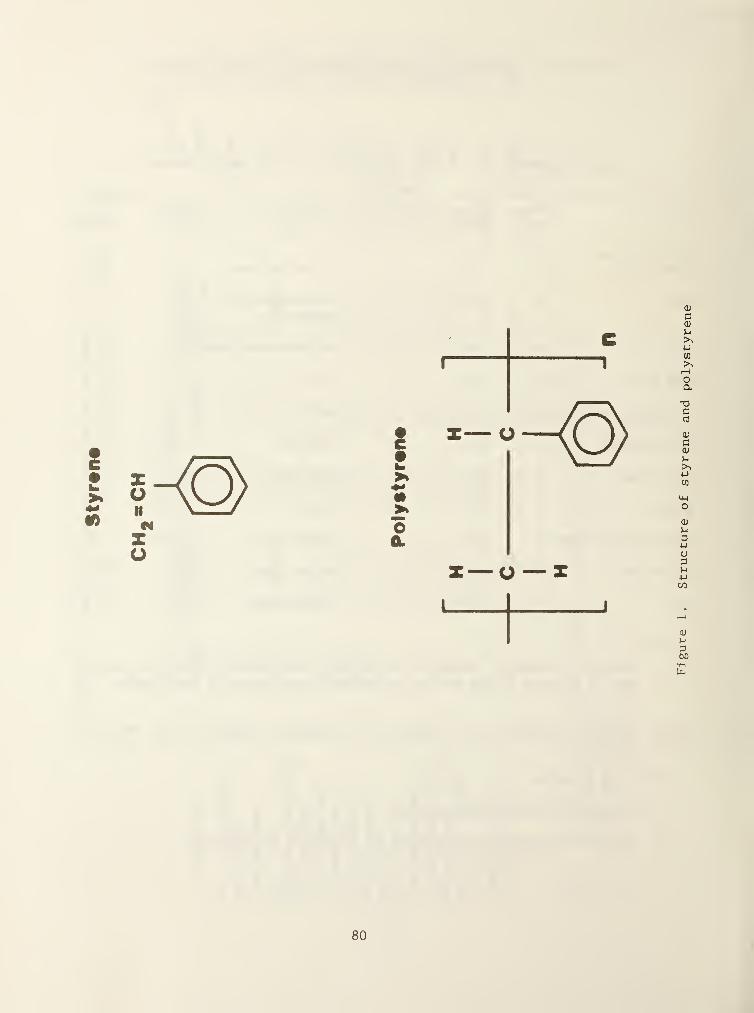
Styr«n«
80
Fi
guTe
1.
StructufG
of
styrGne
and
polystyr

NBS-114A 'REV. 2 -eci
O.S. OEPT. OF COMM.
4.
BIBLIOGRAPHIC DATASHEET (See instructions)
1. PUBLICATION ORREPORT NO.
NBSIR-85/3277
2. Performing Organ. Report No. 3.
TITLE AND SUBTITLE
PubI ication Date
March 1986
POLYSTYRENES: A REVIEW OF THE LITERATURE ON THE PRODUCTS OFTHERMAL DECOMPOSITION AND TOXICITY
5 . AUTHOR(S)
Joshua L. Gurman, Laura Baier, and Barbara C. Levin
6. PERFORMING ORGANIZATION (If joint or other than NBS. see in struction s)
NATIONAL BUREAU OF STANDARDSDEPARTMENT OF COMMERCEMJkSH HCGXBK.XK0CX30ZMXGaithersburg, MD 20899
7 . Contract/Grant No.
8. Type of Report & Period Covered
9. SPONSORING ORGANIZATION NAME AND COMPLETE ADDRESS (Street. City. State. ZIP)
U. S. Consumer Product Safety CommissionBethesda, MD 20207
10. SUPPLEMENTARY NOTES
Document describes a computer program; SF-185, FIPS Software Summary, is attached.
11. ABSTRACT (A 200-word or less factual summary of most significant information. If document includes a significantbibliography or literature survey, mention it her^
The current English literature through 1984 on the products of pyrolysisand combustion from polystyrenes and the toxicity of those products is
reviewed. Among 57 compounds detected by chemical analyses of the thermaldecomposition products produced under various atmospheric conditions (vacuum,inert, and oxidative), the main volatile component is the styrene monomer.Evidence is provided that the mass fraction of styrene increases with furnacetemperatures at least through 500°C. At 800°C and above, the concentration ofstyrene decreases. In oxidative atmospheres, carbon monoxide (CO), carbondioxide (COj) and oxidative hydrocarbons are formed. The concentrations of COand CO 2 are a function of temperature and combustion conditions, i.e., greateramounts are produced in the flaming than in the non-flaming mode. Elevendifferent test procedures were used to evaluate the toxicity of the pyrolysisand combustion atmospheres of polystyrenes. The more toxic environmentsproduced under flciming conditions appear to be mainly attributable to CO andCO 2 . Incapacitating effects observed during exposures to non-flaming effluentsare not due to CO and CO 2 but rather to some other toxicant, probably thestyrene monomer. When compared to other common materials used in buildings andresidences, polystyrenes, in general, are among the least toxic.
12. KEY WORDS (Six to twelve entries; alphabetical order; capitalize only proper names; and separate key words by semicolon s)
Combustion products; fire data; literature reviews; polystyrene;pyrolysis products; test methods; toxicity.
13. AVAILABILITY
Uni imited
1 1
For Official Distribution. Do Not Release to NTIS
rn Order From Superintendent of Documents, U.S. Government Printing Office, Washington, D.C.20402.
[77^ Order From National Technical Information Service (NTIS), Springfield, VA. 22161
14. NO. OFPRINTED PAGES
15. Price
v^SCOMM.r,r. = -'
tn ^TDAJt!^ ., 4iiH^ >i M^i*<T^o)<ii tnosiVit^lP t%m^ \o y-)<Nri((w< ^ikU:>b) M*1
M ^$91 ti$Ltc>'tdH ^to nJidiwoi mdi t>4S moft ooUiumI/sos fenft ^
«£» IcoliUMfd x^ brnidlmob ubmttyqmot tl s«iua4jttJiJ'JBAo) ont^^SlPnoo »k‘tOfi<f0osLi0 mifoltox 7«1^ b«3t/b<>^5 si >ui;o?q horf i;«&qeii03c»!> wV
t«riiqma$r •ir«txiii «d> 4Ut Utono^moo otJ3oJB»f ftlm odS «( »vjt;:}ahlxoJ|brui ,trni
ffS
.' i»
r')
•:>«i|i9Ur) ttooompnl mtvt^rxio \a aoiJojrsf ••«« odJ llodJI WIvotS *i J^3o»b/vSH biiM D*OOII iA .5*OOC iljfjfcirtr ’ta^uJaaiiqawJ
j^bixonooi nod^tsU fkmyBft^oaao yoiimbhto nl.^ ^i«eM»7T^b vrr»i\;Ja
«m»i»k73fy*9<t03 odft .tnwtfat #a» «rw>rf^*aft-»i»vrf np>i|fc,^i;n |^fi«
i'sm.taBtg tOaoiJkbnon bnu »%uioittqm»3 Xo o^daxiir^ « mb |0D bn* *%
nonroii .ubiom gakmoiX^ (ton nl aoih anlliBl} mdi^oi i«3(Xbn'Tq oiM. liirwdaiji*
»l«yio7*^ ml:l to x^io^xo:) odS oJ Imkux tmtmt BmitTba^yg fo^S knoiottibojrtmfOori'Xfm o»cn ^fT .tuumtxioxloq to po7miii»omJo noMiojuiutdi brui
biu^OO oJ ol4o:iOdl'xSio \lfUm od oi sBHtjqji oitoliihtioo gatmtt '^obau bB^aboi*)
oi gakiub b«V7*«do tdd«%l* gr}i;)M:fJiom<i»:tnt
f^odJ x.ltHtpil(y*q ^atmctlutiJ »>^)o «no« oi 7Bdfmi iird ^00 bn* 00 oJ mtt Jotf •?*bm tisaitlkM4 fti bovit^ ofmk^TOdm (t&^tnoo rmdso o'9 ha^oqiooa tmdki itmonm ehoixio,
,|NkB*Jt i»4l gflotm otMi ,Lmioo»$ ni naotm^x^oxloq ^ob;fnobl1l^»^l
mm mtiAd»iWiwwi* v4 '<•<1 ttnf, s^»Vn) ;t*hf»<* o> vizj tflA<plf’¥^T4r
..„ T. .
:*^d07x^nxSo^ |«-»*li Mil r«i3uborr^ nokjaudmoC^,® )»bodJ^ iWlJ JMJ’HrbOTq j ij
. ..
^ -.,., ^
a YTi’Ji^lAv*I
,tj
^ 6*n«<i('U C3 1tiTH 9» MPmtpn t«M oO .«w4i/4)1xiiC} ItliiiHO lO^
3AI iOOttPtdf^O ^1^0 )(»»«n%»v»0 .I.U io*fcnWnl>#A*#ff ««o>S t*l»*0 £3!'
% Itw*kV «ofvi*« no«i*<*ni4fll >«3<rti<a»T Uin9i^«M i»MO |*^
T 4' ^W:: k j V'lft M II