Hygrothermal Performance of Timber-Framed External Walls ...
380
-
Upload
khangminh22 -
Category
Documents
-
view
2 -
download
0
Transcript of Hygrothermal Performance of Timber-Framed External Walls ...

�������������� ������������
���������
���������� �������� �� ��������� ������������ �� ������� ������� �������������� ���������� ������� ����������� ��� ��������������� ������ ���� ����������������������������
�������!""#

Tampereen teknillinen yliopisto. Julkaisu 658 Tampere University of Technology. Publication 658 Juha Vinha Hygrothermal Performance of Timber-Framed External Walls in Finnish Climatic Conditions: A Method for Determining the Sufficient Water Vapour Resistance of the Interior Lining of a Wall Assembly Thesis for the degree of Doctor of Technology to be presented with due permission for public examination and criticism in Rakennustalo Building, Auditorium RG202, at Tampere University of Technology, on the 11th of April 2007, at 12 noon. Tampereen teknillinen yliopisto - Tampere University of Technology Tampere 2007

Supervisor and Custos: Professor, Dr. Ralf Lindberg Tampere University of Technology Department of Civil Engineering Institute of Structural Engineering Tampere, Finland Preliminary assessors: Professor, Dr. Carl-Eric Hagentoft Chalmers University of Technology School of Civil Engineering Department of Building Physics Göteborg, Sweden Professor, Dr. Hugo Hens Katholieke Universiteit Leuven Department of Civil Engineering Laboratory of Building Physics Leuven, Belgium Opponents: Professor, Dr. Mark Bomberg Syracuse University Department of Mechanical, Aerospace, and Manufacturing Engineering Syracuse, New York, USA Professor, Dr. Carl-Eric Hagentoft Chalmers University of Technology School of Civil Engineering Department of Building Physics Göteborg, Sweden ISBN 978-952-15-1742-6 (printed) ISBN 978-952-15-1782-2 (PDF) ISSN 1459-2045

Tampere University of Technology Publication 658 Juha Vinha
Hygrothermal Performance of Timber-Framed External Walls in Finnish Climatic Conditions: A method for Determining the Sufficient Water Vapour Resistance of the Interior Lining of a Wall Assembly ERRATA 11.4.2007
Location Was Should be
Page 15, explanations of equation 1.6
cva is heat capacity of air at constant volume (∼1200 J/(kg⋅K)) cpa is heat capacity of air at constant pressure (∼713 J/(kg⋅K))
cva is heat capacity of air at constant volume (∼713 J/(kg⋅K)) cpa is heat capacity of air at constant pressure (∼1000 J/(kg⋅K))
Page 47, third paragraph
… if more accurate data in unavailable (Künzel et al. 2000).
… if more accurate data is unavailable (Künzel et al. 2000).
Page 49, fourth paragraph
… yhe convective heat flow rate through a gap or hole.
… the convective heat flow rate through a gap or hole.
Page 67, Table 1.8, Sherwood (1985)
Walls with plastic performed well, but those without plastic MC was in some cases over 20 wt%; no wood decay observations.
Walls without plastic performed well, but those with plastic sometimes had MC over 20 wt%; no wood decay observations.
Page 124, Figure 2.24
… extra humidification in winter that raise relative humidity to at least 25% RH.
… extra humidification in winter that raise relative humidity to 25% RH at the maximum.
Page 331, last reference
Finch, G., Straube, J. & Hubbs, B. 2006. Building envelope …
Reference is redundant here. It already appeared on page 316.
Page 337, second last reference
Vinha, J. & Käkelä P. 2007. Moisture Performance of Timber-Framed External Walls in Finnish Climatic Conditions.
Vinha, J. & Käkelä P. 2007. Puurunkoisten ulkoseinien kosteustekninen toiminta Suomen ilmasto-olosuhteissa.
Appendix 3, 3/4, explanation 7
The value was set to 1.0 because it cannot be lower than the m-value of air.
The value was set to 1.0 because it cannot be lower than the µ-value of air.

To my wife Minna and sons Saku, Ville and Lassi Luja tahto vie vaikka läpi harmaan kiven.
Where there’s a will, there’s a way.


i
ABSTRACT This study looked into the moisture performance of timber-framed external wall assemblies in Finnish climatic conditions by examining the effects of the diffusion of water vapour in wall assemblies. The study has been preceded by decades of discussion about the need of a vapour barrier in the interior wall lining of external wall assemblies. Much research has been conducted related to this subject worldwide in the last 70 years, and studies have shown that in Nordic climatic conditions the interior wall lining always requires sufficient water vapour resistance against the diffusion of the water vapour emitting from indoor air. On the other hand, it has also been found that external wall assemblies can be implemented without incorporating a tight vapour barrier into the interior wall lining. Furthermore, in more southern climatic conditions the interior wall lining may have to be permeable to water vapour when the direction of the diffusion flow is from the outside in. Yet, despite numerous studies, agreement has not been reached on the minimum water vapour resistance that should be required of the interior wall lining of a timber-framed wall assembly under different conditions. Consequently, different guidelines and regulations for water vapour resistance values of interior wall linings exist also in countries located in highly similar climatic conditions. Comprehensive assessment of the moisture performance of wall assemblies requires establishing the performance criteria and limit values that an assembly must meet, the outdoor and indoor conditions to be used in designing moisture performance, and the assembly solution and used materials as well as their building physical properties. The acceptability of the moisture performance of an external wall assembly depends essentially on all these factors during the service life of a building. The aim of this study has been firstly to create a method which allows examining the moisture performance of timber-framed external wall assemblies in different situations. The first phase involved setting the performance criteria, limit values and reference boundary conditions for analysing wall assemblies under Finnish climatic conditions. Then, the effect of the different properties of the assembly layers on the moisture performance of the wall was examined followed by the setting of minimum values for the water vapour resistance ratio between the interior and exterior linings of different wall types based on selected criteria and study conditions. An attempt has been made to ensure the reliability of the developed analysis method by conducting different laboratory and field tests and calculational analyses in connection with the study. External wall assemblies were examined in the laboratory with building physical research equipment developed during this study, the key building physical properties of the materials used in assembly tests were determined for calculational analyses, external wall assemblies were also analysed in field conditions in a one-family house and in test houses at the test field of Tampere University of Technology, indoor air excess moisture was analysed in field tests of timber-framed one-family and row houses, and the performance of the used heat, air and moisture transfer simulation model (HAM model) was verified by tests conducted in various situations. Moisture condensation and mould growth within were chosen as the performance criteria of the external wall assembly. Limit values were selected according to the following principle:

ii
The temperature and relative humidity conditions of the exterior wall lining must not be more critical than those of the exterior wall lining of the most critical but still acceptable wall assembly (reference wall) where those conditions result only from the effect of outdoor air conditions. Also, the temperature and relative humidity conditions of the interior wall lining must not be more critical than those of indoor air. The limit value in the moisture performance analysis of the assembly was the maximum continuous condensation time of the moisture condensation analysis, and in the mould growth analysis the maximum mould index. In Finnish climatic conditions it is not possible to set design requirements for timber-framed external wall assemblies that allow no condensation or mould growth at all in the exterior wall lining. The maximum continuous condensation time of this study was 34 days in the exterior wall lining and 0 days in the interior wall lining. The respective maximum mould index was 1.96 in the exterior wall lining and < 1 in the interior wall lining. When these performance criteria are applied, moisture condensation is generally the design criterion for diffusion. Moisture reference years (MRYs) representing a 30-year period of Finnish climatic conditions were selected for both performance criteria. The climatic conditions of four localities were selected to represent Finnish climate. Moisture reference years were selected so that only 10% of the years are more critical with respect to the examined criterion than the selected years. Indoor air conditions were selected so that standard temperature was 21°C and excess moisture values varied between 0 and 8 g/m3 in winter. On the basis of the field study, the recommendable design value of excess moisture in Finnish one-family and row houses is 4 to 5 g/m3 in winter conditions. In connection with the field study a set of design curves for excess moisture as a function of outdoor air temperature was drawn. The studied walls are typical assemblies used in Finland and other Nordic countries. All walls had the following structural layers: cladding, ventilation gap, sheathing, thermal insulation, air/vapour barrier and interior board. On the basis of conducted field tests, diffusion analyses of timber-framed external wall assemblies need not be complemented by separate analyses of the impact of driving rain, wind, solar radiation and surface undercooling since these factors can be factored into the thermal surface resistance value of the sheathing in a calculational analysis of the northern wall. This facilitates significantly the study of the moisture performance of a wall assembly. The best ways to increase the reliability of the performance of an exterior wall assembly against the harmful effects of diffusion from indoor air are to increase the water vapour resistance of the interior wall lining and thermal resistance of sheathing. Low water vapour resistance of the sheathing is an important factor for good moisture performance of the assembly. The research results indicate that a plastic vapour barrier behind the interior board is safe in all typical indoor and outdoor air conditions occurring in Finnish climatic conditions. With this assembly solution relative humidity as well as the risk for moisture condensation and

iii
mould growth are at their lowest on the interior surface of the sheathing since indoor air moisture does not affect the moisture performance of the assembly. In Finnish climatic conditions an assembly may be implemented also without a plastic vapour barrier in the interior wall lining. Then, the required water vapour resistance ratio between the interior and exterior wall linings depends on the sheathing and thermal insulation used. The key properties of the layers which improve the moisture performance of a moisture-permeable assembly are the high thermal resistance and low water vapour resistance of the sheathing. Hygroscopic thermal insulation retards the wetting of the assembly in autumn and its drying in spring. Therefore, high moisture capacity of thermal insulation can also improve the performance of the assembly if the water vapour resistance of the sheathing is low. When the excess moisture of indoor air is 4 to 5 g/m3 in winter conditions, the minimum water vapour resistance values between the interior and exterior wall linings are typically in the 0 to 80:1 range. If sheathings highly permeable to water vapour are used, the required resistance ratio typically varies within the 0 to 40:1 range. The present specification of the Finnish Building Code of 5:1 for the water vapour resistance ratio between interior and exterior wall linings is not sufficient in most cases. That water vapour resistance ratio is acceptable only if the thermal resistance of the sheathing is high. The water vapour resistance of the paper-based air barrier membranes presently on the market is normally so low that many assemblies implemented with them do not even meet the existing specification for the resistance ratio between interior and exterior wall linings (min. 5:1) if the interior finishing is excluded from the analysis. The method for analysing external wall assemblies created in connection with this research may also be used, where applicable, to analyse the moisture performance of layered wall assemblies in other climatic conditions. Neverthless, the limit values for moisture condensation and mould growth must always be redefined for the climatic conditions of other countries. Keywords: Building physics, timber-framed external walls, ventilation gap, analysis method, water vapour resistance ratio, performance criteria, limit values, boundary conditions, diffusion, capillary flow, condensation, mould growth, laboratory tests, field tests, calculational analyses, HAM models

iv
FOREWORD The moisture performance of timber-framed external wall assemblies with and without a vapour barrier has been the subject of continuous discussion in Finland as well as other countries for several decades. It still remains one of the most hotly contested issues in building physics research. I became interested in the subject and started exploring the impact of various factors on the performance of wall assemblies. As my exploration progressed, my interest turned increasingly toward providing an overall view of the performance of timber-framed wall assemblies in Finnish climatic conditions. The deeper I delved into the subject, the more contributory factors I discovered that had to be taken into account in building the overall view. As a result, more research was needed which required spending more time on the subject. On several occasions I felt unsure about whether the subject matter can be viewed as a single logical entity. Perhaps my persistent and uncompromising nature made me pursue my goal despite all difficulties. Now the massive undertaking is over, and the results are compiled in this dissertation. Studies related to this dissertation have been conducted as part of various projects at Tampere University of Technology (TUT), Institute of Structural Engineering, where I have been the principal researcher and organiser. I have ideated and developed the presented analysis method and the related examinations on the basis of these studies. Many of the researchers of my group and other TUT personnel have assisted in the implementation of various parts of the research. M.Sc. Timo Niemelä and M.Sc. Pasi Käkelä were involved in the development of the building physical research equipment by constructing it and developing the measurement and control systems, M.Sc. Pekka Viitala wrote the control program for the equipment, M.Sc. Antero Miettinen updated the software while M.Sc. Kauko Sahi and Lab. Tech. Kari Häyrinen were responsible for implementing the equipment’s electrical systems. M.Sc. Pasi Käkelä conducted the tests on external wall assemblies with the building physical research equipment. He also ran the field tests on the one-family house and at the TUT test field. M.Sc. Minna Teikari processed further the measurement data from the TUT test field for calculations. The building material tests were conducted by M.Sc. Antti Mikkilä, M.Sc. Ilkka Valovirta and M.Sc. Minna Korpi. Field tests on timber-framed one-family and row houses and compilation of the results were done primarily by M.Sc. Minna Korpi, M.Sc. Ilkka Valovirta and M.Sc. Antti Mikkilä from TUT and M.Sc. Lari Eskola and M.Sc. Juha Jokisalo from Helsinki University of Technology (HUT). M.Sc. Targo Kalamees was involved in making measurements and compiling results at both universities. M.Sc. Heli Toukoniemi and M.Sc. Hanna Aho from TUT, and Eng. Kai Jokiranta from HUT, also contributed significantly to the field measurements on timber-framed one-family and row houses. M.Sc. Targo Kalamees made calculational analyses with different HAM programs and compared the results to measurement results from laboratory and field tests. He also did the calculational analyses related to determining the design values of indoor air excess moisture as well as preliminary calculations relating to selection of critical outdoor air conditions and performance of structures in actual
v
conditions. I wish to extend my sincere thanks to everyone involved in these studies for their input. It has been a pleasure working with researchers like you. Special thanks to Pasi Käkelä who was the key person in the implementation of many practical parts of the research. Without Pasi’s help, the studies would never have been completed. B.S. Jorma Tiainen deserves recognition for his translation of my dissertation into English. I also appreciate Sari Merontausta and Elina Soininen for their assistance in making some of the drawings. The studies related to the dissertation have been funded by the National Technology Agency of Finland (TEKES) and 18 Finnish companies and associations to whom I express my gratitude. My special thanks go to M.Sc. Lasse Pöyhönen from TEKES for enjoyable cooperation over the years. I am also indebted to the Finnish Meteorological Institute for providing weather data from various localities for my research for a reasonable compensation. Warm thanks also to the preliminary assessors of my dissertation, Prof. Carl-Eric Hagentoft from Chalmers University of Technology and Prof. Hugo Hens from Katholieke Universiteit Leuven. Their valuable comments and advice are greatly appreciated. Prof. Ralf Lindberg, the supervisor of my research, has supported me in many ways during my work. He has given me the freedom to conduct my research independently, and has followed its progress and results with interest. With him I have had numerous fruitful and encouraging discussions about issues related to my research. I express my thanks to him for his support and confidence during all my years as a researcher at Tampere University of Technology. My colleague M.Sc. Jari Hietala also deserves thanks for the many profitable discussions with him relating to my work. He has been a good sounding board for new ideas providing feedback on their feasibility. I also appreciate the contribution of my other colleagues and Prof. Matti Pentti and Ass. Prof. Dominique Derome from Concordia University, Montreal, Canada who spurred me on with my research. Heartfelt thanks to my parents who have tirelessly encouraged me in my postgraduate studies and with writing my dissertation. I know that you are also greatly relieved now that the undertaking is over. Likewise, I am grateful to my parents-in-law for your support for my work. I also greatly appreciate the caring of my brother and friends who persuaded me to relax through sports and other activities, which enabled me to continue the work on my dissertation with renewed energy. Above all, I am indebted to my family: my sons Saku, Ville and Lassi – and particularly my dear wife Minna – who has had to attend to daily family affairs mostly by herself over

vi
these years. Without the support of you all, this work could never have been finished. I sincerely hope that this means an end to the long hours away from home, and that we will be able to spend more time at our summer place and pursuing other hobbies. Tampere, March 23rd, 2007 Juha Vinha

vii
HYGROTHERMAL PERFORMANCE OF TIMBER-FRAMED EXTERNAL WALLS IN FINNISH CLIMATIC CONDITIONS:
A Method for Determining the Sufficient Water Vapour Resistance of the Interior Lining of a Wall Assembly
TABLE OF CONTENTS
ABSTRACT i
FOREWORD iv
TABLE OF CONTENTS vii
NOTATIONS xi
TERMINOLOGY xv
1 INTRODUCTION 1 1.1 Background 1 1.2 Research goals and hypotheses 4 1.3 Limitations of the research 5
1.3.1 Criteria for moisture performance of the wall assembly 5 1.3.2 Outdoor air conditions 6 1.3.3 Indoor air conditions 7 1.3.4 Wall assembly solution and used materials 7
1.4 Research methodology and structure 9 1.5 Research equipment and methods developed in connection with the
research 12 1.6 Research schedule 12 1.7 Literature review 13
1.7.1 Basic concepts of building physics 13 1.7.2 Rules and regulations concerning water vapour resistance of interior
lining of wall assembly 54 1.7.3 Advantages and drawbacks of moisture-permeable wall assembly 58 1.7.4 Studies dealing with the impact of the vapour barrier on the
performance of the external wall assembly 66
2 FACTORS AFFECTING THE MOISTURE PERFORMANCE OF EXTERNAL WALLS 75 2.1 Performance criteria and limit values set for the moisture performance of a
wall assembly 75 2.1.1 Background 75

viii
2.1.2 Rules and regulations issued by various countries concerning allowed condensation and mould growth in external wall assemblies 81
2.1.3 Performance criteria and limit values chosen for the research 84 2.2 Outdoor air conditions 89
2.2.1 Bases for selecting moisture reference years 89 2.2.2 Localities chosen for analysis in Finland 92 2.2.3 Analysis of moisture condensation risk 94 2.2.4 Analysis of mould growth risk 101 2.2.5 Critical outdoor air conditions for mould growth analysis of interior
wall lining 114 2.2.6 Conclusions 116
2.3 Indoor air conditions 117 2.3.1 Target values and fluctuation of indoor air conditions 117 2.3.2 Indoor air excess moisture 117 2.3.3 Indoor air conditions selected for the study 125
2.4 Wall assembly solution and used materials 125 2.4.1 Impact of different material layers and properties 125 2.4.2 Impact of ventilation gap 126
3 LABORATORY TESTS ON EXTERNAL WALLS AND MATERIALS 128 3.1 Building physical research equipment 128
3.1.1 Background 128 3.1.2 Parts of the equipment 128 3.1.3 Operating principle 133 3.1.4 Measurement systems 134 3.1.5 Measured and calculated values of the test 135 3.1.6 Calibration of measurement sensors and warm chamber 136 3.1.7 Measurement uncertainties 137
3.2 Wall tests 138 3.2.1 Building of test elements and test arrangements 139 3.2.2 Boundary conditions and test time 143 3.2.3 Tested wall assemblies 145 3.2.4 Test results 145 3.2.5 Conclusions 163
3.3 Material tests 164 3.3.1 Thermal conductivity 166 3.3.2 Water vapour permeability 169 3.3.3 Equilibrium moisture content 172 3.3.4 Water absorption coefficient 173 3.3.5 Capillary saturation moisture content 174 3.3.6 Other material properties 175 3.3.7 Conclusions 175
ix
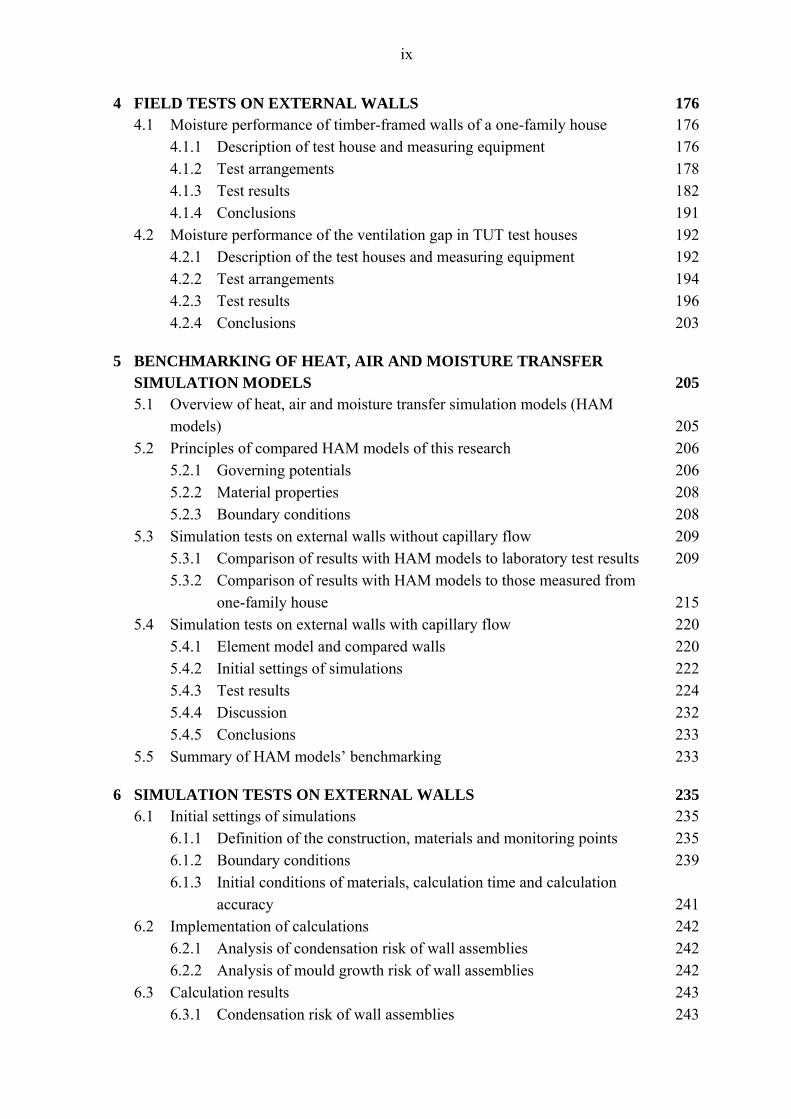
4 FIELD TESTS ON EXTERNAL WALLS 176 4.1 Moisture performance of timber-framed walls of a one-family house 176
4.1.1 Description of test house and measuring equipment 176 4.1.2 Test arrangements 178 4.1.3 Test results 182 4.1.4 Conclusions 191
4.2 Moisture performance of the ventilation gap in TUT test houses 192 4.2.1 Description of the test houses and measuring equipment 192 4.2.2 Test arrangements 194 4.2.3 Test results 196 4.2.4 Conclusions 203
5 BENCHMARKING OF HEAT, AIR AND MOISTURE TRANSFER SIMULATION MODELS 205 5.1 Overview of heat, air and moisture transfer simulation models (HAM
models) 205 5.2 Principles of compared HAM models of this research 206
5.2.1 Governing potentials 206 5.2.2 Material properties 208 5.2.3 Boundary conditions 208
5.3 Simulation tests on external walls without capillary flow 209 5.3.1 Comparison of results with HAM models to laboratory test results 209 5.3.2 Comparison of results with HAM models to those measured from
one-family house 215 5.4 Simulation tests on external walls with capillary flow 220
5.4.1 Element model and compared walls 220 5.4.2 Initial settings of simulations 222 5.4.3 Test results 224 5.4.4 Discussion 232 5.4.5 Conclusions 233
5.5 Summary of HAM models’ benchmarking 233
6 SIMULATION TESTS ON EXTERNAL WALLS 235 6.1 Initial settings of simulations 235
6.1.1 Definition of the construction, materials and monitoring points 235 6.1.2 Boundary conditions 239 6.1.3 Initial conditions of materials, calculation time and calculation
accuracy 241 6.2 Implementation of calculations 242
6.2.1 Analysis of condensation risk of wall assemblies 242 6.2.2 Analysis of mould growth risk of wall assemblies 242
6.3 Calculation results 243 6.3.1 Condensation risk of wall assemblies 243

x
6.3.2 Mould growth risk of wall assemblies 248 6.3.3 Impact of limit values on acceptability of moisture performance of
wall assemblies 253 6.3.4 Impact of MRY on acceptability of moisture performance of wall
assemblies 256 6.3.5 Impact of exterior surface resistance of sheathing on moisture
performance of wall assemblies 259 6.3.6 Combined effect of sheathing and thermal insulation on moisture
performance of wall assemblies 262 6.3.7 Impact of plastic vapour barrier on mould growth risk in interior
wall lining 264 6.4 Summary of calculational analyses 272
7 DISCUSSION 277 7.1 Performance criteria and limit values set for the moisture performance of a
wall assembly 277 7.1.1 Moisture condensation 277 7.1.2 Mould growth 278
7.2 Factors increasing uncertainty of the research results 278 7.2.1 Measurement errors of the laboratory and field tests 279 7.2.2 Errors of the calculational analyses 279 7.2.3 Errors of the condensation analysis 280 7.2.4 Errors of the mould growth model 282 7.2.5 Factors improving the reliability of the performance of a wall
assembly 285 7.2.6 Factors impairing the reliability of the performance of a wall
assembly 287 7.2.7 Factors improving and impairing the reliability of the performance
of a wall assembly 289 7.2.8 Summary of the factors of uncertainty related to the review of the
research results 292 7.3 Maximum water vapour resistance of sheathing 294 7.4 Minimum water vapour resistance of interior wall lining 296 7.5 Need of safety factors or safety margins in building physical design 297 7.6 Application of the research results to other climatic conditions and envelope
assemblies 299 7.7 Suggested further research 301
8 CONCLUSIONS 303
REFERENCES 311
APPENDICES

xi
NOTATIONS
Greek lower case letters:
α heat transfer coefficient W/(m2·K)α absorptivity -βν water vapour transfer coefficient m/sδa water vapour diffusion coefficient of stagnant
air with respect to partial water vapour pressure kg/(m·s·Pa)
δν water vapour (moisture) permeability with respect to humidity by volume
m2/s
δp water vapour (moisture) permeability with respect to partial water vapour pressure
kg/(m·s·Pa)
ε emissivity -φ contact angle -η dynamic viscosity N·s/m2
ϕ relative humidity % RHκa air conductivity m3/(m·s·Pa), m2/(s·Pa)κw moisture conductivity kg/(m·s·Pa)κwT thermal moisture conductivity kg/(m·s·K)λ thermal conductivity W/(m·K)μ water vapour diffusion resistance factor -ν humidity by volume kg/m3, g/m3
Δνexc excess moisture of indoor air kg/m3, g/m3
Δνdef average saturation deficit of outdoor air kg/m3, g/m3
θ temperature °Cρ reflectivity -ρ density kg/m3
σ Stefan-Bolzmann constant 5.67 ×10⁻⁸ W/(m2·K4)σ surface tension coefficient of water N/mτ transmissivity -ξϕ specific moisture capacity calculated as the
slope of sorption curve kg/m3
ξs specific moisture capacity calculated as the slope of suction curve
kg/(m3·Pa)
ψ moisture content volume by volume m3/m3, vol%
Greek upper case letters:
Φ heat flow rate WΠ factor kg/m3
xii
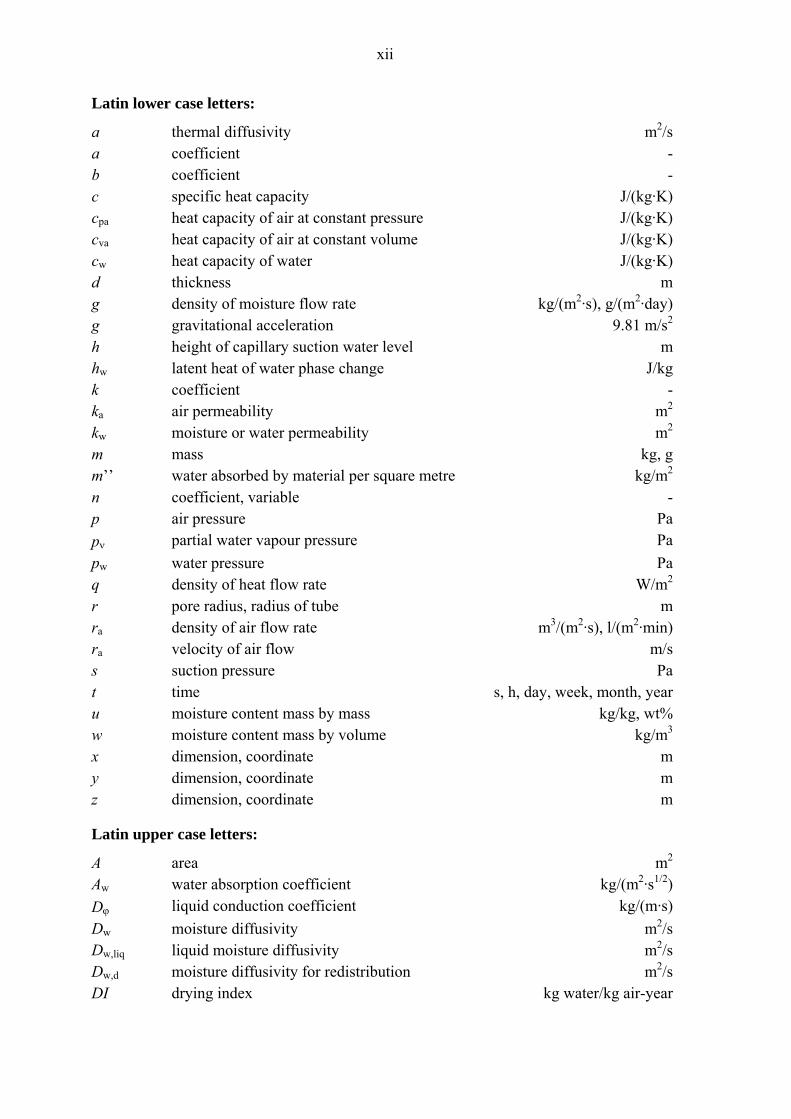
Latin lower case letters:
a thermal diffusivity m2/sa coefficient -b coefficient -c specific heat capacity J/(kg·K)cpa heat capacity of air at constant pressure J/(kg·K)cva heat capacity of air at constant volume J/(kg·K)cw heat capacity of water J/(kg·K)d thickness mg density of moisture flow rate kg/(m2·s), g/(m2·day)g gravitational acceleration 9.81 m/s2
h height of capillary suction water level mhw latent heat of water phase change J/kgk coefficient -ka air permeability m2
kw moisture or water permeability m2
m mass kg, gm’’ water absorbed by material per square metre kg/m2
n coefficient, variable -p air pressure Papν partial water vapour pressure Papw water pressure Paq density of heat flow rate W/m2
r pore radius, radius of tube mra density of air flow rate m3/(m2·s), l/(m2·min)ra velocity of air flow m/ss suction pressure Pat time s, h, day, week, month, yearu moisture content mass by mass kg/kg, wt%w moisture content mass by volume kg/m3
x dimension, coordinate my dimension, coordinate mz dimension, coordinate m
Latin upper case letters:
A area m2
Aw water absorption coefficient kg/(m2·s1/2)Dϕ liquid conduction coefficient kg/(m·s)Dw moisture diffusivity m2/sDw,liq liquid moisture diffusivity m2/sDw,d moisture diffusivity for redistribution m2/sDI drying index kg water/kg air-year

xiii
E surface emissive power W/m2
Eb surface emissive power of blackbody W/m2
G moisture flow rate kg/s, g/dayH total enthalpy J/m3
Ka air permeance m3/(m2·s·Pa), m/(s·Pa)M mould index -Ma molar mass of air 28.96 kg/kmolMw molar mass of water 18.02 kg/kmolMI moisture index -Nu Nusselt number -Pn normal atmospheric pressure 101,325 PaR thermal resistance m2·K/WR gas constant 8314.3 J/(kmol·K)Ra air flow rate m3/s, l/minT absolute temperature KSa air flow resistance m2·s·Pa/m3, s·Pa/mSQ surface quality of wood -U thermal transmittance W/(m2·K)V volume m3
W wood species -Wν water vapour (moisture) permeance with respect
to humidity by volume m/s
Wp water vapour (moisture) permeance with respect to partial water vapour pressure
kg/(m2·s·Pa)
WI wetting index mm/yearZν water vapour (moisture) resistance with respect
to humidity by volume s/m
Zp water vapour (moisture) resistance with respect to partial water vapour pressure
m2·s·Pa/kg
Mathematical symbols:
∂ operator for partial differential Δ difference operator ∇ nabla operator, gradient
Most common subscripts:
ν water vapour a air crit critical e exterior, outdoor i interior, indoor p pressure le exterior wall lining

xiv
li interior wall lining s surface sat saturation se exterior surface sh sheathing si interior surface w water, liquid, moisture
Abbreviations:
ASHRAE American Society of Heating, Refrigerating and Air Conditioning Engineers BBR Swedish Building Code
(in Swedish: Boverkets byggregler) BS British Standards CEN European Committee for Standardization
(in French: Comité Européen de Normalisation) DIN German Institute for Standardization
(In German: Deutches Institut für Normung) DRY Durability reference year EN European Standard
(in German: Europäische Norm) EPS Expanded polystyrene FINAS Finnish Accreditation Service HAM Heat, air and moisture transfer (simulation model) IEA International Energy Agency ISO International Organization for Standardization MC Moisture content of porous material (see terminology) MRY Moisture reference year (see terminology) MVOC Microbe volatile organic compound OSB Oriented strand board PUR Polyurethane PVC Polyvinyl chloride RakMK Finnish Building Code
(in Finnish: Suomen rakentamismääräyskokoelma) RIL Association of Finnish Civil Engineers
(in Finnish: Suomen Rakennusinsinöörien Liitto) RH Relative humidity of air (see terminology) RH/T Relative humidity and temperature (measurement sensor) TUT Tampere University of Technology VOC Volatile organic compound WVRR Water vapour resistance ratio between exterior and interior wall linings (see
terminology) XPS Extruded polystyrene

xv
TERMINOLOGY
Air barrier An air barrier is a material layer of the interior wall lining whose main function is to prevent air flow through a wall. The air flow resistance of an air barrier is high.
Air conductivity Air conductivity, κa, refers to the air volume that under a steady-state passes in one unit of time as a laminar flow through a homogeneous layer of material with an area equal to one surface unit and thickness equal to one unit of length, when the pressure difference between the atmospheres on opposite sides of the material layer is one unit.
Air permeance Air permeance, Ka, indicates the air flow that under a steady-state passes in one unit of time as a laminar flow through a material layer or an assembly one surface unit in size, when the pressure difference between the atmospheres on opposite sides of the material layer or the assembly is one unit.
Air flow resistance Air flow resistance, Sa, refers to the reciprocal of air permeance. The air flow resistance of a specific material layer can be derived from the equation Sa = d/κa.
Capillarity Capillarity refers to the property of a porous material to transfer liquid water by capillary suction pressure.
Capillary condensation Capillary condensation occurs in a capillary pore of a material when the pore fills completely with water due to pore underpressure. Capillary condensation occurs first in the narrowest capillary pores. Capillary condensation may occur within a material even while its moisture content is in the hygroscopic range (ϕ ≤ 98% RH).
Capillary flow Capillary flow (capillary conduction, capillary action) is the movement of moisture due to surface tension forces (capillary suction) within small spaces depending on the porosity and structure of the material.
Capillary range The capillary range is the RH range between 98 and 100% RH for a material. The capillary range falls between the maximum hygroscopic moisture content and maximum moisture content.
Capillary saturation moisture content Capillary saturation moisture content, wcap, ucap or ψcap, is the completely saturated equilibrium moisture content of a material when subject to 100% RH. It is lower than

xvi
the maximum moisture content due to air pockets trapped in the pore structure of material.
Cladding Cladding (siding) is a material layer on the external surface of a wall whose main purpose is to protect the wall assembly from mechanical stress and to prevent harmful penetration of driving rain into the ventilation gap.
Condensation Condensation refers to the phase change of water vapour into water or ice on the surface or inside a material layer where the humidity by volume of air reaches the humidity by volume at saturation (ϕ = 100% RH). In this study moisture condensation inside an external wall assembly refers to this phenomenon (see interstitial condensation).
Convection Convection occurs when a gas or a liquid flows due to an external force (forced convection) or as a result of differences in density due to temperature differences (natural convection). Heat and water vapour are carried along by the air flowing due to convection.
Critical moisture content Critical moisture content, wcrit or ucrit, is the lowest moisture content of a material which is required to initiate moisture transfer in the continuous liquid phase.
Critical relative humidity Critical relative humidity, ϕcrit, is the relative humidity above which mould growth is possible on the surface of a given material at a certain temperature. Each material has a different critical relative humidity value.
Diffusion Diffusion (gas diffusion) is movement of gas molecules that seeks to equalise the differences in concentrations (or partial pressures) of a certain gas in a gas mixture. Diffusion moves a gas from a region of higher to one of lower concentration.
Driving rain Driving rain (wind-driven rain) is rain falling on a vertical surface.
Drying rate Drying rate refers to the moisture flow rate from a wall assembly when indoor or outdoor air conditions change allowing the wall to start drying from a higher moisture content to a lower one.
Equilibrium moisture content Equilibrium moisture content refers to the material moisture content at which material moisture losses and gains under prevailing temperature and RH conditions are identical.

xvii
Envelope In this research envelope refers to the external walls, doors, windows and roof of a building bounder by outdoor air.
Excess moisture Excess moisture (excess humidity, moisture supply, moisture balance, moisture increment, vapour supply), Δνexc, is the difference between the humidities by volume of a building’s indoor air and outdoor air. Indoor air excess moisture is the result of moisture production by people or living activities.
Exterior wall lining Exterior wall lining refers to the part of the wall assembly between the interior and exterior surfaces of the sheathing(s).
Extra moisture If the moisture adsorbed in the materials of the wall assembly exceeds the equilibrium moisture contents warranted by the prevailing interior and exterior surface conditions, the difference in moisture contents is called extra moisture.
Heat capacity Heat capacity (specific heat capacity), c, indicates the heat (energy) required to increase the temperature of a dry unit mass of a material by one degree.
High hygroscopic thermal insulation High hygroscopic thermal insulations consist of sawdust, cutter chipping and their mixture as well as other porous natural fibre insulations whose maximum hygroscopic moisture content, whygr ≈ 40 kg/m3.
Humidity by volume Humidity by volume (water vapour content), v, expresses the amount of water vapour in the air. Differences in humidity by volume values tend to become equalised through diffusion.
Humidity by volume at saturation Humidity by volume at saturation (water vapour content at saturation), vsat, is the maximum possible water vapour content of air at a certain temperature.
Hygroscopic range The hygroscopic range is the range of relative humidity in a material between 0 and 98% RH. The calculational analyses of this research set the hygroscopic range between 0 and 97% RH, since the equilibrium moisture contents of materials were measured in that range.
Hygroscopic thermal insulation Hygroscopic thermal insulation consist of cellulose, flax and hemp as well as other porous natural fibre insulations whose maximum hygroscopic moisture content, whygr ≈ 40 kg/m3.

xviii
Hygroscopicity Hygroscopicity refers to the property of a porous material to adsorb and attract moisture from the air and to desorb it back into air. The more hygroscopic a material is, the higher its moisture capacity.
Interior finishing Interior finishing refers to the surface treatment and/or surfacing material applied to the interior surface of the interior board.
Interior wall lining The interior wall lining refers to the part of the assembly between the interior surface of the interior board/finishing and the exterior surface of the air/vapour barrier.
Internal convection Internal convection occurs in the porous thermal insulation layer of the wall. Internal convection is caused by temperature differences between the upper and lower sections of the wall assembly and by wind penetrating to the insulation layer through the sheathing layer.
Interstitial condensation Interstitial condensation refers to the condensation of moisture on surfaces between material layers inside the wall.
Latent heat Latent heat, hw, refers to the energy bound or released when the water phase (ice, liquid water, water vapour) changes.
Limit value The limit value is the chosen value of the performance criterion which, if exceeded, makes the moisture performance of the wall unacceptable.
Maximum continuous condensation time Maximum continuous condensation time, tmax, refers to the longest continuous time period in a year when the moisture in a structure remains condensed into water or ice, or the moisture content of a material lies in the capillary range.
Maximum hygroscopic moisture content Maximum hygroscopic moisture content, whygr, uhygr or ψhygr, is the material equilibrium moisture content at 98% RH relative humidity. This moisture content corresponds approximately to the maximum amount of water captured from the surrounding humid air that can be stored in a material at isothermal conditions.
Maximum moisture content Maximum moisture content, wmax, umax or ψmax, is the material moisture content that corresponds to the saturation state where open pores are completely filled with water. It can only be produced under experimental conditions in a vacuum.

xix
Moisture capacity Moisture capacity (specific moisture capacity) is the increase in the mass of moisture in a unit volume of the material that follows a unit increase in suction, ξs, or vapour pressure, ξϕ.
Moisture conductivity Moisture conductivity, κw, of a material is defined as the ratio between the density of moisture flow rate and the magnitude of suction (or external water pressure) gradient in the direction of the flow. The moisture conductivity value considers the following moisture transfer modes: surface diffusion, capillary flow, gravitational flow and hydraulic flow.
Moisture content (MC) Moisture content of a material can be defined as follows: the mass of moisture per unit volume of the dry material, w, the mass of moisture per unit mass of the dry material, u, or the volume of moisture per unit volume of the dry material, ψ.
Moisture diffusivity Moisture diffusivity, Dw, of a material is defined as the ratio between the density of moisture flow rate and the magnitude of material moisture content gradient in the direction of the flow. The moisture diffusivity value considers the impact of all moisture transfer modes. When the effect of water vapour diffusion is subtracted from the moisture diffusivity value, the result is liquid moisture diffusivity, Dw,liq.
Moisture-permeable material In a moisture-permeable material moisture can transfer relatively easily to different parts of the material or through a material layer by different moisture transfer modes.
Moisture-permeable wall A moisture-permeable wall (vapour-permeable wall) has a tight air barrier in the interior wall lining but no vapour barrier.
Moisture reference year (MRY) The moisture reference year (moisture design reference year) is an actual year selected to depict the outdoor conditions of an area or country over a certain time period. The moisture reference years of this study have been selected from a period of 30 years so that only 10% of the years are more critical with respect to moisture condensation and mould growth than the selected year.
Mould index The mould index, M, describes the visible mould growth rate on the surface of wood material. The higher the index, the more mould growth on the surface of the wood. The mould index varies between 0 and 6.
Non-hygroscopic thermal insulation Non-hygroscopic thermal insulations consist of glass and rock wool and other porous thermal insulations whose maximum hygroscopic moisture content, whygr ≤ 5 kg/m3.

xx
Partial water vapour pressure Partial water vapour pressure, pν, expresses the partial pressure of water vapour in the air. If total gas pressure does not vary much water vapour content can be replaced with partial water vapour pressure.
Performance criterion A performance criterion is a physical, chemical or biological phenomenon selected for evaluating the moisture performance of a wall. Performance criteria are used to assess the acceptability of the moisture performance of walls in different conditions.
Reference wall In the case of the reference wall, the temperature and relative humidity conditions of the exterior wall lining are most critical (from the viewpoint of moisture conditions and mould growth) but still acceptable when the conditions are only affected by outdoor air conditions.
Regression method The regression method is used in determining the water vapour permeability of materials; it measures water vapour permeability by using several RH condition pairs and computes water vapour permeability as a function of RH based on test results using regression analysis.
Relative humidity (RH) Relative humidity, ϕ, indicates the humidity by volume of air as a proportion of humidity by volume at saturation at a certain temperature.
Saturation deficit Saturation deficit, Δνdef, is the average difference between outdoor air’s humidity by volume at saturation and humidity by volume.
Sheathing Sheathing is a material layer whose main function is to prevent harmful air flow in the thermal insulation layer of a wall due to wind.
Sorption curve The sorption curve or sorption isotherm depicts the relationship between the relative humidity and the equilibrium moisture content of a material at a constant temperature.
Steady-state A system that is in a steady-state (stationary state) takes in and discharges constant amounts of thermal energy and mass in a unit of time. In steady-state, temperatures and the contents of various substances have reached an equilibrium and do not change over time.

xxi
Suction curve The suction curve (water retention curve) or suction isotherm depicts the relationship between the capillary suction pressure and the equilibrium moisture content of a material at a constant temperature.
Supercooled water Water that exists as a liquid below 0°C is called supercooled water. Water molecules have to form an embryo of ice for the freezing process to start. This happens typically when a particle within a supercooled water droplet has a similar crystalline structure as ice. In practice, most water droplets in clouds remain supercooled when the air is slightly colder than 0°C and will not freeze until they reach a temperature of -10°C.
Surface condensation Surface condensation refers to moisture condensation on the interior surface of a wall assembly.
Surface diffusion Surface diffusion is defined as moisture transfer in the water molecule layers sorbed at the pore walls of hygroscopic materials and in micro-capillaries.
Surface resistance Surface resistance, Rs, refers to the thermal resistance of the air layer close to the interior or exterior surface of an assembly which depends on the air flow rate close to the surface and the long-wave heat radiation between it and surrounding surfaces. In this study the exterior surface resistance of the external wall accounts also for the impact of solar radiation, surface undercooling and thermal properties of cladding which makes their separate examination unnecessary. The layer of air close to the surface of the assembly also has a water vapour resistance, Zν,s, which is, however, small enough to be usually ignored in building physical analyses.
Surface undercooling Surface undercooling refers to the long-wave heat radiation from the exterior surfaces of a building into cold space whereby the exterior surface temperature of envelopes may fall below the temperature of outdoor air.
Thermal conductivity Thermal conductivity, λ, indicates the heat volume that under a steady-state passes in a time unit through a homogeneous material layer one surface unit in size and one unit of length thick, when the temperature difference between the atmospheres on the opposite sides of the material layer is one unit. Basically, the thermal conductivity value describes a material’s ability to transmit heat solely by conduction but in building physical applications it has also been used to account for the impact of all heat transfer modes in porous material.

xxii
Thermal resistance Thermal resistance, R, of a material layer or an assembly indicates, in steady-state, the ratio of the temperature difference between the isothermal surfaces on opposite sides of an assembly to the density of the heat flow rate passing through the material layer. The thermal resistance of a material layer can be derived from the equation R = d/λ.
Thermal transmittance Thermal transmittance, U, indicates the heat volume that under a steady-state passes in a time unit through a material layer or an assembly one surface unit in size, when the temperature difference between the atmospheres on opposite sides of the material layer or assembly is one unit.
Vapour barrier A vapour barrier is a material layer of the interior wall lining whose main function is to prevent harmful diffusion of water vapour into or within a wall. At the same time, the vapour barrier can also function as an air barrier. The water vapour resistance of a vapour barrier is high.
Ventilation gap A ventilation gap is a cavity behind the cladding of an external wall in contact with outdoor air through its upper and lower sections. The main purpose of the air flow in the ventilation gap is to prevent driving rain from penetrating inside the wall and to dry out the excess moisture inside the wall.
Water vapour diffusion resistance factor Water vapour diffusion resistance factor, μ, is defined as the ratio between the water vapour diffusion coefficient of stagnant air and that of a material under identical thermodynamic conditions (same temperature and pressure).
Water vapour permeability Water vapour permeability, δν or δp, indicates the amount of water vapour that under a steady-state passes in a time unit through a homogeneous material layer one surface unit in size and one unit length thick, when the difference in the humidities by volume (or partial water vapour pressure difference) of the atmospheres on opposite sides of the material layer is one unit. Basically, the water vapour permeability value describes a material’s ability to transmit moisture solely by water vapour diffusion but in building physical applications it has also been used to account for the impact of all moisture transfer modes in porous material in the hygroscopic range.
Water vapour permeance Water vapour permeance, Wν or Wp, indicates the amount of water vapour that under a steady-state passes in a time unit through a material layer or an assembly one surface unit in size, when the difference in the humidities by volume (or partial water vapour pressure difference) of the atmospheres on opposite sides of the material layer or the assembly is one unit.
xxiii
Water vapour resistance Water vapour resistance, Zν or Zp, refers to the reciprocal of water vapour permeance. To be precise, only water vapour permeance reflects the impact of the mass transfer coefficients of interfaces, but their share is practically insignificant. The water vapour resistance of a specific material layer can be derived from the equation Zν = d/δν or Zp = d/δp.
Water vapour resistance ratio (WVRR) The water vapour resistance ratio of an external wall assembly indicates the water vapour resistance of the interior wall lining divided by the water vapour resistance of the exterior wall lining.
Weatherisation membrane The weatherisation membrane is a paper- or polymer-based thin membrane used as a sheathing of timber-framed external walls.
10% level critical year The 10% level critical year is a moisture reference year chosen so that 10% of the years of a given period are more critical than this year based on a certain performance criterion.

xxiv

1 INTRODUCTION
1.1 Background
The timber-frame has traditionally been the predominant solution for Finnish one-family and row houses. This frame type has been chosen for 80% of them in recent years (Omakotirakentaja 04/05 2005). The cladding of timber-framed houses is either brick or wood with a ventilation gap and sheathing behind. The thermal insulation of the walls of the majority of the houses is mineral wool (rock wool or glass wool) and a vapour/air barrier of plastic foil is generally installed behind the interior board. The vapour barrier may also be at a depth of 50 mm from the interior surface of the timber frame to facilitate electrical installations (Fig. 1.1). During the last two decades, many new natural and man-made materials have entered the markets and become increasingly prevalent components of the external wall assemblies of one-family and row houses. Alternative solutions for the traditional wall assembly containg a vapour barrier have been studied in Finland since the early 1980s. One alternative that has been widely investigated is the moisture-permeable wall assembly, often called the “breathing wall assembly“. In that assembly the internal plastic vapour barrier is usually replaced with a moisture-permeable air barrier paper. In some solutions the air barrier paper is omitted completely and interior boards are used to make the assembly airtight. Instead of mineral wool, natural fibre insulations – especially cellulose insulations – are used for thermal insulation of such assemblies. Moisture-permeable walls have been studied extensively also in other Nordic countries, Central Europe and North America (see Ch. 1.7.4). In North America these studies began already in the late 1930s.
Cladding
Ventilation gap
Sheathing
Thermal insulation +wooden studs
Air barrier/
Interior board
+--- ++
vapour barrier
Interior finishing
Figure 1.1 Typical timber-framed external wall assemblies of Finnish one-family and row houses.

2
Moisture-permeable walls are used assuming that they improve the moisture performance of the assembly and quality of indoor air. Another goal is to promote the use of natural fibre-based building materials in wall assemblies. The intention is to make the vapour permeability of the interior wall lining as low as possible while ensuring the reliable functioning of the assembly. This changes the moisture performance of the assembly compared to one incorporating a vapour barrier. Water vapour can transfer by diffusion through the interior surface of the moisture-permeable assembly in both directions depending on the humidity by volume of the air on opposite sides of the surface. Presently, a good 10% of built Finnish timber-framed one-family and row houses have wall assemblies with cellulose insulation (Omakotirakentaja 04/05 2005). One basis for this study of moisture-permeable walls were the numerous favourable experiences from earlier built sawdust insulated houses which did not have a plastic vapour barrier in the interior lining of the wall. On the other hand, people’s demands with regard to housing conditions were also lower at that time; living conditions were different and less water was consumed than today. Actually, the walls of the houses were also built differently from the modern moisture-permeable ones. There was almost always diagonal boarding behind the interior board/building board on the interior surface of the assembly which served as a quite good vapour barrier. There was also diagonal boarding behind the cladding, with higher vapour resistance than most presently used sheathing materials have. The sawdust used as thermal insulation had considerably higher moisture capacity than today’s natural fibre insulations thanks to its high density. The U-value of wall assemblies was also significantly higher than presently due to the higher thermal conductivity of sawdust insulation and smaller insulation thicknesses than today. Consequently, the temperature near the exterior surface of the assembly was higher, and the relative humidity of pore air lower, whereby the risk of moisture condensation and mould growth was lower. An essential difference was also that the buildings were not as airtight as nowadays. Stove heating of the buildings did, however, create an underpressure inside, and the resulting convection through the wall assemblies from the outside in did not bring additional moisture into the assembly. In recent years the moisture performance of wall assemblies with and without a vapour barrier has been discussed continuously. Both have advantages and drawbacks depending on the situation. (see Ch. 1.7.3). Yet, the performance of assemblies and buildings is to be assessed comprehensively attempting to determine the true significance of the advantages and drawbacks. Such assessment is, however, difficult to the extent that there is insufficient knowledge about the impacts of all factors. People’s own valuations also bear on the matter. There are nevertheless issues that are clearly more important in the study of the performance of different wall assemblies. These issues include, for instance, condensation of moisture and mould growth on the interior surface of the sheathing during different seasons.

3
Many studies and practical experiences tell that other modes of moisture transfer besides diffusion of water vapour – convection, capillary flow and gravitational flow (see Ch. 1.7.1) – cause much wider and more severe moisture damage in assemblies than water vapour diffusion. There is also quite wide consensus with regard to these modes of moisture transfer in that their impact on wall assemblies should be limited as much as possible. As to diffusion of water vapour, the views, however, differ. The principle that detrimental diffusion of water vapour into wall assemblies should be prevented is quite generally accepted. Under Finnish winter conditions the direction of the diffusion flow is almost always from inside out, due to indoor air excess moisture, which means that diffusion in external walls should be restricted by increasing the water vapour resistance of the interior wall lining (see Fig. 1.24). On the other hand, views differ about the magnitude of the water vapour resistance required of the interior wall lining to prevent harmful diffusion, and whether increasing the water vapour resistance of the interior wall lining impedes the functioning of the assembly. Indoor air excess moisture is one of the most important factors affecting the water vapour resistance required of the interior surface of the external wall. The excess moisture, again, depends primarily on two things: building ventilation and moisture product of occupants and their living activities. Most wall assemblies perform flawlessly from the viewpoint of water vapour diffusion if indoor air excess moisture is low. The situation changes when excess moisture of indoor air increases. Views about the typical range of indoor air excess moisture vary for residential buildings. The aim of design must nevertheless be that wall assemblies perform properly independent of the living and water use habits of the occupants. The humidity of indoor air does not affect the moisture performance of the external wall assembly if the interior wall lining incorporates a tight vapour barrier. If the cladding of the wall and the ventilation gap behind it protect the assembly from the impact of driving rain, the moisture contents of the assembly depend totally on the relative humidity of outdoor air. Then, the moisture contents of the wall materials are also of the lowest possible level. The moisture contents and relative humidities of the pore air of moisture-permeable assemblies, again, are typically higher since water vapour from indoor air also enters them (see Fig. 1.24). The valid Finnish Building Code and related guidelines (RakMK C2 1998, RIL 107 2000) instruct that the water vapour resistance of the interior wall lining is to be at least fivefold compared to that of the exterior wall lining. Yet, the code and guidelines are somewhat contradictory about the resistance that should be required of the interior wall lining. According to the code, the performance of the assembly is normally always acceptable if it has a resistance ratio of at least 5:1. The guidelines, on the other hand, insist that the external wall should normally incorporate a vapour barrier, or otherwise the performance

4
of the assembly must always be ensured by further investigations. The codes of different countries also differ significantly from each other in this respect (see Ch. 1.7.2). The lack of uniform design guidelines has many causes. Firstly, no generally accepted performance criteria have been established for the moisture performance of wall assemblies. Also, climatic conditions, types of assemblies and building materials are different in different countries which means that it is difficult to set uniform criteria. For instance, it is impossible to set a general limit value for mould growth since some countries have outdoor air conditions that are essentially more conducive to mould growth than others’. Presently some principles exist for selecting the reference boundary conditions for outdoor and indoor air for investigations, but they must be applied and complemented according to the subject of study. Safety factors are not used in building physical surveys which requires accurate knowledge about the most critical outdoor and indoor conditions and variations in them in order to be able to produce correct design instructions. On the other hand, safety factors are not as indispensable in building physical surveys as in loading evaluations since occasional exceedance of critical conditions in the former does not result in as serious consequences in the performance of assemblies as in the latter. Furthermore, the analysis of the moisture performance of external walls is complicated since providing a comprehensive view of the performance of assemblies requires using several different research methods and combining their results. Moreover, the calculational analysis of numerous new building materials is difficult as all their building physical properties are not available. These products include, especially, various types of air barrier and weatherisation membranes but deficiences exist also in the case of other building materials. On the other hand, research equipments, measuring systems and calculation programs have reached the level of sophistication that enables them to provide a more reliable comprehensive view of the issue under study only in the last few years.
1.2 Research goals and hypotheses
The goals of the research have been: 1) to determine the performance criteria, limit values and boundary conditions for
timber-framed external walls in Finnish climatic conditions that ensure their proper moisture performance from the viewpoint of diffusion
2) to define the minimum values for the water vapour resistance ratio between the interior and exterior linings of different external wall assemblies in Finnish climatic conditions at different indoor air excess moisture values

5
The hypotheses of the research have been: 1) The minimum water vapour resistance ratio required of a timber-framed external
wall assembly depends during the use of the building essentially on used performance criteria and limit values, indoor and outdoor air conditions and the structural solution and used materials.
2) The water vapour resistance ratio between the interior and exterior wall linings of timber-framed external walls can be determined by a new and more accurate method taking into account the factors mentioned above.
3) The moisture performance of a timber-framed external wall assembly depends essentially also on other building physical properties of structural layers than the water vapour resistance ratio between the interior and exterior wall linings.
1.3 Limitations of the research
1.3.1 Criteria for moisture performance of the wall assembly
The research has focussed on hygrothermal performance of timber-framed external walls in a heated residential building in Finnish climate. Diffusion, capillary flow and surface diffusion are the moisture transfer mechanisms considered in the research. Condensation of moisture and mould growth in the assembly were selected as performance criteria. The selected moisture condensation and mould growth criteria were thought to constrain sufficiently also the occurrence of other detrimental phenomena in timber-framed external walls (e.g. changes in material properties, decrease in stiffness and strength, deformations, crumbling, cracking, rotting, adhesion loss of glues, amount of material emissions, colour changes, bacterial growth, insect damage, loosening of metal fasteners and corrosion of metal fasteners and parts). The calculational analyses of the study did not consider the impact of various moisture leaks on the performance of the wall assembly. It has been assumed that the structural layers have been designed and installed so as to prevent capillary and gravitational moisture transfer into the assembly. It has further been assumed that building ventilation creates a slight underpressure indoors or that the air barrier is sufficiently impermeable to prevent detrimental convection through the structure from the inside out. Different types of moisture leaks have, however, been considered in determining the recommended maximum water vapour resistance of the sheathing to ensure proper drying of the structure in case of occasional moisture leaks. The study has not taken into account the impact of the assembly’s internal convection on its performance. It has been assumed that the thermal insulation has been installed with such care that no air leakage routes remain in the insulation layer or at its edges, which

6
would considerably increase internal convection. Convection inside the thermal insulation layer increases the moisture stress in the upper section of the wall assembly, and its impact can be separately determined if necessary. The impact of construction-time moisture has not been considered in the study. It has been assumed that building materials do not get significantly wetted during construction or that the phases of construction are implemented so as to allow wall materials to dry sufficiently before installation of the interior wall lining. Moreover, construction time is short compared to the entire service life of the building. The study has also omitted looking into the durability and building physical performance of the cladding of the wall assembly. The performance of the cladding depends on more conditions-related factors than the internal sections of the assembly (e.g. driving rain and solar radiation). The performance criteria set for cladding also depend essentially on the selected cladding material.
1.3.2 Outdoor air conditions
The outdoor air conditions of the study consist of temperatures and relative humidity values measure in Finland during different seasons. Air temperature and relative humidity have been used as they are the key factors determining the impact of diffusion on the moisture performance of a timber-framed external wall assembly. In the examination of outdoor air conditions, the impacts of the ventilation gap on the conditions behind both timber and brick cladding were considered. In the same connection the impacts of other factors (driving rain, wind, solar radiation and surface undercooling) on the temperature and moisture conditions in the ventilation gap were studied in field tests. The impacts of these factors on the performance of the assembly have been taken into account in determining the exterior surface resistance of a sheathing incorporating a ventilation gap. The external wall assembly selected for study was a shaded northern wall, which generally is the most critical alternative from the viewpoint of diffusion in Finland. The performance of the external wall assembly was studied around the year. Most attention was, however, paid to the most critical seasons as to moisture performance, that is, autumn and winter. In calculational analyses, temperatures and relative humidities measured from outdoor air at 3-hour intervals were used to calculate 24-hour average intervals inside the analysed wall. These intervals were selected to ensure good accuracy of the results. The analyses did not consider temporary fluctuations in outdoor air conditions since their significance for the issue under study is minor.

7
In the laboratory tests connected to the study, temperature and relative humidity were kept constant during autumn and winter periods but were varied during spring periods. The conditions were chosen so as to represent typical average outdoor air conditions in Finland during the different seasons.
1.3.3 Indoor air conditions
The research targeted heated buildings whose assumed indoor air temperature is the normal room temperature the year round. In most calculational analyses indoor air temperature was 21°C as recommended in the Classification of Indoor Climate 2000 (2001). Some analyses concerning the moisture performance of interior wall linings were done at 19°C since there a lower indoor temperature was a more critical alternative for the moisture performance of the assembly. In laboratory tests indoor air temperature was 20°C. The study looked primarily at indoor air RH and excess moisture values that occur in indoor air as a result of normal living activities. Excess moisture values were measured in Finnish one-family and row houses. The average indoor air excess moisture varies between seasons and is higher in winter than in summer. Thus, indoor air excess moisture was varied in the calculations as a function of outdoor air temperature. The impact of excess moisture was examined in the range 0−8 g/m3. Temporary changes within each 24-hour period were not considered when determining indoor air conditions, as they have not been noticed to have any major effect on the moisture performance of the exterior section of the wall assembly. Seasonal fluctuations in indoor air temperature were also ignored since indoor air temperature can be considered to be nearly constant during the heating season, which is the most critical period as concerns moisture performance.
1.3.4 Wall assembly solution and used materials
The study examined timber-framed external wall assemblies bounded by indoor and outdoor air. The study assumed that the wall assemblies had been built carefully and professionally so that their moisture performance is not significantly affected by construction defects. The moisture contents of the materials of the assembly were assumed to remain most of the time in the hygroscopic range. The time period required for the initial moisture contents of wall materials to reach the level corresponding to prevailing indoor and outdoor conditions was taken into account in calculations by calculating the changes in condition over a one-year period before the beginning of the target reference year.

8
The examined assemblies were layered assemblies whose most critical point as concerns moisture performance is the interior surface of the sheathing. The subject assemblies were composed of layers whose properties and performance were defined as follows (layers presented from outermost to innermost).
Cladding
The assumed cladding was either wood or brick, the two most typical cladding materials of timber-framed houses in Finland. Cladding was assumed to form a continuous layer providing good protection from rain and wind but relatively little thermal insulation. The research results can also be applied to other cladding materials that meet the above definitions. Especially in the case of brick cladding, driving rain may occasionally penetrate through cladding. The study analysed also the impact of rain water penetration on the humidities by volume of the ventilation gap.
Ventilation gap
The researched assemblies had a ventilation gap (20−30 mm) behind the cladding, whose primary function was to prevent the moisture from driving rain from entering the wall assembly and to allow extra moisture to escape from the assembly. The air flow in the ventilation gap is assumed to be such that moisture exits the assembly efficiently enough. The impact of the temperature and RH conditions of the ventilation gap on the moisture performance of the wall was also been examined.
Sheathing
The sheathing was assumed to be a continuous, highly moisture permeable layer that prevents harmful convection flows in the thermal insulation layer due to wind. The sheathing layer could be either of board or membrane, hygroscopic or non-hygroscopic and capillary or non-capillary. The study focussed mainly on sheathings with a water vapour resistance, Zν ≤ 20 ×103 s/m.
Thermal insulation
Thermal insulation was assumed to be of the open-pore type with higher water vapour permeability than the sheathing. Consequently, the interior surface of the sheathing was the most critical area from the viewpoint of mould growth and condensation. The thermal insulation could be hygroscopic or non-hygroscopic and capillary or non-capillary supplied as batts or rolls or as blown-in loose-fill insulation. Thermal insulations with open pores divide roughly into three groups based on moisture capacity: non-hycroscopic, hygroscopic and high hygroscopic thermal insulations (see Ch. 6.1.1).

9
The impact of anti-mould agents added to building materials – primarily to natural fibre insulations – aimed to inhibit mould growth was not taken into account in the calculational analyses. Yet, their use contributes to the desired performance of the wall assembly in conditions conducive to mould growth (see Ch. 7.2.5).
Air/vapour barrier
Due to the airtightness requirement, all wall assemblies had an air barrier on the interior surface of the thermal insulation. The air conductivity of the air barrier was assumed so low as to prevent convection flows through the air barrier. All air barrier materials always have a certain water vapour resistance. If the water vapour resistance of the air barrier is high, it also functions also as a vapour barrier. In moisture-permeable assemblies the water vapour resistance of the air barrier is significantly lower than that of the vapour barrier.
Interior board
Gypsum board is the most common material of interior boards in the walls of timber-framed one-family and row houses. However, the results of this study are applicable to all interior surface materials whose building physical properties are known. The water vapour resistance of the interior wall lining is the sum of the resistances between the interior surface of the interior board/finishing and the exterior surface of the air/vapour barrier. The vapour resistance of the interior board may in some instances be considerably higher than that of the air barrier.
Interior finishing
The water vapour resistance of interior finishing can be factored into the water vapour resistance of the interior wall lining, if its contribution is sufficiently well known and its remaining part of the assembly for the entire life cycle can be ensured. It is, however, often recommendable not to consider the interior finishing (paint or wallpaper) when determining the water vapour resistance of the interior wall lining. Then, it just provides a margin of safety with respect to moisture performance (see Ch. 7.2.5). No interior finishing was used in the laboratory tests of wall assemblies in this study to allow accurate determination of the water vapour resistance of the interior wall lining.
1.4 Research methodology and structure
Acquiring a comprehensive view of the subject of research requires using several different research methods. Building physics is a field of research where use of different research methods is especially important since numerous factors affect the results received and the conclusions drawn from them. The essential research methods in building physics are field tests, laboratory tests and calculational analyses. All these method have their advantages and drawbacks which affect the interpretation of research results (Table 1.1).

10
Table 1.1 Advantages and drawbacks of different research methods in building physical research.
Research method Advantages Drawbacks Field tests Assemblies are affected by actual
outdoor and indoor air conditions. Tests reveal impact of building orientation. Test results can be compared to calculated results and used to verify them.
The criticality of outdoor air conditions is not know beforehand. The mutual significance of subfactors affecting test results may remain unclear. Test results describe the performance of the building in question and depend on the quality of construction. Tests typically take at least one year.
Laboratory tests Assemblies and materials can be tested under controlled conditions. The significance of individual factors can be examined in tests. Test results may be used as initial data in calculational analyses (material properties) and in comparison and verification of calculated results (assembly tests).
All outdoor air condition factors and fluctuations over a period of one year cannot be modelled by assembly tests; test conditions are always simplified and testing time limited. Material tests are typically conducted only at certain temperature and humidity conditions although real-life conditions change and vary over a wider range than the selected test conditions.
Calculational analyses
A large number of results are acquired quickly. Impact of different factors can be examined in great detail by calculational analyses. Calculations allow determining beforehand what kinds of field and laboratory tests are the most sensible to conduct.
Correctness of results depends on the correctness of the initial data fed into the program. More detailed analysis requires a large volume of initial data and more complicated HAM models, which increases the risk of errors. Computer programs have their own limitations related to computing principles and initial data which means that results never fully correspond to the actual situation.
This study analysed the moisture performance of timber-framed external wall assemblies using all of the above three methods (Fig. 1.2).

11
Laboratorytests
Field testsCalculationalanalyses
Literature
Material property tests
Modellingof wallsin MRYconditions
Wall assembly tests
Research results
Selectionof moisturereferenceyears (MRY)
Comparisonbetween testresults andHAM models
Performanceof walls ofone-familyhouse
Indoor airconditionsof 102 one-family androw houses
Outdoor airconditionsof 4 Finnishlocalities
Performanceof ventilationgaps of TUTtest houses
Maximumcondensationtime andmould indexanalyses
Building physicalresearch equipment
Figure 1.2 Structure of this research. The laboratory test conducted as part of the research consisted of material tests and assembly tests. Material tests were used to determine building physical properties of materials as a function of temperature and relative humidity. Their aim was to reveal how the properties of various materials change as temperature and moisture conditions change and to provide a wider range of material properties than before for calculational analysis of

12
assemblies. The goal of assembly tests was to establish in practice the performanceal differences between various types of assemblies under different conditions and to acquire comparison data for calculational analyses from controlled test conditions. Broad field tests examined the temperature and humidity conditions of indoor air and related changes in Finnish timber-framed one-family houses. The outdoor air temperatures and relative humidities of four Finnish localities over a 30-year period measured by the Finnish Meteorological Institute may also be considered research data from field tests. In the case of assemblies, the performance of walls with and without a vapour barrier was examined in a one-family house as well as the temperature and moisture conditions of the ventilation gap of TUT test houses. Calculational analyses initially compared the results of various computer programs with the results of laboratory and field measurements. The program used in the study was selected on the basis of these comparisons. Then, the moisture reference years (MRYs) used in calculations were selected based on the condensation and mould growth risk they pose. Finally, the moisture performance of different wall assemblies in the temperature and moisture conditions of the reference years was examined at different excess moisture values.
1.5 Research equipment and methods developed in connection with the research
A significant number of research equipment and methods were developed for the Institute of Structural Engineering at TUT for the laboratory and field tests of this study: • Calibrated hot box equipment, which can be used for U-value measurements on
envelope assemblies (see Ch. 3.1). • Building physical research equipment, which can be used for analysing building
envelope assemblies in varied outdoor and indoor air conditions (see Ch. 3.1). • Measurement arrangements and methods for building physical material property tests
(see Ch. 3.3) • Field measuring equipment for measurements in test houses (see Ch. 4.1.1).
1.6 Research schedule
Different parts of the research were conducted timewise as follows: • Construction of the building physical research equipment and
calibrated hot box equipment 1994–1998 • Wall assembly tests in winter conditions (8 test walls), test series 1 1997–1998

13
• Field tests on wall assemblies of one-family house 1998–2000 • Wall assembly tests in autumn, winter and spring conditions
(56 test walls), test series 2 2000–2004 • Testing of building physical properties of building materials (42 materials) 2000–2004 • Field tests related to functioning of ventilation gap of TUT test houses 2001–2003 • Field measurements on indoor air conditions in one-family and row houses (102 test houses) 2002–2004 • Calculational analyses 2001–2006
1.7 Literature review
1.7.1 Basic concepts of building physics
This chapter deals with some basic concepts of building physics essential in the examination of the thermal and moisture performance of assemblies. References to sources have been omitted as concerns generally known and accepted theory.
Heat transfer modes
The process by which energy is transported within and between building components of different temperature is known as heat transfer. The science of heat transfer seeks to predict the rate at which energy exchange takes place. Heat transfer can be defined as the transmission of energy from one region to another as a result of a temperature difference between them. Three modes of heat transfer can be identified: • Conduction • Convection • Radiation
Conduction
In conduction, energy is transmitted due to internal vibrations of molecules, without a net displacement of the molecules themselves. The heat flow due to conduction in a homogeneous and isotropic material is expressed by Fourier’s law:
⎟⎟⎠
⎞⎜⎜⎝
⎛∂∂
∂∂
∂∂
−=∇−=zT
yT
xTTq λλλλ ,, (1.1)

14
where q is density of heat flow rate (W/m2) λ is thermal conductivity of material (W/(m·K)) T is temperature (K) x, y, z are dimensions and coordinates (m)
The minus sign is a consequence of the fact that heat is transferred in the direction of decreasing temperature. The gradient, also represented by ∇ (nabla operator), is a vector representing the rate of change for any direction. In many cases the heat flow is approximately one-dimensional (e.g. heat flow through the external wall assembly). Then, the density of heat flow rate in the x direction is expressed as:
xTq
∂∂
−= λ (1.2)
Under the steady-state conditions shown in Figure 1.3, where temperature distribution is linear in the material layer, the density of heat flow rate may be expressed as:
d
TTd
TTq 2112 −=
−−= λλ (1.3)
where
d is thickness of material layer (m) T1,2 are temperatures of material surfaces (K)
T1
T2
λ
d
q
Figure 1.3 One-dimensional heat transfer by conduction.

15
The heat flow rate, Φ (W), through a material may be calculated by the following equation:
d
TTA 21 −=Φ λ (1.4)
By dividing thermal conductivity by the factor ρ0c, called volumetric heat capacity, we can introduce a material property called thermal diffusivity, a (m2/s):
c
a0ρλ
= (1.5)
where
c is specific heat capacity of material (J/(kg·K)) ρ0 is density of dry material (kg/m3)
This material property describes how fast temperature changes propagate in a material. The higher the thermal diffusivity of a material, the faster the material temperature reaches equilibrium after a change in ambient temperature. Specific heat capacity of a material, c, can be given either at constant pressure, cp, or constant volume, cv. These values are approximately the same for solids and liquids, but differ with gases like air. This is due the fact that the volume of a gas changes with pressure. The relationship between the specific heat capacities of air is represented by the following equation:
a
pava MRcc −= (1.6)
where
cva is heat capacity of air at constant volume (∼1200 J/(kg·K)) cpa is heat capacity of air at constant pressure (∼713 J/(kg·K)) R is gas constant (8314.3 J/(kmol·K)) Ma is molar mass of air (28.96 kg/kmol)
Building physics uses the cpa value since the volume of air may change while air pressure is almost constant. Specific heat capacity changes as a material becomes wet. The change can be calculated as follows:

16
)w(ccc0
w0 ρ+= (1.7)
where
c0 is heat capacity of dry material (J/(kg·K)) cw is heat capacity of water (∼4200 J/(kg·K))
Although thermal conductivity actually describes a material’s ability to transmit heat by conduction, in building physical applications the thermal conductivity of a material includes typically all modes of heat transmission. In a porous material, such as glass wool, radiation and convection may affect remarkably the total thermal conductivity of a material (Fig. 1.4). In Figure 1.4, D is the diameter of glass fibre.
Thermal conductivity λW/m°C 0.045
0.040
0.035
0.030
0.025
0.020
0.015
0.010
0.005
0
Glassfiber Tm = 20°C D = 5 x10⁻⁶ m
Total heat transfer
Heat transfer in gas
1.0 0.99 0.98 0.97 Porosity ε
Radiation
Conduction in solids
0 10 20 30 40 50 60 70 80 kg/m3
Density ρ Figure 1.4 The mechanisms of heat transfer in a fibrous material. (Bankvall 1972b) Themal conductivity can be measured in a laboratory by transient or steady-state-methods. The most widely used steady-state measurement equipment are the guarded hot plate (ISO 8302 1991) and the heat flow meter (ISO 8301 1991) (see Ch. 3.3.1).

17
The thermal conductivity of a porous material is affected, for instance, by ambient air temperature and relative humidity as well as changes in the material´s properties due to time, mechanical stress and wetting. The thermal conductivity of materials increases as temperature and relative humidity rise (e.g. Sandberg 1992; Langlais et al. 1994; Vinha et al. 2005b) (see App. 3). The impact of moisture and wind as well as variation in material properties have been considered in the design of envelope assemblies by using normal thermal conductivity, λn, (in Finland) or design thermal conductivity, λdesign, (in rest of Europe) as the design value of materials instead of the λ10 measured in the laboratory. The thermal resistance of a material layer, R (m2·K/W) (Eq. 1.8), is often also used in building physical calculations. It indicates the resistance of the material layer in question to transmission of heat through it.
λdR = (1.8)
The thermal resistance of entire assemblies (e.g. external wall assemblies) is described by thermal transmittance, U (W/(m2·K)). The U-value of an assembly consisting of homogenous layers may be calculated by the following equation:
nRRRRR
U+++++
=...
1
21sesi
(1.9)
where
Rsi is interior surface resistance (m2·K/W) Rse is exterior surface resistance (m2·K/W) R1,2…n are thermal resistances of individual material layers 1, 2…n (m2·K/W)
The impact of cold bridges is considered by calculating upper and lower limits for the assembly’s U-value as well as the overall U-value of the assembly based on them (ISO 6946 1996). If there is a 5-fold difference in the thermal conductivities of adjoining materials of a material layer, the U-value of the structure cannot be determined by the above method (RakMK C4 2003, RIL 225 2004). Then, the effect of cold bridges must be accounted for by adding a term to the U-value. The thermal resistances of an assembly’s interior and exterior surfaces are reciprocals of the combined heat transfer coefficients, α (Eq. 1.10). The combined transmittance factor is in practice the sum of the thermal transmittance factors for convection and radiation; the transmittance factor for heat conduction in air is so small that it can be ignored.
18
radconv
s11
ααα +==R (1.10)
where
αconv is convection heat transfer coefficient (W/(m2·K)) αrad is radiation heat transfer coefficient (W/(m2·K))
The convection and radiation heat transfer coefficients are dealt with in more detail in connection with convection and radiation in this chapter. The interior and exterior surface resistance values of external wall assemblies have been determined experimentally. The value used for the interior surface is 0.13 m2·K/W and that for the exterior surface 0.04 m2·K/W (ISO 6946 1996). If there is a well-ventilated air gap behind the cladding, the thermal resistance of the ventilation gap and cladding can be disregarded and the same surface resistance value used for the exterior and interior sides of the wall (i.e. 0.13 m2·K/W) (ISO 6946 1996). In order to be able to determine the temperature distribution in an assembly and the density of the heat flow rate in a non-stationary situation (see Eq. 1.2), an equation for the energy balance must be established which expresses the energy conservation requirement:
⎟⎠⎞
⎜⎝⎛
∂∂
−∂∂
−=∂∂
xT
xtTc λρ (1.11)
where
ρ is density of material (kg/m3) c is specific heat capacity of material (J/(kg·K)) t is time (s)
Since the thermal conductivity value of a material already considers the impact of all heat transfer modes, the energy balance equation does not have to include terms representing the material’s internal convection and radiation. On the other hand, if the analysis is intended to consider the heat transferring with the air flow through the material, a term is to be separately included. In combined heat and moisture transfer analyses, the energy balance equation should also consider the impact of the latent heat of the water phase change, hw (J/kg) (see Fig. 1.17). Then, the energy balance equation may be written as:
⎟⎠⎞
⎜⎝⎛
∂∂
∂∂
+⎟⎠⎞
⎜⎝⎛
∂∂
−∂∂
−=∂∂
xxh
xT
xtTc νδλρ νw (1.12)

19
Convection
Convection heat transfer is the result of the flow of a fluid, in building physics generally of air or sometimes water. The heat is carried by the heat capacity of the fluid from one point to another. Convection heat transfer may occur in three different forms: • Forced convection • Natural convection • Convection with phase change Forced convection occurs when the flow is caused by an external means, such as a fan, a pump, or atmospheric winds. On the other hand, natural (or free) convection occurs when the flow is induced by buoyancy forces, which arise from density differences caused by temperature variations in the fluid. In the case of external walls, forced convection typically travells through the wall assembly. On the other hand, most of the internal convection in a wall is natural convection. This phenomenon will be examined further below under "Internal convection of walls". Typically, the transferring energy is sensible or internal thermal energy of the fluid. However, there are also convection processes involving latent heat exchange. Latent heat exchange is generally associated with a phase change between the liquid and vapour states of a fluid (e.g. boiling and condensation of water). The density of the convective heat flow rate, qconv (W/m2), from material surface to air is expressed by Newton’s law of cooling: )( asconvconv TTq −= α (1.13)
where
αconv is convection heat transfer coefficient (W/(m2·K)) Ts is surface temperature (K) Ta is temperature of ambient air (K)
The convection heat transfer coefficient, αconv, depends on the conditions in the boundary layer, which are influenced by surface geometry, the nature of fluid motion (laminar or turbulent) and the assortment of fluid thermodynamic and transport properties. Literature presents various equations for determining convection heat transfer coefficients for building physical applications (Nevander & Elmarsson 1994; Hagentoft 2001).

20
If we analyse one-dimensional heat convection through a gap or hole in steady-state conditions, the net density of convective heat flow rate, qconv, may be expressed as: )( 21apaaconv TTrcq −= ρ (1.14)
where
ρa is density of air (∼1.2 kg/m3) cpa is heat capacity of air at constant pressure (∼1000 J/(kg·K)) ra is density of air flow rate (m3/(m2·s)) T1,2 are temperatures at the ens of a gap or hole (K)
Heat transfers also by conduction in the air flowing through a gap or a hole, but its share is normally so small that it can be ignored in analyses. The net convective heat flow rate, Φconv (W), through a gap or hole may be calculated by the following equation (Fig 1.5): )()( 21apaa21apaaconv TTRcTTArcqA −=−==Φ ρρ (1.15)
where
A is area of gap or hole (m2) Ra is air flow rate (m3/s)
ρacpa
T1
0 L
Ra
T2
Φconv
A
Figure 1.5 One-dimensional heat transfer through a hole by convection. Literature presents different equations for air flow rate, Ra, depending on the geometry of the tube and the nature of air flow (laminar or turbulent) (Nevander & Elmarsson 1994; Mills 1999; Hagentoft 2001; Incropeda & de Witt 2002). The air flow rate is determined by the pressure losses inside the air gap and the entrance and exit pressure losses. Density of air flow rate (or velocity of air flow) through a porous material layer may be expressed by Darcy’s law:
xp
xpkr
∂∂
−=∂∂
−= aa
aa κ
η (1.16)

21
where ka is air permeability of material (m2) ηa is dynamic viscosity of air (∼0.017 ×10⁻³ N·s/m2) κa is air conductivity (m3/(m·s·Pa)) p is air pressure (Pa)
Under steady-state conditions (Fig. 1.6) this equation may be expressed as:
d
ppd
ppr 21a
12aa
−=
−−= κκ (1.17)
where
p1,2 are air pressures on opposite sides of the material layer (Pa)
d
ra
p1
p2
κa
Figure 1.6 One-dimensional air flow through a material layer. The air flow rate, Ra (m3/s), through the material layer may be expressed as:
)pp(SA)pp(AK
dppAArR 21
a21a
21aaa −=−=
−== κ (1.18)
where
Ka is air permeance of material layer (m3/(m2·s·Pa), m/(s·Pa)) Sa is air flow resistance of material layer (m2·s·Pa/m3, s·Pa/m)
When analysing one-dimensional heat convection through a porous and homogenous material layer in steady-state conditions, one must consider the combined heat transfer by convection and conduction. This is due the fact that as air flows through a porous material, part of the heat transfers through air by conduction while part transfers to the pore walls of the material and starts to transfer by conduction through the solid material. Thus, the shares of the heat flow transferring by convection and conduction change as a function of the material layer thickness.

22
Internal convection of walls
When porous thermal insulations are used, so-called internal convection also occurs in external walls. It is mainly due to the temperature difference between the upper and lower sections of the wall, but is sometimes also caused by wind (Fig. 1.7). In natural convection air circulates along the surfaces of the porous thermal insulation layer. The direction of air flow is bottom up at the interior surface of the layer and top to bottom at the exterior surface. In connection with the installation of thermal insulation, continuous air channels easily form at corners of studs and boards and at interfaces of material layers, which increases internal convection.
A B+-+-
Figure 1.7 Air flow routes due to internal convection in external wall assemblies. A: convection due to
temperature difference between upper and lower sections of wall, B: convection due to temperature differences and wind.
Internal convection increases considerably the thermal flow through the external wall assembly. This phenomenon can be characterised by the so-called Nusselt number, Nu (–). It tells how much internal convection increases the density of heat flow rate through the assembly (Eq. 1.19).
cd
convcd
qqNu += (1.19)

23
where qcd+conv is density of heat flow rate caused by conduction and convection (W/m2) qcd is density of heat flow rate caused by conduction (W/m2)
Kokko et al. (1997) have, for instance, observed that if 200 mm thermal insulation is used, its effective thickness is around 175 mm (-12%), while that of 300 mm thermal insulation is less than 250 mm (-17%). Internal convection transports water vapour to the interior surface of the sheathing in the upper section of the assembly. This increases moisture condensation and mould growth risk in the upper section. Internal convection may also cool the exterior surface of the vapour barrier in the lower section of the assembly thereby increasing the risk of moisture condensation and mould growth risk on the interior surface of the vapour barrier (Kohonen et al. 1986). The impacts of internal convection can be reduced effectively, for instance, by building a vertical water-vapour permeable convection break in the upper section of the wall assembly.
Radiation
Heat radiation is energy emitted by matter that is at a finite temperature. Radiation may issue from solid surfaces, liquids and gases. Regardless of the form of matter, the emission may be attributed to changes in the electron configurations of the constituent atoms or molecules. The energy of the radiation field is transported as electromagnetic waves (or alternatively as photons). While the transfer of energy by conduction or convection requires the presence of a material medium, radiation does not. In fact, radiation transfer is most effective in a vacuum. The radiation from the sun is short-wave radiation while real surfaces emit long-wave radiation. The total radiation from the sun and real surfaces is superimposed by radiation of various wavelengths. The surface emissive power, E (W/m2), is obtained by integration over all wavelengths. There is an upper limit to surface emissive power, Eb (W/m2), which is prescribed by the Stefan-Bolzmann law (Eq. 1.20). Such a surface is called an ideal radiator or blackbody. 4
sb TE σ= (1.20)
where
σ is Stefan-Bolzmann constant (5.67 ×10⁻⁸ W/(m2·K4)) Ts is surface temperature (K)
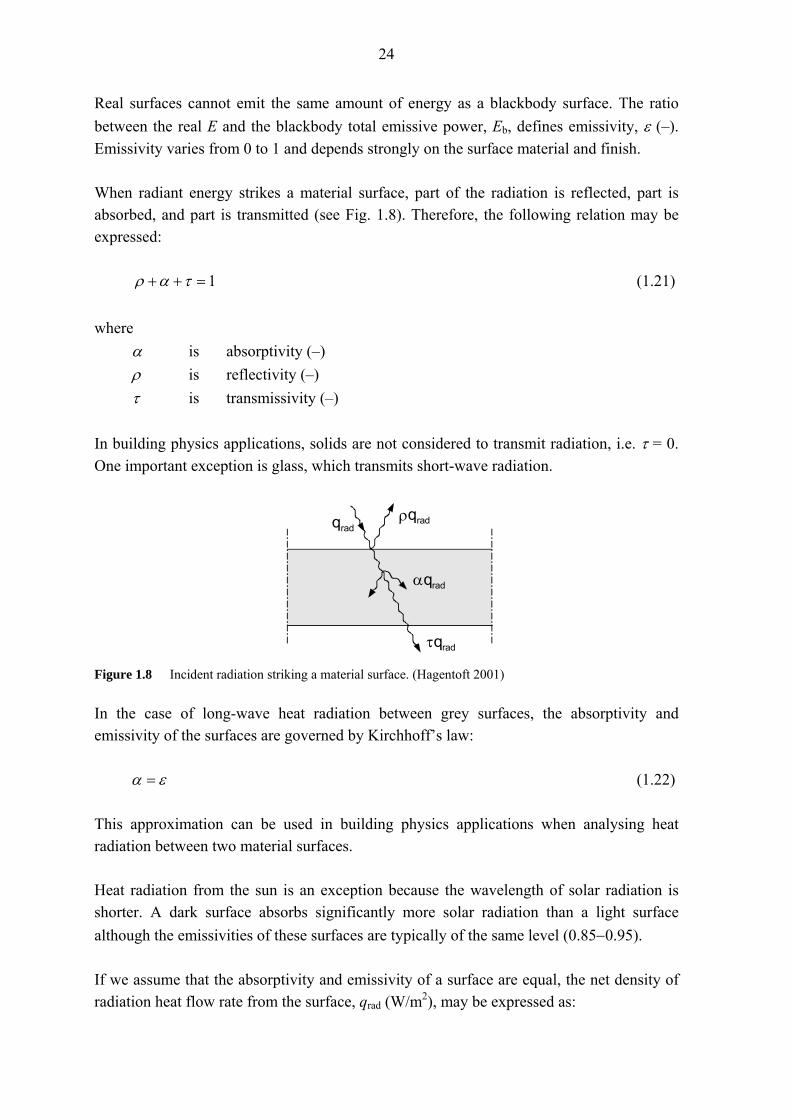
24
Real surfaces cannot emit the same amount of energy as a blackbody surface. The ratio between the real E and the blackbody total emissive power, Eb, defines emissivity, ε (–). Emissivity varies from 0 to 1 and depends strongly on the surface material and finish. When radiant energy strikes a material surface, part of the radiation is reflected, part is absorbed, and part is transmitted (see Fig. 1.8). Therefore, the following relation may be expressed: 1=++ ταρ (1.21) where
α is absorptivity (–) ρ is reflectivity (–) τ is transmissivity (–)
In building physics applications, solids are not considered to transmit radiation, i.e. τ = 0. One important exception is glass, which transmits short-wave radiation.
qrad
αqrad
ρqrad
τqrad Figure 1.8 Incident radiation striking a material surface. (Hagentoft 2001) In the case of long-wave heat radiation between grey surfaces, the absorptivity and emissivity of the surfaces are governed by Kirchhoff’s law:
εα = (1.22) This approximation can be used in building physics applications when analysing heat radiation between two material surfaces. Heat radiation from the sun is an exception because the wavelength of solar radiation is shorter. A dark surface absorbs significantly more solar radiation than a light surface although the emissivities of these surfaces are typically of the same level (0.85−0.95). If we assume that the absorptivity and emissivity of a surface are equal, the net density of radiation heat flow rate from the surface, qrad (W/m2), may be expressed as:

25
)( 4sur
4srad TTq −= εσ (1.23)
where
Tsur is temperature of surrounding surfaces (K) The lower the temperature of the surrounding surfaces, the more heat radiates off the surface of the observed body. Then, the surface temperature of the observed body may fall below the temperature of the ambient air. This actually occurs, for instance, on clear winter nights when heat radiates into cold space from the external surfaces of a building. Then exterior surfaces of the envelope may cool several degrees (typically 0–20°C) below outdoor air temperature. This phenomenon is known as surface undercooling. In the case of many applications, it is convenient to express the net radiation heat exchange from a material surface in the same form as earlier in the convection Equation 1.13: )( sursradrad TTq −= α (1.24)
where
αrad is radiation heat transfer coefficient, (W/(m2·K)) By combining Equations 1.23 and 1.24, the radiation heat transfer coefficient may be expressed as:
3surs2sur
2ssursrad )
2(4))(( TTTTTT +
≈++= εσεσα (1.25)
The approximate formula in Equation 1.25 can be used when the temperature difference between surfaces is relatively small. That is normally the case in building physical applications.
Moisture in air
Air consists of many gases, each contributing its partial pressure to total air pressure. The partial pressure contributed by water vapour is denoted by pν (Pa). It can also be expressed as humidity by volume, ν (kg/m3). The General Gas Law expresses the relationship between humidity by volume and partial water vapour pressure:
vpR
MRT
pM)15.273(
ww
θν ν
+== (1.26)

26
where Mw is molar mass of water (18.02 kg/kmol) R is gas constant (8314.3 J/(kmol·K)) T is air temperature (K) θ is air temperature (°C)
Due to the liquid-gas equilibrium of water, air can only hold a certain amount of water vapour at a given temperature. That maximum value is referred to as water vapour saturation pressure, pν,sat (Pa), or humidity by volume at saturation, νsat (kg/m3). At temperatures below 0°C the water vapour saturation pressure over water in liquid form differs from the saturation pressure over ice. This is due the fact that the water vapour saturation pressure of ice-gas equilibrium is lower than the saturation pressure of liquid water-gas equilibrium. In practice, the water vapour pressure of air can be higher than the water vapour saturation pressure over ice for short periods since the ground is not always covered by snow and climatic changes of short duration affect relative humidity. Then outdoor air also contains so-called supercooled water vapour. Hygroscopic materials tend to reach equilibrium moisture content with relative humidity over liquid water as their temperature is reduced below 0°C. This has the curious consequence that it is possible to dry out hygroscopic materials in a sub-zero atmosphere at 100% RH over ice. This phenomenon is also important when we analyse condensation in assemblies in winter conditions (see Ch. 7.2.3). Relative humidity of air, ϕ (% RH), is defined as the actual water vapour pressure of air (or a space) divided by water vapour saturation pressure. It can also be defined as the humidity by volume of air divided by humidity by volume at saturation (Eq. 1.27). At temperatures below 0°C, relative humidity can be given over liquid water or over ice.
satsatν,
ν 100,100ννϕϕ ==
pp (1.27)
In meteorological practice, relative humidity is typically given over liquid water. Moisture sensors also generally measure relative humidity of air over liquid water. On the other hand, in building physical applications and HAM modelling of envelopes water vapour saturation pressure over ice is commonly used with below 0°C temperatures. There are many equations for calculating water vapour saturation pressure over liquid water and ice (e.g. Björkholz 1991, Nevander & Elmarsson 1994). The following equation for the water vapour saturation pressure over liquid water was presented by Hyland & Wexler (1983):

27
)Ln(1065459673010144520930104176476801048640239010139149930
10580022060Ln
1
37
24
1
1
4satν,
T.T.T.T.
.
T/.p
×+
×−
×+
×−
×+
×−=
−
−
−
(1.28)
This equation is applied, for instance, by the HMP 233 humidity transmitters manufactured by Vaisala Ltd. used in the laboratory and field test measurements of this research (see Chs. 3 and 4). The Finnish Meteorological Institute has also used primarily Vaisala Ltd’s measuring sensors that apply the above equation in measuring relative humidities. The following equation for water vapour saturation pressure over ice presented in DIN 4108-5 (1981) standard is used mostly in this research.
nbap )100
(satν,θ
+= (1.29)
0°C ≤ θ ≤ 30°C a = 288.68 b = 1.098 n = 8.02 -20°C ≤ θ < 0°C a = 4.689 b = 1.486 n = 12.3 Nevander & Elmarsson (1994) found that equation applicable also in the -40 to 80°C temperature range. The EN ISO 13788 (2001) standard also gives equations for determining water vapour saturation pressure over ice:
⎪⎩
⎪⎨
⎧
°<
°≥=
+
+
C05,610
C05,610
5.265875.21
3.237269.17
satν,
θ
θ
θθ
θθ
whene
whenep (1.30)
The WUFI-2D program, used in the calculational analyses of this research, also calculates water vapour saturation pressure over ice using Equation 1.31 (Künzel 1995). It is similar in form to the one presented in EN ISO 13788 (2001) standard.
⎪⎩
⎪⎨
⎧
°<
°≥=
+
+
C0611
C0611
442724422
182340817
satν,
θ
θ
θθ
θθ
whene
whenep
.
.
.
.
(1.31)
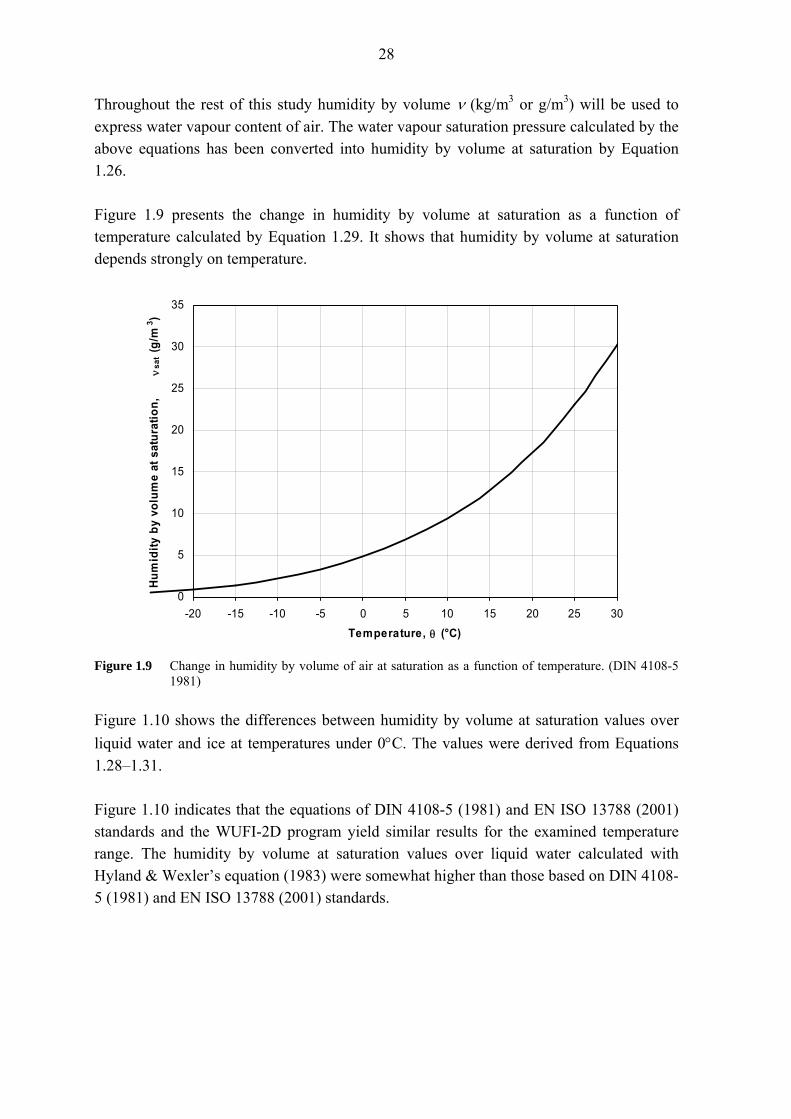
28
Throughout the rest of this study humidity by volume ν (kg/m3 or g/m3) will be used to express water vapour content of air. The water vapour saturation pressure calculated by the above equations has been converted into humidity by volume at saturation by Equation 1.26. Figure 1.9 presents the change in humidity by volume at saturation as a function of temperature calculated by Equation 1.29. It shows that humidity by volume at saturation depends strongly on temperature.
0
5
10
15
20
25
30
35
-20 -15 -10 -5 0 5 10 15 20 25 30Temperature, θ (°C)
Hum
idity
by
volu
me
at s
atur
atio
n,
νsa
t (g/
m3 )
Figure 1.9 Change in humidity by volume of air at saturation as a function of temperature. (DIN 4108-5
1981)
Figure 1.10 shows the differences between humidity by volume at saturation values over liquid water and ice at temperatures under 0°C. The values were derived from Equations 1.28–1.31. Figure 1.10 indicates that the equations of DIN 4108-5 (1981) and EN ISO 13788 (2001) standards and the WUFI-2D program yield similar results for the examined temperature range. The humidity by volume at saturation values over liquid water calculated with Hyland & Wexler’s equation (1983) were somewhat higher than those based on DIN 4108-5 (1981) and EN ISO 13788 (2001) standards.

29
0
1
2
3
4
5
6
-40 -35 -30 -25 -20 -15 -10 -5 0 5 10
Temperature , θ (°C)
Hum
idity
by
volu
me
at s
atur
atio
n,νs
at (g
/m3 )
Hyland & Wexler (1983), over liquid waterDIN 4108-5 (1981), over iceEN ISO 13788 (2001), over iceWUFI 2D program, Künzel (1995), over ice
Figure 1.10 Change in humidity by volume of air at saturation calculated over liquid water and ice as a
function of temperature. The differences between the equations become more pronounced when the relative humidity values yielded by them are compared. Table 1.2 presents relative humidity values over ice and liquid water at different temperatures when humidity by volume of air equals humidity by volume at saturation over ice. Table 1.2 Relative humidity over ice and liquid water in different temperatures when humidity by
volume of air equals humidity by volume at saturation over ice.
Temperature (°C) Relative humidity over ice (% RH)
Relative humidity over liquid water (% RH)
0 100 100.0
-5 100 95.3
-10 100 90.7
-15 100 86.4
-20 100 82.3
-25 100 78.5
-30 100 74.9
-35 100 71.3
-40 100 67.9
Moisture content of porous material
Porous building materials have a complex pore structure. The solid surfaces of the pores in contact with water vapour have the tendency to capture and localise the water molecules on them. This phenomenon is called adsorption. The maximum amount of moisture adsorbed

30
by a given amount of material depends on the temperature, the relative humidity, and the surface area of the material pores. Furthermore, each material has its own characteristic affinity towards water. This affinity is commonly referred to as hygroscopicity. The equilibrium moisture content of a material has typically been presented as a function of the relative humidity of ambient air and is depicted by the sorption curve (Fig. 1.11). A more correct name for it is the sorption isotherm, because the equilibrium moisture content is also dependent on temperature. The moisture content of a material is defined as: • Mass of moisture per unit volume of the dry material, w (kg/m3) • Mass of moisture per unit mass of the dry material, u (kg/kg, wt%) • Volume of moisture per unit volume of the dry material, ψ (m3/m3, vol%)
0 10 20 30 40 50 60 70 80 90 100
Relative Humidity, %
Hygroscopic Range
Critical Moisture Content
Capillary Moisture Content
Maximum Moisture Content
Depending on the material, capillary condensation maystart anywhere in this range
Moi
stur
e C
onte
nt
Figure 1.11 Sorption isotherm of a porous building material. (Kumaran 2001) In the low relative humidity range the water molecules are adsorbed to the pore walls, first in single molecule layers and at higher relative humidities in multimolecule layers. Then, capillary condensation takes place. The capacity of the internal structure of the material to store water increases when this process starts, which can be seen from the increasing slope of the sorption isotherm (see Fig. 1.11). A growing number of pores are filled with water at higher relative humidity. The smaller pores are filled first, and at higher relative humidities larger pores are also filled (Fig. 1.12).

31
a. Diffusion flow and b. Diffusion and surface c. Diffusion, surface surface adsorption diffusion flows diffusion and capillary
flows in smaller pores
d. Diffusion, surface e. Capillary flow f. Hydraulic flow and diffusion and capillary flow capillary flows
cell wall cell opening
Diffusion
Surface diffusion
Figure 1.12 Phases of moisture adsorption. (Ojanen et al. 1989b) A material can store only a limited amount of water captured from the ambient humid air under isothermal conditions. The relative humidity value which corresponds to this maximum hygroscopic moisture content, whygr, uhygr, or ψhygr, is approximately 98% RH. The range between 0 and 98% RH is called the hygroscopic range (see Fig. 1.11). Capillary condensation in pores may start anywhere in this range, but there is no continuity of liquid water at the macroscopic level. A considerable additional amount of water can be absorbed by the pore structure, if the material is in contact with liquid water. Soon after the moisture content of a material has reached the capillary range, moisture starts to transfer in the continuous liquid phase in the material. This point is called the critical moisture content, wcrit, ucrit or ψcrit. After this point, the moisture flow through the material increases remarkably. The upper limit for the moisture content of a material in contact with liquid water is called the capillary saturation moisture content, wcap, ucap or ψcap (Fig. 1.13). The maximum possible water content of a material, when all the pores are filled with water, is called the maximum moisture content, wmax, umax or ψmax. This level is difficult to reach, since air is easily trapped inside the pores of a material. In experiments a building material has adsorbed moisture to the maximum moisture content level when the process has occurred in a vacuum.

32
hygroscopic range 0 < ϕ < 98% RH
solid material pore volume
w (ϕ) sorption curve
maximum hygroscopicmoisture content whygr
critical moisture content wcrit maximum moisture
capillary saturationmoisture content wcap
content wmax
Figure 1.13 Moisture in a material. (Nevander & Elmarsson 1994) Sorption isotherms describe average equilibrium moisture contents in different temperature and relative humidity conditions. A rise in temperature decreases the equilibrium moisture content of a material. When temperature is reduced below 0°C, hygroscopic materials tend to maintain an equilibrium with supercooled water (relative humidity over liquid water) (see Fig. 1.10). Each sorption isotherm can also be presented by adsorption and desorption isotherms. The adsorption isotherm describes the amount of moisture adsorbed by the material when it has been moved from lower to higher relative humidity. The desorption isotherm, again, presents the equilibrium moisture content of a material after drying when it has been moved from higher to lower relative humidity. Usually it retains more moisture during desorption than it can adsorb at any given relative humidity. This phenomenon is referred to as hysteresis (Fig. 1.14).
Relative humidity, ϕ (% RH)
50 10098
Moi
stur
e co
nten
t, w
(kg/
m³)
adsorption curve
desorption curve
Figure 1.14 Adsorption and desorption curves of a material and the hysteresis effect.

33
Various explanations have been given for the hysteresis phenomenon. One likely reason is the so-called ink-bottle effect. The pore system of a material always has wider sections of sufficient cross section where capillary condensation does not form as the material wets to a moisture content corresponding to a certain RH. As the material dries, water may, on the other hand, remain in larger pores filled at higher RH if they are connected to the rest of the pore system only through narrower pores, and the material’s pores no longer form an integrated capillary system. Capillary attraction, the internal cohesion of water and adhesion between water and the pore surface, retains water in narrower pores. These forces prevent water from exiting the larger pores (Fig. 1.15).
Adsorption Desorption Figure 1.15 Equilibrium moisture content is different in adsorption and desorption – hysteresis. (Nevander
& Elmarsson 1994) In real conditions the moisture content of a material is very seldom in the equilibrium described by the above adsorption and desorption curves. As humidity conditions change, the equilibrium moisture content of a material changes differently in the area between these curves depending on the conditions of the initial and final situations (Pedersen 1990; Hedenblad 1996). Fluctuations in outdoor air conditions also affect the equilibrium moisture content of a material. The average relative humidity of the pore air of a material is not the same as the average humidity fluctuation of outdoor air (Arfvidsson 1998). It has been observed in practice that the change in materials’ moisture content under transient conditions cannot be fully explained by the most common moisture transfer modes (Claesson & Håkansson 1993; Time 1996; Absetz 1999). This is due to the numerous transfer modes of moisture in porous material (see Tables 1.3 and 1.4) and the change in material properties as moisture content changes. Consequently, present HAM programs do not allow comprehensive modelling of changes in moisture contents within a material under changing conditions. Calculational analyses covering longer periods and targeting the hygroscopic range do, however, already yield quite accurate results (see Ch. 5). Moreover, for most building physical examinations it is enough that the equilibrium moisture content of a material is presented by a single sorption curve (see Ch. 5.3). As can be seen from Figure 1.11, the sorption curve does not describe accurately the change in equilibrium moisture content in the capillary range. That is why another

34
moisture retention curve, the so-called suction curve, is used alongside the sorption curve (Fig. 1.16).
Suction pressure, s (Pa)
Moi
stur
e co
nten
t, u
(kg/
kg)
adsorption curve
desorption curve
hygroscopicrange
ucap
umax
Figure 1.16 Suction curve. (Pedersen 1990) The suction curve normally presents the change in equilibrium moisture content as a function of suction pressure or pore radius. The relationship between suction pressure and pore radius is determined by Equation 1.42. Since suction pressure may vary over a wide range, the suction curve is usually given in the form of a logarithmic scale. Grunewald et al. (2003) stated that the suction curve is the most important material characteristic in building physical calculations. The suction curve is composed of an adsorption and a desorption curve, as is the sorption curve, and a corresponding hysteresis phenomenon exists between them (Bomberg 1973). The tail end of the suction curve, where suction pressure is high (≥ 2.65 MPa), describes the equilibrium moisture content of the material in the hygroscopic range. As suction pressure decreases we enter the capillary range. The adsorption curve ends at capillary saturation moisture content, and the desorption curve starts from maximum moisture content. Because it is very difficult to reach maximum moisture content, it is questionable whether this section of the suction curve represents a real state of equilibrium (Pedersen 1990). The suction curve can be defined by the pressure plate method which has been examined in more detail by, for instance, Cloutier & Fortin (1991) and Janz (1997). To understand the performance of the suction curve in the wet region, it is necessary to study the distribution of pore sizes. Some materials tend to have collectives of pores of equal size. When they are filled (or emptied), suction pressure remains almost steady while equilibrium moisture content, naturally, changes. The curve shown in Figure 1.16 is typical for cellular concrete having two pore size collectives with radii close to 10-4 and 10-7 m (Pedersen 1990).

35
Based on the suction and sorption curves it is also possible to determine the specific moisture capacity of a material. Specific moisture capacity can be calculated as the slope of the suction curve, ξs (kg/(m3·Pa)). For the hygroscopic range, it can be calculated also as the slope of the sorption curve, ξϕ (kg/m3).
ϕ
ξξ ϕ ∂∂
=∂∂
=w
sw ,s (1.32)
This material property is analogous to specific heat capacity, c, which is a material thermal property (see Eq. 1.7).
Moisture transfer modes
In building physics applications, moisture and air transfer are the most typical examples of mass transfer. In this connection air transfer (convection) is treated only as a moisture transfer mode. Moisture may be present in the three normal states (vapour, liquid and solid) as well as in the adsorbed state. Subject to changes in temperature and vapour pressure, it is possible for moisture to undergo a change of state, or phase transition, as shown in Figure 1.17. Phase changes affect two properties of moisture: its mobility and energy content. Both properties influence the hygrothermal performance of building materials and components. Energy released or bound in connection with a phase change is called latent heat.
GAS (VAPOUR)
SOLID (ICE)
FROSTSUBLIME
DESORBADSORB
ADSORBED (SURFACE LAYERS)
LIQUID (WATER)
EVAPORATECONDENSE
FREEZE
MELT
Figure 1.17 Various processes undergone by moisture that involve phase changes. (Kumaran et al. 1994) In vapour and liquid state, water molecules are more mobile than in the solid and adsorbate states. Most moisture also transfers in the vapour and liquid state. Thus, building physics research has concentrated mainly on vapour and liquid transport.

36
Any transfer process is brought about by a driving force or a potential. Moisture transfer is, therefore, analogous to heat transfer due to a temperature gradient across two locations. However, to date it has not been possible to identify an experimentally realisable single potential that causes moisture transfer. For practical reasons, the driving potential for moisture transfer has been considered the result of a set of experimentally realisable driving potentials. Kumaran et al. (1994) summarised moisture transfer processes as shown in Table 1.3. Table 1.3 Moisture transfer (transport) processes in building materials and components. (Kumaran et al.
1994)
Transport process Participating state Potential (Difference)
Gas diffusion Vapour Vapour pressure
Liquid diffusion Liquid Concentration
Surface diffusion Adsorbate Concentration
Thermal diffusion Vapour and liquid Temperature
Capillary flow Liquid Suction pressure
Convective flow Vapour Air pressure
Gravitational flow Liquid Height
Poiseuille flow Liquid Liquid pressure
Moisture transfer modes have been listed in various publications in different ways, and there is variation in the names, especially among less significant transport modes and their potentials. For instance, Künzel (1995) classified moisture transfer modes as shown in Table 1.4. Table 1.4 List of moisture transfer (transport) mechanisms occurring in practice, their causes and driving
potentials. (Künzel 1995)
Transport mechanism Cause and potential of transport
Gas diffusion Vapour pressure (temperature, total pressure)
Molecular transport (effusion) Vapour pressure
Solution diffusion Vapour pressure
Vapour transport
Convection Total pressure gradient
Capillary conduction Capillary suction stress
Surface diffusion Relative humidity
Seepage flow Gravitation
Hydraulic flow Total pressure differentials
Electrokinesis Electrical fields
Liquid transport
Osmosis Ion concentrations

37
Here we shall only study the most important moisture transfer modes from the viewpoint of this research: gas diffusion, surface diffusion, capillary flow, convection and gravitational flow.
Gas diffusion (water vapour diffusion)
Diffusion is a process of equalisation. A difference in water vapour concentration results in a net transfer of water molecules to the region with the lowest concentration. Since molecular motion is random, there is equal probability of any water molecule moving in any direction. Accordingly, more water molecules move from a higher concentration to a lower concentration than vice versa. The general expression, Fick’s law, for water vapour diffusion through an air or a material layer in the one-dimensional case is:
x
g∂∂
−=νδ ν (1.33)
where
g is density of moisture flow rate (kg/(m2·s)) δν is water vapour permeability with respect to humidity by volume (m2/s) ν is humidity by volume (kg/m3)
As Equation 1.33 shows, density of moisture flow rate is calculated with an equation of the same form as the density of heat flow rate (Eg. 1.2). Fick’s law may also be presented using partial water vapour pressure difference:
xpg
∂∂
−= νpδ (1.34)
where
δp is water vapour permeability with respect to partial water vapour pressure (kg/(m·s·Pa))
The relations between these permeability values are obtained from the relation between the potentials (see Eq. 1.26). Thus, the following equation may be written:
pw
ν)15.273( δθδ
MR +
= (1.35)

38
Both water vapour permeability values and potentials (humidity by volume and partial water vapour pressure) are widely used in building physical applications. These values are determined typically by the cup test method, which is described more precisely in Chapter 3.3.2 and, for instance, in EN ISO 12572 (2001). This research uses primarily water vapour permeability, δν, and humidity by volume, ν. In Central Europe water vapour permeability is often substituted by the water vapour diffusion resistance factor, μ (−), which can be calculated from the following equation:
p
a
δδμ = (1.36)
where δa is water vapour diffusion coefficient of stagnant air (kg/(m·s·Pa)) δp is water vapour permeability (kg/(m·s·Pa)) Water vapour diffusion coefficient of stagnant air depends on temperature and air pressure. There are many equations for calculating it. The WUFI-2D program used in the calculational analyses of this study uses the following equation to determine water vapour diffusion coefficient of stagnant air:
n
81.07
a PT⋅10×2.0
=−
δ (1.37)
where T is absolute ambient temperature of the laboratory test (K), when
measuring water vapour permeability Pn is normal atmospheric pressure (101,325 Pa) The water vapour diffusion resistance factor tells how many times greater the water vapour resistance of the examined material is compared to the water vapour resistance of an air layer of equal thickness. If μ equals 1, the material is as permeable to water vapour as stagnant air. Thus, μ must always be ≥ 1. Under the steady-state one-dimensional conditions shown in Figure 1.18, the density of the moisture flow rate through a porous material layer may be expressed as:
dd
g 21ν
12ν
ννδννδ −=
−−= (1.38)

39
where ν1,2 are humidities by volume on opposite sides of material surfaces (kg/m3)
This equation is analogous to the density of heat flow rate (see Eq. 1.3).
ν1
δν
d
g
ν2
Figure 1.18 One-dimensional water vapour transfer by diffusion. As noted above, moisture transfer in porous material in the hygroscopic range takes place by several different mechanisms. The water vapour permeability measured by the cup method is thus actually the sum of the effects of several moisture transfer mechanisms, as is the thermal conductivity measured in thermal conductivity tests. Consequently, to be scientifically correct, we should use the term "moisture permeability" also in the hygroscopic range instead of "water vapour permeability". Yet, water vapour permeability is a widely used term in research on moisture transfer in the hygroscopic range. Therefore, this study also uses the term "water vapour permeability, δν". On the other hand, the term "moisture permeability, kw" has been used to describe liquid water transfer through a material. In the hygroscopic range the water vapour permeability of a material typically increases as the relative humidity of pore air rises. In the case of some materials, such as porous thermal insulations, water vapour permeability remains nearly constant (see App. 3). The increase in water vapour permeability is mainly the result of surface diffusion and capillary transfer, but pure water vapour diffusion may also increase somewhat as a material grows moist in the hygroscopic range (Fig. 1.19). This is due the fact that the distance that water vapour transfers by diffusion through the material becomes shorter since part of the pores are filled with water and water vapour transfers by diffusion only between these water islands. Beyond the hygroscopic range, the share of gas diffusion drops gradually to zero, and subsequently moisture is transferred only as capillary or hydraulic flow (see Fig. 1.12).

40
Wat
er v
apou
r per
mea
bilit
y, δ
ν (m
2 /s)
50 100 %Relative humidity, ϕ (% RH)
Pure water vapourpermeability
Moisture transfer bysurface diffusion
Moisture transfer bycapillary suctionTotal water vapour
permeability
Figure 1.19 Water vapour permeability of porous material as a function of relative humidity. The water vapour permeability of porous material is affected not only by relative humidity but also by, for instance, ambient air temperature and changes in the material’s properties due to time, mechanical stress or wetting. A rise in temperature increases water vapour permeability values. Water vapour permeability can be assigned only to materials whose thickness can be measured relatively accurately (e.g. thermal insulations and building boards). The thickness of vapour barrier membranes cannot be measured accurately, which is why the water vapour permeability of these materials is represented by water vapour resistance, Zν (s/m) or Zp (m2·s·Pa/kg), which is the property of a certain material layer and independent of material thickness (Eq. 1.39). The water vapour resistance of board materials is also often determined. Water vapour resistance indicates the degree to which the material layer in question resists the transmission of water vapour. Sometimes materials are also assigned a water vapour permeance, Wν (m/s) or Wp (kg/(m2·s·Pa)), which is the reciprocal of the water vapour resistance value.
p
pν
ν δδdZordZ == (1.39)
This study expresses the water vapour resistances of different material layers as Zν values since the analyses used water vapour content, ν (g/m3), as the transfer potential of water vapour. Besides thermal resistance, also called surface resistance, the surface air layer of an assembly also has water vapour resistance, Zv,s. Surface water vapour resistance is the reciprocal of the water vapour transfer coefficient, βν (m/s) (Eq. 1.40). The water vapour

41
transfer coefficient is an analogous term to heat transfer coefficient, α, earlier used in connection with conduction.
ν
sν,1β
=Z (1.40)
Literature contains water vapour resistance values, or water vapour transfer coefficients, for the interior and exterior surfaces of walls (e.g. Künzel 1995; Hagentoft 2001), but the values are so small that they are often ignored in building physical applications. In order to be able to determine the humidity by volume distribution in an assembly and the density of moisture flow rate in a non-stationary situation (see Eq. 1.33), an equation for the moisture balance must be established which expresses the mass conservation requirement:
⎟⎟⎠
⎞⎜⎜⎝
⎛∂∂
−∂∂
−=∂∂
=∂∂
xxtw
tu ν
δρ ν (1.41)
If the moisture transferring through the material as part of the air flow is considered in the analysis, this term must be separately accounted for in the mass balance equation.
Capillary flow
Capillary flow is the result of differences in pore water pressure. Figure 1.20 shows a small tube in contact with liquid water. The water level is higher in the tube than in the ambient water. This is due to capillary suction, which has its physical explanation in the attraction between the water molecules and the tube walls as well as the surface tension phenomenon. The suction, that is, the underpressure, s (Pa), under the water meniscus is given by the following equation:
)cos(r
s φσ2= (1.42)
where
σ is surface tension coefficient (~0.073 N/m) r is radius of tube (m) φ is contact angle between the water meniscus and the tube walls (–)

42
φ
σ
r
Pressure
Air pressure
Cap
illary
suc
tion
P
s
h
Figure 1.20 Schematic view of the water column (left) and the pressure conditions (right) in a cylindrical
capillary. (Küntzel 1995) Suction lifts up the water in the tube to a level where equilibrium exists between capillary and gravitational forces. Assuming a contact angle, φ, equal to zero, which is a quite good approximation for normal building materials, the following equation may be written:
gr
hr
sghw
w22
ρσσρ =⇒== (1.43)
where
ρw is density of water (kg/m3) g is gravitational acceleration (9.81 m/s2) h is maximum height of water level in suction (m)
The relation between humidity of pore air and suction pressure is governed by Kelvin’s law:
RT
sMw
wlnρ
ϕ −= (1.44)
Table 1.5 presents some relationships between pore radius, maximum height of water level in suction, suction pressure in a capillary tube and relative humidity of the capillary air. Strictly speaking, these results apply only to cylindrical tubes. However, they can also be used to evaluate porous materials.

43
Table 1.5 Relationship between pore radius, maximum height of water level in suction, suction pressure in a capillary tube and relative humidity of capillary air at 20°C.
Pore radius r (m)
Maximum height of water level in suction
h (m)
Suction pressure in a capillary
s (MPa)
Relative humidity of capillary air
ϕ (% RH)
10-9 15,000 150 34
10-8 1,500 15 90
10-7 150 1.5 99
10-6 15 0.15 99.9
10-5 1.5 0.015 99.99
10-4 0.15 0.0015 ∼ 100
10-3 0.015 0.00015 ∼ 100
When a dry material is set in contact with liquid water, the density of moisture flow into the material, g (kg/(m2·s)), is given by:
t
Ag2
w= (1.45)
where
Aw is water absorption coefficient (kg/(m2·s1/2)) t is time (s)
The coefficient Aw has been measured for several types of materials as well as for some materials of this study (see Ch. 3.3.4 and App. 3). Because Aw is almost constant only during a certain time period, it has to be determined before suction starts to decrease. The water absorption coefficient can be determined, for instance, by the method presented in DIN 52617 (1987). The general form of the density of moisture flow rate through a porous material layer in the hygroscopic and capillary range may be also described by Darcy’s law:
xs
xpkg
∂∂−=
∂∂−= w
w
ww κ
ηρ (1.46)
where
kw is water permeability (m2) ηw is dynamic viscosity of water (N·s/m2) κw is moisture conductivity (kg/(m·s·Pa))

44
Surface diffusion, capillary flow, gravitational flow and hydraulic flow are the moisture transfer modes considered in the value of moisture conductivity, κw. Pure water vapour diffusion, on the other hand, is considered separately in the value of water vapour permeability. Moisture conductivity depends on the material’s moisture content and the shape of the suction curve. Moisture conductivity increases considerably after the material reaches critical moisture content, wcrit, and continuous capillary flow starts. Subsequently, its value changes quite slowly until capillary saturation moisture content, wcap, is reached. Thereafter, moisture conductivity does not change essentially, even if the material reaches its maximum moisture content, wmax (Fig. 1.21). As temperature falls, capillary flow slows down, and when water freezes it stops completely. However, in material pores water freezes at lower temperatures due to the underpressure caused by capillary suction. Thus, capillary transfer of moisture occurs in materials also when the temperature of ambient air is below 0 °C.
Moisture content, w (kg/m3)
wcrit wmaxwcapwhygr
Moi
stur
e co
nduc
tivity
, κw (k
g/(m
⋅ s⋅ P
a))
κw,max
Figure 1.21 Moisture conductivity of porous material as a function of moisture content. Figure 1.21 shows that moisture flow increases when the moisture content of a material increases. Therefore, the density of moisture flow rate can also be determined by using moisture content as the driving potential:
xwD
xuDg
∂∂
−=∂∂
−= ww0ρ (1.47)
where
ρ0 is density of dry material (kg/m3) Dw is moisture diffusivity (m2/s)

45
Moisture diffusivity, Dw, determines how fast moisture changes propagate in a material. The higher the moisture diffusivity of a material, the faster it reaches equilibrium moisture content after a change in ambient relative humidity of air. It is an analogous characteristic to the earlier presented thermal diffusivity, a (see Eq. 1.5). The moisture diffusivity value considers the impact of all moisture transfer modes. Thus, it can also be determined in the hygroscopic range. Moisture diffusivity in the hygroscopic range can also be calculated with water vapour permeability, δν, using Equation 1.48. In this equation the water vapour permeability value also considers the impact of all moisture transfer modes in the hygroscopic range (see Fig. 1.19).
ϕ
νδξ
D satνw = (1.48)
where
ξϕ is specific moisture capacity of material in hygroscopic range (kg/m3) (see Eg. 1.32)
Figure 1.22 gives an example of the change in moisture diffusivity of brick and light-weight concrete as a function of moisture content.
brick
light-weightconcrete
10-5
10-6
10-7
10-8
10-9
10-10
10 50 100 150 200 250
Moisture content, w (kg/m3)
Moi
stur
e di
ffusi
vity
, Dw
(m2 /s
)
300
Figure 1.22 Example of moisture diffusivity, Dw. (Nevander & Elmarsson 1994) Equation 1.48 allows determining the moisture diffusivity for liquid moisture transfer, Dw,liq (m2/s), with the help of Equation 1.49. This value accounts for the effects of surface diffusion, capillary flow, gravitational flow and hydraulic flow.

46
ϕϕ
νδδνδξξ
DD satν,0νsatν,0wliqw,
)( −=−= (1.49)
where
δν,0 is pure water vapour permeability at low relative humidities (kg/m3) (ϕ ≤ 50% RH).
The following equation depicts the relation between moisture diffusivity and moisture conductivity:
s
wliqw, ξ
κ=D (1.50)
where
ξs is specific moisture capacity of material in capillary range (kg/(m3·Pa) (see Eq. 1.32)
Due to hysteresis of the suction curve, the values of moisture conductivity and moisture diffusivity are different during the wetting and drying processes of a material. Moreover, as earlier found, the change in the moisture content of a material under transient conditions is affected by so many factors that it is difficult to determine the actual value of moisture conductivity and moisture diffusivity in various situations. The liquid moisture diffusivity value is often used in examining moisture transfer in the capillary range since it is somewhat easier to determine in a laboratory than the moisture conductivity value. Moisture conductivity and liquid moisture diffusivity in the capillary range can be determined by measuring transient moisture profiles of building material samples – for instance, by the gamma-ray attenuation method or some other appropriate technique (Kohonen & Ojanen 1983; Salonvaara 1990; Kumaran et al. 1994; Janz 1997; Arfvidsson 1998). However, only relatively few sets of data on these coefficients have been available so far (Kumaran et al. 1994). It is likely due to the significant technical efforts required to measure these moisture transfer coefficients (Künzel 1995). However, it must be noted that the liquid moisture diffusivity value and the gradient of moisture content as the driving force of capillary flow are not suitable for the HAM models used in this research due to their inability to distinguish the potentials acting on moisture, their inability to describe moisture hysteresis, their inability to describe hygric non-equilibrium processes and their inability to describe the saturated water flow potential and discontinuity of liquid water transport at material interfaces. Basically, these disadvantages are caused by the fact that moisture content is not the real driving potential of capillary flow. (Grunewald et al. 2003)

47
Künzel (1995) used a third capillary flow driving potential: relative humidity. As mentioned earlier, relative humidity is related to capillary pressure according to Kelvin’s law (see Eq. 1.44). The density of moisture flow rate can thus also be expressed as follows:
x
Dg∂∂
−=ϕ
ϕ (1.51)
where
Dϕ is liquid conduction coefficient (kg/(m·s)) The following relationship exists between the liquid conduction coefficient and moisture diffusivity (Künzel 1995):
ϕϕ ∂
∂=
wDD w (1.52)
Künzel (1995) also determined the relation between moisture diffusivity for suction (liquid moisture diffusivity) and the water absorption coefficient as follows:
12
cap
wliqw,
cap100083 −
⎟⎟⎠
⎞⎜⎜⎝
⎛≈ w/w
wA.D (1.53)
This equation is valid for most mineral building materials. In the equation, the lower limit of capillary moisture transfer of a material can be set at the moisture content corresponding to 80% RH, if more accurate data in unavailable (Künzel et al. 2000). The WUFI-2D program selected for the calculational analyses of this research uses Equations 1.51–1.53 (see Chs. 2.2, 5 and 6). In addition, Künzel et al. (2000) gave a rough estimation of moisture diffusivity for redistribution, Dw,d (m2/s), which describes the speed of distribution of the imbibed water when wetting is finished. Redistribution is dominated by the smaller capillaries since their higher capillary tension draws the water out of the larger capillaries. Since redistribution is a slower process than suction, the moisture diffusivity for redistribution is generally markedly lower (typically about one tenth) than liquid moisture diffusivity. (Künzel et al. 2000). Nevertheless, the theory of moisture redistribution is not generally accepted. The moisture balance equation for capillary flow may be presented as:
⎟⎟⎠
⎞⎜⎜⎝
⎛∂∂
−∂∂
−=∂∂
=∂∂
xs
xtw
tu
wκρ (1.54)
This equation is analogous to Equations 1.11 and 1.41.

48
We obtain a combined moisture balance equation for diffusion and capillary flow by combining Equations 1.41 and 1.54:
⎟⎟⎠
⎞⎜⎜⎝
⎛∂∂
∂∂+⎟⎟
⎠
⎞⎜⎜⎝
⎛∂∂
∂∂=
∂∂=
∂∂
xs
xxxtw
tu
wν κνδρ (1.55)
Strictly speaking, this transfer equation is true only for isothermal processes. For nonisothermal processes a term representing the thermal gradient also has to be included (Kumaran et al. 1994). The corresponding equation may be expressed as:
⎟⎟⎠
⎞⎜⎜⎝
⎛∂∂
∂∂+⎟⎟
⎠
⎞⎜⎜⎝
⎛∂∂
∂∂+⎟⎟
⎠
⎞⎜⎜⎝
⎛∂∂
∂∂=
∂∂=
∂∂
xT
xxs
xxxtw
tu
wTwν κκνδρ (1.56)
where
κwT is thermal moisture conductivity (kg/(m·s·K)) However, thermal moisture conductivity is very difficult to determine accurately and has mostly been omitted in HAM models (see Ch. 5.2.1).
Surface diffusion
As noted above, as water vapour pressure increases, the thickness of the water layer on the material´s pore surfaces grows (see Fig. 1.12). Finally, the binding force of the top water molecules may become so low that they may return to the gas phase of the pore. Surface adsorption is, however, possible immediately after separation. Such moisture transfer caused by jumping water molecules is called surface diffusion. In contrast to continuous capillary flow, which is normally observed only at water contents above the critical, surface diffusion begins to be noticed already at 30% RH, for instance, in paper products (Künzel 1995). Surface diffusion is liquid transport when the driving potential is moisture content or relative humidity of material. Surface diffusion is not usually calculated separately but is accounted for in the value of capillary flow or water vapour diffusion. However, because its driving potential is the same as that of capillary flow, it is advisable to take it into account together with capillary flow by using a calculation technique independent of vapour diffusion (Künzel 1995).
Convection
Moisture convection is caused by the fact that an air flow can carry water vapour molecules, water droplets as well as snow crystals. Air and moisture can flow through porous building materials and gaps, cracks and holes. Normally, the latter are mainly responsible for air leakages.

49
If we analyse one-dimensional moisture convection through a gap or hole in steady-state conditions, the net density of convective moisture flow rate, gconv (kg/(m2·s)), may be expressed as: )( 21aconv νν −=rg (1.57)
Water vapour transfers also by diffusion in the air flowing through a gap or hole, but its share is normally so small that it can be ignored in analyses. The net convective moisture flow rate, Gconv (kg/s), through a gap or hole may be expressed as (Fig. 1.23): )( 21aconv νν −=RG (1.58)
0 L
Ra
ν2ν1
Gconv
A
Figure 1.23 One-dimensional water vapour transfer through a hole by convection. Equations 1.57 and 1.58 are analogous to Equations 1.14 and 1.15 which describe yhe convective heat flow rate through a gap or hole. Literature presents different equations for air flow rate, Ra, depending on the geometry of the tube and the nature of air flow (laminar or turbulent) (Nevander & Elmarsson 1994; Mills 1999; Hagentoft 2001; Incropeda & de Witt 2002). When analysing one-dimensional moisture convection through a porous and homogenous material layer in steady-state conditions, one must consider the combined moisture transfer by convection and diffusion. This is due the fact that as air flows through a porous material, part of the water vapour transfers through air also by diffusion. Thus, the shares of the moisture flow transferring by convection and diffusion change as a function of the material layer thickness. The situation corresponds to the above heat transfer by convection through a material layer.
Gravitational flow (seepage flow)
Gravity makes liquid water flow down through cracks and holes as well as material layers. In building physics gravitational flow typically results from rain or condensation.

50
Hydraulic flow
The pores of a layer subjected to a liquid water pressure difference, Δpw (Pa), over a long period of time fill with water. The flow of water through the layer can be estimated by applying Darcy’s law as in the case of capillary flow (see Eq. 1.46):
d
ppd
ppx
pkg w2w1w
w1w2w
w
w
ww
−=
−−=
∂∂
−= κκη
ρ (1.59)
Moisture conductivity is the same material property as in capillary moisture transfer. However, here moisture transfer is caused by external water pressure. In building physics the penetration of water into a material by hydraulic flow is studied, for instance, in different basin and dam structures.
Moisture transfer through external walls in Finnish climate
Differences in the humidities by volume (partial pressure of water vapour) on opposite sides of the external wall assembly tend to equalise as water vapour travells through the wall assembly due to diffusion from an area of higher concentration to one of lower concentration. Figure 1.9 shows that humidity by volume of outdoor air is very low in winter, even if its relative humidity is high. Consequently, the humidity by volume of indoor air is generally higher in winter when the diffusion of water vapour from the inside out tends to equalise the prevailing difference in humidities by volume. Diffusion is the stronger, the larger the indoor air excess moisture. Figure 1.24 shows the basic differences in the performance of a timber-framed wall assembly with and without vapour barrier in Finnish winter conditions. In Finnish climatic conditions − as in cold climates in general − the relative humidity of outdoor air is naturally high in autumn and winter and the air can, therefore, receive little water vapour. Thus, water vapour from inside the building easily increases the moisture content of the exterior wall section to a level conducive to mould growth or causes condensation on the surface of the sheathing. The most critical point in timber-framed wall assemblies is generally the interior surface of the sheathing, as the water vapour passing through the thermal insulation layer meets a denser surface there. If the moisture flow from inside the assembly is too high, condensation of moisture or mould growth starts first on the interior surface of the sheathing. A too high moisture flow is the result of too low water vapour resistance of the interior wall lining which cannot lower sufficiently the humidity by volume of pore air on the cold side of the wall. That is why sufficient water vapour resistance of the interior wall lining must always be ensured.

51
+21°C
θ = -10°C
6.4 g/m3
18.3 g/m3
ν = 2.0 g/m3
ϕ = 90% RH ∼75% RH
11% RH
35% RH
WALL WITH VAPOUR BARRIER WALL WITHOUT VAPOUR BARRIER= MOISTURE-PERMEABLE WALL
+-
νsat = 2.2 g/m3
+21°C
θ = -10°C
6.4 g/m3
18.3 g/m3
ν = 2.0 g/m3
ϕ = 90% RH100% RH
35% RH
+-
νsat = 2.2 g/m3
Condense area
Diffusion Diffusion
Relative humidity
Humidity by volume
Temperaturedistribution
at saturation distribution
Humidity by volumedistribution
distribution
Figure 1.24 Principle drawing of the differences in performance of wall assemblies with and without
vapour barrier in Finnish winter conditions. When humidity by volume on the interior surface of the sheathing reaches humidity by volume at saturation, moisture starts to condensate. That is when the relative humidity of a material’s pore air reaches 100% RH (see moisture-permeable wall in Fig. 1.24). In practice, moisture condenses on the interior surface of sheathing since that is where relative humidity generally first reaches 100% RH. The temperature at which moisture condensation starts is called the dew point. As earlier stated, in subzero temperatures condensation begins in the wall assembly as relative humidity on the interior surface of the sheathing reaches humidity by volume at saturation over ice (see Fig. 1.10). The temperature corresponding to this condition is called the frost point. In a wall assembly with a vapour barrier the internal vapour barrier prevents moisture from entering the assembly. Then, the relative humidity of the interior surface of the sheathing depends only on outdoor air conditions and is at the lowest possible level (see wall with vapour barrier in Fig. 1.24). The thermal and moisture conditions of the external wall assembly differ from the conditions for determining water vapour permeability in that a temperature difference prevails across the external wall, while water vapour permeability tests are conducted at constant temperature. In water vapour permeability tests the driving potentials of all modes of moisture transfer (gas diffusion, surface diffusion and capillary flow) decrease in the same direction through the material layer. In the external wall assembly, again, the

52
moisture content and relative humidity of the exterior wall section is higher (see Fig. 1.24), meaning that surface diffusion and capillary flow work in a different direction than gas diffusion in the thermal insulation layer (Fig. 1.25).
Relative humidity
Outdoor
Vapour pressure
Indoor
Transport mechanisms in capillary pores
Vapour diffusion(adsorbed water stationary)
Vapour diffusion andliquid transport inadsorbed phase
Capillary transport
Incr
ease
in h
umid
ity
Moisture transport potentials in building elements
Figure 1.25 Schematic diagram showing moisture transfer (transport) in a porous hygroscopic building
material with the gradients of vapour pressure and relative humidity running in opposite directions (winter conditions). (Künzel 1995)
The phenomenon described in Figure 1.25 introduces some error into calculations if the water vapour permeability of the thermal insulation increases as a function of relative humidity, and this value is assumed to be entirely due to gas diffusion (see Fig. 1.19). Thus, it is recommendable to use a pure water vapour permeability value across the entire hygroscopic and capillary range, and to account for other modes of moisture transfer in the moisture conductivity value, κw, or the liquid moisture diffusivity value, Dw,liq. The problem is that the pure water vapour permeability value is difficult to determine at high moisture contents. Therefore, a value measured in dry conditions is usually selected for the water vapour permeability of a material, and it is expected to remain constant under

53
all moisture conditions. However, as Figure 1.19 shows, that assumption does not always hold true. Yet, it is more correct than the alternative that water vapour permeability is the sum of capillary transport, surface diffusion and gas diffusion. Therefore, it was used in the calculational analyses of this study (see Chs. 5.4 and 6). Moreover, in this study the assumption was quite correct because the measured water vapour permeabilities of materials were also typically constant as a function of relative humidity (see App. 3). If we examine the performance of an external wall assembly on the basis of Figure 1.25, we find that as moisture content increases on the exterior surface of thermal insulation, the capillary flow in the opposite direction increases until it becomes the dominant mode of moisture transfer on the exterior surface of thermal insulation. Hagentoft (2001) explained this phenomenon as follows: At first, water vapour is transferred to the interior surface of the sheathing by diffusion. If condensation starts, water is transported back, in the inward direction, by capillary suction. The above phenomenon means that liquid water condenses on the interior surface of sheathing only when the adjacent material layers have reached their capillary saturation moisture content, wcap. If the materials are not capillary, the capillary saturation moisture content equals the maximum hygroscopic moisture content, whygr (see Fig. 1.13). However, this phenomenon does not occur in reality, if the temperature of the interal surface of sheathing is under 0°C, since then the condensing water vapour freezes onto the surface of the sheathing (Thue et al. 1996; Vinha & Käkelä 1999) (see Ch. 3.2.4). As a result, moisture does not transfer from the condensate surface by capillary flown even if the thermal insulation and sheathing material are capillary. Furthermore, condensation of liquid water is also possible even if the moisture content of a capillary thermal insulation is clearly under capillary saturation moisture content. This may be due, for instance, to the existence of a narrow air gap between the capillary insulation and the non-capillary sheathing which prevents capillary moisture from travelling inward from the surface of the sheathing (see Ch. 3.2.4). Besides the above-described modes of moisture transfer, internal convection within a porous thermal insulation layer also transports water vapour passing through the wall into the upper section of the assembly onto the interior surface of the sheathing. Consequently, more critical conditions typically prevail there than can be produced in calculational analyses of diffusion which ignore convection. The impact of internal convection on the moisture performance of external wall assemblies has been examined in many studies and discovered to be considerable, especially if the thermal insulation has been installed so that air gaps remain in the assembly or that air can leak through it (e.g. Bankvall 1972; Nieminen 1987; Hagentoft & Harderup 1996; Thue et al. 1996; Uvsløkk et al. 1996;

54
Økland 1996; Geving et al. 1997c; Kokko et al. 1997; Hens & Janssens 1999; Kokko et al. 1999; Rose & McCaa 1998; Uvsløkk et al. 1999; Riesner et al. 2004).
Environmental barriers of the assembly
Assemblies are provided different environmental barriers intended to protect them from various exterior and interior driving forces in building physical design. Bomberg & Brown (1993) listed the environmental barriers and driving forces shown in Table 1.6. Table 1.6 Environmental barriers and driving forces. (Bomberg & Brown 1993)
Driving force Environmental barrier Design goal
Vapour pressure Vapour retarder Vapour diffusion control
Wind pressure and rain Pressure equalised rain (PER) screen
Eliminates wind pressure difference across rain screen
Rain Air gap with weather barrier and flashing
Provides capillary break and leads water away
Ground water Damp proofing, gravel or crushed stone layer
Provides capillary break
Air pressures (wind loads, stack effects, etc)
Air barrier (continuous airtight materials and load support)
Carries wind loads to the desired location
Air pressure and high indoor humidity
Air barrier Controls moisture flow due to air leakage
Wind pressure difference Weather barrier with load support
Eliminates effects of windwashing
Temperature difference Thermal insulation Reduces the rate of heat flow
High temperature, e.g. fire Thermal barrier, e.g. drywall Prevents rapid temperature rise on susceptible materials
1.7.2 Rules and regulations concerning water vapour resistance of interior lining of wall assembly
Finnish building instructions contain some rules and regulations on the water vapour resistance required of the interior lining of a wall assembly. The instructions, however, vary by publications and are also partially contradictory. Part C2 of the Finnish Building Code (RakMK C2 1998) states the following: "The water vapour resistance and air-tightness of an external wall and its various layers, adjoining structures and joints must be such that the moisture content of the wall due to diffusion or convection of indoor air water vapour does not cause harm. Both structural moisture and water occasionally entering into the wall from the outside and the inside must be able to exit without causing damage or risk to health."

55
The Code also states:
"If a wall assembly is permeable to indoor air water vapour or air to a harmful degree, the vapour- and air-tightness of the wall are to be secured by installing material layers in appropriate places to function as a vapour barrier, an air barrier or sheathing."
"The water vapour resistance of an assembly layer on the warm side of open-pore thermal insulation must be at least five-fold compared to that of an assembly layer on the cold side. Otherwise, a separate vapour barrier is to be installed to the warm side of the thermal insulation of the assembly. An exception can be made if the reliability of the moisture performance of the assembly has been proven by experience or studies."
The Finnish instructions for water- and moisture-proofing of buildings (RIL 107 2000) state the following:
"In timber- and steel-framed lightweight external walls the aim should be to reduce the indoor air humidity entering the assembly by making the interior wall lining air- and vapour-tight and by decreasing water vapour resistance in the direction where partial water vapour pressure decreases. The vapour- and air-tightness of a framed wall is secured by installing an air barrier on the interior surface of an open-pore thermal insulation layer and a highly moisture-permeable sheathing on its exterior surface. A vapour barrier should generally be used for the air barrier. The water vapour resistance of the assembly layer on the warm side of the thermal insulation must be at least five-fold compared to that of the sheathing on the cold side."
"If the assembly has no vapour barrier, the harmlessness of a larger-than-normal moisture mass flow must be ensured by a reliable study. The study must cover the different conditions during the service life of the assembly. It must also be ascertained that the humidity by volume of indoor air can be kept sufficiently low. If indoor air relative humidity is high occasionally or for the long term (e.g. wet area, humidification of indoor air), a vapour barrier must be used in a framed external wall or some other vapour-proof layer added to the interior surface of the assembly."
According to RakMK C2 (1998), an external wall assembly is acceptable whenever the water vapour resistance of the interior wall lining is five-fold compared to that of the exterior wall lining (sheathing). Even lower water vapour resistance ratios are possible based on further clarification. On the other hand, according to RIL 107 (2000), wall assemblies are generally to have a vapour barrier – if not, further clarification of their moisture performance is required. This guideline says that the water vapour resistance ratio between the interior and exterior wall linings must always be at least 5:1.
Neither source defines in more detail the harmful moisture content of a wall. Neither do they cite an accurate minimum value for the water vapour resistance of the interior lining of an external wall assembly or the maximum value for the water vapour resistance of the

56
sheathing. On the other hand, RIL 107 (2000) gives a minimum value of 110 ×103 s/m (15 ×109 m2·s·Pa/kg) (at 20°C and < 40% RH in winter) for the water vapour resistance of a vapour barrier installed on the interior lining of wooden roof assembly. In more humid spaces and closed assemblies the water vapour resistance of the vapour barrier must be higher. The earlier presented RIL 107 (1989) instructions gave the above-mentioned minimum water vapour resistance value also for timber-framed external wall assemblies. Since the sheathing materials used in Finland today typically have water vapour resistances in the 1.5–15 ×103 s/m range (see App. 3), the water vapour resistance ratio required of roof assemblies, when sheathing is used, is 7.5 to 75:1. These values are considerably higher than the 5:1 given for external wall assemblies. Table 1.7 is a compilation of water vapour resistance values presented in the building codes and guidelines of various countries for the interior section of external wall assemblies. Table 1.7 Minimum values for water vapour resistance, Zν, of interior wall lining of external wall
assembly given by building codes and guidelines of various countries.
Country Water vapour resistance values, Zν, of interior wall lining Remarks CEN member countries (1
• No particular limit values
Finland (2, 3
• Resistance should be at least five-fold compared to the cold side. Lower resistance of warm side of wall is also possible based on further clarification. (RakMK C2 1998) • Vapour barrier should usually be used. Lower resistance of warm side of wall is also possible based on further clarification. Resistance should always be at least five-fold compared to the cold side. (RIL 107 2000)
Directions have been mentioned in different references
Sweden (4, 5
• No particular limit values in present requirements (Boverkets byggregler 2002) • Earlier requirements: Resistance shall be at least five-fold compared to the cold side and no lower than 100 ×103 s/m (Extracts from the Swedish Building Code 1984)
Requirements have been mentioned in different references
Norway (6 • No particular limit values Denmark (7 • No particular limit values Germany (8, 9
• No particular limit values
UK (10 • Resistance should be at least five-fold compared to the cold side. • If condensation inside the assembly is considered harmful, then a) a vapour control layer of adequate resistance should be located on the warm side of the insulation; possibly in conjunction with; b) a vented or ventilated airspace should exist immediately behind any highly resistant cladding.
Directions

57
Canada (11 • Resistance shall be at least 163 ×103 s/m (≤ 45 ng/(m2·s·Pa)). • Resistance shall be at least 488 ×103 s/m (≤ 15 ng/(m2·s·Pa)), when used where high resistance to vapour movement is required, such as in wall constructions that incorporate exterior cladding or sheathing with low water vapour permeance. • A vapour barrier is not required where it can be shown that uncontrolled vapour diffusion will not adversely affect a) the health or safety of building users, b) the intended use of the building, or c) the operation of building services.
Requirements
USA (12, 13
• Resistance shall be at least 128 ×103 s/m (≤ 1.0 perm, ≤ 0.0572 ×10⁻⁹ kg/(m2·s·Pa)). Exceptions: a) In constructions where moisture or its freezing will not damage the materials. b) Where the county in which the building is being constructed is considered a hot and humid climate area and identified in the International Energy Conservation Code. c) Where other approved means to avoid condensation in unventilated framed wall, floor, roof and ceiling cavities are provided.
Requirements
1) EN ISO 13788 (2001) 2) RakMK C2 (1998) 3) RIL 107 (2000) 4) Boverkets byggregler, BBR (2002) 5) Extracts from the Swedish Building Code, SBN 1980 (1984) 6) Technical Regulations under the Planning and Building Act (1997) 7) Bygningsreglement (1995) 8) DIN 4108-3 (1981) 9) DIN 4108-5 (1981) 10) BS 5250 (1989) 11) National Building Code of Canada (1995) 12) International Energy Conservation Code (2000) 13) International Residential Code for One- and Two-Family Dwellings (2000) To sum up, Table 1.7 indicates that all countries have not set limit values for the water vapour resistance of the interior wall lining. The building regulations of these countries state that external wall assemblies are to be designed so that harmful condensation of moisture or other harmful phenomena due to moisture cannot occur within assemblies (see Ch. 2.1.2). In North America (earlier also in Sweden) a minimum value has been set for the water vapour resistance of the interior wall lining. Finland and Great Britain (earlier also Sweden) have set a minimum value for the water vapour resistance ratio between the interior and exterior wall linings, which is 5:1 in both countries.

58
1.7.3 Advantages and drawbacks of moisture-permeable wall assembly
The water vapour permeability of the interior lining of a timber-framed external wall assembly is increased in the hope of gaining advantages related to the moisture performance of the assembly and indoor air quality. On the other hand, decreasing the water vapour resistance of the interior wall lining may be detrimental to the assembly and lower indoor air quality. Research results on observed advantages and drawbacks have been published, and some have also been verified in practice. The following is a compilation of the advantages and drawbacks of the moisture-permeable wall assembly compared to one with a vapour barrier.
Advantages of moisture-permeable wall assembly
1) The risk of condensation and mould growth on the exterior surface of the moisture-permeable air barrier of the wall assembly decreases as moisture enters the assembly from the outside.
When cladding – especially of brick – is wetted by driving rain, moisture may transfer in the assembly by capillary flow or gravitational flow from the outside in if the assembly has no ventilation gap or the gap contains, for instance, squeezed out mortar that connects the sheathing to the cladding (see Chs. 2.2.5 and 6.3.7). This phenomenon can be prevented effectively by providing a well-functioning ventilation gap behind the cladding. Use of non-capillary cladding, sheathing and thermal insulation materials also limits this problem. Extra moisture bound in the cladding may transfer from the outside in also by diffusion and convection. Solar radiation may increase the temperature of the cladding significantly above ambient temperature whereby the moisture bound in the cladding materials starts to evaporate into the ventilation gap air. If the humidity by volume of the ventilation gap air exceeds the humidity by volume close to the interior surface of the assembly, moisture begins to transfer by diffusion also towards the interior surface of the assembly (Nevander & Elmarsson 1994). Convection may also transfer moisture into the wall through gaps and holes. Moisture transfer from the outside in is most significant in summer, when the wall receives more solar radiation and outdoor air temperature is at its highest (e.g. TenWolde & Mei 1986; Tobiasson 1989; Korsgaard & Rode 1992; Timusk 1992; Burch 1993a; Burch & TenWolde 1993b; Burch et al. 1995; Zarr et al. 1995; Harderup 1998; Straube 2001a; Lstiburek 2001; Mukhopadhyaya et al. 2002). The impact of inward diffusion and convection can be best reduced by providing a well-functioning ventilation gap behind the cladding as well as by lowering the water vapour resistance of the interior wall lining or by using non-hygroscopic cladding and sheathing materials and hygroscopic thermal insulation materials.

59
No major drawbacks resulting from inward moisture flow have been observed in Finland in wood- or brick-clad wall assemblies with a functioning ventilation gap behind the cladding (Pirinen 2006). Conducted studies indicate that the humidity by volume of the ventilation gap is, on average, on a level with outdoor air’s the year around (Lehtinen & Viljanen 1999; Lehtinen et al. 2000) (see Ch. 4.2.4). On the basis of a calculational analysis made in Chapter 6.3.7, the humidity by volume of outdoor air or the moisture content of sheathing do not impede the moisture performance of the assembly in summer. The detrimental effects of inward moisture convection are reduced by the fact that pressure differences across the building envelope in summer due to differences in air density are quite small since indoor and outdoor air temperature are nearly the same. In unheated buildings, such as free-time residential buildings, condensation of moisture on the exterior surface of the interior vapour barrier may occur if outdoor air temperature and relative humidity rise quickly. Also then, the direction of water vapour diffusion is towards the cool interior surface (Andersen 1987). However, the phenomenon is generally short-lived since indoor air temperature lags slightly behind outdoor air temperature. Condensation can be prevented by heating the building moderately also in winter. In warm/hot and humid climate the direction of the diffusion flow may be for a large part of the year from the outside in, if the interior of the building is air conditioned. In that case, the interior surface of the assembly must not have a vapour barrier if the water vapour resistance of the exterior surface is quite low (TenWolde & Mei 1986; Korsgaard & Rode 1992; Timusk 1992; Burch & TenWolde 1993b; Burch et al. 1995; Zarr et al. 1995; Harderup 1998; Straube 2001a; Lstiburek 2001; Mukhopadhyaya et al. 2002). In warm and humid conditions it is sometimes justified to install a vapour barrier on the exterior wall lining instead (Tobiasson 1989; Burch 1993a). In winter, the direction of the diffusion flow may nevertheless also be from the inside out even in a relatively warm climate, which means that both types of conditions must be taken into account in designing the water vapour resistance of the interior wall lining. In a warm and humid climate the wall may be realised, for instance, as a sandwich structure where both surfaces are water vapour-proof or by using closed-cell thermal insulation (EPS, XPS or PUR) with high water vapour resistance. In Finland sandwich structures are also used when the moisture flow is from the outside in (e.g. with cold stores). However, the sandwich structure is risky if moisture leaks occur since it dries out slowly (see Chs. 6.4 and 7.3). For this reason, open-pore thermal insulations have often been replaced with more moisture-proof closed-cell insulations also in cold stores.

60
2) The interior wall lining allows the assembly to dry out to indoor air if the structure contains excess construction-time moisture or moisture from occasional leaks and the water vapour resistance of the exterior wall lining is high.
This factor is the more significant, the more water vapour-tight and/or wet the exterior wall lining of the assembly is. Assemblies of this type consists of, for example, old and massive walls with extra thermal insulation placed inside (e.g. Häupl et al. 2000, Sedlbauer & Künzel 2000) as well as non-aerated roof assemblies with bitumen felt or other kind of vapour-tight membrane as waterproofing on the exterior surface (e.g. Condren 1982; Korsgaard & Rode 1992; Janssens et al. 1995; Künzel 1996; Hens & Janssens 1998, Künzel 1998; Derome 1999; Fechner & Häupl 2001; Straube 2001a). In these cases, the water vapour resistance of the interior wall lining must be evaluated from the viewpoints of the wetting risk and drying rate of assemblies. In North America, plywood and OSB, which are quite water vapour-tight, are used also as sheathing in new wall assemblies. Their use is justified by the need to stiffen the building. Thereby the interior surface of the structure that is water vapour permeable allows quicker drying of the structure than in the case of a wall with a vapour barrier (Karagiozis & Salonvaara 1999). Yet, reducing the water vapour resistance of sheathing is more effective as concerns drying and safer as regards moisture stresses due to indoor air. In wall assemblies with a moisture-permeable sheathing and a ventilation gap behind the cladding, no problems with drying have been observed. If the sheathing is highly moisture-permeable, a moisture-permeable interior surface does not increase significantly the exit of extra moisture (Vinha et al. 2002a; Vinha & Käkelä 2004b) (see Ch. 3.2.4). 3) The risk of moisture condensation and mould growth on the surface of the moisture-
permeable air barrier of the wall assembly decreases if the space behind the air barrier can cool down.
The space behind the air barrier can cool down if thermal insulation and sheathing have not been installed carefully in the assembly. A situation like this may occur especially by studs and at various joints (Viljanen 1981; Kosteus- ja homevaurioituneen rakenteen kuntotutkimus 1997; Hens & Janssens 1999; Pirinen 2006). Blown-in and manually compacted thermal insulations are critical in this respect as they may settle over time. Internal convection within the assembly may also cool the exterior surface of the sheathing in the lower section of the wall assembly (Kohonen et al. 1986). In the above situations, the transfer of the vapour barrier 50 mm outward from the interior surface of the timber frame further increases the risk of condensation.

61
4) The wall assemblies are moisture-permeable, meaning that the excessively high relative humidity of indoor air decreases in summer and autumn.
The comfort of occupants dictates that the relative humidity of indoor air should be neither very low nor very high. Several ranges of RH are recommended in literature. The trend of the last few years has been to narrow down the RH range from what was suggested in earlier publications. For example, Seppänen & Seppänen (1997) suggest that indoor air humidity should be 25–45% RH. In practice, these values are quite often exceeded in summer and autumn (Kalamees et al. 2004a; Vinha et al. 2004a; Kalamees et al. 2005; Vinha et al. 2005a; Kalamees et al. 2006b). Simonson et al. (2001) have analysed the impact of assemblies with and without vapour barrier on bedroom air by calculations. The results indicate that in the case of a room with a moisture-permeable roof assembly and walls, humidity was, on average, about 7% RH lower in summer than in the case of a room with vapour tight envelope. The difference between maximum values could be as much as 35% RH. The calculations did not take into account the effect of the hygroscopic mass inside the room on the test results. The analyses were made in the outdoor air conditions of four European localities (one being Helsinki, Finland). The moisture production to indoor air was 60 g/h for 9 h/d. Moisture-permeable assemblies lowered RH the more, the higher the indoor air excess moisture of the building. In summer, excess moisture is, however, small compared to winter (see Fig. 2.23). High excess moisture and high relative humidity of air are often the result of poorly functioning ventilation. 5) Wall assemblies are permeable to carbon dioxide which lowers carbon dioxide
content of indoor air. The carbon dioxide content of indoor air depends essentially on the ventilation of the building. When there is hardly any ventilation, the carbon dioxide contents of impermeable and permeable assemblies may differ by more than 30% (Salonvaara 1998a; Niemelä et al. 2000). In a building with good ventilation, however, the difference is not significant (under 10%) (Niemelä et al. 2000). Moreover, it should be remembered that indoor air quality is normally determined by impurities and emissions which occur in even smaller contents than carbon dioxide, such as VOCs (volatile organic compounds), odours, dusts, smokes, etc. Thus, moisture-permeable assemblies do not reduce the ventilation need of a building (Björk et al. 1997; Niemelä et al. 2000).

62
6) Moisture leaks in wall assemblies become earlier visible on the inside. For instance, when the roofing leaks, water may collect in the roof assembly on top of the vapour barrier causing the moisture damage to be noticed later than in the case of a moisture-permeable air barrier (Straube 2001a). A similar situation occurs also in wall assemblies: for instance, as a result of roofing leaks or moisture leaks at joints between windows and doors and the frame, water may sit in the lower section of the assembly for long (Chouinard & Lawton 2001; Kayll 2001; Pirinen 2006). Hygroscopic thermal insulations may also delay noticing of moisture leaks as they adsorb moisture. The problem may be alleviated, for instance, by using air barrier membranes whose water permeability decreases as they become wet (Korsgaard 1986; Korsgaard & Rode 1992; Janssens et al. 1995; Künzel 1996; Hens & Janssens 1998; Künzel 1998; Fechner & Häupl 2001) or by facilitating the exit of water at risky points through structural solutions. 7) Moisture-permeable wall assemblies with hygroscopic thermal insulation stabilise
moisture and temperature fluctuations of indoor air. Several studies have shown that the hygroscopic mass in a room may affect the moisture and temperature conditions of indoor air. Thus, the interior coating of the roof assembly and walls affects moisture and temperature conditions if it is hygroscopic (Wong & Wang 1990; Hagentoft 1996; Padfield 1999; Simonson 2000; Rode et al. 2001; Simonson et al. 2001). However, it must be remembered that buildings also have many other surfaces besides the envelope surfaces (e.g. partition walls and intermediate floors) whose hygroscopic surface materials may stabilise the temperature and RH conditions of indoor air (Svennberg et al. 2004). Furniture, books and textiles also contribute to the stabilisation of indoor air conditions. For example, Hagentoft (1996), Olsson (1996), Airaksinen & Kurnitski (2003b), Christensen & Bunch-Nielsen (2003), and Vinha et al. (2005a) have found that use of hygroscopic materials in interior envelope surfaces has no major effect on the fluctuation of indoor air RH conditions. In the examined buildings other factors had a much larger impact on the relative humidity of indoor air than the hygroscopicity of ceiling and external walls. Therefore, further research data on the importance of various contributing factors in stabilising indoor air humidity are needed. The impact of the thermal insulation layer behind the wallboard on indoor RH conditions is, naturally, even smaller than that of the interior surface. Simonson et al. (2001) discovered that in the case of a hygroscopic wallboard (e.g. wood panel, plywood or wood fibreboard), the insulation behind the wallboard has little effect on the moisture performance between a wall and indoor air. In the case of a gypsum board, hygroscopic thermal insulation has been observed to have a slight impact on the moisture performance of the interior surface (Ojanen & Salonvaara 2002a). On the other hand, Olsson (1996) and

63
Hagentoft (2001) found that moisture content varies only in layers a few millimetres thick on the surface of timber and gypsum board during the moisture changes occuring during a day. In any case, the relative humidity of indoor air can stabilised nearly as effectively by wall assemblies with a vapour barrier behind the interior board. 8) Manufacture of paper-backed air barrier membranes consumes less non-renewable
natural resources, and they are easier to recycle and dispose of. Olsson (1996), among others, has mentioned the negative side of plastic – its manufacture uses up non-renewable resources. However, the membranes generally remain in buildings for a long time which means that, in principle, they need not be replaced during the service life. Consequently, there is little need for recycling and disposal of air barrier membranes. An additional assumed advantage of paper-based membranes over plastic ones is that the latter become brittle from exposure to ultraviolet radiation. Today’s plastic vapour barriers are, however, made to withstand UV light, and their long-term durability has not been found to cause any significant practical problems (Niiranen 1994; Pirinen 2006).
Drawbacks of moisture-permeable wall assembly
1) Indoor air moisture enters the wall assembly which increases the risk of mould growth within in autumn and condensation in winter.
The level of mould growth and condensation risk depends on indoor air excess moisture – the higher it is, the higher the risk of moisture damage (see Chs. 1.7.4, 2.1.3, 3.2.4 and 6.3). The amount of excess moisture can be reduced by functioning ventilation. Assemblies may at times be subject also to other moisture stresses due, for instance, to convection and internal convection, which makes the extra moisture load on assemblies due to diffusion the more important. 2) The wall assembly gets wetter whereby deformations of sheathing and thermal
insulation increase and their strength and air-tightness decrease. The size of deformations in sheathing materials depends on their hygroscopicity – the more hygroscopic the material, the larger the deformations. Deformations may decrease the air-tightness of joints increasing the assembly’s internal convection (Nieminen 1987). Lower air-tightness, again, has detrimental impacts on the performance of the wall assembly itself (e.g. extra moisture enters the wall and thermal resistance of the assembly weakens). The wetting of the sheathing also weakens its strength properties, for instance, from the viewpoint of the building’s rigidity when gypsum or wood fibreboard is used (Hagentoft 1998).

64
Moist-blown thermal insulations have also been observed to settle and arch more as a result of moisture deformations (Nieminen 1987; Nieminen 1989b). This, again, increases internal convection in thermal insulation layers as well as heat losses and the risk of condensation in the external wall (see Ch. 1.7.1). 3) The wall assembly gets wetter which increases thermal conductivity of the sheathing
and thermal insulation. The higher the moisture capacity of the thermal insulation, the more thermal conductivity increases as moisture content increases (Burch et al. 1989; Sandberg 1992; Langlais et al. 1994; Kumaran 1996; Rissanen & Viljanen 1998; Hansen et al. 2001; Valovirta & Vinha 2003; Valovirta & Vinha 2004; Vinha et al. 2005b) (see Ch. 3.3.1 and App. 3). 4) Wall assemblies are more permeable to moisture whereby indoor air becomes too
dry in winter. In a study by Simonson et al. (2001), the relative humidity of a bedroom with moisture-permeable roof assembly and walls was, on average, about 5% RH lower in winter than that of a room with assemblies incorporating a vapour barrier. However, individual RH values were lower in the case of the room with a vapour barrier (min. value was 15% RH lower than with the room with moisture-permeable roof assembly and walls). The calculations did not take into account the impact of the hygroscopic mass in the room on the test results. Too dry indoor air is often a problem anyway, and a moisture-permeable envelope only serves to make the situation worse. Simonson et al. (2001) found that the average relative humidity of a bedroom with moisture-permeable roof assembly and walls was under 25% RH, the recommended lower limit of relative humidity, for 0−4 weeks longer annually. Kalamees et al. (2004a) also discovered that too dry indoor air conditions (RH < 20% RH) occur more often in winter if moisture-permeable envelope structures are used. Additional humidification of a dwelling, again, causes further problems to wall assemblies. Thus, moisture-permeable assemblies are not suitable for buildings where the intention is to keep indoor air humidity high the year round. 5) A moisture-permeable interior wall lining does not prevent diffusion of harmful
gases, VOC emissions and odours within or without the assembly from entering indoor air.
In high radon areas the joints of the lower section of the wall must be paid special attention to prevent the gas from entering indoor air by diffusion. The mould growth which occasionally occurs in assemblies also generates harmful gases and odours, which can

65
diffuse into indoor air (Nielsen 1995). Sheathing and thermal insulation materials as well as their additives can also emit VOCs into indoor air. On the other hand, existing data on the diffusion resistance of plastic vapour barriers to other gases than water vapour are also insufficient. High diffusion resistance to water vapour does not necessarily mean similar protection against other gases and VOC emissions. 6) Corrosion risk of metal fasteners and parts close to the exterior surface of the wall
assembly increases. Prolonged corrosion of metal fasterners and parts may cause damage affecting the strength of the assembly. Corrosion of carbon steel can start when relative humidity exceeds 60% RH at 20°C temperature (Hagentoft 1998; EN ISO 13788 2001). The mould- and fire-retardants used in natural fibre insulations have furthermore been found to accelerate the corrosion of metal fasteners and parts (Nieminen 1987; Rose & McCaa 1998; Salonvaara & Nieminen 1998). However, the fasteners are often zinc-coated or of stainless steel and have high corrosion resistance (see Ch. 2.1.1). In practice, corrosion of metal fasteners typically requires that moisture condenses on the interior surface of the sheathing. 7) Water can penetrate into the wall assembly easier due to a localised moisture leak
inside (e.g. from home appliances). The moisture damage risk from home appliances can also be reduced by many other measures such as drainage and water trays. One drawback attached to paper-based moisture-permeable membranes is that they are believed to tear more easily which poses a greater risk of air leaks in the assembly. However, according to a broad field study conducted at Tampere University of Technology and Helsinki University of Technology, the air-tightness of an envelope with an air barrier membrane depends first and foremost on the quality of the installation work and other material layers of the interior wall lining besides the air barrier (Korpi et al. 2004; Vinha et al. 2005a).

66
1.7.4 Studies dealing with the impact of the vapour barrier on the performance of the external wall assembly
In recent decades numerous studies have been conducted on timber-framed moisture-permeable external walls and the impact of the vapour barrier on the moisture performance of wall assemblies. All the central research methods have been employed: field tests, laboratory tests and calculational analyses. Some studies have applied several methods. The share of calculational analyses has increased in the last few years, which is natural as the performance and reliability of calculation programs has improved. Table 1.8 presents most of the studies. The need for a vapour barrier in a timber-framed external wall has been studied in many older studies in addition to the studies presented in Table 1.8 (e.g. Rogers 1938; Rowley et al. 1938; Rowley 1939; Teesdale 1939; Dill & Cottony 1946; Britton 1948a; Britton 1948b; Britton 1949; Hutcheon 1953; Hutcheon 1954; Verrall 1962; Hutcheon 1963; Anderson 1972; Duff 1972; Anderson & Sherwood 1974; Kieper et al. 1976; Latta 1976; Burch & Treado 1978; Weidt 1980; Weatherization study 1980). Unfortunately, the original articles were not available to this author, which is why they have been excluded from Table 1.8. Some studies have compiled the oldest studies in North America dealing with the vapour barriers of timber-framed external wall assemblies (e.g. TenWolde 1989; Moisture in Canadian Wood-Frame House Construction 1992; Straube 2001a; Bomberg & Onysko 2002b; Rose 2003). Table 1.8 presents the research methods used in the studies, selected performance criteria and limit values for acceptability of walls as well as overall conclusions on the moisture performance of walls. The conclusions about the performance of walls are quite general and do not specify performanceal differences between different assembly variations, even if the study had done so. The conclusions are aimed at providing an overall view of how moisture-permeable walls and walls with a vapour barrier or a vapour retarder performd in the studies.

67
Table 1.8 Research on moisture-permeable external wall assemblies.
Research method Author(s) and year
Field Lab. Calc.
Performance criteria/ limit values MC = moisture content
Conclusions/ General performance of walls WVRR = water vapour resistance ratio plastic = plastic foil as vapour barrier inside vapour retarder = quite vapour-tight layer inside
Burch et al. (1979) X X limited MC of materials/ limited moisture condensation
Walls with plastic performed well; all those without plastic did not. Extra insulation on exterior side of sheathing improved moisture performance of moisture-permeable walls.
Rossiter et al. (1981) X no moisture condensation Moisture-permeable walls performed well.
Stewart (1981) X limited moisture condensation
Moisture-permeable walls performed well if WVRR ≥ 5:1
Tsongas et. Al. (1981) X no moisture accumulation, no wood decay
Moisture-permeable walls performed well.
Wang (1981) X X no moisture condensation, no mould growth
Some walls with and without vapour retarder did not perform.
Nielsen & Andersen (1982)
X MC ≤ 20 wt% Moisture-permeable walls performed well if WVRR > 1:1.
Stewart (1982) X X MC ≤ 20 wt% Moisture-permeable walls did not perform if WVRR = 1:5, but did quite well if WVRR = 5:1.
Wettermann (1982) X MC ≤ 20 wt% Wall with plastic performed best. In some walls without plastic MC increased to a quite high level.
Luft (1983) X limited moisture condensation, MC ≤ 30 wt%
No difference between walls with and without plastic, but sheathing was more vapour-tight in wall with plastic.
Sherwood (1983) X no wood decay, limited dimensional changes, MC ≤ 20 wt%
Walls with plastic performed well, but in those without plastic MC was in some cases over 20 wt%; no wood decay observations.
Kohonen et al. (1985) X X no moisture accumulation Walls with and without plastic performed well.
Sherwood (1985) X no wood decay, limited dimensional changes, MC ≤ 20 wt%
Walls with plastic performed well, but those without plastic MC was in some cases over 20 wt%; no wood decay observations.
TenWolde & Mei (1986)
X X no moisture condensation Walls without plastic performed well, but those with plastic did not.
Tobiasson & Harrington (1986)
X no moisture accumulation, limited moisture condensation
Vapour retarder is needed when RH of indoor air is high enough. In north the limit value is much lower (20–30% RH) than in south (80% RH).
Tsongas (1986) X no wood decay, MC below capillary range
Walls with and without plastic performed well and similarly.
Nieminen (1987) X X X no moisture accumulation, limited MC variations
Walls with vapour retarder performed well. Walls without vapour retarder performed well in field tests, but some did not perform in laboratory tests (high MC variations) and calculational analyses (moisture accumulation).
Burch et al. (1989) X X limited moisture condensation
Moisture condensed in moisture-permeable walls.
Merrill & TenWolde (1989)
X no wood decay, no mould growth, no deformations of cladding
A lot of moisture damage was observed in walls without plastic, but also in walls with plastic. Wood decay was observed only in some walls.
Nieminen (1989b) X MC ≤ 20 wt%, limited MC variations
Some moisture-permeable walls did not perform.
Schuyler et al. (1989) X X X drying time Wall without plastic dried a little bit faster than wall with plastic.
Tobiasson (1989) X no moisture accumulation, limited moisture condensation
Vapour retarder is needed when RH of outdoor air is high enough and house is air-conditioned (near US southern coast).

68
Tsongas (1990) X no wood decay, MC below capillary range,
MC was sometimes high in moisture-permeable walls, but there was no wood decay.
Burch & Thomas (1991)
X MC below capillary range/ no moisture condensation
Walls with plastic performed well, but some without plastic did not.
Korsgaard & Rode (1992)
X MC below capillary range/ no moisture condensation
Walls with more moisture-permeable vapour retarder performed better than wall with plastic vapour barrier.
Burch (1993a) X limited moisture condensation, no mould growth, ϕ ≤ 80% RH
Some walls with vapour retarder did not perform in hot and humid climate.
Burch & TenWolde (1993b)
X limited moisture condensation, no mould growth, ϕ ≤ 80% RH
Walls with vapour retarder performed well in cold climate, but some did not perform in hot and humid climate. Walls without vapour retarder performed well in hot and humid climate, but some did not perform in cold climate.
Karagiozis & Kumaran (1993)
X no moisture accumulation Walls with plastic and vapour retarder performed well if Zν,li ≥ 36.6 to 122 ×103 s/m.
Burch et al. (1995) X limited moisture condensation, no mould growth, ϕ ≤ 80% RH
Walls with vapour retarder performed well in cold climate, but did not perform in hot and humid climate. Walls without vapour retarder performed satisfactory well in both climates.
Nielsen (1995) X limited moisture condensation and mould growth
Walls with plastic performed better than those without plastic.
Sundström & Davidsson (1995)
X X no moisture condensation Walls with plastic performed well, but some without plastic did not.
TenWolde & Carll (1995)
X X limited moisture condensation and mould growth
Some moisture-permeable walls did not perform.
Tsongas et al. (1995a) X MC below capillary range, limited mould growth
Walls with plastic performed well if there were no holes through the foil. Some walls without plastic did not perform.
Tsongas & Olson (1995b)
X X no wood decay, MC below capillary range, no plywood delamination
Almost all moisture permeable walls did not perform. Wood decay was observed in almost all walls.
Zarr et al. (1995) X X MC below capillary range Walls with and without vapour retarder performed well.
Hagentoft & Harderup (1996)
X limited MC of materials, no mould growth
Walls with plastic performed well, but ones without plastic did not if Δνexc > 3.5 g/m3.
Sikander (1996) X X limited mould growth, VOC emissions
Some moisture-permeable walls did not perform, but damage was probably caused mainly by moisture convection and construction-time moisture.
Thue et al. (1996) X no moisture condensation,no mould growth
Walls with high inner resistance performed well, but ones with low inner resistance (Zν,li ≤ 53 ×103 s/m) did not.
Geving (1997a) X X limited moisture content Walls with plastic performed equally well or a little better than walls without plastic.
Geving (1997b) X mould growth risk ≤ 10% The mould growth risk was about 70% in analysed moisture-permeable wall.
Hänninen et al. (1997) X limited moisture condensation
Walls with plastic performed well, but without plastic did not if Zν,li = 110 ×103 s/m.
Harderup (1998) X no moisture condensation,no mould growth
In wall with plastic condensation risk was higher, but mould growth risk was lower or equal to that of wall without plastic.
Rode (1998) X limited moisture condensation and mould growth
Walls with plastic performed well, but some without plastic did not.

69
Rose & McCaa (1998) X MC ≤ 20 wt%, limited mould growth
Walls with plastic performed well, but some without plastic did not.
Harderup (1999) X amount of condensate water
In walls with plastic the amount of condensation was smaller than in walls without plastic.
Karagiozis & Salonvaara (1999)
X limited mould growth Walls without plastic performed better than ones with plastic.
Kokko et al. (1999) X X no moisture accumulation, limited mould growth
Walls with and without plastic performed well when WvRR ≥ 3:1.
Rode et al. (1999) X no mould growth ϕ ≤ 85% RH
Walls with plastic performed well, but some without plastic did not.
Uvsløkk et al. (1999) X MC under 20 wt% Some walls with both high and low interior lining water vapour resistance did not perform.
Vinha & Käkelä (1999) Vinha & Käkelä (2000) Vinha et al. (2001a), Vinha et al. (2001b)
X no moisture condensation Walls with plastic performed well, but some without plastic did not.
Andersen (2000) X colour changes Walls with low WVRR did not perform.
Levin & Gudmunsson (2000)
X X no moisture condensation,no mould growth
Walls without plastic in field test performed well, but not in calculational analysis.
Simonson (2000a) X X limited moisture condensation, no mould growth
Moisture-permeable wall performed well.
Kauriinvaha et. al. (2001a)
X X X no mould growth Moisture-permeable walls performed well.
Kauriinvaha et al. (2001b)
X X no mould growth Walls with and without plastic performed well.
Käkelä et al. (2001), Käkelä & Vinha (2002) Vinha et al. (2003b)
X X no moisture condensation, no mould growth
Walls with and without plastic performed well.
Salonvaara et al. 2001 X moisture content under capillary range
Wall without vapour barrier performed better than wall with vapour barrier.
Straube (2001a) X limited moisture condensation
Some walls with and without plastic did not perform.
Mukhobadhyaya et al. (2002)
X limited moisture content Walls with vapour barrier were drier than walls without vapour barrier.
Lstiburek et al. (2002) X no mould growth, ϕ ≤ 80% RH
Walls with plastic performed well, but those without plastic and high ϕ inside did not. Some walls without plastic and lower ϕ inside did not perform.
Vinha et al. (2002a), Vinha & Käkelä (2004b), Vinha & Käkelä (2007)
X no moisture condensation,no mould growth
Walls with plastic performed well, but some without plastic did not.
Cristensen & Bunch-Nielsen (2003)
X MC ≤ 20 wt% Walls with and without plastic performed well.
Onysko & Bomberg (2004)
X no wood decay, no mould growth
Some walls with and without vapour barrier did not perform.
Riesner et al. (2004) X limited moisture condensation < 0.5 kg/m2 or < 1.0 kg/m2,no mould growth
Some walls with high and low WVRR did not perform.
Burke (2005) X no moisture condensation, no mould growth
There was no condensation in walls if WVRR ≥ 5:1 and no mould growth if WVRR ≥ 200:1.
Finch et al. (2006) X X no mould growth, no metal corrosion
Moisture permeable wall did not perform.
Pirinen (2006) X no mould growth In walls with plastic some mould growth was observed if thermal insulation was poorly installed. In walls without plastic some mould growth caused by diffusion was observed.

70
Performance criteria and limit values
Six primary performance criteria were applied in the research: • Moisture must not accumulate in assemblies, but all moisture condensed during
winter must exit the assembly during summer. • No wood decay may occur in the assembly. • Moisture content of wood-based materials must be below the capillary range (≤ 25–
30 wt%) which means that moisture condensation is not acceptable. • Moisture content of wood-based materials must not exceed 20 wt%. • Limited or no moisture condensation allowed in the assembly. • Limited or no mould growth allowed in the assembly. Several of the above criteria were selected as performance criteria for part of the studies. The first four performance criteria were used more frequently in older studies. Often when moisture condensation and/or mould growth were used as performance criteria, the sections of the assembly where these phenomena were allowed, or their extent, were not defined accurately – or whether any condensation or mould growth was allowed at all. Table 1.8 presents the phenomena or conditions which may be considered to have been used as performance criteria or limit values for walls in various studies. The interpretations may be erroneous in some cases. Especially in the case of mould growth, the difficulty of setting an acceptable limit value is understandable since the mould growth calculation models required for this type of analysis have become available only in the last few years. Earlier, the criterion for mould growth, in the case of timber and timber-based materials, has actually been a moisture content not exceeding 20 wt% when temperature was > 0°C (Kohonen 1985; Thue et al. 1996). At 20°C temperature 20 wt% corresponds to about 80% RH of the pore air of timber. This criterion is, however, quite rough, and today’s mould growth models allow more accurate analysis of the mould growth risk of assemblies. On the whole, mould growth has been adopted more widely as a performance criterion only in studies conducted in recent years.
Outdoor air conditions
According to Table 1.8, the moisture performance of timber-framed external walls has been researched mostly in the USA, Canada, Denmark, Finland, Sweden and Norway. A significant part of the studies were conducted in conditions milder than Finnish outdoor air conditions. Especially many of the field and laboratory tests done in the USA and Denmark belong to this group. Some of the studies were conducted under warm/hot and humid outdoor air conditions.

71
The target years of different studies have been selected on the basis of quite different principles. In field tests, naturally, the performance of assemblies has been examined in the conditions prevailing during the tests. Calculational analyses, again, use a certain year (e.g. the same as in field tests), an average year, a reference year chosen for energy consumption calculations, the critical year selected on a certain criterion, and recently also the 10% level critical year based on a certain criterion, which means that 10% of the years are more critical with respect to the observed factor than the selected test year.
Indoor air conditions
Indoor air temperature has generally been around 20°C in the studies. Relative humidity and indoor air excess moisture, on the other hand, have varied a lot. In some studies excess moisture has been only about 1 g/m3 (e.g. Levin & Gudmunsson 2000), whereas, for example, Thue et al. (1996) examined assemblies at excess moisture values in the 10−12 g/m3 range. Excess moisture values of other studies have ranged between the above values. Conditions may also have existed, particularly in field tests, where the relative humidity of indoor air was not controlled at all (e.g. Andersen 2000).
Differences between assemblies
A characteristic feature of, especially the early studies, is the essentially thinner insulation compared to the assemblies built in Finland today. When significantly thinner insulation is used, the temperature of the interior surface of the sheathing rises and the moisture performance of the assembly improves. For instance, in many older cold climate studies the thickness of thermal insulation was less than 100 mm. Another major structural difference is the lack of a ventilation gap behind the cladding. Many studies conducted prior to the mid-1980s looked at wall assemblies of this type. Such studies have also been conducted later especially in North America. Some studies have also looked into multilayer assemblies where the thermal insulation layer has been divided up by different building boards (Kohonen et al. 1985; Nieminen 1987; Nieminen 1989b). The water vapour permeability of the interior lining of a moisture-permeable wall assembly was often given as an absolute value or as a water vapour resistance ratio between interior and exterior wall linings. However, not nearly all studies told directly how moisture-permeable the analysed walls were. Many studies also used assemblies with plastic vapour barriers or vapour retarders (e.g. paint or bitumen membrane) as comparison assemblies. The interior finishing of the wall assembly has been taken into account in part of the studies and ignored in the rest. In field measurements the interior finishing has generally

72
been included, but in laboratory tests and calculational analyses the both practice has varied.
Performance of external wall assemblies with vapour barrier
An external wall assembly containing a plastic vapour barrier or a corresponding vapour retarder in the interior wall lining performd flawlessly in all conducted studies where the issue was examined from the viewpoint of diffusion from the inside out. Assemblies with a vapour barrier also performd at least as well or better than the compared moisture-permeable assemblies. In studies conducted under warm/hot and humid outdoor air conditions moisture-related problems were typically observed outside the vapour barrier due to moisture transferring from the outside in (e.g. TenWolde & Mei 1986; Tobiasson 1989; Korsgaard & Rode 1992; Burch 1993a; Burch & TenWolde 1993b; Burch et al. 1995; Zarr et al. 1995; Harderup 1998; Straube 2001a; Lstiburek 2001; Mukhopadhyaya et al. 2002). However, such problems were not noticed in field tests in Finland (Pirinen 2006). In addition, for instance, Schuyler et al. (1989), Karagiozis & Salonvaara (1999) and Straube (2001a) found that the use of a tight interior vapour barrier slows down the drying of construction-time extra moisture in an assembly in cold climates when the external surface of the wall is quite vapour-tight.
Performance of moisture-permeable external wall assemblies
Conclusions about the moisture performance of moisture-permeable external wall assemblies vary considerably between studies. Part of the studies find the performance of assemblies acceptable while others consider their use risky and view them with reservation. In the worst cases even significant wood decay occurred in moisture-permeable walls (e.g. Tsongas & Olson 1995b). Different research results and conclusions are understandable since the outdoor and indoor air conditions, assemblies and performance criteria used in the analysis have varied a lot by studies. This is an indication of the basic problem related specifically to studies on moisture-permeable walls. The end result has varied widely according to selected conditions, assemblies and criteria. In order to be able to evaluate reliably the performance of moisture-permeable assemblies, the research conditions must be defined and performance of assemblies analysed based on different assembly solutions. Perhaps the most important factors in the examination of the performance of a moisture-permeable assembly are the performance criteria and limit values set for the assembly. If the only limit value for the moisture performance of an assembly is that no accumulation of moisture in the assembly is allowed, moisture-permeable assemblies meet this criterion extremely well (e.g. Kohonen et al. 1985). In this study considerable amounts of moisture

73
condensed on the interior surface of the sheathing, and the moisture contents of wood-based materials in some areas also exceeded 20 wt% at temperatures above 0°C. These have, however, been considered acceptable phenomena since all the water that condensed in the assembly dried out during the summer. The situation is the same also if the limit value is set so as to not allow, for instance, any wood decay in the assembly (e.g. Tsongas et al. 1981). In this study external wall assemblies performed well since no wood decay was observed. On the other hand, it was found that other non-decay fungi and bacteria were commonly present in samples taken from wall assemblies. Based on the conducted studies, it can be stated that the general trend has been to adopt tougher performance criteria to limit mould growth and condensation. The increase in moisture damage and the general rise in building standards have certainly contributed to the trend. Also, as safety factors are not necessarily used in designing assemblies, the use of more stringent performance criteria enable the assembly to cope with occasional exceptional moisture loads, too.
Recommended design principles for wall assemblies
Despite the large number of the studies, very few of them recommended precise limit values for the water vapour resistance of the interior or exterior wall lining or the water vapour resistance ratio between the interior and exterior wall linings. This is certainly due the fact that studies have generally examined only certain individual assemblies under certain conditions, and cannot, therefore, give generally applicable instructions for designing assemblies. Even when studies do give limit values, they are based on quite limited observation and are generalisations. The minimum values for the water vapour resistance of interior or exterior wall linings or the water vapour resistance ratio between these wall linings suggested by various studies have been compiled in Table 1.9. The presented recommendable water vapour resistance ratios vary between 1 and 50:1. However, most of the recommendations are between 5 and 10:1. Riesner et al. (2004) also considered the impact of the assembly’s internal convection in determining recommendable water vapour resistance ratios. The widest range for the recommendable water vapour resistance of interior wall lining (12.8 to 1280 ×103 s/m) was given by Bomberg and Brown (1993).

74
Table 1.9 Recommended limit values for water vapour resistance of interior or exterior wall lining or water vapour resistance ratio between interior and exterior wall linings suggested by various studies.
Author(s) and year Recommended limit values
Stewart (1981) Zli/Zle ≥ 5
Wang (1981) Zli/Zle > 1 to over 10, Zν,li > 128 ×103 s/m (Wli < 1 perm)
Nieminen (1989b) Zli/Zle ≥ 5 to 7
Timusk (1992) Zli/Zle ≥ 5 to 10
Bomberg & Brown (1993) Zν,li ≥ 12.8 to 1280 ×103 s/m (Wli ≤ 0.1 to 10 perm)
Thue et al. (1996) Zν,li < 198 ×103 s/m choose Zli/Zle > 50 (Zp,li < 27 ×109 m2·s·Pa/kg) 198 < Zν,li < 264 ×103 s/m choose Zli/Zle > 25 (27 < Zp,li < 36 ×109 m2·s·Pa/kg) Zν,li < 264 ×103 s/m choose Zli/Zle > 10 (Zp,li > 36 ×109 m2·s·Pa/kg)
Hänninen et al. (1997) Zν,li ≥ 110 ×103 s/m (Zp,li ≥ 15 ×109 m2·s·Pa/kg)
Kokko et al. (1999) Zli/Zle ≥ 5, Zν,le ≤ 36.6 to 73.3 ×10³ s/m (Zp,le ≤ 5 to 10 ×109 m2·s·Pa/kg)
Uvsløkk et al. (1999) Zli/Zle ≥ 7 Vinha & Käkelä (1999) Vinha et al. (2002a) Vinha & Käkelä (2004b)
Zli/Zle ≥ 5
Andersen (2000) Zli/Zle > 1
Simonson (2000a) Zli/Zle ≥ 3 to 7 Kauriinvaha et al. (2001a) Kauriinvaha et al. (2001b)
Zli/Zle ≥ 5, Zν,li ≥ 110 ×103 s/m (Zp,li ≥ 15 ×109 m2·s·Pa/kg) Zν,le ≤ 22 ×103 s/m (Zp,le ≤ 3 ×10⁹ m2·s·Pa/kg)
Bomberg & Onysko (2002b)
Zν,li ≥ 36.6 to 73.3 ×10³ s/m (Wp,li ≤ 0.2 to 0.4 ×10⁹ kg/(m2·s·Pa))
Riesner et al. (2004) Zli/Zle ≥ 10 when ka,ins ≤ 50 ×10-10 m2 Zli/Zle ≥ 30 when ka,ins = 500 ×10-10 m2
In summing up the previous studies, it can be stated that they do not present a coherent view of the performance criteria and limit values for a moisture-permeable assembly in different conditions. The selected boundary conditions of walls and their selection principles also vary greatly. In addition, the instructions concerning the water vapour resistance ratio required between the interior and exterior wall linings or the absolute water vapour resistance required of the interior wall lining vary a lot. Consequently, this study examined those issues in more detail.

75
2 FACTORS AFFECTING THE MOISTURE PERFORMANCE OF EXTERNAL WALLS
The acceptability of the moisture performance of a timber-framed external wall assembly during its service life depends on the following four factors: • the performance criteria and limit values set for the wall assembly’s moisture
performance • the outdoor air conditions • the indoor air conditions • the wall assembly solution and used materials This chapter presents the principles that allow considering the above factors in the analysis of the moisture performance of timber-framed wall assemblies. During construction, the acceptability of the assembly’s performance is determined on the basis of the above-mentioned factors as well as the initial moisture contained in building materials. Yet, the situation during construction is different since the construction phase is short and indoor air conditions and the examined assembly may be different during use. Thus, it is possible to set different performance criteria and more permissive limit values for an assembly during construction than during use. This study assumes that wall assemblies and building materials are protected during construction so that they are not subject to abnormal moisture loads. Due to the short duration of construction, it may be assumed that moisture stresses during occupation are more significant from the viewpoint of a building. Consequently, construction-time thermal and moisture performance analyses have been excluded from this work.
2.1 Performance criteria and limit values set for the moisture performance of a wall assembly
2.1.1 Background
The starting point of the moisture performance-related design of wall assemblies is always to prevent moisture from entering the assembly to the extent possible, as well as to ensure that extra moisture in the assembly dries out, since it is very difficult to protect an assembly against moisture throughout its service life. In addition to these measures, the moisture conditions of the wall assembly are to be examined also through calculational analyses in order to ensure its proper functioning.

76
Condensation of moisture
Earlier calculational analysis of the moisture performance of wall assemblies has focussed primarily on condensation of assemblies: generally on the condensation of the interior surface and interstitial condensation within assemblies. Interstitial condensation has typically referred to condensate forming at the interface between two material layers when the relative humidity of pore air reaches 100% RH (see Fig. 1.23). Condensation surveys have normally been based on simplified calculation models since advanced calculation applications have not been widely available (see Ch. 1.7.4). One such application is the Glaser method developed in Germany which allows drawing the partial pressure curve for water vapour and estimating the amount of moisture condensing in the assembly (Glaser 1959). Many other methods for the study of the moisture performance of assemblies have been developed on the basis of this calculation application (RIL 155 1984). Another method, which uses the Glaser method to monitor the performance of an assembly during periods of condensation and drying, has also been used in Germany (DIN 4108-3 1981). The most important performance criterion of that calculation method is that the water, which has condensed in the assembly during the condensation period, dries out during the drying period. A 60-day period in winter has been selected as the condensation period and a 90-day period in summer as the drying period. During those periods outdoor and indoor air conditions remain constant in analyses. During the condensation period outdoor air conditions are -10°C and 80% RH and indoor air conditions 20°C and 80% RH. During the drying period the indoor and outdoor air conditions are the same at 12°C and 70% RH and the condensation zone conditions 12°C and 100% RH. Other criteria have also been set for the performance of assemblies; they are listed in Chapter 2.1.2. That calculation model has also been used in many other countries including Finland (RIL 155 1984). A calculation method of the same type is presented also in EN ISO 13788 (2001) standard, which deals with the moisture performance design of assemblies. With this method, the performance of an assembly is examined in monthly sequences for which constant temperature and moisture conditions have been chosen. The criterion for acceptable moisture performance with this method is also that all moisture accumulated during the winter period dries out during the summer months (see Ch. 2.1.2). The weakness of these calculation methods is that they have undergone many simplifications to allow manual calculation. The following are some of the reasons causing errors in calculated results (EN ISO 13788 2001):

77
a) Thermal conductivity depends on moisture content, and heat is released/absorbed by condensation/evaporation. This changes temperature distribution and saturation values and affects the amount of condensation/drying.
b) Constant material properties are approximations. c) Capillary suction and liquid moisture transfer occur in many materials which may
change moisture distribution. d) Air movements through cracks or within air spaces may change moisture distribution
by convection. Rain or melting snow may also affect moisture conditions. e) Real boundary conditions do not remain constant over a month. f) Most materials are, at least to some extent, hygroscopic and can adsorb water vapour. g) One-dimensional moisture transfer is assumed. h) The effects of solar and long-wave radiation are neglected. Due to the many sources of possible error, these calculation methods are less suitable for certain building components and climates. Neglecting moisture transfer in the liquid phase normally results in an overestimate of the risk of interstitial condensation in some cases. In building elements where air flow through or within the element occurs, the calculated results can be very unreliable and great caution should be used in interpreting them. (EN ISO 13788 2001) In practice, this type of simplified calculational analysis is primarily suited for a rough estimate of the moisture performance of an assembly. It may be used in certain stationary situations to determine whether moisture condenses in an assembly and whether it can dry out of it. The amount of condensed moisture, on the other hand, cannot be determined accurately. One way of assessing the moisture performance of envelope assemblies from the viewpoint of condensation is the so-called pivot points method (Sanders 1996). IEA Annex 24 specifies the three following pivot points for determining transitions between four internal climate classes: Pivot 1: The maximum internal vapour pressure before condensation starts within a north
facing wall under mean January conditions Pivot 2: The maximum internal vapour pressure before there is a net accumulation of
condensation over a year within a north facing wall. Pivot 3: The maximum internal vapour pressure before there is a net accumulation of
condensation over a year within a flat roof. These pivot values depend on both the external climate and the construction used to develop them. One major assumption behind the climate class and pivot value concept is that of ‘worst case’ constructions with an exterior surface totally impermeable and an interior surface permeable to water vapour. Within this constraint, however, both the

78
radiation properties of the external surface and the thermal properties of the structure, both of which affect the calculated pivot points, can vary. Thus, it is recommendable to calculate ‘standard pivots’ based on a specified construction – these can determine the effect of those climate parameters included in the model used and can be used to investigate the geographical variation of the pivot values, drawn contour maps, etc. These can then be generalised to any construction with an impermeable external surface by deriving climate dependant coefficients that can be used to correct the pivot values. (Sanders 1996) Versatile building physical calculation software (HAM models), which allows much more detailed analysis of assemblies than before, is available today (see Ch. 5.1). The new applications can also take into account most of the factors mentioned above. Nowadays, in calculations based on HAM models, the amount of condensed moisture is not always the performance criterion for an assembly; moisture contents of building materials at various points of the assembly may also be the criterion. Then, the moisture performance of the assembly is evaluated based on how long a detrimental moisture content prevails in some section of the assembly. There are at least two reasons for this practice. In many cases, it is difficult to calculate the amount of moisture condensing on the surface of the sheathing since the migration of moisture may be affected by many factors simultaneously (see Ch. 7.1.1). On the other hand, deterioration of building materials is generally the result of excessively high moisture content, which is, therefore, a more accurate indicator of an assembly’s moisture performance than the amount of condensed moisture. HAM models do not, however, provide a reliable overall picture of the moisture performance of an assembly − particularly in the capillary range (see Chs. 5.4, 7.2.2 and 7.2.3). Yet, a quite general starting assumption in calculations with HAM models is also that interstitial moisture condensation or exceedance of the maximum hygroscopic moisture content by the material’s moisture content in the assembly can be allowed as long as the extra moisture dries out during the summer.
Mould growth
During the past decade the mould growth occurring in assemblies has gained increasing importance as a design criterion. This is justified since the substances secreted by mould spores and moulds (so-called microbial volatile organic compounds, MVOCs) are suspected of being harmful to the health and comfort of people. Moisture condensation, on the other hand, is generally more problematic for the structure itself. Naturally, condensation of moisture may also lead to mould growth and even rotting of assemblies. In many instances mould growth, however, begins already before condensation.

79
The main factors affecting mould growth are water, temperature and nutrients. The nutritional requirements are minimal and are satisfied either by the material constituents or by minor contamination of the surface by, for instance, dust. The temperature range where mould growth can take place is given as 0−50°C. Many moulds can survive temperatures of 60−70°C for a short period of time. Optimum growth conditions exist in the 20−30°C temperature range. In building physical applications water is the limiting factor for mould growth. Variations in temperature and moisture conditions also play a big role. In addition to the major factors affecting mould growth discussed above, radiation, air movement and oxygen may also be of importance (Hagentoft 1998). The acidity (pH) of a material has also been found to affect mould growth (Matilainen & Kurnitski 2003a). In practice mould growth is essentially affected by the properties of the materials serving as a substrate and the changes occurring in them as they age (see Figs. 2.12–2.14 and Ch. 7.2.4). Many studies have shown that significant mould growth does not occur when relative humidity is under 80% RH and temperature 20°C (IEA Annex XIV 1991; Viitanen 1996; EN ISO 13788 2001). In some cases the lower limit for mould growth may, however, be even 62–65% RH (Hagentoft 1998). As mentioned earlier, with timber-framed walls the performance criterion is often set at a moisture content of 20 wt%, which corresponds to the equilibrium weight of wood just at 20°C temperature and 80% RH. This limit value does not, however, always indicate wood materials’ susceptibility to mould growth as mould grows on the surface of a material where it is affected primarily by surface moisture conditions (Viitanen 1996). In the case of some wood-based materials 20 wt% actually corresponds to higher relative humidity than in the case of wood. It has often also been difficult to comply with this limit value in the case of the exterior section of a wall assembly since the lower temperature of outdoor air increases the relative humidity of air and the moisture content of wood. Information on mould growth at lower temperatures has also been scarce. Practice has, however, proven that no significant mould growth occurs in subzero temperatures. For the above reasons, the starting point in design is presently that mould growth is more acceptable in the exterior section than in the interior section of an assembly. Yet, no generally accepted mould growth criteria for envelope assemblies exist in Finland or other countries. New calculation models have been developed recently which allow analysing the mould growth in assemblies more accurately; mould growth has also been examined under different temperature and moisture conditions (e.g. Nevander & Elmarsson 1994; Viitanen 1996; Hukka & Viitanen 1999; Clarke et al. 1999; Sedlbauer 2001; Sedlbauer 2002; Nofal & Morris 2002). Naturally, these calculation models still have many limitations since the

80
progress and regression of mould growth as a biological process is hard to model mathematically (see Chs. 2.2.4 and 7.2.4). Yet, the models have enabled more varied and better analysis of the moisture performance of assemblies.
Other performance criteria
Other criteria can also be set for the performance of the interior section of a timber-framed external wall assembly, such as changes in material properties, decrease in stiffness and strength, deformations, crumbling, cracking, rotting, adhesion loss of glues, amount of material emissions, colour changes, bacterial growth, insect damage, loosening of metal fasteners and corrosion of metal fasteners and parts. Hagentoft (1998), among others, has examined the impact of some of the above factors on the performance of assemblies. Most of the above factors will be taken into account if the performance of the assembly is analysed from the viewpoint of moisture condensation (or moisture content of materials in the capillary range) and mould growth and sufficiently tight limit values are set for the performance criteria. This is due the fact that the moisture content critical for condensation and mould growth is often lower than that for the other mentioned factors. The main exception is the corrosion of carbon steel which requires under 60% RH at 20°C temperature not to occur (Hagentoft 1998; EN ISO 13788 2001). On the other hand, Salonvaara & Nieminen (1998b) have observed that zinc-coated light-alloy metal-framed wall assemblies perform well in Finnish climatic conditions even though the relative humidity of the exterior section generally exceeds 60% RH. In the case of zinc-coated steel components, 80% RH at temperatures exceeding 0°C may be considered the critical moisture content (Salonvaara & Nieminen 1998b). The metal components of timber-framed assemblies consist mainly of fasteners which are normally also zinc-coated or of stainless steel. The moisture performance of the cladding of a timber-framed wall assembly is also influenced strongly by condition factors other than temperature and relative humidity (e.g. solar radiation, wind and driving rain). The most critical orientation of the assembly from the viewpoint of moisture performance also generally varies according to stresses and performance criteria. The performance criteria set for the exterior surface, again, depend essentially on the properties of selected materials (e.g. wear, cracking, erosion, crystallisation of salts, airtightness, corrosion of metal parts, deformations and colour changes). Different structural solutions (ventilation gap, joints and details, eaves and plinths) can also be used to influence the performance of the exterior surface besides choice of materials. The study of mould growth on cladding also requires a different approach than the study of mould growth inside an assembly since exterior growth typically occurs at points where the moisture introduced by driving rain cannot dry out quickly enough (joints, window and door jambs, etc.) (see Ch. 2.2.4). This is naturally much more significant from the viewpoint of mould growth than the relative humidity of

81
air. Since the building physical stresses on the cladding are considerably heavier than those on the interior sections of the assembly, a shorter service life requirement can justifiably be set for cladding than the interior sections where necessary. Examination of the moisture performance of cladding has nevertheless been excluded from this study.
2.1.2 Rules and regulations issued by various countries concerning allowed condensation and mould growth in external wall assemblies
The EN ISO 13788 (2001) standard presents the common instructions for CEN member countries as concerns the moisture performance of walls. These instructions are to be complied with by all member states. Moreover, each country has its national codes which may provide more detailed instructions for the design of the moisture performance of walls.
CEN member countries
Surface condensation can cause damage to unprotected building materials that are sensitive to moisture. It is acceptable, if temporary and limited, for instance, on windows and tiles in bathrooms, when the surface does not adsorb the moisture and adequate measures are taken to prevent the moisture from coming into contact with adjacent sensitive materials. To avoid mould growth, the relative humidity of a surface should not exceed 80% RH for several days. Other criteria, such as ϕsi ≤ 60% RH to avoid corrosion, can be used, where appropriate (EN ISO 13788 2001). Interstitial condensation is acceptable if all condensate from each interface is expected to evaporate during the summer months. The risk of degradation of building materials and deterioration of thermal performance as a consequence of the calculated maximum amount of moisture shall also be considered according to regulatory requirements and other guidelines of product standards (EN ISO 13788 2001).
Finland
If a wall assembly can be permeated by a detrimental amount of indoor air water vapour or air, the vapour- or air-tightness of the wall is ensured by installing material layers in the proper places to function as a vapour barrier, an air barrier or a sheathing (RakMK C2 1998). RIL 107 (2000) also states that moisture transferring into the external wall by diffusion must not cause damage. It is noteworthy that RIL 107 (2000) requires a vapour barrier in the roof assembly if it can be shown by calculations that condensation of moisture will occur in the assembly as a result of diffusion (see also Ch. 1.7.2).

82
Sweden
Buildings are to be implemented so that construction-time moisture or later moisture intrusion do not cause damage, microbial growth, offensive odours or other hygienic problems (Boverkets byggregler 2002). Walls and facade claddings, windows, doors, fasteners, ventilation system components, joints and other details penetrating walls or coming into contact with them are to be implemented so as to prevent detrimental occurrence of moisture (Boverkets byggregler 2002).
Norway
Construction works shall be so designed as to prevent rain or snow, surface water, ground water, supply water and air moisture from penetrating and causing moisture damage, mould, fungi or other hygienic problems (Technical Regulations under the Planning and Building Act 1997). Materials and structures shall be so dry at the time of placing/sealing that problems of growth of micro-organisms, decay of organic materials and increased gas emission do not arise (Technical Regulations under the Planning and Building Act 1997).
Denmark
Assemblies are to be implemented so that rain and snow, surface water, ground water, soil moisture, building moisture, condensation water, air moisture and moisture stresses during the building’s service life do not cause moisture damage or problems (Bygningsreglement 1995). Roof and external wall assemblies as well as crawl spaces, which contain moisture-sensitive materials, are to be protected from detrimental accumulation of condensation water (Bygningsreglement 1995).
Germany
Condensation occurring in assemblies is not considered detrimental if the increase in moisture content does not weaken the thermal resistance of building materials and thermal insulations or cause deformations in building materials. These conditions are met when the following is ensured (DIN 4108-3 1981): a) It must be possible for the moisture that has condensed inside the assembly during
the wetting period to be able to dry out. b) Condensation must not damage building materials (e.g. through corrosion, mould
growth)

83
c) The amount of water condensed in roof and wall assemblies must not exceed 1.0 kg/m2. This condition does not apply in the case of items d) and e).
d) On surfaces between structural layers made of non-capillary building materials, the total amount of condensed water must not exceed 0.5 kg/m2 (e.g. where mineral wool insulation or an air gap adjoins a vapour barrier or a concrete surface).
e) The moisture content of wood must not increase more than 5 wt% and that of wood-based materials more than 3 wt% during the wetting period.
Great Britain
The design objectives should be as follows: prevention of harmful surface or interstitial condensation, prevention of mould growth and economical reduction of nuisance condensation (BS 5250 1989).
Canada
Canada’s Building Code does not actually take a position on whether condensation of water or mould growth should be allowed in an assembly. Yet, the National Building Code of Canada (1995) does set out the following general requirement for the performance of an assembly: A vapour barrier is not required where it can be shown that uncontrolled vapour diffusion will not adversely affect any of (a) the health or safety of building users, (b) the intended use of the building, or (c) the operation of building services.
USA
The design shall not create conditions of accelerated deterioration from moisture condensation. Frame walls, floors and roof assemblies not ventilated to allow moisture to escape shall be provided with an approved vapour retarder (International Energy Conservation Code 2000).
Summary of the rules and regulations of various countries
Most building codes do not directly mention mould growth in assemblies, but in the general text state that assemblies are to be designed so that moisture damage does not occur in them and that they cause no harm to building users. This regulation applies also to harmful mould growth within assemblies. There are two reasons for the lack of specific regulations on mould growth: studies on moisture performance have paid increasing attention to mould growth only in recent years, and it has been difficult to take mould growth into account in assembly design since suitable calculation models have not been available.

84
In summation, moisture condensation and mould growth on the interior surface of an assembly are generally considered unacceptable, but are allowed within an assembly unless they are detrimental. Yet, specific limit values have not been set except in Germany. That country has also set limits for the deformation of wood and wood-based materials. In general, assessment of what constitutes a detrimental level of condensation and mould growth has been left to the assembly designer.
2.1.3 Performance criteria and limit values chosen for the research
Based on the above account, it may be stated that the moisture condensing in an assembly (or moisture content of materials in the capillary range) and mould growth within it are the two most important criteria in analysing the moisture performance within a timber-framed wall assembly. Consequently, they have also been chosen as the performance criteria of this study. When considering the limit values for moisture condensation and mould growth in an external wall assembly, the starting point should be that these limit values can be met in practice. As mentioned earlier, general limit values cannot be set for the amount of condensed water and mould growth since the climatic conditions of countries vary too much. In southern countries mould growth is typically as bigger problem than condensation. In northern countries, again, the risk of condensation is clearly bigger, but mould growth also occurs in assemblies. The ability of various materials and assembly solutions to withstand condensation and mould growth may also differ significantly. Stone-based materials and structures often endure major moisture stresses without damage. In the case of timber-framed assemblies it is not sensible to allow significant condensation (or the moisture content of materials to reach the capillary range) and mould growth, if they can be avoided by proper design. On the other hand, indoor and outdoor air conditions unavoidably occur when moisture condenses within structures creating favourable conditions for mould growth. For example, if thin sheathing materials are used, moisture may condense on the interior surface of the sheathing even though there is a plastic vapour barrier behing the interior board. This is because moisture cannot exit the assembly quickly enough as temperature conditions change (Uvsløkk et al. 1999; Harderup 1999) (see Chs. 2.2.3 and 3.2.4). This phenomenon is at its strongest when thin sheathings with low thermal resistance and high water vapour resistance are used (see Fig. 6.7). Thus, it is not possible to set requirements for the performance of assemblies that allow no moisture condensation or mould growth at all within them. Experience also tells us that condensation periods of short duration do not normally increase the risk of moisture damage significantly.

85
The following is a compilation of the detrimental effects of interstitial condensation of moisture and high moisture content of materials on the moisture performance of a wall:
• Strength and stiffness of wood-based materials decrease and their structural deformations increase (e.g. swelling of sheathing and delamination of plywood) (Sherwood 1983; Burch & Thomas 1991; Tsongas & Olson 1995b; Hagentoft 1998).
• Deformations of sheathings facilitates formation of air channels through the sheathing layer which increase internal convection within the assembly as well as convection through it. Air flows, again, increase, for instance, the building’s energy consumption and moisture stresses on the assembly. (Nieminen 1987)
• The elasticity of thermal insulations decreases and blown thermal insulations settle and arch. Settling increases internal convection within the assembly which further increases condensation in the upper wall portion and heat losses through the wall (Nieminen 1987; Nieminen 1989b)
• The thermal conductivity of thermal insulations and the sheathing increase (Burch et al. 1989; Sandberg 1992; Langlais et al. 1994; Kumaran 1996; Rissanen & Viljanen 1998; Hansen et al. 2001; Valovirta & Vinha 2003; Valovirta & Vinha 2004; Vinha et al. 2005b).
• The corrosion risk of metal fasteners and parts of the assembly increases (Nieminen 1987; Rose & McCaa 1998; Salonvaara & Nieminen 1998b; Lawton 2004).
• Large variations in the moisture contents of materials loosen nails and separate wood cladding and structural components from each other (Burch & Thomas 1991; Garrahan et al. 1991).
• In winter, the water frozen on the interior surface of the sheathing forms a layer of ice which increases the water vapour resistance of the exterior wall lining. As a result, more moisture condenses in the assembly (Ojanen 1996; Thue et al. 1996).
• Condensed water may flow to the lower section of the assembly causing mould growth and rotting if the water cannot dry out of the assembly. The higher the water vapour resistance of the sheathing, the higher the risk of moisture flowing to the lower sections of an assembly (Uvsløkk et al. 1999).
Part of the above phenomena occur in the assembly in the hygroscpic range already before condensation starts, but condensation and rise of moisture content to the capillary range boost their impact (Nevander & Elmarsson 1994). Mould growth is particularly detrimental when it occurs on interior surfaces or structures in immediate contact with indoor air. Special attention has to be paid to prevention of mould growth there. Today the aim is to make the ventilation of residential buildings completely based on negative pressure, or balanced, so that during winter underpressure prevails in the lower wall section and overpressure in the upper section compared to outdoor air. Since it is

86
impossible to make a building completely airtight, all external walls have points where air flows through material layers from the outside in. Air flows through assemblies may carry mould particles, especially substances secreted by microbes (MVOCs), also from within an assembly into indoor air (Airaksinen 2003a). Consequently, there is good reason to limit mould growth also in the exterior section of the assembly to the extent possible. For the above reasons the limit values of the performance criteria of this research were selected according to the following basic principle: A timber-framed external wall assembly with a ventilation gap should be designed in the following way from the viewpoint of moisture condensation and mould growth: The temperature and relative humidity conditions of the exterior wall lining must not be more critical than those of the exterior wall lining of the most critical but still acceptable wall assembly (reference wall), where those conditions are caused solely by outdoor air conditions. In addition, the temperature and relative humidity conditions of the interior wall lining must not be more critical than those of indoor air. Here,exterior wall lining refers to the section between the interior and exterior surfaces of the sheathing(s), and the interior wall lining to the section between the interior surface of the interior board/interior finishing and the exterior surface of the air/vapour barrier. In the case of the section between these linings, the limit value of the performance criterion may be considered to change linearly between the limit values set for the exterior and interior wall linings (Fig. 2.1).
limit value ofexterior wall lining
limit value ofinterior wall lining
limit value ofexterior wall lining
limit value ofinterior wall lining
exterior wall lining exterior wall lining
interior wall lininginterior wall lining
Figure 2.1 Principle drawing of change in limit value of performance criterion set for an exterior wall
across the assembly.

87
This principle of selecting limit values can be used as a design guide for timber-framed external wall assemblies with a ventilation gap independent of the selected climatic conditions. The moisture condensation (or moisture content of materials in the capillary range) and mould growth criteria of an assembly are selected in accordance with the climatic conditions of the target country, and the temperature and moisture conditions within the wall assembly are analysed using the same calculation methods used to analyse the most critical but still acceptable wall assembly. If the temperature and relative humidity conditions are often conducive to condensation or mould growth in the most critical but still acceptable wall assembly, these phenomena are to be allowed to affect also the exterior lining of all other wall assemblies to the same extent. The limit values for moisture condensation and mould growth in timber-framed external wall assemblies under Finnish conditions were selected for this study on the basis of the above principles. The limit value for moisture condensation in the exterior wall lining is defined in Chapter 2.2.3. The used criterion for moisture condensation is the maximum continuous condensation time on the interior surface of the sheathing (or the moisture content of materials remaining continuously in the capillary range). The critical reference year was determined with the help of outdoor air saturation deficit. The limit value for condensation in the exterior wall section was selected so that the continuous condensation period does not exceed 34 days. No condensation is allowed in the interior wall section since the relative humidity of indoor air never reaches 100% RH. The limit value for mould growth on the exterior wall lining is set in Chapter 2.2.4. The mould growth risk of the assembly is examined in this study by the mould growth calculation model presented in Chapter 2.2.4 where mould growth is denoted by the mould index, M (Viitanen 1996; Hukka & Viitanen 1999; Viitanen et al. 2000). The limit values of the mould growth criterion have also been presented based on the mould index. The maximum value for the exterior wall section must not exceed 1.96, which corresponds to slight microscopically detectable mould growth on the exterior wall lining (see Table 2.1). No mould growth at all is allowed in the interior wall section since mould does not typically grow in indoor air conditions (see Ch. 6.3.7). Then the limit value for the mould index is 1. Figure 2.2 presents the performance criteria and limit values used in this study.

88
tmax = 34 days
MOISTURE CONDENSATION CRITERION
Mmax = 1.96
MOULD GROWTH CRITERION
+ +-
tmax = 0 days Mmax < 1.0
-
Figure 2.2 The limit values for moisture condensation (or moisture content of materials in the capillary
range) and mould growth criteria for various sections of the external wall assembly selected for the study.
The rate of moisture condensation can be examined on the basis of several variables. These include combined condensation periods during the winter, maximum continuous condensation time, combined condensed moisture amounts and maximum amount of condensed moisture. This study analyses the rate of condensation on the basis of maximum continuous condensation time primarily for the following reasons:
• Maximum continuous condensation time describes the performance of an assembly under continuous condensation stress. Continuous condensation stress is generally more critical for the performance of an assembly than more frequent condensation periods of shorter duration.
• Many HAM programs, such as the WUFI-2D used in this study, can calculate condensation time much more easily and quicker than the amount of condensed moisture. Calculation of the condensed moisture amount requires modelling material layers in thin slices on both sides of the condensing surface and combining moisture contents of all material layers in the capillary range.
• Wood-based sheathing materials swell up at high moisture contents which can significantly alter their moisture content, w (kg/m3). This may result in significant errors is calculating the maximum volume of condensed moisture.
• In reality, thin material layers reach their maximum moisture content at different times which makes it even more difficult to calculate the maximum amount of condensed moisture.
Generally speaking, as the maximum continuous condensation time increases, the maximum amount of condensed moisture also increases. These variables do not, however, change in direct proportion to each other, and their relationship also depends on the examined assembly.

89
Throughout the rest of this study only the term "moisture condensation criterion" will be used for simplicity as the performance criterion that limits both moisture condensation and the moisture content of different materials from reaching the capillary range.
2.2 Outdoor air conditions
2.2.1 Bases for selecting moisture reference years
Today the outdoor air conditions used in calculational analyses of assemblies generally consist of the climate data for a certain year. That year may be, for instance, an average year, a year of field testing, or a year used earlier for some other structural engineering analysis. For instance, the outdoor air conditions of the city of Jyväskylä in 1979 have been widely used in moisture performance studies in Finland. Those conditions were originally selected for energy consumption calculations (Tammelin & Erkiö 1987). Test years chosen on such a basis are not, however, always critical, for instance, when examining the risk of moisture condensation and mould growth in assemblies. The same problem is noticed in connection with field tests lasting only a few years. The test period is then generally too short for ascertaining the performance of the assemblies under all conditions. Yet, the schedule does not normally allow field testing of longer duration. For these reasons reliable examination of the moisture performance of assemblies requires outdoor air condition data covering a long period. A 30-year survey period is typically used in climatic studies and can, therefore, also be considered suitable for building physical examinations. The ISO 15927-1 (2003) standard and IEA Annex 24 report (Sanders 1996) also recommend a 30-year period for surveying outdoor air conditions. A moisture reference year (MRY) is selected from that period to represent the outdoor air conditions critical for the moisture performance of assemblies. However, there are no generally accepted guidelines for the selection criteria of critical conditions, so they must be established separately in each case. Different countries have used different methods for defining MRYs; the IEA Annex 24 report (Sanders 1996) contains some of them. Different conditional factors have been used in defining MRYs, and the resulting test years have been either calculated or actual years. The condition values of MRYs have varied from values measured hourly to monthly averages. MRYs have generally been selected with a view to examining condensation in assemblies. Not a single one of these definition methods has used mould growth as the performance criterion. As a rule, it is better to select an actual year as the MRY than to calculate a theoretical reference year based on conditions. Thereby we can be certain that the conditions in

90
question do occur in outdoor air. The conditions of the selected MRY must also be quite critical – clearly more critical than average conditions since no safety factors are used in building physical analyses. On the other hand, it is not necessary to select the most critical year for analyses since occasional exceedance of conditions does not cause severe problems in the performance of assemblies. An important consideration is also that the selection of the MRY should be based on the climate of the chosen region, not on the examined assembly (Djebbar et al. 2001). Sanders (1996), on the other hand, suggests a method proposed by Hens and Ali Mohamed for the selection of the durability reference year (DRY) where the degree of condensation is analysed using different types of assemblies. Geving (1997a) and Harderup (1998) have also suggested that the moisture reference year should be selected on the basis of the examined assembly. The IEA Annex 24 report (Sanders 1996) instructs that outdoor air temperature and moisture conditions should not exceed the conditions of the selected MRY more than once every ten years on average. This criterion is quite well justified based on the above considerations and means that only 10% of the years are more critical than the MRY (10% level MRY). The same performance criterion has also been used in other earlier studies (e.g. Geving 1997a; Salonvaara et al. 2001; TenWolde & Walker 2001; Lstiburek et al. 2002). It has also been used to define the MRYs for outdoor air in this research.
Orientation of examined wall assembly
External wall assemblies are affected by many conditional factors (driving rain, wind and solar radiation) whose impacts depend on the walls’ orientation. Especially in the case of brick cladding, the moisture from driving rain may penetrate into the ventilation gap (Lehtinen & Vijanen 1989; Nevander & Elmarsson 1994; Hens & Janssens 1999). The results of Chapter 4, on the other hand, indicate that the cladding, ventilation gap and sheathing of the assembly are capable of eliminating the impact of wind and driving rain on the inside of the assembly. Furthermore, conducted field tests show that air flow is capable of removing excess moisture from the ventilation gap if moisture cannot transfer by capillary action to the sheathing, for instance, through squeezed out mortar (see Ch. 4). Consequently, driving rain and wind did not have to be considered separately in the calculational analyses. Thus, the only conditional factor dependent on orientation of concern is the impact of solar radiation. The lowest possible amount of solar radiation constitutes the most critical alternative when evaluating the moisture condensation and mould growth risk of the assembly’s exterior lining. Thus, the most critical location for an assembly is the shaded northern wall of a building. The calculations and laboratory tests of the research are based on this alternative which means that the results can be applied to all wall assemblies of the building.

91
Often solar radiation and surface undercooling during clear nights are considered in the value of the equivalent outside temperature used in calculations. In this research, these factors are considered in the exterior surface resistance value (see Ch. 4.2.3). The value also takes into account the effect of long-wave radiation (see Eq. 1.10) and thermal properties of cladding. Since driving rain, wind, solar radiation and surface undercooling need not be considered separately in calculational analyses, the MRY can be selected solely on the basis of outdoor air temperature and RH values. This simplifies considerably the selection of the MRY and gives a higher degree of certainty that the selected MRY corresponds to the 10% critical level. It also allows selecting the same MRY based on only the climate of the chosen region for all wall assemblies. If the impact of other outdoor air factors had to be considered separately when selecting the MRY, it would be difficult to determine the 10% critical level MRY since different factors may be critical in different years (e.g. Geving 1997a; Harderup 1998). In other words, if a timber-framed external wall has no ventilation gap behind the cladding, selection of the MRY becomes much more complicated, and the method presented here would not as such be suited for assessing the moisture performance of wall assemblies of the type examined in this work.
Effect of several performance criteria
If several performance criteria are selected for moisture performance analyses of assemblies, as in this study, the selected MRY should be equally critical with respect to all selected performance criteria. Yet, in practice it is very difficult to find a single MRY that fully meets the 10% criticality limit with respect to all selected criteria. This is due the fact that critical conditions from the viewpoint of different performance criteria may occur in different years. Furthermore, if different levels of criticality are accepted for different performance criteria, the mutual weights of these criteria must be considered in the selection. In Finland, critical conditions for moisture condensation occur in years when wintertime temperatures are low and relative humidity high. Critical conditions for mould growth, again, occur during years when air temperature and relative humidity are high in autumn and late summer. Thus, separate MRYs for outdoor air have been selected for condensation and mould growth analyses. Calculational analyses based on MRYs can finally disclose the performance criterion and MRY that determine the acceptability of the moisture performance of an assembly in different cases (see Ch. 6.3). As mentioned in Chapters 1.7.3 and 1.7.4, it is also possible for moisture to reach a critical level on the exterior surface of the air/vapour barrier in summer, if the humidity by volume of outdoor air is high and/or the sheathing is moist and moisture starts to migrate inward. Therefore, a separate MRY was selected in Chapter 2.2.5 for examining this phenomenon.
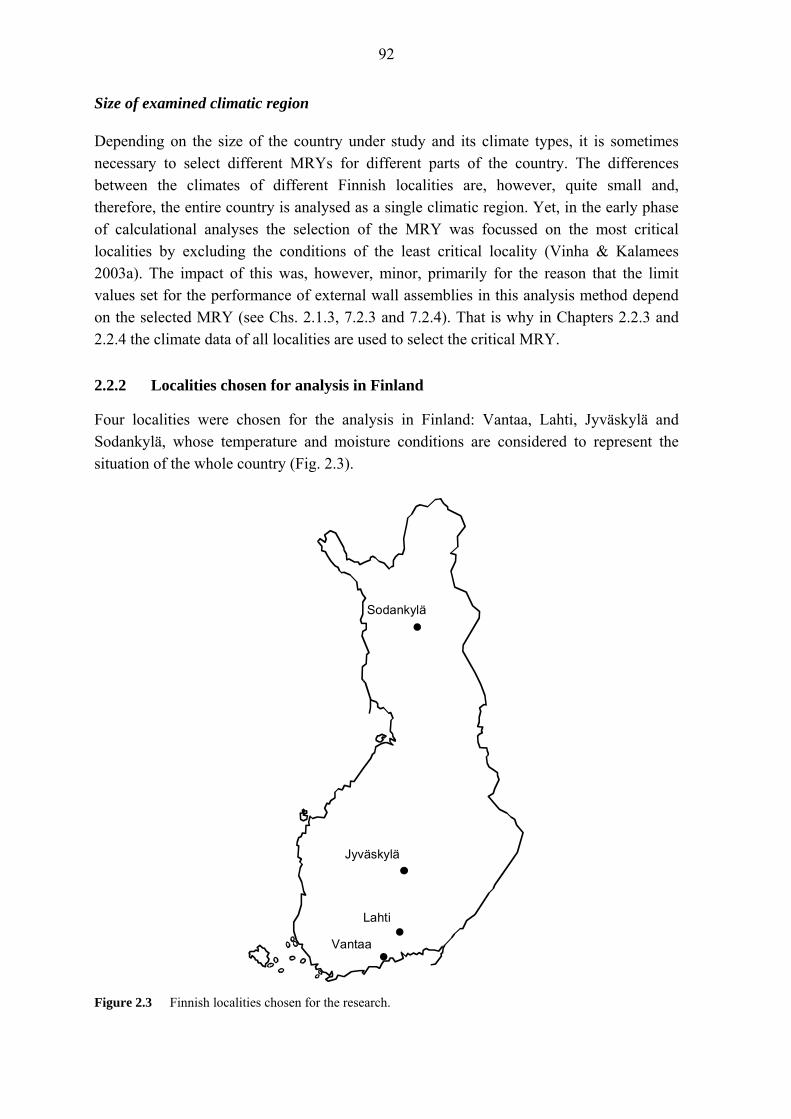
92
Size of examined climatic region
Depending on the size of the country under study and its climate types, it is sometimes necessary to select different MRYs for different parts of the country. The differences between the climates of different Finnish localities are, however, quite small and, therefore, the entire country is analysed as a single climatic region. Yet, in the early phase of calculational analyses the selection of the MRY was focussed on the most critical localities by excluding the conditions of the least critical locality (Vinha & Kalamees 2003a). The impact of this was, however, minor, primarily for the reason that the limit values set for the performance of external wall assemblies in this analysis method depend on the selected MRY (see Chs. 2.1.3, 7.2.3 and 7.2.4). That is why in Chapters 2.2.3 and 2.2.4 the climate data of all localities are used to select the critical MRY.
2.2.2 Localities chosen for analysis in Finland
Four localities were chosen for the analysis in Finland: Vantaa, Lahti, Jyväskylä and Sodankylä, whose temperature and moisture conditions are considered to represent the situation of the whole country (Fig. 2.3).
Sodankylä
Jyväskylä
Lahti
Vantaa
Figure 2.3 Finnish localities chosen for the research.
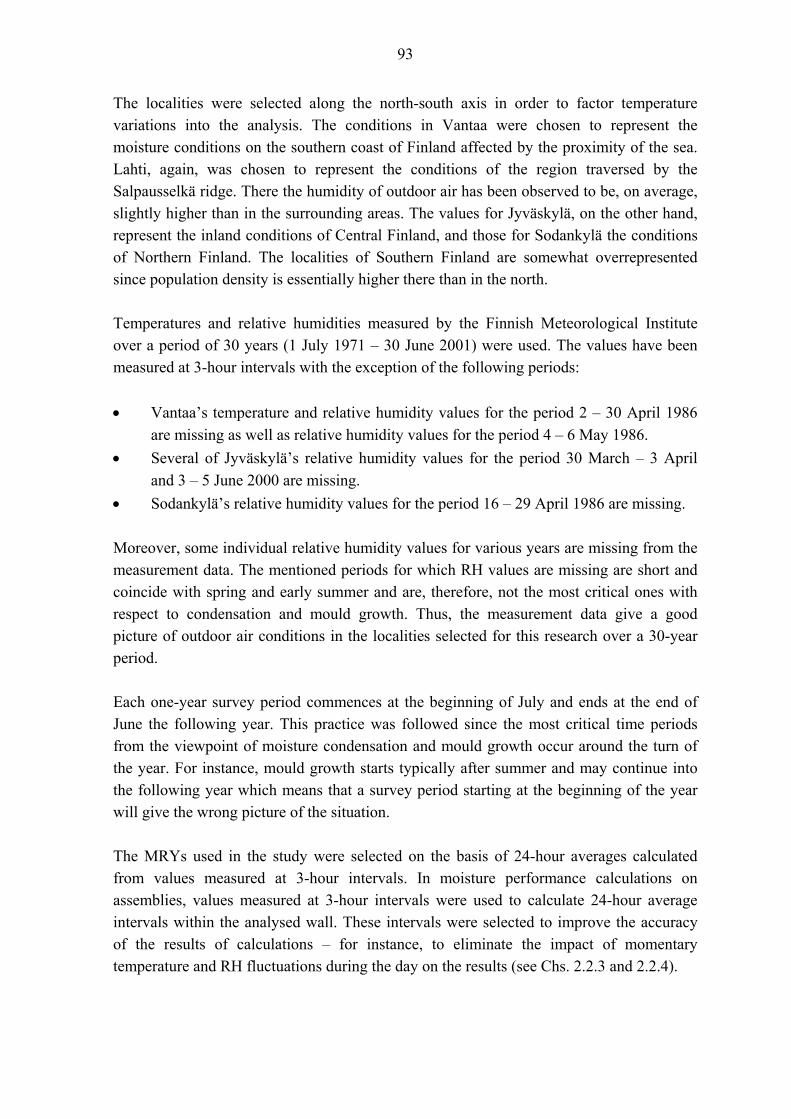
93
The localities were selected along the north-south axis in order to factor temperature variations into the analysis. The conditions in Vantaa were chosen to represent the moisture conditions on the southern coast of Finland affected by the proximity of the sea. Lahti, again, was chosen to represent the conditions of the region traversed by the Salpausselkä ridge. There the humidity of outdoor air has been observed to be, on average, slightly higher than in the surrounding areas. The values for Jyväskylä, on the other hand, represent the inland conditions of Central Finland, and those for Sodankylä the conditions of Northern Finland. The localities of Southern Finland are somewhat overrepresented since population density is essentially higher there than in the north. Temperatures and relative humidities measured by the Finnish Meteorological Institute over a period of 30 years (1 July 1971 – 30 June 2001) were used. The values have been measured at 3-hour intervals with the exception of the following periods: • Vantaa’s temperature and relative humidity values for the period 2 – 30 April 1986
are missing as well as relative humidity values for the period 4 – 6 May 1986. • Several of Jyväskylä’s relative humidity values for the period 30 March – 3 April
and 3 – 5 June 2000 are missing. • Sodankylä’s relative humidity values for the period 16 – 29 April 1986 are missing. Moreover, some individual relative humidity values for various years are missing from the measurement data. The mentioned periods for which RH values are missing are short and coincide with spring and early summer and are, therefore, not the most critical ones with respect to condensation and mould growth. Thus, the measurement data give a good picture of outdoor air conditions in the localities selected for this research over a 30-year period. Each one-year survey period commences at the beginning of July and ends at the end of June the following year. This practice was followed since the most critical time periods from the viewpoint of moisture condensation and mould growth occur around the turn of the year. For instance, mould growth starts typically after summer and may continue into the following year which means that a survey period starting at the beginning of the year will give the wrong picture of the situation. The MRYs used in the study were selected on the basis of 24-hour averages calculated from values measured at 3-hour intervals. In moisture performance calculations on assemblies, values measured at 3-hour intervals were used to calculate 24-hour average intervals within the analysed wall. These intervals were selected to improve the accuracy of the results of calculations – for instance, to eliminate the impact of momentary temperature and RH fluctuations during the day on the results (see Chs. 2.2.3 and 2.2.4).

94
2.2.3 Analysis of moisture condensation risk
Selection of MRY critical for condensation
The criticality of outdoor air conditions for the condensation risk of an assembly has typically be assessed by comparing the differences in the humidities by volume of outdoor air with the humidity by volume at saturation at the same temperature. The difference is called the saturation deficit. The smaller the difference between the humidity by volume of air and humidity by volume at saturation, the larger the risk of water condensating in the assembly. In other words, outdoor air saturation deficit indicates the magnitude of the potential of moisture drying out of the assembly and evaporating into outdoor air. In some recent studies this type of analysing methods have been used to select test years critical for the moisture performance of an assembly. The so-called Π-factor method was developed in Sweden for selecting test conditions. The Π-factor (kg/m3) is calculated by the same principle as saturation deficit (Harderup 1996; Harderup 1998). In Canada, the so-called moisture index, MI, is calculated for each year. The moisture index is arrived at by dividing the wetting index, WI, (defined as average annual rainfall, mm/year) by the drying index, DI (kg water/kg air-year). The drying index for the entire year is calculated by the same principle as the outdoor air saturation deficit (Cornick & Chown 2001; Cornick et al. 2002). The criticality of outdoor air for moisture condensation was determined also in this study by using saturation deficit values. The differences between various years were determined by examining saturation deficit values in the most critical season, that is, winter. Since winter falls around the turn of the year, each one-year survey period commenced at the beginning of July and ended at the end of June the following year. Outdoor air average saturation deficit, Δνdef (kg/m3), was calculated as follows: esatdef ννν −=Δ (2.1)
where
νsat is humidity by volume at saturation over liquid water at outdoor air temperature during a certain time period (kg/m3)
νe is humidity by volume of outdoor air over liquid water during a certain time period (kg/m3)
Because the relative humidity values of outdoor air have been measured over liquid water, the humidities by volume of the winter months have been calculated by Equations 1.26–1.28. Therefore, the actual saturation deficits may have been somewhat smaller than

95
calculated values since saturated humidity over water is difficult to attain in subzero temperatures. The criticality assessment began by selecting the three coldest winter months in Finland as the survey period of this research: December, January and February (Vinha & Kalamees 2003a). More detailed calculations did, however, show that average saturation deficit should be determined for a period approximately as long as the allowed continuous condensation time of the exterior wall lining. Otherwise, the true order of criticality of different years cannot be determined satisfactorily. Thus, minimum average saturation deficits for a month (30 days) were determined for different years by calculating moving averages at 3-hour intervals. Figure 2.4 shows these average saturation deficits calculated with Equation 2.1 over a 30-year period for the localities selected for the study.
0.0
0.1
0.2
0.3
0.4
0.5
0.6
1971
-72
1972
-73
1973
-74
1974
-75
1975
-76
1976
-77
1977
-78
1978
-79
1979
-80
1980
-81
1981
-82
1982
-83
1983
-84
1984
-85
1985
-86
1986
-87
1987
-88
1988
-89
1989
-90
1990
-91
1991
-92
1992
-93
1993
-94
1994
-95
1995
-96
1996
-97
1997
-98
1998
-99
1999
-200
0
2000
-200
1Year
Ave
rage
sat
urat
ion
defic
it of
one
mon
th,
Δν
def (
g/m
3 )
Vantaa Lahti Jyväskylä Sodankylä
0.164 g/m3
Figure 2.4 Outdoor air average saturation deficits, Δνdef, in four Finnish localities in 1971–2001. The
values represent minimum moving averages of one month (30 days). Calculation was started at the beginning of July each year and finished at the end of June the next year.
Figure 2.4 reveals that 1-month outdoor air minimum saturation deficits are largest in Vantaa on the southern coast of Finland and smallest in Sodankylä in northern Finland. Thus, the outdoor air conditions of Sodankylä in 1985–86 can be selected as the 10% level MRY, where saturation deficit was 0.164 g/m3 (13th lowest average saturation deficit in data covering 120 years). Figure 2.5 shows the changes in outdoor air saturation deficit in Sodankylä in 1985−86 by months. The figure indicates that saturation deficit values are much lower in winter months than in summer.

96
0
2
4
6
8
10
12
14
16
18
20
0 730 1460 2190 2920 3650 4380 5110 5840 6570 7300 8030 8760
Time (months)
Satu
ratio
n de
ficit,
Δν d
ef (g
/m3 )
1-month period when average saturation deficit reached its minimum value this year (Nov 28 -Dec 28)
Mar '86 Jun '86May '86Apr '86Jul '85 Aug '85 Sep '85 Oct '85 Nov '85 Dec '85 Feb '86Jan '86
Figure 2.5 Changes in outdoor air saturation deficit, Δνdef, in Sodankylä in the period 1 July 1985 – 30
June 1986. The allowed limit value of moisture condensation is to be determined on the basis of the most critical wall assembly (reference wall) accepted with respect to condensation. The laboratory tests on wall assemblies showed that an assembly is the more critical for condensation, the lower the thermal resistance of the sheathing (see Ch. 3.2.4). Thus, it is appropriate to use as the reference wall an assembly whose sheathing consists of a thin membrane. The acceptability of the moisture performance of a wall assembly can then be evaluated merely on the basis of the water vapour resistance of the sheathing As the water vapour resistance of the weatherisation membrane increases, the condensation risk of the assembly increases. Thus, the most critical assembly is the one with a weatherisation membrane of the maximum allowed water vapour resistance. When determining maximum water vapour resistance, one should monitor the increase in condensation time or the amount of condensed moisture as water vapour resistance increases. Figure 2.6 depicts a wall assembly used to examine the impact of the water vapour resistance of the weatherisation membrane on the length of continuous condensation time.

97
Weatherisation membrane 1 mm
Thermal insulation 200 mm +Wooden studs 200×50 mm, c/c 600 mm (C13)
Plastic vapour barrier (C11)
Gypsum board 13 mm (C1)
+-
1) Glass wool (D1)2) Cellulose insulation (D4)
Figure 2.6 Example wall assemblies for analysing moisture condensation risk on interior surface of
sheathing. The interior surface of the wall incorporated a plastic vapour barrier, meaning that moisture condensed onto the interior surface of the weatherisation membrane merely as a result of outdoor air conditions as stated in Chapter 2.1.3. The thermal insulations in the analysis were cellulose insulation and glass wool to allow comparison of the impact of hygroscopic and non-hygroscopic insulation on condensation time. The material properties are presented in Appendix 3. The properties of the weatherisation membrane used in the calculations were the following: ρ0 = 360 kg/m3, cp = 1500 J/(kg⋅K), porosity = 0.6, λ = 0.2 W/(m⋅K), w = 0 kg/m3 and Dw,liq = 0 m2/s. The used outdoor air conditions were the temperature and moisture conditions of the MRY selected earlier. The WUFI-2D program, used for all other calculations of this research, was also used in this calculational analysis. The improved calculation accuracy of the WUFI-2D program was made use of in the calculations in order to define the condensation times of the reference structure as precisely as possible. The properties of the program are described in more detail in Chapter 5. Figure 2.7 shows maximum continuous condensation time, tmax, as a function of the water vapour resistance of the weatherisation membrane. It shows that as water vapour resistance exceeds 4 ×10³ s/m, condensation time starts to increase sharply in a cellulose-insulated assembly. As water vapour resistance exceeds 9 ×10³ s/m, the same phenomenon occurs also in a glass wool-insulated assembly. As the water vapour resistance of the sheathing increases further, condensation time increases at a slower rate. The water vapour resistance of the sheathing is then so high that continuous condensation time can no longer be considered a reliable indicator of the moisture performance of an assembly. Neither is the water vapour resistance ratio between the interior and exterior surface of the wall a relevant criterion for evaluating it.

98
020406080
100120140160180200220240
0 5 10 15 20 25 30 35 40 45 50 55 60 65 70 75 80 85 90 95 100
Water vapour resistance of weatherisation membrane, Zν ×103 (s/m)
Max
imum
con
tinuo
us c
onde
nsat
ion
time,
t m
ax (d
ays)
Glass wool + membraneCellulose insulation + membrane
Area analysed in this research
34 days
Figure 2.7 Maximum continuous condensation time, tmax, on interior surface of weatherisation membrane
as a function of water vapour resistance of weatherisation membrane. The temperature and RH conditions of the MRY for moisture condensation were used as outdoor air conditions (Sodankylä 1 July 1985 – 30 June 1986).
The acceptable maximum value of the water vapour resistance of the weatherisation membrane is to be selected from the range where maximum continuous condensation time starts to rise sharply. The cellulose-insulated structure in Figure 2.7 is the more critical one. This is understandable since in humid and warm weather cellulose insulation stores more moisture which does not have time to exit the structure as temperature suddenly drops. Therefore, the maximum value of the water vapour resistance of the weatherisation membrane should be selected on the basis of the performance of this structure. An even more critical structure, in principle, is one with a thermal insulation more hygroscopic than cellulose. Sawdust and chipping are such insulations, but they are not used with membranous sheathings – and less in general. Thus, there are good grounds for using a more traditional hygroscopic insulation in the reference assembly. The maximum water vapour pressure of sheathing selected on the basis of Figure 2.7 was 5 ×10³ s/m which makes the maximum continuous condensation time 34 days. This is a good value also in that it also corresponds to the 1-month period for determining average saturation deficit which was the selection criterion for establishing the order of criticality of different years. The maximum amount of condensed moisture accumulating during the 34-day condensation period was analysed by more accurate calculations. The results indicate that a condensation period of 34 days corresponds to the typical maximum amount of condensed moisture of 50–150 g/m2. These values are clearly lower than the limit values of the German DIN 4108-3 (1981) standard of 1000 g/m2 for capillary building materials and 500 g/m2 for non-capillary building materials (see Ch. 2.1.2). This seems to indicate that the calculated limit value need not been tightened. The result means that a 34-day continuous

99
condensation time should be accepted for all external wall assemblies in Finnish climatic conditions.
Validity of selected MRY
The feasibility of the described MRY selection method was studied in the following example calculation. The analysed wall assemblies and used materials were the ones presented earlier in Figure 2.6. The analysis concentrated on the length of the maximum continuous condensation time for the interior surface of the sheathing in the climatic conditions of the 24 most critical years in Finland (see Fig. 2.4). Indoor air temperature was set at a constant 21°C and the excess moisture value used in winter conditions was 4 g/m3. Excess moisture was varied as a function of outdoor air temperature according to Figure 2.24. However, indoor air humidity by volume was inconsequential in the calculations since the interior surface of the assembly always incorporated a plastic vapour barrier. Temperature and RH conditions were calculated with the WUFI-2D program. The same principles were followed and the same calculation model was used in the calculations as in the calculational analyses to be presented later in Chapter 6. The improved calculation accuracy of the WUFI-2D program was also made use of. Figure 2.8 shows the maximum continuous condensation time for the interior surface of the sheathing in various years.
0
5
10
15
20
25
30
35
40
45
50
Jyvä
skyl
ä 97
-98
Jyvä
skyl
ä 96
-97
Sod
anky
lä 8
4-85
Sod
anky
lä 8
6-87
Sod
anky
lä 8
1-82
Sod
anky
lä 8
9-90
Jyvä
skyl
ä 95
-96
Sod
anky
lä 7
8-79
Sod
anky
lä 7
5-76
Laht
i 95-
96
Laht
i 85-
86
Sod
anky
lä 9
8-99
Sod
anky
lä 8
5-86
Jyvä
skyl
ä 78
-79
Jyvä
skyl
ä 75
-76
Sod
anky
lä 7
9-80
Jyvä
skyl
ä 90
-91
Sod
anky
lä 9
0-91
Sod
anky
lä 7
1-72
Sod
anky
lä 7
7-78
Van
taa
85-8
6
Van
taa
86-8
7
Laht
i 73-
74
Van
taa
95-9
6
Max
imum
con
tinuo
us c
onde
nsat
ion
time,
t max
(day
s)
0.00
0.02
0.04
0.06
0.08
0.10
0.12
0.14
0.16
0.18
0.20
Satu
ratio
n de
ficit
of o
ne m
onth
in o
utdo
or a
ir,Δ
ν def
(g/m
3 )
t_max, Glass wool t_max, Cellulose insulation Δν_def, Outdoor air
tmax = 34 days
tmax, Cellulose insulationtmax, Glass wool Δνdef, Outdoor air Figure 2.8 Maximum continuous condensation times, tmax, on interior surface of weatherisation membrane
(Zν = 5 ×10³ s/m) in the outdoor air conditions of the 24 most critical years for condensation selected on the basis of the minimum average saturation deficit of one month in each year.

100
Figure 2.8 shows that as outdoor air minimum average saturation deficit decreases, the maximum continuous condensation time of the assembly generally increases in the case of a cellulose-insulated wall. The only notable exceptions were Sodankylä in 1989–90 and Vantaa in 1986–87. The differences in the results can be partly explained by the fact that in some instances a longer continuous condensation period may have been interrupted by a period of a few days favourable for drying. Calculation accuracy also affects results when a material’s moisture content is close to the upper limit of the hygroscopic range. Condensation times varied more in the wall with glass wool insulation. That was caused by the low moisture capacity of glass wool, which allows changes in temperature and relative humidity to dry out the interface between the thermal insulation and weatherisation membrane much quicker than with a cellulose-insulated wall. Consequently, there is good reason to compare the criticality of different years to the results of calculations on the cellulose-insulated wall. It must also be noted that the order of criticality of different years may change if the examined structure changes – there may be differences in the thermal insulation capacity and moisture capacity of the sheathing. Sheathing and hygroscopic thermal insulation materials slow down changes in the relative humidity of the pore air on the interior surface of the sheathing which means that changes in outdoor air conditions have a slightly delayed impact within the assembly. Yet, selection of the MRY solely on the basis of outdoor air conditions was preferred to allow analysing different assemblies on the basis of the same MRY. On the other hand, finding just the right critical year is not necessary for the analysis method of this study since the limit values selected for the moisture performance of assemblies are determined by the selected MRY. For instance, if the selected year is highly critical for condensation, the maximum continuous condensation time of the reference wall also increases which is why other wall assemblies are also allowed condensation times of equal length. Respectively, selection of a less critical year decreases the continuous condensation time of the reference wall thereby also tightening the limit value for other wall assemblies. On the basis of the above facts and Figure 2.8, it can be stated that the used MRY selection method is accurate enough for picking a year that is critical for the condensation of a wall assembly for calculational analysis. Thus, the 1985–86 outdoor conditions in Sodankylä can be selected to represent the critical MRY for moisture condensation in this study.

101
2.2.4 Analysis of mould growth risk
This study analysed the mould growth risk of an exterior wall assembly using an analysis model (Hukka & Viitanen 1999) developed on the basis of research conducted by Viitanen (1996). The model includes mathematical equations for calculating mould growth values, while it also takes into account the delay in mould growth under dry conditions. The model was built on the basis of mould growth laboratory tests on pine and spruce test specimens. The model has been used in several earlier studies on mould growth in assemblies (Ojanen 1998; Salonvaara et al. 1998c; Desjarlais et al. 2001; Kurnitski 2000; Kurnitski et al. 2001; Karagiozis & Salonvaara 2001; Ojanen et al. 2002b; Matilainen & Kurnitski 2003a; Matilainen et al. 2003b). The shortcomings and limitations of the calculation model are dealt with in more detail in Chapter 7.2.4.
The mould growth model
The test material of Viitanen’s mould growth studies consisted of small samples (7×15×50 mm) of pure kiln dried pine and spruce sapwood. The experimental data behind the model covered temperatures between 5 and 40°C and relative humidities between 75 and 100% RH. The tests were conducted in both constant and fluctuating humidity conditions. The exposure time in constant conditions was at least 12 weeks while in fluctuating conditions it varied between 6 and 24 weeks (Hukka & Viitanen 1999). The calculation model presented by Hukka & Viitanen (1999) used the mould index, M, which could vary between 0 and 6, to represent mould growth (Table 2.1). Mould growth initiated when the mould index exceeded 1. Mould index values were defined on the basis of visual observation of mould growth on the surfaces of pine and spruce test specimens (Viitanen 1996). Table 2.1 Mould index, M, for the experiments and modelling. (Viitanen et al. 2000)
Index Growth rate
0 No growth Spores not activated
1 Some growth detectable only by microscopy Initial stages of hyphae growth
2 Moderate growth detectable by microscopy Coverage more than 10% (microscopy)
3 Some growth detected visually New spores produced
4 Clear visually detected growth Coverage more than 10% (visually)
5 Plenty of visually detected growth Coverage more than 50% (visually)
6 Very heavy and tight growth Coverage around 100% (visually)

102
Experiments have suggested that the temperature and relative humidity conditions conducive to initiation of mould growth on wooden material can be expressed as a mathematical function (Eq. 2.2) The favourable temperature range is 0 to 50°C, and the critical relative humidity, ϕcrit (% RH), required for initiation of mould growth is a function of temperature, θ (°C) (Fig. 2.9). (Hukka & Viitanen 1999)
⎩⎨⎧
°>°≤+−+−
=CwhenCwhen
crit 2080200.10013.3160.000267.0 23
θθθθθ
ϕ (2.2)
-10 0 10 20 30 40 50 60
100
95
90
85
80
75R
H (%
)
Temperature (°C)
Col
d
Hot
Figure 2.9 Conditions favourable to initiation of mould growth on wooden material as a mathematical
model. (Hukka & Viitanen 1999) The final mould coverage on a surface is dependent on temperature and humidity conditions, suggesting that a certain limiting value exists above which the mould index does not rise irrespective of length of exposure in basically favourable conditions (Fig. 2.10). Experiments have suggested that the largest possible value of the mould index, Mmax (–), assumes a parabolic equation (Hukka & Viitanen 1999):
2max )
100(2
10071
−−
−−−
+=crit
crit
crit
critMϕ
ϕϕϕ
ϕϕ (2.3)

103
100
95
90
85
80
75
RH
(%)
0 2 4 6 8 10 12 14 16 18 20Temperature (°C)
M=5
M=4
M=3
M=2M=1
Figure 2.10 Temperature dependent critical relative humidity needed for mould growth at different values
of mould index. (Hukka & Viitanen 1999) If the mould index, M, is presumed to increase linearly over time, and time, t, is measured in days, the following equation may be written for calculating the mould growth index (Hukka & Viitanen 1999):
21)02.6633.014.0ln9.13ln68.0exp(71 kk
SQWdtdM
+−+−−=
ϕθ (2.4)
where W is type of wood (0 = pine, 1 = spruce)
SQ is quality of surface (0 = re-sawn after drying, 1 = original) k1, k2 are correction coefficients
The growth rate of mould fungi is defined by the correction coefficient, k1 (Eq. 2.5). In the early stages of mycelium growth (M < 1, start of growth), growth is slower than during the later stages (M > 1). The upper limit for mould growth, which is possible to achieve in certain temperature and humidity conditions, is taken into account by the correction coefficient, k2 (Eq. 2.6). This coefficient defines the retardation of growth in the later stages. (Viitanen et al. 2000)
⎪⎩
⎪⎨⎧
>−
≤= 1
1/2
11
mv
1 Mwhentt
Mwhenk (2.5)
)(3.2exp1 max2 MMk −−= (2.6)
where tv is the predicted response time (weeks) for growth of mould fungi (M = 3)
tm is the predicted response time (weeks) for growth of mould fungi (M = 1)

104
tv and tm can be calculated from regression Equations 2.7 and 2.8 (Hukka & Viitanen 1999): )02.6633.014.0ln9.13ln68.0exp(m +−+−−= SQWt ϕθ (2.7)
)50.6106.0ln72.12ln74.0exp(v ++−−= Wt ϕθ (2.8)
A mathematical expression for the delay of mould growth when conditions become unfavourable (RH drops below the critical RH) can be written based on the time that has passed from the beginning of the dry period (t – t1) (Eq. 2.9). The visual appearance of the surface does not necessarily change during the dry periods, but a finite delay in growth after the dry period can be clearly observed. (Hukka & Viitanen 1999)
⎪⎩
⎪⎨
⎧
>−−≤−≤
≤−−=
httwhenhtthwhen
httwhen
dtdM
24016.02460
6032.0
1
1
1
(2.9)
The experimental data behind this equation cover dry periods between 6 h and 14 days, but the functional form of Equation 2.9 is based only on a small number of experiments, and cannot thus be considered the best possible. Knowledge about the influence of longer dry periods on mould growth is very limited as are data on conditions below 0°C. In the absence of better information, Equation 2.9 may be applied also to such situations, although the validity of such application is questionable. (Hukka & Viitanen 1999) Due to the many factors of uncertainty related to the model in volatile conditions, the calculated mould index values should be regarded as representing the possible activity of mould fungi on a wood surface (Viitanen & Salonvaara 2001). The laboratory tests on which the calculation model is based have not examined mould growth at temperatures below 0°C (Viitanen 1996), but experience tells that no significant mould growth occurs in subzero temperatures. On the other hand, sufficient data on the retardation of mould growth in cold temperatures is not available. Consequently, it has been assumed for the the purposes of the calculational analyses of this study that mould index, M, stays constant while temperature remains below zero, which means that no mould growth or retardation occurs in the assembly. In this study the mould index values for different years were always calculated over a one-year period commencing at the beginning of July and ending at the end of June the next year (the same way as in the condensation surveys). This was done since the value of the mould index typically starts to rise after summer in Finnish conditions. In the calculations

105
the mould index value always started from 0 in July, which made the values of different years mutually comparable. Calculations on the development of the mould index in different types of wall assemblies revealed that, in many instances, the index reaches its maximum value only in spring (see Fig. 6.3). However, a maximum mould index determined in spring is unreliable since the analysis also covers the long winter period. Thus, the maximum mould indices were determined prior to the beginning of the continuous period of subzero temperature when outdoor air temperature remains above 0°C most of the time. On these grounds 1 July – 31 June was chosen as the maximum mould index value survey period in each year (see Fig. 6.3). Thereby the analysis covers also autumn conditions which are the most critical for mould growth, and for which the calculation model produces the most reliable results. The calculation model did not account for the possible combined effect of the mould indices of several consecutive years since sufficiently reliable examination of that was not available due to the uncertainty of calculations concerning the winter and spring periods. In annual calculations, the mould index did not always return to 0 at the end as in the case of the year selected as the MRY (see Fig. 2.11). Thus, combined effect of mould indices is possible, at least in principle, when many bad years occur consecutively. In principle, it is also possible for the combined effect of certain type of mould growth to occur also when consecutive years are not conducive to mould growth. This is due the fact that the mycelium growth occurring after a favourable year does not completely disappear from the surface of a material (Hukka & Viitanen 1999). Thus, the total amount of mycelium may increase during each favourable year whereby the amount of mould growth in a very favourable year is larger than if the material surfaces had been clean at the start of the year in question. This is also one reason for limiting mould growth as much as possible (see Ch. 2.1.3).
Effect of calculation interval on the mould index value
When the mould index value is calculated under changing conditions, its value depends also on how often it is calculated. In fluctuating conditions the mould index is the larger the shorter the calculation interval. This is due the fact that under fluctuating conditions the mould index rises faster than it falls. Figure 2.11 presents the development of the mould index on the surface of regular pine sawn goods in the outdoor air conditions of Lahti in 2000−01 based on averages calculated at 24-hour intervals (MRY critical for mould growth was selected for the analysis, see Fig. 2.16). The figure also includes mould index values based on 3-, 6- and 12-hour calculation intervals for comparison. In the tests underlying the calculation model, temperature and

106
RH conditions were altered at intervals no shorter than 6 hours (Viitanen 1996). Thus, 6 hours can be considered the minimum calculation interval.
0
1
2
3
4
5
6
0 730 1460 2190 2920 3650 4380 5110 5840 6570 7300 8030 8760
Time (months)
Mou
ld in
dex,
M (-
)
Interval 24 h
Interval 12 h
Interval 6 h
Interval 3 h
Jun '01May '01Apr '01Mar '01Feb '01Jan '01Dec '00Nov '00Oct '00Sep '00Aug '00Jul '00
Figure 2.11 Changes in the mould index, M, on the surface of regular pine sawn goods in the outdoor
conditions of Lahti during the period 1 July 2000 – 30 June 2001. Depicted is the change in the mould index based on average outdoor air temperature and RH values calculated at 3-, 6-, 12- and 24-hour intervals.
Figure 2.11 shows that the mould index starts to rise at the beginning of October and increases rapidly till mid-December. Here the index reached its maximum value before the year end – as nearly every year. Figure 2.11 also clearly indicates the impact of the calculation interval on the mould index. Mould index values calculated on the basis of shorter intervals are clearly larger, and especially those calculated in spring are unrealistically high. Mould growth calculated on the basis of shorter intervals would thus be a process of heavy annual accumulation if critical years follow one another. This is largely due to the basic assumption of the analysis according to which the mould index does not change as long as temperature remains under 0°C. The figure shows plainly why a mould index value calculated on the basis of shorter than 24-hour intervals is unreliable. The calculation interval may have to be made even longer than 24 hours to make mould growth correspond to the actual situation. In summation, the mould index calculation interval selected for this study was 24 hours to allow eliminating the impact of momentary changes during a day. This increases the accuracy of mould index calculation.

107
Effects of wood species and surface conditions on the mould index value
Mould growth tests indicated that mould growth is different on pine and spruce – pine test specimens moulded faster than spruce specimens (Viitanen 1996). The surface quality of the test specimen also affected mould growth – an original surface directly from the kiln moulded faster than a re-sawn one (Viitanen 1996). This is why the mould growth model provides different calculation options depending on the analysed wood species and surface type (see Eq. 2.4). In actual construction the surface of sawn goods may be considered to correspond to the original surface and that of planed or dimensioned lumber to the re-sawn surface. Figure 2.12 shows the development of the mould index on the surfaces of pine and spruce sawn goods in the 2000−01 outdoor air conditions of Lahti based on averages calculated at 24-hour intervals. The differences in mould growth between an original surface from the kiln and a re-sawn surface are also examined. The figure indicates that wood species and surface quality also affect the magnitude of the mould index. Hardwoods, such as birch and aspen, have been found to be more susceptible to mould growth, on average, than pine and spruce (Kokko et al. 1999; Pasanen et al. 2001). Those species are, however, not used in wall and roof assemblies in Finland. The MRY selected for the analysis was determined on the basis of values for the original surface of pine sawn goods after drying.
0
1
2
3
4
5
6
0.1. 28.12. 26.12. 23.12. 21.12. 18.12. 16.12. 13.12. 11.12. 8.12. 6.12. 3.12. 1.12.
Time (months)
Mou
ld in
dex,
M (-
)
Pine, original surface
Pine, re-sawn surface
Spruce, original surface
Spruce, re-sawn surface
Jun '01May '01Apr '01Mar '01Feb '01Jan '01Dec '00Nov '00Oct '00Sep '00Aug '00Jul '00
Figure 2.12 Changes in mould index, M, on the surface of sawn pine and spruce goods in the outdoor air
conditions of Lahti in the period 1 July 2000 – 30 June 2001. The figure also shows the impact of different surfaces on the magnitude of the mould index. The analysis used 24-hour averages of temperature and RH values measured from outdoor air.

108
In this study the value assigned to factor W of Equation 2.4 was 0 (pine) while the value assigned to factor SQ was 1 (original surface directly from the kiln), since this option provides the most critical mould index value for the calculations. A timber-frame of regular sawn pine also remains a widely used alternative although use of planed and dimensioned sawn lumber has increased in timber-framed external wall assemblies in Finland.
Correlation between calculated mould index and field test results
Mould growth on the wood surfaces of buildings bounded by outdoor air has also been examined in a field study involving nine subjects (Kokko et al. 1999). The mould index values of samples taken from the subjects (29 pcs) were determined in a laboratory using the same criteria as in Table 2.1. According to the study, the value of the mould index in the examined samples varied between 0 and 3. Higher mould index values were measured in some areas where rain water had probably remained for a longer period (e.g. interior surfaces of window architraves) as well as in the attic due a construction defect. Thus, the results of field tests corroborate the results of calculations shown in Figure 2.16. Yet, it must be kept in mind that the number of examined subjects and samples was relatively small. Pasanen et al. (2001) studied mould growth on pieces of spruce in the temperature and moisture conditions of the crawl space and compared it with the mould index values calculated by the mould growth model. Pieces of spruce measuring 40×40×5 cm were placed in the crawl spaces of three houses. The pieces were attached to plywood and sterilised at 85°C overnight, after which they were inoculated with three different mould species. Uninoculated samples were used as negative controls. Two sets of samples were prepared for each crawl space and put in place on 23 May 2000. The first set was removed for analyses after two months and the other set was analysed after four months’ exposure. To avoid external fungal contamination and water sources, the samples were suspended in air to ensure transfer water only from the air during the test period. The fungal spore counts of samples were determined by microbial analysis. Although they were high, no visible growth was observed on the surface of the spruce samples. However, some spots of visible growth could be observed on the back of the pieces of plywood made of birch. The mould indices calculated on the basis of temperature and RH values of crawl spaces were between 1 and 2 which is also interpreted as non-visible growth. Therefore, the mould index can be used as a tool in the estimation of the risk for mould growth if temperature and moisture conditions are measured over sufficiently long periods. (Pasanen et al. 2001)

109
Mould growth on other materials
Ritschkoff et al. (2000) also studied mould growth on other materials according to the mould index classification of Table 2.1 (Figs. 2.13 and 2.14). Figure 2.15, again, shows the rise in mould indices on the surface of pine sawn goods, taken from the kiln, under the same conditions.
6
5
4
3
2
1
0
Mou
ld in
dex
(0-5
)
0 4 8 12 16 20 24 28 32
A
Time (week)
plywoodcement screed
fibre boardconcrete
particle boardgypsum
6
5
4
3
2
1
0
Mou
ld in
dex
(0-5
)
0 4 8 12 16 20 24 28 32
Time (week)
B
6
5
4
3
2
1
0
Mou
ld in
dex
(0-5
)
0 4 8 12 16 20 24 28 32
Time (week)
6
5
4
3
2
1
0
Mou
ld in
dex
(0-5
)
0 4 8 12 16 20 24 28 32
Time (week)
C D
Figure 2.13 Susceptibility of wood- and stone-based building materials to mould contamination at constant
humidity and temperature conditions. A = 90% RH, 15°C, B = 90% RH, 23°C, C = 97% RH, 15°C, D = 97% RH, 23°C. (Ritschkoff et al. 2000)
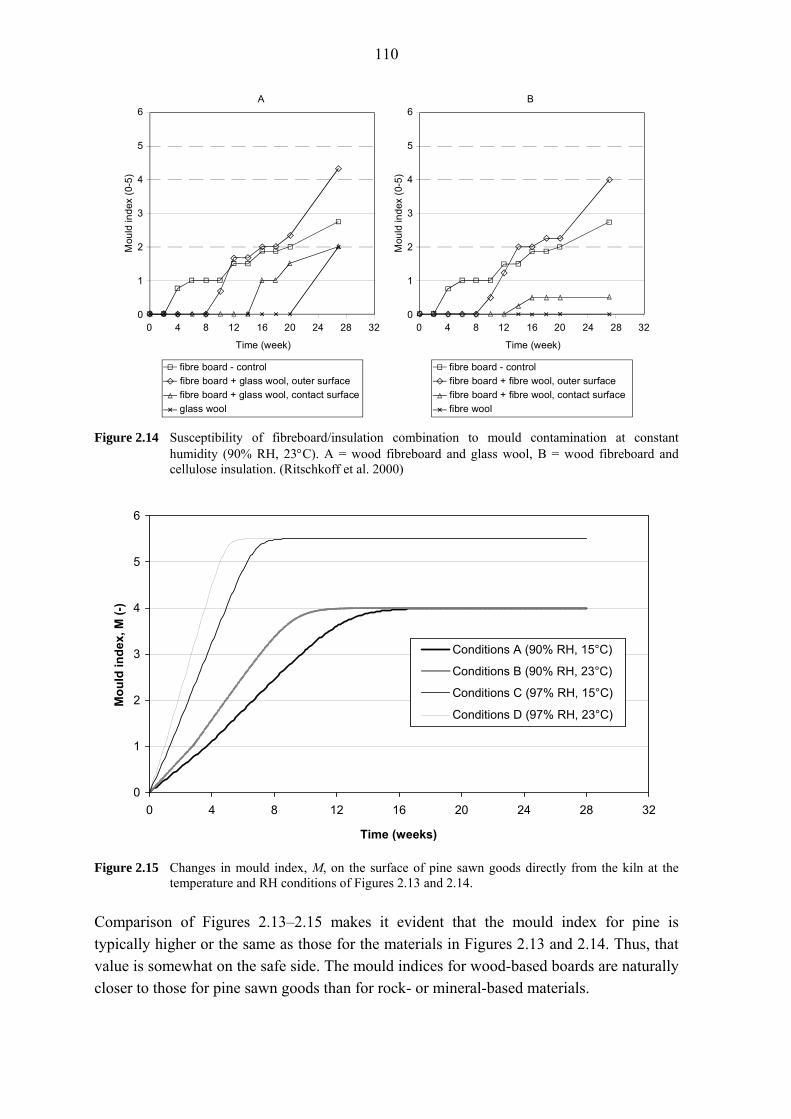
110
6
5
4
3
2
1
0
Mou
ld in
dex
(0-5
)
0 4 8 12 16 20 24 28 32
A
Time (week)
6
5
4
3
2
1
0
Mou
ld in
dex
(0-5
)
0 4 8 12 16 20 24 28 32
Time (week)
B
fibre board + glass wool, contact surfacefibre board + glass wool, outer surfacefibre board - control
glass woolfibre board + fibre wool, contact surfacefibre board + fibre wool, outer surfacefibre board - control
fibre wool Figure 2.14 Susceptibility of fibreboard/insulation combination to mould contamination at constant
humidity (90% RH, 23°C). A = wood fibreboard and glass wool, B = wood fibreboard and cellulose insulation. (Ritschkoff et al. 2000)
0
1
2
3
4
5
6
0 4 8 12 16 20 24 28 32
Time (weeks)
Mou
ld in
dex,
M (-
)
Conditions A (90% RH, 15°C)
Conditions B (90% RH, 23°C)
Conditions C (97% RH, 15°C)
Conditions D (97% RH, 23°C)
Figure 2.15 Changes in mould index, M, on the surface of pine sawn goods directly from the kiln at the
temperature and RH conditions of Figures 2.13 and 2.14. Comparison of Figures 2.13–2.15 makes it evident that the mould index for pine is typically higher or the same as those for the materials in Figures 2.13 and 2.14. Thus, that value is somewhat on the safe side. The mould indices for wood-based boards are naturally closer to those for pine sawn goods than for rock- or mineral-based materials.
111
Timber-framed wall assemblies typically contain different wood-based boards, insulations and membranes which means that the mould index for pine sawn goods selected as the performance criterion does represent reasonably well also the performance of the other materials. On the other hand, comparisons were made only in standard conditions and the laboratory, which means that further information about performance in real-life situations is needed. Often there is also organic dust and dirt on the interfaces between materials n actual assemblies which may increase mould growth. In such instances, the mould growth criterion set for wood may be quite accurate also for inorganic materials (e.g. mineral wools). Based on Figures 2.13–2.15 the development of the mould index on the surface of pine sawn goods may also be used to estimate the mould growth in timber-framed external wall assemblies. Viitanen is convinced that his model is also suited for analysing mould growth on other wood-based materials (Viitanen & Salonvaara 2001). Figure 2.14 also shows how the anti-mould agent of cellulose insulation retards mould growth in the insulation as well as on the adjoining surfaces at high RH values. The impact of anti-mould agents on the mould growth in an assembly is not, however, considered in this research since assemblies typically include areas unaffected by anti-mould agents, and, on the other hand, sufficient data on the properties and long-term protection effectiveness of different anti-mould agents do not exist. Yet, the anti-mould agents contained by thermal insulations constitute an additional safety factor for ensuring the moisture performance of an assembly under conditions conducive to mould growth (see Ch. 7.2.5).
Selection of critical MRY for mould growth
Outdoor air conditions in the ventilation gap of the northern wall of a building are quite similar to the conditions outdoors (see Figs. 4.17–4.20) which means that mould growth on the surfaces of the ventilation gap can be assessed directly on the basis of outdoor air conditions. Since the ventilation gap is part of the exterior lining of the wall assembly, the mould growth risk on the interior surface of the sheathing must not exceed that of outdoor air either. Thus, the limit value for mould growth can be determined with the help of outdoor air temperature and moisture conditions. Figure 2.16 presents the maximum mould index values, Mmax, for the surface of regular pine sawn goods (most critical surface and wood species alternative, see Fig. 2.12) in the outdoor air conditions of the localities selected for study over a period of 30 years. The mould index calculation interval was 24 hours in order to be able to eliminate the impact of momentary changes during a day (see Fig. 2.11).

112
0
1
2
3
4
5
6
1971
-72
1972
-73
1973
-74
1974
-75
1975
-76
1976
-77
1977
-78
1978
-79
1979
-80
1980
-81
1981
-82
1982
-83
1983
-84
1984
-85
1985
-86
1986
-87
1987
-88
1988
-89
1989
-90
1990
-91
1991
-92
1992
-93
1993
-94
1994
-95
1995
-96
1996
-97
1997
-98
1998
-99
1999
-200
0
2000
-200
1
Year
Max
imum
mou
ld in
dex,
Mm
ax (-
)
Vantaa Lahti Jyväskylä Sodankylä
1.96
Figure 2.16 Maximum mould index, Mmax, for the surface of regular pine sawn goods in outdoor air in four
Finnish localities in 1971–2001. The values are maximum values during the period 1 July – 31 Dec. of each year. Calculation was started at the beginning of July each year, and finished at the end of June the next year.
Figure 2.16 shows that the mould index values in Sodankylä are typically lower than in the other localities due to its more northern location. The selected 10% level MRY represented the outdoor air conditions of Lahti in 2000–01 where the maximum mould index value was 1.96.
Validity of selected MRY
The usefulness of this MRY selection criterion was examined the same way as in the moisture condensation surveys. The analysed wall assemblies and used materials were the same ones presented earlier in Figure 2.6. Indoor air temperature was set at a constant 21°C, and the excess moisture value used in winter conditions was 4 g/m3. Excess moisture was varied as a function of outdoor air temperature according to Figure 2.24. Indoor air humidity did not, however, play a role in the calculations since the interior surface of the assembly always incorporated a plastic vapour barrier. The WUFI-2D program was used for the calculations. The same principles were followed and the same calculation model was used in the calculations as in the calculational analyses to be presented later in Chapter 6. The improved calculation accuracy of the WUFI-2D program was also made use of. Figure 2.17 shows the maximum mould index for the interior surface of the weatherisation membrane in the climatic conditions of the 24 most critical years in Finland.

113
0.0
0.5
1.0
1.5
2.0
2.5
3.0
3.5
4.0
Laht
i 85-
86
Laht
i 91-
92
Laht
i 84-
85
Laht
i 74-
75
Jyvä
skyl
ä 74
-75
Van
taa
84-8
5
Van
taa
81-8
2
Laht
i 79-
80
Jyvä
skyl
ä 88
-89
Laht
i 92-
93
Jyvä
skyl
ä 00
-01
Jyvä
skyl
ä 98
-99
Laht
i 00-
01
Jyvä
skyl
ä 90
-91
Van
taa
74-7
5
Laht
i 80-
81
Jyvä
skyl
ä 92
-93
Laht
i 77-
78
Van
taa
85-8
6
Van
taa
79-8
0
Van
taa
72-7
3
Van
taa
86-8
7
Jyvä
skyl
ä 96
-97
Jyvä
skyl
ä 79
-80
Max
imum
mou
ld in
dex,
Mm
ax (-
)
0.0
0.5
1.0
1.5
2.0
2.5
3.0
3.5
4.0
Max
imum
mou
ld in
dex
in o
utdo
or a
ir,M
max
(-)
M_max, Glass wool M_max, Cellulose insulation M_max, Outdoor air
Mmax = 1.96
Mmax, Glass wool Mmax, Cellulose insulation Mmax, Outdoor air Figure 2.17 Maximum mould index, Mmax, on interior surface of weatherisation membrane (Zν = 5 ×10³
s/m) in the outdoor air conditions of the 24 most critical years for mould growth selected on the basis of maximum mould index value of outdoor air each year.
Figure 2.17 shows how mould growth risk can be assessed quite well on the basis of the maximum mould index derived from outdoor air temperature and RH measurements. That is possible because the comparison calculations were made with the same calculation model used in selecting the critical years. There was some variation in the criticality of different years also here. As with the condensation risk analyses, the differences were the result of, for example, accuracy of calculation. The mould index calculation interval also affected the results. On the other hand, short-term changes in temperature and RH did not affect the results as essentially as in the condensation risk analyses since the mould index value was cumulative and changed slowly as conditions changed. According to Figure 2.17, a selection criterion based on the maximum mould index value of outdoor air is good enough for determining the critical MRY for mould growth. Thus, the outdoor air conditions of Lahti in 2000−01 could be selected as the critical MRY for mould growth in this study.

114
2.2.5 Critical outdoor air conditions for mould growth analysis of interior wall lining
Mould growth risk of interior wall lining due to outdoor air
Earlier in Chapter 1.7.3, it was stated that in summer conditions moisture may occasionally transfer by diffusion also from the outside in. The phenomenon grows in significance when wet cladding dries into the ventilation gap due to solar radiation. A southern or south-western wall would be most critical in that respect because solar radiation and driving rain have the strongest impact on the cladding there. However, the RH measurements of this study as well as other Finnish researches prove that humidities by volume are on a level of with outdoor air’s in ventilation gaps also on the southern side of buildings, indicating that the occasional extra moisture of timber or brick cladding does not contribute significantly to the humidity of air there (see Chs. 4.1.3 and 4.2.3–4.2.4). Moisture bound in the sheathing is not a problem in this respect either, since the sheathing cannot be wetted by driving rain. Moreover, solar radiation warms the air in the ventilation gap and reduces RH whereby the moisture content of the sheathing does not rise as high as on the shaded northern wall (see Figs. 4.17–4.20). Calculational analyses on the issue also yielded the same result. This means that the mould risk of the exterior surface of the vapour barrier can be examined solely on the basis of outdoor air humidity by volume excluding the impact of solar radiation. Thus, humidity by volume of outdoor air, νe, was used as an indicator in selecting the 10% level critical MRY. The higher the average humidity by volume, the higher the risk that relative humidity on the exterior surface of the vapour barrier reaches the range favourable to mould growth. Since mould growth is a slow process, an examination interval of three months (90 days) was chosen. Here, the 1-year survey period commenced at the beginning of January since the most critical conditions occur in summer. Moving averages were in this case also calculated at 3-hour intervals. Figure 2.18 shows these average humidity by volume values for the localities selected for the study. Here, the analysis was based exceptionally on weather data from 29 years since data on summer conditions were available only for that period. The lack of one year/location does not affect the selection of the critical MRY essentially.

115
0
2
4
6
8
10
12
14
1972
1973
1974
1975
1976
1977
1978
1979
1980
1981
1982
1983
1984
1985
1986
1987
1988
1989
1990
1991
1992
1993
1994
1995
1996
1997
1998
1999
2000
Year
Ave
rage
hum
idity
by
volu
me
of th
ree
mon
th,
νe
(g/m
3 )
Vantaa Lahti Jyväskylä Sodankylä
10.14 g/m3
Figure 2.18 Outdoor air average humidities by volume, νe, in four Finnish localities in 1972–2000 during
summer. The values are maximum moving averages of three months (90 days). Calculation was started at the beginning of January each year and finished at the end of December the same year.
Figure 2.18 shows that in Sodankylä, in northern Finland, outdoor air humidity by volume values were clearly smaller in summer than in the other localities. In this case the outdoor air conditions of Lahti in 1988 were selected as the 10% critical level MRY as average humidity by volume there was 10.14 g/m3 (13th highest average humidity by volume in data covering 116 years).
Mould growth risk of interior wall lining due to indoor air
Wall assemblies where the vapour barrier is installed at a depth of 50 mm from the interior surface of the structure have a greater risk of relative humidity reaching a level favourable to mould growth on the interior surface of the vapour barrier. With them, the risk for mould growth increases as outdoor air temperature drops in winter or outdoor air humidity by volume increases in summer. The above selected MRY can be used for summer-time analyses, but a 10% critical level MRY was selected for wintertime analysis using outdoor air temperature, θe, as the indicator. Also here, three months (90 days) was chosen as the examination period in winter. The analysis of each year commenced at the beginning of July and ended at the end of June the following year. Moving averages were also in this case calculated at 3-hour intervals. Figure 2.19 shows these average temperature values over a 30-year period for the localities selected for the study.

116
-25
-20
-15
-10
-5
019
71-7
2
1972
-73
1973
-74
1974
-75
1975
-76
1976
-77
1977
-78
1978
-79
1979
-80
1980
-81
1981
-82
1982
-83
1983
-84
1984
-85
1985
-86
1986
-87
1987
-88
1988
-89
1989
-90
1990
-91
1991
-92
1992
-93
1993
-94
1994
-95
1995
-96
1996
-97
1997
-98
1998
-99
1999
-200
0
2000
-200
1
YearA
vera
ge te
mpe
ratu
re o
f thr
ee m
onth
, θe
(°C
)
Vantaa Lahti Jyväskylä Sodankylä
-14.97°C
Figure 2.19 Outdoor air average temperature, θe, in four Finnish localities in 1971–2001 during winter. The
values are minimum moving averages of three months (90 days). Calculation was started at the beginning of July each year and finished at the end of June the next year.
Figure 2.19 indicates that average temperatures in Sodankylä are lower than elsewhere in Finland. Generally, in years when outdoor air saturation deficit was small, outdoor air temperature was also low (see Fig. 2.4). The outdoor air conditions of Sodankylä in 1977–78 were selected as the 10% level critical MRY where the average temperature of three months was -14.97°C.
2.2.6 Conclusions
In summation of the criticality comparisons of different years, it may be stated that saturation deficit, Δνdef, and mould index, M, vary a lot. Consequently, MRYs should be 10% level critical years. On the other hand, finding just the right critical year is not necessary when using the analysis method of this study since the limit values selected for the moisture performance of assemblies are determined by the selected MRY. In practice, the criticality of the selected MRY depends also to some extent on the studied assembly. Nevertheless, outdoor air saturation deficit and mould index are good indicators of moisture condensation and mould growth risk on the interior surface of sheathing. Figures 2.4 and 2.16 also clearly show that a year that is critical with respect to one performance criterion is not necessarily critical with respect to another. The MRY critical for moisture condensation (Sodankylä, 1985–86) is not critical for mould growth. In the case of the MRY critical for mould growth (Lahti, 2000–01) the situation is similar but the other way around. Summer-time mould growth is not generally a problem with external wall assemblies in Finnish climatic conditions which means that the MRY critical for

117
mould growth can be selected on the basis of mould growth analyses made in autumn conditions. Separate MRYs had to be selected for the mould growth risk analysis of interior wall lining with a plastic vapour barrier. These MRYs were chosen based on different indicators than when analysing the moisture conditions of the exterior surface of the assembly. Possible indicators for the analysis are humidity by volume, νe, and temperature, θe, of outdoor air.
2.3 Indoor air conditions
2.3.1 Target values and fluctuation of indoor air conditions
No generally accepted indoor air design conditions for building physical analyses of envelope assemblies exist in Finland. The Classification of Indoor Climate 2000 (2001) publication gives target values for indoor air temperature and relative humidity for different indoor climate classes, but practice has shown that these values are difficult to reach during all seasons. With respect to temperature, the target values (20–23°C) are reached quite well during the heating season, but attainment of the summer values (22–27°C) is difficult at times since dwellings do not have air conditioning. Relative humidity target values (25–45% RH) are given only for the best indoor climate class, S1. In reality, the relative humidity of indoor air may vary over a wider range being lower than the target value in winter and higher in spring and autumn. Indoor air temperature and humidity conditions have been studied in several Western European countries in recent years (Sanders 1996). The results indicate that conditions there differ from the typical Finnish conditions in many respects. Both indoor air temperature and relative humidity fluctuate much more in those countries than in Finland. This is largely due to lower room temperatures of buildings in winter in Western Europe.
2.3.2 Indoor air excess moisture
Indoor air excess moisture, Δνexc, is the most important factor in the analysis of the impact of indoor air conditions on the moisture performance of wall assemblies. It indicates how much higher the humidity by volume of indoor air is than that of outdoor air. The higher the excess moisture, the larger the potential difference between the humidities by volume of indoor and outdoor air, and the more water vapour tends to transfer through the assemblies from the inside out. As stated earlier in Chapter 1.7.3, in certain situations the humidity by volume of outdoor air may exceed that of indoor air (negative indoor air excess moisture) resulting in moisture flow from the outside in. However, in Finnish climatic conditions the humidity by volume of indoor air is almost always higher than that of outdoor air during wintertime (θe ≤ 5°C) (see Fig. 2.24).

118
The level of indoor air excess moisture can be determined in two ways. By measuring indoor and outdoor air temperature and RH values we can determine the difference in humidity by volume (or the difference in partial water vapour pressure). Or it can be determined on the basis of the building’s moisture production rates and total ventilation rate. Total ventilation rate consists of the ventilation rate of the ventilation system and the ventilation rate of the envelope’s air leakages. Literature presents the moisture production rates of various activities which can be added up to arrive at total moisture production (e.g. Björkholz 1991; TenWolde & Walker 2001; ASHRAE Handbook 2001; Aoki-Kramer & Karagiozis 2004). The resulting excess moisture values are, however, estimates as it is difficult to measure moisture production rates and ventilation rates accurately in practice. Field tests on Finnish timber-framed one-family and row houses show that excess moisture estimates based on estimated moisture production may differ considerably from measured values (Kalamees et al. 2004a; Kalamees et al. 2005; Vinha et al. 2005a; Kalamees et al. 2006b). Therefore, estimated moisture production must not be used to determine the actual excess moisture values of buildings. Van der Kooi & Knorr (1973), Hens (1992), Tolstoy et al. (1993), Sanders (1996), Rodriquez et al. (2000), Jenssen et al. (2002), Janssens & Hens (2003), Gustavsson et al. (2004) and Rose & Francisco (2004) are among those who have earlier studied indoor air excess moisture. Excess moisture values have been measured in several studies on a few test buildings or dwellings, but relatively few studies based on broader measurement data exist. In 1991–1992 an extensive field study was conducted in Sweden targeting the indoor air conditions and excess moisture of more than 700 one-family houses and 400 apartments (Tolstoy et al. 1993; Tolstoy 1994). The study covered a period of about one month at each test site, and the measurements were made between October ‘91 and March ‘92. The oldest buildings had been built before 1940 and the newest ones prior to 1989. Figure 2.20 is a summary of the excess moisture measurement results. In single-family houses excess moisture ranged between 0 and 8 g/m3 and in apartments between 0 and 7 g/m3. The average for one-family houses was 3.9 g/m3 and for apartments 2.9 g/m3. The difference between one and multi-family residential buildings emanates partly from the higher ventilation rate in multi-family buildings and partly from the greater moisture production of one-family houses. (Tolstoy 1994)
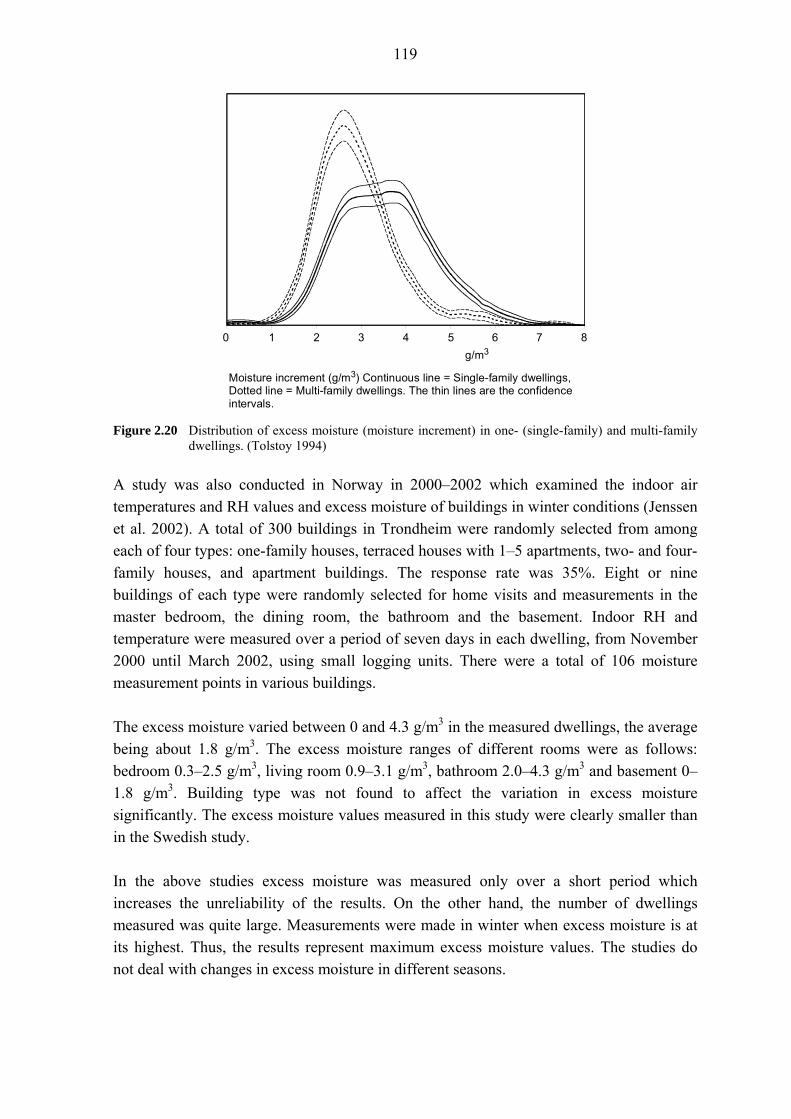
119
0 1 2 3 4 5 6 7 8g/m3
Moisture increment (g/m3) Continuous line = Single-family dwellings,Dotted line = Multi-family dwellings. The thin lines are the confidenceintervals.
Figure 2.20 Distribution of excess moisture (moisture increment) in one- (single-family) and multi-family dwellings. (Tolstoy 1994)
A study was also conducted in Norway in 2000–2002 which examined the indoor air temperatures and RH values and excess moisture of buildings in winter conditions (Jenssen et al. 2002). A total of 300 buildings in Trondheim were randomly selected from among each of four types: one-family houses, terraced houses with 1–5 apartments, two- and four-family houses, and apartment buildings. The response rate was 35%. Eight or nine buildings of each type were randomly selected for home visits and measurements in the master bedroom, the dining room, the bathroom and the basement. Indoor RH and temperature were measured over a period of seven days in each dwelling, from November 2000 until March 2002, using small logging units. There were a total of 106 moisture measurement points in various buildings. The excess moisture varied between 0 and 4.3 g/m3 in the measured dwellings, the average being about 1.8 g/m3. The excess moisture ranges of different rooms were as follows: bedroom 0.3–2.5 g/m3, living room 0.9–3.1 g/m3, bathroom 2.0–4.3 g/m3 and basement 0–1.8 g/m3. Building type was not found to affect the variation in excess moisture significantly. The excess moisture values measured in this study were clearly smaller than in the Swedish study. In the above studies excess moisture was measured only over a short period which increases the unreliability of the results. On the other hand, the number of dwellings measured was quite large. Measurements were made in winter when excess moisture is at its highest. Thus, the results represent maximum excess moisture values. The studies do not deal with changes in excess moisture in different seasons.

120
Based on buildings’ temperature and RH values measured in Western Europe, the EN ISO 13788 (2001) standard has defined the recommendable design values for excess moisture as a function of outdoor air temperature (Table 2.2 and Fig. 2.21). Table 2.2 Internal humidity classes. (EN ISO 13788 2001)
Humidity class
Building
1 Storage areas
2 Offices, shops
3 Dwellings with low occupancy
4 Dwellings with high occupancy, sports halls, kitchens, canteens; buildings heated with un-flued gas heaters
5 Special buildings, e.g. laundry, brewery, swimming pool
-5Monthly mean outdoor air temperature, θe
0 5 10 15 20 25 °C0
0.002
0.004
0.006
0.008
270
540
810
1080 5
4
3
2
1
Δν Δρkg/m3 Pa
Figure 2.21 Variation of internal humidity classes with external temperature. (EN ISO 13788 2001) In Table 2.2 internal humidity is divided into five humidity classes. In dwellings with low occupancy (humidity class 3) the recommended design excess moisture is 4 to 6 g/m3 during winter (temperature under 0°C) while in dwellings with high occupancy (humidity class 4) the recommended value is 6 to 8 g/m3 during winter. The curves of Figure 2.21 show how excess moisture decreases as outdoor air temperature rises. Yet, no clear-cut physical basis can be found to connect outdoor air temperature with excess moisture. The decrease in excess moisture as temperature rises is likely the result of people airing rooms more, drying laundry and spending more time outdoors whereby the moisture production rates within the building decrease.
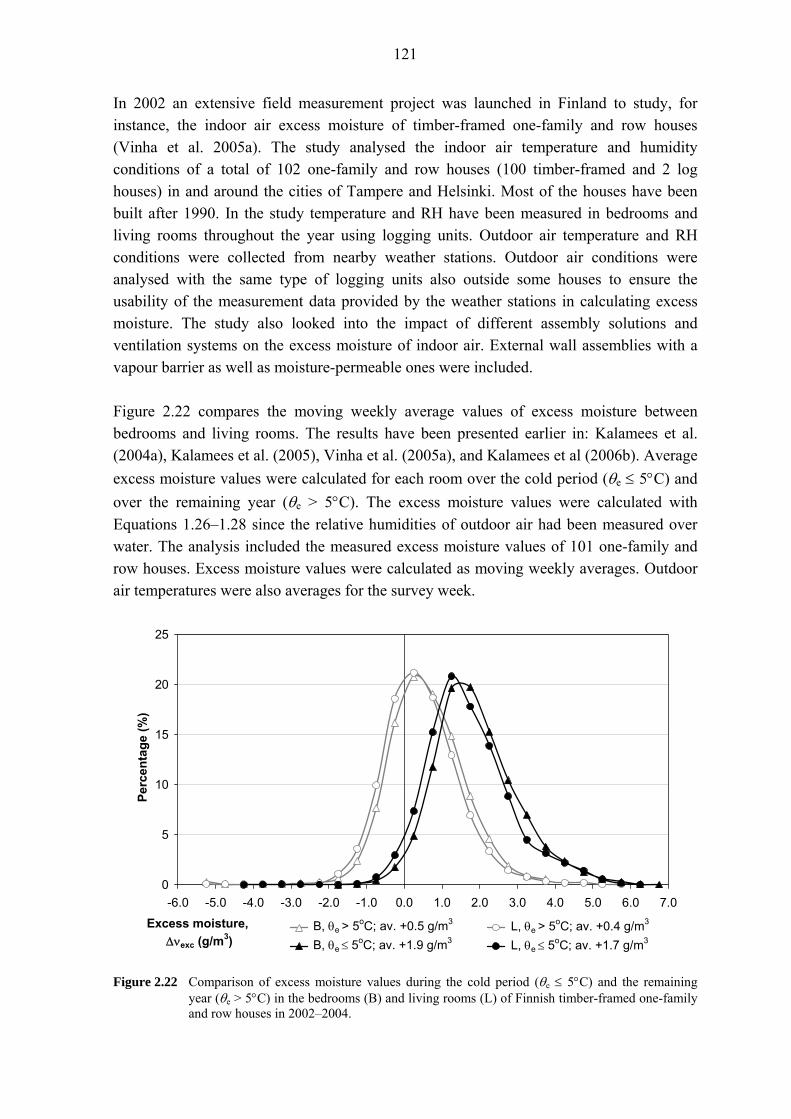
121
In 2002 an extensive field measurement project was launched in Finland to study, for instance, the indoor air excess moisture of timber-framed one-family and row houses (Vinha et al. 2005a). The study analysed the indoor air temperature and humidity conditions of a total of 102 one-family and row houses (100 timber-framed and 2 log houses) in and around the cities of Tampere and Helsinki. Most of the houses have been built after 1990. In the study temperature and RH have been measured in bedrooms and living rooms throughout the year using logging units. Outdoor air temperature and RH conditions were collected from nearby weather stations. Outdoor air conditions were analysed with the same type of logging units also outside some houses to ensure the usability of the measurement data provided by the weather stations in calculating excess moisture. The study also looked into the impact of different assembly solutions and ventilation systems on the excess moisture of indoor air. External wall assemblies with a vapour barrier as well as moisture-permeable ones were included. Figure 2.22 compares the moving weekly average values of excess moisture between bedrooms and living rooms. The results have been presented earlier in: Kalamees et al. (2004a), Kalamees et al. (2005), Vinha et al. (2005a), and Kalamees et al (2006b). Average excess moisture values were calculated for each room over the cold period (θe ≤ 5°C) and over the remaining year (θe > 5°C). The excess moisture values were calculated with Equations 1.26–1.28 since the relative humidities of outdoor air had been measured over water. The analysis included the measured excess moisture values of 101 one-family and row houses. Excess moisture values were calculated as moving weekly averages. Outdoor air temperatures were also averages for the survey week.
0
5
10
15
20
25
-6.0 -5.0 -4.0 -3.0 -2.0 -1.0 0.0 1.0 2.0 3.0 4.0 5.0 6.0 7.0
Excess moisture, Δνexc (g/m3)
Perc
enta
ge (%
)
M Te>5oC . E Te>5oCM Te<5oC E Te<5oC
L, θe > 5oC; av. +0.4 g/m3
L, θe ≤ 5oC; av. +1.7 g/m3B, θe > 5oC; av. +0.5 g/m3
B, θe ≤ 5oC; av. +1.9 g/m3
Figure 2.22 Comparison of excess moisture values during the cold period (θe ≤ 5°C) and the remaining
year (θe > 5°C) in the bedrooms (B) and living rooms (L) of Finnish timber-framed one-family and row houses in 2002–2004.

122
Figure 2.22 shows that the average excess moisture during the cold period (θe ≤ 5°C) was 1.8 g/m3 and during the rest of the year (θe > 5°C) 0.5 g/m3. The maximum amount of average excess moisture during the cold period (result from one room) was 5 g/m3 while during the remaining year it was 3.1 g/m3 (Kalamees et al. 2004a). Excess moisture values were higher in winter than in summer due to, for instance, differences in moisture production and functioning of ventilation. Figure 2.22 demonstrates that excess moisture values measured in bedrooms and living rooms did not differ significantly. The values were slightly lower in houses with wall assemblies more permeable to moisture, but the differences were quite small (Kalamees et al. 2004a). For hygrothermal calculations and sensitivity analysis under different hygrothermal loads, it is necessary to know the distribution of different excess moisture levels over the whole outdoor air temperature range. Different excess moisture levels indicating moisture performance of houses across the full range of moisture production are shown in Figure 2.23 (Kalamees et al. 2004a; Vinha et al. 2004a; Kalamees et al. 2005; Vinha et al. 2005a; Kalamees et al 2006b). These curves were calculated from the maximum excess moisture curves for each room and were sorted so that average excess moisture values during the cold period (θe ≤ 5ºC) were: 1 g/m3, 2 g/m3, 3 g/m3, 4 g/m3, and 5 g/m3. Maximum excess moisture values were calculated as moving weekly averages. On the basis of these curves, a 1 g/m3 change in excess moisture during the cold period (θe ≤ 5ºC) corresponds to a 0.5 g/m3 change during the warm period (θe ≥ 15ºC).
0
1
2
3
4
5
6
-25 -20 -15 -10 -5 0 5 10 15 20 25Weekly average outdoorair temperature, θe (
oC)
Exce
ss m
oist
ure,
Δν e
xc (g
/m3 )
+5g/m³ +4g/m³ +3g/m³+2g/m³ +1g/m³
Figure 2.23 Excess moisture measurement results at different humidity load levels as a function of weekly average outdoor air temperature for Finnish timber-framed one-family and row houses in 2002–2004.

123
Figure 2.23 reveals that maximum excess moisture values remain fairly constant until outdoor air temperature exceeds 5°C. Thereafter, the value decreases linearly until it become almost constant at about 15°C. The same pattern recurs independent of the excess moisture level under scrutiny. The shown excess moisture curve, that indicates an excess moisture of 4 g/m3 in winter and 1.5 g/m3 excess moisture in summer conditions, corresponds to the 10% critical level of the measured material. In other words, this excess moisture curve can be used as a design value for excess moisture under normal conditions. The excess moisture values under winter conditions measured in Finnish studies are generally smaller than those defined in the EN ISO 13788 (2001) standard (see Figs. 2.21 and 2.23). However, maximum excess moisture values remain quite constant in winter as also indicated by the EN ISO 13788 standard. Nevertheless, the following clear differences have been found to exist between measurement results and values presented in the EN ISO 13788 (2001) standard: • Maximum excess moisture values remain quite constant at outdoor air temperatures
≤ 5°C or ≥ 15°C. The corresponding limit values of the EN ISO 13788 standard are ≤ 0°C and ≥ 20°C.
• In summer conditions the excess moisture value is not 0 g/m3, but it changes as the winter value changes.
Similar results have been received by, for instance, Janssens & Hens (2003) who compared earlier research results from Holland and Belgium to those of the ISO 13788 (2001) standard. Their comparisons also indicated that the ISO 13788 (2001) standard overestimates the humidity by volume of dwellings, except at higher outdoor air temperatures ≥ 10°C, when it underestimates it. Janssens & Hens (2003) also found, in line with the findings of a Finnish study (Kalamees et al. 2004a; Vinha et al. 2005; Kalamees et al. 2006b), that excess moisture is greater in autumn than in spring. During the first cold and dry months of autumn, walls release the vapour stored within during summer, hence increasing excess moisture. After winter, the opposite takes place: the walls have dried and can adsorb moisture from the air when outdoor air temperature and humidity rise. Thus, autumn conditions are a more important criterion for the moisture performance of envelope assemblies than spring conditions. The above analysis can be summed up by stating that there is reason to define different design curves for indoor air excess moisture in Finnish conditions than the ones presented in EN ISO 13788 (2001) standard. This is justified, for instance, because mould growth can be a critical factor for the moisture performance of envelope assemblies in spring and

124
autumn conditions, when the excess moisture of indoor air at higher temperatures significantly increases the risk. The average floor area of the test dwellings in the excess moisture analysis was 43 m2/occupant, meaning that the results on excess moisture apply to Finnish one-family and row houses of average living space. In houses with more occupants per floor area, the design values for excess moisture need to be increased. By comparing the occupancy rates of the analysed houses, it can be estimated that for houses with a high occupancy rate (available living space < 30 m2/occupant), the design value for excess moisture should be 5 g/m3 during the winter period. Then, the design curve would consider any extra humidification in the house, the target value being 25% RH. If indoor air is humidified so as to increase relative humidity above 25% RH in winter, the design values for excess moisture must be determined separately. (Vinha et al. 2005a) The set of design curves shown in Figure 2.24 can be drawn on the basis of the above results for the excess moisture of one-family and row houses in Finnish outdoor air conditions. The curves are applicable if the air change rate of a house is at least 0.3 1/h. At lower rates, the level of excess moisture must be estimated separately.
0
1
2
3
4
5
6
7
8
9
-30 -25 -20 -15 -10 -5 0 5 10 15 20 25 30
Outdoor air temperature, θe (°C)
Exce
ss m
oist
ure
of in
door
air,
Δν e
xc (g
/m3 )
Suitable design value of excess moisture in severe conditionsSuitable design value of excess moisture in normal conditions
Figure 2.24 Design curves for excess moisture of one-family and row houses in Finnish outdoor air conditions. Normal conditions apply to houses with a normal occupancy rate and no extra humidification. Severe conditions apply to houses with a high occupancy rate (available living space < 30 m2/occupant) and/or extra humidification in winter that raise relative humidity to at least 25% RH. (Vinha et al. 2005a)

125
2.3.3 Indoor air conditions selected for the study
The indoor air temperature selected for the calculational analyses on the basis of the Classification of Indoor Climate 2000 (2001) was 21°C, which is close to the target average temperature in all indoor air classes (S1–S3). This value can also be reached quite easily during the heating season in Finland. In the analyses of the moisture performance of the interior wall lining in winter conditions, a lower than normal indoor air temperature was a more critical alternative for the moisture performance of an assembly. The indoor temperature for these analyses was selected on the basis of measurements made in bedrooms of Finnish one-family and row houses (Vinha et al. 2005a). The 10% level critical indoor air temperature selected for this study was 20°C, but a small margin of safety was added due to the fact that the occupants can very easily control indoor air temperature; thus 19°C was used (see Chs. 2.2.5 and 6.3.7). Only one house in the sample of 94 one-family and row houses had a lower indoor air temperature in winter conditions. Indoor air temperature may be even lower than 19°C, but that is often the result of the occupants staying home less than usual. Then indoor air excess moisture is also probably lower than normal. Indoor air excess moisture, on the other hand, varies quite a lot as indicated by the field studies presented above. In different studies it has varied between 0 and 8 g/m3. Consequently, excess moisture in winter conditions was selected as a variable for the study, the focus being the range between 0 and 8 g/m3. A change in excess moisture as a function of outdoor air temperature was considered in the calculations in accordance with the design curves of Figure 2.24.
2.4 Wall assembly solution and used materials
2.4.1 Impact of different material layers and properties
Many studies have been conducted on the impact of the material layers and properties of external wall assemblies on the assembly’s moisture performance. Some of them (e.g. Stewart 1981; Burch & Thomas 1991; Karagiozis & Salonvaara 1995; Geving 1997a; Janssens & Hens 1998; Kumaran & Wang 1999; Salonvaara et al. 2001) made more detailed calculational analyses of the impact of various factors. Salonvaara et al. (2001), for example, analysed the significance of the variation in material properties to the moisture performance of a wall assembly using the Monte Carlo stochastic model. They found that variation in the properties of a material may have a considerable effect on the performance of an assembly made of that material – it either improves or impairs it. Calculation and design models have also been created based on the properties of different material layers, for example, by Lehtinen & Lehtonen (1997) who examined the moisture

126
performance of wall assemblies on the basis of the thermal resistance and water vapour resistance ratios of thermal insulation and sheathing. Of individual factors, the impact of the water vapour resistance of the interior wall lining on the performance of the assembly has been examined the most. These studies were dealt with earlier in Chapter 1.7.4. Many of these studies also looked into the significance of other building physical material properties and material layers for the performance of the assembly. However, despite numerous earlier research efforts, sufficient information about the significance and order of importance of various factors with respect to the overall performance of an external wall assembly has not been available. This study has also investigated this area. The ventilation gap behind the cladding is one of the most important structural factors affecting the moisture performance of an assembly. Therefore, it has been dealt with separately in Chapters 2.4.2 and 4. Some other structural factors and material properties will be considered later in Chapters 3.2.4, 6.3 and 7.2.
2.4.2 Impact of ventilation gap
Timber-framed external wall assemblies in Finland typically have a ventilation gap between the cladding and the sheathing (see Fig. 1.1). The upper and lower sections of the ventilation gap open to outdoor air which allows the air in the gap to circulate. In wood-clad walls the ventilation gap is typically 20–25 mm wide while in brick-clad walls its minimum width has been set at 30 mm (RakMK C2 1998). The ventilation gap performs two important functions in relation to the moisture performance of an external wall assembly. Firstly, it prevents extra moisture that has penetrated past the cladding from passing into the wall assembly. Secondly, the convection that occurs in the ventilation gap significantly aids the drying of the assembly if extra moisture for some reason gets inside the assembly. Many studies have observed moisture damage in assemblies due to the absence of a ventilation gap or its deficient performance (Nieminen 1987; Lehtinen & Vijanen 1989; Nieminen 1989b; Niiranen 1994; Lehtinen et al. 2000; Kayll 2001; Chouinard & Lawton 2001; Hazleden & Morris 2001; Beaulieu et al. 2002; Hansen et al. 2002; Lawton 2004). The U-value of a wall assembly with a ventilation gap is calculated in Finland by ignoring the impact of the cladding, by assuming the conditions of the ventilation gap to correspond to those of outdoor air, and by using the same thermal resistance for the exterior surface (0.13 m2·K/W) of the sheathing as for the interior surface of the wall (ISO 6946 1996; RakMK C4 2003). This surface resistance value is higher than the normal thermal

127
resistance of the exterior surface (0.04 m2·K/W) and considers the thermal resistance of cladding and the ventilation gap. The water vapour resistance of the surface of the sheathing was not taken into account in calculations. Use of a higher exterior surface resistance would improve the moisture performance of the assembly also in diffusion analysis since the temperature of the exterior surface of the sheathing would rise while relative humidity would fall. To clarify this issue, this study also examined the temperature and RH conditions of the ventilation gap as well as the exterior surface resistance values from laboratory and field tests (see Chs. 3 and 4).

128
3 LABORATORY TESTS ON EXTERNAL WALLS AND MATERIALS
3.1 Building physical research equipment
3.1.1 Background
In the initial phase of the research it was decided that new type of research equipment would be needed for reliable analysis of external wall assemblies to allow regulating outdoor and indoor air condition factors under controlled conditions independent of each other. That also required an accurate computerised measurement and control system with a suitable control program. Calibrated hot box equipment had just been built at the Institute of Structural Engineering at TUT which allowed determining the thermal transmittance, the U-value, of an assembly (Vinha 1998). Outdoor and indoor air temperature measurement and control systems had been developed for this equipment previously which provided a good basis for the development of new equipment. Outdoor and indoor air relative humidity and the pressure difference between indoor and outdoor air were made additional controllable quantities of the new equipment. Infrared radiators were also installed outside for controlling the temperature of the exterior surface of the assembly. The major development work on the calibrated hot box equipment and building physical research equipment took a total of about 4 years (1994–1998). The intention was to use the equipment to model the temperature and moisture conditions occurring in nature, which is why a feature was built into the equipment which allows, for instance, controlling humidity in subzero temperatures. Another major new feature compared to earlier equipment was that all thermal, moisture and air flows to and from the research equipment are measured during testing. This also allows separate measurement of the thermal flow into an assembly due to convection and conduction as well as the moisture flow due to convection and diffusion (Vinha & Käkelä 1999). The parts, operating principle, calibration and uncertainties of measurement of various quantities are briefly dealt with in the following. A more detailed description of the equipment is available in a TUT publication (Vinha & Käkelä 1999).
3.1.2 Parts of the equipment
The research equipment consists of a warm chamber and a protective chamber in a big freezer room. The front wall of the warm chamber has a test opening where the assembly to be studied is inserted. The protective chamber is opposite the warm chamber facing the exterior surface of the assembly to be studied. The warm chamber is controlled to match

129
the conditions of indoor air and the protective chamber to match those of outdoor air (Fig. 3.1).
EVAPORATORS AND FANS
TEST ELEMENT
FAN
HEATERS
METAL BAND
OUTDOORAIR
OUTER BAFFLE+ SENSORS
OUTEREVAPORATOR
INDOORAIR INNER BAFFLE
+ SENSORS
HEATER + FAN
INNEREVAPORATOR
BALANCE
FREEZER ROOM
PROTECTIVECHAMBER WARM CHAMBER
Figure 3.1 The building physical research equipment of TUT.
The test is controlled by various measurement and control instruments, some of which are inside the chambers and some in a measurement room outside the freezer room (Figs. 3.2 and 3.3). The measurement, control and calculation procedures during a test are performed by a computer that runs a control program designed for the test, in question.
Freezer room
The interior dimensions of the freezer room used as a cold chamber are: width 2.7 m, length 6.4 m, and height 2.6 m. The temperature of the freezer room is adjustable within the -35 to 20ºC range.
Warm chamber
The exterior dimensions of the warm chamber are 1,800×1,800×1,100 mm. The warm chamber is designed to be as air-tight as possible to allow controlling the pressure difference. For this reason, the interior of the chamber is a cabinet welded of 6 mm PVC boards (front wall thickness is 10 mm). The cabinet is surrounded by 150 mm polyurethane insulation (front wall insulation thickness is 400 mm) whose outer surface is of film-coated

130
plywood covered with a waterproofing compound. Outside the chamber there is a support frame of aluminium profiles. For better tightness, all joints are also sealed with silicone. The test opening of the warm chamber is 1,200×1,200 mm2 and 400 mm deep. The sides of the test opening are of plywood laminated on both sides, which has good moisture resistance but relatively low thermal conductivity and thermal expansion. The side plywood boards are supported and attached to the plastic cabinet by a wooden frame. The plastic boards extend over the inner edge of the test opening, providing 25 mm wide flanges for installing the assemblies to be studied. Sealings of cellular rubber are glued to the flanges. There are eight support points outside the test opening where the tested element is tightened against the inner flanges by eight threaded bars. A steel band with rubber seals is used for tightening.
Protective chamber
In the early stage of the research equipment design, the target value for relative humidity of outdoor air was set at 90% RH even at subzero temperatures. However, the maximum relative humidity of refrigerated rooms (such as freezer rooms) is typically around 60–80% RH. The low relative humidity is due the fact that airborne water vapour tends to condense on the cold surfaces of evaporators. In the research equipment, this problem was solved by using a protective chamber to separate the outdoor air to be controlled from the freezer room air. The walls of the protective chamber are of thin polycarbonate sheets, which makes it possible to control the temperature by changing the temperature of the freezer room. A high outdoor RH is maintained in the protective chamber by forced air circulation. The air circulation is achieved by two fans. There are also heating sheets on the surfaces of the chamber to allow defrosting the surfaces if necessary. The exterior dimensions of the protective chamber are 1,800×1,800×600 mm. The load-bearing frame of the chamber is of aluminium angle profiles, as in the warm chamber. The protective chamber is sealed against the warm chamber with similar rubber seals as the element to be studied.
Baffles
Baffles are placed on both sides of the test element to produce more even temperature and air flow conditions near the surfaces of the test wall. The baffles also serve as mounting racks for the measurement sensors.

131
The baffles are of aluminium. The reverse sides of the sheets are of reflective aluminium while the surfaces facing the test element are painted matt black. Both the inner and outer baffles are attached to the warm chamber. The area of the inner baffle is 1,000×1,000 mm2 and that of the outer baffle 1,200×1,200 mm2.
Figure 3.2 The warm chamber (on the right) and protective chamber in the freezer room.
Figure 3.3 Measurement and control instruments of the research equipment.

132
Measuring equipment
The building physical research equipment uses the following kinds of measuring equipment. • Temperature sensors • Moisture transmitters • Air flow transmitters • Differential pressure transmitters • Laminar pipes • A balance • A voltmeter The equipment may also be outfitted, for instance, with heat flow meters and radiation sensors as necessary.
Control equipment
The control equipment consist of the following: • Heating control equipment • Refrigeration control equipment • Moisture control equipment • Differential pressure control equipment • Air flow control equipment • Heat radiation control equipment The control equipment regulate the heating of the interior of the warm chamber, the refrigeration of the freezer room, the humidification of indoor and outdoor air, the differential pressure across the test wall, the velocity of air flow near the cladding and in the ventilation gap of the test wall, and radiation heating of the cladding of the test wall.
Control program
Measurement is controlled by CLIMATE software. It consists of input files, the actual measurement and control program and output files. The software was written in DOS-based Quick Basic version 4.5. A corresponding program is used with TUT’s calibrated hot box equipment and field measuring equipment.

133
Other equipment and accessories
The building physical research equipment includes an alarm system which informs about possible problems during the test. There is also an automatic reactivation system in case of power failure. There are also separate accessories for calibration of temperature sensors and moisture transmitters. For the calibration of leakage air from the warm chamber, there is a metal-clad calibration sheet as well as five calibration elements of EPS sheet of different thicknesses for calibrating heat loss flow rate.
3.1.3 Operating principle
To test the impact of environmental conditions on assemblies, the desired indoor and outdoor air conditions are created on opposite sides of the test wall. The main controlled variables are temperature, relative humidity and pressure difference across the assembly. Tests can be made either under constant or varying conditions. A test under constant conditions examines the performance of the test wall in a steady-state situation. In a test under varying conditions, one or more environmental factors are varied at certain intervals. Cyclical variation is useful in modelling, for example, changes in pressure difference or changes in outdoor conditions during a day. Before starting the experiment, the control program’s input files are prepared by entering data on the measurement arrangements, channels, measured variables, calibration factors of measurement sensors, test conditions, properties of the element to be tested, and measurement values to be observed during the test. The measurement and control procedure is fully computerised. The output values of a total of about one hundred measurement channels are read at intervals of one minute. The computer then computes various values for the assembly under study based on the measured values. The values measured and calculated during the test are stored in output files at 15 minute intervals. Based on the measurement results, the computer controls the indoor and outdoor air conditions to match the set values as closely as possible. The progress of the test can be monitored on numerical and graphical display pages. Constant indoor and outdoor air conditions were reached in the tests rather quickly: typically within one day from the start of the test. On the other hand, reaching equilibrium moisture contents in test walls may take considerably longer (even longer than a month). It depends on the initial moisture contents and water vapour permeabilities of the materials used in the test wall and the controlled environmental conditions. In constant condition tests a single condition setting typically runs for at least a week while the overall test duration is about 1−2 months. Cyclical test durations may vary more widely depending on the varied condition factors.

134
3.1.4 Measurement systems
The research equipment measures temperatures with LM 335 type semiconductor sensors manufactured by the National Semiconductor Corporation. Air temperature sensors are shielded from heat radiation by placing them inside special radiation shields of aluminium. Sensors are also shielded against humidity by shrink-on plastic sleeves. A thin aluminium sheet with high thermal conductivity is glued to the bottom of surface temperature sensors, which ensures that the sensor temperature is as close to the surface temperature as possible. The sensors are shielded from the effects of humidity by a chemical metal compound and painted matt black to make their heat radiation properties match the properties of the mounting surfaces. Metal jacket sensors are covered by a metal tube and filled with epoxy glue to protect them against water and moisture in severe conditions. Relative humidity and temperature are measured by HMP 233 type humidity transmitters manufactured by Vaisala Ltd. The humidity sensor is a capacitive sensor whereas the temperature sensor, Pt 100, is a semiconductor sensor. The humidity sensor measures relative humidity over liquid water. Different filters are used at the ends of the sensors depending on whether they are used to measure humidity and temperature of ambient air or the air in the porous material at the test wall. Velocity of air flow is measured by AFT-1D type air flow transmitters manufactured by Envic Ltd. The measurement sensor of the transmitter is a hot-wire anemometer. Outdoor air flow velocity is measured by a transmitter with a range of 0 to 10 m/s and indoor air flow velocity with a transmitter with a range of 0 to 1.0 m/s. The pressure difference across the test wall is measured by FCO 16 type differential pressure transmitters manufactured by Furness Control Ltd. The shields are equipped with foam plastic filters to equalise pressure fluctuations. The differential pressure transmitter can also be used for measuring the air flow rate if the free ends of the hoses are connected to a laminar pipe. The research equipment uses laminar pipes manufactured by Furness Control Ltd. for 0.02, 0.2, 2.0 and 30 l/min volume flows. An electric balance is used for measuring water evaporation from the vessel used for humidifying the indoor air of the warm chamber. The used balance is the LP 6200 S manufactured by Sartorius Ltd. Voltages can be measured by two parallel methods in tests. In the first method, the voltage signals of the measurement channels are sent to the data logger, through which the voltmeter measures each signal in the desired order. The second method uses an AD/DA converter card inside the computer to digitalise the analog voltage signals, and the

135
computer converts them back to analog voltage values. The building physical research equipment uses mostly a voltmeter and a data logger for measuring the channels. The voltmeter is the HP 34401A Multimeter manufactured by Hewlett Packard Ltd. When measuring heating power, the voltmeter is also used for measuring the electric current as a voltage. This requires a current/voltage converter that uses an electric resistor to convert the current of the power supply circuit to a voltage. The computer uses a conversion equation to reconvert the voltage reading to a current reading.
3.1.5 Measured and calculated values of the test
Measured values
Examples of variables measured during the test: • Temperature indoors, outdoors, on the surfaces and in the test element θ (ºC) • Relative humidity indoors, outdoors and in the test element ϕ (% RH) • Differential pressure across the test element Δp (Pa) • Humidity by volume indoors, outdoors and in the test element ν (g/m3) • Velocity of air flow indoors, outdoors and in the ventilation gap ra (m/s) • Total air flow rate to and from the warm chamber Ra,tot (l/min) • Total moisture flow rate from the warm chamber Gtot (g/day) • Total heat flow rate from the warm chamber Φtot (W) Samples taken from the test element yield the following data: • Moisture content of building materials u (kg/kg, wt%), w (kg/m3) • Amount of moisture in building materials m (g) • Condensation rate behind the sheathing (visual evaluation)
Calculated values
The measured variables can be used to calculate various other values for the test element (most of the values are presented more accurately by Vinha & Käkelä (1999)): • Air flow rate through the test element Ra (l/min) • Density of air flow rate through the test element ra (l/(m2·min)) • Velocity of air flow through the test element ra (m/s) • Air permeance of the test element Ka (m/(s·Pa)) • Air conductivity of the test element κa (m2/(s·Pa)) • Air flow resistance of the test element Sa (s·Pa/m)

136
• Moisture flow rate into the test element G (g/day) • Density of moisture flow rate into the test element g (g/(m3·day)) • Moisture flow rate into the test element by diffusion Gdif (g/day) • Density of moisture flow rate into the test element by diffusion gdif (g/(m2·day)) • Moisture flow rate into the test element by convection Gconv (g/day) • Density of moisture flow rate into the test element by convection gconv (g/(m2·day)) • Water vapour permeance of the test element Wν (m/s) • Water vapour permeability of the test element δν (m2/s) • Water vapour resistance of the test element Zν (s/m) • Heat flow rate through the test element Φ (W) • Density of heat flow rate through the test element q (W/m2) • Heat flow rate into the test element by conduction Φcond (W) • Density of heat flow rate into the test element by conduction qcond (W/m2) • Heat flow rate into the test element by convection Φconv (W) • Density of heat flow rate into the test element by convection qconv (W/m2) • Thermal transmittance of the test element U (W/(m2·K)) • Thermal conductivity of the test element λ (W/(m·K)) • Thermal resistance of the test element R (W/(m2·K)) The building physical test also tells whether the temperatures and RH conditions of the assembly are conducive to mould growth. The earlier presented Equation 2.2 was used in the analysis.
3.1.6 Calibration of measurement sensors and warm chamber
Temperature sensors are calibrated in a special calibration vessel, where about 70 temperature sensors can be calibrated at the same time. Calibration of temperature sensors takes place also in the freezer room, and measurements are made using the same equipment as in the actual test. A calibrated glass tube thermometer placed in the vessel with the sensors is typically used as a reference in calibration. The vessel also has a fan that circulates the air inside to decrease temperature differences. There are separate calibration vessels for the calibration of humidity sensors where about 5 humidity sensors can be calibrated at a time. Humidity sensors are calibrated using saturated solutions of salt that produce certain RH levels in the ambient air. There are two solutions: one produces a high RH and the other a low RH. Calibration is done with the same equipment as in the actual test. Other measurement sensors and equipment (air flow transmitters, differential pressure transmitters, laminar pipes, balance and voltmeter) are calibrated either by the manufacturer or an authorised calibration service.

137
The amount of leakage air from the warm chamber is calibrated by placing a calibration sheet in the test opening and measuring the air flow rate into or from the warm chamber under various differential pressure conditions. The calibration sheet measures 1,190×1,190 mm2 and is impermeable to air. It is made of plywood with a steel sheet glued to the inner surface. The thermal energy consumption of the warm chamber is calibrated by placing calibration elements of different thicknesses and known thermal conductivity in the test opening. Elements of different thicknesses are needed because the share of the heat flow rate transmitted through the perimeter of the test opening changes with element thickness (ISO 8990 1994). There are 5 calibration elements; their area is 1,185×1,185 mm2 and their thicknesses 50 mm, 100 mm, 200 mm, 300 mm and 350 mm. The elements are made of S 30 class (density > 30 kg/m3) polystyrene sheets (EPS) and surfaced with matt black plastic foil. The thermal conductivity of EPS sheets was determined also at TUT by heat-flow meter equipment (see Ch. 3.3.1). Temperature and relative humidity sensors as well as the amount of leakage air from the warm chamber have been calibrated, on average, at one year intervals. Other measurements sensors and equipment including the thermal energy consumption of the warm chamber have been calibrated at longer intervals – typically every three years.
3.1.7 Measurement uncertainties
The uncertainties of some measurements were determined using the equations presented in FINAS S12 (1992). The measurement uncertainties of other measured variables were determined on the basis of our own or the manufacturer’s calibration. The uncertainties of measured variables are presented in Table 3.1. Table 3.1 The uncertainties of measured variables in the building physical test.
Variable Uncertainty
Individual temperatures (TUT’s sensors) ±0.4ºC
Average temperatures, group of 5 sensors (TUT’s sensors) ±0.2ºC
Temperature (RH/T sensors) ±0.1ºC (20ºC) ±0.005ºC/ºC
Relative humidity
±2.0% RH (0 to 90% RH) ±3.0% RH (90 to 100% RH)
Differential pressure across the test element ±1.0 Pa Velocity of air flow ±0.1 m/s + 3% of reading Air flow rate to or from the warm chamber ±0.1 l/min Moisture production to the warm chamber ±5.0 g/day
Total heating power fed to the warm chamber (Excluding heat power generated by sensors and balance)
±0.1 W
Moisture content of materials ±1.0 wt%

138
The uncertainty of the measurement of relative humidity may be higher than the given values if the temperature differs considerably from the calibration temperature of 20°C. The uncertainty of calculated values is usually about ±5% of the result with a safety factor of 2, if there are no variables that change cyclically during the test (e.g. temperature, humidity by volume or pressure difference). The uncertainty of the results can be higher if one or more condition variables are changed cyclically.
3.2 Wall tests
The building physical research equipment was used to study a total of 64 external wall assemblies (of 47 different types) between 1997 and 2004. During the first test series (1997–1998) eight wall assemblies were analysed under Finnish winter conditions. In another test series (2000–2004) 56 wall assemblies were analysed under Finnish autumn, winter and spring conditions. Tests on wall assemblies were conducted in the hygroscopic range with the exception of four test walls of the second series where the impacts of moisture damage on the performance of the assembly in the capillary range were examined. Primarily the following factors were analysed in the laboratory tests on wall assemblies: 1) Impact of indoor air excess moisture and building physical properties of material
layers on the hygrothermal performance of a wall assembly in autumn conditions (analysis of mould growth risk) and in winter conditions (analysis of moisture condensation risk)
2) Impact of indoor air excess moisture and building physical properties of material layers on drying rate of extra moisture in spring conditions
3) Moisture performance of assembly in the capillary range following a moisture leakage
4) Moisture performance of assembly subject to convection with under- or overpressure inside
5) Impact of extension of air/vapour barrier and interior board attachments on air-tightness of wall assembly
6) Impact of different initial moisture contents on moisture performance of assembly 7) Impact of condensation on moisture content of thermal insulation materials 8) Correlation between relative humidity of pore air and moisture content of building
materials 9) Changes in temperature and moisture conditions of ventilation gap compared to those
of outdoor air conditions The main focus of the research were items 1 and 2, and results related to them are mainly analysed in this context. Only the results of test series 2 will be examined since they

139
provide a more comprehensive picture of the studied subjects. This is due both the larger number of tests on mutually comparable wall assemblies and more versatile analysis of conditions where the impacts of three seasons on the moisture performance of wall assemblies were studied. More detailed results from the assembly tests of first test series are presented in TUT report (Vinha & Käkelä 1999). Results of the wall assembly tests of the first and second test series have been published earlier also in conference publications (Vinha & Käkelä 2000; Vinha et al. 2001a; Vinha et al. 2001b; Vinha et al. 2002a; Käkelä & Vinha 2003; Vinha & Käkelä 2004b).
3.2.1 Building of test elements and test arrangements
Building of test elements
The tested walls were assembled in frames of 9 mm film-coated plywood to eliminate air and moisture losses. The frames of the second test series measured 1,185×1,185 mm2 and their thickness varied between 195 and 229 mm, depending on the tested wall type. Each test element was divided into four sectors (test walls) by a 47 mm wide bracing, and the edges were lined with 18 mm wide mixed plywood sheets. The insulation layer of each test wall was 542×542 mm2 (Fig. 3.4). Some test elements were divided vertically only into two sectors (capillary range tests). In these tests the insulation layer on both sides was 542×1,131 mm2.
Wall 1 Wall 2
Wall 3 Wall 4
9 18542
47542
918
1185
918
542
4754
29
18
1185
- +
25 195 - 229
RH/T sensor, standard positionRH/T sensor, variable position
718 25 43
264 7
171
2575
7
Figure 3.4 Structure of test element and location of measurement points.

140
The elements were usually assembled so that the interior board with the air/vapour barrier was installed first on the inner edge of the frame. Then, thermal insulation materials and the sheathing were installed. Sheathings of different walls were separated from each other by a plastic foil to prevent capillary moisture flow from one sheathing to another. The interior board, the air/vapour barrier and the sheathing were sealed to the rabbets of the frame with silicone (Fig. 3.5). The interior board was always uncoated. The loose thermal insulation materials were also weighed to determine their density before the test. The same external wood cladding was used in all wall assemblies: horizontal panelling (22 mm) with a ventilation gap (25 mm) behind it (see Fig. 3.4). The upper and lower sides of the ventilation gap opened into outdoor air.
Figure 3.5 Measurement sensors were installed during the construction of the test element.
Measurement points
Surface temperature sensors were placed in each corner of the test element and one the middle. The corner sensors were attached at a distance of 150 mm from the sides of the tested element. Air temperature sensors and surface sensors of the baffles were placed in corresponding locations inside and outside the tested element (see Fig. 3.1). Air sensors were installed on both sides of the tested element between the baffle and the element surface at a distance of 150 mm from both surfaces. The sensors of humidity transmitters were placed inside the wall to measure both temperature and relative humidity. In all tests the sensors were placed next to the air/vapour barrier and the sheathing in the insulation layer of the wall assembly (see Fig. 3.4). Sensor positions were also varied by tests. These positions are also presented in
141
Figure 3.4. The measurement point of humidity sensors was approximately 6.5 mm from the surfaces of the sheathing and the inner sheet because the diameter of sensors was 13.5 mm. Air flow and humidity sensors were placed in the middle of the ventilation gap viewed from the side and in the middle of the tested element viewed from the front. The air flow and humidity sensors were located on both sides of the tested element between the baffle and the element surface at a distance of 150 mm from both surfaces. Viewed from the front, these sensors were also located in the centre of the test element. The measurement sensors were installed inside the wall assembly before attaching the sheathing. The sensor cables were led through the sheathing and the holes were sealed with silicone (see Figs. 3.5 and 3.6).
Initial moisture contents of materials
The thermal insulation and sheathing materials used in tests were stored prior to the tests at either 86 or 55% RH and about 23°C. Initially two different initial moisture contents were used in an attempt to determine their impact on the relative humidity values of the assembly in a test. Test walls where the initial moisture contents of the sheathing and thermal insulation corresponded to 55% RH at the beginning of the test are marked "a", whereas test walls where the initial moisture contents corresponded to 86% RH are marked "b" (see App. 1). The tests indicated that the relative humidities of pore air remained slightly lower in the case of assemblies with lower initial moisture content (see Figs. 3.8−3.10 and 3.14). Since equilibrium was reached faster using 86% RH, and since it also was a somewhat more critical alternative from the viewpoint of the moisture performance of assemblies, only 86% RH initial moisture content was used in the rest of the wall assembly tests. In practice, the initial moisture content of insulation materials was lower since moisture evaporated from insulation in connection with the installation of the test element. The change in the moisture content of mineral wool insulations was especially large – their pore-air relative humidity at the exterior surface of the insulation could be under 50% RH at the beginning of the test. This factor was nevertheless of little signficance in the case of mineral wools since, as the test proceeded, moisture content quickly increased due to the low moisture capacity of mineral wool. The timber-frame and the interior surface attached to it (air/vapour barrier + interior board) were stored before the tests at 70% RH and about 23°C. The moisture content of the timber-frame did, however, vary slightly in practice depending on the storage time before tests. The exterior wood cladding was stored continuously at the temperature and moisture conditions of the freezer room.

142
An additional four wall tests modelling a moisture leak situation were run, where two litres of water was poured into the insulation layer of assemblies from above before the test started. The water was poured slowly and evenly across the entire surface of the thermal insulation. Tests using the same outdoor and indoor air conditions were conducted on wall assemblies with an insulation area of 542×1,131 mm2. These test walls are marked "c" (see App. 1).
Installation of the test element
Before installation of the wall element, the inner baffle was placed inside the warm chamber, and the measurement sensors needed in the test were mounted on it. The indoor air humidifying vessel was also filled with water and its aperture was set to a suitable size. The wall element to be tested was lifted into the test opening and centred with it. The element was sealed to the edge of the test opening by filling the installation gap with polypropylene insulation and by sealing the outer edges of the gap with duct tape (Fig. 3.6). Then, the tested element was fastened to the flanges of the test opening with a metal band. Finally, the cladding was mounted on the outer surface of the element.
Figure 3.6 Test element installed in the test opening of the warm chamber. The test walls on the right are
still without sheathing showing the spots where RH/T sensors have been installed on the outer surface of the thermal insulation.
The outer baffle with its sensors was mounted outside the warm chamber. The evaporator vessel in the protective chamber was filled with warm water, and the protective chamber was moved beside the warm chamber (see Fig. 3.1).
143
Taking of material samples and visual observations
At the beginning of the test, and after each pressure difference period, samples were taken from the sheathing and the insulation layer behind it. For the taking of the samples and installation of the pieces of wood, ∅ 75 mm holes were drilled in the sheathing. The holes were sealed with plugs of the same material as the sheathing, so they did not change the air-tightness of the wall at the sampling point. The moisture contents of material samples were determined by the weighing-drying-weighing method. The results were compared to values measured with RH sensors. In connection with taking material samples, the interior side of the sheathing was also examined visually and by touching to determine whether moisture had condensed on the surface.
3.2.2 Boundary conditions and test time
The target values of Table 3.2 were used as indoor and outdoor air conditions in the wall assembly tests of series 2. The outdoor air temperature and RH conditions were selected to correspond to average autumn, winter and spring conditions in Finland. Indoor air temperature was kept constant throughout. The relative humidity of indoor air was controlled so that excess moisture was 4 or 6 g/m3 in autumn and 4 g/m3 in winter and spring. The pressure difference was not adjusted on opposite sides of assemblies in the tests. Table 3.2 Target conditions of test series 2 in laboratory tests on external wall assemblies.
Variable Autumn 4 g/m3
Autumn 6 g/m3
Winter 4 g/m3
Spring 4 g/m3
θ indoor 20°C 20°C 20°C 20°C
θ outdoor 7°C 7°C −10°C −6 to 10°C, 1 cycle/day
ϕ indoor 62% RH 73% RH 35% RH 46% RH
ϕ outdoor 85% RH 85% RH 90% RH 50 to 90% RH, 1 cycle/day
Δp 0 Pa 0 Pa 0 Pa 0 Pa
Figure 3.7 shows the changes in conditions during one test. The total test time varied, depending on the studied assemblies, from 4 to 14 weeks, the average being about 9 weeks. The shift from autumn conditions to winter conditions occurred during a transition period of about one week in order to allow more time for the moisture contents of building materials to adapt to winter conditions. Under spring conditions outdoor air temperature was controlled in 24-hour cycles by heaters placed in front of the cladding. This was done to model the daily change in the temperatures of the exterior surface of the wall due to solar radiation.

144
-10
0
10
20
30
40
50
60
70
80
90
100
1 2 3 4 5 6 7 8
AUTUMN WINTER SPRING
Test time (weeks)
Tem
pera
ture
, θ (°
C),
Rel
ativ
e hu
mid
ity, ϕ
(% R
H) ϕ outdoor
ϕ indoor
θ indoor
θ outdoor
0
Figure 3.7 Principle illustration of changes in test conditions during a single test. The major deviations in test conditions compared to the indoor and outdoor target conditions of Table 3.2 at the end of the test periods were the following: • In spring conditions the actual relative humidity of outdoor air was about 20% RH
lower (the average was about 50% RH and range of variation from 32% RH to 78% RH) than the target value in all tests, because cyclical temperature control complicated the control of the relative humidity of outdoor air. Consequently, indoor air excess moisture was about 5 g/m3 in spring conditions.
• During wintertime the actual excess moisture of indoor air was about 3.8 g/m3 in all tests because the humidity by volume difference between indoor and outdoor air was controlled in building physical research equipment by using calculated values over ice. In reality, however, the humidity sensors measured relative humidity over liquid water.
• Due to the temperature difference between the interior and exterior sides of the wall, a small pressure difference naturally existed across the assembly: typically from -1 to 2 Pa (positive pressure difference means overpressure on the warm side of an assembly). Average pressure differences varied in the 0–1 Pa range during different test periods.
• In the tests on elements 1–4, the 6 g/m3 excess moisture in autumn conditions was excluded.
• In the test on element 5x, winter and spring conditions were excluded due to the breakdown of the cooling system.
• In the test on element 5, the autumn excess moisture was initially 6 g/m3 and subsequently 4 g/m3.

145
• In the test on element 7, outdoor air relative humidity was about 9% RH above normal while the autumn target excess moisture was 4 g/m3. The real indoor air excess moisture was then about 3.4 g/m3.
• In the test on element 13, outdoor air relative humidity was about 8% RH above normal while the autumn target excess moisture was 6 g/m3. The real indoor air excess moisture was then about 5.4 g/m3.
• In the test on element 14, indoor air relative humidity was about 7% RH above normal while the autumn target excess moisture was 4 g/m3. The real indoor air excess moisture then was about 5.3 g/m3.
• In tests on elements 4, 6, 8 and 10, indoor air relative humidity was above normal during winter and spring periods, and in the case of element 10 also during autumn periods. This resulted from the high water vapour resistance of the interior wall lining of the test elements which slowed down the exit of extra moisture from indoor air. Yet, that had precious little impact on the moisture performance of test walls since the moisture flow into the assembly was small or nearly nonexistent. Thus, all assemblies were in line with the test results in this respect.
Measured outdoor and indoor air conditions at the end of test periods are presented in Appendix 2. The results are given as 12-hour (autumn and spring conditions) or 24-hour (spring conditions) averages. Variation in temperature and RH conditions was typically smaller at the end of autumn and winter periods than the uncertainty of the measurement of these quantities (see Ch. 3.1.7). The temperature and RH conditions of the ventilation gap at the end of test periods are also presented in Appendix 2. The air flow in the ventilation gap was not controlled in the tests since the rate remained naturally in the 0.1–0.15 m/s range in most cases. This corresponded quite closely with the flow rates measured behind wood cladding in field tests (see Chs. 4.1.3 and 4.2.2). Yet, it must be noted that the uncertainty of measurement of the velocity of air flow measured in laboratory and field tests was high (±0.1 m/s + 3% of reading).
3.2.3 Tested wall assemblies
The material layers of the tested wall assemblies are shown in Appendix 1. It also presents some building physical properties of each test wall. Material properties are shown in Appendix 3. These material values were also determined during this research project (see Ch. 3.3).
3.2.4 Test results
This chapter has mainly analysed the impact of the properties of different material layers on the relative humidity of the interior surface of the sheathing and the drying rate of the assembly in the selected test conditions. The most important measurement results as

146
regards the examined wall assemblies are also shown in the tables of Appendix 2. The measurement results are 12-hour averages from the end of autumn and winter periods and 24-hour averages from the end of spring periods. The presented temperature and RH values measured at the exterior and interior surfaces of thermal insulation have been measured laterally in the middle of the insulation layer (see Fig. 3.4). In autumn and winter conditions relative humidity at the exterior surface of insulation was typically higher than at a stud (values measured in the lower section of the assembly in Test walls 1–8). This was largely due the fact that the temperature at a stud was generally slightly higher due to the cold bridge effect than in the middle of the insulation layer. The calculational modelling also yielded the same result. The moisture content of a stud at the beginning of the test also affected the RH values measured next to a stud. This is one of the reasons why relative humidity was higher next to a stud in part of the walls. In spring conditions RH values were almost without exception higher at a stud due to the slower drying of the stud. Temperatures were correspondingly lower in spring conditions by a stud probably because the temperature of the moist timber frame changed more slowly in varying spring conditions than the temperature of the surrounding thermal insulation – thus remaining somewhat cooler, on average, during the spring period. Measurement results were also affected by the assembly’s internal convection and the measurement accuracy of sensors. When viewing the results, one must remember that the measurement points were located, on average, about 6.5 mm from the surface of the sheathing due to the diameter of measuring sensors (see Ch. 3.2.1). Thus, relative humidities on the surface of the sheathing were somewhat higher than the measured values. Moreover, relative humidities were still slowly changing in many tests as test conditions were changed, especially during autumn periods (see Figs. 3.18 and 5.7). Test conditions were changed at certain intervals so that test times would not become unreasonably long.
Impact of air/vapour barrier on performance of external wall
Figures 3.8–3.10 present the relative humidities of the pore air of the interior surface of the sheathing of test walls as a function of the water vapour resistance ratio between the interior and exterior wall linings. The figures give only the results for walls whose water vapour resistance ratio was ≤ 15:1. Water vapour resistance ratios have been calculated from the results measured in water vapour permeability tests (see App. 3). Measurement results for Test walls 1–40 at the end of each condition period have been compiled. Figures 3.8 and 3.9 show the measurement results in autumn conditions when indoor air excess moisture was 4 g/m3 and 6 g/m3. Figure 3.10 shows the results in winter conditions when excess moisture was 4 g/m3. Results for all walls are found in Figures 3.14–3.15 and in Appendix 2.

147
The figures displaying autumn conditions also indicate the RH limit value conducive to mould growth (82.5% RH on average) at the temperature conditions of the interior surface of the sheathing. The limit value was calculated with Equation 2.2. Exceedance of the limit value does not necessarily mean mould growth in the assembly since the initiation of mould growth always takes time. That time is the longer the closer the relative humidity of pore air is to the limit value (see Ch. 2.2.4). In any case, the limit value gives an idea of which walls are more critical for mould growth than others.
50
55
60
65
70
75
80
85
90
95
100
0 1 2 3 4 5 6 7 8 9 10 11 12 13 14 15
Water vapour resistance ratio, Zli/Zle (-)
Rel
ativ
e hu
mid
ity a
t int
erio
r sur
face
of s
heat
hing
,ϕ
(% R
H)
5a
16b4a6a3a 4b
14b26b 9xb
3b, 5b, 6b9b, 25b, 27b28b
11xb10xb 19b20b
17b12xb
18b12b
10b 11b
Favourable conditionsfor mould growth
34b, 36b
38b37b, 39b
40b
Figure 3.8 Relative humidities of the pore air of external wall assemblies at the interior surface of the
sheathing as a function of water vapour resistance ratio. Measurements were made in autumn conditions as excess moisture was 4 g/m3. The black balls represent test walls where moisture condensed on the interior surface of the sheathing. The white balls represent test walls studied while the relative humidity of outdoor air was about 9% RH higher than in the case of the rest (see App. 2). Therefore, they are not fully comparable with the others.
Figure 3.8 shows that when the water vapour resistance ratio between the interior and exterior wall linings is small, many assemblies are at risk for mould growth in the test conditions selected for the study. In the case of some of these walls the water vapour resistance ratio even exceeded 5:1. Wall types with resistance ratios < 5:1 often also include assemblies presently regarder in Finland as moisture-permeable wall assemblies. This study proves that such walls do not even meet the minimum requirement of RakMK C2 (1998) for the water vapour resistance ratio of an assembly if the interior finishing of the assembly is not taken into account in the analyses.
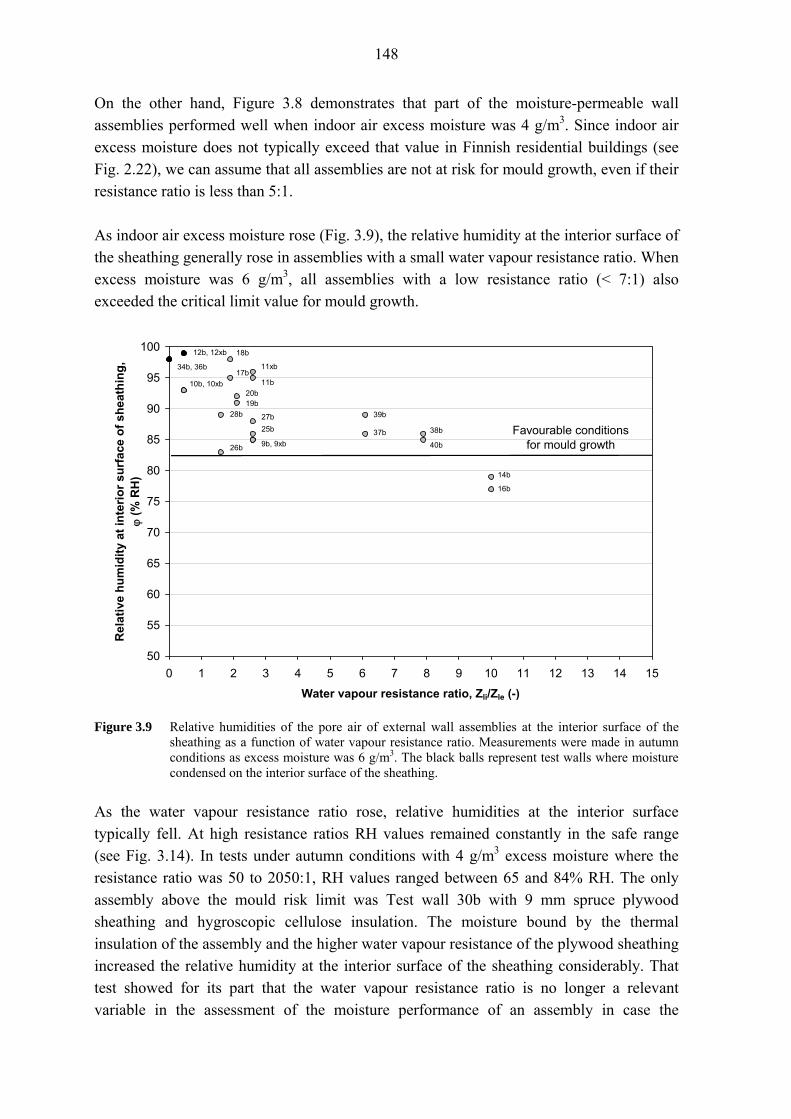
148
On the other hand, Figure 3.8 demonstrates that part of the moisture-permeable wall assemblies performed well when indoor air excess moisture was 4 g/m3. Since indoor air excess moisture does not typically exceed that value in Finnish residential buildings (see Fig. 2.22), we can assume that all assemblies are not at risk for mould growth, even if their resistance ratio is less than 5:1. As indoor air excess moisture rose (Fig. 3.9), the relative humidity at the interior surface of the sheathing generally rose in assemblies with a small water vapour resistance ratio. When excess moisture was 6 g/m3, all assemblies with a low resistance ratio (< 7:1) also exceeded the critical limit value for mould growth.
50
55
60
65
70
75
80
85
90
95
100
0 1 2 3 4 5 6 7 8 9 10 11 12 13 14 15
Water vapour resistance ratio, Zli/Zle (-)
Rel
ativ
e hu
mid
ity a
t int
erio
r sur
face
of s
heat
hing
,ϕ
(% R
H)
Favourable conditionsfor mould growth
10b, 10xb
18b
17b
28b
26b
19b20b
16b
14b
11b
11xb
9b, 9xb
27b25b
12b, 12xb
38b
40b
39b
34b, 36b
37b
Figure 3.9 Relative humidities of the pore air of external wall assemblies at the interior surface of the
sheathing as a function of water vapour resistance ratio. Measurements were made in autumn conditions as excess moisture was 6 g/m3. The black balls represent test walls where moisture condensed on the interior surface of the sheathing.
As the water vapour resistance ratio rose, relative humidities at the interior surface typically fell. At high resistance ratios RH values remained constantly in the safe range (see Fig. 3.14). In tests under autumn conditions with 4 g/m3 excess moisture where the resistance ratio was 50 to 2050:1, RH values ranged between 65 and 84% RH. The only assembly above the mould risk limit was Test wall 30b with 9 mm spruce plywood sheathing and hygroscopic cellulose insulation. The moisture bound by the thermal insulation of the assembly and the higher water vapour resistance of the plywood sheathing increased the relative humidity at the interior surface of the sheathing considerably. That test showed for its part that the water vapour resistance ratio is no longer a relevant variable in the assessment of the moisture performance of an assembly in case the

149
sheathing has high water vapour resistance and moisture can enter the assembly. The impacts of high water vapour resistance will be looked at again in connection with the test results for the capillary range (see Fig. 3.19). Test results proved that some assemblies are at risk for mould growth even though their resistance ratio is higher than 5:1. Likewise, some assemblies are not at risk even if their resistance ratio is less than 5:1. The moisture performance of an assembly is thus dependent also on other structural factors besides the water vapour resistance ratio between indoor and outdoor air (see Ch. 2.4.1). By comparing Figures 3.8 and 3.9 we can also determine the impact of the assembly’s initial moisture content on the test results. In the case of assemblies whose sheathing and thermal insulation materials were stored at 55% RH prior to the tests (Assemblies 1a–8a), the RH at the interior surface of the sheathing did not rise as high as with walls kept in more humid conditions (86% RH; Assemblies 1b–8b). On the other hand, the RH at the exterior surface of the thermal insulation of many assemblies had not yet reached its final level but continued to rise slowly. This indicates that in a real-life situation the differences would have been smaller than the measured values. The differences in measurement results were likely due to the hysteresis of the materials’ sorption curves in adsorption and desorption situations and differences between properties of test materials. The test results in winter conditions (Fig. 3.10) were quite similar to those in autumn conditions. During the winter period moisture condensed in many wall assemblies which had a low water vapour resistance ratio. In other words, assemblies that were critical for mould growth in autumn conditions were also critical for moisture condensation in winter conditions. When moisture condensed on the interior surface of sheathing in winter the relative humidity of pore air was typically near 90% RH. This was the result of the used humidity sensors measuring relative humidity over water which meant that relative humidity did not reach 100% RH near the freezing surface in subzero conditions (see Table 1.2). Moreover, as earlier stated, relative humidity at the measurement point was always slightly lower than on the sheathing surface due to the cross section of the measurement sensor. Figure 3.10 shows that moisture condensed on Test walls 37b−40b in winter although their water vapour resistance ratio was relatively high. This was due the fact that the moisture content of thermal insulations and studs close to the exterior surface of the assembly had risen during autumn, but could not exit quickly enough in winter. Moisture condensed on these structures particularly because they had a thin weatherisation membrane for sheathing, which had practically no thermal resistance. Therefore, as outdoor air temperature fell, the backside of the membrane froze which started condensation (see Fig. 3.13). This issue was examined earlier in Chapter 2.1.3 and will be returned to in Chapter 6.3.1.

150
50
55
60
65
70
75
80
85
90
95
100
0 1 2 3 4 5 6 7 8 9 10 11 12 13 14 15
Water vapour resistance ratio, Zli/Zle (-)
Rel
ativ
e hu
mid
ity a
t int
erio
r sur
face
of s
heat
hing
,ϕ
(% R
H)
19b
10b
12b
25b, 27b
3b18b 9b
20b17b
11b
26b
4a
4b5a
6a
3a
16b
14b
6b, 28b5b
36b
34b
38b, 40b
37b
39b
Figure 3.10 Relative humidities of the pore air of external wall assemblies at the interior surface of the
sheathing as a function of water vapour resistance ratio. Measurements were made in winter conditions as excess moisture was 4 g/m3. The black balls represent test walls where moisture condensed on the interior surface of the sheathing. The white balls represent test walls studied while excess moisture was higher than the target value (see App. 2). This did not have a significant effect on test results since the water vapour resistance of the interior section of walls was high.
When water vapour resistance ratio was high and thermal resistance of sheathing was adequate, there was no condensation problem with wall assemblies even in winter (see Fig. 3.15). At high resistance ratios (50 to 2050), RH values ranged between 55 and 84% RH. Based on the results, it can be stated that increasing the water vapour resistance ratio above a certain value no longer improves essentially the moisture performance of an external wall assembly in autumn and winter conditions with respect to diffusion. The impact of just the water vapour resistance of the interior wall lining on the moisture performance of the assembly can be clearly determined by looking at the test results of Appendix 2. When the water vapour resistance of the interior surface was low (≤ 8.4 ×10³ s/m), the relative humidities of the exterior surface of the assembly with a 4 g/m3 excess moisture varied between 70 and 97% RH. As the resistance of the interior surface increased, this range narrowed essentially. For instance, at a water vapour resistance value of 147 ×103 s/m (Test walls 13b–16b), the range of RH values was 76 to 80% RH, and at 364–371 ×103 s/m (Test walls 21b–24b) the respective RH value was 75 to 79% RH. These test results clearly indicate that the lower the interior surface water vapour resistance, the more the moisture performance of the external wall assembly depends on the other material layers of the wall.

151
Impact of sheathing on performance of external wall assembly
Thermal resistance of sheating
The impact of the thermal resistance of the sheathing on the moisture performance of the external wall assembly is explained by Figures 3.11–3.13. They show the relative humidities of the pore air at the interior surface of sheathings of moisture-permeable walls whose water vapour resistance ratio, and water vapour resistance of the interior wall lining, are approximately of the same level. Thus, the results are mutually comparable. The survey includes walls with interior linings whose water vapour resistance is about 6.4 to 8.4 ×10³ s/m and water vapour resistance ratio 1.6 to 3.2:1. Thermal resistance values were computed from the measurement results of thermal conductivity tests on materials (see App. 3). Figures 3.11–3.13 show that the thermal resistance of the sheathing also has a clear impact on the RH of the interior surface of the sheathing. Good thermal resistance of the sheathing does not, however, by itself ensure proper performance of the wall assembly since the RH conditions of Test walls 3b, 5b, 6b and 28b were above the critical RH value for mould growth even though they had a sheathing layer that provided good thermal insulation. Also in the case of test walls with a high water vapour resistance ratio, increasing the thermal resistance of the sheathing lowered the RH values of the interior surface of the sheathing (see App. 2). Thus, higher thermal resistance of the sheathing improves the moisture performance of all external wall assemblies independent of the water vapour resistance of the interior wall lining. Good examples of the impact of the thermal resistance of the sheathing were also the results on Test walls 29b–32b where 9 mm spruce plywood was used as sheathing. In Test walls 29b and 31b, a 25 mm glass wool sheathing was added on the exterior surface of the plywood. Test walls 30b and 32b had the actual thermal insulation layer correspondingly 25 mm thicker which meant that the overall thickness of thermal insulation was the same in all walls. Used thermal insulations were rock wool and cellulose (see App. 1). The addition of a glass wool sheathing board on the exterior surface of the plywood lowered relative humidity at the interior surface of the plywood by about 6 to 20% RH depending on outdoor air conditions. This boosted the moisture performance of assemblies so that their relative humidities in autumn conditions stayed more clearly below the range favourable to mould growth (see App. 2). Consequently, if plywood is required on the exterior surface of an assembly, for instance, to make the building rigid, its performance with respect to diffusion improves if a thin thermal insulation is attached to the exterior surface. Tsongas et al. 1995a and Ojanen 1998, among others, have observed this earlier in their research. Extra insulation on the exterior surface of the sheathing appears to improve drying of the assembly also after occasional moisture leaks (see Fig. 3.19).

152
50
55
60
65
70
75
80
85
90
95
100
0.0 0.1 0.2 0.3 0.4 0.5 0.6 0.7 0.8
Thermal resistance of sheathing, Rsh (m2·K/W)
Rel
ativ
e hu
mid
ity a
t int
erio
r sur
face
of s
heat
hing
,ϕ
(% R
H)
19b20b17b18b
11xb
9b, 25b, 27b
9xb
5a
6a3a
3b, 5b, 6b
28b
26b
11b
Favourable conditionsfor mould growth
Figure 3.11 Relative humidities of the pore air of external wall assemblies at the interior surface of the
sheathing as a function of thermal resistance. Measurements were made in autumn conditions as excess moisture was 4 g/m3. The white balls represent test walls studied while the relative humidity of outdoor air was about 9% RH higher than with the others (see App. 2). Therefore, these walls are not fully comparable with the others.
50
55
60
65
70
75
80
85
90
95
100
0.0 0.1 0.2 0.3 0.4 0.5 0.6 0.7 0.8
Thermal resistance of sheathing, Rsh (m2·K/W)
Rel
ativ
e hu
mid
ity a
t int
erio
r sur
face
of s
heat
hing
,ϕ
(% R
H)
26b
28b
11xb
11b
27b
25b
9b, 9xb
19b20b
17b
18b
Favourable conditionsfor mould growth
Figure 3.12 Relative humidities of pore air of external wall assemblies at the interior surface of the
sheathing as a function of thermal resistance. Measurements were made in autumn conditions as excess moisture was 6 g/m3.

153
50
55
60
65
70
75
80
85
90
95
100
0.0 0.1 0.2 0.3 0.4 0.5 0.6 0.7 0.8
Thermal resistance of sheathing, Rsh (m2·K/W)
Rel
ativ
e hu
mid
ity a
t int
erio
r sur
face
of s
heat
hing
,ϕ
(% R
H)
3b5b6b, 28b
26b3a
6a
5a
18b
20b
17b, 19b
25b, 27b
9b
11b
Figure 3.13 Relative humidities of pore air of external wall assemblies at the interior surface of the
sheathing as a function of thermal resistance. Measurements were made in winter conditions as excess moisture was 4 g/m3. The black balls represent test walls where moisture condensed on the interior surface of the sheathing.
Figures 3.14 and 3.15 demonstrate the impact of increasing the thermal resistance of sheathing on moisture conditions of wall assemblies as the water vapour resistance of the interior surface increases. Figure 3.14 presents the relative humidities of all tested wall assemblies at the end of the autumn period as a function of the water vapour resistance ratio between the interior and exterior surfaces of the assembly on a logarithmic scale. Figure 3.15 presents the situation in winter conditions. In the figures the assemblies are divided into three groups on the basis of the thermal resistance of sheathing. Figures 3.14 and 3.15 show how higher thermal resistance of sheathing also improved the moisture performance of wall assemblies with a vapour barrier. Increasing the water vapour resistance of the interior surface of the wall also reduced the relative humidity of the interior surface of the sheathing up to a certain limit. At high resistance ratios, RH values generally remained constantly in the safe range. The only assembly above the mould risk limit in autumn conditions was Test wall 30b (ϕ = 84% RH) with spruce plywood as sheathing and cellulose insulation. It showed for its part that the water vapour resistance ratio is no longer a relevant variable in assessing the moisture performance of an assembly if the sheathing has high water vapour resistance and moisture can enter into the assembly. In general, relative humidity values at the interior surface of sheathing depended significantly on the moisture content of the thermal insulation at the beginning of the test in the case of test walls with plywood sheathing.

154
50
55
60
65
70
75
80
85
90
95
100
0.001 0.01 0.1 1 10 100 1000 10000Water vapour resistance ratio, Zli/Zle (-)
Rel
ativ
e hu
mid
ity a
t int
erio
r sur
face
of s
heat
hing
,ϕ
(% R
H)
Thermal resistance of sheathing 0.0 - 0.09 m²·K/W
Thermal resistance of sheathing 0.46 - 0.63 m²·K/W
Thermal resistance of sheathing 0.94 - 1.07 m²·K/W
Favourable conditions for mould growth 35b
40b38b
37b, 39b
9b, 25b,27b
9xb
4b
4a
5a
6a
3a
26b3b, 5b, 6b
28b
11xb
11b10xb
10b
34b, 36b
12xb
12b
17b
18b
32b
30b
29b15b
13b
16b
14b33b
7a8b
7b1b
21b
22b
8a
1a
24b
23b
31b 2a
2b
19b
20b
Figure 3.14 Relative humidities of pore air of all external wall assemblies at the interior surface of
sheathing as a function of the water vapour resistance ratio between the interior and exterior surface of the assembly. The measurements were made in autumn conditions as indoor air excess moisture was 4 g/m3. The black balls depict test walls where moisture condensed on the interior surface of the sheating.
50
55
60
65
70
75
80
85
90
95
100
0.001 0.01 0.1 1 10 100 1000 10000Water vapour resistance ratio, Zli/Zle (-)
Rel
ativ
e hu
mid
ity a
t int
erio
r sur
face
of s
heat
hing
,ϕ
(% R
H)
Thermal resistance of sheathing 0.0 - 0.09 m²·K/W
Thermal resistance of sheathing 0.46 - 0.63 m²·K/W
Thermal reistance of sheathing 0.94 - 1.07 m²·K/W
35b
38b, 40b
37b9b
4b
4a
5a
6a3a
26b
6b, 28b
11b
10b
34b 12b 17b
18b
32b
30b
29b
15b
13b16b
14b
33b
7a
8b
7b
1b, 8a 21b
22b
1a
24b23b
31b
2a
2b
19b20b
36b 3b5b
25b,27b 39b
Figure 3.15 Relative humidities of pore air of external wall assemblies at the interior surface of sheathing
as a function of the water vapour resistance ratio between the interior and exterior surface of the assembly. The measurements were made in winter conditions as indoor air excess moisture was 4 g/m3. The black balls depict test walls where moisture condensed on the interior surface of the sheating.

155
In the case of assemblies with a vapour barrier, no moisture condensation occurred even in winter conditions – the assemblies performed impeccably in all tests. However, the results indicate that increasing the water vapour resistance ratio above a certain value does not improve the assembly’s moisture performance significantly in relation to diffusion in autumn and winter conditions.
Water vapour resistance of sheathing
The next subject of analysis was the change in relative humidity at the interior surface of sheathing in Test walls 13b–16b (Fig. 3.16). These walls had plastic-coated paper of high water vapour resistance as a vapour barrier. Thus, hardly any moisture transferred from indoors into the assembly by diffusion – moisture transferred into the assembly and out of it almost exclusively through the sheathing. The sheathing of Test walls 13b and 15b was gypsum board, which has low water vapour resistance (2.6 ×10³ s/m) while that of Test walls 14b and 16b was wood hardboard, which has clearly higher water vapour resistance (14.0 ×10³ s/m). Moreover, the moisture capacity of wood hardboard is higher than that of gypsum board. The sheathing boards were relatively similar as to other properties – both are hygroscopic and capillary and have low thermal resistance. The thermal insulation of Test walls 13b and 14b was cellulose while that of walls 15b and 16b was glass wool.
0
10
20
30
40
50
60
70
80
90
100
0 1 2 3 4 5 6 7 8 9
Time (weeks)
Rel
ativ
e hu
mid
ity a
t int
erio
r sur
face
of s
heat
hing
,ϕ
(% R
H)
Test wall 13bTest wall 14bTest wall 15b Test wall 16b
Autumn, 6 g/m3Autumn, 4 g/m3 Spring, 5 g/m3Winter, 4 g/m3
Figure 3.16 Changes in relative humidity of pore air at the interior surface of sheathing in Test walls 13b–
16b. Figure 3.16 demonstrates that increasing the water vapour resistance of sheathing slowed down the wetting of the insulation layer by outdoor air in autumn conditions – and respectively drying of the wall in spring conditions. Also, under spring conditions, changes in outdoor air conditions had a lesser effect behind the denser sheathing (amplitude of RH

156
was smaller). In this test all walls dried relatively fast as the spring period began since no moisture transferred into the assembly from indoors. Figure 3.17 shows the changes in relative humidity at the interior surface of sheathing in Test walls 9b–12b. These walls were similar to the ones of the previous test, except that moisture-permeable bitumen paper (material B5, App. 3) was used as an air barrier in the interior wall lining. In other respects Test walls 9b and 10b corresponded to Test walls 13b and 14b, as did Test walls 11b and 12b to Test walls 15b and 16b.
0
10
20
30
40
50
60
70
80
90
100
0 1 2 3 4 5 6 7 8 9 10 11
Time (weeks)
Rel
ativ
e hu
mid
ity a
t int
erio
r sur
face
of s
heat
hing
,ϕ
(% R
H)
Test wall 9bTest wall 10bTest wall 11bTest wall 12b
Autumn, 6 g/m3 Autumn, 4 g/m3 Winter, 4 g/m3 Spring, 5 g/m3
Figure 3.17 Changes in relative humidity of pore air at the interior surface of sheathing in Test walls 9b–
12b. Figure 3.17 also tells us that, in these tests, the relative humidity of the interior surface of the sheathing rose much higher than when a vapour barrier was used. Moisture also condensed behind the sheathing in these walls under winter conditions. This was natural since the water vapour resistance ratio between the interior and exterior surface was low. Relative humidity changed slower at the interior surface of the denser sheathing (wood hardboard) also in this test (Test walls 10b and 12b). What is noteworthy about this test, however, is that assemblies with wood hardboard for sheathing did not dry significantly during the spring period. In other words, if extra moisture has entered into an assembly, a vapour-tight sheathing slows down its drying considerably. The numerous cases of moisture damage to assemblies with plywood or OSB board as sheathing are practical examples of that same phenomenon (see Ch. 7.3). Good examples of the impact of vapour-tight sheathing on the wetting of an assembly are also Test walls 31b and 32b with spruce plywood on the exterior surface and rock wool as

157
thermal insulation. The humidities by volume at the interior surface of the plywood sheathings of these walls were continuously lower than in the ventilation gap in autumn conditions (see App. 2). The water vapour resistances of their interior wall lining and sheathing were so high that moisture transfer into the wall was slow.
Moisture capacity of sheathing
The impact of the sheathing’s moisture capacity can be examined on the basis of the results on Test walls 19b, 20b, 26b and 28b (Fig. 3.18). All of them were moisture-permeable. In Test walls 19b and 26b the thermal insulation was hygroscopic while that of Test walls 20b and 28b was mineral wool. Test walls 26b and 28b had a 25 mm porous fibreboard as sheathing while Test walls 19b and 20b used a thin weatherisation membrane. The water vapour resistances of sheathings were, however, quite similar. Since Test walls 19b and 20b had a thin sheathing, their thermal insulation was 25 mm thicker than that of Test Walls 26b and 28b. Other properties of the wall materials were quite similar.
0
10
20
30
40
50
60
70
80
90
100
0 1 2 3 4 5 6 7 8 9 10 11
Time (weeks)
Rel
ativ
e hu
mid
ity a
t int
erio
r sur
face
of s
heat
hing
,ϕ
(% R
H)
Test wall 19bTest wall 20bTest wall 26bTest wall 28b
Figure 3.18 Changes in relative humidity of pore air at the interior surface of sheathing in Test walls 19b,
20b, 26b and 28b. Fig. 3.18 shows that in the case of Test walls 26b and 28b, where porous fibreboard was used as sheathing, the relative humidities of pore air changed more slowly than with thin weatherisation membrane sheathing. In practice, a hygroscopic sheathing retards the wetting of an assembly and mould growth in the autumn period. In spring conditions the effect is the opposite, but mould growth is typically not as critical a factor in spring as it is in autumn conditions (see Ch. 2.2.4). Thus, a hygroscopic sheathing board improves the moisture performance of a wall assembly slightly. Yet, its impact is not as big as, for

158
instance, that of the water vapour resistance of the interior wall lining or the thermal resistance of the sheathing. Figure 3.18 also shows clearly the significance of thermal resistance for an assembly. The water vapour resistance ratio between the interior and exterior surface and the water vapour resistance of sheathing were much the same with all assemblies, but in assemblies with a thin sheathing (Test Walls 19b and 20b), relative humidities rose considerably higher than at the interior surface of thermally insulating sheathing. Moisture also condensed in these assemblies in the winter period.
Impact of thermal insulation on performance of external wall assembly
Thermal resistance/thickness of thermal insulation
The impact of the thermal resistance of thermal insulation on the performance of the wall assembly can be studied from Figures 3.8–3.10. Test walls 9b, 11b, 25b and 27b were otherwise similar except that the thermal insulation of Test walls 25b and 27b was 25 mm thinner. The figures show that the relative humidities of pore air in Test walls 25b and 27b were somewhat lower than in Test walls 9b and 11b. On the other hand, in winter conditions water condensed within Test wall 25b as it did within Test walls 9b and 11b. The test results show, however, that the use of thinner thermal insulation improves the moisture performance of a wall. But it is not sensible in practice since Finnish thermal insulation requirements mandate an external wall U-value ≤ 0.25 W/m2K (RakMK C3 2003). Otherwise, the U-value of walls would have to be compensated for by improving the thermal insulation of other structural components or by analysing the total energy consumption of a building (RakMK C3 2003). The U-values calculated for the test walls of laboratory tests are presented in Appendix 1. The values were calculated according to the principles of RakMK C4 (2003) using normal thermal conductivity, λn, values. Examination of the values reveals that walls insulated with sawdust + chipping do not meet today’s thermal insulation regulations. Yet, to make the test results comparable as to moisture performance it was deemed necessary to use the same thermal insulation thicknesses for all walls. It is also not economical to make walls so thick that a sawdust-insulated wall would meet the required U-value. In the case of the sawdust-insulated wall the above-mentioned compensation procedure can be followed in order to attain the overall U-value required of a building.
Water vapour resistance of thermal insulation
The water vapour resistance of thermal insulation affects the hygrothermal performance of the wall if the insulation’s water vapour resistance accounts for a significant share of the assembly’s total resistance. However, this study included only open pore thermal insulations whose water vapour resistances were low. They affect the performance of an

159
assembly only if the water vapour resistance of its interior and exterior surface layers is very low. Yet, that is sometimes possible with moisture-permeable walls. The test series included no wall assemblies that would have allowed examining the impact of this phenomenon since they were not mutually comparable as to their other properties.
Moisture capacity of thermal insulation
The impact of the moisture capacity of thermal insulation on the moisture performance of the external wall assembly can be also studied from Figures 3.16 and 3.17. As earlier stated, Test walls 9b, 10b, 13b and 14b had hygroscopic thermal insulation while Test walls 11b, 12b, 15b and 16b had mineral wool. Figure 3.16 shows that it takes longer to reach a steady RH level during autumn and spring conditions in the case of Test walls 13b and 14b than with Test walls 15b and 16b. The same relationship exists between Test walls 9b and 10b and Test walls 11b and 12b (see Fig. 3.17). In other words, the moisture capacity of thermal insulation retards RH change at the exterior surface of insulation material as does sheathing. As stated earlier, that phenomenon is beneficial on the whole since autumn conditions, when hygroscopic insulation retards the rise in relative humidity at the interior surface of the sheathing, are more critical for mould growth and moisture condensation than spring conditions (see Ch. 2.2.4). However, when the thermal resistance of the sheathing is low and water vapour resistance is high, an assembly with hygroscopic thermal insulation can be more critical in moisture condensation analyses (see Ch. 6.3.1). This is because hygroscopic thermal insulation can bind a lot of moisture, and the moisture cannot exit the assembly quickly enough as temperature drops (see Chs. 2.1.3 and 6.3.1).
Capillary activity of thermal insulation
The tests showed that in winter conditions (θe < 0°C) moisture condensed and froze on the interior surface of the sheathing although a capillary thermal insulation was used (Test walls 9b, 10b, 17b, 19b, 25b, 37b and 38b) (see Fig. 3.10). The only difference was that condensation started somewhat later in the wall with capillary and hygroscopic insulation. The same fact was discovered already in earlier studies (see Chs. 1.7.3 and 1.7.4). The impact of the capillary activity of thermal insulation on moisture condensation in autumn conditions (θe > 0°C) was analysed in Test walls 34b and 36b. In these tests plastic foil was used as sheathing, and the air barrier of the interior surface was bitumen paper which subjected the assemblies to the highest possible condensation risk. The thermal insulation of Test wall 34b was flax and that of Test wall 36b glass wool. During testing moisture condensed inside both test walls behind the plastic foil already in the autumn period, and the interior surface of the plastic was covered with condensate throughout the test. The only difference was, again, that condensation started somewhat

160
later in the flax-insulated wall. Thus, hygroscopic and capillary thermal insulation were unable to prevent condensation of water on the interior surface of the plastic although capillary suction is supposed to transfer water back towards the inner parts of the assembly (see Ch. 1.7.1). The test indicated that condensation may also occur on the interior surface of the sheathing in walls with capillary thermal insulation, even when the condensed moisture is in liquid form. This phenomenon was likely the result of a very narrow air gap between the sheathing and the thermal insulation which prevented capillary transfer of moisture from the surface inward. Also, the flax insulation of the wall was not as capillary an insulation as, for instance, cellulose (Vinha et al. 2005b). In any case, the same phenomenon may just as well occur in actual assemblies, meaning that moisture may condense on the interior surface of the sheathing in both autumn and winter conditions independent of the open pore thermal insulation material used.
Moisture content of materials during condensation
The measured moisture contents of material samples near the interior surface of sheathing corresponded quite closely to those derived from RH readings with the help of sorption curves (Vinha et al. 20002b; Valovirta & Vinha 2004; Vinha et al. 2005b). The moisture contents of thermal insulations and sheathings were in the hygroscopic range also in assemblies where moisture condensed in winter conditions. One reason for that was that the freezing of moisture prevented capillary flow from the point of condensation to the rest of the assembly and, thereby, the moisture content from rising into the capillary range (Ch. 1.7.1). Moreover, the average thickness of thermal insulation samples was about 25 mm while samples from sheathing boards were as thick as the boards. Thus, test results do not show the moisture content of a material at exactly the interface between thermal insulation and sheathing.
Drying properties of walls in the hygroscopic range
More detailed examinations of the drying of test walls are presented in Käkelä & Vinha (2002) and Vinha & Käkelä (2004b). Only the impact of different material layers and properties on the drying of walls are reiterated here. The test results showed that a hygroscopic insulation and sheathing material and a more vapour tight sheathing material increase the drying time of walls in spring conditions. Wood hardboard (A8, App. 3) did not perform acceptably in the tests as it failed to prevent moisture from entering into the wall from indoor air by diffusion. Because the water vapour resistance of wood hardboard was about 14.0 ×10³ s/m in this test, the suitable water vapour resistance of thin sheathing is lower (see Fig. 2.7) (Vinha & Käkelä 2002a; Vinha & Käkelä 2004b).

161
On the other hand, Test walls 29b–32b where spruce plywood (A11, App. 3) was used as sheathing dried quite well, even though the water vapour resistance of the plywood was quite high (8.3 ×10³ s/m). In their case drying was a little bit slower when extra thermal insulation was used on the exterior side of the plywood. This was probably due the fact that then plywood was drier and, thus, its water vapour resistance was a little bit higher (15.5 ×10³ s/m together with extra insulation). It is interesting to note that these walls dried clearly faster than ones with wood hardboard as sheathing although the combined water vapour resistance of plywood and glass wool board was about the same as that of wood hardboard. The test proved that sheathing may also have a water vapour resistance of 15 ×103 s/m if it has high thermal resistance. This was also shown later by calculations in Chapter 6.3.6. The drying test results also indicated that a plastic vapour barrier on the inside did not slow the drying of walls considerably when the other material layers were the same and the sheathing was quite vapour-permeable (Vinha & Käkelä 2002a; Vinha & Käkelä 2004b).
Drying properties of walls in the capillary range
Moisture leakage was modelled with Test walls 41c–44c by pouring two litres of water into the assemblies from above (see Ch. 3.2.1). The aim of these tests was to examine drying of the assemblies after a moisture leak. The sheathing of Walls 42c and 44c consisted of 9 mm spruce plywood + 25 mm glass wool board while that of Walls 41c and 43c was 25 mm wood fibreboard. The relative humidities at the interior surface of the sheathing measured during different test periods are shown in Figure 3.19. Results were measured from the upper wall section which was the most critical from the viewpoint of moisture performance. In all tests water condensed on the interior surface of the sheathing in the upper wall section during autumn and winter. Yet, the measurement results on Test walls 41c and 42c indicated lower relative humidities in the upper wall section (see Fig. 3.19). This was partly due the fact that the water poured into the assembly became very unevenly distributed in the thermal insulation layer, which created localised points of condensation on the interior surface of the sheathing. Moreover, the water poured into Test walls 41c and 42c ran first along the flax fibres to the interior surface of the sheathing, and from there into the lower wall section, before exiting the assembly outdoors. That is why these assemblies did not contain as much extra moisture at the start of the drying period as cellulose insulated walls. The cellulose insulation of Test walls 43c and 44c, on the other hand, was better at binding extra moisture locally preventing moisture from becoming distributed very widely in the assembly. In springtime all assemblies dried quite well. These tests indicated no big differences in the performance of 9 mm spruce plywood + 25 mm glass wool board and 25 mm porous

162
fibreboard. Drying was also about as fast as with corresponding Test walls 29b and 31b in the hygroscopic range.
0
10
20
30
40
50
60
70
80
90
100
0 1 2 3 4 5 6 7 8 9 10 11 12 13 14
Time (weeks)
Rel
ativ
e hu
mid
ity a
t int
erio
r sur
face
of s
heat
hing
,ϕ
(% R
H)
Test wall 41cTest wall 42cTest wall 43cTest wall 44c
Figure 3.19 Changes in relative humidity of pore air at the interior surface of sheathing in upper wall
sections in capillary range tests on Test walls 41c−44c. The RH sensor of Test wall 44c got wet and stopped working during the test.
Exterior surface resistances of sheathings
The surface resistances of tested walls can be also determined on the basis of measured results. The thermal resistance values of walls, Rwall, can be determined as the sum of the thermal resistances of material layers (see Eqs. 1.8 and 1.9). Since the heat flow through a wall assembly is the same across the assembly, the surface resistance of the exterior surface of sheathing, Rsh,se, can also be calculated based on the thermal resistance and temperature of the wall (Eq. 3.1).
sesh,si
esesh,wallsesh, θθ
θθ−
−= RR (3.1)
where
θsh,se is temperature of exterior surface of sheathing (ºC) θe is temperature of outdoor air (ºC) θsi is temperature of interior surface of wall (ºC)
The thermal resistance values of walls were calculated by the method presented in EN ISO 13788 (2001) standard using laboratory values measured at 10°C and 65% RH as thermal

163
conductivity values of wall materials. These values produced the minimum surface resistance values of exterior surfaces. It should be noted that the test elements of laboratory tests consisted of several different wall assemblies which means that the evaluation of the total thermal resistance of a test element involved factors of uncertainty. The best time to evaluate the exterior surface resistance of a test element was the winter period when the temperature difference between the interior and exterior surfaces was at its greatest. The surface resistance between the exterior surface of the sheathing and outdoor air ranged from 0.22 to 0.37 m2·K/W depending on the analysed test elements. About half of the temperature difference between the exterior surface of the sheathing and outdoor air resulted from the temperature difference between outdoor air and air in the middle of the ventilation gap, and the other half from the temperature difference between the air in middle of the ventilation gap and the exterior surface of the sheathing.
3.2.5 Conclusions
Laboratory tests on external wall assemblies showed that the moisture performance of wall assemblies is affected by the material layers of the wall and their building physical properties in addition to outdoor and indoor air conditions. The detrimental effects of diffusion from indoor air are best prevented by increasing the water vapour resistance ratio between the interior and exterior wall linings or the water vapour resistance of the interior wall lining, as well as by increasing the thermal resistance of the sheathing. However, other material layers and properties also affect the performance of assemblies. The drying of an assembly, on the other hand, can best be improved by lowering the water vapour resistance of the sheathing. Hygroscopic thermal insulation and sheathing materials slow down changes in relative humidity within the assembly in fluctuating outdoor and indoor air conditions. This usually improves the moisture performance of the assembly as summer conditions evolve into winter conditions, when the relative humidity of pore air increases in the exterior portion of the wall. On the other hand, the same factor retards the drying of the wall in spring conditions. Autumn and winter conditions are, however, typically more critical for the moisture performance of an assembly than spring conditions, meaning that in many instances hygroscopic thermal insulation and sheathing improve its moisture performance. Many of the walls of the test did not meet the minimum 5:1 requirement set in RakMK C2 (1998) for the water vapour resistance ratio between the interior and exterior wall linings, if the interior finishing of the assembly is excluded. Yet, some of these assemblies have been used as external wall assemblies in Finland in recent years. Wall assemblies with a low water vapour resistance ratio also proved the most critical for mould growth and moisture condensation in conducted laboratory tests.

164
In some assemblies with a resistance ratio above 5:1, moisture condensation and conditions conducive to mould growth existed on the exterior surface of the thermal insulation. On the other hand, all assemblies with a resistance ratio under 5:1 were not critical with respect to diffusion from the inside out. As a matter of fact, the sufficiency of the water vapour resistance ratio/water vapour resistance of the interior wall lining of wall assemblies varies considerably depending on the outdoor and indoor air conditions and the assembly in question. The determination of the minimum value of the resistance ratio between the interior and exterior wall linings in different situations requires calculational analyses in addition to laboratory tests. The results of laboratory tests showed which wall assemblies are more critical from the viewpoint of moisture performance than others. Laboratory tests by themselves are not enough to indicate which walls perform sufficiently well in Finnish climate since the selected outdoor air conditions were average conditions, and the tests did not take into account the changes in outdoor and indoor air conditions over a period of a year. Wall assemblies should be examined by calculational analyses in actual conditions to shed light also on this area (see Ch. 6). The exterior surface resistances yielded by laboratory tests met the requirements of ISO 6946 (1996) and RakMK C4 (2003), according to which the interior surface resistance value of 0.13 m2·K/W may be used as the exterior surface resistance value of the sheathing. However, the values were measured in a laboratory, using smaller than normal wall assemblies, which requires that also field tests on exterior surface resistances are conducted.
3.3 Material tests
Traditionally, the most important building physical property of a material has been its thermal conductivity which is necessary for calculating the U-value of building components and energy consumption. Normally the air conductivity or air permeance of materials has also been determined for the same purpose. It has also been necessary to determine the water-tightness of waterproofings. The capillary properties of soil types and building materials that come into contact with liquid water as part of assemblies have also been measured. Other material properties have previously been published occasionally, but material manufacturers have not been obliged to define them for the products they manufacture. The equilibrium moisture content has generally been the only material property which has been given as a function of relative humidity. Other building physical properties have been given as fixed values independent of the temperature or moisture conditions under study. As the analysis of the moisture performance of assemblies has increased, demand for equilibrium moisture content and water vapour permeability/water vapour resistance

165
values and capillary properties has also increased. In order to be able to improve the accuracy of calculation programs, it has also become necessary to use material properties expressed as a function of temperature and relative humidity. Part of today’s calculation applications already accept variable material property data (see Ch. 5). The last few years have also witnessed the publication of material values as a function of both temperature and relative humidity/moisture content (Saarimaa et al. 1989; Kumaran 1996; Hedenblad 1996; Rissanen & Viljanen 1998; Kumaran 2001). There is also available calculation software with ready-made material libraries concerning different material properties. Yet, there is still a shortage of material property values since the properties of materials used in different countries differ even when made of the same raw materials. New products are also continuously being launched on the market with only the property/properties important for their use having been defined. Building physical analysis, on the other hand, requires that all key material properties of products are experimentally defined. The values needed for diffusion analyses are thermal conductivity, water vapour permeability/water vapour resistance and equilibrium moisture content. The water absorption coefficient/liquid moisture diffusivity and capillary saturation moisture content are needed for capillary range analyses and air conductivity/air flow resistance for convection analyses. The dry density of materials is also needed for calculations. Part of the material values for calculational analyses can also be drawn from literature, such as specific heat capacity and porosity. Comprehensive data on materials used in Finland as a function of temperature and relative humidity have not been available earlier. Thus, one of the goals of this research has been to define the key material properties of the materials used in the tests on assemblies at various temperature and RH conditions. The tests involved a total of 42 materials which divided into the following material layer groups: interior boards, air barriers, vapour barriers, thermal insulations, frame material and sheathings. The tests defined the properties needed both in diffusion and capillary flow analysis: thermal conductivity, water vapour permeability/resistance, equilibrium moisture content, water absorption coefficient and capillary saturation moisture content. Thermal conductivity, water vapour permeability/resistance and equilibrium moisture content were defined as a function of humidity. Thermal conductivity and water vapour permeability/resistance values were also defined at different temperatures even though they could not be used with the calculation program selected for the calculational analyses. Water vapour resistance values were defined for all studied materials. Thermal conductivity, equilibrium moisture content and dry density values were defined for most materials, the exception being membranes. The water absorption coefficient and capillary

166
saturation moisture content were defined for capillarily active materials with the exception of membranes. In the case of some building boards of similar type, the thermal conductivity, equilibrium moisture content and capillary properties of only one were measured. This chapter presents briefly the test methods for use definition of material properties used in the calculational analyses with the WUFI-2D program, which were published in more detail in Vinha et al. (2005b). The publication also includes various material properties; a summary of the values used in the calculational analyses of this study is presented in Appendix 3. The appendix shows separately material values measured in laboratory tests and those drawn from literature. The results of material tests have also been presented earlier in Vinha et al. (2002b), Valovirta & Vinha (2003), and Valovirta & Vinha (2004).
3.3.1 Thermal conductivity
Thermal conductivity values of materials were defined in the study by a heat flow meter which meets the requirements of ISO 8301 (1991) standard for measuring the thermal conductivity of materials. LaserComp Fox 304 equipment manufactured by LaserComp Ltd., USA was used. The equipment consist of the actual measurement unit, cooling apparatus, and a computer which controls the measuring process. Measurement is fully automated. The equipment include two heat flow meters between which the examined specimen is placed (Fig. 3.20). The maximum area of a specimen is 305×305 mm2 and thickness 100 mm. Thermal flow is measured from a 200×200 mm2 area in the middle of the specimen. The direction of thermal flow in the equipment can be changed, as can the temperature range (surface temperatures of specimen) between -20 and 90°C. The absolute uncertainty of measurement of the equipment is ±3%. The area of the specimens used in this study was 305×305 mm2 while thickness varied by the material in question. The thickness of thermal insulation specimens was 50 mm and that of boards generally their nominal thickness. The thermal conductivity of thinner board materials was determined by stacking several specimens on top each other. A frame was made of 50 mm PUR sheet for measuring loose insulations, and the amount of the studied insulation corresponding to the target density was weighed into it. The direction of the thermal flow in measurements varied so that both directions (top to bottom and bottom up) were used with mineral wool insulations since the measurements indicated that the direction of thermal flow had no significant impact on registered thermal conductivity values. On the other hand, with hygroscopic materials the direction of thermal flow was always top to bottom since the migration of moisture has been found to cause errors in measurement results when the direction of thermal flow is the opposite (Sandberg

167
1992; Langlais et al. 1994). Measurement time varied between 1 and 48 hours depending on the studied material. Hygroscopic materials had the longest measurement time in order that their moisture contents could stabilise to correspond to the temperature gradient during measurement.
Hot
Cold
θ1
θ2
Heat flow meter 2
Heat flow meter 1
Test specimen
Lower plate
Upper plate
qd
Measurement area Figure 3.20 Principle illustration of thermal conductivity measurement using TUT heat flow meter
equipment. Moisture transfer from the warm surface of a test specimen to a colder surface resulted in moisture condensation on the surface of the cold plate when the initial moisture content of the test specimen was 86 or 97% RH. The level of condensation was the higher, the higher the moisture content of the material before the test. Thus, these tests measured thermal conductivity from specimens dryer than existing materials which probably yielded values somewhat lower than actual conductivities. Thermal conductivity of building materials was measured at four different average temperatures: -10, 0, 10 and 20°C. The used surface temperature difference was 20°C. The specimens measured at each temperature had been pre-stored at four different relative humidities at 20°C temperature. Thermal conductivity was also determined at maximum hygroscopic moisture content by impregnating specimens with an amount of water corresponding to the equilibrium moisture content in question and by allowing moisture to equalise in the specimens before measurement. Thus, the equilibrium moisture contents of specimens corresponded to the following relative humidity values: 0, 33, 65, 86 and 97% RH. Before tests all specimens were wrapped in thin plastic foil to prevent moisture from escaping from the materials during measurement. Three specimens were measured at all temperature/RH conditions. Thus, each test material was subjected to a total of 60 thermal conductivity tests.

168
Thermal conductivity of materials, λθ1,2 (W/(m·K)), at the mean temperature between the upper and lower plates was determined as follows:
212,1θ θθ
λ−
=qd (3.2)
where
q is density of heat flow rate (W/m2) d is thickness of test specimen (m) θ1 is temperature of the upper plate (ºC) θ2 is temperature of the lower plate (ºC)
In some cases the measured thermal conductivity value could drop a little, even if the material’s moisture content increased. However, such deviations were incidental and very small. Measured thermal conductivity values were adjusted for calculations by regression analysis, so that they stayed the same or increased as the moisture content of a material increased (see App. 3). The thermal conductivity values of building materials are typically published as design values which are higher than values measured in the laboratory. The design value considers, for instance, increases in thermal conductivity due to wind, moisture and variation in material properties. The Finnish Building Code (RakMK C4 2003) refers to the design value of thermal conductivity as normal thermal conductivity, λn, while the laboratory value is denoted by λ10. In Finland, the laboratory value is measured at 10°C average temperature and 65% RH relative humidity from a pre-stored test specimen. The alternative is to use the European design thermal conductivity value, λdesign, which is determined differently than normal thermal conductivity. The thermal conductivity values used in the calculations of this study were from tests since all other used material properties were measured in the laboratory. The only exceptions are the U-values of walls in Appendix 1 which were calculated using the normal thermal conductivity values of materials presented in Appendix 3. The thermal conductivity values used in calculations and presented in Appendix 3 were determined at 10°C average temperature. Measured values for thermal conductivity were lower than normal thermal conductivity values for each material (see App. 3). Thermal conductivity of water (0.6 W/(m·K) was typically used in HAM simulations for 100% RH values. An exception were thin membranes whose thermal conductivity did not affect the results of calculations significantly.

169
The thermal conductivities used in calculations were measured at a lower temperature (10°C) than at which the materials were stored prior to tests (23°C). Consequently, the average relative humidities of the pore air of materials were somewhat lower at the measurement temperature than in pre-storage due to the temperature and moisture dependence of equilibrium moisture content (see Ch. 1.7.1). Thus, the thermal conductivity values fed into the WUFI–2D calculation program corresponded to actual measured equilibrium moisture contents.
3.3.2 Water vapour permeability
Water vapour permeability values of materials were determined by the traditional cup method (Fig. 3.21). The guidelines of EN ISO 12572 (2001) on conducting water vapour permeability tests were followed for the most part.
Saline solution
Sealant
Test specimen
Test cup
Vapour tight epoxy ring
Air space
g
ϕi νi
νeϕe
ϕsalt νsalt
θ1
θ1
d
Figure 3.21 Principle illustration of water vapour permeability measurement by the wet cup method. Traditionally water vapour permeability has been measured on the basis of one or two pairs of RH conditions by the so-called dry cup method, where relative humidity, ϕ, inside the test cup is 0% RH and about 50% RH on the outside, and the wet cup method, where relative humidity inside the test cup is about 98% RH and about 50% RH on the outside. Then, the water vapour permeability of a material is defined in conditions that represent the average of the conditions inside and outside the test cup. In this study water vapour permeabilities were determined on the basis of several pairs of RH conditions and water vapour permeability as a function of RH was calculated on the basis of test results by regression analysis (Fig. 3.22). The same regression method has also been used in other studies: e.g. Saarimaa et al. (1989) and Hedenblad (1996). In the regression method a function, g(Δν), between moisture flow density and humidity by volume was derived, which best described the received test results. The used function was either a linear, a polynomial or an exponential model. By deriving this moisture flow density equation for the difference in humidity by volume of air we arrived at the change in

170
water vapour permeance, Wν, in relation to humidity by volume (Eq. 3.3). This value could be used to calculate the other values describing the water vapour permeability of the material using conversion equations (Mikkilä 2001).
ννν
∂Δ∂
=Δ)()(ν
gW (3.3)
Figure 3.22 illustrates the difference between the so-called traditional test method and the regression method. The methods do not differ in how they determine mass flow but in the calculational analysis of results. TRADITIONAL METHOD REGRESSION METHOD USED IN THIS STUDY
0 20 40 60 80 100
Relative humidity, ϕ (% RH)
Den
sity
of m
oist
ure
flow
rate
,g
(kg/
(m2 ·s
))
Measurement 1 (0 / 55 % RH)Measurement 2 (55 / 97 % RH)
Δν1
Δν2
0 20 40 60 80 100
Relative humidity, ϕ (% RH)
Den
sity
of m
oist
ure
flow
rate
,g
(kg/
(m2 ·s
))
Measurement 1 (33 / 55 % RH)
Measurement 2 (33 / 76 % RH)
Measurement 3 (33 / 86 % RH)
Measurement 4 (33 / 97 % RH)
g(Δν)
Figure 3.22 Differences between the traditional method and the regression method of this study used to
measure water vapour permeability. (Mikkilä 2001) The regression method allows determining the water vapour permeability/resistance of a material as a function of RH more accurately, while it also yields a result for water vapour permeability at higher relative humidity than the traditional wet cup test. However, tests have to be conducted with more RH condition pairs. Based on the conducted tests, the recommended minimum number of RH condition pairs is four (Mikkilä 2001). A drawback of the regression method is the large potential difference of water vapour at high humidities on opposite sides of the rest specimen. Then, water exits the test cup faster increasing simultaneously the thickness of the air layer underneath the material. This, again, increases the overall water vapour resistance between the water surface of the test cup and outdoor air (see Fig. 3.19). The uncertainty of the measurement result increases, especially with highly permeable materials, although the aim is to eliminate the impact of the air layer’s water vapour resistance from test results through calculations. A large potential difference may also cause errors in measurements on very dense materials since a relatively small air leak at the interface of the material and the cup will

171
result in a larger error in the measurement result. On the other hand, the measurement of, for instance, vapour barrier membranes of high water vapour resistance is difficult as a rule under the test arrangements designed for the traditional cup test. The measurement result of this study concerning the vapour barrier plastic was also unreliable, which is why water vapour resistance values found in literature were used in calculational analyses. The outside diameter of the test cup in the conducted water vapour permeability tests was 110 mm and material thickness was 3.2 mm. The full depth of the cup was 50 mm. Permeabilities of thermal insulations were measured from 50 mm specimens while specimens of nominal thickness were used in the case of other materials. When testing light thermal insulations and loose insulations, a fine mesh wire gauze was used as a support structure under the bottom surface of specimens. An amount of loose insulations corresponding to the target density was weighed into the test cup. The air layer between the upper surface of the saline solution and the lower surface of the material was, on average, 22.5 mm thick in tests at 23°C, and 32.5 mm thick in tests at 5 and -10°C. The water vapour resistance of this air layer caused the difference in humidity by volume between the upper surface of the saline solution and the lower surface of the material (see Fig. 3.21). The impact of the air layer’s water vapour resistance on test results was taken into account by applying the correction coefficient presented in EN ISO 12572 (2001) standard. The validity of the correction procedure was also checked by measuring relative humidity values inside the cup near the lower surface of the material. Tests were conducted at three different temperatures whose averages were -10, 5 and about 23°C. In all tests, moisture passed from the test cup to outdoor air (so-called wet cup test). The relative humidity of outdoor air was the same 33% RH in all tests, and the relative humidity inside the cups was varied with saturated saline solutions. At 5 and 23°C temperatures the relative humidities inside the cups were 55, 76, 86 and 97% RH. At -10°C temperature only three RH conditions were used: 44, 76 and 86% RH, since saturated saline solutions made with other salts did not maintain the RH of the test cup constant enough in subzero conditions. The change in the weight of test cups was monitored by regular weighings about three times a week under all measurement conditions. Measurements were always made at a temperature that corresponded to the storage conditions. The density of the moisture flow that had penetrated the specimen was determined by weighings. A Sartorius LP 1200 S balance manufactured by Sartorius Ltd. was used. The replicability of the results measured with the balance (standard deviation) was ±0.001 g and linearity ±0.002 g. A test was continued until changes in the density of moisture flow were sufficiently small. The measurements on a single RH condition pair took about a month. Three samples of each material were measured under all conditions. Thus, a total of 33 cup test results were received for a single test material.

172
In reality, other forms of moisture transfer have also contributed to the measured water vapour permeability/resistance values as was stated in Chapter 1.7.1. The major ones are surface diffusion and capillary flow which start to increase the transfer of water vapour through a material at high relative humidity values. Convection may also influence the results somewhat, especially when light thermal insulation is used where the air flow along the exterior surfaces of test specimens increases transport of water vapour through the material. However, in this study this material property is referred to as water vapour permeability since the transfer of water vapour through a material occurs mainly in the form of vapour due to diffusion in the studied hygroscopic range. In water vapour permeability tests these different forms of moisture transfer worked in the same direction meaning that the measured water vapour permeability was the sum of all these factors. However, due to temperature difference, the situation inside the assembly is such that the water vapour diffusion in the thermal insulation layers occurs in a different direction than capillary flow and surface diffusion (see Fig. 1.25). Therefore, the water vapour permeability value used in calculations should be one representing dry conditions, and the impact of capillary moisture transfer should be dealt with separately, if the program allows it (see Ch. 1.7.1). In this study the moisture transfer properties of materials were determined as described above for all materials for which a liquid moisture diffusivity value could be determined (see Eq. 1.53). In the case of thin membranes, the calculations used changing water vapour permeability values since their water vapour diffusion and capillary moisture transfer could not be measured separately. On the other hand, the water vapour permeability of most materials measured in the study did not change significantly as humidity changed, which indicates that the impact of capillary flow in these materials is very small in the hygroscopic range (see App. 3). The quantity used to depict the water vapour permeability of materials in the calculations was the water vapour diffusion resistance factor, μ (–). The μ-value of a material was derived from the water vapour permeability, δp, using Equations 1.36 and 1.37. The water vapour diffusion resistance factor was determined by the regression method up to relative humidity of 100% RH.
3.3.3 Equilibrium moisture content
The equilibrium moisture contents of materials were determined by storing the test specimens at a certain relative humidity and by weighing them at certain intervals for so long that their weight no longer changed significantly. Equilibrium moisture content was determined as the difference between the weight of a dry specimen and one in the equilibrium state. In the tests the equilibrium moisture content of materials was measured at moisture contents corresponding to 33, 55, 75, 83, 93 and 97% RH. The average

173
temperature of the tests was about 20°C. Moreover, dry test specimen values were measured after kiln drying. Some tests were also conducted at lower temperatures. The equilibrium moisture content of materials was also measured at the temperature corresponding to the storage conditions of test specimens. The same Sartorius LP 1200 S balance was used to weigh the materials as in water vapour permeability measurements. The equilibrium moisture content of materials was measured separately in adsorption and desorption conditions. Thus, the sorption curves for materials were determined on the basis of measurements conducted under 11 different types of conditions. In each case equilibrium moisture content was measured from three specimens made of the same material. The test periods varied significantly depending on the moisture capacities of tested materials. At their shortest, the tests took about 1 month/RH condition, but in the case of wood-based boards the stabilisation period could be over 3 months/RH condition. Test specimens of board material measured 200×200 mm2. Thermal insulations were measured in round test cups 160 mm in diameter. With faster stabilising materials tests were conducted so that moisture was allowed to adsorb to the test specimen only through one or two surfaces. This provided extra information on the adsorbtion of moisture to a material in a situation that corresponded to that prevailing in a wall assembly. In calculational analyses the average of measured adsorption and desorption values was used since they could not be fed separately into the selected WUFI-2D program. Moisture content values measured at maximum hygroscopic moisture content (97% RH) were used also in HAM simulations for 100% RH values.
3.3.4 Water absorption coefficient
The water absorption coefficient, Aw, of materials was determined by the method presented in DIN 52617 (1987) standard. In the test, the tested material was placed in a plastic tube, which was placed in water so that 2–10 mm of the bottom section of the material was under water (Fig. 3.23). The top end of the tube opened into room air, and the bottom end had a wire mesh, which prevented the material from sliding into the water. The outside diameter of the tube was 110 mm and material thickness was 3.2 mm. The tests were done at about 23°C. The height of a material sample was made greater than the maximum height of water level in suction for the material in question, that is, the height to which water rose in the material due to capillary suction.

174
maximum height of
capillary suction
material specimen
tube
water
water level in suction
h
Figure 3.23 Principle illustration of water absorption coefficient measurement system. The water absorption coefficient, Aw (kg/(m2·s1/2)) was determined by the following equation:
tAm w'' = (3.4) where
m’’ is water absorbed by material per square metre (kg/m2) t is time (s)
As Equation 3.4 shows, the amount of water absorbed into a material by capillary action is proportional to the square root of time. In practice, this means that the water absorption rate is highest immediately at the beginning of a test and then slows down continually, until the material reaches its maximum capillary moisture content. Subsequently, water no longer absorbs into the material. The water absorption coefficient was determined by weighing the test specimen at fixed times. Time was measured from the beginning of the test. The water absorption coefficient was determined in the initial stage of a test whereby the amount of water absorbed into the material increased almost linearly as a function of the square root of time.
3.3.5 Capillary saturation moisture content
The capillary saturation moisture content of materials was also determined by the method presented in DIN 52617 (1987) standard. The test arrangement was the same as in Figure 3.23, except that the height of material specimens was made clearly smaller than the maximum height of water level in suction for the material in question. The test was continued until the weight of the test specimen no longer changed. The maximum duration of tests was about 2 months, and they were conducted at about 23°C.
175
Capillary saturation moisture content, wcap (kg/m3), was calculated by the following equation:
0
wcap V
mw = (3.5)
where
mw is water absorbed into material (kg) V0 is volume of dry material (m3)
Since, for instance, wood-based materials swell as they get wet, their capillary saturation moisture content may exceed 1000 kg/m3 – wood hardboard (A8, App. 3) was one such material. Yet, capillary saturation moisture content values above 1000 kg/m3 cannot be fed into calculation programs. For that reason, the porosity of some wood-based materials was increased above the real value to enable feeding the true capillary saturation moisture content of a material into the program (see App. 3).
3.3.6 Other material properties
The other material properties needed in calculational analyses were dry density, porosity and specific heat capacity. Dry density values of materials were determined on the basis of weighing results after drying. The densities of membranes were determined from rolls at the prevailing relative humidity. Porosity and specific heat capacity values of materials were drawn from literature.
3.3.7 Conclusions
An attempt was made to determine the properties of the building materials used in tests on wall assemblies as accurately as possible in order that they could also be used in calculational analyses of external walls. Tests were conducted at several different temperatures and relative humidities to find out how the properties change due to temperature and RH. Individual differences between material specimens were taken into account by measuring properties of three parallel test specimens under all conditions. Measured material properties were also compared to values presented in literature, and correspondence was found in the case of all other studied materials except for the water vapour resistance of plastic foil. That value was drawn from literature for calculational analyses.

176
4 FIELD TESTS ON EXTERNAL WALLS
4.1 Moisture performance of timber-framed walls of a one-family house
The object of this research was to compare the moisture performance of external walls under real conditions to the performance indicated by laboratory tests. The research plan also included designing and constructing measuring equipment to allow studying the performance of the external walls of an experimental house during different seasons. The equipment was to incorporate a continuously operating measuring system which could be used, for instance, to measure relative humidity, temperatures, pressure difference and air flow. This chapter presents, the measurement results on the test house that are essential for this research will be presented. More detailed information about the study and received results has been published in Vinha et al. (2003b). Research results from measurements on the one-family house have also been published in Käkelä et al. (2001) and Käkelä & Vinha (2002).
4.1.1 Description of test house and measuring equipment
Location and construction site of test house
The test house was located in Lieto near the southern coast of Finland where winters are milder than inland. Due to the higher outdoor air temperatures there, the risk of interstitial moisture condensation in the wall assembly is smaller in winter than inland. On the other hand, longer periods of humid and warm conditions sometimes create more favourable conditions for mould growth. In addition, the close proximity of the sea also increases wind speeds and driving rains. These factors increase the moisture stress on the external wall which places emphasis on the functioning of the exterior cladding and the ventilation gap. The location of the house was very open – no trees or tall buildings were close by. Thus, no blind areas with respect to wind and sun existed. The terrain surrounding the test house was quite flat in general, typical for southwestern Finland.
Basic data on the test house
The area of the building was 107 m2 with the possibility of building 54 m2 of additional space upstairs. The upstairs was not in residential use during the tests. The house had mechanical exhaust ventilation.

177
The sensors used in field tests were installed on the southern wall of the test house for technical reasons. Thus, the typical measurement results represented the most favourable outdoor air conditions in winter because solar radiation increased temperature and decreased relative humidity in the ventilation gap. On the other hand, because the dominant wind direction in Southern Finland is from the southwest (Suomen kartasto, vihko 131 1987, 1988), driving rain hits the southern wall the heaviest during summer and autumn. In addition, the stronger solar radiation can increase water penetration through the cladding. Figure 4.1 shows the southern wall of the test house where the sensors were installed.
Figure 4.1 Southern wall of test house where the sensors were installed.
Field measuring equipment
The construction and the operating principle of the measuring equipment were based largely on the calibrated hot box equipment (CHB) (Vinha 1998) and building physical research equipment earlier built at TUT (Vinha & Käkelä 1999) (see Ch. 3.1). The operating principle of the equipment is presented in Figure 4.2. The control program for the equipment is also the same as used with building physical research equipment (see Ch. 3.1.2). During this study measurements were read every 5 minutes from sensors and averages were calculated at one-hour intervals. Temperatures and relative humidities were measured in tests by Vaisala Ltd’s HMP 233 type humidity transmitters and humidity/temperature (RH/T) sensors made at TUT. The type of the RH sensors used with TUT sensors was HIH-3605-B which are manufactured by Honeywell Ltd. TUT’s RH/T sensors used as temperature measurement components

178
National Semiconductor Corporation’s LM 335 type semiconductor sensors. The same temperature sensors were also used in surface temperature measurements and some individual measurements within the assembly. The velocity of air flow in the ventilation gap was measured by AFT-1D type air flow sensors (measurement range 0 to 5.0 m/s) made by Envic Ltd. Pressure difference across the external wall was measured by Huba Control AG’s type T70 differential pressure transmitters. The uncertainty of measurement of TUT’s RH sensors over the entire measured RH range was about ± 5% RH based on calibrations. Uncertainties of measurement of other measured quantities were the same as presented earlier in Chapter 3.1.7.
AD/DAconverter
Channelselector
TransmitterPowersupply
Alarmsystem
PC Sensor
- pressuredifference
- humidity
- temperature
- air flow
- humidity
- temperatureSensor
Figure 4.2 Operating principle of the field measuring equipment.
4.1.2 Test arrangements
Preparation of test wall sectors
The house was built of prefabricated large wall panels with a timber frame (50×150 mm). The thermal insulation of the test house was of cellulose batts (150 mm). Wood fibreboard was used for sheathing and bitumen paper for air barrier. The interior surface was covered with gypsum board. The cladding was board and batten siding with a ventilation gap (25 mm) behind. Figure 4.3 shows the cross-section of the wall assembly. For comparison measurements, the thermal insulation of one 600 mm wide insulated sector was changed to glass wool and the bitumen paper was changed to a plastic vapour barrier. This wall assembly is also presented in Figure 4.3. Thus, measurements were performed on one cellulose-insulated and one glass wool-insulated wall sector side by side on the southern wall of the bedroom. The building physical material properties of the used wall materials are presented in Appendix 3. The codes for these materials are also shown in Figure 4.3.

179
- +
WallpaperGypsum board 13 mm (C1)Plastic vapour barrier (C11)Glass wool 150 mm (D1)Wooden studs 50×150 mm,c/c 600 mm (C13) Wood fibreboard 25 mm (A2)Ventilation gap 25 mm:vertical battens 5 mm, c/c 600 mm +horizontal laths 20×75 mm, c/c 600 mmBoard and batten siding 25×100 mm
WALL SECTOR 1 WALL SECTOR 2
WallpaperGypsum board 13 mm (C1)Bitumen paper (C10)Cellulose batt insulation 150 mm (D3)Wooden studs 50×150 mm,c/c 600 mm (C13) Wood fibreboard 25 mm (A2)Ventilation gap 25 mm:vertical battens 5 mm, c/c 600 mm +horizontal laths 20×75 mm, c/c 600 mmBoard and batten siding 25×100 mm
Figure 4.3 Cross-sections of tested wall assemblies. The measuring equipment was installed in the walk-in closet of the house. Sensor leads were drawn to the bedroom where the analysed wall sectors were located (Fig. 4.4).
Figure 4.4 Pictures taken during installation of sensors on 10 Nov ‘98. The left picture shows sensor penetrations to the outside and to Sector 2 (left side). The picture on the right shows the glass wool and plastic vapour barrier installed in Sector 1. Holes in the bitumen paper of Sector 2 were patched up with tape. Part of the walk-in closet, which houses the measuring equipment, can also been seen in the background (the partition is still missing). After the measurements, the plastic vapour barrier and the glass wool of Sector 1 were replaced with bitumen paper and cellulose insulation batts.

180
The seams of vapour and air barriers were taped with duct tape to make them as tight as possible to ensure that no convection leakage points remained in the wall. Penetrations for sensors were also sealed with silicone. In addition, the sheathing was cut between sectors to prevent moisture from migrating by capillary flow from one sector to the other. The water vapour resistance ratio between the interior and exterior wall linings was about 3.3:1 in the cellulose batt-insulated wall (Sector 2) and about 760:1 in the glass wool-insulated wall (Sector 1). The wallpaper did not increase the water vapour resistance of the interior surface significantly. Thus, the cellulose batt-insulated wall did not meet the guidelines of RakMK C2 (1998) (see Ch. 1.7.2).
Positioning of measurement sensors
Three types of temperature sensors were used in the measurements: surface sensors, air sensors and metal jacket sensors (see Ch. 3.1.4). The surface sensors of the interior surface were attached to the gypsum board underneath the wallpaper. The surface sensors were positioned at the midpoint between two wall studs, one up and down in each measured sector. The distance of sensors from the upper sills was 350 mm and from the lower sills 300 mm. Surface sensors were placed at corresponding points on both sides of the cladding and on the exterior surface of sheathing. There was also one air sensor up and down on the exterior and interior side of the assembly. Moreover, two metal jacket sensors were located at the interface between the lower sill and the concrete slab. Figure 4.5 shows the vertical positions of sensors. Other measurement sensors and equipment were installed as follows: air flow sensors in the ventilation gap, RH/T sensors for outdoor and indoor air on the surfaces of thermal insulation layers and in the ventilation gap, and differential pressure transmitters for indoor and outdoor air measurements on both sides of wall assemblies. The air flow sensors in the ventilation gap (both sectors) were installed midway between floor and ceiling. The RH/T sensor for indoor air was placed about 200 mm down from the ceiling of the room. The RH/T sensor for outdoor air was positioned midway between the floor and ceiling about 50 mm from the external wall. This sensor was shielded against rain and direct solar radiation so that air flow within the casing was possible. The RH/T sensors in the ventilation gap (both sectors) were also installed midway between floor and ceiling. In addition, RH/T sensors were placed on the warm and cold sides of the insulation layer in corresponding locations to the surface temperature sensors. HMP 233 type humidity transmitters were used to measure humidity of outdoor air and exterior surfaces of thermal insulation while indoor air values were measured with humidity sensors made at TUT.

181
One measurement point for differential pressure was placed about 200 mm below the ceiling of the room. Correspondingly, another measurement point was located at the same height outside the wall. The other set of measurement points for differential pressure were about 200 mm above floor level on both sides of external walls. Thus, measurement points for differential pressure were placed at corresponding distances from the ceiling and floor surfaces as the surface temperature sensors (see Fig. 4.5).
~200
~200
Temperature sensorRH/T sensorAir flow sensorPressure difference
2800
350
350
1400
Figure 4.5 Vertical positioning of measurement sensors in both wall sectors.
Taking of structural samples and visual observations
At the beginning of measurements and in connection with data collection (at about 3-month intervals) structural samples were taken from the sheathing and the insulation layer behind it. Holes (∅ 75 mm) were drilled in the sheathing for sample taking. The holes were sealed with plugs of the same material as the sheathing to ensure that they would not change the air and water vapour resistance of the sheathing at the sampling point. The moisture contents of the samples were determined by the weighing-drying-weighing method. The results were compared with the moisture content values derived from measured relative humidity values with the help of sorption curves. Visual observations

182
were also made in connection with sampling concerning possible icing and condensation behind the sheathing.
Research timetable
Construction of the test house started in the summer of 1998. In October ‘98 the roof was up (panels had been installed, floors cast, etc.). Measurement sensors were installed in mid-November when electricity and heating had been installed for the construction of the house and the interior works were under way. The house was finished in January ‘99 and remained vacant until early May of that year. From then on, it was inhabited by a family of three. The initial values were measured from the walls during the period 16 − 17 November 1998. Actual measurement began on 21 December 1998. Measurements ended and the sensors were removed on 29 March 2000. After measurements, the glass wool and the plastic vapour barrier were replaced with cellulose insulation batts and bitumen paper. The old sheathing was also replaced by new wood fibreboard.
4.1.3 Test results
Test results essential from the viewpoint of the moisture performance of walls are presented in this chapter. To simplify matters, the results are presented mainly as monthly averages or moving daily averages. Averages are based on values measured or calculated at 5-minute intervals. A moving daily average is based on 288 measurement values whose averages have been calculated at one-hour intervals. In any review of the results, it should also be considered that an equipment malfunction disrupted measurements in April, July and part of August of 1999. Therefore, the averages for these months were calculated on the basis of less data than in the case of other months.
Outdoor and indoor air conditions
Figure 4.6 shows the prevailing outdoor and indoor air conditions over the entire measurement period as monthly averages.

183
-10
0
10
20
30
40
50
60
70
80
90
100
InitialsituationNov '98
Dec '98 Jan '99 Feb '99 Mar '99 Apr '99 May '99 Jun '99 Jul '99 Aug '99 Sep '99 Oct '99 Nov '99 Dec '99 Jan '00 Feb '00 Mar '00
Month
Rel
ativ
e hu
mid
ity, ϕ
(% R
H)
Tem
pera
ture
, θ (°
C)
RH, indoor airRH, outdoor airTsilmaTuilma
ϕ, indoor airϕ, outdoor airθ, indoor airθ, outdoor air
Figure 4.6 Monthly relative humidity and temperature averages of outdoor and indoor air. Averages for
initial situation are based on the period 16 − 17 November 1998. Outdoor air conditions in ‘99 were extreme: the winter was marked by severe cold spells while the summer was extremely dry and hot. Due to the hot summer, indoor air temperature was also high in summer: under 25°C in the lower parts of the room and even above 27°C in the upper parts. December ‘98 and early January ‘99, again, were warmer and rainier than average. Variations in indoor air RH corresponded closely to those of outdoor air humidities by volume. In summer, the rooms were aired and less humidity apparently formed, which made conditions inside and outside quite similar (see Ch. 2.3.2). Naturally, the conditions changed as outdoor air temperature fell. The lowest excess moisture in summer was 1.1 g/m3 (July 1999) whereas during the winter months (winter 2000) it ranged from 3.3 to 3.8 g/m3. The humidity by volume of indoor air was about 1 g/m3 smaller in winter 1999 than in winter 2000, when the building was occupied. At the beginning of the measurement period, the humidity by volume of indoor air increased as a result of the escape of residual construction-time moisture. Naturally, moisture production decreased as a function of time due to the drying of walls. When the occupants moved in (at the end of April), the moisture production increased which boosted humidity by volume and excess moisture of indoor air (Fig. 4.7). Excess moisture of indoor air also varied by seasons.

184
2.3
3.23.6
2.6
2.0
3.1
1.7
1.1
1.9
3.1 3.3 3.43.7 3.8
3.5 3.7
0
1
2
3
4
5
6
7
8
9
10
11
12
Dec '98 Jan '99 Feb '99 Mar '99 Apr '99 May '99 Jun '99 Jul '99 Aug '99 Sep '99 Oct '99 Nov '99 Dec '99 Jan '00 Feb '00 Mar '00
Month
Hum
idity
by
volu
me,
ν (
g/m
3 )
v indoor air
v outdoor air
moisture deficit
ν, indoor air
ν, outdoor airΔνexc, excess moisture
Figure 4.7 Humidity by volume of indoor and outdoor air and excess moisture of indoor air expressed as
monthly averages.
Relative humidities of wall assemblies
Differences in the relative humidities of wall assemblies were the clearest between the exterior surfaces of insulation layers of different wall sectors. Figure 4.8 shows the variation in monthly average relative humidities at the exterior surface of the thermal insulation layer during the measurement period. During the first month of measurements (December 1998), the assemblies still probably contained residual construction-time moisture. At the interior surface of the insulation layer the variations in relative humidity were smaller and the RH values were always under 50% RH. However, it has to be underlined that the measurement uncertainty of interior surface humidity sensors was high because the covers of the sensors were too vapour-tight (see Ch. 5.3.2). Figure 4.8 shows that the maximum monthly RH values for glass wool were about 10 to 15% RH lower than those for cellulose insulation. There were also differences between upper and lower sections of the insulation layer. Initially, relative humidity was higher in the lower sections of thermal insulation than in the upper sections (even exceeded 90% RH in the lower section of cellulose insulation). This was the result of residual construction-time moisture emanating, for instance, from the cast floor. Yet, the situation was the opposite only a month later (on completion of the building), and it remained such for almost the entire measurement period. Only during the summer months did some levelling occur between the upper and lower sections since the indoor and outdoor air conditions
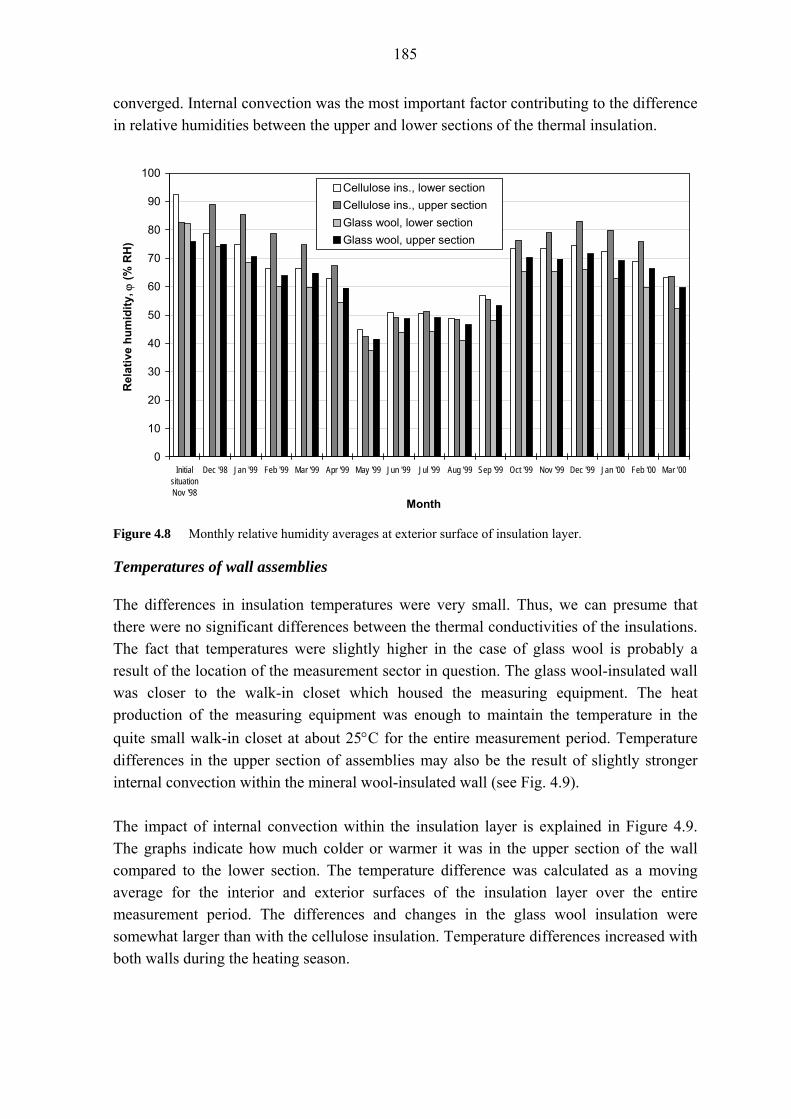
185
converged. Internal convection was the most important factor contributing to the difference in relative humidities between the upper and lower sections of the thermal insulation.
0
10
20
30
40
50
60
70
80
90
100
InitialsituationNov '98
Dec '98 Jan '99 Feb '99 Mar '99 Apr '99 May '99 Jun '99 Jul '99 Aug '99 Sep '99 Oct '99 Nov '99 Dec '99 Jan '00 Feb '00 Mar '00
Month
Rel
ativ
e hu
mid
ity, ϕ
(% R
H)
Cellulose ins., lower sectionCellulose ins., upper sectionGlass wool, lower sectionGlass wool, upper section
Figure 4.8 Monthly relative humidity averages at exterior surface of insulation layer.
Temperatures of wall assemblies
The differences in insulation temperatures were very small. Thus, we can presume that there were no significant differences between the thermal conductivities of the insulations. The fact that temperatures were slightly higher in the case of glass wool is probably a result of the location of the measurement sector in question. The glass wool-insulated wall was closer to the walk-in closet which housed the measuring equipment. The heat production of the measuring equipment was enough to maintain the temperature in the quite small walk-in closet at about 25°C for the entire measurement period. Temperature differences in the upper section of assemblies may also be the result of slightly stronger internal convection within the mineral wool-insulated wall (see Fig. 4.9). The impact of internal convection within the insulation layer is explained in Figure 4.9. The graphs indicate how much colder or warmer it was in the upper section of the wall compared to the lower section. The temperature difference was calculated as a moving average for the interior and exterior surfaces of the insulation layer over the entire measurement period. The differences and changes in the glass wool insulation were somewhat larger than with the cellulose insulation. Temperature differences increased with both walls during the heating season.

186
-1.0
-0.5
0.0
0.5
1.0
1.5
2.0
2.5
3.0
1.11.1998 31.12.1998 1.3.1999 30.4.1999 29.6.1999 28.8.1999 27.10.1999 26.12.1999 24.2.2000 24.4.2000
Date (day.month.year)
Tem
pera
ture
diff
eren
ce, Δ
θ (°
C)
Glass wool, external surface upper/lower sectionGlass wool, internal surface upper/lower sectionCellulose insulation, external surface upper/lower sectionCellulose insulation, internal surface upper/lower section
Figure 4.9 Temperature differences between upper and lower sections of insulation layer. The readings of
the lower section sensor were subtracted from those of the upper section sensor. The graphs represent 24-hour moving averages.
Figure 4.9 shows that the vertical temperature difference on the warm side of the insulation was smaller (typically under 0.5°C) than on the cold side where the difference in winter could be around 1°C. The temperature differences are an indication of convection inside the walls. A comparison of Figures 4.8 and 4.9 reveals that relative humidity was higher in the upper section of the insulation layer than in the lower section while temperature was also higher in the upper section. Thus, the most critical conditions from the viewpoint of mould growth existed in the upper sections of walls on the exterior surface of the insulation.
Comparison of temperatures and humidities by volume of ventilation gap and outdoor air
Figure 4.10 shows the average temperature difference between the middle of the ventilation gap and outdoor air as a function of outdoor air temperature for the entire measurement period for the one-family house. Figure 4.11, again, presents the average difference in humidity by volume between the middle of the ventilation gap and outdoor air as a function of outdoor air temperature. Equations 1.26–1.28 of Chapter 1.7.1 were used in calculating the humidity by volume differences. Figures 4.10 and 4.11 show individual measurement results as points as well as the average curve derived from them. The points represent individual measurement results at one-hour intervals. The average curve was calculated on the basis of average results measured at one-hour and 1°C intervals.

187
-5.0
-4.0
-3.0
-2.0
-1.0
0.0
1.0
2.0
3.0
4.0
5.0
-35 -30 -25 -20 -15 -10 -5 0 5 10 15 20 25 30 35
Outdoor air temperature, θe (°C)
Tem
pera
ture
diff
eren
ce b
etw
een
vent
ilatio
n ga
p an
d ou
tdoo
r air,
Δθ
(°C
)
Figure 4.10 Temperature difference between the middle of the ventilation gap and outdoor air as a function
of outdoor air temperature. The points represent individual measurement results at one-hour intervals.
-5.0
-4.0
-3.0
-2.0
-1.0
0.0
1.0
2.0
3.0
4.0
5.0
-35 -30 -25 -20 -15 -10 -5 0 5 10 15 20 25 30 35
Outdoor air temperature, θe (°C)
Hum
idity
by
volu
me
diffe
renc
e be
twee
n ve
ntila
tion
gap
and
outd
oor a
ir, Δ
ν (g
/m3 )
Figure 4.11 Humidity by volume difference between the middle of the ventilation gap and outdoor air as a
function of outdoor air temperature. The points represent individual measurement results at one-hour intervals.
Figure 4.10 shows that as outdoor air temperature fell below 0°C, the temperature difference between the middle of the ventilation gap and outdoor air increased. Measurement results indicate that the temperature in the ventilation gap was higher than that of outdoor air during the heating season, and that the difference depended almost

188
linearly on outdoor air temperature. The difference was due to both solar radiation and heat flowing from the inside out by conduction. The temperature differences in summer shown in Figure 4.10, on the other hand, do not correspond to reality since outdoor air conditions at the test house were also measured close to the southern wall (see Ch. 4.1.2). Therefore, solar radiation raised the temperature reading of this outdoor air measuring sensor, even though it was protected from direct solar radiation. Furthermore, as stated in Chapter 4.1.3, most summertime measurements failed due to malfunctioning of the measuring equipment. The average differences in humidity by volume between the middle of the ventilation gap and outdoor air, again, were almost equally independent of outdoor air temperature (Fig. 4.11). Thus, solar radiation and driving rain did not increase the average humidity by volume of the ventilation gap in relation to outdoor air. Consequently, it can be stated that the air flow in the ventilation gap was able to eliminate the extra moisture from the outside and the inside as well as to dry the assembly effectively. This despite the fact that the rate of air flow in the ventilation gap was low, typically in the 0 to 0.2 m/s range. One reason for the slow air flow was the structure of the ventilation gap (Fig. 4.12). Horizontal laths had been placed at 600 mm intervals for attaching the board and batten siding. Battens approx. 5 mm thick had been attached underneath them to allow vertical air flow (the battens also sealed the vertical seams between sheathings). However, the battens had sunk into the sheathing to which they had been nailed which had narrowed the gap. Thus, the horizontal laths acted as "obstructions" in the ventilation gap. Vertical air flow occurred nevertheless through the gaps in the board and batten siding. Moreover, the gap provided at the top of the siding was small. Air flow sensors were situated about 1 cm from the sheathing.
Gypsum board
StudThermal insulation
Horizontal laths c/c 600 mmBoard and batten siding
Sheathing
Air flow sensor
5
Spacer battens
600
Figure 4.12 Position of air flow sensors in ventilation gap behind the board and batten siding. Examination of the individual measurement points of Figures 4.10 and 4.11 reveals that individual differences in temperature and humidities by volume measured in the same outdoor air temperature range varied widely in the research and that the variation increased as outdoor air temperature rose. The larger variation was mostly due to increased solar

189
radiation falling on the exterior wall surfaces. Moreover, surface undercooling, thermal properties of the cladding and the velocity of air flow in the ventilation gap also affected the differences in the temperatures and humidities by volume between the middle of the ventilation gap and outdoor air. Figures 4.10 and 4.11 show that the ventilation gap improved the drying of the wall. Moreover, it also reduced the mould growth risk of the wall and the risk of moisture condensing in the wall assembly since an increase in temperature lowered the RH of the air in the ventilation gap compared to outdoor air. The solar radiation falling on the wall surface further improved the situation because it also increased the temperature in the ventilation gap but had no effect on humidity by volume values. Therefore, the most critical situation as to mould growth and condensation of wood-clad external wall assemblies existed on the northern side of the building where solar radiation was quite insignificant.
Exterior surface resistance of sheating
Figure 4.13 presents the average temperature difference between the exterior surface of the sheathing and outdoor air as a function of outdoor air temperature. This temperature difference describes the overall thermal surface resistance of the exterior surface (sheathing) (see Ch. 2.2.1). The average temperature difference curve was calculated on the basis of four measurement points of sheathing surface temperature. The calculations were made by the same principle as those in Figures 4.10 and 4.11.
0
1
2
3
4
5
6
7
8
-35 -30 -25 -20 -15 -10 -5 0 5 10 15 20 25 30 35
Outdoor air temperature, θe (°C)
Tem
pera
ture
diff
eren
ce b
etw
een
exte
rior s
urfa
ce o
f sh
eath
ing
and
outd
oor a
ir, Δ
θ (°
C)
One-family house, southern wall
Surface resistance 0.13 m²·K/W
Surface resistance 0.04 m²·K/W
Fig. 4.13 Average temperature difference between exterior surface of sheathing and outdoor air as a
function of outdoor air temperature for researched wall assemblies of the one-family house. The figure also shows the temperature difference graphs corresponding to surface resistances 0.04 m2·K/W and 0.13 m2·K/W of the exterior surface of the sheathing.

190
Temperature difference graphs for the same assemblies corresponding to surface resistances 0.04 and 0.13 m2·K/W have also been included in the figure. These surface resistance values were included in the analyses since they are used as the exterior surface resistances of the external wall assembly in U-value studies (ISO 6946 1996, RakMK C4 2003). The exterior surface resistances of the sheathing were calculated using Equation 3.1. Thermal resistances, Rwall, of walls were calculated with the calculation method presented in EN ISO 13788 (2001) standard using laboratory thermal conductivities, λ10, of wall materials (see App. 3). The resulting thermal resistance of a glass wool-insulated wall was 4.18 m2·K/W and that of a cellulose-insulated wall 3.95 m2·K/W. A comparison of the graphs of surface resistances against measured results reveals that the average exterior surface resistances of the sheathing are clearly over 0.13 m2·K/W. In winter (θe < 0°C) the average exterior surface resistance of both wall sectors fluctuated typically between 0.45 and 0.65 m2·K/W. By comparing Figures 4.10 and 4.13 one sees that the temperature difference between outdoor air and the exterior surface of the sheathing is about twice that between the middle of the ventilation gap and outdoor air. Laboratory tests gave the same result earlier (see Ch. 3.2.4).
Risk of mould growth and moisture condensation inside wall assemblies
The mould growth risk survey was based on the equations and limit values presented in Chapter 2.2.4. In the case of the examined walls, conditions conducive to mould growth were exceeded somewhat only in the upper section of the exterior part of the cellulose insulation. Even then, the mould index, M, was only 0.13 meaning that no mould growth occurred in the wall assembly during the measurement period. In the other parts, the mould index did not actually rise at all. Time-wise, the relative humidity of the exterior surface of the thermal insulation was above the critical mould limit, ϕcrit, in Sector 2 (cellulose batt insulation + bitumen paper) for 40 days of the measurement period and in Sector 1 (glass wool + plastic vapour barrier) less than half a day. Outdoor air conditions were conducive to mould growth for a total of 62 days during the measurement period. On the other hand, the air conditions in the ventilation gap were conducive to mould growth for only about 20 days. These times describe well the impact of the ventilation gap on the reduction of the risk for mould growth which was already confirmed earlier. As stated previously, the risk for mould growth is nevertheless highest in a wall facing north.

191
Another important factor was the degree of possible condensation inside the assembly. However, no condensation was observed in the examined walls in connection with sampling. Relative humidity values also remained under 100% RH at all times.
4.1.4 Conclusions
The measurements on the one-family house showed that the relative humidity of pore air rises higher at the interior surface of the sheathing in the case of a moisture-permeable assembly also in real conditions (about 10 to 15% RH higher at a maximum). This was the case despite the fact that the thermal insulation of the moisture-permeable assembly was of cellulose which retards the rise in the relative humidity of pore air somewhat. In other words, in Finnish climatic conditions the water vapour resistance of the interior wall lining is much more significant from the viewpoint of wall moisture contents than the hygroscopicity of thermal insulation. Yet, at the test site, the conditions never became critical as to mould growth or moisture condensation, partly for the reason that the measurements were conducted on the southern wall where the solar radiation falling on it increased the temperatures of the exterior wall lining thereby improving the assembly’s capacity to dry out. The moisture performance of external wall assemblies was also improved by the use of a thermally insulating sheathing on the exterior surfaces of assemblies. In addition, the excess moisture was quite normal during the measurement period, and the house was unoccupied at the initial phase of measurements. Under more critical indoor and outdoor air conditions, however, the risk for condensation and mould growth in the case of a moisture-permeable wall is higher than in the case of a wall with a vapour barrier. Although the southern wall was just about the most critical with respect to driving rain penetration into the assembly, the average humidity by volume of the ventilation gap did not exceed that of outdoor air during the entire measurement period. Thus, we can state that wood cladding protected the assembly by preventing significant moisture transport into the ventilation gap as a result of driving rain and solar radiation. The average humidity by volume of the ventilation gap, again, was determined by the RH of outdoor air. The velocity of air flow in the ventilation gap, although low (0 to 0.2 m/s), was sufficient to dry out any possible extra moisture in the gap air and carry it outside. The exterior surface resistances of the sheathing calculated on the basis of outdoor air temperature and RH conditions were clearly higher than the 0.13 m2·K/W given in ISO 6946 (1996) and RakMK C3 (2003). However, solar radiation affected measurement results in the case of the analysed wall assemblies. The cladding was board and batten siding which decreased the velocity of air flow in the ventilation gap and, for its part, increased surface resistance. The analysis did not look into the conditions in a ventilation gap behind brick cladding which is the other typical cladding alternative in Finland.

192
4.2 Moisture performance of the ventilation gap in TUT test houses
In 2001–2002 TUT test houses were subjected to measurements intended to provide a more accurate picture of the temperature and RH conditions in the ventilation gap in different conditions, the impact of driving rain, wind, solar radiation and surface undercooling on the conditions, and the level of surface resistance of sheathings facing different cardinal directions. The impact of both wood and brick cladding on the conditions in the ventilation gap was also a target.
4.2.1 Description of the test houses and measuring equipment
Test houses
Wood- and brick-clad test houses at the TUT test building site, originally built for energy consumption studies on wall assemblies, were selected for the tests (Fig. 4.14).
Figure 4.14 Test houses used to measure ventilation gap temperature and RH of external wall assembly. Wood-clad test house on the left and brick-clad test house on the right. The test houses were photographed from the southeast.
Both buildings had a ventilation gap in contact with outdoor air behind the exterior cladding. The test houses were of the same size and shape. Their internal area was 2,400×2,400 mm2 and floor-to-ceiling height 2,600 mm (Fig. 4.15). The external dimensions varied depending on the thickness of the wall assembly. The roof and base floor assemblies of the buildings were identical. The roofs were pitched. The buildings had no windows, and the door of both test houses was on the eastern side.

193
The buildings were oriented north to south and east to west on the test site. Driving rain and solar radiation could fall quite unhindered on the surfaces on the test houses since the test site lay in quite open terrain and the houses did not have long eaves.
2400
2600
1 : 7
Polyurethane foam insulation(100 + 100) mm
Chipboard 22 mm
+20oC
+2 g/m3
Polyurethane foam insulation(100 + 100) mm
Ventilatedcrawl space
1300
RH/T measurement pointsin ventilation gap
1300
Figure 4.15 Cross-section of brick-clad test house structure. The wood-clad test house was similar except
for the exterior wall. (Lindberg et al. 1998)
Measuring equipment
Both test buildings had their own measuring and control equipment which, besides performing measurements, also controlled the temperature and RH conditions of indoor air. The measurements on the test buildings were performed with measuring equipment of the same type as used in laboratory tests and the measurement of the external walls of the one-family house (see Chs. 3.1 and 4.1.1). The measurement results on TUT test houses were transferred to a computer using an AD/DA converter as in the case of the measurements on the one-family house (see Fig. 4.2). The measuring equipment used with TUT test houses, however, had a different measurement and control program.

194
Measurements on test houses were made at one-minute intervals from which 30-minute averages were computed. Temperatures and relative humidities were measured by HMP 233 type moisture transmitters manufactured by Vaisala Ltd. The velocity of air flow in the ventilation gap was also measured by Envic Ltd’s AR-1-V type air flow sensors. The measurement range of the air flow sensor was 0 to 1.0 m/s in the wood-clad test house and 0 to 0.5 m/s in the brick-clad one. The measurement uncertainties of measured quantities were the same as in the laboratory tests (see Ch. 3.1.7).
4.2.2 Test arrangements
Studied assemblies
The wall assemblies of the test houses are presented in Figure 4.16. The interior side of the wall assemblies differed from those used in the laboratory tests since the formed assemblies had originally been selected for energy consumption studies of wall assemblies (Lindberg et al. 1998). This study, however, focussed on the temperature and RH conditions in the ventilation gap and its moisture performance, which the material layers of the interior section of the wall had little impact on. In the wood-clad assembly the water vapour resistance ratio between the interior and exterior wall linings was about 150:1 and that of the brick-clad assembly about 35:1. Figure 4.16 also presents the types of building materials whose material properties are defined in Appendix 3 to this study.
BRICK-CLAD WALL
Galvanised wall ties ∅ 5 mm, 4 pcs/m2
Setting coatCalcium silicate brick 135×198×300 mm
Rock wool 30 mm + weatherisation membrane (A6)Rock wool 125 mm (D2)
Ventilation gap 20 mmFacing clay brick 85×85×285 mm
395
WOOD-CLAD WALL
Planed log 1136×180 mm2 (C13)Blown cellulose insulation 120 mm (D4)+ wooden studs 120×41 mm, c/c 600 mm (C13) Wood fibreboard 12 mm (A13)Ventilation gap 22 mm
Wood cladding 20×195 mm+ vertical battens 22×41 mm, c/c 600 mm
285
+-+-
Figure 4.16 Wall assemblies of wood- and brick-clad test houses.
Measurement points
The tests measured the temperatures and relative humidities of outdoor and indoor air and the middle of the ventilation gap. The velocity of air flow in the ventilation gap of both assembly solutions was also measured. The points for ventilation gap temperature/RH measurements were located in the test buildings so that each external wall facing in a different direction had one. Thus, there were a total of four measurement points in both test houses in the air space of the ventilation gap.

195
The measurement points of the brick-clad test house were at the mid-point of each wall about 1,600 mm from the outside corners and 1,300 mm from the lower edge of the wall, as viewed from the outside (see Fig. 4.15). The sensors of the wood-clad test house were about 1,200 mm from the left outside corner and 1,300 mm from the lower edge of each wall. In the wood-clad building the horizontal location of sensors was determined by the vertical lathing in the ventilation gap – the lath spacing of the wall was 600 mm. In the horizontal direction sensors were installed midway between two battens in the middle of the wall. On the eastern sides, where the doors of the buildings were located, sensors could not be placed in the middle of the wall. Therefore, they were installed at a distance of about 450 mm from the outside corners of the wall. In the wood-clad building the sensor was placed to the right of the door and in the brick-clad building to the left of the door. Sensors were lowered into ventilation gaps from above. During the installation it was noticed that the 12 mm wood fibreboard used as sheathing in the wood-clad building had swollen due to moisture, blocking up the ventilation gap at places in the lower wall section. However, at the locations of the sensors the ventilation gap was free of obstructions. In the brick-clad building the ventilation gap was free of obstructions in all directions with the exception of a few occurrences of squeezed out mortar. Air flow sensors were installed in the northern wall of both test houses. For installation, a hole was drilled through the wall from the inside, and a sensor was inserted in the hole so that the sensor head was in the ventilation gap. Then, the penetration point was sealed in order to eliminate thermal and air leakages. Outdoor air temperature and relative humidity were measured at a measurement point protected against rain which was also on the test site. Indoor air sensors were located in the middle of indoor spaces.
Indoor and outdoor air conditions
The target indoor air temperature during the heating season was 20ºC, and relative humidity was controlled so that the indoor air target excess moisture with respect to outdoor air was constantly 2 g/m3. In measurements during the heating season (1 Oct 2002 – 28 Feb 2003) indoor air temperature varied in the wood-clad test house between 18.2 and 22.9°C, the average being 19.9°C, while in the brick-clad house temperature varied between 19.2 and 25.7°C, the average being 19.9°C. Indoor air excess moisture varied in the wood-clad house between -1.5 and 1.7 g/m3, the average being 1.6 g/m3. The excess moisture range of the brick-clad house was 0.9 to 4.2 g/m3, the average being 2.1 g/m3.

196
In the summer period fluctuations in temperature and excess moisture were wider since the building had no cooling. During the entire test period the temperature of the wood-clad house fluctuated within the 18.2 to 26.1°C range and that of the brick-clad house within the 17.9 to 28.1°C range. Indoor air excess moisture, again, ranged between -8.9 and 5.2 g/m3 in the wood-clad house and between -6.0 and 4.3 g/m3 in the brick-clad house. The outdoor air conditions of the measurement period were primarily typical for Finland. Autumn 2002 was perhaps an exception in that rainfall was then less than normal. Consequently, the driving rain stress on external walls was also lower during that period.
Research timetable
Temperature and RH measurements concerning the ventilation gap of the brick-clad test house started on 22 Nov 2001. The corresponding measurements on the wood-clad test house began on 8 Feb 2002. Measurement of air flow velocity started at both houses on 15 May 2002. All measurements continued until 28 Feb 2003 when the test ended. Thus, the temperature and RH measurement periods for both test houses were over 1 year.
4.2.3 Test results
Comparison of ventilation gap and outdoor air temperatures
Figures 4.17 and 4.18 show the average measured temperature difference between the middle of the ventilation gap and outdoor air as a function of outdoor air temperature. The figures include test results measured from walls facing north, south, east and west. The average curves were calculated on the basis of average results measured at 30-minute and 2°C intervals. Individual measurement values measured in the same outdoor air temperature range varied in the same way as the measurement results on a one-family house (see Fig. 4.10). The wider fluctuation was largely due to increased solar radiation, but surface undercooling and delays in the changes of conditions between the middle of the ventilation gap and outdoor air also played a role. When assessing the test results, one should consider that average values based on very high and low outdoor air temperature values were derived from a much smaller number of test results than the results represented by the middle section of the curve.

197
0
1
2
3
4
5
6
7
8
9
10
11
12
-35 -30 -25 -20 -15 -10 -5 0 5 10 15 20 25 30 35Outdoor air temperature, θe (°C)
Tem
pera
ture
diff
eren
ce b
etw
een
vent
ilatio
n ga
p an
d ou
tdoo
r air,
Δθ
(°C
)Eastern wall
Southern wall
Western wall
Northern wall
Exterior surface resistance 0.13 m²·K/W
Exterior surface resistance 0.04 m²·K/W
Figure 4.17 Average temperature difference between the middle of the ventilation gap and outdoor air as a
function of outdoor air temperature in the wood-clad test house in different cardinal directions. The figure also displays the temperature difference graphs corresponding to exterior surface resistances 0.04 m2·K/W and 0.13 m2·K/W.
0
1
2
3
4
5
6
7
8
9
10
11
12
-35 -30 -25 -20 -15 -10 -5 0 5 10 15 20 25 30 35
Outdoor air temperature, θe (°C)
Tem
pera
ture
diff
eren
ce b
etw
een
vent
ilatio
n ga
p an
d ou
tdoo
r air,
Δθ
(°C
)
Eastern wall
Southern wall
Western wall
Northern wall
Exterior surface resistance 0.13 m²·K/W
Exterior surface resistance 0.04 m²·K/W
Figure 4.18 Average temperature difference between the middle of the ventilation gap and outdoor air as a
function of outdoor air temperature in the brick-clad test house in different cardinal directions. The figure also displays the temperature difference graphs corresponding to exterior surface resistances 0.04 m2·K/W and 0.13 m2·K/W.

198
Comparison of Figures 4.17 and 4.18 reveals that the ventilation gap temperature was higher in winter behind brick cladding than behind wood cladding. One reason for that was that the velocity of air flow in the ventilation gap behind brick cladding was lower (see Fig. 4.21) whereby the cooling effect of the air flow weakened. Also, brick-cladding bound more heat in day-time than wood-cladding which also kept the ventilation gap warmer for longer during night-time. In the case of the wood-clad test house, the temperature difference measured on the northern side was the smallest, as could be assumed, since the northern wall also receives the least solar radiation. On the other hand, the temperature measured on the eastern side was the lowest in the case of the brick-clad test house. This may be partly explained by the nearby door frame and corner of the building (see Ch. 4.2.2). The mechanical ventilation of the test house may have caused a compensation air flow through the door frame from the outside in. This air flow may also have cooled the air in the ventilation gap near the frame. Temperature differences of ventilation gap air were quite small in other cardinal directions during the winter period. It is likely that the smaller air flow of the ventilation gap and the higher heat capacity of the brick facade equalised the temperature differences between the cardinal directions in the brick-clad test house. When temperature was above 0°C, the temperature difference between the middle of the ventilation gap and outdoor air started to increase radically. Then, the temperatures of walls facing different cardinal directions started to diverge more clearly from each other. In summer, the air in the ventilation gaps of the southern wall was, on average, up to 10°C warmer than outdoor air. That temperature difference was about the same regardless of used cladding material. Even in the case of the northern wall the average difference was 2 to 3°C at a maximum. The temperature differences between the ventilation gap and outdoor air measured in the test houses were real also in summer since air temperature was measured at a specific measuring point at a distance from the test houses (see Fig. 4.10).
Comparison of moisture conditions of ventilation gap and outdoor air
Figures 4.19 and 4.20 show the average humidity by volume difference between the middle of the ventilation gap and outdoor air as a function of outdoor air temperature. The figures show the measured results for all cardinal directions as in the case of the temperature difference graphs. The average value curves were calculated according to the same principles as in Figures 4.17 and 4.18. Equations 1.26–1.28 of Chapter 1.7.1 were used to calculate the humidity by volume differences.
With respect to humidity by volume, individual values measured in the same outdoor air temperature range varied similarly, and for the same reasons, as the results on the one-family house (see Fig. 4.11).

199
-3.0
-2.5
-2.0
-1.5
-1.0
-0.5
0.0
0.5
1.0
1.5
2.0
2.5
3.0
-35 -30 -25 -20 -15 -10 -5 0 5 10 15 20 25 30 35
Outdoor air temperature, θe (°C)
Hum
idity
by
volu
me
diffe
renc
e be
twee
n ve
ntila
tion
gap
and
outd
oor a
ir, Δ
ν (g
/m3 )
Eastern wall
Southern wall
Western wall
Northern wall
Figure 4.19 Average difference in humidity by volume between the middle of the ventilation gap and
outdoor air of wood-clad test house as a function of outdoor air temperature in different cardinal directions.
-3.0
-2.5
-2.0
-1.5
-1.0
-0.5
0.0
0.5
1.0
1.5
2.0
2.5
3.0
-35 -30 -25 -20 -15 -10 -5 0 5 10 15 20 25 30 35
Outdoor air temperature, θe (°C)
Hum
idity
by
volu
me
diffe
renc
e be
twee
n ve
ntila
tion
gap
and
outd
oor a
ir, Δ
ν (g
/m3 )
Eastern wall
Southern wall
Western wall
Northern wall
Figure 4.20 Average difference in humidity by volume between the middle of the ventilation gap and
outdoor air of brick-clad test house as a function of outdoor air temperature in different cardinal directions.
Figures 4.19 and 4.20 show that average humidities by volume were no higher in the ventilation gap air than in outdoor air. Thus, the RH of the ventilation gap was lower than that of outdoor air since the average temperature of the ventilation gap was always

200
somewhat higher than that of outdoor air (see Figs. 4.17 and 4.18). Therefore, any possible occasional penetration of rain water through the timber or brick cladding did not have an impact on the average humidity by volume of the ventilation gap – at least not in these measurements. Actually, it can be said on the basis of Figures 4.19 and 4.20 that the humidity by volume of the ventilation gap was even lower than that of outdoor air when temperature was above 0°C. This same phenomenon could be observed also in the earlier measurements on the one-family house (see Fig. 4.11). A possible explanation is that the material interfaces in the ventilation gap tend to adsorb moisture as temperature rises thereby creating a saturation deficit there. On the other hand, when materials give up moisture, extra water vapour exits the ventilation gap quickly carried by the air flow.
Velocity of air flow in the ventilation gap
The velocities of air flow in ventilation gaps behind timber and brick cladding are shown in Figure 4.21. The average curves of Figure 4.21 were calculated by the same principle as those of Figures 4.17−4.20.
0.00
0.05
0.10
0.15
0.20
0.25
-35 -30 -25 -20 -15 -10 -5 0 5 10 15 20 25 30 35
Outdoor air temperature, θe (°C)
Velo
city
of a
ir flo
w, r
a (m
/s)
Northern, wood-clad wallNorthern, brick-clad wall
Figure 4.21 Average velocity of air flow in ventilation gap of northern wall of wood- and brick-clad test
house as a function of outdoor air temperature. Figure 4.21 shows that the average velocity of air flow in the ventilation gap increased as temperature rose. During the winter period the velocity of air flow may have risen above average also due to wind since the measurement results show a clear peak behind the wood cladding then. The velocity of air flow was slightly higher behind the wood than the brick cladding. One must, however, consider that the measurement uncertainty of velocity of air

201
flow was so high (±0.1 m/s + 3% of reading, see Ch. 3.1.7) that results measured from different assemblies do not necessarily differ from each other in reality. The velocity of air flow behind the wood cladding of the test house was almost as high as in the one-family house in winter. The ventilation gap of this test house was realised with vertical lathing which allowed free movement of air from the bottom up. The ventilation gap of the one-family house was implemented with horizontal laths (see Fig. 4.12), but there solar radiation on the southern wall increased the velocity of air flow in the ventilation gap. The velocity of air flow in the ventilation gap of the brick-clad test house was very low while temperature was under 10°C. Then the ventilation gap in effect functioned as a closed air gap whose thermal resistance was significantly higher than that of an open ventilation gap. Consequently, the temperature in the ventilation gap behind brick cladding was also higher. On the other hand, the velocity of air flow in the eastern wall’s ventilation gap, where the temperature difference with outdoor air was the smallest, was not measured. Based on Figures 4.17, 4.18 and 4.21, solar radiation affects ventilation gap temperatures in two ways. It raises the temperatures of the exterior surface of the wall compared to outdoor air while also increasing the velocity of air flow in the ventilation gap, which, again, tends to decrease the temperature difference between outdoor and ventilation gap air. However, in summer the surface temperature-raising impact of the sun is clearly more dominating.
Exterior surface resistances of test walls
Figures 4.17 and 4.18 also include the temperature difference graphs corresponding to exterior surface resistances 0.04 and 0.13 m2·K/W. The surface resistance graphs were calculated using Equation 3.1. Thermal resistances, Rwall, of walls were calculated by the method presented in EN ISO 13788 (2001) standard based on laboratory thermal conductivities, λ10, of wall materials (see App. 3). The resulting thermal resistance of a wood-clad wall was 4.00 m2·K/W and that of a brick-clad wall 4.81 m2·K/W. The U-value of the brick-clad wall was also measured from the interior surface of the northern wall of the test house in winter conditions with a heat flow meter; the result was about 0.19 W/m2K. The thermal resistance of the brick-clad wall calculated from that value, excluding the impact of cladding and surface resistances, was about 5.0 m2·K/W. That corresponded quite closely to the calculated thermal resistance of the brick-clad wall. Consequently, the calculated thermal resistance values of the walls could be considered sufficiently reliable. When examining the temperature differences shown in Figures 4.17 and 4.18 and the temperature difference graphs corresponding to different exterior surface resistances, one must remember that they are not directly comparable with each other. This is because

202
surface resistances depict temperature difference between the exterior surface of the sheathing and outdoor air while the test results depict the difference between the middle of the ventilation gap air and outdoor air. In the TUT test houses the measuring sensors could not be attached directly onto the exterior surface of the sheathing since the test houses had been built before the tests and it was not possible to dismantle the cladding for installing surface sensors. It was earlier established that the temperature difference between the exterior surface of the sheathing and outdoor air in the case of the wood-clad external wall was about twofold compared to that between the middle of the ventilation gap air and outdoor air (see Chs. 3.2.4 and 4.1.3). If this assessment is applied to the test results of Figures 4.17 and 4.18, it may be stated that the average surface resistance of the northern wall (θe ≤ 0°C) of the wood-clad test house varied from 0.02 to 0.22 m2·K/W in winter, and that of eastern wall of the the brick-clad test house from 0.08 to 0.40 m2·K/W. The surface resistance of the wood-clad wall was thus essentially lower than in the earlier measurements on the one-family house (see Fig. 4.13). There were several reasons for this. The most important one was that the northern wall of the test houses received clearly less solar radiation than the southern wall of the one-family house. The measurements were also made in different years and localities, which means that differences in outdoor air conditions (e.g. solar radiation and surface undercooling) had an impact. Although surface resistance values behind the brick cladding were somewhat higher than behind the wood cladding, one must remember that driving rain penetrates brick cladding more easily than wood cladding, for instance in a windy coastal area. Therefore, it is justified to determine the surface resistance of sheathing also in this case on the basis of values measured from a wood-clad wall. That improves to some extent the reliability of the moisture performance of the ventilation gap of a brick-clad wall in severe driving rain conditions. Since the humidities by volume of the ventilation gap were on the same level or lower than outdoor air’s (see Figs. 4.19 and 4.20), a surface resistance value determined directly on the basis of temperature differences can be used as the surface resistance of the exterior surface. The above-mentioned surface resistance values incorporate more factors of uncertainty than usually since the measurement points were in the ventilation gap, not on the exterior surface of the sheathing. In specific instances the sensor might also have been closer to either the cladding or the sheathing. Thus, accurate surface resistance values are difficult to determine on the basis of the measurements. Yet, the measurements show that the resistance of the exterior surface may be significantly lower than the 0.13 m2·K/W

203
suggested by ISO 6946 (1996) standard and RakMK C4 (2003) especially behind timber cladding. Further, it must be remembered that the temperature difference between the sheathing’s exterior surface and outdoor air in the lower section of the wall is smaller than in the middle or upper section since the outdoor air entering the ventilation gap has not had time to warm up by then. This reduces the surface resistance values in the lower section of the wall further. On the other hand, for example with respect to condensation, the upper section of the external wall is generally the most critical area since the assembly’s internal convection transports water vapour to the upper section of the assembly (see Fig. 1.7).
4.2.4 Conclusions
Based on the test conducted on TUT test houses, the temperature of the ventilation gap exceeded that of outdoor air in all cardinal directions – the least in the north and east, the most in the south. The temperature difference also increased as outdoor air temperature rose. The temperature difference between the middle of the ventilation gap air and outdoor air of the wood-clad test house in the most critical cardinal direction (north) corresponded to the temperature difference of an overall surface resistance of 0.02 to 0.22 m2·K/W in winter conditions. The temperature difference in the most critical cardinal direction (east) of the brick-clad house corresponded to the temperature difference of a surface resistance of 0.08 to 0.40 m2·K/W in winter conditions. The thermal surface resistance derived for wood cladding was essentially lower than the values yielded by previous laboratory tests and the field measurements on the one-family house. On the other hand, the measurements were different, for instance, with respect to year of measurement, locality, cardinal direction and structure of ventilation gap. From the viewpoint of exterior surface resistance, the ventilation gap with vertical lathing is the most critical structural solution as concerns wood cladding. The humidities by volume of ventilation gaps, on average, remained at the same or lower level than those of outdoor air. Thus, the moisture conditions of the ventilation gap are no more critical than those of outdoor air behind either cladding type (wood or brick). Lehtinen et al. (2000), among others, received the same result with respect to brick cladding already earlier. The test building of their study was located by the Finnish coast in Helsinki, and they focussed on the upper floors of the building (a four-storey building). The results of this research show that even though rain water could sometimes penetrate through a brick wall, it did not raise remarkably the average humidities by volume of the ventilation gap compared to outdoor air. This same phenomenon was noticed on both the southern and northern sides of the building. The measurement results of Chapter 4.1 for a one-family house, again, show that closer proximity to the coast did not increase the humidity by volume of the ventilation gap behind wood cladding compared to outdoor air.

204
The same conclusion can also be drawn on the basis of an earlier study where temperatures and relative humidities behind a wooden facade were measured by the Finnish coast in Helsinki (Lehtinen & Viljanen 1999). Based on the test results, it appears that driving rain, wind, solar radiation and surface undercooling do not increase the humidity by volume of the ventilation gap behind wood or brick cladding during any season if there is a functioning ventilation gap behind the cladding in contact with outdoor air. That is why the impact of these factors has not been separately considered in the diffusion analyses of the external wall. Since the humidities by volume of the ventilation gap were of the same level or lower than outdoor air’s, a surface resistance value determined directly on the basis of temperature differences can be used as the surface resistance of the exterior surface. Solar radiation does not increase significantly the temperatures of the exterior surface of the wall in the case of the most critical northern alternative in winter. Thus, solar radiation does not affect significantly the exterior surface resistance of a wall assembly under these conditions. For the calculation of thermal transmittance, U, standards ISO 6946 (1996) and RakMK C4 (2003) suggest using a sheathing exterior surface resistance of 0.13 m2·K/W with an external wall with a ventilation gap. The above-mentioned test results do not support using this value in calculational analyses of moisture performance. One must, however, remember that average surface resistance has been assumed to be 0.13 m2·K/W when calculating the thermal transmittance factor for a wall, if all cardinal directions are considered. Thus, the surface resistance value of 0.13 m2·K/W can be used here. Analyses of the moisture performance of assemblies should, however, be based on the most critical cardinal direction, meaning that a lower surface resistance value is to be used. In addition, even small changes in exterior surface resistance may be significant for condensation or mould growth when trying to establish the lower limit for the water vapour resistance of the interior wall lining in moisture performance studies (see Ch. 6.3.5). Based on the test results, a surface resistance of 0.04 m2·K/W should be assigned to the sheathing in the case of a wood-clad and brick-clad external wall in diffusion analyses. In brick-clad walls this value also offsets to some extent the higher humidity by volume in the air gap compared to outdoor air possibly caused by driving rain in windy coastal areas. This same surface resistance value may also be used for other claddings of timber-framed walls (e.g. metal claddings).

205
5 BENCHMARKING OF HEAT, AIR AND MOISTURE TRANSFER SIMULATION MODELS
5.1 Overview of heat, air and moisture transfer simulation models (HAM models)
The development of calculation software suited for building physical analyses has been especially rapid during the last 15 years due to the new possibilities offered by information technology. Today there are versatile calculation programs which allow examining the temperature and moisture performance of assemblies as a function of time in changing indoor and outdoor air conditions. The software is typically based on the finite-difference method and allows examining 1D, 2D or 3D structural models depending on the program. Programs have been developed at various research institutes; some are commercial while others are reserved only for the institutes’ own use. Some examples of the commercial programs and their developers: • 1D-HAM, Chalmers University of Technology, Sweden and Massachusetts Institute
of Technology, USA (Hagentoft 1993; Hagentoft & Blomberg 2000) • DELPHIN, University of Dresden, Germany (Grunewald 1997) • MATCH, Technical University of Denmark, Denmark (Pedersen 1990; Rode &
Burch 1995, Match manual 1997) • MOIST, National Institute of Standards and Technology, NIST, USA (Burch &
Thomas 1991; Burch & Chi 1997) • WUFI, Fraunhofer Institute for Building Physics, Germany (Künzel 1995; Künzel et
al. 2000) • HygIRC 1-D, National Research Centre of Canada, NRC (Maref et al. 2002; Cornick
2006) Some examples of programs reserved solely for use by research institutes themselves: • LATENITE, Technical Research Centre of Finland, VTT (Salonvaara & Karagiozis
1994; Karagiozis 1997) • MOISTURE EXPERT, Oak Ridge National Laboratory, ORNL, USA (Karagiozis
2001) • TCCC2D, Technical Research Centre of Finland, VTT (Ojanen & Kohonen 1989a) • WALLDRY, Canada Mortgage and Housing Corporation, CMCH (Schuler et al.
1989; Scott & Lawton 1991)

206
Many other programs in addition to the above-mentioned ones are listed, for instance, in the following sources: Hens & Janssens (1992), Hens (1996a), Lehtinen & Lehtonen (1997) and Straube & Burnett (2001). The functioning of calculation programs in different calculation situations has been studied and compared to the results yielded by other programs (Hens 1996a; Hens et al. 1996b; Geving 1997a; Nofal et al. 2001; Bomberg et al. 2002a; Hagentoft et al. 2004; Cornick 2006) or test results (Burch et al. 1989; Scott & Lawton 1991; Zarr et. al. 1995; Geving & Thue 1996; Geving 1997a; Geving et al. 1997c; Rode et al. 2001; Maref et al. 2002). Differences between programs and results of tests and calculational analyses have been observed – especially when analysing the capillary range. Individual differences also exist in the application of programs and feeding of intial values. Moreover, programs are continually being developed and updated meaning that no data on the functioning of the newest versions exists for comparison. Thus, in order to be able to evaluate the suitability of different programs for the calculational analysis in question, one must perform test calculations on the situation under study with them.
5.2 Principles of compared HAM models of this research
The aim was to find a usable calculation program for the calculational analyses of this research which would yield reliable results. The properties of three commercial programs on the market were compared mutually with that in mind. The selected programs were 1D-HAM 2.0, MATCH 1D 1.5 and WUFI-2D 2.1. The programs were used to calculate comparison values for the results measured in a laboratory and in the field.
5.2.1 Governing potentials
The 1D-HAM (version 2.0) is a basic model that solves the problem of one-dimensional coupled heat, air and moisture transfer in a multi-layered porous wall. The program is based on the finite-difference method. Moisture is transferred by diffusion in the vapour phase. No liquid water transport occurs. Air flow through the material layer is considered by the model and, therefore, water vapour convection through the materials is also taken into account. Heat is transferred by conduction, radiation, convection and latent heat. (Hagentoft 1993; Hagentoft & Blomberg 2000) Humidity by volume is used as the governing potential for moisture transfer. Temperature is the governing potential in the heat transfer equation. The two transport processes are coupled through the transfer of latent heat and the temperature dependence of humidity at saturation, which together with the actual relative humidity determine the humidity by

207
volume. Relative humidity is determined by the water content of the material through the sorption isotherm. (Hagentoft 1993; Hagentoft & Blomberg 2000) The governing equation for energy transfer is:
twhTcr
xT
xtTc
∂∂
+⎟⎠⎞
⎜⎝⎛ +
∂∂
−∂∂
−=∂∂
wpaaa ρλρ (5.1)
The governing equation for moisture transfer is:
⎟⎠⎞
⎜⎝⎛ +
∂∂
−∂∂
−=∂∂ vr
xv
xtw
aνδ (5.2)
Explanations of the notations in Equations 5.1–5.6 are presented at the beginning of the study and most of them are also explained in Chapter 1.7.1. The MATCH program (version 1.5) is a DOS-based one-dimensional model for transient calculation of the coupled transport of heat and moisture through composite building constructions. The program is based on the finite-difference method. For moisture flow the program uses two potentials: vapour pressure is used as the driving potential for diffusion and suction pressure for liquid flux. Heat is transferred by conduction, radiation, and latent heat. Humidity by volume at saturion is calculated over liquid water at subzero temperatures (Pedersen 1990; Rode & Burch 1995; Match manual 1997). A modified version of the program also calculates the air flow through the material layer (Hens 1996a). However, the version used in this research does not consider air flow in the assessment of moisture performance. The governing equation for energy transfer is:
⎟⎠⎞
⎜⎝⎛
∂∂
∂∂
+⎟⎠⎞
⎜⎝⎛
∂∂
∂∂
=∂∂
xp
xh
xT
xtTc ν
pw δλρ (5.3)
The governing equation for moisture transfer is:
⎟⎠⎞
⎜⎝⎛
∂∂
∂∂
+⎟⎠⎞
⎜⎝⎛
∂∂
∂∂
=∂∂
xs
xxp
xtu
wν
p κδρ (5.4)
The WUFI-2D program (version 2.1) is a Windows-based two-dimensional program for the heat and moisture-transfer analysis of building envelope constructions based on the finite-difference method.

208
The program introduces two potentials for moisture flow: the liquid transport flux depends on relative humidity and the vapour diffusion flux depends on vapour pressure. Heat is transferred by conduction, radiation, and latent heat. The air flow through the material layer is not considered in the assessment of moisture performance. Humidity by volume at saturion is calculated over ice at subzero temperatures (Künzel 1995, Künzel et al. 2000). The governing equation for energy transfer is:
))p((h)T(tT
TH
satν,pw ϕδλ ∇∇+∇∇=∂∂
⋅∂∂ (5.5)
The governing equation for moisture transfer is:
))(( satν,p pDt
w ϕδϕϕϕ ϕ ∇+∇∇=
∂∂
⋅∂∂ (5.6)
The biggest difference between the above balance equations is that the MATCH program uses suction pressure as capillary flow potential while the WUFI-2D program uses the relative humidity calculated on the basis of equilibrium moisture content as the pontential (see Ch. 1.7.1).
5.2.2 Material properties
The MATCH and WUFI-2D programs can be fed with water vapour permeability and thermal conductivity as a function of relative humidity/moisture content. These variables are fed into the 1D-HAM program as fixed values. WUFI-2D uses the water vapour diffusion resistance factor, μ (−), which was determined earlier by Equations 1.36 and 1.37. As Equation 1.37 shows, WUFI-2D allows considering the effect of a change in temperature on the vapour diffusion resistance factor of air. MATCH, again, allows considering the impact of temperature change on the thermal conductivity of materials. The moisture storage function is fed differently with different programs. Only MATCH uses both the adsorption and desorption curves to define the moisture storage function. WUFI-2D uses average values of the adsorption and desorption curves (or just adsorption values if desorption values are not available). With 1D-HAM three straight lines approximate the moisture storage function.
5.2.3 Boundary conditions
All programs allow feeding changing temperature and relative humidity values as indoor and outdoor air conditions. They all also take into account solar radiation and

209
undercooling. WUFI-2D can also analyse the impact of driven rain on assemblies. MATCH, for its part, can analyse with a certain accuracy the effects of cloudiness and wind on the heat transfer coefficient of a surface.
5.3 Simulation tests on external walls without capillary flow
5.3.1 Comparison of results with HAM models to laboratory test results
Compared walls
At first, the hygrothermal performance of three wall assemblies was compared through calculations which excluded the effect of capillary moisture transfer (Kalamees & Vinha 2003). Test walls 1b, 3b and 5a were chosen for the comparison (Fig. 5.1; see App. 1). All three of the above-mentioned HAM programs were used in the calculational analyses of these walls.
- +
Gypsum board 13 mm (C1)Plastic sheet (C11)Glass wool 173 mm (D1)Wooden studs 48×173 mm (C13) Wood fibreboard 25 mm (A2)Ventilation gap 25 mmBoarding 22 mm
TEST WALL 1b
Gypsum board 13 mm (C1)Bitumen paper (B5)Cellulose insulation 173 mm (D4)Wooden studs 48×173 mm (C13) Wood fibreboard 25 mm (A2)Ventilation gap 25 mmBoarding 22 mm
Gypsum board 13 mm (C1)Bitumen paper (B5)Sawdust + chipping 173 mm (D67)Wooden studs 48×173 mm (C13) Wood fibreboard 25 mm (A2)Ventilation gap 25 mmBoarding 22 mm
TEST WALL 3b TEST WALL 5a
Figure 5.1 Test walls 1b, 3b and 5a whose hygrothermal performance was compared to calculated results.
Initial settings of simulations
The material properties used in these calculations are presented in Kalamees & Vinha (2003). These properties are, as to their essential parts, the same as those given in Appendix 3. Some of those properties were changed slightly after the calculations, but the changes were not significant. In the WUFI-2D program equilibrium moisture contents of materials were represented by sorption graphs of equilibrium moisture content. Constant material values were given to water vapour permeability/resistance and thermal conductivity in the case of the 1D-HAM program since variable values could not be fed into it. The equilibrium moisture content graph was also depicted by three linear lines in the 1D-HAM program. These values were chosen to correspond to the measured values as well as possible. The thicknesses of thin membranes were set at 1 mm in all calculation programs and the water vapour resistance value of membranes was calculated so that it

210
would correspond to the water vapour resistance value, Zν, derived from the laboratory test. All calculational analyses excluded capillary moisture transfer since the 1D-HAM programs could not deal with that phenomenon. On the other hand, the relative humidities of pore air within walls were so low in the tests that capillary transfer of moisture had little effect on the calculation results. In all programs the upper limit of the hygroscopic region was set to correspond to 100% RH since this RH value had to be made to correspond to the maximum hygroscopic moisture content in the 1D-HAM program to produce a sensible end result. The target values for indoor and outdoor air boundary conditions were presented earlier in Chapter 3.2.2. The boundary values used in the calculations were hourly averages measured in laboratory tests. Because the surface heat transfer coefficients were not constant during laboratory tests, calculations were based on surface data, and the surface heat transfer coefficient was set to infinity. The boundary temperatures used in calculations were the interior surface temperature of the gypsum board and the exterior surface temperature of the sheathing. Relative humidities of the same surfaces were calculated from the relative humidities of indoor air and the ventilation gap, so that the same humidity by volume prevailed in the air and on the surface. The temperature and relative humidity monitoring points were located in the same spots as in the laboratory tests (6.5 mm from the exterior and interior surface of the thermal insulation layer). The element models of assemblies were made to resemble each other to the extent possible. Tighter element spacing was used at interfaces of structural layers where changes in conditions were the largest. The initial moisture contents of materials were selected so that they corresponded to the measured initial values as well as possible. Although all materials reached the target equilibrium moisture content before the test (see Ch. 3.2.1), they all dried more or less during the construction of the wall assembly. The thermal insulation materials dried the most. The insulation layer was divided into two parts with different initial moisture contents, and some iteration was done to get the best relationship between calculated results and laboratory results. The initial temperature values were set to 20–21°C in all calculations. All calculation programs used the same initial values.
Test results
The calculated and measured temperatures and relative humidities of Test walls 1b, 3b and 5a are shown in Figures 5.2–5.7. Comparison points are located on the interior (i) and exterior (e) surface of the thermal insulation layer.

211
-10
-5
0
5
10
15
20
25
0 7 14 21 28
Time (days)
Tem
pera
ture
, θ (o C
)
LAB i 1D-HAM i MATCH i WUFI-2D iLAB e 1D-HAM e MATCH e WUFI-2D e
Figure 5.2 Calculated and measured temperatures of Wall 1b. The upper lines represent temperatures of
the interior (i) and the lower lines temperatures of the exterior (e) surface of the insulation layer.
0
10
20
30
40
50
60
70
80
90
100
0 7 14 21 28
Time (days)
Rel
ativ
e hu
mid
ity, ϕ
(% R
H)
LAB i 1D-HAM i MATCH i WUFI-2D iLAB e 1D-HAM e MATCH e WUFI-2D e
Figure 5.3 Calculated and measured relative humidities of Wall 1b. The lower lines represent relative
humidities of the interior (i) and the upper lines relative humidities of the exterior (e) surface of the insulation layer.

212
-10
-5
0
5
10
15
20
25
0 7 14 21 28 35 42 49 56
Time (days)
Tem
pera
ture
, θ (o C
)
LAB i 1D-HAM i MATCH i WUFI-2D iLAB e 1D-HAM e MATCH e WUFI-2D e
Figure 5.4 Calculated and measured temperatures of Wall 3b. The upper lines represent temperatures of
the interior (i) and lower lines temperatures of the exterior (e) surface of the insulation layer.
0
10
20
30
40
50
60
70
80
90
100
0 7 14 21 28 35 42 49 56
Time (days)
Rel
ativ
e hu
mid
ity, ϕ
(%R
H)
LAB i 1D-HAM i MATCH i WUFI-2D iLAB e 1D-HAM e MATCH e WUFI-2D e
Figure 5.5 Calculated and measured relative humidities of Wall 3b. The lower lines represent relative
humidities of the interior (i) and the upper lines relative humidities of the exterior (e) surface of the insulation layer.

213
-10
-5
0
5
10
15
20
25
0 7 14 21 28 35 42 49
Time (days)
Tem
pera
ture
, θ (o C
)
LAB i 1D-HAM i MATCH i WUFI-2D iLAB e 1D-HAM e MATCH e WUFI-2D e
Figure 5.6 Calculated and measured temperatures of Wall 5a. The upper lines represent temperatures of
the interior (i) and the lower lines temperatures of the exterior (e) surface of the insulation layer.
0
10
20
30
40
50
60
70
80
90
100
0 7 14 21 28 35 42 49
Time (days)
Rel
ativ
e hu
mid
ity, ϕ
(% R
H)
LAB i 1D-HAM i MATCH i WUFI-2D iLAB e 1D-HAM e MATCH e WUFI-2D e
Figure 5.7 Calculated and measured relative humidities of Wall 5a. The lower lines represent relative
humidities of the interior (i) and the upper lines relative humidities of the exterior (e) surface of the insulation layer.

214
The calculated temperatures are rather accurate for all wall types. The biggest differences between measured and calculated temperatures during a stable period (0.4ºC) occurred in Wall 5a in autumn and winter on the interior surface of the insulation layer. In springtime the biggest differences in all wall types occurred at the exterior surface of the insulation layer: in the daytime they were -1.7 to 3.7ºC and at night -0.14 to 0.8ºC. In spring the daily average measured temperature was colder than the calculated one in walls with glass wool and cellulose insulation. In the case of Wall 5a, with mixed sawdust and chipping insulation, the opposite was true: the daily average measured temperature was higher than the calculated temperature. When we look at relative humidity figures, we observe bigger differences between measured and calculated values than in the case of temperature curves. The difference between the curves at the beginning and end of the test period is similar, but the shapes of the curves are different. Measured-value curves are more sensitive to humidity changes. For example, at the exterior surface of the insulation, measured relative humidity rises at the beginning of the test faster than calculated values, but it also falls quicker after winter. In addition, this difference in sensitivity results in phase differences between measured and calculated highest and lowest amplitude values. The biggest difference between measured and calculated relative humidity values in a stable period occurred in Wall 5a, with sawdust insulation, in the wintertime, on the interior surface of the insulation layer. These values calculated by all programs were about 5% RH higher than measured values (see Fig. 5.7). The biggest difference between measured and calculated relative humidity values, in all cases, occurred in cyclic springtime in Wall 3b. The greatest variation in the test results on this wall were 13–16% RH from values calculated by different programs (see Fig. 5.5). The amplitude of measured values in springtime was also higher than the amplitude of the calculated values. In the case of hygroscopic materials and bigger sorption hysteresis effect (Wall 5a), MATCH yielded values closer to the calculated ones than the others. On the other hand, in the case of Wall 3b the values calculated with 1D-HAM were closer to measured values than MATCH and WUFI-2D values. Based on these verification tests, the results of the 1D-HAM program were as good as those yielded by other programs although that program is not capable of varying the values of material properties.
215
Conclusions
Measured values were more sensitive to humidity change. Relative humidity rose and fell quicker than calculated values. For instance, Geving (1997a) noted the same phenomenon in his studies. When boundary conditions were highly variable (springtime), this phenomenon also caused phase differences between measured and calculated highest and lowest amplitude values. Despite these differences between the results of laboratory tests and calculations, the laboratory measurements corresponded to the calculated results well enough and were of the same level over the long term. Thus, all the used programs: 1D-HAM, MATCH and WUFI-2D, performed sufficiently well in the calculational analyses.
5.3.2 Comparison of results with HAM models to those measured from one-family house
The research results from field measurements on the one-family house were also compared with those yielded by calculation programs in an effort to ensure the performance of the programs also in actual calculational analyses of indoor and outdoor air conditions. The aim of the comparison was to determine how closely test results measured under actual conditions correspond to those provided by calculation programs. The test house and the studied assemblies were described earlier in Chapters 4.1.1–4.1.2.
Initial settings of simulations
Modelling was done by WUFI-2D 2.1 and 1D-HAM 2.0 software. The material properties used in these simulations are presented in Vinha et al. (2003b). These properties are, as to their essential parts, the same as those given in Appendix 3. Some properties were changed slightly after the calculations, but the changes were not significant. The WUFI-2D program used as materials’ equilibrium moisture contents the sorption graphs of equilibrium moisture content. Constant values were given to water vapour permeability/resistance and thermal conductivity in the case of the 1D-HAM program since variable values cannot be fed into it. The equilibrium moisture content graph was also depicted by three linear lines in the 1D-HAM program. These values were chosen to correspond to the measured values as well as possible. The upper limit of the hygroscopic range was 100% RH in both programs. The thicknesses of thin membranes were set to 1 mm in both calculation programs and the water vapour resistance value of membranes was calculated so that it corresponded to the water vapour resistance value, Zν, derived from the laboratory test. Values measured from the interior surface of the interior board were used for indoor air temperature and RH conditions, and values from the exterior surface of the sheathing represented outdoor air conditions. The measured values were average values of two RH/T

216
sensors located up and down in both wall assemblies (see Ch. 4.1.2). The surface resistance of the interior and exterior surface was set to zero which allowed eliminating errors due to variation in surface resistance in the calculations. Hourly averages of measured values were used in the calculations to arrive at daily averages. The monitoring points for temperature and relative humidity in the walls modelled for the calculation programs were in the same spots as in the laboratory tests (6.5 mm from the exterior and interior surface of the thermal insulation layer). The measured values were average values of two RH/T sensors located up and down in both wall assemblies (see Ch. 4.1.2). In the initial situation, the moisture contents of materials corresponded to the relative humidities of pore air presented in Table 5.2. The initial temperature was set at 20ºC in all calculations. The materials of the external wall section were assigned higher moisture contents at the beginning of calculation in order that they would correspond more closely to the actual initial situation. For this reason, the thermal insulation layer was also divided into two sections of equal thickness. Table 5.2 Initial relative humidities of porous air of materials in HAM simulation of one-family house
walls.
Material Initial relative humidity
of porous air (% RH)
Gypsum board 47
Timber frame 73
Wood fibreboard 79
Glass wool, internal section 47
Glass wool, external section 79
Cellulose batt insulation, internal section 47
Cellulose batt insulation, external section 79
Test results
Figures 5.8–5.11 show the calculated and measured temperatures and relative humidities at the exterior and interior surfaces of thermal insulation layer.

217
-30
-20
-10
0
10
20
30
40
12.98 01.99 02.99 03.99 04.99 05.99 06.99 07.99 08.99 09.99 10.99 11.99 12.99 01.00 02.00 03.00 04.00
Date (month.year)
Tem
pera
ture
, θ (
°C)
Measured temp., interior surface of insulation Measured temp., exterior surface of insulationCalculated temp., interior surface of insulation (WUFI-2D) Calculated temp., exterior surface of insulation (WUFI-2D)Calculated temp., interior surface of insulation (1D-HAM) Calculated temp., exterior surface of insulation (1D-HAM)
Figure 5.8 Temperatures of exterior and interior surface of glass wool insulation (Sector 1), measured and calculated. Measured values are hourly averages and calculated ones daily averages.
-30
-20
-10
0
10
20
30
40
12.98 01.99 02.99 03.99 04.99 05.99 06.99 07.99 08.99 09.99 10.99 11.99 12.99 01.00 02.00 03.00 04.00
Date (month.year)
Tem
pera
ture
, θ (°
C)
Measured temp., interior surface of insulation Measured temp., exterior surface of insulationCalculated temp., interior surface of insulation (WUFI-2D) Calculated temp., exterior surface of insulation (WUFI-2D)Calculated temp., interior surface of insulation (1D-HAM) Calculated temp., exterior surface of insulation (1D-HAM)
Figure 5.9 Temperatures of exterior and interior surface of cellulose insulation (Sector 2), measured and calculated. Measured values are hourly averages and calculated ones daily averages.

218
0
10
20
30
40
50
60
70
80
90
100
12.98 01.99 02.99 03.99 04.99 05.99 06.99 07.99 08.99 09.99 10.99 11.99 12.99 01.00 02.00 03.00 04.00
Date (month.year)
Rel
ativ
e hu
mid
ity, ϕ
(% R
H)
Measured RH, interior surface of insulation Measured RH, exterior surface of insulationCalculated RH, interior surface of insulation (WUFI-2D) Calculated RH, exterior surface of insulation (WUFI-2D)Calculated RH, interior surface of insulation (1D-HAM) Calculated RH, exterior surface of insulation (1D-HAM)
Figure 5.10 Relative humidities of exterior and interior surface of glass wool insulation (Sector 1), measured and calculated. Measured values are hourly averages and calculated ones daily averages.
0
10
20
30
40
50
60
70
80
90
100
12.98 01.99 02.99 03.99 04.99 05.99 06.99 07.99 08.99 09.99 10.99 11.99 12.99 01.00 02.00 03.00 04.00
Date (month.year)
Rel
ativ
e hu
mid
ity, ϕ
(% R
H)
Measured RH, interior surface of insulation Measured RH, exterior surface of insulationCalculated RH, interior surface of insulation (WUFI-2D) Calculated RH, exterior surface of insulation (WUFI-2D)Calculated RH, interior surface of insulation (1D-HAM) Calculated RH, exterior surface of insulation (1D-HAM)
Figure 5.11 Relative humidities of exterior and interior surface of cellulose insulation (Sector 2), measured
and calculated. Measured values are hourly averages and calculated ones daily averages. As to temperatures, the results of calculations and measurements corresponded closely. The differences were small during the entire simulation period.

219
The calculated RH values for the exterior surface of thermal insulation also corresponded quite closely with the test results. In general, the differences were ≤ ±10% RH. In the case of the cellulose-insulated wall, the difference between measured and calculated results was somewhat smaller than in the case of the glass wool-insulated wall. The differences were the result of, for instance, possible extra moisture in the walls (construction-period moisture, small moisture leaks), variation in material properties, internal convection within the assemblies, uncertainty of measurements and calculation principles of HAM programs. Occasional differences also resulted from the fact that the measurement results were averages calculated at one-hour intervals while the results of calculations were averages calculated at one-day intervals.
The differences between relative humidities measured from the interior surface of the thermal insulation and calculated values were significantly larger – particularly in the glass wool-insulate wall where the maximum differences were over 25% RH. The obvious reason for this was the different type of moisture sensor used for interior surface measurements which had a casing so tight that the sensor could not react properly to changes in RH within the wall.
A comparison of measured and calculated results also reveals that the relative humidities of the pore air of thermal insulations changed more slowly in calculations than in reality. This same phenomenon was noticed earlier in connection with laboratory tests (see Ch. 5.3.1). The difference is likely due the software since it is more difficult to react properly to very quick changes in conditions during calculations.
The results produced by the WUFI-2D and 1D-HAM programs contained no significant differences. Hardly any differences were noted with regard to temperatures. Differences in relative humidity values were 2 to 3% RH at the maximum (slightly higher with the glass wool-insulated than the cellulose-insulated wall). Also, the less accurate material properties fed into the 1D-HAM program had no significant impact on the end results, at least for these walls.
The WUFI-2D program was finally used to do comparison calculations that also considered capillary transfer of moisture. Yet, the results remained nearly the same since the relative humidities at the monitoring points of both walls remained most of the time below 80% RH.
Conclusions
It can be stated based on the measurements and calculations, that the results from field tests and HAM models correspond closely enough. The differences between measured and calculated results related to conditions of the exterior surface are acceptable. The differences in the RH conditions of the interior surface, again, were the result of deficiently functioning measurement sensors. Consequently, both HAM models, WUFI-2D and 1D-HAM, performed sufficiently well in this example calculation.

220
5.4 Simulation tests on external walls with capillary flow
In all laboratory tests on external walls, calculational results based solely on diffusion analysis did not correspond as closely to test results as in the case of the test walls examined previously in Chapter 5.3.1. The sheathings of these test walls were generally more vapour tight than in the assemblies assessed in Chapter 5.3.1. These assemblies were also examined to determine whether calculations yield better results when capillary moisture transfer is included in them. WUFI-2D software was used for the calculations.
5.4.1 Element model and compared walls
The basic principle of the element model used in the calculational analyses is shown in Figure 5.12. The same model was also used in the calculations with the WUFI-2D program in Chapter 5.3.1 WUFI-2D. The calculations done with the WUFI-2D program in Chapter 5.3.2 also used a nearly similar element model.
Figure 5.12 Example of element model (left) and different material layers (right) used in calculational
analyses. The monitoring points are also indicated.

221
In the element model, the 550 mm wide insulation space was framed with 25 mm wide wood studs. The frame material was pine (C13, App. 3). The width of the studs was half of the typical width of sawn goods in Finland due to the symmetry of the calculation model. Thus, the width of the entire structure was 600 mm. In calculational analyses 3 elements were used to model 1 mm membranes in the thickness direction and 3–9 elements to model thicker boards. Separate thin, 13 mm wide, layers were made in the thermal insulation layer that corresponded to the width of the RH/T sensors used in the measurements. The monitoring points were placed halfway between the layers to correspond to the measurement points of laboratory tests. The layers were modelled using 5 elements. The other parts of the thermal insulation layers were modelled using 7–11 elements. The same numbers of elements were also used to model the wooden studs in the thermal insulation layers. Five elements were used for modelling the thinner thermal insulation layers in the width direction, 17 elements for modelling the wide thermal insulation layer, and 5 element layers for modelling half of the wooden stud. The outermost element layer was always 0.1 mm in the thickness direction and 1 mm in the width direction. Table 5.1 presents the material layers of the examined test walls (see also App. 1). Table 5.1 Material layers of analysed wall assemblies.
Number of wall
Interior board Air/vapour barrier Thermal insulation
Sheathing
3b Gypsum board
13 mm (C1) Bitumen paper
(B5) Cellulose insulation
173 mm (D4a) Wood fibreboard
25 mm (A2)
9b Gypsum board
13 mm (C1) Bitumen paper
(B5) Cellulose insulation
198 mm (D4a) Gypsum board
9 mm (A1)
10b Gypsum board
13 mm (C1) Bitumen paper
(B5) Cellulose insulation
198 mm (D4a) Wood hardboard
4.8 mm (A8)
11b Gypsum board
13 mm (C1) Bitumen paper
(B5) Glass wool
198 mm (D1) Gypsum board
9 mm (A1)
12b Gypsum board
13 mm (C1) Bitumen paper
(B5) Glass wool
198 mm (D1) Wood hardboard
4.8 mm (A8)
17b Gypsum board
13 mm (C1) Bitumen paper
(B5) Flax insulation 198 mm (D5)
Weatherisation membrane (B3)
18b Gypsum board
13 mm (C1) Bitumen paper
(B5) Rock wool
198 mm (D2) Weatherisation membrane (B3)
29b Gypsum board
13 mm (C1) Plastic foil (C11) +
plywood 9 mm (A11)Cellulose insulation
173 mm (D4a) Plywood 9 mm (A11) + glass wool 25 mm (A4)
31b Gypsum board
13 mm (C1) Plastic foil (C11) +
plywood 9 mm (A11)Rock wool
173 mm (D2) Plywood 9 mm (A11) + glass wool 25 mm (A4)

222
5.4.2 Initial settings of simulations
Calculations were made with and without the effect of capillary flow. The material properties used in these calculations are presented in Appendix 3. Thermal conductivity values measured at 10°C were used in calculations because the average temperature of the whole wall assembly is quite near this value between September and April in Finland. The constant water vapour diffusion resistance factors, μ (–), measured by cup tests were typically used in calculational analyses. In the case of thin membranes, however, calculations were based on changing water vapour diffusion resistance factors since it would have been very difficult to consider the effect of capillary moisture transfer by other means with these materials. On the other hand, because the membranes were thin, there was no need to make a separation between water vapour diffusion and capillary moisture transfer. The thickness of thin membranes were set to 1 mm in all calculations, and the μ-value of membranes was calculated so that it corresponded to the water vapour resistance value, Zν, derived from the laboratory test. The calculations used μ-values measured at 23°C since the sorption curve and water absorption coefficient, Aw, which describes capillary moisture transfer in a material, were also determined near that temperature. In capillary analyses, liquid moisture diffusivity, Dw,liq, was determined from measured water absorption coefficient values using Equation 1.53. Liquid moisture diffusivity values for materials were calculated at two different moisture contents: one corresponded to the moisture content at which capillary moisture transfer is assumed to start while the other one corresponded to capillary saturation moisture content, wcap. The values were fed manually into the program since the performance of the WUFI-2D program was found unreliable in some instances if the program calculated these values itself. When the mentioned values are fed into the program, capillary moisture transfer is considered in the calculations whenever the relative humidity of the material’s pore air exceeds the RH value corresponding to the lower moisture content (Künzel et al. 2000). Moisture diffusivity values were not determined for thin membranes since capillary moisture transfer was considered in the vapour diffusion resistance factors. As stated in Chapter 3.3.2, the water vapour resistance of many materials remained constant or nearly constant across the measurement range. In cup tests, the upper limit of the measurement range for most materials was about 80–85% RH; in the case of wood-based hardboards (chipboard, plywood and wood hardboard) the range extended to about 95% RH. The impact of capillary flow was set to start affecting the materials from the relative humidity value where the measurement results of cup tests ended. In the case of wood-based board, whose water vapour resistance was constant in the hygroscopic range, the impact was set to start at 97% RH value; with other materials the limit was 80% RH.

223
However, with plywood and pine water vapour resistance changed significantly already in the hygroscopic range. Capillary flow was set to start affecting these materials when the value of water vapour resistance started to diminish. In the case of pine it meant 65% RH and with plywood 55% RH (see App. 3). This was done to make the calculated liquid moisture diffusivity value represent the effect of capillary moisture transfer as accurately as possible already in the hygroscopic range. Some comparison calculations were made for these materials also by using changing water vapour diffusion resistance factors. Moisture diffusivity for redistribution, Dw,d, was assigned the same value at a moisture content corresponding to the starting point of capillary flow (55–97% RH) as liquid moisture diffusivity while at capillary saturation moisture content its value was one tenth of that of liquid moisture diffusivity. These settings were recommended in the WUFI-2D program’s manual (Künzel et al. 2000). Sorption graphs of equilibrium moisture content were used as equilibrium moisture contents of materials. Eguilibrium moisture content values measured at 97% RH were used to represent material property values at maximum hygroscopic moisture content. Capillary saturation moisture content values were set to correspond to 100% RH. The boundary values used in the calculations were hourly averages measured in laboratory tests. The boundary temperatures used in calculations were the interior surface temperature of the gypsum board and the exterior surface temperature of the sheathing. The surface heat transfer coefficient was set to infinity. Relative humidities of the same surfaces were calculated from the relative humidities of indoor air and the ventilation gap, so that the same humidity by volume prevailed in the air and on the surface. The initial moisture contents of sheathing and thermal insulation were varied in calculational analyses. In some, sheathing and thermal insulation were assigned the same initial moisture content while in others sheathing had a higher moisture content. The used initial moisture contents related to each test wall are given in Figures 5.13–5.19. The initial moisture contents of the other components of the assembly (timber frame, gypsym board used as interior board and air/vapour barrier) were set to correspond to 70% RH since the used test element was stored in a freezer room under those conditions. The initial temperature values were set to 20°C in all calculations. During the calculations the temperature and RH conditions of the test wall were monitored on the interior surface of the sheathing. In the walls the temperature and relative humidity monitoring points were located in the same spots as in the laboratory tests (6.5 mm from the exterior surface of the thermal insulation layer). The normal calculation accuracy of the WUFI-2D program was always used.

224
5.4.3 Test results
Figures 5.13–5.19 demonstrate the change in the relative humidity of pore air of the test walls only close to the interior surface of the sheathing since changes in moisture conditions are greatest there. It should be noted that the figures are different in scale. Figure 5.13 shows the change in relative humidity of the earlier examined Test wall 3b with and without the effect of capillary flow. That wall was chosen for analysis because there the calculations on the effect of capillary flow differed the most from previous calculations (see Fig. 5.5). In capillary calculations with WUFI-2D, water vapour diffusion resistance values, μ, of all materials were constant (relatively dry material values, ϕ < 50% RH). The used initial moisture content of sheathing and thermal insulation in the calculations was the equilibrium moisture content corresponding to 78% RH (same initial moisture content as in calculations of Figure 5.5).
50
55
60
65
70
75
80
85
90
95
100
0 7 14 21 28 35 42 49 56
Time (days)
Rel
ativ
e hu
mid
ity a
t int
erio
r sur
face
of s
heat
hing
,ϕ
(% R
H)
Measured RH1D-HAMMATCHWUFI-2DWUFI-2D with capillary flow
Figure 5.13 Calculated and measured relative humidities on interior surface of sheathing in Wall 3b. The
moisture contents of the sheathing and thermal insulation corresponded to 78% RH at the beginning of calculations.
Figure 5.13 reveals that inclusion of capillary moisture in the calculation did not here essentially affect the result. This was because relative humidity on the interior surface of the sheathing was quite low throughout the test which reduced the impact of capillary moisture transfer considerably. Two weeks from the beginning of drying, results of calculations were already quite close to test results.
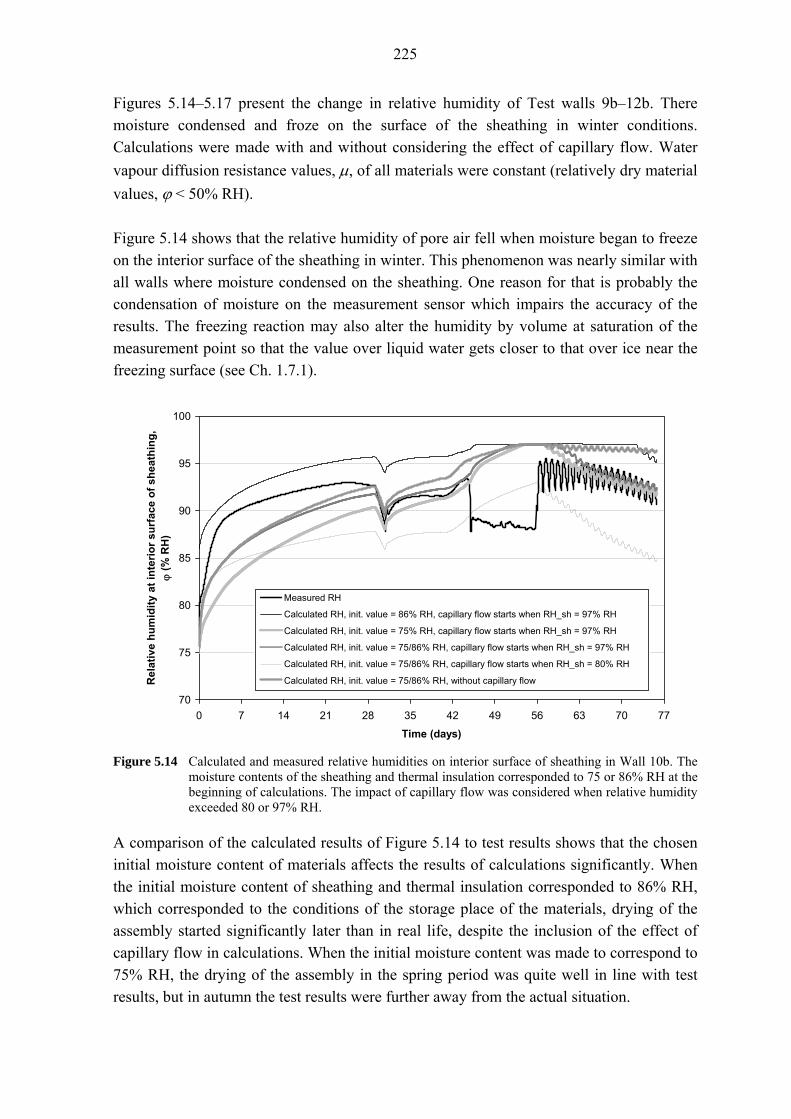
225
Figures 5.14–5.17 present the change in relative humidity of Test walls 9b–12b. There moisture condensed and froze on the surface of the sheathing in winter conditions. Calculations were made with and without considering the effect of capillary flow. Water vapour diffusion resistance values, μ, of all materials were constant (relatively dry material values, ϕ < 50% RH). Figure 5.14 shows that the relative humidity of pore air fell when moisture began to freeze on the interior surface of the sheathing in winter. This phenomenon was nearly similar with all walls where moisture condensed on the sheathing. One reason for that is probably the condensation of moisture on the measurement sensor which impairs the accuracy of the results. The freezing reaction may also alter the humidity by volume at saturation of the measurement point so that the value over liquid water gets closer to that over ice near the freezing surface (see Ch. 1.7.1).
70
75
80
85
90
95
100
0 7 14 21 28 35 42 49 56 63 70 77
Time (days)
Rel
ativ
e hu
mid
ity a
t int
erio
r sur
face
of s
heat
hing
,ϕ
(% R
H)
Measured RH
Calculated RH, init. value = 86% RH, capillary flow starts when RH_sh = 97% RH
Calculated RH, init. value = 75% RH, capillary flow starts when RH_sh = 97% RH
Calculated RH, init. value = 75/86% RH, capillary flow starts when RH_sh = 97% RH
Calculated RH, init. value = 75/86% RH, capillary flow starts when RH_sh = 80% RH
Calculated RH, init. value = 75/86% RH, without capillary flow
Figure 5.14 Calculated and measured relative humidities on interior surface of sheathing in Wall 10b. The
moisture contents of the sheathing and thermal insulation corresponded to 75 or 86% RH at the beginning of calculations. The impact of capillary flow was considered when relative humidity exceeded 80 or 97% RH.
A comparison of the calculated results of Figure 5.14 to test results shows that the chosen initial moisture content of materials affects the results of calculations significantly. When the initial moisture content of sheathing and thermal insulation corresponded to 86% RH, which corresponded to the conditions of the storage place of the materials, drying of the assembly started significantly later than in real life, despite the inclusion of the effect of capillary flow in calculations. When the initial moisture content was made to correspond to 75% RH, the drying of the assembly in the spring period was quite well in line with test results, but in autumn the test results were further away from the actual situation.

226
The impact of capillarity on calculation results was compared when the initial moisture content of sheathing corresponded to 86% RH and that of thermal insulation to 75% RH. These initial moisture contents were chose because the cellulose insulation could dry to some extent during its installation in the test assembly (see Ch. 3.2.1). Calculation results reveal that capillarity also affects them clearly in spring. In calculations where capillary moisture transfer was not considered, relative humidity remained high on the interior surface of the sheathing throughout the spring period. When capillary moisture transfer was considered in calculations, and capillary flow started in the wood hardboard at the moisture content corresponding to 97% RH, relative humidity began to decrease at the same rate as in the tests. However, if capillary flow in wood hardboard started at a moisture content corresponding to the lower relative humidity (80% RH), the assembly dried too fast with respect to the real situation. In water vapour permeability tests, the permeance of wood hardboard remained constant across the measuring range up to about 95% RH. This also shows that significant capillary moisture transfer begins in wood hardboard only in the capillary range. Consequently, the pore air RH of a material corresponding to the beginning of capillary flow was selected in later calculations in accordance with the principles presented in Chapter 5.4.2. These relative humidities of pore air are also presented in Appendix 3. In summary of the calculational analyses on Test wall 10b, it may be said that the calculated results corresponded most closely to test results when the initial moisture content of the sheathing corresponded to 86% RH and the initial moisture content of thermal insulation to 75% RH and the impact of capillary flow was considered in calculations. The inclusion of capillary flow in calculations had a similar effect also in the case of Wall 12b although it did not incorporate hygroscopic or capillary thermal insulation (Fig. 5.15). The wood hardboard used as sheathing material did, however, affect the transfer of capillary moisture also in this assembly. Figure 5.15 indicates that if calculations did not consider capillary moisture transfer, the assembly did not dry at all during the spring period. When capillary flow was taken into account, relative humidity on the interior surface of the sheathing was essentially lower and drying did occur in spring. However, in this case the true moisture content of the assembly was higher in autumn and early spring although the moisture contents of both the sheathing and the thermal insulation corresponded to 86% RH at the beginning of calculations. On the other hand, the initial moisture content of the glass wool used as thermal insulation had little significance in calculations because its moisture capacity is low. In real life, water condensed onto the interior surface of the sheathing in autumn in this test wall. Yet, one must note that, for instance, raising the initial moisture content of the sheathing would put the calculated results even more in line with the test result.
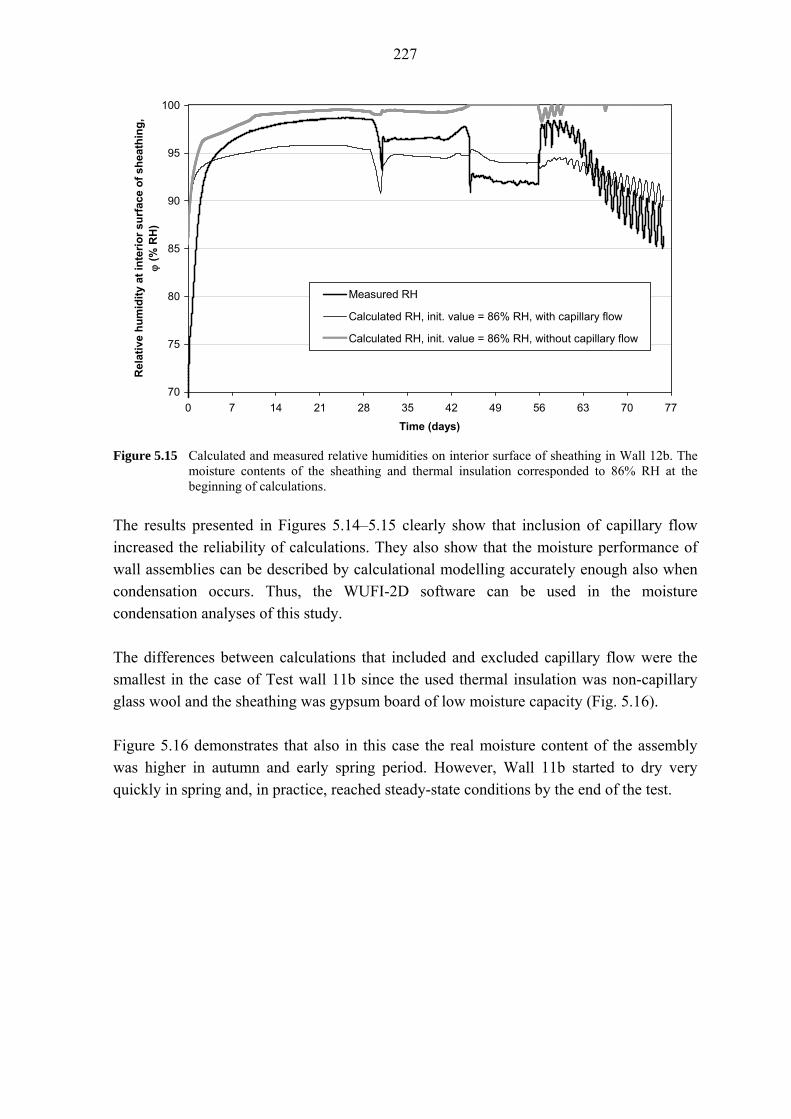
227
70
75
80
85
90
95
100
0 7 14 21 28 35 42 49 56 63 70 77
Time (days)
Rel
ativ
e hu
mid
ity a
t int
erio
r sur
face
of s
heat
hing
,ϕ
(% R
H)
Measured RH
Calculated RH, init. value = 86% RH, with capillary flow
Calculated RH, init. value = 86% RH, without capillary flow
Figure 5.15 Calculated and measured relative humidities on interior surface of sheathing in Wall 12b. The
moisture contents of the sheathing and thermal insulation corresponded to 86% RH at the beginning of calculations.
The results presented in Figures 5.14–5.15 clearly show that inclusion of capillary flow increased the reliability of calculations. They also show that the moisture performance of wall assemblies can be described by calculational modelling accurately enough also when condensation occurs. Thus, the WUFI-2D software can be used in the moisture condensation analyses of this study. The differences between calculations that included and excluded capillary flow were the smallest in the case of Test wall 11b since the used thermal insulation was non-capillary glass wool and the sheathing was gypsum board of low moisture capacity (Fig. 5.16). Figure 5.16 demonstrates that also in this case the real moisture content of the assembly was higher in autumn and early spring period. However, Wall 11b started to dry very quickly in spring and, in practice, reached steady-state conditions by the end of the test.

228
30
40
50
60
70
80
90
100
0 7 14 21 28 35 42 49 56 63 70 77
Time (days)
Rel
ativ
e hu
mid
ity a
t int
erio
r sur
face
of s
heat
hing
,ϕ
(% R
H)
Measured RH
Calculated RH, init. value = 86% RH, with capillary flow
Calculated RH, init. value = 86% RH, without capillary flow
Figure 5.16 Calculated and measured relative humidities on interior surface of sheathing in Wall 11b. The
moisture contents of the sheathing and thermal insulation corresponded to 86% RH at the beginning of calculations.
Figure 5.17 compares the calculated results on Test wall 9b with the test results. The initial moisture content of cellulose insulation in the calculations was 75% RH as in Test wall 10b.
40
50
60
70
80
90
100
0 7 14 21 28 35 42 49 56 63 70 77
Time (days)
Rel
ativ
e hu
mid
ity a
t int
erio
r sur
face
of s
heat
hing
,ϕ
(% R
H)
Measured RH
Calculated RH, init. value = 75/86% RH, with capillary flow
Calculated RH, init. value = 75/86% RH, without capillary flow
Figure 5.17 Calculated and measured relative humidities on interior surface of sheathing in Wall 9b. The
relative humidity of the sheathing corresponded to 86% RH and that of the thermal insulation to 75% RH at the beginning of calculations.

229
The calculation results on Test wall 9b were in line with those of Test wall 3b: at the beginning of the drying period, the assembly dried considerably faster than calculations indicate. Consideration of capillary moisture transfer in calculations did not make drying essentially faster. Yet, also in this case calculated results got closer to test results over time. Moisture condensation did not impact measured RH values with this wall as clearly as with Test walls 10b, 11b and 12b. Sometimes calculated results differed essentially from test results, even though capillary flow was considered. One such wall was Test wall 17b which had flax thermal insulation (Fig. 5.18). According to calculation results, Test wall 17b dried relatively slowly in spring although in reality it dried quickly. Here, the difference between calculated and test results was largely caused by the material properties of flax insulation. This is supported by the calculational analyses on Test wall 18b which was otherwise the same as Wall 17b but the thermal insulation was rock wool. Test wall 18b dried similarly in calculational analyses as in reality, indicating that the differences in calculation results were not caused by the weatherisation membrane used as sheathing.
40
50
60
70
80
90
100
0 7 14 21 28 35 42 49 56 63 70
Time (days)
Rel
ativ
e hu
mid
ity a
t int
erio
r sur
face
of s
heat
hing
,ϕ
(% R
H)
Measured RH
Calculated RH, init. value = 86% RH, with capillary flow
Calculated RH, init. value = 86% RH, without capillary flow
Figure 5.18 Calculated and measured relative humidities on interior surface of sheathing in Wall 17b. The
moisture contents of the sheathing and thermal insulation corresponded to 86% RH at the beginning of calculations.
The differences between calculated and test results with respect to Test wall 17b were probably the result of the liquid moisture diffusivity, Dw,liq, of flax insulation being higher in reality than the value used in calculations. Liquid moisture diffusivity was determined on the basis the water absorption coefficient, Aw, and Equation 1.53. Consequently, the

230
difference may be due the water absorption coefficient actually being larger than the value yielded by a capillary test (see Ch. 3.3.4), or that Equation 1.53 does not describe sufficiently well the relationship between the water absorption coefficient and liquid moisture diffusivity in hygroscopic wood-based materials. The above factors may also more generally be responsible for the slower changing relative humidities of pore air in calculational analyses compared to reality. Figure 5.19 demonstrates the moisture performance of Test wall 29b. Also here, calculations were done with and without capillary flow. The calculation without capillary flow was two-fold. In the first instance, the water vapour diffusion resistance factors of all materials were constant (relatively dry material values, ϕ < 50% RH). In the second instance, the water vapour diffusion resistance factor of spruce plywood was variable as indicated by the material data of Appendix 3. The initial moisture contents of sheathing in the calculations were 86 or 75% RH while the initial moisture contents of thermal insulation were moisture contents corresponding to 75 or 55% RH.
30
40
50
60
70
80
90
100
0 7 14 21 28 35 42 49 56
Time (days)
Rel
ativ
e hu
mid
ity a
t int
erio
r sur
face
of s
heat
hing
,ϕ
(% R
H)
Measured RH over liquid water
Calculated RH, init. value = 75/86% RH, with capillary flow when μ-values are constant
Calculated RH, init. value = 55/75% RH, with capillary flow when μ-values are constant
Calculated RH, init. value = 55/75% RH, without capillary flow when μ-values are constant
Calculated RH, init. value = 55/75% RH, without capillary flow when μ-values are variable
Figure 5.19 Calculated and measured relative humidities on interior surface of sheathing in Wall 29b. The
moisture content of the sheathing corresponded to 86 or 75% RH, and that of thermal insulation to 75 or 55% RH, at the beginning of calculations.
Figure 5.19 reveals that also in this case measurement results differed from calculated results for all test periods, independent of whether the calculations considered the effect of capillary moisture flow. Here, the differences were, however, very large. Moreover, the calculation results suggested that the interior surface of the sheathing of Wall 29b was wet throughout the autumn and winter period whereas in reality the assembly was dry except in early autumn.

231
Calculations based on high initial moisture contents (plywood 86% RH and cellulose insulation 75% RH) produced results radically different from the test results although the results of calculations and the test corresponded closely at the beginning of the test. The situation did not improve much even if the initial moisture contents of the sheathing and thermal insulation were lowered. Neither did the consideration of capillary moisture transfer in the calculations change the end result essentially. It is hard to tell what caused such a large difference between measured and calculated results. One explanation could be that air had flowed behind the sheathing plywood from outdoors or indoors, which had dried the assembly. That is highly unlikely though, since the seams and joints of elements were carefully sealed and the pressure difference across the assembly was small during the test. Internal convection within the assembly may also have affected measurement results to some extent, but it is difficult to believe that even it could have caused such large differences between the results of calculations and tests. This big a difference between the results of calculations and tests occurred only in the case of assemblies where spruce plywood was used as sheathing. On that basis, one might think that the material properties set for plywood do not correspond to the real situation. This view is also supported by the calculational analyses on Test wall 31b. It was otherwise similar to Wall 29b except that it had rock wool for thermal insulation instead of cellulose. In that test wall the relative humidities on the interior surface of the sheathing also changed in different directions during autumn and winter periods. Thus, the difference in the calculation results was not the result of the thermal insulation used. No significant mistakes could be found in the review of the definition of the material properties of spruce plywood either. The differences between the measured and calculated results are also so large that it is difficult to explain them just by differences in water vapour permeability and liquid moisture diffusivity values. To some extent, the difference may be explained by the change in the water vapour resistance of plywood as temperature falls. Even if that is so, the results of material tests do not provide a logical explanation for the detected differences since the water vapour resistance of plywood measured at 5°C was somewhat lower than the value measured at 23°C, while at -10°C it was higher. Figure 5.19 also shows that when a fixed value measured in dry conditions was used as the water vapour diffusion resistance factor of plywood, and the effect of capillarity was accounted for with the help of liquid moisture diffusivity, the calculated result was practically the same as when the water vapour diffusion resistance factor of plywood varied and the effect of the capillary flow was excluded from calculations. This indicates that the liquid moisture diffusivity value used in calculations corresponds to the increase in water vapour permeability measured for plywood in water vapour permeability tests as relative humidity increases. The result also conforms to the theory presented in Chapter 1.7.1.

232
5.4.4 Discussion
When comparing the results of calculations and tests, one must remember that the results of measurements always involve some uncertainty (see Table 3.1). When temperature falls under 0°C, moisture may condense on the surface of the RH/T sensor and increase the uncertainty of measured results. Moreover, the diameter of the RH/T sensor was quite large (13.5 mm) and thermal insulation around the sensor had not been installed as ideally as assumed in calculations. Any possible air channels near the installed sensor, and the convection flows within, may also explain why the relative humidities of pore air changed more quickly in the tests than in calculations. The initial moisture content of materials had a big impact on the results of calculations, especially when capillary moisture transfer was not considered in them. To produce a certain initial moisture content for materials in laboratory tests, all sheathing and thermal insulation materials were kept in a climate chamber at 23°C temperature and 55 or 86% RH. Although all materials reached the equilibrium level before the test, they all dried more or less during the construction of the wall assembly. The insulation materials dried the most (see Ch. 3.2.1). Thus, the moisture content of hygroscopic insulation materials had a major influence on the calculated results. Therefore, when doing calculations that last over a year to analyse the hygrothermal performance of a wall assembly, the calculations should start a year earlier to allow the moisture contents of materials to stabilise before the beginning of the year subject to the analysis (see Ch. 6.1.2). Material properties depend on environmental conditions such as temperature and relative humidity. Material properties are also affected by, for instance, the age of the material, variations in its manufacturing process as well as its chemical interaction with other materials. Because it is not possible to determine all properties accurately, some simplifications, limitations or approximations have been made which may result in differences in the comparison of measured and calculated values. On the other hand, when relative humidity was under 90% RH, the calculated results based on constant material properties were as accurate as those based on changing material values (see Ch. 5.2.2). Inclusion of capillary moisture transfer in calculations did not always narrow the differences between results of tests and calculations. Especially in the case of wall assemblies which had spruce plywood as sheathing or flax insulation as thermal insulation, the results of calculations and tests differed significantly independent of whether the effect of capillary moisture flow was considered or not. One reason for that could have been the differences between actual and measured material properties. It is also possible that Equation 1.53, used to convert the measured water absorption coefficient into liquid moisture diffusivity value, is not usable in the examination of hygroscopic wood-based materials. Internal convection within the test assembly can also affect test results to some extent.

233
5.4.5 Conclusions
The following differences between measured and calculated values were observed in simulation tests on walls including the effect of capillary moisture flow: • Measured values were more sensitive to humidity change which was noted already in
Chapters 5.3.1 and 5.3.2. • The selected moisture content had a significant impact on test results. Therefore, in
calculational analyses of assemblies, calculations should start a year before the beginning of the actual examination period in order to allow initial moisture contents to stabilise to correspond to the actual situation (see Ch. 6.1.2).
• Consideration of capillary moisture transfer in calculations improved results considerably when using capillary materials in the assembly and the relative humidity of the materials’ pore air was > 90% RH.
• Hygrothermal performance of assemblies could be modelled reliably enough also when condensation occurred for relatively short periods. Since the limit value of the maximum continuous condensation time in this study was 34 days, the calculational analyses of condensation are quite reliable.
In some cases the differences between measured and calculated results were so big that more detailed research is required to discover the reasons for them – especially when spruce plywood is used as sheathing or flax insulation as thermal insulation of the assembly. Spruce plywood was nevertheless included in the calculational analyses because the calculation results in connection with the benchmarking were more critical for the performance of the assembly than test results. In reality, assemblies that have plywood as sheathing may, thus, perform better than the calculation results of Chapter 6 indicate. The test results indicate that all HAM programs perform grnerally well enough if the relative humidity of pore air in the assembly is under 90% RH. If relative humidity is higher, a calculation program that also considers capillary moisture transfer produces better results. Consequently, the calculational modelling of external wall assemblies is to be realised so that it also considers the effect of capillary moisture flow.
5.5 Summary of HAM models’ benchmarking
On the basis of the above comparison, it can be stated that several useful commercial HAM programs exist for the diffusion analysis of timber-framed external wall assemblies in the hgroscopic range. The WUFI-2D program was selected for the calculational analyses of wall assemblies in this research mainly for the following reasons:
• the calculated results correspond to test results with sufficient accuracy,

234
• the program can be used to analyse the performance of assemblies also in the capillary range which provides a more reliable view of the performance of assemblies at high relative humidity,
• the hygrothermal performance of assemblies could be modelled with sufficient reliability when condensation occurred,
• the program is straightforward to use, which reduces the probability of making mistakes,
• the program allows modelling assemblies in two dimensions whereby the impact of frame structures can be better taken into account,
• material properties changing with relative humidity can be fed into the program, • the program is generally used in building physical calculation and is available to all.

235
6 SIMULATION TESTS ON EXTERNAL WALLS
6.1 Initial settings of simulations
Chapter 5 examined the applicability of the WUFI-2D (version 2.1) program to the analysis of the moisture performance of timber-framed external walls and found that the performance of assemblies in different temperature and RH conditions can be determined sufficiently well with the program. Therefore, the calculational analyses of this chapter were made using that program. The use and properties of the WUFI-2D program are described in more detail, for instance, in Künzel (1995) and Künzel et al. (2000). Here, we shall only look at the initial settings of the program used in the analyses of different external wall assemblies.
6.1.1 Definition of the construction, materials and monitoring points
The studied assembly was modelled as three adjacent insulation sectors. The width of insulation spaces was 550 mm, and they were framed with 25 mm wide wood studs. The frame material was pine (C13, App. 3). Width of the studs was half of the typical width of sawn goods in Finland due to the symmetry of the calculation model. Various thermal insulation sectors were separated from each other by a 50 mm material layer of very high water vapour and thermal resistance. Thus, walls insulated with different thermal insulations did not affect one another during the calculations. The width of the entire structure was thus 1,900 mm (Fig. 6.1). The thickness of the thermal insulation layer was 200 mm. That thickness was chosen to meet the present Finnish thermal insulation requirements for insulations other than a mixture of sawdust and chipping. In the case of some wall assemblies 175 mm insulation is sufficient. Results based on 200 mm thermal insulation can also be applied to the assemblies studier here since the calculation results were found to be on the safe side (the interior surface of the sheathing was slightly warmer than with 200 mm insulation). The open pore insulation materials were divided into three groups by hygroscopicity:
• Non-hygroscopic thermal insulations Glass and rock wool and other porous thermal insulations not significantly hygroscopic (whygr ≤ 5 kg/m3).
• Hygroscopic thermal insulations Cellulose, flax and hemp insulation as well as other porous natural fibre insulations (whygr ≈ 15 kg/m3).
• High hygroscopic thermal insulations Sawdust, cutter chipping and their mixture as well as other porous natural fibre insulations (whygr ≈ 40 kg/m3).

236
As to their other building physical properties, these thermal insulations are quite similar in spite of the higher thermal conductivity of the high hygroscopic thermal insulations. For calculational analyses, one insulation representing each group was selected for each insulation layer: glass wool on top (D1, App. 3), cellulose insulation in the middle (D4, App. 3) and a mixture of sawdust and chipping (50:50) on the bottom (D67, App. 3).
Figure 6.1 Example of element model (left) and different material layers (right) used in calculational
analyses. The locations of monitoring points are also marked in the drawings.
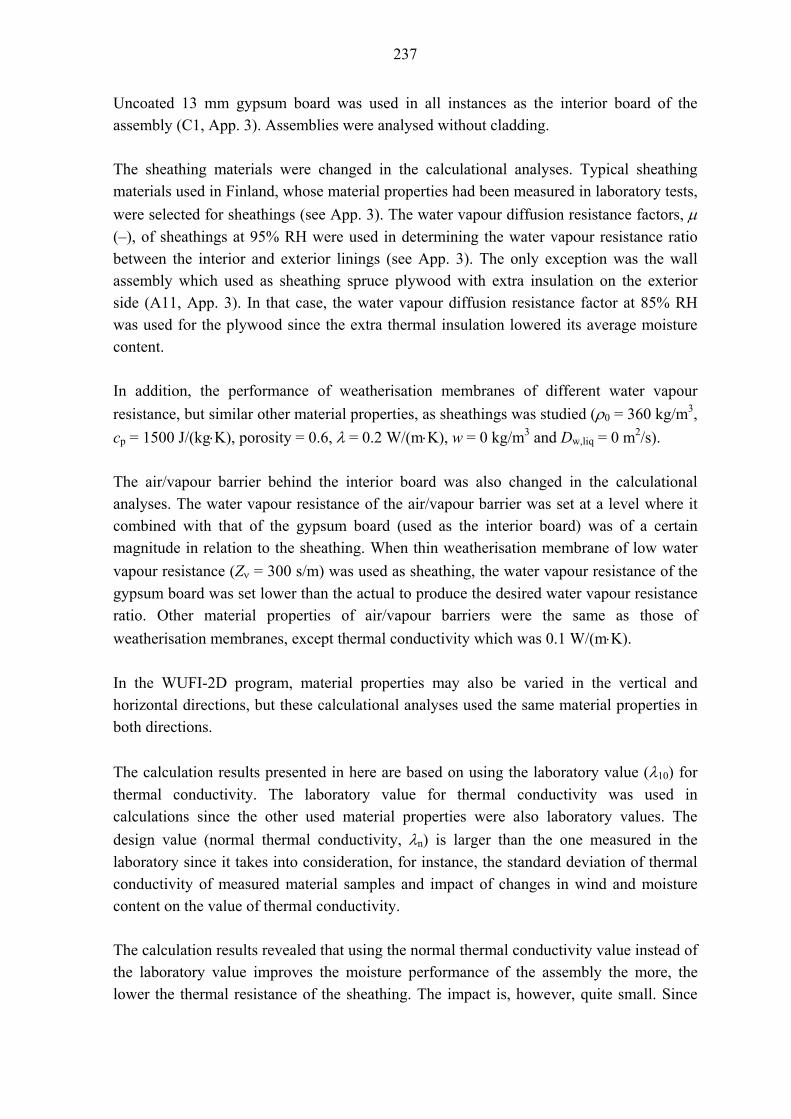
237
Uncoated 13 mm gypsum board was used in all instances as the interior board of the assembly (C1, App. 3). Assemblies were analysed without cladding. The sheathing materials were changed in the calculational analyses. Typical sheathing materials used in Finland, whose material properties had been measured in laboratory tests, were selected for sheathings (see App. 3). The water vapour diffusion resistance factors, μ (–), of sheathings at 95% RH were used in determining the water vapour resistance ratio between the interior and exterior linings (see App. 3). The only exception was the wall assembly which used as sheathing spruce plywood with extra insulation on the exterior side (A11, App. 3). In that case, the water vapour diffusion resistance factor at 85% RH was used for the plywood since the extra thermal insulation lowered its average moisture content. In addition, the performance of weatherisation membranes of different water vapour resistance, but similar other material properties, as sheathings was studied (ρ0 = 360 kg/m3, cp = 1500 J/(kg⋅K), porosity = 0.6, λ = 0.2 W/(m⋅K), w = 0 kg/m3 and Dw,liq = 0 m2/s). The air/vapour barrier behind the interior board was also changed in the calculational analyses. The water vapour resistance of the air/vapour barrier was set at a level where it combined with that of the gypsum board (used as the interior board) was of a certain magnitude in relation to the sheathing. When thin weatherisation membrane of low water vapour resistance (Zν = 300 s/m) was used as sheathing, the water vapour resistance of the gypsum board was set lower than the actual to produce the desired water vapour resistance ratio. Other material properties of air/vapour barriers were the same as those of weatherisation membranes, except thermal conductivity which was 0.1 W/(m⋅K). In the WUFI-2D program, material properties may also be varied in the vertical and horizontal directions, but these calculational analyses used the same material properties in both directions. The calculation results presented in here are based on using the laboratory value (λ10) for thermal conductivity. The laboratory value for thermal conductivity was used in calculations since the other used material properties were also laboratory values. The design value (normal thermal conductivity, λn) is larger than the one measured in the laboratory since it takes into consideration, for instance, the standard deviation of thermal conductivity of measured material samples and impact of changes in wind and moisture content on the value of thermal conductivity. The calculation results revealed that using the normal thermal conductivity value instead of the laboratory value improves the moisture performance of the assembly the more, the lower the thermal resistance of the sheathing. The impact is, however, quite small. Since

238
the actual thermal conductivity of materials normally lies between the laboratory and normal values, use of laboratory values in moisture performance calculations yields results that are slightly more on the safe side. Therefore, it is also the better alternative for designing assemblies. Thermal conductivity values measured at 10°C were used in calculations because the average temperature of the whole wall assembly is quite near this value between September and April in Finland. The water vapour resistance of materials was determined with the WUFI-2D program using the water vapour diffusion resistance factor, μ (–), which also required calculating the thickness of the material (see Eqs. 1.36 and 1.37). The thicknesses of thin membranes cannot be determined accurately which means that their thickness was set to 1 mm and the μ-value was calculated to correspond to the water vapour resistance value, Zν, derived from laboratory tests for this material layer thickness. The calculations used μ-values measured at 23°C since the sorption curves and water absorption coefficients, Aw, were also determined near that temperature. The calculational analyses considered also the effect of capillary flow since the benchmarking of the WUFI-2D model showed that at high relative humidities of pore air the calculations produced results more in line with the actual situation (see Ch. 5.2.3). The effect of capillary flow was taken into account by including the liquid moisture diffusivity value, Dw,liq, determined from the measured value of water absorption coefficient by Equation 1.53. When the measured μ-value of a material was constant, the impact of capillary flow in materials was set to start at the relative humidity value where the measurement results on water vapour permeability with cup tests ended. With some wood-based boards that value was 97% RH and with other materials 80% RH. If the measured μ-value of a material changed as a function of relative humidity (as with e.g. pine and spruce plywood), the constant value of dry conditions (35% RH) was selected as the μ-value, and the effect of capillary flow was set to begin at the point where the μ-value started to decrease (see Chs. 5.4.2 and 5.4.3) This value was 65% RH for pine and 55% RH for spruce plywood. Moisture diffusivity for redistribution, Dw,d, was assigned the same value at a moisture content corresponding to starting point of capillary flow (55–97% RH) as liquid moisture diffusivity while at the capillary saturation moisture content its value was one tenth of that of liquid moisture diffusivity. These settings were recommended in the WUFI-2D program’s manual (Künzel et al. 2000). Values measured at 97% RH were used in the program to represent material property values at maximum hygroscopic moisture content. Therefore, moisture condensed in the assembly or the relative humidity of the material rose to the capillary range as the relative

239
humidity of pore air exceeded that value. Capillary saturation moisture content values were set to correspond to 100% RH. In the WUFI-2D program the assembly layer always consists of at least 3 elements in both the thickness and width directions. In calculational analyses 3 elements were used to model 1 mm membranes in the thickness direction, 5 elements to model thicker boards, and 13 elements to model the thermal insulation layer as well as the wooden studs and the heat and moisture resistance layer. In the width direction 15 elements were used for modelling the thermal insulation layer and 5 element layers for modelling half of the wooden stud and the heat and moisture resistance layer between the studs (see Fig. 6.1). The outermost element layer was always 0.1 mm in the thickness direction and 1 mm in the width direction. During the calculations the temperature and RH conditions of the test assembly were monitored at eight points. Two points were located so as to monitor the conditions of the interior and exterior surface of the assembly. The other points were located on the exterior and interior surfaces of each insulation layer (see Fig. 6.1). At the interface of sheathing and thermal insulation the monitoring points were on the side of the insulation layer since preliminary calculations indicated that conditions conducive to condensation occur first on that side. The WUFI-2D program does not allow having the monitoring points for the exterior and interior surfaces of the insulation layer exactly on the surface of material layers which means that these points were actually located midway between the innermost and outermost elements of the insulation layer. Thus, they were at a distance of 0.05 mm from the surface of the insulation layer. Laterally, the monitoring points were in the middle of the insulation layer since temperature was found to be lowest there and, consequently, the risk for condensation and mould growth the highest. The WUFI-2D program was also used for individual calculations to study the impact of various factors on the moisture performance of an assembly. The element model targeted by these calculations was essentially the same as the one presented in Figure 6.1 (see Chs. 6.3.3–6.3.6).
6.1.2 Boundary conditions
Outdoor air conditions
Moisture reference years (MRYs) representing Finnish climatic conditions were used as outdoor air conditions (see Ch. 2.2). Temperature and RH conditions measured in Sodankylä between 1 July 1985 and 30 June 1986 were used in condensation risk analyses and the corresponding values measured in Lahti between 1 July 2000 and 30 June 2001 in mould growth risk analyses.

240
The normal value for atmospheric pressure of 101,325 Pa was used in calculations. The modelling also considered the impact of driving rain, wind, solar radiation and surface undercooling since they can be factored in through the surface resistance set for the exterior surface of the sheathing in the case of a northern wall with a ventilation gap (see Ch. 4). The temperature and RH conditions of the MRY were fed into the program at 3-hour intervals which is the measurement interval used by the Finnish Meteorological Institute. The results of calculations were 24-hour moving averages. Values measured directly over water were used as RH values although the WUFI-2D program calculated relative humidity at under 0°C from humidity by volume at saturation over ice. This was done because the benchmarking of the WUFI-2D program in Chapter 5 showed that then the results of calculations correspond sufficiently well to test results. The relative humidity of the ventilation gap may also in reality be closer to the RH measured over liquid water during winter conditions. This is because the hygroscopic materials of ventilation gap surfaces tend to maintain an equilibrium with humidity by volume over liquid water as their temperature is reduced below 0°C. Then the actual moisture deficit of outdoor air is approximately the same as that of the outdoor air data fed into the WUFI-2D program.
Indoor air conditions
The standard temperature of 21°C, which corresponds to today’s recommended values in Finland (Classification of Indoor Climate 2000, 2001), represented indoor air conditions. Relative humidity of indoor air was set so that it always corresponded to a certain excess moisture, Δνexc (g/m3). The value of excess moisture varied as a function of outdoor air temperature as shown in Figure 2.24. The impact of excess moisture was examined over the 0 to 8 g/m3
range. Indoor air temperature and RH conditions were also fed into the program at 3-hour intervals. Based on the excess moisture values measured in timber-framed one-family and row houses, the recommendable design value for excess moisture is in the 4–5 g/m3 range depending on the number of occupants and indoor air humidification in winter (see Fig. 2.24). These values are marked in the figures presenting the results with thicker lines. Figure 6.2 gives an example of the variation in indoor air excess moisture in Sodankylä outdoor air conditions of 1985−86 when the value of the excess moisture was set at 5 g/m3 at under 5°C temperature as shown in Figure 2.24.

241
0
1
2
3
4
5
6
0 732 1464 2196 2928 3660 4392 5124 5856 6588 7320 8052
Time (months)
Exce
ss m
oist
ure,
Δν e
xc (g
/m3 )
Single values (3 h)24 hours average values
Jan '86Dec '85Nov '85Oct '85Sep '85Aug '85 Jun '86May '86Apr '86Mar '86Feb '86Jul '85
Figure 6.2 Variation in indoor air moisture in Sodankylä outdoor air conditions of 1985–86 when excess
moisture was set at 5 g/m3 at under 5°C temperatures. The variation in the excess moisture shown in the figure depends on outdoor air temperature as shown in Figure 2.24.
Surface resistances
The measurements of Chapter 4 indicated that 0.04 m2·K/W should be used as the thermal resistance of the exterior surface of sheathing – thus that value was selected for calculations (see Ch. 4.2.5). The normal value of 0.13 m2·K/W was used as the thermal resistance of the interior surface. Water vapour resistances of interior and exterior surfaces were assumed to be zero in the calculations. Chapter 6.3.5 examines the effect of the thermal resistance of the exterior surface (0.13 m2·K/W), used in U-value calculations, on the moisture performance of assemblies. The edges of the assembly in the width direction were closed in the program so that outdoor and indoor conditions affected assemblies only through exterior and interior surfaces.
6.1.3 Initial conditions of materials, calculation time and calculation accuracy
In the initial situation all wall materials were at 20°C temperature and their equilibrium moisture content corresponded to 65% RH. Calculation was always started a year before the actual MRY in order to allow initial moisture contents of the assembly to stabilise to correspond to the actual situation. Thus, the total calculation time was always 2 years. Condensation and mould growth risk analyses were, however, started at the beginning of the actual MRY (1st of July).

242
Calculations were made using the normal calculation accuracy of the WUFI-2D program since pre-calculation tests indicated that more accurate calculation did not improve the accuracy of results.
6.2 Implementation of calculations
6.2.1 Analysis of condensation risk of wall assemblies
The condensation risk analyses of wall assemblies determined the excess moisture value at which continuous periods of condensation did not exceed 34 days on the interior surface of the sheathing in winter conditions. The value of excess moisture was varied at 1 g/m3 intervals in calculational analyses to find two adjacent values: one at which continuous condensation time was shorter than 34 days in the assembly, and another at which the time was longer than 34 days. The final excess moisture value in each analysis was determined by drawing a line between the derived continuous condensation time values and reading the value from the point where the line intersected the 34 day maximum continuous condensation time. Curves indicating the water vapour resistance ratio value at which the continuous condensation time of 34 days occurs in each assembly were produced using different excess moisture values.
6.2.2 Analysis of mould growth risk of wall assemblies
The mould growth risk analyses of wall assemblies determined the excess moisture value at which the maximum mould index of the interior surface of the sheathing does not exceed the set limit value. The limit value of 1.96 measured in the outdoor air conditions of the selected MRY was used (see Ch. 2.1.3). The mould growth index of the analysed assemblies was determined over the period 1 July – 31 December since the performance of the mould growth model is unreliable in winter conditions (Ch. 2.2.4). Figure 6.3 gives examples of typical mould growth index development during the winter period. In some instances the mould index reached its maximum value at the end of December, stayed more or less constant through winter, and fell in spring (see 12 mm wood fibreboard with glass wool thermal insulation). However, in some assemblies the mould index still continued to rise in winter only reaching its maximum value in spring (see 25 mm wood fibreboard with glass wool thermal insulation). In part of the assemblies, the mould index remained constant during winter but rose quickly in spring and started declining only thereafter (see spruce plywood with glass wool insulation).

243
0.0
0.5
1.0
1.5
2.0
2.5
1.7. 31.7. 30.8. 30.9. 30.10. 30.11. 30.12. 29.1. 1.3. 31.3. 1.5. 31.5. 1.7.Date (day.month)
Mou
ld in
dex,
M (-
)
Wood fibreboard 12 mm + glass wool insulation, Z_li / Z_le = 10, Δν_exc = 5 g/m³ Wood fibreboard 25 mm + glass wool insulation, Z_li / Z_le = 5, Δν_exc = 5 g/m³ Spruce plywood 9 mm + glass wool insulation, Z_li / Z_le = 20, Δν_exc = 5 g/m³
Time period used to determine the maximum mould index value
Spruce plywood 9 mm + glass wool insulation, Zli/Zle = 20, Δνexc = 5 g/m3Wood fibreboard 25 mm + glass wool insulation, Zli/Zle = 5, Δνexc = 5 g/m3Wood fibreboard 12 mm + glass wool insulation, Zli/Zle = 10, Δνexc = 5 g/m3
Figure 6.3 Examples of change in mould index on the interior surface of sheathing in some external wall
assemblies in the outdoor air conditions of the MRY critical for mould growth (Lahti 2000–01). The excess moisture of indoor air is 5 g/m3 in winter conditions according to Figure 2.24.
The calculation was implemented according to the same principle as the condensation analysis. Here, two adjacent excess moisture values, at which the maximum mould index was above and below the selected limit value, were bracketed. The excess moisture value in the analysis in question could be read off a line drawn to connect these mould index values. As a result of the analysis, other curves were produced for the same wall assemblies using different water vapour resistance ratios of interior and exterior wall linings. Curves indicate the resistance ratio value at which the maximum mould index of the assembly in question exceeds the limit value selected for the analysis.
6.3 Calculation results
6.3.1 Condensation risk of wall assemblies
Figures 6.4–6.7 show the water vapour resistance ratio, Zli/Zle (–), between the interior and exterior linings of timber-framed external wall assemblies required to prevent continuous condensation period exceeding 34 days from occurring on the interior surface of the sheathing due to diffusion from the inside out. The lowest analysed water vapour resistance ratio was 2:1. The figures present wall assemblies implemented with different sheathing materials and three thermal insulations (glass wool, cellulose and mixed sawdust + chipping). The results are presented as a function of the indoor air excess moisture values,

244
Δνexc (g/m3), in winter conditions (outdoor air temperature ≤ 5°C) (see Fig. 2.24). The calculations were done in the outdoor air conditions of the MRY critical for moisture condensation (Sodankylä, 1 July 1985 – 30 June 1986). All figures demonstrate that the required water vapour resistance ratio between the interior and exterior wall linings changes linearly as excess moisture changes in moisture condensation risk analyses. This is an interesting observation, which improves considerably the reliability of the analysis, since the fluctuations caused by individual calculations do not affect the value of the required water vapour resistance ratio significantly. All in all, only a small number of calculations on assemblies showed significant differences between the values of the required water vapour resistance ratio and the linearly changing values.
0
2
4
6
8
10
12
14
16
18
20
22
24
26
28
30
0 1 2 3 4 5 6 7 8Excess moisture of indoor air in winter, Δν exc (g/m3)
Wat
er v
apou
r res
ista
nce
ratio
, Zli/Z
le (-
)
WFB 12 mm/ glass wool
WFB 12 mm/ cellulose insulation
WFB 12 mm/ sawdust + chipping
WFB 25 mm/ glass wool
WFB 25 mm/ cellulose insulation
WFB 25 mm/ sawdust + chipping
GWB 30 mm/ glass wool
Lin. (WFB 12 mm/ glass wool)
Lin. (WFB 12 mm/ celluloseinsulation)Lin. (WFB 12 mm/ sawdust +chipping)Lin. (WFB 25 mm/ glass wool)
Lin. (WFB 25 mm/ celluloseinsulation)Lin. (WFB 25 mm/ sawdust +chipping)Lin. (GWB 30 mm/ glass wool)
WFB = Wood fibreboardGWB = Glass wool board
Figure 6.4 Required water vapour resistance ratio between interior and exterior linings of external wall
assemblies with 12mm and 25 mm wood fibreboard (A13) (A2) and 30 mm glass wool board (A3) sheathings to prevent continuous condensation periods exceeding 34 days in the conditions of the MRY critical for condensation. The results are presented as a function of indoor air excess moisture under winter conditions. Required water vapour resistance ratios of glass wool board with cellulose insulation and mixed sawdust + chipping were so low that they did not appear in the range observed in this figure.

245
Figure 6.4 shows clearly that as the thermal resistance of the sheathing grows, the water vapour resistance ratio required of the assembly decreases. When 30 mm glass wool board is used as sheathing, the required water vapour resistance ratio is less than 5:1 with all thermal insulations. The figure also shows that if mixed sawdust + chipping is used for thermal insulation, a clearly lower water vapour resistance ratio is required. This is due the fact that this thermal insulation has high moisture capacity, meaning that it wets more slowly in winter than the others. For the same reason, the required water vapour resistance ratio with cellulose insulation is somewhat lower than in the case of glass wool. Yet, here the difference is distinctly smaller.
0
2
4
6
8
10
12
14
16
18
20
22
24
26
28
30
32
34
36
38
40
42
44
46
48
50
0 1 2 3 4 5 6 7 8Excess moisture of indoor air in winter, Δν exc (g/m3)
Wat
er v
apou
r res
ista
nce
ratio
, Zli/Z
le (-
)
GB 9 mm/ glass wool
GB 9 mm/ cellulose insulation
GB 9 mm/ sawdust+chipping
WHB 4.8 mm/ glass wool
WHB 4.8 mm/ cellulose insulation
OSB 12 mm/ glass wool
Lin. (GB 9 mm/ glass wool)
Lin. (GB 9 mm/ cellulose insulation)
Lin. (GB 9 mm/ sawdust+chipping)
Lin. (WHB 4.8 mm/ glass wool)
Lin. (WHB 4.8 mm/ celluloseinsulation)Lin. (OSB 12 mm/ glass wool)
GB = Gypsum boardWHB = Wood hardboardOSB = Oriented strand board
Figure 6.5 Required water vapour resistance ratio between interior and exterior linings of external wall
assemblies with 9 mm gypsum board (A1), 4.8 mm wood hardboard (A8) and 12 mm OSB (C6) sheathings to prevent continuous condensation periods exceeding 34 days in the conditions of the MRY critical for condensation. The results are presented as a function of indoor air excess moisture under winter conditions. In the case of wood hardboard with mixed sawdust + chipping, and OSB with cellulose insulation and mixed sawdust + chipping, the continuous condensation time was always over 34 days, meaning that these assemblies are not acceptable based on the limit value of moisture condensation defined in this study.

246
Figure 6.5 reveals that lower thermal resistance of sheathing requires a higher water vapour resistance ratio of the assembly. In the case of a more vapour-tight sheathing, use of hygroscopic thermal insulation increases the risk of condensation in the assembly essentially. This is because the moisture bound in the thermal insulation can no longer exit as easily into outdoor air as outdoor air temperature drops. Thus, we are faced with the same phenomenon as when analysing the maximum continuous condensation time of the reference wall in Chapter 2.2.3. Examination of the presented assembly, which has vapour-tight OSB as sheathing, discloses that although the water vapour resistance of the sheathing is high, the water vapour resistance ratio required of the assembly can be low. Yet, the absolute water vapour resistance required of the interior surface of the assembly is quite high (see also Fig. 6.20).
05
1015202530354045505560
65707580859095
100105110115120125130
0 1 2 3 4 5 6 7 8
Excess moisture of indoor air in winter, Δν exc (g/m3)
Wat
er v
apou
r res
ista
nce
ratio
, Zli/Z
le (-
)
SP 9 mm/ glass wool
SP 9 mm/ cellulose insulation
SP 9 mm + GWB 30 mm/ glasswool
SP 9 mm + GWB 30 mm/ celluloseinsulation
SP 9 mm + GWB 30 mm/sawdust+chipping
Lin. (SP 9 mm/ glass wool)
Lin. (SP 9 mm/ cellulose insulation)
Lin. (SP 9 mm + GWB 30 mm/glass wool)
Lin. (SP 9 mm + GWB 30 mm/cellulose insulation)Lin. (SP 9 mm + GWB 30 mm/sawdust+chipping)
SP = Spruce plywoodGWB = Glass wool board
Figure 6.6 Required water vapour resistance ratio between interior and exterior linings of external wall
assemblies with 9 mm spruce plywood (A11) and combined 9 mm spruce plywood (A11) + 30 mm glass wool board (A3) sheathings to prevent continuous condensation periods exceeding 34 days in the conditions of the MRY critical for condensation. The results are presented as a function of indoor air excess moisture under winter conditions. In the case of spruce plywood with mixed sawdust + chipping, continuous condensation time was always over 34 days, meaning that this assembly is not acceptable based on the limit value of moisture condensation defined in this study.

247
Figure 6.6 shows that installation of 30 mm thermal insulation board on the exterior surface of the spruce plywood improves the moisture performance of the wall assembly considerably. When sheathing consists of just plywood, the use of hygroscopic thermal insulation impairs the performance of the assembly. This figure distinctly shows that if plywood must be used as sheathing in a building, for instance as stiffening, it is absolutely necessary to install external thermal insulation on it.
05
101520
2530354045505560
65707580859095
100105
110115120125130
0 1 2 3 4 5 6 7 8Excess moisture of indoor air in winter, Δν exc (g/m3)
Wat
er v
apou
r res
ista
nce
ratio
, Zli/Z
le (-
)
Membrane Zv = 3000 s/m/ glasswool
Membrane Zv = 3000 s/m/ celluloseinsulation
Membrane Zv = 3000 s/m/ sawdust+ chipping
Membrane Zv = 1000 s/m/ glasswool
Membrane Zv = 1000 s/m/ celluloseinsulation
Lin. (Membrane Zv = 3000 s/m/glass wool)
Lin. (Membrane Zv = 3000 s/m/cellulose insulation)
Lin. (Membrane Zv = 3000 s/m/sawdust + chipping)
Lin. (Membrane Zv = 1000 s/m/glass wool)
Lin. (Membrane Zv = 1000 s/m/cellulose insulation)
Figure 6.7 Required water vapour resistance ratio between interior and exterior linings of external wall
assemblies with weatherisation membrane as sheathing (Zν = 3000 s/m and 1000 s/m) to prevent continuous condensation periods exceeding 34 days in the conditions of the MRY critical for condensation. The results are presented as a function of indoor air excess moisture under winter conditions. The required water vapour resistance ratios when using weatherisation membrane (Zν = 1000 s/m) with mixed sawdust + chipping and weatherisation membrane (Zν = 300 s/m) with all thermal insulation materials were so low that they did not appear in the range observed in this figure.
Figure 6.7 deals with the same phenomenon as the earlier figures: when the water vapour resistance of a thin sheathing increases, the use of hygroscopic thermal insulation requires higher water vapour resistance ratio of the assembly. If the thermal insulation is mixed sawdust + chipping and the water vapour resistance of the weatherisation membrane is 1000 s/m, the required water vapour resistance ratio is much lower than when using glass

248
wool or cellulose as thermal insulation. When the water vapour resistance of the sheathing is 3000 s/m, it makes no difference what kind of thermal insulation material is selected for a wall assembly. Figures 6.4–6.7 show that the water vapour resistance ratio between the interior and exterior wall linings of many assemblies must be clearly above 5:1 as indoor air excess moisture increases. On the other hand, a resistance ratio lower than 5:1 is sufficient with some assemblies. At the recommendable excess moisture design value of 4–5 g/m3, presented in Chapter 2.3.2, the minimum resistance ratio values are in the 0 to 80:1 range. When sheathings that are highly permeable to water vapour are used, the required resistance ratio typically varies between 0 and 40:1. On the other hand, the required water vapour resistance ratios of well insulating sheathings (25 mm wood fibreboard, 30 mm glass wool board and a combination of 9 mm spruce plywood + 30 mm glass wool board) were in the 0 to 10:1 range. The water vapour resistance and moisture capacity of the sheathing do, however, also affect the results to some extent. Sometimes the moisture stress acting within the assembly, resulting from outdoor air alone, is heavy enough to render the assemblies unacceptable based on the limit value of moisture condensation selected for this study (e.g. mixed sawdust + chipping with wood hardboard, spruce plywood, OSB or weatherisation membrane with Zν = 5000 s/m, see Ch. 2.2.3).
6.3.2 Mould growth risk of wall assemblies
Figures 6.8–6.11 show the water vapour resistance ratio, Zli/Zle (–), between the interior and exterior wall linings of timber-framed external wall assemblies required to prevent the mould index, M (–), from climbing on the interior surface of the sheathing above the maximum value for outdoor air (1.96) due to diffusion from the inside out. The lowest analysed water vapour resistance ratio was 2:1. The figures present wall assemblies implemented with different sheathing materials and the three different thermal insulations used (glass wool, cellulose insulation and mixed sawdust + chipping). The results are presented as a function of indoor air excess moisture values, Δνexc (g/m3), in winter conditions (outdoor air temperature ≤ 5°C; see Fig. 2.24). The calculations were done in the outdoor air conditions of the MRY critical for mould growth (Lahti, 1 July 2000 – 30 June 2001). Figures 6.8–6.11 show that the required water vapour resistance ratio between interior and exterior wall linings changes linearly as excess moisture changes also in mould growth risk analyses. The required water vapour resistance ratios calculated as part of the analyses differed very little from the linearly changing values with respect to all assemblies. Also here, linear correlation increases significantly the reliability of the analysis and facilitates the analysis of the results.

249
0
2
4
6
8
10
12
14
16
18
20
0 1 2 3 4 5 6 7 8Excess moisture of indoor air in winter, Δν exc (g/m3)
Wat
er v
apou
r res
ista
nce
ratio
, Zli/Z
le (-
)WFB 12 mm/ glass wool
WFB 12 mm/ cellulose insulation
WFB 12 mm/ sawdust + chipping
WFB 25 mm/ glass wool
WFB 25 mm/ cellulose insulation
WFB 25 mm/ sawdust + chipping
Lin. (WFB 12 mm/ glass wool)
Lin. (WFB 12 mm/ celluloseinsulation)Lin. (WFB 12 mm/ sawdust +chipping)Lin. (WFB 25 mm/ glass wool)
Lin. (WFB 25 mm/ celluloseinsulation)Lin. (WFB 25 mm/ sawdust +chipping)
WFB = Wood fibreboard
Figure 6.8 Required water vapour resistance ratio between interior and exterior linings of different
external wall assemblies with 12 mm (A13) and 25 mm (A2) wood fibreboard sheathings to prevent assembly’s mould index from exceeding the maximum value for outdoor air of 1.96 on the interior surface of the sheathing in the conditions of the MRY critical for mould growth. The results are presented as a function of indoor air excess moisture under winter conditions. The required water vapour resistance ratios with 30 mm glass wool board (A3) and all thermal insulation materials were so low that they did not appear in the range observed in this figure.
Figure 6.8 reveals that in the case of mould growth higher thermal resistance of sheathing lowers the water vapour resistance ratio between the interior and exterior linings of a wall assembly as in the condensation analyses. Likewise, higher moisture capacity of thermal insulation reduces the mould growth risk of an assembly.

250
0
2
4
6
8
10
12
14
16
18
20
22
24
26
28
30
32
34
36
38
40
0 1 2 3 4 5 6 7 8Excess moisture of indoor air in winter, Δν exc (g/m3)
Wat
er v
apou
r res
ista
nce
ratio
, Zli/Z
le (-
)GB 9 mm/ glass wool
GB 9 mm/ cellulose insulation
GB 9 mm/ sawdust+chipping
WHB 4.8 mm/ glass wool
WHB 4.8 mm/ cellulose insulation
WHB 4.8 mm/ sawdust + chipping
OSB 12 mm/ glass wool
OSB 12 mm/ cellulose insulation
OSB 12 mm/ sawdust + chipping
Lin. (GB 9 mm/ glass wool)
Lin. (GB 9 mm/ cellulose insulation)
Lin. (GB 9 mm/ sawdust+chipping)
Lin. (WHB 4.8 mm/ glass wool)
Lin. (WHB 4.8 mm/ celluloseinsulation)Lin. (WHB 4.8 mm/ sawdust +chipping)Lin. (OSB 12 mm/ sawdust +chipping)Lin. (OSB 12 mm/ glass wool)
Lin. (OSB 12 mm/ celluloseinsulation)
GB = Gypsum boardWHB = Wood hardboardOSB = Oriented strand board
Figure 6.9 Required water vapour resistance ratio between interior and exterior linings of different
external wall assemblies with gypsum board 9 mm (A1), wood hardboard 4.8 mm (A8) and OSB 12 mm (C6) sheathings to prevent assembly’s mould index from exceeding the maximum value for outdoor air of 1.96 on the interior surface of the sheathing in the conditions of the MRY critical for mould growth. The results are presented as a function of indoor air excess moisture under winter conditions.
Figure 6.9 demonstrates that the required water vapour resistance ratio increased as thermal resistance of the sheathing decreased, if the sheathing was highly permeable to water vapour (gypsum board 9 mm). On the other hand, with more vapour-tight sheathings the mould growth risk decreased (4.8 mm wood hardboard and 12 mm OSB). The likely reason is that the vapour-tight and hygroscopic sheathing slowed the increase in relative humidity on its interior surface due to outdoor air in autumn conditions. However, it should be noted here that a vapour-tight sheathing may actually increase mould growth risk as mould may begin to grow in spring conditions. This is because the assemblies dry more slowly which maintains favourable conditions for mould growth on the interior surface of the sheathing for a longer period. Figure 6.9 also tells that higher moisture capacity of thermal insulation reduced the mould growth risk of an assembly, even if the water vapour resistance of the sheathing was high.

251
0
2
4
6
8
10
12
14
16
18
20
22
24
26
28
30
0 1 2 3 4 5 6 7 8Excess moisture of indoor air in winter, Δν exc (g/m3)
Wat
er v
apou
r res
ista
nce
ratio
, Zli/Z
le (-
)SP 9 mm/ glass wool
SP 9 mm/ cellulose insulation
SP 9 mm/ sawdust+chipping
SP 9 mm + GWB 30 mm/ glasswool
SP 9 mm + GWB 30 mm/ celluloseinsulation
SP 9 mm + GWB 30 mm/sawdust+chipping
Lin. (SP 9 mm/ glass wool)
Lin. (SP 9 mm/ cellulose insulation)
Lin. (SP 9 mm/ sawdust+chipping)
Lin. (SP 9 mm + GWB 30 mm/glass wool)
Lin. (SP 9 mm + GWB 30 mm/cellulose insulation)
Lin. (SP 9 mm + GWB 30 mm/sawdust+chipping)
SP = Spruce plywoodGWB = Glass wool board
Figure 6.10 Required water vapour resistance ratio between interior and exterior linings of different
external wall assemblies with 9 mm spruce plywood (A11) and a combination of 9 mm spruce plywood + 30 mm glass wool board (A3) sheathings to prevent assembly’s mould index from exceeding the maximum value for outdoor air of 1.96 on the interior surface of the sheathing in the conditions of the MRY critical for mould growth. The results are presented as a function of indoor air excess moisture under winter conditions.
Figure 6.10 points out that using extra thermal insulation on the exterior surface of spruce plywood sheathing reduced the water vapour resistance ratio required of the assembly also in relation to mould growth risk.

252
0
5
10
15
20
25
30
35
40
45
50
55
60
65
70
75
80
0 1 2 3 4 5 6 7 8Excess moisture of indoor air in winter, Δν exc (g/m3)
Wat
er v
apou
r res
ista
nce
ratio
, Zli/Z
le (-
)Membrane Zv = 3000 s/m/ glasswool
Membrane Zv = 3000 s/m/ celluloseinsulation
Membrane Zv = 3000 s/m/ sawdust+ chipping
Membrane Zv = 1000 s/m/ glasswool
Membrane Zv = 1000 s/m/ celluloseinsulation
Membrane Zv = 1000 s/m/ sawdust+ chipping
Membrane Zv = 300 s/m/ glasswool
Membrane Zv = 300 s/m/ celluloseinsulation
Lin. (Membrane Zv = 3000 s/m/glass wool)
Lin. (Membrane Zv = 3000 s/m/cellulose insulation)
Lin. (Membrane Zv = 3000 s/m/sawdust + chipping)
Lin. (Membrane Zv = 1000 s/m/glass wool)
Lin. (Membrane Zv = 1000 s/m/cellulose insulation)
Lin. (Membrane Zv = 1000 s/m/sawdust + chipping)
Lin. (Membrane Zv = 300 s/m/glass wool)
Lin. (Membrane Zv = 300 s/m/cellulose insulation)
Figure 6.11 Required water vapour resistance ratio between interior and exterior linings of different
external wall assemblies with weatherisation membrane sheathing (Zν = 3000 s/m, 1000 s/m and 300 s/m) to prevent assembly’s mould index from exceeding the maximum value for outdoor air of 1.96 on the interior surface of the sheathing in the conditions of the MRY critical for mould growth. The results are presented as a function of indoor air excess moisture under winter conditions. The required water vapour resistance ratios with weatherisation membrane (Zν = 300 s/m) and mixed sawdust + chipping were so low that they did not appear in the range observed in this figure.
In the case of thin membranes, an increase in water vapour resistance increased the required water vapour resistance ratio between interior and exterior wall linings, while higher moisture capacity of thermal insulation lowered it. In other words, higher moisture capacity of thermal insulation reduced the mould growth risk of an assembly independent of the water vapour resistance of the sheathing. Figures 6.8–6.11 show that the water vapour resistance ratio between the interior and exterior linings must be clearly higher than 5:1 in many wall assemblies to prevent mould growth. Thus, the minimum value of 5:1 recommended by RakMK C2 (1998) is not sufficient based on either of the performance criteria selected for this research.

253
Figures 6.8–6.11 also reveal that the limit value for moisture condensation selected for the study is typically clearly more critical than the limit value for mould growth in Finnish climatic conditions. The limit value for mould growth was, however, more critical in some instances when weatherisation membrane (Zν = 300 s/m) or gypsum board was used as sheathing (see Table 6.3). Based on the examined assemblies, the mould growth index may become more critical, especially if thin, relatively permeable weatherisation membranes are used for sheathing. The limit value for mould growth selected for the research may also become the more important criterion if the water vapour resistances of the internal and external linings of the assembly decrease significantly as relative humidity rises. This is due the fact that in autumn conditions the relative humidity of the interior surface of the wall is higher, and that of the exterior surface respectively somewhat lower, than in winter conditions. As a consequence, the resistance ratio between the interior and exterior wall linings may be considerably lower in autumn than in winter. For instance, the water vapour resistance of paper-based air barriers and weatherisation membranes may change significantly as relative humidity changes (see App. 3). Thus, this phenomenon must be taken into account in designing the water vapour resistance ratio of the assembly.
6.3.3 Impact of limit values on acceptability of moisture performance of wall assemblies
As earlier stated in Chapter 1.7.4, the acceptability of the moisture performance of a wall assembly depends essentially on the limit values allowed in the assembly. Figures 6.12 and 6.13 examine the impact of the chosen limit value on the required water vapour resistance ratio between the interior and exterior linings of the examined assemblies in the outdoor air conditions of the MRY critical for moisture condensation (Sodankylä, 1 July 1985 – 30 June 1986) and mould growth (Lahti, 1 July 2000 – 30 June 2001). The external walls selected for the analysis where ones with either a weatherisation membrane Zν = 3000 s/m or 12 mm wood fibreboard (A13, App. 3) as sheathing and the same thermal insulations as in the analyses of Chapters 6.3.1 and 6.3.2. The calculation was done the same way as in Chapters 6.3.1 and 6.3.2. The excess moisture of indoor air was 5 g/m3 in winter conditions according to Figure 2.24. Figure 6.12 presents the change in the required water vapour resistance ratio of the analysed assemblies when the acceptable maximum continuous condensation time changes. Figure 6.12 reveals that a shorter maximum continuous condensation time has little impact on the required water vapour resistance of a wall with 12 mm wood fibreboard as sheathing. If the thermal resistance of the sheathing were higher, the impact would be even smaller. On the other hand, when weatherisation membrane (Zν = 3000 s/m) was used as

254
sheathing, a shorter condensation time increased the required water vapour resistance ratio of the assembly strongly. A a matter of fact, a higher water vapour resistance ratio does not even improve the performance of the assembly if acceptable maximum condensation time is less than 20 days. This means that with this limit value, the assembly in question is no longer acceptable from the viewpoint of moisture condensation. On the other hand, Figure 6.12 demonstrates that if the water vapour resistance ratio between the interior and exterior lining is 5:1, considerably longer maximum continuous condensation times have to be accepted in assemblies. When 12 mm wood fibreboard is used as sheathing, the maximum continuous condensation time is about 160 days, and with a weatherisation membrane (Zν = 3000 s/m) as sheathing, the maximum continuous condensation time can be up to 200 days – over half a year. Therefore, a 5:1 resistance ratio is not acceptable for these assemblies.
0
20
40
60
80
100
120
140
160
180
200
220
240
0 10 20 30 40 50 60 70 80 90 100 110 120 130 140 150
Water vapour resistance ratio, Zli/Zle (-)
Max
imum
con
tinuo
us c
onde
nsat
ion
time,
tm
ax (d
ays)
Memb. Zv = 3000 s/m/GWMemb. Zv = 3000 s/m/ CI
Memb. Zv = 3000 s/m/S+CWFB 12 mm/ GW
WFB 12 mm/ CI
WFB 12 mm/ S+C
Limit value of thisresearch (34 days)
WFB = Wood fibreboardGW = Glass woolCI = Cellulose insulationS+C = Sawdust + chipping
Figure 6.12 Impact of acceptable maximum continuous condensation time on the interior surface of the
sheathing on the required water vapour resistance ratio between interior and exterior linings of some external wall assemblies. The results were calculated in the conditions of the MRY critical for moisture condensation (Sodankylä 1985–86). The excess moisture of indoor air was 5 g/m3 in winter conditions according to Figure 2.24.
If the used condensation limit value were that “moisture must not accumulate in the assembly”, the required water vapour resistance ratio between the interior and exterior wall linings would be even lower than 5:1 for these assemblies. Thereby mould growth would be a more critical factor for the moisture performance of an assembly than condensation. Thus, the requirement that moisture must not accumulate in the assembly is not an acceptable limit value either.

255
The selection of the mould growth limit value also affects essentially the water vapour resistance ratio value required of the assembly. Figure 6.13 shows the change in the required water vapour resistance ratio value between the interior and exterior linings of the examined assemblies when the acceptable maximum mould index changes. Figure 6.13 demonstrates the same basic issues that were observed when the performance of assemblies was analysed with respect to moisture condensation. If maximum mould index is set, for instance, at level 1, which means that mould does not grow on the interior surface of the sheathing, it is still possible to design a wall where 12 mm wood fibreboard is used as a sheathing. Then the required water vapour resistance ratio varies between 2 and 20:1 depending on used thermal insulation. If weatherisation membrane (Zν = 3000 s/m) is used as sheathing instead, the maximum mould index 1 cannot be reached. On the other hand, Airaksinen (2003) discovered that mould spores may also pass through the sheathing from outdoor air into indoor air carried by air flows. Thus, limiting mould growth on the interior surface of the sheathing to a level lower than what occurs in outdoor air is not sensible from the viewpoint of an assembly’s moisture performance.
0
1
2
3
4
5
6
0 10 20 30 40 50 60 70 80 90 100 110 120 130 140 150
Water vapour resistance ratio, Zli/Zle (-)
Max
imum
mou
ld in
dex,
Mm
ax (-
)
Memb. Zv = 3000 s/m/ GW
Memb. Zv = 3000 s/m/ CI
Memb. Zv = 3000 s/m/ S+C
WFB 12 mm/ GW
WFB 12 mm/ CI
WFB 12 mm/ S+C
Limit value of this research(1.96)
WFB = Wood fibreboardGW = Glass woolCI = Cellulose insulationS+C = Sawdust + chipping
Figure 6.13 Impact of acceptable maximum mould index on the interior surface of the sheathing on the
required water vapour resistance ratio between interior and exterior linings of some external wall assemblies. The results were calculated in the conditions of the MRY critical for mould growth (Lahti 2000–01). The excess moisture of indoor air was 5 g/m3 in winter conditions according to Figure 2.24.

256
If the analysed assemblies were to be implemented so that the water vapour resistance ratio between interior and exterior wall linings is 5:1, the maximum mould index for a wall where wood fibreboard is used as sheathing would be chosen in this research. On the other hand, if a weatherisation membrane were to be used as sheathing, we would have to accept a mould index value over 4.5 in the most critical situation. This means that approximately 20–30% of the interior surface of the sheathing would be covered in mould. That is a clearly unacceptable level. To sum up the above analyses, the acceptability of the moisture performance of timber-framed external walls depends largely on the set limit values. In many instances this explains the fact that many studies have produced different results and conclusions concerning the moisture performance of assemblies, although the assemblies, and even the conditions, have been quite similar.
6.3.4 Impact of MRY on acceptability of moisture performance of wall assemblies
The impact of the moisture reference year (MRY) on the acceptability of the moisture performance of a timber-framed wall assembly is analysed in the following. The assemblies were the same as above, that is, ones with a thin weatherisation membrane (Zν = 3000 s/m) and 12 mm wood fibreboard (A13, App. 3) as sheathing. The performance of these assemblies was studied on the basis of the MRYs selected for the study as well as two other MRYs: the average year for criticality of moisture condensation and the average year for criticality of mould growth. The calculations were done the same way as in Chapters 6.3.1 and 6.3.2. Table 6.1 presents the years selected for analyses based on the calculation results of Figures 2.4 and 2.16. Table 6.1 Selected MRYs for analysis of acceptability of moisture performance of timber-framed
external wall assemblies.
Criticality of MRY Performance criteria 10% level Average
Moisture condensation Sodankylä 1985–1986 Lahti 1978–1979
Mould growth Lahti 2000–2001 Sodankylä 1981–1982
Figure 6.14 presents the water vapour resistance ratio, Zli/Zle (–), between the interior and exterior linings of analysed wall assemblies required to prevent a maximum continuous condensation period exceeding 34 days from occurring on the interior surface of the sheathing. Similarly, Figure 6.15 presents the water vapour resistance ratio between the interior and exterior wall linings of same wall assemblies required to prevent the mould index, M (–), from climbing on the interior surface of the sheathing above the maximum value for outdoor air (1.96). The results are presented as a function of wintertime excess moisture conditions, Δνexc (g/m3) (outdoor air temperature ≤ 5°C; see Fig. 2.24).

257
0
5
10
15
20
25
30
35
40
45
50
55
60
65
70
75
80
85
90
95
100
105
110
115
120
125
130
0 1 2 3 4 5 6 7 8Excess moisture of indoor air in winter, Δν exc (g/m3)
Wat
er v
apou
r res
ista
nce
ratio
, Zli/
Z le (-
)
10% level MRY (Memb. Zv = 3000s/m/ GW)10% level MRY (Memb. Zv = 3000s/m/ CI)10% level MRY (Memb. Zv = 3000s/m/ S+C)10% level MRY (WFB 12 mm/ GW)
10% level MRY (WFB 12 mm/ CI)
10% level MRY (WFB 12 mm/S+C)Average MRY (Memb. Zv = 3000s/m/ GW)Average MRY (Memb. Zv = 3000s/m/ CI)Average MRY (Memb. Zv = 3000s/m/ S+C)Average MRY (WFB 12 mm/ GW)
Average MRY (WFB 12 mm/ CI)
Average MRY (WFB 12 mm/ S+C)
Lin. (10% level MRY (Memb. Zv =3000 s/m/ GW))Lin. (10% level MRY (Memb. Zv =3000 s/m/ CI))Lin. (10% level MRY (Memb. Zv =3000 s/m/ S+C))Lin. (10% level MRY (WFB 12 mm/GW))Lin. (10% level MRY (WFB 12 mm/CI))Lin. (10% level MRY (WFB 12 mm/S+C))Lin. (Average MRY (Memb. Zv =3000 s/m/ GW))Lin. (Average MRY (Memb. Zv =3000 s/m/ CI))Lin. (Average MRY (Memb. Zv =3000 s/m/ S+C))Lin. (Average MRY (WFB 12 mm/GW))Lin. (Average MRY (WFB 12 mm/CI))Lin. (Average MRY (WFB 12 mm/S+C))
WFB = Wood fibreboardGW = Glass woolCI = Cellulose insulationS+C = Sawdust + chipping
Figure 6.14 Impact of MRY on the moisture condensation risk on the interior surface of the sheathing. The
figure shows the required water vapour resistance ratio between interior and exterior linings of some external wall assemblies to prevent condensation periods exceeding 34 days in the conditions of a 10% level critical and average MRY. The criticality levels of these MRYs mean that 10% and 50% of the years are more critical for moisture condensation than the selected MRY. The results are presented as a function of indoor air excess moisture under winter conditions.
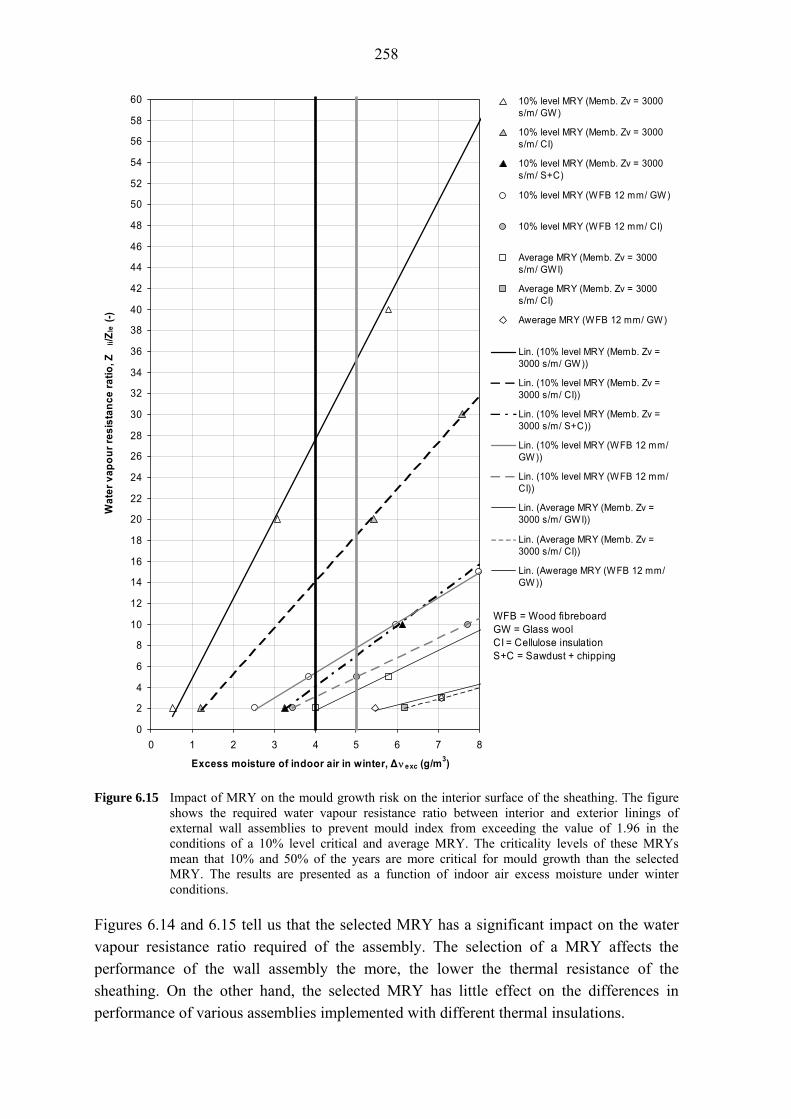
258
0
2
4
6
8
10
12
14
16
18
20
22
24
26
28
30
32
34
36
38
40
42
44
46
48
50
52
54
56
58
60
0 1 2 3 4 5 6 7 8
Excess moisture of indoor air in winter, Δν exc (g/m3)
Wat
er v
apou
r res
ista
nce
ratio
, Zli/Z
le (-
)10% level MRY (Memb. Zv = 3000s/m/ GW)
10% level MRY (Memb. Zv = 3000s/m/ CI)
10% level MRY (Memb. Zv = 3000s/m/ S+C)
10% level MRY (WFB 12 mm/ GW)
10% level MRY (WFB 12 mm/ CI)
Average MRY (Memb. Zv = 3000s/m/ GWI)
Average MRY (Memb. Zv = 3000s/m/ CI)
Awerage MRY (WFB 12 mm/ GW)
Lin. (10% level MRY (Memb. Zv =3000 s/m/ GW))
Lin. (10% level MRY (Memb. Zv =3000 s/m/ CI))
Lin. (10% level MRY (Memb. Zv =3000 s/m/ S+C))
Lin. (10% level MRY (WFB 12 mm/GW))
Lin. (10% level MRY (WFB 12 mm/CI))
Lin. (Average MRY (Memb. Zv =3000 s/m/ GWI))
Lin. (Average MRY (Memb. Zv =3000 s/m/ CI))
Lin. (Awerage MRY (WFB 12 mm/GW))
WFB = Wood fibreboardGW = Glass woolCI = Cellulose insulationS+C = Sawdust + chipping
Figure 6.15 Impact of MRY on the mould growth risk on the interior surface of the sheathing. The figure
shows the required water vapour resistance ratio between interior and exterior linings of external wall assemblies to prevent mould index from exceeding the value of 1.96 in the conditions of a 10% level critical and average MRY. The criticality levels of these MRYs mean that 10% and 50% of the years are more critical for mould growth than the selected MRY. The results are presented as a function of indoor air excess moisture under winter conditions.
Figures 6.14 and 6.15 tell us that the selected MRY has a significant impact on the water vapour resistance ratio required of the assembly. The selection of a MRY affects the performance of the wall assembly the more, the lower the thermal resistance of the sheathing. On the other hand, the selected MRY has little effect on the differences in performance of various assemblies implemented with different thermal insulations.

259
In condensation risk analyses, the required water vapour resistance ratio was about 30–50% lower when the average year was used instead of the 10% level critical year. The differences were even greater in mould risk analyses where the required water vapour resistance ratio was about 60–90% lower when the average MRY was used. The results show that in Finland the difference between the average and the 10% level critical year is larger from the viewpoint of mould growth than in the case of condensation.
6.3.5 Impact of exterior surface resistance of sheathing on moisture performance of wall assemblies
This chapter has dealt with the impact of the exterior surface resistance of sheathing on the moisture performance of wall assemblies. It compared the surface resistance value for the exterior surface of 0.04 m2·K/W used in calculations to 0.13 m2·K/W, which is used to calculate U-values for exterior walls with a ventilation gap (ISO 6946 1996, RakMK C2 1998). The analysis targeted the same assemblies as above (external wall assemblies with weatherisation membrane (Zν = 3000 s/m) or 12 mm wood fibreboard (A13, App. 3) for sheathing). The calculations were done the same way as in Chapters 6.3.1 and 6.3.2. Figure 6.16 presents the water vapour resistance ratio, Zli/Zle (–), between the interior and exterior linings of analysed wall assemblies required to prevent a maximum continuous condensation period exceeding 34 days from occurring on the interior surface of the sheathing. The calculations were done in the outdoor air conditions of the MRY critical for moisture condensation (Sodankylä, 1 July 1985 – 30 June 1986). Figure 6.17, again, presents the water vapour resistance ratio between the interior and exterior wall linings of same wall assemblies required to prevent the mould index, M (–), from climbing on the interior surface of the sheathing above the maximum value for outdoor air (1.96). The calculations were done in the outdoor air conditions of the MRY critical for mould growth (Lahti, 1 July 2000 – 30 June 2001). The results are presented as a function of wintertime excess moisture conditions, Δνexc (g/m3) (outdoor air temperature ≤ 5°C; see Fig. 2.24). Figures 6.16 and 6.17 show that higher exterior surface resistance of the sheathing improves the moisture performance of assemblies the more, the lower the thermal resistance of the sheathing itself. In condensation risk analyses, the required water vapour resistance ratio was about 35–75% lower, and in the mould growth risk analyses about 30–60% lower, when a weatherisation membrane (Zν = 3000 s/m) was used as sheathing. On the other hand, when the sheathing was 12 mm wood fibreboard, a higher surface resistance had a clearly smaller effect: in condensation risk analyses, the required water vapour resistance ratio was about 5–35% lower, and in mould growth risk analyses, about 10–20% lower. If the sheathing is a board of good thermal resistance, the significance of higher surface resistance in the analysis of the moisture performance of the assembly decreases further.

260
Moreover, an examination of the condensation risk of the assembly reveals that higher surface resistance of the exterior surface lowered the required water vapour resistance ratio the more, the higher the moisture capacity of the thermal insulation.
0
5
10
15
20
25
30
35
40
45
50
55
60
65
70
75
80
85
90
95
100
105
110
115
120
125
130
0 1 2 3 4 5 6 7 8Excess moisture of indoor air in winter, Δν exc (g/m3)
Wat
er v
apou
r res
ista
nce
ratio
, Zli/
Z le (-
)
Rse = 0.04 m²·K/W (Memb. Zv = 3000s/m/ GW)Rse = 0.04 m²·K/W (Memb. Zv = 3000s/m/ CI)Rse = 0.04 m²·K/W (Memb. Zv = 3000s/m/ S+C)Rse = 0.04 m²·K/W (WFB 12 mm/ GW)
Rse = 0.04 m²·K/W (WFB 12 mm/ CI)
Rse = 0.04 m²·K/W (WFB 12 mm/ S+C)
Rse = 0.13 m²·K/W (Memb. Zv = 3000s/m/ GW)Rse = 0.13 m²·K/W (Memb. Zv = 3000s/m/ CI)Rse = 0.13 m²·K/W (Memb. Zv = 3000s/m/ S+C)Rse = 0.13 m²·K/W (WFB 12 mm/ GW)
Rse = 0.13 m²·K/W (WFB 12 mm/ CI)
Rse = 0.13 m²·K/W (WFB 12 mm/ S+C)
Lin. (Rse = 0.04 m²·K/W (Memb. Zv =3000 s/m/ GW))Lin. (Rse = 0.04 m²·K/W (Memb. Zv =3000 s/m/ CI))Lin. (Rse = 0.04 m²·K/W (Memb. Zv =3000 s/m/ S+C))Lin. (Rse = 0.04 m²·K/W (WFB 12 mm/GW))Lin. (Rse = 0.04 m²·K/W (WFB 12 mm/CI))Lin. (Rse = 0.04 m²·K/W (WFB 12 mm/S+C))Lin. (Rse = 0.13 m²·K/W (Memb. Zv =3000 s/m/ GW))Lin. (Rse = 0.13 m²·K/W (Memb. Zv =3000 s/m/ CI))Lin. (Rse = 0.13 m²·K/W (Memb. Zv =3000 s/m/ S+C))Lin. (Rse = 0.13 m²·K/W (WFB 12 mm/GW))Lin. (Rse = 0.13 m²·K/W (WFB 12 mm/CI))Lin. (Rse = 0.13 m²·K/W (WFB 12 mm/S+C))
WFB = Wood fibreboardGW = Glass woolCI = Cellulose insulationS+C = Sawdust + chipping
Figure 6.16 Impact of exterior surface resistance of 0.04 m2·K/W and 0.13 m2·K/W on the moisture
condensation risk on the interior surface of the sheathing. The figure shows the required water vapour resistance ratio between interior and exterior linings of some external wall assemblies to prevent continuous condensation periods exceeding 34 days in the conditions of the MRY critical for moisture condensation (Sodankylä 1985–86). The results are presented as a function of indoor air excess moisture under winter conditions.

261
0
2
4
6
8
10
12
14
16
18
20
22
24
26
28
30
32
34
36
38
40
42
44
46
48
50
52
54
56
58
60
0 1 2 3 4 5 6 7 8
Excess moisture of indoor air in winter, Δν exc (g/m3)
Wat
er v
apou
r res
ista
nce
ratio
, Zli/Z
le (-
)
Rse = 0.04 m²·K/W (Memb. Zv = 3000s/m/ GW)
Rse = 0.04 m²·K/W (Memb. Zv = 3000s/m/ CI)
Rse = 0.04 m²·K/W (Memb. Zv = 3000s/m/ S+C)
Rse = 0.04 m²·K/W (WFB 12 mm/ GW)
Rse = 0.04 m²·K/W (WFB 12 mm/ CI)
Rse = 0.13 m²·K/W (Memb. Zv = 3000s/m/ GW)
Rse = 0.13 m²·K/W (Memb. Zv = 3000s/m/ CI)
Rse = 0.13 m²·K/W (Memb. Zv = 3000s/m/ S+C)
Rse = 0.13 m²·K/W (WFB 12 mm/ GW)
Rse = 0.13 m²·K/W (WFB 12 mm/ CI)
Lin. (Rse = 0.04 m²·K/W (Memb. Zv =3000 s/m/ GW))
Lin. (Rse = 0.04 m²·K/W (Memb. Zv =3000 s/m/ CI))
Lin. (Rse = 0.04 m²·K/W (Memb. Zv =3000 s/m/ S+C))
Lin. (Rse = 0.04 m²·K/W (WFB 12 mm/GW))
Lin. (Rse = 0.04 m²·K/W (WFB 12 mm/CI))
Lin. (Rse = 0.13 m²·K/W (Memb. Zv =3000 s/m/ GW))
Lin. (Rse = 0.13 m²·K/W (Memb. Zv =3000 s/m/ CI))
Lin. (Rse = 0.13 m²·K/W (Memb. Zv =3000 s/m/ S+C))
Lin. (Rse = 0.13 m²·K/W (WFB 12 mm/GW))
Lin. (Rse = 0.13 m²·K/W (WFB 12 mm/CI))
WFB = Wood fibreboardGW = Glass woolCI = Cellulose insulationS+C = Sawdust + chipping
Figure 6.17 Impact of exterior surface resistance of 0.04 m2·K/W and 0.13 m2·K/W on the mould growth
risk on the interior surface of the sheathing. The figure shows the required water vapour resistance ratio between interior and exterior linings of some external wall assemblies to prevent mould index from exceeding the value of 1.96 in the conditions of the MRY critical for mould growth (Lahti 2000–01). The results are presented as a function of indoor air excess moisture under winter conditions.
Figures 6.16 and 6.17 indicate that when thermally non-insulating sheathings are used, the thermal surface resistance of the sheathing has an essential impact on the moisture performance of assemblies. Therefore, its value should be on the safe side in design calculations. The figures of Chapters 6.3.1–6.3.4 also show that if thin weatherisation

262
membranes are used, it is often more straightforward to select a plastic vapour barrier for the interior surface since the water vapour resistance ratio required of assemblies is also sensitive to the effects of many other factors. If the water vapour resistance of a membrane is very low (≤ 500 s/m), that is of no major significance since the absolute water vapour resistance required of the interior surface changes quite little even if there is a considerable change in the water vapour resistance ratio.
6.3.6 Combined effect of sheathing and thermal insulation on moisture performance of wall assemblies
The calculation results of Chapters 6.3.1 and 6.3.2 bring out well the fact that the moisture performance of a timber-framed external wall assembly depends essentially also on other building physical properties of the structural layers than the water vapour resistance ratio between interior and exterior wall linings. Other major factors include water vapour resistance, thermal resistance, moisture capacity of sheathing and moisture capacity of thermal insulation. Calculation results further suggest that these factors have a different effect on the moisture performance of an exterior wall assembly in different situations. The following example calculation analyses this issue in more detail. Figure 6.18 shows examples of the thermal resistance required of the sheathing in different timber-framed external walls as a function of water vapour resistance under critical conditions for condensation, when the water vapour resistance ratio between interior and exterior wall linings is 5:1. The excess moisture of indoor air in winter conditions in all calculations was 5 g/m3 (θe ≤ 5°C). The calculations were done the same way as in Chapters 6.3.1 and 6.3.2. The thermal resistance of the sheathing was such that the maximum continuous condensation period of 34 days was not exceeded on the interior surface of the sheathing. The calculations were done in the outdoor air conditions of the MRY critical for moisture condensation (Sodankylä, 1 July 1985 – 30 June 1986). Limit value of moisture condensation was chosen as the criterion of these calculations since it proved generally more critical than the limit value of mould growth. The analysis used the same thermal insulations in walls as in Chapters 6.3.1 and 6.3.2. The sheathing was of a material whose moisture capacity, ξ, and liquid moisture diffusivity, Dw,liq, corresponded either to the properties of glass wool board (non-hygroscopic sheathing) (A3, App. 3) or wood fibreboard (hygroscopic sheathing) (A2, App. 3). The water vapour diffusion resistance factor, μ, and thermal resistance, R, of the sheathing were changed in the calculations. The thickness of the sheathing was kept the same throughout the calculations (30 mm). It should be noted when reviewing the results that the used sheathings do not correspond exactly to any existing materials. For example, the density of the sheathing increases in most cases as its water vapour permeability decreases. With hygroscopic materials this means that the material can also bind more moisture. Yet, in the example calculation the density and moisture content of the sheathing remain the same although water vapour resistance increases.

263
0.0
0.2
0.4
0.6
0.8
1.0
1.2
1.4
1.6
1.8
2.0
0 2 4 6 8 10 12 14 16 18 20 22 24 26 28 30
Water vapour resistance of sheathing, Zν (×103 s/m)
Suffi
cien
t the
rmal
resi
stan
ce o
f she
athi
ng,
Rsh
(m2 ·K
/W)
WVRR 5:1, non-hygroscopic sheathing 30 mm, non-hycroscopic thermal insulationWVRR 5:1, non-hygroscopic sheathing 30 mm, hygroscopic thermal insulationWVRR 5:1, non-hygroscopic sheathing 30 mm, high hygroscopic thermal insulationWVRR 5:1, hygroscopic sheathing 30 mm, non-hygroscopic thermal insulationWVRR 5:1, hygroscopic sheathing 30 mm, hygroscopic thermal insulationWVRR 5:1, hygroscopic sheathing 30 mm, high hygroscopic thermal insulationPolyn. (WVRR 5:1, non-hygroscopic sheathing 30 mm, non-hycroscopic thermal insulation)Polyn. (WVRR 5:1, non-hygroscopic sheathing 30 mm, hygroscopic thermal insulation)Polyn. (WVRR 5:1, non-hygroscopic sheathing 30 mm, high hygroscopic thermal insulation)Polyn. (WVRR 5:1, hygroscopic sheathing 30 mm, non-hygroscopic thermal insulation)Polyn. (WVRR 5:1, hygroscopic sheathing 30 mm, hygroscopic thermal insulation)Polyn. (WVRR 5:1, hygroscopic sheathing 30 mm, high hygroscopic thermal insulation)
Figure 6.18 Sufficient thermal resistance of the sheathing of some external wall assemblies to prevent a
continuous condensation period exceeding 34 days in the conditions of the MRY critical for moisture condensation (Sodankylä 1985–86). The water vapour resistance ratio between interior and exterior wall linings was always 5:1, and excess moisture of indoor air in winter conditions was 5 g/m3. The results are presented as a function of water vapour resistance of sheathing.
Figure 6.18 tells us firstly that the relationship between the water vapour resistance and thermal resistance of sheathing is not constant. Initially, the thermal resistance required of sheathing increases fast with all assemblies as the water vapour resistance of sheathing increases from 0 to 4000 s/m. Subsequent changes in required thermal resistance are slower. In the observed range, for assemblies with non-hygroscopic sheathings, the required thermal resistance of sheathing increases as long as the water vapour resistance of sheathing increases. On the other hand, it is very interesting to note that when hygroscopic sheathing is used, the required thermal resistance of sheathing starts to diminish with assemblies incorporating low or hygroscopic thermal insulation. Moreover, in the case of assemblies with non-hygroscopic sheathings, the required thermal resistance of sheathing is the higher, the lower the moisture capacity of the thermal

264
insulation. With assemblies incorporating hygroscopic and vapour permeable sheathings, required thermal resistance is also the higher, the lower the moisture capacity of the thermal insulation. However, the situation reverses when the water vapour resistance of sheathing increases. Then, an assembly incorporating non-hygroscopic hygroscopic thermal insulation needs a sheathing of low thermal insulation to ensure a water vapour resistance ratio of 5:1. The above example calculation proves that the impact of different material properties on the moisture performance of assemblies is a quite complicated issue. Therefore, it is difficult to give straightforward and universally applicable instructions concerning sufficient water vapour resistance of the interior wall lining and the water vapour resistance ratio between interior and exterior wall linings. Each assembly must be analysed individually to provide a reliable picture of its performance.
6.3.7 Impact of plastic vapour barrier on mould growth risk in interior wall lining
Earlier in Chapter 2.2.5, 10% level critical MRYs were selected for the mould growth risk analysis of the interior wall lining in summer and winter. This chapter analyses the moisture performance of the plastic vapour barrier of the interior wall lining by using those MRYs as outdoor air conditions.
Mould growth risk on exterior surface of plastic vapour barrier due to outdoor air
The mould growth risk of the exterior surface of the vapour barrier in summer, when the humidity by volume of outdoor air is high, is analysed next. Earlier in Chapter 2.2.5, it was found that the effect of solar radiation need not be considered separately in analyses, if there is a ventilation gap behind the cladding of the external wall assembly. The analysed wall assemblies and used materials were the same as earlier in Figure 2.6, except that the water vapour resistance of the sheathing was 300 s/m, which allowed water vapour to transfer quickly by diffusion onto the interior surface of the assembly. This assembly was also found more critical than assemblies which used a moisture retaining sheathing. Mixed sawdust and chipping (material D67) was also included as an insulation. Used material properties were those of Appendix 3. Indoor air temperature was set at a constant 21°C, and the excess moisture value used in winter conditions (θe ≤ 5°C) was 5 g/m3. Excess moisture was varied as a function of outdoor air temperature according to Figure 2.24. This meant that in summer conditions (θe ≥ 15°C) indoor air excess moisture was 2.0 g/m3. However, indoor air humidity by volume did not play any significant role in the calculations since the interior surface of the assembly incorporated a plastic vapour barrier. The outdoor air conditions of Lahti were selected as the MRY of the analyses (see Fig. 2.17). The same principles were followed and the same calculation model was used in the calculations as in the other calculational

265
analyses of Chapters 6.3.1–6.3.6, with the exception that the actual analysis was made for the period between the beginning of January and the end of December. Figure 6.19 shows the relative humidities on the exterior surface of the vapour barrier of the example assemblies. Included are also relative humidity values of indoor air.
0
10
20
30
40
50
60
70
80
90
100
0.00 730.00 1460.00 2190.00 2920.00 3650.00 4380.00 5110.00 5840.00 6570.00 7300.00 8030.00 8760.00
Time (months)
Rel
ativ
e hu
mid
ity, ϕ
(% R
H)
Interior surface Glass wool Cellulose insulation Sawdust + chipping
Jan '88 Dec '88Nov '88Oct '88Sep '88Aug '88Jul '88Jun '88May '88Apr '88Mar '88Feb '88
Favourable conditions for mould growth
Figure 6.19 Changes in relative humidity on the exterior surface of the plastic vapour barrier of external
wall assemblies in 1988 outdoor air conditions of Lahti. The values were calculated for the entire year starting from January till the end of December of the same year. The excess moisture of indoor air was 5 g/m3 in winter conditions, and it was varied as a function of outdoor air temperature according to Figure 2.24.
The relative humidities on the exterior side of the plastic vapour barrier in Figure 6.19 were under 80% RH practically all the time. Only in the wall that had glass wool as thermal insulation did relative humidity reach 80% RH for a short while. The figure further indicates that when more hygroscopic thermal insulations are used, the maximum RH values remain lower than with the glass wool-insulated wall assembly. The highest relative humidity values in indoor air occur due to indoor air excess moisture. But even there, conditions favourable for mould growth exist only for a short period. Corresponding calculational analyses were made also in the outdoor air conditions of the other most critical years selected on the basis of humidity by volume in summer. The result was always the same: the critical relative humidity for mould growth (ϕcrit = 80% RH) was either not exceeded, or exceeded for just a very short while. Therefore, the mould index was always clearly below 1. In practice, the mould growth risk of the exterior surface of the vapour barrier is even smaller in most buildings since indoor air temperature typically

266
rises above 21°C in summer as outdoor air temperature rises. This is due the fact that only few Finnish dwellings are cooled in summer. In summation, moisture diffusion from the outside in is of little significance in Finnish climatic conditions from the viewpoint of the moisture performance of an assembly in heated buildings. It does not necessitate lowering the water vapour resistance of the interior wall lining either. Consequently, a plastic vapour barrier is not critical for mould growth or moisture condensation in Finnish climatic conditions. Practical experience also corroborates that (Pirinen 2006).
Mould growth risk on interior surface of plastic vapour barrier due to indoor air
The impact of indoor air excess moisture on the mould growth risk on the interior surface of the air/vapour barrier is analysed by the following example calculations. The studied assemblies and used materials were presented in Fig. 6.20. Used material properties were those of Appendix 3. The air/vapour barrier of the assemblies had been recessed 50 mm to facilitate electrical installations. That made the interior surface of the vapour barrier subject to more critical conditions than when it was immediately behind the interior board. The laths inside the vapour barrier were either vertical or horizontal (Fig. 6.20). The thermal insulation layer on the exterior side of the vapour barrier was either 150 mm or 125 mm thick. These thicknesses were chosen to meet the present Finnish thermal insulation requirements in the case of insulations other than a mixture of sawdust and chipping.
+-
E
Weatherisation membrane 1 mm(Zν = 0.3 ×10³ s/m)
Glass wool (D1)150 mm + 50 mm or 125 mm + 50 mm
Wooden studs 150×50 mm or125×50 mm, c/c 600 mm (C13)
Gypsum board 13 mm (C1)
+-+-
Analysed points
TYPE 1 TYPE 2
A
B
C
D
Wooden laths 50×50 mm,c/c 600 mm (C13)
Plastic vapour barrier (C11) orair barrier membrane (Zν = 40 ×103 s/m)
Figure 6.20 Example wall assemblies for analysing mould growth risk on interior surface of vapour barrier
(cross sections from above). In type 1 the laths inside the vapour barrier are vertical and in type 2 horizontal. The monitoring points are also indicated.

267
Monitoring points were located in the assemblies as follows: A = interior surface of wall, B = interior surface of wooden lath, C = interior surface of vapour/air barrier in the middle of insulation space, and D, E = interior surface of vapour/air barrier in the middle of wooden stud. At point D there was a wooden lath and at point E glass wool insulation on the interior side. Calculational analyses were made for humid summer conditions (outdoor air conditions of Lahti in 1988 were selected as the MRY, see Fig. 2.17) as well as cold winter conditions (outdoor air conditions of Sodankylä in 1977–78 were selected as the MRY, see Fig. 2.18). In calculational analyses of summer conditions indoor air temperature was 21°C while in analyses of winter conditions it was 19°C. The excess moisture of indoor air was varied as a function of outdoor air temperature according to Figure 2.24. The same principles were followed in the calculations as in the other calculational analyses of Chapters 6.3.1–6.3.6, with the exception that the plastic vapour barrier was in a different location in the assembly. A new element model was made for the calculations which depicts the assembly from above showing both sides of the stud. The 50 mm stud had 275 mm wide thermal insulation sections on both sides that accounted for half of the distance between two studs. The width of the entire structure was thus 600 mm (Fig. 6.21). In calculational analyses, 3 elements were used to model 1 mm membranes in the thickness direction, 5 elements to model gypsum board, 9 element layers to model the thicker thermal insulation layer, and 5 elements to model the thinner insulation layer. The same number of elements were also used to model the wooden studs in the thermal insulation layers. In the width direction, 7 elements were used for modelling the thermal insulation layer and 5 element layers for modelling the wooden stud. The outermost element layer was always 0.1 mm in the thickness direction and 1 mm in the width direction. Calculational analyses were made only for glass wool since preliminary calculations suggested that glass wool was the most critical thermal insulation material for the moisture performance of the vapour barrier. As it happens, mineral wool is used almost exclusively as extra insulation on the interior surface of the vapour barrier in Finland.

268
Figure 6.21 Example of element model (left) and different material layers (middle and right) used in
calculational analyses. The monitoring points are also indicated. Figure 6.22 presents the maximum mould indices of the analysed points A–E of Fig. 6.20 during a humid summer in Finland. The maximum mould index values were given as a function of indoor air excess moisture values in winter conditions (θe ≤ 5°C; see Fig. 2.24). Excess moisture was varied as a function of outdoor air temperature according to Figure 2.24 which means that, for instance, the excess moisture value 5 g/m3 corresponded in summer conditions to 2.0 g/m3 (θe ≥ 15°C). Figure 6.22 shows that the maximum mould index value at all monitoring points was clearly under 1, meaning that no mould growth occurred. A maximum mould index of 0–1 can be allowed since conditions favourable to mould growth occur even in indoor air conditions at times. For instance, with the indoor air RH conditions of Figure 6.19 and temperatures of the monitoring point in question the maximum mould index value is 0.16. Thus, the humid summer conditions were not critical for the performance of the assemblies of Figure 6.20 in Finland. Figure 6.22 also shows that thinner thermal insulation had no effect on the maximum mould index in summer. The values of all measuring points were not determined at high excess moisture values since in the analysed cases the mould index rose much higher in winter than in summer, which also affected the value in summer.

269
0
0.2
0.4
0.6
0.8
1
1.2
0 1 2 3 4 5 6 7 8
Excess moisture of indoor air in w inter, Δν exc (g/m3)
Max
imum
mou
ld in
dex,
Mm
ax (-
)A, GW 150 + 50 mmand 125 + 50 mm
B, GW 150 + 50 mmand 125 + 50 mm
C, GW 150 + 50 mmand 125 + 50 mm
D, GW 150 + 50 mmand 125 + 50 mm
E, GW 150 + 50 mmand 125 + 50 mm
Limit value for mouldgrowth
GW = Glass wool
Figure 6.22 Maximum mould index values of points A–E presented in Fig. 6.20 during a humid summer in
Finland. Thickness of the thermal insulation layer on the exterior side of the plastic vapour barrier was 150 mm or 125 mm in calculational analyses. Calculations were made in the outdoor air conditions of Lahti starting at the beginning of January 1988 and finishing at the end of December the same year. The results are presented as a function of indoor air excess moisture under winter conditions. Excess moisture was varied as a function of outdoor air temperature according to Figure 2.24.
Figure 6.23 presents the maximum mould indices at analysed points A–E of Figure 6.20 during a cold winter in Finland. The maximum mould index values were given as a function of indoor air excess moisture values in winter conditions (θe ≤ 5°C; see Fig. 2.24). Figure 6.23 demonstrates that if horizontal laths are used on the interior side of the vapour barrier to improve the wall’s thermal insulation, an area most critical for mould growth is created on the interior surface of the barrier at the vertical frame. There, the mould index value exceeds 1 as the excess moisture of indoor air exceeds 3 g/m3. This means that when excess moisture is higher than 3 g/m3, the interior surface of the vapour barrier becomes more important in the design of the moisture performance of the assembly. Since such excess moisture values are quite normal, the use of internal horizontal laths is not recommendable in external wall assemblies where the vapour barrier is recessed 50 mm from the interior surface of the insulation. When the same assemblies use vertical laths on the interior side of the vapour barrier, the mould index exceeds 1 on the interior surface of the vapour barrier when excess moisture of indoor air exceeds 5 g/m3. Since the recommendable excess moisture design value in winter is 4–5 g/m3 (see Fig. 2.24), a plastic vapour barrier can be used in external wall assemblies also at the depth of 50 mm from the interior surface of the insulation if vertical laths are installed on the interior side of the vapour barrier.

270
In both cases, 25 mm thicker thermal insulation on the exterior side of the vapour barrier improved the performance of the wall assembly. Therefore, it is recommendable to use a thicker thermal insulation layer in assemblies where the vapour barrier is recessed 50 mm into the assembly. A rule of thumb based on these analyses is that at least ¾ of the thermal insulation should be outside the vapour barrier. Nielsen (1995) also recommended the same ratio in his study.
0
1
2
3
4
5
6
0 1 2 3 4 5 6 7 8Excess moisture of indoor air in w inter, Δν exc (g/m3)
Max
imum
mou
ld in
dex,
Mm
ax (-
)
A, GW 150 + 50 mm
B, GW 150 + 50 mm
C, GW 150 + 50 mm
D, GW 150 + 50 mm
E, GW 150 + 50 mm
A, GW 125 + 50 mm
B, GW 125 + 50 mm
C, GW 125 + 50 mm
D, GW 125 + 50 mm
E, GW 125 + 50 mm
Limit value for mouldgrowth
GW = Glass wool
Figure 6.23 Maximum mould index values at points A–E of Figure 6.20 as a function of indoor air excess
moisture under winter conditions. Thickness of the thermal insulation layer on the exterior side of the plastic vapour barrier in calculational analyses was 150 mm or 125 mm. Calculations were done in the outdoor air conditions of Sodankylä starting at the beginning of July 1977 and ending at the end of June 1978.
The maximum mould indices of the analysed points shown in Figure 6.23 were also determined when indoor air temperature was 21°C. The results indicated that a 2°C increase in temperature allows a 0–1 g/m higher excess moisture, depending on indoor air conditions, before the interior surface of the vapour barrier becomes subject to mould growth risk. This proves that indoor air temperature has a significant impact on the moisture performance of an external wall assembly when the vapour barrier is recessed 50 mm from the interior surface of the insulation. Another case where the plastic vapour barrier was replaced with an air barrier more permeable to moisture was also analysed in this connection. The water vapour resistance of the air barrier (Zν = 40 ×103 s/m) was selected so as to be sufficient with a sheathing of 12 mm or 25 mm wood fibreboard (see Table 6.3). The other material properties of the air barrier were the same as those of the weatherisation membrane presented earlier in Figure 2.6.

271
Figure 6.24 presents the maximum mould indices at the analysed points C and E of Figure 6.20 during a cold winter in Finland. The maximum mould index values were given as a function of indoor air excess moisture values in winter conditions (θe ≤ 5°C; see Fig. 2.24).
0
1
2
3
4
5
6
0 1 2 3 4 5 6 7 8Excess moisture of indoor air in winter, Δν exc (g/m3)
Max
imum
mou
ld in
dex,
Mm
ax (-
)
C, plas tic, GW 150 + 50 mm
E, plas tic, GW 150 + 50 mm
C, m embrane (Zv = 40 ×10³s /m ), GW 150 + 50 m mE, m embrane (Zv = 40 ×10³s /m ), GW 150 + 50 m mC, plas tic, GW 125 + 50 mm
E, plas tic, GW 125 + 50 mm
C, m embrane (Zv = 40 ×10³s /m ), GW 125 + 50 m mE, m embrane (Zv = 40 ×10³s /m ), GW 125 + 50 m mLim it value for m ould growth
GW = Glass wool
Figure 6.24 Maximum mould index values at points C and E of Figure 6.20 as a function of indoor air
excess moisture under winter conditions. The thickness of the thermal insulation layer on the exterior side of the plastic vapour barrier or air barrier (Zν = 40 ×103 s/m) was 150 mm or 125 mm in calculational analyses. Calculations were done in the outdoor air conditions of Sodankylä starting at the beginning of July 1977 and ending at the end of June 1978.
According to Figure 6.24, an air barrier more permeable to moisture also improves the performance of an assembly so that the excess moisture value of indoor air can be 0–1 g/m higher depending on the section of the assembly, than in the case of a plastic vapour barrier. This is significant mainly if horizontal laths are installed on the interior side of the barrier. However, even then relative humidity reaches a level critical for mould growth if indoor air excess moisture exceeds 3 or 4 g/m3. This means that a moisture-permeable air barrier does not necessarily improve the performance of a wall assembly enough in all instances. It is safest to make the internal laths vertical. Vertical laths on the interior surface of the assembly also facilitate installation of internal wall boards.

272
6.4 Summary of calculational analyses
Calculational analyses of external wall assemblies show that the acceptability of the moisture performance of assemblies depends on the performance criteria and limit values set for them (Ch. 6.3.1, 6.3.2 and 6.3.3), selected outdoor and indoor air conditions (Chs. 6.3.1, 6.3.2 and 6.3.4) and chosen structural solution and materials (Chs. 6.3.1, 6.3.2, 6.3.5, 6.3.6 and 6.3.7), as stated in Chapter 2. Thus, hypothesis 1 proposed in Chapter 1.2 has been confirmed. The results of the tests and calculations of Chapters 3, 4 and 6 demonstrate that the moisture performance of a timber-framed external wall assembly depends essentially also on other building physical properties of structural layers than the water vapour resistance ratio between the interior and exterior wall linings. This confirms hypothesis 2 proposed in Chapter 1.2. The calculation results also show that by using the new method described in this study, the water vapour resistance ratio between the interior and exterior wall linings of timber-framed external walls can be determined more accurately by taking into account the factors mentioned above. Thus, hypothesis 3 proposed in Chapter 2.1 is also confirmed. The building physical properties of material layers found by the calculations to improve the moisture performance of timber-framed external wall are listed in Table 6.2. There are also other material properties that affect the performance of wall assemblies (e.g. the water vapour resistance of thermal insulation), but they have been excluded from this study. The results of structural tests made in connection with this study support the results of Table 6.2 (see Ch. 3.2.4). The best way of improving the performance of the external wall assembly in Finnish conditions is to increase the water vapour resistance of the interior wall lining and the thermal resistance of the sheathing. Low water vapour resistance of sheathing is also an important factor in improving the moisture performance of the assembly. Higher moisture capacity and capillary activity of the sheathing also seemed to improve the performance of assemblies in all situations, but they were not as significant as the above-mentioned factors. In most cases, high moisture capacity of thermal insulation also improves the moisture performance of wall assemblies. Yet, it must be noted that the moisture capacity of thermal insulation affected the moisture performance of a wall assembly mainly when the used insulation was mixed sawdust + chipping. On the other hand, the differences between glass wool and cellulose insulation were quite small.

273
Table 6.2 Properties of structural layers of external wall which improve moisture performance of exterior wall lining against water vapour diffusion from the inside out.
Structural layer Property that improves moisture performance of assembly
Sheathing
High thermal resistance Low water vapour resistance High moisture capacity (hygroscopicity) High capillary activity
Thermal insulation
High moisture capacity (hygroscopicity), when sheathing is vapour permeable and/or heat-insulating Low moisture capacity (hygroscopicity), when sheathing is quite vapour tight High capillary activity (Low thermal resistance) not sensible due to thermal insulation requirement
Interior wall lining:
- Air/vapour barrier - Interior board - Interior finishing
High water vapour resistance
If the premise of this research – that the conditions of the exterior wall lining must not be more critical than those of the exterior wall lining of the most critical but still acceptable wall assembly, where those conditions are caused solely by outdoor air conditions – is established as the performance principle for external wall assemblies, the required water vapour resistance ratio of wall assemblies has to be determined in most cases on the basis of the selected condensation criterion. Table 6.3 presents examples of the required water vapour resistance ratios of the analysed walls when the excess moisture of indoor air is 5 g/m3 in winter conditions according to Figure 2.24. Depending on the selected sheathing and thermal insulation material, this ratio typically varies within the 0 to 80:1 range. With sheathings highly permeable to water vapour, the resistance ratio typically varies from 0 to 40:1. The resistance ratio of at least 5:1 suggested by the valid Finnish Building Code (RakMK C2 1998) is thus, not sufficent in most cases. On the other hand, a resistance ratio lower than 5:1 is sufficient with some assemblies.

274
Table 6.3 Examples of minimum water vapour resistance ratios and minimum water vapour resistances of interior lining of timber-framed external walls when excess moisture of indoor air is 5 g/m3 in winter conditions according to Figure 2.24. The values were determined using the analysis method of this study and given performance criteria and limit values in the most critical situation. The used minimum water vapour resistance ratio was 2:1 since the performance of assemblies was not analysed by calculation models using values smaller than that.
Thermal insulation
Non-hygroscopic whygr ≤ 5 kg/m3
Hygroscopic whygr ≈ 15 kg/m3
High hygroscopic whygr ≈ 40 kg/m3 Sheathing material
Zli/Zle Zν,li x103 s/m
Zli/Zle Zν,li x103 s/m
Zli/Zle Zν,li x103 s/m
Glass wool board 30 mm (A3)
4:1 6.2 2:1 3.1 2:1 3.1
Wood fibreboard 25 mm (A2)
9:1 38 8:1 34 2:1 8.5
Wood fibreboard 12 mm (A13)
18:1 44 15:1 37 3:1 7.3
Gypsum board 9 mm (A1)
20:1* 53 21:1 55 10:1 26
Wood hardboard 4.8 mm (A8)
14:1 200 28:1 390 Not acceptable
Oriented strand board (OSB) 12 mm (C6)
11:1 790 Not acceptable Not acceptable
Spruce plywood 9 mm (A11)
26:1 220 78:1 650 Not acceptable
Spruce plywood 9 mm (A11) + glass wool board 30 mm (A3)
6:1 93 7:1 110 5:1 78
Weatherisation membrane, Zν = 300 s/m
40:1* 12 10:1* 3.0 2:1 0.6
Weatherisation membrane, Zν = 1000 s/m
41:1 41 31:1 31 2:1 2.0
Weatherisation membrane, Zν = 3000 s/m
73:1 220 76:1 230 74:1 220
Weatherisation membrane, Zν = 5000 s/m
110:1 550 Plastic vapour
barrier Not acceptable
In cases indicated by (*) the mould risk analysis yielded a higher resistance ratio that the condensation time analysis. The minimum water vapour resistance values of the interior lining of the wall assemblies of Table 6.3 are depicted by bars in Figure 6.25. The figure indicates that the absolute water vapour resistance required of the interior surface of an assembly may be high although the water vapour resistance ratio required of the assembly is low (e.g. OSB with glass wool insulation, see Table 6.3).

275
3330
0 50 100 150 200 250 300 350 400 450 500 550 600 650 700 750 800
Membrane Zv = 5000 s/m
Membrane Z_v = 3000 s/m
Membrane Z_v = 1000 s/m
Membrane Z_v = 300 s/m
Spruce plyw ood 9 mm (A11) +glass w ool board 30 mm (A3)
Spruce plyw ood 9 mm (A11)
Oriented strand board(OSB) 12 mm (C6)
Wood hardboard 4.8 mm (A8)
Gypsum board 9 mm (A1)
Wood f ibreboard 12 mm (A13)
Wood f ibreboard 25 mm (A2)
Glass w ool board 30 mm (A3)
Minim um w ater vapour res is tance of interior lining, Zν ,li (×103 s /m )
Non-hygroscopic thermal insulation
Hygroscopic thermal insulation
High hygroscopic thermal insulation
Sheathing m aterial
Membrane Zν = 300 s/m
Membrane Zν = 1000 s/m
Membrane Zν = 3000 s/m
Membrane Zν = 5000 s/m
Figure 6.25 Minimum water vapour resistance values, Zν, of interior lining with different sheathing and
thermal insulation materials when excess moisture of indoor air is 5 g/m3 under winter conditions according to Fig 2.24.
Figure 6.25 also reveals that plastic-coated papers, whose water vapour resistance value typically varies between 100 ×103 s/m and 400 ×103 s/m, are sufficiently vapour-tight for use in interior wall lining, if the exterior surface incorporates a sheathing that is highly permeable to water vapour. On the other hand, their water vapour resistance is not always sufficient for use with denser sheathings (wood hardboard, spruce plywood, OSB and weatherisation membrane with Zν = 5000 s/m); then the only sensible solution is to use plastic foil in the interior wall lining. Moreover, Figure 6.25 points out that extra thermal insulation on the exterior surface of spruce plywood sheathing reduces the water vapour resistance required of the assembly interior wall lining.

276
It must also be noted that even if some assemblies with vapour-tight sheathings perform acceptably in relation to water vapour diffusion, there are still risks related to them in case water enters them occasionally due to a moisture leak (see Ch. 7.3). Therefore, their use is not recommendable in timber-framed external wall assemblies. It is, however, encouraging that spruce plywood sheathing with 25 mm extra insulation on the exterior side allowed moisture to dry out of the assembly reasonably quickly in earlier conducted laboratory tests (see Ch. 3.2.4). The sensitivity analyses of Chapters 6.3.3 and 6.3.4 showed that the limit values set for the acceptable performance of assemblies, and the used MRY, affect essentially the performance of external wall assemblies. When the analysis method presented in this study is used, their significance is, however, smaller since the limit values for moisture condensation and mould growth are selected according to the MRY chosen for the analysis. Consequently, finding just the right MRY for calculational analyses is not critical for the reliability of calculation (see Chs. 7.2.3 and 7.2.4). The moisture performance of a timber-framed external wall assembly is also affected essentially by the surface resistance of the exterior surface of the sheathing, if the thermal resistance of the sheathing itself is low. This is more pronounced when thin weatherisation membranes are used as sheathing. Since many other factors also affect the moisture performance of wall assemblies with weatherisation membranes, it is recommendable to always use a plastic vapour barrier on the interior surface of the assembly with weatherisation membranes. An exception are membranes highly permeable to water vapour with water vapour resistance ≤ 500 s/m. It should also be kept in mind that weatherisation membranes increase internal convection of the assembly since they cannot be installed tightly onto the surface of thermal insulation. A plastic vapour barrier can be used in external wall assemblies also at a depth of 50 mm from the interior surface of the insulation, if vertical laths are installed on the interior side of the vapour barrier. As a rule, horizontal laths are not recommendable on the interior surface of a wall. Adding extra thermal insulation on the exterior side of the vapour barrier improves the moisture performance of the wall assembly. It is recommendable that at least ¾ of the thermal insulation is outside the vapour barrier. Replacing a plastic vapour barrier installed at a depth of 50 mm from the interior surface of the insulation by an air barrier somewhat more permeable to moisture improves the performance of the interior wall lining to some extent.

277
7 DISCUSSION
7.1 Performance criteria and limit values set for the moisture performance of a wall assembly
No generally accepted performance criteria and limit values exist for analysing the moisture performance of envelope assemblies. Some recent studies have, however, found that such generally accepted limit values would be useful (e.g. TenWolde & Rose 1996). The performance criteria and limit values that a timber-framed external wall assembly is to meet were specifically defined for this study (see Chs. 2.1 and 2.2). The results and conclusions of the study depended essentially on the defined limit values. Their tightening or easing would have changed the test results considerably (see Ch. 6.3.3). Consequently, building physical surveys can produce different results and conclusions even when the studied assemblies and indoor and outdoor conditions are the same (see Ch. 1.7.4).
7.1.1 Moisture condensation
The limit value for the condensation criterion selected for the research (no continuous condensation times over 34 days allowed within walls) is tighter than that of the calculation model of the EN ISO 13788 (2001) standard which allows as much moisture to condense within an assembly in winter as can dry out in summer. It is also typically tighter than the limit values for condensed moisture of 1000 g/m2 and 500 g/m2 given in DIN 4108-3 (1981) standard depending on the used building materials (see Ch. 2.1.2 and 2.2.3). On the other hand, the rules and regulations of many countries consider condensation harmful and something to be avoided (see Ch. 2.1.2). It is also noteworthy that in practice condensation may exceed the limit value selected for this study due to the factors of uncertainty presented in Chapter 7.2. The guidelines of the EN ISO 13788 (2001) standard cover all of Europe. Yet, for example, the selection of the condensation limit value depends on the local construction mode and climate, etc. In many Central European countries external walls are normally masonry which is why they withstand longer-term condensation better. And in a milder climate condensed water does not freeze in assemblies very often, either. In the Nordic countries the situation is different and a stricter limit value for condensation is justified for timber-framed walls. It is to be noted that the maximum continuous condensation time of the analysis method presented in this study is not the same everywhere but varies according to type of climate. If the assembly is located in a climate where the maximum continuous condensation time on the interior surface of the sheathing increases significantly solely due to outdoor air

278
conditions, a condensation time of the same duration should be accepted on the same surface from the combined effect of indoor and outdoor air conditions. It is altogether a different question whether timber-framed wall assemblies should be used in locations where their risk of being damaged is high in any case. Instead of continuous condensation time, the condensation criterion could also be the volume of moisture condensed in the assembly, as was the case in several earlier studies. Determining the maximum amount of condensed moisture in different situations would require considerably more time for calculations; yet the ensuing benefits would be minor due to many factors of uncertainty related to the calculations. These factors of uncertainty are dealt with in more detail in Chapter 7.2.3. In general, the more moisture is allowed to condense in the wall assembly, or the longer materials are allowed to stay in the capillary moisture range, the more erroneous results calculations can produce with respect to the moisture performance of assemblies. The risk of wrongly designed assemblies would also increase as a result.
7.1.2 Mould growth
EN ISO 13788 (2001) standard as well as many national guidelines state that mould growth in assemblies should be avoided to the highest extent possible (see Ch. 2.1). Therefore, the mould growth limit value selected for this study, that mould growth within the assembly must not be stronger than in the ventilation gap and outdoor air, is justified. As was found in connection with moisture condensation, more mould growth may occur in practice than the limit value selected for this study due to the factors of uncertainty presented in Chapter 7.2. The maximum mould index of the analysis method presented in this study is not the same everywhere but changes according to climate. If the building is situated in a climate where mould growth on the exterior surfaces of wall assemblies occurs solely as a result of outdoor air temperature and RH, it should also be allowed to affect the exterior lining of the wall assembly to the same extent. This limit value is the most understandable one, and it is also a realistic goal. Naturally, if the mould growth on the exterior surface of the wall is caused by rain, mould growth for the same reason must not allowed within the assembly since it must be designed so that rain water cannot enter into it.
7.2 Factors increasing uncertainty of the research results
There are always inaccuracies and deficiencies in the measurement results of laboratory and field tests, the results yielded by a calculation program and the modelling of investigated phenomena, which increase the uncertainty of test results (Chs. 7.2.1–7.2.4). Yet, the principles of the presented analysis method will remain valid even if the correspondence between calculation and test results can be improved in future.

279
There are also other factors which, for one reason or another, have not been taken into account in the analysis of assemblies, that also affect the performance of external wall assemblies. They either improve or weaken the reliability of the moisture performance of external wall assemblies (Chs. 7.2.5–7.2.7).
7.2.1 Measurement errors of the laboratory and field tests
Measurement errors in laboratory and field tests affect test results and can thereby, depending on the situation, give us a picture of the moisture performance of the analysed assembly that is better or worse than actual, or they can change the building physical properties of the analysed material. The impact of these errors has been limited in this research by using several sensors at each point as a rule and by calibrating the sensors at certain intervals. The used relative humidity sensors were the latest capacitive sensors to come to the market claimed to provide low measurement uncertainty. The biggest errors in laboratory tests on wall assemblies may occur due to air leaks through the assembly. That is why special attention was given to the elimination of this problem in the test walls (see Ch. 3.2.1). Measurement errors are also caused by the fact that a sensor always takes up some space which makes its ideal installation impossible. In the results yielded by some individual measurement sensors for some measured quantities, errors larger than the given measurement uncertainties were observed. They are mentioned in connection with the test results (see Chs. 3−5 and App. 2). In general, it can still be said that, based on the calibrations and control measurements conducted, no errors were observed in the measurements that essentially affected test results. Errors occurring in measurements on timber-framed assemblies are dealt with in more detail, for instance, in an article by Straube et al. (2002).
7.2.2 Errors of the calculational analyses
The results of calculations never provide a complete picture of the real-life situation since the calculation principles of calculation programs have their own individual limitations and always need to be simplified in order to keep calculation from becoming too complicated and time-consuming. Real-life assemblies also are never ideal but have defects and weaknesses. Calculation accuracy also depends essentially on the correctness of fed material data (see Chs. 5 and 7.2.7) and initial moisture conditions of materials (see Ch. 5). To reduce that error potential, the key building physical properties of all materials used in the calculational analyses of this study were determined separately (see Ch. 3.3). Moreover, the accuracy of calculation depends on things like the user’s familiarity with running the program. The user must learn how to use the calculation program while

280
solving the problem at hand and how changes in different initial values affect measurement results. He must also be able to interpret correctly the results yielded by the program. Due to the factors of uncertainty related to the results of the calculation software, this study compared the results from the calculation program with the results from laboratory and field tests (see Chs. 5.2 and 5.3). The comparison showed that the results from the calculation program correspond closely enough with test results in the hygroscopic range and in situations where condensation exists for a few weeks. Thus, calculational modelling can be used to analyse the moisture performance of a wall assembly in that range. It is essential for solving the studied problem that the calculated temperature and RH conditions are on a level with the actual long-term conditions (see Figs. 5.8–5.11). Momentary fluctuations during a day, on the other hand, have little impact on the end result.
7.2.3 Errors of the condensation analysis
Condensation as a phenomenon is well known but calculation results concerning the maximum continuous condensation time or amount of condensed water may nevertheless be erroneous due to many factors. In condensation situations, for instance the following factors introduce further errors into calculation results: • material properties change and deformations occur in materials due to freezing-
thawing reactions (e.g. settling of insulations and swelling of materials), • within the assembly, near the condensing surface, humidity by volume at saturation
may fluctuate in subzero conditions between the values over ice and over liquid water (see Ch. 1.7.1),
• at under 0°C temperatures condensing moisture is not adsorbed in materials – as assumed by HAM programs – but freezes onto the surface of the sheathing (see Ch. 3.2.4),
• the water vapour resistance of the condensed surface increases as the ice layer thickens at under 0°C temperatures (Ojanen 1996; Thue et al. 1996),
• moisture may transfer into a wall assembly by gravitation or internal convection, • narrow air gaps between sheathing and thermal insulation prevent capillary moisture
transfer between the condensing surface and thermal insulation (see Ch. 3.2.4). Practice has also shown that the accuracy of calculation software compared to the real-life situation decreases when we move form the hygroscopic range to the capillary range (Geving et al. 1997c). This is the result of many contributory factors which affect the transfer of moisture in the assembly in the capillary range as well as the lack of knowledge about factors affecting moisture transfer in material pores (see Ch. 1.7.1). Calculation accuracy of software is also highly significant since condensation occurs as the moisture content of a material changes sharply as a function of relative humidity. Then

281
convergence errors may be introduced into calculations which change the moisture content of a material. That affects calculation results, especially when the moisture content is close to the limit of the hygroscopic range. Calculation errors may interrupt the condensation period or extend it beyond the actual one. On the other hand, this factor did not seem to have any major effect in general since the lengths of the condensation periods of Figures 6.4–6.7 increased fairly linearly as indoor air excess moisture increased. In the case of assemblies with thin and vapour-tight sheathings the values did, however, fluctuate more strongly. An attempt was made to eliminate the errors related to maximum continuous condensation time in this research in two different ways. Firstly, because the allowed limit value of maximum continuous condensation time of the exterior wall lining was calculated on the basis of the reference wall, with the same assumptions and the same MRY as were used to calculate the condensation time on the basis of other assemblies, any errors in condensation time would have had an impact of nearly the same magnitude on both calculation results. Thus, the ratio of the maximum continuous condensation times of the interior surfaces of the sheathing of the analysed wall and the reference wall remained much the same, even if the absolute value of the condensation time was slightly off. Consequently, the results of moisture condensation calculations described quite accurately the condensation risk inside an assembly compared to the condensation risk of the reference wall. Moreover, since the limit value for moisture condensation depended on the MRY selected for the analysis, finding just the right MRY for calculational analyses was not necessary from the viewpoint of the reliability of calculations. If the selected MRY is very critical for condensation, the maximum continuous condensation time increases more in the case of the reference wall; therefore, condensation times of equal length are permitted also for other wall assemblies. Correspondingly, in the case of a less critical MRY, the continuous condensation time of the reference wall decreases which, again, tightens the limit value set for other wall assemblies. However, it should be noted that calculation accuracy is best when the selected MRY is quite critical for moisture condensation. Secondly, because the required water vapour resistance ratio between interior and exterior wall linings seemed to change linearly as excess moisture changed in condensation risk analyses, calculational analysis using different indoor air excess moisture values increased significantly the reliability of results as well as made their analysis easier. Thereby the fluctuations caused by individual calculation results did not have as signficant an effect on the value of the required water vapour resistance ratio.

282
7.2.4 Errors of the mould growth model
The mould growth model of this study incorporates several limitations and factors of uncertaintly which increase the uncertainty of the absolute mould index value (see Ch. 2.2.4). Consequently, an effort was made in this research to eliminate any possible flaws of the mould growth model the same way as in the condensation analysis. The allowed limit value of the maximum mould index of the exterior wall lining was calculated on the basis of the reference wall, with the same assumptions and the same MRY as were used to calculate the mould index for other wall assemblies. This means that any errors in the determination of the mould index had an impact of nearly the same magnitude on both calculation results. Furthermore, since the limit value for mould growth depended on the MRY selected for analysis, finding just the right MRY for calculational analyses was not necessary from the viewpoint of their reliability. This principle means in practice that the mould index of the exterior wall lining always stays at about the same level as the mould index of outdoor air for the MRY in question. Also in this case the calculation accuracy is, however, best when the selected MRY is quite critical for mould growth. The required water vapour resistance ratio between interior and exterior wall linings seems to change linearly as excess moisture changes also in mould growth risk analyses, meaning that calculational analysis with different indoor air excess moisture values increases the reliability of the results also there. The calculation focussed on the development of the mould index on the original sawn surface of pine sapwood where the development is fastest according to the calculational model. In reality, the interior surface of sheathing is of other materials which means that the mould index typically develops more slowly on their surface (see Figs. 2.12–2.14). The maximum mould index value was also always calculated before the continuous subzero temperature period since sufficient data on the retardation of mould growth in cold temperatures are not available. The mould growth risk of vapour-tighter sheathings may actually be higher than calculated in this study since mould may start to grow in spring conditions. This is due the fact that assemblies dry more slowly then which maintains conditions favourable for mould growth for longer on the interior surface of the sheathing. This is one reason why materials impermeable to water vapour should not be used as sheathing. This study did not examine mould growth in spring conditions since the risk for it in the outdoor air conditions of spring is small, and the MRY for mould growth was selected on the basis of autumn conditions. A mould risk analysis in spring conditions would, in

283
principle, require selecting an MRY whose conditions are critical specifically in spring. On the other hand, in the case of walls with vapour-tighter sheathings, the limit value of moisture condensation chosen for the analysis was clearly the more important criterion, which probably means that it is a more critical limit value also with respect to mould growth in spring. As a matter of fact, moisture condensation is critical with these assemblies just because they dry slowly in spring conditions. In other words, springtime moisture stress on these assemblies was considered already in the moisture condensation risk analysis. It must also be noted that autumn conditions are generally a more important criterion as to indoor air excess moisture than spring conditions (see Ch. 2.3.2). This is because the walls have dried after winter and may adsorb moisture from the air as outdoor air temperature and humidity rise. Thereby indoor air excess moisture remains smaller in spring than in autumn conditions when extra moisture is still retained by assemblies after summer. The actual value of the mould index may differ from the calculated one. Yet, some studies have shown that the calculated mould index correlates quite closely with mould growth observed in test specimens (Kokko et al. 1999, Pasanen et al. 2001). This study has endeavoured to do mould index calculations so that errors in absolute mould indices would be as small as possible (see Ch. 2.2.4). Factors that increase the uncertainty of the calculation of the absolute mould index value are dealt with in the following paragraphs.
Variation in mould growth properties of materials
The mould growth model of this research was built on the basis of mould growth tests conducted on material specimens made of pine and spruce sapwood. If the mould growth properties of the materials and surfaces used in assemblies differ from the alternative used in calculations (sawn pine goods from the kiln), mould may start to grow on these materials at a quicker or slower rate depending on the situation. When the mould growth model was being contrived, it was noted that the use of spruce, or the resawing of the surface of dried sawn goods, decreases mould growth compared to the situation selected for the calculational analysis. The mould growth properties of heartwood and sapwood are also different in reality. There is not enough information yet on how mould growth on various timber- and mineral-based building materials correlates with mould growth on the surface of timber. However, in studies conducted at certain temperature and humidity conditions differences between materials have been observed (Samuelson & Blomquist 1996; Nielsen et al. 2000; Ritschkoff et al. 2000). According to the study by Ritschkoff et al. (2000) and comparison calculations based on Viitanen’s mould growth model, mould growth is generally slower on other building materials than on sawn pine goods which means that the calculation results of this study are in most cases on the safe side (see Ch. 2.2.4). Especially concrete
284
and other stone-based building materials have been found to be clearly less susceptible to mould growth than wood-based materials (Viitanen 2004). On the other hand, organic dust is quite often found on the surfaces of various materials – its susceptibility to mould growth is much like wood’s. The inherent susceptibility of materials to mould growth also varies by material properties, nutrients and age. It should also be noted that there are slight differences between the mould species growing on different materials which means that differences between the harmfulness of mould species as well as their growth rate may exist. If the goal is to limit more strongly the growth of mould species detrimental to health, mould growth on building materials favoured by those species should also be limited more. That is why the most critical alternative presented in the mould growth model was selected as the basis of calculations: the surface of sawn pine goods from the kiln.
Variation in temperature and RH conditions
The laboratory tests that serve as the basis of the mould growth model were conducted only at certain constant conditions or at variable conditions changing at certain intervals. In these conditions mould growth was monitored for a certain period of time. Mould growth under other conditions was estimated based on these tests. In reality, especially outdoor air conditions change quite rapidly which means that test specimens are subject to constantly changing temperature and RH conditions. The validity of the mould growth model under quickly changing conditions has not been sufficiently documented so far as the operation of the model under field conditions has been analysed quite little. The magnitude of the index calculated under varying conditions depends on how often the change in the mould index is calculated (see Fig. 2.11). In this study the mould index was calculated at 24-hour intervals in order to be able to eliminate the impact of momentary changes during a day. Changes in outdoor air conditions, however, were calculated at 3-hour intervals based on the measurement data. One reason for the differences between the results of mould growth analyses is also the selected excess moisture design curves where the magnitude of excess moisture varies when outdoor air temperature is over 5°C (see Fig. 2.24). A drop in outdoor air temperature below that decreases mould growth but increases excess moisture. The combined effect of these factors is slightly different in different years.
Performance of moulds under unfavourable conditions
The laboratory tests serving as the basis of the mould growth model were conducted at 5 to 45°C temperature. Tests run in dry conditions (ϕ < 75% RH) were of quite short duration (a maximum of 14 days), which means that the assessment of the retardation of mould growth based on them involves factors of uncertainty (Hukka & Viitanen 1999).

285
Mould performance at temperatures below 0°C was not analysed in the studies which form the basis of the calculation model although such temperatures occur quite commonly in Finland. For the purposes of this study it was assumed that the mould index neither rises nor falls at temperatures below 0°C. Practical experiences concerning mould growth support the view that no significant mould growth occurs in subzero temperatures. Thus, the assumption applied in the calculations, that the mould index would remain constant at temperatures below 0°C, is probably on the safe side. However, further research data on the retardation of mould growth in subzero conditions is required. In principle, it is possible that several consecutive years conducive to mould growth may result in accumulation of mould growth in an assembly. Analysis of this phenomenon does, however, require better understanding of mould performance under unfavourable conditions to make the calculation of the mould index more reliable also during the winter and spring periods.
7.2.5 Factors improving the reliability of the performance of a wall assembly
Solar radiation from other directions and during other seasons of the year
The study examined the performance of the northern wall of a building in winter conditions since it is the most critical wall from the viewpoint of the moisture performance of an assembly. The impact of solar radiation on the exterior surface resistance of the sheathing has also been taken into account. More solar radiation falls on wall surfaces facing other directions than north, which decreases the moisture content of the exterior wall section and the relative humidity of the ventilation gap (see Figs. 4.18–4.21). In addition, the impact of solar radiation is stronger in other seasons than winter. Solar radiation also improves the performance of the northern wall, for instance, in mould growth risk analyses in autumn. On the other hand, solar radiation may occasionally cause moisture transfer by diffusion from cladding wetted by driving rain towards the interior section of the assembly (see Ch. 1.7.3). Yet, since a ventilation gap is always left behind cladding in Finland, this phenomenon has not been observed to cause any harm in Finnish climatic conditions (see Ch. 4.2.4). The field measurements and calculational analyses of this study also came to the same conclusion (see Chs. 4 and 6.3.7). In general, the significance of diffusion from the outside in is the greater, the warmer and rainier the climate the building is located in. Thus, it can be stated that in Finnish climatic conditions solar radiation primarily improves the moisture performance of a timber-framed external wall assembly. The impact of other cardinal directions and seasons was not considered in the calculational analyses since the idea was to examine the performance of the assembly in the most critical situation.

286
Of course, it is possible, for instance, to design external wall assemblies facing different cardinal directions differently, but, in practice, that is too complicated and time consuming considering the needs of building physical design.
Interior finishing of the wall assembly
The minimum values presented for water vapour resistance ratios and the water vapour resistance of interior wall lining in the study can be used to design an assembly where the impact of the interior finishing is taken into account. Then, one must, however, ensure that the water vapour resistance of the finishing meets the set requirement throughout the wall, and that the finishing will remain part of the assembly and retain its properties for the entire service life of the assembly. Yet, it is often recommendable not to include the water vapour resistance of the interior finishing in the value of the water vapour resistance of the interior wall lining since the water vapour resistances of interior finishings and materials vary a lot, and it is not possible to use generally applicable values for the water vapour resistances of surface layers. The water vapour resistance of paints depends crucially on the quality of the painting, and the resistance value may change over time, for instance, as the properties or the paint change or due to its cracking. On the other hand, data on the water vapour resistances of wallpapers are insufficient. Furthermore, it must be possible to change, for instance, the wallpaper according to building occupancy and the wishes of people which makes its inclusion in design risky. Exclusion of the interior finishing from calculations adds a margin of safety to the moisture behaviour of the assembly.
Mould protection of building materials
The adding of anti-mould agents to natural fibre insulations decreases mould growth thereby adding a margin of safety to the performance of the assembly in conditions conducive to mould growth. The impact of these agents has not, however, been included in the calculational analyses of this study since there are insufficient data available on the properties and long-term effectiveness of various agents. For instance, it is unclear how long anti-mould agents remain in thermal insulations and what kinds of substances can be used in the future. Furthermore, in some products the anti-mould agent is not spread throughout the insulation. Nieminen (1987), Rose & McCaa (1998) and Salonvaara & Nieminen (1998b) observed that the boric compounds used as anti-mould agents also increase the risk of corrosion of metal fasteners and parts in the exterior section of the assembly. It must also be kept in mind that the wall assembly always contains materials that are not treated with anti-mould agents. Paajanen et al. (1994) and Ritchkoff et al. (2000) noted that the anti-mould agents of thermal insulation also reduce mould growth on the surfaces of the materials around the insulation but are not able to completely eliminate it (see Ch. 2.2.4). On the other hand, the

287
field tests by Sikander (1996) and Rose & McCaa (1998) detected mould growth on the interior surface of the sheathing although it had been installed directly against mould-protected cellulose insulation. It should also be remembered that anti-mould agents increase the reliability of the moisture performance of an assembly only as far as mould analysis is concerned. They have no influence on the moisture condensation risk which was typically a more crucial factor in this study.
7.2.6 Factors impairing the reliability of the performance of a wall assembly
Moisture leaks in assembly
If water enters the assembly due to a moisture leak (capillary or gravitational flow), it is generally much more detrimental to the performance of the assembly than diffusion. The starting point of the design of assemblies must be that such moisture leaks are prevented to the highest degree possible.
Convection through assembly from inside out
Convection flows through the external wall from the inside out bring extra moisture into the assembly, especially in autumn and winter conditions. Convection from the inside out raises the moisture content of the exterior section of the assembly as diffusion does but is often more detrimental. If convection from the inside out occurs in an assembly, the extra moisture stress from the diffusion of water vapour impairs the performance of the assembly further. Earlier an effort was made to avoid this phenomenon by building houses with negative pressure ventilation where the direction of the convection flow was from the outside in. However, this made harmful gases, such as the radon in soil, flow into the houses from outside. As a considerable share of Finnish houses are located in radon-affected areas, ventilations are nowadays designed to be balanced. As a result, houses equipped with today’s mechanical air supply and exhaust systems have overpressure in the upper sections of the rooms and underpressure in the lower sections during winter. In such conditions special attention has to be given to the airtightness of the envelope.
Internal convection
When porous thermal insulations are used, internal convection transports water vapour to the interior surface of the sheathing in the upper section of the assembly. Thus, more critical conditions are typically found there than produced by diffusion calculations excluding convection. Internal convection may also cool the exterior surface of the vapour

288
barrier in the lower section of the wall which increases moisture condensation and mould growth risk on the interior surface of the vapour barrier (Kohonen et al. 1986). Moisture condensation in the exterior wall lining increases sheathing deformations and facilitates formation of air channels through the sheathing layer which increase internal convection within the assembly as well as convection through it (Nieminen 1987) (see Ch. 2.1.3). This was an important reason for selecting the limit values of the performance criteria of this research according to the basic principle presented in Chapter 2.1.3. This research assumes that thermal insulations have been installed with enough care to prevent the formation of significant convection channels within the thermal insulation layer. The impact of internal convection may also be reduced by installing vertical convection breaks of low water vapour resistance in the thermal insulation layer (e.g. paper membranes; Kokko et al. 1997) and by using thermal insulations of low air conductivity (Nieminen 1987; Riesner et al. 2004). Riesner et al. (2004) found that air permeability of thermal insulation ka ≤ 10 ×10-10 m2 prevents the moisture damage risk to the wall assembly from internal convection. That figure corresponds to air conductivity κa ≤ 60 ×10-6 m3/(m⋅s⋅Pa) calculated by Equation 1.15 when dynamic viscosity of air ηa = 0.017 ×10⁻³ N⋅s/m2. Yet, in practice, there are always some convection channels within the thermal insulation layer which is why some internal convection occurs also there. Where necessary, the impact of internal convection should be considered separately in calculations.
Construction-time moisture
During and immediately after construction the conditions for wall assemblies may be considerably more critical for mould growth and water vapour condensation than during occupation. Especially the moisture contents of wet timber and wet-blown cellulose insulation may differ considerably from equilibrium moisture contents. If building materials get severely wetted during construction, a timber-framed wall assembly will suffer moisture damage independent of the materials used. However, the impact of construction-time moisture was not considered in this research since the construction period is relatively short and construction-time moisture stress can be significantly reduced by proper protection of materials and heating and ventilation of the building.
289
7.2.7 Factors improving and impairing the reliability of the performance of a wall assembly
Convection through assembly from outside in
Convection through the external wall assembly from the outside in may dry the assembly if the convection flow is high enough (Stewart 1998). In real conditions, convection from the outside in does not, however, have any major impact on the moisture contents of wall materials (Vinha & Käkelä 1999). Nevertheless, convection from the outside in does prevent indoor air moisture from entering assemblies through holes and gaps in the air barrier. On the other hand, convection from the outside in may transport dirt, dust, mould spores and odour from assemblies into room air (Airaksinen 2003a) thereby detrimentally affecting the occupants’ comfort and, possibly, also their health. Convection from the outside in may also cool the exterior side of the air/vapour barrier if the sheathing and thermal insulations are installed carelessly. This, again, increases mould growth and moisture condensation risk on the interior surface of the air/vapour barrier.
Variation in material properties
Building physical material properties may vary due to many different reasons such as variations in raw material and manufacturing processes, material storage, installation and handling, changes in temperature and moisture conditions and changes in properties over time due to various factors (e.g. mechanical stress, loads, moisture, carbon dioxide, salts, dirt, dust and heat radiation). Variation in material properties can improve or impair the moisture performance of a wall assembly remarkably (see Ch. 2.4.1). Therefore, these material properties have to be determined relatively accurately. The latest HAM programs allow feeding increasingly detailed material properties, but certain simplifications are still necessary. For example, WUFI-2D cannot deal with the hysteresis of the sorption curve or material properties as a function of temperature. An exception is the water vapour diffusion coefficient of stagnant air which changes as a function of temperature (see Eq. 1.37). On the other hand, the comparison calculations of Chapter 5 show that calculation results do not necessarily change significantly even if the detailedness of the material properties fed into programs varies. Geving (1997a) noticed this same phenomenon. Moreover, one must keep in mind that some material data affect calculation results more than the rest (Geving 1997a). Thermal conductivity values measured at 10°C were used in calculations because the average temperature of the whole wall assembly is quite near this value between

290
September and April in Finland. On the other hand, the calculations used μ-values measured at 23°C since the sorption curves and water absorption coefficients, Aw, were also determined near that temperature. Moreover, the uncertainty of measurement of μ-values determined at lower temperatures is also greater since the difference in the humidity by volume over the material specimen was lower due to lower humidity by volume at saturation (see Ch. 1.7.1). The material values of this study were defined as a function of relative humidity in order that the error from the change in RH would be as small as possible. Material tests were conducted with several test specimens (3/test condition) in order to reduce the uncertainty from variation in material properties. The aim was to run the tests in accordance with valid standards as far as possible or to use a more accurate method. The deviations in test results were for the most part quite small which was considered to justify using the mean of test results as a sufficiently accurate value of the building physical property of each material. Moreover, use of the regression method to determine water vapour resistance values as a function of relative humidity improved the accuracy of each material property in most cases (Mikkilä 2001). Received test results were also compared to the material properties yielded by other studies, and they were found to correspond quite closely to earlier measured results (Vinha et al. 2002b; Vinha et al. 2005b). In this research, the biggest difference between the results of the WUFI-2D program and measurements occurred in the speed of change of the moisture content of hygroscopic materials. In reality, hygroscopic thermal insulations and sheathings react quicker to changes in moisture conditions than in the calculation program (see Chs. 5.3 and 5.4). Thus, conditions critical for moisture condensation and mould growth are attained slightly faster than calculated in hygroscopic materials, but, on the other hand, these materials also dry faster. One reason for the above mentioned phenomenon could have been the differences between actual and measured material properties – especially the water absorption coefficient value, Aw. It must be noted that the moisture properties of materials are actually porosity-related and that changes in pore size distribution have a major impact especially on capillarity. It is also possible that Equation 1.53, used to convert the measured water absorption coefficient value into the liquid moisture diffusivity value, Dw,liq, is not usable in the analysis of hygroscopic wood-based materials. Internal convection within the test assembly is also a factor that can affect test results to some extent.
Annual variation in outdoor air conditions
Outdoor air moisture reference years (MRYs) were selected so that only 10% of the years, on average, were more critical for moisture condensation or mould growth in the assembly than the MRY. Consequently, temperature and RH conditions more favourable than the

291
MRY’s improved the performance of the assembly while more critical conditions impaired it (see Ch. 6.3.4). The design of assemblies had to, however, always be based on an analysis of moisture performance under critical conditions. In practice, the selected MRY did not necessarily correspond exactly to 10% criticality since the properties of the examined assembly also had an impact (see Figs. 2.8 and 2.17).
Climatic variation between different localities
Safety against moisture condensation and mould growth in timber-framed external walls varies across Finland. It is somewhat higher than in the case of the 10% level MRY in relation to condensation risk in southern Finland and somewhat lower in northern Finland. The situation is the opposite with mould growth risk. This type of climatic variation always occurs when analysing a geographical area larger than one locality as a single climatic region.
Variation in exterior surface resistance of sheathing
The exterior surface resistance of the sheathing may in reality be higher or lower than the 0.04 m2·K/W selected for the research (see Figs. 4.17 and 4.18). When surface resistance is higher, it raises the temperature of the interior surface of the sheathing thereby improving the moisture performance of the assembly. A lower surface resistance correspondingly impairs it (see Ch. 6.3.5). The importance of exterior surface resistance decreases as the thermal resistance of sheathing increases (see Figs. 6.14 and 6.15). The selected surface resistance value is based on the measurement results for the most critical cardinal direction (north). It is feasible when there is a ventilation gap in contact with outdoor air behind the cladding. The value is quite small, and, therefore, the actual average surface resistance is typically higher in brick-clad walls, and in autumn conditions also in wood-clad walls. In the case of brick-clad walls this value improves the reliability of the moisture performance to some extent in exceptional driving rain and wind conditions, especially in coastal areas (see Ch. 4.2.4). Larger surface resistance values, on the other hand, are possible in other cardinal directions where solar radiation increases the temperature in the ventilation gap compared to outdoor air. The exterior surface resistance value of this study considered the effects of air flow rate in the ventilation gap, long-wave heat radiation, solar radiation, surface undercooling and thermal properties of the cladding. Thus, changes in them have an impact on the surface resistance value. Surface resistance also varies in the vertical direction of the wall, being typically lowest in the lower section of the assembly and highest in the upper section. As the air flow rate decreases, the exterior surface resistance of the sheathing and the temperature in the ventilation gap increase. As the air flow rate increases the effect is the

292
opposite. Different kinds of blockages and structural obstructions typically decrease the air flow rate (see Ch. 4.1) while, for instance, wind and solar radiation increase it. In practice, however, solar radiation increases the exterior surface resistance of the sheathing since the heat radiation falling on the surface is a much more significant factor that the increased air flow due to the increase in temperature. It must also be noted that although the decrease in air flow rate increases the exterior surface resistance of the sheathing, the air flow rate should not be intentionally lowered as it impairs the drying of the assembly. Surface undercooling, again, lowers the exterior surface resistance of the sheathing. This phenomenon is typically strongest when outdoor air temperature is low because low temperature usually occurs when the sky is clear in winter. Therefore, the effect of surface undercooling can be more remarkable in years critical for moisture condensation risk analysis. On the other hand, if the cladding has high thermal diffusivity, it retards drastic changes in ventilation gap temperatures.
Variation in excess moisture
In this study excess moisture was assumed to change along with outdoor air temperature according to the design curves presented in Fig. 2.24. In reality, there is variation in excess moisture that, depending on the case, either improves or impairs the performance of an assembly. Nevertheless, if the suitable excess moisture values of Figure 2.24 are used in designing assemblies, the actual excess moisture will generally be lower than the design value. Then, smaller excess moisture of indoor air will improve the moisture performance of wall assemblies.
7.2.8 Summary of the factors of uncertainty related to the review of the research results
Many factors related to boundary conditions and the assembly and materials affect the values derived from the research and increase their uncertainty. Therefore, it is of utmost importance that analyses of wall assemblies consider the impact of all factors essential from the viewpoint of the moisture performance of the assembly. The factors affecting the moisture performance of a wall assembly used in calculational analyses are to be selected so that the chosen value or condition covers most of the situations and stresses the assembly is subjected to. That provides more assurance that the wall assemblies function reliably under any conditions. Many of the following selections made for the calculational analyses of this study improve the performance reliability of the assembly compared to the average situation: • Outdoor air conditions were selected so that only 10% of the years are more critical
for the moisture performance of the assembly than the MRYs.

293
• Solar radiation was not included in the weather data, meaning that its favourable effects was not considered in the moisture performance of the wall assembly. Thus, the examined assembly corresponded to the shaded northern wall of a building.
• The value used for exterior surface resistance was 0.04 m2⋅K/W, which is smaller than the average value for brick-clad walls. In autumn conditions it is also smaller than the average value of wood-clad walls.
• The insulation layer thickness of the assembly was selected to represent a critical case and to meet today’s thermal insulation regulations in Finland.
• The mould-growth limiting effect of any possible anti-mould agents added to building materials was not considered.
• The calculations analysed the development of the mould index on original sawn surface of pine sapwood which provides the most critical mould index value for them.
• The moisture performance of wall assemblies was always examined at the most critical points depending on the case.
• In the mould growth risk analysis of the interior wall lining in winter conditions, interior air temperature was selected so that only one house of the sample of 94 houses had a lower temperature. In that case the selected value probably represented a level which was more critical than the 10% critical level of actually occurring indoor temperatures in Finland.
• Critical excess moisture values were used as indoor air conditions. Since indoor air excess moisture was selected as a variable for the study, the wall assemblies can, if necessary, be designed for a higher excess moisture than the measured 10% critical level.
The following measures were taken in this research to eliminate any possible flaws of the maximum continuous condensation time and mould growth analyses: • The allowed limit values of maximum continuous condensation time and maximum
mould index of the exterior wall lining were calculated on the basis of the reference wall, with the same assumptions and MRYs as were used to calculate the continuous condensation time and mould index of other assemblies, which means that any errors in moisture condensation and mould growth had an impact of nearly the same magnitude on both calculation results. Furthermore, since the limit values for moisture condensation and mould growth depend on the MRYs selected for the analysis, finding just the right MRYs is not necessary for the reliability of calculation.
• The required water vapour resistance ratio between interior and exterior wall linings seems to change linearly as excess moisture changes in both moisture condensation risk and mould growth risk analyses which means that calculational analyses with

294
different indoor air excess moisture values increase the reliability of the results in both cases.
• The maximum mould index value was always calculated before the start of the continuous period of subzero temperature since sufficient data on the retardation of mould growth in cold temperatures are not available.
It must also be remembered that the results from the used WUFI-2D program were compared to the results of laboratory and field test measurements. This benchmarking showed that the WUFI-2D program can be used to analyse the moisture performance of wall assemblies. Important factors of uncertainty are the internal convection of the assembly and variation in material properties. Internal convection may concentrate moisture loading in the upper sections of the assembly and cool the interior lining of the lower section of the assembly, while also causing variation in material properties. Variation in material properties can either improve or impair the performance of an assembly depending on the situation. The effects of these factors can be considered, for instance, by increasing the water vapour resistance of the interior wall lining above the minimum value. The effect of the wall assembly’s internal convection can also be reduced by building vertical convection breaks in the upper section of the assembly and by using thermal insulations of low air conductivity. Part of the factors that impair the performance of the assembly are related to other moisture performance phenomena and modes of moisture transfer than diffusion (convection flow through assembly from the inside out, capillary and gravitational transport of moisture and construction-time moisture). The assembly must always be protected against the detrimental effects of these factors which is why they were excluded from this study.
7.3 Maximum water vapour resistance of sheathing
The Finnish Building Code, RakMK C2 (1998), states that the water vapour resistance of the sheathing must be low enough to allow the water transported from the inside, construction-time moisture and occasional moisture loads to dry without causing damage. The issue of the proper maximum value of water vapour resistance is not addressed here. Maximum water vapour resistance values recommended by various studies are compiled in Table 1.9. It has already several times been noted also in connection with this research that to ensure the drying capacity of a timber-frame external wall assembly, the water vapour resistance of the sheathing must be sufficiently low (see Chs. 3.2.4, 6.4 and 7.2.4). Thus, there is good reason to set a maximum value for that resistance. Yet, determining the correct maximum value is difficult since the moisture performance of the external wall assembly is

295
not dependent solely on the water vapour resistance of the sheathing (see Fig. 6.18). In this study, 5 ×10³ s/m was selected as the maximum value for the water vapour resistance of a thin thermally non-insulating sheathing since with a higher resistance the maximum continuous condensation time on the interior surface of the sheathing started to increase rapidly (see Fig. 2.7). The calculations of Chapter 6, however, show that the water vapour resistance of the sheathing can be made even much higher, if the thermal resistance and/or moisture capacity of the sheathing are increased simultaneously. The properties of the used thermal insulation also affect the acceptable water vapour resistance value of the sheathing. That is the case, especially when the performance of the assembly is examined from the viewpoint of water vapour diffusion. In practice, maximum water vapour resistance should be determined on the basis of how quickly the assembly dries after occasional moisture leaks. That is also a challenging task since it is difficult to assess the extent of a moisture leak that the assembly should be able to suffer without major damage. Plywood and OSB boards, which are typically used as sheathings in North America, are substantially denser than most typical Finnish sheathing materials. The denser sheathings in North America make the assemblies into sandwich-type structures. The risks for these assemblies are primarily related to moisture leakage situations. Practical experience from them has been gained, for instance, in the Vancouver area where timber-framed external wall assemblies have suffered extensively from moisture damage. The damage resulted partly from poorly implemented joints and details, which allowed moisture to enter the assemblies, and partly from too tight exterior surfaces (plywood, OSB board or some other kind of vapour-tight sheathing), which have prevented assembly moisture from evaporating to outdoor air (Merrill & TenWolde 1989; Tsongas & Olson 1995b; Lawton 1999; Rousseau 1999; Kayll 2001; Chouinard & Lawton 2001; Desjarlais et al. 2001; Hazleden & Morris 2001; Beaulieu et al. 2002; Lawton 2004). Often, these assemblies have also lacked a ventilation gap behind the cladding. Tests on assemblies that model a moisture damage situation found that it mattered little whether 25 mm wood fibreboard or 9 mm spruce plywood + 25 mm glass wool board was used for sheathing. In both cases, the assemblies dried nearly as fast (see Fig. 3.19). On the other hand, 4.8 mm wood hardboard by itself was too dense from the viewpoint of drying (see Fig. 3.17), even though its water vapour resistance was slightly lower (14.0 ×10³ s/m) than the combined water vapour resistance of 9 mm spruce plywood + 25 mm glass wool board (15.5 ×10³ s/m). Based on these tests, plywood with extra insulation on the exterior surface can perform satisfactorily as a sheathing even in situations where occasional moisture leaks occur. Further tests are, however, required since this study dealt with only a few instances of moisture leaks.

296
Based on the results of this study, the recommended maximum value for water vapour resistance of the sheathing is in the 5–20 ×103 s/m range depending on its thermal resistance and moisture capacity. Then, the water vapour resistance ratio between the interior and exterior wall linings can also be used as a design criterion for assemblies.
7.4 Minimum water vapour resistance of interior wall lining
Present U.S. and Canadian building codes stipulate minimum values for the water vapour resistance of the vapour barrier of an external wall assembly (see Ch. 1.7.2). No such values are stipulated in Finland. There is, however, good reason to set such values in order to make the water vapour resistance of all assemblies meet at least a certain minimum level. Thue et al. (1996), among others, have also stated it is necessary to set a minimum value also for the water vapour resistance of the interior wall lining in addition to the water vapour resistance ratio between the interior and exterior wall linings. Bomberg and Onysko (2002b), among others, have discovered on the basis of other studies that a water vapour resistance of 36.6 to 73.3 ×10³ s/m (5 to 10 ×109 m2·s·Pa/kg) is sufficient in most countries. The calculational analyses of Chapter 6 show that the water vapour resistance between interior and exterior wall linings may be very low with some assemblies, even though indoor air excess moisture is high. On that basis, the water vapour resistance of the interior surface of the assembly could be made very low (see Table 6.3). Nevertheless, roof and wall assemblies permeable to water vapour have been found to lower the relative humidity of indoor air (see Ch. 1.7.3) which means that they add to the problems caused by dry indoor air in winter. This is one important reason why it is beneficial to set a minimum value for the water vapour resistance of the interior wall lining even if the moisture performance of the assembly itself is flawless. In practice, the minimum water vapour resistance of the moisture-permeable interior wall lining of Finnish one-family and row houses is about 10 ×103 s/m, being the combination of the water vapour resistances of the gypsum board, the air barrier paper and the wallpaper. Often the water vapour resistance may be clearly higher than that depending on the interior finishing. Since field measurements on timber-framed one-family and row houses indicated that houses with moisture-permeable wall assemblies have lower indoor air humidity by volume in winter (Kalamees et al. 2004a), the minimum water vapour resistance of the interior wall lining should be set higher than 10 ×103 s/m. The typical moisture-permeable assemblies used in Finland incorporate a sheathing of 12 mm or 25 mm wood fibreboard and cellulose thermal insulation. According to Table 6.3, the water vapour resistance of the interior surface of such assemblies should be about 40 ×103 s/m, if indoor air excess moisture is 5 g/m3. This could be a good choice for the

297
minimum value of the water vapour resistance of the interior wall lining until more detailed research results become available.
7.5 Need of safety factors or safety margins in building physical design
Safety factors are not generally used today in the building physical design of assemblies which stresses the need for design analyses in critical situations. It is generally assumed that building physical design without safety factors is feasible since occasional exceedance of design conditions is not as dangerous from the viewpoint of assembly performance as, for example, in the loading analyses of assemblies. The situation is analogous to, for instance, the making of bending analyses of assemblies where safety factors are not used either but the design strengths of serviceability limit state are relied on. On the other hand, the use of safety factors is also problematic in many cases because an assembly may perform differently under different conditions. Typical such situations occur when the direction of the moisture flow in the assembly changes: diffusion, convection or capillary transport from the outside in as a result of moisture stress due to driving rain, cooling of the interior space or not heating it, or when the building is located in warmer and more humid climate (see Ch. 1.7.3). If a safety factor is used in designing the water vapour resistance of the interior surface of the assembly in the case of water vapour transport from the inside out, it correspondingly impairs the performance of the assembly when the direction is the opposite. The selection of the layers of the assembly then requires a compromise solution where the goal is to design the best possible assembly from the viewpoint of overall performance. In instances where the performance of the assembly does not change in different situations or seasons, a safety factor can be introduced to the design of the moisture performance of an assembly. One such instance is, for example, the water vapour transport from the inside out in a heated residential building in Finnish climate examined in this study. There the water vapour resistance of the interior wall lining, for instance, can be increased above the minimum level without any detrimental consequences. Then we are speaking of a safety margin. Yet, it should be remembered that after a certain limit, increased water vapour resistance of the interior wall lining no longer has a significant effect on the moisture performance of the assembly from the viewpoint of diffusion. If extra security is sought by increasing indoor air excess moisture in a design situation, the performance of the interior wall lining must also be considered if the air/vapour barrier is recessed 50 mm into the thermal insulation. A safety factor or safety margin may be used to eliminate the remaining factors of uncertainty related to analyses, for instance, with respect to used material properties, internal convection within the assembly, and the fact that even critical conditions do not

298
cover all cases. The last mentioned issue will be an increasingly important contributing factor in the future since different kinds of extreme conditions will probably occur more frequently as a result of the climate change. When using the steady-state calculation method presented in EN ISO 13788 (2001) standard, it is suggested that indoor air excess moisture be multiplied by a safety factor of 1.1, or the relative humidity of indoor air should by increased by 5% RH. That safety factor considers mainly the inaccuracies of the calculation method (see Ch. 2.1.1). It does not take into account the performance of the occupants which can have a significant effect on ventilation. Chapter 7.2.8 demonstrated that increasing the water vapour resistance of the interior lining can improve the reliability of the moisture performance of the assembly enabling the assembly to cope better, for instance, with internal convection. In principle, the reliability of the performance of the assembly can also be improved by taking measures that deal with, for instance, the convection through it. Then we are talking about designing the assembly to withstand combined moisture stresses. This issue has earlier been discussed by, for instance, Swinton & Mitalas (1990), TenWolde & Rose (1996) and (Riesner et al. 2004). The problem with analyses of convection through assemblies – as well as analyses of other problems due to construction defects – is to know the kind of defect one should make allowance for in design. Moreover, convection causes moisture problems in the assembly that are more localised than ones caused by diffusion. Therefore, measures taken to prevent excess diffusion do not necessarily eliminate the effects of convection (e.g. increasing the water vapour resistance of interior lining does not improve the performance of the assembly vis-à-vis convection through a hole in the vapour barrier). On the other hand, the harmful effects of internal convection can be eliminated better by increasing the water vapour resistance of the assembly’s internal lining (Riesner et al. 2004). As previously found, elimination of the convection through a timber-framed external wall by the right material selections and careful work is of utmost importance. There are many different ways of doing that in practise (Korpi et al. 2004). The detrimental effects of convection may be reduced by the same material properties of sheathing and thermal insulation that improve the performance of the assembly with respect to diffusion (see Table 6.2). The use of safety factors in the loading analyses of assemblies typically increases construction costs, for instance, through higher material inputs, larger space reservations and heavier installation equipment. That problem does not generally exist in building physical analyses since extra safety can easily be provided just by changing material properties: e.g. using a tighter vapour barrier behind the interior board does not increase construction costs.

299
In summation it may be stated that in building physical analyses the hygrothermal performance of assemblies and materials under different conditions must be known. In situations where incorporation of extra safety into the assembly does not cause any problems in relation to its performance, extra safety can be used to improve the moisture performance of the assembly. Then it is also justified since several factors of uncertainty generally affect the performance of assemblies. Real-life situations also occur which are even more critical for the hygrothermal performance of the assembly than the design conditions (see Ch. 7.2.8).
7.6 Application of the research results to other climatic conditions and envelope assemblies
The calculation model and principle of selecting the MRY presented in this research can be used, as applicable, also in other countries in analysing the moisture performance of timber-framed external wall assemblies. A representative sample of outdoor air conditions from among the localities of each country is to be selected for calculational analyses. If the differences in conditions in various parts of a country are large, different MRYs must be selected for different areas. The method of selecting two different outdoor air MRYs for moisture condensation and mould growth developed in this study has already been used to conduct similar analyses in Estonian climatic conditions. It was observed that there the value of the outdoor air mould index was somewhat higher in the reference year than in Finland (Kalamees & Vinha 2004b). This was expected since the average outdoor air temperature is slightly higher in Estonia than in Finland while relative humidity is about the same. In warmer countries, where the direction of water vapour diffusion in a wall assembly may change with seasons, it is important that the moisture performance of an assembly is analysed with respect to both exterior and interior wall linings. The analysis requires using several different MRYs selected according to the critical conditions of each case. The analysis may be based on the principles applied in this study (see Chs. 2.2.5 and 6.3.7). Examination of the interior surface of the wall increases in importance also in Finland when the building is unheated or heated intermittently. The basic assumption of the calculation model presented in this study is that the assembly always has a functioning ventilation gap behind the cladding. If the ventilation gap of the assembly functions poorly or is missing, the moisture transferring through the cladding by capillary and gravitational action must always be taken into account in the analysis of the assembly’s moisture performance along with the effect of solar radiation. The sandwich-type assembly is a typical example of such an assembly. In practice, analysis of such assemblies is much more complicated.

300
If the external wall assembly comprises several layers where water may condense or mould growth occur, the performance of each interface between layers must always be examined separately. A typical assembly of this type in Finland is the sawdust-insulated wall whose U-value is improved by extra insulation on the inside. In its case, the limit values of the performance criteria to be set for the assembly at each point are also to be defined. The limit values of the method presented in this study get linearly tighter as we move towards the interior surface of the assembly (see Ch. 2.1.3). The analysis method used in this study may also be used in analysing the moisture performance of wall assemblies in multi-storey buildings. However, in apartment blocks indoor air excess moisture can be higher than in one-family and row houses, which must be considered in calculational analyses. Kalamees (2006a) found that the design value for indoor air excess moisture in apartments should be 6 g/m3 in winter conditions based on the design curves of Figure 2.24. The principles of the calculation model may sometimes also be applied to wooden roof and base floor assemblies. It must, however, be preceded by more detailed study of the conditions in the ventilation gap and crawl space since the temperature and moisture conditions there differ much more from outdoor air conditions that those of the ventilation gap of a northern external wall. The ventilation of the roof assembly and crawl space is often poor which increases the relative humidity of air. This is due the fact that thermic convection does not circulate air in horizontal, low ventilation spaces as effectively as in vertical wall assemblies. Additional variables in the case of roof assemblies are stronger solar radiation in daytime and surface undercooling at night. The conditions of the crawl space, again, are affected essentially by the moisture and temperature of the soil. In practice, the above-mentioned factors make the conditions in the roof assembly and crawl space generally more critical than outdoor air conditions. Then, transfer of extra moisture from indoors into the assembly increases the risk of moisture condensation and mould growth. For these reasons, and in the absence of more detailed researched data, a higher minimum water vapour resistance value should be used for the interior lining in the design of roof and base floor assemblies than with wall assemblies. RIL 107 (2000) suggests 110 ×103 s/m (15 ×109 m2·s·Pa/kg) for roof assemblies. Also, in high radon emission areas, base floor assemblies should always be designed so as to prevent radon from entering buildings. A base floor with a crawl space underneath must then have plastic foil on the upper surface of the assembly. Application of the analysis method to assemblies other than timber-framed ones must always be considered case by case. The reason is that this calculation model used for mould growth risk analysis of assemblies is based on mould growth tests on wood materials while mould growth on, for instance, stone-based materials is different. The capillarity and high moisture capacity of stone-based materials also alter the calculational

301
analysis significantly. In principle, moisture condensation of longer duration may be allowed in the case of stone-based materials since moisture does not damage them as easily. In many cases it is also necessary to set other performance criteria for assemblies built of other materials which are more crucial from the viewpoint of the moisture performance of the assembly (e.g. corrosion risk of metal parts or cracking of cladding surface) (see Ch. 2.1.1).
7.7 Suggested further research
During the study various research and development needs relating to the hygrothermal performance of envelope assemblies emerged. The following measures are suggested: Comprehensive design guidelines for the moisture performance of timber-framed wall assemblies in Finnish climatic conditions should be drawn up on the basis of the analysis method developed during this study. The moisture reference years for mould growth and condensation risk analyses concerning the climatic conditions of other countries are to be determined separately for each country. In countries with a warm and humid climate, critical situations do occur also on the interior lining of the assembly which must be analysed since the direction of the diffusion flow within the assembly may change daily and seasonally. Moreover, a new suitable exterior surface resistance value of sheathing has to be determined in these conditions. If a country has several regions of clearly distinct climatic conditions, they must be examined separately. The moisture performance of timber-framed wall assemblies in unheated or intermittently heated buildings requires further study. Information is needed especially about how indoor air conditions vary as outdoor air conditions change. The critical performance criteria and limit values for other types of envelope assemblies than timber-framed ones need a lot of more research. As concerns mould growth, more results of comparisons between the mould growth model and natural mould growth are needed. More information about mould growth on materials other than wood is also needed. That will allow more reliable evaluation of the correctness of the absolute mould index values compared to reality and selecting mould growth limit values for assemblies built of different types of materials. Closer examination of diffusion in roof and base floor assemblies requires analysing the temperature and moisture conditions of the ventilation/crawl space and factors affecting them in different conditions through a broad field study. Then, it will be possible to create more accurate reference boundary conditions also for roof and base floor assemblies.

302
Application of this method and limit values to the analysis of old layered assemblies, which contain several critical points from the viewpoint of condensation and mould growth, also requires further research. Comparison of the results of tests and calculations showed that there are differences between the results of calculation programs and measurements despite the determination of the used material properties in connection with the study. Narrowing these differences requires detailed analysis focussing on the determination of material properities and the factors of uncertainty and problem areas related to the modelling of assemblies. More accurate determination of the maximum water vapour resistance of sheathing requires tests where the drying capacity of wall assemblies is examined after occasional moisture leaks. The impact of thermal insulation installed on the exterior side of a quite vapour-tight sheathing on the drying capacity of a wall assembly after moisture leaks should also be studied further. The hygrothermal performance of plywood as a sheathing material also needs to be analysed more to make the results of calculations and tests more comparable. Determining a more accurate minimum value for the water vapour resistance of the interior wall lining requires analysing the change in relative humidity within buildings whose envelope is permeable to water vapour. The most accurate data available on the water vapour resistances of the interior surface of building envelopes are also needed. More information about the effects of construction-time moisture stresses on the moisture performance of timber-framed envelope assemblies is required in order that construction companies may be provided more detailed instructions for the protection and use of building materials and construction site moisture control. Despite the best efforts to prevent convection through the assembly, some air will leak through it anyway. Therefore, further information about the moisture performance of timber-framed external wall assemblies is needed.

303
8 CONCLUSIONS
This study analysed the hygrothermal performance of timber-framed external wall assemblies in heated residential buildings in Finnish climatic conditions. It examined the impact of the water vapour transported by diffusion from indoor air into external wall assemblies. All central building physical research methods were used in the examination of the moisture performance of external wall assemblies: field tests, laboratory tests and calculational analyses. That was necessary for forming a reliable conception of the moisture performance of different wall assemblies under various conditions. A new method for determining the sufficient water vapour resistance of the interior lining of a wall assembly was created on the basis of conducted tests and calculational analyses. The method was used to determine the sufficient water vapour resistance of the interior lining of different types of timber-framed exterior wall assemblies and the minimum water vapour resistance ratio values between the interior and exterior wall linings required in Finnish climatic conditions. In addition, the significance of various structural factors to the moisture performance of timber-framed external wall assemblies was studied. The laboratory tests conducted as part of the study divided into material tests and wall assembly tests. Material tests determined the building physical properties of materials as a function of temperature and relative humidity. The aim of material tests was to determine the extent to which the properties of various materials vary as temperature and moisture conditions change thereby providing more widely applicable material properties for calculational analysis of assemblies. The goal of the wall assembly tests was to verify in practice the performanceal differences between different types of assemblies under different conditions and to produce reference material from controlled conditions for calculational analyses. Extensive field tests were conducted on the indoor air temperature and moisture conditions of Finnish timber-framed one-family and row houses and changes in them. The outdoor air temperatures and relative humidities measured by the Finnish Meteorological Institute in four different Finnish localities may also be considered research data from field tests. As to assemblies, the performance of assemblies permeable and non-permeable to water vapour was studied in a one-family house. The temperature and moisture conditions of the ventilation gap were studied in the same one-family house and in TUT test houses. Calculational analyses were made to compare the results of different calculation programs with those from field measurements, and the results of the analyses were used to select the program to be used in the study. Finally, the moisture performance of various wall assemblies was studied under the temperature and moisture conditions of the MRYs at different excess moisture values.

304
A brief summary of the principles of the new analysis method is provided below. The method was used to determine four factors contributing essentially to the acceptability of timber-framed external wall assemblies during the service life of the building. These contributory factors are: (1) the performance criteria and limit values set for the wall assembly’s moisture performance, (2) the outdoor air conditions, (3) the indoor air conditions and (4) the selected wall assembly and its materials. The method also includes the calculation principles for conducting the analysis. Performance criteria and limit values • Moisture condensation and mould growth were selected as performance criteria for
moisture performance. • The limit values for acceptable performance of the external wall assembly were set
according to the following principle: The temperature and relative humidity conditions of the exterior wall lining must not be more critical than those of the exterior wall lining of the most critical but still acceptable wall assembly (reference wall), where those conditions are caused solely by outdoor air conditions. In addition, the temperature and relative humidity conditions of the interior wall lining must not be more critical than those of indoor air.
• For the part of the wall between these linings, the limit value of the performance criterion may be considered to change linearly between the limit values set for the exterior and interior wall linings.
• The limit value variables used in analysing moisture performance are maximum continuous condensation time, tmax, in the case of moisture condensation analysis, and maximum mould index, Mmax, in the case of mould growth analysis. In this study the maximum continuous condensation time of exterior wall lining was 34 days and that of interior wall lining 0 days. The maximum mould index for the exterior wall lining was 1.96 and < 1 for the interior wall lining.
• Since the selected limit values depend on the outdoor air conditions of the survey location, they change from country to country. The limit values are determined by the same calculational analyses used to examine the different wall assemblies themselves. Thus, any possible errors of the calculation methods have the same effect on both the determination of limit values and the calculation results of various wall assemblies. That improves essentially the accuracy of this analysis method.
Outdoor air conditions • Several localities of the surveyed climatic area, which represent the conditions of that
area and changes in them as well as possible, are selected for the analysis. • Measured temperature and relative humidity values for the selected localities over a
30 year period are collected for analysis. On the basis of conducted field tests, those

305
weather data are sufficient for determining the critical year, if there is a well functioning ventilation gap behind the cladding of the wall assembly. Then, solar radiation and driving rain do not affect essentially the moisture performance of the wall assembly behind the ventilation gap.
• Two MRYs are selected from among the weather data: one for moisture condensation and another for mould growth analyses.
• Each observed year begins on 1 July and ends on 30 June the next year. That period is most suitable for analysing the moisture performance of an exterior wall lining because the risk for moisture condensation and mould growth is typically low in summer and starts to increase thereafter.
• The MRY critical for moisture condensation in the exterior lining of a wall assembly is determined on the basis of the average excess moisture of outdoor air, which is calculated as a moving average over a period of one month (30 days).
• The MRY critical for mould growth in the exterior lining of a wall assembly is determined by a calculational mould growth model developed earlier at VTT Finland.
• The mould index that depicts mould growth risk in the mould growth model is calculated at 24-hour intervals to make the calculated mould growth correspond more closely to the real situation. The mould index varies between 0 and 6. The value 0 means no mould growth on a material surface while the value 6 means a surface completely covered by mould.
• The level of mould growth risk in different years is assessed before the beginning of the continuous period of subzero temperature since test data on subzero conditions was not available during the development of the model.
• The MRY corresponding to both performance criteria is selected so that only 10% of the observed years are more critical with respect to the subject of analysis.
• The exterior surface resistance of the assembly (exterior surface of the sheathing) used in calculations is 0.04 m2K/W, despite the fact that assemblies always have a ventilation gap behind the cladding.
• The moisture performance of a non-permeable vapour barrier in the interior lining of an assembly is examined separately. Two outdoor air MRYs which are critical for mould growth in the interior lining of a wall assembly are also selected. The conditions of the exterior surface of the vapour barrier in summer are analysed by selecting the MRY on the basis of average water vapour content. The conditions of the interior surface of the vapour barrier in winter are analysed by selecting the MRY on the basis of average outdoor air temperature; in summer the same MRY is used as in the analysis of the exterior surface of the vapour barrier. When summer conditions are analysed, the MRY begins, in deviation from the other cases, on 1 January and ends on 31 December. In both cases average conditions are calculated over a period of 3 months (90 days) since mould growth requires longer exposure. The analyses

306
use the same mould growth model as is used to analyse the conditions of the exterior surface of the assembly.
• Both MRYs for the analysis of the interior wall lining are selected so that only 10% of the years are more critical in respect of the analysed issue.
Indoor air conditions • The indoor air temperature is selected to correspond to the typical indoor air
temperature in autumn and winter conditions. Indoor air temperature is constant in calculational analyses of moisture performance of exterior wall lining. In this study it was 21°C.
• In the mould growth risk analysis of the interior wall lining a lower temperature is also used for indoor air temperature – one that corresponds to at least the 10% critical level of actually occurring indoor temperatures. This must be done since fluctuations in indoor temperature have a major effect on test results in the analysis of interior wall linings.
• The critical moisture conditions of indoor air are selected on the basis of a more accurate set of excess moisture curves based on measurements from 101 one-family and row houses in Finland.
• The design values of indoor excess moisture have been determined so that in only 10% of the cases indoor air excess moisture is higher. In normal conditions, the design value of excess moisture in winter conditions is thus 4 g/m3. When humidification is used or the number of occupants is large, the design value is 5 g/m3.
• Calculational analyses are based on different indoor air excess moisture values whereby the effect of calculation errors of individual calculations diminishes. In this study excess moisture fluctuated between 0 and 8 g/m3.
Wall assembly solution and used materials • Calculational analyses target the most critical point with respect to the hygrothermal
performance of the assembly. In the exterior wall lining that point is on the interior surface of the sheathing or in the middle of the thermal insulation layer.
• Calculational analyses cover broadly combinations of different types of thermal insulations and sheathings to consider the water vapour permeability/resistance, thermal conductivity/resistance, moisture capacity and capillarity of materials. Each combination has to be analysed separately since the combined effect of material properties in different situations is difficult to evaluate by other methods.
• The performance of a tight vapour barrier in the interior lining is examined separately. Then, the most critical point of the assembly depends on the situation in question. The most critical point may be on the interior or exterior surface of the

307
vapour barrier and laterally either in the middle of the thermal insulation layer or in the middle of a wooden stud.
The hypotheses of this research were confirmed by conducted tests and calculational analyses: • The minimum required water vapour resistance ratio between the interior and
exterior linings of timber-framed external wall assemblies during the service life of the building depends essentially on the performance criteria and limit values, indoor and outdoor air conditions, and the structural solution and the materials used in the analysis.
• The water vapour resistance ratio between the interior and exterior wall linings of
timber-framed external walls can be determined by a new and more accurate method which takes into account the above factors.
• The moisture performance of a timber-framed external wall assembly depends
essentially also on other building physical properties of structural layers than the water vapour resistance ratio between the interior and exterior wall linings.
The other main results of this research are the following: • In Finnish climatic conditions it is not possible to set design requirements for timber-
framed external wall assemblies that allow no condensation of moisture or mould growth at all.
• A ventilation gap behind the cladding prevents driving rain from entering the interior
of the assembly as well as allows it to dry. In addition, it reduces the risk of moisture condensation and mould growth within a timber-framed wall assembly.
• There is no need for separate examination of the impact of driving rain, wind, solar
radiation and surface undercooling in the diffusion analysis of a timber-framed external wall assembly which has a ventilation gap behind the cladding. There these factors can be accounted for in the value of the exterior surface resistance of the sheathing used in calculational analysis. Moreover, the calculational analyses can be done ignoring the cladding and the ventilation gap.
• The valid Finnish building code (RakMK C4 2003) suggests 0.13 m2·K/W as the
exterior surface resistance of an assembly with a ventilation gap when calculating the U-value of a wall. However, that value is too large in the case of a shaded northern wall, which is most critical from the viewpoint of water vapour diffusion. Surface

308
resistance has a big impact on the moisture performance of assemblies where thermal resistance of the sheathing is low. This means that the surface resistance value 0.04 m2·K/W should be used in moisture performance analyses.
• The relative humidities of materials’ pore air changed more slowly in calculational
analyses than in reality. This could be due, for instance, to differences between real and measured material properties and the effect of internal convection within the test assemblies. It is also possible that the equation used by the WUFI-2D program, which was used to convert the measured water absorption coefficient into liquid moisture diffusivity, does not correspond sufficiently well to the actual situation when analysing hygroscopic wood-based materials.
• Inclusion of capillary moisture transfer in calculations improved calculation results
considerably when the assembly incorporated capillary materials with relative humidity of their pore air > 90% RH.
• Based on the limit values and performance criteria selected for this study, moisture
condensation is generally the design criterion for diffusion. Mould growth is more critical for the moisture performance of the wall assembly only in some individual cases.
• The best ways to increase the reliability of the performance of an exterior wall
assembly against the harmful effects of diffusion from indoor air are to increase the water vapour resistance of the interior wall lining and thermal resistance of sheathing. Low water vapour resistance of sheathing is also an important factor in improving the moisture performance of an assembly.
• After a certain limit, little can be gained by increasing the water vapour resistance of
the interior wall lining. That limit depends on the sheathing and thermal insulation used.
• Using a plastic vapour barrier behind the interior board is safe in all typical indoor
and outdoor air conditions of the Finnish climate. With this assembly solution relative humidity as well as the risk of moisture condensation and mould growth are at their lowest on the interior surface of the sheathing since indoor air moisture does not affect the moisture performance of the assembly.
• In an external wall assembly that meets Finnish thermal insulation regulations
(RakMK C3 2003) (insulation thickness ≥ 175 mm), a plastic vapour barrier installed at a depth of 50 mm from the interior surface of thermal insulation also works well if

309
the laths on the interior side of the vapour barrier have been installed vertically and opposite the wooden studs on the exterior side of the vapour barrier.
• It is recommendable to use a thicker thermal insulation layer in assemblies where the
vapour barrier is recessed 50 mm into the assembly. A rule of thumb is that at least ¾ of the thermal insulation should be outside the vapour barrier.
• It is recommendable to use a plastic vapour barrier in the interior wall lining if a
weatherisation membrane with water vapour resistance > 500 s/m is used for sheathing. This is because wall assemblies incorporating weatherisation membranes are the most critical with respect to many factors affecting moisture performance.
• In Finnish climatic conditions an assembly may be implemented also without a
plastic vapour barrier in the interior wall lining. The required water vapour resistance ratio between interior and exterior wall linings depends then on the sheathing and thermal insulation used.
• The key properties of the layers which improve the moisture performance of a
moisture-permeable assembly are the high thermal resistance and low water vapour resistance of the sheathing.
• A hygroscopic thermal insulation retards the wetting of the assembly in autumn and
its drying in spring. Therefore, high moisture capacity of thermal insulation also improves the performance of the assembly when the water vapour resistance of the sheathing is low.
• It is recommended to use 4 or 5 g/m3 as the design value of excess moisture in one-
family and row houses in Finland. Then, the minimum water vapour resistance values between the interior and exterior wall linings are typically in the 0 to 80:1 range. With sheathings highly permeable to water vapour the required resistance ratio typically varies between 0 and 40:1.
• The present specification of the Finnish Building Code (RakMK C2 1998) of 5:1 for
the water vapour resistance ratio between interior and exterior wall linings is not sufficient in most cases. That water vapour resistance ratio is acceptable only if the thermal resistance of the sheathing is high.
• The water vapour resistance values produced by the study are minimum values that
include no safety factor. In Finnish climatic conditions the moisture performance of these assemblies can be further improved by increasing the minimum value of the given water vapour resistance of interior lining. That increases performance

310
reliability, for instance, with respect to variation in material properties and internal convection.
• The water vapour resistance of the paper-based air barrier membranes presently on
the market is normally so low that many assemblies implemented with them do not even meet the existing specification for the resistance ratio between interior and exterior wall linings (min. 5:1) if the interior finishing is excluded from the analysis.
• If the water vapour resistance of the sheathing exceeds 15 ×103 s/m, the water vapour
resistance ratio between the interior and exterior wall linings no longer describes the moisture performance of the assembly sufficiently well. This is true especially if the thermal resistance of the sheathing is low. In wall assemblies with vapour-tight sheathings, the drying rate of the assembly becomes the most critical factor for moisture performance in spring conditions and in situations of occasional moisture leaks.
• Too low water vapour resistance of the interior wall lining is not recommendable
even if the moisture performance of the assembly is good enough from the viewpoint of diffusion. This is because the air in a building with an excessively moisture-permeable envelope assembly is too dry for a quite long period in winter.
• The method for analysing external wall assemblies created in connection with this
research (principles for selecting performance criteria and limit values as well as indoor and outdoor air conditions) may also be used, where applicable, to analyse the moisture performance of layered wall assemblies in other climatic conditions. In other climatic conditions the limit values of moisture condensation and mould growth are different and must always be determined anew for each climate.

311
REFERENCES Absetz, I. 1999. Moisture transport and sorption in wood and plywood, Theoretical and
experimental analysis originating from wood cellular structure. Ph.D. thesis. Espoo, Helsinki University of Technology, Department of Civil and Environmental Engineering, Publication 102. 90 p. + app. 182 p.
Airaksinen, M. 2003a. Moisture and fungal spore transport in outdoor air-ventilated crawl spaces in a cold climate. Ph.D. thesis. Espoo, Helsinki University of Technology, Department of Mechanical Engineering, Report A7. 66 p.
Airaksinen, M. & Kurnitski, J. 2003b. Hygroskooppisten materiaalien vaikutus sisäilmaan – kenttämittaukset pientalossa. Sisäilmastoseminaari 2003, Sisäilmastoyhdistys ry. Espoo, Suomi, maaliskuu 19–20. Pp. 103-108. (in Finnish)
Andersen, N.E. 1987. Summer condensation in a unheated buildings. Proceedings of the Symposium on Building Physics in the Nordic Countries. Lund, Sweden, August 24–27. Pp. 843-849.
Andersen, T. 2000. Fugt i træskeletvægge – Korttidsmålinger og tilstanden efter 20 år. SBI-meddelelse 131, Hørsholm, Statens Byggeforskningsinstitut. 25 p. (in Danish)
Anderson, L.O. 1972. Condensation problems: their prevention and solution. Madison, Wisconsin, Forest Product Laboratory, USDA Forest Service Research Paper FPL 132.
Anderson, L.O. & Sherwood, G.E. 1974. Condensation Problems in Your House: Prevention and Solution. Washington D.C., U.S. Department of Agriculture, Forest Service, Bulletin No. 373.
Aoki-Kramer, M. & Karagiozis, A.N. 2004. A new look at residential interior environmental loads. Proceedings of the DOE/ORNL/ASHRAE/BETEC/CIBSE/ SBSE International Conference, Performance of Exterior Envelopes of Whole Buildings IX, Clearwater Beach, Florida, USA, December 5–10. Session IIIA, 10 p.
Arfvidsson, J. 1998. Moisture Transport in Porous Media. Modelling Based on Kirchhoff Potentials. Ph.D. thesis. Lund, Lund University, Department of Building Physics, Report TVBH-1010. 105 p.
ASHRAE Handbook. 2005. Fundamentals. Atlanta, American Society of Heating, Refrigerating and Air-Conditioning Engineers.
Bankvall, C.G. 1972a. Natural convective heat transfer in insulated structures. Lund, Lund University, Lund Institute of Technology, Division of Building Technology, Report 38. 150 p.
Bankvall, C.G. 1972b. Heat transfer in insulation and insulated structure. Ph.D. thesis. Lund, Lund University, Lund Institute of Technology, Division of Building Technology, Report 39. 19 p.

312
Beaulieu, P., Bomberg, M., Cornick, S., Dalgliesh, A., Desmarais, G., Djebbar, R., Kumaran, K., Lacasse, M., Lackey, J., Maref, W., Mukhopadhyaya, P., Nofal, M., Normandin, N., Nicholls, M., O’Connor, T., Quirt, D., Rousseau, M., Said, N., Swinton M., Tariku F. & van Reenen, D. 2002. Hygrothermal Response of Exterior Wall Systems to Climate Loading: Methodology and Interpretation of Results for Stucco, EIFS, Masonry and Siding Clad Wood Frame Walls. Ottawa, National Research Council of Canada, Institute for Research in Construction, Final Report from Task 8 of MEWS project, Research Report IRC-RR-118. 175 p.
Björk, F., Lundblad, D. & Ödeen, K. 1997. Transport of air, tracer gas and moisture through a cellulose fibre insulated structure. Nordic Journal of Building Physics, Vol. 1, 10 p.
Björkholtz, D. 1991. Lämpö ja kosteus, rakennusfysiikka. Helsinki, Rakentajain kustannus Oy. 150 p. (in Finnish)
Bomberg, M. 1974. Moisture Flow through Porous Building Materials. Ph.D. thesis. Lund, Lund University, Lund Institute of Technology, Division of Building Technology, Report 52. 188 p.
Bomberg, M. & Brown, W.C. 1993. Building envelope: heat, air and moisture interactions. Journal of Thermal Insulation and Building Envelopes, Vol. 16, pp. 306-311.
Bomberg, M., Carmeliet, J., Grunewald, J., Holm, A., Karagiozis, A., Künzel, H. & Roels, S. 2002a. Position Paper on Material Characterization and Ham Model Benchmarking. Proceedings of the 6th Symposium on Building Physics in the Nordic Countries. Trondheim, Norway, June 17–19. Vol. 1, pp. 143-150.
Bomberg, M. & Onysko, D. 2002b. Heat, Air and Moisture Control in Walls of Canadian Houses: A Review of the Historic Basis for Current Practices. Journal of Thermal Envelope & Building Science, Vol. 26, pp. 3-32.
Boverkets byggregler, BBR. 2002. Karlskrona, Boverket. 161 p. (in Swedish)
Britton, R.R., 1948a. Condensation in walls and roofs. Housing and Home Finance Agency, Technical papers 1,2 and 3.
Britton, R.R., 1948b. Condensation in walls and roofs. Housing and Home Finance Agency, Technical paper 8.
Britton, R.R., 1949. Condensation in wood frame walls under variable state conditions of exposure. Housing and Home Finance Agency, Technical paper 12.
BS 5250. 1989. British Standard Code of practice for Control of condensation in buildings. UK, British Standards Institution. 80 p.
Burch, D.M. & Treado, S.J. 1978. A technicue for protecting retrofitted wood-frame walls from condensation damage. ASHRAE Transactions. Vol. 84, Part 1. New York, American Society of Heating, Refrigerating and Air-Conditioning Engineers.
313
Burch, D.M., Contreras, A.G. & Treado, S.J. 1979. The use of low-moisture-permeability insulation as an exterior retrofit system – a condensation study. ASHRAE Transactions. Vol. 85, Part 2. New York, American Society of Heating, Refrigerating and Air-Conditioning Engineers. Pp. 547-562.
Burch, D.M., Thomas, W.C., Mathena, L.R., Licitra, B.A. & Ward, D.B. 1989. Transient Moisture and Heat Transfer in Multilayer Nonisothermal Walls – Comparison of Predicted and Measured Results. Proceedings of ASHRAE/DOE/BTECC/CIBSE Conference, Thermal Performance of the Exterior Envelopes of Buildings IV, Orlando, Florida, USA, December 4–7. Pp. 513-531.
Burch, D.M. & Thomas, W.C. 1991. An analysis of moisture accumulation in a woodframe wall subjected to winter climate. Washington D.C., National Institute of Standards and Technology, NISTIR 4674. 36 p.
Burch, D.M. 1993a. An analysis of moisture accumulation in walls subjected to hot and humid climates. ASHRAE Transactions. Vol. 99, Part 2. Atlanta, American Society of Heating, Refrigerating and Air-Conditioning Engineers. Pp. 1013-1021.
Burch, D.M. & TenWolde, A. 1993b. A Computer Analysis of Moisture Accumulation in the Walls of Manufactured Housing. ASHRAE Transactions. Vol. 99, Part 2. Atlanta, American Society of Heating, Refrigerating and Air-Conditioning Engineers. Pp. 977-989.
Burch, D.M., Saunders, C.A. & TenWolde, A. 1995. Manufactured Housing Walls That Provide Satisfasctory Moisture Performance in all Climates. Washington D.C., National Institute of Standards and Technology, NISTIR 5558. 30 p.
Burch, D.M. & Chi, J. 1997. MOIST, A PC Program for Predicting Heat and Moisture Transfer in Building Envelopes, Release 3.0. Washington D.C., National Institute of Standards and Technology, NIST Special Publication 917. 45 p.
Burke, S. 2005. Förhållandet mellan ånggenomgångsmotståndet i den kalla respektive den varma sidan av en yttervägg med träregelstomme. Lund, LTH, Avdelning för Byggnadsfysik. 35 p.
Bygningsreglement. 1995. København, Boligministeriet, bygge- og Boligstyrelsen. 203 p. (in Danish)
Chouinard, K.L. & Lawton, M.D. 2001. Rotting Wood Framed Apartments – Not Just a Vancouver Problem. Proceedings of Eight Conference on Building Science and Technology: Solutions to Moisture Problems in Building Enclosures, Toronto, Canada, February 22–23. Pp. 303-318.
Christensen, G. & Bunch-Nielsen, T. 2003. Measurement of moisture conditions in cellulose insulated wall and roofs with and without PE-vapour barriers in 32 occupied Danish dwellings. Proceedings of Second International Conference on

314
Building Physics, Research in Building Physics, Antwerpen, Belgium, September 14–18. Pp. 565-569.
Claesson, J. & Håkansson, H. 1993. Modelling of Moisture Flow in Wood, Fundamental Experiments and Analyses. Proceedings of the 3th Symposium on Building Physics in the Nordic Countries, Copenhagen, Danmark, September 13–15. Pp. 19-26.
Clarke, J.A., Johnstone C.M., Kelly, N.J., McLean, R.C., Anderson J.A., Rowan N.J. & Smith, J.E. 1999. A technique for the prediction of the conditions leading to mould growth in buildings. Building and Environment 34, pp. 515-521.
Classification of Indoor Climate 2000. 2001. Target values, Design Guidance and Product Requirements. Espoo, Finnish Society of Indoor Air Quality and Climate. 40 p.
Cloutier, A. & Fortin, Y. 1991. Moisture content – water potential relationship of wood from saturated to dry conditions. Wood Science and Technology. Vol. 25, pp. 263-280.
Condren, S.J. 1982. Vapor Retarders in Roofing Systems: When Are They Nesessary? In: Lieff & Trechsel (eds.). Moisture Migration in Buildings, STP 779. Philadelphia, USA, American Society for Testing and Materials. Pp. 5-27.
Cornick, S.M. & Chown, G.A. 2001. Defining Climate Regions as a Basis for Specifying Requirements for Precipitation Protection for Walls. Ottawa, National Research Council of Canada, Institute for Research in Construction, Report from Task 4 of MEWS Project, Research Report NRCC-45001. 38 p.
Cornick, S., Dalgliesh, A., Said, N., Djebbar, R., Tariku, F. & Kumaran M.K. 2002. Environmental Conditions. Ottawa, National Research Council of Canada, Institute for Research in Construction, Final Report from Task 4 of MEWS Project, Research Report IRC-RR-113. 108 p.
Cornick, S. 2006. Results of the HAMSTAD Benchmarking Exercises Using hygIRC 1-D version 1.1. Ottawa, National Research Council of Canada, Institute for Research in Construction, Research Report IRC-RR-222. 92 p.
Derome, D. 1999. Moisture occurrence in roof assemblies containing moisture storing insulation and its impact on the durability of building envelope. Ph.D. thesis. Montreal, Concordia University, Department of Building, Civil and Environmental Engineering. 207 p.
Desjarlais, A.O., Karagiozis, N.K. & Ki-Kramer, M.A. 2001. Wall Moisture Problems in Seattle. Proceedings of the DOE/ORNL/ASHRAE/BETEC/NRC/CIBCE Conference, Performance of Exterior Envelopes of Whole Buildings VIII: Integration of Building Envelopes, Clearwater Beach, Florida, USA, December 2–7. Session XB, 8 p.

315
Dill, R.S. & Cottony, H.V. 1946. Laboratory observations of condensation in wall specimens. U.S. Department of Commerce, National Bureau of Standards, Building Materials and Structures Report BMS106.
DIN 4108-3. 1981. Wärmeschutz im Hochbau, Klimabedingter Feuchteschutz, Anforderungen und Hinweise für Planung und Ausführung. Deutches Institut für Normung. 9 p. (in German)
DIN 4108-5. 1981. Wärmeschutz im Hochbau, Berechnungsverfahren. Deutches Institut für Normung. 16 p. (in German)
DIN 52617. 1987. Bestimmung des Wasseraufnahmekoeffizienten von Baustoffen. Deutches Institut für Normung. 4 p. (in German)
Djebbar, R., van Reenen, D. & Kumaran, M.K. 2001. Environmental Boundary Conditions for Long-term Hygrothermal Calculations. Proceedings of the DOE/ORNL/ ASHRAE/BETEC/NRC/CIBCE Conference, Performance of Exterior Envelopes of Whole Buildings VIII: Integration of Building Envelopes, Clearwater Beach, Florida, USA, December 2–7. Session IIA, 13 p.
Duff, J.E. 1972. Vapor Barrier Decreases Moisture Conditions in Wood Walls Exposed to Air Conditioning and Heating. USDA Forest Service, Research Paper SE-98.
EN 12524. 2000. Building materials and products – Hygrothermal properties – Tabulated design values. Brussels, European Committee for Standarization. 10 p.
EN ISO 12572. 2001. Hygrothermal performance of building materials and products – Determination of water vapour transmission properties. Brussels, European Committee for Standardization. 32 p.
EN ISO 13788. 2001. Hygrothermal performance of building components and building elements – Internal surface temperature to avoid critical surface humidity and interstitial condensation – Calculation methods. Brussels, European Committee for Standardization. 36 p.
Extracts from the Swedish Building Code, SBN 1980. 1984. Building Structures, Components and Installations. Stockholm, The National Board of Physical Planning and Building. 290 p.
Fechner, H. & Häupl, P. 2001. Wooden Roof Structures with High Vapor Retarder, Low Vapor Retarder, and Moisture-Dependent Vapor Retarder. Proceedings of the DOE/ORNL/ASHRAE/BETEC/NRC/CIBCE Conference, Performance of Exterior Envelopes of Whole Buildings VIII: Integration of Building Envelopes, Clearwater Beach, Florida, USA, December 2–7. Session IIIA, 7 p.
FINAS S12. 1992. Suositus kalibroinnin mittausepävarmuuden määrittämisestä. Helsinki, Mittatekniikan keskus. 23 p. (in Finnish)

316
Finch, G., Straube, J. & Hubbs, B. 2006. Building envelope performance monitoring and modelling of West Coast rainscreen enclosures. Proceedings of the Third International Building Physics Conference, Research in Building Physics and Building Engineering, Montreal, Canada, August 27–31. Pp. 335-343.
Garrahan, P., Meil, J. & Onysko, D.M. 1991. Moisture in framing lumber: field measurement, acceptability and use surveys: volume 1. Ottawa, Canada Mortage and Housing Corporation. 96 p.
Geving, S. & Thue, J.V. 1996. Measurements and computer simulations of the hygrothermal performance of leightweight roofs. Proceedings of the 4th Symposium on Building Physics in the Nordic Countries: Building Physics ‘96, Espoo, Finland, September 9–10. Vol. 2, pp. 541-548.
Geving, S. 1997a. Moisture design of building constructions: Hygrothermal analysis using simulation models, Part I and Part II. Ph.D. thesis. Trondheim, Norwegian University of Science and Technology, Department of Building and Construction Engineering. 138 p. + papers and reports.
Geving, S. 1997b. A systemathic method for hygrothermal analysis of building constructions using computer models. Prooceedings of Fifth International Conference of Building Simulation (IBPSA), Prague, Czech Republik, September 8–10.
Geving, S., Karagiozis, A. & Salonvaara, M. 1997c. Measurements and Two-Dimensional Computer Simulations of the Hygrothermal Performance of a Wood Frame Wall. Journal of Thermal Insulation and Building Envelopes, Vol. 20, pp. 301-319.
Glaser, H. 1959. Graphisches Verfahren zur Untersuchung von Diffusionsvorgängen. Kältetechnik, Jahrgang 11, Heft 10, pp. 345-349. (in German)
Grunewald, J. 1997. Diffusiver und konvektiver Stoff- und Energietransport in kapillarporösen Baustoffen. Doktor-Ingenieur Dissertation. Dresden, Technischen Universität Dresden, Fakultät Bauingenieurwessen, Institut fur bauklimatik, Dresdner Bauklimatische Hefte, Heft 3. 177 p. + app. 17 p. (in German)
Grunewald, J., Häupl, P. & Bomberg, M. 2003. Towards An Engineering Model of Material Characteristics for Input to Ham Transport Simulations – Part 1: An Approach. Journal of Thermal Envelope & Building Science, Vol. 26, pp. 343-366.
Gustavsson, T., Bornehag, C-G. & Samuelson, I. 2004. Temperature, relative humidity and air exchange rate in 390 dwellings. Proceedings of CIB W40 Meeting, Glasgow, UK, September 1–3. Papers Friday 3 September, 12 p.
Hagentoft C.-E. 1993. PC-program: 1D-HAM, Calculates the moisture conditions, the temperature and the heat flow in a wall with multi layers. Lund, Lund University, Department of Building Physics, Notes on Heat Transfer 5-93, Report TVBH-7147. 8 p.

317
Hagentoft, C.-E. & Harderup, E. 1996. Moisture Conditions in a North Facing Wall with Cellulose Loose Fill Insulation: Constructions with and without Vapor Retarder and Air leakage. Journal of Thermal Insulation and Building Environment, Vol. 19, pp. 228-243.
Hagentoft, C.-E. 1998. IEA Annex 24: Task 5: Performances and Practice, The Impact of Heat, Air and Moisture Transport on Energy Demand and Durability. Leuven, Acco, International Energy Agency, Energy Conservation in Buildings and Community Systems, Heat, Air and Moisture Transfer in Insulated Envelope Parts (HAMTIE), Final Report, Vol. 5. 56 p.
Hagentoft C.-E. & Blomberg, T. 2000. 1D-HAM coupled heat, air and moisture transport in multi-layered wall structures. Manual with brief theory and an example, Version 2.0. Lund, Gothenburg Group for Computational Building Physics. 13 p.
Hagentoft, C.-E. 2001. Introduction to Building Physics. Lund, Studentlitteratur. 422 p.
Hagentoft, C.-E., Sasic Kalagasidis, A., Adl-Zarrabi, B., Roels, S., Carmeliet, J., Hens, H., Grunewald, J., Funk, M., Becker, R., Shamir, D., Adan, O., Brocken, H., Kumaran, K. & Djebbar, R. 2004. Assessment Method of Numerical Prediction Models for Combined Heat, Air and Moisture Transfer in Buildings Components: Benchmarks for One-dimensional Cases. Journal of Thermal Envelope & Building Science, Vol. 27, pp. 327-352 p.
Hansen, K.K., Rode, C., de Place Hansen, E.J., Padfield, T. & Kristiansen, F. 2001. Experimental Investigation of the Hygrothermal Performance of Insulation Materials. Proceedings of the DOE/ORNL/ASHRAE/BETEC/NRC/CIBCE Conference, Performance of Exterior Envelopes of Whole Buildings VIII: Integration of Building Envelopes, Clearwater Beach, Florida, USA, December 2–7. Session IA, 10 p.
Hansen, M.H., Nicolajsen, A. & Stang, B.D. 2002. On the Influence of Cavity Ventilation on Moisture Content in Timber Frame Walls. Proceedings of the 6th Symposium on Building Physics in the Nordic Countries. Trondheim, Norway, June 17–19. Vol. 2, pp. 603-610.
Harderup, E. 1996. Methods for determination of the risk of critical moisture conditions with natural external climate. Proceedings of the 4th Symposium on Building Physics in the Nordic Countries. Espoo, Finland. Vol. 2, pp. 579-586.
Harderup, E. 1998. Metoder att välja korrektioner vid fuktberäkningar med variabelt utomhusklimat. Ph.D. thesis. Lund, Lund University, Department of Building Physics. Report TVBH-1011. 242 p. (in Swedish)
Harderup, L.-E. 1999. Simplified statistical method to determine the risk of condensation by diffusion in building elements. Proceedings of the 5th Symposium on Building Physics in the Nordic Countries, Göteborg, Sweden, August 24–26. Vol. 2, pp. 537-544.
318
Hazleden, D.G. & Morris, P.I. 2001. The Influence of Design on Drying of Wood-Frame Walls Under Controlled Conditions. Proceedings of the DOE/ORNL/ASHRAE/ BETEC/NRC/CIBCE Conference, Performance of Exterior Envelopes of Whole Buildings VIII: Integration of Building Envelopes, Clearwater Beach, Florida, USA, December 2–7. Session IXA, 19 p.
Hedenblad, G. 1996. Fuktsäkerhet i byggnader, Materialdata för fukttransport-beräkningar. Rapport T19, Stockholm, Byggforskningsrådet. 55 p. (in Swedish)
Hens, H. 1992. Indoor Climate Classes. Internal Report IEA Annex 24 T2-B-92/02. International Energy Agency. Heat, air and moisture transfer through new and retrofitted insulated envelope Parts (HAMTIE). 15 p.
Hens, H. & Janssens, A. 1992. IEA Annex 24: Enquiry on HAMCaT Codes, Task 1: Modelling. International Energy Agency, Energy Conservation in Buildings and Community Systems, Heat, Air and Moisture Transfer in Insulated Envelope Parts (HAMTIE), Report. 23 p.
Hens, H. 1996a. IEA Annex 24: Task 1: Modelling. Leuven, Acco, International Energy Agency, Energy Conservation in Buildings and Community Systems, Heat, Air and Moisture Transfer in Insulated Envelope Parts (HAMTIE), Final Report, Vol. 1. 90 p.
Hens, H., Ojanen, T., Kunzel, H. M., Dow, G., Rode, C. & Hagentoft, C.-E. 1996b. IEA Annex 24: Task 1: Modelling, Addendum. Leuven, Acco, International Energy Agency, Energy Conservation in Buildings and Community Systems, Heat, Air and Moisture Transfer in Insulated Envelope Parts (HAMTIE), Final Report, Vol. 1. 150 p.
Hens, H. & Janssens, A. 1998. Application of a New Type of Air and Vapor Retarder in a Self-Drying Sloped Roof with a Catherdal Ceiling. Proceedings of the DOE/ORNL/ASHRAE/BETEC Conference, Thermal Performance of the Exterior Envelopes of Buildings VII, Clearwater Beach, Florida, USA, December 6–10. Pp. 15-27.
Hens, H. & Janssens, A. 1999. Risk analysis applied on insulated cavity walls with a partial or complete fill behind the brick veneer. Proceedings of the 5th Symposium on Building Physics in the Nordic Countries, Göteborg, Sweden, August 24–26. Vol. 2, pp. 755-764.
Hukka, A. & Viitanen, H. 1999. A Mathematical Model of Mould Growth on Wooden Material. Wood Science and Technology, Vol. 33, pp. 475-485.
Hutcheon, N. 1953. Fundamental considerations in the design of exterior walls for buildings. Ottawa, National Research Council Canada, NRC Paper No. 3087, Division of Building Research, Technical Paper No. 37.

319
Hutcheon, N.B. 1954. Control of water vapour in dwellings. Ottawa, National Research Council Canada, NRC Paper No. 3343, Division of Building Research, Technical Paper No. 19.
Hutcheon, N.B. 1963. Humidified Buildings. Canadian Building Digest. UDC 697.93. National Research Council of Canada, Division of Building Research.
Hyland, R.W. & Wexler, A. 1983. Formulations for the Thermodynamic Properties of the Saturated Phases of H2O from 173.15 K to 473.15 K. ASHRAE Transactions. Vol. 89, Part 2A. Atlanta, American Society of Heating, Refrigerating and Air-Conditioning Engineers. Pp 500-519.
Hänninen, J., Rissanen, R. & Viljanen, M. 1997. Sahateollisuuden purutuotteet rakennusten eristemateriaalina. Espoo, Teknillinen korkeakoulu, Talonrakennustekniikan laboratorio, Julkaisu 59. 130 p + app. 1 p. (in Finnish)
Häupl, P., Fechner, H. & Petzold, H. 2000. Moisture atlas for envelope parts. Proceedings of the International Building Physics Conference, Tools for design and engineering of buildings, Eindhoven, The Netherlands, September 18–21. Pp. 565-572.
IEA Annex XIV. 1991. Guidelines and Practice. Leuven, Acco, International Energy Agency, Energy Conservation in Buildings and Community Systems, Condensation and Energy, Report, Vol. 2. 57 p.
Incropera F.P. & DeWitt, D.P. 2002. Fundamentals of Heat and Mass Transfer. 5th ed. New York, John Wiley and Sons. 981 p.
International Energy Conservation Code. 2000. USA, International Code Council, Inc. 198 p.
International Residential Code for One- and Two-Family Dwellings. 2000. USA, International Code Council, Inc. 566 p.
ISO 6946. 1996. Building components and building elements – Thermal resistance and thermal transmittance – Calculation method. Genève, International Organization for Standardization. 25 p.
ISO 7345. 1987. Thermal insulation – Physical quantities and definitions. Genève, International Organization for Standardization. 7 p.
ISO 8301. 1991. Thermal insulation – Determination of steady-state thermal resistance and related properties – Heat flow meter apparatus. Genève, International Organization for Standardization. 38 p.
ISO 8302. 1991. Thermal insulation – Determination of steady-state thermal resistance and related properties – Guarded hot plate apparatus. Genève, International Organization for Standardization. 47 p.

320
ISO 8990. 1994. Thermal insulation – Determination of steady-state thermal transmission properties – Calibrated and guarded hot box. Genève, International Organization for Standardization. 19 p.
ISO 9346. 1987. Thermal insulation – Mass transfer – Physical quantities and definitions. Genève, International Organization for Standardization. 6 p.
ISO 15927-1. 2003. Hygrothermal performance of buildings – calculation and presentation of climatic data – Part 1: Monthly means of single meteorological elements. Genève, International Organization for Standardization. 26 p.
Janssens, A., Hens, H. & Silberstein, A. 1995. A Study of Parameters Influenceing the Hygric Performance of Insulated Sloped Roofs Without Air Barrier. Proceedings of the DOE/ORNL/ASHRAE/ BETEC Conference, Thermal Performance of the Exterior Envelopes of Buildings VI, Clearwater Beach, Florida, USA, December 4–8. Pp. 283-295.
Janssens, A. & Hens, H. 1998. Condensation risk assessment. Proceedings of the DOE/ORNL/ASHRAE/BETEC Conference, Thermal Performance of the Exterior Envelopes of Buildings VII, Clearwater Beach, Florida, USA, December 6–10. Pp. 199-206.
Janssens, A. & Hens, H. 2003. Development of indoor climate classes to assess humidity in dwellings. Proceedings of the 24th AIVC-Conference Ventilation, Humidity Control and Energy. Washington D.C., USA. Pp.41-46.
Janz, M. 1997. Methods of measuring the moisture diffusivity at high moisture levels. Licentiate thesis. Lund, Lund University, Lund Institute of Technology, Division of Building Materials, Report TVBM-3076. 73 p.
Jenssen, J.A., Geving, S. & Johnsen, R. 2002. Assessments of indoor air humidity in four different types of dwellings randomly selected in Trondheim, Norway. Proceedings of the 6th Symposium on Building Physics in the Nordic Countries. Trondheim, Norway, June 17–19. Vol. 2, pp. 729-735.
Kalamees, T. & Vinha, J. 2003. Hygrothermal calculations and laboratory tests on timber-framed wall structures. Building and Environment, Vol. 38, pp. 689-697.
Kalamees, T., Kurnitski, J. & Vinha, J. 2004a. Indoor Temperature, Humidity, and Moisture Production in Lightweight Timber-Framed Detached Houses. Proceedings of the DOE/ORNL/ASHRAE/BETEC/CIBSE/SBSE International Conference, Performance of Exterior Envelopes of Whole Buildings IX, Clearwater Beach, Florida, USA, December 5–10. Session IIIA, 13 p.
Kalamees, T. & Vinha, J. 2004b. Estonian Climate Analysis to Select Moisture Reference Year for Hygrothermal Calculations. Journal of Thermal Envelope & Building Science, Vol. 27, pp. 199-220.
321
Kalamees, T., Kurnitski, J. & Vinha, J. 2005. Indoor humidity loads in Finnish detached houses. Proceedings of the 7th Symposium on Building Physics in the Nordic Countries. Reykjavik, Iceland, June 13–15. Vol. 2, pp. 1163-1170.
Kalamees, T. 2006a. Indoor Hygrothermal Loads in Estonian Dwellings. Proceedings of the 4th European Conference on Energy Performance & Indoor Climate in Buildings, Lyon, France, November 20-22. 6 p.
Kalamees, T., Vinha, J. & Kurnitski, J. 2006b. Indoor Humidity Loads and Moisture Production in Lightweight Timber-frame Detached Houses. Journal of Building Physics, Vol. 29, pp. 219-246.
Karagiozis, A.N. & Kumaran, M.K. 1993. Computer model calculations on the performance of vapor barriers in Canadian residential buildings. ASHRAE Transactions. Vol. 99, Part 2. Atlanta, American Society of Heating, Refrigerating and Air-Conditioning Engineers. Pp. 991-1003.
Karagiozis, A.N. & Salonvaara M. 1995. Influence of material properties on the hygrothermal performance of a high-rise residential wall. ASHRAE Transactions. Vol. 101, Part 1. Atlanta, American Society of Heating, Refrigerating and Air-Conditioning Engineers. Pp. 647-655.
Karagiozis, A. 1997. Moisture Engineering. Proceedings of Sevent Conference on Building Science and Technology: Durability of buildings – Design, Maintenance, Codes and Practices. Toronto, Canada. Pp. 93-112.
Karagiozis, A. & Salonvaara, M. 1999. Whole building hygrothermal performance. Proceedings of the 5th Symposium on Building Physics in the Nordic Countries, Göteborg, Sweden, August 24–26. Vol. 2, pp. 745-753.
Karagiozis, A. & Salonvaara, M. 2001. Hygrothermal system-performance of a whole building. Building and Environment, Vol. 36, pp. 779-787.
Kauriinvaha, E., Sutela, R., Yrjölä, R. & Viljanen, M. 2001a. Kosteusteknisesti turvallinen sahanpurueristeinen pientalo. Espoo, Teknillinen korkeakoulu, Talonrakennus-tekniikan laboratorio, Julkaisu 118. 87 p. (in Finnish)
Kauriinvaha, E., Viljanen, M., Pasila, A., Kymäläinen, H.-R. & Pehkonen, A. 2001b. Kasvikuitu pellolta rakennuksen lämmöneristeeksi. Espoo, Teknillinen korkeakoulu, Talonrakennustekniikan laboratorio, Julkaisu 117. 92 p. (in Finnish)
Kayll, D.G. 2001. The Role of the Building Envelope Professional in the Aftermath of Vancouver’s Leaky Condominium Crisis. Proceedings of the DOE/ORNL/ ASHRAE/BETEC/NRC/CIBCE Conference, Performance of Exterior Envelopes of Whole Buildings VIII: Integration of Building Envelopes, Clearwater Beach, Florida, USA, December 2–7. Session IIB, 12 p.

322
Kieper, G.W., Caemmerer, W. & Wagner, A. 1976. A new diagram to evaluate the performance of building constructions with a view to water water vapor diffusion. Proceedings of CIB W40 Meeting, Washington D.C., USA.
Kohonen, R. & Ojanen, T. 1983. Rakennusmateriaalien vesihöyrynläpäisevyyden ja kosteudenjohtavuuden määritysmenetelmä. Espoo, Valtion teknillinen tutkimuskeskus, VTT Tutkimuksia 188. 74 p. (in Finnish)
Kohonen, R., Määttä, J., Nieminen, J., Ojanen, T. & Saarimaa, J. 1985. Höyrynsuluton puurunkoinen seinärakenne Enso-koetalossa. Espoo, Valtion teknillinen tutkimuskeskus, VTT Tiedotteita 441. 54 p. + app. 18 p. (in Finnish)
Kohonen, R., Kokko, E., Mähönen, T. & Ojanen, T. 1986. Mineraalivillaeristyksen ilmavirtaukset ja tuulensuojaus. Espoo, Valtion teknillinen tutkimuskeskus, VTT Tutkimuksia 431. 119 p. (in Finnish)
Kokko, E., Ojanen, T. & Salonvaara, M. 1997. Uudet vaipparakenteet, Energian säästö ja kosteustekniikka. Espoo, Valtion teknillinen tutkimuskeskus, VTT Tiedotteita 1869. 90 p. (in Finnish)
Kokko, E., Ojanen, T., Salonvaara, M., Hukka, A. & Viitanen, H. 1999. Puurakenteiden kosteustekninen toiminta. Espoo, Valtion teknillinen tutkimuskeskus, VTT Tiedotteita 1991. 160 p. (in Finnish)
Korpi, M., Vinha, J. & Kurnitski, J. 2004. Airtightness of Timber-Framed Houses with Different Structural Solutions. Proceedings of the DOE/ORNL/ASHRAE/BETEC/ CIBSE/SBSE International Conference, Performance of Exterior Envelopes of Whole Buildings IX, Clearwater Beach, Florida, USA, December 5–10. Session XIB, 6 p.
Korsgaard, V. 1986. Hygro Diode Membrane: A New Vapor Barrier. Proceedings of ASHRAE/DOE/BTECC Conference, Thermal Performance of the Exterior Envelopes of Buildings III, Clearwater Beach, Florida, USA, December 2–5, 1985. Atlanta, American Society of Heating, Refrigerating and Air-Conditioning Engineers. Pp. 985-991.
Korsgaard, V. & Rode, C. 1992. Laboratory and Practical Experience with a Novel Water-Permeable Vapor Retarder. Proceedings of the ASHRAE/DOE/BTECC Conference, Thermal Performance of the Exterior Envelopes of Buildings V, Clearwater Beach, Florida, USA, December 7–10. Pp. 480-490.
Kosteus- ja homevaurioituneen rakennuksen kuntotutkimus. 1997. Ympäristöopas 28. Helsinki, Ympäristöministeriö. 143 p. (in Finnish)
Kumaran, M.K., Mitalas, G.P. & Bomberg, M.T. 1994. Fundamentals of Transport and Storage of Moisture in Building Materials and Components. In: Trechsel H.R. (ed.). ASTM Manual 18: Moisture Control in Buildings, Chapter 1. Philadelphia, USA, American Society for Testing and Materials. Pp. 3-17.

323
Kumaran, M.K. 1996. IEA Annex 24: Task 3: Material properties. Leuven, Acco, International Energy Agency, Energy Conservation in Buildings and Community Systems, Heat, Air and Moisture Transfer in Insulated Envelope Parts (HAMTIE), Final Report, Vol. 3. 135 p.
Kumaran, M.K. & Wang, J. 1999. How Well Should One Know the Hygrothermal Proberties of Building Materials? Proceedings of CIB W40 Meeting, Prague, Czech Republic, August 30 – September 2. Pp. 47-52.
Kumaran, M.K. 2001. Hygrothermal Proberties of Building Materials. In: Trechsel H.R. (ed.). ASTM Manual 40: Moisture Analysis and Condensation Control in Building Envelopes, Chapter 3. Philadelphia, USA, American Society for Testing and Materials. Pp. 29-65.
Kurnitski, J. 2000. Humidity control in outdoor-air-ventilated crawl spaces in cold climate by means of ventilation, ground covers and dehumidification. Ph.D. thesis. Espoo, Helsinki University of Technology, Department of Mechanical Engineering. Report A3. 182 p.
Kurnitski, J., Pasanen, P. & Matilainen, M. 2001. Ryömintätilan kosteus ja mikrobit, Loppuraportti. Espoo, Teknillinen korkeakoulu, LVI-tekniikan laboratorio, Raportti B69. 92 p. + app. 3 p. (in Finnish)
Künzel, H.M. 1995. Simultaneous heat and moisture transport in building components, One and two-dimensional calculation using simple parameters. Stuttgart, IRB Verlag, Fraunhofer-Informationszentrum Raum und Bau. 102 p. + tables and figures.
Künzel, H.M. 1996. Humidity controlled vapour retarders reduce risk of moisture damages. Proceedings of the 4th Symposium on Building Physics in the Nordic Countries: Building Physics ‘96. Espoo, Finland, September 9–10. Pp. 447-454.
Künzel, H.M. 1998. More Moisture Load Tolerance of Construction Assemblies Through the Application of a Smart Vapor Retarder. Proceedings of the DOE/ASHRAE/ ORNL/BETEC/NRCC/CIBCE Conference, Thermal Performance of the Exterior Envelopes of Buildings VII, Clearwater Beach, Florida, USA, December 6–10. Pp. 129-132.
Künzel, H.M., Holm, A., Eitner, V. & Schmidt, T. 2000. WUFI-2D: Program Description, A PC-Program for Analyzing the Two-Dimensional Heat and Moisture Transport in Building Components. Fraunhofer-Institut for Building Physics, Holzkirchen. 156 p.
Käkelä, P., Vinha, J. & Lindberg, R. 2001. Moisture Performance of Timber-Framed External Wall Element Structure Under Finnish Outdoor Climate, Field Test. Proceedings of International Conference on Building Envelope Systems and Technologies, ICBEST 2001. Ottawa, Canada. Vol. 1, pp. 217-221.
324
Käkelä, P. & Vinha, J. 2002. Outdoor Field Test of Timber-Framed External Wall Element Structure. Proceedings of the 6th Symposium on Building Physics in the Nordic Countries. Trondheim, Norway, June 17–19. Vol. 2, pp. 843-849.
Käkelä, P. & Vinha, J. 2003. Rakenteiden kuivuminen, rakennekokeet. Sisäilmasto-seminaari 2003, Sisäilmastoyhdistys ry. Espoo, Suomi, maaliskuu 19–20. Pp. 85-90. (in Finnish)
Langlais, C., Silberstain, A. & Sandberg, P.E. 1994. Effects of Moisture on the Thermal Performance of insulating Materials. In: Trechsel H.R. (ed.). ASTM Manual 18: Moisture Control in Buildings, Chapter 4. Philadelphia, USA, American Society for Testing and Materials. Pp. 54-71.
Lawton, M. 1999. Vancouver’s Rotting Condominium Problem – How Did We Get Into This Mess? Journal of Thermal Envelope and Building Science, Vol. 22, pp. 356-363.
Lawton, M. 2004. Lessons to be Learned from Performance Failures of Framed Walls in High-Rise Buildings. Proceedings of the DOE/ORNL/ASHRAE/BETEC/CIBSE/ SBSE International Conference, Performance of Exterior Envelopes of Whole Buildings IX, Clearwater Beach, Florida, USA, December 5–10. Session IVB, 10 p.
Latta, J. 1976. Vapour barriers – What are they? Are they effective? Ottawa, Canadian Building Digests, No. 175.
Lehtinen, T. & Viljanen, M. 1989. Tiilijulkisivupintaisen seinärakenteen toiminnan varmistaminen viistosadetta vastaan. Espoo, Teknillinen korkeakoulu, Talonrakennustekniikan laboratorio, Julkaisu 16. 58 p. (in Finnish)
Lehtinen, T. & Lehtonen H. 1997. Rakennusfysikaalisen mitoituksen kehittäminen, Puurankaisten ulkoseinien kosteustekninen mitoitusmenetelmä. Espoo, Teknillinen korkeakoulu, Talonrakennustekniikan laboratorio, Julkaisu 68. 84 p. + app. 4 p. (in Finnish)
Lehtinen, T. & Viljanen, M. 1999. Viikin puukerrostalojen käytön aikaisten rakennus-fysikaalisten mittausten tulokset. Espoo, Teknillinen korkeakoulu, Talonrakennustekniikan laboratorio, Julkaisu 106. 42 p. (in Finnish)
Lehtinen, T., Kangas, R. & Kettunen, A.-V. 2000. Brickwork as Renowating Solution for Facades. Proceedings of Healthy Buildings 2000 Conference, Microbes, Moisture and Building Physics, Espoo, Finland, August 6–10. Vol. 3, pp. 445-450.
Levin, P. & Gudmundsson, K. 2000. Moisture in Constructions with Loose-Fill Insulation and no Vapour Barrier. Nordic Journal of Building Physics, Vol. 2, 13 p.
Lindberg, R., Keränen, H. & Teikari, M. 1998. Ulkoseinärakenteen vaikutus rakennuksen energiankulutukseen. Tampere, Tampere teknillinen yliopisto, Talonrakennustekniikan laboratorio, Julkaisu 90. 33 p + app. 25 p. (in Finnish)

325
Tampere, Tampereen teknillinen korkeakoulu, Talonrakennustekniikan laboratorio, Julkaisu 106. 42 p. (in Finnish)
Lstiburek, J.W. 2001. Hygrothermal Climate Regions, Interior Climate Classes, and Durability. Proceedings of Eight Conference on Building Science and Technology: Solutions to Moisture Problems in Building Enclosures. Toronto, Canada. Pp. 319-329.
Lstiburek, J.W., Karagiozis, A. & Ueno, K. 2002. Feasibility of Establishing Criteria for Permeable Envelope and/or Non-Mechanical Ventilation for Detached Single One or Two Family Residential Construction (Final Paper). Building Science Corporation’s Final Paper to the Minnesota Department of Administration of Building Codes and Standards Division. 99 p.
Luft, F.J. 1983. A Study of Moisture Migration and Accumulation in Residential Stud Walls. Proceedings of ASHRAE/DOE Conference, Thermal Performance of the Exterior Envelopes of Buildings II, Las Vegas, Nevada, USA, December 6–9,1982. New York, American Society of Heating, Refrigerating and Air-Conditioning Engineers. Pp. 1078-1089.
Maref, W., Lacasse, M. & Booth, D. 2002. Benchmarking of IRC’s Advanced Hygrothermal Model – hygIRC Using Mid- and Large-Scale Experiments. Ottawa, National Research Council of Canada, Institute for Research in Construction, Research Report RR-126. 38 p.
Match manual, version 1.5. 1997. Virum, Bygge- og Miljøteknik ApS. 104 p.
Matilainen, M. & Kurnitski, J. 2003a. Moisture conditions and energy consumption in highly insulated outdoor ventilated crawl spaces in cold climates. Energy and Buildings, Vol. 35, pp. 175-187.
Matilainen, M., Kurnitski, J. & Seppänen, O. 2003b. Moisture conditions and energy consumption in heated crawl spaces in cold climates. Energy and Buildings, Vol. 35, pp. 203-216.
Merrill, J.L. & TenWolde A. 1989. Owerview of Moisture-Related Damage in One Group of Wisconsin Manufactured Homes. ASHRAE Transactions. Vol. 95, Part 1. Atlanta, American Society of Heating, Refrigerating and Air-Conditioning Engineers. Pp. 405-414.
Mikkilä, A. 2001. Rakennusmateriaalien vesihöyrynläpäisevyyden muuttuminen eri kosteuspitoisuuksissa. Diplomityö. Tampere, Tampereen teknillinen korkeakoulu, Rakennustekniikan osasto. 61 p. + app. 91 p. (in Finnish)
Mills, A.F. 1999. Basic Heat & Mass Transfer. 2nd ed., Upper Saddle River, Prentice Hall. 1000 p.
326
Moisture in Canadian wood-frame house construction: problems, research and practise from 1975 to 1991. 1992. Ottawa, Canada Mortage and Housing Corporation. 57 p. + appendices.
Mukhopadhyaya, P., Kumaran, K., van Reenen, D. & Tariku, F. 2002. Influence of Sheating Membrane and Vapour Barrier on Hygrothermal Response of Stucco Walls. Proceedings of Canada-Japan Housing R&D Building Envelope Experts Meeting #2, Vancouver, Canada, April 8. Pp. 180-187.
National Building Code of Canada. 1995. Ottawa, National Research Council of Canada. 571 p.
Nevander, L.E. & Elmarsson, B. 1994. Fukthandbok, Praktik och teori. 2nd ed. Stockholm, AB Svensk Byggtjänst. 538 p. (in Swedish)
Nielsen, A. & Andersen, N.E. 1982. Fugt og varmetekniske målinger i tage og ydervægge, SBI-forsøgshus. Glostrup, Statens Byggeforsknings-institut, SBI-rapport 134. 24 p. (in Danish)
Nielsen, A. 1995. Use of Statistics for Prediction of Condensation in a Wall Construction. Proceedings of Indoor Air Quality of Practice, Moisture and Cold Climate Solutions Conference, Oslo, Norway. 10 p.
Nielsen, K.F., Nielsen, P.A. & Holm, G. 2000. Growth of Moulds on Building Materials Under Different Humidities. Proceedings of Healthy Buildings 2000 Conference, Microbes, Moisture and Building Physics, Espoo, Finland, August 6–10. Vol. 3, pp. 283-293.
Niemelä, T., Vinha, J. & Lindberg, R. 2000. Carbon Dioxcide Permeability of Cellulose-Insulated Wall Structures. Tampere, Tampere University of Tecnology, Laboratory of Structural Engineering, Publication 104. 55 p.
Nieminen, J. 1987. Höyrynsuluton puuseinärakenne. Espoo, Valtion teknillinen tutkimuskeskus, VTT Tiedotteita 735. 140 p. + app. 23 p. (in Finnish)
Nieminen, J. 1989a. Selluloosaeristeen painuminen seinärakenteissa. Espoo, Valtion teknillinen tutkimuskeskus, VTT Tiedotteita 1016. 33 p. + app. 3 p. (in Finnish)
Nieminen, J. 1989b. Höyrynsulun tarve puuseinässä. Espoo, Valtion teknillinen tutkimuskeskus, VTT Tiedotteita 1050. 61 p. (in Finnish)
Niiranen, T. 1994. Rakentamisen virheet. Helsinki, Helsingin kaupungin rakennus-valvontavirasto, Julkaisu 4. 51 p. (in Finnish)
Nofal, M., Straver, M. & Kumaran, K. 2001. Comparison of Four Hygrothermal Models in Terms of Long-Term Performance Assessment of Wood-Frame Constructions. Proceedings of Eight Conference on Building Science and Technology: Solutions to Moisture Problems in Building Enclosures. Toronto, Canada, February 22–23. Pp. 118-138.

327
Nofal, M. & Morris, P. 2002. Criteria for Unacceptable Damage on Wood Systems. Proceedings of Canada-Japan Housing R&D Building Envelope Experts Meeting #2, Vancouver, Canada, April 8. Pp. 188-200.
Ojanen, T. & Kohonen, R. 1989a. Hygrothermal influence of air convection in wall structures. Proceedings of the ASHRAE/DOE/BTECC/CIBSE Conference, Thermal Performance of the Exterior Envelopes of Buildings IV, Orlando, Florida, USA, December 4–7. Pp. 234-249.
Ojanen, T., Salonvaara, M., Kohonen, R. & Nieminen, J. 1989b. Kosteuden siirtyminen rakenteissa, Laskentamenetelmät. Espoo, Valtion teknillinen tutkimuskeskus, VTT Tiedotteita 595. 102 p. (in Finnish)
Ojanen, T. 1996. Criteria for the Hygrothermal Performance of Wind Barrier Structures. Proceedings of the 3rd Symposium on Building Physics in the Nordic Countries, Copenhagen, Denmark, September 13–15. Pp. 643-652.
Ojanen, T. 1998. Improving the Drying Efficiency of Timber Frame Walls in Cold Climates by Using Exterior Insulation. Proceedings of the DOE/ ASHRAE/ORNL/BETEC/NRCC/CIBCE Conference, Thermal Performance of the Exterior Envelopes of Buildings VII, Clearwater Beach, Florida, USA, December 6–10. Pp. 155-164.
Ojanen, T. & Salonvaara, M. 2002a. Kuivumiskykyiset ja sateenpitävät rakenteet. Espoo, Valtion teknillinen tutkimuskeskus, VTT Tiedotteita 2168. 66 p. + app. 3 p. (in Finnish)
Ojanen, T., Salonvaara, M. & Luoma, M. 2002b. Rakenteiden homeenkasvun numeerisen mallintamisen vaatimukset. Sisäilmastoseminaari 2002, Sisäilmastoyhdistys ry. Espoo, Suomi, tammikuu 30–31. Pp. 203-208. (in Finnish)
Ojanen, T. & Salonvaara, M. 2003. A method to determine the moisture buffering effect of structures during diurnal cycles of indoor air moisture loads. Proceedings of Second International Conference on Building Physics, Research in Building Physics, Antwerpen, Belgium, September 14–18. Pp. 353-361.
Olsson, M. 1996. Houses built with ecological aspects. Proceedings of the 4th Symposium on Building Physics in the Nordic Countries: Building Physics ‘96, Espoo, Finland, September 9–10. Pp. 141-148.
Omakotirakentaja 04/05. 2005. Lämmöneristeet. Helsinki, Rakennustutkimus RTS Oy. (in Finnish)
Onysko, D. & Bomberg, M. 2004. The functional requirements for WRB exposed to incidental water leakage, Part 3: Evaluation of Wall Systems Involving WRB Materials. Proceedings of CIB W40 Meeting, Glasgow, UK, September 1–3. Papers Wednesday 1 September, 13 p.

328
Økland, Ø. 1996. Effect of Convection on the Hygrothermal Performance of Timber Frame Walls – Resuls from Experimental Investigations. Proceedings of the 4th Symposium on Building Physics in the Nordic Countries: Building Physics ‘96, Espoo, Finland, September 9–10. Pp. 141-148.
Paajanen, L., Ritschkoff, A.-C. & Viitanen, H. 1994. Lämmöneristeiden merkitys rakennusten biologisissa vaurioissa. Espoo, Valtion teknillinen tutkimuskeskus, VTT Julkaisuja 791. 64 p. + app. 8 p. (in Finnish)
Padfield, T. 1999. Humidity buffering of the interior climate by absorbent walls. Proceedings of the 5th Symposium on Building Physics in the Nordic Countries, Göteborg, Sweden, August 24–26. Vol. 2, pp. 637-644.
Pasanen, P.O., Kolari, S., Pasanen, A.-L. & Kurnitski, J. 2001. Fungal Growth on Wood Surfaces at different Moisture Conditions in Crawl Spaces. Proceedings of International Conference on Indoor Air Quality 2001, Moisture, Microbes and Health Effects: Indoor Air Quality and Moisture in Buildings. San Francisco, USA. Session 4, 8 p.
Pedersen, C.R. 1990. Combined heat and moisture transfer in building constructions. Ph.D. thesis. Copenhagen, Technical University of Denmark, Thermal Insulation Laboratory, Report 214. 132 p.
Pirinen, J. 2006. Pientalojen kosteusvauriot, Lähtökohtana asukkaiden kokemat terveyshaitat. Väitöskirja. Tampereen teknillinen yliopisto, Rakennustekniikan osasto. Helsinki, Hengitysliitto Heli ry, Hengitysliiton julkaisuja 19/2006. 124 p. (in Finnish)
RakMK C2. 1998. Kosteus, määräykset ja ohjeet 1998. Suomen rakentamismääräys-kokoelma, Helsinki, Ympäristöministeriö. 11 p. (in Finnish)
RakMK C3. 2003. Lämmöneristys, määräykset 2003. Suomen rakentamismääräys-kokoelma, Helsinki, Ympäristöministeriö. 7 p. (in Finnish)
RakMK C4. 2003. Lämmöneristys, ohjeet 2003. Suomen rakentamismääräyskokoelma, Helsinki, Ympäristöministeriö. 28 p. (in Finnish)
Riesner, K., Hagentoft, C.-E. & Mainka, G.-W. 2004. Condensation risk within loose fill insulation due to natural convection in vertical cavities. Proceedings of the DOE/ ORNL/ASHRAE/BETEC/CIBSE/SBSE International Conference, Performance of Exterior Envelopes of Whole Buildings IX, Clearwater Beach, Florida, USA, December 5–10. Session VIIIA, 12 p.
RIL 107. 1989. Rakennusten veden- ja kosteudeneristysohjeet. Helsinki, Suomen Rakennusinsinöörien Liitto ry. 75 p. (in Finnish)
RIL 107. 2000. Rakennusten veden- ja kosteudeneristysohjeet. Helsinki, Suomen Rakennusinsinöörien Liitto ry. 211 p. (in Finnish)
329
RIL 155. 1984. Lämmön- ja kosteudeneristys. Helsinki, Suomen Rakennusinsinöörien Liitto ry. 389 p. (in Finnish)
RIL 225. 2004. Rakennusosien lämmönläpäisykertoimien laskenta. Ohje standardien SFS-EN ISO 10456 ja SFS-EN ISO 6946 soveltamiseen. Helsinki, Suomen Rakennusinsinöörien Liitto ry. 115 p. (in Finnish)
Rissanen, R. & Viljanen, M. 1998. Kasvikuitupohjaiset materiaalit lämmöneristeinä. Espoo, Teknillinen korkeakoulu, Talonrakennustekniikan laboratorio, Julkaisu 77. 72 p. (in Finnish)
Ritschkoff, A.-C., Viitanen, H. & Koskela, K. 2000. The Responce of Building Materials to the Mould Exposure at Different Humidity and Temperature Conditions. Proceedings of Healthy Buildings 2000 Conference, Microbes, Moisture and Building Physics, Espoo, Finland, August 6–10. Vol. 3, pp. 317-322.
Rode, C. & Burch, D. 1995. Empirical Validation of a Transient Computer Model for Combined Heat and Moisture Transfer. Proceedings of the DOE/ORNL/ASHRAE/ BETEC Conference, Thermal Performance of the Exterior Envelopes of Buildings VI, Clearwater Beach, Florida, USA, December 4–8. Pp. 283-295.
Rode, C. 1998. Organic Insulation Materials: Effect on Indoor Humidity and Necessity of a Vapor Barrier. Proceedings of the DOE/ASHRAE/ORNL/BETEC/NRCC/CIBCE Conference, Thermal Performance of the Exterior Envelopes of Buildings VII, Clearwater Beach, Florida, USA, December 6–10. Pp. 109-121.
Rode, C., Kristiansen, F. & Rasmussen, N.T. 1999. Investigation of the hygrothermal performance of alternative insulation materials. Proceedings of the 5th Symposium on Building Physics in the Nordic Countries, Göteborg, Sweden, August 24–26. Vol. 1, pp. 137-144.
Rode, C., Grau, K. & Mitamura, T. 2001. Model and Experiments for Hygrothermal Conditions of the Envelope and Indoor Air of Buildings. Proceedings of the DOE/ORNL/ASHRAE/BETEC/NRC/CIBCE Conference, Performance of Exterior Envelopes of Whole Buildings VIII: Integration of Building Envelopes, Clearwater Beach, Florida, USA, December 2–7. Session IIA, 12 p.
Rodriquez, E., Baaliña, A., Molina, M., Santaballa, J.A., Vázquez, A., Castellanos, L.R. & Infante, C. 2000. Indoor/outdoor humidity in mild climate domestic buildings in a Coruña (Spain). Proceedings of Healthy Buildings 2000 Conference, Microbes, Moisture and Building Physics, Espoo, Finland, August 6–10. Vol. 2, pp. 119-124.
Rogers, T.S. 1938. Preventing condensation in insulated structures. Architectural Record, March 1938, pp. 109-119.
Rose, W.B. & McCaa, D.J. 1998. Temperature and moisture performance of wall assemblies with fiberglass and cellulose insulation. Proceedings of the DOE/ ASHRAE/ORNL/BETEC/NRCC/CIBCE Conference, Thermal Performance of the

330
Exterior Envelopes of Buildings VII, Clearwater Beach, Florida, USA, December 6–10. Pp. 133-144.
Rose, W.B. 2003. The rise of the diffusion paradigm in the US. Proceedings of Second International Conference of Building Physics, Research in Building Physics, Antwerpen, Belgium, September 14–18. Pp. 327-334.
Rose, W.B. & Francisco P.W. 2004. Field Evaluation of the Moisture Balance Technique to Characterize Indoor Wetness. Proceedings of the DOE/ORNL/ASHRAE/ BETEC/CIBSE/SBSE International Conference, Performance of Exterior Envelopes of Whole Buildings IX, Clearwater Beach, Florida, USA, December 5–10. Session VIIIB, 6 p.
Rossiter, W.J., Weidt, J.L. & Saxler, R.J. 1981. A Field Survey of the Performance Proberties of Insulation Used to Retrofit Cavity Walls of Residences. Proceedings of the ASHRAE/DOE/ORNL Conference, Thermal Performance of the Exterior Envelopes of Buildings, Kissimmee, Florida, USA, December 3–5, 1979. New York, American Society of Heating, Refrigerating and Air-Conditioning Engineers. Pp. 901-915.
Rousseau, M. 1999. An Overview of the Survey of Building Envelope Failures in the Coastal Climate of British Columbia, Performed by Morrison-Hershfield Limited for CMCH 1996. Journal of Thermal Envelope and Building Science, Vol. 22, pp. 364-367.
Rowley, F.B., Algren, A.B. & Lund, C.E. 1938. Condensation of Moisture and Its Relation to Building Construction and Operation. ASHVE Transactions. No. 1115, Vol. 44. American Society of Heating and Ventilating Engineers. Pp. 239-249.
Rowley, F.B. 1939. A Theory Covering the Transfer of Vapor Through Materials. ASHVE Transactions. No. 1134, Vol. 45. American Society of Heating and Ventilating Engineers. P. 545.
Saarimaa, J., Nieminen, J., Rautiainen, L., Ojanen, T. & Kohonen, R. 1989. Kosteuden siirtyminen rakenteissa, Rakennusaineiden kosteustekniset ominaisuudet. Espoo, Valtion teknillinen tutkimuskeskus, VTT Tiedotteita 644. 98 p. (in Finnish)
Salonvaara, M. 1990. A Transient method to Determine Moisture and Heat Transport Coefficients of Porous Materials. Proceedings of the 2nd Symposium on Building Physics in the Nordic Countries. Trondheim, Norway, June 17–19. Vol. 1, pp. 355-360.
Salonvaara, M. & Karagiozis, A. 1994. Moisture transport in building envelopes using an approximate factorization solution method. Proceedings of the 2nd Annual Conference of the CFD Society of Canada, Toronto, Canada, . Pp. 317-326.
Salonvaara, M.H. 1998a. Prediction of Hygrothermal Performance of Building Envelope Parts Coupled with Indoor Climate. ASHRAE Transactions. Vol. 104, Part 2.

331
Atlanta, American Society of Heating, Refrigerating and Air-Conditioning Engineers. Pp. 908-918.
Salonvaara, M.H. & Nieminen, J. 1998b. Hygrothermal Performance of a New Light Gauge Steel-Framed Envelope System. ASHRAE Transactions. Vol. 104, Part 2. Atlanta, American Society of Heating, Refrigerating and Air-Conditioning Engineers. Pp. 1256-1262.
Salonvaara, M.H., Ojanen, T.T., Kokko, E. & Karagiozis, A.N. 1998c. Drying Capabilities of Wood Frame Walls with Wood Siding. Proceedings of the DOE/ ASHRAE/ORNL/BETEC/NRCC/CIBCE Conference, Thermal Performance of the Exterior Envelopes of Buildings VII, Clearwater Beach, Florida, USA, December 6–10. Pp. 165-177.
Salonvaara, M., Karagiozis, A. & Holm, A. 2001. Stochastic Building Envelope Modelling – The Influense of Material Properties. Proceedings of the DOE/ORNL/ ASHRAE/BETEC/NRC/CIBCE Conference, Performance of Exterior Envelopes of Whole Buildings VIII: Integration of Building Envelopes, Clearwater Beach, Florida, USA, December 2–7. Session IIIA, 8 p.
Samuelson, I. & Blomquist, G. 1996. Microbiological Decay of Building Materials a Comparison of Different Methods of Analysis. Proceedings of the 4th Symposium on Building Physics in the Nordic Countries, Helsinki, Finland. Pp. 27-34.
Sandberg, P.I. 1992. Determination of the Effects of Moisture on the Thermal Transmissivity of Cellulose Fiber Loose-Fill Insulation. Proceedings of the ASHRAE/DOE/BTECC Conference, Thermal Performance of the Exterior Envelopes of Buildings V, Clearwater Beach, Florida, USA, December 7–10. Pp. 517-525.
Sanders, C. 1996. IEA Annex 24: Task 2: Environmental Conditions. Leuven, Acco, International Energy Agency, Energy Conservation in Buildings and Community Systems, Heat, Air and Moisture Transfer in Insulated Envelope Parts (HAMTIE), Final Report, Vol. 2. 96 p.
Schuyler. G.D., Swinton, M. & Lankin, J. 1989. Walldry – A computer model that simulates moisture migration through frame walls – Comparison to field data. Proceedings of ASHRAE/DOE/BTECC/CIBSE Conference, Thermal Performance of the Exterior Envelopes of Building IV, Orlando, Florida, USA, December 4–7. Pp. 492-505.
Scott, M.A. & Lawton, M. 1991. Laboratory experimentation in wood frame wall drying with comparisons to WALLDRY (modified 1986 version). Ottawa, Canada Mortage and Housing Corporation (CMHC), Report no. 39165.OR/4. 43 p. + appendices.
Finch, G., Straube, J. & Hubbs, B. 2006. Building envelope performance monitoring and modelling of West Coast rainscreen enclosures..

332
Sedlbauer, K. & Künzel. H.M. 2000. Field tests confirm the trend: Vapour-permeable is better than vapour-tight. Proceedings of the International Building Physics Conference, Tools for design and engineering of buildings, Eindhoven, The Netherlands, September 18–21. Pp. 555-563.
Sedlbauer, K. 2001. Vorhersage von Schimmelpilzbildung auf und in Bauteilen. Doktor-Ingenieur Dissertation. Stuttgart, Universität Stuttgart, Fakultät Bauingenieur- und Vermessungswesen. 158 p. + tables and figures. (in German)
Sedlbauer, K. 2002. Prediction of Mould Growth by Hygrothermal Calculation. Journal of Thermal Envelope and Building Science, Vol. 25, pp. 321-336.
Seppänen, O. & Seppänen, M. 1997. Rakennusten sisäilmasto ja LVI-tekniikka. Helsinki, Sisäilmayhdistys ry. 279 p. (in Finnish)
Sherwood, G.E. 1983. Condensation Potential in High Thermal Performance Walls – Cold Winter Climate. Madison, USDA Forest Service, Forest Products Laboratory, Research paper 433. 20 p.
Sherwood, G.E. 1985. Condensation Potential in High Thermal Performance Walls – Hot, Humid Summer Climate. Madison, USDA Forest Service, Forest Products Laboratory, Research paper 455.
Sikander, E. 1996. Fuktsäkerhet hos några typer av byggnadskonstruktioner. SP Rapport 1996:34. Borås, Sveriges Provnings- och Forskningsinstitut. 72 p. (in Swedish)
Simonson, C.J. 2000. Moisture, Thermal and Ventilation Performance of Tapanila Ecological House. Espoo, Technical Research Centre of Finland, VTT Research Notes 2069. 146 p.
Simonson, C.J., Salonvaara, M. & Ojanen, T. 2001. Improving indoor climate and comfort with wooden structures. Espoo, Technical Research Centre of Finland, VTT Publications 431. 291 p.
Stewart, M.B. 1981. Annual Cycle Moisture Analysis. Proceedings of the ASHRAE/ DOE/ORNL Conference, Thermal Performance of the Exterior Envelopes of Buildings, Kissimmee, Florida, USA, December 3–5, 1979. New York, American Society of Heating, Refrigerating and Air-Conditioning Engineers. Pp. 887-896.
Stewart, M.B. 1982. An Experimental Approach to the Study of Moisture Dynamics in Walls. In: Lieff M. & Trechsel H.R. (eds.). Moisture Migration in Buildings, STP 779. Philadelphia, USA, American Society for Testing and Materials. Pp. 92-101.
Stewart, W.E. 1998. Effect of Air Pressure Differential on Vapor Flow Through Sample Building Walls. ASHRAE Transactions. Vol. 104, Part 2. Atlanta, American Society of Heating, Refrigerating and Air-Conditioning Engineers. Pp. 17-24.
Straube, J.F. 2001a. The Influence of Low-Permeance Vapor Barriers on Roof and Wall Performance. Proceedings of the DOE/ORNL/ASHRAE/BETEC/NRC/CIBCE Conference, Performance of Exterior Envelopes of Whole Buildings VIII:

333
Integration of Building Envelopes, Clearwater Beach, Florida, USA, December 2–7. Session IXA, 12 p.
Straube, J.F. & Burnett E.F.P. 2001b. Overview of hygrothermal analysis methods. In: Trechsel H.R. (ed.). ASTM Manual 40: Moisture Analysis and Condensation Control in Building Envelopes, Chapter 5. Philadelphia, USA, American Society for Testing and Materials. Pp. 81-89.
Straube, J.F., Onysko, D. & Schumacher, C. 2002. Methodology and Design of Field Experiments for Monitoring the Hygrothermal Performance of Wood Frame Enclosures. Journal of Thermal Envelope & Building Science, Vol. 26, pp. 123-151.
Sundström, J. & Davidsson, T. 1995. Hygroskopiska Isolermaterials fuktpåverkan i en konstruktion. Byggnadsingenjörsprogrammet – Examensarbete, Borås, Högskolan i Borås, Institutionen för teknik. 62 p. (in Swedish)
Suomen kartasto, vihko 131, 1987. 1988. Ilmasto. Helsinki, Maanmittaushallitus, Suomen Maantieteellinen Seura. 31 p. + app. 1 p. (in Finnish)
Svennberg, K., Hedegaard, L. & Rode, C. 2004. Moisture Buffer Performance of a Fully Furnished Room. Proceedings of the DOE/ORNL/ASHRAE/BETEC/CIBSE/SBSE International Conference, Performance of Exterior Envelopes of Whole Buildings IX, Clearwater Beach, Florida, USA, December 5–10. Session IVA, 11 p.
Swinton, M.C. & Mitalas, G.P. 1990. The Effect of Separating the Air and Vapour Barriers on Moisture Movement in Walls – A Discussion Paper. Proceedings of the Fifth Conference on Building Sciense and Technology. Toronto, Canada, March 1–2. Pp. 133-155.
Tammelin, B. & Erkiö, E. 1987. Energialaskennan säätiedot – Suomalainen testivuosi. Helsinki, Ilmatieteen laitos, Raportti 7. 109 p. (in Finnish)
Technical Regulations under the Planning and Building Act. 1997. Oslo, National Office of Building Technology and Administration. 55 p.
Teesdale, L.V. 1939. Condensation Problems in Modern Buildings. Madison, Wisconsin, Department of Agriculture, Forest Service, Forest Products Laboratory, Report No. 1196.
TenWolde, A. & Mei, H.T. 1986. Moisture Movement in Walls in a Warm Humid Climate. Proceedings of the ASHRAE/DOE/BTECC Conference, Thermal Performance of the Exterior Envelopes of Buildings III, Clearwater Beach, Florida, December 2–5, 1985. Atlanta, American Society of Heating, Refrigerating and Air-Conditioning Engineers. Pp. 570-582.
TenWolde, A. 1989. Moisture Transfer Through Materials and Systems in Buildings. In: Trechsel, H.R. & Bomberg, M. (eds.). Water Vapor Transmission Through Building Materials and Systems: Mechanisms and Measurement, STP 1039. Philadelphia, USA, American Society for Testing and Materials. Pp. 11-18.

334
TenWolde, A. & Carll, C. 1995. Moisture Accumulation in walls: Comparison of Field and Computer-Predicter data. Proceedings of the DOE/ORNL/ASHRAE/BETEC Conference, Thermal Performance of the Exterior Envelopes of Buildings VI, Clearwater Beach, Florida, USA, December 4–8. Pp. 297-305.
TenWolde, A. & Rose, W.B. 1996. Moisture Control Strategies for the Building Envelope. Journal of Thermal Insulation and Building Envelopes, Vol. 19, pp. 206-214.
TenWolde, A. & Walker, S.I. 2001. Interior Moisture Design Loads for Residences. Proceedings of the DOE/ORNL/ASHRAE/BETEC/NRC/CIBCE Conference, Performance of Exterior Envelopes of Whole Buildings VIII: Integration of Building Envelopes, Clearwater Beach, Florida, USA, December 2–7. Session VA, 6 p.
Thue, J.V., Skogstad, H.B. & Homb, A. 1996. Wood Frame Walls in Cold Climate-Vapour Barrier Requirements. Journal of Thermal Insulation and Building Envelopes, Vol. 20, pp. 63-75.
Time, B. 1996. Moisture transport and absorption properties of wood. Proceedings of the 4th Symposium on Building Physics in the Nordic Countries: Building Physics ‘96. Espoo, Finland, September 9–10. Pp. 413-421.
Timusk, J. 1992. The nature of moisture problems and their cause. Proceedings of the Sixth Conference on Building Science and Technology, Toronto, Canada, March 5–6. Pp. 163-173.
Tobiasson, P.E. & Harrington, M. 1986. Vapor Drive Maps of the U.S. Proceedings of the ASHRAE/DOE/BTECC Conference, Thermal Performance of the Exterior Envelopes of Buildings III, Clearwater beach, Florida, USA, December 2–5, 1985. Atlanta, American Society of Heating, Refrigerating and Air-Conditioning Engineers. Pp. 663-672.
Tobiasson, P.E. 1989. Vapor Retarders to Control Summer Condensation. Proceedings of ASHRAE/DOE/BTECC/CIBSE Conference, Thermal Performance of the Exterior Envelopes of Building IV, Orlando, Florida, USA, December 4–7. Pp. 566-572.
Tolstoy, N., Borgström, M., Högberg, H. & Nilsson, J. 1993. Bostadsbeståndets tekniska egenskaper. Gävle, Statens institut för byggnadsforskning, ELIB-rapport 6. 104 p. (in Swedish)
Tolstoy, N. 1994. The Condition of Buildings, Investigation methodology and applications. Stockholm, The Royal institute of Technology. 62 p.
Tsongas, G.A., Odell, F.G. & Thompson, J.C. 1981. A Field Study of Moisture Damage in Walls Insulated Without a Vapour Barrier. Proceedings of the ASHRAE/DOE/ ORNL Conference, Thermal Performance of the Exterior Envelopes of Buildings, Kissimmee, Florida, USA, December 3–5, 1979. New York, American Society of Heating, Refrigerating and Air-Conditioning Engineers. Pp. 801-815.

335
Tsongas, G.A. 1986. The Spokane Wall Insulation Project: A Field Study of Moisture Damage in Walls Insulated Without a Vapor Barrier. Proceedings of the ASHRAE/DOE/BTECC Conference, Thermal Performance of the Exterior Envelopes of Buildings III, Clearwater beach, Florida, USA, December 2–5, 1985. Atlanta, American Society of Heating, Refrigerating and Air-Conditioning Engineers. Pp. 556-569.
Tsongas, G.A. 1990. The Northwet wall moisture study: Afield study of moisture in the exterior walls of New Northwest energy-efficient homes. In: McElroy, D.L. & Kimpflen, J.F. (eds.). Insulation Materials, Testing, and Applications, STP 1030. Philadelphia, USA, American Society for Testing and Materials. Pp. 464-482.
Tsongas, G., Burch, D., Roos, C. & Cunningham, M. 1995a. A Parametric Study of Wall Moisture Contents Using a Revised Variable Indoor Relative Humidity Version of the "MOIST" Transient Heat and Moisture Trasfer Model. Proceedings of the DOE/ORNL/ASHRAE/BETEC Conference, Thermal Performance of the Exterior Envelopes of Buildings VI, Clearwater Beach, Florida, USA, December 4–8. Pp. 307-319.
Tsongas, G. & Olson, J. 1995b. Tri State Homes: A Case Study of Extensive Decay in the Walls of Older Manufactured Homes with an Exterior Vapor Retarder. Proceedings of the DOE/ORNL/ASHRAE/BETEC Conference, Thermal Performance of the Exterior Envelopes of Buildings VI, Clearwater Beach, Florida, USA, December 4–8. Pp. 207-218.
Uvsløkk, S., Skogstad, H.B. & Aske, I.J. 1996. Natural Convection in Timber Frame Walls with thick Thermal Insulation Layer. Proceedings of the 4th Symposium on Building Physics in the Nordic Countries: Building Physics ‘96. Espoo, Finland, September 9–10. Pp. 315-322.
Uvsløkk, S., Geving, S. & Thue, J.V. 1999. Hygrothermal Performance of Timber Frame Walls, Results from Test House Measurements. Proceedings of the 5th Symposium on Building Physics in the Nordic Countries. Göteborg, Sweden, August 24–26. Vol. 2. Pp. 653-660.
Valovirta, I. & Vinha, J. 2003. Puurakenteisten ulkoseinärakenteiden materiaalien rakennusfysikaaliset ominaisuudet. Sisäilmastoseminaari 2003, Sisäilmastoyhdistys ry. Espoo, Suomi, maaliskuu 19–20. Pp. 91-96. (in Finnish)
Valovirta, I. & Vinha, J. 2004. Water Vapor Permeability and Thermal Conductivity as a Function of Temperature and Relative Humidity. Proceedings of the DOE/ORNL/ ASHRAE/BETEC/CIBSE/SBSE International Conference, Performance of Exterior Envelopes of Whole Buildings IX, Clearwater Beach, Florida, USA, December 5–10. Session XIIIA, 16 p.
Van der Kooi, J. & Knorr, K.T. 1973. De temperatuuren vochtigheid in woningen. Klimaatbeheersing, Vol. 2, pp. 490-496. (in Dutch)
336
Verrall, A.F. 1962. Condensation in air-cooled buildings. Forest Products Journal, Vol. 12, pp. 531-536.
Viitanen, H. 1996. Factors affecting the development of mould and brown decay in wooden material and wooden structures, Effect of humidity, temperature and exposure time. Ph.D. thesis. Uppsala, The Swedish University of Agricultural Sciences, Department of Forest Products. 58 p. + appendices.
Viitanen, H., Hanhijärvi, A., Hukka, A. & Koskela, K. 2000. Modeling Mould Growth and Decay Damages. Proceedings of Healthy Building 2000 Conference, Microbes, Moisture and Building Physics, Espoo, Finland, August 6–10. Vol. 3, pp. 341-346.
Viitanen, H. & Salonvaara, M. 2001. Failure Criteria. Chapter 4, ASTM Manual 40: Moisture Analysis and Condensation Control in Building Envelopes, Ed. H. R. Trechsel. Philadelphia, American Society for Testing and Materials. Pp. 66-80.
Viitanen, H. 2004. Betonin ja siihen liittyvien materiaalien homehtumisen kriittiset olosuhteet – betonin homeenkesto.Espoo, Valtion teknillinen tutkimuskeskus, VTT Working Papers 6. 25 p. (in Finnish)
Viljanen, M. 1981. Infrapunakuvaus rakennuksen ulkovaipan lämmöneristysvirheiden ja ilmavuotojen määrittämisessä. Espoo, Valtion teknillinen tutkimuskeskus, VTT Tiedonanto 13. 97 p. + app. 2 p. (in Finnish)
Vinha, J. 1998. Rakenteiden lämmöneristysominaisuuksien mittauslaitteisto. Lisensiaatin-tutkimus. Tampere, Tampereen teknillinen korkeakoulu, Rakennustekniikan osasto. 106 p. + app. 17 p. (in Finnish)
Vinha, J. & Käkelä, P. 1999. Water Vapour Transmission in Wall Structures Due to Diffusion and Convection. Tampere, Tampere University of Technology, Laboratory of Structural Engineering, Publication 103. 110 p.
Vinha, J. & Käkelä, P. 2000. Water Vapour Transmission in Wall Structures Due to Diffusion and Convection. Proceedings of Healthy Buildings 2000 Conference, Microbes, Moisture and Building Physics, Espoo, Finland, August 6–10. Vol. 3, pp. 197-202.
Vinha, J., Käkelä, P. & Lindberg, R. 2001a. Moisture Performance of Timber-Framed External Wall Structures. Proceedings of International Conference on Building Envelope Systems and Technologies, ICBEST 2001, Ottawa, Canada. Vol. 1, pp. 137-142.
Vinha, J.O., Käkelä, P. & Lindberg, R. 2001b. Moisture Behavior of Timber-Framed External Wall Structures in Nordic Climate. Proceedings of International Conference on Indoor Air Quality 2001, Moisture, Microbes and Health Effects: Indoor Air Quality and Moisture in Buildings, San Francisco, USA, November 4–7. Session 4, 8 p.
337
Vinha, J., Käkelä, P. & Lindberg, R. 2002a. Moisture Transport in Timber-Framed External Wall Structures in Nordic Climate – Laboratory Tests. Proceedings of the 6th Symposium on Building Physics in the Nordic Countries, Trondheim, Norway, June 17–19. Vol. 2, pp. 595-602.
Vinha, J., Mikkilä, A., Valovirta, I. & Lindberg, R. 2002b. Water Vapour Resistance of Materials as a Function of Humidity. Proceedings of the 6th Symposium on Building Physics in the Nordic Countries, Trondheim, Norway, June 17–19. Vol. 2, pp. 501-508.
Vinha, J. & Kalamees, T. 2003a. Principles to Analyse The Moisture Performance of Timber-Framed External Wall Assembly Due to Diffusion. Proceedings of the Ninth Conference on Building Sciense and Technology, Design and Construction of Durable Building Envelopes, Vancouver, Canada, February 27–28. Pp. 123-140.
Vinha, J., Käkelä, P. & Kalamees, T. 2003b. Puurunkoisten seinärakenteiden kosteusteknisen toiminnan vertailu omakotitalossa. Tampere, Tampere teknillinen yliopisto, Talonrakennustekniikan laboratorio, Julkaisu 116. 54 p + app. 11 p. (in Finnish)
Vinha, J., Korpi, M., Valovirta, I., Kalamees, T. & Kurnitski, J. 2004a. Sisäilman kosteuslisä suomalaisissa pientaloissa. Sisäilmastoseminaari 2004, Sisäilmastoyhdistys ry. Espoo, Suomi, maaliskuu 17–18. Pp. 81-86 (in Finnish)
Vinha, J. & Käkelä, P. 2004b. Drying Rate of Timber-Framed External Wall Assemblies in Nordic Climate. Proceedings of the DOE/ORNL/ASHRAE/BETEC/CIBSE/SBSE International Conference, Performance of Exterior Envelopes of Whole Buildings IX, Clearwater Beach, Florida, USA, December 5–10. Session VIA, 11 p.
Vinha, J., Korpi, M., Kalamees, T., Eskola, L., Palonen, J., Kurnitski, J., Valovirta, I., Mikkilä, A. & Jokisalo, J. 2005a. Puurunkoisten pientalojen kosteus- ja lämpötilaolosuhteet, ilmanvaihto ja ilmatiiviys. Tampere, Tampereen teknillinen yliopisto, Talonrakennustekniikan laboratorio, Julkaisu 131. 102 p. + app. 10 p. (in Finnish)
Vinha, J., Valovirta, I., Korpi, M., Mikkilä, A. & Käkelä, P. 2005b. Rakennusmateriaalien rakennusfysikaaliset ominaisuudet lämpötilan ja suhteellisen kosteuden funktiona. Tampere, Tampereen teknillinen yliopisto, Talonrakennustekniikan laboratorio, Julkaisu 129. 101 p. + app. 211 p. (in Finnish)
Vinha, J. & Käkelä, P. 2007. Moisture Performance of Timber-Framed External Walls in Finnish Climatic Conditions. Acta Universitatis Ouluensis C. Oulu, University of Oulu. 29 p. (in Finnish, accepted for publishing)
Wang, F.S. 1981. Comparative Studies of Vapour Condensation Potentials in Wood Framed Walls. Proceedings of the ASHRAE/DOE/ORNL Conference, Thermal Performance of the Exterior Envelopes of Buildings, Kissimmee, Florida, USA,
338
December 3–5, 1979. New York, American Society of Heating, Refrigerating and Air-Conditioning Engineers. Pp. 836-846.
Weatherization study. 1980. Wisconsin, The Wisconsin Office of State Planning and Energy for the Wisconsin Department of Agriculture, Trade and Consumer Protection
Weidt, J.L. 1980. Minnesota retrofit insulation in situ test program extension and review. Oak Ridge, Oak Ridge National Laboratory, ORNL/SUB-79/13660/1.
Wettermann, T. 1982. Control of Moisture Migration in Light Frame Walls. In: Lieff & Trechsel (eds.). Moisture Migration in Buildings, STP 779. Philadelphia, USA, American Society for Testing and Materials. Pp. 102-109.
Wong, S.P.W. & Wang, S.K. 1990. Fundamentals of simultaneous heat and moisture transfer between the building envelope and the conditioned space air. ASHRAE Transactions. Vol. 96, Part 2. Atlanta, American Society of Heating, Refrigerating and Air-Conditioning Engineers. Pp. 73-83.
Zarr, R.R., Burch, D.M. & Fanney, A.H. 1995. Heat and Moisture transfer in wood-based wall construction: Measured versus predicted. Gaithersburg, Maryland, National Institute of Standards and Technology, NIST Building Science Series 173. 72 p.

APPENDICES
Appendix 1
Properties and materials of test walls in second laboratory test series 2 pages Appendix 2
Test results of second laboratory test series 4 pages Appendix 3
Building physical properties of materials 4 pages

Appendix 1 1/2

Appendix 1 2/2

Appendix 2 1/4
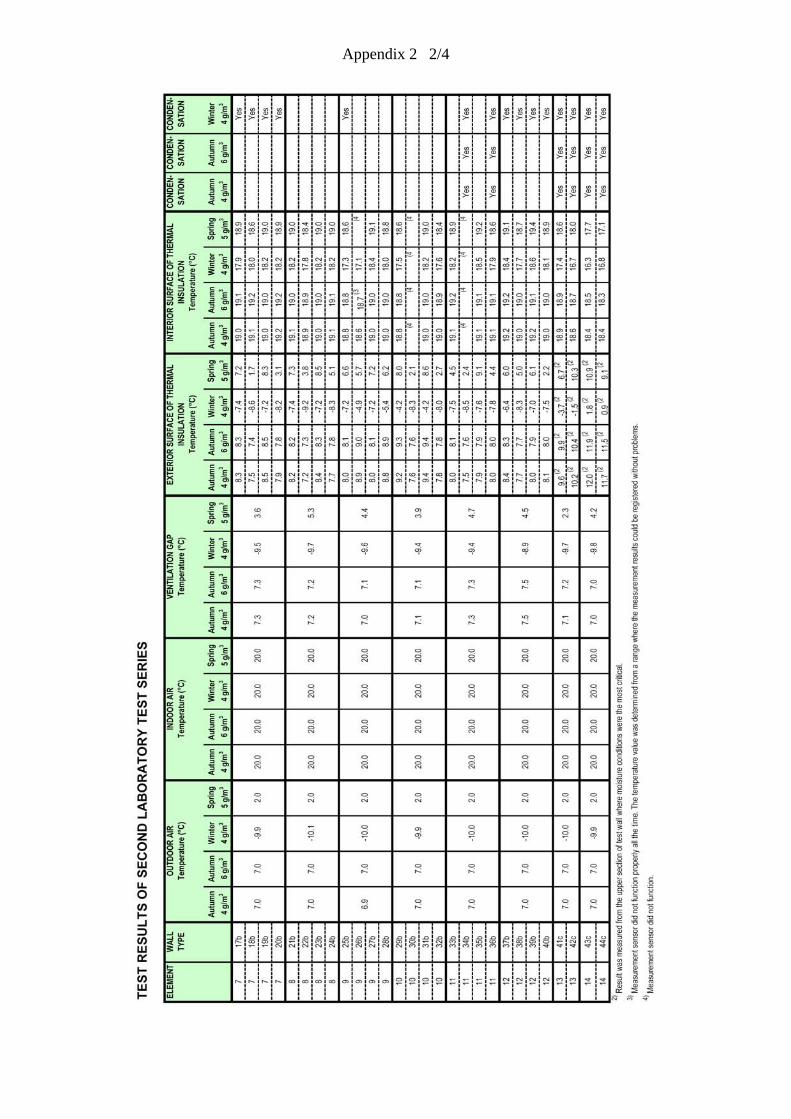
Appendix 2 2/4

Appendix 2 3/4

Appendix 2 4/4

Appendix 3 1/4
BUILDING PHYSICAL PROPERTIES OF MATERIALS
MATERIAL DRYDENSITY
POROSITY HEATCAPACITY
kg/m3 m3/m3 J/(kg·K) 0 33 55 65 75 80 83 86 93whygr
97wcap
100A1 Gypsum board 9 mm 774 0.68 1100 0.0 6.1 8.2 8.9 9.7 10.8 11.4 13.4 18.2 23.8 500A2 Wood fibreboard 25 mm 280 0.85 1500 0.0 12.3 20.0 24.1 28.2 35.7 40.2 47.6 64.8 74.8 140A3 Glass wool board 30 mm 73 0.94 850 0.0 0.51 0.58 0.60 0.62 0.91 1.1 1.6 2.9 3.3 4.1A4 Glass wool board 25 mm + weather. memb. 104 0.93 850 0.0 0.80 0.90 0.97 1.0 1.4 1.7 2.6 4.7 5.4 6.8A5 Rock wool board 30 mm 92 0.94 850 0.0 0.19 0.21 0.25 0.28 0.33 0.36 0.38 0.44 0.56 0.70A6 Rock wool board 30 mm + weather. memb. 120 0.93 850 0.0 0.21 0.24 0.27 0.29 0.35 0.38 0.43 0.54 0.64 0.80A7 Cellulose insulation board 25 mm 63 0.95 2000 0.0 4.9 6.4 7.9 9.4 11.4 12.7 17.5 28.9 32.6 710A8 Wood hardboard 4.8 mm 1140 0.999 (2 1500 0.0 69.9 88.2 125 163 195 214 236 288 328 990 (3
A9 Chipboard 12 mm 723 0.80 (2 1500 0.0 43.7 60.4 82.8 105 127 140 149 170 197 760A11 Spruce plywood 9 mm 394 0.65 1500 0.0 22.9 31.0 43.2 55.4 67.5 74.8 86.5 114 126 590A13 Wood fibreboard 12 mm 270 0.85 1500 0.0 12.4 19.6 22.4 25.2 33.6 38.7 45.9 62.7 71.3 210B1 Weatherization membrane 360 (1 0.60 1500B2 Weatherization membrane 250 (1 0.60 1500B3 Weatherization membrane 230 (1 0.60 1500B4 Weatherization membrane 390 (1 0.60 1500B5 Bitumen paper 940 (1 0.60 1500B6 Bitumen crape 540 (1 0.60 1500B7 Bitumen blanket 860 (1 0.60 1500B8 Bitumen paper 840 (1 0.60 1500B9 Bitumen crape 620 (1 0.60 1500C1 Gypsum board 13 mm 574 0.77 1100 0.0 4.6 6.3 6.7 7.1 8.0 8.6 9.9 13.5 17.7 370C2 Wood fibreboard 12 mm 234 0.85 1500 0.0 10.4 16.9 19.8 22.7 29.5 33.6 39.8 54.2 62.2 150C3 Chipboard 12 mm 592 0.999 (2 1500 0.0 34.9 49.1 69.1 89.1 106 116 128 158 172 990 (4
C6 Oriented strand board (OSB) 12 mm 646 0.90 (2 1500 0.0 37.1 53.0 72.9 92.7 110 121 133 162 183 840C7 Plastic coated paper 940 (1 0.30 2000C8 Waxed paper 880 (1 0.30 1500C9 Plastic coated paper 760 (1 0.30 2000
C10 Bitumen paper 740 (1 0.60 1500C11 Plastic film 980 0.001 2300C12 Building paper 750 0.60 1500C13 Pine 10 mm 532 0.90 (2 2700 0.0 32.3 45.0 62.6 80.1 97.5 108 126 169 185 870C14 Air barrier paper 600 (1 0.60 1500C15 Air barrier paper 990 (1 0.60 1500D1 Glass wool 50 mm 22 0.98 850 0.0 0.45 0.54 0.66 0.78 0.98 1.0 1.3 1.9 2.4 3.0D2 Rock wool 50 mm 37 0.97 850 0.0 0.15 0.23 0.33 0.43 0.53 0.59 0.62 0.69 0.93 1.2D3 Cellulose batt insulation 50 mm 51 0.95 2000 0.0 2.8 3.8 4.8 5.7 7.3 8.2 11.3 18.5 22.2 650D4 Cellulose insulation 50 mm (loose) 37 0.97 2000 0.0 1.9 3.1 4.0 4.8 6.1 6.8 8.6 12.9 15.2 430
D4a Cellulose insulation 50 mm (loose) 60 0.95 2000 0.0 3.1 5.0 6.4 7.8 9.8 11.0 14.0 20.9 24.6 570D5 Flax insulation 50 mm 39 0.97 2000 0.0 1.8 2.7 3.2 3.7 5.0 5.7 8.6 15.3 17.6 94D6 Sawdust 50 mm (loose) 168 0.87 2500 0.0 10.7 16.2 19.9 23.6 28.4 31.2 34.4 42.0 47.5 720D7 Chipping 50 mm (loose) 130 0.90 2500 0.0 7.8 11.8 14.5 17.1 20.7 22.8 25.5 31.8 36.3 540
D67 Sawdust + chipping 50 mm (loose) 149 0.89 2500 0.0 9.3 14.0 17.2 20.3 23.2 24.9 28.5 36.9 41.9 6301) The value was determined from a roll at laboratory relative humidity. 2) The value is bigger than in reality to allow for swelling of board in calculations. 3) The measured value was over 1000 kg/m3 because of swelling.4) The measured value was about 1000 kg/m3 because of swelling.
SORPTION CURVEw (kg/m3), f(ϕ ) [+23°C]
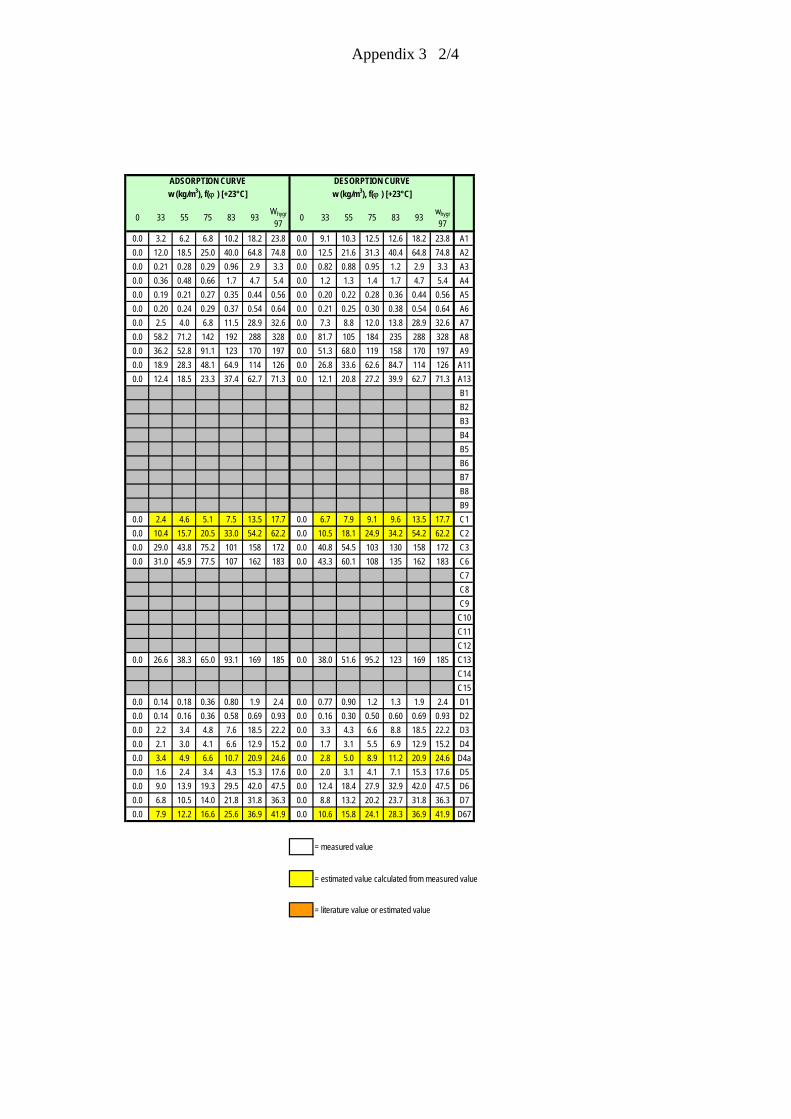
Appendix 3 2/4
0 33 55 75 83 93Whygr
970 33 55 75 83 93
whygr
970.0 3.2 6.2 6.8 10.2 18.2 23.8 0.0 9.1 10.3 12.5 12.6 18.2 23.8 A10.0 12.0 18.5 25.0 40.0 64.8 74.8 0.0 12.5 21.6 31.3 40.4 64.8 74.8 A20.0 0.21 0.28 0.29 0.96 2.9 3.3 0.0 0.82 0.88 0.95 1.2 2.9 3.3 A30.0 0.36 0.48 0.66 1.7 4.7 5.4 0.0 1.2 1.3 1.4 1.7 4.7 5.4 A40.0 0.19 0.21 0.27 0.35 0.44 0.56 0.0 0.20 0.22 0.28 0.36 0.44 0.56 A50.0 0.20 0.24 0.29 0.37 0.54 0.64 0.0 0.21 0.25 0.30 0.38 0.54 0.64 A60.0 2.5 4.0 6.8 11.5 28.9 32.6 0.0 7.3 8.8 12.0 13.8 28.9 32.6 A70.0 58.2 71.2 142 192 288 328 0.0 81.7 105 184 235 288 328 A80.0 36.2 52.8 91.1 123 170 197 0.0 51.3 68.0 119 158 170 197 A90.0 18.9 28.3 48.1 64.9 114 126 0.0 26.8 33.6 62.6 84.7 114 126 A110.0 12.4 18.5 23.3 37.4 62.7 71.3 0.0 12.1 20.8 27.2 39.9 62.7 71.3 A13
B1B2B3B4B5B6B7B8B9
0.0 2.4 4.6 5.1 7.5 13.5 17.7 0.0 6.7 7.9 9.1 9.6 13.5 17.7 C10.0 10.4 15.7 20.5 33.0 54.2 62.2 0.0 10.5 18.1 24.9 34.2 54.2 62.2 C20.0 29.0 43.8 75.2 101 158 172 0.0 40.8 54.5 103 130 158 172 C30.0 31.0 45.9 77.5 107 162 183 0.0 43.3 60.1 108 135 162 183 C6
C7C8C9
C10C11C12
0.0 26.6 38.3 65.0 93.1 169 185 0.0 38.0 51.6 95.2 123 169 185 C13C14C15
0.0 0.14 0.18 0.36 0.80 1.9 2.4 0.0 0.77 0.90 1.2 1.3 1.9 2.4 D10.0 0.14 0.16 0.36 0.58 0.69 0.93 0.0 0.16 0.30 0.50 0.60 0.69 0.93 D20.0 2.2 3.4 4.8 7.6 18.5 22.2 0.0 3.3 4.3 6.6 8.8 18.5 22.2 D30.0 2.1 3.0 4.1 6.6 12.9 15.2 0.0 1.7 3.1 5.5 6.9 12.9 15.2 D40.0 3.4 4.9 6.6 10.7 20.9 24.6 0.0 2.8 5.0 8.9 11.2 20.9 24.6 D4a0.0 1.6 2.4 3.4 4.3 15.3 17.6 0.0 2.0 3.1 4.1 7.1 15.3 17.6 D50.0 9.0 13.9 19.3 29.5 42.0 47.5 0.0 12.4 18.4 27.9 32.9 42.0 47.5 D60.0 6.8 10.5 14.0 21.8 31.8 36.3 0.0 8.8 13.2 20.2 23.7 31.8 36.3 D70.0 7.9 12.2 16.6 25.6 36.9 41.9 0.0 10.6 15.8 24.1 28.3 36.9 41.9 D67
= measured value
= estimated value calculated from measured value
= literature value or estimated value
ADSORPTION CURVEw (kg/m3), f(ϕ ) [+23°C]
DESORPTION CURVEw (kg/m3), f(ϕ ) [+23°C]

Appendix 3 3/4
BUILDING PHYSICAL PROPERTIES OF MATERIALS
MATERIAL
0 35 45 55 65 75 85 95 100 µ (-) Zν (×103 s/m) δν (×10-6 m2/s)
A1 Gypsum board 9 mm 7.9 7.9 7.9 7.9 7.9 7.9 7.9 7.9 7.9 7.9 2.62 3.4A2 Wood fibreboard 25 mm 4.6 4.6 4.6 4.6 4.6 4.6 4.6 4.6 4.6 4.6 4.29 5.8A3 Glass wool board 30 mm 1.4 1.4 1.4 1.4 1.4 1.4 1.4 1.4 1.4 1.4 1.58 19.0A4 Glass wool board 25 mm + weather. memb. 1.8 1.8 1.8 1.8 1.8 1.8 1.8 1.8 1.8 1.8 1.68 14.9A5 Rock wool board 30 mm 1.5 1.5 1.5 1.5 1.5 1.5 1.5 1.5 1.5 1.5 1.63 18.4A6 Rock wool board 30 mm + weather. memb. 1.7 1.7 1.7 1.7 1.7 1.7 1.7 1.7 1.7 1.7 1.85 16.2A7 Cellulose insulation board 25 mm 2.0 2.0 2.0 2.0 2.0 2.0 2.0 2.0 2.0 2.0 1.88 13.3A8 Wood hardboard 4.8 mm 79 79 79 79 79 79 79 79 79 79 14.1 0.34A9 Chipboard 12 mm 146 146 143 139 136 133 130 127 126 137 60.9 0.20A11 Spruce plywood 9 mm (6 232 232 232/54 216 126 73 42 25 19 100 33.1 0.27A13 Wood fibreboard 12 mm 5.5 5.5 5.5 5.5 5.5 5.5 5.5 5.5 5.5 5.5 2.46 4.9B1 Weatherization membrane (5 87 87 87 87 87 87 87 87 87 87 3.23B2 Weatherization membrane (5 35 35 35/47 17 6.8 2.8 1.1 1.0 (7 1.0 (7 22 0.82B3 Weatherization membrane (5 255 255 197 159 133 114 100 89 85 150 5.57B4 Weatherization membrane (5 318 318 252 206 174 151 133 119 113 193 7.16B5 Bitumen paper (5 137 137 137 137/58 98 62 40 25 20 100 3.70B6 Bitumen crape (5 152 152 152 152/60 122 81 53 35 28 116 4.29B7 Bitumen blanket (5 419 419 419 419/64 400 281 197 137 115 335 12.4B8 Bitumen paper (5 121 121 121 121/62 110 76 52 36 30 101 3.76B9 Bitumen crape (5 151 151 151 151/63 139 97 67 46 38 129 4.70C1 Gypsum board 13 mm 6.9 6.9 6.9 6.9 6.9 6.9 6.9 6.9 6.9 6.9 3.32 3.9C2 Wood fibreboard 12 mm 4.8 4.8 4.8 4.8 4.8 4.8 4.8 4.8 4.8 4.8 2.12 5.7C3 Chipboard 12 mm 39 39 39 39 39 39 39 39 39 39 17.4 0.69C6 Oriented strand board (OSB) 12 mm 162 162 162 162 162 162 162 162 162 162 71.9 0.17C7 Plastic coated paper (5 9900 9900 9800 9700 9610 9520 9430 9340 9290 9640 358C8 Waxed paper (5 650 650 650/54 634 372 219 129 76 58 304 11.3C9 Plastic coated paper (5 3880 3880 3880 3880 3880 3880 3880 3880 3880 3880 144
C10 Bitumen paper (5 293 293 293 293/58 213 136 87 56 44 187 6.93C11 Plastic film 0.2 mm (5 89000 89000 89000 89000 89000 89000 89000 89000 89000 89000 3330 0.00003C12 Building paper (5 23 23 23 23 23 23 23 23 23 23 0.84C13 Pine 10 mm (6 84 84 84 84/57 58 37 23 15 12 49 18.1 0.55C14 Air barrier paper (5 433 433 433 433/64 418 303 219 159 135 357 13.5C15 Air barrier paper (5 1200 1200 1200 1200 779 496 316 201 161 695 26.2D1 Glass wool 50 mm 1.2 1.2 1.2 1.2 1.2 1.2 1.2 1.2 1.2 1.2 2.24 22.3D2 Rock wool 50 mm 1.2 1.2 1.2 1.2 1.2 1.2 1.2 1.2 1.2 1.2 2.24 22.3D3 Cellulose batt insulation 50 mm 1.3 1.3 1.3 1.3 1.3 1.3 1.3 1.3 1.3 1.3 2.48 20.1D4 Cellulose insulation 50 mm (loose) 1.3 1.3 1.3 1.3 1.3 1.3 1.3 1.3 1.3 1.3 2.41 20.8
D4a Cellulose insulation 50 mm (loose) (6 1.7 1.7 1.61 1.53 1.46 1.39 1.33 1.28 1.25 1.5 3.07 17.7D5 Flax insulation 50 mm 1.4 1.4 1.4 1.4 1.4 1.4 1.4 1.4 1.4 1.4 2.51 19.9D6 Sawdust 50 mm (loose) 2.1 2.1 2.1 2.1 2.1 2.1 2.1 2.1 2.1 2.1 3.83 13.0D7 Chipping 50 mm (loose) 2.5 2.5 2.5 2.5 2.5 2.5 2.5 2.5 2.5 2.5 4.57 10.9
D67 Sawdust + chipping 50 mm (loose) 2.3 2.3 2.3 2.3 2.3 2.3 2.3 2.3 2.3 2.3 4.20 12.05) The µ -value of membrane was determined by using 1 mm as a thickness of membrane.6) The µ -value was transient only in some calculations concerning the benchmarking of HAM-programs. 7) The value was set to 1.0 because it cannot be lower than the m-value of air.8) The direction of suction was directly against the grains.9) The value is mean of suction measurements in the direction of and directly against the fibres.
WATER VAPOUR DIFFUSION RESISTANCE FACTORµ (-), f(ϕ ) [+23°C]
MOISTURE TRANSFER COEFFICIENTSConstant values [+23 °C]

Appendix 3 4/4
WATER ABS.COEFFICIENT
λn R65% RH
Aw (kg/(m2·s1/2)) ϕwcap
1000 33 65 86 whygr
97wcap
100W/(m·K) m2·K/W
0.076 80 1.02E-10 8.78E-08 0.19 0.19 0.19 0.20 0.21 0.60 0.21 0.047 A10.005 80 2.82E-11 4.85E-09 0.050 0.051 0.052 0.054 0.056 0.60 0.055 0.48 A2
0.031 0.031 0.031 0.031 0.031 0.60 0.037 0.98 A30.031 0.031 0.031 0.031 0.031 0.60 0.037 0.80 A40.032 0.032 0.032 0.032 0.032 0.60 0.041 0.94 A50.033 0.033 0.033 0.033 0.033 0.60 0.041 0.92 A6
0.086 80 8.09E-11 7.24E-08 0.037 0.037 0.037 0.038 0.040 0.60 0.041 0.67 A70.030 97 3.44E-11 3.49E-09 0.11 0.11 0.12 0.13 0.14 0.60 0.13 0.040 A80.082 97 2.65E-10 4.42E-08 0.11 0.11 0.12 0.13 0.14 0.60 0.14 0.10 A90.022 55 7.60E-12 5.28E-09 0.11 0.11 0.11 0.12 0.13 0.60 0.13 0.082 A110.004 80 4.17E-12 1.38E-09 0.048 0.049 0.050 0.052 0.055 0.60 0.055 0.24 A13
0.10 0.20 0.20 ~0.0 B10.10 0.20 0.20 ~0.0 B20.10 0.20 0.20 ~0.0 B30.10 0.20 0.20 ~0.0 B40.10 0.10 0.12 ~0.0 B50.10 0.10 0.12 ~0.0 B60.10 0.10 0.12 ~0.0 B70.10 0.10 0.12 ~0.0 B80.10 0.10 0.12 ~0.0 B9
0.076 80 1.85E-10 1.59E-07 0.19 0.19 0.19 0.20 0.21 0.60 0.21 0.068 C10.005 80 1.72E-11 4.34E-09 0.049 0.050 0.051 0.053 0.055 0.60 0.055 0.24 C20.015 97 2.90E-12 8.72E-10 0.11 0.11 0.12 0.13 0.14 0.60 0.14 0.10 C30.011 97 2.93E-12 6.52E-10 0.11 0.11 0.12 0.13 0.14 0.60 0.14 0.10 C6
0.10 0.10 0.12 ~0.0 C70.10 0.10 0.12 ~0.0 C80.10 0.10 0.12 ~0.0 C90.10 0.10 0.12 ~0.0 C100.40 0.40 0.40 ~0.0 C110.10 0.10 0.12 ~0.0 C12
0.004 (8 65 1.32E-13 8.03E-11 0.10 0.11 0.12 0.13 0.15 0.60 0.12 0.083 C130.10 0.10 0.12 ~0.0 C140.10 0.10 0.12 ~0.0 C150.035 0.035 0.035 0.035 0.035 0.60 0.041 1.4 D10.034 0.034 0.034 0.034 0.034 0.60 0.041 1.5 D2
0.086 80 7.19E-11 6.65E-08 0.037 0.037 0.038 0.039 0.042 0.60 0.041 1.3 D30.074 80 1.18E-10 1.07E-07 0.038 0.038 0.038 0.039 0.042 0.60 0.041 1.3 D40.065 80 5.56E-11 4.94E-08 0.040 0.040 0.041 0.042 0.044 0.60 0.05 1.2 D4a
0.009 (9 80 5.01E-11 3.48E-08 0.035 0.036 0.036 0.038 0.041 0.60 0.041 1.4 D50.14 80 1.89E-10 1.44E-07 0.055 0.056 0.057 0.061 0.069 0.60 0.08 0.88 D60.034 80 1.96E-11 1.51E-08 0.053 0.054 0.055 0.057 0.060 0.60 0.08 0.91 D70.087 80 9.34E-11 7.25E-08 0.052 0.052 0.054 0.057 0.064 0.60 0.08 0.93 D67
= measured value
= estimated value calculated from measured value
= literature value or estimated value
THERMAL CONDUCTIVITYλ10 (W/(m·K)), f(ϕ ) [+10°C]
LIQUID MOISTURE DIFFUSIVITYDw,liq (m2/s), f(ϕ ) [+23°C]

������������� ����� �����������������������
������������������������ ����� �!�"���#$%&������������'#�� ��(