Cost Estimate - of PMAY(G) House for the Plain Areas ) House ...
Upload
khangminh22Category
view
1download
0
Beyond the Four Walls of PMAYResource efficiency, thermal comfort and liveability in the affordable housing sector
POLICY BRIEF ON PRADHAN MANTRI AWAS YOJANA


Beyond the Four Walls of PMAYResource efficiency, thermal comfort and liveability in the affordable housing sector
POLICY BRIEF ON PRADHAN MANTRI AWAS YOJANA
Centre for Science and Environment

Research direction: Anumita Roychowdhury
Writers: Anumita Roychowdhury, Rajneesh Sareen and Mitashi Singh
Research support: Sugeet Grover and Varnika Upmanyu
Editor: Arif Ayaz Parrey
Cover and design: Ritika Bohra
Production: Rakesh Shrivastava and Gundhar Das
© 2020 Centre for Science and Environment
Material from this publication can be used, but with acknowledgement.
Maps are not to scale.
Citation: Anumita Roychowdhury, Rajneesh Sareen and Mitashi Singh, Beyond the four walls of PMAY: Resource efficiency, thermal comfort and liveability in the affordable housing sector, Centre for Science and Environment, New Delhi
Published by
Centre for Science and Environment41, Tughlakabad Institutional AreaNew Delhi 110 062Phones: 91-11- 40616000Fax: 91-11-29955879E-mail: [email protected] Website: www.cseindia.org
Shakti Sustainable Energy Foundation (Shakti) seeks to facilitate India's transition to a sustainable energy future by aiding the
design and implementation of policies in the following sectors: Clean power, energy efficiency, sustainable urban transport,
climate policy and clean energy finance.
The views and analysis expressed in this document do not necessarily reflect the views of Shakti Sustainable Energy
Foundation. The Foundation also does not guarantee the accuracy of any data included in this publication nor does it accept
any responsibility for the consequences of its use.

1. WHY THIS POLICY BRIEF? 7 An introduction
2. HOUSING DEMAND AND SHORTAGE 33 The number game and its ramifications 3. STATUS OF IMPLEMENTATION 39 The verticals and their horizontal development
4. LIVEABILITY AND SUSTAINABILITY 54 Choices that will determine the future of cities
5. LESSONS AND NEXT STEPS 67 Acceleration and course correction needed
ANNEXURES 75
REFERENCES 84
CONTENTS


1WHY THIS POLICY BRIEF?An introduction
VIKAS CHOUDHARY / CSE

8 Beyond the four walls of PMAY
Pradhan Mantri Awas Yojana—India’s flagship affordable housing policy—was launched in 2015 with an aim to provide serviced dwelling units to every Indian citizen by 2022. It has two components: Pradhan
Mantri Awas Yojana, Urban (PMAY-U) and Pradhan Mantri Awas Yojana, Gramin. As PMAY-U completes its fifth year of implementation, we can draw lessons from on-ground experience, to understand how it is helping address the housing needs of targeted groups while addressing the larger urban agenda of liveability, sustainability and thermal comfort for all. This can help inform course correction for more effective delivery of housing stock.
PMAY-U—the ‘Housing for All’ mission—is India’s latest attempt to close the urban housing gap in the country. A sum of around Rs 8,500 crore has been spent under the programme during 2017–18, and a consistent sum of Rs 6,000 crore is being spent by the Union government every year since 2016. A lot of effort has been put in to grant infrastructure status to housing and to reduce goods and services tax (GST) rates to 1 per cent in order to turn around the real estate sector in favour of affordable housing.
With an aim to construct 11.2 million housing units by 2022, the country is looking at a massive development opportunity and challenge. The requirement of resources for this programme will be colossal. In 2010 McKinsey Global Institute estimated an urban housing demand of 25 million units, which will require at least 200,000 hectares of land. The need for power generation and distribution, wastewater treatment and solid waste management infrastructure will also be enormous.
If not addressed in a timely manner, conventional planning practices can lead to the construction of an affordable housing stock that fails to respond well to the needs of the target population—the section most vulnerable to climate change. This can threaten India’s efforts for climate change adaptation and fulfilment of national and international targets such as those under the Sustainable Development Goal No. 11 (related to housing and common services).
However, with adequate guidance, this is also a great opportunity to plan and design housing that is climate-appropriate, resource-efficient, safe, healthy, comfortable and, most importantly, affordable to the rapidly multiplying urban masses, especially the urban poor. It is important to note that housing broadly accounts for 70 per cent of land use in cities. If housing is made central to urban planning, environmental approaches to spatial planning and service provisions in urban areas will change. Thus, the problems associated with housing as well as the opportunities around it become vital to development. Putting housing at the centre of urban planning will also help to address exclusionary development. For example, when urban slums develop an ecosystem of services, opportunities emerge around it. Currently, this is addressed through ‘zoning’ that invariably pushes these habitats to the city periphery and does not allow holistic solutions to livelihood and development requirements of residents.
In order to be considered for support under PMAY-U, states need to estimate their housing demand and prepare their Housing for All Plan of Action
Aiming to construct 11.2
million housing units by 2022,
the country is looking at
a massive development
opportunity and challenge

9Resource efficiency, thermal comfort and liveability in the affordable housing sector
(HFAPoA), that they need to submit first to the State Level Sanctioning and Monitoring Committee (SLSMC) and then the Central Sanctioning and Monitoring Committee (CSMC).
The larger context of this programme is that housing accounts for more than 70 per cent land use in most cities. It is no longer considered simply a roof over one’s head. It plays a crucial role in sustainable development. According to UN-Habitat, housing determines the mutual relationship between every single human being and shapes the surrounding physical and social spaces. It determines cities’ spatial forms, densities, urban environments and the degrees of exclusion or inclusion in terms of collective and civic life which, together with socio-economic conditions, are the essence of urban dynamics. UN-Habitat recognizes housing—and not city development, jobs or the economy—to be at the core of urbanization. At Habitat-III in 2016, nations unanimously accepted that the fate of cities will largely depend on how housing is placed in the respective development agenda of nations and cities.
Meanwhile, in India, one in every six urban dwellers lives in unplanned colonies called slums. Haphazard growth of towns and a large proportion of sub-standard houses—poorly ventilated, over-crowded and often lacking in essential amenities such as water and light—has been a reality since the 1950s.
After a series of policies launched one after the other to facilitate slum clearance, housing finance, and most importantly, land availability through planning norms (see Annexure 1), even today around 65 million people live in informal and unplanned colonies and many more live in sub-standard housing, according to the Census 2011 and the National Sample Survey Organization (NSSO). This means something is gravely amiss about our planning and development systems.
In view of this, Centre for Science and Environment (CSE) has investigated how states are progressing under PMAY-U. In order to do so, secondary data from CSMC presentations and reports available on the Ministry of Housing and Urban Affairs Minister (MoHUA) website has been used to understand the latest housing demand as per the states and the methods used to estimate it; as well as to throw light on how this demand corresponds to the issue of slums and sub-standard housing in states; the status of implementation in terms of houses sanctioned, grounded for construction and completed; and, how each vertical under the PMAY-U is performing.
CSE has attempted to understand how states with high housing demand are planning and implementing their housing policies. For instance, who is providing the land, where is this land located, what role does the private sector play, have any innovative models been adopted by the states, how are they fast-pacing their housing construction, do the states have any long-term strategy for mass housing that may include sustainability planning and fiscal frameworks?
This investigation has highlighted a few key issues.
The fate of cities will largely depend on how housing is placed in the development agenda of nations and cities

10 Beyond the four walls of PMAY
SDG 11.1 calls for ensuring
access for all to adequate, safe and affordable
housing and basic services
and upgrading slums by 2030
NEED FOR BETTER ESTIMATION OF HOUSING DEMANDHousing targets under PMAY-U are based on the Report of the Technical Group on Urban Housing Shortage of the MoHUA, that had estimated a shortage of 18.78 million units in urban areas in 2012. This target was later revised to 20 million units. As part of PMAY-U guidelines, states are in the process of establishing their demand through online and offline surveys. Discussions with state governments suggest that actual housing demand may be much higher than the target for PMAY-U. However, latest MoHUA data suggests validated national housing demand to be 11.2 million. Unofficial estimates report a higher housing demand in view of the fact that close to 14 million households live in urban slums under unliveable conditions and that India is adding around 4 million people to slums every year (as per Census 2011). This calls for revisiting the criteria for establishing housing shortage.
Considerable subjectivity is involved in estimating this demand. The criteria adopted to define housing demand that include homelessness, building rejection, non-serviceability of buildings, and congestion or overcrowding can be interpreted in many ways. For example, in India, if a married couple does not have a room of their own, it is considered congestion. But internationally, if children of a certain age do not have separate rooms, it is also defined as congestion. Therefore, by changing the parameters (and the way they are defined) estimates of housing demand can vary susbtantially. It is time to revisit and standardize some of these parameters so that housing demand estimates are not too fluid to render to a firm roadmap.
A more realistic and improved housing demand assessment is needed to address the challenge, otherwise there policy anomalies may arise. For instance, the December 2018 Sustainable Development Goal (SDG) Index: Baseline Report of Niti Aayog has scored and ranked states based on four criteria to assess their performance against SDG goals. For the housing criteria, it has considered the SDG 11.1 on ‘ensuring access for all to adequate, safe and affordable housing and basic services and upgrade slums by 2030’. For this purpose, Niti Aayog has selected the performance of PMAY-U as the indicator of achievement and set the following targets for assessment:i) 100 per cent houses completed under PMAY-U as a percentage of the net
demand assessment for housesii) Zero per cent urban households living in slums
This 100 per cent compliance with PMAY-U would need more realistic estimation of demand for delivery of quality shelters. The number of dwelling units aimed for under PMAY-U and the objective of the second indicator of ‘slum free’ India will require a relook at the numbers of housing units. According to the UN’s Sustainable Development Solutions Network, which has developed the SDGs, ‘sound metrics and data are critical for turning the SDGs into practical tools for problem solving’. Also, the idea of ‘slum free’ is a misnomer as even the PMAY-U data indicates self construction by the poor will dominate housing supply for the poor. Therefore, quality inputs will become critical in the sector.

11Resource efficiency, thermal comfort and liveability in the affordable housing sector
Congestion, non-serviceability, obsolescence and homelessness are the four factors of housing demand estimation
Moreover, this kind of scoring and assessment will need updated data on housing demand for better policy making. For example, the 2018 Niti Aayog Index has ranked states like Goa as frontrunners based on four criteria. For the housing criterion, it has included an older estimate of 2012 and based on that reports a good performance. But PMAY-U came into force in 2015. The Niti Aayog Index reports that Goa has completed 35.71 per cent of the number of houses demanded under PMAY-U. However, as per the latest PMAY-U progress report and CSMC presentations available on the MoHUA website, Goa placed a demand of 4,845 units and had completed 594 units as of 1 July 2019—12.26 per cent completion. Housing demand in Goa was estimated to be even higher by the Technical Group on Urban Housing Shortage—at 60,000. This further reduces the percentage of houses completed in Goa as per the net demand.
The case of Goa provides a clear indication of the need for clarity in estimation. When the demand assessment for houses in the country is on the conservative side, performance on SDG India Index is not very representative of the ground situation and the actual need for quality shelters. Moreover, the index has been prepared for 2030, while PMAY-U aims to meet the assessed demand for houses by 2022. By 2030, housing demand in India will shoot up even further, since it is rare to saturate the housing market with supply in such a dynamic scenario.
SDG India Index has been prepared for 2030, while PMAY-U aims to meet the assessed demand for houses by 2022. By 2030, housing demand in India will shoot up even further, since it is rare to saturate the housing market with supply in such a dynamic scenario
VIK
AS
CH
OU
DH
ARY
/ C
SE

12 Beyond the four walls of PMAY
STATUS OF PMAY-U IMPLEMENTATION According to the latest demand surveys available in the CSMC reports, the top 15 states accrue a total demand of 17.67 million dwelling units. This number is close to the housing demand estimated by the Technical Group on Urban Housing Shortage in 2012. States have used similar factors—congestion, non-serviceability, obsolescence and homelessness—as the Technical Group to determine their housing demand. Bihar, Gujarat, Jharkhand and Rajasthan, surprisingly, registered almost half the total demand estimated in 2012.
Around 8.3 million dwelling units had been sanctioned by 1 July 2019, of which only 2.6 million have been completed, according to the state-wise PMAY-U progress available on the MoHUA website. This means around 74 per cent of the total target of 11.2 million has been addressed in the four years of implementation of PMAY-U. With this fast pace of approvals and construction, it becomes extremely important to see that the new constructions meet requirements of sustainability. States with top housing shortages—Karnataka, Maharashtra, Tamil Nadu, Telangana, Uttar Pradesh and West Bengal—have yet to receive sanctions for more than half of their demand.
A much faster pace of approvals and construction is needed to achieve the target in the remaining three years of PMAY-U while meeting the sustainability criteria
Affordable housing must
take into account the
huge projected increase in slum
population

13Resource efficiency, thermal comfort and liveability in the affordable housing sector
About 34 per cent projects under PMAY-U are being delivered under the `Affordable Housing in Partnership' vertical
However, it is also clear that a better estimation of housing demand is needed under PMAY-U. India’s urban population grew from 285 million in 2001 to 377 million in 2011 according to the Census data. The population living in slums more than doubled during the same decade. This underlines the inability of state governments and urban local bodies (ULBs) to understand their housing demand and respond appropriately. In cities like Jabalpur and Visakhapatnam, about 45 per cent of the total population lives in unplanned and informal settlements. Five states—Andhra Pradesh, Maharashtra, Tamil Nadu, Uttar Pradesh and West Bengal—account for nearly two-thirds (61.9 per cent) of the total slum population of the country. Cities will need a comprehensive strategy to address the quality of housing in such regions.
This is not only about getting the numbers right. It is also about ensuring availability of services, affordability, habitability in terms of protection from climate vulnerability, accessibility, locational advantage and security of tenure. Any emerging housing policy will have to address these aspects.
SELF-CONSTRUCTION AND INCREMENTAL HOUSING DOMINATE APPROVED PROJECTS UNDER PMAY-UIt is an interesting revelation that incremental housing has received the most traction among the four verticals of the PMAY-U, with 63 per cent of the houses falling under ‘Beneficiary-led Construction’ vertical (the other verticals being in situ slum redevelopment, affordable housing programme and credit-led housing). While this vertical creates the least responsibility and liability for the government, it also indicates dependence of the target group on self-constructed and plotted housing typology. It is imperative to recognize that incremental construction is important, and needs planning and design interventions to be sustainable, resource-sufficient and climate-responsive.
If self-construction is going to be so extensive, then PMAY-U needs a strategy to build enabling policies and capacities to inform and enable this group of clientele and stakeholders on sustainability and thermal comfort criteria in terms of materials, designs, energy management and decentralized common services. Currently, voluntary groups and non-governmental organizations are extending such support. However, a more formal and structured approach is the need of the hour, to ensure that PMAY-U support enables wider dissemination of technical and professional knowledge and local skill building.
RAJNEESH SAREEN / CSE

14 Beyond the four walls of PMAY
PARTNERSHIP SEGMENT AFFORDABLE HOUSING NEEDS GUIDANCE ON SUSTAINABILITY AND RESOURCE EFFICIENCYOut of the total approved projects under PMAY-U, 34 per cent are being delivered under the ‘Affordable Housing in Partnership’ vertical by the state governments and private sector together. This review shows that, currently, nearly the entire focus is on speed and ease of construction and material choices in this housing stock.
While beneficiary-led construction vertical has received maximum sanctions overall, in Andhra Pradesh, Gujarat, Karnataka and Maharashtra more units have been sanctioned under the ‘Affordable Housing in Partnership’ vertical. The degree of involvement of the private sector varies depending on the aspects of land, design, construction, and operation and maintenance of the stock. More involvement will mean that the private sector will have to bear higher cost to provide affordable housing.
An overview of CSMC reports of a few states reveals that most affordable housing in partnership projects are taken up on government land; a public body or government identifies and acquires land, and a private developer designs and constructs under a procurement process undertaken by the respective State Level Nodal Authority. Under this arrangement, the implementation of most projects coincides with the first and second models of the public–private partnership (PPP) Policy, 2017. Units are transferred to the public authority after completion, that allots them to beneficiaries. State governments cap construction costs of such arrangements between Rs 1,000 and Rs 1,300 per sq ft, making them much cheaper than existing market rates.
It appears that due to the price capping, private sector response to PMAY-U is not enthusiatic as anticipated. Governments have to provide several other incentives. A mandatory condition under PMAY-U requires state and city governments to provide for additional floor area ratio (FAR)/floor space index (FSI)/transferable development rights (TDR), and relax the rules of density for slum redevelopment and low-cost housing. These provisions generally result in dense and high-rise development typologies not suitable for the target group. Most states are opting for development of above G+4 structures, for instance, G+10 in Telangana and G+7 in Gujarat. Other incentives include exemption on stamp duty and bringing down GST on affordable housing to 1 per cent. Despite these incentives, states and ULBs are still required to contribute financially to encourage private sector participation and to improve access to housing for beneficiaries. States like Telangana have even subsidized the cost of basic materials like cement, sand and steel for affordable housing.
Subsidies will have to be linked with performance of the housing stock to ensure quality and liveability of the houses. If this is not done, private sector will circumvent the need for thermal comfort and energy efficiency in upcoming mass affordable housing. The cost of inclusion of thermal comfort and energy efficiency raises the overall cost of the construction, as it involves alternative materials and envelope designs. State governments will need to offset this rise in costs through viability gap funding or other incentives after
Subsidies will have to be linked
with performance of the housing
stock to ensure liveability
15Resource efficiency, thermal comfort and liveability in the affordable housing sector
In situ slum rehabilitation and credit-linked subsidy system together contributed only 5 per cent of the houses sanctioned under PMAY-U by 1 July 2019
adequate market research. Ground assessments underline the need for detailed guidelines ensuring energy-efficient building materials combine with optimum architectural design for thermal comfort of occupiers. Speed and convenience of construction should not be the only guiding factors for this sector.
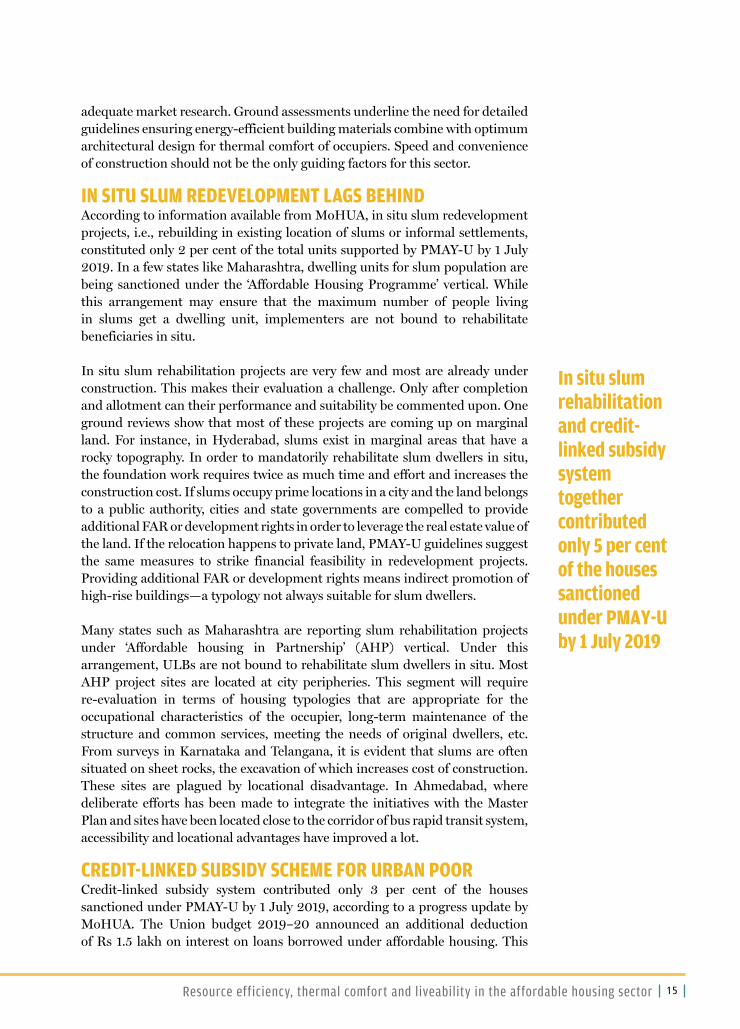
IN SITU SLUM REDEVELOPMENT LAGS BEHINDAccording to information available from MoHUA, in situ slum redevelopment projects, i.e., rebuilding in existing location of slums or informal settlements, constituted only 2 per cent of the total units supported by PMAY-U by 1 July 2019. In a few states like Maharashtra, dwelling units for slum population are being sanctioned under the ‘Affordable Housing Programme’ vertical. While this arrangement may ensure that the maximum number of people living in slums get a dwelling unit, implementers are not bound to rehabilitate beneficiaries in situ.
In situ slum rehabilitation projects are very few and most are already under construction. This makes their evaluation a challenge. Only after completion and allotment can their performance and suitability be commented upon. One ground reviews show that most of these projects are coming up on marginal land. For instance, in Hyderabad, slums exist in marginal areas that have a rocky topography. In order to mandatorily rehabilitate slum dwellers in situ, the foundation work requires twice as much time and effort and increases the construction cost. If slums occupy prime locations in a city and the land belongs to a public authority, cities and state governments are compelled to provide additional FAR or development rights in order to leverage the real estate value of the land. If the relocation happens to private land, PMAY-U guidelines suggest the same measures to strike financial feasibility in redevelopment projects. Providing additional FAR or development rights means indirect promotion of high-rise buildings—a typology not always suitable for slum dwellers.
Many states such as Maharashtra are reporting slum rehabilitation projects under ‘Affordable housing in Partnership’ (AHP) vertical. Under this arrangement, ULBs are not bound to rehabilitate slum dwellers in situ. Most AHP project sites are located at city peripheries. This segment will require re-evaluation in terms of housing typologies that are appropriate for the occupational characteristics of the occupier, long-term maintenance of the structure and common services, meeting the needs of original dwellers, etc. From surveys in Karnataka and Telangana, it is evident that slums are often situated on sheet rocks, the excavation of which increases cost of construction. These sites are plagued by locational disadvantage. In Ahmedabad, where deliberate efforts has been made to integrate the initiatives with the Master Plan and sites have been located close to the corridor of bus rapid transit system, accessibility and locational advantages have improved a lot.
CREDIT-LINKED SUBSIDY SCHEME FOR URBAN POORCredit-linked subsidy system contributed only 3 per cent of the houses sanctioned under PMAY-U by 1 July 2019, according to a progress update by MoHUA. The Union budget 2019–20 announced an additional deduction of Rs 1.5 lakh on interest on loans borrowed under affordable housing. This

16 Beyond the four walls of PMAY
subsidy follows the previous interest subvention of upto Rs 2.67 lakh under the ‘Credit-linked Subsidy System’ vertical of PMAY-U. However, with the revised carpet area definitions, Credit-linked subsidy system can easily be claimed to have been designed to cater to the middle- and upper-income segments. This scheme also has a tendency of increasing the carpet area beyond what is considered normal for housing for economically weaker sections (EWS).
The scope of Credit-linked subsidy system vertical remains limited for lower-income households who work in the informal sector and face challenges in producing the documentation required—such as income proof—to avail finance under the scheme. Inaccessibility of housing finance to the lower-income rung can be exemplified by the fact that most housing credit went to segments with loan tickets of at least Rs 10 lakh and above, according the National Housing Bank’s 2018 report. National Housing Bank is a ‘Primary Lending Institution’ under PMAY-U.
While a dense and compact typology increases efficiency in terms of usage of land and distribution of services, a high-rise building may underperform on sustainability, affordability and adaptive comfort
Most local bodies have not planned
for affordable housing with a view to reduce
the distance and cost of
commute for the lower-income
population MIT
ASH
I SIN
GH
/ C
SE

17Resource efficiency, thermal comfort and liveability in the affordable housing sector
Lack of integration with transport along with low FAR/FSI and density norms fosters sprawls
ADDRESS LIVEABILITY AND SUSTAINABILITY OF AFFORDABLE HOUSINGFrom the perspective of sustainability and liveability, housing projects will have to consider a whole gamut of criteria—at the level of building typology and design; thermal comfort, resource efficiency and common services related to water, energy and waste; and at the neighbourhood level; locational aspects, connectivity and urban greens.
There are some mandatory requirements under PMAY-U that, if addressed properly, can take care of the liveability aspects of projects. PMAY-U has mandated states to identify land for affordable housing and relax development norms to a great extent in order to avail benefits of the scheme. These provisions place anticipated developments at risk of ad hoc interventions and losing potential to design the built stock in a way that is liveable, efficient and has superior environmental performance.
One mandatory condition under PMAY-U is earmarking land for affordable housing in master plans. This is an important condition as it allows assessment of suitability of locations from usability and liveability perspectives. But this opportunity is compromised simply by the fact that currently, 76.2 per cent of the 7,953 census towns in India do not a have a master plan. However, due to this mandatory condition, cities are preparing or amending their master plans in an ad hoc manner. As a result, not much thought has been put into identifying suitable locations for upcoming affordable housing. An overview of ongoing affordable housing projects suggests that most local bodies have not planned for affordable housing with a view to reduce the distance and cost of commute for the lower-income population. Housing projects are coming up in most unsuitable areas. Lack of integration with transport along with low FAR/FSI and density norms fosters sprawls. Increased distances result in increased investment towards infrastructure. This not only has an impact on the environment and resources, but socio-cultural quality of the city too.
Most states have not reached a stage of housing planning where they take into account these issues. Their planning regime is limited to including affordable housing by reserving a percentage of the number of units or area of land—15–25 per cent—in any housing construction. However, there are positive examples such as the ‘residential affordable housing zone’ created by Ahmedabad Urban Development Authority, which is a zoning-based intervention. This zone has been created to ensure transit-serviced affordable housing.
While a dense and compact typology increases efficiency in terms of usage of land and distribution of services, a high-rise building may underperform on sustainability, affordability and adaptive comfort. Studies show that the taller a building, the higher are the emissions per square metre due to higher cement and steel load per unit area. Taller buildings need additional services such as lifts and water pumps. There is a recurring need to invest money into their

18 Beyond the four walls of PMAY
operations and maintenance and to place adequate efforts in their upkeep. These are tremendous responsibilities for the people belonging to lower-income groups (LIGs).
Such typologies will have to be revisited and made more nuanced not only to address environmental sustainability but also to pinpoint appropriate typology needed for the targeted class of households with different household-based occupational needs. Moreover, these interventions will have to be supported by common area services related to water and waste.
States are yet to utilize the opportunity provided by several national initiatives on energy, water and waste management. Guidance frameworks such as National Action Plan on Climate Change, Liveability Index, environmental conditions in model building bye-laws 2016, Eco Niwas Samhita, solar rooftop programmes, AMRUT, Swachh Bharat Mission and other state-level policies are not reflected in the ongoing affordable housing construction. These will have to be taken into account to improve liveability.
NEED TO FOCUS ON THE LINK BETWEEN ENERGY EFFICIENCY AND THERMAL COMFORTIndia’s Cooling Action Plan has categorically stated the goal of thermal comfort for all. This needs to be integrated with the requirement of affordable housing. While planning for improved energy efficiency in buildings, it is also important to target for improved thermal comfort through material choices, designs and orientation.
Energy use in buildings is a function of building design (including orientation and envelope) and materials used
It is imperative to prioritize
design and construction of
housing in a way that maximizes
thermal comfort and minimizes
energy use
MITASHI SINGH / CSE
19Resource efficiency, thermal comfort and liveability in the affordable housing sector
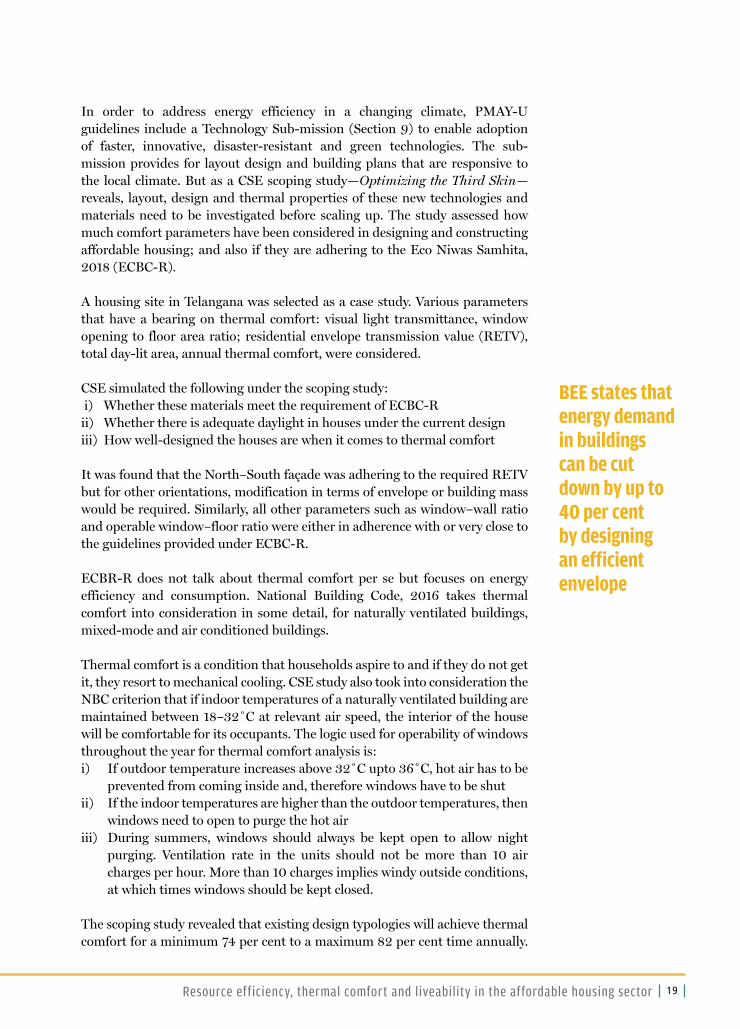
In order to address energy efficiency in a changing climate, PMAY-U guidelines include a Technology Sub-mission (Section 9) to enable adoption of faster, innovative, disaster-resistant and green technologies. The sub-mission provides for layout design and building plans that are responsive to the local climate. But as a CSE scoping study—Optimizing the Third Skin—reveals, layout, design and thermal properties of these new technologies and materials need to be investigated before scaling up. The study assessed how much comfort parameters have been considered in designing and constructing affordable housing; and also if they are adhering to the Eco Niwas Samhita, 2018 (ECBC-R).
A housing site in Telangana was selected as a case study. Various parameters that have a bearing on thermal comfort: visual light transmittance, window opening to floor area ratio; residential envelope transmission value (RETV), total day-lit area, annual thermal comfort, were considered.
CSE simulated the following under the scoping study: i) Whether these materials meet the requirement of ECBC-Rii) Whether there is adequate daylight in houses under the current designiii) How well-designed the houses are when it comes to thermal comfort
It was found that the North–South façade was adhering to the required RETV but for other orientations, modification in terms of envelope or building mass would be required. Similarly, all other parameters such as window–wall ratio and operable window–floor ratio were either in adherence with or very close to the guidelines provided under ECBC-R.
ECBR-R does not talk about thermal comfort per se but focuses on energy efficiency and consumption. National Building Code, 2016 takes thermal comfort into consideration in some detail, for naturally ventilated buildings, mixed-mode and air conditioned buildings.
Thermal comfort is a condition that households aspire to and if they do not get it, they resort to mechanical cooling. CSE study also took into consideration the NBC criterion that if indoor temperatures of a naturally ventilated building are maintained between 18–32˚C at relevant air speed, the interior of the house will be comfortable for its occupants. The logic used for operability of windows throughout the year for thermal comfort analysis is:i) If outdoor temperature increases above 32˚C upto 36˚C, hot air has to be
prevented from coming inside and, therefore windows have to be shutii) If the indoor temperatures are higher than the outdoor temperatures, then
windows need to open to purge the hot airiii) During summers, windows should always be kept open to allow night
purging. Ventilation rate in the units should not be more than 10 air charges per hour. More than 10 charges implies windy outside conditions, at which times windows should be kept closed.
The scoping study revealed that existing design typologies will achieve thermal comfort for a minimum 74 per cent to a maximum 82 per cent time annually.
BEE states that energy demand in buildings can be cut down by up to 40 per cent by designing an efficient envelope
20 Beyond the four walls of PMAY
For the rest of the year, households will have to use mechanical cooling in composite climate zones. Maximum thermal comfort will be achieved in units oriented in the North-South direction.
CSE evaluated day-lit area within constructions as part of the scoping study. NBC guides the amount of daylight to be provided. In the given design, around 47 per cent of the total living area will receive daylight and that too when no building is shading another building. Wherever buildings are shading each other, the day-lit area will only be about 15 per cent. This is inconsistent with the results of ECBC-R analysis in the same project, where the subject design delivers good visual light transmittance as a result of the window–wall ratio.
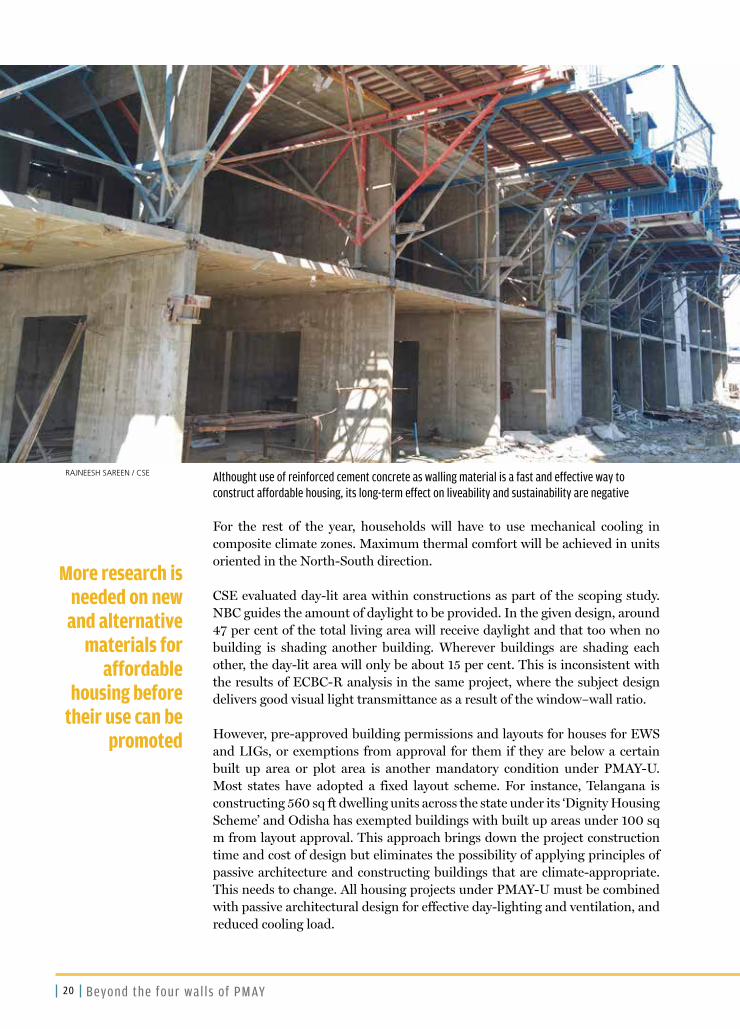
However, pre-approved building permissions and layouts for houses for EWS and LIGs, or exemptions from approval for them if they are below a certain built up area or plot area is another mandatory condition under PMAY-U. Most states have adopted a fixed layout scheme. For instance, Telangana is constructing 560 sq ft dwelling units across the state under its ‘Dignity Housing Scheme’ and Odisha has exempted buildings with built up areas under 100 sq m from layout approval. This approach brings down the project construction time and cost of design but eliminates the possibility of applying principles of passive architecture and constructing buildings that are climate-appropriate. This needs to change. All housing projects under PMAY-U must be combined with passive architectural design for effective day-lighting and ventilation, and reduced cooling load.
Althought use of reinforced cement concrete as walling material is a fast and effective way to construct affordable housing, its long-term effect on liveability and sustainability are negative
More research is needed on new
and alternative materials for
affordable housing before
their use can be promoted
RAJNEESH SAREEN / CSE
21Resource efficiency, thermal comfort and liveability in the affordable housing sector
MATERIAL CHOICES FOR SUSTAINABILITYCSE has simulated multiple materials proposed by BMTPC as part of the scoping study.
CSE found that autoclaved aerated concrete (AAC) blocks deliver the best thermal comfort, followed by insulation based technologies. Technologies with waffle-crete system, glass fibre reinforced gypsum and pre-cast large concrete panels performed weakest in the project’s composite climate zone. Surprisingly, compressed stabilized earthen blocks (CSEB) provided better thermal comfort than fly-ash bricks, even though their RETV performance was weaker than fly-ash bricks in the given climate zone.
This leads us to the biggest learning from these two analyses: RETV in ECBC-R is not adequately representative of thermal comfort. Instead, materials with high thermal mass were able to achieve good thermal comfort, even when they performed only average in terms of RETV value.
While materials with high thermal mass are generally very good for thermal comfort, they may have limitations regarding the speed of construction. But a great number of low-rise and low-density typologies being constructed under PMAY-U could leverage the thermal mass of such materials to achieve thermal comfort. Further, walling assemblies combining materials with high thermal mass and insulation can result in better thermal comfort and energy performance and need to be explored.
Moreover, Indian Standard SP:41 (S&T) (about performance of walling) states that time taken to transfer heat through a wall increases by upto three times when the insulation is placed on the outside of the regular masonry external wall compared to when it is placed on the inside of the same wall. This means the sequence of the layers of materials makes a difference in the thermal comfort of an occupant, although the U-value does not change. For these and other factors, ECBC-R’s reliance on U-value needs to change.
Today, monolithic concrete structures—large grey buildings—have high thermal transmittance; they take outside heat inside the buildings, thus raising questions about sustainability of new materials and construction designs. There is a need to promote material that have slower rate of thermal transmittance or materials that can lose heat and help in night purges of heat. Building codes do not contain much guidance on these issues.
Passive design is grossly neglected under the current mass housing regime and users do not get options to control heat, daylight ingress, or night purge. Low-rise and high density typologies are still more attractive and suitable for creating denser and more shaded places. Choice of materials guides embodied energy, whereas building typology and design guide operational energy. For high-rise typologies, operational energy is much higher as more expensive services are needed to maintain thermal comfort inside them.
It is important to maximize installation of solar rooftop at the design and construction stage of affordable housing
22 Beyond the four walls of PMAY
While there is a growing consensus that material, technology and design will have to align to deliver on comfort targets, addressing these concerns within the market paradigm will be challenging. For instance, private sector-led affordable housing schemes face several challenges. An industry survey carried out by the Future Institute shows that while developers are being given incentives in terms of extra floor area ratio (FAR), they have been unable to utilize even the existing FAR. They cannot build taller as the cost of services increases rapidly in high-rise typologies. Moreover, as land use is skewed towards providing more and more housing, adequate provision of open spaces becomes a casualty. In fact, the industry-based survey found that if design provisions are made for elements like more daylight penetration, costs become prohibitive. The study found that construction materials and technologies make up for most of the costs of housing. Developers go for the bare minimum of additional services and provisions. Awareness about design solutions tailored to climatic and micro-climatic zones is also severely limited.
RENEWABLE ENERGY AND SUFFICIENCYThere is no specific provision for use of renewable energy or solar rooftop in the PMAY-U. But it is important to align the needs of PMAY-U with other related policy provisions. For instance, Environment Impact Assessment (EIA), 2006 notification acknowledges solar energy as a promising power source to be installed and expanded in the built sector. The notification asks for 1 per cent of connected load to be met by solar power and mandatory solar-powered street and common area lighting and water heating. The National Solar Mission pushes for decentralized and off-grid applications. However, an initial investigation by CSE on solar power generation in affordable housing revealed that states are not fully utilizing the potential offered by solar power to meet energy demands. This is a scenario where governments are failing to provide electricity to a number of affordable housing projects even after beneficiaries move into the dwelling units.
For instance, Rajasthan’s Unified Building Bye-laws mandate solar water heating and solar powered common area lighting only for residential plots larger than 500 sq m. Most affordable housing projects do not have solar energy plants so far. Gujarat, with a mandate of meeting 5 per cent of connected load from solar in group housing, has only recently installed rooftop solar power plants at a few government-owned projects such as at Kathwada (Ahmedabad)—which involves 588 EWS units. Private sector projects are expected to provide more dwelling units and are often overlooked for such provisions. There is a need for stronger bye-laws to enable this.
Sometimes states can put in place more stringent regulations than the national guidelines. For example, while EIA Notification, 2006 mandates that 1 per cent of the total demand load be met by solar rooftop energy in a project with built-up area of more than 5000 sq m, state governments of Gujarat and Haryana have mandated that at least 5 per cent of the total demand load be met by solar energy while adopting EIA guidelines in their building bye-laws. Most states have solar policies in place, offering subsidies and tax exemptions to offset some of the capital costs of such projects. For instance, Gujarat amended its Solar
There is a need to prioritize
common environmental
services that are safe, hygienic,
equitable, low-impact, simple to operate and maintain, and
affordable

23Resource efficiency, thermal comfort and liveability in the affordable housing sector
Power Policy, 2015 and Residential Rooftop Solar Subsidy, 2016, reducing the permissible load to 1 kWp capacity (grid-interactive) to increase penetration of solar energy in small residential units. Subsidy cuts the establishment cost from Rs 69,000 per kW to Rs 38,300 per kW.
Further, renewable energy service companies (RESCOs) are offering competitive prices, including establishment, operation and maintenance costs for solar power plants. Latest auctions conducted by Solar Energy Council of India saw solar power tariffs settle between Rs 2.44 and Rs 6.20 per unit. This scenario reinforces the need to increase solar penetration in the built sector and mainstream it for affordable housing.
However, the poor uptake of solar rooftop programme thus far suggests that it is important to make mandatory provisions at the design and construction stage of buildings and open spaces, especially in the case of affordable housing. This needs to include right and access to terrace usage, installments and long-term maintenance arrangements, and technical support and metering systems that builders and the government will have to provide for.
With any development rises the need for services like water and power supply, and wastewater and solid waste management
About 60 per cent of solid waste in India consists of organic matter; new projects should push for its on-site treatment and composting
MITASHI SINGH / CSE

24 Beyond the four walls of PMAY
DECENTRALIZATION OF COMMON SERVICESThere are no separate provisions for rainwater harvesting, and decentralized waste and wastewater treatment in the PMAY-U guidelines. These services are guided by model buildings bye-laws, state building bye-laws and the EIA Notification of 2006. This alignment is critical.
A zero draft Environment Impact Notification launched in May 2019 empowers ULBs to stipulate environmental conditions while giving buildings permissions for building and construction projects with built-up areas more than or equal to 20,000 sq m and less than 50,000 sq m. There is also a requirement for third party monitoring. Most affordable housing projects fall under this category, making building bye-laws very important regulatory documents to mainstream common environmental services in upcoming housing projects.
Operation and maintenance (O&M) of common utilities and services in affordable housing projects is the responsibility of residents after developer serves its O&M charge (lasting for around three-five years) according to the PPP models under PMAY-U. On top of that, centralized systems demand recapitalization—average life of equipment when their maintenance is to levels delivering standard performance—of over 20 years, which adds to the financial burden on residents.
There is a need to prioritize technologies that are safe, hygienic, equitable, low-impact, simple to operate and maintain, and, finally, affordable. Decentralized common resource service systems fit the criteria to a great extent. These service systems need to be weaved together.
Decentralized services, such as nature-based systems for wastewater treatment, require less effort and money to operate and maintain. Further, conventional service systems, such as sewage treatment plants, require hefty recapitalization efforts and funds. When most affordable housing projects are being transferred to the beneficiaries for operation and maintenance, cost-effective techniques will need to be promoted strongly. This needs comprehensive guidelines enabling low-impact construction, and operation and maintenance.
Each state has its own geo-climatic characteristics and the potential for different environmental services. Efforts to identify this potential and appropriately address it are key in building low-impact and climate-responsive developments. Experience suggests that comprehensive national guidelines to encourage low-impact and decentralized environmental services along with interventions in building bye-laws to ensure nuanced adoption can enable low-impact and climate-responsive development. Efforts are also needed for capacity building of ULBs for effective scrutiny and implementation of these services.
With any development rises the need for services like water supply, wastewater treatment, power supply and solid waste management. The target of providing 11.2 million dwelling units approximately translates into a requirement of formal systems for 7,560 million litres a day (MLD) of potable water supply, to treat 6,048 MLD of wastewater, to meet 8,064 GWh of annual power
Poor uptake of solar rooftop
suggests it is important
to make mandatory
provisions at the stage of design and
construction

25Resource efficiency, thermal comfort and liveability in the affordable housing sector
Each state has its own geo-climatic characteristics and the potential for different environmental services
consumption needs and manage 22,400 tonnes of solid waste per day, which is currently being done in a compromised and unorganized manner. Demand for biodiversity and green spaces is equally enormous.
The Solid Waste Management Rules, 2016, provide for segregation of waste into three separate streams, biodegradable, non-biodegradable and domestic hazardous wastes. States and cities are working on adoption of the rules for effective implementation in this context; for instance, Delhi released its Solid Waste Management Bye-laws in January 2018. From a functional perspective in affordable housing, especially the lower-income rung, sensitization on reduction, reuse and recycling forms a parallel capacity-building dimension. However, ensuring that less waste leaves the site would result in a smaller volume of waste going into community bins, which would mean less waste needing to be transported, sorted, treated and finally disposed of in landfills. This cuts the costs and effort required in solid waste management. About 60 per cent of solid waste in India consists of organic matter. On-site treatment of organic waste by composting can help deal with it.
INFORMING AND SUPPORTING BENEFICIARY-LED CONSTRUCTIONAbout 63 per cent of projects approved under PMAY-U are beneficiary-led construction projects. Self-owned and self-constructed houses are built incrementally; allow pacing of construction as per the convenience of the owner. It is a dominant strategy for housing of lower-income groups. It is important to inform this process in terms of building typologies, material choices, building design for thermal comfort, community space, and space to meet the needs of artisan activities. Such interventions are also needed to improve the quality, safety and stability of structures.
Even though this is the largest construction segment under PMAY-U, its clientele does not normally have access to technical knowledge support in terms of sustainability and liveability features that can be incorporated. To enable this process, the formation and mobilization of a network of architects and planners to work with communities is vital.
Several voluntary groups and non-governmental organizations have begun to provide support to these beneficiaries in terms of low-cost but sustainable building design, material choices, use of daylighting among others. Some of the notable examples are Micro Home Solutions in low-income housing of Mangolpuri in Delhi, and Urbz Mumbai in low-income settlements of Shivaji Nagar and Dharavi. Moreover, Cure has helped to develop common decentralized services like wastewater treatment, drainage and toilets in a resettlement colony called Savda Ghevra, near Delhi. Designing and constructing housing for safe, healthy and comfortable indoors in dwelling units includes use of different materials such as mud blocks, fly ash bricks, bamboo, reflective paints, insulated corrugated sheets, and green roofs, as well as shading devices and elements for aiding ventilation and day lighting. This is an important lesson for PMAY-U reforms.

26 Beyond the four walls of PMAY
Such interventions are critical in view of the scale of this kind of construction. For instance, around two million people live in resettlement colonies in Delhi that were chalked out under government’s Site and Services Scheme, according to a report by Micro Home Solutions (mHS). Evicted slum dwellers are allotted plots (12.5 sq m to 20 sq m) in these resettlement colonies with temporary or perpetual lease rights. Resettlers have to pay first for the plot and then the entire construction of their respective dwellings.
There is a huge incremental housing market that needs to be influenced to improve liveability of a substantial population. mHS aims to increase the quantity and quality of low-income housing by intervening in self-constructed segments. Their Design Homes Solutions is a mechanism that involves financial and technical assistance and is provided to identified families that are planning to self-construct or expand their housing. A construction investment aimed at improving the quality of life can range from Rs 25,000 (minor repairs) to Rs 500,000 (vertical expansion).
Today, adding a second or third floor, a toilet or a kitchen to a home is a common process that goes on all year-round in these colonies. This kind of construction is not guided by building norms and safety codes, rather it is influenced by informal knowledge of construction. Self-construction is acknowledged by a number of organizations, who are providing solutions to upgrade liveability in incremental housing.
Bottom-up efforts led by architects and planners have revealed that the urban poor are willing to invest in upgrades if there is hand-holding and the process solves their problems adequately. Involvement from the design stage itself through the construction and O&M establishes ownership of the community over the infrastructure. PMAY-U has to acknowledge this and better inform self-construction via a dedicated network of urban practitioners.
RENTAL HOUSING GAP IN PMAY-UAt present, there is no provision for rental housing under PMAY-U. But given the profile and the need of housing among low-income categories, there is an enormous demand for rental housing. There is a need to promote rental housing and affordable rentals. A draft National Urban Rental Housing Policy, 2015 exists and needs to be improved, implemented and leveraged. While there are multiple aspects that characterize rental housing, the most important, especially in the Indian context, is affordability—which is the proportion of income that a household can afford to spend towards a shelter. In 2008, the Deepak Parekh committee report suggested an upper limit of 30 per cent monthly household income to be spent on housing rent. The push for leveraging private sector participation has resulted in mechanisms that prioritize home ownership, neglecting the potential of rental housing. Going forward, this segment will have to be addressed within the framework of the larger housing policy.
The huge incremental
housing stock needs
technical support to
improve its liveability

27Resource efficiency, thermal comfort and liveability in the affordable housing sector
NEXT STEPSAs PMAY-U progresses further and to meet the larger goals of sustainability, there are several lessons to be drawn from on-ground implementation that can inform the programme better.
At the outset, demand surveys must be improved to better reflect projected housing demand. This will require a robust housing data repository. Lack of a consistent definitions on housing also needs to be addressed.
To improve sustainability and liveability, state sustainability guidelines or city sustainability frameworks need to be integrated with state building bye-laws, or master or development plans of cities. Over a period of time, most housing schemes and the basic services for urban poor they entail, integrated housing and slum development programmes, and Rajiv Awas Yojana all have reported issues related to unsuitable building typologies, liveability, construction quality, cost of living, and operations and maintenance, among many others. These problems have compelled beneficiaries to remain in informal settlements. This will have to be addressed.
Currently, state governments are focusing on producing voluminous stock of buildings at speed. Initiatives such as Global Housing Technology Challenge have been launched with a view to identify construction techniques that enable governments to meet their targets by 2022. This approach risks creation of underperforming assets and infrastructure that will not fulfill the target of providing quality and liveable shelters to low-income groups.
States and cities need to put beneficiaries at the centre of planning for affordable housing schemes to meet the requirements of the target population in terms of suitable building typologies and design, flexible ownership models, low cost of living, and less operation and maintenance efforts. There are multiple ways of
To maximize comfort and minimize operational energy use, the interplay between design and materials should be exhausted at the design stage itself
MITASHI SINGH / CSE
Rental housing needs to be addressed within the framework of the larger housing policy

28 Beyond the four walls of PMAY
addressing this—state-specific guidance frameworks, affordable housing bye-laws, updating housing policies, and augmenting master plans, among others. Enormous capacity-building efforts will also be required to ensure community outreach and effective implementation of the agenda. This indicates a great opportunity to work at state- and city-levels.
Location• Conduct socio-economic surveys to understand livelihood pattern of the
lower-income segment in urban agglomerations.• Identify major economic hotspots and suitable locations along transit
networks across urban agglomerations to promote mixed-income housing to provide maximum affordable housing in that catchment. Zoning-based inclusion can enable earmarking of land for affordable housing in strategically suitable locations for the target population.
• Prioritize uplifting socio-cultural amenities before construction of housing. For instance, ensure basic services including functional primary schools, public medical facilities and other amenities within a short radius of the affordable housing site. Instruments such as Location Attractiveness Index can help in checking the availability and status of infrastructure and amenities in a locality to inform decision making.
• Promote affordable housing in master or development plans by offering incentives. Link incentives to delivery on liveability standards.
• Ensure alternative housing models to minimize the need for relocation. Cities have informal dormitories in marginal areas. Rental housing is a demand-side intervention and is essentially need-based. It recognizes the fact that people seek only a decent shelter, preferably near the hubs of economic activity, and not necessarily the ownership of that shelter. This population includes construction workers, seasonal workers and casual labourers.
Transportation and connectivity• Ensure that new affordable housing sites and mixed-income developments
are located within a 400–500 metre radius of public transit stations. National Transit-Oriented Development Policy has also made such provisions.
• Provide walkable connections to public transport. Ensure safe access through street design interventions.
• Assign bus routes, augment bus fleet, and provide affordable bus services to connect affordable housing sites with key destinations and place of economic activity.
• Discourage parking in new development and in zones close to transit nodes and mandate this in local bye-laws.
Layout and building design• Many states are working with a fixed layout or design template and prioritizing
materials that enable fast-paced construction. Design of buildings and material choices can guide liveability—daylighting, ventilation and thermal comfort—as well as the cost of living. When designed well with climate-appropriate materials, need for active lighting and cooling decreases, which helps in keeping energy costs in the country at a minimum and reduces the energy bills for beneficiaries as well.

29Resource efficiency, thermal comfort and liveability in the affordable housing sector
•The interplay between design and materials should be exhausted at the design stage itself, with a view to maximize comfort and minimize operational energy use. Simulation exercises and guidelines such as Eco Niwas Samhita, 2018 can inform this interplay. The CSE study titled Optimizing the Third Skin establishes this relationship for a sample housing project in Telangana. The study reveals that there is much opportunity to work on designs and materials opted for by the state government to enable compliance with Eco Niwas Samhita, 2018. When it comes to thermal comfort, it is also now imperative for states to check that needs of thermal comfort as per the India Cooling Action Plan are met in upcoming housing stock.
•The orientation of mass housing must be fixed to maximize daylighting and ventilation. Buildings should be oriented along the east–west axis of a site in a way that a majority of the vertical surface area of the buildings is facing north and south. Optimizing the Third Skin reveals that buildings oriented along the north–south direction are the most comfortable, thermally. East–west orientation works in favour of mutual shading by reducing solar ingress through the east and west façades. When there are constraints to such orientation of building blocks due to the shape of the site, alternative arrangement can be worked out.
•Built form must be aligned to correspond to the predominant wind direction, which can be derived from local wind rose diagrams. CSE observed a few sample housing projects in different states. In most cases, buildings are clustered along the road network planned for the site. Buildings at an angle to the predominant wind direction will increase penetration of wind in the buildings as well as in open spaces.
•Compact clustering of buildings on a site must be prioritized. Compact built forms reduce built footprint on the land, increase efficiency of common services by reducing space needed for distribution, and facilitate mutual shading, thus allowing cost savings. For instance, a study by BEE quantifies that mutual shading can reduce solar radiation exposure in a building by about 35 per cent and cut on demand for space cooling. The study was conducted on three built forms in Delhi (all 12 storey blocks) during the hottest months of the year, 1 April to 30 June.
•Construction of high-rise buildings should be avoided, and building height should ideally be capped at a mid-rise (G+4 to G+7) development. Affordable housing development in India is strongly incentivized by offering additional FAR/FSI and transferable development rights. In order to accommodate maximum dwelling units in a project site and ensure financial feasibility, high-rise structures are being preferred; for instance, G+9 in Telangana and G+7 in Gujarat. High-rise buildings are not suitable for the poor or lower-income segments, and they also underperform on sustainability, affordability and adaptive comfort. Taller buildings need additional services such as lift sand water pumps and there is a recurring need to invest money into their operations and maintenance. Taller the building, higher the emissions per unit area due to higher steel and cement loading per unit area. A study by

30 Beyond the four walls of PMAY
architect Ashok Lall suggests CO2 emissions increase by upto 35 per cent when a structure goes from a mid-rise to high-rise development. The height of buildings also plays a role in wind penetration.
•Building envelope design and shading devices are the primary factors determining its heat gains or losses (hence foreshadowing the need for space heating or cooling). Eco Niwas Samhita, 2018 suggests net heat gain—expressed as Residential Envelope Transmittance Value (RETV)—through building envelope (excluding roof) should not exceed 15 W/sq m in any climate zone except the cold zone. The efficiency of an envelope can also be determined by the ratio of exposed surface area and built-up area of a dwelling unit. Another CSE study on housing project samples from different states reveals that if the ratio is higher than 0.92, the envelope is not efficient.
•Transitional housing typologies to cater to the needs of target groups need to be explored. Typologies that allow gradual shift from incremental housing to compact group housing are available and must be utilized.
•Community participation in the design process of formal as well as incremental housing under the beneficiary-led construction vertical should be promoted. Local architects should also be involved in this process.
Renewable energy potential•Targets to increase residential rooftop solar power generation based on
calculated potential in states need to be set.•The proportion of connected load requirement to be met mandatorily by
solar must be increased based on assessed potential.•Solar power generation is space-intensive. Scaling up decentralized solar
power generation would require ample rooftop space, i.e., 10 sq m for every kWp installed as suggested by the Ministry of New and Renewable Energy. Rooftop space availability for solar PV installation must be maximized by reserving a minimum rooftop space for it.
•Building permission process must be made more stringent to make the private sector deliver on mandatory solar power generation requirements. Long-term maintenance and management of these systems must be worked out so that they do not present a challenge to the low-income category.
Material choice• A ready-reckoner of locally available materials must be prepared, and it must
include information on properties such as thermal comfort, recyclability, recycled content, embodied energy, emissions intensity, toxicity, sustainability, safety, etc. Central Public Works Department (CPWD) guidelines for sustainable habitat provides several such parameters along with their weightage in a sustainability index to inform decision-making on materials.
• Building Material and Technology Promotion Council is promoting technologies that offer benefits such as low maintenance, low life-cycle costs, better durability, improved thermal and acoustical performance, better hazard resistance, and minimum wastage. A few technologies such as monolithic

31Resource efficiency, thermal comfort and liveability in the affordable housing sector
concrete construction, expanded polystyrene core panel systems and light-gauge steel frame systems are included in the Schedule of Rates by the Central Public Works Department (CPWD). Before beginning construction, states need to investigate what RETV or thermal comfort the chosen material or walling technology is delivering with the given design and in the native climate. If performing to the standards provided in Eco Niwas Samhita and National Building Code, there is a need to promote and mainstream the materials and techniques by mass production and mainstreaming in construction procurement by providing fiscal support to offset their higher cost, if any.
• Materials with high thermal mass, like compressed stabilized earthen blocks (CSEB), must be promoted over materials with insulation properties. Thermal mass plays a key role in achieving thermal comfort in naturally ventilated buildings (that affordable housing buildings are).
Common environmental services • Currently, there is weak to no convergence among a number of schemes or
initiatives launched at the national- and state-levels. Due to the urgency to deliver housing units and to maintain cost-effectiveness, most affordable housing projects are exempt from mandatory provisions in bye-laws, such as meeting 1 per cent of the total energy demand load through solar rooftop energy. Now is a great opportunity to weave the provisions and incentives under various policies together to enable low-impact constructions.
• Decentralized wastewater treatment and rainwater harvesting will have to be integrated more explicitly with these projects. This will also require more appropriate approaches for management and operation of these systems. Currently, beneficiaries are made responsible for operation and maintenance of common utilities and services after three–five years of allotment according to the PPP models under PMAY-U. This situation adds to the woes of the beneficiaries, firstly because it demands a lot of effort and secondly because the financial burden. It will have to be reinvented to prevent the already overburdened centralized utilities and service systems from breaking down. These conventional systems also come with high operations and maintenance costs, and require recapitalization, something EWS can ill-afford.
Water and wastewater management• Topography analysis to deploy water-sensitive urban design and planning
or sustainable urban drainage systems on-site, such as swales, berms, rain gardens, retention basin, etc. will have to be explored.
• Rainwater harvesting potential of the site must be calculated and rainwater conservation maximized.
• Alternative decentralized wastewater treatment technologies such as nature-based solutions must be explored to suit the local context and to implement and replace conventional sewage treatment plants (STPs).
• At the design stage, water balance charts must be prepared and targets must be set to meet maximum water demand by recycling and reusing harvested rainwater and treated wastewater.
32 Beyond the four walls of PMAY
Solid waste management• Three-way segregated waste collection areas must be provided on site.• Enable on-site treatment of biodegradable waste—for about 300 grams
per capita per day—by using low-cost methods such as pit composting and vermi-composting. Provide for treatment areas in layout plans.
• Build capacity of residents on segregation, on-site treatment of biodegradable waste and effective management of non-biodegradable waste.
Beneficiary-led constructionThe analysis of PMAY-U’s progress has shown that 63 per cent approved projects are under the vertical of beneficiary-led construction. As self construction will remain the dominant source of housing provisions, it is important to create an enabling mechanism within the PMAY-U framework to provide technical and professional help and support to the beneficiaries on design, material, and service planning of this type of construction.

90% xxxx
2 HOUSING DEMAND AND SHORTAGEThe number game and its ramifications
VIKASH CHOUDHARY / CSE

34 Beyond the four walls of PMAY
Rapidly growing population and urbanization have handed India a major housing shortage problem. While there is no denying the tangibility of the problem, its severity is a cause of debate, primarily because there is
confusion over the way housing shortage is defined and measured. For example, a 2012 report of the MoHUA technical group on urban housing shortage used four major criteria and data from 65th round of NSSO and Census 2011 to determine India’s housing shortage for the Five Year Plan 2012–17.1 The four criteria are:1. Homelessness: Persons or households who do not own or rent any kind
of shelter.2. Obsolescence: Dwelling units aged above 80 and those above 40 years old
and reported to be in ‘bad’ condition by their occupants.3. Non-serviceability: Katcha houses (those with walls and roofs of straw,
cloth, etc.) that have limitations in providing formal infrastructure such as access roads, water supply, sanitation and sewerage.
4. Congestion: Units of built-up area under 300 sq ft, wherein a married couple does not have a separate room.
Together, the criteria yielded a shortage of 18.78 million housing units, with congestion being the biggest contributor (see Graph 1: Breakdown of housing shortage in India). However, obsolescence is vaguely defined and the other three criteria have been interpreted differently by different agencies collecting data and estimating numbers, resulting in discrepancies in estimations. An example of this discrepancy is the difference in the number of slum households in India as per NSSO, 2012 (8.8 million households) and 2011 Census (13.92 million households).
Graph 1: Breakdown of housing shortage in India
Non-serviceability (Katcha)
Obsolescence
Congestion
Homelessness
5%
12%
80%
3%
Source: Report of the Technical Group on Urban Housing Shortage, 2012–17
The MoHUA report defines households earning under Rs 5,000 per month as the ‘economically weaker section’ (EWS) and households earning between Rs 5,001 and Rs 10,000 per month as the ‘lower-income group’ (LIG). Together, these two groups contribute around 96 per cent to the country’s housing shortage.
Besides poverty, the other major factor responsible for housing shortage is rampant urbanization. The relationship between urbanization and proliferation
There is confusion over
the way housing shortage is
defined and measured

35Resource efficiency, thermal comfort and liveability in the affordable housing sector
of slums is strong. As per Census 2011, about 38.3 per cent slum population of the country lives in cities with a million-plus population.2 The 2015 Slums Compendium of India suggests that there are cities where as much as 45 per cent of the population lives in slums (see Annexure 2). These facts skew the estimated demand for housing. Unofficial estimates put the housing demand at a higher level in view of the fact that close to 14 million households live in urban slums with unliveable conditions and that India is adding around four million people to slums every year (as per Census 2011).3 Unofficial numbers suggest that the country needs to build at least 40 million dwelling units immediately to provide quality habitat to people living in urban areas.
PMAY-U was conceived within the context of this housing shortage and demand. The programme evolved from the many policies related to provision of housing for the poor and low-income groups and redevelopment of informal settlements implemented over the last few decades (see Annexure 1). It also inherited the confusion regarding the definitions of housing demand and shortage. Originally, the programme worked with data from the Technical Group under MoHUA (that had estimated a national urban housing demand of 18.78 million units). PMAY-U aimed to meet this housing shortage by 2022. But its target was later revised to 20 million units on the basis of new surveys.4
According to recent MoHUA data, the validated demand in the country stands at 11.2 million dwelling units.
PMAY-U has given states a key role in assessing demand. The first requirement under PMAY-U is for the states to prepare their ‘Housing for All’ Plan of Action (HFAPoA). A state-level nodal authority then takes the HFAPoA first to the
States have been given a key role in assessment of housing demand, they must optimize adoption of PMAY-U guidelines for realistic need-based construction and delivery
Some estimates suggest that 40 million dwelling units need to be built to provide quality habitat to people in urban areas
MITASHI SINGH / CSE

36 Beyond the four walls of PMAY
state-level Sanctioning and Monitoring Committee (SLSMC) and then the Central Sanctioning and Monitoring Committee (CSMC) for approval and disbursement of funds under PMAY-U.
According to the latest demand surveys available in the CSMC reports, the 15 states reporting the most demand together require 17.67 million dwelling units (see Graph 2: State-wise housing demand in India and Graph 3: Demand as per new surveys).5 This number is already close to the national estimate given in 2012 by the Technical Group.
Graph 2: State-wise housing demand in India
0 500000 1000000 1500000 2000000 2500000 3000000 3500000
ODISHA
HARYANA
DELHI
KERALA
JHARKHAND
GUJARAT
KARNATAKA
MADHYA PRADESH
RAJASTHAN
BIHAR
TAMIL NADU
ANDHRA PRADESH
WEST BENGAL
MAHARASHTRA
UTTAR PRADESH
Demand (No. of dwelling units)
Stat
es
Source: Report of the Technical Group on Urban Housing Shortage 2012–17
Graph 3: Demand as per new surveys*
0 500000 1000000 1500000 2000000 2500000 3000000
KERALA
ASSAM
JHARKHAND
HARYANA
GUJARAT
BIHAR
RAJASTHAN
MADHYA PRADESH
WEST BENGAL
ANDHRA PRADESH
TAMIL NADU
TELANGANA
KARNATAKA
MAHARASHTRA
UTTAR PRADESH
Demand (No. of dwelling units)
Stat
es
* As of 31 July 2019
Source: Compiled from various CSMC presentations available on MoHUA website
It is difficult to ascertain if demand surveys represent actual need for housing in states. PMAY-U guidelines ask states to use 2011 Socio-Economic Caste Census (SECC) data to refresh their housing demand estimates, only based on which the scheme funds will be provided.6 Telangana, a new state, does not have SECC data for its new administrative areas. It conducted household surveys in 2014. With a whopping 1.5 million units, Telangana placed a fresh housing
Besides poverty, the other
major factor responsible for housing
shortage is rampant
urbanization

37Resource efficiency, thermal comfort and liveability in the affordable housing sector
demand fourth after Uttar Pradesh, Maharashtra and Karnataka, and more than that of undivided Andhra Pradesh. Based on the SECC data, undivided Andhra Pradesh had an estimated shortage of 1.27 million units. Telangana has only about two-fifths of the population of undivided Andhra Pradesh. That its demand would be more than that of undivided Andhra Pradesh (albeit updated about five years later) raises questions about the appropriateness of the data sources as well as the methods used at the state-level for ascertaining housing demand.
Then there is the case of Delhi, where shortage was estimated to be about 0.49 million units by the Technical Group. About one-third of the population in the state lives in sub-standard housing and the city needs no less than two million housing units for the lower-income group, according to the Economic Survey of Delhi 2018–19. No surveys are being carried out in Delhi as part of PMAY-U, and CSMC reports do not have updated data on Delhi. This strongly suggests that the 11.2 million national target does not include the national capital’s substantial housing demand.
Maharashtra, Karnataka, Tamil Nadu and Andhra Pradesh have increased their housing demand by about 0.64 million, 0.91 million, 0.14 million and 0.11 million units respectively over the 2012 Technical Group estimates. On the other hand, surveyed demand in Uttar Pradesh and West Bengal has decreased slightly from the 2012 numbers.
The assessed housing demand in Bihar, Gujarat, Jharkhand and Rajasthan has fallen to almost half of the corresponding 2012 numbers. This is improbable. Two possibilities exist: Either these states have not completed their demand
Undivided Andhra Pradesh had a shortage of 1.27 million units. Telangana has only two-fifths of its population, but more demand. Can the methods used to ascertain demand be correct?
MITASHI SINGH / CSE
It is likely that the national target of 11.2 million dwelling units under PMAY-U does not include Delhi's substantial housing demand
38 Beyond the four walls of PMAY
surveys, or they have created sufficient housing inventories to house the population belonging to EWS and LIG. While the latter is less likely, there is a need for deeper investigation to validate the scenario of housing demand in these (and other) states.
The discrepancies that have crept into the assessment of housing demand can be exemplified by data sets related to Goa. Niti Aayog’s Sustainable Development Goals (SDGs) Index, 2018 reports that Goa has met 35.71 per cent of its target under PMAY-U.7 But, as per the latest PMAY-U progress report and CSMC presentations available on the MoHUA website, Goa placed a demand of 4,845 units for its urban areas and completed 594 units by 1 July 2019. This means it had only met 12.26 per cent of the target. If we combine the housing demand and completion data for PMAY-U and PMAY-G (i.e., rural) available on MoHUA and Ministry of Rural Development (MoRD) websites respectively, Goa has met 23.4 per cent of its targets under PMAY for urban and rural housing. But the SDG Index does not specify if the reported progress is for urban areas only or if it includes the progress for PMAY (G) as well. Going forward, these inconsistencies and ambiguities will need to be addressed.
SDG India Index has renewed the focus on an accurate housing demand assessment. Against the SDG 11.1 global target of ‘ensuring access for all to adequate, safe and affordable housing and basic services and upgrading slums by 2030’, Niti Aayog has selected two indicators to demonstrate the country’s performance:1. Houses completed under PMAY-U as a percentage of the net demand
assessment. The target is to increase this to 100 per cent by 2030.2. Percentage of urban households living in slums. The target is to reduce this
to zero by 2030.
The number of dwelling units aimed for under PMAY-U and the objective of the second indicator of ‘slum free’ India will require a relook at the assessment of housing demand. According to UN’s Sustainable Development Solutions Network (that has developed the SDGs) ‘sound metrics and data are critical for turning SDGs into practical tools for problem solving’. Consistent data will be critical in determining the true progress of the country’s flagship policy on housing.
Consistent data will be
critical in determining
the true progress of
India's flagship policy on
housing

3STATUS OF IMPLEMENTATIONThe verticals and their horizontal development
MITASHI SINGH / CSE

40 Beyond the four walls of PMAY
Overall, around 8.3 million housing units were sanctioned under PMAY-U by 1 July 2019, of which only 2.6 million units have been completed, according to the state-wise PMAY-U progress reports
available on the MoHUA website.8 Going by these numbers, 26 per cent units will need to be sanctioned and 77 per cent units need to be completed in the next three years to meet the goal of ‘Housing for All’ mission.
An assessment of the state-wise progress of PMAY-U reveals that a few states—Andhra Pradesh, Gujarat, Haryana, Jharkhand and Odisha—have received sanctions for units much closer to their housing demand and can be said to be progressing faster than the rest of the states. States with top housing shortages—Karnataka, Maharashtra, Tamil Nadu, Telangana, Uttar Pradesh and West Bengal—have yet to receive sanctions for more than half of their demand.
SEGMENT-WISE PROGRESSPMAY-U is not one uniform programme. It has four separate verticals:1. In situ slum redevelopment2. Beneficiary-led construction and enhancement3. Affordable housing in partnership4. Credit-linked Subsidy Scheme
The first three verticals are sponsored schemes, partly funded by the Central
Graph 4: State-wise PMAY-U progress as of 1 July 2019
0
500000
1000000
1500000
2000000
2500000
3000000
UTTA
R P
RA
DESH
MA
HA
RA
SHTR
A
KA
RN
ATA
KA
TELA
NG
AN
A
TA
MIL
NA
DU
AN
DH
RA
PR
AD
ESH
WEST
BEN
GA
L
MA
DH
YA
PR
AD
ESH
GU
JAR
AT
RA
JAST
HA
N
BIH
AR
HA
RY
AN
A
JHA
RK
HA
ND
ASS
AM
KER
ALA
OD
ISH
A
UTTA
RA
KH
AN
D
JAM
MU
& K
ASH
MIR
MA
NIP
UR
AR
UN
AC
HA
L PR
AD
ESH
SIK
KIM
MEG
HA
LAY
A
GO
A
CH
ATTIS
GA
RH
TR
IPU
RA
PU
NJA
B
MIZ
OR
AM
NA
GA
LAN
D
DELH
I (U
T)
Dem
an
d (
No
. o
f d
wellin
g u
nit
s)
States
Demand as per new surveys Sanctioned Completed
Source: Demand compiled from various CSMC presentations and progress compiled from the state-wise progress reports available on MoHUA website
74 per cent of the target units under PMAY-U
had been sanctioned by
July 2019

41Resource efficiency, thermal comfort and liveability in the affordable housing sector
government, with the rest of the funds coming from state governments, urban local bodies (ULBs), development authorities and the beneficiaries. The last vertical—credit-linked subsidy scheme (CLSS)—is fully funded by the Central government and implemented through primary-lending institutions such as public sector banks, scheduled commercial banks and housing finance corporations.
Graph 5: Vertical-wise units approved for construction under PMAY-U
63%
32%
3% 2%
BLC
AHP
CLSS
ISSR
Source: Compiled from the various CSMC presentations available on MoHUA website
CSMC reports available on MoHUA website show that primacy has been given under PMAY-U to incremental construction by direct beneficiaries. As many as 63 per cent houses sanctioned under PMAY-U by 1 July 2019 fall under the beneficiary-led construction and enhancement vertical, followed by affordable housing in partnership vertical (that are built by the government or in partnership with the industry) with 32 per cent of the total sanctions; while in situ slum redevelopment and CLSS have received little traction—2–3 per cent. With more sanctions, this split might change but the larger picture will remain the same.
BENEFICIARY-LED CONSTRUCTION AND ENHANCEMENTBeneficiaries of PMAY-U are EWS households seeking capital to construct their houses or to improve existing dwelling units. EWS households are broadly defined as households having an annual income of upto Rs 3 lakh with discretion being allowed at the state- (or Union territory-) level to redefine the income criteria as per local conditions, after due consultation with the Centre.
Beneficiary-led construction extends capital support of Rs 1. 5 lakh to EWS households to construct or improve their houses. Beneficiaries identified by HFAPoA and not able to avail the advantages under any other mission component can also seek a Central assistance of Rs 1.5 lakh. The grant is sanctioned after verification of land (or even patta) documents, approval of the layout and inspection of the site. It is transferred to the bank accounts of the beneficiaries through the direct transfer mode in three–four instalments based on the progress on the construction. Progress is measured through geo-tagged
Beneficiary-led constructions and enhancements constitute 63 per cent of houses sanctioned under PMAY-U by 1 July 2019

42 Beyond the four walls of PMAY
photographs of the dwelling units.
The primacy given to this vertical under the PMAY-U is for a good reason. According to an older estimate of the Institute of Urbanology, between 1997 and 2002, public and private developers together built 0.5 million houses in urban areas but people built 8.5 million units in informal settlements. This trend has continued. In cities with populations of over a million, more than 40 per cent of the lower-income segment lives in self-constructed dwellings.
Incremental housing colonies have a fluid character and bring home the many advantages of flexibility. They provide the right amount of co-benefits to keep this population preferring incremental housing in unplanned informal settlements over formal housing provided at city peripheries. Some of these benefits are proximity to community networks, better livelihood opportunities, access to social amenities, and familiar and more suitable buildings.
Beneficiary-led construction is popular under PMAY-U because it lessens the liability for the government. However, these dwellings are characterized by basic construction techniques that may lack structural safety, and compromise on health and hygiene of the dwellers. Therefore, there is a strong need to investigate the implications of this typology in the long-run as cities strive to develop sustainably by following a compact development model.
AFFORDABLE HOUSING IN PARTNERSHIP While most states and Union territories follow the national pattern, wherein the beneficiary-led construction vertical has received maximum sanctions overall, in Andhra Pradesh, Gujarat, Karnataka and Maharashtra more units have been sanctioned under affordable housing in partnership vertical.
Any housing project can avail support under this vertical, provided that at least 35 per cent of the houses are for EWS. The government—any public body—or a private developer can initiate a project under affordable housing partnership. A single project should have a minimum of 250 houses; however, states are
According to an older estimate of the Institute of Urbanology, between 1997 and 2002, public and private developers together built 0.5 million houses in urban areas while people built 8.5 million units in informal settlements in the same time
VIK
AS
CH
OU
DH
ARY
/ C
SE
Incremental housing colonies
have a fluid character and
bring home the many
advantages of flexibility

43Resource efficiency, thermal comfort and liveability in the affordable housing sector
90% xxxx
Incremental housing in Delhi
Delhi presents an intriguing demonstration of why and how incremental housing gains significance over government-provided formal housing from the perspective of the urban poor. About 60 per cent of Delhi’s population lives in sub-standard settlements with quasi-legal land tenures.9 These sub-standard or informal settlements include squatter settlements, resettlement colonies, unauthorized colonies and urban villages. In the 1960s, Delhi had 110 unauthorized colonies with a total population of 221,000. Today, there are 1,797 unauthorized colonies. According to the latest Economic Survey, about 5.5 million residents of Delhi live in sub-standard areas, of which three million live in slums.10 &11
Access to economic activityInformal settlements in Delhi are mainly located and formed in the vicinity of institutional and industrial areas, urban villages and transitioning areas. More than organic development, these settlements are informal land delivery systems that are devoid of any formal service infrastructure but not ‘services’ that are provided by informal systems.
For instance, Sangam Vihar is a huge unauthorized colony, located in southeastern Delhi, and housing about one million people.12 It is a mixed-use locality, with uses ranging from residential to commercial to small-scale industrial. This colony came up because of its proximity to Okhla and Tughlakabad industrial areas. There are ample opportunities of livelihood, and individuals can walk or cycle to work. Transportation cost hardly exceeds Rs 10 per day when city buses or informal services like Gramin Seva are used.
Flexibility of renting and habitation typologySangam Vihar is dominated by rental housing, mostly preferred by informal labour. Plots of size as small as 450 sq ft are shaped to accommodate three rooms on each floor. Each house has a ground plus three floors, on an average. The average rent of a room is Rs 2,500 per month. Formal housing at the city periphery has similar incidental rents.
Access to public amenities trumps lack of basic infrastructureSince there is no piped water supply, private (informal) companies sell water at the rate of Rs 200 per month. The quality of water is compromised, so a few households
buy bottled water at the same rate of Rs 200 per month. Households are required to pay the costs of sanitation considering the fact that there are no sewerage lines and all unauthorized colonies have makeshift septic tanks. The cost of emptying and cleaning septic tanks is around Rs 200 every three–four months, i.e., Rs 50 per month, on an average.
Even after making a number of compromises regarding the quality of life, individuals choose to stay in these colonies. This is primarily due to livelihood opportunities attached with the locations and accessibility to public services. Moreover, being in close proximity to economically active localities and planned areas ensures proximity of social amenities such as schools, healthcare facilities, community buildings, banks, post offices, etc. These benefits become crucial for the families (and not just individuals) living in such quarters.
Opportunity to expand and land entitlementApart from rental housing, informal settlements provide an opportunity to own land as well. Individuals that settle within the economic fabric of the city over a period of time expand their families and prefer to buy dwelling units. Plots of sizes as small as 225 sq ft are available in these unauthorized colonies. The cost of a plot in Sangam Vihar ranges from Rs 4,000 per sq ft to Rs 5,300 per sq ft, while construction cost ranges between Rs 1,100 and 1,200 per sq ft.
Formal housing at the outskirts of Delhi costs about Rs 12.8 lakh per unit with an average built-up area of 320 sq ft.13 Shelling out Rs 17–18 lakh in unauthorized colony such as Sangam Vihar would yield about 400 sq ft built-up area (in a typical G+1 structure on a 225 sq ft plot) including the land. It will also provide the opportunity to expand in future by adding floors.
VIK
AS
CH
OU
DH
ARY
/ C
SE

44 Beyond the four walls of PMAY
empowered to reduce this requirement in accordance with the PMAY-U guidelines. A Central assistance of Rs 1.5 lakh per dwelling unit is available for EWS houses in these projects.
With the launch of PMAY-U, government of India had anticipated significant private sector interest in affordable housing. Four years have passed, and this pull is yet to be seen. A public–private partnership (PPP) policy was launched in September 2017 to catalyze this interest.14 The policy contains eight models of development, with varying involvement of the private sector, i.e., for land, design, construction, operation and maintenance of the stock, and allotment to beneficiaries. Six of these models utilize government and two private land.
An overview of the CSMC reports of a few states reveals that most affordable housing partnership projects are executed on government land. Under this framework, a public body or government agency identifies and acquires land, whereas private developers design and construct, and bid the cost in a procurement process undertaken by the respective state-level nodal authority. The developer finishes the project and hands over the dwelling units to the public authority for allotment (see Figure 1: Government land-based subsidized housing framework). The responsibility of operation and maintenance of units lies with the beneficiaries. In some cases, the public authority caps the bid cost; this approach is the Model 1 of the PPP policy. Under it, all units are handed over to the government.
Under Model 2, the sale price for EWS and LIG units is capped in mixed-income group housing projects. For instance, in Rajasthan, the sale price has been capped at Rs 1,200 per sq ft (including Rs 150 per sq ft to ULBs for construction of external infrastructure and Rs 50 per sq ft for maintenance of the infrastructure) for both EWS and LIG units.
In Andhra Pradesh, Gujarat, Karnataka and Maharashtra, a majority of the units have been sanctioned under affordable housing in partnership vertical
Significant private sector
interest was anticipated
when PMAY-U was launched.
Four years have passed, and
this pull is yet to be seen
MITASHI SINGH / CSE

45Resource efficiency, thermal comfort and liveability in the affordable housing sector
Figure 1: Government land-based subsidized housing framework
Source: Public Private Partnership Models for Affordable Housing, MoHUA, 2017
From our interactions with the developer community, we found that Models 1 and 2 are preferred over other models by them. But the capping of bid costs and sale prices has dampened the spirit of private enterprise in this sector. With the result, only about 32 per cent of total unit approvals under PMAY-U have been under affordable housing in partnership vertical. The government has tried to sweeten PPP deals in the sector by providing several additional incentives such as exemption on stamp duty, bringing down GST on affordable housing to 1 per cent, and providing additional floor area ratio (FAR) or development rights (see Box: State-level incentives for the affordable housing programme). Despite such initiatives, state governments and ULBs end up paying substantial amounts to either encourage private sector participation in this vertical or to improve access to housing for beneficiaries under this vertical (see Table 1: Financial burden-sharing in select states).
Table 1: Financial burden-sharing in select statesState Central
shareState share
ULB share Beneficiary share
Per dwelling unit cost
Rs lakh
Telangana 1.5 6.25 0.15–0.9 0 7.90–8.65
Chhattisgarh 1.5 2.5 0 0.75 4.75
Uttar Pradesh 1.5 1 0 2 4.5
Source: Compiled from CSMC presentations of the states, 2019
By public authority (PA)
By private developer
By beneficiary
Land identification
Land procurement
Land provisioning
Preparation of technical guidelines
Call for bid
Activity flowchart
Beneficiary identification
Beneficiary to pay a predetermined amount to PA
Beneficiary/ RWA to maintain the property
Construction of the housing project
Transfer of housing units to PA by the private
developer. PA to pay back at predetermined cost
Selection / empanelment of private developer
Handover of dwelling units to the beneficiary
Fixed parameters: Predetermined number of units, area, time and specifications
Bid parameters: Per unit cost (Lowest lump sum amount)
*The payment by PA to private developer shall be milestone-based.
Ensuring liveability and sustainability of affordable housing through design and alternative materials can raise the construction cost by Rs 250 per sq ft but is worthwhile

46 Beyond the four walls of PMAY
Government-capped construction rates are much lower than market rates. In Telangana, for instance, the cost of construction of affordable housing averages at around Rs 1,800 per sq ft, whereas government had capped it between Rs 1,050 per sq ft to 1,200 per sq ft under the scheme guidelines, later increasing it to Rs 1,294 per sq ft based on market response. To ensure financial feasibility of this rate, developers have resorted to using alternative construction technologies to fast-pace the delivery of houses and upgrade their construction experience portfolio. The state government is supporting these technologies and heavily subsidizing construction materials such as sand, cement and steel. This means subsidies are going into the purchase of undesirable material.
Governments need to link subsidies with performance of the housing stock, else the private sector will end up constructing houses that are not liveable for the lower-income population. Ensuring thermal comfort, energy efficiency and environmental sustainability in affordable housing through design and alternative materials can raise the construction cost by at least Rs 200–250 per sq ft over the prevalent market rates. This generally includes cost of compliance with environment impact assessment or energy conservation building code, etc. Governments need to invest in this cost to make it feasible for private developers and fulfill the national targets of ensuring thermal comfort for all and uplifting liveability.
State-level incentives for the affordable housing programme
Greater Hyderabad Municipal Corporation (GHMC) began procuring design and construction of EWS units at the rate of Rs 1,000 per sq ft as per the state guidelines.15 It received a poor response from the construction market, where the rates were as high as Rs 1,800 per sq ft. Currently, the construction cost has been capped at around Rs 1,294 per sq ft in urban areas for high-rise typology. A gap still exists, to compensate for which the following subsidies are being provided to developers:
Steel: The state was buying steel from manufacturers at a negotiated base rate of Rs 32,550 per tonne. In early 2018, the market value for steel jumped to Rs 53,100 per tonne, bringing much of the construction to a halt due to unwillingness of the steel industry to supply at the discounted rate. The 2BHK scheme
requires about 0.6 million tonne of steel (0.145 million tonne for rural houses, 0.104 million for urban, and the remaining 0.35 million tonne for GHMC area) for the targeted 2.8 lakh units. Considering the high demand, the government reset the base price to Rs 43,600 per tonne.16
Sand: The state government has facilitated free availability of sand to the developers. Telangana State Sand Mining Rules, 2015 exempt sand extraction of any cost for use in EWS housing schemes.17
Cement: The state government entered into a memorandum of understanding (MoU) with the Cement Manufacturers Association to supply 27.25 lakh million tonnes of cement at the rate of Rs 230 per bag for EWS housing project development. Transportation costs were settled at Rs 2 per bag.18
Governments have tried to sweeten PPP deals in AHP by providing
several additional
incentives such as exemption on
stamp duty

47Resource efficiency, thermal comfort and liveability in the affordable housing sector
IN SITU SLUM REDEVELOPMENTAround 90,000 units have been sanctioned under the in situ slum redevelopment (ISSR) vertical of PMAY-U as per the CSMC reports available on MoHUA’s website. This constitutes only 2 per cent of the total units supported by PMAY-U by 1 July 2019. Most dwelling units in slums are being sanctioned under the affordable housing programme vertical. While this arrangement may ensure that slum dwellers get a dwelling unit, implementers are not bound to rehabilitate the beneficiaries in situ.
In situ slum rehabilitation vertical is designed to rehabilitate eligible slum dwellers in situ by involving the private sector. The land is to be provided by the public authority along with a Central government assistance of Rs 1 lakh per dwelling unit. There are not many in situ slum rehabilitation projects and most of them are already under construction. Only after completion and allotment can their performance and suitability be commented upon.
In situ development may be a fine idea in principle, but it might have negative repercussions on the ground. For instance, in Hyderabad, slums have been built on marginal areas with rocky topography. In order to mandatorily rehabilitate slum dwellers in situ, the foundation work requires twice the time and effort, increasing the construction costs.
On the other hand, slums can also exist in prime locations in the city. If the land belongs to a public authority, city and state governments are compelled to provide additional FAR or development rights in order to leverage the real estate value of such land. In case of private land, PMAY-U guidelines suggest taking a similar approach to make these redevelopment projects financially feasible. Creation of additional FAR or development rights means constructing high-rise buildings—a typology not very suitable for slum dwellers. For instance, in the city centre of Hyderabad, projects under this vertical are G+10 structures.
Many state governments are effectively subsidizing purchase of construction materials such as sand, cement and steel, whose desirability is questionable and a subject of proper research and analysis. This must stop
MITASHI SINGH / CSE
Around 14 million households live in slums in India, but only 2 per cent of the santions under PMAY-U cater to this vast population
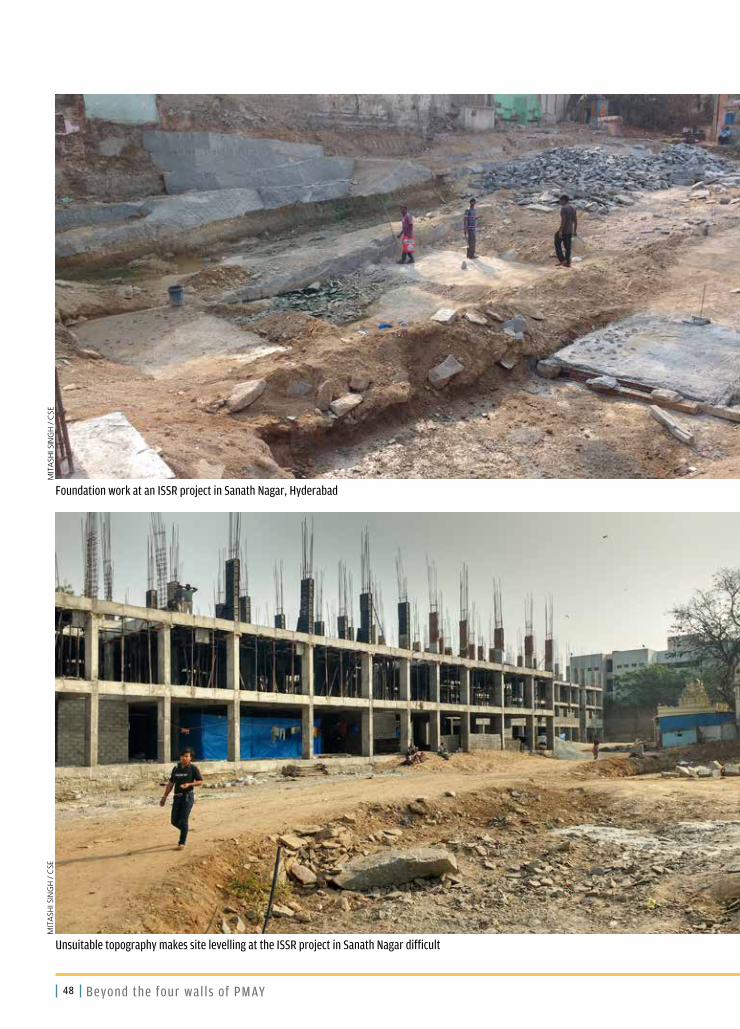
48 Beyond the four walls of PMAY
Unsuitable topography makes site levelling at the ISSR project in Sanath Nagar difficult
Foundation work at an ISSR project in Sanath Nagar, Hyderabad
MIT
ASH
I SIN
GH
/ C
SEM
ITA
SHI S
ING
H /
CSE

49Resource efficiency, thermal comfort and liveability in the affordable housing sector
CREDIT-LINKED SUBSIDY SCHEME: FOR URBAN POOR? Credit-linked subsidy scheme (CLSS) was purportedly meant for the affordable housing sector, but the way it defined carpet areas of the dwelling units (that could avail the credit-linked subsidies) gave lending institutions a lot of leeway to provide loans to the financially secure as well.
Until July 2018, CLSS for EWS and LIG households received 160,992 beneficiaries, whereas CLSS for the middle-income group (MIG) households received 44,064 sanctions, according to a report by the National Housing Bank.19 Based on this performance, and to push primary lending institutions (PLIs) to finance dwelling units for EWS and LIG households, the Committee on Monitoring of CLSS designated certain targets for these PLIs for the year 2018–19. The targets are similar for EWS and LIG, and MIG households. By 1 July 2019, only 3 per cent of houses sanctioned under PMAY-U fell under CLSS, according to the progress reports updated on MoHUA’s website (see Table 2: Proposed targets for credit-linked subsidy scheme).
Table 2: Proposed targets for credit-linked subsidy scheme*Particulars Total target
(number of units)
Percentage of total targets under CLSS
Number of EWS or LIG
units
Number of MIG units
Public sector banks (PSBs)
235,000 46 94,000 (40 per cent)
1,41,000 (60 per cent)
Private sector banks 50,000 10 30,000 (60 per cent)
20,000 (40 per cent)
Housing finance companies (HFCs)
190,000 37 1,14,000 (60 per cent)
76,000 (40 per cent)
Other PLIs 35,000 7 – –
Total (excluding Other PLIs)
475,000 – 2,38,000 2,37,000
*2018–19
Source: Compiled from reports of the Committee on Monitoring of Credit-linked Subsidy Scheme
CLSS for MIG was launched in January 2017 with the carpet area capped at 90 sq m for MIG I and 110 sq m for MIG II.20 This capping was increased to 120 sq m and 150 sq m in November 2017, and to 160 sq m and 200 sq m in June 2018 for MIG I and MIG II categories respectively22 (see Table 3: Carpet area increments under credit-linked subsidy scheme for the middle-income group).21&22A 200 sq m carpet area for a dwelling unit means 250 sq m of built up area; this 2,690 sq ft area is lavish enough for a three bedroom-hall-kitchen (BHK) apartment (sometimes even a four BHK), and easily falls under the higher-income segment.
The Union budget 2019–20 was announced with an additional deduction of Rs 1.5 lakh on interest on loans borrowed under affordable housing. This subsidy follows the previous interest subvention of upto Rs 2.67 lakh under the CLSS vertical of PMAY-U. Under the revised carpet area definitions, CLSS subsidy can easily be claimed and designed for and cater to middle- and upper-income segments. In addition, the enabling ecosystem for housing finance is
Credit-linked subsidy scheme was meant for the poor, but defined carpet area in a way that allowed lending institutions to provide loans to the financially secure as well

50 Beyond the four walls of PMAY
also available to all households, irrespective of their economic condition (see Box: Enabling ecosystem for housing finance).
Table 3: Carpet area increments under credit-linked subsidy scheme for the middle-income groupClass Carpet area
(January 2017, in
sq m)
Carpet area
(November 2017,
in sq m)
Carpet area (June
2018, in sq m)
Built-up area
(sq m)
MIG I 90 120 160 200
MIG II 110 150 200 250
Source: Compiled from several CLSS guidelines and amendment letters available on MoHUA website
Housing loan amounts of up to Rs 2 lakh witnessed the most defaults, with gross non-performing assets (NPA) being 11.33 per cent for public sector banks (PSB). Housing finance companies (HFC) also saw a sharp surge in housing loan NPAs in this slab. Such numbers only served as discouragement to financing institutions (both PSBs and HFCs) to lend to the lower-income rung—the primary target group of PMAY-U. Consequently, loan disbursement in slabs of less than Rs 2 lakh; Rs 2–5 lakh; and Rs 5–10 lakh faced a decline by 18.71 per cent, 34.14 per cent, and 14.17 per cent respectively in 2017–18.23
The country already has a stock of 11 million units lying vacant in the upper-income segment, according to the 2011 Census. This is ironic in the light of the official housing shortage of around 11.2 million in the country. Access to CLSS remains limited for EWS and LIG households who work in the informal sector, and face challenges in producing the required documentation—such as income proof—to avail finance under the scheme. The inaccessibility of housing finance to lower-income rungs is exemplified by the fact of most housing credits going to the segments with loan tickets of at least Rs 10 lakh and above, as per the 2018 report of National Housing Bank.24
The structure of CLSS makes it attractive for HIG and MIG, defeating its purpose
MIT
ASH
I SIN
GH
/ C
SE
The carpet area of subsidized
housing under CLSS can be as
high as 2,690 sq ft, enough for
a lavish three-bedroom house

51Resource efficiency, thermal comfort and liveability in the affordable housing sector
Enabling ecosystem for housing finance
Government of India has adopted several measures since the launch of PMAY-U to mobilize investment in the affordable housing sector. While there is an ample push to create an enabling environment for the developers, more efforts are still needed.
Removing barriers for investment: In 2017, the government granted ‘infrastructure status’ to affordable housing to boost construction.25 This move enables affordable housing projects to avail associated benefits like lower borrowing rates and increased flow of foreign and private capital.
Reprioritization of existing institutional buildings: The revised guidelines on time-bound closure of sick and loss-making Central public sector enterprises and disposal of movable and
immovable assets give priority to use of land under the fixed assets for affordable housing.26
Tax concessions: GST rates have been brought down to 1 per cent (from 8 per cent previously) for affordable houses being constructed after 1 April 2019. This applies to all houses meeting the criteria laid by the GST council for affordable housing.27 The criteria is that a house should have an area of 60 sq m in metros, and 90 sq m in non-metros, with a sale value of up to Rs 45 lakh. As far as the public sector goes, the government dedicated budgetary allocations worth Rs 5,000 crore to PMAY-U in 2016–17. Since then, the allocation for PMAY-U has increased in absolute terms (see Graph 6: Budget allocation for PMAY-U), but remained consistent at around 1 per cent of the total budget outlay for MoHUA.28
Graph 6: Budget allocation for PMAY-U
0
1000
2000
3000
4000
5000
6000
7000
8000
9000
10000
2016–17 2017–18 2018–19 2019–20
Budget allocation for PMAY
from 2016–17 to 2019–20
(budget estimate)
Budget allocation for PMAY
from 2016–17 to 2019–20
(revised estimate)
Budget allocation for PMAY
from 2016–17 to 2019–20
(actual expenditure)
Source: Compiled from Expenditure Budget documents

52 Beyond the four walls of PMAY
Rental housing—a gap in PMAY-U
Currently, there is no provision for rental housing under PMAY-U. However, it is increasingly being felt that building typologies need to diversify to provide for rental housing.
Internal migration in India is escalating rapidly. The Economic Survey 2016–17 uses projections from the 2011 Census, rail traffic data and changes in population in different age categories to demonstrate that migration in 2011–16 had nearly doubled to nine million per year from 5.5–6 million per year in 2001–11.29 This migration is mostly of working class population moving into urban areas for better livelihood opportunities.
These internal migrants comprise the bulk of the population in the country looking for rental homes. Renting instead of buying a dwelling space has many benefits for this group, including low initial investment, absence of the inflexibility of housing loans, and more freedom to choose a location or shift from one location to another, thus adjusting to income volatility.
However, there is a mismatch between the demand and supply of affordable rental housing. The Economic Survey 2017–18 highlights this by pointing out that the share of rental housing has actually declined in Indian cities since independence, from 54 per cent in 1961 to 28 per cent in 2011.30&31 The bulk of the migrant population not living in rented spaces is absorbed by the teeming informal settlements and slums.
Even for those who do rent a dwelling space, the conditions are often far from cozy. Shabby and extremely congested rental spaces are the order of the day. Centre for Policy Research studied informal rental housing typologies and experiences of low-income renters in the main clusters of informal housing in Badshahpur, Chakkarpur, Gurgaon Central and Kapasehra clusters in Gurugram. Most of these informal settlements are clustered around commercial hubs or sources of livelihood.32
The share of migrant workers in the local population in such settlements is as high as 60–90 per cent.33 They are forced to live in sub-standard accommodations; the report mentions that a whopping 72 per cent migrant population in these settlements takes up awfully tiny living spaces where a bunch of them have to share toilets.34
What is true of Gurugram also holds water in other major cities like Bengaluru, Delhi, and Mumbai, all cities with high rates of immigration. The 2018–19 Economic Survey of Delhi mentions that 32.59 per cent households in the national capital live in an informal rented dwelling, out of which 24.9 per cent households live without a formal (written) lease contract.35&36
The living conditions of people living in such quarters mirror those of the migrant workers living in the clusters in Gurugram.
Then there is the economic aspect of rental housing. In a 2008 report, the Deepak Parekh committee suggested that a household should not spend more than 30 per cent of its monthly income on renting a dwelling space.37 This upper limit seems too generous for most rental spaces, considering their small size, lack of comfort and amenities, and the limited financial means of the migrant workers renting them.
Over the years, multiple policy efforts have concentrated on formalizing rental housing, making it better and a part of the solution to the larger problem of housing. In 2007, the National Urban Housing and Habitat Policy emphasized the adoption of a multi-pronged approach to increase the urban rental stock of India.38 But the push for leveraging private sector participation resulted in mechanisms that prioritized home ownership, neglecting the potential of rental housing.
This was followed in 2013 by the Rajiv Awas Yojana (RAY), that declared rental and transit housing as the preferred choice towards meeting its targets in order to accommodate ‘tenants of slums, labourers, floating population and the urban homeless’.39 Not only this, RAY included norms for the states to clearly elaborate on the mechanisms they would be adopting for the management of rental housing, including rent fixation, operation and maintenance, and vacancy norms.
VIK
ASH
CH
OU
DH
ARY
/ C
SE
53Resource efficiency, thermal comfort and liveability in the affordable housing sector
90% xxxx
Subsequently, a Ministry of Labour directive requested states to create housing stock for construction workers as a welfare measure by utilizing the Construction Workers Welfare Fund set up under the Central Building and Other Construction Workers (Regulation of Employment and Conditions of Service) Act, 1996, for which states collect cess on construction projects.40
The biggest roadblock for these policies and programmes was on-ground implementation, and many follow-up problems like post-occupancy operations and maintenance, lack of rental associations to manage the affairs of rented clusters, and constructions that were sub-standard or inaccessible.
This led the then Ministry of Housing and Urban Poverty Alleviation to create the draft National Urban Rental Housing Policy (NURHP) 2015.41 The national rental policy objectives targeted three kinds of rental housing options—social rental housing (for vulnerable groups, the urban poor, EWS and LIG, and the homeless), need-based rental housing (for migrant labour, single women and men, and students) and market-driven rental housing (for the working class, MIG and HIG). Interventions were categorized as demand-side and supply-side. For demand generation, the policy advocates primary and secondary surveys for target group identification, fiscal and non-fiscal incentives to tenants such as tax exemptions, housing vouchers, etc., and encourages the creation of institutional owners. On the supply side, it suggests implementation of the Model Tenancy Act, 2015, encouragement of PPP and residential rental management companies for creation of social or need-based rental housing, earmarking a certain percentage of dwelling units in Central- or state-level housing schemes, fiscal and non-fiscal incentives to home owners, and an online portal or database for the rental housing stock.
The policy encourages a balanced approach by recommending roles and responsibilities for all stakeholders in the rental housing scenario, especially the tenants whose responsibilities have rarely been addressed in previous policies. However, the draft NURHP does not provide directions regarding on-ground implementation. Moreover, it does not address the case of the existing informal rental housing market that forms a substantial portion of the current stock but remains illegal, and therefore unregulated, leading to poor quality of life.
To address some of these challenges and to create a focused programme either within the PMAY-U framework or otherwise, it might be instructive to delve into the public rental housing policies and schemes in select states as well as other countries.
In Odisha, following a Labour Ministry directive, three rental projects were announced under the Odisha Building and Other Construction Workers’ Welfare Board and the Urban Development department.42 Under these projects, infrastructure services such as drinking water, electricity, sanitation, connectivity and other amenities were made available to tenants at affordable prices. In 2015, Odisha Urban Housing Mission–Awaas constructed rental housing complexes that were integrated with centres for social upliftment.43 The mission was also able to converge with other programmes, such as the Smart City Mission, on these projects. Most importantly, stakeholder-specific housing types were provided based on an assessment of their needs. These are very fair and replicable features.
Andhra Pradesh has created a policy for a rent-to-own model and already given it effect in two municipalities.44 Here, the buyer deposits a monthly installment equivalent to an EMI). The EMI has an 80 per cent rent component and 20 per cent thrift component, and when the amount of EMI reaches 10 per cent of the total price, the unit will be registered on the buyer’s name and hypothecated to the bank and government.
In Thailand, the Government Housing Bank provides long-term credit to small landlords who own land for constructing low-cost rental apartments.45 The bank provides up to 100 per cent of total construction cost with repayment periods of up to 15 years, compared to the five–seven years average among other lenders, reducing the pressure of repayment.
In Hanoi in Vietnam, flexibility in regulations and provisions of increased FAR, on the condition that the extension in such additional construction is used to provide affordable rental housing, has resulted in poor households now being able to afford to rent flats in multi-storey buildings in informal areas.46
In Vienna, Austria, the Housing Office publicizes information regarding the legal aspects of housing and an overview of all the subsidized apartments in the city, enabling renters to locate a house that meets their needs and apply for subsidies, while also providing landlords a forum to advertise their homes. This set-up helps save transaction and opportunity costs involved in searching an affordable rental accommodation.
Chile’s ‘Subsidio Leasing Habitacional’ grants are a rent-to-own model that can easily be adopted in India.47 In these schemes, the beneficiary initially buys a share in the dwelling unit and pays rent on the remaining share with the right to buy the property later. This ensures home ownership at the end of a prolonged duration of time, while ensuring that the poor household has a shelter in the meantime.

LIVEABILITY AND SUSTAINABILITYChoices that will determine the future of cities4 VIKASH CHOUDHARY / CSE

55Resource efficiency, thermal comfort and liveability in the affordable housing sector
Housing programmes in India have focused on increasing the number of housing units and incremental construction, with limited reference to the overall resource efficiency, and sufficiency and connectivity of
neighbourhoods. However, without addressing these issues, the basic purpose of providing affordable housing cannot be met.
From the perspective of sustainability and liveability, housing projects will have to consider a whole gamut of criteria. At the building level, building typology and design are critical for ensuring thermal comfort and resource efficiency with regard to water, energy and waste; and at the neighbourhood level, locational aspects, connectivity and urban greens are critical for ensuring liveability that also determines the usability of the housing stock.
There are some mandatory requirements under PMAY-U that, if applied properly, can address the liveability aspects of projects. But before they can be addressed, a review of the extent to which they are already being met is necessary. Unfortunately, by mandating that states identify land for affordable housing and relax development norms to a great extent in order to avail the benefits of the scheme, PMAY-U has heightened the risk of ad hoc interventions where the building stock may not necessarily be liveable and efficient or have a superior environmental performance.
In the absense of affordable public transport, large numbers of labourers are forced to commute to and from cities using informal transport modes
PMAY-U has heightened the risk of ad hoc interventions where the building stock may not necessarily be liveable and efficient
VIKASH CHOUDHARY / CSE

56 Beyond the four walls of PMAY
LOCATIONPMAY-U requires earmarking of land in master plans for affordable housing. In theory, this should allow cities and towns to ensure that the distance and cost of the daily commute of lower-income population is kept at a minimum. This can be done by creating affordable housing projects as close to their source of livelihood as possible or by providing affordable public transportation. However, 76.2 per cent of the 7,953 census towns in India do not have a master plan. To fulfil the requirement of PMAY-U, most cities and towns are preparing or amending their master plans in an ad hoc manner.
For example, in Jaipur, urban expansion is radiating northwards and southwards from the airport area. Most affordable housing projects are located in the Vatika and Sanganer area in the southern periphery of the city. A few projects are located in the north-western periphery along the State Highway 20 in the Kalwar tehsil. These projects were delivered under the Rajasthan government’s affordable housing in partnership scheme launched in 2009 and are located at a distance of 25–30 km from the economic centres of the city. Projects sanctioned under newer schemes such as the 2015 Chief Minister’s Jan Awas Yojana are located even further. There is no city bus connectivity for these areas. A framework for identification of sites for affordable housing is also absent (see Map 1: Location of affordable housing in Jaipur).
Similarly, Telangana’s 2BHK scheme is being implemented by Greater Hyderabad Municipal Corporation in Hyderabad’s urban areas. Most housing projects under the scheme, such as Ahmedguda, Bahadurapally, Dommara Pochampally and Kolluru are located near the outer ring road. Hyderabad Master Plan 2031 has reserved 500 metre buffers on both sides of the outer ring
Source: State level Nodal Authority for PMAY, Rajasthan
Map 1: Location of affordable housing in Jaipur
JAIPUR
Kalwar
20KM
Theekariya
22KM
Sanganer
15 KM
Vatika
29KM
Chaksu
42 KM
Cities must ensure that the
distance and cost of the daily
commute of lower-income population is
kept as low as possible

57Resource efficiency, thermal comfort and liveability in the affordable housing sector
road as a multi-use zone. The affordable housing projects do not fall under this zone. On an average, these sites are about 25 km from the city centre; the largest housing project at Kolluru (V) is at a distance of about 33 km from the city centre. There is no social and physical infrastructure around most of these sites and only a handful of city buses ply on the outer ring road. Bahadurapally and Dommara Pochampally are also in close proximity to forest and conservation land (see Map 2: Location of affordable housing in Hyderabad).
Map 2: Location of affordable housing in Hyderabad
Source: Greater Hyderabad Municipal Corporation
In Delhi, 35 per cent of the new affordable housing stock created by Delhi Development Authority (DDA) in Narela has no takers due to its location and acute shortage of public transport.48
But all is not doom and gloom when it comes to creating better master plans that take into account location-related requirements of affordable housing. The Ahmedabad Development Plan presents a better case of inclusion by coming up with a zoning-based planning instrument. The city has notified a kilometre-wide buffer space along the outer ring road as the residential affordable housing zone (RAH) (see Map 3: Residential affordable housing zone in Ahmedabad). Ahmedabad Bus Rapid Transit corridors are planned to intersect the RAH zone and provide frequent connectivity to the rest of the city. These corridors are zoned for a transit-oriented development. To catalyze development in the RAH zone, incentives such as 50 per cent additional FSI, reservation of 10 per cent of FSI for commercial use elsewhere in the city and timed (two years) validity of these incentives, which shall lapse in absence of construction, have been offered.
HYDERABAD
D-Pochampally
25 KM
Ahmedguda
26KM
City Centre
Bahadurapally
25 KM
Kollur V
32 KM
One-third of the new affordable housing stock created by DDA in Narela has no takers due to its location and acute shortage of public transport

58 Beyond the four walls of PMAY
Map 3: Residential affordable housing zone in Ahmedabad
Source: Ahmedabad Development Plan, 2021
In fact, many models have been developed to ensure more wholesome urban development. Cities can utilize these models while contemplating better integration of affordable housing in their master plans.
For example, ICICI Home Finance uses a Location Attractiveness Index (LAI) to undertake property research across cities. It evaluates any given locality using
Good / low costAbove averageAverage/medium cost
Below averageBad / high cost
Hinjewadi
Infrastructure (connectivity, roads, markets, schools)
Residential cost
Proximity to organized retail
Proximity to commercial development
Future infrastructure development
Future employment generation
VimanNagar/Kharadi Hadapsar
Kalyani-nagar
Aundh/Baner
Wakad/Pimple-
SaudagarDeccan Kothrud
NIBM/Wanowrie
Figure 1: Location Attractiveness Index used for localities in Pune
Source: ICICI Property Services Group, 2012
Khodiyar
17 KM
Bopal
14.5 KMKathwada
15 KM
Vastral
12 KMVatva
11KM
AHMEDABAD

59Resource efficiency, thermal comfort and liveability in the affordable housing sector
indicators such as infrastructure (public transport, roads, schools and markets), residential cost, proximity to organized retail and commercial development, and future infrastructure development and employment generation. Localities are ranked from good or low-cost to bad or high-cost in order to inform how ready or suitable they are for housing provision. Good or low-cost means decision makers needs to invest less in providing the required infrastructure since it already exists to some extent. Pune Municipal Corporation and Lucknow Nagar Nigam are a few ULBs that have adopted this technique in their master plans and use it widely in taking decisions on development.
These efforts needs to be catalyzed and synergized. Ineffective planning contributes substantially to sub-optimal use of land and is regressive when it comes to sustainability. Lack of integration with transport facilities, combined with low FAR or FSI and density norms foster sprawl. Increased distances result in increased investment towards infrastructure. This not only has a negative impact on the environment and resource consumption, but also worsens the socio-cultural quality of a city.
BUILDING TYPOLOGY FOR SUSTAINABILITYAnother mandatory condition under PMAY-U requires states and cities to provide for additional floor area ratio (FAR), floor space index (FSI), or transferable development rights (TDR) and relaxed density rules for slum redevelopment and low-cost housing. These provisions generally result in a dense and high-rise development typology. Most states are opting for development above G+4 structures, for instance, G+10 in Telangana and G+7 in Gujarat.
While a dense and compact typology increases efficiency in terms of usage of land and distribution of services, it underperforms on sustainability and affordability. Taller a building, higher are the emissions per unit area due to higher steel and cement loading per unit area. A study by architect Ashok Lall suggests CO2 emissions increase by upto 35 per cent when a structure goes from a mid-rise to high-rise development. The height of buildings also plays a role in wind penetration on the site. Taller buildings need additional services such as lifts and water pumps. There is recurring need to invest money into their operations and maintenance, and place adequate efforts in their upkeep. This creates a tremendous financial burden on people belonging to the lower-income group. Such typologies will have to be revisited.
BUILDING DESIGN AND MATERIALS FOR THERMAL COMFORT AND ENERGY EFFICIENCYIndia’s Cooling Action Plan (ICAP) has categorically stated the goal of thermal comfort for all. This goal needs to be integrated with the requirement of affordable housing. To achieve this, it is important to target improved thermal comfort through material choice, design and orientation planning in the development of improved energy efficiency in buildings.
CO2 emissions increase by upto 35 per cent when a structure goes from a mid-rise to high-rise development

60 Beyond the four walls of PMAY
Energy use in buildings is a function of building design (including orientation and envelope) and materials used. Building orientation guides the wind and sun penetration. Building envelope plays a key role in daylight penetration, and heat transfer in and out of a building. Building envelope includes the roof, walls, windows and doors that are exposed to the exterior. Heat transfer through the roof and walls is governed by the materials used. Therefore, thermal transmittance property of materials is another area that determines thermal comfort in buildings. BEE acknowledges that energy demand in buildings can be cut down by up to 40 per cent by designing an efficient envelope.
PMAY-U guidelines include a technology sub-mission (Section 9) to enable adoption of faster, innovative, disaster-resistant and green technologies. The sub-mission provides for layout design and building plans that are responsive to local climates. To help the proper functioning of the sub-mission, a cell has been set up in the BMTPC. It released a compendium of prospective technologies—third in the series—for mass housing in September 2018, which was later updated.49 The compendium takes into account multiple attributes to judge a material. They are divided into primary, secondary and tertiary attributes. Criteria like thermal performance and embodied energy are classified as tertiary attributes for identification of materials and technologies.
However, the compendium provides incomplete information about many criteria. For example, a criterion such as thermal performance is not comparable across technologies. Some technologies use the U-value (thermal transmittance, that is, the heat transmission in unit time through unit area of a material), some use the K-value(thermal conductivity, that is the time rate of steady state heat flow through a unit area), while still others use the temperature change between the interior and exterior through the use of a particular technology. This makes comparisons between technologies difficult. Streamlining of the information regarding alternative materials and construction technologies being promoted by BMTPC is needed.
A Global Housing Technology Challenge (GHTC) has been launched under the sub-mission to identify materials and technologies befitting of the criteria and
A 10-level affordable housing structure for EWS families may be efficient in terms of land utilization, but has a high cost of maintenance and bigger environment footprint
Critical criteria like thermal
performance and embodied
energy have been relegated
as tertiary in the identification of
materials and technologies
by BMTPC
MIT
ASH
I SIN
GH
/ C
SE

61Resource efficiency, thermal comfort and liveability in the affordable housing sector
to draw plans to scale up those technologies. Six ‘lighthouse projects’ have been launched in Agartala, Chennai, Indore, Lucknow, Rajkot and Ranchi. They represent different geo-climatic regions and are scheduled to be developed and monitored as living labs as part of GHTC. The government is providing a grant of Rs 2 lakh per dwelling unit to offset the cost of alternative materials or construction technology that will be used in the lighthouse projects. However, this grant is not subject to thermal or energy performance of materials, since the criteria for GHTC are similar to the ones utilized by BMTPC.
A massive stock is being built at a rapid pace under PMAY-U. Inefficient design and poor choice of materials can put the stock under intensive energy use due to compromised thermal comfort. Eco-Niwas Samhita (ECBC-R) guides energy performance whereas National Building Code (NBC) guides thermal comfort and daylighting requirements in a structure. A CSE scoping study found that housing projects are not taking these requirements into consideration while designing and opting for materials. The study found that a sample project’s design complies to ECBC-R for RETV when most units face North-South direction. But if simulated using the NBC criteria, the layout and design used will provide thermal comfort for a minimum 74 per cent to a maximum 82 per cent time of the year. Maximum thermal comfort will be achieved in units facing North-South direction. For the rest of the period, households will have to use mechanical cooling in the study’s composite climate zone.
The building material industry is undergoing a transformation at the moment and it is important to inform it by identifying materials that perform best
MIT
ASH
I SIN
GH
/ C
SE
It is imperative to prioritize design and construction of housing in a way that maximizes thermal comfort and minimizes energy use

62 Beyond the four walls of PMAY
Design housing that
is climate-appropriate,
Leveraging solar power potential of affordable housing
Solar power is not specifically part of PMAY-U. But it is important to leverage existing policy on renewable energy for built environment. For instance, Environment Impact Assessment (2006) notification acknowledges solar energy as a promising power source to be installed and expanded in the built sector. The notification asks for 1 per cent of connected load to be met by solar power and mandatory solar-powered street and common area lighting and water heating.
The National Solar Mission pushes for decentralized and off-grid applications. It aims to leap-frog the fossil-fuel trajectory of growth by directly moving to solar to electrify new developments. However, an initial investigation by CSE on solar power generation in affordable housing revealed that states are not fully utilizing the potential offered by solar power to meet energy demands.
For instance, Rajasthan’s unified building bye-laws mandate solar water heating and solar powered common area lighting only for residential plots larger than 500 sq m. Most affordable housing projects do not have solar energy plants so far, including large projects. Gujarat, with a mandate of meeting 5 per cent of connected load from solar in group housing, has only recently installed rooftop solar power plants at Kathwada (Ahmedabad) project involving 588 EWS units, which is a government-owned
project. Computation of solar rooftop potential at the same site reveals that around 16 per cent of the connected load can be met by solar energy. With a lot of affordable housing units under construction, governments need to use this potential to the maximum.
Most states have solar policies in place, offering subsidies and tax exemptions to offset some of the capital cost. For instance, Gujarat amended its Solar Power Policy, 2015 and Residential Rooftop Solar Subsidy, 2016, reducing the permissible load to 1 kWp capacity (grid-interactive) to increase penetration of solar energy in small residential units. The subsidy cuts the establishment cost from Rs 69,000 per kW to Rs 38,300 per kW.
Further, renewable energy service companies (RESCOs) are offering competitive prices including establishment, operation and maintenance costs for solar power plants. The latest auctions conducted by Solar Energy Council of India saw solar power tariffs of between Rs 2.44 and Rs 6.20 per unit. This scenario reinstates the need to increase solar penetration in the built sector and mainstream it for affordable housing. But given the income sensitivity of this segment, this will require special attention from installation to long-term technical and maintenance support, and management that will have to be led by developers and the government.
AH
MED
ABA
D U
RBA
N D
EVEL
OPM
ENT
AU
THO
RITY

63Resource efficiency, thermal comfort and liveability in the affordable housing sector
According to the study, around 47 per cent of the total living area will receive daylight and that too when no building is shading another building. Wherever buildings are shading each other, the day-lit area will only be 15 per cent. These findings are in contrast to the visible light transmittance (VLT) results under ECBC-R—based on window–wall ratio (WWR)—according to which daylight in the sample project is ample. This means the criteria of WWR, as used by ECBC-R, may not be representative As people with meagre incomes will inhabit these units, the cost of this elevated energy use due to inefficient design will incident substantially on them. Therefore, it is imperative to prioritize design and construction of housing in a way that maximizes thermal comfort, optimizes daylight ingress and minimizes energy use.
There is a great need as well as an ample opportunity to investigate thermal properties of new materials and technologies before scaling up. CSE’s scoping study reveals not all new materials and technologies are fit for every climate zone—especially thermal comfort of the poor. This compatibility needs to be checked before implementation. Autoclaved aerated concrete (AAC) blocks deliver the best thermal comfort, followed by insulation-based technologies. Technologies with waffle-crete system, glass fibre reinforced gypsum and pre-cast large concrete panels performed weakest in the sample project’s composite climate zone. Surprisingly, compressed stabilized earthen blocks (CSEB) provided better thermal comfort than fly-ash bricks, even though their RETV performance was weaker than fly-ash bricks in the same climate zone. This implies RETV in ECBC-R is not adequately representative of thermal comfort. Instead, materials with high thermal mass were able to achieve good thermal comfort, even when they performed only average in terms of RETV.
Anil Agarwal Environmental Training Institute: A model nature-based wastewater treatment system
DH
RUV
PA
SRIC
HA
/ C
SE
Thermal properties of new technologies must be investigated from the angles of thermal comfort and energy performance before scaling up

64 Beyond the four walls of PMAY
While materials with high thermal mass are generally very good for thermal comfort, they may have limitations regarding the speed of construction. But a great number of low-rise and low-density typologies being constructed under PMAY-U could leverage the thermal mass of such materials to achieve thermal comfort. Further, walling assemblies combining materials with high thermal mass and insulation can result in better thermal comfort for all. These are guided by the Indian Standard SP:41 (S&T) (about performance of walling) and need to be explored in the context of PMAY-U.
Affordable housing projects tend to favour pre-approved building design templates that leave little scope for design and material interventions. This should give way to a more wholesome and locally-viable design sense and material choice.
DECENTRALIZATION OF COMMON ENVIRONMENTAL SERVICESThere are no separate provisions for rainwater harvesting, decentralized waste management and wastewater treatment in PMAY-U guidelines. These services are guided by model buildings bye-laws, state building bye-laws and the Environment Impact Assessment (EIA) Notification, 2006.
A zero draft Environment Impact Notification launched in May 2019 empowers ULBs to stipulate environmental conditions while giving building permissions for building and construction projects with a built-up area equal to or greater than 20,000 sq m and lesser than 50,000 sq m.50 There is also a requirement for third party monitoring. Most affordable housing projects fall under this category, which makes building bye-laws a very important regulatory document to mainstream common environmental services in upcoming housing construction.
With any development emerges the need for services like water supply, wastewater treatment, power supply and solid waste management. The previous target of providing 18.78 million dwelling units translated into an estimated requirement of formal systems for the yearly supply of 12,677 MLD of potable water, treatment of 10,142 MLD of wastewater per year, provision of 1,690 GWh of electricity annually, and management of 37,560 tonnes of solid waste per day. Currently, this is being done in a compromised and unorganized manner. Demand for biodiversity and green spaces is equally enormous.
Utilities and service infrastructure in India revolves around centralized systems that are already overburdened. Most cities are facing upto 50 per cent deficits in their requirements. On the other hand, there is enough evidence that conventional centralized systems are expensive. For instance, according to an approximation, treating one MLD of sewage costs around Rs 1 crore through a centralized system, excluding land cost.51
Decentralized services, such as nature-based systems for wastewater treatment, require less effort and money to operate and maintain. Further, conventional service systems, such as a sewage treatment plant, require hefty recapitalization
Each state has its own varied
geo-climatic characteristics
and, hence, the potential for different
environmental services

65Resource efficiency, thermal comfort and liveability in the affordable housing sector
efforts and funds. Since most affordable housing projects are being transferred to the beneficiaries for operation and maintenance, cost-effective techniques need to be strongly promoted. This will need comprehensive guidelines that enable low-impact construction, operations and maintenance.
Each state has its own varied geo-climatic characteristics and, hence, the potential for different environmental services. Efforts to identify this potential and requisitely address it are key towards low-impact and climate-responsive development. Experience suggests comprehensive national guidelines to encourage low-impact and decentralized environmental services along with interventions in building bye-laws to ensure nuanced adoption can enable this. Efforts are also needed for capacity building of ULBs for effective scrutiny and implementation of these services.
INFORMING BENEFICIARY-LED CONSTRUCTIONAbout 63 per cent of projects approved under PMAY-U are beneficiary-led constructions. This significant share also calls for informing this vertical with affordable sustainability criteria. Self-owned and self-constructed houses, incrementally built, allow pacing of construction as per the convenience of the
Low-cost material and innovative design can combine beautifully to improve thermal comfort and, thus, liveability of self-constructed houses
INST
ITU
TE O
F U
RBA
NO
LOG
Y
To provide adequate technical support, networks of architects and planners need to work with self-constructing communities

66 Beyond the four walls of PMAY
owner. It is a dominant strategy for the housing of lower-income groups. Today, adding a second or third floor, toilet or kitchen is a common process that goes on all year-round in these colonies. This kind of construction is not guided by building norms and safety codes, but by informal knowledge of construction.
Even though this is the largest construction segment under PMAY-U, its clientele does not normally have access to technical knowledge support in terms of the sustainability and liveability features that can be incorporated. It is important to inform this process in terms of building typology, material choice, building design for thermal comfort, community space, and space for artisanal activities. Such interventions are also needed to improve the quality, safety and stability of structures. To enable such support, formation and mobilization of a network of architects and planners to work with the community is vital.
It may be highlighted that several voluntary groups and non-governmental organizations have begun to provide voluntary support to these beneficiaries in terms of low-cost but sustainable building design, material choices, and use of daylighting, among others.
This intervention is critical in view of the scale of such construction. For instance, around two million people live in resettlement colonies in Delhi that were chalked out under government’s Site and Services Scheme, according to a report by Micro Home Solutions.52 Evicted slum dwellers are allotted plots (each around 12.5–20 sq m) in these resettlement colonies with temporary or perpetual lease rights. Resettlers have to pay first for the plot and then the entire construction of their respective dwellings.
Micro Homes Solutions (mHS) aims to improve the quantity and quality of low-income housing by intervening in the self-constructed segment. Design Homes Solutions (DHS) is a mechanism that involves financial and technical assistance and is provided to identified families who are planning to self-construct or expand their houses. A construction investment aimed at improving the quality of life can range from Rs 25,000 (minor repairs) to Rs 500,000 (vertical expansion).53
A number of architects and planners are creating basic services in self-constructed colonies. In Savda Ghevra, Delhi bottom-up efforts have revealed that urban poor are willing to invest in upgrades, if there is hand holding and the process solves their problems adequately. Involvement from the design stage itself, through construction, and operation and maintenance, establishes ownership of the community on infrastructure. Sanitation systems includes a nature-based wastewater treatment and recycling plant. Designing and constructing housing for safe, healthy and comfortable indoors in dwelling units includes use of different materials such as mud blocks, fly-ash bricks, bamboo, reflective paints, insulated corrugated sheets, and green roofs, among other things, as well as shading devices and elements for aiding ventilation and daylighting.
Several voluntary groups and non-
governmental organizations
provide support to low-income
beneficiaries for sustainable and
cheap design and material choices

90% xxxx
5 LESSONS AND NEXT STEPSAcceleration and course correction needed
MITASHI SINGH / CSE

68 Beyond the four walls of PMAY
PMAY-U has been at work for a few years now and a few important lessons can be drawn from its on-ground implementation, going forward. Firstly, demand surveys projecting housing demand need to be improved.
This will require robust housing data repositories and addressing the lack of consistent definition of and data on housing. Secondly, state sustainability guidelines and city sustainability frameworks need to be integrated with building bye-laws, and master and development plans.
Currently, state governments focus on producing voluminous stock at speed. Initiatives such as the Global Housing Technology Challenge have been launched with a view to identify construction techniques that enable governments to meet their targets by 2022. This approach has a risk of creating underperforming assets and infrastructure that will not fulfill the target of providing quality and liveable shelters to the low-income groups. States and cities need to put beneficiaries at the centre of planning for affordable housing schemes to meet the requirements of the target population in terms of suitable building typology and design, flexible ownership models, low cost of living, and less operation and maintenance efforts.
Fundamentally, addressing location, transportation, common environmental services, design and material choices for thermal comfort that are design appropriate and affordable for occupational groups is important. There are multiple ways of addressing this—state-specific guidance frameworks, affordable housing bye-laws, updating housing policies, augmenting master plans, among others.
Enormous capacity building efforts will also be required to ensure community outreach and effective implementation of the agenda. This creates a great opportunity to work at state- and city-levels.
LOCATION•Conduct socio-economic surveys to understand livelihood pattern of the
lower-income segment in urban agglomerations.• Identify major economic hotspots and suitable locations along transit
networks across urban agglomerations to promote mixed-income housing by providing maximum affordable housing in that catchment. Zoning-based inclusion can enable earmarking of land for affordable housing in strategically suitable locations for the target population.
•Prioritize uplift of socio-cultural amenities before construction of housing. For instance, ensure that basic services like functional primary schools, public medical clinics and other basic amenities exist within a short radius of the affordable housing site. Instruments such as Location Attractiveness Index can help in checking the availability and status of infrastructure and amenities in a locality to inform decision making.
•Promote affordable housing in master and development plans by offering incentives. Link incentives to delivery on liveability standards.
•Ensure alternative housing models to minimize the need for relocation. Cities have informal dormitories in marginal areas. Rental housing is a demand-side intervention and is essentially need-based. It recognizes the fact that
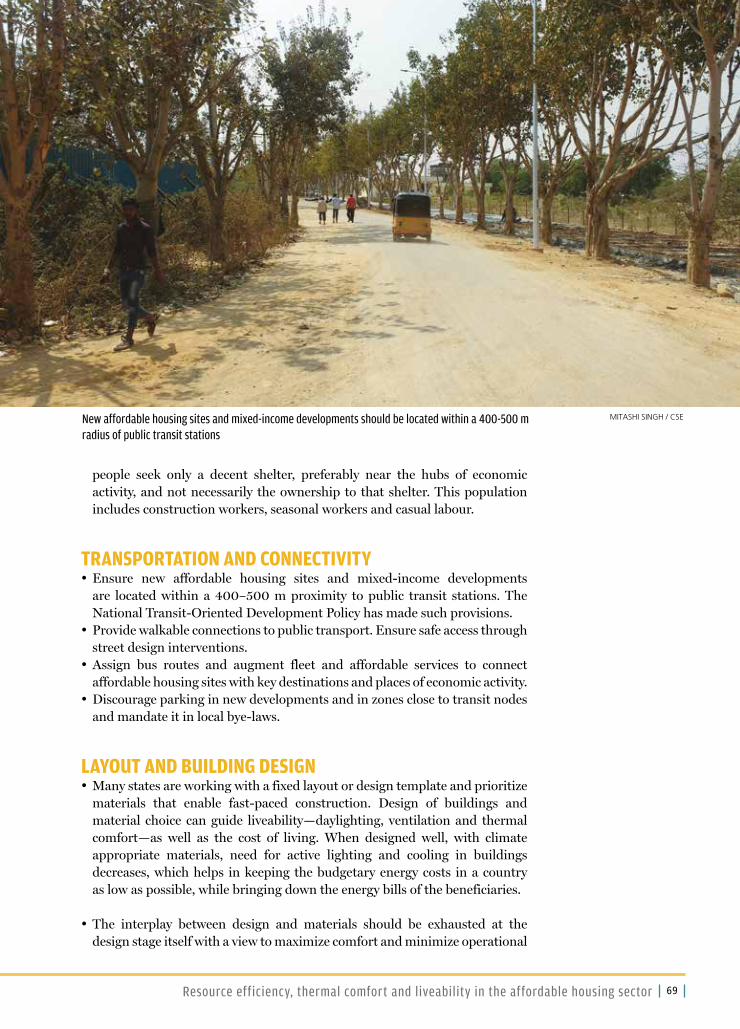
69Resource efficiency, thermal comfort and liveability in the affordable housing sector
people seek only a decent shelter, preferably near the hubs of economic activity, and not necessarily the ownership to that shelter. This population includes construction workers, seasonal workers and casual labour.
TRANSPORTATION AND CONNECTIVITY•Ensure new affordable housing sites and mixed-income developments
are located within a 400–500 m proximity to public transit stations. The National Transit-Oriented Development Policy has made such provisions.
•Provide walkable connections to public transport. Ensure safe access through street design interventions.
•Assign bus routes and augment fleet and affordable services to connect affordable housing sites with key destinations and places of economic activity.
•Discourage parking in new developments and in zones close to transit nodes and mandate it in local bye-laws.
LAYOUT AND BUILDING DESIGN•Many states are working with a fixed layout or design template and prioritize
materials that enable fast-paced construction. Design of buildings and material choice can guide liveability—daylighting, ventilation and thermal comfort—as well as the cost of living. When designed well, with climate appropriate materials, need for active lighting and cooling in buildings decreases, which helps in keeping the budgetary energy costs in a country as low as possible, while bringing down the energy bills of the beneficiaries.
•The interplay between design and materials should be exhausted at the design stage itself with a view to maximize comfort and minimize operational
New affordable housing sites and mixed-income developments should be located within a 400-500 m radius of public transit stations
MITASHI SINGH / CSE

70 Beyond the four walls of PMAY
energy use. Simulation exercises and guidelines such as Eco Niwas Samhita, 2018 can inform this interplay. A CSE study titled Optimizing the Third Skin establishes this relationship in a sample housing project in Telangana. The study reveals that there is ample opportunity to work on designs and materials opted for by the state government to enable compliance with the Eco Niwas Samhita, 2018. When it comes to thermal comfort, it is also imperative for states to check that while confirming with Eco Niwas Samhita, needs of thermal comfort as per the India Cooling Action Plan are also met in upcoming housing stock.
•Fix the orientation of mass housing to maximize daylighting and ventilation. Orient buildings along the east–west axis in a way that ensures that a majority of the vertical surface area of buildings is facing north and south. For instance, Optimizing the Third Skin reveals that units oriented along the north–south axis are thermally the most comfortable and the RETV is the lowest when a building is east–west oriented. East–west orientation works in favour of mutual shading by reducing solar ingress through the east and west façades of buildings. Wherever constraints to such orientation of building blocks exist due to the shape of a site, alternative arrangements can be worked out.
•Align built form corresponding to the predominant wind direction, which can be derived from the local wind rose diagrams. CSE observed a few sample housing projects in different states. In most cases, buildings are clustered along the road network planned for the site. Building at an angle to the predominant wind direction will increase penetration of wind in the buildings as well as the open spaces.
•Prioritize a compact clustering of buildings. Compact built form reduces built footprint on the land, increases efficiency of common services by requiring
The interplay between design and materials should be exhausted at the design stage itself with a view to maximize comfort and minimize operational energy use
MIT
ASH
I SIN
GH
/ C
SE

71Resource efficiency, thermal comfort and liveability in the affordable housing sector
less space for distribution and facilitates mutual shading, saving money. For instance, a study by BEE found that mutual shading reduces solar radiation exposure by about 35 per cent, reducing the demand for space cooling.54
•Refrain from high-rise buildings, and ideally cap building height to a mid-rise (G+4 to G+7) development. Affordable housing development in India is strongly incentivized by offering additional FAR or FSI and transferable development rights. In order to accommodate maximum dwelling units in a project site and make it financially feasible, high-rise structures are being preferred. For instance, G+9 in Telangana and G+7 in Gujarat. High-rise buildings are not suitable for lower-income segments. They also underperform on sustainability, affordability and adaptive comfort. Taller buildings need additional services such as lifts and water pumps and there is a recurring need to invest money in their operation and maintenance.
•Envelope design and shading devices are majorly responsible for heat gain or loss from a building and, hence, determine the need for space cooling or heating. Eco Niwas Samhita, 2018 suggests net heat gain—expressed as RETV—through building envelope (excluding roof) should not exceed 15 watt per sq m, in all climate zones except cold climate. Efficiency of envelope can also be determined by the ratio of exposed surface area and built-up area of the dwelling unit. Another CSE study on housing project samples from different states reveals that if the ratio is higher than 0.92, the envelope is not efficient.
•Explore transitional housing typologies to cater to the needs of target groups. These are typologies that allow gradual shift from incremental housing to compact group housing.
•Encourage community participation in the design process of formal as well as incremental housing under the BLC vertical. Involve local architects.
MAXIMIZE RENEWABLE ENERGY POTENTIAL•Set targets to increase residential rooftop solar power generation based on
calculated potential in states.• Increase the per cent of connected load requirement to be met mandatorily
by solar power based on assessed potential.•Solar power generation is space-intensive. Scaling up decentralized solar
power generation would require ample rooftop space, i.e., 10 sq m for every kWp installed as suggested by the Ministry of New and Renewable Energy. Maximize availability of solar PV installation by reserving a minimum rooftop space.
•Make building permission process stringent to force the private sector to deliver on mandatory solar power generation requirements. But work out the long-term maintenance and management that may be a challenge for the lower-income category.

72 Beyond the four walls of PMAY
MATERIAL CHOICES•Prepare a ready-reckoner of locally available materials, which must include
information on properties such as thermal comfort, recyclability, recycled content, embodied energy, emissions intensity, toxicity, sustainability and safety. CPWD’s guidelines for sustainable habitat provide several such parameters along with their weightage in a sustainability index to inform decision-making on materials.
•Building Material and Technology Promotion Council is promoting technologies that offer benefits such as low maintenance, low life-cycle cost, better durability, improved thermal and acoustical performance, better hazard resistance and low wastage. A few technologies such as monolithic concrete construction, expanded polystyrene core panel system and light-gauge steel frame systems are included in the schedule of rates by the CPWD. Before construction, states need to investigate what RETV or thermal comfort the chosen material or walling technology is delivering within the given design and native climate. If performing to the standards of Eco-Niwas Samhita and National Building Code, those materials and techniques must be promoted by mass production and mainstream in construction procurement by providing fiscal support to offset higher costs, if any.
Ready-reckoners of locally available materials, which include information on properties such as thermal comfort, recyclability, recycled content, embodied energy, emissions intensity, toxicity, sustainability and safety, can be extremely useful
MIT
ASH
I SIN
GH
/ C
SE

73Resource efficiency, thermal comfort and liveability in the affordable housing sector
•Promote materials with high thermal mass, like compressed stabilized earthen block (CSEB), especially in internal walls. Thermal mass plays a key role in thermal comfort in naturally ventilated buildings like affordable housing.Optimizing the Third Skin found that RETV does not equate with thermal comfort. Even when the performance of the materials is only average in terms of RETV, their high thermal mass helps them achieve better thermal comfort. For instance, a 160 mm fly ash brick has a superior thermal transmittance or U-value of 1.5 W/m2 K compared to CSEB with a U-value of 2.47 W/m2 K, but CSEB helps achieves better thermal comfort.
COMMON ENVIRONMENTAL SERVICES •Currently, there is no or weak convergence among a number of schemes or
initiatives launched at national- and state-levels. Due to the urgency to deliver housing units and to maintain cost-effectiveness, most affordable housing projects are exempt from certain mandatory provisions in bye-laws such as meeting 1 per cent of the total energy demand load through solar rooftop energy. Now is a great opportunity to weave the provisions and incentives under various policies together to enable low-impact construction.
•Decentralized wastewater treatment and rainwater harvesting will have to be integrated more explicitly with these projects. This will require more appropriate approaches for management and operation of these systems. Currently, beneficiaries are made responsible for operation and maintenance of common utilities and services after three–five years of allotment according to the PPP models under PMAY-U. This situation adds to the woes of the beneficiaries, firstly because it demands efforts and funds. More decentralized services and infrastructure that are cost-effective, sustainable and demand less effort for operation and maintenance are the need of the hour.
Water and wastewater management•Mandate topography analysis to deploy water sensitive urban design and
planning or sustainable urban drainage systems on-site, such as swales, berms, rain gardens, retention basin.
•Calculate the rainwater harvesting potential of the site and maximize rainwater conservation.
•Explore alternative decentralized wastewater treatment technologies such as nature-based solutions that suit the local context and implement them to replace conventional sewage treatment plants.
•At the design stage, prepare water balance charts and set targets to meet maximum water demand by recycling and reusing harvested rainwater and treated wastewater.
Solid waste management•Provide three-way segregated waste collection areas in the site.•Enable on-site treatment of biodegradable waste—for about 300 g per capita
per day—by using low-cost methods such as pit composting and vermi-composting. Provide treatment areas in layout plans.
•Build capacity of the residents on segregation, on-site treatment of biodegradable waste and effective management of non-biodegradable waste.
74 Beyond the four walls of PMAY
ENABLE BENEFICIARY-LED CONSTRUCTIONThe analysis of PMAY-U progress has shown that 63 per cent approved projects are under the vertical of beneficiary-led construction. As self construction will remain the dominant source of housing provisions, it is important to create an enabling mechanism within the PMAY-U framework to provide technical and professional help and support on designs, materials, and services involved in the planning and execution of this type of construction.
PROMOTE RENTAL HOUSING WITHIN HOUSING POLICYA substantial section of the lower-income population lives in rented accommodation. This section does not strive to own a house immediately, either due to financial constraints or because rented accommodation affords them the opportunity to move easily if a new source of livelihood presents itself somewhere else. Some states and urban bodies have initiated projects of affordable rental housing and are exploring models like rent-to-own, but these isolated efforts need to be integrated within larger programmes like PMAY-U.

75Resource efficiency, thermal comfort and liveability in the affordable housing sector
ANNEXURE 1: A POLICY HISTORYChronology of affordable housing and slum development policies First Plan (1951–56) | Public-sector domination, as private enterprise by itself was not equipped to deal with the housing needs of lower-income groups.55
Schemes in this period:1954: Lower-income Housing Scheme1956: Slum Clearance and Improvement Scheme
Second Plan (1956–61) | Focus on affordable housing solutions for targeted demographic, especially lower-income groups (LIGs).56
Schemes in this period:1959: Middle-income Group (MIG) Housing Scheme1959: Land Acquisition and Development Scheme1959: Village Housing Projects Scheme
Third Plan (1961–66) | Attention to creation of master plans, focus on availability of land and new building techniques. Also focussed on collecting housing statistics.57
Legislation in this period:1961: Rent Control Act• Created a disincentive towards private
sector involvement.58
This period also saw large-scale institutionalization. Many state housing boards were created. Others bodies created in this period:59
• Ministry of Housing and Urban Poverty Alleviation (MoHUPA)
• Central Public Works Department (CPWD)• National Building Organisation (NBO)• Town and Country Planning Organization
Challenges:60
Construction in retrospect, always lagging demand.
Large portion of homes misappropriated by MIG and HIG.
Pure subsidy approach was a drain on the exchequer.
No community involvement project design or implementation.
Popularity of private, illegal but affordable, well-located housing grew.
ANNEXURES

76 Beyond the four walls of PMAY
1970s–80s: ERA OF SLUMS AS A SOLUTION AND DEVELOPMENT OF HFIsPlanning started to include location, transport, access
to services, etc. under ‘housing’.
Fourth Plan (1969–74) | Introduction of planning
principles, especially for urban centres.61 Concept of
‘Slums as a Solution’—focus on refurbishment and in
situ development (also promoted by World Bank-
funded projects)
Schemes in this period:
1972: Environmental Improvement of Urban Slums
Fifth Plan (1975–80) | Introduction of cross-
subsidization approach to provide homes for EWS and
LIGs.62
Schemes in this period:
1976: Urban Land Ceiling and Regulation Act (ULCRA)• Exemptions from state acquiring private surplus
land (above a certain defined limit) if it was used to promote lower-income housing.63
Sixth Plan (1980–85) | Introduction of beneficiary
contribution.64
Schemes in this period:
1980: Sites and Services Scheme
1985: Indira Awas Yojana
Seventh Plan (1985–90) | Greater involvement of NGOs
and community participation.
Housing programmes linked with poverty
alleviation.65
Schemes in this period:
1986: Urban Basic Services Scheme (UBS)• Recognized the urban poor as a separate category.66
1987: National Housing Policy• Recognized shelter as a basic human need and
linked it with quality of life.67
1990: Night Shelter Scheme for Pavement Dwellers
Establishment of Housing Finance Institutions (HFIs):68
• 1970: Housing and Urban Development Corporation (HUDCO)
• 1977: Housing Development Finance Corporation (HDFC)
• 1987: National Housing Bank (NHB) • 1990: Building Materials and technology Promotion
Council (BMTPC) replaces NBO
Challenges69:
Government employees, MIGs or HIGs remained the main beneficiaries of public housing expenditure and the deepening finance market.
Community participation only on paper.
Frequent changes to structure and of institutional frameworks of programmes.
National Housing Policy (NHP)
1987 did not correct the existing
structural inequalities.

77Resource efficiency, thermal comfort and liveability in the affordable housing sector
1970s–80s: ERA OF SLUMS AS A SOLUTION AND DEVELOPMENT OF HFIsPlanning started to include location, transport, access
to services, etc. under ‘housing’.
Fourth Plan (1969–74) | Introduction of planning
principles, especially for urban centres.61 Concept of
‘Slums as a Solution’—focus on refurbishment and in
situ development (also promoted by World Bank-
funded projects)
Schemes in this period:
1972: Environmental Improvement of Urban Slums
Fifth Plan (1975–80) | Introduction of cross-
subsidization approach to provide homes for EWS and
LIGs.62
Schemes in this period:
1976: Urban Land Ceiling and Regulation Act (ULCRA)• Exemptions from state acquiring private surplus
land (above a certain defined limit) if it was used to promote lower-income housing.63
Sixth Plan (1980–85) | Introduction of beneficiary
contribution.64
Schemes in this period:
1980: Sites and Services Scheme
1985: Indira Awas Yojana
Seventh Plan (1985–90) | Greater involvement of NGOs
and community participation.
Housing programmes linked with poverty
alleviation.65
Schemes in this period:
1986: Urban Basic Services Scheme (UBS)• Recognized the urban poor as a separate category.66
1987: National Housing Policy• Recognized shelter as a basic human need and
linked it with quality of life.67
1990: Night Shelter Scheme for Pavement Dwellers
Establishment of Housing Finance Institutions (HFIs):68
• 1970: Housing and Urban Development Corporation (HUDCO)
• 1977: Housing Development Finance Corporation (HDFC)
• 1987: National Housing Bank (NHB) • 1990: Building Materials and technology Promotion
Council (BMTPC) replaces NBO
Challenges69:
Government employees, MIGs or HIGs remained the main beneficiaries of public housing expenditure and the deepening finance market.
Community participation only on paper.
Frequent changes to structure and of institutional frameworks of programmes.
National Housing Policy (NHP)
1987 did not correct the existing
structural inequalities.
1990s–2000s: ERA OF POST-LIBERALIZATION–INVOLVEMENT OF PRIVATE SECTOREighth Plan (1992–97) | Government legislative support for private sector participation. Creation of a financial framework.70
Schemes and legislation in this period:
1990: Nehru Rozgar Yojana’s Scheme of Housing and Shelter
Upgradation (SHASHU)
1990–01: Urban Basic Services for the Poor (UBSP)1997: National Slum Development Program (NSDP)• Money pumping by the Centre to augment state
government funds.• Nehru Rozgar Yojana (NRY) and Prime Minister’s
Integrated Urban Poverty Eradication Program incorporated for a holistic approach.71
1992: 74th Constitutional Amendment Act• Shifted the housing and urban poverty alleviation
responsibilities to the local area level through ULBs.72
Ninth Plan (1997–2002) | Direct intervention and targeted subsidies in this period. Housing finance market deepened.73
Schemes in this period:1998: National Housing and Habitat Policy • Focus on intervention in the vulnerable sector like women,
SC and STs.74
1998: Two Million Housing Programme
2001: Valmiki Ambedkar Awas Yojana
Tenth Plan (2002–07) | Large-scale urban reform interventions for infrastructure, housing and poverty alleviation75.
Schemes in this period:
2005: Jawaharlal Nehru National Urban Renewal Mission
(JNNURM)• Repealed ULCRA• Committed to securing property rights and basic services
for the poor• Engaged private sector in housing delivery76
Eleventh Plan (2007–12) | Greater involvement and
devolution to Urban Local Bodies (ULBs), that started with
the 74th Constitutional Amendment.77
Challenges:78
The deepening housing
finance market
continued to benefit
MIG/ HIG more than
EWS/ LIGs.
Problem in assembling
land for the poor and
affordable housing.
ULBs underdeveloped
to participate fully in
housing and urban
poverty alleviation.
Community
participation still
remained largely on
paper.
JNNURM suffered from
the fragmented policy
approach, in trying
‘one size fits all’.
Slum rehabilitation
was included as a
component under
JNNURM.
No legislation to tackle
the problem of access
to land by the poor.

78 Beyond the four walls of PMAY
2010s onwards: SLUM FREE CITIES AND HOUSING FOR ALLRajiv Awas Yojana (RAY), 201179
• Aim: To prevent slum formation through legislation
• Focuses on quality habitat for urban poor and slum dwellers, including those living in non-notified slums
• Aims to provide public amenities
Creation of Slum Free City Plan of Action
(SFCPoA), which includes:• Curative and preventive solutions with regard
to slums• Satellite mapping for data collection• Biometric data recording to create the digital
slum database• Capacity building of bodies and practitioners
Pradhan Mantri Awas Yojana—Housing for All
(PMAY), 201580
• Aim: To provide a pucca house with water connection, toilet, uninterrupted electricity supply and access to every Indian household by 2022.
With four verticals:
In situ slum rehabilitation (ISSR)• Additional FAR or FSI norms for private
developers.• Provision of selling the ‘remaining’ built-up
area, after slum-residents’ rehabilitation.• Constitution of a single managing authority.
Credit-linked Subsidy Scheme (CLSS)• Interest subvention for EWS or LIGs.
Affordable housing in partnership (AHP)• 35 per cent of total constructed houses
reserved for EWS.
Beneficiary-led construction (BLC)• Support to EWS beneficiaries, giving
legitimacy to incremental housing
Challenges:
RAY, 2011
States only planning curative, not
preventive measures, e.g., SFCPoA,
Lucknow.
Cohesive on-ground strategy missing.
Discrepancies in primary data collection,
e.g., SFCPoA, Hyderabad.
No incorporation of livelihood
strategies or community involvement,
e.g., SFCPoA, Indore
PMAY, 2015
Lack of latest scientific data assessment
mechanism based on factors like indoor
quality, hygiene, structural safety
and liveability; instead of previous
assessment factors like congestion and
obsolescence
Lack of effective mapping and creation
or updating of database to create
effective master plans.
Lack of effective assessment and
approval parameters like quality of
construction, comfort and liveability
in the structures, socio-cultural
responsiveness of the habitat and low-
impact to the environment.
Capacity building of beneficiaries and
ULBs for the upkeep of the built stock.

79Resource efficiency, thermal comfort and liveability in the affordable housing sector
ANNEXURE 2: GROWTH OF UNPLANNED AND INFORMAL SETTLEMENTS IN CITIES OR SLUMS
The relationship between urbanization and proliferation of slums is strong. This can be exemplified by the fact that about 38.3 per cent slum population in the country lives in cities with million-plus population, as per the Census 2011.81 The Slums Compendium of India, 2015 suggests that there are cities where as much as 45 per cent population lives in slums (see Urban population growth vs slum population growth in cities and Million-plus cities with high slum population).
Urban population growth vs slum population growth in cities0 10000000 20000000 30000000 40000000 50000000 60000000 70000000 80000000 90000000
100000000
2001 2011
2001 2011
Slum population
Urban population
0
50000000
100000000
150000000
200000000
250000000
300000000
350000000
400000000
0 10000000 20000000 30000000 40000000 50000000 60000000 70000000 80000000 90000000
100000000
2001 2011
2001 2011
Slum population
Urban population
0
50000000
100000000
150000000
200000000
250000000
300000000
350000000
400000000 Source: Census 2001 and 2011
Million-plus cities with high slum populationCity Total population Slum population Slum population
as per cent of
population of the city
Jabalpur 1,081,677 483,626 44.71
Visakhapatnam 1,728,128 770,971 44.61
Vijayawada 1,143,232 451,231 39.47
Greater Mumbai 12,442,373 5,206,473 41.84
Nagpur 2,405,665 859,487 35.73
Meerut 1,305,429 544,859 41.74
Agra 1,585,704 533,554 33.65
Raipur 1,027,264 406,571 39.58
Greater Hyderabad 6,993,262 2,287,014 32.70
Kota 1,001,694 319,309 31.88
Kolkata 4,496,694 1,409,721 31.35
Chennai 4,646,732 1,342,337 28.88
Source: Slum Compendium of India, 2015

80 Beyond the four walls of PMAY
According to the Slums Compendium of India, 2015 slums in Maharashtra inhabit 11.8 million people, which is 18.1 per cent of the population of the country. This is followed by Andhra Pradesh with 10.2 million, West Bengal with 6.4 million, Uttar Pradesh with 6.2 million and Tamil Nadu with 5.8 million persons. In fact, these five states account for about two-thirds (61.9 per cent) of the total slum population of the country (see Slum population and housing demand in states).
Slum population and housing demand in statesState Slum population (Census
2011)
Housing demand (CSMC
reports as of 1 July 2019)
Maharashtra 11,800,000 2,589,000
Andhra Pradesh 10,200,000 1,380,000
West Bengal 6,400,000 1,162,000
Uttar Pradesh 6,200,000 2,764,000
Tamil Nadu 5,800,000 1,391,000
Madhya Pradesh 5,690,000 1,151,000
Karnataka 3,290,000 1,936,000
Rajasthan 2,070,000 614,000
Gujarat 1,680,000 449,000
Bihar 1,240,000 565,000
Source: Slum Compendium of India 2015; CSMC reports available on MoHUA website
Living condition among the slums vary substantially, according to a study carried out by London School of Economics and University of Oxford.82 Based on a primary survey of about 8,300 households living in 279 slums in three cities of India, the study suggests that the living condition vary according to economic well-being and access to services. For instance, a slum assessed as ‘tenable’ can have a good number of dwellers living in misery, such as five persons sleeping in a 9 x 13 feet room, or there could be basic services but no tenure security, or there could be nothing but ample livelihood opportunity.
This situation indicates diverse policy implications, which may not require a one-shot solution of rehabilitating the slum population. Datasets become very important in this case. This ground reality is instrumental in approaching a slum and responding with appropriate strategy.
Unless and until cities capture these nuances, they will be unable to provide responsive habitat solutions to this substantial population and progress towards sustainable urbanization.
What are slums?Slums are commonly used in policies to describe informal settlements within cities that have inadequate housing and miserable living conditions. People living in slums are subject to overcrowding, insecure land tenures, lack of

81Resource efficiency, thermal comfort and liveability in the affordable housing sector
access to basic minimum civic services such as safe drinking water, sanitation, storm drainage, solid waste management, internal and approach roads, street lighting, education and health care, and poor quality of shelter.
Many of these habitations are located in environmentally fragile and dangerous zones prone to landslides, floods and other disasters that make poor residents highly vulnerable. A significant proportion of slum dwellers also face social burdens and health problems worse than their non-slum and rural counterparts.
As per the Census 2011: • All areas in a town or city notified as ‘slum’ by the state, UT administration
or local government, housing and slum boards, etc., under any statute including a ‘slum act’ are considered as notified slum.
• All areas recognized as ‘slum’ by state and local government, UT administration, housing and slum boards, etc., which may have not been formally notified as slum under any statute are categorized as recognized slum.
• A compact area of at least 300 populations or about 60–70 households of poorly built congested tenements, in unhygienic environment usually with inadequate infrastructure and lacking proper sanitary and drinking water facilities in the state or UT are categorized as identified slums.
In India, the definition of slums was put forth by the Census and the National Sample Survey Organization (NSSO). The prior’s definition delivers 65.49 million persons living in slums and the latter’s 44 million. According to UN Habitat’s definition, India has 104 million slum dwellers. Census includes all three aforementioned categories of slums, whereas NSSO includes both notified and non-notified slums. In addition, each state has a unique definition of slums in keeping with the distinctive socio-economic characteristics of the region, its terrain and slum housing conditions. There are various definitions of slums adopted by the state governments based on slum acts of the respective states.
Pushed to the periphery, challenges of relocationLocation of housing not only determines the cost of land but also the expenditure a household may incur due to transport. The closer the city centre, the higher will be the cost of land, whereas, the farther from the job centres, more extensive will be the transportation and its cost, both as an activity and expense, and less will be livelihood opportunities. Considering the principle of agglomeration, economies, location and connectivity have a direct implication on housing choice from the urban poor’s perspective.
An ad hoc or inappropriate identification of location for housing has a direct repercussion on the urban poor’s income, expenses and liveability. Unplanned and peripheral locations have a compromised access to livelihood, are devoid of active public transport and have lack of social amenities such as schools, markets, health clinics and community centres.
Sub-missions under JNNURM, Basic Services for Urban Poor (BSUP) and Integrated Housing and Slum Development Programme (IHSDP) are
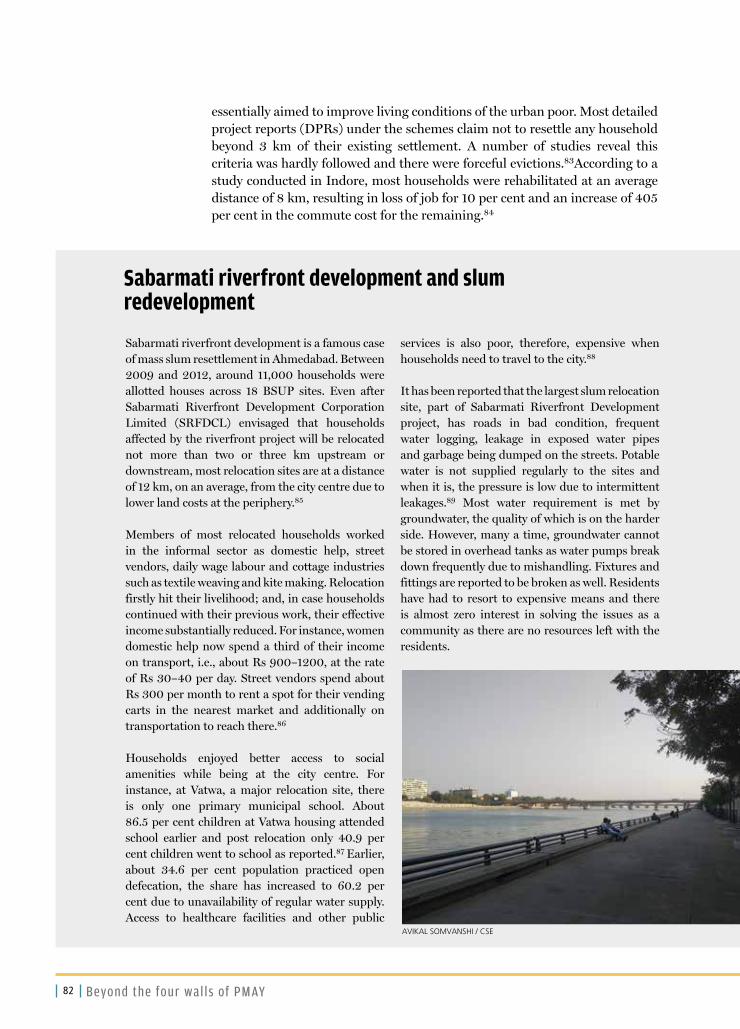
82 Beyond the four walls of PMAY
essentially aimed to improve living conditions of the urban poor. Most detailed project reports (DPRs) under the schemes claim not to resettle any household beyond 3 km of their existing settlement. A number of studies reveal this criteria was hardly followed and there were forceful evictions.83According to a study conducted in Indore, most households were rehabilitated at an average distance of 8 km, resulting in loss of job for 10 per cent and an increase of 405 per cent in the commute cost for the remaining.84
Sabarmati riverfront development and slum redevelopment
Sabarmati riverfront development is a famous case of mass slum resettlement in Ahmedabad. Between 2009 and 2012, around 11,000 households were allotted houses across 18 BSUP sites. Even after Sabarmati Riverfront Development Corporation Limited (SRFDCL) envisaged that households affected by the riverfront project will be relocated not more than two or three km upstream or downstream, most relocation sites are at a distance of 12 km, on an average, from the city centre due to lower land costs at the periphery.85
Members of most relocated households worked in the informal sector as domestic help, street vendors, daily wage labour and cottage industries such as textile weaving and kite making. Relocation firstly hit their livelihood; and, in case households continued with their previous work, their effective income substantially reduced. For instance, women domestic help now spend a third of their income on transport, i.e., about Rs 900–1200, at the rate of Rs 30–40 per day. Street vendors spend about Rs 300 per month to rent a spot for their vending carts in the nearest market and additionally on transportation to reach there.86
Households enjoyed better access to social amenities while being at the city centre. For instance, at Vatwa, a major relocation site, there is only one primary municipal school. About 86.5 per cent children at Vatwa housing attended school earlier and post relocation only 40.9 per cent children went to school as reported.87 Earlier, about 34.6 per cent population practiced open defecation, the share has increased to 60.2 per cent due to unavailability of regular water supply. Access to healthcare facilities and other public
services is also poor, therefore, expensive when households need to travel to the city.88
It has been reported that the largest slum relocation site, part of Sabarmati Riverfront Development project, has roads in bad condition, frequent water logging, leakage in exposed water pipes and garbage being dumped on the streets. Potable water is not supplied regularly to the sites and when it is, the pressure is low due to intermittent leakages.89 Most water requirement is met by groundwater, the quality of which is on the harder side. However, many a time, groundwater cannot be stored in overhead tanks as water pumps break down frequently due to mishandling. Fixtures and fittings are reported to be broken as well. Residents have had to resort to expensive means and there is almost zero interest in solving the issues as a community as there are no resources left with the residents.
AVIKAL SOMVANSHI / CSE

83Resource efficiency, thermal comfort and liveability in the affordable housing sector
Women, children, elderly and the disabled then become most vulnerable in these locations with reduced mobility and accessibility to jobs and services. For instance, women work as domestic help in cities, make frequent trips to the market, and pick and drop children from schools.
The urban poor depend on city infrastructure and services more than the other income segments. This is why, even after allotment of a formal dwelling unit under a scheme, the poor have chosen to stay in an informal settlement to have better mobility, access to livelihood and right to the city. This is the primary reason slum-focused schemes like JNNURM and RAY have not been able to curb proliferation of slums on vacant and marginal lands in dense city centres.
Weak response under the in situ slum development vertical of PMAY-U indicates the government is finding it difficult to rehabilitate slum dwellers. With relocation involved, PMAY-U is making the same mistake as the previous initiatives. At the same time, the cons of in situ rehabilitation can also not be overlooked. The process requires the beneficiaries to live in a transit camp for years. Moving to these camps not only disrupts the way of life but often creates worse living conditions than a slum with makeshift infrastructure.

84 Beyond the four walls of PMAY
1. Anon 2012. Report of the Technical Group on Urban Housing Shortage (TG-12) (2012–17), National Buildings Organisation, Ministry of Housing and Urban Poverty Alleviation, New Delhi
2. Anon 2015. Slums in India: A Statistical Compendium, National Buildings Organisation, Ministry of Housing and Urban Poverty Alleviation, New Delhi
3. Ibid.
4. Anon 2019. About PMAY, Real Estate Act-a pioneering legislation, to have a long term transformative effect, Ministry of Housing and Urban Affairs, New Delhi. Available at http://mohua.gov.in/cms/about-pmay.php, as accessed on 17 July 2019
5. Anon 2019. CSMC Minutes along with Presentations, Ministry of Housing and Urban Affairs, New Delhi. Available at http://mohua.gov.in/cms/csmc-minutes.php, as accessed on 21 July 2019
6. Anon 2015. Pradhan Mantri Awas Yojana: Housing for All (Urban) Scheme Guidelines, Ministry of Housing and Urban Affairs, New Delhi. Available at http://www.pmaymis.gov.in/PDF/HFA_Guidelines/hfa_Guidelines.pdf, as accessed on 28 May 2019
7. Anon 2018. SDG India Index—Baseline Report 2018, NITI Aayog, New Delhi. Available at https://niti.gov.in/writereaddata/files/SDX_Index_India_21.12.2018.pdf, as accessed on 28 May 2019
8. Anon 2019. PMAY State Wise Progress, Ministry of Housing and Urban Affairs, New Delhi. Available at http://mohua.gov.in/cms/progress-pmay.php, as accessed on 12 July 2019
9. Neelim Risbud 2019. “Policies for Tenure Security in Delhi”, Holding Their Ground: Secure Land Tenure for the Urban Poor in Developing Countries, Earthscan, London and New York
10. Shivani Singh 2018. Regularising unauthorised colonies can’t be Delhi’s development model, Hindustan Times, New Delhi. As available at https://www.hindustantimes.com/opinion/regularising-unauthorised-colonies-can-t-be-delhi-s-development-model/story-qMkGd5wyC7OQirbBJaYrfL.html, as accessed on 2 July, 2019
11. Anon 2019. Economic Survey of Delhi 2018–19, Planning Department Government of NCT of Delhi, New Delhi
12. Shahana Sheikh, Subhadra Banda, Bijendra Jha, and Ben Mandelkern 2015. Limbo in Sangam Vihar: Delhi’s Largest Agglomeration of Unauthorised Colonies, Centre for Policy Research, New Delhi. Available at https://www.cprindia.org/research/reports/limbo-sangam-vihar-delhi%E2%80%99s-largest-agglomeration-unauthorised-colonies, as accessed on 3 July 2019
13. Anon 2019. Delhi Awas Yojna. Available at https://www.delhiaawasyojna.com/, as accessed on 3 July 2019
14. Anon 2017. Public Private Partnership Models for Affordable Housing, Ministry of Housing and Urban Affairs, New Delhi. Available at http://mohua.gov.in/upload/uploadfiles/files/PPP%20Models%20for%20Affordable%20Housing.pdf, as accessed on 3 July 2019
15. Anon 2015. Guidelines for implementation of 2 Bedroom Housing Programme in the State, Government of Telangana, Hyderabad. Available at https://2bhk.telangana.gov.in/GJWebFiles/24/99.pdf, as accessed on 4 July 2019
16. Maddy Deekhshith 2018. Telangana hikes steel price for 2 BHK project, Deccan Chronicle, Hyderabad. Available at https://www.deccanchronicle.com/nation/current-affairs/170218/telangana-hikes-steel-price-for-2bhk-project.html, as accessed on 5 July 2019
REFERENCES

85Resource efficiency, thermal comfort and liveability in the affordable housing sector
17. Anon 2015. Telangana State Sand Mining Rules 2015, Government of Telangana, Hyderabad. Available at https://2bhk.telangana.gov.in/GJWebFiles/24/105.pdf, as accessed on 5 July 2019
18. Anon 2016. G.O. Rt. No. 178, dated 2.11.2016, Government of Telangana, Hyderabad. Available at https://2bhk.telangana.gov.in/GJWebFiles/26/145.doc, as accessed on 5 July 2019
19. Anon 2018. Report on Tend and Progress of Housing in India, National Buildings Organisation, New Delhi. Available at https://nhb.org.in/wp-content/uploads/2019/03/NHB-T&P-2018-Eng.pdf, as accessed on 5 July 2019
20. Anon 2017. Credit Linked Subsidy scheme for Middle Income Group (CLSS for MIG): Operational Guidelines, Ministry of Housing & Urban Affairs, New Delhi. Available at http://mohua.gov.in/upload/uploadfiles/files/4CLSS-MIG-Guidelines.pdf, as accessed on 10 July 2019
21. Anon 2017. No.I-11016/15/2015-HFA-4(Pt)/E-9028212, Ministry of Housing and Urban Affairs, New Delhi. Available at http://mohua.gov.in/upload/uploadfiles/files/MIG_CLSS%242017Nov29110244.pdf, as accessed on 10 July 2019
22. Anon 2018, No.I-11016/15/2016-HFA-4(Pt)/E-9029212, Ministry of Housing and Urban Affairs, New Delhi. Available at http://mohua.gov.in/upload/uploadfiles/files/9029212(3).pdf, as accessed on 10 July 2019
23. Anon 2018. Report on Tend and Progress of Housing in India, National Buildings Organisation, New Delhi. Available at https://nhb.org.in/wp-content/uploads/2019/03/NHB-T&P-2018-Eng.pdf, as accessed on 10 July 2019
24. Ibid.
25. Anon 2017. Updated Harmonized Master List of Infrastructure Sub-sectors, Ministry of Finance, New Delhi. Available at https://dea.gov.in/sites/default/files/e%20Gazette%20-publishing%20date%205th%20April%2C%202017.pdf, as accessed on 10 July 2019
26. Anon 2018. Cabinet approves Revised guidelines on time bound closure of sick/ loss making Central Public Sector Enterprises and disposal of movable and immovable assets, Press Information bureau, New Delhi. Available at http://pib.nic.in/PressReleseDetail.aspx?PRID=1534494, as accessed on 10 July 2019
27. Anon 2019. Decisions taken by the GST Council in the 34thmeeting held on 19thMarch, 2019 regarding GST rate on real estate sector, Press Information bureau, New Delhi. Available at https://pib.gov.in/newsite/PrintRelease.aspx?relid=189462, as accessed on 10 July 2019
28. Anon 2019. Union Budget, Ministry of Finance, New Delhi. Available at https://www.indiabudget.gov.in/, as accessed on 10 July 2019
29. Anon 2017. Economic Survey 2016–17, Economic Division, Department of Economic Affairs, New Delhi
30. Ibid.
31. Ibid.
32. Mukta Naik 2015. “Informal Rental Housing Typologies and Experiences of Low-income Migrant Renters in Gurgaon, India,” Environment and Urbanization Asia, SAGE, India
33. Ibid.
34. Ibid.
35. Ibid.
36. Ibid.
37. Anon 2008. Report of the High Level Task Force on Affordable Housing for All, NAREDCO, New Delhi
38. Anon 2007. National Urban Housing and Habitat Policy, Ministry of Housing and Urban Poverty Alleviation, New Delhi

86 Beyond the four walls of PMAY
39. Anon 2013. Rajiv Awas Yojana, Ministry of Housing and Urban Poverty Alleviation, New Delhi. Available at http://mohua.gov.in/cms/raji-awasyojana.php, as accessed on 15 July 2019.
40. Anon 2018. Model Welfare Scheme, Ministry of Labour, New Delhi. Available at https://labour.gov.in/sites/default/files/Model%20Welfare%20Scheme%28Final%29.pdf, as accessed on 15 July 2019
41. Anon 2015. Draft National Urban Rental Housing Policy, 2015, Ministry of Housing and Urban Poverty Alleviation, New Delhi.
42. Hemanta Pradhan 2017. OBOCWWB and Urban Development Department Rental housing project. Available on https://timesofindia.indiatimes.com/city/bhubaneswar/21-rental-housing-projects-for-construction-labourers-to-come-up-in-odisha/articleshow/58447369.cms, as accessed on 15 July 2019
43. Anon 2018. Odisha Urban Housing Mission – Awaas. Available at http://mohua.gov.in/upload/uploadfiles/files/Odisha.pdf, as accessed on 15 July 2019
44. Anon 2018. Andhra Pradesh Affordable Housing ‘Rent-to-Own’ Model. Available at https://www.devalt.org/images/L2_ProjectPdfs/Draft%20Urban%20Housing%20Policy.pdf?Oid=97, as accessed on 17 September 2019
45. Chantana Chanond 2009. Pro-Poor Housing Finance. Available at http://s3.amazonaws.com/zanran_storage/www.ghb.co.th/ContentPages/45842968.pdf, as accessed on 15 July 2019
46. Anon 2018. Vietnam Affordable Housing. Available at http://documents.worldbank.org/curated/en/240541467995097856/pdf/100706-WP-P150619-PUBLIC-Box393231B-2015-10-16-05-45.pdf, as accessed on 15 July 2019
47. Anon 2019. Subsidio Leasing Habitacional grants. Available at https://www.chileatiende.gob.cl/fichas/5176-subsidio-de-leasing-habitacional, as accessed on 15 July 2019
48. Sidharath Roy 2019. “Over 3,000 allottees give up 1BHK DDA Narela flats,” The Times of India, New Delhi. Available at https://timesofindia.indiatimes.com/city/delhi/over-3000-allottees-give-up-1bhk-dda-narela-flats/articleshow/70562057.cms, as accessed on 11 July 2019
49. Anon 2018. Compendium of Prospective Emergin Technologies for Mass Housing, Ministry of Housing and Urban Affairs, New Delhi. Available at http://bmtpc.org/DataFiles/CMS/file/PDF_Files/BMTPC_Compendium_ET_Sept2018_3rdEdition.pdf, as accessed on 19 July 2019
50. Anon 2019. Zero Draft of the Environment Impact Assessment Notification 2019, Ministry of Environment Forest and Climate Change, New Delhi. Available at https://imgs.mongabay.com/wp-content/uploads/sites/30/2019/05/22103405/Zero-Draft-EIA-Notification-2019-for-comments_compressed1.pdf, as accessed on 19 July 2019
51. Suresh Kumar Rohilla and Dublin Dwivedi 2013. Reinvent Recycle Reuse, Centre for Science and Environment, New Delhi
52. Aden van noppen, John Backman, Marco Ferrario, Mukta Naik, Rakhi Mehra and Vyas Yenghkom 2011. Self Construction: Enabling Safe and Affordable Housing in India, micro Home Solutions, New Delhi. Available at http://www.mhscitylab.org/wp-content/uploads/2016/11/mHS-l-Self-Construction-ReportTI.pdf, as accessed on 29 July 2019
53. Ibid.
54. Anon 2014. Design Guidelines for Energy Efficient Multi-Storey Residential Buildings, Bureau of Energy Efficiency, Ministry of Power, New Delhi. Available at https://beeindia.gov.in/sites/default/files/Design%20Guideline_Book_0.pdf, as accessed on 17 September 2019
Annexure 1
55. Anon 2018. Five Year Plans, Planning Commission, New Delhi. Available at http://planningcommission.nic.in/plans/planrel/fiveyr/welcome.html, as accessed on 16 July 2019
56. Ibid.

87Resource efficiency, thermal comfort and liveability in the affordable housing sector
57. Ibid.
58. Pritika Hingorani 2011. Revisiting Low Income Housing, Indian Institute of Human Settlement. Available at http://iihs.co.in/knowledge-gateway/wp-content/uploads/2017/07/Low-Income-Housing.pdf, as accessed on 16 July 2019
59. Ibid.
60. Ibid.
61. Anon 2018. Five Year Plans, Planning Commission, New Delhi. Available at http://planning commission.nic.in/plans/planrel/fiveyr/welcome.html, as accessed on 16 July 2019
62. Ibid.
63. Pritika Hingorani 2011. Revisiting Low Income Housing, Indian Institute of Human Settlement. Available at http://iihs.co.in/knowledge-gateway/wp-content/uploads/2017/07/Low-Income-Housing.pdf, as accessed on 16 July 2019
64. Ibid.
65. Anon 2018. Five Year Plans, Planning Commission, New Delhi. Available at http://planning commission.nic.in/plans/planrel/fiveyr/welcome.html, as accessed on 16 July 2019
66. Pritika Hingorani 2011. Revisiting Low Income Housing, Indian Institute of Human Settlement. Available at http://iihs.co.in/knowledge-gateway/wp-content/uploads/2017/07/Low-Income-Housing.pdf, as accessed on 16 July 2019
67. Ibid.
68. Ibid.
69. Ibid.
70. Anon 2018. Five Year Plans, Planning Commission, New Delhi. Available at http://planning commission.nic.in/plans/planrel/fiveyr/welcome.html, as accessed on 16 July 2019
71. Pritika Hingorani 2011. Revisiting Low Income Housing, Indian Institute of Human Settlement. Available at http://iihs.co.in/knowledge-gateway/wp-content/uploads/2017/07/Low-Income-Housing.pdf, as accessed on 16 July 2019
72. Ibid.
73. Anon 2018. Five Year Plans, Planning Commission, New Delhi. Available at http://planning commission.nic.in/plans/planrel/fiveyr/welcome.html, as accessed on 16 July 2019
74. Pritika Hingorani 2011. Revisiting Low Income Housing, Indian Institute of Human Settlement. Available at http://iihs.co.in/knowledge-gateway/wp-content/uploads/2017/07/Low-Income-Housing.pdf, as accessed on 16 July 2019
75. Anon 2018. Five Year Plans, Planning Commission, New Delhi. Available at http://planning commission.nic.in/plans/planrel/fiveyr/welcome.html, as accessed on 16 July 2019
76. Pritika Hingorani 2011. Revisiting Low Income Housing, Indian Institute of Human Settlement. Available at http://iihs.co.in/knowledge-gateway/wp-content/uploads/2017/07/Low-Income-Housing.pdf, as accessed on 16 July 2019
77. Ibid.
78. Ibid.
79. Anon 2011. Rajiv Awas Yojana, Ministry of Housing and Urban Poverty Alleviation, New Delhi. Available at https://smartnet.niua.org/content/69cdbbff-68d9-46f9-8a48-a8afc9af6325, as accessed on 16 July 2019
80. Anon 2015. Pradhan Mantri Awas Yojana, Ministry of Housing and Urban Poverty Alleviation, New Delhi. Available at https://pmaymis.gov.in/, as accessed on 16 July 2019

88 Beyond the four walls of PMAY
Annexure 2
81. Anon 2015. Slums in India - A Statistical Compendium, National Buildings Organisation, Ministry of Housing and Urban Affairs, New Delhi. Available at http://www.indiaenvironmentportal.org.in/files/file/SLUMS_IN_INDIA_Slum_Compendium_2015_English.pdf, as accessed on 17 September 2019
82. Emily Rains, Anirudh Krishna and Erik Wibbels 2018. Urbanisation and India’s Slum Continuum, International Growth Centre, London School of Economics. Available at https://www.theigc.org/wp-content/uploads/2018/02/Rains-et-al_Working-paper_cover.pdf, as accessed on 17 September 2019
83. Youth for Unity and Voluntary Action 2019. Human Rights Assessment of Housing Schemes in Indore, YUVA Centre, Navi Mumbai. Available at http://yuvaindia.org/wp-content/uploads/2017/03/Human-Rights-Assessment-of-Housing-Schemes-in-Indore.pdf, as accessed on 17 September 2019
84. Sejal Patel and Ritika Mandhyan 2014. Impoverishment assessment of slum dwellers after off-site and on-site resettlement: a case of Indore, Commonwealth Journal of Local Governance. Available at https://www.researchgate.net/publication/276395387_Impoverishment_assessment_of_slum_dwellers_after_off-site_and_on-site_resettlement_a_case_of_Indore, as accessed on 17 September 2019
85. Darshini Mahadevia, Neha Bhatia and Bharti Bhonsale 2014. Slum Rehabilitation Schemes (SRS) across Ahmedabad: Role of an External Agency, CEPT University, Ahmedabad. Available at https://cept.ac.in/UserFiles/File/CUE/Working%20Papers/Revised%20New/27CUEWP%2027_Slum%20Rehabilitation%20Schemes%20(SRS)%20across%20Ahmedabad%20-%20Role%20of%20an%20External%20Agency.compressed.pdf, as accessed on 17 September 2019
86. Darshini Mahadevia, Renu Desai and Suchita Vyas 2014. City profile: Ahmedabad, CEPT University, Ahmedabad. Available at https://www.researchgate.net/publication/265520017_City_Profile_Ahmedabad, as accessed on 18 September 2019
87. Anon 2016. A Study on Socio-Economic Impact of Sabarmati Riverfront on Life of Displaced Communities, Imperial Journal of Interdisciplinary Research. Available at https://www.onlinejournal.in/IJIRV2I7/278.pdf, as accessed on 18 September 2019
88. Sejal Patel, Richard Sliuzas and Navdeep Mathur 2015. The risk of impoverishment in urban development-induced displacement and resettlement in Ahmedabad, International Institute for Environment and Development (IIED). Available at https://journals.sagepub.com/doi/pdf/10.1177/0956247815569128, as accessed on 18 September 2019
89. Renu Desai 2018. Urban Planning, Water Provisioning and Infrastructural Violence at Public Housing Resettlement Sites in Ahmedabad, India, CEPT University, Ahmedabad. Available at http://www.water-alternatives.org/index.php/alldoc/articles/vol11/v11issue1/421-a11-1-5/file, as accessed on 18 September 201


Beyond the four walls of PMAY
Design housing that
is climate-appropriate,
Centre for Science and Environment41, Tughlakabad Institutional Area, New Delhi 110 062, India Ph: +91-11-40616000 Fax: +91-11-29955879Website: www.cseindia.org
Pradhan Mantri Awas Yojana (PMAY), India’s flagship affordable housing policy, has been ushered in at an interesting cusp of history. Never before has an experiment to meet housing needs of the country’s teeming millions been tried at this scale. In doing so, PMAY has brought the age-old question of what constitutes a ‘house’ to the centre of policy debate and planning.
Are four walls and a roof enough to declare a construction a house? Does the term also engender questions of comfort and liveability? How much importance should the design and construction of a house pay to environmental sustainability in our climate-constrained era? How can resource efficiency and thermal comfort remain affordable for low-income groups?
This policy brief raises these and more questions, and suggests ways in which PMAY can deal with them.
Copyright © 2022 FDOKUMEN