Reactor Model for the Underground Coal Gasification (UCG) Channel
27
I NTERNATIONAL J OURNAL OF C HEMICAL R EACTOR E NGINEERING Volume 4 2006 Article A37 Reactor Model for the Underground Coal Gasification (UCG) Channel Anil N. Khadse * Mohammed Qayyumi † Sanjay M. Mahajani ‡ Preeti Aghalayam ** * Indian Institute of Technology, Bombay, [email protected] † Indian Institute of Technology, Bombay, [email protected] ‡ Indian Institute of Technology, Bombay, [email protected] ** Indian Institute of Technology, Bombay, [email protected] ISSN 1542-6580 - 10.2202/1542-6580.1351 Downloaded from PubFactory at 09/07/2016 02:41:42AM via free access
-
Upload
independent -
Category
Documents
-
view
0 -
download
0
Transcript of Reactor Model for the Underground Coal Gasification (UCG) Channel

INTERNATIONAL JOURNAL OF CHEMICAL
REACTOR ENGINEERING
Volume 4 2006 Article A37
Reactor Model for the Underground CoalGasification (UCG) Channel
Anil N. Khadse∗ Mohammed Qayyumi†
Sanjay M. Mahajani‡ Preeti Aghalayam∗∗
∗Indian Institute of Technology, Bombay, [email protected]†Indian Institute of Technology, Bombay, [email protected]‡Indian Institute of Technology, Bombay, [email protected]∗∗Indian Institute of Technology, Bombay, [email protected]
ISSN 1542-6580
- 10.2202/1542-6580.1351Downloaded from PubFactory at 09/07/2016 02:41:42AM
via free access

Reactor Model for the Underground Coal Gasification(UCG) Channel
Anil N. Khadse, Mohammed Qayyumi, Sanjay M. Mahajani, and PreetiAghalayam
Abstract
Underground Coal Gasification (UCG) is the process of in-situ conversion ofcoal into combustible products (syngas) which can be used either as fuel or asa chemical feedstock. In this study, the gasification channel is viewed as a one-dimensional packed bed reactor. The packed bed reactor model is solved incor-porating chemical reactions and mass transfer effects. A pseudo-transient modelis simulated for temperature and composition profiles of the gas and solid phases.The movements of the pyrolysis and the reaction front are obtained. The modelresults are in qualitative agreement with literature. The effects of various operat-ing parameters are studied in detail. Steam/O2 ratio, inlet O2 and total pressuredetermine the solid temperature profile and hence the outlet gas composition. Thesimulations are performed for two sets of kinetics parameters. The solid tem-perature profile and outlet gas compositions change significantly with a change inkinetics parameters. The main motivation behind this study is to provide a theoret-ical base for understanding the critical aspects of UCG and to provide a tool whichcoupled with experiments will help in determining the commercial feasibility ofthe UCG process.
KEYWORDS: underground coal gasification (UCG), 1-D packed bed model,moving reaction zone, coal kinetics
- 10.2202/1542-6580.1351Downloaded from PubFactory at 09/07/2016 02:41:42AM
via free access

1. INTRODUCTION Underground Coal Gasification (UCG) is the process of in-situ conversion of coal into combustible products (synthesis gas) which can be used either as fuel or as a chemical feedstock (Walker et al., 2001; Green, 2000). UCG offers a number of environmental and other advantages over conventional mining, and is therefore proposed to be the coal utilization technique of the future. UCG eliminates the need for mining and may be used in deep or steeply dipping, unminable coal seams. It also eliminates the need for specialized coal processing equipment and gasification reactors. Other benefits of UCG include increased worker safety, no surface disposal of ash and coal tailing, low dust and noise pollution, low water consumption, larger coal resource exploration and low methane emission to the atmosphere (Walker et al., 2001; DTI, 2001; Green, 2000; Beath et al., 2002). But UCG involves some environmental impacts such as land subsidence and ground water reserve pollution that serve as disadvantages. Thus there is a need for a thorough environmental impact assessment and complete risk analysis before implementation of UCG.
UCG in its most general form consists of a pair of process wells (one injector and one producer), some specified distance apart, drilled from the surface into the coal seam (Savins, 1982; Walker et al., 2001). A permeable link between the two wells is made with various known drilling and well linking techniques. Once a permeable link is developed, an oxidant blast (consisting of air or a mixture of steam and oxygen) is injected at high rate and high pressure into one of the wells and gasification of the coal is started. This consumes the bulk of the coal producing a combustible gas mixture containing CO, CO2, CH4, H2 and other materials such as H2O, char, H2S, tars, etc. (Savins, 1982). The gas is then cleaned, treated and sent for various uses as a chemical feedstock or for power generation (Green, 2000). A schematic of UCG is shown in Figure 1. The successful application of such a process would provide a low to medium heating gas (88.23 –264.70 kJ/mol), depending on whether air or a mixture of oxygen - steam is used (Edgar and Gregg, 1981).
Figure 1. Schematic of the UCG process
There have been two aspects of modeling UCG processes, one which deals with determining concentration, temperature and pressure profiles and another which deals with determining the cavity growth, subsidence and other such mechanical aspects. All the existing models either consider the UCG channel as a packed bed (Thorsness et al., 1978; Thorsness and Charles, 1985; Thorsness and Kang, 1986; Yang, 2004) or as a free channel where the reactions only take place at the wall (Magnani and Ali, 1975; Yang and Liu, 2003). Perkins et al., (2003) have developed a detailed Computational Fluid Dynamics (CFD) model of UCG which incorporates many complex behaviors such as cavity growth and water intrusion. The various mathematical models available (Yang, 2004; Perkins et al., 2003) incorporate different phenomena associated with UCG but do not give a clear idea about the relative importance of various phenomena in determining the viability of UCG. The detailed analysis considering
1Khadse et al.: Reactor Model for the Underground Coal Gasification (UCG) Channel
- 10.2202/1542-6580.1351Downloaded from PubFactory at 09/07/2016 02:41:42AM
via free access

the number of reactions occurring and the effect of the various input parameters are not clearly described. Here we have performed mathematical simulations and presented a detailed analysis of results which is not evident in open literature. The main motivation of this study is to develop a mathematical tool for UCG that will reasonably predict the temperature, composition profiles for the given coal properties and kinetic data, and to explain the observed features in physical forms.
2. REACTOR MODEL The Packed bed reactor model is the most popular model used for simulation of UCG (Thorsness and Kang, 1986; Thorsness et al., 1978) and it views the UCG channel as similar to a packed bed where coal particles are filled in the reactor and undergo oxidation and gasification. This reactor is a special type of chemical reactor where the solid reactant is stationary and is consumed by moving gasifying agents. Modeling of such a reactor requires special consideration of the stationary reactant. The examination of the actual UCG cavity suggests that it consists of three distinct zones, the bottom zone consisting of ash, a porous zone of char and coal rubble over the ash layer and finally an empty channel at the top. Though the UCG cavity should be considered as a combination of a packed bed and a free channel, only the packed bed model was chosen for simulation because a significant portion of the gasification takes place inside the packed portion. The various assumptions and important aspects of the model are as follows:
• Mass and energy balances are written separately for the solid and the gaseous phase. • 1-D assumption for mass and energy balances is made. It may not be justified for actual UCG because
the two dimensional effects of heat losses through the adjacent coal seam and changes in the reactor size with time and length may be important. But this assumption is very important in order to keep the model simple and to capture the crucial effects of the reaction kinetics.
• Darcy's Law is used as the momentum balance for the flow within the packed bed.
The model equations describing this packed bed reactor are a set of partial differential equations (Yang, 2004) and solving them requires significant computational efforts and time. Here, we use a pseudo steady state approach to convert the partial differential equations into ordinary differential equations. The system of ordinary differential equations is easy to solve and is less time consuming. The following section describes the approach used.
2.1. Pseudo steady state model
The reactor is modelled as a transient, 1-D packed bed, consisting of a set of partial differential equations. One important characteristic of this system is that there are large differences in the characteristic times of the variables. For instance the gas velocity is of the order of 0.01 to 0.1 m/s, thus the characteristic flow time through a zone thickness (∆x) of 0.005 m is 0.05 to 0.5 sec. The rate of coal burning is of the order of 0.1 to 0.2 m/hr, thus the characteristic time for the burning front will be 90 to 180 sec. As there are large differences in characteristic times for the gas and solid species we can assume that the gas phase attains steady state before any significant changes occur in the solid phase temperature and composition (Winslow, 1976). This assumption helps us to divide our system of equations into two parts; one consisting of steady state gas phase mass and energy balances in only the length domain and another set of solid balance equations in time domain only. This essentially is the concept of the pseudo steady state model (Thorsness et al., 1978) used here. The advantage of incorporating this simplification is that it converts the system of stiff partial differential equations into a system of ordinary differential equations, which makes the solution much easier numerically.
Some of the other assumptions and important features of the model used here are: • Axial dispersion is not accounted for in the gas phase balances. • Gas phase consists of eight species (N2, O2, H2O, H2, CH4, CO, CO2 and tar). • Solid phase consists of two species (coal and char). • A complete set of nine reactions (equations 6 to 14), including four heterogeneous (gas-solid)
reactions, water gas shift, three gas phase oxidations and pyrolysis are considered. • Mass transfer resistances between gases and solid particles are accounted for all
heterogeneous reactions by suitable modification to kinetic rate constants (Thorsness, 1978).
2 International Journal of Chemical Reactor Engineering Vol. 4 [2006], Article A37
- 10.2202/1542-6580.1351Downloaded from PubFactory at 09/07/2016 02:41:42AM
via free access

• Changes in coal and char compositions are accounted as they are defined as CHaOb in the model, where the a and b values vary with the type of coal used (to be obtained from ultimate analysis).
• Provisions are made to simulate the initial ignition period where the coal bed is heated to start the reactions, including handling the changes in the feed composition during ignition and after the ignition period.
Due to the one dimensional framework of the model and lack of adequate information, several phenomena that may be important for the finer detailed prediction of UCG are not considered in this model. These include the effects of tar condensation and plugging, gas losses to surroundings, water intrusion from surroundings and heat losses. Water intrusion is also likely to make a significant impact on the product gas composition and gross calorific value (Perkins et al., 2003). Nevertheless, the present model is very beneficial since it is simple, less time consuming and represents the system reasonably well, in particular the detailed reaction chemistry.
It is our objective to simulate this model and analyze the effects of various operating and model parameters on the temperature and gas phase and solid compositions in UCG.
2.2. Model equations
2.2.1. Gas phase species mass balance
(1)
where Ci is the concentration of ith gaseous component (kmol/m3), ug is the gas velocity (m/s), x is the axial distance (m), Rj is the reaction rate of jth reaction (kmol/m3 s) and ija is the stoichiometric coefficient for ith gaseous component in jth reaction, n is the number of reactions.
2.2.2. Solid phase species mass balance
(2)
where ρi is the concentration of ith solid component (kg/m3), Mi is the molecular weight (kg/kmol), t is the time (s), Rj is the reaction rate of jth reaction (kmol/m3 s) and
ijsa is the stoichiometric coefficient for ith component
in the jth reaction.
2.2.3. Gas phase velocity
(3)
where ug is the gas velocity (m/s), x is the axial distance (m), P is the total pressure (kPa), T is the gas temperature (K), R is the gas constant and ija is the stoichiometric coefficient for ith gaseous component in jth reaction.
2.2.4. Gas phase energy balance
(4)
1
( ) ng i
ij jj
u Ca R
x =
∂=
∂ ∑
1ij
ni
i s jj
M a Rt
ρ=
∂ =∂ ∑
8
1 1
ng g g
ij jj i
du u dP u dT RT a Rdx Pdx Tdx P = =
− ⎡ ⎤= + + ⎢ ⎥
⎣ ⎦∑∑
8
1 1
( )gasn
i pi g T s j ji j
dTC C u h T T H Rdx= =
= − − − ∆∑ ∑
3Khadse et al.: Reactor Model for the Underground Coal Gasification (UCG) Channel
- 10.2202/1542-6580.1351Downloaded from PubFactory at 09/07/2016 02:41:42AM
via free access

where Cpi is the heat capacity of the ith component (kcal/kmol K), T is the gas temperature (K), Ts is the solid temperature (K), hT is the heat transfer coefficient (kcal/s m3 K), Rj is the reaction rate of jth reaction (kmol/m3 s), ∆Hj is the heat of of jth reaction (kcal/kmol), ngas is the number of gas phase reactions.
2.2.5. The solid phase energy balance
(5)
where Csi is the heat capacity of the ith component (kcal/K), k is thermal conductivity of the solid (kcal/s m K), Ф is the porosity of the bed, hT is the heat transfer coefficient (kcal/s m3 K), nsolid is the number of gas-solid reactions. The number of reactions, reaction rate expressions and heat and mass transfer correlations used are listed in the Appendix.
3. SOLUTION STRATEGY
The model gives rise to a set of ten gas-phase balance equations which are to be solved in length domain and a set of three solid balance equations in time domain. These two sets of equations are to be solved sequentially one after another to obtain the solution. The solution starts by initializing all the variables. Then the gas phase balance equations are solved using ‘DLSODE’ in FORTRAN (or ‘ODE15s’ in MATLAB), marching from the inlet to the outlet using the values of solid components and temperature at the previous time. Then using the obtained rates the solid phase balances are solved by explicit finite difference method so as to march to a new time, thus obtaining solid densities and temperature at a new time. Using the solid density values at the new time the solution of the gas phase ODE’s across the length gives gas compositions at that time. Alternate solution of the two sets of equations is the main theme of the solution strategy. Figure 2 gives the solution strategy for solving the pseudo steady state model. The solutions are obtained for different time and length steps. The time and length steps were chosen such that the solution is independent of further reduction in time and length steps.
The complete model including all the reactions and parameters was solved using the strategy discussed above. The solution requires coal and char ultimate analysis data for the calculation of stoichiometry, and the inlet and initial conditions for all the variables as input. The important input parameters for the simulation are given in Table 1. These simulation parameters are assigned based on previous literature experimental and simulation data (Thorsness et al., 1978). Simulations with these inputs will be considered as the base case for understanding the results and carrying out other parametric studies. The simulation results of the base case are illustrated in detail, using temperature profiles, solid and gas phase species concentrations, reaction rates and exit concentrations. It should be mentioned here that the steam/O2 ratio has been chosen in the base case as 5, and that this is rather high compared to practical UCG operations. As a consequence, our simulation results may be interpreted as being an optimistic estimate in terms of calorific values, compared to practical UCG.
2
1 1
(1 ) ( )solidn
s si si T s j j
i j
dT TC k h T T H Rdt x x
ρ φ= =
∂∂ ⎡ ⎤= − + − − ∆⎢ ⎥∂ ∂⎣ ⎦∑ ∑
4 International Journal of Chemical Reactor Engineering Vol. 4 [2006], Article A37
- 10.2202/1542-6580.1351Downloaded from PubFactory at 09/07/2016 02:41:42AM
via free access

Figure 2. Solution strategy for the pseudo steady state model
Table 1. Input parameters for the base case
Sr.No. Parameter Value
1 Reactor length 1 m
2 Reactor diameter 0.15 m
3 Inlet gas compositions
O2
N2
H2O
Steam /O2 ratio
Mole percentage
21% during ignition and 15.4 % in gasification
79% during ignition, 7.6 % in gasification
0% during ignition and 77 % in gasification
5
4 Ignition period 5 cm for 1000 s.
5 Inlet pressure 4.8 atm
6 Feed and initial temperature
430 K
End L = Lend t = tend
Start
L =0, Yi = Yi,feed, Tg = Tg,feed
I/P initial solid densities, temp and inlet gas conc. and temp
t =0
t =t+dt
L =L+dL
Solve solid mass & energy balance using Rt-1,L+dLto get ρt,L+dL & Ts, t,L+dL
Calculate Rt,L+dL
Solve for gas mass & energy balance using solver
Obtain Yt,L+dLand Tg, t,L+dL
5Khadse et al.: Reactor Model for the Underground Coal Gasification (UCG) Channel
- 10.2202/1542-6580.1351Downloaded from PubFactory at 09/07/2016 02:41:42AM
via free access

Sr.No. Parameter Value
7 Coal type Sub-bituminous Wyodak coal (Thorsness et al., 1978)
8 Initial coal density 500 kg/m3
9 Initial particle diameter 0.01 m
10 Initial porosity 0.2
11 Molar flow rate 2×10⁻³ kmol/m2 s
4. RESULTS AND DISCUSSIONS The temperature profiles along the length obtained at different times are shown in Figure 3. Solid and dotted lines represent solid and gas temperatures respectively. The solid temperature profiles are explained in detail. The first profile shows the temperature during the ignition period where the heat is supplied to the initial 5 cm of the bed. The feed during the ignition period is purely air (no steam), this ensures that only combustion and pyrolysis reactions take place. The oxidation is restricted due to the absence of char and majority of the heat supplied during the ignition is used to create char by pyrolysis of coal. The temperature profile at 20000 sec shows two distinctly visible boundaries. The right boundary indicates the pyrolysis front where the coal is converted into char by liberation of volatiles. The left boundary indicates the reaction front where the combustion and gasification reactions start as the gaseous reactants come in contact with char. The region beyond the pyrolysis front indicates the presence of unreacted coal. The temperature rises steeply at the start of the reaction zone due to the highly exothermic oxidation reactions and then drops at the end of the reaction zone due to the endothermic gasification and pyrolysis reactions. A closer look at the temperature profile after it reaches maximum temperature shows a steeper decrease initially then a slight increase followed by a more gradual decrease. The steep decrease in the initial part is justified due to the highly endothermic gasification reactions and the gradual decrease in the later part is essentially only due to the pyrolysis reaction. The plot of temperature at different times i.e. Figure 3, indicates a clear movement of the reaction and pyrolysis zones signifying the consumption of coal and char along the reactor length.
The reaction rates obtained from our simulations are plotted in Figure 4, showing higher steam gasification and oxidation reaction rates. As the oxygen consumption is very fast, the reaction zone is very sharp and thin. The methanation, CO2 gasification, water gas shift reaction and gas phase oxidation reactions are very slow compared to gasification reactions. Oxidation, steam gasification and CO2 gasification reaction zones are thin and hence they are shown in Figure 4 by adjusting the length scale. This is because the oxidation reaction is fast which increases solid temperature. The increased temperature in that zone is utilized by steam gasification and CO2 gasification. The rate of CO2 gasification is very less compared to steam gasification. The products formed react with remaining O2 by gas phase oxidation reactions which is a single peak as shown in Figure 4. Figure 5 shows the plot of the reaction rate and solid temperature at various positions at 20000 sec. Figure 5 clearly indicates that the gasification reactions take place in the high temperature zone above 800 K and that pyrolysis reaction takes place above 600 K. Methanation and water gas shift reactions cover the entire temperature zone but their rates are lower. The increase of solid temperature due to oxidation and then the decrease due to gasification and pyrolysis reactions as described earlier is clearly seen in Figure 5.
Figure 6 shows the plot of compositions of gas phase species along the length of the reactor at 20000 sec. Oxygen and steam remain unreacted up to a length of 38 cm, indicating that the coal bed is exhausted up to this point, at this time. Once the reactants enter the reaction zone, oxygen starts reacting exothermically with char to produce CO2. Due to the high temperatures (see Figure 3) the steam gasification also starts simultaneously. Because of the higher steam gasification reaction rate the product consists of H2 and CO. Due to constant rate of water gas shift reaction in the gasification zone we also observe a slight increase in H2 concentration compared to CO. As the rate of methanation reaction is smaller than the gasification reactions the methane concentration is very low and methane forms essentially due to the pyrolysis reaction and not the methanation reaction. It is also observed that the steam gasification stops within the reaction zone even when there is a considerable amount of char and steam remaining unconsumed. This is because gasification rates are very low for temperatures below 800K as indicated by Figure 5. The gas phase concentrations remain unchanged beyond the reaction zone as there are no significant reactions due to considerably low temperatures.
6 International Journal of Chemical Reactor Engineering Vol. 4 [2006], Article A37
- 10.2202/1542-6580.1351Downloaded from PubFactory at 09/07/2016 02:41:42AM
via free access

0 10 20 30 40 50 60 70 80 90 100400
500
600
700
800
900
1000
1100
1200
1300
1400
Length (cm)
Tem
pera
ture
(K)
250 sec
10000 sec
20000 sec
30000 sec Pyrolysis front
Reaction front Reaction zone
____ Solid temperature ........ Gas temperature
Figure 3. Temperature profiles along the reactor length at different times
Figure 4. Plot of reaction rates at 20000 sec
0 20 40 60 80 1000
0.005
0.01
0.015
Rea
ctio
n ra
te(k
mol
/m3 s
)
Length(cm)30 35 40 45 50
0
0.005
0.01
0.015
0.02
Rea
ctio
n ra
te(k
mol
/m3 s
)
Length(cm)
30 35 40 45 500
0.02
0.04
0.06
Rea
ctio
n ra
te(k
mol
/m3 s
)
Length(cm)30 35 40 45 50
0
1
2
3
4x 10⁻⁹
Rea
ctio
n ra
te(k
mol
/m3 s
)
Length(cm)
0 20 40 60 80 1000
1
2x 10⁻⁵
Rea
ctio
n ra
te(k
mol
/m3 s
)
Length(cm)0 20 40 60 80 100
0
2
4
6x 10⁻⁴
Rea
ctio
n ra
te(k
mol
/m3 s
)
Length(cm)
water gas shift reactiongas phase oxidation
Methanation
Co2 gasificationSteam gasification
OxidationPyrolysis
7Khadse et al.: Reactor Model for the Underground Coal Gasification (UCG) Channel
- 10.2202/1542-6580.1351Downloaded from PubFactory at 09/07/2016 02:41:42AM
via free access

35 40 45 50 55 60 65 70 75 800
0.02
0.04
0.06
Rea
ctio
n ra
te (k
mol
/m3 s
)
35 40 45 50 55 60 65 70 75 80400
500
600
700
800
900
1000
1100
1200
Length (cm)
Tem
pera
turtu
re (K
)
Steam gasification
Oxidation
CO2 gasification x 107
Methanation x 103
Water gas shift x 102
Pyrolysis
Solid temperature
Figure 5. Reaction rates and solid temperature at 20000 sec.
Figure 6. Gas phase composition profiles at 20000 sec.
8 International Journal of Chemical Reactor Engineering Vol. 4 [2006], Article A37
- 10.2202/1542-6580.1351Downloaded from PubFactory at 09/07/2016 02:41:42AM
via free access

0 10 20 30 40 50 60 70 80 90 1000
50
100
150
200
250
300
350
400
450
500
Length (cm)
Den
sity
(kg/
m3 )
10000 sec 20000 sec 30000 sec
coal
char
____ ........
Coal Char
Figure 7. Coal and char densities along the reactor length
Figure 7 shows the profiles of densities of coal and char along the reactor length at three different times. The solid lines indicate the coal density and the dotted lines indicate char density. The coal boundary indicates the pyrolysis front continuously producing char. The char produced by pyrolysis is consumed by combustion and gasification in the reaction zone. Beyond this region the coal is not yet converted to char and prior to this region all the char present has already been consumed by gasification reactions. There is a region where a mixture of the coal and char exists, as pyrolysis can occur at temperatures lower than 600K but gasification can not, as seen in Figure 5.
The reaction and pyrolysis front positions at different times are shown in Figure 8. A linear propagation of the two boundaries along with time with an increase in gap between them is observed. This implies that the pyrolysis zone moves faster than reaction front because of a zone of low temperature of large width. The width of the reaction zone increases with time. This change in the reaction zone width is only dependent on the relative rates of pyrolysis and char reactions.
It should also be noted that as the pyrolysis reaction is a prerequisite for the char reactions to take place, the width of the reaction zone could never decrease below a limit. However, maximizing the product calorific value and increasing steam conversion requires a larger reaction zone.
The exit concentrations from the reactor are plotted against time in Figure 9. This helps us to understand the variation in the final output gas compositions. It is seen that there are large changes occurring before the time 5000 sec. These initial changes are due to the change in the feed from air during the ignition period, to a mixture of air and steam after the ignition period. These plots indicate that a constant concentration of CO2 and CO/H2 ratio i.e. approximate steady state is reached in terms of exit concentrations after the initial changes and is maintained until the reaction zone is very close to the exit where the coal bed is nearly exhausted. As the coal bed is consumed fully at around 30000 sec, beyond this time the products are due to the reactions of char i.e. combustion and gasification. Hence, there is a decrease in the concentration of CO and H2 in the exit gases and there is absence of CH4 which is primarily formed in pyrolysis in this case. The higher steam in exit gas is due to higher steam/O2 ratio.
9Khadse et al.: Reactor Model for the Underground Coal Gasification (UCG) Channel
- 10.2202/1542-6580.1351Downloaded from PubFactory at 09/07/2016 02:41:42AM
via free access

Figure 8. Reaction and pyrolysis front positions at different times.
Figure 9. Plot of exit gas compositions versus time for the pseudo steady state model
0
0.1
0.2
0.3
0.4
0.5
0.6
0.7
0 10 20 30 40 50Time/1000(sec)
Mol
e fr
actio
n
H2O
H2
CH4 CO
O2 CO2
10 International Journal of Chemical Reactor Engineering Vol. 4 [2006], Article A37
- 10.2202/1542-6580.1351Downloaded from PubFactory at 09/07/2016 02:41:42AM
via free access

0
50
100
150
200
250
0 10 20 30 40 50
Time/1000(sec)
Cal
orifi
c va
lue(
kJ/m
ol)
Figure 10. Calorific value of the gas with time
Figure 10 shows the variation of the calorific value of the exit product gas, on dry basis, with time. The gross calorific value of the exit gas is calculated as (Harker and Backhurst, 1981)
(6)
Here Hi is the heat of combustion of the gas ‘i’ (kJ/mol) and yi are the mole fractions of the gas ‘i’ in the product gas on dry basis. From Figure 10 we can see that the calorific value is approximately constant from 5000 to 30000 sec as in case of exit gas compositions (see Figure 9). This result is very important as it simplifies the design and feasibility calculations which are mainly based on the exit compositions.
00.050.1
0.150.2
0.250.3
0.350.4
0.45
0 5 10 15 20 25 30Time/1000 (sec)
Dry
gas
mol
e fra
ctio
n
CO
H2
CO2
CH4
H2_Run 5
H2_Run 4
CO_Run 5
CO_Run 4
CO2_Run 4, 5
CH4_Run 5
CH4_Run 4
Figure 11. Comparisons of dry gas compositions with experimental results from Thorsness et al., (1978).
The simulation results are compared with experimental results from Thorsness et al., (1978) in Figure 11. These experiments were performed on 1.5m long packed bed reactor with inlet steam/O2 ratio of 6, inlet O2 of 13.8% and total pressure of 4.83 atm. We performed our simulations for the same conditions as in the experiments. The simulation results are in good qualitative agreement with the experimental results reported by Thorsness et al.,
2 2 4 4( / ) co co H H CH CHCalorific Value kJ mol H y H y H y= + +
11Khadse et al.: Reactor Model for the Underground Coal Gasification (UCG) Channel
- 10.2202/1542-6580.1351Downloaded from PubFactory at 09/07/2016 02:41:42AM
via free access
(1978). The results are also qualitatively comparable with the model predictions of Thorsness et al., (1978). Both the models are able to predict the movement of the pyrolysis and the reactions front, gas and solid compositions. The results are not quantitatively comparable because there are some differences in the two models. In their work, they consider 5 solid species (coal, char, mobile water, fixed water and ash), while we account for only two solid species (coal and char). They consider coal drying and water evaporation whereas we neglected these two reactions. The information regarding the initial heating rate and time is not reported by them. In our model, during ignition period air is used and the bed is heated by external source for initial length (see Table 1). In their work specifying exit pressure solves gas velocity equation. In our model, the solution is obtained by initializing all variables at inlet of the reactor. Due to differences in the number of reactions and species considered, initial heating rate and time, and so on, a quantitative match is not expected between our simulation results and theirs.
5. PARAMETRIC STUDY In this section, the effect of different parameters on the solid temperature profile, gas composition, width of reaction zone, rate of reaction zone movement and calorific value has been analyzed. The effects of controlling parameters like H2O/O2 ratio, O2 concentration in feed and total pressure are studied here. The effect of coal kinetics is also studied for two types of coals.
5.1 Effect of O2 feed concentration Here the effect of changing the feed O2 concentration while keeping the H2O/O2 ratio constant is studied, in order to examine the effect of the limiting reactant concentration. Keeping the H2O/O2 ratio of 5 as the base case, the O2 feed concentration is varied. Three different cases with O2 concentrations of 5%, 10% and 15.4% (which is the base case) are used to illustrate the results. The inlet gas compositions after ignition are shown in Table 2.
Table 2. Inlet gas compositions for effect of O2 feed concentration. Sr.No Inlet gas (mol %) Case-I Case-II Case-III
1 O2 5 10 15.4 2 N2 70 40 7.6 3 H2O 25 50 77 4 Steam/ O2 ratio 5 5 5
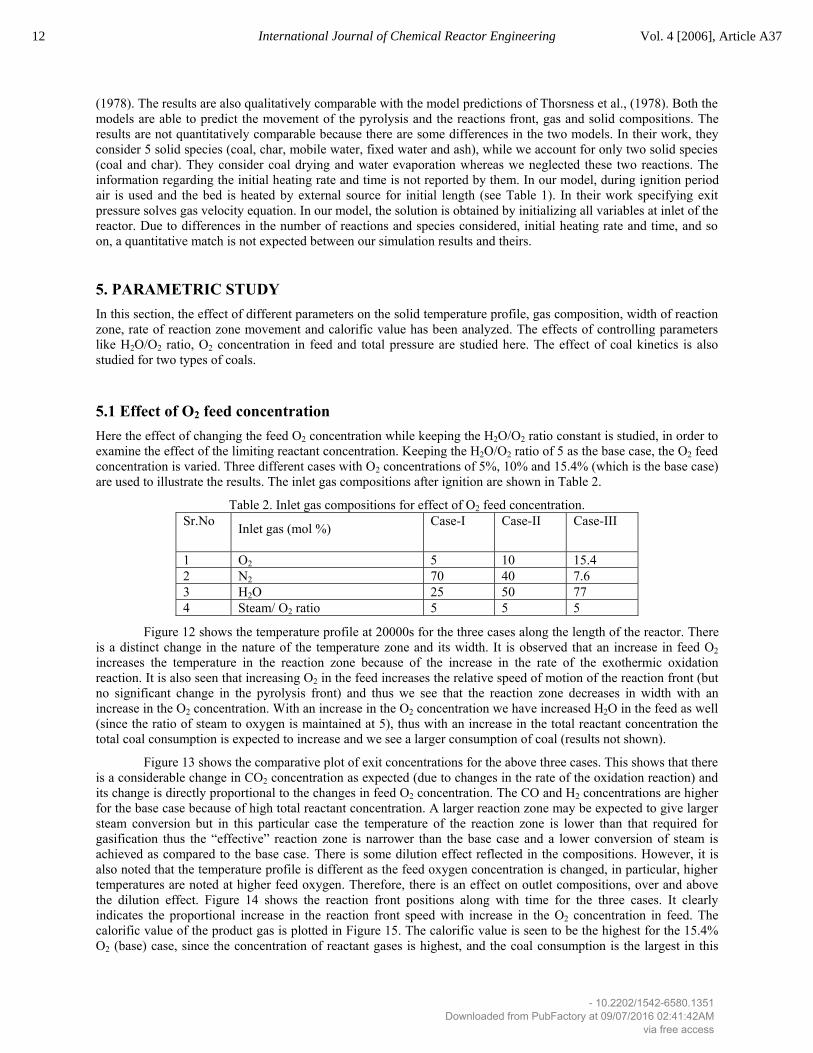
Figure 12 shows the temperature profile at 20000s for the three cases along the length of the reactor. There is a distinct change in the nature of the temperature zone and its width. It is observed that an increase in feed O2 increases the temperature in the reaction zone because of the increase in the rate of the exothermic oxidation reaction. It is also seen that increasing O2 in the feed increases the relative speed of motion of the reaction front (but no significant change in the pyrolysis front) and thus we see that the reaction zone decreases in width with an increase in the O2 concentration. With an increase in the O2 concentration we have increased H2O in the feed as well (since the ratio of steam to oxygen is maintained at 5), thus with an increase in the total reactant concentration the total coal consumption is expected to increase and we see a larger consumption of coal (results not shown).
Figure 13 shows the comparative plot of exit concentrations for the above three cases. This shows that there is a considerable change in CO2 concentration as expected (due to changes in the rate of the oxidation reaction) and its change is directly proportional to the changes in feed O2 concentration. The CO and H2 concentrations are higher for the base case because of high total reactant concentration. A larger reaction zone may be expected to give larger steam conversion but in this particular case the temperature of the reaction zone is lower than that required for gasification thus the “effective” reaction zone is narrower than the base case and a lower conversion of steam is achieved as compared to the base case. There is some dilution effect reflected in the compositions. However, it is also noted that the temperature profile is different as the feed oxygen concentration is changed, in particular, higher temperatures are noted at higher feed oxygen. Therefore, there is an effect on outlet compositions, over and above the dilution effect. Figure 14 shows the reaction front positions along with time for the three cases. It clearly indicates the proportional increase in the reaction front speed with increase in the O2 concentration in feed. The calorific value of the product gas is plotted in Figure 15. The calorific value is seen to be the highest for the 15.4% O2 (base) case, since the concentration of reactant gases is highest, and the coal consumption is the largest in this
12 International Journal of Chemical Reactor Engineering Vol. 4 [2006], Article A37
- 10.2202/1542-6580.1351Downloaded from PubFactory at 09/07/2016 02:41:42AM
via free access
case.
5.2 Effect of Steam/O2 ratio Oxygen is required for providing heat by oxidation for the gasification reactions, but it is basically undesirable as it reduces the calorific value of the product gas by increasing CO2 in the system. On the other hand, steam is required for gasification reactions to increase the calorific value but endothermicity of the steam gasification reaction reduces the temperature to a level where the reactions stop. Thus the ratio of steam and oxygen in the feed will play an important role in optimization of product calorific value, subsequent to the initial ignition period. Keeping the mole fraction of O2 constant at 15.4% in feed, the ratio of H2O/ O2 is changed by changing the amount of H2O. The base case with an H2O/O2 ratio of 5 will be compared with two cases with H2O/O2 ratios of 3 and 1. The inlet gas compositions after ignition are shown in Table 3.
Table 3. Inlet gas compositions for effect of Steam/O2 ratio. Sr.No Inlet gas (mol %) Case-I Case-II Case-III
1 O2 15.4 15.4 15.4 2 N2 69.2 38.4 7.6 3 H2O 15.4 46.2 77 4 Steam/ O2 ratio 1 3 5
Figure 16 show the plot of temperature profile at 20000 s and from this profile it is clear that an increase in the H2O/ O2 ratio decreases the maximum temperature reached and decreases the width of the reaction zone. The speed of reaction zone propagation is not greatly affected by the feed H2O/O2 ratio. Figure 17 shows a comparative plot of exit compositions for the three cases. There are very large changes in the H2O concentration which are essentially because H2O in feed is changed to obtain the desired feed ratio. As the ratio of H2O/O2 is increased the amount of CO and H2 formed is higher as expected due to increase of H2O in feed. It is however noticed that the ratio of CO to H2 at the outlet does not change significantly. It is also seen that the H2O/O2 feed ratio does not influence the concentration of CO2 in the exit. This is justified, as the feed concentration of O2 is kept constant.
It is to be noted that an increase in the H2O/O2 ratio decreases the N2 in the system and increases the amount of reactant gases, thus increasing the dry calorific value of the exit gases. It is inferred from the above analysis that a decrease in H2O/O2 ratio increases the reaction zone temperature and width thus providing suitable conditions for higher reactant conversion. But it is also seen that increasing the H2O/O2 ratio decreases the inert concentration, thus the base case (H2O/O2 =5) provides the maximum calorific value of the product gases among the three cases considered as shown in Figure 18. It is seen that change in gas compositions are slight but GCV is changed significantly because GCV is calculated for dry gas. Dry gas compositions will be different than that seen in Figure 17.
Figure 12. Plots of temperature for different O2 concentrations in feed, keeping the inlet steam/oxygen ratio constant at 5.
13Khadse et al.: Reactor Model for the Underground Coal Gasification (UCG) Channel
- 10.2202/1542-6580.1351Downloaded from PubFactory at 09/07/2016 02:41:42AM
via free access

05
101520253035404550
H2O H2 CO2 CO CH4
Out
let g
as c
ompo
sitio
n(%
) O2=5%O2=10%O2=15.4%
Figure 13. Plots of exit gas compositions for different O2 concentrations in feed, keeping the inlet steam/oxygen ratio constant at 5.
Figure 14. Plots of reaction front position for different O2 concentrations in feed, keeping the inlet steam/oxygen ratio constant at 5.
0
50
100
150
200
250
0 10 20 30 40 50
Time/1000(sec)
Cal
orifi
c va
lue(
kJ/m
ol)
O2=15.4%O2=10%O2=5%
Figure 15. Plots for calorific value of gas for different O2 concentrations in feed, keeping the inlet steam/oxygen ratio constant at 5.
14 International Journal of Chemical Reactor Engineering Vol. 4 [2006], Article A37
- 10.2202/1542-6580.1351Downloaded from PubFactory at 09/07/2016 02:41:42AM
via free access

Figure 16. Plots of temperature different steam/O2 ratio in feed, keeping the O2 concentration constant at 15.4 %.
05
101520253035404550
H2O H2 CO2 CO CH4
Out
let g
as c
ompo
sitio
n(%
) Steam/O2=1Steam/O2=3Steam/O2=5
Figure 17. Plots of exit gas compositions for different Steam/O2 ratio in feed, keeping the O2 concentration constant at 15.4%.
0
50
100
150
200
250
0 10 20 30 40 50
Time/1000(sec)
Calo
rific
val
ue(k
J/m
ol)
steam /O2=5steam/O2=3steam/O2=1
Figure 18. Plots of calorific value of gas at different steam/O2 ratios.
15Khadse et al.: Reactor Model for the Underground Coal Gasification (UCG) Channel
- 10.2202/1542-6580.1351Downloaded from PubFactory at 09/07/2016 02:41:42AM
via free access

5.3 Effect of steam/O2 ratio in the absence of nitrogen Here the effect of changing the feed O2 concentration is studied. Pure oxygen, instead of air, is used along with steam. O2 concentrations are varied from 10 to 90% in the feed, the remaining being steam. In this case, nitrogen is not considered, so that the effect of inerts may be separated out. Figure 19 shows the calorific value of the product gases at 20000 sec. It clearly indicates the O2 inlet concentration of about 40% gives maximum calorific value. Here dry gas calorific value remains more or less constant up to 40 % O2 concentration and then decreases while the calorific values considering steam (for calculation of mole fractions of product gas) increases up to 40% O2 and then decreases if O2 concentration is further increased. The inlet gas compositions after ignition are given in Table 4.
Table 4. Inlet gas compositions for effect of Steam/O2 ratio in absence of nitrogen Sr.No Inlet gas (mol %) I II III IV V VI VII VIII IX
1 O2 10 20 30 40 50 60 70 80 90 2 N2 0 0 0 0 0 0 0 0 0 3 H2O 90 80 70 60 50 40 30 20 10 4 Steam/ O2 ratio 9 4 2.33 1.5 1 0.66 0.43 0.25 0.11
There is an increase in the outlet CO2 concentration when more oxygen is added, as expected and the change in outlet CO2 concentration is directly proportional to the change in the concentration of O2 in the feed. The case with a feed O2=40% and steam=60% gives maximum CO and H2. For lower feed O2 concentrations (<30%) unreacted steam is high in the outlet product gas, or overall reactivity is low. Increasing the O2 concentration beyond 40%, decreases the unreacted steam but increases the CO2 in the outlet product gas. Thus there is a trade-off between low overall reactivity at low feed O2 concentrations and high rate of oxidation to undesired CO2 at higher feed O2 concentrations.
0
50
100
150
200
250
O2=0.1
O2=0.2
O2=0.3
O2=0.4
O2=0.5
O2=0.6
O2=0.7
O2=0.8
O2=0.9
CV(
kJ/m
ol)
CV(dry gas)CV(with steam)
Figure 19. Comparison of calorific value of gas for different pure O2 concentration in feed at 20000 sec.
5.4 Effect of inlet pressure Effect of inlet pressure is studied at 4.8, 10 and 20 atmosphere total pressure. There is no significant effect of inlet pressure on the reaction zone movement for the three pressures studied here. The maximum solid temperature attained is higher at higher pressure. The reaction zone width remains approximately constant. The calorific values of the outgoing gas in all the cases remain nearly unchanged, as indicated in Figure 20. Thus, the overall influence of pressure (in this range) on UCG is small, for the conditions and kinetics considered here.
16 International Journal of Chemical Reactor Engineering Vol. 4 [2006], Article A37
- 10.2202/1542-6580.1351Downloaded from PubFactory at 09/07/2016 02:41:42AM
via free access

0
50
100
150
200
250
0 10 20 30 40 50
Time/1000(sec)
Calo
rific
val
ue(k
J/m
ol)
P=4.8 atmP=10 atmP=20 atm
Figure 20. Plots of gas calorific value at different total pressures.
5.5 The effect of coal type and kinetics The effect of coal type is studied by comparing similar results obtained using Falkirk lignite coal data (Mann et al., 2004) with the base case of sub-bituminous Wyodak coal. The kinetic rate expressions are obtained from Yang and Liu (2003). The coal stoichiometric coefficients are calculated using ultimate analysis data of the Falkirk lignite coal (Mann et al., 2004). The pre exponential factor and activation energy for each reaction are taken from Mann et al., (2004). The pyrolysis and gas phase oxidation reaction rates are assumed same as earlier due to absence of data. The same operating conditions are kept as that listed in Table 1. The base case is denoted as case-I and lignite coal kinetics case as case-II.
The temperature profiles are shown in Figure 21. The plot shows that reaction front moves faster in case-II (lignite coal). The front is 10 cm ahead of the case-I (sub-bituminous coal) at 20000 sec. Another important observation is that the maximum temperature is higher and reaction zone is wider in case-II. The coal density and char density profiles are shown in Figure 22 and 23, indicating faster consumptions of coal and char in case-II , at a particular time.
Figure 21. Solid temperature profiles for two coal kinetics.
17Khadse et al.: Reactor Model for the Underground Coal Gasification (UCG) Channel
- 10.2202/1542-6580.1351Downloaded from PubFactory at 09/07/2016 02:41:42AM
via free access

Figure 22. Coal density profiles for two coal kinetics
Figure 23. Char density profiles for two coal kinetics
18 International Journal of Chemical Reactor Engineering Vol. 4 [2006], Article A37
- 10.2202/1542-6580.1351Downloaded from PubFactory at 09/07/2016 02:41:42AM
via free access

0 20 40 60 80 1000
0.005
0.01
0.015
0.02
Rea
ctio
n ra
te(k
mol
/m3 s
)
Length(cm)40 45 50 55 60
0
0.005
0.01
0.015
0.02
Rea
ctio
n ra
te(k
mol
/m3 s
)
Length(cm)
0 20 40 60 80 1000
0.01
0.02
0.03
0.04
Rea
ctio
n ra
te(k
mol
/m3 s
)
Length(cm)40 45 50 55 60
0
2
4
6
8x 10
-11
Rea
ctio
n ra
te(k
mol
/m3 s
)
Length(cm)
0 20 40 60 80 100-5
0
5
10
15x 10
-9
Rea
ctio
n ra
te(k
mol
/m3 s
)
Length(cm)0 20 40 60 80 100
0
0.005
0.01
0.015
0.02
0.025
Rea
ctio
n ra
te(k
mol
/m3 s
)
Length(cm)
Pyrolysis Oxidation
Steam gasification Co2 gasification
Methanation water gas shift reaction
Figure 24. Reaction rates at 20000 sec for case-II
0
510
1520
25
3035
4045
50
H2O H2 CO2 CO CH4
Out
let g
as c
ompo
stio
n (%
)
Case-ICase-II
Figure 25. Comparison of gas compositions at 20000 sec
19Khadse et al.: Reactor Model for the Underground Coal Gasification (UCG) Channel
- 10.2202/1542-6580.1351Downloaded from PubFactory at 09/07/2016 02:41:42AM
via free access

0
50
100
150
200
250
0 10 20 30 40 50
Time/1000(sec)
Cal
orifi
c va
lue(
kJ/m
ol)
case-Icase-II
Figure 26. Comparisons of calorific value of the two coals
Figure 24 shows the individual reaction rates at 20000 sec for case-II. If we compare Figures 4 and 24, pyrolysis rates are same in both the cases. Oxidation reaction rate is higher in case-II which justifies higher maximum temperatures. Steam gasification rate is lower in case-II but has a wider zone. The methanation and CO2 gasification rates are lower than case-I. The important feature of case-II is the higher rate of water gas shift reaction which changes the gas product distribution. In case-II, we get higher H2 but very low CO because water gas shift reaction consumes CO to give H2 and CO2. Figure 24 clearly shows differences in gas compositions at 20000 sec for these two cases. From Figure 25 it is observed that higher H2 and CO2 and lower H2O are obtained in the case of lignite coal (case-II). The calorific values are compared in Figure 26, which indicates that the calorific value of product gas from lignite coal (case-II) is lower than sub-bituminous coal(case-I) which is as anticipated due to the low carbon content in the lignite coal. The higher H2 and near completion of the water gas shift reaction in case of lignite coal (case-II) will be beneficial for CO2 capture.
From the above parametric study it is clear that input parameters do not influence the pyrolysis reaction explicitly, whereas the reaction front position and speed are entirely dependent on many input parameters such as reactant concentrations, H2O/O2 ratios and so on. The coal type and its kinetics affect the product gas distribution and hence calorific value of the gas. But one important observation is that approximately constant product gas compositions and calorific values of the product gas over the time period 5000-35000 sec are obtained in all the cases. This will be beneficial for reactor performance and utilization of gases and thus feasibility of the process.
6. CONCLUSIONS
The packed bed reactor model developed in the present work is successfully able to predict behaviors such as solid and gas phase compositions and temperatures profiles along with a moving reaction zone. All the trends and effects of various parameters are justifiable logically. The results were compared qualitatively with the existing literature. However quantitative comparison is not possible because of the lack of information on certain parameters used in the literature model and experiments. In spite of several changes occurring within the reactor the exit concentrations are approximately at steady value after an initial period. Increasing the reaction zone width increases the extent of the gasification reactions and thus optimum operating conditions for maximizing the zone width must be determined carefully. Parametric study done in this work has provided detailed insight into the system and can be used for further optimization studies. Increase in feed H2O to O2 ratio and reducing inerts like nitrogen help increase the calorific value of the product gas. A feed of about 40% O2 and 60% steam gives optimum outlet product composition (high CO and H2) for the sub-bituminous coal considered in the present study.
Due to the one dimensional framework of the model and lack of adequate information, several phenomena that may be important for the finer detailed prediction of UCG are not considered in this model. These include the effects of tar condensation and plugging, gas losses to surroundings, water intrusion from surroundings and heat
20 International Journal of Chemical Reactor Engineering Vol. 4 [2006], Article A37
- 10.2202/1542-6580.1351Downloaded from PubFactory at 09/07/2016 02:41:42AM
via free access

losses. Water intrusion will affect the product gas composition and gross calorific value. Nevertheless, the present model is very beneficial since it is simple, less time consuming and represents the system reasonably well, in particular the detailed reaction chemistry. A two- or three-dimensional model is required for a better and more detailed description of the various phenomena occurring in the UCG process and the work in this direction is underway in our research group.
NOTATIONS
Ci Concentration of species, mol/m3 Cpi Specific heat of the component i in the gas phase, kcal/mol K Csi Specific heat of the component i in the solid phase, kcal/mol K fi Factor that decides what fraction of reaction heat goes to the gas phase ∆Hj Heat of reaction j, kcal/kmole k Thermal conductivity of gas, kcal/s m K ky Mass transfer coefficient, kmole/m3s Mi Molecular weight of solid species, kg/Kmole P Gas pressure, kPa R Gas constant, kcal/mole/ºK Rj Reaction rate, kmole/m3s T Absolute temperature, ºK Tg Temperature of the gas phase, K Ts Temperature of solid phase, K t Time, sec ug Velocity of the gas phase, m/s x Distance, m yi Mole fraction of component i in the gas phase.
Greek Letters Ф Porosity ρ Density, kg/m3
REFERENCES
Beath, A., Wendt, M. and Mallett, C., “Optimization of Underground Coal Gasification for improved performance and reduced environmental impact”, CSIRO Exploration and Mining Research Group, (2002), (http://www.australiancoal.csiro.au/pdfs/min-bea.pdf accessed on 17 May 2006).
DTI, “Review of Underground Coal Gasification Technological Advancement”, R – 211, DTI/Pub URN 01/1041, (2001), (http://www.ecdti.co.uk/cgibin/perlcon.pl accessed on 17 May 2006).
Edgar, F. T. and Gregg, D.,“Underground Gasification of Coal” in “Chemistry of Coal Utilization: 2nd
Supplementary volume”, Ed. Elloitt, M., John Wiley and Sons, NJ, USA, ( 1981).
Green, M., “UK Programme on Underground Coal Gasification”, R–250, DTI, (2000),
( http://www.dti.gov.uk/energy/coal/cfft/cct/pub/pdfs/r250b.pdf last accessed on July 2004).
Harker, J.H. and Backhurst, J.R., “Fuel and energy”, Academic Press, London, 1981.
Magnani, C. F. and Farouq Ali, S. M., “Mathematical Modeling of the Stream Method of Underground Coal Gasification”, Society of Petroleum Engg. Journal, vol. 15, 425, (1975).
Mann, M. D., Knutson. R. Z. and Ergance, J., “Modeling of Reaction Kinetics of Steam Gasification for Transport
21Khadse et al.: Reactor Model for the Underground Coal Gasification (UCG) Channel
- 10.2202/1542-6580.1351Downloaded from PubFactory at 09/07/2016 02:41:42AM
via free access
Gasifiers”, Fuel, vol.83, 1643-1650, (2004).
Perkins, G., Saghafi, A. and Sahajwalla, V.,“Numerical Modeling of Underground Coal Gasification and its application to Australian Coal Seam Conditions”, School of Material Science and Engineering, University of new South Wales, Sydney, Australia,( 2003).( http://www.ac3.edu.au/edu/papers/perkinsg01.pdf on 17 May 2005)
Savins, J. G., “Process of Underground Coal Gasification”, Mobil Oil Corporation, New York, US Patent 4356866, ( 1982).
Thorsness, C.B and Charles B.,”General-purpose, Packed-bed Model for Analysis of Underground Coal Gasification Processes”, Lawrence Livermore National Laboratory Report, Ucid-20731, (1985).
Thorsness, C.B and Kang S. W.,”Further Development of a General-purpose, Packed-bed Model for Analysis of Underground Coal Gasification Processes,” Lawrence Livermore National Laboratory Report, Ucrl-92489, (1986).
Thorsness, C.B, Greens, E.A. and Sherwood, A., “A One Dimensional Model for in situ Coal Gasification”, Lawrence Livermore National Laboratory Report, UCRL 52523, (1978).
Walker, L. K., Blinderman, M. S. and Brun, K., “An IGCC Project at Chinchilla, Australia Based on Underground Coal Gasification”, 2001 Gasification Technologies Conference, San Francisco, 8 – 10,( 2001).
Winslow A., M., “Numerical Model for Coal Gasification in Packed Bed”, International symposium on combustion, 16th, Cambridge, Massachusetts, 503-514, (1976).
Yang, L. and Liu, S., “Simulation on Heat and Mass Transfer in the Process of Underground Coal Gasification”, Numerical Heat Transfer, Part A, 44, 537 – 557, (2003).
Yang, L., “Study on the model Experiment and Numerical Simulation for Underground Coal Gasification”, Fuel, vol. 83, 573-584, (2004).
22 International Journal of Chemical Reactor Engineering Vol. 4 [2006], Article A37
- 10.2202/1542-6580.1351Downloaded from PubFactory at 09/07/2016 02:41:42AM
via free access
APPENDIX
2.3. Major reactions in UCG
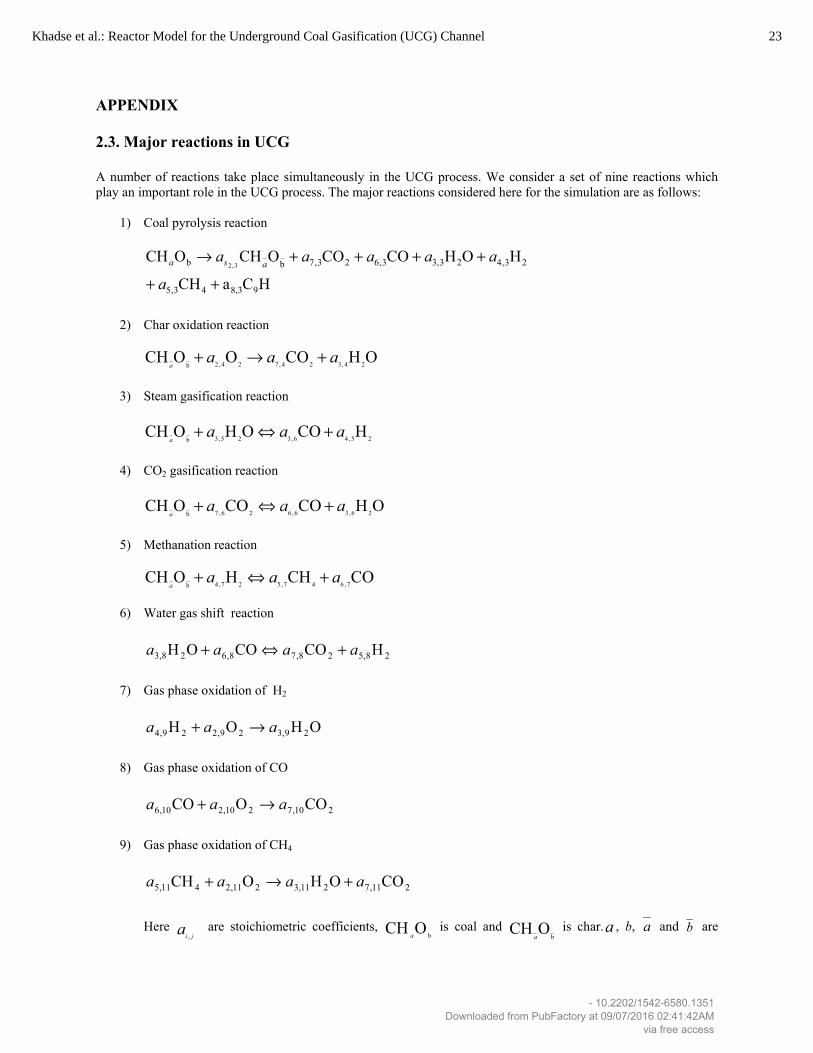
A number of reactions take place simultaneously in the UCG process. We consider a set of nine reactions which play an important role in the UCG process. The major reactions considered here for the simulation are as follows:
1) Coal pyrolysis reaction
HCaCH
HOHCOCOOCHOCH
98,343,5
23,423,33,623,7bb 3,2
++
++++→
a
aaaaa asa
2) Char oxidation reaction
OHCOOOCH 24,324,724,2baaa
a+→+
3) Steam gasification reaction
25,46,325,3bHCOOHOCH aaa
a+⇔+
4) CO2 gasification reaction
OHCOCOOCH 26,36,626,7baaa
a+⇔+
5) Methanation reaction
COCHHOCH 7,647,527,4baaa
a+⇔+
6) Water gas shift reaction
28,528,78,628,3 HCOCOOH aaaa +⇔+
7) Gas phase oxidation of H2
OHOH 29,329,229,4 aaa →+
8) Gas phase oxidation of CO
210,7210,210,6 COOCO aaa →+
9) Gas phase oxidation of CH4
211,7211,3211,2411,5 COOHOCH aaaa +→+
Here jia , are stoichiometric coefficients,
bOCH a is coal and
bOCH
a is char.a , b, a and b are
23Khadse et al.: Reactor Model for the Underground Coal Gasification (UCG) Channel
- 10.2202/1542-6580.1351Downloaded from PubFactory at 09/07/2016 02:41:42AM
via free access

determined from coal and char ultimate analysis. The rate expressions used for simulation of the model are obtained from Thorsness et al., (1978). The reaction rates are expressed in a detailed manner so as to include the kinetic dependences, equilibrium and mass transfer limitations. Reactions 2-5 are gas solid reactions and reactions 6-9 are gas phase reactions.
Reaction rates:
1) Pyrolysis reaction (equation 6)
2) Reaction rates of gas-solid reactions (equations 7-11) are expressed as
Where, Rc is effective reaction rate including equilibrium limitations (kmol/m3 s), ρc is the char concentration (kg/m3), ρcoal is the coal density (kg/m3), ko is the pre exponential factor, E is the activation energy, yr is the reactant mole fraction, yp is the product mole fractions, KE is the equilibrium constant, G∆ is the free energy for the reaction, ky is the mass transfer coefficient and yi is limiting reactant mole fraction.
3) Rate of gas phase oxidation reaction (equations 12-14)
All three gas phase reaction can be given rates zero or all the rates are assigned a value such that the remaining oxygen gets consumed immediately. In present case all three reactions given a nonzero rate by the following expression:
Tg < Tig, Rgo =0, where Tig is ignition temperature (here taken 450K), Tig< Tg< Tig+ 200, Rgo = R [(Tg – Tig)/200], Tg ≥ Tig + 200, Rgo = R
Where R = β (dv/dx) CO2. Here CO2 is the concentration of oxygen and β is a fractional consumption per unit (here taken 0.1).
⎟⎠⎞
⎜⎝⎛ −=
RTEkR coalp exp0ρ
0
11 1
1
exp
j
c m
p
c c i rr E
m y i
R
R R
yR k P y
y K
Ek kRT
R k y
ρ
=+
⎛ ⎞⎛ ⎞⎜ ⎟⎜ ⎟= × × −⎜ ⎟⎜ ⎟⎜ ⎟⎜ ⎟⎝ ⎠⎝ ⎠
⎛ ⎞= −⎜ ⎟⎝ ⎠
=
⎟⎠⎞
⎜⎝⎛ ∆−=
RTGK E exp
24 International Journal of Chemical Reactor Engineering Vol. 4 [2006], Article A37
- 10.2202/1542-6580.1351Downloaded from PubFactory at 09/07/2016 02:41:42AM
via free access
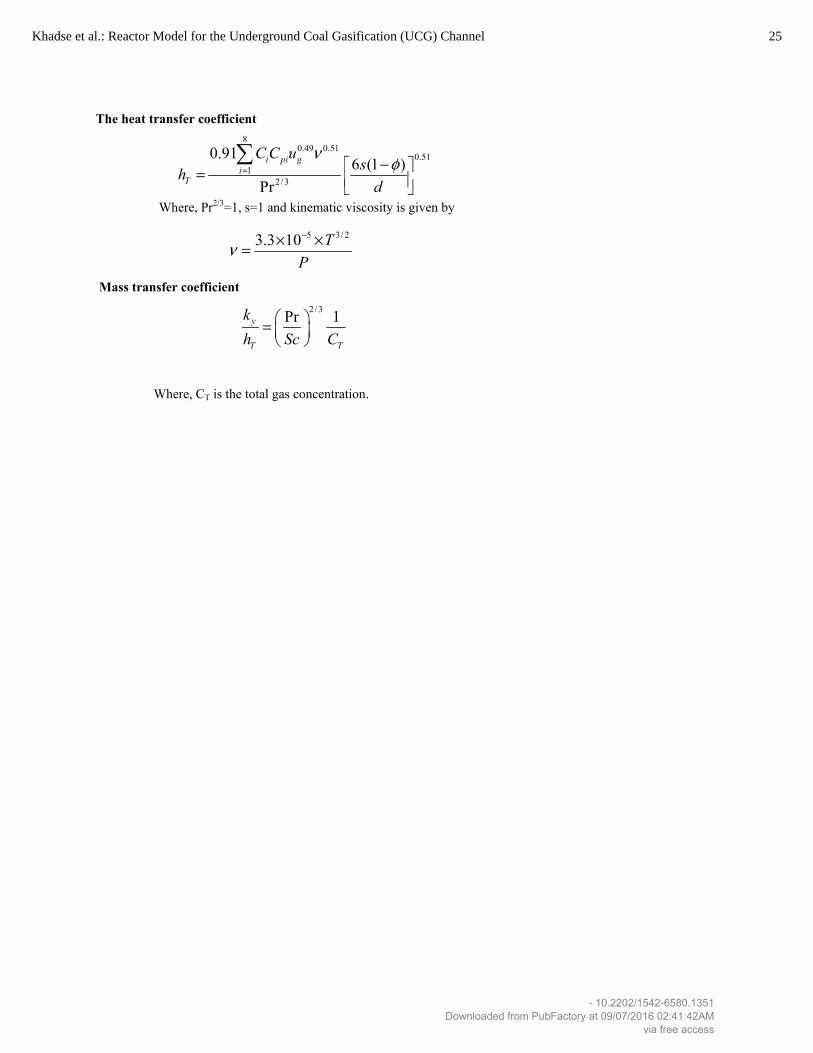
The heat transfer coefficient
Where, Pr2/3=1, s=1 and kinematic viscosity is given by
Mass transfer coefficient
Where, CT is the total gas concentration.
80.49 0.51
0.511
2/3
0.916 (1 )
Pr
i pi gi
T
C C ush
d
νφ= −⎡ ⎤= ⎢ ⎥⎣ ⎦
∑
2/3Pr 1y
T T
kh Sc C
⎛ ⎞= ⎜ ⎟⎝ ⎠
5 3/ 23.3 10 TP
ν−× ×=
25Khadse et al.: Reactor Model for the Underground Coal Gasification (UCG) Channel
- 10.2202/1542-6580.1351Downloaded from PubFactory at 09/07/2016 02:41:42AM
via free access