The spread F Experiment (SpreadFEx): Program overview and first results
20
Earth Planets Space, 61, 411–430, 2009 The spread F Experiment (SpreadFEx): Program overview and first results D. C. Fritts 1 , M. A. Abdu 2 , B. R. Batista 2 , I. S. Batista 2 , P. P. Batista 2 , R. Buriti 3 , B. R. Clemesha 2 , T. Dautermann 4 , E. de Paula 2 , B. J. Fechine 2 , B. Fejer 5 , D. Gobbi 2 , J. Haase 4 , F. Kamalabadi 6 , B. Laughman 1 , L. M. Lima 7 , H.-L. Liu 8 , A. Medeiros 3 , P.-D. Pautet 2,5 , D. M. Riggin 1 , F. S˜ ao Sabbas 2 , J. H. A. Sobral 2 , P. Stamus 1 , H. Takahashi 2 , M. J. Taylor 5 , S. L. Vadas 1 , and C. M. Wrasse 9 1 NorthWest Research Associates, Colorado Research Associates Division, Boulder, CO 2 Instituto Nacional de Pesquisas Espaciais (INPE), S˜ ao Jos´ e dos Campos, Brazil 3 Universidade Federal de Campina Grande, Campina Grande, Para´ ıba, Brazil 4 Purdue University, West Lafayette, IN 5 Utah State University, Logan, UT 6 University of Illinois, Urbana, IL 7 Universidade Estadual da Para´ ıba, Campina Grande-PB, Brazil 8 National Center for Atmospheric Research, Boulder, CO 9 IP&D—Universidade do Vale do Para´ ıba—UNIVAP, S˜ ao Jos´ e dos Campos—SP, Brazil (Received July 27, 2007; Revised February 13, 2008; Accepted June 3, 2008; Online published May 14, 2009) We performed an extensive experimental campaign (the spread F Experiment, or SpreadFEx) from September to November 2005 to attempt to define the role of neutral atmosphere dynamics, specifically wave motions propagating upward from the lower atmosphere, in seeding equatorial spread F and plasma bubbles extending to higher altitudes. Campaign measurements focused on the Brazilian sector and included ground-based optical, radar, digisonde, and GPS measurements at a number of fixed and temporary sites. Related data on convection and plasma bubble structures were also collected by GOES 12 and the GUVI instrument aboard the TIMED satellite. Initial results of our analyses of SpreadFEx and related data indicate 1) extensive gravity wave (GW) activity apparently linked to deep convection predominantly to the west of our measurement sites, 2) the presence of small-scale GW activity confined to lower altitudes, 3) larger-scale GW activity apparently penetrating to much higher altitudes suggested by electron density and TEC fluctuations in the E and F regions, 4) substantial GW amplitudes implied by digisonde electron densities, and 5) apparent direct links of these perturbations in the lower F region to spread F and plasma bubbles extending to much higher altitudes. Related efforts with correlative data are defining 6) the occurrence and locations of deep convection, 7) the spatial and temporal evolutions of plasma bubbles, the 8) 2D (height-resolved) structures of plasma bubbles, and 9) the expected propagation of GWs and tides from the lower atmosphere into the thermosphere and ionosphere. Key words: Equatorial spread F , plasma instabilities, plasma bubbles, plasma bubble seeding, thermospheric gravity waves. 1. Introduction Considerable progress has been made in recent years in understanding the occurrence, morphology, and variability of equatorial spread F (ESF) and plasma bubbles pene- trating to higher altitudes. Despite this, an understanding of the conditions seeding ESF and plasma bubbles has re- mained elusive, with neither observations nor theory suffi- ciently comprehensive or persuasive to be definitive. Com- puted Rayleigh-Taylor Instability (RTI) growth rates based on known flow structures are typically too small, and it is unclear whether seeding can be entirely a plasma process or whether neutral perturbations are necessary to enhance plasma instability growth rates. Gravity waves (GWs) have been suggested as a trigger in many studies, either directly via density and/or velocity perturbations at the bottomside F layer or indirectly via mapping of electric field or other Copyright c The Society of Geomagnetism and Earth, Planetary and Space Sci- ences (SGEPSS); The Seismological Society of Japan; The Volcanological Society of Japan; The Geodetic Society of Japan; The Japanese Society for Planetary Sci- ences; TERRAPUB. field-line-integrated perturbations generated by GWs inter- acting with sporadic E ( E s ) layers or other fields at lower altitudes off the dip (magnetic) equator. However, definitive proof of GW seeding, the “smoking gun”, observational or theoretical, has yet to be found. These issues motivated a combined experimental, modeling, and theoretical program initiated with two field campaigns performed in Brazil dur- ing “moon down” conditions from September to Novem- ber 2005. Our measurements employed a suite of airglow cameras, VHF and meteor radars, digisondes, and GPS re- ceivers at a number of fixed and temporary sites and cor- relative measurements with the Jicamarca Radio Observa- tory in Peru and via satellite (GUVI aboard TIMED and CHAMP) to characterize the neutral atmosphere and iono- sphere as fully as possible during these periods. The pri- mary goal of the spread F Experiment (SpreadFEx) was to test the theory that GWs play an essential role in the seed- ing of ESF and plasma bubbles extending to much higher altitudes. The purpose of this paper is to summarize our ex- perimental design and describe our initial analysis results. 411
-
Upload
independent -
Category
Documents
-
view
5 -
download
0
Transcript of The spread F Experiment (SpreadFEx): Program overview and first results
Earth Planets Space, 61, 411–430, 2009
The spread F Experiment (SpreadFEx): Program overview and first results
D. C. Fritts1, M. A. Abdu2, B. R. Batista2, I. S. Batista2, P. P. Batista2, R. Buriti3, B. R. Clemesha2, T. Dautermann4,E. de Paula2, B. J. Fechine2, B. Fejer5, D. Gobbi2, J. Haase4, F. Kamalabadi6, B. Laughman1, L. M. Lima7,
H.-L. Liu8, A. Medeiros3, P.-D. Pautet2,5, D. M. Riggin1, F. Sao Sabbas2, J. H. A. Sobral2, P. Stamus1,H. Takahashi2, M. J. Taylor5, S. L. Vadas1, and C. M. Wrasse9
1NorthWest Research Associates, Colorado Research Associates Division, Boulder, CO2Instituto Nacional de Pesquisas Espaciais (INPE), Sao Jose dos Campos, Brazil
3Universidade Federal de Campina Grande, Campina Grande, Paraıba, Brazil4Purdue University, West Lafayette, IN
5Utah State University, Logan, UT6University of Illinois, Urbana, IL
7Universidade Estadual da Paraıba, Campina Grande-PB, Brazil8National Center for Atmospheric Research, Boulder, CO
9IP&D—Universidade do Vale do Paraıba—UNIVAP, Sao Jose dos Campos—SP, Brazil
(Received July 27, 2007; Revised February 13, 2008; Accepted June 3, 2008; Online published May 14, 2009)
We performed an extensive experimental campaign (the spread F Experiment, or SpreadFEx) from Septemberto November 2005 to attempt to define the role of neutral atmosphere dynamics, specifically wave motionspropagating upward from the lower atmosphere, in seeding equatorial spread F and plasma bubbles extendingto higher altitudes. Campaign measurements focused on the Brazilian sector and included ground-based optical,radar, digisonde, and GPS measurements at a number of fixed and temporary sites. Related data on convectionand plasma bubble structures were also collected by GOES 12 and the GUVI instrument aboard the TIMEDsatellite. Initial results of our analyses of SpreadFEx and related data indicate 1) extensive gravity wave (GW)activity apparently linked to deep convection predominantly to the west of our measurement sites, 2) the presenceof small-scale GW activity confined to lower altitudes, 3) larger-scale GW activity apparently penetrating to muchhigher altitudes suggested by electron density and TEC fluctuations in the E and F regions, 4) substantial GWamplitudes implied by digisonde electron densities, and 5) apparent direct links of these perturbations in the lowerF region to spread F and plasma bubbles extending to much higher altitudes. Related efforts with correlativedata are defining 6) the occurrence and locations of deep convection, 7) the spatial and temporal evolutions ofplasma bubbles, the 8) 2D (height-resolved) structures of plasma bubbles, and 9) the expected propagation ofGWs and tides from the lower atmosphere into the thermosphere and ionosphere.Key words: Equatorial spread F , plasma instabilities, plasma bubbles, plasma bubble seeding, thermosphericgravity waves.
1. IntroductionConsiderable progress has been made in recent years in
understanding the occurrence, morphology, and variabilityof equatorial spread F (ESF) and plasma bubbles pene-trating to higher altitudes. Despite this, an understandingof the conditions seeding ESF and plasma bubbles has re-mained elusive, with neither observations nor theory suffi-ciently comprehensive or persuasive to be definitive. Com-puted Rayleigh-Taylor Instability (RTI) growth rates basedon known flow structures are typically too small, and it isunclear whether seeding can be entirely a plasma processor whether neutral perturbations are necessary to enhanceplasma instability growth rates. Gravity waves (GWs) havebeen suggested as a trigger in many studies, either directlyvia density and/or velocity perturbations at the bottomsideF layer or indirectly via mapping of electric field or other
Copyright c! The Society of Geomagnetism and Earth, Planetary and Space Sci-ences (SGEPSS); The Seismological Society of Japan; The Volcanological Societyof Japan; The Geodetic Society of Japan; The Japanese Society for Planetary Sci-ences; TERRAPUB.
field-line-integrated perturbations generated by GWs inter-acting with sporadic E (Es) layers or other fields at loweraltitudes off the dip (magnetic) equator. However, definitiveproof of GW seeding, the “smoking gun”, observational ortheoretical, has yet to be found. These issues motivated acombined experimental, modeling, and theoretical programinitiated with two field campaigns performed in Brazil dur-ing “moon down” conditions from September to Novem-ber 2005. Our measurements employed a suite of airglowcameras, VHF and meteor radars, digisondes, and GPS re-ceivers at a number of fixed and temporary sites and cor-relative measurements with the Jicamarca Radio Observa-tory in Peru and via satellite (GUVI aboard TIMED andCHAMP) to characterize the neutral atmosphere and iono-sphere as fully as possible during these periods. The pri-mary goal of the spread F Experiment (SpreadFEx) was totest the theory that GWs play an essential role in the seed-ing of ESF and plasma bubbles extending to much higheraltitudes. The purpose of this paper is to summarize our ex-perimental design and describe our initial analysis results.
411
412 D. C. FRITTS et al.: FIRST RESULTS OF THE SPREAD F EXPERIMENT (SPREADFEX)
More detailed analyses of SpreadFEx data, supporting the-oretical studies, and assessments of specific potential GWinfluences at bottomside F layer altitudes will appear in aforthcoming SpreadFEx special issue of Annales Geophys-icae.
We begin in Section 2 by reviewing what is known ofESF and plasma bubble dynamics based on !30 years ofobservations, modeling, and theory, and what we under-stand of GW excitation and propagation into the thermo-sphere/ionosphere (TI). Our SpreadFEx campaign objec-tives and measurement strategy employed for our two fieldcampaigns and an overview of our initial analyses are de-scribed in Sections 3 and 4. Section 5 provides a discussionof potential direct GW contributions to ESF and plasmabubble seeding at the bottomside F layer, as these are theonly contributions we can assess within the scope of thisoverview. A summary of our initial results is presented inSection 6. The majority of the data discussed here are from24 to 27 October 2005 during our second SpreadFEx cam-paign interval. However, some of these data (particularlyairglow and some GPS measurements) were collected un-der clear skies during our first campaign interval.
2. Summary of Previous Studies2.1 ESF and plasma bubbles
ESF on the bottomside of the F layer yields ionosondesignatures virtually every night of its occurrence season.Strong ESF and plasma bubbles typically arise during thepre-reversal enhancement (PRE) of the zonal electric fieldwhen upward E " B plasma drifts elevate the F layer suf-ficiently (Heelis et al., 1974; Fejer et al., 1999). RTI is be-lieved to be responsible for these plasma instabilities, andnonlinear RTI growth causes flux tube-aligned plasma de-pletions to rise to the topside ionosphere, where they mayattain equatorial apex heights of !1000–1500 km in welldeveloped cases. Plasma bubbles that penetrate to high al-titudes occur on only !30 to 60% of nights, are apparentlyuncorrelated at closely spaced longitudes, but may shareseeding conditions, and exhibit seasonal, solar-cycle, ge-ographic, and geomagnetic dependencies (McClure et al.,1977; Sobral et al., 1980a, b, 2002; Mendillo and Tyler,1983; Abdu et al., 1992; Aggson et al., 1992; McClure etal., 1998; Fejer et al., 1999; Sobral et al., 2001; Hysell andBurcham, 2002; Rodrigues et al., 2004; Stolle et al., 2006;Su et al., 2008). In particular, increasing solar flux corre-lates with greater PREs of plasma drift, earlier ESF seedingand irregularity appearance, and higher initial altitudes (Hy-sell and Burcham, 2002).
GWs are potentially important in providing modulationsof plasma densities, velocities, and electric fields neededto seed RTI via either 1) direct neutral density and hori-zontal and/or vertical velocity perturbations at the bottom-side F layer or 2) GW-plasma interactions at lower alti-tudes that create plasma density, velocity, and/or electricfield perturbations that map to higher altitudes (Woodmanand LaHoz, 1976; Kelley et al., 1981; Anderson et al.,1982; Valladares et al., 1983; Kelley, 1989; Hysell et al.,1990; Kelley and Hysell, 1991; Huang et al., 1993; Huangand Kelley, 1996a, b, c; Sekar and Kelley, 1998; Tayloret al., 1998; Prakash, 1999; Tsunoda, 2005, 2006, 2007).
GW perturbations have been suggested to lead to local cur-rent and electric field fluctuations having the wavelengthof the GW (Klostermeyer, 1978; Kelley, 1989). More re-cently, GW interactions with sporadic E (Es) layers weresuggested by Prakash (1999) to yield electric field pertur-bations that map efficiently to the bottomside F layer; arelated mechanism involves the mapping of large-scale po-larization electric fields arising from Es layer instability tothese same altitudes (Tsunoda, 2005, 2006, 2007). Thesefluctuations are suggested to seed RTI extending to greateraltitudes. Major challenges to these proposed mechanisms,however, are apparent random associations of Es layers andESF (Batista et al., 2008).
Observed plasma bubble scales and modeled initial con-ditions vary considerably, but are typically in the range of10’s to 100’s of km in the plane normal to the magnetic field(Ossakow, 1981; Tsunoda, 1981; Haerendel et al., 1992;Sultan, 1996), seeding altitudes are !200 to 300 km at thedip equator, but may be 100 km or more lower away fromthe dip equator, and perturbations must apparently be suf-ficiently aligned along magnetic field lines so as to yielda field-line-integrated perturbation of sufficient magnitude(Huang and Kelley, 1996c). Indeed, GW density pertur-bations of a few % or vertical velocity perturbations of afew m s#1 are critical seed elements in models that havesought to describe RTI and plasma bubble growth and mor-phology to date (Huang and Kelley, 1996a, b). We also notethat the anticipated arrival time at the bottomside of the Flayer of large-amplitude GWs arising from tropical convec-tion is !1 to 2 hours after maximum convective activity(Vadas and Fritts, 2004) and coincides closely with earlyevening times of strong ESF and bubble onset (Swartz andWoodman, 1998).
Because of the field-aligned nature of plasma fluctua-tions, much of the modeling of ESF and plasma bubbles hasbeen two-dimensional (2D). These efforts captured some ofthe gross features of the morphology and examined sensitiv-ity to seeding conditions and scales (Scannapieco and Os-sakow, 1976; Keskinen et al., 1980; Zalesak and Ossakow,1980; Hysell et al., 1990; Huang et al., 1993; Sekar et al.,1995). Other efforts accounted approximately for variationsof key parameters along the magnetic field (and with al-titude) and for key observed ESF and bubble features viafield-line-integrated methods (Zalesak et al., 1982; Keski-nen et al., 1998). Fully three-dimensional (3D) linear andnonlinear studies have been performed more recently thathave delineated the impacts on growth rates and structureand yielded reasonable agreement with observations (Basu,2002; Keskinen et al., 2003). The study by Keskinen et al.(2003) also reproduced bubble structures with sharp densitygradients extending up to the equatorial anomaly.
Studies specific to GW seeding of strong ESF and plasmabubbles have examined the necessary conditions for suchseeding and the structure of resulting plasma bubbles, in-cluding dependence on GW amplitudes and zonal wave-lengths, the implications of initial amplitudes for RTI en-hancements, the need (or lack of) for spatial resonance,the influences of zonal shear on plasma bubble scales anddepths, and the impact of Pedersen conductivity on GW-induced perturbations (Hysell et al., 1990; Huang et al.,
D. C. FRITTS et al.: FIRST RESULTS OF THE SPREAD F EXPERIMENT (SPREADFEX) 413
1993; Sekar et al., 1995; Huang and Kelley, 1996a, b, c;Sekar and Kelley, 1998). These studies have addressedthe physical mechanisms enabling GW seeding of ESF andplasma bubbles. Another statistical study of potential GWseeding by McClure et al. (1998) demonstrated potentiallysignificant correlations between regions of enhanced (de-pleted) F region irregularity occurrence and regions of an-ticipated strong (weak) tropical convection. They evennoted that an anomalous enhancement accompanied en-hanced convection and sea surface temperatures during amajor El Nino. Thus, statistical correlations suggest the po-tential importance of the mechanisms modeled by variousgroups and point to deep tropical convection as a potentiallyimportant source of such GW perturbations.2.2 ESF and RTI growth rates
Numerous theoretical efforts have addressed the neutraland plasma conditions contributing to ESF and RTI growthrates. While various theories have provided insights into thelikely environments favoring ESF, RTI, and plasma bubbleformation, they have also frequently failed to yield suffi-ciently large growth rates for plausible large-scale neutraland plasma flows. This has been a large part of the mo-tivation for invoking GW perturbations, as one componentof the geophysical noise spectrum, in the seeding of RTIand plasma bubbles. Most previous efforts have addressedRTI growth rates, which depend largely on the plasma en-vironment, but with potential GW influences exerted ei-ther directly at the bottomside F layer or at lower alti-tudes that then map to the bottomside F layer (Ossakow,1981; Zalesak et al., 1982; Sultan, 1996; Prakash, 1999;Abdu, 2001; Tsunoda, 2005, 2006, 2007). However, a re-cent series of studies has considered an alternative insta-bility mechanism depending directly on the neutral zonalwind that appears to achieve sufficiently large growth ratesthat explicit GW seeding of instabilities was suggested notto be required (Kudeki and Bhattacharyya, 1999; Hyselland Kudeki, 2004; Hysell et al., 2004, 2005; Kudeki et al.,2007).
A flux tube-integrated version of the generalized RTIlinear growth rate based on Sultan (1996) can be writtenas
!FT = "FP
"EP + "F
P
!
EB
# U PFT + g
#eff
"
1LFT
# $FT (1)
where E is the zonal electric field (which arises from theevening PRE in the zonal electric field due to F layer dy-namo), g is the acceleration due to gravity, "E,F
P are thefield line integrated conductivities for the E- and F-regionsegments of a field line, U P
FT is the conductivity-weighted,flux tube-integrated vertical wind (normal to B), LFT is thelength scale of the density gradient, $ is the recombinationloss rate, #eff is the effective ion-neutral collision frequency,and subscripts FT stand for flux tube-integrated quantities.In Eq. (1), GW influences can only be expressed throughtheir impacts on the various plasma quantities affecting theRTI growth rate.
An alternative theory for preconditioning the bottomsideF layer for ESF initiation and RTI claimed by the authorsto not require GW seeding (Kudeki et al., 2007) yields a
growth rate
! !Un # Up
2L(2)
where Un and Up are the zonal (eastward) neutral andplasma velocities and L is the length scale of the densitygradient. These conditions differ in important respects fromthose considered previously to be key to RTI growth itself.The dominant requirements appear to be 1) a significanteastward neutral wind at the bottomside F layer, 2) a west-ward plasma drift at these altitudes, such that the eastwardwind in the plasma coordinate is U ! 200 m s#1, and 3)a vertical plasma gradient having an effective scale lengthof L ! 20 km or less. Kudeki et al. (2007) have arguedthat such conditions favor an instability having a westwardphase tilt with altitude of 45$ induced via vertical Peder-son currents. The obvious question, to be addressed furtherin Section 5, is whether GWs can contribute meaningfullyto, or modulate, this latter mechanism, either through ini-tial conditions or altered growth rates or both. We focus onthe latter mechanism here because we can easily estimatedirect GW influences at the bottomside F layer, but are un-able to easily assess the potentially competitive mechanismsinvolving the creation of electric fields at Es layers at loweraltitudes and their mapping to the bottomside F layer in thisinitial SpreadFEx overview. More detailed assessments ofGW influences on plasma dynamics and instabilities will beprovided in our SpreadFEx special issue (see, in particular,Fritts et al., 2008a, b; Abdu et al., 2008; Kherani et al.,2008).2.3 GWs in the thermosphere/ionosphere
GWs are now understood to play a number of key rolesin neutral atmosphere dynamics extending from the Earth’ssurface into the lower thermosphere (LT). GW effects in themesosphere and lower thermosphere (MLT) are well docu-mented and arise due to the attainment of large amplitudes,transports of energy and momentum from sources at loweraltitudes, and turbulence, mixing, and flux divergences ac-companying instability processes. The roles of GWs inionospheric and plasma processes, in contrast, are less wellknown but also potentially important. As in the neutral at-mosphere, GW importance in the ionosphere hinges on theirpenetration to high altitudes and their attainment of largeamplitudes. GWs have been suggested to play a role in theseeding of RTI, strong ESF, and plasma bubbles penetratingto high altitudes, though their roles continue to be debatedand definitive observational evidence has yet to emerge.
Of the various sources of GWs in the MLT, deep tropicalconvection is arguably one of the most significant, correlat-ing with enhanced variances in the stratosphere (Tsuda etal., 2000) and with GWs having large amplitudes and pen-etrating to and well above the mesopause (Taylor and Hap-good, 1988; Piani et al., 2000; Lane et al., 2001; Sentmanet al., 2003; Vadas and Fritts, 2004, 2005, 2006; Vadas,2007). Models of GW structure at OH airglow altitudes(!87 km) that arise from convection are able to describethe qualitative character and some of the more quantita-tive aspects of the observed GW field quite well. Impor-tantly, tropical sources apparently remain competitive withthe auroral zones even at very high altitudes (Hocke andSchlegel, 1996). Convection does not obviously explain all
414 D. C. FRITTS et al.: FIRST RESULTS OF THE SPREAD F EXPERIMENT (SPREADFEX)
of the GWs apparently propagating to high altitudes in theTI, however. Evidence of such motions in ISR data fromArecibo Observatory and the MU radar suggest penetra-tion to much higher altitudes than implied for the spatialscales typically arising from convection (Oliver et al., 1997;Djuth et al., 1997, 2004). This, and the inability to exciteand propagate GWs having very large spatial scales fromthe lower atmosphere, suggest an additional source in theMLT, likely secondary GW generation due to GW insta-bility and mean-flow interactions (Vadas and Fritts, 2001,2002; Vadas et al., 2003; Vadas, 2007; Fritts and Vadas,2008).
GWs arising from individual convective plumes havingfrequencies of % ! N/3, where N is the buoyancy fre-quency, can penetrate to lower thermospheric altitudes of!150 to 200 km altitudes under solar minimum conditions(Vadas and Fritts, 2004, 2005, 2006). Under solar maxi-mum conditions, during which thermospheric densities in-crease and kinematic viscosities decrease dramatically, thesame sources yields GWs that can penetrate to substan-tially higher altitudes (Vadas and Fritts, 2006; Vadas, 2007).Larger-scale GWs, likely not arising from individual con-vective plumes but rather as secondary radiation at higheraltitudes, can penetrate to substantially higher altitudes un-der all solar conditions (Vadas, 2007). Together, theseGW sources yield perturbations that span the spatial scalesobserved in plasma bubbles, horizontal scales of !40 to400 km, and may reach substantial amplitudes at higher al-titudes (Fritts and Vadas, 2008). Despite their small ampli-tudes at lower altitudes, the !5 to 15 scale heights betweenGW source regions and the bottomside F layer, and an ex-pected suppression of GW instability processes that con-strain amplitudes at lower altitudes (by the exponentiallyincreasing kinematic viscosity), appear to allow GW per-turbations to be large at the bottomside F layer. Specifi-cally, horizontal and vertical winds, vertical displacements,and perturbation electron densities and electric fields dueto GWs will likely be substantial at these altitudes (seebelow). While our SpreadFEx results to date are prelimi-nary, it appears difficult at this stage to argue that GW per-turbations cannot make plausible contributions to ESF andplasma bubble seeding conditions. Indeed, we believe thatour initial data analyses, summarized below, suggest a sig-nificant role for neutral atmospheric waves in general andGWs in particular. These results will be elaborated furtherby Abdu et al. (2008), Fritts et al. (2008b), and Kherani etal. (2008) in the SpreadFEx special issue of Annales Geo-physicae.
3. Overview of the Spread F Experiment (Spread-FEx)
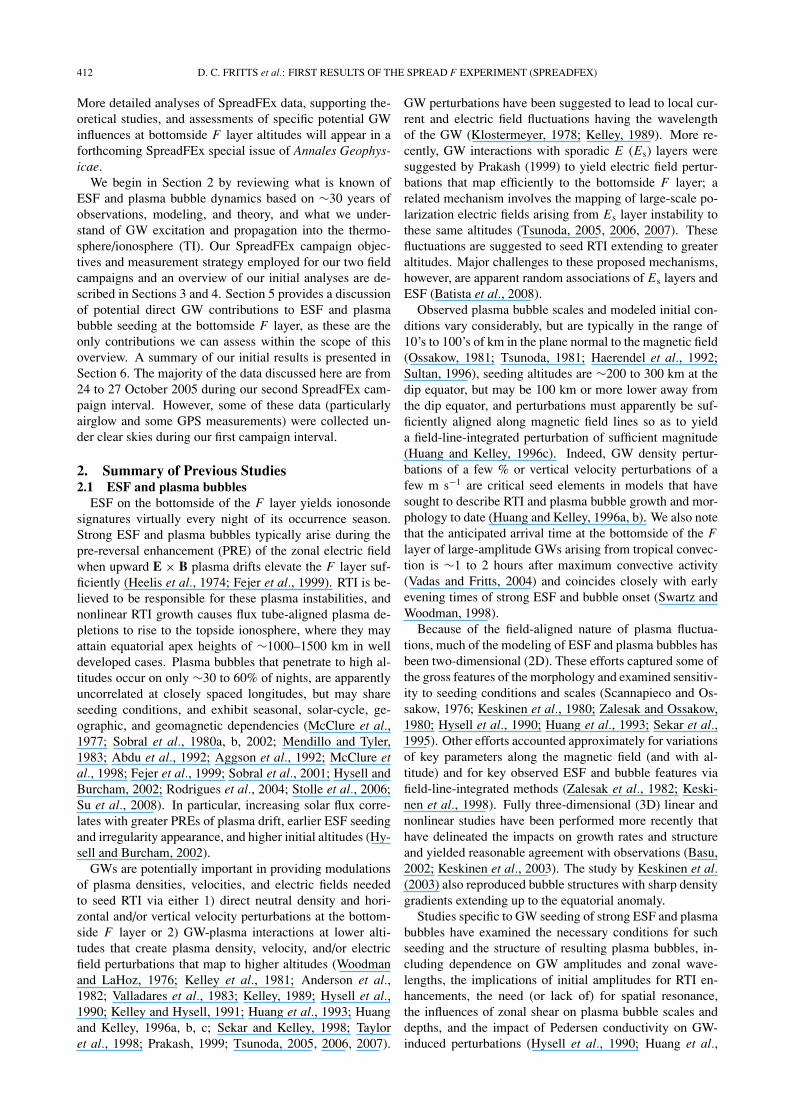
The primary goal of SpreadFEx was to perform observa-tional and modeling studies that would quantify the poten-tial roles of GWs in seeding ESF and RTI in the bottomsideF layer leading to plasma bubbles penetrating to higher al-titudes. Because of the statistical links of plasma bubbles totropical convection, we designed an experiment that wouldprovide sensitivity to both neutral atmosphere responses todeep convection and plasma instabilities and structures athigher altitudes over Brazil. The specific link envisioned
Fig. 1. Cartoon of GWs arising from deep convection, their penetrationinto the TI, and their potential contributions to ESF, RTI, and plasmabubble seeding.
was via GW coupling from deep convection, with both GWperturbations and mean responses contributing to potentialseeding of ESF, RTI, and plasma bubbles at higher altitudes,as depicted in Fig. 1. Specific questions motivating theseefforts include
1) Do GWs play a significant role in the generation ofESF and plasma bubbles at greater altitudes?
2) How do GW perturbations to the bottomside F layeralter the seeding conditions conducive to RTI and ESFgeneration?
3) If GWs are an important component of ESF and bubblegeneration, what are the geophysical parameters con-trolling their influences?
4) Are the GW roles in ESF and bubble generation suf-ficiently correlated with other measured geophysicalparameters to allow a parameterization of these roles?
To address these issues, we designed a research programcomprising three components. The first component was ex-perimental, and included two measurement campaigns dur-ing “moon down” conditions from 25 September to 10 Oc-tober and from 23 October to 8 November 2005. Thesemeasurement campaigns employed a suite of airglow cam-eras, VHF and meteor radars, digisondes, and GPS re-ceivers at a number of fixed and temporary sites, as well ascorrelative measurements via satellite (GOES 12 and GUVIaboard TIMED) to characterize the neutral atmosphere andionosphere as fully as possible during these periods. Thesecond component of SpreadFEx was a series of analysisefforts. A third component included modeling of GW exci-tation and propagation in response to deep convection andplasma simulations of GW seeding to aid in the interpreta-tion of our field data.
Our field measurements were performed in central andeastern Brazil and employed ground-based optical and radarinstrumentation in collaboration with colleagues at Insti-tuto Nacional de Pesquisas Espaciais (INPE) in Brazil, UtahState University (USU), and Purdue University (PU). INPEoptical and radar instrumentation was located at severalfixed sites, including Sao Luis, Fortaleza, Cariri, and Ca-choeira Paulista extending from !2 to 23$S geographic lat-itude and from !0 to 17$S magnetic latitude, with GPS in-strumentation more widely distributed. Additional tempo-
D. C. FRITTS et al.: FIRST RESULTS OF THE SPREAD F EXPERIMENT (SPREADFEX) 415
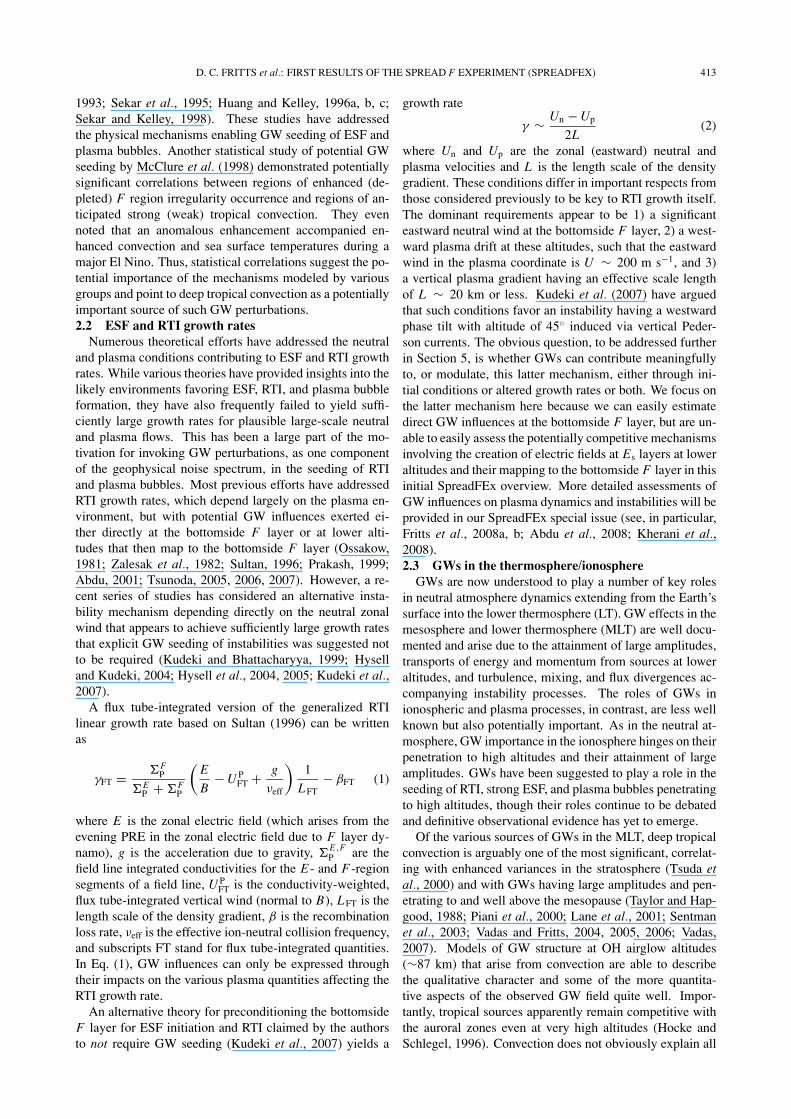
Fig. 2. Measurement sites in Brazil employed for the SpreadFEx measurement campaigns. GPS receivers were much more widely distributed, with!25 sites available for SpreadFEx.
Table 1. Instrumentation at the fixed INPE and temporary SpreadFEx measurements sites employed for our experiment. GPS were also available at!20 other locations in Brazil.
Site Geogr. Magnetic Airglow VHF Meteor Digisonde GPSlatitude latitude radars radars
Sao Luis 2.6 S 1.5 S X X XFortaleza 3.9 S 5 S X X
Cariri 7.4 S 8 S X X XFazenda Isabel 15 S 9 S X XCach. Paulista 22.7 S 17 S X X X X
rary optical and GPS measurements were made at FazendaIsabel north of Brasilia and several nearby sites. Specif-ically, VHF radars at Sao Luis defined ESF altitudes andplasma bubble structures at the magnetic equator (de Paulaand Hysell, 2004), meteor radars defined MLT winds atCariri and Cachoeira Paulista (Batista et al., 2004; Buritiet al., 2007), digisondes defined electron densities at sev-eral dip latitudes (Batista and Abdu, 2004), airglow camerasdefined both GW structures at MLT altitudes and plasmabubble structures at higher altitudes in the thermosphere atseveral locations south of the magnetic equator in order toassess the spatial and temporal variability of these processes(Medeiros et al., 2004), and GPS sensors were employed toattempt to define the spatial and temporal variations in elec-tron densities (Lanyi and Roth, 1988). The instrument lo-cations and their relation to the magnetic equator are shownin Fig. 2 and listed in Table 1.
4. Initial Results from SpreadFEx4.1 Convection, GW sources and propagation
4.1.1 GOES 12 indications of deep convectionGOES 12 visible, IR, and water vapor measurements overBrazil (at 1-, 4-, and 8-km resolutions, respectively) pro-vided the best way to quantify the locations, scales, andintensities of deep convection leading to GW generationand propagation to higher altitudes during SpreadFEx. Coldcloud-top temperatures indicate deep convection, and tem-poral variations between successive images provide an in-dication of updraft intensities and durations. These data are
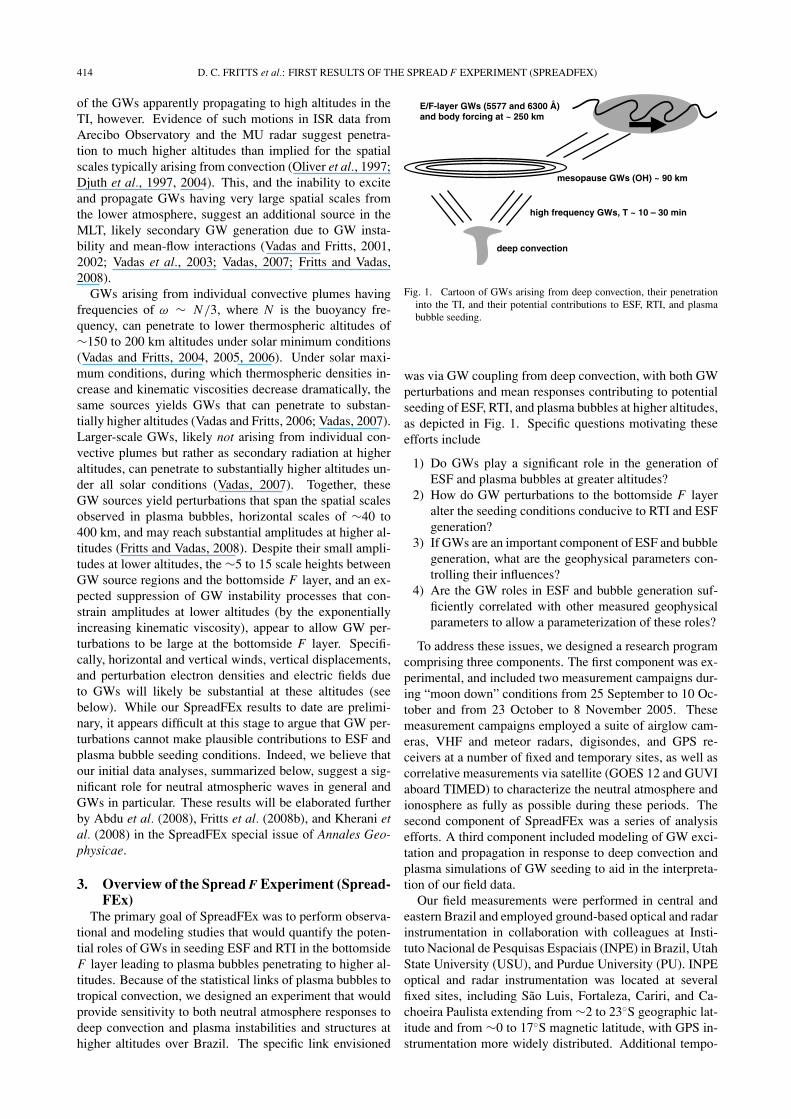
being employed to estimate the spatial and temporal scalesof convective plumes that are assumed to launch GWs prop-agating into the MLT and to higher altitudes. An example ofthe GOES 12 IR data showing deep convection, color-codedto highlight the coldest convective plumes, is shown for ref-erence in Fig. 3. This image shows a number of regions ofactive, deep convection. Five exhibit extensive cold tem-peratures, assumed to be the largest and most mature con-vection, and the major sources of GWs at this time. Theseoccur near (2$S, 68.5$W), (2.5$S, 67$W), (6$S, 62$W),(8.5$S, 62$W), and (10$S, 50.5$W). Brasilia is at (15$S,47$W), our temporary optical site was !100 km north, andthe dip equator is shown for reference. There are also aseries of smaller cells having cold cloud tops, but smallerspatial scales, a number of which would also be activelyexciting additional GWs. The largest and deepest convec-tion is the most efficient source of GWs that penetrate to thehighest altitudes, but the horizontal extent of the cloud topIR signatures often overestimates convective plume widthsdue to their generation of cirrus cloud shields as they ma-ture. Indeed, recent high-resolution numerical studies byLane et al. (2003) and Lane and Sharman (2006) show thatsuch large-scale convection is often modulated by smaller-scale !5-km plumes.
4.1.2 Ray tracing of GWs into the TI Based on ini-tial assessments of plume scales in the GOES 12 imagery,the five dominant convective plumes seen in Fig. 3 were as-sumed to have full-width, half maximum (FWHM) spatialscales of (10, 10, 5) km for the 1st, 2nd, and 4th plumes,
416 D. C. FRITTS et al.: FIRST RESULTS OF THE SPREAD F EXPERIMENT (SPREADFEX)
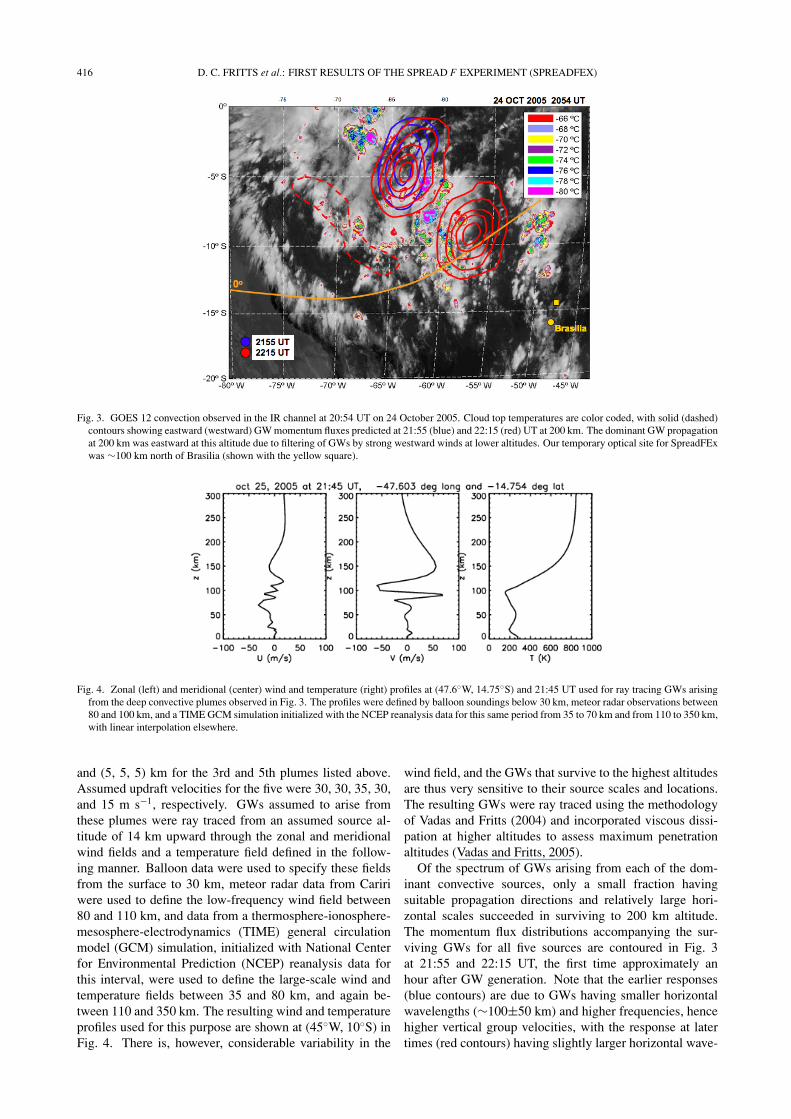
Fig. 3. GOES 12 convection observed in the IR channel at 20:54 UT on 24 October 2005. Cloud top temperatures are color coded, with solid (dashed)contours showing eastward (westward) GW momentum fluxes predicted at 21:55 (blue) and 22:15 (red) UT at 200 km. The dominant GW propagationat 200 km was eastward at this altitude due to filtering of GWs by strong westward winds at lower altitudes. Our temporary optical site for SpreadFExwas !100 km north of Brasilia (shown with the yellow square).
Fig. 4. Zonal (left) and meridional (center) wind and temperature (right) profiles at (47.6$W, 14.75$S) and 21:45 UT used for ray tracing GWs arisingfrom the deep convective plumes observed in Fig. 3. The profiles were defined by balloon soundings below 30 km, meteor radar observations between80 and 100 km, and a TIME GCM simulation initialized with the NCEP reanalysis data for this same period from 35 to 70 km and from 110 to 350 km,with linear interpolation elsewhere.
and (5, 5, 5) km for the 3rd and 5th plumes listed above.Assumed updraft velocities for the five were 30, 30, 35, 30,and 15 m s#1, respectively. GWs assumed to arise fromthese plumes were ray traced from an assumed source al-titude of 14 km upward through the zonal and meridionalwind fields and a temperature field defined in the follow-ing manner. Balloon data were used to specify these fieldsfrom the surface to 30 km, meteor radar data from Caririwere used to define the low-frequency wind field between80 and 110 km, and data from a thermosphere-ionosphere-mesosphere-electrodynamics (TIME) general circulationmodel (GCM) simulation, initialized with National Centerfor Environmental Prediction (NCEP) reanalysis data forthis interval, were used to define the large-scale wind andtemperature fields between 35 and 80 km, and again be-tween 110 and 350 km. The resulting wind and temperatureprofiles used for this purpose are shown at (45$W, 10$S) inFig. 4. There is, however, considerable variability in the
wind field, and the GWs that survive to the highest altitudesare thus very sensitive to their source scales and locations.The resulting GWs were ray traced using the methodologyof Vadas and Fritts (2004) and incorporated viscous dissi-pation at higher altitudes to assess maximum penetrationaltitudes (Vadas and Fritts, 2005).
Of the spectrum of GWs arising from each of the dom-inant convective sources, only a small fraction havingsuitable propagation directions and relatively large hori-zontal scales succeeded in surviving to 200 km altitude.The momentum flux distributions accompanying the sur-viving GWs for all five sources are contoured in Fig. 3at 21:55 and 22:15 UT, the first time approximately anhour after GW generation. Note that the earlier responses(blue contours) are due to GWs having smaller horizontalwavelengths (!100±50 km) and higher frequencies, hencehigher vertical group velocities, with the response at latertimes (red contours) having slightly larger horizontal wave-
D. C. FRITTS et al.: FIRST RESULTS OF THE SPREAD F EXPERIMENT (SPREADFEX) 417
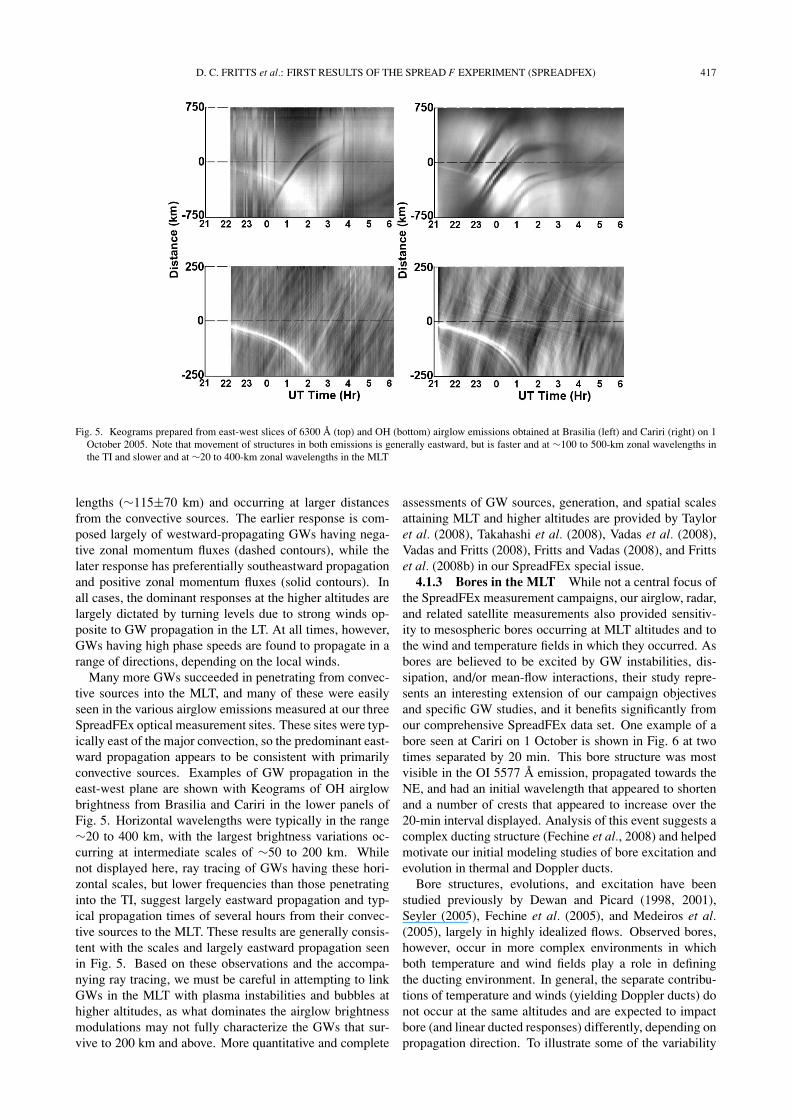
Fig. 5. Keograms prepared from east-west slices of 6300 A (top) and OH (bottom) airglow emissions obtained at Brasilia (left) and Cariri (right) on 1October 2005. Note that movement of structures in both emissions is generally eastward, but is faster and at !100 to 500-km zonal wavelengths inthe TI and slower and at !20 to 400-km zonal wavelengths in the MLT
lengths (!115±70 km) and occurring at larger distancesfrom the convective sources. The earlier response is com-posed largely of westward-propagating GWs having nega-tive zonal momentum fluxes (dashed contours), while thelater response has preferentially southeastward propagationand positive zonal momentum fluxes (solid contours). Inall cases, the dominant responses at the higher altitudes arelargely dictated by turning levels due to strong winds op-posite to GW propagation in the LT. At all times, however,GWs having high phase speeds are found to propagate in arange of directions, depending on the local winds.
Many more GWs succeeded in penetrating from convec-tive sources into the MLT, and many of these were easilyseen in the various airglow emissions measured at our threeSpreadFEx optical measurement sites. These sites were typ-ically east of the major convection, so the predominant east-ward propagation appears to be consistent with primarilyconvective sources. Examples of GW propagation in theeast-west plane are shown with Keograms of OH airglowbrightness from Brasilia and Cariri in the lower panels ofFig. 5. Horizontal wavelengths were typically in the range!20 to 400 km, with the largest brightness variations oc-curring at intermediate scales of !50 to 200 km. Whilenot displayed here, ray tracing of GWs having these hori-zontal scales, but lower frequencies than those penetratinginto the TI, suggest largely eastward propagation and typ-ical propagation times of several hours from their convec-tive sources to the MLT. These results are generally consis-tent with the scales and largely eastward propagation seenin Fig. 5. Based on these observations and the accompa-nying ray tracing, we must be careful in attempting to linkGWs in the MLT with plasma instabilities and bubbles athigher altitudes, as what dominates the airglow brightnessmodulations may not fully characterize the GWs that sur-vive to 200 km and above. More quantitative and complete
assessments of GW sources, generation, and spatial scalesattaining MLT and higher altitudes are provided by Tayloret al. (2008), Takahashi et al. (2008), Vadas et al. (2008),Vadas and Fritts (2008), Fritts and Vadas (2008), and Frittset al. (2008b) in our SpreadFEx special issue.
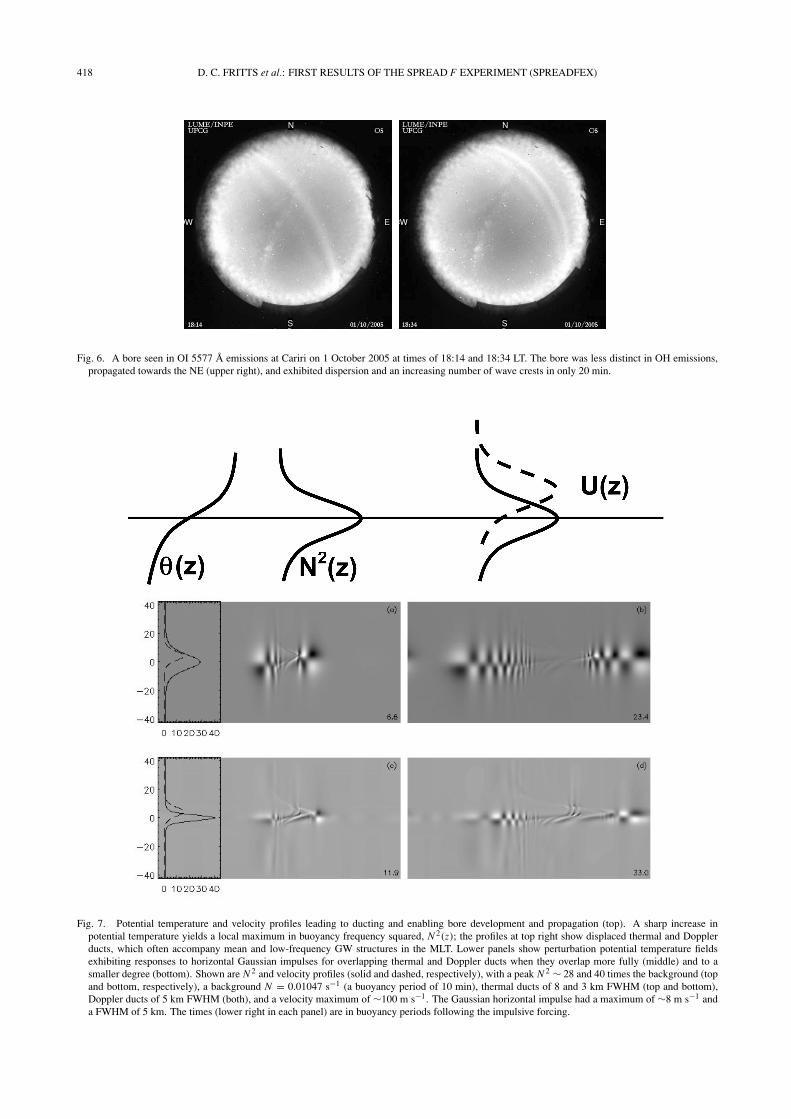
4.1.3 Bores in the MLT While not a central focus ofthe SpreadFEx measurement campaigns, our airglow, radar,and related satellite measurements also provided sensitiv-ity to mesospheric bores occurring at MLT altitudes and tothe wind and temperature fields in which they occurred. Asbores are believed to be excited by GW instabilities, dis-sipation, and/or mean-flow interactions, their study repre-sents an interesting extension of our campaign objectivesand specific GW studies, and it benefits significantly fromour comprehensive SpreadFEx data set. One example of abore seen at Cariri on 1 October is shown in Fig. 6 at twotimes separated by 20 min. This bore structure was mostvisible in the OI 5577 A emission, propagated towards theNE, and had an initial wavelength that appeared to shortenand a number of crests that appeared to increase over the20-min interval displayed. Analysis of this event suggests acomplex ducting structure (Fechine et al., 2008) and helpedmotivate our initial modeling studies of bore excitation andevolution in thermal and Doppler ducts.
Bore structures, evolutions, and excitation have beenstudied previously by Dewan and Picard (1998, 2001),Seyler (2005), Fechine et al. (2005), and Medeiros et al.(2005), largely in highly idealized flows. Observed bores,however, occur in more complex environments in whichboth temperature and wind fields play a role in definingthe ducting environment. In general, the separate contribu-tions of temperature and winds (yielding Doppler ducts) donot occur at the same altitudes and are expected to impactbore (and linear ducted responses) differently, depending onpropagation direction. To illustrate some of the variability
418 D. C. FRITTS et al.: FIRST RESULTS OF THE SPREAD F EXPERIMENT (SPREADFEX)
EW EW
S
N
S
N
Fig. 6. A bore seen in OI 5577 A emissions at Cariri on 1 October 2005 at times of 18:14 and 18:34 LT. The bore was less distinct in OH emissions,propagated towards the NE (upper right), and exhibited dispersion and an increasing number of wave crests in only 20 min.
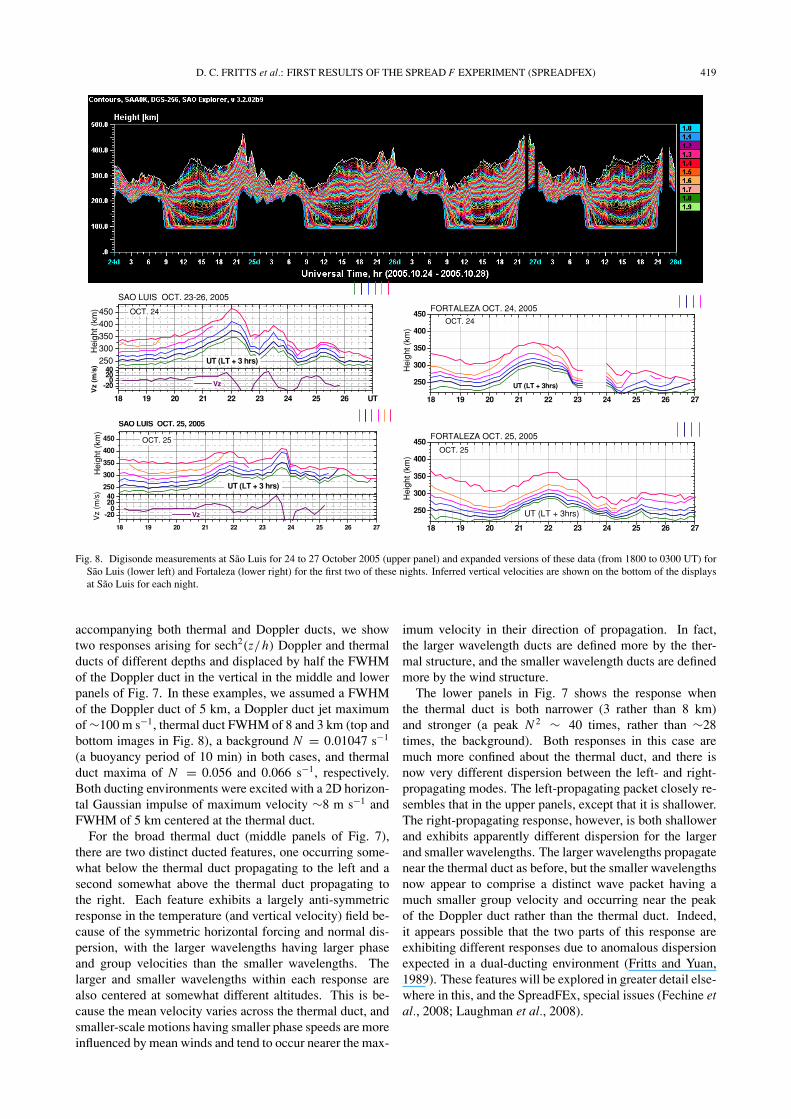
Fig. 7. Potential temperature and velocity profiles leading to ducting and enabling bore development and propagation (top). A sharp increase inpotential temperature yields a local maximum in buoyancy frequency squared, N 2(z); the profiles at top right show displaced thermal and Dopplerducts, which often accompany mean and low-frequency GW structures in the MLT. Lower panels show perturbation potential temperature fieldsexhibiting responses to horizontal Gaussian impulses for overlapping thermal and Doppler ducts when they overlap more fully (middle) and to asmaller degree (bottom). Shown are N 2 and velocity profiles (solid and dashed, respectively), with a peak N 2 ! 28 and 40 times the background (topand bottom, respectively), a background N = 0.01047 s#1 (a buoyancy period of 10 min), thermal ducts of 8 and 3 km FWHM (top and bottom),Doppler ducts of 5 km FWHM (both), and a velocity maximum of !100 m s#1. The Gaussian horizontal impulse had a maximum of !8 m s#1 anda FWHM of 5 km. The times (lower right in each panel) are in buoyancy periods following the impulsive forcing.
D. C. FRITTS et al.: FIRST RESULTS OF THE SPREAD F EXPERIMENT (SPREADFEX) 419
250300350400450 OCT. 24
Hei
ght (
km)
UT (LT + 3 hrs)
SAO LUIS OCT. 23-26, 2005
18 19 20 21 22 23 24 25 26 UT
-200
2040
Vz
(m/s
)
Vz
18 19 20 21 22 23 24 25 26 27
250
300
350
400
450OCT. 24
Hei
ght (
km)
UT (LT + 3hrs)
FORTALEZA OCT. 24, 2005
250
300
350
400
450 OCT. 25
Hei
ght (
km)
UT (LT + 3 hrs)
SAO LUIS OCT. 25, 2005
18 19 20 21 22 23 24 25 26 27
-200
2040
Vz
(m/s
)
Vz
18 19 20 21 22 23 24 25 26 27
250
300
350
400
450OCT. 25
Hei
ght (
km)
UT (LT + 3hrs)
FORTALEZA OCT. 25, 2005
Fig. 8. Digisonde measurements at Sao Luis for 24 to 27 October 2005 (upper panel) and expanded versions of these data (from 1800 to 0300 UT) forSao Luis (lower left) and Fortaleza (lower right) for the first two of these nights. Inferred vertical velocities are shown on the bottom of the displaysat Sao Luis for each night.
accompanying both thermal and Doppler ducts, we showtwo responses arising for sech2(z/h) Doppler and thermalducts of different depths and displaced by half the FWHMof the Doppler duct in the vertical in the middle and lowerpanels of Fig. 7. In these examples, we assumed a FWHMof the Doppler duct of 5 km, a Doppler duct jet maximumof !100 m s#1, thermal duct FWHM of 8 and 3 km (top andbottom images in Fig. 8), a background N = 0.01047 s#1
(a buoyancy period of 10 min) in both cases, and thermalduct maxima of N = 0.056 and 0.066 s#1, respectively.Both ducting environments were excited with a 2D horizon-tal Gaussian impulse of maximum velocity !8 m s#1 andFWHM of 5 km centered at the thermal duct.
For the broad thermal duct (middle panels of Fig. 7),there are two distinct ducted features, one occurring some-what below the thermal duct propagating to the left and asecond somewhat above the thermal duct propagating tothe right. Each feature exhibits a largely anti-symmetricresponse in the temperature (and vertical velocity) field be-cause of the symmetric horizontal forcing and normal dis-persion, with the larger wavelengths having larger phaseand group velocities than the smaller wavelengths. Thelarger and smaller wavelengths within each response arealso centered at somewhat different altitudes. This is be-cause the mean velocity varies across the thermal duct, andsmaller-scale motions having smaller phase speeds are moreinfluenced by mean winds and tend to occur nearer the max-
imum velocity in their direction of propagation. In fact,the larger wavelength ducts are defined more by the ther-mal structure, and the smaller wavelength ducts are definedmore by the wind structure.
The lower panels in Fig. 7 shows the response whenthe thermal duct is both narrower (3 rather than 8 km)and stronger (a peak N 2 ! 40 times, rather than !28times, the background). Both responses in this case aremuch more confined about the thermal duct, and there isnow very different dispersion between the left- and right-propagating modes. The left-propagating packet closely re-sembles that in the upper panels, except that it is shallower.The right-propagating response, however, is both shallowerand exhibits apparently different dispersion for the largerand smaller wavelengths. The larger wavelengths propagatenear the thermal duct as before, but the smaller wavelengthsnow appear to comprise a distinct wave packet having amuch smaller group velocity and occurring near the peakof the Doppler duct rather than the thermal duct. Indeed,it appears possible that the two parts of this response areexhibiting different responses due to anomalous dispersionexpected in a dual-ducting environment (Fritts and Yuan,1989). These features will be explored in greater detail else-where in this, and the SpreadFEx, special issues (Fechine etal., 2008; Laughman et al., 2008).
420 D. C. FRITTS et al.: FIRST RESULTS OF THE SPREAD F EXPERIMENT (SPREADFEX)
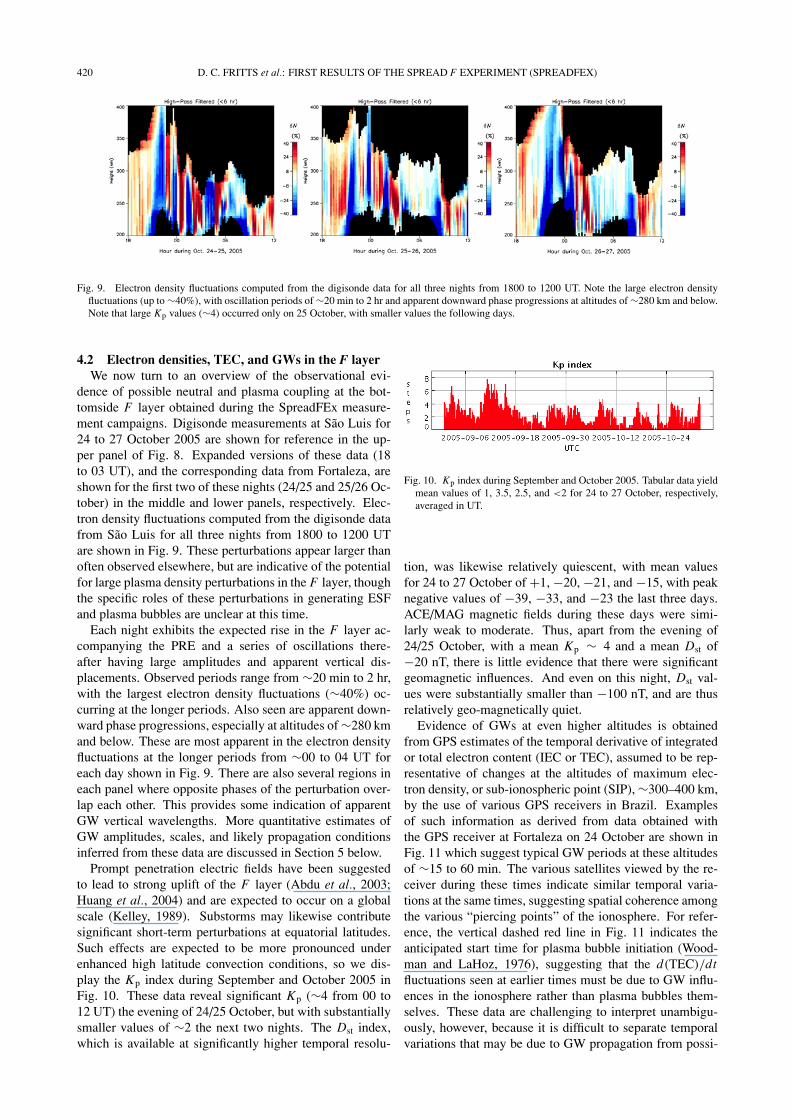
Fig. 9. Electron density fluctuations computed from the digisonde data for all three nights from 1800 to 1200 UT. Note the large electron densityfluctuations (up to !40%), with oscillation periods of !20 min to 2 hr and apparent downward phase progressions at altitudes of !280 km and below.Note that large Kp values (!4) occurred only on 25 October, with smaller values the following days.
4.2 Electron densities, TEC, and GWs in the F layerWe now turn to an overview of the observational evi-
dence of possible neutral and plasma coupling at the bot-tomside F layer obtained during the SpreadFEx measure-ment campaigns. Digisonde measurements at Sao Luis for24 to 27 October 2005 are shown for reference in the up-per panel of Fig. 8. Expanded versions of these data (18to 03 UT), and the corresponding data from Fortaleza, areshown for the first two of these nights (24/25 and 25/26 Oc-tober) in the middle and lower panels, respectively. Elec-tron density fluctuations computed from the digisonde datafrom Sao Luis for all three nights from 1800 to 1200 UTare shown in Fig. 9. These perturbations appear larger thanoften observed elsewhere, but are indicative of the potentialfor large plasma density perturbations in the F layer, thoughthe specific roles of these perturbations in generating ESFand plasma bubbles are unclear at this time.
Each night exhibits the expected rise in the F layer ac-companying the PRE and a series of oscillations there-after having large amplitudes and apparent vertical dis-placements. Observed periods range from !20 min to 2 hr,with the largest electron density fluctuations (!40%) oc-curring at the longer periods. Also seen are apparent down-ward phase progressions, especially at altitudes of !280 kmand below. These are most apparent in the electron densityfluctuations at the longer periods from !00 to 04 UT foreach day shown in Fig. 9. There are also several regions ineach panel where opposite phases of the perturbation over-lap each other. This provides some indication of apparentGW vertical wavelengths. More quantitative estimates ofGW amplitudes, scales, and likely propagation conditionsinferred from these data are discussed in Section 5 below.
Prompt penetration electric fields have been suggestedto lead to strong uplift of the F layer (Abdu et al., 2003;Huang et al., 2004) and are expected to occur on a globalscale (Kelley, 1989). Substorms may likewise contributesignificant short-term perturbations at equatorial latitudes.Such effects are expected to be more pronounced underenhanced high latitude convection conditions, so we dis-play the Kp index during September and October 2005 inFig. 10. These data reveal significant Kp (!4 from 00 to12 UT) the evening of 24/25 October, but with substantiallysmaller values of !2 the next two nights. The Dst index,which is available at significantly higher temporal resolu-
Fig. 10. Kp index during September and October 2005. Tabular data yieldmean values of 1, 3.5, 2.5, and <2 for 24 to 27 October, respectively,averaged in UT.
tion, was likewise relatively quiescent, with mean valuesfor 24 to 27 October of +1, #20, #21, and #15, with peaknegative values of #39, #33, and #23 the last three days.ACE/MAG magnetic fields during these days were simi-larly weak to moderate. Thus, apart from the evening of24/25 October, with a mean Kp ! 4 and a mean Dst of#20 nT, there is little evidence that there were significantgeomagnetic influences. And even on this night, Dst val-ues were substantially smaller than #100 nT, and are thusrelatively geo-magnetically quiet.
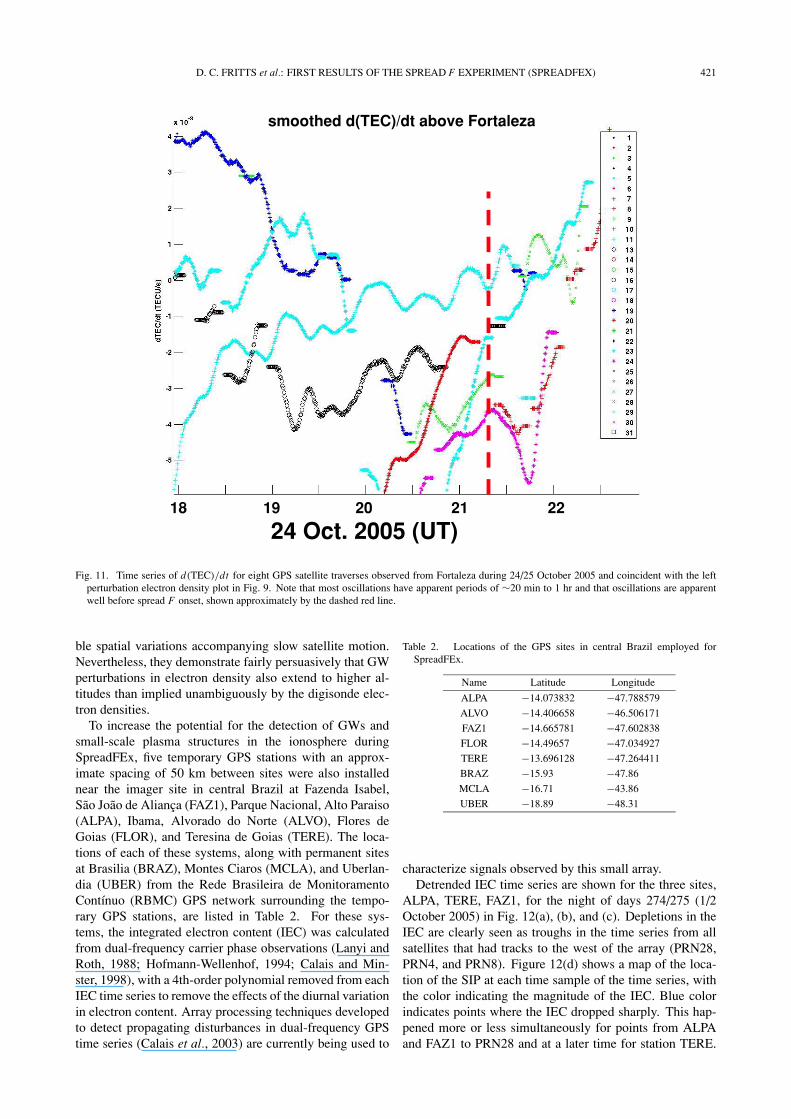
Evidence of GWs at even higher altitudes is obtainedfrom GPS estimates of the temporal derivative of integratedor total electron content (IEC or TEC), assumed to be rep-resentative of changes at the altitudes of maximum elec-tron density, or sub-ionospheric point (SIP), !300–400 km,by the use of various GPS receivers in Brazil. Examplesof such information as derived from data obtained withthe GPS receiver at Fortaleza on 24 October are shown inFig. 11 which suggest typical GW periods at these altitudesof !15 to 60 min. The various satellites viewed by the re-ceiver during these times indicate similar temporal varia-tions at the same times, suggesting spatial coherence amongthe various “piercing points” of the ionosphere. For refer-ence, the vertical dashed red line in Fig. 11 indicates theanticipated start time for plasma bubble initiation (Wood-man and LaHoz, 1976), suggesting that the d(TEC)/dtfluctuations seen at earlier times must be due to GW influ-ences in the ionosphere rather than plasma bubbles them-selves. These data are challenging to interpret unambigu-ously, however, because it is difficult to separate temporalvariations that may be due to GW propagation from possi-
D. C. FRITTS et al.: FIRST RESULTS OF THE SPREAD F EXPERIMENT (SPREADFEX) 421
24 Oct. 2005 (UT) 18 19 20 21 22
smoothed d(TEC)/dt above Fortaleza
Fig. 11. Time series of d(TEC)/dt for eight GPS satellite traverses observed from Fortaleza during 24/25 October 2005 and coincident with the leftperturbation electron density plot in Fig. 9. Note that most oscillations have apparent periods of !20 min to 1 hr and that oscillations are apparentwell before spread F onset, shown approximately by the dashed red line.
ble spatial variations accompanying slow satellite motion.Nevertheless, they demonstrate fairly persuasively that GWperturbations in electron density also extend to higher al-titudes than implied unambiguously by the digisonde elec-tron densities.
To increase the potential for the detection of GWs andsmall-scale plasma structures in the ionosphere duringSpreadFEx, five temporary GPS stations with an approx-imate spacing of 50 km between sites were also installednear the imager site in central Brazil at Fazenda Isabel,Sao Joao de Alianca (FAZ1), Parque Nacional, Alto Paraiso(ALPA), Ibama, Alvorado do Norte (ALVO), Flores deGoias (FLOR), and Teresina de Goias (TERE). The loca-tions of each of these systems, along with permanent sitesat Brasilia (BRAZ), Montes Ciaros (MCLA), and Uberlan-dia (UBER) from the Rede Brasileira de MonitoramentoContınuo (RBMC) GPS network surrounding the tempo-rary GPS stations, are listed in Table 2. For these sys-tems, the integrated electron content (IEC) was calculatedfrom dual-frequency carrier phase observations (Lanyi andRoth, 1988; Hofmann-Wellenhof, 1994; Calais and Min-ster, 1998), with a 4th-order polynomial removed from eachIEC time series to remove the effects of the diurnal variationin electron content. Array processing techniques developedto detect propagating disturbances in dual-frequency GPStime series (Calais et al., 2003) are currently being used to
Table 2. Locations of the GPS sites in central Brazil employed forSpreadFEx.
Name Latitude Longitude
ALPA #14.073832 #47.788579ALVO #14.406658 #46.506171FAZ1 #14.665781 #47.602838FLOR #14.49657 #47.034927TERE #13.696128 #47.264411BRAZ #15.93 #47.86MCLA #16.71 #43.86UBER #18.89 #48.31
characterize signals observed by this small array.Detrended IEC time series are shown for the three sites,
ALPA, TERE, FAZ1, for the night of days 274/275 (1/2October 2005) in Fig. 12(a), (b), and (c). Depletions in theIEC are clearly seen as troughs in the time series from allsatellites that had tracks to the west of the array (PRN28,PRN4, and PRN8). Figure 12(d) shows a map of the loca-tion of the SIP at each time sample of the time series, withthe color indicating the magnitude of the IEC. Blue colorindicates points where the IEC dropped sharply. This hap-pened more or less simultaneously for points from ALPAand FAZ1 to PRN28 and at a later time for station TERE.
422 D. C. FRITTS et al.: FIRST RESULTS OF THE SPREAD F EXPERIMENT (SPREADFEX)
a)
b)
c)
d)
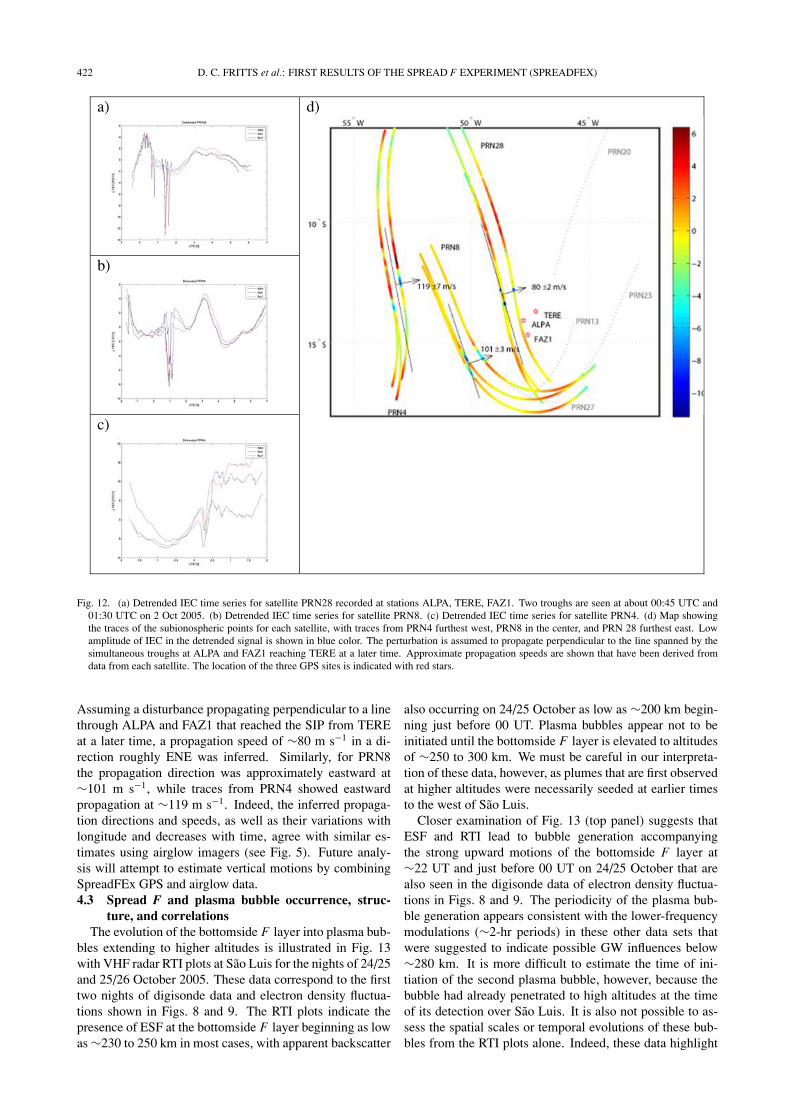
Fig. 12. (a) Detrended IEC time series for satellite PRN28 recorded at stations ALPA, TERE, FAZ1. Two troughs are seen at about 00:45 UTC and01:30 UTC on 2 Oct 2005. (b) Detrended IEC time series for satellite PRN8. (c) Detrended IEC time series for satellite PRN4. (d) Map showingthe traces of the subionospheric points for each satellite, with traces from PRN4 furthest west, PRN8 in the center, and PRN 28 furthest east. Lowamplitude of IEC in the detrended signal is shown in blue color. The perturbation is assumed to propagate perpendicular to the line spanned by thesimultaneous troughs at ALPA and FAZ1 reaching TERE at a later time. Approximate propagation speeds are shown that have been derived fromdata from each satellite. The location of the three GPS sites is indicated with red stars.
Assuming a disturbance propagating perpendicular to a linethrough ALPA and FAZ1 that reached the SIP from TEREat a later time, a propagation speed of !80 m s#1 in a di-rection roughly ENE was inferred. Similarly, for PRN8the propagation direction was approximately eastward at!101 m s#1, while traces from PRN4 showed eastwardpropagation at !119 m s#1. Indeed, the inferred propaga-tion directions and speeds, as well as their variations withlongitude and decreases with time, agree with similar es-timates using airglow imagers (see Fig. 5). Future analy-sis will attempt to estimate vertical motions by combiningSpreadFEx GPS and airglow data.4.3 Spread F and plasma bubble occurrence, struc-
ture, and correlationsThe evolution of the bottomside F layer into plasma bub-
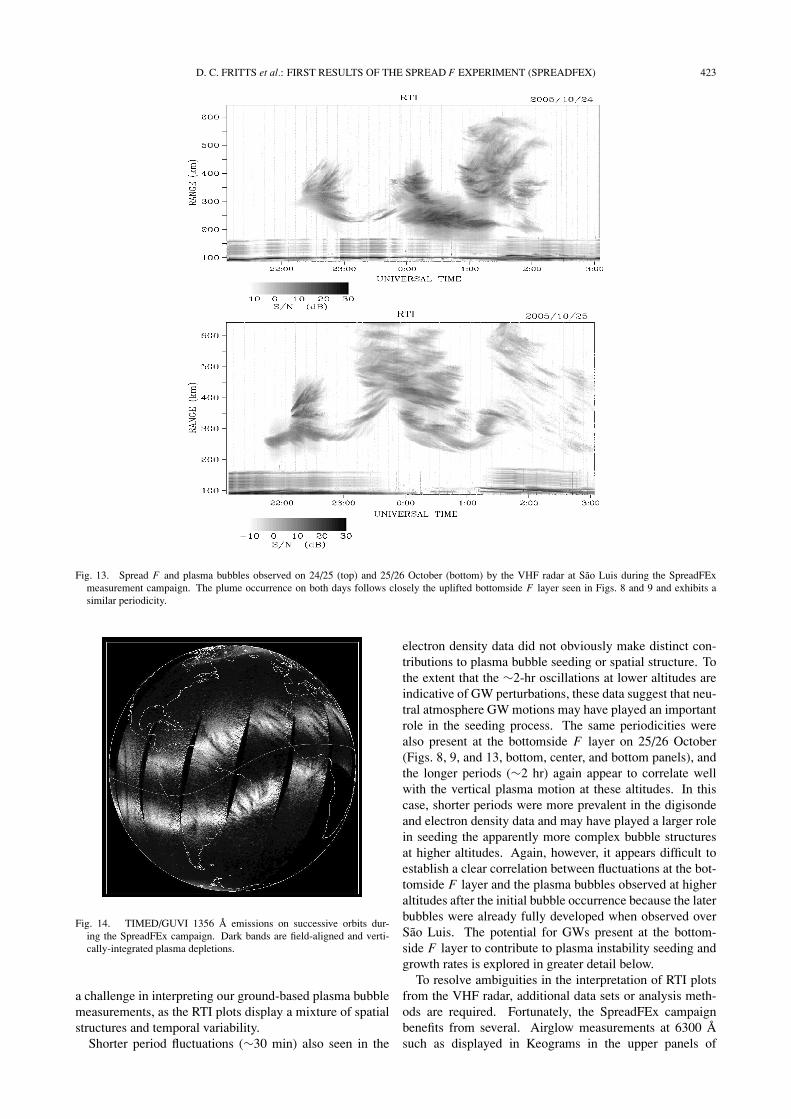
bles extending to higher altitudes is illustrated in Fig. 13with VHF radar RTI plots at Sao Luis for the nights of 24/25and 25/26 October 2005. These data correspond to the firsttwo nights of digisonde data and electron density fluctua-tions shown in Figs. 8 and 9. The RTI plots indicate thepresence of ESF at the bottomside F layer beginning as lowas !230 to 250 km in most cases, with apparent backscatter
also occurring on 24/25 October as low as !200 km begin-ning just before 00 UT. Plasma bubbles appear not to beinitiated until the bottomside F layer is elevated to altitudesof !250 to 300 km. We must be careful in our interpreta-tion of these data, however, as plumes that are first observedat higher altitudes were necessarily seeded at earlier timesto the west of Sao Luis.
Closer examination of Fig. 13 (top panel) suggests thatESF and RTI lead to bubble generation accompanyingthe strong upward motions of the bottomside F layer at!22 UT and just before 00 UT on 24/25 October that arealso seen in the digisonde data of electron density fluctua-tions in Figs. 8 and 9. The periodicity of the plasma bub-ble generation appears consistent with the lower-frequencymodulations (!2-hr periods) in these other data sets thatwere suggested to indicate possible GW influences below!280 km. It is more difficult to estimate the time of ini-tiation of the second plasma bubble, however, because thebubble had already penetrated to high altitudes at the timeof its detection over Sao Luis. It is also not possible to as-sess the spatial scales or temporal evolutions of these bub-bles from the RTI plots alone. Indeed, these data highlight
D. C. FRITTS et al.: FIRST RESULTS OF THE SPREAD F EXPERIMENT (SPREADFEX) 423
Fig. 13. Spread F and plasma bubbles observed on 24/25 (top) and 25/26 October (bottom) by the VHF radar at Sao Luis during the SpreadFExmeasurement campaign. The plume occurrence on both days follows closely the uplifted bottomside F layer seen in Figs. 8 and 9 and exhibits asimilar periodicity.
Fig. 14. TIMED/GUVI 1356 A emissions on successive orbits dur-ing the SpreadFEx campaign. Dark bands are field-aligned and verti-cally-integrated plasma depletions.
a challenge in interpreting our ground-based plasma bubblemeasurements, as the RTI plots display a mixture of spatialstructures and temporal variability.
Shorter period fluctuations (!30 min) also seen in the
electron density data did not obviously make distinct con-tributions to plasma bubble seeding or spatial structure. Tothe extent that the !2-hr oscillations at lower altitudes areindicative of GW perturbations, these data suggest that neu-tral atmosphere GW motions may have played an importantrole in the seeding process. The same periodicities werealso present at the bottomside F layer on 25/26 October(Figs. 8, 9, and 13, bottom, center, and bottom panels), andthe longer periods (!2 hr) again appear to correlate wellwith the vertical plasma motion at these altitudes. In thiscase, shorter periods were more prevalent in the digisondeand electron density data and may have played a larger rolein seeding the apparently more complex bubble structuresat higher altitudes. Again, however, it appears difficult toestablish a clear correlation between fluctuations at the bot-tomside F layer and the plasma bubbles observed at higheraltitudes after the initial bubble occurrence because the laterbubbles were already fully developed when observed overSao Luis. The potential for GWs present at the bottom-side F layer to contribute to plasma instability seeding andgrowth rates is explored in greater detail below.
To resolve ambiguities in the interpretation of RTI plotsfrom the VHF radar, additional data sets or analysis meth-ods are required. Fortunately, the SpreadFEx campaignbenefits from several. Airglow measurements at 6300 Asuch as displayed in Keograms in the upper panels of
424 D. C. FRITTS et al.: FIRST RESULTS OF THE SPREAD F EXPERIMENT (SPREADFEX)
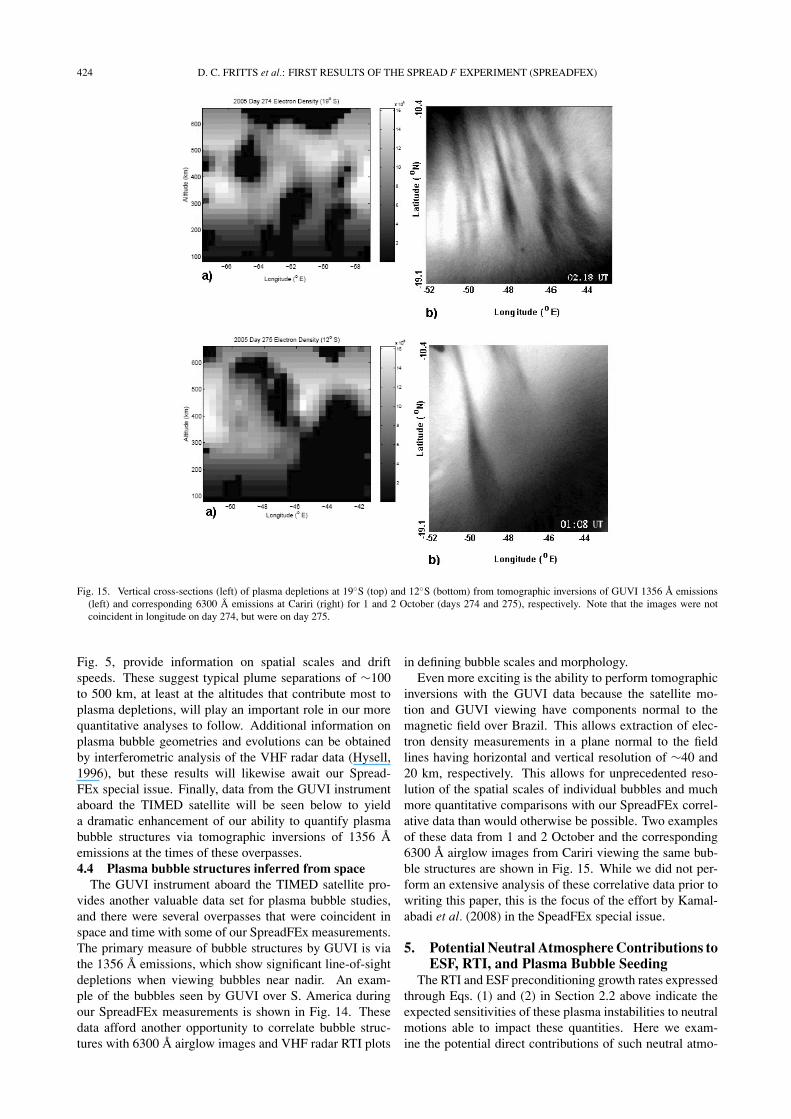
Fig. 15. Vertical cross-sections (left) of plasma depletions at 19$S (top) and 12$S (bottom) from tomographic inversions of GUVI 1356 A emissions(left) and corresponding 6300 A emissions at Cariri (right) for 1 and 2 October (days 274 and 275), respectively. Note that the images were notcoincident in longitude on day 274, but were on day 275.
Fig. 5, provide information on spatial scales and driftspeeds. These suggest typical plume separations of !100to 500 km, at least at the altitudes that contribute most toplasma depletions, will play an important role in our morequantitative analyses to follow. Additional information onplasma bubble geometries and evolutions can be obtainedby interferometric analysis of the VHF radar data (Hysell,1996), but these results will likewise await our Spread-FEx special issue. Finally, data from the GUVI instrumentaboard the TIMED satellite will be seen below to yielda dramatic enhancement of our ability to quantify plasmabubble structures via tomographic inversions of 1356 Aemissions at the times of these overpasses.4.4 Plasma bubble structures inferred from space
The GUVI instrument aboard the TIMED satellite pro-vides another valuable data set for plasma bubble studies,and there were several overpasses that were coincident inspace and time with some of our SpreadFEx measurements.The primary measure of bubble structures by GUVI is viathe 1356 A emissions, which show significant line-of-sightdepletions when viewing bubbles near nadir. An exam-ple of the bubbles seen by GUVI over S. America duringour SpreadFEx measurements is shown in Fig. 14. Thesedata afford another opportunity to correlate bubble struc-tures with 6300 A airglow images and VHF radar RTI plots
in defining bubble scales and morphology.Even more exciting is the ability to perform tomographic
inversions with the GUVI data because the satellite mo-tion and GUVI viewing have components normal to themagnetic field over Brazil. This allows extraction of elec-tron density measurements in a plane normal to the fieldlines having horizontal and vertical resolution of !40 and20 km, respectively. This allows for unprecedented reso-lution of the spatial scales of individual bubbles and muchmore quantitative comparisons with our SpreadFEx correl-ative data than would otherwise be possible. Two examplesof these data from 1 and 2 October and the corresponding6300 A airglow images from Cariri viewing the same bub-ble structures are shown in Fig. 15. While we did not per-form an extensive analysis of these correlative data prior towriting this paper, this is the focus of the effort by Kamal-abadi et al. (2008) in the SpeadFEx special issue.
5. Potential Neutral Atmosphere Contributions toESF, RTI, and Plasma Bubble Seeding
The RTI and ESF preconditioning growth rates expressedthrough Eqs. (1) and (2) in Section 2.2 above indicate theexpected sensitivities of these plasma instabilities to neutralmotions able to impact these quantities. Here we exam-ine the potential direct contributions of such neutral atmo-
D. C. FRITTS et al.: FIRST RESULTS OF THE SPREAD F EXPERIMENT (SPREADFEX) 425
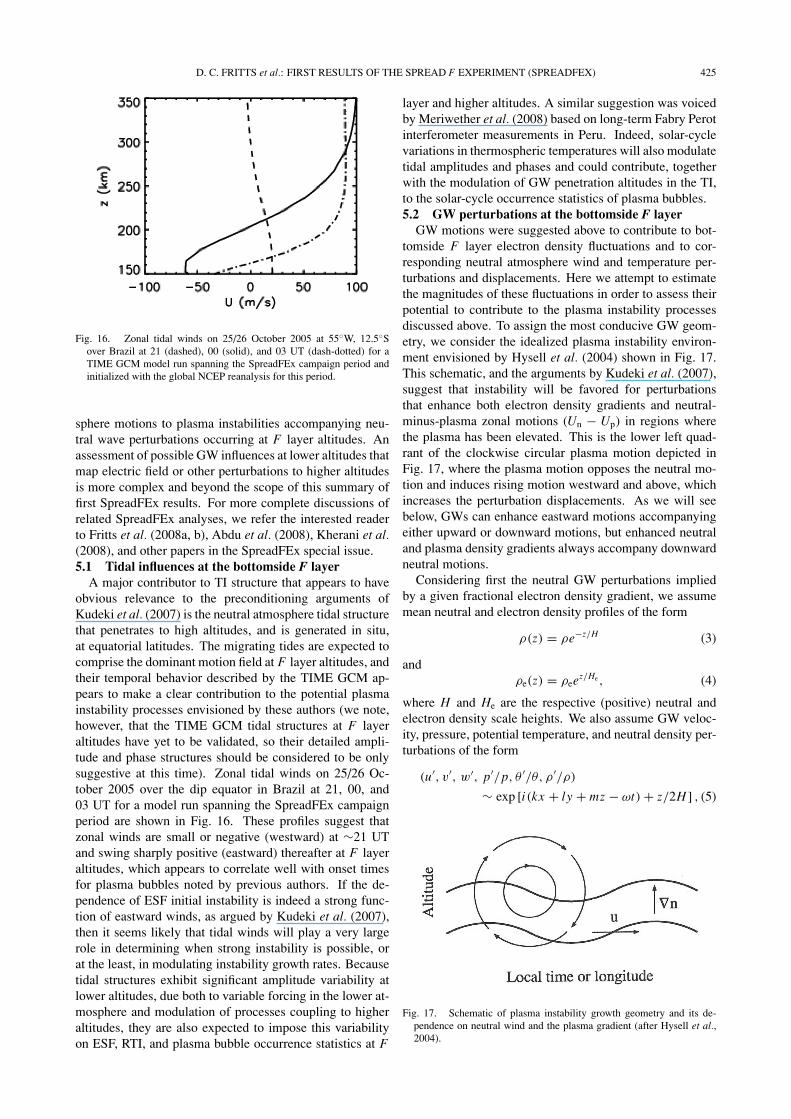
Fig. 16. Zonal tidal winds on 25/26 October 2005 at 55$W, 12.5$Sover Brazil at 21 (dashed), 00 (solid), and 03 UT (dash-dotted) for aTIME GCM model run spanning the SpreadFEx campaign period andinitialized with the global NCEP reanalysis for this period.
sphere motions to plasma instabilities accompanying neu-tral wave perturbations occurring at F layer altitudes. Anassessment of possible GW influences at lower altitudes thatmap electric field or other perturbations to higher altitudesis more complex and beyond the scope of this summary offirst SpreadFEx results. For more complete discussions ofrelated SpreadFEx analyses, we refer the interested readerto Fritts et al. (2008a, b), Abdu et al. (2008), Kherani et al.(2008), and other papers in the SpreadFEx special issue.5.1 Tidal influences at the bottomside F layer
A major contributor to TI structure that appears to haveobvious relevance to the preconditioning arguments ofKudeki et al. (2007) is the neutral atmosphere tidal structurethat penetrates to high altitudes, and is generated in situ,at equatorial latitudes. The migrating tides are expected tocomprise the dominant motion field at F layer altitudes, andtheir temporal behavior described by the TIME GCM ap-pears to make a clear contribution to the potential plasmainstability processes envisioned by these authors (we note,however, that the TIME GCM tidal structures at F layeraltitudes have yet to be validated, so their detailed ampli-tude and phase structures should be considered to be onlysuggestive at this time). Zonal tidal winds on 25/26 Oc-tober 2005 over the dip equator in Brazil at 21, 00, and03 UT for a model run spanning the SpreadFEx campaignperiod are shown in Fig. 16. These profiles suggest thatzonal winds are small or negative (westward) at !21 UTand swing sharply positive (eastward) thereafter at F layeraltitudes, which appears to correlate well with onset timesfor plasma bubbles noted by previous authors. If the de-pendence of ESF initial instability is indeed a strong func-tion of eastward winds, as argued by Kudeki et al. (2007),then it seems likely that tidal winds will play a very largerole in determining when strong instability is possible, orat the least, in modulating instability growth rates. Becausetidal structures exhibit significant amplitude variability atlower altitudes, due both to variable forcing in the lower at-mosphere and modulation of processes coupling to higheraltitudes, they are also expected to impose this variabilityon ESF, RTI, and plasma bubble occurrence statistics at F
layer and higher altitudes. A similar suggestion was voicedby Meriwether et al. (2008) based on long-term Fabry Perotinterferometer measurements in Peru. Indeed, solar-cyclevariations in thermospheric temperatures will also modulatetidal amplitudes and phases and could contribute, togetherwith the modulation of GW penetration altitudes in the TI,to the solar-cycle occurrence statistics of plasma bubbles.5.2 GW perturbations at the bottomside F layer
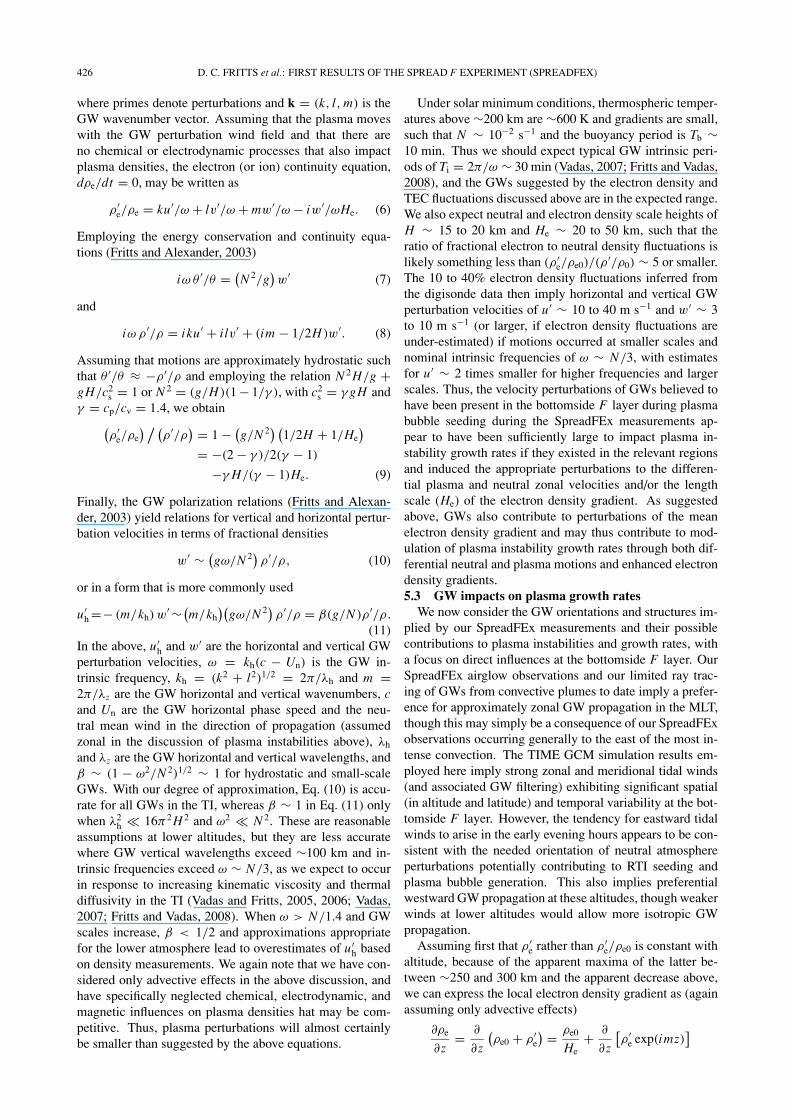
GW motions were suggested above to contribute to bot-tomside F layer electron density fluctuations and to cor-responding neutral atmosphere wind and temperature per-turbations and displacements. Here we attempt to estimatethe magnitudes of these fluctuations in order to assess theirpotential to contribute to the plasma instability processesdiscussed above. To assign the most conducive GW geom-etry, we consider the idealized plasma instability environ-ment envisioned by Hysell et al. (2004) shown in Fig. 17.This schematic, and the arguments by Kudeki et al. (2007),suggest that instability will be favored for perturbationsthat enhance both electron density gradients and neutral-minus-plasma zonal motions (Un # Up) in regions wherethe plasma has been elevated. This is the lower left quad-rant of the clockwise circular plasma motion depicted inFig. 17, where the plasma motion opposes the neutral mo-tion and induces rising motion westward and above, whichincreases the perturbation displacements. As we will seebelow, GWs can enhance eastward motions accompanyingeither upward or downward motions, but enhanced neutraland plasma density gradients always accompany downwardneutral motions.
Considering first the neutral GW perturbations impliedby a given fractional electron density gradient, we assumemean neutral and electron density profiles of the form
&(z) = &e#z/H (3)
and&e(z) = &eez/He , (4)
where H and He are the respective (positive) neutral andelectron density scale heights. We also assume GW veloc-ity, pressure, potential temperature, and neutral density per-turbations of the form
(u%, v%, w%, p%/p, ' %/', & %/&)
! exp [i(kx + ly + mz # %t) + z/2H ] , (5)
Fig. 17. Schematic of plasma instability growth geometry and its de-pendence on neutral wind and the plasma gradient (after Hysell et al.,2004).
426 D. C. FRITTS et al.: FIRST RESULTS OF THE SPREAD F EXPERIMENT (SPREADFEX)
where primes denote perturbations and k = (k, l, m) is theGW wavenumber vector. Assuming that the plasma moveswith the GW perturbation wind field and that there areno chemical or electrodynamic processes that also impactplasma densities, the electron (or ion) continuity equation,d&e/dt = 0, may be written as
& %e/&e = ku%/% + lv%/% + mw%/% # iw%/%He. (6)
Employing the energy conservation and continuity equa-tions (Fritts and Alexander, 2003)
i% ' %/' =#
N 2/g$
w% (7)
and
i% & %/& = iku% + ilv% + (im # 1/2H)w%. (8)
Assuming that motions are approximately hydrostatic suchthat ' %/' & #& %/& and employing the relation N 2 H/g +gH/c2
s = 1 or N 2 = (g/H)(1 # 1/! ), with c2s = ! gH and
! = cp/cv = 1.4, we obtain#
& %e/&e
$ % #
& %/&$
= 1 ##
g/N 2$ #
1/2H + 1/He$
= #(2 # ! )/2(! # 1)
#! H/(! # 1)He. (9)
Finally, the GW polarization relations (Fritts and Alexan-der, 2003) yield relations for vertical and horizontal pertur-bation velocities in terms of fractional densities
w% !#
g%/N 2$ & %/&, (10)
or in a form that is more commonly used
u%h =# (m/kh) w% !
#
m/kh$#
g%/N 2$ & %/& = $(g/N )& %/& .
(11)In the above, u%
h and w% are the horizontal and vertical GWperturbation velocities, % = kh(c # Un) is the GW in-trinsic frequency, kh = (k2 + l2)1/2 = 2(/)h and m =2(/)z are the GW horizontal and vertical wavenumbers, cand Un are the GW horizontal phase speed and the neu-tral mean wind in the direction of propagation (assumedzonal in the discussion of plasma instabilities above), )h
and )z are the GW horizontal and vertical wavelengths, and$ ! (1 # %2/N 2)1/2 ! 1 for hydrostatic and small-scaleGWs. With our degree of approximation, Eq. (10) is accu-rate for all GWs in the TI, whereas $ ! 1 in Eq. (11) onlywhen )2
h ' 16(2 H 2 and %2 ' N 2. These are reasonableassumptions at lower altitudes, but they are less accuratewhere GW vertical wavelengths exceed !100 km and in-trinsic frequencies exceed % ! N/3, as we expect to occurin response to increasing kinematic viscosity and thermaldiffusivity in the TI (Vadas and Fritts, 2005, 2006; Vadas,2007; Fritts and Vadas, 2008). When % > N/1.4 and GWscales increase, $ < 1/2 and approximations appropriatefor the lower atmosphere lead to overestimates of u%
h basedon density measurements. We again note that we have con-sidered only advective effects in the above discussion, andhave specifically neglected chemical, electrodynamic, andmagnetic influences on plasma densities hat may be com-petitive. Thus, plasma perturbations will almost certainlybe smaller than suggested by the above equations.
Under solar minimum conditions, thermospheric temper-atures above !200 km are !600 K and gradients are small,such that N ! 10#2 s#1 and the buoyancy period is Tb !10 min. Thus we should expect typical GW intrinsic peri-ods of Ti = 2(/% ! 30 min (Vadas, 2007; Fritts and Vadas,2008), and the GWs suggested by the electron density andTEC fluctuations discussed above are in the expected range.We also expect neutral and electron density scale heights ofH ! 15 to 20 km and He ! 20 to 50 km, such that theratio of fractional electron to neutral density fluctuations islikely something less than (& %
e/&e0)/(&%/&0) ! 5 or smaller.
The 10 to 40% electron density fluctuations inferred fromthe digisonde data then imply horizontal and vertical GWperturbation velocities of u% ! 10 to 40 m s#1 and w% ! 3to 10 m s#1 (or larger, if electron density fluctuations areunder-estimated) if motions occurred at smaller scales andnominal intrinsic frequencies of % ! N/3, with estimatesfor u% ! 2 times smaller for higher frequencies and largerscales. Thus, the velocity perturbations of GWs believed tohave been present in the bottomside F layer during plasmabubble seeding during the SpreadFEx measurements ap-pear to have been sufficiently large to impact plasma in-stability growth rates if they existed in the relevant regionsand induced the appropriate perturbations to the differen-tial plasma and neutral zonal velocities and/or the lengthscale (He) of the electron density gradient. As suggestedabove, GWs also contribute to perturbations of the meanelectron density gradient and may thus contribute to mod-ulation of plasma instability growth rates through both dif-ferential neutral and plasma motions and enhanced electrondensity gradients.5.3 GW impacts on plasma growth rates
We now consider the GW orientations and structures im-plied by our SpreadFEx measurements and their possiblecontributions to plasma instabilities and growth rates, witha focus on direct influences at the bottomside F layer. OurSpreadFEx airglow observations and our limited ray trac-ing of GWs from convective plumes to date imply a prefer-ence for approximately zonal GW propagation in the MLT,though this may simply be a consequence of our SpreadFExobservations occurring generally to the east of the most in-tense convection. The TIME GCM simulation results em-ployed here imply strong zonal and meridional tidal winds(and associated GW filtering) exhibiting significant spatial(in altitude and latitude) and temporal variability at the bot-tomside F layer. However, the tendency for eastward tidalwinds to arise in the early evening hours appears to be con-sistent with the needed orientation of neutral atmosphereperturbations potentially contributing to RTI seeding andplasma bubble generation. This also implies preferentialwestward GW propagation at these altitudes, though weakerwinds at lower altitudes would allow more isotropic GWpropagation.
Assuming first that & %e rather than & %
e/&e0 is constant withaltitude, because of the apparent maxima of the latter be-tween !250 and 300 km and the apparent decrease above,we can express the local electron density gradient as (againassuming only advective effects)
*&e
*z= *
*z
#
&e0 + & %e
$
= &e0
He+ *
*z
&
& %e exp(imz)
'
D. C. FRITTS et al.: FIRST RESULTS OF THE SPREAD F EXPERIMENT (SPREADFEX) 427
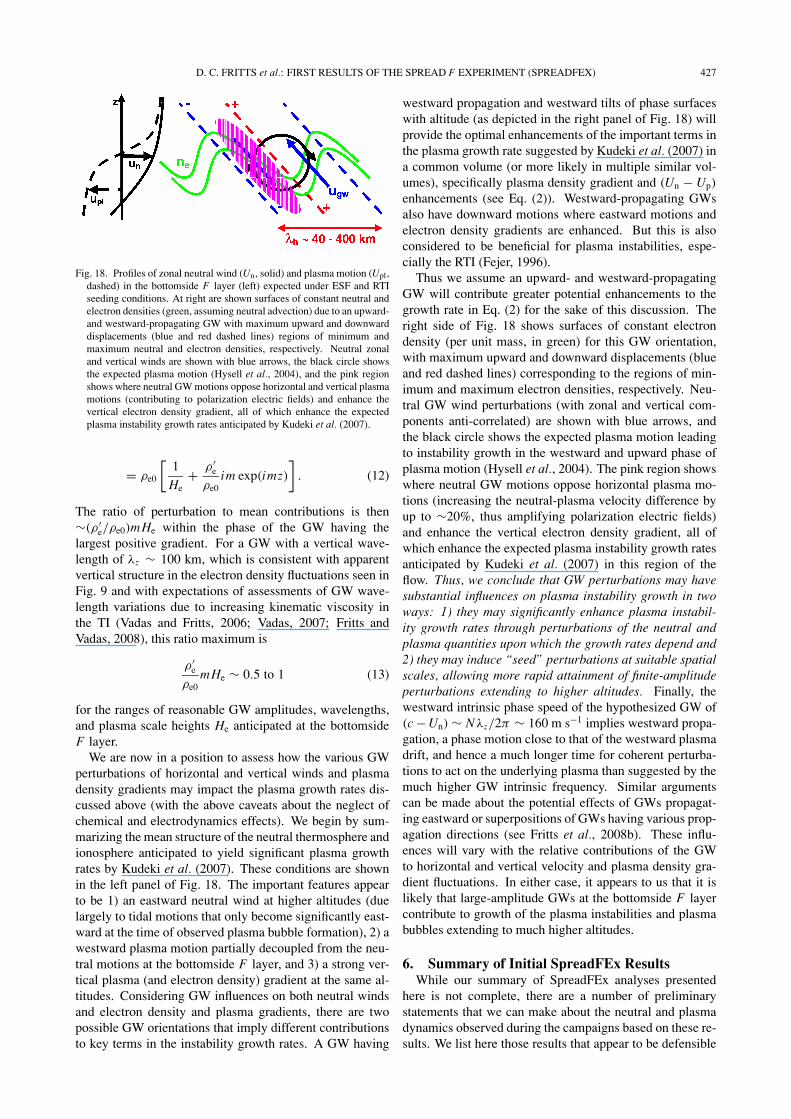
Fig. 18. Profiles of zonal neutral wind (Un, solid) and plasma motion (Upl,dashed) in the bottomside F layer (left) expected under ESF and RTIseeding conditions. At right are shown surfaces of constant neutral andelectron densities (green, assuming neutral advection) due to an upward-and westward-propagating GW with maximum upward and downwarddisplacements (blue and red dashed lines) regions of minimum andmaximum neutral and electron densities, respectively. Neutral zonaland vertical winds are shown with blue arrows, the black circle showsthe expected plasma motion (Hysell et al., 2004), and the pink regionshows where neutral GW motions oppose horizontal and vertical plasmamotions (contributing to polarization electric fields) and enhance thevertical electron density gradient, all of which enhance the expectedplasma instability growth rates anticipated by Kudeki et al. (2007).
= &e0
(
1He
+ & %e
&e0im exp(imz)
)
. (12)
The ratio of perturbation to mean contributions is then!(& %
e/&e0)m He within the phase of the GW having thelargest positive gradient. For a GW with a vertical wave-length of )z ! 100 km, which is consistent with apparentvertical structure in the electron density fluctuations seen inFig. 9 and with expectations of assessments of GW wave-length variations due to increasing kinematic viscosity inthe TI (Vadas and Fritts, 2006; Vadas, 2007; Fritts andVadas, 2008), this ratio maximum is
& %e
&e0m He ! 0.5 to 1 (13)
for the ranges of reasonable GW amplitudes, wavelengths,and plasma scale heights He anticipated at the bottomsideF layer.
We are now in a position to assess how the various GWperturbations of horizontal and vertical winds and plasmadensity gradients may impact the plasma growth rates dis-cussed above (with the above caveats about the neglect ofchemical and electrodynamics effects). We begin by sum-marizing the mean structure of the neutral thermosphere andionosphere anticipated to yield significant plasma growthrates by Kudeki et al. (2007). These conditions are shownin the left panel of Fig. 18. The important features appearto be 1) an eastward neutral wind at higher altitudes (duelargely to tidal motions that only become significantly east-ward at the time of observed plasma bubble formation), 2) awestward plasma motion partially decoupled from the neu-tral motions at the bottomside F layer, and 3) a strong ver-tical plasma (and electron density) gradient at the same al-titudes. Considering GW influences on both neutral windsand electron density and plasma gradients, there are twopossible GW orientations that imply different contributionsto key terms in the instability growth rates. A GW having
westward propagation and westward tilts of phase surfaceswith altitude (as depicted in the right panel of Fig. 18) willprovide the optimal enhancements of the important terms inthe plasma growth rate suggested by Kudeki et al. (2007) ina common volume (or more likely in multiple similar vol-umes), specifically plasma density gradient and (Un # Up)
enhancements (see Eq. (2)). Westward-propagating GWsalso have downward motions where eastward motions andelectron density gradients are enhanced. But this is alsoconsidered to be beneficial for plasma instabilities, espe-cially the RTI (Fejer, 1996).
Thus we assume an upward- and westward-propagatingGW will contribute greater potential enhancements to thegrowth rate in Eq. (2) for the sake of this discussion. Theright side of Fig. 18 shows surfaces of constant electrondensity (per unit mass, in green) for this GW orientation,with maximum upward and downward displacements (blueand red dashed lines) corresponding to the regions of min-imum and maximum electron densities, respectively. Neu-tral GW wind perturbations (with zonal and vertical com-ponents anti-correlated) are shown with blue arrows, andthe black circle shows the expected plasma motion leadingto instability growth in the westward and upward phase ofplasma motion (Hysell et al., 2004). The pink region showswhere neutral GW motions oppose horizontal plasma mo-tions (increasing the neutral-plasma velocity difference byup to !20%, thus amplifying polarization electric fields)and enhance the vertical electron density gradient, all ofwhich enhance the expected plasma instability growth ratesanticipated by Kudeki et al. (2007) in this region of theflow. Thus, we conclude that GW perturbations may havesubstantial influences on plasma instability growth in twoways: 1) they may significantly enhance plasma instabil-ity growth rates through perturbations of the neutral andplasma quantities upon which the growth rates depend and2) they may induce “seed” perturbations at suitable spatialscales, allowing more rapid attainment of finite-amplitudeperturbations extending to higher altitudes. Finally, thewestward intrinsic phase speed of the hypothesized GW of(c # Un) ! N)z/2( ! 160 m s#1 implies westward propa-gation, a phase motion close to that of the westward plasmadrift, and hence a much longer time for coherent perturba-tions to act on the underlying plasma than suggested by themuch higher GW intrinsic frequency. Similar argumentscan be made about the potential effects of GWs propagat-ing eastward or superpositions of GWs having various prop-agation directions (see Fritts et al., 2008b). These influ-ences will vary with the relative contributions of the GWto horizontal and vertical velocity and plasma density gra-dient fluctuations. In either case, it appears to us that it islikely that large-amplitude GWs at the bottomside F layercontribute to growth of the plasma instabilities and plasmabubbles extending to much higher altitudes.
6. Summary of Initial SpreadFEx ResultsWhile our summary of SpreadFEx analyses presented
here is not complete, there are a number of preliminarystatements that we can make about the neutral and plasmadynamics observed during the campaigns based on these re-sults. We list here those results that appear to be defensible
428 D. C. FRITTS et al.: FIRST RESULTS OF THE SPREAD F EXPERIMENT (SPREADFEX)
at this stage, and refer readers to our forthcoming Spread-FEx special issue of Annales Geophysicae for more com-prehensive analyses. Current conclusions include:
a) deep convection appears to be a significant and viablesource of GWs penetrating into the MLT and to thebottomside F layer, depending on GW scales, frequen-cies, and propagation directions;
b) GWs spanning a wide range of scales and frequenciescan reach the MLT, but only GWs having large scalesand high frequencies can reach higher altitudes;
c) GWs arising from convection are strongly influencedby lower atmospheric and MLT winds that dictatewhich GW frequencies, scales, and propagation direc-tions allow penetration to the bottomside F layer andabove;
d) digisonde electron densities suggest GWs havingdownward phase motions (upward propagation), peri-ods of !20 min to 2 hr, and significant electron den-sity perturbations at the bottomside F layer, with cor-responding implied neutral density and wind perturba-tions;
e) GPS data suggest GWs of similar periods extending toeven higher altitudes before and after plasma bubbleoccurrence;
f) smaller-scale GWs and wave-mean flow interactionsappear to excite bores in the MLT that exhibit a varietyof dispersive and nonlinear responses;
g) VHF radar and digisonde data suggest a connection be-tween rising plasma motions, decreasing electron den-sities, increasing plasma gradients, and plasma bubbleinitiation;
h) VHF radar, digisonde, GPS, airglow, and GUVI datasuggest an ability to quantify plasma perturbations inaltitude, longitude, and time; however, it remains un-clear how these perturbations are related to plasmabubble generation;
i) neutral zonal tidal winds appear to play an impor-tant role in enabling spread F seeding, given the tran-sition from westward to eastward neutral motions at!250 km and above in the early evening hours;
j) the multiple correlative data sets collected during theSpreadFEx campaigns are among the most compre-hensive available, and will likely enable more quantita-tive conclusions upon completion of our various anal-yses;
k) our initial results lead us to conclude that GWs mayhave sufficient perturbation amplitudes and impacts oninstability growth rate at the bottomside F layer thattheir potential role in ESF and plasma bubble seedingshould not be discounted;
and
l) it remains to be quantified fully how the GW neu-tral and electron density perturbations identified in ourSpreadFEx experiment affect the generation of ESFand plasma bubbles extending to higher altitudes.
Acknowledgments. The SpreadFEx field program and data anal-ysis were supported by NASA under contracts NNH04CC67C andNAS5-02036. Related modeling and theoretical activities weresupported by NSF grants ATM-0314060 and ATM-0537311 andAFOSR contract FA9550–06-C-0129. We also thank M. R. Haus-man and L. J. Nickisch for their assistance in analyzing GPS datafrom Fortaleza and V. T. Rampinelli, E. Bataglin, J. Sempere, N.D. Candido, and the Sao Joao d’Alianca’s House of Representa-tives and Sao Joao d’Alianca’s Mayor’s House for local supportduring the campaign. CPTEC-INPE provided assistance with theGOES 12 data analysis. Some of the authors also had partial sup-port from Conselho Nacional de Desenvolvimento Cietifico e Tec-nologico CNPq (Abdu, Sobral, de Paula, I. Batista, Takahashi, andGobbi). Finally, we thank Wenbin Wang and two anonymous re-viewers for helpful comments on the manuscript.
ReferencesAbdu, M. A., Outstanding problems in the equatrial ionosphere-
thermosphere system relevant to spread F , J. Atmos. Sol.-Terr. Phys.,63, 869, 2001.
Abdu, M. A., I. S. Batista, and J. H. A. Sobral, A new aspect of magneticcontrol of equatorial spread F , J. Geophys. Res., 97, 14,897, 1992.
Abdu, M. A., I. S. Batista, H. Takahashi, J. MacDougall, J. H. So-bral, A. F. Medeiros, and N. B. Trivedi, Magnetospheric distur-bance induced equatorial plasma bubble development and dynamics:A case study in Brazilian sector, J. Geophys. Res., 108(A12), 1449,doi:10.1029/2002JA009721, 2003.
Abdu, M. A., E. A. Kherani, I. S. Batista, E. R. de Paula, and D. C.Fritts, An evaluation of the ESF/bubble irregularity growth conditionsunder gravity wave influences based on observational data from theSpreadFEx campaign, Ann. Geophys., SpreadFEx special issue, 2008(submitted).
Aggson, T. L., N. C. Maynard, W. B. Hanson, and L. Saba Jack, Electricfield observations of equatorial bubbles, J. Geophys. Res., 97, 2997,1992.
Anderson, D. N., A. D. Richmond, B. B. Balsley, R. G. Roble, M. A.Biondi, and D. P. Sipler, In situ generation of gravity waves as a possibleseeding mechanism for equatorial spread-F , Geophys. Res. Lett., 9,789–792, 1982.
Basu, B., On the linear theory of equatorial plasma instability: compari-son of different descriptions, J. Geophys. Res., 107(A8), doi:10.1029/2001JA000317, 2002.
Batista, I. S. and M. A. Abdu, Ionospheric variability at Brazilian low andequatorial latitudes: comparison between observations and IRI model,Adv. Space Res., 34, 1894–1900, 2004.
Batista, P. P., B. R. Clemesha, A. S. Tokumoto, and L. M. Lima, Struc-ture of the mean winds and tides in the meteor region over CachoeiraPaulista, Brazil (22.7$S,45$W) and its comparison with models, J. At-mos. Sol.-Terr. Phys., 66(6–9), 623–636, 2004.
Batista, I. S., M. A. Abdu, A. J. Carrasco, B. W. Reinisch, E. R. de Paula,and N. J. Schuch, Equatorial spread F and sporadic E-layer connectionsduring the Brazilian Conjugate Point Equatorial Experiment—COPEX,J. Atmos. Sol.-Terr. Phys., 2008 (in press).
Buriti, R. A., W. K. Hocking, P. P. Batista, A. F. Medeiros, and B. R.Clemesha, Observations of equatorial mesospheric winds over Cariri(7.4 S) by a meteor radar and comparison with existing models, Ann.Geophys., 2007 (submitted).
Calais, E. and J. B. Minster, GPS, earthquakes, the ionosphere, and theSpace Shuttle, Phys. Earth Planet. Inter., 105(3–4), 167–181, 1998.
Calais, E., J. S. Haase, and J. B. Minster, Detection of ionospheric pertur-bations using a dense GPS array in Southern California, Geophys. Res.Lett., 30(12), 2003.
de Paula, E. R. and D. L. Hysell, The Sao Luis 30 MHz coherent scatterionospheric radar: system description and initial results, Radio Sci., 39,RS1014, doi:10.1029/2003RS002914, 2004.
Dewan, E. M. and R. H. Picard, Mesospheric bores, J. Geophys. Res.,103(D6), 6295–6306, 1998.
Dewan, E. M. and R. H. Picard, On the origin of mesospheric bores, J.Geophys. Res., 106(D3), 2921–2928, 10.1029/2000JD900697, 2001.
Djuth, F. T., M. P. Sulzer, J. H. Elder, and V. B. Wickwar, High-resolutionstudies of atmosphere-ionosphere coupling at Arecibo Observatory,Puerto Rico, Radio Sci., 32, 2321–2344, 1997.
Djuth, F. T., M. P. Sulzer, S. A. Gonzales, J. D. Mathews, J. H. Elder,and R. L. Walterscheid, A continuum of gravity waves in the Arecibo
D. C. FRITTS et al.: FIRST RESULTS OF THE SPREAD F EXPERIMENT (SPREADFEX) 429
thermosphere?, Geophys. Res. Lett., 31, doi:10.1029/2003GL019376,2004.
Fechine, J., A. F. Medeiros, R. A. Buriti, H. Takahashi, and D. Gobbi,Mesospheric bore events in the equatorial middle atmosphere, J. Atmos.Sol.-Terr. Phys., 67, 1774–1778, 2005.
Fechine, J., C. M. Wrasse, H. Takahashi, A. F. Medeiros, P. P. Batista,B. R. Clemesha, L. M. Lima, D. Fritts, M. J. Taylor, P. D. Paulet,M. G. Mlynczak, and J. M. Russell, Mesospheric bore event duringSpreadsFEx campaign, Ann. Geophys., SpreadFEx special issue, 2008(submitted).
Fejer, B. G., Natural ionospheric plasma waves, in Modern IonosphericScience, edited by H. Kohl, R. Ruster, and K. Schlegel, pp. 217–273,Max-Planck Institut fur Aeronomie, Lindau, Germany, 1996.
Fejer, B. G., L. Scherliess, and E. R. de Paula, Effects of the vertical plasmadrift velocity on the generation and evolution of equatorial spread F , J.Geophys. Res., 104, 19,859, 1999.
Fritts, D. C. and L. Yuan, An analysis of gravity wave ducting in the atmo-sphere: Eckart’s resonances in thermal and Doppler ducts, J. Geophys.Res., 94(D15), 18,455–18,466, 1989.
Fritts, D. C. and M. J. Alexander, Gravity dynamics and effects in themiddle atmosphere, Rev. Geophys., 41, doi:10.1029/2001RG000106,2003.
Fritts, D. C. and S. A. Vadas, Gravity wave penetration into the thermo-sphere: Sensitivity to solar cycle variations and mean winds, Ann. Geo-phys., 2008 (in press).
Fritts, D. C. et al., Overview and summary of the spread F Experiment(SpreadFEx), Ann. Geophys., SpreadFEx special issue, 2008a (in press).
Fritts, D. C. et al., Gravity wave and tidal influences on equatorial spread Fbased on observations during the spread F Experiment (SpreadFEx),Ann. Geophys., SpreadFEx special issue, 2008b (submitted).
Haerendel, G., J. V. Eccles, and S. Cakir, Theory of modeling the equatorialevening ionosphere and the origin of the shear in the horizontal plasmaflow, J. Geophys. Res., 97, 1209–1223, 1992.
Heelis, R. A., P. C. Kendall, R. J. Moffett, D. W. Windel, and H. Rishbeth,Electrical coupling of the E and F regions and its effect on F-regiondrifts and winds, J. Planet. Space Sci., 22, 743, 1974.
Hocke, K. and K. Schlegel, A review of atmospheric gravity wavesand traveling ionospheric disturbances: 1982–1995, Ann. Geophys., 14,917–940, 1996.
Hofmann-Wellenhof, B., Global Positioning System: theory and practice,355 pp., Springer-Verlag, New York, 1994.
Huang, C. S. and M. C. Kelley, Nonlinear evolution of equatorial spread-F . 1. On the role of plasma instabilities and spatial resonance associatedwith gravity wave seeding, J. Geophys. Res., 101, 283, 1996a.
Huang, C. S. and M. C. Kelley, Nonlinear evolution of equatorial spread-F . 2. Gravity wave seeding of Rayleigh-Taylor instability, J. Geophys.Res., 101, 293, 1996b.
Huang, C. S. and M. C. Kelley, Nonlinear evolution of equatorial spread-F .4. Gravity waves, velocity shear, and day-to-day variability, J. Geophys.Res., 101, 24,523, 1996c.
Huang, C. S., M. C. Kelley, and D. L. Hysell, Nonlinear Rayleigh-Taylorinstabilities, atmospheric gravity waves, and equatorial spread-F , J.Geophys. Res., 98, 15,631, 1993.
Huang, C. S., J. C. Foster, L. P. Goncharenko, G. D. Reeves, J. L. Chau, K.Yumoto, and K. Kitamura, Variations of low-latitude geomagnetic fielsand Dst index caused by magnetospheric substorms, J. Geophys. Res.,109, A05219, doi:10.1029/2003JA010334, 2004.
Hysell, D. L., Radar imaging of equatorial F region irregularities withmaximum entropy interferometry, Radio Sci., 31(6), 1567–1578, 1996.
Hysell, D. L. and J. D. Burcham, Long term studies of equatorial spread Fusing the JULIA radar at Jicamarca, J. Atmos. Sol.-Terr. Phys., 64,1531–1543, 2002.
Hysell, D. L. and E. Kudeki, Collisional shear instability in the equa-torial F region ionosphere, J. Geophys. Res., 109, A11301, doi:10.1029/2004JA010636, 2004.
Hysell, D. L., M. C. Kelley, W. E. Swartz, and R. F. Woodman, Seedingand layering of equatorial spread-F , J. Geophys. Res., 95, 17,253, 1990.
Hysell, D. L., J. Chun, and J. L. Chau, Bottom-type scattering layers andequatorial spread F , Ann. Geophys., 22, 4061, 2004.
Hysell, D. L., M. F. Larsen, C. M. Swenson, A. Barjatya, T. F. Wheeler,M. F. Sarango, R. F. Woodman, and J. L. Chau, Onset conditions forequatorial spread Fdetermined during EQUIS II, Geophys. Res. Lett.,32, L24104, doi:10.1029/2005GL024743, 2005.
Kamalabadi, F. et al., Electron densities in the lower thermosphere fromGUVI 1356 tomographic inversions in support of SpreadFEx, Ann. Geo-phys., SpreadFEx special issue, 2008 (submitted).
Kelley, M. C., The Earth’s Ionosphere, 487 pp., Academic Press, SanDiego, 1989.
Kelley, M. C. and D. L. Hysell, Equatorial spread F and neutral atmo-spheric turbulence: a review and a comparative anatomy, J. Atmos. Ter-res. Phys., 53, 695–708, 1991.
Kelley, M. C., M. F. Larsen, C. LaHoz, and J. P. McClure, Gravity waveinitiation of equatorial spread F : A case study, J. Geophys. Res., 86,9087–9100, 1981.
Keskinen, M. J., S. L. Ossakow, and P. K. Chaturvedi, Preliminary report ofnumerical simulations of intermediate wavelength collisional Rayleigh-Taylor instability in equatorial spread-F , J. Geophys. Res., 85, 1775,1980.
Keskinen, M. J., S. L. Ossakow, S. Basu, and P. Sultan, Magnetic fluxtube integrated evolution of equatorial ionospheric plasma bubbles, J.Geophys. Res., 103, 3957, 1998.
Keskinen, M. J., S. L. Ossakow, and B. G. Fejer, Three-dimensional non-linear evolution of equatorial ionospheric spread-F bubbles, Geophys.Res. Lett., 30, 1855, doi:10.1029/2003GL017418, 2003.
Kherani, E. A., M. A. Abdu, E. R. de Paula, D. C. Fritts, J. H. A. Sobral,and F. C. de Meneses Jr., The impact of gravity waves rising from con-vection in the lower atmosphere on the generation and nonlinear evo-lution of equatorial plasma bubbles, Ann. Geophys., SpreadFEx specialissue, 2008 (submitted).
Klostermeyer, J., Nonlinear investigation of the spatial resonance effect inthe nighttime equatorial F region, J. Geophys. Res., 83, 3753, 1978.
Kudeki, E., A. Akgiray, M. Milla, J. L. Chau, and D. L. Hysell, Equatorialspread-F initiation: post-sunset vortex, thermospheric winds, gravitywaves, J. Atmos. Sol.-Terr. Phys., 69, 2416–2427, 2007.
Kudeki, E. and S. Bhattacharyya, Postsunset vortex in equatorial F-regionplasma drifts and implications for bottomside spread F , J. Geophys.Res., 104, 28,163, 1999.
Lane, T. P. and R. D. Sharman, Gravity wave breaking, secondarywave generation, and mixing above deep convection in a three-dimensional cloud model, Geophys. Res. Lett., 33, L23813, doi:10.1029/2006GL027988, 2006.
Lane, T. P., M. J. Reeder, and T. L. Clark, Numerical modeling of gravitywaves generated by deep tropical convection, J. Atmos. Sci., 58, 1249–1274, 2001.
Lane, T. P., R. D. Sharman, T. L. Clark, and H.-M. Hsu, An investigationof turbulence generation mechanisms above deep convection, J. Atmos.Sci., 60, 1297–1321, 2003.
Lanyi, G. E. and T. Roth, A comparison of mapped and measured totalionospheric electron-content using global positioning system and bea-con satellite-observations, Radio Sci., 23(4), 483–492, 1988.
Laughman, B., D. C. Fritts, and J. Werne, Numerical simulation of boregeneration and morphology in thermal and Doppler ducts, Ann. Geo-phys., SpreadFEx special issue, 2008 (submitted).
McClure, J. P., W. B. Hanson, and J. F. Hoffman, Plasma bubble andirregularities in the equatorial ionosphere, J. Geophys. Res., 82, 2650,1977.
McClure, J. P., S. Singh, D. K. Bamgboye, F. S. Johnson, and H. Kil, Oc-currence of equatorial F region irregularities: Evidence for troposphericseeding, J. Geophys. Res., 103, 29,119–29,135, 1998.
Medeiros, A. F., R. A. Buriti, E. A. Machado, H. Takahashi, P. P. Batista, D.Gobbi, and M. J. Taylor, Comparison of gravity wave activity observedby airglow imaging at two different latitudes in Brazil, J. Atmos. Sol.-Terr. Phys., 60, 647–654, 2004.
Medeiros, A. F., J. Fechine, R. A. Buriti, H. Takahashi, C. M. Wrasse, andD. Gobbi, Response of OH, O2, and OI5577 airglow emissions to themesospheric bore in the equatorial region of Brazil, Adv. Space Res.,35, 1971–1975, 2005.
Mendillo, M. and A. Tyler, The geometry of depleted plasma regions inthe equatorial ionosphere, J. Geophys. Res., 88, 5778, 1983.
Meriwether, J., M. Faivre, C. Fesen, P. Sherwood, and O. Veliz, Newresults on equatirla thermospheric winds and the midnight temperaturemaximum, Ann. Geophys., 2008 (in press).
Oliver, W. L., Y. Otsuka, M. Sato, T. Takami, and S. Fukao, A climatol-ogy of F region gravity wave propagation over the middle and upperatmosphere radar, J. Geophys. Res., 102, 14,499–14,512, 1997.
Ossakow, S. L., Spread-F theories—A review, J. Atmos. Terres. Phys., 43,437, 1981.
Piani, C., D. Durran, M. J. Alexander, and J. R. Holton, A numericalstudy of three-dimensional gravity waves triggered by deep tropicalconvection, J. Atmos. Sci., 57, 3689–3702, 2000.
Prakash, S., Production of electric field perturbations by gravity wavewinds in the E region suitable for initiating equatorial spread F , J.
430 D. C. FRITTS et al.: FIRST RESULTS OF THE SPREAD F EXPERIMENT (SPREADFEX)
Geophys. Res., 104, 10,051–10,069, 1999.Rodrigues, F. S., E. R. de Paula, M. A. Abdu, A. C. Jardim, K. N. Iyer, P.
M. Kintner, and D. L. Hysell, Equatorial spread F irregularity character-istics over Sao Luis, Brazil, Radio Sci., 39, doi:10.1029/2002RS002826,2004.
Scannapieco, A. J. and S. L. Ossakow, Nonlinear spread-F , Geophys. Res.Lett., 3, 451, 1976.
Sekar, R. and M. C. Kelley, On the combined effects of vertical shear andzonal electric field patterns on nonlinear equatorial spread F evolution,J. Geophys. Res., 103, 20,735–20,747, 1998.
Sekar, R., R. Suhasini, and R. Raghavarao, Evolution of plasma bubblesin the equatorial F region with different seeding conditions, Geophys.Res. Lett., 22, 885, 1995.
Sentman, D. D., E. M. Wescott, R. H. Picard, J. R. Winick, H. C. Stenbaek-Nielson, E. M. Dewan, D. R. Moudry, F. T. Sao Sabbas, and M. J.Heavner, Simultaneous observation of mesospheric gravity waves andsprites generated by a Midwestern thunderstorm, J. Atmos. Sol.-Terr.Phys., 65, 537–550, 2003.
Seyler, C. E., Internal waves and undular bores in mesospheric inversionlayers, J. Geophys. Res., 110, D09S05, doi:10.1029/2004JD004685,2005.
Sobral, J. H. A., M. A. Abdu, and I. S. Batista, Airglow studies on theionosphere dynamics over low latitude in Brazil, Ann. Geophys., 36(2),199–204, 1980a.
Sobral, J. H. A., M. A. Abdu, I. S. Batista, and C. J. Zamlutti, Associationbetween plasma bubble and airglow disturbances over Brazilian lowlatitudes, Geophys. Res. Lett., 11(7), 980–982, 1980b.
Sobral, J. A. H., H. Takahashi, M. A. Abdu, M. J. Taylor, H. Sawant, D. C.Santana, D. Gobbi, A. F. de Medeiros, C. J. Zamlutti, N. J. Schuch, andG. L. Borba, Thermospheric F-region travelling disturbances detectedat low latitude by an OI (630 nm) imager system, Adv. Space Sci., 27,1201–1206, 2001.
Sobral, J. H. A, M. A. Abdu, H. Takahashi, M. J. Taylor, E. R. de Paula, C.J. Zamlutti, and G. L. Borba, A study of the ionospheric plasma bubblesclimatology over Brazil, based on 22 years (1977–1998) of OI 630 nmairglow observation, J. Atmos. Terr. Phys., 64(12–14), 1517–1524, 2002.
Stolle, C., H. Luhr, M. Rother, and G. Balasis, Magnetic signatures ofequatorial spread F as observed by the CHAMP satellite, J. Geophys.Res., 111, A02304, doi:10.1029/2005JA011184, 2006.
Su, S.-Y., C. K. Chao, and C. H. Liu, On monthly/seasonal/longitudinalvariations of equatorial irregularity occurrencesand their relationshipwith the postsunset vertical drift velocities, J. Geophys. Res., 113,A05307, doi:10.1029/2007JA012809, 2008.
Sultan, P. J., Linear theory and modeling of the Rayleigh Taylor instabilityleading to the occurrence of equatorial spread F , J. Geophys. Res., 101,26875–26891, 1996.
Swartz, W. E. and R. F. Woodman, Same night observations of spread-Fby the Jicamarca Radio Observatory in Peru and CUPRI in Alcantara,Brazil, Geophys. Res. Lett., 25, 17–20, 1998.
Takahashi, H., M. J. Taylor, P.-D. Pautet, A. F. Medeiros, D. Gobbi, C.M. Wrasse, J. Fechine, M. A. Abdu, I. S. Batista, E. Paula, J. H. A.Sobral, D. Arruda, S. Vadas, F. S. Sabbas, and D. Fritts, Simultaneousobservation of ionospheric plasma bubbles and mesospheric gravitywaves during the SpreadFEx Campaign, Ann. Geophys., SpreadFExspecial issue, 2008 (in review).
Taylor, M. J. and M. A. Hapgood, Identification of a thunderstorm as asource of short period gravity waves in the upper atmospheric nightglowemissions, Planet. Space Sci., 36, 975, 1988.
Taylor, M. J., J.-M. Jahn, S. Fukao, and A. Saito, Possible evidence ofgravity wave coupling into the mid-latitude F region ionosphere duringthe SEEK campaign, Geophys. Res. Lett., 25, 1801–1804, 1998.
Taylor, M. J. et al., Gravity waves in the OH airglow layer observedduring the SpreadFEx campaign in Brazil, SpreadFEx special issue,Ann. Geophys., 2008 (submitted).
Taylor, M. J., P. D. Pautet, A. F. Medeiros, R. Buriti, J. Fechine, D.C. Fritts, S. Vadas, H. Takahashi, and F. Sao Sabbas, Characterizingmesospheric gravity waves near the magnetic equator, Brazil during the
SpreadFEx campaign, Ann. Geophys., SpreadFEx special issue, 2008(submitted).
Tsuda, T., M. Nishida, and C. Rocken, A global morphology of gravitywave activity in the stratosphere revealed by the GPS occultation data(GPS/MET), J. Geophys. Res., 105, 7257–7274, 2000.
Tsunoda, R. T., Time evolution and dynamics of equatorial backscatterplumes: 1. Growth phase, J. Geophys. Res., 86, 139–149, 1981.
Tsunoda, R. T., On the enigma of day-to-day variability in equa-torial spread F , Geophys. Res. Lett., 32, L08103, doi:10.1029/2005GL022512, 2005.
Tsunoda, R. T., Day-to-day variability in equatorial spread F : Is theresome physics missing?, Geophys. Res. Lett., 33, L16106, doi:10.1029/2006GL025956, 2006.
Tsunoda, R. T., Seeding of equatorial plasma bubbles with electricfields from an Es-layer instability, J. Geophys. Res., 112, A06304,doi:10.1029/2006JA012103, 2007.
Vadas, S. L., Horizontal and vertical propagation and dissipation of gravitywaves in the thermosphere from lower atmospheric and thermosphericsources, J. Geophys. Res., 112, A06305, doi:10.1029/2006JA011845,2007.
Vadas, S. L. and D. C. Fritts, Gravity wave radiation and mean responsesto local body forces in the atmosphere, J. Atmos. Sci., 58, 2249–2279,2001.
Vadas, S. L. and D. C. Fritts, The importance of spatial variability in thegeneration of secondary gravity waves from local body forces, Geophys.Res. Lett., 29(20), 10.1029/2002GL015574, 2002.
Vadas, S. L. and D. C. Fritts, Thermospheric responses to gravity wavesarising from mesoscale convective complexes, J. Atmos. Sol.-Terr.Phys., 66, 781–804, 2004.
Vadas, S. L. and D. C. Fritts, Thermospheric responses to gravity waves:Influences of increasing viscosity and thermal diffusivity, J. Geophys.Res., 110, D15103, doi:10.1029/2004JD005574, 2005.
Vadas, S. L. and D. C. Fritts, The influence of increasing temperatureand solar variability on gravity wave structure and dissipation in thethermosphere, J. Geophys. Res., TIMED special issue, 111, A10812,doi:10.1029/2005JA011510, 2006.
Vadas, S. L. and D. C. Fritts, Reconstruction of the gravity wave field fromconvective plumes via ray tracing, Ann. Geophys., SpreadFEx specialissue, 2008 (submitted).
Vadas, S. L., D. C. Fritts, and M. J. Alexander, Mechanism for the gener-ation of secondary waves in wave breaking regions, J. Atmos. Sci., 60,194–214, 2003.
Vadas, S. L., M. J. Taylor, P.-D. Pautet, P. Stamus, D. C. Fritts, F. SaoSabbas, and V. Thiago, Convection: The likely source of the medium-scale gravity waves observed in the OH airglow layer near Brasilia,Brazil, during the SpreadFEx campaign, Ann. Geophys., SpreadFExspecial issue, 2008 (submitted).
Valladares, C. E., W. B. Hanson, J. P. McClure, and B. L. Cragin, Bot-tomside sinusoidal irregularities in the equatorial F region, J. Geophys.Res., 88, 8025, 1983.
Woodman, R. F. and C. LaHoz, Radio observations of F-region equatorialirregularities, J. Geophys. Res., 85, 5447, 1976.
Zalesak, S. T. and S. L. Ossakow, Nonlinear equatorial spread F : Spatiallylarge bubbles resulting from large horizontal scale initial perturbations,J. Geophys. Res., 85, 2131, 1980.
Zalesak, S. T., S. L. Ossakow, and P. K. Chaturvedi, Nonlinear equatorialspread F : The effect of neutral winds and background Pedersen con-ductivity, J. Geophys. Res., 87, 151, 1982.
D. C. Fritts (e-mail: [email protected]), M. A. Abdu, B. R. Batista,I. S. Batista, P. P. Batista, R. Buriti, B. R. Clemesha, T. Dautermann, E.de Paula, B. J. Fechine, B. Fejer, D. Gobbi, J. Haase, F. Kamalabadi,B. Laughman, L. M. Lima, H.-L. Liu, A. Medeiros, P.-D. Pautet, D. M.Riggin, F. Sao Sabbas, J. H. A. Sobral, P. Stamus, H. Takahashi, M. J.Taylor, S. L. Vadas, and C. M. Wrasse