experiment for Process Control
13
Experiment – Control 3 By, Group A4 (b) : Piyush Lakhmani (11D020027) Abhinay Korukonda (110020076) Vaibhav Gupta Rahul Parmata
Transcript of experiment for Process Control

Experiment – Control 3
By,
Group A4 (b) :
Piyush Lakhmani (11D020027)
Abhinay Korukonda (110020076)
Vaibhav Gupta
Rahul Parmata

Aim of the Experiment
The experiments aims at studying the input-output relation of an
interacting tank system by analyzing the system’s open loop
behavior on given positive and negative step inputs.
The relation obtained would be used to get the controller
parameters. We will use those parameters to set the controller such
that it gives minimum offset and stable output

Schematic
• Manipulated variable – Fi (m3/s)• Disturbance Variable – Fd (m3/s)• Controlled variable – h2 (m)

Introduction
System – Interacting Tank system – both h1 and h2 affect each other
We have 2 tanks and there are interconnected. The water flow into
tank 1 is Fi and tank 2 is Fd. Height of water in tank1 is h1 and in tank
2 is h2.
Controller is a PI controller. Set point and Fd are kept fixed to a
certain value and the controller controls Fi to reach the set point
value of h2

Theory
Open Loop systems – Systems in which there is no controller. Any
change in input affect the output according to the process
dynamics. The process has an inertia, or opposing force which tries
to oppose the changes brought in by the manipulated variable and tends to achieve a steady state. We analyze this behavior of the
system to get its dynamics
Closed loop systems - Here, output is affected by not only input but by controllers which tend to sense the variation between set value
and current value, work out their dynamics and send a signal to end
element which may be a valve. This helps us to achieve stable
output if the controller settings are proper
Theory
Servo Response
• When the step change is made in the set point and then the response of the system in presence of the controller is said to be servo response
∆𝑦 = (𝐺𝑝𝐺𝑐
𝐺𝑝𝐺𝑐 + 1)∆𝑦𝑑
Regulatory Response
• When the change is made in the disturbance variable, then the response of the system in presence of controller is termed as regulatory response
∆𝑦 = (1
𝐺𝑝𝐺𝑐 + 1)∆𝐹𝑑
Gp= Plant dynamics, Gc = controller dynamics, ∆𝑦 = output response, ∆𝑦d = change in set point, ∆𝐹𝑑 = Change in disturbance variable

Procedure
We get the Controller gain and time constant from the previous
experiment.
The set point is initially fixed to 9 mA and Fd is set to 10 mA
Fi is regulated by the controller
Once we start the experiment, we see that h2 increases from 0 to 9 mA
Then, we change the value of set point and see the output response
Same is done for negative step change in set point.
Again, we repeat the same steps for step changes in Fd and record the
results
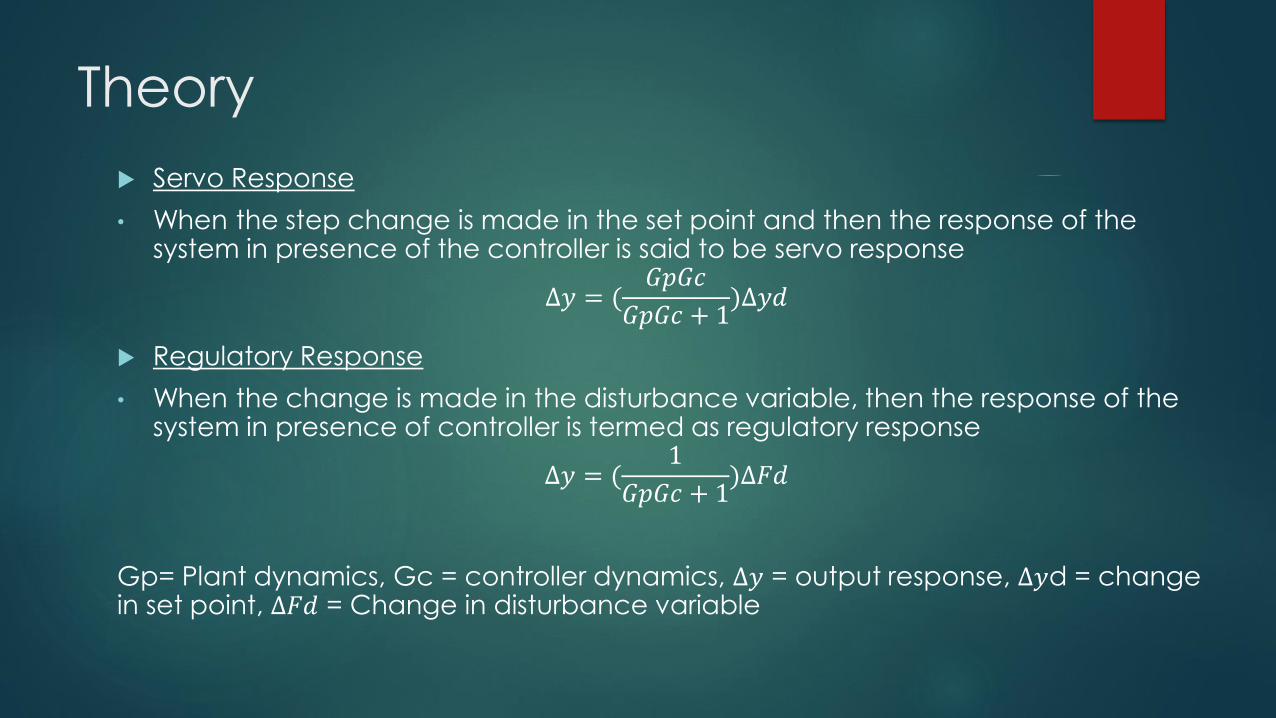
Results
1. Initial Configuration:
Set point = 9 mA
Fd = 10 mA
h2 (s.s)= 9 mA

Positive Step change in set point (+3 mA)
Set Point = 12 mA
Fd = 10 mA
H2(s.s) = 12 mA
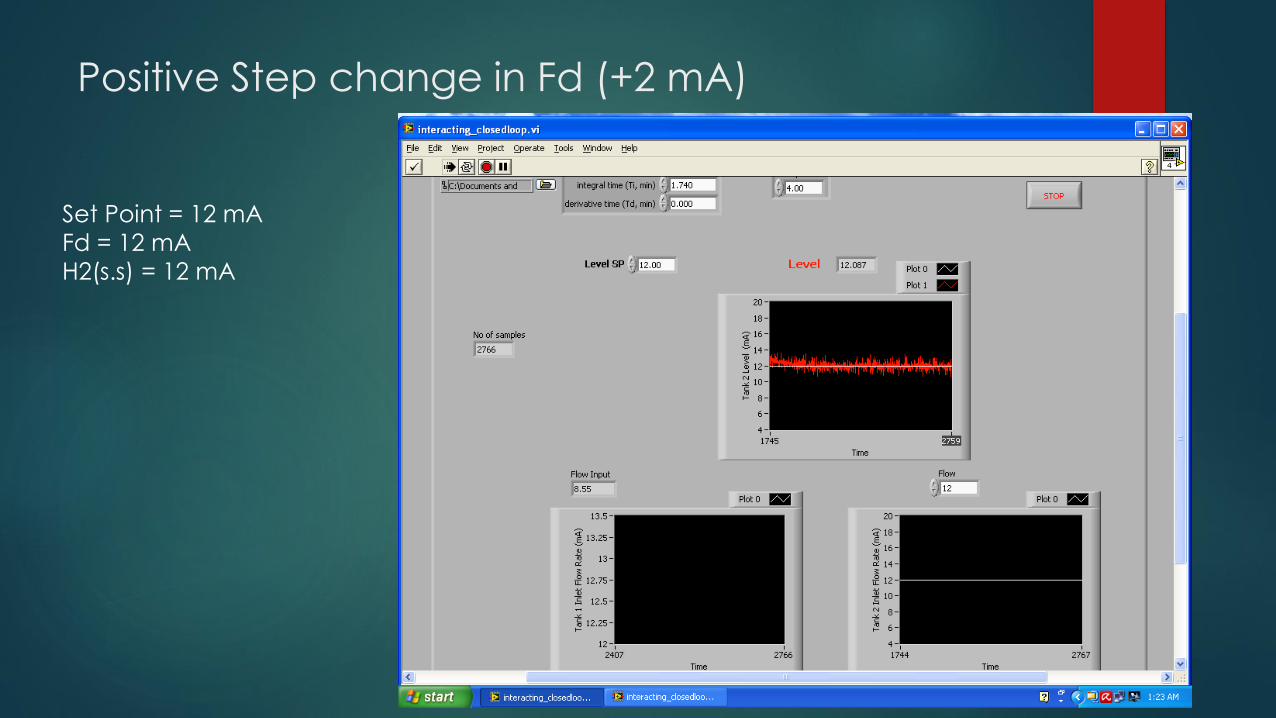
Positive Step change in Fd (+2 mA)
Set Point = 12 mA
Fd = 12 mA
H2(s.s) = 12 mA
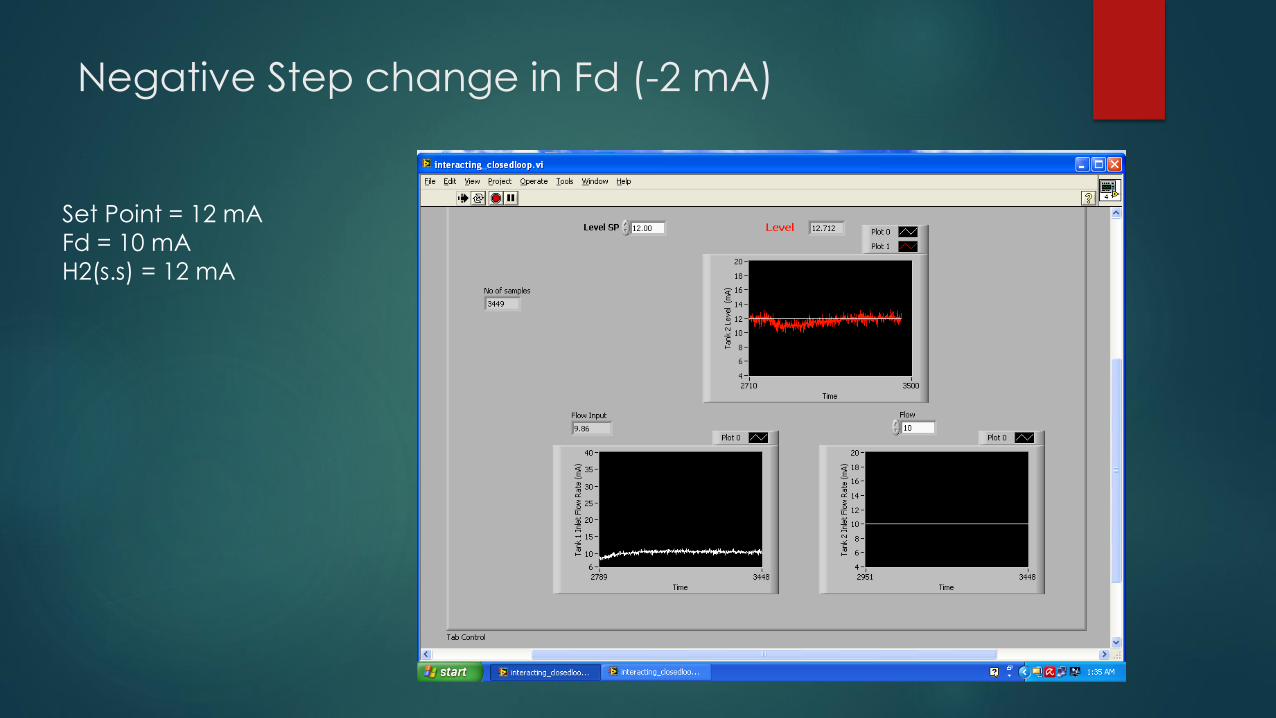
Negative Step change in Fd (-2 mA)
Set Point = 12 mA
Fd = 10 mA
H2(s.s) = 12 mA

Overall variation in H2, set point and Fd
0
2
4
6
8
10
12
14
16
1
123
245
367
489
611
733
855
977
1099
1221
1343
1465
1587
1709
1831
1953
2075
2197
2319
2441
2563
2685
2807
2929
3051
3173
3295
3417
va
lue
in m
A
H2 vs set point and Fd
H2
Set Value
Fd

Conclusion
PI controller was able to remove offset for both servo and regulatory
cases
P controller is unable to remove offset unless there is an integrator in
the process itself