SPENT FLUIDIZED CRACKING CATALYST (FCC) - ShareOK
79
SPENT FLUIDIZED CRACKING CATALYST (FCC) - A POTENTIAL ADSORBENT FOR HEAVY METALS By NIKHIL S JAPTIWALE Bachelor of Engineering – Chemical Engineering University of Mumbai Mumbai, India 2009 Submitted to the Faculty of the Graduate College of the Oklahoma State University in partial fulfillment of the requirements for the Degree of MASTER OF SCIENCE July, 2013
-
Upload
khangminh22 -
Category
Documents
-
view
5 -
download
0
Transcript of SPENT FLUIDIZED CRACKING CATALYST (FCC) - ShareOK
SPENT FLUIDIZED CRACKING CATALYST (FCC) -
A POTENTIAL ADSORBENT
FOR HEAVY METALS
By
NIKHIL S JAPTIWALE
Bachelor of Engineering – Chemical Engineering
University of Mumbai
Mumbai, India
2009
Submitted to the Faculty of the Graduate College of the
Oklahoma State University in partial fulfillment of the requirements for
the Degree of MASTER OF SCIENCE
July, 2013
ii
SPENT FLUIDIZED CRACKING CATALYST (FCC) -
A POTENTIAL ADSORBENT
FOR HEAVY METALS
Thesis Approved:
Dr. Gary L. Foutch
Thesis Adviser
Dr. AJ Johannes
Dr. Josh Ramsey

iii
Name: NIKHIL S JAPTIWALE Date of Degree: JULY, 2013 Title of Study: SPENT FLUIDIZED CRACKING CATALYST (FCC) – A POTENTIAL
ADSORBENT FOR HEAVY METALS Major Field: CHEMICAL ENGINEERING Abstract: Spent fluidized cracking catalyst (FCC) can be utilized as an adsorbent for heavy metals from wastewater. The material is available in huge amount from refineries as a solid waste. This waste is sent to the landfill, once discarded. The potential of spent FCC to immobilize heavy metals from wastewater is explored during this study. The phenomenon considered is adsorption and ion-exchange. FCC is a zeolite material with alumina matrix and clay filler. The catalyst is contaminated by deposition of very small amount of heavy metals such as nickel and vanadium. Thus, it is rejected from the process as a waste, though most of its adsorption capacity remains; can be utilized for heavy metals uptake from wastewater. In this study, the heavy metal tested is copper. Batch experiments are performed to measure the capacity with pH in acidic range. The maximum capacity is found to be ~ 4.7 mg/g and occurs at pH near 6. The capacity increases with pH till above value and then decreases. Ion-exchange seems playing major role in heavy metals uptake; although other adsorption mechanisms such as pore filling, complex formation, and precipitate adsorption cannot be totally ruled out. The study provides an insight about the utilization of spent FCC material in wastewater treatment.

iv
TABLE OF CONTENTS
Chapter Page I. INTRODUCTION ......................................................................................................1
Industrial wastewater ...............................................................................................1 Water contaminants .................................................................................................2 Decontamination methods .......................................................................................2 Heavy metals separation techniques ........................................................................5 Outline of the work ..................................................................................................7 II. FLUIDIZED CRACKING CATALYST (FCC) .......................................................8 Catalytic cracking operation ....................................................................................8 Fluidized cracking catalyst ....................................................................................11 Catalysis during cracking reactions .......................................................................13 Catalyst deactivation ..............................................................................................15 Spent FCC – a potential heavy metals adsorbent...................................................17 III. REMOVAL OF WATER CONTAMINANTS .....................................................21 Recent adsorption studies of heavy metals ............................................................22 Factors affecting adsorption ...................................................................................28 IV. METHODOLOGY, RESULTS AND DISCUSSION ...........................................34 Materials and experimental methods .....................................................................36 Materials ..........................................................................................................36 Experimental methods .....................................................................................37
Batch adsorption studies ............................................................................37 Sampling method .......................................................................................38 Spectrophotometric measurement of Cu(II) ..............................................39 Bathocuproine method ...............................................................................39 Detection limit of copper by bathocuproine method .................................40 Calibration..................................................................................................41
Results and discussion ...........................................................................................41 Solubility limit of copper .................................................................................41
v
Chapter Page Effect of initial solution pH on capacity ..........................................................42 Variation of pH during adsorption ...................................................................50 Maximum adsorption capacity .........................................................................50
V. CONCLUSION AND FUTURE STUDY .............................................................52 REFERENCES ............................................................................................................54 APPENDIX 1 – PREPARATION OF COLORING REAGENT ................................60 APPENDIX 2 – CALIBRATION CURVES ...............................................................63 APPENDIX 3 – EXPERIMENTAL TABLES ............................................................69
vi
LIST OF TABLES
Table Page 4.1 FCC E-cat sample details ....................................................................................37
4.2 Maximum adsorption capacities of Cu on zeolite/clay adsorbents .....................51
A1.1 Characteristics of coloring reagents (Bathocuproine method) .........................62
A3.1 Details of capacity v/s initial pH data ..............................................................69
vii
LIST OF FIGURES
Figure Page 2.1 Feed stock generation path for a fluidized catalytic cracking unit in a typical
refinery ..................................................................................................................9
4.1 Solubility of copper with pH at 25°C .................................................................35
4.2 Effect of initial pH on adsorption capacity of spent FCC for removal of
Cu ........................................................................................................................44
4.3 Comparison of percentage adsorption with pH (Data obtained from Parida
et al. 2011) ..........................................................................................................45
4.4 Comparison of percentage adsorption with pH (Data obtained from Ajmal
et al. 2001) ..........................................................................................................46
4.5 Comparison of percentage adsorption with pH (Data obtained from
Inglezakis et al. 2003) .........................................................................................47
4.6 Comparison of adsorption capacity with pH (Data obtained from
Álvarez-Ayuso et al. 2003) .................................................................................48
A2.1 Calibration curve (Sample pH = 2, No buffer) ................................................63
A2.2 Calibration curve (Sample pH = 2, Buffer pH = 3) .........................................64
A2.3 Calibration curve (Sample pH = 3, No buffer) ................................................64
A2.4 Calibration curve (Sample pH = 3, Buffer pH = 3) .........................................65
A2.5 Calibration curve (Sample pH = 4, Buffer pH = 3) .........................................65
viii
A2.6 Calibration curve (Sample pH = 5, No buffer) ................................................66
A2.7 Calibration curve (Sample pH = 5, Buffer pH = 3) .........................................66
A2.8 Calibration curve (Sample pH = 5.5, Buffer ph = 4) .......................................67
A2.9 Calibration curve ( Sample pH = 6, Buffer pH = 3) ........................................67
A2.10 Calibration curve (Sample pH = 7, Buffer pH = 3) .......................................68

ix
NOMENCLATURE
�� Equilibrium capacity of spent FCC (mg/g)
�� Initial concentration (mg/L)
�� Final concentration (mg/L)
� Volume of the solution (L)
� Mass of FCC added (g)
1
CHAPTER I
INTRODUCTION
Water is an inevitable ingredient of living organisms, including human life. Most of the
water found on earth is in non-usable form. Thus, it has to be processed, rather purified, to
ameliorate its quality suitable for direct use. Numerous water applications are found in
household, agriculture and industry. Major industrial applications include: as a utility (cooling
water, steam), chemical reactant, and solvent. Almost all industrial water processes produce
contamination termed as wastewater. The severe effects of wastewater include: disturbing natural
life cycles, water cycle, and the food chain. Thus, wastewater decontamination is necessary.
INDUSTRIAL WASTEWATER
Various industries generate considerable quantities of wastewater: refineries and
petrochemical, semiconductor, metal plating, and inorganic chemicals plants. Besides process-
contaminated water, utility water is also discarded, for example, cooling tower blow down.
Hydrocarbons and natural gas extraction activities, such as fracturing, generate flow-back and
producer water from underground deposits in high volumes. After originating or passed through
underground deposits during hydro fracturing process, this water is contaminated with different
organic and inorganic chemicals. Flowback also contains additives such as biocides, anti-scaling
agents, friction reducers, polymer breaking agents, lubricants, anti-foam agents, and viscosity
stabilizers. These chemicals contribute to groundwater contamination.
2
WATER CONTAMINANTS
The major contaminants of industrial wastewater can be divided among acids, alkalis, oil
and grease, organics and inorganics; such as, salts and metals. Government bodies enforce
regulations on permissible limits of these pollutants before they are discharged. These limits may
vary by type of industry. The primary objective of this work is to study the removal of heavy
metal contaminants found commonly in industrial wastewater: antimony, arsenic, barium,
cadmium, chromium, cobalt, copper, lead, mercury, molybdenum, nickel, selenium, silver, tin,
titanium, vanadium, and zinc. The contributors to heavy metals discharge are metal plating
industries, metal forming, alloy manufacturing industries, metal products and machinery
manufacturers, mining operations, fertilizer, insecticides and fungicides, ammunition and battery
industries.
DECONTAMINATION METHODS
Several water treatment methods are used by industry to control the release of
environmental pollutants. These methods are classified as physical, chemical and biological
treatments. Based on the influent and effluent water quality, a suitable combination of these
methods is implemented. Some of the major water decontamination techniques are described
here. Also, separation techniques pertaining to the heavy metals are discussed.
1. Coagulation, flocculation and sedimentation – These processes separate suspended solids
from the wastewater. Separation is based on the principle of gravity settling. Solid
contaminant particles of higher density settle at the bottom of the tank. The process
continues until the weight of the solid is balanced by its compressive strength.
Sometimes, to improve the settling rate, coagulants and flocculants are added to the
liquid promote agglomeration. Examples of such chemicals are strong electrolytes, lime,
alumina, sodium silicate, chlorides and sulfates of iron. In case of coagulation, stabilized
3
colloidal particles are aggravated with physical and chemical treatments. Destabilization
involves mechanisms such as electrostatic charge reduction, interparticle bridging, and
entrapment of fine particles in coagulation products (Cherry 1982). Higher sludge
production is anticipated in sedimentation with coagulation.
2. Biological treatments – Organic bio-degradable wastes from almost all types of
wastewater is treated by these methods. The method consists of a bacterial conversion of
dissolved or suspended organic matter in wastewater to cell tissue and gaseous end
products. The cell tissue is removed by gravity settling. Activated sludge process,
nitrification, aerobic/anaerobic digestion are examples of these treatments.
3. Reverse and Forward osmosis – Reverse Osmosis (RO) is one of the membrane filtration
based desalination technologies used most commonly. Other desalination methods
include thermal technologies which are more energy intensive but sometimes can be
better for desired water quality and quantity. A semi permeable membrane produces
almost pure water from saline water feed. This membrane is permeable to water and has
low permeability for dissolved substances. RO is a differential pressure technique. The
feed is forced through the membrane with a pressure higher than its osmotic pressure. At
this condition, water permeates through the membrane from higher to lower
concentration side. At equal or low pressure difference on both sides of the membrane, a
net water flow in the direction of lower to higher solute concentration is observed.
Osmotic pressure is a certain value for a particular solution. It depends upon the solute
concentration. Membrane performance is often limited by mechanisms such as fouling,
scaling, and membrane deterioration causing damage to rejection capability. Membrane
fouling can be avoided partly by pre-treatment of feed water. Membrane cleaning and
replacement is also done. Other pressure driven technologies include nanofiltration,
ultrafiltration and microfiltration are used for removal of colloidal particles, bacteria,
viruses and larger protein molecules (Fritzmann et al. 2007).
4
Osmosis is passage of water across the selectively permeable membrane due to the
osmotic differential pressure. Cath et al. (2006) have summarized the principles and
applications of Forward Osmosis (FO) as a review. The process is similar to RO except
the driving force for mass transport is osmotic pressure difference. A major advantage of
FO is low/no hydraulic pressure. The technique has a wide range of applications today
from water treatment and food processing to power industry as well as novel methods of
controlled drug release. In the last few decades, major progress in membrane science is
observed more for RO than FO.
4. Adsorption and Ion exchange – Adsorption is widely used separation technique for
solutes primarily in solid or gaseous forms and is a reversible phenomenon. In most
cases, solid adsorbent (the material on which adsorption occurs) are used for removal of
adsorbate (the material adsorbed) either from liquid/aqueous solutions or gaseous
mixtures. Some of the major commercial adsorbents are activated carbons, silica gel
(water adsorbent), molecular sieve zeolites, synthetic polymers or resins. The process
has environmental applications such as removal of pollutants from air, wastewater. Other
applications include drying of gases, separation of solvents, colored impurities and other
organics. Activated carbon adsorption has a significant importance in separation of
wastewater contaminants; especially organics. Porous structure and large surface areas of
activated carbon are responsible for the phenomena.
The mechanism involves three steps as, diffusion of solute from bulk liquid/gas
to the external surface of the adsorbent, diffusion of solute through the pores and finally
its adsorption on active sites. Physical forces or chemical forces are responsible for
holding the adsorbate particles. Large pore surface area and pore volume are primary
characteristics of various adsorbents. Adsorption performance depends upon the
characteristics of adsorbent and mass transfer in the bulk phase as well as inside the
5
adsorbent structure. Regeneration is necessary when the adsorbent is saturated.
Adsorption-regeneration in parallel operation is a preferred way in industry.
Ion exchange is a reversible (with very few exceptions) diffusion process similar
to adsorption with an addition of selective stoichiometric replacement of ions from
electrolytes. Ions transport from liquid to solid exchanger and vice a versa. Ion
exchange processes are used mainly for decontamination of industrial wastewater,
recovery of metals, rare earths and sometimes in kinetic applications such as catalysis.
As described by (Helfferich 1995), the major difference in adsorption and ion exchange is
that ion exchange is a stoichiometric process. An ion from solution is stoichiometrically
replaced by another ion from solid resin. Nevertheless, ion exchange processes are
accompanied by adsorption-desorption mechanisms.
5. Evaporation – Evaporation is a comparatively more energy consuming process but is
often applicable where all other decontamination techniques are inefficient. Vacuum or
multiple effects evaporation can be solutions to higher energy requirements. The process
evaporates water leaving out solutes increasing their concentration in the solution. In
practice, there can be some carryover of solute in condensate. The carryover may also
contain other decontaminating agents.
HEAVY METALS SEPARATION TECHNIQUES
This section describes treatments pertaining to the common metal wastes. Metal plating
industries are one of the major contributors to the heavy metals contamination of water. The
wastewater can contain metals cadmium, copper, nickel, zinc, lead, iron. Additionally, some
precious metals can also be present such as gold, silver, platinum, palladium. Others are non-
metal contaminants which include oil and grease, biodegradable compounds, suspended solids.
After reviewing the types and characteristics of contaminants and wastewater flow rates, suitable
treatment techniques are utilized for the cost effective removal.
6
1. Hydroxide precipitation – Hydroxide precipitation is a chemical treatment followed by a
physical separation of precipitate by sedimentation. Steps involved in the operation are
pH adjustment, precipitation and flocculation. Commonly used precipitating reagents are
alkaline compounds lime and sodium hydroxide. Coagulating agents are needed since
metal hydroxides tend to be colloidal in nature. A final pH adjustment may be required
to control high pH due to alkaline chemicals. Sometimes a staged precipitation is
necessary with respect to varying solubility of different metals with pH.
2. Sulfide precipitation – High reactivity of sulfides with heavy metals and insolubility of
the heavy metal sulfides over broad pH range can make sulfide precipitation superior
over hydroxide precipitation. Hydrogen sulfide or soluble salts like sodium sulfide is
used for metals precipitation. The treatment is performed with addition of minimum of
excess sulfide since sulfide itself is toxic in nature and further treatment may be required
for removal. Disposal of metal sulfide sludge can also be a problem.
3. Chromium reduction – Hexavalent chromium is reduced to trivalent chromium in
wastewater. The process is accomplished chemically by adding reducing agents like
sodium bisulfite as well as by an electrochemical chromium reduction. This enables
alkaline precipitation of chromium which is separated later by sedimentation.
4. Oxidation by hydrogen peroxide – This method is mainly used for cyanide destruction,
though metals are also removed from cyanide wastewaters containing zinc or cadmium
(Cherry 1982). The cyanide is converted to less toxic cyanate state while metals are
precipitated as oxides or hydroxides. Precipitates are removed by settling or filtration.
5. Treatment of complexed metals wastes – The metals in the waste streams are attached to
chemicals (complexing agents) which prevent their removal using conventional
techniques such as hydroxide precipitation, settling. A precipitation at high pH is
particularly applicable in the case of complexed metal wastes. Chemicals are added to
waste solutions which break complex bond and allow the metals to precipitate.

7
These techniques fall into the category of physicochemical treatments applied widely to
heavy metals removal from plating wastewater with their features simple equipment, capability of
large volume of water treatment and low cost. Other conventional methods for heavy metals
separation include ion exchange, vacuum evaporation, solvent extraction and membrane
technologies.
OUTLINE OF THE WORK
This work is focused primarily on industrial wastewater. The treatment method of
primary attention is Adsorption. Spent fluidized cracking catalyst (FCC), a solid refinery waste,
is considered as an adsorbent for wastewater contaminants. The objective of the study is to
explore the utilization of spent FCCs as an adsorbent for heavy metals from wastewater. A
literature review pertaining to the removal of contaminant heavy metals mainly by adsorption and
ion exchange technique is attempted in this work. Spent FCC samples are tested to study their
adsorption capacity.
The steps in this work can be summarized with following points.
1. Studying FCC properties as well as suitable adsorbent characteristics.
2. Testing the potential of spent FCC for heavy metals adsorption with laboratory
experiments (Heavy metal tested is copper during this study).
Adsorption kinetics study of heavy metals on spent FCC is not a part of the objectives
here. For this work, readers are requested to consider terms “sorption” and “adsorption” having
the same meaning, though in some literature they are defined differently. If the literature expects
different meaning for these terms, a clarification is provided in this thesis with a definition limited
to the particular article, along with the other related description.
8
CHAPTER II
FLUIDIZED CRACKING CATALYST (FCC)
Catalysis is a very extensive and emphasized topic in reaction engineering. Prior to
envisaging the idea of spent catalyst utilization for adsorption, an overview of catalysts use in
process industry is presented. To be specific, this chapter provides an overview of fluidized
catalytic cracking operation in refinery focusing on their properties and characteristics. As the
chapter proceeds, information about deactivation of FCC catalyst is described. The chapter
concludes with possible adsorption mechanisms on spent FCC catalysts for heavy metals from
aqueous solution; as well as advantages and limitations of spent FCC catalyst as an adsorbent.
CATALYTIC CRACKING OPERATION
The goal of petroleum refining is to convert low value crude oil to higher value fuels in
usable forms such as gasoline, diesel, and kerosene. Before delivery of the final products, crude
oil is processed through several operations in the form of different feed stocks. Crude oil first
passes through the atmospheric distillation tower, the bottoms of which are sent to the vacuum
distillation unit. Vacuum unit separates gas oil from other residues. Collectively, gas oil
fractions from these atmospheric and vacuum separation operations are a feed stock material for
fluidized catalytic cracking unit (FCCU). In some refineries, a delayed coker run downstream to
the vacuum unit producing some additional gas oil which may be mixed with FCCU feed stock.
Also, atmospheric and vacuum resid is blended sometimes with FCCU feed stock. The objective
9
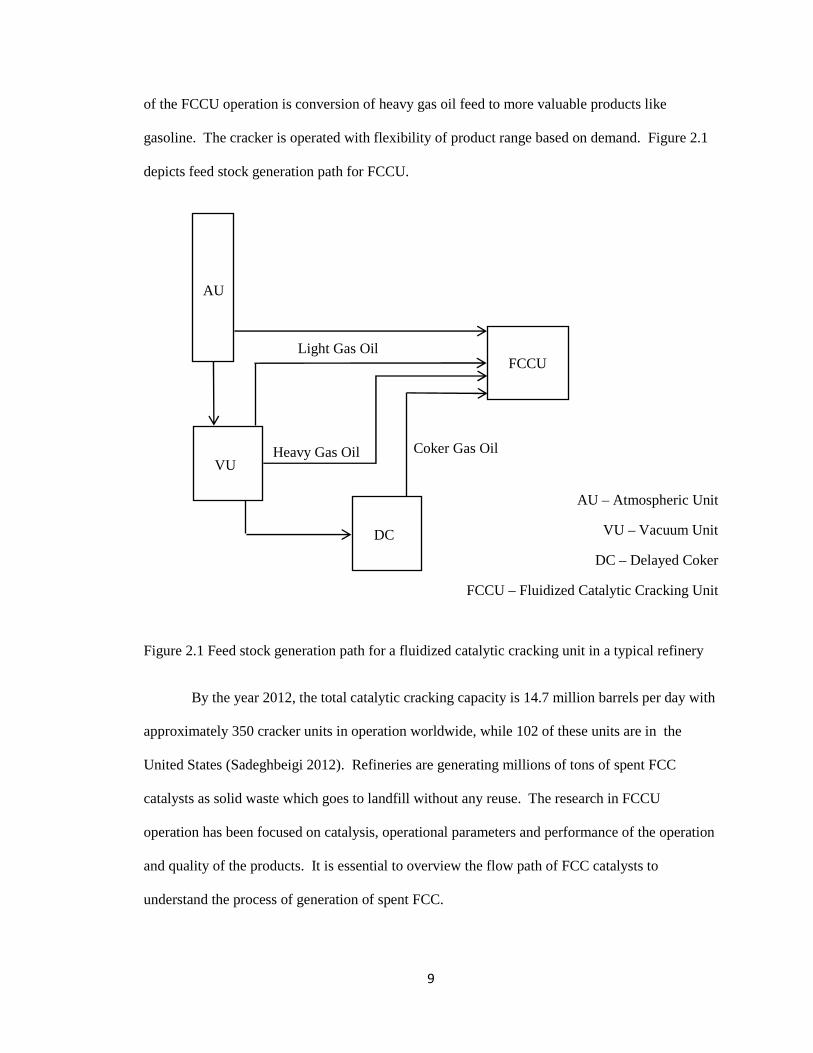
of the FCCU operation is conversion of heavy gas oil feed to more valuable products like
gasoline. The cracker is operated with flexibility of product range based on demand. Figure 2.1
depicts feed stock generation path for FCCU.
AU – Atmospheric Unit
VU – Vacuum Unit
DC – Delayed Coker
FCCU – Fluidized Catalytic Cracking Unit
Figure 2.1 Feed stock generation path for a fluidized catalytic cracking unit in a typical refinery
By the year 2012, the total catalytic cracking capacity is 14.7 million barrels per day with
approximately 350 cracker units in operation worldwide, while 102 of these units are in the
United States (Sadeghbeigi 2012). Refineries are generating millions of tons of spent FCC
catalysts as solid waste which goes to landfill without any reuse. The research in FCCU
operation has been focused on catalysis, operational parameters and performance of the operation
and quality of the products. It is essential to overview the flow path of FCC catalysts to
understand the process of generation of spent FCC.
AU
VU
DC
FCCU Light Gas Oil
Heavy Gas Oil Coker Gas Oil
10
The process starts with feed preheating. The usual source of heat is main fractionator
pumparound streams while sometimes a fired heater is used. The preheated feed is injected at the
base of the riser where it comes in contact with hot regenerated catalyst. The reactions occurring
in riser are endothermic and the heat is supplied by the hot catalyst stream. The cracking
reactions occur as soon as the feed is vaporized. The vapors along with catalyst leave through the
top of the riser. The residence time is typically 1-4 seconds in the riser which is sufficient for
virtually all reactions to take place. A quick separation of spent catalyst from vapors is essential
since substantial activity of spent catalyst in the riser can lead to undesirable cracking reactions.
As a consequence of cracking reactions, a carbonaceous material called coke is deposited on the
catalyst which reduces its activity. Deposition of the coke has a significant impact discarding the
catalyst from service as well as in the study of adsorption for water contaminants which will be
explained later. Catalyst loses its activity primarily due to very small amounts of metal
contaminants such as nickel and vanadium from heavy oil feed stock.
Cyclones are used to separate catalysts from vapors before passing them to catalyst
strippers. Stripping steam displaces entrained hydrocarbons from catalyst pores. Higher
temperature and residence time in stripper cause conversion of hydrocarbons to light vapor
products though part of hydrocarbons reach to the regenerator along with spent catalyst. The
spent catalyst to the regenerator contains 0.4 – 2.5 % coke based on the quality of feed stock
(Sadeghbeigi 2000). Air supplied in the regenerator burns off coke on spent catalyst. A
regenerator cyclone system is used to collect entrained catalyst. The hot regenerated catalyst
flows back to the riser. A fresh catalyst makeup is continually needed. The circulating catalyst is
called equilibrium catalyst or E-cat and is periodically withdrawn for disposal.
11
FLUIDIZED CRACKING CATALYST
In 1920s, Eugene Houdry discovered the cracking of heavy hydrocarbons using acid
treated solid catalyst; while the first cracking unit was commercialized in 1936. From 1940s,
catalytic cracking has truly revolutionized the refinery (Avidan 1993). The improvement of the
process as well as the catalyst has been progressive since then and again, a revolutionary change
occurred once zeolites were introduced in early 1960s as a major constituent of cracking catalyst.
Furthermore, factors such as improvement in yield and selectivity, environmental impact are
responsible for continuous research in the field of FCC catalysis. By this day, there are over 120
FCC catalyst formulations available in the market (Sadeghbeigi 2000).
FCC catalyst has a zeolite as a major component while its other constituents include
matrix, binder, filler and additives like metal traps.
Zeolite – Zeolite is a key element of any FCC catalyst. Around 250 years ago, the
material was introduced as “zeolite” and its significant properties were described by Alex Fredrik
Cronstedt (Colella and Gualtieri 2007, Masters and Maschmeyer 2011). Different types of
zeolites produced synthetically resembling the naturally occurring samples called faujasite are
used in the manufacture of FCC catalyst. Silica (SiO2) to alumina (Al2O3) ratio (Si/Al), pore size
distribution, unit cell size, rare earth level are some major properties that make zeolite samples
distinguishable from one another and cause significant impact on the characteristics of FCC
catalyst. They are particularly responsible for the variations in catalytic activity and stability of
the catalyst. Based on the desired yield of cracking reactions, the right catalyst with essential
properties is selected.
Zeolites are viewed as a crystalline, inorganic polymer material (Venuto and Habib 1979,
Kulprathipanja 2010) having a well-defined tetrahedral (pyramidal) lattice structure with silicon
or aluminum atom at the center surrounded by four oxygen atoms at four corners. The silicon
12
atom is in +4 oxidation state providing a neutral charge on the tetrahedron while if aluminum
atom with +3 oxidation state is present, the tetrahedron possesses a -1 net charge. Commonly, a
sodium ion balances the negative charge in latter case, when zeolites are synthesized in sodium
hydroxide solution. Sodium tends to affect adversely the catalytic activity as well as
hydrothermal stability. It is displaced by ammonium ion. A rare earth metal ion or hydrogen ion
is often ion-exchanged with zeolite which improves thermal and hydrothermal stability and
activity. Rare earths act as bridges between acid sites in zeolite framework.
Another feature of these lattices is that they have a network of small pores with large
internal surface area, and is responsible for providing catalytically active sites. The pore size
varies with different types of zeolite materials. Only selective hydrocarbon molecules are
admitted through these pores based on their size. A unit cell size is an important parameter
characterizing zeolite structure which is a function of Si/Al ratio during zeolite synthesis step and
is defined as the distance between repeating cells (Sadeghbeigi 2000) or length of the smallest
repeating unit in the crystal structure (Wilson 1997).
Matrix – It is a part of catalyst other than zeolite with no activity; and an active matrix
refers to the same but having catalytic activity. Alumina, amorphous in nature, is the material
which primarily constitutes matrix. Other materials are silica-alumina gels, clays etc. An active
matrix provides sufficient surface area and active sites for cracking of large hydrocarbon
molecules which cannot diffuse through zeolite pores (Scherzer 1991). Additionally, alumina
provides a good support for dispersion of metals such as nickel and thus, can function as a metal
trap (Maselli and Peters 1984) and saves zeolite from its premature deactivation.
Binder – The role of a binder is to hold all catalyst components together. Some of the
binder materials may show catalytic activity.
13
Filler – The filler is a clay material, Kaolin, most common in the catalysts, and improves
the physical properties of the catalyst such as density and size distribution.
According to the changing demand in specifications of cracking products (e.g. gasoline
octane), different types of FCC catalysts are used by the refiners. Major types are type X, type Y,
ZSM-5, ultra-stable Y or USY zeolites. Also, there are other extensive types of zeolites
available, used in non-catalytic applications. (e.g. zeolite A as an ion exchanger in powdered
laundry detergent). Certainly, knowledge about the adsorption characteristics of different types
of zeolites is important, provided they differ significantly, to study the possible differences in
water contaminant adsorption behavior. However, note that the experimental data presented in
chapter IV represents the incipient level of evaluating heavy metals separation potential of spent
FCC. Therefore, no details such as zeolite type of FCC catalyst are considered during the
experimental study.
CATALYSIS DURING CRACKING REACTIONS
The objective of this work is to study spent FCC catalyst as an adsorbent and not as a
catalyst. Thus, studying the adsorption characteristics of FCC catalyst is of utmost importance.
Also, to note that, during most of the catalytic mechanisms, adsorption is highly significant to
play the role of catalyst by the catalyst material. Based on this discussion, fundamental
knowledge of catalytic mechanism is helpful; and hence, a short description is provided herein.
The FCC catalysis sometimes termed as zeolite catalysis or molecular sieve catalysis, the
latter as being responsible for limiting access to molecules beyond certain size to catalytic sites.
The FCC operation is a heterogeneous catalysis system where FCC catalyst is in solid phase and
reactant heavy oil feed is vaporized in the fluidized bed reactor. A usual sequence of steps for
conversion of reactants to products in such system is well known and as follows (Smith 1981).
1. Mass transport of reactants from bulk fluid phase to solid surface of catalyst.
14
2. Diffusion of the reactants through the pores to the active sites.
3. Adsorption of reactants on the active sites.
4. Chemical reaction reactants conversion to products.
5. Reverse of first three steps to release products back into the bulk fluid phase.
A typical hydrocarbon cracking operation is a system comprising of series of heterogeneous
catalytic reactions and is no exception to above steps. To focus more on catalysis, adsorption step
is an opening act as described by Kulprathipanja (2010). The interaction involves physical (van
der Waals) and chemical components (polarity, chemical reactions). Charges on zeolite structure
arise due to Bronstëd acid sites, cations. An acid-base reaction between Bronstëd acid sites and
organics is very common. Transport of reactant molecule by microporous diffusion is necessary
to access acid sites. A molecular sieving action is common in zeolites, which disallows
molecules beyond certain critical size to diffuse through the pores and adsorb in channels and
cavities. The presence of coke on the surface and inside the pores of the catalyst structure hinders
specifically the diffusion step since accessibility of the pores is reduced due to the blockage.
Different components from the reaction mixture often follow above mentioned steps. Completion
of above sequence with desired reactions and products is anticipated in FCC operation. But,
interruption of these steps by contaminants, especially heavy metals, leads to the deactivation of
the catalyst. Activity decreases rapidly by undesired hydrocarbons/coke formation promoted by
very small amount of metals like nickel and vanadium; though much of the metal uptake capacity
still remains after withdrawal of deactivated catalyst. Mitchell (1980) reported that, the
deactivation effect becomes pronounced at metal levels above 1000 ppm nickel equivalent. The
nickel equivalent is defined as nickel content in ppm plus 1/5th vanadium content in ppm; as
vanadium has approximately 1/5th the effect of nickel as a dehydrogenating agent (Hildebrand et
al. 1973). His paper mentions metals deposition as a continuous phenomenon, though, the
maximum level of possible deposition has not been found reported until now.
15
CATALYST DEACTIVATION
Similar to catalysis, catalyst deactivation is a separate and vast subject. This section
deals specifically with FCC catalyst deactivation in reactor-regenerator cycles. The deactivation
of FCC catalyst takes place by many ways during cracking reactions mainly due to the formation
and deposition of coke and metals from heavy oil. Coke is nothing but hydrocarbons which are
not removed from the catalyst porous structure by stripping. Catalyst poisoning is classified as
reversible and irreversible type. Deactivation by coke falls under the category of reversible
poisoning with some limitations, while metals like vanadium deposited on the catalyst lead to the
irreversible loss of activity as the catalyst is damaged. Iron, copper are also examples causing
irreversible poisoning, though they are not considered as severe as nickel and vanadium (Venuto
and Habib 1979). Nitrogen compounds can readily get adsorbed on the catalyst sites causing an
instantaneous but temporary poisoning (Psarras et al. 2007). Alkaline metals can also neutralize
catalytic acid sites. Nickel and vanadium catalyze dehydrogenation reactions specifically leading
undesirable coke formation, reduces selectivity of gasoline (Gladrow 1981, Scherzer 1991,
Cerqueira et al. 2008). Additionally, vanadium weakens the crystallinity of zeolite structure
which is a strong reason for activity and selectivity losses (Habib et al. 1977, Pine 1990, Psarras
et al. 2007). Contaminant metals may be trapped in matrix to limit coke formation (Scherzer
1991, Yang et al. 1994, Cerqueira et al. 2008).
Another way is hydrothermal deactivation/dealumination showing irreversible nature. It
is considered as a critical factor in loss of crystallinity by effects of high temperature and steam
partial pressure (Eastwood et al. 1971). Steam at higher temperature destroys zeolite Al-O-Si
bonding. This alters surface area, porosity and deposits alumina inside the pores as well as on
exterior surface (Scherzer and Bass 1973, Moreno and Poncelet 1997, Psarras et al. 2007). This
type of dealuminated zeolite has lower unit cell size, distorted zeolite crystalline structure
possessing higher activity but lower selectivity which results in more coke (Wilson 1997).

16
The deactivation mechanism is complex. Many undesirable hydrocarbon reactions are
involved producing carbonaceous coke which is retained on the catalyst. Coke formed during
cracking reactions block catalyst pores as well as is deposited on active sites. The retention of
coke molecules on the active sites is generally due to their strong adsorption and low volatility or
stripability. Also, in porous zeolite catalysts, coke molecules are formed inside the pores
blocking the acid sites (Guisnet and Magnoux 2001). A partial blockage results when coke is
distributed on the external surface reducing the pore diameter. Certainly, this causes an
inaccessibility or additional resistance to diffusion of reactants to active sites particularly because
coke molecules tend to adsorb on them (Hopkins et al. 1996, Williams et al. 1999, Cerqueira et al.
2008).
Pine (1990) has studied destruction of USY zeolites by vanadium. He investigated the
effect of other metals sodium, potassium, lithium, rare earths on the rate of reaction. He
summarizes that the metals, vanadium and nickel, deposit on the catalyst and promote undesirable
side reactions leading to coke formation. Vanadium attack with steam causes destruction of
zeolites (Järås 1982, Maselli and Peters 1984, Scherzer 1991). In the presence of steam, the
deposited vanadium is carried inside the zeolite structure to facilitate further reaction. Mitchell
(1980) describes, once the continual deposition of these metals on catalyst surface reaches a
certain level, the product distribution is altered by yielding more carbon and hydrogen. This
happens due to the ability of these metals to catalyze dehydrogenation reactions. The metal
tolerances for various types of FCC catalysts are different; and so is their response to metals
contamination (Cimbalo et al. 1972).
FCC catalysts undergo circulation through reactor-regenerator many times. Catalyst
attrition takes place during these cycles leading to loss of FCC catalyst fines and the resulting
catalyst samples have wider particle size distribution as an effect of attrition. It is common
practice to withdraw some catalyst when operating with heavy oil feed containing higher metals.

17
Due to such entrainment and withdrawal of catalyst particles, frequent catalyst make up results in
catalyst age distribution inside the cracker. The mixture of young (low metal deposition, high
activity) and old (high metal deposition, low activity) catalyst is called as Equilibrium catalyst (E-
cat) (Cerqueira et al. 2008). E-cat samples show changes in properties such as the surface areas
lowered by a factor ~3 to 3.5, reduction in pore volume and increase in bulk density is seen
(Venuto and Habib 1979). Table 4.1 in Chapter IV depicts analysis of FCC E-cat samples used
during the experimental study.
Now, with a fundamental knowledge of catalytic mechanism and deactivation, it is easier
to visualize the metals deposition phenomena in spent FCC catalysts. Note that the change in
catalyst properties due to pore blockage, chemical coke formation can affect the deposition
behavior.
SPENT FCC - A POTENTIAL HEAVY METALS ADSORBENT
Several adsorption mechanisms are possible by which these metals are retained on FCC
catalyst. This section discusses possible mechanisms for heavy metals uptake from their aqueous
solutions on FCC catalyst. The objective is to study the characteristics of spent FCC catalyst
making it a suitable adsorbent for heavy metals. Spent FCC catalyst “as is” or without any pre-
treatment is considered. Knowledge of adsorption mechanism can help investigate different
pretreatments leading to suitable adsorbent characteristics. The other factor is conditions under
which the adsorption takes place. Metals Ni, V are deposited in FCC reactor-regenerator from
heavy oil in vapor phase while in case of wastewater treatment; removal of metals is from the
aqueous phase.
Zeolites are known for their versatility with regard to their applications such as detergent
manufacture, ion-exchange resins and catalysts manufacture in petroleum industry, molecular
sieving separation processes (e.g. water, CO2, H2S adsorption) (Bhatnagar and Sillanpää 2010).
18
Zeolite is the basic constituent of FCC catalyst. The matrix is an amorphous material responsible
for catalyst physical properties, although an active matrix can contribute to catalytic activity,
additionally. The following explanation deals with the possible metal uptake by these materials
in FCC catalyst.
1. Cation exchange in zeolites
Ion-exchange is one of the major applications of zeolites in water softening. Pollutant
metal ions from water/aqueous solution are exchanged with tolerable cations from resins.
Similar ion-exchange mechanism can be visualized with spent FCC catalyst with zeolite
as a base material. As described in this chapter, a proton is commonly present which
balances the net negative charge in the AlO4 tetrahedron of zeolite structure. This proton
can be readily ion-exchanged with a metal cation from its aqueous solution.
2. Pore-filling
This type of mechanism is observed with porous activated carbon. The concept is well
explained in (Patrick 1995) and has been studied comprehensively by Dubinin. Large
surface areas are available on the walls and inside randomly arranged pores of
microporous catalyst structure. As described by Patrick (1995), when the concept of
surface area is studied with porous solids the question arises of where and what is the
surface since, the pores are three dimensional volume elements while a surface is flat,
with two dimensions. Thus, adsorption is viewed as progressive filling of micropores
instead coverage of surface. Inglezakis (2007) studied the application of Dubinin-
Astakhov (DA) isotherm, which is based on micropore volume filling type adsorption, to
ion exchange system. He discusses modification of DA isotherm to use in liquid
adsorption and ion exchange system. Many other studies (Khan et al. 1995, Erdem et al.
2004, Rengaraj et al. 2004, Donat et al. 2005, Karapinar and Donat 2009) for adsorption
of metals from aqueous solution where DA/Dubinin-Radushkevich (DR) isotherm is
19
applied by researchers are also referred in his paper. He finally concludes that this type
of mechanism and thus, DA isotherm is applicable to ion-exchange systems with certain
modification.
Pore size is an important property since the accessibility of adsorbent internal
structure depends upon it. Since, spent/coked catalyst is being dealt with; the probability
of pore blockage by coke molecules is higher, limiting scope for adsorption by pore
filling. On the other hand, there may be some porosity associated with coke/carbon
molecules contributing to uptake of heavy metals as well as other organic contaminants.
3. Matrix – metal traps
Many times, the matrix acts as a sink to sodium and other contaminant metals. Thereby,
it improves the metal resistance of the catalyst my trapping metal contaminants like Ni,
V. Various natural clays (metakaolin, sepiolite) are recommended as metal traps
(Scherzer 1991). The metal trapping characteristic of matrix can help separate heavy
metals from wastewater.
4. Chemical reactions – ligand formation and chelation
If metal ions from aqueous solution form a complex with any constituent of FCC
catalyst/organic coke molecules, it can assist the metal retention process. Such type of
adsorption is termed as chemisorption.
While studying heavy metal uptake on FCC catalyst by all possible ways as described
above; there are several other factors that can affect the process. Description of these factors and
their effects is presented in “factors affecting adsorption” section of chapter III.
Adsorption/ion-exchange type water treatment methods are very common in industries.
The process is well established and nowadays, the research is focused primarily on developing
cost effective adsorbents. Literature provides information about hundreds of adsorbents tested, so
far, for removal of heavy metals, including zeolite materials. By the end of this chapter,

20
advantages of using spent FCC catalyst as an adsorbent for removal of heavy metals form
wastewater are summarized.
1. Availability of spent catalysts – Millions of pounds of FCC spent catalysts is
generated in refineries each year. The material is currently disposed of in landfills.
The waste material can be available at essentially no cost. Reutilization of such solid
waste material may be a potentially cost effective solution for heavy metals
contaminants removal from wastewaters.
2. Physical properties – The FCC catalysts are designed specifically with small particle
size and large surface area. The zeolite structure possesses a porous crystalline
structure. Along with the addition of suitable matrix and binder, the properties are
optimized to provide stability. These characteristics are favorable for rapid ion-
exchange rates and utilization of ion-exchange sites due to small diffusion distances
inside pores. Properties of FCC E-cat samples can be referred in Table 4.1.
3. Ion-exchange – FCC catalysts are intrinsic Bronstëd acid possessing proton exchange
capacity with metals cations. Additionally, free alumina has surface hydroxyls that
are active for heavy metals removal.
4. Other advantages are, well characterized uniformity in structure of FCC catalyst
which cannot be observed with other industrial waste adsorbents, non-organic nature
of FCC catalyst avoiding its degradation and thus, migration of adsorbed
contaminants with time.
On the other hand, there are some limitations for removal of heavy metals by spent FCC
catalyst such as pore blockage by coke reducing their accessibility and competition from other
materials (e.g. organics).
21
CHAPTER III
REMOVAL OF WATER CONTAMINANTS
Numerous wastewater treatment methods are employed in industry today. The objective
of all treatments is separation of water contaminants and thus, improvement of water quality for
discharge to the environment or reuse. A practice in designing wastewater treatment systems is to
classify contaminants in specific groups with certain characteristics and then devise a scheme for
separation by different unit operations. Treatment methods are identified generally as primary,
secondary and tertiary. Primary methods like flocculation, sedimentation, precipitation,
biological treatments are most common in industry. Most of the time tertiary methods fall in the
category of polishing techniques and are employed when reuse of the purified water is desired.
Research has been continuously progressing for several years in the field of separation of
water contaminants. This period can be approximately divided into two halves. First half focuses
mainly on development of separation techniques. And investigation, development as well as
utilization of novel materials and cost reduction of the usual techniques have been continued till
date. In recent years, emphasis was on utilization of by products and waste materials for
immobilization of water contaminants. Current work leads in a similar pathway based on an
innovative idea of investigating spent fluidized cracking catalysts (FCC) as potential adsorbents
for water contaminants. The phenomena of adsorption and ion-exchange are associated with this
separation.
22
Several adsorbents and ion exchange materials have been tested and their performance
reported in literature. Commercially activated carbon has been a well-known adsorbent used for
treatment of water as well as air. Some adsorbents are suited better for certain pollutants based
on their characteristics. In many cases, the adsorbents tested were carbonaceous materials and
zeolites. Significant performance of these materials has made them common in current
wastewater treatments.
This chapter presents a literature review on water contaminant removal, focused on heavy
metals, from wastewater. The objective is to study the literature collectively and not to segregate
based on types of adsorption materials. The proposed adsorbent material for heavy metals
removal in this study is spent/coked FCC—a combination of carbon and zeolite aluminosilicate.
RECENT ADSORPTION STUDIES OF HEAVY METALS
Heavy metals contamination is a huge problem for wastewater originating from industries
such as metal plating facilities, mining operations, and tanneries. Their discharge poses a threat
to life through surface and ground water contamination. Although the emissions of these metals
are relatively low, they tend to accumulate in living organisms and are non-degradable.
Commonly found metals include Hg, Pb, Cu, Cr, Ni, Zn, and Cd. These metals have toxic effects
on humans, animals and plants.
Removal of these metals is primarily accomplished by precipitation. Other techniques,
like adsorption and ion-exchange, are employed sometimes, considering factors such as the level
of decontamination and cost of treatment. Many waste materials are being tested for adsorptive
treatment to enhance cost effectiveness. The research has been continuously focused, in recent
years, on the improvement of the technique with novel materials and its cost reduction (Repo et
al. 2011). Various materials have been synthesized; targeting optimum properties of pollutants
adsorbents. The other aspect is a pre-treatment of adsorbent materials to enhance their
23
performance. This section discusses heavy metals adsorption studies focusing on capacity and
characteristics of materials tested in the past few decades.
Juyo et al. (2008) performed kinetic and equilibrium studies for removal of mercury from
aqueous solution. NaY zeolite and waste FCC catalyst were tested as adsorbents. They
concluded the waste FCC capacity for removal of mercury is lower than that of NaY zeolites,
attributable to the lower surface area. Experiments performed at 25.4° C and 35° C indicated
higher capacity of zeolite at 35° C while the FCC capacity decreased.
Adsorption of copper from aqueous solution using amine functionalized molecular sieve
material (NH2-MCM-41) was performed by Parida et al. (2011). Higher amine loading favored
adsorption. The maximum adsorption (76%) was obtained at 323 K, pH 5.5 and the minimum
Cu(II) concentration evaluated. Lower extents of adsorption at higher initial concentrations of
Cu(II) is attributed to the competition between metal ions to occupy adsorption sites.
Equilibrium and kinetics studies of metals Cr(III), Ni(II), Zn(II), Cu(II) and Cd(II) have
been performed on natural (clinoptilolite) and synthetic (NaP1) zeolites by Álvarez-Ayuso et al.
(2003). Sorption capacities for synthetic zeolites were observed to be 10 times greater than for
natural zeolites. The study reported that sorption isotherms for these metals followed Langmuir
isotherm. The term “sorption” is newly defined in this study as a surface retention process
irrespective of mechanism, adsorption or precipitation or the loss of chemical species from
aqueous phase to contiguous solid phase (Sposito 1986). Metals sorption is reported to be pH
dependent; being higher with increasing pH. They concluded that Cr and Cu are preferentially
sorbed over Cd, Ni and Zn in case of both synthetic and natural zeolites, hydroxide precipitation
being the main mechanism for Cr and Cu while others follow cation exchange mechanism for
their retention on zeolites.

24
Erdem et al. (2004) tested the adsorption behavior of natural zeolites (clinoptilolite) with
Co(II), Cu(II), Zn(II) and Mn(II). The effect of initial metal ions concentrations on adsorption
was studied. Percentage adsorption of these metals as well as their distribution coefficient values
decrease with increasing initial concentration in aqueous solution. They attribute the metals
uptake to diffusion, ion exchange and adsorption. Diffusion was faster through pores but
becomes retarded through smaller diameter structural channels of microporous zeolites (Malliou
et al. 1994). The adsorption selectivity Co(II) > Cu(II) > Zn(II) > Mn(II) is attributed to the
charge density and hydrated diameter of cations. The charges of all metal ions are same (+2).
Therefore, the biggest diameter ions, Mn(II), have minimum adsorption while the reverse is true
for Co(II) ions with least diameter.
Malliou et al. (1994) studied the ion exchange behavior of clinoptilolite for Pb and Cd.
The influence of particle size and solution temperature was examined. The effective diffusion
coefficients for ions through zeolites pores as well as lattice channels are reported to decrease
with zeolite particle size which indicates reduced ionic mobility. The metal uptake and ion
exchange rates are increased by decreasing particle size. The exchange increased with external
solution temperature for both Pb and Cd.
A similar study for heavy metal ions Pb(II), Cu(II), Fe(III) and Cr(III) was conducted by
Inglezakis et al. (2003). Natural Greek clinoptilolite was examined in terms of ion exchange
selectivity toward above metals in single and multicomponent solutions in batch. The other
factors studied were the influence of clinoptilolite on solution acidity and the effect of acidity on
the ion exchange process. Selectivity for a metal couple A/B is defined as ratio of metal uptake at
time t. Despite the fact that solutions contained the same quantity of metal equivalents, the
amount of metal uptake was different for each metal. In the multicomponent systems, the
selectivity of each metal was observed to be changing with time and the trend was different for
each metal, which supports that the selectivity is concentration dependent. The change in
25
selectivity suggests that the ion exchange is a dynamic process where the binding forces between
cations and zeolite are relatively weak and cations residing on zeolites can be replaced several
times by other metal ions. Stability is achieved only at equilibrium. They also mentioned that the
selectivity is system specific (e.g. two-component system or multi-component system) and thus,
beyond predictions, experimental data is needed in each case. They also report that the ion-
exchange of metals is favored by high acidity; however, it should be lower than the minimum
acidity for precipitation.
Singh et al. (2000) tested a natural zeolite (~ 75% clinoptilolite) and three types of
synthetic zeolites for sorption of Cd to evaluate the possible use in reducing Cd from
contaminated soils. Zeolites were added to 0.01 M NaClO4 with different Cd concentrations at
constant temperature to study their sorption behavior. Synthetic zeolites showed much higher
capacities than natural zeolites. Sorption increased with increasing pH for all types of zeolites
and decreasing zeolite particle size for natural zeolite which may be due to the greater
accessibility of pores and channels.
Ok et al. (2007) used fine zeolite by-product during natural zeolite processing mixed with
Portland cement (75:25) to adsorb heavy metals from wastewater. Batch experiments were
performed to study adsorption kinetics and capacity. Cu adsorption capacity of the mixture
decreased with increasing particle size. Adsorption of Cd, Cu, Pb and Zn increased with pH.
Above pH 6, the percent adsorbed for these metals increased significantly, attributed to the
precipitation of metal complexes. This is an interesting observation as adsorbent used is a
mixture of zeolite and Portland cement (composed of CaO, Al2O3, SiO2 (Bye 1999)). This
suggests possibility of similar type of adsorption on spent FCC as is composed of an
aluminosilicate material. The maximum adsorption capacity for Cu was reported as 23.25 mg g-1.
They report, the maximum adsorption capacities of heavy metals about two times greater than the
type of activated carbon used in the study.
26
García-Sánchez et al. (1999) studied sorption of heavy metals by silicate minerals with
influence of adsorbent particle size, pH between range 4-6 and ionic strength on adsorption.
They report decrease in Cd(II) adsorption capacity with increasing particle size of adsorbent
sepiolite keeping other variables unchanged: adsorbent dose, initial concentration of Cd(II),
shaking time and pH. Increase in adsorbent dosage increases metal retention; but, does not have
much effect after certain value. Adsorption on sepiolite increased with pH. The effect of ionic
strength of the solution was studied by addition of KNO3 which facilitates competition between
K(I) and Cd(II) ions. The adsorption of Cd(II) decreased slightly on sepiolite with KNO3 as an
additional electrolyte in the solution keeping the same variables unchanged. Cation exchange
capacity represents a very small portion of total adsorption capacity, which is a reason for such a
small change in adsorption. Note that sepiolite is recommended as metal trap by Scherzer (1991).
Hadjar et al. (2004) developed a composite material using Kieselguhr and charcoal and
tested it as an adsorbent for Pb from aqueous solution. Pretreatment included pyrolysis and acid
treatment. FCC also undergoes similar type of regenerative treatment partially. They describe
these treatments allow pore modification and uniform distribution of carbonaceous material on
surface, thus enhance adsorption properties. Due to the formation of metal complexes and
presence of metal ions with various degrees of activity, their behavior in aqueous solution is a
complex phenomenon. Studying the effect of pH, they have mentioned the competition between
Pb+2 and protons. The capacity increases with pH with comparatively smaller rate around pH 4
at which hydroxides are formed. The maximum capacity of 114.94 mg/g is reported. They
attribute adsorption to various mechanisms such as ion-exchange, surface complexation.
A pyrolyzed coffee residue mixed with clay (major components: SiO2 57.45%, Al2O3
24.12%) is tested for adsorption of heavy metals by Boonamnuayvitaya et al. (2004). They
performed trial runs to decide pretreatment conditions and came up with pyrolysis temperature of
500° C, ratio of coffee residue to clay 80:20 and particle diameter 4 mm. This can be viewed as
27
adsorption on a carbonaceous material with a silica base. They observed, higher the clay content
in mixture, lower the capacity and attributed to coverage of active sites/pores by clay. Also, they
found, higher adsorption at lower diameter yielding high specific surface area. The maximum
adsorption capacity of Cu is reported 31.2 mg/g. Capacity for Cd+2 increased with pH attributed
to two factors, competition of H+ ions at lower pH and highly negative-charged adsorbent at
higher pH due to high zeta potential. Increased adsorption with temperature is ascribed to more
active sites. Adsorption per unit surface area was very high for this adsorbent compared to
activated carbon caused by higher fraction of mesopores. Though, surface area of activated
carbon was very high, pore size of the adsorbent mixture was large.
Kadirvelu et al. (2001) studied removal of heavy metals from industrial wastewater by
activated carbon prepared from agricultural waste coirpith. Their experiments showed maximum
removal of heavy metals as: Cu(II) 73% at pH 5.0, Hg(II) 100% at pH 3.5, Pb(II) 100% at pH 4.0,
Cd(II) 100% at pH 4.0 and Ni(II) 92% at pH 3.5. Increasing adsorbent carbon concentration
increased percent removal of metal ions.
Apak et al. (1998) studied heavy metals cation retention by metallurgical solid wastes red
mud and fly ash. They mention surface precipitation and chemical adsorption play important role
for heavy metal ions removal (Apak and Ünseren 1987) in their study. Acid treatment for both
adsorbents and further heat treatment was performed with red mud to modify the material
properties especially surface area. These pretreatments did not increase metal loading capacities
significantly. They noted that sorption of all metal cations (except Cd(II) on fly ash) took place at
pH below point of zero charge (PZC) of sorbents, indicated specific adsorption by hydrous oxide
as a dominant mechanism. The irreversible character of adsorption for selected adsorbents is
confirmed by very low values of desorption distribution coefficients compared to that of
adsorption.

28
Much of the literature is related to studying waste materials, materials with zeolite base
and carbonaceous material. The reason is that the proposed adsorbent material in this study—
spent FCC possesses all above characteristics and hence, with these common characteristics may
show a significant potential for heavy metals removal from wastewater. Also, these studies
attribute adsorption to various mechanisms. One or more of such mechanisms may be
responsible for adsorption on spent FCC. The purpose of this review is to focus on the heavy
metals adsorbents used previously which, to some extent, match their components and properties
with spent FCC. This may help assess the probability of adsorption on FCC, mechanisms and
factors governing the same. The goal is to assess the potential and further enhance the adsorption
characteristics of spent FCC for its utilization in wastewater treatment.
FACTORS AFFECTING ADSORPTION
The following factors are considered for the adsorption of solid material from the
aqueous solution on solid adsorbent.
1. Initial concentration
Higher percentage of metal adsorbed with low initial concentration, reported by Erdem et
al. (2004) and Parida et al. (2011). The reason being, competition between large number
of metal ions to occupy adsorption sites, as explained by Parida et al. (2011). A similar
discussion, to some extent, is presented by Qiu et al. (2009) where they studied the effect
of silica based adsorbent feed at constant initial concentration of Cr(VI). They attribute,
the increase in adsorption at higher adsorbent feed due to increased absolute adsorption
surface/cites. From this literature it seems studying adsorbent dosage with regard to
initial concentration (ratio of initial metal concentration and adsorbent dosage) is
essential.
2. Cation exchange capacity (CEC)
29
This factor is more significant when ion-exchange is the highest contributive mechanism
to adsorption. The type of zeolite having more CEC will be more efficient. As
mentioned in the previous chapter, different types of zeolite materials are used to
synthesize FCC. Babel and Kurniawan (2003), Ouki and Kavannagh (1997) reported
that, chabazite is superior to clinoptilolite due to its higher CEC. The fact behind this
superiority is higher Al substitution of Si providing a favorable negative framework for
cation exchange.
3. Hydrated radii of cations
Zeolites have a porous structure. Metal ions (or other adsorbate) have to pass through
these pores to access the ion-exchangeable cations from zeolites (or to access active
sites). Cations with lower hydrated radii should access these pores comparatively easily
to show improved selectivity. To some extent, this explanation leads to adsorption by
pore filling mechanism. Following are hydrated radii of some heavy metal cations: Zn =
4.30 A°, Cd = 4.26 A°, Cu = 4.19 A°, Ni = 4.04 A°, Cr = 4.61 A°, Pb = 4.01 A°
(Nightingale 1959). According to García-Sánchez et al. (1999), retention of metals
follows inverse order of hydrated radii i.e. more adsorption for lower radii which explains
the effect. But, this is not true in each case as observed by Leinonen and Lehto (2001)
for commercial zeolites. They conclude, pore structure is not a critical factor determining
selectivity.
4. Effect of ionic strength
Álvarez-Ayuso et al. (2003) studied the effect of ionic strength by addition of divalent
calcium to the solution. The decrease in adsorption by higher ionic strength is attributed
to competing ions. They explain the effect is significant with metals adsorbed by an ion-
exchange mechanism and not so in case of adsorption by precipitation. A similar
observation is reported by García-Sánchez et al. (1999) while studying adsorption of
cadmium on mineral sepiolite.

30
5. Solution pH /hydroxide precipitation
Solution pH is the major variable controlling precipitation of metals in their aqueous
solution. Thus, where the adsorption is significantly affected by precipitation, pH of the
solution is an import parameter. For example, when adsorption is primarily by ion-
exchange, it is favored at a pH lower than precipitation pH and vice a versa, in case of
adsorption by precipitation. At very low pH, competition by H+ ions may have inverse
effect on ion-exchange of metal cations. The above discussion is valid testing adsorption
of a single metal, as different precipitation pH values exist for different metals.
As mentioned by Leinonen and Lehto (2001) and reiterated by Álvarez-Ayuso et al.
(2003) and Erdem et al. (2004), zeolites, in general, are weakly acidic in nature, having
higher equilibrium selectivity for hydrogen, which leads to higher pH with relatively
dilute solutions. Thus, in such cases, it can be possible that adsorption at lower initial pH
have an impact on equilibrium pH of the solution.
R-Na + H2O ↔ RH + Na+ + OH-
Literature reports different observations of the pH effect on adsorption based primarily on
adsorption mechanisms.
6. Solubility product
It is the maximum product of concentrations of ions in equilibrium with the electrolyte at
a certain temperature. In simple words, it provides information about the extent an
electrolyte is dissociated or in ionic form in the solution. The higher the solubility
product, the higher the dissociation and lower the solubility product constant defined as
negative logarithm of solubility product. This means electrolytes with high solubility
product constant show more tendency of precipitation. Evaluating adsorption by
precipitation, the concept is helpful.
31
7. Point of zero charge on adsorbents (PZC)
PZC is the pH value at which net total particle charge is zero. The total particle charge
constitutes: structural charge, net charge by adsorbed proton/hydroxide ion and charge by
adsorbed ion. The sum of all charges must be zero to satisfy the constraint of surface
charge balance. In other words, structural charge and charge by surface complexed
proton/hydroxide ion must be balanced by all other adsorbed ions (Sposito 1998).
PZNPC (Point of zero net proton charge: pH value at which net proton surface charge is
zero) of synthetic zeolites is higher than natural zeolites as reported by Álvarez-Ayuso et
al. (2003), García-Sánchez et al. (1999). They conclude precipitation is main mechanism
of retention of metals Cr and Cu, which is higher on synthetic zeolites showing higher
PZNPC. Apak et al. (1998) mention the adsorption of metals in hydrous oxide form at
pH lower than PZC.
8. Adsorbent particle size
Many researchers (Malliou et al. 1994, García-Sánchez et al. 1999, Boonamnuayvitaya et
al. 2004, Ok et al. 2007) report that adsorption of heavy metals increases with decreasing
particle size of adsorbents. The change is minimized at equilibrium for lead uptake on
clinoptilolite (Malliou et al. 1994). They studied metals adsorption on zeolite material or
clay mineral. This effect is ascribed to increased active/specific surface area of adsorbent
(Boonamnuayvitaya et al. 2004) and probability of solid-solution interaction as adsorbate
must diffuse through the aggregates to access active sites and spend longer interaction
time (García-Sánchez et al. 1999) in case of larger diameter particles. Studying effect of
adsorbent particle size may help devise adsorbent pretreatment such as sieving.
9. Adsorbent surface area
Generally, adsorption increases with specific surface area of adsorbent, also another
decisive factor is availability of certain pore sizes (Boonamnuayvitaya et al. 2004).
(Boonamnuayvitaya et al. 2004) report, though the surface area of activated carbon is
32
very large compared to other adsorbent (coffee residue and clay mixture or CC-
adsorbent), adsorption capacity per unit area of CC-adsorbent was higher due to higher
fraction of mesopores. Literature (Boonamnuayvitaya et al. 2004, Hajdar et al. 2004)
report improvement of porous structure, surface areas and thus, adsorption characteristics
by pyrolysis, which can be considered as a potential pretreatment for spent FCC.
10. Silica to alumina (Si/Al) ratio
Adsorption increases with higher aluminum content i.e. higher sorption capacities are
found with lower Si/Al ratios (Ouki and Kavannagh 1997, Leinonen and Lehto 2001,
Álvarez-Ayuso et al. 2003). This seems obvious when ion-exchange is the dominating
mechanism; since aluminum provides negative framework favorable to positively
charged metal ions. However, lower Si/Al ratio have a tendency to take up H+ ions from
solution, competitive to uptake of metal cations. This H+ ion transport results in high
equilibrium pH (Leinonen and Lehto 2001). Si/Al ratio also affects the cation exchange
capacity (CEC) of zeolite as mentioned by Babel and Kurniawan (2003), Ouki and
Kavannagh (1997). Lower Si/Al provides higher CEC as described previously.
11. Zeta potential
Zeta potential is a parameter that indicates the electrical potential at the surface of the
particle (Boonamnuayvitaya et al. 2004). Particle charge is one of the parameters that
can be used to control coagulation. Total particle charge is distributed all over the
particle in two layers; in bulk water phase and in attached water layer to the particle,
which is bound with it. The actual charge in these layers cannot be measured; but the
residual charge at the interface is measurable called zeta potential (Cherry 1982).
Boonamnuayvitaya et al. (2004) measured zeta potential for the particular adsorbent
mixture they used in their study of heavy metals adsorption. They found their samples
indicating negative zeta potential favorable to adsorption of positively charged metal
ions. Its magnitude increased with pH. Since, at higher pH, hydroxyl ions are prevalent,
33
more scope for metal ions transport exists from solution. The zeta potential of silica was
found (Albrecht et al. 2011) negative and increasing its magnitude with pH up to ~5.5.
This suggests, adsorption of Cu+2 ions having no impact on surface chemistry which may
not be true after precipitation since trend in change of zeta potential is reversed at
precipitation.
12. Temperature
Adsorption of Cd+2 increases with temperature, reported by Boonamnuayvitaya et al.
(2004), when tested on a mixture of coffee residue and clay as adsorbent. They reason
that more activation of sites occurs at high temperature. According to them, electrostatic
force is involved with adsorption. Parida et al. (2011) also report increase in adsorption
of Cu+2 with temperature, establishing chemisorption as a responsible mechanism.
These factors affect simultaneously during the adsorption process based on nature of
adsorbents, operating conditions. So, to generalize their effect is challenging. A large amount of
experimental data can be supportive studying their effect with particular adsorbent like spent
FCC. Some of the above factors may be responsible governing the adsorption behavior of heavy
metals on spent FCC. Noting this, suitable characteristics can be selected such as particle size,
FCC with certain zeolite type, and pH. Pretreatments to achieve these characteristics can be
investigated further.
34
CHAPTER IV
METHODOLOGY, RESULTS AND DISCUSSION
As discussed in Chapter I, the objective of this research is to evaluate the adsorption
potential of spent FCC catalyst for heavy metals from wastewater. Many heavy metals such as
Hg(II), Pb(II), Cu(II) are found in industrial wastewater. The probability of discharge of such
metals is higher from industries involving metals processing. These heavy metals are toxic for
living organisms and should be controlled before environmental discharge. The heavy metal
tested in this study is copper in its ionic form Cu(II). Industries whose wastewaters may contain
significant amount of copper are mining, ammunition, fertilizer and pigments industry and metal
plating, finishing. The metal is found either in simple ionic form or in a complexed form as
organic ligands. This study targets the metal in its ionic form Cu(II). Although copper is
essential for human health, it is a potentially toxic element in excess and will accumulate in the
human body leading to serious effects. Many water pollution control agencies list the maximum
recommended concentration of Cu(II) in drinking water in the range 1-1.5 mg/L (Rengaraj et al.
2004, Prasanna Kumar et al. 2006, Parida et al. 2011).
Adsoption is one of the most efficient, viable and cost effective technique for removal of
heavy metals form wastewater (Parida et al. 2011). Various natural and synthetic adsorbents have
been tested, so far, for removal of copper (García-Sánchez et al. 1999, Hussein et al. 2004,
Prasanna Kumar et al. 2006, Ok et al. 2007, Parida et al. 2011).
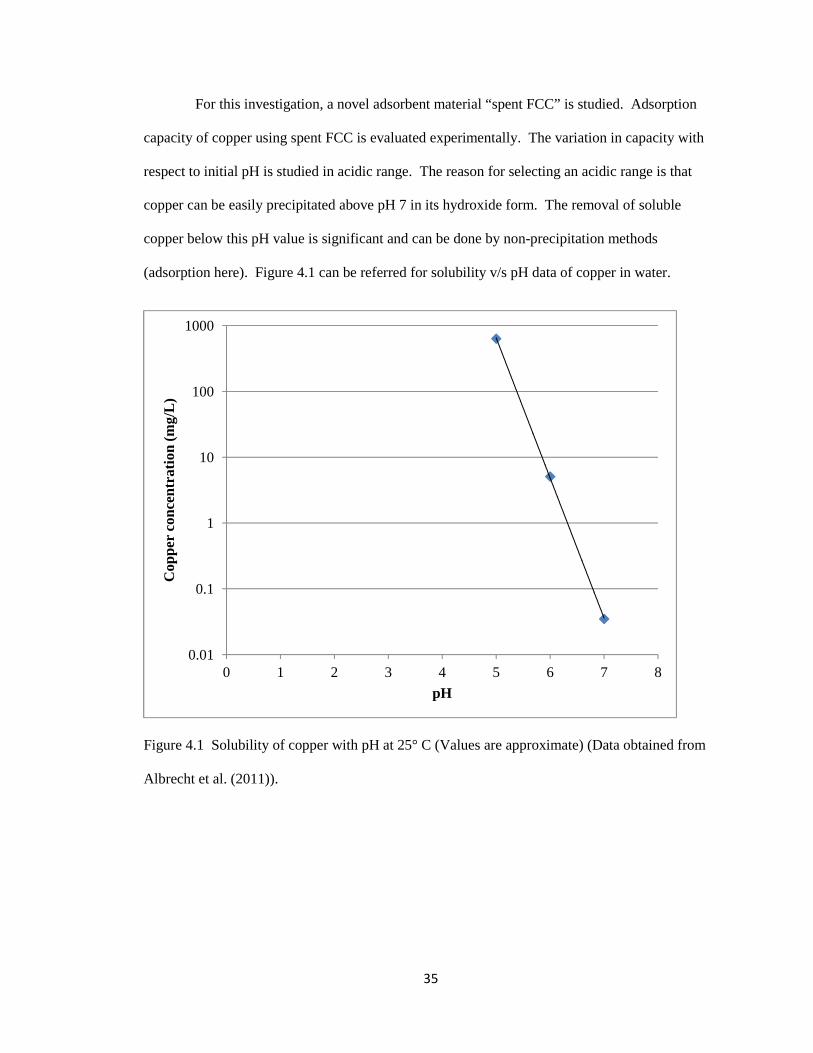
35
For this investigation, a novel adsorbent material “spent FCC” is studied. Adsorption
capacity of copper using spent FCC is evaluated experimentally. The variation in capacity with
respect to initial pH is studied in acidic range. The reason for selecting an acidic range is that
copper can be easily precipitated above pH 7 in its hydroxide form. The removal of soluble
copper below this pH value is significant and can be done by non-precipitation methods
(adsorption here). Figure 4.1 can be referred for solubility v/s pH data of copper in water.
Figure 4.1 Solubility of copper with pH at 25° C (Values are approximate) (Data obtained from
Albrecht et al. (2011)).
0.01
0.1
1
10
100
1000
0 1 2 3 4 5 6 7 8
Cop
per
conc
entr
atio
n (m
g/L
)
pH

36
MATERIALS AND EXPERIMENTAL METHODS
Materials
Spent FCC catalyst samples (E-cat) were used “as received” i.e. without any pretreatment
from Conoco-Phillips Inc. Detailed characteristics of these samples are provided in Table 4.1. A
tissue culture grade cupric sulfate (CuSO4.5H2O) from Fisher Scientific, Fair Lawn, NJ (assay >=
98%) was used to prepare aqueous solution of copper in de-ionized water. NaOH (0.5 N and 1 N)
and HCl (2-4%, 10%, 20%) are used for pH adjustments.
For preparation of coloring reagent (Bathocuproine method), the reagents used are:
Laboratory grade bathocuproine (2,9-dimethyl-4,7-diphenyl-1,10-phenanthroline) from GFS
chemicals, Inc. Columbus, OH, a reducing agent hydroquinone (>= 99%) from Sigma-Aldrich,
St. Louis, MO, sodium chloride (NaCl) and citric acid monohydrate (C6H8O7.H2O) from Fisher-
Scientific, Fair Lawn, NJ.
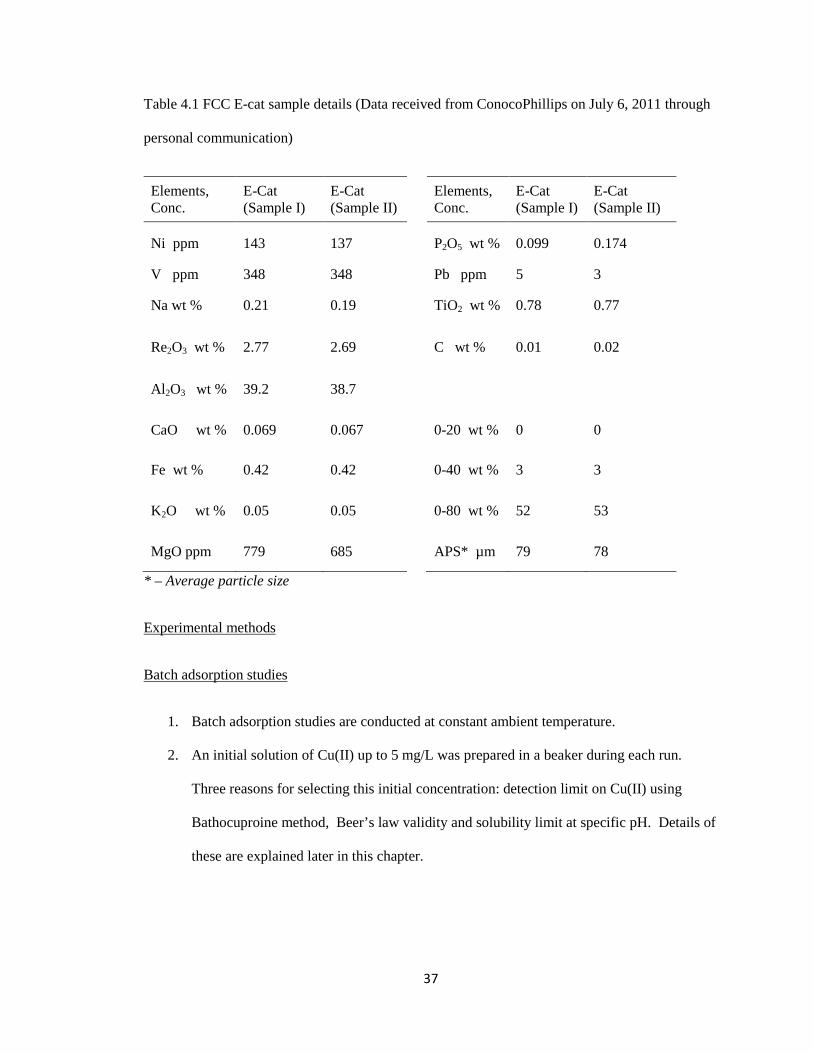
37
Table 4.1 FCC E-cat sample details (Data received from ConocoPhillips on July 6, 2011 through
personal communication)
Elements, Conc.
E-Cat (Sample I)
E-Cat (Sample II)
Elements, Conc.
E-Cat (Sample I)
E-Cat (Sample II)
Ni ppm 143 137
P2O5 wt % 0.099 0.174
V ppm 348 348
Pb ppm 5 3
Na wt % 0.21 0.19
TiO2 wt % 0.78 0.77
Re2O3 wt % 2.77 2.69
C wt % 0.01 0.02
Al 2O3 wt % 39.2 38.7
CaO wt % 0.069 0.067
0-20 wt % 0 0
Fe wt % 0.42 0.42
0-40 wt % 3 3
K2O wt % 0.05 0.05
0-80 wt % 52 53
MgO ppm 779 685
APS* µm 79 78
* – Average particle size
Experimental methods
Batch adsorption studies
1. Batch adsorption studies are conducted at constant ambient temperature.
2. An initial solution of Cu(II) up to 5 mg/L was prepared in a beaker during each run.
Three reasons for selecting this initial concentration: detection limit on Cu(II) using
Bathocuproine method, Beer’s law validity and solubility limit at specific pH. Details of
these are explained later in this chapter.
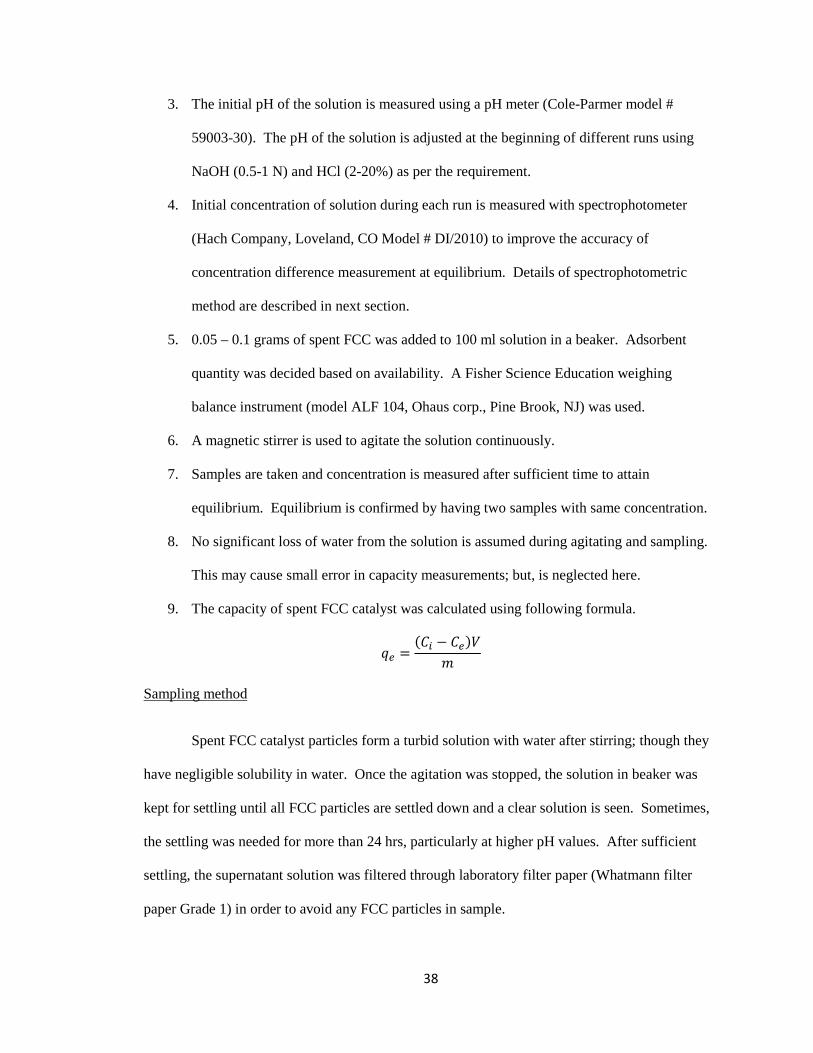
38
3. The initial pH of the solution is measured using a pH meter (Cole-Parmer model #
59003-30). The pH of the solution is adjusted at the beginning of different runs using
NaOH (0.5-1 N) and HCl (2-20%) as per the requirement.
4. Initial concentration of solution during each run is measured with spectrophotometer
(Hach Company, Loveland, CO Model # DI/2010) to improve the accuracy of
concentration difference measurement at equilibrium. Details of spectrophotometric
method are described in next section.
5. 0.05 – 0.1 grams of spent FCC was added to 100 ml solution in a beaker. Adsorbent
quantity was decided based on availability. A Fisher Science Education weighing
balance instrument (model ALF 104, Ohaus corp., Pine Brook, NJ) was used.
6. A magnetic stirrer is used to agitate the solution continuously.
7. Samples are taken and concentration is measured after sufficient time to attain
equilibrium. Equilibrium is confirmed by having two samples with same concentration.
8. No significant loss of water from the solution is assumed during agitating and sampling.
This may cause small error in capacity measurements; but, is neglected here.
9. The capacity of spent FCC catalyst was calculated using following formula.
�� � ��� ����
Sampling method
Spent FCC catalyst particles form a turbid solution with water after stirring; though they
have negligible solubility in water. Once the agitation was stopped, the solution in beaker was
kept for settling until all FCC particles are settled down and a clear solution is seen. Sometimes,
the settling was needed for more than 24 hrs, particularly at higher pH values. After sufficient
settling, the supernatant solution was filtered through laboratory filter paper (Whatmann filter
paper Grade 1) in order to avoid any FCC particles in sample.
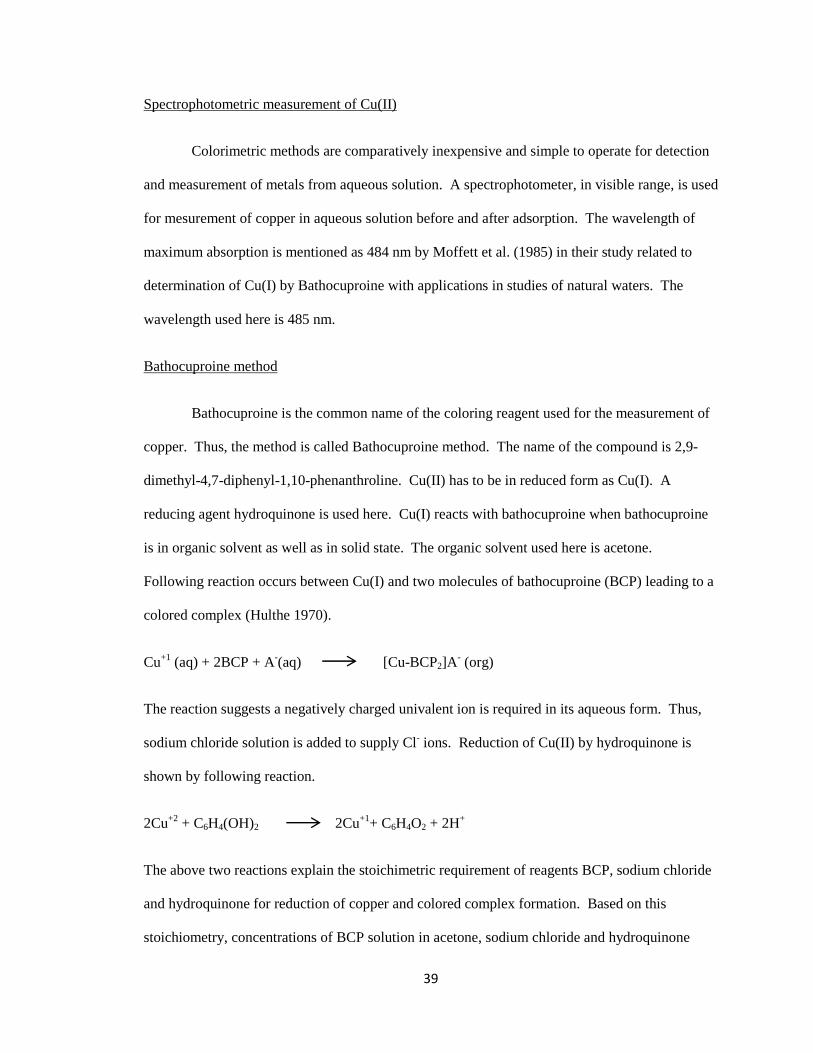
39
Spectrophotometric measurement of Cu(II)
Colorimetric methods are comparatively inexpensive and simple to operate for detection
and measurement of metals from aqueous solution. A spectrophotometer, in visible range, is used
for mesurement of copper in aqueous solution before and after adsorption. The wavelength of
maximum absorption is mentioned as 484 nm by Moffett et al. (1985) in their study related to
determination of Cu(I) by Bathocuproine with applications in studies of natural waters. The
wavelength used here is 485 nm.
Bathocuproine method
Bathocuproine is the common name of the coloring reagent used for the measurement of
copper. Thus, the method is called Bathocuproine method. The name of the compound is 2,9-
dimethyl-4,7-diphenyl-1,10-phenanthroline. Cu(II) has to be in reduced form as Cu(I). A
reducing agent hydroquinone is used here. Cu(I) reacts with bathocuproine when bathocuproine
is in organic solvent as well as in solid state. The organic solvent used here is acetone.
Following reaction occurs between Cu(I) and two molecules of bathocuproine (BCP) leading to a
colored complex (Hulthe 1970).
Cu+1 (aq) + 2BCP + A-(aq) [Cu-BCP2]A- (org)
The reaction suggests a negatively charged univalent ion is required in its aqueous form. Thus,
sodium chloride solution is added to supply Cl- ions. Reduction of Cu(II) by hydroquinone is
shown by following reaction.
2Cu+2 + C6H4(OH)2 2Cu+1+ C6H4O2 + 2H+
The above two reactions explain the stoichimetric requirement of reagents BCP, sodium chloride
and hydroquinone for reduction of copper and colored complex formation. Based on this
stoichiometry, concentrations of BCP solution in acetone, sodium chloride and hydroquinone
40
solution in water and their required dosages to measure concentration of copper from aqueous
solution are decided. Detailed calculations are provided in Appendix 1.
Color formation is less at lower values of pH. The same is described in Clesceri et al.
(1998) and the recommended pH is 4 to 5. The sample is buffered with sodium citrate buffer at
pH 3/pH 4 which provided a good color development.
Chloride and citrate species do not interfere (Smith and Wilkins 1953). Also, following
species can be tolerated with an error less than ±2%: sodium (concentration 1000 mg/L) (Clesceri
et al. 1998).
Detection limit of copper by Bathocuproine method
The parameter that sets the detection limit of copper with bathocuprouine method, in this
particular case, is solubility of BCP in acetone. To note that, BCP is insoluble in water and has to
be dissolved in organic solvent for BCP-Cu colored complex formation. Based upon the practical
observation during preparation of BCP-acetone solution, it seems that the solubility of BCP in
acetone may be approximately 0.4 g/L. Beyond this limit, the BCP particles can be clearly seen
in the acetone even after a vigorous agitation.
Another parameter for copper detection limit, in this particular case, is the volume of
sample that can be accumulated in vials. The volume of vials used is approximately 5 mL. Thus,
the sample volume should be close to 5 mL so that the beam of light can be effectively passed
through the liquid.
The mention of “in this particular case” in above two paragraphs signifies that the copper
detection limit may be higher if total volume of sample is increased as is possible with different
size vials. Above discussion resonably answers “Why the initial concentration was selected up to
5 mg/L?”. For additional details, Appendix 1 can be referred.
41
Calibration
The spectrophotometer works on the principle of Beer’s law which says, absorbance
varies lineraly with concentration. For the measurement of copper concentration, Beer’s law
applies over the range 1-10 mg/L as mentioned by Smith and Wilkins (1953). This is one of the
reason for selection of initial concentration of the Cu(II) solution.
The intensity of color developed is different at different pH values and thus, the
absorbance. Although, a buffer solution is added to the samples; the instrument is calibrated at all
pH values tested to improve accuracy of measurements. Calibration curves at each pH value are
provided in Appendix 2.
RESULTS AND DISCUSSION
Experiments are done to define the capacity of spent FCC for adsorption of heavy metal
copper from aqueous solutions. Variation in capacity with initial pH is studied to find out the
maximum loading of copper and the pH of its occurance. The solution pH changes during
adsorption process. Experimental findings and discussion are presented hereafter.
Solubility limit of copper
Solubility of copper is highly affected by pH due to formation of its hydroxide.
Separation of copper by precipitation is very common technique. Copper is precipitated in its
hydroxide form at higher pH values. From the solubility data (Figure 4.1), copper remains in
water in ionic form at pH below 7. On the other hand, at higher pH, it is precipitated as
hydroxide. Thus, studying separation of copper in the acidic range is sensible as it is dissolved
and the precipitation is unlikely.

42
Effect of initial solution pH on capacity
Adsorption capacities at different pH in acidic range are evaluated experimentally.
Experiments are done in triplicates at each pH. The solution pH affects both the adsorbate and
adsorbent properties as degree of ionization of copper and ion-exchange facilitated between
zeolite component of spent FCC and H+ ions from solution, respectively (Júnior et al. 2009, Repo
et al. 2011). Undoubtedly, spent FCC has variable capacity with pH. Figure 4.2 shows the
capacity data with different initial solution pH values. The maximum loading is obtained at pH
close to 6. To note, this is the pH (See Figure 4.1) below which the precipitation is no more
significant (for intial concentration i. e. < 5 mg/L during this study) and copper remains in ionic
form in the aqueous solution. The reason supporting adsorption in ionic form is ion-exchange
with cations from zeolite material of FCC. Also, maximum capacity region is very narrow with
respect to initial pH of solution. The capacity reaches a peak and decreases in the precipitation
region suggesting adsorption of copper in ionic form.
A capacity decreases with pH was observed. As pH is lowered, more H+ ions are
available in the solution which become competitive to Cu(II) ions for ion-exchange (García-
Sánchez et al. 1999, Álvarez-Ayuso et al. 2003, Júnior et al. 2009, Repo et al. 2011). This effect
reduces adsorption of Cu(II) ions and thus, their capacity; as the exchange sites are competitively
utilized by H+ ions. This provides a rationale for the observation “lower capacity at lower initial
pH” which suggests clearly ion-exchange is a primary mechanism for adsorption. Also, there is a
possibility of adsorption by other mechanisms , such as complex formation and pore filling; but,
ion-exchange seems dominating. The coke deposited on the FCC may also contribute to
adsorption, partly. In such case, the adsorption may not be stronger compared to ion-exchange
where an ionic force is present.
43
The observation is recorded during experimentation about turbidity of the solution. The
solution becomes turbid as soon as it is stirred with FCC. Since, FCC has a negligible solubility
in water, the particles should settle down quickly when stirring is stopped and a clear solution
should be seen. But, this was not the case at each pH value. At lower pH, particles settle down in
few hours and a clear solution (seen by naked eyes) was obtained. While, at higher pH, it takes
longer time to settle down FCC particles and some turbidity still remains. The turbidity at higher
pH is associated mainly to hydroxide precipitation. Since, the adsorption capacity decreases with
increasing pH after pH 6; above observation supports that precipitation does not favor adsorption
of copper on FCC. Thus, ion-exchange is primary mechanism for adsorption.
The turbidity poses a limitation during spectrophotometric determination of copper. A
sodium citrate buffer was used during sample preparation helps eliminate the limitation.

44
Figure 4.2 Effect of initial pH on adsorption capacity of spent FCC for removal of Cu. (Above
solubility chart is reproduced from Figure 4.1 to view solubility and capacity variation with pH,
together)
0.01
0.1
1
10
100
1000
0 1 2 3 4 5 6 7 8
Cop
per
conc
entr
atio
n (m
g/L
)
pH
0.00
1.00
2.00
3.00
4.00
5.00
6.00
0 1 2 3 4 5 6 7 8
Cap
acit
y (m
g/g)
Initial pH
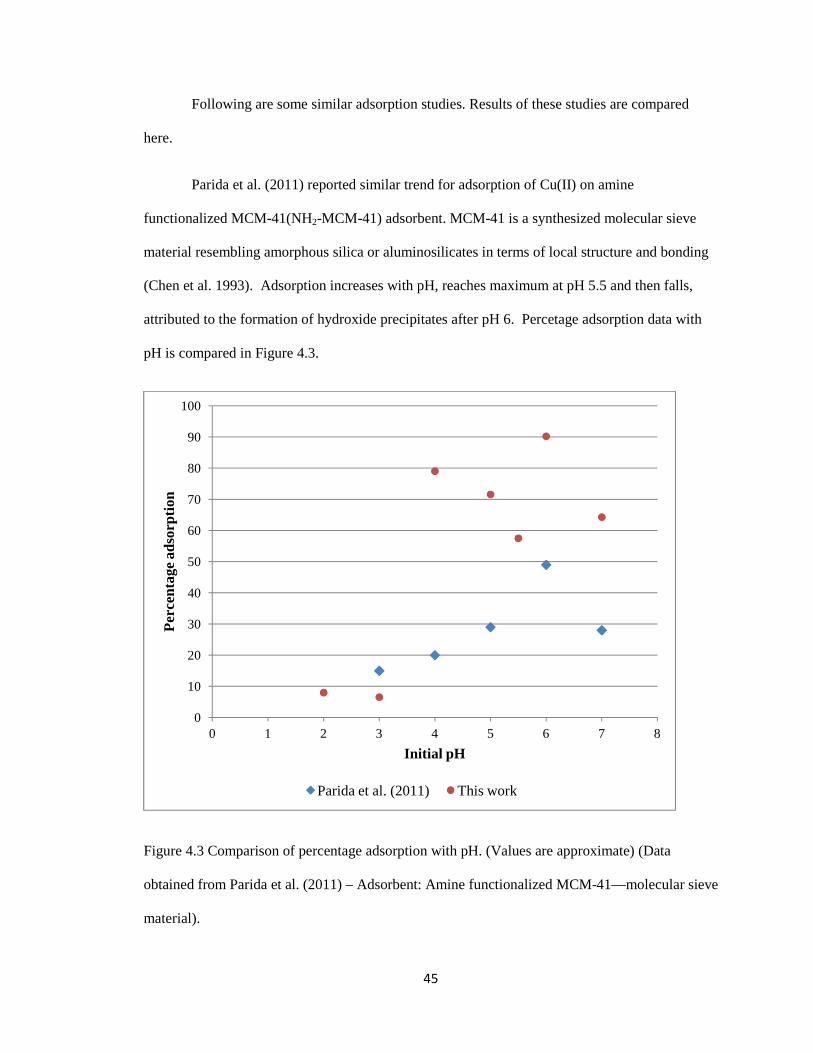
45
Following are some similar adsorption studies. Results of these studies are compared
here.
Parida et al. (2011) reported similar trend for adsorption of Cu(II) on amine
functionalized MCM-41(NH2-MCM-41) adsorbent. MCM-41 is a synthesized molecular sieve
material resembling amorphous silica or aluminosilicates in terms of local structure and bonding
(Chen et al. 1993). Adsorption increases with pH, reaches maximum at pH 5.5 and then falls,
attributed to the formation of hydroxide precipitates after pH 6. Percetage adsorption data with
pH is compared in Figure 4.3.
Figure 4.3 Comparison of percentage adsorption with pH. (Values are approximate) (Data
obtained from Parida et al. (2011) – Adsorbent: Amine functionalized MCM-41—molecular sieve
material).
0
10
20
30
40
50
60
70
80
90
100
0 1 2 3 4 5 6 7 8
Per
cent
age
adso
rpti
on
Initial pH
Parida et al. (2011) This work
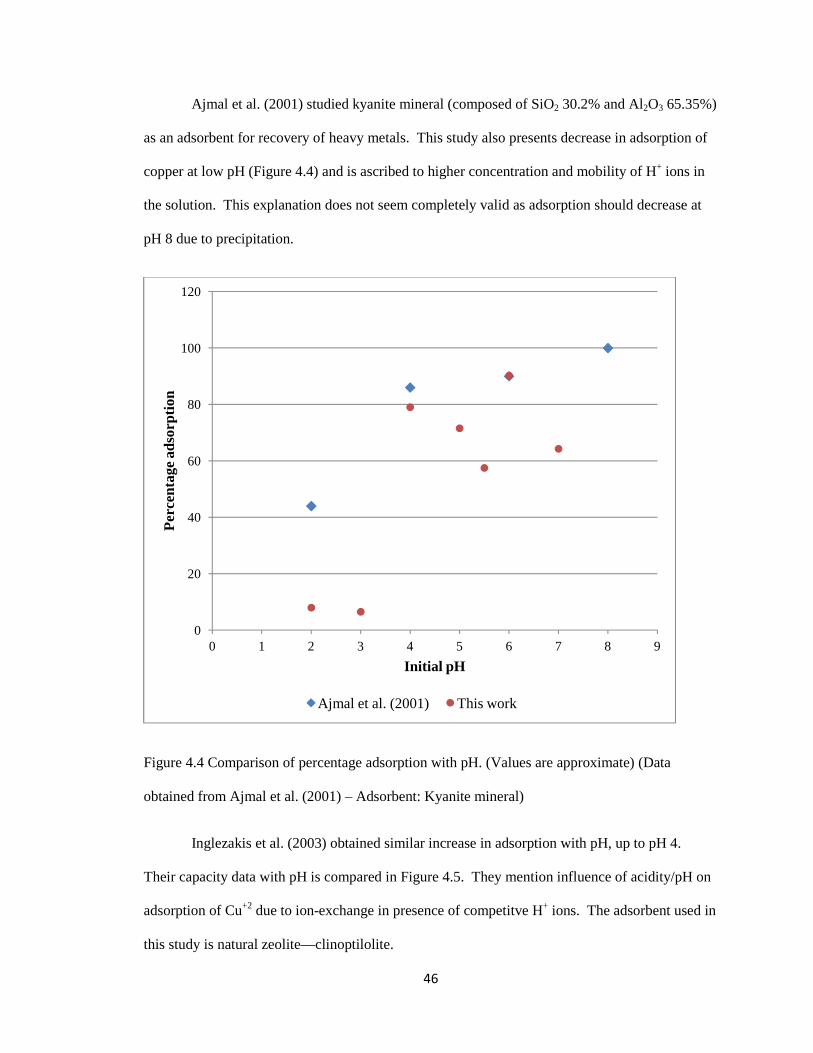
46
Ajmal et al. (2001) studied kyanite mineral (composed of SiO2 30.2% and Al2O3 65.35%)
as an adsorbent for recovery of heavy metals. This study also presents decrease in adsorption of
copper at low pH (Figure 4.4) and is ascribed to higher concentration and mobility of H+ ions in
the solution. This explanation does not seem completely valid as adsorption should decrease at
pH 8 due to precipitation.
Figure 4.4 Comparison of percentage adsorption with pH. (Values are approximate) (Data
obtained from Ajmal et al. (2001) – Adsorbent: Kyanite mineral)
Inglezakis et al. (2003) obtained similar increase in adsorption with pH, up to pH 4.
Their capacity data with pH is compared in Figure 4.5. They mention influence of acidity/pH on
adsorption of Cu+2 due to ion-exchange in presence of competitve H+ ions. The adsorbent used in
this study is natural zeolite—clinoptilolite.
0
20
40
60
80
100
120
0 1 2 3 4 5 6 7 8 9
Per
cent
age
adso
rpti
on
Initial pH
Ajmal et al. (2001) This work

47
Figure 4.5 Comparison of adsorption capacity with pH. (Values are approximate) (Data obtained
from Inglezakis et al. (2003) – Adsorbent: Clinoptilolite).
Similarly, effect of pH on adsorption of different metals on both natural and synthetic
zeolite samples was tested by Álvarez-Ayuso et al. 2003. They observed small increase with
initial pH (Figure 4.6) attributed to the similar competitve ion-exchange process.
0.00
0.50
1.00
1.50
2.00
2.50
3.00
3.50
4.00
4.50
5.00
0
5
10
15
20
25
30
0 1 2 3 4 5 6 7 8
Cap
acit
y (m
g/g)
Cap
acit
y (m
g/g)
Initial pH
Inglezakis et al. (2003) This work
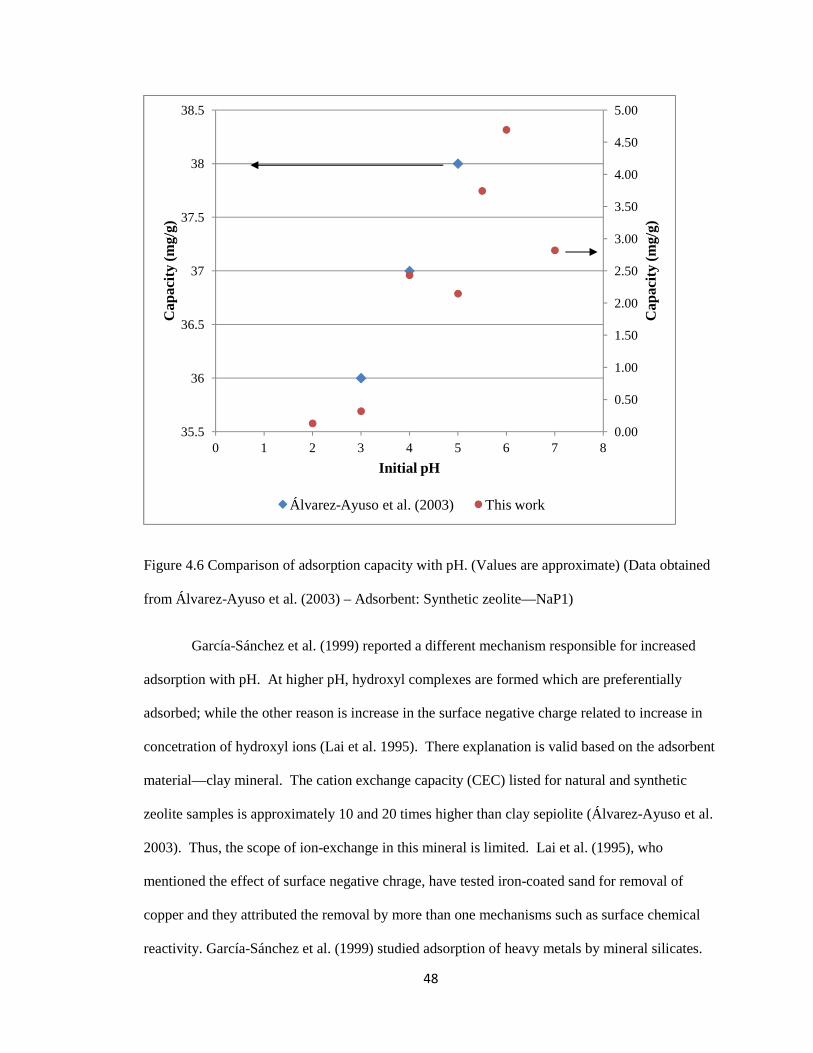
48
Figure 4.6 Comparison of adsorption capacity with pH. (Values are approximate) (Data obtained
from Álvarez-Ayuso et al. (2003) – Adsorbent: Synthetic zeolite—NaP1)
García-Sánchez et al. (1999) reported a different mechanism responsible for increased
adsorption with pH. At higher pH, hydroxyl complexes are formed which are preferentially
adsorbed; while the other reason is increase in the surface negative charge related to increase in
concetration of hydroxyl ions (Lai et al. 1995). There explanation is valid based on the adsorbent
material—clay mineral. The cation exchange capacity (CEC) listed for natural and synthetic
zeolite samples is approximately 10 and 20 times higher than clay sepiolite (Álvarez-Ayuso et al.
2003). Thus, the scope of ion-exchange in this mineral is limited. Lai et al. (1995), who
mentioned the effect of surface negative chrage, have tested iron-coated sand for removal of
copper and they attributed the removal by more than one mechanisms such as surface chemical
reactivity. García-Sánchez et al. (1999) studied adsorption of heavy metals by mineral silicates.
0.00
0.50
1.00
1.50
2.00
2.50
3.00
3.50
4.00
4.50
5.00
35.5
36
36.5
37
37.5
38
38.5
0 1 2 3 4 5 6 7 8
Cap
acit
y (m
g/g)
Cap
acit
y (m
g/g)
Initial pH
Álvarez-Ayuso et al. (2003) This work
49
The effect of pH was studied with adsorbent mineral sepiolite and metals Zn(II), Cd(II), Cu(II),
Ni(II). The maximum capacity for adsorption of copper on sepiolite is reported as 6.93 mg/g.
A different observation, during adsorption of Cd, Pb, Cu and Zn, was reported by Ok et
al. (2007). These metals were tested as their nitrate salts in aqueous solution. The adsorbent was
formed by mixing by-product zeolite from natural zeolite processing and Portland cement
(75:25). Their experimental data shows continuous increase in adsorption with increasing initial
pH of the solution. According to them, this is possibly due to precipitation of metal complexes.
Interesting to note that, the adsorbent mixture has more zeolite component; still, the dominant
mechanism is precipitation. That means, in case of spent FCC, there is an adsorption by
precipitation; though ion-exchnage seems prominent from data obtained in this work. It is
possible that spent FCC matrix is preoccupied by metals deposition and thus, shows less scope
for adsorption by precipitation on matrix. Matrix acts a metal trap avoiding metals reach zeolite
(Maselli and Peters 1984).
The explanation by Ok et al. (2007) is congruent with the previous one by García-
Sánchez et al. (1999) but does not seem totally applicable to our case where adsorption found
plummet in precipitation region. This, once again, supports the higher possibility of ion-
exchnage mechanism.
As initial pH becomes lower, more Cu+2 ions are available and adsorption should
increase. But, in such case, competitive H+ ions seem to have significant effect which takes it
back to the higher contribution by ion-exchnage. In simple words, at lower pH values, ion-
exchange is significant; but with more H+ ions than Cu+2 ions from solution. Obviously, as initial
pH is lowered, H+ ions in the solution would be quantitively very high compared to Cu+2 ions for
such a small initial concentration of copper used (up to 5 mg/L) during these experiments.

50
The initial concentration can not be maintained exactly constant for each run due to
experimental errors such as lesser precision in weighing balance and dilution error during
preparation of the initial solution. To account for this, the initial copper concentration in the
solution is measured by spectrophotometer before proceeding for each run. A future study to
understand effect of initial concentration on adsorption capacity can be undertaken to aquire more
knowledge.
Availability and transport of H+ ions to and from solution should have effect on solution
equilibrium pH which is discussed next.
Variation of pH during adsorption
The pH of the solution is recorded during adsorption at the time of each sample. The pH
increased for lower initial pH range 2-4, while remaining almost unchanged for higher range 5-7.
If a low initial pH (e.g. pH = 2) is selected, the variation in number is not significant; but, to note
that, at such a low pH, considerable change in concentration of H+ ions is required to shift the pH
with very small number. On the other side, a tiny change in concentration of H+ ions is sufficient
to deviate pH notably in case of high initial pH (e.g. pH = 6).
The above observation suggests that, large amount of H+ ions are available and
transported competitively from solution to adsorbent at lower pH range. At high pH range, less
H+ ions are available and scope for transport of Cu+2 ions is higher.
Maximum adsorption capacity
According to experimental data (Figure 4.2), the maximum capacity for adsorption of
copper on spent FCC is ~ 4.7 mg/g and occurs at initial solution pH 6. The capacity can be
higher and occurs in the vicinity of pH 6. Some adsorption studies (Álvarez-Ayuso et al. 2003,
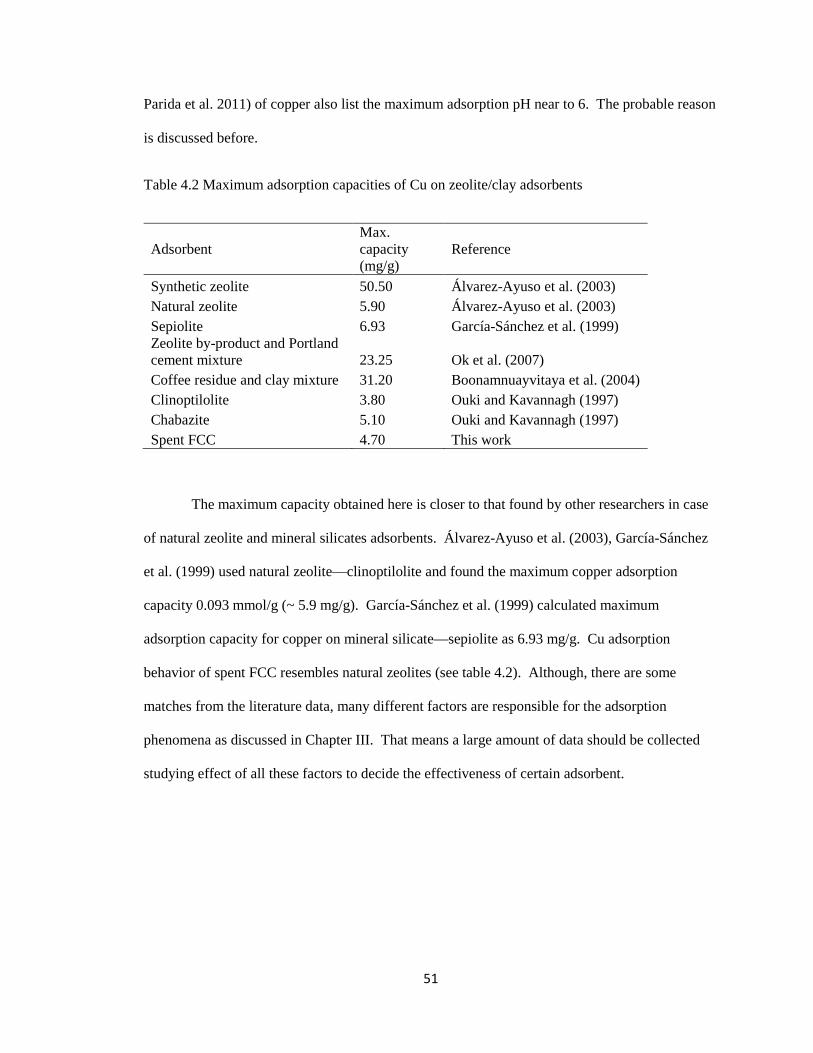
51
Parida et al. 2011) of copper also list the maximum adsorption pH near to 6. The probable reason
is discussed before.
Table 4.2 Maximum adsorption capacities of Cu on zeolite/clay adsorbents
Adsorbent Max. capacity (mg/g)
Reference
Synthetic zeolite 50.50 Álvarez-Ayuso et al. (2003) Natural zeolite 5.90 Álvarez-Ayuso et al. (2003) Sepiolite 6.93 García-Sánchez et al. (1999) Zeolite by-product and Portland cement mixture 23.25 Ok et al. (2007) Coffee residue and clay mixture 31.20 Boonamnuayvitaya et al. (2004) Clinoptilolite 3.80 Ouki and Kavannagh (1997) Chabazite 5.10 Ouki and Kavannagh (1997) Spent FCC 4.70 This work
The maximum capacity obtained here is closer to that found by other researchers in case
of natural zeolite and mineral silicates adsorbents. Álvarez-Ayuso et al. (2003), García-Sánchez
et al. (1999) used natural zeolite—clinoptilolite and found the maximum copper adsorption
capacity 0.093 mmol/g (~ 5.9 mg/g). García-Sánchez et al. (1999) calculated maximum
adsorption capacity for copper on mineral silicate—sepiolite as 6.93 mg/g. Cu adsorption
behavior of spent FCC resembles natural zeolites (see table 4.2). Although, there are some
matches from the literature data, many different factors are responsible for the adsorption
phenomena as discussed in Chapter III. That means a large amount of data should be collected
studying effect of all these factors to decide the effectiveness of certain adsorbent.
52
CHAPTER V
CONCLUSION AND FUTURE STUDY
Utilization of a novel adsorbent—spent FCC catalyst for removal of heavy metals
contaminants from wastewater is explored in this study. Very few studies, specific to use of spent
FCC as an adsorbent for heavy metals are available in literature such as by Juyo et al. (2008).
Adsorption capacity of spent FCC catalyst for copper from aqueous solution is evaluated
experimentally. The adsorbent “spent FCC” is used in the form “as received” (i.e. without any
pretreatment) from the industry. The effect of initial pH of the solution on adsorption is studied
to find out the maximum capacity and corresponding pH.
The maximum capacity of adsorption of copper on spent FCC without any pretreatment
is found as ~ 4.7 mg/g and occurs at pH near 6. Approximately above this pH, the capacity
decreases drastically. At these higher pH values, copper is precipitated in its hydroxide forms.
This suggests the tendency of adsorption of copper in its ionic form on spent FCC. The
adsorption decreases with lowering pH. Ion-exchange seems as a primary mechanism for
adsorption. The fundamental zeolite material contributes to ion-exchange of copper from
solution. The competitve H+ ions, at lower pH, reduce the capacity. At lower pH, more H+ ions
are available in the solution which tend to facilitate their transport and ion-exchange on adsorbent
and hence compete with Cu+2 ions. This apparently suppresses copper uptake by FCC. Thus,
53
although, more copper is in ionic form at lower pH, its adsorption decreases. Other mechanisms
such as pore filling, comlexing can not be totally ruled out; but their contribution should be very
small. Adsorption studies with several different heavy metals will help elucidate the ion-
exchange mechanism being common and most significantly contributive.
As per most of the regulations, the pH of the water discharged to environment should be
in range 6-8. Using spent FCC adsorbent is consistent with a maximum capacity at pH 6 for
removal of copper. During copper removal by usual methods like precipitation, additional
chemicals (precipitating agents/pH controlling agents) are added to wastewater. Spent FCC can
be a cost effective solution with an addition to facilitate reuse of refinery waste material.
This study along with experimental findings provides an insight about the spent FCC as a
potential adsorbent for removal of heavy metals from wastewater. There is a scope for
investigation of this material for other heavy metals and water contaminants such as organics; as
the material itself is in coked form, may show affinity for simulataneous removal of different type
of wastewater contaminants. During further investigation of various contaminants removal,
factors affecting the adsorption can be studied separately. Based on this knowledge, a suitable
pretreatment of spent FCC to enhance its adsorption properties can be envisaged and tested. The
goal would be to treat spent FCC to optimize its adsorption performance and in future, to
establish spent FCC in commercial wastewater treatment methods.
54
REFERENCES
Ajmal, M., R. A. K. Rao, R. Ahmad, J. Ahmad and L. A. K. Rao (2001). "Removal and recovery of heavy metals from electroplating wastewater by using Kyanite as an adsorbent." Journal of Hazardous Materials 87(1–3): 127-137.
Albrecht, T. W. J., J. Addai-Mensah and D. Fornasiero (2011). "Effect of pH, Concentration and Temperature on Copper and Zinc Hydroxide Formation/Precipitation in Solution." CHEMECA 2011: Engineering a Better World: Sydney Hilton Hotel, NSW, Australia, 18-21 September 2011: 2100.
Álvarez-Ayuso, E., A. García-Sánchez and X. Querol (2003). "Purification of metal electroplating waste waters using zeolites." Water Research 37(20): 4855-4862.
Apak, R., E. Tütem, M. Hügül and J. Hizal (1998). "Heavy metal cation retention by unconventional sorbents (red muds and fly ashes)." Water Research 32(2): 430-440.
Apak, V. and E. Ünseren (1987). "Treatment of wastewater and effluents with solid industrial wastes for the adsorptive removal of heavy metal contaminants." Flocculation in Biotechnology and Separation Systems. Amsterdam: Elsevier Science: 765-771.
Avidan, A. A. (1993). "Origin, development and scope of FCC catalysis." Studies in Surface Science and Catalysis 76: 1.
Babel, S. and T. A. Kurniawan (2003). "Low-cost adsorbents for heavy metals uptake from contaminated water: a review." Journal of Hazardous Materials 97(1–3): 219-243.
Bhatnagar, A. and M. Sillanpää (2010). "Utilization of agro-industrial and municipal waste materials as potential adsorbents for water treatment—A review." Chemical Engineering Journal 157(2–3): 277-296.
Boonamnuayvitaya, V., C. Chaiya, W. Tanthapanichakoon and S. Jarudilokkul (2004). "Removal of heavy metals by adsorbent prepared from pyrolyzed coffee residues and clay." Separation and Purification Technology 35(1): 11-22.
Bye, G. C. (1999). Portland Cement: Composition, Production And Properties, Thomas Telford Limited.

55
Cath, T. Y., A. E. Childress and M. Elimelech (2006). "Forward osmosis: Principles, applications, and recent developments." Journal of Membrane Science 281(1–2): 70-87.Cerqueira, H. S., P. Ayrault, J. Datka and M. Guisnet (2000). "Influence of coke on the acid properties of a USHY zeolite." Microporous and Mesoporous Materials 38(2–3): 197-205.
Cerqueira, H. S., G. Caeiro, L. Costa and F. Ramôa Ribeiro (2008). "Deactivation of FCC catalysts." Journal of Molecular Catalysis A: Chemical 292(1–2): 1-13.
Chen, C.-Y., H.-X. Li and M. E. Davis (1993). "Studies on mesoporous materials: I. Synthesis and characterization of MCM-41." Microporous Materials 2(1): 17-26.
Cherry, K. F. (1982). Plating waste treatment, Ann Arbor Science.
Cimbalo, R., R. L. Foster and S. J. Wachtel (1972). "Deposited metals poison FCC catalyst." Oil and Gas Journal 70(20): 112-117.
Clesceri, L. S., A. E. Greenberg and A. D. Eaton (1998). Standard Methods for the Examination of Water and Wastewater, 20th Edition, APHA American Public Health Association.
Colella, C. and A. F. Gualtieri (2007). "Cronstedt’s zeolite." Microporous and Mesoporous Materials 105(3): 213-221.
Donat, R., A. Akdogan, E. Erdem and H. Cetisli (2005). "Thermodynamics of Pb2+ and Ni2+ adsorption onto natural bentonite from aqueous solutions." Journal of Colloid and Interface Science 286(1): 43-52.
Erdem, E., N. Karapinar and R. Donat (2004). "The removal of heavy metal cations by natural zeolites." Journal of Colloid and Interface Science 280(2): 309-314.
Eastwood, S. C., C. J. Plank and P. B. Weisz (1971). "New developements in catalytic cracking" Proceedings of Eighth world petroleum congress, 4:245-254.
Fritzmann, C., J. Löwenberg, T. Wintgens and T. Melin (2007). "State-of-the-art of reverse osmosis desalination." Desalination 216(1–3): 1-76.
García-Sánchez, A., E. Álvarez-Ayuso and O. Jiménez de Blas (1999). "Sorption of heavy metals from industrial waste water by low-cost mineral silicates." Clay minerals 34(3): 469-477.
Gladrow "Hydrocarbon conversion with zeolite catalyst in metals-absorbing matrix" US Pat. 4292169, 1981.
Guisnet, M. and P. Magnoux (2001). "Organic chemistry of coke formation." Applied Catalysis A: General 212(1–2): 83-96.
Habib, E. T., Jr., H. Owen, P. W. Synder, C. W. Streed and P. B. Venuto (1977). "Artificially Metals-Poisoned Fluid Catalysts. Performance in Pilot Plant Cracking of Hydrotreated Resid." Industrial and Engineering Chemistry Product Research and Development 16(4): 291-296.
56
Hadjar, H., B. Hamdi and Z. Kessaïssia (2004). "Adsorption of heavy metal ions on composite materials prepared by modification of natural silica." Desalination 167(0): 165-174.
Helfferich, F., (1995). Ion-Exchange, Dover.
Hildebrand, R., G. P. Huling and G. F. Ondish (1973). "HDS and FCC UPS Premium Product Mix." Oil and Gas Journal 71: 112.
Hopkins, P. D., J. T. Miller, B. L. Meyers, G. J. Ray, R. T. Roginski, M. A. Kuehne and H. H. Kung (1996). "Acidity and cracking activity changes during coke deactivation of ultrastable Y zeolite." Applied Catalysis A: General 136(1): 29-48.
Hulthe, P. (1970). "A bathocuproine reagent-paper for the rapid semi-quantitative determination of copper in the 1 to 70 p.p.m. range." Analyst 95(1129): 351-355.
Hussein, H., S. F. Ibrahim, K. Kandeel and H. Moawad (2004). “Biosorption of heavy metals from waste water using Pseudomonas sp.” Electronic Journal of Biotechnology 7(1): 38-46.
Inglezakis, V. J. (2007). "Solubility-normalized Dubinin–Astakhov adsorption isotherm for ion-exchange systems." Microporous and Mesoporous Materials 103(1–3): 72-81.
Inglezakis, V. J., M. D. Loizidou and H. P. Grigoropoulou (2003). "Ion exchange of Pb2+, Cu2+, Fe3+, and Cr3+ on natural clinoptilolite: selectivity determination and influence of acidity on metal uptake." Journal of Colloid and Interface Science 261(1): 49-54.
Järås, S. (1982). "Rapid methods of determining the metals resistance of cracking catalysts." Applied Catalysis 2(4–5): 207-218.
Júnior, O. K., L. V. A. Gurgel, R. P. de Freitas and L. F. Gil (2009). "Adsorption of Cu(II), Cd(II), and Pb(II) from aqueous single metal solutions by mercerized cellulose and mercerized sugarcane bagasse chemically modified with EDTA dianhydride (EDTAD)." Carbohydrate Polymers 77(3): 643-650.
Juyo, J., G. Camargo, J. Tirano, L. Giraldo and J. C. Moreno-Piraján (2008). “Adsorption of mercury (II) onto NaY zeolite and waste FCC catalyst.” Electronic Journal of Environmental, Agricultural and food chemistry 7(6): 2969-2983.
Kadirvelu, K., K. Thamaraiselvi and C. Namasivayam (2001). "Removal of heavy metals from industrial wastewaters by adsorption onto activated carbon prepared from an agricultural solid waste." Bioresource Technology 76(1): 63-65.
Karapinar, N. and R. Donat (2009). "Adsorption behaviour of Cu2+ and Cd2+ onto natural bentonite." Desalination 249(1): 123-129.
Khan, S. A., R. Rehman and M. A. Khan (1995). "Adsorption of chromium (III), chromium (VI) and silver (I) on bentonite." Waste Management 15(4): 271-282.
Kulprathipanja, S. (2010). Zeolites in Industrial Separation and Catalysis, Wiley.

57
Lai, C., S. L. Lo and C. F. Lin (1995). "Evaluating an iron-coated sand for removing copper from water." Water science and Technology 30(9): 175-182.
Leinonen, H. and J. Lehto (2001). "Purification of metal finishing waste waters with zeolites and activated carbons." Waste Management & Research 19(1): 45-57.
Malliou, E., M. Loizidou and N. Spyrellis (1994). "Uptake of Lead and Cadmium by Clinoptilolite." Science of the Total Environment 149(3): 139-144.
Maselli, J. M. and A. W. Peters (1984). "Preparation and Properties of Fluid Cracking Catalysts for Residual Oil Conversion." Catalysis Reviews 26(3-4): 525-554.
Masters, A. F. and T. Maschmeyer (2011). "Zeolites – From curiosity to cornerstone." Microporous and Mesoporous Materials 142(2–3): 423-438.
Mitchell, B. R. (1980). "Metal Contamination of Cracking Catalysts. 1. Synthetic Metals Deposition on Fresh Catalysts." Industrial & Engineering Chemistry Product Research and Development 19(2): 209-213.
Moffett, J. W., R. G. Zika and R. G. Petasne (1985). "Evaluation of bathocuproine for the spectro-photometric determination of copper(I) in copper redox studies with applications in studies of natural waters." Analytica Chimica Acta 175(0): 171-179.
Moreno, S. and G. Poncelet (1997). "Dealumination of small- and large-port mordenites: A comparative study." Microporous Materials 12(4–6): 197-222.
Nightingale, E. R. (1959). "Phenomenological Theory of Ion Solvation. Effective Radii of Hydrated Ions." The Journal of Physical Chemistry 63(9): 1381-1387.
Ok, Y. S., J. E. Yang, Y.-S. Zhang, S.-J. Kim and D.-Y. Chung (2007). "Heavy metal adsorption by a formulated zeolite-Portland cement mixture." Journal of Hazardous Materials 147(1–2): 91-96.
Ouki, S. K. and M. Kavannagh (1997). "Performance of natural zeolites for the treatment of mixed metal-contaminated effluents." Waste Management & Research 15(4): 383-394.
Parida, K., K. G. Mishra and S. K. Dash (2011). "Adsorption of Copper(II) on NH2-MCM-41 and Its Application for Epoxidation of Styrene." Industrial & Engineering Chemistry Research 51(5): 2235-2246.
Patrick, J. W. (1995). Porosity in carbons: characterization and applications, Halsted Press.
Pine, L. A. (1990). "Vanadium-catalyzed destruction of USY zeolites." Journal of Catalysis 125(2): 514-524.
Prasanna Kumar, Y., P. King and V. S. R. K. Prasad (2006). "Equilibrium and kinetic studies for the biosorption system of copper(II) ion from aqueous solution using Tectona grandis L.f. leaves powder." Journal of Hazardous Materials 137(2): 1211-1217.

58
Psarras, A. C., E. F. Iliopoulou, N. Nalbandian, A. A. Lappas and C. Pouwels (2007). "Study of the accessibility effect on the irreversible deactivation of FCC catalysts from contaminant feed metals." Catalysis Today 127(1–4): 44-53.
Qiu, J., Z. Wang, H. Li, L. Xu, J. Peng, M. Zhai, C. Yang, J. Li and G. Wei (2009). "Adsorption of Cr(VI) using silica-based adsorbent prepared by radiation-induced grafting." Journal of Hazardous Materials 166(1): 270-276.
Rengaraj, S., Y. Kim, C. K. Joo, K. Choi and J. Yi (2004). "Batch adsorptive removal of copper ions in aqueous solutions by ion exchange resins: 1200H and IRN97H." Korean Journal of Chemical Engineering 21(1): 187-194.
Repo, E., J. K. Warchoł, A. Bhatnagar and M. Sillanpää (2011). "Heavy metals adsorption by novel EDTA-modified chitosan–silica hybrid materials." Journal of Colloid and Interface Science 358(1): 261-267.
Sadeghbeigi, R. (2000). Fluid Catalytic Cracking Handbook: Design, Operation and Troubleshooting of FCC Facilities, Gulf.
Sadeghbeigi, R. (2012). Chapter 1 - Process Description. Fluid Catalytic Cracking Handbook (Third Edition). Oxford, Butterworth-Heinemann: 1-42.
Scherzer, J. (1991). "Designing FCC catalysts with high-silica Y zeolites." Applied Catalysis 75(1): 1-32.
Scherzer, J. and J. L. Bass (1973). "Infrared spectra of ultrastable zeolites derived from type Y zeolites." Journal of Catalysis 28(1): 101-115.
Singh, B., B. J. Alloway and F. J. M. Bochereau (2000). "Cadmium sorption behavior of natural and synthetic zeolites." Communications in Soil Science and Plant Analysis 31(17-18): 2775-2786.
Smith, G. F. and D. H. Wilkins (1953). "New Colorimetric Reagent Specific for Copper." Analytical Chemistry 25(3): 510-511.
Smith, J. M. (1981). Chemical engineering kinetics, McGraw-Hill.
Sposito, G. (1986). "Distinguishing Adsorption from Surface Precipitation." ACS Symposium Series 323: 217-228.
Sposito, G. (1998). "On points of zero charge." Environmental science & technology 32(19): 2815-2819.
Venuto, P. B. and E. T. Habib (1979). Fluid Catalytic Cracking with Zeolite Catalysts, M. Dekker.
Williams, B. A., S. M. Babitz, J. T. Miller, R. Q. Snurr and H. H. Kung (1999). "The roles of acid strength and pore diffusion in the enhanced cracking activity of steamed Y zeolites." Applied Catalysis A: General 177(2): 161-175.

59
Wilson, J. W. (1997). Fluid Catalytic Cracking Technology and Operations, PennWell Books.
Yang, S.-J., Y.-W. Chen and C. Li (1994). "Metal-resistant FCC catalysts: effect of matrix." Applied Catalysis A: General 115(1): 59-68.
60
APPENDIX 1
PREPARATION OF COLORING REAGENT
A set of stoichiometric calculations are performed to decide the concentrations
and dosages of chemicals used for preparation of coloring reagent and sample for
spectrophotometric testing. Explanations are provided hereafter.
The complexing reagent bathocuproine (BCP) must be dissolved in organic to
facilitate complex formation reaction. The organic solvent used is acetone. So, it is the
solubility of BCP in acetone that fundamentally decides concentration and dosages of
BCP-acetone and other reagents.
A suitable volume of sample (2 mL) considering the total volume of vial (5 mL)
is selected. The other reagents added to the sample are sodium chloride (0.5 mL),
hydroquinone solutions (0.5 mL) and a citrate buffer (pH 3/pH 4) (1 mL) along with
BCP-acetone solution (0.5 mL). Thus, the total volume of the sample in the vial becomes
4.5 mL, sufficient to record the absorbance by spectrophotometer.
From experimental observation, the solubility limit of BCP in acetone was found
to be approximately 0.4 g/L at room temperature. When BCP-acetone solution of this
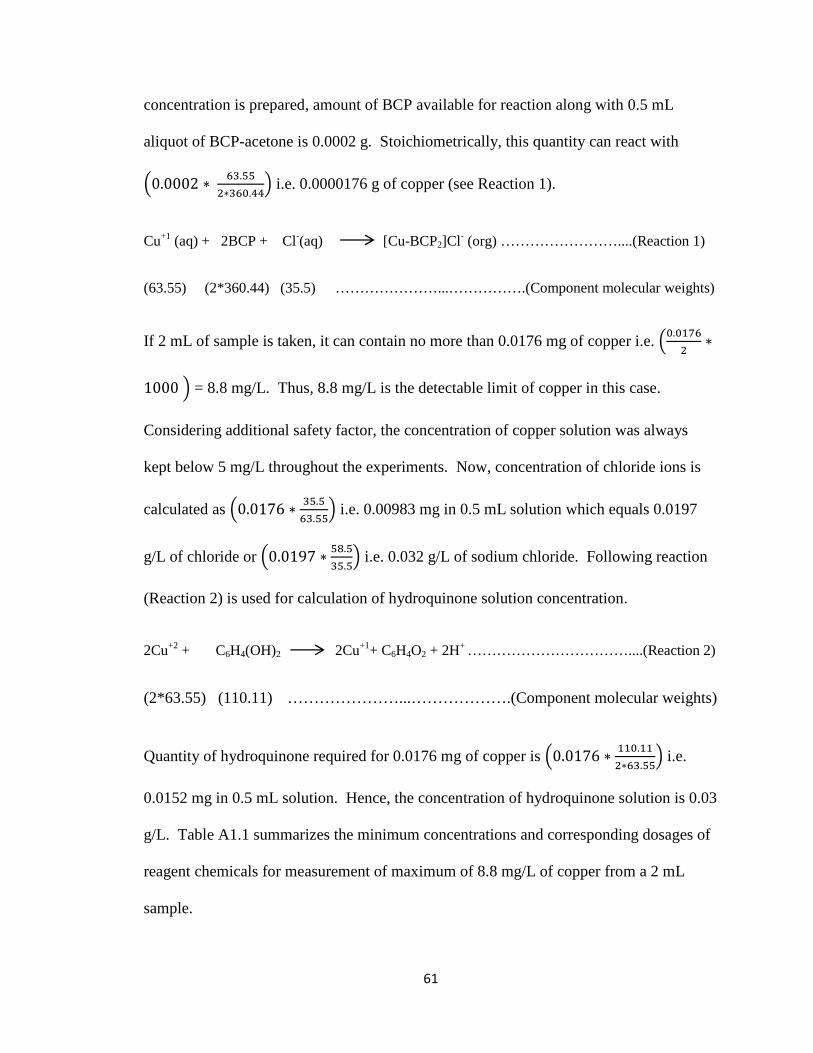
61
concentration is prepared, amount of BCP available for reaction along with 0.5 mL
aliquot of BCP-acetone is 0.0002 g. Stoichiometrically, this quantity can react with
�0.0002 � ��.�������.��� i.e. 0.0000176 g of copper (see Reaction 1).
Cu+1 (aq) + 2BCP + Cl-(aq) [Cu-BCP2]Cl- (org) ……………………....(Reaction 1)
(63.55) (2*360.44) (35.5) …………………...…………….(Component molecular weights)
If 2 mL of sample is taken, it can contain no more than 0.0176 mg of copper i.e. ��.����� �
1000 � = 8.8 mg/L. Thus, 8.8 mg/L is the detectable limit of copper in this case.
Considering additional safety factor, the concentration of copper solution was always
kept below 5 mg/L throughout the experiments. Now, concentration of chloride ions is
calculated as �0.0176 � ��.���.��� i.e. 0.00983 mg in 0.5 mL solution which equals 0.0197
g/L of chloride or �0.0197 � ��.���.�� i.e. 0.032 g/L of sodium chloride. Following reaction
(Reaction 2) is used for calculation of hydroquinone solution concentration.
2Cu+2 + C6H4(OH)2 2Cu+1+ C6H4O2 + 2H+ ……………………………....(Reaction 2)
(2*63.55) (110.11) …………………...……………….(Component molecular weights)
Quantity of hydroquinone required for 0.0176 mg of copper is �0.0176 � ���.������.��� i.e.
0.0152 mg in 0.5 mL solution. Hence, the concentration of hydroquinone solution is 0.03
g/L. Table A1.1 summarizes the minimum concentrations and corresponding dosages of
reagent chemicals for measurement of maximum of 8.8 mg/L of copper from a 2 mL
sample.
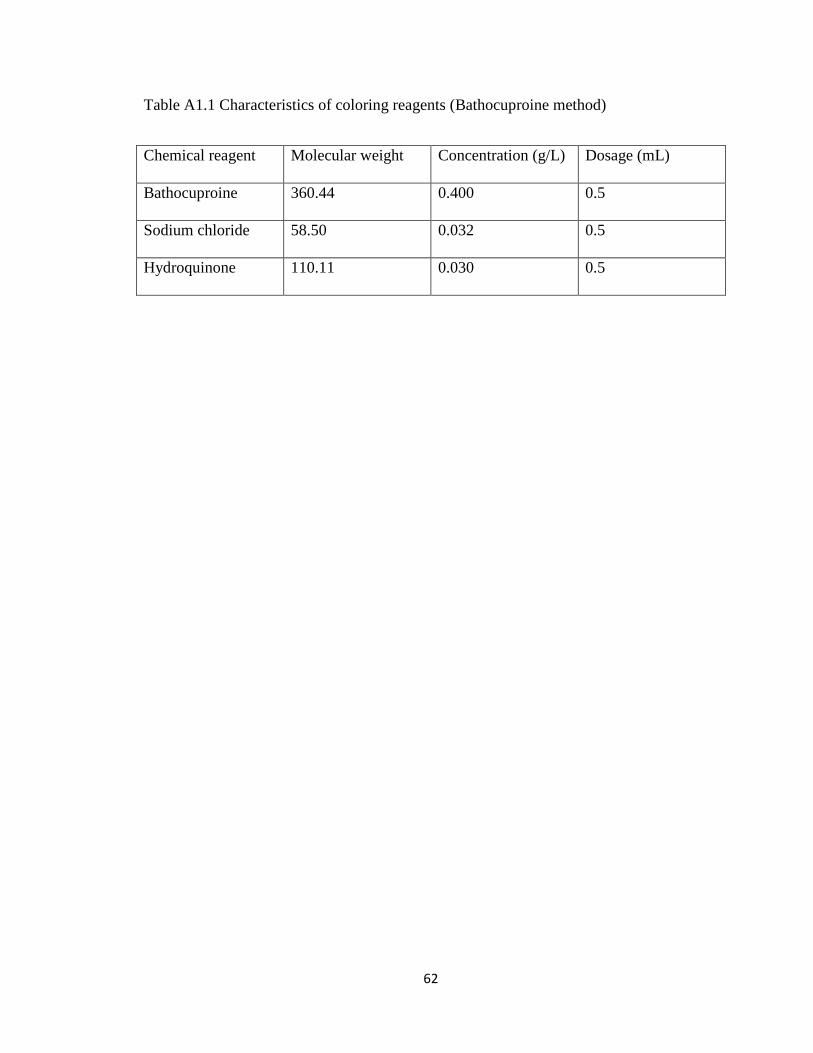
62
Table A1.1 Characteristics of coloring reagents (Bathocuproine method)
Chemical reagent Molecular weight Concentration (g/L) Dosage (mL)
Bathocuproine 360.44 0.400 0.5
Sodium chloride 58.50 0.032 0.5
Hydroquinone 110.11 0.030 0.5
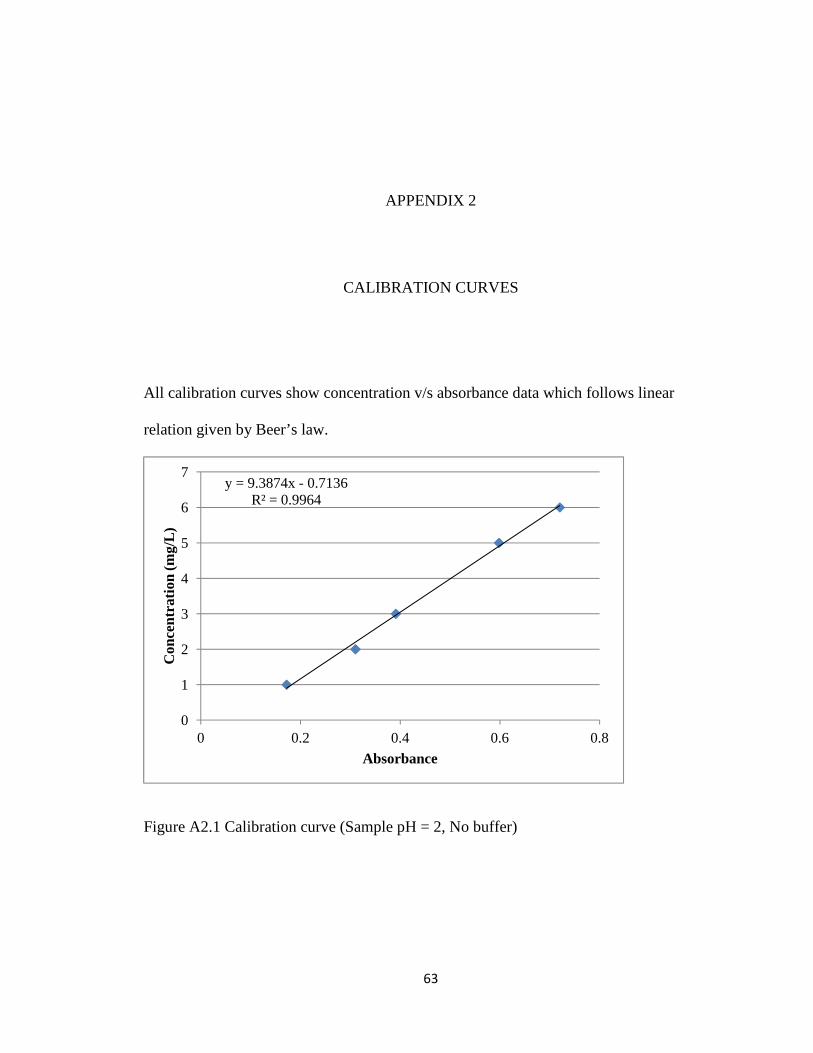
63
APPENDIX 2
CALIBRATION CURVES
All calibration curves show concentration v/s absorbance data which follows linear
relation given by Beer’s law.
Figure A2.1 Calibration curve (Sample pH = 2, No buffer)
y = 9.3874x - 0.7136R² = 0.9964
0
1
2
3
4
5
6
7
0 0.2 0.4 0.6 0.8
Con
cent
rati
on (m
g/L
)
Absorbance
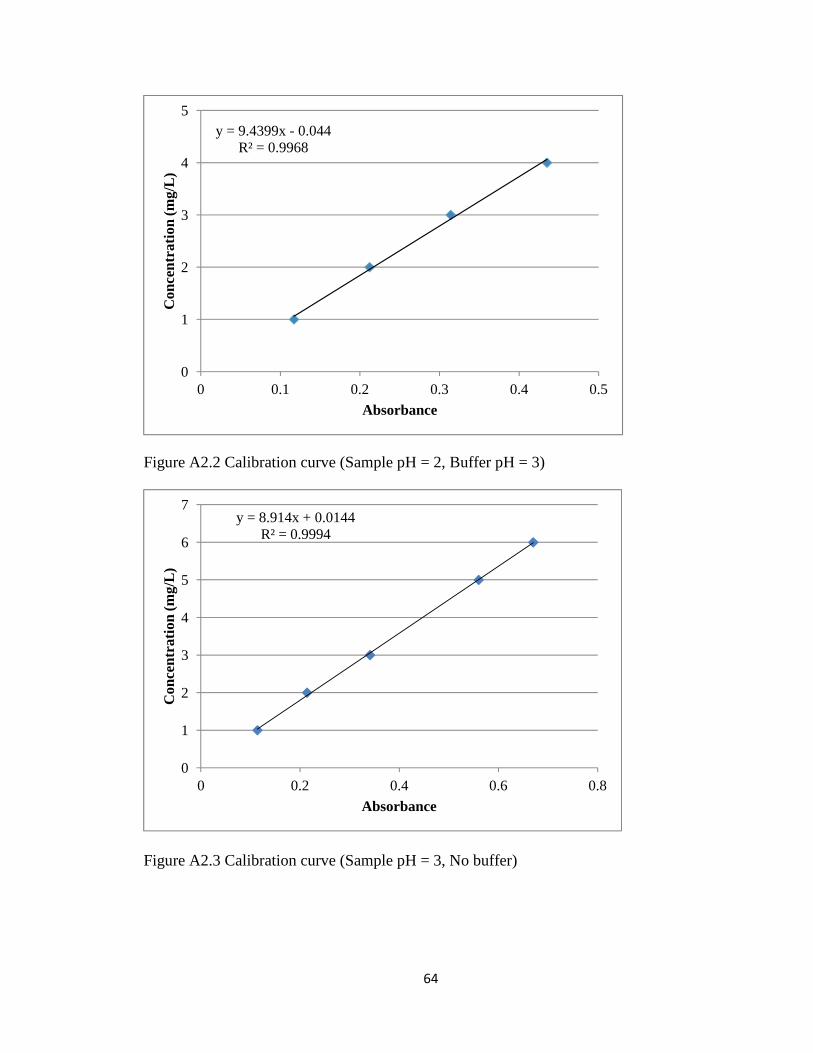
64
Figure A2.2 Calibration curve (Sample pH = 2, Buffer pH = 3)
Figure A2.3 Calibration curve (Sample pH = 3, No buffer)
y = 9.4399x - 0.044R² = 0.9968
0
1
2
3
4
5
0 0.1 0.2 0.3 0.4 0.5
Con
cent
rati
on (m
g/L
)
Absorbance
y = 8.914x + 0.0144R² = 0.9994
0
1
2
3
4
5
6
7
0 0.2 0.4 0.6 0.8
Con
cent
rati
on (m
g/L
)
Absorbance
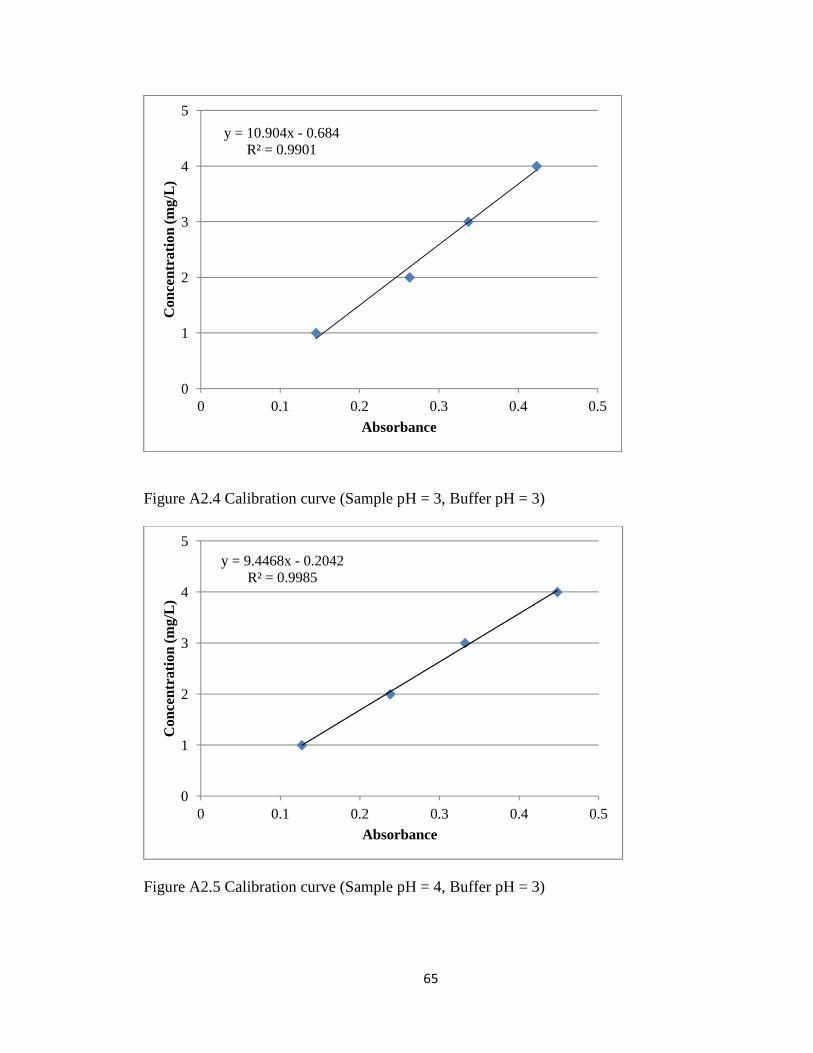
65
Figure A2.4 Calibration curve (Sample pH = 3, Buffer pH = 3)
Figure A2.5 Calibration curve (Sample pH = 4, Buffer pH = 3)
y = 10.904x - 0.684R² = 0.9901
0
1
2
3
4
5
0 0.1 0.2 0.3 0.4 0.5
Con
cent
rati
on (m
g/L
)
Absorbance
y = 9.4468x - 0.2042R² = 0.9985
0
1
2
3
4
5
0 0.1 0.2 0.3 0.4 0.5
Con
cent
rati
on (m
g/L
)
Absorbance

66
Figure A2.6 Calibration curve (Sample pH = 5, No buffer)
Figure A2.7 Calibration curve (Sample pH = 5, Buffer pH = 3)
y = 8.3702x + 0.2342R² = 0.9989
0
1
2
3
4
5
6
7
0 0.2 0.4 0.6 0.8
Con
cent
rati
on (m
g/L
)
Absorbance
y = 15.777x - 1.2333R² = 0.9658
0
1
2
3
4
5
6
7
0 0.1 0.2 0.3 0.4 0.5
Con
cent
rati
on (m
g/L
)
Absorbance
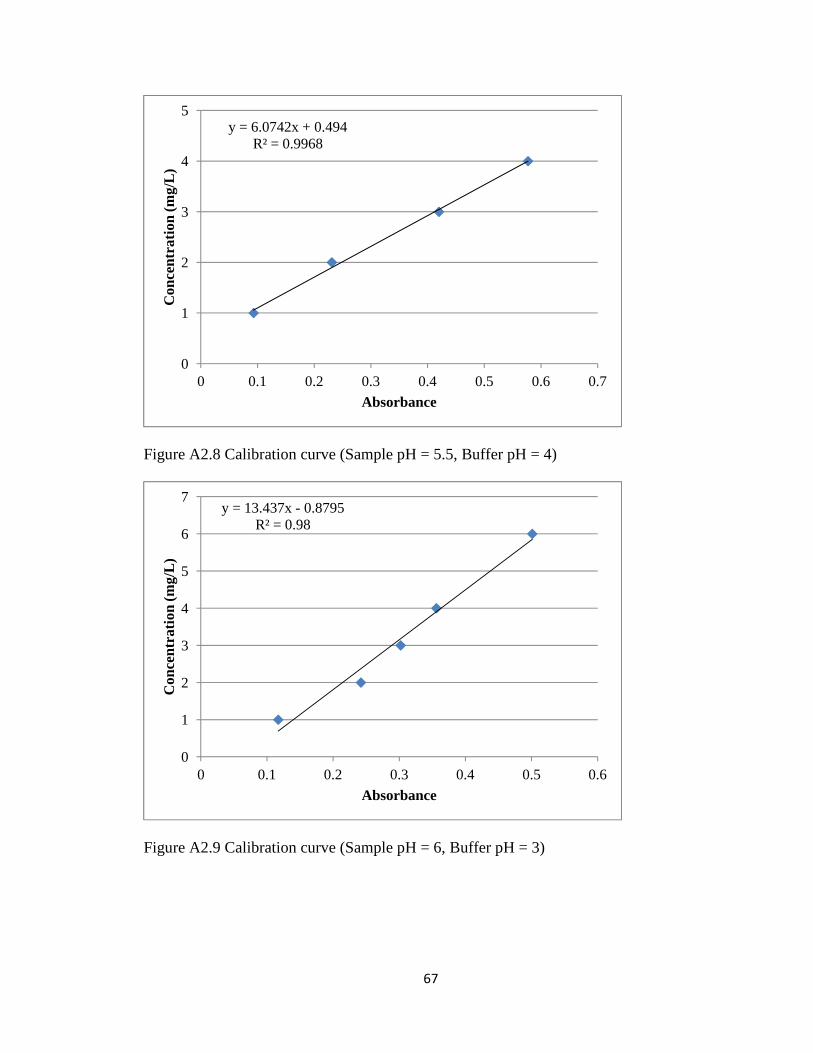
67
Figure A2.8 Calibration curve (Sample pH = 5.5, Buffer pH = 4)
Figure A2.9 Calibration curve (Sample pH = 6, Buffer pH = 3)
y = 6.0742x + 0.494R² = 0.9968
0
1
2
3
4
5
0 0.1 0.2 0.3 0.4 0.5 0.6 0.7
Con
cent
rati
on (m
g/L
)
Absorbance
y = 13.437x - 0.8795R² = 0.98
0
1
2
3
4
5
6
7
0 0.1 0.2 0.3 0.4 0.5 0.6
Con
cent
rati
on (m
g/L
)
Absorbance

68
Figure A2.10 Calibration curve (Sample pH = 7, Buffer pH = 3)
y = 9.1059x - 0.1361R² = 0.998
0
1
2
3
4
5
0 0.1 0.2 0.3 0.4 0.5
Con
cent
rati
on (m
g/L
)
Absorbance
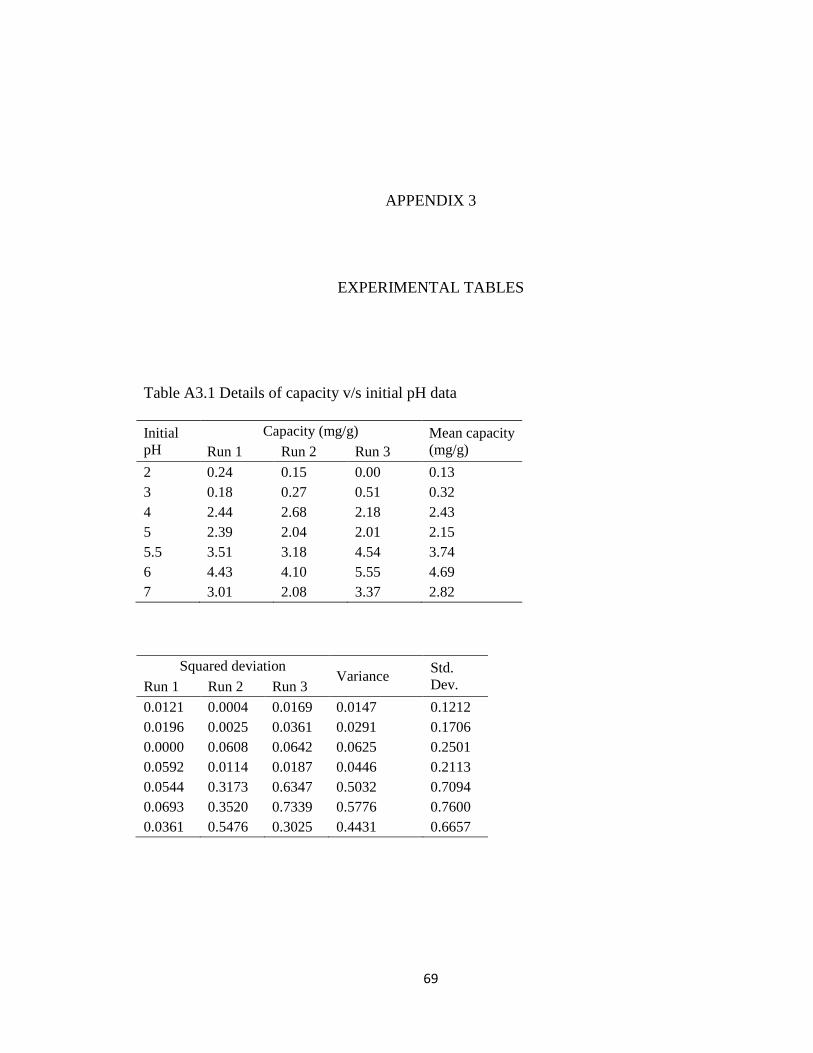
69
APPENDIX 3
EXPERIMENTAL TABLES
Table A3.1 Details of capacity v/s initial pH data
Initial pH
Capacity (mg/g) Mean capacity (mg/g) Run 1 Run 2 Run 3
2 0.24 0.15 0.00 0.13 3 0.18 0.27 0.51 0.32 4 2.44 2.68 2.18 2.43 5 2.39 2.04 2.01 2.15 5.5 3.51 3.18 4.54 3.74 6 4.43 4.10 5.55 4.69 7 3.01 2.08 3.37 2.82
Squared deviation Variance
Std. Dev. Run 1 Run 2 Run 3
0.0121 0.0004 0.0169 0.0147 0.1212 0.0196 0.0025 0.0361 0.0291 0.1706 0.0000 0.0608 0.0642 0.0625 0.2501 0.0592 0.0114 0.0187 0.0446 0.2113 0.0544 0.3173 0.6347 0.5032 0.7094 0.0693 0.3520 0.7339 0.5776 0.7600 0.0361 0.5476 0.3025 0.4431 0.6657

VITA
Nikhil S Japtiwale
Candidate for the Degree of
Master of Science Thesis: SPENT FLUIDIZED CRACKING CATALYST (FCC) – A POTENTIAL
ADSORBENT FOR HEAVY METALS Major Field: Chemical Engineering Biographical:
Education: Completed the requirements for the Master of Science in Chemical Engineering at Oklahoma State University, Stillwater, Oklahoma in July, 2013.
Completed the requirements for the Bachelor of Engineering in Chemical Engineering at University of Mumbai, Mumbai, India in May, 2009. Experience: Worked as Teaching and/or Research Assistant at School of Chemical Engineering, Oklahoma State University from August 2011 to July 2013. Worked as Assistant Engineer – Chemical at TATA Consulting Engineers Ltd. Mumbai, India from July 2010 to June 2011. Worked as Management Trainee – Process Engineering and Technology at Nocil Ltd., Navi Mumbai, India from July 2009 to June 2010.