Tunable Electroluminescence in Planar Graphene/SiO 2 Memristors
www.elsevier.com/locate/jnoncrysol
Journal of Non-Crystalline Solids 352 (2006) 2801–2810
c-Fe2O3/SiO2 nanocomposites for magneto-opticalapplications: Nanostructural and magnetic properties
D. Ortega a,*, J.S. Garitaonandia b, C. Barrera-Solano a, M. Ramırez-del-Solar a,E. Blanco a, M. Domınguez a
a Departamento de Fısica de la Materia Condensada, Facultad de Ciencias, Universidad de Cadiz,
Campus Universitario del Rıo San Pedro, 11510 Puerto Real (Cadiz), Spainb Departamento de Fısica Aplicada II, Facultad de Ciencias, Universidad del Paıs Vasco,Apartado 644, 48080 (Bilbao), Spain
Received 22 July 2005; received in revised form 3 March 2006Available online 9 June 2006
Abstract
Monolithic nanocomposites consisting in c-Fe2O3 (maghemite) nanoparticles embedded in a silica gel have been prepared as potentialmagneto-optic materials, suitable for magnetic field sensing. The effects of several processing parameters on the structural and magneticproperties of the samples were evaluated to optimize their performance. Their structural properties have been studied by means of X-raydiffraction, thermogravimetric analysis and transmission electron microscopy, while the magnetic behavior has been characterized byMossbauer spectroscopy and Faraday magnetometry. Our results indicate that maghemite crystallization conditions must be carefullycontrolled to obtain nanoparticles of an adequate size and to avoid subsequent evolution to other undesired ferric oxide phases.� 2006 Elsevier B.V. All rights reserved.
PACS: 81.20.Fw; 81.07.Bc; 81.40.Rs; 76.80.+y
Keywords: Magnetic properties; Mossbauer effect and spectroscopy; TEM; Nanocomposites; Nanoparticles; Sol–gels (xerogels); Thermal properties; X-ray diffraction
1. Introduction
The study of maghemite (c-Fe2O3)/silica nanocompos-ites has been undertaken from several points of view,regarding either their synthetic route [1] or their final tech-nological applications [2]. We have specifically focused ourinvestigation on xerogels containing ferrimagnetic maghe-mite nanoparticles, not only for their optical [3,4], magnetic[5–8] and magneto-optic [9,10] properties, but also becauseof their particular structure, which acts like a modifier ofthe properties that the nanoparticles would have out ofthe gel matrix, either in a suspension or in a bulk form.Maghemite/silica composites, as previously reported by
0022-3093/$ - see front matter � 2006 Elsevier B.V. All rights reserved.
doi:10.1016/j.jnoncrysol.2006.03.056
* Corresponding author. Tel.: +34 956 016 569; fax: +34 956 016 288.E-mail address: [email protected] (D. Ortega).
other authors [11,12], exhibit magneto-optical Faradayeffect (MOFE), which is a desirable feature to develop mag-netic field sensors from these materials [13,14].
Maghemite is a ferrimagnetic material which representsthe low temperature phase of iron oxide, and it easilyevolves into the more stable phase, hematite (a-Fe2O3),when submitted to high temperatures. Thus, special caremust be taken to avoid the appearance of hematite whileiron oxide xerogels are heat treated at temperatures above500 �C, since its antiferromagnetic nature can seriouslyaffect the desired ferrimagnetic behavior of the final nano-composite. In addition, the silica matrix magnetic dilutioneffect, the superparamagnetic behavior of the smallest par-ticles and the coexistence of more than one iron oxidephase give rise to a complex magnetic response. The pres-ent work is aimed to investigate the influence of processingconditions in the tailoring of magnetic properties of these
2802 D. Ortega et al. / Journal of Non-Crystalline Solids 352 (2006) 2801–2810
kinds of systems. Results of the magneto-optical character-ization of these samples will be published elsewhere [15].
2. Experimental
Iron oxide (c-Fe2O3) particles hosted in a silica matrixhave been synthesized by the sol–gel method. Tetraethox-ysilane (TEOS) and Fe(NO3)3 Æ 9H2O were used as precur-sors with a Fe/Si ratio of 15 wt%. Samples were preparedat room temperature following the classical method, byhydrolysis of TEOS (ethanol diluted at 30%) with 4 molH2O/mol TEOS, where the iron salt was previously dis-solved. Aqueous salt solution pH was adjusted to the val-ues indicated in Table 1 with nitric acid. Thehomogeneous solution was mechanically stirred for5 min. Finally, formamide, used as a drying control chem-ical additive (DCCA), was added in a molar ratio of 4 mol/mol TEOS. The resulting sols were kept in hermeticallysealed cylindrical tubes and left for gelation at a fixed tem-perature of 50 �C. In all samples, the gelation point wasreached after 1 day approximately. To ensure completeremoval of syneresis liquid, samples were aged during dif-ferent periods of several days and dried at 50 �C for fivedays. During this stage, a progressive darkening of sampleswas observed, probably due to iron complexation asFe[(H2O)6]3+ [16] and subsequent evolution to fresh poly-meric species as the sol pH value approaches 2.5 after theformamide addition, which is the maximum value mea-sured value during the monitoring of gelation period[16,17].
Finally, the samples were heat treated up to 700 �C in anitrogen stream (0.1 l/min), in order to eliminate the resid-uals from the pore network, promote the crystallization ofc-Fe2O3 particles and stabilize them.
Thermogravimetric analyses (TGA) of the samples wereperformed in a Perkin–Elmer TGA7 with constant heatingrate experiments at 0.5 �C/min, in the 50–900 �C range, onmonolithic pieces. Crystallization of the particles into thecomposites was studied by X-ray diffraction (XRD) in aPHILIPS PW1830 diffractometer using CuKa radiation in
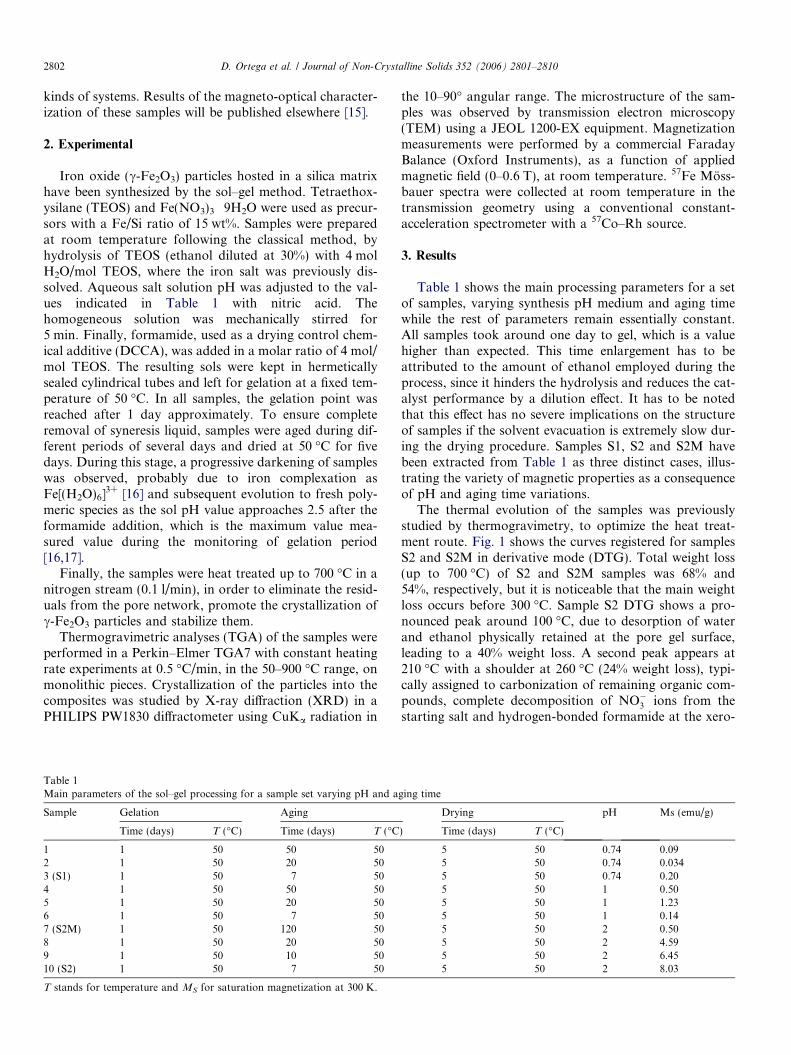
Table 1Main parameters of the sol–gel processing for a sample set varying pH and a
Sample Gelation Aging
Time (days) T (�C) Time (days) T (�C
1 1 50 50 502 1 50 20 503 (S1) 1 50 7 504 1 50 50 505 1 50 20 506 1 50 7 507 (S2M) 1 50 120 508 1 50 20 509 1 50 10 5010 (S2) 1 50 7 50
T stands for temperature and MS for saturation magnetization at 300 K.
the 10–90� angular range. The microstructure of the sam-ples was observed by transmission electron microscopy(TEM) using a JEOL 1200-EX equipment. Magnetizationmeasurements were performed by a commercial FaradayBalance (Oxford Instruments), as a function of appliedmagnetic field (0–0.6 T), at room temperature. 57Fe Moss-bauer spectra were collected at room temperature in thetransmission geometry using a conventional constant-acceleration spectrometer with a 57Co–Rh source.
3. Results
Table 1 shows the main processing parameters for a setof samples, varying synthesis pH medium and aging timewhile the rest of parameters remain essentially constant.All samples took around one day to gel, which is a valuehigher than expected. This time enlargement has to beattributed to the amount of ethanol employed during theprocess, since it hinders the hydrolysis and reduces the cat-alyst performance by a dilution effect. It has to be notedthat this effect has no severe implications on the structureof samples if the solvent evacuation is extremely slow dur-ing the drying procedure. Samples S1, S2 and S2M havebeen extracted from Table 1 as three distinct cases, illus-trating the variety of magnetic properties as a consequenceof pH and aging time variations.
The thermal evolution of the samples was previouslystudied by thermogravimetry, to optimize the heat treat-ment route. Fig. 1 shows the curves registered for samplesS2 and S2M in derivative mode (DTG). Total weight loss(up to 700 �C) of S2 and S2M samples was 68% and54%, respectively, but it is noticeable that the main weightloss occurs before 300 �C. Sample S2 DTG shows a pro-nounced peak around 100 �C, due to desorption of waterand ethanol physically retained at the pore gel surface,leading to a 40% weight loss. A second peak appears at210 �C with a shoulder at 260 �C (24% weight loss), typi-cally assigned to carbonization of remaining organic com-pounds, complete decomposition of NO�3 ions from thestarting salt and hydrogen-bonded formamide at the xero-
ging time
Drying pH Ms (emu/g)
) Time (days) T (�C)
5 50 0.74 0.095 50 0.74 0.0345 50 0.74 0.205 50 1 0.505 50 1 1.235 50 1 0.145 50 2 0.505 50 2 4.595 50 2 6.455 50 2 8.03

Fig. 1. DTG of S2 (dotted line) and S2M (full line) samples, illustratingthe structural influence of post-aging in the studied composites.
D. Ortega et al. / Journal of Non-Crystalline Solids 352 (2006) 2801–2810 2803
gel surface [18]. A further weight loss takes place beyond550 �C, which is typically assigned to the removal of watercoming from additional polycondensation and dehydroxy-lation of iron oxyhydroxides [19].
A similar profile was obtained for sample S1. In con-trast, DTG of S2M sample reveals some differences relatedto maturing effect in the nanocomposites. This effect leadsto a 20% reduction of the total weight loss, mainly due tothe elimination of most water and alcohol excess, asrevealed the less significant DTG first peak (15% weightloss). Nevertheless, the increase of the weight loss above200 �C (36%) indicates that additional surface reactionsare promoted during this step which, as described later, willinfluence the Fe2O3 particles formation. It is very notice-able that the later peak grows at the expense of the firstone. The second DTG peak is referred to the process ofoxyhydroxides formation from adsorbed water and otherhydroxilated species present inside the gel [20].
When experiments are carried out in an oxygen atmo-sphere, no remarkable differences are noticed in the curves,except for a better resolution of 210 and 260 �C peaks.However, nanocomposites appearance, once treated at700 �C, is significantly different depending on the atmo-sphere: in oxygen flow, clean reddish pieces of glassy gelare obtained whereas nitrogen flow induces a progressivedarkening from core to surface of the samples. This obser-vation could be related to the absence of oxygen in the sur-face surroundings, although it is generated inside the poresfrom oxygenated organic compounds decomposition.Other authors have pointed out that organic residues pro-mote the conversion to maghemite trough a magnetiteintermediate transition [21,22], but in those cases, thehighly probable formation of iron oxyhydroxides as pre-cursors of final oxides [23] was not taken into account aswell as no direct measurements indicating the existence ofmagnetite were provided. In agreement with the resultsfrom DTG experiments, elimination of the solvents andorganic residues trapped in the gel network and promotion
of maghemite particles formation, were accomplished byheat treating the samples under N2 stream at 0.5 �C/minup to 700 �C, following a multi-ramp path with steps at100 �C (16 h), 180 �C (6 h), 300 �C (3 h) and 700 �C (3 h).It is noteworthy to remark that, in most of the cases, aninert atmosphere, e.g. nitrogen, is needed to observe thetransformation to c-Fe2O3 phase [24], while oxygen favorsthe appearance of a-Fe2O3. Furthermore, the presence ofwater vapor either generated in the sample surroundingsduring water evacuation from the xerogel pores or con-tained within the employed gas flow, also enhances the for-mation of a-Fe2O3, as demonstrated in dedicatedexperiments with water saturated gas flows [25]. Finally,the temperature was reduced at 0.5 �C/min down to roomtemperature, and iron oxide doped silica xerogels resulted,with physical and mechanical properties dependent of pro-cessing conditions.
Fig. 2 shows the XRD patterns corresponding to thethree samples studied obtained at room temperature. Atlow diffraction angles, we may observe the typical broaddiffraction halo due to the amorphous silica matrix. Athigher angles, several diffraction peaks appear which canbe assigned to both c-Fe2O3 (s) and a-Fe2O3 (j) phases,as indicated on these profiles. It should be noticed thatpeaks are more intense for samples prepared at pH = 2,S2 sample showing the best c phase conversion, as revealedby the large 36� peak, assigned to maghemite.
As a general trend, a slight broadening of the Braggpeaks full-width-at-half-maximum (FWHM) is observedwith the decreasing in processing pH, pointing out theexpected particle size increases from S1 to S2M or S2 sam-ples. However, the most noticeable effect due to additionalaging is the presence of a-Fe2O3 phase reflections in a lar-ger extent in the S2M pattern than in the S2 one. So,whereas the S2 sample contains mainly c-Fe2O3 phase,sample S2M includes a mixture of both phases.
This trend is confirmed by information derived fromTEM micrographs (Fig. 3). As shown in Fig. 4, histogramscorresponding to S2M and S2 comprise a broader sizerange than that obtained for sample S1, with a mean par-ticle size of 3 nm, as opposite to 5 nm for the former ones.In fact, the intensity decrease observed in the most charac-teristic peaks of S1 diffraction pattern is surely related witha higher number of small particles. S2 histogram illustratesa broad particle size distribution with a large amount ofsmaller nanoparticles. Regarding the particles shape,TEM micrographs show quasi-spherical particles in allthe samples.
On the other hand, Fig. 5 shows 57Fe Mossbauer spectracorresponding to the three studied samples. The spectraclearly shows two main contributions as arising from com-ponents with different magnetic behaviors; one sextet cor-responding to ferrimagnetic maghemite and one doubletdue to the superparamagnetic behavior exhibited by thesmallest particles, diminishing the doublet/sextet ratio fromS1 to S2. The fitting of the spectra has been performedusing the NORMOS program, developed by Brand et al.

Fig. 2. XRD spectra of samples S1, S2M and S2. The most characteristic peaks of each iron oxide phase are marked with (s) for the maghemitereflections and with (j) for the hematite ones. The inset shows the relationship between two selected peaks ratio in commercial maghemite/hematitemixtures (h) and hematite percentage. Each sample (m) is located along the line that best fits this relationship, and an estimation of their hematite contentis made.
2804 D. Ortega et al. / Journal of Non-Crystalline Solids 352 (2006) 2801–2810
[26]. This allows a simultaneous fit of crystalline spectrawith the possible addition of a distribution of hyperfinefields BHF. As it can be observed in the spectra, the mag-netic component is the result of contributions from differ-ent magnetically non-equivalent Fe atoms presented inthe same phase. This fact can be understood if we take intoaccount the microstructure of the sample. There is not ahomogeneous size for the nanoparticles and, besides, thesurface and bulk atoms present different chemical sur-roundings. As the Mossbauer spectroscopy is a local tech-nique, these differences will be reflected in the subspectrumhindering the fitting of the later by two well differenced sex-tets. For this reason, we have chosen a distribution ofhyperfine fields to fit the magnetic component, whoseresults are presented at the right hand of Mossbauer spec-
tra. The corresponding hyperfine parameters of samplesand those of pure oxides are summarized in Table 2, forcomparison. All parameters were referred to a-Fe at roomtemperature. The isomeric shift and quadrupolar shiftingvalues extracted from Mossbauer spectra fall within thetypical range attributed to Fe3+ ions and reveals its highspin state. Furthermore, the calculations of doublet/sextetarea ratios let us valuate the percentage of those phasesin superparamagnetic state corresponding to each sample:73.4% (S1), 60.0% (S2M) and 16.8% (S2).
Finally, Fig. 6 shows the magnetization curves of thesamples at 300 K. At this temperature, they are non-hyster-etic, as expected for samples which should contain nano-particles both above and below the superparamagnetic(SPM) limit, but in the unblocked regime. There is not a

Fig. 3. TEM micrographs of the three samples under study, showing thesize and morphology of iron oxide nanoparticles.
Fig. 4. Size distribution histograms obtained from TEM micrographs.
D. Ortega et al. / Journal of Non-Crystalline Solids 352 (2006) 2801–2810 2805
simple relationship to describe the magnetic behavior of thesamples, due to the complex Fe2O3 phase composition. Inprinciple, we may have c-Fe2O3 particles both above andbelow the SPM limit, as mentioned before, but also antifer-romagnetic a-Fe2O3 particles. At first glance, magnetiza-
tion decreases with aging time and pH which, as we shalldiscuss later, may be derived from both particle size andthe phase of the formed iron oxide.
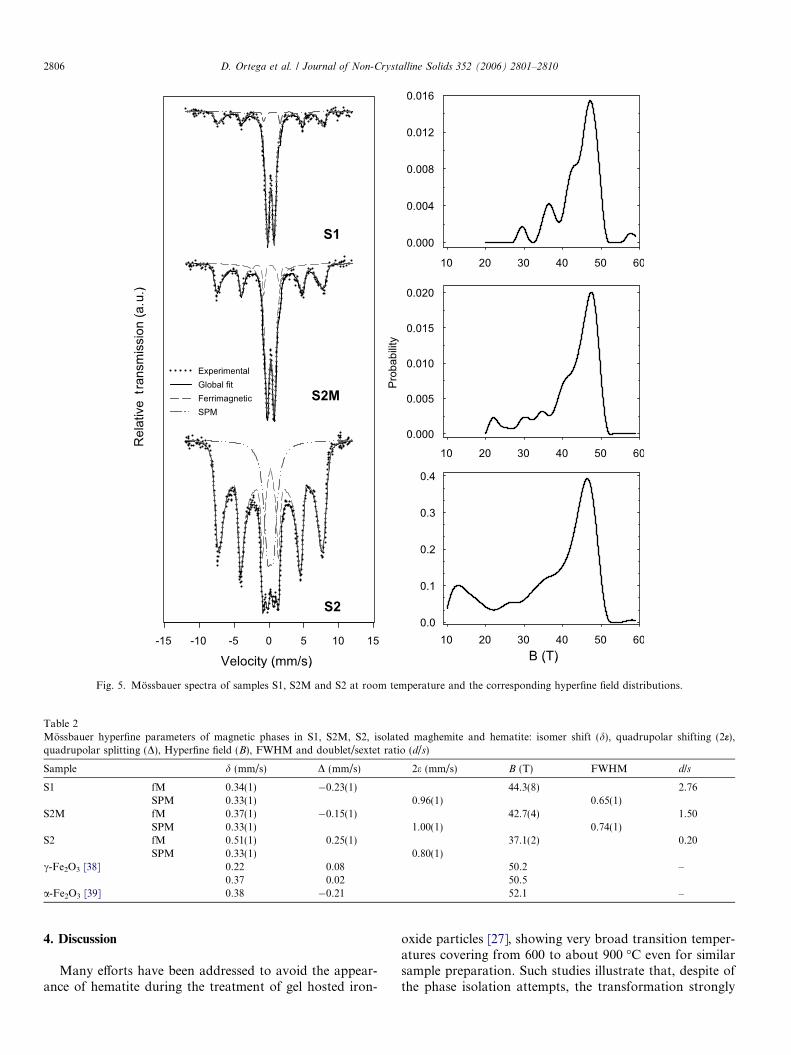
Fig. 5. Mossbauer spectra of samples S1, S2M and S2 at room temperature and the corresponding hyperfine field distributions.
Table 2Mossbauer hyperfine parameters of magnetic phases in S1, S2M, S2, isolated maghemite and hematite: isomer shift (d), quadrupolar shifting (2e),quadrupolar splitting (D), Hyperfine field (B), FWHM and doublet/sextet ratio (d/s)
Sample d (mm/s) D (mm/s) 2e (mm/s) B (T) FWHM d/s
S1 fM 0.34(1) �0.23(1) 44.3(8) 2.76SPM 0.33(1) 0.96(1) 0.65(1)
S2M fM 0.37(1) �0.15(1) 42.7(4) 1.50SPM 0.33(1) 1.00(1) 0.74(1)
S2 fM 0.51(1) 0.25(1) 37.1(2) 0.20SPM 0.33(1) 0.80(1)
c-Fe2O3 [38] 0.22 0.08 50.2 –0.37 0.02 50.5
a-Fe2O3 [39] 0.38 �0.21 52.1 –
2806 D. Ortega et al. / Journal of Non-Crystalline Solids 352 (2006) 2801–2810
4. Discussion
Many efforts have been addressed to avoid the appear-ance of hematite during the treatment of gel hosted iron-
oxide particles [27], showing very broad transition temper-atures covering from 600 to about 900 �C even for similarsample preparation. Such studies illustrate that, despite ofthe phase isolation attempts, the transformation strongly

Fig. 6. Magnetization curves for S1, S2M and S2 registered at 300 Kshowing the experimental data (s) and curve fit (–).
D. Ortega et al. / Journal of Non-Crystalline Solids 352 (2006) 2801–2810 2807
depends on the sample processing, and in all cases it hasbeen found the eventual occurrence of hematite.
Thermogravimetric results reveal that the samples pro-cessing preserve a significant amount of residues to remove,which are sensitive for interaction with iron oxide precur-sors. In fact, the evolution of DTG peaks when additionalaging takes place, indicates a major contribution of the sec-ond peak in 200–300 �C range to the total weight loss. BothS2 and S2M gels exhibit the loss from nitrates decomposi-tion just at the starting of the second DTG peak. As we
shall show in a future paper, the decrease in the ratio ofthe first peak area to the second one progressively occursas iron content becomes higher, since hydroxyl groupsfrom solvents and silanol groups at the gel surface areinvolved in the oxyhydroxides formation. Solvent volumeemployed in our samples is enough to dissolve 15 wt% iron,ensuring a complete transformation. Fig. 1 demonstratesthat aging time in samples favors the conversion to oxyhy-droxides, as well as allows the sol–gel reactions to continuebeyond drying stage, establishing a competition betweenthem that will mark the phase and the size of nanoparticlesinside. The fact that effective weight loses only appears upto 300 �C probably indicates that, for increasing tempera-tures, the main processes are phase changes in the ironoxide nanoparticles and, in a lower extension, particlegrowth [28].
A general analysis of diffraction patterns presented inFig. 2 reveals that, firstly, not all characteristic peaks ofiron oxide phases are clearly shown and, secondly, peakintensities and widths differ from those expected for a bulksample. Other authors have pointed out that the presenceof additional phases to maghemite is observed when ironcontents exceed 23 wt% [29]; in our samples, the iron con-tent is, however, lower than this level and both maghemiteand hematite phases could be clearly identified from dif-fraction patterns, depending on the Fe/Si ratio and pro-cessing conditions. It should be apparent from the S1diffraction pattern an intensity decrease in most character-istic peaks as a consequence of the higher number of smal-ler particles. The size reduction apparently produced by thepH decreasing can be due to the competition between par-ticle growing process and both the structural relaxationand further polycondensation of the gel network. Gener-ally, at a given temperature, formamide concentrationand composition of TEOS/Ethanol/Water system, thehigher the pH the larger the gel pores [30]. In more acidicconditions (like sample S1), the hydrolysis reaction isfavored, generating a weakly branched system, which willproduce the solid gel. These conditions accelerate the firststage cross-linking of silica network, leaving smaller holesfor particles to grow in.
In accordance with TEM and XRD observations, theamount of nanoparticles in superparamagnetic state growsfrom S2 to S1 as pH is decreasing, as indicated by the inter-pretation of Mossbauer spectra. As compared with isolatedoxides, the nanocomposites hyperfine field values fromMossbauer data fits are generally lower. This can be inter-preted from the synergy between the increasing numbers ofatoms at particles’ surface as well as the related surface spincanting. To our knowledge, nanoparticles are not chemi-cally bonded to matrix, so dipolar interactions are morelikely than superexchange to reduce hyperfine field.
From S1 to S2, the emerging of a ferrimagnetic sextetdue to the presence of maghemite particles is observed,and its area increases at the expense of the central doublet.This contribution to the spectra takes place while the cen-tral doublet is gradually broadening. The anisotropy

2808 D. Ortega et al. / Journal of Non-Crystalline Solids 352 (2006) 2801–2810
energy, supposing a single domain uniaxial particle system,is given by:
Ea ¼ KV sin2 h; ð1Þwhere K is the anisotropy constant, V the volume and h theangle between the magnetization and the easy axis of mag-netization. Anisotropy expression of maghemite/hematiteis rather more complex than that expressed in Eq. (1),but it is worth to make that simplification for the followingdiscussion. From S2 to S1, V is decreasing down to a crit-ical value which allows the thermal fluctuations to contin-uously reverse the spin orientation. In that sense, S1contains a larger fraction of superparamagnetic particleswith a modest ferrimagnetic contribution from the rest ofmaghemite particles. On the other hand, S2 exhibits a mag-netically split sextet coupled with a more or less wide dou-blet. The S2 profile is rather different from those of S1 andS2M, with an asymmetrically broadening of lines, probablydue to the enhanced interactions between nanoparticles.TEM images of S2M and S2 are very similar and fromthem, almost the same particle distribution is obtained,but their magnetic behavior is quite different. The explana-tion of this fact must be found in the iron oxide phase ob-tained after high temperature treatments. The vast majorityof the iron atoms present within the sample belongs to theferrimagnetic larger particles because they posses a highervolume than the smaller ones, nevertheless there are agreater number of a-Fe2O3 particles compared to the c-Fe2O3 ones. It is possible to make an estimation of theweighed contribution of each type of particles to samplemagnetization, by means of the diameter/volume relation-ship and Mossbauer data. An estimation of the superpara-magnetic limit can be obtained if the SPM phasepercentage, calculated from the relative area of doubletto sextet signals in the Mossbauer spectrum of sample S2,is compared with its volume distribution function, deducedfrom particle size distribution histogram in Fig. 4. Forsample S2, SPM phase composition is estimated as 16.8%and this percentage corresponds to the volume of particleswith diameter below 10 nm. This value is not far from theestimations made by other authors for similar systems [31].
Magnetization curves have been fitted considering thedifferent phases contributions: (i) for maghemite nanopar-ticles above the SPM limit, a simple Frohlich relationshiphas been considered; (ii) for c-Fe2O3 nanoparticles belowthe SPM limit, the usual Langevin function was taken intoaccount and (iii) for hematite nanoparticles, we have con-sidering, as shown by Neel [32–34], that they may have anet magnetic moment, due to the non-exact compensationof the two magnetic sublattices, i.e. the imbalance in thenumber of ‘up and down’ spins in its structure. Accordingto Neel [35], the uncompensated moment of AFM particlesis given by
lp ¼ lAN a; ð2Þ
where lA is the atomic moment and N is the number ofmagnetic atoms per particle. In the case of hematite, a
has been proposed to be 1/3, due to its structure, composedof alternating compensated planes with incomplete top andbottom planes (i.e. where randomness in the distribution ofmagnetic ions occurs only on the particles surface).
Thus, the contribution to magnetization from theseAFM particles is considered as:
MAFM ¼ N p;AFM � lp;avg; ð3Þ
where Np,AFM is the number of hematite particles andlp,avg is their average magnetic moment, i.e. an average sizefor these kind of particles is considered here. This averagesize is taken from the TEM measurements in Figs. 3 and 4.
Considering the magnetization coming from all thephases and their different behavior with applied magneticfield, the experimental curves were fitted to the followingrelationship:
M ¼ xAFMMAFM þ xfMM fM þ xSPMMSPM; ð4Þwhere xAFM, xfM and xSPM are, respectively, the estimatedfractions of a-Fe2O3, c-Fe2O3 in particles above the SPMlimit and those below this limit. As previously mentioned,for the second contribution, a Frohlich [36,37] (non-hyster-etic) relationship has been considered. Thus, the magneti-zation from the bigger maghemite particles is taken as
M fM ¼aH
1þ bH; ð5Þ
where a/b gives the saturation magnetization for thisphase.
On the other hand, for the maghemite particles belowthe SPM limit, the MSPM is deduced from the usual Lange-vin function
MSPM ¼ N SPMlSPM cothl0lSPMH
kBT
� �� kBT
l0lSPMH
� �; ð6Þ
where NSPM is the number of SPM particles with averagemagnetic moment lSPM, also taken from the size distribu-tion in Fig. 4.
Table 3 summarizes all the results obtained in the fit-tings of magnetization curves, comparing them with thoseobtained from XRD measurements. Magnetization of sam-ple S1 corresponds to a set of very small particles with analmost equal fraction of hematite and maghemite phases.This result is compatible both with XRD measurements(Fig. 2) and size distribution histogram deduced fromTEM observations (Fig. 4). In the cases of samples S2and S2M, interpretation is more complex. For sample S2,a 73% of ferromagnetic phase (c-Fe2O3 particles abovethe SPM limit) is estimated. For this result to be in agree-ment with the size distribution of Fig. 4, the SPM limitmust be set around 13 nm and it has to be considered thatthere are not hematite particles in this high size range. Theamount of hematite and maghemite particles with sizesbelow this limit is almost identical. Although most of theparticles are in the blocked state, the magnetization curveis still essentially anhysteretic, i.e. blocked particles musthave a low coercivity, as a consequence of c-Fe2O3 cubic

Table 3Estimated composition of samples deduced from XRD and from magnetization curve fittings to Eq. (4)
Sample Composition estimated from XRD Composition estimated from magnetization curve fittings
a-Fe2O3 (%) c-Fe2O3 (%) a-Fe2O3 (%) SPM c-Fe2O3 (%) fM c-Fe2O3 (%)
S1 50 50 54 45 1S2M 70 30 65 33 2S2 10 90 12 15 73
D. Ortega et al. / Journal of Non-Crystalline Solids 352 (2006) 2801–2810 2809
structure, spherical shape of particles and random orienta-tion of their magnetic moments that would lower magneticanisotropy. Additionally, the fact that bigger particles maybe multidomain cannot be ignored.
On the contrary, for sample S2M, with a size distribu-tion diagram similar to that of sample S2, the majorityphase must be hematite, even more in the high size range,to accomplish the magnetization curve. This fact can bealso observed in the XRD pattern of Fig. 2, where hematitereflections are more noticeable than maghemite ones in thissample. Values of relative hematite and maghemite compo-sition, deduced from the comparisons of XRD patternswith those of several mixtures of commercial hematiteand maghemite powders, are also in agreement with thesevalues deduced from the magnetization fits. The estimatedvalue of the SPM limit here is larger than the one obtainedin a similar way from Mossbauer spectra, but this is anexpected result if one considers the different experimentaltime in both techniques.
5. Conclusions
Several Fe2O3/SiO2 nanocomposites have been preparedby sol–gel process, using iron (III) nitrate as nanoparticlesprecursor. After drying and aging, doped xerogels wereheat treated up to 700 �C. Samples were characterized byXRD, TEM, TGA, Mossbauer spectroscopy and Faradaymagnetometry. It was found that modifying aging and pHconditions used in the synthesis of Fe2O3/silica nanocom-posites, it is possible to tune up the size and phase ofembedded nanoparticles, thus determining their magneticproperties. Although all the samples exhibit a mixture ofa and c iron oxide phases, it has been shown that higherpH conditions and shorter aging time, leads to a highermaghemite conversion efficiency, with a larger nanoparticlesize. Thermogravimetry experiments reveal the influence ofaging time on the resulting phases, by modifying the con-version route from the iron nitrate precursor to the finaloxide.
The most significant features from XRD patterns are apeak broadening trend as pH decreases (due to the smallersize of the particles, confirmed by TEM) and the increase ofreflections from a iron oxide phase (as a result of the agingtime).
The nanoparticles size and iron oxide phase mixturegovern the magnetic behavior revealed by Mossbauer spec-troscopy and magnetization measurements. By fittingMossbauer and magnetization curves, taking into account
XRD and size distribution histograms from TEM, estima-tions of 10 nm (Mossbauer) and 13 nm (magnetometry) forthe SPM limit of c-Fe2O3 nanoparticles have resulted. Itcan be concluded that processing conditions of S2 sampleleads to a better ferrimagnetic nanoparticles conversionyield. Yet, due to their small particle size and matrix nat-ure, these composites still possess an acceptable transpar-ency which, combined with the observed magneticproperties, make them suitable to be used in magneto-opti-cal devices.
Acknowledgements
These investigations have been supported by the Span-ish MCyT/FEDER under projects MAT2002-02179 andMAT2002-04087-C02-C01. The authors would like togratefully thank to J. Gonzalez, J. M. Gonzalez-Leal andR. Litran for the technical support and fruitful discussions.
References
[1] A. Bourlinos, A. Simopoulos, D. Petridis, H. Okumura, G. Had-jipanayis, Adv. Mater. 13 (2001) 289.
[2] D. Jamon, S. Robert, F. Donatini, J.J. Rousseau, C. Bovier, H. Roux,J. Serrughetti, V. Cabuil, D. Zins, IEEE Trans. Magn. 37 (2001) 3803.
[3] P. Mazzoldi, G.W. Arnold, G. Battaglin, F. Gonella, R.F. Haglund,J. Non-Linear Opt. Phys. Mater. 5 (1996) 285.
[4] P. Chakraborty, J. Mater. Sci. 33 (1998) 2235.[5] R.D. Shull, J.J. Ritter, A.J. Shapiro, L.J. Swartzendruber, L.H.
Bennett, J. Appl. Phys. 67 (1990) 4490.[6] E. Tronc, D. Fiorani, M. Nogues, A.M. Testa, F. Lucari, F. Orazio,
J.M. Greneche, W. Wernsdorfer, N. Galvez, C. Chaneac, J. Magn.Magn. Mater. 262 (2003) 6.
[7] C. Caizer, C. Savii, M. Popovici, Mater. Sci. Eng. B 97 (2003) 129.[8] C. Caizer, Phys. B: Cond. Matter. 327 (2003) 27.[9] F. Bentivegna, M. Nyvlt, J. Ferre, J.P. Jamet, A. Brun, S. Visnovsky,
R. Urban, J. Appl. Phys. 85 (1999) 2270.[10] R.F. Ziolo, E.P. Giannelis, B.A. Weinstein, M.P. O’Horo, B.N.
Ganguly, V. Mehrotra, M.W. Russel, R. Huffman, Science 257 (1992)219.
[11] F. Bentivegna, J. Ferre, M. Nyvlt, J.P. Jamet, D. Imhoff, M. Canva,A. Brun, P. Veillet, S. Visnovsky, F. Chaput, J.P. Boilot, J. Appl.Phys. 83 (1998) 7776.
[12] G. Rosa, H. Guerrero, D. Levy, A. Alvarez-Herrero, J. Appl. Phys.97 (2005) 064314.
[13] T.W. Cease, J.G. Driggans, IEEE Trans. Power Deliver 6 (1991)1374.
[14] H. Katsukawa, H. Ishikawa, H. Okajima, T.W. Cease, IEEE Trans.Power Deliver 11 (1996) 702.
[15] D. Ortega, PhD Thesis, Universidad de Cadiz, 2006.[16] A.E. Gash, T.M. Tillotson, J.H. Satcher, L.W. Hrubesh, R.L.
Simphon, Chem. Mater. 13 (2001) 999.[17] C.M. Flynn Jr., Chem. Rev. 84 (1984) 34.

2810 D. Ortega et al. / Journal of Non-Crystalline Solids 352 (2006) 2801–2810
[18] E. Blanco, M. Ramirez-del-Solar, N. de la Rosa-Fox, L. Esquivias,Mater. Lett. 22 (1995) 265.
[19] L. Li, G. Li, R.L. Smith, H. Inomata, Chem. Mater. 12 (2000) 3705.[20] S. Ponce-Castaneda, J.R. Martınez, F. Ruiz, S. Palomares-Sanchez,
O. Domınguez, J. Sol–Gel. Sci. Tech. 25 (2002) 29.[21] T. Gonzalez-Carreno, M.P. Morales, M. Gracia, C.J. Serna, Mater.
Lett. 18 (1993) 151.[22] F. del Monte, M.P. Morales, D. Levy, A. Fernandez, M. Ocana, A.
Roig, E. Molins, K. O’Grady, C.J. Serna, Langmuir 13 (1997) 3627.[23] S. Ponce-Castaneda, J.R. Martınez, S. Palomares-Sanchez, F. Ruiz,
O. Ayala-Valenzuela, J.A. Matutes-Aquino, J. Sol–Gel. Sci. Tech. 27(2003) 247.
[24] K. Woo, H.J. Lee, J.P. Ahn, Y.S. Park, Adv.Mater. 15 (2003) 1761.[25] G.S. Chopra, C. Real, M.D. Alcala, L.A. Perez-Maqueda, J. Subrt,
J.M. Criado, Chem. Mater. 11 (1999) 1128.[26] R.A. Brand, J. Lauer, D.M. Herlach, J. Phys. F: Metal Phys. (1983)
675.[27] I.K. Battisha, H.H. Afify, I.M. Hamada, J. Magn. Magn. Mater. 292
(2005) 440.
[28] C. Cannas, G. Concas, A. Musinu, G. Piccaluga, G. Spano, Z.Naturforsch., A: Phys. Sci. 54A (1999) 513.
[29] P. Ayyub, M. Multani, M. Barma, V.R. Palkar, R. Vijayaraghavan, J.Phys. C: Solid State Phys. (1988) 2229.
[30] C.J. Brinker, G.W. Scherer, Sol gel science. The physics and chemistryof sol–gel processing, Academic Press Inc., 1990.
[31] J.L. Dormann, D. Fiorani, E. Tronc, Magnetic relaxation in fine-particle system, John Wiley, New York, 1997.
[32] L. Neel, C. R. l’Academie. Sci. 252 (1961) 4075.[33] L. Neel, C. R. l’Academie. Sci. 253 (1961) 9.[34] L. Neel, C. R. l’Academie. Sci. 253 (1961) 1286.[35] L. Neel, Low Temperature Physics, Gordon & Breach, London, 1962.[36] R.D. Zysler, D. Fiorani, A.M. Testa, J. Magn. Magn. Mater. 224
(2001) 5.[37] D.C. Jiles, Introduction to Magnetism and Magnetic Materials,
Chapman and Hall Publishers, London and New York, 1998.[38] H. Annersten, S.S. Hafner, Z. Kristallogr. 137 (1973) 321.[39] F.V.d. Woude, Phys. Stat. Sol. 17 (1966) 417.
Copyright © 2022 FDOKUMEN