Characterization of blanking induced magneto-mechanical cut ...
204
Faculty of Engineering / Department of Mechanical Engineering Characterization of blanking induced magneto-mechanical cut edge defects in non-oriented electrical steel By: Ammar Dawood Ghali Al-Rubaye A thesis submitted to the Department of Mechanical Engineering, University of Sheffield in partial fulfilment of the requirements for the degree of Doctor of Philosophy Academic supervisors: Dr. Hassan Ghadbeigi (MEC) Prof. Kais Atallah (EEE) July 2019
-
Upload
khangminh22 -
Category
Documents
-
view
0 -
download
0
Transcript of Characterization of blanking induced magneto-mechanical cut ...

Faculty of Engineering / Department of Mechanical Engineering
Characterization of blanking induced magneto-mechanical
cut edge defects in non-oriented electrical steel
By:
Ammar Dawood Ghali Al-Rubaye
A thesis submitted to the Department of Mechanical Engineering,
University of Sheffield in partial fulfilment of the requirements
for the degree of Doctor of Philosophy
Academic supervisors:
Dr. Hassan Ghadbeigi (MEC)
Prof. Kais Atallah (EEE)
July 2019

I
Abstract
Electrical steels play a vital role in the generation and use of electricity as they are widely
used in a range of electrical equipment for industrial and domestic appliances. The
material is usually manufactured in the form of cold-rolled thin strips that are stacked
together to form the laminated stacks used to form the stator and rotor parts of electric
motors. As the individual layers are made mostly by blanking and piercing processes the
quality of the final product directly affects the performance of the electrical machines.
The blanking process results in local plastic deformation and texture modification in
electrical steels which will affect the magnetic and mechanical performance of the electric
motors and transformers. Therefore, the main aim of the project is to obtain a better
understanding of the global and local magneto-mechanical properties of the sheet material
at the cut edge and vicinity area to optimise design parameters used for the final products.
An experimental investigation was designed and implemented to study the
mechanism of blanking operation and local magneto-mechanical properties of thin strip
electrical steels at the cut edge. The deformation at the cut edges was identified regarding
main blanking parameters such as deformation rate, material thickness and sheet
orientation at a specific clearance. The thickness of individual laminates plays a critical
role in the magnetic performance of the manufactured power units. However, the thinner
gauges introduce challenges to the manufacturing and processing of the material,
especially in the high-speed cutting operations. Therefore the study was considered using
two different thin gauge thickness with different grain orientations of electrical steel with
nominated thickness 0.2 mm and compare results with those for 0.35 mm sheet thickness.
A novel blanking experiment together with Digital Image Correlation was
designed in order to identify local strain distribution in laminates of both the used
thicknesses during the blanking process. That was done to achieve a better understanding
of deformation induced microstructural damage in the vicinity of the cut edge. Also, a
bespoke single sheet magnetic tester was designed and built to determine the effect of
blanking induced cut edge damage on magnetic properties in the form of hysteresis losses
and quantify magnetic deterioration in the produced laminations. The microstructure of
cut edge deformation and the fracture surface was observed using both optical and

II
scanning electron microscopes. Furthermore, Nano-indentations tests were implemented
in the deformed area at the cut edges to characterize local deformation.
The results showed that the cutting process parameters have a significant impact on the
mechanical and magnetic properties and the cut edge quality. The reduced thickness also
introduced a great challenge in preparing samples for all the tests that were done. Sheet
thickness had a significant role on the hysteresis loss and extension of deformation and
strain amount. The results also showed that the blanking speed also has an important
influence on blanking results and thereby more affected in mechanical and magnetic
properties. However, it was observed that the thickness of the laminations plays an
important role due to the small number of grains in the thickness direction causing the
individual grains to have a significantly high effect on the local properties of the produced
parts. The change in the cutting location regarding the grains could cause different
deformation state. This variations in the blanking deformation make it very difficult to
determine the extension of deformation or give clear trend to the blanking behaviour
effects upon the mechanical and magnetic properties.
The achieved results can be used to enhance our knowledge and be practically
implemented through the interconnection between the inputs of the cutting process and
the outputs represented by the edge quality and affected properties. This investigation can
also be incorporated in improving the manufacturing process in order to manage magnetic
property deterioration, thereby exploiting the full potential of the magnetic materials; as
a result, improving the machine’s performance.

III
Declaration
Described in this dissertation is work performed in the Department of Mechanical
Engineering, the University of Sheffield between October 2014 and October 2018. I
hereby declare that no part of this work has been submitted as an exercise for a degree at
this or any other university. This thesis is entirely the result of my own work and includes
nothing which is the outcome of collaboration, except when stated otherwise. This thesis
contains 127 figures and 10 tables and about 50,000 words.

IV
Dedication
To my parents Father and mother,
To my family, wife and children Rusul and Mohammed,
To my brothers and sisters
I dedicate this work.
Ammar

V
Acknowledgements
First of all, I would like to thank Almighty Allah for everything in my life.
This research project would not have been possible without the support of
many people;
Initially, I would like to express my deep sincere gratitude to my
supervisor, Dr Hassan Ghadbeigi for his support and guidance throughout
the project and for the knowledge that I received from him and his great
amount of time and effort he spent to help me to accomplish this project,
I would also thank my second supervisor Professor Kais Atallah for the
valuable information that he gave me and his support during my study,
I would like to thanks the Ministry of Higher Education and Scientific
Research in Iraq to nominating me to the scholarship and financial support
to complete my high education.
I also want to thank all the technical staff in the Mechanical, Electrical, and
Materials Engineering Departments at the University of Sheffield, who
helped me to carry out my experimental work and providing laboratory
facilities,
I also thank all my friends and colleagues for their supporting and
cooperation,
I would like to express my gratitude to my family whose have always given
me their support for the duration of my studies, my wife and my children,
Finally, I would like to thank from all my heart, my parents for their
encouragement, and continue praying for me, and for supporting me
spiritually.

VI
Nomenclature
Symbols
μ Permeability, tesla/A/m
μ0 Permeability of free space, 4π × 10−7
ɸ Quantity of flux, weber
ρ Resistivity, _m, ohm metres
A Area, m2
B Induction, tesla
f Frequency, Hz
H Applied field, A/m
HC Coercive force, A/m
I Current, amps
J Intrinsic magnetisation (B–H), tesla
N, n Number of winding turns
R Resistance, ohms
T Temperature (Celsius)
t Time
V Voltage, volts
W Power, watts
Abbreviations
ES Electrical steel
GO Grain orientation
NGO Non grain orientation
SST Single Sheet Tester
DW Domain wall
ASM American Society for Metals
ASME American Society of Mechanical Engineers
ASTM American Society for Testing and Materials
COE Cube-on-edge
DC Direct current
AC Alternative current
DIC Digital image correlation
FCC Face-centred cubic
HAZ Heat-affected zone
DAZ Deformation affected zone
SEM Scanning electron microscopy

VII
Contents
Abstract …………………………………………………………………….…………….I
Declaration ...................................................................................................................... III
Dedication ....................................................................................................................... IV
Acknowledgements .......................................................................................................... V
Nomenclature .................................................................................................................. VI
Symbols .......................................................................................................................... VI
Abbreviations .................................................................................................................. VI
List of Figures .................................................................................................................. X
List of Tables ................................................................................................................ XV
1 Introduction ......................................................................................................... 1
Introduction ........................................................................................................ 1
Problem Description ........................................................................................... 2
Research objectives and novelty ........................................................................ 4
Thesis Outline .................................................................................................... 5
2 Literature review ................................................................................................... 6
Introduction ........................................................................................................ 6
Electrical Steel (E.S) .......................................................................................... 7
2.2.1 Electrical steel applications ........................................................................ 7
2.2.2 Classification of electrical steel .................................................................. 8
2.2.3 Material isotropy and grains orientation ..................................................... 9
2.2.4 Metallurgical properties ............................................................................ 11
2.2.5 Methods for manufacturing electrical steels ............................................. 13
Magnetic properties of ES ................................................................................ 16
2.3.1 Ferromagnetic domains and magnetic properties ..................................... 16
2.3.2 Domain structure and domain walls motion ............................................. 17
2.3.3 Parameters of magnetic properties and hysteresis phenomena ................. 19
2.3.4 Magnetic power losses .............................................................................. 22
Measuring magnetic properties of electrical steel sheets ................................. 24
Methods for cutting laminations ...................................................................... 27
Blanking process .............................................................................................. 35
2.6.1 Mechanism of the blanking process .......................................................... 36
2.6.2 Analysis of applied stresses during the blanking process ......................... 37
2.6.3 Influence of various process parameters on blanked edge quality ................. 39

VIII
2.6.4 Effect of blanking parameters on the cutting force and cut edge quality . 40
2.6.5 Effect of sheet thickness on the cutting force and cut edge quality .......... 43
2.6.6 Effect of blanking speed on the cutting force and cut edge quality .......... 45
2.6.7 Strain fields measurement ......................................................................... 47
Effect of plastic deformation and residual stress on the magnetic properties .. 50
Effects of blanking on the magnetic properties ................................................ 56
Characterization of local deformation using hardness variations .................... 59
Summary .......................................................................................................... 61
3 The experimental methodology ........................................................................ 64
3.1 Introduction ...................................................................................................... 64
3.2 Material selection ............................................................................................. 65
3.3 Measurement of mechanical properties ........................................................... 66
3.3.1 Tensile tests ............................................................................................... 66
3.3.2 Tensile strain measurement using DIC ..................................................... 68
3.3.3 Blanking dies setup ................................................................................... 70
3.3.4 Blanking dies design ................................................................................. 71
3.3.5 Blanking parameters ................................................................................. 72
3.3.6 Blanking force assessments ...................................................................... 74
3.3.7 In-situ strain measurement during blanking using DIC ............................ 74
Nano-indentation tests ...................................................................................... 78
Magnetic tests using the single sheet tester ...................................................... 82
3.5.1 Design of the new SST apparatus ............................................................. 83
3.5.2 Determination of magnetization curve and hysteresis loss ....................... 86
3.5.3 Uncertainty and limitations of determination the magnetization curve and
complete hysteresis loop ........................................................................... 89
Microstructural analysis ................................................................................... 90
3.6.1 Samples preparation .................................................................................. 90
3.6.2 Microstructure examination ...................................................................... 92
Summary .......................................................................................................... 93
4 Experimental results ............................................................................................ 94
Introduction ...................................................................................................... 94
Characterization of mechanical properties ....................................................... 94
4.2.1 Tensile tests ............................................................................................... 94
4.2.2 Strain distribution in uniaxial loading …………………………………..96
Blanking process results ................................................................................. 103

IX
4.3.1 Blanking load stroke ............................................................................... 103
4.3.2 Strain distribution in the blanking process ............................................. 105
4.3.3 Characterization of local deformation using Nano-indentation .............. 115
Magnetic properties outcomes ....................................................................... 120
4.4.1 Effect of uniaxial deformation on magnetic properties .......................... 120
4.4.2 Effect of induced blanking deformation on magnetic properties ........... 125
Microstructural analysis of the cut edge ........................................................ 131
4.5.1 Investigation of the induced cut edge fracture surface ........................... 131
4.5.2 Deformation analysis of cut edge fracture .............................................. 140
4.5.3 Estimation of the depth of cut edge deformation .................................... 146
4.5.4 Estimation of the grain size and number over the sheet thickness ......... 148
Summary ........................................................................................................ 149
5 Discussions and statistical analysis ................................................................... 151
Introduction .................................................................................................... 151
The critical influences of the cut edge microstructure ................................... 151
Plastic strain and magnetic properties under uniaxial tension ....................... 154
Defects evolution during the blanking process .............................................. 156
Blanking local strain and the depth of deformation ....................................... 158
The effects of blanking plastic deformation on magnetic properties ……….162
Statistical Analysis ......................................................................................... 164
5.7.1 Interaction between parameters and response ........................................ 165
5.7.2 Analysis of Variance (ANOVA) ............................................................. 165
5.7.3 The impact strength of the maximum equivalent strain versus sheet
thickness, blanking speed, and sheet orientation .................................... 166
5.7.4 The impact strength of the maximum cutting force of the full die versus
sheet thickness, blanking speed, and sheet orientation ........................... 168
5.7.5 The impact strength of the maximum hysteresis loss versus thickness,
blanking speed, sheet orientation ........................................................... 169
Summary ........................................................................................................ 171
6 Conclusions and future works ........................................................................... 172
Conclusions .................................................................................................... 172
Recommendations for future work ................................................................. 174
References ..................................................................................................................... 177
Appendix A ................................................................................................................... 187
Appendix B ................................................................................................................... 188

X
List of Figures
Figure 2.1: Main applications of ES: a) electrical motor, b) electrical transformer …….………. 8
Figure 2.2: Types of magnetic materials ……………………………………………..…………. 8
Figure 2.3: Electrical steel grains orientation system: (a) B.C.C lattice, (b, c) the anisotropy of ES
due to the oriented texture …………………………………………………….……………….. 10
Figure 2.4: Micrograph of NGO electrical steel etched in 2% Nital …………………..……… 11
Figure 2.5: Effects of some elements on iron properties, a) material resistivity, b) Magnetic and
electrical properties ……………………………………………………………………………. 12
Figure 2.6: Phase diagram of Fe-Si alloys and the effect of Si on the material structure ………12
Figure 2.7: Electrical steel making outline ……………………………………………….…… 14
Figure 2.8: The Production route of fully processed GO electrical steel …………..……….…. 15
Figure 2.9: The Production route of fully processed NGO electrical steel ……………………. 15
Figure 2.10: Typical domain structures observed in ferroelectric material ……………………. 17
Figure 2.11: Schematic of spin rotation in a 180º domain wall ……………………………..… 18
Figure 2.12: Observations of domains at grain boundaries in NGO steel ………………….…. 18
Figure 2.13: Initial magnetization curve and permeability for iron …………………………… 20
Figure 2.14: Typical magnetization and hysteresis curve ……………………………………... 21
Figure 2.15: a) Differences between the AC and DC magnetization on the hysteresis loops, b)
Effect of applied current and flux density on the hysteresis loops …………………….………. 22
Figure 2.16: Lamination sheet and inter-laminar eddy current ………………………….…..… 24
Figure 2.17: Magnetic measurement methods used to determine magnetic properties and iron
losses in electrical steel sheets ……………………………………………………….………... 25
Figure 2.18: Single sheet tester fixtures for measuring magnetic properties ………….………. 25
Figure 2.19: Lamination cutting methods, a) blanking, b) Wire EDM, c) Laser cutting, and d)
water-jet ………………………………………………………………………………..……… 28
Figure 2.20: Effects of different sheet cutting processes on the cut edge ………….…….…… 30
Figure 2.21: Cut edge surface roughness produced by different cutting methods …….……… 30
Figure 2.22: Blanking process mechanism ………………………………………….……….... 35
Figure 2.23: Punching, blanking, and piercing operations ………………………….………… 35
Figure 2.24: Blanking process deformation stages …………………………………………… 36
Figure 2.25: Deformations zones of the cut edge: a) characteristic edge in blanking process, b)
blank side-scheme areas ……………………………………………………………….…….... 37
Figure 2.26: Forces distribution in the workpiece during blanking process ………….…….… 38
Figure 2.27: Typical load-stroke curve of a blanking ………………………………………….. 38
Figure 2.28: Parameters affecting the blanking process ………………………………...……… 39

XI
Figure 2.29: a) Effects of clearance on the deformations zone and vicinity areas, b) Vickers
hardness contours expressing the cold working in the shared region …………………….…… 40
Figure 2.30: Effect of clearance and tools radii on deformations of cut edge …………………. 41
Figure 2.31: The principle of the DIC measurement method based on the differences between the
target subset and the reference subset ………………………………………………………….. 48
Figure 2.32: TEM micrographs of Fe 3% Si under tensile loading ……………………………. 51
Figure 2.33: Hysteresis loops of elastically and plastically deformed samples for uniaxial tensile
stress and magnetic flux density in RD and TD …………………………….….……………… 52
Figure 2.34: Effect of various stresses on the energy loss ……………………………….……. 53
Figure 2.35: Hysteresis loops measured at elastic and plastic tensile stresses …………….…… 55
Figure 2.36: Deformation and strains visible at the edge, induced by blanking process ……… 56
Figure 3.1: Outline of the research structure ……………………………………………….…... 65
Figure 3.2: Size and orientation of tensile samples in both RD and TD according to the sheet
rolling direction…………………………………………………………………………..…….. 67
Figure 3.3: Material under tension at different strain states …………………………….…….. 67
Figure 3.4: Tensile tests at different plastic extensions……………………..……………...….. 68
Figure 3.5: Macrograph of the tensile test sample with random speckle pattern…………….….68
Figure 3.6: Full blanking die (Type A) ……………………………….……………………...... 70
Figure 3.7: One side free blanking die (Type B) …... …………………………………….……71
Figure 3.8: A virtual representation of the blanked samples to illustrate sample size, orientation,
and test locations regarding the sheet rolling direction………………………………………… 73
Figure 3.9: Blanking tools, machine control, and Lavision DIC system…………….……….... 75
Figure 3.10: Schematic of blanking and DIC test setup……………………………………..…. 77
Figure 3.11: DIC and specimen setup for deformation area measurement of the ES………..…. 77
Figure 3.12: Nano-indentation system…………………………………………………….…… 79
Figure 3.13: (a) Elastic-plastic deformation at the maximum applied load, (b) Plastic deformation
after releasing the load ……………………………………………………………………….… 79
Figure 3.14: Load-penetration curve of the Nano-indentation test…………………………….. 80
Figure 3.15: Determination of the actual position of the indenter in the Nano-indentation
system………………………………………………………………………………………..… 81
Figure 3.16: SST system design and coils arrangement……………………………………..….84
Figure 3.17: (a) Flux path in closed double yoke system, (b) Flux coil path in ES sheet……….85
Figure 3.18: SST equipment parts connections and electrical circuit………………………….. 85
Figure 3.19: Full design of new single sheet magnetic tester …………………………….…… 86
Figure 3.20: Determination of hysteresis loss: (a) entire hysteresis curve, (b) absorbed energy area
w1, (c) dissipated energy area w2 …………………………………………………………….. 87
Figure 3.21: Arrangement of the cut samples in the cold mounting…………………………... 91

XII
Figure 4.1: Tensile rate sensitivity at different test speeds, a) 0.2 RD, b) 0.2 TD, c) maximum
UTS and yield stress values with standard deviation error bars……………………………….. 95
Figure 4.2: Tensile rate sensitivity at different test speeds, a) 0.35 RD, b) 0.35 TD, c) maximum
UTS and yield stress values with standard deviation error bars…………………………….…. 96
Figure 4.3: Stress-Strain curves for 0.2, 0.35 in RD, TD samples at 10 mm/min test speed…….97
Figure 4.4: Macrograph of tensile samples at different plastic extensions ………………..……97
Figure 4.5: The strain error analysis for the tensile samples determined with DIC ............98
Figure 4.6: Maximum normal strain distribution of tensile samples at different stages of extension
during the tensile tests of 0.2 RD………………………………………………………….…… 99
Figure 4.7: Maximum normal strain distribution of tensile samples at different stages of extension
during the tensile tests of 0.2 TD………………………………………………………….….. 100
Figure 4.8: Maximum normal strain distribution of tensile samples at different stages of extension
during the tensile tests of 0.35 RD……………………………………………………….…… 101
Figure 4.9: Maximum normal strain distribution of tensile samples at different stages of extension
during the tensile tests of 0.35 TD…………………………………………………………..… 102
Figure 4.10: Blanking load-stroke displacements for 0.2 and 0.35, RD and TD samples……. 103
Figure 4.11: Maximum load stroke at different blanking speeds for full die……………..….. 104
Figure 4.12: Maximum load stroke at different blanking speeds for the die type B………….. 104
Figure 4.13: The strain error analysis for the blanking samples determined with DIC......105
Figure 4.14: Maximum equivalent strain distributions during the blanking process in different
stages at 100 mm/min for 0.2 RD 100 sample………………………………………………... 108
Figure 4.15: Maximum equivalent strain distributions during the blanking process in different
stages at 500 mm/min for 0.2 RD 500 sample……………………………………….……….. 108
Figure 4.16: Maximum equivalent strain distributions during the blanking process in different
stages at 1000 mm/min for 0.2 RD 1000 sample……………………………………………... 109
Figure 4.17: Maximum equivalent strain distributions during the blanking process in different
stages at 100 mm/min for 0.2 TD 100 sample………………………………………………… 110
Figure 4.18: Maximum equivalent strain distributions during the blanking process in different
stages at 500 mm/min for 0.2 TD 500 sample………………………………………………… 110
Figure 4.19: Maximum equivalent strain distributions during the blanking process in different
stages at 1000 mm/min for 0.2 TD 1000 sample……………………………………………... 111
Figure 4.20: Maximum equivalent strain distributions during the blanking process in different
stages at 100 mm/min for 0.35 RD 100 sample……………………………………………..… 112
Figure 4.21: Maximum equivalent strain distributions during the blanking process in different
stages at 500 mm/min for 0.35 RD 500 sample…………………………………………….… 112
Figure 4.22: Maximum equivalent strain distributions during the blanking process in different
stages at 1000 mm/min for 0.35 RD 1000 sample…………………………………………….. 113

XIII
Figure 4.23: Maximum equivalent strain distributions during the blanking process in different
stages at 100 mm/min for 0.35 TD 100 sample………………………………………………. 114
Figure 4.24: Maximum equivalent strain distributions during the blanking process in different
stages at 500 mm/min for 0.35 TD 500 sample…………………………………………….… 114
Figure 4.25: Maximum equivalent strain distributions during the blanking process in different
stages at 1000 mm/min for 0.35 TD 1000 sample……………………………………..………. 115
Figure 4.26: General effects of blanking speeds and sheet thickness, orientation regarding max.
equivalent strain……………………………………………………………………………… 115
Figure 4.27: Nano-hardness distribution as a function of the distance from the cut edge for 0.2
RD 1000 sample, a) 3D distribution of hardness values b) SEM image of indents locations
regarding the cut edge……………………………………………………………………..….. 116
Figure 4.28: Nano-hardness distribution as a function of the distance from the cut edge for 0.35
RD 1000 sample, a) 3D distribution of hardness values b) SEM image of indent locations
regarding the cut edge…………………………………………………………………..…….. 117
Figure 4.29: The average Nano-hardness value of the material…………………………….... 117
Figure 4.30: The distributions of Nano indentation values for 0.2 mm sheet thickness at different
blanking speeds. …………………………………………………………………………...…. 118
Figure 4.31: The effect of the blanking parameters against the hardness values of 0.2 ES sheet
thickness……………………………………………………………………………………… 119
Figure 4.32: The distributions of Nano indentation values for 0.35 mm sheet thickness at different
blanking speeds……………………………………………………………………………….. 120
Figure 4.33: The effect of the blanking parameters against the hardness values of 0.35 ES sheet
thickness …………………………………………………………………………………..….. 121
Figure 4.34: Hysteresis loops of 0.2 RD of ES samples at different elongations of tension … 122
Figure 4.35: Hysteresis loops of electrical steel type 0.2 TD samples at different stages of
elongations of tension ………………………………………………………………………… 123
Figure 4.36: Hysteresis loops of electrical steel type 0.35 RD samples at different stages of
elongations of tension…………………………………………………………………………. 124
Figure 4.37: Complete hysteresis loops of electrical steel type 0.35 TD samples at different stages
of elongations of tension…………………………………………………………………….... 125
Figure 4.38: Maximum flux density at different stages of elongations of tension for the different
electrical steel samples categories…………………………………………………………..... 126
Figure 4.39: Hysteresis loops of electrical steel type 0.2 RD samples cut by blanking process at
different blanking speeds……………………………………………………………………... 127
Figure 4.40: Hysteresis loops of electrical steel type 0.2 TD samples cut by blanking process at
different blanking speeds……………………………………………………………………... 128

XIV
Figure 4.41: Hysteresis loops of electrical steel type 0.35 RD samples cut by blanking process at
different blanking speeds……………………………………………………………………... 129
Figure 4.42: Hysteresis loops of electrical steel type 0.35 TD samples cut by blanking process at
different blanking speeds………………………………………………………………….….. 130
Figure 4.43: Hysteresis losses of electrical steel samples cut by blanking process at different
blanking speeds…………………………………………………………………………….…. 131
Figure 4.44: Standard error bar for the maximum flux density at different blanking speeds for the
different electrical steel samples categories ………………………………………….……….. 132
Figure 4.45: SEM image for induced blanking cut edges of 0.2 RD samples at different blanking
speeds, A) 100 mm/min, B) 500 mm/min, C) 1000 mm/min……………………………….... 133
Figure 4.46: Microstructure at higher magnification of some selected areas in Figure 4.45 a,b) At
shear and fracture zones, c,d) At rollover and shear zones…………………………….………. 134
Figure 4.47: EDS analysis for the square part indicated in the Figure 4.46d…………..…….. 135
Figure 4.48: SEM image for induced blanking cut edges of 0.2 TD samples at different blanking
speeds, A) 100 mm/min, B) 500 mm/min, C) 1000 mm/min………………………………….. 136
Figure 4.49: Microstructure at higher magnification of some selected areas in Figure 4.48 of 0.2
TD samples. a,b) At shear and fracture zones, c) at fracture and burr zones, d) At rollover and
shear zones……………………………………………………………………………….…… 137
Figure 4.50: EDS analysis for the square part indicated in the Figure 4.49d……….………… 137
Figure 4.51: SEM image for induced blanking cut edges of 0.35 RD samples at different blanking
speeds, A) 100 mm/min, B) 500 mm/min, C) 1000 mm/min………………………………… 138
Figure 4.52: Microstructure at higher magnification of some selected areas in Figure 4.51 of 0.35
RD samples. a) At shear and fracture zones, b) At rollover and shear zones…………………. 139
Figure 4.53: SEM image for induced blanking cut edges of 0.35 TD samples at different blanking
speeds, A) 100 mm/min, B) 500 mm/min, C) 1000 mm/min……………………………….... 140
Figure 4.54: Microstructure at higher magnification of some selected areas in Figure 4.53 of 0.35
RD samples, a) At shear and fracture zones, b) At rollover and shear zones………………… 140
Figure 4.55: SEM image for cut edge surface induced by EDM method used to prepare ES
samples ……………………………………………………………………………………….. 141
Figure 4.56: Cut edge fracture surface for 0.2 RD sample at different blanking speeds……....143
Figure 4.57: Cut edge fracture surface for 0.2 TD sample at different blanking speeds……… 144
Figure 4.58: Cut edge fracture surface for 0.35 RD sample at different blanking speeds…….. 145
Figure 4.59: EDS analysis for the square parts indicated in the Figure 4.58 IIIb………….….. 146
Figure 4.60: Cut edge fracture surface for 0.35 TD sample at different blanking speeds…….. 147
Figure 4.61: Optical micrographs for induced blanking cut edges of 0.2 RD samples at different
blanking speeds, a) 100 mm/min, b) 500 mm/min, c) 1000 mm/min………………………….. 148

XV
Figure 4.62: Optical micrographs for induced blanking cut edges of 0.2 TD samples at different
blanking speeds, a) 100 mm/min, b) 500 mm/min, c) 1000 mm/min…………………………. 149
Figure 4.63: Optical micrographs for induced blanking cut edges of 0.35 RD samples at different
blanking speeds, a) 100 mm/min, b) 500 mm/min, c) 1000 mm/min…………………………. 149
Figure 4.64: Optical micrographs for induced blanking cut edges of 0.35 TD samples at different
blanking speeds, a) 100 mm/min, b) 500 mm/min, c) 1000 mm/min…………………………. 150
Figure 4.65: Optical micrographs for the (a) 0.2 mm and (b) 0.35 mm electrical sheet thicknesses
at low magnification of 20X…………………………………………………………………... 151
Figure 5.1: Magnetic hysteresis losses and the induced blanking strain regarding blanking
conditions………………………………………………………………………………….….. 165
Figure 5.2: Effect of blanking and material factors on the induced equivalent strain ……..….169
Figure 5.3: Effect strength of blanking and material factors on the induced cutting force …....171
Figure 5.4: Effect strength of blanking and material factors on the hysteresis losses ………...172
Figure 0.1: local strain coordinate system ………..……………………………………….…. 189
List of Tables
Table 2.1: Comparison of the performance of lamination cutting methods ............................... 34
Table 3.1: Electrical steel chemical composition ...................................................................... 66
Table 3.2: DIC setting parameters for tensile tests ......................................................................69
Table 3.3: Categorization of blanking samples. ......................................................................... 73
Table 3.4: DIC setting parameters for blanking tests …………………………………………..76
Table 5.1: ANOVA model for plastic strains versus blanking parameters. .............................. 167
Table 5.2: ANOVA model for the cutting force versus blanking parameters ……………….. 168
Table 5.3: ANOVA model for the hysteresis losses versus blanking parameters. .................... 169
Table 5.4: ANOVA model summary of the factors’ impact strength on the blanking results ... 170
Table 0.1: Grains size calculations for both ES thickness 0.2 and 0.35 mm ............................. 188

Chapter one Introduction
1
1
Introduction
Introduction
Improving production processes and product quality is a very important issue and ongoing
concern for researchers seeking to enhance the quality of products as part of a global trend
towards reducing energy consumption along with achieving high machines performance
[1]. The laminations of core are one of the main components of transformers or the stator
and rotor parts of electric motors. The blanking process is used to cut the sheet material
to the required shape by mass production at low cost and therefore remains the most
commonly preferred cutting process for producing laminations [2].
Electrical steels are widely used as lamination materials in the electrical industry
because of their superior electrical properties such as high permeability and low magnetic
losses and the low cost [3]. However, the blanking process induces plastic deformation
and local damage at the cut edge which in turn causes negative effects on material
properties and the cut edge quality. Among all features of the final product, the produced
magnetic properties are extremely important for blanked electrical steels because these
are directly correlated to the performance of electrical motors. Magnetic properties are
influenced negatively by cut edge distortion and texture modification that are considered
as sources of stress concentrations and poor properties in the material [4].
It is essential to detect, quantify, and when possible eliminate the edge
deformation through optimisation of the blanking parameters in order to produce high-
quality final blanked electrical steels. Therefore, this research focuses on the effects of

Chapter one Introduction
2
blanking parameters on magneto-mechanical properties at the cut edge of thin sheet
electrical steels, to understand the local properties of the sheet material at the cut edge
and the vicinity area.
Problem Description
Blanking is the preferred process for producing electrical steel laminations for electrical
machines and transformers. Ideally, this process should take in ES sheets and deliver
perfect blanked parts with the same properties as the feedstock used. However, in
practice, a range of defects can arise during the blanking operation. The presence of edge
and vicinity area defects remains the most serious problem in the blanking process; this
is because they interfere with the performance of the final product [4].
During this cutting process, the material is plastically deformed and residual
stresses are generated, especially at the cutting edge and the vicinity area. The induced
deformation can affect the mechanical and magnetic properties of the electrical steel sheet
due to modifying of the material’s features and edge surface profile in the deformation
zone. Distortion in local cut edge grains occurs due to the exposure of the cut zone to
diverse stresses such as tension, compression, and shear [3]. In such a process, plastic
deformation occurs due to the movement of an edge dislocation across the crystal lattice
under a shear stress. The presence of a dislocation can lower the shear stress required to
cause slip [4]. The dislocations can become entangled and interfere with each other, whilst
barriers such as grain boundaries, impurities in the material may cause impediments. The
increased shear stress required to overcome these entanglements and impediments results
in an increase in the overall strength and the hardness of the metal or, as it is known, strain
hardening. The greater the deformation, the greater the number of entanglements and
hence the higher the increase in the metal’s strength. The dislocation density increases
proportionally to the plastic strain, thereby affecting the material’s permeability and flux
density in the edge region [5].
The blanking process can cause a number of defects in the metal crystals such as
micro-voids and cracks. Mechanical and electrical properties of metals, such as yield
stress, fracture strength, electrical conductivity, and magnetic losses can adversely be
affected by these imperfections [5]. The other important issue is the generation of burrs,
which inevitably occurs when displacing metals mechanically such as by blanking,
causing burrs to be formed on the cut edge. Much effort is expended to restrain burr

Chapter one Introduction
3
effects. The burr size relates to the appropriate die design regarding the material
properties [1]. The deterioration of magnetic properties may occur due to crystal
deformation; where the disrupted crystal lattice will produce a region of locked-in stresses
and dislocations due to the cold work [6]. These sites pin domain walls, impair
permeability and increase power loss [3].
Analysis of the blanking process is very compelex because this process includes
multiple factors that simultaneously play a role in the generation of defects. For example,
since the speed of the cutting operation relates directly to the economics of lamination
production, a high cutting rate is preferred. Also, thinner sheets may have better magnetic
performance but require more laminations to give stack height. The mismatch between
the punching parameters could cause changes in the geometrical shape of the cut edge.
Typically, as the region of disruption spreads some distance from a sheared edge, using
appropriate die parameters will minimize process damage at the cutting area. Cutting the
small parts such as stator lamination teeth will increase the effect of the process due to
the convergence of the effect of the edges. The blanking die contains a lot of parts.
However, designing new blanking ideas may eliminates some parts, such as the stripper
plate and feeding control, depending on the experience with using the process and the
required aims. The analysis of cut edge deformation is very difficult because of the small
size of the deformation zone and the process deformation takes place in the closed area
inside the die cavity. The challenge of the test is increased when the used sheet material
thickness is very thin.
The research problem can be summed up in terms of the analysis of the blanking
process using new techniques and strategies to investigate the mechanisms of blanking
and cut-edge formation of thin sheets of electrical steel to achieve a better understanding.
In addition, it involves linking the affected the mechanical and magnetic properties and
the affected edge features regarding the process parameters. Because of the interactions
among the various process factors, improving the quality of the final product could
depend on considering all these factors and the corresponding results simultaneously.

Chapter one Introduction
4
Research objectives and novelty
Blanking processes involve a lot of variables and phases and their interactions make the
cutting mechanism system extremely complex. An experimental investigation was
adopted to emulate the actual blanking tests. It has become known that the blanking
process results in a local plastic deformation and generated stresses concentrate at the cut
edge and extend to the vicinity area of deformation zone, which causes deterioration of
the magnetic-mechanical performance of electrical steels.
Therefore, the project focused on investigating blanking mechanisms and local
magneto-mechanical properties of thin sheet non-grain oriented steels at the cut edge
concerning deformed or damaged material.
One of the main novelties of this research is represented by using new techniques
and strategies to investigate the mechanisms of blanking through such as implementing
the high-speed digital image correlation technique (DIC) to visualize cut edge damage
during the blanking process on an in-situ blanking rig. Moreover, to illustrate the failure
mechanism of the material and give a clear view of the material’s behaviour on crack
initiation and propagation during the cutting process. Furthermore, a new small single
sheet magnetic tester (SST) was designed and utilized to accommodate a specific flat
specimen and measure magnetic properties to determine the general magneto-properties
and specific hysteresis losses. That could lead to the development of a production strategy
regarding the microstructure and mechanical properties of the material that improves the
quality of the final blanked material.
The project aimed to use of a new generation gauge of electrical steel. It might be
the first time that the thin sheet (with thickness 0.2 mm) steel has been used to analyse
and measure the deformation and damage during blanking and link it to the magnetic
properties and comparing the results with those for 0.35 mm steel. In line with the
industrial trend to increase machine efficiency and reduce the total losses.
The project also attempts to evaluate the effective weight for the process
parameters such as blanking speed, material thickness, and sheet orientation regarding
the magnetic losses. Finally, one of the major research thrusts involves finding
connections among blanking process parameters and the mechanical, magnetic, and
microstructure properties regarding the deformed cut edge of electrical steel.

Chapter one Introduction
5
Thesis Outline
The thesis is organized in six chapters with the following content:
• Chapter 1: This, the current chapter, gives a brief introduction about the scope of the
thesis, the aims and novelty of this research.
• Chapter 2: This presents the literature review and gives a general introduction to the
electrical steel material and its industrial manufacturing method. A simple comparison is
made between popular lamination materials and cutting methods. In addition, the physical
magnetization process is explained and typical measurement methods for iron losses in
the single sheet of electrical steel are discussed. The blanking process mechanism and
cutting parameters affecting the cut edge features and affecting magneto-mechanical
properties are introduced as well. Finally, a summary is provided of the main knowledge
gap.
• Chapter 3: Gives an overview on the empirical methodology followed in this study,
including the selection of research material and the new practical methods and techniques
that are used, along with presentation of illustrative designs and tools. The measurement
setup developed in this project is also described in this chapter.
• Chapter 4: Determines the effects of blanking operation on local magneto-mechanical
properties at the cut edge through the study outcomes. Characteristics of mechanical
properties including tensile, Nano-indentation, and strain measurements are evaluated.
Furthermore, it evaluates the possibility of using the measured results to characterize the
magnetic properties losses in ES due to the influence of the cutting process. Also, the
microstructure and local material features at the cut edge and the fracture surface are
examined.
• Chapter 5: Discussion and comparison are conducted of the measured results in order
to identify and interpret their causes and consequences. Simple statistical results analysis
is also carried out to establish direct relations between the blanking parameters and
induced deformation and the blanked properties.
• Chapter 6: Provides a brief conclusion of the main results of this thesis and presents
proposals for future activities to investigate the cut edge deformation induced by
magneto-mechanical cut edge defects in electrical steel.

Chapter two Literature review
6
2
Literature review
Introduction
Blanking process is a manufacturing operation where sheet metals are cut into
specific geometries using the interaction of blanking die and punch sets. In this operation,
the material experiences a large localized deformation where the cutting edges of the die-
punch meet in order to shear away boundaries of the products. This localized deformation
could adversely affect micromechanical and microstructural properties of the parts at the
vicinity of the cut section which is called the cut edge. The blanking process induces
damage in parts of the cut edge; this deformation becomes more critical when the cut area
and sheet thickness are small [1, 3]. Steel grades with a high percentage of Si content are
widely used in electrical applications and mostly referred to as Electrical Steel (ES).
These materials are usually provided as very thin sheets ready to be blanked in specific
complex geometries for use in applications such as the stator and rotor of electromotor
cores, or the laminations of transformers. The presence of high Si content in ES together
with their small thickness makes them prone to severe cut edge defects such as localized
deformation and excessive burr which in turn result in the loss of magnetic efficiency in
the final products. Therefore, this chapter will deal with the ES material in some detail
and clarify the blanking mechanism and steps. In addition, it will explain the main
principles of the magnetic properties and power losses to convey how blanking
deformation affects the material’s properties. Moreover, it will refer to the techniques and
tests used in analysis by relevant studies and the results of those researches.

Chapter two Literature review
7
Electrical Steel (E.S)
Electrical steel is a type of low carbon steel, sometimes referred to as lamination steel,
silicon steel, or transformer steel. However, the term electrical steel has become the most
popular and indicates a magnetic material formed of cold rolled sheets with a high
percentage of silicon element. These sheets, called laminations, are assembled to form
the cores of transformers or the stator and rotor parts of electric motors. Laminations may
be cut to desired shapes either by a blanking process in mass production or by laser and
wire erosion for smaller quantities [1, 3]. The magnetic performance of ES sheets is
increased through reducing their thickness as this reduces the generated eddy current loss
[1, 7]. For this reason, a new generation of classical electrical steels has been developed,
for example, the steel with a thin gauge of 0.2 mm used in the current study [8].
2.2.1 Electrical steel applications
Electrical steel sheets are used in a wide range of equipment, from the simplest domestic
appliances to the modern technologies such as the core of the traction motors of electric
vehicles (EV) and hybrid electric vehicles (HEV). The continued demand for smaller,
lighter, more powerful and efficient motors is the driving force for investigating and
developing methods for enhancing the performance of electrical steel sheets [7].
There are some other magnetic materials such as Nickel and Cobalt iron alloys
which could used in similar or particular electrical applications [3, 9]. Cobalt steels are
used primarily in aircraft applications where size and weight are critical [10], whereas
Nickel steels are used with a high frequency ranging from 500 to 50000 Hz in inductors,
transformers and communication equipment [1]. However, electrical steel sheet is the
most commonly used ferromagnetic material due to its relatively high magnetic properties
such as high permeability and lower loss in addition to its good formability and lower
cost compared to other materials [11]. Figure 2.1 shows the main applications and their
component ES laminations.

Chapter two Literature review
8
Figure 2.1: Main applications of ES: a) electrical motor, b) electrical transformer [1, 12].
2.2.2 Classification of electrical steel
Magnetic materials include ferromagnetic and ferri-magnetic materials that can be
categorized into three types including; soft magnetic materials, hard magnetic materials,
and semi-hard magnetic material based on their magnetization and demagnetization
processes. ES is considered as a soft ferromagnetic material; the different types of
magnetic material are shown in Figure 2.2 [8].
Figure 2.2: Types of magnetic materials [8].

Chapter two Literature review
9
Soft magnetic materials are typically used for applications in which small
magnetic fields are applied to switch the magnetization direction, whereas hard magnetic
materials (or permanent magnets) are used in applications where the magnetization does
not change unless relatively large magnetic fields are applied, such as in speakers and
microphones [9]. ES materials can be divided into the following categories according to
their magneto-mechanical and microstructural properties [1, 3]:
1) Non-Grain Oriented (NGO): In which the magnetic properties are assumed to be
approximately the same in different directions of the material; therefore, it is used in
rotational applications such as electrical motors.
2) Grain Oriented (GO): In which the magnetic properties are most powerful toward the
rolling direction, but it has inferior properties in other directions; therefore, this type is
preferred for stationary applications such as transformers.
2.2.3 Material isotropy and grains orientation
At room temperature, the electron spins are spontaneously aligned within iron crystal to
give self-saturation, whilst some directions can be much more easily magnetized than
others [8]. The material is considered to have isotropic magnetic properties if its
properties do not change regarding grains orientation and to have anisotropic properties
if its properties are affected by the texture orientation.
Non-oriented electrical steels have different grains orientation, these differences
in direction can make the magnetization of the material much easier at low saturation
levels. There are two complex systems of slip directions; plane orientations (100, 110,
and 111), and planes orientations (001 and 011). Figure 2.3 shows the case when the
grains orientations of (001) or (011) planes parallel to the plane direction of the sheet of
the (100). In case of oriented electrical steel, the grains orientation is controlled toward
the rolled direction (called the cube-on-edge (COE) or Goss texture) so that the axes of
planes (001) and (100) are identical [7, 9]. Modification of texture can be achieved by
applying a complex series of cold rolling and heat treatment operations that causes the
grains to grow in such a way that makes the material easy to magnetize in sheet rolling
direction. This process will enhance the magnetic properties in the rolling direction but
produces relatively poor magnetic properties in the transverse direction (90◦) [1]. The
figure also shows the iron lattice and grains orientation system. The (100) direction is the

Chapter two Literature review
10
easy cube edge direction; (110) is the hard cube face diagonal direction; (111) is the
hardest cube body diagonal direction [3].
Figure 2.3: Electrical steel grains orientation system: (a) B.C.C lattice, (b, c) the
anisotropy of ES due to the oriented texture [3].
Magneto-crystalline anisotropy means that more energy is needed to magnetize
material in a certain direction, either RD or TD. Additionally, tensile stresses ease the
process of magnetization and reduce the power loss. Conversely, compressive stresses
interfere with the magnetization process negatively [13]. The excitation of the material is
affected by the sheet grain orientation; thereby the magnetic properties become sensitive
to the grain’s direction. It is notable to mention that although the material is assumed to
be isotropic, the magnetic properties are reported not to be identical in the RD and TD
directions of the material [14].

Chapter two Literature review
11
2.2.4 Metallurgical properties
Electrical steels have a structure of body centred cubic crystals [15], which contains
several elements such as Silicon, Manganese, Aluminium, and carbon in small
percentages. Electrical Steel’s microstructure is similar to that of low-carbon sheet steels;
the microstructure of a typical motor lamination steel is shown in Figure 2.4 [16]. The
non-oriented grades contain minor amounts of cementite and inclusions and low sulphur
levels, often below 0.01%; in the oriented grades sulphides and nitrides are used to
improve grain orientation by promoting secondary recrystallization [1, 3].
Figure 2.4: Micrograph of NGO electrical steel etched in 2% Nital [16].
Silicon is used as the main effective additive element because it causes increasing
the electrical resistivity and decreases the induced eddy currents, thus lowering the power
core loss [3, 7]. Electrical steel may have from 0-6.5% Si, whereas commercial alloys
have silicon content of up to 3.2% [2]. Very high silicon content (e.g., >4.0%) may result
in lowering of induction permeability saturation density, as well as potentially changing
the alloy phase or mechanical properties in the form of increasing the brittleness.
Depending on the type of product, aluminium and manganese are added in amounts of
less than 1.0%, in order to gain the benefits of increased resistivity, obtaining an optimal
grain size, and reducing the impurity content. It is worthy of notice that increasing the
grain size will reduce the core losses up to a certain grain size [9]. Figure 2.5 shows the
influences of some elements on the resistivity of iron (A), and percentage of silicon (B)
in proportion to the magnetic and electrical parameters.

Chapter two Literature review
12
Figure 2.5: Effects of some elements on iron properties, a) material resistivity, b) Magnetic
and electrical properties [8].
Carbon, sulphur, and nitrogen are undesirable elements in the Fe-Si alloy because
they form impurities in the material composition; for example, carbon element
precipitates as carbides. Higher content of these elements may lead to restraint of the
domain movement and cause power losses. Therefore, these materials are tightly
controlled during the manufacturing process of the material [16]. Fe-Si alloys consist of
a binary system; the two main components are Fe and Si [15]. The Iron-silicon phase
diagram in Figure 2.6 , shows the effect of increasing the percentage of Si on the material
structure. The nanostructure and Nano-precipitates such as non-metallic inclusions may
also have an impact on the magnetic properties because they limit grain growth during
final annealing [17].
Figure 2.6: Phase diagram of Fe-Si alloys and the effect of Si on the material
structure [8, 15].

Chapter two Literature review
13
2.2.5 Methods for manufacturing electrical steels
The initial ES production steps are similar to those for carbon steel. Firstly, as in the initial
stage for steel making, the steel is melted in a blast furnace and continuously poured to
make slabs, then hot rolling from the initial casting ingot to small gauge thickness of
about few millimetres, followed by cold rolling to the desired thickness up to 0.1 mm
[18], and to achieve good surface conditions. Before cold rolling, the coils are exposed to
heating, side-trim and pickling processes to remove scale and provide a surface suitable
for cold rolling. The sheets are heat treated to homogenize the internal structure of the
metal and achieve the required characteristics and finally coiled up and side trimmed [3].
As a result of these processes, the steel crystals are stretched and flattened in the
same direction of rolling. That will reduce the grain size and increase the grain boundary.
The grain boundary is considered as a boundary of a big domain or small polarization
zones, which contain many small domains. Therefore, a reduction of the domain size
produces lower core losses; this can be accomplished by reducing grain size or by
applying tensile stress in the rolling direction [9]. Electrical steel can be produced in two
states: first, fully-processed, in which case the material is completely developed with all
the final properties, and second, a semi-processed state, where the material is produced
to the final thickness without full annealing heat treatment. The users need to adapt the
heat treatment according to the required magnetic properties [1, 9]. Figure 2.7 shows the
technological path of ES sheets production according to the Cogent Power Company (the
supplier of electrical steel material for the current study) [18].

Chapter two Literature review
14
Figure 2.7: Electrical steel making outline [18].
The following two typical routes in Figure 2.8 and 2.9 show the main differences in
production of two electrical steel types which are essentially related to the alignment
direction of grains and heat treatments.

Chapter two Literature review
15
Figure 2.8: The Production route of fully processed GO electrical steel [3, 8].
Figure 2.9: The Production route of fully processed NGO electrical steel [3, 8].

Chapter two Literature review
16
Magnetic properties of ES
When a ferromagnetic sheet is placed within an external magnetic field, the material’s
structure is affected because of electron movement in the atoms. A rearrangement of the
domain structure takes place, mainly due to domain wall movement. The domains
energetically tend directionally to the applied field direction. Therefore, it is essential to
understand the principles of the magnetic domain structure and factors influencing the
magnetic properties in order to understand the behaviour of the material during the diverse
deformations and the reasons for improvement or deterioration in these properties. In
addition, it is important to identify the terms used to describe and quantify magnetic
materials such as hysteresis loops and induction and including the magnetic field and flux
density.
2.3.1 Ferromagnetic domains and magnetic properties
Soft ferromagnetic materials such as ES can be easily magnetized and demagnetized [7].
This unique property of ferromagnetic materials lies in the ability of small externally
applied fields to organize domains in the crystal structure, which can greatly influence
the switching to the magnetization state [9]. The magnetic domain structure can be
explained starting from the atom structure in the material. At the centre of an atom there
is a nucleus around which electrons orbit in a complicated manner. Each electron has an
electric charge generated as a result of its spin or rotation around itself. Also there is a
magnetic moment caused by its rotation around the nucleus. The atom has a large number
of electrons. Therefore, the resultant magnetic moment tendency is associated with the
overall directions of the electrons. The number of electrons which are effective in
contributing to the atomic magnetic moment is called the Bohr magneto number [3, 19].
The magnetization process in ferromagnetic materials comes from the electrons’
movements in orbit. Small polarization zones with a micro field, known as domains, are
generated inside the materials. The boundaries between domains, called domain walls or
Bloch walls, become mobile when a sufficient field is applied [9]. The grains in the
material have many domain areas. Therefore, each grain will have special behaviour on
the axis of magnetization. These grains could have irregular directions, and thus the whole
material consists of a large number of magnetized areas in a random direction, as shown
in Figure 2.10. When all the electrons’ movement aligns with the external field direction,

Chapter two Literature review
17
a powerful overall directionally coordinated magnetic field is generated. This internal
spontaneous magnetic field that aligns the electron spins could stop at the grain boundary
of the metal [3].
Figure 2.10: Typical domain structures observed in ferroelectric material [20].
In ferromagnetic material such as ES, when a large enough field is applied, all the
atomic moments become aligned preferentially along the applied field direction, in what
is known as the saturated state [9]. The saturation state of magnetization depends on the
number of atoms per unit volume and the Bohr number. The arranging of atomic magnetic
moments in parallel to the applied direction can occur only at low temperatures. The
higher temperatures can cause random movements, which increase up to a value called
the Curie temperature (Tc), where the thermal agitation overcomes the effect of the
coupling forces; thereby the material loses its ferromagnetic properties [19].
2.3.2 Domain structure and domain walls motion
During the magnetization process, an internal magnetic field is generated opposed to the
aligning of the electromagnetic atomic spins. Consequently, created a localized region
contain pairs that equal in value and opposite in charge direction, called dipoles. The
dipoles make a gradual transition from the first domain alignment to the second through
the domain walls. Figure 2.11 shows a schematic diagram of the domain wall movement
and spin dipoles. If a single crystal of iron is magnetized, the crystal will be in a high
potential energy state, but magnetization of an increased number of crystals or domains
will reduce the energy in ferromagnetic polycrystalline material [21].

Chapter two Literature review
18
Figure 2.11: Schematic of spin rotation in a 180º domain wall [21].
The process of domains alignment follows the easy axes of the material anisotropy
based on the displacement of domain walls and the rotation of the dipoles inside the
domains [22]. The domain pattern is dependent on the grain boundary regarding the
applied field. Figure 2.12 shows the effect of grain boundaries on the domains’
movement when the magnetization field in non-oriented silicon steel material is applied.
The figure illustrates how the random domain patterns begin to organize gradually from
the low field (Figure 2.12a) to the high field (Figure 2.12d) where the domains are
clearly seen stops at grain boundaries.
Figure 2.12: Observations of domains at grain boundaries in NGO steel [22].
The distribution of local domain walls in NGO electrical steel sheet is very
complicated and depends on many factors such as grain structure and size, material
impurities, local stress, and local potential energy [8, 20]. Pinning of these domain walls
by small oxide precipitates and strain fields is considered as the main cause of reduction

Chapter two Literature review
19
of magneto-static energy inside the precipitates. If the magnetic field is increased to a
certain extent, the domain exhibits various movements in addition to its natural
movement, including:
1) The domain wall twists or jumps on encountering obstacles that are formed because of
plastic deformation or precipitations. These domain wall jumps are called Barkhausen
jumps and cause ferromagnetic hysteresis due to the absorption of one of the neighbouring
domains [19]. The domain walls have been observed to move in curved lines around the
precipitates in non-oriented steel [17].
2) The domains can rotate in preferred directions close to the field, the final alignment
occurs in the main field direction by the continuous raising of the field [19].
2.3.3 Parameters of magnetic properties and hysteresis phenomena
The presence of a magnetic field strength H, sometimes called magnetic field intensity,
in an area A, can generate a magnetic flux Φ. The magnetic flux density B, also known
as magnetic induction, depends on the magnetic properties of the medium described by
permeability (μ) and the magnetization of material [3, 8]. H is measured in units of
Amperes per meter, Φ is measured in units of Wb or Weber, and B is measured in Tesla
units or Weber per meter. The related parameters between them are the permeability μ or
(B/H), hysteresis losses (H×dB/dt), and polarization J or (B−μ0H).
When a piece of steel is brought near a magnet or subjected to a magnetic field,
the magnetization in the iron process is described by a magnetization curve or B-H loop.
This curve can be obtained by plotting the magnetic induction B against the field strength
H. The B-H curve is a fundamental relationship for describing the essential information
regarding the magnetic properties of materials [23]. The permeability of free space (μ0)
is equal to 4π10-7 [H/m]. Figure 2.13 shows the relationships between the flux density,
magnetic field, and the permeability.

Chapter two Literature review
20
Figure 2.13: Initial magnetization curve and permeability for iron [24].
Magnetic hysteresis is a physical property of ferromagnetic materials that results in the
dissipation of wasted energy in the form of heat energy that is proportional to the area of
the magnetic hysteresis loop, in what is known as hysteresis loss [2, 25].
Figure 2.14 shows a typical magnetization curve (B-H curve) to explain the
behaviour of a ferromagnetic core. When the core is un-magnetized, both B and H start
from zero (point 0) of the curve. When the current increases in a positive direction, the
magnetic field strength and flux density increases linearly (o-a curve) until reaching the
saturation state. When any further increase in the magnetic field strength has no effect on
the value of B, this point on the graph is called Magnetic Saturation or core saturation.
Saturation occurs when the random arrangement of the domain structure within the core
material reaches the ideal alignment that induces a maximum flux density. Then, when
the magnetizing current and magnetic field reduced to zero, the flux will not reach zero
due to the residual magnetism present within the core (a-b curve).
This retaining of some magnetism is called retentivity or remanence and the
remaining of flux density is called residual magnetism (Br). That occurs because of some
of the tiny molecular magnets do not return completely to the original state. The way of
zeroing the flux density is by reversing the direction of the current to make the value of
the magnetic field negative. This effect is called a Coercive Force (Hc). The reverse of
the magnetic field will cause re-arranging the molecular magnets of the core until
becomes un-magnetized (at point c). The increase in the current and magnetic field in the
reverse direction will cause reach the core to the saturation point but in the opposite
direction (point d) which is symmetrical to point a.

Chapter two Literature review
21
If applying the same procedure but with reversing the magnetizing current flowing
through the coil, the second half of the loop will be reached, i.e. (d-e-f-a) curve. The fully
B-H curve representing the magnetic hysteresis loop. Soft ferromagnetic materials such
as silicon steel have very narrow magnetic hysteresis loops. Soft magnetic materials can
be magnetized using AC and DC currents, the magnetic properties are varying in these
two conditions. In the AC condition, the magnetic losses occur due to the continuous
reversing the direction of magnetic poles. DC magnetization also incurs hysteresis losses
as magnetic poles are alternately reversing directions of one cycle and can show
behaviour similar to that of AC. The shape of the hysteresis loop depends on the used
material type [7, 26].
Figure 2.14: Typical magnetization and hysteresis curve [21].
A. Krings and J. Soulard [27] explained that the change in magnetic losses in both
AC and DC magnetization occurs due to the movement of domain walls. Also, hysteresis
losses could arise at DC due to the fact that even though the magnetization change is very
slow, the local magnetization inside the domains changes rapidly. Figure 2.15a,
illustrates the differences between AC and DC magnetization in the hysteresis loop states.
The solid curve is the DC hysteresis loop. The loop becomes wider at the higher frequency
which means more losses as shown by the dotted lines. Therefore, it is evident that Br and
Hc may change with frequency even for the same Bm. However, at any frequency, the
hysteresis loss is proportional to the area of the B-H loop. Increase in loop area with
frequency is usually attributed to flow of eddy currents. Figure 2.15b shows that the flux
density is also proportional to the applied current for a given frequency. Increasing the

Chapter two Literature review
22
number of turns of the magnetization coil leads to increase in the current and thereby an
increase in the magnetic field. Therefore, the largest loop corresponds to the highest
applied current at maximum flux density Bm. If the effective current is reduced, a smaller
B-H loop results, with lower flux density Bm3. When the current is reduced further, lower
flux density is reached as in Bm2 and Bm1 [28]. The saturated state can be reached by
applying sufficient current and magnetic field depending on the material type and size.
Figure 2.15: a) Differences between the AC and DC magnetization on the hysteresis loops,
b) Effect of applied current and flux density on the hysteresis loops [28].
2.3.4 Magnetic power losses
The difference between the supplied and the output magnetic power is called the power
loss [7]. It can also be defined as dissipation of energy as heat. The power loss is a very
important property in determining the material’s quality because of its contribution to
total losses in machines, usually given as loss per cycle or watts per kilogram for a specific
frequency. Permeability in ES applications is a secondary quantity and it is inversely
related to the magnetic loss at the fixed magnetization condition [22]. The power energy
loss can be generated from the following three sources [1, 26]:
1) Core losses or magnetic losses, which include hysteresis losses, eddy current, and
anomalous losses of motor components [29].
2) Mechanical losses, which result due to friction and winding losses or copper losses.
3) Stray load losses are the losses which are caused by variation in load.

Chapter two Literature review
23
Usually, thin sheets of electrical steel are preferred for use in the manufacture of
the stator and rotor cores, to reduce eddy current losses in the iron core as a result of the
alternating flux induced during operation [7]. Hysteresis loss occurs due to the
irreversible nature of the magnetization process of a magnetic material when an external
field is applied, whereas eddy loss occurs due to the currents flow in the opposite direction
to the electromotive force (emf) induced in the material due to the magnetic field [29].
One means of limiting the energy losses of ES steel sheet is by lowering the sheet
thickness to reduce eddy current losses [30]. The power loss generally decreases at a
certain thickness because the eddy current loss component tends to decrease in spite of
the hysteresis loss component tending to increase with decreasing thickness. The eddy
current loss decreases linearly with reduction in thickness [31].
Several factors appear to be responsible for the reductions in energy losses with
decreasing thickness of ES sheet. The main reason for reducing loss is the change in the
material’s permeability. The other factor influencing the energy losses of thin sheet is the
dependence of 180 ° domain wall spacing on sample thickness [30, 32]. Also, the
concentrated electric fields at domain boundaries in thin sheets could contribute to
increasing the eddy current losses [30]. There is a discrepancy between the sum of
hysteresis and classical eddy current loss when compared to the specific total loss in a
material. This difference is due to the anomalous losses. The increase in the number of
domain walls because of increase in the grain numbers and grain boundaries at lower
thickness results in reduced domain wall velocity for the same magnetization response
because of reduction in the domain widths [29].
The inter-laminar eddy currents may occur between core laminations, as shown
in Figure 2.16 [1]. Therefore, the lamination is insulated by a coating layer on one or
both sides to prevent circulation of currents between the sheets. Also, insulation increases
electrical resistance between laminations to reduce eddy currents and to provide
resistance to corrosion or rust [1]. There are numerous types of coating, organic and
inorganic, that can be selected depending on the application [7]. The eddy current loss is
proportional to the square of the thickness of flat-rolled magnetic materials, which
indicates that reducing the lamination thickness by half could reduce the eddy current
losses by one-fourth. The contribution of eddy-current loss to the total loss is less than
that of the hysteresis loss at low frequency. However, the hysteresis loss becomes greater

Chapter two Literature review
24
than would be expected based on power-frequency considerations alone. Thus, hysteresis
loss plays an important role at high as well as low frequencies [33].
Figure 2.16: Lamination sheet and inter-laminar eddy current [1].
Measuring magnetic properties of electrical steel sheets
There are different standard tests for investigating and evaluating the magnetic properties
and iron losses of lamination steels. Some are used to test the stack of laminations or the
whole core before windings are applied and mounted into motors, such as the ring test as
shown in Figure 2.17a. In this test method the core assembly steps such as welding,
riveting, and bolting need to be considered. Another testing method is used to test
individual sheets to measure and characterize the sheet material’s properties and is called
the single sheet tester SST. Normally this test method is applied to measure power loss
and define the magnetic property of ES. Such measurements play an important role in
supplying valuable data on magnetic parameters and the quality of products. The best
known method is called Epstein frame measurements and is a test that uses three layers
of four ribbons with 25 cm length and 3 cm width, squarely placed and overlapping at the
corners [3]. The Epstein test is considered as a general standard for comparing lamination
properties among different manufacturers, despite having drawbacks relating to sample
size and errors due to the overlapping corners as shown in Figure 2.17b.

Chapter two Literature review
25
Figure 2.17: Magnetic measurement methods used to determine magnetic properties and
iron losses in electrical steel sheets [3].
With the Epstein frame, measurements are taken using wide samples and it is thus
not suitable for loss investigations in small sheet parts [27]. The drawbacks of the Epstein
test can be avoided by using the single sheet tester. The SST method is used in a wide
range of magnetic circuits in different configurations. For example, it may be used with
or without closure yokes and with or without H-coils for direct sensing of the magnetic
field strength [3]. However, the use of two-sided yokes is preferred to cancel the eddy
current pools which add to measured losses and which may form in the strip at the limbs
of one yoke. Some SST fixtures are shown in Figure 2.18.
Figure 2.18: Single sheet tester fixtures for measuring magnetic properties [3].
M. Mikulec [34] investigated the accuracy of H-coil methods by evaluating the
total measurement errors made by the single sheet testers (SST) in relation to the magnetic

Chapter two Literature review
26
properties. It was found that the causes of the measuring errors depended on the method
of determining magnetic field strength in the specimen and measuring equipment. B.
NAAS [35] evaluated the magnetic field strength using the single sheet tester for
individual square sheet (500*500 mm2) materials. The measurement efficiency was tested
under unidirectional and sinusoidal flux density. It was found that the primary current did
not have an effect because the frame shape was very complex and distant from the field,
so two tangential coils were used to increase sensing of the magnetic field strength and
obtain measured quantities. J. P. Schlegel [36], on the other hand, examined methods of
measuring the magnetic properties and losses of individual non-oriented electrical steel
sheets. The study examined three common types of test: single sheet tester, Epstein frame,
and ring test.
A comparison was conducted to show the value and the efficiency of each
measurement method, taking into account industrial considerations such as cost, time,
complexity and accuracy of measurement. The ring test was found to be less expensive
and more accurate than the other two types. In another study, E. Usak [37] studied the
qualities of the double yoke type of single sheet tester. A magnetization field was applied
by means of four magnetizing coils to a small specimen consisting of electrical steel
strips. Test parameters such as the magnetization of field strength and flux density from
the induction coil were measured. The measured quantities were compared with the
results gained by the standard Epstein test method. The study found that the results
differed between the two test methods and that it is important to calibrate the magnetizing
circuit individually for each specimen. However, even with calibration, the magnetization
curves were different from sample to sample. T. Nakata [38] investigated the efficiency
of single sheet testers on the magnetic properties and iron losses measurement. SST was
tested in different positions regarding the yoke position and the specimen material’s
dimensions and type. The study found that when using the closure yoke in the horizontal
position loss measurement was highly influenced by the specimen width. Also, it
commented that the accuracy of measurement at the horizontal position is less compared
to the vertical type. N. Takahashi [39] examined a new method of testing magnetic
properties for different sample sizes and geometries. The new technique included using
an electromagnet and a specific probe with a very small active area. The test demonstrated
the possibility of measuring the magnetic properties of a sheet or cylindrical shapes of
soft electrical steel materials.

Chapter two Literature review
27
Moreover, the new test produced similar results in comparison with the conventional
SST. H. Matsuo and M. Enokizono [40] used the single-sheet tester system to measure
magnetic properties and losses for ES under DC power condition in both gain
orientations. A comparison between magnetic hysteresis loops was conducted at a variety
of magnetic flux densities. The research showed the possibility of using SST efficiently.
Measurements indicated that the loss was dependent on the flux density and increased
with increasing the indication flux. N. Takahashi [41] used the single sheet tester with
two excitation coils in order to measure the magnetic properties of individual laminations
of grain-oriented electrical steel. For accurate measuring, the SST was applied using
diagonal exciting coils under high flux condition in arbitrary directions. The flux density,
field strength and iron losses were measured under alternating rotating magnetic flux
excitation. The results showed that there was an error between the two orthogonal coils
of the B and H coils and clockwise excitation was different from that under counter-
clockwise excitation, so the average value of the loss was obtained to conduct comparison
with the ordinary Epstein tester measurements. Many investigations have been carried
out of single sheet testing in relation to measuring magnetic properties. Each magnetic
tester has specific features and the selection of tester type will depend on the required
accuracy of measurement, sample size, the measurement position, and excitation type.
Methods for cutting laminations
There are many steps in the manufacturing of any machine core, including cutting
the ES laminations, stacking, welding or sticking, and riveting. Any of these steps could
have a significant negative effect on the resulting magnetic properties of the final product
[3, 5]. The cutting process, which involves cutting the material and producing the final
geometry of the electrical steel sheets, is a highly important procedure in the
manufacturing of iron cores of electrical machines. It could cause modification of the
material’s texture at the cut edge, which could then influence the original magnetic
properties and lead to an increase in the iron losses [3]. Several cutting methods are
available, such as punching (blanking or piercing), laser, wire EDM, and jet water, as
shown in Figure 2.19. Method selection depends on several factors including production
rate, cost, edge quality, and application type [5].

Chapter two Literature review
28
Figure 2.19: Lamination cutting methods, a) blanking, b) Wire EDM, c) Laser cutting,
and d) water-jet [5, 42, 43].
The punching process shown in Figure 2.19a, is performed by applying shear
force using two tools called punch and die. The blanking method, which is the one
adopted in the current study, requires specific dies to be made for the particular lamination
geometry. Tool surfaces and the sharp edge can be affected by continuous production due
to wear processes. Sometimes, both the stator and rotor laminations are cut
simultaneously from the same sheet in order to reduce the amount of waste material and
the time consumed by the cutting process [44]. The most important problem encountered
during stamping cutting is burr formation at the lamination edges. These burrs may form
electric paths for inter-laminar eddy current under assembly pressures. Consequently, the
stamping operation must be carefully designed and controlled in order to keep the
stamping burrs as small as possible [1]. The concepts and parameters of the blanking
cutting process will be discussed in detail in the following section.
The electrical discharge method (EDM), sometimes called spark erosion, is shown
in Figure 2.19b. In this process, an electric spark is used to separate the work piece from
the material by applying a pulsating electrical charge of high-frequency current through
the electrode to the work piece. There are two types of EDM processes, one of which uses
a formed electrode and the other uses a continuous moving wire electrode (Wire- EDM).
EDM operations create surfaces with a relatively high roughness value of about 0.8 to 1.3

Chapter two Literature review
29
μm. Wire -EDM operation is commonly used to produce the prototypes of cores, pins,
and stamping dies in small quantities [46].
In the laser cutting process shown in Figure 2.19c, a laser beam is used as a
thermal source to cut the material in different thicknesses. This method is applied to large-
size laminations for which the stamping process may not be suitable [46]. This technique
is also suitable for fast fabrication of motor prototypes because of its flexibility and its
good dimensional accuracy. The drawbacks of laser cutting are the low productivity, and
the higher cost compared to the blanking process. Changing the laser blanking speed can
affect the cut edge quality. During laser cutting, an oxide film is generated on the burr,
thereby reducing the conductivity of burr contact and reducing inter-laminar losses [1].
The abrasive water-jet (AWJ) machining process shown in Figure 2.19d, uses a
high-pressure water flow mixed with abrasive particles. The material is cut by spraying a
jet of high-speed water from the nozzle onto the material surface. There is no heat
generated in this process and it leaves no burrs or rough edges. It is a versatile machining
process that is usually used for edge finishing and de-burring operations. Water-jet cutting
can be an easy and efficient way of producing prototype parts. The main disadvantage of
water-jet cutting is the limited number of materials that can be cut economically, and the
time taken to cut parts can be very long and very costly. Also, thick parts such as stacked
laminations cannot be cut with dimensional accuracy, and rough and wavy patterns may
form on the cut surface. Moreover, the use of high-pressure water with abrasives requires
special pressure intensifiers and sapphire nozzles that are costly and have limited flow
capacity [45].
The effects of these processes on the magnetic properties of individual lamination
electrical steels have been studied and compared to identify the preferred cutting method.
Y. Demir et al. [46] studied the influence of punching, wire EDM, and laser-cut on
stacked laminations for the rotor and stator of electrical motors. All tests were performed
under the same conditions. The results of the comparison between the motor
performances showed that the motor with wire-cut sheets produced the nearest results to
the designed data compared to other methods. Also, microscopic observation of the effect
of the cutting methods on the cut edge microscopically indicated that the blanking process
produced a less affected edge, as shown in Figure 2.20 a, b, and c.

Chapter two Literature review
30
Figure 2.20: Effects of different sheet cutting processes on the cut edge [46].
S. Bayraktar and Y. Turgut reported similar results, using 0.5 mm of NGO
laminations cut with different cutting methods and tested under AC current conditions.
The authors found that the water-jet cutting resulted in the highest magnetic loss. The cut
edge showed a higher amount of plastic deformation when using punching and AWJ,
while the laser and EDM methods caused thermal degradation of the material.. The study
also found that higher motor efficiency is achieved in cutting methods which produce
lower average surface roughness (Ra), which is the case with punching, whereas in AWJ
it is high, as shown in Figure 2.21 [47].
Figure 2.21: Cut edge surface roughness produced by different cutting methods [47].

Chapter two Literature review
31
V. Manescu [48] investigated the induced magnetic loss due to the laser and water jet
cutting methods for ES with the thickness of 0.65 mm. The study found that the hysteresis losses
were less for water jet than the laser cutting and depend on the impurities of the material. Because
the laser method produced thermal stresses and local damages of the crystalline lattice and thereby
affected the magnetic properties. This was explained according to domain wall impeded by the
dislocation networks. Also, the permeability was influenced by both cutting processes [48]. The
extension of deformation was approximately 0.3 mm, the extent of the affected area was
less in the punching process than the laser cutting. Regarding the grains orientation, the
differences in losses results were less than 10% between rolling and transverse directions,
while differences in permeability were above 20%. Y. Kurosakia [49] also investigated
the magneto properties of Non-grain oriented electrical steel (0.5mm thick and 2% Si).
Blanking, laser cutting, and Wire EDM were used to produce ring shape sheets. The
results showed the deterioration in magnetic properties due to the EDM method was lower
than with the blanking and laser processes. Also, the hardness values at the cut edge were
less in EDM than with blanking or laser, a finding which the researcher attributed to the
porous surface produced by WEDM cutting.
Each of the cutting processes affects the cut edge quality and the mechanical and
magnetic properties of the material. Therefore, many studies have been done to
investigate the deformation effect at the cut edge. H. Naumoski et al. [50] investigated
the influence of laser, EDM, and punching cutting on the magnetic properties of non-
oriented electrical steel with a thickness of 0.35 mm and 2.8% silicon. The study indicated
that all cutting processes induce stresses inside the material close to the cut edge and these
stresses cause deterioration of magnetic properties. The EDM and laser processes
produced straight cut edge profiles, while punching induced a typical burr and plastic
deformation. The maximum permeability was decreased by about 35% and the losses
were increased by 20% by using the punching technique. In addition, the observation test
of domain wall displacement showed the domain structure changed over the first two to
three grain rows near the edge. The domain wall movement could be the main reason for
the changes in magnetic properties.
S Steentjes et al. [51] analysed the impact of material degradation on iron losses
due to punching and laser cutting for non-oriented electrical steels of thickness 0.3 mm
(2.4 % Si). Many 120 mm × 120 mm sheets were cut into smaller stripes in an attempt to
investigate the local magnetic properties. The measurements showed increases of the
hysteresis loss and decrease in magnetic permeability. The researchers explained that the

Chapter two Literature review
32
magnetic properties were affected as a result of the local modifications in the edge texture
and stress state of the material; for example, dislocations and residual stresses during the
punching process or thermal deterioration across the heat-affected zone in the case of
laser cutting. T. Bulin et al. [52] described changes in magnetic properties after punching,
laser, and spark cutting for toroid shaped samples of ES sheets M470-50A with thickness
0.5 mm (1.7% wt Si). The ring core magnetic test measurements showed that the sample
that underwent EDM cutting exhibited the best magnetic parameters. In contrast to laser
cutting, an important increase in total losses was observed in comparison with the
punched samples. The study did not observe any changes in grain sizes in any sample,
but plastic deformation was seen near the cut edge of the punched sample. Magnetic
measurement also demonstrated that heat stress can cause significant changes in the
material and its properties.
René Siebert et al. [53] investigated the effect of punching and laser cutting on
the magnetic properties under both DC and AC conditions. Two electrical steel sheets
with thicknesses of 0.35 and 0.5 mm were cut as strips in different widths from 5-30 mm.
The study indicated that different cutting techniques under any power supply conditions
can affect the structural features of the cutting edge. In the mechanical cutting, the plastic
deformation appeared in the zone near the cutting line and caused a drop in the magnetic
flux in the region. While cutting by laser process induced thermal stress which caused a
decrease in the magnetic flux over the sheet width.
A. Belhadj et al. [54] investigated both the magnetic properties and the
microstructure of non-oriented electrical sheets with a thickness of 0.65 mm. The study
indicated that the mechanically cut samples retained better magnetic properties compared
with the laser cut samples because residual thermal stress drawbacks caused an increase
in the coercive field and a drop in the permeability. The laser process led to a drastic
change in the texture of the HAZ along the cut edge. In addition, the study referred to the
main factors which affect the magnetic domains’ distribution and wall motions; for
example, the texture obstacles which could pin the domain walls, such as grain boundary,
precipitates, and dislocations. They also found that the mechanical cutting process
generates a deformation affected zone (DAZ) less wide than the heat affecting zone
(HAZ) produced in the laser cutting process.
M. Emura et al. [55] studied the magnetic properties for NGO electrical steel with
0.485 mm sheet thickness and 2% Si content using punching, laser, and EDM processes

Chapter two Literature review
33
with and without heat treatment. A plastic deformation was observed at the punching cut
edge that extended about 0.3 mm, while the laser technique did not deform the grains and
produced a sharp edge. The study showed that the cutting process had more effect on the
magnetic permeability than on the magnetic induction losses. The differences between
processes were less than 10% for losses and more than 20% for permeability. Also, it was
found to be preferable to conduct annealing before rather than after the cutting process.
R. Roumaine et al. [56] tested NGO electrical steel with 0.65 mm thickness using
both punching and EDM techniques. The researchers observed a plastic deformation near
the cutting edge induced by punching methods. On the other hand, the EDM method did
not induce mechanical stresses in the cutting edge zone because of the absence of contact
between the material and cutting element. The deterioration of the magnetic properties
was higher in the case of the punching method. This deterioration was interpreted
according to the domain wall pinning resulting from the material dislocation network.
The study also explained that the area affected by cutting is located around the core
lamination teeth, and the accumulation of the effects of a group of teeth could result in a
strong impact on the overall behaviour of the machine.
E. Gomes Araujo et al. [57] discussed the effect of the microstructural changes
resulting from mechanical and laser cutting on the hysteresis losses of non-oriented
electrical steel with 0.5 mm thickness. Plastic deformation was visible near to the
mechanical cutting line, whereas laser cutting did not induce clear changes in the sheet
surface morphology. The investigation also found that the magnetic losses became worse
at large grain size. According to P. Lazari et al. [58], the resulting microstructure features
were quite different between the mechanical and laser cutting methods, although both
caused worsening of the magnetic properties of the tested electrical steels. The damage
caused by the laser method was more extensive than that caused by the blanking process
due to the temperature gradient during the process resulting in a substantial permeability
reduction.
G. Loisos and A J. Moses [59] confirmed that changes occur in the microstructure
of the material near the cut edge through using both blanking and laser methods to cut
flat rectangular plate of electrical steel sheets 0.5mm. The study attributed the high
magnetic loss after laser cutting to the rapid heating and cooling causing thermal stresses,
despite the fact that high temperatures may cause grain growth which is sometimes
beneficial for the magnetic properties. In addition, the induced plastic deformation in the

Chapter two Literature review
34
blanking process affected the magnetic flux distribution which in turn influenced the
magnetic domain structure and domain wall motion during the magnetization process. P.
Baudouin et al. [60] conducted a comparison between laser cut technique and punching
cutting for three grades of ES with 0.31 thickness and 2.98% Si. Their results tended to
indicate the superiority of mechanical cutting for the larger samples, whereas the laser
cutting gave more satisfactory results for the smaller samples. The laser cutting technique
caused more deterioration, although it was difficult to make a clear evaluation of the effect
of the internal stresses on the magnetic properties of the electrical steels following cutting.
Each method is still selected for use in industry depending on the particular
application and influence of the material [43]. However, it is generally accepted that the
punching process is the most preferred method and the most desirable for producing core
laminations from electrical steel sheets. This is because it can be used for mass production
at lower cost and with acceptable cut edge quality compared to the others methods.
Therefore, this method is adopted in the present study to achieve the study purpose of
quantifying local deformation of blanking induced magneto-mechanical cut edge defects
in electrical steel. Table 2.1 presents a general comparison of the performance of the
different cutting methods in terms of the most important factors:
Table 2.1: Comparison of the performance of lamination cutting methods [43, 46].
Punching Wire EDM Laser cutting Jet water
Production size Mass
production
Prototype
laminations
only
Prototype and
large-size
laminations
Prototype and
de-burring
operation
Cost and time
consumed in
large-scale
production
Fast, low cost Very slow and
high cost
Very slow and
high cost
Very slow and
high cost
Product shape
flexibility
Dies cannot be
changed easily
Flexible
geometry
design
Flexible
geometry
design
Flexible
geometry
design
Defects
at cut edge
Plastic
deformation
Residual stress,
edge burrs,
no thermal
distortion
High thermal
stress,
Burn coating
layer
High thermal
stress,
Formation of
oxide film,
Burn coating
layer
No burrs or
thermal
distortion,
rough and non-
straight edge for
thick sheet

Chapter two Literature review
35
Blanking process
Blanking is a process used to cut sheet material to the required shape. The process is
usually performed using a set of cutting tools called a die and punch as shown in Figure
2.22. When the material is sheared during the blanking process, a plastic deformation
occurs and stresses are generated in the sheet at the cut edge that cause work hardening.
The strengthening of the metal occurs because of dislocation movements and dislocation
within the crystal structure of the material.
The sheet is cut along the shearing line in one step to separate it from the
surrounding material. If the cut part is the desired product, then the process is called
blanking. Whereas, if the original sheet is the product and the cut part is scrap, then this
method is referred to as piercing. Both are sometimes referred to as punching, as shown
in Figure 2.23. The process is performed at room temperature. Occasionally, if the sheets
are extremely thick or high strength material is used, then warm or hot stamping is
performed to decrease the forming force and increase formability [4, 61].
Figure 2.22: Blanking process mechanism [5].
Figure 2.23: Punching, blanking, and piercing operations [5].

Chapter two Literature review
36
2.6.1 Mechanism of the blanking process
The blanking method consists of four sequential deformation stages that complete the cut
cycle, as seen in Figure 2.24. Shearing generally starts when the edges of the die and
punch come into contact with the top and bottom edges of the workpiece. In the second
stage, the punch moves down and pushes the material against the die cutting edge to form
the rollover zone. Then the punch moves more and penetrates further inside the material
to produce a shearing surface. Finally, cracks are formed on points A and B, and C and
D as shown in Figure 2.22. Cracks propagate to meet each other and complete separation,
with the fracture surfaces resulting due to these cracks. If proper clearance and precise
alignment are achieved, the fracture lines on the opposite sides will meet, resulting in a
straight cut edge and smooth surface separation of the workpieces [61, 62].
Figure 2.24: Blanking process deformation stages [61].
Different zones called rollover, shear, fracture and burr zones are generated in the cut
edge surface of blank sections during the blanking operations; the size of each zone is
dependent on process parameters such as tool condition and material properties. The ratio
between these areas represents the quality of the cut edge; usually, large shear zone and
smaller burr zone represent good edge quality [64]. The cut edge zones are shown in
Figure 2.25 and defined as follows:
Rollover zone (Zr): Initial plastic deformation that forms at the top of the cut
surface due to the first entry of the punch into the sheet material.
Shear/burnish zone (Zs): Smooth and shiny area resulting from material shearing
due to the penetration of the punch into the work before fracture begins. Two areas
could be generated if the cracks do not grow toward each other.

Chapter two Literature review
37
Fracture/rupture zone (Zf): Below the burnish is the fractured zone, a relatively
rough surface of the cut edge. The depth of crack penetration (Dcp).
Burr zone (Zb): An extended area of material at the bottom of the edge caused
by plastic elongation of the metal during the last separation of the metal.
Figure 2.25: Deformations zones of the cut edge: a) characteristic edge in blanking
process, b) blank side-scheme areas [63].
Blanking can cause further effects when a mismatch occurs between the punching
strategies used and the material’s properties. Burr is an important feature that can arise
when displacing metal during the blanking process. Burr is a sharp edge that forms at the
cut edge. Appropriate selection of blanking parameters, for example, sharp tools, suitable
clearances, and high blanking speed, could reduce the burr size [4, 63].
2.6.2 Analysis of applied stresses during the blanking process
The cutting forces have two components: vertical (FV) and horizontal(FH). Affecting both
is nonlinearity near to the cutting edge because of the existence of the distance l between
the vertical compression forces. Thus bending stresses are created and lead to tilting of
the sheet, as shown in Figure 2.26. In addition to these forces, there are frictional forces
(µFV or H) between the workpiece and the die and punch tools which increase the required
cutting force [4, 63].

Chapter two Literature review
38
Figure 2.26: Forces distribution in the workpiece during blanking process [63].
The following equations can be used to estimate the cutting force and stress required to
conduct the blanking process:
F = L × t × S𝑠 (2.1)
S𝑠 =F
Ap (2.2)
Where F is the force required for blanking, l is the perimeter of the cut, t is the
sheet thickness, SS is the shear strength of the material, and Ap is the cross-sectional
cutting area. The blanking quality is assessed according to the zones formed at the cutting
edge, and these areas directly relate to the punch movement steps during the process, each
step corresponding to load value. Figure 2.27 shows a typical force-time diagram of the
punch movement during operation.
Figure 2.27: Typical load-stroke curve of a blanking [4, 63].
At step 1, an elastic deformation occurs. Then, in step 2, the material is flowing and this
may cause a strain hardening, in which the force existing here increases up to the
maximum load. At this stage, the cross-section is not reduced, and sharing has not started.
The increased pressure at the cutting edges at step 3 prevents the material from flowing,

Chapter two Literature review
39
and shear starts. The blanking force decreases because of decrease in the cross-section,
despite the strain hardening of the material. In the step 4 an initial crack is generated in
both contact sides between the sheet and tools and fracture starts and then grows until
complete separation occurs; because of the limit of material formability exceeding the
cutting, the force will decrease rapidly during this phase [63].
2.6.3 Influence of various process parameters on blanked edge quality
There have been several research on the effects of blanking parameters on the
process results and the sheared edge quality. Figure 2.28 shows an infographic of the
possible parameters affecting the blanking process according to E. Al-Momani [65].
Figure 2.28: Parameters affecting the blanking process as indicated in [65].
As the material undergoes severe plastic deformation and shearing during the
blanking process, the micromechanical properties of the sheets close to the cut edge are
adversely affected by the blanking process and thereby the material properties are
changing negatively during the cutting process. These changes occur due to shearing
stresses and crystal deformation [50, 62].
It was reported [63] that the blanking parameters effects are interlinked therefore
it is very difficult to study their effects individually; for instance, tool wear increases with
a large punch and die edges radius and could cause height burr. Additionally, tool wear
is increased by increasing the clearance; therefore, sometimes lubrication is necessary to
reduce punch wear [63]. Therefore, most studies showed the parameters in a way that

Chapter two Literature review
40
demonstrate their effect on one of the process output such as the required process load or
the sheared cut edge quality with specific process settings. For example; the effect of
clearance on the cutting force and the geometry of the shared edge profile regarding the
sheet thickness and material properties, or tool wear and tool life, or blanking speed and
production rate with blanking load [66]. Also, the quality of the cut edge is dependent on
blanking parameters, therefore the optimization of the blanking process depends on the
required part quality and production rate. However, according to the studies related to the
blanking process, there is a strong dependence between the geometrical quality of the
blanked part and the magnitude of the force applied on the tool as well as the variations
in the process factors [66].
2.6.4 Effect of blanking parameters on the required cutting force and
cut edge quality
Clearance refers to the space between the die and the punch and it directly affects
the blanking performance regarding the quality and shape of the cut edges of sheet
material. The clearance is one of the key parameters affecting the blanking performance
and cut edge quality. The clearance is one of the key parameters affecting the blanking
performance and cut edge quality. It value mainly depends on the type of material to be
cut as well as the sheet thickness and estimated to be at approximately 5-20 % of the
thickness [4,5]. When clearance increases the material tends to be pulled into the die
rather than being sheared and the zone of deformation zone becomes bigger with a rough
sheared edge [5]. That can lead to an increase in the shear zone and a decrease in the
rupture zone [5, 63]. Figure 2.29 shows the effects of clearance and strain hardening at
the shared area.
Figure 2.28: a) Effects of clearance on the deformations zone and vicinity areas, b) Vickers
hardness contours expressing the cold working in the shared region [5].

Chapter two Literature review
41
According to [4] for blanking of 0.58 mm sheet thick, that when the clearance
between the punch and die increases, the rollover zone, fracture zone, fracture angle and
burr increase while the shear zone decreases. Excessive clearance causes large plastic
deformation and lowered tool life. While using insufficient clearance produces secondary
shear i.e. the cracks originating at the punch and die do not meet and cause further
material stressed and thereby expending more energy. The impact of factors clearance
and tools radii regarding cut edge zones are shown in Figure 2.30.
Figure 2.30: Effect of clearance and tools radii on deformations of cut edge [4].
C.Husson et al. [67] conducted blanking simulations of a copper alloy of sheet
thickness 0.58mm and compared it with experimental results. The effect of punch-die
clearance on the part edge quality was studied in the range of 2.5 -19 %t during blanking
of 3.5mm diameter holes. It was found that rollover and shear edge increase and fractured
edge decreases with increase in blanking clearance. The fracture angle increases
significantly with clearance.
R.Wiedenmann et al. [68] conducted blanking studies on steel with 1.4mm thick. The
effect of clearances on part edge quality in the range of 5-20%t was studied during
blanking of 10mm diameter holes. It is reported that the size of roll over and fracture
zones increase with clearance while the shear zone decreases with clearance.
Some studies have focused on the influence of the main blanking factors on the
quality of the cutting edge and the required energy or load applied. For example, S.

Chapter two Literature review
42
Subramonian [69] investigated the influence of tool wear and stresses generated on the
tool life, the study showed that the induced blanking stress was decreased with increasing
punch radius. S.K. Maiti [70] conducted analysis of the blanking process of thin sheet
mild steel to examine the impacts of die clearance, friction, and material thickness on the
required process load. The achieved results showed that blanking load increases with
reducing the tool clearance and when the coefficient of friction is increased.
Moreover, the change in the clearance did not affect the growth of the plastic
deformation zone. A. Zaid [71] reviewed the effect of some blanking parameters
including die and punch clearance, tool edge radius, and the effect of punch and die wear
on the force and energy required for the operation as well as on the quality of the products.
The study found that, at the low blanking speed of about 5 mm/min, the sharp tool edge
with small radius produced better blanking quality. The blanking force and energy were
found to decrease with increasing punch radius and possibly affect the tool life. Moreover,
increasing the profile radius caused enlargement of the shear zone and delay in crack
formation.
R. Hamblin [66] attempted to optimize the interaction between the clearance, tools
wear, and sheet thickness on the cutting force and the geometry of the shared edge profile.
The results also demonstrated a complex variation in the process parameters. Moreover,
there was strong interdependence between the blanked geometrical quality and the force
applied by the tool. It was found that higher energy was required to cut thicker sheets
whereas the blanking energy decreased with increasing clearance to-sheet thickness ratio
c/t. Shim, et al. [72] conducted experimental studies in thin sheet metal blanking to
investigate the effect of punch speed, lubrication, and tool clearance on the sheared
surface and fracture locations during the deformation process. It was shown that an
increase in punch–die corner radius causes an increase in the burr height and expansion
of the effective sheared surface and early crack initiation. A.M. Govaerts [73] attempted
to determine the stress relation for large strains in the localized shear zone by conducting
tensile testing to characterize the criteria. The study found that characterization of the
blanking stresses using tensile results is not valid because of the large strains in the
localized shear zone. Greban et al. [74] investigated the effects of both sheet
microstructure and process parameters upon the cutting edge quality. The quality of sheet
metal blanking was quantified according to the relative ratio of the known four cut edge
zones. A better blanking quality was identified by a small fracture zone and a larger

Chapter two Literature review
43
shared zone with lower burr height. The study showed that the burr size depended mainly
on the blanking clearance and the material type rather than the rate of work hardening. In
addition, the roll-over zone was influenced by the geometry of the blanking process,
whereas the shared and fractured areas were mainly influenced by the mechanical
properties of the sheet. Usually, the blanking process is performed at room temperature.
However, Qin et al. [75] conducted the blanking process on Non-oriented electrical steel
at a different temperature of about 100 °C. The microstructure results showed that
increasing punching temperature or refining grain size can improve the ductility and
punch-ability of the material, but affect the edge quality by producing larger burrs at the
cut edge.
2.6.5 Effect of sheet thickness on the required cutting force and cut
edge quality
The Increasing demand to improve the magnetic properties by means of reducing
the eddy current loss led to reducing the thickness of the sheets used in the blanking
process. However, reducing the sheet thickness can affect the grain size cross the
thickness sheet area. In addition to the affecting the cut edge zones such as the fracture
and shear areas. The increasing the sheet thickness will increase the blanking load, as the
cut area will increase [76].
As the sheet thickness reduces, the effects of grain sizes (size effect) increase and the
understanding of the blanking process becomes more complex. Thus, the deformation
behaviour of the blanking process not only relates to the blanking parameters but also
relates to the grain size of ES sheet. This is mostly due to the fact that few grains exist
through the thickness of the sheets leading to large variations not only in the cut edge
profile but also in blanking deformation distribution. Therefore, the grain size has a
significant influence on the blanking process [76].
Joo, et al. [77] studied the size effect in the punching process. The study indicated
that when there are only a few grains cross the sheet thickness, the conventional ductile
fracture by crack initiation and propagation does not occur and the shear deformation is
dominated along the cutting line. Blanking tests of the thin sheet were conducted by Xu,
et al. [76] to investigate the influence of die clearance and grain size on the deformation
and fracture behaviour of thin sheet material. The results showed that the deformation
depth decreases with an increase of specimen thickness. Based on the experimental results

Chapter two Literature review
44
of the blanking process, the shear deformation is concentrated with just a few grains that
confined by the punch and the die. The distribution and crystal orientation of grains also
play a decisive role in shear deformation observed in sheet metal blanking process. With
the decrease of sheet thickness, the number of grains in the cross section of the sheet
decreases and the effect of anisotropy of grain becomes more visible.
The slip and coordination of grains during the shearing deformation is a very
complex system, as mentioned in the literature [78], where the distribution of sheared
edge was still remained rollover, burnish, fracture and burr. However, the fracture
mechanism could change from ductile fracture to slip and separation with the decrease of
length scale because of the existence of a few grains in the thickness direction. That makes
the orientation of these grains very important, especially for the cutting direction. The
grains having an extremely unfavourable orientation towards the blanking direction leads
to more difficult shear deformation and coordination. The results also showed that the
blanking force decreased with the increased relative blanking clearance ratio.
It is reported that the sheets with coarser grains could show a strong variation not
only in maximum blanking force but also in the cut edge profile [76]. It is shown that for
the sheets having larger grain sizes the geometry of the cross-section significantly varies
not only in the profile of blanking edge but also in the distribution of rollover, burnish,
fracture and burr zones. These extreme differences can be related to the variation of
deformation behaviour during the blanking process where only a few systems are
available to define the deformation mechanics. However, for the case of sheets having
fine-grained microstructures, there could be more random grain orientations some of
which would be in favour of applied deformation and stresses, therefore, the effect of
grains orientation will be smaller having more favourable grain sliding systems. In the
blanking process of coarse-grained sheet specimen, the grain crystal orientation varies
and the sliding systems are oriented differently with the blanking direction.
The material deformation during blanking is not only related to the blanking
parameters such as clearance, but also to the grain size of the sheet. Therefore, the ratio
of blanking clearance to grain size may considerate as one of the main factors to influence
the deformation behaviour of blanking.

Chapter two Literature review
45
2.6.6 Effect of blanking speed on the required cutting force and cut
edge quality
Punch speed can be expressed as the number of strokes per time or punch moving distance
per time [5]. The sheared edge can undergo severe cold working due to the high shear
strains involved, and when the blanking speed is increased, the heat generated by plastic
deformation may limited to a narrower zone creating adiabatic heating conditions [5].
Blanking can be performed at different blanking speeds depending on the blanked
part application and the available machine capacity and blanking conditions such as tool
life, parts accuracy, material properties and thickness, and production rate. Blanking is
sometimes performed at very high speed when large numbers of products and high
precision are required, such as in the case of electronics parts. High-speed blanking is
usually run at speeds of around 2000 strokes per minute. Cutting forces change very
rapidly during material breakthrough. These forces can affect the tool life of dies and
parts quality [4]. Increasing blanking punch speed can improve edge quality by means of
lowering the altitude of burr and rollover zones while the shear zone increases. In
addition, higher the blanking speeds can reduce production costs and energy consumption
[79]. The blanking speed may rise to a very high value called ultra-speed wherein the
punch velocity can reach more than 5 m/ s. UHS blanking can provide very high cut edge
quality to produce a fine blanking product at a lower cost. At ultra-speed, materials go
through the different blanking phases including elastic, plastic, and fracture.
Moreover, different cut-edge zones may form and may omit the formation of
rolled edges and burrs. The conversion of mechanical work into the thermal energy and
presence of adiabatic heating conditions results in an increase of the temperature in the
deformation zone during a very short period of about 100μs. The heat generated will not
dissipate as quickly as it is being produced, which leads to instant softening of the
material. The kinetic energy of the moving parts and potential rebounds may also affect
the generated deformation and stresses in the cut edge [4]. The generated heat is
distributed to the vicinity of the cut area by thermal conduction. In high punch velocities,
the limited balancing of temperature causes concentrating temperature at the deformed
cutting edge. In contrast, at slow punch velocity, the heat is dissipated out of the shearing
zone because there is enough time for thermal conduction to occur [80]. The velocity of
blanking has a significant influence on the forces generated in blanking such as [81].

Chapter two Literature review
46
There are conflicting data concerning the effects of shearing speed on the energy
requirement for shearing [82]. Depending on the strain rate and the flow strength of the
material, there could be a reduction in the energy required for shearing [82]. However,
there are three available potential explanations; first, when the strain rate becomes
sufficiently high, thermal softening effects that outweigh work hardening may occur in
the shearing zone [81]. Another possible explanation is that the elastic compressive forces
stored in the punch during blanking are released more rapidly at higher speeds [81]. The
other possible explanation is that the quick impact of punch speed can apply high kinetic
energy and cause quick crack initiation and propagation in the material; this reason could
apply to the normal blanking speeds.
Several studies of the blanking process have been proposed to assess the influence
of blanking parameters, but only a few are concerned with the punch velocity regarding
the blanking cut edge deformation as it usually describes regarding the blanking load.
Marouani et al. [83] conducted experimental and numerical investigations of the sheet
metal blanking process to study the influence of punch speed (strain rate) and the
clearance on the punch force, punch penetration and the shape of the cut edge. A 0.65
mm thick sheet of non-oriented electrical steel was used. A range of die clearance and
punch velocity of 23 to 123 mm/s were applied. The results showed that the maximum
punch force increases when the clearance decreases. Additionally, it was found that the
shape of the cut edge is affected by the strain rate (punch velocity) where the sheared
zone increases with the punch velocity. In addition, the clearance is shown to affect the
punch penetration at fracture, and consequently, the shape of the cut edge.
Grunbaum et al, [84] investigate the blanking process for different materials at
clearances ranging from 5 - 20%T sheet thickness. 12.7mm diameter holes were blanked.
Experiments were conducted at different blanking speeds ranging from 0.15- 3.6 m/sec.
according to the reported findings, the length of the shear zone is in direct correlation
with the blanking velocity while it decreases with an increase in clearance for all
materials. Hirsch et al. [85] conducted experiments to measure punch loads in high-speed
blanking for various stroke rates 100, 300, 500 and 1000 strokes per minute for 0.29 mm
sheet thickness. The results showed that the measured blanking force was increased with
increasing cutting speed a bit and caused high vibrations of the stripper plate. Goijaerts,
et al. [86] described the effect of punch speed on the blanking process for punch velocities
from 10 mm/s up to approximately 1 m/s. The results showed a drop in the maximum

Chapter two Literature review
47
blanking force at larger punch speeds. This is reported to be a due to an increase in the
thermal softening effect for the blanking process at larger punch speeds. Gaudilliere, et
al. [87] measured the blanking force at different speeds for different sheet thicknesses of
2-4 mm. The measured of maximum force was decreased with increasing punch speed.
The study showed that the specimen fracture takes place earlier for a lower penetration
depth of the punch when the punch speed increases. Also, according to the authors,
thermal softening of the material can play a key role compared with the strain and strain
rate hardening. This is partly supported by the stud from Grunbaum, et al. [88] who
investigated variations in the effects of different levels of blanking speeds on the blanking
force and energy. The results at very high blanking speed showed a very high temperature
concentration in a narrow shearing zone. In addition, the kinetic energy at high speeds
was much higher than the energy required for the normal blanking speed. Moreover,
results of part quality investigations have demonstrated the positive influence of high
blanking speeds on the quality of the part edge. S.Krrabaj et al. [89] investigated the effect
of blanking speed on the blanking performance using different punch-die clearances at
different blanking speeds. The study found that conducting the process at higher speeds
caused reduction in the punching force and improved the quality of the part edge as
represented in a larger shear zone, smaller burr height, and rollover area. The study
showed that the speed of the deformation significantly affects the blanking force. Also, it
was concluded that at a specific blanking speed, the relationship becomes nonlinear
between the speed and force. Meanwhile, at different blanking speeds, the cut material
can show different behaviour which can result in a diverse cutting force [89].
2.6.7 Strain fields measurement
The traditional extensometers are used to measure the strain. However, they are limited
to measure the average strain on a selected length. Even though this technique is accurate,
but it is complex to operate especially for very small deformation area with a non-axial
flow direction of the material [90]. All of these drawbacks of using the extensometer can
be avoided by using the Digital Image Correlation or DIC technique. The DIC can
measure the full-field strain distribution in the material during various deformations
conditions [91]. The studies demonstrated that DIC is an accurate and reliable approach
for taking strain measurements. The non-contact optical technique is well suited for
characterizing the mechanical properties of the material in both elastic and plastic ranges.

Chapter two Literature review
48
DIC method includes acquiring images for the specimen surface before, during, and after
deformation. The distribution of displacement vectors is obtained by recognition of
kinematic changes in the surface patterns feature [92]. The measurement of displacement
in DIC can be determined by solving nonlinear simultaneous equations of the subset
deformation. Strains are obtainable by differentiating the measured displacements of the
new position of the subset of the reference image in the deformed image, as shown in
Figure 2.31[93].
Figure 2.31: The principle of the DIC measurement method based on the differences
between the target subset and the reference subset [94].
The natural features of the surface pattern can be used as a reference pattern, or
random speckles can be created artificially using spray paint, usually by making two
layers, white background with black speckles, or vice versa [93]. According to S.
Yoneyama [93], using a small subset size increases measurement accuracy. The
appropriate subset size depends on the number and size of the speckles or features in the
random pattern regarding the deformation area.
The selection of DIC camera and focusing lens depends on the application rate
and deformation zone size. For example, high-speed blanking requires a camera with a
very high recording rate because of the short duration of the process and low thickness of
the sheet [93]. The DIC camera is placed in such a way that the optical axis is
perpendicular to the sample surface. The system can be coupled with microscopy to reveal
the micro-scale measurement [13]. To achieve more contrast with high image resolution,
zooming of the lens should be avoided [93].
The system has advantages represented by high accuracy of providing a whole
field of true strain measurement. Also, DIC can measure strains at any point in the
specimen or local strain, in addition to measuring the average strain or global strain by

Chapter two Literature review
49
applying the strain gauge cross the gauge length [95]. However, DIC method also has
some disadvantages; for example, the sample surface should have clear features, the
measurement depends on the quality of the imaging system, and this technique cannot be
applied only on exposed surfaces [13].
Practically, there have been few previous attempts to conduct strain measurement
during the blanking process. That is because many technical challenges can appear when
implementing full-field techniques such as DIC to measure local strain in the material
during blanking operation, including the limited access to the deformation zone and the
high speed of deformation, and very thin sheet such as electrical steel sheets [90, 92].
Goijaerts, et al. [96] conducted DIC at low blanking speed on stainless steel sheet with a
1mm thickness. The study located markers of the surface features to use as the random
pattern. The results proved that the DIC method was suitable for observing the local strain
fields in a blanking. Chen, et al. [90] investigated the strains distribution during operation
of the Punch-stretch method. This work included using the 3D digital image correlation
test to evaluate the strain distribution only for the area around the punch when the sheet
was stretched. The cameras were attached to the hole in the upper die and the punch was
travelling at a very low speed of about 0.5 mm/s. The study found that the DIC technique
could provide accurate data for investigating the strain behaviour. According to the study,
the specimens with lower width were exposed to fracture faster because the strain path is
prone to uniaxial tension and change in the formability of the material. Moreover, the
DIC cameras should not be attached to test tools because vibration and instability of the
camera could affect the image quality and measurement accuracy. V. Bratus et al. [97]
investigated the stamping process using electrical steel sheets with a thickness of 0.5 mm.
System images followed the speckles during deformation with a CCD camera, and spray
paint was used to create the speckles on the sample surface. The results focused on the
profile of the round cutting edge in different directions. According to the study, the shear
strain had no influence on the diversity on the final profile of the cutting edge.
Liutkus, et al. [91] conducted a 3D DIC for a punching experiment to investigate
the plastic deformation of a sample in a tubular die having two narrow slots on opposing
sides to allow two cameras to view the rear surface of the specimen. Three different
punches tip geometries were used in these experiments. The obtained images were
processed with a commercial software from Correlated Solutions (VIC) to calculate the
full field measurements on the rear surface of the thin disk specimen. The material showed

Chapter two Literature review
50
significant strain hardening. In addition, the material’s behaviour changed at high
temperature, with the material showing decreasing flow stress with increasing
temperature. Slavic et al. [98] used an in-situ blanking apparatus to identify the effect of
blanking on electrical steel sheet with 0.5 mm thickness. Small holes were produced to
study blanking parameters such as load, speed, punch-die misalignment, and temperature.
The blanking speeds ranged from a very slow 0.1 m/s up to 4.5 m/s. Laser displacement
and a thermal camera were used to measure the velocity and temperature of the sheet
metal during the blanking process. The results showed that the punch-die misalignment
changed the maximum force by up to 4%. Furthermore, the temperature of the sheet
surface was increased by approximately 20◦C and the research supposed that the hot-spot
temperature inside the shear zone could be several times higher. The blanking force
decreased slightly with an increase of the blanking speed, which the researcher attributed
to the softening of the sheet metal because of the increase of temperature in the shear
zone. Another reason could be inertia or the acceleration of the punch during blanking
which was found to significantly affect the identified blanking force.
Wang and Wierzbicki [99] implemented the DIC test in blanking of high strength
steel sheet with a thickness of 1.6 mm. The test was interrupted to study the crack
formation and propagation during the blanking. The tests were performed at a very low
cross-head speed of 0.01mm/min. The results showed that two cracks were formed when
blanking with a small die clearance, while only one crack arose when a large clearance
was used and this caused formed the burr feature. Wang, et al. [100] conducted a similar
study to compare the DIC results with the traditional method using an extensometer. Both
were conducted simultaneously during a tensile test, with the front surface of the
specimen measured by DIC and the back side of the specimen measured by the
extensometer. The average results were convergent. However, the DIC measured the full-
range strain distribution during the tensile test, while the extensometer measured only the
average tensile strain. The studies demonstrated that DIC is an accurate and reliable
approach for taking strain measurements.
Effect of plastic deformation and residual stress on the
magnetic properties
When removing the applied elastic stress will permit the metal to return to essentially a
stress-free condition and the magnetic properties will recover their original state.

Chapter two Literature review
51
Therefore, the measurement should be carried out during the applying of the loads when
investigating the effect of elastic stress on the magnetic properties.
At plastic deformation, the material will retain permanent strain even though the
loads are removed and elastic stresses are relaxed [3, 23]. In this case of deformation, the
measurement can be performed after the test on the deformed samples. A complex of
plastic deformation occurs due to the blanking process at cut edges of ES sheet when
producing teeth and slots of the laminations. The impurities, residual stress, and grain
boundaries could increase the effect of the deformation, causing a significant impact on
the pinning of domain wall movement and thereby on the loss as explained in the previous
sections. The average domain wall velocity will decrease and cause slower transverse
energy due to pinning of domain wall movements that will result in an increase in losses
compared to uniform wall motion, as the magnetic energy loss is proportional to the
square of the wall velocity [23].
Dislocations of crystal lattice consider as the major pinning centres for domain
wall movement [13]. Therefore, increase in the dislocation density will cause more
hindering of domain wall movement and result in a large increase of energy loss at plastic
strains. Generally, the dislocations stop at grain boundaries or precipitates in the
material, however, increasing applied stress will lead to these pinning points tearing
off and expansion of the dislocations [13]. Figure 2.32 shows the microstructure
during a tensile test of silicon steel from un-deformed state to the different stages of
plastic deformation. The figure illustrates the effects of increasing plastic
deformation in the forms of development of simple dislocations into clusters and
then into wavy slip bands concentrated at grain boundaries [13].
Figure 2.32: TEM micrographs of Fe 3% Si under tensile loading [13].
Leuning et al. [101], studied the effect of elastic and plastic tensile mechanical
loading on the magnetic properties of NGO electrical steel with 0.5 mm sheet thickness.

Chapter two Literature review
52
Particular attention was paid to the effect of magnetic anisotropy, or the influence of the
direction of applied mechanical stress with respect to the rolling direction. Three samples
for both directions (RD and TD) were exposed to different mechanical loadings above
yield strength. The plastic deformations are characterized according to the resulting strain
or elongation that corresponding to externally applied mechanical stresses. , thereafter,
separately characterized magnetically using SST tester. The plastic deformations showed
a strong effect on the shape of the hysteresis loops and thereby the magnetic properties,
such as coercivity Hc and the magnetizability as shown in Figure 2.33. Also, the research
showed that the iron losses behave analogously to the change of coercivity and
magnetization. The applied mechanical stresses affect hysteresis losses due to its strong
relation to the material microstructure. The losses increased with increasing the plastic
tensile stress. Small plastic deformations lead to a significant increase of required
magnetization field strength and coercivity. However, it was observed that elastic stress
caused a very low loss or sometimes improvement in the magnetic properties. The
explanation of the effect of the elastic mechanical stresses was caused by homogeneous
elongation across the entire specimen by deviating atoms of the crystal lattice from their
equilibrium position. After having the mechanical load are removed, the domain
restructured and the initial state is restored.
Figure 2.33: Hysteresis loops of elastically and plastically deformed samples for
uniaxial tensile stress and magnetic flux density in RD and TD [101].
Generally, plastic stresses lead to harmful effects by causing a degradation of
magnetic properties. The only exception, to some extent, is in the case of tensile stress.
The standard explanation is related to the interaction between domain walls and the

Chapter two Literature review
53
dislocations produced by the deformation, which led to a proposal that hysteresis loss is
proportional to the square root of the dislocation density [102]. The magnetic properties
of electrical steels are especially sensitive to the stress arising from the stamping process
of electrical steel. This effect occurs because of the distortion of the crystals in the strained
metal. This distortion of the crystals affects the magnetization characteristics of the
material [3].
Permiakov [23] applied mechanical loads in the rolling direction of NGO
electrical steel sheets of two different thicknesses, 0.50 and 0.65 mm. The results showed
that the area enclosed by the BH loops under tension reduced in comparison with the
stress-free condition, but further increase of the tensile stress resulted in only a little
change in the BH loops, as shown in Figure 2.34. While the compressive stresses led to a
considerable deterioration of the magnetic properties. Also, the area of the B-H loop under
compression stress is larger than those of stress-free condition. On the contrary, the tensile
stress improves the magnetic properties especially in the direction of the apply stress.
Figure 2.34: Effect of various stresses on the energy loss [23].
Also, the investigation of the grain size effect has shown that larger grains are less
sensitive to the applied tensile stress than the compression stress [7, 23]. The magnetic
properties of a non-oriented electrical steel sheet with 0.5 sheet thickness were tested
under compressive stress using a single sheet tester. It was found that the permeability
decreased in both RD and TD directions as the compressive stresses applied [23]. Also,
the hysteresis loss in the rolling direction increased more than the transverse direction
when applied compressive stresses. Iordache and Hug [103] investigated the influences
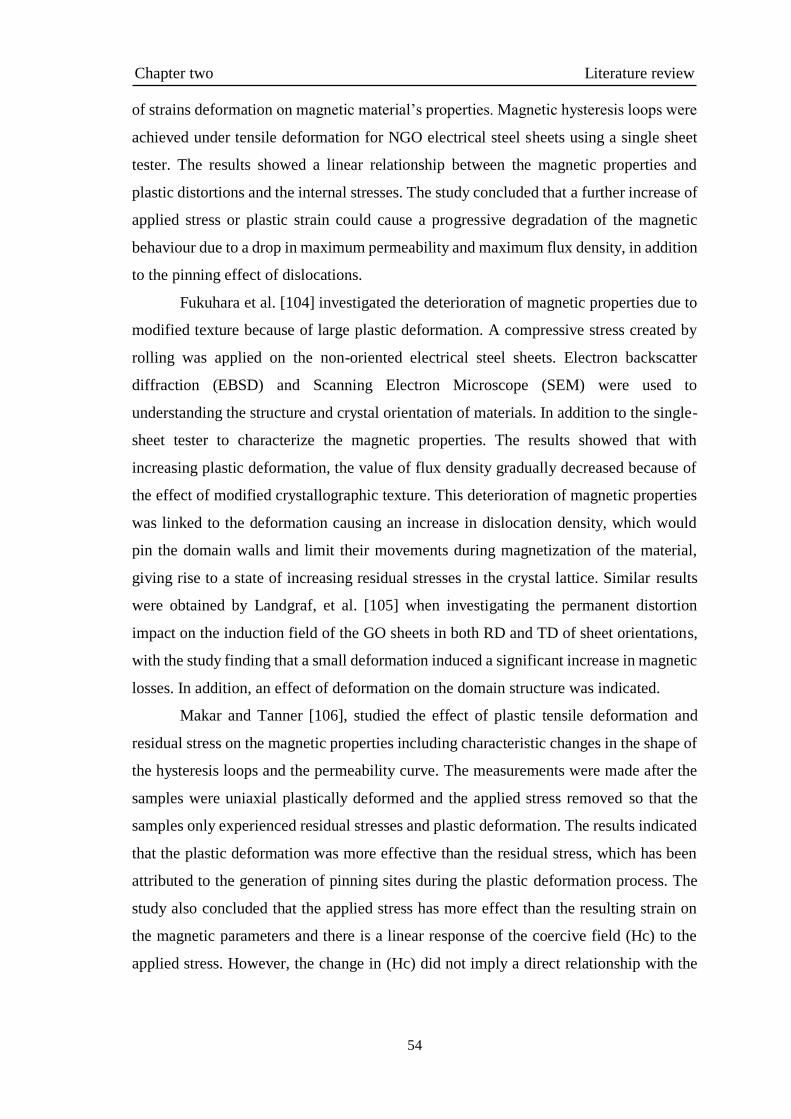
Chapter two Literature review
54
of strains deformation on magnetic material’s properties. Magnetic hysteresis loops were
achieved under tensile deformation for NGO electrical steel sheets using a single sheet
tester. The results showed a linear relationship between the magnetic properties and
plastic distortions and the internal stresses. The study concluded that a further increase of
applied stress or plastic strain could cause a progressive degradation of the magnetic
behaviour due to a drop in maximum permeability and maximum flux density, in addition
to the pinning effect of dislocations.
Fukuhara et al. [104] investigated the deterioration of magnetic properties due to
modified texture because of large plastic deformation. A compressive stress created by
rolling was applied on the non-oriented electrical steel sheets. Electron backscatter
diffraction (EBSD) and Scanning Electron Microscope (SEM) were used to
understanding the structure and crystal orientation of materials. In addition to the single-
sheet tester to characterize the magnetic properties. The results showed that with
increasing plastic deformation, the value of flux density gradually decreased because of
the effect of modified crystallographic texture. This deterioration of magnetic properties
was linked to the deformation causing an increase in dislocation density, which would
pin the domain walls and limit their movements during magnetization of the material,
giving rise to a state of increasing residual stresses in the crystal lattice. Similar results
were obtained by Landgraf, et al. [105] when investigating the permanent distortion
impact on the induction field of the GO sheets in both RD and TD of sheet orientations,
with the study finding that a small deformation induced a significant increase in magnetic
losses. In addition, an effect of deformation on the domain structure was indicated.
Makar and Tanner [106], studied the effect of plastic tensile deformation and
residual stress on the magnetic properties including characteristic changes in the shape of
the hysteresis loops and the permeability curve. The measurements were made after the
samples were uniaxial plastically deformed and the applied stress removed so that the
samples only experienced residual stresses and plastic deformation. The results indicated
that the plastic deformation was more effective than the residual stress, which has been
attributed to the generation of pinning sites during the plastic deformation process. The
study also concluded that the applied stress has more effect than the resulting strain on
the magnetic parameters and there is a linear response of the coercive field (Hc) to the
applied stress. However, the change in (Hc) did not imply a direct relationship with the

Chapter two Literature review
55
numbers of pinning sites because of the differences in pinning between domain walls due
to the anisotropic of the dislocations during plastic deformation.
The effect of residual stress on the magnetic behaviour was also studied as an in-
situ experiment while the sample remained under stress [106] examined [107]. These
included the influence of stresses before and after the yield point on the magnetic
properties of high strength steels by means of hysteresis loops, permeability curves, and
magnetostriction loops. The results observed the change in magnetic behaviour before
yield and this raises when a sample is approaching the yield point. The changes in the
coercive field and remnant magnetisation were complicated when applying the low field.
While, at the high field, the magnetisation decreases continuously with increasing strain.
At low field magnetisation, below and near the knee of the curve are initially increases
before decreasing at higher stress levels and there is no visible change in the straight
section of the curves as shown in Figure 2.35.
Figure 2.35: Hysteresis loops measured at elastic and plastic tensile stresses [107].
Kuleev et al. [108] also studied the influence of plastic deformations on the
changes in the shapes of hysteresis loops and permeability of low carbon ferromagnetic
steels. The results showed that there is a reduction in the hysteresis loops of low carbon
steel after its plastic deformation due to the residual stresses because the distortion of the
grains. The study also focused on the material anisotropy at the level of individual grains
of the polycrystalline under external actions of fields and stresses. When the samples are

Chapter two Literature review
56
plastically deformed, and the load is reduced the loops decrease and this dependents on
the type of domain structure.
Effects of blanking on the magnetic properties
During the blanking process, ES laminations are exposed to various mechanical stresses
which produce a plastic deformation resulting from the distortion of the crystal structure
and modification of the material texture. The applied yield stress on an individual grain
in a metal sample depends in part on its crystallographic orientation and that therefore
different grains in a sample are likely to undergo different amounts of yield for a given
stress.
One of the effects of the residual stress of steels is on the magnetic properties
[106]. The influence of these stresses often results in drastic deterioration of the magnetic
properties of the sheet at the cut edge and the vicinity area. It is important to quantify the
effective stresses that cause this deterioration of the magnetic properties in order to obtain
the desired magnetic performance [3, 23]. Figure 2.36 shows a micrograph of the cut edge
of the NGO electrical sheet resulting from the blanking process. The deformation bands
may present visual evidence of plastic deformation and stresses generated by punching,
seemingly bending in the direction of movement of the punch. Increasing the extension
of the deformed area could express more deformation of the cut edge [2].
Figure 2.36: Deformation and strains visible at the edge, induced by blanking process.
Besides deformation of the material’s crystals at the cut edge and the generation
of shearing stress in the vicinity area, blanking defects can also include changes in the
sheared edge geometry and production of burrs [3, 4]. Schoppa et al. [109] investigated

Chapter two Literature review
57
the effects of manufacturing steps on the motor core performance. The study concluded
that the induced stresses of stamping NGO electrical steel sheets are one of the main
factors in increasing the material’s magnetic loss. Also, the deep extension of the residual
stresses from the cut edge can cause more deterioration of the magnetic properties. A
similar conclusion was obtained by Singh et al. [110].
The blanking process can cause a negative effect on the flux distribution and
domain pattern in the cutting region. Senda et al. [111] studied the affected flux density
due to the stamping process using NGO sheets with a thickness of 0.5 mm. The study
found that the domain patterns changed due to the punching process at the vicinity area
of the sheared edge, which implied the existence of a strong strain effect. In addition, the
degradation of the flux density in the affected region increased with a decrease in the
magnetic field. The width of the degraded region was less than 1 mm. Peksoz et al. [112]
also studied the deterioration of flux distribution in the cutting region using the same
material and measuring system. The observed results showed that the punching process
caused a significant drop in localized flux density in a region up to 10 mm from close to
the cut edge. Moreover, a remarkably large variation in deterioration of magnetic
properties was found with respect to the grain size.
The lamination teeth design can also increase the effect of the blanking process
on the magnetic loss. Kedous et al. [113] investigated the influence of punching on the
magnetic behaviour in the stator teeth of the electrical motor. The study found a high
degradation in terms of magnetic loss was induced by the teeth punching of NGO
electrical steel with 0.65 mm sheet thickness. The study indicated that the influences of
punching can increase due to the lamination teeth geometry. Their large number and small
size could cause convergence in the cut edge deformation. According to the study, the
small tooth can constitute a small part of the magnetic circuit that could distort the flux
path. Also, punching caused an alteration in the material texture.
Usually, the effect of punching on the magnetic loss is measured using a large
sheet; then the sheet is cut into strips and the magnetic loss is measured according to the
cut line length. Moses et al. [114] described some effects of punching on the flux
distribution and power loss of NGO electrical steel with around 0.5 mm sheet thickness.
The sheet material was cut into 2, 4, and 8 strips and then the magnetic properties were
measured by SST. The cutting into narrow strips showed an increased the power loss of
up to 30%, with a significantly change in the B-H loops. Similar degradation of the B-H

Chapter two Literature review
58
curves was found at frequencies of 50 and 400 Hz. The study stated that the flux density
at all locations tended to increase due to the build-up of stress at the increasing number
of cut edges. A similar study by Schoppa et al. [115] investigated the deterioration of flux
density in the vicinity area of the cutting edges. The magnetic loss was measured for a
large sheet of NGO electrical steel, then for the same sheet size with a cut from the middle.
The study indicated deterioration in the magnetic properties because of the induced
mechanical stresses due to cutting. Also, increasing the cutting length caused an increase
in core loss.
It has been reported that grain size has a significant influence on the cut edge
deformation type, which in turn causes variation in measurements of the resultant effect
of blanking. Rygal et al. [116] investigated the influence of cutting stress on the magnetic
field and flux density distribution in non-oriented electrical steels. The study implemented
two grades of ES sheets with 0.5 and 0.35mm sheet thickness. According to the obtained
data, the investigation identified a significant variation in the extent of the degradation
due to differences in grain size. The study also indicated that the cutting caused a
reduction in permeability of the area close to the cut edge.
Weiss et al. [117] investigated the influence of the residual stresses induced by
punching on the magnetic properties. NGO electrical steel with two sheet thicknesses of
0.35 and 0.5 mm was used. The study used a micro-hardness test for analysis of the cut
edge area and SST to identify the magnetic properties. The sample was cut into a number
of strips. The study results indicated that the shearing process generally causes a
deterioration of magnetic properties and steepening of the B-H Hysteresis loop. The
magnetic losses increased with increasing cutting line length and were highly dependent
on the flux distribution in the crystallographic texture. In addition, the stress and hardness
distribution values were not constant along the extent of the deformation or throughout
the blank thickness. Moreover, it has been found that grain size has a significant impact
on the crystalline material deformation that may lead to considerable deviations in results
used in the analysis of the cut edge surface. Sheet thickness and cutting parameters alter
the stress state and the structure near the cut edge, whilst blanking speed also can affect
the hysteresis losses, especially at low speeds.

Chapter two Literature review
59
Characterization of local deformation using hardness variations
Hardness testing is one of the most important methods used to characterize the mechanical
properties and quantify the local deformation of material. During cold work such as the
blanking process, the sheet metal can be exposed to plastic deformation due to the applied
mechanical loads. This can alter the mechanical properties of material and cause strain
hardening at the cut edge and the vicinity area [117, 118]. The determination of
mechanical properties from the hardness values could be considered as a reverse
engineering, and is used for analysis to find the equivalent properties for the deformation
state [119].
Generally, hardness testing is considered as a non-destructive technique and use
to assess the material’s resistance to plastic deformation through measuring mechanical
properties such as strength, ductility, and fatigue resistance [120]. The hardness test can
be based on various scales, for example, Macro, Micro, or Nano scale. Hardness values
could be affected by material composition, impurities, grain morphology and boundaries.
Therefore, hardness testing could produce varying values for the same surface [119].
Nano-indentation is sometimes called instrumented indentation or Nano-
hardness. The main advantage of Nano-indentation is that it provides information about
mechanical properties such as hardness, elastic modulus, and yield strength through the
load and displacement curve measured during loading and unloading tests [121].
There are two known indenters used in Nano-indentation: Berkovich and cube
corner. The Berkovich indenter is a three-sided pyramid with a face angle of 65.3o with
the vertical axis [122, 123]. The cube corner is also a three-sided pyramid and represents
precisely the corner of a cube. The indents produce very small projection area; therefore,
with optical microscopy it is not possible to observe the indents. The most accurate way
to measure the distance between the indents’ location and the cut edge is by using SEM
observation.
Studies that have exploited the hardness tests to identify the local deformation of
blanking process include the work of H. Cao et al. [118] who used Nano-indentation and
the punching process to study the distribution of residual stress and magnetic domain
structure of non-oriented electrical steel with 0.5 mm sheet thickness. The residual stress
calculation was determined according to the hardness values. The results showed the
residual compressive stress generated around the sheared edge and the width of the stress
affected zone was almost equal to the material thickness. The results demonstrate that it

Chapter two Literature review
60
is feasible to estimate the residual stress by Nano-indentation method. A similar study,
done by Pulnikov et al. [124], investigated the induced stresses due to the mechanical
cutting of NGO electrical steels with thickness of about 0.65 mm. The micro-hardness
analysis showed strongly fluctuating values but with a decreasing trend starting from the
cut edge area and extending less than 1 mm. Moreover, BenIsmail [125] implemented the
inverse analysis methods by using the Nano-indentation tests to determine the cut edge
zone affected by the blanking process. The Nano-indentation measurements were used to
compute the yield stress near the cut edge of NGO material with thickness of about 0.65
mm. The study found that the determination of material characteristics and their
equivalency requires a comprehensive understanding of the affected part of the material.
Some research has explored the relationships between hardness values and the
other mechanical properties; for example, Oliver and Pharr [126] presented an analysis
technique to improve the method for determining mechanical properties from indentation
load-displacement data. The obtained data for six tested materials showed that the
indentation load-displacement curves is not linear; therefore, data were derived to
determine mechanical properties. Shen and Tan [127] investigated the correlation
between hardness and yield strength using Nano-indentation. Their study served to
provide a baseline understanding of the relationship between indentation hardness and
overall yield strength for multi-layered elastic-plastic materials.
Furthermore, Giannakopoulos and Suresh [128] identified a general theoretical
framework for instrumented sharp indentation and used the inverse method to extract
material properties through instrumented indentation. The method provided a theoretical
correlations between penetration depth and true contact area for a sharp indenter, without
the need for visual observations. This study also illustrated that the ratio of plastic work
to total work from the area under the indentation curve may give sufficient information
to find the required properties. These results have been evaluated by Venkatesh et al.
[129] where the study attempted to assess the validity of the existing theoretical
framework in two ways: first, by direct analysis, where the characteristics of the B-H
curve are predicted from known material properties, second, by applying inverse analysis,
where the material elastic-plastic properties are estimated from the measured loading and
unloading P-h responses. The study showed that the Young’s modulus and hardness of a
wide variety of materials can be extracted from the P-h response with good accuracy.
Poon et al. [130] reassessed the various assumptions used in extracting the linearly elastic

Chapter two Literature review
61
material properties in an elastic-plastic indentation. In addition, the study proposed a new
methodology to extract the yield stress of materials using Nano indentation by directly
measuring the projected contact area. In another study, Heinrich et al. [131] compared
the results of using two different Nano indenter tips. The study led to a new methodology
that included the friction between the indenter and the material for extracting material
properties of an unknown elastic–plastic material using Nano-indentation.
The hardness values can be affected by the material grain size as it is shown by
Zhang et al. [132] who studied the relationship between the mechanical properties of the
material by applying the hardness test to materials of different grain size. The study found
that coarse-grained and ultrafine-grained materials produced quite different results in
terms of the relationship between strength and hardness. Also, it was found the ratio of
hardness to UTS is lower than 3 in the materials with high ductility and this ratio could
increase to a high level in brittle materials.
Summary
The literatures showed that the blanking process is the preferred method for producing
the laminations of cores of electrical steel sheets (ES), due to the high production rate,
good dimensions, and low cost. Nevertheless, the blanking process results in local plastic
deformation and stresses at the cutting edge and the vicinity area, which can affect the
mechanical and magnetic properties of electrical steel.
The appropriate selection of a lamination material depends on the material’s final
application. Non-grain oriented silicon steel material is a highly efficient and low-cost
material that is widely used in industry. Therefore, it has been chosen for this research.
Since the electrical steel application is related to its electrical and magnetic properties,
therefore, considering these properties to the blanking condition and cut edge quality
could provide valuable knowledge that may lead to better understanding of how to
improve product performance.
The blanking process involve a lot of variables and phases, and their interactions
make the cutting mechanism extremely complex. Many studies have investigated
blanking variables from different viewpoints to understand the cutting process regarding
the cut edge quality. However, more investigations are need to extend the knowledge in
blanking parameters and material behaviour on the mechanical and magnetic properties

Chapter two Literature review
62
of the blanked sheet. Nonetheless, the most reliable way to improve blanking process
performance is to acquire further experimental data.
Blanking speed has been reported as one of the most important blanking
parameters, as it can affect both mechanical and magnetic properties. Nevertheless, no
direct correlation for the influence of blanking speed on the magnetic properties has yet
been provided, certainly not in relation to different grain orientations. It has been found
that the cutting speed was only studied relative to the cutting force and the quality of the
cut edge. Moreover, blanking speed usually implemented in different speeds depending
on the production rate, therefore it is difficult to determine its impacts.
When studying non-grain-oriented (NGO) electrical steels, Particular attention
should be paid to the effect of magnetic anisotropy, i.e., the influence of the direction of
applied mechanical stress with respect to the rolling direction because in rotating
electrical machines a homogeneous and isotropic magnetic field in all rotation directions
is necessary to ensure consistent behaviour at all times, in every planar direction.
Therefore, each experiment is performed in rolling direction (RD) as well as transversal
direction (TD) to enable comparison and to ensure comprehensible considerations.
Considered as a whole, it has been observed that most of the previous studies
conducted by Electronic and Electrical Engineering (EEE) groups were concerned with
the effects resulting from deformation through the cutting process on the magnetic
properties and power losses of Electrical steel (ES), often of thickness less than 0.5 mm,
without focusing on mechanical aspects and die design. Conversely, mechanical
engineering researchers tended to focus on the effects of blanking process parameters and
die design on the blanked quality for different materials, mostly of thickness no less than
1 mm, but tended not to study the impact of product quality on the magnetic properties.
In addition, previous research has indicated that reducing the thickness of the sheet leads
to improved magnetic properties by reducing losses of eddy currents. However, reducing
the thickness of the sheet will lead to a change in mechanical properties due to the rolling
process. This effect become noticeable in the blanking process, especially for very thin
sheet, where the number of grains will significantly reduce along the thickness of the
sheet. This in turn makes the features of a single grain play a key role in determining the
deformation of cut and the quality of the cut edge. Also, the changing of the cutting
location could lead to change the type of distortion caused by the cutting process.
Thereby, that can result in difficulties of determination the extent of the deformation from

Chapter two Literature review
63
the cut edge to the rest of the material. Therefore, studying the effect of the cutting process
on the thin sheet may result in change in the basics of the known cutting mechanism.
Therefore, the current research focused on the use of blanking process in thin sheet with
0.2 mm thickness and compared the results with 0.35 mm sheet thick.
Using new techniques to investigate and analysis the blanking process may lead
to finding more detailed information that contributes to the development of the process
and the quality of the product. For examples, DIC identified as an effective tool for
identifying local deformation. Although, some research attempts to implement DIC
during the blanking process. However, all of these studies were conducted at low blanking
speed and high sheet thickness. Therefore, implementing high-speed DIC on much
thinner sheet may give new and wider picture of deformation by the high blanking
mechanism. Due to the occurrence of cold forming and strain hardening at the cutting
edge, micro hardness measurement was used for identifying the local edge deformation.
The applying of Nano- indentation tests in the current study could provide a valuable data
on the random distribution of the cut edge deformation. The single sheet magnetic tester
is an appropriate method for measuring the magnetic properties and power losses for an
individual sheet of electrical steel. However, different sample shape and size required a
different magnetic tester system, especially for small-size. The next chapter will explain
in detail the new techniques and tool designs utilized in this study.
To conclude, investigating the blanking process and blanked quality of thin ES
sheet from both mechanical and magnetic aspects regarding the deformed cut edge at
different cutting conditions such as such deformation rate, material grain orientations and
sheet thickness that could make a good contribution in terms of developing the process
design of the final product of the blanking process.

Chapter three The experimental methodology
64
3
The experimental methodology
3.1 Introduction
This chapter focuses on the methodology adopted for all the experimental works
undertaken in the present study. The chapter provides details of the materials used,
samples preparation, testing and analysis techniques, and the blanking procedures
including dies design. The design, fabrication and testing conditions of a new magnetic
single sheet tester (SST) are also reported in this chapter. The newly developed magnetic
testing rig was used to assess the blanking induced defects in the magnetic properties of
the selected materials. Figure 3.1 presents a flowchart outlining all the experimental
works and characterization methods used in this research.

Chapter three The experimental methodology
65
Figure 3.1: Outline of the research structure.
3.2 Material selection
Two cold rolled non-grain orientation grades (CRNGO) of fully processed electrical steel
sheets were used in this research. The grades were NO20 and NO35 according to the
company standards of the supplier, Cogent Power- TATA steel Company. The materials
have a silicon content of about 3wt. % Si, and the chemical composition is shown in Table
3.1.Two different nominal thicknesses of 0.2 and 0.35 mm have been adopted to show
the thickness impact upon the cut edge type and magneto-mechanical properties. It is
worth mentioning that the selected 0.2 mm electrical steel grade thickness (NO20) is

Chapter three The experimental methodology
66
considered as a new generation of ES developed by the provider company as an attempt
to enhance the efficiency of material used for higher rotational speed motors.
Table 3.1: Electrical steel chemical composition.
Element C Si MN P Cr Ni Cu Al
Mass percent
(wt. %) 0.0039 3.15 0.18 0.019 0.029 0.014 0.026 1.09
Material texture isotropy and grains orientation are among the most important
parameters for determining the magnetic properties of steel sheets because these features
can affect the magnetization process and power losses. The non-oriented ES magnetic
properties in rolling (RD) and transverse (TD) directions may differ according to the
cutting plane direction due to differences in the material’s grains direction at the cutting
edge. Therefore it is important to study the effect of blanking in both RD and TD direction
on magneto mechanical defects generated by the cutting process. To that end, the study
cases were categorized into 0.2RD, 0.2TD, 0.35RD, and 0.35TD groups. These cases
were applied for all tension and blanking processes tests, where 0.2 and 0.35 were the
material thicknesses and RD and TD the grain orientations. Subsequently, the results were
also divided into four fully parallel paths. The selected material was cut using the wire
EDM method (at blanking speed of 6 mm/min with 0.25 wire diameter) to produce both
standard tensile test samples (bone shape) and blanking implementation samples.
3.3 Measurement of mechanical properties
3.3.1 Tensile tests
Standard tensile test samples were prepared according to the ASTM standard [133] to
carry out the tensile tests. DIC technique was also implemented during the tensile test.
The tensile test was conducted in a 25kN electro-mechanical Tinius Olsen H25KS test
frame. The sub-size of the tensile sample was used to reduce the amount of material
consumed and to ensure it would fit in the magnetic tester. The standard tensile
samples’ dimensions are shown in Figure 3.2.

Chapter three The experimental methodology
67
Figure 3.2: Size and orientation of tensile samples in both RD and TD according to the
sheet rolling direction.
The tensile tests were carried out in different ways for different purposes as follows:
i. Investigation of the strain rate sensitivity at different test speeds 1, 5, and 10
mm/min.
ii. Investigation of the magnetic properties under uniaxial tension at different
plastic extensions.
The magnetic properties can be measured under tension at different strain states because
the material is exposed to different strains during the tensile tests as shown in Figure 3.3.
For example, the elastic-plastic state under the loaded condition (from point A to B), or
under unloaded condition after the release of stress (from point B to C), or free-stress
condition to the plastically deformed material (from point C to B). Each state has a
different tensile plastic deformation and different magnetic properties [23].
Figure 3.3: Material under tension at different strain states [134].
The tensile test was interrupted to preserve different plastic deformation. This
strategy resulted in samples with different plastic strains in the material in order to

Chapter three The experimental methodology
68
investigate the effect of plastic deformation on the magnetic properties. The increment
extension was 1mm between each sample until the maximum possible extension without
fracture. In front of each elongation, a maximum strain value is provided, and the UTS
that caused it. The real stress-strain values were obtained using the DIC technique during
tensile tests, as illustrated in Figure 3.4.
Figure 3.4: Tensile tests at different plastic extensions.
3.3.2 Tensile strain measurement using DIC
Digital image correlation technique can be used to measure strains deformation in a test
specimen during tensile, shear, or compression tests [135]. Therefore, the DIC technique
was used during tensile tests to measure both local and global strain distribution across
the tensile samples. Before the test, the tensile specimens were painted with a white
background and then with a random black speckle pattern to enable data capture by DIC
camera. The airbrush technique was used to produce the required pattern of speckles on
the surface of the sample. Figure 3.5 shows a macrograph of the tensile test sample with
a speckle pattern.
Figure 3.5: Macrograph of the tensile test sample with random speckle pattern.

Chapter three The experimental methodology
69
The DIC system from LaVision was used with Davis 8.4 image correlation software for
analysis the tension deformation. Maximum normal strain components were extracted for
all stages of the extension during the tensile tests because of the tensile strain in the thin
sheets is affected in one direction parallel to the applied load direction.
To calculate the strains, the images are divided into subsets were using larger
subsets increases the strain resolution but lowers the spatial resolution, i.e. the distance
between two measurement points. The subsets are separated by steps that are the physical
distance between the centres of two adjacent subsets. The. While reducing the step size
increases the spatial resolution but lowers the strain resolution [136]. A sensitive study
was done to determine the most optimum DIC parameters such as the subset size and step
size led to select the accurate calculation mode with subset 23 and step size 9 as a DIC
set-up for processing the captured images. Table 3.2 present the DIC parameters setting
used to gain the correlation data regarding both hardware and software DIC system.
Table 3.2: DIC setting parameters for tensile tests.
Technique Digital image resolution (DIC)
Software Davis 8.4
Subset size 23 pixel (≈ 0.55 mm)
Step size 9 pixel (≈ 0.21 mm)
Camera LaVision Image E-lite
Lens Tonkina AT-X PROD 100 mm F2.8
Image resolution 2480 x 2073 pixel
Scale factor 42.0544 pixel/mm
Field of view 104160 x 87066 (Resolution x Scale factor)
Frame rate recording 10 image/s
Spatial Resolution (1/42.0544 )*9= 0.214 mm
(step size x Scale factor)
The image acquisition frequency was increased to 10 Hz to give more visualization
details of the material behaviour during the test. The camera was placed at the same level
as the sample using a tripod, and the optical axis was aligned to be normal to the centre
of the gauge length with a sharp focus. The region of interest was selected in such a way
that it covered the sample gauge length. In addition, to extract the force and crosshead
extensions of the tensile machine, two channels were connected between the tensile

Chapter three The experimental methodology
70
machine and DIC system across the acquisition card. This helped to synchronize the
machine data with the DIC results such as the number of image and strain value at each
step of the test.
3.3.3 Blanking dies setup
Two kinds of blanking die sets were designed and manufactured to perform in-situ strain
measurement during blanking and run a full cut on the samples to study the affected
magnetic properties of the blanked samples with known cutting conditions.
Die design concepts were based on the sample size, quantity, and the edge quality.
The first type was a fully closed die (die type A) as shown in Figure 3.6, and the second
was a die with one open side (die type B) as shown in Figure 3.7. Since two material
thicknesses, 0.2 and 0.35 mm, and two orientations, RD and TD, were used in the study,
four blanking tools (two of die type A, and two of die type B) with appropriate punches
that would fit a clearance of around 10% of the thickness of the ES sheets needed to be
made. The new insight into the blanking process enabled by the new experimental
blanking tools may allow a more detailed understanding of the blanking process and
potentially lead to the developing of better products.
Figure 3.6: Full blanking die (Type A), 1) Machine ram, 2) load cell, 3) upper plate, 4)
blank holder, 5) bushings and pillars, 6) spring, 7) punch block, 8) die block, 9) lower plate
Although the die type A can emulate industrial dies, it normally operates in a
closed area which would have prevented investigation inside the cutting deformation

Chapter three The experimental methodology
71
zone. Therefore, one side was removed from the die type A as a new blanking method
that would allow measuring of local sheet strains during blanking using the DIC technique
at the different blanking parameters including blanking speed, thickness, and material
sheet orientation.
Figure 3.7: One free blanking die Type B, 1) machine ram, 2) load cell, 3) upper plate, 4)
blank holder, 5) bushings and pillars, 6) spring, 7) punch block, 8) die block, 9) lower plate
3.3.4 Blanking dies design
The ideal blanking die needs to incorporate many parts including die- set, die- punch
blocks, die- punch holders, guide bushings and pillars, stripper, pilot and finger stop for
automatic stop, and fasteners parts such as screws and dowels. However, some
supplementary parts of the blanking tool were dispensed with because they were not
needed for the investigative purposes of the current study [62].
Tools steel material for cold work that heat-treated to a hardness of 59HRC was
used for manufacturing both die and punch because its characteristics of high hardness
and resistance to abrasion make it ideal for manufacturing blanking tools. Tool steel can
be classified in terms of alloys, heat treatment, and applications. While the remaining die
parts and support plates were made from mild steel, the die opening concept was given
special consideration in order to facilitate the exit of the blank from the die. The clearance
between the punch and die was applied to be approximately equal for all used dies for
both material thicknesses, 0.2 and 0.35 mm.

Chapter three The experimental methodology
72
Due to the light load required to accomplish cutting of a thin sheet, a centre post
die-set was chosen of a size that would fit the designed blanked part, to help align the tool
and ensure that the punch head and the die would share the same middle plane. All parts
of the blanking die were assembled and built within the die set. The bushing and guidepost
require particular attention as they could affect the precision of the cutting process.
Blanking dies were designed to cut the thin sheets of electrical steel and produce
project samples of rectangular shape (50×10 mm2) that were cut from the previously
prepared samples. Punches were connected to the punch holder and then to the upper plate
of the die set. The machine ram was moved down to push the punch down until it cut the
material inside the die cavity. During the process, the cutting force was recorded by the
load cell between the machine’s ram and the blanking die. On the opposite side, the die
blocks were mounted on the lower plate of the die set which was fixed on the test
machine’s lower platform. Three springs were used to fasten the sheet material to the
blank holder plate during the blanking process. The stripper plate is able to travel up and
down on the shank of the punch. All die parts were fastened together using socket head
screws and threaded holes. The cutting tests were implemented using the Tinius Olsen
H25KS tension-compression machine.
3.3.5 Blanking parameters
The blanking process was implemented at three different blanking speeds, 100, 500, and
1000 mm/min, with 1000 mm/min being the maximum speed for the machine. The
electrical steel sheets samples prepared using wire EDM were made with an additional
10 mm on all sides so that they would be larger than the produced rectangle blanked to
size 50 ×10 mm2. All the sheet samples, for the 0.2 and 0.35 mm thicknesses and the RD
and TD orientations, were cut using the blanking process. Figure 3.8 shows the schematic
of the virtual shape of the blanked samples to illustrate the sample size, orientation, and
test locations regarding the sheet rolling direction. The samples produced by die A were
used to investigate the cut edge quality, local deformation using Nano-indentation, and
magnetic properties using the SST because this type emulates the real samples produced
in the industry. On the other hand, the samples produced by die type B were used only to
implement DIC technique during the blanking process for measuring the local strain in
the cut edge and vicinity area.
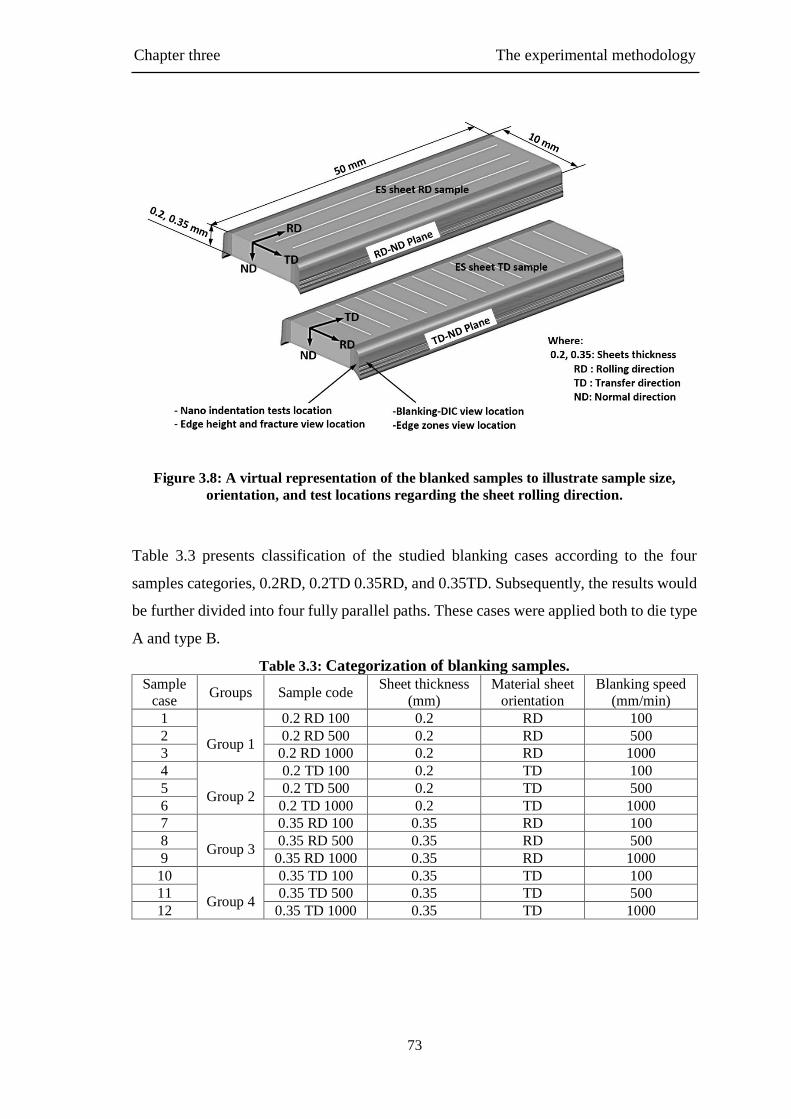
Chapter three The experimental methodology
73
Figure 3.8: A virtual representation of the blanked samples to illustrate sample size,
orientation, and test locations regarding the sheet rolling direction.
Table 3.3 presents classification of the studied blanking cases according to the four
samples categories, 0.2RD, 0.2TD 0.35RD, and 0.35TD. Subsequently, the results would
be further divided into four fully parallel paths. These cases were applied both to die type
A and type B.
Table 3.3: Categorization of blanking samples.
Sample
case Groups Sample code
Sheet thickness
(mm)
Material sheet
orientation
Blanking speed
(mm/min)
1
Group 1
0.2 RD 100 0.2 RD 100
2 0.2 RD 500 0.2 RD 500
3 0.2 RD 1000 0.2 RD 1000
4
Group 2
0.2 TD 100 0.2 TD 100
5 0.2 TD 500 0.2 TD 500
6 0.2 TD 1000 0.2 TD 1000
7
Group 3
0.35 RD 100 0.35 RD 100
8 0.35 RD 500 0.35 RD 500
9 0.35 RD 1000 0.35 RD 1000
10
Group 4
0.35 TD 100 0.35 TD 100
11 0.35 TD 500 0.35 TD 500
12 0.35 TD 1000 0.35 TD 1000

Chapter three The experimental methodology
74
3.3.6 Blanking force assessments
The blanking force can be defined as the force required to penetrate the sheet material
with the punch [137]. Blanking forces were measured and used to compare the
performance of the cutting action under the selected conditions. Blanking forces can be
estimated theoretically according to the sample cut size and material type. However, the
theoretical calculation of force needs to be increased by 20-40% because it is affected by
cutting and material conditions [64, 137]. The current study adopted the experimental
results to determine the actual force values during the blanking process. Also, the
blanking force was calculated theoretically to confirm the results.
The critical value of the blanking load occurs when the force increases up to the maximum
magnitude because this represents the ultimate resistance of the material to the applied
load, in addition to its importance in determining the required machine capacity.
Blanking force was tracked throughout the blanking operation to record the load-
stroke of the punch movement. During the downward movement of the punch, the force
values jump to their maximum when the punch contacts the sheet surface and then the
force rapidly decreases on complete separation because of the decrease in the cross-
section and the limit of material formability exceeding the cutting [138]. Therefore, the
beginning of the sudden change of values was considered as the starting point of the actual
sheet cut. All the values at this stage were subtracted from the values derived from the
earlier steps.
3.3.7 In-situ strain measurement during blanking using DIC
The new laboratory blanking apparatus (Die type B) in Figure 3.7 was designed in such
way that the specimen can be observed by the DIC camera and avoid blocking the view
by blanking tools (the punch and die) during the test. Therefore, the main feature of this
die is that one cutting side was opened up to expose the cut edge to outside view and
allow the camera to capture images throughout the cutting stages. In blanking tests of thin
ES sheets, major challenges are presented by the very small deformation zone represented
by the thickness of the sample (0.2 and 0.35 mm), as well as the high-speed movement of
the punch during the blanking process associated with this test.

Chapter three The experimental methodology
75
The deformation of the specimen was recorded by camera and processed through
DIC method and measuring the sheet local strain during blanking process. To obtain the
required resolution, a micro-lens with a high magnification was used. The full DIC system
arrangement is shown in Figure 3.9.
Figure 3.9: Blanking tools, machine control, and Lavision DIC system.
A sensitive study was done to determine the most optimum DIC parameters such
as the subset size and step size led to select the subset 11 and step size 4 with accurate
calculation mode as a DIC set-up for processing the captured images. Table 3.4 present
the DIC parameters setting used to gain the correlation data regarding both hardware and
software DIC system. Maximum equivalent strains were extracted for blanking samples
because during the process, the material exposes to the tension, shear, and compression.
Therefore, the strain values transform at each point and the local shear values may
minimize or maximize due to the turning of the coordinate system of the principle strain
mode (see Appendix A). Thereby, the equivalent strain could better express the strain in
blanked material than the normal stain as it is a resultant of both principle and shear
strains.

Chapter three The experimental methodology
76
Table 3.4: DIC setting parameters for blanking tests.
Technique Digital image resolution (DIC)
Software Davis 8.4
Subset size 11 pixel (≈ 0.095 mm)
Step size 4 pixel (≈ 0.035 mm)
Camera High speed Phantom
Lens Tonkina AT-X PROD 100 mm F2.8
Image resolution 1280 x 608 pixel
Scale factor 115 pixel/mm
Field of view or Image size 147200 x 69920 (Resolution x Scale factor)
Frame rate recording 2000 i/s
Spatial Resolution (1/115 )*4= 0.0347 mm
(step size x Scale factor)
A high-speed camera (Phantom) was used to capture images during the test,
However, with such kind of camera, there is limited image storage capacity. Therefore,
the image resolution was reduced to increase the number of recorded images and thereby
increase the recording time. The actual time taken to cut a 0.2 mm sheet thickness with
1000 mm/min punch speed is 12 ms.To reduce the light captured by the sensor, the
exposure time or shutter speed was reduced to be 316 µs. Also, the saturation of the sensor
dynamic range was avoided using the intensity calibration to reduce the image noise. The
distance between the camera and the specimen surface was around 20 cm. The maximum
camera temperature 35 Co.
In order to guarantee capturing images of the deformation area, high attention was
given to the instant of starting recording image and beginning of blanking test. Both were
starting exactly at the same time, as a result, images were acquired before, during, and
after finishing the test. Later the images when the punch touches the surface of sample
and even cut the sample were selected for processing and analysis by DIC software.
Figure 3.10 illustrates the blanking test setup with DIC and camera position. The
distance between the camera and the cut edge depends on the size of the region of interest
and can affect the image quality. Figure 3.11 shows the region of interest for the specimen
and the setup of the blanking tools. The airbrush technique was used to produce the
required speckle pattern in the side section of the samples. Despite the considerable

Chapter three The experimental methodology
77
challenge faced in creating an acceptable number of speckles in this small area of the
specimen, approximately 15 speckles were obtained along the thickness.
A random speckles pattern was applied to carry out the DIC strain measurement.
The use of a common spray can did not give enough speckles; therefore, an airbrush was
used in association with a magnifier lens to create the required number of speckles. An
airbrush and fluid acrylic black and white paint conforming to the standard [139] were
used to create a much finer speckle pattern.
Figure 3.10: Schematic of blanking and DIC test setup.
Figure 3.11: DIC and specimen setup for deformation area measurement of the ES.

Chapter three The experimental methodology
78
Nano-indentation tests
The Nano-indentation test was implemented for the thin sheet electrical steel material at
the cut edges and vicinity area to measure material properties and show the distribution
of residual stress on the sheared edge and the nearby area. It is known that there is a strong
relationship between the hardness and tensile strength. Therefore, the deformation could
be estimated based on the specific hardness test results. Finding the hardness values for
the material involves forward analysis of the mechanics of indentation, while extracting
material properties from results through instrumented indentation can be considered as
inverse analysis [119]. Using the theoretical framework for instrumented indentation
enables the determination of elastic and plastic properties of materials based on the
correlations between the indenter penetration depth and true contact area.
In addition to the advantages of high resolution, this test allows estimation of the
mechanical properties and the residual stresses based on the theories of characterizing
indentation at different size scales. Also, Nano indentation allows the investigation to be
conducted very close to the end of the cut edge.
Nano-indentation testing was implemented using the Triboscope Nano-
mechanical test instrument supplied by the Hysitron Corporation, as shown in Figure
3.12. The test was carried out in the form of two areas of indents starting from the cut
edge until stability of the hardness value was achieved. Each area contained 25 indenters
that were distributed in the form of a matrix with five arrows and five columns with a
space between the indenters of 10 µm. A fixed load of 5000 µN was applied to each single
indent with trapezoid load and un-load function and 15S dwell time. Two indents arrays
were conducted in order to cover most of the affected deformation area because the
maximum scan area (scan size) for the single test was 50µm. The Berkovich indenter tip
was used in the current test, with a total included angle on the tip of 142.3 degrees, and
with a half angle of 65.35 degrees [122].

Chapter three The experimental methodology
79
Figure 3.12: Nano-indentation system.
In the Nano indentation test, the indenter is pushed into the surface of the sample
to produce both elastic and plastic deformation of the material, as illustrated in Figure
3.13. The main difference from macro or micro-indentation tests is that in the Nano
indentation machines, the displacement h and the load L are continuously monitored with
high precision.
Figure 3.13: (a) Elastic-plastic deformation at the maximum applied load, (b) Plastic
deformation after releasing the load [120].
Nano hardness values were calculated by analysis of the produced curve of the
load P as a function of the depth of the indenter’s penetration inside the material h. The
P-h curve data can give details about material properties such as Young’s modulus and
yield strength. Figure 3.14 shows the schematic of the load-penetration depth (P- h) curve
for the Berkovich indenter at the cut edge for one of the cut samples of electrical steel
sheet used in the current study.

Chapter three The experimental methodology
80
Figure 3.14: Load-penetration curve of the Nano-indentation test.
The Nano-indentation test includes applying and removing a single load for each
indent. The total load is applied in a cycle, firstly, the load reaches maximum value
followed by holding and then unloading. During loading, the curve follows the equation
3.1. Where Pmax is the maximum indentation load that causes the hmax depth and creates
the projected contact area Amax on the indented surface and C is the indentation curvature
which is a measure of the resistance of the material to indentation. While in the unloading
part of curve is used to find the hardness value H from the equation 3.2. The slope S of
the unloading curve is used to calculate E from the equation 3.3 [128,129].
𝑃𝑚𝑎𝑥 = 𝐶 . ℎ𝑚𝑎𝑥2 (3.1)
𝐻 = 𝑃 𝑚𝑎𝑥
𝐴 (3.2)
𝐸 = 𝑆 √𝜋
2√𝐴𝑚𝑎𝑥 (3.3)
The induced plastic deformation of the cutting process is a consequence of the
tension, compression, and shear stresses. Thereby the induced strain due to the blanking
process may exceed the tensile strain. Also, the hardness values in the cut edge
deformation area could be much higher than the ultimate tensile strength. Therefore,
characterization using a tensile test may not be suitable to express the local strain in the
blanked sheet because of the limited strain data in the tensile test [86, 140].

Chapter three The experimental methodology
81
During the Nano-indentation test, it was quite a big challenge to locate the
indenter at the end of the cut edge because of the difficulty to determine exactly the end
of the cut edge according to the test vision.
In addition, the cold mounting causes shrinkage between the material edges that
may cause a difference in surface level between the sheet material and the mounted
material. Thus the surface topography becomes greater than the maximum vertical
movement of the indenter, which should not exceed 3.5 µ vertically. So, it is not possible
to conduct the test exactly at the edge (i.e. Zero edge coordinate) and instead it should
take place in a nearby area but still within the deformation zone. Moreover, cold mounting
can cause some discharge of static electricity at the material surface that may affect the
test in the form of causing unclear AFM images.
Figure 3.15 shows how difficult it is to determine exactly the cut edge position
before implementing the actual test even when using Nano-scope AFM images (Atomic
force microscopy AFM is a very-high-resolution type of scanning probe microscopy SPM
used to indicate material topography). The dark red line in the figure represents a low
height level area because of shrinkage in the polymer of the cold mounting. The only
way to measure the indents’ location was after the test by using SEM observation.
(a) Vision system (b) Nano-scope AFM image
Figure 3.15: Determination of the actual position of the indenter in the Nano-indentation
system.

Chapter three The experimental methodology
82
Magnetic tests using the single sheet tester
Power loss is the most important magnetic property in relation to ES, followed by the
permeability of the steel during magnetic analysis. The thickness and material grain
orientation are directly linked to the power loss. The Epstein test is usually used for
measuring magnetic properties for electrical steel sheets; however, this apparatus has
certain limitations. For example, the test is not suitable for small samples. Also, an
accurately dimensioned square is needed, and when the material is thin, air gaps may
open up at the corners of limbs and some weights may be required. Use of the single sheet
tester (SST) can overcome these drawbacks. Therefore, in the current study, SST was
adopted to measure the magnetic properties of the deformed samples of electrical steel
sheets. The device was designed and fabricated proportional to the sample conditions and
size.
The results of measurement of the power loss in single sheet test specimens
usually correlate with the Epstein frame results. However, power loss measurements
gained by the single sheet method are entirely independent of the Epstein frame.
Accordingly, the results from the single sheet tester may differ from those of the Epstein
frame even for same sample material and size and test conditions such as magnetization
and induction coils, the power supplied, and frequency [3]. Moreover, the current study
is interested in drawing comparisons between the influences of sheet thickness, grain
orientation, and blanking speed upon the cut edge deformation. Therefore, the measured
flux density and hysteresis losses needed to be normalized.
There is a wide diversity of physical forms and magnetic circuits which can be
applied to investigate the magnetic properties of electrical steel. Therefore, it is important
to select a suitable physical form of tester that matches the standard principles. The
apparatus used to measure magnetic properties in the current study is a type of single
sheet tester (SST). The test was intended to measure the ES magnetic properties at DC
power conditions to determine the specific hysteresis loss and general magneto-properties
for tensile and blanked specimens in different cutting conditions.
The following considerations have been incorporated regarding the SST system design:
- The Small single sheet tester (SST) needs to be appropriate for determining the
magnetic properties of samples when insufficient material is available for using
other known testers such as the Epstein or ring test [141].

Chapter three The experimental methodology
83
- Although the small specimen size is critical, the SST is not expected to achieve
similar accuracy to the Epstein test methods. In addition to the specimen size
consideration, there may beconsiderable variation in magnetic properties.
Therefore, the test results, in general, represent averages of magnetic quality. This
test method is suitable for specification acceptance, service evaluation, research
and development and design [142].
- A double-yokes fixture was used to complete the magnetic circuit and prevent
formation of eddy current pools in the strip. Yokes (cores) were constructed from
grain-oriented electrical steels in the preferred grains orientation in thicknesses
not exceeding (0.35 mm) to reduce flux losses [141].
- The number of turns in the primary and secondary windings should preferably be
equal and wound in the same direction from a common starting point at one end
of the coil form; the number of turns depends on the mass of specimen and test
frequency [141].
- The test is used to determine the normal induction curve and the hysteresis loop
(B-H loop) by rapid reversals of the direct current. Magnetic field strength and
magnetic induction range from zero to flux saturation of the material [138].
- Temperature increase has a significant effect on the test measurements and it
should not exceed 50Co. Therefore, cooling fans were used and the coil
temperature was monitored using a temperature sensor or the thermocouple [143].
- Due to the small sheet volume represented by the cut area and material thickness,
a slight change in the properties and loss was expected due to the blanking effect.
To measure this loss, very sensitive flux meter devices were used with a micro-
magnetic field measurement range accuracy. Two flux meters were used to
validate results readings.
3.5.1 Design of the new SST apparatus
A new single sheet tester was designed and built according to the requirements of the
project including samples sizes and magnetization field strength. The tester fixture can
accommodate the flat rectangular shape of the blanked specimen (50 ×10 mm2) and the
tensile samples. The blanking dies were used to produce electrical steel sheet samples at
different blanking speeds for the 0.2 and 0.35 mm thicknesses and in the RD and TD sheet

Chapter three The experimental methodology
84
grain orientations. The magnetic properties and hysteresis losses of samples were then
compared. Following the SST standards [138, 143], the new apparatus consisted of a pair
of U cores, which were manufactured from grain oriented silicon steel. The first U core
was fixed to the apparatus base, while the second could be moved up and down to allow
the specimens to be inserted and removed, as shown in Figure 3.16a. Also, a pair of coils
was built: a magnetization coil (N1) was connected to terminal 1 for magnetizing the
sample, which in turn was connected to the power supply circuit. In addition, an induction
coil (N2) was built and connected to terminal 2 to sense the change in created flux in the
specimen, and then connected to a flux meter device. Both N1 and N2 were winded around
special bobbins built by a 3D printing technique, as illustrated in Figure 3.16b. The air
gap between the sample and the induction coil was designed to be very small so that its
effect would not be significant.
Figure 3.16: SST system design and coils arrangement.
The current in the coil produces a magnetic field around the sample. The parallel
and closed field lines in this region exhibit a highly uniform and strong field. Field lines
behave in a similar way to how a bar magnet would if it had a north pole at one end and
South Pole at the other end. The strength of the magnetic field can be increased by
increasing the current in the coil, increasing the number of coils in the solenoid, and using
a soft iron core. The full magnetic flux path in the closed double yoke system and in ES
sheet are shown in Figure 3..17.
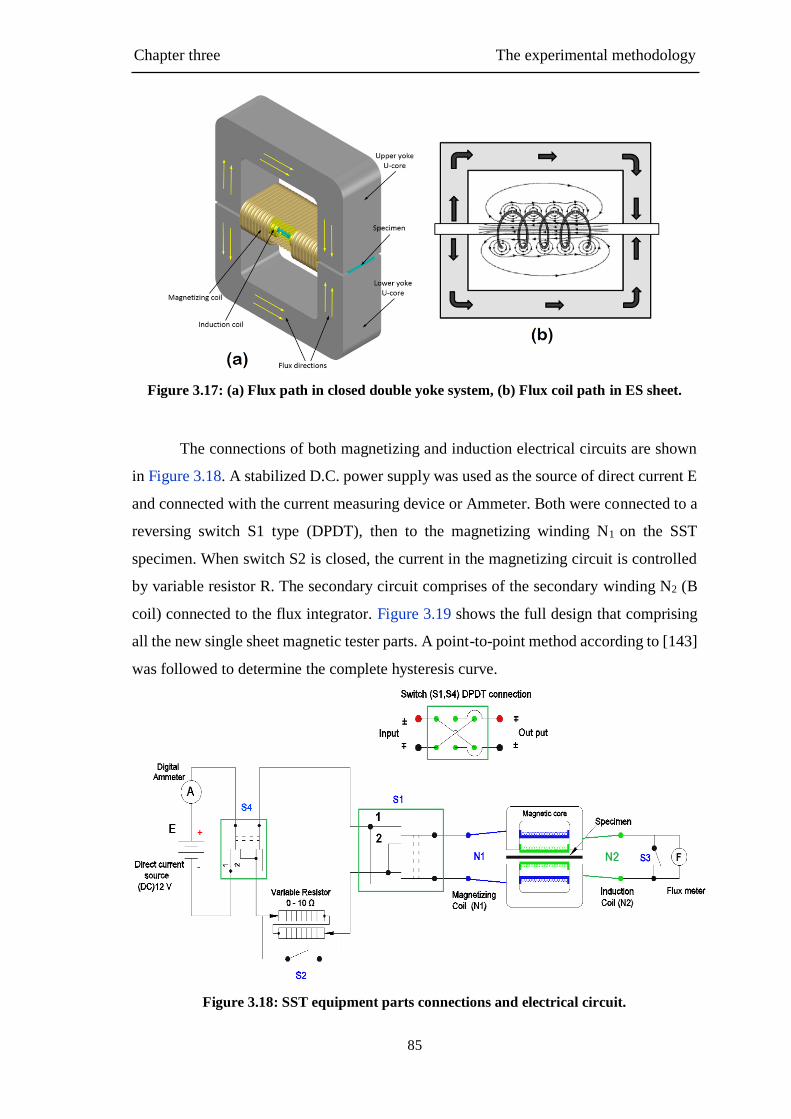
Chapter three The experimental methodology
85
Figure 3.17: (a) Flux path in closed double yoke system, (b) Flux coil path in ES sheet.
The connections of both magnetizing and induction electrical circuits are shown
in Figure 3.18. A stabilized D.C. power supply was used as the source of direct current E
and connected with the current measuring device or Ammeter. Both were connected to a
reversing switch S1 type (DPDT), then to the magnetizing winding N1 on the SST
specimen. When switch S2 is closed, the current in the magnetizing circuit is controlled
by variable resistor R. The secondary circuit comprises of the secondary winding N2 (B
coil) connected to the flux integrator. Figure 3.19 shows the full design that comprising
all the new single sheet magnetic tester parts. A point-to-point method according to [143]
was followed to determine the complete hysteresis curve.
Figure 3.18: SST equipment parts connections and electrical circuit.

Chapter three The experimental methodology
86
Figure 3.19: Full design of new single sheet magnetic tester, (1) Power supply, (2) Switch
4, (3) Cooling fans, (4) Variable Resistors, (5) Switch 2, (6) Switch 1, (7) Thermocouple, (8)
Cables, (9) Terminal 1 for N1 coil, (10) SST System, (11) Double Yokes, (12) Terminal 2
for N2 coil, (13) Switch 3, (14) Flux meter 1, (15) Flux meter 2.
3.5.2 Determination of magnetization curve and hysteresis loss
The hysteresis magnetization loops can be achieved by applying several steps using the
SST tester: First, a low current is passed through the magnetizing winding N1. The current
is then reversed about ten times by reversing switch S1 to bring the material into a steady
cyclic state. When switch S3 is opened, the flux integrator reading corresponds to the
reversal of the magnetizing field is recorded. Here, the flux meter should be zeroed and
then a current of value sufficient to produce the maximum magnetic field strength
required shall be passed through the magnetizing winding N1. This current shall be slowly
reduced to zero, then reversed and increased to its maximum negative value, reduced to
zero, reversed again and increased to its maximum positive value.
Through this procedure, the corresponding values of the magnetic field strength
(H) and the magnetic flux density (B) can be obtained, from which the points of the
hysteresis loop were determined and plotted. After each measurement, the test specimen
was de-magnetized from a magnetic field strength by means of repeated reversals of S1.
A short time was allowed to elapse between each reversal to ensure that the magnetic
field had completely penetrated the test specimen. The magnetizing current shall never
Chapter three The experimental methodology
87
be decreased during the measurements, otherwise the test specimen shall be demagnetized
before resuming measurements. Similar test details were reported in [143].
The values of magnetic field strength were calculated manually depending on the
current values that varied with the change of resistor values, according to the following
equation:
H×L = N × I (3.4)
Where: H: is the magnetic field strength, in amperes per meter (A/m), N: is the
number of turns of magnetizing winding, L: is the mean magnetic path length, in meters,
and I is the magnetizing current, in amperes.
The magnetic flux density is obtained from the corresponding magnetic flux
density and cross-section area of the specimen. Remanent flux density is the measured
magnetic flux density value (in Tesla) when the magnetic field strength is zero on the
hysteresis loop. Coercive field strength is the measured magnetic field strength value (in
amperes per meter) when the magnetic flux density is zero on the hysteresis loop. The
hysteresis energy can be obtained from half of a hysteresis loop [144, 145] as illustrated
in Figure 3.20.
Figure 3.20: Determination of hysteresis loss: (a) entire hysteresis curve, (b) absorbed
energy area w1, (c) dissipated energy area w2 [145].
The shaded area between the BH curve and the B axis in Figure 3.21b represents
the work done per unit volume of material. When H increases from zero to Hmax (from
points 1 to point 2), the absorbed energy per unit volume is:
w1 = ∫ HdBBmax
−Br (3.5)

Chapter three The experimental methodology
88
While the dissipated energy in Figure 3.21c when H decreases from Hmax to zero is:
w2 = ∫ HdBBr
Bmax (3.6)
The total hysteresis loss is equal to the energy used to establish field minus energy
released by the collapse of the field. Therefore, the energy required to magnetize the core
represented by the area under the curve from points 1 to point 2 is more than the returns
area under the curve from points 2 to point 3 [144,145].
From another view, the back of the electromotive force, also called the
electromagnetic field (emf) differs from the generated one. As the emf is proportional to
the change in flux, which means that the remaining flux changes less than the generated
flux. Therefore, it can be concluded that the total power lost over one complete cycle is
proportional to the area within the hysteresis loop.
According to the Steinmetz hysteresis law, the hysteresis loss per m3 per cycle of
magnetization of a magnetic material depends on the maximum flux density and the
magnetic quality of the material [146].
Wh = Kh × f × Bmaxn ( joule/m3/cycle) (3.7)
Where Kh is Steinmetz hysteresis constant depending on the nature of the
magnetic material, n is empirical index Steinmetz exponent equal to 1.6 when the Bmax is
between 0.1 and 1.2 Wb/m2, f (Hz) is frequency of reversals of magnetization because
the hysteresis loss changes with each cycle of the core, alternating from positive to the
negative magnitude of B, which means the loss is directly proportional to the frequency
of operation. Calculating the hysteresis power loss requires either dividing the hysteresis
work over the specimen volume size to convert it to watts (joule/s), or converting the
density of the material to watts/kg. Therefore, the formula for the hysteresis power loss
will be:
𝑃ℎ = 𝑊ℎ /𝜌 (Watt/kg) (3.8)
Hysteresis loss is essentially independent of the load current; it depends just on the
flux and hence the voltage; thereby the efficiency of a transformer drops towards zero
with the load current.

Chapter three The experimental methodology
89
3.5.3 Uncertainty and limitations of determination the magnetization
curve and complete hysteresis loop
According to the standard [143], there are two methods can be used to determine the
normal magnetization curve and complete hysteresis loop when conducted SST: the
continuous recording method and the point-by-point method.
To utilize the continuous recording method, additional equipment is required. For
example, the output from the flux integrator meter should be connected to the Y axis of
an X-Y recorder, plotter or computer interface. Also, the terminals of this resistor should
be connected to the X-axis of the same devices. The system can be in overall give direct
readings of magnetic flux density and the magnetic field strength in form of B-H loop.
However, in the continuous recording method, the overall uncertainty may be increased
depending on the resolution of the recorder system.
In addition, if digital control is performed, two signal digital-to-analogue
converter with specific lab view software setting is required. Also, because the output
signal from a digital-to-analogue converter is a stepwise waveform, so it required a low-
pass filter to smooth the signal and reduce data noise as well.
All these additions will increase the complexity and cost of the tester. Therefore,
to keep the tester as simple as possible, the point-by-point method has been used in the
current SST measurements in spite of its limitation that could lead to increasing the
measurements uncertainty, for example, the measurements data are recording manually
result in a limit number of points. That was due to the many reasons such as the test time
is short (the duration of test is approximately 12 ms). In addition, the reading flux value
is corresponding to a specific value of the current at a specific resistor value. Also, sample
shape, corner, cross-section, and hysteresis characteristics of yokes can affect the
measurement. However, absolute accuracy is difficult to attain. Therefore, precautions
must be taken to avoid the uncertainty in test accuracy.
In addition, the area inside the hysteresis loop represents the total hysteresis loss and
equal to the energy required to magnetize the core. Thereby, determining the hysteresis
loop by limited points could lead to reducing loops accuracy and thereby the loss is not
accurately determined. Consequently, a problem could arise with the measuring of the
area of the loops of the deformed samples and the calculation of the hysteresis loss will
be affected.

Chapter three The experimental methodology
90
Microstructural analysis
Material microstructures have a strong influence on the properties, therefore blanked
samples microstructures were investigated at the deformed cut edge. Samples were
prepared for microstructure analysis using a series of standard operations including
sectioning, mounting, polishing, etching, and coating. Both optical and scanning electron
microscopy (SEM) were used to examine the microstructure of the cut edge of blanked
electrical steel thin sheet. In general, the microstructure preparation procedures of
electrical steel are similar to those used for low-carbon steels [9]. In addition, different
samples were prepared without etching and coating for Nano-indentation tests, whilst
some further specimens, such as those used to examine the edge zones of the cut edge,
were observed without preparation in order to assess the surface state.
3.6.1 Samples preparation
To prepare the samples for microstructure examination, several steps needed to be
implemented including: sectioning, mounted, grinding, polishing, etching, conductive
coating or silver painting. Each step depends on the material type and size. Care needed
to be taken to ensure the preparation of the sample surface was done accurately according
to the following steps:
Sectioning and mounting of the samples was conducted in such a way as to expose
the cut edge profile and deformation [147]. The blanked samples were manually sectioned
from the blanked sheet using the Tin cutter with great caution to prevent alteration of the
structure of the metal or damage to the sample at the cut edge, as this would lead to
erroneous results. Then the samples were cold mounted in order to provide the required
support for mechanical grinding, polishing and hardness measurements and to identify
the sample code.
In general, there are two mounting methods: hot mounting, also called
compression mounting, and cold mounting. Hot mounting involves using Bakelite
thermosetting material and applying heat of around 150-180 °C and high pressure around
290bar to the specimen [148]. The heating cycle may cause changes in the microstructure,
or the pressure may cause delicate specimens to collapse or deform. Therefore, it was
decided to use cold mounting because it does not involve application of pressure and heat
to protect the thin sheet specimen edge and preserve the integrity of the material’s surface

Chapter three The experimental methodology
91
features during preparation. Cold mounting uses a mixture of resin and hardener [149].
The cold mounting powder was mixed with the liquid Acri-Kleer system in a ratio of 2:1.
A system from Met Prep Company was selected because it is transparent, offers fast
solidification and exhibits lower volume shrinkage. Figure 3.21 shows the prepared
samples in the mould.
Figure 3.21: Arrangement of the cut samples in the cold mounting.
Grinding and polishing of the samples was carried out using a progressive
sequence of abrading operations, from coarse abrasive paper of grade 400µ to a finer
grinding paper of 1200µ. The microscopic structure of the electrical steel is very sensitive
to water [9] and during grinding tends to oxidize quickly, within around 10 seconds,
especially after removing the coating layer, because of the use of nitrogen gas in the heat
treatment used in ES manufacturing. For this reason, water was avoided completely in
the final stages of sample preparation and an oil-based diamond lubricant was used
instead. Although this produced an acceptable surface, it was noted that there were some
depositions of debris sticking to the surface caused by the oil’s influence. Therefore, a
polycrystalline diamond alcohol-based compound with the alcohol-based diamond
lubricant was used instead. Isopropanol or ethanol solutions were used for washing
samples. Gradually, polishing with a cloth was applied, starting with white cashmere
cloth at 6 and 3 µ and progressing to smooth Trounoire black cloth at 1µ.
This was followed by etching and coating, whereby the microstructure features
were revealed through chemical etching using 2% Nital etchant at room temperature. The
solution consists of a mixture of nitric acid HNO3 and alcohol such as Methanol CH3OH
or Ethanol C2H6O [9]. This etching solution was used to reveal the grain boundaries and

Chapter three The experimental methodology
92
deformation bands. The best results in the current work were obtained by submerging the
sample in Nital reagent for 40-50 S and then directly washing the sample using
Isopropanol or ethanol.
When a small sample is surrounded by a relatively big non-conductive area such
as cold mounting, the electrons with a negative charge will gather locally, causing
specimen charge-up and thus preventing the emission of secondary electrons. The
illumination of the electron beam in SEM will be affected directly by this charge-up and
this will affect image quality in the form of abnormal contrast and shift in image [150].
Therefore, to reduce specimen charge-up, the specimen surfaces were coated with gold
to a thickness of some microns using a gold coating machine type EMSCOPE, SC500 for
two minutes. In addition, silver paint was applied to reduce charge-up and to give the
specimen surfaces uniform conductivity. This conductive silver paint, type AGG3691
Agar quick drying silver paint suspension, was applied around the cold mounting and
through the middle of the sample.
3.6.2 Microstructure examination
Optical light microscopy was performed using a Nikon Eclipse LV150 microscope to
examine the cut edge microstructure. The microscope was equipped with Buehler
OmniMet software for the image analysis and to determine the extent of the distortion
areas at the cut edge and vicinity area. The line intercept method [151].
was used to measure the average grain size according to ASTM standard E112 standard
by drawing a line across the sample image and marking each intersection between grains.
The edge surface created by the blanking process was observed under a scanning
electron microscope (SEM), using a field emission gun Inspect F microscope, at an
accelerating voltage of 20 kV and spot size of 4 µm, in the secondary electron (SE)
imaging mode to observe the cut edge profile and vicinity area and microstructure features
of fracture surface at higher magnification. In addition, it enabled expression of the edge
surface topography and the different cutting phases including rollover, shear, fracture
zones, and burr height directly without material preparation or etching. Inspect F was
further used to investigate the Nano-hardness samples to observe the indents’ positions
in relation to the cut edge. The working distance (WD) was increased slightly under direct
camera vision (CCD) by moving the sample platform down to reduce the charging effect
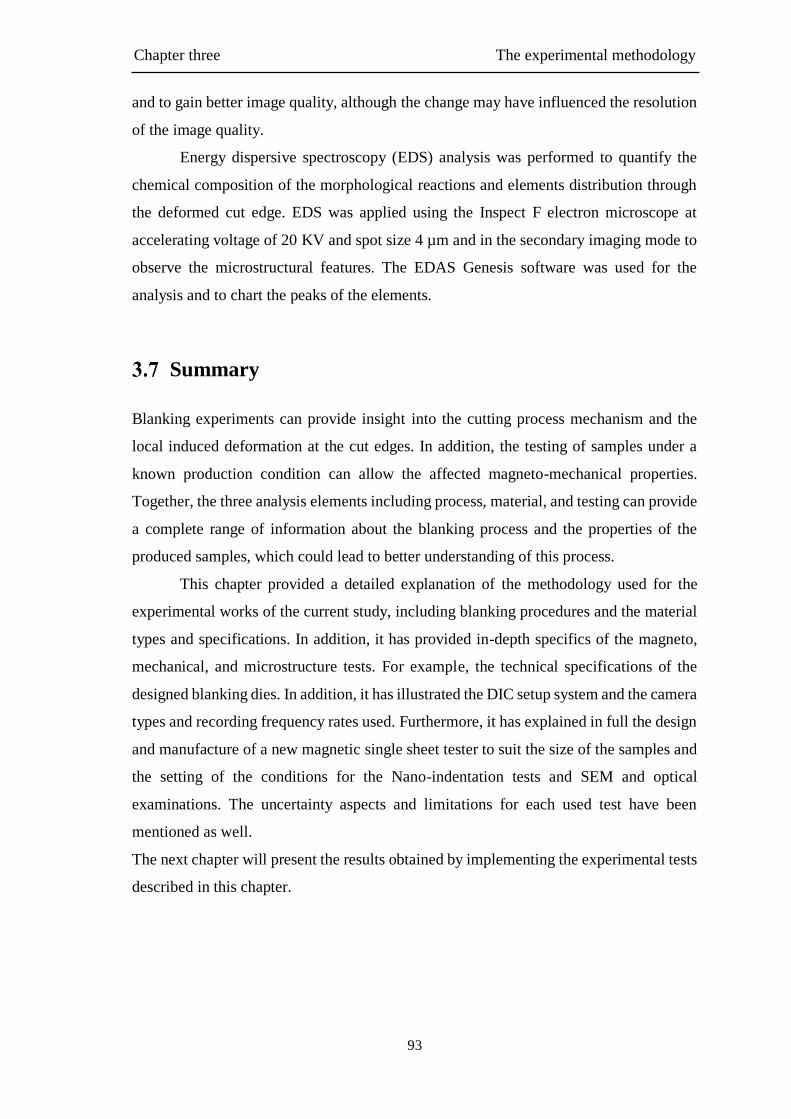
Chapter three The experimental methodology
93
and to gain better image quality, although the change may have influenced the resolution
of the image quality.
Energy dispersive spectroscopy (EDS) analysis was performed to quantify the
chemical composition of the morphological reactions and elements distribution through
the deformed cut edge. EDS was applied using the Inspect F electron microscope at
accelerating voltage of 20 KV and spot size 4 µm and in the secondary imaging mode to
observe the microstructural features. The EDAS Genesis software was used for the
analysis and to chart the peaks of the elements.
Summary
Blanking experiments can provide insight into the cutting process mechanism and the
local induced deformation at the cut edges. In addition, the testing of samples under a
known production condition can allow the affected magneto-mechanical properties.
Together, the three analysis elements including process, material, and testing can provide
a complete range of information about the blanking process and the properties of the
produced samples, which could lead to better understanding of this process.
This chapter provided a detailed explanation of the methodology used for the
experimental works of the current study, including blanking procedures and the material
types and specifications. In addition, it has provided in-depth specifics of the magneto,
mechanical, and microstructure tests. For example, the technical specifications of the
designed blanking dies. In addition, it has illustrated the DIC setup system and the camera
types and recording frequency rates used. Furthermore, it has explained in full the design
and manufacture of a new magnetic single sheet tester to suit the size of the samples and
the setting of the conditions for the Nano-indentation tests and SEM and optical
examinations. The uncertainty aspects and limitations for each used test have been
mentioned as well.
The next chapter will present the results obtained by implementing the experimental tests
described in this chapter.

Chapter four Experimental results
94
4 Experimental results
Introduction
This chapter presents the experimental results obtained from the blanking process and the
conducting of mechanical, microstructure, and magnetic characterizations for the tested
material. Processes and tests settings and conditions were explained previously in the
experimental work chapter. Generally, the results are divided into four main sections in
order to report on the effect of material thickness of 0.2 and 0.35 mm as well as the loading
orientations RD and TD. The investigation results for each of these categories are shown
and linked through expressing their material properties and quantifying the deformation
at the cut edge and the vicinity area in accordance with the objectives of the research.
Characterization of mechanical properties
4.2.1 Tensile tests
The tensile tests were carried out for standard tensile samples of electrical steel at
different crosshead speeds of 1, 5, 10 mm/min at room temperature to find out the
influence of variation in test speed on the mechanical properties of the material. Figure
4.1a, b show tensile engineering stress-strain curves for 0.2 mm thick materials at the RD
and TD orientation subjected to different loading speed with strain rate from about 0.67
to 6.67 10-3/s. The figures illustrate that there is a limited dependency on the test
orientation and the material behaviour seems to be more consistent at higher loading
speeds. In addition, there are some differences in material properties when tested at lower

Chapter four Experimental results
95
loading speeds, the lowest yield and tensile strength being observed at 1mm/min testing
speed.
Figure 4.1c shows standard deviation error bars for the tensile results in Figure
4.1a and b regarding the yield stress and UTS values. Generally, results are less steady in
the TD direction; this might be due to the grains structure in the local cross-section of the
thin sheet.
Figure 4.1: Tensile rate sensitivity at different test speeds, a) 0.2 RD, b) 0.2 TD, c)
maximum UTS and yield stress values with standard deviation error bars.
Tensile tests were also done for 0.35 sheet thickness under the same tests
conditions as for the 0.2 thick sheets to verify the influence of sheet thickness on the
tensile results at different strain rates. Figure 4.2a, b show there is a little variation in the
mechanical properties of the thicker material compared to the thinner one. The figures
also show a limited dependency on the test orientation. However, the material’s behaviour
is still more consistent at higher loading speeds. Therefore, the speed 10 mm/min was

Chapter four Experimental results
96
adopted in all tensile tests for the current research. Figure 4.2c shows more stability in
the tensile results for 0.35 sheet thickness than the 0.2 in both sheet orientations; this
could be confirmation of the influence of grains in the local cross-section of the sheet on
the variation of tensile results.
Figure 4.2: Tensile rate sensitivity at different test speeds, a) 0.35 RD, b) 0.35 TD, c)
maximum UTS and yield stress values with standard deviation error bars.
4.2.2 Strain distribution in uniaxial loading
DIC technique was used to measure the strain distribution on the tensile samples tested at
10 mm/min. Figure 4.3 shows the stress-strain curves of electrical steel for the two sheet
thicknesses and orientations. As it was expected, the graph illustrates higher extension
for rolling direction than for the transverse direction due to the applied axial tensile load
being parallel to the rolling direction.
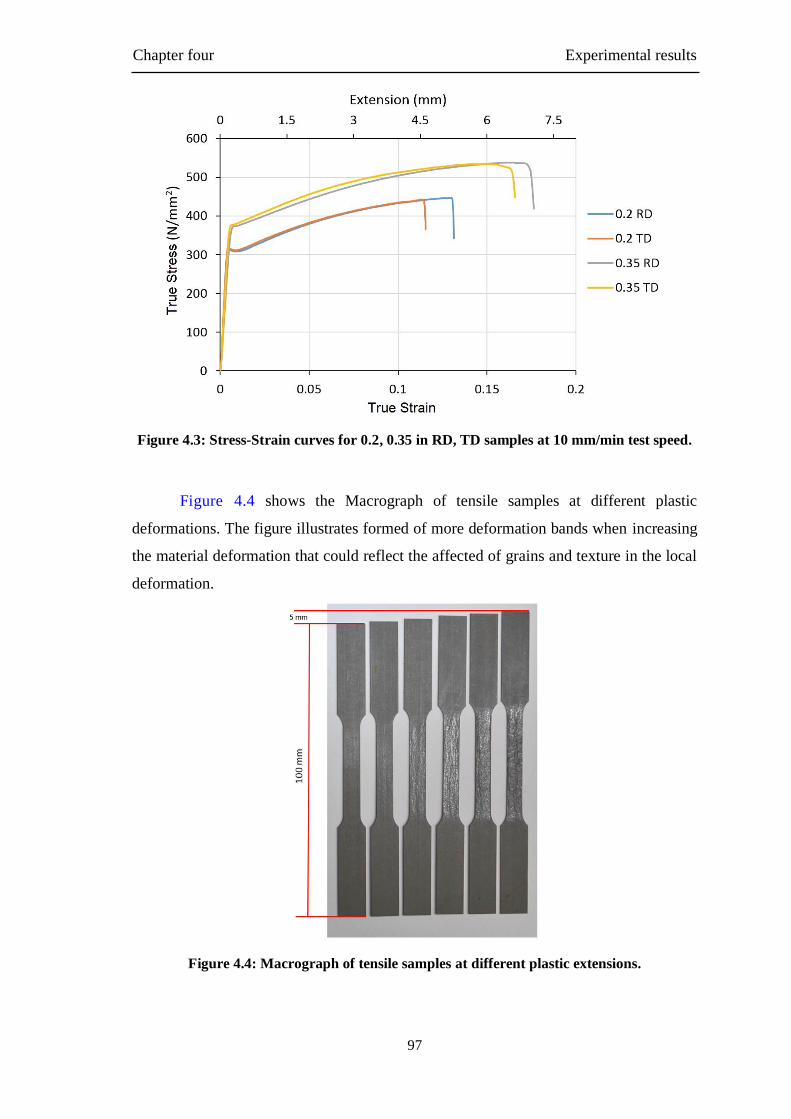
Chapter four Experimental results
97
Figure 4.3: Stress-Strain curves for 0.2, 0.35 in RD, TD samples at 10 mm/min test speed.
Figure 4.4 shows the Macrograph of tensile samples at different plastic
deformations. The figure illustrates formed of more deformation bands when increasing
the material deformation that could reflect the affected of grains and texture in the local
deformation.
Figure 4.4: Macrograph of tensile samples at different plastic extensions.

Chapter four Experimental results
98
In order to evaluate the DIC accuracy measurement, the error calculations
have been made by analysis some un-deformed images or static images before
applying loads of tensile specimens. Around 5 images have been taken with a time
interval equal to the imaging time of the test have been analysed with DIC to quantify
the maximum error in the measured strain values during tensile tests. Figure 4.5
shows that the resulting strain map with a maximum strain value of about 0.03, which
is negligible compared to the strain values recorded during the test. Thereby, all
values of the measured strains during tensile tests using DIC technique in the current
study represent the absolute values of the true strains results including the error
values.
Figure 4.5: The strain error analysis for the tensile samples determined with DIC.
Figure 4.6 to 4.9 show the distribution of the local strains during different stages
of the tensile test for both 0.2 and 0.35 mm sheet thickness in both RD and TD orientations
of electric steel. The figures demonstrate that the deformation of samples is almost
uniform all over the gauge section. Also, there is no clear local necking and the local
deformation instantly results in a fracture. According to the local concentration areas of
strain distribution, the figures illustrate that the crack begins to form at the edge of the
samples in the late stages of the test. Then the crack propagates quickly to the fracture
stage. That may because of the small thickness of the sheet or because the sheet edges
were affected by the induced HAZ due to the EDM process when preparing samples,
where the stresses are concentrated and the local strain value rises significantly.

Chapter four Experimental results
99
Figure 4.6: Maximum normal strain distribution of tensile samples at different stages of extension during the tensile tests of 0.2 RD.

Chapter four Experimental results
100
Figure 4.7: Maximum normal strain distribution of tensile samples at different stages of extension during the tensile tests of 0.2 TD.

Chapter four Experimental results
101
Figure 4.8: Maximum normal strain distribution of tensile samples at different stages of extension during the tensile tests of 0.35 RD.

Chapter four Experimental results
102
Figure 4.9: Maximum normal strain distribution of tensile samples at different stages of extension during the tensile tests of 0.35 TD.

Chapter four Experimental results
103
Blanking process results
4.3.1 Blanking load stroke
During the blanking process, the cutting force value changes in a cutting cycle. Therefore,
to measure the value of the force accurately, the cutting force evolution was constantly
recorded by the load cell. When the punch moves down and touches the sheet surface, the
cutting force values increase sharply and this is considered as the starting point of the
actual sheet cut. Therefore, the actual force required to cut the sheet material was
calculated by subtracting the maximum load from the value at the touch point. Figure
4.10 shows the blanking load-displacement for samples at the blanking speed of 100
mm/min.
Figure 4.10: Blanking load-stroke displacements for 0.2 and 0.35, RD and TD samples.
Figure 4.11 shows the blanking forces at different test speeds for all ES tested
samples. The figures show the cutting load is not affected by the sheet orientation, but
there is a significant impact of the blanking speed on the required cutting force to
accomplish the blanking process in the full die (type A). The force values were the
greatest at the lower speed of 100 mm/min.
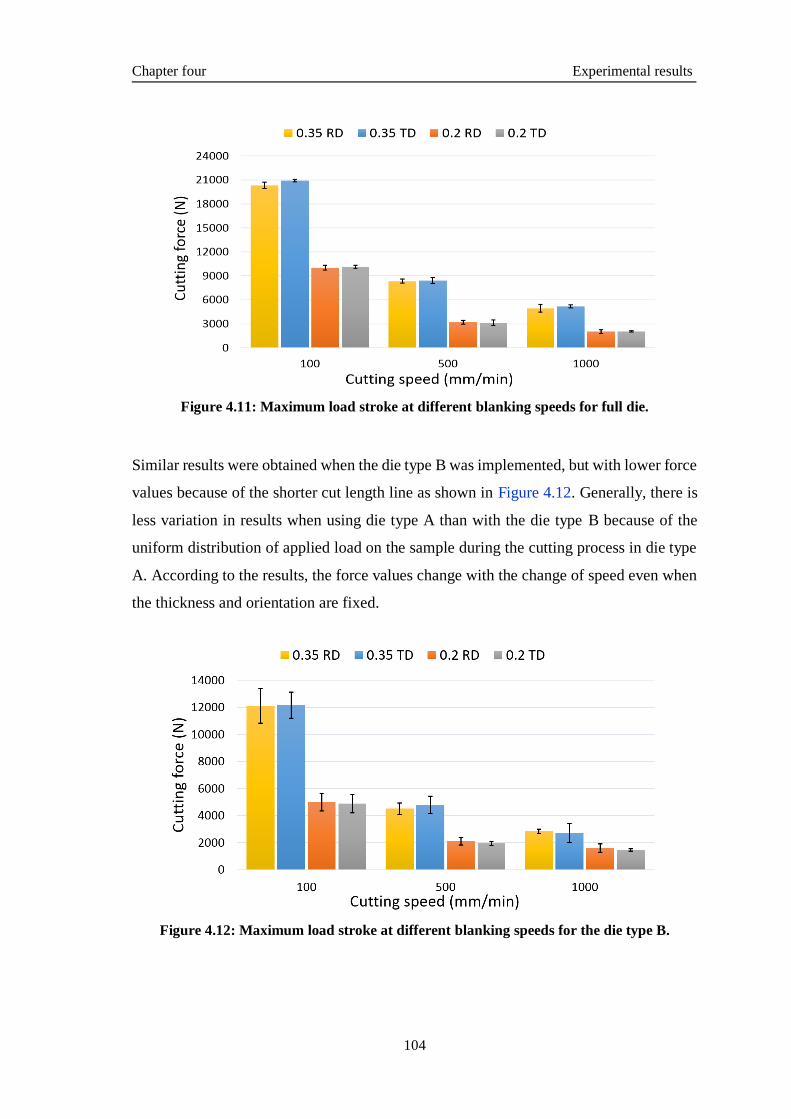
Chapter four Experimental results
104
Figure 4.11: Maximum load stroke at different blanking speeds for full die.
Similar results were obtained when the die type B was implemented, but with lower force
values because of the shorter cut length line as shown in Figure 4.12. Generally, there is
less variation in results when using die type A than with the die type B because of the
uniform distribution of applied load on the sample during the cutting process in die type
A. According to the results, the force values change with the change of speed even when
the thickness and orientation are fixed.
Figure 4.12: Maximum load stroke at different blanking speeds for the die type B.

Chapter four Experimental results
105
4.3.2 Strain distribution in the blanking process
The DIC test was used to investigate the strain distribution in electrical steel sheets in-
situ blanking process and suitable DIC set-up as explained in previous chapter.
To evaluate the DIC accuracy measurement of blanking tests, the error
calculations have been made by analysis of 20 static images in the un-deformed
conditions before applying loads with a time interval equal to the imaging time of the test.
As it supposed to have no strain when the samples are not loaded, therefore any calculated
strain is due to the systematic errors in image processing. These images have been
analysed at different settings of DIC parameters to set the proper setting that can give the
lower error. Figure 4.13 shows the maximum error in the measured strain values during
blanking tests for the current settings. The resulting strain map illustrates a maximum
strain value of 0.018, which can be considered as a small value (less than 10 % compared
to the maximum strain values recorded during the blanking test). Thereby, all values of
the measured strains in the current study represent the absolute values of the true strains
results including the obtained error values.
Figure 4.13: The strain error analysis for the blanking samples determined with DIC.
Analysing high-speed DIC tests results during the blanking process included
many challenges. For examples, the difficulty of the timing of DIC image acquisition and
the determining of the instant of beginning deformation because of the high rate recording

Chapter four Experimental results
106
system and high-speed punch movement. In addition, there are differences in fracture
moment between the sample because of the differences in applied speeds and blanking
conditions. Therefore, it was unattainable to select specific images for the comparison
between different samples at different blanking cases at exactly the same punch position.
However, regardless of the punch position, the last image before the fracture and
separation of the blank from the sheet could show the state of the blanked part. Also, the
seed point or reference point of analysis was localized in the die side only in order to stop
the correlation when the separation occurs because disappearing of the speckles.
Therefore, the last image before stopping the correlation was considered to represent the
maximum deformation for the blanked sample. Several stages have been illustrated
during the blanking process to show the mechanism of the process.
In addition, the state of the deformation varies from sample to another because it
depends on the local grains and their orientations at the cut edge location. The following
high-speed DIC results show the deformation that occurred during the blanking process
for the current case study. However, the comparison has been avoided and each test was
treated individually.
Figures 4.14 to 4.16 show the distribution of equivalent strains during the four
stages of the blanking cutting process of 0.2 RD samples at three different cutting speeds.
The first stage shows strains concentration on the sample surfaces at the contact points
with the edges of each die and punch. The second stage shows the expansion of
deformation with an increase in strain value due to the increase of punch load. Then, the
deformation continues to increase in the following stage because of increased penetration
of the punch in the sample. The last stage before the instance of fracture shows the largest
value of strains and represents the final deformation at the cut edge in the blanking
process. It is notable to mention that the deformation can concentrate on both sides of the
sheet only when applying very small clearance [62]. Also, the punch, die, and the blank
holder seems unclear or blurred because the DIC camera was focused only on the small
deformation area of the sample.
Figure 4.14 shows the strain distribution of the 0.2RD100 sample, the maximum
strain values increased from the beginning of the cutting process to reach about 45%. This
equivalent strain value was decreased to 40% when the blanking speed increased to 500
mm/min as shown in Figure 4.15. The least strain value was resulted with highest
blanking speed to be about 35% at 1000 mm/min, as illustrated in Figure 4.16.

Chapter four Experimental results
107
Figure 4.14: Maximum equivalent strain distributions during the blanking process in
different stages at 100 mm/min for 0.2 RD 100 sample.
Figure 4.15: Maximum equivalent strain distributions during the blanking process in
different stages at 500 mm/min for 0.2 RD 500 sample.

Chapter four Experimental results
108
Figure 4.16: Maximum equivalent strain distributions during the blanking process in
different stages at 1000 mm/min for 0.2 RD 1000 sample.
In general, a similar behaviour of material related to the mechanism of the process
was observed for the equivalent strains distribution in the 0.2TD electrical steel samples
as a result of applying the blanking process in the rolling direction. Figures 4.17 to 4.19
show relatively lower strain values to those in orientation RD even with the same sheet
thickness and cutting condition. The highest value of equivalent strains with regard to
cutting conditions was identified as about 40%. Both blanking speed and grain orientation
have affected the deformation by means of changing the strain values.

Chapter four Experimental results
109
Figure 4.17: Maximum equivalent strain distributions during the blanking process in
different stages at 100 mm/min for 0.2 TD 100 sample.
Figure 4.18: Maximum equivalent strain distributions during the blanking process in
different stages at 500 mm/min for 0.2 TD 500 sample.

Chapter four Experimental results
110
Figure 4.19: Maximum equivalent strain distributions during the blanking process in
different stages at 1000 mm/min for 0.2 TD 1000 sample.
In order to investigate the effect of the sheet thickness, similar results were
obtained to the 0.35mm electrical steel sheet thickness. Figure 4.20 to 4.22 show the
distribution of equivalent strains of the 0.35RD samples in the cut-edge and vicinity area
during the cutting process. Because the sheet sample was thicker (0.35 mm), the speckles
in the cross-section of the sheet deformation area increased. This resulted in production
of clearer images than for the 0.2 thick samples, due to the improved correlations between
the subsets.
It seems that the mechanism of process is similar for both material thicknesses, as
the deformation increase with increase the penetration of the punch in the material.
Figure 4.20 shows the strain distribution of the sample 0.35RD100, the maximum strain
values was increased during the process stages to reach about 40%. This equivalent strain
value was decreased to the 36% when the blanking speed increased to 500 mm/min as
shown in Figure 4.21. The least strain value was resulted with highest blanking speed to
be about 32% at 1000 mm/min, as illustrated in Figure 4.22.

Chapter four Experimental results
111
Figure 4.20: Maximum equivalent strain distributions during the blanking process in
different stages at 100 mm/min for 0.35 RD 100 sample.
Figure 4.21: Maximum equivalent strain distributions during the blanking process in
different stages at 500 mm/min for 0.35 RD 500 sample.

Chapter four Experimental results
112
Figure 4.22: Maximum equivalent strain distributions during the blanking process in
different stages at 1000 mm/min for 0.35 RD 1000 sample.
Figure 4.23 to 4.25 show the distribution of equivalent strains of the 0.35TD
samples in the cut-edge deformation zone and the vicinity area. Similar material
behaviour was observed to that in rolling direction, but lower strains values were
produced. The highest value of equivalent strains regarding cutting conditions was about
36%.
Chapter four Experimental results
113
Figure 4.23: Maximum equivalent strain distributions during the blanking process in
different stages at 100 mm/min for 0.35 TD 100 sample.
Figure 4.24: Maximum equivalent strain distributions during the blanking process in
different stages at 500 mm/min for 0.35 TD 500 sample.

Chapter four Experimental results
114
Figure 4.25: Maximum equivalent strain distributions during the blanking process in
different stages at 1000 mm/min for 0.35 TD 1000 sample.
Figure 4.26 shows the general material behaviour during the blanking process, according
to the maximum equivalent strain obtained in the current deformation case study. It can
be seen that the larger deformation zone is obtained at the lower blanking speeds. In
addition, transverse orientation produced lower strain than the rolling direction regarding
the applied of the direction of cutting line.
Figure 4.26: General effects of blanking speeds and sheet thickness, orientation regarding
max. equivalent strain.

Chapter four Experimental results
115
4.3.3 Characterization of local deformation using Nano-indentation
Nano indentation tests were conducted at the cut edge and the vicinity area to indicate the
plastic deformation regarding the different cutting conditions. Tests were carried out in
the middle of the cut edge using 50 indenters extend within a distance of about 150 µm
from the cut edge.
A 3D distributions of measured Nano-hardness values as a function of distance
from the cut edge and through-thickness distance are shown in Figures 4.27 and 4.28 for
both 0.2 and 0.35 sheet thicknesses respectively. That was to illustrate the variation
between hardness values for those indents at the same distance to the cut edge as they do
not clearly appear in the 2D graphs. The figures show that the hardness values
significantly increase toward the cut edge, in the case of both sheet thicknesses. The
change in the hardness values could indicate the influenced of the cutting edge zone by
the deformation due to the cutting process. This deformation causes strain hardening that
leads to increasing material resistance to the penetration of the indenter. Therefore, the
high value of hardness may be interpreted as a result of the existence of high deformation
and strain hardening. The variance in hardness values could be explained by the effect on
the indenter of impurities and grain boundaries [5].
Figure 4.27: Nano-hardness distribution as a function of the distance from the cut edge for
0.2 RD 1000 sample, a) 3D distribution of hardness values b) SEM image of indents
locations regarding the cut edge.

Chapter four Experimental results
116
Figure 4.28: Nano-hardness distribution as a function of the distance from the cut edge for
0.35 RD 1000 sample, a) 3D distribution of hardness values b) SEM image of indent
locations regarding the cut edge.
Generally, high hardness values are located in the area very close to the edge. This
high value graduating in the vicinity area of the high affected zone. The lowest hardness
values and located at the outer end of the deformation area when the hardness values are
close to the hardness value of the general material. The average hardness value of the ES
sheets away from the cut edge was measured using the Nano-indentation test as shown in
Figure 4.29. The average Nano-hardness value of the material was about 3.5GPa.
Figure 4.29: The average Nano-hardness value of the material.
Figure 4.30 shows Nano-hardness values regarding the distance from the cut edge
for the 0.2 mm thickness samples in both rolling and transverse direction at different

Chapter four Experimental results
117
blanking speeds. Clear degradation can be observed in the hardness values in the form
of very high values at the edge around 7GPa at 5 µm away from the edge and then sharp
descended in the vicinity area until reaching the general sheet hardness value.
It is very difficult to identify the depth of the deformation area according to the
hardness measurements because of the big variations. However, the position of the
stability of the hardness values at the general hardness value of the sheet given in Figure
4.29 was considered as the end of the deformation. According to the current results, the
size of the plastic deformation zones is slightly varied depending on the deformation
condition. The average extension of deformation for 0.2 ES samples were reached to
around 100 µm in most cutting cases.
Figure 4.30: The distributions of Nano indentation values for 0.2 mm sheet thickness at
different blanking speeds.

Chapter four Experimental results
118
In order to show the effect of the blanking parameters against the hardness values, the
average hardness values at distance between 25 to 30 µm for different parameters are
illustrated in Figure 4.31.
Figure 4.31: The effect of the blanking parameters against the hardness values of 0.2 ES
sheet thickness at specific distance to the cut edge.
To investigate the influence of sheet thickness, the same strategy was applied to
the 0.2 thickness sheet as on the ES sheet with 0.35 mm thickness. Generally, all cases
show the deformation is distributed randomly around the cut edge. However, there is
some variation in the hardness values in that they are higher close to the cut edge and
descend gradually with increasing distance to the vicinity areas.
Figure 4.32 shows Nano-hardness measurements regarding the distance from the
cut edge for the 0.35 mm thickness samples in both rolling and transverse direction at
different blanking speeds. A similar trend to the 0.2 samples was apparent in the form of
high value at the cut edge and sharp descended in the neighbour area. However, a lower
ranges of hardness values than 0.2 were observed around 6GPa at the edge. The average
depth of the deformation area according to the current hardness measurements were
around 80 µm in most cutting cases.

Chapter four Experimental results
119
Figure 4.32: The distributions of Nano indentation values for 0.35 mm sheet thickness at
different blanking speeds.
A similar results was obtained to show the effect of the blanking parameters of
0.35 mm ES sheet thickness against the hardness values, the average hardness values at
distance between 25 to 30 µm for different parameters are illustrated in Figure 4.33. The
figures illustrate that the size of the plastic deformation zone is almost consistent in all of
the samples, however, the total DAZ is varying depending on the deformation condition
and local grains condition.

Chapter four Experimental results
120
Figure 4.33: The effect of the blanking parameters against the hardness values of 0.35 ES
sheet thickness at specific distance to the cut edge.
Magnetic properties outcomes
The dissipation of energy causes hysteresis loss because of the reversal of the material’s
magnetism. The magnetic hysteresis loops (B-H curves) were measured for all blanking
samples in the current study to determine the effect on the magnetic properties caused by
the induced deformation due to the blanking process at different conditions, which would
reflect the blanked quality magnetically. Moreover, the magnetic properties under
different plastic elongations of tension were investigated. The hysteresis losses can be
estimated through the residual of induction flux density induced by the magnetizing field,
i.e. the area under the hysteresis loop. Because of the current study is considered as a
comparative investigation between blanking and tensile samples at different conditions.
Therefore, the measured flux density values were normalized, because of the differences
between the current test conditions and the standard test settings regarding the apparatus
design and testing conditions.
4.4.1 Effect of uniaxial deformation on magnetic properties
The hysteresis loops were measured for the tensile samples at different plastic elongations
by interrupting the tensile test with an increment of 1 mm until sample fracture. The

Chapter four Experimental results
121
conditions of the magnetic tester or the single sheet tester were explained earlier in
chapter three.
The area inside the hysteresis loop represents the total hysteresis loss. However,
determining the hysteresis loop by limited points could lead to reducing loops accuracy
and thereby the loss is not accurately calculated. Consequently, a problem could arise
with the measuring of the area of the loops of the deformed samples and the calculation
of the hysteresis loss will be affected. Therefore, only the type and size of loops by means
of saturation points between the different samples will be investigated.
Figure 4.34 shows the hysteresis loops for 0.2 RD tensile samples. The figure shows the
different sizes of the hysteresis loop for each elongation. Although the limited of
measured points lead to not show the coercivety points clearly, the larger loop area was
for the not deformed sample by means of saturation point. The size of the loops was
reduced when increase in the elongation. The induced hysteresis loop at 5 mm was the
smallest one and had lower saturation point.
Figure 4.34: Hysteresis loops of 0.2 RD of ES samples at different elongations of tension.

Chapter four Experimental results
122
Figure 4.35 shows hysteresis loops for 0.2 TD sample at each stage of elongation
under tension. The figure also shows a bigger hysteresis loop for the not deformed sample
than for the remaining deformed samples represented by a higher saturation point. The
size of the loops decreased with increases in the elongation of deformation ranging from
1 mm to 5mm. Generally, the hysteresis loops exhibited similar shapes and trends due to
the use of the same tests settings.
Figure 4.35: Hysteresis loops of electrical steel type 0.2 TD samples at different stages of
elongations of tension.
Figure 4.36: shows that the B-H loops for all the elongations of the tension of the
0.35 RD electrical steel sample exhibit similar behaviour to the 0.2 RD sample regarding
the existing differences between the deformed and undeformed samples, which means
that sheet thickness has a little influence on the magnetic properties.

Chapter four Experimental results
123
Figure 4.36: Hysteresis loops of electrical steel type 0.35 RD samples at different stages of
elongations of tension.
Figure 4.37 shows hysteresis loops for the 0.35 TD sample at each stage of
elongation under tension. The figure also present lower saturation point for higher
elongation stage. All hysteresis loops were of similar shapes and trends due to use of the
same test conditions. The not deformed sample induced a different hysteresis loop than
the deformed samples which reflect the influences of the deformation upon the magnetic
structure and domain wall movements.
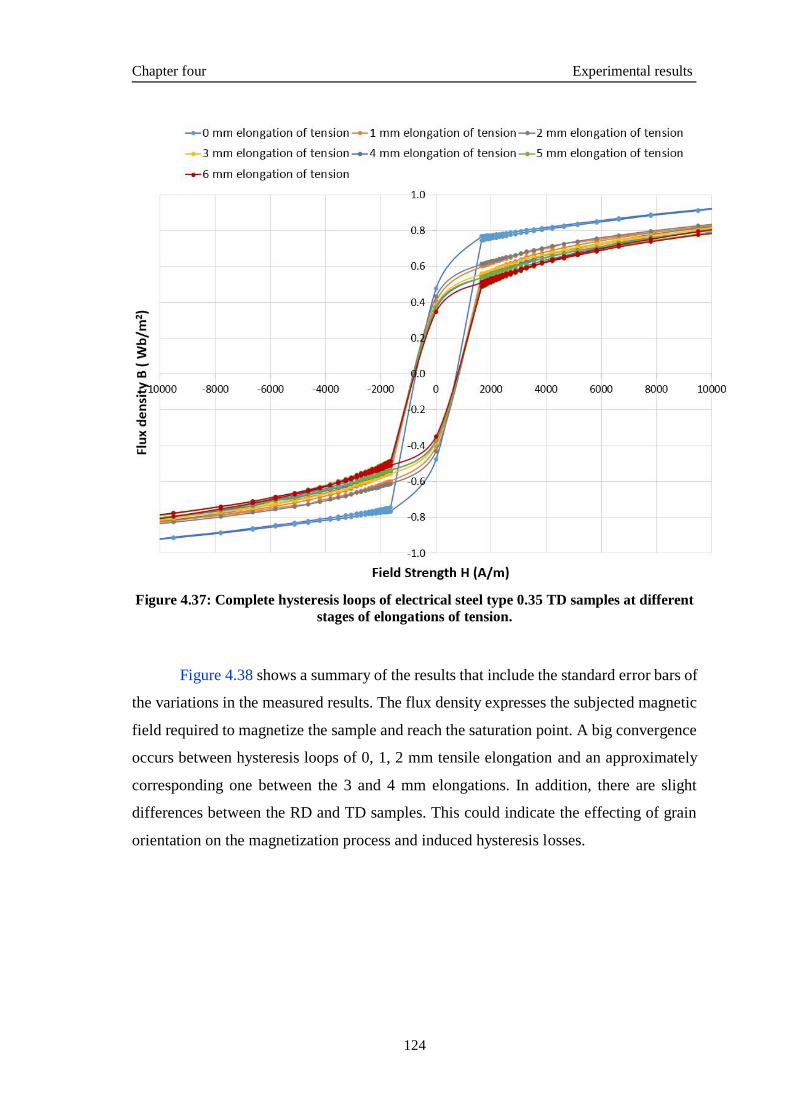
Chapter four Experimental results
124
Figure 4.37: Complete hysteresis loops of electrical steel type 0.35 TD samples at different
stages of elongations of tension.
Figure 4.38 shows a summary of the results that include the standard error bars of
the variations in the measured results. The flux density expresses the subjected magnetic
field required to magnetize the sample and reach the saturation point. A big convergence
occurs between hysteresis loops of 0, 1, 2 mm tensile elongation and an approximately
corresponding one between the 3 and 4 mm elongations. In addition, there are slight
differences between the RD and TD samples. This could indicate the effecting of grain
orientation on the magnetization process and induced hysteresis losses.

Chapter four Experimental results
125
Figure 4.38: Maximum flux density at different stages of elongations of tension for the
different electrical steel samples categories
4.4.2 Effect of induced blanking deformation on magnetic properties
The effect of the blanking process on the magnetic properties was investigated. The
hysteresis loops were obtained, and hysteresis losses were calculated for the produced ES
samples at a different cutting condition of the full die (die type A) using the single sheet
tester. Figure 4.39 shows the complete hysteresis loops for the 0.2 RD samples at different
blanking speeds. A small differences between the hysteresis loops can be observed
because the loops had very close saturation levels. That may reflect the convergent effect
of the variation of blanking speed on the magnetic properties of electrical steel. Hysteresis
losses were calculated according to the loops areas because of presence a kind of
identically loops shape. However, it can be seen that the hysteresis loop induced by the
lower blanking speed of 100 mm/min was slightly wider, thereby causing a higher
hysteresis loss.
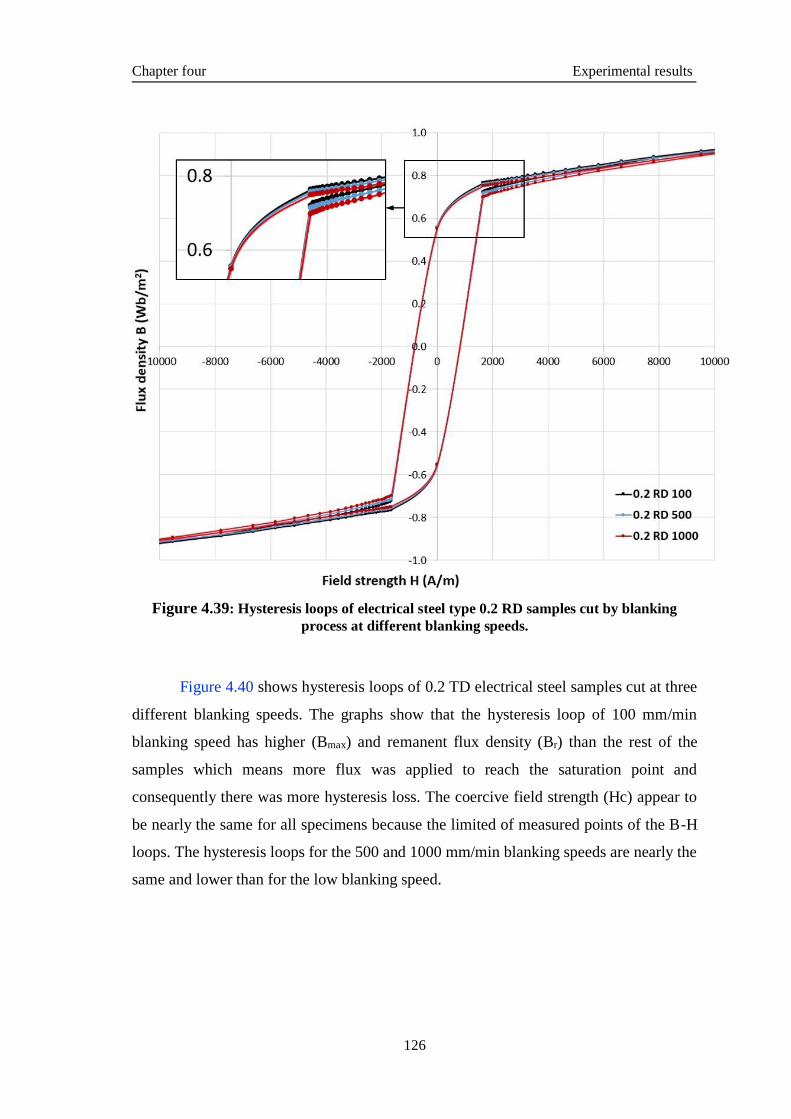
Chapter four Experimental results
126
Figure 4.39: Hysteresis loops of electrical steel type 0.2 RD samples cut by blanking
process at different blanking speeds.
Figure 4.40 shows hysteresis loops of 0.2 TD electrical steel samples cut at three
different blanking speeds. The graphs show that the hysteresis loop of 100 mm/min
blanking speed has higher (Bmax) and remanent flux density (Br) than the rest of the
samples which means more flux was applied to reach the saturation point and
consequently there was more hysteresis loss. The coercive field strength (Hc) appear to
be nearly the same for all specimens because the limited of measured points of the B-H
loops. The hysteresis loops for the 500 and 1000 mm/min blanking speeds are nearly the
same and lower than for the low blanking speed.

Chapter four Experimental results
127
Figure 4.40: Hysteresis loops of electrical steel type 0.2 TD samples cut by blanking
process at different blanking speeds.
Similar investigations were done on magnetic properties of electrical steel sheet
with thickness 0.35 mm in both grain orientations, RD and TD, at different blanking
speeds. Figure 4.41 shows the B-H loops of electrical steel type 0.35 RD samples cut at
three blanking speeds, 100, 500, and 1000 mm/min. Similar behavior to that of the 0.2
samples was observed, resulting in similarly shaped hysteresis loops. Wider loops
resulted from the lower blanking speed of 100 mm/min. Loop size decreased with
increased blanking speed, reflecting less deformation of the affected cut edge.

Chapter four Experimental results
128
Figure 4.41: Hysteresis loops of electrical steel type 0.35 RD samples cut by blanking
process at different blanking speeds.
Figure 4.42 shows the B-H loops of electrical steel 0.35 TD samples cut at
different blanking speeds. Less differences was observed between 100 and 500 mm/min.
Smaller loops resulted from the lower blanking speed of 1000 mm/min.

Chapter four Experimental results
129
Figure 4.42: Hysteresis loops of electrical steel type 0.35 TD samples cut by blanking
process at different blanking speeds.
Figure 4.43 illustrates the hysteresis power losses of electrical steel samples cut
by blanking process with respect to the flux density. The hysteresis loss at 100 mm/min
was slightly higher than the hysteresis losses at 500 and 1000 mm/min. This may indicate
that increasing the blanking speed can reduce the cut edge deformation and minimize
hysteresis power losses.

Chapter four Experimental results
130
(a) 0.2 RD
(b) 0.2 TD
(c) 0.35 RD
(d) 0.35 TD
Figure 4.43: Hysteresis losses of electrical steel samples cut by blanking process at
different blanking speeds.
Figure 4.44 shows the maximum flux density at different blanking speeds for all electrical
steel samples with standard deviation error bars. The figure illustrates that the generated
flux density is less in the 0.35 thick samples. Also, high induced flux density was induced
at the low blanking speed samples and it is higher for RD than TD. Also, the variations
in the values of the flux density were more for the thin sheets. As the thickness increases
the variations become smaller.

Chapter four Experimental results
131
Figure 4.44: Standard error bar for the maximum flux density at different blanking
speeds for the different electrical steel samples categories
Microstructural analysis of the cut edge
The microstructure and fracture surface at the cut-edge for different blanking conditions
were analysed using optical and SEM microscope in order to determine the effect of
applied blanking processes on the microstructural morphology of the sheets. The location
and analysis of the microstructure imaging was explained in chapter three in Figure 3.8.
The results were derived from SEM and optical imaging and EDS test analysis.
4.5.1 Investigation of the induced cut edge fracture surface
All the produced cut-edge surfaces in the tested samples were examined at the same
position with respect to the blanking die to illustrate the generated zones in the fracture
surface including the rollover, shear or burnish, fracture or rupture, and burr zones. The
samples were tested directly after the cutting process without any microstructure
preparation in order to maintain the resulting edges. A 1000 µm long section at the middle
of the sample’s width was selected for all the analysed samples for the sake of
consistency.
Figure 4.45 shows the SEM micrographs of the fracture surfaces produced by
blanking of 0.2RD samples using different blanking speeds. All the four zones are clearly

Chapter four Experimental results
132
visible in the cut edge surface in spite of the small sample section size. In addition, some
black areas spotted on the fracture surface which may have formed due to the rapid
staining of the material and the contaminants after the blanking process. These black
sections were neither treated nor cleaned in order to avoid modifying the induced cut edge
surface. The figure also shows that the proportion of shear zone to fracture zone increases
at the low blanking speed of 100 mm/min (sample A), which indicates greater penetration
of the punch inside the material. This proportion reduces at the higher blanking speed of
1000 mm/min (sample C). That means the fracture zone increases when the blanking
speed is increased, which may reflect the fact that the material sheet fails faster at high-
speed cutting.
Figure 4.45: SEM image for induced blanking cut edges of 0.2 RD samples at different
blanking speeds, A) 100 mm/min, B) 500 mm/min, C) 1000 mm/min.

Chapter four Experimental results
133
Figure 4.46: Microstructure at higher magnification of some selected areas in Figure 4.45
a,b) At shear and fracture zones, c,d) At rollover and shear zones.
Figure 4.46 shows high magnification micrographs of the selected areas of the 0.2
RD samples in Figure 4.45. Shear, fracture, and burr zones can be observed in Figure 4.46
a, b in different regions. The shear area appears as a smooth, flat surface, with some
scratch lines apparent in the shear zone that are potentially the result of friction caused
between the blanked material and the die cavity wall when the punch pushes the material
out of the die cavity. The fracture area is located below the burnished area and their
surfaces appear as a rough and ruptured area. Meanwhile, the burr zone resembles an
extension of the material at the bottom of the edge. Figure 4.46 c shows the rollover zone
which located at the top of the cut surface. While Figure 4.46 d shows the shear zone next
to the rollover zone. Due to the applied plastic deformation in the rollover zone, the sheet
coating has been broken and separated from the surface and created those features on the
surface.
Figure 4.47 shows elemental analysis by EDS test of the selected area in
Figure 4.46 d. The analysis reveals the presence of the main elements such as Fe, Si, and
Fracture zone Shear zone
Shear zone
Burr Burr
Rollover zone
Shear zone

Chapter four Experimental results
134
Al in the ES sheet material’s composition in addition to the high percentage of O and C
elements relating to the polymer material that makes up the coating layer.
Figure 4.47: EDS analysis for the square part indicated in the Figure 4.46 d.
Figure 4.48: SEM image for induced blanking cut edges of 0.2 TD samples at different
blanking speeds, A) 100 mm/min, B) 500 mm/min, C) 1000 mm/min.

Chapter four Experimental results
135
Figure 4.48 illustrates the cut edge zones for 0.2 TD samples at three blanking
speeds. Generally, similar behaviour to the 0.2 RD and all of the four zones is exhibited
in the cut edge surface. However, there is a bigger shear zone and smaller fracture zone
compared with the 0.2 RD samples at all blanking speeds. This means there was more
penetration of the punch inside the material before fracture of the material.
Figure 4.49 Figure 4.shows high magnification micrographs of selected areas of
the 0.2 TD sample shown in Figure 4.48. The shear and fracture zones are illustrated in
Figure 4.49 a, b. Also, the shear surface can be recognized as a flat, burnished, and smooth
surface, while the fracture zone surface is rough and ruptured. Figure 4.49 c, d show the
burr and rollover zones respectively. The burr appears as an area of small ridges and rough
protrusions, the structure being similar to that of the fracture area.
Figure 4.49: Microstructure at higher magnification of some selected areas in Figure 4.48
of 0.2 TD samples. a,b) At shear and fracture zones, c) at fracture and burr zones, d) At
rollover and shear zones.
Scratch lines
Burr
Direction of punch movement
Rollover zone

Chapter four Experimental results
136
Figure 4.50Figure 4. shows the elemental analysis by EDS test for the selected area
in figure 4.60d. The analysis displays the presence of the main elements such as Fe, Si,
and Mn in ES sheet material composition in addition to the high percentage of O and C
elements relating to the polymer material that makes up the coating layer and is not within
the original material structure.
Figure 4.50: EDS analysis for the square part indicated in the Figure 4.49d.
The sheet thickness 0.35 mm was investigated to show the influences of sheet
thickness on the induced cut edges zones and their features. Figure 4.51 shows the cut
edge surface zones formed by blanking process for 0.35 RD samples at three blanking
speeds, 100, 500, and 1000 mm/min. The zones are wider and the boundaries between
them are clearer and sharper compared with the 0.2 mm sheet thickness. A significant
increase is observed in the shear area and a decrease in fracture area size.
Figure 4.52 shows magnification of the selected area of the 0.35 RD sample in
Figure 4.51. The shear and fracture zones can be shown in the Figure 4.52a where the
smooth shear surface extends somewhat regularly along the edge surface. The fracture
zone surface is generally similar to that of the fracture area in the 0.2 mm sheet thickness.
Figure 4.52b shows the rollover zone, where some clusters are apparent due to peeling of
the coating layer.

Chapter four Experimental results
137
Figure 4.51: SEM image for induced blanking cut edges of 0.35 RD samples at different
blanking speeds, A) 100 mm/min, B) 500 mm/min, C) 1000 mm/min.
Figure 4.52: Microstructure at higher magnification of some selected areas in Figure 4.51
of 0.35 RD samples. a) At shear and fracture zones, b) At rollover and shear zones.

Chapter four Experimental results
138
Figure 4.53 shows the cut edge surface zones formed by blanking process for 0.35
TD samples at different blanking speeds. The figures illustrate an increase in the fracture
area and reduction in the shear area compared with the rolling orientation at the same
thickness, behaviour reflecting that faster failure of the material can occur under this
cutting condition. There is a small difference in the zones’ features in both grain
orientations, RD and TD, for 0.35 mm sheet thickness as shown in Figure 4.54a, b at
higher magnification of the selected areas of the shear, fracture, and rollover zones.
Figure 4.53: SEM image for induced blanking cut edges of 0.35 TD samples at different
blanking speeds, A) 100 mm/min, B) 500 mm/min, C) 1000 mm/min.

Chapter four Experimental results
139
Figure 4.54: Microstructure at higher magnification of some selected areas in Figure 4.53
of 0.35 RD samples, a) At shear and fracture zones, b) At rollover and shear zones.
It is worth mentioning that the microstructure of the cut edge induced by wire
EDM method is different from that induced by blanking method. Tensile samples and the
initial sheets for blanking process were cut by wire EDM method. Figure 4.55 illustrates
the absence of the four regions formed by blanking process. Instead, the EDM cut edge
surface has only a single microstructure which is similar to the fracture zone produced in
the blanking process.
Figure 4.55: SEM image for cut edge surface induced by EDM method used to prepare ES
samples.

Chapter four Experimental results
140
4.5.2 Deformation analysis of cut edge fracture
The burnished zone is formed purely by plastic flow of the material, as there is no crack
formation or propagation in this region. However, the crack initiates and is propagated in
the rupture zone during the blanking process. Therefore, a rough surface is produced by
material splitting. After production of the burnished zone, the material undergoes a
combined loading of shear and tension resulting in initiation of cracks and then the
fracture surface is created. The latter cause separation of material during the cutting
process. The fracture zone has many features such as small dents, pits, micro-cracks, and
micro-voids. The method used to modify the material’s texture and the distortion of the
cut edge could have a significant impact on the material’s behaviour and the quality of
the cut edge produced in the blanking process.
Figure 4.56 shows the fracture surface features for 0.2 RD samples at different
blanking speeds of 100, 500, and 1000 mm/min. All micrographs on the left side of the
figures illustrate a full cut edge profile at low magnification, while part (b) of the figures
demonstrate the selected affected areas of the fracture surfaces at high magnification as
indicated by the square shapes in the micrographs (a). Plastic shear bands at the cut edge
can be observed at the fractured edge, especially near to the burr zone. The figures show
the voids generated during the final stages of the blanking process where the material
undergoes mixed tensile-shear failure mode. It seems that the void concentration is higher
closer to the burr formation zone.
Figure 4. Figure 4.57 show fracture types for 0.2 TD samples at blanking speeds
of 100, 500, and 1000 mm/min. Generally, a similar trend of fracture deformation is
apparent in the transverse grain orientation samples to that seen in the rolling grain
orientation samples. However, the figures show less affected areas, although some large
voids near to the cut edge can be observed in figures (b).

Chapter four Experimental results
141
I. 0.2 RD 100 sample at blanking speed 100 mm/min.
II. 0.2 RD 500 sample at blanking speed 500 mm/min.
III. 0.2 RD 1000 sample at blanking speed 1000 mm/min.
Figure 4.56: Cut edge fracture surface for 0.2 RD sample at different blanking speeds.
Micro voids
Shear bands
Shear bands

Chapter four Experimental results
142
I. 0.2 TD 100 sample at blanking speed 100 mm/min.
II. 0.2 TD 500 sample at blanking speed 500 mm/min.
III. 0.2 TD 1000 sample at blanking speed 1000 mm/min.
Figure 4.57: Cut edge fracture surface for 0.2 TD sample at different blanking speeds.

Chapter four Experimental results
143
I. 0.35 RD 100 sample at blanking speed 100 mm/min.
II. 0.35 RD 500 sample at blanking speed 500 mm/min.
III. 0.35 RD 1000 sample at blanking speed 1000 mm/min.
Figure 4.58: Cut edge fracture surface for 0.35 RD sample at different blanking speeds.

Chapter four Experimental results
144
Figure 4.58 show fracture types for 0.35RD samples at different blanking speeds
of 100, 500, and 1000 mm/min respectively. Generally, a large number of voids can be
observed, with some elongated voids in the shear deformation gathering to form
something similar to cracks. Some defects are shown also in the area near to the edge.
Figure 4.59 shows elemental analysis by EDS test for the selected area in
Figure 4.58 III b. The analysis displays a high percentage of O, C, and N elements in the
indicated area 1 besides the main electrical steel alloy elements, relating to the coating
layer ingredients. Meanwhile, no clear elements can be seen in area 2, although the test
searched for elements within the body and not just the shell (The letter K after an element
symbol refers to a body element, whereas the letter L refers to elements found in the
shell). The results of the analysis may indicate the presence of deep voids, which may
have resulted due to the applied plastic deformation.
Figure 4.59: EDS analysis for the square parts indicated in the Figure 4.58 IIIb.
Figure 4.60 show fracture types for 0.35 TD samples at different blanking speeds
of 100, 500, and 1000 mm/min respectively. Figures (a) on the left side illustrate a full
cut edge profile at low magnification of SEM observation, while the micrographs (b) on
the right side demonstrate high magnification of the indicated fracture area in the
micrographs (a). Generally, less number of voids can be seen for 0.35 TD compared with
0.35 RD samples. The cutting process produced less distortion regarding these
parameters, which was concentrated in specific locations. The characteristics of these
areas are similar to those seen in the previous samples. Moreover, in all cases, the fracture
angle is much larger for the low speed, as is more obvious with the thicker material.

Chapter four Experimental results
145
I. 0.35 TD 100 sample at blanking speed 100 mm/min.
II. 0.35 TD 500 sample at blanking speed 500 mm/min.
III. 0.35 TD 1000 sample at blanking speed 1000 mm/min.
Figure 4.60: Cut edge fracture surface for 0.35 TD sample at different blanking speeds.

Chapter four Experimental results
146
4.5.3 Estimation of the depth of cut edge deformation
Optical micrographs were used to determine the extension of deformation from the cut
edge by indicating the limits of shear bands deformation. Moreover, they would indicate
the grain number over the deformation area.
Figure 4.61 shows the optical microscopic micrographs of the sample 0.2 RD at
different speeds. The crystalline boundaries appear clearer and show the presence of only
two grains at the cut edge area. All the deformation expansions were within the large
grains and shear bands are more visible in larger grains at the vicinity of the cut edge. In
addition, the deformed grains pointed towards the punch movement direction when
moving from the rollover area to the burr area which means the grains are stretched in the
direction of cut. However, the extension of deformation still random and depends on the
size of local grains at the cut edge.
Figure 4.61: Optical micrographs for induced blanking cut edges of 0.2 RD samples at
different blanking speeds, a) 100 mm/min, b) 500 mm/min, c) 1000 mm/min.
Figure 4.62 shows the optical microscopic micrographs of the sample 0.2 TD at
different speeds and indicates the presence of only two to three grains at the cut edge area.
The extension of plastic deformation seems to be concentrated at the fracture zone more
than the rollover and shear zones. The deformed grains were also pointing towards the
punch movement direction. The expansion of deformation seems to have stopped at the
grain boundaries.
(a) (b) (c)

Chapter four Experimental results
147
Figure 4.62: Optical micrographs for induced blanking cut edges of 0.2 TD samples at
different blanking speeds, a) 100 mm/min, b) 500 mm/min, c) 1000 mm/min.
Figure 4.63 shows the optical microscopic micrographs of the sample 0.35 RD at
different speeds. Also, about 2-3 grains are present at the cut edge area. The deformation
is less relative to the thickness of sample and concentrated in specific locations along the
cut edge line, possibly because of the increase in the sample thickness.
Figure 4.63: Optical micrographs for induced blanking cut edges of 0.35 RD samples at
different blanking speeds, a) 100 mm/min, b) 500 mm/min, c) 1000 mm/min.
Figure 4.64 shows the optical microscopic micrographs of the sample 0.35 RD at
different speeds. About 2-3 grains are present at the cut edge area. The extensions of
plastic deformation are distributed along the cut edge, but it does not extend much from
the edge. It should be noted that it is very difficult to measure or even estimate the amount
(a) (b) (c)
(a) (b) (c)

Chapter four Experimental results
148
of the extension because it represents a variable state that depending on the case of the
sample.
Figure 4.64: Optical micrographs for induced blanking cut edges of 0.35 TD samples at
different blanking speeds, a) 100 mm/min, b) 500 mm/min, c) 1000 mm/min.
The micrograph results can prove that the defects are depending on the texture
and grain dimension at the cut edge. It seems that if the cutting line occurs inside the
grain, the deformation will extend further, especially if the grain size is very big. That
means that the expansion of deformation could be impeded by the grain boundaries.
Thereby the grain size and location play the key roles in deformation extension.
4.5.4 Estimation of the grain size and number over the sheet thickness
The size of the grains in the sheet material is very important in the blanking process
because of the small number existing over the sheet thickness. Therefore, grain size can
cause changes in the edge quality and the type of edge fracture. Generally, the effect of
grain size on the cutting process increases when the sheet thickness is reduced.
Figure 4.65 a, b illustrates the number of grains existing for both the ES sheet
thicknesses, 0.2 and 0.35 mm. The number of grains across the thickness of the material
was limited to 2-3 and 4-5 for the 0.2 mm and 0.35 mm thicknesses, respectively.
Therefore, the local grains features at the cut edge are playing an important role in the
mechanics of deformation of blanking process of the thin sheet samples. According to
the figure, the average grain size for the 0.2 mm thickness samples was approximately
103 µm, whereas it was about 140 µm for the 0.35 mm thickness (see appendix B).
(a) (b) (c)

Chapter four Experimental results
149
Figure 4.65: Optical micrographs for the (a) 0.2 mm and (b) 0.35 mm electrical sheet
thicknesses at low magnification of 20X.
Summary
Electrical steel sheets were successfully cut using the blanking process for two different
thicknesses, 0.2 and 0.35 mm, and two-grain orientations, RD and TD, at three different
blanking speeds of 100, 500, and 1000 mm/min. The following experimental tests, which
presented quite serious challenges due to the small sheet thickness of the produced
samples, were carried out:
Mechanical properties for ES sheets and cut edge area were characterized using
tensile tests, DIC technique, and Nano indentation tests.
Material microstructure and cut edge fracture and zones deformation were
examined using SEM, optical and the EDS tests.
Magnetic properties and hysteresis losses in both tension and blanking condition
were investigated using a single sheet magnetic tester.
Strain distribution due to both tensile and blanking deformation was tested using
DIC technique.
The results of these experiments tests were presented. The importance of these
investigations lies in identifying the deformation distributed around the cut edge. The
results proved that the methods used were effective to give a clear conception of the effect

Chapter four Experimental results
150
of the edge deformation on the material’s properties. The analysis of the results also
indicated of uncontrolled nature of the deformation because it depends on the type and
size of a limited number of grains that exist in the cut area that can change the blanking
deformation according to the cutting location. The next chapter will attempt to establish
links between some of the most important findings in order to reach accurate conclusions
and provide further discussion related to the cut edge deformation, in particular those
aspects that are most influential regarding cut edge deformation.
Chapter five Discussion and statistical analysis
151
5 Discussions and statistical analysis
Introduction
The results of the characterization of cut edge deformation and the effects on magneto-
mechanical properties reported in the previous section will be discussed in this section.
Moreover, the potential errors and limitations of the developed and applied methods with
a critical analysis of the results obtained will be discussed. This will be done in order to
establish a relationship between blanking parameters and outcomes of deformation which
could provide further explanation and understanding of the consequences of the
deformation. In addition, the statistical analysis of the results will be used to determine
the most statistically significant operational parameters in terms of the cut-edge quality.
The critical influences of the cut edge microstructure
The current study presents the effects of a possible case study of the blanking
deformation with microstructure images of the cut edge grains for specific blanking
parameters on the magnetic and mechanical properties of the blanked thin sheet of ES.
The induced deformation plays an important role in the evolution of the final blanking
product. Using thin sheets of electrical steel led to reducing the number of local grains at
the cut edge region. These small number of grains could be different in size and shape.
Also, the position of cutting line is varied and cannot be controlled as the sheets are

Chapter five Discussion and statistical analysis
152
randomly feeding to the blanking dies. That can lead to rising several critical issues
regarding the analysis of induced deformation of the blanking process, for examples, the
deformation will vary from sample to sample even with same blanking setting and
therefore it is very difficult to determine the effects of the induced deformation or specify
any fixed trend regarding the process parameters.
The grain size has a significant influence on the blanking process, when there are
only a few grains cross the sheet thickness, even the fracture type by means of crack
initiation and propagation may differ and thereby the deformation depth could increase
or decrease and also the cut edge zones will change along the cutting line, that was well
reported in [72, 73].
As a result, characterized blanking induced deformation behaviour and the cut
edge quality may not only relate to the blanking parameters as reported in [116, 117].
These are also influenced by the condition of the grains at the cut edge where the presence
of few grains across the thickness can show a strong variation not only in the cut edge
profile but also in blanking deformation distribution.
The grains orientation and coordination also play a crucial role in shear
deformation. With the decrease of sheet thickness, the number of grain in the cross section
of the sheet decreases and possibly grains size become bigger that will lead to increase
the anisotropy of the local deformation mechanisms and individual grains become key
players on affecting the local shear deformation in blanking as mentioned in the literature
[74]. However, as it is explained previously the finer grains in the microstructure
increases the number of active grains during deformation, therefore statistically there may
be more favourable deformation orientations in the critical zone. Where the blanking
deformation of fine-grained in sheet specimen takes place with the most favourable grain
sliding systems. This will result in a more uniformly distributed deformation conditions
as shown by [74]. While in the coarse-grained sheet specimen, the grain crystal
orientation varies and the slipping systems are oriented differently with the blanking
direction. The grains with an unfavourable orientation towards the blanking direction may
lead to shear deformation more difficult. That makes the orientation of these grains very
important, especially for the cutting direction, these differences are related to the variation
of deformation behaviour during the blanking process.
The microstructural results (Figures 4.45, 4.48, 4.51, and 4.53) for the cut edge surface
demonstrated that the cut edge surface consists of four distinct regions: rollover,
burnished, rupture, and burr zones. This is a typical condition in all sheet metal blanking

Chapter five Discussion and statistical analysis
153
operations as reported in [63, 64]. These SEM images showed that the cut edge zones
occur sequentially and the size of each zone is affecting by the sheet thickness. According
to the cut edge fracture results (Figure 4.45 to 4.54). The larger shear zones at lower
blanking speed indicate more penetration of the punch into the material. Therefore, the
fracture zone is expected to increase, at the expense of smaller shear zone when the
blanking speed is increased. This indicates that the material fails more quickly due to
possible faster crack initiation and propagation because of the applied kinetic energy [4].
The shear bands are formed due to the applied elongation and shear
stress/deformation. According to the images of cut edge fracture analysis (Figure 4.56 to
4.60), the shear deformation is concentrated with just a few grains that confined by the
punch and the die. Also, the shear bands are propagating and elongating in alignment in
parallel to the direction of punch movement. The qualitative analysis of the SEM
micrographs indicates that the density of the shear bands are higher close to the cut edge
and the bands are densely packed in a narrow zone. This can indicate that the severe
plastic deformation occurred within a narrow zone because of excessive the punch
penetrated into the sheet thickness lead to exposing the material to more shear and
compression stresses and results in more dislocations. This shows the severity of the
plastic deformation in these regions that could be linked to the measured plastic strains
and the high hardness values obtained from the Nano-indentation results.
Moreover, the higher amount of shear bands visible at the low blanking speeds
support the theory that the punch penetration is higher for this testing condition as the
larger punch penetration should be compensated by more material deformation and flow
around the punch to facilitate the blanking process. In contrast for the higher speeds, the
crack propagations will take the dominant role, as already explained, therefore less
material will deform in these cases.
The observed cut edge deformation in the current study are in a good agreement
with the literature findings [152, 153]. The shear band becomes more obvious with greater
penetration of the punch because of the involvement of more grains in the shearing
process. While the shear bands become less visible with a decreasing number of grains in
the shared area as seen in Figure 4.61 to 4.64. Similar findings are also reported in the
literature [154]. In addition, a few large-sized grains appeared over the sheet thickness
section as shown in Figure 4.65. That can prove the big role of the individual local grain
on the mechanics of deformation at the cut edge of thin sheet samples. The anisotropic
property of the single grain makes the deformation inhomogeneous and the slipping

Chapter five Discussion and statistical analysis
154
direction of the grain may not be in the blanking direction [154]. Moreover, it may not be
accurate to generalize the process of thin sheet analysis according to the thick sheet
analysis, as it seems the material behaviour may be different because increasing the
number of local grains at the cut edge will increase the stability for grains effects.
Plastic strain and magnetic properties under uniaxial tension
The tensile testing at different rates was conducted to verify the rate sensitivity of
used two different thicknesses (0.2 and 0.35 mm) at different grain orientations (RD and
TD) of the thin steel sheets. The tensile results (Figures 4.1 and 4.2) show that the samples
strength has a limited dependency on the test orientation and the material behaviour is
more consistent at higher loading speeds. Also, the increase of tension test speed led to
slightly higher tensile strength regardless of the specimen orientation. The material
properties were affected when reducing the sheet thickness and led to varying the
mechanical properties, for example, the yield stress was decreased for thinner sheets
similar trend was reported by [155].
Moreover, the material properties slightly changed when tested at lower loading
speeds by means of lowering the tensile yield. This behaviour could be attributed to the
small thickness and grain size of the sample [133, 156]. The other possible reason is the
effect of the machine's stiffness/compliance on the results. Lower strain rate can cause
less stiff (more compliant) testing machine [157].
The tensile results in Figure 4.3 also showed that the samples elongation was
affected by the applied tension direction with the higher extension for rolling direction
which is well documents in the literature [155]. This is due to the application of the axial
tensile load parallel to the rolling direction. The anisotropy and grain orientation have a
great impact on the plastic deformation, the flow stress tends to decrease when the
thickness of the sheet decreases [155]. The figure also showed some differences in the
tensile results for the selected material having sheet thicknesses, which could be attributed
to slight variation in the chemical composition and the effects of the manufacturing and
rolling processes. Also, grain size may play the main role in crack initiation and
propagation. Also, the existing of few grains in the local deformation zones may affect
the strength of bonding between the grains orientation [155, 156].

Chapter five Discussion and statistical analysis
155
The conducting of the DIC technique during the tensile tests gave a vision of the
strains distribution in each stage of the test. The local strain distribution in uniaxial
loading was reported in Figure 4.6 to 4.9 during different stages of interpreting the tensile
test. A uniform deformation of samples all over the gauge length was observed.
However, the processing analysis of the captured images using the Davis software
includes several parameters could affect the accuracy of the analysis results. For
examples, the image resolution and the selection of the proper subset and step size that
directly related to the speckles number and size inside the deformation zone. The
measured strain errors associated with the DIC technique results due to the uncertainty in
pinpointing the intersections of the deformed grids to measure the strain distribution and
the error associated with the correlation parameters and algorithms used in DIC [158].
Additionally, a small difference in the selected gauge size for strain calculation can also
introduce errors in the obtained results.
Figure 4.5 illustrating the error values in the measured strain values distributed
over the analysed region, the figure shows a maximum error value of about 3%, this value
can be negligible compared to the large strain values measured during the tensile test
about 45%. Consequently, the error analysis results proved of the presence of acceptable
error percentage, about less than 10% regarding the maximum amount of deformation
applied during the tensile tests of ES steel. Similar error levels are reported in the
literature even for smaller applied strain [159].
The strain distribution images illustrated that there is no local necking and the
fracture occurs instantly, where the fast crack formation and propagation caused through
concentration of stress at the crack edge. The micrographs in Figure 4.4 also confirms
that. This may be attributed to the high percentage of silicon in the ES material that can
increase the material brittleness and affect the fracture type [155].
To investigate the effect of plastic deformation on the magnetic properties, the
tensile test was interrupted with an increment extension 1 mm plastic deformation where
each elongation is corresponding to a strain value that provided precisely by DIC test.
Each deformed tensile sample was measured using the magnetic single sheet tester.
The increase of the dislocation at larger deformation causing to increase the
spacing between domains and lead to facilitate of domain wall movement and
achievement of the saturation state [22]. Dislocations in crystal lattice are the major
pinning centres for domain wall movement. Whenever the dislocation density increases
will cause more hindering of domain wall movement and result in large magnetic losses.

Chapter five Discussion and statistical analysis
156
Figure 2.32 could prove this idea by showing the development of simple dislocations into
wavy slip bands when increasing plastic deformation [13].
The hysteresis loops (Figures 4.34 to 4.37) were shrunk when applied plastic
deformation during tensile tests. This was more evident at the saturation level and
minimal variations were observed at the coercivity points due to the limitations of the
applied method. The change of the hysteresis loop is reported to be directly linked to the
applied deformation will change the stress state and distance of the active domains in the
samples [101]. Additionally, the variations observed between the RD and TD curves
could be explained by the material tends to deformation and local grain orientation across
the tested regions.
The changing in the magnetic hysteresis loops are mainly due to domain walls
motion when applying a magnetic field [21]. Therefore, the domain theory about the
aligning domain and the motion of the domain wall consider as a suitable tool for
providing a physical explanation of the stress effect in electrical steels [20]. A free-stress
condition can be described as a small number of large domains oriented inside each grain
close to the rolling direction [23]. Applying tensile stress seems to improve the domain
structure because it leads to the refining of the wall spacing of main domains that results
in an almost ideally oriented domain structure [22]. This may because the thinner sheet
could contain a larger number of grains along sample length, and thereby more grain
boundaries. Each grain boundary is considered as a big domain wall that may contain
many regions of small domains. Therefore, this creates more pinning sites of domain
movements and thereby causes more loss [9]. The results proved that hysteresis loops are
highly influenced by the sheet thickness and less by the grain orientation.
Defects evolution during the blanking process
Blanking process was reported as the preferred method and the most desirable
way to produce the final shape of the stator and rotor laminations because it can be used
for mass production at lower cost [43, 46]. Moreover, it was concluded that electrical
steel sheet is the most common material used as a lamination material due to its relatively
good magnetic properties, such as high permeability and lower loss [11, 3].

Chapter five Discussion and statistical analysis
157
However, several effects can be induced by the blanking process, for example, as
the blanking process is implemented under cold working conditions, it produces a region
of residual stress that spreads some distance from the sheared edge, as shown in Figure
4.30 to 4.33 and reported in studies [3, 4]. Additionally, although the small deformation
zones and the effect of built-up compression could suppress the generation of fracture
zones in the shear surface and minimize the crack size [61], the increased dislocations
density due to blanking induced plastic deformation [6] could affect the local mechanical
and magnetic properties of the sheet [13]. Accumulations of these dislocations generate
pin sites restrain domain walls movements and impair permeability and increase power
loss [3]. The microstructural defects of the cut edge surface can be observed in Figure
4.45 to 4.54 of the cut edge surface fracture.
These results showed that cut edge geometry defects were affected by the
implemented blanking conditions, which in turn can influence the magnetization process
and the distribution of flux around the cut edge [3] that reflected in the different hysteresis
loops size as shown in Figure 4.39 to 4.42. The magnetic properties represented by the
hysteresis loops and losses in the current study was changed due to the blanking effects
that could increase or decrease according to the changing of process parameters.
Consequently, all the above-reviewed blanking effects can prove the affected the
magneto-mechanical properties of the cut edge. For example, the production of burrs may
cause electrical contact between the laminations of the core. Soft steel could produce long
burrs that lead to an increase in magnetic loss [1].
The results of the cutting force were recorded by a load cell attached to the upper
plate of the die are shown in Figures 4.11 to 4.12. The study showed that the speed of the
deformation significantly affects the blanking force. Where the study found that
conducting the process at higher speeds caused a reduction in the punching force and
improved the quality of the part edge as represented in a larger shear zone, smaller burr
height, and rollover area. Also, at different blanking speeds, the cut material can show
different behaviour which can result in a diverse cutting force as reported in [89], that
because it also depends on the condition of local grains at the cut edge and fracture type.
The cutting force was decreased as a result of increasing the blanking speeds even
when the thickness and orientation are fixed for all produced sample in both used blanking
dies. That matched the finding by some of the previous researches [86], although others
noticed some variation in the relation between them [82]. There are conflicting data
concerning the effects of shearing speed on the energy requirement for shearing [82]. That

Chapter five Discussion and statistical analysis
158
because each study implement the cutting process in different blanking speeds some at
very slow up to 10 mm/s and others at very high speed up to 10 m/s. That could be
attributed to the fact that the higher speeds may result in less plastic deformation that
could cause higher kinetic energy and therefore quicker shear crack initiation,
propagation, and fracture [87]. That means a reduction of shear area and increase of the
fracture zone as shown in Figures 4.45 to 4.54. In other words, the energy required for
plastic deformation is lower, therefore there is higher stored elastic energy that could
facilitate shear crack propagation [5, 82]. Other possible interpretation is the thermal
conduction and distribution of heat to the vicinity of the cut area by. In high punch
velocity, the limited balancing of temperature causes a higher temperature at the
deformed cutting edge. In contrast, at slow punch velocity, the heat is dissipated out of
the shearing zone because there is enough time for thermal conduction to occur [80].
Accordingly, the other mentioned reason is that the short time of high blanking speed can
lead to concentration of generated heat in the material, causing a thermal softening and
reduction of the force required to cut the sample [80, 81].
However, because the speeds used in the blanking process in the current study were
not very high, the reason for the decrease in cutting force could fluctuate between the two
mentioned explanations. In addition, the blanking force measurements also show that the
increase of thickness leads to an increase of the force value, which occurs because of the
increase of the deformed area due to the larger thickness.
Blanking local strain and the depth of deformation
The evolution of local plastic deformation in electrical steel has been studied using a DIC
technique in-situ blanking process and the Nano-indentation test at the cut edge. Tests
were performed using a specially blanking die and suitable DIC set-up. Implementing this
test was associated with big challenges because of the very small deformation zone
represented by the thickness of the sample and the high-speed punch movement.
Maximum equivalent strain were extracted for blanking samples because the
deformation region undergoes a combined loading of shear, tension, and compression
during the blanking process [63]. Therefore, the strain values could include axial strains
components in addition to the shear strains components. Thereby, the equivalent strain
could better express the strain in blanked material than the normal stain as it is a resultant
of both principle and shear strains.

Chapter five Discussion and statistical analysis
159
The strain distribution around the sheared edge was measured through tracking
the initiation and evolution of damage over the thickness of the sheet at different stages
of the process using DIC tests. According to the DIC results, the observed deformation
was started from the contact point between the punch and the sheet surface, then grew
towards the die side, as shown in most of DIC results during the blanking process, this
trend was also reported by K.wang [99]. Sometimes, the deformation may concentrate on
both sides of the sheet when applying very small clearance may reach 2% of sheet
thickness [62, 137]. Which is not the case on current cutting condition as the clearance is
around 10%t, therefore the figures 4.14 to 4.25 showed the strain starts concentred from
the punch side. That because of the breakoff angle of the cracks between the punch and
die sides will not meet when extended because applying insufficient or excessive
clearance [62]. Consequences the cutting zone and lead to extend or narrow the
deformation effect. The obtained results illustrated the cut edge zones and stages for the
mechanism of blanking process starting when the punch touches the sheet surface then
shear and crack formation until the fracture stage and separation. However, the analysis
process of induced blanking strain in a thin sheet of ES using the digital image correlation
(DIC) technique includes many issues that could affect the analysis results. For examples:
the results showed that there are differences in fracture moment between samples due to
the applied diverse blanking speeds that can cause different impact energy which results
in different material resistance and thereby different yield points. In addition, the high-
speed movement of the punch and the induced vibrations due to the impact with the sheet
surface lead to the difficulty of the determining of the instant of touching blanking tool
(Punch) to the sheet surface because of the high rate recording system and high-speed
punch movement. Moreover, the low thickness will lead to reducing the possibility of
generating speckles across the sheet thickness. Also, the small deformation zone will lead
to reducing the image resolution.
The individual analysis of the blanking test cases because of the difficulty in the
timing of DIC image acquisition at different blanking speeds, and regardless of the punch
position, the last image before the fracture and separation of the blank from the sheet
showed the state of the part after blanking which can represent the maximum deformation
for the blanked sample. In addition, although the state of the deformation may vary from
sample to another because it depends on the local grains and their orientations at the cut
edge location. The high-speed DIC results showed the deformation that occurred during
the blanking process for the current case studies.

Chapter five Discussion and statistical analysis
160
The processing analysis of the captured images using the Davis software also
includes several parameters could affect the accuracy of the analysis results. For
examples, the image resolution and the select of the proper subset and step size that
directly related to the speckles number and size inside the deformation zone. The
measured strain errors associated with the DIC technique results due to the uncertainty in
pinpointing the intersections of the deformed grids to measure the strain distribution and
the error associated with the correlation parameters and algorithms used in DIC [158].
Implementing the high-speed DIC technique during relative high-speed blanking
process resulting in significant challenges and problems in strain measurements
especially with triggering, timing, spatial resolution and errors. The error analysis of the
DIC technique has revealed that the existence of error though small in strain distribution
patterns obtained from DIC. An average error of about 1.8% in strain values was found
over the entire analysed area of the blanking process as shown in Figure 4.13. This value
can be negligible compared to the large strain values measured during the process.
However, the DIC technique under-determines the strain values with an average error of
about 5% for the amount of deformation applied during the blanking tests of ES steel.
In spite of the uncertainties associated with the applied DIC measurement
technique, a qualitative comparison of the measured strain maps showed a larger
deformation zone is generated for lower blanking speeds. In addition, transverse
orientation produced lower strain than the rolling direction regarding the applied of the
direction of cutting line. This trend could be due to the increased plastic deformation and
the time required for the material to flow around the cut edge. Also the grains orientations
in a parallel direction to the cutting line led to increasing of the extent of deformation.
The Nano-indentation test was implemented for the thin sheet electrical steel
material at the cut edges and vicinity area to identify the mechanical properties and show
the distribution of residual stress on the sheared edge and the nearby area. It is known that
there is a strong relationship between hardness and tensile strength [5]. Therefore, the
deformation could be estimated based on the hardness results through the correlations
between the indenter penetration depth and true contact area. Also, Nano-scale can allow
the investigation to be conducted very close to the end of the cut edge. However, the high
variability of the Nano-indentation measurements makes it difficult to pick out clear
trends regarding process parameters.
Figures 4.30 to 4.33 showed that the local hardness of at the vicinity of the cut edge
changes dramatically with values as high of about 6.5 to 3.5 Gpa at a distance of 100

Chapter five Discussion and statistical analysis
161
microns from the cut edge where the value reached the average hardness of the bulk
material. Such a large variation of the local hardness could be related to the strain
hardening effect as the material experiences large plastic strains, showed by the DIC
maps, as well as the presence of residual stresses around the plastically affected zones.
The residual stresses affect the penetration load of the indenter and therefore the Nano-
indentation measurements read higher values for the loading part of the curve. The
obtained hardness profile could, therefore, be an indicator of residual stress depth as also
reported in [3, 4].
However, the change in the hardness values between those close and far from the
cut edge proved the influences the cutting-edge zone by the deformation resulting from
the blanking process as shown in Nano-indentation results (Figures 4.30 and 4.32) . That
because of the deformation can causes strain hardening and leads to increasing hardness
values due to increased material resistance to the penetration of the indenter [103, 104].
As the higher values of hardness were observed concentrated near to the cut edge and
widely distributed, that could lead to conclude that the impact of the plastically deformed
zone on the mechanical properties is greater than that of the stressed area as shown in all
obtained results. These results matched the finding by [5].
It is very difficult to identify the depth of the deformation area according to the
hardness measurements because of the variations. However, the position of the stability
of the hardness values regarding the general hardness value of the sheet could be
considered as the end of the deformation. According to the current results, the size of the
plastic deformation is varied between samples depending on the deformation condition.
The average extension of deformation for 0.2 ES samples was reached to around 100 µm
in most cutting cases and slightly less for 0.35 ES samples. Also, there is no clear trend
to explain the effect of the rolling and transverse orientation regarding the hardness values
Moreover, in order to show the variation of hardness values at a specific distance
from the cut edge regarding the blanking parameters, the average hardness values at
distance between 25 to 30 µm for different samples as illustrated in Figure 4.31. A similar
result was obtained to show the effect of the blanking parameters of 0.35 mm ES sheet
thickness against the hardness values as illustrated in Figure 4.33. The figures illustrate
proved the high variation of hardness results even at same position to the cut edge,
however, the total DAZ is varying depending on the blanking condition and local grains
condition.

Chapter five Discussion and statistical analysis
162
The effects of blanking induced plastic deformation on
magnetic properties
The link between the electrical steel material and the magnetic applications means that
the edge deformation could directly correlates with the magnetic properties. It is already
shown that the induced plastic deformation due to the blanking process causes residual
stresses, thereby having a harmful effect on the magnetic properties of the material [113]
and resulting in much larger B-H loops and a high energy loss [114]. These locked-in
stress areas can affect the magnetizing process of the material and impair permeability
and increase power loss [3,116]. In addition, dislocations of the crystal lattice are the
major pinning centres for domain wall movement. Therefore, the increase of the
dislocation density will cause more impeding of domain wall movement and result in a
large increase in energy loss [54, 56].
It is already reported that the applied plastic deformation and locked-in stresses
could increase the hysteresis losses [3] due to the higher amount of energy required to
break the barrier developed by the induced dislocations [13] and magnetize the material.
The effects of the blanking process on the magnetic properties were demonstrated through
measuring the hysteresis loops of blanked samples at different cutting conditions applied
in the current study. The hysteresis losses were calculated from loops for electrical steel
samples by subtracting the absorbed energy from the dissipated energy [144, 145].
Figures 4.39 to 4.42 showed that for the applied cutting conditions the loops
changes in way of its size which can indicate the affected magnetic properties by these
changes in the cutting process and material conditions as reported in [114]. However, this
could be considered with caution as there were not enough data points, due to the
limitations of the applied technique to determine the full hysteresis loop, especially
around the coercivity points. The changing in the cutting parameters can affect the size
of the hysteresis loops in a complicated way due to the interaction between these
parameters. For example, the increasing of the blanking speed could reduce the hysteresis
loss as shown in Figure 4.43. Additionally, the effect of blanking speed is well visible in
the graphs in which higher speed reduces the loss. This is well linked the aforementioned
theory about the observed plastically deformation zone and the energy required for the
blanking since the higher speeds induce less plastic deformation, therefore the magnetic
domains are less disturbed, leading to reduced hysteresis losses.

Chapter five Discussion and statistical analysis
163
The trend is also reported in the literature, according to [5, 63], the die clearance
can lead to increase or decrease the stressed area and thereby affect the magnetic
properties. Figure 5.1 shows the links between the calculated magnetic losses and the
induced blanking-DIC strain of the same sample regarding the blanking speeds and
material thickness. The figure illustrates a logical trend of hysteresis losses with the
maximum measured strain by DIC, wherein higher losses are attributed to the larger
measured strains. In addition, there is a proportional relation between the induced strain
and the magnetic losses, or, in other words, when the strain is being increased, the
hysteresis losses will increase as well. Also, it is noticeable that increasing the blanking
speed can lead to the reduction of hysteresis losses because the induced deformation is
less at high speed as shown in the DIC results.
Figure 5.1: Magnetic hysteresis losses and the induced blanking strain regarding
blanking conditions.
In addition, the figure shows that sheet thickness has a significant influence on the
hysteresis losses and magnetic properties, where the hysteresis losses being higher at the
low sheet thickness. Although the general known trend is that the thinner the sheet is
better the magnetic properties [7, 30], and the power loss generally decreases at lower
thickness because the eddy current loss component tends to decrease linearly with
reducing the thickness [30, 31]. Contrary, the hysteresis losses component tends to
increase with decreasing the sheet thickness [31]. This is because the hysteresis loss
results due to the irreversible nature of the magnetization process of a magnetic material,

Chapter five Discussion and statistical analysis
164
whereas the eddy loss occurs due to the currents flow in the opposite direction to the
electromotive force (emf) induced in the material due to the magnetic field [29]. There
is a discrepancy between the sum of hysteresis and classical eddy current loss when
compared to the specific total loss in a material. This difference is due to anomalous losses
[29].
Several factors appear to be responsible for the reductions in energy losses with
decreasing thickness of ES sheet such as the change in the material’s permeability. The
other factor that could influence the energy loss of the thin sheet is the domain wall
spacing on sample thickness because of reducing the grains number [32]. The increase in
the number of domain walls because of the increase in grain boundaries along the length
of the sheet (see Figure 3.17 for the flux flow path and Figure 4.65 for grains number
along the ES sheets) with a lower thickness results in reduced domain wall velocity and
thereby reducing the flow of magnetic flux and affect the magnetization process.
Moreover, the flux density is more intensive in the thinner sheets because the
applied magnetic field is constant and the cross-sectional area is smaller. The losses are
increased at high flux density [160].
According to Figure 4.44, the flux density in the thinner sheets is higher than the thicker
one because the applied magnetic field is constant and the cross-sectional area is smaller for thin
sheet. The high flux density can associate with a higher hysteresis loss as reported by [160]. This
is due to the amount of flow flux density is related to the absorbed energy. The evidence for this
is that when domain wall movement is high, the absorbed energy will be less and thereby the
hysteresis loss is less. Conversely, deformation will lead to slow the domain wall movements, in
consequence, more flux are needed to absorb more energy to overcome the constraints and thereby
increase the dissipated energy and cause high loss [19].
Statistical Analysis
The results of the experimental tests can be analysed to obtain meaningful information
through establishing the conditions in the process and estimating the contribution and
significance of individual parameters and their interactions.
The statistical software Minitab 18 was used to analyse the results. Analysis of
variance (ANOVA) was adopted to analyse experimental data to identify the important
parameters, and the statistical results and ANOVA statistics (R-square, adjusted R-
square, standard error) were examined to find out whether the model fits and is

Chapter five Discussion and statistical analysis
165
acceptable. Usually, the ANOVA models are used with the design of experiments (DOE)
to design and analyse cases that involve a response change as a function of one or more
independent variables [161]. However, the current work only used the statistical model
to analyse the obtained experimental results and not as a prediction model to determine
the impact strength of outputs regarding the process conditions by linking the input
variables with the results of one or more outputs [162].
5.7.1 Interaction between parameters and response
The input variables, also called parameters, are values that change and provide an output,
and can be divided into quantitative and qualitative variables [163]. In the current study,
the input variables are the cutting process and material conditions which comprises two
electrical sheet thicknesses: 0.2 and 0.35 mm, two sheet orientations: RD and TD, and
three blanking speeds: 100,500, 1000 mm/min, and one clearance 10% from the
thickness. The response, meanwhile, is also the output variable of the experiment. The
response of this study is the quantities of the cut edge properties and deformations. The
interaction between parameters occurs when the response of one variable differs at
different levels from that of another variable [163]. The goodness of the ANOVA model
depends on the residual of the difference between the response value (the output variable)
and the predicted value [163].
5.7.2 Analysis of Variance (ANOVA)
The analysis of variance (ANOVA) was used to determine the significance of cutting
parameters on the cut edge deformation and properties results. ANOVA analysis includes
terms such as [163]:
The source: represents the main parameters (independent variables) and the
interactions that have effects on the response (dependent variable).
F-value: is a statistical test used to find out how close the parameter is with the
dataset. The F critical value is around 4 of the slope of the normal distribution of
data analysis. When the variable is smaller than 4, it is an insignificant factor.
Conversely, the higher F-value indicates a significant effect [163].
P-value: indicates whether the results are statistically significant. Therefore, it
provides a clear and concise summary of the significance of the experimental

Chapter five Discussion and statistical analysis
166
results. The range of the P-value is from 0 to 1. The confidence level or the
significance level of the parameter interaction is considered as a significant factor
when the P-value is less than the confidence level 5% [163].
Standard deviation (S): is a function for measuring the goodness of the fit and is
calculated in the units of the response. The standard error represents the average
distance of the observed values from the fitted line. Thus, the smaller the value of
the standard error, the closer the observations are to the line of best fit.
R-squared (R-sq.): also known as the coefficient of determination and indicates
the goodness of the data fit in the model and ranging from 0 to 100%. The model
fit of the analyzed data becomes better when the R-squared is high. The adjusted
R-squared (adj.-R-sq.) is used when the model is complex and has many
independent variables that related to each other and it is always less than R-
squared. While the predicated R-squared (pred.-R-sq.) is used to indicate the
acceptance of the model fitting by predict responses for new observations data.
5.7.3 The impact strength of the maximum equivalent strain versus
sheet thickness, blanking speed, and sheet orientation
Differentiation of the impact strength between variables of the blanking process was
implemented to find out the strength of affected parameters such as sheet thickness, grain
orientation, and blanking speed on the deformation outcomes. This differentiation could
be employed in industry during the blanking process. Due to the few values and the simple
model level, the general linear fitting statistical model was used in ANOVA analysis to
find the relationship between all factors of the blanking process and material conditions
for each response, including maximum strain, cutting force, the extension of deformation,
and magnetic losses.
The statistical model was applied to investigate the effect strength of blanking and
material factors on the induced equivalent strain of all electrical steel samples. Table 5.1
shows the model summary and information of factors effect on the induced strain values
in the sheets during the blanking process. The analysis of variance shows that the effect
of the grain orientation factor has a larger F-value (32.87), thereby it is considered to have
a more significant effect than the other factors on the value of strain. Next is the blanking
speed factor, while the least important factor is the thickness of the sheets. The table

Chapter five Discussion and statistical analysis
167
summarizing the model illustrates that the model has good quality of fit due to the high
value of R-squared components.
Table 5.1: ANOVA model for plastic strains versus blanking parameters.
Factor Information:
Factor Levels Values F-Value P-Value
Sheet thickness 2 0.20, 0.35 11.66 0.011
Blanking speed 3 100, 500, 1000 29.35 0.000
Grain Orientation 2 RD, TD 32.87 0.001
Model Summary:
S R-sq. (adj.-R-sq.) (pred.-R-sq.)
2.36668 93.65% 90.02% 81.34%
The graph of ANOVA analysis to determine the tendency of the significant impact
of cutting parameters on blanking strain is shown in Figure 5.2. In such graphs, the higher
slope expresses the significant effect of this factor. The mean value line passing through
the mid-line of the plots illustrates good quality of the analysis model. The model results
indicate that the effect of sheet orientation is greater than those of sheet thickness and
blanking speed.
Figure 5.2: Effect of blanking and material factors on the induced equivalent strain.

Chapter five Discussion and statistical analysis
168
5.7.4 The impact strength of the maximum cutting force of the full die
versus sheet thickness, blanking speed, and sheet orientation
Table 5.2 shows the model summary and information of the impact of blanking and
material parameters on the maximum measured cutting force values during the blanking
process. The factor information shown in this model is the same as in the previous model
due to the use of the same input parameters. The analysis of variance shows a higher F-
value 36.8 for the blanking speed factor; thereby it is considered to have a more
significant effect than the other factors on the cutting force value. This is followed by the
sheet thickness factor with 27.53 F value, while grain orientation is not an important
factor and does not affect the cutting force according to the very small F-value. The model
summary also illustrates good quality of the model due to the high value of R-squared
components.
Table 5.2: ANOVA model for the cutting force versus blanking parameters.
Factor Information:
Factor Levels Values F-Value P-Value
Sheet thickness 2 0.20, 0.35 27.53 0.001
Blanking speed 3 100, 500, 1000 36.80 0.000
Grain Orientation 2 RD, TD 0.02 0.893
Model Summary:
S R-sq. (adj.-R-sq.) (pred.-R-sq.)
2.06688 93.53% 89.83% 80.98%
Figure 5.3 shows the stronger effect of blanking and material factors on the
measured maximum cutting force values. The second part presents the effect of blanking
speed on the force values; the sharp decline explains the significant effect of this factor.
The level grain orientation slope reflects a very low effect. Also, the mean value line
passing through the mid-line of the plots illustrates good quality of the analysis model.

Chapter five Discussion and statistical analysis
169
Figure 5.3: Effect strength of blanking and material factors on the induced cutting force.
5.7.5 The impact strength of the maximum hysteresis loss versus
thickness, blanking speed, sheet orientation
Table 5.4 shows the model summary and information of blanking and material parameters
on the maximum hysteresis losses values calculated for blanking samples using magnetic
SST test. The factor information shown in the model is the same as that in the previous
model due to use of the same input parameters. The analysis of variance shows a larger
F-value (67.59) of the sheet thickness factor; thereby it is considered to have a more
significant effect than the other factors on the value of cutting force, followed by the grain
orientation factor. The least effective factor is blanking speed.
Table 5.3: ANOVA model for the hysteresis losses versus blanking parameters.
Factor Information:
Factor Levels Values F-Value P-Value
Sheet thickness 2 0.20, 0.35 67.59 0.000
Blanking speed 3 100, 500, 1000 3.74 0.079
Grain Orientation 2 RD, TD 4.99 0.061
Model Summary:
S R-sq. (adj.-R-sq.) (pred.-R-sq.)
0.045531 91.96% 87.36% 76.37%

Chapter five Discussion and statistical analysis
170
Figure 5.4 shows the impact strength of blanking and material factors on the calculated
maximum hysteresis losses values. The first part presents the effect of sheet thickness on
mean hysteresis losses values. The factor has a sharp slope which explains the significant
effect of this factor, while convergence between the slopes of blanking speed and grain
orientation reflects convergence in the strength level of the effect. The mean value line
passing through the mid-line of the plots illustrates good quality of the analysis model.
Figure 5.4: Effect strength of blanking and material factors on the hysteresis losses.
Table 5.5 summarizes the strength effects of the blanking parameters on the blanking
results according to the calculated F-Value of the statistical model. The results show that
the blanking speed plays an important role in all blanking results. There are variations in
effect between the input and output parameters, therefore it is difficult to achieve
optimization between these factors.
Table 5.4: Summary of ANOVA models of the factors’ impact strength on the blanking
results
Results \ Factor Sheet
thickness
Blanking
speed
Sheet
Orientation
Max. equivalent strain ** ** ***
Max. cutting force ** *** *
Max. hysteresis loss *** ** **
*** Very important factor, ** Important factor, * Not important factor

Chapter five Discussion and statistical analysis
171
Summary
This chapter has discussed the results produced on the cut edge deformation of NGO electrical
steel sheets and linked some of the most important results regarding the changes induced during
the blanking process. The deformation features of each sample were characterized and an
ANOVA statistical analysis model was applied to investigate the strength of the affected
parameters of the blanking process and material conditions. Material behaviour was discussed in
each case to give a description of the cut edge deformation and characterize the blanking induced
magneto-mechanical and modified edge texture of the cut edge defects in non-oriented electrical
steel. Also, the most critical issues affecting the stage of blanking deformation were also discussed
including grains conditions at the cut edge and the limitations associated with the testing
techniques.

Chapter six Conclusions and future works
172
6
Conclusions and future works
Conclusions
In this study, the effect of the blanking operation on the local magnetic and mechanical
properties and local deformation at the cut edge and vicinity area of the non-grain
orientation electrical steels thin sheet has been experimentally investigated. The cutting
process conditions were two thin sheets of thicknesses 0.2 and 0.35 mm, about 10%
clearance between the punch and die, three blanking speeds of 100, 500, and 1000
mm/min, and two grain orientations of ES sheet, in rolling and transverse directions.
These conditions were chosen to produce different cut samples. Then, samples were
tested using different methods including tensile tests, digital image correlation technique
during both blanking and tensile testing, and Nano-Indentation was used to evaluate the
mechanical properties. SEM and optical microstructure examinations allowed evaluation
of the integrity of the structure. The magnetic single sheet tester was used to investigate
the magnetic properties.
Based on work conducted, the data collected from these tests, the main conclusions
are drawn as follows:

Chapter six Conclusions and future works
173
According to the microstructure examinations, there are a small number of grains
across the thickness of the sheet around 2 to 3 grains because of the low sheet
thickness. Therefore, the cut edge deformation was heavily influenced by the local
grains’ location and size at the cut edge leading to the high variation in the results.
Also, this can indicate that grain size and location play the key roles in
deformation extension. Thereby, the sample to sample variability is very high and
the effects of blanking parameters are therefore too difficult to determine.
Generally, the methods used in this study are effective, but the efficiency of their
results depends on the conditions of the process applied to it. Thereby, due to the
sensitivity of applying these techniques on the blanking process of thin sheets
involving many challenges, errors, and limitations. Therefore, the maximum
possible accuracy of performed tests for the investigation and analysis should be
taken into account in order to minimize results errors.
The results demonstrated that blanking and material parameters had a significant
effect on the cut edge quality. However, the high variation in the results means
any investigation in the blanking deformation on thin sheets representing one of
the possible deformation cases. In other words, the obtained results in each case
cannot be generalized on the general behaviour of the material. Therefore, it is
preferred to avoid comparisons and each test treated individually.
The current design of blanking dies produced good edge geometry of the cut edge.
This cut edge had different characteristics at different cutting conditions. That can
indicate the influencing of the process parameters such as the blanking speed,
sheet thickness and grain orientation. The impact strength of these conditions
varies according to the type of deformation.
According to the results of blanking force measurement, sheet orientation has little
influence, while blanking speed has a significant impact on the cutting load, with
higher force recorded at the lower speed of 100 mm/min.

Chapter six Conclusions and future works
174
The measurements of the local strains distribution on the cut edge using the digital
image correlation (DIC) technique enabled to investigate and visualize the
mechanism of the high-speed blanking operation in a thin sheet of ES. However,
the analysis process of induced blanking strain using this technique includes many
issues that could affect the analysis results. For examples, the difficulty in the
triggering, timing of DIC image acquisition at a specific moment of blanking
process. Moreover, the spatial resolution of captured images led to the analysis
error because of the small deformation zone and high speed of punch movement.
The Nano- indentation test is usually used to indicate stresses and strains induced
in the deformed areas. Although the results for applying hardness test on the
blanking process showed very high values close to the cut edge then reducing with
increasing distance from the edge. However, the variability of the Nano-
indentation measurements makes it impossible to pick out clear trends with
process parameter.
The magnetic properties deteriorated due to the blanking effects caused by
changes in the domain structure and divergence between domain walls due to the
dislocations deformations. The results show that sheet thickness has a significant
influence on the hysteresis losses and magnetic properties. Despite the higher
thickness of the 0.35 mm samples, the hysteresis losses were less than for the low
sheet thickness of 0.2 mm. Moreover, there is a clear impact for the blanking speed
on the hysteresis losses, where the cutting at high-speed can reduce this magnetic
loss.
Recommendations for future work
Further investigations could be conducted to carry out related work that we did not have
time to do. These investigations could focus on the cutting process or the methods for
characterization of mechanical and magnetic properties, or even quantifying the
deformation of the cut edge and vicinity area. Although the current study produced
positive results, the results could be enhanced and more precise results produced by
carrying out additional work. These works could provide details to supplement the current

Chapter six Conclusions and future works
175
study results. The following proposals present some main points of interesting ideas
aligned with the current research that could provide a starting point for future studies:
Experiments could be conducted using a different selection of electrical sheet
thicknesses, for example, 0.1 and 0.5 mm, to establish the effect of sheet thickness
on the cut edge deformation.
The blanking process could be implemented with different clearances between the
die and the punch to investigate the effect of small and large clearance on the
deformation zone.
Magnetic single sheet tests could be performed by applying AC power supply for
the purpose of comparison with the current results and the test could be conducted
using different current frequencies.
Electron Backscatter Diffraction (EBSD) could be used to observe the grain
orientation, grain morphology and the crystal deformation at the edge zone.
Finite element analysis models in 2D or 3D could be tested under the flux field
condition to investigate the effect of the cut edge on the magnetic properties for a
wide range of blanking variables, such as clearance, tools edge, sheet thickness,
which might be difficult to carry out using experimental procedures.
Development of a damage-failure model for the blanking process to predict
magneto-mechanical damage at the cut edge and investigate the interaction of
multiple variables of the blanking process.
Different types and grades of electrical steel material could be used, such as
oriented electrical steel or different types of coating layer.
The blanking process could be carried out using a lubricant during the operation
or under a different heat condition (higher than the room temperature but below
the recrystallization temperature).

Chapter six Conclusions and future works
176
It might be useful for future researchers to take into consideration the following
challenges and limitations that were faced during this study:
The blanking process occurs in a closed and tiny area, especially in the case of the
thin sheets, which makes it difficult to access the deformation zone during the
process.
The variation of cut edge deformation increases the difficulty of conducting
precise evaluation. Also, testing and analysis in the current study were made more
difficult by the fact that all tests were conducted in a specific area at the end of
the cut edge.
The very small differences between the cases of the study made it difficult to
distinguish them easily and increased the required accuracy of the tests.
Expansion of investigation into blanking parameters is very difficult
experimentally. For example, using different clearance between the punch and die
means manufacturing more dies. Because two sheet thicknesses were used, two
more dies for each additional clearance were required. Therefore, there were
higher cost and time requirements due to the doubling of all tests.
Conducting sensitive edge tests meant the procedures had to be more
sophisticated, starting from taking samples from the blanking die, and then cold
mounting with highly precise identifying of the position of the cut edge.
Because the material is very sensitive to water it is very hard to prepare samples
with less than 1µ surface roughness. Moreover, to keep the cut edge safe from
thermal stresses and high-pressure effects it was necessary to use cold mounting
with conductive gold coating and silver paint to enhance the sample surface’s
conductivity in order to obtain high quality SEM images.

177
References
[1]Wei Tong, “Mechanical Design of Electric Motors,” Radford, Virginia. 2014
[2]AK Steel, “Selection of Electrical Steels for Magnetic Cores,” Elements, pp. 1–28, 2007.
[3]P. Beckley, “Electrical Steels for rotating machines.” Institution of Engineering and
Technology, London, 2002.
[4]T. Altan, A.E. Tekkaya, “Sheet metal forming processes and applications,” ASM
International, ISBN-10: 0-61503-844-2, 2012.
[5]S Kalpakjian and S R Schmid, Manufacturing engineering and technology, sixth
edition, Pearson education, Inc. 2010.
[6] D. Jiles, “Introduction to Magnetism and Magnetic Materials,” First edition 1991
[7] D. S. Petrovi, “Non-Oriented Electrical Steel Sheets,” vol. 44, pp. 8, 2010.
[8] S. Tumanski, “Hand book of magnetic measurements,” Taylor and Francis group, 2011.
[9] Vander Voort and W. Baldwin, “Metallography and Microstructures Handbook,” ASM Int.,
vol. 9, p. 2733, 2004.
[10]B. Frederic, W. Thierry, and F. Hervé, “The use of iron-nickel and iron-cobalt alloys in
electrical engineering, and especially for electrical motors,” EEIC 2007, pp. 394–401, 2007.
[11] J. M. D. Coey, “Magnetic materials,” J. Alloys Compd., vol. 326, no. 1–2, pp. 2–6, 2001.
[12] http://www.dfliq.net/optimizing-electrical-motor-efficiency and http:// www.eilamination.
Com/tag/silicon-steel-lamination.
[13]C. Schayes, “Low cycle fatigue of the Fe-3Si steel : damage mechanisms and strain
localisation by EBSD,” p. 206, 2016.
[14]W. M. Arshad et al., “Incorporating Lamination Processing and Component Manufacturing
in Electrical Machine Design Tools,” 2007 IEEE Ind. Appl. Annu. Meet, pp. 94–102, 2007.
[15] H. Baker, ASM handbook, Alloy Phase Diagrams. Int., vol. 3, p. 1741, 1998.
[16] B. L. Bramfitt and A. o. Benscoter, Metallographer’s Guide - Practices and Procedures for
Irons and Steels. 2002.
[17] D. Steiner Petrovic, B. Markoli, and M. Ceh, “The nanostructure of non-oriented electrical
steel sheets,” J. Magn. Magn. Mater, vol. 322, no. 20, pp. 3041–3048, 2010.
[18] https://cogent-power.com/products, grain-oriented, non-oriented -electrical-steel.
[19] K. Atallah, “Iron losses in brushless permanent magnet DC-machine,” 1993.
[20]D. Fang, F. Li, B. Liu, Y. Zhang, J. Hong, and X. Guo, “Advances in Developing Electro-
mechanically Coupled Computational Methods for Piezoelectric /Ferroelectrics at Multi-
scale,” Appl. Mech. Rev., vol. 65, no. 6, p. 060802, 2013.

178
[21] Roy A. Colclaser, S. D.-N. Materials and Devices for electrical engineer and physicists.
Network: McGraw-Hill 1985.
[22] A. Hubert, R. Schafer, “Magnetic domains, the analysis of magnetic microstructures,”1998.
[23]V. Permiakov, “1D and 2D Magnetization in Electrical Steels under Uniaxial Stress,” ISBN
90-8578-022-5, NUR 961, 967, 2005.
[24]D. Jiles, Introduction to Magnetism and Magnetic Materials, Chapman & Hall, 1991.
[25] Springer handbook of materials measurement methods, vol. 9, no. 7–8. 2006.
[26] H. Kronmuller and S. Parkin, “Handbook of Magnetism and Advanced Magnetic
Materials, Volume 1: Fundamentals and Theory,” John Wiley & Sons, Ltd. ISBN:
978-0-470- 02217-7, 2007.
[27] A. Krings, J. Soulard, “Overview and Comparison of Iron Loss Models for electrical
Machines,” J. Electrical. Eng., vol. 10, pp. 162–169, 2010.
[28] Reuben Lee, “Electronic Transformers and Circuits - Core Materials,” Fast Spectr. React,
vol. 9781441995, pp. 1–9, 2012.
[29] S. Ramanathan, “Study of dislocations from continuous flattening anneal and its effect on
magnetic properties of grain oriented electrical steel,” thesis,” 2013.
[30] S. D. Washko, R. F. Miller, “Sheet thickness effects on energy losses in 3% silicon-
iron,” J. Magnetism. Magnetic. Material, vol. 19, no. 1–3, pp. 361–364, 1980.
[31] K. Takeda and T. Yamaguchi, “Magnetic properties in thinned oriented Si-Fe sheet,” IEEE
transactions on magnetics, VOL.MAG-23, NO. 5, pp. 3233–3235, 1987.
[32]P. W. Neurath, “Hysteresis and Eddy Losses in Silicon Iron as a Function of Sheet
Thickness,” J. Appl. Phys., vol. 30, no. 4, pp. S88–S89, 1959.
[33]J. Barranger, “Hysteresis and eddy current losses of a transformer lamination,” NASA, TN
D-3114, Lewis Research Centre, E-2992, November 1965, 2018.
[34]M.Mikulec, “Accuracy of single sheet testers,” vol. 112, pp. 112–114, 1992.
[35]B. Naas, D. Hachi, H. Hammache, B. Naas, and D. Moussaoui, “Measurement of the
Magnetic Field in the Single Sheet Tester 500 * 500 mm 2,” no. 3, pp. 58–61, 2014.
[36]J. P. Schlegel, N. J. Batistela, N. Sadowski, J. P. A. Bastos, M. Rigoni, A. A. De Espíndola,
and L. V. Dokonal, “Testing strategies to evaluate non-oriented electrical steels losses,” J.
Microwaves, Optoelectron. Electromagn. Appl., vol. 11, no. 2, pp. 304–315, 2012.
[37]Elemír Ušák, Jan Bydžovský, Volodymyr Stoyka, František Kováč “ANALYSIS OF
CAPABILITIES OF SMALL DOUBLE-YOKE SINGLE SHEET TESTER,” vol. 59, no. 7,
pp. 21–24, 2008.
[38]T. Nakata, N. Takahashi, K. Fujiwara, and M. Nakano, “Study of horizontal-type single sheet
testers,” J. Magn. Magn. Mater, vol. 133, no. 1–3, pp. 416–418, 1994.

179
[39]N. Takahashi, D. Miyagi, F. Inoue, and M. Nakano, “Novel measurement method of DC
magnetic properties having freedom of specimen shape,” J. Appl. Phys., vol. 109, no. 7, pp.
1–4, 2011.
[40] M. Enokizono, H. Matsuo, “A measurement system for 2D DC-biased properties of
magnetic materials,” Journal of Magnetism and Magnetic Materials 254–255, 39–42, 2003.
[41] N. Takahashi et al. “Development of the 2D single sheet tester using diagonal exciting coil
and the measurement of magnetic properties of GO electrical steel sheet, IEEE transactions
of magnetics, Vol 47, 2011.
[42] J.R. Duflou, and W. Dewulf, “On the complementarity of TRIZ and axiomatic design,”
Procedia Engineering, 9, pp.633–639, 2011.
[43] S.P. Bhise, and M.Y. Shinde, “Study of Process Parameters Used in Wire-electric Discharge
Machining,” IJRASET jouenal, volume 4, pp.485–489, 2016.
[44] M. F. Handbook and S. B. Heidelberg, “Metal Forming Handbook,”vol. 3, and no. c. 1998.
[45]P. P. Badgujar and M. G. Rathi, “Abrasive Waterjet Machining-A State of Art,” J. Mech.
Cilvil Eng., vol. 11, no. 3, pp. 59–64, 2014.
[46]Y. Demir, O. Ocak, Y. Ulu, and M. Aydin, “Impact of lamination processing methods on the
performance of permanent magnet synchronous motors,” Int. Conf. Electrical. Mach., pp.
1218–1223, 2014
[47]S. Bayraktar and Y. Turgut, “Effects of different cutting methods for electrical steel
sheets on performance of induction motors,” Proc. Inst. Mech. Eng. Part B J. Engineering
Manufacturing, 2016.
[48] V. Manescu, G. Paltanea, and H. Gavrila, “Some Important Effects of the Water Jet and
Laser cutting methods on the Magnetic Properties of the Non-oriented Silicon Iron Sheets,”
ATEE, pp451-455, 2015.
[49]Y. Kurosaki, H. Mogi, H. Fujii, T. Kubota, and M. Shiozaki, “Importance of punching and
workability in non-oriented electrical steel sheets,” , vol. 320, pp. 2474–2480, 2008.
[50]H. Naumoski, B. Riedmüller, A. Minkow, and U. Herr, “Investigation of the influence of
different cutting procedures on the global and local magnetic properties of non-oriented
electrical steel,” J. Magn. Magn. Mater, vol. 392, pp. 126–133, 2015.
[51]S. Steentjes, G. Von Pfingsten, and K. Hameyer, “An application-oriented approach for
consideration of material degradation effects due to cutting on iron losses and
magnetizability,” IEEE Trans. Magn., vol. 50, no. 11, pp. 2–5, 2014.
[52] T. Bulín, E. Svabenska, M. Hapla, C. Ondrusek, and O. Schneeweiss, “Magnetic properties
and structure of non-oriented electrical steel sheets after different shape processing,” Acta
Phys. Pol. A, vol. 131, no. 4, pp. 819–821, 2017.

180
[53] R. Siebert, J. Schneider, and E Beyer, “Laser Cutting and Mechanical Cutting of Electrical
Steels and its Effect on the Magnetic Properties,” IEEE transactions on magnetics, pp.
2001904, VOL. 50, 2014.
[54] A. Belhadj, et al. “Effect of laser cutting on microstructure and on magnetic properties of
grain non-oriented electrical steels,” vol. 256, no. 5, pp. 20–31, 2003.
[55] M. Emura, F. J. G. Landgraf, W. Ross, and J. R. Barreta, “The influence of cutting technique
on the magnetic properties of electrical steels,” J. Magn. Magn. Mater, vol. 254-255, pp.
358–360, 2003.
[56]G. Paltanea, and G. Horia, “The effect of mechanical and electrical discharge cutting
technologies on the magnetic properties of non-oriented silicon iron,” 2017.
[57] E. G. Araujo, et al. , “Dimensional Effects on Magnetic Properties of Fe–Si Steels due to
Laser and Mechanical Cutting,” IEEE, VOL. 46, pp213-216, 2010.
[58] P. Lazari, K. Atallah, and J. Wang, “Effect of Laser Cut on the Performance of Permanent
Magnet, Assisted Synchronous Reluctance Machines,” vol. 51, no. 11, 2015.
[59] G. Loisos and A. J. Moses, “Effect of mechanical and Nd:YAG laser cutting on magnetic
flux distribution near the cut edge of non-oriented steels,” J. Mater. Process. Technol., vol.
161, no. 1–2 SPEC. ISS, pp. 151–155, 2005.
[60] P. Baudouin, A. Belhadj, F. Breaban, A. Deffontaine, and Y. Houbaert, “Effects of Laser
and Mechanical Cutting Modes on the Magnetic Properties of Low and Medium Si Content
Non-oriented Electrical Steels,” Magn. Int. Conf., vol. 38, no. 5, pp. 3213–3215, 2002.
[61]M.P. Groover, “Fundamentals of Modern Manufacturing, Materials, Processes and
Systems,”4th edition, John Wiley & Sons, Inc. 2010
[62] J R Paquin, R E Crowley, Die design fundamentals, Second edition, industrial press,
Inc. 1987.
[63] S.L. Semiatin, Forming and Forging, ASM Handbook, Volume 14 of the 9th Edition Metals
Handbook, 1993.
[64]V. Boljanovic, “Sheet metal forming processes and die design,” Technol. Eng., 2nd
edition, industrial press Inc. 2014.
[65]E. Al-Momani, I. Rawabdeh’’ An Application of Finite Element Method and Design of
Experiments in the Optimization of Sheet Metal Blanking Process’’ JJMIE, Jordan Journal
of Mechanical and Industrial Engineering, V2, N1,ISSN 1995-6665, P53 -63, 2008.
[66]R. Hambli, “Design of experiment based analysis for sheet metal blanking processes
optimisation,” Int. J. Adv. Manuf. Technol., vol. 19, no. 6, pp. 403–410, 2002.
[67]C. Husson, Correia, J. P. M., Daridon, L., & Ahzi, S ‘’ Finite elements simulations of thin
Copper sheets blanking: Study of blanking parameters on sheared edge quality. Journal of
Materials Processing Technology, 199(1-3), 74-83, 2008.

181
[68] R.Wiedenmann, Sartkulvanich,P., & Altan,T.’’ FEA on the effect of sheared edge quality in
blanking upon hole expansion of advanced high strength steel’’ IDDRG 2009.
[69]S. Subramonian, T. Altan, B. Ciocirlan, and C. Campbell, “Optimum selection of variable
punch-die clearance to improve tool life in blanking non-symmetric shapes,” Int. J.
Mach.Tools Manuf., vol. 75, pp. 63–71, 2013.
[70]S.K . Maiti, A. A. Ambekar, U. P. Singh, P.P. Date, and K. Narasimhan, “Assessment of the
influence of some process parameters on sheet metal blanking,” J. Mater. Process. Technol.,
vol. 102, no. 1–3, pp. 249–256, 2000.
[71]A. l O. Zaid, “Blanking and piercing theory, applications and recent experimental results,”
IOP Conf. Ser. Mater. Sci. Eng., vol. 60, p. 012065, 2014.
[72]K. H. Shim, S. K. Lee, B. S. Kang, and S. M. Hwang, “Investigation on blanking of thin sheet
metal using the ductile fracture criterion and its experimental verification,” J. Mater. Process.
Technol., vol. 155–156, no. 1–3, pp. 1935–1942, 2004.
[73]A. M. Goijaerts, L. E. Govaert, and F. P. T. Baaijens, “Evaluation of ductile fracture models
for different metals in blanking,” J. Mater. Process. Technol., vol. 110, pp. 312–323, 2001.
[74]F. Gréban, G. Monteil, and X. Roizard, “Influence of the structure of blanked materials upon
the blanking quality of copper alloys,” J. Mater. Process. Technol., vol. 186, pp. 27–32, 2007.
[75]J. Qin, P. Yang, W. Mao, and F. Ye, “Punchability and Punching Fracture Behavior of High
Silicon Steel Sheets,” J. Iron Steel Res. Int., vol. 22, no. 9, pp. 852–857, 2015.
[76] J Xu, B Guo, C Wang, and D Shan’’ Blanking clearance and grain size effects on micro
deformation behavior and fracture in micro-blanking of brass foil’’ International Journal of
Machine Tools and Manufacture, V60, Pages 27-34, 2012.
[77] B.Y. Joo, S.H. Rhim, S.I.’’ Micro-hole fabrication by mechanical punching process, Journal
of Materials Processing Technology 170 (3), 593–601, 2005.
[78] J. Xu, B. Guo, D.B. Shan, Size effects in micro blanking of metal foil with miniaturization,
International Journal of Advanced Manufacturing Technology 56, P5–8, 515–522, 2011.
[79]D Zakariya Lubis and M Mahardika’’ Influence of Clearance and Punch Velocity on the
Quality of Pure Thin Copper Sheets Blanked Parts’’Materials Science and Engineering 157,
012012 doi:10.1088/1757, 2016.
[80] P. Demmel, H. Hoffmann, R. Golle, C. Intra, and W. Volk, “Interaction of heat generation
and material behaviour in sheet metal blanking,” CIRP Manufacturing Technology 64, 249–
252, 2015.
[81] S. Subramonian, T. Altan, C. Campbell, and B Ciocirlan, “Determination of forces in high
speed blanking using FEM and experiments,” Journal of Materials Processing Technology
213, 2184– 2190, 2013.
[82] T. A. C. Stock and A. L. Wingrove, “The energy required for high speed shearing of steel,”
Journal of mechanical engineering science, Vol. 13 No 2, pp 110-115, 1971.

182
[83] H. Marouani, A. Ben Ismail, E. Hug, M. Rachik’’ Rate-dependent constitutive model for
sheet metal blanking investigation’’ Materials Science and Engineering, 162–170, 2008.
[84] Grunbaum et al, Influence of high cutting speeds on the quality of blanked parts. Report No.
ERC/NSM- S-96-19, Centre for Precision Forming, Columbus, 1996.
[85] M Hirsch, P Demmel, R Golle, and H Hoffmann’’ Light Metal in High-Speed Stamping
Tools. Key Engineering Materials, 473, 259-266, 2011.
[86] A. M. Goijaerts, “Prediction of Ductile Fracture in Metal Blanking,” The Eindhoven
University of Technology, doctoral thesis 1999.
[87] C. Gaudilliere, N. Ranc, A. Larue, A. Maillard, and P. Lorong, “High Speed Blanking: An
Experimental Method to Measure Induced Cutting Forces,” Exp. Mech., vol. 53, no. 7, pp.
1117–1126, 2014.
[88] M. Grunbaum, J. Breitling, and T. Altan, “Influence of high blanking speeds on the quality
of blanked parts,” ERC Rep., pp. 5–96, 1996.
[89] S. Krrabaj, B. Bytyqi, and H. Osmani, “Influence of Blanking speed on the Quality of
Blanked Parts,” 15th Int. Research Mach. Assoc. Technol., no. September, pp. 817–820, 2011.
[90] X. Chen, X. Xie, J. Sun, and L. Yang, “Full Field Strain Measurement of Punch-stretch Tests
Using Digital Image Correlation,” SAE Int. J. Mater. Manuf., vol. 5, pp. 345–351, 2012.
[91]T. J. Liutkus, “Digital Image Correlation in Dynamic Punch Testing and Plastic Deformation
Behavior of Inconel 718,” 2014.
[92] S. Daly, “Principles and Techniques of Digital Image Correlation,” Microsc. Microanal. vol.
17, no. S2, pp. 1946–1947, 2011.
[93]S. Yoneyama, “Basic principle of digital image correlation for in-plane displacement and
strain measurement,” Adv. Compos. Mater, vol. 3046, no. February, pp. 1–19, 2016.
[94] B.Pan, J. Yuan, Y. Xia, “Strain field denoising for digital image correlation using a
regularized cost-function,” Optics and Lasers in Engineering 65 pp9-17, 2015.
[95]L. Yang, L. Smith, a. Gothekar, and X. Chen, “Measure Strain Distribution Using Digital
Image Correlation (DIC) for Tensile Tests,” pp. 1–27, 2010.
[96] A. M. Goijaerts, Y. W. Stegeman, L. E. Govaert, D. Brokken, W. A. M. Brekelmans, and F.
P. T. Baaijens, “Can a new experimental and numerical study improve metal blanking?,” J.
Mater. Process. Technol., vol. 103, no. 1, pp. 44–50, 2000.
[97] V. Rratus, F. Kosel, and M. Kovac, “Determination of optimal cutting edge geometry on a
stamped orthotropic circular electrical steel sheet,” J. Mater. Process. Technol., vol. 210, no.
2, pp. 396–407, 2010.
[98] J. Slavic, S. Bolka, V. Bratus, and M. Boltezar, “A novel laboratory blanking apparatus for
the experimental identification of blanking parameters,” J. Mater. Process. Technol., vol. 214,
no. 2, pp. 507–513, 2014.

183
[99] K. Wang and T. Wierzbicki, “Experimental and numerical study on the plane-strain blanking
process on an AHSS sheet,” Int. J. Fract., vol. 194, no. 1, pp. 19–36, 2015.
[100]Y. H. Wang et al., “Whole field sheet-metal tensile test using digital image correlation,”
vol. 34, no. 2, pp. 54–59, 2010.
[101] N. Leuning, S.Steentjes, M.Schulte, W.Bleck, K.Hameyer’’ Effect of elastic and plastic
tensile mechanical loading on the magnetic properties of NGO electrical steel’’ Journal of
Magnetism and Magnetic Materials 417, 42–48, 2016.
[102] F. J. G. Landgraf, “Nonoriented electrical steels,” Jom, vol. 64, no. 7, pp. 764–771, 2012.
[103] V. E. Iordache and E. Hug “Effect of mechanical strain on the magnetic properties of
electrical steel,” J. Opto. Electron Adv. Mater., vol. 6, no. 4, pp. 1297–1303, 2004.
[104] M. Fukuhara, T. Yonamine, F. J. G. Landgraf, and F. P. Missell, “Evolution of magnetic
properties and crystallographic texture in electrical steel with large plastic deformation,”
J. Appl. Phys., vol. 109, pp. 23–26, 2011.
[105] F. J. G. Landgraf, M. Emura, K. Ito, and P. S. G. Carvalho, “Effect of plastic deformation
on the magnetic properties of non-oriented electrical steels,” , vol. 215, pp. 94–96, 2000.
[106] J.M. Makar and B.K. Tanner’’ The effect of plastic deformation and residual stress on the
permeability and magnetostriction of steels’’ Journal of Magnetism and Magnetic Materials
222-304, 2000.
[107] J.M. Makar and B.K. Tanner’’ The effect of stresses approaching and exceeding the yield
point on the magnetic properties of high strength pearlitic steels’’ NDT&E International,
Vol. 31, No. 2, pp. 117-127, PII: SO963-8695(97)OOOO8-X, 1998.
[108] V. G. Kuleev, T. P. Tsar’kova, E. Yu. Sazhina, and A. S. Doroshek’’ The Influence of
Plastic Deformations of Low Carbon Ferromagnetic Steels on the Changes in the Shapes
of Their Hysteresis Loops and the Field Dependences of the Differential Permeability’’,
Journal of Nondestructive Testing, Vol. 51, No. 12, pp. 738–749, 2015.
[109] A. Schoppa, J. Schneider, and C. D. Wuppermann, “Influence of the manufacturing process
on the magnetic properties of non-oriented electrical steels,” , vol. 215, pp. 74–78, 2000.
[110] D. Singh, A. Belahcen, and A. Arkkio, “Effect of Manufacturing on Stator Core Losses,”
pp. 106-110.
[111] K. Senda, M. Ishida, Y. Nakasu, and M. Yagi, “Influence of shearing process on domain
and magnetic properties of non-oriented electrical steel,” vol. 304, pp. 513–515, 2006.
[112] A. Peksoz, S. Erdem, and N. Derebasi, “Mathematical model for cutting effect on magnetic
flux distribution near the cut edge of non-oriented electrical steels,” Comput. Mater. Sci.,
vol. 43, no. 4, pp. 1066–1068, 2008.
[113] A. Kedous-Lebouc, B. Cornut, J. C. Perrier, P. Manfé, and T. Chevalier, “Punching
influence on magnetic properties of the stator teeth of an induction motor,” J. Magn. Magn.
Mater, vol. 254–255, pp. 124–126, 2003.

184
[114] A. J. Moses, N. Derebasi, G. Loisos, and A. Schoppa, “Aspects of the cut-edge effect stress
on the power loss and flux density distribution in electrical steel sheets,” J. Magn. Magn.
Mater, vol. 215, pp. 690–692, 2000.
[115] A. Schoppa, J. Schneider, and J. Roth, “Influence of the cutting process on the magnetic
properties of non-oriented electrical steels,” , vol. 216, pp. 215–217, 2000.
[116] R. Rygal et al., “Influence of cutting stress on magnetic field and flux density distribution
in non-oriented electrical steels,” J. Magn. Magn. Mater, vol. 215–216, pp. 687–689, 2000.
[117] H. A. Weiss et al., “Influence of shear cutting parameters on the electromagnetic properties
of non-oriented electrical steel sheets,” J. Magn. Magn. Mater, vol. 421, pp. 250–259, 2017.
[118] H. Cao et al., “The influence of punching process on residual stress and magnetic domain
structure of non-oriented silicon steel,” J. Magn. Magn. Mater, vol. 406, pp. 42–47, 2016.
[119] Wego Wang, “Reverse engineering, technology of reinvention,” Taylor and Francis Group,
LLC, 2011
[120] E. Broitman, “Indentation Hardness Measurements at Macro, Micro, and Nanoscale: A
Critical Overview,” Tribol. Lett, vol. 65, no. 1, pp. 1–18, 2017.
[121] J. Menscik,” Simple models for the characterization of the mechanical properties by
nanoindentation,” vol. 5. 2011.
[122] C. Anthony, F.Cripps,” Nanoindentation,” Third edition springer, 2011.
[123] M. A. Meyers and K. K. Chawla, “Mechanical Behaviour of Materials,” 2009.
[124] A. Pulnikov, P. Baudouin, and J. Melkebeek, “Induced stresses due to the mechanical
cutting of non-oriented electrical steels,” J. Magn. Magn. Material, vol. 254–255, pp. 3, 2003.
[125] A. Ben Ismail, M. Rachik, P. E. Mazeran, M. Fafard, and E. Hug, “Material characterization
of blanked parts in the vicinity of the cut edge using nanoindentation technique and inverse
analysis,” Int. J. Mech. Sci., vol. 51, no. 11–12, pp. 899–906, 2009.
[126]W. C. Oliver and G. M. Pharr, “An improved technique for determining hardness and elastic
modulus using load and displacement sensing indentation experiments,” 1992.
[127]Y. L. Shen and X. H. Tan, “On the correlation between hardness and yield strength in
multilayered elastic-plastic materials,” J. Mater. Sci., vol. 40, no. 17, pp. 4683–4686, 2005.
[128]A. E. Giannakopoulos and S. Suresh, “Determination of elastoplastic properties by
instrumented sharp indentation,” Scr. Mater., vol. 40, no. 10, pp. 1191–1198, 1999.
[129] T.A. Venkatesh, K.J. Van Vliet, A.E. Giannakopoulos and S. Suresh, “Determination of
elastoplastic properties by instrumented sharp indentation: guidelines for property
extraction,” Scripta mater. 42 (2000) 833–839, Pergamon, elsevier, 2000.
[130]B. Poon, D. Rittel, and G. Ravichandran, “An analysis of Nano indentation in elastic-plastic
solids,” Int. J. Solids Struct., vol. 45, no. 25–26, pp. 6399–6415, 2008.

185
[131]C. Heinrich, A. M. Waas, and A. S. Wineman, “Determination of material properties using
Nano indentation and multiple indenter tips,” Int. J. Solids Structure, vol. 46, no. 2, pp. 364-
376, 2009.
[132]P. Zhang, S. X. Li, and Z. F. Zhang, “General relationship between strength and hardness,”
Mater. Sci. Eng. A, vol. 529, no. 1, pp. 62–73, 2011.
[133] ASTM Int., “Standard Test Methods for Tension Testing of Metallic Materials 1,” ASTM,
no. C, pp. 1–27, 2009.
[134] M. J. Sablik, T. Yonamine, F. J. G. Landgraf, “Modelling plastic deformation effects in
steel on hysteresis loops with the same maximum flux density," IEEE Transaction of
Magnetics, Vol. 40, pp. 3219-3226, 2004.
[135] H. Lemmen and R. Alderliesten, “The power of Digital Image Correlation for detailed
elastic-plastic strain measurements,” Emeseg, pp. 73–89, 2008.
[136] M. A. Sutton, J. J. Orteu, and H. W. Schreier’’ Image Correlation for Shape, Motion and
Deformation Measurements, Basic Concepts, Theory and Applications’’ Springer Science,
ISBN: 978-0-387-78746-6, 2009.
[137] C Donaldson, G H Lecain, and V C Goold, Tool Design, Third edition, Tata McGraw- hill
edition, 35th 2005.
[138]ASTM, A341/ A341M, “Standard Test Method for Direct Current Magnetic Properties of
Materials Using D-C Parameters and the Ballistic Test Methods,” pp.1–13, 2011.
[139] A. S. for T. and Materials, “Standard practice for labelling art materials for chronic health
hazards,” 1984 Annu. B. ASTM Stand., vol. 94, no. Reapproved, pp. 956–960, 1984.
[140]W. D. Callister, D. G. Rethwisch, “Materials Science and Engineering, an Introduction,”
Eighth Edition, Wiley Inc., 2010.
[141]ASTM, A1036-04, “Standard Guide for Measuring Power Frequency Magnetic properties
of Flat-Rolled Electrical Steels Using Small Single Sheet Testers,” pp. 1–5, 2009.
[142]ASTM, A804/A804M-04 “Standard Test Methods for Alternating-Current Magnetic
Properties of Materials at Power Frequencies Using Sheet-Type Specimens,” pp. 1–15, 2009.
[143]B. S. En 60404-4, “Magnetic materials –Methods of measurement of D.C magnetic
properties of magnetically soft material,” pp. 1–26, 1997+A2 2008
[144]F. Barrell, “Capacitors, Magnetic Circuits and Transformers,” Electronics and Power,
vol. 12, no. 1. p. 17, 1966.
[145]D. F. O. R. Development and D. D. I. E. C. Ts, Rotating electrical machines. 2002.
[146]B.L. Theraja, A.K. Theraja, “Electrical technology,” Volume I, S. Chand and company
LED. 2005
[147]E3-11, “Standard Guide for Preparation of Metallographic Specimens 1,” ASTM, vol. I, pp.
1–12, 2011.

186
[148]K. Geels, W. Kopp, and M. Ruckert, “Metallographic and Material graphic Specimen
Preparation, Light Microscopy, Image Analysis and Hardness Testing. 2007.
[149]Buehler Sum-Met, “A Guide to Materials Preparation & Analysis. 2004.
[150]Jeol, “A Guide to Scanning Microscope Observation,” Image Rochester NY, pp. 1–36, 2004
[151] M. Shabani and A. Mazahery, "Prediction of mechanical properties of cast A356 alloy as a
function of microstructure and cooling rate," Arch Metal Mater, vol. 56, pp. 671-675, 2011.
[152]Z. H. Chen, L. C. Chan, T. C. Lee, and C. Y. Tang, “An investigation on the formation and
propagation of shear band in fine-blanking process,” J. Mater. Process. Technol., vol. 138,
no. 1–3, pp. 610–614, 2003.
[153]Y. Wen, Z.H. Chen, and Y. Zang, “Failure Analysis of a Sheet Metal Blanking Process
Based on Damage Coupling Model,” JMEPEG, 3288-Volume 22 (11) Journal of Materials
Engineering and Performance , 2013.
[154] M. Wang, W. Lun, “Micro-scaled Products Development via Micro-forming,” Springer,
ISBN 978-1-4471-6325-1, 2014.
[155] H. Hoffmann, S. Hong, “Tensile Test of very thin Sheet Metal and Determination of Flow
Stress Considering the Scaling Effect,” Vol. 55(1), pp.263-266, 2006.
[156] T.A. Kals, Ralf Eckstein, “Miniaturization in sheet metal working,” 103, pp.95-101, 2000.
[157] ISO 6892-1:2016, BSI Standards, Ambient Tensile Testing of Metallic Materials, pp.1-5.
Available at: www.instron.com.
[158]H. Ghadbeigi & C. Pinna & S. Celotto’’ Quantitative Strain Analysis of the Large
Deformation at the Scale of Microstructure: Comparison between Digital Image Correlation
and Microgrid Techniques’’ Society for Experimental Mechanics, 52:1483–1492, 2012.
[159]Sutton MA, Turner JL, Bruck HA, Chae TA’’ Full-field representation of discretely sampled
surface deformation for displacement and strain analysis. Experimental Mechanics,
31(2):168–177, 1991.
[160]D. Miyagi, Y. Aoki, M. Nakano, and N. Takahashi, “Effect of Compressive Stress in
Thickness Direction on Iron Losses of Non-oriented Electrical Steel Sheet,” IEEE
Transactions on Magnetics, VOL. 46, NO. 6, pp 2040-2043, 2010.
[161] R. L. Mason, R. F. Gunst, and J. L. Hess, Statistical Design and Analysis of Experiments.
2003.
[162]P. G. Mathews, Design of Experiments with MINITAB. ASQ Quality Press, 2005.
[163]R. K. Roy, Design of experiments using the Taguchi approach: 16 steps to product and
process improvement. John Wiley & Sons, 2001.
[164]Davis Software, Manual, V8.4, LaVision, 1005, 1003001, DaVis-D84, 2017.
[165]Strain Master, help, LaVision, 1003017, StrainMaster-D84, 2017.

187
Appendix A
The normal strain (also called principle strain) represents the strain component Exx, or
Eyy in a rotated coordinate system, the bigger value is called maximum normal strain, the
smaller minimum normal strain. The maximum shear strain is the shear in a coordinate
system 45o, where the residual shear becomes maximum. The Local strain coordinate
system is shown in the Figure 0.5.
Figure 0.1: local strain coordinate system [164].
The 2D strain components can be calculated using the following matrix, where each
parameter value for which a differential equation under given conditions [165].
|Exx ExyEyx Eyy
|
The following formulas express the calculation of the maximum and minimum normal
stain modes. In addition to the shear and equivalent strains [164, 165]:
𝐸max = Exx + Eyy
2+ √|
(Exx − Eyy)2
4+
Exy + Eyx
2|
𝐸min = Exx + Eyy
2− √|
(Exx − Eyy)2
4+
Exy + Eyx
2|
𝐸shear = √|(Exx − Eyy)2
4+
Exy + Eyx
2|
The equivalent strain can be calculated according to the following equation:
𝐸𝑒𝑞. = 2
3 √
3(𝑒𝑥𝑥2 + 𝑒𝑦𝑦
2 + 𝑒𝑧𝑧2 )
2+
3(𝛾𝑥𝑦2 + 𝛾𝑦𝑧
2 + 𝛾𝑧𝑥2 )
4
where 𝑒 and 𝛾 are the engineering and shear strains respectively.

188
Appendix B
According to the Figure 4.84, the grain size was estimated using the following formula:
Average grain size = line length / numbers of grains over the line
Table 0.1: Grains size calculations for both ES thickness 0.2 and 0.35 mm.