
Laser generated magneto-plasmonic Fe-Au Nanoparticles
150
Laser generated magneto-plasmonic Fe-Au Nanoparticles: Formation, Real Structure and Properties Inaugural Dissertation by Anna (Tymoczko) Piatek born in Bielawa, Poland for the degree of Doctor of Natural Science - Dr. rer. nat. - Faculty of Chemistry University Duisburg-Essen Germany Essen, 2020
-
Upload
khangminh22 -
Category
Documents
-
view
0 -
download
0
Transcript of Laser generated magneto-plasmonic Fe-Au Nanoparticles

Laser generated magneto-plasmonic Fe-Au
Nanoparticles: Formation, Real Structure
and Properties
Inaugural Dissertation
by
Anna (Tymoczko) Piatek
born in Bielawa, Poland
for the degree of
Doctor of Natural Science
- Dr. rer. nat. -
Faculty of Chemistry
University Duisburg-Essen
Germany
Essen, 2020

The present thesis was conducted from March 2016 to April 2020 in the research group
of Prof. Dr.-Ing. Stephan Barcikowski at the Institute for Technical Chemistry of the
University of Duisburg Essen.
Disputation date: 02.07.2020
Referees: Prof. Dr.-Ing. Stephan Barcikowski, UDE
Prof. Dr. Lorenz Kienle, CAU
Chairman: Prof. Dr. Mathias Ropohl, UDE
Diese Dissertation wird über DuEPublico, dem Dokumenten- und Publikationsserver derUniversität Duisburg-Essen, zur Verfügung gestellt und liegt auch als Print-Version vor.
DOI:URN:
10.17185/duepublico/72682urn:nbn:de:hbz:464-20200917-085729-3
Alle Rechte vorbehalten.

For My Parents,
Alicji and Marka Tymoczko
‘‘Ora et Labora‘‘ - Bóg jest Miłością

Abstract
Gold-iron binary alloy nanoparticles delivering next to magneto-plasmonic properties,
surface available for the bio-conjugation. The combination of noble and less expensive
metal such as nickel, iron or cobalt, is a widespread tool for a biomedical application
like MRI/optical-dual imaging or photothermal therapy. For this purpose, the laser-
generated nanoparticle is advantageous due to control over the atomic composition
and alloying degree. Nevertheless, properties of such nanomaterials are morphology
dependent. Hence, synthesis of various structures such as alloy, Core-Shell, multi
core-shell is possible, yet the design over the ultrastructure is still challenging, due to
a lack of a fundamental understanding of the synthesis process. A recent intensively
studied concept is a mechanistic model, created based on the combination of
experimental and theoretical approaches.
In this study, the nanoscale phase diagram for binary AuFe alloy system synthesized
via laser ablation was designed based on a combination of experimental data and the
thermodynamic calculations. In this regard, various nanoparticle compositions were
considered. In the second part, an experimental approach was used, due to the lack
of a theoretical model considering the complexity of the liquid environment and
kinetically controlled processes. In this regard, the influence of laser parameters, such
as target composition, liquid environment and pulse duration on the final ultrastructure
was investigated. In this context, ideal conditions regarding the synthesis of iron-gold
Core-Shell nanoparticles were determined.
At last based on data gathered from the experimental approach combined with
thermodynamic calculations, a mechanistic model for nanoparticle formation
mechanism was summarized. Finally, proposed models’ transferability was
successfully confirmed by another magneto-plasmonic binary system, in this case,
AuCo.
Kurzzusammenfassung
Nanopartikel aus einer binären Gold-Eisen-Legierung, die neben den magneto-
plasmischen Eigenschaften auch eine für die Biokonjugation verfügbare Oberfläche
bieten. Die Kombination von Edel- und preiswerten Metallen, wie Nickel, Eisen oder
Kobalt, sind ein weit verbreitetes Werkzeug für biomedizinische Anwendungen wie
MRI/optisch-duale Bildgebung oder photothermische Therapie. Zu diesem Zweck sind
lasergenerierte Nanopartikel aufgrund der Kontrolle der atomaren Zusammensetzung
und den Legierungsgrad vorteilhaft. Dennoch sind die Eigenschaften solcher
Nanomaterialien morphologieabhängig. Daher ist die Synthese verschiedener
Strukturen wie Legierung Nanopatikeln, Kern-Schale Nanopatikeln, Multi-Kern-Schale
Nanopatikeln möglich. Das Design der Ultrastruktur stellt jedoch immer noch eine
Herausforderung dar, da es an einem grundlegenden Verständnis des
Syntheseprozesses mangelt. Ein kürzlich intensiv untersuchtes Konzept ist ein
mechanistisches Modell, das auf der Kombination von experimentellen und
theoretischen Ansätzen beruht.
In dieser Studie wurde ein nanoskaliges Phasendiagramm für ein binäres AuFe-
Legierungssystem, das mittels Laserablation synthetisiert wurde. Das Phasendiagram
wurde auf der Grundlage experimenteller Daten mit ergänzenden thermodynamischen
Berechnungen erstellt. Dabei wurden verschiedene Nanopartikel-
Zusammensetzungen berücksichtigt. Im zweiten Teil wurde ein experimenteller Ansatz
verwendet, da es kein theoretisches Modell gibt, das die Komplexität der flüssigen
Umgebung oder den Prozess der kinetisch kontrollierten Laserablation in Flüssigkeiten
berücksichtigt. In diesem Zusammenhang wurde der Einfluss von Laserparametern,
wie zusammensetzung, Flüssigkeitsumgebung und Pulsdauer auf die endgültige
Ultrastruktur untersucht. In diesem Zusammenhang wurden ideale Bedingungen für
die Synthese von Eisen-Gold-Kern-Schale-Nanopartikeln ermittelt.
Schließlich wurden für alle gegebenen Ultrastrukturen detaillierte Charakterisirung
durchgeführt. Basierend auf den Daten, die aus dem experimentellen Ansatz in
Kombination mit thermodynamischen Berechnungen gewonnen wurde, wurde ein
Modell für den Mechanismus der Nanopartikelbildung zusammengefasst. Schließlich
wurde die Übertragbarkeit der vorgeschlagenen Modelle durch ein weiteres
Legierungssystem, in diesem Fall AuCo, erfolgreich bestätigt.

VI
Table of Contents 1.Introduction .............................................................................................................. 1
2. State of Art .............................................................................................................. 6
2.1 The AuFe alloy system ......................................................................................... 6
2.2 Nanoparticles properties ....................................................................................... 8
2.3 Colloidal Synthesis of alloy nanoparticles ........................................................... 12
2.3.1 Chemical synthesis ...................................................................................... 12
2.3.2 Laser ablation in liquids ................................................................................ 13
2.4 Nanoparticle formation – modeling ..................................................................... 18
3. Objectives ............................................................................................................. 21
4. Results and Discussion ........................................................................................ 24
4.1 Nanoscale phase diagram for AuFe generated via laser ablation in liquids........ 24
4.1.1 Nanoparticle and target composition ............................................................ 24
4.1.2 Nanoparticle ultrastructure ........................................................................... 27
4.1.3 How Crystal Structure and Phase Segregation of Au-Fe Alloy Nanoparticles
is ruled by Molar Fraction and Size ....................................................................... 28
4.1.3.1 Au50Fe50 core-shell ultrastructure verification ............................................ 34
4.2 Impact of target, pulse duration and liquid environment on the final Au-Fe NPs
structure .................................................................................................................... 37
4.2.1 High yield one step laser synthesis of core-shell Au-Fe nanoparticles- the
influence of pulse length and target structure ........................................................ 37
4.2.1.1 Theoretical model for AuFe NPs ............................................................... 53
4.2.2 Ultrastructure, colloidal stability and size distribution of core-shell Au-Fe LAL
generated NPs tuned by the liquid environment. ................................................... 57
4.3. Characterization of the AuFe ultrastructure ....................................................... 69
4.3.1 Chemical stability of Au-Fe NPs ................................................................... 69
4.3.2 Thermal stability of AuFe NPs ...................................................................... 73
4.4 Formation mechanism proposal for AuFe system. ............................................. 76
4.4.1 High core-shell formation – transferability to AuCo system .......................... 82
5. Summary .............................................................................................................. 88
6. Outlook ................................................................................................................. 93
7. Appendix ............................................................................................................... 94
7.1 Reference ........................................................................................................... 94
7.2 Supporting information ...................................................................................... 105
7.3 Material and Methods ....................................................................................... 131
7.3.1 Nanoparticles synthesis and characterization ............................................ 131

VII
7.3.2 Pulsed laser ablation in liquids (LAL) ......................................................... 131
7.3.3 Single pulse laser ablation .......................................................................... 132
7.3.4 UV-Vis Spectroscopy (UV-Vis) ................................................................... 133
7.3.5 High-angle annular dark-field scanning transmission electron microscopy
(STEM-HAADF) and EDX analysis ..................................................................... 133
7.3.6 Selected area diffraction (SEAD) ................................................................ 135
7.3.7 X-Ray Diffraction (XRD) ............................................................................. 135
7.4 Curriculum Vitae ............................................................................................... 136
7.5 List of Authored and Co-author Publications .................................................... 138
7.6 Declarations ...................................................................................................... 140
7.7 Acknowledgment .............................................................................................. 143

1
1. Introduction
The combination of two or more elements in one alloy[1] nanoparticle (NP), is
beneficial in numerous applications[2, 3] e.g. in sensing devices[4, 5], composite
materials[6, 7], catalysts[8-11], solar cells[12], data storage devices[13], biomedical
applications[14, 15] and many more[1, 16], where optical, magnetic and electrical
properties can be combined. The design of the multifunctional binary alloy
nanomaterial is still limited due to the elusive fundamental understanding of the
laser ablation process. In particular, the full utilization of the properties is hindered
by the generation of various ultrastructures. Thus, a combination of experimental and
theoretical approaches may represent a new strategy to overcome those problems, by
rationalization of the result through a nanoscale phase-diagram enriched by the
nanoparticle formation mechanism model. Here the experimental exploration of the
morphology and phase stability is supported with the thermodynamic calculations. The
model has a potential to unravel the understanding of the nanoparticle formation
mechanism during laser ablation in liquids (LAL). Furthermore, it constitutes a solution
for the generation of various morphologies in controllable manner, even for immiscible
or partially miscible alloy systems.
One example of a thermodynamically forbidden composition would be AuFe alloy NP,
which is not accessible by conventional synthesis technique. The successful formation
of the bimetallic AuFe alloy NPs was reported in the literature with LAL method,
synthetized even from a fully separated layered target configuration[17]. Laser ablation
in liquids is a simple but sophisticated method, which allows the generation of ligand-
free electrostatically stabilized NPs. This method was first described in 1993 by Fojtik
and Henglein and focused on the generation of the NPs from the bulk target, where no
purification is required[18]. For the synthesis, metal /metal oxide/ alloy targets are
required, placed in the liquid of choice (e.g. in cuvette), where the laser beam is
focused on the target surface[10, 19]. To successfully perform the ablation only a few
Watt laser power input is necessary yet, the ablation threshold must be reached or
exceeded[20]. Due to interaction between the laser beam and the surface, where
massive power density is focused in a small region, absorption of photons results in
ejection of ablated mater (solid fragments, highly excited species, atoms, droplets

2
cluster, and ions), with the majority of them captured directly within the laser-induced
cavitation bubble. Variation of the final product can be adjusted by the exchange of the
target (formation of alloys from alloy targets) or liquid (formation of oxide in water from
oxidation sensitive metals, reversed core-shell configuration with an oxide shell)[21,
22]. For once, alloy NPs synthesized by LAL can play an important role in catalysis.
Not only do they fulfill the requirements for 12 principles of ‘’ green chemistry’’ due to
their pure and stable nature[22, 23] but they also allow to drastically reduce the amount
of noble metal without sacrificing catalytic performance[24]. These include synthesis
of homogenous AuFe nanoalloys with enhanced electrocatalytic properties towards
oxygen evolution reaction[24]. The formation of nanoalloys with the content of Fe
above the thermodynamic predictions (> 11%), can be formed due to fast kinetics of
the nanoparticle formation during LAL[20].
Next to alloy NPs, nanoparticles arranged in a Fe@Au core-shell (CS) morphology
are highly interesting. Here, a metallic iron core would allow harvesting higher
magnetic spin densities[25] in contrast to iron oxide predominantly found in the
nanoparticles. Furthermore, two additional properties are gained, mainly surface
plasmon resonance from the gold shell[26, 27] as well as the possibility to
functionalize the NPs surface[28, 29]. Systems composed of an iron core and a gold
shell were shown to exhibit advanced photocatalytic activity in low-temperature
oxidation of carbon monoxide[30], and showed controlled reactivity and magnetic
recyclability for a reaction such as reduction of 4-nitrophenol[31] in comparison to pure
element NPs. However, more recently, a growing interest was devoted to the
biomedical application of AuFe NPs. In particular, nanotechnology is a new step in the
direction of making targeted drug delivery[32, 33] and stem cell tracking[34] safer by
facilitation of bioconjugation via thiol-gold chemistry[35]. Indeed, gold shell not
only delivers surface available as a carrier, but also plasmonic properties along with
biocompatible protection of an oxidation susceptible iron core, which can find it use
e.g. during MRI /optical-dual imaging[36]. The most important factors for application in
biomedicine as well as in catalysis are clean NPs. Unfortunately, Fe@Au core-shell
nanoparticles are very tedious to produce using chemical co-precipitation[26] and
reversed micelle methods[37] as contaminations by precursors must be
removed in an additional step[38]. Furthermore, chemically synthesized Fe@Au
nanoparticles were shown to be unstable as the iron core oxidizes with time[39].

3
Finally, considering economic accepts, laser-based synthesis is more cost-efficient
than chemical reduction, in case high productivity is reached[40].
Despite the outstanding advantages of LAL, CS formation by LAL is still limited, due
to competitive processes, yielding a second mode of particles with a different
morphology namely solid solution NPs. Research activities have thus focus on the
identifying the conditions during LAL, towards either alloy or CS morphology, which
contributes towards particular properties. Hence previous work has identified the
amount of Fe content required towards better control of optical and magnetic
properties, with possible application in e.g. SERS[41]. By the variation of the molar
fraction in the target control over the final NPs composition was achieved, yet
only in case of Au rich targets (Au 100 – 80 at. %) and after the post-synthesis cleaning
procedure. The increase of iron (up to 50 at %) in the material used for the ablation,
inherently exhibits the formation of either alloy or segregated structures as reported
by Wagener et. al.[42]. Nevertheless, previous experimental studies were
concentrated mostly on Au rich NPs, with insufficient information about system with
higher Fe contents; although an indication of higher phase segregation for NPs with
Fe doping at 44% was observed[27, 41, 42]. Moreover, the impact of surrounding
media on the final composition was examined, based on layered AuFe film targets[17].
The authors could conclusively prove that not only material in the target but also liquid
affects the mixing grade of formed alloy NPs for Au rich targets. Moreover, the
interaction between ablated species and the liquid environment was suggested as an
important factor during NPs formation. This theory was further confirmed by Wagener
et al., who showed that the interaction between the liquid environment and the surface
of the nanoparticles contributed to the phase segregation and elemental distribution in
laser-generated Fe@Au NPs[42]. The Fe@Au core-shell morphology was
predominant in acetone, whereas in water inverse Au core and Fe3O4 shell was
generated[42]. Indeed, according to Amendola et al. and Wagener et al. findings, alloy
formation is expected for targets with high Au content, whereas for composition > 44%
CS was an additional fraction[41, 42]. So far, no conclusive research was performed
for target composition with high iron contents. Moreover, the pulse duration impact on
CS formation was investigated only for composition Au50Fe50[42]. Nevertheless, to
prepare outline nanoscale phase-diagram, next to experimental data, the
thermodynamic model should be considered.
4
The interplay between non-equilibrium and high-temperature conditions as well as
fast quenching rate during the ablation process and the thermodynamic preferences
is far from trivial making the NPs ultrastructure/size control challenging[43]. A
significant issue is the investigation of kinetic or thermodynamic contribution
during LAL. For miscible elements, such as AuAg, monophasic alloy NPs with
composition resembling alloy target can be achieved[44, 45]. Yet, large deviations
were reported for noble metals doped with elements such as Cu or Fe. Chattopadhyay
and Malviya proposed Cu-Ag molar ratio – morphology/size dependency model, where
with means of Gibbs free energy of the elements and the wettability of the alloy either
phase segregation core-shell or alloy formation can be predicted[46]. Here, Cu rich
small NPs minimize their surface free energy by forming core-shell NPs, whereas
bigger sizes with lower Cu content formed biphase or single phase[46]. All things
considered, this study suggests the thermodynamically controlled formation of AgCu
NPs, indicating the slow formation of the NPs despite the fast nucleation process
during LAL. Contrarily to this prediction, systems with limited miscibility in bulk, such
as AuFe[47], PtRu[48], AuPt[49], and AgPt[50] form metastable alloy NPs, indicating
a kinetically controlled process caused by fast cooling. Where by increasing the free
surface energy for smaller NPs diameter formation of metastable alloy NPs was made
possible[51]. To get a better understanding of kinetic or thermodynamic contribution
during LAL, simple thermodynamic model proposed by Chattopadhyay et al.[46] will
be employed to AuFe system. Moreover, the fabrication of the mechanistic formation
model for iron-gold nanoparticles with the whole range of compositions will be
addressed here, which was not reported in the literature so far.
The experimental studies presented in this thesis explore a way for more efficient
control over the AuFe LAL-generated NPs. The present work combines experimental
and theoretical approaches for the design of nanoscale phase-diagram. In this regard,
the formation mechanism for AuFe NPs generated via LAL will be addressed. Until
now, most of the studies, are limited with regard to the variability of the NPs design by
evaluation of one parameter at the time. The aim of this thesis was to provide a
systematic study addressing an entire formation process during LAL with possible
morphologies and stability of various phases. In this context, the influence from the
target composition, liquid environment, and pulse duration on the CS NPs formation

5
was clarified. The focus was laid on the investigation of kinetic or thermodynamic
contribution during LAL. For this purpose, the thermal and chemical stability of various
phases was investigated. The formation mechanism, as well as nanoscale phase-
diagram, may contribute towards improved control over ultrastructure of the AuFe alloy
generated, with possible transferability towards another binary alloy systems,
generated via laser ablation in liquids. Moreover, the data gathered within this work
may contribute to the knowledge of fundamental understanding of the laser ablation in
liquid.

6
2. State of Art
In the following chapter alloy nanoparticles properties, synthesis route, as well as
formation mechanism during laser ablation in liquids, will be summarized for AuFe
binary alloy system.
2.1 The AuFe alloy system
The desire to design multifunctional nanomaterials[3, 7, 16, 52, 53], especially for
immiscible or partially miscible alloy nanoparticles has stimulated huge interest for the
generation of NPs via laser ablation in liquids[54-56]. Nevertheless, the combination of
iron and gold into one single particle is far from trivial. In general, the phase diagram
and their thermodynamic information can be helpful towards alloy morphology control.
Due to the fact, that the transformation from bulk alloy to nanoalloys is manifested e.g
by changes in melting temperature, crystal order, superparamagnetism, surface
plasmon resonance, etc[1, 52], a nanophase diagram would contribute towards a
better understanding of the nanomaterial at the nanoscale. For this reason, based on
the experimental and theoretical approaches, a model of the nanoscale phase-diagram
will be proposed in this work. Nevertheless, before the nanoscale system can be
summarized, the AuFe bulk phase diagram has to be considered (Figure 1). The
transformation occurring for a gold-iron system will be explained with two
representative configurations; Au15Fe85 and Au85Fe15. In both cases at higher
temperatures (1600°C), both gold and iron are in a liquid state. Au has a lower melting
point, therefore it would stay longer in this state (Au 1064°C/ Fe 1538°C). In this regard,
at the liquidus line interface, solid iron would be surrounded by gold in a liquid phase.
The solidification of the primary phase and peritectic reaction [(γ-Fe) + liquid (Au)]
play important role in the alloying process and occurs for iron-rich materials (with Au
8-43 at. %) at 1173°C. Here, two solid phases are present, with the same FCC
structures. The miscibility gap occurs between the temperature of the peritectic
reaction and the temperature of eutectoid transformation at 868°C (γ-Fe) (Au) +
(α-Fe). Similarly, as for iron-rich, gold-rich configuration Au85Fe15 contains 2 phases,
both in FCC configuration.

7
Figure 1: Au-Fe bulk phase-diagram redrawn from ref [115].
Upon further cooling below 600°C, next to FCC gold, FCC iron will transfer into BCC
phase. Additionally, the gold-rich FCC phase substituted with Fe will be present.
Interestingly, the solubility of iron in gold, as well as gold in iron, will constantly
decrease below the eutectoid temperature, which results in the precipitation of α-Fe. It
was suggested by Bosco et al., that the competition between precipitation of γ-Fe and
α-Fe in the Au matrix occurs constantly[57]. Contrarily to the metastable FCC phase,
BCC phase is considered a stable phase[56]. Yet, FCC phase has a lower driving force
required for the nucleation due to the same FCC matrix for both Au and Fe[56].
To conclude, based on the bulk phase diagram, iron core (BCC) surrounded by gold
shell (FCC) nanoparticle would be expected as the most thermodynamically stable
morphology at room temperature[56]. In accordance with the Hume-Rothery Rule[58],
the miscibility of Au and Fe defines the system as immiscible because of differences
in the lattice parameter (Au 0,4 nm; Fe 0,28 nm) and in the surface energies (Au 1,5
Jm-2; Fe 2.4 Jm-2)[56]. Therefore, the second rule proposed by Guisbiers et al. can be
applied[59], where gold segregates to the surface as its surface energy it smaller than
for Fe. Alloy formation is possible only by the application of the kinetically controlled
method, allowing the formation of a metastable alloy (FCC Au and FCC iron), as
predicted by the miscibility gap.

8
2.2 Nanoparticles properties
A combination of two or more elements in one alloy was already used by early
civilization e.g in ancient Egypt. ‘’Electrum’’ gold-silver coins were employed by
Lydians, due to its low mining and processing requirements[59]. Also, gold-copper
‘’Tumbaga’’ alloys were used by pre-Columbian civilization mostly in jewelry and
decoration field[60]. Nowadays, high interest for nanoalloy remains as the physical and
chemical properties can be controlled based on the nanoparticle size, composition,
degree of chemical ordering[61], and segregation degree[46]. Additionally, the surface
to volume ratio in comparison to bulk increases drastically allowing new properties to
be harvested[62]. The exploitation of Au-Fe or Au-Co nanostructures are particularly
interesting due to their physical and chemical properties[32, 37, 63]. This includes a
high surface to volume ratio, relevant for catalysis[62], and the possibility to form of
multifunctional plasmono-magnetic alloy nanoparticles. Indeed, the gold shell delivers
a combination of advantages, surface available for bioconjugation, plasmonic
properties but also biocompatible protection of iron/cobalt core against oxidation. Such
properties found its use e.g. during MRI /optical-dual imaging[36], photothermal
therapy[64], light-induced vapor generation[65], photoacoustic imaging[66] and many
more. In the case of Au, plasmonic nanoparticles play a fundamental role in everyday
technology. The optical properties are correlated with surface plasmon resonance
(SPR)[67], which is formed after dipole is built. In the interaction of incident
electromagnetic radiation (light) with a nanoparticle, the electrons in the conduction
band of the nanoparticle can be excited to vibration/oscillation. In principal SPR is a
collective oscillation of conduction band electrons at the metal interface[68]. This
process is schematically proposed in Figure 2. Due to the interaction with the electric
field, there is a distortion of the electron cloud relative to the atomic nucleus. The
Coulomb interaction provides a restoring force that causes the electron cloud to return
to its original position[69, 70].
Figure 2: Schematic proposal for Surface Plasmon resonance[71].

9
By a renewed interaction with the electric field of light, the electron cloud is distorted
again. This repetitive process causes an oscillation of the surface electrons, also called
plasmons[72]. LSPR (localized surface plasmon resonance) is characteristics for
materials such as Au, Ag and Ti[73]. The phenomenon of surface plasmon resonance
is responsible for the fact that colloidal gold in the form of nanoparticles no longer
appears golden but red[74]. Hence, SPR is strongly dependent on the material, size,
structure, surface functionalization[75]. Consequently, Au NPs with a diameter around
90 nm, would appear in purple color instead of red observed for 30 nm Au NPs, this
results from the SPR peak shift into the red range[76]. Additionally, increase of the
absorbance in the near infrared (IR) range of the spectrum or broadening of the SPR
peak, indicating a greater scattering of the particle, meaning that the NPs size
increased e.g due to agglomeration or aggregation or deformation[73]. Nanoparticles
containing a non-spherical shape also differ in their extinction spectrum[71]. In
particular, for a nanorods, with a structure long in one dimension, a second peak
corresponding to the longitudinal shape appears in the NIR range in addition to the
SPR peak, which is widened and shifted into the red region[77]. Moreover, in the case
of alloys, dampening of the SPR can be observed, which was previously reported by
Zhang et.al, for gold-iron core-shell structures[78]. Remarkably, the iron gold core-shell
system showed more pronounced red-shifted SPR in comparison to iron oxide core
surrounded by a gold shell[79]. This difference may arise from the difference in particle
size and shell thickness. The optical properties of AuFe NPs were further investigated
by Amendola et al. He could conclusively prove that the plasmon band was damped
due to the iron atom present in the gold lattice for Au89Fe11 configuration[27]. In fact,
an iron particle does not have plasmon resonance in the visible range. Nevertheless,
non-linear dependency from the iron doping on the damping was established, which
can be correlated to the impact from the iron d state on the relaxation frequency of the
conduction electrons[27].
On the other side, magnetic particles with properties, like superparamagnetic, high
coactivity and high magnetic susceptibility of iron/cobalt nanoparticles[80, 81] have
great importance for e.g data storage[13], biomedical application[82], and
catalysis[83]. Contrary to metal oxides, metallic NPs have larger magnetization. Yet,
metal NPs are exposed to the oxidation[84] in the air, resulting in the loss or
fluctuations of the magnetic properties. By the combination of the biocompatible

10
gold[85] shell, protection of the magnetism can be achieved. The iron/cobalt is
ferromagnetic and has a high magnetic moment density (220 emu/g) due to four
unpaired electrons in 3d orbitals[81, 86]. Classification of the magnetism is based on
its response to the applied magnetic field and the presence of unpaired electrons[13].
The materials which have no unpaired electrons, and are unaffected by a magnetic
field are called diamagnetic. To some extent all materials reveal response towards the
magnetic field, such materials are called paramagnets[82]. Paramagnets have one or
more unpaired electrons and can be attracted by a magnet. In the case of the
paramagnetic state, magnetic moments are random therefore its net magnetic
moments cancel each other out and are equal zero[87]. Whereas, ferromagnetic and
antiferromagnetic are considered magnetic ordered materials. For ferromagnetic, all
atomic magnetic moments are aligned in parallel order, those elements contain
permanent magnetic properties, and are not dependent on the magnetic field[87]. High
magnetism can be obtained only when nanoparticle contains high crystallinity and
core-shell phase[78]. Interestingly for NPs with a diameter below 20 nm, due to the
limited size of the domain, superparamagnetic behavior is observed[88].
Superparamagnetism occurs in small ferromagnetic or ferromagnetic NPs. Commonly,
Ferro- and ferri- magnetic NPs can undergo their transition to a paramagnetic state
above Curie temperature, whereas superparamagnetic transition occurs below this
temperature (called blocking temperature)[87]. Moreover, superparamagnetic NPs are
single domain. The magnetization in superparamagnetic NPs undergoes constant
fluctuations (oscillation), which is thermally driven. Each oscillation has various periods
to complete, which is called Neel relaxation time[89]. Such fluctuation is possible for
the small crystal sizes, as then the thermal energy kT (where k is Boltzmann’s constant
and T is the absolute temperature), would be sufficient to cause the changes of the
magnetization direction. Magnetic behavior is only present under the application of the
magnetic field[86]. Once the magnetic field is eliminated, NPs lose their magnetism at
the temperature above the blocking temperature[90]. This enables the NPs to avoid
the aggregation and lead to better colloidal stability[91].
Several groups reported the synthesis of magnetic core capsulated with gold shell[31,
92], with their surface been functionalized with various drugs and molecules towards
biomedical application[93, 94]. Magnetic properties of the NPs are dependent on the
core size and ultrastructure (single and multicore), chemical composition (oxidation

11
degree), whereas plasmonic properties are mainly defined by the size and the
shape[79]. High magnetism reported by Zhang et al. for iron-gold core-shell NPs,
showed its dependency from the crystal phase and particle interface[78]. Mass
magnetization per iron content of 210 emu/g was detected, corresponding to 96% of
the value reported for the bulk iron (220 emu/g)[78]. These results can be contributed
to the highly crystalline iron core. Additionally, magnetic measurements performed by
Wagener et al. confirmed, magnetic properties of Au50Fe50 CS NPs with the
magnetization of only 10.3 emu/g[42]. Nevertheless, the presence of coexisting
magneto-plasmonic properties in gold shell surrounding iron core was proved. The
complexity of adjustment of the plasmonic-magnetic properties will be described with
a schematic model shown in Figure 3. By the alternation of the ultrastructure either in
the iron core – gold satellite (A.) or by iron core – gold shell (B.) configuration with
spherical and non-spherical shape (C.), various properties may be more
pronounced[79].
Figure 3: Schematic model of possible ultrastructure of gold-iron system with the iron core, surrounded by gold in form of satellites (A.), and two representative core-shell morphologies with spherical and non-spherical shape, redraw from ref [62]. All proposed nanoparticles were synthesized chemically as described elsewhere[79].
For example, by the ultrastructure A, higher magnetization is present with a high gold
specific area, furthermore, functionalization of uncovered Fe is possible. Whereas,
ultrastructure B, provides good colloidal stability as well as biocompatibility of the NPs
in aqueous media, yet lowest magnetization. Moreover, different optical properties may
occur in dependency from the NPs shape (spherical or nonspherical) e.g. ultrastructure
C. Even though magnetism decrease can be observed, the iron core is inert from the
oxidation, which may alter the magnetic properties of unprotected iron[79].

12
To summarize the most optimal ultrastructure would be an iron core with gold shell, to
harvest plasmonic and magnetic properties, with surface available for the
functionalization.
2.3 Colloidal Synthesis of alloy nanoparticles
Synthesis of the colloidal metal nanoparticles can occur via chemical synthesis with
help of atomic precursors e.g from the reduction of metal salts (bottom-up approach)
or by breaking down the bulk material (top-down) via milling or combination of both e.g
via laser ablation (top-down and bottom-up)[20]. The art of the synthesis may
determine AuFe NPs ultrastructure and consequently, it may influence their properties.
Thus, the following sub-sections give an overview of the following methods, with a
focus on their advantages and disadvantages, pointing out the parameters, which may
affect the AuFe morphology.
2.3.1 Chemical synthesis
The first reported gold colloid was prepared by M. Faraday in 1857, who synthesized
Au NPs by treating aqueous HAuCl4 with phosphorus dissolved in CS2 in a two-phase
system[95]. Furthermore, Turkevich et al. discovered in 1951 a method to synthesized
monodispersed spherical gold NPs in the aqueous phase by reducing chloroauric acid
with trisodium citrate[96]. In his procedure citrate anions are used both for reduction
as well as stabilization purposes. The synthesis of monodisperse alloy NPs is more
challenging. During chemical synthesis, additional stabilizing agents are required to
control the NPs growth as well as hinder the agglomeration process[39]. The size,
shape, and composition of chemically synthesized NPs are the most important aspects
of the solution based colloid synthesis as they are a key feature for most NPs
application[94]. During chemical synthesis, generally few consecutive steps such as
nucleation, controlled or uncontrolled growth and precipitation of saturated particles
are required[97]. The biggest challenge is to stop the reaction at the most convenient
time. For example, injection of the salt at the wrong time may lead to polydispersed
size distribution[98]. In the case of Au-Fe synthesis, one example would be the
reduction of Au salt and decomposition of Fe where sequential ion implantation of iron
in gold nanoparticle embedded in a silica matrix occurs[99]. To overcome the

13
difference in the redox potential of iron and gold, this procedure is performed in two
steps. Therefore, in the first step, the iron salt (a mixture of Fe3+ and Fe2+) is first
reduced with an excess NaBH4 solution, generating a high yield precursor iron
complex. In the second step, gold salt is mixed with the Fe precursor and capping
ligands and reduced with NaHB4, generating ligand stable Au-Fe NPs[99].
Simultaneous co-precipitation of noble and transition metal precursors is, however,
challenging due to the difference in the redox potentials. A second common method
for Au-Fe particle synthesis is the reverse micelle method. Where the inner core of the
particle act as a nanoreactor and the growth can be controlled by water molecules
inside the hydrophilic core. The aqueous core of reverse micelle leads to homogenous
nucleation, during which the micellar diffusion would control the particle growth[39].
Gold iron core-shell nanoparticles are very tedious to produce using chemical co-
precipitation and reversed micelle methods as contaminations by precursors have to
be removed in an additional step. Furthermore, chemically-synthesized Fe@Au
nanoparticles were shown to be unstable as the iron core oxidizes with time.
2.3.2 Laser ablation in liquids
Well established laser ablation in a liquid technique has a huge advantage over other
methods as it excludes the use of toxic species or by-products adsorbing on the
nanoparticle surface[100]. Nanoparticles, which are covered with ligands are mostly
undesired for application in e.g heterogeneous catalysis as the adsorption efficiency
and catalytic activity is reduced, or biomedical application, as the ligands are blocking
the available spots for drugs, protein, etc binding. By using the laser ablation method,
we can optimize the size[100] and the composition[22] of the generated nanoparticles
for various materials by e.g changing the target, laser parameter and/or the liquid
environment[20, 21, 101]. In Figure 4, the principle of laser ablation is explained in a
schematic way. During laser ablation in the chosen liquid incident laser pulse
penetrates the surface of the starting bulk material (metal, metal oxide, ceramics,
semiconductors)[102]. The interaction of a laser beam with bulk target surface results
in the absorption of photons, where massive power density is focused in a small
region(Figure 3 a)[20]. The electrons of the ablated target absorb photons from the
laser beams. The absorption process is material and pulse duration dependent, which

14
may lead to different ablation mechanism[22]. In the case of short ns pulse, main
interactions are based on the thermal processes; and are as follow; vaporization,
boiling and melting[103]. Here, the rapid heating to the critical temperature of the solid
target leads to detachment of the ablated matter by explosive boiling mechanism[104].
On the other side, short pulse duration (ps and fs) undergo photoionization, in which
material is ablated in a similar range to the electron-lattice thermalization speed[104].
Plasma plume is formed as a result of the ionization of the matter within the ablation
process (Figure 3 b)[22].
Figure 4: Schematic model illustrating the fundamental process during laser ablation in liquids, with a) initial phase in which laser is absorbed by the bulk target, b) followed by the plasma plume ignition and expansion. The transfer from plasma plume occurs through vaporization of liquid in contact with hot plasma c) The expansion of the cavitation bubble occurs until it reaches its maximum at 20 % of a lifetime, followed by shrinking and collapse resulting in the release of particle into the liquid. Schematic representation with key points during laser ablation redrawn from ref [106].
The liquid pushes laser-induced plasma into a thermodynamic state of higher
temperature, pressure and higher density (about 1020 cm-3 depending on the laser
pulse energy[105]). The temperature of the plasma can reach up to thousands of
kelvins, whereas the pressure hundreds of pascals[106]. This may favor the formation
of metastable phases, which are in high temperature, a high-pressure region on their
thermodynamic equilibrium phase diagram, due to fast cooling rates[27]. The lifetime
of the plasma can be increased based on the laser parameters (e.g by increasing the
laser energy)[107] and surrounding liquid (e.g by addition of salt)[108], generally, the
duration of the plasma lies between tens of ns to few µs[109] for each laser pulse.
Sakka et al., as well as Lam et al., indicated that the chemical reactions between the
species inside the plasma last for several µs[109, 110]. However, a detailed study from
Tamura et al. has shown, that plasma and cavitation bubble coexist in the early stage,
indicating that the ablated species such as atoms, clusters, and ions most likely interact
with the liquid[111]. The transfer from the plasma to the cavitation bubble occurs via
the vaporization of liquid in contact with hot plasma plume, and it is dependent on the
15
pulse energy (Figure 3 c). In the initial cavitation bubble stage, embryonic particles
grow by attracting atoms, clusters, and droplets, however, this process is diffusion-
limited[112]. Furthermore, clusters can be formed by coalescence of individual growing
particles[19, 113]. Nanoparticles may grow after LAL synthesis even up to several
days[114]. Expansion of the cavitation bubble occurs until it reaches its maximal height,
at around 20% lifetime, followed by hemispherical shrinking until its collapse with
possible multi-rebound, where NPs are released into the surrounding liquid or
redeposited on the target (Figure 3 d)[115, 116]. Furthermore, the cavitation bubble
collapse (Figure 3 e) may lead to the mechanical ablation of the target, leading to the
formation of additional NPs[107]. Dynamics of the cavitation bubble and its role during
NPs formation was investigated by Plech et al. with means of X-ray small-angle
scattering analysis[117], where the bimodal formation of smaller (<10 nm) primary and
agglomerated bigger (>40 nm) secondary NPs was proposed. Here liquid-solid
interface was proven to be a critical parameter for bubble motion, where secondary
particles along with the solvent molecules are confined within the cavitation bubble,
indicating the liquid-particles interaction before the cavitation bubble collapse.
Whereas, primary NPs are most likely formed via nucleation and growth and are in
direct contact with the surrounding liquid media before bubble collapse[118].
Additionally, plasma heated supercritical water phase, and cold bubble vapor may
provide conditions for NPs crystallization[20]. Moreover, bimodality can be attributed
to different regimes and corresponding thresholds, where 3 areas within the ablation
beam can be distinguished: ablation area with the highest fluence in the center spot,
annealing area with the lower fluence regime ring, and finally modification area with
the outmost area[119]. Numerous investigations have been conducted regarding size
control of LAL generated NPs, as with the size the physical and chemical properties
can be modified. Particle size distribution varies depending on many parameters e.g.
the material and liquid environment etc. For example, liquid surrounding not only
impacts the colloidal stability (steric by addition of polymer or electrostatic stability via
e.g adsorbates hydroxyl groups)[120], surface oxidation degree (depending on the
redox potential)[121], but also influence crystal growth[42]. Hence, during laser
fragmentation in acetonitrile hcp crystal structure was obtained for Ni, contrarily to fcc
phase in water, most likely due to the specific heat of the organic liquids[122].
Moreover, liquid properties contribution towards cavitation bubble size, lifetime and

16
mobility during the ablation[123]. Additionally, control of the liquid thickness and liquid
flow to maximize productivity and to avoid temporal and spatial concentration gradients
respectively should be considered. Moreover, the size of the particles can be quenched
by the addition of the additives. However, not all additives bring benefits, some may
lead to an increase in viscosity[124] or due to degradation would lead to
contaminations[125]. Higher liquid viscosity and density lead to plasma confinement
and shorter lifetime of the cavitation bubble[126]. Viscosity changes the diffusion
constant of the particle nuclei and their collision rate to form aggregates and bigger
nanoparticles, as described by LSW theory[19]. Some efforts have focused on
synthesizing NPs in the various liquid environment, yet constant parameter evaluation
is extremely difficult. Hereby, the sophisticated but easy technique of LAL grants not
only bare but also ligand modified surface, which contributes to higher colloidal stability
and size control. In case a clean NPs surface is required, a small addition of micromolar
salt concentration can also improve size quenching drastically and can contribute to a
more narrow particle size distribution[127]. Moreover, re-irradiation of colloid causing
particle fragmentation[128] or melting[129] may be used as a considerable technique
for size control. Without the addition of external quenching additives, bimodality may
still be observed. Consequently, additional centrifugation steps are often required to
achieve clean size fraction[21].
The obvious aim of understanding the formation mechanism during LAL, emerges as
depending on the NPs size and the structure, completely different applications may
emerge. In this context, an elucidation of the decisive factors during LAL is particularly
crucial. For this purpose review of e.g. bimetallic alloy NPs can contribute
comprehensive insights into a mechanistic scenario during the laser ablation process.
Remarkably, stable alloy phases can be generated even for materials, which are
immiscible or partially immiscible in bulk[54]. Precisely, alloy degree was shown to be
controlled by adjusting the target composition (bulk alloy target or pressed mixture of
metal powders)[22]. In this regard, alloys such as; AgPt, AuPt[45], AgCu[46], AuAg[44],
AuFe, PtPb[130] and FeMn[131] were successfully synthesized[19, 55]. The alloy
formation is facilitated due to an increased ratio between surface energy in regard to
total free energy, resulted from the particle size decrease[16, 56]. Identifying the
stoichiometry of the synthesized NPs revealed, the value nearly identical with the target
used for the ablation[44, 132]. In the case of AgAu, perfect monophasic crystals were

17
produced, which can be correlated to the fact that these elements have no miscibility
gap[44]. Yet, generation of the homogenous alloy is strictly material dependent, which
may lead to nonstoichiometric alloy or to other phase segregated structures (core-
shell, Janus like morphologies, etc) as shown in Figure 5[55]. Here, material resistance
towards oxidation plays a crucial role, and more precisely the redox potential of the
ablated material[78].
In addition, the morphology of the alloy nanoparticles’ may be affected by the
surrounding liquid environment during the early stages of laser ablation. Hence,
depending on the target, for example, for the ablation of metal in water, a chemical
reaction - oxidation may be more pronounced than e.g. thermodynamic preferences,
leading to the formation of an oxide NPs[20, 21].
Figure 5: Schematic representation of possible alloy structures[55].
Lam et. al. demonstrated the formation of Al2O3, based on molecular simulation of the
nucleation phase, suggesting, that the ablated material interacts with the liquid
molecules leading to oxide formation[133]. Additionally, the impact of surrounding
media on the final composition was examined based on layered AuFe film targets[17].
The authors could conclusively prove that not only material in the target but also liquid
affects the mixing grade of formed alloy NPs for Au rich targets. Moreover, the
interaction between ablated species and the liquid environment was suggested as an
important factor during NPs formation. This theory was further confirmed by Wagener
et al., who showed that the interaction between the liquid environment and the surface
of the nanoparticles contributed to the phase segregation and elemental distribution in
laser-generated Fe@Au NPs[42]. The Fe@Au core-shell morphology was

18
predominant in acetone, whereas in water inverse Au core and Fe3O4 shell was
generated[42]. Indeed, according to Amendola et al. and Wagener et al. findings, alloy
formation is expected for targets with high Au content, whereas for composition > 44%
CS was an additional fraction[42]. So far, no conclusive research was performed for
targets composition with high iron contents. Moreover, the pulse duration impact on
CS formation was investigated only for composition Au50Fe50. Nevertheless, to prepare
outline nanoscale phase-diagram, next to experimental data, the thermodynamic
model has to be included.
2.4 Nanoparticle formation – modeling
Models predicting composition and ultrastructure at certain synthesis conditions are
now implemented at the bulk scale. Yet, the information on the temperature-dependent
phases transformation is still limited for nanosystems. Classic bulk phase diagram
cannot be applied for nanoalloy system, as the number of atoms as well as volume is
much smaller[112, 134]. Furthermore, as the surface effects dominate, state function
is no longer directly proportional to the number of atoms[104, 135]. Theoretical
approach e.g Metropolis Monte Carlo, Density Functional Theory is still limited due to
restriction of modeling, which is only suitable for a limited number of atoms. To
overcome these challenges, many groups dedicate their work to determine nanoalloy
phase diagrams by applying a combination of the experimental and computational
approaches. In these studies, 3-dimensional phase diagrams; size, composition, and
temperature were considered towards various ultrastructure formation[46]. With the
help of thermodynamic calculation, Chattopadhyay et al. described how surface energy
for different compositions and sizes would predict segregation or alloyed structure for
Ag-Ni & Ag-Cu NPs generated via LAL[46, 136]. Thus, based on the proposed model
the morphology transition of the NPs is composition dependent. In the case of AgCu,
a transformation occurred from two-phase intraparticle structure to randomly
segregated structure and finally to core-shell morphology. Their thermodynamic model
was based on the free energy of mixing and the wettability of the alloy phase. As a
result 3D model was established in which free surface energy was presented as a
function of size and composition. Overall, the particle decrease leads the free energy
increase, and therefore NPs with smaller sizes would prone to form core-shell
structures. To that
19
end, the indication of the generation of a particle in thermodynamic equilibrium was
proposed for LAL synthesis[46]. Moreover, the proposed model can be applied if
certain assumptions can be fulfilled. For example, based on the Hume Rothery rule, if
within the system crystal (e.g FCC), atomic radius and electronegativity would be
similar solid solution can be predicted[58]. Whereas, in the case of a system with a
substantial variation for given parameters, phase segregation should occur. Therefore,
thermodynamic model may result in various ultrastructure characteristic for particular
material. Next to thermodynamic calculation predicting morphology based on the size
and particle composition, a intensive research was focused on the simulation of early
stage during the ablation process.
In this context, issues such as bimodality, or alloying degree were addressed. In this
regard, Zhigilei et al. offered a potential explanation for ultra and short pulse duration
suggesting that the size of the LAL synthesized nanoparticle is explained based on 2
different mechanisms[137]. It is hypothesized, that larger particles form by the ejection
of liquid droplets from a superheated metal molten layer, destabilized by Rayleigh
Taylor instabilities and impaction from metal droplets from underlying layers. The
smaller NPs, on the other hand, are believed to be formed by rapid nucleation of
ejected atoms and smaller atom clusters[137]. Despite the formation mechanism is
described for short pulse duration, an indication of target and liquid environment impact
on the size distribution, and perhaps on the ultrastructure emerges. Moreover, a
possible explanation of the ablation mechanism during laser ablation was summarized,
in which during long ns pulse duration, meting and vaporization occurs[103] whereas
ps short pulse duration can be described as almost instantaneous solid-vapor
transition of the atoms of the target[138]. Due to the prolonged time inside the
cavitation bubble under heated state (> 5000 K)[139, 140], prolonged cavitation bubble
lifetime would arise, due to additional heating of the plasma, caused by the partial
overlap of the pulse width and the duration of the existing plasma plume[103, 138].
The extended lifetime of the cavitation bubble by application of larger pulse energy
was previously validated by Park et.al[108]. In this regard, the impact form the cooling
rates, which in the gas phase is lower than in the liquid phase[108], may impact the
final morphology of the particle. Finally, based on, Povarnitsyn et al. simulations,
prediction of the origin from particle size can be given. In this context, smaller NPs, are
predicted to be

20
formed in the liquid+gas phase region, whereas the larger are closer to the molten
layer region as described by Zhigilei et al[19, 112, 141].
The relevance of the experimental and theoretical approaches was successfully
demonstrated to be the most promising tool towards the description of nanoalloy
systems. Therefore, in order to generate FeAu NPs with tunable properties via LAL, a
combination of Chattopadhyay et al. model as well series of experiments were
executed in this work[46]. Mainly, the impact from the liquid surrounding (chain length,
heat capacity, and viscosity), availability of the material (Au:Fe ratio), as well as a
condition during laser ablation (pulse duration impact), and the target type (bulk vs thin
layered target) were evaluated.

21
3. Objectives
The aim of this work addresses significant shortcomings of the available information
during the nanoparticles formation process of immiscible or partially miscible
alloy systems during LAL synthesis. Expansion of the knowledge about the
formation mechanism would give an opportunity towards better control of the
corresponding ultrastructures, which is one of the current challenges of LAL. At the
moment nanoscale phase diagram for AuFe system is not available, due to lack
of the information of the physical and chemical processes involved during LAL
synthesis. To govern such versatility, a combination of the experimental and
theoretical approaches will be applied and will be summarized in form of the
nanoscale phase diagram with a simplified formation mechanism proposal.
In this perspective, the following aspects will be considered:
i. How does the target composition influence the ultrastructure of the
nanoalloy NPs? How relevant is the equilibrium miscibility of final NPs
formed under non-equilibrium conditions? (Figure 6 a)
ii. Does the laser pulse duration influence the final NPs ultrastructure? How
relevant are the conditions during LAL to the formation mechanism?
(Figure 6 b)
iii. How does the liquid environment impact the synthesized NP
ultrastructure? Can a clear correlation between liquid property and
ultrastructure be established? (Figure 6 b)
iv. Is the NPs formation kinetically or thermodynamically controlled?
What is the nature of LAL generated NPs, are they metastable or
thermodynamically stable ultrastructures? (Figure 6 c.)
v. Finally, is the proposed model suitable for other combinations of
magneto-plasmonic binary systems with similar properties (AuCo)? What
are the limitations of this approach? (Figure 6 d.)
Core-shell NPs with an iron core and a gold shell are of particular interest as they
allow the combination of magneto-plasmonic properties in one material. To reach
full potential of control over the NPs ultrastructure design, nanophase diagram based

22
on the experimental data enriched by the thermodynamic calculations will be
proposed.
Furthermore, the focus would be laid on the systematical variation of the synthesis
parameter such as the liquid environment (alcohols, ketones, and oils), target
(alloy, thin layer target), and laser parameters (pulse duration, short ps vs long
ns pulse) towards high CS NPs yield (Figure 6 b). The evaluation of the
ultrastructure, size, and composition of the NPs, as well as thermal and chemical
stability will be performed with the help of HAADF-STEM imaging, Selected area
(electron) diffraction (SEAD) patterns, accompanied by Energy Dispersive X-Ray
(EDX) spectroscopy. Finally, model describing formation mechanism of the laser-
generated AuFe NPs will be addressed. Thus, the transferability of the model to
another binary alloy system, in this case, AuCo will be evaluated.

23
Figure 6: Schematic overview of main objectives in this thesis including a) Proposal of the nanoscale phase diagram for AuFe binary alloy system b) factors affecting high yield of AuFe CS NPs during LAL c) Thermal and chemical stability evaluation of the AuFe NPs d) Proposal of the NPs formation mechanism during LAL, followed by an application of the schematic model towards another binary systems (AuCo).

24
4. Results and Discussion
The following results and their discussion will be presented in four subchapters. In the
first chapter based on the data collected from the experimental and theoretical
approach, the proposed nanoscale phase diagram will be given. Here, different
compositions of Au:Fe (Fe100, Au5Fe95, Au20Fe80, Au35Fe65, Au50Fe50, Au65Fe35,
Au80Fe20, Au95Fe5, Au100) and NPs‘ diameter between 5 and 50 nm were considered.
In the second part, the contribution towards high iron gold core-shell yield during laser
ablation in liquids is characterized with regard to layered target (alloy, AuFe/glass,
FeAu/glass, and AuFeauFe/glass), liquid parameter (heat capacity, chain length, and
viscosity) and pulse duration (short ps and long ns). This subchapter is enriched by the
updated theoretical model, which considers the interface energy as the thermodynamic
driving force towards element segregation. Thirdly, the evaluation of the various
ultrastructure’s thermal and chemical stability is performed. Finally, the fundamental
NP formation mechanism of binary AuFe alloy via laser ablation is liquid is
summarized. In addition, transferability to another magneto-plasmonic binary system
will be evaluated. The results summarized in this dissertation point toward the
importance of careful parameter choice during LAL NP synthesis and confirmed
successful control of the ultrastructure for both analyzed systems (AuFe and AuCo).
4.1 Nanoscale phase diagram for AuFe generated via laser
ablation in liquids
4.1.1 Nanoparticle and target composition
Gold-iron nanoparticles were analyzed by employing EDX analysis in order to obtain a
comprehensive impression on their composition. The successful generation of the
reproducible composition of the NPs with high colloidal stability is required before the
evaluation of the parameter affecting the formation mechanism of AuFe NPs can be
performed. To exclude the variation in the composition of the NPs generated via LAL
in acetone, EDX analysis of targets used for the ablation and synthesized NPs was

25
performed. Apart from Au35Fe65, STEM-EDX analysis revealed the same composition
of NPs in correlation to the ablated target. The composition of the NPs stayed within
with a small error range (below 5 %) as shown in Figure 7 a. Representative STEM
pictures for nanoparticles with composition Au20Fe80 and Au50Fe50 are shown in Figure
8b. Huge variation in the composition of Au35Fe65 can be correlated to a high
abundance of impurities within the sample, therefore Au35Fe65 and Au65Fe35, were
excluded from the study. Based on the observed trend it can be stated that the overall
composition of the NPs, independent from its structure, (Figure 7 b and S1) can be
controlled by the target elemental ratio. The results are in correlation with previously
published reports, in which the composition of the AuFe alloy NPs, was adjusted with
the target composition.
Figure 7: a) EDX evaluation of target and NPs composition b) with STEM images for representative compositions; Au20Fe80 and Au50Fe50 in acetone generated via ns laser (composition is based on EDX analysis presented in Figure S1) c) Oxidation degree in the target used for the ablation measure via EDX analysis d) EDX analysis of the AuFe colloids before and after ablation.
Nevertheless, when considering NPs composition, oxidation has to be taken into
account. This assumption is reasonable due to the fact, that iron is highly sensitive to

26
oxidation, and therefore the formation of the iron oxide layer on the target surface may
occur. According to literature, the formation of the oxide NPs is common, especially for
iron in the oxidizing environment. Moreover, oxidation of the iron core may lead to NPs
with lower magnetization and nonmetallic band structure. Therefore, in order to
evaluate if the oxidation of the target would lead to a generation of oxidized NPs, EDX
analysis of the NP and the target was applied. For the evaluation of the oxidation
degree of the target, 6 representative targets compositions were chosen (with Fe
content 10,20,50,80,90 at. %). As has been shown in Figure 7 c, the oxidation degree
varies between 10-30 % and does not exceed 30%. Furthermore, to confirm the
sufficiency of the ablation method, EDX analysis of representative core-shell NPs was
performed, proving that no oxide was detected inside the NP (Figure S2).
Nevertheless, the analysis clearly confirmed no oxide within the NP, indicating the
preservation of the magnetic properties. Magnetic properties for LAL generated AuFe
NPs were previously confirmed by Amendola et al., yet only for Au rich composition.
The evaluation of the magnetic properties of iron-rich NPs will be addressed in chapter
4.2.1.
Since the NP composition can be controlled with the composition in the target used for
the ablation, the clarification of the composition of the previously ablated target has to
be evaluated. To identify, to which extend previously ablated surface may impact the
composition of the synthesized NPs, both previously synthesized surface and unused
surface were compared. For this purpose 3 representative compositions (Au20Fe80,
Au50Fe50, Au80Fe20) were chosen. To this end, the ablation of the previously ablated
surface was confirmed to have a negligible impact on the NPs composition. In fact,
only 5 % error range in regard to NPs composition was validated as depicted in Figure
7 d between NPs synthesized from the unused surface (before LAL) and surface, which
has been already ablated (after LAL). The small deviation may arise from the
generation of various NPs ultrastructure, e.g alloy or CS configuration.
Overall, it was demonstrated that NPs composition can be tuned with the composition
in the target used for the ablation. Moreover, oxidation of the target has a negligible
impact on the NPs composition, the same as the surface previously used for the
ablation.

27
4.1.2 Nanoparticle ultrastructure
During LAL synthesis various ultrastructure can be generated in dependency from the
material, it is therefore mandatory to provide a classification of the possible
ultrastructure. In this context, four ultrastructures were determined, alloy NPs with
disordered solid solution (SS) mixture, core-shell (CS) NPs with iron core and gold
shell; jellyfish structures with gold shell, iron core with extra gold core within as well as
multi core-shell NPs (MC), with one or many cores (Figure 8 a). To simplify the analysis
within this work, jellyfish ultrastructure will be considered as MC NPs. Whereas, CS,
MC, and jellyfish are considered as one group of phase segregated (PS) NPs.
Regarding, the composition of the respective NPs, EDX analysis was used to
determine the element distribution within the NP for two representatives NP, SS, and
jellyfish. (Figure 8 b). In this regard, EDX elemental mapping confirmed gold (green)
and iron (yellow) regions within the NP. For SS, distinctive mixing can be observed,
where both gold (green) and iron (yellow) are distributed within the whole NP, whereas,
in case of jellyfish, gold (green) is distributed in the core and the shell, filled in between
with iron (yellow).
Figure 8: a) Classification of possible ultrastructure for iron-rich NPs generated via LAL in acetone b) EDX mapping of representing NPs; SS and jellyfish (iron –yellow, gold-green color)
A clear distinctive difference between the other structures can be evaluated with the
STEM with HAADF detector, in which elemental distribution is investigated by Z-
contrast imaging. This evaluation is based on the large difference in the atomic number
between iron and gold, characterized in bright (gold) and dark (iron) areas visible in
the STEM image. Here, next to SS and jellyfish, further two ultrastructures were
determined, CS with a dark iron core and bright gold shell, and MC with gold distributed
within the NP, enriched by multi iron cores.

28
4.1.3 How Crystal Structure and Phase Segregation of Au-Fe Alloy
Nanoparticles is ruled by Molar Fraction and Size
Published in: ’’How Crystal Structure and Phase Segregation of Au-Fe Alloy Nanoparticles is ruled by Molar Fraction and Size’’ Nanoscale, 2018, 10, 16434-16437;
A.Tymoczko, M. Kamp, Oleg Prymak, Christoph Rehbock, Jurij Jakobi, Ulrich
Schürmann, Lorenz Kienle, and Stephan Barcikowski
The application for Au-Fe nanoalloy is determined by its internal phase structure. Our
experimental and theoretical findings explain how the prevalence of either core-shell
or solid solution structure is ruled by the target composition and the particle diameter.
Furthermore, we found metastable phases not predefined by the bulk phase diagram.
Au-Fe nanomaterials with a defined internal structure[55] are beneficial for
numerous possible applications[142]. One example would be in catalysis, where a
solid solution structure improves electrocatalytic oxygen evolution[24]. In contrast, a
core-shell structure with a metallic iron core and a gold shell could be applicable in
biomedicine e.g during MRI/optical dual imaging[143]. Here the metallic iron core
would allow to harvest higher magnetic spin densities in contrast to iron oxide
predominantly found in nanoparticles (NPs) generated by conventional routes[25].
Additionally, the gold shell could provide surface plasmon resonance as well as the
possibility to functionalize the NPs surface via Au-thiol chemistry[28]. As Fe@Au core-
shell nanoparticles are very tedious to produce using chemical co-precipitation and
reversed micelle methods due to contamination caused by the reactants Laser Ablation
in Liquids (LAL)[19] is a viable alternative, producing ligand-free nanoparticles in gram
scale[144]. Up to date intensive research in the area of laser-generated gold-rich Au-
Fe alloy NPs has been conducted aiming at control over optical and magnetic
properties of NPs in correlation with the composition and the surrounding media.
Metastable alloys with different mixing grades[145] were synthesized, with clear
dependency from the molar ratio[146] and surrounding liquids[42]. Even though the
Au-Fe system has been subjected to a number of experimental investigations a deeper
understanding of the complex formation mechanism in correlation to target
composition and the particle diameter for the whole Au:Fe NPs range is still lacking.
Herein we report that in Au-Fe NPs formed by LAL the emergence of a core-shell (CS)

29
structure is favored for NPs with diameter exceeding 10 nm, Fe molar fractions in the
target > 35 % and deviating crystal structure (Au - face-centered cubic (FCC) & Fe –
body-centered cubic (BCC)). On the other hand, disordered solid solution (SS)
nanoparticles with Fe - FCC structure and number mean diameters < 10 nm always
form independently from the Fe content. Au-Fe NPs were synthesized using LAL in
acetone (see SI for details) from bulk targets with varied Fe:Au ratios. High-resolution
imaging by scanning transmission electron microscopy (TEM) in combination with
energy-dispersive X-ray spectroscopy (EDX) line scans revealed the formation of two
clearly distinguishable internal phase structures, a disordered solid solution and a
FeAu@AuFe core-shell structure (Fig. 9, Fig. S 3). In consecutive experiments, we
aimed to elucidate to what extent the emergence of these structures was correlated
with target composition, particle diameter and the overall crystal structure determined
by X-ray powder diffraction (XRD).
Notably, for iron-rich NPs (Fe > 35%), 2 fractions of NPs with below and above 10
nm number mean diameter were detected (Fig. 10a, Fig. S4). Bimodal size
distributions were expected as previously shown, based on different ablation
mechanism[144]. In contrarily, from Au rich targets (Fe < 35%) particle size distribution
with number mean diameter < 10 nm were generated. The overall decrease of larger
particles in gold-rich alloy NPs, may be explained by size quenching caused by specific
solvent-surface interactions between gold-rich surfaces and acetone[100]. These
findings seem to indicate that next to the NPs diameter, target composition has an
influence on the ultrastructure of Au-Fe NPs.
Figure 9: EDX composition analysis for Au-Fe LAL generated NPs in Acetone (disordered Solid solution SS [left] and core-shell CS [right]).
Based on this we deduced a clear particle diameter / Fe % – structure dependency.
Our analysis revealed that all particles with a number mean diameter < 10 nm had a
disordered solid solution structure, while core-shell was only found for NPs > 10 nm.

30
This trend was quantified by determining the volume-weighted CS NPs yield (Fig. 10
a). It may be concluded that phase segregation (CS-formation) is only observed for
NPs with diameters > 10 nm and Fe molar fractions > 35 %. Additionally, disordered
SS forms independently of the target composition. The results clearly show that NPs
with diameters < 7 nm would be thermodynamically more stable as SS NPs
independently from Fe molar ratio.
Figure 10: Factors determining the disordered solid solution versus core-shell yield; a)
Nanoparticle size-target composition dependency (disordered SS & CS NPs) for Au-Fe NPs
generated by LAL in Acetone. b) Influence on the CS yield % based on the average size of Au-
Fe NPs for both Volume (Vol. %) and Number ratio (Nr. %) c) Theoretical calculations are
based on the Chattopadhyay model.[136]
Figure 11: Au-Fe lattice parameters (FCC 1, FCC 2, FCC 3 represent alloy structures with different substitution grades) and weighted phase ratios between BCC/FCC structures measured by XRD.

31
In the case of NPs with diameters > 7 nm, phase segregation and hence the
emergence of CS NPs should be preferred (Fig. 10 c). These calculations confirm our
experimental findings, showing CS structures only for mean particle diameters > 10
nm (Fig. 10a). The correlation between diameter and CS yield was further verified by
the investigation of two laser-generated colloids with deviating diameter distribution but
identical target composition (Au50Fe50) (Fig. 10b). The results are fully consistent with
our expectations, the number of generated CS increases with increasing NPs size.
Even though CS yield increased with increasing Fe molar fraction and diameter, the
disordered SS alloy NPs are always present independently from the target
composition. This is surprising as in accordance to the Hume-Rothery Rule [58],
miscibility of Au and Fe defines the system as mostly immiscible (bulk solubility at room
temperature: 3% Au in Fe and 0.3% Au in Fe) [56] because of differences in the lattice
parameters (AuFCC 4.076 Å; FeBCC 2.866 Å) and in the surface energies (Au 1.5 Jm-2;
Fe 2.4 Jm-2) [147, 148]. Based on this, the segregated phase (CS) should be the only
thermodynamically stable phase. To examine this phenomenon in more detail, we
determined the crystal structure of the generated Au-Fe NPs by X-Ray powder
diffraction (XRD) including Rietveld refinement and calculation of lattice parameters for
FCC and BCC phases (Fig. 11 a, Fig. S5). The analysis revealed, that for target
compositions > 65 % a BCC iron phase was dominant in the NPs, which basically
coincides with the occurrence of CS phase structures in transmission electron
microscopy (TEM). In this context, it should be noted that the lattice constants of this
phase are slightly elevated compared to bulk Fe, which points at the partial substitution
of iron with Au. In addition, an Au-Fe FCC structure is detectable over the whole
composition range, which can be clearly attributed to the disordered SS NPs in gold-
rich samples. In iron-rich samples, however, disordered SS NPs and gold-rich shells
cannot be differentiated based on XRD. This Au-FCC phase exhibits a reduction in
lattice parameters from 4.1 – 3.95 Å while increasing the iron molar fraction up to 65
%, which proves alloy formation and substitutions by iron atoms in the FCC-Au lattice.
Thermodynamic calculations, described in more detail elsewhere by Chattopadhyay et
al., [136] were employed to predict how the most favored ultrastructure (SS or CS NPs)
depends on particle diameter (Fig. 10 c). In this model Gibbs free energies for CS and
SS morphology at predefined diameter and composition are calculated, indicating
thermodynamically most stable structure by minimum Gibbs energy, confirmed by

32
Wulff construction[149]. Even though a slight dependence of the free energy on the
composition was observed the impact of the as substitutions are significantly higher
than those predicted by the bulk phase diagram (Fig. 12), formation of a metastable
phase is verified. For iron contents > 65, % the substitution by Fe within the FCC-Au
decreases due to competition between BCC/FCC phase as predicted by Baricco [150].
In general, the FCC Au-Fe phase exhibits the strongest negative deviations from
Vegard´s law at composition around 50:50. Similar observations were also made in
Ag-Au nanoparticles produced by the same method [151]. Finally, the mass fractions
of FCC/BCC were calculated from the Rietveld refined peaks (Fig. 11b). Here we can
clearly observe that an increase in the BCC fraction also goes along with a more
pronounced CS formation (compare Fig. 10a). These data show, that next to the size
restrictions, the NPs´ crystal structure correlates with the phase segregation. However,
one peculiarity was found for the Au50 Fe50 as well as to a smaller extent for the
Au65Fe35 composition. Here we clearly verified the formation of CS structures by TEM,
while on the other hand no BCC iron was found. These findings may indicate that CS
structures may also form based on two FCC alloy structures (gold-rich Au-Fe shell
around iron-rich Fe-Au core) with distinguishable compositions. Here an AuFe@AuFe
is formed. The presence of up to three distinguishable FCC structures in the XRD
seems to point in this direction, however, this phenomenon cannot be comprehensively
explained based on these data.
As we could clearly verify that the LAL-generated Au-Fe NPs are metastable
structures with alloy cores and alloy shells, in this final paragraph we aim to elucidate
their formation mechanism during LAL based on the bulk Au-Fe phase diagram (Fig.
12). At the first stage, both Au and Fe are rapidly cooled down from the liquid state.
Gold would stay longer in this state as its melting temperature is lower (Au 1064°C; Fe
1538°C) [150]. Therefore, at the liquidus line interface, solid Fe would be surrounded
by liquid Au. In the case of Fe rich systems, e.g Au20Fe80, Fe can crystallize as either
BCC or FCC. Hence both structures will be present upon solidification of the entire
phase and will shape the final structure, containing BCC iron-rich cores with minimal
Au substitution as well as gold-rich FCC phases, either as isolated particles or as gold-
rich alloy shells. Metastable states, in this case, are indicated by higher substitution of
Fe in Au and Au in Fe in contrast to thermodynamically-favored phases at room
temperature. On the other hand, for Au rich alloys e.g. Au80Fe20 only FCC iron can

33
form upon crystallization. As phase transformation from FCC to BCC may be kinetically
hindered due to the fast cooling inherent to LAL process, therefore only FCC Au-Fe
alloy NPs emerged, and no BCC iron is found.
In conclusion, the final internal phase structure (ultrastructure) of Au-Fe NPs
generated by LAL in acetone is critically affected by the target composition and the
particle diameter. The formation of CS is favored in iron-rich targets (Fe mol % > 35),
for particles > 10 nm and results in BCC iron crystal structures. We could conclusively
prove that LAL generates non-equilibrium alloy materials containing FeAu@AuFe
core-shell structures where core and shell are both alloys. Next to the fundamental
significance of this work in understanding the laser-based alloy formation process it
may also give access to novel metastable Au-Fe alloy nanomaterials with potential
future applicability in catalysis and biomedicine.
Figure 12: The formation mechanism for Au-Fe nanoparticles generated by LAL. Marked points represent the exemplary phases for Au20Fe80 (orange cool down arrow) and Au80Fe20 (blue cool down arrow) samples. Nanoparticles surrounded with green line represent the metastable phase, whereas red line thermodynamically stable phases. Au-Fe phase diagram redrawn from ref 115

34
4.1.3.1 Au50Fe50 core-shell ultrastructure verification
Based on the Au-Fe bulk phase diagram independently form the NPs’ composition,
completely phase segregated iron@gold core-shell morphology would be
thermodynamically favored at room temperature (Figure 1)[61]. In other words, the iron
core (BCC iron with minimal Au substitution) should be surrounded by Au shell.
Nevertheless, in the paper presented in chapter 4.1.3, non-equilibrium alloy formation,
with alloy shell and alloy core was reported[152]. For example, Au20Fe80, in which BCC
core resembles higher Au substitution contrarily to thermodynamically favored phase,
as well as Au rich FCC phase in the form of alloy shell or additional fraction of the NPs.
This assumption was made based on XRD analysis, in which calculated lattice
constants with elevated values in comparison to bulk Fe, indicated partial substitution
of iron with Au (for BCC iron phase). To this end, the experimental data indicates that
LAL process during AuFe NP formation is kinetically controlled, as schematically
shown in nanoscale phase diagram depicted in Figure 12. Notably, NPs are kinetically
hindered during transformation leading to formation of FCC gold shell and BCC iron
core. Remarkably, although in the case of Au50Fe50 NPs no iron BCC phase was
detected, next to a solid solution, CS fraction was found (Figure 11). From a theoretical
point of view, the metastable iron FCC phase would be more easily implemented into
gold FCC phase, due to the low driving force for the nucleation[57], leading to the
formation of solid solution NPs. However, considering the proposed nanoscale phase
diagram (Figure 13), it can be assumed, that similarly like for Au20Fe80, for Au50Fe50
composition iron BCC core with alloy shell should be observed (Figure 12 - green
circle). Au50Fe50 composition undergoes a similar transformation path (Figure 13 -
violet line) in comparison to another iron-rich composition (e.g Figure 12 - orange line).
At very high temperatures (above 1538°C) both iron and gold are in liquid form,
followed by rapid cooling up to the liquidus line interface, at which solidified iron would
be surrounded by liquid gold. Notably, Fe crystalizes as either FCC or BCC (Figure 13
- green circle), which are considered as metastable phase, due to higher Au
substitution into the Au matrix, contrarily to thermodynamically favored phase (Figure
13 - red circle). This complexity is already manifested in chapter 4.1.3. Admittedly, XRD
analysis revealed only FCC iron phase, as it may undermine the signal coming from
the poly-dispersed

35
sample, this can be, however, circumvented by the complementary SEAD analysis of
individual CS NP.
Therefore, this study is an attempt to address the phenomena of Au50Fe50 CS formation
when two FCC phase (for Au and Fe) are present. In this regard, by the combination
of sophisticated STEM, EDX line measurements and SEAD analysis, quantitative
composition and crystal structure of the individual components of the Au50Fe50 CS NP’
ultrastructure were determined. (Figure 14 a).
Figure 13: The nanoscale phase diagram proposal for iron-gold system generated via LAL. Marked points represent the exemplary phases for Au50Fe50 (violet cool down arrow). Nanoparticles surrounded with green line represent the metastable phase, whereas red line thermodynamically stable phases. Au-Fe phase diagram redrawn from ref 56.
Gold and iron elemental distribution of individual CS NP was identified by Z-contrast
imaging. The large difference in an atomic number of iron and gold is reflected in the
high contrast between dark core and bright shell layout as depicted in Figure 14 a.
Substantial element segregation was confirmed by EDX line scan measurement as
shown in Figure 14a. Au content decrease into the direction towards the core (between
6 and 10 nm), whereas the content of iron increases. Admittedly, the gold signal

36
doesn’t decrease up to zero in the core part, due to overlapping signal coming from
the shell. Based on this data, the core composition can not be fully distinguished,
therefore additional evaluation with the help of SEAD patterns was employed.
In this approach, the experimental and simulated diffraction patterns comparison,
allowed to exclude the presence of Fe FCC phases in the core, due to missing
reflection 002 with 1.71 Å. The fitted pattern for an FCC Fe core does not fit to the
experimental results due to wrong intensity distribution and the occurrence of an
additional reflection.The intensity is distributed on concentric rings, which coincides
with the intensities of Au-FCC and Fe-BCC phases (marked in Figure 14 b in red).
Figure 14: Evaluation of the composition and crystal phase for the representative iron-gold core-shell nanoparticle, evaluated with a) EDX line scan measurements (left) for Au50Fe50 NP, shown in STEM picture (STEM-HAADF detector) b) SAED pattern for Au50Fe50 with fitted simulated ED pattern of a core-shell ultrastructure with Au-rich alloy shell and bcc core (Figure S6).
The accordance with d-spacing and intensity of the fitted and measured diffraction
patterns underline the crystal structure of the NPs. Even though, a reflection of BCC
Fe and FCC Au overlap, the SEAD pattern confirmed that the lattice spacing of the
representative phases fit with the one expected for BBC Fe and FCC Au (Figure 14 b).
The results illustrate that core-shell can be formed if the Hume-Rothery rule is fulfilled.
This rule states, that next to surface energy, the difference in the crystal phase will
contribute towards the phase segregation of the AuFe system. As a results, core-shell
structure with iron core (BCC) and gold shell (FCC) would be formed. This statement
applies for target composition with Fe content > 50 at. %, where BCC iron phase was
detected (Figure 11).

37
4.2 Impact of target, pulse duration and liquid environment on
the final Au-Fe NPs structure
4.2.1 High yield one step laser synthesis of core-shell Au-Fe nanoparticles- the
influence of pulse length and target structure
Assuming that the plasma plume ignition and expansion is dependent on the pulse
duration, leading to either ’’hot’’ (ns) or ’’cold’’ (ps) ablation, we could expect changes
either within the size or the ultrastructure of the generated NPs[22, 153]. Therefore,
long and short pulse durations 8 ns [3,78 J/cm2; 15 kHz] and 10 ps [3,1 J/cm2; 100
kHz], respectively, were analyzed and compared in Figure 15 a-c. In Figure 15 a and
b, bulk targets are compared, whereas in Figure 15 c thin layer target is depicted. Laser
parameters were adjusted towards comparable fluence (pulse energy/area) and are in
a range of approximately 3 J/cm2. Based on STEM data, two parameters were
considered; ultrastructure (solid solution vs. core-shell and multi core-shell NPs) and
the corresponding diameter of the NP.
Figure 15: Ex situ histograms of scanning transmission microscopy with mean diameter for SS and CS (black number) nanoparticles, with PS Yield % [CS+MC NPs] (orange number). All results are number weighted. Electron miscroscopic pictures show representative fraction of core-shell and alloy nanoparticles for a) ablation of alloy bulk target with 8 ns [3,78 J/cm2; 15 kHz], b) alation of alloy bulk target via 10 ps [3,1 J/cm2; 100 kHz], c) ablation of thin layer target via 6 ns [3,1 J/cm2, 100 kHz]. In all cases ablation was performed for alloy target configuration with Au50Fe50 composition in acetone.
Notably, for all samples generated via different pulse duration 3 fractions of NPs were
detected, SS; CS and MC NPs. As expected from the theoretical calculation presented
in chapter 4.1.3, SS resembled an average diameter below 10 nm for ns pulse duration,
contrarily to ps short pulse in which SS NPs with 16 nm were found. In regard to phase
segregated NPs, in both samples, diameter exceeded 10 nm (ns: 15,7 nm for CS and

38
21 nm for MC; ps: 23 nm for CS and 28 nm for MC). Interestingly, even though increase
in average size was observed, decrease in PS yield occurred (from 46 % / per number
& 91% / per volume for long ns pulse duration to 29 % / per number and 89 % / per
volume for short ps pulse duration). Indicating, that if batch targets are compared, the
short pulse duration may contribute to the formation of kinetically favored
ultrastructures.
The reason for that can be found in the formation mechanism, which may be dependent
on the pulse duration[117, 153]. A substantial difference by direct comparison between
long ns and short ps pulse can be stated to the lifetime of the laser-induced plasma at
the solid surface[20]. Remarkably, in case of ultrashort pulse duration – femtosecond
pulse duration, ablation is considered to be caused by the almost instantaneous solid-
vapor transition of the atoms of the target.[154] This assumption is made based on the
fact, that the pulse width is much shorter than the electron cooling time, and therefore
electron-lattice coupling time can be neglected[138]. This means that the ablation
occurs before the lattice is thermally heated up by the electrons. Contrarily to, ns pulse
duration, in which target lattice is heated[103]. Thus, during ns ablation, the pulse width
is longer than the lattice cooling time, leading to partial overlap between the pulse and
the plasma lifetime. In general, in the case of ns pulse duration, ablation occurs via
melting and then vaporization, whereas a part of the energy from the laser is lost as a
heat transfer into the target[20, 103]. Hence, for ps pulse duration, the intermediate
between long and ultrashort pulse duration mechanism can be assumed, resembling
characteristics of the ultrashort fs pulses if the width remains below 10 ps[155]. To
summarized, a short pulse is characterized by a phase explosion, whereas long pulse
with melting and vaporization, which may impact the diameter of the NP or/and its
ultrastructure[20].
Many groups, e.g. Calvo [55], Belashchenko [61] tried to predict and explain by
computational modeling, why either solid solution or phase segregation in bimetallic
nanoparticles occurs. However, in complicated ultrafast non-equilibrium processes,
e.g. laser ablation in liquids, modeling reaches its limitations, as many processes
cannot be taken into account. The variation between thermodynamic and kinetic
stabilities, along with modeling for systems with thousands of atoms is still challenging.
Nevertheless, based on theoretical prediction summarized in chapter 4.1.3, a diameter
of the NP, affect the ultrastructure of the NP. Besides, the properties of the NP are in

39
direct dependency from NPs’ structure. One important issue in this context, therefore,
is the size distribution. Especially, during ultrashort pulses, which frequently yields
bimodal size distributions. The recent modeling approach proposed by Zhigilei’s
offered a potential explanation claiming that the size of the LAL synthesized
nanoparticle is explained based on 2 different formation mechanisms[104, 137]. It is
hypothesized, that larger particles form by the ejection of liquid droplets from a
superheated metal molten layer, destabilized by Rayleigh Taylor instabilities and
impaction from metal droplets from underlying layers. The smaller NP, on the other
hand, are believed to be formed by rapid nucleation of ejected atoms and smaller atom
clusters. This explanation, confirmed the observed results as shown in Figure 15. Short
ps pulse duration, resemble a bigger diameter for PS NPs, yet with a lower fraction in
comparison to SS NPs. Here, the smaller SS NPs may be formed by the rapid
nucleation, whereas a small fraction of SS NPs by the ejection of liquid droplets,
contributing to NPs with a diameter above 10 nm. CS NPs are most likely generated
in the region closer to the molten layer as predicted by Povarnitsyn [141].
In the case of ns pulse duration, the formation mechanism simulation is still limited, as
only the early stage of the LAL process can be considered[104]. Nevertheless, during
long ns pulse duration, as the pulse width is longer than the lifetime of the plasma
plume (few ns), additional energy is delivered from the laser pulse directly into the
plasma, leading to prolong the lifetime of the plasma plume[103]. In consequence, an
ablated matter within the plasma plume stays longer in a heated state (>5000K)[139,
140]. Moreover, prolong plasma plume results in the longer cavitation bubble lifetime,
as the higher liquid volume is evaporated[139, 140]. It is worth to mention, that during
ps ablation pulse width is to short and therefore, no overlapping with plasma plume
and pulse duration will occur. Based on this, the assumption can be made, than ablated
matter during ns pulse duration, not only undergoes different ablation mechanism
(melting and vaporization), but also the time the ablated matter passes from the hot
liquid state into the solid-state may be affected[20]. Owning to the experimental data,
NPs generated via ns pulse duration are most likely generated with conditions close to
the thermodynamic equilibrium, whereas NPs synthesized via ps pulse duration are
kinetically trapped products.
Hence, by application of shorter pulse duration (10 ps) higher PS yield was not
achieved, the geometry of the target, more precisely its thickness resembled a huge

40
advantage towards almost pure PS formation. Next to bulk Au50Fe50 alloy target
ablated with 8 ns [3,78 J/cm2; 15 kHz], thin Au50Fe50 alloy target was ablated at
comparable conditions with 6 ns [3,1 J/cm2, 100 kHz]. As shown in Figure 15, PS yield
for thin target with 80 nm thickness, represents 87 % of PS per number (99 % per
volume) in comparison to bulk alloy target, where only 46 % of PS per number (91 %
per volume) were synthesized as shown in Figure 15 c and a respectively. Next to the
high PS formation, diameter increased drastically as well, which is in correlation with
theoretical calculation (chapter 4.1.3), predicting phase segregation for bigger NPs
(above 10 nm). Overall, the pulse duration can be used to tune the NPs diameter, while
the changes of the ultrastructure are negligible. Remarkably, target geometry revealed
a huge impact on the PS yield, where PS production doubled from 46 % to 90 % by
simply decreasing target thickness to 80 nm.
These findings motivated us (cooperation with Dr. V. Amendola - University of Padova)
to perform a series of experiments for thin multilayer targets for both long ns and short
ps pulse duration. Previous works already confirmed a distinctive correlation between
the size and the AuFe NPs composition (Chapter 4.1.3). Hereby, we aimed to elucidate
to what extent the target geometry (bulk vs thin multilayered targets), and the pulse
duration (short ps and long ns pulse) influence the yield of CS NPs.

41
Published in: ,,One-Step Synthesis of Fe-Au Core-Shell Magnetic-Plasmonic Nanoparticles Driven by Interface Energy Minimization’’
Nanoscale Horiz., 2019,4, 1326-1332
Anna Tymoczko, Marius Kamp, Christoph Rehbock, Lorenz Kienle, Elti Cattaruzza,
Stephan Barcikowski, and Vincenzo Amendola
Directing the assembly of atoms into core-shell particles generally requires elegant but
sophisticated procedures. Here we show how the thermodynamic driving force to a
minimization of surface and interface energy can be exploited to produce colloidal Fe-
Au core-shell nanoparticles in one step and with a yield approaching 99.7% in mass.
This is obtained by laser ablation with nanosecond pulses of thin bimetallic films
immersed in acetone. The Fe-Au core-shell nanoparticles show magnetic and
plasmonic properties, and a surface available to bioconjugation and analytical assays.
This laser-assisted synthetic method represents a step forward the facile preparation
of core-shell nanospheres with multiple appealing functionalities.
One of the main challenges in nanochemistry is represented by the control of atomic
assembly into bimetallic heterogeneous nanocrystals with complex structures, such as
core-shell (CS) nanoparticles (NPs)[156, 157]. CS is of particular applicative interest
because they allow the combination of different properties simultaneously in the same
nanomaterial,[158-160] or the construction of new structures with appealing
functions.[161] CS NPs are especially desirable for avoiding core degradation in a
reactive environment, or for preventing leaching of harmful elements from the core to
the surroundings.[147] Besides, organic molecules are easily grafted on transition
metals or oxide NPs when these are coated with a noble metal shell.[162]
The unique magnetic, optical, electronic and chemical properties displayed by CS NPs,
in comparison to single-phase NPs, come at the price of a more difficult synthesis.[156]
To date, CS nanocrystals have been obtained with extraordinary precision in the
composition, size, and morphology through elegant procedures,[162-164] especially
consisting of stepwise seed-mediated growth in solution.[165] However, these
examples often require multiple or complex steps, involving toxic or pollutant
compounds, which can introduce impurities due to the many solutions and reagents
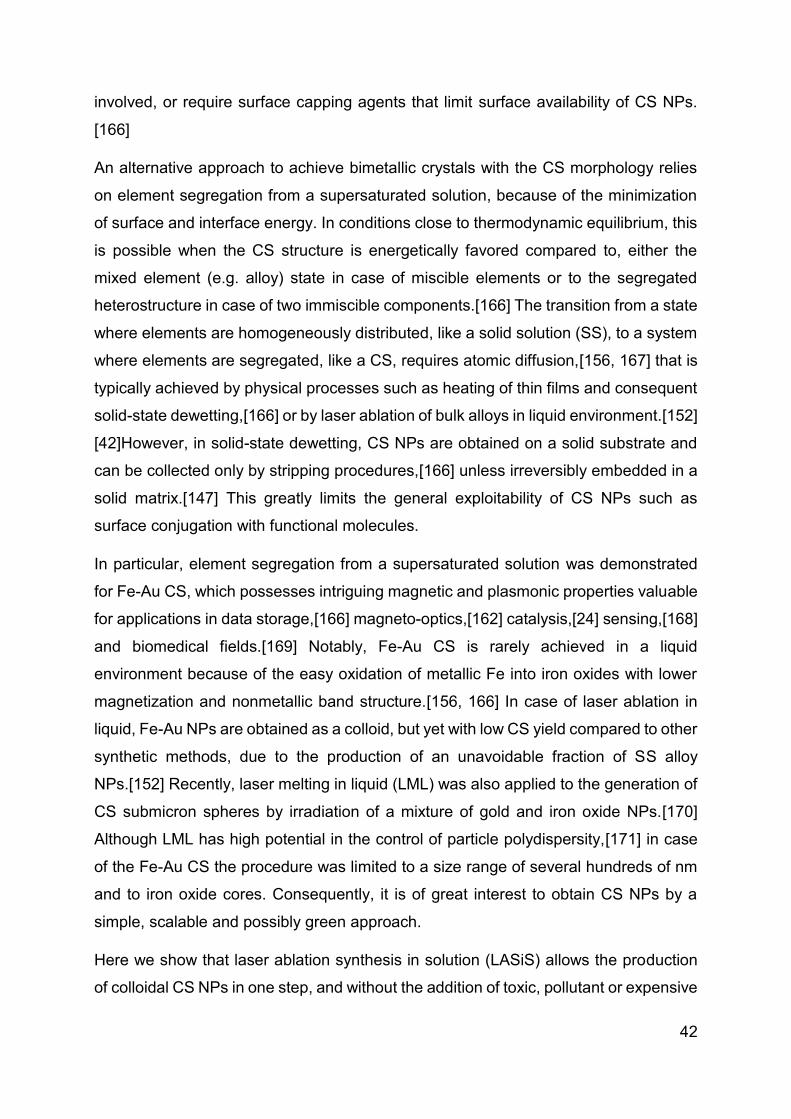
42
involved, or require surface capping agents that limit surface availability of CS NPs.
[166]
An alternative approach to achieve bimetallic crystals with the CS morphology relies
on element segregation from a supersaturated solution, because of the minimization
of surface and interface energy. In conditions close to thermodynamic equilibrium, this
is possible when the CS structure is energetically favored compared to, either the
mixed element (e.g. alloy) state in case of miscible elements or to the segregated
heterostructure in case of two immiscible components.[166] The transition from a state
where elements are homogeneously distributed, like a solid solution (SS), to a system
where elements are segregated, like a CS, requires atomic diffusion,[156, 167] that is
typically achieved by physical processes such as heating of thin films and consequent
solid-state dewetting,[166] or by laser ablation of bulk alloys in liquid environment.[152]
[42]However, in solid-state dewetting, CS NPs are obtained on a solid substrate and
can be collected only by stripping procedures,[166] unless irreversibly embedded in a
solid matrix.[147] This greatly limits the general exploitability of CS NPs such as
surface conjugation with functional molecules.
In particular, element segregation from a supersaturated solution was demonstrated
for Fe-Au CS, which possesses intriguing magnetic and plasmonic properties valuable
for applications in data storage,[166] magneto-optics,[162] catalysis,[24] sensing,[168]
and biomedical fields.[169] Notably, Fe-Au CS is rarely achieved in a liquid
environment because of the easy oxidation of metallic Fe into iron oxides with lower
magnetization and nonmetallic band structure.[156, 166] In case of laser ablation in
liquid, Fe-Au NPs are obtained as a colloid, but yet with low CS yield compared to other
synthetic methods, due to the production of an unavoidable fraction of SS alloy
NPs.[152] Recently, laser melting in liquid (LML) was also applied to the generation of
CS submicron spheres by irradiation of a mixture of gold and iron oxide NPs.[170]
Although LML has high potential in the control of particle polydispersity,[171] in case
of the Fe-Au CS the procedure was limited to a size range of several hundreds of nm
and to iron oxide cores. Consequently, it is of great interest to obtain CS NPs by a
simple, scalable and possibly green approach.
Here we show that laser ablation synthesis in solution (LASiS) allows the production
of colloidal CS NPs in one step, and without the addition of toxic, pollutant or expensive

43
chemicals, simply starting from an equimolar Au-Fe alloy thin film supported on a soda-
lime glass slide. Although LASiS is usually performed with bulk targets, the use of thin
films can provide several advantages for laser ablation synthesis of bimetallic
nanocrystals. Due to constant progress of Physical Vapour Deposition (PVD)
techniques, in terms of quality and deposition rate, as required to meet the increasing
demand of the industry, the surface area that can be deposited by a commercial PVD
apparatus is usually 2 m2 at a deposition rate of 10 nm/minute.[172, 173] Besides, the
focal distance of the laser beam does not require continuous adjustment during LASiS
with thin-film targets, contrary to what is required by bulk targets due to their
consumption.[174]
Here, following the typical LASiS procedure, the metallic film was immersed in acetone,
and 1064 nm (6 ns) laser pulses at 22.6 mJ/pulse (3.1 J/cm2) were used to transform
the solid material in a colloidal solution of Fe-Au NPs (Figure 16A). Acetone was
selected as the most favorable liquid environment for the formation of Fe-Au CS
nanoparticles, according to our previous reports.[42, 175, 176] Besides, the colloids
obtained in acetone exhibited excellent stability for several days, with only a slow
tendency to sedimentation over several weeks (SI7). In the second part of this study,
the results are compared to complementary experiments conducted in the same liquid
environment and with the same wavelength of 1064 nm, but with 10 ps pulses at 0.08
mJ/pulse (4 J/cm2).
The colloid obtained by ns LASiS of the equimolar Fe-Au film in acetone was analyzed
by scanning transmission electron microscopy (STEM) with the HAADF detector
(Figure 16B) to investigate element distribution in the NPs by Z-contrast imaging. The
Fe-Au system is favorable for the investigation of CS owing to the large difference
between the atomic numbers of the two constituting elements.[177] From the dark-
core/bright-shell NPs layout observed from Z-contrast STEM images, it is immediately
evident that the sample is composed of CS NPs where the low Z element segregated
in the core and the high Z element accumulated in the shell. In rare cases, multiple
cores are embedded in the same shell. The CS morphology is robust enough to remain
stable in the liquid as well as after deposition on the TEM grid, without the need for a
protecting layer as in other reports.[147] The chemical composition of the NPs was
analyzed by scanning transmission electron microscopy with energy-dispersive X-ray
spectroscopy (EDXS) and resulted to be Fe 50 ± 5 at.% and Au 50 ± 5 at.%, i.e.

44
unchanged compared to the alloy target composition. EDXS unambiguously identified
the distribution of Fe and Au atoms within individual CS (Figure 16C). EDXS line scan
on a couple of CS NPs (Figure 16D) further substantiated element segregation into CS
architecture.
Although the reflections of body centered cubic (bcc) Fe and face centered cubic (fcc)
Au overlap, the selected area electron diffraction (SAED) pattern taken from CS NPs
(Figure S8) shows that the lattice spacing of the respective phases agree with those
expected for bcc Fe and fcc Au. Besides, the comparison of the SAED pattern with
simulated patterns reported in Figure 16E allows to exclude the presence of fcc Fe
phases. Joined with the CS structure evidenced by the Z-contrast images and EDXS
analysis, this allows the conclusion that the CS NPs should be two components with
different crystal structure Fe-bcc (core) and Au-fcc (shell). Besides, the optical
absorption spectrum of the CS colloid (Figure S9) exhibits an absorption edge in
agreement with previous reports about LASiS of CS Fe-Au NPs in acetone.[42]
The size distribution measured by TEM (Figure 16F) has the well-known LogNormal
structure expected with LASiS, whose origin has been recently explained by molecular
dynamics simulations of the ablation process.[178] From a detailed analysis of STEM
images, it is found that a minority of homogeneous solid solution (SS) NPs exist and
that this population is limited to relatively small sizes below 15 nm. Overall, in number-
weighted particle size characterization, the fraction of CS accounts to the 87% of total,
that reaches a remarkable value of 99% for sizes above 15 nm. It is worth to stress
that a conservative approach was adopted for these statistics, because all NPs with
size below 5 nm were counted as SS, due to the difficulty of a precise discrimination
between the two morphologies in this size range from Z-contrast STEM images.
However, for those applications where the surface is the reference parameter, such as
catalysis[179] or realization of smart self-assembled plasmonic nanosystems coated
with functional molecules,[161, 180] the CS NPs accounts for the 99% of the total
available surface. The overwhelming weight of CS population becomes nearly unity
(99.7%) when the volume-weighted distribution is considered. Despite the unavoidable
fraction of small SS NPs, these values point to laser ablation in liquid as a highly
efficient route to the generation of CS NPs relevant for surface or mass-weighted
applications such as in magnetism, plasmonic and nanomedicine.

45
Figure 16: A) Sketch of synthetic approach based on laser ablation in liquid: laser pulses are focused
on a Fe-Au alloy thin film supported on soda-lime glass and dipped in pure acetone, and NPs resulting
from metal film ablation are collected as a colloid. B) Representative Z-contrast STEM image of NPs,
showing core-shell structure. C) Bidimensional EDXS elemental maps of a representative CS NP, with
Au shell in yellow (M-edge) and Fe core in red (K-edge). D) EDXS elemental line scan analysis on a
couple of CS NPs further demonstrates Fe segregation in the core (red line) and formation of the Au
shell (yellow line). E) Rotational average intensity profiles of the experiment (blue line) and the
simulations for a CS NP with Au fcc shell and Fe-bcc (black line) and Fe-fcc (red line) core. The presence
of Fe-fcc can be excluded by comparing the simulated diffraction intensities, overall indicating that the
SAED pattern is compatible with a nanostructure containing Au-fcc and Fe-bcc. F) Size histogram of
NPs is well fitted with a LogNormal function (black line),and is composed by 87% of CS NPs and 13%
of SS NPs. The fraction of CS is 99% in the size range above 15 nm. Reproduced from Ref. with
permission from The Royal Society of Chemistry
The Fe-Au CS NPs show a ready response to the external magnetic field and can be
easily aligned on a substrate such as a glass microscope slide by approaching a
permanent magnet (see Figure 17A). This is relevant for the realization of transparent
coatings with improved conductivity.[181] Besides, given the presence of a plasmonic
gold shell, these nanoparticles can be conjugated with thiolated molecules, purified by
magnetic attraction, and exploited for surface enhanced Raman scattering (SERS)
detection of compounds adsorbed on their surface, as demonstrated with an aromatic
thiol (nitrothiophenol, Figure 17B). Effective surface functionalization is key to improve
sample monodispersity after LASiS, that typically requires the addition of stabilizing
ligands after the synthesis, followed by post-synthesis selective centrifugation
approaches,[182] although this procedure is sometimes difficult in case of
ferromagnetic NPs.
The ability of the CS NPs to act as nanoantennas was demonstrated further by SERS
detection of a benchmark Raman reporter such as malachite green (4-[(4-
dimethylaminophenyl)phenyl-methyl]-N,N-dimethylaniline), even at a concentration as
low as 10-8 M, equivalent to 10 fmol of analyte added (Figure 17C). These values are
comparable to those typically achieved with magnetic-plasmonic nanosystems, which

46
spans from 10-6 to 10-15 M depending on analyte type, volume of solution added,
excitation wavelength and acquisition time.[183, 184] In fact, local electromagnetic field
enhancement of up to a factor of 30 was estimated at a wavelength of 532 nm by
numerical calculations on a representative dimer of coupled Fe-Au CS NPs, which
corresponds to a SERS enhancement factor of 106 at the electromagnetic hot spot
between the two NPs (Figure 17D). Local field enhancement is known to scale with the
volume of the NPs,[185] and it is therefore very favorable in the present CS NPs
because of their size in the range of tens of nanometers. For this reason, the
calculation in Figure 2D refers to a dimer of CS NPs with relatively large size, compared
to the TEM measured size distribution, because the strongest contribution to SERS
signals comes from the tail of NPs with larger size.[185, 186] However, also if we
consider a dimer of CS NPs with the average size (22.4 nm) and shell thickness (4.4
nm) extracted from TEM analysis, a SERS enhancement factor of 106 at the
electromagnetic hot spot between the two NPs is observed (Figure S9).
The synergy of magnetic and plasmonic properties can greatly facilitate the SERS
experiments, in terms of time, signal intensity and amount of material used because
the CS NPs can be accumulated in a pre-determined point of the substrate prior to the
analysis, by using a small permanent magnet.[183, 184] This is shown in Figure 26E,
where a tiny amount of either CS NPs (0.7 g, 10 g/mL) or a SERS benchmark
represented by commercial Au NPs (50 nm in diameter, 1.5 g, 22 g/mL) was mixed
with 7.5 pmol of MG in water and drop casted on a glass substrate. Due to the stability
of CS NPs, solvent evaporation without the presence of magnetic field does not leave
any appreciable agglomerate that can be used for SERS analysis (left side of Figure
26E); in fact, the Raman spectra recorded on the area of deposition do not contain the
spectral signature of the analyte. When the same colloid is evaporated by placing a
small (2 mm in diameter) permanent magnet below the glass substrate, the CS NPs
are accumulated in a single point, that can be easily identified by the naked eye and
emits bright Raman signals coming from the analyte (center of Figure 17E). Even in
case of the reference Au NPs sample, the deposit is rather homogeneously distributed
on the glass substrate after solvent evaporation, but some aggregates can be
observed thanks to the higher concentration and lower stability of the colloid (right side
of Figure 17E). In this case, the spectral signature of MG is observed in some of the
aggregates, although not in all of them, which forces the operator to a time-consuming

47
investigation of different points until reaching those with a detectable signal. These
results showing the ability to collect all the NPs in a predetermined point are promising
in perspective of the application of the CS NPs for magnetic-plasmonic analytical
assays.[183, 184] NPs accumulation is the most frequent strategy to increase the
sensitivity when analyte concentration is low and the NPs are endowed with
functionalities capable of binding the analyte. In this way, also the quantity of NPs can
be reduced, which is desirable when the cost of the nanomaterial is high due to
conjugation with expensive biomolecules (for instance custom-made antibodies or
peptides).
Figure 17: A) Optical microscope image of Fe-Au NPs dried on a microscope glass slide in the presence of an external magnetic field, which provoked NPs alignment along the field direction because of the magnetic properties of the Fe cores. B) Raman spectrum (532 nm excitation) of Fe-Au NPs coated with nitrothiophenol (NTP), showing all the peaks characteristics of the ligand. C) Raman spectra of malachite green (MG) drop casted on Fe-Au NPs at different concentrations, allowing detection of the analyte down to only 10 fmol of compound added on the substrate. D) Bidimensional map of SERS enhancement factor (GSERS) for 532 nm excitation, calculated for a dimer of CS NPs like that shown in the STEM figure above. The result indicates that Raman signal can be enhanced of up to 106 times at the junction between CS NPs (electromagnetic hot spot), thus confirming the plasmonic properties of the Au shell in CS NPs. E) Comparison of Raman spectra in selected points (upper part), substrate morphology after liquid evaporation (central part), and bidimensional Raman intensity map at 1615 cm-
1 (lower part) for three cases: CS NPs mixed with MG and dried on glass without a permanent magnet (left); CS NPs mixed with MG and dried on glass with a permanent magnet below the substrate (center, a black deposit of CS NPs is visible); commercial 50 nm Au NPs mixed with MG and dried on glass (right).
The CS yield achieved in this study is remarkably larger than the best value reported
in literature to date by LASiS (48 % referring to number-weighted histogram).[152]
Indeed, the main factors determining the equilibrium structure of bimetallic
nanocrystals obtained by LASiS are still largely unknown. To better understand what
drives the improved efficiency of Fe-Au alloy film conversion into NPs with CS
morphology, the LASiS procedure was applied to a series of metal films with constant

48
total thickness (Figure 18A) where the two elements are completely segregated in a
bilayer (Fe/Au/glass or Au/Fe/glass) or in a quadrilayer (Au/Fe/Au/Fe/glass) that can
be considered as an intermediate case between the bilayer and the single alloy layer.
Previous experiments about laser ablation of Fe-Au multilayers in ethanol and water
evidenced that the two elements are mixed during the process, resulting in bimetallic
NPs.[176] Indeed, also in this case CS yield is lower with multilayer targets than with
the alloy film (Figure 18B), although surface- or volume-weighted CS fractions with still
good yield of 90% are measured in samples originated from laser ablation of the Fe/Au
and the Au/Fe/Au/Fe films. The general trend suggests that the targets with a topmost
layer of Au show the lowest CS yield, while the alloy film ablation provides the largest
CS yield. This is a favorable point for CS synthesis because the production of a single
homogeneous Fe-Au alloy film by various well-established large scale thin film
deposition technologies is more convenient compared to multilayers.[187]
It should be noted that the best yield of CS by LASiS reported in literature to date (48%
in number) was achieved with bulk Fe-Au alloy targets in acetone, using 1064 nm
nanosecond laser pulses and 0.36 mJ/pulse (4 J/cm2).[152] This motivated a further
laser ablation experiment with a lower pulse energy of 0.08 mJ/pulse (4 J/cm2), using
10 ps pulses at 1064 nm. The resulting CS yield is clearly lower than with ns pulses
(Figure 18C), pointing to the importance of laser pulse parameters in the determination
of NPs morphology.
Figure 18: A) Different types of Fe-Au films tested for LASiS of Fe-Au NPs in acetone. B) CS versus SS yield measured for samples obtained by ns laser ablation of the different film types. C) Same as B) but for ps laser ablation.

49
In parallel, a difference in the size histograms of NPs is observed by changing film
structure and laser pulse parameters (Figures S10 and S11), with a prevalence of small
particles in samples obtained with ps pulses. On the other hand, as shown in Figure
19A, a clear correlation exists between average NPs size and CS yield, with higher CS
yields found when mean diameters of the particles are higher, which prevalently occurs
in nanoparticles from ns-pulse ablation. The plot of Figure 19A suggests that the
fraction of CS NPs is negligible when NPs average size extracted from the LogNormal
size distribution is below ca. 10 nm. In addition, Figure S12 shows that high CS yield
occurs when the CS fraction has a larger mean diameter than the corresponding SS
fraction.
To understand the structural behavior of Fe-Au NPs, one should consider that the
thermodynamic driving force for element segregation relies on the reduction of
interface energy.[157, 167, 188] It is known since the contribution of J. W. Gibbs in
1874,[189] that the morphology of a given material is such that the total surface energy
is minimal, and the Fe-Au systems are characterized by a large difference in surface
energies between Fe and Au (1.500 J m-2 for (111) Au compared to 2.417 J m-2 for
(100) Fe).[177] Besides, the Fe-Au system supports several other features suitable for
element segregation and formation of CS nanocrystals, which are the structural
dissimilarity of body-centered cubic (bcc) iron and face-centered cubic (fcc) gold, and
the large difference in lattice parameters (0.28665 nm for Fe cell and 0.40784 nm for
Au cell).[147, 166, 177, 190] The different crystal structure of Fe and Au accounts also
for the large miscibility gaps of the bimetallic system, with the solubility of Au in bcc Fe
that is just 0.1 at.% even at 500 °C. [147, 177]
To illustrate how the balance between surface and interface energies determines the
morphology of Fe-Au NPs, a thermodynamic model for interface segregation was
applied (see ESI for details). Consistently with previous findings about laser-generated
Fe-Au CS nanocrystals,[152] the thermodynamic model clearly shows that smaller
nanoparticles have higher thermodynamic tendency to remain in a single phase
(Figure 28B), whereas, above a size threshold of 10 nm for Fe(50)Au(50) nanocrystals,
the thermodynamically stable phase is the CS structure. The reason is that quantities
such as surface and interface energies scale with the fraction of interface atoms over
the total, dominating the energetic balance for particles smaller than ca. 10 nm in
diameter.[188] In the SS structure, the fraction of surface Fe atoms increases with the

50
total fraction of Fe, and Fe is characterized by the highest surface free energy
contribution, therefore the size threshold for CS formation is lower for higher Fe content
(see Figure S12 in ESI).
The results of Figure 19B are compatible with the trend of Figure 19A, when
considering that NPs size distribution is LogNormal. In fact, the linear trend in Figure
19A is the consequence of the progressive shift of the LogNormal size distribution to
smaller sizes and the concomitant decrease of the fraction of NPs exceeding the
thermodynamic threshold for CS formation.
Overall, the energetic difference between CS and SS helps understanding how surface
and interfacial energies affect the geometry of Fe-Au NPs. However, the
correspondence between the thermodynamic model and our experimental results is
not complete, given the presence of SS NPs larger than 10 nm in several samples. In
LASiS, CS formation occurs as a consequence of nanoparticle cooling in conditions
close to thermodynamic equilibrium from the melted state, where element distribution
is homogeneous, to the solid state, where a thermodynamic driving force to element
segregation is observed in the bulk Au-Fe alloy phase diagram.[152] At the nanoscale,
the thermodynamic advantage in element segregation is partially balanced by the
energy needed for the formation of new interfaces, which is larger for smaller
nanoparticles, resulting in CS NPs only above a size threshold of ca. 10 nm for
equimolar Fe-Au composition (Figure 19B). In practice, it should be noted that
thermodynamic equilibrium models are not applicable for kinetically trapped
products,[152, 157, 188] and Fe-Au alloys can exist in metastable state when atomic
diffusivity is rapidly frozen.[152, 175, 191] For instance, the cooling rate of ablated
matter with ps pulses has been simulated by Zhigilei et al. to reach ~ 7 x 10¹¹ K/s.[178]
Here, we found that 99.7 % in mass of CS nanoparticles is achieved by laser ablation
with ns pulses of 80 nm thick Fe-Au alloy film in acetone, while LASiS with ps pulses
gives low CS yield. According to molecular dynamics simulations and plasma
diagnostics experiments, laser ablation mechanism is different when ns or ps pulses
are used.[112, 178, 192, 193] In particular, with ns pulses, the laser beam partially
overlaps in time with the plasma plume and contributes to heating the plasma.[192]
With ps pulses, the overlap between laser beam and plasma plume only occurs for a
negligible fraction of the plasma plume lifetime, that is on the timescale of hundreds of
ns.[192] Therefore, although the exact formation mechanism of CS NPs in LASiS

51
deserves further investigation to be fully elucidated, we can hypothesize that, in LASiS
with ns pulses and thin alloy films, the majority of nanoparticles pass from the hot liquid
state to the solid state in a condition that is close to thermodynamic equilibrium,
resulting in CS nanoparticles (as sketched on the right side of Figure 19C). With ps
pulses, the largest fraction of NPs forms far from thermodynamic equilibrium (as
sketched on the left side of Figure 19C). Another contributing factor is the size of NPs
obtained with ns pulses, which was observed to exceed the size threshold for CS
formation.
Besides, it is well known that a cavitation bubble (CB) occurs during later stages of
NPs formation in LASiS, and that CB lifetime can play a role on particle formation
because, during this stage, the NPs are immersed in the CB gas phase.[192, 193] CB
lifetime increases with the laser pulse energy (in this case, it is 22.6 mJ for ns pulses
and 0.08 mJ for ps pulses).[192] Because cooling rates in the gas phase are much
lower than in the liquid phase, the particles formed in a longer-lasting CB have more
time to reach thermodynamic equilibrium by element segregation, as required for CS
formation. On the other hand, shorter CB lifetimes would mean the NPs are more
quickly exposed to the cooling liquid, forming metastable structures before that
element segregation occurs, as required for SS formation.
Therefore, both the differences in pulse duration and pulse energy are compatible with
the experimental observation that, with ps pulses: i) nanoparticles have smaller
average size, and ii) the nanoparticles prevalently consist in the metastable solid
solution also when the size is above the thermodynamic threshold for element
segregation into CS structure.
In the case of LASiS with ns pulses, a further advantage is represented by the use of
a thin film target instead of a bulk one. In fact, previous experiments of LASiS with thin
Au films evidenced that the average size of nanoparticles continuously decreases by
increasing the thickness of the target from < 100 nm to > 100 nm.[194]

52
Figure 19: A) Plot of average Fe-Au NPs size versus CS yield for the samples obtained with ns (black
dots) and ps (red dots) pulses from laser ablation of the four film types. Linear fit of experimental results
is also reported (dashed line), indicating the absence of CS NPs for average size approaching 7.5 nm.
B) Gibbs free energy calculated for SS (red line) and CS (black line) morphologies as a function of NPs
size, for a composition of Fe:Au 1:1. C) Sketch of NPs formation during LASiS with the Au-Fe alloy
target: with ns pulses (right), NPs form by cooling in conditions close to thermodynamic equilibrium, and
with average size exceeding the thermodynamic threshold for element segregation into CS morphology;
with ps pulses (left), NPs form by quick cooling in conditions far from thermodynamic equilibrium, and
with average size not exceeding the thermodynamic threshold for element segregation into CS
morphology, thus remaining in large part in a metastable SS phase.
In summary, we presented a facile synthetic strategy to produce colloidal Fe-Au
magnetic plasmonic CS NPs in one step. The core-shell architecture, with Au atoms
forming homogeneous layers around Fe cores, is achieved with yield of 87% in number
and 99.7% in mass by the equilibrium segregation phenomenon, because of the
reduction of the total interfacial energy in the system. The procedure, based on laser
ablation of an alloy thin film in acetone, is simple, green and does not introduce
chemical contaminants. We further showed that core-shell NPs yield versus solid
solution NPs is tunable by adjusting the thin film structure and laser pulse parameters.
The potential of this method is large, considering that it exploits widely implemented
thin-film technologies and well-established laser ablation in liquid procedures to
generate nanomaterials with complex structure and multiple functionalities of interest
for forefront applications in catalysis, nanomedicine, photonics, and information
technology.

53
4.2.1.1 Theoretical model for AuFe NPs
Herein in chapter 4.1.3 and 4.2.1 a significant discrepancy between the theoretical
model and experimental data was observed. Hence, in previous calculation pure
elemental gold shell and pure elemental iron core were considered, the EDX line scan
supported by SEAD analysis confirmed alloy character of the shell (Figure 14). The
thermodynamic calculations published by Chattopadhyay et al.[46] consider NPs
composition and the NPs diameter and describe thermodynamic force to minimize the
surface and interface energy, based on the size and the composition of the NPs. The
limitations of this approach are, however, the application only of either fully segregated
phase (CS) or fully mixed-phase (SS). In order to implement the complexity of
additional possible ultrastructures, e.g alloy shell and pure iron core updated model
are employed to the existing equation. All changes within the initial equation (Equation
A) used to perform the theoretical calculations of the Au-Fe alloy shell and iron core
system were described in chapter S5-1 (equation C) (Figure 20 e-3), with results shown
in Figure 20 d.
Moreover, an additional discrepancy was found between experimental and theoretical
models, as some of the NPs exceeded the 10 nm size restriction for the solid solution
phase (chapter 4.2). Therefore, after a detailed evaluation of the model, an updated
version of the equation was proposed. In the initial model (chapter 4.1.3) false
assumption was taken, that diameter used for e.g calculation of the size-specific
surface energy, the number of atoms on the surface of particle of particular diameter
or another diameter dependent parameter is considered as an average nanoparticle
diameter (equation A) and can be applied as one value for iron (DFe) and gold (DAu).
Nevertheless, an updated version is proposed, in which diameter for iron and gold are
considered individually. In this context, in the adapted model (equation B), a diameter
of the core and shell are considered separately as schematically shown in Figure 20
e-2. Updated calculations are described in detail in chapter S5, with resulted theoretical
calculations depicted in Figure 20 c.
In this context, all calculations were performed for 3 representative compositions
Au15Fe85, Au50Fe50, and Au85Fe15. At last, the threshold for phase-segregated
ultrastructure was determined as cut off diameter as depicted in Figure 20 f for all
equations (A, B and C).

54
In the following chapter, calculation toward the most favored equilibrium phase was
evaluated. Thus, the most favored state would be if Gibbs free energy would have the
lowest value, as the interface and surface energies should be minimized in order to
formed phase in thermodynamic equilibrium[189]. The results obtained based on the
Chattopadhyay’s model[46] showed small variation in Gibbs free energy for
representative Au50Fe50 SS NPs, where the values differ between 25-31 kJ/mol (Figure
20 a; S14). Notably, SS NPs with high Au content is characterized by lower Gibbs
energy. On the other side, Gibb's free energy for CS NPs varies between few kJ/mol
up to 50 kJ/mol. Contrarily to SS NPs, Fe rich, bigger NPs have smaller free surface
energy. These results indicate that next to the NPs diameter, the composition may
contribute to the thermodynamic equilibrium of the NPs. A similar trend has been
observed for adapted equations B and C, as shown in Figure 20 c and d. Yet, the
overall shift towards higher free Gibbs surface energies was observed. Concerning the
competitive process between CS and SS NPs, the most relevant information is,
however, obtaining the threshold Gibbs free energy for CS NPs. This complexity is
already manifested in experimental data, in which synthesis of the pure CS fraction
was not successful so far. A similar trend can be observed for equations B and C, in
which NPs with a smaller diameter are more favoured for SS, whereas NPs with bigger
diameter for phase segregated phase – CS. In order to address the impact from size
threshold on the particular morphologies, cut off diameter towards CS phase was
established and compared between results obtained from different equations (A, B and
C). To that end cut off diameter, resembling diameter which needs to be reached to
form CS in thermodynamic equilibrium is summarized in Figure 20 f. In the case of the
first model (equation A), cut off diameter was around 9 nm for Au-rich NPs and 7 nm
for iron-rich NPs. Independently from the equation modification similar trend was
observed, where iron-rich NPs showed the smallest cut off diameter. For the second
modification in equation B, cut off diameter increased up to 20 nm for Au rich NPs. On
the other side, Au50Fe50 resembled a small deviation from the first equation (A) and is
characteristics wit value 10 nm. Iron-rich NPs cut off diameter did not change. In the
case of alloy shell and pure iron core NPs (Equation C), the trend remained in which
Au rich NPs have the highest cut off diameter with value 23 nm. Whereas for Au50Fe50,
increase up to 13 nm, and for iron-rich up to 8 nm was observed. Remarkably, an
adaptation of the equation A, leads to CS-threshold shift from 10 nm to above 20 nm

55
for Au rich NPs (Figure 20 c, d, f). Indicating, that for systems where competition
between SS and e.g. alloy-shell iron-core is considered,
Figure 20: Theoretical evaluation of phase thermodynamic equilibrium characterized by calculated Gibbs free energy for a solid solution (SS) and core-shell (CS) particles based on the model described elsewhere161 and summarized in form of 3D graphic (a-b). Note, that the variation between the Gibbs free energy for SS resemble low deviation in contrast to CS particle. Moreover, phases in thermodynamic equilibrium were further evaluated for the model with adapted iron and gold diameters as schematically shown in e-1 and e-2, as well as evaluation of the CS with alloy shell and pure iron core (d, e-3). The calculation performed with the updated values is described in more detail in chapter S5 and S5-1. Threshold diameter favouring CS particle was determined as a function of particle composition (f).

56
SS with a bigger diameter would be possible. This validated the detection of few SS
NPs with sizes above 10 nm. Nevertheless, this applies only for Au rich NPs, as in the
case of Fe rich threshold for CS NPs don’t exceed 13 nm, for all adapted equations
(equation B and C).
The substantial difference between the threshold for CS phase applies only to the gold-
rich system, where the threshold required for phase segregation formation shifted from
10 to 20 nm. This can explain the absence of phase segregated NPs for Au rich NPs
(chapter 4.1.3) and the presence of few SS NPs which were bigger than 10 nm (chapter
4.2). Interestingly, for a system with Fe content above 50 at % the variation between
threshold size for 3 evaluated equations, remained within a few nm ranges. This can
be explained by the similarity in size between the iron diameter (DFe) and Au diameter
(DAu), excluding a remarkable impact of the updated value on the overall equation. In
regard to alloy shell and pure iron core, threshold size for phase segregation show the
highest values. For gold-rich systems, 22.5 nm where calculated, whereas for iron-rich
system size below 10 nm, but still approximately 3 nm higher than the values for pure
gold shell and the iron core. This can be explained, by the fact that alloy shell and iron
core are not in thermodynamic equilibrium, therefore they require higher energy input
to be formed.
To summarize, the thermodynamic model considering NPs composition and the size
can be successfully implemented as an additional tool towards ultrastructure control.
By this method NPs diameter threshold can be established for 3 various ultrastrucutres,
SS, CS with pure elemental gold and iron and finally, CS with alloy shell and pure
elemental iron. Nevertheless, despite NPs composition and NPs diameter can be
considered in this model, aspects such as liquid environment nor pulse duration can
be implemented into the equation. Therefore, the additional experimental approach
would be useful to address the NP formation mechanism during LAL.

57
4.2.2 Ultrastructure, colloidal stability and size distribution of core-shell Au-Fe
LAL generated NPs tuned by the liquid environment.
The nanoparticle formation during laser ablation is impacted through many factors, e.g
target composition, laser parameter or even target geometry as demonstrated in
previous chapters (4.1-4.2.1.1). Therefore, by adjusting the ablation approach and
choosing the suitable parameter, control over the ultrastructure can be achieved.
Nevertheless, the interaction between Au-Fe NPs and the liquid environment has not
been addressed in the literature in a comprehensive way so far. The reason is the
difficulty with the execution of a systematic parameter study, as even for one group of
liquids many parameters such as viscosity, density, refractive index, etc. change at the
same time. Since the systematic evaluation of specific parameters is not possible, a
simplified overview of physical properties' impact on the nanoparticle's ultrastructure,
size, and colloidal stability is assessed in this chapter. Therefore, chemical interaction
between particles and liquid species will not be taken into account. In this regard
selected parameters such as heat capacity, chain length and viscosity will be
systematically evaluated. For this purpose, 3 groups of liquids were chosen, ketones,
alcohols, and glycols with additional highly viscous PAO40 oil, respectively.
Wagener et al. presented, that LAL in ultra-pure water caused reversed CS
ultrastructure with a gold core and iron oxide shell[42]. Oxide and hydroxide species
are frequently found during LAL, as the dissolved oxygen and oxidizing species are
formed from the plasma-induced decomposition of water, and those species will
interact with the ablated matter[39, 105, 109]. Despite the higher solubility of oxygen
in acetone in comparison to water, less oxidized NPs were found. This oxidation of the
ablated material is predicted to occur at the early stages of the cavitation bubble
lifetime[105]. So far Amendola et al. validated this theory by evaluating the impact of
the upper layer on the final composition of the NPs within the liquid environment with
oxidizing character [17]. The approach was based on the evaluation of the NPs
generated from thin-film targets with either gold or iron in the outer layer ablated in
water. Element in the upper layer, which was more sensitive to oxidation (iron), lead to
formation of iron-rich alloy NPs. Briefly, this effect arises from the sacrificial layer of the
outermost layer being oxidized, allowing lower layer form alloys with high abundance
of iron. These results seem to indicate that the oxidation of the NPs occurs at the early

58
stages of the ablation. Nevertheless, thermodynamically driven oxidation may occur at
later stages in the liquid for highly sensitive materials[195]. Therefore, the conclusion
can be drawn that the stabilization effect of the liquid may have a more pronounced
impact on the AuFe NPs than the chemical reaction between the ablated species and
dissolved O2. More precisely, the interaction of solvent or solvent residues and not only
the oxidation by dissolved O2 rules particle stabilization and ultrastructure. Another
example of stability control of pure elements may be achieved with pH adjustment[20]
or with low electrolyte concentration[108], as the surface charge density increases due
to anion-specific adsorption on the NPs surface[196]. Highly charged surfaces
contribute to the electrostatic stabilization of the particle. Alternatively, the addition of
surfactants stabilizes NPs through steric effect[20]. Indeed, control can be won by the
addition of surfactants or by adjusting pH (possible only in water), however, the main
focus of this work lies on detailed analysis of the physical liquid parameter such as
viscosity, heat capacity, surface tension, etc, and therefore additional stabilization
techniques will not be evaluated.
To validate the theory, that the CS Au-Fe ultrastructure is stabilized by the surrounding
liquid, the experimental approach was focused on the comparison between water and
acetone. To illustrate the impact of the stability on the ultrastructure two references;
acetone, water and one mixture of water and acetone (1:1) were analyzed for the
Au50Fe50 system. One remarkable consequence of the acetone stabilization for Au
would be the formation of the CS with an iron core and gold shell. The stabilization is
expected to be provided by the formation of enolates and alcoholates. Therefore, a
clear trend with an increase in diameter and CS yield should be observed by the
addition of acetone in water. Owning to oxidation character of the water, based on
Wagener et al. findings[42], it would be expected that reversed CS with iron oxide shell
and gold core or alloy with oxidized iron will be found. This approach was evaluated
based on the CS yield (in this case all phase segregated NPs present) and the NPs
size. Results are summarized in Figure 21 a-c and e. CS yield increases from 6 % (in
number) in water up to 50 % (in number) in acetone, while 50:50 Vol % water-acetone
mixture still resembles 39 % (in number) of CS NPs. This trend goes along with a shift
towards bigger diameters and broadening in size distribution for NPs ablated in pure
water, which indicates low colloidal stability. Furthermore, the colloidal stability of the
NPs was confirmed by UV-Vis spectroscopy measured at day 1 and day 30, confirming
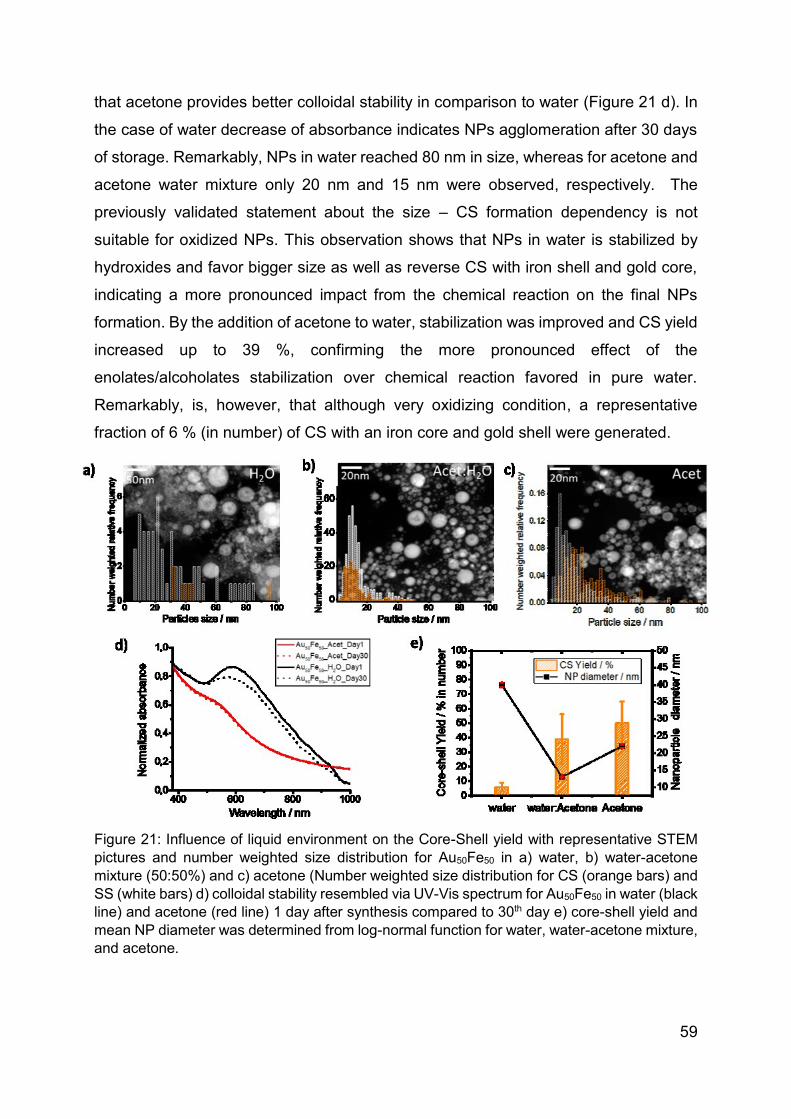
59
that acetone provides better colloidal stability in comparison to water (Figure 21 d). In
the case of water decrease of absorbance indicates NPs agglomeration after 30 days
of storage. Remarkably, NPs in water reached 80 nm in size, whereas for acetone and
acetone water mixture only 20 nm and 15 nm were observed, respectively. The
previously validated statement about the size – CS formation dependency is not
suitable for oxidized NPs. This observation shows that NPs in water is stabilized by
hydroxides and favor bigger size as well as reverse CS with iron shell and gold core,
indicating a more pronounced impact from the chemical reaction on the final NPs
formation. By the addition of acetone to water, stabilization was improved and CS yield
increased up to 39 %, confirming the more pronounced effect of the
enolates/alcoholates stabilization over chemical reaction favored in pure water.
Remarkably, is, however, that although very oxidizing condition, a representative
fraction of 6 % (in number) of CS with an iron core and gold shell were generated.
Figure 21: Influence of liquid environment on the Core-Shell yield with representative STEM
pictures and number weighted size distribution for Au50Fe50 in a) water, b) water-acetone
mixture (50:50%) and c) acetone (Number weighted size distribution for CS (orange bars) and
SS (white bars) d) colloidal stability resembled via UV-Vis spectrum for Au50Fe50 in water (black
line) and acetone (red line) 1 day after synthesis compared to 30th day e) core-shell yield and
mean NP diameter was determined from log-normal function for water, water-acetone mixture,
and acetone.

60
In the following section SS (grey bars), CS (orange bars) and MC (green bars) yield,
as well as NPs diameter (SS – grey, CS – orange, MC- green) were summarized for
various liquids as shown in Figure 22 a-b. Gold-iron nanoparticles were generated with
the representative Au20Fe80 NPs by ns-pulse laser ablation in ketones, alcohols, and
glycols. Furthermore, water will not be considered here due to highly oxidizing
character observed for AuFe systems. In previous studies, in which CS was detected
by synthesis via LAL, acetone was used, therefore acetone will be considered as
reference. For the comparison reason, Fe rich targets were used owning to the high
PS yield (52 % in number) to other AuFe composition as presented in chapter 4.1.3.
Moreover, the relationship between the physical parameter of the liquid environment,
the size and ultrastructure of the generated NPs were studied. Composition and the
NPs size were evaluated with STEM, whereas stability was determined using UV-Vis
spectroscopy. PS yield was established by counting > 500 NPs per sample from STEM
Figure 22: Influence of liquid type on the phase segregation yield for Au20Fe80 generated via 8ns laser ablation [3.85 mJ/cm2; 15 kHz], with comparison between a) CS Yield (orange bars), multi CS (MC, green bars) and SS (gray bars), [error bars for SS depicted in Figure S20]. Evaluation of the correlation between the liquid type and particle diameter b) Number weighted median nanoparticles diameter for SS, CS and MC NPs for all analyzed liquids (blue marked area – ketones, green marked areas – alcohols, purple marked area – glycols with polyolefin) - Figure S16, c) 3 representative STEM images for acetone, 2-butanone and 3-pentanone, characterized with increasing MC yield and decrease in shell thickness, respectively.

61
images. The analysis revealed (Figure 22 a, S15), that the highest phase segregated
structures (PS = CS + MC) yield was obtained for the ketones 2-butanone (75,5 % in
number) and 3-pentanone (75,6 % in number). At the same time, it becomes apparent
that they contained the highest MC yield, > 30 % in number.
Improvement in phase segregated structure productivity has its limits, as the phase
segregated yield decreased again for higher ketones, 3-hexanone where only 50 % (in
number) were detected, same as for the acetone (52 %). Nevertheless, also here a
high amount of MC was present with value at 20% (in number). For comparison, the
glycols (ethylene glycol and diethylene glycol) and ethanol showed the lowest phase
segregated structure yield, < 30 % (in number). Apart from ethanol, which generated
the lowest phase-segregated structure yield (< 20%), alcohols; methanol and propanol
generate 60 and 40 % phase segregated structures respectively. Methanol, however,
has high MC content, whereas propanol could be a good alternative for acetone, as is
contains only a small amount of MC NPs. The low thermal and chemical stability of MC
NPs (NPs with one or more iron cores or jellyfish; both are characterized with very thin
Au shell) was confirmed in previous chapter 4.3.1-4.3.2. Notably, PAO40 oil
(Polyalphaolefin 40), which is characteristic with high viscosity, shows quite moderate
CS yield with a generation of 40 % of CS (in number), only 12 % less than acetone.
Significantly, no MC NPs were found here, yet harvesting of the NPs generated in
highly viscous oils is quite challenging. To sum up, ketones showed the highest phase
segregated structure yield, however with a high content of MC NPs, whereas glycols,
the lower amount of MC, yet lower PS yield as well. Interestingly, PAO40, showed
moderate CS formation, with no MC NPs detected.
In our previous work, we already confirmed a distinctive correlation between the size
and the Fe-Au NPs composition[152] and confirmed this experimentally with an
extended thermodynamical model (chapter 4.1.1). Two different modes were detected;
well-mixed alloy NPs SS and phase segregated core-shell NPs with pure Fe core
surrounded by Au rich shell (including a low amount of MC NPs). We could verify,
experimentally and theoretically, that smaller NPs with higher Au elemental content
would form disordered alloy SS-NPs, while on the other hand phase segregated CS-
NPs formed at average diameter >10 nm and Fe at % >35%[152]. Admittedly, we
would expect that for NPs with a bigger diameter more CS should be generated, yet

62
MC NPs were previously considered as CS NPs and not as a separate fraction. This
assumption was made based on the very low content of MC (< 5%), which were found
only in a few samples for the ablation in acetone. After a detailed analysis of the
chemical and thermal stability of the particular ultrastructure, low stability of MC NPs
was proven, therefore separate consideration of CS and MC is required.
In the following section, the main focus would be laid on the NP diameters and their
correlation towards particular ultrastructures in selected liquids. For this purpose, size
distributions were analyzed separately for SS, CS and MC NPs. Representative
number mean diameters for particles ablated in different liquids were summarized in
Figure 22 b). Mean diameters were acquired from the fitting of the particle size
distributions with a log-normal function. In most samples, independent of the liquid
environment, a clear distinction between smaller SS and bigger phase segregated NPs
was observed. With the exception of 2-butanone or 3-pentanone where the distinction
between SS and CS NPs diameter was minimal (21/20 nm and 26/24 nm respectively).
Moreover, ethanol and propanol surprisingly showed a smaller mean diameter for CS
(26 and 19 nm respectively) in comparison to SS (103 and 28 nm respectively) NPs.
In regard to MC NPs, the high similarity in size to CS NPs is observed for ketones
(19/17 nm for acetone, 20/20 nm for 2 butanone, 24/24 nm for 3-pentanone and 20/23
nm for 3-hexanone). In the case of alcohol, MC NPs diameter was higher than the CS
NPs, 6 nm higher for methanol (30/26 nm), 18 nm for ethanol (44/26 nm) and 17 nm
for propanol (36/19 nm). Whereas no MC NPs were detected for diethyl glycol and
PAO40 oil. In general, the mean diameter of the generated NPs, varies between 10
and 50 nm, with an exception from ethanol, where alloy NPs with a mean diameter
around 100 nm were found. In the group of ketones mean (SS + CS + MC NPs)
diameter resembled an increasing trend, starting with 13 nm for acetone and reaching
25 nm for 3-pentanone, only to decrease again down to 15 nm for 3-hexanone (Figure
S17). Here, a clear size-composition trend can be observed, where acetone yields 52
% of segregated structures in number, 2-butanone, and 3-pentanone around 75 % in
number and then decreases again for 3-hexanone until 50 % in number. Although for
alcohols with longer chain length C3-5, stable and smaller NPs would be expected[197,
198], the results showed an opposite effect. Where NPs size first increase from 16 nm
(methanol) to 63 nm (ethanol), only to decrease again to 23 nm (isopropanol) as shown

63
in Figure S19. Moreover, glycol represents high mean diameter with 17 nm for ethylene
glycol and 39 nm for diethylene glycol, however, low PS yield.
Contrarily to the thermodynamic prediction towards phase segregation for NPs with
size > 10 nm, no substantial increase in PS NPs was observed. This means that a
higher number of efficiently stabilized large SS NPs, which are not in thermodynamic
equilibrium occurred. The obtained results indicating that next to the NPs composition
as well as the NPs size (chapter 4.1.3), the liquid environment plays an important role
in ultrastructure control. For ketones, a clear size-ultrastructure trend was validated,
whereas more polar liquids like water and alcohols seem to exhibit strong liquid effect
not predicted by the simple theoretical calculations, which only consider the elements
free surface energies.
To better elucidate the effect from physical properties of the liquid environment on the
PS productivity, radar chart with phase segregated (CS + MC) NPs yield in
dependency from chosen liquid parameter (surface tension, refractive index, density,
heat capacity, and viscosity) were plotted. The impact on the phase segregation yield
for all parameters was evaluated separately and is depicted in Figure 23 b-d. Overview
of all considered parameters is summarized in a radar chart in Figure 23 a.
As expected, glycols with the lowest CS yield (below 30% in number) showed clear
deviation from the other liquids (Figure 23 a) with the biggest variation for refractive
index (RI), surface tension (ST), density and viscosity. Remarkably, for PAO40, which
also resembled low 40 % (lower than acetone 52%) CS yield, RI, surface tension as
well as viscosity deviation is observed. Interaction of the refractive index and the laser
intensity may play a crucial role during LAL; this process is known as the self-focusing
Kerr effect. This leads to a shortening of the focal distance, as a liquid would act as an
additional collecting lens, decreasing productivity[20]. However, this effect applies only
for very short pulse duration, where high peak power can be reached, therefore it will
not be discussed here. Nevertheless, based on the results summarized in Figure 23 b,
no apparent trend can be concluded. Surface tension on the other side may impact the
nanoparticle growth by suppressing small cavitation bubble. As shown in Figure 23 a,
for NPs generated in liquids with high surface tension (> 30 mN/m) low PS yield (lower

64
than for acetone 52%) was observed e.g. for glycols and PAO40 oil. Interestingly, for
glycols average diameter was above 10 nm, indicating negligible quenching effect.
Unfortunately, no clear surface tension - PS yield trend can be observed, as the lowest
PS yield was for ethanol with low surface tension (below 25 mN/m) and at the same
time for glycols with high surface tension (above 40 mN/m). Moreover, even though for
lower surface tension values, more PS NPs were detected, still no correlation between
surface tension – PS yield is apparent (ketones – high PS yield; alcohols – low PS
yield for similar surface tension values). Based on the van der Waals model, pressure
inside the cavitation bubble is proportionally dependent on the surface tension of the
liquid[199]. Meaning, that if surface tension is high the pressure inside the cavitation
bubble will be high as well. Yet, surface effect showed a negligible influence on the
cavitation bubble lifetime, whereby comparison of alcohols and water, density[200] or
more likely the ablated material thickness and laser pulse parameters[201] resembled
a more pronounced impact on the cavitation bubble lifetime. In general, Amans et al.
and Lam et al. showed that surface tension and viscosity can be neglected during the
first cavitation bubble cycle[200]. On the other side, remarkably next to high surface
tension values, glycols and PAO40 oil resemble high viscosity (< 20 mPa*s) as well.
The effect of the viscosity on the NPs formation will be discussed in the following
section.
Among all investigated parameters, viscosity appears however to have the biggest
impact on the NPs morphology (Figure 24 d, f). Interestingly, ethylene glycol with a
viscosity above 10 mPa*s, was characteristic with displaced iron core (Figure 24 d).
Whereas, highly viscous liquid (above 40 mPa*s) contributed to the formation of non-
spherical NPs. Remarkably, as shown in Figure 24 f, PS yield decreases up to
diethylene glycol with increasing viscosity with an exception for ethanol. In addition,
contrarily to observed trend in which PS yield decreases if viscosity increases, a slight
increase for PAO40 was observed (up to 40%) as shown in Figure 24 f. However, not
only the PS yield changed but also a spherical character of the NPs as seen in
representative STEM images in Fig 24 d. Ablation efficiency is enhanced when the
viscosity of the solvent increases, due to improvement of the plasma plume
confinement on the ablated crater or due to slowed down dynamics of the cavitation
bubble. Furthermore, high viscosity impacts the collision rate leading to the formation

65
Figure 23: a) For the evaluation of the liquid environment effect on the AuFe morphology, an overview of the chosen parameters (surface tension, refractive index, density, viscosity, and heat capacity,) was prepared in form of a radar chart. Influence from the liquid environment on the generation of the phase-segregated phase was summarized as a function of the following parameters; b) the refractive index, c) surface tension, d) density. The evaluation focused on the 3 representative groups of liquids, alcohols, ketones and highly viscous liquid (glycols and PAO40 oil).
of small particles and may reduce aggregation[202]. Additionally, with higher viscosity,
smaller NPs would be expected due to a decrease in cavitation bubble lifetime as
shown by Chrisey group[203]. Remarkably, no clear size-viscosity trend can be
observed (Figure S21 a), yet by excluding PAO40 oil, with increasing viscosity lower
PS yield is noticeable (Figure 24 f). One must not forget that not only one parameter
defines the ultrastructure but a mixture of several factors, where one parameter may
show a more pronounced character over the final NPs structure. It's instructive at this
stage to illustrate that the final statement can not be made based only on the evaluation
of the early stage of the ablation of plasma plume lifetime. From a theoretical point of
view, it is difficult to predict the exact transformation of the NPs up to its final state.
In regard to ketones (acetone, 2-butanone and 3-pentanone), a clear correlation
between PS yield and the heat capacity can be observed (Figure 24 e). Notably, with
increasing heat capacity values, higher PS yield was observed. Representative STEM

66
images confirming the trend are shown in Figure 24 d. Then again 3-hexanone showed
lower PS yield, even though it contains higher heat capacity value (Figure 24d,e).
Admittedly, Kanitz et al. showed no significant plasma shape change with variation of
the heat capacity of the liquid (water, acetone, and toluene), yet weaker plasma is
distinguishable for organic solvents[204]. Moreover, Waag et al. reported on how the
temperature of the ablated target as well as the colloid may impact on the NPs
productivity. In his study, he proposed that low productivity can be contributed to the
organic solvents, which have a lower heat capacity and higher viscosity[205].
Figure 24: Overview in form of radar chart, summarizing the impact from the chosen liquid parameters towards high PS yield, shown separately for 3 groups of liquids a) ketones, b) glycols (with PAO40 oil) and c) alcohols, along with d) changes within the morphology for Au20Fe80 NP in dependency from the liquid type used during ablation is shown as representative STEM pictures. Finally, dependency from the PS yield from e) heat capacity and f) viscosity for e) acetone, 3-pentanone, and f) Ethylene glycol and Polyolefin (PAO40) generated via 8ns short pulse by LAL is given.

67
The only possible explanation coming to mind would be that heat capacity may
influence the solidification process of the ablated material and recondensating in the
liquid. Nevertheless, due to lack of experimental or theoretical data this prediction can
not be confirmed. Despite the lack of explanation, there is indeed a relation between
an increase in heat capacity and PS for ketones (acetone, 2-butanon and 3-pentanone)
with an exception for 3-hexanone. Thus, based on the available data statement can be
made in which the results indicate that higher heat capacity value may favor the
formation of the segregated phase, yet only to a certain point. Nevertheless, up to date,
this can not be explained.
In summary, up to date no clear trend between one chosen laser parameter and PS
yield can be made. The most pronounced impact from laser parameters was viscosity
and heat capacity. Interestingly, with increasing viscosity, PS yield decreased,
indicating that plasma plume confinement or slow bubble dynamics does not favor PS
formation. On the other side high heat capacity, which may affect the cooling and
solidification process, not only improved CS yield but also the generation of MC NPs.
In the last section of this chapter, the NP size distribution for evaluated liquids will be
summarized. The size distribution is described by the dimensionless parameter which
is characterized by the PDI value. The polydispersity index (PDI) was calculated from
the resulting xC-value and the standard deviation w² of the distribution[21].
Polydisperse index (PDI) with a value below 0.3 represents narrow size distribution
(monodisperse), while higher values represent broader size distribution (polydisperse).
In Figure 25 overview of the size distribution is shown with two representative size
distribution for narrow size distribution in acetone in Figure 25 b and wide size
distribution in methanol Fig 25 c. In comparison, narrow size distribution can be found
for ketones (PDI well below 0.3), while glycols and alcohols lead to a broad size
distribution with a PDI > 0.3 (Figure 25a, S19). Here again, ketones show the most
promising liquid for LAL, with the narrowest size distribution. When the size distribution
is wide, additional extraction techniques would be required. For most of the
applications, the size is an important factor especially for catalysis or biomedical
application where the high surface of the NPs is required either for an electrochemical
reaction or bio-conjugation.
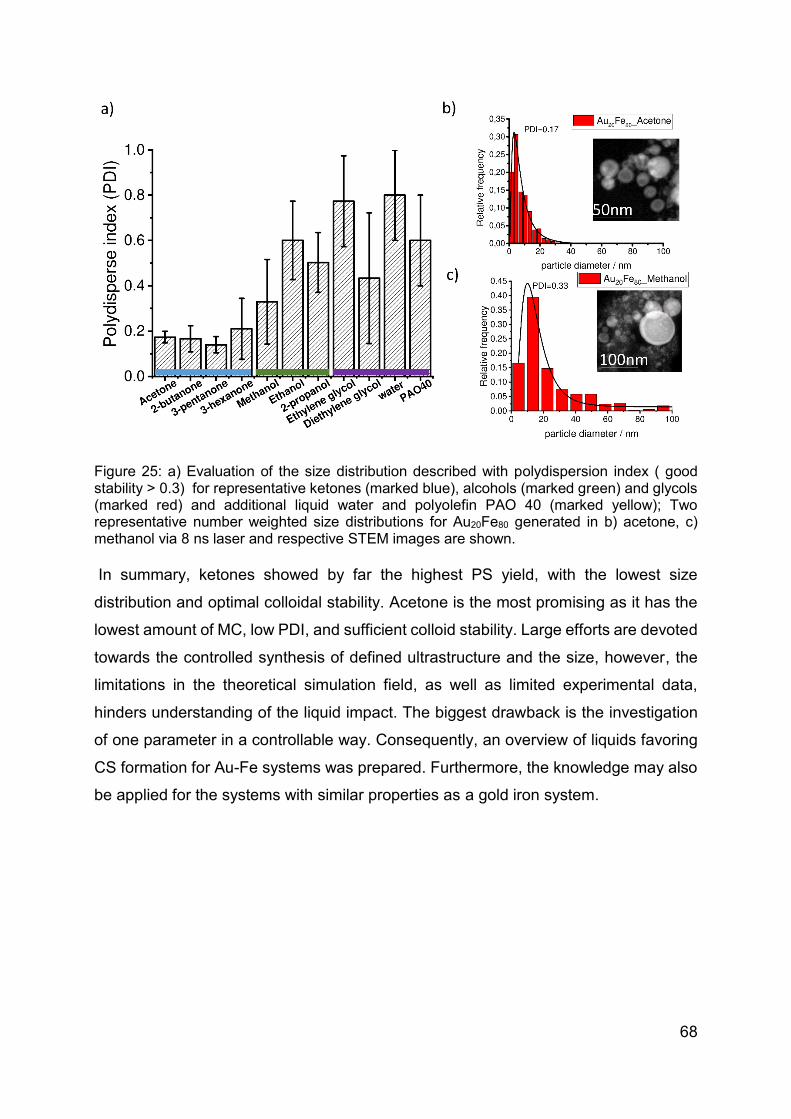
68
Figure 25: a) Evaluation of the size distribution described with polydispersion index ( good stability > 0.3) for representative ketones (marked blue), alcohols (marked green) and glycols (marked red) and additional liquid water and polyolefin PAO 40 (marked yellow); Two representative number weighted size distributions for Au20Fe80 generated in b) acetone, c) methanol via 8 ns laser and respective STEM images are shown.
In summary, ketones showed by far the highest PS yield, with the lowest size
distribution and optimal colloidal stability. Acetone is the most promising as it has the
lowest amount of MC, low PDI, and sufficient colloid stability. Large efforts are devoted
towards the controlled synthesis of defined ultrastructure and the size, however, the
limitations in the theoretical simulation field, as well as limited experimental data,
hinders understanding of the liquid impact. The biggest drawback is the investigation
of one parameter in a controllable way. Consequently, an overview of liquids favoring
CS formation for Au-Fe systems was prepared. Furthermore, the knowledge may also
be applied for the systems with similar properties as a gold iron system.

69
4.3. Characterization of the AuFe ultrastructure
As shown in the previous chapter, independently from the conditions during the LAL
synthesis, alloy and phase segregated structures are generated. In this chapter,
questions regarding chemical and thermal stability of thus ultrastructures will be
addressed. In order to achieve a complete and detailed overview of microstructural
change, in-situ and ex-situ approach will be applied.
4.3.1 Chemical stability of Au-Fe NPs
To evaluate the chemical stability of the various ultrastructure’s, etching of Au-Fe NPs
with various ultrastructures under acidic conditions (with various HNO3 concentrations)
were performed and reported by Marius Kamp et al[206]. Different ultrastructures were
investigated via transmission electron microscopy (STEM) to assess any changes
within the composition and the ultrastructure of the Au-Fe NPs. Representative NPs
before and after etching treatment are shown in Figure 26.
Figure 26: I. Chemical stability of the particle structure evaluated by the elemental distribution for various moprhologies of representative Au20Fe80 composition with a-h) STEM analysis before and after etching with conc. HNO3 II. Elemental distribution driven from EDX mapping determined for etched A. Au20Fe80 and B. Au50Fe50 NPs[206].
The NPs with average composition Au20Fe80 showed four different ultrastructures,
namely solid solution, multi core-shell, jellyfish and core-shell, respectively. This variety
is representatively shown in the form of STEM images depicted in Figure 26 I. a-d. For
the illustration, selected images were compared before and after etching treatment as
shown in Figure 26 a-d and identified with Z-contrast images (Figure 26 e-h).
Remarkably, preservation of the initial template morphologies occurred despite the

70
treatment under acidic conditions, resembling good mechanical stability. In particular,
the degree of the porosity for both elements was considered an important aspect
characterizing the stability of the NP. Briefly, the higher Au concentration, as well as
low porosity grade, resulted in brighter contrast. Interestingly, the data gathered in
Figure 26, where iron core showed lower contrast, suggests higher porosity of the NP.
This effect originates from the generation of voids and the formation of oxides.
Moreover, Z-contrast SEM analysis was performed to establish the amount of Fe
removed during the etching treatment. After etching, independently from the samples
very low Fe content (only ~ 5 at%) was found in the nanoporous Au. Remarkably, even
a thin Au shell preserved its shape after the etching procedure. There seems to be a
compelling reason to argue, that Fe was leached through permeable Au shell, via
pinholes, which are shown in Figure 27 (pinholes marked as asterisks in Figure 27 a
and b). One remarkable consequence is the possibility of porosity control by simply
adjusting the acid concentration. The result in Figure 27 h-j validated that statement in
which 0.1 M led to the dissolution of a small amount of Fe (low porosity), 6 M to
moderate Fe dissolution, whereas concentrated nitric acid led to full Fe dissolution
(high porosity, Figure 27 e-h; ii).
Figure 27: Chemical stability of the core-shell morphology determined with Z-contrast STEM image of an etched MCS NP at tilting angle -31° a) STEM image of an NP with pinholes b) STEM image of the same MCS NP at tilting angle of 17° and EDX elemental maps of Au-M, Fe-K and O-K are shown. In d)-g) the formation mechanism of dealloying is described by a simplified reaction scheme[207]. h-j) Exemplary Z-contrast images for different acid concentrations (48 h). From left to right the acid concentration (0.1M;8M, concentrated) used and the degree of dealloying increases, dealloying with concentrated nitric acid results in almost complete dissolution of the Fe core[206].
Furthermore, the Fe shell inside the NP was partially dissolved with Fe oxide present,
as confirmed by EDX mapping (Figure 27 c), where Au (yellow), Fe (red), and O
(orange) are present. This confirms our prediction that Fe can dissolve through the
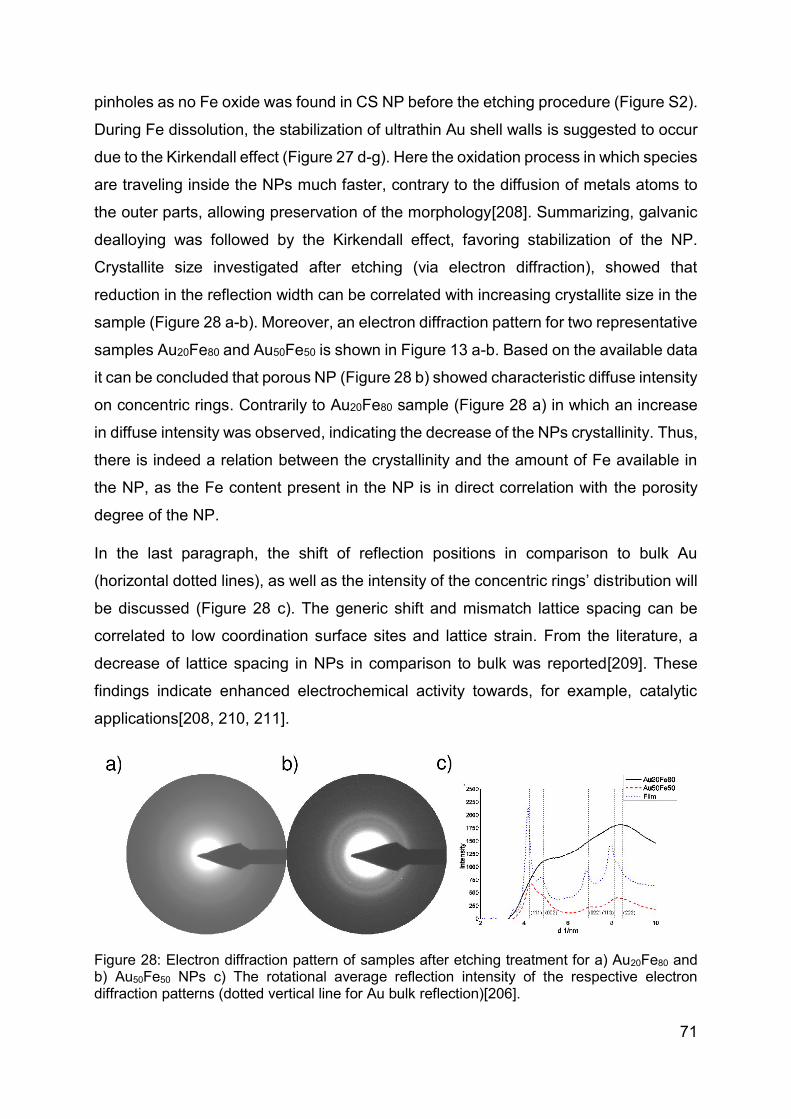
71
pinholes as no Fe oxide was found in CS NP before the etching procedure (Figure S2).
During Fe dissolution, the stabilization of ultrathin Au shell walls is suggested to occur
due to the Kirkendall effect (Figure 27 d-g). Here the oxidation process in which species
are traveling inside the NPs much faster, contrary to the diffusion of metals atoms to
the outer parts, allowing preservation of the morphology[208]. Summarizing, galvanic
dealloying was followed by the Kirkendall effect, favoring stabilization of the NP.
Crystallite size investigated after etching (via electron diffraction), showed that
reduction in the reflection width can be correlated with increasing crystallite size in the
sample (Figure 28 a-b). Moreover, an electron diffraction pattern for two representative
samples Au20Fe80 and Au50Fe50 is shown in Figure 13 a-b. Based on the available data
it can be concluded that porous NP (Figure 28 b) showed characteristic diffuse intensity
on concentric rings. Contrarily to Au20Fe80 sample (Figure 28 a) in which an increase
in diffuse intensity was observed, indicating the decrease of the NPs crystallinity. Thus,
there is indeed a relation between the crystallinity and the amount of Fe available in
the NP, as the Fe content present in the NP is in direct correlation with the porosity
degree of the NP.
In the last paragraph, the shift of reflection positions in comparison to bulk Au
(horizontal dotted lines), as well as the intensity of the concentric rings’ distribution will
be discussed (Figure 28 c). The generic shift and mismatch lattice spacing can be
correlated to low coordination surface sites and lattice strain. From the literature, a
decrease of lattice spacing in NPs in comparison to bulk was reported[209]. These
findings indicate enhanced electrochemical activity towards, for example, catalytic
applications[208, 210, 211].
Figure 28: Electron diffraction pattern of samples after etching treatment for a) Au20Fe80 and b) Au50Fe50 NPs c) The rotational average reflection intensity of the respective electron diffraction patterns (dotted vertical line for Au bulk reflection)[206].

72
To summarize, the porosity of the NP can be controlled by variation of Fe content or
acid concentration. Even though iron can be removed through the leaching procedure,
by simply adjusting the acid concentration, stabilization of the Au shell is remarkable.
Gold shell iron core structure is stable with acid treatment up to < 0.1 M nitric acid.
Moreover, such an approach delivers an easy way to control a surface composition
and porosity degree, which can be directly applied in catalysis.

73
4.3.2 Thermal stability of AuFe NPs
Aiming for a better understanding of the formation mechanism of Au-Fe NP, it is
important to characterize their equilibrium morphology and the possible metastable
structures. In this regard, thermal stability tests were performed and reported by M.
Kamp et al.[212] The thermal stability was investigated using an in situ STEM heating
experimental set up with a Gatan 652 double tilt heating holder. The reliable and stable
temperature measurement was confirmed in previous studies[213]. During this test,
the heating rate was 10 °C per minute, where at chosen temperatures the temperature
was held for 10 minutes[214]. Two representative compositions were chosen, Au50Fe50
(42% CS per number) and Au20Fe80 (62% CS per number), as in both cases CS and
SS ultrastructure were present. The in-situ analysis was complemented with the ex-
situ electron tomography evaluation.
Figure 29: a) Schematic representation of two representative compositions, namely Au50Fe50 and Au20Fe80 NPs (with STEM-EDX analysis presented in Figure S1) b) Schematic tomography reconstruction of isosurface before heating at 20°C and after heating (700°C) c) EDX elemental mapping and STEM pictures of tetrakis hexahedron structures after heating treatment of 700°C.[212]

74
The schematic overview for NPs transformation at the chosen temperatures during in
situ STEM experiment is shown in Figure 29. The stability of representative, SS, CS
with a thin shell and CS with thick shell were evaluated in temperature window from
0°C to 700°C. In all cases, CS NPs were thermally stable up to 250°C. In the case of
Fe rich Au20Fe80 CS NP (with thick shell), a transformation occurred into Fe rich core
cube-shape faceted by truncated Au rich pyramids with intermediate lamellar
structures. Tetrakis hexahedrons structure were previously reported in the literature,
e.g. Langlois et al.[147], reported synthesis via physical vapor deposition at 800°C, of
equilibrium morphology with Fe cube, capped with the truncated Au pyramids (tetrakis
hexahedrons), same as in case of iron-rich CS NP reported in this work (Figure 29 b).
Minimization of the interfacial energy as a driving force was proven by the interface
analysis via TEM, which indicated epitaxial growth of Au and Fe cube along [001].
Furthermore, 3D tomography reconstruction model, together with the elemental
mapping confirmed the symmetric arrangement and the planar interfaces of the tetrakis
hexahedron ultrastructure as predicted by Wulffs[215] (Figure 29 b). For tomography
tilting series, a high angle tilting holder was used with applied maximum tilt angles of
65° to reduce artifacts from missing wedge[216]. Representative STEM images along
with EDX mapping (Figure 29 c) confirmed the tetrakis hexahedron structures after
annealing up to 700°C towards thermodynamically stable CS NPs, as predicted by
Casanove et. al[217]. A clear distinction between the gold (yellow) shell and iron (blue)
core can be observed in Figure 29 c. Noteworthy is, however, the intermediate state of
lamellar morphology, based on the alternating Au rich and Fe rich stripes, with a large
interface area as confirmed by Z-Contrast. Unfortunately, with available TEM
technique more detailed information about phase segregation are simply not
accessibly. Hence, Amram and Rabkin et al.[166] reported lamellar spacing of 200 nm,
by Au-Fe bilayer heating procedure, indicating strong dependency from the size and
the NP composition. On the other side CS with thinner Au shell (< 5 nm), for Au50Fe50
and Au20Fe80, transformation into a biphase final structure was observed (Figure 29 a,
S21). One remarkable contribution here is the elastic energy increase with reduced
shell thickness, making Janus biphase ultrastructure energetically more favorable, due
to the minimization of the interface area between Au and Fe. Interestingly, Casanove
[217] et al. showed that the shell thickness does not contribute to the overall NPs
stability like in the case of another system, for instance, Ag-Cu. Interestingly, our

75
results showed that the Au shell thickness defined the NPs stability and led to the
formation of the biphase final structure at 700°C (Figure S21). This leads to the
conclusion that the thicker shell is required to improve the stability of the CS NPs.
All things considered, it may be concluded, that during a heating experiment,
equilibrium structures were generated at 700°C. The hypothesis was rationalized, by
the controlled experiment in which morphologies retained their transformed equilibrium
structures after cooling them to room temperature.
To summarize, the results of in-situ experiments delivered a new understanding of the
formation mechanism of Au-Fe NPs during LAL, its thermodynamic stability as well as
temperature-dependent transformation. The metastable character of AuFe NPs
synthesized via LAL and their stability up to 250 °C is underlined by the results
presented. Hence, the transformation towards a stable morphology in equilibrium is
strongly affected by the NPs composition and size. Remarkably, shell thickness
contributes towards overall NPs stability, where with thicker shell higher stability can
be achieved.
76
4.4 Formation mechanism proposal for AuFe system.
Producing colloidal nanoparticle through laser ablation in liquids has become a popular
technique to synthesize binary alloy NPs. In contrast to chemical synthesis, in which
NPs with clean surfaces and particular structures are not accessible. Nevertheless,
control over various ultrastructures in the context of harvesting the relevant properties
is still challenging during laser ablation synthesis. For instance, the basic mechanism
during nanoparticle formation is up to date still not fully understood. In this context, the
model of the nanoscale phase diagram enriched by simple thermodynamic calculations
and experimental approach for binary AuFe system has been implemented towards a
better fundamental understanding of the laser ablation mechanism. A phase diagram
was used, to gain more insight into possible equilibrium state of the AuFe NPs, by
complementary calculations considering NPs composition, size and minimization of
their surface energy as described by Gibbs[189]. As a result, NPs synthetized during
LAL were suggested to be in non-equilibrium alloy phase, indicating a kinetically
controlled process[152]. Admittedly, an approach based on the nanoscale phase
diagram allows the prediction of NPs composition and its possible ultrastructure, yet
certain conditions such as liquid environment or laser parameters are not considered.
Briefly, in aim to control the generation of particular core-shell morphology, conditions
during laser ablation had to be established through systematic experimental study, as
summarized in chapter 4.2. Therefore, within this chapter, parameters towards the
highest yield of the AuFe core-shell structure are highlighted, as this particular
morphology contains a combination of magnetic, plasmonic properties[27] as well as
the possibility to functionalize the NPs surface through Au-thiol chemistry[218]. Finally,
the formation mechanism of AuFe NPs during LAL, was validated according to results
presented in chapters 4.1.3-4.3, and summarized in form of a schematic model as
depicted in Figure 30.
This paragraph aims to elucidate a final correlation between the target (Au:Fe molar
ratio), liquid environment (heat capacity, length of the chain and viscosity) and NPs
formation mechanism during laser ablation in liquids. In previous chapters (4.2-4.3), it
was shown, that independently from the target composition bimodal particle size
distributions were present, as predicted by Zhigilei et al.[137] In the case of Au rich
targets, only SS NPs were found. Whereas for iron-rich targets, size distribution with

77
larger core-shell particles and smaller solid solution nanoparticles were detected.
Furthermore, the formation of core-shell nanoparticles was not probable in particles <
10 nm, if BCC phase was not present. The diameter of the NP and its correlation to
either alloy or segregated phase was determined via simple thermodynamic
calculations[136], in which element segregation was shown to be oriented based on
the minimization of the surface and interface energy. Remarkably, CS yield can be
controlled by adjusting Au:Fe molar ratio in the target used for the ablation, whereas
with increasing Fe content, higher CS yield can be achieved. To improve the CS yield
even further alloy (Au50Fe50) thin multilayer targets were proposed, allowing the
generation of > 90 % of CS NPs without changing the 50:50 NPs composition. Here,
both target geometry (more precisely thickness), as well as pulse duration (ns long
pulse duration), affects the final NPs composition. In the case of short ps pulse duration
metastable SS NPs are favored, contrarily to long ns pulse duration, where CS yield
reaches almost unity. Therefore, to reach high CS NPs yield an alloy thin multilayer
target is proposed.
The last considered parameter was liquid surrounding, where heat capacity, chain
length and the viscosity were taken into consideration. Here, it is important to mention,
the difficulty of constant parameter change within one group of liquids. Therefore, liquid
property – CS yield relation cannot be delivered here. Consequently, the overview of
3 groups of liquids with the impact on the CS yield was summarized. In general, CS
formation is possible independently from the liquid environment. Whereas, next to
methanol only 2-pentanone and 3-pentanone showed higher CS yield in comparison
to acetone. CS yield improved only by several percents, however, the amount of Multi
core-shell NPs also increased, which resembles low thermal and chemical stability as
shown in the chapter (4.1.2). The most promising parameters toward high Au-Fe CS
yield, are summarized schematically in Figure 30. Based on these findings, it can be
summarized, that well-mixed iron-rich alloy thin targets lead to high yield of CS NP, if
ablation occurs at long ns pulse duration in acetone.
Since a more refined approach toward the understanding of the formation mechanism
is required, the liquid environment will not be considered for the mechanistic model.
The lack of the verified trend between CS formation and the clear physical parameter
is apparent. In this regard, only pulse duration (long ns and short ps duration) and

78
target alloy or layered target) during the mechanistic model of the formation
mechanism proposal will be addressed.
Figure 30: Schematic overview of the relevant parameters towards high AuFe core-shell yield generated via laser ablation in liquids.
To gain more insight into the NP formation mechanism, the complexity of the ablation
mechanism should be considered. Namely, ablation for long ns and short ps pulse
durations depicted schematically in Figure 31 a. Notably, bigger NPs diameter was
observed during long ns pulse duration (Figure 15). This effect arises from the fact that
both pulse durations are characterized with different ablation mechanism[153]; during
long ns pulse duration, meting and vaporization occurs[103] whereas ps short pulse
duration can be described as almost instantaneous solid-vapor transition of the atoms
of the target[138]. One remarkable consequence of the influence of the pulse duration
is for instance effect on the CS yield as shown in chapter 4.2.1. Notably, long ns pulse
resembled high CS, > 90 % in number if alloy 80 nm targets were used. Owning to
prolong time inside the cavitation bubble under heated state (> 5000 K)[139, 140].
Prolong cavitation bubble lifetime arises from the prolong plasma lifetime, which results
from the additional heating of the plasma, due to partial overlap of the pulse width and
the duration of the existing plasma plume[103, 138]. Increased lifetime of the cavitation
bubble by application of larger pulse energy was reported previously by Park et.al[108].
Concerning the impact form the cooling rates, which in gas phase is lower than in the
liquid phase[108], a statement can be made, that NPs in CB during ns pulse ablation
have more time to reach their thermodynamic equilibrium. On the other side, NPs
generate during ps are form far from the thermodynamic equilibrium and alternatively,

79
NPs can be formed as metastable structure if the NPs will be kinetically trapped e.g
when atomic diffusivity would be rapidly frozen[219]. In case of ps, NPs will be cooled
more rapidly by being exposed to the liquid phase, as their CB lifetime is shorter[155].
This phenomenon is proposed schematically in Figure 31 b, in which CB size
corresponds to the lifetime period, the longer the lifetime the bigger the size of the CB.
Considerable attention must be paid to the fact that SS NPs are present independently
from the conditions applied. Povarnitsyn et al. proposed based on the simulation, that

80
Figure 31: Schema of the mechanistic model for a) the AuFe formation mechanism during laser ablation in liquids for short ps and long ns pulse duration, b) for NPs generated for alloy target (*) c) and generated via fully separated layered target.
smaller NPs are formed in the liquid gas region (Figure 31 b-3.)[141]. Notably, in
accordance with thermodynamic calculations smaller NPs < 10 nm, are more
thermodynamically favored in SS configuration. Whereas, the larger NPs are formed
in the molten layer (Figure 3 b-2) region, therefore here CS morphology would be
favored ( > 10 nm; chapter 4.1.3). This hypothesizes may be confirmed by Zhigilei

81
et al. simulation in which he proposed, that within the CB different regions can be
assumed to be incubators delivering different conditions towards NPs diameter
formation[104]. Moreover, this statement is further confirmed by the observation made
in chapter 4.2.1, in which for fully separated layered targets during ps short pulse
ablation, limited mixing of topmost layer resulted in the formation of almost pure Au
NPs (Au rich NPs with only a few % of iron). In addition, only several representative
CS NPs were found in this sample. Au rich NPs, are most likely generated in the liquid
+ gas phase region (Figure 31 c-3), whereas CS are in the region closer to the molten
layers (Figure 31 c-2). Nevertheless, low CS yield can be verified by the short relative
CB lifetime, hindering the full transformation of the NPs towards the equilibrium phase.
In the case of long ns pulse, no simulation is available, however, based on the
experimental approach conclusion can be drawn, that during ns long pulse, mixing in
the early stages of the ablation is more apparent in comparison to the short ps pulse
duration. Moreover, a higher yield of CS validated these predictions. At last, SS
fraction, which is present in all ablated samples, further confirms the prediction of NPs
formation- region dependency. Meaning, that within the CB, the formation of the NPs
is depending on the duration but also the condition in particular regions of the CB. It
can not be forgotten, that this formation mechanism considers only early stages of the
ablation, in which simulation is not able to predict neither long ablation nor later stages
of the ablation e.g after bubble collapse. After bubble collapse, the reset of the formed
NPs morphology may occur and undergo not described here transformation/formation
process. Nevertheless, a clear correlation between simulation and experimental data
may contribute towards a fundamental understanding of the AuFe NP formation
mechanism.
To summarize, the careful choice of pulse duration will impact different ablation
mechanism, in case of short ps pulse ablations, metastable kinetically trapped product
will be synthetized, especially if they are generated from fully separated layered target.
Thus, well-mixed target contributes towards higher CS yield, if long ns pulse duration
is applied. Here, the CS yield, would be dependent from the composition and size of
the particle, as predicted by the thermodynamic calculations

82
4.4.1 High core-shell formation – transferability to AuCo system
In the aim to prove the accuracy of the model proposed in chapter 4.4, contributing
towards better control over nanoparticle ultrastructure, AuCo system was selected.
Similar to iron, cobalt may transfer between FCC crystal phase additional crystal
phase. Iron can transfer between 2 crystal phases FCC and BCC, whereas cobalt
between FCC and HCP. According to Hume-Rothery rule phase segregation can only
occur if 2 different phases are present[217, 220]. As gold has FCC phase, any
elements with another crystal phase would favour phase segregation. Furthermore,
this rule predicts phase segregation for a system where electronegativity, crystal
structure, atomic radius shows the substantial difference, contrarily to elements with
similar properties, which favour alloy formation. This is, however, a simplified
assumption, as this prediction does not take into account liquid environment impact,
which may also have a distinctive influence on NPs formation during LAL. Therefore,
for a more precise comparison with AuFe only AuCo generated in acetone will be
considered.
For the evaluation of the model proposed in the previous chapter, 3 comparison
parameters were chosen. First of all, phase segregated (CS + MC) and MC yields were
compared (Figure 33 a and b). Followed by an evaluation of the size dependency from
the AuCo composition (Figure 33 c, d). Finally, with the help of XRD the crystal
structure was analyzed (Figure 34-35). All the results were summarized and compared
with the AuFe system.
Analysis of both, AuFe and AuCo revealed similar ultrastructure classes: SS, CS and
MC NPs (Figure 32, S22). For the simplification purpose, the comparison was focused
only on the segregated phases, including CS and MC NPs (Figure 33 a). EDX mapping
confirmed Au (purple color) and Co-rich regions (yellow color), by detection of Co-K
and Au-L signals for representative CS NPs (Figure 32 a). The low resolution of the
EDX mapping image was caused by drift correction during analysis.
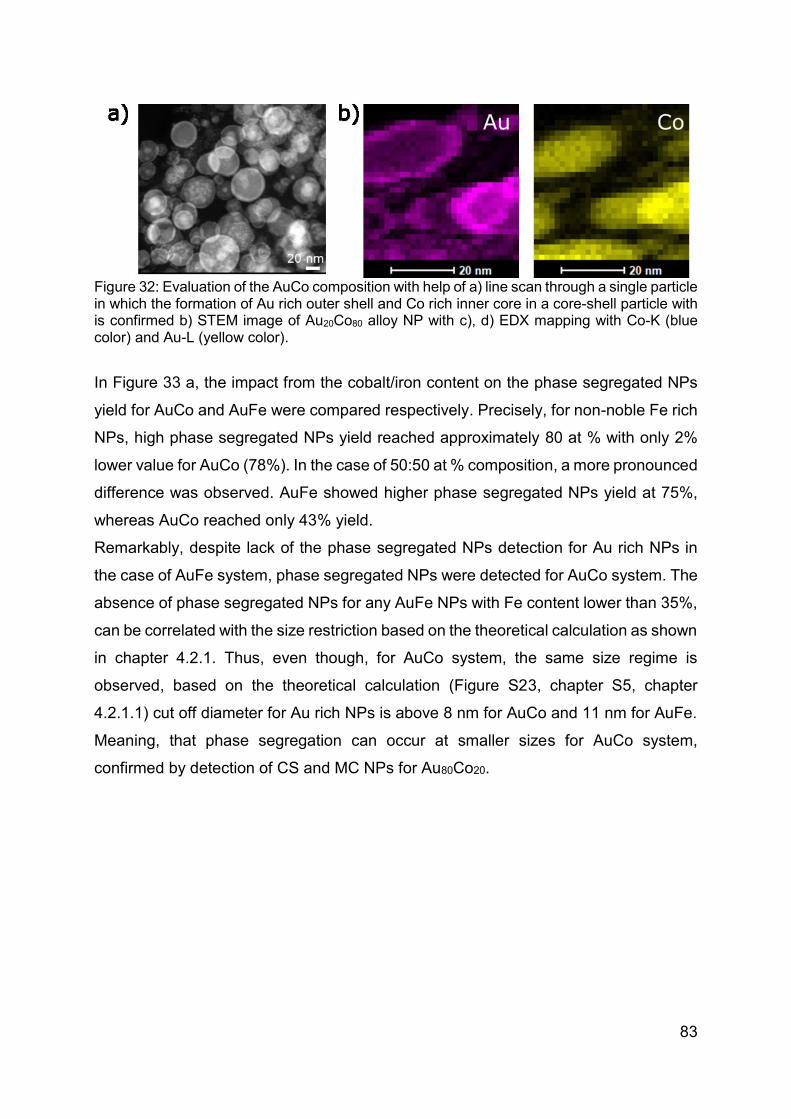
83
Figure 32: Evaluation of the AuCo composition with help of a) line scan through a single particle in which the formation of Au rich outer shell and Co rich inner core in a core-shell particle with is confirmed b) STEM image of Au20Co80 alloy NP with c), d) EDX mapping with Co-K (blue color) and Au-L (yellow color).
In Figure 33 a, the impact from the cobalt/iron content on the phase segregated NPs
yield for AuCo and AuFe were compared respectively. Precisely, for non-noble Fe rich
NPs, high phase segregated NPs yield reached approximately 80 at % with only 2%
lower value for AuCo (78%). In the case of 50:50 at % composition, a more pronounced
difference was observed. AuFe showed higher phase segregated NPs yield at 75%,
whereas AuCo reached only 43% yield.
Remarkably, despite lack of the phase segregated NPs detection for Au rich NPs in
the case of AuFe system, phase segregated NPs were detected for AuCo system. The
absence of phase segregated NPs for any AuFe NPs with Fe content lower than 35%,
can be correlated with the size restriction based on the theoretical calculation as shown
in chapter 4.2.1. Thus, even though, for AuCo system, the same size regime is
observed, based on the theoretical calculation (Figure S23, chapter S5, chapter
4.2.1.1) cut off diameter for Au rich NPs is above 8 nm for AuCo and 11 nm for AuFe.
Meaning, that phase segregation can occur at smaller sizes for AuCo system,
confirmed by detection of CS and MC NPs for Au80Co20.

84
Figure 33: a) Phase segregated nanoparticles and b) Multi core-shell Yield dependency from Au content at % for both AuFe (gray bars) and AuCo (green bars) generated via 8 ns laser in acetone. Size composition dependency for molar ratio AuCo (green bars) (Figure S25) and AuFe (gray bars) system for c) core-shell NPs and d) solid solution NPs.
Nevertheless, high MC yield was detected for AuCo system (Figure 33b), especially
for high Co content NPs (Au20Co80), with value > 50% of MC NPs. On the other side,
only 20% were detected for Au50Co50 configuration and below 3% for Au rich one
(Au80Co20). Contrarily, only composition Au50Fe50 showed around 5% MC within phase
segregated NPs fraction, whereas other compositions did not show any MC presence.
Notably, MC NPs are not desired as thin Au shell leads to low thermal and chemical
stability (as proven in chapter 4.1.2).
In order to assess the diameter of the AuCo NPs (Figure 33 c), additional theoretical
calculations as described in S5 chapter were performed (Figure S23). Interestingly, for
AuCo cut off diameter for CS formation was the same as for AuFe approximately below
10 nm. The results depicted in Figure 33, confirmed this prediction, as phase
segregated NPs (Figure 33 c) were all above 10 nm, whereas solid solution below 10
nm (Figure 33 d). The only exception was Au80Fe20, where SS NPs were around 11
nm, which can be correlated to the theoretical prediction that phase segregation would

85
be favored above 11 nm (chapter 4.2.1.1). A general trend can be observed for AuFe,
where with increasing Au content, the size of the NPs increases, yet a decrease of
phase segregation yield was observed. From the previous findings it was validated
that, next to the bigger size (chapter 4.1.3), high Fe content leads to the formation of
the phase segregated NPs. Therefore, by evaluating the experimental data both; size
and the Fe content has to be considered. From the available data, it can be concluded
that AuCo system did not show a clear size – composition trend. Both Au and Fe rich
NPs showed similar diameters, whereas Au50Fe50 configuration was characteristic with
a smaller diameter slightly above 5 nm.
Considering AuFe, BCC crystal phase was detected for Fe rich NPs, where high phase
segregation yield was detected. In the aim to evaluate the crystal structure of AuCo
system XRD analysis was performed (Figure 34). This method focused on 3
compositions Au20Co80, Au50Co50, Au80Co20 and Co as a reference. As shown in Figure
34 AuFe depicts 3 different FCC phases and 1 BCC phase (Figure 34 a). Whereas,
AuCo resembles only 2 different FCC phases for all Au-Co compositions, contrarily to
pure Co where an additional 1 HCP phase was detected (Figure 34 b). Interestingly,
CS formation was possible even though no HCP crystal structure was detected.
Figure 34: Phase ratio a) FCC1-3/BCC for AuFe system b) FCC1/FCC2/HCP for AuCo system (Figure S24).
Lack of addition HCP and high CS formation may be explained by the presence of
nanocrystalline Co phase. Dingea et al proposed next to HCP and FCC new crystal
structures of -Co which belongs to the P4132 space group with a cubic structure and
lattice parameter a=6.097±0.001 Å[221]. Such a structure was up to now only possible
through the solution-phase approach. Therefore, the formation of CS NPs can be

86
contributed to nanocrystalline Co favoring phase segregation due structure, which is
less dense than both FCC and HCP. Synthesis of such nanocrystalline structures can
be contributed to the high-temperature high-pressure condition inside the cavitation
bubble followed by fast cooling (> 1010 Ks-1), leading to the formation of kinetically
controlled metastable structures[222]. Furthermore, nanocrystalline cobalt resembles
magnetic properties, which are dependent on the phase. For example, the symmetric
low coercitivity of the Co can be used in an electronic devices, etc[223].
Lattice parameter in Figure 35 summarizes 3 differently substituted FCC crystal
structures in regard to AuFe system. Apart from Au50Fe50 with a slightly elevated value
to the Au lattice parameter at 4.07, FCC 1 resembled a decreasing trend with
increasing Fe content. Similarly FCC 2, can be characterized with a decreasing trend
when Fe doping increases. FCC 3 is only present for Au50Fe50 as previously described
in chapter 4.1.3. AuCo resembled a similar behavior trend in comparison to the AuFe
system.
Figure 35: Lattice parameter corresponding to FCC 1,2 3 for a) AuFe system and FCC 1 & 2 for b) AuCo system.
Lattice parameter for FCC 1 phase of Co did not deviate resembling only a small
decrease in lattice parameter from 4.08 to 4.07. Contrarily to FCC 2 phase where
pronounced decrease from 4.08 to 4.02 for Au50Co50 composition can be observed,
followed by a slight increase of up to 4.025 for Cobalt rich NPs. In both cases, it is
evident that the substitution of Fe/Co atoms leads to a decrease of the lattice
parameter of pure Au.
87
In summary, the model presented in chapter 4.4 was proven to be suitable for another
binary system. Similar to AuFe, it is characterized with 3 different ultrastructures, SS,
CS and MC NPs. Prediction based on the simple theoretical calculations (chapter S5),
indicating that the phase segregation is more favored for bigger NPs (approximately
above 10 nm), and was validated for both AuFe and AuCo with the presented data.
With regard to crystal phase, phase segregation in CS NPs for AuCo system was most
likely contributed to Co. Interestingly, CS formation was possible despite absence of
difference crystal phase (HCP), which according to Hume-Rothery Rule would be
required in order for the particle to segregate. Nevertheless, this phenomenon can not
be fully explain up to date. At last, as predicted by theoretical calculations, non noble
metal composition contribution towards high phase segregation yields was validated.
To sum up, the proposed model can be used for other binary systems, in which phase
segregation driven by Gibbs free surface energy minimization can be predicted
considering the particle composition and size.

88
5. Summary
The combination of magnetic, optical and electrical properties in one alloy nanoparticle
is beneficial in numerous applications. The design of the multifunctional binary alloy
nanomaterial is still limited due to the lack of a fundamental understanding of the laser
ablation process. The biggest challenge is the precise clarification of the formation
mechanism during laser ablation in liquids, both experimentally and theoretically. In
particular, the full utilization of the properties is hindered by the generation of various
ultrastructures. Despite the progress in the fundamental understanding of laser
ablation of alloys in liquids, many challenges such as nanoparticle ultrastructure and
size control remain to be solved. Control over the final alloy nanoparticles composition
and structure can be achieved by adjusting parameters such as molar ratio, pulse
duration, liquid environment, etc. In the aim to better elucidate the importance of
condition during laser ablation, binary system Au-Fe was chosen for the systematic
study. In particular, adjustment of the parameters towards high iron core gold shell
configuration was motivated by high application demand in comparison to solid solution
(alloy) nanoparticles.
The aim of this thesis was the design of the iron-gold nanoparticle formation
mechanism model, by addressing an entire formation process during laser ablation
with possible morphologies and stability of various phases. In this context, the influence
from the target composition (Au:Fe molar ratio, multilayer- vs alloy-target), pulse
duration: short ps- and long ns-pulse and liquid environment (alcohols, ketones, and
highly viscous liquids) on the CS NPs formation was clarified. Nanoparticle
ultrastructure, size, and the NPs composition were evaluated with the help of
HAADF-STEM imaging, accompanied by Energy Dispersive X-Ray (EDX)
spectroscopy. The focus was laid on the investigation of kinetic or thermodynamic
contribution during LAL. For this purpose, thermal and chemical stability of various
phases were investigated. In particular, nanophase diagram enriched by the formation
mechanism model, and its transferability towards another binary alloy systems,
generated via laser ablation in liquids was addressed.

89
In this work, the limitations of the pure core-shell NPs fraction formation due to the
competitive process of synthesis of a solid solution will be addressed by the designed
nanophase diagram. In the aim to design such model, a combination of simple
thermodynamic calculations with the experimental approach was employed. The
formation of the phase segregated nanoparticles was predicted based on the size and
the molar fraction and then compared with the experimental approach. Here free
surface Gibbs energy described NPs with a bigger diameter (>10 nm) as phase
segregation favoring, due to its low value contrarily to solid solution NPs, only favored
for smaller diameters (<7 nm). Admittedly, a certain discrepancy between the
experimental and theoretical data was noted, in which a small fraction of SS solution
resembled higher diameter, as predicted by the model (< 20nm). This can be correlated
to the limitation of the model in case of the kinetically controlled morphologies. In this
regard, the model does not apply for the structure which is not in thermodynamic
equilibrium. For this reason, the model was extended toward another ultrastructure,
with an alloy shell and pure elemental core. The recalculated values were
characteristics with a shift for the bigger diameter threshold required to build the CS
(in thermodynamic equilibrium) for gold-rich particles, from 7 to 23 nm. Yet only small
variation in threshold diameter was observed for NPs with iron content > 50 at. %.
Further, despite circumventing another relevant parameter involved during the laser
ablation mechanism, a prediction based on those simple thermodynamic model was
successfully confirmed experimentally. Further considering the adapted model, an
interesting finding was made, namely, the formation of SS particles with a diameter
below 10 nm, was observed independently from the target composition. Whereas, CS
formation was observed only if the iron composition was above 50 at. %. However, the
CS NPs are fundamentally different depending on target composition in gold-rich
targets, the growth of these particles is quenched by interactions of gold-rich particles
with the solvent acetone, yielding average particle sizes < 10 nm. As the iron-rich NPs,
need to implement more iron, probably in BCC morphology and are consequently
prone to form larger core-shell structures. To summarize, Fe FCC crystal structure
favors SS NPs only when size is quenched below 10 nm. Whereas CS would be
preferred for NPs with an average size above 10 nm, where high Fe fraction (above
50 at. %) and BCC crystal structure would attribute to phase segregation toward CS
NPs. Remarkably, by comparison to the bulk phase diagram, in which fully segregated

90
iron core with the gold shell would be expected at the room temperature, non-
equilibrium iron core with alloy shell were generated via laser ablation. Detailed, EDX
and XRD analysis, confirmed alloy character of the shell, and formation of SS. These
findings suggest kinetically controlled formation mechanisms during laser ablation of
the iron gold system. Nevertheless, nanophase diagram can only deliver relevant
information about the composition at a particular temperature, yet parameters such as
liquid environment nor the pulse duration during laser ablation can be employed.
To this end, an experimental study has explored ways to more efficiently control the
particle size and ultrastructure. First of all the pulse duration effect on the final NPs
composition was tested for long ns and short ps pulse durations with Au50Fe50
composition having various thin layered target configurations. Mainly bilayer
(AuFe/glass, FeAu/glass), multilayered (AuFeAuFe/glass) and Au/Fe alloy
configuration. In all cases, bimodality was found with two different NPs structures small
(<10 nm) solid solution alloy NPs and larger (>10 nm), segregated CS NPs. The results
revealed that for both ns and ps pulse duration, the target with the outermost layer of
Au leads to the formation of low CS yield, contrarily to alloy film, which allows high CS
production. Nevertheless, CS yield was clearly lower for ps pulse duration than in the
case of ns pulse duration, pointing out the importance of laser parameter in the
determination of the final morphology. During short ps pulses, short plasma and
cavitation bubble lifetime contribution to the formation of metastable alloy NPs. By
contrast, for long ns pulse cavitation bubble lifetime is extended, allowing, therefore,
phases closer to the thermodynamic equilibrium (CS) to be formed. Hence, the highest
CS yield was achieved for long ns pulse from alloy targets and reached around 99 %
per volume (87 % per number). Therefore, for Fe-Au system, it can be concluded, that
well-mixed targets, as well as long ns pulses, lead to high CS yield as more time is
given in the early stages of NPs formation to get closer to the thermodynamic
equilibrium state (CS), overcoming diffusion limitation with pre-well-mixed elements in
the target.
In addition, large efforts were devoted towards the controlled synthesis of defined
ultrastructure and the size by application of various liquid environments, however, the
limitations in the theoretical simulation field, as well as limited experimental data
reported in the literature, hinders understanding of the liquid impact. The biggest

91
drawback is the evaluation of one parameter in a controllable way. Hence, although no
clear trend between one chosen laser parameter and CS yield can be identified, an
overview of liquid favoring high CS yield was summarized. Therefore, for the
investigation on the impact of the liquid environment on the NPs ultrastructure alloy
target with high Fe content (Au20Fe80) was chosen. Three groups of liquids were
selected aiming to understand the liquid-particle interaction during LAL, mainly ketones
(heat capacity), alcohols (chain length) and glycols with additional highly viscous
PAO40 oil (viscosity). Overall, the generation of CS NPs was possible independently
from the liquid environment. However, the most pronounced impact on high CS
productivity was observed for viscosity and heat capacity. Interestingly with increasing
viscosity, CS yield decreased, indicating that plasma plume confinement or bubble
dynamic does not favor CS formation. On the other side heat capacity, which may
impact the cooling and solidification rates, not only improve CS yield but also the
generation of MC NPs. To summarize ketones showed the highest CS yield, with the
lowest size distribution and an optimal stability for Fe rich NPs. Acetone is the most
promising as during synthesis the lowest amount of MC was produced, with narrow
size distribution and sufficient colloid stability.
Finally, the formation mechanism for the gold iron binary alloy system during laser
ablation was addressed. To this end, the evaluation of either kinetic or thermodynamic
contribution during laser ablation was investigated. In this context, detailed analysis
with HAADF-STEM, EDX, and XRD was performed, revealing 4 different ultrastructure
solid solution (SS), core-shell (CS), multi core-shell (MC) and jellyfish. Based on the
bulk phase diagram, CS with a pure iron core and the gold shell would be
thermodynamically favored. Yet, independently from the applied condition during LAL,
SS alloy NPs were always present. Thus, indicating kinetically controlled contribution
regarding NPs formation. Remarkably, phase segregation between the gold shell and
iron core within CS NPs was not completed. A significant amount of iron was found in
the gold shell, with the quantity depending on the composition in the target. The pure
nature of Fe core can be justified by BCC crystal structure, where only a few % of gold
can be implemented. The nanoparticle in non-equilibrium phase was further confirmed
by thermal stability test, where NPs with high Fe content, both

92
SS and CS transformed into a phase in thermodynamical equilibrium, the tetrakis
hexahedron structures. Whereas, NPs with composition Au50Fe50 fell apart. Another
example showing the importance of molar ratio not only on the CS yield but also on
NPs stability. Moreover, shell thickness contributes to the thermal stability leading to
element separation in the case of a particle with thin Au rich shell. Worth to mention is
the chemical stability of the CS NPs, where the negligible impact on the architecture of
the Au shell was observed, after etching with concentrated acid. Fe was leached out,
leaving porous stable Au particle. The results collected within this work, reveal the
critical role of the pulse duration, composition and size of the particle towards
morphology control. The formation mechanism proposal is supported based on the
data collected in this work and is summarized as followed. The NP formation during
LAL is a kinetically controlled process, which based on the pulse duration allows the
NP to either formed phase close to their thermodynamic equilibrium state (long ns
pulse) or are captured as kinetically frozen products (short ps pulse) in metastable
alloy form. Notably, alloy target contributed towards higher CS yield, yet SS
morphology is always present, and most likely generated in the liquid/gas region of the
cavitation bubble due to is size restricted as predicted by simple theoretical
calculations. Whereas CS NPs are formed in the region closer to the molten layers. No
statement can be made based on the liquid environment, apart from the conclusion
that CS formation is possible independently from the liquid. In summary, the
significance of size and the elemental fraction in target, target thickness, pulse
duration, and that the liquid, which has a profound influence on the final composition
of the AuFe laser-generated NPs was shown.
The combination of theoretical and experimental approaches represent a promising
tool to gain more knowledge in the fundamental understanding of nanoparticle
formation during laser ablation in liquids. The proposed model transferability was
confirmed for another binary alloy system, and therefore it may be used for further
systems, for which phase segregation is driven by Gibb’s free surface energy under
the restriction of Hume-Rothery rule.

93
6. Outlook
Although the experimental and theoretical approach within this thesis contributed to
knowledge about nanoparticle formation mechanism during laser ablation in liquid, yet
for towards full understanding of this process, there are still many aspects to be
discovered. Here the detailed analysis of parameters such as molar ratio, liquid
environment, and pulse duration as well as a detailed investigation of Core-shell
ultrastructure contributed towards the mechanistic model, relevant for other binary
systems fulfilling Hume-Rothery rule towards phase segregation.
Further experiments should be conducted with various binary, trinary system e.g
FeCoAu or FeNiAu. Where a combination of simulation and experimental data would
allow preparing a library of conditions for preparation of various ultrastructure with
different compositions depending on the required application. Such an idea is driven
by the lack of phase diagram at nanoscale for many binary alloy systems.
Additionally, an extension of the investigated parameter, especially liquid environment,
as well as another laser parameter e.g., pulse energy, could contribute even further to
more precise control over either CS or SS NPs formation. The most pressing issue is
the competitive formation of SS independently from the applied condition. This
accounts for the question if a clean fraction of either SS or CS can be generated via
laser ablation in liquid. Due to its magnetic properties, additional techniques such as
centrifugation or membrane selection are not sufficient to separate smaller SS (< 10
nm) from bigger CS (<10 nm) NPs. Preliminary experiments also with the magnetic
field were unfortunately unsuccessful. Moreover, NPs stabilization in acetone is lost if
transferred into water in case of membrane separation, encouraging to look for
alternative conditions towards biomedical application.

94
7. Appendix
7.1 Reference 1. F. Calvo, Nanoalloys: from fundamentals to emergent applications, , ed. Elsevier. 2013,
Oxford. 2. Gajanan, K. and S.N. Tijare, Applications of nanomaterials. Materials Today:
Proceedings, 2018. 5(1): p. 1093-1096. 3. Abdullaeva, Z., Nanomaterials in Daily Life Compounds, Synthesis, Processing and
Commercialization. 2017: Springer, Cham. 4. Olea-Mejía, O., et al., SERS-active Ag, Au and Ag–Au alloy nanoparticles obtained by
laser ablation in liquids for sensing methylene blue. Applied Surface Science, 2015. 348: p. 66-70.
5. Wadell, C., et al., Hysteresis-free nanoplasmonic Pd-Au alloy hydrogen sensors. Nano Lett, 2015. 15(5): p. 3563-70.
6. Malaki, M., et al., Advanced Metal Matrix Nanocomposites. Metals, 2019. 9(3): p. 330. 7. Gangopadhyay, P., Metallic Alloy Nanoparticles and Metal-Semiconductor
Nanomaterials. NanoWorld Journal, 2018. 04(03). 8. Roy Chowdhury, S., K. Kanti Bera, and S. Kumar Bhattacharya, Enhanced and
Synergistic Catalysis of Green Synthesized Pd-Ag Alloy Nanoparticles for Anodic Oxidation of Propan-2-ol in Alkali. Materials Today: Proceedings, 2018. 5(1): p. 2171-2178.
9. Carpenter, M.K., et al., Solvothermal synthesis of platinum alloy nanoparticles for oxygen reduction electrocatalysis. J Am Chem Soc, 2012. 134(20): p. 8535-42.
10. Marzun, G., et al., Laser synthesis, structure and chemical properties of colloidal nickel-molybdenum nanoparticles for the substitution of noble metals in heterogeneous catalysis. J Colloid Interface Sci, 2017. 489: p. 57-67.
11. Million, N.C., V. ; Wile, P. ; Rehbock, C. ; Vogt, P. M. ; Pich, A. ; Barcikowski, S., Water-based, surfactant-free cytocompatible nanoparticle-microgel-composite biomaterials - rational design by laser synthesis, processing into fiber pads and impact on cell proliferation. BioNanoMaterials, 2017. 18(3-4): p. 1-18.
12. Springer, A., et al., Development of new processes for welding of thermal Al–Cu solar absorbers using diode lasers. Journal of Laser Applications, 2012. 24(5).
13. Reiss, G. and A. Hutten, Magnetic nanoparticles: applications beyond data storage. Nat Mater, 2005. 4(10): p. 725-6.
14. Cao, Y.J., R.; Mirkin, C. , DNA-Modified Core-Shell Ag/Au Nanoparticles. J. Am. Chem. Soc., 2001. 123: p. 7961−7962.
15. Sun, Q.K., A.; Wang, Q.; Jena, P.; Kawazoe, Y.; Marquez, M., Effect of Au Coating on the Magnetic and Structural Properties of Fe Nanoclusters for Use in Biomedical Applications: A density functional Theorical Study. Rev. B: Condens. Matter Mater. Phys., 2006. 73: p. 134409.
16. Ferrando, R., Jellinek, J., Johnston, R. L., Nanoalloys: From theory to applications of alloy clusters and nanoparticles. Chemical Reviews, 2008. 108(3): p. 845-910.
17. Amendola, V., et al., Formation of alloy nanoparticles by laser ablation of Au/Fe multilayer films in liquid environment. J Colloid Interface Sci, 2017. 489: p. 18-27.
18. Rehbock. C, J.J.G.L., et. Al, , Current state of laser synthesis of metal and alloy nanoparticles as ligand-free reference materials for nano-toxicological assays. Beilstein J Nanotechnol., 2014. 5: p. 1523–1541.
19. Zhang, D., B. Gokce, and S. Barcikowski, Laser Synthesis and Processing of Colloids: Fundamentals and Applications. Chem Rev, 2017. 117(5): p. 3990-4103.
20. Zhang Dongshi, G.B., Barcikowski Stephan Laser synthesis and processing of colloids; fundamentals and applicaiton. ACS publications.

95
21. Barcikowski, S.A., Vincenzo; Marzun, Galina; Rehbock, Christoph; Reichenberger, Sven; Zhang, Dongshi; Gökce, Bilal, Handbook of Laser Synthesis of Colloids. 2016.
22. Amendola, V. and M. Meneghetti, What controls the composition and the structure of nanomaterials generated by laser ablation in liquid solution? Phys Chem Chem Phys, 2013. 15(9): p. 3027-46.
23. Anastas, P.E., N., Green chemistry principals and practice. Chem. Soc. Rev. , 2010. 39: p. 301-312.
24. Vassalini, I., et al., Enhanced Electrocatalytic Oxygen Evolution in Au-Fe Nanoalloys. Angew Chem Int Ed Engl, 2017. 56(23): p. 6589-6593.
25. Kleibert, A., et al., Structure, morphology, and magnetic properties of Fe nanoparticles deposited onto single-crystalline surfaces. Beilstein J Nanotechnol, 2011. 2: p. 47-56.
26. M., L.-M.L., Tailoring surface plasmons through the morphology and assembly of metal nanoparticles. . Langmuir 2006. 22: p. 32-41.
27. Amendola, V., et al., Coexistence of plasmonic and magnetic properties in Au89Fe11 nanoalloys. Nanoscale, 2013. 5(12): p. 5611-9.
28. Dykman, L.A. and N.G. Khlebtsov, Gold nanoparticles in biology and medicine: recent advances and prospects. Acta Naturae, 2011. 3(2): p. 34-55.
29. S., P.S.B., Conjugation efficiency of laser-based bioconjugation of Gold nanoparticles with nucleic acids. . J. Phys. Chem. C, 2009. 113: p. 19830−19835.
30. Ke, F., et al., Controlled synthesis of novel Au@MIL-100(Fe) core-shell nanoparticles with enhanced catalytic performance. Chem Commun (Camb), 2013. 49(13): p. 1267-9.
31. Ke, F., L. Wang, and J. Zhu, Multifunctional Au-Fe3O4@MOF core-shell nanocomposite catalysts with controllable reactivity and magnetic recyclability. Nanoscale, 2015. 7(3): p. 1201-8.
32. Yun-Qian Li, M.X., Udesh Dhawan, Wai-Ching Liu, Kou-Ting Wu, Xin-Rui Liu, Chingpo Lin, Gang Zhao, Yu-Chuan Wu, and Ren-Jei Chung, Iron–gold alloy nanoparticles serve as a cornerstone in hyperthermia-mediated controlled drug release for cancer therapy. Int J Nanomedicine, 2018. 13: p. 5499–5509.
33. Kayal S. , R.R.V.J., Anti-cancer drug loaded Iron-Gold core-shell nanoparticles (Fe@Au) for magnetic drug targeting. . Nanotechnol. 10: p. 5527–5539.
34. Sun, X., et al., Tracking stem cells and macrophages with gold and iron oxide nanoparticles – The choice of the best suited particles. Applied Materials Today, 2019. 15: p. 267-279.
35. Alele, N., et al., Ultrafiltration membrane-based purification of bioconjugated gold nanoparticle dispersions. Separation and Purification Technology, 2016. 157: p. 120-130.
36. Jun, Y.W., J.H. Lee, and J. Cheon, Chemical design of nanoparticle probes for high-performance magnetic resonance imaging. Angew Chem Int Ed Engl, 2008. 47(28): p. 5122-35.
37. Cho, S.J., et al., Gold-coated iron nanoparticles: a novel magnetic resonance agent for T-1 and T-2 weighted imaging. Nanotechnology, 2006. 17(3): p. 640-644.
38. Dahl, J.A., B.L. Maddux, and J.E. Hutchison, Toward greener nanosynthesis. Chem Rev, 2007. 107(6): p. 2228-69.
39. Cho, S.J., et al., Growth mechanisms and oxidation resistance of gold-coated iron nanoparticles. Chemistry of Materials, 2005. 17(12): p. 3181-3186.
40. Jendrzej S., D.G.B., Epple M. Barcikowski S., , How Size Determines the Value of Gold: Economic Aspects of Wet Chemical and Laser-Based Metal Colloid Synthesis,. 2017. 18(9): p. 1012–1019
41. Amendola, V., et al., Magneto-plasmonic Au-Fe alloy nanoparticles designed for multimodal SERS-MRI-CT imaging. Small, 2014. 10(12): p. 2476-86.
42. Wagener, P., et al., Solvent-surface interactions control the phase structure in laser-generated iron-gold core-shell nanoparticles. Sci Rep, 2016. 6: p. 23352.

96
43. Gokce, B., V. Amendola, and S. Barcikowski, Opportunities and Challenges for Laser Synthesis of Colloids. Chemphyschem, 2017. 18(9): p. 983-985.
44. Neumeister, A., et al., Monophasic ligand-free alloy nanoparticle synthesis determinants during pulsed laser ablation of bulk alloy and consolidated microparticles in water. Phys Chem Chem Phys, 2014. 16(43): p. 23671-8.
45. Zhang, J., et al., Preparation of PtAu Alloy Colloids by Laser Ablation in Solution and Their Characterization. The Journal of Physical Chemistry C, 2012. 116(24): p. 13413-13420.
46. Malviya, K.D. and K. Chattopadhyay, Synthesis and Mechanism of Composition and Size Dependent Morphology Selection in Nanoparticles of Ag–Cu Alloys Processed by Laser Ablation Under Liquid Medium. The Journal of Physical Chemistry C, 2014. 118(24): p. 13228-13237.
47. I.-C. Chiang and D.-H. Chen, Synthesis of monodisperse feau nanoparticles with tunable magnetic and optical properties. Advanced Functional Materials, 2007. 17(8): p. 1311–1316.
48. C. W. Hills, N.H.M., and R. G. Nuzzo, The size-dependent structural phase behaviors of supported bimetallic (Pt-Ru) nanoparticles. The Journal of Physical Chemistry B, 2003. 107(12): p. 2626–2636.
49. Luo, M.M.M., V. Petkov, N. N. Kariuki, L. Wang, P. Njoki, D. Mott, Y. Lin, and C.-J. Zhong, , Phase properties of carbon-supported gold-platinum nanoparticles with different bimetallic compositions. Chemistry of materials, 2005. 17(12): p. 3086–3091.
50. Z. Peng and H. Yang, Ag–Pt alloy nanoparticles with the compositions in the miscibility gap. Journal of Solid State Chemistry, 2008. 181(7): p. 1546–1551.
51. S. Xiao, W.H., W. Luo, Y. Wu, X. Li, and H. Deng, Size effect on alloying ability and phase stability of immiscible bimetallic nanoparticles. The European Physical Journal B-Condensed Matter and Complex Systems, 2006. 54(4): p. 479-484.
52. Damien Alloyeau, C.M., Christian Ricolleau, Nanoalloys: Synthesis, Structure and Properties. 2012: Springer Science & Business Media.
53. Kolosnjaj-Tabi, J., et al., The One Year Fate of Iron Oxide Coated Gold Nanoparticles in Mice. ACS Nano, 2015. 9(8): p. 7925-39.
54. Swiatkowska-Warkocka, Z., et al., Synthesis of new metastable nanoalloys of immiscible metals with a pulse laser technique. Sci Rep, 2015. 5: p. 9849.
55. Calvo, F., Nanoalloys: From Fundamentals to Emergent Applications. 2013: Elsevier. 56. Favez, D., J.D. Wagniere, and M. Rappaz, Au-Fe alloy solidification and solid-state
transformations. Acta Materialia, 2010. 58(3): p. 1016-1025. 57. Bosco, Phase transformations in Au–Fe melt spun alloys. Materials Science and
Engineering A, 2004. 375(1): p. 468-472. 58. Mizutani, U., Hume-Rothery Rules for structural Complex Alloy Phases. CRC Press.
2011. 59. Guisbiers, G., et al., Electrum, the Gold-Silver Alloy, from the Bulk Scale to the
Nanoscale: Synthesis, Properties, and Segregation Rules. ACS Nano, 2016. 10(1): p. 188-98.
60. Guisbiers, G., et al., Gold-copper nano-alloy, "Tumbaga", in the era of nano: phase diagram and segregation. Nano Lett, 2014. 14(11): p. 6718-26.
61. Zhuravlev, I.A., et al., Phase stability, ordering tendencies, and magnetism in single-phase fcc Au-Fe nanoalloys. Physical Review B, 2017. 96(13).
62. Handwerker, C.A. and T.M. Pollock, Emerging Science and Research Opportunities for Metals and Metallic Nanostructures. Jom, 2014. 66(7): p. 1321-1341.
63. Cheng, G. and A.R. Hight Walker, Synthesis and characterization of cobalt/gold bimetallic nanoparticles. Journal of Magnetism and Magnetic Materials, 2007. 311(1): p. 31-35.
64. Estelrich, J. and M.A. Busquets, Iron Oxide Nanoparticles in Photothermal Therapy. Molecules, 2018. 23(7).

97
65. Fang, Z., et al., Evolution of light-induced vapor generation at a liquid-immersed metallic nanoparticle. Nano Lett, 2013. 13(4): p. 1736-42.
66. Anderson, S.D., V.V. Gwenin, and C.D. Gwenin, Magnetic Functionalized Nanoparticles for Biomedical, Drug Delivery and Imaging Applications. Nanoscale Res Lett, 2019. 14(1): p. 188.
67. Eustis, S. and M.A. El-Sayed, Why gold nanoparticles are more precious than pretty gold: Noble metal surface plasmon resonance and its enhancement of the radiative and nonradiative properties of nanocrystals of different shapes. Chemical Society Reviews, 2006. 35(3): p. 209-217.
68. Homola, J., Surface Plasmon Resonance Based Sensors, ed. S.S.B. Media. 2006. 69. Yi-Tao Long, C.J., Localized Surface Plasmon Resonance Based Nanobiosensors.
2014: Springer Science & Business Media. 70. Jana, J., M. Ganguly, and T. Pal, Enlightening surface plasmon resonance effect of
metal nanoparticles for practical spectroscopic application. RSC Advances, 2016. 6(89): p. 86174-86211.
71. Duyne., K.A.W.u.R.P.V., Localized surface plasmon resonance spectroscopy and sensing. . Annu. Rev. Phys. Chem.,, 2007. 58(1): p. 267 – 297.
72. Kelly, K.L., et al., The optical properties of metal nanoparticles: The influence of size, shape, and dielectric environment. Journal of Physical Chemistry B, 2003. 107(3): p. 668-677.
73. Pal., S.K.G.u.T., Interparticle coupling effect on the surface plasmon resonance of gold nanoparticles: From theory to applications. Chem. Rev., 2007. 107(11): p. 4797 – 4862.
74. Erik C. Dreaden, A.M.A., Xiaohua Huang, Catherine J. Murphy und Mostafa A. El-Sayed. , The golden age: gold nanoparticles for biomedicine. . Chem. Soc. Rev., , 2012. 41(7): p.:2740 – 2779.
75. Link, S. and M.A. El-Sayed, Shape and size dependence of radiative, non-radiative and photothermal properties of gold nanocrystals. International Reviews in Physical Chemistry, 2000. 19(3): p. 409-453.
76. Peter N. Njoki, I.-I.S.L., Derrick Mott, Hye-Young Park, Bilal Khan, Suprav Mishra, Ravishanker Sujakumar, Jin Luo und Chuan-Jian Zhong. , Size correlation of optical and spectroscopic properties for gold nanoparticles. . J. Phys. Chem. C, , 2007. 111(40): p.:14664 – 14669.
77. Xiaohua Huang, I.H.E.-S., Wei Qian und Mostafa A. El-Sayed. , Cancer cell imaging and photothermal therapy in the near-infrared region by using gold nanorods. J. Am. Chem. Soc., , 2006. 128(6): p. 2115 – 2120.
78. Zhang, J., Post, M, Veres, T., Jakubek, Z. J, Guan, J., Wang, D., Normandin, F., Laser assinded synthsis of supermagnetic Fe@Au Core-Shell nanoparticles. J. Phys. Chem. B., 2006. 110: p. 7122-7128.
79. Nguyen, T.T., F. Mammeri, and S. Ammar, Iron Oxide and Gold Based Magneto-Plasmonic Nanostructures for Medical Applications: A Review. Nanomaterials (Basel), 2018. 8(3).
80. Abd-Elsalam, K.A., Mohamed A. Mohamed, Prasad Ram Magnetic Nanostructures: Environmental and Agricultural Applications. 2019: Springer.
81. Bautin, V.A., et al., Magnetic properties of polycrystalline cobalt nanoparticles. AIP Advances, 2017. 7(4).
82. Reddy, L.H., Arias, J. L., Nicolas, J, Couvreur, P., Magnetic nanoparticles: design and characterization, toxicity and biocompatibility, Pharmacutical and biomedical applications. Chem Rev., 2012. 112: p. 5818-5878.
83. Hudson, R., et al., Highly efficient iron(0) nanoparticle-catalyzed hydrogenation in water in flow. Green Chemistry, 2013. 15(8).
84. Maneeratanasarn, P., et al., Synthesis of phase-controlled iron oxide nanoparticles by pulsed laser ablation in different liquid media. Physica Status Solidi a-Applications and Materials Science, 2013. 210(3): p. 563-569.

98
85. Fan J.H., H.W.I., Li W.T., Yeh J.M. , Biocompatibility Study of Gold Nanoparticles to Human Cells. Lim C.T., Goh J.C.H., 2009. 23(13th International Conference on Biomedical Engineering.).
86. Gubin, S.P., Magnetic nanoparticle 2007, Wiley-VCH. 87. Wijn, H.P.J., Magnetic Properties of Metals: d-Elements, Alloys and Compounds. 2012:
Springer Science & Business Media,. 88. Thanh, N.T., Clinical Applications of Magnetic Nanoparticles: From Fabrication to
Clinical Applications. 2018: CRC Press, . 89. Thanh, N.T.K., MAGNETIC NANOPARTICLES From Fabrication to Clinical
Applications. 2012: CRC Press. 90. W. Schütt, C.G., U. Häfeli, , Hybridoma, , 1997. 16: p. 109. 91. Neuberger, T., et al., Superparamagnetic nanoparticles for biomedical applications:
Possibilities and limitations of a new drug delivery system. Journal of Magnetism and Magnetic Materials, 2005. 293(1): p. 483-496.
92. Redolfi, E., Pastoriza-santos, I., Lak, A., Pellegrino, T., Pérez-juste, J., Mattoli, V. , Plasmonic / Magnetic Nanocomposites: Gold Nanorods-Functionalized Silica Coated Magnetic Nanoparticles. Journal of colloid and interface science., 2017. 502: p. 201-209. .
93. Silva, S.M., Tavallaie, R., Sandiford, L., Tilley, D., Gooding, J.J. Gold Coated 2016; , Magnetic Nanoparticles : From Preparation to Surface Modification for Analytical and Biomedical Applications. Chemical Communications. , 2016. 52: p. 7528-7540
94. Kinoshita, T., Seino, S., Mizukoshi, Y. , Functionalization of Magnetic Gold / Iron-
Oxide Composite Nanoparticles With Oligonucleotides and Magnetic Separation of Specific Target. . Journal of Magnetism and Magnetic Materials., 2007. 311: p. 255-258
95. Faraday, M., The Bakerian Lecture: Experimental Relations of Gold (and Other Metals) to Light. Philosophical Transactions of the Royal Society of London, 1857. 147: p. 145–181.
96. Turkevich, J., P.C. Stevenson, and J. Hillier, A Study of the Nucleation and Growth Processes in the Synthesis of Colloidal Gold. Discussions of the Faraday Society, 1951. 11(11): p. 55-&.
97. Wang, X., et al., Rapid construction of TiO2 aggregates using microwave assisted synthesis and its application for dye-sensitized solar cells. RSC Advances, 2015. 5(12): p. 8622-8629.
98. Murray, C.B., C.R. Kagan, and M.G. Bawendi, Synthesis and Characterization of Monodisperse Nanocrystals and Close-Packed Nanocrystal Assemblies. Annual Review of Materials Science, 2000. 30(1): p. 545-610.
99. Sousa, F., et al., Superparamagnetic Nanoparticles as High Efficiency Magnetic Resonance Imaging T2 Contrast Agent. Bioconjug Chem, 2017. 28(1): p. 161-170.
100. Amendola, V. and M. Meneghetti, Laser ablation synthesis in solution and size manipulation of noble metal nanoparticles. Phys Chem Chem Phys, 2009. 11(20): p. 3805-21.
101. Yang, G., Laser ablation in liquids: Applications in the synthesis of nanocrystals. Progress in Materials Science, 2007. 52(4): p. 648-698.
102. Barcikowski, S.C., G., Advanced nanoparticle generation and excitation by lasers in liquids. Phys. Chem. Chem. Phys., 2013. 15: p. 3022–3026.
103. H. Yoo, S.H.J., X.L. Mao, R. Greif, R.E. Russo, ,, Evidence for phase-explosion and generation of large particles during high power nanosecond laser ablation of silicon.
Appl. Phys. Lett. , 2000. 76: p. 783-785. . 104. Zhigilei, L.V., Z. Lin, and D.S. Ivanov, Atomistic Modeling of Short Pulse Laser Ablation
of Metals: Connections between Melting, Spallation, and Phase Explosion. The Journal of Physical Chemistry C, 2009. 113(27): p. 11892-11906.

99
105. Sakka, T., et al., Laser ablation at solid-liquid interfaces: An approach from optical emission spectra. Journal of Chemical Physics, 2000. 112(19): p. 8645-8653.
106. Dell'Aglio, M.G., R.; De Pascale, O.; De Giacomo, A., Mechanism and Proceses of pulsed laser ablation in liquids during nanoparticles production. Apll. surf. Sci. , 2015. 348: p. 4-9.
107. Kabashin, A.V. and M. Meunier, Synthesis of colloidal nanoparticles during femtosecond laser ablation of gold in water. Journal of Applied Physics, 2003. 94(12).
108. Kim, K.K., Roy, M., Kwon, H., Song, J.K., Park S. M., , Laser ablation dynamics in liquid phase: the effects of magnetic field and electrolyte 2015, J. Appl. Phys. . p. 074302.
109. Lam, J., et al., Al2O3 nanoparticles synthesis by pulse laser ablation in liquids a plasma analysis. Phys. Chem. Chem. Phys, 2014. 16: p. 963-973.
110. Matsumoto, A., et al., Transfer of the Species Dissolved in a Liquid into Laser Ablation Plasma: An Approach Using Emission Spectroscopy. Journal of Physical Chemistry C, 2015. 119(47): p. 26506-26511.
111. Tamura, A.M., A.; Fukami, K.; Nishi, N.; Sakka, T., Simultaneous Observation of Nascent Plasma and Bubble Induced by Laser Ablation in Water with Various Pulse Durations. . J. Appl. Phys., 2015. 117: p. 173304.
112. C.-Y. Shih, C.W., M. V. Shugaev and L. V. Zhigilei, , Atomistic Modeling of Nanoparticle Generation in Short Pulse Laser Ablation of Thin Metal Films in Water. J. Colloid Interface Sci., 2017. 489: p. 3–17.
113. Zhang, D.G.k., B.; Notthoff, C.; Barcikowski, S. and 1., Layered Seed-Growth of AgGe Football-like Microspheres via Precursor-Free. Sci. Rep. , 2015. 5: p. 13661.
114. Jendrzej, S., et al., Barrierless growth of precursor-free, ultrafast laser-fragmented noble metal nanoparticles by colloidal atom clusters - A kinetic in situ study. J Colloid Interface Sci, 2016. 463: p. 299-307.
115. Tomko, J.N., J. J.; Jimenez, R.; Tan, Y.; Steiner, M.; Fitz-Gerald, J. M.; Bubb, D. M.; O’Malley, S. M. , Size and Polydispersity Trends Found in Gold Nanoparticles Synthesized by Laser Ablation in Liquids. . Phys. Chem. Chem. Phys., 2015. 17: p. 16327−16333.
116. Bubb, D., Cavitation Bubble Dynamics and Nanoparticle Size Distributions in Laser Ablation in Liquids,, in ANGEL. 2016: Essen, Germany.
117. Ibrahimkutty, S., et al., Nanoparticle formation in a cavitation bubble after pulsed laser ablation in liquid studied with high time resolution small angle x-ray scattering. Applied Physics Letters, 2012. 101(10).
118. Wagener, P., et al., Dynamics of silver nanoparticle formation and agglomeration inside the cavitation bubble after pulsed laser ablation in liquid. Phys Chem Chem Phys, 2013. 15(9): p. 3068-74.
119. Bonse, J.B., S.; Kruger, J.; Kautek, W.; Lenzner, M., Femtosecond Laser Ablation of Silicon−Modification Thresholds and Morphology. . Appl. Phys. A: Mater. Sci. Process., 2002. 74: p. 19−25.
120. Dörfler, H.-D., Grenzflächen und kolloid-disperse Systeme: Physik und Chemie; . 2002, Berlin: Springer.
121. Musaev, O.R., et al., Influence of the liquid environment on the products formed from the laser ablation of tin. Applied Physics A, 2013. 113(2): p. 355-359.
122. Jung, H.J. and M.Y. Choi, Specific Solvent Produces Specific Phase Ni Nanoparticles: A Pulsed Laser Ablation in Solvents. Journal of Physical Chemistry C, 2014. 118(26): p. 14647-14654.
123. Lam, J., et al., Dynamical study of bubble expansion following laser ablation in liquids. Applied Physics Letters, 2016. 108(7).
124. Tsuji, T.T., D. H.; Okazaki, Y.; Nakanishi, M.; Tsuboi, Y.; Tsuji, M. , Preparation of Silver Nanoparticles by Laser Ablation in Polyvinylpyrrolidone Solutions. Appl. Surf. Sci. , 20098. 254: p. 5224−5230.

100
125. Mortazavi, S.Z., et al., Hydrogen storage property of laser induced Pd-nanoparticle decorated multi-walled carbon nanotubes. Rsc Advances, 2013. 3(5): p. 1397-1409.
126. Tsuji, T.T., Y.; Kitamura, N.; Tsuji, M. , Microsecond-Resolved Imaging of Laser Ablation at Solid−Liquid Interface:Investigation of Formation Process of Nano-Size Metal Colloids. . Appl. Surf. Sci. , 2004. 229(365-371).
127. Rehbock, C., et al., Size control of laser-fabricated surfactant-free gold nanoparticles with highly diluted electrolytes and their subsequent bioconjugation. Phys Chem Chem Phys, 2013. 15(9): p. 3057-67.
128. Waag, F., et al., Adjusting the catalytic properties of cobalt ferrite nanoparticles by pulsed laser fragmentation in water with defined energy dose. Sci Rep, 2017. 7(1): p. 13161.
129. Zhang, D., et al., Germanium Sub-Microspheres Synthesized by Picosecond Pulsed Laser Melting in Liquids: Educt Size Effects. Sci Rep, 2017. 7: p. 40355.
130. Hagedorn, K.L., B.; Marcinkevicius, A. , Intermetallic PtPb Nanoparticles Prepared by Pulsed Laser Ablation in Liquid. J. Electrochem. Soc. 2013, , 2013. 160: p. F106−F110.
131. Zhang, D.M., Z.; Spasova, M.; Yelsukova, A. E.; Lu, S.; Farle, M.; Wiedwald, U.; Gokce, B., Formation Mechanism of LaserSynthesized Iron-Manganese Alloy Nanoparticles, Manganese Oxide NanosheetsandNanofibers. Part.Part.Syst.Charact, 2016. 34: p. 1600225.
132. Jakobi, J.M.n.-M.n., A.; Chakravadhanula, V. S. K.; Kienle, L.; Wagener, P.; Barcikowski, S. , Stoichiometry of Alloy Nanoparticles from Laser Ablation of PtIr in Acetone and Their Electrophoretic Deposition on PtIr Electrodes. Nanotechnology 2011. 22: p. 145601. .
133. Lam, J.A., D. Dujardin, C.; Ledoux, G.; Allouche, A.-R., Atomistic mechanism for the nucleationof aluminium oxide nanoapraticles. J. Phys. chem. A, 2015. 119.
134. Mazhukin, V.I., Laser Ablation - From Fundamentals to Applications chapter Nanosecond Laser Ablation: Mathematical Models, Computational Algorithms, Modeling, ed. T. Itina. 2017: Open access peer-reviewed Edited Volume.
135. Peng, H., et al., Modeling the Phase Stability of Janus, Core–Shell, and Alloyed Ag–Cu and Ag–Au Nanoparticles. The Journal of Physical Chemistry C, 2015. 119(4): p. 2186-2195.
136. Srivastava, C., et al., Size dependent microstructure for Ag–Ni nanoparticles. Acta Materialia, 2011. 59(16): p. 6501-6509.
137. Shih, C.Y., et al., Two mechanisms of nanoparticle generation in picosecond laser ablation in liquids: the origin of the bimodal size distribution. Nanoscale, 2018. 10(15): p. 6900-6910.
138. C. Momma, B.N.C., S. Nolte, F. von Alvensleben, A. Tünnermann, H. Welling, B. Wellegehausen, , Short-pulse laser ablation of solid targets, . Opt. Commun., 1996. 129: p. 134-142. .
139. R. Tanabe, T.T.P.N., T. Sugiura, Y. Ito, Bubble dynamics in metal nanoparticle formation by laser ablation in liquid studied through high-speed laser stroboscopic videography,. Appl. Surf. Sci. , 2015. 351: p. 327-331.
140. A. Matsumoto, A.T., A. Kawasaki, T. Honda, P. Gregorcic, N. Nishi, K. Amano, K. Fukami, and T. Sakka, Comparison of the overall temporal behavior of the bubbles produced by short- and long pulse nanosecond laser ablations in water using a laser-beam-transmission probe. Appl. Phys. A 2016. 122: p. 234.
141. Mikhail E. Povarnitsyn, T.E.I., Pavel R. Levashov and Konstantin V. Khishchenko, Mechanisms of nanoparticle formation by ultra-short laser ablation of metals in liquid environment. Physical Chemistry Chemical Physics 2013. 15(9): p. 3108-3114.
142. Lu, A.H., E.L. Salabas, and F. Schuth, Magnetic nanoparticles: synthesis, protection, functionalization, and application. Angew Chem Int Ed Engl, 2007. 46(8): p. 1222-44.
143. Liz-Marzan, L.M., Tailoring surface plasmons through the morphology and assembly of metal nanoparticles. Langmuir, 2006. 22(1): p. 32-41.

101
144. Streubel, R., S. Barcikowski, and B. Gokce, Continuous multigram nanoparticle synthesis by high-power, high-repetition-rate ultrafast laser ablation in liquids. Opt Lett, 2016. 41(7): p. 1486-9.
145. Amendola, V., et al., Magneto-plasmonic Au-Fe alloy nanoparticles designed for multimodal SERS-MRI-CT imaging. Pub Med, 2014. 10(12): p. 2476-86.
146. Swiatkowska-Warkocka, Z., et al., Various Morphologies/Phases of Gold-Based Nanocomposite Particles Produced by Pulsed Laser Irradiation in Liquid Media: Insight in Physical Processes Involved in Particles Formation. Journal of Physical Chemistry C, 2017. 121(14): p. 8177-8187.
147. Langlois, C., et al., Fully Crystalline Faceted Fe-Au Core-Shell Nanoparticles. Nano Lett, 2015. 15(8): p. 5075-80.
148. Calvo, F., et al., Modeling Iron–Gold Nanoparticles Using a Dedicated Semi-Empirical Potential: Application to the Stability of Core–Shell Structures. The Journal of Physical Chemistry C, 2017. 121(8): p. 4680-4691.
149. Barmparis, G.D., et al., Nanoparticle shapes by using Wulff constructions and first-principles calculations. Beilstein J Nanotechnol, 2015. 6: p. 361-8.
150. Baricco, M., Metastable phases and phase diagrams. METALLURGIA FISICA, 2004. 151. Prymak, O., et al., Crystallographic characterization of laser-generated, polymer-
stabilized 4 nm silver-gold alloyed nanoparticles. Materials Chemistry and Physics, 2018. 207: p. 442-450.
152. Tymoczko, A., et al., How the crystal structure and phase segregation of Au-Fe alloy nanoparticles are ruled by the molar fraction and size. Nanoscale, 2018. 10(35): p. 16434-16437.
153. N. Chichkov, C.M., S. Nolte, F. von Alvensleben, A. Tünnermann, , Femtosecond, Picosecond and Nanosecond Laser Ablation of Solids,. Appl. Phys. A, 1996. 63: p. 109-115.
154. Lewis, L.J. and D. Perez, Laser ablation with short and ultrashort laser pulses: Basic mechanisms from molecular-dynamics simulations. Applied Surface Science, 2009. 255(10): p. 5101-5106.
155. J. Lam, D.A., F. Chaput, M. Diouf, G. Ledoux, N. Mary, K. Masenelli-Varlot, V. Motto-Ros, and C. Dujardin, Al2O3 nanoparticles synthesised by pulsed laser ablation in liquids: a plasma analysis, . Phys. Chem. Chem. Phys. , 2014. 16: p. 963-973. .
156. Y. Xia, K.D.G., H.-C. Peng and X. Xia, , Angew. Chemie Int. Ed., 2017,, 2017. 56,: p. 60–95.
157. A. R. Tao, S.H.a.P.Y., . Small, 2008. 4: p. 310–325. 158. J. Joo, E.J.K., J. Kang, M. Skalak, E. J. Anglin, A. P. Mann, E. Ruoslahti, S. N. Bhatia
and M. J. Sailor, , Nanoscale Horizons,, 2016. 1: p. 407–414. 159. J. Zhang, Y.H., X. Jin, A. Nazartchouk, M. Liu, X. Tong, Y. Jiang, L. Ni, S. Sun, Y. Sang,
H. Liu, L. Razzari, F. Vetrone and J. Claverie, , Nanoscale Horizons, 2019. ,4: p. 907–917.
160. D. H. Hasenöhrl, A.S., V. Strauss, L. Wibmer, S. Klein, D. M. Guldi and A. Hirsch,, J. Mater. Chem. B,, 2017. 5: p. 8591–8599.
161. S. J. Tan, M.J.C., D. Luo and W. Cheng, Nat. Nanotechnol., 2011. 6: p. 268–276. 162. D. Yang, X.P., Y. He, Y. Wang, G. Chen, W. Wang and Z. Lin, , Angew. Chemie, 2015.
127: p. 12259–12264. 163. D. Dong, Q.S., D. Sikdar, Y. Zhao, Y. Liu, R. Fu, M. Premaratne and W. Cheng,,
Nanoscale Horizons, 2019. 4: p. 940–946. 164. J. Park, S.C., A. Oh, H. Jin, J. Joo, H. Baik and K. Lee, , Nanoscale Horizons, 2019. 4:
p. 727–734. 165. P.-C. Chen, J.S.D., B. Meckes, L. Huang, Z. Xie, J. L. Hedrick, V. P. Dravid and C. A.
Mirkin, . J. Am. Chem. Soc., 2017. 139: p. 9876–9884. 166. Amram, D. and E. Rabkin, Core(Fe)-shell(Au) nanoparticles obtained from thin Fe/Au
bilayers employing surface segregation. ACS Nano, 2014. 8(10): p. 10687-93.

102
167. J. Vernieres, S.S., J. Zhao, P. Grammatikopoulos, R. Ferrando, K. Nordlund, F. Djurabekova and M. Sowwan, , Adv. Sci., 2019. 1900447.
168. J. Canet-Ferrer, P.A., A. Ribera, J. V. Usagre and S. A. Maier, , Nanoscale Horizons, 2017. 2: p. 205–216.
169. J. Kim, S.P., J. E. Lee, S. M. Jin, J. H. Lee, I. S. Lee, I. Yang, J.-S. Kim, S. K. Kim, M.-H. Cho and T. Hyeon, , Angew. Chemie, 2006. 118: p. 7918–7922.
170. H. Fuse, N.K., Y. Ishikawa, Z. Swiatkowska-Warkocka, H. Fuse, N. Koshizaki, Y. Ishikawa and Z. Swiatkowska-Warkocka, , Nanomaterials, 2019. 9: p. 198.
171. H. Wang, A.P., K. Kawaguchi, X. Li, Z. Swiatkowska-Warkocka and N. Koshizaki, Angew. , Chemie Int. Ed., 2010. 49: p. 6361–6364.
172. A. Baptista, F.J.G.S., J. Porteiro, J. L. Míguez, G. Pinto and L. Fernandes, , Procedia Manuf., 2018. 17: p. 746–757.
173. U. Seyfert, U.H., G. Teschner and J. Strümpfel,, SVC Bull., 2015: p. 22–26. 174. S. Wirtz, A.C., M. Labusch, G. Marzun, S. Barcikowski, D. Söffker, S. F. Wirtz, A. P. A.
Cunha, M. Labusch, G. Marzun, S. Barcikowski and D. Söffker, , Sensors, , 2018. 18: p. 1775.
175. V. Amendola, M.M., O. M. Bakr, P. Riello, S. Polizzi, S. Fiameni, H. Dalaver, P. Arosio, T. Orlando, C. de Julian Fernandez, F. Pineider, C. Sangregorio and A. Lascialfari, , Nanoscale, 2013. 5: p. 5611–5619.
176. V. Amendola, S.S., F. Carraro and E. Cattaruzza, , J. Colloid Interface Sci., 2017, 489, 18–27., 2017.
177. D. Amram, Y.A.a.E.R., Acta Mater., 2016. 102: p. 342–351. 178. C.-Y. Shih, R.S., J. Heberle, A. Letzel, M. V. Shugaev, C. Wu, M. Schmidt, B. Gökce,
S. Barcikowski and L. V. Zhigilei,, Nanoscale, 2018. 10: p. 6900–6910. 179. M. B. Gawande, A.G., T. Asefa, H. Guo, A. V. Biradar, D.-L. Peng, R. Zboril and R. S.
Varma, , Chem. Soc. Rev., 2015. 44: p. 7540–7590. 180. Z. Luo, J.H., L. Menin, Q. K. Ong and F. Stellacci,, Angew. Chemie Int. Ed., 2017. 56:
p. 13521–13525. 181. G. Beck, S.B., V. S. K. Chakravadhanula, M. Comesaña-Hermo, M. Deng, M. Farle, M.
Hilgendorff, J. Jakobi, J. Janek, L. Kienle, B. Mogwitz, T. Schubert and F. Stiemke, , Thin Solid Films, 2015. 595: p. 96–107.
182. V. Amendola, S.S., S. Agnoli, S. Polizzi and M. Meneghetti,, Nanoscale, 2014. 6: p. 1423–1433.
183. H. Lai, F.X.a.L.W., J. Mater. Sci.,, 2018. 53: p. 8677–8698. 184. D. Song, R.Y., F. Long and A. Zhu,, J. Environ. Sci., 2019. 80: p. 14–34. 185. V. Amendola and M. Meneghetti, Adv. Funct. Mater., 2012. 22: p. 353–360. 186. V. Amendola, R.P., M. Frasconi, O. M. Maragò and M. A. Iatì, , J. Phys. Condens.
Matter, 2017. 29: p. 203002. 187. K. Seshan and D. Schepis. Handbook of Thin Film Deposition, . 2018, Elsevier Ltd. 188. W. T. Osowiecki, X.Y., P. Satish, K. C. Bustillo, E. L. Clark and A. P. Alivisatos, , J. Am.
Chem. Soc., 2018. 140: p. 8569–8577. 189. J. W. Gibbs, Trans. Connect. Acad. Arts Sci., 1876. 111: p. 108–248. 190. F. Calvo, N.C., J. Morillo and M. Benoit, , J. Phys. Chem. C, 2017. 121: p. 4680–4691. 191. Y. P. Lee, Y.V.K., V. V Nemoshkalenko, R. Gontarz and J. Y. Rhee,, Phys. Rev. B,
2003. 67: p. 104424. 192. K. K. Kim, M.R., H. Kwon, J. K. Song and S. M. Park,, J. Appl. Phys., 2015. 117: p.
074302. 193. S. Barcikowski, A.P., K. S. Suslick and A. Vogel, , MRS Bull., 2019. 44: p. 382–391. 194. S. Scaramuzza, M.Z.a.V.A., J. Phys. Chem. C, 2016. 120: p. 9453–9463. 195. Yan, Z.B., R, Chrisey, d. B., The generation of Ag-Ag2O complex nanostructures by
exmier laser ablation of Ag in water. Phys. Chem. Chem. Phys, 2013. 15: p. 3052-3056.
196. Mafune, F., Physical preparation of size-selected gold nanoaprticles in solution: laser ablation and laser induced size control. J. Phys. Chem. B, 2002. 106(7575-7577).

103
197. Werner, D., et al., Examination of Silver Nanoparticle Fabrication by Pulsed-Laser Ablation of Flakes in Primary Alcohols. The Journal of Physical Chemistry C, 2008. 112(5): p. 1321-1329.
198. Yang, G., Laser Ablation in Liquids: Principles and Applications in the Preparation of Nanomaterials, ed. C. series. 2012.
199. Xiao, J., et al., External field-assisted laser ablation in liquid: An efficient strategy for nanocrystal synthesis and nanostructure assembly. Progress in Materials Science, 2017. 87: p. 140-220.
200. Lam, J., Pulsed Laser Ablation in Liquid : towards the comprehension of the growth processes. 2015.
201. De Giacomo, A., et al., Cavitation dynamics of laser ablation of bulk and wire-shaped metals in water during nanoparticles production. Phys Chem Chem Phys, 2013. 15(9): p. 3083-92.
202. Oseguera-Galindo, D.O.M.-B., A.; Guetaz, L., Effects on the confinig solvent on the size distribution of silver NPs by laser ablation. Nanopart. Res., 2012. 14: p. 1133.
203. Yan, Z.B., R, Chrisey, d. B., Hollow nanoparticle generation on laser induced cavitation bubble via bubble interface pinning. Appl. Phys. Lett. , 2010. 97: p. 124106.
204. Kanitz, A., et al., Impact of liquid environment on femtosecond laser ablation. Applied Physics A, 2017. 123(11).
205. Waag, F., Laser Synthesis of Metallic and Oxidic Transition Metal, Multi-Element Nanoparticles for Catalytic Applications, in Faculty of Chemistry Institute for Technical Chemistry I University of Duisburg-Essen. 2019, University of Duisburg-Essen: Essen. p. 280.
206. Kamp, M.T., Anna; Schürmann, Ulrich; Jakobi, Jurij; Rehbock, Christoph; Barcikowski, Stephan; Kienle, Lorenz, Templated dealloying: designing novel ultrastructures by memory effect. Crystal Growth & Design, 2019.
207. Latscha, H.P., Klein, H. A., Eds.; , Säure-Base-Systeme. In Anorganische Chemie: Chemie-Basiswissen I. Springer Berlin Heidelberg:, ed. Springer-Lehrbuch;. 2007, Berlin, Heidelberg, .
208. Anderson, B.D. and J.B. Tracy, Nanoparticle conversion chemistry: Kirkendall effect, galvanic exchange, and anion exchange. Nanoscale, 2014. 6(21): p. 12195-216.
209. Qi, W.H.W., M. P. J. , Size and Shape Dependent Lattice Parameters of Metallic Nanoparticles. Nanoparticle Res. , 2005. 7(1): p. 51-57.
210. Pedireddy, S., et al., Nanoporous Gold Bowls: A Kinetic Approach to Control Open Shell Structures and Size-Tunable Lattice Strain for Electrocatalytic Applications. Small, 2016. 12(33): p. 4531-40.
211. Zhang, J. and C.M. Li, Nanoporous metals: fabrication strategies and advanced electrochemical applications in catalysis, sensing and energy systems. Chem Soc Rev, 2012. 41(21): p. 7016-31.
212. Kamp, M., et al., Temperature-Dependent Ultrastructure Transformation of Au–Fe Nanoparticles Investigated by in Situ Scanning Transmission Electron Microscopy. Crystal Growth & Design, 2018. 18(9): p. 5434-5440.
213. Hansen, A.-L.D., T.; Winkler, M.; Ditto, J.; Johnson, and J.D.B. D. C.; Koenig, K.; Kienle, L.; Bensch, W. , Synthesis and Thermal Instability of High-Quality Bi2Te3/Sb2Te3 Superlattice Thin Film Thermoelectrics. Chem. Mater., 2014. 26: p. 6518−6522.
214. Koch, C., et al., Enhanced temperature stability and exceptionally high electrical contrast of selenium substituted Ge2Sb2Te5 phase change materials. Rsc Advances, 2017. 7(28): p. 17164-17172.
215. Barmparis, G.D., et al., Nanoparticle shapes by using Wulff constructions and first-principles calculations. Beilstein Journal of Nanotechnology, 2015. 6: p. 361-368.
216. Bals, S.V.A., S.; Van Tendeloo, G. , High Resolution Electron Tomography Curr. Opin. Solid State Mater. Sci. , 2013. 17: p. 107−114.

104
217. Benoit, M., et al., Structural and electronic properties of the Au(001)/Fe(001) interface from density functional theory calculations. Physical Review B, 2012. 86(7).
218. Petersen, S. and S. Barcikowski, Conjugation Efficiency of Laser-Based Bioconjugation of Gold Nanoparticles with Nucleic Acids. The Journal of Physical Chemistry C, 2009. 113(46): p. 19830-19835.
219. Anna Tymoczko, a.M.K., Christoph Rehbock, Lorenz Kienle, Elti Cattaruzza, Stephan Barcikowski, Vincenzo Amendola, One-step synthesis of Fe–Au core–shell magnetic-plasmonic nanoparticles driven by interface energy minimization. Nanoscale Horiz., 2019. 4: p. 1326-1332.
220. Favez, D., J.D. Wagnière, and M. Rappaz, Au–Fe alloy solidification and solid-state transformations. Acta Materialia, 2010. 58(3): p. 1016-1025.
221. Dinega, D.P. and M.G. Bawendi, A Solution-Phase Chemical Approach to a New Crystal Structure of Cobalt. Angew Chem Int Ed Engl, 1999. 38(12): p. 1788-1791.
222. Bang, J.H.a.K.S.S., Applications of ultrasound to the synthesis of nanostructured materials. Advanced materials, 2010. . 22 2010. 10: p. 1039-1059.
223. Osorio-Cantillo, C.a.O.P.-P., Synthesis and characterization of metastable nanocrystalline cobalt. . Journal of Applied Physics,, 2019. 105(7): p. 07A332.
224. E. Cattaruzza, G.B., F. Gonella, R. Polloni, B. F. Scremin, G. Mattei, P. Mazzoldi and C. Sada, , Appl. Surf. Sci., 2007. 254: p. 1017–1021.
225. E. Cattaruzza, G.B., P. Riello, D. Cristofori and M. Tamisari, , Appl. Surf. Sci., 2014. 320: p. 863–870.
226. V. Amendola, S.S., F. Carraro and E. Cattaruzza,, J. Colloid Interface Sci., 2017. 489: p. 18–27.
227. E. C. Le Ru and P. G. Etchegoin, Chem. Phys. Lett., 2006. 423: p. 63–66. 228. B. T. Draine and P. J. Flatau, arXiv, , 2010: p. 1002.1505. 229. B. T. Draine and P. J. Flatau, J.Opt.Soc.Am.A, 1994. 11: p. 1491–1499. 230. J. J. Goodman, B.T.D.a.P.J.F., Opt.Lett, 1991. 16: p. 1198–1200. 231. R. L. Olmon, B.S., T. W. Johnson, D. Shelton, S.-H. Oh, G. D. Boreman and M. B.
Raschke, , Phys. Rev. B, 2012. 86: p. 235147. 232. P. Johnson and R. Christy, Phys. Rev. B, 1974. 9: p. 5056–5070. 233. U. Kreibig and M. Vollmer, Optical Properties of Metal Clusters, , ed. Springer. 1995,
Berlin. 234. I. Barin, O.K.a.O.K. Thermochemical properties of inorganic substances,. 1977, Berlin,
Heidelberg,: Springer Berlin Heidelberg, . 235. H. Okamoto, T.B.M., L. J. Swartzendruber and P. A. Beck, , Bull. Alloy Phase
Diagrams, , 1984,. 5: p. 592–601. 236. W. Mönch, Semiconductor Surfaces and Interfaces. Vol. 26. 2001, Berlin Heidelberg:
Springer Berlin Heidelberg,. 237. H. Fredriksson, U.A., Physics of functional materials, ed. W.I.O. service). 2008: John
Wiley & Sons, . 238. W. H. Qi, M.P.W., M. Zhou and W. Y. Hu, , J. Phys. D. Appl. Phys., 2005. 38: p. 1429–
1436. 239. Kittel, C., Introduction to solid state physics,. 2005: I Wiley,. 240. Williams, R.H., Semiconductor surfaces and interfaces,. Vol. 33. 1983: Springer
Science & Business Media. 241. C. N. Singman, J. Chem. Educ, 1984. 61: p. 137.

105
7.2 Supporting information
Figure S1: a) Summarized chemical composition for Au20Fe80 and Au50Fe50 from STEM-EDX analysis b) Measurements EDX spectrum for sample Au20Fe80 obtained from the area marked in STEM pictures shown in c); c) STEM pictures for Au20Fe80 (top) and Au50Fe50 (bottom).
Figure S2: Elemental distribution analyzed with the EDX line scan for representative Au50Fe50
NPs generated in acetone, showing no oxygen present in the iron core (black line).
106
How Crystal Structure and Phase Segregation of Au-Fe Alloy
Nanoparticles is ruled by Molar Fraction and Size
Experimental Section
Au-Fe nanoparticles synthesis
For all studies Au-Fe alloy targets (fem Institut für Edelmetalle und Metallchemie,
Schwäbisch Gmünd) with varied Au:Fe atomic % ratio (10:90, 20:80, 35:65, 50:50,
65:35, 80:20 and 90:10) were ablated in Acetone 99.98 % (Carl-Roth GmbH,
Karlsruhe). LAL was performed with a 10 ns Nd:YAG laser (Rofin Sinar Technologies,
Plymouth) at 1064nm with a repetition rate of 15 kHz and a fluence 3.85 mJ/cm2. A
lens with a focal length of 100 mm was used to focus the beam through a glass window
into the batch reactor containing the Au-Fe alloy target emerged in 30 mL acetone.
The alloy target was placed vertically to the bottom of the batch-chamber. Additionally,
an electrical motor was mounted at the back of the chamber to assure a constant flow
of the ablated material, avoiding absorption of the laser energy by already generated
NPs. The amount of ablated mass was determined gravimetrically by weighing the
target before and after laser ablation using a microbalance.
Particle analysis
The size and the internal composition of LAL generated Au-Fe nanoparticles were
determined using transmission electron microscopy STEM-HAADF (FEI, Tecnai F30
G2 STWIN). 10 µL of the colloid dispersion were pipetted onto a carbon-coated copper
microgrid and dried overnight. The ferret diameter of the sample was measured for
weighted 1000 nanoparticles each. The results were plotted both as to the number and
volume-weighted distribution and fitted using a log-normal function. The average
particle size was obtained from the Xc values of this fit. Energy dispersive x-ray
spectroscopy is a suitable method for quantitative elemental detection of the iron gold
system. Thus differentiation of the elements and corresponding oxide is distinct. EDX
results are obtained by STEM-EDX measurements with Phillips XL 30 with EDAX DX-
4. Therefore, different kind of EDX spectra is generated. The integration over a large
number of nanoparticles confirms the coincidence of target and nanoparticle
composition. Based on Z-contrast of STEM-HAADF imaging mode, a distinct hint of
the ultrastructure is possible. EDX mapping and line scans characterize the existence

107
of the CS ultrastructure in each sample. Furthermore, the absence of oxidation
especially in the iron core of Au@Fe nanoparticles was proved by this method. By
means of X-ray powder diffraction (XRD) using a Bruker D8 Advance diffractometer
(Cu Kα radiation, λ = 1.54 Å; 40 kV, 40 mA) a phase composition of all targets and
produced Au-Fe NPs was determined. The target materials were positioned in the
sample holder. All nanoparticle samples were prepared from a high concentrated
colloid a homogenously distributed on a silicon single crystal to minimize scattering.
To determine the phase ratios, lattice parameters and percentage of the Fe/Au
substitution in the FCC and BCC structures as well as to estimate the average
crystallite sizes from diffraction peak broadening reflections (using the Scherrer
equation), the Rietveld refinement was performed with the Bruker software TOPAS
4.2. The patterns of cubic Au-FCC (#004-0784) and Fe-BCC (#006-0696) phases from
the ICDD database were used as a reference for the qualitative phase analysis, which
was done with a Diffrac. suite EVA V1.2 from Bruker.
Characterization of Au-Fe laser-generated nanoparticles
Figure S3: Representation of possible Au-Fe alloy ultrastructure generated via LAL in Acetone. The structure of Au-Fe bimetallic nanoparticle can be defined by distribution mode of the two elements and its orientation is described as a) Core Shell arrangement with clearly defined segregated Au-Fe phase boundary (Core Shell nanoparticles) b) randomly mix:ed alloy structure (disordered solid solution nanoparticles).
Figure S4: Two representative number-weighted particle size histograms for LAL generated Au95Fe5 and Au50Fe50 nanoparticles analyzed by HAADF STEM (blue bars Disordered Solid Solution NPs, orange bars Core-Shell NPs).
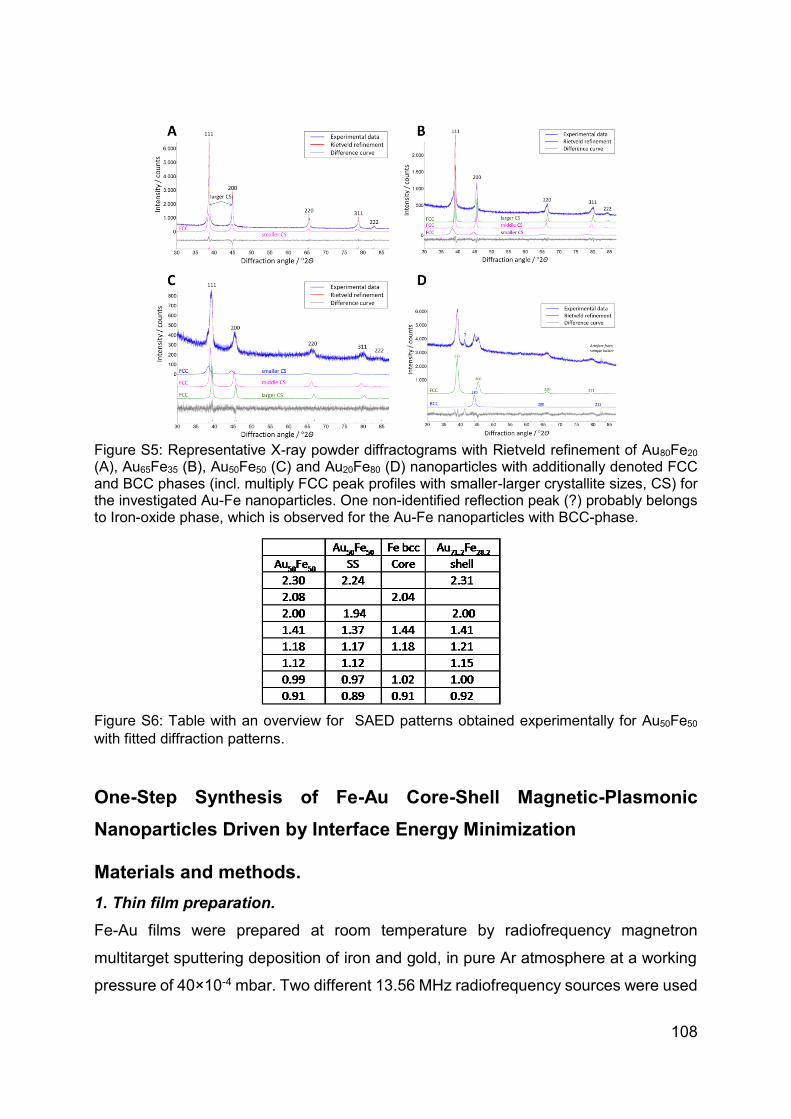
108
Figure S5: Representative X-ray powder diffractograms with Rietveld refinement of Au80Fe20 (A), Au65Fe35 (B), Au50Fe50 (C) and Au20Fe80 (D) nanoparticles with additionally denoted FCC and BCC phases (incl. multiply FCC peak profiles with smaller-larger crystallite sizes, CS) for the investigated Au-Fe nanoparticles. One non-identified reflection peak (?) probably belongs to Iron-oxide phase, which is observed for the Au-Fe nanoparticles with BCC-phase.
Figure S6: Table with an overview for SAED patterns obtained experimentally for Au50Fe50
with fitted diffraction patterns.
One-Step Synthesis of Fe-Au Core-Shell Magnetic-Plasmonic
Nanoparticles Driven by Interface Energy Minimization
Materials and methods.
1. Thin film preparation.
Fe-Au films were prepared at room temperature by radiofrequency magnetron
multitarget sputtering deposition of iron and gold, in pure Ar atmosphere at a working
pressure of 40×10-4 mbar. Two different 13.56 MHz radiofrequency sources were used
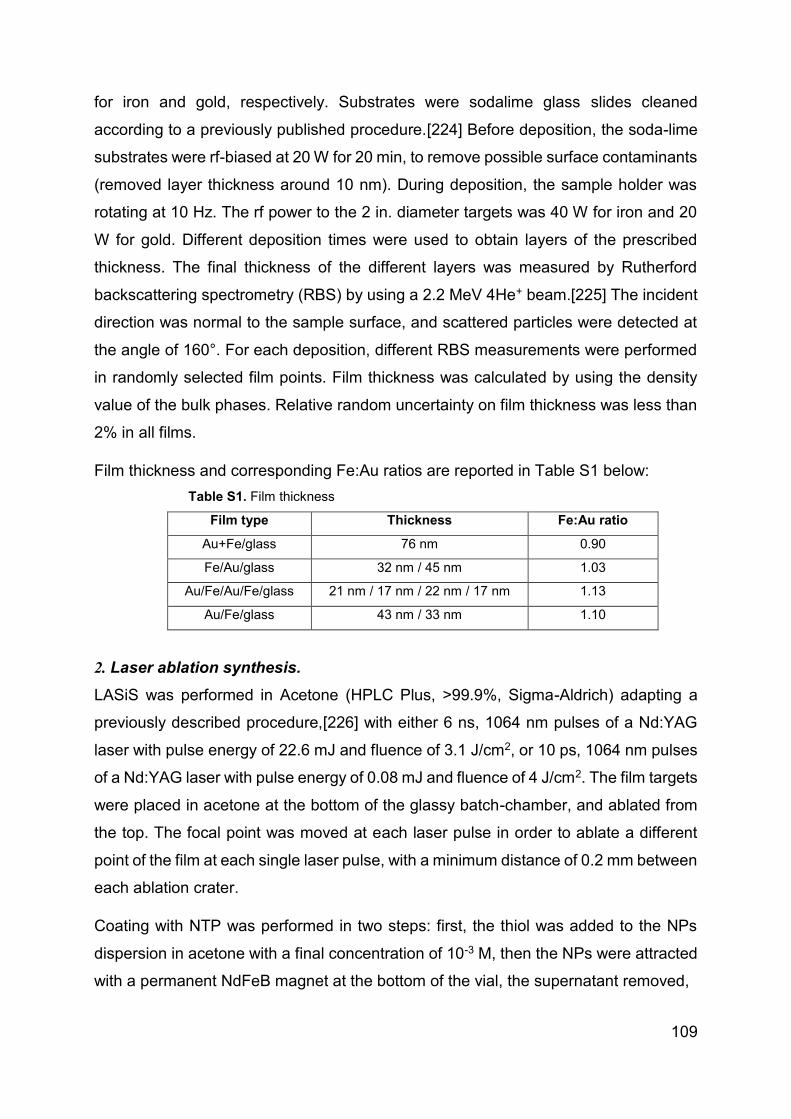
109
for iron and gold, respectively. Substrates were sodalime glass slides cleaned
according to a previously published procedure.[224] Before deposition, the soda-lime
substrates were rf-biased at 20 W for 20 min, to remove possible surface contaminants
(removed layer thickness around 10 nm). During deposition, the sample holder was
rotating at 10 Hz. The rf power to the 2 in. diameter targets was 40 W for iron and 20
W for gold. Different deposition times were used to obtain layers of the prescribed
thickness. The final thickness of the different layers was measured by Rutherford
backscattering spectrometry (RBS) by using a 2.2 MeV 4He+ beam.[225] The incident
direction was normal to the sample surface, and scattered particles were detected at
the angle of 160°. For each deposition, different RBS measurements were performed
in randomly selected film points. Film thickness was calculated by using the density
value of the bulk phases. Relative random uncertainty on film thickness was less than
2% in all films.
Film thickness and corresponding Fe:Au ratios are reported in Table S1 below:
Table S1. Film thickness
Film type Thickness Fe:Au ratio
Au+Fe/glass 76 nm 0.90
Fe/Au/glass 32 nm / 45 nm 1.03
Au/Fe/Au/Fe/glass 21 nm / 17 nm / 22 nm / 17 nm 1.13
Au/Fe/glass 43 nm / 33 nm 1.10
2. Laser ablation synthesis.
LASiS was performed in Acetone (HPLC Plus, >99.9%, Sigma-Aldrich) adapting a
previously described procedure,[226] with either 6 ns, 1064 nm pulses of a Nd:YAG
laser with pulse energy of 22.6 mJ and fluence of 3.1 J/cm2, or 10 ps, 1064 nm pulses
of a Nd:YAG laser with pulse energy of 0.08 mJ and fluence of 4 J/cm2. The film targets
were placed in acetone at the bottom of the glassy batch-chamber, and ablated from
the top. The focal point was moved at each laser pulse in order to ablate a different
point of the film at each single laser pulse, with a minimum distance of 0.2 mm between
each ablation crater.
Coating with NTP was performed in two steps: first, the thiol was added to the NPs
dispersion in acetone with a final concentration of 10-3 M, then the NPs were attracted
with a permanent NdFeB magnet at the bottom of the vial, the supernatant removed,
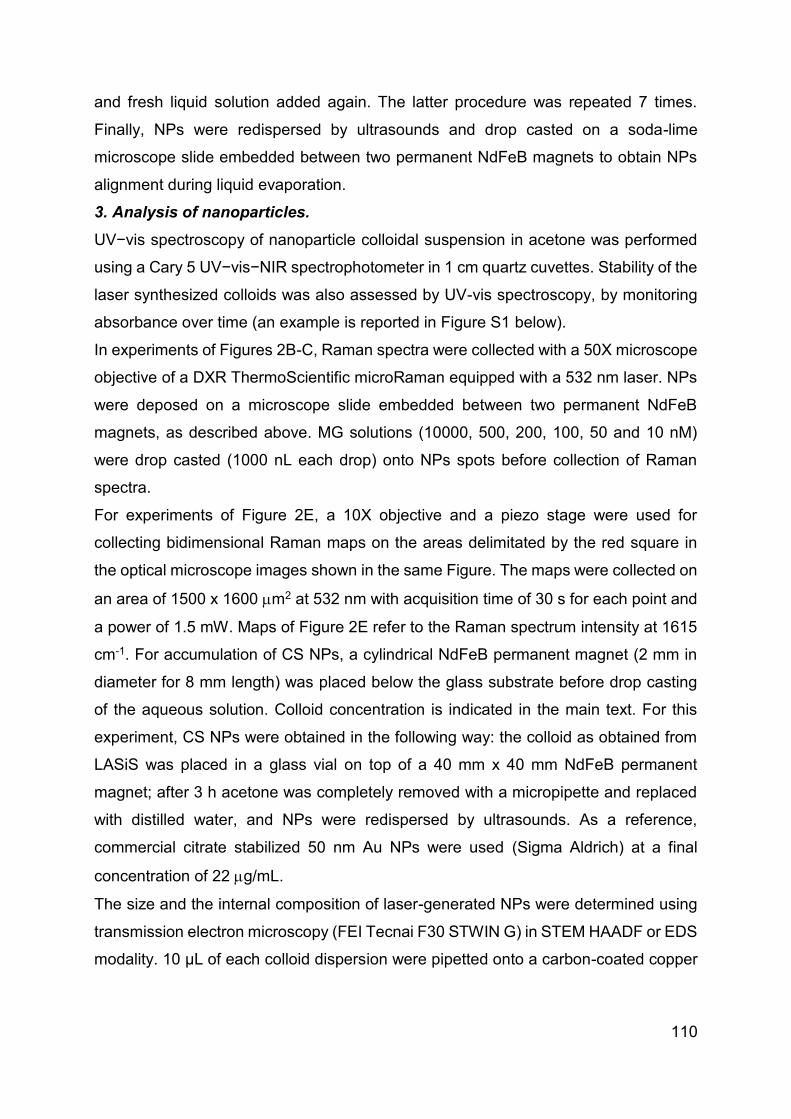
110
and fresh liquid solution added again. The latter procedure was repeated 7 times.
Finally, NPs were redispersed by ultrasounds and drop casted on a soda-lime
microscope slide embedded between two permanent NdFeB magnets to obtain NPs
alignment during liquid evaporation.
3. Analysis of nanoparticles.
UV−vis spectroscopy of nanoparticle colloidal suspension in acetone was performed
using a Cary 5 UV−vis−NIR spectrophotometer in 1 cm quartz cuvettes. Stability of the
laser synthesized colloids was also assessed by UV-vis spectroscopy, by monitoring
absorbance over time (an example is reported in Figure S1 below).
In experiments of Figures 2B-C, Raman spectra were collected with a 50X microscope
objective of a DXR ThermoScientific microRaman equipped with a 532 nm laser. NPs
were deposed on a microscope slide embedded between two permanent NdFeB
magnets, as described above. MG solutions (10000, 500, 200, 100, 50 and 10 nM)
were drop casted (1000 nL each drop) onto NPs spots before collection of Raman
spectra.
For experiments of Figure 2E, a 10X objective and a piezo stage were used for
collecting bidimensional Raman maps on the areas delimitated by the red square in
the optical microscope images shown in the same Figure. The maps were collected on
an area of 1500 x 1600 m2 at 532 nm with acquisition time of 30 s for each point and
a power of 1.5 mW. Maps of Figure 2E refer to the Raman spectrum intensity at 1615
cm-1. For accumulation of CS NPs, a cylindrical NdFeB permanent magnet (2 mm in
diameter for 8 mm length) was placed below the glass substrate before drop casting
of the aqueous solution. Colloid concentration is indicated in the main text. For this
experiment, CS NPs were obtained in the following way: the colloid as obtained from
LASiS was placed in a glass vial on top of a 40 mm x 40 mm NdFeB permanent
magnet; after 3 h acetone was completely removed with a micropipette and replaced
with distilled water, and NPs were redispersed by ultrasounds. As a reference,
commercial citrate stabilized 50 nm Au NPs were used (Sigma Aldrich) at a final
concentration of 22 g/mL.
The size and the internal composition of laser-generated NPs were determined using
transmission electron microscopy (FEI Tecnai F30 STWIN G) in STEM HAADF or EDS
modality. 10 µL of each colloid dispersion were pipetted onto a carbon-coated copper

111
microgrid and dried overnight. The Feret diameter of the sample was measured for a
minimum of 500 NPs for each sample with help of Image J software.
4. Numerical calculations.
GSERS was evaluated as the 4th power of the ratio between the local electric field Eloc in
the proximity to the surface of the metal nanostructure and the incident electric field E0
from a linearly polarized 532 nm electromagnetic radiation, according to ref.[182, 186,
227]. Eloc was calculated by the discrete dipole approximation (DDA) method using the
DDSCAT 7.1 and the relative DDFIELD packages.[228] The Fe-Au CS dimer of Figure
2D was built with two spheres of, respectively, 70 and 62 nm in external diameter and
52 and 46 nm in core diameter, with an interparticle gap of 2 nm. The final target
resulted in 6.5 105 dipoles and interdipole spacing lower than 1 nm. The Fe-Au CS
dimer of Figure S3A was built with two equal spheres of 22.4 nm in external diameter
(according to the average NPs diameter extracted from the size histogram of Figure
1F) and 4.4 nm in shell thickness (according to the average NPs shell thickness
extracted from the histogram in Figure S3B), and with an interparticle gap of 1 nm. The
final target resulted in 7.6 105 dipoles and interdipole spacing lower than 1 nm. For
metal particles in the 2–200 nm size range, an error smaller than 10% is achieved
using a number of dipoles at least of the order of 104 and using an interdipole spacing
much smaller than the wavelength of interest,[228-230] as in the present case. The
optical constants of Au and Fe were obtained from ref.[231] and [232] respectively.
The optical constants were corrected for the particle size, as reported previously.[186,
233]
Figure S7: UV-vis spectra of the colloid obtained by ns LASiS with the Fe/Au/glass film in
acetone, collected 1 h (black line) and 16 days (red line) after the synthesis. A limited decrease
in absorbance is observed after 16 days, that is still the 87 ± 1 % of its value 1h after LASiS.
400 600 800 10000.0
0.1 Fe/Au/glass ns Acetone
1 h after LASiS
16 days after LASiS
Ab
so
rba
nce
Wavelength (nm)

112
Figure S8: Left: SAED pattern of Fe-Au CS NPs synthesized from alloy target. The intensity is distributed on concentric rings, which coincides with the intensities of Au-fcc and Fe-bcc phase (the respective lattice planes are indicated in red). By superimposing of the lattice spacing (Au-fcc and Fe-bcc) a direct assignment to the Fe-bcc phase is not possible, except when all further phases of Fe can be precluded. The only additional known stable metal iron phase is Fe-fcc. However, the position of the Fe-fcc (002) reflection (marked in white) shows no intensity in the experiment, confirming the absence of this phase. Right: Rotational average intensity profiles of the experiment (blue line) and the simulations for a CS NP with Au fcc shell and Fe-bcc (black line) and Fe-fcc (red line) core. The presence of Fe-fcc can be excluded by comparing the simulated diffraction intensities, overall indicating that the SAED pattern is compatible with a nanostructure containing Au-fcc and Fe-bcc.
Figure S9: a) Bidimensional map of SERS enhancement factor (GSERS) for 532 nm excitation, calculated for a dimer of CS NPs with average size of 22.4 nm (according to the size histogram reported in Figure 1F) and shell thickness of 4.4 nm (according to the TEM measured histogram of shell thickness reported in Figure S3B).
0 2 4 6 8 10 12 14 16 18 200
10
20
Fre
quency (
%)
Shell thickness (nm)
Shell thickness
Average: 4.4 ± 2.7 nm
B) A)
-20 -10 0 10 20 30 40-20
-10
0
10
20
Le
ng
th (
nm
)
Length (nm)
1E+061E+051E+041E+031E+021E+011E+001E-011E-021E-03
GSERS
Ek

113
Figure S10: Representative STEM-HAADF pictures for all samples.
Figure S11: Cumulative histogram (CS+SS counts) showing number-weighted particle diameter distribution for all synthetized Fe-Au colloids.
Au_H2O_ps
50nm 100nm
Au/Fe_nsFe/Au_ns
50nm
Au/Fe/Au/Fe_ns
20nm
AuFeAuFe_ps
50nm
FeAu_ps
100nm
50nm
AuFeAuFe_ns
50nm50nm
FeAu_ns
AuFeAuFe_ps
100nm 50nm50nm
Au/Fe_nsFe/Au_ns
Fe/Au_ps
Fe/Au_ps Au/Fe_ps
Au/Fe_ps
Au/Fe/Au/Fe_ps
Au/Fe/Au/Fe_ps
Au/Fe/Au/Fe_ps
Alloy_ns
50nm
20nm
Alloy_ps
20nm
Alloy_ns
40nm
Alloy_ps
Fe-Au_ns
Fe-Au_ns
Fe-Au_ps
Fe-Au_ps
50nm
0 20 40 60 80 100 120 1400
20
40
60
80
100
120
140
counts
Au/Fe_ps
CS
SS
size (nm)
0 20 40 60 80 100 120 1400
20
40
60
80
100
120
140
160
180
200
counts
Au/Fe_ns
CS
SS
size (nm)
0 20 40 60 80 100 120 1400
20
40
60
80
100
120
counts
Au/Fe/Au/Fe_ps
CS
SS
size (nm)
0 20 40 60 80 100 120 1400
20
40
60
80
100
120
140
160
180
200
220
counts
Au/Fe/Au/Fe_ns
CS
SS
size (nm)
0 20 40 60 80 100 120 1400
20
40
60
80
100
120
counts
Fe/Au_ps
CS
SS
size (nm)
0 20 40 60 80 100 120 1400
20
40
60
80
100
120
counts
Fe/Au_ns
CS
SS
size (nm)
0 20 40 60 80 100 120 1400
20
40
60
80
100
120
140
160
180
counts
Fe-Au_ps
CS
SS
size (nm)
0 20 40 60 80 100 120 1400
20
40
60
80
100
120
140
160
180
counts
Fe-Au_ns
CS
SS
size (nm)
Fe-Au/glass Au/Fe/glassAu/Fe/Au/Fe/glassFe/Au/glass

114
Figure S12: (A) Plot of Gibbs free energy calculated for SS (red lines) and CS (black lines) as a function of NPs size, and for three representative compositions: Fe(15)Au(85) (dashed lines), Fe(50)Au(50) (continuous lines), and Fe(85)Au(15) (dotted lines). (B-C) Plot of Gibbs free energy for CS (black dots) and SS (red dots) for the three compositions, for nanospheres with size of 5 nm (B) and 20 nm (C).
10 20 30 40 50 60 70 80 9020
22
24
26
28
30
32
34 Core-Shell_20 nm
Solid Solution_20 nm
Gib
bs fre
e e
nerg
y / (
kJ(m
ol)
Fe content / at %
10 20 30 40 50 60 70 80 9035
40
45
50
55
60
65
70
75 Core-shell NP_ 5 nm
Solid solution NP_ 5 nm
Fe content / at %
Gib
bs fre
e e
nerg
y / (
kJ(m
ol)
10 20 30 40 5010
20
30
40
50
60 CS
Au(85)Fe(15)
Au(50)Fe(50)
Au(15)Fe(85)
SS
Au(85)Fe(15)
Au(50)Fe(50)
Au(15)Fe(85)
Gib
bs f
ree
en
erg
y (
kJ/m
ol)
NP size (nm)
B) A) C)
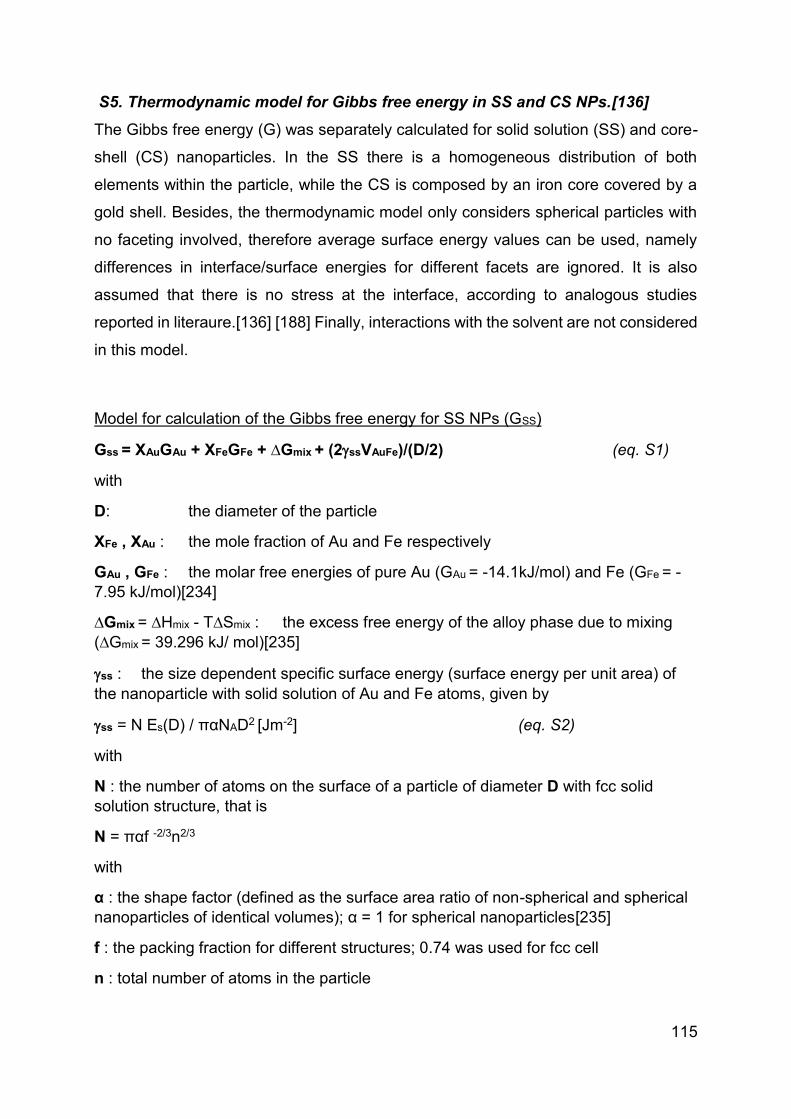
115
S5. Thermodynamic model for Gibbs free energy in SS and CS NPs.[136]
The Gibbs free energy (G) was separately calculated for solid solution (SS) and core-
shell (CS) nanoparticles. In the SS there is a homogeneous distribution of both
elements within the particle, while the CS is composed by an iron core covered by a
gold shell. Besides, the thermodynamic model only considers spherical particles with
no faceting involved, therefore average surface energy values can be used, namely
differences in interface/surface energies for different facets are ignored. It is also
assumed that there is no stress at the interface, according to analogous studies
reported in literaure.[136] [188] Finally, interactions with the solvent are not considered
in this model.
Model for calculation of the Gibbs free energy for SS NPs (GSS)
Gss = XAuGAu + XFeGFe + ∆Gmix + (2ssVAuFe)/(D/2) (eq. S1)
with
D: the diameter of the particle
XFe , XAu : the mole fraction of Au and Fe respectively
GAu , GFe : the molar free energies of pure Au (GAu = -14.1kJ/mol) and Fe (GFe = -
7.95 kJ/mol)[234]
∆Gmix = ∆Hmix - T∆Smix : the excess free energy of the alloy phase due to mixing
(∆Gmix = 39.296 kJ/ mol)[235]
ss : the size dependent specific surface energy (surface energy per unit area) of
the nanoparticle with solid solution of Au and Fe atoms, given by
ss = N Es(D) / παNAD2 [Jm-2] (eq. S2)
with
N : the number of atoms on the surface of a particle of diameter D with fcc solid
solution structure, that is
N = παf -2/3n2/3
with
α : the shape factor (defined as the surface area ratio of non-spherical and spherical
nanoparticles of identical volumes); α = 1 for spherical nanoparticles[235]
f : the packing fraction for different structures; 0.74 was used for fcc cell
n : total number of atoms in the particle

116
with
n = R3/r3
R = D/2 : the radius of the nanoparticle
r : the composition weighted average of rAu and rFe, the atomic radii of the elements
in the fcc cell, given by
rAu : 0.288 nm (for fcc structure)[236]
rFe : 0.258 nm (for fcc structure) [237]
Es(D) : the size-dependent specific surface energy for a particle, given by[136, 238]
Es(D) = {2-[Zs(D)/Zb] -[Zs(D)/Zb]1/2}Eci(D)/2
with
Eci(D) = Ec(D)/{1-p(D){2-[Zs[D]/Zb]- -[Zs[D]/Zb]1/2}/2
where:
p(D) = Ns(D)/Ntot(D) : the relation between the total number of atoms present on the
surface, Ns(D), and inside a particle, Ntot(D), of a given size, respectively
Zs(D) : size dependent average coordination number of surface atoms
Zb : average coordination number of the internal atoms
Ec(D) : size and composition dependent cohesive energy, given by
Ec(D) = xAuEAu (1-(αD2/ndAu2) + xFeEFe (1-(αD2/ndFe
2) - XAuXFe A
XAu , XFe : the molar fraction of Au and Fe, respectively
EAu , EFe : the bulk cohesive energies of Au and Fe, respectively
EAu = 368 kJ/mol[239]
EFe = 413 kJ/mol[235]
dAu , dFe : the atomic diameters of Au and Fe, respectively
n : the total number of atoms in the particle
A : interaction parameter with a value of 60 kJ/mol[235]
NA : Avogadro’s number
and resulting in:

117
Table S2. The size dependent specific surface energy (surface energy per unit area) of the
Au-Fe solid solution nanoparticle for three representative compositions
ss(dAu,dFe) (J/m-2)
NPs size / nm Au15Fe85 Au50Fe50 Au85Fe15
5 2.1 2.09 1.88
7.5 2 1.96 1.77
10 2 1.91 1.72
15 1.99 1.87 1.69
20 1.98 1.85 1.67
25 1.97 1.84 1.66
30 1.96 1.83 1.65
35 1.96 1.83 1.65
40 1.95 1.83 1.65
45 1.95 1.82 1.65
50 1.95 1.82 1.65
60 1.95 1.82 1.65
70 1.95 1.82 1.65
120 1.95 1.82 1.65
170 1.95 1.82 1.65
VAuFe : the molar volume of fcc AuFe solid solution, with
VAuFe = XAu . VAu + XFe . VFe
Calculated and summarized in Table S3:
Table S3. Calculated molar volume values for three representative compositions.
With VAu and VFe being the molar volume of pure iron and gold, respectively.
Au:Fe at % V/ cm3/mol
Au 10.21
Au85Fe15 9.96
Au50Fe50 8.55
Au15Fe85 7.4
Fe 6.93

118
Model for calculation of the Gibbs free energy for CS NPs (GCS)
GCS = XAuGAu + XFeGFe + αAuSAuAu + αFeSFeFe + Gint (eq. S3)
with
XFe , XAu : the mole fraction of Au and Fe respectively
GAu , GFe : the molar free energies of pure Au (GAu = -14.1kJ/mol) and Fe (GFe = -
7.95 kJ/mol)[234]
αAu , αFe : the fractions of surface atoms of Au and Fe vs the total number of Au
and Fe atoms in the particle, where
αFe = NFe/nFe
αAu = NAu/nAu
with
nAu , nFe: total number of Au or Fe atoms, that for a core-shell is given by
nFe = RFe3/rFe
3fFe
nAu = RAu3/rAu
3fAu - RFe3/rAu
3fAu
with
fAu , fFe : the packing fraction for Au and Fe structures. 0.74 was used for
fcc structure and applied for Au and 0.68 was used for bcc structure
applicable to Fe
rAu , rFe: the atomic radii of the Au or Fe structure
rAu : 0.288 nm (for fcc structure)[240]
rFe : 0.248 nm (for bcc structure)[237]
NAu , NFe : number of the surface atoms of Au or Fe, given by
NFe = παfFe-2/3nFe
2/3
NAu = παfAu-2/3nAu
2/3
with
α : the shape factor (defined as the surface area ratio of non-spherical
and spherical nanoparticles of identical volumes); α= 1 for spherical
nanoparticles[238]
RAu/Fe: the radius of the iron core for Fe, or the radius of the whole particle
for Au, as illustrated in the following Figure S7.

119
Figure S13: Schematic representation illustrating how core and shell diameters are identified.
The diameter of the iron core was calculated based on simple geometric assumptions.
The following Table S4 depicts the Fe-core diameters in correlation with particle
composition and overall particle diameter:
Table S4. Atomic versus Volume fraction in CS NPs.
Atomic versus Volume
fractions in CS NPs with
different Fe content
atomic % Vol %
85 80
50 41
15 11
SAu , SFe: the surface areas occupied by 1 mole of atoms of Au and Fe,
respectively, where
SAu = 4.3 x 10⁴ m2
SFe = 3.2 x 10⁴ m2
Au , Fe : the size dependent specific surface energy (surface energy per unit area)
of the nanoparticle for either Au and Fe atoms, given by:
Fe = NFe Es(DFe) / παNADFe2 [Jm-2] (eq. S4a)
Au = NAu Es(DAu) / παNADAu2 [Jm-2] (eq. S4b)
with

120
NAu , NFe: the number of atoms on the surface of a particle of diameter DAu , DFe
(for Au the particle surface is equal to the surface of the NPs (Au is outside),
while for Fe the surface of the iron core is assumed, Figure S7).
N Au/Fe = παf Au/Fe -2/3n Au/Fe 2/3
with
α : the shape factor (defined as the surface area ratio of non-spherical and
spherical nanoparticles of identical volumes) α= 1 for spherical
nanoparticles[238]
f Au , fFe: the packing fraction for different structures. 0.74 was used for FCC
structure and applied for Au and 0.68 was used for BCC structure
applicable to Fe
nAu/Fe = RAu/Fe3/rAu/Fe
3fAu/Fe
with
rAu , rFe : the atomic radii of Au and Fe in the respective structures
rAu : 0.288 nm (for fcc structure)
rFe : 0.248 nm (for bcc structure)
RAu , RFe : the radii of spherical nanocrystal; for Fe we assumed the radius of
the iron core, while for Au we assumed the diameter of the whole
particle as illustrated in Figure S7.
Es(DAu) , Es(DFe): size-dependent specific surface energy for a particle of size
DAu or DFe
For each metal (Au or Fe):
Es(D) = {2-[Zs(D)/Zb] -[Zs(D)/Zb]1/2}Eci(D)/2
Eci(D) = Ec(D)/{1-p(D){2-[Zs[D]/Zb]- -[Zs[D]/Zb]1/2}/2
p(D) = Ns(D)/Ntot(D)
where:
Zs(D) : size dependent average surface coordination number of
the metal
Zb : the average coordination number of the internal atoms of the
metal
Ec(D) : size and composition dependent cohesive energy for that
metal
Ec(DAu) = EAu (1-(αDAu2/ndAu2)

121
Ec(DFe) = EFe (1-(αDFe2/ndFe2)
with
EAu , EFe : the bulk cohesive energies of Au and Fe, respectively.
EAu : 368 kJ/mol
EFe : 413 kJ/mol
DAu , DFe : the radii of spherical nanocrystal; for Fe we assumed the radius of
the iron core, while for Au we assumed the diameter of the whole particle as
illustrated in Figure S7.
dAu , dFe : are the atomic diameters of Au and Fe, respectively.
N : total number of atoms in the particle
p(D) : is the relation between the total number of atoms present on the surface
Ns(D) and
inside a particle Ntot(D) of a given size, respectively
α : the shape factor (defined as the surface area ratio of non-spherical and
spherical nanoparticles of identical volumes); α= 1 for spherical
nanoparticles
Gint : the Gibbs free energy contribution given by the geometrical (geo) and chemical
(chem) factors, that can be written as:
Gint = A (geo + chem)
(eq. S5)
geo = (F/2) (Au+Fe) (eq. S5a)
chem = {XAu ∆HAu_in_Fe / [Co(VAu)2/3 + XFe ∆HFe_in_Au / [Co(VFe)2/3]} (eq. S5b)
Resulting in:
Gint = A [(0.33/2) (Au+Fe)]+[{XAu ∆HAu_in_Fe / [Co(VAu)2/3 + XFe ∆HFe_in_Au /
[Co(VFe)2/3]}] (eq. S6)
with
A : surface area occupied by 1 mole of interfacial atoms, as described in Table
S5 below
Table S5. Calculated values for surface area occupied by 1 mole of interfacial atoms
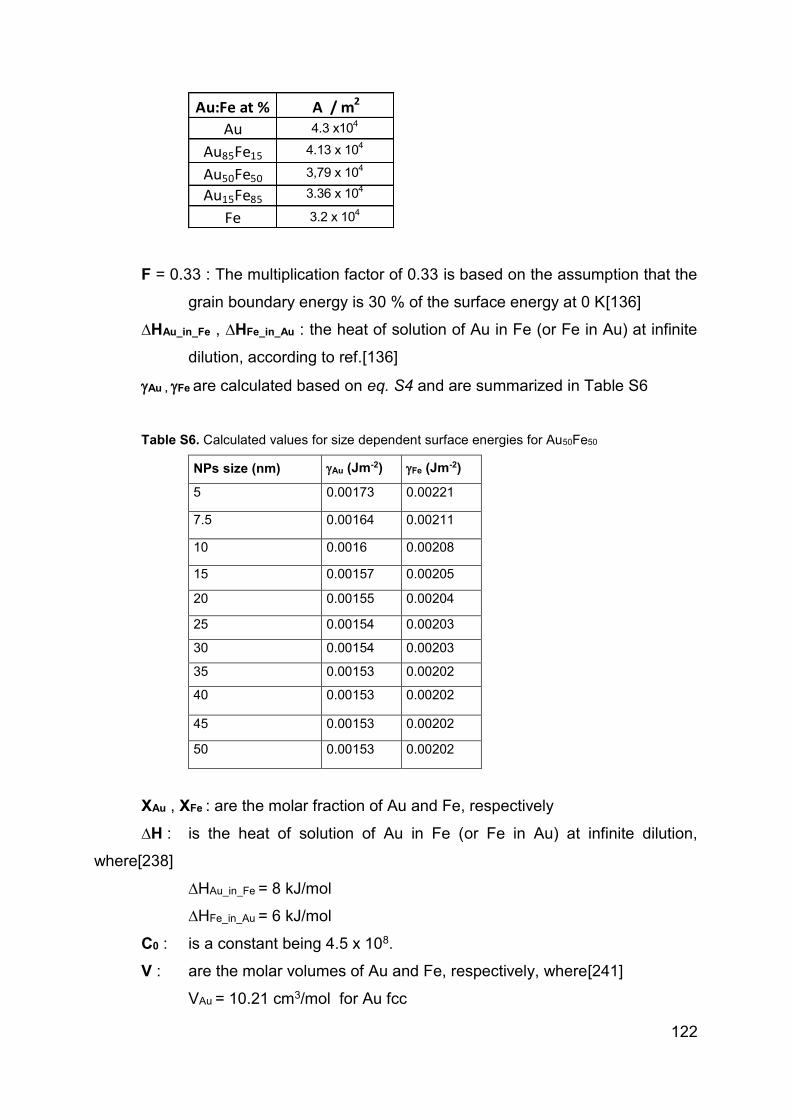
122
F = 0.33 : The multiplication factor of 0.33 is based on the assumption that the
grain boundary energy is 30 % of the surface energy at 0 K[136]
∆HAu_in_Fe , ∆HFe_in_Au : the heat of solution of Au in Fe (or Fe in Au) at infinite
dilution, according to ref.[136]
Au , Fe are calculated based on eq. S4 and are summarized in Table S6
Table S6. Calculated values for size dependent surface energies for Au50Fe50
NPs size (nm) Au (Jm-2) Fe (Jm-2)
5 0.00173 0.00221
7.5 0.00164 0.00211
10 0.0016 0.00208
15 0.00157 0.00205
20 0.00155 0.00204
25 0.00154 0.00203
30 0.00154 0.00203
35 0.00153 0.00202
40 0.00153 0.00202
45 0.00153 0.00202
50 0.00153 0.00202
XAu , XFe : are the molar fraction of Au and Fe, respectively
∆H : is the heat of solution of Au in Fe (or Fe in Au) at infinite dilution,
where[238]
∆HAu_in_Fe = 8 kJ/mol
∆HFe_in_Au = 6 kJ/mol
C0 : is a constant being 4.5 x 10⁸.
V : are the molar volumes of Au and Fe, respectively, where[241]
VAu = 10.21 cm3/mol for Au fcc
Au:Fe at % A / m2
Au 4.3 x10⁴
Au85Fe15 4.13 x 10⁴
Au50Fe50 3,79 x 10⁴
Au15Fe85 3.36 x 10⁴
Fe 3.2 x 10⁴

123
VFe = 7.09 cm3/mol for Fe bcc
An example of Gibbs free energy for three representative compositions of Fe-Au CS
NPs is reported in the previous Figure S6.
S5-1. Updated calculations
1. Primary equation as described above (pure iron core and pure gold shell) –Figure
S16 a)
Gss = XAuGAu + XFeGFe + ∆Gmix + (2ssVAuFe)/(D/2)
GCS = XAuGAu + XFeGFe + αAuSAuAu + αFeSFeFe + Gint
D - particle diameter
2. Adapted equation for CS NPs with diameter (pure iron core and pure gold shell) –
Figure S16 b)
Gss = XAuGAu + XFeGFe + ∆Gmix + (2ssVAuFe)/(D/2)
GCS = XAuGAu + XFeGFe + αAuSAuAu + αFeSFeFe + Gint
D – considered separately for DAu and DFe (Figure S15)
3. Adapted equation with AuFe alloy shell and pure iron core – Figure S16 c)
Gss = XAuGAu + XFeGFe + ∆Gmix + (2ssVAuFe)/(D/2)
GCS = XAuFeGAuFe + XFeGFe + αAuFeSAuFeAuFe + αFeSFeFe + Gint
Gint = A [(0.33/2) (AuFe+Fe)]+[{XAuFe ∆HAu_in_Fe / [Co(VAu)2/3 + XFe ∆HFe_in_Au /
[Co(VFe)2/3]}]

124
D – considered separately for DAu and DFe (Figure S15)
Figure S14: Theoretical calculations for SS and CS compositions for 3 representative Au15Fe85, Au50Fe50 and Au85Fe15 a) CS with pure iron core and gold shell according to method described elsewhere141 b) CS with pure iron and pure shell with modified equation as described in chapter SI 5 c) CS with pure iron and alloy shell d) Comparison of Cut off diameter favouring phase segregation for all 3 calculation methods, for CS with pure iron core and gold shell according to method described elsewhere (black bar), CS with pure iron and pure shell with modified equation as described in chapter SI 5 c (red bar) and CS with pure iron and alloy shell (blue).
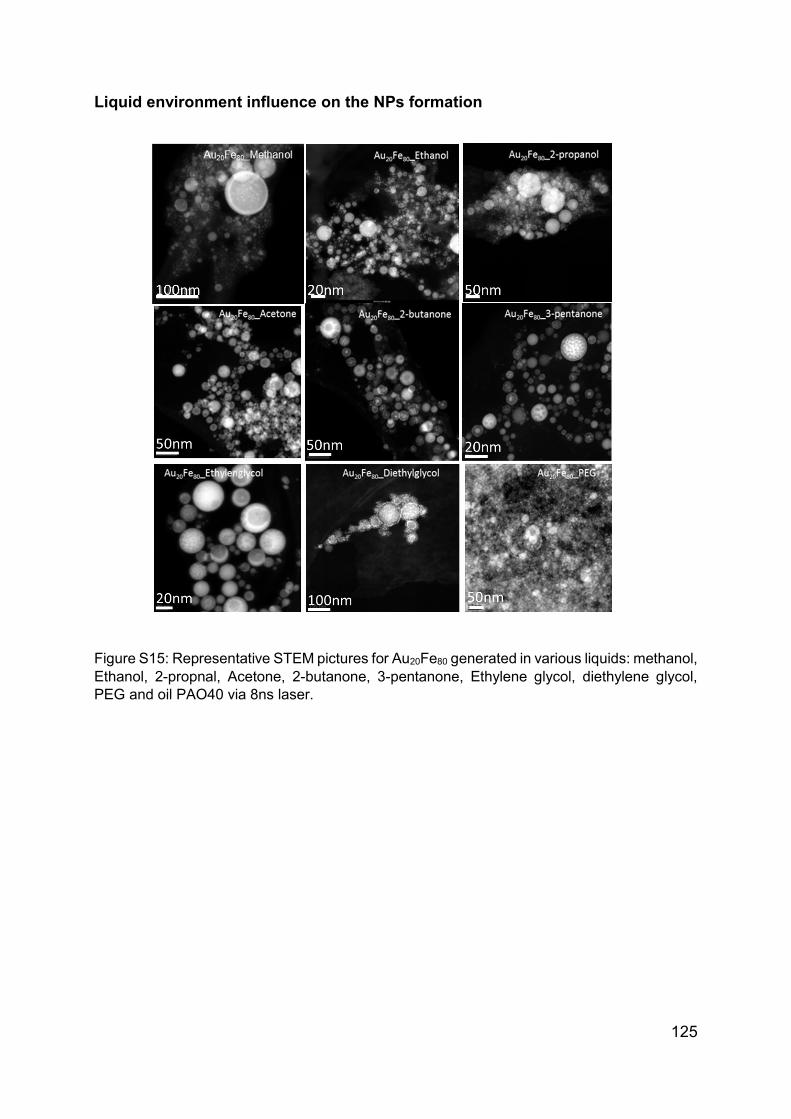
125
Liquid environment influence on the NPs formation
Figure S15: Representative STEM pictures for Au20Fe80 generated in various liquids: methanol,
Ethanol, 2-propnal, Acetone, 2-butanone, 3-pentanone, Ethylene glycol, diethylene glycol,
PEG and oil PAO40 via 8ns laser.
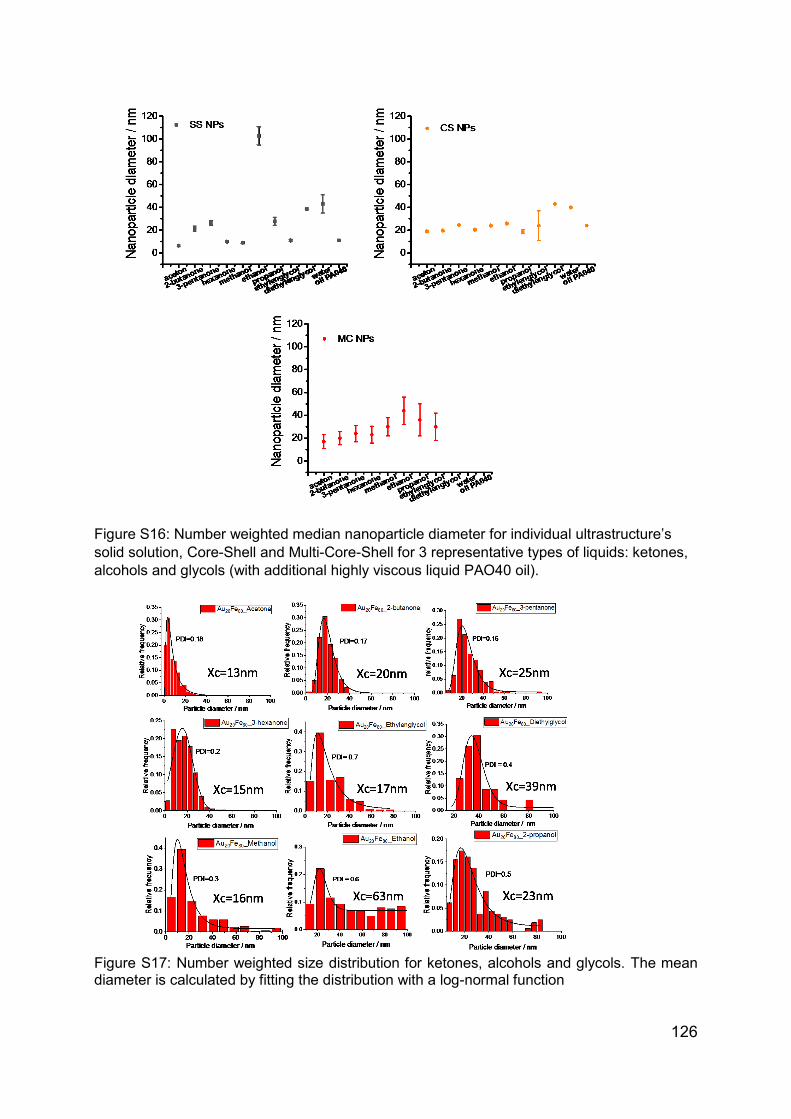
126
Figure S16: Number weighted median nanoparticle diameter for individual ultrastructure’s
solid solution, Core-Shell and Multi-Core-Shell for 3 representative types of liquids: ketones,
alcohols and glycols (with additional highly viscous liquid PAO40 oil).
Figure S17: Number weighted size distribution for ketones, alcohols and glycols. The mean diameter is calculated by fitting the distribution with a log-normal function

127
Figure S18: Overview of parameters influencing the AuFe diameter, namely a) viscosity b)
heat capacity c) refractive index and d) density for Au20Fe80 configuration generated via 8 ns
with LAL.
Figure S19: Schematic overview of chemical structures for the liquid used in the chapter 4.2.2.

128
Figure S20: Yield of solid solution number weighted for for 3 representative types of liquids:
ketones, alcohols and glycols (with additional highly viscous liquid PAO40 oil).
Figure S21: Morphology changes for Au20Fe80 sample with representative Z-contrast images
recorded during in situ heating for selected temperatures; 250°C, 550°C and 700°C.

129
Figure S22: Representative STEM pictures for AuCo and AuFe for 3 compositions: 20:80; 50:50: and 80:20, all samples were generated in Acetone via 8 ns laser.
Figure S23: Theoretical calculation for AuCo as described in chapter S5 with distinction of cut
off diameter for Core-Shell nanoparticle formation.

130
Figure S24: XRD analysis of crystal phase for AuCo with a) XRD patterns of Au, Au80Co20, Au50Co50 and Au20Co80 and Co NPs generated by PLAL showing two FCC structure for the bi-metallic NPs b) XRD patterns of Au, Au80Co20, Au50Co50 and Au20Co80 and Co targets used for laser ablation showing a structure close to FCC-Au for the bi-metallic targets
Figure S25: Particle statistics for solid solution (SS), core-shell (CS), multi core-shell (MCS) and multi core (MC) structures for Au80Co20, Au50Co50 and Au20Co80 compositions generated by LAL. The mean diameter is calculated by fitting the distribution with a log-normal function

131
7.3 Material and Methods
7.3.1 Nanoparticles synthesis and characterization
AuCo target preparation
3 different compositions of gold cobalt targets (Au20Co80, Au50Co50 and Au80Co20) were
prepared by pressing micro powders of Au (Chempur, 0.3-3 micron, 99.9+%) and Co
(Chempur, 2-4 micron, 99.5%) using a hydraulic press. To obtain homogenous mixture
respective ratios were in a mortar. Au foil targets was used to generated Au
nanoaprticles, whereas Co NPs were synthetized from the powder. Two hours
sinteration at 800°C of pressed targets occurred under the presence of a reductive
atmosphere (95% N2; 5% H2) to avoid Co oxidation. After sinteration process, all
targets were polished with help of sand paper to remove any surface contaminations.
AuFe targets
Au-Fe bulk alloy targets with different Au:Fe atomic % ratio
(10:90,20:80,50:50,81.5:18.5 and 90:10) were bought from fem Institut für Edelmetalle
und Metallchemie, Schwäbisch Gmünd company.
7.3.2 Pulsed laser ablation in liquids (LAL)
For all studies Au-Fe alloy targets (fem Institut für Edelmetalle und Metallchemie,
Schwäbisch Gmünd) with different Au:Fe atomic % ratio (10:90,20:80,50:50,81.5:18.5
and 90:10) were ablated in Acetone 99,8% (from Carl-Roth GmbH, Karlsruhe). LAL
was performed with 10 ns Nd:YAG laser (Rofin Sinar Technologies, Plymouth) at
1064nm with a repetition rate of 15kHz and a fluence 3.85mJ/cm2. A lens with a focal
length of 100mm was used to focus the beam through a glass window into a batch
reactor containing the Au-Fe alloy target emerged in 30ml acetone. The alloy target
was placed vertically to the bottom of the batch-chamber. Additionally, an electrical
motor was mounted at the back of the chamber to assure a constant flow of the ablated
material, avoiding absorption of the laser energy from already generated NPs. The

132
amount of ablated mass was determined gravimetrically by weighting the target before
and after laser ablation using a microbalance.
Threshold fluene for Au 0,6 J/cm2 (ps)
Threshold fluene for Fe 1,15 J/cm2 (ps) 1,3 J/cm2 (ns?)
7.3.3 Single pulse laser ablation
Six different targets were ablated in 2 ml Acetone (HiperSolChroma) and 2 ml water
(Mili). AuFe multilayers on glass films were prepared by Prof. Cattaruzza.
Description of Au-Fe films on glass (4 sets packaged under vacuum): # 363:
Au/Fe/glass, total thickness ca. 80 nm, relative thickness Fe/Au=1.10, # 364:
Au/Fe/Au/Fe/glass, total thickness ca. 80 nm, relative thickness Fe/Au=1.13, # 365:
Fe/Au/glass, total thickness ca. 80 nm, relative thickness Fe/Au=1.03, # 366:
Au+Fe/glass (AuFe alloy on glass), total thickness ca. 80 nm, relative thickness
Fe/Au=0.90, # 367: Au/glass, total thickness ca. 100 nm, # 369: Fe/glass, total
thickness ca. 70 nm.
Parameter [unit] ps-laser ns-laser
Power [W] 15.6 5.5
Pulse energy [mJ] 0.156 0.36
Wavelength [nm] 1064 1064
Spiral diameter [mm] 6 6
Repetition rate [kHz] 100 15
Focal length [mm] 100.1 100
Distance (f lens to target) [cm] 12 12
Fluence [J cm-2] 3.12 3.78
laser beam
electrolyte
stirrer
metal target
quartz window

133
New material was ablated for each pulse to avoid target modification and melting.
Laser parameters are as follow: 10 ps laser Pulse energy 0.156 mJ, Repetition rate
100kHz and Fluence 1,8J/cm2. Experiments were performed at Duisburg Essen
University in Germany. Ablation using 10 ns laser was performed at Padova University
in Italy. Laser parameters are as follow Pulse energy (22.6 mJ/pulse, 10ns, 1064nm)
7.3.4 UV-Vis Spectroscopy (UV-Vis)
UV/Vis extinction spectroscopy is a spectroscopic technique in which a sample is
irradiated with light of different wavelengths in the ultraviolet-visible spectral region. A
Specific absorbance is an result of the induced electronic transitions. For this the
transmitted light is detected in correlation to the incident light. To the set up of
Spectrophotometer belong a sample holder, a light source, a monochromator and a
detector. Based on the Beer-Lambert Law, the absorbacne of a solution is in direct
correlation to the concentration of the absorbing species and the path length.
Therefore, this method can be used as tool to quantify absorbing species.
Quarzcuvette with d=10 mm were used for all measrments. UV-Vis Spectrum were
analyse between 200-1000 nm. To avoid agglomeration each AuFe colloid were
placed for 10 min in ultrasonic bath before each measurment.
7.3.5 High-angle annular dark-field scanning transmission electron microscopy
(STEM-HAADF) and EDX analysis
Analysis with help of STEM has similar properties to detection via TEM, The difference
lies in the electron beam, which scans the sample in a raster, whereas the electron
beam is focused on a small spot. TEM, enables the direct imaging with a high-voltage,
focues electron-beam. While the electron beam passes through the sample, electrons
are diffracted by atomic planes of the sample. This results in formation of the
transmission electron diffraction patterns, then magnified image is created. The image
contrast is determined by the thickness of the sample and the material-dependent
absorption of electrons. Similarly to TEM, STEM uses the different ways of the
interaction of the electron beam with the species in aim to create an image. Here the
spot size cant exceed 1 nm, and therefore for this purpose Field Emission Gun is used.
The biggest advantage of the STEM is the possibility of application of different imaging
modes at once, which is not accessible during TEM measurements.

134
High Resolution Transmission Electron Microscopy, is an additional imaging mode,
which allows the creation of higher resolution images (of 0.1 nm). The principle is
based on the fact, that phase contrast is used and not the analysis of the difference in
the intensity resulted due to absorption of the sample, used in bright field mode. The
phase contrast, on the other side, evaluates the phase shifts of the electron waves.
The electron wave interacts with the positive core of an atom leading to the phase shift.
As a result am image with the plane of the electron waves interface is generated. This
approach has many advantages towards crystalline material analysis.
Both of this approaches are enriched by the elemental analysis with Energy dispersive
X-Ray spectroscopy. In this method, the high energy electron beam is focused on the
sample, leading to removal of the electrons from the core shells into ionize atoms of
the sample. An electron from the upper shell with take place it former position after the
inner shell electron is removed. The electro from the upper shell is characteristics with
the higher energy than the electron in the inner shell. The EDX detector measures the
difference of the energy between both of them will be released as X-Rays. According
to Pauli principal each element has a specific X-Rays and therefore it can be
characterized. Finally the elemental structure of the analyzed sample can be
established.
Size and the internal composition were determined using transmission electron
microscopy STEM-HAADF (FEI Company, Tecnai F30, STWIN G). 10µL of the colloid
dispersion were pipetted onto a carbon-coated copper microgrid and dried overnight.
The ferret diameter was measured with the aid of a measuring tool in Digital
micrograph by averaging 1000 nanoparticles. The results were plotted both as number
and volume-weighted distribution and fitted using a log-normal function. The average
particle size was obtained from the expected values Xc) of this fit. Energy dispersive
x-ray spectroscopy is a suitable method for quantitative elemental detection of iron
gold system. Thus differentiation of the elements and corresponding oxide is distinct.
EDX results are obtained by STEM-EDX measurements with Phillips XL 30 with EDAX
DX-4. Therefore, different kind of EDX spectra are generated. The integration over a
large number of nanoparticles confirms the coincidence of target and nanoparticle
composition. Based on Z-contrast of STEM-HAADF imaging mode, a distinct hint of
the ultrastructure is possible. CS nanoparticles can be identified, but EDX mapping
and line scans are sufficient to prove the existence of the CS ultrastructure in each

135
sample. Furthermore, the absence of oxidation especially in the iron core of Fe@Au
nanoparticles can be proved.
7.3.6 Selected area diffraction (SEAD)
SEAD is powerful technique, frequently used to study crystal structure of materials.
The sample is irradiated with an electron beam by an incident parallel beam. A
diffraction pattern appearing, contains electrons from the whole range of the
illuminated area. A first diffraction pattern appears in the focal plane of the objective
lens, whereas the image is show in the plane of this lens. Thank to magnification lens
intermediate image or the diffraction pattern is generated.
7.3.7 X-Ray Diffraction (XRD)
By means of X-ray powder diffraction (XRD) using a Bruker D8 Advance diffractometer
(Cu Kα radiation, λ = 1.54 Å; 40 kV, 40 mA) a phase composition of all targets and
produced FeAu NPs was determined. Comparing to the bulk materials just positioned
in sample holder, all nanoparticles from a high-concentrated colloid were
homogenously distributed on a silicon single crystal to minimize scattering. To
determine the phase ratios, lattice parameters and percentage of the Fe/Au
substitution in the FCC and BCC structures as well as to estimate AuFe. The average
crystallite sizes from diffraction peak broadening reflections (using the Scherrer
equation), the Rietveld refinement was performed with the Bruker software TOPAS
4.2. The patterns of cubic Au-FCC (#004-0784) and Fe-BCC (#006-0696) phases from
the ICDD database were used as reference for the qualitative phase analysis, which
was done with a Diffrac.Suite EVA V1.2 from Bruker.

136
7.4 Curriculum Vitae
Der Lebenslauf ist in der Online-Version aus Gründen des Datenschutzes nicht
enthalten.

137

138
7.5 List of Authored and Co-author Publications
Peer-Reviewed Publications
1.) Anna Tymoczko, Marius Kamp, Oleg Prymak, Christoph Rehbock, Jurij Jakobi,
Ulrich Schürmann, Lorenz Kienle and Stephan Barcikowski. How the crystal structure
and phase segregation of Au–Fe alloy nanoparticles are ruled by the molar fraction and
size. Nanoscale, 2018,10, 16434-16437
2.) Anna Tymoczko, Marius Kamp, Christoph Rehbock, Lorenz Kienle, Elti
Cattaruzza, Stephan Barcikowski and Vincenzo Amendola. One-step synthesis of Fe–
Au core–shell magnetic-plasmonic nanoparticles driven by interface energy minimization.
Nanoscale Horiz., 2019,4, 1326-1332
3.) Marius Kamp, Anna Tymoczko, Ulrich Schürmann, Jurij Jakobi, Christoph Rehbock
Klaus Rätzke, Stephan Barcikowski, Lorenz Kienle. Temperature-Dependent
Ultrastructure Transformation of Au–Fe Nanoparticles Investigated by in Situ Scanning
Transmission Electron Microscopy. Cryst. Growth Des. 2018, 18, 9, 5434-5440.
4.) Marius Kamp, Anna Tymoczko, Ulrich Schürmann, Jurij Jakobi, Christoph Rehbock Klaus Rätzke, Stephan Barcikowski, Lorenz Kienle. Temperature-Dependent Ultrastructure Transformation of Au–Fe Nanoparticles Investigated by in Situ Scanning Transmission Electron Microscopy. Cryst. Growth Des. 2018, 18, 9, 5434-5440.
Oral presentation (presenting author*)
1.) Anna Tymoczko, Marius Kamp, Christoph Rehbock, Lorenz Kienle, Stephan
Barcikowski Laser generated magneto-plasmonic Au-Fe Nanoparticles: Formation
mechanism, Real Structure and properties, 6th EuCheMS Chemistry Congress,
September 2016, Seville (Spain).
2.) Anna Tymoczko, Marius Kamp, Oleg Prymak, Christoph Rehbock, Jurij Jakobi,
Ulrich Schürmann, Lorenz Kienle and Stephan BarcikowskiModeling the formation
mechanism for magneto-plasmonic Au@Fe NPs generated via laser ablation. 7.
Junges Chemie Symposium Ruhr, October 2016, Dortmund.
3.) A. Tymoczko, M. Kamp, C. Rehbock, J.Jakobi, U. Schürmann, S. Barcikowski, L.
Kienlei. The formation mechanism and internal phase structure of AuFe alloy

139
nanoparticle generated via laser ablation in liquids. XXVI International Materials
Research Congress (IMRC August 2017) in Cancun, Mexico.
4.) Anna Tymoczko*, Marius Kamp, Christioph Rehbock, Ulrich Schürmann, Oleg
Prymak, Lorenz Kienle, Stephan Barcikowski. How does the crystal structure influence
the final composition of the Au-Fe alloy nanoparticles generated via pulsed laser
ablation in liquids? 26th Annual Meeting of the German Crystallographic Society (DGK)
March 2018, Essen.
5.) Anna Tymoczko*, Marius Kamp, Christioph Rehbock, Ulrich Schürmann, Oleg
Prymak, Lorenz Kienle, Stephan Barcikowski High yield one step laser synthesis of
core-shell Fe-Au nanoparticles is influenced by target composition and nanoparticle
size. The 2019 Spring Meeting of the European Materials Research Society, May 2019,
in Nice, France
Poster Presentation
1.) Anna Tymoczko, Marius Kamp, Oleg Prymak, Christoph Rehbock, Jurij Jakobi,
Ulrich Schürmann, Lorenz Kienle and Stephan Barcikowski. Formation mechanism of
AuFe nanoparticles via laser ablation. CENIDE, NanoBioPhotonics-Symposium, 2016,
Duisburg
2.) Anna Tymoczko, Marius Kamp, Oleg Prymak, Christoph Rehbock, Jurij Jakobi,
Ulrich Schürmann, Lorenz Kienle and Stephan Barcikowski. Understanding the
formation mechanism of magneto-plasmonic Au-Fe Nanoparticles (NPs) generated by
pulse laser ablation in liquid (PLAL). 7. NRW Nano-Konferenz - NMWP, December
2016, Münster
3.) Anna Tymoczko, Marius Kamp, Oleg Prymak, Christoph Rehbock, Jurij Jakobi,
Ulrich Schürmann, Lorenz Kienle and Stephan Barcikowski. How does the crystal
structure influence the final composition of the Au-Fe alloy nanoparticles generated via
pulsed laser ablation in liquids? 26th Annual Meeting of the German Crystallographic
Society (DGK) March 2018, Essen.

140
7.6 Declarations
Experimental contribution:
1.) STEM, TEM, EDX line scans / mapping and SEAD patterns experiments and data
interpretation (chapter 4.3), size distribution statistics (chapter 4.2.2) were carried
out by Marius Kamp, Faculty o Engineering, CAU Kiel
2.) X-Ray powder diffraction (XRD) for AuFe and AuCo was executed by Dr. Oleg
Prymak, Institute of Inorganic Chemistry, UDE Essen,
3.) Single pulse laser ablation with 10 ns laser, SERS, Raman Spectra was carried out
by Dr. Vincenzo Amendola, Dep. of Chemical Sciences 1 , University of Padova
4.) Laser ablation of AuFe in various liquids was performed by Roger Aumuller, UDE,
Essen
5.) Laser ablation of AuCo was conducted by Dr. Jacob Johny, UDE, Essen
Publication contribution:
Results on the target composition and size of the particles impact on the Core-
Shell Yield have been published in the scientific journal Nanoscale:
Anna Tymoczko, Marius Kamp, Oleg Prymak, Christoph Rehbock, Jurij Jakobi, Ulrich
Schürmann, Lorenz Kienle and Stephan Barcikowski. How the crystal structure and
phase segregation of Au–Fe alloy nanoparticles are ruled by the molar fraction and size.
Nanoscale, 2018,10, 16434-16437
The authors gave the following contributions: The experimental design was given by
SB, AT and CR. Experiments were conducted by AT, MK and OP. Data analysis and
interpretation were performed by AT, CR, MK, US, OP, JJ, LK and SB. The first draft
was written by AT under the guidance of SB. All authors revised the manuscript.
Results on the target geometry and pulse duration of the particles impact on the
Core-Shell Yield have been published in the scientific journal Nanoscale
Horizons:
Anna Tymoczko, Marius Kamp, Christoph Rehbock, Lorenz Kienle, Elti
Cattaruzza, Stephan Barcikowski and Vincenzo Amendola. One-step synthesis of Fe–
Au core–shell magnetic-plasmonic nanoparticles driven by interface energy minimization.
Nanoscale Horiz., 2019,4, 1326-1332
The authors gave the following contributions: The experimental design was given by
SB, AT, CR and VA. Experiments were conducted by AT, MK, EC and VA. Data
analysis and interpretation were performed by AT, CR, MK, VA, EC, LK and SB. The
first draft was written by AT under the guidance of VA and SB. All authors revised the
manuscript.

141
Results on the temperature on the particles ultrastructure have been published
in the scientific journal Nanoscale Horizons:
Marius Kamp, Anna Tymoczko, Ulrich Schürmann, Jurij Jakobi, Christoph Rehbock,
Klaus Rätzke, Stephan Barcikowski, Lorenz Kienle. Temperature-Dependent
Ultrastructure Transformation of Au–Fe Nanoparticles Investigated by in Situ Scanning
Transmission Electron Microscopy. Cryst. Growth Des. 2018, 18, 9, 5434-5440.
The authors gave the following contributions: The experimental design was given by
MK, US and LK. Experiments were conducted by AT, KR and MK. Data analysis and
interpretation were performed by AT, CR, MK, US, KR, JJ, LK and SB. The first draft
was written by MK under the guidance of LK. All authors revised the manuscript.
Results on the etching on the particles ultrastructure stability have been
published in the scientific journal Nanoscale Horizons:
Marius Kamp, Anna Tymoczko, Ulrich Schürmann, Jurij Jakobi, Christoph Rehbock
Stephan Barcikowski, Lorenz Kienle. Templated dealloying: designing novel
ultrastructures by memory effect. Cryst. Growth Des. 2019, 19, 9, 4957-4963.
The authors gave the following contributions: The experimental design was given by
MK, US and LK. Experiments were conducted by AT and MK. Data analysis and
interpretation were performed by AT, CR, MK, US, JJ, LK and SB. The first draft was
written by MK under the guidance of LK. All authors revised the manuscript.
The following student works have been completed under my co-supervision:
Laura Theimann, Master Thesis, Lehramt, October 2016-Mai 2017: ’’ Aufarbeitung von
Fe@Au-Nanopartikeln und deren Charakterisierung mittels Cyclovoltammetrie‘‘
Roger Aumuller, Bachelor Thesis, March 2017- June 2017 ‘’ Auswirkungen von
Lösemittel auf die Kern-Schale-Strukturen von Gold-/Eisennanopartikel.‘‘
Jarno Banas, Analytic Practical, Study of laser generated Fe@Au core-shell
nanoparticles via Cyclic Voltammetry.
Johny Jacob, Guest Researcher, September 2018-March 2019 ’’Evaluation of the
mechanistic AuFe model with another binary system, AuCo’’

142
I hereby state that I have not received the opportunity to take part in the present
doctoral proceedings via commercial channels. In particular, I have not engaged the
services of any organization which will, for a fee, recruit supervisors for the process of
preparing doctoral dissertations. Nor have I engaged the services of any such
organization to carry out, either totally or in part, the tasks which I am obliged to perform
as part of the examination requirements. I have received assistance, and will in the
future receive assistance, from third parties only to an extent which is commensurate
with good scholarly practice and permitted by the laws on examinations.
I am aware that making any false declarations in this statement can cause me to be
excluded from the doctoral proceedings or, at a later date, result in termination of the
proceedings or revocation of an already awarded doctoral title.

143
7.7 Acknowledgment
I would like to thank my PhD supervisor Prof. Dr.-Ing. Stephan Barcikowski for providing me this interesting and challenging research topic, the very good scientific supervision with many stimulating discussions and the seemingly unlimited number of ideas. I would also like to thank him for making it possible for me to attend numerous conferences to present many of our research results. But I would also like to thank for the numerous activities besides working hours, which have created a phenomenal working atmosphere in the TCI group.
I would like to thank Prof. Dr. Lorenz Kienle for helpful tips and discussions, and for enabling a successful cooperation with his research group.
In addition to the thanks to both professors, my sincere thanks go to Dr. Christoph Rehbock for his constant readiness for discussions and his extraordinary motivation to achieve the project goals. Many thanks for the numerous fruitful discussions and meetings.
I would like to thank Dr. Vincenzo Amendola for his willingness to conduct single pulse experiments and for stimulating discussions during our collaboration.
I would like to thank Marius Kamp for the pleasant cooperation and his support. In particular, I thank him for the nanoparticle characterization with electron miscroscopy methods and his refreshing ideas during project meetings.
I thank my hard-working students Laura Theimann, Roger Aumulller, Jarno Banas for their productive cooperation. Especially many thanks to Dr. Jacob Johny, for many interesting discussions during his stay in Germany.
For the constant support and the many advices, the great working atmosphere and the wonderful time, I would like to thank all employees of TC I: Carmen, Sebastian, René, Jurij, Alex H., Alex L., Anna Z., Bilal, Christoph, Claudine, Dieter, Elisabeth, Frank, Friedrich, Galina, Ina, Lisa, Marcus, Mark, Nina, Philipp, Stephan, Sven K., Sven R. and Tim. Especially, Sandra, Ruksan and Jacob for very memorable moments, support, motivation and friendship.
Special appreciation for my husband Christian, for his support, motivation and his patience.
Last but not least, I would like to thank my family, and my brother, people who where always there for me and made me the person I am today. In this way I would like to thank them for the beautiful childhood and youth, in which you taught me the most important values.