Performance improvement of plasmonic sensors using a ...
19
HAL Id: hal-02073261 https://hal.archives-ouvertes.fr/hal-02073261 Submitted on 17 Dec 2020 HAL is a multi-disciplinary open access archive for the deposit and dissemination of sci- entific research documents, whether they are pub- lished or not. The documents may come from teaching and research institutions in France or abroad, or from public or private research centers. L’archive ouverte pluridisciplinaire HAL, est destinée au dépôt et à la diffusion de documents scientifiques de niveau recherche, publiés ou non, émanant des établissements d’enseignement et de recherche français ou étrangers, des laboratoires publics ou privés. Performance improvement of plasmonic sensors using a combination of AC electrokinetic effects for (bio)target capture Quentin Avenas, Julien Moreau, Marion Costella, Arbi Maalaoui, Abdelkader Souifi, Paul Charette, Julien Marchalot, Marie Frénéa-Robin, Michael Canva To cite this version: Quentin Avenas, Julien Moreau, Marion Costella, Arbi Maalaoui, Abdelkader Souifi, et al.. Performance improvement of plasmonic sensors using a combination of AC electrokinetic ef- fects for (bio)target capture. Electrophoresis, Wiley-VCH Verlag, 2019, 40, pp.1426 - 1435. 10.1002/elps.201800436. hal-02073261
-
Upload
khangminh22 -
Category
Documents
-
view
2 -
download
0
Transcript of Performance improvement of plasmonic sensors using a ...
HAL Id: hal-02073261https://hal.archives-ouvertes.fr/hal-02073261
Submitted on 17 Dec 2020
HAL is a multi-disciplinary open accessarchive for the deposit and dissemination of sci-entific research documents, whether they are pub-lished or not. The documents may come fromteaching and research institutions in France orabroad, or from public or private research centers.
L’archive ouverte pluridisciplinaire HAL, estdestinée au dépôt et à la diffusion de documentsscientifiques de niveau recherche, publiés ou non,émanant des établissements d’enseignement et derecherche français ou étrangers, des laboratoirespublics ou privés.
Performance improvement of plasmonic sensors using acombination of AC electrokinetic effects for (bio)target
captureQuentin Avenas, Julien Moreau, Marion Costella, Arbi Maalaoui, AbdelkaderSouifi, Paul Charette, Julien Marchalot, Marie Frénéa-Robin, Michael Canva
To cite this version:Quentin Avenas, Julien Moreau, Marion Costella, Arbi Maalaoui, Abdelkader Souifi, et al..Performance improvement of plasmonic sensors using a combination of AC electrokinetic ef-fects for (bio)target capture. Electrophoresis, Wiley-VCH Verlag, 2019, 40, pp.1426 - 1435.�10.1002/elps.201800436�. �hal-02073261�
www.electrophoresis-journal.com Page 1 Electrophoresis
www.electrophoresis-journal.com Page 1 Electrophoresis
Received: 10 15, 2018; Revised: 01 15, 2019; Accepted: 02 04, 2019
This article has been accepted for publication and undergone full peer review but has not been
through the copyediting, typesetting, pagination and proofreading process, which may lead to
differences between this version and the Version of Record. Please cite this article as doi:
10.1002/elps.201800436.
This article is protected by copyright. All rights reserved.
<PE-AT>Performance improvement of plasmonic sensors
using a combination of AC electrokinetic effects
for (bio)target capture
Quentin Avenas1,2, Julien Moreau4, Marion Costella1,3, Arbi Maalaoui1,3,
Abdelkader Souifi2, Paul Charette1, Julien Marchalot3, Marie Frénéa-Robin3 and
Michael Canva1,4
1 Laboratoire Nanotechnologies et Nanosystèmes, LN2 ; CNRS - Université de Sherbrooke - INSA Lyon ; 3IT,
Sherbrooke, Canada
2 Institut des Nanotechnologies de Lyon ; CNRS - INSA Lyon - Université Claude Bernard Lyon 1 ;
Villeurbanne, France
3 AMPERE ; CNRS - Université de Lyon - École Centrale Lyon - INSA Lyon - Université Claude Bernard Lyon 1 ; F-
69130, Ecully, France
4 Laboratoire Charles Fabry ; CNRS – Institut d’Optique Graduate School, Université Paris Saclay ;
Palaiseau, France
Corresponding author: Quentin Avenas
Title: PhD Student
Full postal address: 111 rue Cuvier, 69006 Lyon
E-mail address: [email protected]
https://orcid.org/0000-0002-1006-6412
List of abbreviations:
ACEO: Alternating current electroosmosis
DEP: Dielectrophoresis
www.electrophoresis-journal.com Page 2 Electrophoresis
This article is protected by copyright. All rights reserved.
ETE: Electrothermal effect
IDE: Interdigitated electrodes
RIU: Refractive index unit
ROI: Region of interest
SPR: Surface plasmon resonance
SPRI: Surface plasmon resonance imaging
TE: Transverse electric
TM: Transverse magnetic
UV: Ultraviolet
Keywords: Biosensor, Dielectrophoresis; Electroosmosis; Surface plasmon resonance.
Abstract
Analytes concentration techniques are being developed with the appealing expectation to
boost the performance of biosensors. One promising method lies in the use of electrokinetic forces.
We present hereafter a new design for a microstructured plasmonic sensor which is obtained by
conventional microfabrication techniques, and which can easily be adapted on a classical surface
plasmon resonance imaging (SPRI) system without further significant modification. Dielectrophoretic
trapping and electro-osmotic displacement of the targets in the scanned fluid are performed
through interdigitated 200 µm wide gold electrodes that also act as the SPR-sensing substrate. We
demonstrate the efficiency of our device’s collection capabilities for objects of different sizes (200
nm and 1 µm PS beads, as well as 5-10 µm yeast cells). SPRI is relevant for the spatial analysis of the
mass accumulation at the electrode surface. We demonstrate that our device overcomes the
diffusion limit encountered in classical SPR sensors thanks to rapid collection capabilities (< 1
minute) and we show a consequent improvement of the detection limit, by a factor greater than
300. This study of an original device combining SPRI and electrokinetic forces paves the way to the
development of fully integrated active plasmonic sensors with direct applications in life sciences,
electrochemistry, environmental monitoring and agri-food industry.
Color online: See article online to view Figs. 1–5 in color.
Additional supporting information may be found in the online version of this article at the publisher’s
web-site.
<PE-FRONTEND>
1. Introduction
1.1 SPRI
Surface Plasmon Resonance (SPR) is a powerful detection technique for analyzing biomolecular
interactions [1]–[3] with applications in various domains such as life sciences, electrochemistry or
www.electrophoresis-journal.com Page 3 Electrophoresis
This article is protected by copyright. All rights reserved.
food and environment safety. SPR sensors allow for label-free, real-time, quantitative and sensitive
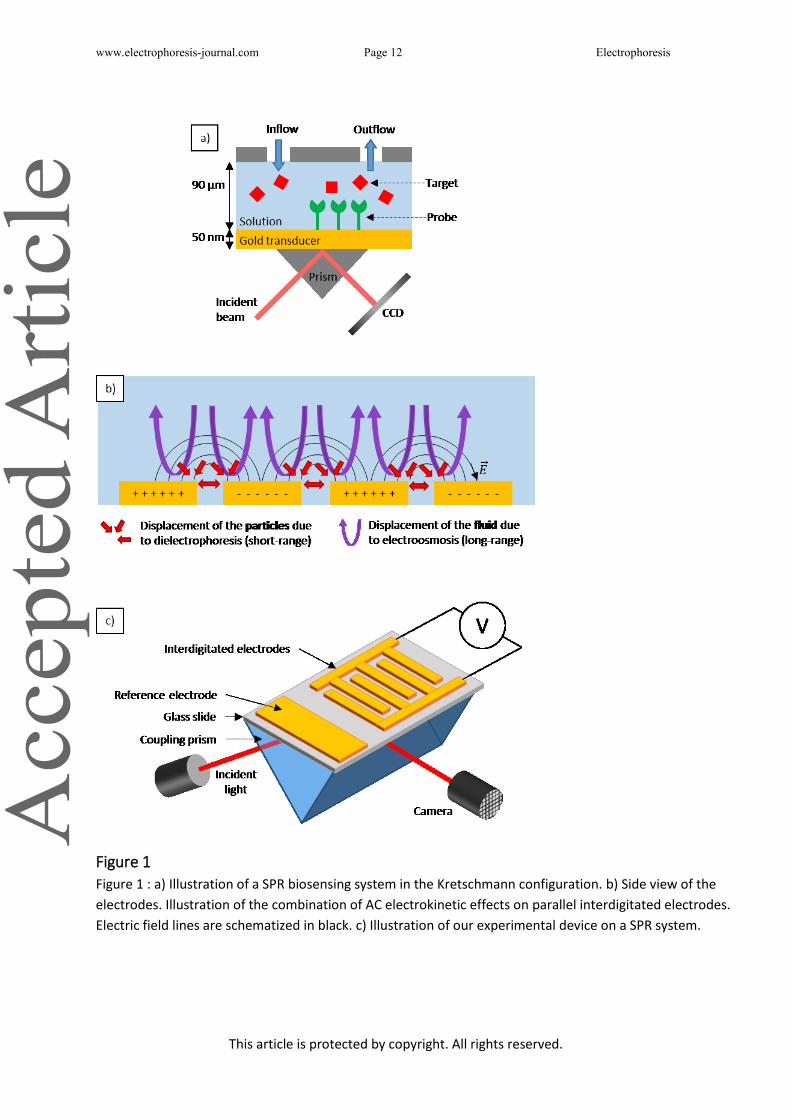
detection and/or analysis [4] of intermolecular events. They are usually used in the Kretschmann
configuration, as described on Figure 1.a): the metal film is illuminated through a prism by an
incident beam that is then reflected except for a particular angle and wavelength where light is
absorbed by the electrons at the metal-dielectric interface. These resonance angle and wavelength
depend on the optical properties of the materials near the interface. Biomolecular events at the
surface (e.g. target/probe interaction as illustrated on Figure 1.a)) locally change the refractive index
and are thus detected by tracking the coupling resonance angle (or wavelength) shifts. In a
complementary manner SPR Imaging (SPRI) usually consists in the measurement of reflectivity
variations at a fixed angle and wavelength. This technique provides spatial information [5],[6] and
led to the development of high-throughput SPR biochips [7]–[10]. The high interest in this
technology has led different research groups to reach the maximal theoretical resolution limit in the
last decade [11]. However, as a surface-based sensing technique, it can only detect molecules if they
are near the surface (typically, less than 200 nm away). Thus, the diffusion limit is the main obstacle
to performance enhancement of all surface-based sensors today [12], and particularly SPRI biochips.
Figure_1
1.2 Electrohydrodynamic (EHD) forces
Microfluidic transport strategies have been studied since the last two decades in order to
overcome the diffusion limit [13]. Amongst all the existing techniques, electrokinetic effects are
particularly interesting because they are applicable to a wide range of target sizes and types. They
also can be induced within devices of various materials and geometries [14], depending on the
objective. Thus, they could easily be adapted to the structure of a SPRI sensor using the gold sensing
surface as an electrode and thereby bring an answer to the problem of the diffusion limit.
Electrokinetic effects such as electrophoresis, dielectrophoresis (DEP), alternating current
electro-osmosis (ACEO) and electro-thermal effect (ETE) have been widely studied [15]–[19] and
enable different ways of breaking this limit. Since electrophoresis is conventionally carried out using
a direct current field, undesirable effects like alteration of the gold surface may affect the monitored
signal. Hence we chose to use AC electrokinetic effects and to implement them on an SPRI sensor.
Pioneering results on sensor enhancement by combined EHD/DEP were reported from 2003
by Hughes’ group [20]–[23]. Coupling of electrokinetic actuation and evanescent light sensing on the
same device was demonstrated for the first time in 2003 by the same group [24] and AC electric field
enhanced nanoplasmonic detection has been reported by two different groups [25],[26] more
recently. In this paper, we demonstrate that SPRI can be used in conjunction with AC electrokinetic
effects not only to improve the sensor response but also to analyse the respective contributions of
DEP and ACEO effects.
2. Materials and methods
2.1 Design and fabrication of the device
Our device consists of coplanar gold interdigitated electrodes (IDE) on a microscope glass
slide, as shown on Figure 1.c). Rectangular IDE enable massive parallel manipulation of objects as
they can easily be arranged in large arrays [27]. Additionally, their simple fabrication process
www.electrophoresis-journal.com Page 4 Electrophoresis
This article is protected by copyright. All rights reserved.
involves a single photolithography step. Moreover, their symmetrical geometry enables a theoretical
study of the device that fits well with the experimental results, as demonstrated later. Lastly, the
fact that the electrodes are integrated on the same substrate makes it easily adaptable to a classical
SPRI system, in which they can also be used as sensing areas.
Electrodes are 200 µm wide and separated with a 150 µm gap. These dimensions enable
easy and rapid fabrication of the biochip. A large gold electrode is also present 1 mm away from the
IDE, whose purpose is to provide a comparison with a classical SPRI sensor during experiments. It is
not connected to the electrical circuit and it will be referred to as the “control electrode”.
The fabrication process is straightforward: the substrate, a classical BK7 glass microscope
slide, was first cleaned with acetone, ethanol and water. Then an adhesion layer of Ti (3 nm) and the
transducing layer of Au (47 nm) were evaporated onto the substrate. The samples were then spin-
coated with AZ5214 (MicroChem) and insulated with UV (within an UV-Kub) before the photoresist
development using AZ726MIF developer. The principal advantage of the fabrication technique lies in
the use of an acetate photomask during this step, which reduces the cost of each new design while
suiting our resolution requirements. Finally, the metal layers were etched with Gold etchant and
Titanium etchant, the photoresist was stripped with acetone and the samples were cleaned again
with acetone, ethanol and DI water.
2.2 Experimental protocol
2.2.1 Solution preparation
Aqueous solutions containing different analytes were studied. Polybead® Amino Microspheres of
200 nm and 1 µm diameter were purchased from Polysciences. Each beads solution was prepared by
diluting the stock suspension with ultrapure water whose conductivity before the dilutions was
measured to be 5.5 x 10⁻⁶ S/m. The initial concentration of the commercial solution of 200 nm beads
was 5.68 x 10¹² particles/ml, that of the 1µm beads solution was 1.13 x 10¹² particles/mL. Both types
of beads have a positive Clausius-Mossotti (CM) factor in pure water at the considered frequencies
(see Figure 4 and section 3.3 about the MyDEP calculations) and are therefore expected to
experience positive dielectrophoresis. Solutions of beads were diluted 1000 times for the trapping
experiments and spatial study. Several dilutions of the 200 nm beads solution, detailed in Figure
5.b), were made for the study of detection limit enhancement. Baker’s yeast cells (saccharomyces
cerevisiae, purchased from VahineTM) were used as biological model objects. They were rehydrated
in water and resuspended at a concentration evaluated to 4.3x10⁴ cells/ml with a Malassez counting
cell.
For the calculation of the CM factor, a spherical model of concentric layers was adopted. We used a
radius of 3.5 µm and considered the cell membrane and the cell wall to be respectively 8 nm and
220 nm thick. Input values for the electrical conductivity of the cytoplasm, the cell membrane and
the cell wall were respectively 0.3 S/m, 25 µS/m and 24 mS/m. The dielectric constants of these
compartments were respectively set to 50, 6 and 60 (default values extracted from MyDEP database,
and originated from [28]).
www.electrophoresis-journal.com Page 5 Electrophoresis
This article is protected by copyright. All rights reserved.
2.2.2 Experimental workflow
Our device was first mounted on a BK7 glass prism in the Kretschmann configuration. Oil was
used to optimize the optical contact between the SPRI chip and the prism. A 90 µm thick Mylar® seal
was placed onto the chip before the prism/chip/Mylar® system was clamped against the wall of the
experimental bench. This supporting wall has two holes through which medium enters and exits the
fluidic cell. A photography of this system is provided in the Supporting Information (Figure S1). Fluid
flow was induced through the fluid circuit thanks to a peristaltic pump (Gilson, Minipuls 3).
At the beginning of each experiment, pure water was injected in the fluidic cell and an
angular scan was performed to determine the working angle at the chosen wavelength (740 nm).
The camera (Hamamatsu, C11440), motors (used to move the camera and the light source) and
thermal regulation of the fluidic cell were controlled with a LabVIEW program. Before the beginning
of each electrokinetic experiment, a stable baseline was acquired and a calibration step was
performed with a glycerol/water solution, equivalent to a variation of 1 x 10⁻³ RIU (Refractive Index
Units) [7]. Then the function generator (Agilent, 33120A) was operated manually to apply a
sinusoidal signal. The application of an electric potential at a low frequency on the gold sensing
surface can affect the SPR signal even in pure water, due to oxidation of the metal [29],[30] or
changes in the repartition of charges at the metal/dielectric interface [31]. However, we verified
experimentally that with the electrical parameters we used (frequency greater than 500 Hz, voltage
lower than 10 Vpp) it had no influence on our SPR measurements, which is consistent with the
literature [29].
Two different processes were used for particle collection under AC electrokinetic effects. For
the spatial study, the experiments consisted in successive identical sequences: the sample was
injected, the pump was switched off and then the function generator was switched on after a short
relaxation step. There was therefore no flow during the mass transport step. After particle
collection, the function generator was switched off and fresh medium was injected in the fluidic cell
before the beginning of the next sequence. The protocol used for determining the limit of detection
was different, as the electric field was applied during the injection in order to maximize the quantity
of trapped objects.
2.2.3 Imaging methods
The SPRI system was described in a previous article [32] and is schematized on Figure 1.c).
The fabricated device is mounted on a BK7 glass prism and clamped against the fluidic cell. Electrode
contact pads are electrically connected to a function generator thanks to alligator clips.
Images in TE and TM polarizations were collected during the experiment at a framerate of
approximately 1 image/s. Intensity measurements on different regions of interest (ROI) were then
extracted using ImageJ software, and calculations were made afterwards in order to convert them
into RIU variations, based on the calibration step [7]. Intensity measurements were also conducted
on the reference electrode, which is not connected to the electrical circuit, for comparison with the
signal that would be obtained with a classical SPR biochip. Moreover, diffusive effects induced a
second phase of slow signal growth after the rapid trapping phase. In this study we focused on the
rapid collection of particles. Thus, for the last part of this study, the signal was measured after a
fixed time of 30 s which was the same for each measurement, therefore ensuring their
comparability.
www.electrophoresis-journal.com Page 6 Electrophoresis
This article is protected by copyright. All rights reserved.
Optical microscopy observations (using a 20 × objective) were made with an Axiovert 40
Zeiss microscope (used in bright field mode) and an Eclipse LV150 Nikon microscope (used in dark
field mode).
3. Results and discussion
3.1 Collection of different particles
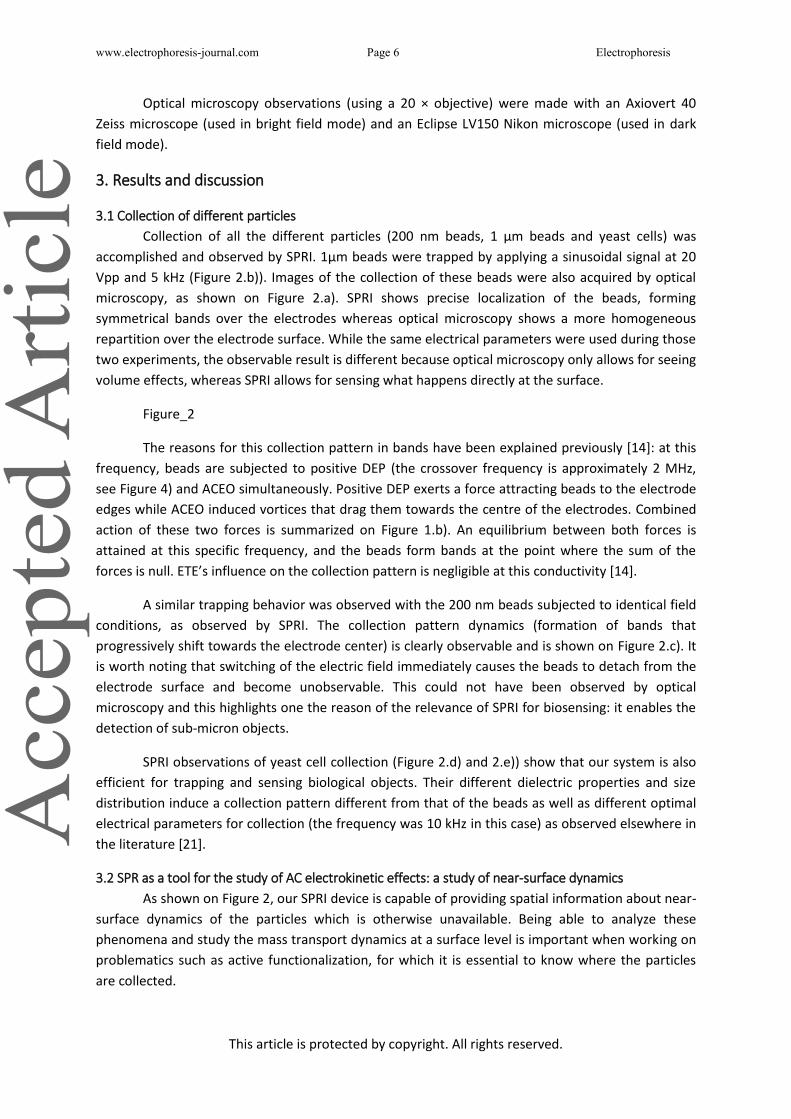
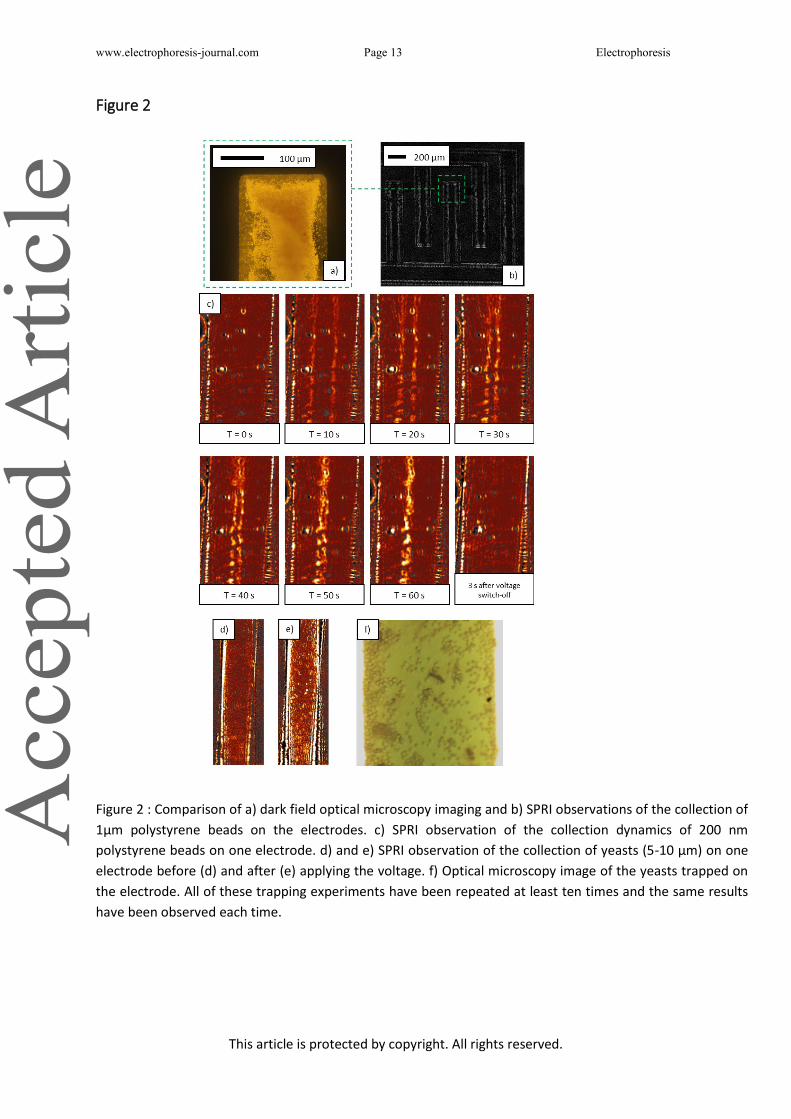
Collection of all the different particles (200 nm beads, 1 µm beads and yeast cells) was
accomplished and observed by SPRI. 1µm beads were trapped by applying a sinusoidal signal at 20
Vpp and 5 kHz (Figure 2.b)). Images of the collection of these beads were also acquired by optical
microscopy, as shown on Figure 2.a). SPRI shows precise localization of the beads, forming
symmetrical bands over the electrodes whereas optical microscopy shows a more homogeneous
repartition over the electrode surface. While the same electrical parameters were used during those
two experiments, the observable result is different because optical microscopy only allows for seeing
volume effects, whereas SPRI allows for sensing what happens directly at the surface.
Figure_2
The reasons for this collection pattern in bands have been explained previously [14]: at this
frequency, beads are subjected to positive DEP (the crossover frequency is approximately 2 MHz,
see Figure 4) and ACEO simultaneously. Positive DEP exerts a force attracting beads to the electrode
edges while ACEO induced vortices that drag them towards the centre of the electrodes. Combined
action of these two forces is summarized on Figure 1.b). An equilibrium between both forces is
attained at this specific frequency, and the beads form bands at the point where the sum of the
forces is null. ETE’s influence on the collection pattern is negligible at this conductivity [14].
A similar trapping behavior was observed with the 200 nm beads subjected to identical field
conditions, as observed by SPRI. The collection pattern dynamics (formation of bands that
progressively shift towards the electrode center) is clearly observable and is shown on Figure 2.c). It
is worth noting that switching of the electric field immediately causes the beads to detach from the
electrode surface and become unobservable. This could not have been observed by optical
microscopy and this highlights one the reason of the relevance of SPRI for biosensing: it enables the
detection of sub-micron objects.
SPRI observations of yeast cell collection (Figure 2.d) and 2.e)) show that our system is also
efficient for trapping and sensing biological objects. Their different dielectric properties and size
distribution induce a collection pattern different from that of the beads as well as different optimal
electrical parameters for collection (the frequency was 10 kHz in this case) as observed elsewhere in
the literature [21].
3.2 SPR as a tool for the study of AC electrokinetic effects: a study of near-surface dynamics
As shown on Figure 2, our SPRI device is capable of providing spatial information about near-
surface dynamics of the particles which is otherwise unavailable. Being able to analyze these
phenomena and study the mass transport dynamics at a surface level is important when working on
problematics such as active functionalization, for which it is essential to know where the particles
are collected.
www.electrophoresis-journal.com Page 7 Electrophoresis
This article is protected by copyright. All rights reserved.
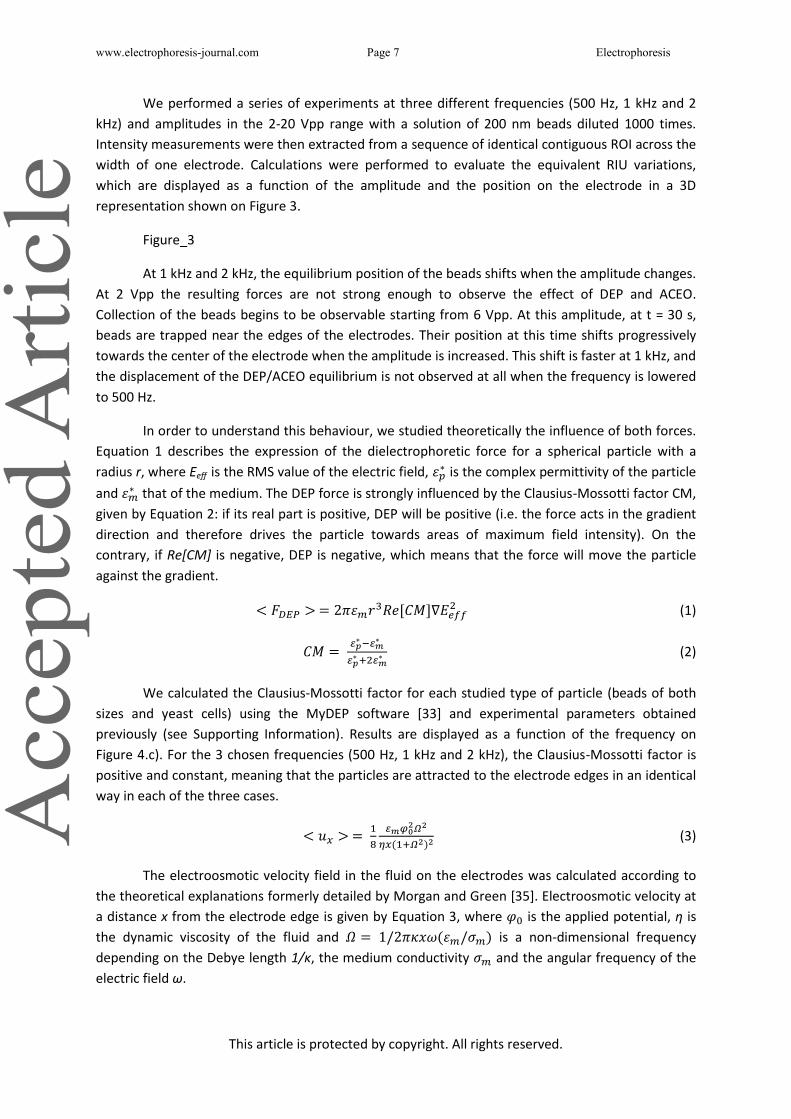
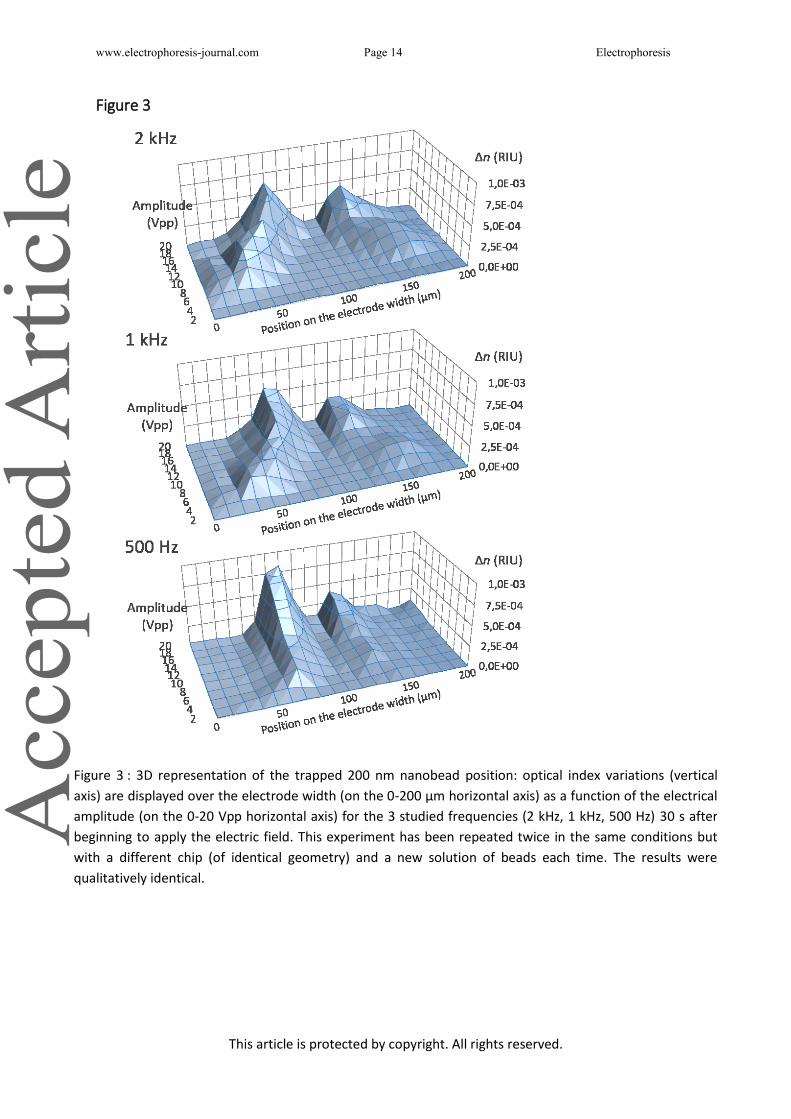
We performed a series of experiments at three different frequencies (500 Hz, 1 kHz and 2
kHz) and amplitudes in the 2-20 Vpp range with a solution of 200 nm beads diluted 1000 times.
Intensity measurements were then extracted from a sequence of identical contiguous ROI across the
width of one electrode. Calculations were performed to evaluate the equivalent RIU variations,
which are displayed as a function of the amplitude and the position on the electrode in a 3D
representation shown on Figure 3.
Figure_3
At 1 kHz and 2 kHz, the equilibrium position of the beads shifts when the amplitude changes.
At 2 Vpp the resulting forces are not strong enough to observe the effect of DEP and ACEO.
Collection of the beads begins to be observable starting from 6 Vpp. At this amplitude, at t = 30 s,
beads are trapped near the edges of the electrodes. Their position at this time shifts progressively
towards the center of the electrode when the amplitude is increased. This shift is faster at 1 kHz, and
the displacement of the DEP/ACEO equilibrium is not observed at all when the frequency is lowered
to 500 Hz.
In order to understand this behaviour, we studied theoretically the influence of both forces.
Equation 1 describes the expression of the dielectrophoretic force for a spherical particle with a
radius r, where Eeff is the RMS value of the electric field, is the complex permittivity of the particle
and that of the medium. The DEP force is strongly influenced by the Clausius-Mossotti factor CM,
given by Equation 2: if its real part is positive, DEP will be positive (i.e. the force acts in the gradient
direction and therefore drives the particle towards areas of maximum field intensity). On the
contrary, if Re[CM] is negative, DEP is negative, which means that the force will move the particle
against the gradient.
(1)
(2)
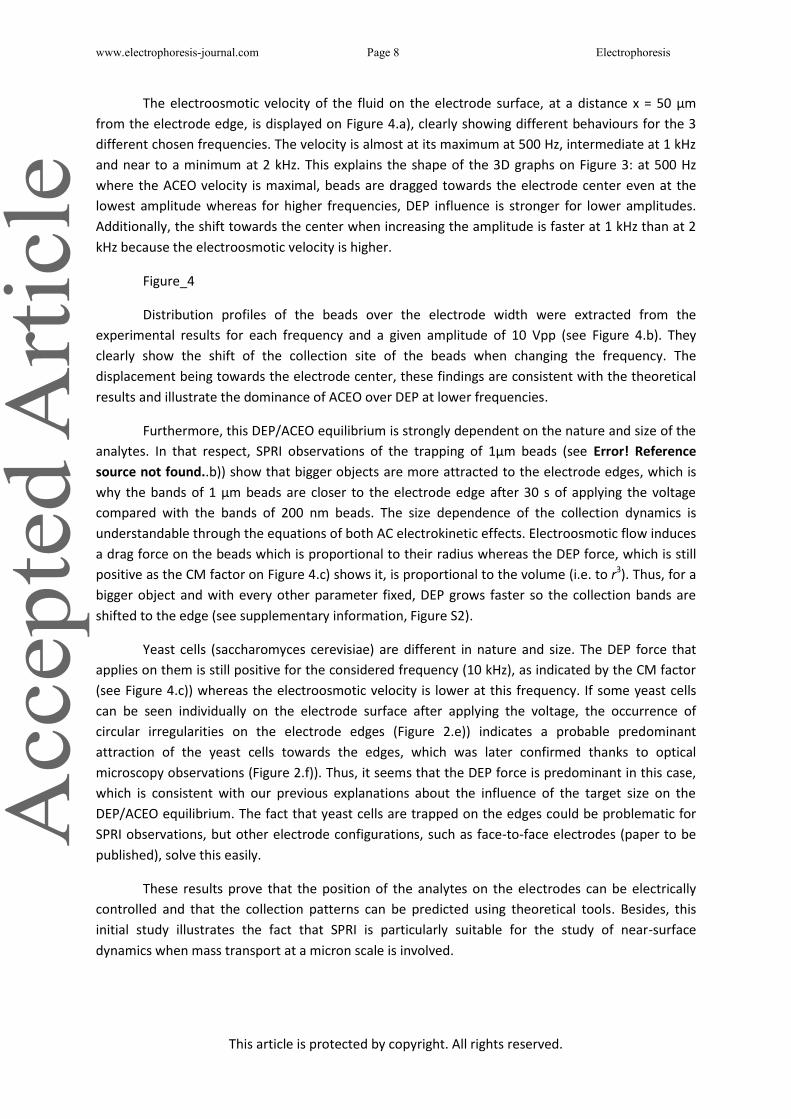
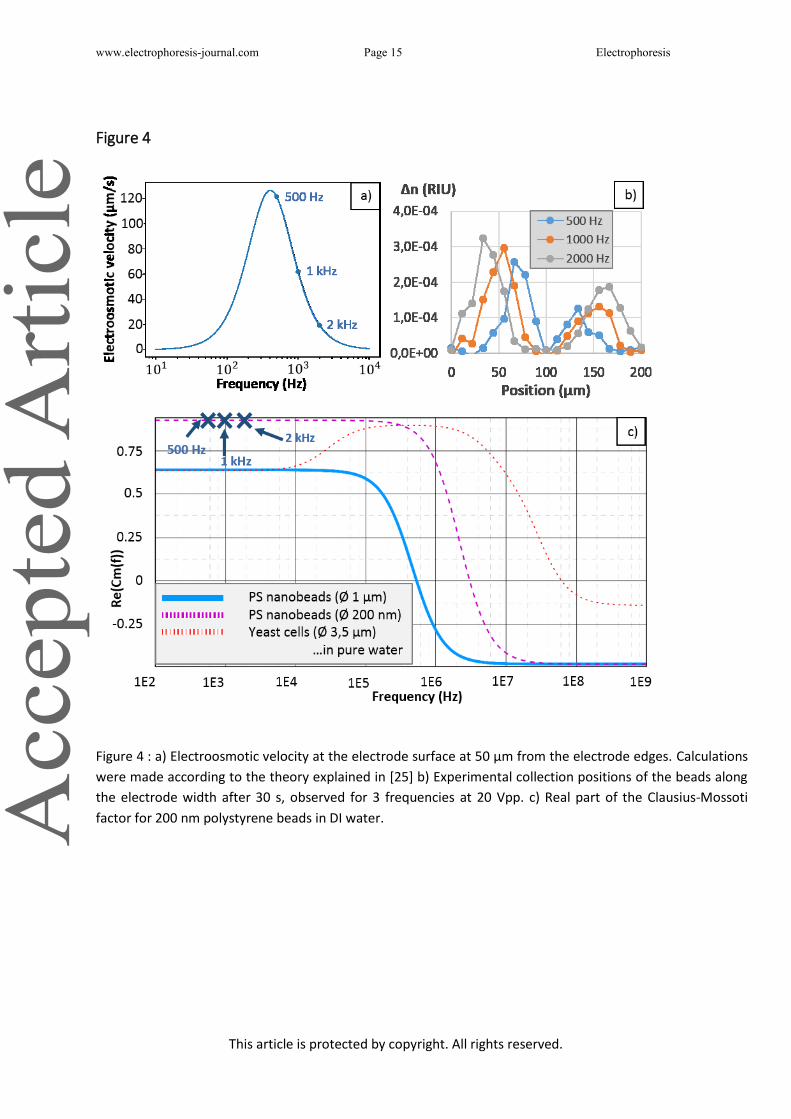
We calculated the Clausius-Mossotti factor for each studied type of particle (beads of both
sizes and yeast cells) using the MyDEP software [33] and experimental parameters obtained
previously (see Supporting Information). Results are displayed as a function of the frequency on
Figure 4.c). For the 3 chosen frequencies (500 Hz, 1 kHz and 2 kHz), the Clausius-Mossotti factor is
positive and constant, meaning that the particles are attracted to the electrode edges in an identical
way in each of the three cases.
(3)
The electroosmotic velocity field in the fluid on the electrodes was calculated according to
the theoretical explanations formerly detailed by Morgan and Green [35]. Electroosmotic velocity at
a distance x from the electrode edge is given by Equation 3, where is the applied potential, η is
the dynamic viscosity of the fluid and is a non-dimensional frequency
depending on the Debye length 1/κ, the medium conductivity and the angular frequency of the
electric field ω.
www.electrophoresis-journal.com Page 8 Electrophoresis
This article is protected by copyright. All rights reserved.
The electroosmotic velocity of the fluid on the electrode surface, at a distance x = 50 µm
from the electrode edge, is displayed on Figure 4.a), clearly showing different behaviours for the 3
different chosen frequencies. The velocity is almost at its maximum at 500 Hz, intermediate at 1 kHz
and near to a minimum at 2 kHz. This explains the shape of the 3D graphs on Figure 3: at 500 Hz
where the ACEO velocity is maximal, beads are dragged towards the electrode center even at the
lowest amplitude whereas for higher frequencies, DEP influence is stronger for lower amplitudes.
Additionally, the shift towards the center when increasing the amplitude is faster at 1 kHz than at 2
kHz because the electroosmotic velocity is higher.
Figure_4
Distribution profiles of the beads over the electrode width were extracted from the
experimental results for each frequency and a given amplitude of 10 Vpp (see Figure 4.b). They
clearly show the shift of the collection site of the beads when changing the frequency. The
displacement being towards the electrode center, these findings are consistent with the theoretical
results and illustrate the dominance of ACEO over DEP at lower frequencies.
Furthermore, this DEP/ACEO equilibrium is strongly dependent on the nature and size of the
analytes. In that respect, SPRI observations of the trapping of 1µm beads (see Error! Reference
source not found..b)) show that bigger objects are more attracted to the electrode edges, which is
why the bands of 1 µm beads are closer to the electrode edge after 30 s of applying the voltage
compared with the bands of 200 nm beads. The size dependence of the collection dynamics is
understandable through the equations of both AC electrokinetic effects. Electroosmotic flow induces
a drag force on the beads which is proportional to their radius whereas the DEP force, which is still
positive as the CM factor on Figure 4.c) shows it, is proportional to the volume (i.e. to r3). Thus, for a
bigger object and with every other parameter fixed, DEP grows faster so the collection bands are
shifted to the edge (see supplementary information, Figure S2).
Yeast cells (saccharomyces cerevisiae) are different in nature and size. The DEP force that
applies on them is still positive for the considered frequency (10 kHz), as indicated by the CM factor
(see Figure 4.c)) whereas the electroosmotic velocity is lower at this frequency. If some yeast cells
can be seen individually on the electrode surface after applying the voltage, the occurrence of
circular irregularities on the electrode edges (Figure 2.e)) indicates a probable predominant
attraction of the yeast cells towards the edges, which was later confirmed thanks to optical
microscopy observations (Figure 2.f)). Thus, it seems that the DEP force is predominant in this case,
which is consistent with our previous explanations about the influence of the target size on the
DEP/ACEO equilibrium. The fact that yeast cells are trapped on the edges could be problematic for
SPRI observations, but other electrode configurations, such as face-to-face electrodes (paper to be
published), solve this easily.
These results prove that the position of the analytes on the electrodes can be electrically
controlled and that the collection patterns can be predicted using theoretical tools. Besides, this
initial study illustrates the fact that SPRI is particularly suitable for the study of near-surface
dynamics when mass transport at a micron scale is involved.
www.electrophoresis-journal.com Page 9 Electrophoresis
This article is protected by copyright. All rights reserved.
3.3 Detection limit enhancement
Knowing that we were able to collect beads on the electrodes, our next objective was to
quantify the performances of our device. Being able to predict the exact position of the beads allows
for choosing precisely the region over which the signal is quantified, in order to get the maximal
sensitivity: in this case, beads are collected at the center of the electrodes and thus, we measured
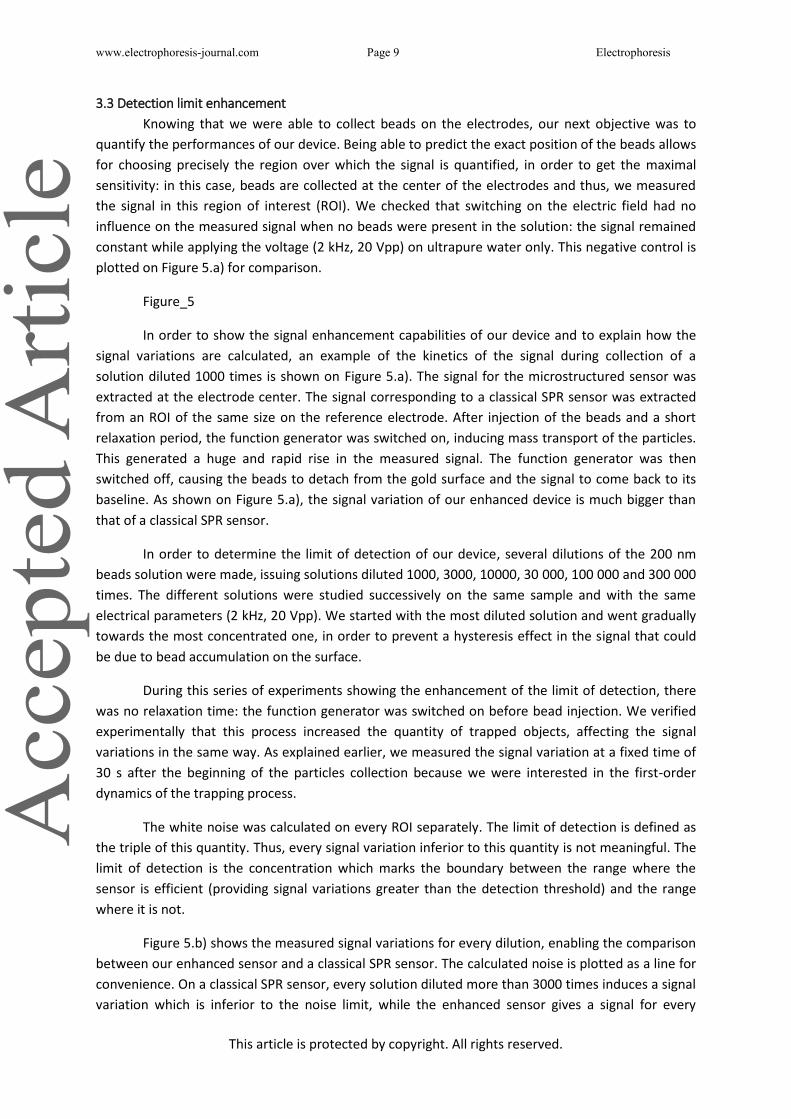
the signal in this region of interest (ROI). We checked that switching on the electric field had no
influence on the measured signal when no beads were present in the solution: the signal remained
constant while applying the voltage (2 kHz, 20 Vpp) on ultrapure water only. This negative control is
plotted on Figure 5.a) for comparison.
Figure_5
In order to show the signal enhancement capabilities of our device and to explain how the
signal variations are calculated, an example of the kinetics of the signal during collection of a
solution diluted 1000 times is shown on Figure 5.a). The signal for the microstructured sensor was
extracted at the electrode center. The signal corresponding to a classical SPR sensor was extracted
from an ROI of the same size on the reference electrode. After injection of the beads and a short
relaxation period, the function generator was switched on, inducing mass transport of the particles.
This generated a huge and rapid rise in the measured signal. The function generator was then
switched off, causing the beads to detach from the gold surface and the signal to come back to its
baseline. As shown on Figure 5.a), the signal variation of our enhanced device is much bigger than
that of a classical SPR sensor.
In order to determine the limit of detection of our device, several dilutions of the 200 nm
beads solution were made, issuing solutions diluted 1000, 3000, 10000, 30 000, 100 000 and 300 000
times. The different solutions were studied successively on the same sample and with the same
electrical parameters (2 kHz, 20 Vpp). We started with the most diluted solution and went gradually
towards the most concentrated one, in order to prevent a hysteresis effect in the signal that could
be due to bead accumulation on the surface.
During this series of experiments showing the enhancement of the limit of detection, there
was no relaxation time: the function generator was switched on before bead injection. We verified
experimentally that this process increased the quantity of trapped objects, affecting the signal
variations in the same way. As explained earlier, we measured the signal variation at a fixed time of
30 s after the beginning of the particles collection because we were interested in the first-order
dynamics of the trapping process.
The white noise was calculated on every ROI separately. The limit of detection is defined as
the triple of this quantity. Thus, every signal variation inferior to this quantity is not meaningful. The
limit of detection is the concentration which marks the boundary between the range where the
sensor is efficient (providing signal variations greater than the detection threshold) and the range
where it is not.
Figure 5.b) shows the measured signal variations for every dilution, enabling the comparison
between our enhanced sensor and a classical SPR sensor. The calculated noise is plotted as a line for
convenience. On a classical SPR sensor, every solution diluted more than 3000 times induces a signal
variation which is inferior to the noise limit, while the enhanced sensor gives a signal for every

www.electrophoresis-journal.com Page 10 Electrophoresis
This article is protected by copyright. All rights reserved.
solution, including the most diluted one with a 1 000 000 dilution factor). Hence, we can conclude
that our device enables the enhancement of the limit of detection by a factor greater than 300 in the
given measurement time interval. This experiment was repeated multiple times and similar results
were obtained, issuing the same (or greater) enhancement factor.
4. Conclusion and perspectives
We presented a new design for a SPRI sensor capable of operating AC electrokinetic effects
in order to trap the target analytes onto its sensing surface. We demonstrated the efficiency of its
collection capabilities for objects of different sizes (200 nm and 1 µm PS beads, yeast cells of about
7.5 µm). The observed mass transport dynamics were understood and theoretically explained with
an excellent consistency with the experimental results. In this regard, SPR appears to be a
particularly well-suited tool for the study of AC electrokinetic effects dynamics near the surface of
the electrodes. Finally, we demonstrated that our device achieves its goal of overcoming the
diffusion limit, by showing that the limit of detection could be enhanced by more than two orders of
magnitude.
Aside from highlighting one more achievement in the field of SPRI sensing, this work paves the
way to the development of a new generation of active plasmonic biosensors, capable of controlling
mass transport to enhance their performance. The fully integrated approach presented here has the
advantage of allowing for excellent compatibility of the biochip component with already existing SPR
systems and thus for rapid development, commercialization and routine use whenever needed
devices. Furthermore, other configurations, such as face-to-face electrodes, or other substrate
modifications, such as nanostructuration, also have their own advantages and are currently under
further studies.
Acknowledgements
LN2 is an international laboratory (Unité Mixte Internationale UMI 3463) jointly managed by
French CNRS and the Université de Sherbrooke as well as the Université de Lyon (INSA de Lyon, ECL,
CPE Lyon) and the Université Grenoble Alpes (UGA). Quentin Avenas acknowledges support from the
French doctoral scholarship as well as MITACS and the IDEX Lyon program. He also thanks the
Laboratoire Charles Fabry and the Laboratoire Ampère for providing access to their equipment.
The authors have declared no conflict of interest.
5 REFERENCES
[1] Homola, J., Piliarik, M., in Surface Plasmon Resonance Based Sensors (Ed.: Homola, J.), Springer, Berlin, 2006.
[2] Campbell, C., Kim, G., Biomaterials 2007, 28, 2380–2392. [3] Moreau, J., Cloarec, J.-P., Charette, P. G., Barbillon, G., Canva, M., In Handbook of Enhanced
Spectroscopy, Taylor & Francis Group, New York, 2015.
www.electrophoresis-journal.com Page 11 Electrophoresis
This article is protected by copyright. All rights reserved.
[4] Moreau, J., Cloarec, J.-P., Charette, P., Goossens, M., Canva, M., Vo-Dinh, T., In Biomedical Photonics Handbook, Second Edition: Biomedical Diagnostics (Ed.: Vo-Dinh, T.), CRC Press, Boca Raton, 2014, pp. 199–264.
[5] Rothenhäusler, B., Knoll, W., Nature 1998, 615–617. [6] Brockman, J. M., Nelson, B. P., Corn, R. M., Annu. Rev. Phys. Chem. 2000, 51, 41–63. [7] Bardin, F., Bellemain, A., Roger, G., Canva, M., Biosens. Bioelectron. 2009, 24, 2100–2105. [8] Piliarik, M., Párová, L., Homola, J., Biosens. Bioelectron. 2009, 24, 1399–1404. [9] Hottin, J., Moreau, J., Roger, G., Spadavecchia, J., Millot, M.-C., Goossens, M., Canva, M.,
Plasmonics 2007, 2, 201–215. [10] Boozer, C., Kim, G., Cong, S., Guan, H., Londergan, T., Curr. Opin. Biotechnol. 2006, 17, 400–405. [11] Piliarik, M., Homola, J., Optics Express 2009, 17, 16505–16517. [12] Sheehan, P. E., Whitman, L. J., Nano Lett. 2005, 5, 803–807. [13] Lee, C.-Y., Chang, C.-L., Wang, Y.-N., Fu, L.-M., Int. J. Mol. Sci. 2011, 12, 3263–3287. [14] Oh, J., Hart, R., Capurro, J., Noh, H. (Moses), Lab Chip 2009, 9, 62–78. [15] Green, N. G., Ramos, A., González, A., Morgan, H., Castellanos, A., Phys. Rev. E 2000, 61, 4011. [16] González, A., Ramos, A., Green, N. G., Castellanos, A., Morgan, H., Phys. Rev. E 2000, 61, 4019. [17] Green, N. G., Ramos, A., González, A., Morgan, H., Castellanos, A., Phys. Rev. E 2002, 66. [18] Bazant, M. Z., Squires, T. M., Phys. Rev. Lett. 2004, 92. [19] Ren, Y., Song, C., Liu, W., Jiang, T., Song, J., Wu, Q., Jiang, H., Electrophoresis 2018; doi:
10.1002/elps.201800325. [20] Hoettges, K. F., McDonnell, M. B., Hughes, M. P., J. Phys. D: Appl. Phys. 2003, 36, L101. [21] Hübner, Y., Hoettges, K. F., McDonnell, M. B., Carter, M. J., Hughes, M. P., Int. J. Nanomed. 2007,
2, 427. [22] Fatoyinbo, H. O., Hoettges, K. F., Reddy, S. M., Hughes, M. P., Biosens. Bioelectron.2007, 23,
225–232. [23] Mohtar, M. N., Hoettges, K. F., Hughes, M. P., Electrophoresis 2014, 35, 345–351. [24] Hoettges, K. F., Hughes, M. P., Cotton, A., Hopkins, N. A., McDonnell, M. B., IEEE Eng. Med. Biol.
Mag. 2003, 22, 68–74. [25] Barik, A., Otto, L. M., Yoo, D., Jose, J., Johnson, T. W., Oh, S.-H., Nano Lett. 2014, 14, 2006–2012. [26] Kuroda, C., Iizuka, R., Ohki, Y., Fujimaki, M., Japan. J. Appl. Phys. 2018, 57, 057001. [27] Menad, S., El-Gaddar, A., Haddour, N., Toru, S., Brun, M., Buret, F., Frenea-Robin, M., Langmuir
2014, 30, 5686–5693. [28] Talary, M. S., Burt, J. P. H., Tame, J. A., Pethig, R., J. Phys. D: Appl. Phys. 1996, 29, 2198–2203. [29] Lioubimov, V., Kolomenskii, A., Mershin, A., Nanopoulos, D. V., Schuessler, H. A., Appl. Optics
2004, 43, 3426–3432. [30] Huang, Y., Pitter, M. C., Somekh, M. G., Zhang, W., Xie, W., Zhang, H., Wang, H., Fang, S., Sci.
China Phys. Mech. Astron. 2013, 56, 1495–1503. [31] Lopatynskyi, A. M., Lopatynska, O. G., Poperenko, L. V., Chegel, V. I., Guiver, M. D.,
Semiconductor Physics Quantum Electronics and Optoelectronics, National Academy of Sciences of Ukraine, Kyiv 2008.
[32] Sereda, A., Moreau, J., Canva, M., Maillart, E., Biosens. Bioelectron. 2014, 54, 175–180. [33] Cottet, J., Fabregue, O., Berger, C., Buret, F., Renaud, P., Frénéa-Robin, M., Biophys. J. 2019, 116,
12–18. [34] Menad, S., Assemblage permanent de micro-objets par diélectrophorèse associée à une méthode
de couplage covalent, PhD Thesis, Autre, Ecole Centrale de Lyon 2014. [35] Morgan, H., Green, N. G., AC electrokinetics: colloids and nanoparticles, Microtechnologies and
microsystems series, Research Studies Press, Baldock, Philadelphia 2003.
www.electrophoresis-journal.com Page 12 Electrophoresis
This article is protected by copyright. All rights reserved.
Figure 1
Figure 1 : a) Illustration of a SPR biosensing system in the Kretschmann configuration. b) Side view of the
electrodes. Illustration of the combination of AC electrokinetic effects on parallel interdigitated electrodes.
Electric field lines are schematized in black. c) Illustration of our experimental device on a SPR system.
www.electrophoresis-journal.com Page 13 Electrophoresis
This article is protected by copyright. All rights reserved.
Figure 2
Figure 2 : Comparison of a) dark field optical microscopy imaging and b) SPRI observations of the collection of
1µm polystyrene beads on the electrodes. c) SPRI observation of the collection dynamics of 200 nm
polystyrene beads on one electrode. d) and e) SPRI observation of the collection of yeasts (5-10 µm) on one
electrode before (d) and after (e) applying the voltage. f) Optical microscopy image of the yeasts trapped on
the electrode. All of these trapping experiments have been repeated at least ten times and the same results
have been observed each time.
www.electrophoresis-journal.com Page 14 Electrophoresis
This article is protected by copyright. All rights reserved.
Figure 3
Figure 3 : 3D representation of the trapped 200 nm nanobead position: optical index variations (vertical
axis) are displayed over the electrode width (on the 0-200 µm horizontal axis) as a function of the electrical
amplitude (on the 0-20 Vpp horizontal axis) for the 3 studied frequencies (2 kHz, 1 kHz, 500 Hz) 30 s after
beginning to apply the electric field. This experiment has been repeated twice in the same conditions but
with a different chip (of identical geometry) and a new solution of beads each time. The results were
qualitatively identical.
www.electrophoresis-journal.com Page 15 Electrophoresis
This article is protected by copyright. All rights reserved.
Figure 4
Figure 4 : a) Electroosmotic velocity at the electrode surface at 50 µm from the electrode edges. Calculations
were made according to the theory explained in [25] b) Experimental collection positions of the beads along
the electrode width after 30 s, observed for 3 frequencies at 20 Vpp. c) Real part of the Clausius-Mossoti
factor for 200 nm polystyrene beads in DI water.

www.electrophoresis-journal.com Page 16 Electrophoresis
This article is protected by copyright. All rights reserved.
Figure 5
www.electrophoresis-journal.com Page 17 Electrophoresis
This article is protected by copyright. All rights reserved.
Supporting Information
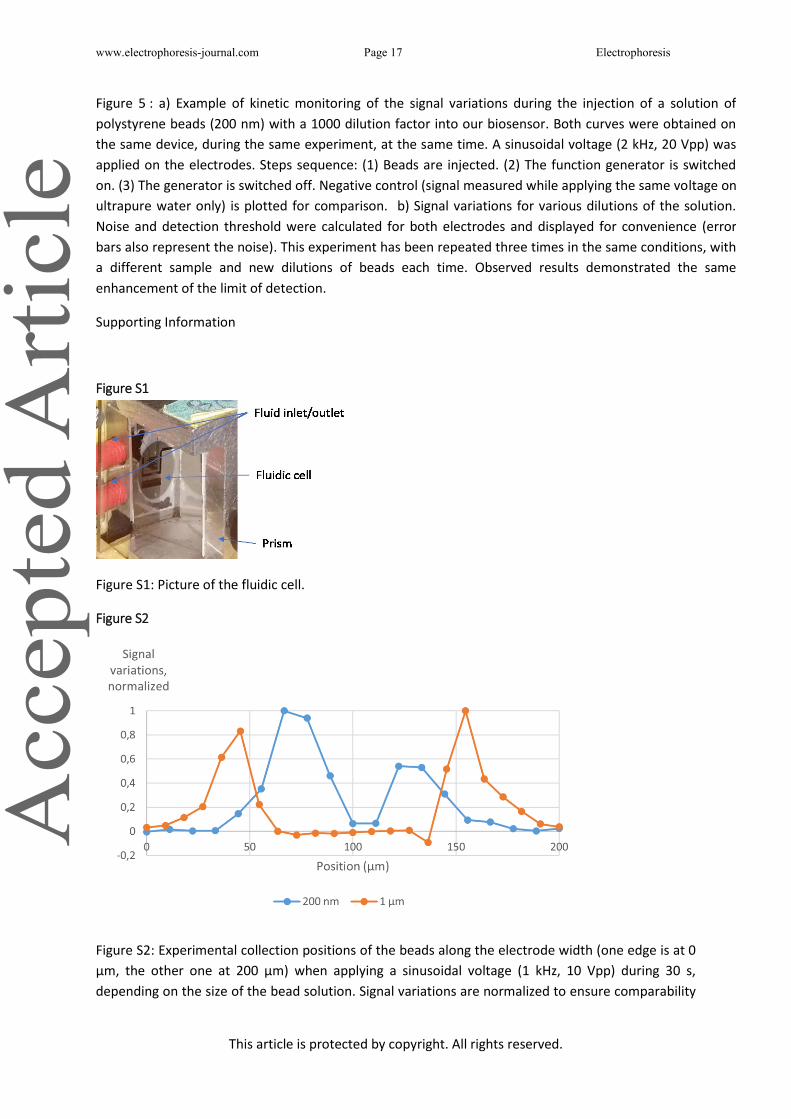
Figure S1
Figure S1: Picture of the fluidic cell.
Figure S2
Figure S2: Experimental collection positions of the beads along the electrode width (one edge is at 0
µm, the other one at 200 µm) when applying a sinusoidal voltage (1 kHz, 10 Vpp) during 30 s,
depending on the size of the bead solution. Signal variations are normalized to ensure comparability
Figure 5 : a) Example of kinetic monitoring of the signal variations during the injection of a solution of
polystyrene beads (200 nm) with a 1000 dilution factor into our biosensor. Both curves were obtained on
the same device, during the same experiment, at the same time. A sinusoidal voltage (2 kHz, 20 Vpp) was
applied on the electrodes. Steps sequence: (1) Beads are injected. (2) The function generator is switched
on. (3) The generator is switched off. Negative control (signal measured while applying the same voltage on
ultrapure water only) is plotted for comparison. b) Signal variations for various dilutions of the solution.
Noise and detection threshold were calculated for both electrodes and displayed for convenience (error
bars also represent the noise). This experiment has been repeated three times in the same conditions, with
a different sample and new dilutions of beads each time. Observed results demonstrated the same
enhancement of the limit of detection.
www.electrophoresis-journal.com Page 18 Electrophoresis
This article is protected by copyright. All rights reserved.
(1 µm beads induce much bigger variations than 200 nm beads). As explained in the discussion, the
position of the 1 µm beads is closer to the edge because the DEP force grows faster than ACEO with
the size of the targeted object.
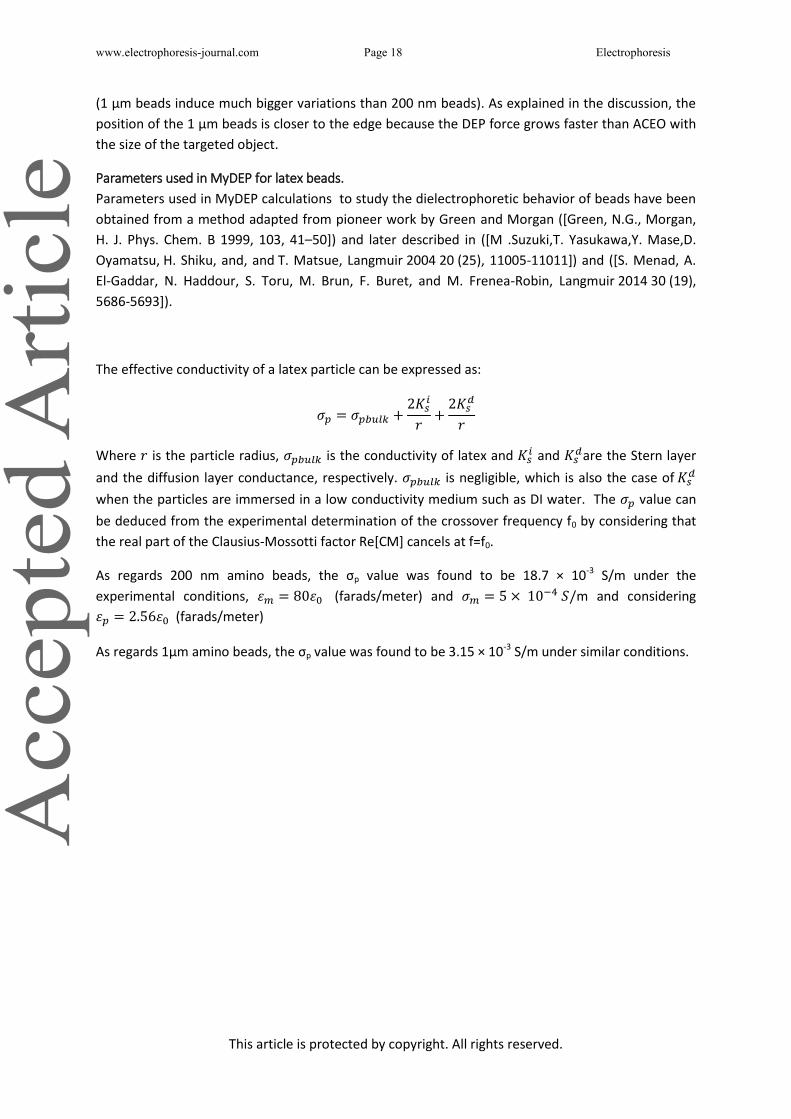
Parameters used in MyDEP for latex beads.
Parameters used in MyDEP calculations to study the dielectrophoretic behavior of beads have been
obtained from a method adapted from pioneer work by Green and Morgan ([Green, N.G., Morgan,
H. J. Phys. Chem. B 1999, 103, 41–50]) and later described in ([M .Suzuki,T. Yasukawa,Y. Mase,D.
Oyamatsu, H. Shiku, and, and T. Matsue, Langmuir 2004 20 (25), 11005-11011]) and ([S. Menad, A.
El-Gaddar, N. Haddour, S. Toru, M. Brun, F. Buret, and M. Frenea-Robin, Langmuir 2014 30 (19),
5686-5693]).
The effective conductivity of a latex particle can be expressed as:
Where is the particle radius, is the conductivity of latex and and
are the Stern layer
and the diffusion layer conductance, respectively. is negligible, which is also the case of
when the particles are immersed in a low conductivity medium such as DI water. The value can
be deduced from the experimental determination of the crossover frequency f0 by considering that
the real part of the Clausius-Mossotti factor Re[CM] cancels at f=f0.
As regards 200 nm amino beads, the σp value was found to be 18.7 × 10⁻³ S/m under the
experimental conditions, (farads/meter) and m and considering
(farads/meter)
As regards 1µm amino beads, the σp value was found to be 3.15 × 10⁻³ S/m under similar conditions.