Typical Severe Service Application Challenges & Engineered ...
Upload
khangminh22Category
view
3download
0
ANTIBACTERIAL, PLASMONIC, AND TOXIC PROPERTIES OF ENGINEERED NANOPARTICLES
A Thesis presented to the Faculty of the Graduate School
University of Missouri
In Partial Fulfillment
of the Requirements for the Degree
Doctor of Philosophy
by
Trang Ha Dieu Nguyen
Drs. Mengshi Lin, Azlin Mustapha Thesis Supervisors
DECEMBER 2016

© Copyright by Trang Ha Dieu Nguyen 2016 All rights reserved.

The undersigned, appointed by the dean of the Graduate School, have examined the thesis entitled
ANTIBACTERIAL, PLASMONIC AND TOXIC PROPERTIES OF ENGINEERED NANOPARTICLES
Presented by Trang Ha Dieu Nguyen,
a candidate for the degree of Doctor of Philosophy,
and hereby certify that, in their opinion, it is worthy of acceptance.
Mengshi Lin, Ph.D., Food Science Program
Azlin Mustapha, Ph.D., Food Science Program
Bongkosh Vardhanabhuti, Ph.D., Food Science Program
Chong He, Ph.D., Department of Statistics

ii
ACKNOWLEDGEMENTS
In the heat of moment, when many ideas for the acknowledgment part of my dissertation
come along, I was so excited. This dissertation took me four and a half years and it has
given me much of challenges and joyfulness. This work would not have been possible
without the guidance and supports of all the following individuals. First and foremost, I
would like to thank my two wonderful advisors, Drs. Mengshi Lin and Azlin Mustapha.
Dr. Lin is a facilitator and a mentor who abundantly helped and offered me invaluable
assistance, supports and encouragements during my time in Mizzou. I believe he spent
hundreds of hours editing my manuscripts, even in the weekends. Dr. Mustapha inspired
me by her enthusiasm, energy, and excellent knowledge. I cannot fulfill my dissertation
without her advice and guidance when I had problems with my experiments. She is the
person who has proven that a female scientist can balance well between her family and
career!
I would like to show my gratitude to my committee members, Dr. Vardhanabhuti and
Dr. He through the journey. I appreciate their valuable suggestions and comments,
especially Dr. V for her co-authorship in one of my manuscripts.
I also would like to express my thanks to Dr. Koc, Dr. Clarke, Dr. Gruen, Dr. Elmore,
Dr. Alexander for letting me help them in teaching assistance. I have learned from them
teaching methods, curricula and appropriate manner when interacting with students.

iii
I thank my past and present lab members and from different labs for being wonderful
colleagues to work with. Special thanks are given to Zhang Zhong for his co-authorship
and assistance.
I acknowledge the Vietnam International Education Development under the Ministry of
Education and Training for financial support in the first two years of my study.
Finally, I owe my deepest gratitude to my family in Vietnam and my husband’s family
in the US for endless love, support, and encouragement, without which I could not finish
my work. My husband and my sons Yanni and Raphael are the greatest gifts that God
brought to me. Thank you all for being with me, loving me unconditionally, being my
support and inspiring me every single day of my life.

iv
TABLE OF CONTENTS
ACKNOWLEDGEMENTS ................................................................................................ ii
LIST OF TABLES ............................................................................................................ vii
LIST OF FIGURES ......................................................................................................... viii
ABSTRACT ....................................................................................................................... xi
CHAPTER 1 ....................................................................................................................... 1
Introduction ......................................................................................................................... 1
1.1 Background .......................................................................................................... 1
1.2 Objectives .................................................................................................................. 3
CHAPTER 2 ....................................................................................................................... 5
Literature review ................................................................................................................. 5
2.1 Nanomaterials and current uses in foods and consumer products ....................... 5
2.2 Surface enhanced Raman spectroscopy (SERS) and its enhancement mechanisms 13
2.3 Applications of SERS for Food Adulterant Detection ....................................... 17
2.4 SERS substrates.................................................................................................. 18
2.5 Antibacterial properties of inorganic ENPs ....................................................... 20
2.6 Mechanisms of antimicrobial properties of inorganic ENPs ............................. 26
2.7 Physical and chemical properties of inorganic ENPS affect their antimicrobial activities ........................................................................................................................ 29
2.8 Cytotoxicity of inorganic NPs to human cells ................................................... 32
2.9 Mechanisms of cytoxocity of ENPS .................................................................. 35
2.10 Physical and chemical properties of NMs associated with nanotoxicity ........... 36
2.11 Toxicity Assessment of NPs .............................................................................. 39
2.11.1 Cell uptake .................................................................................................. 40
2.11.2 Cell viability................................................................................................ 41
2.11.3 Cell functions .............................................................................................. 41
CHAPTER 3 ..................................................................................................................... 48
Use of Graphene and Gold Nanorods as Substrates for Detection of Pesticides by Surface Enhanced Raman Spectroscopy ........................................................................................ 48

v
3.1 Introduction ........................................................................................................ 50
3.2 Materials and Methods ....................................................................................... 52
3.2.1 Preparation of chemicals ............................................................................. 52
3.2.2 Gold film silicon substrate .......................................................................... 53
3.2.3 Synthesis of gold nanorods ......................................................................... 53
3.2.4 Fabrication of SERS substrates ................................................................... 54
3.2.5 SERS measurements ................................................................................... 55
3.2.6 Data analysis ............................................................................................... 55
3.3 Results and Discussions ..................................................................................... 57
CHAPTER 4 ..................................................................................................................... 69
Use of Aminothiophenol as an Indicator for the Analysis of Silver Nanoparticles in Consumer Products by Surface-Enhanced Raman Spectroscopy (SERS) ........................ 69
4.1 Introduction ........................................................................................................ 71
4.2 Materials and Methods ....................................................................................... 74
4.2.1 Materials ..................................................................................................... 74
4.2.2 Characterization of Ag NPs in the products ............................................... 75
4.2.3 Determine Ag NPs in tested products ......................................................... 75
4.2.4 Conjugation of PATP onto Ag NPs ............................................................ 75
4.2.5 Detection of Ag NPs Using SERS and PATP-Ag NPs conjugation ........... 76
4.2.6 Data Analysis .............................................................................................. 76
4.3 Results and Discussion ....................................................................................... 77
CHAPTER 5 ..................................................................................................................... 86
Toxicity of Graphene Oxide on Intestinal Bacteria, and Caco-2 Cells ............................. 86
5.1 Introduction ........................................................................................................ 87
5.2 Materials and Methods ....................................................................................... 89
5.2.1 Characterization of GO ............................................................................... 89
5.2.2 Preparation of Bacterial strains ................................................................... 90
5.2.3 Effect of GO on the growth of E. coli, L. acidophilus, and B. animalis ..... 90
5.2.4 Mammalian cell study ................................................................................. 91
5.2.5 MTT reduction assay .................................................................................. 92
5.2.6 WST-8 proliferation assay .......................................................................... 93
5.2.7 Scanning electron microscopy (SEM) analysis .......................................... 93

vi
5.2.8 Transmission electron microscopy (TEM) analysis ................................... 94
5.2.9 Statistical analysis ....................................................................................... 94
5.3 Results and Discussion ....................................................................................... 95
CHAPTER 6 ................................................................................................................... 108
Antibacterial Properties of Selenium Nanoparticles and Their Toxicity on Caco-2 Cells......................................................................................................................................... 108
6.1 Introduction ...................................................................................................... 109
6.2 Materials and Methods ..................................................................................... 110
6.2.1 Chemicals, bacterial strains mammalian cells .......................................... 110
6.2.2 Characterization of Se NPs ....................................................................... 111
6.2.3 Preparation of bacterial strains .................................................................. 112
6.2.4 Synthesis of Se NPs .................................................................................. 112
6.2.5 Effect of Se NPs on the growth of bacterial strains .................................. 113
6.2.6 Mammalian cell study ............................................................................... 113
6.2.7 MTT reduction assay ................................................................................ 114
6.2.8 WST-8 proliferation assay ........................................................................ 114
6.2.9 Scanning electron microscopy (SEM) ...................................................... 115
6.2.10 Transmission electron microscopy (TEM) ............................................... 115
6.2.11 Statistical analysis ..................................................................................... 116
6.3 Results and Discussion ..................................................................................... 116
6.3.1 Characterization of Se NPs ....................................................................... 116
6.3.2 Antibacterial effects of Se NPs on pathogenic bacteria ............................ 118
6.3.3 Cytotoxic effect of Se NPs on Caco-2 cells .............................................. 124
CHAPTER 7 ................................................................................................................... 128
Conclusions and Future Plans ......................................................................................... 128
Appendix ......................................................................................................................... 131
References ....................................................................................................................... 132
VITA ............................................................................................................................... 169

vii
LIST OF TABLES
Table Page
Table 1. Food and Food-related products that claim to contain nanoparticles ................... 6
Table 2. Antibacterial effect of inorganic ENPs against different microorganisms ......... 20
Table 3. In vitro cytotoxicity effects of graphene materials and Se NPs .......................... 33
Table 4. Band assignment of major peak in SER spectra form three pesticides* ............ 63
Table 5. Limit of detection of using G-Au-AuNRS substrate for detection of azinphos-
methyl, carbaryl, and phosmet .......................................................................................... 68
Table 6. Total concentration of silver and Ag NPs, average size, and the intensity of SERS
spectra acquired from five commercial products .............................................................. 84
Table 7. GO characteristics, values presented means ± SD from triplicate measurements.
........................................................................................................................................... 97
Table 8. The zeta-potential values of selenium nanoparticles. ....................................... 118
Table 9. Zeta potential values of bacteria strains ............................................................ 124

viii
LIST OF FIGURES
Figure Page
Figure 2-1. Schematic of a surface-enhanced light scattering process (Schatz and others
2006; Alonso-González and others 2012)......................................................................... 14
Figure 3-1. Structure of substrates: (a) graphene-Au-AuNR (G-Au-AuNR); (b) graphene-
AuNR (G-AuN); (c) Au-AuNR. ....................................................................................... 54
Figure 4-1. SERS spectra of PATP, PATP mixed with AgNO3, PATP with 30 nm Ag NP3.
........................................................................................................................................... 78
Figure 4-2. Comparisons of enhancement effects from Ag NPs. ..................................... 79
Figure 4-3. Concentration-dependent SERS spectra (part of full scale) of Ag NPs with
PATP (10 mg/mL) as an indicator (A); the linear relation between Raman intensity and Ag
NPs concentration (B). ...................................................................................................... 80
Figure 4-4. SERS spectra four five Ag NPs-containing dietary and antimicrobial products.
Negative controls were prepared using the solvent of PATP (methanol). ........................ 82
Figure 4-5. Characterization of Ag NPs in the dietary supplements and antimicrobial
products. (A) Dietary supplement; (B) nasal spray; (C) dietary supplement; (D) dietary
supplement; (E) dietary supplement. ................................................................................ 83
Figure 5-1. UV–vis absorption spectrum of GO aqueous dispersion (A). FTIR spectrum of
dried graphite oxide sample (B). ....................................................................................... 96
Figure 5-2. TEM images of GO aqueous dispersion ........................................................ 96

ix
Figure 5-3. Effect of GO on the growth of E. coli (a), L. acidophilus (b), and B. animalis
(c). ..................................................................................................................................... 99
Figure 5-4. SEM images of E. coli, L. acidophilus, and B. animalis without (A, C, E) and
with (B, D, F) GO treatment. .......................................................................................... 101
Figure 5-5. Cell viability of Caco-2 cells determined by the MTT assay after 24 h exposure
to different concentrations of GO. Data represent means ± SD. Means with the same letters
are not significantly different (P > 0.05). ........................................................................ 102
Figure 5-6. Cell viability of Caco-2 cells determined by the WST-8 assay after 24 h
exposure to different concentrations of GO. Data represent means ± SD. Means with the
same letters are not significantly different (P > 0.05). .................................................... 103
Figure 5-7. TEM images of Caco-2 cells (A, C) control and (B, D) treated with GO. .. 105
Figure 5-8. Cell viability of Caco-2 cells determined by MTT and WST-8 assays after a
24-h exposure to GO-pretreated media. Data represent means ± SD. Means with the same
letters are not significantly different (P > 0.05). ............................................................. 106
Figure 6-1. An UV-vis absorbance spectrum of Se NPs solution (A) and a FTIR spectrum
of condensed Se NPs (B). ............................................................................................... 117
Figure 6-2. TEM image of Se NPs.................................................................................. 118
Figure 6-3. Effect of Se NP on the growth of E. coli O157:H7 (A), L. monocytogenes (B),
Salmonella (C), and S. aureus (D) ...................................................................................119

x
Figure 6-4. Microbial counts (CFU/mL) of S. aureus after 15 h of exposure to different
concentrations of Se NPs. Data with the same letter are not significantly different (P ˃ 0.05)
..........................................................................................................................................119
Figure 6-5. SEM images of S. aureus without (left) and with (right) Se NP treatment ..120
Figure 6-6. TEM images of S. aureus without (left) and with (right) Se NP treatment ..121
Figure 6-7. Cell viability of Caco-2 cells determined by MTT assay (A) and WST-8 assay
(B) after a 24-h exposure to different concentration of Se NPs. Data represent mean ± SD.
Means with the same letters are not significant different (P ˃ 0.05) ...............................124

xi
ANTIBACTERIAL, PLASMONIC AND TOXIC PROPERTIES OF ENGINEERED
NANOPARTICLES
Dieu-Trang Nguyen Ha
Drs. Mengshi Lin, Azlin Mustapha Thesis Supervisors
ABSTRACT
There has been increasing application of novel nanomaterials in recent years in the area of
agriculture and food science. This dissertation aims to study novel nanomaterials and
investigate their applications in food safety, and to develop and use surface-enhanced
Raman spectroscopy (SERS) as a rapid, simple, and sensitive analytical method to improve
food safety. There have been increasing applications of nanomaterials in various areas,
which may cause human exposure and environmental pollution. Therefore, it is important
to study the toxicity of different nanomaterials against bacteria and human cells. The
objectives of this study were to: (1) develop new types of substrate consisting of monolayer
graphene, gold film, and/or gold nanorod structures; (2) detect and measure silver
nanoparticles (Ag NPs) in consumer products using SERS and aminothiophenol as an
indicator molecule; (3) investigate the effect of graphene oxide (GO) on human intestinal
bacteria and human intestinal cells; (4) study the antimicrobial activity of selenium
nanoparticles (Se NPs) against foodborne pathogens and the toxicity of Se NPs against
Caco-2 cells. A simple, fast, and efficient method was developed to fabricate new SERS
substrates by coating a gold nanorod-decorated graphene sheet on silicone substrate. The
results demonstrate that GO is biocompatible and has a potential to be used in agriculture

xii
and food science, indicating that more studies are needed to exploit its potential
applications. The data show that Se NPs can be used as an antimicrobial agent to inhibit
the growth of Staphylococcus aureus in foods and can potentially be used as a
chemopreventative and chemotherapeutic agent. More studies are needed to elucidate the
mechanisms of Se NPs and GO’s cytotoxicity and their antibacterial properties. More
research is also needed to improve the performance of SERS substrates using different
materials and use them in improving food safety.

1
CHAPTER 1
Introduction
1.1 Background
There have been a surge of food safety incidents and scandals in recent years, which have
raised concerns from consumers about food safety issues. One of the most notorious food
safety incident occurred in China about the contamination of melamine in milk in 2007 to
2008 (Chan and others 2008). In 2010, cowpea contaminated with isocarbophos, a highly
toxic pesticide, was found in Hainan Province. Clenbuterol, an illegal veterinary drug, was
used to feed pigs and the consumption of the pork resulting in flustered, trembling,
headache, nausea, and vomiting for humans (Xue and Zhang 2013). The bacterium
Escherichia coli O104:H4 was found in fenugreek seeds from Egypt and killed and
sickened many people in the European Union (Jia and Jukes 2013). Furthermore, the
United States Department of Agriculture (USTA) estimated that the increased consumption
of fresh produce is responsible for 48% of all the reported food illnesses in the US (Painter
and others 2013).
To improve food safety and minimize food incidents, it is crucial to have suitable
techniques to detect food contaminants that are usually present at low concentrations in
foods and other consumer products. The method should be fast, cheap, and sensitive to
quickly detect contaminated foods and prevent unsafe products from reaching consumers.
Current analytical methods for the detection and quantification of food adulterants in
commercial products include high performance liquid chromatography (HPLC), gas

2
chromatography mass spectroscopy (GC/MS), and other methods. These techniques have
been widely used to analyze both chemical and biological contaminants in different food
products. For example, Wahed and others (2016) employed HPLC to quantify
formaldehyde in mango, fish, and milk. Solid phase extraction and HPLC or GC-MS can
be used to detect ochratoxin A in Italian red wines (Giovannoli and others 2014), mineral
oils in foods (Sharareh and others 2015), melamine and cyanuric acid in dairy products
(Pan and others 2013). However, those methods are time-consuming and labor-intensive.
They often require complicated procedures of sample pretreatment and well-trained
personnel to operate the equipment. Although recent advance and developments in
analytical techniques have been observed, there still exist many challenges and
opportunities to improve the current technology and use simple, rapid, versatile, and
inexpensive tools for the detection of food contaminants.
With the increasing use of nanomaterials and nanotechnology in various areas over the
last two decades, there have been more applications of nanotechnology in different areas.
Nanomaterials are defined as materials with a size of at least one dimension from 1 to 100
nm. The nanoscale size and unique properties of nanomaterials render them to have
different properties from their bulk materials. For example, silver nanoparticles (Ag NPs)
can enhance the intensity of Raman signals by more than a thousand times, which will be
used for SERS substrates. By choosing different types of nanomaterials and specific
techniques, the development of fast, simple, and sensitive methods to measure food
contaminants and improve food safety became possible. The aforementioned food safety
incidents have driven the need to develop rapid, sensitive, and robust methods to detect
such food adulterants.

3
The applications of engineered nanomaterials (ENMs) have received much attention in
recent years due to their unique properties that can be used in the food industry, such as in
nanosensors, pathogen detection, and antimicrobial applications (Duncan 2011). For
example, metal oxide nanoparticles are antimicrobial agents that can inhibit the growth of
foodborne pathogens (Marambio-Jones and Hoek 2010; Sirelkhatim and others 2015).
Nanoparticle-based sensors can provide a platform to detect microbes, pesticides, or
chemical contaminants in complex matrices (Arora and others 2011; Sharma and
Mutharasan 2013; Duncan 2011). Carbon-based nanomaterials (carbon nanotubes,
graphene, graphene oxide, etc.) have been used in food packaging because of their
exceptional ability in serving as a graphene-based nanofiller to limit both oxygen
permeation and light transmission in polymer films. However, the toxicity of these ENPs
is still not fully understood and not much is known about the behavior of them upon
ingestion and whether they inhibit natural gut microflora. Therefore, it is of critical
importance to (1) develop suitable techniques to detect ENMs at low concentrations in
foods and other consumer products; and (2) investigate antibacterial properties and toxicity
of ENMs towards human.
1.2 Objectives
The objectives of this study were to:
1. Develop new types of substrate consisting of monolayer graphene, gold film, and/or
Au nanorod structure.
- evaluate SERS measurement for detection of three types of pesticides:
azinphos-methyl, carbaryl, and phosmet;

4
- quantify the analytes and the detection limit of the methods.
2. Detect and measure silver nanoparticles (Ag NPs) in consumer products using
surface enhanced Raman spectroscopy (SERS)
- use SERS coupled with aminothiophenol (PATP) as an indicator for detecting
Ag NPs in five commercial products;
- evaluate the capacity of SERS method for Ag NP determination by using
transmission electron microscopy (TEM) and inductively coupled plasma
optical emission spectrometry (ICP-OES) as validation methods.
3. Investigate the effect of graphene oxide (GO) on human intestinal bacteria and
human intestinal cells
- investigate the effects of GO on microbial proliferation of three strains of
intestinal bacteria: Escherichia coli K12, Lactobacillus acidophilus ADH, and
Bifidobacterium animalis Bif-6;
- evaluate the morphology and viability of Caco-2 cells, a heterogeneous human
epithelial colorectal adenocarcinoma cell line, after exposure to GO.
4. Antimicrobial activity of selenium nanoparticles (Se NPs) against foodborne
pathogens and the toxicity of Se NPs against human intestinal cells
- study the growth of different strains of pathogenic bacteria (E. coli O157:H7, S.
aureus, and Salmonella) in the presence and absence of Se NPs;
- evaluate the toxicity of Se NPs against Caco-2 cells, a heterogeneous human
epithelial colorectal adenocarcinoma cell line, after exposure to Se NPs by
using two proliferation assays, including MTT and WST-8.

5
CHAPTER 2
Literature review
2.1 Nanomaterials and current uses in foods and consumer products
Engineer nanomaterials (ENMs) have many unique properties that make them suitable
for use in various consumer goods and for applications in food production and packaging.
According to the available inventory from the Woodrow Wilson Inventory (2016), a large
number of nanoparticles have been used in medicine, foods, food packaging, dietary
supplements, over-the-counter drugs, and many other consumer products ranging from
cosmetics and toothpaste to paints and clothing (socks, T-shirts). The inventory also shows
1814 consumer products containing nanoparticles has risen steadily over the past 5 years.
The Food and Beverages category contains only 118 products (6.5% of the total) while the
Health and Fitness category contains the most products (908, or 50% of the total). Silver is
the most frequently used in food category (35.5%) that often claims to have antimicrobial
properties.
A list of food or consumer products that claim to contain nanoparticles has been compiled
from available databases (Nanodatabase, Nanowek, Nanotechproject.org), literature, and
the internet (Table 1). The nanomaterials can be found mostly in supplements, food
packaging, and food additives. Besides inorganic ENPs (silver, gold, zinc oxide, carbon,
etc.), organic ENMs that have been used in a vast majority of food supplements are organic
micelles or nanocarriers including nanoencapsulates. These nano delivery systems often
contain vitamins or functional bioactive compounds coated by a wall or barrier. In food

6
applications, three types of food-grade polymers consisting of lipid-based, protein-based,
and polysaccharide nanoparticles (NPs) are usually used. Among them, lipid-based NPs
are the most applied organic NPs due to their natural origin and capability of trapping
compounds with different solubility. Table 1 shows that starch appears to be the most used
polysaccharides for nano-carriers in food implications.
ENPs used in the food packaging mostly contain silver and clay. Similar to food
supplements, silver is mainly used as an antimicrobial agent in food packaging, food
storage containers, and appliances. Currently, there is no direct addition of silver in foods
while gold NPs has been used in a liquor from Taiwan. It is understandable since people
have added gold in foods thousands of years ago. Nanoclay is mostly used to manufacture
food packaging materials, especially for plastic/glass bottles to improve mechanical
strength and gases/volatile components barrier.
Table 1. Food and food-related products that claim to contain nanoparticles
Category Nanoparticles Supplier Label claims References
Dietary supplements Ag NPs Natural-
Immunogenics Corp
Nano colloid 10-50 ppm [1]
Ag NPs Nature City Anti-Bacterial, Anti-Viral, Non-Toxic, Non-Pharmaceutical
[2]
Ag NPs Activz Support the body's natural healing mechanisms.
[3]
Ag NPs Fair vital 500 ppm, antibacterial effect
[4]
Ag NPs American Biotech Labs
10 ppm, help boost the immune system
[5]
Ag NPs Silver Support Increase immune system immensely
[6]
Ag NPs Silvix3-Natural Care Products
10 ppm support arsenal and boost the immune defenses
[7]

7
Ag NPs Sovereign Silver Nano Hydrosol
10 ppm, safely support the immune system
[8]
Ag NPs Skybright Natural Health
6-8 ppm, support the body’s immune system and natural healing ability
[9]
Ag NPs MesoSilver-Purest Colloids Inc.
0.65 nm or less in diameter, fortify the immune system
[10]
Ag NPs ASAP Double strength- American Biotech Labs
Immune system support [11]
Ag NPs SilverBiotics- American Biotech Labs
Immune system support [12]
Ag NPs MaatShop Immune system boost Helps support eye, nose, throat, ear and lung health
[13]
Ag NPs Allan Sutton Assist in eradication of bacteria.
[14]
Ag NPs Skybright Natural Health
Antimicrobial protection [15]
Ag NPs Galaxia Nano Technology Limited™
For high cholesterol, diabetes, gout, constipation, weight loss, beauty and other obvious effects
[16]
Ag NPs NanoSil™-10 Greenwood Consumer Products
Used as an immune support system
[17]
Nano-Sized Self-assembled Liquid Structures
NutraLease Ltd. Vehicles to targeted compounds (such as nutraceuticals and drugs)
[18]
Nanocarrier/ingredients
Nanotrim™ Dramatically improve cellular health and the burning of fat for energy
[19]
Nanocarrier/ingredients
Fohow Natural regenerating healthcare food product.
[20]
Nano encapsulation
NanoSlim NanoSLIM formula helps losing weight faster
[21]
Nanopowder Nanoceuticals™ Artichoke Nanoclusters- RBC Life Sciences®, Inc.
Reduce the surface tension of foods and supplements to increase wetness and absorption of nutrients
[22]
Nanopowder Nanoceuticals™ Spirulina
Reduce the surface tension of foods and
[23]

8
Nanoclusters- RBC Life Sciences®, Inc
supplements to increase wetness and absorption of nutrients
Nano encapsulation
Iovate Health Sciences Research, Inc.
Enhance compound absorption, giving the nanoparticulated particles the ability to easily enter the body
[24]
Diatomaceous earth
Bio-Sim-Nano Health Solutions
Immune system support, anti-Candida and detox
[25]
Silicon Nanosiliceo Kapseln- Neosino
[26]
Au NPs Utopia Silver Supplements Colloidal Gold 8
[27]
Au NPs (0.65 nm in diameter)
Mesogold - Colloids for Life LLC
Improve mental acuity, brain function
[28]
Au NPs Colloidial Gold-MaatShop
Remove blockages from the body and thereby enhance vital life force.
[29]
Zinc MesoZinc-Purest Colloids Inc.
Promotes healthy skin, supports healthy cartilage regeneration.
[30]
Copper MesoCopper Purest Colloids Inc.
Promotes healthy skin, supports healthy cartilage and tendon regeneration.
[31]
Iridium Meso Iridium Purest Colloids Inc.
Promotes improved cellular metabolism
[32]
Platinum (10 pp) MesoPlatninum Purest Colloids Inc.
Promotes increased mental focus and concentration
[33]
Platinum, gold and silver
Colloidial Golden Platinum-MaatShop
Optimizes DNA function and protects the body against degenerative disease
[34]
Palladium Meso Palladium-Purest Colloids Inc.
Highest particle surface area for maximum effectiveness.
[35]
Micelle Nutrition Centre Ltd
Mimics the way fats are handled in the gut, enhances the absorption of nutrients by up to 300%
[36]
A micelle, 30 nm in diameter
CoQ Softgels -Solgar
Transforms fat-soluble nutrients into water-soluble ones -
[37]

9
significantly increasing absorption.
Nano-encapsulation
Muscletech sports nutrition supplements
Rapid delivery of multivitamin complexes
[38]
Lyposomal Nano-spheres
Vitamin C- LivOn Labs
Encapsulate Vitamin C gently slip across the intestinal wall and into the blood
[39]
Micelle 30 nm diameter
Aquanova Higher and faster intestinal and dermal resorption and penetration of active ingredients.
[40]
Nano encapsulation natural lipids
NanoResveratrol™ Life Enhancement
Slip through tiny openings and gain access to the cells
[41]
Unknown Life Enhancement (discontinued)
Nourish and protect body cells, tissues, and organs, guarding against the effects of aging
[42]
Curcuminoids Life Enhancement (discontinued)
Requires low doses of curcumin to reach sustainable levels of curcumin in the blood plasma
[43]
Nanoparticulated aminos
Alpha Amino Prototype MuscleTech
Build a massive amount of rock-hard muscle.
[44]
Nanocarrier (mineral clusters)
RBC Life Sciences®, Inc.
Hydrate the cells and perform its many vital functions more effectively
[45]
Silica MesoSilica™ - Purest Colloids Inc.
Promotes healthy skin and rejuvenates collagen and elastin.
[46]
Silicate mineral (300 mg/capsule)
Microhydrin® -RBC Life Sciences®, Inc.
Supplies the body building blocks to help create energy, enhance endurance and speed recovery
[47]
Calcium Good State - Liquid Ionic Minerals Calcium
0.1 nm in diameter, strong bones and teeth and for the maintenance of healthy gums
[48]
Calcium and magnesium
Good state Lower blood pressure and may prevent bone loss associated with brittle bones, keep the skin health
[49]

10
Calcium Mag-I-Cal.com Absorb Nano Cal/Mag greater than with most competing products.
[50]
CoQ10 and ß-Cyclodextrin
Genceutic Naturals
More stable, retaining much greater stability against heat and light
[51]
Zeolite crystals Vitality Products Co. Inc.
Supports a healthy immune system, helps remove heavy metals, toxins and other substances from the body
[52]
Food storage containers Ag NPs Kinetic Go Green Keeps foods fresher up to
3 times longer than conventional plastic food storage
[53]
Ag NPs Basic Nanosilver Oso Fresh
[54]
Ag NPs FresherLonger™ Sharper Image®
Antibacterial [55]
Ag NPs Fresh Containers™ Always Fresh
Remove damaging gases [56]
Ag NPs (20 ppm) A-DO Global Antibacterial, Antibiotic effect
[57]
Ag NPs Quan Zhou Hu Zheng Nano Technology Co., Ltd
Antimicrobial protection
[58]
Clay Top Nano Technology Co., Ltd.
Reduce spiciness, brings more aroma to malt wine,
[59]
Coating Nano film Constantia Multifilm
Oxygen barrier, better than a metallized PET and PVdC coated PET film at a lower coating weight and cost.
[60]
Food coatings
Monodisperse distribution of nano-particles
TopScreen DS13 -Topchim
Water-based and bio-wax barrier, higher temperature resistance and less sticky
[61]
Mother's milk pack
Ag NPs Jaco [62]
Water bottle
Ag NPs Chronic Nano Technology
Removes free radicals, enhance immunity
[63]

11
Water bottle
Ag NPs A-DO Global Antibacterial, antibiotic effect
[64]
Salad bowl
Ag NPs Changmin Chemicals
[65]
Pan Carbon Melitta Prepare foods quickly be hot (up to 30 percent of the normal cooking time)
[66]
Filter Nano alumina NanoCeram-PAC Argonide
High efficiency for capturing very fine particles
[67]
Water filter
Ceramic Eurodia Extract water at the same time as monovalent ions
[68]
Plastic wrap
ZnO SongSing Nano Technology Co., Ltd.
Anti-UV, reflecting IR, sterilizing and anti-mold
[69]
Beer Bottle Plastics
Clay Voridian Keep the beer fresher and extend the shelf life.
[70]
Beer bottle
Clay Honeywell Zero oxygen transmission rates for extended periods of time
[71]
Foods Wine Au NPs Taiwanese
YuShanJin Increase sensory (reducing burning mouth feel)
[72]
Chocolate Syrup
Titanium dioxide Albertsons 0.0025 μg Ti/mg [73]
Chocolate Syrup
Titanium dioxide The Hershey Company
0.0026 μg Ti/mg [74]
Canola oil
Nanodrops (micelle)
Shemen Industries Inhibit transportation of cholesterol from the digestive system into the bloodstream
[75]
Mineral water
Ag NPs (100 pm) La Posta del Aguila
For baby and mom in the gestation period, Antimicrobial protection
[76]
Chocolate
Nanocarrier Nanoceuticals™ Slim Shake Chocolate
Enhance the taste and the benefits of food
[77]
Tea Selenium nanoparticles
Shenzhen Become Industry & Trade Co., Ltd.
Annihilation of viruses [78]
adhesives Biopolymer (starch)
Ecosynthetix Instant tack and faster drying times than traditional starch
[79]

12
Tooth powder
Nanopowder (silicon)
RBC Life Sciences®, Inc.
Reduces the surface tension of foods and supplements to increase wetness and absorption of nutrients
[80]
Appliance Chopping board
Ag NPs Husk's Kitchen Anti-bacteria Biodegradable
[81]
Cutting board
Ag NPs A-DO Global Anti-bacteria [82]
Cutting board
Ag NPs Pro-Idee GmbH & Co. KG
Combat bacteria and kill 99.9 % of all germs.
[83]
Frying pan
Ag NPs Concord Cookware
Nano Silver Marble Coating Inside and Out
[84]
Ag NPs Korea King Sterilization and anti-bacterial
[85]
Ag NPs Amoré TM Kitchenware
Inhibit growth of micro, mold, mildew
[86]
Water filter
Ag NPs Katadyn Asia Inc. Hinders bacteria from growing through the pores of the ceramic tube, disinfects the ceramic body continuously
[87]
Convection Oven with Wok Base
Nano-Carbon Fiber
Sunpentown Instant heating, save in cooking time and energy costs
[88]
Tea pot Metals Top Nano Technology Co., Ltd.
Release tea flavor in 30 seconds
[89]
Glass bakeware
Nanofilms Nanofilm Develop non-stick coatings for glass
[90]
Ag NPs Westfalia Wergzeugcompany GmbH & CO KG
Antibacterial and germfree cocking
[91]
Cookware
Glaze Ceramcor LLC Retains and distributes heat perfectly
Pan Nano-ceramic Bialetti A water-based coating made of Ti and suspended silicate micro-particles
[92]
Kitchenware
Ag NPs Nano Care Technology, Ltd.
Kill the attached bacteria and microbial in ten minutes and the effect can last for a long time
[93]
Coffee maker
Ag NPs Saeco United States Inc.
Guarantee all components in contact with milk are perfectly clean
[94]

13
Fruit & Vegetable Cleaner
Ag NPs Jiekang Technology(ShenZhen)Co.,Ltd.
Suppresses bacteria growth
[95]
Fruit & Vegetable Cleaner
Ag NPs 3EVER Co.,Ltd Kill colon Bacillus, Salmonella and E. coli O-157
[96]
Cooking spray
Ag NPs SongSing Nano Technology Co., Ltd.
Killing Staphyloccus. K. pneumoniae, E. coli, P. aeruginosa, etc
[97]
Baby stuffs Nursing bottle
Ag NPs BabyDream Help protect babies with weak immunity from gems, the source of all diseases.
[98]
Mug cup Ag NPs BabyDream Help protect babies with weak immunity from gems, the source of all diseases.
[99]
Pacifier Ag NPs BabyDream Help protect babies with weak immunity from gems, the source of all diseases.
[100]
2.2 Surface enhanced Raman spectroscopy (SERS) and its enhancement mechanisms
SERS is a branch of Raman spectroscopy in which probed molecules are adsorbed onto
the roughness surface of coinage metals. This results in significant enhancement of the
Raman signals by many orders of magnitude in highly localized optical fields of these
structures. There are two widely accepted mechanisms of SERS, namely electromagnetic
and charge transfer mechanism (Shende and others 2010a; Lin 2010).
Electromagnetic mechanism
The enhancement factors (EF) at each molecule of this mechanism is given by
� = |�()|� |�(�)|�
Where E() is the local electric-field enhancement factor at the incident frequency and
E (’) is the corresponding factor at the Stokes-shifted frequency ’. Below is the

14
schematic of a surface-enhanced light scattering process. The schematic shows the inelastic
scattering process (Raman) (1 2) from an object (O) in the presence of a metal structure
that acts as an optical antenna (A) (Fig. 2-1). Einc() denotes the incident field, EA() is
the field directly radiated by the antenna, and EAOA() is the field radiated by the object
via the antenna.
Figure 2.2-1. Schematic of a surface-enhanced light scattering process, adapted from (Schatz and others 2006; Alonso-González and others 2012).
Acting as an antenna, the metal nanostructure enhances the incoming field Einc of
frequency 1 by a factor f1, generating a local field Eloc (hot spot) in its proximity:
Eloc = f1Einc (1)
The metal nanostructure also enhances the scattering off the object (O) at the Raman-
shifted frequency 2 by an enhancement factor f2. The field EAOA scattered off the object
via the antenna is thus given by
EAOA (proportional) f2 Eloc =f1f2 Einc (2)
The index AOA indicates the scattering path: the incoming light first polarizes the
antenna A, the local field of the antenna polarizes the object O, and finally the local field
of the object acts back on the antenna (A) which radiates as a result of this interaction. We

15
can approximate f1 = f2 = f when the difference between 1 and 2 is small and when
illumination and detection direction are the same, the latter being a consequence of the
reciprocity theorem. In this case, the antenna-enhanced field scattered off the object, EAOA,
scales with the square the local field enhancement
EAOA = f2 (3)
f is the complex nature of the field enhancement:
f =|�|��Dj� (4)
where |�| is the magnitude of the field enhancement and Dj� the phase shift induced by
the antenna relative to the incident field. Form (3) and (4), the scattered intensity IAOA
|����|� (typically measure in an experiment) scales with the fourth power of the
magnitude of the local field enhancement
IAOA |�|� (5)
The equations (1-5) are used to highlight the electromagnetic mechanism of the
enhancement
Chemical or charge transfer mechanism
Recently, some researchers argued that the EF required for single molecule surface
enhanced Raman spectroscopy (SMSERS) and the role of electromagnetic mechanism
enhancement may have been significant overestimated. They suggested that charge transfer
(CT) for chemical enhancement mechanism may be important in SMSERS (Centeno and
others 2006; Park and Kim 2010; Shende and others 2010a). This contribution arises either
from electronic coupling between the adsorbate (molecules/object) and nanostructured
features (nanoparticles) on the metal or from the fluctuations of molecule-surface charge-

16
transfer interactions. Generally speaking, we assume that the CT mechanism of SERS is
similar to a resonance Raman process and has only two steps:
Step 1: laser photon (h) produces the resonant transfer of one electron from the metal
(M) to vacant orbitals of the adsorbate (A) yielding the excited CT state (A M+)
When the electron comes back to the metal in step 2, a Raman photon (h’) can be
emitted if the molecule remains vibrationally excited (A*)
Step 2: A - M+ A* - M + hv’
The enhanced vibrations in Raman are related to differences between the equilibrium
geometry and gradients (vibrational wavenumbers) of the potential energy surfaces (PES)
of the involved electronic states, and accounting for the Franck-Condon and Herzberg-
Teller contributions relevant in all electronic spectroscopies.
Herein, we observe the contribution of the CT mechanism in the SERS signal of a single
4-aminobenzenethiol (ABT) with EF of 106 – 108. The well-defined Au nanoparticle-ABT-
Au thin film (TF) junctions were used to illustrate how EM and CT mechanisms works.
The ABT adsorbs onto the Au NP surface via the amino (-NH2) groups in contact with
NPs, produce strong b2-band intensity. When the laser excitation energy is chosen to match
an electronic transition energy (h = hie), the denominator of the first term becomes very
small, and, consequently, the polarizability becomes very large. This is the resonance
Raman condition. The electronic transitions can occur when a molecule (ABT) forms a
bond with AuNPs. In this case, some of the Au plasmon electrons can escape from the
surface, propagate through space (ballistic electrons), and couple to the molecular orbits of
chemisorbed or even physisorbed molecules. The magnitude of the transfer is especially

17
large if the relative energies of the lowest unoccupied occupied molecular orbit (LUMO)
and the highest occupied molecular orbit (HOMO) ae close in energy to the metal Fermi
level. Different NPs have difference in Fermi energies (e.g. AgNP 5.0 eV vs. AuNP 5.5
eV) may lead to different metal-molecule electronic coupling, producing different intensity
of excited band modes. In conclusion, chemical enhancement = static enhancement (10
times) + resonance enhancement (103 -104 times).
2.3 Applications of SERS for Detection of Food Adulterants
Over the last decade, SERS has rapidly developed. SERS is a branch of Raman
spectroscopy in which probed molecules are adsorbed onto the roughened surface of
coinage metals, resulting in significant enhancement of the Raman signals. SERS have
been increasingly applied to detect chemical contaminants or adulterants in foods, such as
melamine, antibiotics, veterinary drugs, and pesticides (Du and others 2010; Fan and others
2011a; Shende and others 2010a; Liu and others 2012a; Saute and others 2012).
In particular, the detection of pesticides by SERS has received much attention due to the
toxicity of pesticides to humans, animals, and the environment. The Environmental
Protection Agency (EPA) has set maximum residue levels (MRL) for various pesticide
residues in different agricultural and processed foods (Gilden and others 2010). Recent
examples of using SERS for pesticide detection in real foods include apple juices (Zhang
and others 2015b), apple and tomato peels (Fan and others 2014a; Li and others 2014;
Zhang and others 2014), and orange juice (Shende and others 2010b).
One of most crucial components of SERS is an efficient substrate that can activate
surface plasmons (Lin 2010). To date, various types of substrates have been developed.
18
Novel nanomaterials, particularly nanostructured metals enable SERS to be a sensitive,
quick, and accurate method for food analysis. Two widely used nanomaterials for
fabrication of SERS substrates are gold (Au) and silver (Ag).
A strong enhancement of SERS largely depends on the performance of a good substrate.
SERS coupled with Au NPs was applied for the detection of two organophosphates (OP)
pesticides (azinphos-methyl and phosmet) and carbaryl pesticide extracted from fruits (Liu
and others 2012a), chlorpyrifos-methyl in orange juice (Shende and others 2010), and
melamine in milk and processed foods (He and others 2008; Lin and others 2008). Silver
was used for qualitative and quantitative determination of melamine (Du and others 2010;
Liu and others 2010a), food- and water-borne bacteria (Fan and others 2011), restricted
antibiotics (He and others 2009). However, silver is expensive and can be easily oxidized.
Besides, most noble metals have a poor biocompatibility and their fabrication methods are
quite complex, difficult to control or keep clean. All the aforementioned disadvantages can
decrease the enhancement of metal substrates. Therefore, it is necessary for us to develop
a new substrate for SERS as well as an alternative material that meet further requirements
such as cheap, easy to obtain, strong EM, and biocompatible.
2.4 SERS substrates
Graphene, a two-dimension nanomaterial composed of sp2 bonded carbon atoms, has a
great potential in SERS applications due to its unique properties. The enhancement
mechanism of graphene is believed to be from the partial contribution of the high thermal
conductivity of graphene (Xu and others 2012). Graphene is the thinnest known material
with a thickness of only one atom, and it is stronger than steel (Chen and others 2008a;

19
Geim and Novoselov 2007a; Kuila and others 2011; Lee and others 2008). Graphene can
be made by mechanical exfoliation from graphite that is abundant on the earth and we can
observe their unique physical and chemical properties through common and convenient
methods/techniques for most laboratories (Castro and others 2010; Chen and others 2011;
Loh et al. 2010; Neto et al. 2009; Wang et al. 2011). Also, it is biocompatible and a robust
material (Wang et al. 2011). To date, great progress has been made in using graphene and
their derivatives in various applications. For example, graphene and graphene oxide (GO)
were investigated by Huang and Wan to design an electrochemical/electric biosensor for
detecting virus and E. coli K12. The large-size graphene film was grown by chemical vapor
deposition and functionalized with anti-E. coli antibodies and a passivation layer.
Significant conductance increase of the graphene device was observed after exposure to E.
coli at a concentration as low as 10 CFU/mL, while no significant response was triggered
by a high concentration of P. aeruginosa (Huang and others 2011b). Therefore, graphene
is a promising nanoscale material that can be used for supporting metal nanostructures
(Applerot and others 2012; Liang and others 2012; Xu and others 2012). However, its
potential as a substrate for SERS has not been investigated thoroughly, particularly in the
area of detection of food contaminants.
Currently, the main SERS enhancers are still relying on the EM of noble metal (Au or
Ag) nanostructures. Gold nanorods (Au NRs), an anisotropic nanostructure, have gained
much attention due to its unique ability to interact with light of varying wavelengths
(Murphy and others 2005; Grzelczak and others 2010; Rycenga and others 2011). Au NRs
display two separate surface plasmon resonance (SPR) bands known as transverse and
longitudinal plasmon bands. The ability of tuning the SPR as a function of aspect ratio

20
enables Au NRs to become effective SERS substrates. By functionalizing the Au NRs
with the target antibodies and monitoring the change of longitudinal SPR, Au NRs
have been applied in the detection of food pathogens, pesticides residues, and
environmental toxins (Singh and others 2009; Wang and Irudayaraj 2010; Wang and
Irudayaraj 2008; Wang and others 2010).
One of the challenges for most current commercial SERS substrates is that they are made
of silicon-based chips that are thick, heavy, and non-flexible (Nanova 2014; Silmeco 2014).
It is of paramount importance to find lightweight, flexible, and bendable materials to
fabricate novel SERS substrates for versatile applications. Among all these reviewed
materials, graphene is a promising and cost-effective nanoscale material that can be used
for supporting metal nanostructures. In addition, by depositing Au NRs in the substrate,
numerous hot-spots for SERS can be created and thus exhibit strong Raman enhancement
due to unique properties of graphene and the deposited Au NRs.
2.5 Antibacterial properties of inorganic ENPs
Some ENPs have been shown to exhibit antimicrobial properties against a number of
foodborne microorganisms, including pathogens. Table 2 summarizes recent published
studies (2011 - 2016) on antimicrobial properties of inorganic ENPs ranging from metal,
metal oxide, and carbon-based materials against pathogenic bacteria, viruses, and parasites.
For example, most recent studies show that Se NPs have unique antibacterial properties to
Trichophyton rubrum (Yip and others 2014), Candida albicans (Kheradmand and others
2014), Pseudomonas aeruginosa, and Proteus mirabilis (Shakibaie and others 2015).
Table 2. Antibacterial effect of inorganic ENPs against different microorganisms

21
Microorganisms ENPs Effect References Selenium NPs Bacteria and yeasts Trichophyton rubrum
Padded onto fabric PSP–Se NPs
Inhibited more than 99.7% of growth over a testing period of 7 days
(Yip and others 2014)
Candida albicans Produced from Lactobacillus species
Enhanced antifungal activity against C. albicans.
(Kheradmand and others 2014)
Staphylococcus aureus 50–100 nm Totally inhibited bacterial growth in vitro
(Chudobova and others 2014)
S. aureus and Pseudomonas. aeruginosa
50 nm Inhibited the growth of S. aureus and P. aeruginosa by 80%∼90% after 72 hours on paper towel
(Wang and Webster 2014)
Escherichia coli (MTCC 433) and Bacillus subtilis (MTCC 441)
Ag–Se NP Displayed zone of inhibition in both cases on agar medium
(Mittal and others 2014)
Thirty strains of S. aureus, P. aeruginosa, and Proteus mirabilis
80–220 nm Inhibited the biofilm of S. aureus, P. aeruginosa, and P. mirabilis by 42%, 34.3%, and 53.4%, respectively
(Shakibaie and others 2015)
S. aureus 100 nm Inhibited growth of S. aureus in broth after 3, 4, and 5 hours at 7.8, 15.5, and 31 µg/mL
(Tran and Webster 2011b)
Ag NPs Bacteria and Fungi S. aureus, E. coli, Klebsiella pneumoniae, B. subtilis, Enterococcus faecalis, P. aeruginosa
Showed significant antibacterial activity against all the pathogenic bacteria
(Namasivayam and others 2011)
S. aureus and Streptococcus mutans, C. albicans
Ag NPs coated medical devices
0·1% of Ag NPs combination showed bactericidal effect against two bacterial strains. 0·5% Ag NPs combination had fungicidal potential
(Nam 2011)

22
E. coli and S. aureus Bacterial cellulose- Ag NPs composite
(Barud and others 2011)
S. aureus, methicillin-sensitive S. aureus (MSSA), and MRSA
5–10 nm Showed both bacteriostatic and bactericidal effects
(Ansari and others 2011)
Salmonella Typhi, Staphylococcus epidermidis, S. aureus, P. aeruginosa, P. vulgaris, E. coli, K. pneumoniae
Ag colloids 20–45 nm MIC was found to be 2–4 μg ml−1
(Lkhagvajav and others 2011)
Bacteriophage MS2 Average 21 nm Facilitate MS2 to
infect E. coli host in one-hour prior exposure
(You and others 2011)
Parasites Hematophagous parasites 60–150 nm (Jayaseelan and
others 2012b) ZnO NPs Parasites Blood feeding parasites 60–120-nm Mortality effects
were 100% after 12 h
(Kirthi and others 2011)
Bacteriophage MS2 Average 39 nm Facilitate MS2 to
infect E. coli host in one-hour prior exposure
(You and others 2011)
Bacteria, yeast and fungi Campylobacter jejuni Average ∼30 nm The action of ZnO
nanoparticles against C. jejuni was determined to be bactericidal, not bacteriostatic
(Xie and others 2011)
Botrytis cinerea and Penicillium expansum
70 ± 15 nm At concentrations > 3 mM can significantly inhibit the growth of two bacteria
(He and others 2011)
Salmonella Typhimurium and S. aureus
≤50 nm Reduced the cell number to zero within 8 h
(Tayel and others 2011)
S. aureus 10–30 nm Showed a much stronger antibacterial effect on Gram-positive
(Premanathan and others 2011a)

23
bacteria than on Gram-negative ones
E. coli, Bacillus subtilis, and S. aureus
50–70 nm ZnO found to be the second toxic among the tested nanoparticles (CuO, NiO, and Sb2O3)
(Baek and An 2011)
S. aureus proliferation and biofilm formation
ZnO on PVC composite
Presence of ZnO reduced active bacteria on samples
(Seil and Webster 2011)
P.aeruginosa and Aspergillus flavus
Biosynthesis, average 57.72 nm
The maximum zone of inhibition was Pseudomonas aeruginosa (22 ± 1.8 mm) and Aspergillus flavus (19 ± 1.0 mm).
(Jayaseelan and others 2012a)
S. Typhimurium and S. aureus in ready-to-eat poultry meat
On packaging materials Size ≤ 100 nm
Reduced the number of inoculated target bacteria from log seven to zero within 10 days at 8°C.
(Akbar and Anal 2014)
Streptococcus mutans and Lactobacillus
Powder with an average particle size of 50 nm
Exhibited higher antibacterial activity against two bacteria compared to the control groups
(Kasraei and others 2014)
Salmonella in liquid egg albumen
PLA coatings with 250 mg or more ZnO
The combinations effectively reduced pathogens or inhibited their growth
(Jin and Gurtler 2011)
S. aureus and B. subtilis Ag doped ZnO The changes in concentration of Ag affected the MIC value
(Sharma and others 2013)
Mesophilic and halophilic bacterial cells
100 nm Reduced the growth of Enterobacter sp. by 50%, while 80% reduction was observed in halophilic Marinobacter sp.
(Sinha and others 2011)
Bacterial and fungal pathogens Biosynthesized 40 nm
More enhanced biocidal activity against various pathogens when compared to
(Gunalan and others 2012)

24
chemical ZnO nanoparticles
S. aureus and P. aeruginosa Combined with ultrasound and average size of 60 nm
Providing over a 4-log reduction (equivalent to antibiotics) compared to no treatment after just 8 h.
(Seil and Webster 2012)
E. coli and Staphylococcus Green synthesis using Hibiscus subdariffa leaf extract 12–46 nm
Showed well bactericidal efficiency at concentration higher than that of 50 μg ml−1
(Bala and others 2015)
Pathogenic strains (B. subtilus, Bacillus megaterium, S. aureus, Sarcina lutea, E. coli, P. aeruginosa, K. pneumoniae, P. vulgaris, C. albicans and Aspergillus niger )
Exhibit a good bacteriostatic effect but poor bactericidal effect towards all pathogens tested
(Yousef and Danial 2012)
C. albicans 11.6 nm A concentration-dependent effect of ZnO on the viability of C. albicans and MIC was 0.1 mg/ml
(Lipovsky and others 2011)
P. aeruginosa 20±3 nm Bacterial clearance in the liver but did not alter bacterial clearance from the blood
(Watson and others 2015)
Graphene (G) and its derivatives
Bacteria E. coli Graphene oxide (GO)
membranes 92% and 72% of E. coli remaining 1 hour and 5 hours after deposited on the membrane surfaces
(Schaepe 2015)
E. coli GO Bacteria reduce graphene oxide to bactericidal graphene in a self-limiting manner
(Akhavan and Ghaderi 2012b)

25
E. coli, S. Typhimurium, E. faecalis, B. subtilis
Synthesized by a hydrothermal approach
Predominant antibacterial activity compared to the standard antibiotic, kanamycin
(Krishnamoorthy and others 2012b)
S. aureus and E. coli G-Based photothermal agent
Effective killing of up to 99% of both bacteria in 10 min
(Wu and others 2013)
G Derivative–Poly-L-Lysine Composites
The most potent antibacterial agent
(Some and others 2012)
Graphene polymer (PVK-GO) nanocomposite films
90% more effective in preventing bacterial colonization relative to the unmodified surface
(Li and others 2011b)
E. coli and P. aeruginosa. Ag NP-GO hybrid materials
Good antimicrobial activity against both bacteria
(Fan and others 2014b)
Ag/G polymer Hhdrogel
(Fan and others 2014b)
P. aeruginosa and S. aureus G nanofilms with different edge lengths and different angles of orientation
Exhibited variable bactericidal efficiency toward ttwo pathogenic bacteria
(Pham and others 2015)
E. coli O157:H7 Bio-Conjugated CNT-Bridged 3D Porous GO Membrane
High efficient removal of E. coli O157:H7 bacteria
(Nellore and others 2015b)
Methicillin-resistant S. aureus (MRSA) pathogens
Peptide-conjugated GO membrane
Almost 100% of MRSA can be removed and destroyed from the water sample
(Nellore and others 2015a)
P. syringae and X. campestris pv. undulosa) Fungal pathogens (F. graminearum and F. oxysporum
GO Killed nearly 90% of the bacteria and repressed 80% macroconidia germination
(Chen and others 2014)
Streptococcus mutans G nanoplatelets Killed effect of GNPs on S. mutans cells and depended on lateral size and thickness.
(Rago and others 2015)
E. coli, S. Typhimurium, B. subtilis, and E. faecalis
GO-modified ZnO NPs
Excellent antibacterial activity
(Zhong and Yun 2015)

26
2.6 Mechanisms of antimicrobial properties of inorganic ENPs
Mechanisms of antibacterial properties of inorganic ENPs are still not well understood.
The toxicity of ENPs to microbes is frequently attributed to the formation of reactive
oxygen species (ROS), the release of toxic metal ions, the penetration into the cell, and cell
membrane disruption (Fig. 2-2).
Figure 2-2. The illustration of possible antimicrobial mechanisms of metal oxide NPs (adapted from Djurišić and others 2015).
ROS formation
ROS has been attributed to the cell damage in many studies (Sharma and others 2012;
Gurunathan and others 2012; Fu and others 2014; Fu and others 2012; Li and others 2012;
Shi and others 2012; Zhang and others 2013) while there have been a very few works
showing non-ROS mediated toxicity of NPs (Lyon and others 2008) (Krishnamoorthy and
others 2012a), (Leung and others 2014). Interactions between NPs and the cells result in
ROS production, not NPs producing ROS spontaneously by themselves (Djurišić and
others 2015). ROS generation has been linked to oxygen vacancies, free radicals,
superoxide ions, and hydrogen peroxide. The formation of free radical is also a well-known

27
antibacterial mechanism of Ag NPs (Prabhu and Poulose 2012). When NPs attach to the
bacterial cells, these radicals can damage the cell membrane and make it porous, which can
lead to cell death (Danilczuk and others 2006; Kim and others 2007). Similar to metal and
metal oxide, oxidative stress is a mechanism involved in the toxicity of carbon-based NMs
(Seabra and others 2014). If ROS is not reduced or eliminated, cellular macromolecules,
such as proteins, DNA, and lipids can be damaged (Sanchez and others 2011).
Release of metal ions and toxicity
The hypothesis of releasing of metal ions by NPs is usually tested by comparing the
toxicity of metal NPs with the toxicity of different metal salts (chlorides, nitrates, etc.).
These metal ions can interact with the thiol groups of many vital enzymes and inactivate
them (Prabhu and Poulose 2012). The inhibition of a respiratory enzyme by silver ions can
lead to the generation of ROS that then attack the cell itself. Moreover, the cells take up
ions, which inhibit several functions in the cell and causes damage of the cells. Toxicity
due to metal ion release has been reported for ZnO (Liu and others 2009; Sirelkhatim and
others 2015), Ag (Ma and others 2011; Sondi and Salopek-Sondi 2004), CuO, NiO, MgO,
WO3 (Horie and others 2012), and CeO2 (Thill and others 2006; Eom and Choi 2009; Park
and others 2008). A study suggested that the mechanism involves the release of Ag+ ions
since both Ag NPs and AgNO3 were deionized through ion exchange resin (Kim and others
2009). The deficiency of free Ag+ ions existed in the Ag NP solutions, but an evident
decrease in Ag+ ion concentration was observed in the solution of AgNO3. In case of ZnO
NPs, there have been conflicting reports about the relationship between Zn+ release and
antibacterial activity of ZnO NPs. For example, Cupriavidus necator cells were exposed
to Zn2+ resulted in up-expression of proteins related to metabolic processes, while the

28
exposure to ZnO NPs will lead to up-expression of proteins related to biosynthesis of
membrane-associated proteins (Neal and others 2012).
Other mechanisms
Another mechanism of antimicrobial properties of ENPs is structural changes in the cell
membrane. The toxicity of metal oxide NPs was attributed to the adhesion of NPs to the
cell membrane, thus causing oxidative stress to the cell by changing cell membrane
permeability, viscosity, transport exchanges, and eventually leading to cell death (Neal
2008; Applerot and others 2012; Thill and others 2006). ENPS are able to interact with the
cell membrane not only via electrostatic interaction but also other possible interactions,
including van der Waals forces, hydrophobic interaction, and receptor-ligand interaction.
These different types of physicochemical interactions between NPs and bacterial cells can
explain why negatively charged NPs may easily attach to a Gram-negative cell. Some
studies verified the cell membrane disruption by metal oxide by proteomics assays that
show cell membrane distortion upon exposure to NPs (Leung and others 2012; Neal and
others 2012; Pagnout and others 2012; Gogniat and others 2006; Liu and others 2009). Ag
NPs have the ability to attach to a bacterial cell wall and eventually penetrate it, form “pits”
and accumulate on the cell surface (Sondi and Salopek-Sondi 2004). Zhang and others
(2007) clearly showed that the presence of ZnO NPs led to the damage of the cell
membrane of E. coli (Zhang and others 2007). Cell membrane damage through physical
anchor of graphene possessing sharp edges was also investigated in a study of toxicity of
graphene family materials (Akhavan and Ghaderi 2010; Gurunathan and others 2012). For
example, Liu and other (2013) (Liu and others 2011c) demonstrated that the toxic
mechanism of GO and reduced GO involved the material deposition on the cells and

29
membrane stress caused by direct contact with sharp sheets of the material. However, the
direct contact mechanism should be carefully considered when studying the toxicity since
the toxic effects still occur even if the NPs and bacteria are separated by a membrane and
attachment without the cell damage can also occur for some types of NPs.
Another proposed mechanism involves the interaction of NPs with sulfur and phosphorus
of the bacterial DNA that results in cells being unable to replicate thus killing the microbes
(Hatchett and White 1996). The dephosphorylation in tyrosine residues of Gram-negative
bacteria was also observe as a potential mechanism of nanotoxicity (Kokubo and others
2007).
2.7 Physical and chemical properties of inorganic ENPS affect their antimicrobial activities
The toxicity of NPs depends on the size, composition, surface modification, and intrinsic
properties of the tested bacteria. These bacterial properties include the type of cell wall
(Gram-positive vs. Gram-negative), growth rate, and biofilm formation (Hajipour and
others 2012). However, in this review, only the physical and chemical properties of
inorganic ENPs available in the literature are discussed as related to their antimicrobial
activities.
Sizes of NPs
Many studies attributed the toxicity of TiO2 NPs to their small particle size (Jiang and
others 2009; Kim and Kwak 2008; Kiser and others 2009; Park and others 2012; Tong and
others 2013; Xiong and others 2013). Lin and others (2014) studied the toxicities of five
types of TiO2 NPs with different particle sizes (10 - 50 nm) and crystal phases against E.
coli. The antibacterial effects of TiO2NPs as revealed by dose-effect experiments decreased

30
with increasing particle size and rutile content of the TiO2 NPs. The TiO2 NPs with anatase
crystal structure and smaller particle size produced a higher content of intracellular ROS
and thus greater antibacterial effect (Lin and others 2014). Similar to TiO2 NPs, many
reports have showed that particle size can affect the antibacterial activity of ZnO NPs
(Yamamoto 2001; Jones and others 2008; Padmavathy and Vijayaraghavan 2008). For
example, Yamamoto (2001) investigated the effect of particle size of ZnO NPs over a range
of 100–800 nm on S. aureus and E. coli. The authors found that the antibacterial activity
of ZnO NPs increased with the decrease of particle size. The other results also showed that
ZnO suspension with 12 nm particles was more effective than the suspension with large
particle sizes (Padmavathy and Vijayaraghavan 2008). The reason may due to the fact that
smaller size of ZnO NPs with higher surface areas have increased the amount of H2O2
(Ohira and others 2008).
Shape of NPs
ZnO spherical nanoparticles with ~ 30 nm of average diameter size showed the highest
antibacterial activity. Yamamoto et al. (2004) concluded that antibacterial activity of ZnO
powders was increased when the lattice constant value in the hexagonal structure of ZnO
powders improved. For carbon-based NMs, a systematical study investigated the
antibacterial effects of different GO suspensions with different lateral sizes (of more than
100 times) and with distinct size distributions by (Liu and others 2012b). The antibacterial
activities of GO sheets against E. coli cells were found to be stronger in larger GO sheets
than in smaller sheets. The reason may be that the larger GO sheets likely cover cells more
easily, which may block their active sites on the membrane. Whereas the smaller GO sheets

31
inefficiently attached to the bacterial surfaces, resulting a weaker antibacterial activity (Liu
and others 2012c).
Surface properties
Doping is one of widely used methods for the modification of NPs (Yamamoto and
others 2000; Lin and Haynes 2009; Manna and others 2012). The results indicated that Ag-
doped ZnO NPs had better antibacterial activity compared with ZnO NPs. Gordon et al.
(2011) doped iron oxide onto ZnO NPs to produce magnetic nanoparticles with
antibacterial activity which later was found to be dependent on the weight ratio [Zn]:[Fe].
The higher the ratio was, the higher the antibacterial activity. The antimicrobial activity of
hydroxyapatite nanocomposite embedding Ag NPs significantly inhibited the growth of
E. coli JM110 and Micrococcus luteus (Miranda and others 2012).
Liu and Kim applied nanocomposite consisting of genipin-crosslinked
chitosan/poly(ethylene glycol)/ZnO/Ag as the wound-healing and burn dressing material.
The results indicated that hydrogel patch doped with Ag NPs had higher antibacterial
activity than hydrogel (Liu and Kim 2012). Similarly, these authors demonstrated that
TiO2 nanotubes loaded with Ag NPs killed S. aureus bacteria during the first several days
and prevented their adhesion for 30 days.
Dimension and morphology
Wang and others (2007) studied the relationship between antibacterial activity and
various orientations of ZnO arrays (Wang and others 2007b). The results indicated that
randomly oriented ZnO nano-arrays showed better antibacterial activity against E. coli
compared with less or well-defined oriented ZnO nano-arrays.

32
2.8 Cytotoxicity of inorganic NPs to human cells
Nanotechnology has skyrocketed in recent years and can provide multifunctional
strategies such as nanostructured materials, pathogen detection, antimicrobial agents which
offers many potential benefits to the consumers (Duncan 2011). Nanomaterials (NMs) are
of great interest due to their unique properties at the nanoscale (< 100 nm) as compared to
bulk materials. However, the development of nanotechnology has increased the likelihood
of human expose to NMs and environmental pollution by NMs. Numerous studies have
been published about the potential hazards of different NMs, including inorganic NPs
(metal and metal oxide), carbon nanotubes, graphene and its derivatives. For example,
studies have shown the dose-dependent cytotoxicity of selenium (Se ) NPs in different
cells, such as A375 human melanoma cells (Chen and others 2008b), HeLa cells (Luo and
others 2012), HCT-8 tumor (Gao and others 2014), H22 hepatocarcinoma cells (Gao and
others 2014), and human hepatoma HepG2 cells (Estevez and others 2014). On the other
hand, some studies demonstrated that nanosized Se exhibit excellent in vitro and in
vivo biological activities and low toxicity (Zhang and others 2001; Peng and others 2007;
Pi and others 2013; Wang and others 2007a). Graphene oxide has been shown to have very
mild or even no cytotoxicity in a variety of cells, such as PC12 cells (Zhang and others
2010), HeLa cells, human fibroblasts (Liao and others 2011), A549 human lung cancer
cells (Chang and others 2011), and human hepatoma HepG2 cells (Sasidharan and others
2012). The toxicity of NMs has also been shown in different organisms including rodents,
humans, and aquatic species (zebrafish, algae, etc.). In addition, despite great enthusiasm
about the applications of NMs in food packaging and biomedicine, some concerns remain
about the potential toxicity and biocompatibility of NMs. Therefore, it is of critical

33
importance to investigate the toxicity of these nanomaterials before applying them in
various areas. Table 3 summarizes the in vitro cytotoxicity effects of graphene materials
and selenium NPs.
Table 3. In vitro cytotoxicity effects of graphene materials and Se NPs
Cell line Effect References Graphene family
materials
H22 hepatocarcinoma cells
Layered Graphene nanoplatelets
Not fully pahgocytosed
(Song and others 2014)
HepG2 cells (Chiang and others 2012)Yuan
A549 Human Lung
Graphene oxide films Promotes cell attachment an proliferation
(Chang and others 2011)
HK-2 normal human kidney cells
Reduced graphene oxide
(Compton and Nguyen 2010)
HK-2, MDA-MB-231, and A549 cell
Cu2O nanocrystal–reduced graphene oxide hybrid ∼4 nm
The cell viability was dependent on the irradiation time, concentration, and the cell type
(Hou and others 2013)
MCF-7/Hs-578T and PC-3 cells
Functionalized graphene oxide sheets
> 50% decrease in metabolic activity
(Yoon and others 2013)
Mouse pheochromocytoma (PC12) cells
Graphene oxide (Zhang and others 2010)
Adenocarcinomic human alveolar basal epithelial cells (A549 cell) Human lung epithelial cells (A549 cell)
Graphene oxide nanosheets
0% viability loss Around 50% decrease Around 1.5% viability loss
(Chang and others 2011)
Human skin fibroblasts Graphene oxide Graphene
<20% viability loss (Liao and others 2011)
Murine mammary tumor line EMT6 cells
PEGylated graphene oxide (NGO-PEG)
NGO-PEG was non-cytotoxic to EMT6 cells after 24 h incubation.
(Zhang and others 2011b)
HeLa, HepG 2, and HEP-2 cells
PEI-Grafted Graphene Oxide (PEI-GO)
Significantly low cytotoxicity
(Zhang and others 2011a)
HA–GO/Ce6 nanohybrids
HA–GO/Ce6 nanohybrid
Showed without appreciable toxicity
(Li and others 2013)

34
Hela (FA receptor positive) and A549 (FA receptor negative) cells
FA–NGO–PVP Low cytotoxic to Hela cells
(Huang and others 2011a)
Selenium NPs MCF-7 breast adenocarcinoma cells, Hep G2 hepatocellular carcinoma cells, Hela cells, and HK-2 normal human kidney cells
AAs-modified selenium nanoparticles (SeNPs@AAs) 70-nm
Internalized by MCF-7 cells and lower cytotoxicity toward HK-2 cells
(Feng and others 2014)
HCT-8 tumor Combined with irinotecan
Dramatically inhibited tumor growth and significantly induced apoptosis of tumor cells
(Gao and others 2014)
HepG2 cells Chitosan-stabilized selenium nanoparticles
Induced a certain degree of apoptosis and a drastic reduction of the level of expression of Cdk1
(Estevez and others 2014)
Dalton lymphoma (DL) cell lines
Ag–Se NPs Cytotoxic to the tumor cells at 50 μg/mL and above
(Mittal and others 2014)
H22 hepatocarcinoma cells
Cytotoxicity was associated with production of reactive oxygen species
(Wang and Webster 2014)
A549 Human Lung Adenocarcinoma Cells
Soluble polysaccharide–protein complexes (PRW-Se NPs)
Inhibited the growth of A549 cells
(Pi and others 2013)
HepG2 human hepatocellular carcinoma cells
Dose dependent (Zhang and others 2008)Zhang et al. 2012
HK-2 normal human kidney cells
No effect (Yip and others 2014)
MCF-7 human breast cacinoma cells
Polysaccharides–protein complexes (PSP)-Selenium NPs
Inhibited the growth and dose dependent
(Pi and others 2013)
HeLa (human cervical carcinoma) cells and MDA-MB-231 (human breast carcinoma) cells
NanoSe0, 10–40 μmol/L)
Inhibited the growth of cells in a dose-dependent manner
(Luo and others 2012)
HeLa human cervical carcinoma cells
sSalic acid surface-decorated selenium
Induced dose-dependent apoptosis
(Feng and others 2014)

35
nanoparticles (SA–Se–NPs)
2.9 Mechanisms of cytotoxicity of ENPS
Several mechanisms of how NPs can cause toxicity to living cells have been proposed in
recent studies. Figure 2-3 illustrates a systematic review of all possible mechanisms of
ENPs. The formation of biological ROS, such as hydroxyl radical, hydrogen peroxide,
singlet oxygen and superoxide radical is a predominant mechanism leading to nanotoxicity
(Yin and others 2012). In addition to cellular oxidative stress, other biological reactions
can generate ROS in vivo. For example, transition metals (copper or iron) can be involved
in one-electron oxidation-reduction reactions, resulting in the formation of ROS (Halliwell
and Gutteridge 2015; Meng and others 2009). ROS can cause a failure in cells to maintain
normal physiological redox-regulated functions, leading to DNA-strand breaks (Nel and
others 2006), nucleic acid modification (Evans and others 2004), and finally to cell death
due to genotoxic effects (Chiang and others 2012; Fu and others 2012; Xia and others
2011). Numerous studies have found the association between NM toxicity and ROS
mediation in many biological systems, such as humans and mammalian cells. For example,
the formation of ROS has been identified in toxicity studies of quantum dots (Winnik and
Maysinger 2012), silica NPs, CuO (Akhtar and others 2010), ZnO NPs (Sharma and others
2012), TiO2 (Chiang and others 2012; Yin and others 2012; Gurr and others 2005), Co3O4,
Ag NPs [(Kim and Ryu 2013; Wang and others 2011b). Similar to metal oxide NPs,
carbon-based NPs also induced ROS, lipid peroxide, oxidative stress, and mitochondrial
dysfunction (Sanchez and others 2011; Zhang and others 2010; Chang and others 2011;
Gurunathan and others 2012).

36
Figure 2-3. Nanomaterial-induced toxicity mediated by ROS generation (adapted from (Fu and others
2014).
Another mechanism of nanotoxicity is the release of ions from NMs (Lacerda and others
2009; Navarro and others 2008). NMs have shown to be able to release toxic ions by
corrosion or dissolution. The NPs firstly can internalize through the cell membrane and
then release ion species once inside the cell. These toxic cations released from NPs are
responsible for detrimental effects (Casals and others 2012). One of the most apparent
examples is the case of Ag NPs where the bactericidal effect of Ag NPs has found to be
associated with the number of released Ag+ ion. It was also found that these ions can cause
an increase in ROS production (Zheng and others 2011). In conclusion, the formation of
ROS, as a result of NP reactivity, and the speciation of the released ions play an important
role in the potential toxicity of NPs.
2.10 Physical and chemical properties of NMs associated with nanotoxicity
The ROS formation from NMs is dependent on the physical and chemical properties of
the NMs, biological testing systems, and different cell lines/organism (Shaligram and

37
Campbell 2013). The properties include size, shape, surface area, surface coating, stability,
oxidation status, impurities, degree of aggregation and agglomeration (Ray and others
2009; Nel and others 2006; Xia and others 2008; Lin and Wang 2005; Lu and others
2010b). In addition to these critical factors, interactions between NMs and biological
factors may affect the generation of ROS and resulting their toxicity. All these aspects
should be accounted for in the toxicity of NPs when conducting the assessment.
Size and shape
As mention previously, the tiny NPs can penetrate cell membranes or barriers of living
organisms and cause cell disruption. The smaller the particles are, the greater the potential
to enter cellular organisms. Therefore, NPs with such a small size, can reach different
body’s organs such as the lung (Akhtar and others 2010), and skin (Lu and others 2010b)].
Interestingly, antibacterial properties or toxic effects also increase as the size of NPs
decrease (Auffan and others 2009). Li and others studied long wired NMs in cultured
fibroblasts that caused the cell failure division, DNA damage, and an increase of ROS
(Persson and others 2013). For example, Yin et al (Yin and others 2012) studied the
photocytotoxicity of nano-TiO2 of four different sizes (<25 nm, 31 nm, <100 nm, and 325
nm) and two different crystal forms (anatase and rutile) in human skin keratinocytes.
However, there are some exceptions in the relationship between the size and cytotoxicity
of NPs. For example, exposure of A549 cells to GO did not show cell uptake, although
size-dependent cytotoxicity and dose-dependent oxidative stress were observed.
In addition to the size, the shape may directly influence NM-induced toxicity. For ZnO
NPs, the snowflake particles seem to be the most active in cytotoxicity among other
morphologies including wishers, and spherical shapes. Hexangonal plate ZnO nanocrystals

38
were found to display significant higher activity than rod-shaped crystals (Mclaren and
others 2009). External morphology can affect cell uptake in the following order:
rods/spheres > cylinders > cubes (Qiu and others 2010; Gratton and others 2008; Chithrani
and others 2006). Overall, the size and shape may make huge difference in interactions
between respective NPs and biological systems. For the toxicity assessment, asymmetrical
properties of NPs may provide crucial information for the interpretation the toxicity.
Surface characteristics of NPs
Cooper NPs modified with different surface ligands (8-mercaptooctanoic acid, 12-
mercaptododecanoic acid, and 16-mercaptohexadecanoic acid) exhibited different
oxidation activity leading to different levels of ROS formation (Shi and others 2012).
Similarly, different function groups attached to the surface of fullerenes are important
determinant of their toxicity (Nel and others 2006). Another study shows that graphene
oxide (GO) determined the correlation between the amounts of oxygen content/functional
groups of GO and their toxicological behavior towards A549 cells (Das and others 2013).
The study indicated that the reduction in the oxygen functional groups or the increase in
the C:O ratio made reduced GO, more biologically inert and therefore less cytotoxic than
graphene and GO. Recently, Liu et al. also concluded that by controlling the functional
group density of graphene-based material, it is possible to minimize their environmental
risks and increase their applications. Therefore, surface modifications have many potential
applications based on their capabilities in antioxidative activities and free radicals
generation.
Liu and others functionalized rGO sheets (single-layered nano-rGO sheets∼20 nm in
average lateral dimension) with PEG polymer chains through non-covalent bonding (Liu

39
and others 2008). A low level of toxicity of the functionalized rGO toward human epithelial
breast cancer cells was observed (Liu and others 2008). Similar results were obtained by
Wojtoniszak and others, in which fibro blasts cells were exposed to GO and reduced GO
functionalized with different dispersants (PEG, Pluronic P123, and sodium deoxycholate)
(Wojtoniszak and others 2012). The authors concluded that the cell toxicity depends on the
type of dispersant. Moreover, oxidized graphene nanoribbons were synthesized via
longitudinal unzipping of multi-walled carbon nanotubes and the toxicity mechanism of
the prepared materials on cells is highly dependent on the surface of the NMs (Chen and
others 2012).
These line of studies found that cells readily take up NPs via either active or passive
mechanisms. However, particles of the same material can show completely different
characteristics and toxicity with the slightest differences in surface coating, charge, shape
or size (Li and others 2012). This makes it very difficult to define the behavior and toxicity
of NPs when in contact with biological systems. More research is needed to better
understand the mechanisms and pathways of NPs in the body following their ingestion or
exposure. Some NPs seem to be able to take a pre-existing transport mechanism through
the body using endocytotic mechanisms that is the same method that viruses do (Elsaesser
and Howard 2012). Therefore, if the body is exposed to NPs, people have to be aware of
the toxicity of NPs.
2.11 Toxicity Assessment of NPs
In vitro techniques are useful in modeling the potential interactions between NPs and
cells within in vivo environment of the body or the GI tract (Gamboa and Leong 2013). It

40
is known that altering the size of particles to within the nanometer range may cause them
to behave differently within the human body by influencing their absorption, distribution,
metabolism and excretion, thereby altering their potential toxicity. The in vitro methods
used to assess NP toxicity can be divided into two categories: functional assays and
viability assays (Palombo and Deshmukh 2014).
2.11.1 Cell uptake
Cell uptake measures a NP’s ability to penetrate cellular membrane; therefore it does not
directly assess toxicity of NPs but links the NP’s capacity to induce toxic effects. One of
common methods for assessing uptake is transmission electron microscope (TEM) that has
the benefit of indicating the exact localization of particles within a cell. This technique has
been used to examine the cell uptake of most studied NPs, including Ag, Au, SiO2, TiO2,
etc. Besides, inductively coupled plasma atomic emission spectroscopy (ICP-AES),
inductively coupled plasma mass spectrometry (ICP-MS), and fluorescence imaging are
employed to compare the uptake differences from different physical/chemical properties
of Au NPs [(Hauck and others 2008), Co NPs (Wu and others 2004), and TAT peptide-
quantum dots (Lu and others 2010a).
Minimization of drawbacks when preparing samples for TEM measurement is essential.
The fixation procedure has significant impact on the morphology of cells. For examples,
osmium post-fixation blackens samples, and reacts with NMs (MgO, Ag NPs), resulting in
mistakes of image interpretation. Therefore, the observation of NPs inside the cytoplasm
is likely due to their infusion after the membrane disruption in sample preparation steps
(Neal 2008).

41
2.11.2 Cell viability
The most common cytotoxicity assays to assess the toxicity of NPs are metabolic activity
assays and apoptosis assay. Among them, MTT seems to be the most popular assay that
was used to characterize the toxicity NPs although it has been reported to be inappropriate
assay in studies with carbon nanotubes (Seabra and others 2014; Horváth and others 2013;
Zhang and others 2010). Several similar assays, for examples MST, MTS, XTT, WST-8
have been employed in different manufactured NPs (Das and others 2013; Gao and others
2014; Kim and Ryu 2013; Prabhu and Poulose 2012; Shaligram and Campbell 2013; Tong
and others 2013). Another dye (alamar blue) which is reduced to the fluorescent products
(resorufin) by living cells has also been used to assess toxicity of SiO2 coated CdSe QDs
and functionalized Au NPs (Han and others 2008)
2.11.3 Cell functions
Commonly used functional assays are grouped by the cellular process, such as DNA
synthesis and damage, altered gene expression, oxidative stress, cell proliferation, and
exocytosis.
DNA synthesis assay provides important information about the proliferation state and
damage of cells. The comet assay or single-cell gel electrophoresis assay is the most
common method to assess the cellular toxicity to detect any damage of DNA when NPs
come in contact with human cells is. The assay measures the number of single-strand
breaks in DNA and has been used to assess DNA damage after cells expose to Ag, SiO2,
CeO2, Co, and MWCNTs (Chiang and others 2012; Evans and others 2004; Persson and
others 2013; Sharma and others 2012; Eom and Choi 2009). Other methods are checking

42
for the presence of micronuclei or chromosomal aberrations and the expression of proteins
implicated in DNA repair.
An increase of ROS formation has been studied to understand the mechanisms of the
toxicity of NPs. Generally, the presence of ROS in the cells can be directly or indirectly
measured using a spectroflourimetry/flow cytometry and electron spin resonance
spectroscopy. Both types of methods can be employedfor different ROS scavengers
(DMSO, sodium azide, N-acetylcysteine, furfuryl alcohol, ethanol, mannitol, salicylic acid,
etc.). However, most of ROS scavenger compounds, there is no strong evidence of 100%
selectivity for a certain type of ROS. Another most common technique of ROS detection
is the use of luminescent probes which is low cost, biocompatible and nontoxicity for in
vivo measurements (Schäferling and others 2011). However, some NMs can affect the
probes directly, causing false positive (Lyon and others 2008) and probes themselves could
react with other chemicals (surfactants) which could lead in significant artifacts (Leung
and others 2014). Therefore, careful interpretation of results is necessary.
Exocytosis is single-cell measurement method that provides the effect of NMs on vital
cellular processes, such as exocytosis, and quantifies the number of chemical messenger
molecules released per vesicle, release kinetics, and the frequent of vesicle fusion. The
method have been utilized to reveal changes of cells in response to SiO2, TiO2, Ag and Au
(Love and Haynes 2010; Love and others 2012).
References for Table 2
1. http://nanodb.dk/en/search-database/?keyword=food
2. http://nanodb.dk/en/product/?pid=4299

43
3. http://nanodb.dk/en/product/?pid=4292
4. http://nanodb.dk/en/product/?pid=4288
5. http://nanodb.dk/en/product/?pid=4280
6. http://nanodb.dk/en/product/?pid=4279
7. http://nanodb.dk/en/product/?pid=2997
8. http://nanodb.dk/en/product/?pid=3024
9. http://nanodb.dk/en/product/?pid=2224
10. http://nanodb.dk/en/product/?pid=2553
11. http://nanodb.dk/en/product/?pid=2085
12. http://www.silverbiotics.com/
13. http://nanodb.dk/en/product/?pid=2538
14. http://www.nanotechproject.org/cpi/products/allan-suttons-original-colloidal-
silver/
15. http://www.nanotechproject.org/cpi/products/colloidal-silver-liquid/
16. http://www.nanotechproject.org/cpi/products/galaxia-nano-technology-limitedtm-
nano-oxygen-supply-living-east-cup/
17. http://www.nanotechproject.org/cpi/products/nanosiltm-10/
18. http://www.nanotechproject.org/cpi/products/nano-sized-self-assembled-liquid-
structures-nssl-supplements/
19. http://www.nanotechproject.org/cpi/products/nanotrimtm/
20. http://www.nanotechproject.org/cpi/products/oral-liquid-sanqing/
21. http://www.nanotechproject.org/cpi/products/nanoslim/

44
22. http://www.nanotechproject.org/cpi/products/nanoceuticalstm-artichoke-
nanoclusters/
23. http://www.nanotechproject.org/cpi/products/nanoceuticalstm-spirulina-
nanoclusters/
24. http://www.nanotechproject.org/cpi/products/nano-vapor/
25. http://spiritofmaat.com/store/nano-technologies-2/nano-2-bio-sim-2/
26. http://www.nanotechproject.org/cpi/products/nanosiliceo-kapseln/
27. http://nanodb.dk/en/product/?pid=4287
28. http://www.colloidsforlife.com/Colloidal-Gold
29. http://spiritofmaat.com/store/supplements-2/colloidal-gold/
30. https://www.purestcolloids.com/mesozinc.php
31. https://www.purestcolloids.com/mesocopper.php
32. https://www.purestcolloids.com/mesoiridium.php
33. http://www.nanotechproject.org/cpi/products/mesoplatinum-r/
34. http://spiritofmaat.com/store/supplements-2/colloidal-golden-platinum/
35. https://www.purestcolloids.com/mesopalladium.php
36. http://nanodb.dk/en/product/?pid=2551
37. http://nanodb.dk/en/product/?pid=3009
38. http://nanodb.dk/en/product/?pid=2887
39. http://nanodb.dk/en/product/?pid=2049
40. http://nanodb.dk/en/product/?pid=2533
41. http://www.nanotechproject.org/cpi/products/aquanova-r-novasol-r/

45
42. http://nanodb.dk/en/product/?pid=2808\http://www.life-
enhancement.com/shop/product/nsr-nanoresveratrol
43. http://nanodb.dk/en/product/?pid=2519
44. http://nanodb.dk/en/product/?pid=2671
45. http://nanodb.dk/en/product/?pid=2041
46. http://www.nanotechproject.org/cpi/products/hydraceltm/
47. http://nanodb.dk/en/product/?pid=4284
48. http://www.nanotechproject.org/cpi/products/microhydrin-r-products/
49. http://nanodb.dk/en/product/?pid=3405
50. http://nanodb.dk/en/product/?pid=3404
51. http://nanodb.dk/en/product/?pid=2576
52. http://www.nanotechproject.org/cpi/products/24hr-microactive-r-coq10/
53. http://www.nanotechproject.org/cpi/products/acz-nano-advanced-cellular-zeolite/
54. http://nanodb.dk/en/product/?pid=3446
55. http://nanodb.dk/en/product/?pid=3449
56. http://nanodb.dk/en/product/?pid=3447
57. http://www.nanotechproject.org/cpi/products/food-container-ns/
58. http://www.nanotechproject.org/cpi/products/quan-zhou-hu-zheng-nano-
technology-co-ltd-r-nano-silver-storage-box-baoxianhe/
59. http://www.nanotechproject.org/cpi/products/nano-flagon-moon-drunker/
60. http://www.nanotechproject.org/cpi/products/n-coat/
61. http://www.nanowerk.com/products/product.php?id=30
62. https://carousell.com/p/16406326/

46
63. http://nanodb.dk/en/product/?pid=3407
64. http://www.nanotechproject.org/cpi/products/nano-silver-ns-315-water-bottle/
65. http://www.nanotechproject.org/cpi/products/nano-silver-salad-bowl/
66. http://www.nanotechproject.org/cpi/products/aluminium-foil-from-toppits/
67. http://www.nanowerk.com/products/product.php?id=24
68. http://www.nanowerk.com/products/product.php?id=32
69. http://www.eurodia.com/index.php/en/technologies-2/membrane-filtration
70. http://www.nanotechproject.org/cpi/products/nano-plastic-wrap/
71. http://www.nanotechproject.org/cpi/products/beer-bottle-plastics/
72. http://www.nanotechproject.org/cpi/products/hite-brewery-beers/
73. http://world.taobao.com/item/21579600153.htm?spm=a312a.7700714.0.0.RhlDsZ
#detail
74. http://nanodb.dk/en/product/?pid=4183
75. http://nanodb.dk/en/product/?pid=4183
76. http://www.nanotechproject.org/cpi/products/canola-active-oil/
77. http://www.nanotechproject.org/cpi/products/maternal-water/
78. http://www.nanotechproject.org/cpi/products/nanoceuticalstm-slim-shake-
chocolate/
79. http://www.nanotechproject.org/cpi/products/nanotea/
80. http://www.nanotechproject.org/cpi/products/adhesive-for-mcdonalds-burger-
containers/
81. http://www.nanotechproject.org/cpi/products/nanoceuticalstm-microbright-tooth-
powder/

47
82. http://nanodb.dk/en/product/?pid=4272
83. http://www.nanotechproject.org/cpi/products/nano-silver-cutting-board/
84. http://www.nanotechproject.org/cpi/products/nano-silver-cutting-board-1/
85. http://nanodb.dk/en/product/?pid=4256
86. http://nanodb.dk/en/product/?pid=3790
87. http://www.nanotechproject.org/cpi/products/marathon-ceramic-filter/
88. http://nanodb.dk/en/product/?pid=3777
89. http://www.nanotechproject.org/cpi/products/nano-tea-pot-aroma/
90. http://nanodb.dk/en/product/?pid=2044
91. http://www.nanotechproject.org/cpi/products/xtrema-cookware/
92. http://www.nanotechproject.org/cpi/products/bialetti-r-aeternum-saute-pan/
93. http://www.nanotechproject.org/cpi/products/antibacterial-kitchenware/
94. http://www.nanotechproject.org/cpi/products/primea-touch-plus/
95. http://www.nanotechproject.org/cpi/products/digital-ultrasonic-fruit-vegetable-
cleaner-mb-0598/
96. http://www.nanotechproject.org/cpi/products/washer/
97. http://www.nanotechproject.org/cpi/products/nano-silver-spray/
98. http://nanodb.dk/en/product/?pid=2994
99. http://nanodb.dk/en/product/?pid=2995
100. http://nanodb.dk/en/product/?pid=2996

48
CHAPTER 3
Use of Graphene and Gold Nanorods as Substrates for Detection of
Pesticides by Surface Enhanced Raman Spectroscopy
Abstract
This study aimed to use gold nanorods and graphene as key materials to fabricate high-
performance substrates for the detection of pesticides by surface enhanced Raman
spectroscopy (SERS). Three types of pesticides (azinphos-methyl, carbaryl, and phosmet)
were selected. Gold nanorods have great potential to be used as a SERS substrate because
it is easy to tune the surface plasmon resonance of the nanorods to the laser excitation
wavelength of Raman spectroscopy. Graphene is a promising nanoscale material that can
be used for supporting metal nanostructures. Three types of novel SERS substrates were
fabricated, including graphene−gold film−gold nanorod (G-Au-AuNR) substrate, gold
film−gold nanorod (Au-AuNR) substrate, and graphene coupled with gold nanorods (G-
AuNR). The results demonstrate that G-Au-AuNR substrates exhibited the strongest

49
Raman signals of the selected pesticides, followed by the Au-AuNR substrates. G-AuNR
exhibited the weakest Raman signals, and no characteristic spectral features of the analytes
were obtained. A partial least-squares method was used to develop quantitative models for
the analysis of spectral data (R= 0.94, 0.87, and 0.86 for azinphos-methyl, carbaryl, and
phosmet, respectively). The G-Au-AuNRs substrate was able to detect all three types of
pesticides at the parts per million level with limits of detection at around 5, 5, and 9 ppm
for azinphos-methyl, carbaryl, and phosmet, respectively. These results indicate that
combining gold nanorods and graphene has great potential in the fabrication of sensitive,
lightweight, and flexible substrates for SERS applications to improve food safety.
Keywords: graphene, gold nanorods, pesticides, SERS, detection

50
3.1 Introduction
Organophosphate (OP) and carbamate (CB) are pesticides that have been widely used
for decades in agriculture around the world. These compounds can be used to kill insects,
arthropods, and pests. However, there has been mounting concern about the residues of
these pesticides in foods due to their widespread presence and negative effects on human
health. They are highly toxic to humans via different routes of exposure. Residues of these
contaminants in foods may cause serious health problems, such as asthma, mutagenic and
teratogenic effects, birth defects, and even death (Cairns and Sherma 1992; Liu and others
2012a).
Current analytical methods for detection of pesticides in fruits and vegetables include
liquid chromatography-mass spectrometry, fluorescence polarization immunoassay, and
multienzyme inhibition assay (Liu and others 2012a). However, those methods are time-
consuming, expensive, and labor-intensive, often require complex procedures of sample
pretreatment and well-trained technicians to operate the instruments (Lin 2010). Therefore,
it is of critical importance to have rapid, sensitive, and accurate analytical methods to detect
pesticide residues in foods. Despite recent advances and developments in analytical
techniques, there still exist many challenges and opportunities to improve the current
technology and use simple, rapid, versatile, and inexpensive tools for detection of
contaminants.
Over the last two decades, surface enhanced Raman spectroscopy (SERS) has received
much attention in the analytical chemistry, food safety, and other areas. SERS is a branch
of Raman spectroscopy in which probed molecules (e.g. pesticides, toxins, etc.) adsorbed
onto the roughened surface of coinage metals, resulting in significant enhancement of the

51
Raman signals. SERS have been increasingly applied for the detection of chemical
adulterants or contaminants (e.g. melamine, veterinary drugs, and pesticides) in foods, food
ingredients, and animal feeds (Du and others 2010; Fan and others 2011a; He and others
2009; Lin and others 2008; Shende and others 2004; Shende and others 2010b; Yakes and
others 2008).
One of the most crucial components for SERS is an efficient substrate that can activate
surface plasmons (Lin 2010). Most SERS substrates consist of two essential elements: a
thin layer of noble metal such as gold (Au) or silver (Ag), and a supporting material such
as silicon. Gold nanorod (AuNRs), an anisotropic nanostructure, has gained much attention
due to its unique ability to interact with light of varying wavelengths (Murphy and others
2005; Grzelczak and others 2010; Rycenga and others 2011). AuNRs display two separate
surface plasmon resonance (SPR) bands known as transverse and longitudinal plasmon
bands. The ability of tuning the SPR as a function of aspect ratio enables gold nanorods to
become effective SERS substrates.
Most current commercial SERS substrates are silicon-based chips that are thick, heavy,
and non-flexible (Nanova 2014; Silmeco 2014). There exists a need to use lightweight,
flexible, and bendable materials to fabricate novel SERS substrates for versatile
applications. Graphene, a two dimension nanomaterial composed of sp2 bonded carbon
atoms, has a great potential in SERS applications due to its unique properties. It is the
thinnest known material with a thickness of only one atom and it is stronger than steel
(Chen and others 2008a; Geim and Novoselov 2007a; Kuila and others 2011; Lee and
others 2008). Graphene is a promising nanoscale material that can be used for supporting

52
metal nanostructures (Applerot and others 2012; Liang and others 2012; Xu and others
2012).
In this study, we aimed to develop new types of substrate consisting of monolayer
graphene, gold film, and/or AuNRs structure. The performance of these substrates was
evaluated in SERS measurement for detection of three types of pesticides. Multivariate
statistical analysis such as partial least squares (PLS) was used in data analysis for
quantification of the analytes and the detection limits of the target analytes were obtained
and evaluated.
3.2 Materials and Methods
3.2.1 Preparation of chemicals
Cetyltrimethylammonium bromide (CTAB), silver nitrate, ascorbic acid, and HAuCl4
were purchased from Sigma-Aldrich (St. Louis, MO, USA). Silicon wafer were purchased
from Ted Pella (Redding, CA, USA). Two OP pesticides (azinphos-methyl and phosmet)
and one CB pesticide (carbaryl) were purchased from Fisher Scientific (Pittsburgh, PA,
USA). All the glassware was carefully washed with aqua regia freshly prepared before
experiments.
Pure pesticide solutions: 100 ppm (w/v) stock solutions of azinphos-methyl, phosmet,
and carbaryl were prepared in volumetric flasks using a mixed solvent system
(acetonitrile/H2O = 1:1, v/v). Solutions of 0.01, 0.1, 0.5, 1, 10, and 50 ppm pesticides were
prepared by serial dilutions from the 100 ppm solution. The solvent without pesticides was
used as the control.

53
3.2.2 Gold film silicon substrate
A thin layer of gold was deposited on a silicon wafer or monolayer graphene substrate
(Graphene Supermarket, NY, USA) in a desktop sputter coater (Quorum Technologies
K650X, UK). Samples were grown with an argon pressure of 0.06 - 0.09 mBar. The
thickness of gold film was measured by a quartz crystal microbalancer.
3.2.3 Synthesis of gold nanorods
AuNRs were synthesized using a seed-mediated method. Seed solution was prepared by
adding 120 µL of a freshly prepared ice-cold solution of 10 mM sodium borohydride into
0.1 mL of 0.1 M CTAB and 0.1 mL of 5 mM HAuCl4 aqueous solution at 25oC. The
resulting pale brown solution was vortexed for 2 min and then stored at 25oC for 1 h in the
dark. Growth solution was prepared by mixing 42.5 mL of 0.1 M CTAB, 1.35 mL of 10
mM HAuCl4, 0.27 mL of 10 mM silver nitrate, and 0.65 mL of 0.1 M ascorbic acid. The
solution was homogenized by gentle stirring and in the resulting colorless solution, 0.075
mL of freshly prepared seed solution was added followed by gently stirring for 20 s. The
reaction mixture was set aside in the dark at 28oC for 24 h. The solution turned from
colorless to greenish brown or reddish brown. Finally, the AuNR solution was centrifuged
at 4293 g for 10 min (Eppendorf MiniSpin) to remove excess CTAB and redispersed in
milliQ water (18.2 MΩ cm). The centrifugation procedure was repeated at 1073 g for 10
min in order to get purified AuNRs. The purified AuNRs were dispersed in 100 µL milliQ
water and sonicated (45 kHz) for 30 min.

54
3.2.4 Fabrication of SERS substrates
Purified AuNRs were dispersed in milliQ water (1 mL AuNR solution pellet in 20 µL
water). Then 10 μL of AuNR solution was casted on (1) a mono layer graphene silicon
slide (G-AuNR); (2) a gold film (40 nm thickness)-mono layer graphene-silicon slide (G-
Au-AuNR); and (3) a gold film (40 nm thickness)-silicon (Au-AuNR). All the prepared
substrates were placed in petri dishes that were sealed by adhesive tape and put in a
humidity chamber (humidity of ~30%) at 25oC. The drops on the silicon surface were
finally dried after 3 h of evaporation. Figure 3-1 describes the structure of each type of
substrate.
Figure 3-1. Structure of substrates: (a) graphene-Au-AuNR (G-Au-AuNR); (b) graphene-AuNR (G-AuN);
(c) Au-AuNR.

55
3.2.5 SERS measurements
A volume of 0.2 μL of the pure pesticide solution was transferred onto the surface of a
substrate using a micropipette. The substrate, which was fixed on a glass slide, was then
placed on a hot plate and heated at 40°C until the solvent completely evaporated. A
Renishaw RM1000 Raman Spectrometer System (Gloucestershire, UK) equipped with a
Leica DMLB microscope (Wetzlar, Germany) was used in this study. This system is
equipped with a 785-nm near-infrared diode laser source. During the measurement, light
from the high power (maximum at 300 mW) diode laser was directed and focused onto the
sample on a microscope stage through a ×50 objective. Raman scattering signals were
detected by a 578 × 385 pixels charge-coupled device array detector. The size of each pixel
was 22 × 22 μm. Spectral data were collected by WiRE 3.2 software (Gloucestershire, UK).
In this study, the spectra of samples were collected using a ×50 objective with 10-s
exposure time, 0% focus, and ~20 mW laser power in the extended mode. Detection ranges
for each pesticide were 500-1800 cm-1 for all the pesticides. The detection range was
determined in a way that the range was as narrow as possible, but no obvious signals were
missed.
3.2.6 Data analysis
The software Delight version 3.2.1 (D-Squared Inc., LaGrande, OR, USA) was used for
data analysis. SERS spectral data were analyzed following our previously published
methods (Liu and others 2012a). Firstly, data pre-processing algorithms including
polynomial subtract were employed to adjust the baseline shift. In this study, the
chemometric analysis was performed using the partial least squares (PLS) method and

56
leave-one-out (LOO) cross-validation algorithm. The partial least squares (PLS) model, a
multivariate statistical regression model, was constructed to predict analyte concentrations
in tested samples. The number of PLS latent variables was optimized based on the lowest
root mean square error of prediction (RMSEP) values to avoid overfitting of spectral data.
In this study, spectral data were smoothed with a Gaussian function at 4 cm−1 followed by
a second derivative transformation with a 12 cm−1 gap before PLS was conducted.
RMSEP=�∑ (�̂����)���
� (1)
In this equation, n is the number of samples, ĉi is the predicted pesticide concentration
(ppm), and ci is the actual pesticide concentration (ppm). The correlation coefficient (R)
and RMSEP were used to evaluate the model. The higher the R value or the lower the
RMSEP value is, the better predictability the model has.
LOO cross-validation was used to evaluate the quality of the PLS model (Martens and
Naes 1992; Lin and others 2003). Basically, (n-1) samples were used to build a calibration
model. Each sample in the data set was the eventually used for this loop procedure. In this
way, the cross-validation acts as LOO on the whole samples. The predicted analyte
concentrations (pesticide) in test samples was calculated based on correlations between
spectral features and chemical reference values and then compared with the reference
values.
The limit of detection (LOD) with 99.86% confidence interval can be calculated from
the PLS calibration curve based on characteristic peaks in SERS spectra using the
following formula [2]:
LOD = 3σ/m (2)

57
in which σ is the standard error of predicted concentration, and m is the slope of the
calibration curve. In a PLS model, σ equals to RMSEP.
3.3 Results and Discussions
Figure 3.3-2. Raman spectra of 100 ppm azinphos-methyl; (b) of 100 ppm carbaryl; (c) of 100 ppm phosmet on Au- G substrate with different thickness of the Au film.
Three different thickness of the Au film (40, 50, and 60 nm) were used to assess the
optimum thickness for SERS substrates. Overall, no significant difference between the
thickness and the intensity of characteristic peaks of azinphos-methyl, carbaryl, and
phosmet were observed (Fig. 3-2). Hence, an Au film with thickness of 40 nm was used
for further experiments.

58
The SPR of synthesized AuNRs displays two adsorption features as shown in Fig. 3-3b.
This result is in agreement with several previous reports (Murphy and others 2011; Saute
and others 2012; Tong and others 2009) that showed a strong feature at 778 nm of AuNRs
due to the resonant propagation of surface plasmons along the longitudinal axis. A weak
peak at 540 nm is a characteristic peak of the impurities of spherical gold nanoparticles.
Overall, the long AuNRs are dominant in the purified AuNR solution, which can be used
for SERS measurement with a 785 nm excitation source. In addition, the UV-vis absorption
spectrum in Fig. 6b shows a narrow absorption band, indicating a highly monodispersed
substrate morphology. TEM imaging demonstrates that AuNRs are rod shaped with a width
and length of 119.87 and 50.69 nm, respectively. The aspect ratio (length/width) of AuNRs
is ~2.36 (Fig. 3-3a). The TEM image also shows that there was a small amount of cubic
and spherical nanoparticles on the TEM grids.
Figure 3.3-3.TEM image of AuNRs (a) and UV-vis spectrum of purified AuNRs (b).

59
To investigate whether G-Au-AuNR, G-AuNR, and Au-AuNR substrates can be used as
effective SERS substrates in detection of pesticides, a droplet of each pesticide solution
was deposited on the surface of the substrate. As shown in Fig. 3-4a, no visible Raman
signals of azinphosmet were observed on the G-AuNR substrate, while obvious SERS
peaks of azinphosmet were obtained on the G-Au-AuNR and Au-AuNR substrate. The
same results were also obtained for carbaryl (Fig. 3-4b) and phosmet (data not shown). The
band assignments of the peaks are consistent with previous studies (Liu and others 2012a).
A strong peak at 1380 cm-1 is due to symmetric vibration of the naphthalene ring and a
peak at 1440 cm-1 arises from an unspecified vibration of this ring. Interestingly, we found
that Raman signals of all three types of pesticides on G-Au-AuNR substrate are much
stronger than those on G-AuNR and Au-AuNR substrate. To calculate the contribution of
enhancement from graphene, we chose the SERS intensity of carbaryl on these three
substrates at two selected characteristic peaks (1380 and 1440 cm-1). As shown in Fig. 3-
4c, the SERS intensity of these two peaks of carbaryl on G-Au-AuNR substrate are two
times higher than that of Au-AuNR and hundreds of times higher than that of G-AuNR
substrate.

60
Figure 3.3-4. (a) Raman spectra of 100 ppm azinphos-methyl; (b) of 100 ppm carbaryl on Au-AuNR, G-Au-AuNR, and G-AuNR substrate. The peaks marked by the star (*) are the characteristic band of
pesticides; (c) Intensity of two character peaks of carbaryl on three kinds of substrate.
There are two widely accepted mechanisms for SERS enhancement: electromagnetic
mechanism (EM) and chemical mechanism (CM). EM is considered the main
enhancement, resulting from the large increase of the local electric field caused by SPR on
roughened metal surface, such as gold or silver. Several recent studies suggested that SERS
enhancement can be not only from the gold nanostructure (AuNR and Au film), but also

61
from the monolayer graphene (Applerot and others 2012; Ling and others 2009; Schedin
and others 2010; Yu and others 2012; Kim and others 2010b). The enhancement
mechanism of graphene is believed to be from the partial contribution of high thermal
conductivity of graphene. Xu et al. (2012) observed that the morphology of the metal film
changed after a relatively large laser power exposure if there was no graphene layer present,
while it remained stable for the G-Au film substrate (Xu and others 2012). Although SERS
signals on Au-AuNR substrate were much stronger than that on G-AuNR, the Raman
intensity of characteristic peaks of azinphos-methyl was slightly weaker than that of G-
Au-AuNR.
Schedin and others (2010) studied SERS measurement using graphene patterned with a
square array of Au nanodisks on SiO2(300 nm)/Si and implied that both G and 2D bands
of graphene at 633 nm were significantly enhanced (Schedin and others 2010). The authors
found that the graphene scales combined with the nanoparticle cross section, the fourth
power of the Mie enhancement, are inversely proportional to the tenth power of the
separation between graphene and the nanoparticle. The grown AuNRs significantly
enhanced Raman signals of reduced graphene oxide (rGO) by 34-fold at the tip of the long
AuNRs, which is the highest Raman enhancement of rGO by gold nanostructures ever
reported (Schedin and others 2010). Ling et al. (2009) used graphene as a substrate for
Raman enhancement (Ling and others 2009). By coupling or not coupling with gold
nanoparticles (AuNPs) or silver nanoparticles (AgNPs), the Raman signals of the
molecules on monolayer graphene are clearer, stronger, and more reproducible than that
on the SiO2/Si substrate, indicating a clear SERS effect on the atomically flat surface of
monolayer graphene. Additionally, the authors also found that graphene makes the SERS

62
system more stable and graphene-SERS (G-SERS) process does not require special sample
preparation. Their results showed that the enhancement factor of G-SERS was even slightly
higher than those of normal SERS for most of bands and the presence of the graphene layer
did not cause the localized EM field to decay observably in its vicinity and possibly led to
additional chemical enhancement (Ling and others 2009).
Kim and others (2010) obtained Raman spectra of a single layer graphene sheet placed
in different gold substrates in the context of SERS. The difference in the enhancement
factors among various gold substrates is explained with a model based on the spatial
distribution and polarization of the local field and the orientation of inserted graphene sheet
(Kim and others 2010b). Besides graphene, its other two derivatives, graphene oxide (GO)
and rGO have also been studied as promising substrates for SERS. A study used GO-based
SERS substrate to acquire Raman spectra of rodamine, melamine, and cephalexin (Liang
and others 2012). But the results showed a weak enhancement of SERS due to CM of
graphene (Liang and others 2012). This same conclusion was also reached in another study
of Yu and others (Yu and others 2012). In our study, we observed that the main SERS
enhancer still relied on the EM of noble metal nanostructures. This is consistent with
another study (Lu and others 2011) using fabricated Ag or AuNPs-decorated rGO on Si
substrate as an efficient SERS substrate to detect aromatic molecules with a low detection
limit at nM level. Due to the combination of AuNPs and graphene, the Raman signals of
the dye were dramatically enhanced by this novel substrate (Lu and others 2011). In
summary, this line of studies demonstrates that G-Au-AuNR substrate is a promising SERS
substrate for detection of various analytes.

63
Most commercial SERS substrates are either in the form of a colloidal solution
containing metal nanoparticles or are silicon chip-based flat substrates with a thin layer of
metal deposited on top. The main drawback of colloidal SERS substrates is that a surfactant
is needed to stabilize the solution and prevent or reduce the aggregation and precipitation
of metallic nanoparticles. The surfactant may affect the SERS measurement and the
reproducibility of colloidal SERS substrates is low (Aroca and others 2005; Fan and others
2011b). In addition, target molecules have to be mixed with colloidal SERS nanoparticles,
which complicates the sample preparation step and limits the application of colloidal SERS
substrates. In contrast, chip-based SERS substrates are more stable and have good
reproducibility. Sample solution can be easily transferred onto a substrate using a
micropipette.
In addition, we studied the reliability of G-Au-AuNRs substrate in characterization and
quantification of pesticides. Fig. 3-5 shows the average SERS spectra of different
concentrations of azinphos-methyl and a linear calibration curve was constructed by
monitoring the intensity of the peaks in selected region (500 – 1800 cm-1). Similar results
were provided for carbaryl (Fig. 3-6) and phosmet (Fig. 3-7). The band assignments are
shown in Table 4.
Table 4. Band assignment of major peak in SER spectra form three pesticides*
Band (cm1) Assignment Azinphosmethyl 585 (C=O) deformation vibration 703 Benzene ring breathing 778, 899 1,2,3-triazine ring breathing 1026 Asymmetric P-O-C deformation vibration 1224 (C-H) in P-O-CH3
1260 (C-N) in S-CH2-N

64
1283 (C-N) in S-CH2-N 1334 1,2,3-triazine ring breathing 1364 O-H stretching 1450 (N≡N) stretching 1497 1,2,3-triazine ring breathing Carbaryl 868 CH2 out of plane deformation vibration 1340 NO2 symmetric stretching mode 1380 Symmetric ring vibration 1575 (C=C) phenyl stretch Phosmet 607, 653 (P=S) stretch 714 Benzene ring breathing 1018 Asymmetric P-O-C deformation vibration 1196 (C-H) in P-O-CH3 1410 (C-H) in S-CH3-N 1535 N=N stretching
* References (2, 26-28)
PLS analysis was conducted to obtain the RMSEP values from the PLS models of each
pesticide. The lowest RMSEP value was achieved and used to construct the PLS prediction
model. Fig. 3-5b illustrates the plot between the predicted concentration and actual
concentration of pesticides (R = 0.87; RMSEP = 15.87 × 10⁻⁵). For carbaryl (Fig. 3-6) and
phosmet (Fig. 3-7), R values are 0.87 and 0.84, and RMSEP values are 16.08×10⁻⁵ and
21.21×10⁻⁵, respectively.
Figures 3-5b, 3-6b, and 3-7b were plotted between actual concentrations and predicted
concentrations. Actual concentrations (X-axis) were prepared solutions with known
concentrations (0-100 ppm) of pesticides. Predicted concentrations (Y-axis) were
calculated based on PLS model (between spectral features and pesticide concentration
reference values) and validated based on LOO cross validation. For example, there are
eight spectra collected from each concentration of pesticide, then seven spectra were used
for running PLS model and one spectra in the dataset was used for validation of the model.
Eventually, each sample in the whole data set was used for this loop procedure.
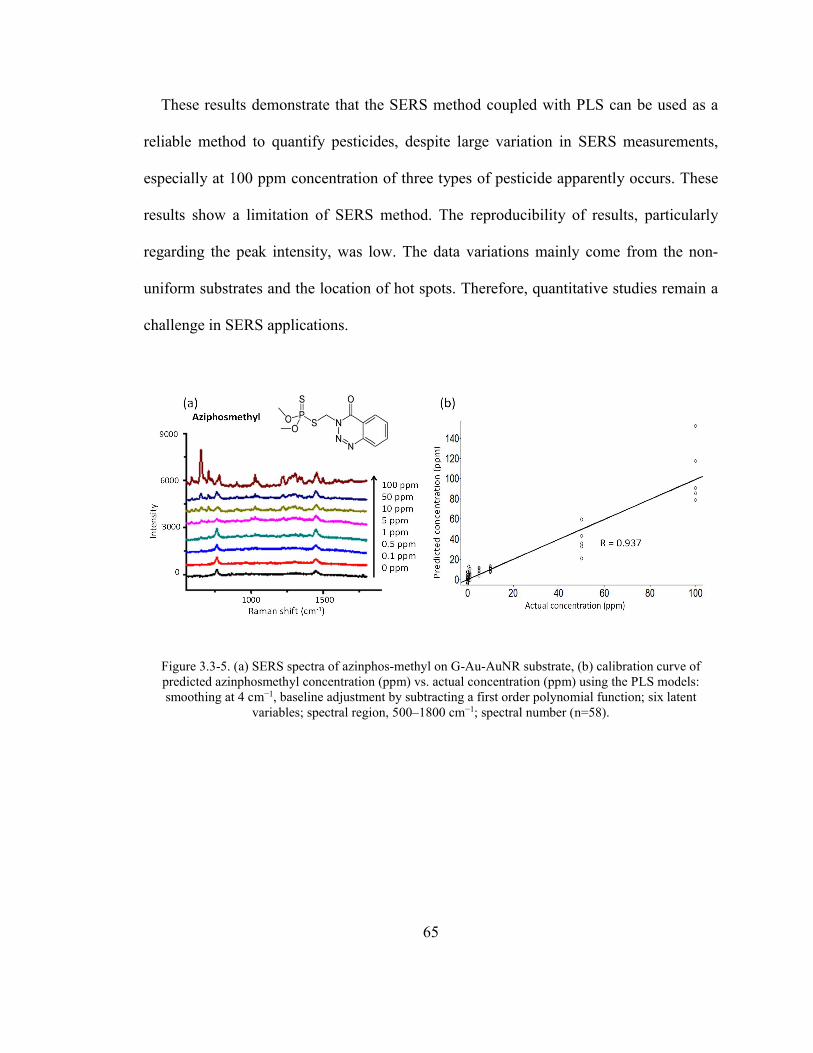
65
These results demonstrate that the SERS method coupled with PLS can be used as a
reliable method to quantify pesticides, despite large variation in SERS measurements,
especially at 100 ppm concentration of three types of pesticide apparently occurs. These
results show a limitation of SERS method. The reproducibility of results, particularly
regarding the peak intensity, was low. The data variations mainly come from the non-
uniform substrates and the location of hot spots. Therefore, quantitative studies remain a
challenge in SERS applications.
Figure 3.3-5. (a) SERS spectra of azinphos-methyl on G-Au-AuNR substrate, (b) calibration curve of predicted azinphosmethyl concentration (ppm) vs. actual concentration (ppm) using the PLS models: smoothing at 4 cm−1, baseline adjustment by subtracting a first order polynomial function; six latent
variables; spectral region, 500–1800 cm−1; spectral number (n=58).

66
Figure 3.3-6. (a) SERS spectra of Carbaryl on G-Au-AuNR substrate, (b) calibration curve of predicted carbaryl concentration (ppm) vs. actual concentration (ppm) using the PLS models: smoothing at 4 cm−1, baseline adjustment by subtracting a first order polynomial function; three latent variables; spectral region
500–1800 cm-1 spectral number (n=52).

67
Figure 3.3-7. (a) SERS spectra of phosmet, (b) calibration curve of predicted phosmet concentration (ppm) vs. actual concentration (ppm) using the PLS models: smoothing at 4 cm−1, baseline adjustment by subtracting a first order polynomial function; five latent variables; spectral region, 500–1800 cm−1;
spectral number (n=75).
The LOD of azinphos-methyl, phosmet, and carbaryl of G-Au-AuNRs substrate was
calculated by equation 2. The calibration curve of azinphos-methyl is shown in Fig. 3-8.
Figure 3.3-8. Calibration curve of predicted azinphos-methyl concentration (ppm) vs. actual concentration (ppm) using the PLS models: smoothing at 4 cm−1, baseline adjustment by subtracting a first order polynomial function; five latent variables; spectral region, 500–1800 cm−1; spectral number (n=74).

68
As compared to the maximum residue limits of the three pesticides in fruits (apples) of
FAO/WHO and England standard (Table 5), the LOD of the SERS method coupled with
this substrate meets the requirement for carbaryl and phosmet. However, more studies are
needed to improve the results of this method for testing azinphos-methyl.
Table 5. Limit of detection of using G-Au-AuNRS substrate for detection of azinphos-
methyl, carbaryl, and phosmet
Pesticides R LOD (ppm) 70%
recovery MRL 1 (ppm) MRL 2 (ppm)
Carbaryl 0.915 5 3.647 6-10 5
Phosmet 0.800 9 6.125 10 10* Azinphos-methyl
0.914 5 3.598 1
1
1 Maximum residue limits in apple of FAO/WHO
2 Maximum residue limits in apple of England
* Codex Alimentarius Commission
In summary, a simple, fast, and efficient method was developed to fabricate new SERS
substrates by coating an AuNR-decorated graphene sheet on Si substrate. This substrate
exhibits strong Raman enhancement due to unique properties of graphene and the deposited
AuNRs. The performance of this G-Au-AuNRs substrate was evaluated using three types
of pesticides (azinphos-methyl, carbaryl, and phosmet). The LOD of carbaryl and phosmet
meet the maximum residue limits set by the FAO/WHO and EU. These results demonstrate
that there is a great potential to use graphene and gold materials for food safety
applications. More research is needed to improve the performance of SERS substrates
using different materials and use them to test real food products.

69
CHAPTER 4
Use of Aminothiophenol as an Indicator for the Analysis of Silver
Nanoparticles in Consumer Products by Surface-Enhanced Raman
Spectroscopy (SERS)
Abstract
Silver nanoparticles (Ag NPs) are one of the top five engineered nanoparticles that have
been used in various products. Current methods for the measurement of Ag NPs are time
consuming and expensive. Therefore, it is of critical importance to develop novel strategies
to detect the presence of Ag NPs at low concentrations in different matrices. This study
aimed to detect and measure Ag NPs in consumer products using surface-enhanced Raman
spectroscopy (SERS) and aminothiophenol (PATP) as an indicator molecule that binds
strongly with Ag NPs. Quantification and qualification of Ag NPs were achieved using this
method of acquiring SERS signals from Ag NPs-PATP complexes. Four dietary
supplement products and one nasal spray were selected to evaluate the performance of
SERS in the detection of Ag NPs. Inductively coupled plasma optical emission
spectrometry (ICP-OES) and transmission electron microscopy (TEM) were utilized to
measure the physical properties of Ag NPs in the samples. The results demonstrate that
signature Raman peaks of PATP can be used to distinguish Ag NPs from silver bulk
particles and silver nitrate. SERS is able to detect Ag particles with different sizes ranging
from 20 to 100 nm, with the highest intensity for ~30 nm Ag NPs. Partial least squares
method was used to develop quantitative models for the analysis of spectral data (R = 0.94).

70
These results indicate that the conjugation of Ag NPs with PATP can be measured by
SERS. This technique is a simple and rapid method and has a great potential to detect Ag
NPs in various products.
Key words: PATP, silver nanoparticle, SERS.

71
4.1 Introduction
Engineered nanoparticles (ENPs) have received much attention in recent years due to
their unique properties that can be used in nanosensors, pathogen detection, and
antimicrobial application (Yada and others 2014). For examples, metal oxide nanoparticles
are antimicrobial agents that can inhibit the growth of foodborne pathogens (Marambio-
Jones and Hoek 2010; Sirelkhatim and others 2015). Nanoparticle-based sensors can
provide a platform to detect microbes, pesticides, or chemical contaminants in complex
matrices (Arora and others 2011; Sharma and Mutharasan 2013; Yada and others 2014).
Among various ENPs, silver nanoparticles (Ag NPs) are one of the top five nanoparticles
widely used in pharmaceutical products, building materials, and consumer products
(Shukla and others 2011; Cho and others 2009; Park and others 2010; Asare and others
2012). Around 24% of commercial nano-based products are claimed to contain Ag NPs
(Nanotechnologies 2016). Ag NPs have been used in antimicrobial food packaging
materials because of their exceptional ability to prevent bacterial growth. Ag NPs also have
found in various areas, ranging from textiles, dietary supplements, cosmetics, household
products, cleaning agents, and medical uses (nasal spray, top cream band aid, etc.)
(Marambio-Jones and Hoek 2010; Wijnhoven and others 2009; Duncan 2011).
Despite increasing applications of Ag NPs, some concerns have been raised about their
safety and potential negative effects on human health (Vandebriel and De Jong 2012).
Recent studies show that Ag NPs may enter the human body via different routes, potentially
damaging the organs and cause serious human diseases (Sung and others 2011; Podila and
Brown 2013). To fully understand the effects of NPs on human health, it is of critical

72
importance to have suitable techniques to detect Ag NPs that are usually present at low
centrations in the foods and other consumer products.
Current analytical methods for the detection, characterization and quantification Ag NPs
in commercial products include scanning electron microscopy (SEM), transmission
electron microscopy (TEM), and energy dispersive X-ray spectroscopy (EDS). These
techniques have been widely used to characterize the size, shape, elemental composition,
and surface morphology of NPs. For example, Lozano employed EDS to quantify
engineered Ag NPs in coffee, milk, and water (Lozano and others 2012). In addition to the
electron microscope, inductively coupled plasma optical emission spectrometry (ICP-
OES) or inductively coupled plasma mass spectrometry (ICP-MS) have been employed to
determine metal NPs in agricultural and food samples (Falandysz and others 2001; Ikem
and others 2002; Loeschner and others 2013). Single particle ICP-MS (SP-ICP-MS) can
be used to differentiate between whole nanoparticles in matrices and their solvated residual
ions (Singh and others 2014). Zhang used TEM, SEM, EDS, and ICP-OES for the detection
of Ag NP contamination in fresh pears (Zhang and others 2012). However, ICP-OES or
ICP-MS provides total silver content without information or very low resolution on particle
size (Drescher and others 2012). There has also been success with the detection of
inorganic engineered nanomaterials by dynamic light scattering (DLS) in orange juice
(Gallego-Urrea and others 2011); or coupled matrix-assisted laser desorption/ionization—
time-of-flight spectrometry (MALDI-TOF) with hydrodynamic chromatography (HDC) to
separate nanoscale liposomes from an orange-flavored beverage (Helsper and others 2013).
However, those characterization methods are time-consuming and labor-intensive. They
often require complicated procedures of sample pretreatment and well-trained personnel to

73
operate the equipment. Although recent advances and developments in analytical
techniques have been observed, there still exist many challenges and opportunities to
improve the current technology and use simple, rapid, versatile, and inexpensive tools for
the detection of Ag NPs in commercial products.
Surface-enhanced Raman spectroscopy (SERS) is a novel technique that has received
much attention in the analytical chemistry, food safety, and other areas over the last two
decades. SERS is a branch of Raman spectroscopy in which probed molecules adsorbed
onto the roughened surface of noble metals, resulting in significant enhancement of the
Raman signals. With the enhanced signals, SERS is able to detect trace amounts of analyte
molecules with the potential to detect a single molecule (Ahmed and Gordon 2012; Kneipp
and others 1998; Kneipp and others 1997). SERS have been increasingly applied for the
detection of chemical adulterants or contaminants (e.g. melamine, veterinary drugs, and
pesticides) in foods, food ingredients, and animal feeds (Zhang and others 2015a; Zhai and
others 2011; Zhang and others 2015b; Song and others 2013).
Most previous SERS studies were focused on using gold or silver as a substrate to detect
various analytes. However, in this study we investigated the feasibility of using SERS to
detect Ag NPs in complex matrices using 4-aminothiophenol (p-aminothiopheno, PATP)
as a Raman reporter. PATP is an aromatic thiol that has been found to be an ideal molecule
for SERS analysis. PATP can be strongly adsorbed onto most SERS substrate and can
produce very strong SERS signals (Hu and others 2007; Huang and others 2012; Kim and
others 2010a; Wang and others 2007c; Zheng and others 2003). Furthermore, PATP is very
sensitive to the metal materials that can be a very good platform for identifying electronic
SERS properties (Huang and others 2012). To the best of our knowledge, this is the first

74
study to use SERS coupled with PATP as an indicator for detecting Ag NPs in commercial
products. Additionally, TEM and ICP-OES were used to evaluate the capacity of SERS
method for the determination of Ag NPs.
4.2 Materials and Methods
4.2.1 Materials
Ethanol (≥ 99.5%), AgNO3 (99.8%), and 4-aminothiophenol (PATP) were all purchased
from Sigma-Aldrich (St. Louis, MO, USA). Methanol 99%) and nitric acid were from
Fisher Scientific (Pittsburgh, PA). Spherical Ag powder with a diameter of 0.5 – 1 μm
(99.9%) was purchased from Alfa Aesar (Ward Hill, MA, USA). Citrate-capped Ag NP
colloids with a diameter of 20, 30, 60, or 100 nm and a mass concentration of 20 mg/L
were purchased from NanoComposix (San Diego, CA, USA). Five commercial products
that are claimed to contain Ag NPs were purchased from Walgreens and Amazon.
Additional information about these products is listed below.
(a) A dietary supplement whose label lists 96% positively charged silver particles (10
ppm);
(b) A nasal spray that is claimed to contain 30 ppm of pure colloidal silver;
(c) A dietary supplement whose label lists pure nano silver particles suspended at 50 ppm
in distilled water;
(d) A mineral supplement which lists purified silver of 30 ppm and purified water as the
ingredients;
(e) A dietary supplement that claims to contain 10 ppm of nano colloidial sliver.
We use “S1-S5” to represent these products according to the (a)-(e) order.

75
4.2.2 Characterization of Ag NPs in the products
An aliquot of Ag NP suspension sample (10 μL) was directly placed onto the
copper/carbon 200 mesh grids, air dried in a laminar flow hood for ~3 h, then analyzed by
a JEOL 1400 (JEOL Ltd., Tokyo, Japan).
4.2.3 Determine Ag NPs in tested products
The total silver content in each product was measured by inductively coupled plasma
optical emission spectrometry (Varian Vista-MPX CCD Simultaneous ICP-OES, Walnut
Creek, CA, USA). Before measurement, a volume of 10 mL samples were acid-digested
with 10 mL HNO3 (Fisher Scientific, ACS Reagent) in a microwave digester. The digested
content was diluted with DI water to 50 mL, and then filtered before subjected to the ICP-
OES measurement.
To determine Ag NPs, it is needed to separate Ag NPs and silver ion. All the samples
were diluted 1:10 with Mill-Q water and went through 0.2 μm (25 mm diameter) sterile
Millex® filters (Merck Millipore, Darmstadt, Germany) to separate particles smaller than
200 nm from larger particles in select samples. A 3-KDa-cutoff centrifuge filtering unit
(Millipore Amicon Ultra-15, at 3,578 × g, 30 min) was used to isolate Ag NPs from ionic
silver. The filtrates were collected and digested using the aforementioned method before
being subjected to the ICP-OES measurement.
4.2.4 Conjugation of PATP onto Ag NPs
Conjugations of Ag NPs and PATP were prepared via thiol groups of PATP and Ag NPs.
Briefly, Ag NP solutions (20 mg/L) were mixed with 10 mg/L PATP (volume ratios of
3:17). The mixture was incubated in a mixer (Max Mix II 37600, Thermolyne, Fisher

76
Scientific) for 1 h at room temperature. The solution was then centrifuged for 5 min at
3,915 ×g to concentrate the Ag NPs-PATP complexes to the bottom of the centrifuge tube.
The aggregation was then deposited onto a gold slide for air drying in a fume hood. PATP
alone was used as a blank control while a mixture of PATP and AgNO3 (20 mg/L) were
considered a negative and a positive control, respectively. In addition, the five commercial
products were amended with PATP using the method described above.
4.2.5 Detection of Ag NPs Using SERS and PATP-Ag NPs conjugation
The samples on a gold slide were immediately analyzed by a Renishaw RM1000 Raman
Spectrometer System (Gloucestershire, UK) equipped with a Leica DMLB microscope
(Wetzlar, Germany) and a 785-nm near-infrared diode laser source. During the
measurement, light from a high power diode laser was directed and focused onto the sample
on a microscope stage through an objective. Raman scattering signals were detected by a
578 × 385 pixels charge-coupled device array detector. The WiRE 3.4 software
(Gloucestershire, UK) was used to collect spectral data. In this study, the spectra of samples
were collected using a ×50 objective with 10-s exposure time, 0% focus, and ~20 mW laser
power in the extended mode. Detection ranges for each pesticide were 400-1800 cm-1 for
all the measurements.
4.2.6 Data Analysis
The software Delight version 3.2.1 (D-Squared Inc., LaGrande, OR, USA) was used for
data analysis. Eight locations in each sample were randomly measured and averaged to get
a final spectrum, which was then compared across all samples treatments. In this study, the
analysis of SERS spectral data was similar to the method described in the chapter 3. Briefly,

77
polynomial subtract were employed to adjust the baseline shift. The chemometric analysis
was performed using the partial least-squares (PLS) method and leave-one-out (LOO)
cross-validation algorithm. The number of PLS latent variables was optimized based on
the lowest root mean square error of prediction (RMSEP) values to avoid over-fitting of
spectral data. Spectral data were smoothed with a Gaussian function at 4 cm−1 followed by
a second derivative transformation with a 12 cm−1 gap before the PLS was conducted. The
correlation coefficient (R) and RMSEP were used to evaluate the model based on the R
value or the RMSEP value. Normally, the higher the R value is, the better predictability
model has.
4.3 Results and Discussion
Effectiveness of SERS-Based Method to Characterize and Quantify Ag NPs
Figure 4-1 shows the SERS spectra of PATP, PATP mixed with AgNO3 or silver powder,
and PATP mixed with 30 nm Ag NP3. It can be observed that only PATP-Ag NPs generated
significantly enhanced Raman signals, whereas PATP alone yielded no Raman signals.
This was due to the electromagnetic enhancement and the chemical enhancement produced
by the charge transfer between Ag NPs and PATP through the Ag-S groups. Several
prominent peaks can be observed, such as υ(CS) at 1078 cm-1 (a1 mode), and b2 modes (in-
plane, out-of-phase modes) located at 1590, 1435 and 1143 cm-1. The apparent
enhancement of the b2 modes has been ascribed to the charge transfer of the metal to the
adsorbed molecules and demonstrates that PATP adopts a perpendicular orientation to the
metal surface (Zheng and others 2003). A similar SERS characteristic pattern of PATP was
also observed in other previous studies (Hu and others 2007; Huang and others 2012; Kim

78
and others 2010a; Zheng and others 2003). Interestingly, AgNO3 and silver bulk material
provided no enhancement to the Raman signals of PATP, indicating that only nanoparticle-
specific reactions occurred between Ag NPs and PATP. This can be used to distinguish Ag
NPs from other silver species.
Figure 4-1. . SERS spectra of PATP, PATP mixed with AgNO3, PATP with 30 nm Ag NP3.
Effect of different sizes of Ag NPs on the SERS enhancement
Four different sizes of Ag NPs (20, 30, 60, and 100 nm) were used to evaluate the
feasibility of SERS to detect Ag NPs. For 20, and 30 nm Ag NPs, strong and consistent
SERS signals of PATP were obtained exhibiting the specific vibrational modes of PATP.
However, signal intensity and sharpness of characteristic peaks began to decrease with the
increase of particle size (Fig. 4-2). This phenomenon can be explained by the size and
shape dependent excitation of Ag NPs (Yoon and others 2009). Furthermore, Ag NPs
arranged closed to each other could produce more intensive electromagnetic enhancement
Raman shift (cm-1)
400 600 800 1000 1200 1400 1600 1800
PATP + AgNO3
PATP + 30 nm Ag NPs
PATP
Ram
an I
nten
sity
PATP + Ag powder 0.5 – 1 µm

79
at the junction between them (Lu and others 2009; Orendorff and others 2005). Kelly et al.
(2003) studied the face-averaged electric-field enhancement for the 30 and 60 nm spheres.
It was suggested that with the larger sphere, it is possible for the largest SERS enhancement
to be at a location on the surface that is not along the polarization direction (Kelly and
others 2003). Njoki observed that the correlation of the SP band with the particle size of
gold nanoparticles (10−100 nm diameters) is a key factor that are responsible for the SERS
effect of the nanoparticles in solution (Njoki and others 2007). This is in general agreement
with our result that the range of 20-100 nm seemed to be in the suitable size for SERS
detection.
Figure 4-2. Comparisons of enhancement effects from Ag NPs.
Quantification of Ag NPs by SERS
In addition, we studied the reliability of the SERS method in the characterization and
quantification of Ag NPs. Figure 4-3A shows the average SERS spectra of samples with a
concentration range of 0-20 ppm of 20 nm Ag NPs. A linear calibration curve was
Raman shift (cm-1)
400 600 800 1000 1200 1400 1600 1800
Ram
an I
nte
nsi
ty
20 nm
30 nm
60 nm
100 nm
Raman shift (cm-1)

80
constructed by monitoring the intensity of the peaks in a selected region (400−1800 cm−1).
PLS analysis was conducted to obtain the RMSEP values from the PLS models. The lowest
RMSEP value was achieved and used to construct the PLS prediction model. Figure 3B
illustrates the plot between the predicted concentration and actual concentration of
pesticides (R= 0.94). Higher initial concentrations of Ag NPs resulted in more Ag NPs in
the Ag NPs-PATP complexes that were associated with additional PATP molecules. These
results demonstrate that the SERS method coupled with PLS can be used as a reliable
method to quantify Ag NPs.
Figure 4-3. Concentration-dependent SERS spectra (part of full scale) of Ag NPs with PATP (10 mg/mL) as
an indicator (A); the linear relation between Raman intensity and Ag NPs concentration (B).

81
To further evaluate the quantification of the SERS method, we established a linear
calibration curve between the concentration of Ag NPs and the Raman intensity of a strong
peak at 1079 cm-1. The linear relationship clearly demonstrates the potential of SERS in
analysis Ag NPs in simple solutions (data not shown). However, it is likely that the Raman
intensity of the conjugation of Ag NPs-PATP can be affected by the complex matrix of the
commercial products. These thoughts led us to investigate the feasibility of this method for
the detection of Ag NPs in five commercial products. Figure 4-4 shows that the spectra of
negative controls (samples (S1 to S5) + solvent of PATP) were in low intensity and no
distinctive peaks were observed. In contrast, prominent and distinctive peaks (1079, 1143,
and 1430 cm-1) of Ag NP-PATP complexes were produced by the products (S2, S3, and
S5) after interacting with 10 mg/L of PATP. Less prominent but still detectable peaks (1079
and 1143 cm-1) were also observed for S1 and S4 as shown in the Table 8. As compared
to the spectra of Ag NPs-PATP complex, the spectra of nasal spray (S2) show similar
features, indicating that food matrices may have influence on the Raman signals and thus
on the detection of Ag NPs. While the spectra of dietary supplement were more affected
by their natural matrices, the characteristic Raman signals of Ag NPs-PATP were still
clearly observed. However, the order of advertised silver concentration as S3 > S2 = S4 >
S1 = S5 was different from the total silver concentration measured based on the SERS
intensity of the peaks at 1079 and 1143 cm-1 (S2 > S5 > S3 > S4 > S1). These discrepancies
may come from the fact that not all silver in the products was nano-sized and those
nanoparticles may not have the same size distribution.

82
Figure 4-4. SERS spectra four five Ag NPs-containing dietary and antimicrobial products. Negative controls were prepared using the solvent of PATP (methanol).

83
TEM and ICP-OES analysis were conducted to analyze the size and concentration of Ag
NPs in the samples, which can be used to validate the SERS method. The total silver
concentration in five commercial products was determined by ICP-OES (Table 6). The
measured results were different from the claimed concentrations on the label, except for
the sample S5. The total silver concentration of sample S3 was ~121 ppm that was higher
than the claimed concentration on the label. The order of claimed silver concentration as
S3 > S2 = S4 > S1 = S5 was different from the total silver concentration measured by ICP-
OES of the products (S3 > S2 > S5 > S1 > S4).
Figure 4-5. Characterization of Ag NPs in the dietary supplements and antimicrobial products. (A) Dietary supplement; (B) nasal spray; (C) dietary supplement; (D) dietary supplement; (E) dietary supplement.
As noted in Table 6, the concentrations of Ag NPs (< 3 kDa) in the products were not in
the same order as the SERS signal intensity, but the concentrations of S2, S3, and S5

84
remained the top three versus S1 and S4 based on SER intensity and ICP-OES method.
TEM was used to analyze the size distribution of Ag NPs (Figure 4-5 and Table 6) to
determine the potential effect of particle size on the SERS intensity. The average size of
Ag NPs in S1, S2 and S3 were 54.6, 47.2, and 54.8 nm respectively, which is larger than
those in S4 (30.8 nm) and S5 (34.3 nm). The size range of Ag NPs in the products (20-100
nm) is often suitable size for SERS signals enhancement. It was observed that the closer
the particle size to the optimum range (30 - 40 nm), the higher the signal intensity. Thus, it
is speculated that S2 and S5 would produce stronger SERS intensity than S1 and S3 at the
same concentrations of Ag NPs. Interestingly, the sample S4 had a significant lower
concentration of Ag NPs (0.1 mg/L) than the rest of samples and thus its SERS signals
were low as well, even though its size was very close to the optimum range. Overall, TEM
and ICP-OES can be used to validate the SERS measurements that can reflect the size and
concentration of Ag NPs in commercial available products.
Table 6. Total concentration of silver and Ag NPs, average size, and the intensity of SERS spectra acquired from five commercial products
Product Claimed concentration of Ag (ppm) on the label
Total silver concentration (ppm)
Silver nanoparticles concentration (ppm) (< 3 kDa)
SERS intensity at
SERS intensity at
Average size measured by TEM (nm)
1079 cm-1 1143.9 cm-1
S1 10 5 4.6 161 194 54.6 S2 30 17 16.2 101,061 100,277 47.2 S3 50 121 120 9,545 8,332 54.8 S4 30 0.4 0.1 260 259 30.8 S5 10 10 8.2 61,855 32,835 34.3

85
In summary, a simple, fast, and effect method was developed to detect and measure Ag
NPs in commercial products using SERS method. PATP can be used as a Raman indicator
that binds strongly with Ag NPs. In this study, the feasibility of SERS method was
evaluated by measuring Ag NPs in four dietary supplements and one nasal spray with a
minimum sample preparation. The findings were validated by a combination of ICP-OES
and TEM methods. These results demonstrate that there is a great potential to use SERS
for food safety applications. More research is needed to enhance the conjugation between
Ag NPs and PATP as well as other promising indicators.

86
CHAPTER 5
Toxicity of Graphene Oxide on Intestinal Bacteria, and Caco-2 Cells
Abstract
In recent years, novel nanomaterials have received much attention due to their great
potential in agriculture, food safety, and food packaging. Among them, graphene and
graphene oxide (GO) are emerging as promising nanomaterials that may have a profound
impact on food packaging. However, there are some concerns from consumers and the
scientific community about the potential toxicity and biocompatibility of nanomaterials. In
this study, we investigated the antibacterial properties of GO against human intestinal
bacteria. The cytotoxicity of GO was also studied in vitro using the Caco-2 cell line derived
from a colon carcinoma. Electron microscopy was used to investigate the morphology of
GO and the interaction between GO flakes and Caco-2 cells. GO at different concentrations
(10 - 500 µg/mL) exhibited no toxicity against the selected bacteria and a mild cytotoxic
action on Caco-2 cells after 24 h of exposure. The results show that weak adsorption of
medium nutrients may contribute to GO’s low toxicity. This study suggests that GO is
biocompatible and has a potential to be used in agriculture and food science, indicating that
more studies are needed to exploit its potential applications.
Keywords: graphene oxide, toxicity, intestinal bacteria, Caco-2 cells

87
5.1 Introduction
Graphene is firstly defined by Geim and Novoselov as a flat monolayer of carbon atoms
tightly packed into a two-dimensional honeycomb lattice (Geim and Novoselov 2007b).
Later, graphene oxide (GO) is synthesized using flake graphite as a starting material and
chemically functionalized to build a range of reactive oxygen functional groups on the
surface (Dreyer and others 2009). Owing to their unique properties, graphene and its
derivatives emerge as a new class of nanomaterials that are only one atom thick, but offer
new insights for many applications. In recent years, graphene has been investigated for
applications in food packaging because of their exceptional ability in serving as a graphene-
based nanofiller to limit both oxygen permeation and light transmission in polymer films.
For example, Compton et al. (Compton and others 2010) demonstrated that polystyrene-
graphene nanocomposites (PGN) have more potential than polystyrene as a packaging
material that can greatly increase the shelf life of perishable goods. In addition to PGN,
GO-reinforced starch films exhibited higher thermal stability, better moisture barrier
property, and can effectively protect against UV light (Li and others 2011b). These results
suggest that starch-GO biocomposites have promising applications as UV-shielding
packing materials (Li and others 2011b). Another type of carbon-based nanocomposite is
graphene nanoplates that can form a heat-resistant, high-barrier nanocomposite which is
promising in food packaging applications (Ramanathan and others 2008).
Recent observations that graphene and GO are biocompatible with bacterial and cellular
growth further support their promise for the aforementioned applications. Most previous
studies indicated very mild or even no cytotoxicity of GO in a variety of cells, such as
PC12 cells (Zhang and others 2010), HeLa cells, human fibroblasts (Liao and others 2011),

88
A549 human lung cancer cells (Chang and others 2011), and human hepatoma HepG2 cells
(Sasidharan and others 2012). Ruiz and others (2011) conclusively demonstrated that GO
does not have intrinsic antibacterial, bacteriostatic, and cytotoxic properties in both
bacterial and mammalian cells. Moreover, GO has been proven as a general enhancer of
cellular growth by increasing cell attachment and proliferation capabilities (Ruiz and others
2011). However, numerous conflicting studies about the antimicrobial properties of GO
have been reported. Some studies demonstrated that graphene and its derivatives induced
cellular toxicity (Vallabani and others 2011) and possess antibacterial properties (Sekhon
2010; Liu and others 2011a; Liu and others 2011b; Pandey and others 2011). Despite great
enthusiasm about applications of graphene-based nanomaterials in food packaging and
biomedicine, some concerns remain about the potential toxicity and biocompatibility of
graphene and its derived materials. Therefore, it is of critical importance to investigate the
toxicity of these nanomaterials before applying them in food packaging.
This study aimed to investigate the effect of GO on human intestinal bacteria and human
intestinal cells. We investigated the effects of GO on microbial proliferation of three strains
of intestinal bacteria, including Escherichia coli K12, Lactobacillus acidophilus ADH, and
Bifidobacterium animalis Bif-6. Additionally, a systematic study on the toxicity of GO was
performed by evaluating the morphology and viability of Caco-2 cells, a heterogeneous
human epithelial colorectal adenocarcinoma cell line, after exposure to GO.

89
5.2 Materials and Methods
5.2.1 Characterization of GO
Characterization of GO was conducted by Fourier transform infrared (FTIR)
spectroscopy, UV−vis absorption spectroscopy, dynamic light scattering (DLS), and
transmission electron microscopy (TEM). FTIR spectra were acquired using a Nicolet 8700
spectrometer (Thermo Scientific) with a dried GO sample prepared by the evaporation of
the original GO dispersion. The acquired spectra of each sample were the average result
of 128 interferogram scans with a resolution of 4 cm−1. UV−vis absorption spectra were
recorded in a double-beam Varian spectrophotometer. The average particle diameter and
electrical charge (zeta potential) of GO were measured by a Zetasizer Nano ZS (Malvern
Instruments, Worcestershire, U.K.) equipped with a red laser (633 nm). Samples were
diluted with Milli-Q water/TSB/cell medium at ambient temperature for particle size and
zeta potential measurements. For each sample, two DLS measurements were conducted
with at least 12 runs with each run lasting 10 s. During the measurements, light from the
laser was directed and focused on the cuvette containing 1.2 mL sample solution. The
particle size was reported as the Z-average mean diameter. The zeta-potential values were
reported as the average of measurements obtained from three prepared samples with three
readings made per sample. An aliquot of GO sample (0.1 mg/mL) was directly placed on
the copper/carbon 200 mesh grids and dried at 45oC for characterization by TEM. The
TEM images were taken by a FEI Tecnai F30 Twin (Oregon, USA) operated at an
accelerating voltage of 200 kV.

90
5.2.2 Preparation of Bacterial strains
Three bacterial strains (E.coli K-12, L. acidophilus ADH, and B. animalis Bif-6) were
obtained from the Food Microbiology Laboratory at University of Missouri, Columbia,
MO. E. coli K 12 was grown in tryptic soy broth supplemented with 0.5% yeast extract
(TSBY; Difco Labs., BD Diagnostics Systems, Sparks, MD, USA). L. acidophilus ADH,
and B. animalis Bif-6 were grown in Lactobacilli MRS broth (Difco Labs.) Before the
treatments, bacterial strains were freshly prepared by transferring 100 µL of each culture
into separate tubes containing 10 mL of respective broth media. Tubes were incubated
aerobically for E. coli K12 and anaerobically for L. acidophilus ADH and B. animalis Bif-
6 overnight at 37oC to reach ~108 CFU/mL.
5.2.3 Effect of GO on the growth of E. coli, L. acidophilus, and B. animalis
An aqueous dispersion of single-layer GO with an average flake particle size of 500 nm
was purchased from ACS (ACS Material, MA, USA). The concentration of the original
suspensions was 10 mg/mL. The GO-free solution was prepared by filtering GO
suspensions through an Anodisc membrane with a pore size of 20 nm (Whatman Inc.,
Clifton, NJ, USA).
All the strains, incubated overnight in TSB were inoculated (100 µL) into broth media
containing different concentrations (100, 200, 300, and 400 µg/mL) of GO suspensions,
and 400 µg/mL of GO-free solution. Both GO suspensions and the GO-free solution were
added to the broth media before autoclaving. To increase the solubility of GO in the broth
media, all GO suspensions were sonicated for 3 h (Cole-Parmer 42 kHz). After inoculating
the cultures to TSBY or MRS broth containing GO dispersions and GO-free solution,
91
samples were incubated at 37oC in a shaking incubator. The purpose of using a shaking
incubator was to minimize the aggregation of GO in the broth and to allow for a consistent
contact between bacterial cells and GO. The samples were diluted with peptone water in a
series of concentrations from 10-1 to 10-9 CFU/mL, then 100 µL was spread on TSBY for
E. coli K12 at 0, 4, 10, and 24 h, and Lactobacilli MRS agar for L. acidophilus ADH and
B. animalis Bif-6, at 0, 4, 10, and 24 h.
5.2.4 Mammalian cell study
Caco-2 cells (ATCC, Rockville, MD) were cultured in T75 flasks at 37°C in an
atmosphere with 5% CO2. The medium was Eagle’s minimum essential medium (MEM,
GIBCO, NY, USA) supplemented with 20% fetal bovine serum (FBS, Hyclone, GE
Healthcare, UT, USA) and 1% antibiotic antimycotic solution (containing 10,000 units/mL
penicillin G, 10 mg/mL streptomycin sulfate and 25 μg/mL amphotericin B, GIBCO). The
cells were cultivated for 3-4 days and then seeded at densities of 104 - 105 cells/mL (0.1
mL/well) in a 96-well plate by trypsinizing and centrifuging at 8.4 ×g for 5 min. After 24
h, cells were incubated with 150 μL of GO solutions at different concentrations (10, 100,
200, 500, and 1500 μg/mL) that were previously mixed with the media (1:2 ratio). All GO
solutions were sonicated for 3 h (Cole-Parmer 42 kHz) before mixing with the media. After
a 24-h exposure, cell viability was measured by the conventional MTT reduction assay and
WST-8 proliferation assay.
In a separate experiment, to test the effect of the nutrient depletion by GO on the toxicity,
the GO samples (10, 100, 200, 500, and 1500 μg/mL) were incubated in culture medium
(cell-free) at 37°C under 5% CO2 for 24 h. Then, the mixtures were centrifuged at 5000 xg

92
for 10 min to remove the precipitate (GO). The GO free supernatants were collected and
introduced to Caco-2 cells. After 24-h exposure, cell viability was measured by the
conventional MTT reduction assay and WST-8 proliferation assay.
5.2.5 MTT reduction assay
The colorimetric 3-(4,5-dimethylthiazol-2-yl)-2,5-diphenyltetrazolium bromide (MTT,
ATCC) test assesses cell metabolic activity by measuring the ability of the mitochondrial
succinate-tetrazolium reductase system to convert the yellow dye (MTT) to a purple-
colored formazan in living cells. Briefly, Caco-2 cells were incubated with 150 μL of
different concentrations of GO in the media. After 24 h incubation, the cells were washed
with phosphate buffered saline (PBS, 1×) three times and incubated again in 100 μL of the
media. Into each well was added 10 μL of an MTT stock solution, followed by incubation
at 37°C for 4 h under 5% CO2. The dark blue formazan crystals formed in intact cells were
solubilized with 100 μL of detergent reagent and left in the dark overnight. Absorbance
was recorded at 570 nm using a microplate reader (Biotek, VT, USA) and 655 nm as
reference. Cells without GO exposure were used as a negative control and cell-free
experiments were also performed as a positive control. The cell viability (% of control) is
modified following the equation by previous published papers (Chang and others 2011;
Liao and others 2011).
Cell viability (%) =�������� �������
��������� � ������� × 100%
Where ODtreat is the optical density of the cells exposed to the GO sample, ODcontrol is
the optical density of the negative control sample and ODblank is the optical density of the
wells at 655 nm.

93
5.2.6 WST-8 proliferation assay
Briefly, Caco-2 cells were incubated with 150 μL of different concentrations of GO in
the media. After 24 h, the cells were washed with PBS (1×) three times and incubated again
with 100 μL of media. Into each well was added 10 μL of WST-8 stock solution (Cayman
Chemical, MI, USA), followed by incubation for 4 h at 37°C under 5% CO2. A volume of
80 μL of the mixture was transferred to another 96-well plate. Absorbance was recorded at
450 nm using a microplate reader (Biotek, VT, USA) and 655 nm as reference. Cells
without GO exposure were used as a negative control and cell-free samples were also used
as a positive control. The cell viability (% of control) is modified following the equation
by previous published papers (Chang and others 2011; Liao and others 2011).
Cell viability (%) =�������� �������
��������� � ������� ×100%
where ODtest is the optical density of the cells exposed to the GO sample, ODcontrol is the
optical density of the negative control sample and ODblank is the optical density of the wells
at 655 nm.
5.2.7 Scanning electron microscopy (SEM) analysis
The three bacterial strains treated or untreated with GO were fixed with a primary
fixative (2.5 glutaraldehyde, 2% paraformaldehyde in 0.1 M Na-Cacodylate buffer, pH
7.4). Samples were then rinsed three times with ultrapure water, followed by dehydration
with a series of ethanol solutions (10, 30, 50, 70, 90, and 100%). The dehydrated samples
were immediately dried by a critical point dryer (Auto-Samdri 815 Automatic Critical
Point Dryer; Tousimis, Rockville, MD, USA), mounted on SEM stubs and coated with a
thin layer of carbon using a sputter coater (K575X Turbo Sputter Coater; Emitech, Ltd,

94
Kent, UK). The coated samples were observed under a Hitachi S-4700 Field Emission
Scanning Electron Microscope (Hitachi High Technologies America, USA).
5.2.8 Transmission electron microscopy (TEM) analysis
Samples treated with GO were fixed with a primary fixative (2% paraformaldehyde, 2%
glutaraldehyde in 0.1 Na-cacodylate) and microwaved under vacuum conditions at 120 W.
The samples were rinsed with 0.1 M cacodylate buffer and embedded in HistoGel, followed
by buffer rinsing using 2-mercaptoethanol solution for 3 times. The samples were treated
by a secondary microwave fixation with 1% osmium tetroxide. The samples were placed
in 4oC for 1 h, then quickly rinsed three times with 0.1 M 2-mercaptoethanol, then rinsed
three times with ultrapure water. The samples were dehydrated with ethanol solutions (20,
50, 70, 90, and 100%) and 100% acetone solution. They were then infiltrated with
Epon/Spurr’s resin and polymerized at 60oC for 24 h. The sample blocks were processed
in 85 nm thin sections with a Leica Ultracut UCT Ultramicrotome (Leica Microsystems
GmbH, Wetzlar, Germany). The sections were placed on carbon coated grids and the
samples were then analyzed by JEOL 1400 (JEOL, Ltd, Tokyo, Japan).
5.2.9 Statistical analysis
Mean values for CFU cell counts and percent viability for each GO concentration were
calculated and the significant differences (P ≤ 0.05) determined using SAS Program (SAS
9.3, SAS Institute, Cary, NC). When significant differences were found, multiple
comparisons were performed using Tukey's Studentized Range HSD test at P ≤ 0.05 level
of significance.

95
5.3 Results and Discussion
To characterize the GO used in this study, UV–vis absorption, FTIR, DLS measurement,
and TEM were employed. The sample of diluted GO aqueous dispersion (20 μg/mL) was
examined by a UV–vis absorption spectrum. As shown in Figure 5-1A, an UV-vis
spectrum of GO displays a maximum absorption at 230 nm due to the π–π* transition of
aromatic C═C bonds and a shoulder around 300 nm due to the n−π* transition of C═O
bonds. Both were consistent with previous reports (Akhavan and Ghaderi 2010; Chen and
others 2012; Compton and Nguyen 2010; Dreyer and others 2009; Liu and others 2008;
Stankovich and others 2007). Figure 5-1B shows a typical FTIR spectrum obtained for
dried GO powders, exhibiting some characteristic features, including intense band at 3430
cm−1 (O−H stretching vibrations), the bands at 1726 cm−1 (C═O stretching vibrations from
carbonyl and carboxylic groups), 1588 cm−1 (skeletal vibrations from unoxidized graphitic
domains), and 1226 cm−1 (C−OH stretching vibrations). In additional to the UV-vis and
FTIR data, TEM images clearly show the single layer of GO (Figure 5-2). These results
prove the presence of different types of oxygen functionalities on the GO and confirmed
that the GO used in our study was a single-layer sheet.

96
Figure 5-1. UV–vis absorption spectrum of GO aqueous dispersion (A). FTIR spectrum of dried graphite oxide sample (B).
Figure 5-2. TEM images of GO aqueous dispersion.
The surface charge and aggregation state of nanomaterials critically influence their in
vitro cytotoxicity. Particularly, the surface charges of nanoparticles play an important role
in cell-nanoparticle interactions because cell membranes themselves are charged (Arvizo
and others 2010; Liu and others 2010). As shown in Table 7, the zeta (ζ)-potentials GO
used in this study were negative. The GO samples had the highest negative ζ-potential in
MilliQ water, followed by the cell culture medium and TSB. The results demonstrate the
different oxygen amount on the surface of GO and poor aqueous dispersity of GO in TSB
and cell culture medium. We also employed DLS to obtain a rough measure of the lateral

97
size distributions of the GO in aqueous dispersion (Table 7). The GO flakes are more
accurately described as 2-D objects, and the average flake diameter obtained from DLS
(589 ± 90 nm) is not their real average dimension. However, such apparent values might
exhibit close correlation to the relative physical sizes of the GO in different solvents
(Chang and others 2011). We observed that the size of the resulting GO aggregates in water
was the highest, followed by those in the cell medium and TSB. The size of GO is similar
to other GO materials in previous studies (Akhavan and Ghaderi 2010; Chang and others
2011; Chen and others 2012; Dikin and others 2007; Liu and others 2008; Tayel and others
2011; Ruiz and others 2011), except for the abnormal size in TSB and cell media. This can
be explained by the fact that GO tends to aggregates in high salted environments (Liao and
others 2011).
Table 7. GO characteristics, values presented means ± SD from triplicate measurements.
Samples measured at 10 µg/mL.
Characteristicq Valueb
-Potential in Milli-Q water - 32.7 ± 0.9 mV
-Potential in TSB - 10 ± 0.14 mV
-Potential in cell culture medium - 10.5 ± 0.3 mV Average diameter in Milli-Q water 589.7 ± 94 nm Average diameter in TSB 3658.3 ± 31 nm Average diameter in cell culture medium 229.5 ± 100 nm
a Samples measured at 10 μg/mL.
b-Values are means ± SD from triplicate measurement
Initially, different concentrations (0, 10, 200 μg/mL) of GO were used to assess their
effects on intestinal Gram negative (E. coli K-12) and Gram positive (L. acidophilus ADH

98
and B. animalis Bif-6) bacteria. The results show that there were no significant differences
(P ≥ 0.05) between the control and treated samples (data not shown). Therefore, higher
concentrations (100, 200, 300, and 400 μg/mL) of GO were employed for further studies.
Figure 5-3 shows the growth curves of three different strains of bacteria incubated with
different concentrations of GO and GO-free solution. At the highest concentration of GO
(400 μg/mL), no significant effect on E. coli K-12 (P ≥ 0.05) was observed between the
control, the GO-free, and all the treatments. At the 10 h of incubation, the numbers of
treated cells (100 and 300 μg/mL) slightly decreased but by much less than 1 log CFU/mL
as compared to that of the control, indicating no significant differences between these GO
treatments and the control. The same results were observed for experiments using L.
acidophilus and B. animalis. Figure 5-4 shows the SEM images of the intact morphology
of treated bacterial cells.

99
Figure 5-3. Effect of GO on the growth of E. coli (a), L. acidophilus (b), and B. animalis (c).
7
7.5
8
8.5
9
9.5
10
10.5
11
0 h 4 h 10 h 24 h
7
7.5
8
8.5
9
9.5
10
0 h 4 h 10 h 24 h
7
7.5
8
8.5
9
9.5
10
10.5
0 h 4 h 10 h 24 h
Bac
teri
al c
oun
t (L
og C
FU
/mL
)
b
c
a
0 GO-Free 100 ug/mL 200 ug/mL 300 ug/mL 400 ug/mL
Incubation time

100
Previous studies (Akhavan and Ghaderi 2012a; Wang and others 2011a; Ruiz and others
2011; Liu and others 2011a) found that the precipitation of GO in the culture media may
act as a scaffold for bacterial attachment, proliferation, and biofilm formation. Our results
are in accord with these findings. The same conclusion was reached in a study about using
graphene as an anodic catalyst of microbial fuel cells. A large number of E. coli cells
accumulated on the electrode surface and successfully adhered to one another with no
inhibition of bacterial growth. Recently, the E. coli biocompatibility of GO sheets was
proven through Akhavan and Ghaderi’s study (Akhavan and Ghaderi 2012a). Based on the
results acquired by X-ray photoelectron spectroscopy, the authors concluded that E. coli
cells were adsorbed and proliferated on GO sites. Further, Wang et al. demonstrated the
lack of toxicity of GO to Shewanella sp. that are an important family of dissimilatory metal-
reducing bacteria. These bacteria’s metabolism is via generating electrons from a cell
interior to external electron acceptors. Therefore, by investigating the extracellular electron
transfer pathways at the cell/GO interface, both direct electron transfer and electron
mediators were displayed in GO reduction (Wang and others 2011a).

101
Figure 5-4. SEM images of E. coli, L. acidophilus, and B. animalis without (A, C, E) and with (B ,D, F) GO treatment.
Both MTT and WST-8 proliferation assays are based on measuring the mitochondrial
activity of human colon cells but using different dyes. The MTT test assesses cell metabolic
activity by measuring the ability of the mitochondrial succinate-tetrazolium reductase
system to convert positively charged yellow dye to purple-colored formazan in living cells.
The WST-8 assay operates on the same MTT assay principle but uses a negatively charged,
water-soluble tetrazolium dye. Our results demonstrate that adherent Caco-2 cells were

102
unaffected at all selected GO concentrations for 24 h, and the dose-dependent cytotoxicity
of GO was not observed (Figure 5-5). Even at the highest GO concentrations (500 μg/mL),
more than 99% of the cell viability still remained. There was no significant difference in
cell viability between the control and samples treated with different concentrations of GO.
The cytotoxicity of GO tested by two assays was very mild with approximately 1-5%
decrease in percentage of viability. As compared to the MTT results, WST-8 data showed
a reduction in cell viability at the highest GO concentration (500μg/mL) (Figure 5-6).
However, there was no significant difference in the cell viability between the control and
treatments. Therefore, both MTT and WST-8 results show no dose-dependent effects of
GO on the mitochondrial activity of Caco-2 cells.
Figure 5-5. Cell viability of Caco-2 cells determined by the MTT assay after 24 h exposure to different concentrations of GO. Data represent means ± SD. Means with the same letters are not significantly
different (P > 0.05).
GO concentration (µg/mL)
0
20
40
60
80
100
120
Control GO-free 3.33 33.33 66.66 133.33 166.66 500
aa
aa
aa a
a
% V
iabi
lity

103
Figure 5-6. Cell viability of Caco-2 cells determined by the WST-8 assay after 24 h exposure to different concentrations of GO. Data represent means ± SD. Means with the same letters are not significantly
different (P > 0.05).
TEM images clearly illustrate a few changes in the microvilli of treated Caco-2 cells as
compared to the control (Figure 5-7).
Nutrient depletion induced by nanomaterial adsorption is a well-recognized reason for
the nanotoxicity (Chang and others 2011). In addition, even though there was no
statistically significant difference in viability loss between the control and the treatments,
the viability reduction apparently occurs. These results led us to test a hypothesis that
nutrient depletion could be a reason for the toxicity induced by GO adsorption. Therefore,
the influence of culture medium adsorption on the toxicity of GO was investigated. Eagle’s
medium was pre-treated with GO samples separately for 24 h and the supernatants were
collected and introduced into Caco-2 cells. If the cells did not survive in the GO-pretreated
culture medium, it was concluded that the adsorption of nutrients on GO contributes to the
GO concentration (µg/mL)
0
20
40
60
80
100
120
140
Control GO-free 3.33 33.33 66.66 133.33 166.66 500
% V
iabi
lity
abc
bc
bc bcc
ababc
a

104
toxicity. The same patterns of cell viability of pre-treated medium were observed as
compared to the non-treated medium. The two assays, MTT and WST-8, were employed
to test the viability of Caco-2 cells. All the treatments were not significantly different from
the control and the GO-free samples (Figure 5-8). These results demonstrate that the
adsorption of nutrients on GO sheets from the medium did not affect the cells. This is in
agreement with a previous study (Chang and others 2011) in which cells grew just as well
as the control cells. In addition, similar results were reported in other studies that showed
very mild cytotoxicity of GO on mammalian cells (Chang and others 2011; Zhang and
others 2010; Liao and others 2011). The mild cytotoxicity of GO can be explained by the
fact that the presence of GO nanosheets in phago-endosomes did not cause any apparent
adverse changes in the cellular morphology and ultrastructure (Horváth and others 2013).
Some studies investigated graphene in the form of film that can exhibit excellent
biocompatibility with no viability inhibition of mammalian cells. Li et al observed good
biocompatibility of graphene films toward mouse neuronal cells. Cell numbers and average
neurite length on graphene films were significantly enhanced during 2-7 days following
cell seeding. GO films on HT-29 cells were proved to promote cell enhancement and
proliferation (Li and others 2011a).

105
Figure 5-7. TEM images of Caco-2 cells (A, C) control and (B, D) treated with GO.
Several recent studies investigated the differences in biocompatibility of GO films and
GO dispersions (Chang and others 2011; Chen and others 2012; Liu and others 2008; Ruiz
and others 2011). Some studies showed that GO is toxic while others do not show any or
very mild toxicity of GO. One of the reasons for these contradicting resultsis probably due
to the differences in the cell lines used in each study. Another reason may be the correlation
between the amounts of oxygen content/functional groups of GO and their toxicological
behavior towards A549 cells (Das and others 2013). These observations indicate that the
reduction in the oxygen functional groups or the increase in the C:O ratio made graphene
derivatives, such as reduced GO, more biologically inert and therefore less cytotoxic than

106
others (graphene and GO). Recently, Liu et al. also concluded that by controlling the
functional group density, size and conductivity of graphene-based material, it is possible
to minimize their environmental risks and increase their application potential (Liu and
others 2011b). In this study, we used the single-layer GO water dispersion with the C:O
ratio of about 1.67. Collectively, our results indicate that GO exhibited a mild cytotoxic
activity on Caco-2 cells, as shown by the MTT and WST-8 cell viability tests.
Figure 5-8. Cell viability of Caco-2 cells determined by MTT and WST-8 assays after a 24-h exposure to GO-pretreated media. Data represent means ± SD. Means with the same letters are not significantly
different (P > 0.05).
In summary, the toxicity of graphene oxide on intestinal bacteria and Caco-2 cells was
investigated using in vitro studies. This study also compared a widely used chemical
cytotoxicity MTT assay to a new WST-8 assay. Our results demonstrate that GO is
0
20
40
60
80
100
120
140
Control GO-free 3.33 33.33 66.66 133.33 166.66 500
MTT assay
WST-8 assay
aa a
a
a
a
aa
aa
aa
a
aa
a
GO concentration (g/mL)
% C
ell
viab
ilit
y

107
biocompatible and has a potential to be used for various purposes. However, the tendency
for GO to agglomerate in cell culture and bacteria broth, makes it difficult for assessments
of its health risks. More effort is required to further investigate their cytotoxicity and
elucidate mechanisms of how the unique properties (e.g., shape, surface properties,
dispersibility) of GO affect human health at hierarchical levels from cellular to the whole
organism.

108
CHAPTER 6
Antibacterial Properties of Selenium Nanoparticles and Their Toxicity
on Caco-2 Cells
Abstract
Selenium nanoparticles (Se NPs) are emerging as a promising nanomaterial that can
potentially be used for a wide range of applications. However, little is known about their
antimicrobial activities to microorganism or potential toxicity to humans. In this study, we
investigated the antibacterial properties of Se NPs against four important foodborne
pathogens (Escherichia coli O157:H7, Staphylococcus aureus, Salmonella, and Listeria
monocytogenes). The cytotoxicity of Se NPs was also studied in vitro using the Caco-2 cell
line. Bacterial counts were determined by agar plate counting. Scanning and transmission
electron microscopies (SEM and TEM, respectively) were utilized to determine changes in
cell morphology during exposure to Se NPs. Se NPs at concentrations of 20 µg/mL or
higher exhibited antimicrobial properties against S. aureus, but not on the other three
pathogens. Se NPs also exhibited various degrees of toxicity on Caco-2 cells after 24 h of
exposure. The results of this study show that Se NPs can be used as an antimicrobial agent
to inhibit the growth of S. aureus and potentially be used as in food safety applications.
More studies are needed to fully elucidate the mechanisms of Se NPs’ cytotoxicity and
antibacterial properties.
Keywords: selenium nanoparticles, toxicity, foodborne pathogen, Caco-2 cells

109
6.1 Introduction
In recent years, various novel nanomaterials have received much attention due to their
great potential in biomedical sciences, engineering, agriculture, and food safety. Among
them, selenium nanoparticles (Se NPs) are emerging as promising nanomaterials that can
be potentially used for a wide range of applications. Selenium is an important trace element
for animal and human health. Normal selenium levels in adults are around 81 μg and the
dietary requirement is ~55 μg per day with an upper limit of ~400 μg (Monsen 2000). Se
NPs have been sold on the market as a food additive in a tea product that claims to possess
a number of health benefits (Huang 2012).
Some studies show that Se NPs have unique antibacterial activities against Trichophyton
rubrum (Yip and others 2014), Candida albicans (Kheradmand and others
2014), Pseudomonas aeruginosa, and Proteus mirabilis (Shakibaie and others 2015). Se
NPs can be used for food safety applications, including as antibacterial nano-coatings, in
food packaging, and in functional foods (Khiralla and El-Deeb 2015; Vale and others
2010). For example, nano-coatings containing Se NPs have been used to inhibit bacterial
growth (Wang and Webster 2014). Other studies have shown the dose-dependent
cytotoxicity of Se NPs in different cells, such as A375 human melanoma cells (Chen and
others 2008b), HeLa cells (Luo and others 2012), HCT-8 tumor (Gao and others 2014),
H22 hepatocarcinoma cells (Gao and others 2014), and human hepatoma HepG2 cells
(Estevez and others 2014). Novotny et al. (2010) found that seleno-compounds can be used
as a chemopreventative and chemotherapeutic agents (Novotny and others 2010). Some
studies demonstrated that nanosized Se exhibit excellent in vitro and in vivo biological

110
activities and low toxicity (Zhang and others 2001; Peng and others 2007; Pi and others
2013; Wang and others 2007a).
However, very few studies have been conducted on the antimicrobial properties of Se
NPs against foodborne pathogens and little is known about the antiproliferative activity of
nanosized Se and their underlying mechanisms. The objective of this study was to
investigate the antimicrobial activity of Se NPs against foodborne pathogens by studying
the growth of different strains of pathogenic bacteria in the presence and absence of Se
NPs. Bacterial counts were determined by the plate cell growth counting, and scanning
electron microscopy (SEM) and transmission electron microscopy (TEM) were employed
to accurately determine the changes in cell morphology after their exposure to Se NPs.
Additionally, two proliferation assays, including MTT and WST-8 were performed to
evaluate the toxicity of Se NPs against Caco-2 cells, a heterogeneous human epithelial
colorectal adenocarcinoma cell line, after exposure to Se NPs.
6.2 Materials and Methods
6.2.1 Chemicals, bacterial strains mammalian cells
Sodium selenite, L-glutathione (reduced form, GSH), and bovine serum albumin (BSA)
were purchased from Sigma-Aldrich (St. Louis, MO, USA). Escherichia coli O157:H7
(strains MF1847, 505b, 3178-85, C7927), Staphylococcus aureus (strains 183B, beta-
hemolytic, DLV1, FRI), Salmonella (Salmonella Typhimurium 788, Salmonella
Enteritidis B&B3, Salmonella Thompson I4-1), and Listeria monocytogenes (strains
ScottA, Brie, 7644, Murray) were obtained from the Food Microbiology Laboratory,
University of Missouri, Columbia, MO. All strains, except L. monocytogenes, were grown
111
in tryptic soy broth (TSBY; Difco Labs., BD Diagnostics Systems, Sparks, MD, USA). L.
monocytogenes was grown in brain heart infusion broth (BHI, Difco Labs). Caco-2 cells
were procured from ATCC (Rockville, MD). Eagle’s minimum essential medium and
phosphate-buffered saline (PBS 10×) (MEM, GIBCO, NY, USA) were used for cultivating
and washing cells, respectively.
6.2.2 Characterization of Se NPs
Fourier transform infrared (FTIR) spectroscopy, UV-vis absorption spectroscopy,
dynamic light scattering (DLS), and transmission electron microscopy (TEM) were utilized
to characterize the synthesized Se NPs. FTIR spectra were acquired using a Nicolet 380
spectrometer (Thermo Scientific) to observe the chemical composition of Se NP. The
acquired spectra of each sample were the average result of a resolution of 4 cm−1 and 128
interferogram scans. The UV-vis absorption spectra of diluted Se NPs dispersion in Milli-
Q water (100 μg/mL) was measured by a double-beam Varian spectrophotometer (Varian
Inc., Palo Alto, CA, USA). The average particle diameter and electrical charge (zeta
potential) of Se NPs were measured by a Zetasizer Nano ZS (Malvern Instruments,
Worcestershire, U.K.) equipped with a red laser (633 nm). Samples were diluted with Milli-
Q water at ambient temperature to a final Se NPs concentration of 100 μg/mL for particle
size and zeta potential measurements. For each sample, two DLS measurements were
conducted with at least 12 runs with each run lasting 10 s. During the measurements, light
from the laser was directed and focused on the cuvette containing 1.2 mL sample solution.
The particle size was reported as the Z-average mean diameter. The zeta-potential values
were reported as the average of measurements obtained from three prepared samples with

112
three readings made per sample. An aliquot of Se NP sample (100 μg/mL) was directly
placed on the copper/carbon 200 mesh grids and air dried for characterization by TEM
(JEOL 1400, JEOL Ltd., Tokyo, Japan).
6.2.3 Preparation of bacterial strains
Bacterial strains were freshly prepared by transferring 100 µL of each culture into
separate tubes containing 10 mL of respective broth media. Tubes were incubated
aerobically at 37oC overnight to reach ~108 CFU/mL. The cocktail strains were prepared
by adding 1 mL of each strain into 10 mL of TSBY or BHI broth.
6.2.4 Synthesis of Se NPs
Se NPs were prepared via a reduction of sodium selenite by L-glutathione based on a
previously described method (Tran and Webster 2011a). Briefly, 3 mL of 25 mM Na2SeO3,
3 mL of 100 mM GSH, and 0.15 g BSA were added to 9 mL of Milli-Q water (18.2 MΩcm).
A volume of 1 M NaOH was added to the reactant solution to bring the pH of the solution
to the alkaline range (~7.4), at which point the solution immediately turned from colorless
to a clear red color. The Se NP solution was centrifuged at 4,830×g for 10 min (Eppendorf
MiniSpin, NY, USA) to remove excess BSA and re-dispersed in Milli-Q water. The
purified Se NPs were dispersed five times in Milli-Q water and sterilized by filtering the
suspension through a membrane with a pore size of 450 nm (Thermo Fisher, PA, USA).
The Se NP-free solution was prepared by filtering Se NP suspensions through an Anodisc
membrane with a pore size of 20 nm (Whatman Inc., Clifton, NJ, USA).

113
6.2.5 Effect of Se NPs on the growth of bacterial strains
All cocktail strains were incubated overnight in TSBY or BHI at 37oC and then
inoculated (100 µL) into broth media containing different concentrations (10, 20, 30, 40,
and 50 µg/mL) of Se NPs and 40 µg/mL of Se NP-free solution. A shaking incubator was
used during bacterial incubation at 37oC. Using a shaking incubator helped to minimize the
aggregation of Se NPs in the broth and to allow for a consistent contact between Se NPs
and bacterial cells. After 0, 4, 10, 15, and 20 h of incubation, the samples were diluted with
peptone water in a series of concentrations from 10-1 to 10-8 CFU/mL, and then 1 mL was
pour-plated on BHI agar for L. monocytogenes, and on TSBY for E. coli O157:H7, S.
aureus, Salmonella.
6.2.6 Mammalian cell study
Caco-2 cells were cultured and harvested following our previously described method
(Nguyen and others 2015). Caco-2 cells (ATCC, Rockville, MD) were cultured in T75
flasks at 37°C in an atmosphere with 5% CO2. The medium was Eagle’s minimum essential
medium (MEM, GIBCO, NY, USA) supplemented with 20% fetal bovine serum (FBS,
Hyclone, GE Healthcare, UT, USA) and 1% antibiotic solution (containing 10,000
units/mL penicillin G, 10 mg/mL streptomycin sulfate and 25 μg/mL amphotericin B,
GIBCO). Cells were cultivated for 3 to 4 days and then seeded at densities of 104- 05
cells/mL (100 μL/well) in a 96-well plate by trypsinizing and centrifuging for 5 min at
8.4×g. After 24 h, cells were incubated with different concentrations of Se NPs (10, 20, 30,
and 40 µg/mL). Cell viability after a 24-h exposure was measured by the MTT reduction
assay and the WST-8 proliferation assay.

114
6.2.7 MTT reduction assay
MTT assay (ATCC) assesses the cell metabolic activity by measuring the ability of the
mitochondrial succinate-tetrazolium reductase system to convert the yellow dye (3-(4,5-
dimethylthiazol-2-yl)-2,5-diphenyltetrazolium bromide) to a purple-colored formazan in
living cells. A volume of 150 μL of different concentrations of Se NPs diluted in the media
was added to Caco-2 cells. After 24 h of exposure, cells were washed three times with
phosphate buffered saline PBS (1×) and then freshly incubated again in 100 μL of the
media. MTT stock solution (10 μL) was added into each well and the cells incubated for
an additional 4 h under 5% CO2 at 37°C. A volume of 100 μL of detergent reagent was
added to solubilize the dark blue formazan crystals formed in intact cells under dark
conditions overnight. A microplate reader (Biotek, VT, USA) was employed to record
absorbance at 570 nm (655 nm as reference). Negative control and positive control
experiments were cells without Se NPs exposure and cell-free treatments, respectively. The
cell viability (% of control) was calculated following the equation:
Cell viability (%) =�������� �������
��������� � ������� × 100%
Where ODblank is the optical density of the wells at 655 nm, ODcontrol is the optical density
of the negative control sample, and ODtreat is the optical density of the cells treated with Se
NPs at 570 nm.
6.2.8 WST-8 proliferation assay
Similar to the MTT assay, Caco-2 cells also incubated for 24 h with different
concentrations of Se NPs in the media. Then the cells were washed with PBS (1×) three
times and incubated again with 100 μL of media. Into each well was added 10 μL of WST-

115
8 stock solution (Cayman Chemical, MI, USA), followed by incubation at 37°C under 5%
CO2 for 4 h. A volume of 80 μL of the mixture was transferred to another 96-well plate. A
microplate reader (Biotek, VT, USA) was employed to record the absorbance at 450 nm
(655 nm as reference). Negative control and positive control experiments were cells
without Se NPs exposure and cell-free treatments, respectively. The cell viability was
calculated according to the aforementioned equation.
6.2.9 Scanning electron microscopy (SEM)
A primary fixative (2.5 glutaraldehyde, 2% paraformaldehyde in 0.1 M Na-Cacodylate
buffer, pH 7.4) prepared by the Electron Microscope Core of the University of Missouri,
Columbia, MO was used to fix four cocktail bacterial strains treated or untreated with Se
NPs. Samples were then rinsed with ultrapure water three times, followed by dehydration
with a series of ethanol solutions (10, 30, 50, 70, 90, and 100%). Then, they were
immediately placed in a critical point dryer (Auto-Samdri 815 Automatic Critical Point
Dryer; Tousimis, Rockville, MD, USA) to dry. Dried samples were mounted on SEM stubs
and coated with a thin layer of carbon using a sputter coater (K575X Turbo Sputter Coater;
Emitech, Ltd, Kent, UK). A Hitachi S-4700 Field Emission Scanning Electron Microscope
(Hitachi High Technologies America, USA) was used to observe the morphological
changes in the bacterial cells.
6.2.10 Transmission electron microscopy (TEM)
A primary fixative (2% paraformaldehyde, 2% glutaraldehyde in 0.1 Na-cacodylate)
prepared by the Electron Microscope Core of the University of Missouri, Columbia, MO
was used to fix samples treated with Se NPs. Sample were microwaved under vacuum

116
conditions at 120 W, then rinsed with 0.1 M cacodylate buffer, embedded in HistoGel, and
buffer rinsed for 3 times with 2-mercaptoethanol solution. A solution of 1% osmium
tetroxide was used as a secondary microwave fixation of treated samples. The samples
were placed in a fridge at 4oC for 1 h, then quickly rinsed with 0.1 M 2-mercaptoethanol
three times, followed by an ultrapure water rinse for three times. The samples were
dehydrated with ethanol solutions (20, 50, 70, 90, and 100%) and 100% acetone solution.
Finally, they were infiltrated with Epon/Spurr’s resin and polymerized at 60oC for 24 h. A
Leica Ultracut UCT Ultramicrotome (Leica Microsystems GmbH, Wetzlar, Germany) was
used to process samples in 85 nm thin sections. The prepared sections were placed on
carbon coated grids and observed by a JEOL 1400 (JEOL, Ltd, Tokyo, Japan).
6.2.11 Statistical analysis
SAS (SAS 9.3, SAS Institute, Cary, NC) was used to calculate the mean values of cell
counts and percent viability for each Se NP concentration, and to determine the significant
differences (P ≤ 0.05) between the treatments and control (Proc GLM). When significant
differences were found, multiple comparisons were performed by using the Tukey's
Studentized Range HSD test at a level of significance of P ≤ 0.05.
6.3 Results and Discussion
6.3.1 Characterization of Se NPs
As shown in Figure 6-1A, an UV-vis spectrum of Se NPs exhibits a maximum absorption
at 220 nm with another peak at 250 nm. These results are in agreement with previous
reports (Singh and others 2010; Lin and Wang 2005; Zhang and others 2008; Oluwafemi
and others 2008). The peak at 220 nm is a characteristic peak of the small size of Se NPs

117
with a mean diameter of 20 nm (Lin and Wang 2005). The peak at 250 nm was due to the
formation of Se NPs during reduction of selenium ions (Fesharaki and others 2010; Patil
and Yamamoto 2008). Figure 6-2B shows a typical FTIR spectrum obtained from the Se
NP solution, which exhibits some characteristic features, including an absorption peak of
the hydroxyl group (-OH) of Se NPs at 3389 cm-1, a band at 1650 cm-1 (C=O stretching
vibrations of the peptide bond), and a peak near 1400 cm-1 from the carboxyl group COO-
. These results indicate that the Se surface was strongly adsorbed and passivated with
protein molecules (BSA), resulting in the formation of a uniform and spherical
morphology.
Figure 6-1. An UV-vis absorbance spectrum of Se NPs solution (A) and a FTIR spectrum of condensed Se NPs (B).
TEM images show that Se NPs had a spherical shape with an average diameter of 50 nm
(Figure 6-2). The average hydrodynamic diameter of Se NPs measured by DLS was ~40
nm, which was smaller than that shown in TEM images. These results demonstrate that Se
NPs are in the nanoscale size. The surface charges and aggregation state of nanomaterials
critically influence their in vitro cytotoxicity. Particularly, the surface charges of

118
nanoparticles play an important role in cell-nanoparticle interactions because cell
membranes themselves are charged (Arvizo and others 2010; Liu and others 2010). Zeta
potential is an important property to assess the actual state of the nanoparticles and their
stability in the solutions. Nanoparticles with a relatively high zeta potential could exhibit a
strong stability in aqueous solutions. As shown in Table 8, the zeta (ζ)-potentials of Se NPs
were negative (~-32 mV), which enables a strong dispersibility of Se NPs.
Figure 6-2. TEM image of Se NPs.
Table 8. The zeta-potential values of selenium nanoparticles.
Characteristics Valuea
-Potential in Milli-Q water Average diameter in Milli-Q water
- 31.9 ± 1.7 mV 40.1 ± 2.3 nm
aValues presented means ± SD.
6.3.2 Antibacterial effects of Se NPs on pathogenic bacteria
Figure 6-3 shows the growth curves of four different cocktail strains of bacteria incubated
with different concentrations of Se NPs. The culture tubes containing Se NPs did not show

119
any apparent reduction in bacterial growth (Figure 6-3A, B, and C). At the highest
concentration of Se NPs (50 μg/mL), numbers of treated cells slightly decreased after 10 h
of incubation, but by less than 1 log CFU/mL as compared to that of the control, indicating
no significant effects (P ≥ 0.05) of Se NPs on E. coli O157:H7. The same results were
observed for experiments using Salmonella and L. monocytogenes. However, significant
inhibitory effects of Se NPs were observed (P 0.05) on S. aureus at concentrations of 10-
50 μg/mL (Figure 6-3D). Se NPs at the concentration of 10 μg/mL initially showed
inhibitory effects from 10 to 15 h, but the effects diminished at 20 h of treatment. At the
15 h of incubation, the numbers of cells treated by Se NPs were more than 1 log CFU/mL
lower than the control, indicating a dose-dependent toxicity effect of Se NPs on S. aureus
(Figure 6-4). However, there were no significant differences between the treatments (10-
50 μg/mL). The results demonstrate that Se NPs are antimicrobial at a concentration of 10
μg/mL or higher and can inhibit the growth of S. aureus. SEM images clearly show some
abnormal changes in the membrane of treated bacterial cells (Figure 6-5). The cellular
shrinkage and irregular shape were apparent as compared to the control. Although cell
viability decreased after 10 and 15 h of exposure, the cells revived back up as shown in
Fig. 6-4. This helped to explain why the TEM images illustrate a very slight change in the
morphology of treated cells as compared to the control (Figure 6-6). These results show
that the antimicrobial effects of Se NPs are bacteriostatic and not bactericidal.

120
Figure 6-3. Effect of Se NP on the growth of E. coli O157:H7 (A), L. monocytogenes (B), Salmonella (C), and S. aureus (D).
7.5
8
8.5
9
9.5
10
1 2 3 4 5 6
a
b
b
bb b
Control 10 20 30 40 50
Concentration (μg/mL)
Bac
teri
al c
ounts
(L
og C
FU
/mL
)

121
Figure 6-4. Microbial counts (CFU/mL) of S. aureus after 15 h of exposure to different concentrations of Se NPs. Data with the same letter are not significantly different (P ˃ 0.05).
Figure 6-5. SEM images of S. aureus without (left) and with (right) Se NP treatment.

122
Figure 6-6. TEM images of S. aureus without (left) and with (right) Se NP treatment.
Some previous studies found that Se NPs may inhibit the growth of S. aureus by up to
60 times compared with the control (Chudobova and others 2014; Wang and Webster 2014;
Tran and Webster 2011a). Another study used Se NPs (80–220 nm) in an antibacterial
coating to inhibit the growth of this pathogen. Inhibitory effects were observed at early
time points (up to 5 h) using Se NPs-coated biofilms as compared to the uncoated
counterpart (Tran and Webster 2011a). Although our results are in agreement with these
findings, showing the antimicrobial effect of Se NPs to S. aureus, we show that Se NPs are

123
not a potent antibacterial agent to S. aureus as compared to previous studies. The most
interesting finding of our study is that the total inhibition concentration of Se NPs should
be at least 10 μg/mL, which is higher than results published by Chudobova and others. The
reasons may come from the differences in the size, the shape, and the purity of Se NPs used
in the study. In addition, our approach was based on the microbial plate counting method
that is more accurate than the optical density approach that was used in some previous
studies.
Our results show no significant differences between the other three bacterial samples (E.
coli O157:H7, L. monocytogenes, and Salmonella) treated by Se NPs and the control, which
indicates that Se NPs does not have antimicrobial effects on these three pathogenic
bacterial strains. Since bacterial surface is negatively charged while the synthesized Se NPs
also have negatively surface potential, there would be a relatively repulsive interaction
between them (Arakha, Saleem, Mallick, & Jha, 2015). As a result, it is difficult for Se NPs
to attach onto or penetrate the cell membrane and cause damages. In addition, it may need
a higher concentration of NPs to have significant effects on these bacteria. Previous studies
showed that S. aureus is a Gram-positive bacterium with relatively less negative surface
potential among the studied bacteria. The bacteria exhibited inhibitory activity at same
concentration NPs that found against other Gram-negative bacteria. However, our study
shows that S. aureus is the most negatively charged as compared to other bacteria (Table
9) and thus it is most susceptible to Se NPs. These results highlight the difficulty in
understanding the characteristics of bacterial cell surface and their resistance to the
antimicrobial agents. Although it is reported that interfacial potential at the ZnO NP-

124
bacteria interface is largely responsible for the antimicrobial propensity of ZnO NPs
(Arakha and others 2015).
Moreover, our data show that the coccus shape of S. aureus may make it more vulnerable
than others bacteria in the presence of Se NPs. This result is in agreement with previous
studies (Premanathan and others 2011b; Reddy and others 2007. However, some studies
demonstratedthat rod-shaped bacteria tend to be more susceptible than coccus-shaped
bacteria (Rahman 2007; Kim and others 2007). Therefore, further studies are needed to
elucidate the potential interaction of bacteria cells with NPs.
Table 9. Zeta potential values of bacteria strains
6.3.3 Cytotoxic effect of Se NPs on Caco-2 cells
The MTT test results demonstrate that adherent Caco-2 cells were slightly affected by
Se NPs at 20, and 40 μg/mL for 24 h, but a dose-dependent cytotoxicity of Se NPs was not
observed (Figure 6-7A). There was no significant difference in cell viability between the
control and samples treated with different concentrations of Se NPs. Even a reduction in
cell viability at the high Se NP concentration (40 μg/mL) was only about 20%. Compared
to the MTT results, the WST-8 data show a reduction in cell viability at every Se NPs
concentration (Figure 6-7B). In addition, there was significant difference in the cell
viability between the control and treatments. Therefore, based on WST-8 results, there was
an effect of Se NPs on Caco-2 cells but no dose-dependent effect on the mitochondrial
Bacteria Zeta potential (mV)
E. coli O157:H7 -9.05 Salmonella -7.12 Staphylococcus aureus -10.73 Listeria monocytogenes -7.77

125
activities of these cells. However, the viability reduction apparently occurs in both assays
as compared between the control and some concentrations of the treatments. This is in
agreement with a previous study (Feng and others 2014) in which cells were affected by
70-nm FA–Se NPs that were internalized in the MCF-7 cells through folate receptor-
mediated endocytosis and targeted mitochondrial located regions through endocytic
vesicles transporting. In addition, similar results were reported in other studies that show
the cytotoxicity of Se NPs on mammalian cells. The cytotoxicity of Se NPs can be
explained by the fact that the nanosized Se inhibited growth of HCT-8 tumor cells partially
through caspases mediated apoptosis (Gao and others 2014). However, the mechanism of
the cytotoxicity of Se NPs has remained unclear. Mittal et al. (2014) observed that Ag–Se
NPs are cytotoxic to Dalton lymphoma cells but the dose-dependent cytotoxicity depends
on silver nanoparticles against DLA cells, and not on activities of Se NPs. Moreover, at the
present time, data related to selenium or Se NPs are not convincing enough to allow general
recommendation for using Se NPs as an effective agent for chemoprevention of cancer
(Novotny and others 2010). Collectively, our results indicate that Se NPs exhibit a mild
cytotoxic activity on Caco-2 cells, as shown by the MTT and WST-8 cell viability tests.

126
Figure 6-7. Cell viability of Caco-2 cells determined by MTT assay (A) and WST-8 assay (B) after a 24-h exposure to different concentration of Se NPs. Data represent mean ± SD. Means with the same letters are
not significant different (P ˃ 0.05).
In summary, the toxicity of Se NPs on pathogenic bacterial cocktail strains and Caco-2
cells was investigated via in vitro studies. This study also compared a widely used chemical
cytotoxicity MTT assay with a new WST-8 assay. Our results demonstrate that Se NPs has
0
20
40
60
80
100
120
140
Control 10 20 30 40 50
Concentration (μg/mL)
% V
iabi
lity
0
20
40
60
80
100
120
140
Control 10 20 30 40 50
B
A
a
a
a
a
a
a
a
b bb
b
b
Concentration (μg/mL)

127
antibacterial activity against S. aureus, but not on E. coli, Salmonella, and L.
monocytogenes. SEM and TEM results show cellular shrinkage and irregular shape of
treated bacterial cells, indicating that the antimicrobial effects of Se NPs are bacteriostatic
and not bactericidal. Se NPs can be used as an antimicrobial agent to inhibit the growth
of S. aureus and can be potentially used for food safety or biomedical applications. More
studies are needed to fully elucidate the mechanism and effects of cytotoxicity and
antibacterial properties of Se NPs and investigate their application in the industry.

128
CHAPTER 7
Conclusions and Future Plans
This dissertation is a comprehensive study involving multiple projects about using
various nanomaterials and nanotechnologies to improve food safety. The results are
summarized as below:
First, a simple, fast, and efficient method was developed to fabricate new SERS
substrates by coating an AuNR-decorated graphene sheet on Si substrate. This substrate
exhibits strong Raman enhancement due to unique properties of graphene and the deposited
AuNRs. The limit of detection of carbaryl and phosmet meet the maximum residue limits
set by the FAO/WHO and EU. These results demonstrate that there is a great potential to
use graphene and gold materials for food safety applications.
Second, the feasibility of SERS method was evaluated by measuring Ag NPs in four
dietary supplements and one nasal spray with a minimum sample preparation. PATP can
be used as a Raman indicator that binds strongly with Ag NPs. The results demonstrate that
distinctive Raman peaks of PATP can be used to distinguish Ag NPs from silver bulk
particles and silver nitrate. SERS is able to detect Ag particles with different sizes ranging
from 20 to 100 nm, with the highest intensity for ~30 nm Ag NPs. The findings were
validated by a combination of ICP-OES and TEM methods. These results demonstrate that
there is a great potential to use SERS for food safety applications.
Third, in addition to the study the application of nanomaterials, we investigated the
antibacterial properties of GO against human intestinal bacteria (E. coli K-12, L.

129
acidophilus ADH, and B. animalis Bif-6). The cytotoxicity of GO was also studied in vitro
using the Caco-2 cell line derived from a colon carcinoma. GO at different concentrations
(10 - 500 g/mL) exhibited no toxicity against the selected bacteria and a mild cytotoxic
action on Caco-2 cells after 24 h of exposure. The results show that weak adsorption of
medium nutrients may contribute to GO’s low toxicity. This study suggests that GO is
biocompatible and has a potential to be used in agriculture and food science. Nevertheless,
more studies are needed to exploit its potential applications.
Last, we studied the antibacterial properties of Se NPs against four important foodborne
pathogens (E. coli O157:H7, S. aureus, Salmonella, and L. monocytogenes). The
cytotoxicity of Se NPs was also studied in vitro using the Caco-2 cell line. Se NPs at
concentrations of 10 g/mL or higher exhibited antimicrobial properties against S. aureus,
but not on the other three pathogens. Se NPs also exhibited various degrees of toxicity on
Caco-2 cells after 24 h of exposure. The results demonstrate that Se NPs can be used as an
antimicrobial agent to inhibit the growth of S. aureus, and can potentially be used in food
safety and biomedical applications.
However, further studies are needed to explore potential applications of novel
nanomaterials. We foresee that more research is needed to improve the performance of
SERS substrates using different materials and use them to test real food products.
Enhancement of the conjugation between Ag NPs and PATP as well as other promising
indicators will be an interesting topic for research. More effort is required to further
investigate the cytotoxicity of GO and Se NPs and elucidate the mechanism of how their

130
unique properties (shape, surface properties, and dispersibility, etc.) affect human health at
hierarchical levels from cellular to the whole organism.
The antibacterial and cytotoxic effects of NPs on Caco-2 cells in our study occurred at
very high levels, which are above those already documented in other in vivo and in vitro
studies. Therefore, the amount of NP exposure should be carefully considered in future in
vivo and human studies.
In addition, our studies show that MTT and WST assays have some limitations such as
the interference from chemicals and cell medium. Another assay for studying nanotoxicity
(sulforhodamine B (SRB) assay) will be considered in our future studies. On the other
hand, 96 AQ is also a good assay for the measurement of toxicity of carbon-based
nanomaterials.

131
Appendix
1. Abbreviations
Au: Gold
Ag: Silver
DLS: Dynamic light scattering
G: Graphene
GO: Graphene oxide
LOD: Limit of Detection
LSPR: Localized surface plasmon resonance
NP: Nanoparticle
NR: Nanorod
rGO: reduced graphene oxide
Se: Selenium
SERS: Surface enhanced Raman spectroscopy
2. Unit conversions
ppm: part per million (mg/kg)
ppb: part per billion (μg/kg)
.

132
References
2016. Woodrow Wilson Inventory
Ahmed A, Gordon R. 2012. Single molecule directivity enhanced Raman scattering using
nanoantennas. Nano letters 12(5):2625-30.
Akbar A, Anal AK. 2014. Zinc oxide nanoparticles loaded active packaging, a challenge
study against Salmonella typhimurium and Staphylococcus aureus in ready-to-eat
poultry meat. Food Control 38:88-95.
Akhavan O, Ghaderi E. 2010. Toxicity of graphene and graphene oxide nanowalls against
bacteria. ACS nano 4(10):5731-6.
Akhavan O, Ghaderi E. 2012a. Escherichia coli bacteria reduce graphene oxide to
bactericidal graphene in a self-limiting manner. Carbon 50(5):1853-60.
Akhavan O, Ghaderi E. 2012b. Escherichia coli bacteria reduce graphene oxide to
bactericidal graphene in a self-limiting manner. Carbon 50(5):1853-60.
Akhtar MJ, Ahamed M, Kumar S, Siddiqui H, Patil G, Ashquin M, Ahmad I. 2010.
Nanotoxicity of pure silica mediated through oxidant generation rather than
glutathione depletion in human lung epithelial cells. Toxicology 276(2):95-102.
Alonso-González P, Albella P, Schnell M, Chen J, Huth F, García-Etxarri A, Casanova F,
Golmar F, Arzubiaga L, Hueso L. 2012. Resolving the electromagnetic mechanism
of surface-enhanced light scattering at single hot spots. Nature communications
3:684.

133
Ansari M, Khan H, Khan A, Malik A, Sultan A, Shahid M, Shujatullah F, Azam A. 2011.
Evaluation of antibacterial activity of silver nanoparticles against MSSA and
MRSA on isolates from skin infections. Biol Med 3(2):141-6.
Applerot G, Lellouche J, Lipovsky A, Nitzan Y, Lubart R, Gedanken A, Banin E. 2012.
Understanding the antibacterial mechanism of CuO nanoparticles: revealing the
route of induced oxidative stress. Small 8(21):3326-37.
Arakha M, Saleem M, Mallick BC, Jha S. 2015. The effects of interfacial potential on
antimicrobial propensity of ZnO nanoparticle. Scientific reports 5.
Aroca RF, Alvarez-Puebla RA, Pieczonka N, Sanchez-Cortez S, Garcia-Ramos JV. 2005.
Surface-enhanced Raman scattering on colloidal nanostructures. Adv. Colloid
Interface Sci. 116(1–3):45-61.
Arora P, Sindhu A, Dilbaghi N, Chaudhury A. 2011. Biosensors as innovative tools for the
detection of food borne pathogens. Biosensors and Bioelectronics 28(1):1-12.
Arvizo RR, Miranda OR, Thompson MA, Pabelick CM, Bhattacharya R, Robertson JD,
Rotello VM, Prakash Y, Mukherjee P. 2010. Effect of nanoparticle surface charge
at the plasma membrane and beyond. Nano letters 10(7):2543-8.
Asare N, Instanes C, Sandberg WJ, Refsnes M, Schwarze P, Kruszewski M, Brunborg G.
2012. Cytotoxic and genotoxic effects of silver nanoparticles in testicular cells.
Toxicol. 291(1):65-72.
Auffan M, Rose J, Wiesner MR, Bottero J-Y. 2009. Chemical stability of metallic
nanoparticles: a parameter controlling their potential cellular toxicity in vitro.
Environmental Pollution 157(4):1127-33.

134
Baek Y-W, An Y-J. 2011. Microbial toxicity of metal oxide nanoparticles (CuO, NiO,
ZnO, and Sb 2 O 3) to Escherichia coli, Bacillus subtilis, and Streptococcus aureus.
Science of the Total Environment 409(8):1603-8.
Bala N, Saha S, Chakraborty M, Maiti M, Das S, Basu R, Nandy P. 2015. Green synthesis
of zinc oxide nanoparticles using Hibiscus subdariffa leaf extract: effect of
temperature on synthesis, anti-bacterial activity and anti-diabetic activity. RSC
Advances 5(7):4993-5003.
Barud HS, Regiani T, Marques RF, Lustri WR, Messaddeq Y, Ribeiro SJ. 2011.
Antimicrobial bacterial cellulose-silver nanoparticles composite membranes.
Journal of Nanomaterials 2011:10.
Cairns T, Sherma J. 1992. Emerging strategies for pesticide analysis: CRC Press.
Casals E, Gonzalez E, Puntes V. 2012. Reactivity of inorganic nanoparticles in biological
environments: insights into nanotoxicity mechanisms. Journal of Physics D:
Applied Physics 45(44):443001.
Centeno SP, Lopez-Tocon I, Arenas JF, Soto J, Otero JC. 2006. Selection rules of the
charge transfer mechanism of surface-enhanced Raman scattering: The effect of the
adsorption on the relative intensities of pyrimidine bonded to silver nanoclusters.
The Journal of Physical Chemistry B 110(30):14916-22.
Chan E, Griffiths S, Chan C. 2008. Public-health risks of melamine in milk products. The
Lancet 372(9648):1444-5.
Chang Y, Yang S-T, Liu J-H, Dong E, Wang Y, Cao A, Liu Y, Wang H. 2011. In vitro
toxicity evaluation of graphene oxide on A549 cells. Toxicology letters 200(3):201-
10.

135
Chen H, Müller MB, Gilmore KJ, Wallace GG, Li D. 2008a. Mechanically strong,
electrically conductive, and biocompatible graphene paper. Adv. Mater.
20(18):3557-61.
Chen J, Peng H, Wang X, Shao F, Yuan Z, Han H. 2014. Graphene oxide exhibits broad-
spectrum antimicrobial activity against bacterial phytopathogens and fungal
conidia by intertwining and membrane perturbation. Nanoscale 6(3):1879-89.
Chen L, Hu P, Zhang L, Huang S, Luo L, Huang C. 2012. Toxicity of graphene oxide and
multi-walled carbon nanotubes against human cells and zebrafish. Science China
Chemistry 55(10):2209-16.
Chen T, Wong Y-S, Zheng W, Bai Y, Huang L. 2008b. Selenium nanoparticles fabricated
in Undaria pinnatifida polysaccharide solutions induce mitochondria-mediated
apoptosis in A375 human melanoma cells. Colloids. Surf. B Biointerfaces
67(1):26-31.
Chiang H-m, Xia Q, Zou X, Wang C, Wang S, Miller BJ, Howard PC, Yin JJ, Beland FA,
Yu H. 2012. Nanoscale ZnO induces cytotoxicity and DNA damage in human cell
lines and rat primary neuronal cells. Journal of nanoscience and nanotechnology
12(3):2126-35.
Chithrani BD, Ghazani AA, Chan WC. 2006. Determining the size and shape dependence
of gold nanoparticle uptake into mammalian cells. Nano letters 6(4):662-8.
Cho W-S, Cho M, Jeong J, Choi M, Cho H-Y, Han BS, Kim SH, Kim HO, Lim YT, Chung
BH. 2009. Acute toxicity and pharmacokinetics of 13 nm-sized PEG-coated gold
nanoparticles. Toxicol. Appl. Pharm. 236(1):16-24.

136
Chudobova D, Cihalova K, Dostalova S, Ruttkay-Nedecky B, Rodrigo MAM, Tmejova K,
Kopel P, Nejdl L, Kudr J, Gumulec J. 2014. Comparison of the effects of silver
phosphate and selenium nanoparticles on Staphylococcus aureus growth reveals
potential for selenium particles to prevent infection. FEMS Microbiol. Lett.
351(2):195-201.
Compton OC, Kim S, Pierre C, Torkelson JM, Nguyen ST. 2010. Crumpled graphene
nanosheets as highly effective barrier property enhancers. Advanced materials
22(42):4759-63.
Compton OC, Nguyen SBT. 2010. Graphene oxide, highly reduced graphene oxide, and
graphene: versatile building blocks for carbon‐based materials. Small 6(6):711-23.
Danilczuk M, Lund A, Sadlo J, Yamada H, Michalik J. 2006. Conduction electron spin
resonance of small silver particles. Spectrochimica Acta Part A: Molecular and
Biomolecular Spectroscopy 63(1):189-91.
Das S, Singh S, Singh V, Joung D, Dowding JM, Reid D, Anderson J, Zhai L, Khondaker
SI, Self WT. 2013. Oxygenated functional group density on graphene oxide: Its
effect on cell toxicity. Particle & Particle Systems Characterization 30(2):148–57.
Dikin DA, Stankovich S, Zimney EJ, Piner RD, Dommett GH, Evmenenko G, Nguyen ST,
Ruoff RS. 2007. Preparation and characterization of graphene oxide paper. Nature
448(7152):457-60.
Djurišić AB, Leung YH, Ng A, Xu XY, Lee PK, Degger N. 2015. Toxicity of metal oxide
nanoparticles: mechanisms, characterization, and avoiding experimental artefacts.
Small 11(1):26-44.

137
Drescher D, Giesen C, Traub H, Panne U, Kneipp J, Jakubowski N. 2012. Quantitative
imaging of gold and silver nanoparticles in single eukaryotic cells by laser ablation
ICP-MS. Analytical chemistry 84(22):9684-8.
Dreyer DR, Park S, Bielawski CW, Ruoff RS. 2009. The chemistry of graphene oxide.
Chem. Soc. Rev. 39(1):228-40.
Du X, Chu H, Huang Y, Zhao Y. 2010. Qualitative and quantitative determination of
melamine by surface-enhanced Raman spectroscopy using silver nanorod array
substrates. Appl. Spectrosc. 64(7):781-5.
Duncan TV. 2011. Applications of nanotechnology in food packaging and food safety:
barrier materials, antimicrobials and sensors. Journal of colloid and interface
science 363(1):1-24.
Eom H-J, Choi J. 2009. Oxidative stress of CeO 2 nanoparticles via p38-Nrf-2 signaling
pathway in human bronchial epithelial cell, Beas-2B. Toxicology letters 187(2):77-
83.
Estevez H, Garcia-Lidon JC, Luque-Garcia JL, Camara C. 2014. Effects of chitosan-
stabilized selenium nanoparticles on cell proliferation, apoptosis and cell cycle
pattern in HepG2 cells: comparison with other selenospecies. Colloids. Surf. B
Biointerfaces 122:184-93.
Evans MD, Dizdaroglu M, Cooke MS. 2004. Oxidative DNA damage and disease:
induction, repair and significance. Mutation Research/Reviews in Mutation
Research 567(1):1-61.

138
Falandysz J, Szymczyk K, Ichihashi H, Bielawski L, Gucia M, Frankowska A, Yamasaki
S-I. 2001. ICP/MS and ICP/AES elemental analysis (38 elements) of edible wild
mushrooms growing in Poland. Food Additives & Contaminants 18(6):503-13.
Fan C, Hu Z, Mustapha A, Lin M. 2011a. Rapid detection of food-and waterborne bacteria
using surface-enhanced Raman spectroscopy coupled with silver nanosubstrates.
Appl. Microbiol. Biotechnol.:1-9.
Fan M, Andrade GFS, Brolo AG. 2011b. A review on the fabrication of substrates for
surface enhanced Raman spectroscopy and their applications in analytical
chemistry. Anal. Chim. Acta 693(1–2):7-25.
Fan Y, Lai K, Rasco BA, Huang Y. 2014a. Analyses of phosmet residues in apples with
surface-enhanced Raman spectroscopy. Food Control 37:153-7.
Fan Z, Liu B, Wang J, Zhang S, Lin Q, Gong P, Ma L, Yang S. 2014b. A novel wound
dressing based on Ag/graphene polymer hydrogel: effectively kill bacteria and
accelerate wound healing. Advanced Functional Materials 24(25):3933-43.
Feng Y, Su J, Zhao Z, Zheng W, Wu H, Zhang Y, Chen T. 2014. Differential effects of
amino acid surface decoration on the anticancer efficacy of selenium nanoparticles.
J. Chem. Soc., Dalton Trans. 43(4):1854-61.
Fesharaki PJ, Nazari P, Shakibaie M, Rezaie S, Banoee M, Abdollahi M, Shahverdi AR.
2010. Biosynthesis of selenium nanoparticles using Klebsiella pneumoniae and
their recovery by a simple sterilization process. Braz. J. Microbiol. 41(2):461-6.
Fu PP, Xia Q, Hwang H-M, Ray PC, Yu H. 2014. Mechanisms of nanotoxicity: generation
of reactive oxygen species. Journal of food and drug analysis 22(1):64-75.

139
Fu PP, Xia Q, Sun X, Yu H. 2012. Phototoxicity and environmental transformation of
polycyclic aromatic hydrocarbons (PAHs)—light-induced reactive oxygen species,
lipid peroxidation, and DNA damage. Journal of Environmental Science and
Health, Part C 30(1):1-41.
Gallego-Urrea JA, Tuoriniemi J, Hassellöv M. 2011. Applications of particle-tracking
analysis to the determination of size distributions and concentrations of
nanoparticles in environmental, biological and food samples. TrAC Trends in
Analytical Chemistry 30(3):473-83.
Gao F, Yuan Q, Gao L, Cai P, Zhu H, Liu R, Wang Y, Wei Y, Huang G, Liang J. 2014.
Cytotoxicity and therapeutic effect of irinotecan combined with selenium
nanoparticles. Biomaterials 35(31):8854-66.
Geim AK, Novoselov KS. 2007b. The rise of graphene. Nature materials 6:183 - 91.
Gilden RC, Huffling K, Sattler B. 2010. Pesticides and health risks. Journal of Obstetric,
Gynecologic, & Neonatal Nursing 39(1):103-10.
Giovannoli C, Passini C, Di Nardo F, Anfossi L, Baggiani C. 2014. Determination of
ochratoxin A in Italian red wines by molecularly imprinted solid phase extraction
and HPLC analysis. Journal of agricultural and food chemistry 62(22):5220-5.
Gogniat G, Thyssen M, Denis M, Pulgarin C, Dukan S. 2006. The bactericidal effect of
TiO2 photocatalysis involves adsorption onto catalyst and the loss of membrane
integrity. FEMS microbiology letters 258(1):18-24.
Gratton SE, Ropp PA, Pohlhaus PD, Luft JC, Madden VJ, Napier ME, DeSimone JM.
2008. The effect of particle design on cellular internalization pathways.
Proceedings of the National Academy of Sciences 105(33):11613-8.

140
Grzelczak M, Vermant J, Furst EM, Liz-Marzán LM. 2010. Directed self-assembly of
nanoparticles. ACS Nano 4(7):3591-605.
Gunalan S, Sivaraj R, Rajendran V. 2012. Green synthesized ZnO nanoparticles against
bacterial and fungal pathogens. Progress in Natural Science: Materials International
22(6):693-700.
Gurr J-R, Wang AS, Chen C-H, Jan K-Y. 2005. Ultrafine titanium dioxide particles in the
absence of photoactivation can induce oxidative damage to human bronchial
epithelial cells. Toxicology 213(1):66-73.
Gurunathan S, Han JW, Dayem AA, Eppakayala V, Kim J-H. 2012. Oxidative stress-
mediated antibacterial activity of graphene oxide and reduced graphene oxide in
Pseudomonas aeruginosa. Int J Nanomedicine 7(5901):e14.
Hajipour MJ, Fromm KM, Ashkarran AA, de Aberasturi DJ, de Larramendi IR, Rojo T,
Serpooshan V, Parak WJ, Mahmoudi M. 2012. Antibacterial properties of
nanoparticles. Trends in biotechnology 30(10):499-511.
Halliwell B, Gutteridge JM. 2015. Free radicals in biology and medicine: Oxford
University Press, USA.
Han Y, Jiang J, Lee SS, Ying JY. 2008. Reverse microemulsion-mediated synthesis of
silica-coated gold and silver nanoparticles. Langmuir 24(11):5842-8.
Hatchett DW, White HS. 1996. Electrochemistry of sulfur adlayers on the low-index faces
of silver. The Journal of Physical Chemistry 100(23):9854-9.
Hauck TS, Ghazani AA, Chan WC. 2008. Assessing the effect of surface chemistry on
gold nanorod uptake, toxicity, and gene expression in mammalian cells. Small
4(1):153-9.

141
He L, Lin M, Li H, Kim NJ. 2009. Surface‐enhanced Raman spectroscopy coupled with
dendritic silver nanosubstrate for detection of restricted antibiotics. J. Raman
Spectrosc. 41(7):739-44.
He L, Liu Y, Mustapha A, Lin M. 2011. Antifungal activity of zinc oxide nanoparticles
against Botrytis cinerea and Penicillium expansum. Microbiological research
166(3):207-15.
Helsper JP, Peters RJ, Brouwer L, Weigel S. 2013. Characterisation and quantification of
liposome-type nanoparticles in a beverage matrix using hydrodynamic
chromatography and MALDI–TOF mass spectrometry. Analytical and
bioanalytical chemistry 405(4):1181-9.
Horie M, Fujita K, Kato H, Endoh S, Nishio K, Komaba LK, N
akamura A, Miyauchi A, Kinugasa S, Hagihara Y. 2012. Association of the physical and
chemical properties and the cytotoxicity of metal oxide nanoparticles: metal ion
release, adsorption ability and specific surface area. Metallomics 4(4):350-60.
Horváth L, Magrez A, Burghard M, Kern K, Forró L, Schwaller B. 2013. Evaluation of the
toxicity of graphene derivatives on cells of the lung luminal surface. Carbon 64:45-
60.
Hou C, Quan H, Duan Y, Zhang Q, Wang H, Li Y. 2013. Facile synthesis of water-
dispersible Cu 2 O nanocrystal–reduced graphene oxide hybrid as a promising
cancer therapeutic agent. Nanoscale 5(3):1227-32.
Hu X, Wang T, Wang L, Dong S. 2007. Surface-enhanced Raman scattering of 4-
aminothiophenol self-assembled monolayers in sandwich structure with

142
nanoparticle shape dependence: off-surface plasmon resonance condition. The
Journal of Physical Chemistry C 111(19):6962-9.
Huang P, Xu C, Lin J, Wang C, Wang X, Zhang C, Zhou X, Guo S, Cui D. 2011a. Folic
acid-conjugated graphene oxide loaded with photosensitizers for targeting
photodynamic therapy. Theranostics 1(13):240-50.
Huang Q. 2012. Nanotechnology in the food, beverage and nutraceutical industries:
Elsevier.
Huang Y-F, Wu D-Y, Zhu H-P, Zhao L-B, Liu G-K, Ren B, Tian Z-Q. 2012. Surface-
enhanced Raman spectroscopic study of p-aminothiophenol. Physical Chemistry
Chemical Physics 14(24):8485-97.
Huang Y, Dong X, Liu Y, Li LJ, Chen P. 2011b. Graphene-based biosensors for detection
of bacteria and their metabolic activities. Journal of Materials Chemistry
21(33):12358-62.
Ikem A, Nwankwoala A, Odueyungbo S, Nyavor K, Egiebor N. 2002. Levels of 26
elements in infant formula from USA, UK, and Nigeria by microwave digestion
and ICP–OES. Food Chemistry 77(4):439-47.
Jayaseelan C, Rahuman AA, Kirthi AV, Marimuthu S, Santhoshkumar T, Bagavan A,
Gaurav K, Karthik L, Rao KB. 2012a. a. Spectrochimica Acta Part A: Molecular
and Biomolecular Spectroscopy 90:78-84.
Jayaseelan C, Rahuman AA, Rajakumar G, Santhoshkumar T, Kirthi AV, Marimuthu S,
Bagavan A, Kamaraj C, Zahir AA, Elango G. 2012b. Efficacy of plant-mediated
synthesized silver nanoparticles against hematophagous parasites. Parasitology
research 111(2):921-33.

143
Jia C, Jukes D. 2013. The national food safety control system of China–a systematic
review. Food Control 32(1):236-45.
Jiang J, Oberdörster G, Biswas P. 2009. Characterization of size, surface charge, and
agglomeration state of nanoparticle dispersions for toxicological studies. Journal of
Nanoparticle Research 11(1):77-89.
Jin T, Gurtler J. 2011. Inactivation of Salmonella in liquid egg albumen by antimicrobial
bottle coatings infused with allyl isothiocyanate, nisin and zinc oxide nanoparticles.
Journal of applied microbiology 110(3):704-12.
Jones N, Ray B, Ranjit KT, Manna AC. 2008. Antibacterial activity of ZnO nanoparticle
suspensions on a broad spectrum of microorganisms. FEMS microbiology letters
279(1):71-6.
Kasraei S, Sami L, Hendi S, AliKhani M-Y, Rezaei-Soufi L, Khamverdi Z. 2014.
Antibacterial properties of composite resins incorporating silver and zinc oxide
nanoparticles on Streptococcus mutans and Lactobacillus. Restorative dentistry &
endodontics 39(2):109-14.
Kelly KL, Coronado E, Zhao LL, Schatz GC. 2003. The optical properties of metal
nanoparticles: the influence of size, shape, and dielectric environment. The Journal
of Physical Chemistry B 107(3):668-77.
Kheradmand E, Rafii F, Yazdi MH, Sepahi AA, Shahverdi AR, Oveisi MR. 2014. The
antimicrobial effects of selenium nanoparticle-enriched probiotics and their
fermented broth against Candida albicans. DARU 22(1):48.

144
Khiralla GM, El-Deeb BA. 2015. Antimicrobial and antibiofilm effects of selenium
nanoparticles on some foodborne pathogens. LWT-Food Sci. Technol. 63(2):1001-
7.
Kim DS, Kwak S-Y. 2008. Photocatalytic inactivation of E. coli with a mesoporous TiO2
coated film using the film adhesion method. Environmental science & technology
43(1):148-51.
Kim JS, Kuk E, Yu KN, Kim J-H, Park SJ, Lee HJ, Kim SH, Park YK, Park YH, Hwang
C-Y. 2007. Antimicrobial effects of silver nanoparticles. Nanomedicine:
Nanotechnology, Biology and Medicine 3(1):95-101.
Kim K, Lee HB, Yoon JK, Shin D, Shin KS. 2010a. Ag nanoparticle-mediated Raman
scattering of 4-aminobenzenethiol on a Pt substrate. The Journal of Physical
Chemistry C 114(32):13589-95.
Kim N, Oh MK, Park S, Kim SK, Hong BH. 2010b. Effect of gold substrates on the Raman
spectra of graphene. Bull. Korean Chem. Soc. 31(4):999.
Kim S, Choi JE, Choi J, Chung K-H, Park K, Yi J, Ryu D-Y. 2009. Oxidative stress-
dependent toxicity of silver nanoparticles in human hepatoma cells. Toxicol. In
Vitro 23(6):1076-84.
Kim S, Ryu DY. 2013. Silver nanoparticle‐induced oxidative stress, genotoxicity and
apoptosis in cultured cells and animal tissues. Journal of Applied Toxicology
33(2):78-89.
Kirthi AV, Rahuman AA, Rajakumar G, Marimuthu S, Santhoshkumar T, Jayaseelan C,
Velayutham K. 2011. Acaricidal, pediculocidal and larvicidal activity of
145
synthesized ZnO nanoparticles using wet chemical route against blood feeding
parasites. Parasitology research 109(2):461-72.
Kiser M, Westerhoff P, Benn T, Wang Y, Perez-Rivera J, Hristovski K. 2009. Titanium
nanomaterial removal and release from wastewater treatment plants.
Environmental science & technology 43(17):6757-63.
Kneipp K, Kneipp H, Kartha VB, Manoharan R, Deinum G, Itzkan I, Dasari RR, Feld MS.
1998. Detection and identification of a single DNA base molecule using surface-
enhanced Raman scattering (SERS). Physical Review E 57(6):R6281.
Kneipp K, Wang Y, Kneipp H, Perelman LT, Itzkan I, Dasari RR, Feld MS. 1997. Single
molecule detection using surface-enhanced Raman scattering (SERS). Physical
review letters 78(9):1667.
Kokubo H, Ding B, Naka T, Tsuchihira H, Shiratori S. 2007. Multi-core cable-like TiO2
nanofibrous membranes for dye-sensitized solar cells. Nanotechnology
18(16):165604.
Krishnamoorthy K, Manivannan G, Kim SJ, Jeyasubramanian K, Premanathan M. 2012a.
Antibacterial activity of MgO nanoparticles based on lipid peroxidation by oxygen
vacancy. Journal of Nanoparticle Research 14(9):1-10.
Krishnamoorthy K, Veerapandian M, Zhang L-H, Yun K, Kim SJ. 2012b. Antibacterial
efficiency of graphene nanosheets against pathogenic bacteria via lipid
peroxidation. The Journal of Physical Chemistry C 116(32):17280-7.
Kuila T, Bose S, Khanra P, Mishra AK, Kim NH, Lee JH. 2011. Recent advances in
graphene-based biosensors. Biosens. Bioelectron. 26(12):4637-48.

146
Lacerda SHDP, Park JJ, Meuse C, Pristinski D, Becker ML, Karim A, Douglas JF. 2009.
Interaction of gold nanoparticles with common human blood proteins. ACS nano
4(1):365-79.
Lee C, Wei X, Kysar JW, Hone J. 2008. Measurement of the elastic properties and intrinsic
strength of monolayer graphene. Science 321(5887):385-8.
Leung Y, Chan C, Ng A, Chan H, Chiang M, Djurišić A, Ng Y, Jim W, Guo M, Leung F.
2012. Antibacterial activity of ZnO nanoparticles with a modified surface under
ambient illumination. Nanotechnology 23(47):475703.
Leung YH, Ng A, Xu X, Shen Z, Gethings LA, Wong MT, Chan C, Guo MY, Ng YH,
Djurišić AB. 2014. Mechanisms of antibacterial activity of MgO: Non‐ROS
mediated toxicity of MgO nanoparticles towards Escherichia coli. Small
10(6):1171-83.
Li F, Park S-J, Ling D, Park W, Han JY, Na K, Char K. 2013. Hyaluronic acid-conjugated
graphene oxide/photosensitizer nanohybrids for cancer targeted photodynamic
therapy. Journal of Materials Chemistry B 1(12):1678-86.
Li N, Zhang X, Song Q, Su R, Zhang Q, Kong T, Liu L, Jin G, Tang M, Cheng G. 2011a.
The promotion of neurite sprouting and outgrowth of mouse hippocampal cells in
culture by graphene substrates. Biomaterials 32(35):9374-82.
Li R, Liu C, Ma J. 2011b. Studies on the properties of graphene oxide-reinforced starch
biocomposites. Carbohydrate Polymers 84(1):631-7.
Li X, Zhang S, Yu Z, Yang T. 2014. Surface-enhanced raman spectroscopic analysis of
phorate and fenthion pesticide in apple skin using silver nanoparticles. Applied
spectroscopy 68(4):483-7.

147
Li Y, Zhang W, Niu J, Chen Y. 2012. Mechanism of photogenerated reactive oxygen
species and correlation with the antibacterial properties of engineered metal-oxide
nanoparticles. Acs Nano 6(6):5164-73.
Liang W, Chen X, Sa Y, Feng Y, Wang Y, Lin W. 2012. Graphene oxide as a substrate for
Raman enhancement. Appl. Phys. A Mater. Sci. Process.:1-5.
Liao K-H, Lin Y-S, Macosko CW, Haynes CL. 2011. Cytotoxicity of graphene oxide and
graphene in human erythrocytes and skin fibroblasts. ACS Applied Materials &
Interfaces 3(7):2607-15.
Lin M. 2010. The application of surface‐enhanced Raman spectroscopy to identify and
quantify chemical adulterants or contaminants in foods. Handbook of Vibrational
Spectroscopy.
Lin M, Cavinato AG, Huang Y, Rasco BA. 2003. Predicting sodium chloride content in
commercial king (Oncorhynchus tshawytscha) and chum (O. keta) hot smoked
salmon fillet portions by short-wavelength near-infrared (SW-NIR) spectroscopy.
Food Research International 36(8):761-6.
Lin M, He L, Awika J, Yang L, Ledoux D, Li H, Mustapha A. 2008. Detection of melamine
in gluten, chicken feed, and processed foods using surface enhanced Raman
spectroscopy and HPLC. J. Food Sci. 73(8):T129-T34.
Lin X, Li J, Ma S, Liu G, Yang K, Tong M, Lin D. 2014. Toxicity of TiO 2 nanoparticles
to Escherichia coli: effects of particle size, crystal phase and water chemistry. PloS
one 9(10):e110247.

148
Lin Y-S, Haynes CL. 2009. Synthesis and characterization of biocompatible and size-
tunable multifunctional porous silica nanoparticles. Chemistry of Materials
21(17):3979-86.
Lin Z-H, Wang CC. 2005. Evidence on the size-dependent absorption spectral evolution
of selenium nanoparticles. Mater. Chem. Phys. 92(2):591-4.
Ling X, Xie L, Fang Y, Xu H, Zhang H, Kong J, Dresselhaus MS, Zhang J, Liu Z. 2009.
Can graphene be used as a substrate for Raman enhancement? Nano Lett.
10(2):553-61.
Lipovsky A, Nitzan Y, Gedanken A, Lubart R. 2011. Antifungal activity of ZnO
nanoparticles—the role of ROS mediated cell injury. Nanotechnology
22(10):105101.
Liu B, Zhou P, Liu X, Sun X, Li H, Lin M. 2012a. Detection of pesticides in fruits by
surface-enhanced Raman spectroscopy coupled with gold nanostructures. Food
Bioprocess Tech. :1-9.
Liu J, Tang J, Gooding JJ. 2012b. Strategies for chemical modification of graphene and
applications of chemically modified graphene. Journal of Materials Chemistry
22(25):12435-52.
Liu L, Liu J, Wang Y, Yan X, Sun DD. 2011a. Facile synthesis of monodispersed silver
nanoparticles on graphene oxide sheets with enhanced antibacterial activity. New
Journal of Chemistry 35(7):1418.
Liu S, Hu M, Zeng TH, Wu R, Jiang R, Wei J, Wang L, Kong J, Chen Y. 2012c. Lateral
dimension-dependent antibacterial activity of graphene oxide sheets. Langmuir
28(33):12364-72.

149
Liu S, Ng AK, Xu R, Wei J, Tan CM, Yang Y, Chen Y. 2010. Antibacterial action of
dispersed single-walled carbon nanotubes on Escherichia coli and Bacillus subtilis
investigated by atomic force microscopy. Nanoscale 2(12):2744-50.
Liu S, Zeng TH, Hofmann M, Burcombe E, Wei J, Jiang R, Kong J, Chen Y. 2011b.
Antibacterial activity of graphite, graphite oxide, graphene oxide and reduced
graphene oxide: membrane and oxidative stress. ACS nano 5(9):6971–80.
Liu S, Zeng TH, Hofmann M, Burcombe E, Wei J, Jiang R, Kong J, Chen Y. 2011c.
Antibacterial activity of graphite, graphite oxide, graphene oxide, and reduced
graphene oxide: membrane and oxidative stress. ACS nano 5(9):6971-80.
Liu Y, He L, Mustapha A, Li H, Hu Z, Lin M. 2009. Antibacterial activities of zinc oxide
nanoparticles against Escherichia coli O157: H7. Journal of Applied Microbiology
107(4):1193-201.
Liu Y, Kim H-I. 2012. Characterization and antibacterial properties of genipin-crosslinked
chitosan/poly (ethylene glycol)/ZnO/Ag nanocomposites. Carbohydrate polymers
89(1):111-6.
Liu Z, Robinson JT, Sun X, Dai H. 2008. PEGylated nanographene oxide for delivery of
water-insoluble cancer drugs. Journal of the American Chemical Society
130(33):10876-7.
Lkhagvajav N, Yasa I, Celik E, Koizhaiganova M, Sari O. 2011. Antimicrobial activity of
colloidal silver nanoparticles prepared by sol-gel method. Dig J Nanomater
Biostruct 6(1):149-54.
Loeschner K, Navratilova J, Købler C, Mølhave K, Wagner S, von der Kammer F, Larsen
EH. 2013. Detection and characterization of silver nanoparticles in chicken meat

150
by asymmetric flow field flow fractionation with detection by conventional or
single particle ICP-MS. Analytical and bioanalytical chemistry 405(25):8185-95.
Love SA, Haynes CL. 2010. Assessment of functional changes in nanoparticle-exposed
neuroendocrine cells with amperometry: exploring the generalizability of
nanoparticle-vesicle matrix interactions. Analytical and bioanalytical chemistry
398(2):677-88.
Love SA, Maurer-Jones MA, Thompson JW, Lin Y-S, Haynes CL. 2012. Assessing
nanoparticle toxicity. Annual review of analytical chemistry 5:181-205.
Lozano O, Mejia J, Tabarrant T, Masereel B, Dogné J-M, Toussaint O, Lucas S. 2012.
Quantification of nanoparticles in aqueous food matrices using particle-induced X-
ray emission. Analytical and bioanalytical chemistry 403(10):2835-41.
Lu G, Li H, Liusman C, Yin Z, Wu S, Zhang H. 2011. Surface enhanced Raman scattering
of Ag or Au nanoparticle-decorated reduced graphene oxide for detection of
aromatic molecules. Chem. Sci. 2(9):1817-21.
Lu S, Xu X, Zhao W, Wu W, Yuan H, Shen H, Zhou C, Li LS, Ma L. 2010a. Targeting of
embryonic stem cells by peptide-conjugated quantum dots. PLoS One 5(8):e12075.
Lu W, Senapati D, Wang S, Tovmachenko O, Singh AK, Yu H, Ray PC. 2010b. Effect of
surface coating on the toxicity of silver nanomaterials on human skin keratinocytes.
Chemical physics letters 487(1):92-6.
Lu Z, Ruan W, Yang J, Xu W, Zhao C, Zhao B. 2009. Deposition of Ag nanoparticles on
porous anodic alumina for surface enhanced Raman scattering substrate. Journal of
Raman Spectroscopy 40(1):112-6.

151
Luo H, Wang F, Bai Y, Chen T, Zheng W. 2012. Selenium nanoparticles inhibit the growth
of HeLa and MDA-MB-231 cells through induction of S phase arrest. Colloids.
Surf. B Biointerfaces 94:304-8.
Lyon DY, Brunet L, Hinkal GW, Wiesner MR, Alvarez PJ. 2008. Antibacterial activity of
fullerene water suspensions (nC60) is not due to ROS-mediated damage. Nano
letters 8(5):1539-43.
Ma J, Zhang J, Xiong Z, Yong Y, Zhao XS. 2011. Preparation, characterization and
antibacterial properties of silver-modified graphene oxide. Journal of Materials
Chemistry 21(10):3350.
Manna P, Ghosh M, Ghosh J, Das J, Sil PC. 2012. Contribution of nano-copper particles
to in vivo liver dysfunction and cellular damage: Role of IκBα/NF-κB, MAPKs and
mitochondrial signal. Nanotoxicology 6(1):1-21.
Marambio-Jones C, Hoek EM. 2010. A review of the antibacterial effects of silver
nanomaterials and potential implications for human health and the environment.
Journal of Nanoparticle Research 12(5):1531-51.
Martens H, Naes T. 1992. Multivariate calibration: John Wiley & Sons.
Mclaren A, Valdes-Solis T, Li G, Tsang SC. 2009. Shape and size effects of ZnO
nanocrystals on photocatalytic activity. Journal of the American Chemical Society
131(35):12540-1.
Meng H, Xia T, George S, Nel AE. 2009. A predictive toxicological paradigm for the safety
assessment of nanomaterials. Acs Nano 3(7):1620-7.

152
Miranda M, Fernández A, Lopez-Esteban S, Malpartida F, Moya JS, Torrecillas R. 2012.
Ceramic/metal biocidal nanocomposites for bone-related applications. Journal of
Materials Science: Materials in Medicine 23(7):1655-62.
Mittal AK, Kumar S, Banerjee UC. 2014. Quercetin and gallic acid mediated synthesis of
bimetallic (silver and selenium) nanoparticles and their antitumor and antimicrobial
potential. J. Colloid Interface Sci. 431:194-9.
Monsen ER. 2000. Dietary reference intakes for the antioxidant nutrients: vitamin C,
vitamin E, selenium, and carotenoids. J. Am. Diet. Assoc. 100(6):637-40.
Murphy CJ, Sau TK, Gole AM, Orendorff CJ, Gao J, Gou L, Hunyadi SE, Li T. 2005.
Anisotropic metal nanoparticles: synthesis, assembly, and optical applications. J.
Phys. Chem. B 109(29):13857-70.
Murphy CJ, Thompson LB, Chernak DJ, Yang JA, Sivapalan ST, Boulos SP, Huang J,
Alkilany AM, Sisco PN. 2011. Gold nanorod crystal growth: from seed-mediated
synthesis to nanoscale sculpting. Curr. Opin. Colloid Interface Sci. 16(2):128-34.
Nam K-Y. 2011. In vitro antimicrobial effect of the tissue conditioner containing silver
nanoparticles. The journal of advanced prosthodontics 3(1):20-4.
Namasivayam S, Ganesh S, Avimanyu B. 2011. Evaluation of anti-bacterial activity of
silver nanoparticles synthesized from Candida glabrata and Fusarium oxysporum.
Int J Med Res 1(3):131-6.
Nanotechnologies TPoE. 2016. www.nanotecproject.org.
Q-SERS. 2014August 1, 2014] Available from: www.q-sers.com.

153
Navarro E, Baun A, Behra R, Hartmann NB, Filser J, Miao A-J, Quigg A, Santschi PH,
Sigg L. 2008. Environmental behavior and ecotoxicity of engineered nanoparticles
to algae, plants, and fungi. Ecotoxicology 17(5):372-86.
Neal AL. 2008. What can be inferred from bacterium–nanoparticle interactions about the
potential consequences of environmental exposure to nanoparticles? Ecotoxicology
17(5):362-71.
Neal AL, Kabengi N, Grider A, Bertsch PM. 2012. Can the soil bacterium Cupriavidus
necator sense ZnO nanomaterials and aqueous Zn2+ differentially?
Nanotoxicology 6(4):371-80.
Nel A, Xia T, Mädler L, Li N. 2006. Toxic potential of materials at the nanolevel. Science
311(5761):622-7.
Nellore BP, SekharáSinha S, ReddyáChavva S, ChandraáRay P. 2015a. Antimicrobial
peptide-conjugated graphene oxide membrane for efficient removal and effective
killing of multiple drug resistant bacteria. RSC advances 5(24):18881-7.
Nellore BPV, Kanchanapally R, Pedraza F, Sinha SS, Pramanik A, Hamme AT, Arslan Z,
Sardar D, Ray PC. 2015b. Bio-conjugated CNT-bridged 3D porous graphene oxide
membrane for highly efficient disinfection of pathogenic bacteria andremoval of
toxic metals from water. ACS applied materials & interfaces 7(34):19210.
Nguyen TH, Lin M, Mustapha A. 2015. Toxicity of graphene oxide on intestinal bacteria
and Caco-2 cells. J. Food Protect. 78(5):996-1002.
Njoki PN, Lim I-IS, Mott D, Park H-Y, Khan B, Mishra S, Sujakumar R, Luo J, Zhong C-
J. 2007. Size correlation of optical and spectroscopic properties for gold
nanoparticles. The Journal of Physical Chemistry C 111(40):14664-9.

154
Novotny L, Rauko P, Kombian S, Edafiogho I. 2010. Selenium as a chemoprotective anti-
cancer agent: reality or wishful thinking. Neoplasma 57(5):383-91.
Ohira T, Yamamoto O, Iida Y, Nakagawa Z-e. 2008. Antibacterial activity of ZnO powder
with crystallographic orientation. Journal of Materials Science: Materials in
Medicine 19(3):1407-12.
Oluwafemi S, Revaprasadu N, Ramirez A. 2008. A novel one-pot route for the synthesis
of water-soluble cadmium selenide nanoparticles. J. Cryst. Growth 310(13):3230-
4.
Orendorff CJ, Gole A, Sau TK, Murphy CJ. 2005. Surface-enhanced Raman spectroscopy
of self-assembled monolayers: sandwich architecture and nanoparticle shape
dependence. Analytical chemistry 77(10):3261-6.
Padmavathy N, Vijayaraghavan R. 2008. A comparative study on antibacterial properties
of MgO nanoparticles prepared under different calcination temperature. Enhanced
Science and Technology of Advanced Material 8(1).
Pagnout C, Jomini S, Dadhwal M, Caillet C, Thomas F, Bauda P. 2012. Role of
electrostatic interactions in the toxicity of titanium dioxide nanoparticles toward
Escherichia coli. Colloids and Surfaces B: Biointerfaces 92:315-21.
Painter JA, Hoekstra RM, Ayers T, Tauxe RV, Braden CR, Angulo FJ, Griffin PM. 2013.
Attribution of foodborne illnesses, hospitalizations, and deaths to food
commodities by using outbreak data, United States, 1998–2008. Emerg Infect Dis
19(3):407-15.
Palombo M, Deshmukh M. 2014. Daniel Myers, Jieming Gao, Zoltan Szekely, and Patrick
J. Sinko1. Annual Review of Pharmacology and Toxicology 54:27.1-.18.

155
Pan X-D, Wu P-g, Yang D-J, Wang L-Y, Shen X-H, Zhu C-Y. 2013. Simultaneous
determination of melamine and cyanuric acid in dairy products by mixed-mode
solid phase extraction and GC–MS. Food Control 30(2):545-8.
Pandey H, Parashar V, Parashar R, Prakash R, Ramteke PW, Pandey AC. 2011. Controlled
drug release characteristics and enhanced antibacterial effect of graphene
nanosheets containing gentamicin sulfate. Nanoscale 3(10):4104-8.
Park E-J, Choi J, Park Y-K, Park K. 2008. Oxidative stress induced by cerium oxide
nanoparticles in cultured BEAS-2B cells. Toxicology 245(1):90-100.
Park E-J, Yi J, Kim Y, Choi K, Park K. 2010. Silver nanoparticles induce cytotoxicity by
a Trojan-horse type mechanism. Toxicol. in Vitro 24(3):872-8.
Park S, Lee S, Kim B, Lee S, Lee J, Sim S, Gu M, Yi J, Lee J. 2012. Toxic effects of
titanium dioxide nanoparticles on microbial activity and metabolic flux.
Biotechnology and bioprocess engineering 17(2):276-82.
Park W-H, Kim ZH. 2010. Charge transfer enhancement in the SERS of a single molecule.
Nano letters 10(10):4040-8.
Patil NT, Yamamoto Y. 2008. Coinage metal-assisted synthesis of heterocycles. Chem.
Rev. 108(8):3395-442.
Peng D, Zhang J, Liu Q, Taylor EW. 2007. Size effect of elemental selenium nanoparticles
(Nano-Se) at supranutritional levels on selenium accumulation and glutathione S-
transferase activity. J. Inorg. Biochem. 101(10):1457-63.
Persson H, Købler C, Mølhave K, Samuelson L, Tegenfeldt JO, Oredsson S, Prinz CN.
2013. Fibroblasts cultured on nanowires exhibit low motility, impaired cell
division, and DNA damage. Small 9(23):4006-16.

156
Pham VT, Truong VK, Quinn MD, Notley SM, Guo Y, Baulin VA, Al Kobaisi M,
Crawford RJ, Ivanova EP. 2015. Graphene induces formation of pores that kill
spherical and rod-shaped bacteria. ACS nano 9(8):8458-67.
Pi J, Jin H, Liu R, Song B, Wu Q, Liu L, Jiang J, Yang F, Cai H, Cai J. 2013. Pathway of
cytotoxicity induced by folic acid modified selenium nanoparticles in MCF-7 cells.
Appl. Microbiol. Biot 97(3):1051-62.
Podila R, Brown JM. 2013. Toxicity of engineered nanomaterials: A physicochemical
perspective. J. Biochem. Molecular Toxicol. 27(1):50-5.
Prabhu S, Poulose EK. 2012. Silver nanoparticles: mechanism of antimicrobial action,
synthesis, medical applications, and toxicity effects. International Nano Letters
2(1):1-10.
Premanathan M, Karthikeyan K, Jeyasubramanian K, Manivannan G. 2011a. bSelective
toxicity of ZnO nanoparticles toward Gram-positive bacteria and cancer cells by
apoptosis through lipid peroxidation. Nanomedicine: Nanotechnology, Biology and
Medicine 7(2):184-92.
Premanathan M, Karthikeyan K, Jeyasubramanian K, Manivannan G. 2011b. Selective
toxicity of ZnO nanoparticles toward Gram-positive bacteria and cancer cells by
apoptosis through lipid peroxidation. Nanomedicine: Nanotechnology, Biology and
Medicine 7(2):184-92.
Qiu Y, Liu Y, Wang L, Xu L, Bai R, Ji Y, Wu X, Zhao Y, Li Y, Chen C. 2010. Surface
chemistry and aspect ratio mediated cellular uptake of Au nanorods. Biomaterials
31(30):7606-19.

157
Rago I, Bregnocchi A, Zanni E, D'Aloia A, De Angelis F, Bossu M, De Bellis G, Polimeni
A, Uccelletti D, Sarto M. 2015. Antimicrobial activity of graphene nanoplatelets
against Streptococcus mutans. Nanotechnology (IEEE-NANO), 2015 IEEE 15th
International Conference on: IEEE. p. 9-12.
Rahman MS. 2007. Handbook of food preservation: CRC press.
Ramanathan T, Abdala A, Stankovich S, Dikin D, Herrera-Alonso M, Piner R, Adamson
D, Schniepp H, Chen X, Ruoff R. 2008. Functionalized graphene sheets for
polymer nanocomposites. Nature Nanotechnology 3(6):327-31.
Ray PC, Yu H, Fu PP. 2009. Toxicity and environmental risks of nanomaterials: challenges
and future needs. Journal of Environmental Science and Health Part C 27(1):1-35.
Reddy KM, Feris K, Bell J, Wingett DG, Hanley C, Punnoose A. 2007. Selective toxicity
of zinc oxide nanoparticles to prokaryotic and eukaryotic systems. Applied physics
letters 90(21):213902.
Ruiz ON, Fernando KS, Wang B, Brown NA, Luo PG, McNamara ND, Vangsness M, Sun
Y-P, Bunker CE. 2011. Graphene oxide: a nonspecific enhancer of cellular growth.
ACS nano 5(10):8100-7.
Rycenga M, Cobley CM, Zeng J, Li W, Moran CH, Zhang Q, Qin D, Xia Y. 2011.
Controlling the synthesis and assembly of silver nanostructures for plasmonic
applications. Chem. Rev. 111(6):3669-712.
Sanchez VC, Jachak A, Hurt RH, Kane AB. 2011. Biological interactions of graphene-
family nanomaterials: an interdisciplinary review. Chemical research in toxicology
25(1):15-34.

158
Sasidharan A, Panchakarla LS, Sadanandan AR, Ashokan A, Chandran P, Girish CM,
Menon D, Nair SV, Rao CN, Koyakutty M. 2012. Hemocompatibility and
Macrophage Response of Pristine and Functionalized Graphene. Small 8(8):1251-
63.
Saute B, Premasiri R, Ziegler L, Narayanan R. 2012. Gold nanorods as surface enhanced
Raman spectroscopy substrates for sensitive and selective detection of ultra-low
levels of dithiocarbamate pesticides. Analyst 137(21):5082-7.
Schaepe SM. 2015. Engineering graphene oxide membranes for contaminant removal and
bacterial inactivation.
Schäferling M, Grögel DB, Schreml S. 2011. Luminescent probes for detection and
imaging of hydrogen peroxide. Microchimica Acta 174(1-2):1-18.
Schatz GC, Young MA, Van Duyne RP. 2006. Electromagnetic mechanism of SERS.
Surface-enhanced Raman scattering: Springer. p. 19-45.
Schedin F, Lidorikis E, Lombardo A, Kravets VG, Geim AK, Grigorenko AN, Novoselov
KS, Ferrari AC. 2010. Surface enhanced Raman spectroscopy of graphene. ACS
Nano 4(10):5617–26.
Seabra AB, Paula AJ, de Lima R, Alves OL, Durán N. 2014. Nanotoxicity of graphene and
graphene oxide. Chemical research in toxicology 27(2):159-68.
Seil JT, Webster TJ. 2011. Reduced Staphylococcus aureus proliferation and biofilm
formation on zinc oxide nanoparticle PVC composite surfaces. Acta biomaterialia
7(6):2579-84.
Seil JT, Webster TJ. 2012. Antibacterial effect of zinc oxide nanoparticles combined with
ultrasound. Nanotechnology 23(49):495101.

159
Sekhon BS. 2010. Food nanotechnology–an overview. Nanotechnology, science and
applications 3(10):1-15.
Shakibaie M, Forootanfar H, Golkari Y, Mohammadi-Khorsand T, Shakibaie MR. 2015.
Anti-biofilm activity of biogenic selenium nanoparticles and selenium dioxide
against clinical isolates of Staphylococcus aureus, Pseudomonas aeruginosa, and
Proteus mirabilis. J. Trace Elem. Med. Bio. 29:235-41.
Shaligram S, Campbell A. 2013. Toxicity of copper salts is dependent on solubility profile
and cell type tested. Toxicology in Vitro 27(2):844-51.
Sharareh M, Maryam T, Azadeh K, Ali MS. 2015. Effect of UV irratdiation on quantity
and structure of aflatoxinds using HPLC, GC/MS, and FT-IR techniques. Ludus
Vitalis 11(1):64-9.
Sharma H, Mutharasan R. 2013. Review of biosensors for foodborne pathogens and toxins.
Sensors and actuators B: Chemical 183:535-49.
Sharma N, Kumar J, Thakur S, Sharma S, Shrivastava V. 2013. Antibacterial study of silver
doped zinc oxide nanoparticles against Staphylococcus aureus and Bacillus subtilis.
Drug Invention Today 5(1):50-4.
Sharma V, Anderson D, Dhawan A. 2012. Zinc oxide nanoparticles induce oxidative DNA
damage and ROS-triggered mitochondria mediated apoptosis in human liver cells
(HepG2). Apoptosis 17(8):852-70.
Shende C, Gift A, Inscore F, Maksymiuk P, Farquharson S. 2004. Inspection of pesticide
residues on food by surface-enhanced Raman spectroscopy. Proc. of SPIE Vol. p.
29.

160
Shende C, Inscore F, Sengupta A, Farquharson S. 2010a. Surface‐Enhanced Raman
Spectroscopy: Theory and Application to the Analysis of Chlorpyrifos in Orange
Juice. Handbook of Vibrational Spectroscopy.
Shende C, Inscore F, Sengupta A, Stuart J, Farquharson S. 2010b. Rapid extraction and
detection of trace chlorpyrifos-methyl in orange juice by surface-enhanced Raman
spectroscopy. Sens. Instrum. Food Qual. Saf. 4(3):101-7.
Shi M, Kwon HS, Peng Z, Elder A, Yang H. 2012. Effects of surface chemistry on the
generation of reactive oxygen species by copper nanoparticles. ACS nano
6(3):2157-64.
Shukla RK, Kumar A, Pandey AK, Singh SS, Dhawan A. 2011. Titanium dioxide
nanoparticles induce oxidative stress-mediated apoptosis in human keratinocyte
cells. J. Biomed. Nanotechnol. 7(1):100-1.
SERS. 2014Augut 1, 2014] Available from: http://www.silmeco.com/.
Singh G, Stephan C, Westerhoff P, Carlander D, Duncan TV. 2014. Measurement methods
to detect, characterize, and quantify engineered nanomaterials in foods.
Comprehensive Reviews in Food Science and Food Safety 13(4):693-704.
Singh S, Mishra S, Srivastava R, Gopal R. 2010. Optical properties of selenium quantum
dots produced with laser irradiation of water suspended Se nanoparticles. J. Phys.
Chem. C 114(41):17374-84.
Sinha R, Karan R, Sinha A, Khare S. 2011. Interaction and nanotoxic effect of ZnO and
Ag nanoparticles on mesophilic and halophilic bacterial cells. Bioresource
technology 102(2):1516-20.

161
Sirelkhatim A, Mahmud S, Seeni A, Kaus NHM, Ann LC, Bakhori SKM, Hasan H,
Mohamad D. 2015. Review on zinc oxide nanoparticles: antibacterial activity and
toxicity mechanism. Nano-Micro Letters 7(3):219-42.
Some S, Ho S-M, Dua P, Hwang E, Shin YH, Yoo H, Kang J-S, Lee D-k, Lee H. 2012.
Dual functions of highly potent graphene derivative–poly-L-lysine composites to
inhibit bacteria and support human cells. ACS nano 6(8):7151-61.
Sondi I, Salopek-Sondi B. 2004. Silver nanoparticles as antimicrobial agent: a case study
on E. coli as a model for Gram-negative bacteria. Journal of colloid and interface
science 275(1):177-82.
Song E, Han W, Li C, Cheng D, Li L, Liu L, Zhu G, Song Y, Tan W. 2014. Hyaluronic
acid-decorated graphene oxide nanohybrids as nanocarriers for targeted and pH-
responsive anticancer drug delivery. ACS applied materials & interfaces
6(15):11882-90.
Song X, Li H, Al-Qadiri H, Lin M. 2013. Detection of herbicides in drinking water by
surface-enhanced Raman spectroscopy coupled with gold nanostructures. Food
Measure 7(3):107-13.
Stankovich S, Dikin DA, Piner RD, Kohlhaas KA, Kleinhammes A, Jia Y, Wu Y, Nguyen
ST, Ruoff RS. 2007. Synthesis of graphene-based nanosheets via chemical
reduction of exfoliated graphite oxide. Carbon 45(7):1558-65.
Sung JH, Ji JH, Song KS, Lee JH, Choi KH, Lee SH, Yu IJ. 2011. Acute inhalation toxicity
of silver nanoparticles. Toxicol. and Industrial health 27(2):149-54.

162
Tayel AA, EL‐TRAS WF, Moussa S, EL‐BAZ AF, Mahrous H, Salem MF, Brimer L.
2011. Antibacterial action of zinc oxide nanoparticles against foodborne pathogens.
Journal of Food Safety 31(2):211-8.
Thill A, Zeyons O, Spalla O, Chauvat F, Rose J, Auffan M, Flank AM. 2006. Cytotoxicity
of CeO2 nanoparticles for Escherichia coli. Physico-chemical insight of the
cytotoxicity mechanism. Environmental science & technology 40(19):6151-6.
Tong L, Wei Q, Wei A, Cheng JX. 2009. Gold nanorods as contrast agents for biological
imaging: optical properties, surface conjugation and photothermal effects.
Photochem. Photobiol. 85(1):21-32.
Tong T, Binh CTT, Kelly JJ, Gaillard J-F, Gray KA. 2013. Cytotoxicity of commercial
nano-TiO 2 to Escherichia coli assessed by high-throughput screening: effects of
environmental factors. Water research 47(7):2352-62.
Tran PA, Webster TJ. 2011a. Selenium nanoparticles inhibit Staphylococcus aureus
growth. Int. J. Nanomedicine 6:1553.
Tran PA, Webster TJ. 2011b. Selenium nanoparticles inhibit Staphylococcus aureus
growth. International journal of nanomedicine 6:1553.
Vale G, Rodrigues A, Rocha A, Rial R, Mota A, Gonçalves M, Fonseca L, Capelo J. 2010.
Ultrasonic assisted enzymatic digestion (USAED) coupled with high performance
liquid chromatography and electrothermal atomic absorption spectrometry as a
powerful tool for total selenium and selenium species control in Se-enriched food
supplements. Food Chem. 121(1):268-74.

163
Vallabani N, Mittal S, Shukla RK, Pandey AK, Dhakate SR, Pasricha R, Dhawan A. 2011.
Toxicity of graphene in normal human lung cells (BEAS-2B). Journal of
Biomedical Nanotechnology 7(1):106-7.
Vandebriel RJ, De Jong WH. 2012. A review of mammalian toxicity of ZnO nanoparticles.
Nanotechnol., Sci. and App. 5:61.
Wang G, Qian F, Saltikov CW, Jiao Y, Li Y. 2011a. Microbial reduction of graphene oxide
by Shewanella. Nano Research 4(6):563-70.
Wang H, Zhang J, Yu H. 2007a. Elemental selenium at nano size possesses lower toxicity
without compromising the fundamental effect on selenoenzymes: comparison with
selenomethionine in mice. Free Radic. Biol. Med. 42(10):1524-33.
Wang Q, Webster TJ. 2014. Selenium nanoparticles inhibit various bacterial growth on
paper towels. MRS Proceedings: Cambridge Univ Press. p. 1626-0855.
Wang X, Yang F, Yang W, Yang X. 2007b. A study on the antibacterial activity of one-
dimensional ZnO nanowire arrays: effects of the orientation and plane surface.
Chemical Communications (42):4419-21.
Wang Y, Aker WG, Hwang H-m, Yedjou CG, Yu H, Tchounwou PB. 2011b. A study of
the mechanism of in vitro cytotoxicity of metal oxide nanoparticles using catfish
primary hepatocytes and human HepG2 cells. Science of the total environment
409(22):4753-62.
Wang Y, Zou X, Ren W, Wang W, Wang E. 2007c. Effect of silver nanoplates on Raman
spectra of p-aminothiophenol assembled on smooth macroscopic gold and silver
surface. The Journal of Physical Chemistry C 111(8):3259-65.

164
Watson CY, Molina RM, Louzada A, Murdaugh KM, Donaghey TC, Brain JD. 2015.
Effects of zinc oxide nanoparticles on Kupffer cell phagosomal motility, bacterial
clearance, and liver function. International journal of nanomedicine 10:4173.
Wijnhoven SW, Peijnenburg WJ, Herberts CA, Hagens WI, Oomen AG, Heugens EH,
Roszek B, Bisschops J, Gosens I, Van De Meent D. 2009. Nano-silver–a review of
available data and knowledge gaps in human and environmental risk assessment.
Nanotoxicology 3(2):109-38.
Winnik FM, Maysinger D. 2012. Quantum dot cytotoxicity and ways to reduce it. Accounts
of chemical research 46(3):672-80.
Wojtoniszak M, Chen X, Kalenczuk RJ, Wajda A, Łapczuk J, Kurzewski M, Drozdzik M,
Chu PK, Borowiak-Palen E. 2012. Synthesis, dispersion, and cytocompatibility of
graphene oxide and reduced graphene oxide. Colloids and Surfaces B:
Biointerfaces 89:79-85.
Wu M-C, Deokar AR, Liao J-H, Shih P-Y, Ling Y-C. 2013. Graphene-based photothermal
agent for rapid and effective killing of bacteria. ACS nano 7(2):1281-90.
Wu N, Fu L, Su M, Aslam M, Wong KC, Dravid VP. 2004. Interaction of fatty acid
monolayers with cobalt nanoparticles. Nano letters 4(2):383-6.
Xia Q, Boudreau MD, Zhou Y-T, Yin J-J, Fu PP. 2011. UVB photoirradiation of aloe vera-
formation of free radicals, singlet oxygen, superoxide, and induction of lipid
peroxidation. Journal of Food and Drug Analysis 19(4).
Xia T, Kovochich M, Liong M, Mädler L, Gilbert B, Shi H, Yeh JI, Zink JI, Nel AE. 2008.
Comparison of the mechanism of toxicity of zinc oxide and cerium oxide

165
nanoparticles based on dissolution and oxidative stress properties. ACS nano
2(10):2121-34.
Xie Y, He Y, Irwin PL, Jin T, Shi X. 2011. Antibacterial activity and mechanism of action
of zinc oxide nanoparticles against Campylobacter jejuni. Applied and
environmental microbiology 77(7):2325-31.
Xiong S, George S, Ji Z, Lin S, Yu H, Damoiseaux R, France B, Ng KW, Loo SCJ. 2013.
Size of TiO2 nanoparticles influences their phototoxicity: an in vitro investigation.
Archives of toxicology 87(1):99-109.
Xu W, Ling X, Xiao J, Dresselhaus MS, Kong J, Xu H, Liu Z, Zhang J. 2012. Surface
enhanced Raman spectroscopy on a flat graphene surface. Proc. Natl. Acad. Sci.
U.S.A. 109(24):9281-6.
Xue J, Zhang W. 2013. Understanding China's food safety problem: An analysis of 2387
incidents of acute foodborne illness. Food Control 30(1):311-7.
Yada RY, Buck N, Canady R, DeMerlis C, Duncan T, Janer G, Juneja L, Lin M,
McClements DJ, Noonan G, Oxley J, Sabliov C, Tsytsikova L, Vázquez-Campos
S, Yourick J, Zhong Q, Thurmond S. 2014. Engineered nanoscale food ingredients:
evaluation of current knowledge on material characteristics relevant to uptake from
the gastrointestinal tract. Comprehensive Reviews in Food Science and Food Safety
13(4):730-44.
Yakes BJ, Lipert RJ, Bannantine JP, Porter MD. 2008. Detection of Mycobacterium avium
subsp. paratuberculosis by a sonicate immunoassay based on surface-enhanced
Raman scattering. Clin. Vaccine Immunol. 15(2):227-34.

166
Yamamoto N, Inui K, Matsuyama Y, Harada A, Hanamura K, Murakami F, Ruthazer ES,
Rutishauser U, Seki T. 2000. Inhibitory mechanism by polysialic acid for lamina-
specific branch formation of thalamocortical axons. The Journal of Neuroscience
20(24):9145-51.
Yamamoto O. 2001. Influence of particle size on the antibacterial activity of zinc oxide.
International Journal of Inorganic Materials 3(7):643-6.
Yin J-J, Liu J, Ehrenshaft M, Roberts JE, Fu PP, Mason RP, Zhao B. 2012. Phototoxicity
of nano titanium dioxides in HaCaT keratinocytes—generation of reactive oxygen
species and cell damage. Toxicology and applied pharmacology 263(1):81-8.
Yip J, Liu L, Wong KH, Leung PH, Yuen CWM, Cheung MC. 2014. Investigation of
antifungal and antibacterial effects of fabric padded with highly stable selenium
nanoparticles. J. Appl. Polym. Sci 131(17).
Yoon HJ, Kim TH, Zhang Z, Azizi E, Pham TM, Paoletti C, Lin J, Ramnath N, Wicha MS,
Hayes DF. 2013. Sensitive capture of circulating tumour cells by functionalized
graphene oxide nanosheets. Nature nanotechnology 8(10):735-41.
Yoon JK, Kim K, Shin KS. 2009. Raman scattering of 4-aminobenzenethiol sandwiched
between Au nanoparticles and a macroscopically smooth Au substrate: effect of
size of Au nanoparticles. The Journal of Physical Chemistry C 113(5):1769-74.
You J, Zhang Y, Hu Z. 2011. Bacteria and bacteriophage inactivation by silver and zinc
oxide nanoparticles. Colloids and Surfaces B: Biointerfaces 85(2):161-7.
Yousef JM, Danial EN. 2012. In vitro antibacterial activity and minimum inhibitory
concentration of zinc oxide and nano-particle zinc oxide against pathogenic strains.
Journal of Health Sciences 2(4):38-42.

167
Yu X, Lin K, Qiu K, Cai H, Li X, Liu J, Pan N, Fu S, Luo Y, Wang X. 2012. Increased
chemical enhancement of Raman spectra for molecules adsorbed on fluorinated
reduced graphene oxide. Carbon 50(12):4512-7.
Zhai F, Huang Y, Li C, Wang X, Lai K. 2011. Rapid determination of ractopamine in swine
urine using surface-enhanced Raman spectroscopy. Journal of Agricultural and
Food Chemistry 59(18):10023-7.
Zhang J, Wang X, Xu T. 2008. Elemental selenium at nano size (Nano-Se) as a potential
chemopreventive agent with reduced risk of selenium toxicity: comparison with se-
methylselenocysteine in mice. Toxicol. Sci. 101(1):22-31.
Zhang JS, Gao XY, Zhang LD, Bao YP. 2001. Biological effects of a nano red elemental
selenium. Biofactors 15(1):27-38.
Zhang L, Jiang Y, Ding Y, Povey M, York D. 2007. Investigation into the antibacterial
behaviour of suspensions of ZnO nanoparticles (ZnO nanofluids). Journal of
Nanoparticle Research 9(3):479-89.
Zhang L, Lu Z, Zhao Q, Huang J, Shen H, Zhang Z. 2011a. Enhanced chemotherapy
efficacy by sequential delivery of siRNA and anticancer drugs using PEI‐grafted
graphene oxide. Small 7(4):460-4.
Zhang W, Guo Z, Huang D, Liu Z, Guo X, Zhong H. 2011b. Synergistic effect of chemo-
photothermal therapy using PEGylated graphene oxide. Biomaterials 32(33):8555-
61.
Zhang W, Li Y, Niu J, Chen Y. 2013. Photogeneration of reactive oxygen species on
uncoated silver, gold, nickel, and silicon nanoparticles and their antibacterial
effects. Langmuir 29(15):4647-51.

168
Zhang Y, Ali SF, Dervishi E, Xu Y, Li Z, Casciano D, Biris AS. 2010. Cytotoxicity effects
of graphene and single-wall carbon nanotubes in neural phaeochromocytoma-
derived PC12 cells. Acs Nano 4(6):3181-6.
Zhang Y, Wang Z, Wu L, Pei Y, Chen P, Cui Y. 2014. Rapid simultaneous detection of
multi-pesticide residues on apple using SERS technique. Analyst 139(20):5148-54.
Zhang Y, Yu W, Pei L, Lai K, Rasco BA, Huang Y. 2015a. Rapid analysis of malachite
green and leucomalachite green in fish muscles with surface-enhanced resonance
Raman scattering. Food Chemistry 169:80-4.
Zhang Z, Kong F, Vardhanabhuti B, Mustapha A, Lin M. 2012. Detection of engineered
silver nanoparticle contamination in pears. Journal of agricultural and food
chemistry 60(43):10762-7.
Zhang Z, Yu Q, Li H, Mustapha A, Lin M. 2015b. Standing gold nanorod arrays as
reproducible SERS substrates for measurement of pesticides in apple juice and
vegetables. Journal of food science 80(2):N450-N8.
Zheng J, Zhou Y, Li X, Ji Y, Lu T, Gu R. 2003. Surface-enhanced Raman scattering of 4-
aminothiophenol in assemblies of nanosized particles and the macroscopic surface
of silver. Langmuir 19(3):632-6.
Zheng X, Wu R, Chen Y. 2011. Effects of ZnO nanoparticles on wastewater biological
nitrogen and phosphorus removal. Environmental science & technology
45(7):2826-32.
Zhong L, Yun K. 2015. Graphene oxide-modified ZnO particles: synthesis,
characterization, and antibacterial properties. International journal of nanomedicine
10:79.

169
VITA
Trang Nguyen was born in Vietnam on November 20, 1983. She got her Bachelor of
Engineering in Food Engineering at the National University of Vietnam in 2006. Trang
came to China in 2007 and received her Master of Science in Food Science and Technology
at the Shanghai Ocean University in 2010. She worked as a faculty in the Department of
Food Analysis, Institute of Biotechnology and Food technology, Hochiminh University of
Industry, Vietnam for two years. Trang joined the Food Science Department of University
of Missouri to pursue her Ph.D. degree from fall 2012 to 2016.
A B
Copyright © 2022 FDOKUMEN