
Gold nanostructures: engineering their plasmonic properties for biomedical applications
11
Gold nanostructures: engineering their plasmonic properties for biomedical applications Min Hu, ae Jingyi Chen, a Zhi-Yuan Li, b Leslie Au, a Gregory V. Hartland, c Xingde Li, d Manuel Marquez e and Younan Xia* a Received 6th July 2006 First published as an Advance Article on the web 6th September 2006 DOI: 10.1039/b517615h The surface plasmon resonance peaks of gold nanostructures can be tuned from the visible to the near infrared region by controlling the shape and structure (solid vs. hollow). In this tutorial review we highlight this concept by comparing four typical examples: nanospheres, nanorods, nanoshells, and nanocages. A combination of this optical tunability with the inertness of gold makes gold nanostructures well suited for various biomedical applications. Introduction Gold nanostructures have been a subject of intensive research for their fascinating surface plasmon resonance (SPR) proper- ties. What is SPR? 1 It is an optical phenomenon arising from the interaction between an electromagnetic wave and the conduction electrons in a metal. Under the irradiation of light, the conduction electrons in a gold nanostructure are driven by the electric field to collectively oscillate at a resonant frequency relative to the lattice of positive ions. At this resonant frequency, the incident light is absorbed by the nanostructure. Some of these photons will be released with the same frequency in all directions and this process is known as scattering. At the same time, some of these photons will be converted into phonons or vibrations of the lattice and this process is referred to as absorption. In general, the SPR peak of a gold nanostructure should include both scattering and absorption components. The cross-sections of these two components can be substantially different depending on the size and shape of the nanostructure. For gold nanospheres about 50 nm in diameter, the SPR peak is positioned at 520 nm, and this peak is responsible for the ruby red colour displayed by conven- tional gold colloids. 2 Michael Faraday was the first person to observe this spectacular phenomenon. In 1857, he prepared the first stable suspension of gold colloids by reducing gold chloride with phosphorus in water. 3 Some of his original samples are still preserved and on display at the Faraday Museum in London. The SPR spectra of gold nanostructures can be calculated by solving Maxwell’s equations. For spherical particles, this was accomplished in 1908 by Gustav Mie, a German physicist. 4 In 1912, Richard Gans modified the Mie theory to include spheroids. 5 Later, the capability of this theory was further extended to cover a number of other simple systems. 6 These days, one can still use the formulas derived by Mie to conveniently compute the SPR spectra (including both scattering and absorption) of a spherical particle in any size. However, since exact solutions to Maxwell’s equations are known only for spheres, concentric spherical shells, spheroids, and infinite cylinders, an approximation is required to solve the equations for other geometries. The approximation of a Department of Chemistry, University of Washington, Seattle, WA 98195-1700, USA. E-mail: [email protected] b Institute of Physics, Chinese Academy of Sciences, Beijing 100080, P. R. China c Department of Chemistry and Biochemistry, University of Notre Dame, Notre Dame, IN 46556-5670, USA d Department of Bioengineering, University of Washington, Seattle, WA 98195, USA e INEST Group, Research Center, Philip Morris Inc., Richmond, VA 23234, USA Min Hu received his BS in Material Science and Engineering from the University of Science and Technology of China (USTC) in 2000. He received his PhD in physical chemistry from the University of Notre Dame (with Professor Gregory V. Hartland) in 2005. He is cur- rently a Philip Morris USA INEST postdoctoral fellow with Marquez and Xia. Jingyi Chen received her BS degree in 1997 from the Sun Yat-Sen University in China and her MA degree (with Professor Kimberly A. Bagley) in 2002 from the Department of Chemistry, SUNY College at Buffalo. She is currently a PhD candi- date in chemistry with Xia. Min Hu Jingyi Chen TUTORIAL REVIEW www.rsc.org/csr | Chemical Society Reviews 1084 | Chem. Soc. Rev., 2006, 35, 1084–1094 This journal is ß The Royal Society of Chemistry 2006
Transcript of Gold nanostructures: engineering their plasmonic properties for biomedical applications
Gold nanostructures: engineering their plasmonic properties for biomedicalapplications
Min Hu,ae Jingyi Chen,a Zhi-Yuan Li,b Leslie Au,a Gregory V. Hartland,c Xingde Li,d Manuel Marqueze andYounan Xia*a
Received 6th July 2006
First published as an Advance Article on the web 6th September 2006
DOI: 10.1039/b517615h
The surface plasmon resonance peaks of gold nanostructures can be tuned from the visible to the
near infrared region by controlling the shape and structure (solid vs. hollow). In this tutorial
review we highlight this concept by comparing four typical examples: nanospheres, nanorods,
nanoshells, and nanocages. A combination of this optical tunability with the inertness of gold
makes gold nanostructures well suited for various biomedical applications.
Introduction
Gold nanostructures have been a subject of intensive research
for their fascinating surface plasmon resonance (SPR) proper-
ties. What is SPR?1 It is an optical phenomenon arising from
the interaction between an electromagnetic wave and the
conduction electrons in a metal. Under the irradiation of light,
the conduction electrons in a gold nanostructure are driven by
the electric field to collectively oscillate at a resonant frequency
relative to the lattice of positive ions. At this resonant
frequency, the incident light is absorbed by the nanostructure.
Some of these photons will be released with the same frequency
in all directions and this process is known as scattering. At the
same time, some of these photons will be converted into
phonons or vibrations of the lattice and this process is referred
to as absorption. In general, the SPR peak of a gold
nanostructure should include both scattering and absorption
components. The cross-sections of these two components can
be substantially different depending on the size and shape of
the nanostructure. For gold nanospheres about 50 nm in
diameter, the SPR peak is positioned at 520 nm, and this peak
is responsible for the ruby red colour displayed by conven-
tional gold colloids.2 Michael Faraday was the first person to
observe this spectacular phenomenon. In 1857, he prepared the
first stable suspension of gold colloids by reducing gold
chloride with phosphorus in water.3 Some of his original
samples are still preserved and on display at the Faraday
Museum in London.
The SPR spectra of gold nanostructures can be calculated by
solving Maxwell’s equations. For spherical particles, this was
accomplished in 1908 by Gustav Mie, a German physicist.4 In
1912, Richard Gans modified the Mie theory to include
spheroids.5 Later, the capability of this theory was further
extended to cover a number of other simple systems.6 These
days, one can still use the formulas derived by Mie to
conveniently compute the SPR spectra (including both
scattering and absorption) of a spherical particle in any size.
However, since exact solutions to Maxwell’s equations are
known only for spheres, concentric spherical shells, spheroids,
and infinite cylinders, an approximation is required to solve
the equations for other geometries. The approximation of
aDepartment of Chemistry, University of Washington, Seattle,WA 98195-1700, USA. E-mail: [email protected] of Physics, Chinese Academy of Sciences, Beijing 100080, P.R. ChinacDepartment of Chemistry and Biochemistry, University of Notre Dame,Notre Dame, IN 46556-5670, USAdDepartment of Bioengineering, University of Washington, Seattle,WA 98195, USAeINEST Group, Research Center, Philip Morris Inc., Richmond,VA 23234, USA
Min Hu received his BS inM a t e r i a l S c i e n c e a n dE n g i n e e r i n g f r o m t h eUniversity of Science andTechnology of China (USTC)in 2000. He received his PhD inphysical chemistry from theUniversity of Notre Dame(with Professor Gregory V.Hartland) in 2005. He is cur-rently a Philip Morris USAINEST postdoctoral fellowwith Marquez and Xia.
Jingyi Chen received her BSdegree in 1997 from the SunYat-Sen University in Chinaand her MA degree (withP r o f e s s o r K i m b e r l y A .Bagley) in 2002 from theDepartment of Chemistry,SUNY College at Buffalo.She is currently a PhD candi-date in chemistry with Xia.
Min Hu Jingyi Chen
TUTORIAL REVIEW www.rsc.org/csr | Chemical Society Reviews
1084 | Chem. Soc. Rev., 2006, 35, 1084–1094 This journal is � The Royal Society of Chemistry 2006
choice is based upon discrete dipole approximation (DDA). In
principle, this numerical approach can be easily applied to gold
nanostructures of any arbitrary shape.7
The SPR properties of gold nanostructures have found use
in a rich variety of applications. Gold nanospheres, for
example, have been used to make colourful glasses for over
one thousand years. This is probably the first practical
application of nanomaterials in history, although clearly the
people who made the glasses had no idea about the mechanism
of colouration. Another astonishing example comes from the
Lycurgus cup (Roman 400 A.D.) which reflects green light and
transmits ruby red light. This is again built upon the unique
scattering and absorption properties of gold nanospheres
embedded in the glass. In addition to these ancient demonstra-
tions, gold colloids have also found extensive use in
contemporary techniques such as colorimetric sensing8 and
surface-enhanced Raman scattering (SERS).9 This tutorial
review mainly focuses on the biomedical applications derived
from the scattering and/or absorption power of gold nano-
structures. A common feature of these applications is the use
of near infrared light (800 nm to 1200 nm) to achieve deep
penetration into soft tissues.10 We begin with gold nanospheres
to introduce the Mie theory, and then use nanorods, nano-
shells, and nanocages as three typical examples to illustrate
how their plasmonic peaks can be shifted from the visible to
the near infrared region by engineering their shapes and
structures (i.e., solid vs. hollow). At the end, we highlight two
innovative applications enabled by these novel gold nano-
structures: optical contrast enhancement and photothermal
treatment.
Gold nanospheres
Nanoparticles prepared in a solution phase tend to have a
spherical shape because this shape has the smallest surface area
relative to objects of other shapes (when the volume is fixed). It
is worth noting that most of the gold nanospheres reported in
literature are not in a truly spherical shape. They are multiply
twinned particles with a more or less rounded profile and with
facets on the surface. In a sense, these particles should be
correctly called quasi-spheres. One of the most popular
protocols for preparing gold nanospheres is based on the
Professor Zhi-Yuan Li receivedhis BS in optoelectronics fromthe University of Science andTechnology of China (USTC)in 1994 and then worked as agraduate student on photoniccrystals and near-field optics atthe Institute of Physics,Chinese Academy of Sciences.After obtaining his PhD degreein 1999, he worked as a post-doctoral fellow at the HongKong University of Sciencea n d T e c h n o l o g y , t h eUniversity of Washington, andthe Ames National Laboratory.
He is currently a professor in the Institute of Physics at theChinese Academy of Sciences in Beijing.
Lesl ie Au attended theUniversity of Washington andgraduated in 2005 with adouble BS degree in chemistryand biology. She is currently aPhD candidate in chemistrywith Xia.
Zhi-Yuan Li Leslie Au
Professor Gregory V. Hartlandreceived his BSc in 1985 fromthe University of Melbourne,Australia. He obtained his PhDin physical chemistry from theUniversity of California at LosAngeles (with Professor PeterFelker) in 1991. He thenworked as a postdoctoral fellowa t t h e U n i v e r s i t y o fPennsylvania (1991–94) withProfessor Hai-Lung Dai. Hejoined the faculty at theUniversity of Notre Dame in1994. He was promoted toAssociate Professor in 2000
and Professor in 2004. He is currently a member of theAdvisory Boards for the Journal of Physical Chemistry andPhysical Chemistry Chemical Physics.
Professor Xingde Li receivedhis BS degree in physics fromthe University of Science andTechnology of China (USTC)in 1990. He received his PhDdegree in physics from theUniversity of Pennsylvania(with Professor Arjun G.Yodh) in 1998. He thenworked as a postdoctoral fel-low at MIT (with ProfessorJames G. Fujimoto). Hestarted as an AssistantProfessor of Bioengineeringa t t h e U n i v e r s i t y o fWashington in 2001.
Gregory V. Hartland Xingde Li
This journal is � The Royal Society of Chemistry 2006 Chem. Soc. Rev., 2006, 35, 1084–1094 | 1085

reduction of HAuCl4 by citrate in water, which was first
described in 1951 by Turkevitch and is now commonly referred
to as the ‘‘Turkevitch method’’.11 In this method, citrate serves
as both a reducing agent and an anionic stabilizer. It yields
15 nm nanospheres with a fairly narrow size distribution
through the following reaction:
6AuCl42 + C6H8O7 + 5H2O )
6CO2 + 24Cl2 + 6Au0 + 18H+ (i)
The Turkevitch method has been modified by a number of
groups to produce gold nanospheres with diameters ranging
from 15 to 150 nm by either controlling the ratio of citrate to
HAuCl412 or employing a c-radiation method.13 Other
reduction methods have also been developed to achieve a
better control over the size and size uniformity, including the
‘‘Schmid method’’ published in 198114 and the ‘‘Brust–
Schiffrin method’’ reported in 1994.15 Seed-mediated growth
is another technique frequently used for producing spherical
nanoparticles of different sizes. Recently, Murphy and co-
workers have demonstrated that the size of gold nanospheres
could be tuned from 5 to 40 nm by controlling the ratio
between the seed and the precursor.16 Gold nanorods can also
be conveniently generated by employing the seed-mediated
growth method (vide infra). Because of space limit, readers
who are interested in the synthesis of gold nanospheres can
further refer to a recent review by Daniel and Astruc.17
The ruby red colour displayed by suspension of gold
spherical nanoparticles can be quantitatively explained by
considering the scattering of an electromagnetic wave from the
nanoparticles. The light scattering theory falls into two
categories.18 The first one was developed by Lord Rayleigh,
which is only applicable to small, spherical particles made of a
dielectric (non-absorbing) material. The second one was
derived by Gustav Mie, which represents a generic solution
to scattering and it can be applied to spherical particles of any
size and composed of an absorbing or non-absorbing material.
Thus, Mie theory is most useful in describing the optical
properties of metallic spherical particles. Mie theory is the
exact solution to Maxwell’s electromagnetic field equations for
a plane wave interacting with a homogenous sphere of radius
R with the same dielectric constant as bulk metal. The
extinction cross-section (Cext) of the spheres can be obtained
as a series of multipole oscillations if the boundary conditions
are specified. The extinction efficiency factor Qext is defined as
the ratio of the extinction cross-section to the physical cross-
sectional area (pR2), and it is a sum of both scattering and
absorption. In a more specific case, when the diameter of the
spherical particle is much smaller than the wavelength of the
radiation (2R % l) and only dipole oscillation contributes to
the extinction cross-section, the electrodynamic calculation can
be simplified by ignoring high order terms. This gives the most
popular form of Mie theory for spherical particles:1
Cext~24p2R3e
3=2m
l
e2
e1z2emð Þ2ze22
(1)
In this equation, em is the dielectric constant of the
surrounding medium, e = e1 + ie2 is the complex dielectric
constant of the particle. From eqn (1), a resonance peak occurs
whenever the condition of e1 = 22em is satisfied. This is the
SPR peak which accounts for the brilliant colours of various
metal nanoparticles.
Fig. 1 shows the extinction spectra calculated using Mie
theory for gold nanospheres of different sizes. Their SPR
peaks are located at ca. 520 nm. The peak slightly shifts to the
red and becomes broader as the particle diameter increases to
100 nm. The broadening can be attributed to enhanced
Dr Manuel Marquez receivedhis BSc and MSc degrees inchemistry from Simon BolivarUniversity in Venezuela. Heobtained his PhD in organicchemistry from Yale Universityin 1996 (with ProfessorKenneth Wiberg). He was aCAPIT Postdoctoral Fellowwith Professor Steve Suib atUConn. In late 1999 heaccepted a position as director(and founder) of the NanoteKConsortium (sponsored byKraft Foods R&D). In 2005he moved to PMUSA where he
currently is the Group Leader of the Interdisciplinary Network ofEmerging Science and Technologies (INEST). He is an AdjunctProfessor in the Harrington Department of Bioengineering atArizona State University as well as in the MechanicalEngineering, VCU, Richmond, VA. He is also a GuestScientist at the Center for Theoretical and ComputationalNanosciences, NIST, and at the Nanotechnology Center, LosAlamos National Laboratory. His major areas of researchinclude molecular engineering, nanotechnology, nanoscale prop-erties and microfluidics.
P r o f e s s o r Y o u n a n X i areceived his BS in chemicalphysics from the University ofScience and Technology ofChina (USTC) in 1987. Hereceived his MS degree ininorganic chemistry from theUniversity of Pennsylvania(with Professor Alan G.MacDiarmid) in 1993, andPhD degree in physical chem-istry from Harvard University(with Professor George M.Whitesides) in 1996, afterwhich he stayed at Harvardand worked as a postdoctoral
fellow with Professors George M. Whitesides and Mara Prentiss.He started at the University of Washington as an AssistantProfessor of Chemistry in 1997 and was promoted to Professor in2004. His research interests include nanostructured materials,photonic crystals, colloidal chemistry, self-assembly, surfacemodification, electrospinning, microfabrication, magnetic nano-particles, and novel devices for photonics, optoelectronics, anddisplays.
Manuel Marquez Younan Xia
1086 | Chem. Soc. Rev., 2006, 35, 1084–1094 This journal is � The Royal Society of Chemistry 2006
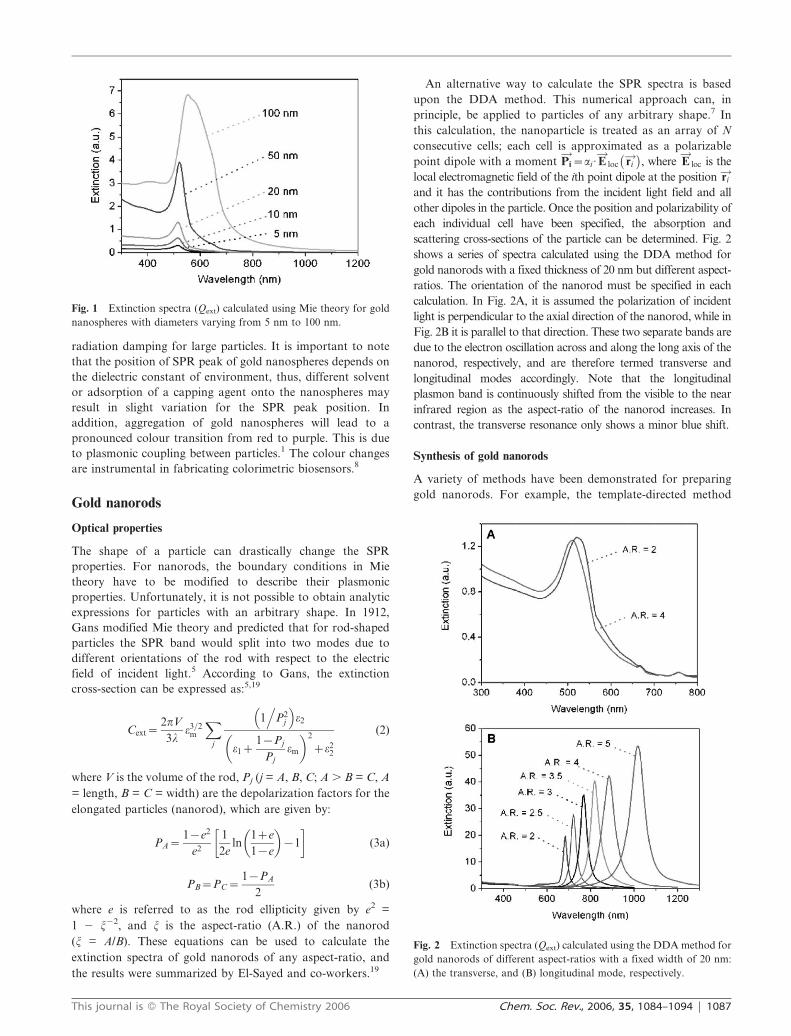
radiation damping for large particles. It is important to note
that the position of SPR peak of gold nanospheres depends on
the dielectric constant of environment, thus, different solvent
or adsorption of a capping agent onto the nanospheres may
result in slight variation for the SPR peak position. In
addition, aggregation of gold nanospheres will lead to a
pronounced colour transition from red to purple. This is due
to plasmonic coupling between particles.1 The colour changes
are instrumental in fabricating colorimetric biosensors.8
Gold nanorods
Optical properties
The shape of a particle can drastically change the SPR
properties. For nanorods, the boundary conditions in Mie
theory have to be modified to describe their plasmonic
properties. Unfortunately, it is not possible to obtain analytic
expressions for particles with an arbitrary shape. In 1912,
Gans modified Mie theory and predicted that for rod-shaped
particles the SPR band would split into two modes due to
different orientations of the rod with respect to the electric
field of incident light.5 According to Gans, the extinction
cross-section can be expressed as:5,19
Cext~2pV
3le3=2
m
X
j
1.
P2j
� �e2
e1z1{Pj
Pj
em
� �2
ze22
(2)
where V is the volume of the rod, Pj (j = A, B, C; A . B = C, A
= length, B = C = width) are the depolarization factors for the
elongated particles (nanorod), which are given by:
PA~1{e2
e2
1
2eln
1ze
1{e
� �{1
� �(3a)
PB~PC~1{PA
2(3b)
where e is referred to as the rod ellipticity given by e2 =
1 2 j22, and j is the aspect-ratio (A.R.) of the nanorod
(j = A/B). These equations can be used to calculate the
extinction spectra of gold nanorods of any aspect-ratio, and
the results were summarized by El-Sayed and co-workers.19
An alternative way to calculate the SPR spectra is based
upon the DDA method. This numerical approach can, in
principle, be applied to particles of any arbitrary shape.7 In
this calculation, the nanoparticle is treated as an array of N
consecutive cells; each cell is approximated as a polarizable
point dipole with a moment Pi!
~ai:E!
loc ri!� �
, where E!
loc is the
local electromagnetic field of the ith point dipole at the position ri!
and it has the contributions from the incident light field and all
other dipoles in the particle. Once the position and polarizability of
each individual cell have been specified, the absorption and
scattering cross-sections of the particle can be determined. Fig. 2
shows a series of spectra calculated using the DDA method for
gold nanorods with a fixed thickness of 20 nm but different aspect-
ratios. The orientation of the nanorod must be specified in each
calculation. In Fig. 2A, it is assumed the polarization of incident
light is perpendicular to the axial direction of the nanorod, while in
Fig. 2B it is parallel to that direction. These two separate bands are
due to the electron oscillation across and along the long axis of the
nanorod, respectively, and are therefore termed transverse and
longitudinal modes accordingly. Note that the longitudinal
plasmon band is continuously shifted from the visible to the near
infrared region as the aspect-ratio of the nanorod increases. In
contrast, the transverse resonance only shows a minor blue shift.
Synthesis of gold nanorods
A variety of methods have been demonstrated for preparing
gold nanorods. For example, the template-directed method
Fig. 2 Extinction spectra (Qext) calculated using the DDA method for
gold nanorods of different aspect-ratios with a fixed width of 20 nm:
(A) the transverse, and (B) longitudinal mode, respectively.
Fig. 1 Extinction spectra (Qext) calculated using Mie theory for gold
nanospheres with diameters varying from 5 nm to 100 nm.
This journal is � The Royal Society of Chemistry 2006 Chem. Soc. Rev., 2006, 35, 1084–1094 | 1087

pioneered by Martin and others,20 the electrochemical method
introduced by Wang,21 the seed-mediated growth method
demonstrated by Murphy,22 and the photochemical reduction
method recently reported by Yang.23 This review only covers
the electrochemical and seed-mediated growth methods as
these two methods have been commonly used.
Electrochemical method. This synthesis can be conducted in
a simple, two-electrode cell, with a gold plate serving as the
anode and a platinum plate as the cathode. Both metal
electrodes are immersed in an electrolyte solution that contains
a mixture of surfactants such as hexadecyltrimethylammonium
bromide (C16TAB) and tetradodecylammonium bromide
(TC12AB). The C16TAB serves not only as a supporting
electrolyte but also as a capping agent to prevent the
nanoparticles from lateral growth while the TC12AB acts as
a rod-inducing agent. The electrolytic cell is then placed in an
ultrasonic bath. A small amount of acetone and cyclohexane
are added into the electrolytic solution before electrolysis.
Acetone is used for weakening the micellar framework, and
cyclohexane is necessary for facilitating the formation of
elongated, rod-like C16TAB micelles.24 Electrolysis is carried
out under a constant current mode for a typical period of
20 min. During the synthesis, the bulk gold metal is converted
from the anode to gold complex ions AuBr42, and these ions
are driven by the current to the cathode. The reduction
reaction takes place at the interfacial region between the
cathode and the electrolytic solution. The gold complex ions
may also combine with the cationic surfactants to facilitate the
formation of rod-like gold nanoparticles.
To better control the aspect-ratio of the gold nanorods, an
additional silver plate is added to the electrolytic solution. The
AuBr42 produced from the anode oxidizes the silver metal to
ions (in the form of AgBr), and it is found that the
concentration of silver ions and their release rate can affect
the length of the nanorods. However, the detailed mechanism
is still not very clear. Yang and co-workers proposed a
mechanism to account for the role of the silver ions in the
synthesis of gold nanorods using a photochemical method.23
Briefly, silver exists in either AgBr or neutral cluster forms
because of the competition between the photoreduction and
chemical reactions with AuCl42. This redox dynamics
modulates the nascent surface of gold nanocrystals that are
produced by UV reduction, and subsequently the growth rate
along a particular direction is enhanced. It is believed by these
authors that this mechanism is also shared by the electro-
chemical method when a silver electrode is involved.23
Seed-mediated growth method. A number of groups reported
the use of seeds to facilitate the formation of monodispersed
gold nanorods. Different reducing regents can be employed,
such as hydroxylamine, sodium citrate, and ascorbic acid. A
systematic study has recently been reported by Murphy and
co-workers.25 In a typical process, a solution of 3.5 nm gold
seed particles is first prepared by reducing HAuCl4 with
sodium borohydride (NaBH4) in the presence of citrate, which
serves only as the capping agent since it cannot reduce gold salt
at room temperature. A growth solution containing HAuCl4and C16TAB is mixed with freshly prepared ascorbic acid
solution (a mild reductant) and then added to a seed solution
to generate gold nanorods. Although gold nanospheres are
also formed in this synthesis, they can be readily removed
(together with the excess surfactants) via centrifugation. Most
recently, Mulvaney and co-workers investigated the factors
affecting the formation of gold nanorods and modified the
solution-phase synthesis to adjust the length of the rods from
25–170 nm.26 Fig. 3 shows a typical TEM image of the gold
nanorods as well as UV–Vis extinction spectra of such
nanorods with different aspect-ratios from the Mulvaney
group.27 Note that the optical features of these experimentally
synthesized nanorods are consistent with the spectra calculated
using the DDA method.
The mechanism for the formation of rod-like nanoparticles
in an aqueous surfactant medium has been investigated by
several groups.28,29 It was proposed that the trimethylammo-
nium head group of C16TAB can selectively bind to specific
crystallographic facets of the seeds and/or rods, while the tails
of C16TAB can form a bilayer structure with each other
through van der Waals interactions. These bilayers play an
important role in promoting the formation of nanorods.28
Experimental studies found that surfactants with longer chain
lengths led to longer rods with higher yields as compared to
shorter ones. Due to the limit of space, readers are encouraged
to learn more current research into gold nanorods in a recent
review.30
Gold nanoshells
Based on calculation, Neeves and Birnboim proposed in 1989
that a composite spherical particle consisting of a metallic shell
and a dielectric core could give rise to SPR modes with their
wavelengths tunable over a broad range of the electromagnetic
spectrum.31 Halas and co-workers were the first to produce
gold nanoshells with SPR peaks in the near-infrared region by
coating silica beads with gold shells of variable thickness.32
They further demonstrated that the SPR peaks of gold
nanoshells could be conveniently tuned by controlling the
Fig. 3 UV–visible absorption spectra of Au nanorods with different
aspect-ratios synthesized via citrate-capped seeds. The longitudinal
peak shifts to the near-IR region as the amount of Au seeds decreases.
The average lengths (L) and widths (w) for the different spectra are as
follows: (a) L = 46 ¡ 6 nm, w = 20.7 ¡ 2.3 nm; (b) L = 61 ¡ 5 nm, w =
21.5 ¡ 1.9 nm; (c) L = 73 ¡ 4 nm, w = 22.1 ¡ 1.5 nm; (d) L = 75 ¡
6 nm, w = 22.4 ¡ 1.7 nm; (e) L = 89 ¡ 7 nm, w = 22.2 ¡ 2.0 nm; (f)
L = 108 ¡ 7 nm, w = 22.8 ¡ 1.6 nm. The right panel shows a
representative TEM image of the sample corresponding to spectrum-f.
1088 | Chem. Soc. Rev., 2006, 35, 1084–1094 This journal is � The Royal Society of Chemistry 2006
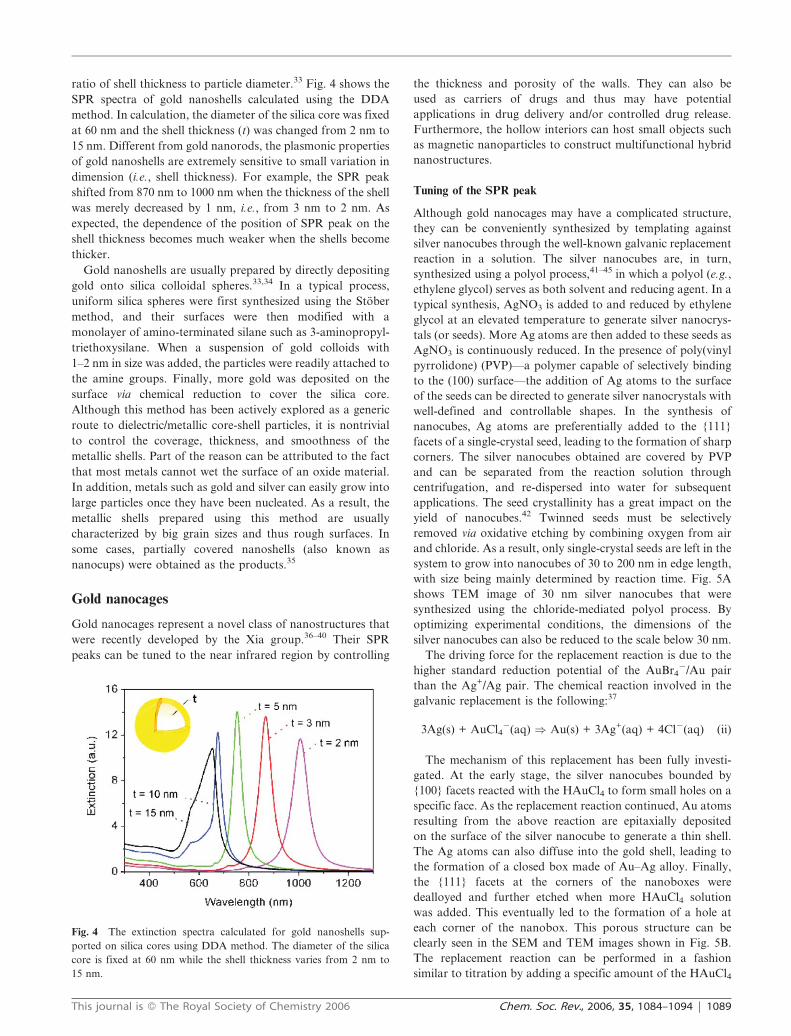
ratio of shell thickness to particle diameter.33 Fig. 4 shows the
SPR spectra of gold nanoshells calculated using the DDA
method. In calculation, the diameter of the silica core was fixed
at 60 nm and the shell thickness (t) was changed from 2 nm to
15 nm. Different from gold nanorods, the plasmonic properties
of gold nanoshells are extremely sensitive to small variation in
dimension (i.e., shell thickness). For example, the SPR peak
shifted from 870 nm to 1000 nm when the thickness of the shell
was merely decreased by 1 nm, i.e., from 3 nm to 2 nm. As
expected, the dependence of the position of SPR peak on the
shell thickness becomes much weaker when the shells become
thicker.
Gold nanoshells are usually prepared by directly depositing
gold onto silica colloidal spheres.33,34 In a typical process,
uniform silica spheres were first synthesized using the Stober
method, and their surfaces were then modified with a
monolayer of amino-terminated silane such as 3-aminopropyl-
triethoxysilane. When a suspension of gold colloids with
1–2 nm in size was added, the particles were readily attached to
the amine groups. Finally, more gold was deposited on the
surface via chemical reduction to cover the silica core.
Although this method has been actively explored as a generic
route to dielectric/metallic core-shell particles, it is nontrivial
to control the coverage, thickness, and smoothness of the
metallic shells. Part of the reason can be attributed to the fact
that most metals cannot wet the surface of an oxide material.
In addition, metals such as gold and silver can easily grow into
large particles once they have been nucleated. As a result, the
metallic shells prepared using this method are usually
characterized by big grain sizes and thus rough surfaces. In
some cases, partially covered nanoshells (also known as
nanocups) were obtained as the products.35
Gold nanocages
Gold nanocages represent a novel class of nanostructures that
were recently developed by the Xia group.36–40 Their SPR
peaks can be tuned to the near infrared region by controlling
the thickness and porosity of the walls. They can also be
used as carriers of drugs and thus may have potential
applications in drug delivery and/or controlled drug release.
Furthermore, the hollow interiors can host small objects such
as magnetic nanoparticles to construct multifunctional hybrid
nanostructures.
Tuning of the SPR peak
Although gold nanocages may have a complicated structure,
they can be conveniently synthesized by templating against
silver nanocubes through the well-known galvanic replacement
reaction in a solution. The silver nanocubes are, in turn,
synthesized using a polyol process,41–45 in which a polyol (e.g.,
ethylene glycol) serves as both solvent and reducing agent. In a
typical synthesis, AgNO3 is added to and reduced by ethylene
glycol at an elevated temperature to generate silver nanocrys-
tals (or seeds). More Ag atoms are then added to these seeds as
AgNO3 is continuously reduced. In the presence of poly(vinyl
pyrrolidone) (PVP)—a polymer capable of selectively binding
to the (100) surface—the addition of Ag atoms to the surface
of the seeds can be directed to generate silver nanocrystals with
well-defined and controllable shapes. In the synthesis of
nanocubes, Ag atoms are preferentially added to the {111}
facets of a single-crystal seed, leading to the formation of sharp
corners. The silver nanocubes obtained are covered by PVP
and can be separated from the reaction solution through
centrifugation, and re-dispersed into water for subsequent
applications. The seed crystallinity has a great impact on the
yield of nanocubes.42 Twinned seeds must be selectively
removed via oxidative etching by combining oxygen from air
and chloride. As a result, only single-crystal seeds are left in the
system to grow into nanocubes of 30 to 200 nm in edge length,
with size being mainly determined by reaction time. Fig. 5A
shows TEM image of 30 nm silver nanocubes that were
synthesized using the chloride-mediated polyol process. By
optimizing experimental conditions, the dimensions of the
silver nanocubes can also be reduced to the scale below 30 nm.
The driving force for the replacement reaction is due to the
higher standard reduction potential of the AuBr42/Au pair
than the Ag+/Ag pair. The chemical reaction involved in the
galvanic replacement is the following:37
3Ag(s) + AuCl42(aq) ) Au(s) + 3Ag+(aq) + 4Cl2(aq) (ii)
The mechanism of this replacement has been fully investi-
gated. At the early stage, the silver nanocubes bounded by
{100} facets reacted with the HAuCl4 to form small holes on a
specific face. As the replacement reaction continued, Au atoms
resulting from the above reaction are epitaxially deposited
on the surface of the silver nanocube to generate a thin shell.
The Ag atoms can also diffuse into the gold shell, leading to
the formation of a closed box made of Au–Ag alloy. Finally,
the {111} facets at the corners of the nanoboxes were
dealloyed and further etched when more HAuCl4 solution
was added. This eventually led to the formation of a hole at
each corner of the nanobox. This porous structure can be
clearly seen in the SEM and TEM images shown in Fig. 5B.
The replacement reaction can be performed in a fashion
similar to titration by adding a specific amount of the HAuCl4
Fig. 4 The extinction spectra calculated for gold nanoshells sup-
ported on silica cores using DDA method. The diameter of the silica
core is fixed at 60 nm while the shell thickness varies from 2 nm to
15 nm.
This journal is � The Royal Society of Chemistry 2006 Chem. Soc. Rev., 2006, 35, 1084–1094 | 1089

solution to the suspension of silver nanocubes. The size of the
holes and the thickness of the walls can be easily adjusted by
controlling the molar ratio of silver nanocubes to HAuCl4.
It is important to note that the galvanic replacement
method can also be easily extended to templates in other
shapes such as spheres and nanorods to produce a variety of
functional nanostructures including single- or multiple-walled
nanotubes.37
The SPR peaks of gold nanocages can be tuned by
controlling the degree of galvanic replacement reaction to
generate walls of different thicknesses and porosities. Fig. 6
shows aqueous solutions containing the gold nanocages, as
well as their UV–Vis extinction spectra. The solutions were
prepared by titrating 30 nm silver nanocubes with different
volumes of 1 mM HAuCl4 solution. It is clear that the
positions of these SPR peaks could be continuously shifted
from the visible (ca. 400 nm for silver nanocubes) to the near
infrared region up to 1200 nm. Our DDA calculations indicate
that the gold nanocages synthesized using the replacement
reaction also have extremely large scattering and absorption
cross-sections, implying their potential applications in biome-
dical imaging and photothermal therapy.38–40
Applications of gold nanostructures
The strong dependence of SPR peaks on local environment, as
predicted by Mie theory and observed in many experiments,
have made gold nanostructures attractive candidates for
colorimetric sensors.8,46 The great sensitivity of the SPR peaks
also makes gold nanoparticles well-suited for bioassay
applications.47 The nanoparticle–protein conjugate structures
include either direct binding of antigen or exposure of an
antibody-derived surface to free antigen and then to a
secondary antibody–Au–nanoparticle conjugate. This type of
immunoassay has allowed the development of gold nanopar-
ticle tags for antigen detection.48 Analytes such as DNA, metal
ions, and antibodies can all be detected by observing the visible
colour changes due to metal nanoparticle aggregation. The
detection mechanism is based on the change in optical
properties due to plasmon–plasmon interaction between
adjacent gold nanoparticles, which yields a colour change
from characteristic ruby-red of gold colloid to a blue-purple
color upon colloid aggregation. Because of the large scattering
cross-sections of gold nanostructures, the Rayleigh resonance
scattering can be detected using dark field microscopy. Van
Duyne and co-workers recently demonstrated the use of gold
nanoparticles as ‘‘light scattering biochips’’ for the selective
detection of biomolecules.49 Due to extremely large enhance-
ment of the local electromagnetic field, the metal nanoparticles
have been widely used as the substrates for surface-enhanced
Raman scattering (SERS). This enhancement arises from two
major mechanisms. The first one has a chemical origin, which
is due to the formation of a charge-transfer complex between
the surface and the analyte molecule. The second one can be
attributed to the enhancement in electromagnetic field as a
result of strong surface plasmon resonance of metal nanopar-
ticle. The second mechanism plays a crucial role in the
amplification of both the incident laser field and the scattered
Raman field through their interaction with particle surface.
Readers interested in SERS are recommended to explore more
details from many reviews and books available on this
subject.50 Furthermore, the high absorption cross-section of
gold nanoparticles has also enabled them to assist drug
Fig. 5 (A) TEM image of the as-synthesized silver nanocubes with an
edge length on the scale of 30 nm. (B) SEM image of gold nanocages
(nanoboxes with truncated corners) prepared by refluxing an aqueous
solution containing both silver nanocubes and HAuCl4. The inset
shows a TEM image of these hollow, porous nanostructures.
Fig. 6 Upper panel: vials containing gold nanocages (suspended in
water) that were prepared by titrating silver nanocubes with different
volumes of HAuCl4 solution. Lower panel: extinction spectra recorded
from aqueous suspensions of these gold nanocages, with the volume of
HAuCl4 solution labelled on each curve.
1090 | Chem. Soc. Rev., 2006, 35, 1084–1094 This journal is � The Royal Society of Chemistry 2006
delivery. For example, Halas and co-workers have shown that
gold nanoshells loaded in hydrogels absorbed the near-infrared
light, and the heat generated from the absorption caused the
hydrogels to collapse, thus producing a modulated release of a
soluble drug trapped in the hydrogel matrix.51 For all these
applications, it is an advantage to operate in the near-infrared
region, a transparent window for blood and other types of
biological samples.
Contrast enhancement for optical imaging
Like gold nanorods and nanoshells, the optical properties of
gold nanocages can be precisely tuned to the specific
wavelength in the electromagnetic spectrum. Compared with
the former two nanostructures, nanocages can have stronger
absorption in the near infrared while maintaining their relative
small dimensions (e.g., 30 nm in edge length). This feature
makes gold nanocages a class of ideal contrast enhancement
agents for use with optical imaging modalities like optical
coherence tomography (OCT).38 OCT is a technique based on
the Michelson interferometer, which measures the interference
signal between light backscattered from the sample and a
reference beam. It is receiving great attention for its ability to
perform high-resolution, non-invasive optical biopsies of tissue
microanatomy. In conventional OCT, the envelope of inter-
ference fringes as well as the peak intensity of the envelope is
displayed for tomographic imaging. Spectroscopic optical
coherence tomography (SOCT), a technique for revealing the
wavelength-dependent backscattering at a given position,
measures the interference fringes (rather than the envelope).
Spatially resolved spectra can be obtained by short-time
Fourier transform (STFT) of the interferogram.39 For both
OCT and SOCT, the image contrast is mainly governed by
intrinsic optical absorption and scattering of biological tissues.
As a result, it is hard to resolve the minor morphological
changes involved in the early stage development of a disease.
To demonstrate the potential of gold nanocages as contrast
enhancement agents, both OCT and SOCT were performed on
phantom samples with and without gold nanocages. The size
of the nanocages is 35 nm and their SPR peak was tuned to
700 nm, which is on the blue side of the OCT source spectrum.
Each phantom is made of gelatine embedded with TiO2
granules to mimic the background scattering of typical
biological tissues. In addition, the phantom is partially doped
with gold nanocages at nM concentration. The OCT and
SOCT imaging are conducted using a 7-fs Ti:Sapphire laser
with a spectrum range from 700 nm to around 900 nm and the
central wavelength is at 825 nm. As the laser was scanned over
the tissue phantom, the intensity of back-scattered light was
measured as a function of depth. Because of the intense
absorption of the gold nanocages, a strong modulation of the
back-scattered spectrum can be observed on the blue side, i.e.,
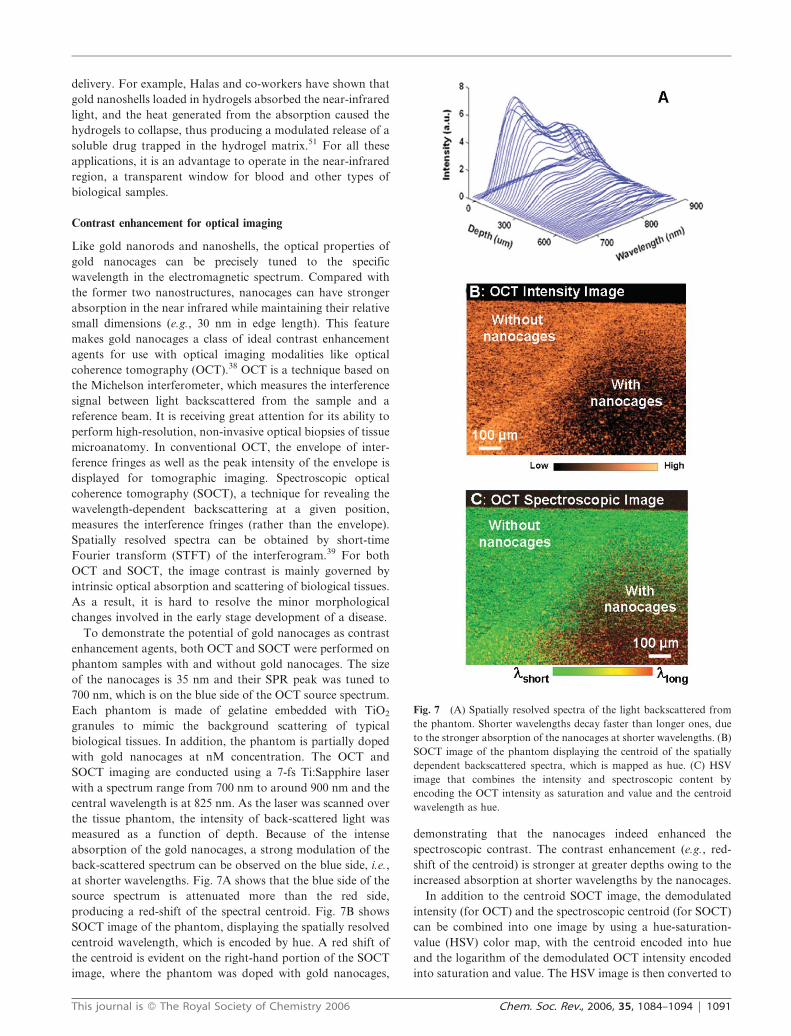
at shorter wavelengths. Fig. 7A shows that the blue side of the
source spectrum is attenuated more than the red side,
producing a red-shift of the spectral centroid. Fig. 7B shows
SOCT image of the phantom, displaying the spatially resolved
centroid wavelength, which is encoded by hue. A red shift of
the centroid is evident on the right-hand portion of the SOCT
image, where the phantom was doped with gold nanocages,
demonstrating that the nanocages indeed enhanced the
spectroscopic contrast. The contrast enhancement (e.g., red-
shift of the centroid) is stronger at greater depths owing to the
increased absorption at shorter wavelengths by the nanocages.
In addition to the centroid SOCT image, the demodulated
intensity (for OCT) and the spectroscopic centroid (for SOCT)
can be combined into one image by using a hue-saturation-
value (HSV) color map, with the centroid encoded into hue
and the logarithm of the demodulated OCT intensity encoded
into saturation and value. The HSV image is then converted to
Fig. 7 (A) Spatially resolved spectra of the light backscattered from
the phantom. Shorter wavelengths decay faster than longer ones, due
to the stronger absorption of the nanocages at shorter wavelengths. (B)
SOCT image of the phantom displaying the centroid of the spatially
dependent backscattered spectra, which is mapped as hue. (C) HSV
image that combines the intensity and spectroscopic content by
encoding the OCT intensity as saturation and value and the centroid
wavelength as hue.
This journal is � The Royal Society of Chemistry 2006 Chem. Soc. Rev., 2006, 35, 1084–1094 | 1091
a RGB (red-green-blue) image as shown in Fig. 7C, where a
change in hue (i.e., a red-shift) is accompanied by a decrease in
image intensity in the right-hand portion of the image. On the
other hand, the extinction cross-section of the gold nanocages
can be quantified from the depth-dependent OCT intensity. To
avoid contributions from multiple wavelengths to the extinc-
tion cross-section, only one wavelength at the resonance peak
of the nanocages is presented. The depth-dependent OCT
backscattered intensity at a single wavelength can be readily
obtained from the spectroscopic OCT analysis. For the 35 nm
gold nanocages, the absorption cross section determined from
the experiments was 1.13 6 10214 m2, which is about 5 orders
stronger than conventional dyes such as Indocyanine Green
(ICG). This absorption cross section is of the same order of
magnitude as gold nanoshells. However, the dimension of the
nanocages is much smaller than the nanoshells. These results
suggest that gold nanocages can serve as an excellent candidate
of absorption contrast agents for OCT imaging. The extremely
large absorption cross sections also indicate their use as an
effective photothermal therapeutic agent.
Photothermal effect
Gold nanocages can be easily bioconjugated with antibodies
for selective targeting of cancer cells. Exposure of the
nanocages to light can convert the absorbed photons into
phonons, leading to a temperature increase of the lattice. Heat
dissipation from the hot particles may selectively cause
damages to the targeted cancer cells.40 This phenomenon is
referred to as the photothermal effect of the metal nano-
particles and such an effect has been studied in an initial
experiment by exposing gold nanocages supported on a copper
grid to a camera flash. Each flash of light increased the
temperature of the nanocages because they absorbed the
incident photons. After exposure, the Au nanocages were
transformed into solid spherical particles, indicating that the
absorbed energies generated a lattice temperature beyond the
melting point of the nanocages. This photothermally reshaping
of the nanocages was attributed to the poor thermal
conductivities of the surrounding materials (e.g., air and thin
carbon film on the TEM grid) which were in contact with the
Au nanocages.
In biological system, the tissues and cells are essentially in a
water environment, thus, the photothermal effect will be
different. The photothermal properties of gold nanocages in an
aqueous solution have been studied using ultrafast laser
spectroscopy (or time-resolved spectroscopy).52 In a typical
experiment, a short pulse from a regeneratively amplified
Ti:Sapphire laser was split into two components: pump and
probe beams. The pump laser perturbs the absorption of the
nanocages solution while the probe laser monitors the
transient absorption induced by the former. The intense pump
laser pulse excites the electrons and induces a hot electron
distribution. Due to the small value for heat capacity of
electrons, the temperature of the electron distribution can
be very high. The electrons subsequently equilibrate with
the lattice through an electron–phonon (e-ph) coupling
process. This often occurs on a picosecond timescale, and
has been extensively studied for spherical particles. Once the
temperature of the electrons and lattice have equilibrated, the
energy is transferred to the surroundings—which is water in
the experiments—on a ten-to-hundred picoseconds timescale.
On the other hand, the energy deposited by the laser pulses is
channelled into the phonon mode. This increases the
temperature of the lattice and causes the particle to expand.
The time scale for heating is faster than the period of the
phonon mode that correlates with the expansion coordinate,
thus the vibrational mode can be coherently excited for
nanocages.
By probing the vibrational period, one can get information
of the lattice temperature created by laser excitation as well
as the elastic constants of the materials. The latter is beyond
the scope of this review and will not be addressed here. From
the view point of physics, the softening of the vibrational
period with increasing power is related to the temperature of
the lattice, thus the temperature jump can be determined
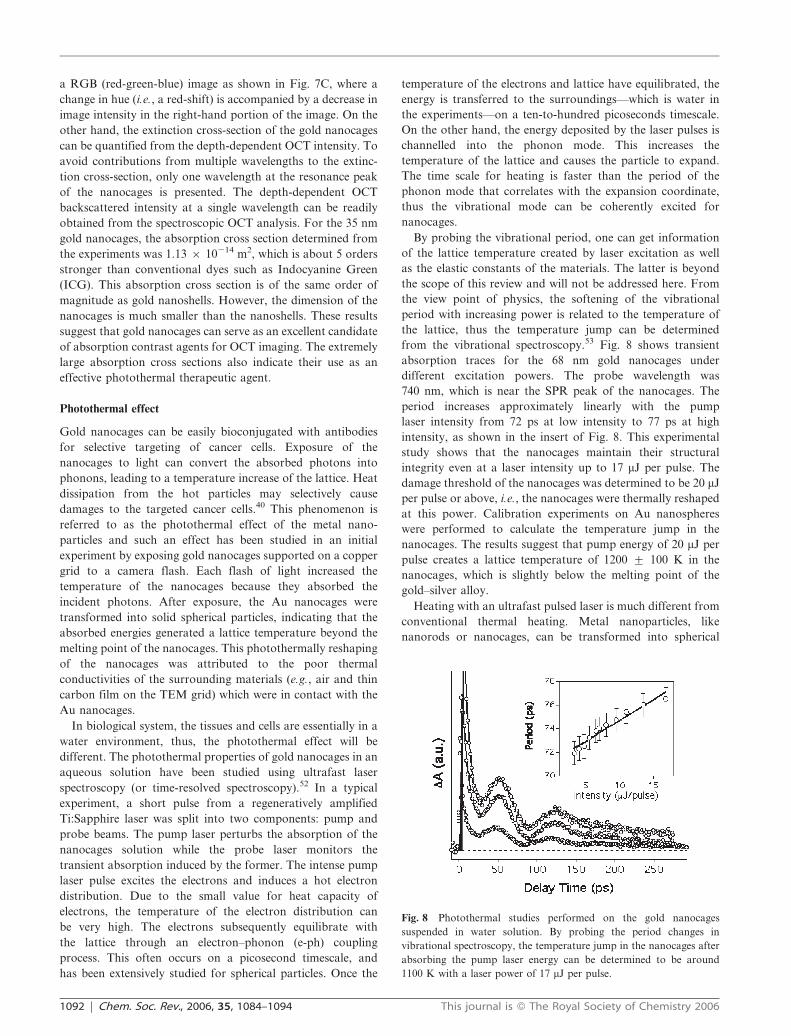
from the vibrational spectroscopy.53 Fig. 8 shows transient
absorption traces for the 68 nm gold nanocages under
different excitation powers. The probe wavelength was
740 nm, which is near the SPR peak of the nanocages. The
period increases approximately linearly with the pump
laser intensity from 72 ps at low intensity to 77 ps at high
intensity, as shown in the insert of Fig. 8. This experimental
study shows that the nanocages maintain their structural
integrity even at a laser intensity up to 17 mJ per pulse. The
damage threshold of the nanocages was determined to be 20 mJ
per pulse or above, i.e., the nanocages were thermally reshaped
at this power. Calibration experiments on Au nanospheres
were performed to calculate the temperature jump in the
nanocages. The results suggest that pump energy of 20 mJ per
pulse creates a lattice temperature of 1200 ¡ 100 K in the
nanocages, which is slightly below the melting point of the
gold–silver alloy.
Heating with an ultrafast pulsed laser is much different from
conventional thermal heating. Metal nanoparticles, like
nanorods or nanocages, can be transformed into spherical
Fig. 8 Photothermal studies performed on the gold nanocages
suspended in water solution. By probing the period changes in
vibrational spectroscopy, the temperature jump in the nanocages after
absorbing the pump laser energy can be determined to be around
1100 K with a laser power of 17 mJ per pulse.
1092 | Chem. Soc. Rev., 2006, 35, 1084–1094 This journal is � The Royal Society of Chemistry 2006
particles upon thermal heating at a much lower temperature
than their corresponding melting points, for example, the gold
nanocages will become nanospheres at about 250 uC while they
maintain their shapes under ultrafast laser pulse excitation
with very high temperature jumps. The fact that the nanocages
maintain their structure up to high lattice temperatures is good
for photothermal therapy applications. The goal in photo-
thermal therapy is to use near infrared light to image and kill
cancer cells (for example) via selective heating. For this to
work with metal nanoparticles, the particles must be stable
under laser irradiation. The present work shows that for
nanocages in solution, ultrafast laser excitation can create
extremely high lattice temperatures without destroying the
particles: The gold nanocages are still intact at 17 mJ per
pulse, which corresponds to a lattice temperature around
1100 ¡ 100 K. This stability arises because of the rapid heat
dissipation in solution. Note that thermally reshaping nano-
cages to spheres would greatly reduce their absorbance in the
near infrared, and make them poor choices for photothermal
therapy. In biomedical applications, the energy deposited by
the laser will be directly transferred to the cell, creating a
temperature jump far beyond where the cancer cell remains
alive (ca. 330 K), eventually resulting in cell death. Thus, the
combination of high repetition rate of near infrared, ultrafast
laser sources with gold nanocages is very promising for
photothermal therapy.
Concluding remarks
In the preceding sections, we have reviewed various
approaches to engineering the plasmonic properties of gold
nanostructures. Here we want to compare these different
nanostructures in the context of biomedical applications where
the exact magnitudes of both scattering and absorption are
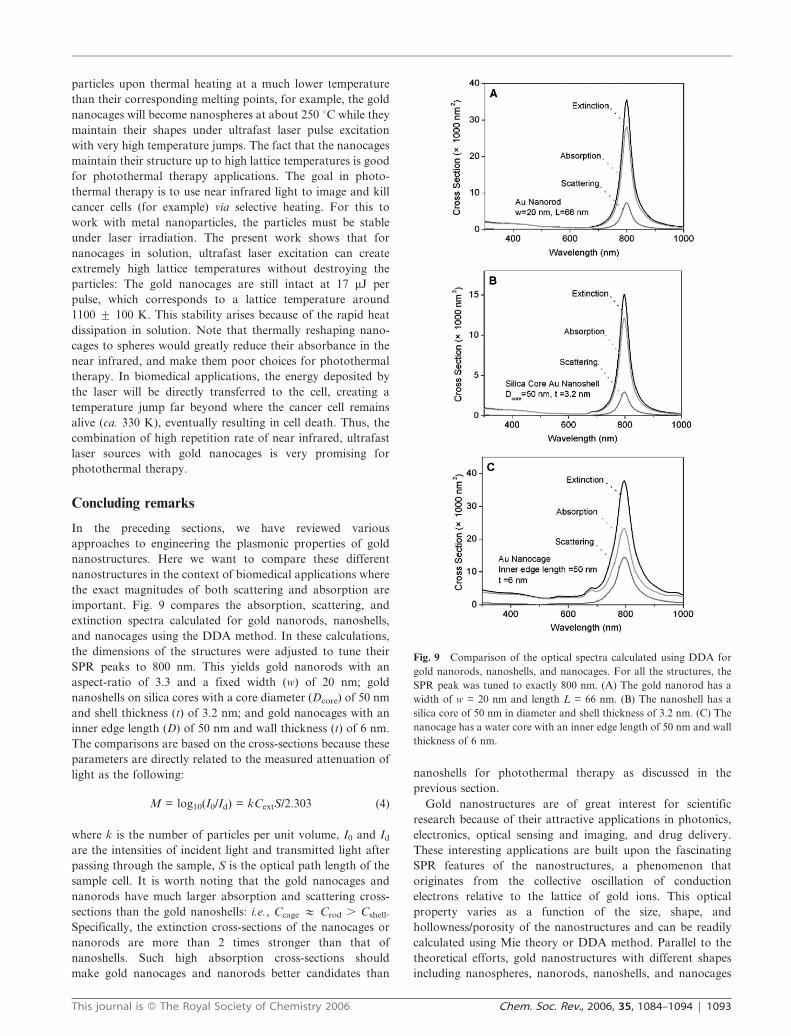
important. Fig. 9 compares the absorption, scattering, and
extinction spectra calculated for gold nanorods, nanoshells,
and nanocages using the DDA method. In these calculations,
the dimensions of the structures were adjusted to tune their
SPR peaks to 800 nm. This yields gold nanorods with an
aspect-ratio of 3.3 and a fixed width (w) of 20 nm; gold
nanoshells on silica cores with a core diameter (Dcore) of 50 nm
and shell thickness (t) of 3.2 nm; and gold nanocages with an
inner edge length (D) of 50 nm and wall thickness (t) of 6 nm.
The comparisons are based on the cross-sections because these
parameters are directly related to the measured attenuation of
light as the following:
M = log10(I0/Id) = kCextS/2.303 (4)
where k is the number of particles per unit volume, I0 and Id
are the intensities of incident light and transmitted light after
passing through the sample, S is the optical path length of the
sample cell. It is worth noting that the gold nanocages and
nanorods have much larger absorption and scattering cross-
sections than the gold nanoshells: i.e., Ccage # Crod . Cshell.
Specifically, the extinction cross-sections of the nanocages or
nanorods are more than 2 times stronger than that of
nanoshells. Such high absorption cross-sections should
make gold nanocages and nanorods better candidates than
nanoshells for photothermal therapy as discussed in the
previous section.
Gold nanostructures are of great interest for scientific
research because of their attractive applications in photonics,
electronics, optical sensing and imaging, and drug delivery.
These interesting applications are built upon the fascinating
SPR features of the nanostructures, a phenomenon that
originates from the collective oscillation of conduction
electrons relative to the lattice of gold ions. This optical
property varies as a function of the size, shape, and
hollowness/porosity of the nanostructures and can be readily
calculated using Mie theory or DDA method. Parallel to the
theoretical efforts, gold nanostructures with different shapes
including nanospheres, nanorods, nanoshells, and nanocages
Fig. 9 Comparison of the optical spectra calculated using DDA for
gold nanorods, nanoshells, and nanocages. For all the structures, the
SPR peak was tuned to exactly 800 nm. (A) The gold nanorod has a
width of w = 20 nm and length L = 66 nm. (B) The nanoshell has a
silica core of 50 nm in diameter and shell thickness of 3.2 nm. (C) The
nanocage has a water core with an inner edge length of 50 nm and wall
thickness of 6 nm.
This journal is � The Royal Society of Chemistry 2006 Chem. Soc. Rev., 2006, 35, 1084–1094 | 1093
have been developed using various synthetic strategies. A
combination of these efforts have recently established the
agreement between the experimentally measured SPR spectra
and those computed using the DDA method. The SPR peaks
of these nanostructures can be tuned over a broad range from
the visible to the near infrared. The remarkable SPR properties
and biocompatibility of gold make them promising both as a
contrast agent for in vivo optical imaging, and as a therapeutic
agent for photothermal treatment of cancer.
Acknowledgements
This work has been supported in part by a DARPA-DURINT
subcontract from Harvard University, a fellowship from the
David and Lucile Packard Foundation, and the National
Science Foundation. Y. X. is an Alfred P. Sloan Research
Fellow (2000–2005) and a Camille Dreyfus Teacher Scholar
(2002–2007). Z.-Y. L. was supported by the National Natural
Science Foundation of China (No. 10525419). X. L. acknowl-
edges the support from the NSF (Career Award). G. V. H.
acknowledges the support of the Petroleum Research Fund
administered by the American Chemical Society, and the NSF.
We thank Prof. Paul Mulvaney and Jorge Perez-Juste for
allowing us to use Fig. 3 from their group.
References
1 U. Kreibig and M. Vollmer, Optical Properties of Metal Clusters,Springer, Berlin, 1995.
2 P. Mulvaney, Langmuir, 1996, 12, 788.3 M. Faraday, Philos. Trans. R. Soc. London, 1857, 147, 145.4 G. Mie, Ann. Phys., 1908, 25, 377.5 R. Gans, Ann. Phys., 1912, 37, 881.6 M. I. Mishchenko, W. J. Wiscombe, J. W. Hovenier and
L. D. Travis, in: Light Scattering by Nonspherical Particles:Theory, Measurements and Applications, ed. M. I. Mishchenko,J. W. Hovenier and L. D. Travis, Academic Press, San Diego,2000.
7 K. L. Kelly, E. Coronado, L. L. Zhao and G. C. Schatz, J. Phys.Chem. B, 2003, 107, 668.
8 R. A. Reynolds, C. A. Mirkin and R. L. Letsinger, J. Am. Chem.Soc., 2000, 122, 3795.
9 P. M. Tessier, O. D. Velev, A. T. Kalambur, J. F. Rabolt,A. M. Lenhoff and E. W. Kaler, J. Am. Chem. Soc., 2000, 122,9554.
10 J. L. West and N. J. Halas, Annu. Rev. Biomed. Eng., 2003, 5, 285.11 J. Turkevitch, P. C. Stevenson and J. Hillier, Discuss. Faraday Soc.,
1951, 11, 55.12 M. A. Hayat, Colloidal Gold: Principles, Methods and Applications,
Academic Press, San Diego, 1989.13 A. Henglein and D. Meisel, Langmuir, 1998, 14, 7392.14 G. Schmid, R. Pfeil, R. Boese, F. Bandermann, S. Meyer,
G. H. M. Calis and J. W. A. van der Velden, Chem. Ber., 1981,114, 3634.
15 M. Brust, M. Walker, D. Bethell, D. J. Schiffrin and R. Whyman,J. Chem. Soc., Chem. Commun., 1994, 801.
16 N. R. Jana, L. Gearheart and C. J. Murphy, Chem. Mater., 2001,13, 2313.
17 M. C. Daniel and D. Astruc, Chem. Rev., 2004, 104, 293.
18 H. C. van de Hulst, Light Scattering by Small Particles, DoverPublications, New York, 1981.
19 S. Link and M. A. El-Sayed, Int. Rev. Phys. Chem., 2000, 19, 409and references therein.
20 C. R. Martin, Chem. Mater., 1996, 8, 1739.21 S. S. Chang, C. W. Shih, C. D. Chen, W. C. Lai and C. R. C. Wang,
Langmuir, 1999, 15, 701.22 C. J. Murphy, T. K. Sau, A. M. Gole, C. J. Orendorff, J. X. Gao,
L. F. Gou, S. E. Hunyadi and T. Li, J. Phys. Chem. B, 2005, 109,13857 and references therein.
23 F. Kim, J. H. Song and P. D. Yang, J. Am. Chem. Soc., 2002, 124,14316.
24 M. Toernblom and U. Henriksson, J. Phys. Chem. B, 1997, 101,6028.
25 N. R. Jana, L. Gearheart and C. J. Murphy, J. Phys. Chem. B,2001, 105, 4065.
26 J. Perez-Juste, L. M. Liz-Marzan, S. Carnie, D. Y. C. Chan andP. Mulvaney, Adv. Funct. Mater., 2004, 14, 571.
27 M. Hu, X. Wang, G. V. Hartland, P. Mulvaney, J. Perez-Juste andJ. E. Sader, J. Am. Chem. Soc., 2003, 125, 14925.
28 J. X. Gao, C. M. Bender and C. J. Murphy, Langmuir, 2003, 19,9065.
29 B. Nikoobakht and M. A. El-Sayed, Langmuir, 2001, 17, 6368.30 J. Perez-Juste, I. Pastoriza-Santos, L. M. Liz-Marzan and
P. Mulvaney, Coord. Chem. Rev., 2005, 249, 1870.31 A. E. Neeves and M. H. Birnboim, J. Opt. Soc. Am. B, 1989, 6,
787.32 R. D. Averitt, D. Sarkar and N. J. Halas, Phys. Rev. Lett., 1997,
78, 4217.33 S. J. Oldenburg, R. D. Averitt, S. L. Westcott and N. J. Halas,
Chem. Phys. Lett., 1998, 288, 243.34 R. D. Averitt, S. L. Westcott and N. J. Halas, J. Opt. Soc. Am. B,
1999, 16, 1824.35 C. Charnay, A. Lee, S. Q. Man, C. E. Moran, C. Radloff,
R. K. Bradley and N. J. Halas, J. Phys. Chem. B, 2003, 107, 7327.36 Y. Sun and Y. Xia, Science, 2002, 298, 2176.37 Y. Sun and Y. Xia, J. Am. Chem. Soc., 2004, 126, 3892.38 J. Chen, F. Saeki, B. J. Wiley, H. Cang, M. J. Cobb, Z. Y. Li,
L. Au, H. Zhang, M. B. Kimmey, X. Li and Y. Xia, Nano Lett.,2005, 5, 473.
39 H. Cang, T. Sun, Z. Y. Li, J. Chen, B. J. Wiley, Y. Xia and X. Li,Opt. Lett., 2005, 30, 3048.
40 J. Chen, B. Wiley, Z. Y. Li, D. Campbell, F. Saeki, H. Cang, L. Au,J. Lee, X. Li and Y. Xia, Adv. Mater., 2005, 17, 2255.
41 F. Fievet, J. P. Lagier and M. Figlarz, MRS Bull., 1989, 14, 29.42 B. Wiley, T. Herricks, Y. Sun and Y. Xia, Nano Lett., 2004, 4,
1733.43 B. Wiley, Y. Sun, B. Mayers and Y. Xia, Chem.-Eur. J., 2005, 11,
454.44 S. H. Im, Y. T. Lee, B. Wiley and Y. Xia, Angew. Chem., Int. Ed.,
2005, 44, 2154.45 B. Wiley, Y. Sun, J. Chen, H. Cang, Z.-Y. Li, X. Li and Y. Xia,
MRS Bull., 2005, 30, 356.46 J. W. Liu and Y. Lu, J. Fluoresc., 2004, 14, 343.47 S. J. Oldenburg, C. C. Genick, K. A. Clark and D. A. Schultz,
Anal. Biochem., 2002, 309, 109.48 N. T. K. Thanh and Z. Rosenzweig, Anal. Chem., 2002, 74, 1624.49 A. D. McFarland and R. P. Van Duyne, Nano Lett., 2003, 3, 1057.50 Z. Q. Tian, B. Ren and D. Y. Wu, J. Phys. Chem. B, 2002, 106,
9463 and references therein.51 S. R. Sershen, S. L. Westcott, N. J. Halas and J. L. West, J. Biomed.
Mater. Res., 2000, 51, 293.52 M. Hu, H. Petrova, J. Chen, J. M. McLellan, A. R. Siekkinen,
M. Marquez, X. Li, Y. Xia and G. V. Hartland, J. Phys. Chem. B,2006, 110, 1520.
53 G. V. Hartland, Phys. Chem. Chem. Phys., 2004, 6, 5263.
1094 | Chem. Soc. Rev., 2006, 35, 1084–1094 This journal is � The Royal Society of Chemistry 2006