ISO-VISCOSITY CURVES FOR CaO-SiO - GTT-Technologies
19
ISO-VISCOSITY CURVES FOR CaO-SiO 2 -Al 2 O 3 -MgO STEELMAKING SLAGS AT 1500ºC Augusto Lachini Pereira – LaSid/Federal University of Rio Grande do Sul Vinicius Cardoso da Rocha – LaSid/Federal University of Rio Grande do Sul Wagner Viana Bielefeldt – LaSid/Federal University of Rio Grande do Sul Antônio Cezar Faria Vilela – LaSid/Federal University of Rio Grande do Sul Date: 12/06/2020 GTT Users’ Meeting 2020
-
Upload
khangminh22 -
Category
Documents
-
view
0 -
download
0
Transcript of ISO-VISCOSITY CURVES FOR CaO-SiO - GTT-Technologies

ISO-VISCOSITY CURVES FOR CaO-SiO2-Al2O3-MgO STEELMAKING
SLAGS AT 1500ºC
Augusto Lachini Pereira – LaSid/Federal University of Rio Grande do Sul
Vinicius Cardoso da Rocha – LaSid/Federal University of Rio Grande do Sul
Wagner Viana Bielefeldt – LaSid/Federal University of Rio Grande do Sul
Antônio Cezar Faria Vilela – LaSid/Federal University of Rio Grande do Sul
Date:12/06/2020
GTT Users’ Meeting 2020

• INTRODUCTION
• DEVELOPMENT
– Experimental X calculated
– Iso-viscosity curves
• RESULTS AND DISCUSSION
– Convergence data
– Iso-viscosity curves
• CONCLUSIONS
• NEXT STEPS
Summary
GTT Users’ Meeting 2020

• Why study the viscous behavior of the steelmaking slags?
INTRODUCTIONV
isco
us
beh
avio
r
Gas permeability
Heat transfer
Reduction of FeO
Rate of desulphurization
Physical-chemicalproperties
For more than six decadesthe slag viscosities arestudied
➢ Theoretical research➢ Industrial application
For these reasons
To improve the
steel cleanliness
GTT Users’ Meeting 2020

Viscosity
Chemical composition
Temperature
Fraction Liquid/Solid
INTRODUCTION
High. Temp Viscosity
measurement
Thermodynamic predictions

• For thermodynamic predictions it is possible to apply mathematical models or
thermodynamic softwares to obtain viscosities for a given range of chemical composition
and temperature of slags.
INTRODUCTION
Viscosity Value
Mathematical equations
Thermodynamics softwares
GTT Users’ Meeting 2020

INTRODUCTION
Steel
Slag
• As known, steelmaking slags in high temperatures presents two-phase melt, Phase
Mixture, in which it contains a liquid fraction and a solid fraction.
Solid fraction
Liquid fraction
Slag
Solid particles hamper the viscositymeasurements in the Phase Mixture.
GTT Users’ Meeting 2020
• The steelmaking slags, at secondary refining,
conventionally contains CaO, SiO2, Al2O3, MgO,
(CSAM System);

• The aim of the present work is to apply a mathematical model and thermodynamic
software, FactSage 7.2, to the Phase Mixture and thermodynamic software to the Liquid
Phase, FactSage 7.2, to obtain the slags viscosities in CSAM system, for a given
temperature of 1500ºC and within a range of chemical composition of slags.
• And calculate the convergence of the experimental data, collected in the literature, with a
calculated data.
INTRODUCTION
Calculated
Viscosity Data
Roscoe-Einstein
EquationPhase-Mixture
FactSage 7.2 Liquid Phase
Reference
Viscosity DataGTT Users’ Meeting 2020

DEVELOPMENT - Experimental X calculated
• In order to verify the accuracy of the FactSage 7.2 software in the system CSAM,
experimental viscosity data were collected through published works
GTT Users’ Meeting 2020

DEVELOPMENT - Experimental X calculated
GTT Users’ Meeting 2020

DEVELOPMENT - Iso-viscosity curves
Equilib
Viscosity
Modules
FToxid
FactPS
Databases
Phase
fraction
Solid
Liquid
Liquid
viscosityEffective
viscosity of slag
Roscoe-Einstein
model
Melts
𝜼𝒆 = 𝜼 (𝟏 − 𝒄)−𝟐.𝟓

• Composition ranges of calculated slags in the viscosity database (mass%).
DEVELOPMENT - Iso-viscosity curves
GTT Users’ Meeting 2020

• In order to verify the convergence between the FactSage calculations and the reference
viscosity data, for each slag composition, it was evaluated by the difference between
measured and calculated viscosity value:
𝛿𝑖 =𝜂𝑅𝑒𝑓𝑒𝑟𝑒𝑛𝑐𝑒 − 𝜂𝐹𝑎𝑐𝑡𝑆𝑎𝑔𝑒
𝜂𝑅𝑒𝑓𝑒𝑟𝑒𝑛𝑐𝑒
• A performance analysis of the reference source on viscosity (η) calculations through
FactSage was evaluated by average relative error, Δ, for N measurements of viscosity.
𝛥 =1
𝑁
𝑖=1
𝑁
𝛿𝑖 × 100%
DEVELOPMENT - Iso-viscosity curves
GTT Users’ Meeting 2020

RESULTS AND DISCUSSION - Convergence data
According with Literature,the viscosity measurementsvalues may differ fromrecommended values by anaverage of ± 30%.
GTT Users’ Meeting 2020

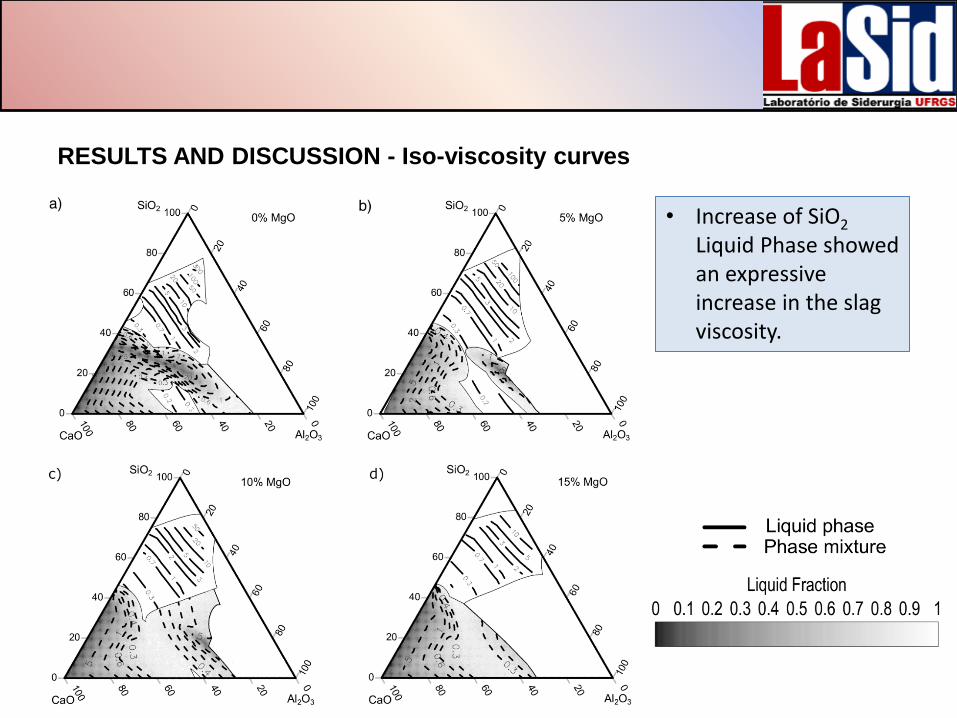
RESULTS AND DISCUSSION - Iso-viscosity curves
• MgO typically as a network “modifier”
• CaO Liquid Phase: viscosity decreasePhase Mixture: “double effect”
• Melilite

RESULTS AND DISCUSSION - Iso-viscosity curves
Melilite ((Ca2(Al,Mg,Fe2+)(Si,Al)2O7)
RESULTS AND DISCUSSION - Iso-viscosity curves
• Increase of SiO2
Liquid Phase showed an expressive increase in the slag viscosity.

• The viscosities calculated through chemical compositions of the literature were generally
within the acceptable range of relative error compared to the literature (up to 30%).
• By the analysis proposed it is possible to visualize that the effect of the MgO content
decreases the viscosity in the Liquid Phase.
• The effect of the CaO oxide for the Phase Mixture showed a double effect. Initially a
reduction in viscosity subsequently, tends to increase viscosity. However in Liquid Phase
tends to decrease the viscosity.
• The FactSage 7.2 showed to be very promising for the creation of quarteternary systems
with iso-viscosity curves.
CONCLUSIONS
GTT Users’ Meeting 2020

Acknowlegments
GTT Users’ Meeting 2020
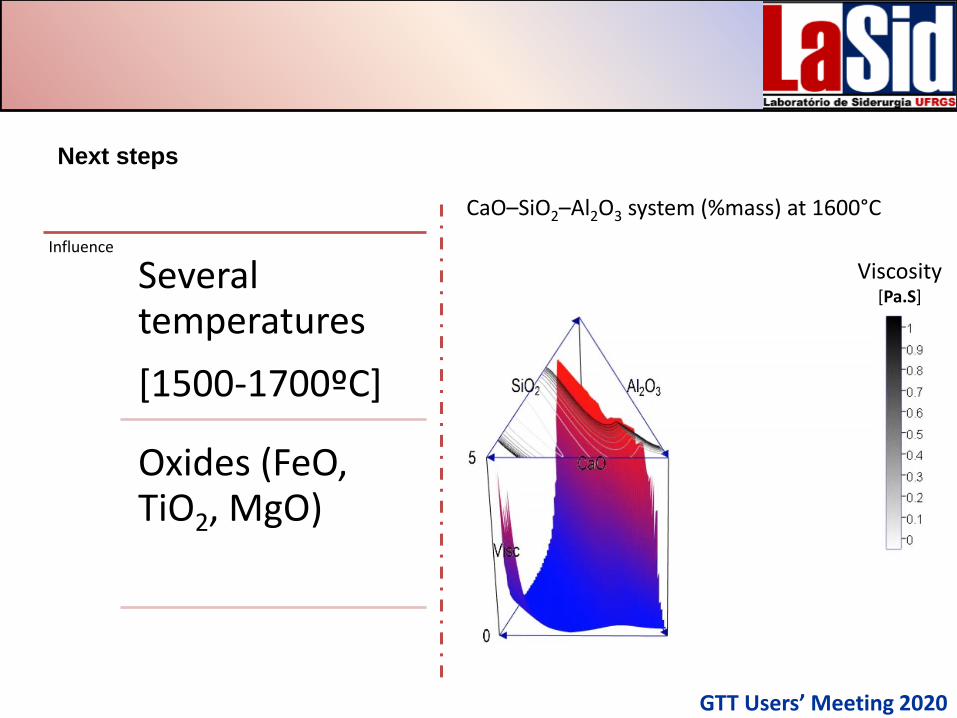
Next steps
GTT Users’ Meeting 2020
Influence
Several temperatures
[1500-1700ºC]
Oxides (FeO, TiO2, MgO)
Viscosity[Pa.S]
CaO–SiO2–Al2O3 system (%mass) at 1600°C