
Knowledge Representation - Ontological Engineering - SNS ...
Upload
khangminh22Category
view
1download
0
Food Texture and Viscosity: Concept and Measurement by Malcolm C. Bourne
• ISBN: 0121190625
• Publisher: Elsevier Science & Technology Books
• Pub. Date: March 2002

Preface to the Second Edition
Many wonderful advances have been made in understanding what texture isall about and in instrumentation to measure the texture and viscosity of foodssince the first edition of this book was published in 1982. Hence the need fora second edition.
This book is still intended for those who want to know more about textureand viscosity of food, how these properties are measured and relate to humanassessments of textural quality. It draws together literature from many sourcesincluding journals in chemistry, dentistry, engineering, food science, foodtechnology, physics, psychology and rheology. Scientific and trade journalsdedicated to special food groups, books, proceedings and commercial literaturehave also been utilized. Journal of Texture Studies has been a major source ofinformation for new developments in the field.
The treatment is descriptive and analytical with the minimum of mathe-matics. Equations are given only when they illuminate the discussion and thenonly in the simplest form. Their derivations, however, are not given, this is nota mathematics text book. Additions have been made to every chapter, andalthough most of them are small, their cumulative effect is great.
Chapter 1 defines texture terms, discusses the importance of textural prop-erties of foods, locates texture in the overall area of food science, gives someinteresting general facts about texture, and a brief history of earlier develop-ments in the field. Chapter 2 describes physical interactions between the humanbody and food – a necessary background for the ensuing chapters. A new section on the hand has been added because gentle squeezing of food is gainingincreased attention. Chapter 3, a new chapter, describes the importance ofphysics in texture measurement. The rigor of the physics approach is neededin our field. However, the limitations of physics to resolve complex practicalproblems is also noted. Chapter 4 describes the principles of objective methodsof texture measurement, including ideas that have yet to evolve into commercialavailable instruments, and provides a foundation for the following chapter.
Prelims.qxd 1/10/02 3:47 PM Page 15

A major goal of this chapter is to move the thinking about texture from a food-by-food basis to general principles that can be applied to all foods. Chapter 5describes commercial instruments and their use. Although the use of universaltesting machines and computer retrieval and analysis of force–time data havebecome widespread (a great advance in the author’s opinion) there is still a place for the small, simple instruments that are also described. Chapter 6provides a brief description of commercial viscometers. The description of thevarious types of viscous flow has been moved to Chapter 3 (physics). Therehave been a number of great advances in instrumentation, especially for controlled shear stress viscometers. Chapter 7 describes sensory methods formeasuring texture and viscosity and is an essential component of this book.Many sensory scientists have no interest in texture. It is hoped this chapterwill awaken their interest in texture as a sensory attribute. Chapter 8, a newchapter, covers our present level of understanding of correlations betweenphysical measurements and sensory assessments of texture and viscosity.Chapter 9 outlines a system for selecting a suitable instrument, or a suitabletest procedure for a universal testing machine with the minimum of time andcost. Appendix I lists the names and addresses of suppliers of instruments forthose who are interested in purchasing equipment. Appendix II gives data ontexture–temperature relationships that are too long to fit comfortably intoChapter 8. Appendix III lists test conditions for specific foods in universaltesting machines. I have no vested interest in any corporation that sells texture-measuring instruments and have endeavored to be unbiased in describingcommercial instruments, and to make the list as complete as possible.Appendix IV gives examples of sensory texture profiles on eleven differentfoods.
Many people will read this book selectively. The practising food technologistand quality controller will concentrate on Chapters 5, 6 and 9. The professorand college student might spend most time on Chapters 3 and 4. The sensoryscientist will find Chapters 7 and 8 of greatest interest. The laboratory man-ager wanting to establish a texture laboratory will find Chapter 9 andAppendix I useful. Everybody should find Chapters 1 and 2 of great interest.
I have expressed my own opinions and interpretations in this volumebecause I believe most readers will appreciate some guidance rather than asimple listing of many facts of varying levels of usefulness and accuracy. Evenif subsequent reports show the guidance to be wrong at times, I hope mostreaders will find useful the methods and yardsticks offered. My personal conviction that empirical tests have been responsible for most of the successesin practical food texture measurement is reflected in the extended discussionof empirical methodology. However, it is a pleasure to report that some ofthese empirical tests are now being given serious attention by the researchcommunity and are on the way to becoming rigorous, fundamental tests.
I acknowledge with thanks help from many sources in the preparation of thissecond edition. A number of individuals and organizations provided figures orcompiled tables and their contributions are noted wherever that figure or table
xvi Preface
Prelims.qxd 1/10/02 3:47 PM Page 16

appears. I particularly thank J. Barnard, O. Campanella, B. R. Heath, M. Peleg,A. S. Szczesniak and Z. M. Vickers, each of whom critically reviewed one ormore chapters in the draft stage and made numerous suggestions for improve-ment. I also thank K. C. Diehl, S. A. Brown, J. Faubion, K. M. Hiiemae, G. J. Bourne, T. Gibson and N. Marriott who clarified specific points for me,and B. A. Andersen who typed the many additions and M. M. Walczak whotyped the subject index. My colleague, Prof. M. A. Rao has provided encour-agement and fruitful discussions for many years. Representatives from a num-ber of instrument suppliers have been helpful in clarifying details about theirinstruments. I sincerely thank each one for their contribution.
The two pictures on the cover depict the dual nature of food texture meas-urement. Only humans can assess the textural quality of food. In this picturethe firm, plump, succulent texture of strawberry is measured sensorially whilethe firmness is also measured by compression in a machine. Instruments thatmeasure physical properties are widely used and have led to great improve-ments in building and maintaining a high level of textural quality in most ofour food supply. Nevertheless, instrument readings are worth little unless cal-ibrated against the human senses. I thank Stable Micro Systems Inc. for pro-viding these cover pictures.
Preface xvii
Prelims.qxd 1/10/02 3:47 PM Page 17

Table of Contents
Preface to the Second Edition
Ch. 1 Texture, Viscosity and Food
Ch. 2 Body-Texture Interactions
Ch. 3 Physics and Texture
Ch. 4 Principles of Objective Texture Measurement
Ch. 5 Practice of Objective Texture Measurement
Ch. 6 Viscosity Measurement
Ch. 7 Sensory Methods of Texture and Viscosity Measurement
Ch. 8 Correlation Between Physical Measurements and Sensory
Assessments of Texture and Viscosity
Ch. 9 Selection of a Suitable Test Procedure
App. I Suppliers of Texture and Viscosity Measuring Instruments
App. II Effect of Temperature on Texture Measurements
App. III Guidelines and Conditions for Testing Foods
App. IV Examples of Sensory Texture Profiles
References
Index

Texture, Viscosity, and Food
Introduction
The four principal quality factors in foods are the following.
1. Appearance, comprising color, shape, size, gloss, uses the optical sense.
2. Flavor, comprising taste (perceived on the tongue) and odor (perceivedin the olfactory center in the nose), is the response of receptors in theoral and nasal cavities to chemical stimuli. These are called ‘the chemicalsenses’.
3. Texture is primarily the response of the tactile senses to physical stimuli that result from contact between some part of the body and thefood. The tactile sense (touch) is the primary method for sensing texture but kinesthetics (sense of movement and position) and some-times sight (degree of slump, rate of flow), and sound (associated with crisp, crunchy and crackly textures) are also used to evaluate texture.
4. Nutrition comprises major nutrients (carbohydrates, fat, protein) andminor nutrients (minerals, vitamins, fiber).
Other factors, such as cost, convenience, and packaging, are also importantbut are not considered quality factors of foods. Of the above listed the firstthree are termed ‘sensory acceptability factors’ because they are perceived bythe senses directly. Nutrition is a quality factor that is not perceived by thesenses.
The sensory acceptability factors of foods are extremely important becausepeople obtain great enjoyment from eating their food and, furthermore, theenjoyment of food is a sensory pleasure that is appreciated from the cradle tothe grave.
C H A P T E R
1
Chap-01.qxd 1/10/02 4:11 PM Page 1

Importance of Texture
The importance of texture in the overall acceptability of foods varies widely,depending upon the type of food. We could arbitrarily break it into threegroups:
1. Critical: Foods in which texture is the dominant quality characteristic;for example, meat, potato chips, cornflakes and celery.
2. Important: Foods in which texture makes a significant but not a dominantcontribution to the overall quality, contributing, more or less equally, withflavor and appearance; for example, most fruits, vegetables, cheeses, bread,most other cereal-based foods and candy fall into this category.
3. Minor: Foods in which texture makes a negligible contribution to theoverall quality; examples are most beverages and thin soups.
Achieving the desired textural quality of food has important economic considerations. A good example of this is found in beef. Supermarkets in theUnited States sell cuts of beef that range from less than three dollars per kiloto more than twenty dollars per kilo. The main determinant in this wide rangeof price is its texture. Beef that is tough or dry either sells for a low price or ismade into ground beef or various kinds of sausage, whereas tender beef commands a higher price and is usually sold in the form of roasts and steaks.When one considers the many millions of kilos of beef consumed each year inthe United States it becomes abundantly clear that textural quality has majoreconomic importance.
The importance of texture in foods was indirectly pointed out by Schiffman(1977; Schiffman et al., 1978), who fed 29 different foods to people who hadbeen blindfolded and asked them to identify the foods based only on flavor.The samples had been pureed by blending and straining in order to eliminatetextural clues. Some of the data from Schiffman’s work are shown in Table 1.1.It is remarkable to discover how poorly many foods are identified when theirtexture and color are concealed and flavor is the only attribute that can be usedfor identification. Young adults of normal weight were able to identify correctlyonly 40.7% of the foods used in the study. It is surprising to find, for example,that only 4% of the respondents could identify cabbage correctly by flavoronly, 15% for pork, 41% for beef, and 51% for carrots.
The importance of texture, relative to other quality factors of foods, may beaffected by culture. For example, in a study of food patterns of the United Statesand Caribbean Blacks, Jerome (1975) stated: ‘For Afro-Americans of southernrural origin, the element of primary importance associated with food patternsis texture; flavor assumes secondary importance.’
Another indication of the importance of texture in food is the large size ofthe dental industry in developed countries. This is due primarily to the factthat people do not want to be deprived of the gratifying sensations that arisefrom eating their food. From the nutritional standpoint it is possible to have acompletely adequate diet in the form of fluid foods that require no mastication,
2 Texture, Viscosity, and Food
Chap-01.qxd 1/10/02 4:11 PM Page 2

but few people are content to live on such a diet. As their tooth function dete-riorates with age, they undergo the inconvenience and cost of dental care thatrestores tooth function and enables them to continue to enjoy the textural sen-sations that arise from masticating their food.
The deeply ingrained need to chew on things is also found among infants.Growing infants are provided with teething rings and similar objects in orderto give them something to satisfy their need for biting and chewing. If thebaby is not given something on which it can chew, it will usually satisfy itsneed to chew on items such as the post of its crib, father’s best slipper, or theexpensive toy given by a doting grandmother.
Szczesniak and Kahn (1971) conducted in-depth interviews with home-makers and found that texture awareness in the United States is often apparentat a subconscious level and that it is taken more or less for granted; however,when the textural aspects did not come up to expectations, there was a sharpincrease in the awareness of the texture and criticism of the textural deficien-cies. The authors state that
If the texture of a food is the way people have learned to expect it to be, and if it is psychologi-cally and physiologically acceptable, then it will scarcely be noticed. If, however, the texture is not as it is expected to be … it becomes a focal point for criticism and rejection of the food.Care must be taken not to underestimate the importance of texture just because it is taken forgranted when all is as it should be.
In a widely cited study, Schutz and Wahl (1981) obtained 420 valid returnsfrom a mail ballot to a random group of people living in Sacramento,California, asking them to distribute 10 points on a constant sum scale amongthe characteristics of appearance, flavor and texture according to the attributes’
Importance of Texture 3
Table 1.1 Percentage of Correct Identification of Pureed Foodsa
Normal weight Obese Normal weightFood (young) (young) (aged)
Apple 81 87 55Strawberry 78 62 33Fish 78 81 59Lemon 52 25 24Carrot 51 44 7Banana 41 69 24Beef 41 50 27Rice 22 12 15Potato 19 69 38Green pepper 19 25 11Pork 15 6 7Cucumber 8 0 0Lamb 4 6 —Cabbage 4 0 7Mean for 29 foods 40.7 50.0 30.4
aFrom Schiffman (1977), Schiffman et al. (1978).
Chap-01.qxd 1/10/02 4:11 PM Page 3

importance to the respondent for 94 foods when eaten. The overall meanswere 2.57 for appearance, 4.92 for flavor and 2.51 for texture which impliesthat texture is less important than flavor in food acceptability. However, if weassume that the flavor score is equally divided between taste and odor, theoverall means become 2.57 for appearance, 2.46 for odor, 2.46 for taste and2.51 for texture and then texture carries about the same weight as the otheracceptability factors for foods.
Some other interesting points about texture importance found in this reportby Schutz and Wahl (1981) are as follows. (1) Males and those with a highereducation gave significantly higher scores for texture compared with thegroup as a whole. (2) The 10 foods with the highest texture score were rawbean sprouts, raw celery, white bread, shredded wheat cereal, iceberg lettuce,oatmeal, angel food cake, raw apples, puffed corn cereal and raw carrots. It issurprising to find that this group did not include beef steak as having a high texture score. (3) The 10 items with the lowest texture score were all liq-uids: coffee, cola soft drinks, red table wine, beer, soy sauce, grape juice,lemon juice, barbecue sauce, apricot nectar and tomato juice. Texture scoresranged from 1.33 for coffee to 2.17 for tomato juice with a mean score of1.745. As pointed out earlier, texture is of minor importance for most bever-ages and hence, it is surprising to find in this report that even coffee scored1.33 points for texture out of a total of ten points for all acceptability factors.
The Vocabulary of Texture
Szczesniak and Kleyn (1963) gave a word association test to 100 people todetermine their degree of texture consciousness and the terms they used todescribe texture. Seventy-eight descriptive words were used by the partici-pants. These authors concluded that texture is a discernible characteristic, butthat it is more evident in some foods than others. Foods that elicited the high-est number of texture responses either were bland in flavor or possessed thecharacteristics of crunchiness or crispness.
Yoshikawa et al. (1970a,b,c) conducted tests in Japan that were similar to those conducted by Szczesniak’s group in the United States. They asked140 female college students to describe the texture of 97 foods and collected406 different words that describe textural characteristics of foods. In a similarstudy Rohm (1990) asked 208 college students in Austria to describe 50 foodsand obtained 105 texture words. Rohm et al. (1994) compared texture words(in German) generated by students in Dresden, Hannover and Vienna. Thesestudies showed the importance of textural properties as a factor in food qual-ity and the great variety of textures found in food. The 10 most frequently usedwords in these three studies are listed in Table 1.2. It is interesting to noticethat six of these 10 words are common to all three lists. It is also noteworthythat the Japanese used 406 descriptive words as compared to 78 words in theUnited States and 105 words in Austria.
4 Texture, Viscosity, and Food
Chap-01.qxd 1/10/02 4:11 PM Page 4

Perhaps the richer textural vocabulary of the Japanese is due partly to thegreater variety of textures presented in Japanese cuisine, making them moresensitive to subtle nuances in textures, and partly to the picturesque Japaneselanguage which uses many onomatopoeic words. For example, Yoshikawa et al.(1970a) assign to each of the following expressions the meaning of some formof crispness: kori-kori, pari-pari, saku-saku, pori-pori, gusha-gusha, kucha-kucha, and shaki-shaki.
In a second study (Szczesniak, 1971), a word association test was given to150 respondents and the results were similar to the first study. This test againshowed that texture is a discernible characteristic of foods and the awarenessof it generally equivalent to that of flavor. This study also found that womenand people in the higher economic brackets showed a higher level of aware-ness of the textural properties of foods than did the general population.
The language used to describe the textural properties of foods is veryimportant, especially in sensory testing and consumer verbalizations of quality.An international standard nomenclature is needed to ensure that researchreports from different countries are referring to exactly the same properties.Table 1.2 shows that there can be many similarities between countries but thereis not complete unanimity.
Drake (1989) compiled a list of 54 words for textural properties of foodsand with the help of over 50 collaborators found their equivalent meanings in22 other languages ranging from Bahasa to Welsh. One conclusion from thiscomprehensive compilation is that since every meaning could be found inevery language the knowledge and interest in texture is universal and knowsno national boundaries. An appendix to Drake’s list provided 200 additionalEnglish words that sometimes have a textural/rheological meaning.
The Vocabulary of Texture 5
Table 1.2 Most Frequently Used Texture Wordsa
United Statesb Japanc Austriad
Crisp Hard CrispDry Soft HardJuicy Juicy SoftSoft Chewy CrunchyCreamy Greasy JuicyCrunchy Viscous StickyChewy Slippery CreamySmooth Creamy FattyStringy Crisp WateryHard Crunchy Tough
78 words 406 words 105 words
aIn descending order of frequency.bSzczesniak and Kleyn (1963).c Yoshikawa et al. (1970a).dRohm (1990).
Chap-01.qxd 1/10/02 4:11 PM Page 5

Lists of texture words in Spanish have been published by Badui (1988),Anzaldúa-Morales (1989), and Pedrero and Pangborn (1989).
Anzaldúa-Morales (1990) pointed out that some words that might appear to translate into another language easily are not always equivalent. For exam-ple, the English word ‘viscous’ might seem to translate into Mexican Spanish‘viscoso’ but that is incorrect. The correct Spanish word is ‘esposo’ meaningthick. ‘Viscoso’ means slimy like raw egg white or okra.
Lawless et al. (1997) compared many sensory texture terms in Finnish andEnglish and reported that the number of terms can be reduced by use of principal component analyses. They also noted that English often gives morethan one meaning to a word whereas they are clearly distinguished with noambiguity about their meaning in Finnish. For example, the word ‘thick’ inEnglish might refer to dimension (‘a thick potato chip’) or resistance to flow (maple syrup is thick) whereas in Finnish the word for thick (dimension)is ‘paksu’ and for thick (viscous) is ‘jahmea’. They conclude that the dimen-sions of texture are consistent across cultures but there are differences innuance. They also state ‘the similarities in texture words and their conceptualgroupings are more similar than they are different in these two languages(English and Finnish) having very different linguistic roots’.
Oram (1998) studied the food vocabulary of Australian schoolchildren aged6–11 years, and adults, using 126 words that might relate to food, 10 non-foodwords (e.g. jump) and 10 non-words (e.g. frunp). He found that by age 6–7(grade 1 in school) children already have a limited vocabulary that refers to awide range of food attributes and this vocabulary then grows as they becomeolder. More than 60% of grade 1 schoolchildren identified as food words, 26out of the 126 food words presented, and this number increased to 29 for grade3 schoolchildren, 58 for grade 5 schoolchildren and 68 for adults. More than75% of respondents in each of the four groups (grade 1, grade 3, grade 5 andadults) considered the following as food words: chewy, creamy, crunchy,fresh, juicy, munchy, watery. The following words were identified as foodwords by more than 75% of the respondents in three of the four groups: crisp,crumbly, crusty, hot, mashed, saucy, spicy.
Texture and Time of Day
Szczesniak and Kahn (1971) reported that time of day exerted a strong influenceon textural awareness and flavor. At breakfast, most people prefer a restrictedrange of familiar textures that lubricate the mouth, remove the dryness ofsleep, and can be swallowed without difficulty. New or unfamiliar textures,and textures that are difficult to chew, are not wanted at breakfast.
People are willing to accept a wider range of textures at the midday mealjust so long as it is quick and easy to prepare and not messy to eat. After all,this is a practical meal with a limited time for preparation and consumption.
6 Texture, Viscosity, and Food
Chap-01.qxd 1/10/02 4:11 PM Page 6

Texture is most appreciated and enjoyed at the evening meal. This is thetime for relaxation, which comes after the day’s work and, for most people, isthe largest meal of the day when several courses are served and a wide rangeof textures is expected and relished. The appetizer (nondemanding texturesand flavors that stimulate the flow of saliva) is perceived as a preparation for the main meal which follows, and this in turn features a great variety oftextures, including some items that require considerable energy to chew. Notexture seems to be completely inappropriate for the main course so long as thereare several contrasting textures. The same wide range of textures is relished inthose cultures in which the main meal of the day is in the early afternoon.
The dessert features textures that require low energy for mastication andrestore the mouth to a relaxed and pleasant feeling. This is the time for ‘fun’foods that are easy to manipulate and leave a nice feeling in the mouth. Soft,smooth, creamy, or spongy textures are desired. Hard, chewy textures are notwanted at the conclusion of the meal (Szczesniak and Kahn, 1971).
In yet another report, Szczesniak (1972) studied the attitudes of childrenand teenagers to food texture and found it to be an important aspect of theirliking or disliking of specific foods. The young child prefers simple soft textures that can be managed within the limited development of the structuresof the mouth. The child extends its range of relished textures as its teeth, jaws,and powers of coordination develop. This study also showed that teenagershave a high degree of texture awareness that sometimes surpasses that ofadults, suggesting that perhaps the next generation of adult consumers may bemore sophisticated and demanding in terms of textural qualities of the foodsthat they purchase. The teenagers of 1972 are now mature adult consumers.Perhaps the increasing use of texture descriptors in food advertisements is theresponse of the food industry to the texture demands of this age group.
Defective Textures
In a survey of consumer attitudes toward product quality conducted by the A. C. Nielsen Co. in 1973, complaints about product quality were recorded(Anonymous, 1973). The results are shown in Table 1.3. Complaints about a broken or crumbled product (a texture defect) headed the list at 51% ofrespondents. The second item (product freshness) is frequently measured bytextural properties such as firmness. These data indicate that there is room forconsiderable improvement in textural properties of foods that are presentlymarketed.
This observation was supported by Cardello (1996b) who stated, ‘while flavor is commonly found to be the most important sensory factor responsiblefor the liking of many foods, texture is often cited by consumers as the reasonfor not liking certain foods. This is especially true for foods the texture ofwhich may be observed as creating a lack of control in the mouth, e.g. foodswith sticky, soggy or slimy textures’.
Defective Textures 7
Chap-01.qxd 1/10/02 4:11 PM Page 7

Lillford (1991) also comments on the role that the expectation of texturalquality plays in food acceptance in the following words:
Preference (acceptability) and texture perception are judgments made by each of us every timewe eat, without much conscious thought. … First, eating is not an activity to which a great dealof analytical thought or concentration is normally applied. People behave as if their actions are‘scripted’, i.e. they are acting out a process during which a sequence of events is to be expected.Only if the unexpected occurs is any judgment logged. Second, because of the scripted proce-dures, acceptability of food is dependent on the description or expectation of the properties ofthe food being eaten. For example, a simple sugar glass can be fabricated into a boiled sweet(hard) or an aerated structure (crunchy). The one is not normally an acceptable form of the other.Fortunately for the confectionery industry, both are acceptable food concepts if properlydescribed.
Bruhn et al. (1991) studied the perceptions of quality of six fresh fruits byconsumers in California and reported the following levels of dissatisfactionbecause of texture defects (too hard, too soft or mealy): apricot, 37%; cantaloupe,20%; peach, 40%; pear, 35%; strawberry, 20%; and tomato, 50%.
The texture of many foods is not static but changes during storage, and thesechanges usually lower the textural quality. This is a major reason why con-sumers like to have ‘fresh’ foods. Examples of some of the textural changes thatoccur during storage are given in Table 1.4. Preventing, or retarding the deteri-oration of texture during storage is a major preoccupation of food scientists.
Textural Diversity
There is an enormous range in textural characteristics of foods: the chewinessof bread crust and of meat, the softness of marshmallows, the crispness of cel-ery and potato chips, the juiciness of fresh fruits, the smoothness and meltingsensations of ice cream, the soft toughness of bread, the flakiness of fish, thecrumbliness of cake, the melting of jelly, the viscosity of thick soup, the fluidityof milk, the thick smoothness of yogurt, the creaminess of pie topping andmany others. This great range of types of rheological and textural propertiesfound in foods arises from the human demand for variety in the nature of their food.
8 Texture, Viscosity, and Food
Table 1.3 Consumer Complaints About Product Quality a
Type of complaint Total respondents (%)
Broken or crumbled product 51Product freshness 47Contaminated product 28Incorrect carbonation 23Bulged can 16Other 9
aFrom Anonymous (1973).
Chap-01.qxd 1/10/02 4:11 PM Page 8

Table 1.5 lists some of the foods that are produced from wheat. It shows thewide range of textures that can be developed from a single raw material by theuse of suitable processing technologies. In every case, the processed producthas a more tender texture than the wheat grain and it costs much more than thegrains from which it was made.
Textural Diversity 9
Table 1.4 Changes in Food Texture During Storage
Food Texture change Cause
Bread, crumb Firmness increases, springiness decreases Starch retrogradation, moisture transfer from starch to gluten
Bread, crust Crispness decreases, toughness increases Moisture migrates from crumb to crustButter and margarine Firmness and graininess increase, Growth of fat crystals, change in crystal form,
spreadability decreases strengthening of network bondsCake Firmness increases, moist mouthful decreases Starch retrogradation, moisture migrationCheese, ripe Firmness and fracturability increase, Proteolytic changes
springiness decreasesChocolate Graininess develops, surface ‘bloom’ Change of crystal form, sugar or fat crystallize on surfaceCrackers Loss of crispness Moisture absorption from airEggs, fresh Viscosity decreases Loss of CO2 through shell changes proteinFruit, fresh Softening, wilting, loss of crispness, loss of Pectin degradation, respiration, bruising, loss of moisture
juiciness and turgor, weakening of middle lamellaFruits, dried Hardening Loss of moistureFish, frozen Toughening, dryness increases, rubberiness Protein denaturation especially myofibrillar proteins,
develops HCHO generated by trimethylamineoxidaseIce cream Coarseness increases, Ice crystals enlarge
butteriness clumping of fat globulessandiness crystallization of lactosecrumbliness poor protein hydration
Legume seeds Lose ability to soften during cooking Degradation of phytate, lignification, crosslinking of N compounds, loss of microsomal functionality
Mayonnaise Emulsion breaks Fat crystallizationMeat, fresh Toughness increases at first, Rigor mortis
toughness decreases later autolysisMeat, frozen Freezer burn, drip Surface desiccation, reduced water-holding capacityMeat, freeze dried Toughness increases, juiciness decreases Maillard reactionMilk, powdered Stickiness Moisture absorption, lactose changes from glassy to
crystalline stateMustard, prepared Syneresis Colloidal aggregationPickles Softening Degradative enzymes (exogenous or microbial)Pies Crust loses crispness, filling becomes dry Moisture migrates from filling to crustShellfish Softening and mushiness ProteolysisSugar confectionery Crystallinity, stickiness Sugars change from amorphous to crystalline stateTortillas Increased firmness and brittleness, Moisture loss to air, retrogradation of starch
decreased rollabilityVegetables, fresh Toughening (a) lignification, e.g. asparagus, green beans
(b) sugar to starch conversion, e.g. green peas, sweet cornSoftening Pectin degradation, e.g. tomatoesPitting Chilling injury, e.g. bell peppers, green beansLoss of crispness Moisture loss and turgor loss, e.g. lettuce, celery
Xixona, turron Firm to soggy Phase change in sugars, possible breakdown of emulsion
Much of this table is derived from Szczesniak (1997).
Chap-01.qxd 1/10/02 4:11 PM Page 9

Some anthropologists claim that a large part of success of Homo sapiensas a species is due to their ability to learn how to process cereal and legumegrains into forms that would not otherwise be consumable or nutritious (Lillford,1991).
The diversity of relished textures derives from the complexity of the humanmasticatory apparatus which will be described in the next chapter. Briefly,there are three different types of teeth, each of which performs a differentfunction. The mandible ( jaw) can be moved in three planes depending on thenature of the food. The tongue plays an active role in mastication, and for soft-foods such as ice cream and yogurt it is the main agent for developing a swallowable bolus, and the teeth do little work. Saliva plays a major role in preparing many foods for swallowing. People want to use the full potentialof the many modes by which mastication can be accomplished, and thisrequires a diversity of textures. There is no one ‘right’ texture; many differenttypes of textures are relished and demanded by consumers as described above.However, a ‘right’ texture is expected for many foods. For example, celerymust be crisp and moist, whereas fresh peaches must have a soft, melting,
10 Texture, Viscosity, and Food
Table 1.5 Textures of Wheat and Wheat-Based Foods
Item H2O% (approx) Form Texture
Wheat grain 14 Elliptical solid Very hard, vitreousArabic bread Sheets, sometimes layered Slightly tough, chewyBagels 40 Ring Tough, chewyBread
Crumb 38 Solid foam Deformable, chewy, aeratedCrust 8 Sheet Chewy, toughToast, fresh 25 Solid foam Crisp outside, chewy insideMelba toast 4 Solid foam Dry, hard, crunchy
Breakfast cereal, cold 3 Flakes Crisp, fracturable, tenderBreakfast cereal, hot 80 Paste Viscous, gummy, stickyBulgur (peeled wheat)
Uncooked 14 Elliptical solid Hard, semiplasticCooked 60 Elliptical solid Tender, moist, chewy
Cake (chemically leavened) 40 Solid foam Deformable, tender, moistCookies 4 Disks Some types are hard, crunchy and crumbly,
whereas others are soft and chewy, depending on the formulation
Muffins 38 Friable mass Crumbly, tender, moistCrackers 4 Flaky disk Crisp, tender, dry, fracturableDonuts 24 Ring Tender, deformable, adhesiveFlour 15 Powder Not consumed in this formPasta
Uncooked 15 Many shapes Hard, brittle, dryCooked 60 Many shapes Soft, tender, moist, rubbery, slightly chewy,
slippery surfacePie crust 19 Sheets Tender, dryPuffed pastry 15 Layered Flaky, highly aerated, chewyPuffed wheat 4 Elliptical solid Aerated, crisp, dryShredded wheat 6 Coarse fibers Crisp, dry, fibrous
Chap-01.qxd 1/10/02 4:11 PM Page 10

juicy texture to be considered a high quality product. Although cheeses exhibitmany different textures, each type of cheese has its own ‘right’ texture. A goodtexture in a cheddar cheese would be considered unacceptable for a brie cheeseand vice versa.
An historical example of this human need for variety in food is found in theOld Testament. When the children of Israel made their historic 40-year marchfrom Egypt to Palestine across the great desert, God provided their food in theform of manna, which fell nightly in sufficient quantity to feed daily thismigrating nation. Manna was a delicious food to eat; it was known as ‘Breadfrom Heaven,’ and is described as being ‘crisp and sweet as honey.’ We knowit provided all the essential nutrients because the people were free from illnessduring this long period of time. Despite the high quality and excellent sensorycharacteristics of manna, people became tired of eating it every day anddemanded a change. The record says
and the children of Israel also wept again, and said, Who shall give us flesh to eat? We remem-ber the fish, which we did eat in Egypt freely; the cucumbers, and the melons, and the leeks, andthe onions, and the garlick. But now our soul is dried away: There is nothing at all, beside thismanna, before our eyes (Numbers 11:4–6).
On another occasion the children of Israel complained about manna, saying‘Our soul loatheth this worthless bread’ (Numbers 21:5).
The people of the 21st century are just as insistent in demanding a variety oftextures and flavors in their food as were the children of Israel many centuriesago. A large part of the effort of the food industry of our day is directed towardproviding both high quality and a wide variety of textures and viscosities inthe foods that are provided to the public.
Status of Food Texture Measurements
Of the three main acceptability factors of foods (appearance, flavor, texture),texture was the last to attract considerable research attention. Indeed, for manyyears texture was considered the overlooked quality attribute of foods. Thiswas reflected in the low proportion of foods whose texture was routinelymeasured, and the level of satisfaction with those tests that were used. For exam-ple, Muller (1969b) reported a survey of food quality measurements made bythe food processing industry in the United Kingdom. A total of 125 companiesreported on 228 food products with the following results:
• 55% of products used some kind of texture test, but 7% of these wereconsidered to be unsatisfactory;
• 45% used no texture test, but 47% of that number stated they would use atexture test if a good one could be found and 9% had tried using a texturetest and abandoned it, presumably because it had been unsatisfactory.
Szczesniak (1990) outlined what she believed were the major reasons foroverlooking texture as a quality attribute for so many years (see Table 1.6).
Status of Food Texture Measurements 11
Chap-01.qxd 1/10/02 4:11 PM Page 11

However, with the better understanding of what texture is, the availability ofconvenient universal testing machines to measure texture, the increasing useof both instrumental and sensory texture profile analysis, and the public’sincreasing awareness of texture that has occurred over the last three decadeshas created a much improved awareness of texture and its importance. Muchprogress has been made since Muller’s 1969 survey.
Nevertheless, considerable work still lies ahead if appealing textures are tobe provided to the market place at all times. Although adequate proceduresexist to measure the texture of many foods, there are still some texture notesfor which satisfactory instrumental measurement is not yet available. There isstill much to be learned about texture of foods, how to measure all texturenotes, and how to manipulate formulation and processing variables to ensurethat high textural quality is achieved.
Definitions of Texture
This has been a difficult term to define since it means different things to different people. The dictionary definition of texture is of little help because itrelates mainly to textiles and the act or art of weaving and, in general, to ‘thedisposition or manner of union of particles or smaller constituent parts of
12 Texture, Viscosity, and Food
Table 1.6 Reasons Why Texture Was Overlooked as an Attribute and Preference Given to Color and Flavor
1. Much government money, because blindness is a national calamity, was spent on biomedical research aimed at elucidating theanatomy and physiology of the eye and the mechanism of color perception. In contrast, the inability to chew and handle various textures in the mouth is not considered a health problem, and no National Institute of Health (NIH) support for research on texturehas been available. This, however, may change in the future as the incidence of dysphagia (the inability to swallow certain foods) isincreasing among older people and among cancer patients undergoing throat radiation therapy. Another texture-related problem –choking by children on pieces of frankfurters – was brought to the attention of NIH several years ago as a documented and spreadingconsumer concern.
2. Texture is usually taken for granted and consumers do not, as a rule, comment on it unless expectations are seriously violatedor unpleasant associations are triggered. These associations may be with inedible objects (such as slime or straw), or with unpleasantevents.
3. Consumers’ vocabulary to describe texture and its parameters has been generally limited; the phrase ‘it does not taste good’was often taken in the past as meaning that the food has poor flavor, whereas the consumer might have been referring to poor texture,or to both.
4. An off-texture does not signal that the food is unsafe to eat, in contrast to odor, color, and flavor. In extreme cases whereputrefaction of protein-based foods leads to the liquification of the originally solid texture, it is the unpleasant odor that is the firstindication of the food being potentially dangerous to health. An off-texture usually signifies just poor food quality. Wilted lettuce,soggy potato chips, or hard, dry white bread indicates spoiled food, not in the sense that it is hazardous to one’s health, but in thesense that it has suffered a serious loss in acceptability. Low meat quality is reflected in the meat being tough; toughness lowers themarket price of meat thus having an important economic impact.
5. Texture cannot be added ‘from a bottle,’ in contrast to aroma, color and taste, which can be formulated and introduced into compounded or processed foods. It must be created through in situ reactions, the mechanisms of which are still incompletelyunderstood in most instances. Even the simplest case, that of viscosity increase through the use of starch or gums, involves a reaction mechanism. Viscosity of the medium is increased through immobilization of water by macromolecules with some potentialintermolecular bonding. The most distinctive textures are created by nature (fruits, vegetables, meat, etc.).
From Szczesniak (1990). Reprinted from Food Technology 44(a), page 88. Copyright by Institute of Food Technologists.
Chap-01.qxd 1/10/02 4:11 PM Page 12

a body or substance, the fine structure.’ The dictionary definition that comesclosest to the needs of the food technologist states that texture is ‘the mannerof structure, interrelation of parts, structural quality.’ Webster’s dictionarygives examples of texture for textiles and fibers, weaving, artistic compositions,music, poetry, petrography (the study of rocks), texture of a bone or plant, butdoes not even mention foods. In view of this lack of coverage in the dictio-nary, food technologists have endeavored to produce their own definition ofwhat is meant by texture. These definitions fall into two groups.
Group 1 comprises what might be called ‘commodity-oriented’ definitionsin which the term texture is applied to a particular quality attribute of a giventype of food. For example, in ice cream grading, texture means the smooth-ness of the ice cream but does not include other factors such as hardness andmelting properties. In bread grading, texture means uniformity of the crumband even distribution in size of the gas bubbles but does not include the softnessor toughness of the bread.
For example, Coles (1998) states, ‘Bread visual texture refers to the patternof luminance observed in light reflected from the crumb of the leavened bread. In a conventional loaf made of white flour, this patterning is almostentirely due to the variation in brightness caused by contrast between bubblesand their walls’. Coles also states that bread technologists take into account a number of textural features including the number and location of unusuallylarge bubbles, streaking, blind crumb, nonrandom variation of texture withina slice, and longitudinal variation of texture within a loaf.
Ball et al. (1957) gives two definitions for texture of meat. The first, whichthey call a sight definition, is ‘texture of meat is the macroscopic appearanceof meat tissues from the standpoint of smoothness or fineness of grain.’ Thesecond, which they call a feel definition, is ‘the texture of cooked meat is the feel of smoothness or fineness of muscle tissue in the mouth.’ It is note-worthy that neither of these definitions includes the properties of toughness,moistness or juiciness which most people consider of great importance in thequality of meat.
Davis (1937) defines texture of cheese as
that which is evident to the eye, excluding color. … Texture varies in meaning in different local-ities, but is frequently taken to include both closeness (absence of cracks) and shortness or brittleness (easy breaking of a plug).
Davis also defines ‘body’ as that quality which is perceptible to touch.Group 2 considers that texture applies to all foods and endeavors to develop
definitions that reflect a universal coverage of all foods. Some of these defi-
nitions are as follows:
Texture means those perceptions that constitute the evaluation of a food’s physical characteris-tics by the skin or muscle senses of the buccal cavity, excepting the sensations of temperature orpain (Matz, 1962).
Texture can be defined as the sensory manifestation of the structure of the food and the man-ner in which this structure reacts to applied forces, the specific senses involved being vision,kinesthetics and hearing (Szczesniak, 1990).
Definitions of Texture 13
Chap-01.qxd 1/10/02 4:11 PM Page 13

Texture is the composite of those properties (attributes) which arise from the structural elements of food and the manner in which it registers with the physiological senses (Sherman,1970).
In its fullest sense the textural experience during chewing is a dynamic integration of mouth-feel, the prior tactile responses while handling the foodstuff, and a psychic anticipatory statearising from the visible perception of the food’s overall geometry and surface features. …Texture should be regarded as a human construct. A foodstuff cannot have texture, only particu-lar mechanical (and other) properties which are involved in producing sensory feelings or texture notes for the human being during the act of chewing the foodstuff (Corey, 1970).
(Texture is) the attribute of a substance resulting from a combination of physical propertiesand perceived by the senses of touch (including kinesthesis and mouthfeel), sight, and hearing.Physical properties may include size, shape, number, nature and conformation of constituent structural elements (Jowitt, 1974).
Texture is that one of the three primary sensory properties of foods that relates entirely to thesense of touch or feel and is, therefore, potentially capable of precise measurement objectivelyby mechanical means in fundamental units of mass or force (Kramer, 1973).
Texture is the way in which the various constituents and structural elements of a food arearranged and combined in a micro- and macrostructure and the external manifestations of thisstructure in terms of flow and deformation (deMan, 1975).
(Texture comprises) those properties of a foodstuff, apprehended by the eyes and by the skin and muscle senses in the mouth, including roughness, smoothness, graininess, etc. (Anonymous,1964).
Texture (noun): All the mechanical (geometrical and surface) attributes of a food product per-ceptible by means of mechanical, tactile and, where appropriate, visual and auditory receptors(International Organization for Standardization, Standard 5492, 1992).
Texture is the human physiological–psychological perception of a number of rheological andother properties of foods and their interactions (McCarthy, 1987).
Texture is the attribute resulting from a combination of physical properties perceived by thesenses of kinesthesis, touch (including mouth, feel, sight and hearing). The properties may include size, shape, number, nature, and conformation of constituent structural elements.(British Standards Organization No. 5098).
Although we do not have an entirely satisfactory definition of texture wecan say with a high degree of certainty that texture of foods has the followingcharacteristics.
1. It is a group of physical properties that derive from the structure of the food.
2. It belongs under the mechanical or rheological subheading of physicalproperties. Optical properties, electrical and magnetic properties, andtemperature and thermal properties are physical properties that areexcluded from the texture definition.
3. It consists of a group of properties, not a single property.4. Texture is sensed primarily by the feeling of touch, usually in the mouth,
but other parts of the body may be involved (frequently the hands).5. It is not related to the chemical senses of taste or odor.6. Objective measurement is by means of functions of mass, distance, and
time only; for example, force has the dimensions MLT�2, work has thedimensions ML2T�2, and flow has the dimensions L3T�1.
Since texture consists of a number of different physical sensations, it is prefer-able to talk about ‘textural properties,’which infers a group of related properties,
14 Texture, Viscosity, and Food
Chap-01.qxd 1/10/02 4:11 PM Page 14

rather than ‘texture,’ which infers a single parameter. There are still many peo-ple handling foods who talk about the texture of a food as though it were a sin-gle property like pH. It is important to realize that texture is a multifacetedgroup of properties of foods. Table 1.7 lists some relations between texturalparameters of foods and popular terms that are used to describe these properties.
These concepts lead to the following definition. The textural properties of a food are that group of physical characteristics that arise from the structuralelements of the food, are sensed primarily by the feeling of touch, are relatedto the deformation, disintegration, and flow of the food under a force, and aremeasured objectively by functions of mass, time, and distance.
Muller (1969a) claims that the term ‘texture’ should be discarded because it is confusing. In present usage it means both an exact physical property andalso a perceived property. He proposes two terms to take the place of the wordtexture: (1) rheology, a branch of physics that describes the physical propertiesof the food; and (2) haptaesthesis (from the Greek words meaning sensationand touch), a branch of psychology that deals with the perception of themechanical behavior of materials.
Muller compares these two terms with the study of light, which has two dis-tinct branches: (1) optics, the study of the physical properties of light, includingreflection, refraction, wave theory, etc.; (2) vision, the study of the psychologicaland physiological human responses to light, such as the perception of objects,
Definitions of Texture 15
Table 1.7 Relations Between Textural Parameters and Popular Nomenclaturea
Mechanical characteristicsPrimary parameters Secondary parameters Popular terms
Hardness Soft Æ firm Æ hardCohesiveness Brittleness Crumbly Æ crunchy Æ brittle
Chewiness Tender Æ chewy Æ toughGumminess Short Æ mealy Æ pasty Æ gummy
Viscosity Thin Æ viscousElasticity Plastic Æ elasticAdhesiveness Sticky Æ tacky Æ gooey
Geometrical characteristicsClass Examples
Particle size and shape Gritty, grainy, coarse, etc.Particle shape and Fibrous, cellular, crystalline, etc.
orientation
Other characteristicsPrimary parameters Secondary parameters Popular terms
Moisture content Dry Æ moist Æ wet Æ wateryFat content Oiliness Oily
Greasiness Greasy
aFrom Szczesniak (1963a); reprinted with permission of Institute of Food Technologists.
Chap-01.qxd 1/10/02 4:11 PM Page 15

perception of color, light and dark adaptations, etc. Figure 1.1 shows schemat-ically the analogy.
Texture-related Concepts and TheirDefinitions
Some other words that are used in a texture-related sense are:
Kinesthetics. ‘Those factors of quality that the consumer evaluates with hissense of feel, especially mouthfeel’ (Kramer and Twigg, 1959). This wordcomes from the Greek words ‘kinein’ (the muscle sense to move) and ‘aesthe-sis’ (perception).
Body. ‘The quality of a food or beverage, relating variously to its consis-tency, compactness of texture, fullness, or richness’ (Anonymous, 1964).‘That textural property producing the mouthfeel sensation of substance’(Jowitt, 1974). ‘The quality of a food or beverage relating either to its consis-tency, compactness of texture, fullness, flavor, or to a combination thereof’(American Society for Testing and Materials, Standard E253-78a).
Chewy. ‘Tending to remain in the mouth without rapidly breaking up or dis-solving. Requiring mastication’ (Anonymous, 1964). ‘Possessing the texturalproperty manifested by a low resistance to breakdown on mastication’ (Jowitt,1974).
Haptic. ‘Pertaining to the skin or to the sense of touch in its broadest sense’(Anonymous, 1964).
Mealy. ‘A quality of mouthfeel denoting a starchlike sensation. Friable’(Anonymous, 1964). ‘Possessing the textural property manifested by the pres-ence of components of different degrees of firmness or toughness’ (Jowitt,1974).
Mouthfeel. ‘The mingled experience deriving from the sensations of theskin in the mouth during and/or after ingestion of a food or beverage. It relatesto density, viscosity, surface tension, and other physical properties of thematerial being sampled’ (Anonymous, 1964). ‘Those textural characteristicsof a food responsible for producing characteristic tactile sensation on the sur-faces of the oral cavity; the sensation thus produced’ (Jowitt, 1974).
16 Texture, Viscosity, and Food
LIGHT
OPTICS(physical)
reflectionrefractionwave theory
sizecolorshapelight and dark adaptation
Young's modulusshear modulusPoisson's ratioviscosityloss compliance
mouthfeelhardnesschewinessgumminessadhesiveness
VISION(perceived)
RHEOLOGY(physical)
HAPTAESTHESIS(perceived)
TEXTUREFFiigguurree 11..11 Comparison ofphysical measurement andhuman perception of light andtexture. (After Muller, 1969a.)
Chap-01.qxd 1/10/02 4:11 PM Page 16

Getaway. ‘That textural property perceived as shortness of duration ofmouthfeel’ (Jowitt, 1974).
The following definitions were all developed by the International Organiza-tion for Standardization, Standard 5492/3, 1979:
Consistency. ‘All the sensations resulting from stimulation of the mechanicalreceptors and tactile receptors, especially in the region of the mouth, and vary-ing with the texture of the product.’
Hard (adjective). ‘As a texture characteristic, describes a product whichdisplays substantial resistance to deformation or breaking. The correspondingnoun is hardness.’
Soft (adjective). ‘As a texture characteristic, describes a product which dis-plays slight resistance to deformation. The corresponding noun is softness.’
Tender (adjective). ‘As a texture characteristic, describes a product which,during mastication, displays little resistance to breaking. The correspondingnoun is tenderness.’
Firm (adjective). ‘As a texture characteristic, describes a product which, dur-ing mastication, displays moderate resistance to breaking. The correspondingnoun is firmness.’
Hardness (noun) is the perceived force required to break the sample intoseveral pieces during the first bite by the molars (Guraya and Toledo, 1988).
Crunchiness (noun) is the perceived cumulative intensity of force requiredby repeated incremental failures of the product by chewing up to five timeswith the molars (Guraya and Toledo, 1988).
Texture Versus Viscosity
Viscosity is defined as the internal friction of a fluid or its tendency to resistflow. Both gases and liquids have viscosity but viscosity of gases will not bediscussed because there are no gaseous foods. However, some foods containentrained gases. For example, ice cream is typically 50% air by volume, andapple flesh may contain 25% gas by volume. Some highly extruded crispysnack foods such as corn curls exceed 90% air by volume. Jones et al. (2000)showed that in 36 branded ready-to-eat breakfast cereals the volume attributedto pores ranged from 68.2% for flakes made from a mixture of corn, wheat,oats and barley to 99.5% for puffed wheat.
At first sight the distinction between texture and viscosity seems simple –texture applies to solid foods and viscosity applies to fluid foods. Unfortunately,the distinction between solids and liquids is so blurred that it is impossible toclearly demarcate between texture and viscosity. While rock candy can defi-
nitely be considered as a solid and milk a liquid, there are many solid foodsthat exhibit some of the properties of liquids and many liquid foods that exhibitsome of the properties of solids. Some apparently solid foods behave like liquids when sufficient stress is applied.
Texture Versus Viscosity 17
Chap-01.qxd 1/10/02 4:11 PM Page 17

The indistinct separation between solids and liquids results in some confu-sion in the literature between food texture and viscosity and that confusion isreflected to some extent in this book. The author has followed the arbitrarydistinction that foods that are usually considered to be solid or near-solid arediscussed in Chapters 4 and 5 and foods that are usually considered to be liq-uid or near-liquid are discussed in Chapter 6. Some of the tests for solid foodsdescribed in Chapters 4 and 5 should really be discussed in Chapter 6 on viscosity, and some of the material in Chapter 6 could have been discussed inChapters 4 and 5.
The nature of the overlap between solids and liquids should become moreclear when the reader reaches the end of Chapter 6. At this point, the readershould be aware that the distinction between solids and liquids is not clearcutand that some inconsistencies in treatment are found because of this problem.
Texture and Food Processing
Much food processing is directed to changing the textural properties of thefood, generally in the direction of weakening the structure in order to make iteasier to masticate. From the nutritional standpoint wheat could be eaten aswhole grains but most people find them too hard to be appealing. Instead, thestructure of the wheat kernel is destroyed by grinding it into flour, which isthen baked into bread with a completely different texture and structure thanthe grain of wheat. The texture of leavened bread is much softer and less densethan that of grains of wheat and is a more highly acceptable product, judgingby the quantity of bread that is consumed (see Table 1.5, page 10).
The processing that is needed to develop desirable textural properties infoods can be expensive. In the United States the wholesale price of wheat isabout 10–20 cents per kilo while the retail price of bread is usually in therange of one dollar to several dollars per kilo. The wide disparity in pricebetween bread and wheat indicates the high cost of conversion of wheat graininto bread and also the price people are prepared to pay to obtain the type oftextures they desire. Breakfast cereals made from wheat that has been rolledinto flakes cost over $2 per kilo which is another indication of the price thatpeople will pay to convert grains of wheat into a more texturally desirable form.One of the major reasons for cooking most vegetables before consumption isto soften them and make them easier to masticate.
Although much food processing is deliberately designed to modify texturalproperties, there are some instances where the textural changes are inadver-tent, being a side result of processing for some other purpose. These texturalchanges are frequently undesirable. A good example of this is the extremesoftening and severe textural degradation that results from canning, freezing,or irradiation preservation of fruits and vegetables. In some instances thedamage to texture is so great that the resultant product is unsalable, in whichcase that processing method is not used on that commodity. For example, the
18 Texture, Viscosity, and Food
Chap-01.qxd 1/10/02 4:11 PM Page 18

dose of about two million rads (20 kilogray) required to sterilize horticulturalcrops causes such extreme softening of the tissue that it has eliminated theincentive to continue research to resolve questions on the safety of irradiation-sterilized fruit.
Foods might be classed into two groups, depending on the relative ease withwhich texture can be controlled:
1. Native foods are those foods in which the original structure of the agri-cultural commodity remains essentially intact. With these foods the foodtechnologist has to take what nature provides in the form of fruit, fish,meat, poultry, vegetables, etc., and can only change the texture by processing methods such as heating, cooling, and size reduction.Usually there is almost no direct control over the composition of thesefoods, although with some of them it is possible to partially control the composition and texture by breeding, time of harvest, and culturalfactors.
2. Formulated foods are those foods that are processed from a number ofingredients to make a food product that is not found in nature. Manynative foods are transformed into ingredients for formulated foods, butin doing so the native plant or animal structure and organization is usu-ally lost. Examples of this type of commodity are bread, ketchup, icecream, jellies, mayonnaise, candy, cheese, margarine and sausage. Withthis class of commodity it is possible to change the formulation by thenumber, amount, and quality of ingredients that are used in addition toprocessing variables, and hence there are more options available to con-trol the texture of the finished product and to develop specified textures and structures not found in native foods.
A large number of ingredients, called ‘texturizing agents’ are available tothe food technologist to help bring the texture of foods into the range preferredby consumers. The Handbook of Food Additives (Ash and Ash, 1995) is aninternational guide to more than 7500 substances that are permitted to beadded to foods in one or more countries. More than 700 of these substancesare described as texturizers, thickeners, viscosity modifiers, bodying agents,gelling agents and stiffening agents. These give the product development specialist a large array of aids to develop the desired textures.
Vincent (1986) estimated that the annual world food production of texturiz-ing agents exceeded one million tons. Starch and modified starches contributed82% of this amount. Other texturizing agents whose sales exceed 10,000 tonsper annum are gum acacia, alginates, carrageenans, carboxymethylcellulose,gelatin, guar gum, locust bean gum, pectin and xanthan gum.
Some texturizing agents are only needed in small amounts. For example,the US Food and Drug Administration permits the addition of 0.4% calciumchloride to processed vegetables to improve their firmness. This effect isachieved by the calcium ions crosslinking the pectin material naturally presentin the vegetable by forming salt bridges.
Texture and Food Processing 19
Chap-01.qxd 1/10/02 4:11 PM Page 19

Despite the wide range of options available, food technologists have expe-rienced great difficulty in fabricating foods that closely simulate native foodsbecause of their cellular structure and complex structural organization. Theturgor that provides much of the crispness of many fresh fruits and vegetablesarises from the physiological activity of the living tissue and is unlikely everto be duplicated in a fabricated analog.
Textural properties are used as the basis of selection or rejection of certainparts of foods. Many children dislike the texture of bread crust and engage invarious subterfuges to avoid eating it. Texture is the main reason why the skinof some fruits and vegetables is eaten whereas that of other fruits and vegeta-bles is not eaten. The skin is usually eaten with the fleshy portion when it istender or thin, as in the strawberry, cherry, green pea, and green bean. Theskin is usually not eaten when it is texturally objectionable because it is thick,hard, tough, hairy, fibrous, or prickly, as in the grapefruit, pumpkin, mango,peach, banana, and pineapple. Of course, there are some borderline cases; somepeople peel their apples, figs, potatoes, and tomatoes before eating while othersdo not.
A great deal of attention has been given to ‘texturizing’ vegetable proteins.Most people enjoy the chewy fibrous texture of muscle meat but this kind oftexture is not found in vegetable proteins. Vegetable proteins generally costless than animal proteins because the biological conversion of vegetable protein into animal protein by the cow, pig, or chicken is inefficient, with, typically, 5–20% of the protein fed to the animal recovered as edible proteinfood. This inefficient conversion raises the cost of animal protein. In contrast,the direct conversion of vegetable protein into products with a meatlike chewytexture by modern processing technology is usually 70–90% efficient.
Considerable research attention is presently being given to imparting ameat-like texture to vegetable proteins in order to obtain the desirable chewytexture of meat coupled with the lower cost of the vegetable proteins and (forsome people) avoidance of cholesterol and other undesirable features of meat.Substantial progress has been made in developing meatlike textures in vegetableproteins but more progress is needed before these products are equal to themeat in their overall textural properties.
The problem of imparting a desirable texture to a food is exemplified in theproblems of fish protein concentrate (FPC). The production of FPC makesavailable for human consumption the protein from many species of fish thatare normally not used. The general process is to remove the fat and moisturefrom the fish and grind the residue into a powder. The problems of developinga bland flavor and absence of fishy flavor, and obtaining stability and goodnutritional value of the FPC have been solved, but the problem of utilizingFPC for food has not been satisfactorily solved. FPC is a dry powder and nomore a food than is wheat flour a food. It is a food ingredient that must be fabricated into a food in much the same way as wheat flour is fabricated intobread, cookies, and similar products and this has proven to be an extremelydifficult task. Dry FPC has such poor functional properties that it cannot be
20 Texture, Viscosity, and Food
Chap-01.qxd 1/10/02 4:11 PM Page 20
used to develop texture in formulated foods. At the present time the only satisfactory use for FPC is to add it to existing foods at levels that are so lowthat the textural properties of that food disguise the presence of FPC.
The problem of fabricating vegetable proteins into foods with acceptabletexture is extremely difficult. Only those food technologists who have wrestledwith this problem know how difficult it is. Several years ago a chemist, writingon future sources of food, wrote:
The polymer chemist who has produced an almost endless variety of fibers, gels, gums, resins,and plastic products would encounter no major difficulty in incorporating synthetic food materi-als in products of nearly any desired consistency or texture, and could prepare highly acceptablecounterparts of steak, Jell-o, cheese, or seafood.
This scientist should be sentenced to spend 10 years hard labor in the productdevelopment laboratory for making such a misleading statement! Acceptabletexture has been a limiting factor in the development of many fabricated foods.
Texture and Health
Because obesity has become a major health problem in the industrializedcountries the food industry devotes considerable effort to bring low caloriefoods and beverages to the market in an effort to alleviate the problems ofoverweight. Maintaining satisfying textural properties of manufactured foodswhile reducing or eliminating fat or sugar is a daunting problem.
The Human Nutrition Unit of Sydney University developed a satiety index(SI) as a method to measure the filling powers of different foods. They foundthat different foods have very different effects on energy production and sati-ety which is the feeling of fullness that arises after eating (Holt, 1999). Highsatiety foods tended to have bulky, crunchy, or fibrous textures which makesthem relatively more difficult to chew and swallow. Holt (1999) give as exam-ples of high SI foods potatoes, oatmeal porridge, steak, fish, apples, oranges,brown pasta and baked beans. These authors believe that the consumption oflow fat, bulky, chewy foods gives a long-lasting feeling of satiety and hencereduces total caloric intake.
Dr Minoru Onozuka and his team at Gifu University School of Medicine inJapan have evidence that chewing stimulates the brain and helps it retain mem-ory (Onozuka et al., 1999, 2000). Mice whose molars were extracted to reducemasticatory effectiveness did not perform as well on memory tests as similarmice with teeth. The aged molarless mice showed a significantly reducedlearning ability compared with age-matched control mice but there was nodifference between control and molarless young adult mice. Onozuka et al.suggest there is a link between reduced mastication ability and hippocampalneuron loss as a risk factor for senile impairment of spatial memory. Althoughthese particular experiments were performed on mice, this work supports asmall but growing body of evidence that reduced ability to masticate is associated with Alzheimer’s dementia. The tentative conclusion is that elderly
Texture and Health 21
Chap-01.qxd 1/10/02 4:11 PM Page 21

people who want to retain their memory and fend off dementia should do morechewing.
Texture and Structure
As pointed out in the definition of texture on pages 12–15 and in a number ofother statements, the textures of foods derive from their structure. The struc-tural organization at the molecular level, the microscopic level, and the macro-scopic level are major determinants of textural quality. Having noted theimportance of structure to texture it must be stated that it is beyond the scopeof this book to describe in detail food structures and how they are measured.The reader is referred to the excellent volume “Microstructural Principles ofFood Processing and Engineering” by Aguilera and Stanley (2nd edition,1999) for a full account of the structural basis of texture.
An example of the connection between structure and texture is given inFig. 1.2 which shows the microstructure of an uncooked hydrated lima beanseed (LHS) and a matching seed boiled in water for 20 min (RHS). In the rawseed the tissue breaks across the cells when stressed because the middlelamella that cements the cells together is stronger than the cell walls. Duringcooking, the pectic material in the middle lamella is depolymerized, causing itto become weaker than the cell walls, and fracture now occurs through themiddle lamella leaving the cells unbroken.
Whether plant tissues break across cell walls or between cells has a greateffect on their textural sensations. For example, in the potato it is desirable tokeep whole cells, because when the cell walls break, starch grains spill outimparting an undesirable pasty, gummy, sticky texture. In contrast, for apple,it is desirable to break the cell walls to allow the cell sap to spill into the mouthimparting the much relished sensation of juiciness. When the apple flesh frac-tures between cells no juice is released and that apple has a dry, mealy texture.
Rheology and Texture
Rheology is the study of the deformation and flow of matter. The science ofrheology can be applied to any product and in fact was developed by scientistsstudying printing inks, plastics, rubber, and similar materials. Chapter 3 providesa simple introduction to the basic concepts of rheology.
Food rheology is ‘the study of the deformation and flow of the raw materi-als, the intermediate products, and the final products of the food industry’(White, 1970). In this definition the term ‘food industry’ should be broadlydefined to include the behavior of foods in the home.
Psychophysics is ‘the study of the relationship between measurable stimuliand the corresponding responses’ (International Organization for Standardiza-tion, Standard 5492/1, 1977).
22 Texture, Viscosity, and Food
Chap-01.qxd 1/10/02 4:11 PM Page 22

Psychorheology. There are two types of definitions given to psychorheology.The first is a scientific definition: (1) psychorheology is a branch of psycho-physics dealing with the sensory perception of rheological properties of foods.Another definition, which might be called a people-centered definition, is thefollowing: (2) psychorheology is the relationship between the consumer pref-erences and rheological properties of foods.
Both of these definitions are meant to bridge the gap between the physicalor rheological properties of foods and the sensing of those properties by thehuman senses (see Fig. 1.1, page 16).
The science of rheology has many applications in the field of food accept-ability, food processing, and handling. A number of food processing operationsdepend heavily upon rheological properties of the product at an intermediatestage of manufacture because this has a profound effect upon the quality of thefinished product. For example, the rheology of bread dough, milk curd, andmeat emulsions are important aspects in the manufacture of high-quality
Rheology and Texture 23
FFiigguurree 11..22 Scanning electron micrograph of the fractured surface of a hydrated lima beanseed. LHS, uncooked. Starch grains can be seen inside the broken cells. RHS, boiled for 20 min.The cell walls do not break. Starch granules can be seen pressing against the unbroken flexiblecell walls. (From Rockland and Jones, 1974. Reprinted from J. Food Science 3399, 344, 1974.Copyright by Institute of Food Technologists.)
Chap-01.qxd 1/10/02 4:11 PM Page 23

bread, cheese, and sausage products. The agricultural engineer is interested inthe ability of foods to be handled by machinery and in the creep and recoveryof agricultural products that are subjected to stresses, particularly long-termstresses resulting from storage under confined conditions such as the bottomof a bulk container.
Viscosity, especially non-Newtonian viscosity, is an important componentof the quality of most fluid and semifluid foods. The food engineer is interestedin the ability to pump and mix liquid and semiliquid foods. Plasticity, pseudo-plasticity, and the property of shear thinning are important quality factors infoods and the study of these properties is part of the science of rheology. A wide variety of foods, such as butter, margarine, applesauce, tomato catsup,mayonnaise, peanut butter, and many puddings are either plastic or pseudo-plastic in nature. They are required to spread and flow easily under a smallforce but to hold their shape when not subjected to any external force otherthan gravity. All of these properties fall within the field of rheology.
When celebrating the golden anniversary of the founding of the field of rheology, the then president of the American Society of Rheology singled outfor special comment the interesting rheological characteristics of foods in thefollowing words:
One of the world’s greatest rheological laboratories is in the kitchen. Who can cease to wonderat the elasticity of egg white, or of the foam it forms when beaten with air? At the transformationof gelatin from a watery solution to an elastic gel? At the strange flow properties of mayonnaise,ketchup, peanut butter, or starch paste? Or at the way bread dough defies both gravity and centri-fugal force as it climbs up the shaft of the beater? (Krieger, 1979).
Rheology is important to the food technologist because it has many appli-cations in the three major categories of food acceptability:
1. Appearance. There is a small component of rheology in appearancebecause certain structural and mechanical properties of some foods can be determined by appearance; for example, we can see how wellmaple syrup pours from the bottle and covers the pancake.
2. Flavor. Rheology has no direct part in this category, although the manner of food breakdown in the mouth can affect the rate of release offlavor compounds.
3. Touch. Rheological properties are a major factor in the evaluation offood quality by the sense of touch. We hold foods in the hand and fromthe sense of deformability and recovery after squeezing frequentlyobtain some idea of their textural quality. For example, fresh bread ishighly deformable whereas stale bread is not; the flesh of fresh fishrecovers quickly after squeezing while the stale fish does not. During the process of mastication a number of rheological properties such as thedeformation that occurs on the first bite and the flow properties of thebolus (the mass of chewed food with saliva) are sensed in the mouth.
The importance of rheology in foods has been well established in the preceding discussion. However, the science of rheology does not cover all of
24 Texture, Viscosity, and Food
Chap-01.qxd 1/10/02 4:11 PM Page 24

the aspects that should be included in the broad definition of food texture.Mastication is a process in which pieces of food are ground into a very finestate, but the process of size reduction (synonyms are comminution, disinte-gration, pulverization, and trituration) does not belong in the field of rheology.During mastication the size and shape of food particles and their surfaceroughness are sensed and become important attributes of the overall texturalsensation. Brandt et al. (1963) described the surface properties of food particlesin the sensory terms of powdery, chalky, grainy, gritty, coarse, lumpy, beady,flaky, fibrous, pulpy, cellular, aerated, puffy, and crystalline. They are called‘geometrical properties’ or, ‘particulate properties’ because they relate largelyto the mouthfeel of size and shape of particles in the bolus. Bourne (1975a)suggested that the word ‘rugosity’ or surface roughness is an important attrib-ute of the food particles that are sensed in the mouth.
The ability of the food to wet with saliva and to absorb saliva or to releasemoisture or lipid are important textural sensations that also do not belong in the field of rheology. Phase changes resulting from temperature changesoccurring in the mouth are an important part of the texture sensation of somefoods; for example, ice cream, chocolate, and jelly melt in the mouth whereasthe oil in hot soup may solidify in the mouth during mastication. Thesechanges are not rheological properties although they are frequently sensed bychanges in rheological properties.
From this evidence we have to conclude that the field of food texture fallspartly within the field of conventional rheology and partly outside this field.The food technologist certainly needs to define and measure certain rheologi-cal properties of foods, but there are many instances where the classical scienceof rheology is of little help in studies of the textural properties of foods andnonrheological techniques are needed.
Rheology defines and measures properties of foods. But the food technologistis also interested in the process of mastication and the changes in rheologicaland other textural properties that occur during mastication. The fact that funda-mental rheological measurements usually do not correlate as well with sensorymeasurements of texture as do empirical tests may result from the incom-pleteness of the science of rheology to describe all of the changes, or perhapseven the most important changes that are actually sensed in the mouth and areof most interest to the food technologist.
One of the founders of the field of rheology stated,
The flow of matter is still not understood and since it is not mysterious like electricity, it does notattract the attention of the curious. The properties are ill defined and they are imperfectly mea-sured if at all, and they are in no way organized into a systematic body of knowledge which canbe called a science (Bingham, 1930).
Although this comment may not apply today to the field of rheology in general, it is fair to say that it still applies to the subfield of food rheology. Onlya small number of research scientists devote their career to food rheology;there is a large volume of empirical information and a small volume of utilizable fundamental concepts. The author hopes that this book will help
Rheology and Texture 25
Chap-01.qxd 1/10/02 4:11 PM Page 25

systematize the widely scattered body of knowledge in this field and hencepromote the development of the field of food rheology into a rigorousscientific discipline.
Early History
It is not easy to decide where to begin citing the work of the early scientistswho pioneered the development of the study of the texture and viscosity offoods. Robert Hooke (in England in 1660) enunciated the principle of elasticdeformation of solids, giving rise to the descriptive term ‘Hookean solid’ thatis still used today. A contemporary, Isaac Newton (in England in 1687), enun-ciated the law governing the flow of simple liquids, giving rise to the term‘Newtonian fluid.’ However, the findings of these two eminent scientists didnot apply specifically to foods.
Possibly, the first person to develop an instrument expressly for testing foodswas Lipowitz (1861, Germany), who developed a simple puncture tester formeasuring the firmness of jellies (see Fig. 4.2, page 113). Carpi (1884, Italy)also developed a puncture tester for cooled olive oil and other fats. Schwedoff
(1889, France) developed a deformation apparatus for jelly based on a torsiontest and measured rigidity, viscosity, and relaxation.
Babcock (1886) at the New York State Agricultural Experiment Station(now part of Cornell University) devised a viscometer consisting of a hollowbrass cylinder 6.4 cm long that was suspended from a 1.1 m long torsion wire.The cylinder was immersed in milk and caused to oscillate and the degree ofdamping used to measure the viscosity of milks. Babcock’s viscometer designwas used by Woll (1895) at the University of Wisconsin who studied the effectsof processing milk and cream on their viscosity.
Hogarth (1889, Scotland) obtained a patent for a device that measured theconsistency of dough using the same principles as the modern Farinograph.Brabender, in Germany (1901–1980) developed a line of equipment for mea-suring the rheological properties of flour dough and founded companies inGermany and in the United States that still bear his name. Brabender (1965)recalled that an instrument for dough extensibility was developed in Hungaryby Kosutány and Rejtö at the beginning of the last century (Kosutány, 1907).He also pointed out that, in 1905, another Hungarian, Professor Jenö vonHankóczy, designed an apparatus that measured the volume of air that couldbe blown into a disk of washed wheat gluten before it burst. This device wasthe forerunner of the Alveograph.
Wood and Parsons (1891, United States) described a puncture test devel-oped for measuring the hardness of butter. Brulle (1893, France) developed anoléogrammétre to measure the hardness of solid fats using the puncture prin-ciple. Sohn (1893, England), who was independently performing experimentssimilar to Brulle, felt he had been ‘scooped’ when Brulle’s publication
26 Texture, Viscosity, and Food
Chap-01.qxd 1/10/02 4:11 PM Page 26

appeared, and he hurried into print with a description of his apparatus accompanied by a list of seven rules that should be followed to avoid erro-neous results. Perkins (1914, United States) continued the work of Brulle andSohn in developing a puncture test to measure the hardness of fats. Kissling(1893, 1898, Germany) also studied penetration tests on greases and jellies byrecording the time for rods of glass, zinc, or brass of various diameters to sinkthrough the sample. Wender (1895, United States) studied the hardness of but-ter and margarine by measuring the viscosity of chloroform solutions of thefats in a U-shaped capillary viscometer that he called a ‘fluidometer.’ Lindsay(1901; Lindsay et al., 1909; United States) measured the consistency of butterby measuring the depth that a mercury-weighted glass tube penetrated intobutter when allowed to fall a standard height. Meyeringh (1911, Netherlands)also used a puncture test while Hunziker et al. (1912, United States) used adeformation test to measure butter hardness.
Cobb (1896, Australia) measured the hardness of wheat grains by measuringthe force required to cut a grain of wheat in half by a pair of pinchers simulat-ing biting between the front teeth. He defended his objective method againstthe skeptics by stating, ‘If the relative hardness here given differs from preconceived notions, so much the worse for the preconceived notions, unlessit is shown that the methods adopted here are fallacious – an unlikely contin-gency.’ Roberts (1910, United States) used similar procedures to measure thehardness of wheat grains.
Waugh (1901, United States) clearly described a sensory deformation testas follows:
Peaches and apricots are picked as soon as they show the first sign of ripening. The well-trainedpicker tests each fruit by taking it between his thumb and fingers and feeling it with the ball ofhis thumb. The fruit is not squeezed or bruised; but if it has the faintest feeling of mellowness itstime has come, and the picker transfers it to his basket.
Leick (1904a,b Germany) measured Young’s modulus of elasticity of slabsof gelatin gels in tension and compression and showed that the modulus isapproximately proportional to the square of the gelatin concentration. How tomeasure the firmness of jellies was a matter of interest to a number of earlyresearchers, including Alexander (1906), who was awarded a United Statespatent (Alexander, 1908) for his apparatus; E. S. Smith (1909), who was alsoawarded a United States patent; Valenta (1909); Hulbert (1913); Sindall andBacon (1914); Low (1920); C. R. Smith (1920); Sheppard et al. (1920); Oakesand Davis (1922); Freundlich and Seifriz (1923); Sheppard and Sweet (1923);Poole (1925); and Tracy (1928). Bloom (1925) was awarded a United Statespatent for a ‘machine for testing jelly strength of glues, gelatins and the like.’This became the Bloom Gelometer, which is still used by the gelatin industryto measure the jelly grade of gelatins. Tarr (1926, United States) developed theTarr–Baker Jelly Tester, a puncture test that measured the firmness of pectinjellies. Sucharipa (1923, United States) attempted to measure the firmness ofpectin jellies by means of compressed air.
Early History 27
Chap-01.qxd 1/10/02 4:11 PM Page 27

Goldthwaite (1909, 1911, United States) described the texture of a fruitjelly as follows:
The ideal fruit jelly … will quiver, not flow, when removed from its mold; a product with textureso tender that it cuts easily with a spoon, and yet so firm that the angles thus produced retain theirshape; a clear product that is neither syrupy, gummy, sticky, nor tough; neither is it brittle and yetit will break, and does this with a distinct beautiful cleavage which leaves sparkling characteris-tic faces.
It is clear from this description that Goldthwaite understood the multifacetednature of texture.
Washburn (1910, United States) also struggled to define differences in tex-tural properties, going to some effort to distinguish between ‘body’ and ‘tex-ture’ of ice cream. Lehmann (1907a, Germany) devised an apparatus calledthe ‘Dexometer’ to measure the toughness of meat and used the same instru-ment to measure the softening of vegetables during cooking (Lehmann, 1907b).This was probably the first objective test to measure meat toughness. Willardand Shaw (1909, United States) give results from a puncture test that was usedto measure the strength of egg shells but did not describe the equipment.
Professor Morris of Washington State University developed the first punc-ture tester for measuring the firmness of fruit in 1917 but did not publish hisresults for several years (Morris, 1925). In the meantime, other workersbecame aware of his work and developed their own designs of fruit pressuretesters, sometimes publishing before Morris (e.g., Lewis et al., 1919; Murneek,1921; Magness and Taylor, 1925).
A graduate student at Kansas State College by the name of Lyman Bratzlerwas assigned by his advisor, Professor Warner, a research problem involvingtoughness of meat. He developed a mechanical shearing device whose principleof operation is well known today as the Warner–Bratzler Shear (Warner, 1928;Bratzler, 1932, 1949). Tressler (1894–1981), who has made numerous contri-butions to the field of food technology, developed a tenderness test for meatbased on the puncture principle, which he considered to be superior to theWarner–Bratzler Shear (Tressler et al., 1932; Tressler and Murray, 1932). Hecalled the Warner–Bratzler Shear ‘the mousetrap,’ possibly because of themanner in which it snaps back into place when a tough piece of meat finallyshears. Pitman (1930) developed a shear test somewhat similar to the Warner–Bratzler Shear for measuring the firmness of almonds. Tauti et al. (1931,Japan) developed a physical test for measuring the firmness of raw fish.
Bingham (1914) developed a U-tube viscometer with applied air pressurethat he called a ‘plastometer.’ This apparatus was used by Herschel andBergquist (1921) to measure the consistency of starch pastes, and by Porst andMoskowitz (1922) for processed corn products.
Davis (1921, United States) devised the three parallel bar test for measuringthe breaking strength or shortness of cookies, calling it a ‘shortometer.’ Thiswas later improved by Fisher (1933). Hill (1923, 1933, United States) devel-oped the Hill Curd Tester for measuring the firmness of cheese curd; Babcock(1922, United States) developed the falling plummet test for measuring the
28 Texture, Viscosity, and Food
Chap-01.qxd 1/10/02 4:11 PM Page 28
firmness of whipped cream; Vas (1928, Netherlands) developed a penetrome-ter for measuring the firmness of cheese curd; and Knaysi (1927) developed a falling-ball viscometer to measure the viscosity of buttermilk.
Stewart (1923) found that the volume of popped popcorn correlates wellwith popcorn quality. Sayre and Morris (1931, 1932) measured the volume ofjuice that could be expressed from sweet corn and concluded that it was a satisfactory test for physical quality of sweet corn. This procedure eventuallydeveloped into the Succulometer test (Kramer and Smith, 1946).
One person who must be singled out for special mention is Dr George W. ScottBlair (1902–1987). Dr Scott Blair, an Englishman, and one of the founders ofthe science of rheology, is world renowned for his pioneering contributions tofood rheology and also the rheology of soils, plastics, and biological fluids. Heauthored over 250 publications on rheology and is author or editor of sevenbooks. Because of his early work on flour (Scott Blair et al., 1927) and later ondairy products and psychorheology in the 1930s to 1950s, he is considered to bethe ‘father’ of food rheology. In 1929, while on a sabbatic leave at CornellUniversity he attended a meeting in Washington, DC, that resulted in the officialadoption of the term ‘rheology’ and the formation of the (American) Society ofRheology. He was also a founding member and president of the British Societyof Rheology. A special issue of Journal of Texture Studies (Vol. 4, No. 1, 1973)took the form of a festschrift honoring Dr Scott Blair on his seventieth birthday.
A number of contemporary or near-contemporary scientists have mademajor impacts on the development of texture science and technology. Some ofthose who have retired or are recently deceased are listed below. Dr AmihudKramer (1913–1981), Professor of Horticulture at the University of Maryland,made significant advances in our understanding of texture as a quality attrib-ute of fruits and vegetables and led the team that developed what is popularlyknown as the ‘Kramer Shear Press,’ an instrument still widely used today.Laurie Lynch (1900–1974) in Australia developed the multi-pin puncturetester named the Maturometer for measuring texture and maturity of greenpeas and quantified the relationship between texture, maturity, and chemicalcomposition of peas. Dr Toshimaro Sone (1925–1984) in Japan pioneered theuse of fundamental rheological methods to characterize the texture of dairyproducts and related these properties to their internal structure. Dr BirgerDrake, in Sweden, made a number of important contributions to our under-standing of texture including showing how the analysis of food sounds was animportant component of textural quality, especially in crispy and crunchyfoods. Dr Alina S. Szczesniak (now retired), a Principal Scientist at GeneralFoods Corporation (now part of Kraft Foods), pointed out the multidimen-sional nature of texture and its importance to the consumer and developed theprinciples of texture profile analysis for both instrumental and sensory methods.She was a Founding Editor of Journal of Texture Studies in 1969 and served in that capacity for 10 years. A Festschrift honoring her achievements was published in J. Texture Studies Vol. 12 issue 2, 1981. Both Professor Kramerand Dr Szczesniak received the Nicholas Appert Award (in 1976 and 1985,
Early History 29
Chap-01.qxd 1/10/02 4:11 PM Page 29

respectively), the highest award given to members of the Institute of FoodTechnologists. Dr Szczesniak was appointed a Fellow of the InternationalAcademy of Food Science and Technology (IAFoST) in 1999 in recognition ofher outstanding contributions to the field of food texture. Peter Voisey (nowretired), an engineer with Canada Agriculture applied new technologies andengineering principles to modernize and improve many popular empiricaltesting instruments and developed the Ottawa Texturometer and numerousattachments for performing different tests with just one machine. He stressedthe need for dimensional standardization and proper calibration of texture-measuring instruments. Dr Philip Sherman (now Emeritus Professor of FoodRheology at King’s College, University of London, England) and FoundingEditor of J. Texture Studies, a position he held for 24 years, greatly strength-ened the rheological aspects of texture measurement and performed the classical experiment that established the shear rates normally engendered inthe mouth. A Festschrift honoring his work was published in J. Texture StudiesVol. 26 issue 4, 1995. Professor Sherman was appointed a Fellow of theInternational Academy of Food Science and Technology in 1999 in recog-nition of his work on food rheology and in extending that work to other countries. Dr Donald Hamann (1933–1996), Professor of Food Science atNorth Carolina State University who conducted pioneering work on torsion,compression and tensile testing and developed the torsion gelometer and theoretical principles of fracture properties of food gels. Dr David Stanley(now Emeritus Professor of Food Science), University of Guelph, Canada,highlighted the structural and microstructural basis of food texture. Dr Johnde Man (also an Emeritus Professor of Food Science), University of Guelph,Canada, made many contributions to the field, especially in texture and struc-ture of fats and fat-based foods. The author has had the privilege of personallyknowing every person named in this paragraph. Most of this group also playeda less visible role in developing the field by serving on the Editorial Board ofJournal of Texture Studies.
All of the above made notable contributions to the field of food texture andmost of those who are still living maintain an active interest in the field. Thenumber of scientists in the texture field continued to multiply in the 1980s and1990s; their names are referenced throughout the pages of this book. Theirnumber can be expected to increase well into the 21st century due to theincreasing recognition of the importance of texture as a quality affecting foodacceptance, value, and utilization.
Suggestions for Further Reading
The Journal of Texture Studies published bimonthly by Food and NutritionPress, 6527 Main Street, PO Box 374, Trumbull, Connecticut, 06611, USApublishes original research, reviews, and discussion papers on rheology, psychorheology, physical testing and sensory testing of foods. It is the best
30 Texture, Viscosity, and Food
Chap-01.qxd 1/10/02 4:11 PM Page 30

single source of information on developments in the field of food texture, foodrheology and food viscosity.
The following books and articles contain much useful information. Theolder publications will be useful for those who want to trace the developmentof texture technology.
Aguilera, I. M. and D. W. Stanley. 1999. “Microstructural Principles of Food Processingand Engineering,” Second Edition, Aspen Publishers, Gaithersburg, Maryland.
Barnes, H. A., J. F. Hutton, and K. Walters. 1989. “An Introduction to Rheology,”Elsevier, New York.
Blanshard, J. M. V. and P. Lillford, eds. 1987. “Food Structure and Behaviour,”Academic Press, London.
Blanshard, J. M. V. and R. J. Mitchell, eds. 1988. “Food Structure – Its Creation andEvaluation,” Butterworths, London.
Borwanker, R. P. 1992. “Rheology of Foods,” Elsevier Applied Science, New York.Brennan, J. G. 1980. Food texture measurement. In “Development in Food Analysis
Techniques, Vol. 2” (R. D. King, ed.), pp. 1–78. Appl. Sci., London.deMan, J. M., P. W. Voisey, V. F. Rasper, and D. W. Stanley. 1976. “Rheology and
Texture in Food Quality,” Avi, Westport, Connecticut.Escher, F. 1986. “Textur, Rheologie und Struktur in der Lebensmitteltechnologie,”
Juris, Zürick.Faridi, H. and J. M. Faubion, eds. 1990. “Dough Rheology and Baked Product Texture,”
van Nostrand Reinhold, New York.Hartel, R. W. 2001. “Crystallization in Foods,” Asper Publishers, Gaithersburg.Kramer, A. and A. S. Szczesniak, eds. 1973. “Texture Measurements of Foods,” Reidel
Publ., Dordrecht, Netherlands.Lawless, H. T. and H. Heyman. 1999. “Sensory Evaluation of Food – Principles and
Practices,” Aspen Publishers, Gaithersburg, Maryland.Lewis, M. J. 1996. “Physical Properties of Foods and Food Processing Systems,”
Woodhead Publishing Ltd, Cambridge.Matz, S. A. 1962. “Food Texture,” Avi, Westport, Connecticut.Meilgaard, M., G. V. Civille, and B. T. Carr. 1999. “Sensory Evaluation Techniques,”
Third Edition, CRC Press, Boca Raton, Florida.Meiselman, H. L. and H. J. H. MacFie, eds. 1996. “Food Choice, Acceptance and
Consumption,” Blackie Academic and Professional, London.Mohsenin, N. N. 1986. “Physical Properties of Plant and Animal Materials,” Gordon
& Breach, New York, Second Edition.Moskowitz, H. R., ed. 1987. “Food Texture. Instrumental and Sensory Measurement,”
Marcel Dekker, New York.Muller, H. 1973. “An Introduction to Food Rheology,” Crane Russak, New York.Peleg, M. and E. B. Bagley, eds. 1983. “Physical Properties of Foods,” Avi Publishing
Co., Westport, Connecticut.Prentice, J. H. 1984. “Measurements in the Rheology of Foodstuffs,” Elsevier Applied
Science, London.Rao, M. A. and J. F. Steffe. 1992. “Viscoelastic Properties of Foods,” Elsevier Applied
Science, New York.Rha, C. H., ed. 1974. “Theory, Determination, and Control of Physical Properties of
Food Materials,” Reidel Publ., Dordrecht, Netherlands.
Suggestions for Further Reading 31
Chap-01.qxd 1/10/02 4:11 PM Page 31

Rosenthal, A. J., ed. 1999. “Food Texture, Measurement and Perception,” Aspen Publishers Inc., Gaithersburg, Maryland.
Scott Blair, G. W., ed. 1953. “Foodstuffs: Their Plasticity, Fluidity, and Consistency,”Wiley (Interscience), New York.
Scott Blair, G. W. 1958. Rheology in food research. Adv. Food Res. 8, 1–61.Sherman, P. 1970. “Industrial Rheology with Particular Reference to Foods, Pharma-
ceuticals, and Cosmetics,” Academic Press, New York.Sherman, P., ed. 1979. “Food Texture and Rheology,” Academic Press, New York.Society of Chemical Industry. 1960. “Texture in Foods,” Monograph No. 7, Soc. Chem.
Ind., London.Society of Chemical Industry. 1968. “Rheology and Texture of Foodstuffs,” Monograph
No. 27, Soc. Chem. Ind., London.Sone, T. 1973. “Consistency of Foodstuffs,” Reidel Publ., Dordrecht, Netherlands.Van Wazer, J. R., J. W. Lyons, K. Y. Kim, and R. E. Colwell. 1963. “Viscosity and Flow
Measurement. A Laboratory Handbook of Rheology,” Wiley (Interscience), New York.Vincent, J. F. V. and P. J. Lillford, eds. 1991. “Feeding and the Texture of Food,”
Cambridge University Press, Cambridge.
32 Texture, Viscosity, and Food
Chap-01.qxd 1/10/02 4:11 PM Page 32

Body–TextureInteractions
Introduction
The properties of texture and viscosity are perceived by the human senses.Hence, in order to understand texture and viscosity it is necessary to knowsomething about how the human body interacts with food. Most people arewell aware of the structure and function of the teeth, and everybody is famil-iar with the process of mastication and how to squeeze food gently in thehand. Nevertheless, a brief review of these topics is needed to introduce thediscussion of the sensing of texture and viscosity.
Mastication is a process in which pieces of food are ground into a fine state, mixed with saliva, and brought to approximately body temperature inreadiness for transfer to the stomach where most of the digestion occurs. Aftersome residence time in the stomach the food passes to the small intestinewhere digestion continues and from whence the nutrients are absorbed intothe bloodstream and distributed throughout the body. Pulverization of food is the main function of mastication, but it also imparts pleasurable sensa-tions that fill a basic human need. Table 2.1 summarizes the degree of sizereduction that must occur before food can be absorbed and utilized by thebody. The process of mastication is an early step in the process of size reduc-tion to small molecules. Mastication usually reduces particle size by two tothree orders of magnitude before passing to the stomach where anotherapproximately 20 orders of magnitude of size reduction are accomplished bychemical and biochemical action. If food cannot be reduced to particles of theorder of a few multiples of 10�22g, it is not absorbed and utilized but isexcreted.
Other parts of the body, principally the hands, often interact with foodbefore it reaches the mouth. The interaction may be by direct contact betweenthe food and the hand, or through some implement such as knife, spoon or forkheld in the hand. While mastication is a highly destructive process as
C H A P T E R
2
Chap-02.qxd 1/10/02 4:11 PM Page 33

described above, the squeezing of the food in the hand is nondestructive andyet it often provides important clues to the textural quality of the food.
This chapter will give a simple description of the human masticatory appa-ratus and follow this with a description of the hand. Since texture is perceivedby the human senses, one needs to understand how the body interacts withdifferent foods because this is the foundation on which is built an understand-ing of what is needed in objective and subjective tests for texture.
Importance of the Tactile Sense
The sensation of texture is perceived primarily by the sense of touch, how thefood feels in the hand, and in the mouth. The sense of sight is used to assessthe thickness of foods by observing the flow rate of liquids or the degree ofslump of semisolids. The sense of sound perceived by ears is an important fac-tor in determining the degree of crispness or crunchiness in foods. But the tactile sense is the one used more than all the other senses combined to perceivethe textural properties of foods.
To touch and be touched are basic human needs. All five of the humansenses (sight, hearing, taste, odor, touch) are important and have been, andcontinue to be the subject of considerable research effort. However, in com-parison with the other four senses the sense of touch seems to have beenslighted by the research community judging by the amount of published liter-ature on each of the senses.
Four of the senses can be deceived fairly easily but it is difficult to deceivethe sense of touch. For example, artificial flowers can be made so skillfullythat it becomes difficult to tell whether they are real or artificial by looking atthem, but a moment’s touch with the fingers positively identifies which floweris real and which is artificial. Another example of the remarkable sensitivity
34 Body–Texture Interactions
Table 2.1 Steps in the Comminution of Food Before Absorption by the Body
Approx. particle State mass (g) Process Location Implement
Large cookieWhole cookie 20 Biting off Mouth IncisorsMouthsize portion 5 Grinding, crushing Mouth MolarsSwallowable paste (bolus) 1 � 10�2 Biochemical attack Stomach, intestine Acid, enzymesHexose sugar molecules 3 � 10�22 Absorption Intestines —
Whole dressed steerWhole carcass 3 � 105 Sawing and cutting Butcher shop Saw, knivesCooked steak 3 � 102 Cutting Plate Knife and forkMouthsize portion 5 Shearing, grinding Mouth TeethSwallowable paste 1 � 10�2 Biochemical attack Stomach, intestines Acid, enzymesAmino acid molecules 2 � 10�22 Absorption Intestines —
Chap-02.qxd 1/10/02 4:11 PM Page 34

of the tactile sense is found in that frequent human experience of turning thepage of the book, magazine or newspaper; one can immediately tell whetherone or two pages are held between the forefinger and thumb even though asingle sheet of paper is only 0.04–0.14 mm thick.
Sachs (1988) called touch ‘the intimate sense’ and described its importancein the following words.
Throughout the first few days of life, the baby continues to be most affected by the things thattouch her: a soft blanket, warm breast, a firm bed. Even after she has begun to favor sight, sherelies heavily on this most intimate of senses to gather information about her environment. If shespies, say, an alphabet block in her crib, she will pick it up, turn it over in her hands, then put itin her mouth – not, as one might think, to taste the block but to touch it with her lips and tongue,regions of the body that are particularly sensitive to tactile stimuli. She uses her sense of touch,which is not easily fooled, to confirm her sense of sight, which, even when fully mature, is sub-ject to all manner of illusions. The fundamental nature of touch is even more apparent when thesense is deprived of stimulation. Being unable to hear or see does not prevent one from attaininga happy and fruitful existence. … But an existence devoid of tactile sensation is another matter:sustained physical contact with other humans is a prerequisite for healthy relationships and suc-cessful engagement with the rest of one’s environment. … And among humans, denial of physi-cal contact during the first years of life can cause virtually irreversible states of withdrawal.Touch, in short, is the core of sentience, the foundation for communication with the worldaround us, and probably the single sense that is as old as life itself.
Some Definitions
Masticate. To chew, grind, or crush with the teeth and prepare for swallowingand digestion. Note: Mastication is a process.
Bolus. A mixture of chewed food and saliva in the mouth.Deglutition. The act or process of swallowing food. Deglutition tips the
food into the esophagus (gullet), the tube which leads down to the stomach.Deglutition ends the voluntary portion of the digestive process. The rest of thedigestive process is involuntary and automatic.
Since textural properties of foods are perceived primarily in the mouth thereis a need to know something about the structure of the organs and tissues ofthe mouth and the actions that occur during mastication.
1. Teeth (dentes) are the main agent for masticating foods and breakingthem into small pieces. They also play an important role in clear speech andfacial structure and appearance. Crooked, decayed, or missing teeth reducemasticatory efficiency and cause disfigurement and sometimes self-consciousness. From the external viewpoint teeth consist of two parts: (1) thecrown is that part that protrudes above the gums and is visible in the mouthand (2) the root is that portion that is not visible in the mouth but is buried inthe gums and serves to anchor the teeth in the jawbone.
A cross-sectional cut through a tooth shows that it is composed of severallayers of tissues (Fig. 2.1). The enamel is the very hard external layer that cov-ers the crown of the tooth and contacts the food during mastication.Underneath the enamel is the dentin, which is hard tissue forming the body ofthe tooth and which constitutes the principal mass of the tooth. The cementum
Some Definitions 35
Chap-02.qxd 1/10/02 4:11 PM Page 35

is a bonelike tissue that covers the root. The pulp is a soft tissue that occupiesthe central portion of the tooth called the pulp chamber. It contains nerves,arteries, veins, and lymph vessels. These vessels enter the tooth through smallopenings at the tip of the root. The periodontal ligament (membrane) is thelayer of connective tissue that lies between the cementum and the jawbone andhelps to hold or support the tooth in its place. Small elastic fibers are con-nected to the tooth via the cementum along the entire surface of the root. A cusp is a pointed or rounded surface on the crown of the tooth and is the maincontact surface for breaking up the food. It is a prominence on the chewingsurface of a tooth. Cusps wear flat over years of chewing and are progressivelyflattened as one gets older. The teeth are composed principally of calciumphosphate. Teeth are not bones; they are much harder and more dense than bones.
Teeth may be classified according to their shape and the function they per-form (Fig. 2.2). The incisors, located in the center front of the mouth, arewedge-shaped and have a sharp flat edge which is used to cut or incise foods.The cuspids, which are located at the corners of the mouth, have a long heavyroot and a crown with a single pointed cusp. They are often called the ‘eye’teeth or canines. These are used to tear foods. The premolars (bicuspids) arelocated behind or in back of the cuspids and have two cusps and one or tworoots. They are used to both tear and crush foods. The molars are located at theback of the mouth. Each molar has two or three roots and several cusps thatocclude with the opposing molars. Their broad crowns are used to grind andcrush the food with a grinding millstone-type of action.
A child in full dentition has 20 teeth (Fig. 2.3). The 10 teeth in each jawcomprise two central incisors, two lateral incisors, two cuspids, two firstmolars, and two second molars. These primary (deciduous, milk, or ‘baby’)teeth appear between 6 and 24 months in the average child and are shedbetween 6 and 12 years to be replaced by the adult or permanent teeth as thejaw increases in size sufficient to accommodate the larger size and increasednumber of adult teeth.
36 Body–Texture Interactions
Crown
RootJawbone
Periodontal membrane
Cementum
Pulp
Dentin
Enamel
CuspFigure 2.1 Cross-section of atooth. (Copyright by theAmerican Dental Association,reprinted with permission.)
Chap-02.qxd 1/10/02 4:11 PM Page 36

Full dentition in the adult consists of 32 teeth, 16 in each jaw (Fig. 2.3).Each jaw contains two central incisors, two lateral incisors, two cuspids, two first bicuspids, two second bicuspids, two first molars, two second molars,and two third molars. These teeth erupt from the age of approximately 6 to
Some Definitions 37
Figure 2.2 Normal occlusionof permanent teeth. In orderfrom left to right: third molars;second molars; first molars;second bicuspids; first bicuspids;cuspids; lateral incisors; centralincisors. (Copyright by theAmerican Dental Association,reprinted by permission.)
a b
Figure 2.3 (a) Eruption andshedding of the primary teeth.(b) Eruption of the permanentteeth. (Copyright by theAmerican Dental Association,reprinted by permission.)
Chap-02.qxd 1/10/02 4:11 PM Page 37

21 years. The third molars (wisdom teeth) generally appear in the late teens orearly twenties and complete full dentition in the adult. The normal times foreruption and shedding of teeth are shown in Table 2.2.
Partial or full dentures (artificial teeth) may be fitted to offset the loss of natural teeth, but they do not perform as well as healthy natural teeth (seeTables 2.4 and 2.6, pages 47, 51). People with reduced masticatory efficiencycaused by incomplete dentition or dentures often compensate for the deficiencyby selecting foods that are easier to chew and present less challenge to masti-catory function.
2. The lips (labia oris) are the two highly mobile fleshy folds that surroundthe orifice of the mouth and admit food and liquid into the oral cavity. The lipsalso prevent the loss of food from the mouth between masticatory strokes.They have a variety of sensory receptors that can judge the temperature andsome of the textural properties of foods. The lips have a high acuity to touch;they are even more sensitive than the tips of the fingers.
3. Cheeks (buccae) form the sides (lateral walls) of the mouth and face andare continuous with the lips. They consist of outer layers of skin, pads of sub-cutaneous fat, muscles associated with chewing and facial expression, andinner linings of stratified squamous epithelium. The cheeks keep the foodwithin the oral cavity and return the food between the teeth between bites.
4. The tongue (lingua) is a strong, mobile, muscular organ with its baseand central part attached to the floor of the mouth. It occupies much of the oral
38 Body–Texture Interactions
Table 2.2 Eruption and Shedding of Human Teeth
Primary teeth Permanent teeth
Eruption Shedding Eruption (months) (years) (years)
Upper UpperCentral incisor 7½ 7½ Central incisor 7–8Lateral incisor 9 8 Lateral incisor 8–9Cuspid 18 11½ Cuspid 11–12First molar 14 10½ First bicuspid 10–11Second molar 24 10½ Second bicuspid 10–12
First molar 6–7Second molar 12–13Third molar 17–21
Lower LowerCentral incisor 6 6 Central incisor 6–7Lateral incisor 7 7 Lateral incisor 7–8Cuspid 16 9½ Cuspid 9–10First molar 12 10 First bicuspid 10–12Second molar 20 11 Second bicuspid 11–12
First molar 6–7Second molar 11–13Third molar 17–21
Chap-02.qxd 1/10/02 4:11 PM Page 38

space when the mouth is closed. It is a very active organ during the act of mastication, working in close proximity to the teeth but seldom caughtbetween the teeth. Skillful coordinated neuromuscular functions between thetongue and teeth are required for painless mastication. It returns food betweenthe teeth between chews and is actively involved in mixing the bolus withsaliva and in moving the bolus toward the pharynx during swallowing. It isused to break up soft foods against the hard palate without the help of the teethand is the organ most responsible for sensing the surface or geometrical prop-erties of foods because of its ability to perceive minute differences in particlesize, shape, firmness, and roughness. The tongue demonstrates a more acutetactile sensibility than any other part of the body. Two-point sensibility is the shortest distance between two points that can be perceived as two separatestimuli. For the tongue this is 1.4 mm, for the fingertip 2 mm, and for the napeof the neck 36.2 mm. The tongue is also the principal organ of taste and animportant organ of speech.
The presence of particles can affect textural sensations and contribute to theliking or disliking of foods. The feeling of the size, shape, and roughness ofdiscrete particles in the mouth is called ‘geometrical properties’ by Brandt et al. (1963) and ‘particulate properties’ by Hutchings and Lillford (1988).Particles are detected by the tongue and hard palate, especially near the incisors. A description of the most frequently sensed particles together withexamples of foods that exemplify them is given in Table 7.9, page 267. It isremarkable to find just how small a particle can be detected by the tongue. Forexample, Imai et al. (1999) showed that a sensory panel could detect particlesas small as 6 mm in food.
Imai et al. (1999) noted that graininess is a desirable feature of bean pastewhen the starch cells are 100–150 mm across, and of pounded rice cakes whenthe rice flour particles are 75–105 mm across. They also point out that graini-ness is undesirable in smooth foods and cite figures showing how small parti-cles must be to avoid being detected as discrete particles in the mouth (seeTable 2.3).
5. The palate (roof of the mouth) consists of two sections. To the front of themouth (anterior) lies the hard palate (palatum durum), which consists of a bony
Some Definitions 39
Table 2.3 Size Threshold Between Smooth and Grainy Texture
Food Particle size (mmm) Reference
Chocolate 13 Cook, 1982Chocolate 20 Rostagno, 1969Chocolate 25 Hinton, 1970Fondant (sugar crystals) 20–25 Woodruff and Gilder, 1931Ice cream (ice crystals) 55 Fukushima and Kimura, 1992Margarine (fat crystals) 22 Vaisey-Genser et al., 1989Sweetened condensed milk (lactose crystals) 10–12 Sakurai et al., 1993Tofu (soy particles) 24 Numata et al., 1997
Chap-02.qxd 1/10/02 4:11 PM Page 39

skeleton covered with a thin layer of soft tissue. It separates the oral cavity fromthe nasal cavity and presents a hard surface against which foods can be pressedby the tongue to break them up, spread them out, or mix with saliva.
The soft palate (palatum molle), which lies at the back of the mouth (poste-rior), consists of a thick fold of muscular membrane containing muscles, ves-sels, nerves, lymphoid tissues, and mucous glands. During swallowing orsucking it is elevated to close the opening to the nasal cavity, thus preventingfood from entering the nasal cavity from the oral cavity.
6. The gums (gingivae) are composed of dense fibrous tissue that surroundthe teeth and help anchor them. Healthy gingivae effect a cuff creating a bar-rier round the teeth to stop egress from the mouth down the sides of the teeth.
7. Salivary glands provide the saliva that hydrates foods, lubricates thebolus, and begins the digestion of carbohydrates. There are three pairs of sali-vary glands: the sublingual (beneath the tongue), submandibular (beneath thejaw), and parotid (beneath the ear). Secretions from the salivary glands enterthe oral cavity through narrow tubes called salivary ducts.
8. The upper jaw (maxilla) serves to anchor the upper teeth and is fairlyimmobile during mastication. The teeth in the maxilla can be likened to theanvil against which the food is pressed to break and crush it by the lower teeth.The maxilla can move rhythmically during mastication thus contributing toseparation of the jaws.
9. The lower jaw (mandible) is a horseshoe-shaped bone that anchors thelower teeth and articulates (moves) primarily in a reciprocating vertical motionwith approximate sinusoidal speed. A variable amount of lateral (sideways)motion is also present, depending on the nature of the food. Foods that are easily crushed (e.g., snack foods such as potato chips) require little lateral motionwhereas foods that are tough (such as meat and bread crust) require a ratherlarge amount of lateral motion to masticate the food. The mandible translatesforward to bring the upper and lower incisors into alignment during biting off.
A number of muscles are responsible for articulating the mandible. Themost powerful of these is the masseter muscle, which is capable of generatinghigh compressive forces aided by two other powerful muscles, the temporaland medial pterygoid. Lateral and protrusive movements of the mandible arelargely controlled by the lateral pterygoid and suprahyoid muscles. The jawsare operated by the most complex muscular system in the body; five differentmovements are available, most of them generating high forces.
Articulation of the mandible occurs about a highly specialized and complexcomposite joint called the temperomandibular joint, which allows fivedifferent movements – far more than any other joint in the body. The joint con-tains two compartments. During normal chewing action it acts as a hinge jointin which the mandible rotates in a vertical direction in the first compartment(Fig. 2.4). When the jaw is opened very wide or protruded forward, themandible glides out of the first compartment into the second compartment,which is a movable sliding socket. The mandible can be moved laterally when
40 Body–Texture Interactions
Chap-02.qxd 1/10/02 4:11 PM Page 40

in either compartment, although the extent of the sideways movement is lim-ited by the temperomandibular ligaments. From a position in which the inci-sors are in contact, the mandible may be moved downward to open the jaw,laterally for a sideways swing, forward in protrusion, and backward in retru-sion. The temperomandibular joint is remarkable in its flexibility and in thevariety of movements it can accomplish with great force. It is the key to thevarious chewing modes that are available to masticate foods with widelydiffering combinations of physical properties.
Many people can feel the temperomandibular joint move by lightly placingthe tips of the fingers on the jaw just in front of the ears. The hinge action canbe felt by opening and closing the jaw to a moderate degree and the lateralmotion can be felt by swinging the jaw sideways. When the jaw is protrudedor opened very wide, one can feel the joint glide forward from the pure hingecompartment into the socket compartment.
The vertical articulation of the mandible is bilaterally symmetrical becausethe mandible is a single bone and movement in one temperomandibular jointcannot occur without a similar coordinating movement in the correspondingjoint on the opposite side of the mouth.
Temperomandibular joint (TMJ) diseases and disorders are diverse chronicpainful conditions affecting the area where the mandible joins the skull at the articular fossa. Symptoms include pain in the face or jaw joint area,headaches, limited ability to open the mouth, locking of the jaw, and clicking,or grating sounds on opening or closing the jaw. According to the US NationalInstitutes of Health, more than ten million people are affected by TMJ disease
Some Definitions 41
a b
c d
Figure 2.4 The tempero-mandibular joint. (a) In occludedposition; (b) Opened in purehinge position; (c) Opened aswide as possible; (d) In protrudedposition. Notice how themandible slips out of its cup inpositions c and d.
Chap-02.qxd 1/10/02 4:11 PM Page 41

in the US, most of them being premenopausal women. The descriptive term‘temperomandibular joint disease’ is being rapidly replaced in the dental fieldby the term ‘cranio-mandibular pain dysfunction syndrome.’
10. The oral cavity (cavium oris proprium) is the space bounded by the lipsand cheeks, by the palate above, and the muscular floor below. It contains theteeth and tongue.
11. The pharynx is the cavity at the back of the mouth that connects thenasal and oral cavities with the larynx (voice box) and the esophagus (tubularpassageway to the stomach). When the bolus is pushed into the pharynx by thetongue, the swallowing reflex is initiated and the following responses occur inrapid succession:
a. The soft palate is raised, preventing the bolus from entering the nasalcavity.
b. The larynx is elevated to prevent the bolus from entering the trachea(windpipe).
c. The tongue presses up against the soft palate, sealing off the oral cavity from the pharynx while the pharynx moves upward toward thebolus.
d. The muscles at the lower end of the pharynx relax and open the eso-phagus.
e. The muscles of the upper end of the pharynx contract, forcing the bolusinto the esophagus. Peristalsis (alternate contractions and relaxation ofthe muscles along the esophagus that cause a contraction ring to movealong the esophagus) moves the bolus down the esophagus to the stom-ach. When the peristaltic waves reach the stomach, the muscles thatguard its entrance relax and allow the bolus to enter. These muscles contract after the bolus has entered the stomach, closing off the entranceand preventing regurgitation of the acid stomach contents into theesophagus.
f. The muscles and organs return to their normal position.
12. Other. The arm, neck, and shoulder muscles may be brought into use attimes, especially when biting off a piece of tough food.
Occlusion refers to the manner in which the upper and lower teeth meet andfit together as the jaw is closed. In good occlusion the cusp surfaces of theupper teeth fit closely to the lower teeth. The medial occlusal position (or inter-cuspal position) is that position in which the mandible returns when the jawsare snapped shut automatically from a wide opening when no food is in themouth. In this position the upper and lower molars and cuspids are in directcontact and the cusps fit together to give an uneven line while the upper inci-sors lie in front of, and partially cover the lower incisors (see Fig. 2.2, page 37).
From the medial occlusal position the jaw can be protruded (moved forwardafter slight opening) so that the upper and lower incisors meet in readiness forbiting off; in this position the molars do not contact each other. The mandible
42 Body–Texture Interactions
Chap-02.qxd 1/10/02 4:11 PM Page 42

The Sequence of Mastication 43
can be protruded even farther forward by pressing the temperomandibularjoint forward into its second compartment. It can also be retruded until thelower incisors are well behind the upper incisors. From the medial occlusalposition the lower jaw can also be pulled sideways to the right or left (lateralmovement). The ability of the mandible to be moved in all directions from themedial occlusal position allows a wide range of chewing techniques to beemployed.
Malocclusion (bad closing) occurs when the cusps of the upper and lowerteeth do not fit well when the mandible is in the closed position. This is a prob-lem to which dentists devote much attention.
Mastication refers to the entire complex of processes that occurs as the foodis chewed and brought into a condition ready to be swallowed. It may be a vol-untary or involuntary act. This is an extremely complex set of processes that is generally not well understood or appreciated. Mastication is a biting–chewing–swallowing action that is a complex stimulation–motor feedbackprocess in which a constant stream of stimuli travels from mouth to brain anda corresponding stream of instructions travels from the brain to the mouthinstructing it how to proceed (Fig. 2.5). This complexity has been welldescribed by Yurkstas (1965) as follows:
We sometimes fail to appreciate the complexity of the chewing apparatus. It is truly remarkablethat most people perform this function daily, with little or no forethought. Mastication involvesthe use of forces that sometimes exceed 100 lb and pressures that are probably 10,000 lbs in�2. Onehundred blows per minute are often delivered for periods of one-half to one hour at a time. Theseblows are automatically controlled and are precise to within a few hundredths of an inch, since amistimed blow or misguided stroke can cause intense pain or result in considerable damage.
The Sequence of Mastication
The time devoted to masticating a food, number of chews, and type of chewingmotion varies considerably from person to person, and from one food toanother. The sequence below is the most common sequence found with themajority of foods.
(1) Bite off a piece of food with the incisors (initial breakage phase). Softfoods are usually wiped off the spoon with the lips instead of using theincisors.
(2) Cut into small pieces with the incisors when necessary.(3) Puncture or tear apart with cuspids and bicuspids as necessary.(4) Grind into small particles with the molars, simultaneously mixing the
food into a paste with the saliva using both tongue and teeth. Soft,smooth foods are manipulated by the tongue more than by the teeth.This process is mainly one of mixing the food with saliva when thereare no hard pieces to be broken down by the teeth (mush phase).
(5) Swallow the liquid portion and fine particles, retaining the insufficientlychewed portion in the mouth.
Chap-02.qxd 1/10/02 4:11 PM Page 43

44B
ody–Texture Interactions
FOODSTIMULI
PHYSICAL CHEMICAL
Size Shape Texture Consistency Sound Vision SmellTaste
CHEMICAL VISCERAL RECEPTORS
Lesser superficialpetrosal
Chorda tympani
GLOSSOPHARYNGEALNERVE
FACIALNERVE
NUCLEUS TRACTUSSOLITARIUS
OLFACTORYNERVE
SPECIAL RECEPTORS
AUDITORYNERVE
OPTICNERVE
Cortical Centers
MASTICATIONAND
SALIVATIONCENTERS
NUCLEUSSALIVATORIUS
Sublingual gland
Submaxillary gland
GLOSSO -PHARYNGEAL
NERVE
Parotid glands
NUCLEUSX & XI
PHARYNGEALPLEXUS
Palatopharyngeal
Palatoglossus
Levator velipalatini
NUCLEUSXII
HYPOGLOSSALNERVE
MOTOR NEURONC1 - C3
Geniohyoid
Thyrohyoid
Omohyoid
Sternohyoid
Sternothyroid
MOTORNUCLEUS VII
FACIALNERVE
Post. bellyofdigastricStylohyoidBuccinator
TRIGEMINALMOTOR NUCLEUS
Tensorvelipalatini
Lateralpterygoid
Deeptemporal
MassetericMedialpterygoid
Inferioralveolar
Mylohyoid Anteriorbelly ofdigastric
MUSCLE RECEPTORS
MANDIBULAR NERVE
Buccal Lingual Inferioralveolar
GENERAL SOMATIC RECEPTORS
Greaterpalatine
Post. sup.alveolar
Ant. sup.alveolar
Mid. sup.alveolar
Sup.labial
MAXILLARY NERVE
TRIGEMINALSENSORY NUCLEUS
TRIGEMINAL NERVE
EFFE
REN
T SY
STEM
(OU
TPU
T)IN
TEG
RA
TIN
G S
YSTE
MA
FFER
ENT
SYST
EM(I
NPU
T)
Hyoglossus
Genioglossus
Styloglossus
Ant. and post.intrinsic tonguemuscles
MANDIBULAR NERVE
NUCLEUSIX
Figure 2.5 The complex neuromuscular mechanism involved in the act of chewing food. The senses of sound, vision, taste and smell participate indirectly in chewingthrough their influence on the salivary secretion. (From Kapur et al., 1966; reprinted with permission of W.B. Saunders Co.)
Chap-02.qxd 1/10/02 4:11 PM Page 44

(6) Continue the grinding, mixing, and swallowing sequence until thebolus has disappeared and the mouth is empty and ready to bite off thenext piece (clearance phase). Pierson and LeMagnen (1970) showedthat there is only one deglutition for very soft and liquid foods and thatthe number of deglutitions increased as the hardness, dryness, or com-pactness of the food increased. Hiiemae and Palmer (1999) showed thatdeglutition of liquids occurs sooner than for triturated foods, and theydeveloped a model for a bolus formation and deglutition.
Methods and Processes Used forDisintegration of Food
Different mastication processes and combinations of processes are used forpreparing foods for swallowing. The main processes are described below.
(1) Mechanical disintegration. The teeth do most of the work and salivaplays a minor role, e.g. meat and most fruits and vegetables. For foodsthat release much liquid (for example, oranges and juicy meat) someswallowing of the expressed liquid may be needed before serious chew-ing begins.
(2) Softening by absorption of saliva or a beverage that is consumed with dryfoods, e.g. crackers, dry cookies, potato chips, popcorn. Saliva (or bev-erage) plays a major role and its softening effect may be more importantthan the mechanical disintegration accomplished by the teeth. For somefoods saliva absorption may be the rate-determining process that pre-pares the food for deglutition. Some foods are presoftened by absorptionof a liquid before placing the food in the mouth. For example, some peo-ple dunk their cookies in tea or milk because they prefer a softer texture.On the other hand, the softening of dry crisp breakfast cereals in milk isusually considered undesirable.
(3) Melting is caused by a phase change from solid to liquid as food iswarmed in the mouth, e.g. ice cream and gelatin gels. The cocoa butterthat provides most of the textural sensations of chocolate is noteworthyfor having a narrow melting point range just a few degrees below bodytemperature. Its rapid conversion from a hard snappy solid into a vis-cous flavorful liquid provides delightful sensations. Chocolate substi-tutes using fats that do not have the same sharp melting characteristicas cocoa butter usually do not melt completely at body temperature andleave an unpleasant waxy feel in the mouth.
Since viscosity decreases as the temperature increases, cold liquidsbecome thinner as they warm up in the mouth even when there is nophase change.
(4) Hardening caused by a phase change from liquid to solid as hot foodsare cooled in the mouth, e.g. the oil in hot soup may solidify as it is
Methods and Processes Used for Disintegration of Food 45
Chap-02.qxd 1/10/02 4:11 PM Page 45

cooled in the mouth changing from an oily mouth feel to a fatty mouthfeel.
(5) Thinning caused by dilution with saliva, e.g. thick beverages such asmilk shakes and cream soups. The teeth are not used or hardly used.The product is stirred around in the mouth by the tongue until sufficientsaliva has been absorbed to render the bolus thin enough to be swal-lowed easily.
(6) Thinning caused by stirring. Some semiliquid foods exhibit what isknown as ‘shear thinning’ behavior, that is, the viscosity is decreased bythe mechanical stirring imparted by the tongue and shearing as the tonguecompresses the food against the hard palate (Kokini et al., 1977; Kokiniand Dickie, 1982). Shear thinning behavior is described in Chapter 3.
(7) Solution. Hard sugar candies may be licked or sucked until they simplydissolve in the saliva. However, there are people who chew them(mechanical disintegration) in order to get a shorter but more intenseburst of flavor release.
(8) No disintegration. Thin liquids such as coffee, tea and carbonated bev-erages are simply swallowed with virtually no assistance from teeth,tongue or saliva. Slippery foods such as oysters and some Oriental noo-dles are sometimes swallowed whole with no interaction from the teethor saliva and little assistance from the tongue.
Hutchings and Lillford (1988) postulate characteristic ‘breakdown pathways’for different foods as they are prepared for swallowing and that two planesmust both be penetrated before swallowing begins.
Plane 1 is the degree of structure plane. Particle size must be reduced belowa certain level before swallowing can begin.
Plane 2 is the degree of lubrication plane. A certain degree of lubricationmust be exceeded before swallowing begins. The lubrication may comefrom free moisture initially present in the mouth, flow of saliva, or juiceexpressed from the food. In some foods it may come from the release ofoil or fats.
The first few chews on a piece of food are generally slow as one manipu-lates the piece within the mouth to soften it with saliva or cut it into smallerpieces with the incisors. When the bolus reaches a consistency that can bereadily managed, the chewing rate is stepped up to the normal chewing rate,which then remains fairly constant for the remainder of that chewing cycle.
The size of the pieces of food that are swallowed is known as the ‘swallow-ing threshold.’Yurkstas (1965) studied this and concluded:
The results show that the swallowing threshold was directly related to masticatory performance,the correlation coefficient being significant to the 1% level. Thus, people with superior mastica-tory ability attained a finer degree of food pulverization at the swallowing threshold than didpeople who possessed dentitions that were less efficient. The person with the diminished abilityto chew compensated for his dental handicap by swallowing larger particles of food. … People
46 Body–Texture Interactions
Chap-02.qxd 1/10/02 4:11 PM Page 46

who had poor dentitions did not compensate for their dental handicap by chewing for a longerperiod of time or by increasing the number of masticatory strokes.’
Table 2.4 shows the effect of missing teeth on masticatory performance.Kapur et al. (1964) showed that the chewing process by natural teeth is pref-
erential; that is, the coarse particles are ground more rapidly than fine particlesas chewing proceeds, whereas mastication in subjects with complete denturesis nonpreferential – all particles are pulverized at random.
It should be noted that the forces exerted by the teeth provide the stress onthe food while the movement of the jaw provides the strain on the food duringmastication. (These two terms are defined in the next chapter.)
The rate at which people chew depends partly on the food and partly on theperson. Each time the author teaches his class in food rheology he gives thestudents sticks of a well-known brand of chewing gum and asks them tomeasure their chewing rate once the gum has been brought to a ‘steady-state’condition. In this classroom situation the mean chewing rate is approximately60 chews per minute with a range of 24–105 chews per minute (Table 2.5).Using informal tests on a number of people on sticks of the same brand ofchewing gum the author has found a chewing rate as low as 26 chews perminute to a high of 132 chews per minute (Bourne, 1977).
Methods and Processes Used for Disintegration of Food 47
Table 2.4 Effect of Missing Teeth on Masticatory Performance
Chewing efficiency a
Mean Range
Complete dentition 88 75–97Third molar missing 78 45–92Third and one other molar missing 55 17–83Dentures 35 9–57
aChewing efficiency is defined as the percentage of food passing through a 20-mesh screen after20 chews. Data from Yurkstas (1965).
Table 2.5 Chewing Rates on Sticks of Chewing Gum
Chews per minuteNumber of
Year Mean Maximum Minimum respondents
1973 64.5 98 45 341975 54.8 105 27 231977 60.4 84 38 201979 70.3 105 48 281981 65.5 100 24 30
Chap-02.qxd 1/10/02 4:11 PM Page 47

The effect of the food on the chewing rate follows a complex pattern. Whatseems to happen is demonstrated schematically in Fig. 2.6. The chewing rateremains approximately constant as one moves from foods of low toughness tofoods of moderate toughness. This constancy is achieved by increasing thepower output of the jaw (power is the rate of doing work). As the food contin-ues to increase in toughness the limit of comfortable power output is reached.Beyond this point the power output remains approximately constant, and this isachieved by slowing the rate of mastication. One chews tough meat and chewycaramels more slowly than foods that require less energy for mastication.
The chewing pattern is completely changed with extremely hard foods suchas rock candy and nuts in the shell. These foods are usually placed carefullybetween the molars where the maximum leverage is available and the force issteadily increased until the food cracks or shatters. In these cases the com-pression rate before breaking is almost zero. The chewing mode is that of constant rate of increase in force application. This is a stress-dependent typeof mastication in contrast to the usual strain-dependent type.
Rate of Compression between the Teeth
The rate of compression between the teeth varies over a wide range and isaffected by several factors. Table 2.5 indicates the wide range of chewing speedsfrom person to person on a standard product. It has been noted above that thefirst few chews on a piece of food are frequently slower than the regular chew-ing rate and that tough foods are masticated more slowly than tender foods.
How widely the jaw is opened affects the compression speed. Some peoplemake short strokes of the jaws whereas others make longer strokes. Peoplewho make long strokes will have a higher compression rate if they use thesame number of chews per minute because the average compression speed isthe product of the number of chews per minute by twice the distance betweenthe teeth at the point of maximum opening.
The mandible articulates in approximately the arc of a circle around thetemperomandibular joint. The teeth that are closer to this joint move a smallerdistance than the teeth that are farther from the joint. The incisors are the far-thest from the joint and move at about twice the speed of the molars. Evenamong the molars the first molar moves at a faster rate than the third molarbecause of its greater distance from the temperomandibular joint.
The rate of movement of the jaw follows approximately a sine curve. Theactual rate of compression will vary continuously throughout each mastica-tory stroke, reaching a maximum speed at approximately midstroke and fallingto zero at the end of the stoke.
If we assume 60 chews per minute as the average chewing rate, and an averagestroke length of 10 mm, then the average compression rate is 1200 mm min�1, or 20 mm s�1. As noted above, there will be substantial variations from this ‘average’ figure.
48 Body–Texture Interactions
Power output
Chewing rate
Toughness
Figure 2.6 Schematicrepresentation of the relationshipbetween chewing rate and poweroutput on foods of increasingtoughness.
Chap-02.qxd 1/10/02 4:11 PM Page 48

Soothing Effect of Mastication
Mastication has been found to have a pronounced soothing effect. Chewing‘soothes the nerves.’ Fidgeting activities such as finger tapping, leg swinging,pipe smoking, adjusting the hair or mustache, etc., greatly decline in fre-quency when mastication is taking place. The sucking and chewing that a fret-ful baby gives to its thumb or a pacifier is another example of the soothingeffect of mastication. Chewing gum is a harmless way to use the soothingeffect of mastication to relieve tension. For this reason it would be desirable toallow students to chew gum during examinations!
Saliva
The flow of saliva that is generated by the salivary glands (see item 7, page 40)lubricates the bolus, softens dry foods, flushes away small food particles,absorbs juices, initiates the first phase of digestion through its ptyalin content,and aids deglutition. The act of chewing stimulates the flow of saliva. Onestudy found that the mean saliva flow among a group of people at times ofnonstimulation was 26 ml h�1 with a range of 2.5–110 ml h�1 (Jenkins, 1978).When the saliva flow was stimulated in the same people by giving themflavored wax to chew, the saliva flow increased to 46–249 ml h�1. It should be noted that factors other than mastication can stimulate the flow of saliva;for example, the smell or sight of food or talking about food. There is the clas-sical example of Pavlov’s dogs that were conditioned to salivate at the sound-ing of a bell (Pavlov, 1927).
Saliva generally consists of approximately 99.5% water and 0.5% solids,but these figures can vary widely from person to person and from day to daywithin the same person. The main constituent of saliva is a glycoprotein calledmucin which imparts a slimy mucus character to the saliva, thus assisting inthe lubrication of the bolus. Saliva contains the enzyme ptyalin (an amylase)which assists in the biochemical breakdown of the food. The parotid glandsecretion is rich in ptyalin but watery because it is low in mucin. The sub-mandibular gland secretion is viscous because it is rich in mucin but is low inptyalin. The secretion from the sublingual gland is mixed, containing bothptyalin and mucin. Total ash is approximately 0.25%. In a study of 3400 peo-ple it was found that the pH of saliva ranged from 5.6 to 7.6 with a mean of6.75 (Jenkins, 1978).
Van der Reijden et al. (1994) reported that during the day the pH of the oralfluid in the human mouth changes continuously between pH 6.5 to pH 7.5 dueto the intake of food and subsequent acid production by microbial fermenta-tion. Prinz and Lucas (2000) showed that pooled saliva from healthy people isshear thinning in behavior (see Fig. 2.7) but that certain diseases caused a substantial decrease in degree of shear thinning. The term ‘shear thinning’is explained in the next chapter.
Saliva 49
Chap-02.qxd 1/10/02 4:11 PM Page 49
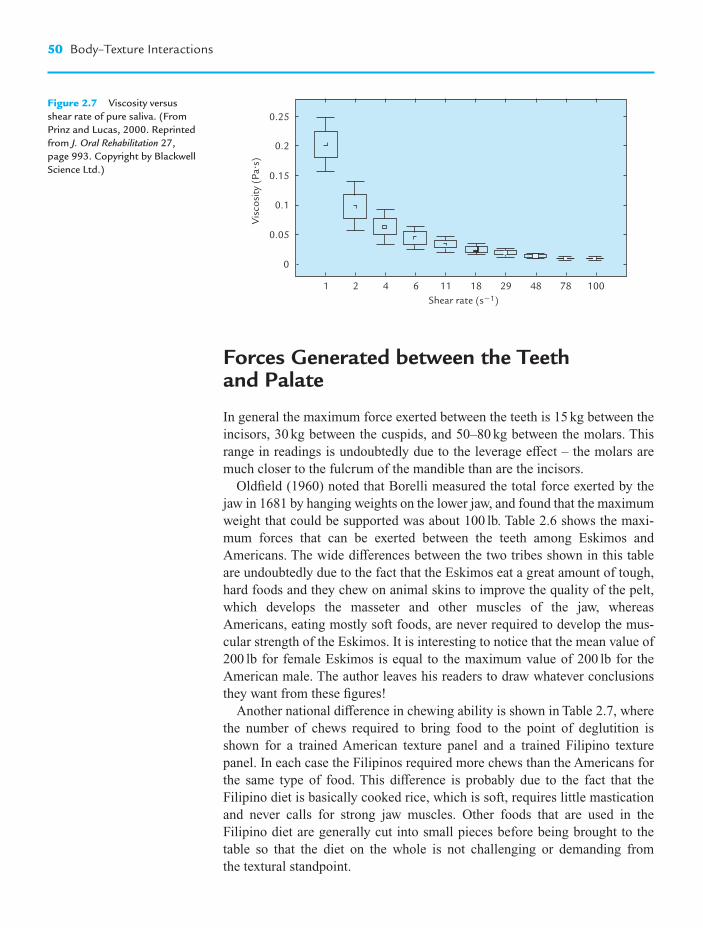
Forces Generated between the Teeth and Palate
In general the maximum force exerted between the teeth is 15 kg between theincisors, 30 kg between the cuspids, and 50–80 kg between the molars. Thisrange in readings is undoubtedly due to the leverage effect – the molars aremuch closer to the fulcrum of the mandible than are the incisors.
Oldfield (1960) noted that Borelli measured the total force exerted by thejaw in 1681 by hanging weights on the lower jaw, and found that the maximumweight that could be supported was about 100 lb. Table 2.6 shows the maxi-mum forces that can be exerted between the teeth among Eskimos andAmericans. The wide differences between the two tribes shown in this tableare undoubtedly due to the fact that the Eskimos eat a great amount of tough,hard foods and they chew on animal skins to improve the quality of the pelt,which develops the masseter and other muscles of the jaw, whereasAmericans, eating mostly soft foods, are never required to develop the mus-cular strength of the Eskimos. It is interesting to notice that the mean value of200 lb for female Eskimos is equal to the maximum value of 200 lb for theAmerican male. The author leaves his readers to draw whatever conclusionsthey want from these figures!
Another national difference in chewing ability is shown in Table 2.7, wherethe number of chews required to bring food to the point of deglutition isshown for a trained American texture panel and a trained Filipino texturepanel. In each case the Filipinos required more chews than the Americans forthe same type of food. This difference is probably due to the fact that theFilipino diet is basically cooked rice, which is soft, requires little masticationand never calls for strong jaw muscles. Other foods that are used in theFilipino diet are generally cut into small pieces before being brought to thetable so that the diet on the whole is not challenging or demanding from the textural standpoint.
50 Body–Texture Interactions
0.25
0.15
0.05
0.2
0.1
0
1 2 4 6 11 18 29 48 78 100Shear rate (s�1)
Visc
osity
(Pa
•s)
Figure 2.7 Viscosity versusshear rate of pure saliva. (FromPrinz and Lucas, 2000. Reprintedfrom J. Oral Rehabilitation 27,page 993. Copyright by BlackwellScience Ltd.)
Chap-02.qxd 1/10/02 4:11 PM Page 50
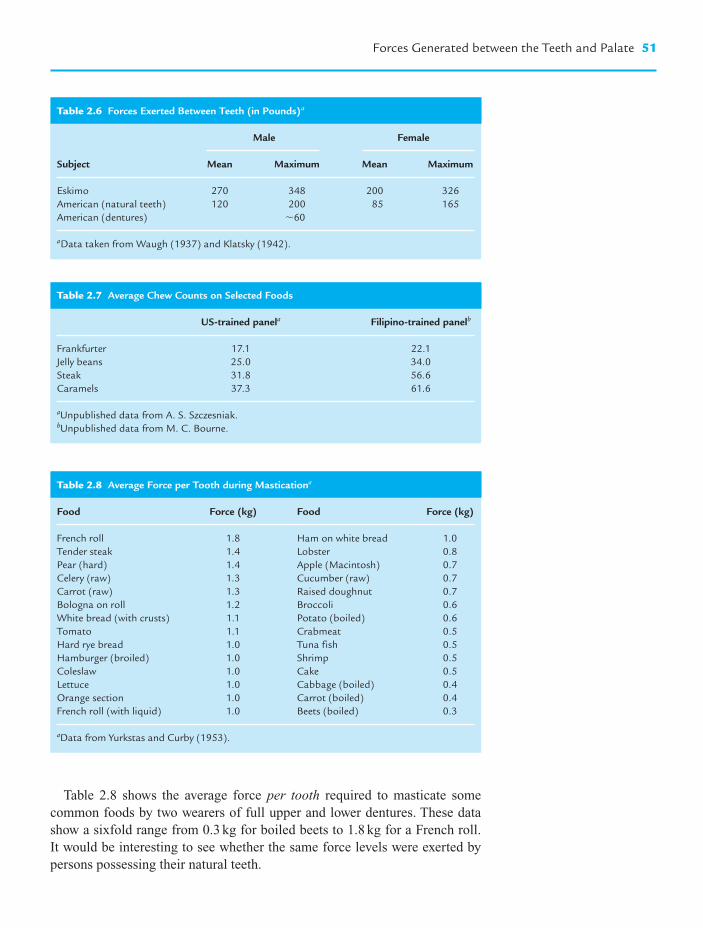
Table 2.8 shows the average force per tooth required to masticate somecommon foods by two wearers of full upper and lower dentures. These datashow a sixfold range from 0.3 kg for boiled beets to 1.8 kg for a French roll. It would be interesting to see whether the same force levels were exerted bypersons possessing their natural teeth.
Forces Generated between the Teeth and Palate 51
Table 2.6 Forces Exerted Between Teeth (in Pounds)a
Male Female
Subject Mean Maximum Mean Maximum
Eskimo 270 348 200 326American (natural teeth) 120 200 85 165American (dentures) �60
aData taken from Waugh (1937) and Klatsky (1942).
Table 2.7 Average Chew Counts on Selected Foods
US-trained panela Filipino-trained panelb
Frankfurter 17.1 22.1Jelly beans 25.0 34.0Steak 31.8 56.6Caramels 37.3 61.6
aUnpublished data from A. S. Szczesniak.bUnpublished data from M. C. Bourne.
Table 2.8 Average Force per Tooth during Masticationa
Food Force (kg) Food Force (kg)
French roll 1.8 Ham on white bread 1.0Tender steak 1.4 Lobster 0.8Pear (hard) 1.4 Apple (Macintosh) 0.7Celery (raw) 1.3 Cucumber (raw) 0.7Carrot (raw) 1.3 Raised doughnut 0.7Bologna on roll 1.2 Broccoli 0.6White bread (with crusts) 1.1 Potato (boiled) 0.6Tomato 1.1 Crabmeat 0.5Hard rye bread 1.0 Tuna fish 0.5Hamburger (broiled) 1.0 Shrimp 0.5Coleslaw 1.0 Cake 0.5Lettuce 1.0 Cabbage (boiled) 0.4Orange section 1.0 Carrot (boiled) 0.4French roll (with liquid) 1.0 Beets (boiled) 0.3
aData from Yurkstas and Curby (1953).
Chap-02.qxd 1/10/02 4:11 PM Page 51

The distribution of forces that were applied to three teeth by two denturewearers fitted with full upper and lower dentures is shown in Table 2.9. Theauthors of this report (Yurkstas and Curby, 1953) state that
Mastication of hard rolls resulted in almost equal force distribution among the three teeth stud-ied. This was due to the fact that initially the rolls were masticated in the first and second bicus-pid area, and, as they were softened, the molar area was utilized to a greater degree. The ingestionof liquids with rolls resulted in a slight posterior distribution of force. The raw vegetables stud-ied were divided into soft and hard categories. Softer raw vegetables showed relatively equalforce distribution on all three teeth, while tougher ones such as carrots were masticated in thefirst bicuspid area. The cooked vegetables showed a definite trend toward the posterior area.When liquids were ingested simultaneously with bread, there was a definite shift towards the first molar area in preference for mastication. Softer meats such as hamburger were definitelymasticated in the molar area, whereas steaks were generally chewed in the bicuspid region.
Takahashi and Nakazawa (1991a) embedded three pressure transducers in apalatal retainer made of thin acrylic resin that fitted the upper dental arch oftwo adult females with normal oral and dental structure. These measured thepressure exerted as they ate gels made with varying concentrations of gelatin.They found that mean palatal pressure increased from about 100 g cm�2 for1% gelatin up to about 250 g cm�2 for 5% gelatin, and then progressivelydecreased for 6% and 7% gelatin gels. They attributed this decrease to the subjects transferring the gels to the teeth because they were too hard to breakup with the tongue.
In a later study, Takahashi and Nakazawa (1992) using gelatin and agar gels ofvarying concentrations, concluded that the oral action was primarily crushing ofthe gel against the hard palate up to a gel strength of 7–10 � 105dyne cm�2
which changed to biting by the teeth when the required force exceeded this value.Takahashi and Nakazawa (1991b) also studied the effect of changing the
viscosity of liquids on palatal pressure by dissolving various levels of carboxy-methylcellulose in orange juice to give apparent viscosities measured at 20 s�1 ranging from 3.4 to 2300 m Pa�s. They found that the palatal pressure
52 Body–Texture Interactions
Table 2.9 Percentage Force Distribution on Three Teeth During Masticationa
First bicuspid Second bicuspid First molarFood (tooth no. 4) (tooth no. 5) (tooth no. 6)
Hard rolls 30 40 30Rolls plus liquid 24 45 32Raw vegetables (tough) 41 33 26Raw vegetables (soft) 37 31 32Cooked vegetables 15 39 46Breads 32 26 43Bread plus liquid 20 27 58Tough meat 19 48 33Tender meat 19 29 52Fish 28 39 33
aData from Yurkstas and Curby (1953).
Chap-02.qxd 1/10/02 4:11 PM Page 52

almost doubled as the viscosity increased 676-fold and attributed the relativeinsensitivity of palatal pressure to changes in viscosity to two factors: (1) lowviscosity juices were swallowed in a single deglutition whereas high viscosityjuices were swallowed in several smaller portions; (2) shear thinning of thethickened juices caused by stirring with the tongue, dilution with saliva, andwarming towards mouth temperature.
Tracking Food Movement Within the Mouth
Lee and Camps (1991) used a computer-based procedure to track the locationof food samples within the mouth in real time. An outline of a human maxillacomplete with teeth was shown on the computer screen. Subjects were givenvarious foods and used a mouse to move a cursor on the screen to show wherethey felt the sample was located in the mouth at any point in time and the datawere stored in the form of X and Y coordinates. Figure 2.8 shows some ofthese evaluations. Water showed a brief residence time (two � 0.5 s movements)whereas honey required four � 1 s movements and both showed no utilizationof teeth which means that only the tongue was used for manipulating the prod-uct. Solid foods showed considerable utilization of the teeth, especially themolars. The harder foods showed longer residence times, for example, thehard candy was moved between the molars and cuspids on both sides of the jaw in about 16 � 3 s movements and fresh potato chip showed one � 1 smovements on the cuspids followed by three � 1 s movements on the molars.
Reasons for Masticating Food
It is worth noting why food is masticated. The major reasons are as follows.
(1) Gratification. Chewing is an enjoyable sensory experience that givesgreat satisfaction. It is one of the few sensory pleasures that lasts fromthe cradle to the grave. This point is especially significant for the olderperson for whom many other sources of pleasure are diminishing.Foods should be selected for the elderly that will give them the maxi-mum masticatory pleasure while satisfying their nutritional needs, andyet not go beyond the limits set by their reduced chewing ability. Aspointed out on page 2, maintaining the gratification that comes fromchewing has led to a large dental industry.
(2) Comminution. Breaking the food into smaller pieces makes swallowingpossible.
(3) Mix with saliva. This lubricates the bolus and softens many hard, dryfoods, making them easier to swallow. The enzymes in the saliva startdigestion of starches.
(4) Temperature adjustment. The human race likes to consume much of itsfood and drink in a cold or hot condition. The mouth seems to be able
Reasons for Masticating Food 53
Chap-02.qxd 1/10/02 4:11 PM Page 53

to withstand a wider temperature range than most other parts of thebody and the residence time during mastication brings the food close to normal body temperature before sending it on to the stomach.
(5) Release flavor. Many substances responsible for odor and taste sensa-tions are released as the food is pulverized, causing a stronger stimulusto the chemical receptors in the oral and nasal cavities.
(6) Increase surface area. The chemical and biochemical attack on thefood in the stomach occurs at the surface of each food particle.
54 Body–Texture Interactions
Water0.5 second interval
Cool whip0.5 second interval
Honey1 second interval
Popcorn1 second interval
Red Delicious apple1 second interval
Whoppers malted milk balls1 second interval
Jolly Rancher hard candy3 second interval
Jujifruit1 second interval
Finn crisps1 second interval
Biscuit dough1 second interval
Stale potato chip1 second interval
Fresh potato chip1 second interval
Figure 2.8 Tracking foods in the mouth. (From Lee and Camps, 1991.) Reprinted from J. Texture Studies 2222, pages 280, 281.Copyright by Food and Nutrition Press Inc.
Chap-02.qxd 1/10/02 4:11 PM Page 54

Mastication greatly increases the surface area available to digestionand also decreases the thickness of each food particle, thus promotingrapid digestion.
Nonoral Methods for Sensing Texture
Although most of the sensing of texture occurs in the mouth and with the lips,it is possible to measure textural properties outside the mouth, most com-monly with the fingers and the hand. It is a common practice to hold andsqueeze foods in the hand, and this frequently gives a good method for assess-ing the textural quality of the food. The food may be squeezed between theforefinger and the opposed thumb or between two, three, or four fingers andthe opposed thumb. It may be squeezed by pressing with the whole palm ontop of the food which is resting on a firm surface such as a table, or the twopalms may be placed at opposite ends of the food and squeezed. The size ofthe object frequently determines the method that is used. The forefinger andopposed thumb are generally used for small objects whereas the entire hand ortwo hands are used on large objects such as a loaf of bread. While the hand isusually used to touch foods, it is possible to use other parts of the anatomysuch as cheeks, elbows, and feet to obtain some index of the textural qualitiesof foods.
The Hand
Two prominent surgeons (Burton and Rockwell, 1994) describe the uniquecombination of incredible strength, sensitivity, and versatility of the hand asfollows:
The philosophic exaltation of the hand by scholars of antiquity is equaled by the profound regardfor its complexity and versatility held today by functional anatomists and surgeons. The hand iscomposed of material of dexterity, strength, sensitivity, and refinement – all in the most complexarray and condensed into a unit weighing significantly less than 1 kg. With this amazing tool weimplement the desires of the human brain, whether requiring the speed and precision of thefingering hand of a concert violinist or the brute power grasp needed to wield a sledgehammer.With the hands the laborer supports a family, the parent loves and cares for a baby, the musicianplays a sonata, the blind ‘read’ and the deaf ‘talk’.
The hand is a wonderfully complex manipulative tool. Much of our tech-nology, music and art derive from the wide range of purposeful actions thatcan be performed by the human hand as directed by the brain. The hand is asensory organ, as well as a manipulative tool, gathering information on touchand temperature and feeding this back to the brain.
The hand, as a sensory organ, is the main focus of interest for the texturetechnologist. A simple description of the structure and operation of the handfollows.
The hand (manus) begins at the wrist (carpus) extending through the palm(metacarpus) to the five fingers (digits): thumb (pollex), index finger (digitus
Nonoral Methods for Sensing Texture 55
Chap-02.qxd 1/10/02 4:11 PM Page 55

indicus), middle finger (digitus medius), ring finger (digitus anularis) and little finger (digitus minimus).
The skeleton of the palm is composed of five thin, long bones(metacarpals). The metacarpals are identified by Latin numerals frommetacarpal I (leading to the thumb) through metacarpal V (leading to the lit-tle finger). The palm is filled by loose connective tissue containing some fat inwhich are embedded the long flexor tendons, small lumbrical muscles, nervesand blood vessels.
Each of the four fingers contain three phalanx bones connected end to end.The top of the finger holds the distal phalanx, which abuts the middle phalanxwhich abuts the proximal phalanx which abuts the metacarpal bones of the palm. The thumb has only two bones, the distal phalanx and proximal phalanx. The distal phalanx (end bones) in the fingers and thumb are somewhatflattened (tuberosity). The fingernail covers the dorsal sides (back) of the dis-tal phalanx, while the front side (anterior) is covered with a fatty pad in whichare embedded many nerve endings that provide the acute sense of touchdetected by the balls of the fingertips. These nerve fibers connect to corpuscu-lar receptors that respond to pressure, temperature, pain and itch. The highdegree of sensory innervation in the fingertips allows many intricate tasks tobe performed including the ‘handfeel’ of foods.
The muscles located within the fingers and palm (intrinsic muscles) aresmall and relatively weak, the main ones being the lumbrical muscles that surround the knuckles and cause the fingers to spread apart or close together.
The strong clenching motion that is achieved by closing the fingers downtowards the palm is mainly achieved by two powerful muscles (extrinsic mus-cles) located in the front (anterior) of the forearm beginning near the elbow andcontinuing about half way to the wrist. These muscles are the flexor digitorumprofundus and flexor digitorum superficialis. The opening of the fingers awayfrom the palm is achieved mainly by two less powerful muscles that lie in theback (posterior) of the forearm, flexor carpi radialis and flexor retinaculum.
It is remarkable that the strong clenching motion of the hand is not poweredby muscles within the hand but by a large mass of muscles concentrated in theupper forearm some 20–40 cm distant from the fingertips. Long tendonsattach to the powerful muscles in the middle forearm and extend through thecarpal tunnel in the wrist to the fingertips in a manner suggestive of a rope andpulley system. The tendons that close the fingers (flexor) are deeply embeddedin the palm while the tendons that straighten them lie just under the skin in theback of the hand. Most people can see the extensor tendons move when thefingers are bent and straightened.
The long flexor tendons that cause the fingers to close are surrounded bysynovial sheaths from the wrist up to the last finger joint. These sheaths lubri-cate the tendons and allow them to move easily with little friction. Most peo-ple can see the long flexor tendons moving just above the wrist when theyclench the hand. They can also see and feel the strong flexor muscles thatpower this movement tighten up just below the elbow.
56 Body–Texture Interactions
Chap-02.qxd 1/10/02 4:11 PM Page 56

The thumb is opposable. In contrast to the fingers, the major muscle thatcloses the thumb (abductor pollicis brevis) stretches from the first joint in thethumb across the lower palm to about the middle of the wrist. Its motion isaided by another intrinsic muscle (flexor pollicis). The extrinsic muscles in theforearm that help move the thumb are one flexor (flexor pollicis longus) andtwo extensors (extensor pollicis longus and extensor pollicis brevis).
The movements of the hand are complex biomechanical operations involv-ing all joints at the same time but they can be broken down into two basic acts:
(1) Power grip. The fingers form one side of a clamp and the palm theother side while the thumb is wrapped around the index finger. Thesemovements are used to hold the steering wheel of the car, the handle ofa suitcase, and the handles of tools. This grip can exert very strongforces.
(2) Precision grip. The ball of the thumb presses against the balls of one ormore fingers (oppositive) exposing the sensory surfaces to the product.This grip can be controlled within short movements and is the one usedto feel items such as foods. It is also the grip used for writing, painting,sewing and other delicate tasks.
Sight
A visual manifestation of texture can be found according to the rate anddegree that foods slump or spread when unrestrained (see pages 161, 216 and224). For example, a firm jelly holds its shape well whereas a soft jelly sags toa greater degree. One observes the viscosity of a liquid or semiliquid food bywatching the rate of flow as it pours from a container or flows across the foodor the plate (Shama et al., 1973).
Sound
Crisp and crunchy foods generate characteristic sounds when masticated. Oneperson can stand behind a screen out of sight of a second person and chew onvarious foods and the second person can quickly decide when a crispy food isbeing chewed just by listening to the sounds being generated. This subject isdiscussed more fully on page 171.
Nonoral Methods for Sensing Texture 57
Chap-02.qxd 1/10/02 4:11 PM Page 57

Physics and Texture
Introduction
This chapter introduces the reader to the branches of physics that are relevantto texture, mainly rheology and physical properties of materials. The conceptof food rheology was introduced in Chapter 1, pages 22–26. Physics is abranch of science that can quickly become complicated and very mathematical.For example, Table 3.1 shows the nomenclature for rheological functions insteady simple shear and linear viscoelasticity recommended by the Society ofRheology. The Society has two more tables giving recommended nomenclaturefor nonlinear viscoelasticity in shear and nonlinear viscoelasticity in extension.One glance at Table 3.1 demonstrates how complex this branch of physics canbecome. Fortunately, many of the rheological functions listed in Table 3.1 prob-ably have little relevance to food.
This account of food physics is introductory and uses the minimum ofmathematics. The reader should consult one or more of the references listed atthe end of this chapter for a more comprehensive description of the principlesof physics.
Rheology is defined as ‘the study of the deformation and flow of matter’. Itsprinciples can be applied to any kind of material ranging from mobile fluidssuch as water, to plastics, blood, paints, cosmetics, soils, glasses, rubber, lubri-cants, ceramic materials, rocks, and of course, foods and beverages. The Societyof Rheology, which has its headquarters in the United States of America, wasfounded in 1929 and now has a membership exceeding 1600 members. Othercountries, including Australia, Japan and the United Kingdom have their ownnational societies of rheology. With this large number of practising rheologists,it is not surprising to find that the field of rheology is well developed and thriving. It needs to be remembered that most of the rheological concepts andinstruments were developed for nonfood products, e.g. plastics, and the foodrheologist, while borrowing freely from conventional rheological theory and
C H A P T E R
3
Chap-03.qxd 1/12/02 7:08 PM Page 59

practice, needs to be alert to the possibility that some of this theory may notbe applicable to foods. As pointed out on page 17, most people have a clearunderstanding of the differences between solids and liquids. However, thereare many substances, including numerous foods, that simultaneously possess
60 Physics and Texture
Table 3.1 Society of Rheology Nomenclature
Quantity Symbol SI units
Steady simple shear
Direction of flow x1 or x mDirection of velocity gradient x2 or y mNeutral direction x3 or z mShear stress s PaShear strain g —Shear rate s�1
Viscosity h Pa�sFirst normal stress function N1 PaSecond normal stress function N2 PaFirst normal stress coefficient c1 Pa�s2
Second normal stress coefficient c2 Pa�s2
Limiting viscosity at zero shear rate h0 Pa�sLimiting viscosity at infinite shear rate h� Pa�sViscosity of solvent or of continuous medium hs Pa�sRelative viscosity (h/hs) hr —Specific viscosity (hr � l) hsp —Intrinsic viscosity [h] m3 kg�1
Linear viscoelasticity
Simple shearShear strain g —Shear modulus (modulus of rigidity) G PaShear relaxation modulus G(t) PaShear compliance J Pa�1
Shear creep compliance J(t) Pa�1
Equilibrium shear compliance Je Pa�1
Steady-state shear compliance Js0 Pa�1
Complex viscosity h*(v) Pa�sDynamic viscosity h�(v) Pa�sOut-of-phase component of h* h�(v) Pa�sComplex shear modulus G*(v) PaShear storage modulus G�(v) PaShear loss modulus G�(v) PaComplex shear compliance J*(v) Pa�1
Shear storage compliance J�(v) Pa�1
Shear loss compliance J�(v) Pa�1
Tensile extensionStrain (True strain) e —Young’s modulus E PaTensile relaxation modulus E(t) PaTensile compliance D Pa�1
Tensile creep compliance D(t) Pa�1
Source: Adapted from Dealy (1994). Reprinted from J. Rheology 38, pages 179, 180. Copyright by Society of Rheology.
&g
Chap-03.qxd 1/12/02 7:08 PM Page 60

some of the properties of both solids and liquids, and measuring and specifyingtheir properties is sometimes difficult.
The classical definition of rheology divides into two parts.
(1) Deformation usually applies to materials that are predominantly solid-like in nature.
(2) Flow usually applies to materials that are predominantly fluid-like innature.
The most important elements in both deformation and flow are the funda-mental quantities of distance, time and mass.
Distance, symbol l, is measured in meters (m)Time, symbol t, is measured in seconds (s)Mass, symbol m, is measured in kilograms, (kg)
A description of these quantities is given in Table 3.13, page 104. A numberof other quantities such as area, volume, force, etc. are derived from variouscombinations of the above three fundamental elements.
Deformation
This section begins by defining the most common units used for measuringand defining deformation. The term ‘displacement’ is sometimes used in placeof deformation.
Force, symbol F, has the dimensions mass � length � time�2 (mlt�2). Theconventional unit of force is the newton, symbol N, named after the Britishphysicist, Sir Isaac Newton (1642–1727). The word ‘load’ is sometimes usedinstead of ‘force.’
Stress is the force per unit area, symbol s (Greek lower case sigma). It hasthe dimensions mlt�2/l2 � ml�1t�2. It is expressed in units of pascals (symbolPa) and named after the French physicist Blaise Pascal (1623–1662) and hasthe units newtons per square meter (N m�2). An earlier and now obsolete unitof stress is the dyne-cm�2. The equation describing stress is simply:
s � F/A
where s is the stress achieved when a force F is applied uniformly to a bodywith area A.
Figure 3.1 explains the difference between force and stress. Suppose a mate-rial of uniform composition is fashioned into two pieces of the same height withone piece 1 cm � 1 cm square and the other 5 cm � 5 cm square. Now supposea steady force of 100 N is uniformly applied to each piece. The force (or load)is 100 N on both pieces, but in the first piece the stress is 100/1 �100 N cm�2
whereas in the second piece it is 100/25 � 4 N cm�2. It is necessary to knowboth the force and the area of the specimen to calculate stress.
If the sample is uniform in shape and composition and the deformation issmall, it is generally assumed that the stress is evenly distributed throughout
Deformation 61
Chap-03.qxd 1/12/02 7:08 PM Page 61

the sample, but when the sample does not present a flat surface to receive theforce, e.g. a sphere such as an orange, or if the sample is nonuniform in struc-ture or composition, e.g. a bread roll, or if the vehicle applying the force hasan uneven surface, e.g. the cusp of a molar, the stress is unevenly distributedthroughout the sample. Also, if the deformation is large, or if the materialsplits, crumbles or breaks the stress is unevenly distributed. In these cases,which are frequent in foods, it becomes very difficult, and often impossible tomap the distribution of stress throughout the sample.
Stress is most commonly applied to foods in compression but it can also beapplied in tension or shear (sideways or lateral).
Strain refers to the change in size or shape of a material when it is subjectedto a stress. It is denoted by the Greek letter � (epsilon) and may be describedin several ways:
(1) Dimensional units, e.g. ‘the strain is x mm’, i.e. the change in height l.(2) Simple ratio: Cauchy strain also called ‘engineering strain’
where l0 is the height or length of the unstressed specimen and l afterthe stress has been applied and l is the change in height (x).
(3) Logarithmic ratio: Hencky strain, also called ‘true strain’ or ‘naturalstrain.’
where ln is the natural logarithm of the ratio of the stressed/unstressedheights.
� � lnl
l0
� ��
�
� ��
�
l l
l
l
l
l l
l
l
l
0
0 0
0
0 0
62 Physics and Texture
100N
100N
area: 1cm2
force: 100Nstress: 100/1�100Ncm�2
5cm�5cm�25cm2
100N100/25�4Ncm�2
Figure 3.1 Stress is dependenton both force and area.
for compression
for tension
Chap-03.qxd 1/12/02 7:08 PM Page 62

A suffix is often used to distinguish Cauchy strain (�c) from Hencky strain(�h). When one of these strains is known, the other can be calculated from itby using the conversion equation:
�h � ln (1 � �c)
Note that both Cauchy and Hencky strains are ratio measurements and,therefore, dimensionless. There are other methods for calculating strain includ-ing Swainger’s strain (�S), Almansi’s strain (�A) and Green’s strain (�G) (Peleg,1985). All these methods of expressing strain are about the same at small dis-placements but their values increasingly diverge at larger displacements.
Also note that stress is always a force measurement and strain is alwaysbased on measurement of a distance. The colloquial use of stress and strain as interchangeable entities (‘the stress and strain of life’) has no place inphysics.
Uniaxial compression is simply compression in one plane. It is the simplestand most widely used mode of testing food texture and is the type of compres-sion that is used in the universal testing machines that are now present in mostfood laboratories.
Bulk compression compresses the product in all three dimensions. It is usu-ally accomplished by hydrostatic pressure, and because of the complex appara-tus required is rarely used for food texture measurements.
Shear occurs when a force is applied laterally (sideways) to a solid bodywhose lower face is locked and stationary. The change in angle of the verticalface (g) is the shear. tan g � l/h. For small deformations the angle of shearin radians equals the shear strain, in which case tan g � g.
The difference between uniaxial compression, bulk compression and shearis illustrated in Fig. 3.2.
Linear elastic describes those materials in which the strain is directly propor-tional to the stress, and the strain returns to zero when the stress is removed.For most foods, stresses and strains must be very small to comply with linear
Deformation 63
F
A
A
L
L
L � L
F
F
L
u
s
s
s
s
s
s
Uniaxial compression Shear Bulk compression
Figure 3.2 Uniaxialcompression, shear, and isotropic(bulk) compression of an elasticsolid. In shear the angle u equalsthe shear strain g. (Reprintedfrom Rao and Rizvi 1986.Engineering Properties of Foods,Figure 5.1 by courtesy of MarcelDekker Inc.)
Chap-03.qxd 1/12/02 7:08 PM Page 63

elastic behavior as shown in Table 3.2. Most texture tests on solid foods uselarge strains that are well beyond the linear elastic range.
Effect of Lubrication
In a series of papers, Professor Sherman’s group at the University of Londonshowed that lubrication, or lack of lubrication, of the contact surface betweenthe food and compressing platen affects the force required to reach a givendegree of compression (Culioli and Sherman 1976; Abu-Shakra and Sherman,1984; Atkin and Sherman, 1984; Goh and Sherman, 1987). A nonlubricatedsurface requires a higher force than a lubricated surface for the same degree ofcompression (see Fig. 3.3). On theoretical grounds it was shown that when acylinder of food is compressed it should assume an hour-glass shape. However,friction between the surface of the food and the contact surface of the com-pressing platen prevents the lateral movement of the food needed to assumethe hour-glass shape and the food bulges in the middle, assuming a barrel
64 Physics and Texture
Table 3.2 Strain Limits for Linear Viscoelastic Behavior
Food Strain limit (%) Reference
Alginate gel 5 to 8 Mancini et al. (1999)Cornstarch gel, fried 4 Rovedo et al. (1999)Dulce de Leche
confectionery type 9 Navarro et al. (1999)common type 3.5 Navarro et al. (1999)low calorie 3.5 Navarro et al. (1999)
Frankfurters 1.5 to 3 Mohsenin and Mittal (1977)Frankfurters 3.8 Skinner and Rao (1986)Fruits, fresh 1.5 to 3 Mohsenin and Mittal (1977)Meat 0.5 Mathevon et al. (1995)
150
100
50
010 20 30
oil
Compression (%)
Emery paper
40 50 60 70 80
Stre
ss (
dyne
cm
�2
� 1
0�4 )
Figure 3.3 Influence of mineraloil and emery paper on the truesurface stress–compressionbehavior of Gouda cheesesamples 25 mm high and 25 mmdiameter tested at a crossheadspeed of 500 mm min�1.(Reprinted from Culioli andSherman, 1976. J. Texture Studies77, page 356. Copyright by Foodand Nutrition Press Inc.)
Chap-03.qxd 1/12/02 7:08 PM Page 64

shape. When samples of cheese were lubricated with a thin film of oil theyassumed an hour-glass shape when compressed, but without the oil theyassumed a barrel shape. The barrel shape was even more noticeable whenemery paper was inserted between the cheese and the metal compressionplates. Others have noted differences in compression force between lubricatedand nonlubricated (bonded) compression (e.g. Montejano et al., 1983a,b;Casiraghi et al., 1985; Chu and Peleg, 1985; Nussinovitch et al., 1992).Therefore, the surface needs to be lubricated if one is to get correct rheologi-cal data from compression tests.
However, Brennan and Bourne (1994) pointed out that two influences arepresent when food is compressed between the molars: (1) saliva acts as alubricant; (2) the cusps of the molars act as anchors to hold the surface andprevent lateral movement. In compression tests on cylinders of Provolonecheese and chicken frankfurter between molars mounted on a TA.XT2 TextureAnalyzer, and with human subjects when they compressed them between theirmolars they found that the samples assumed a barrel shape showing that the anchoring effect of the cusps prevailed over the lubrication provided by thesaliva. In other words, compression between the molars in the mouth gives the equivalent of nonlubricated compression even though it is conducted in a well-lubricated environment. The conclusion from this experiment is that if one is looking for true rheological data, the surface should be lubricated, but if one wants to duplicate what happens in the mouth there should be nolubrication in compression tests.
Time Aspects of Deformation
Suppose an article of food of uniform cross-sectional area is resting on a rigidsurface with a weightless rigid plate resting on the upper side (Fig. 3.4). Supposenow that a weight is placed on the plate and that some mechanism is availableto measure the change in height of the food under this constant compressingforce.
Figure 3.5 illustrates what happens when the material is perfectly elastic.When the weight is placed on the food, there is an immediate deformationcalled ‘instantaneous elastic deformation’ and no further change with time.When the weight is removed, the sample instantaneously and completely recov-ers its original height.
Few foods are perfectly elastic. Most foods possess flow properties in addi-tion to elasticity, most frequently ‘plastic’ and ‘viscoelastic.’ The behavior of aviscoelastic food under these conditions is demonstrated in Fig. 3.6. When theweight is placed on the food, there is an immediate compression of the foodwhich is the instantaneous elastic deformation. This is followed by a prolonged,continuous but decelerating rate of deformation called ‘creep’ or ‘retardeddeformation.’ The deformation continuously increases with time and theo-retically never stops; the slope of the line never becomes perfectly horizontal.
Time Aspects of Deformation 65
Chap-03.qxd 1/12/02 7:08 PM Page 65

When the weight is removed, there is an instantaneous partial elastic recoveryfollowed by further recovery with respect to time called ‘retarded recovery,’ or‘creep recovery.’Again, this line theoretically never becomes horizontal. Withthese products the commodity does not return to its original height; it is permanently and irreversibly compressed. This is known as irreversible or‘permanent deformation,’ or ‘set.’
The viscoelasticity of foods varies widely. A food that is mostly elastic andslightly viscoelastic will give a deformation–time response behavior similar to that shown in Fig. 3.5, whereas a highly viscoelastic product will exhibitbehavior as shown in Fig. 3.6.
Creep and recovery are probably a minor part of the deformation that is nor-mally sensed in the hand because of the short time duration of the squeeze.Sometimes it is important; for example, in bread doughs, which are highly viscoelastic. The irreversible deformation that results from viscoelasticity isfound, for example, in grapefruit that have been tightly packed in a shippingcarton; after being placed on the table where they are free to resume their
66 Physics and Texture
h
h
Original shape
Compressed
00
Instantaneouselasticdeformation
Instantaneouselasticrecovery
Forceremoved
Forceapplied
Time
Def
orm
atio
n
h
Figure 3.4 Schematic ofuniaxial deformation of a solidunder a constant force.
Figure 3.5 Deformation–timerelationship for an elastic bodyunder constant stress.
Chap-03.qxd 1/12/02 7:08 PM Page 66

spherical shape, they will retain flat compression faces for many days, demon-strating the permanent deformation that has occurred.
The above discussion relates to the change in height with respect to timeunder a constant deforming force. Another way of measuring the time aspectsof deformation is to measure the change in force over a period of time at aconstant level of deformation; that is, the product is compressed to a certainheight and held at that compression while changes in force are measured. Thisis a test that is easily performed in the Instron and similar instruments (Bourneet al., 1966). A typical curve for a viscoelastic solid is shown in Fig. 3.7. Theforce increases steeply and almost linearly from O to A when the commodityis compressed. At point A the compression is stopped and the product is heldat a constant height. The force declines, rapidly at first and then more slowlyas the product continues to deform under the force. This decay of stress undera constant strain is known as ‘stress relaxation.’At point B the product is partiallydecompressed by raising the compression plate a short distance and stoppingit again at C. As the product is held with less compression the force willincrease again as the product slowly recovers its original shape. This is knownas ‘recovery.’An elastic solid gives almost the same compression from O to Aas the viscoelastic solid, but when compression is stopped at A the force doesnot change but gives a horizontal line until the solid is decompressed.
The relaxation time is the time required for the stress at constant strain todecrease to l/e of its original value, where e is the base of natural logarithms(2.7183). Since l/e � 0.3678, the relaxation time is the time required for theforce to decay to 36.8% of its original value. This can be measured on instru-ments such as the Instron where a constant compressive strain can be main-tained and the change in force with respect to time is measured. In some cases
Time Aspects of Deformation 67
00
Time
Forceremoved
Forceapplied
Permanent deformation
Def
orm
atio
n
h
Instantaneouselasticdeformation
Instantaneouselasticrecovery
Retardeddeformation
Retardedrecovery
Figure 3.6 Deformation–timerelationship for a viscoelasticbody under constant force.
Chap-03.qxd 1/12/02 7:08 PM Page 67

the time to relax to l/e is excessive, in which case some lower value is taken asan arbitrary relaxation time.
Materials Science
It is now time to introduce some fundamental tests that are widely used in thetheory and practice of materials science.
Young’s ModulusYoung’s modulus of elasticity is the ratio of stress to strain when an elasticsolid material is compressed or extended. It is a measure of stiffness and wasdeveloped by Thomas Young, an English physicist (1773–1829) and it isdescribed by the equation:
where E is Young’s modulus, F is the applied force perpendicular to the areadefined by the stress, A is the cross-sectional area of the test material, L is thelength or height of the test specimen and L the change in length resultingfrom the application of force F. Young’s modulus is equal to the slope of thestress–strain curve. The prefix ‘Young’s’ is sometimes omitted, making thisterm ‘modulus of elasticity.’
Theoretically, Young’s modulus of elasticity should only be used to describeelastic materials. Since most foods are viscoelastic in nature, and many are ofnonuniform shape, size and structure, it is questionable whether this term shouldbe used for foods. Mohsenin and Mittal (1977) pointed out the importance of
EF A
L L
stress
strain � �
��
68 Physics and Texture
Figure 3.7 Force–timerelationship for a viscoelasticbody under constantdeformation.
Recovery
Relaxation
Stopdecompression
B
D
C
A
O
Dec
ompr
essi
on
Com
pres
sion
Stopcompression
Startcompression
Startdecompression
Time
Forc
e
Chap-03.qxd 1/12/02 7:08 PM Page 68
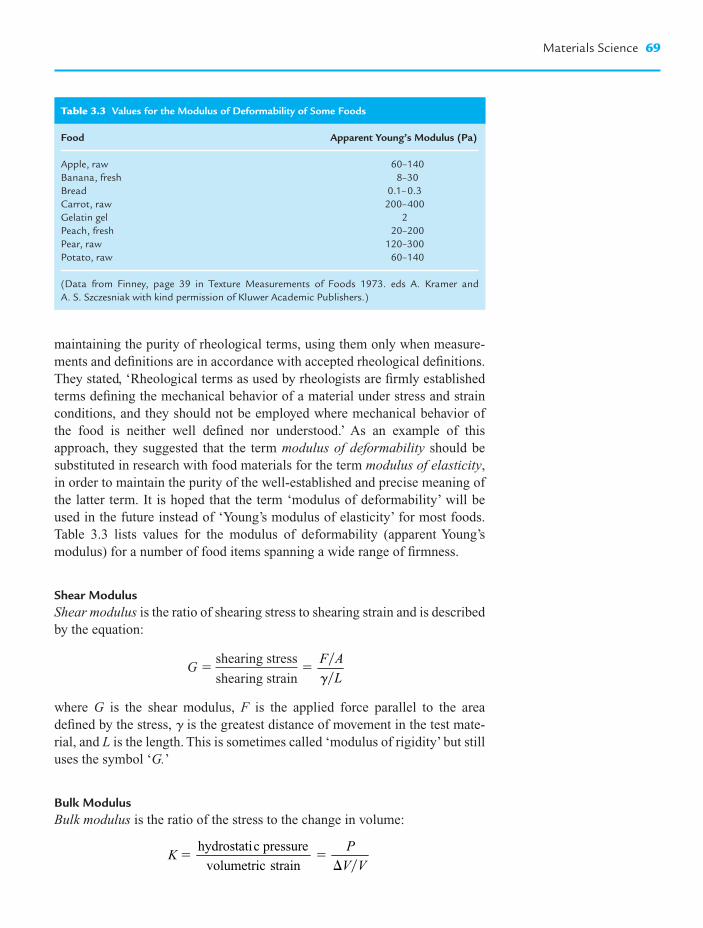
maintaining the purity of rheological terms, using them only when measure-ments and definitions are in accordance with accepted rheological definitions.They stated, ‘Rheological terms as used by rheologists are firmly establishedterms defining the mechanical behavior of a material under stress and strainconditions, and they should not be employed where mechanical behavior ofthe food is neither well defined nor understood.’ As an example of thisapproach, they suggested that the term modulus of deformability should besubstituted in research with food materials for the term modulus of elasticity,in order to maintain the purity of the well-established and precise meaning ofthe latter term. It is hoped that the term ‘modulus of deformability’ will beused in the future instead of ‘Young’s modulus of elasticity’ for most foods.Table 3.3 lists values for the modulus of deformability (apparent Young’s modulus) for a number of food items spanning a wide range of firmness.
Shear ModulusShear modulus is the ratio of shearing stress to shearing strain and is describedby the equation:
where G is the shear modulus, F is the applied force parallel to the areadefined by the stress, g is the greatest distance of movement in the test mate-rial, and L is the length. This is sometimes called ‘modulus of rigidity’ but stilluses the symbol ‘G.’
Bulk ModulusBulk modulus is the ratio of the stress to the change in volume:
KP
V V
hydrostatic pressure
volumetric strain � �
�
� F A
L
��g
Materials Science 69
Table 3.3 Values for the Modulus of Deformability of Some Foods
Food Apparent Young’s Modulus (Pa)
Apple, raw 60–140Banana, fresh 8–30Bread 0.1–0.3Carrot, raw 200–400Gelatin gel 2Peach, fresh 20–200Pear, raw 120–300Potato, raw 60–140
(Data from Finney, page 39 in Texture Measurements of Foods 1973. eds A. Kramer and A. S. Szczesniak with kind permission of Kluwer Academic Publishers.)
shearing stressG �
shearing strain
Chap-03.qxd 1/12/02 7:08 PM Page 69

where K is the bulk modulus, P the force per unit area (pressure) applied from all directions (isotropically), V is the original volume of the unstressedmaterial and V the change in volume resulting from the application of pressure P.
Poisson’s RatioPoisson’s ratio is named after the French physicist Siméon Denis Poisson(1781–1840) and is described by the equation:
where m is Poisson’s ratio, D is the width of the test specimen and L its lengthor height, D and L the changes caused by the application of a stress.
If the volume is unchanged when the stress is applied, Poisson’s ratio is 0.5. Itis less than 0.5 if the volume changes. Since water is essentially incompressible,those foods that contain a high water content such as fruits and vegetables havea Poisson’s ratio close to 0.5 unless they also contain gas. Highly compressibleproducts such as fresh bread crumb have a very low apparent Poisson’s ratio.Table 3.4 lists the apparent Poisson’s ratio for several foods at different levels ofHencky strain. Individual cereal grains usually have a Poisson’s ratio between0.25 and 0.4. Researchers often assume a ratio of 0.3 for cereal grains if theactual Poisson’s ratio is not known (Borgale and Irudayaraj, 1995).
Interrelations Between ModuliE, G, K and m are called ‘material constants’ because they are inherent to thematerial and their values should not be affected by the size and shape of the
70 Physics and Texture
Table 3.4 Apparent Poisson Ratio of Selected Foods at Different Levels of Hencky Strain
Apparent Poisson’s Ratio
Sample ��H �� 0.05 ��H �� 0.12 ��H �� 0.30 ��H �� 0.65 ��H �� 0.90
AppleRed Delicious 0.21 0.25 fJonagold 0.17 0.22 fIdared 0.24 0.24 f
BreadRye 0.28 0.22 0.21 0.19 0.20White 0.17 0.14 0.11 0.07 0.07
Butter 0.42 0.44 0.43 fPotato
Raw 0.38 0.43 0.46 fSteamed 0.40 0.42 f
Reprinted from Rohm, Jaros and de Haan, 1997, J. Texture Studies 28, page 252. Copyright byFood and Nutrition Press Inc.f, product fractured.
lateral strain change in width per unit width D/Dm � � �
axial strain change in length per unit length L/L
Chap-03.qxd 1/12/02 7:08 PM Page 70

test specimen or by the rate of loading or the machine used to make the mea-surement. However, as will become evident later in this chapter, this is an idealconcept. There are often substantial deviations from the ideal in practice,especially when large strains are applied.
Figure 3.2 (page 63) illustrates the difference between compression, shearand bulk compression.
Rheological theory shows that for elastic materials these four moduli areinterrelated as follows:
G � 3EK/(9K � E)K � E/3(1 � 2m) � EG/(9G � 3E) � G[2(1 � m)]/3(1 � 2m)E � 9GK/(3K � G) � 2G(1 � m) � 3K(1 � 2m)m � (E � 2G)/2G � (1 � E/3K)/2
These equations seem to hold well for materials of construction. Table 3.5compares the experimentally measured values with the values calculated fromthe three other moduli. For steel and glass there is good agreement betweenthe measured and calculated values but for rubber there are major differences,amounting to as much as five orders of magnitude for shear modulus. It isobvious that these conversion equations are ineffective for rubber. Since mostfoods are more like rubber than steel it is likely that these equations will be oflittle use for most foods.
Creep Compliance
The increase in deformation or strain as a function of time is called ‘creep’ andthe ratio of the strain at time t to the constant load is called ‘creep compliance.’A typical creep compliance curve can generally be divided into three sectionsas shown in Fig. 3.8.
Creep Compliance 71
Table 3.5 Numerical Values for Rheological Moduli
Value
Substance Modulus Measured Calculated
Steel Shear 8 � 1010 10.1 � 1010
Steel Young’s 25 � 1010 19.2 � 1010
Steel Bulk 16 � 1010 17.3 � 1010
Glass Young’s 7 � 1010 4.96 � 1010
Rubber Shear 2.9 � 1010 2.68 � 105
Rubber Young’s 8 � 105 11.4 � 105
Rubber Bulk 1.9 � 107 8.9 � 104
Calculated from data listed by Muller (1973).
Chap-03.qxd 1/12/02 7:08 PM Page 71

Section 1: Instantaneous compliance is denoted by region A and the symbolJ0 in Fig. 3.8.
where E0 is the instantaneous elastic modulus (Young’s Modulus) and E0 (t) isthe instantaneous strain (i.e. t is almost zero).
Section 2: Time dependent retarded elastic region denoted by B–C and thesymbol JR
JR � Jm [1 �exp(�t/tm)]
where JR is the retarded elastic compliance, Jm is the mean elastic complianceand tm is the mean retardation time.
Section 3: A linear region of elastic compliance denoted by the region C–Dand the symbol Jn, where Jn is the newtonian compliance.
When the load is removed there can be an instantaneous elastic recoveryfrom D to E and a retarded elastic recovery from E to F.
JE0 1
0
�
72 Physics and Texture
Creep Recovery
D
E
H
C
B
A GJ0
Jn
JR
Time (t)
Cre
ep c
ompl
ianc
e J (
I)
J0 � E0
JR � ER
Jn � En
Figure 3.8 Model creep curve.(Reprinted from Sherman,Figure 1.9 in TextureMeasurements of Foods 1973,eds. A. Kramer and A. S. Szczesniak with kindpermission of Kluwer AcademicPublishers.)
Chap-03.qxd 1/12/02 7:08 PM Page 72
A graphical procedure has been developed to solve for all the symbols inthe above equations (for example, see Chen and Fridley, 1972). Jackman andStanley (1995) give a useful report on the use of creep–recovery compliancemeasurements to study the viscoelastic properties of fresh tomatoes.
Viscosity
Everybody is aware that some liquids flow more easily than others. The poetLucretius (96–55 BC) wrote,
We see how quickly through the colander,The wines will flow; on the other hand,The sluggish olive oil delays; no doubt,Because ‘tis wrought of elements more large,Or else more crooked and intertangled.(cited by Markovitz, 1985).
The tendency of a fluid to flow easily or with difficulty has been a subject ofgreat practical and intellectual importance to mankind for centuries. Thefamous English physicist Sir Isaac Newton (1642–1727) was one of the earli-est researchers to study the flow of fluids. In his Principia, the section entitled‘On the Circular Motion of Liquids,’ he stated the hypothesis that ‘the resis-tance which arises from the lack of slipperiness of the parts of the liquid, otherthings being equal, is proportional to the velocity with which the parts of theliquid are separated from one another.’ This principle, that the flow of fluid isdirectly proportional to the force that is applied, is used to describe the class ofliquids known as ‘Newtonian fluids.’Water is the best-known Newtonian fluid.
Other scientists have studied more complex liquids; for example, Schlublerin an 1828 paper on ‘The Fatty Oils of Germany’ included within the physicalconstants a ‘fluidity ratio’ using an instrument that is similar to some of thesimple instruments that are currently used. Poiseuille (1797–1869) performedan elegant study of the flow of fluids in capillary tubes and may be consideredas one of the founders of modern viscometry. Sir George Gabriel Stokes(1819–1903), who was president of the Royal Society from 1885 to 1892, stud-ied the flow of liquids through an orifice and can be considered the founder ofthe efflux type of viscometer.
Some important definitions in viscometry are set out below.
Laminar Flow and Turbulent FlowLaminar flow is streamline flow in a fluid. Turbulent flow is fluid flow in whichthe velocity varies erratically in magnitude and direction.
The difference between laminar flow and turbulent flow is illustrated in Fig. 3.9. Suppose a fluid is being pumped through a pipe at a constant rate anda thin thread of colored solution is injected into the flowing stream. If laminarflow is occurring, the thread of colored solution will move straight down thetube. In the case of turbulent flow there are many eddies and currents, which
Viscosity 73
Chap-03.qxd 1/12/02 7:08 PM Page 73

are shown by the line of colored solution breaking up and forming eddies andvortices as it moves down the pipe. Laminar flow occurs at slow rates of flowand turbulent flow occurs at high rates of flow.
The Reynolds number (Reynolds, 1883) is a dimensionless number definedby an equation that can take several forms, one of which is the following:
Re � 2rQ/prh
where Re is the Reynolds number (a dimensionless number); r, the density ofliquid; Q, the rate of flow; r, the radius of pipe; and h, the viscosity. The pointat which the onset of turbulence occurs is known as the critical Reynolds num-ber, Rc. The critical value of Reynolds number denotes the rate of flow atwhich the flow changes from laminar to turbulent flow. For pipe flow thisoccurs at approximately Rc � 2200 and is shown schematically in Fig. 3.9c,d.Newtonian flow only occurs in the laminar region. Even a Newtonian fluidwill lose its Newtonian behavior when turbulent flow begins. This criticalReynolds number determines the lowest velocity at which turbulent flow cantake place, but it does not determine the highest velocity for the appearance oflaminar flow. It is possible to obtain a laminar flow above the critical Reynoldsnumber, particularly if the fluid is free of colloidal or suspended material andthe pipe is very smooth, giving a metastable region that is somewhat analo-gous to supercooling and superheating effects that can be found when heatingor cooling pure liquids. The point to remember is that a Newtonian fluidappears to be non-Newtonian when the shear rate is very high.
74 Physics and Texture
Laminar or streamline flow
Turbulent flow
Directionof
flow
Onset ofturbulence Onset of
turbulence
Laminar
Turbule
nt
Turb
ulen
tLaminar
a
b
c dSh
ear
stre
ss s
Visc
osity
hShear rate g Shear rate g
Figure 3.9 The differencebetween (a) laminar and (b) turbulent flow; (c) shearstress versus shear rate for a Newtonian fluid in the laminar and turbulent flowrange; (d) viscosity versus shearrate for a Newtonian fluid in the laminar and turbulent flow range.
Chap-03.qxd 1/12/02 7:08 PM Page 74

Dynamic ViscosityDynamic viscosity which is frequently called ‘viscosity,’ or ‘absolute viscos-ity,’ is the internal friction of a liquid or its tendency to resist flow. It is usuallydenoted by h and is defined by the equation
where h is the viscosity; s, the shear stress; and , the shear rate.According to the International Organization for Standardization (ISO) the
unit of measurement for dynamic viscosity is the pascal second (Pa�s). Sincethe pascal second is a large unit of measurement, a more common unit for lowviscosity fluids is the millipascal second (mPa�s) where 1000 mPa�s � 1 Pa�s.
An obsolete, but still widely used unit of viscosity, is the poise (P) namedafter the French scientist Poiseuille (1846). Since this is a large unit of mea-surement, the centipoise is widely used for low viscosity liquids (100 cP � 1 P).The reader is encouraged to use the SI system of Pa�s or mPa�s but shouldknow how to convert poise and centipoise into SI units because most of theolder literature, and some of the more recent literature, expresses viscosity inpoise. Table 3.6 lists the units of measurement of viscosity in the metric system(now obsolete) and the International System of Units (SI) that were officiallyadopted in 1960. The conversion factors that convert metric units to SI unitsare also given in Table 3.6 to help the reader convert data in the older literatureinto SI units.
&g
h s g � � &
Viscosity 75
Table 3.6 Units of Measurement of Viscosity
Old system (metric) New system (SI)
Shear stresssymbol t (Greek tau) � (Greek sigma)unit dyne cm�2 pascal (Pa)dimensions dyne cm�2 newton meter�2 (Nm�2)conversion 1 N � 105 dyne
1 m2 � 104 cm2
1 Pa � 10 dyne cm�2
Shear ratesymbol (Greek gamma dot)unit s�1 s�1
Viscositysymbol h h (Greek eta)unit poise (P) pascal second (Pa�s)conversion 10.00 P � 1.00 Pa�s
1.00 cP � 1.00 mPa�sKinematic viscosity
symbol n n (Greek nu)unit stoke (St) m2 s�1
centistoke (cSt) mm2 s�1
conversion 1cSt � 1 mm2 s�1
Note that the viscosity of water at 20°C is 1.00 centipoise or 1.00 millipascal second.
& &
Chap-03.qxd 1/12/02 7:08 PM Page 75

Table 3.7 shows viscosities of some well-known liquids. It is worth notingthat water at 20°C has a viscosity of 1.0 mPa�s � 1 cP.
FluidityFluidity is the reciprocal of dynamic viscosity. It is occasionally used in placeof viscosity. It is denoted by f, and is defined by the equation
Kinematic ViscosityThis is defined as the absolute viscosity divided by the density of the fluid. Itis usually denoted by �:
where � is the kinematic viscosity, h is the absolute viscosity and r is the density in grams per cubic centimeter. The SI unit for kinematic viscosity isthe meter-square-second.
An obsolete unit of kinematic viscosity is the stoke (after Stokes, 1819–1903). It has the dimensions M2T �1. One centistoke equals 0.01 stoke.
Kinematic viscosity is measured in efflux viscometers because the rate offlow in this type of viscometer is proportional to density as well as viscosity.Kinematic viscosity is widely used in the petroleum industry where the specificgravity of liquid hydrocarbons does not vary widely. Kinematic viscosity isnot used in the food industry to the same extent because a wide range of den-sities can be encountered, which compresses the kinematic viscosity into asmaller range than the absolute viscosity. This is exemplified in Table 3.8,which shows the absolute viscosity and kinematic viscosity of sucrose solu-tions. The absolute viscosity changes from 1.0 mPa�s for water to 480.6 mPa�sfor 70% syrup, whereas over the same range the kinematic viscosity changesfrom 1.0 to 357.4 mm2 s�1.
Relative ViscosityThis is sometimes called the ‘viscosity ratio,’ which is the ratio of the viscosity of a solution to the viscosity of the pure solvent and is defined by
v � �h r s r� � &g
f g /� & s
76 Physics and Texture
Table 3.7 Some Typical Viscosities
Substance Viscosity (cP or mPa��s)
Air 1.86 � 10�4
Water (0°C) 1.7921Water (20°C) 1.000Water (100°C) 0.283820% Sucrose solution (20°C) 1.96740% Sucrose solution (20°C) 6.22360% Sucrose solution (20°C) 56.780% Sucrose solution (20°C) 40,000Diethyl ether (20°C) 0.23Glycerol (20°C) 1759
Chap-03.qxd 1/12/02 7:08 PM Page 76

the equationhrel � h/hs
where hrel is the relative viscosity; h, the viscosity of solution; and hs, the viscosity of solvent.
Apparent ViscosityThis is the viscosity of a non-Newtonian fluid expressed as though it were aNewtonian fluid. It is a coefficient calculated from empirical data as if the fluidobeyed Newton’s law. This concept will be discussed in more detail on p. 83. The symbol ha is used to denote apparent viscosity.
Shear StressShear stress is the stress component applied tangential to the plane on whichthe force acts. It is expressed in units of force per unit area. It is a force vectorthat possesses both magnitude and direction. The SI unit for shear stress is thepascal (Pa) with units of newton meter�2 (N m�2).
The nomenclature committee of the Society of Rheology recommends thats be used to denote shear stress in simple steady shear flow and that t be usedto denote relaxation time or retardation time [Rheol. Bull. 43(2), 6 (1974)]. Inaccordance with this convention, s will be used to denote shear stress in thischapter. However, the reader is cautioned that the older literature and manyrheologists continue to use t to denote shear stress (for example, see Figs 3.17and 3.22, pages 85 and 92 respectively).
Shear RateShear rate is the velocity gradient established in a fluid as a result of anapplied shear stress. It is expressed in units of reciprocal seconds (s�1).
The nomenclature committee of the Society of Rheology (see above) rec-ommends that be used to denote shear rate and that g be used to denoteshear strain. The use of to denote shear rate is conventional among rheolo-gists and will be used in this chapter.
Krumel and Sahar (1975) give some useful guidelines that enable one tothink in practical terms of what various shear rates mean when related to well-known phenomena. A shear rate of 0.1 s�1 approximates rate of film sag, orflow of film over a vertical plate; 0.1–10 s�1approximates the rate of flow of
&
Viscosity 77
Table 3.8 Viscosity and Density of Aqueous Sucrose Solutions at 20°C
Absolute viscosity Kinematic viscosity % Sucrose Specific gravity hh (mPa��s) nn (mm2 s��1)
0 1.00 1.00 1.0020 1.083 1.97 1.8240 1.179 6.22 5.2860 1.289 56.7 44.070 1.350 480.6 357.474 1.375 1628 1188
Chap-03.qxd 1/12/02 7:08 PM Page 77

a normal Brookfield reading; 50 s�1 approximates the shear rate in the mouth;10–100 s�1 approximates the shear rate in tumbling or pouring; 100–1000 s�1
approximates the shear rate in most home mixers; �1000 s�1 approximatesthe shear rate in a blender.
Van Wazer et al. (1963) noted the sensitivity of the eye in judging viscositiesof Newtonian liquids between about 0.1 Pa�s (1 P) and 10 Pa�s (100 P) by theirrate of flow. Below about 0.01 Pa�s (0.1 P) and above about 100 Pa�s (1000 P)the eye cannot distinguish differences in viscosity.
Factors Affecting Viscosity
Temperature
There is usually an inverse relationship between viscosity and temperature.Typical data are shown in Fig. 3.10 which plots the viscosity of water and
78 Physics and Texture
00.2
0.5
1.0
2.0
5.0
10
20
50
100
200
500
20 40 60 80 100
Temperature ( C̊)
Visc
osity
(m
Pa•s
)
75% Sucrose
70% Sucrose
60% Sucrose
40% Sucrose
20% Sucrose
Water
Figure 3.10 Viscosity of waterand sucrose solutions as afunction of temperature.
Chap-03.qxd 1/12/02 7:08 PM Page 78

some sucrose solutions as a function of temperature. Note also from Table 3.7that the viscosity of water at 0°C is 1.79 mPa�s falling steadily to 0.28 mPa�sat 100°C.
Concentration of Solute
There is usually a direct nonlinear relationship between the concentration of a solute and viscosity at constant temperature. Figure 3.11 shows the viscosity–concentration behavior of salt solution and sucrose solutions at constant temperatures. It is typical of the concentration effect on viscosity.Table 3.7 also shows this phenomenon: water at 20°C has a viscosity of1 mPa�s, whereas 80% sucrose solution has a viscosity of approximately40,000 mPa�s.
The concentration may also determine the type of flow behavior. For exam-ple, Velez-Ruiz and Barbosa-Canovas (1998) showed that concentrated milksshowed Newtonian flow up to 22.3% solids, power-law flow from 22.3% to30.5% solids, and Herschel–Bulkley flow above 42.4% solids.
Factors Affecting Viscosity 79
6040200
1
2
5
10
20
50
100
200
0.2
0.5
Sucrose 0˚C
Sucrose 20˚C
Sucrose 60˚C
Sucrose 100˚CNaCl 20˚C
Visc
osity
(m
Pa·s
)
Concentration (% w/w)
Figure 3.11 Viscosity as afunction of concentration ofsucrose solutions at fourtemperatures and sodiumchloride.
Chap-03.qxd 1/12/02 7:08 PM Page 79

Molecular Weight of Solute
There is usually a nonlinear relationship between the molecular weight of thesolute and the viscosity of the solution at equal concentrations. Figure 3.12,shows the viscosity of corn syrups as a function of molecular weight. Cornsyrup is made by hydrolyzing by degrees high-molecular-weight starch intodextrose, a simple hexose monosaccharide. The abbreviation D.E. refers to ‘dextrose equivalent’ and means the equivalent reducing activity of puredextrose. A ‘36-D.E.’ syrup means that 100 g of corn syrup solids has the same chemical reducing capacity as 36 g of pure dextrose. A low D.E. meansa long chain length and high-molecular-weight oligosaccharide. Figure 3.12shows that 5-D.E. corn syrup (consisting principally of long-chain oligosac-charides) has a much higher viscosity at the same solids concentration thanlower average molecular weight corn syrups of equal concentration.
80 Physics and Texture
100,000
50,000
10,000
5000
1000
500
100
50
20
1030 40 50 60
Solids (%)
Visc
osity
(cP
)
5 D.E.
10 D.E.
15 D.E.
20 D.E.
25 D.E.
36 D.E.
Figure 3.12 Viscosity–concentration–molecular weightrelationships for hydrolyzedcornstarch syrups. (From Murrayand Luft, 1973; courtesy of GrainProcessing Corp. Reprinted fromFood Technol. 2277, 33. Copyrightby Institute of FoodTechnologists.)
Chap-03.qxd 1/12/02 7:08 PM Page 80

Pressure
The viscosity of most liquids is essentially constant over a pressure range of0–100 atm. Hence the pressure effect can usually be ignored for foods.
Suspended Matter
This usually increases the viscosity slightly when in low concentrations, buthigh concentrations of suspended matter can cause substantial increasesbecause of entanglement between the particles. High concentrations of sus-pended matter usually render the product non-Newtonian and can lead to plas-tic flow or dilatant flow (see pages 82–87). A number of foods are composedof two phase systems. One of the best examples is fruit and vegetable juices,purees and concentrates in which insoluble cell wall material and fibers aresuspended in a serum containing water-soluble materials such as sugars,acids, and salts. The concentration of the insoluble suspended matter has aprofound effect on the viscosity and the type of viscous flow. Another exam-ple is emulsions such as mayonnaise and salad dressings where the volumeconcentration of the discontinuous phase (oil droplets) also has a profoundeffect on the viscosity and the type of viscous flow.
Types of Viscous Behavior
Newtonian
This is true viscous flow. The shear rate is directly proportional to the shearstress and the viscosity is independent of the shear rate within the laminar flow range. The viscosity is given by the slope of the shear stress–shear ratecurve (see Fig. 3.13). Typical Newtonian fluids are water, and watery beveragessuch as tea, coffee, beer, and carbonated beverages, sugar syrups, most honeys,edible oils, filtered juices, and milk. A Newtonian fluid possesses the simplesttype of flow properties. The characteristics of this type of flow are adequatelydescribed by the equation given above (h � s/ ). A fluid with high viscosityis called ‘viscous’ whereas a fluid with low viscosity is called ‘mobile.’
Many fluid foods are not Newtonian, in fact, they deviate very substantiallyfrom Newtonian flow. And yet there often seems to be a mental fixation onNewtonian-type flow. Some instruments that satisfactorily measure Newtonianflow are far from satisfactory for measuring the flow properties of non-Newtonian fluids, yet one often sees food scientists using equipment designedfor Newtonian fluids to measure viscous properties of non-Newtonian fluids.Much confusion is found in the literature because the viscous properties ofnon-Newtonian fluids have been measured by instruments that are only appli-cable to Newtonian fluids and the data are erroneously interpreted using theconcepts of Newtonian fluids.
&g
Types of Viscous Behavior 81
Chap-03.qxd 1/12/02 7:08 PM Page 81

Non-Newtonian Fluids
Most fluid and semifluid foods fall into one of several classes of non-Newtonian fluids.
Plastic (or Bingham)A minimum shear stress known as the ‘yield stress’ must be exceeded beforeflow begins. This type of flow is often found in foods. Typical examples of thistype of flow are tomato catsup, mayonnaise, whipped cream, whipped eggwhite, and margarine. This type of flow is named after Bingham (1922), whostudied the flow properties of printing inks and discovered the important prin-ciple that no flow occurs at low stress. He identified the point at which flowbegins as the ‘yield stress.’ The term ‘plastic’ refers to materials that exhibitthis yield stress; it does not refer to synthetic plastics.
Figure 3.14 shows the characteristics of plastic flow for three fluid foods.Fluid A has a low yield stress; the rate of flow (shear rate) is directly propor-tional to the shear stress after the yield stress has been exceeded. Fluids B andC have a higher yield stress than A. The rate of flow of fluids B and C is also
82 Physics and Texture
Shea
r st
ress
s
Visc
osity
h
IntermediateIntermediate
MobileMobile
Viscous
a b
Viscous
Shear rate g Shear rate g
Figure 3.13 Newtonian flow: (a) shear stress versus shear rate(note that the straight lines beginat the origin); (b) viscosity versusshear rate (the viscosity remainsconstant with changing shearrate).
a bShear rate g Shear rate g
App
aren
t vi
scos
ity h
aA � C A � C
A
B
CA � B A � B
Shea
r st
ress
s
a
b
c
A
B
C
Figure 3.14 Plastic flow forthree foods A, B, and C. (a) Shearstress versus shear rate. Notethat the lines do not begin at the origin. There is always anintercept (“yield stress”) on the vertical axis. (b) Apparentviscosity versus shear rate forsame three foods. The apparentviscosity decreases withincreasing shear rate. Note thatthe apparent viscosity of fluid Amay be greater or less than thatof fluids B and C, depending onthe shear rate at which themeasurement is taken.
Chap-03.qxd 1/12/02 7:08 PM Page 82

directly proportional to the shear stress after the yield stress has been exceeded.Table 3.9 lists published values for yield stress of some plastic foods.
Apparent viscosity was defined as the viscosity of a non-Newtonian fluid.Since, in a Newtonian fluid, the flow rate is directly proportional to the shearstress and the curve begins at the origin, a single-point measurement sufficesto establish viscosity. One simply measures the shear stress at a standard shearrate, or the shear rate at a standard shear stress, and by drawing a line fromthere to the origin obtains the true Newtonian viscosity. This is known as a ‘one-point test’ and is quite satisfactory for specifying the viscosity of Newtonianfluids.
When this test is used (as is commonly done) on a plastic fluid, the apparentviscosity will change, depending on the shear rate. Figure 3.15 shows howapparent viscosity is measured. Suppose the viscosity of a Newtonian fluid ismeasured at shear rate a and shear rate b. The shear stress measured at shearrate a (Na) is marked on the graph and a line drawn from that point to the origin.Similarly the shear stress is measured at shear rate b (Nb) and a line drawnfrom this point back to the origin. The slope of the line at both shear rates isthe same; this is characteristic of a Newtonian fluid.
In contrast, when a one-point measurement is made at shear rate a on aBingham plastic the apparent viscosity is the slope of the line OPa; at shearrate b the apparent viscosity is OPb. The apparent viscosity changes as theshear rate changes. This explains why the term ‘apparent viscosity’ is usedbecause it implies a Newtonian-type measurement on a non-Newtonian fluid.Figure 3.15 demonstrates the difficulties that can arise from using Newtonianconcepts for non-Newtonian fluids. A plot of apparent viscosity versus shearrate for three Bingham fluids is shown in Fig. 3.14b. This should be compared
Types of Viscous Behavior 83
Table 3.9 Values for Plastic Yield Stress of Some Foods
Type of food and condition Yield stress (dyn cm��2)
Chocolate, melted 12Cream, whipped 400Guar gum, 0.5% solids, in water 20Guar gum, 1.0% solids, in water 135Orange juice, concentrated 60° Brix 7Pear puree, 18.3% solids 35Pear puree, 45.7% solids 339Protein from yeast, 10% solids 0Protein from yeast, 25% solids 42Protein from soy isolate, 20% solids 1271Protein, whey, 20% 21Sucrose, 75% in water 0Tomato puree, 11% solids 20Xanthan gum, 0.5% solids, in water 20Xanthan gum, 1.2% solids, in water 45
Source: Rha (1980).
Chap-03.qxd 1/12/02 7:08 PM Page 83

with Fig. 3.13b. One problem that arises with the use of the concept of appar-ent viscosity is that fluid A can appear to be more viscous, equally viscous, orless viscous than fluids B and C, depending on the shear rate at which the testwas performed (see Fig. 3.14b).
Plastic flow is not always as simple as shown in Fig. 3.14. Houwink (1958)pointed out that the shear stress–shear rate curve for plastic fluids is usuallycurved at low shear rates and he postulated three yield values, which areshown in Fig. 3.16. The extrapolation of the straight-line position of the exper-imental curve to zero shear rate gives true plastic or Bingham flow. The down-ward curvature of the experimental curve at low shear rates is often found inpractice. The shear stress at which curvature begins in the shear stress–shearrate plot is defined as the ‘upper Houwink yield value;’ the intercept on thevertical axis from the extrapolation of the straight-line part of the curve isknown as the ‘extrapolated yield value’ or Bingham value; and the actualintersection of the shear stress–shear rate plot on the vertical axis is known asthe ‘lower Houwink yield value.’ The deviation from linearity of plastic flowat low shear rate is sometimes of importance but for some foods the deviationis so small that it can be safely ignored. For example, Fig. 3.17 shows theexperimental shear stress–shear rate plot of a meat extract that shows trueBingham behavior with no curvature at low shear rates.
Another type of plastic flow is the type in which the shear stress–shear rateplot is nonlinear above the yield stress. The curve may be concave downward(dilatant with a yield stress), or convex downward (pseudoplastic with a yieldstress). It is sometimes known as the ‘mixed type.’ This type of flow is
84 Physics and Texture
a0 c b
Shea
r st
ress
s
Na
Nc
Pb
Nb
Pc
Pa
Newto
nian
Plastic
Shear rate g
Figure 3.15 Shear stress–shearrate plots for a Newtonian fluidand a plastic fluid. Note that theviscosity of the Newtonian fluidN is the same when measured atshear rates a, b and c, whereasthe apparent viscosity of theplastic fluid P is different at eachshear rate.
Chap-03.qxd 1/12/02 7:08 PM Page 84

Types of Viscous Behavior 85
Upper yield value (Houwink)
Extrapolated yield value (Bingham)
Lower yield value (Houwink)
Shea
r st
ress
s
Shear rate g
Figure 3.16 The upper yieldvalue, extrapolated yield valueand lower yield value that isfound in plastic fluids.
100
60
20
00 4 8 12
Shear rate g (s�1)
Shea
r st
ress
t (
Pa)
ty � 17.0 Pa
Figure 3.17 Shear stress–shearrate plot for a concentrated meatextract (T � 77°C). This is a trueBingham plastic that shows alinear relationship all the waydown to zero shear rate.(Courtesy of Dr A. L. Halmos and Dr C. Tiu. Reprinted from J. Texture Studies 1122, page 42,1981, with permission from Foodand Nutrition Press.)
Chap-03.qxd 1/12/02 7:08 PM Page 85

described by the Herschel–Bulkley equation, which is discussed on page 89and is illustrated in Fig. 3.20.
PseudoplasticIn this type of flow an increasing shear force gives a more than proportionalincrease in shear rate, but the curve begins at the origin. The term ‘pseudo-plastic’ was originated by Williamson (1929); it does not refer to syntheticplastics. Salad dressings are a good example of this type of flow. Figure 3.18bshows that the apparent viscosity of a pseudoplastic fluid is dependent on theshear rate and, as in the discussion of plastic flow, it illustrates the danger ofusing a single-point measurement and Newtonian concepts for specifying theflow characteristics of a pseudoplastic fluid. Many pseudoplastic fluids exhibitnearly linear shear stress–shear rate behavior at low shear rates. This is calledthe ‘Newtonian regime.’
Dilatant FlowThe shear stress–shear rate plot of this type of a flow begins at the origin butis characterized by equal increments in the shear stress giving less than equalincrements in the shear rate (Fig. 3.19). Examples are high solids, raw starchsuspensions, and some chocolate syrups. This type of flow is only found in
86 Physics and Texture
Shea
r st
ress
s
Shear rate g Shear rate ga b
Newtonianregime
App
aren
t vi
scos
ity h
a
Figure 3.18 Pseudoplasticflow: (a) shear stress versus shearrate (note the convex line thatbegins at the origin); (b)apparent viscosity versus shearrate (note that the apparentviscosity decreases withincreasing shear rate).
Shea
r st
ress
s
Shear rate g Shear rate ga b
App
aren
t vi
scos
ity h
a
Figure 3.19 Dilatant flow: (a) shear stress versus shear rate (note the concave line that begins at the origin); (b) apparent viscosity versusshear rate (note that theapparent viscosity increases with increasing shear rate).
Chap-03.qxd 1/12/02 7:08 PM Page 86

liquids that contain a high proportion of insoluble rigid particles in suspension.Dilatant flow is fairly rare in the food industry and extremely rare in finishedfood products.
This type of flow is described as ‘dilatant’ because it is associated with anincrease in volume of the fluid as flow occurs, and it only occurs in high con-centration suspensions. Reynolds (1883), who introduced the term ‘dilatancy,’gave quicksand as an example, stating:
When the water-to-sand ratio is such that there is just enough water to fill all the voids, and whenthe volume of voids is at a minimum, any shear applied to force that material to flow disturbs theposition of the particles and causes a dilation of the voids. This leads to the situation in which thetotal volume of the voids is greater than the volume of water present. This results in an apparentpartial dryness which increases the resistance of the material to shearing stress. The dryness isthe result of the time necessary for the capillary forces to provide the additional water requiredfor complete saturation. When the pressure is removed, the sand becomes wet because the voidscontract, and the water which has become excess escapes at the surface.
An equally good example of this type of behavior can be found with a 60%suspension of cornstarch in water.
True dilatancy can probably exist in any suspension so long as the concen-tration is high enough for the material to exist in closely packed form. Theproperty of dilatancy disappears when the suspension is diluted. For example,a 40% cornstarch suspension in water shows no dilatant properties. The densestpacking of spheres is about 74% and one of the least-dense packing is about37%. Hence it is usual to find that the property of dilatancy only appears insuspensions between about 40% and 70% solids concentration.
Some fluids that do not dilate when sheared may still exhibit a dilatant typeof shear stress–shear rate behavior; that is, equal increments in shear stressgive less than equal increments in shear rate. The general term ‘shear thicken-ing’ applies to these fluids as well as to dilatant fluids.
The General Equation for Viscosity
All the above types of flow can be described by the equation
where s is the shear stress, b, a proportionality factor (for a Newtonian fluidthis factor is the viscosity h), C, the yield stress, s, the pseudoplasticity con-stant, which is an index of the degree of nonlinearity of the shear stress–shearrate curve, and , the shear rate. Figure 3.20a shows all types of flow in a single graph. Newtonian flow is represented by a straight line starting at theorigin; dilatant flow starts at the origin and is concave downward, whereaspseudoplastic flow starts at the origin and is concave upward. Plastic flow doesnot begin at the origin and is linear and mixed-type flow is curvilinear with ayield stress and may be concave upward or downward.
Some authors publish a shear rate–shear stress curve instead of the conven-tional shear stress–shear rate curve. Figure 3.20b plots the same types of
&g
s g � �b Cs&
The General Equation for Viscosity 87
Chap-03.qxd 1/12/02 7:08 PM Page 87

flow as Fig. 3.20a but with the position of the axes interchanged. One shouldlearn to recognize the identity of the various types of flow on both types ofplot.
The general equation for viscosity can be used for all of the above types offlow. Table 3.10 lists the values for the exponent s and the intercept C for thevarious types of flow, the form of the general equation that can be used, and asimplified version of the general equation that can be used for that particulartype of flow. For example, the constant C (yield stress) can be dropped out ofthe equation for dilatant, Newtonian, and pseudoplastic flow because there isno yield stress.
Other Flow Equations
A number of other equations, almost all of which are empirical in nature, havebeen described in the literature. These equations usually have no theoreticalfoundation, but because they facilitate the handling of empirical data theyhave some usefulness. Some of the most common ones are listed below.
88 Physics and Texture
Shea
r st
ress
s
Shear rate g Shear stress s
Shea
r ra
te g
a bPs
eudoplastic
with yield point
Pseu
dopl
astic
with
yiel
dpo
int
Plastic or Bingham
Plas
tic o
r Bin
gham
New
toni
an
NewtonianPs
eu
doplastic
Dilatant
Pseu
dopl
astic
Dila
tant
Figure 3.20 (a) Shear stressversus shear rate plots forvarious types of flow; (b) shearrate versus shear stress plots forthe same types of flow.
Table 3.10 Relationship Between Type of Flow and the General Viscosity Equationa
Type of flow s C Equation form
Newtonian 1 0 s � b � h b
True plastic 1 �0 s � b � CPseudoplastic 0 � s � 1 0 s � b s
Dilatant 1 � s � � 0 s � b s
Pseudoplastic with a yield value 0 � s � 1 �0 s � b s � CDilatant with a yield value 1 � s � � �0 s � b s � C
a The general viscosity equation is s � b s � C.b Term b is the true viscosity h.
&g
&g
&g
&g
&g
&g
& &g
Chap-03.qxd 1/12/02 7:08 PM Page 88

The Power Equation (also known as the Ostwald–de Wael model)
Although this is often described as the power law it is in fact an empirical rela-tionship. This widely used equation takes the form
where s is the shear stress, K is a consistency index, is the shear rate, and n isa dimensionless number that indicates the closeness to Newtonian flow. For aNewtonian liquid n � 1; for a dilatant fluid n � 1, and for a pseudoplastic fluidn � 1. The farther the value of n departs from 1.0 the greater is the deviationfrom Newtonian flow. For example, a food with a value of n � 0.9 is fairlyclose to Newtonian flow whereas another food with n � 0.3 deviates substan-tially from Newtonian flow. Most non-Newtonian foods are shear thinning, i.e. n � 1. However, there are occasional examples of a shear-thickening food.
Taking logarithms reduces this equation to the form
A plot of the log shear stress versus log shear rate is linear with a slopeequal to n for those fluids that obey the power equation. The power equation isfrequently used by engineers in designing systems for handling fluid foods.Many systems reduce to a linear relationship over a wide range of shear rateswhen reduced to a log–lot plot. Table 3.11 lists experimentally determinedpower equation constants for some fruit purees and Table 3.12 for a variety ofprocessed foods.
Herschel–Bulkley Model
Fluids that obey this model are characterized by the presence of a yield stressand a linear log shear stress–log shear rate plot (Herschel and Bulkley, 1926).The equation for this model is
where s0 is the yield stress.This equation is of the same form as the last two equations in Table 3.10, the
only difference being in some of the symbols. It takes the same form as thepower equation but with the addition of the yield stress term s0.
The numerical value of the exponent n indicates the closeness to a linearshear stress–linear shear rate plot; the plot is rectilinear when n is 1 and thedegree of curvature of the plot on linear axes increases as the value of n movesaway from unity.
Casson Equation
This equation was developed for printing inks by Casson (1959), but has beenfound to be effective for some foods, particularly chocolate and some other
s s 0� � K n&g
log log log s � �K n &g
&g
s g � K n&
Other Flow Equations 89
Chap-03.qxd 1/12/02 7:08 PM Page 89

90 Physics and Texture
Table 3.11 Power Equation Constants for Some Fruit Purees
Solids Temperature Rheological constants
Product (%) (°C) n K
Applesauce 11.0 30 0.34 116Applesauce 11.0 82 0.34 90Apricot puree 15.4 4.5 0.37 130Apricot puree 15.4 60 0.46 38Apricot puree 19.0 4.5 0.32 220Apricot puree 19.0 60 0.34 88Apricot concentrate 26.0 4.5 0.26 860Apricot concentrate 26.0 60 0.32 400Banana puree — 24 0.458 65Orange juice concentrate — 0 0.542 18.0Orange juice concentrate — 15.0 0.584 11.9Pear puree 18.3 32 0.486 22.5Pear puree 18.3 82 0.484 14.5Pear puree 26.1 32 0.450 62.0Pear puree 26.1 82 0.455 36.0Pear puree 31.0 32 0.450 109.0Pear puree 31.0 82 0.459 56.0Pear puree 37.2 32 0.456 170.0Pear puree 37.2 82 0.457 94.0Pear puree 45.7 32 0.479 355.0Pear puree 45.7 82 0.481 160.0Peach puree 11.9 30 0.28 72Peach puree 11.9 82 0.27 58Plum puree 14 30 0.34 22Plum puree 14 82 0.34 20
Source: Data from Holdsworth (1971).
Table 3.12 Power Equation Parameters for Steady Viscosities of Some Foods
Flow Behavior ConsistencyFood Index n Index K Pa��sn
Butter, stick, unsalted, Land O’ Lakes 0.074 333Butter, whipped, unsalted, Land O’ Lakes 0.042 417Cool Whip, Birdseye 0.378 15.1Cream Cheese, Whipped, Temptee 0.061 776Frosting, canned, Betty Crocker 0.273 550Ketchup, tomato, Heinz 0.107 79.4Margarine, stick, Parkay 0.0043 549Margarine, squeeze, Parkay 0.174 7.6Marshmallow fluff, Durkee-Mower 0.501 670Peanut butter, creamy, Skippy 0.168 316
Source: Bistany and Kokini (1983). Reprinted from J. Rheology 27, page 608. Copyright by Societyof Rheology.
Chap-03.qxd 1/12/02 7:08 PM Page 90

filled fluids. The equation is
where s is the shear stress, s0, the yield stress, ha, the apparent viscosity, and , the shear rate. This equation gives a linear plot for chocolate. It is used as an international standard for measuring the viscosity of chocolate(Rostagno, 1974). Chevalley (1975) reviewed the validity of the Casson equa-tion for chocolate and factors that affect its flow behavior. However, Chevalley(1991) recommended a modified Casson equation. Instead of using the squareroot of the shear stress (s0.5) he found more consistent results using s0.6.Aeschlimann and Beckett (2000) summarized an interlaboratory study ofchocolate viscosity and recommended simply reporting shear stress readingsat several shear rates.
Structural Viscosity
The shear stress–shear rate plots for some fluid foods do not follow any of thetypes of viscous behavior explained above nor do they obey any of the aboveequations, including the general equation for viscosity. Figure 3.21 shows theshear stress–shear rate plot for an instant pudding. It is obvious that this isunlike any of the flow properties discussed above, and it is difficult to reducethis kind of curve to a suitable equation. The first sharp peak in this curve isprobably related to some kind of shear stress needed to start the productflowing while the hump in the center probably represents the breakdown ofsome soft structure. The flow at high shear rates probably approximates pseudo-plastic flow. When this test is repeated on the same sample, the second shearstress–shear rate curve frequently gives a smoother line with the bumps absentor much reduced in size.
&g
s s h a� �0 &g
Other Flow Equations 91
Shea
r st
ress
Shear rate
Figure 3.21 Experimentallydetermined shear stress–shearrate plot for an instant pudding.(Courtesy of Dr A. S. Szczesniak.)
Chap-03.qxd 1/12/02 7:08 PM Page 91

At the present time there is no accepted method for analyzing this type ofcurve and extracting rigorously defined viscosity parameters from it. Halmosand Tiu (1981), who found a similar shape curve when working with concen-trated yeast extracts, measured the area between the first and second curves,expressing this as the work required to break down the structural viscosity(Fig. 3.22). Presumably, the curve obtained on the second test and subsequenttests exhibits plastic flow or something close to pseudoplastic flow.
Time Dependency
Thus far we have assumed that the shear stress at a given shear rate remainsconstant over a period of time. There are a number of fluids in which the shearstress is a function both of the shear rate and the time to which it is subjectedto a shearing force. Newtonian fluids are time independent; hence, this discus-sion does not apply to Newtonian fluids. The four major types of time depend-ency are as follows.
(1) Thixotropic. The apparent viscosity decreases with the time of shearingbut the change is reversible; that is, the fluid will revert to its original state(‘rebuild itself’) on standing. Some starch paste gels are in this class.
(2) Shear thinning. The apparent viscosity decreases with time and thechange is irreversible; that is, it stays in the thinner state when the shear stressis removed. This condition is frequently found in food systems. Some gumsolutions and starch pastes fall into this class.
A fluid may exhibit both thixotropic and shear thinning properties, forexample, when the apparent viscosity decreases with time of shearing and partially recovers its original viscosity after resting.
Figure 3.23 shows shear stress–shear rate curves for a thixotropic and anonthixotropic pseudoplastic fluid. Curve A is nonthixotropic; the curve on
92 Physics and Texture
800
600
400
200
100 200 300 400 5000
0
Shea
r st
ress
t (
Pa)
A
B
Shear rate g (s�1)
Figure 3.22 Repeated shearstress–shear rate curves on thesame sample of concentratedyeast extract (T � 25°C). Curve A, first leg ‘virgin’ sample;curves B, ‘destroyed’ sample.(Courtesy of Dr A. L. Halmosand Dr C. Tiu. Reprinted fromJ. Texture Studies 1122, 43, 1981,with permission from Food andNutrition Press Inc.)
Chap-03.qxd 1/12/02 7:08 PM Page 92

the way down retraces the same path as on the way up. Curve B is thixotropic;the curve on the way down lies below the curve on the way up. The areabetween the up and down curve is called a hysteresis loop. Pradipasena andRha (1977) reported that some globular protein solutions showed hysteresis.Davis (1973) showed the presence of hysteresis in lard and shortening. Theresearcher should be warned that some hysteresis loops are artifacts; twoexamples are (a) a true Newtonian fluid can give an apparent thixotropic hys-teresis loop if viscous heating warms the liquid, and (b) inertial forces cancause a hysteresis loop to appear if the experiment is performed too fast or therotor has a large mass.
(3) Rheopectic. The apparent viscosity increases with time of shearing andthe change is reversible; that is, after resting, the product returns to its originalapparent viscosity. It is rare to find this type of behavior in a food system.
(4) Shear thickening. The apparent viscosity increases with time and thechange is irreversible; that is, it stays thick. When egg white or heavy creamare whipped their viscosity increases until they become stiff. This is an exam-ple of shear thickening. However, it is not a good example because the changein viscosity is due to physical changes in the egg protein and the fat globulesof the cream. Vernon Carter and Sherman (1980) reported that aqueous solu-tions of mesquite tree gum exhibited shear thickening when the shear rateexceeded 100 s�1.
Figure 3.24 portrays in graphical form the various types of time-dependentflow. When a fluid is caused to flow at a constant shear rate over a period oftime the apparent viscosity is constant for Newtonian fluids, it increases for
Time Dependency 93
Shea
r st
ress
s
Shear rate g 00
Down
Down
Up
Up
A
B
Figure 3.23 Shear stress–shearrate curves for a nonthixotropicpseudoplastic fluid (A) and a thixotropic pseudoplastic fluid (B).
Chap-03.qxd 1/12/02 7:08 PM Page 93

rheopectic or shear-thickening fluids, and decreases for thixotropic or shear-thinning fluids. On the other hand, when a fluid is caused to flow over a periodof time under a constant shear stress, a plot of shear rate versus time is con-stant for a Newtonian fluid, it increases for a thixotropic fluid (because theproduct is becoming less viscous), and it decreases for a rheopectic or shear-thickening fluid (because the product is becoming more viscous).
A fluid may exhibit time dependency in addition to other viscous properties.For example, a product may be both plastic and thixotropic, or pseudoplasticand rheopectic. The combination of non-Newtonian flow plus time dependencybrings one into very complex systems, many of which cannot be measuredand described well by presently available instrumental methods. Nevertheless,the food technologist is faced with handling these systems and needs to obtainreliable and reproducible measurements, even though there are few guidelines.
Green (1949), who was an associate of Bingham, discusses the unsatisfac-tory state of analysis for some of these complex fluids. He discusses a practicalrheologist, ‘Bill,’ who has viscosity measuring equipment in his laboratoryand has to produce results describing the flow properties of the commoditiesbeing handled in a manufacturing plant, particularly with regard to the needfor quality control purposes. Green writes as follows:
A dozen theoretical rheologists can give a dozen different explanations as to why Bill’s mea-surements produce the kind of curve they do. Not a single explanation will alter Bill’s curves inany visible way. As far as Bill is concerned, the dozen different theoretical explanations mightjust as well not exist. Bill can, if necessary, get along without them. Bill will find it more desirable,however, to convert his curves into numbers like U, s, and M. Such numbers are easy to enter intoreports and are much easier to interpret when making comparisons of different materials. …There are many ways of converting consistency curves into numbers. Which method should hechoose?
The last sentence in the above quotation is the end of a chapter. Green neverattempted to point out the best way for analyzing these complex consistencycurves. The best conclusion that can be drawn about handling substances withcomplex flow properties is to make as complete a shear stress–shear rate studyas possible, using adequate instrumentation and taking into account the possi-bility of time dependency in order to obtain as complete a picture as possibleof the rheological properties of the system. A single-point measurement of
94 Physics and Texture
Rheopectic
Rheopectic
Newtonian Newtonian
Slightlythixotropic
Thixotropic
Stronglythixotropic
App
aren
t vi
scos
ity h
a
Shea
r ra
te g
TimeTimea b
Figure 3.24 Time dependencyfactors in fluid flow: (a) atconstant rate of shear; (b) atconstant shear stress.
Chap-03.qxd 1/12/02 7:08 PM Page 94

viscosity, which is satisfactory for Newtonian fluids, will be far from satisfac-tory for these complex fluids.
Time dependency is an important factor in the quality of some foods. Forexample, Szczesniak and Farkas (1962) found that aqueous solutions of gumsthat exhibited no time dependency had a slimy mouthfeel, whereas gums thatexhibited a high degree of shear thinning or thixotropy had no sliminess (seeFig. 3.25). This finding was confirmed by Stone and Oliver (1966).
Another example is the manner of change of gelatin dessert. When a gela-tin gel is put into the mouth it melts into a mobile fluid. This thinning effect(which is temperature controlled rather than mechanically controlled) is animportant attribute of the textural quality of gelatin desserts. In contrast, dessertgels made from agar do not melt, because the melting point of agar gels isabout 98°C. One has to chew these gels into small lumps for swallowing, andthis behavior gives an entirely different type of mouthfeel and flavor releasethan a gelatin dessert gel.
Weissenberg Effect (Normal Force)
When a rod is rotated in some viscoelastic fluids, the fluid climbs up the rodagainst the force of gravity because the rotational force acting in a horizontalplane produces another force at right angles to that plane; this is called a normalforce. The tendency of a fluid to flow in a direction normal to the direction ofshear stress is known as the Weissenberg effect or normal force (Weissenberg,1949). The effect has been observed with some flour doughs, cake batters, meltedcheeses, honeys, and aged condensed milk (see Fig. 3.26).
Weissenberg Effect (Normal Force) 95
12
10
8
6
4
2
00.5 1 5 10 50 100
App
aren
t vi
scos
ity (
P)
Shear rate (rpm)
PectinL M PectinLocust beanAgarArabicAmylopectinMesquiteGhattiNa alginateCMC
GuarTragacanthCarrageenanOkraFucoidanCactusKarayaCornstarchAmylosePolysaccharide B 1459
Group C
Group B
Group A
Figure 3.25 Effect of shearrate on apparent viscosity of gumsolutions. Group C were classedas very slimy by a sensory panel,group B as somewhat slimy, andgroup A as nonslimy. (Redrawnfrom Szczesniak and Farkas,1962.)
Chap-03.qxd 1/12/02 7:08 PM Page 95

Viscoelasticity
The word ‘viscoelastic’ means that the material simultaneously exhibits someof the elastic properties of an ideal solid and some of the flow properties of anideal liquid. Some authors reserve the word ‘viscoelastic’ for materials thatare more solid-like than liquid-like and use the term ‘elastico-viscous’ formaterials that are more liquid-like than solid-like. A single word ‘viscoelastic’will be used here.
Figure 3.27 shows schematically the differences between an ideal elasticsolid, which is called a Hookean solid after Robert Hooke (1660) who firstdescribed elastic deformation, an ideal liquid which is called Newtonian liquidafter Isaac Newton (1687) who first described the flow of simple liquids, and
96 Physics and Texture
Figure 3.26 The Weissenbergeffect: the rotation of the glassrod causes the aged sweetenedcondensed milk to climb up therod because of the normal forcethat is generated by the rotation.Many doughs also exhibit thisphenomenon.
Chap-03.qxd 1/12/02 7:08 PM Page 96

a viscoelastic material which combines some of the properties of both. Sup-pose a uniform block of each of these three materials has a constant stressapplied for three time periods and then the stress is removed.
(1) Elastic solid (top line). There is an instantaneous deformation when thedeforming force is applied and no further deformation with time. Thereis complete recovery of the original shape when the force is removed.
(2) Newtonian liquid (middle line). The material begins to flow as soon asthe deforming force is applied and it continues to flow as long as theforce is being applied. There is no recovery of shape when the force isremoved.
(3) Viscoelastic solid (bottom line). There is an instantaneous deformationwhen the deforming force is first applied, and then the material continuesto deform so long as the force is pressing against it. When the force isremoved there is some recovery of the original shape (elastic component)but not a full recovery (viscous component).
It can be seen from this figure that the time scale over which the force isapplied can seem to affect the relative proportions of elastic deformation andviscous flow. Over a short period of time (t1) a viscoelastic material willappear to be mostly elastic whereas over a long period of time (t3) it will seemto be mostly viscous. This demonstrates an important principle in testing ofviscoelastic materials: the material will appear to be mostly elastic in nature inan experiment that is performed quickly but in an experiment that is performedslowly it will appear to be more viscous. Since the human testing of foods(squeezing in the hand, chewing with the teeth, manipulating with the tongue)is usually of short duration, many foods that are actually quite viscoelasticwill appear to be elastic or close to elastic in sensory tests.
Dr Marcus Reiner, a prominent founder of the science of rheology pointedout that, given enough time, everything will flow and cited one example from
Viscoelasticity 97
Figure 3.27 Schematicrepresentation of response ofelastic, viscous and viscoelasticbodies to the application andremoval of a stress.
UnstressedStress applied Stress
removed
Elastic
t1�1s t2�50s t3�100st0 t4
Viscous
Viscoelastic
Chap-03.qxd 1/12/02 7:08 PM Page 97

the Old Testament (Reiner, 1964). Soon after the Children of Israel arrived intheir promised land they won a great battle against the Canaanites under theleadership of the prophetess Deborah. After the victory, Deborah sang praisesto God and said: ‘The mountains melted before the Lord’ (Judges 5:5, KingJames translation). Dr Reiner pointed out that the Hebrew word translated as‘melted’ should really be translated as ‘flowed.’ During the observation timeof a human, the mountains appear to be rock solid, but given God’s infiniteobservation time the mountains can be seen to flow. In other words, everythingflows if you observe it for a long enough time. Reiner proposed the followingequation to describe this effect:
where D is the Deborah number, t is the characteristic relaxation time of thematerial, and T is the time over which the deformation is observed. The relax-ation time t for a perfectly Hookean elastic solid is infinity and for a perfectlyNewtonian liquid it is zero (Reiner, 1964). A high Deborah number corre-sponds to solid-like materials and a low Deborah number to liquid-like mate-rials. As stated above, since T is small for most human–food interactions, theDeborah number will be high, and some foods will appear to the more solid-like in sensory tests than a slow-measuring rheometer would indicate.
Viscoelastic behavior can be divided into two general types.
Type 1: Linear viscoelastic in which the rheological properties are depend-ent on time alone, and not on the magnitude or rate of application of thestress. Most foods show linear viscoelasticity up to small strains of a fewpercent. Table 3.2, page 64 lists the range of linear viscoelastic strain forseveral foods.
Type 2: Nonlinear viscoelastic where the mechanical properties are a func-tion of the time the stress is applied, the magnitude of the stress, and oftenthe rate at which the stress is applied. The study of nonlinear viscoelas-ticity is experimentally and theoretically much more difficult than linearviscoelasticity and yet this is the range in which most foods are com-pressed or sheared in the mouth.
Small Amplitude Oscillatory Testing (SAOT)
The viscous and elastic components of viscoelastic fluids can be measured bySAOT. The test material is usually placed between a cone and plate or parallelplates mounted in a controlled stress rheometer and the cone or plate is madeto oscillate about a central point with a sinusoidal angular velocity at lowamplitude while the shear stress is measured. This is a nondestructive testwhen the amplitude is small. For an elastic solid the shear stress will be inphase with the strain but for a Newtonian fluid the shear stress is 90° out of
D �t
T
98 Physics and Texture
Chap-03.qxd 1/12/02 7:08 PM Page 98

phase with the strain. For a viscoelastic fluid the shear stress lags behind thestrain by an angle of difference Ø that lies between 0° and 90° (see Fig. 3.28).The out of phase angle Ø is measured. The experimental shear stress–timecurve can be broken down into two components.
(1) The stress component in phase with the shear strain is defined as thestorage (or elastic) modulus G�(G prime). It is the ratio of the stress inphase with the strain to the strain. G� � s�/g where s� � shear stressin phase and g � strain.
(2) The stress component 90° out of phase with the shear strain is definedas the loss (or viscous) modulus G� (G double prime). It is the ratio ofthe shear stress out of phase with the strain to the strain. G� � s�/gwhere s� � shear stress 90° out of phase.
These functions are related by the equation:
G�/G� � loss factor � tan Ø � loss tangent
It should be emphasized that small amplitude oscillatory testing must usean amplitude that stays within the linear viscoelastic regime.
Small Amplitude Oscillatory Testing (SAOT) 99
Driving strain
Elastic solid
Newtonian fluid
Viscoelastic fluid
00
00
Time
App
lied
stra
inSt
ress
res
pons
eSt
ress
res
pons
eSt
ress
res
pons
e
0˚
90˚
�˚
b
c
d
a Figure 3.28 The principle ofoscillation viscometry. Appliedstrain versus time (a) andresultant stress versus time that is measured in an elastic solid(b), Newtonian liquid (c) andviscoelastic liquid (d). (Reprintedfrom Bourne and Rao, 1990.Page 221 in InstrumentalMethods for Quality Assurance inFoods, eds Fung and Mathews.By courtesy of Marcel DekkerInc.)
Chap-03.qxd 1/12/02 7:08 PM Page 99

Mechanical Models
Mechanical models or analogs have been developed to help give a mental picture of the different patterns of viscoelasticity. Figure 3.29a depicts an elas-tic solid as a spring and Fig. 3.29b a Newtonian fluid as a piston moving in a dashpot of fluid. A spring and a dashpot arranged in series (Fig. 3.29c) iscalled a Maxwell element and when arranged in parallel a Kelvin–Voigt ele-ment (Fig. 3.29d). Many other models using various combinations of springs,dashpots, Maxwell and Kelvin–Voigt models have been proposed for differentfoods. Figure 3.29e shows one example of a spring linked in parallel with sev-eral springs and dashpots in series. Numerical values for different components
100 Physics and Texture
E1
E2 E3 En
hnh3h2
The Hookean elasticelement
The Newtonian viscouselement
The Kelvin–Voigt modelThe Maxwell model
E
E
E
h
h
h
a
c
e
b
d
The generalized Maxwell model
Figure 3.29 Somefundamental elements andmodels in viscoelasticity.(Reprinted from Finney 1973,pages 49, 50 in TextureMeasurements of Food, edsA. Kramer and A. S. Szczesniakwith kind permission of KluwerAcademic Publishers.)
Chap-03.qxd 1/12/02 7:08 PM Page 100

for each model can be derived by suitable analysis of stress–strain curves. A third element known as the St Venant slider is included in some of thesemodels to include the concept of a limiting frictional force. There is no defor-mation when the stress is less than the limiting frictional force, but above thisthreshold it offers no resistance and slides easily. Drake (1971) proposedanother element ‘traction failure’ represented by two parallel surfaces in closeproximity that move apart when the material fractures. The reader is referredto the references at the end of the chapter for more detailed discussion ofmechanical models.
Van Wazer et al. (1963) point out that electrical circuits can be used just aseffectively as mechanical models to represent elastic, viscous, and viscoelasticmaterials. Electrical models have been used much less frequently than mechan-ical models in the rheological literature, probably because most people canvisualize the action of springs and dashpots more readily than electrical circuits.
Fracture
Engineers design structures ranging from a pencil to a miles-long bridge withthe intent that the structure will not fail or fracture under normal conditions ofuse. The failure of engineering materials of construction is almost always anundesirable event because of the resulting economic losses, interruption ofservices or availability of products, and, in some cases because human livesare put in jeopardy.
In contrast, food scientists want to design structures that will fail under thelimited forces available in the hand and mouth. It can be said that engineersare interested in the strength of materials whereas food scientists are interestedin the weakness of materials. Therefore, both engineers and food scientists areinterested in fracturing of materials, the former to design a structure that willnot fracture and the latter to build a structure that will be certain to fracture.
There are several types of fracture.
Type 1. Simple fracture is the separation of a body into two or more piecesin response to an imposed stress. In most cases the body breaks into twoor more pieces but sometimes the fracture may be partial when the frac-ture plane does completely cross the specimen.
Type 2. Brittle fracture in which there is little or no plastic deformationbefore fracture and a low energy absorption up to fracture. Nuts and goodquality potato chips are a good example of brittle fracture.
Type 3. Ductile fracture in which there is substantial plastic deformationwith high energy absorption before fracture. Meat is an example of duc-tile fracture. It must be noted that there is a continuous gradient frombrittle to ductile fracture.
Every fracture process involves three steps: (1) crack initiation; (2) crackpropagation; and (3) final failure.
Fracture 101
Chap-03.qxd 1/12/02 7:08 PM Page 101
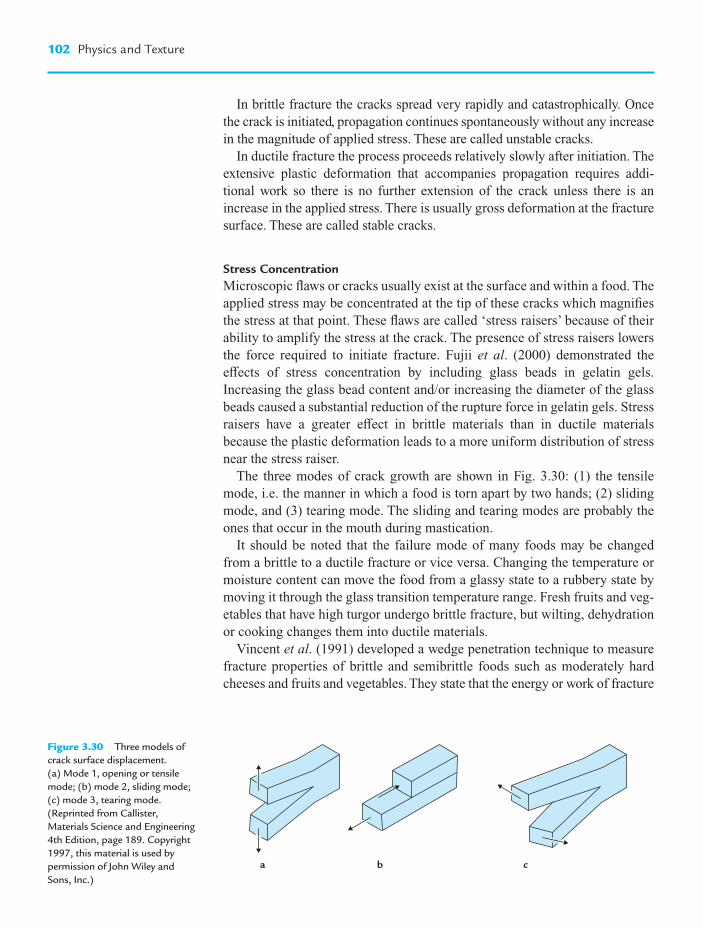
In brittle fracture the cracks spread very rapidly and catastrophically. Oncethe crack is initiated, propagation continues spontaneously without any increasein the magnitude of applied stress. These are called unstable cracks.
In ductile fracture the process proceeds relatively slowly after initiation. Theextensive plastic deformation that accompanies propagation requires addi-tional work so there is no further extension of the crack unless there is anincrease in the applied stress. There is usually gross deformation at the fracturesurface. These are called stable cracks.
Stress ConcentrationMicroscopic flaws or cracks usually exist at the surface and within a food. Theapplied stress may be concentrated at the tip of these cracks which magnifiesthe stress at that point. These flaws are called ‘stress raisers’ because of theirability to amplify the stress at the crack. The presence of stress raisers lowersthe force required to initiate fracture. Fujii et al. (2000) demonstrated theeffects of stress concentration by including glass beads in gelatin gels.Increasing the glass bead content and/or increasing the diameter of the glassbeads caused a substantial reduction of the rupture force in gelatin gels. Stressraisers have a greater effect in brittle materials than in ductile materialsbecause the plastic deformation leads to a more uniform distribution of stressnear the stress raiser.
The three modes of crack growth are shown in Fig. 3.30: (1) the tensilemode, i.e. the manner in which a food is torn apart by two hands; (2) slidingmode, and (3) tearing mode. The sliding and tearing modes are probably theones that occur in the mouth during mastication.
It should be noted that the failure mode of many foods may be changedfrom a brittle to a ductile fracture or vice versa. Changing the temperature ormoisture content can move the food from a glassy state to a rubbery state bymoving it through the glass transition temperature range. Fresh fruits and veg-etables that have high turgor undergo brittle fracture, but wilting, dehydrationor cooking changes them into ductile materials.
Vincent et al. (1991) developed a wedge penetration technique to measurefracture properties of brittle and semibrittle foods such as moderately hardcheeses and fruits and vegetables. They state that the energy or work of fracture
102 Physics and Texture
a b c
Figure 3.30 Three models ofcrack surface displacement. (a) Mode 1, opening or tensilemode; (b) mode 2, sliding mode;(c) mode 3, tearing mode. (Reprinted from Callister,Materials Science and Engineering4th Edition, page 189. Copyright1997, this material is used bypermission of John Wiley andSons, Inc.)
Chap-03.qxd 1/12/02 7:08 PM Page 102

R can be calculated from the following equation:
R � 0.75 (Eu2H3)/a4(1 � 0.64H/a)4
where E is Young’s modulus of the material, u is the distance between the twoears of the sample where the wedge is forcing them apart, H is the half-widthof the sample, and a is the length of one of the ears (see Fig. 3.31). Luytenet al. (1992) provide a useful review of fracture phenomena in food. They conclude that tension and bending tests give more information than compres-sion experiments even though they are more difficult to perform.
The processes of crushing and grinding rely on fracture to reduce particlesize. Rittinger’s law states that the work required to grind a product is propor-tional to the new surface area formed.
Guritno and Hague (1994) reviewed theories of size reduction and con-cluded that they all are special cases of the general mathematical statement.
where dE is the energy required to produce a change, dx is the size of a unitmass of material, X is the characteristic dimension, and K and n are constantsdependent on the grinding machine and the material. This relationship wasdeveloped for grinding minerals which are nonbiological materials. It is notknown whether it is applicable to food materials.
Isotropy and Anisotropy
The words ‘isotropy’ (noun) or ‘isotropic’ (adjective) mean that the materialdisplays the same properties with the same values when measured along axesin different directions.
The words ‘anisotropy’ (noun) or ‘anisotropic’ (adjective) mean that thematerial displays different properties and/or different values of propertieswhen measured along axes in different directions.
Some foods are isotropic whereas other foods are anisotropic. For isotropicfoods it does not matter in which direction it is tested, but for anisotropic foodsit is essential always to test the food from the same direction.
For example, Gonzalez et al. (2000) found that the maximum force requiredto cut cooked lasagna with a standard TA-47 blade mounted in a TA.XT2Texture Analyzer was higher when the blade was oriented perpendicular to thedirection of pasta extrusion during its manufacture than when it was orientedparallel to the direction of extrusion. Therefore, they always set the blade tocut perpendicular to the extrusion direction to ensure consistent results.Abbott and Lu (1996) found that apple flesh was anisotropic and that mechan-ical properties measured in compression were significantly influenced byspecimen orientation, latitude between the stem and calyx, and depth fromskin to core. Khan and Vincent (1993) showed that cylinders of apple flesh
d d
E Kx
X n� �
Isotropy and Anisotropy 103
Figure 3.31 The F-wedge test,showing the structure of thewedge and the deformation of,and the transmission of strainenergy through, the test piece.(From Vincent et al., 1991.Reprinted from J. Texture Studies2222, page 47, 1991. Copyright byFood and Nutrition Press Inc.)
Displacement
Strainenergy
Propagatingthe crack
U
2H
a
Chap-03.qxd 1/12/02 7:08 PM Page 103

compressed in a radial direction fracture by collapse of a single layer of cellsat right angles to the force whereas the same size cylinders compressed in atangential direction fail in shear. The apple compressed in the radial directionshows a higher modulus of deformability and lower strain to fracture thanwhen compressed in a tangential direction. Khan and Vincent also showed thatpotato flesh is isotropic and the compressive properties are the same no matterin which direction it is tested.
Units of Measurement
Scientists and engineers have established a common worldwide standard systemof units to replace the wide range of measuring units that have been used overthe years. This system, called the Système International d’Unités (Interna-tional System of Units) with the abbreviation SI, was adopted at an interna-tional conference in 1960. The SI is basically the metric system extended togive a uniform and rational set of units for all types of measurements. Of particular interest to texture technologists is that SI uses the newton as thestandard unit of force replacing units of mass (e.g. the pound or kilogram) inexpressing force. It is incorrect to use mass to express units of force becauseforce has the dimensions mass � length � (time)�2. Changing to SI eliminatesthe disparity of using mass as a measure of force, and it also eliminates usingthe gravitational constant g to convert mass into force units. One newton forceequals the force generated by gravity on 101.9716 g.
The SI system includes three classes of units: (1) base units, (2) supple-mentary units, and (3) derived units.
104 Physics and Texture
Table 3.13 SI Base Units
Quantity Name Symbol Definition
Length meter m The meter is the length of the path travelled by light in a vacuum during a time interval of 1/299,792,458 of a second.
Mass kilogram kg The mass equal to the mass of the international prototype of the kilogram.Time second s The duration of 9,192,631,770 periods of the radiation corresponding to
the transition between the two hyperfine levels of the ground state of the cesium-133 atom.
Thermodynamic kelvin K The fraction of 1/273.16 of the thermodynamic temperature of the tripletemperature point of water.
Amount of mole mol The amount of substance of a system that contains as many elementary substance entities as there are atoms in 0.012 kg of carbon-12.
Electric current ampere A That constant electric current which, if maintained in two straight parallel conductors of infinite length, of negligible circular cross-section, and placed 1 m apart in vacuum, would produce between these conductors a force equal to 2 � 10�7 N m�1 of length.
Luminous candela cd The candela is the luminous intensity in a given direction of a source that intensity emits monochromatic radiation of frequency 540 � 1012 hertz and that
has a radiant intensity in that direction of 1/683 watt per steradian.
Chap-03.qxd 1/12/02 7:08 PM Page 104
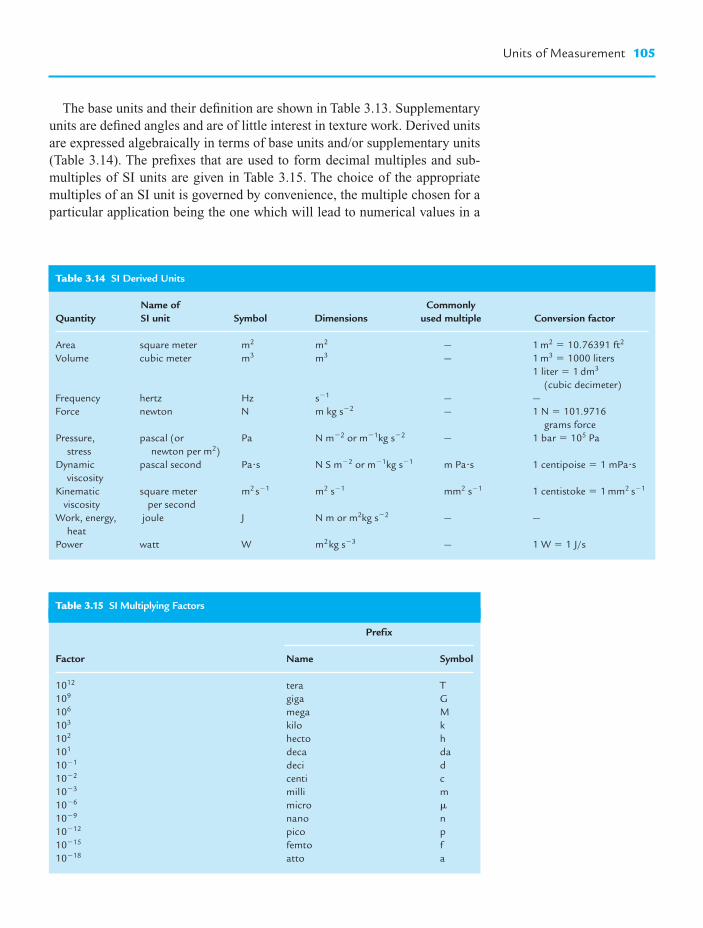
The base units and their definition are shown in Table 3.13. Supplementaryunits are defined angles and are of little interest in texture work. Derived unitsare expressed algebraically in terms of base units and/or supplementary units(Table 3.14). The prefixes that are used to form decimal multiples and sub-multiples of SI units are given in Table 3.15. The choice of the appropriatemultiples of an SI unit is governed by convenience, the multiple chosen for aparticular application being the one which will lead to numerical values in a
Units of Measurement 105
Table 3.14 SI Derived Units
Name of Commonly Quantity SI unit Symbol Dimensions used multiple Conversion factor
Area square meter m2 m2 — 1 m2 � 10.76391 ft2
Volume cubic meter m3 m3 — 1 m3 � 1000 liters1 liter � 1 dm3
(cubic decimeter)Frequency hertz Hz s�1 — —Force newton N m kg s�2 — 1 N � 101.9716
grams forcePressure, pascal (or Pa N m�2 or m�1kg s�2 — 1 bar � 105 Pa
stress newton per m2)Dynamic pascal second Pa�s N S m�2 or m�1kg s�1 m Pa�s 1 centipoise � 1 mPa�s
viscosityKinematic square meter m2 s�1 m2 s�1 mm2 s�1 1 centistoke � 1 mm2 s�1
viscosity per secondWork, energy, joule J N m or m2kg s�2 — —
heatPower watt W m2kg s�3 — 1 W � 1 J/s
Table 3.15 SI Multiplying Factors
Prefix
Factor Name Symbol
1012 tera T109 giga G106 mega M103 kilo k102 hecto h101 deca da10�1 deci d10�2 centi c10�3 milli m10�6 micro �
10�9 nano n10�12 pico p10�15 femto f10�18 atto a
Chap-03.qxd 1/12/02 7:08 PM Page 105

practical range. The multiple is usually chosen so that the numerical value willbe between 0.1 and 1000.
Working in SI units renders obsolete many of the old units of measurement.Some of these are listed in Table 3.16. Since these units have been in use for many years the researcher will often find them when reading the literature.These obsolete units should no longer be used in present work. However, two obsolete units are still being used by some researchers with somejustification: (1) 1.000 centipoise viscosity equals 1.000 millipascal second;(2) 1.000 centistoke kinematic viscosity equals 1.000 square millimeter recip-rocal second.
Suggestions for Further Reading
Barnes, H. A., J. F. Hutton, and K. Walters. 1989. “Introduction to Rheology.” ElsevierScience Publishers, Amsterdam.
Ferry, J. D. 1980. “Viscoelastic Properties of Polymers.” John Wiley, Chichester.Lewis, M. J. 1996. “Physical Properties of Foods and Food Processing Systems.”
Woodhead Publishing, Cambridge.Mohsenin, N. N. 1986. “Physical Properties of Plant and Animal Materials”, 2nd
edition. Gordon and Breach, New York.Peleg, M. and E. B. Bagley, (eds.) 1983. “Physical Properties of Foods.” Avi, Westport.Prentice, J. H. 1984. “Measurements in the Rheology of Foodstuffs.” Elsevier Applied
Science, London.Rao, M. A. and S. S. H. Rizvi. 1986. “Engineering Properties of Foods.” Marcel
Dekker, New York.Rao, M. A. and J. F. Steffe, (eds.) 1992. “Viscoelastic Properties of Foods.” Elsevier
Applied Science, London.Sherman, P. 1970. “Industrial Rheology.” Academic Press, London.Steffe, J. F. 1992. “Rheological Methods in Food Process Engineering.” Freeman
Press, East Lansing, Michigan.Van Wazer, J. R., J. W. Lyons, K. Y. Kim, and R. E. Colwell. 1963. “Viscosity and Flow
Measurement. A Laboratory Handbook of Rheology.” Wiley (Interscience), New York.
106 Physics and Texture
Table 3.16 Units Rendered Obsolete by SI
Name Symbol Conversion to SI units
erg erg 1 erg � 10�7 Jdyne dyn 1 dyn � 10�5 Npoise P 1 P � 0.1 Pa�s
1 centipoise � 1 mPa�sstoke St 1 St � 10�4 m2 s�1
1 centipoise � 1 mm2 s�1
kilogram force kgf 1 kgf � 9.80665 Npounds force lbf 1 lbf � 4.4482 Ncalorie cal 1 cal � 4.1868 J
Chap-03.qxd 1/12/02 7:08 PM Page 106

Principles of ObjectiveTexture Measurement
Introduction
There is such a wide range in types of foods and the types of textural and rhe-ological properties that they exhibit, and such a wide variety of methods usedto measure these properties, that it becomes necessary to attempt to classifythem into groups in order to understand the system. Several classification systems have been propounded.
It is possible to classify texture measurements according to the commoditythat is being tested; for example, tests that are used for cereals, meat, fish, poul-try, vegetables, fruit, dairy products, fats, confectionery, beverages, legumes,emulsions, suspensions and oilseeds, and miscellaneous foods.
Matz (1962) classified foods on the basis of their textural properties intoliquids, gels, fibrous foods, agglomerates of turgid cells, unctuous foods, friablestructures, glassy foods, agglomerates of gas-filled vesicles, and combinationsof these. Sone (1972) classified foods on the basis of their textural propertiesas liquid foods, gel-like foods, fibriform foods, cellular-form foods, edibleoils and fats, and powdered foods.
The classification of texture measurements on the basis of commodity orthe type of textural properties is useful but what is probably a better type ofclassification is based on the type of test that is used, because many tests areapplicable to more than one type of food. When food is placed in the mouth,the structure is destroyed by the act of mastication until it is ready to be swal-lowed. The basic process of mastication occurs regardless of what kind offood is in the mouth. Therefore, it seems logical to concentrate on the type oftest rather than the nature of the food.
Drake (1961) developed a classification system based on the geometry ofthe apparatus as follows: (1) rectilinear motion (parallel, divergent, conver-gent); (2) circular motion (rotation, torsion); (3) axially symmetric motion
C H A P T E R
4
Chap-04.qxd 1/12/02 7:28 PM Page 107

(unlimited, limited); (4) defined other motions (bending, transversal); and (5)undefined motions (mechanical treatment, muscular treatment).
Table 4.1 lists the type of tests that are used for measuring food texture.These may be divided into objective tests that are performed by instrumentsand sensory tests that are performed by people. Objective tests can be dividedinto direct tests that measure real textural properties of materials, and indirecttests that measure physical properties that correlate well with one or more tex-tural properties. Sensory tests can be classified into oral (those tests that areperformed in the mouth) and nonoral (in which some part of the body otherthan the mouth is used to measure the textural properties). Sensory tests willbe discussed in Chapter 7.
Fundamental Tests
These tests measure well-defined rheological properties. Before attempting touse this class of test on foods, it should be borne in mind that they were devel-oped by scientists and engineers interested in the theory and practice of mate-rials of construction, and they may not be very useful in measuring what issensed in the mouth when food is masticated. The outlook of the materials scientist and the food technologist are opposite. One wants to measure thestrength of materials in order to design a structure that will withstand theforces applied to it under normal use without breaking. The other wants tomeasure the strength of food, and frequently weakens its structure deliberatelyso that it will break down into a fine state suitable for swallowing when sub-jected to the limited crushing forces of the teeth, imparting pleasurable sensa-tions during the process of comminution.
For example, intact cereal grains are so hard that most people find itunpleasant to chew them. Much of the cereal processing is designed to converta very hard cereal grain into another form that is easier to chew, e.g. wheatinto bread and maize into tortillas (see Table 1.5, page 10).
When a test piece is broken into two pieces materials scientists normallystop the test because they have all the information they need about the mate-rial. In contrast, food technologists consider that a test has barely begun whena food is broken into two pieces, and they continue the test in order to break it
108 Principles of Objective Texture Measurement
Table 4.1 Types of Tests for Measuring Food Texture
Objective Sensory
Direct Indirect Oral Nonoral
Fundamental Optical Mechanical FingersEmpirical Chemical Geometrical HandImitative Acoustical Chemical Eyes
Other Other
Chap-04.qxd 1/12/02 7:28 PM Page 108

down into progressively smaller pieces. Hence, food texture measurementmight be considered more as a study of the weakness of materials rather thanstrength of materials.
Fundamental tests generally assume (1) small strains (1–3% maximum); (2) the material is continuous, isotropic (exhibiting the same physical proper-ties in every direction), and homogeneous; and (3) the test piece is of uniformand regular shape. Most textural tests made on foods fail to comply with oneor more of the three assumptions listed above.
Fundamental tests are generally slow to perform, do not correlate as wellwith sensory evaulation as do empirical tests, and use expensive equipment.They are not used to any great extent in the food industry but they do have aplace in some research laboratories. Szczesniak (1963b) aptly described theusefulness of fundamental tests as follows:
Since most foodstuffs do not have simple rheological properties that are independent of stressand strain conditions, and since rheological properties once measured and defined are not mean-ingful in a practical sense unless related to functional properties, fundamental tests serve thegreatest value to the food technologist by providing bases for the development of more mean-ingful empirical tests.
Table 4.2 shows the results obtained with apples and peaches by a funda-mental test and an empirical test as compared with sensory evaluation offirmness. The stiffness coefficient, which is essentially an index of Young’smodulus of elasticity and is a fundamental test (see page 68), gives consistentlylower correlations with sensory measurements than does the Magness–Taylortest, which is an empirical type of measurement. In view of the fact that theMagness–Taylor pressure tester costs about $100 and one test can be per-formed in about 30 s whereas the acoustic spectrometer that is used to measurethe stiffness coefficient costs over $30,000 and requires about 15 min to make atest, it can be seen why the food industry generally uses empirical tests.
Introduction 109
Table 4.2 Correlation Coefficient between Sensory and Instrumental Firmness Measurements
Fundamentalstiffness coefficienta Empirical
(f 2m) Magness–Taylorb
Red delicious applesOctober 1968 0.84 0.92March 1969 Not significant 0.71October 1969 0.68 0.89March 1970 0.44 0.86
Elberta peaches 0.87c 0.957
Source: Data from Finney (1971a) and Finney and Abbott (1972).aSonic resonance test, a fundamental test.bPuncture test, an empirical test.cHighest value from 22 experiments.
Chap-04.qxd 1/12/02 7:28 PM Page 109

Muller (1969b) surveyed the types of food texture measurements that areused in the United Kingdom and concluded that of the rheological tests used,‘it is striking that with a few exceptions the methods employed are empirical.This might support the jest that theoretically sound instruments do not work inpractice and those that are theoretically unsound do.’
Empirical Tests
These tests measure parameters that are poorly defined, but from practicalexperience are found to be related to textural quality. This is the most widelyused class of instruments in the food industry. The tests are usually easy toperform, rapid, and frequently use inexpensive equipment. Problems with thistype of test are the poor definition of what is being measured, the arbitrarinessof the test, frequently no absolute standard is available, and the tests are usu-ally only effective with a limited number of commodities. Since empiricaltests are frequently successful in measuring textural properties of foods andare the most widely used in the food industry, this book will deal with themextensively. It is the author’s opinion that these tests should be studied in orderto understand the reasons for their successes and the principles on which theyoperate in order to find how to make them more effective and to make themscientifically more rigorous.
110 Principles of Objective Texture Measurement
Empirical
Ideal
Fundamental Imitative
Figure 4.1 Schematicrepresentation of the idealtexture measuring apparatus andits derivation from empirical,fundamental, and imitativeinstruments. (From Bourne,1975b; reprinted with permissionfrom D. Reidel Publ. Co.)
Chap-04.qxd 1/12/02 7:28 PM Page 110

Imitative Tests
These tests imitate the conditions to which the food material is subjected inpractice. This class may be considered as a subtype of empirical test because thetests are not fundamental tests. Examples of this kind of test are the Farinographand other dough-testing apparatus that imitate the handling and working ofbread dough, the Bostwick Consistometer and Adams Consistometer that measure the flow of semifluid foods across the plate, and butter spreaders.
Figure 4.1 shows schematically the relationships among empirical, funda-mental, and imitative tests, and Table 4.3 lists the advantages and disadvantagesof each type. The ideal texture measuring apparatus should combine the bestfeatures of the fundamental, empirical, and imitative methods and eliminate theundesirable features of each of these. At the present time there is no ideal texturemeasuring equipment or system. Empirical methods are used almost entirely.The future direction of the research should be to move from the empirical
Introduction 111
Table 4.3 Comparison of Different Systems of Objective Texture Measurement of Food
System Advantages Disadvantages
Empirical Simple to perform No fundamental understandingof the test
Rapid Incomplete specification of texture
Suitable for routine quality control Arbitrary procedureGood correlation with sensory Cannot convert data to another
methods systemLarge samples give averaging effect Usually ‘one point’
measurement Calibration difficult
Imitative Closely duplicates mastication or Unknown physical equivalent other sensory methods measurement
Good correlation with sensory Arbitrary proceduremethods
Complete texture measurement Restricted to ‘bite-size’ unitsFundamental Know exactly what is measured Poor correlation with sensory
methodsGood calibration Incomplete specification of
texture Slow
Ideal Simple to perform NoneRapidSuitable for routine workGood correlation with sensoryClosely duplicates masticationComplete texture measurementGood calibrationKnow exactly what is measuredCan use large or small size samples
Source: Adapted from Bourne, 1975c; reprinted with permission of D. Reidel Publ. Co.
Chap-04.qxd 1/12/02 7:28 PM Page 111

into the ideal by including more of the fundamental and imitative aspects inempirical tests. The ideal texture measuring technique will probably be somecombination of the present empirical, fundamental, and imitative methods.
Another method of classification of food texture instruments is on the basisof the variable or variables that are measured in the test. Table 4.4 gives sucha classification and is the system that will be used throughout this book to dis-cuss and classify the principles of objective measurements of food texture.The system classifies according to the principle of the test, not according tothe kind of food. It rests on the assumption that since all foods are ground intoa fine state during mastication, there must be many common elements in theirtextural properties that are not restricted to any one commodity group. Theprinciples of the tests will be discussed in this chapter. Chapter 5 discussescommercially available instruments and their operation and Appendix I liststhe names and addresses of the suppliers of the most frequently used instru-ments for food texture and viscosity.
112 Principles of Objective Texture Measurement
Table 4.4 Objective Methods for Measuring Food Texture
Measured DimensionalMethod variable units Examples
1. Force Force (F ) mlt�2
a. Puncture F mlt�2 Magness–Taylor, Effi-Gib. Extrusion F mlt�2 Shear press,
Tenderometerc. Cutting–Shear F mlt�2 Warner–Bratzler Sheard. Crushing F mlt�2 —e. Tensile F mlt�2 —f. Torque F mlt�2 Rotary Viscometersg. Snapping F mlt�2 Brabender Struct-
o-Graphh. Deformation F mlt�2
2. Distancea. Length l Penetrometers,
Deformationb. Area l2 Grawemeyer
Consistometerc. Volume l3 Bread volume, Juice
volume3. Time Time (T ) t Ostwald Viscometer4. Energy Work (F � D) ml2t�2 —5. Ratio F or D or T Dimensionless Specific gravity
measured twice6. Multiple F and D and T mlt�2, l, t Instron, TA.XT27. Multiple variable Anything Unclear Durometer8. Chemical analysis Concentration Dimensionless (%) Alcohol insoluble solids9. Miscellaneous Anything Anything Optical density, crushing
sounds
Source: Adapted from Bourne (1966a); reprinted from J. Food Sci. 31, 1114, 1966. Copyright byInstitute of Food Technologists.
Chap-04.qxd 1/12/02 7:28 PM Page 112

Force Measuring Instruments
Force measuring instruments are the most common of the texture measuringinstruments. Force has the dimensions mass � length � time�2. The standardunit of force is the newton (N). Because of their multiplicity, this heading is broken into the subclassifications (a) puncture, (b) compression–extrusion, (c) cutting–shear, (d) compression, (e) tensile, (f) torsion, (g) bending andsnapping, and (h) deformation.
Puncture Test
The puncture test measures the force required to push a punch or probe into afood. The test is characterized by (a) a force measuring instrument, (b) pene-tration of the probe into the food causing irreversible crushing or flowing ofthe food, and (c) the depth of penetration is usually held constant.
Puncture testers embody one of the simplest types of texture measuringinstruments and one of the most widely used. The first food puncture tester wasprobably the one developed by Lipowitz (1861), who placed a flat disk 1 or 2 in.(2.5 to 5 cm) in diam on the surface of a gelatin jelly in a beaker (Fig. 4.2). Theflat disk was connected to a funnel by means of a vertical iron rod, and lead shotwas slowly poured into the funnel until there was just sufficient weight to makethe disk penetrate into the jelly. The total weight of the shot, funnel, rod, anddisk was used as a measure of jelly consistency. This early test, although prim-itive, contains the essential elements of the puncture test: namely, a punch thatpenetrates into the food, application of an increasing force (lead shot), andmeasurement of the yield point force (by scales not shown in figure). Thisapparatus evolved into the well-known Bloom Gelometer.
The second food puncture tester was probably the one developed by Carpi(1884), who measured the weight required to force a 2-mm-diam iron rod 1-cmdeep into hardened oils. Brulle (1893) used a similar principle for measuringthe hardness of butter, and Sohn (1893) spelled out the procedure necessary toobtain reproducible results with the Brulle instrument. This developed into theVan Doorn butter tester. The first puncture tester for horticultural products wasdeveloped by Professor Morris in the state of Washington (Morris, 1925). Thisevolved into the well-known Magness–Taylor, Chatillon, and EFFI-GI fruitpressure testers. Tressler et al. (1932) performed a puncture test on meat,which evolved into the Armour Tenderometer (Hansen, 1971, 1972).
Puncture testing instruments are all maximum-force instruments. Theymay be classed into single-probe instruments, such as the Magness–Taylor,EFFI-GI, Chatillon, and the Bloom Gelometer, and the multiple-probe instru-ments such as the Armour Tenderometer, the Christel Texture Meter, and theMaturometer.
Puncture testing instruments might also be classified by the manner inwhich the force is applied. A constant rate of application of force is used for
Force Measuring Instruments 113
Figure 4.2 The Lipowitz JellyTester. (From Lipowitz, 1861.)
Chap-04.qxd 1/12/02 7:28 PM Page 113

some of these instruments (e.g., Magness–Taylor and other fruit pressuretesters, the Armour Tenderometer, and the Bloom Gelometer). Motorized test-ing instruments use a constant rate of travel of the probe, including universaltesting machines such as the Instron and TA.XT2 Texture Analyzer.
Theory of the Puncture TestWhen a punch is mounted in an instrument that automatically draws out aforce–distance or force–time curve (such as the Instron or TA.XT2), five basictypes of curves are obtained, as shown schematically in Fig. 4.3. In types A, B,and C there is an initial rapid rise in force over a short distance of movementas the pressure tip moves onto the commodity. During this stage the commod-ity is deforming under the load; there is no puncturing of the tissues. Thisstage ends abruptly when the punch begins to penetrate into the food, whichevent is represented by the sudden change in slope called the yield point, or sometimes ‘bio-yield point.’ The initial deformation stage is not of greatconcern in puncture testing.
The yield point marks the instant when the punch begins to penetrate intothe food, causing irreversible crushing or flow of the underlying tissues and isthe point of greatest interest in puncture testing. Mohsenin et al. (1963)showed that this is the point where crushing and bruising begins on fruits suchas apples. Considerable work has been done on the implications of the yieldpoint and this will be discussed below.
The third phase of the puncture test, namely, the direction of the forcechange after the yield point and during penetration of the punch into the food,
114 Principles of Objective Texture Measurement
Distance
Forc
e
A
0 0 0 0 0
B C D E
Figure 4.3 Schematicrepresentation of the fivedifferent types of force–distancecurves that are obtained inpuncture tests. (From Bourne,1979b; copyright Academic PressInc. (London) Ltd, withpermission.)
Chap-04.qxd 1/12/02 7:28 PM Page 114

separates the puncture curves into three basic types: A, the force continues toincrease after the yield point; B, the force is approximately constant after theyield point; C, the force decreases after the yield point. There is a continuouschange in slope, from positive slope in type A curves to approximately zeroslope in type B curves to negative slope in type C curves. Type A curves mergeinto type B curves, depending on the steepness of the slope of the force–distance curve after the yield point, and, likewise, type B curves merge intotype C curves. There are occasions when one needs to use subjective criteriato decide whether a curve is type A or B, or type B or C. The sensory and phys-ical meaning of the difference between type A, B, and C curves is presentlynot well understood. Friction of the food along the sides of the punch accountsfor a slightly increasing positive slope in a limited number of cases (for exam-ple, see Thompson et al., 1992), but there are cases (e.g., freshly harvestedapples) where friction cannot account for the increase in force after the yieldpoint has been passed.
A fourth type of curve, shown in curve D, is obtained on some starch pastesand whipped toppings and foams. It is essentially a type A curve except thatthe yield point is not sharply delineated by an abrupt change in slope; ratherthere is a gradual change in slope. The intersection formed by extrapolatingthe two straight-line portions of type D curves is usually a precise and repro-ducible point that can be used as a yield point figure; hence, a type D curvemay be considered as a special case of a type A curve.
The type E curve is found with some starch pastes. This type of commodityshows no yield point, behaves essentially as a viscous liquid, and is unsuitedto the puncture test because no meaningful results can be extracted from atype E puncture test curve at the present time.
Morrow and Mohsenin (1966) showed that the theoretical stress distri-bution under a rigid die acting against a semi-infinite elastic body follows theBoussinesq equation:
(4.1)
where P is the pressure at any point under the punch, F is the total forceapplied to punch, a is the radius of punch, and r is the distance from center ofpunch to stressed area.
According to this equation the stress in the food is highest at the perimeterof the punch and lowest at the center of the punch. This is demonstrated graph-ically in Fig. 4.4. This is a theoretical stress distribution and there are probablysubstantial deviations from this equation in practical situations. This equationonly applies before the yield point is reached; that is, during the deformationstage. The Boussinesq equation does not apply during or after the yield point.The point of major interest in this equation is that the distribution of the stressunder the punch is uneven with the highest stresses at the perimeter.
Using the theory of contact stresses between two bodies pressing againsteach other Yang and Mohsenin (1974) developed an equation for the initial
P F a a r� ��2 2 2 1 2p ( ) /
Force Measuring Instruments 115
Chap-04.qxd 1/12/02 7:28 PM Page 115

slope in the puncture of Rome variety apples as follows:
(4.2)
where F is the force; D, the deformation at axis of symmetry; R, the radius ofcurvature of punch; h1, a complex function; a, the radius of surface of contact;and j, a value between 0 and 1 (put at 0.7 by authors).
F DRh a a R a R
a R a R a R
a R a R
a R a R
a R a R
�� �
�� � � � �
� �
� � � �
� � � �
( ) ( ) ( )( )
( ) ( ) ( )
( ) ( ( )
ln( ) ( )
( )
[
]
/
/
2 3 1
5 1 14 1 9 1
1 2 3
1 2 1
1
12 2 2 2 1 2
2 2 2 2 2 3 2 2 4
2 2 1 2 2 2 2
12
2 2 2 2
34
2 2 2 12
4 4 54
p j� � �
� � �� �
� �
� �
116 Principles of Objective Texture Measurement
r a
a
F
Punch
Semi-infiniteelastic body
Pressure
Surface pressure P at Point A
A
P �F
2pa a2�r2
Figure 4.4 Theoretical stressdistribution in a semi-infiniteelastic body compressed under arigid plunger. P, surface pressureat A; F, total force; a, radius ofpunch; r, distance to A.(Redrawn from Morrow andMohsenin, 1966; copyrightAcademic Press Inc. (London)Ltd, with permission.)
Chap-04.qxd 1/12/02 7:28 PM Page 116

Bourne (1966b) has shown that the yield-point force is proportional to boththe area and perimeter of the punch, and to two different textural properties ofthe food being tested. Figure 4.5 shows schematically what happens at thepoint of penetration of the punch into the food. There is compression of thefood under the punch which is proportional to the area of the punch, andshearing around the edge of the punch which is proportional to the perimeter.This relationship can be expressed in the form of the equation
(4.3)
where F is the force on the punch (in newtons but sometimes it is measured in kg or lb); Kc, the compression coefficient of commodity (N mm�2); Ks, theshear coefficient of commodity (N mm�1); A, the area of the punch (mm2); P, the perimeter of the punch (mm); and C, a constant (N).
The validity of the above equation was proved by means of two sets of flat-faced rectangular-shaped punches: one set had constant perimeter with areavarying from 0.25 to 1.00 cm2 and the second set had constant area withperimeter varying from 4.0 to 8.5 cm. Two circular punches were included:one with a cross-sectional area of 1.00 cm2 and the other with a perimeter of4.0 cm. These punches are shown in Fig. 4.6.
Each of these punches was pressed into foamed polystyrene board and theyield points were measured by means of an Instron machine. Figure 4.7,which plots the mean puncture force against punch area for the constantperimeter punches, shows a rectilinear relationship between puncture forceand punch area. From the equation it follows that the slope of this line givesthe numerical value of the compression coefficient Kc and the intercept on they axis gives the value (KsP � C).
Figure 4.8 shows that a plot of puncture force against punch perimeter isrectilinear provided the area is kept constant. From the equation it follows thatthe slope of this line gives the numerical value of the shear coefficient (Ks) andthe intercept on the y axis gives the value (KcA � C). Since the values of Ks
F K A K P C� � �c s
Force Measuring Instruments 117
Compression� Area
F � Kc A � Ks P � C
Shear� Perimeter
Figure 4.5 Schematicrepresentation of a puncture test.(Reprinted from J. Food Sci. 3311,284, 1966; copyright by Instituteof Food Technologists.)
Chap-04.qxd 1/12/02 7:28 PM Page 117

118 Principles of Objective Texture Measurement
Figure 4.6 Set of rectangular-faced punches used to establisharea- and perimeter-dependenceof puncture force. The device inthe lower right-hand corner holdsthe various punches. (Reprintedfrom J. Food Sci. 3311, 285, 1966;copyright by Institute of FoodTechnologists.)
Intercept � (KsP�C)
Slope � Kc
0
0
2
4
6
8
0.25 0.50 0.75 1.00 1.25
F � Kc A � (Ks P � C)
Constant perimeter
Punch area (cm2)
Punc
ture
for
ce (
kg)
Figure 4.7 Puncture forceversus punch area with constantperimeter on polystyrene boardusing the rectangular-facedpunches shown in Fig. 4.6.(Reprinted from J. Food Sci. 3311,286, 1966; copyright by Instituteof Food Technologists.)
Chap-04.qxd 1/12/02 7:28 PM Page 118
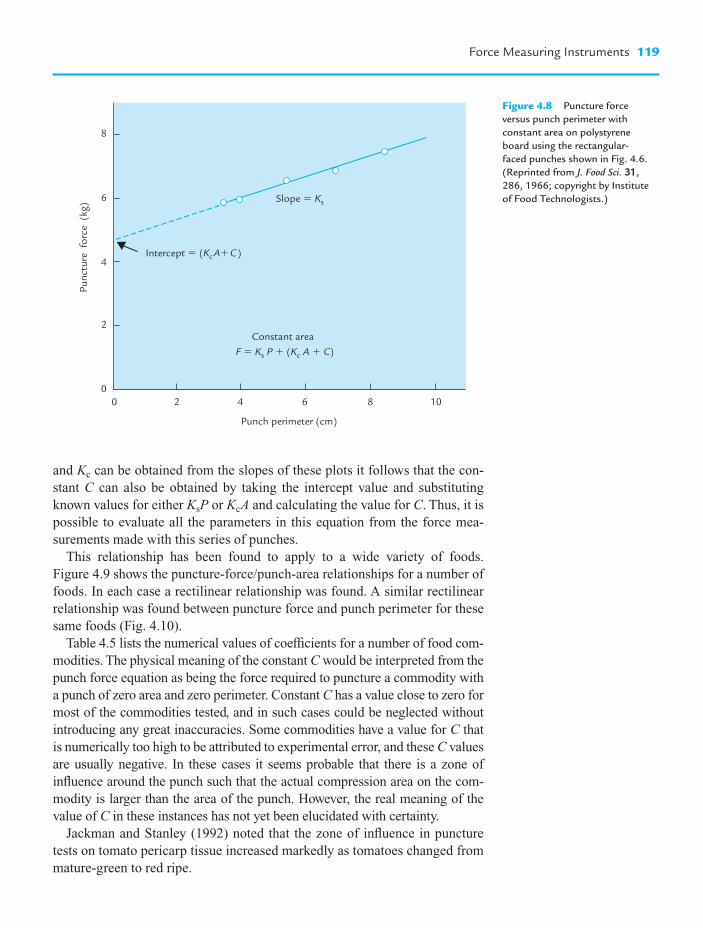
and Kc can be obtained from the slopes of these plots it follows that the con-stant C can also be obtained by taking the intercept value and substitutingknown values for either KsP or KcA and calculating the value for C. Thus, it ispossible to evaluate all the parameters in this equation from the force mea-surements made with this series of punches.
This relationship has been found to apply to a wide variety of foods.Figure 4.9 shows the puncture-force/punch-area relationships for a number offoods. In each case a rectilinear relationship was found. A similar rectilinearrelationship was found between puncture force and punch perimeter for thesesame foods (Fig. 4.10).
Table 4.5 lists the numerical values of coefficients for a number of food com-modities. The physical meaning of the constant C would be interpreted from thepunch force equation as being the force required to puncture a commodity witha punch of zero area and zero perimeter. Constant C has a value close to zero formost of the commodities tested, and in such cases could be neglected withoutintroducing any great inaccuracies. Some commodities have a value for C thatis numerically too high to be attributed to experimental error, and these C valuesare usually negative. In these cases it seems probable that there is a zone ofinfluence around the punch such that the actual compression area on the com-modity is larger than the area of the punch. However, the real meaning of thevalue of C in these instances has not yet been elucidated with certainty.
Jackman and Stanley (1992) noted that the zone of influence in puncturetests on tomato pericarp tissue increased markedly as tomatoes changed frommature-green to red ripe.
Force Measuring Instruments 119
00
2
4
6
8
2 4 6 8 10
Constant area
Punch perimeter (cm)
Punc
ture
for
ce (
kg)
Intercept � (KcA�C)
Slope � Ks
F � Ks P � (Kc A � C)
Figure 4.8 Puncture forceversus punch perimeter withconstant area on polystyreneboard using the rectangular-faced punches shown in Fig. 4.6.(Reprinted from J. Food Sci. 3311,286, 1966; copyright by Instituteof Food Technologists.)
Chap-04.qxd 1/12/02 7:28 PM Page 119

DeMan (1969) confirmed the fact that the puncture force is dependent onboth the area and perimeter of the punch with processed cheese. With butterand margarine, however, he found that the shear coefficient is zero, whichcauses the term KsP to fall out of the puncture equation and makes the punc-ture test on these commodities dependent on area only. DeMan considered
120 Principles of Objective Texture Measurement
0
0
10
20
30
40
2 4 6
Punch perimeter (cm)
Punc
ture
forc
e (k
g)
8
Rutabaga
Carrot
Sweet potato
Irish potato
Apple
Hot dog
Figure 4.10 Puncture forceversus punch perimeter withconstant area on various foodsusing the rectangular punchesshown in Fig. 4.6. (Reprintedfrom J. Food Sci. 3311, 287, 1966;copyright by Institute of FoodTechnologists.)
0
0
10
20
30
40
0.25 0.5 0.75 1.0
Punch area (cm2)
Punc
ture
forc
e (k
g)
1.25
Rutabaga
Carrot
Sweet potato
Irish potato
Apple
Hot dog
Figure 4.9 Puncture forceversus punch area with constantperimeter on various foods usingthe rectangular-faced punchesshown in Fig. 4.6. (Reprintedfrom J. Food Sci. 3311, 286, 1966;copyright by Institute of FoodTechnologists.)
Chap-04.qxd 1/12/02 7:28 PM Page 120

that with fats there is flow rather than compression under the punch, and forthese commodities he postulated the equation
F � Kf A (4.4)
where F is the puncture force; A, the area of the punch; and Kf, the flowcoefficient (replacing Kc, the compression coefficient).
For circular punches the area and perimeter can be substituted by functionsof diameter that follow from the geometry of circles to give the followingequation:
F � (p/4)KcD2 � pKsD � C (4.5)
where D is the diameter of the punch.The puncture equation explains why a simple doubling of the area of a
circular punch usually fails to double the puncture force. When the area of a circular punch is increased by a factor of 2.0, the perimeter is increased by afactor . The puncture force will then be doubled only if the shearcoefficient Ks is zero or if the shape of the punch changed so that both peri-meter and area are doubled.
In designing punches for a test device it is possible to give added or less weightto the shear component by increasing or decreasing the perimeter/area ratio ofthe punch. Figure 4.11 shows two methods of manipulating the perimeter/arearatio of a punch. The first single punch at the bottom of Fig. 4.10 has an areaof 1.00 cm2 and a perimeter of 3.55 cm. The nest of four punches immediatelyabove it has a combined area of 1.00 cm2 and a combined perimeter of 7.10 cm.The nest of four punches will normally give a higher puncture force readingthan a single punch, even though the areas are equal because the amount of
2 141� .
Force Measuring Instruments 121
Table 4.5 Numerical Values of Puncture Test Coefficients for Various Commodities
Compression Shear coefficient Ks Constant CCommodity coefficient Kc (N mm��2) (N mm��1) (N)
Expanded polystyrene 0.477 0.333 �2.26High-density polystyrene 1.29 2.16 �26.9Polyurethane 0.350 0.284 �4.61Apples (raw, Limbertwig variety) 0.737 0.157 0.294Apples (raw, Fr. vonBerl variety) 0.631 0.0686 3.92Banana (ripe, yellow) 0.0422 0.0588 �0.588Creme-filled wafers 0.104 0.137 6.28Carrot (uncooked core tissue) 2.75 �0.0294 21.4Wiener (cold) 0.166 0.00392 1.47Potato (Irish, uncooked) 1.06 0.509 5.88Rutabaga (uncooked) 2.90 0.843 �1.47Sweet potato (uncooked) 1.94 0.883 3.431% agar gel 0.0147 0.0049 �0.09812% agar gel 0.0618 0.0284 �0.1963% agar gel 0.119 0.157 �3.24
Source: Adapted from Bourne (1966b).
Chap-04.qxd 1/12/02 7:28 PM Page 121

shearing with the nest of four punches is double that of the single punch. Thesecond circular punch above the nest of four punches has an area of 0.469 cm2
and a perimeter of 2.42 cm, while its star-shaped partner immediately abovehas the same area but a perimeter of 3.78 cm.
It is possible to obtain numerical values for the shear and compressioncoefficients of a food by using a set of circular-shaped punches (Su andHumphries, 1972; Bourne, 1975b). Dividing the basic puncture equation (Eq. (4.3)) through by the area and converting the perimeter and area intofunctions of the diameter gives the following equation:
F/A � 4Kp /D � Ka � 4C/pD2 (4.6)
According to Eq. (4.6) the plot of F/A against 1/D should be rectilinear with aslope equal to 4Kp and an intercept on the y axis of Ka � 4C/pD2. Dividing Eq. (4.3) by perimeter and converting the area into a function of diametergives the equation:
F/P � KaD/4 � Kp � C/pD (4.7)
122 Principles of Objective Texture Measurement
Figure 4.11 Two pairs ofpunches. Each pair has equalface area but differentperimeters. (Reprinted fromJ. Food Sci. 3311, 288, 1966;copyright by Institute of FoodTechnologists.)
Chap-04.qxd 1/12/02 7:28 PM Page 122

According to this equation a plot of F/P versus diameter of the punch should berectilinear with a slope equal to Ka/4 and an intercept equal to Kp � C/pD. Thevalidity of these equations has been shown to hold quite well for foods, providedpunches larger than approximately 2-mm-diam are used (Bourne 1975b).
The section of a puncture curve beyond the yield point (see Fig. 4.3, page 114)represents the force required to penetrate into the food. In a type A curve the penetration force beyond the yield point increases with penetration depth; thistype of curve is characteristic of freshly picked apples. In a type B curve theforce of penetration is approximately constant; this is typical of many apples thathave been held in cold storage for periods of several months and soft ripe fruitssuch as peaches and pears. In type C curves the force to penetrate is lower thanthe yield-point force. This type of curve is almost always found with raw veg-etables. Type D curves are often found with starch pastes, and toppings.
Yang and Mohsenin (1974) used contact stress theory to develop an equa-tion for the penetration of the punch into Rome apples:
(4.8)
where F is the force; a, the radius of the surface of contact; k, the shearingstrength; n, a correction factor; Ca, a correction factor; and D0, the diameter ofthe assumed cylinder.
Yang and Mohsenin found a good match between the experimental data onRome apples and the above theoretical equation. It is worth noting howeverthat Yang and Mohsenin’s experimental curve is essentially a B type curvewhere the penetration force is approximately constant. Since this was obtainedwith Rome apples it seems almost certain that the experiments were per-formed in the spring on apples that had been held in cold storage for severalmonths. It is unlikely that this equation would apply to freshly harvestedRome apples which give an A type curve. There are no experimental data toshow whether or not Eq. (4.8) applies to foods other than the Rome variety of apples that have been held in cold storage for several months.
The significance of type A, type B, and type C curves, as far as measuringsensory textural characteritistics of foods, remains to be determined. Withapples, the type A curve is typical of a freshly harvested juicy crisp applewhereas the type B curve is typical of dry, softer, and mealy-textured applesthat have been in storage for several months. The type C curve is frequentlyfound in raw vegetables and some apples and seems to be associated with a‘woody’ type of texture. Much work, however, remains to be done in this area.
Semi-infinite GeometryA true puncture test assumes that the sample size is so much larger than thepunch that no difference in the puncture force will be found if the sample ismade even larger. This is called ‘semi-infinite geometry.’ There should be noeffect from the edges, corners or thickness of the sample on the punctureforce. A true puncture test does not occur if there is any cracking, splitting of
F a k nC D a�� �p2
03 2a ln( )�
Force Measuring Instruments 123
Chap-04.qxd 1/12/02 7:28 PM Page 123

the sample, or if a cylinder of food approximately the same diameter as the punch is extruded out in front of the punch. It is generally accepted that thediameter of the sample should be at least three times the diameter of thepunch. For fracturable foods the ratio may need to be greater than three.
The principle of semi-infinite geometry is shown schematically in Fig. 4.12.On the left-hand side the sample is more than three times the diameter of thepunch and semi-infinite geometry is maintained. When the sample size dimin-ishes to the size shown in the central part of Fig. 4.12, semi-infinite geometryis lost and this will not be a true puncture test. The way to overcome this prob-lem is shown on the right-hand side of Fig. 4.12 where semi-infinite geometryis restored by reducing the diameter of the punch to less than one-third thediameter of the sample.
Base Support for Puncture TestAttention needs to be given to the base that supports the specimen being sub-jected to a puncture test because an inappropriate support may introduceerrors. When the specimen is large, the punch will only penetrate a small dis-tance into the food relative to the size of the food and a solid support plate iscorrect (Fig. 4.13a). When the specimen is thin (e.g., a cookie) there is a graverisk of compressing the food against the support plate and the test will becomea combination of puncture and compression or pure compression (Fig. 4.13b).A support plate that has a hole in it centered under the punch is needed for thinor small products (Fig. 4.13c). This allows the punch to penetrate all the waythrough the specimen and into the hole. The diameter of this hole should usu-ally be 1.5–3 times the diameter of the punch to give adequate support to thespecimen. When the hole is almost the same diameter as the punch (Fig. 4.13d),the test changes from true puncture to a ‘punch and die’ test in which a cylin-der of material is cut out from the food and pushed into the hole (see below).When the hole in the support plate is much larger than the punch, the sampleis likely to be bent and pushed into the hole thus changing the test from purepuncture into a bending test or part bending and part puncture test.
The Punch and Die TestWhen the sample is thin and the support plate contains a hole whose diameteris about the same size as the punch diameter, the punch is likely to stamp out
124 Principles of Objective Texture Measurement
Correct CorrectIncorrect
Figure 4.12 The principle ofsemi-infinite geometry. Thepuncture test assumes that thesample is semi-infinite in size, i.e. the sample is so much largerthan the punch that edge effectsand bottom effects areinsignificant. (From the TextureReport, Volume 3. Copyright byTexture Technologies Inc.)
Chap-04.qxd 1/12/02 7:28 PM Page 124

a cylinder of food into the hole (Fig. 4.13d). Although this seems to be a punchtest it uses a different principle known as the punch and die test.
Ahmed et al. (1973) used the punch and die test on citrus skins using theequation
S � F/pDT (4.9)
where S � the shear stress, F � the peak force, D � diameter of the punch andT � thickness of the skin. For this equation to hold, the cylinder of foodshould be punched out all at once. An incorrect low force will be obtainedwhen the punch breaks through the food at one point only followed by a slowspreading of the zone of shear failure around the punch as it continues todescend.
Segars et al. (1975) mounted a punch and die test cell in an Instron to shearthrough 4 mm-thick slices of cooked beef. The punch had a diameter of9.9 mm and the hole a diameter of 10.0 mm. They reported correlationcoefficients of 0.92–0.98 with sensory evaluation of chewiness and difficultyof cutting the beef.
Factors Affecting the Puncture TestThe force measured in a puncture test depends on the following factors.
(1) Nature of the food. A soft product will give a lower puncture force thana hard product.
(2) Size and shape of the punch (see Eq. (4.3, page 117)).
Force Measuring Instruments 125
Correct
Correct
Support with hole
Solid support
Incorrect
Incorrect Incorrect
Figure 4.13 Correct andincorrect supports for puncturetest. (From The Texture ReportVolume 3. Copyright by TextureTechnologies Inc.)
Chap-04.qxd 1/12/02 7:28 PM Page 125

(3) The number of punches used.(4) Depth of penetration has an effect on some, but not on all foods (see
Fig. 4.3, page 114).(5) The speed of travel of the punch is a factor when testing viscoelastic
foods because they are strain-rate sensitive.
Advantages of the Puncture TestThe puncture principle is probably the most frequently used principle formeasuring food texture. Its popularity is the result of a number of advantages.
(1) The tester is mechanically simple and can be performed rapidly.(2) It is easy to perform, whether by hand or in a motorized testing machine.(3) It can be used in most locations.(4) It rapidly distinguishes between samples. For example, Table 4.6 lists
the puncture force on nuts. Despite the wide variation in size and shapeof the different kinds of nuts, a puncture test clearly distinguishesbetween them showing puncture forces ranging from 4.5 N for pinenuts up to 20.3 N for almonds.
(5) It is suitable for many different kinds of foods, and to almost any sizeor shape provided a suitable punch diameter is selected. The author hasused punches ranging from 0.05-mm diameter to measure the cell-wallstrength of potato, to 50-mm diameter to measure the stiffness offoams. This feature is particularly useful when the size or shape vary.For example, the texture of different pasta shapes cannot be comparedby a cutting-shear test, but they can be compared by using the samediameter punch because the size of the sample does not affect the punc-ture force so long as it exceeds semi-infinite geometry.
(6) It is suitable for heterogeneous foods because each component can bepunctured separately. For example, in a chocolate bar containing nuts,raisins and puffed rice, each component can be tested separately
126 Principles of Objective Texture Measurement
Table 4.6 Puncture Force of Nuts
Nut Puncture force and standard deviation (N)
Almond 20.3 � 4.7Brazil nut 17.0 � 5.8Cashew 11.1 � 3.2Hazelnut 19.9 � 4.2Macadamia 13.6 � 1.4Peanut 13.3 � 2.9Pecan 6.7 � 1.3Pine nut 4.5 � 0.7Walnut 5.0 � 0.9
Tests were performed in a TA.XT2 Texture Analyzer using a 1.17-mm diameter circular punchwith a flat face. Crosshead speed 3.0 mm s�1. (Unpublished data from M. C. Bourne.)
Chap-04.qxd 1/12/02 7:28 PM Page 126

whereas most other test principles can only measure some overall prop-erty of the composite structure.
(7) Because it is a rapid test, it can be used to measure the distribution oftextures within particulate foods. For example, Bourne (1972b) punc-tured large numbers of various kinds of cooked bean seeds and foundan approximately normal distribution of puncture forces, as well as therange of forces encountered in each lot. Peleg (1974) mapped thechanges in firmness from skin to center of papaya fruit by a series ofpuncture tests across the cut surface of fruits split in half.
Compression–Extrusion Test
The compression–extrusion test consists of applying force to a food until itflows through an outlet that may be in the form of one or more slots or holesthat are in the test cell. The food is compressed until the structure of the foodis disrupted and it extrudes through these outlets. Usually the maximum forcerequired to accomplish extrusion is measured and used as an index of texturalquality. This type of test is used on viscous liquids, gels, fats, and fresh andprocessed fruits and vegetables. Since extrusion requires that the food flowunder pressure, it seems reasonable to use it on food that will flow fairly readilyunder an applied force and not to use it on those foods that do not flow easily,such as bread, cake, cookies, breakfast cereals, and candy.
A simple type of compression–extrusion test is shown in Fig. 4.14, in whichthe food is placed in a strong metal box with an open top. A loose-fittingplunger is then forced down into the box until the food flows up through thespace between the plunger and the walls of the box. This space is called theannulus.
In Fig. 4.14a the food has been placed in a cell and the compressing platenhas just contacted the surface. In Fig. 4.14b the food, has been packed downsolid so that the air between the particles has been removed. Figure 4.14cshows the actual process of extrusion where the food is forced to flow around
Force Measuring Instruments 127
Annulus
a b c
Plunger
Extrusion cell
Food
Figure 4.14 Schematicdiagram of a simple cell for back-extrusion tests. (a) The plungergoes down and begins to contactthe surface of the food; (b) Thefood is packed down and someliquid may be squeezed out; (c) The food is extruded throughthe annulus.
Chap-04.qxd 1/12/02 7:28 PM Page 127

the space between the edge of the compressing platen and the inside wall ofthe cell.
This is called a ‘back extrusion test’ because the food moves in the oppositedirection to the plunger.
The Ottawa Texture Measuring System (OTMS) (Voisey, 1971b) uses a for-ward extrusion test because the food moves in the same direction as theplunger. Voisey and Nonnecke (1972b) developed test cells for the OTMS thatare square in cross-section and 12.8 cm high. Four sizes of cells were madewith cross-sectional areas of 20, 30, 40 and 50 cm2. The 30 cm2 cell is the mostwidely used size. A separate frame holding either a series of parallel wires ora plate with a grid of holes in it fits into the bottom of the cell. A plunger thatis square in cross-section and clears the inner walls by 0.75 mm is driven downinto the cell forcing the food through the wires or holes and the force is mea-sured. Although the OTMS instrument is no longer commercially available,the OTMS test cells can be obtained from the Instron Corporation.
The standard cell of the Food Technology Texture Press (Kramer ShearPress see Fig. 5.5, page 203) is mixed; half the food is extruded forwardthrough the slits in the bottom of the cell and the other half is extruded back-wards up between the descending blades.
A typical force–distance curve obtained from such an apparatus is shown in Fig. 4.15. From A to B the food is deformed and compressed to pack moreand more tightly into the diminishing space available under the descendingplunger; there is almost no rupture or breaking of the food. At approximatelythe point B the food is packed solid and liquid begins to be pressed from high
128 Principles of Objective Texture Measurement
C
D
B
A
00
Distance
Forc
e
Figure 4.15 Typicalforce–distance curve obtainedwith a simple compression–extrusion test. (Reprinted from‘Rheology and Texture in FoodQuality’ (de Man. Voisey, Rasper,and Stanley, eds.), p. 265; withpermission of AVI Publ. Co.)
Chap-04.qxd 1/12/02 7:28 PM Page 128
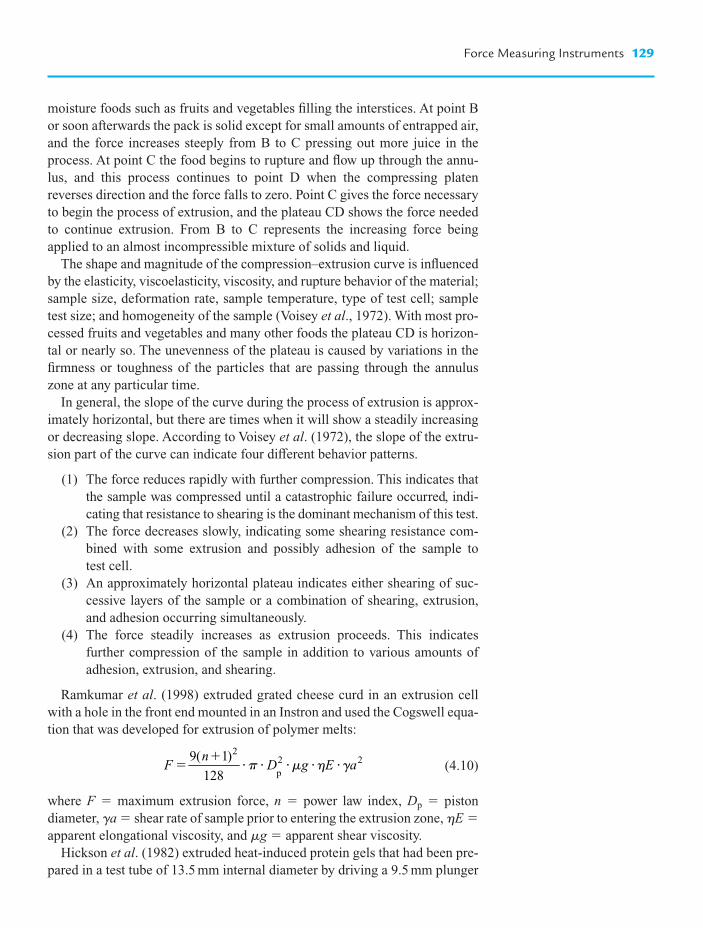
moisture foods such as fruits and vegetables filling the interstices. At point Bor soon afterwards the pack is solid except for small amounts of entrapped air,and the force increases steeply from B to C pressing out more juice in theprocess. At point C the food begins to rupture and flow up through the annu-lus, and this process continues to point D when the compressing platenreverses direction and the force falls to zero. Point C gives the force necessaryto begin the process of extrusion, and the plateau CD shows the force neededto continue extrusion. From B to C represents the increasing force beingapplied to an almost incompressible mixture of solids and liquid.
The shape and magnitude of the compression–extrusion curve is influencedby the elasticity, viscoelasticity, viscosity, and rupture behavior of the material;sample size, deformation rate, sample temperature, type of test cell; sampletest size; and homogeneity of the sample (Voisey et al., 1972). With most pro-cessed fruits and vegetables and many other foods the plateau CD is horizon-tal or nearly so. The unevenness of the plateau is caused by variations in thefirmness or toughness of the particles that are passing through the annuluszone at any particular time.
In general, the slope of the curve during the process of extrusion is approx-imately horizontal, but there are times when it will show a steadily increasingor decreasing slope. According to Voisey et al. (1972), the slope of the extru-sion part of the curve can indicate four different behavior patterns.
(1) The force reduces rapidly with further compression. This indicates thatthe sample was compressed until a catastrophic failure occurred, indi-cating that resistance to shearing is the dominant mechanism of this test.
(2) The force decreases slowly, indicating some shearing resistance com-bined with some extrusion and possibly adhesion of the sample to test cell.
(3) An approximately horizontal plateau indicates either shearing of suc-cessive layers of the sample or a combination of shearing, extrusion,and adhesion occurring simultaneously.
(4) The force steadily increases as extrusion proceeds. This indicates further compression of the sample in addition to various amounts ofadhesion, extrusion, and shearing.
Ramkumar et al. (1998) extruded grated cheese curd in an extrusion cellwith a hole in the front end mounted in an Instron and used the Cogswell equa-tion that was developed for extrusion of polymer melts:
(4.10)
where F � maximum extrusion force, n � power law index, Dp � pistondiameter, ga � shear rate of sample prior to entering the extrusion zone, hE �
apparent elongational viscosity, and mg � apparent shear viscosity.Hickson et al. (1982) extruded heat-induced protein gels that had been pre-
pared in a test tube of 13.5 mm internal diameter by driving a 9.5 mm plunger
Fn
D g E a��
� � � � �9 1
128
22( )
p m h gp2
Force Measuring Instruments 129
Chap-04.qxd 1/12/02 7:28 PM Page 129

mounted in an Instron into the gel and derived the following equation:
(4.11)
where nI � viscosity index, Vp � plunger velocity, Fp � maximum extrusionforce, Lp � distance of plunger travel to reach Fp, K � radius of plunger/innerradius of test tube, a � (1 � K2)/(1 � K2).
For the type of test cell shown in Fig. 4.14 the extrusion force is inverselyproportional to the width of the annulus, as shown in Fig. 4.16 where the max-imum extrusion force for a uniform sample of sized, graded fresh green peasis plotted against the annulus width. With a wide annulus, a small change inannulus width has a small effect on the extrusion force, but as the annuluswidth narrows, the extrusion force increases steeply.
The annulus width also affects the evenness of the force in the plateauregion especially for particulate foods. As the annulus width becomes nar-rower, the force plateau becomes less even, until at very narrow annuluswidths the force fluctuates rapidly along the plateau. Figure 4.17 showsforce–distance plots for extrusion of fresh green peas in a simple back extru-sion cell. A layer of food material moves up between the plunger and the wallof the extrusion cell as extrusion is taking place. When the annulus is wide alarge number of peas can be accommodated within the extrusion zone at anyinstant of time and the extrusion force is the mean force required to crush andextrude a large number of peas. This averaging effect results in a uniformforce along the plateau even though the plateau itself is decreasing slowly. Asthe annulus width is narrowed fewer peas can be accommodated within theextrusion zone at any instant, and the averaging effect is reduced. A singlehard pea will therefore make the force rise to a high level while it is passingthrough the extrusion zone, and likewise a single soft pea will make the forcefall a considerable amount when a narrow annulus width is used. This effect isless pronounced in homogeneous foods such as yogurt.
nV
F
LK
K KIp
p
p
� � �1
21
112
p
a�
���
�
���
���������
���
lnln
130 Principles of Objective Texture Measurement
1200
800
400
0
1 2 4 7 10 20
Annulus width (mm)
Extr
usio
n fo
rce
(kg)
Figure 4.16 Effect of annuluswidth on maximum extrusionforce on fresh green peas. (FromBourne and Moyer, 1968;reprinted from Food Technol. 2222,1015; copyright by Institute ofFood Technologists.)
Chap-04.qxd 1/12/02 7:28 PM Page 130

An important question concerning the extrusion testing technique arises:What width of annulus gives the greatest resolving power in discriminatingbetween two samples of food that are nearly equal in their textural properties?Figure 4.18 shows a plot of the maximum extrusion force of green peas with
Force Measuring Instruments 131
1600
1200
800
400
00 5 5 5
Distance (cm)
Forc
e (k
g)
5 5
75
4
3
2
1
50 0 0 0 0
Figure 4.17 Typicalforce–distance curves obtainedfrom a uniform lot of fresh greenpeas extruded in a simpleextrusion cell with annulus widthsof 1, 2, 3, 4, 5, 7 mm. (FromBourne and Moyer, 1968;reprinted from Food Technol. 2222,1016; copyright by Institute ofFood Technologists.)
1mm
2mm
3mm
4mm
5mm
7mm
10mm
2000
1600
1200
800
400
13 15
Alcohol insoluble solids (%)
Extr
usio
n fo
rce
(kg)
17
Figure 4.18 Extrusion force asa function of alcohol-insolublesolids in a compression–extrusiontest on fresh green peas usingannulus widths of 1, 2, 3, 4, 5, 7,10 mm. (From Bourne andMoyer, 1968; reprinted from FoodTechnol. 2222, 1016; copyright byInstitute of Food Technologists.)
Chap-04.qxd 1/12/02 7:28 PM Page 131

annulus widths ranging from 1 to 10 mm against the alcohol insoluble solids(AIS) of the peas. (Alcohol insoluble solids is a well-established index ofmaturity of green peas and allows evaluation of the textural properties of thepeas independently of the extrusion force.) Figure 4.18 shows that the slopesof the extrusion force versus AIS curves increase as the annulus widthdecreases. However, we need to take into account the fact that as the annuluswidth decreases the test is moving into higher force ranges. This problem isovercome by plotting the logarithm of the extrusion force which normalizesthe forces. In the normalized log-force–AIS relationship (Fig. 4.19), the slopeincreases steadily from 1 to 4 mm annulus and then decreases again. There isa fairly broad plateau from about 4 to 7 mm annulus. The greatest resolvingpower for green peas occurs with a 4 mm-wide annulus. It is noteworthy thatthe FMC Pea Tenderometer and the Texture Press both use slits 1/8 in. wide(3.2 mm), which comes close to the optimal width for the cylindrical extrusioncell on green peas.
The FMC Pea Tenderometer and the standard multibladed test cell of theFood Technology Texture Test System (Texture Press) (see Fig. 5.5, page 203)were originally considered to be based on the principle of shearing under pressure. Bourne and Moyer (1968) pointed out that this class of instrumentwas basically an extrusion test on materials such as green peas. Szczesniak et al. (1970) concluded from extensive study that different foods undergodifferent types of disintegration in the Texture Press. They made the followingpostulates:
(1) In compression, force is proportional to (sample weight)2.(2) In shear, force is proportional to sample weight.(3) In extrusion, force is independent of sample weight.
132 Principles of Objective Texture Measurement
0.04
0.03
0.02
0.01
01 2 3 4
Annulus width (mm)
Slop
e lo
g fo
rce
vers
us A
IS
5 7 10
Figure 4.19 Effect of annuluswidth on the slope of the logforce versus alcohol-insolublesolids in compression–extrusiontest on fresh green peas. (Plottedfrom data of Bourne and Moyer,1968.)
Chap-04.qxd 1/12/02 7:28 PM Page 132
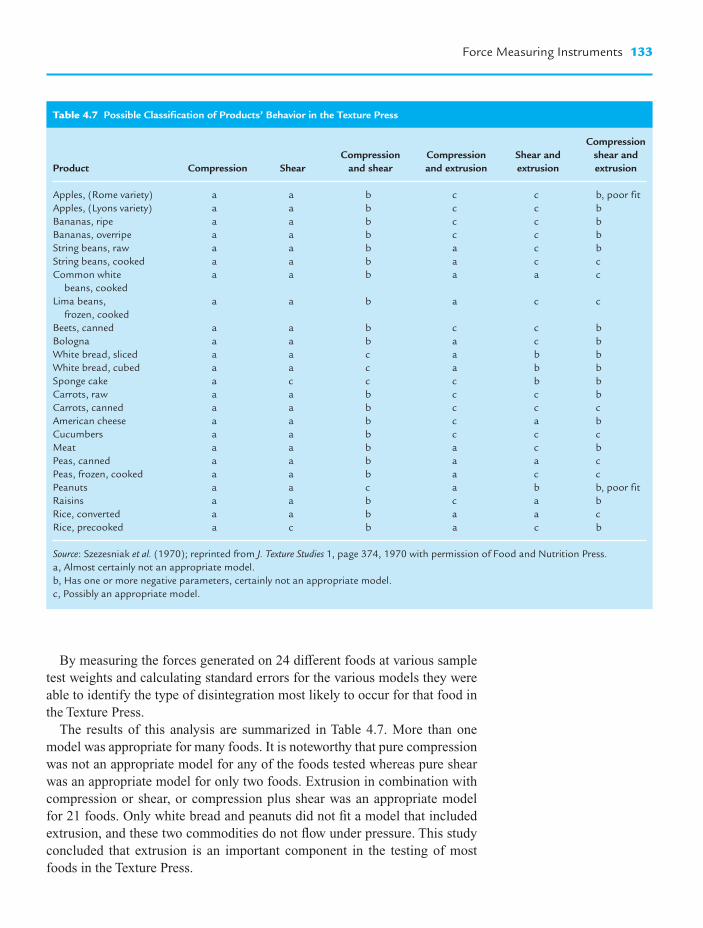
By measuring the forces generated on 24 different foods at various sampletest weights and calculating standard errors for the various models they wereable to identify the type of disintegration most likely to occur for that food inthe Texture Press.
The results of this analysis are summarized in Table 4.7. More than onemodel was appropriate for many foods. It is noteworthy that pure compressionwas not an appropriate model for any of the foods tested whereas pure shearwas an appropriate model for only two foods. Extrusion in combination withcompression or shear, or compression plus shear was an appropriate model for 21 foods. Only white bread and peanuts did not fit a model that includedextrusion, and these two commodities do not flow under pressure. This studyconcluded that extrusion is an important component in the testing of mostfoods in the Texture Press.
Force Measuring Instruments 133
Table 4.7 Possible Classification of Products’ Behavior in the Texture Press
Compression Compression Compression Shear and shear and
Product Compression Shear and shear and extrusion extrusion extrusion
Apples, (Rome variety) a a b c c b, poor fitApples, (Lyons variety) a a b c c bBananas, ripe a a b c c bBananas, overripe a a b c c bString beans, raw a a b a c bString beans, cooked a a b a c cCommon white a a b a a c
beans, cookedLima beans, a a b a c c
frozen, cookedBeets, canned a a b c c bBologna a a b a c bWhite bread, sliced a a c a b bWhite bread, cubed a a c a b bSponge cake a c c c b bCarrots, raw a a b c c bCarrots, canned a a b c c cAmerican cheese a a b c a bCucumbers a a b c c cMeat a a b a c bPeas, canned a a b a a cPeas, frozen, cooked a a b a c cPeanuts a a c a b b, poor fitRaisins a a b c a bRice, converted a a b a a cRice, precooked a c b a c b
Source: Szezesniak et al. (1970); reprinted from J. Texture Studies 1, page 374, 1970 with permission of Food and Nutrition Press.a, Almost certainly not an appropriate model.b, Has one or more negative parameters, certainly not an appropriate model.c, Possibly an appropriate model.
Chap-04.qxd 1/12/02 7:28 PM Page 133

Nozzle ExtrusionVoisey et al. (1979) developed an extrusion test accessory for the OttawaTexture Measuring System that measures the softness of cake frostings (icing)packed in collapsible tubes. Two rollers are pulled over opposite sides of thetube forcing the frosting through the nozzle, which behaves as an extrusionrheometer because the mass-produced tubes are of uniform dimensions andshape. A high correlation (r � �0.96) was found between maximum extru-sion force and sensory evaluation.
Benbow (1971) found that the extrusion of ceramic pastes through a shortcircular hole could be related to the die geometry by the expression
P � Y ln(A0 �A) (4.12)
where P is the pressure for flow through a short circular hole; A0, the area ofthe barrel; A, the die area; and Y, a material parameter. Benbow (1981) sug-gested that this equation would probably hold for food pastes such as cakefrosting.
Pros and Cons of the Back Extrusion TestThe advantages of the back extrusion test are that it is easy to perform, rapidand rugged. The force for the onset of extrusion is independent of sampleweight so it is not necessary to take the time to weigh each sample. It is notaffected by free liquid. Cleaning after each use need not be thorough and it isnot necessary to dry the cell. A possible disadvantage of this cell is that itrequires a high level of force which may be beyond the capacity of some of theuniversal testing machines in which the back extrusion cell is mounted. Also,it is important to ensure that the descending plunger is concentrically posi-tioned within the back extrusion cup in order to have a uniform annulus widtharound its circumference.
Cutting–Shear Test
To an engineer ‘shear’ means the sliding of the contiguous parts of a body rel-ative to each other in a direction parallel to the plane of contact under theinfluence of a force tangential to the section on which it acts. The food tech-nologist sometimes uses shear in this sense but more often uses the word‘shear’ to describe any cutting action that causes the product to be divided intotwo pieces. This cutting action is not the same as true shear, but is widelydescribed as ‘shear’ among food technologists. The difference between trueshear and cutting is shown schematically in Fig. 4.20.
A new term needs to be coined to describe cutting action: this will preservethe purity of the meaning of the word ‘shear’ and will prevent the confusionthat occurs when attempts are made to apply the theory of shear tests to cutting tests.
134 Principles of Objective Texture Measurement
Chap-04.qxd 1/12/02 7:28 PM Page 134

Halmos (1997) proposed the term ‘planar penetration’ to describe this testprinciple. However, the author will use the term ‘cutting-shear’ to distinguishthis type of test from true shear because it maintains some continuity with theearlier literature while avoiding confusion with the well-established rheologi-cal meaning of the word ‘shear’.
The best-known shearing apparatus is the Warner–Bratzler Shear (Warner,1928). The working part of this apparatus consists of a stainless-steel blade0.040 in. (1 mm) thick in which a hole, consisting of an equilateral triangle cir-cumscribed around a 1-in.-diam circle is cut and the edges rounded off to aradius of 0.02 in. (0.5 mm). (In some publications the Warner–Bratzler shearis misrepresented as having a rectangular-shaped hole in the blade.) A sampleof meat, usually a cylinder 0.5 or 1 in. in diam, is placed through the hole andtwo metal anvils, one on each side of the blade, move down forcing the meatinto the V of the triangle until it is cut through (see Fig. 5.7, page 209). A forcegauge measures the maximum force encountered during this cutting action.This is a cutting action rather than a true shear.
Voisey and Larmond (1974) mounted the Warner–Bratzler shear blade andvarious adaptations of the blade in the Instron and studied the effects of chang-ing the dimensions of the blade using wieners as the test material. Figure 4.21shows how the cylindrical piece of wiener is compressed by the descendinganvil and changes cross-sectional shape to conform to the shape of the hole inthe blade. Eventually the sample fills all the available area. The type of failureappears to be principally tension as the sample is stretched around the blade.However, a complex stress pattern is established which is a combination oftension, compression, and shear. It seems probable that most of the so-called‘shear’ tests used on foods are similar in pattern and result in what is pre-dominately tensile failure of the specimens.
Force Measuring Instruments 135
Unstressed body
a
b
Unstressed body
Shear deformation
Shear failure
Figure 4.20 Comparison of (a) true shear failure with (b) cutting–shear failure.
a b
T
c
cd
Figure 4.21 Schematic ofshearing in the triangular blade ofthe Warner–Bratzler Shear. a, Unstressed circular test piece;b, sample deforms undercompression to fill availablespace; c, sample; d, tensionfailure occurs around the edge ofthe shear blade; T, tensile stress.(Courtesy of P. W. Voisey;reprinted with permission fromCanadian Institute of FoodScience and Technology.)
Chap-04.qxd 1/12/02 7:28 PM Page 135

Voisey and Larmond (1974) studied the effect of changing the angle of the cutting edges of the blade. The shearing force increases as the angle of theblade widens from 30° to about 70° after which further widening of the anglecauses no increase in force. These authors also studied the effect of changingthe thickness of the blade and the width of the clearance between the blade andthe moving anvil. Figure 4.22 shows that the force increases as the thickness of the blade increases and it decreases with increasing clearance. These authorsalso found that the rate at which the test is performed introduces significantdifferences in the rupture force and other parameters measured in these tests.In subsequent work Voisey and Larmond (1977) showed that changing the rateof travel of the anvil did not significantly increase the correlation between sensory tenderness rating and the Warner–Bratzler shear rating.
Although no similar work has been reported on muscle meat with its intactfibers, the work of Voisey and Larmond cited above indicates the importanceof standardizing test conditions.
The specifications for the original Warner–Bratzler blade are given on page 135. Many of the blades in use today, especially those supplied with someof the universal testing machines, do not comply with these specifications. Thethickness of the blade, the angle of the hole in it, and the clearance between theblade and the anvil varies between manufacturers. The studies of Voisey andLarmond (1974, 1977) cited above demonstrate that the lack of standardizationof the Warner–Bratzler blade dimensions is a problem that needs to beaddressed. It is probably a major cause of the erratic results reported fromdifferent laboratories using the so-called ‘Warner–Bratzler’ blade on meat.
The original Warner–Bratzler blade was made of stainless steel which isresistant to wear. Many of the modern Warner–Bratzler blades are manufac-tured of aluminum alloy which does not wear as well as stainless steel andprobably falls out of dimensional tolerances more quickly than a stainless-steel blade.
136 Principles of Objective Texture Measurement
1200
1100
1000
900
8000.8
0.1 0.2 0.3 0.4 0.5 0.6 0.7 0.8 0.9 1.0
0.9 1.0 1.1 1.2 1.3 1.4 1.5 1.6Blade thickness (mm)
Clearance between blade and slot (mm)
Forc
e (g
)
x
x
x x
x x
x
Figure 4.22 Effect of bladethickness (�) and clearance (x)between blade and anvil inshearing wieners. (Courtesy of P. W. Voisey; reprinted withpermission from CanadianInstitute of Food Science andTechnology.)
Chap-04.qxd 1/12/02 7:28 PM Page 136

For beef and large muscles from other animals it is customary to cut a cylin-drical sample with either a 0.5 or 1 in. (1.27 or 2.54 cm) internal diameter boring tool for the Warner–Bratzler test. For smaller muscles, e.g. chickenbreast, the whole muscle may be inserted into the triangular hole of the Warner–Bratzler blade. After the sample has been cut into two pieces, the cross-sectionalarea of the newly cut surface is measured and a correction factor applied to themeasured force to compensate for differences in the area of the muscle that wascut. The usual way to measure the cross-sectional area of a noncylindrical spec-imen such as muscle is to press the freshly cut surface on a piece of filter paper,run a pencil line around the perimeter of the wet spot, and measure its area eitherby planimeter, or by cutting it out and weighing after drying.
The relationship between diameter or cross-sectional area of noncylindricalspecimens of the test piece and Warner–Bratzler shear force is not clear at thepresent time. Kastner and Henrickson (1969) found with cooked pork chops anonlinear relationship between diameter and Warner–Bratzler shear force.When their data are recalculated as shear force versus (diam)2 the plot appearsto be linear; that is, the shear force is directly proportional to the cross-sectionalarea. Pool and Klose (1969) found with cooked turkey meat that the shearforce was proportional to (diam)1.2 and they pointed out that the fibers failedin tension. Davey and Gilbert (1969), using a wedge-type shear on beef, foundthe shear force to be proportional to the square root of the area; that is, pro-portional to the diameter. Culioli and Sale (1981) sheared spun fababean protein fibers in a rectangular blade double-shear apparatus and found that themaximum force increased linearly with the initial thickness of the sample overthe range 2–13 mm. In view of the uneven results between different researchersthe only conclusion that can be made at this time is that the diameter of the testpiece should be standardized for any one study.
Wheeler et al. (1996) reported on the effects of sampling, cooking, and coringon Warner–Bratzler force values for beef and Wheeler et al. (1997) comparedWarner–Bratzler shear measurements among five institutions and concluded thatproper execution of a highly standardized procedure is imperative for obtainingaccurate and repeatable Warner–Bratzler force measurements on cooked beef.
Volodkevich (1938) (sometimes spelled Wolodkevich) described a shear testfor meat consisting of two wedges, each with a 2.5-mm radius, that compressand shear the meat. MacFarlane and Marer (1966) developed a similar double-wedge apparatus for measuring the tenderness of lamb, calling their apparatusthe MIRINZ Tenderometer. Smith and Carpenter (1973) developed a similartype of apparatus that was hand operated, calling it the NIP Tenderometer.
Rhodes et al. (1972) mounted the Volodkevich wedge in the Instron andstudied 10 parameters that were extracted from the force–distance curvesusing computer analysis. They concluded that
none of the correlations between sensory data and the single instrumental measurement derivedfrom force–deformation curves has improved significantly on those already reported in the liter-ature; nor has the use of multivariate statistical techniques … produced any more than marginaladvantages.
Force Measuring Instruments 137
Chap-04.qxd 1/12/02 7:28 PM Page 137

Seideman and Theer (1986) confirmed the conclusion of Rhodes et al.(1972). They mounted a Warner–Bratzler blade in an Instron and tested broiledlongissimus muscle steaks from 96 cattle. They extracted six textural parametersfrom the resulting force–time curves and found that peak load (maximum force)was the best predictor of tenderness, and the use of additional instrument mea-surements did not substantially improve predictability of sensory assessment.
Therefore, it seems that simply measuring the maximum force is all theinformation needed from the Warner–Bratzler test.
The Warner–Bratzler blade is sometimes used on foods other than meat. For example, Venkateswara et al. (1986) used the Warner–Bratzler blade tocut through chapaties folded into four layers and found the maximum forcegave a correlation coefficient r � 0.928 with tearing resistance measured byan Elmender paper tearing test.
A number of other single-blade cutting–shear apparatus are described in theliterature; for example, Wiley et al. (1956), whose single-blade shear is nowan optional accessory to the Food Technology Texture Test System. There areseveral reports in the literature of cutting–shear testers that are based on theprinciple of a wire cutting the product; for example, Wilder (1947), Gould(1949), Vanderheiden (1970), Brusewitz et al. (1997) and Kachru et al. (1995).
The standard cell of the Food Technology Texture Test System (frequentlycalled Kramer Shear Press) has some elements of shear in the test. This feature of this test cell is discussed more fully on page 133.
The American Association of Cereal Chemists have a standard method fora cutting–shear test on spaghetti and noodles using a blade mounted in theTA.XT2 Texture Analyzer (AACC Method 66-50).
McComber et al. (1987) devised a double direct shear test by putting cylin-drical samples of potato 30-mm diameter � 30-mm high in a special metalbox just large enough to accommodate the specimen. The central section ofthe box can be moved laterally and shears out a section of the potato about 10-mm thick leaving another 10-mm section below and above which areretained in the box. There are two shear planes in this test.
Compression Tests
There are two main types of compression tests.
Uniaxial CompressionThe sample is compressed in one direction and is unrestrained in the other twodimensions. It causes a change in shape. The volume is unchanged when thePoisson’s ratio m � 0.5. The volume decreases if m 0.5, and the smaller thevalve of m, the greater is the decrease in volume. This is a widely used testprinciple for solid foods. It is usually performed in a universal testingmachine. The platen that compresses the food should be larger in diameterthan the food specimen for a true compression test. When the platen diameteris less than the diameter of the food it becomes a puncture test.
138 Principles of Objective Texture Measurement
Chap-04.qxd 1/12/02 7:28 PM Page 138

For solid foods, uniaxial compression tests can be divided into two classes.
(1) Class A: Nondestructive. The compression force is kept small to ensurethere is no fracture, breaking, or any other irreversible damage done tothe sample. This is used for the deformation test (described later)which imitates the squeezing of food in the hand. The AmericanSociety of Agricultural Engineers published formulas for calculatingthe apparent modulus of elasticity E of food materials of convex shapethat are relatively firm and homogeneous that are compressed by vari-ous loading geometries in a universal testing machine (Fig. 4.23).
(2) Class B: Destructive. The compression force is increased to a level that ensures the sample will break causing irreversible damage to thesample. This is used for instrumental profile analysis (described later).
Force Measuring Instruments 139
R2, R2
sample(e.g. wholevegetable)
R1
1R1
1�
1/2E�
0.338 K3/2 F(1�m2)D3/2
R1
1d4
R1
1� �
1/2E�
0.338 K3/2 F(1�m2)D3/2
d4 1/2
E�0.338 K3/2 F(1�m2)
D3/2
E�0.338 F(1�m2)
D3/2 KU KLRU
1RU
1� � RL
1RL
1�
1/3 1/33/2
F
F
F
F
F
F
a Parallel plate contact
b Single plate contact
c Spherical indenter on a curved surface
d Spherical indenter on a flat surface
R1, R1
R1, R1
R1, R1
sample(e.g. vegetablecut in half)
indenter,diameter of curvature d
sample(e.g. fruit cutin half)
sample(e.g. sliceof fruit)
indenter,diameter ofcurvature d
Figure 4.23 Apparent modulusof elasticity calculated from forceand deformation data for variousloading geometries. E � apparentmodulus of elasticity, Pa, (psi); D � deformation, m (in.); m � Poisson’s ratio; F � force in N(lbf); RU, RU � radii of curvatureat the point of contact for theupper convex surface for loadingcase (a), m (in.); RL, RL � radii of curvature at the point ofcontact for lower convex surfacefor loading case (a), m (in.); R1,
R1 � radii of curvature of convexbody at the point of contact forloading cases (b) and (c); (d) �diameter of curvature of thespherical indenter, m (in.). KU
and KL in case aa are constants.(From ASAE Standards, 1998, p.555. Copyright by AmericanSociety of AgriculturalEngineers.)
Chap-04.qxd 1/12/02 7:28 PM Page 139

Uniaxial compression can also be used for semisolid foods when thesample does not fracture but flows out between the compressing platenand the supporting plate and the supporting hole. This is biaxial flow; itis called ‘imperfect lubricated squeezing flow’ and is described underthe heading ‘Miscellaneous Methods’ (see page 175).
Bulk CompressionThe sample is compressed in three dimensions, usually by means of hydraulicpressure. It causes a change in volume but usually no change in shape. Bulkcompression is seldom used in testing foods, probably because of the slownessand difficulty of performing a test under conditions where the force is appliedby means of hydraulic pressure. Many foods contain variable amounts ofentrapped gas within their structure and since gases are highly compressible,the amount of entrapped gas profoundly affects the bulk compressibility of thefood. White and Mohsenin (1967) describe a low-pressure bulk compressionapparatus and Sharma and Mohsenin (1970) give results from bulk compres-sion of apples. Finney and Hall (1967) performed bulk compression tests onpotato tubers. Figure 4.24 illustrates the difference between uniaxial compres-sion and bulk compression.
Tensile Tests
Tensile tests are not widely used with foods, which is understandable becausethe process of mastication involves compression, not tension, of the foodbetween the molars. It has already been pointed out that food fails in tensionin many cutting–shear tests. Nevertheless, a few tensile tests are performed.One of earliest tensile tests was that of Howe and Bull (1927), who endeav-ored to measure the tensile strength of meat but encountered difficulty in making clamps that would hold the meat so that the meat would not tear at theclamps. Platt and Kratz (1933) cut pieces of bread and cake to a standardshape, held them between large spring paper clips, and ran water into a smallbucket attached to the lower clip until the piece of bread broke and then mea-sured the volume of water. Personius and Sharp (1938) used a similar simpleapparatus for measuring the tensile strength of potato. Halton and Scott Blair(1937) experienced difficulty in performing tensile tests on bread doughbecause of the sagging of the dough and overcame the problem by supporting
140 Principles of Objective Texture Measurement
Unstressed UnstressedStressed Stressed
a bFigure 4.24 Uniaxialcompression (a) and bulkcompression (b) compared.
Chap-04.qxd 1/12/02 7:28 PM Page 140

the dough on a bath of mercury, performing tensile tests in a horizontal planeinstead of the customary vertical plane. It is now known that mercury isslightly volatile at room temperature and that inhalation of the vapor is haz-ardous to health. Therefore, this technique of Halton and Scott Blair (1937)should not be used even though the principle of performing a tensile test on africtionless horizontal plane is an interesting way to overcome the problem ofhandling a food that is too weak to support its own weight.
Guinee and O’Callaghan (1997) performed-tensile tests on Mozzarellacheese by melting the cheese on a horizontal bifurcated platform consisting ofa fixed element and a roller-mounted element that is free to move along a rail.After the ends of the cheese are locked in position a motorized winch drawsthe roller-mounted half of the platform along the rail until the cheese sheetbreaks. The distance the cheese stretches up to its breaking point is measured.
Tschoegl et al. (1970) overcame the problem of dough sag during tensiletesting by suspending doughnut-shaped pieces of dough in a fluid of equaldensity. This technique was used by Rasper et al. (1974) and Rasper (1975).
Nowadays, instruments such as the Instron, Food Technology Texture TestSystem, TA.XT2 Texture Analyzer or other universal testing machine aregenerally used to perform tensile tests.
A conventional tensile test assumes that the sample fractures almost instan-taneously in a plane that is approximately perpendicular to the plane of theapplied tension. The maximum force is the tensile strength of the material.Many foods subjected to tension do not fail suddenly; fracture begins with asmall crack that slowly spreads across the sample over a comparatively longperiod of time and the crack may or may not be perpendicular to the plane ofthe applied tension. Several cracks may appear and spread simultaneously.This type of break makes it difficult to obtain a meaningful interpretation ofthe tensile force measurement.
Another problem with many foods is that of holding the sample so that thebreak occurs within the sample and not at the jaws that hold the sample. Thisproblem is often solved by cutting out dumbbell-shaped test pieces and holdingthe sample at the wide ends. The sample is then more likely to break in the nar-row center portion of the test piece. Pool (1967) devised a unique solution to theproblem of holding the sample in tensile tests by using a fast-acting strong adhe-sive (Eastman 910, methyl 2-cyanoacrylate) to cement the ends of cylinders ofchicken meat to metal plates. The cement forms a bond stronger than the tensilestrength of the chicken in a minute or two. Pool then mounted the two metalplates containing the piece of chicken in the Instron to perform tensile tests.
Tang et al. (1995) solved the problem of holding the sample when performingtensile tests on whey protein concentrate gels by casting the gels in the shape ofa doughnut-shaped ring 30-mm external diameter, 12-mm internal diameter and11-mm thick. The ring-shaped gel specimens were hung over dowel pinsmounted in an Instron and subjected to a tensile force to failure. The gels did notfail at the point of support. Failure began on the inside surface of the ring wherethe stress is predicted to be slightly higher than in other parts of the ring.
Force Measuring Instruments 141
Chap-04.qxd 1/12/02 7:28 PM Page 141

Gillett et al. (1978) developed an attachment that allows the tensile strengthof sliced processed meats to be measured in a horizontal plane. Two horizon-tal plates, each with four rows of protruding vertical metal spikes, are used tohold and extend the sample. A cable runs around a pulley to the load cell of arecording texturometer and pulls the plates apart when the instrument is oper-ating. This attachment is available as an accessory for the Food TechnologyTexture Test System.
Tensile tests are used to measure the adhesion of a food to a surface. In thistype of test the sample of food has a disk pressed onto it after which the forcerequired to pull it off is measured. Jansen (1961) and Claassens (1958,1959a,b) used this technique to measure the stickiness or hesion of butter. TheTexture Profile Analysis parameter of adhesiveness measures the maximumforce required to pull the compression surface from the test piece after the firstcompression and therefore contains one element of tensile testing (Friedmanet al., 1963). Henry and Katz (1969; Henry et al., 1971) used this technique inan Instron to measure the adhesiveness of puddings and toppings and devel-oped and identified several tensile parameters from the force–distance curvethat was so obtained.
Reyes-Vega et al. (1998) measured the tearing strength of corn tortillas by cutting 13 mm-wide strips with the center portion angled at 45° from the vertical to make a test specimen shaped according to the American Society forTesting and Materials method D 624 for plastic films and pulling them apartat 2 mm s�1 until rupture occurred.
Tensile tests are the preferred method for measuring stickiness or adhesive-ness of foods. Hoseney and Smewing (1999) and Kilcast and Roberts (1998)review the literature on this property whose measurement has been difficult tostandardize.
Torsion
In a torsion test a force is applied that tends to rotate or twist one part of the object around an axis with respect to the other parts. The tendency of aforce to produce rotation about an axis is called the torque T with dimensionsmass � length2 � time�2. If a force of F newton is applied to a body at Rmeter from the axis of rotation (Fig. 4.25)
Torque T � FR newton meter.
Torque is often expressed in non-SI units. These can be converted into the SIunit of newton-meter (N m) by using the following multiples:
1 N m torque equals 1.000 � 10�7 dyn-cm980,600 g force-cm9.806 kg force-m0.00706 oz force-in.0.1129 lb force-in.1.355 lb force-ft
142 Principles of Objective Texture Measurement
R
F
Figure 4.25 The torqueprinciple; force F applied atradius R from center of bodycauses a tendency for rotation.
Chap-04.qxd 1/12/02 7:28 PM Page 142

The major application of this test principle is in the rotary viscometers thatare widely used to measure the viscous properties of foods. This applicationwill be discussed in Chapter 6 which deals with viscosity and consistencymeasurements.
The Farinograph and the Mixograph are torque measuring instruments (see pages 211, 212).
Nemitz et al. (1960) and Nemitz (1963) developed a laboratory apparatusthat twisted a whole fish and used it to measure the progress of rigor mortis.Karacsonyi and Borsos (1961) used a torsion device to measure the strengthof dry spaghetti and found it useful for the detection of hidden failures. ScottBlair and Burnett (1963) developed a laboratory torsiometer for measuringthe coagulation of renneted milk in a cheese vat called a ‘cheese curd tor-siometer.’ Hashimoto et al. (1959) used the principle of torsional strain tomeasure the firmness of sausage.
Templeton and Sommer (1933), Mueller (1935), and Voisey and deMan(1970) used the torque principle to measure the change in consistency of prod-ucts that are beaten. Figure 4.26 shows how this apparatus can be used to studythe behavior of products that increase in viscosity as they are whipped.Applesauce maintains a constant torque throughout the whipping time,whereas cream reaches a peak viscosity and then lowers in viscosity as itbreaks down to form butter. The figure also shows the development of viscos-ity in egg whites and a topping mix as they are beaten.
Studman and Yuwana (1992) developed a torsion test for measuring thefirmness of fruits. A fruit such as an apple is impaled on a spindle that carriesa blade 9.8 mm � 7.8 mm. The fruit is rotated by hand causing a vertical rodasymmetrically attached to the spindle to rotate thus raising its center of gravity.The rotation of the fruit is continued until the flesh fails completely. The angle
Force Measuring Instruments 143
Torq
ue (
g cm
)
Time
Egg white
Topping
Apple
Cream
Figure 4.26 Changes in torqueas a function of whipping timefor egg white, dessert topping,applesauce and cream. (Drawnfrom data in Voisey and deMan,1970.)
Chap-04.qxd 1/12/02 7:28 PM Page 143

of the rod measures the crushing strength of the flesh. The measurement takesabout 10 s per fruit and can be adapted to a wide range of fruits. This devicehas been named the Massey Twist Tester.
Diehl et al. (1979) designed a torsion test attachment for use in the Instronand used it to measure structural failure in apple, potato, and honeydew melon.They found tension failure in the torsion test but shear failure in simple com-pression tests. Unlike many previous torsion tests for solid foods, the methodsthey developed allowed the determination of both engineering and true stressand strain to failure. Torsion tests of this type have long been common forengineering materials such as metals and plastics.
Professor Hamann and coworkers at North Carolina State Universityimproved upon the torsion test for solid foods developed by Diehl et al. (1979)by adapting the technique to a Brookfield viscometer. This adaptation hasproved to be valuable for testing gels and meat batters (Hamann, 1983, 1988,1994; Montejano et al., 1983a,b; Howe et al., 1994). They pointed out that intorsion the true strain (Hencky strain) and engineering strain (Cauchy strain)are nearly equal even for large strains, whereas in uniaxial compression thetrue strain is often much larger than the engineering strain especially whenthere is a large degree of compression. This is of particular concern when test-ing surimi and other gels that require very large strains to reach the point offracture.
Hamann’s group showed that in a torsion test where the twisting momentversus angle of specimen twist is linear up to failure
t � 2KM/pr3 (4.13)
where t � shear stress at failure, M � twisting moment or torque to failure, r � radius of specimen at its narrowest point and K is a specimen shape factor which is a function of the smallest diameter of the specimen and theradius of curvature of the capstan shape.
They also showed that the shear strain at failure, or maximum strain g is:
g � 2Kc �pr3Q (4.14)
where c is the angle of twist and Q is a specimen shape factor which is a func-tion of the diameter of the cylinder before shaping the capstan, the radius ofcurvature of the capstan shape, and the length of the shaped section of thefood cylinder. For the torsion testing protocol developed by Hamann andcoworkers for the Brookfield viscometer, K � 1.08 and Q � 8.65 � 106 m�3
and is specific for the shape and dimensions of specimens used with thisdevice. Q is slightly larger than that for the specimen shape originally devel-oped by Diehl et al. (1979), because the disk-shaped ends of the specimenused in the Brookfield procedure contribute to the angle of twist which wasnot the case in the original.
This group also developed a more precise version of the milling machinedeveloped by Diehl et al. (1979) that grinds cylindrical-shape specimens of
144 Principles of Objective Texture Measurement
Chap-04.qxd 1/12/02 7:28 PM Page 144

gels and other foods such as frankfurters into a capstan or dumbbell-shapewith a minimum diameter of 10 mm at the center. A notched styrene disk isthen cemented to each end of the shaped specimen with methylcyanoacrylateadhesive and the assembly is placed in a rotary viscometer where it is twisteduntil failure. The address of Gel Consultants, the company that makes themilling machine, is given in Appendix I.
The advantages of the torsion test are that it produces a pure shear stress and thus maintains sample shape and volume during the test. Also, tension,compression, and shear are created in equal magnitudes, 45° apart, so that avisual examination of the fractured specimen can determine which occurred.More significantly, the stress in which a material is weakest, can be deter-mined. This test principle is particularly suitable for highly deformable foodssuch as elastic gels. The disadvantages are that the shaping and preparation ofthe sample are time consuming. Also, it is not suitable for sticky foods such ascaramels and very soft foods such as some cheeses (Truong and Daubert,2000).
Bending and Snapping Test
Bending and snapping tests are usually applied to food that is in the shape ofa bar or sheet. The two most common types of apparatus are shown schemati-cally in Fig. 4.27. On the left side is the triple beam apparatus in which thepiece of food rests on two supports and a third compressing bar moves downbetween the two supports bending the food until it snaps.
The Bailey Shortometer is used in the baking industry to measure the shortness and snapping properties of crackers and cookies (Bailey, 1934). TheStruc-O-Graph manufactured by the Brabender Company uses the triple-beam principle for measuring snapping and bending in food (see page 212).
The right-hand side of Fig. 4.27 shows a cantilever beam where the productis held at one end and is allowed to bend freely throughout its length. Theamount of bending is measured either by the distance that the unsupported end of the food moves or by the angle it subtends to the horizontal plane.Sterling and Simone (1954) used the cantilever beam principle to measurebending and crispness in almonds. Several laboratory-made instruments that use this principle have been described in the literature; for example, theR.P.C. Droopmeter that measures the bending of french fries under gravity(Anonymous, 1966).
Force Measuring Instruments 145
Triple beam Cantilever
Figure 4.27 Two ways toperform bending and snappingtests.
Chap-04.qxd 1/12/02 7:28 PM Page 145

Somers (1965) gave the following equation for the bending of slices of raw potato 28 mm � 13 mm � 1 mm thick held at one end and considered tobe a cantilever:
Y � Wl4�8EIL (4.15)
where Y is the downward deflection of the potato strip, W the weight of beam,l the projected length of the beam (distance from clamp), L the total length ofbeam, E the apparent elastic modulus and I is the moment of inertia of thecross section.
Suhendro et al. (1998) mounted 30-mm wide strips of corn tortilla that pro-jected horizontally 6.45 mm from a special clamp mounted in the TA.XT2Texture Analyzer using cantilever geometry and measured the force requiredto bend it down 40° from the horizontal position. They reported that the bend-ing force was significantly correlated with subjective scores for rollability andflexibility.
Snappy foods are typified by a rigid unbending texture that breaks suddenlyonce the fracture force has been reached. Bruns and Bourne (1975) studiedsnapping in foods and found that the force required to snap a test specimen ofuniform cross-section complies with mathematical models derived from engi-neering theory. For uniform bars with a rectangular cross-section the snappingequation is as follows:
F � 2�3�cbh2�L (4.16)
where F is the snapping force; �c, the failure stress; b, the width of beam; h,the height of beam; and L, the length of beam between supports. For uniformbars with a cylindrical cross section the snapping equation is
F � �cpR3�L (4.17)
where F is the snapping force; �c, the failure stress; R, radius of beam; and L, the length of beam between supports.
The above equations establish the importance of using samples of uniformsize and shape in this type of test. Particular attention needs to be paid to thethickness of the sample because the snapping force is proportional to thesquare of the thickness or cube of the diameter. If it is impossible to obtain testpieces of uniform size and shape, it is advisable to correct the force dataaccording to the equations above.
Leighton et al. (1934) used the sagging of ice cream bars resting on two sup-ports as a means of measuring the apparent viscosity. They used the equation
h � 5gmL3�1152RI (4.18)
where h is the viscosity; g, the gravity constant; m, the mass of sample; L, thelength between supports; R, the rate of sag in centimeters per second; and I, the moment of inertia of a cross section (0.049D4 for a beam of circular crosssection with diameter D). These workers found that the apparent viscosity ofice cream was in the range of 2 � 107 Pa�s. This seems to be a useful method
146 Principles of Objective Texture Measurement
Chap-04.qxd 1/12/02 7:28 PM Page 146

for measuring extremely high viscosities. Coulter and Combs (1936) usedLeighton’s method to determine the sagging properties of butter.
Van Hecke et al. (1995) noted that standard bending tests for engineeringmaterials propose that the length of the specimen should be at least 16 timesthe thickness because shearing and compression factors come into play whenthe length/thickness ratio is less than about 16. They found this requirementheld for crispy-puffed foods where the deformability modulus increased as thelength/thickness ratio increased from 8 to 20 and was relatively constant whenthe ratio exceeded 20. In reviewing published values for bending–snappingtests on foods Van Hecke et al. (1995) noted that many of the reports use alength/thickness ratio less than 16 which brings into question whether the dataare really reporting a pure bending test.
Baltsavias et al. (1997) found that short-dough biscuits subjected to a three-point bending test had a slightly higher fracture stress and strain when the bottom side of the biscuit was upwards than when in the reverse position. They attributed this to air cells on the bottom side acting as sites for stressconcentration. Baltsavias et al. (1997) used length/thickness ratios of 13.3 and20 and found no difference in results between these two span lengths.
Although the three-point bending test in which the sample is supported on two parallel beams is the most widely used geometry for the bending–snapping test, other geometries are sometimes used. For example, Bourne et al. (1966) supported potato chips over a hollow ring and used a circular dieto fracture them whereas Segnini et al. (1999) supported potato chips on threepins spaced 15 mm apart in the shape of an equilateral triangle and used a5.3 mm diameter rounded face punch to fracture them.
Alvarez et al. (2000) cut rectangular beams 40-mm long � 4-mm wide �8-mm high from apple, carrot, celery and cucumber and mounted them onparallel supports spaced 32 mm apart for a triple-beam fracture test. Beforesnapping these beams, an artificial crack in the form of a notch was made inthe center of the underside of the specimen by pushing a sharp razor bladeabout half-way into the specimen. This is called single-edge notched bend(SENB) geometry which is a well-established test procedure for metals andpolymers. Alvarez et al. (2000) found SENB geometry was readily applicableto crisp foods that exhibit linear elastic behavior up to fracture.
Distance Measuring Instruments
Distance measurements may be divided into three classes: (1) linear measure-ment with dimension of length, (2) area measurement with dimension length2,and (3) volume measurement with dimension length3.
Linear Measuring Instruments
A number of simple testing apparatus that are based upon distance measure-ments are known, including the Bostwick Consistometer, which measures the
Distance Measuring Instruments 147
Chap-04.qxd 1/12/02 7:28 PM Page 147

distance catsup and fruit puree flow along a horizontal trough; the Hilker–Guthrie Plumit, which measures the depth a cylindrical metal rod falls intosour cream and yogurt; the Ridgelimeter, which measures the sag of fruit jellies as a means of obtaining the grade of pectin; and the Haugh egg qualitymeter, which measures the height the white of an egg stands up after breakingout from the shell. The principle of measurement of these instruments is sosimple that it needs no analysis. The instruments themselves will be describedin the following chapter.
A ruler, calipers, or other well-known measuring length instruments aresuitable for simple applications. For example, Hoseney et al. (1979) measuredthe spread of mechanically rounded balls of dough allowed to rest on a smoothplate with dial calipers and calculated a spread ratio � width/height of thedough ball. A higher value indicates more spread. The factors affecting thespread ratio are gravity, pressure of gas developed by the yeast and cohesiveforces within the dough. Dogan and Walker (1999) calculated the spread ofcookies after baking and cooling by measuring the width (w) and height (h)and calculating the spread factor as 10 w/h. For sugar snap cookies theyreported spread factors ranging from 86 to 102.
Arnott et al. (1957) measured the meltability of cheeses by placing cylin-ders of cheese 22-mm diameter � 17-mm high in the center of a glass Petridish and baking in a convection oven at 100°C for 15 min. After cooling, theheight and diameter of the melted cheese mass is measured, and the averagevalue calculated. Other researchers using this procedure call it the ‘ArnottTest’. Yang et al. (1983) used the Schreiber melting test for cheese by placinga disk of cheese 2.3-cm diameter � 0.5-cm high in the center of a 10-cm diam-eter Petri dish with a glass cover and baking it for exactly 5 min in an electricoven preheated to 232°C. The diameter after baking was measured by placingthe disk on a series of concentric circles with lines drawn 0.65-cm apart.Guinee et al. (1999, 2000) measured the flowability of melting cheese by placing cheese disks 6.5-mm thick and 45.5-mm diameter in an oven at 280°Cfor four minutes then measuring the diameter. They defined flowability as thepercentage increase in diameter of the disk after baking.
Robertson and Emani (1974) injected a stream of liquid dye at high velocity(103–104cm s�1) through a small orifice (0.254-mm diam) for a short time(0.1 s) into bread. The energy of the stream is absorbed by the bread; hence,the distance the stream of dye penetrated is an index of bread texture. Goodcorrelations are reported between sensory tests of bread aging and the liquid jetpenetrometry data.
PenetrometerThe Penetrometer consists of a cone and vertical shaft assembly that isallowed to sink into a solid fat under the force of gravity for a standard timeafter which the depth of penetration is measured. The left-hand side ofFig. 4.28 demonstrates the principle. According to Haighton (1959) the following formula applies to cone penetration on solid fats of a wide range
148 Principles of Objective Texture Measurement
Chap-04.qxd 1/12/02 7:28 PM Page 148

of hardness:
C � KW�p1.6 (4.19)
where C is the yield value of the product, K, a constant whose value dependson the cone angle, W, the weight of cone assembly in grams, and P, the pene-tration depth after 5 s.
Mottram (1961) derived a similar formula from studies of penetrometertests on printing inks:
S0 � KMg�hn (4.20)
where S0 is the yield value, M, the mass of cone assembly in grams, g, a grav-ity constant, h, the depth of cone penetration, n � 2 but varies according to thetype of material, and K, a constant depending on cone angle.
Although Mottram’s terminology is not the same as Haighton’s, Eqs. (4.19)and (4.20) are similar in their essential features.
Mottram published an equation for the constant K as follows:
K � (cos2 cot )�p (4.21)
where � ½ cone angle (see Fig. 4.28).Dixon and Parekh (1979) used a cone penetrometer to measure the firmness
of butter and developed the equation
These researchers found that this equation accounted for 96.9% of the variation in observations and 91% of the variation in sensorially perceivedspreadability of butter.
Hayakawa and deMan (1982) reviewed the literature on methods of con-verting penetrometer distances into reproducible units with scientific measur-ing and proposed a Hardness Index HI, where: HI � mass of cone assembly/penetration depth.
These authors also pointed out that different authors recommend differentranges of penetration readings as suitable for good reproducibility:
� Haighton (1959) 7.5–25 mm
butter rmnesscone mass (cone angle)
penetration depthfi �
� �165
2
.
( )
Distance Measuring Instruments 149
D
dDepth of penetration a
a b
Figure 4.28 Principle of (a) thepenetrometer cone and (b) theball indenter.
Chap-04.qxd 1/12/02 7:28 PM Page 149

� Mortensen and Danmark (1978) 5.0–30 mm(cited by Hayakawa and deMan)
� Dixon and Parekh (1979) 2.0–15 mm� Hayakawa and deMan (1982) 1.5–15 mm
The American Oil Chemists Society has a standard for penetrometer usedfor measuring the consistency of fats (AOCS Method Cc16-60) and this pro-cedure is also an official method for the American Association of CerealChemists (method 58-14).
Another type of penetration test that is used on fats and similar products isthe ball indenter that is the principle of the SURDD tester (see Fig. 4.28). A steel ball is pressed onto the material with a constant force for a given time,then it is removed and the diameter of the impression measured (Feuge andGuice, 1959). This test is similar in principle to the Brinell and Vickers hard-ness testers that are used to measure hardness of metals. The following equa-tion applies to this test:
H �100P/(pD/2)[D(D2 � d2)1/2] (4.22)
where H is the hardness index in kilograms per square centimeter; P, the kilogram force on ball; D, the diameter of ball in millimeters (usually in therange 3–12 mm for fats); and d, the diameter of impression in material.
The same principle is used in the Smetar hardness tester, which measures thehardness of wheat grains by the size of the impression made by a diamondindenter (Smeets and Cleve, 1956). It is also used in the adaptation of the BarcolImpressor to measure the hardness of wheat grains (Katz et al., 1959, 1961).
Rebound DistanceWhen dry, mature peas that have been soaked and cooked are bounced off aninclined surface, the horizontal distance they rebound is a function of their elas-ticity coefficient and is related to textural quality (Crean and Haisman, 1965).Firm peas bounce farther than soft peas. Asymmetry of rheologically identicalpeas causes some scatter, but the method can fractionate peas into several frac-tions on the basis of their firmness. The principle of the test is shown in Fig.4.29. The relationship between rebound range and firmness as measured by theMaturometer is shown in Fig. 4.30. These authors developed the followingequation for perfect spheres having known coefficients of elasticity:
rebound range � tv cos(� � � 90) (4.23)
where t �[�v sin(� � � 90) � (v2 sin2(� � � 90) � 2gh)½]g�1; v �
u(sin2 � e2cos2a)½; � is the angle at which pea leaves the plate and equalscot�1(e cot a); a, the angle of the plate to the horizontal; u, the velocity of peajust before hitting the plate; e, the coefficient of elasticity of the pea; h, theheight of the point of impact above the collecting box; and g, a gravitational con-stant. The principle of rebound distance has been used for more than a centuryby the cranberry industry of northeastern United States to separate soft and sub-standard cranberries from sound fruit. Bryan et al. (1978) used the principle of
150 Principles of Objective Texture Measurement
Chap-04.qxd 1/12/02 7:28 PM Page 150

rebound distance to separate cull oranges that have a low coefficient of restitu-tion from sound fruit that have a higher coefficient of restitution.
Hamann and Carroll (1971) used a vibratory technique that depends onelasticity to separate muscadine grapes into maturity grades based on firmnessand to separate bruised blueberries from sound blueberries (Hamann et al.,1973).
Lichtensteiger et al. (1988) measured the impact force response of tomatoesof about the same mass. The green tomato (firm) had the highest peak force
Distance Measuring Instruments 151
a
f
A
B
C
D
E
Figure 4.29 Principle of therebound test: individual peassorted into single file by gates Bfall off conveyor belt AC ontoinclined surface D and bounceinto compartments at E.(Reprinted with permission fromBlackwell Scientific Publications.)
300
200
1003 4 5 6 7 8 9
Rebound range
Ave
rage
mat
urom
eter
rea
ding
(Ib
)
Figure 4.30 Maturity of peasversus rebound range in thebounce test (see Fig. 4.29).(Reprinted with permission fromBlackwell Scientific Publications.)
Chap-04.qxd 1/12/02 7:28 PM Page 151

and the shortest contact time, the red tomato (soft) had the lowest peak forceand the longest contact time whereas the pink tomato was intermediate inpeak force and contact time.
Botta (1991) measured the rebound distance of raw cod fillets by compress-ing them to 500 g force under a 2.5 cm diameter platen, then reducing theforce to 1 g and measuring the distance the fillet rebounded after 1 s. The ratiorebound distance/initial deformation agreed with the texture grades of threeFish Inspection Officers 75–86% of the time.
DeformationDeformation is the change in height or diameter of a food under the applica-tion of a force. Implicit in this definition is the assumption that this is a non-destructive test; that is, the amount of force applied is less than that requiredto break, rupture or cause any other irreversible damage to the commodity.This physical property is usually measured sensorially by squeezing the foodin the hand. Deformation is generally considered to be one method of meas-uring the ‘firmness’ of a commodity. In fact it is preferable to consider it as ameasurement of ‘softness’ because the firm product gives a lower reading thanthe soft product.
Figure 4.31 shows schematically a straight-line force–compression rela-tionship for a firm, medium, and soft commodity. The deformation test usuallymeasures the deformation under a standard force. The application of force Fto three ideal commodities gives deformations f, m, and s, respectively, for thefirm, medium, and soft product (Fig. 4.31a). Occasionally the force requiredto achieve a standard deformation is used (Fig. 4.31b) where standard defor-mation D is achieved by forces s, m, and f. In this case the firm product willgive a higher numerical value than the soft product, but there is a risk that thefirm product will break under the high force required to achieve the standarddeformation.
Although deformation is widely used sensorially for measuring firmness offoods, there is little in the way of instrumentation available for this test. TheBaker Compressimeter is a commercially available instrument that is used formeasuring the firmness of bread crumb, the Ridgelimeter is used to measure
152 Principles of Objective Texture Measurement
Firm
Medium
Soft
Firm
Medium
Soft
Distance
Forc
e
F
a bf m
m
s
s
DDistance
f
Figure 4.31 Deformation ofideal, firm, medium and softsolids: (a) compression distanceis measured at constant force F;(b) force required to achieve astandard compression ismeasured.
Chap-04.qxd 1/12/02 7:28 PM Page 152

the quality of pectin in fruit jellies (Cox and Higby, 1944), and the Marius eggdeformation tester is available for measuring the deformability of whole eggs.The Instron has been adapted for performing deformation testing (Bourne,1967a), and equipment similar to the Instron such as the TA.XT2 TextureAnalyzer could also be adapted in a like manner. The Penetrometer can also beadapted for deformation testing of foods that are not too rigid or too small(Bourne, 1973).
Figure 4.32 shows the most common types of force–deformation curvesthat are found on foods. The majority of products give an A type curve that isconcave downward: this shape is typical of products such as marshmallowsand the softer fruits and vegetables. The linear B type curve is found with rigidproducts such as firm green fruits and vegetables, hard candy, and eggs in theshell. This type obeys Hooke’s law, which states that the deformation of a bodyis directly proportional to the force applied to it. Hooke (in 1678) enunciatedthis law on the basis of tension experiments with metal springs, but any bodythat obeys this law in tension or compression is called a Hookean solid. The Ctype curve, which is S shaped, is found with breads, cakes and other highlyaerated deformable foods and some cheeses.
It is obvious that the higher the applied force the greater will be the defor-mation, even when the relationship is nonlinear. From the geometry ofFig. 4.32 it can be seen that the deformation of a B type product is directlyproportional to the applied force; hence, the deformation at two forces F1 andF2 are directly proportional to those forces; that is,
b1�b2 � F1�F2
Type A products are characterized by a rapid rate of increase in deformation atlow force with the rate decreasing as the force increases; that is,
a1�a2 � F1�F2
Distance Measuring Instruments 153
c1
F1
F2
b1 b2a1 a2c2
Distance
Forc
e
C BA
Figure 4.32 Threecharacteristic types offorce–deformation behavior.
Chap-04.qxd 1/12/02 7:28 PM Page 153

For C type products the deformation increases slowly at first and then morerapidly as the force is increased; hence,
c1�c2 F1�F2
Barrett et al. (2000) postulated three different behaviors for breads thatexhibit the typical C-type curve shown in Fig. 4.32:
Part I. Low force – linear elastic deformation occurs.Part II. Medium force – plastic buckling of cell walls dominates.Part III. High force – densification of the aerated structure occurs.
Since the relationship between force and distance is linear in B type prod-ucts the degree of force that is applied does not change the deformation ratiowhen comparing two samples. For A type products greater resolution betweensamples that are of similar quality is obtained with a small deforming force.This is demonstrated in Table 4.8 which shows the deformation of a fresh, softmarshmallow and a stale and firmer marshmallow. The amount of deformationincreases as the deforming force increases for both marshmallows, but theratio of the deformations declines with increasing force. Table 4.9 shows thata similar relationship exists for apples. Under 2-kg force the ratio of the defor-mations of a flaccid and firm apple was 3.2 whereas above 14 kg the ratios ofthe deformations became equal.
For foods that exhibit A type characteristics it is desirable to use as small adeforming force as practicable in order to achieve maximum resolutionbetween samples. In order to maintain equivalent resolution, the degree ofprecision in the measurement of distance must be higher for firm foods thanfor soft foods because the change in the height of the firm food is less than forsoft food.
Geometry of the Test SpecimenSmall irregularities in the surface of the test product have the potential to givelarge errors in deformation. This is demonstrated in Fig. 4.33, which showsthe deformation curves on vertical cylinders cut from a single frankfurter and
154 Principles of Objective Texture Measurement
Table 4.8 Deformation of Marshmallows
Deformation (mm)
Deforming force (g) A. Soft B. Firm Deformation ratio (A/B)
20 0.80 0.022 3.64100 2.32 0.92 2.52
1000 10.7 6.9 1.555000 18.7 14.9 1.25
Source: Data from Bourne (1967a): reprinted from J. Food Sci. 32, 605, 1967. Copyright byInstitute of Food Technologists.
Chap-04.qxd 1/12/02 7:28 PM Page 154

tested in the Instron. The first curve was obtained on a piece with plane, par-allel ends; the next two curves were obtained on test pieces with plane endsthat were not parallel; and the last curve was obtained on a test piece with oneend curved. The effect of these irregularities in shape is to produce a ‘tail’ atthe low force end of the curve. These tails represent that portion of the defor-mation when less than the complete cross-sectional area of the test piece isbeing compressed. They can introduce large errors into the measurement. Thetest pieces A–D, all cut from the same frankfurter, show deformations of 1.6,
Distance Measuring Instruments 155
Table 4.9 Deformation of Rome Apples When Squeezed
Ratio Force range Deformation of Deformation of Flaccid apple deformation (kg) flaccid apple (mm) firm apple (mm) Firm apple deformation
0–2 2.7 0.85 3.22–4 1.0 0.4 2.54–6 0.7 0.3 2.36–8 0.55 0.3 1.88–10 0.45 0.3 1.5
10–12 0.4 0.3 1.312–14 0.4 0.3 1.314–16 0.3 0.3 1.016–18 0.3 0.3 1.018–20 0.3 0.3 1.0
Source: Data from Bourne (1967b); reprinted with permission of New York State AgriculturalExperiment Station.
00 0 0 01.6
0.05
0.50
1.00
1.05
2.4 3.4 2.5
1.51.51.61.6
A B C D
Shape of test piece:
Forc
e (k
g)
Deformation (mm)
Figure 4.33 Effect ofirregularities in surface of testpiece on deformation test. Notehow the errors are overcome bystarting the deformation a littleabove zero force. (From Bourne,1967a; reprinted from J. Food Sci.3322, 603; copyright by Institute ofFood Technologists.)
Chap-04.qxd 1/12/02 7:28 PM Page 155

2.4, 3.4, and 2.5 mm under a 1 kg deforming force. This source of error can beovercome by measuring the deformation from some reference force level thatis sufficiently above zero to eliminate the effect of the tails. In this case, thedeformations of these four test pieces measured between 0.05 and 1.05 kg are1.6, 1.6, 1.5, and 1.5 mm, which is as uniform as one can expect. Althoughevery care should be taken to minimize the small irregularities at the contactsurfaces, corrections for these irregularities can be made by beginning thedeformation measurements slightly above zero force (Bourne, 1967a).
When the deformation test is performed in a universal testing machine a‘trigger force’ can be installed in the PC program that starts the measurementof compression distance when the trigger force is reached.
For those commodities that give a linear or near-linear force–deformationrelationship (i.e. they obey Hooke’s law), and also for other commodities thatare stressed lightly, it has been shown that the deformation is directly propor-tional to the height of the samples if the cross-sectional area is uniform (e.g.rectangular or circular in cross section).
The equation for Young’s modulus of elasticity (see p. 68) can be rearrangedas follows:
�L � FL/EA (4.24)
Young’s modulus of elasticity E is constant for a given sample; hence, if a con-stant force F is used, the deformation (�L) is directly proportional to theunstressed height L and inversely proportional to the area A. This equation hasbeen confirmed on rectangular solids and upright cylinders cut from agar gels(Brinton and Bourne, 1972).
The deformation of horizontal cylinders of a commodity is inversely andlinearly proportional to the length of the cylinder.
The effect of the changing diameter is more complex. According to Roark(1965), the change in diameter of a horizontal cylinder under compression isgiven by the equation
(4.25)
where D is the diameter; �D, the deformation; P, the force per unit length; v, Poisson’s ratio; E, Young’s modulus; and b, 2.15 (PD/E)½. According to thisequation, the deformation of a horizontal cylinder is the sum of the two terms.The first term P(1� v2)/pE is independent of the diameter and second termis a complex function of the diameter. Experimental data on cylinders of agargels is in general agreement with Eq. (4.25) (Brinton and Bourne, 1972).
The effect of changing the diameter on the deformability of spheres is com-plex because the deformation versus diameter plots are U-shaped. As thediameter increases, the deformation first increases, levels off and thendecreases. The peak deformation is found at smaller diameters as the stiffnessat the gel (concentration of agar) increases. The peak also occurs at smallerdiameters as the deforming force is decreased.
43
� ��
��
D Pv
EP
v
E
DE
P
4
3
14
1
1075
2 2 1 2
1 2
( ) ( )
( )log
( )
.
/
/p pe
156 Principles of Objective Texture Measurement
Chap-04.qxd 1/12/02 7:28 PM Page 156

Figure 4.34 shows that changing the diameter of a sphere can cause thedeformation to increase under some circumstances, and decrease under othercircumstances depending on whether increasing the diameter causes thedeformation to approach the peak or move away from it. The peak deforma-tion appears to be a complex function depending on the rigidity of the gel andthe force of deformation. If a 5% gel deformed between 50 and 200 g force isconsidered typical of the type of test that is commonly applied to whole fruits,it can be seen that there is a comparatively small change in deformability overa wide range of diameters. From 1 cm up to 5 cm diameter, the minimumdeformation is 1.1 mm and the maximum deformation is 1.4 mm. A 500%change in diameter causes a maximum change of about 30% in deformation.Except with small diameter 3% soft gel spheres, the rate of change in defor-mation is comparatively small compared with the change in diameter. Fromthis evidence we draw the tentative conclusion that small changes in diameterwill have only a slight effect on the deformation of a food that is approxi-mately spherical in shape.
According to Hertz theory, the deformation of a rounded specimen com-pressed between parallel plates is given by the equation:
(4.26)EF
DK
R RK
R R�
�� � �
0 338 1 1 1 1 12
3 2 11 1
1 3
22 2
1 2 3 2
. ( )/
/ / /
m �
�
���
�
���
�
��
�
�
��
Distance Measuring Instruments 157
2.5
2.0
1.5
1.0
0.5
00 2 4 6
Diameter (cm)
Def
orm
atio
n (m
m)
3%
5%
Figure 4.34 Effect of diameteron deformation of 5 and 3% agargel spheres illustrated by � and��, respectively. (From Brintonand Bourne, 1972; reprintedfrom J. Texture Studies 33,page 293, with permission fromFood and Nutrition Press.)
Chap-04.qxd 1/12/02 7:28 PM Page 157

where E is the modulus of elasticity; F, force; m, Poisson’s ratio; D, deforma-tion; K1, K2, constants; R1, R1, R2, R2, radii of curvature at contact points.
Equation (4.26) can be rearranged and simplified for the case of flat platescompressing a sphere to give:
(4.27)
This equation predicts an inverse relationship between deformation and radius(deformation � R�1/3). The Hertz theory agrees qualitatively with the experi-mental data for large spheres but it fails to agree for small diameter agar sphereswhere there is a direct relationship between increasing diameter and increas-ing deformation.
Roark (1965) gives the following formula for deformation of a sphere undera flat plate:
(4.28)
where y is the combined deformation of sphere and compressing plate; P, totalload; E, Young’s modulus and D, diameter of sphere. According to this for-mula, the deformation should be proportional to (D)�1/3 which is similar tothe conclusion of the Hertz equation. It should be pointed out that Roark’sequation is intended to be applied to ball bearings and similar objects in whichthe compressing plate and the test sphere presumably have similar mechanicalproperties. The modulus of an agar gel is different from that of the metal com-pression plate by several orders of magnitude. However, Roark’s equation mayapply over a limited range of large diameters for foods.
Real foods of approximate spherical shape such as cherries, apples, onions,tomatoes, and papayas have a far more complex structure than agar gels. AsMorrow and Mohsenin (1966) have pointed out: ‘an intact product such as fruitviolates all fundamental assumptions of homogeneity, isotropy, and continuitythat are normally required in solving elementary materials science problems.’When we add to the complex function between deformation and diameter of auniform material such as an agar gel the additional complexities of the structureof intact foods, the need for additional research, both practical and theoretical,is indicated in order to understand how the diameter affects deformation. It maybe that there is a different relationship for each commodity.
Deformation by AcousticsAnother method of measuring what is, in effect, deformation of a food is anacoustical method. The principle is shown in Fig. 4.35. A sound speaker whichis the driver is placed in contact with a food and caused to produce sound(sonic waves) of constant amplitude which is transmitted into the food. Thefrequency of the vibration is gradually increased from a low to a high value.
yP
E D�155
2
2
1 3
.
/�
�
��
DF
E
k
R�
�0 338 1 2 2 3
1 3
. ( )/
/
m�
���
�
���
158 Principles of Objective Texture Measurement
Driver
Detector
Food
Figure 4.35 Schematic ofacoustic spectrometer methodfor measuring deformability.
Chap-04.qxd 1/12/02 7:28 PM Page 158

A microphone placed in contact with the food at a position 90° to the driveracts as a detector or receiver to pick up the vibrations within the food at eachfrequency. Electronic equipment plots the amplitude of vibration within thefood as a function of the driving frequency. The method has been used forresearch purposes by Abbott et al. (1968a,b), Finney and Norris (1968),Finney et al. (1968, 1978), Finney (1970, 1971a,b,c) and is reviewed by Finney(1972).
A typical curve is shown in Fig. 4.36. The amplitude–frequency relation-ship shows a series of peaks that occur at regular intervals. The first amplitudepeak is called the ‘resonance frequency’ because the natural period of vibra-tion of food is the same as the driver at this frequency. Additional peaks arefound at the first, second, and third harmonics, which are simple multiples ofthe resonance frequency and occur at exactly two times, three times, etc., thefrequency of the resonance frequencies.
If the food is in the shape of a uniform cylinder, Young’s modulus of elasticity can be calculated from the resonance frequency (assuming the foodis elastic, isotropic, homogeneous, and continuous) by means of the followingequation:
E � 4�f 2L2 (4.29)
Distance Measuring Instruments 159
200 400 600 800 1000 2000
Frequency (Hz)
Vibr
atio
n am
plitu
de (
db)
5db
�f
Figure 4.36 A recorder curveshowing amplitude of vibrationof a fruit versus the frequency ofthe input vibration. (From Finneyet al., 1968; reprinted from J. Food Sci. 3322, 643; copyright byInstitute of Food Technologists.)
Chap-04.qxd 1/12/02 7:28 PM Page 159

where E is Young’s modulus of elasticity (dynes per square centimeter); r, the density (grams per cubic centimeter); f, the fundamental longitudinal frequency in hertz (cycles per second); and L, the length of the cylindricalspecimen in centimeters.
Since it is frequently inconvenient and sometimes impossible to cut a uni-form cylinder of tissue, attempts have been made to measure the firmness ofintact units that are approximately spherical in shape. For these cases Finney(1971a) defines a ‘stiffness coefficient’ as f 2m, where f is the resonance fre-quency and m the mass of the article. Cooke (1972) and Cooke and Rand(1973) made a theoretical analysis of the deformation of spheres which indicated that f 2m2/3 should be the mass independent indicator of the shearmodulus rather than f 2m as used by Finney. Clark and Shackelford (1976)used the stiffness modulus f 2m2/3 on peaches with limited success. Abbott et al. (1997) provide a good update of this technique.
Slump TestThe slump test is claimed to have been initially developed to determine theflow properties of freshly mixed concrete (Pashias et al., 1996) but it seemslikely that the principle has been used just as long, or even longer, for foods.The American Society for Testing and Materials publishes a standard methodfor measuring the slump of freshly mixed concrete using the frustum of a cone31 cm high with lower diameter 20 cm and upper diameter 10 cm (ASTM,1990, Method C143-90). It provides an inexpensive, quick, easy and effectiveway to measure the yield stress of high density suspensions. In this test a hol-low cylinder is placed on a horizontal surface, filled level to the top with thefood, then the cylinder is gently removed and the food is allowed to flow out ina horizontal direction under the force of gravity. This is a time-dependent free-surface flow. The profile of the final mound of material as well as the dynam-ics by which the final shape is attained are governed by the rheology. Twomethods are used to measure the degree of slump.
Method 1 is used for stiff foods. It simply measures the height of the sam-ple after a standard time. This is the basis of an official US Department ofAgriculture quality measurement of canned pumpkin pie filling that becameeffective in July 1957 which requires that cans of grade A (US Fancy) pump-kin or squash shall retain not less than 60% of the original height of the con-tainer surface for cans smaller than no. 3 size, and not less than 50% for no. 3size cans and larger when emptied onto a horizontal surface and allowed tostand for two minutes (Fig. 4.37).
Method 2 is used for foods that have a lower yield stress. The diameter ofthe slumped food is measured. This is the basis of the Adams Consistometer,the TUC Cream Corn Meter and the USDA Applesauce Consistometer (seeFig. 5.14, page 224).
Pashias et al. (1996) summarize the theory behind the slump test and notethat it offers a robust and inexpensive method for directly measuring the yieldstresses in the range 30–800 Pa. They derive the following equation that gives
160 Principles of Objective Texture Measurement
Chap-04.qxd 1/12/02 7:28 PM Page 160

a close approximation to the yield stress:
(4.30)
where ty1 is yield stress; s dimensionless slump value, i.e. (original height �
slump height)/original height.Showalter and Christenson (1998) derived the following equation for the
slump test of a Bingham solid:
(4.31)
where s is slump distance (decrease in height); ty, Bingham yield stress; h0, height of unyielded portion after the slump. The prime signs () indicatesthat these are dimensionless numbers. These authors showed that this simpleanalysis mimics the experimental results at least as well as the far moresophisticated finite element solution for yield stress of Bingham materials,such as freshly mixed concrete, mayonnaise and toothpaste.
Omura and Steffe (2001) developed a centrifugal slump test to measure theyield stress of products such as cream cheese, margarine and peanut butterthat are too stiff to flow under gravitational force alone. Cylinders of product1.8-cm diameter � 1.8-cm high were cut with a cork borer and impaled on apin protruding from a 20-cm diameter ring which was spun at speeds ranging
s hh
y� � �� �
1 27
1 10
03
t ln( )
�
�
��
t y s1 1
2
1
2� �
Distance Measuring Instruments 161
Figure 4.37 The slump testperformed on canned pumpkinpie filling. This sample is grade A(US Fancy) because it retainedmore than 60% of its height afterbeing removed from the can.
Chap-04.qxd 1/12/02 7:28 PM Page 161

from 400 to 700 rpm yielding 18–55 g force. The height of the specimens wasmeasured after spinning. The yield stresses calculated from this centrifugalslump test agreed well with values obtained by the vane method.
Two questions that seem not to have been addressed thus far are at whatlevel of yield stress is it advisable to switch from method 1 (measure height)to method 2 (measure diameter) and when does the slump principle becomethe gravity flow principle.
Gravity Current FlowA fluid that is released and allowed to flow under the influence of gravity pri-marily in a horizontal direction over a solid surface or another fluid of higherdensity is called ‘gravity current flow.’ Well-known examples are the spread-ing of an oil slick on the ocean, flow of volcanic lava and the BostwickConsistometer that measures the thickness of tomato purees and similar prod-ucts (Fig. 4.38). Three flow regimes have been identified in gravity currents(McCarthy and Seymour, 1993).
(1) Inertial regime occurs at very short times where the forces of inertiaand gravity predominate.
(2) Viscous regime occurs at intermediate times where flow is determinedby the balance of viscous and gravity forces.
(3) Surface tension regime occurs at long times where viscous forces arebalanced by surface tension forces. The fluid thickness has decreasedso much that gravitational forces play a minor role in the flow.
McCarthy and Seymour (1993) give the following equation for flow in theBostwick Consistometer:
(4.32)
where L is length of gravity current; jy the similarity value which is theoreti-cally 1.41; g, gravitational constant; q, fluid volume per unit width; y, kine-matic viscosity; and t, time. Figure 4.39 plots the distance four Newtonianfluids flow along the trough of the Bostwick Consistometer versus time0.2. Therectilinear relationships shown in this figure demonstrate that the flow offluids in the Bostwick Consistometer can be modeled as a gravity current.
Lgq
t� jy
y
3 1 5
1 5
3
�
�
��⋅
/
/
162 Principles of Objective Texture Measurement
z
x
h
Flow in x-direction (u)
Figure 4.38 Length of gravitycurrent as a function of time andposition. (From McCarthy andSeymour, 1993. J. Texture Studies2244, page 7. Copyright by Foodand Nutrition Press Inc.)
Chap-04.qxd 1/12/02 7:28 PM Page 162

Barringer et al. (1998) confirmed that the Bostwick reading is directly pro-portional to (kinematic viscosity)0.2 and since kinematic viscosity is directlyproportional to time it is equivalent to (time)0.2.
McCarthy and Seymour (1993) conclude that the flow of fluids in theBostwick Consistometer can be modeled as a gravity current, although somemodifications are needed to account for the finite channel width of the apparatus and the non-Newtonian behavior of fruit and vegetable purees.
Area Measuring Instruments
There are probably no true area measuring instruments used in food texturemeasurements. Several consistometers such as the Adams Consistometer, the Cream Corn Meter, and the USDA Standard Consistency Tester (seepage 224) measure the flow of a fluid or semifluid food from a circular con-tainer out across a horizontal plate and the diameter is measured at two pointsat right angles. This is a distance measurement rather than area but is close toarea measuring instruments.
Particle Size DistributionAnalysis of particle size distribution of particulate foods by sieving is prima-rily based on area. Standard woven-wire sieves act as ‘go–no go’ gauges.Particulates with a cross-sectional area less than the screen aperture fallthrough (go) whereas those too large are retained (no go).
Distance Measuring Instruments 163
1.2 1.4 1.6 1.8 2.0 2.2 2.4 2.6
t0.2
0
5
10
15
20
25
30
35
L (c
m)
Corn syrup
Silicone oil 1
Silicone oil 2
Silicone oil 3
Figure 4.39 Experimentalmeasurements of the distancefour Newtonian fluids flow alongthe trough of the BostwickConsistometer versus (time offlow)1/5. (From McCarthy andSeymour, 1993. J. Texture Studies2244, page 8. Copyright by Foodand Nutrition Press Inc.)
Chap-04.qxd 1/12/02 7:28 PM Page 163

Most sieves are made with woven wires and have rectangular apertures. TheAmerican Society for Testing and Materials lists the apertures in the mostwidely used sets of sieves (ASTM Specification E-11-87). The sieve numberis based on the number of wires per linear inch. The number of wires per inchusually increases approximately 1.4-fold for each step which means that thecross-sectional area (aperture) decreases by 2-fold in each step since 1.42 � 2.The normal practice is to nest a series of sieves on top of each other with thecoarsest sieve on top and the finest one at the bottom. The sample is placed onthe top sieve, and the nest is shaken and tapped causing undersize particles tofall through while the rest of the material is held on that screen. Machines areavailable that give a standard shaking and tapping to the nest of sieves. Theamount retained on each sieve is then weighed and expressed as percentageretained on that sieve. For example, the �20# �28# fraction consists of parti-cles that pass through a 20 mesh sieve but are retained on a 28 mesh sieve. Theamount retained can also be expressed on a cumulative basis, that is, the amountretained on one sieve is added to the amount retained on each of the suc-ceeding smaller sieves. A plot of cumulative percentage retained versus thelogarithm of the screen aperture is approximately linear for many products.
The American Society for Agricultural Engineers and the AmericanNational Standards Institute also have specifications for size analysis, butthese standards are directed towards agricultural materials such as grains, hay,and the like, and do not use sieves that are fine enough to discriminate betweenpowdered materials (ANSI/ASAE standard 319.3, July 1997).
A size analysis can be performed on wet foods by washing the productunder a stream of running water. For example, Kimball and Kertesz (1952)washed tomato juices, purees and pastes on a series of five sieves to quantifythe size distribution of the insoluble tomato solids.
For materials that are water soluble it is possible to wet sieve them by usinga fluid other than water. For example, Kean (1958) determined the subsieveparticle size distribution of finely pulverized sugars by suspending the sam-ples in anhydrous isopropyl alcohol.
It is difficult to use sieves for sizing very small particles. Other techniquessuch as sedimentation, sedimentation–photometry, scanning electron micro-scopy, photon correlation spectroscopy, and transmission electron microscopymust then be used. Indirect methods for determining particle size include centrifugation, conductimetric techniques, ultrafiltration, dynamic light scat-tering, single-particle optical sensing, zeta potential, laser diffraction, gassorption and diffusiometric methods (Genovese and Lozano, 2000).
Computer-aided digital image processing techniques now allow one to measurethe size, average size and shape of particles (Tan et al., 1994, 1997; Psotka, 2001).
Volume Measurement
There are a number of useful tests in which a volume measurement is madethat correlates well with some textural property. The volume of a loaf of bread
164 Principles of Objective Texture Measurement
Chap-04.qxd 1/12/02 7:28 PM Page 164

or a cake made from a standard formula by means of displacement of small free-flowing seeds such as caraway seeds is widely used test in the baking industry.Khan and Elahi (1980) report that the maximum volume before collapsing of abatter prepared from wheat flour, baking powder, and water is highly corre-lated with volume and protein content of bread made from that flour. TheSucculometer (Kramer and Smith, 1946) measures the volume of juiceexpressed from sweet corn as a measure of its maturity. The volume of juiceexpressed from various fruits is sometimes used as an index of fruit juiciness.
Many attempts have been made to measure the moistness of meat and fish bymeasuring the volume of fluid expressed under pressure. Child and Baldwell(1934) made a ‘Pressometer’ in which a core of cooked beef or chicken 1.27-cmdiameter and 1.87-cm high was wrapped in filter cloth and subjected to a pres-sure of 250 pounds for 10 min. The loss in weight of the meat was reported aspercent press fluid. Many others have used pressure to measure the amount offluid expressed from meat, poultry and fish including Briskey et al. (1959),Hamm (1960), Dagbjartsson and Solberg (1972), Karmas and Turk (1976) andJauregui et al. (1981). There seems to be no standard procedure for obtainingthe volume to expressed fluid. Zhang et al. (1993) reviewed ten papers pub-lished between 1981 and 1993 and found that the sample size varied from 0.2 to1.5 g, the force from 0.0098 to 57.8 kN and the press time from 0.16 to 20 min.They recommended test conditions of 1 g sample size pressed at 20 kN force for2 min. However, this recommendation has not been implemented (see for exam-ple, Ju and Mittal, 1999; Kerr et al., 2000; Zorrilla et al., 2000).
Lee and Patel (1984) found an inverse relationship between compressionforce on commercial frankfurters and their sensory juiciness. A compressionforce of 181 kg gave a correlation coefficient of r � 0.117 whereas a force of2–3 kg gave a value of r � 0.92 (Table 4.10). Since a force of 2–3 kg is morelikely to be used in the mouth than very high forces, it seems that the use oflow compression forces would likely give a higher correlation with sensoryassessment of juiciness for other meat products.
Lucey et al. (1998) measured the volume of whey separating from yogurtby simply pouring off the free liquid and weighing it. They found this gavebetter results than separating the whey by centrifugation.
Distance Measuring Instruments 165
Table 4.10 Correlation Coefficient Between Sensory Juiciness and Expressible Fluid ofCommercial Frankfurters
Compression Compression Sample Correlationforce (kg) time (s) weight (g) coefficient
181 120 2.0 0.11740 10 0.2 0.2718 60 1.5 0.612–3 17 9–10 0.92
Compiled from data of Lee and Patel (1984).
Chap-04.qxd 1/12/02 7:28 PM Page 165

The US Department of Agriculture standards for canned pumpkin andsquash requires the measurement of the volume of free liquor that separatesafter emptying the can and allowing it to stand for two minutes. For grade A(fancy quality) the volume shall not exceed 10 ml for each 30 oz (0.85 kg) ofproduct and for grade C (standard quality) it cannot exceed 30 ml. The prod-uct is classed as substandard if the volume of free liquor exceeds 30 ml.
Olorunda and Tung (1984) measured the volume of free liquid that sepa-rated from frozen and thawed plantains and reported that it correlated highlywith the degree of cellular damage and texture quality loss.
Time Measuring Instruments
Kinematic viscometers, such as the Ostwald and Zahn measure the time for astandard volume of fluid to flow through a restricted opening. Falling-ball vis-cometers measure the time for a ball to fall a given distance through a liquid.These will be described more fully in the chapter on viscosity.
A few other time measuring instruments are described in the literature. TheGardner Mobilometer measures the time required for a disk and shaft to fall astandard distance through a fluid (Gardner and VanHeuckeroth, 1927). TheBritish Baking and Research Association Biscuit Hardness Tester measuresthe time required for a small circular saw rotating at 15 rpm to cut through a stack of biscuits (Wade, 1968) (see page 226). Rogers and Sanders (1942)describe a method for measuring the firmness of cheese curd that is based onthe time for a cutting head to move a standard distance through the curd undera constant force. Wilder (1947) describes a Fiberometer that measures thetime required to cut across asparagus spears by a 0.041 in.-diam stainless-steelwire under a force of 3 lb.
The Falling Number Method used by the baking industry to determine the a-amylase activity of wheat and rye flours is based on time measurement(Hagberg, 1960, 1961; Perten, 1964, 1967). It measures the time required by a-amylase to liquefy a gelatinized starch paste to a predetermined viscositylevel. The viscosity level is that which allows the stirring rod to fall 70 mm in 1 sunder the influence of gravity. This technique has been adopted as a standardmethod by several countries and by the American Association of Cereal Chemists(No. 56–81A), the International Association of Cereal Chemists (No. 107), andthe International Standardization Organization (ISO/DIS 3093). The apparatusis made by Falling Number AB, Box 32072, S126 11 Stockholm, Sweden.
Work, Energy, and Power MeasuringInstruments
Instruments that use the principle of work and energy are not common.Energy and work both have the dimensions mass � length2 � time�2 which is
166 Principles of Objective Texture Measurement
Chap-04.qxd 1/12/02 7:28 PM Page 166

equivalent to force � distance. Instruments that plot out the force–distancerelationship of a test can provide work functions by measuring the area underthe force–distance curve or by any other technique that gives the force–distance integral. The area under the curve can be obtained by several meth-ods, including (a) measuring the area with a planimeter (convert the areameasurements into work units knowing the force and distance scales); (b) cut-ting out the paper under the curve, weighing it, and converting this into areaknowing the weight of paper per unit area; and (c) counting the number ofsquares on the paper under the curve. Nowadays, computer retrieval offorce–time data is common, and since the computer can be programmed tocalculate force–time integrals and force–distance integrals the measurementof work functions is becoming much more common.
It is important to note that there are two work elements in a compression–decompression cycle. (1) The area under the curve during compression repre-sents the work done on the food by the machine. (2) The area under the curveduring decompression represents the work returned to the machine by the food as it recovers. Generally, the decompression work is small but in theinterest of accuracy it is worth separating these two factors.
The Instron, TA.XT2 Texture Analyzer, the Food Technology Texture TestSystem, and other universal testing machines provide a force–distance curveand hence the area under the curve can be converted into true measurementsof work.
Power is the rate of doing work and has the dimensions mass � length2 �
time�3. A few power measurements have been used. For example, Miyada andTappel (1956) attached a Wattmeter to the electric motor that powered a meatgrinder and, by taking a reading with the meat grinder running empty and thenwith meat being run through at a constant rate, they were able to obtain anindex of the toughness of the meat. Kilborn and Dempster (1965) used a similar principle to measure the power required to knead dough.
Ratio Measuring Techniques
This is not a widely used technique. The numbers obtained are dimension-less since they are derived from the ratio of two measurements of the same variable.
The Texture Profile Analysis parameter of cohesiveness is a ratio becausecohesiveness is defined as
Occasionally relative density correlates with texture. Relative density is thedensity of a product divided by the density of water and is a dimensionlessnumber. For example, La Belle (1964) found that the texture of sour cherries
Ratio Measuring Techniques 167
area under second bite curvearea under first bite curve
Chap-04.qxd 1/12/02 7:28 PM Page 167

and precooked dried beans correlated highly with density. Firm cherries havea low relative density because they do not pack down as much as soft cherries.Precooked dry beans with good texture have a high density because they aresolid whereas those beans that have puffed up during the drying process(butterflied texture) have a much lower relative density. Scott Blair and Coppen(1940) measured the bulk density of cut cheese curd and used this as a texturalindex of the readiness to proceed with the next step in manufacturing. Thespecific gravity of batters has been associated with good volume and texturalquality of baked goods (Funk et al., 1969).
Hoseney et al. (1979) used a ratio method to measure the spreading proper-ties of wheat doughs. A mixed bread dough is mechanically rounded andplaced on a smooth horizontal plate in a fermentation cabinet at 30°C and90% R.H. The dough is unrestrained and is free to spread out under the forceof gravity. The width and height of the dough are measured with calipers every15 min for 1 h. The spread ratio is calculated as width/height. The researchersobtained spread ratios ranging from 1 to 4.
Multiple Variable Instruments
With this class of instrument one variable is measured while several variablesare uncontrolled. The variables may or may not be interrelated and may or maynot be linear. It is usually impossible to establish true dimensional units and toconvert the results from this type of instrument into a conventional system ofmeasurement. Hence it is advisable to avoid using this type of instrument.
An example of this kind of instrument is the Durometer, which was designedto measure the stiffness of rubber but is occasionally used to measure the soft-ness of foods. It consists of a spring-loaded probe that may be hemisphericalor conical in shape that protrudes from an anvil. The probe is pressed onto thefood until the anvil contacts the food, at which time a reading is taken from thedial. At this point the probe has penetrated partly into the food, and partlybackward into the instrument by compressing the spring.
Figure 4.40 shows the relationships of the various parameters involved. Theforce exerted on the food by the probe has a direct linear relationship while the penetration of the probe into the food has an inverse linear relationship to the scale reading. The area and the perimeter have an inverse curvilinearrelationship to the scale reading. It is impossible to convert a Durometer read-ing to any other system of measurement because the force, depth of penetra-tion, area, and perimeter in contact with the food all vary in different ways.Table 4.11 shows the irregular manner in which the various parameters changewith instrument readings.
At high Durometer readings an increasing force is being applied to a dimin-ishing area until, theoretically, at a scale reading of 100, the maximum forceof the spring is being applied to the test material at a point source of zero area;there is zero penetration of the ball into the test material under an infinitely
168 Principles of Objective Texture Measurement
Chap-04.qxd 1/12/02 7:28 PM Page 168

large force per unit area. This characteristic of the instrument explains why theDurometer is unreliable at readings above 80, even when used on rubber.
Chemical Analysis
This indirect method is occasionally used as an index of textural qualities.Several examples are given below.
Alcohol insoluble solids (AIS) is a good index of the maturity and textureof fresh, raw green peas (Kertesz, 1935: Association of Official AnalyticalChemists Method 32.006). This method comprises grinding fresh peas in 80%alcohol in a blender, filtering on a vacuum filter, washing well with 80% alcohol, and drying and weighing the residue. The success of this test dependson the fact that as the peas mature the total solids increase and sugar convertsinto starch. Since starch is insoluble in alcohol, there is a rapid change in AIS as the peas mature.
Chemical Analysis 169
00
0.2
0.4
0.6
0.8
1.0
20 40 60 80 100Durometer scale reading
Frac
tion
of m
axim
um v
alue
Penetration
Area
Force
Penetration
Perimeter
Figure 4.40 Relationshipsbetween force, depth ofpenetration of the ball, area andperimeter of the ball and theDurometer scale reading. (FromBourne and Mondy, 1967;reprinted from Food Technol. 2211,97; copyright by Institute of FoodTechnologists.)
Table 4.11 Relationship Between Durometer Scale and Instrument Variables
Percent of maximum
Durometer scale reading Force Area Penetration depth Perimeter
0 0 100 100 10030 30 91 70 9660 60 64 40 8090 90 18 10 43
100 100 0 0 0
Source: From Bourne and Mondy (1967); reprinted from Food Technol. 21(10), 1388, 1967.Copyright by Institute of Food Technologists.
Chap-04.qxd 1/12/02 7:28 PM Page 169

The 17th edition of ‘Official Methods of Analysis’ published by AOACInternational now designates this test as ‘alcohol precipitate,’ method 924.08(AOAC, 2000).
The pericarp content of sweet corn is a useful index of its maturity (Krameret al., 1949). Corn kernels (100 g) are ground in a blender with water, thenwashed well on a 30-mesh sieve. The starchy endosperm and germ are groundfine enough to pass through the sieve, but the pericarp is sufficiently tough thatit is not chopped fine enough to pass through the screen. After washing thor-oughly, the screen is dried and weighed to give the pericarp content, which isnormally in the range of 1.3–5.2%.
Brovelli et al. (1998) followed the procedure of Kramer et al. (1949) tomeasure the fibrousness of asparagus spears. A 50 g sample of asparagustogether with 420 ml distilled water are microwaved for 8 min in a 600 Wmicrowave oven, blended for 1.5 min. in a Waring Blender, then transferred toa 30 mesh wire screen where it is washed under running water until only fibersremain. After drying for 12 h in a 68°C hot air oven the dry fibers are weighedand expressed as a percentage of the initial 50 g.
Moisture content is sometimes an index of maturity. An example of this issweet corn where a commonly accepted standard is 68%, too tough, over-mature; 68–70%, cream style for canning; 70–76% is whole kernel for canning; 76–78% is suitable for freezing; �78%, too immature.
A chemical index of the amount of collagen in meat performed by deter-mining the hydroxyproline content has been proposed as an index of meattoughness. There is as yet no consensus as to the value of this determinationas an index of meat toughness. The subject was reviewed by Szczesniak andTorgeson (1965).
Miscellaneous Methods
The criteria for inclusion under this heading are (a) that it is an objectivemethod, (b) that the measurement correlates well with texture, and (c) that themethod does not fit into any of the categories described previously.
Optical Methods
The cell fragility method is an optical method that is used to measure thetoughness of fish (Love and Mackay, 1962; Love and Muslemuddin, 1972a,b).In this method a standard weight of fish is homogenized in a blender in a mix-ture of 2% trichloroacetic acid plus 1.2% formaldehyde for a standard timeafter which the optical density is measured. Tender fish grind into a fine stateand give a high optical density whereas tough fish remain as fewer large par-ticles and give a lower optical density. The cell fragility method is reported togive good results for nonfatty fish but less satisfactory results for fatty fish or
170 Principles of Objective Texture Measurement
Chap-04.qxd 1/12/02 7:28 PM Page 170
fish in which advanced bacterial spoilage has occurred. Love (1983) reviewedthis procedure.
Sound
Drake (1963, 1965) analyzed the amplitude and duration of chewing soundsover a wide range of frequencies. This method shows some promise, particularlywith noisy foods, but large variations between sounds generated by differentindividuals complicate the procedure.
Vickers and Bourne (1976a,b) postulated that the property of crispness isprimarily an acoustical sensation that is detected by the ear during the fractur-ing of crisp foods.
Christensen and Vickers (1981) reported that loudness of chewing soundscorrelated highly with sensory crispness and the high correlation was main-tained even when a 100 decibel masking noise was used as an auditory block.Lee et al. (1988) followed the sounds generated during chewing of potatochips and tortilla chips and found that the intensity of a given frequency rangegenerally decreased with consecutive chews, with the higher frequenciesapproaching inaudible levels. Edminster and Vickers (1985) distinguishedbetween crispness and crackliness based on sound analysis and Vickers (1985) reported on how crispiness and crunchiness are related to pitch andloudness. Vickers (1991) wrote a succinct review of sound perception andfood quality.
Dacremont (1995) analyzed the spectral composition of chewing sounds ofeight different foods, and classified items into three classes: (1) crispy foods,such as extruded flat breads, that generate high-pitched sounds with a highlevel of frequencies above 5 kHz; (2) crunchy foods, such as raw carrot, thatgenerate lower pitch sounds with characteristic peaks in the frequency range1.25–2 kHz; (3) crackly foods, such as dry biscuits, that generate low-pitchsounds with a high level of bone conduction.
Brochetti et al. (1992) pointed out that mastication sounds and speechsounds are both produced within the oral cavity and that speech analysis tech-niques such as sound spectrography, oscilloscopic analysis and fast Fouriertransformation would be useful in analyzing mastication sounds.
It seems within the realm of possibility that audiotapes holding expertlycrafted combinations of sound frequencies, loudness and intervals betweensound bursts may one day be used as standards for defining the textural quali-ties of crispness, crunchiness, and crackliness.
Sounds are occasionally used to judge the quality of foods other than crispor crunchy. For example, to judge the quality of watermelon some people layone ear on the skin of the whole melon while rapping their knuckles on it. It isunder ripe if the sound resembles that of tapping your forehead with yourknuckles. If the sound resembles that of rapping your knuckles on the rib cageof your chest it is just right. If it sounds like rapping your knuckles on yourabdomen it is over ripe.
Miscellaneous Methods 171
Chap-04.qxd 1/12/02 7:28 PM Page 171

Ultrasound Tests
The previous section discussed sound analysis within the range of frequenciesheard by the human ear. This section introduces the use of ultrasound withfrequencies higher than can be perceived by the ear (�16 kHz).
The velocity of propagation of a compressional ultrasound wave in a solidmaterial is described by the equation:
(4.33)
where v is velocity of the wave, K is the bulk modulus, G is the rigidity mod-ulus and r is the density of the material. Since a liquid has zero rigidity theequation for a liquid is:
v � (K�r)0.5 (4.34)
Ultrasonic measurements are a nondestructive, noninvasive and nonintrusivetechnique (Povey and McClements, 1988).
Miles et al. (1985) found the speed of 2.5 MHz ultrasonic waves in pig adi-pose tissue explained 88% of the variance in penetrometer measurements offirmness. Nielsen and Martens (1997) reported that ultrasound velocity in car-rots cooked for up to 15 min gave a linear correlation coefficient r � 0.62whereas attenuation measurements gave a correlation of r � 0.52 with Young’smodulus of elasticity. Mulet et al. (1999) found the velocity of 1.0 MHz wavesin cheddar cheese decreased as the cheese was heated and attributed this tochanges in the crystallinity of the fat in the cheese. Mizrach and Flitsanov(1999) reported a second order polynomial coefficient of determination r2 �
0.98 between ultrasonic velocity and firmness measurements on ripening avo-cado fruits. Mizrach et al. (1994) reported a coefficient of determination r2 �
0.999 between firmness and ultrasonic attenuation in melons. Benedito et al.(2000a,b) reported coefficient of determinations between ultrasonic velocityand firmness of Mahon cheese of r2 � 0.81, for elasticity r2 � 0.84. Otherfoods tested by ultrasound include beef (Park et al., 1994); biscuits (cookies)(Povey and Harden, 1981); cheese (Lee et al., 1992) and tofu (Hack et al.,1995). McClements (1997) has reviewed the use of ultrasonics in food testing.
Rollability
Friend et al. (1993) devised a simple semiquantitative method for measuringthe textural quality of tortillas. It consists of wrapping a tortilla around a1.0 cm diameter wooden cylinder (dowel) and then subjectively rating the tor-tilla for cracking and breakage on a five-point scale. The rollability scale is:
1 � no cracking (best quality)2 � signs of cracking but no breaking3 � cracking and breaking beginning on one surface
vK G
��4 3
0 5�
r
��
��
.
172 Principles of Objective Texture Measurement
Chap-04.qxd 1/12/02 7:28 PM Page 172

4 � cracking and breaking imminent on both surfaces5 � unrollable, breaks easily
Using this simple inexpensive device Friend et al. (1993) were able tomeasure the decrease in rollability during storage of tortillas and to identifywhich hydrocolloids were most effective in retaining rollability during stor-age. This test is now widely used to measure the textural quality of tortillas,chapaties and similar products.
Electromyography
Small electrical currents are present in muscles when they contract. By attach-ing electrodes to the skin in the appropriate location it is possible to measurethe electrical activity of muscles that are near the surface of the body. A plotof magnitude of the electrical current versus time is called an electromyogram(EMG). It is a relatively simple method for measuring muscle activity becauseit is not invasive or obtrusive and the attachment of the electrodes to the facedoes not interfere with normal masticatory behavior. The masseter and tem-poralis are two of the major muscles that power mastication and since they liejust under the cheeks their electrical activity is easily reached. Tornberg et al.(1985) were probably the first food scientists to use electromyography. Sakamotoet al. (1989) used EMG to study the chewing pattern of 43 foods and foundthat the chewing energy varied from 3 to 108 for the masseter muscle (closingmouth) and 13 to 154 for the digastric muscle (opening mouth).
Brown (1994) obtained electromyograms from adults who were given gum to chew and found that the results were reproducible for each person and that the EMG patterns were stable over time, but there were significant variationsbetween subjects. However, the subjects in this study reported that electrodesattached to the face did not interfere with normal chewing behavior. Brown et al.(1994a) confirmed that the chewing pattern is stable in each subject for each foodthey chew and they used EMG to measure chewing rate, duration of the chewingsequence, chewing work, manipulation of the bolus, and swallowing events.
Kohyama et al. (1998) used EMG to study the texture of cooked rice andfound that rice with a high amylose content required greater masseter muscleactivity than low amylose rice. The differences between the cultivars weremost strongly evident during the first few chews. Kohyama et al. (2000) foundthat the number of chewing strokes, masticatory time, and total duration ofmastication as measured by electromyography showed a higher correlationwith adhesiveness and stickiness than with hardness. They also found that thedifferences in mastication patterns among the seven subjects studied weregreater than between rice cultivars.
It seems that electromyography is becoming an increasingly useful tool tostudy mastication and texture (Sakamoto et al., 1989; Brown et al., 1994b,1998; Mathevon et al., 1994; Duizer et al., 1996; Mioche and Martin, 1998;Mathoniere et al., 2000; Kemsley et al., 2001).
Miscellaneous Methods 173
Chap-04.qxd 1/12/02 7:28 PM Page 173

Electropalatography
Jack and Gibbon (1995) used the technique of electropalatography (EPG) torecord tongue movement during eating and swallowing and its applicability tostudy differences in texture. For EPG, a thin, custom-made artificial palate isprecisely molded to fit an individual’s hard palate from behind the upper frontteeth to the junction between the soft palate and the hard palate. Embedded inthis artificial palate are 62 electrodes that cover the entire artificial palate.They are arranged in eight rows with eight electrodes in every row except row no. 1 closest to the teeth which has six electrodes. Leadout wires connectthe electrodes to an external processing unit. When the tongue contacts an electrode a signal is sent to the processing unit which records contactsevery 10 ms.
A subject consumed three foods with different textures: (1) low-fat pasteur-ized milk (liquid); (2) yogurt (semisolid); and (3) fruit jelly (gel). Jack andGibbon (1995) divided the contact patterns into three phases: phase 1, anapproach phase when the number of EPG contacts increased; phase 2, a periodof full contact between the tongue and 62 electrodes; phase 3, a release phasewhen the number of contacts decreased. The data showed there is a rollingmovement of the tongue beginning near the teeth, spreading back until all theelectrodes were in contact with the tongue, and then a falling away of thetongue beginning near the teeth and proceeding to the rear of the palate.
Milk required two of these rolling tongue motions to clear it from themouth, yogurt required three, and jelly required up to six rolling cycles, someof which did not give full contact between the tongue and the electrodes.
Multiple-point Sheet Sensor (MSS)
Kohyama and Nishi (1997) tested a procedure developed for occlusal analysison foods. A plastic sheet 5.6 cm � 5.6 cm has printed on it in electrically conductive ink 44 strips in both the x axis and y axis to form a grid of 1936pressure-sensitive points. The maximum pressure limit is 35 kg cm�1. Thegrid is connected to a computer that records the data. Panelists insert the multiple-point sheet sensor in the mouth to cover the lower teeth and thenchew on foods in as normal a manner as possible. The computer printout givesa three-dimensional display of the force at each of the 1936 pressure points. Italso shows changes in pressure and the location of the pressure peaks during mastication. The simultaneous measurement of pressure and its spatial distri-bution provides valuable insights into the process of mastication and how thefood bolus is changing.
Fractal Analysis and Fast Fourier Transform
The force–time plot generated by compression of some foods shows a seriesof steep peaks and dips in rapid succession indicating multiple catastrophic
174 Principles of Objective Texture Measurement
Chap-04.qxd 1/12/02 7:28 PM Page 174

failures. Such a plot is called a ‘noisy record.’An example of a noisy record isshown in Fig. 4.44a, page 181. Noisy plots are commonly found whencrispy–crunchy foods such as prepared dry breakfast cereals are compressed.Deriving useful data from noisy force–time plots was a nearly impossible taskuntil fast computers with appropriate statistical software became available.The algorithm known as Fast Fourier Transform (FFT) seems to be the bestway to filter out noise caused by artifacts in the equipment or procedure and tomeasure the jaggedness of the force–time signature. Professor Peleg at theUniversity of Massachusetts has been leading the development of this tech-nique for foods (Barrett et al., 1992; Peleg, 1993; Rohde et al., 1993; Pelegand Normand, 1995; Ulbricht et al., 1995; Borges and Peleg, 1996) (see alsoBrusewitz et al., 1997 and Norton et al., 1998). This method of analysis ofnoisy data has already been able to characterize the change in texture of dryfracturable foods as their moisture content changes. Fractal analysis of linejaggedness was reviewed by Peleg (1997).
Imperfect Lubricated Squeezing Flow
This test procedure is characterized by an outward and upward flow of a liq-uid or semiliquid in a shallow container when compressed at a constant rateunder a wide plate. It shows promise for measuring the viscous properties ofspreadable foods such as peanut butter and cheese spreads that are difficult tohandle in rotational viscometers. Figure 4.41 explains the principle of lubri-cated squeezing flow where the food is held in a shallow container such as aPetri dish and the diameter of the descending platen is much smaller than thediameter of the container. This geometry avoids some of the problems of test-ing spreadable foods in rotational viscometers including: (1) slip at the wall ofthe rotating member; (2) disruption of the structure caused by transferring intothe viscometer; (3) unknown or variable amount of friction.
Miscellaneous Methods 175
H(t)
F(t)Figure 4.41 The principle ofimperfect lubircated squeezingflow. (From Suwonsichon andPeleg, 1999c. Reprinted from J. Food Engineering 3399, page 218.Copyright 1999 with permissionof Elsevier Science.)
Chap-04.qxd 1/12/02 7:28 PM Page 175

A plot of log (force) versus log (height) becomes linear after several mil-limeters of travel by the descending platen after entry effects have beenpassed. From the slope of the linear section of the force–distance plot one cancalculate the flow behavior index (n) and consistency index (K) of fluids thatfit the power equation.
This procedure requires a thin layer of test material and a wide platen whosediameter is 10-fold to 20-fold greater than the thickness of the sample. Thetheory behind this test was developed by Chatraei et al. (1981), Lee and Peleg(1992) and Damrau and Peleg (1997). The procedure was first used for foodsby Casiraghi et al. (1985) and Bagley et al. (1990). It has been used for tomatoproducts (Lorenzo et al. 1997), peanut butter (Campanella and Peleg, 1987a),tomato ketchup, prepared mustard and mayonnaise (Campanella and Peleg,1987b; Suwonsichon and Peleg 1999c; Corradini et al., 2000), process cheese(Campanella et al., 1987), Ricotta cheese (Suwonsichon and Peleg, 1999a),fresh corn masa (Ramirez-Wong et al., 1996), dulce de leche (Corradini andPeleg, 2000), and yogurt (Suwonsichon and Peleg, 1999b).
Campanella and Peleg (2001) provide a good review of the theory andapplications of squeezing flow viscometry.
Sliding Pin Consistometer (SPC)
Davey (1983) devised a hand-held instrument for measuring the hardness offats that simulates the action of cutting with a knife. A cylinder 3.76-mm longand 0.97-mm diameter is pushed into the fat perpendicular to the surface of thefat. The pin is driven across the fat by a pretensioned spring. When the pin isactuated by a trigger mechanism the time for the spring to move laterally a dis-tance of 16.4 mm is measured electronically. The SPC values on the subcuta-neous adipose of a side of chilled beef were highly correlated with subjectivescores for fat hardness reported by five experienced meat cutters (P 0.001).
Davey and Jones (1985) used the SPC on hard and soft butter, and hard andsoft margarine and reported high correlations with sensory assessment ofhardness and spreadability (r2 � 0.96).
Pendulum Impact Test
Lu et al. (1994) adapted the Izod pendulum test, that is a well-known test formaterials of construction to measure the breaking strength of rape seed pods.A pod is clamped in a vertical position directly under the pivot of a pendulum.A pendulum of adjustable mass and length is pulled back a fixed angle,released, and allowed to strike and break the pod.
The angle the pendulum swings up after the impact is measured by an opti-cal encoder and PC. The rupture energy required to snap the pod is measuredby the reduction in the angle of the upswing after snapping a pod comparedwith the upswing angle when no pod is present. The advantage of this test is
176 Principles of Objective Texture Measurement
Chap-04.qxd 1/12/02 7:28 PM Page 176

that it is dynamic and can achieve rates of loading that are comparable withcommercial handling of produce.
Universal Testing Machines (UTM)
The use of these instruments has become widespread during the last 20 years.Probably, the first UTM dedicated to work with foods was the Instron machinepurchased by the Department of Food Science and Technology, New YorkState Agricultural Experiment Station, Cornell University in 1962. The man-ner in which this strength of materials testing machine was adapted to foods isdescribed by Bourne et al. (1966).
UTMs consist of three essential components:
(1) A drive system that imparts motion to a cross-head that holds part ofthe test cell. The drive system may be double screw, single screw,hydraulic, chain or eccentric and lever system. High-force capacityInstron machines are driven by twin screws and low-force capacitymodels by a single screw. The standard TA.XT2 Texture Analyzer isdriven by a single screw. The Food Technology Corporation TextureTest System is driven hydraulically, the General Foods Texturometer isdriven by an eccentric and lever system and the Lloyd model TA5000is driven by a chain.
(2) Test cells that hold the food and apply force to it. The test cell com-prises two parts. The lower part which is usually stationary is attachedto the base of the machine and supports or contains the food beingtested. The upper part of the test cell is attached to the moving cross-head or arm. Different test cells can be installed that use any test prin-ciple requiring rectilinear movement including puncture, gentlecompression for deformation, major compression for texture profileanalysis, extrusion, cutting–shear, bending–snapping and tensile.
(3) A force measuring and recording system that plots the complete his-tory of the force changes for the duration of the test. The older UTMsuse a strip chart recorder whereas the newer UTMs use a computer toaccumulate both the force–time and force–deformation history anddisplay the result on a video screen.
An advantage of UTMs is that the same basic machine can be configuredfor different kinds of tests. Previously, a new machine had to be purchased forevery different kind of test. Another advantage is that the complete force his-tory is plotted, giving all the changes that occur, including the rate of change(slopes), maximum force (peaks), fracture events (rapid decreases in force),area under the curve (work), and frequently other parameters of interest. Theuse of recorders tends to reduce confidence in the old one-point instrumentsthat measure maximum force only. When a pointer moves over a dial and themaximum force reading is taken, there appears to be an element of certainty
Universal Testing Machines 177
Chap-04.qxd 1/12/02 7:28 PM Page 177

about the results that leads to a feeling of confidence in the instrument. Whenthe same test is repeated in a recording instrument, the maximum force oftenseems to be an arbitrary point to use as an index of textural qualities; there isa loss of confidence in the accuracy of the test and the feeling of infallibilityassociated with some of these simple instruments is lost.
Speed of Data Acquisition
A finite time is required to record the force data generated when foods arecompressed. This was often a serious problem when strip chart recorders wereused. Computer acquisition of force–time data is much faster than strip chartrecorders so problems associated with speed of acquisition of the data are lessfrequent. Nevertheless, even computers take time to record the data and errorscan occur, especially when the force is changing rapidly.
A computer can record information very quickly, store it, then print a graphand calculate numerical results such as means, standard deviations and anyother desired statistical analyses when convenient. Instead of using responsetime, modern electronics and measurement systems are specified by theirbandwidth in Hz. A higher bandwidth equates to a faster response rate. Acommon method to estimate transducer bandwidth is to measure the time inseconds between 10% and 90% points of a step response, then use the follow-ing equation:
transducer channel bandwidth � 0.34�t10–90
From this equation, a strip chart recorder with a 0.5 s response time between 10%and 90% full scale would have an equivalent bandwidth � 0.34/0.5 � 0.68 Hz.A high bandwidth system will record force fluctuations more accurately than alow bandwidth system. When testing foods in which the force changes rapidly(e.g. brittle foods) a high bandwidth system will record significantly higher force values as compared to the same test on a low bandwidth system. Buyers shouldtake bandwidth into account when selecting a test instrument.
The following shortened discussion from the first edition referring to stripchart recorders has been kept in this second edition for three reasons:
(1) Many strip chart recorders are still in use. Most new UTMs have a PCbut some researchers still prefer to use strip chart recorders.
(2) Until about 1990 almost all data were gathered on strip chart recorders.Therefore, in looking at data published before 1990 one should keep inmind the possibility of pen response errors that cause the chart to recordsignificantly lower forces than the true force thus yielding inaccurate data.
(3) Even though computer acquisition of data is fast, time response errorscan still occur. This may become a problem again in the future ashigher compression speeds are used.
The recorders that are customarily used in the food industry measure variablesthat change slowly with time; for example, temperature, gas chromatography,
178 Principles of Objective Texture Measurement
Chap-04.qxd 1/12/02 7:28 PM Page 178
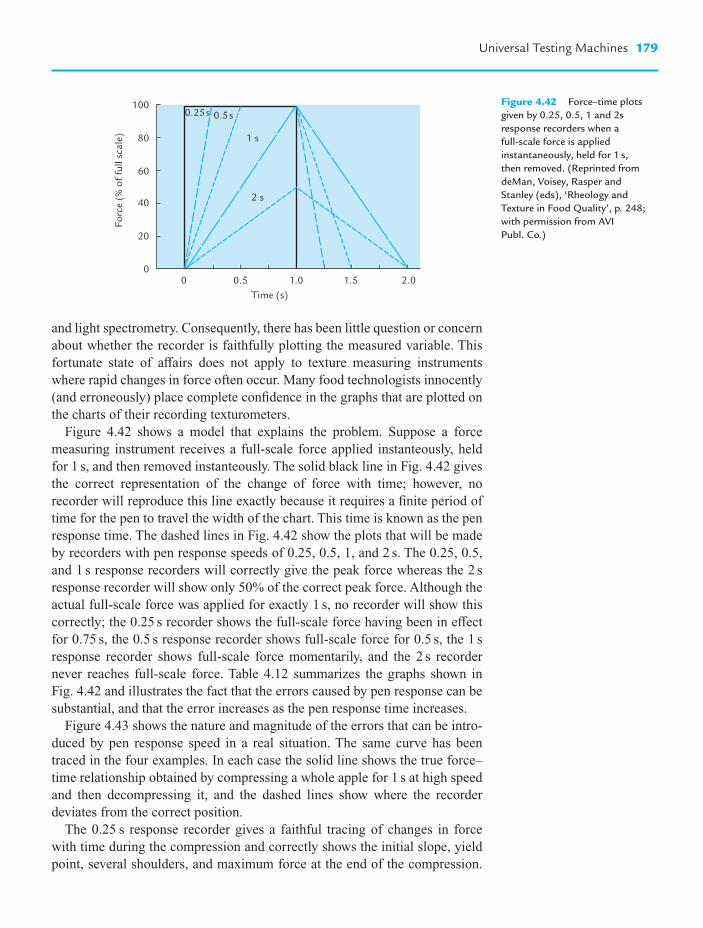
and light spectrometry. Consequently, there has been little question or concernabout whether the recorder is faithfully plotting the measured variable. Thisfortunate state of affairs does not apply to texture measuring instrumentswhere rapid changes in force often occur. Many food technologists innocently(and erroneously) place complete confidence in the graphs that are plotted onthe charts of their recording texturometers.
Figure 4.42 shows a model that explains the problem. Suppose a forcemeasuring instrument receives a full-scale force applied instanteously, heldfor 1 s, and then removed instanteously. The solid black line in Fig. 4.42 givesthe correct representation of the change of force with time; however, norecorder will reproduce this line exactly because it requires a finite period oftime for the pen to travel the width of the chart. This time is known as the penresponse time. The dashed lines in Fig. 4.42 show the plots that will be madeby recorders with pen response speeds of 0.25, 0.5, 1, and 2 s. The 0.25, 0.5,and 1 s response recorders will correctly give the peak force whereas the 2 sresponse recorder will show only 50% of the correct peak force. Although theactual full-scale force was applied for exactly 1 s, no recorder will show thiscorrectly; the 0.25 s recorder shows the full-scale force having been in effectfor 0.75 s, the 0.5 s response recorder shows full-scale force for 0.5 s, the 1 sresponse recorder shows full-scale force momentarily, and the 2 s recordernever reaches full-scale force. Table 4.12 summarizes the graphs shown inFig. 4.42 and illustrates the fact that the errors caused by pen response can besubstantial, and that the error increases as the pen response time increases.
Figure 4.43 shows the nature and magnitude of the errors that can be intro-duced by pen response speed in a real situation. The same curve has beentraced in the four examples. In each case the solid line shows the true force–time relationship obtained by compressing a whole apple for 1 s at high speedand then decompressing it, and the dashed lines show where the recorder deviates from the correct position.
The 0.25 s response recorder gives a faithful tracing of changes in forcewith time during the compression and correctly shows the initial slope, yieldpoint, several shoulders, and maximum force at the end of the compression.
Universal Testing Machines 179
100
80
60
40
20
2 s
1 s
0.25s 0.5s
00 0.5 1.0
Time (s)
Forc
e (%
of f
ull s
cale
)
2.01.5
Figure 4.42 Force–time plotsgiven by 0.25, 0.5, 1 and 2sresponse recorders when a full-scale force is appliedinstantaneously, held for 1 s, then removed. (Reprinted fromdeMan, Voisey, Rasper andStanley (eds), ‘Rheology andTexture in Food Quality’, p. 248;with permission from AVI Publ. Co.)
Chap-04.qxd 1/12/02 7:28 PM Page 179

There is an error during decompression because the force drops to zero almostinstantaneously while the pen arrived at zero about 0.2 s later. The 0.5 s responserecorder gives an incorrect initial slope, misses the abrupt drop in force afterthe yield point, misses the maximum force at the end of the compression by a
180 Principles of Objective Texture Measurement
Table 4.12 Effect of Recorder Response Time on Measurements Obtained from Force–Time Curves a
Pen response time (s)
Parameter Instantaneous 0.25 0.5 1 2
Maximum force 100 100 100 100 50Time to reach maximum force (s) 0 0.25 0.50 1.0 Not reachedTime maximum force is shown (s) 1.0 0.75 0.50 Momentarily Not shownTime some force is shown (s) 1.0 1.25 1.5 2.0 2.0Total area under curve (relative values) 80 80 80 80 40Area under load portion of curve (relative values) 80 70 60 40 20
a Full-scale load applied for 1 s.Source: Bourne (1976); with permission from AVI Publ. Co.
1.6
1.2
0.5s response
Forc
e (k
N)
0.8
0.4
0
Time (s)0 0.5 1.0
1.6
1.2
0.8
0.4
0
0.25s response
Forc
e (k
N)
0 0.5Time (s)
1.0
2s response1.6
1.2
0.8
0.4
0
Forc
e (k
N)
Time (s)0 0.5 1.0 1.5
1s response1.6
1.2
0.8
0.4
0
Forc
e (k
N)
0 0.5Time (s)
1.0 1.5
Figure 4.43 Force–time plotfor a whole apple that is rapidlycompressed in the Instron for 1 sand then decompressed. Thesolid line shows the true force,the dashed line shows error madeby 0.25, 0.5, 1 and 2 s responserecorders. (Reprinted fromdeMan, Voisey, Rasper andStanley (eds), ‘Rheology andTexture in Food Quality’, p. 250;with permission from AVI Publ. Co.)
Chap-04.qxd 1/12/02 7:28 PM Page 180

large margin, and shows a larger decompression area than the 0.25 s responserecorder. It does provide an accurate record of the peaks and shoulders in thecurve from about 0.2 to 0.8 s.
The 1 s response recorder shows an even greater error in the initial slope,maximum force, and decompression, and also fails to record the large shoul-der at 0.8 s. The 2 s response recorder grossly misrepresents the record, asidefrom showing the trough at 0.5 s for a short period. The evidence in this figureshould shatter any feelings of infallibility of recorders and should make everytexture technologist aware of the necessity of always being alert to the possi-bility of errors in the trace the pen makes on the chart.
Occasionally a high-speed recorder is a liability instead of an asset. Voisey(1971a) gave an example of this by attaching a recorder to a Mixograph tomeasure the changes in torque as a wheat dough was kneaded. Figure 4.44ashows the plot obtained with a 0.2 s response recorder. This recorder shows therapid fluctuations from moment to moment in such detail that it is difficult tosee the trend over a period of some minutes. Figure 4.44b shows the same testrepeated with a 12 s response recorder. The momentary fluctuations are lost butthe slow development of dough strength is shown more clearly. Also, the torquescale was reduced from 160 cm kg for the 0.2 s recorder to 40 cm kg for the 12 srecorder, spreading the development curve more fully across the chart. Thepoint of this example is that the recorder’s behavior in any instrument shouldnot be taken for granted but should be selected to give the type and quality ofplots that are best suited to the requirements of each particular experiment.
The important point is whether the rate of change of force occurs more orless rapidly than the ability of the pen to keep up with this rate of change.Figure 4.45 shows the curves that result from compressing a corn curl (a rigidfood) and a cube of cream cheese (a nonrigid food) under identical conditions.The 1 s recorder gives an accurate plot for the cheese, which exhibits a slowrate of change in force, but the same recorder gives an inaccurate trace for the
Universal Testing Machines 181
Time (min)
160
140
120
Mix
ing
torq
ue (
cm k
g)
Mix
ing
torq
ue (
cm k
g)
100
80
60
40
20
0
40ba
35
30
25
20
15
10
5
0
0 1 2 3 4 5 6 7 0 1 2 3 4 5 6
Figure 4.44 Mixing torqueversus time for the Mixograph:(a) 0.2 s response recorder; (b)12 s response recorder. (Courtesyof P. W. Voisey; reprinted from J. Texture Studies, with permissionfrom Food and Nutrition Press.)
Chap-04.qxd 1/12/02 7:28 PM Page 181

corn curl, which undergoes rapid force changes. The critical factor is the rateof change of force in the specimen compared to the maximum rate of changethat the recorder can accurately reproduce. Foods that give slow changes inforce when compressed can tolerate slower response recorders or higher com-pression speeds than foods that give rapid changes in force.
The force–time plots produced by recording texturometers are generallycurved. Straight-line portions are usually of short duration. Whenever onesees long straight lines of uniform slope on the chart or screen one should suspect that perhaps pen response speed is being plotted rather than the truechanges in force. After observing the straight-line portions and the true force–time plots in Figs 4.43 and 4.45 one should become suspicious when extensivestraight lines of standard slope are seen on their force–time plots. One shouldalso become suspicious when the tops of isosceles triangles with a constantpeak angle are seen.
The author has observed laboratories where months or years of data werefound to be worthless because the recorder response lagged behind the trueforces that were generated, and the discrepancy was never recognized.
Most recorder manufacturers will provide the stated pen response speed of their recorder. The pen response speed can be checked in the laboratory asfollows: set the chart running at the maximum speed and then instantaneouslyapply a full-scale force to the load cell, leave it there for a second or two andthen instantaneously remove it. The slope of the force–time line divided by thespeed of travel of the chart will give the pen response time of that recorder.
Texture Profile Analysis (TPA)
A group at the General Foods Corporation Technical Center pioneered the testthat compresses a bite-size piece of food two times in a reciprocating motion
182 Principles of Objective Texture Measurement
Time (s) Time (s)
Forc
e
Forc
e
a bFigure 4.45 Force–time plotfor (a) a rigid food (corn curl)and (b) a soft food (creamcheese) compressed at the samerate in the Instron. The solid lineshows the true force and thedashed lines show the errorsmade by a 1 s response recorder.(Reprinted from deMan, Voisey,Rasper and Stanley (eds),‘Rheology and Texture in FoodQuality’, p. 255; with permissionfrom AVI Publ. Co.)
Chap-04.qxd 1/12/02 7:28 PM Page 182

that imitates the action of the jaw, and extracted from the resulting force–timecurve a number of textural parameters that correlate well with sensory evalu-ation of those parameters (Friedman et al., 1963; Szczesniak et al., 1963). Theinstrument devised especially for this purpose is the General FoodsTexturometer.
The principle of the TPA test is illustrated in Fig. 4.46: A ‘bite-size’ sampleof food of standard size and shape is placed on the baseplate and compressedand decompressed two times by a platen attached to the drive system. To imitate the chewing action of the teeth there should be a high compression.The author usually uses a 90% compression when performing TPA tests in his laboratory. Figure 4.47 shows a typical TPA curve generated by the G. F. Texturometer. The height of the force peak on the first compression cycle(first bite) was defined as hardness; in Fig. 4.47, A is the beginning of the firstcompression and B is the beginning of the second compression. Fracturability(originally called brittleness) was defined as the force of the significant breakin the curve on the first bite (shown as a dashed line in Fig. 4.47). The ratio of the positive force areas under the first and second compressions (A2/A1)was defined as cohesiveness. The negative force area of the first bite (A3)
Texture Profile Analysis 183
Moving platen
Food sample
Base
a b
a b
Second bite
First bite
Figure 4.46 Schematicdiagram of the two compressionsrequired for the texture profileanalysis test. (a) Downstrokeactions during the first andsecond bites; (b) upstrokeactions during the first andsecond bites.
Chap-04.qxd 1/12/02 7:28 PM Page 183

represented the work necessary to pull the compressing plunger away from thesample and was defined as adhesiveness. The distance that the food recoveredits height during the time that elapsed between the end of the first bite and thestart of the second bite (BC) was defined as springiness (originally called elas-ticity). Two other parameters were derived by calculation from the measuredparameters: gumminess was defined as the product of hardness � cohesive-ness; chewiness was defined as the product of gumminess � springiness(which is hardness � cohesiveness � springiness). Szczesniak (1975b) gave anupdated account of the development and changes in the technique since 1963.
In the original description of TPA chewiness was defined as the energyrequired to masticate a solid food product and gumminess as the energyrequired to disintegrate a semisolid food to a state of readiness for swallowing.Szczesniak (1995) pointed out that the distinction has often been overlookedthat gumminess and chewiness are mutually exclusive. Therefore, in reportingTPA measurements one should report either chewiness values, or gumminessvalues but not both for the same food.
The texture parameters identified by the General Foods group gave excellentcorrelations with sensory ratings (Szczesniak et al., 1963). Figure 4.48 showsthe correlation for the hardness scale. High correlations between sensory andinstrument measurements were obtained for the other texture parameters.
The Instron, TA.XT2 Texture Analyzer and some other universal testingmachines have been adapted to perform a modified texture profile analysis(Bourne, 1968, 1974). A typical Instron TPA curve is shown in Fig. 4.49.Bourne closely followed the interpretation of Friedman et al. (1963) with oneexception: instead of measuring the total areas under the curves to obtaincohesiveness, he measured the areas under the compression portion only andexcluded the areas under the decompression portions.
A typical TPA curve obtained in the Instron differs in several major respectsfrom that obtained by the GF Texturometer. This can be seen by comparingFigs 4.47 and 4.49. The Intron curves show sharp peaks at the end of each
184 Principles of Objective Texture Measurement
A1
0
A3
A2
A CB
Time
Fracturability Hardness
Forc
e
Figure 4.47 A typical GFTexturometer curve (slightlyaltered). (Courtesy ofDr A. S. Szczesniak withpermission.)
Chap-04.qxd 1/12/02 7:28 PM Page 184

compression while the GF Texturometer shows rounded peaks. These differencesarise from differences in instrument construction and operation. The GF Tex-turometer is driven by means of an eccentric rotating at constant speed andimparting a sinusoidal speed to the compressing mechanism, while the Instronis driven at constant speed. The GF Texturometer decelerates as it approachesthe end of the compression stroke, momentarily stops, and then slowly accel-erates again as it makes the upward stroke. In contrast, the Instron approachesthe end of the compression stroke at constant speed, abruptly reverses direction,
Texture Profile Analysis 185
Sensory rating
Text
urom
eter
uni
ts
300
Hardness scale
200
100
00 2 4 6 8
Figure 4.48 Correlationbetween sensory evaluation andGF Texturometer for hardness ofnine selected foods. (Courtesy ofDr A. S. Szczesniak; reprintedfrom J. Food Sci. 2288, 401, 1963;copyright by Institute of FoodTechnologists.)
Forc
e
Time
Area 1
Area 2
Area 3
Adhesive force
Stringiness
Fracturability
Downstroke DownstrokeUpstrokeHardness 1
Hardness 2
UpstrokeFirst bite Second bite
Springiness0
Figure 4.49 A generalizedtexture profile analysis curveobtained from the InstronUniversal Testing Machine.(Reprinted from Food Technol. 3322,63, 1978; copyright by Instituteof Food Technologists.)
Chap-04.qxd 1/12/02 7:28 PM Page 185

and performs the upward stroke at constant speed. The constant speed of theInstron versus the continuously changing speed of the GF Texturometer largelyaccounts for the sharp peaks in the Instron in contrast to the rounded peaks ofthe Texturometer.
Another difference is that the supporting platform of the GF Texturometeris flexible; it bends a little as the load is applied. The Instron is so rigid thatbending of the instrument can be ignored. Yet another difference is that thecompressing plate of the Texturometer moves in the arc of a circle, whereas inthe Instron it moves rectilinearly. These three factors taken together accountfor the differences in the TPA curves obtained by the GF Texturometer and theInstron.
Since the Instron gives both a force–time and force–distance curve, the TPAparameters obtained from it can be given dimensions, which are listed inTable 4.13.
Henry et al. (1971) provided a more detailed analysis of the adhesivenessportion of texture profile curve for semisolid foods such as custard, puddings,and whipped toppings. In addition to measuring the area of the adhesivenesscurve they measured its maximum force (symbolized by Fa to denote firmnessunder tension), the recovery in the adhesion portion between the first and sec-ond compressions (Ea to denote elastic recovery under tension), and the ratioof the two adhesion areas (Ca to denote cohesiveness under tension). They cal-culated gumminess under tension (Cha � Fa � Ca � Ea). They also measuredthe property of stringiness (or, inversely, shortness) as the distance the productwas extended during decompression before breaking off (Henry and Katz,1969). Their experiments showed that eight of these parameters accounted formore than 90% of the variation of four sensory factors.
Reports on the Texture Profile Analysis of a number of commodities haveappeared in the literature with some variations on the main themes describedabove. Breene (1975) gave a complete review of this area.
186 Principles of Objective Texture Measurement
Table 4.13 Dimensional Analysis of TPA Parameters a
Mechanical Measured Dimensions of parameter variable measured variable
Hardness Force mlt�2
Cohesiveness Ratio DimensionlessSpringiness Distance lAdhesiveness Work ml2t�2
Fracturability (brittleness) Force mlt�2
Chewiness Work ml2t�2
Gumminess Force mlt�2
Source: Bourne (1966a). Note: This table was incorrectly presented in the original publication.The correct table was published in J. Food Sci. 32, 154, 1967. Copyright by Institute of FoodTechnologists.
Chap-04.qxd 1/12/02 7:28 PM Page 186

Accuracy and Precision of Measurement
It is important to distinguish between accuracy of measurement and precisionof measurement. Accuracy means how closely the measured value comes tothe true value. Precision means how many significant figures are used toexpress the measurement. A nonfood example of the difference between accu-racy and precision follows.
The posted air distance between New York’s Kennedy Airport and London’sHeathrow Airport is 3452 miles. This number, 3452, is accurate and carries ajustifiable degree of precision of four significant figures. When the distance isstated in sequence as:
3452 miles3453 miles3462 miles3552 miles4452 miles
the degree of precision is maintained but the degree of accuracy is degraded ateach step in the series because the error becomes greater each time the erro-neous digit is moved one place to the left.
When the distance is stated in sequence as:
3452 miles3450 miles3500 miles3000 miles
the number is accurate in each step, but the degree of precision is degrading ineach step because there are fewer significant numbers.
One must be alert to expressing measurements to a degree of precision thatcannot be justified by the measuring technique. Continuing with the aboveexample, the distance from New York to London is 3452 miles. Conversiontables state 1 mile � 1.609344 km. Therefore, the distance from New York toLondon can be recalculated as:
3452 miles � 1.609344 � 5555.455488 km
This value is accurate but is given with an unwarranted degree of precisionbecause the expressed value of any quantity should not be given to a greaterdegree of precision than is obtained by the original measurement. In this case,the distance in miles is given to four significant figures (3452 miles). Henceafter converting into kilometers the result cannot be given to more than foursignificant figures (5555 km). Every number after four significant figure isworthless because there is no way to determine whether or not it is correct.
The accuracy of the force measuring system in most universal testingmachines is stated to be 0.5% of the full-scale force. Hence, force measure-ments, and measurements containing a force element (e.g. work) cannot be
Accuracy and Precision of Measurement 187
Chap-04.qxd 1/12/02 7:28 PM Page 187

listed to more than two significant figures from a single measurement, or morethan three significant figures when the mean of several replicate tests isreported. Many UTMs that have a computer readout of force list the force tofive or more significant figures. In such cases it must be remembered that anynumbers past three figures are fictitious and should not be used when report-ing the results of the test.
188 Principles of Objective Texture Measurement
Chap-04.qxd 1/12/02 7:28 PM Page 188

Practice of ObjectiveTexture Measurement
Introduction
This chapter discusses the major commercially available texture measuringinstruments that are available at the present time. The principles on whichthese instruments operate were discussed in the previous chapter. The order inwhich the instruments are described will follow the same sequence as used inthe previous chapter. Appendix I lists the suppliers of these instruments, towhom inquiries for further information and prices should be sent.
Several instruments that are no longer commercially available are described.This is because a considerable amount of data generated by these instrumentshas been published and a brief summary will give the reader a better under-standing of the significance and meaning of the published data.
Force Measuring Instruments
Hand-Operated Puncture Testers
These testers are derived from the improved type of pressure tester developedby Magness and Taylor (1925). These are frequently called ‘pressure testers’but a better description would be to class them as ‘puncture testers.’ Table 5.1lists the specifications of these puncture testers and Fig. 5.1 shows some of the instruments. All these instruments use a spring to measure applied forcewith an indicator to show the maximum test force. This class of instrument is widely used to measure the firmness of fruits and some vegetables.
The Ballauf Company makes two testers, one with a 30-lb spring for firmerproducts and the other with a 10-lb spring. Two punches are provided: 7/16 in.and 5/16 in. diam. The punches have a rounded face and an inscribed line 5/16 in. back from the front end of the punch, indicating the depth to which it
C H A P T E R
5
Chap-05.qxd 1/12/02 10:39 AM Page 189

should be pressed into the test sample. A splash collar prevents juice fromrunning back along the shaft.
Chatillon makes two series of testers. The 719 series covers force ranges of 5, 10, 20, and 40 lb and provides 7/16- and 5/16-in.-diam punches. Thesehave a flat face, there is no inscribed line indicating how far the punch shouldpenetrate into the test sample, and there is no splash collar. The Chatillon 516 series are smaller, lighter instruments with force ranges of 500 and 1000 g.
190 Practice of Objective Texture Measurement
Table 5.1 Specifications of Hand-operated Puncture Testers
Force Plunger travel Punch Instrumentfull scale �� to full scale
Manufacturer graduations force (cm) Diam (in.) Face Length (cm) Weight (g)
Ballauf Co. 30 � 1 lb 13 7/16, 5/16 Rounded 52 700Ballauf Co. 10 � 1/2 lb 13 7/16, 5/16 Rounded 44 530Chatillon 719-40 MRPFR 40 � 1/2 lb 10 7/16, 5/16 Flat 50 500
18 kg � 200 gChatillon 719-20 MRPFR 20 � 1/4 lb 10 7/16, 5/16 Flat 50 450Chatillon 719-10 MRPFR 10 lb � 2 oz 10 7/16, 5/16 Flat 50 420
4.5 kg � 50 gChatillon 719-5 MRPFR 5 lb � 1 oz 10 7/16, 5/16 Flat 50 400
2.2 kg � 50 gChatillon 516-1000 MRPFR 1000 � 10 g 10 0.026, 0.032, Flat 46 180
2 lb � 1/2 oz 0.046, 0.058,0.063
Chatillon 516-500 MRPFR 500 � 5 g 10 0.026, 0.032, Flat 44 1801 lb � 1/4 oz 0.0468, 0.058,
0.063Effi-Gi 12 � 1/4 kg 2 7/16, 5/16 Rounded 13 170
5 � 0.1 kg
FFiigguurree 55..11 Hand-operatedpuncture testers of theMagness–Taylor type. From thebottom up: 30-lb Ballauf with7/16-in.-diam punch, 10-lbBallauf with 5/16-in.-diampunch, 40-lb Chatillon with7/16-in.-diam punch, 20-lbChatillon with 5/16-in.-diampunch, 1000 g Chatillon with0.058-in.-diam punch, and Effi-Gi with 7/16-in.-diampunch.
Chap-05.qxd 1/12/02 10:39 AM Page 190

A small chuck at the end of the shaft is used to hold one of the five punchesthat range from 0.026 to 0.063 in. diam.
The Effi-Gi is the smallest and lightest instrument and most convenient tohandle. It has a dial force gauge and uses the same punches as the Ballauf; 5-kg and 12-kg force scales are available.
The testers are held in one hand, the punch is placed against the sample tobe tested (most commonly a fruit), and steadily increasing force is applieduntil the punch penetrates to the inscribed line. The operator has to decide howfar to make the punch penetrate for those punches that have no inscribed lines.The maximum test force is recorded by a pointer on the force gauge. Thepointer must be returned to zero after each test.
The manner in which these hand gauges are operated affects the readingsthat are obtained. Therefore, it is mandatory to use a standard method to oper-ate this class of instrument. Table 5.2 lists the operating rules that have beendevised in our laboratory.
The springs of these instruments should be calibrated regularly to ensurethat they are giving the correct force readings. The Ballauf instrument is cali-brated by placing the tester vertically on weight scales with the punch down,
Force Measuring Instruments 191
Table 5.2 Operating Rules for Use of a Hand-operated Puncture Tester on Fruits andVegetables
Remove skin from test site (unless it has been shown the skin does not affect the result).
Hold food in one hand against a rigid vertical surface such as a wall, tree trunk, or heavybench. Keep test surface perpendicular to the punch face.
Hold puncture tester in the other hand with the side of the hand resting on the hip and steadily‘lean into’ the tester with hip; this gives a more even rate of force application than pushingwith the arm. Tester must be in a horizontal plane. Erratic motions due to lack of firm support,and pushing with the hand only can cause jerky movement which may cause spuriously highreadings. Since these are maximum force instruments a momentarily high force will berecorded as the test force.
When penetration begins, the operator should pause momentarily in increasing the appliedforce. Penetration will continue at constant force and approximate constant speed with type Bproducts (see Fig. 5.2, page 193). In type C products the punch will accelerate into the fleshpast the inscribed line. The penetration will stop for the type A products even though the forceis maintained; the force is now increased in small increments with a pause between each increment in order to allow the punch to penetrate as far as possible at that force; continueuntil tip penetrates to the inscribed line.
Use a constant diameter punch for any series of tests. If necessary, change to another instrument with a different force spring to cover the force range but do not change the punchdiameter during the experiment.
Do not test near the edge of the test sample. If the edge cracks or splits during a test the resultshould be rejected. This problem can be overcome by testing farther away from the edge orusing a smaller diameter punch.
It is customary to use at least 20–30 fruits per test to obtain representative data. Two readingsare usually made on each fruit: on opposite sides midway between the stem and the blossomends, and away from the suture line.
Source: From Bourne (1979b); with permission from Academic Press Inc. (London) Ltd.
Chap-05.qxd 1/12/02 10:39 AM Page 191

applying force steadily until a given force is registered on the scale, thenreleasing the force and taking the reading on the Ballauf instrument. Continuein this way increasing the force in increments of 10% of the range up to theforce range of the instrument. The weight of the shaft assembly to which the punch is attached must be subtracted from the instrument reading for comparison with the spring balance reading. The shaft assembly in the 30-lbinstrument weighs approximately 300 g (10 oz) and the shaft assembly in the 10-lb instrument weighs approximately 200 g (7 oz). The Ballauf Co. willrecalibrate their instruments at the factory for a nominal fee. These instru-ments can also be calibrated in a universal testing machine.
The vertical calibration method described in the previous paragraph com-pares the instrument spring force plus the mass of the shaft assembly againsta scale reading. There is, therefore, a positive constant error equal to the massof the rod in the calibration readings that must be subtracted. When the instru-ment is used in the normal horizontal operating position, the mass of the shaftassembly no longer affects the reading.
The Effi-Gi is calibrated in the same way as the Ballauf. The zero is adjustedby adding or removing shims to the inside of the instrument.
The Chatillon pressure testers have a knurled knob at the end of barrel near-est the pressure tip. Rotating this knob adjusts the zero point. The zero readingshould be checked while holding the instrument horizontal before each use andadjusted to the correct value. Once this adjustment has been made the knurledring should not be moved. This instrument has a hook at the top end that can beused for measuring tensile forces. To calibrate, the instrument is held in a vertical position with the tip upward, the knurled ring is adjusted to account forthe weight of the shaft to bring the indicator to the zero point, and then weightsare hung on the hook to increase the force applied in suitable increments.
Voisey (1977a) studied the static and dynamic calibration of the Ballauf andEffi-Gi testers by mounting them in the Instron and found that the primarysource of differences between instrument readings was systematic calibrationerrors. These can be corrected. Voisey (1977a) recommended dynamic cali-bration because this simulates the actual operation of the instrument. He alsosuggested that differences between operators could be reduced by trainingoperators to achieve a constant rate of force increase.
These instruments are widely used in the horticultural industry for measur-ing the firmness of fruits and some vegetables, but they could quite well beused for a number of other foods. Ballauf units are operated by holding onehand over the smooth end of the tester. The Chatillon instrument must be heldby the body because of the tension hook protruding from the top. This posesno problem for the lower force ranges but for the 40-lb instrument the bodymust be grasped very tightly to supply sufficient force to prevent the bodyfrom slipping through the hand. A complete set of Chatillon instruments is aneconomical method for obtaining a wide range of forces and a wide range oftip diameters. The Effi-Gi is the most compact of the instruments and can becarried in a pocket. The rounded dial fits comfortably between the forefinger
192 Practice of Objective Texture Measurement
Chap-05.qxd 1/12/02 10:39 AM Page 192

and the thumb. The spring on the Ballauf and Chatillon testers needs to becompressed a long distance to reach full-scale force, whereas on the Effi-Githe distance is much less (Table 5.1). This makes a difference when perform-ing a large number of tests because the amount of work (force � distance)required to operate the Effi-Gi on similar foods is about one fifth that for theother testers that cover the same force range.
A person using these instruments for the first time may be perplexed by thedifferent ways in which these puncture testers handle. Sometimes the punchcan be pushed into the commodity smoothly and gently, making it easy to control the depth of penetration. At other times the punch tends to penetratewith less control, and with some foods it suddenly plunges in past the inscribedline. The punches from these instruments have been mounted in an Instron test-ing machine, which automatically records the complete history of the forcechanges that occur during tests (Bourne, 1965a; Voisey, 1977a). These studieshave thrown considerable light on the performance of the hand puncture testersand on how they should be used. Figure 5.2 shows the three basic types ofcurves that are obtained with horticultural products. In each case there is an initial rapid rise in force over a short distance as the punch moves onto the sample. During this stage the sample is deforming under the applied force; thereis no puncturing of the tissues. This stage ends abruptly when the punch beginsto penetrate into the food, which event is represented by the sudden change inslope called the ‘yield point’ or sometimes ‘bioyield point.’ The yield pointoccurs when the punch begins to penetrate into the food, causing irreversiblecrushing. The third phase of the puncture test, namely, the direction of the forcechange after the yield point and during penetration of the punch into the food,separates the puncture curves into three types: type A, the force continues toincrease after the yield point; type B, the force is approximately constant afterthe yield point; type C, the force decreases after the yield point.
Force Measuring Instruments 193
0
2
4
6
0 2
A B C
YP
YP
YP
MT
MT
MT
0 2
Distance (cm)
Forc
e (k
g)
0 2
FFiigguurree 55..22 Characteristicforce–distance curves obtained bymounting the 5/16-in.-diam punchof the Ballauf tester in the Instron.YP is the yield point and MT theforce reading that would have beenobtained on a hand-operatedpuncture tester. The dotted verticallines represent the depth ofpenetration to the 5/16-in.inscribed line on the pressure tip.(From Bourne, 1965a; reprintedfrom Food Technol. 1199, 414, 1965.Copyright by Institute of FoodTechnologists.)
Chap-05.qxd 1/12/02 10:39 AM Page 193
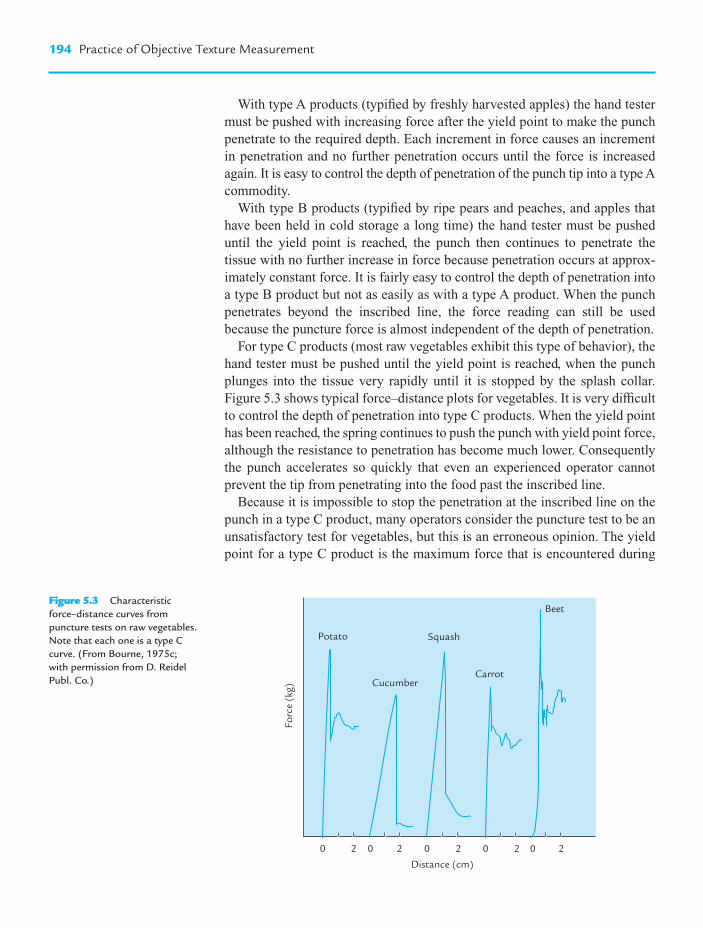
With type A products (typified by freshly harvested apples) the hand testermust be pushed with increasing force after the yield point to make the punchpenetrate to the required depth. Each increment in force causes an incrementin penetration and no further penetration occurs until the force is increasedagain. It is easy to control the depth of penetration of the punch tip into a type Acommodity.
With type B products (typified by ripe pears and peaches, and apples thathave been held in cold storage a long time) the hand tester must be pusheduntil the yield point is reached, the punch then continues to penetrate the tissue with no further increase in force because penetration occurs at approx-imately constant force. It is fairly easy to control the depth of penetration intoa type B product but not as easily as with a type A product. When the punchpenetrates beyond the inscribed line, the force reading can still be usedbecause the puncture force is almost independent of the depth of penetration.
For type C products (most raw vegetables exhibit this type of behavior), thehand tester must be pushed until the yield point is reached, when the punchplunges into the tissue very rapidly until it is stopped by the splash collar.Figure 5.3 shows typical force–distance plots for vegetables. It is very difficultto control the depth of penetration into type C products. When the yield pointhas been reached, the spring continues to push the punch with yield point force,although the resistance to penetration has become much lower. Consequentlythe punch accelerates so quickly that even an experienced operator cannot prevent the tip from penetrating into the food past the inscribed line.
Because it is impossible to stop the penetration at the inscribed line on thepunch in a type C product, many operators consider the puncture test to be anunsatisfactory test for vegetables, but this is an erroneous opinion. The yieldpoint for a type C product is the maximum force that is encountered during
194 Practice of Objective Texture Measurement
0 02 2 0 0 02
Distance (cm)
Forc
e (k
g)
Potato
Cucumber
Squash
Carrot
Beet
2 2
FFiigguurree 55..33 Characteristicforce–distance curves frompuncture tests on raw vegetables.Note that each one is a type Ccurve. (From Bourne, 1975c;with permission from D. ReidelPubl. Co.)
Chap-05.qxd 1/12/02 10:39 AM Page 194

the test. Since the hand tester uses a maximum force reading dial, it will readthe yield point (maximum force) correctly, even though the penetration goes beyond the inscribed line, provided that the test is performed correctly.Therefore, the hand puncture test can be a useful test on raw vegetables andother products that behave in this manner. Table 5.3 shows data in which thepuncture test was performed using the same punches in the Effi-Gi puncturetester and in the Instron; the hand tester gives the correct measurement of theyield point of vegetables (within the limits of experimental error), althoughthe punch penetrated up to the splash collar in every test.
There has been considerable discussion as to whether the skin should or should not be removed at the puncture test site. Figure 5.4, which is a
Force Measuring Instruments 195
Table 5.3 Comparison of Puncture Test by Hand Tester and Instron
Commodity Hand testera mean force (kg) Instronb mean force (kg)
Irish potatoes 10.76 10.86Summer squash 9.78 9.50Beets 12.23 12.59
Source: From Bourne (1975c); with permission from D. Reidel Publ. Co. 5/16-in.-diam punch;mean of 25 punches.aEffi-Gi tester, 5/16-in.-diam tip, operated by hand, read dial force.b5/16-in.-diam tip mounted in Instron, read off yield point.
No skin
Type
ATy
pe B
Type
C
YP MT
YP MT
YP MT YP MT YP MT YP MT
YP MT YP MT YP MT
YP MT YP MT YP MT
Soft skin Medium skin Tough skin
00
0
0
0 0 0
Forc
e
Distance
FFiigguurree 55..44 Schematicrepresentation of force–distancecurves obtained when puncturinghorticultural products with andwithout skin. The left-handcolumn shows the three types ofcurves obtained with skinremoved at the test site. The nextthree columns show the effect ofsoft, medium, and tough skin oneach type of curve. YP is the yieldpoint and MT the force readingthat would have been obtainedon a hand-operated puncturetester. Note that the only effectof the skin is to increase the yieldpoint. The vertical lines indicate5/16-in. penetration point.(From Bourne, 1965b; withpermission from New York StateAgricultural Experiment Station.)
Chap-05.qxd 1/12/02 10:39 AM Page 195

schematic representation derived from thousands of tests with the Instron,clarifies this point. The left-hand column of graphs shows the three differentshapes of force–distance curves that are obtained on horticultural productswith the skin removed (as discussed above; see Fig. 5.2).
Whenever skin is present it must be ruptured by the punch before any sub-stantial penetration of the punch into the food can occur; the force to rupturethe skin is therefore included in the penetration force and this appears as a peak in the yield point force which is superimposed upon a regular type A ortype B curve and an increase in the height of the peak of a type C force–distance curve. The height of the superimposed peak depends on the toughnessof the skin. In type B and type C products, where the flesh yield point force isthe measured quantity, the increase in reading caused by the skin is alwaysreflected in a higher force reading. In some cases (e.g. strawberries) the skin is so soft that the increase is negligible. In the case of a type A commodity withsoft skin the force to rupture the skin is less than the force required to penetrate5/16 in. If the skin is of medium toughness, it generally ruptures at about thesame force required as at the 5/16-in. penetration and only a small increase inforce reading results. Finally, if the skin is quite tough, the force to rupture theskin is well beyond the normal Magness–Taylor force and the force readingwill be noticeably increased. Figure 5.4 explains why the presence of skinsometimes causes an increase in puncture force and at other times it does not.
Since the strength of the skin is not necessarily related to the firmness of theunderlying flesh, it is evident that the skin should be removed if a true mea-surement of flesh firmness is required, unless it has been established that theskin is so tender that it causes a negligible increase or that the product exhibitstype A characteristics and does not have a tough skin.
Equation (4.5) in Chapter 4 (page 121) explains the relationship betweenpunch diameter and puncture force and shows that both area and perimeter ofthe punch are important. This equation demonstrates that the puncture forcedepends on two different properties of the test material and on both the areaand perimeter of the punch. It explains why it is difficult to convert dataobtained with one punch diameter into data obtained with another punchdiameter. For this reason it is mandatory to standardize the punch diameter inany one set of experiments. It is quite acceptable to change the strength of thespring as one moves into a higher or lower force range, but punch diametershould not be changed.
In general, the 7/16-in.-diam punches are used on most fruits because theforce required will be less than 30 lb. The 5/16-in.-diam punch is used on veryhard fruits and raw vegetables when the force would exceed 30 lb with thelarger punch diameter. The small diameter punches of the Chatillon 516 seriesare frequently used on commodities such as sweet corn, green peas, and straw-berries. Haller (1941) gives a good discussion of fruit puncture testers andtheir practical applications and typical results for puncture tests on apples,pears, plums, and peaches. Table 5.4 gives typical puncture force figures forsome apple varieties, and Table 5.5 gives typical figures for several fruits.
196 Practice of Objective Texture Measurement
Chap-05.qxd 1/12/02 10:39 AM Page 196

Force Measuring Instruments 197
Table 5.4 Range of Firmness Readings of Some Apple Varieties by Puncture Testa
Overripe Prime upper
Variety Hard Firm Firm ripe Ripe eating limit
Ben Davis 24–17.5 18–14.5 15–12 13.5–8 13–9 9Delicious 20–16.5 17.5–14 15–11 12–8 12–8 8Grimes golden 27–18 18.5–15 16–12.5 13.5–9 12–8 8Jonathan 21–16 16.5–13.5 14–10.5 12–8 12–8 8Rome beauty 23–18 19–13 16–12.5 13.5–9 13–9 9Stayman winesap 21–16 16.5–13 14–11 12–7 12–8 8Wealthy 20–16 17–13 14–10 11–6 — —Yellow transparent 22–16 17–13 14–10 11–6 — —York imperial 24–18 19–16 17–14 15–9 13–10 10
alb force with 7/16-in.-diam Magness–Taylor tip. Data from Haller (1941).
Table 5.5 Firmness of Various Fruits by Puncture Testa
Fruit Variety Color Stage Firmness (lb)
Apricots Royal Yellowish green 14.5Greenish yellow 10.0Greenish yellow to yellow 7.1Yellow to orange 4.1
Plums Beauty Green to straw tip 13.2Straw to slight pink tip 9.0Straw to red tip 6.11/2 to 1/4 red 4.9
Climax Green to faint straw tip 25.1Straw to greenish yellow 20.7Greenish yellow to red tip 15.51/4 to 3/4 red 8.9
Peaches Elberta Yellowish green, slight blush 17.6Cream to light yellow, slight blush 12.4Full yellow, 1/3 to 1/2 red 3.7
Phillips cling Greenish yellow to yellow 12.0Yellow, 1/4 to 1/2 red 8.8Golden yellow, 1/4 to 3/4 red 8.4
Pears Bartlett Original green 29.2Original green to light green 26.9Light green to yellowish green 21.0Yellowish green 15.2
Beurre hardy Original green 12.3Light green 10.8Light green to yellowish green 8.6
Source: Data from Allen (1932); with permission from Division of Agricultural Sciences,University of California.aMagness–Taylor tester: 7/16-in.-diam tip for apricots and plums; 5/16-in.-diam tip for peachesand pears.
Chap-05.qxd 1/12/02 10:39 AM Page 197

The EPT (Electronic Pressure Tester) uses the standard Magness–Taylor tipsand microprocessor to detect the bioyield point. The fruit is cradled on a plat-form with the skin removed at the test site. The operator pulls down a handlewhich forces the metal tip into the fruit to a depth judged adequate by theoperator. Each reading is displayed as it is performed. When a batch of fruithas been tested the instrument prints the average force and standard deviationfor that batch. This instrument greatly decreases the time required to test anumber of replicates, record the data, and calculate the mean. DeLong et al.(2000) compared the EPT fruit tester with other fruit puncture testers on threecultivars of apples by four operators.
Mechanical and Motorized Puncture Testers
Bloom GelometerThe Bloom Gelometer (Bloom, 1925) is a puncture test designed to measurethe strength of gelatins and gelatin jellies. It consists of a hopper full of leadshot that flows through a tube onto a pan, thus providing the force necessaryto make a plunger penetrate into a standard jelly. Borker et al. (1966) reviewedthe early history of gelatin gel testing and discussed the necessity for frequentmaintenance of alignment and adjustment of the Bloom gelometer.
The 2000 edition of Official Methods of Analysis (published by AOACInternational) gives the details for the preparation of a standard gel. For gela-tin it is method 948.21, and for gelatin dessert powders, method 936.09. Thestandard method for determining the jelly strength of glue is described byDeBeaukelaer et al. (1930). The standard jar containing the standard jelly isplaced in the Bloom Gelometer and adjusted until the flat face of the probe isjust resting on the surface. A 1/2-in.-diameter punch is used for gelatin and a 1-in.-diameter punch is used for gelatin desserts. A lever is tripped allowinglead shot to flow from the hopper into a lightweight aluminum dish on thescale supported by the punch pan at the rate of 200 � 5 g per 5 s. When theplunger has penetrated 4 mm into the jelly (which usually occurs suddenly), anelectrical contact shuts off the flow of shot. The shot is weighed and the weightof shot in grams is expressed as the Bloom of that gel. The Bloom Gelometeris 18 � 19 � 63 cm high and weighs 13 kg.
DeBeaukelaer et al. (1945) showed that the flow rate of 200 g per 5 s causeserrors in soft jellies because the lead shot runs out too fast, and suggested thatfor soft jellies the flow rate should be reduced to 40–50 g per 5 s. Borker andSloman (1969) also found that slowing the flow rate of shot to 45 g per 5 s gavemore precise results and recommended that this flow rate be incorporated asan official standard. As noted above, the 2000 official standard continues touse the 200 g per 5 s rate of shot flow.
Stevens LFRA Texture AnalyzerThis instrument, developed by the Leatherhead Food Research Association(LFRA) in England, was designed to perform the standard Bloom test plus a
198 Practice of Objective Texture Measurement
Chap-05.qxd 1/12/02 10:39 AM Page 198

number of other tests. The instrument stands about 50 cm high, 24 cm wide,and 23 cm deep, and weighs about 12 kg. It replaces the Boucher ElectronicJelly Tester, which is no longer manufactured.
The standard probe is a 1/2-in.-diam flat-faced straight-sided acrylic punchthat has the same dimensions as the punch used for the Bloom test. Punches of other diameters and punches in the form of a needle, ball, or blade are also available. Four speeds of punch travel are available: 12, 30, 60, and120 mm min�1. The maximum stroke of the punch is 15 cm. The penetrationdistance is adjustable from 1 to 29 mm in 1-mm steps. In operation, the testsample is placed beneath the punch and the motor activated. The punch movesdownward at the maximum speed until a force of 5 g is registered, when itautomatically steps down to the selected set speed and travels at this speed forthe selected distance. At the end of the stroke it returns to its original positionat maximum speed. An electronic load cell in the base of the instrumentsenses the force and registers it on a digital readout, which shows the maxi-mum force obtained in the test. The instrument has a capacity of 1000 g forceand reads within 1 g. It can be adapted to a 100-g force capacity and a readingwithin 0.1 g for very soft products.
A recorder is an optional accessory giving force–distance plots of the punc-ture tests. This instrument is a useful general-purpose puncture tester for softproducts. It is used on meat pastes, foams, various gels, and some fats.
MaturometerThis instrument, designed to measure the maturity of fresh green peas, wasdeveloped in Australia and is extensively used in that country. Its intendedpurposes were to objectively measure the maturity of fresh peas and to selectthe optimal harvest time during the growth of the crop that gives the yield andquality required to meet the production objectives of the processor. Its manu-facture is covered by Australian Patent No. 143,316. It consists of 143 1/8-in.-diam flat-face punches set in an array of 11 rows by 13 rows with individualpunches spaced on 7/16-in. centers. A metal plate containing 143 matchingcountersunk holes is positioned underneath the punches.
A pea is lodged in each recess. When the plate of peas is driven upward bya motor, the peas are punctured simultaneously by the pins and the maximumforce is measured on a force scale at the top of the instrument (Lynch andMitchell, 1950, 1952; Mitchell et al., 1961). A matching perforated platemounted over the metal plate that holds the peas prevents the peas from stick-ing to the punches during the return stroke. The instrument has a force capac-ity of 440 lb in 5-lb graduations.
Based on extensive field testing and sensory evaluation, it was found forAustralian conditions that peas harvested at a maturometer reading of 250 lbgave the maximum yield of highest quality peas for canning. A somewhatlower figure is needed for the maximum yield of best-quality peas for freezing.In using the Maturometer Index (MI) as a basis of payment for quality the
Force Measuring Instruments 199
Chap-05.qxd 1/12/02 10:39 AM Page 199

following ranges are recommended for field run ungraded peas:
Grade 1 (canning) consists of peas in the range of 230–270 MI.Grade 2 (canning) consists of peas in the range of 190–230 and270–320 MI.Grade 1 (freezing) consists of all peas up to 200 MI.
The MI of peas in the field increases by an average of 20 lb per day. By test-ing field samples daily it is possible to predict when the figure of 250 lb willbe reached. This enables a pea processor to know several days in advancewhen to harvest a field and the number of fields that will be harvested on agiven day.
Casimir et al. (1971), using a single-punch Maturometer, found a simplecorrelation coefficient r ranging from 0.96 to 0.99 between puncture force andalcohol insoluble solids of individual peas. Casimir et al. (1967) showed thathigh speed of operation of the pea viner caused some bruising and tenderiza-tion of the peas resulting in lower Maturometer readings.
Christel Texture MeterThis instrument (Christel, 1938) consists of a set of 25 flat-faced 3/16-in.-diampunches that are held in a metal plate above a metal cup 2 in. internal diam and
in. deep. A removable metal cover containing a set of holes that match thearray of punches above it rests on top of the cup. The food is placed in the cup,the set of punches is driven down by a hand-operated gear and rack assembly,and the force is registered on an hydraulic pressure gauge with a force capac-ity of 100 or 300 lb.
Armour TenderometerThis instrument consists of an array of -in.-diam stainless-steel probes,3 in. long, with the last inch tapered to a point (Hansen, 1972). The instrumentand its operation are covered by the basic United States Patent No. 3,593,572and by several later patents. Morrow and Mohsenin (1976) analyzed themechanics of a multiple conical probe system of this type. In operation thearray of 10 needles is manually pressed 2 in. into the fifteenth rib eye of a beefcarcass. The maximum force during penetration is recorded on a portablestrain gauge force transducer fitted with a peak force indicator. Measurementsof the maximum force on cold rib eyes in the chill room on the day afterslaughter were found to correlate well with subjective panel tenderness scoreson the same meat cooked after 1 week of aging. Huffman (1974) found theArmour Tenderometer to be superior to USDA quality grade or marbling as ameans of placing cattle into homogeneous tenderness groups.
Some researchers have found low correlations between the ArmourTenderometer readings and sensory panels (Carpenter et al., 1972; Dikemanet al., 1972) whereas others find poor correlation (Henrickson et al., 1972;Parrish et al., 1973; Campion et al., 1975; Harris, 1975). Some of these low
10 18
1 34
200 Practice of Objective Texture Measurement
Chap-05.qxd 1/12/02 10:39 AM Page 200

correlations may have resulted partly from incorrect operator technique(Voisey, 1976). Nevertheless, this Tenderometer was granted the IndustrialAchievement Award by the Institute of Food Technologists in 1973.
Other Puncture TestersThe suppliers of Universal Testing Machines provide a number of probes ofvarious shapes and sizes that are suitable for puncture tests on many differentkinds of foods.
Compression–Extrusion Testers
It was pointed out in the previous chapter that the extrusion principle test cellsusually involve complex combinations of compression, extrusion, shear, fric-tion, and perhaps other effects. For the sake of brevity, the word ‘extrusion’will be used to describe this type of test, but the reader should remember thatthis class of test cell usually involves more than extrusion.
FMC Pea TenderometerThis instrument was developed by the Food Machinery Corporation as anobjective means for measuring the quality and maturity of fresh green peas(Martin, 1937; Martin et al., 1938). A motor-driven grid of 19 stainless-steelblades 1/8 in. thick and spaced 1/8 in. apart are rotated through a second reac-tion grid of 18 similar blades. The peas placed in the cavity between the twogrids are cut and extruded through the slits between the blades. This is commonly known as a shearing device, but it is evident that most of the actionon peas is extrusion. The reaction grid is mounted in bearings and is free torotate, but its rotation is resisted by a weighted pendulum hanging from thesecond grid which swings out of the vertical as the reaction grid rotates. Theforce exerted during extrusion of the peas is reflected in the angular movementof the pendulum and is recorded by a pointer that moves across a sinusoidalscale. The pointer records the maximum force encountered in each test. Themachine is rugged, self-contained, easy to clean, and can stand a lot of abusein a processing plant or at a pea vining station.
Although it is widely used by the pea processing industry as an index ofquality and price to be paid for the peas, it has some serious drawbacks,notably the problem of calibration. If the blades become dented or warped, afriction component is introduced. Voisey and Nonnecke (1971) performed adetailed appraisal of the Pea Tenderometer and found serious differencesamong different Tenderometers being used in industry. The problem of stan-dardizing this instrument has also been discussed by Bourne (1972a).Unilever Research in England have devised a standardization procedure theyclaim maintains agreement to within �1.5 Tenderometer units between allinstruments in their continental European and British factories (Pearson andRaynor, 1975). However, Voisey (1975) still considers the Tenderometer to
Force Measuring Instruments 201
Chap-05.qxd 1/12/02 10:39 AM Page 201

have serious deficiencies. Despite these problems, this instrument continues tobe a widely used method for measuring the quality of peas in the industry.
Texture PressThis versatile and well-known instrument was developed at the University ofMaryland (Kramer et al., 1951; Decker et al., 1957). Although it is commonlyknown as the ‘Kramer Shear Press,’ the name of the instrument has undergoneseveral changes. The instrument was first manufactured by the Bridge FoodMachinery Co. of Philadelphia, and later made by the Lee Corporation ofWashington, DC, and called the Lee Comptroller and later the Lee–KramerShear Press. Later, the rights to manufacture the instrument were acquired by Allo Precision Metals Engineering, Inc., of Rockville, Maryland, and wascalled the Allo–Kramer Shear Press. Presently, it is manufactured by the FoodTechnology Corporation of Chantilly, Virginia, and is known as the FoodTechnology Corporation Texture Test System, abbreviated to FTC Texture TestSystem.
FTC currently produces five variations on the Texture Press design;
The Model TU, for Tenderometer measurements on fresh peasThe Model TM for in plant use on most food productsThe Model T-2000 for general plant lab useThe Model TMS-90 computerized system for research labsThe Model TU-12 for field testing using a 12 V dc power source
The Models TU and TM are watertight designs for plant floor use and havea minimum of operator controls for quick on the spot testing. The T-2000,outfitted with the new TG4-E Integrating Texturegage and TMS-90, with thecomputer control, have more sophisticated hydraulic systems and controls andare not intended for use in harsh environments. The new Model TU-12 allowsagricultural field men to do maturity and texture sampling in the crop fields.Model TMS-2000 is shown in Fig. 5.5.
At this time we will discuss only the basic machine (Model T-2000) fittedwith one of the presently available force measurement devices, that is, DigitalTexture gauge (Model TG4-EI), or a force transducer (loadcell). A number of accessories and various test cells, can be attached to this instrument converting it into a multiple measuring instrument. This mode of operation isdiscussed on page 228 and in Appendix III, Table 1, page 353.
The basic machine, known as the ‘Texture Press,’ is 64 cm wide, 60 cmdeep, 90 cm high, and weighs about 95 kg (see Fig. 5.5). This is a robustmachine that is designed for hard reliable work under wet food processingplant conditions. The system is driven hydraulically. An electrically driven oilpump powers the ram to which the moving parts are attached. Switches con-trol the up and down motion of the ram. The working space for the test cells is4 � 4.5 in.
In the older models the force was measured by a proving ring placedbetween the test cell and the bottom of the ram. In the current models the force
202 Practice of Objective Texture Measurement
Chap-05.qxd 1/12/02 10:39 AM Page 202

is measured by means of a force transducer placed between the bottom of theram and the test cell that is electrically connected to either a direct-readingdigital texture gauge or a TMS-90 computer, both of which can display resultsin metric or English units. The force transducers have long-term stability;once calibrated they hold their performance for extended periods of timeunless overloaded or abused. Force transducers should be returned to the manufacturer periodically for recalibration and inspection.
Six force transducers ranging from �50 to �3000 lb capacity are available.A special force transducer is available for use with fresh peas, which is cali-brated directly in Pea Tenderometer units, and covers the range of 0–500equivalent Tenderometer units. One Tenderometer unit is equivalent toapproximately 6.2 lb/force. The digital texture gauge can be used as a maxi-mum force measuring instrument by utilizing the peak holding switch on thefront of the texture gauge. It can also be used as a total work calculator byusing the integral switch on the gauge. With the switch in the peak position,the digital meter will read the peak maximum force and hold this reading untilmanually reset at the start of the next test.
The standard test cell of the Texture Press consists of a metal box with internal dimensions � � in. high (6.6 � 7.3 � 6.4 cm). A set of2 1
22 782 5
8
Force Measuring Instruments 203
FFiigguurree 55..55 The FoodTechnology Corporation TexturePress (‘Kramer Shear Press’)Model TMS-2000. (Courtesy ofFood Technology Corporation.)
Chap-05.qxd 1/12/02 10:40 AM Page 203
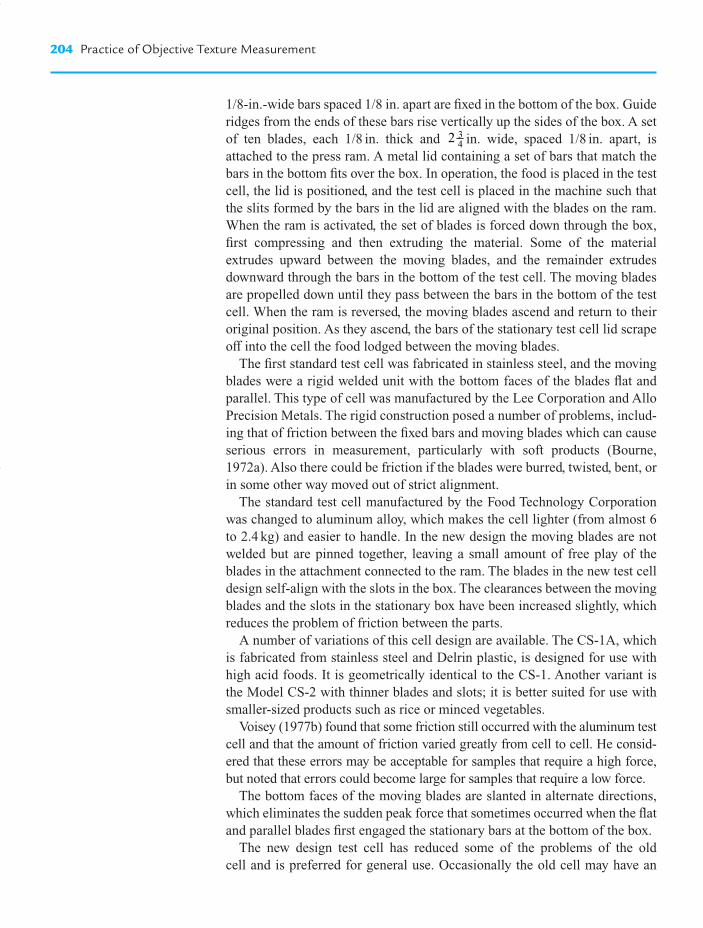
1/8-in.-wide bars spaced 1/8 in. apart are fixed in the bottom of the box. Guideridges from the ends of these bars rise vertically up the sides of the box. A setof ten blades, each 1/8 in. thick and in. wide, spaced 1/8 in. apart, isattached to the press ram. A metal lid containing a set of bars that match thebars in the bottom fits over the box. In operation, the food is placed in the testcell, the lid is positioned, and the test cell is placed in the machine such thatthe slits formed by the bars in the lid are aligned with the blades on the ram.When the ram is activated, the set of blades is forced down through the box,first compressing and then extruding the material. Some of the materialextrudes upward between the moving blades, and the remainder extrudesdownward through the bars in the bottom of the test cell. The moving bladesare propelled down until they pass between the bars in the bottom of the testcell. When the ram is reversed, the moving blades ascend and return to theiroriginal position. As they ascend, the bars of the stationary test cell lid scrapeoff into the cell the food lodged between the moving blades.
The first standard test cell was fabricated in stainless steel, and the movingblades were a rigid welded unit with the bottom faces of the blades flat andparallel. This type of cell was manufactured by the Lee Corporation and AlloPrecision Metals. The rigid construction posed a number of problems, includ-ing that of friction between the fixed bars and moving blades which can causeserious errors in measurement, particularly with soft products (Bourne,1972a). Also there could be friction if the blades were burred, twisted, bent, orin some other way moved out of strict alignment.
The standard test cell manufactured by the Food Technology Corporationwas changed to aluminum alloy, which makes the cell lighter (from almost 6to 2.4 kg) and easier to handle. In the new design the moving blades are notwelded but are pinned together, leaving a small amount of free play of theblades in the attachment connected to the ram. The blades in the new test celldesign self-align with the slots in the box. The clearances between the movingblades and the slots in the stationary box have been increased slightly, whichreduces the problem of friction between the parts.
A number of variations of this cell design are available. The CS-1A, whichis fabricated from stainless steel and Delrin plastic, is designed for use withhigh acid foods. It is geometrically identical to the CS-1. Another variant isthe Model CS-2 with thinner blades and slots; it is better suited for use withsmaller-sized products such as rice or minced vegetables.
Voisey (1977b) found that some friction still occurred with the aluminum testcell and that the amount of friction varied greatly from cell to cell. He consid-ered that these errors may be acceptable for samples that require a high force,but noted that errors could become large for samples that require a low force.
The bottom faces of the moving blades are slanted in alternate directions,which eliminates the sudden peak force that sometimes occurred when the flatand parallel blades first engaged the stationary bars at the bottom of the box.
The new design test cell has reduced some of the problems of the old cell and is preferred for general use. Occasionally the old cell may have an
2 34
204 Practice of Objective Texture Measurement
Chap-05.qxd 1/12/02 10:40 AM Page 204

advantage over the new cell. For example, Ross and Porter (1968, 1969, 1971,1976) used the old design test cell to study the texture of French fries. Theywere able to obtain good results with the old model cell with squared-off endson the moving blades, but their results cannot be duplicated with the new typecell with the slanted blades.
The relationship between the weight of material in the cell and the maxi-mum force during the compression stroke was studied by Szczesniak et al.(1970), and is shown in Fig. 5.6. For two products (white bread and spongecake) a linear relationship is found between sample weight and maximumforce over a limited range of sample weight. deMan and Kamel (1981) alsofound a linear relationship between maximum force and sample weight forcooked poultry meat. The relationship for the other foods was nonlinear, tendingtoward constant force–weight relationship at high fill weights. Some products(e.g. raw apples and cooked dry beans) never reach a linear relationship. Manyproducts attain a constant force independent of sample weight before the cellis filled (e.g. canned beets, peas, carrots, lima beans; frozen peas and limabeans; and raw snap beans and bananas). Thus, for most foodstuffs the forceper sample weight is not constant but decreases as the sample weightincreases. On these grounds it is advisable to use a constant weight of samplein the test cell unless tests show that there is a linear relationship between sam-ple weight and maximum force for that food. Many researchers report TexturePress data as pounds force per gram weight of product. Figure 5.6 shows thatthis procedure is likely to introduce errors, and it should be discontinued.
Force Measuring Instruments 205
Sample weight
(1)
(2)
(3)
Max
imum
forc
e
FFiigguurree 55..66 Typical maximumforce versus sample weightrelationship for standard TexturePress test cell. Behavior (1) isexemplified by white bread andcake, (2) by raw apples andcooked dry beans, and (3) bycanned or frozen vegetables.(Reprinted from J. Texture Studies11, page 366, 1970. Withpermission from Food andNutrition Press Inc.)
Chap-05.qxd 1/12/02 10:40 AM Page 205

The speed of travel of the hydraulic ram is infinitely variable from 0 to20 in. min�1 by adjusting a flow control valve located in the oil supply pipelineto the ram. Ram speed is usually expressed as seconds to travel its full strokeof 3½ in. This procedure poses the problem of using a reciprocal scale, that is,the higher the number in seconds the slower the speed. The formula for con-verting seconds to travel full stroke length into inches per minute, assumingconstant ram speed, is
(3.5/s) � 60 � inches per minute
The viscosity, which affects the rate of flow of the hydraulic oil, depends onthe oil temperature. Hence, at a given setting of the control valve the speed ofthe ram will change with changing oil temperature. Therefore, the ram speedshould be checked after the instrument has been running for some time tocompensate for the effect of the heating of the oil. This is particularly impor-tant for those commodities that are strain-rate sensitive and for very slow ram speeds. Ang et al. (1960) used the Texture Press at a very slow rate of0.46 in. min�1 and found that after 2 h of operation the oil had heated to 165°F,and the speed of travel of the ram had changed. In order to overcome this prob-lem they placed a thermostatically controlled electric immersion heater in the oil bath to preheat the oil to 170°F before testing began. This is the onlyrecorded instance where the temperature of the oil bath needed to be con-trolled in order to maintain adequate control of the speed of the ram. Voisey(1972) in a study of the Texture Press discusses the problem of speed controland concluded that the early models gave inadequate control of ram speed.Current models incorporate an improved temperature compensator flow con-trol valve in the hydraulic control circuit.
The Food Technology Corporation provide another extrusion cell (ModelCE-1 Universal Test Cell) that can be operated in several modes. It consists ofa cast-iron cylinder that mounts in the machine frame. A circular piston isattached to the ram. In one mode the piston is a close fit in the cylinder, and allfood placed in the cylinder is pushed out before it. There is some frictionbetween the piston and the walls of the cylinder. A grid of metal bars or a flatplate containing a single orifice is inserted in the base of the cylinder, and thefood is extruded through the grid or the orifice plate. In the second mode, apiston with a smaller diameter is used and a solid plate is placed in the bottomof the cylinder; in this configuration it acts as a back extrusion cell because thefood is extruded upward between the walls of the cylinder and the sides of thepiston, moving in the opposite direction to the motion of the piston. The annu-lus width in this back extrusion cell is 1/8 in. (3.2 mm), and there is no frictionbetween the piston and the cylinder.
Ottawa Pea TenderometerThe Ottawa Pea Tenderometer is a special version of the Ottawa TextureMeasuring System (Voisey, 1971b, 1974; Voisey et al., 1972; Voisey andNonnecke, 1973a,b) that was adapted specifically for measuring the maturity
206 Practice of Objective Texture Measurement
Chap-05.qxd 1/12/02 10:40 AM Page 206

of fresh peas (Voisey and Nonnecke, 1972a,b, 1973a,b,c). The standard testcell is constructed of 1/2-in.-thick aluminum plate and is square in cross section. The internal cross-sectional area of the cell is 30 cm2 (55 mm alongthe edge), and it stands about 13 cm high. A rectangular plunger made of 1/2-in.-thick aluminum plate is attached to a 1-in.-diam shaft. The plunger has a clearance of 0.275 mm from the wall on each side to eliminate friction.The peas are extruded through a replaceable wire grid that slips into the bottom of this cell. The grid consists of nine wires 2.36 mm diam with a gapof 3.3 mm between the wires. The plunger is driven down into the test cell at 18.2 cm min�1 by a synchronous motor connected through a gear box to asingle vertical screw that moves the crosshead.
Vettori Manghi TenderometroThis Italian-built instrument is similar to the FTC Texture Press in that it usesan array of metal blades that move down and through slots formed by a set ofstationary bars (Andreotti and Agosti, 1965). The instrument is constructed of stainless steel and is driven by a hand-powered crank handle. The capacityof the test cell is 166 ml, which is approximately one third the 450-ml capac-ity of the FMC Pea Tenderometer. An hydraulic gauge measures maximumforce in Tenderometer units on a 0–250 scale. It is used mostly for measuringthe maturity of fresh peas. It can be easily disassembled for cleaning.
FirmTech 2This small instrument, weighing only about 7 kg, is designed to test smallfruits such as blueberries, cherries, grapes, plums, and tomatoes. A smallplaten gently compresses fruits one by one. Two modes of compression are available: (1) measures deformation distance under a standard force; (2) measures force to attain a given deformation. A third option is to performa puncture test using a probe smaller than the fruit. A turntable has a numberof depressions around the perimeter, the size and number of depressions is matched to the size of the fruit. The instrument is controlled by a desktop or laptop computer. A fruit is placed on each depression and the instrument is started. The fruit under the platen is gently compressed, then the turntableautomatically rotates to bring the next fruit under the platen and after it hasbeen compressed, it moves on to the next fruit, and this process continues untilall the fruits on the turntable have been tested. The load cell capacity is 45 N.Approximately 3 s is required to test each fruit.
Cutting–Shear Test
Warner–Bratzler ShearThe test cell of this apparatus consists of a stainless-steel blade 0.040 in. thick in which a hole, consisting of an equilateral triangle circumscribedaround a 1-in.-diam circle, is cut and the edges rounded off to a radius of0.02 in. (Warner, 1928; Bratzler, 1932, 1949). In some publications the
Force Measuring Instruments 207
Chap-05.qxd 1/12/02 10:40 AM Page 207

Warner–Bratzler Shear is misrepresented as having a rectangular-shaped holein the blade. This confusion probably results from the fact that the first exper-imental model of the Warner–Bratzler Shear used a blade with a square hole.Also, some researchers are presently experimenting with square blades.
Two sharp-edged borers that resemble cork borers are provided with theinstrument and are used to cut a 1/2- or 1-in.-diam sample of meat. This sampleis placed through the hole and two metal anvils, one on each side of the blade,move down, forcing the meat into the V of the triangle until it is cut through.A 50-lb capacity spring force gauge with a maximum pointer measures the maximum force encountered during this cutting action. The principle ofthis test has been described on pages 134–138. Although commercially avail-able, the Warner–Bratzler shear has not been patented (see Fig. 5.7).
This instrument measures approximately 23 � 30 � 56 cm high andweighs 14 kg. The anvil moves downward at 23 cm min�1. However, the actualshearing rate is less than 23 cm min�1 because the spring in the gauge is highlyextensible and the blade and the meat move downward to some extent as theforce increases.
A number of studies have been performed to compare Warner–BratzlerShear figures with subjective estimates of tenderness of meat. Szczesniak andTorgeson (1965) thoroughly reviewed the subject of meat tenderness and its measurement. In summarizing 38 studies on beef, four on pork, and nine on poultry these authors list correlation coefficients (r) between theWarner–Bratzler shear and some method of sensory testing ranging from�0.001 to �0.942. Of the 51 papers listed in this review, 41 reported goodagreement or better, and the remainder indicated that correlation was border-line to poor. Szczesniak and Torgeson (1965) commented on the high degreeof variability in the correlation between Warner–Bratzler Shear and sensorytesting and point out that many factors come into play, one of which is the reliability of the sensory panel that is used. At the present time there is noother device that consistently gives better correlations, although the FTCTexture Press is about as good (Szczesniak and Torgeson, 1965). The subjectof Warner–Bratzler Shear correlations with sensory tests is also discussed onpages 298–300 and 335–336.
Although its reliability has often been questioned, the Warner–Bratzlershear is the most widely used device in the United States for measuring toughness of meat. One serious difficulty with this test is the great variabilityof meat. Meat toughness varies markedly from animal to animal, from muscleto muscle within an animal, and also from point to point in the same muscle.Meat to be tested should be sheared across the muscle fibers; hence, samplesshould be cut parallel to the fibers (Hostetler and Ritchey, 1964). The boringtool should be sharpened regularly. Variability in meat is also discussed onpages 305–307.
When cutting the sample core, it is necessary to use a technique that willgive a standard diameter sample because the shear force is affected by thediameter of the test sample (see page 137). A steady, moderate pressure should
208 Practice of Objective Texture Measurement
Chap-05.qxd 1/12/02 10:40 AM Page 208

be maintained on the cutting tool as it is twisted in order to obtain a uniformdiameter along the length of the sample. High pressure will give an hourglass-shaped meat core that is thinner in the center than at the ends. Uneven pres-sure will give a core with uneven diameter along its length. Kastner andHenrickson (1969) recommend mounting the borer in a drill press becausethey found that samples cut with the aid of a drill press were more uniform in
Force Measuring Instruments 209
FFiigguurree 55..77 The Warner–Bratzler Shear: the cylinder ofwood inserted in the triangularblade represents a piece of meat.
Chap-05.qxd 1/12/02 10:40 AM Page 209

diameter, closer to the diameter of the borer, and slightly larger than the hand-cut samples (Table 5.6). These authors also found that more uniform coreswere obtained when cooked pork was held at 4°C for 24 h before cutting thesamples.
The degree of cooking has a great effect on the toughness of meat; hence, itis necessary to have all meat cooked to the same degree of doneness in anyone study. A higher final internal temperature (or degree of doneness) resultsin a higher shear reading. The range of shear readings usually varies fromabout 5 to 25 lb, depending upon the size of the sample, doneness of the meat,and toughness of the meat. Wheeler et al. (1996, 1997) noted that the methodof sampling, thawing frozen beef, cooking and coring affects Warner–Bratzlerreadings (see also pages 335, 336).
Pasta FirmnessMatsuo and Irvine (1969, 1971) used a simulated tooth to deform and cutthrough single strands of cooked spaghetti. Voisey’s group in Ottawa designeda system whereby ten strands of cooked spaghetti were cut by ten 1.5 mmthick blades. This system can be mounted in a universal testing machine or the Ottawa Texturometer. This group reported good results for measuringfirmness and chewiness of cooked spaghetti with this device (Voisey andLarmond, 1972, 1973; Voisey et al., 1978).
The American Association of Cereal Chemists have a standard method formeasuring the firmness of cooked pasta and noodles that uses a small blade tocut through the product (AACC Method 66-50).
Torsion Devices
Most of the torsion measuring instruments are used to measure viscosity offluids, which will be discussed in Chapter 6 where the subject of viscosity iscovered. Three instruments that use the principle of torque and are used onsemisolid foods or in intermediate stages of processing are described below.
210 Practice of Objective Texture Measurement
Table 5.6 Effect of Sample Cutting Method on Warner–Bratzler Shear Test
Cutting toolHand-bored samples Machine-bored samples
diam (cm) Mean diam (cm) Shear force (lb) Mean diam (cm) Shear force (lb)
2.54 2.41 18.4 2.48 19.61.90 1.79 11.6 1.88 12.11.27 1.21 7.5 1.25 8.4
Source: Data from Kastner and Henrickson (1969). Sample material was porcine longissimusdorsi muscle heated to an internal temperature of 72°C in deep fat at 140°C and chilled for 24 hin a 4°C cooler before cutting.
Chap-05.qxd 1/12/02 10:40 AM Page 210

FarinographThis is a basic testing instrument that is used in flour mills, bakeries, andcereal research laboratories to determine the baking quality and moisture-absorbing capacity of flour and the handling properties of bread dough (Munzand Brabender, 1940; Locken et al., 1960; Brabender, 1965). The instrumentworks by mixing wheat flour, water, and sometimes other ingredients in asmall mixing bowl that has two Z-shaped paddles that rotate on a horizontalaxis. The torque required to mix the resulting dough and how this changes during mixing provide a quantitative measure of rheological properties of thedough that correlate well with the way it handles in the bakery. The method ishighly empirical and requires strict control of the conditions. The highly stan-dardized conditions of operation are spelled out in AACC Method No. 54-21,ICC Method No. 115/1 and ISO Method 5530-1.
A new model, Farinograph E with a more compact design that works fullyelectronically with computer-controlled operation and display of the torque–time curve, is now available. It uses the same geometry mixing blades and givesthe same results as the standard Farinograph.
The basic instrument occupies approximately 120 � 120 cm of bench spaceand is about 90 cm high. Three models are available: Model FA2 is powered bya two-speed 0.5-hp electric dynamometer motor that drives the paddles ateither 63 or 31.5 rpm. Model FAH is also driven by a two-speed 0.5-hpdynamometer motor that drives the paddles at either 63 or 126 rpm. ModelDO-V153 (Do-Corder) is powered by a 0.8-hp dc dynamometer motor thatdrives the paddles at any speed between 20 and 210 rpm by means of aninfinitely variable speed control. The mixing bowl is made of stainless steelwith a jacket through which water is circulated from a temperature bath tomaintain constant temperature. Two sizes of mixing bowls are available: 50 and 300 g capacity. The capacity refers to the amount of flour that is used.The actual capacity of the bowl is about 50% more than the weight of the flour.A pair of sigma-shaped blades are standard for mixing flour. A pair of delta-shaped blades can be supplied and are used to study ingredients such as short-enings that cause a change in the consistency.
The blades of the Farinograph mixer/measuring head are driven by a motorthat is suspended to swing freely between precision bearings to form adynamometer. As the mixer blades encounter a resistance torque from the testmaterial, the dynamometer reacts by swinging in the opposite direction of theshaft rotation. The reaction torque acts through the lever system of an analyt-ical scale and is simultaneously recorded on a strip chart recorder. The bakingand milling industry commonly express their results in Brabender units. OneBrabender unit is one meter-gram torque.
The Brabender instruments can be calibrated with weights if needed. Mostusers of the Brabender instruments have a company serviceman routinelycheck each machine yearly. Check (standard) flour samples are routinely dis-tributed by the American Association of Cereal Chemists, 3340 Pilot KnobRoad, St Paul, Minnesota 55121, to compare instruments.
Force Measuring Instruments 211
Chap-05.qxd 1/12/02 10:40 AM Page 211

MixographThis instrument is a recording dough mixer that performs substantially thesame functions as the Farinograph, using a small sample of flour (30 g). Asmaller assembly that accepts a 10-g sample of flour is also available (Finneyand Shogren, 1972). The cup contains three pins and four contrarotating pinsin the mixing head that knead the dough (Swanson and Working, 1933;Larmour et al., 1939). In contrast to the Farinograph, where the mechanicaldynamometer measures the reaction of the motor, the Mixograph has themechanical dynamometer attached to the mixing bowl and measures its reac-tion as the dough is formed and kneaded. A pen attached to the arm recordsthe movement on strip chart.
The resistance offered by the dough to four vertical pins revolving aroundthree stationary pins in the mixing bowl creates a torque in the bowl that isproportional to the shear strength and elasticity of the dough. The Mixographis a standard physical dough tester (American Association of Cereal ChemistsMethod 54–40A). The Mixograph is 80 � 80 � 45 cm high, weighs 50 kg,and uses 15 cm-wide chart paper.
Bending
StructographThis instrument operates on the triple-beam principle (see p. 145). The sample rests on two parallel support bars that are attached to an elevator plat-form that is raised at constant speed to contact a sensor bar mounted above the sample and equidistant between and parallel to the two lower knife edges.A strip chart recorder gives a force–time plot.
This instrument is useful for measuring the force to snap brittle foods. It canalso be used to measure bending deformation from the slope of the force–distance plot on the chart. For nonbrittle foods, a sharp-edged upper knife or apointed cone can be used to measure the force to cut through or penetrate theproduct. This instrument has a variable stroke length up to 70 mm, and a rate oftravel variable from 8 to 320 mm min�1. Samples up to 80 mm wide can beaccommodated. The strip chart recorder is 180 mm wide and the standard chartspeed is 10 mm min�1, but this can be varied by changing gears inside the instru-ment case. The instrument is approximately 50 cm wide, 28 cm deep, 51 cm high,and weighs 18 kg. The force ranges available are 0–500, 0–1000, and 0–2000 g.
Tensile Testers
All the universal testing machines are equipped to perform tensile tests. Theyprovide a wide range of grips to hold different kinds of foods.
ExtensographThis instrument is used in conjunction with the Farinograph to evaluate therheological properties of bread dough in laboratories associated with the flour
212 Practice of Objective Texture Measurement
Chap-05.qxd 1/12/02 10:40 AM Page 212

milling and bread-baking industry. It consists of three parts: (1) the dough-forming devices, which round and roll the dough to standard dimensions, (2) a temperature-controlled fermentation cabinet to allow the dough to relax,and (3) the mechanism that stretches the dough to breaking and reads thechanges in force with extension.
Three parameters are obtained from the Extensograph curve: (1) the energy,which is measured as the area under the curve; (2) resistance to extension,which is the force at 50 mm stretching measured in EU force units(Extensograph units); and (3) extensibility, which is the length of the curve,measured in millimeters.
The standard method for using the Extensograph is described in AACCMethod No. 54-10, ISO Method No. 5530-2 and ICC Method No. 114/1.
The Extensograph can be modified for computer connection for fully auto-matic tests and evaluation with Windows software.
FTC Texture Test SystemThis company provides a tension test cell (model TT-1) comprising a pair ofserrated gripping jaws 1-in. wide. It also has available a thin-slice tensile testcell (model ST-1) with a horizontal work table for tensile tests on productssuch as sliced bologna, cheese, and bread. This is modeled on the accessorydeveloped by Gillett et al. (1978).
Distance Measuring Instruments
Bostwick Consistometer
This simple instrument consists of a level stainless-steel trough that is rectan-gular in cross section and comprises two compartments. The first compartmentis 5 � 5 � 3.8 cm high, and it is separated from the second compartment bymeans of a spring-loaded gate. The second compartment, which is contiguouswith the first compartment, is a trough 5 cm wide, 24 cm long, and about 2.5 cmhigh. The floor of this compartment has a series of parallel lines drawn acrossit at 0.5-cm intervals beginning at the gate and extending to the far end. Itweighs about 800 g (see Fig. 5.8).
In operation, the gate is pressed shut and locked in place by means of a trigger.The first compartment is filled with the material whose consistency is to betested. This is usually a comminuted fruit or vegetable such as applesauce, carrotpuree and other baby foods, tomato catsup and tomato purees. The consistometeris leveled and the trigger is pressed, releasing the gate, which springs up out of theway. The fluid material is then free to flow under the force of gravity from the firstcompartment into the second compartment. The distance it has flowed from thegate after 30 s is measured in centimeters as the Bostwick Consistometer reading.
When the moving front edge of the flowing product is curved, the distanceto the forward edge of the curve is taken. In some products syneresis occurs;
Distance Measuring Instruments 213
Chap-05.qxd 1/12/02 10:40 AM Page 213

in these cases the clear liquid is generally ignored, and the reading is taken atthe front edge of the puree. The width of the clear serum is sometimes alsomeasured in those products in which considerable syneresis occurs.
The United States standard for tomato catsup stipulates that grade A andgrade B quality should be of good consistency, and flow not more than 9 cm in30 s at 20°C in a Bostwick Consistometer. Grade C tomato catsup must have a ‘fairly good consistency’ and flow not more than 14 cm in 30 s at 20°C in aBostwick Consistometer.
Rutgers (1958) reported that this instrument is suitable for nonthixotropicpurees and thick porridges but not for starch-thickened milk puddings.
214 Practice of Objective Texture Measurement
FFiigguurree 55..88 The BostwickConsistometer: (a) sample is infirst compartment with gateclosed; (b) gate is open andsample has flowed along thesecond compartment.
Chap-05.qxd 1/12/02 10:40 AM Page 214

Bookwalter et al. (1968) found the Consistometer to be suitable for processedcornmeals and their protein-enriched blends. Rao and Bourne (1977) found thatthe Bostwick Consistometer was suitable for fruit and vegetable purees but notsuitable for nonpureed foods because they adhered to the gate. It is not suitablefor high solids tomato paste because the paste does not flow far enough in 30 sto give measurable differences between samples. However, some laboratoriesdilute tomato paste with distilled water to reach a standard soluble solids level(°Brix) and then measure its consistency in a Bostwick Consistometer.
Each year the US Agency for International Development donates hundredsof thousands of tons of a precooked corn–soy blend to undernourished peoplein developing countries. One quality specification for this product is that aslurry of 37 g dry corn–soy blend mixed with 100 ml water at 25°C shall givea Bostwick reading of less than 20 cm one minute after raising the gate(Konstance et al., 1999).
The results from this instrument cannot be converted into fundamental rheological parameters because surface tension, wetting power, and possiblyother factors other than viscosity are also involved. Nevertheless, it is a use-ful, rapid quality control tool for products that have a yield point but is not toostiff. McCarthy and Seymour (1993) showed that the Bostwick Consistometerused the gravity flow current principle (see page 162).
The Hilker–Guthrie Plummet
This simple device was developed to measure the consistency or ‘body’ of cultured cream, but it can also be used on other products that have a similar con-sistency (Hilker, 1947; Guthrie, 1952, 1963). The plummet consists of a hollowaluminum tube 1/2 in. diam and in. long weighing about 15 g. The lower endtapers to 1/8 in. diam and is closed off. A series of inscribed lines numbered 1 to10 are etched into the tube at 3/8-in. intervals beginning from the top. The plum-met is mounted in a stand vertically over the commodity to be tested and with thelower tip exactly 12 in. from the surface of the product. It is released and allowedto fall freely into the product. The depth of penetration into the commodity isread off the scale after 5 s. It is customary to take the mean of three tests.
Hilker (1947) gives the following figures for relating the plummet reading tothe viscosity of cultured cream: very thin, 0–2; thin, 2–4; medium, 4–6; good,6–7.5; slightly heavy, 7.5–8.5; heavy, 8.5–10; very heavy, greater than 10.
Ridgelimeter
This little device was developed for judging the grade of fruit pectins and thestiffness of pectin jellies (Cox and Higby, 1944; Anonymous, 1959). Theinstrument is essentially a height-measuring gauge. A pectin jelly is madeunder standard conditions specified by The Institute of Food TechnologistsCommittee on Pectin Standardization (Anonymous, 1959). To make a stan-dard jelly, one assumes a jelly grade and uses (650/assumed grade) grams of
4 12
Distance Measuring Instruments 215
Chap-05.qxd 1/12/02 10:40 AM Page 215

pectin to make the jelly. The jellies are poured into tapered glass tumblers thatare 1.75 in. i.d. at the bottom, 2.5 in. i.d. at the top, and internal height exactly3.125 in. Masking tape is applied to the top of the jar to protrude at least 1/2 in.above the jar (see Fig. 5.9).
The boiling jelly is poured into the jar until it is 1/2 in. above the top of thejar, the excess being retained by the tape. After standing for 20–24 h at25 � 3°C the tape is removed, a wire cutter is moved across the top of the jarto remove the excess jelly, and the jelly is carefully tipped out onto a smallsquare of plate glass that is furnished with the instrument. The pointer of the dial is moved down close to the surface of the jelly. After exactly 2 min thepointer is moved until it just contacts the jelly. The scale gives the percentagesag to the nearest 0.1%. A jelly of ‘standard firmness’ has a sag of 23.5%. The true grade of the test is obtained from the formula
true grade � assumed grade (2.0 � % sag/23.5).
If a more precise calculation is needed, a conversion curve given by Cox andHigby (1944) may be used.
This is a simple but effective instrument and is the standard test used by theindustry for establishing the grade of pectins and fruit jellies.
Penetrometer
This useful instrument was first developed for measuring the firmness or theyield point of materials such as petroleum jelly and bitumen, but it is widely
216 Practice of Objective Texture Measurement
FFiigguurree 55..99 The Ridgelimeter.
Chap-05.qxd 1/12/02 10:40 AM Page 216

used for measuring the firmness or yield point of butter, margarine, and othersolid fats. The principle is described on pages 148–150.
The Penetrometer manufactured by Precision Scientific is described here(see Fig. 5.10). Penetrometers that are very similar are made by several othermanufacturers. The Penetrometer consists of a vertical rod 3/16 in. diam andweighing 47.5 g that can be locked in position and then released to fall freelyunder the force of gravity. At the lower end is a small chuck that can hold var-ious cones and needles. A 4-in.-diam dial gauge that is connected to a depthgauge is used to measure manually the distance the rod falls after release towithin 0.1 mm. The dial is graduated from 0 to 380 in 1/10-mm increments.Penetration measurements can be made to a total depth of 62 mm because thedial pointer can make approximately revolutions.1 2
3
Distance Measuring Instruments 217
FFiigguurree 55..1100 The Penetrometer:different types of cones andneedles are shown resting on thewhite cloth.
Chap-05.qxd 1/12/02 10:40 AM Page 217

This assembly is attached to a vertical shaft by means of a rack and pinionto adjust the height above the sample. The vertical shaft is held in a heavy castaluminum base that has a built-in spirit level and two leveling feet. A triggernormally holds the rod at its highest point in a locked position. When the trigger is pressed, the rod is free to drop. An optional addition is a solenoidtrigger assembly controlled by an electrical timer that when switched onreleases the trigger and then locks it again after 5 s.
To operate, a suitable cone or needle is placed in the chuck, the trigger isreleased, and the rod and cone assembly is lifted up until it reaches the upperstop where it is locked. The needle should then read 0. If it is not 0, a smalladjusting knob beneath the instrument is turned to bring the needle to 0. Thematerial to be tested is positioned beneath the cone, and the whole cone anddial assembly is lowered by means of the rack and pinion until the point of thecone almost touches the surface of the fat. The rack and pinion assembly isthen locked. The final adjustment to bring the point of the cone exactly intocontact with the surface of the sample is made by means of a micrometeradjusting screw. The cone and rod assembly is then released and allowed tosink into the food under the force of gravity for 5 s when it is locked again.Weights are provided that can be added to the top of the rod to increase theforce on the cone. Then the depth gauge is pressed down gently until it reachesa stop on the rod. The dial reading indicates the depth of penetration directlyin tenths of a millimeter. When the dial reading has been recorded, the coneand rod assembly is returned to the 0 position and the instrument is ready tomake the next reading.
There is discussion in the literature as to the exact meaning of thePenetrometer reading and whether the reading measures the yield point of thefat, the consistency, or some combination of these (see page 149). Althoughthis matter is not completely settled, the Penetrometer test is a useful test forsolid fats. It is common to make measurements on fats at several temperaturesin order to determine the range of temperatures over which the fat is workable(i.e. its plastic range).
Maleki and Siebel (1972) used a Penetrometer to measure the deformabil-ity of bread and reported a correlation coefficient (r) of 0.88 betweenPenetrometer units and sensory score of softness. These authors used 5-cm-thick slices of bread, a deforming weight of 203 g for 5 s. Fresh bread gave amean deformation of 13.5 mm whereas 5-day-old bread gave a mean defor-mation of 5.3 mm. Underwood and Keller (1948) used the Penetrometer tomeasure the consistency of tomato paste.
The Penetrometer can be adapted to measure the deformation of manyfoods by using a flat disk in place of the cone (Bourne, 1973). A small flat disk 5 mm thick and 50 mm diam is cut from a piece of hard plastic and a 1/8-in.-diam brass rod inserted in the center of one side of the disk normal tothe plane of the disk. The article of food (e.g., a tomato or other deformablefood) is placed in position in the Penetrometer and the disk is brought downclose to (but not touching) its surface by means of the rack and pinion. The
218 Practice of Objective Texture Measurement
Chap-05.qxd 1/12/02 10:40 AM Page 218

Penetrometer is turned on and the disk and rod are allowed to drop freely for5 s and then locked. The distance the rod and disk have fallen is measured onthe dial gauge. A selected weight is then placed on the upper end of the rod,and the weighted disk and rod assembly is allowed to drop freely again for 5 s,then locked, and a second reading is taken from the dial gauge. The differencebetween the two dial readings gives the deformation of the article in units of0.1 mm for a force change equal to the difference in weight between the rodand disk assembly and the added weight.
In conventional Penetrometer testing with a cone, it is critical that the pointof the cone be placed exactly at the surface of the food. In the deformation testthe initial placement is not critical, since this is a test by difference. The 64-gweight of the unloaded disk and rod assembly is sufficient to give the smallpreliminary compression that eliminates those errors that might be caused byintrinsic irregularities in the surface of the food piece (Bourne, 1967a). Thistechnique has the advantage that the Penetrometer is a relatively inexpensiveinstrument that can easily be adapted for measuring the deformability of foodsthat are reasonably soft and of reasonable size.
Figure 5.11 shows how this technique measured the change in deformationof two tomatoes as they ripen. Since this is a nondestructive test, the sametomato can be tested repeatedly, eliminating the problem of sample to samplevariation, provided the force applied is sufficient to cause no irreversiblechange at the test site.
SURDD Hardness Tester
This instrument was developed by the Southern Utilization Research andDevelopment Division (SURDD) of the United States Department ofAgriculture (USDA) and is designed to determine the hardness and softening
Distance Measuring Instruments 219
0.5
9/20 9/27 10/4 10/11 10/18
1.0
1.5
Def
orm
atio
n (m
m)
Date tested
2.0
2.5
FFiigguurree 55..1111 Change indeformation of two individualtomatoes during ripening asmeasured by the Penetrometer.Lower curve is a firm variety andupper curve is a soft variety. The‘x’ on each curve denotes the daywhen the first sign of pink colorappeared near the blossom endof the fruit. (From Bourne, 1973.Reprinted from J. Food Science 3388,page 721. Copyright by Instituteof Food Technologists.)
Chap-05.qxd 1/12/02 10:40 AM Page 219

characteristics of fats and waxes. The test is based on the Brinell tester that isused to measure the hardness of metals (see p. 149).
The instrument consists of a vertical rod that is free to move within a stand.The lower end of the rod holds a steel ball having a selected diameter from0.125 to 0.500 in. The upper end of the rod holds a small platform on whichweights may be placed. The force is applied by raising the test sample supportplatform upward until all the weight of the ball rests on the sample. In opera-tion, a sample of the fat is placed beneath the ball, a suitable weight rangingfrom 0.2 to 6 kg is placed on the plate, and the ball is allowed to penetrate intothe fat under this force for 1 min. The diameter of the ball and the weight are selected so that the diameter of the impression made in the fat is about one third the diameter of the ball. The diameter of the impression in the fat ismeasured by means of a cathetometer or a magnifying glass with a built-inscale. This measurement can be made to within 0.02 mm.
Haugh Meter
The Haugh meter is used to measure the quality of eggs. It consists of a tripod stand through the center of which a pin is located that can be moved upand down by means of a screw. It is a small instrument, weighing less than 1 kg.The principle of the measurement is based on the fact that high thick albumen(the egg white) indicates good quality, fresh eggs. Figure 5.12 shows in topview and silhouette the relationship between albumen height and egg quality.
In operation, an egg is weighed, the shell is broken gently and the egg isspread out on a horizontal glass plate. The Haugh meter (see Fig. 5.13) isplaced such that the center pin is over the thick white about 10 mm out fromthe edge of the yolk. The screw is turned until the face of the pin just touches(‘kisses’) the albumen. The gauge measures the height of the albumen abovethe plate. Haugh (1937) established that the log of the albumen height isdirectly proportional to the egg quality. The basic equation is
Haugh units � 100 log H
where H is the albumen height in millimeters. The factor 100 is used toremove the decimal.
A correction for the weight of the egg is needed because large eggs willhave higher albumen than small eggs of equal quality. The equation correctingfor the weight of the egg is
where G is 32.2 and W, the weight of the egg in grams. The dial gaugemounted on the tripod is usually calibrated directly in Haugh units by meansof a scale that compensates for variations in egg weight.
Haugh units = 100 log HG W
��
�( )
..30 100
10019
0 37�
�
��
�
�
��
220 Practice of Objective Texture Measurement
Chap-05.qxd 1/12/02 10:40 AM Page 220

Since egg quality is largely determined by heredity, the Haugh meter is usedto identify and breed hens that lay top quality eggs with high albumen.Detailed specifications concerning egg quality have been published, and theHaugh units of the eggs are one index of that quality (USDA Handbook No. 75, ‘Egg Grading Manual’). In order for eggs to be graded AA or Fancy,they need to maintain a moving average of 72 Haugh units or higher. For eggs
Distance Measuring Instruments 221
1. HIGH "AA" or "FRESH FANCY" 2. AVERAGE "AA" or "FRESH FANCY" 3. LOW "AA" or "FRESH FANCY"
4. HIGH "A" 5. AVERAGE "A" 6. LOW "A"
7. HIGH "B" 8. AVERAGE "B" 9. LOW "B"
10. HIGH "C" 11. AVERAGE "C" 12. LOW "C"
INTERIOR QUALITY OF EGGS(Recommended standards for scoring the quality of broken-out eggs)
FFiigguurree 55..1122 Relationshipbetween albumen height and eggquality (USDA photo).
Chap-05.qxd 1/12/02 10:40 AM Page 221
that are labeled Grade A, the flock must maintain a moving average of 60Haugh units or higher.
Baker Compressimeter
This instrument measures the force to press a metal plate onto a 12-mm-thickslice of bread until it has been compressed to 9 mm (25% compression). Asmall motor gradually applies a force by winding up on a spool a cordattached to the compressing lever. The force and degree of compression aremeasured on two scales, and it is possible to measure forces and deformationsat other than 25% compression. The instrument is also used to measure thesoftness of buns, rolls, cakes, and other leavened baked goods.
The Baker Compressimeter is a standard method for measuring the staleness of bread (Cereal Laboratory Methods No. 74-10A, published by theAmerican Association of Cereal Chemists). The relationship between the actualCompressimeter reading and degree of staleness and quality of the bread is amatter of discussion among cereal chemists, and some judgment is needed tointerpret the results (Platt and Powers, 1940; Bice and Geddes, 1949; Crosslandand Favor, 1950; Edelman et al., 1950; Thompson and Meisner, 1950; Bechtelet al., 1953).
Willhoft (1970) developed an empirical equation describing the staling ofbread over a period of six days:
Ft � A(t/ti)B
222 Practice of Objective Texture Measurement
FFiigguurree 55..1133 The Haugh meter(USDA photo).
Chap-05.qxd 1/12/02 10:40 AM Page 222
where Ft is the firmness at time t, measured by an objective test; ti, the time ofinitial measurement; A, a constant which is equal to firmness at time equal tounity; and B, a constant which is equal to the rate of firming.
He showed that a plot of log Ft versus log t is rectilinear with slope equal to the rate of firming constant B. The same author reviewed the theory andmechanism of bread staling and associated changes in textural properties(Willhoft, 1973).
Adams Consistometer and Tuc Cream Corn Meter
These instruments measure the distance a semifluid food flows across a platein a standard time (Adams and Birdsall, 1946). They should be known as theGrawemeyer and Pfund Consistometer if priority is recognized (Grawemeyerand Pfund, 1943).
The Adams consistometer consists of a 12-mm-thick sheet of clear hardplastic (Plexiglas) approximately 37 cm square that is leveled by means ofadjustable legs. A series of concentric circles are inscribed on the underside ofthe sheet at 1/4-in. intervals. The frustum of a stainless-steel cone that is 3 in.diam at the lower face, 2 in. diam at the upper face, and 5 in. high is placed inthe center of the plate. The Tuc Cream Corn Meter is very similar to theAdams Consistometer.
In operation, the cone is placed in position and filled to the top with theproduct. The cone is gently lifted up and the product is allowed to flow out intwo dimensions across the plate. After a standard time the diameter of theproduct is measured along two axes at right angles to each other. The USDAspecification for standard quality cream-style corn stipulates that the averagediameter should not be greater than 30.5 cm after 30 s flow. The product is sub-standard if the diameter is greater than the 30.5 cm.
USDA Consistometer
This is similar in principle to the Adams Consistometer. The USDA flow sheet#1 consists of a thin flexible plastic sheet over which the product flows. Thereceptacle holding the food is a Perspex cylinder 3 in. i.d. and 3¼ in. high. Thedistance of flow is measured from the outer edge of the cylinder in centimeters(see Fig. 5.14). This contrasts with the Adams Consistometer, which measuresinches diameter and includes the diameter of the cone.
The USDA standards for canned applesauce measures the distance of flowafter 1 min on this sheet. The flow value is taken as the average of the readingsat four quadrants of the flow sheet. The readings are taken at the edge of theapplesauce and do not include any free serum that exudes from the sauce. Theamount of free serum that exudes may also be measured. For grade A apple-sauce, regular style, the flow should be not greater than 6.5 cm and for chunkystyle not more than 7.5 cm. For grade B applesauce the flow should not exceed8.5 cm for the regular style and 9.5 cm for the chunky style.
Distance Measuring Instruments 223
Chap-05.qxd 1/12/02 10:40 AM Page 223

Volume Measuring Instruments
Loaf Volume Meter
This apparatus consists of a metal box connected through a rectangular chute toa hopper containing rapeseed. A loaf of bread is placed in the box, which isclosed, a slide in the chute is pulled out, and the rapeseed is allowed to fill thebox. A calibrated scale on a Pyralin face of the volumeter column gives the directreading of the volume of the bread in cubic centimeters. This device is widely
224 Practice of Objective Texture Measurement
FFiigguurree 55..1144 The USDAConsistometer: (a) cylinder is filled with applesauce; (b) cylinder is removed, allowingsauce to flow out.
Chap-05.qxd 1/12/02 10:40 AM Page 224

used in the baking industry to measure loaf volume, which is one index of qual-ity of the loaf (Cathcart and Cole, 1938; Funk et al., 1969) (see Fig. 5.15).
The standard volumeter consisting of a box � in. is designed for the1-lb loaf of bread and can read volumes between 1675 and 3000 cm3. Othersizes available are the ‘Pup size,’ measuring 400–1000 cm3 ‘micro’ size, meas-uring 100–270 cm3, ‘half-pound’ size, measuring 900–1500 cm3, ‘ -lb’ size,measuring 2475–3800 cm3, and a ‘round cake’ size, designed for cakes with
1 12
11585 5
8
5 58
Volume Measuring Instruments 225
FFiigguurree 55..1155 The LoafVolumeter. (Courtesy of NationalManufacturing, A Division ofTMCO Inc.)
Chap-05.qxd 1/12/02 10:40 AM Page 225

measuring volumes of 500–1600 cm3. A ‘dummy’ loaf of standard size is pro-vided with each volumeter to calibrate the rapeseed level in the hopper.
Succulometer
This instrument is designed to measure the volume of juice that can be pressedfrom fresh sweet corn and is used as an index of maturity and quality (Meyer,1929; Sayre and Morris, 1931, 1932; Kramer and Smith, 1946). In operation,a 100-g sample of cut corn is placed in the sample chamber and pressure isapplied through a hydraulic ram that is pumped by hand. A pressure of 500 lbis maintained for 3 min and the juice that flows out is collected in a 25-mlgraduated cylinder. The volume of juice decreases as the corn becomes moremature. Kramer and Smith (1946) relate the Succulometer values to quality ofsweet corn as follows: fancy quality, more than 22 ml of juice; extra standard,19–22 ml; standard, 12–18 ml; substandard, less than 12 ml.
The Food Technology Corporation Texture Press is provided with anoptional accessory in the form of a succulometer cell (Model CR-1), whichallows the succulometer test to be performed in this apparatus.
Time Measuring Instruments
Kinematic viscometers are time measuring instruments. These will be dis-cussed in Chapter 6.
BBIRA Biscuit Texture Meter
The British Baking Industry Research Association (BBIRA) Biscuit Tester isdesigned to measure the hardness of biscuits (cookies and crackers) (Wade,1968). A stack of biscuits is placed in the sample holder and pressed with constant force against a small circular saw blade that is rotating at 15 rpm. Thetime taken to make the saw cut through the stack is recorded by a counter,which stops when the operation is complete. A brush is positioned behind thesaw to clean the teeth. The unit is housed in a fiberglass cover with a door toenable the operator to gain access to the working elements. The door has aPerspex window in it to enable the operator to watch the saw cut operation.This instrument is essentially a comparator; standards must be establishedexperimentally for each type of cookie or cracker.
Miscellaneous Methods
Torry Brown Homogenizer
This instrument is an homogenizer that has been especially designed to mea-sure the toughness of fish by the ‘cell fragility method’ (Love and Mackay,
226 Practice of Objective Texture Measurement
Chap-05.qxd 1/12/02 10:40 AM Page 226

1962; Love and Muslemuddin, 1972a,b; Whittle, 1973, 1975). A 200-mgsample of fish tissue is dropped into the homogenizer cup with 20 ml of a solu-tion consisting of 2% trichloroacetic acid and 1.2% formaldehyde cooled tobelow 6°C. The paddle in the cup is rotated at 8750 rpm for 30 s. Muscle fromfresh fish breaks up into small particles forming a cloudy soup that has a highoptical density whereas muscle from tough fish is shredded into large piecesand has a low optical density. For rough work the optical density of thehomogenate can be viewed by eye. For more accurate work the optical densitycan be read in an absorptiometer.
This method has been shown to give a good index of the deterioration in thetexture of frozen fish. Fatty fish and fish in an advanced stage of bacterialdecay give spurious readings because of the higher optical density imparted to the homogenized liquid by the bacterial cells or fat globules (Love andMuslemuddin, 1972a,b; Love, 1983).
Multiple Measuring Instruments
GF Texturometer
This Texturometer was developed by the central research group of the GeneralFoods Corporation (Friedman et al., 1963; Szczesniak et al., 1963). The com-mercial instrument is manufactured in Japan.
A 1/16-hp electric motor drives an eccentric that is linked to the activatingarm of the instrument. Because it is driven by an eccentric, the arm movesthrough the arc of a circle with the speed varying approximately in a sine wavefunction. To this arm can be attached a variety of plungers made of Lucite,aluminum, or nickel, ranging in diameter from 3 to 50 mm.
Positioned underneath the moving arm to which the plungers are attached isa platform on which the food sample is placed. This platform rests on a can-tilever beam to which strain gauges are attached. Bending of the beam underthe application of a force is sensed by the strain gauges and recorded elec-tronically on a strip chart recorder. This instrument is designed for testing‘bite-size’ pieces of food. The standard piece is a 1/2-in. cube, but particulatefoods (e.g. peanuts) are normally tested as whole units. The mechanics of themovement of the eccentric and compressing arm have been analyzed byBrennan et al. (1975). One Texturometer unit is equivalent to approximately105 g force (�1.03 N), but the actual value can vary to some extent depend-ing on the voltage output of the recorder batteries.
The GF Texturometer was originally used to develop the instrumental textureprofile analysis procedure in which a number of texture properties are extractedfrom the force–time curve when a bite-size piece of food is compressed twotimes. However, instrumental texture profile analysis is now usually performedin universal testing machines (see pages 182–186). Other applications of the GFTexturometer are discussed by Szczesniak and Hall (1975) and Tanaka (1975).
Multiple Measuring Instruments 227
Chap-05.qxd 1/12/02 10:40 AM Page 227

FTC Texture Test System
These systems are variations on the Food Technology Corporation TexturePress, which was described on pages 201–206 but with a number of additionsthat give it expanded utilization, more flexibility in operation, and make itattractive for many research purposes. Some additional accessories will alsobe described below.
The major feature of the laboratory model, the TMS-90 Texture TestSystem, is the addition of a computer to control and monitor the output signalsfrom the Texture Press. The computer has an integrated 100 mm wide thermalprinter, which allows a hard copy output of the graphic and alpha numeric testresults. The system will work in either metric or English units and has a preset texture profile analysis mode with automatic calculation of TPA param-eters and statistical results of multiple sample runs.
The hydraulic drive mechanism and other characteristics of the ram presshave been described previously (see page 202). The force sensor in this modelis the strain gauge type force transducer, which provides a continuous signalthat is directly proportional to the force applied and is transferred electroni-cally to the computer.
The thermal graphics printer is 100 mm wide. After each test the force/distance or force/time graph can be printed. The computer allows the operatorto expand or contract the graphic scaling as desired.
Some additional features standard in the Model TMS-90 Texture Systemsare the following:
(1) Automatic ram cycling using the ‘Program Mode’ that causes the ramto cycle between up to eight preset positions enabling the instrument tobe used for customized cyclic tests.
(2) A ‘TPA Mode’ that allows the operator to perform Texture ProfileAnalysis and program percentage of compression. The operator canalso select from automatic sample height detection or tell the computerthe dimensions of the sample under test. The computer will automati-cally calculate the traditional TPA parameters at the conclusion of thetest(s).
(3) The TMS-90 will also calculate the work done, slope of the forcecurve, time, minimum and maximum forces, and a complete set of statistical results on a series of tests.
(4) A series of six model FTA force transducer load cells with force capac-ities of �10, 50, 100, 250, 1000, and 3000 lb that can measure force inboth compression and tension.
(5) A number of different test cells, including: (a) a single-blade shear cellwith a flat cutting face; (b) a meat shear cell with a V-shaped cuttingface that is similar to the Warner–Bratzler Shear blade; (c) compressiontest accessories that can be used for gentle or extreme compression orcycling compression; (d) a Succulometer test cell for pressing liquidfrom foods such as sweet corn to measure juiciness; (e) a triple-beam
228 Practice of Objective Texture Measurement
Chap-05.qxd 1/12/02 10:40 AM Page 228

bending test cell; (f) a drill chuck that holds 3/16 and 5/16 in. diameterpunches for puncture tests; (g) a tension test cell; (h) a thin-slice tension test cell.
Table AIII.1 in Appendix III (pages 353–357) provides guidelines for test-ing various foods in the Food Technology Corporation Texture Test System.
Ottawa Texture Measuring System (OTMS)
This general purpose testing machine was developed by the EngineeringResearch Service of Agriculture Canada under the direction of P. W. Voisey(Voisey, 1971b; Voisey et al., 1972). It consists of a single screw-operatedpress that is driven by an electric motor via a gear box. A variable-speed motorwith an infinite selection of speeds over the range 2–29 cm min�1 is used forresearch applications. The screw is driven via a brass pin, which breaks whenoverloaded; forestalling damage to the press. The screw drives a carriage upand down two vertical guide rods. Adjustable stops on the guide rod can be setto stop, start, and reverse the motion of the carriage.
A number of test cells have been developed for this instrument (Voisey anddeMan, 1976). In addition, the test cells from most other instruments can beattached to the OTMS by means of an adapter.
Universal Testing Machines (UTM)
The three essential components of UTMs (drive system, test cells and forcemeasuring and recording system) are described on page 177. The first editionof this book described the operation of the Instron in detail because, at thattime, UTMs were just beginning to become popular and the Instron was thefirst UTM to be widely used for foods. The description of UTMs in this edi-tion will be brief for several reasons.
(1) UTMs are now used in most laboratories, so a detailed description is nolonger needed.
(2) Manufacturers of UTMs bring out new models from time to time. Theyperiodically develop new attachments to perform new kinds of tests.
(3) The software to drive UTMs is becoming more important. Ease of use,and ease of setting up new tests and a wide range of different kinds oftests is becoming as important as the basic instrument itself. The soft-ware for UTMs is being upgraded regularly.
Therefore, any detailed description in this book is likely to become obsoletewithin a few years. The addresses of the major suppliers of UTMs for foodpurposes are given in Appendix I. The reader is advised to consult their websites for the latest information on their offerings.
There are many manufacturers of strength of materials UTMs, and most ofthese machines can be adapted to work with foods in the same way that the
Multiple Measuring Instruments 229
Chap-05.qxd 1/12/02 10:40 AM Page 229

Instron was adapted to work with foods (Bourne et al., 1966). However, manyof them do not provide test cells for food applications, and the researcher willhave to design and make his/her own accessories and computer software. Allthe UTMs listed below supply a range of cells appropriate for foods. Anyinstrument that uses a rectilinear motion to measure food texture can be duplicated in a UTM by fitting the appropriate test cell components into it.Instruments that use a rotary or blending movement cannot be duplicated in UTMs because they work on the principle of uniaxial compression orextension.
One precaution that should always be taken when setting up a test cell in aUTM is to ensure that the crosshead travel stops are set in positions that posi-tively prevent accidental metal-to-metal contact of the test cell parts. Mostfood tests involve compression in which metal parts approach each other,often at high speeds. Unless the crosshead travel stops are properly set, themetal parts may collide and, since there is no ‘give’ in these ‘stiff’ machines,the load cell will be broken. Repair of a damaged load cell is expensive andtime consuming. Many UTM suppliers have minimized this problem bydesigning the control mechanism and drive mechanism so that the crossheadwill either stop or reverse direction quickly as soon as an overload is sensed.
Since a number of different test principles are used in UTMs (puncture,extrusion, shear, compression, bending, etc.), any reports of results obtainedshould carefully specify the type of test and the conditions that were used. Forexample, it is not satisfactory to report ‘the Instron test correlated highly (orpoorly) with sensory scores.’ The test principle and all the operating condi-tions must also be stated. Another type of test performed in the same Instronmay have given a better (or worse) correlation. UTMs will give poor results ifan inappropriate test principle or the wrong conditions (e.g. speed of travel)are used. (See Chapter 9 for more discussion on this point.)
InstronThis was the first UTM adapted to food use (Bourne et al., 1966). The InstronCorporation make a wide range of UTMs for a wide range of products, mostof which are nonfood. Table AIII.2 in Appendix III (pages 358–361) listsdetails of food applications of the Instron that have been used in the author’slaboratory using a floor-model machine with a force capacity of 50,000 N.
Figure 5.16 shows the single screw model No. 5542 that is often used forfoods. It has a force capacity of 500 N and crosshead speeds cover the range0.05–1000 mm min�1. Other models with twin screws are available that havea force capacity up to many tonnes. A wide range of accessories are availablefor food texture analysis including fixtures for the Kramer Shear Press andOttawa Texture Measuring System.
TA.XT2 Texture AnalyzerThe standard TA.XT2 Texture Analyzer is a single screw machine that wasdeveloped especially for food work. It has a force capacity of 250 N and
230 Practice of Objective Texture Measurement
Chap-05.qxd 1/12/02 10:40 AM Page 230

crosshead speeds of 6–600 mm min�1. Heavy-duty twin screw models areavailable up to 5000 N force. The TA.XT2 Plus model offers speeds up to2400 mm min�1.
Figure 5.17 shows the TA.XT2 Texture Analyzer and Table AIII.3 inAppendix III (pages 362–368) lists details of applications to many kinds offoods. Stable Micro Systems, and their US Distributor, Texture TechnologiesCorp., have developed an extensive library of food applications and haveestablished a reputation for personally helping customers with their day-to-day texture measurement problems and to work with them to develop new testmethods and applications in operating their instruments.
QTS Texture AnalyzersThis line of single-screw machines was developed from concepts originallyestablished by the Leatherhead Food Research Association in the UnitedKingdom as the Stevens Texture Analyzer. It has a force capacity of 250 N andcrosshead speeds from 5 to 1000 mm min�1 in 1 mm increments. A number ofaccessories for food applications are available. It can be utilized as stand alonebut also can be controlled by a computer.
This company also supplies the LFRA Texture Analyzer which is a smallinstrument with a force capacity of either 1 N or 10 N and comes with probesfor testing gelatin gels and similar products. It has five choices of crossheadspeed from 0.1 to 2.0 mm s�1 and is used for testing soft foods such as gelatingels, yogurt, butter and margarine. It includes the 12.5 mm diameter probe for
Multiple Measuring Instruments 231
FFiigguurree 55..1166 A model of theInstron often used on foods.(Courtesy of InstronCorporation.)
Chap-05.qxd 1/12/02 10:40 AM Page 231

performing the Bloom test in gelatin and the 25 mm diameter probe for theBloom test on gelatin desserts. It can be utilized as stand alone or with com-puter software to analyze the data.
Lloyd Texture AnalyzerA number of accessories for testing foods can be attached to Lloyd machines.The commonly used basic machine is the model TA500 which is chain driven,has a force capacity of 500 N and speed range of 1–1000 mm min�1. Modelswith a higher force capacity are driven by a single screw or double screwdepending on the force level required.
TensipresserThis instrument, designed and manufactured in Japan, is intended for testingof foods, chemicals, and packaging materials in compression or tension. Itfeatures components that are particularly well suited for performing textureprofile analysis under a wide range of test conditions. Model (TTP-50BX) was
232 Practice of Objective Texture Measurement
FFiigguurree 55..1177 The TA.XT2Texture Analyzer. (Courtesy ofStable Microsystems Ltd.)
Chap-05.qxd 1/12/02 10:40 AM Page 232

first manufactured in 1973. The latest model (TTP-50BXII) has been pro-duced since 1993. It is a single screw machine with a force capacity of 500 Nand crosshead speeds of 6–600 mm min�1. It has attachments to perform awide range of texture tests on foods. One interesting feature of Model TTP-50BXII is that it can be programmed to operate either with a uniform cross-head speed or a sinusoidal crosshead speed that approximates the action of the human mandible. The software is in Japanese and English. The operator’smanual is available in Japanese but not in English.
Multiple Measuring Instruments 233
Chap-05.qxd 1/12/02 10:40 AM Page 233

Viscosity Measurement
Introduction
The definition of viscosity and description of the different types of viscositywere given in Chapter 3. It is assumed that the reader has already read Chapter 3because the foundation it provides is needed to gain a full understanding of thematerial in this chapter.
The first thing to remember in measuring viscosity is that the viscosity of fluids is highly temperature dependent (see page 78). The BrookfieldEngineering Laboratory points out that No. 50 motor oil will change its viscos-ity about 10% for a 1°C temperature change at 25°C. This company has encoun-tered materials whose viscosity changed 50% per degree centigrade. Theviscosity of water at 20°C changes 2.5% per 1°C temperature change. Hence, itis impossible to measure the viscosity of water with an accuracy of 0.1% unlessthe temperature is controlled to within 0.04°C. Therefore, in all viscosity mea-surements it is essential that the temperature be closely controlled.
The effect of temperature on viscosity of sucrose syrups is shown in Fig. 3.10 (page 78) and Fig. 3.11 (page 79) and for depectinized apple juice inFig. 8.11 (page 310). The temperature at which viscosity measurements aretaken should be stated with all viscosity data because the data are meaninglessunless the temperature is known. It is assumed that close temperature controlis an essential feature of each system described below.
The various types of viscometers can be classified according to the princi-ple on which they work.
Capillary Type
The time for a standard volume of fluid to pass through a length of capillarytubing is measured. The underlying theory behind capillary viscometers is
C H A P T E R
6
Chap-06.qxd 1/12/02 10:40 AM Page 235

developed fully by a number of authors (see, e.g., Oka, 1960; VanWazer et al.,1963) and will not be given here. This type of flow is described by thePoiseuille equation, which is also known as the Hagen–Poiseuille equation(Hagen, 1839; Poiseuille, 1846):
h � pPr4t /8Vl
where h is the viscosity; P, the driving pressure; r, the radius of capillary; t, the time of flow; V, the volume of flow; and l, the length of capillary.
The driving pressure is usually generated by the force of gravity acting on acolumn of the liquid, although it can be generated by the application of com-pressed air or by mechanical means (as in the Instron Capillary Rheometer).The discussion here will be restricted to glass capillary viscometers.
The Ostwald viscometer is one of the simplest of the glass capillary typesand is shown schematically in Fig. 6.1. There are a number of variations in thedesign of glass capillary viscometers, each with its own specific name andeach claiming certain advantages (VanWazer et al., 1963). For example, theOstwald–Cannon–Fenske Viscometer, which is a widely used modification ofthe Ostwald viscometer, has both arms bent at an angle that brings the center
236 Viscosity Measurement
um
lm
A B
G
C
D
E
F
Figure 6.1 Schematicrepresentation of the Ostwaldviscometer.
Chap-06.qxd 1/12/02 10:40 AM Page 236

of the upper bulbs directly over the center of the lower bulb, thus displacingthe capillary from the vertical position.
The operation of the Ostwald Viscometer will now be described. Otherstyles of glass capillary viscometers are operated in a similar manner, theexact details should be provided by the supplier when it is purchased.
In operation, a standard volume of fluid is pipetted into arm A of theOstwald Viscometer, which should be held in a vertical plane (see Fig. 6.1). Itis not essential that the capillary be exactly vertical but it should be held repro-ducibly at the same angle. The fluid runs down the wide-bore tube C into bulbD and U-tube E. The apparatus is immersed in a constant temperature waterbath until the viscometer and liquid in it reach the standard temperature (about30 min). Suction is then applied at the top of arm B to draw the fluid throughthe capillary F into bulb G until the upper meniscus is above the mark um. The suction is removed and the fluid flows from bulb G through the capillarytube F under the force of gravity. A stop watch is started when the meniscuscrosses the upper mark um and stopped when it crosses the lower mark lm. The viscosity is calculated from the elapsed time.
The AVS/N viscometer is a sophisticated glass capillary that uses light barriers to record the time the meniscus passes the set points and displays theelapsed time on a digital indicator to the nearest 0.01 s. This eliminates errorsin operating the stopwatch and allows the operator to attend to other dutiesonce the test has been started.
For a given viscometer of this type, the dimensions of the radius and lengthof the capillary are constant and the volume is kept constant. The driving pres-sure P is proportional to the hydrostatic head and the density of the fluid. Thehead decreases as the liquid falls in reservoir G. This viscometer is designed tominimize the change in head during the measured portion of the efflux time,and the shape of the bulb G is such that most of the efflux time occurs when thehead is close to its mean value. Variations in the pressure head have no effecton the viscosity measurement of Newtonian fluids but they do affect measure-ments on non-Newtonian fluids, the magnitude of the deviations depending onthe degree to which the fluid departs from Newtonian behavior. For aNewtonian fluid the driving pressure P can be replaced by h � g � r, where his the mean head; g, gravity; and r, the density of the fluid. Since h is constantfor a given viscometer, the Hagen–Poiseuille equation can be simplified to
h � Krt
where K is the instrument conversion factor (phgr4/8Vl) and is a constant foreach instrument. This equation can be rearranged to
h/r � Kt or n � Kt
since kinematic viscosity n � h/r.Hence the kinematic viscosity n of the fluid is obtained by multiplying the
measured efflux time by the instrument conversion factor K. Most laboratorysupply houses will provide the K value for each viscometer at a small addi-tional cost over the price of the viscometer.
Capillary Type 237
Chap-06.qxd 1/12/02 10:40 AM Page 237

If the instrument conversion factor K is not provided or has been lost, it canbe obtained by measuring the efflux time for a fluid of known viscosity:
ns � Kts
where ns is the kinematic viscosity and ts is the efflux time for a standard fluidof known viscosity.
Rearranging this equation gives
K � ns/ts
The Cannon Instrument Co. (PO Box 16, State College, Pennsylvania 16801)supplies a wide range of Newtonian viscosity standards in the form of a series of oils of calibrated viscosity. These are useful for calibrating kinematicviscometers.
Glass capillary viscometers are widely used for measuring low to mediumviscosity Newtonian fluids because of their high degree of accuracy, ease ofoperation, and low cost. Priel et al. (1973) developed a system for a Ubbelohdeglass capillary viscometer that yielded data with an absolute accuracy withinthree parts per million. An essential part of their system was a thermostat witha long-time thermal stability of �2 �10�4°C over a period of 4 weeks.
Because of their low cost it is usual to purchase several glass capillary viscometers if a large number of measurements need to be made. This allowsseveral units to be reaching equilibrium temperature while a measurement isbeing performed on one unit. It is advisable to purchase a series of viscome-ters with a range of capillary diameters when a wide range of viscosities areencountered. A capillary diameter should be selected that gives an efflux timebetween about 200 and 800 s. Figure 6.2 shows some typical glass capillaryviscometers.
The American Society for Testing and Materials (1918 Race Street,Philadelphia, Pennsylvania 19103) has published a standard test method foruse of capillary viscometers on Newtonian fluids: ASTM D445–79, ‘KinematicViscosity of Transparent and Opaque Liquids (and the Calculation ofDynamic Viscosity).’This organization has published another useful document:ASTM-D446–79, ‘Standard Specifications and Operating Instructions forGlass Capillary Kinematic Viscometers.’
A number of corrections need to be made when very accurate results areneeded from glass capillary viscometers. These include correction for thekinetic energy lost in the stream as it issues from the bottom of the capillary,and effects due to the change in the meniscus size and shape as it enters orleaves the capillary, possible turbulence in the capillary, and inadequatedrainage due to liquid adhering to the walls of the viscometer. These errors,and methods for their correction, are discussed in detail by VanWazer et al.(1963). The same authors show how the capillary viscometers may be used for certain non-Newtonian fluids.
The AOAC Official Methods of Analysis Handbook (2000) uses an Ostwaldor Cannon–Fenske capillary viscometer for measuring the viscosity of beer
238 Viscosity Measurement
Chap-06.qxd 1/12/02 10:40 AM Page 238

Capillary Type 239
Figure 6.2 Some glasscapillary viscometers.
(Method 974.07). The method specifies that a capillary be selected that givesa time range between 50 and 150 s, the temperature adjusted to 20.00 � 0.05°C,and that the viscometer be cleaned with chromic acid cleaning solution andrinsed and drained before use.
The Lamb–Lewis Capillary Viscometer was developed by the National FoodProcessors Association (formerly known as the National Canners Association)as a low-cost quality-control instrument for use on tomato juice, fruit nectars,and similar fruit or vegetable juices and blends (Lamb and Lewis, 1959). It isused by the fruit and vegetable juice industry as an internal quality standard(Lamb, 1967). It consists of a 3.8 cm i.d. � 17.8 cm long Lucite chamber fromthe bottom of which protrudes a precision Pyrex glass tube 3 � 0.01 mm i.d.and 29 cm long (see Fig. 6.3). The chamber is filled with liquid, which is
Chap-06.qxd 1/12/02 10:40 AM Page 239
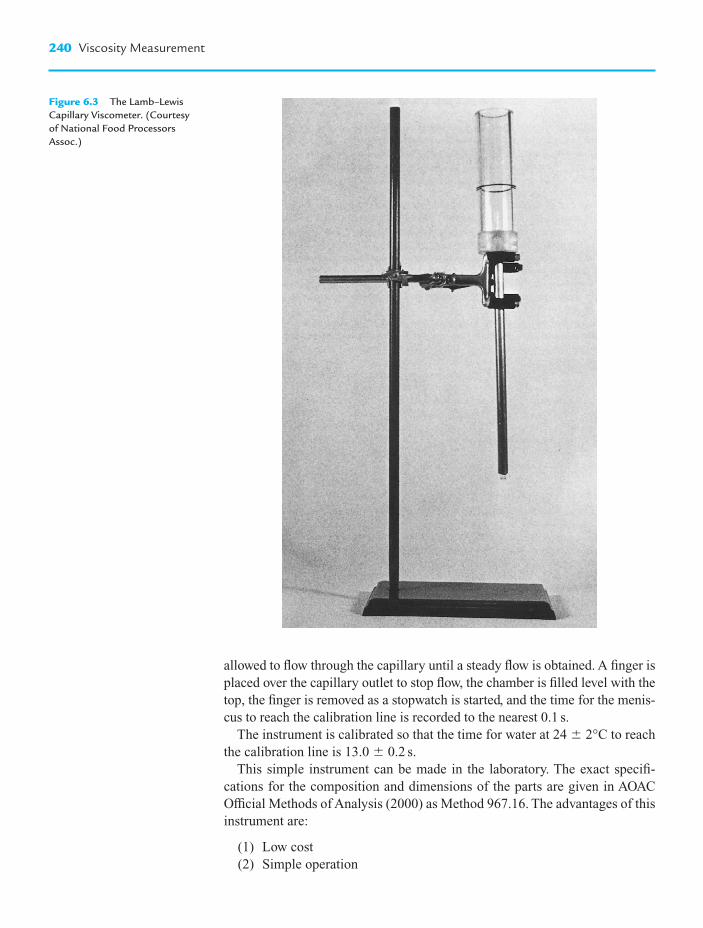
240 Viscosity Measurement
Figure 6.3 The Lamb–LewisCapillary Viscometer. (Courtesyof National Food ProcessorsAssoc.)
allowed to flow through the capillary until a steady flow is obtained. A finger isplaced over the capillary outlet to stop flow, the chamber is filled level with thetop, the finger is removed as a stopwatch is started, and the time for the menis-cus to reach the calibration line is recorded to the nearest 0.1 s.
The instrument is calibrated so that the time for water at 24 � 2°C to reachthe calibration line is 13.0 � 0.2 s.
This simple instrument can be made in the laboratory. The exact specifi-
cations for the composition and dimensions of the parts are given in AOACOfficial Methods of Analysis (2000) as Method 967.16. The advantages of thisinstrument are:
(1) Low cost(2) Simple operation
Chap-06.qxd 1/12/02 10:40 AM Page 240

(3) Rapid(4) Handles Newtonian fluids and non-Newtonian fluids(5) The end point is unambiguous. For some efflux viscometers it is some-
times difficult to decide exactly when to stop the timer as the last fewdrops of fluid drip out.
Tube Viscometry
This might be considered as a wide-bore capillary viscometer with a specialcapability to handle suspensions. It consists of a horizontal tube of uniformcross-sectional area that is usually 0.5 m long and may be even longer. Theinternal diameter typically ranges from 6 mm to 30 mm. Two pressure trans-ducers are attached to the pipe to record the pressure drop (�P) over a givenlength of pipe (L). A constant pressure is maintained at the entrance of thetube that ensures laminar flow occurs and the volumetric flow rate (Q) ismeasured (see Fig. 6.4).
For a non-Newtonian fluid obeying the power law equation the viscosity isgiven by the equation:
where ha is the apparent viscosity, �P is pressure drop over distance L, Q isvolumetric flow rate, R is the radius of tube, and n is the flow behavior indexof a power law fluid.
Care needs to be taken in operation to ensure that the effects of entrance andexit flow are negligible. Steffe (1992) gives a thorough account of the theorybehind the tube viscometer.
h paP
LQ
n
nR�
�
�8
4
3 14�
��������
���
Tube Viscometry 241
Compressedair
Reducingvalve
Pressuregauge
12cm
30cm
Fluid
Ball valveTube
L
D
IN
Figure 6.4 Tube viscometer.(From Saravacos, 1968.Reprinted from Food Technology2222 (12), page 1589. Copyright byInstitute of Food Technologies.)
Chap-06.qxd 1/12/02 10:40 AM Page 241
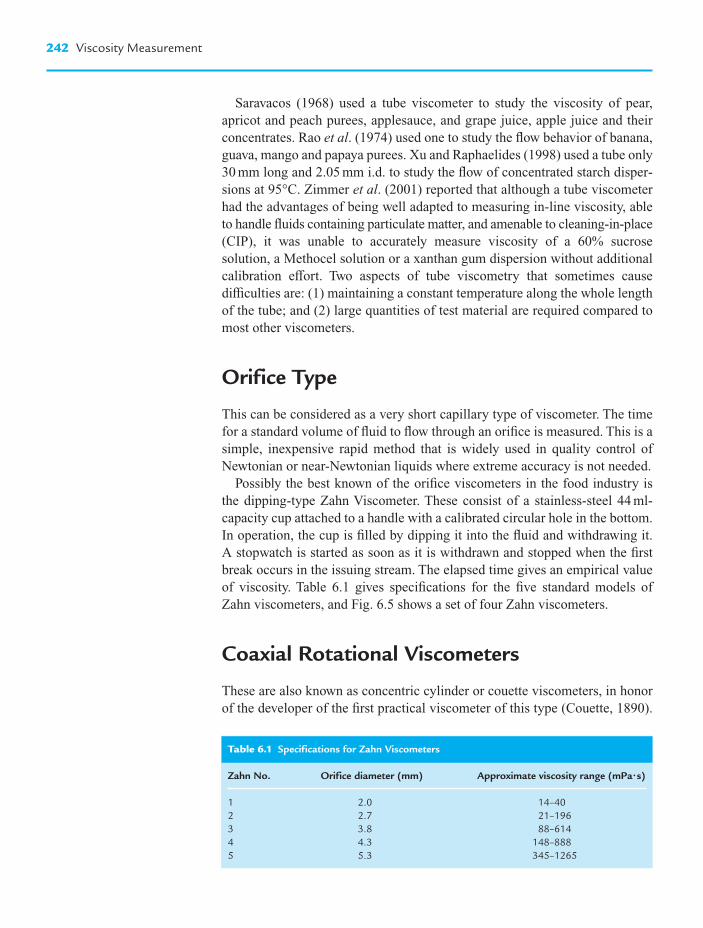
Saravacos (1968) used a tube viscometer to study the viscosity of pear, apricot and peach purees, applesauce, and grape juice, apple juice and theirconcentrates. Rao et al. (1974) used one to study the flow behavior of banana,guava, mango and papaya purees. Xu and Raphaelides (1998) used a tube only30 mm long and 2.05 mm i.d. to study the flow of concentrated starch disper-sions at 95°C. Zimmer et al. (2001) reported that although a tube viscometerhad the advantages of being well adapted to measuring in-line viscosity, ableto handle fluids containing particulate matter, and amenable to cleaning-in-place(CIP), it was unable to accurately measure viscosity of a 60% sucrose solution, a Methocel solution or a xanthan gum dispersion without additionalcalibration effort. Two aspects of tube viscometry that sometimes causedifficulties are: (1) maintaining a constant temperature along the whole lengthof the tube; and (2) large quantities of test material are required compared tomost other viscometers.
Orifice Type
This can be considered as a very short capillary type of viscometer. The timefor a standard volume of fluid to flow through an orifice is measured. This is asimple, inexpensive rapid method that is widely used in quality control ofNewtonian or near-Newtonian liquids where extreme accuracy is not needed.
Possibly the best known of the orifice viscometers in the food industry is the dipping-type Zahn Viscometer. These consist of a stainless-steel 44 ml-capacity cup attached to a handle with a calibrated circular hole in the bottom.In operation, the cup is filled by dipping it into the fluid and withdrawing it. A stopwatch is started as soon as it is withdrawn and stopped when the firstbreak occurs in the issuing stream. The elapsed time gives an empirical valueof viscosity. Table 6.1 gives specifications for the five standard models ofZahn viscometers, and Fig. 6.5 shows a set of four Zahn viscometers.
Coaxial Rotational Viscometers
These are also known as concentric cylinder or couette viscometers, in honorof the developer of the first practical viscometer of this type (Couette, 1890).
242 Viscosity Measurement
Table 6.1 Specifications for Zahn Viscometers
Zahn No. Orifice diameter (mm) Approximate viscosity range (mPa��s)
1 2.0 14–402 2.7 21–1963 3.8 88–6144 4.3 148–8885 5.3 345–1265
Chap-06.qxd 1/12/02 10:40 AM Page 242

The principle is shown schematically in Fig. 6.6. A bob that is circular in crosssection is placed concentrically inside a cup containing the test fluid. Eitherthe cup or the bob is rotated and the drag of the fluid on the bob is measuredby means of some kind of torque sensor. The shear rate–shear stress relation-ship is the same whether the bob is rotated and the cup held stationary or viceversa. This type of viscometer permits continuous measurements to be madeunder a given set of conditions and allows time-dependent effects to be stud-ied. By changing the rate of shear or magnitude of stress it is possible to obtainviscosity measurements over a range of shearing conditions on the same sample. It can be used for both Newtonian and non-Newtonian foods. This isthe most common type of viscometer that is used in the food industry. It mightbe called the ‘workhorse’ viscometer.
The Margules equation (Margules, 1881) applies to the flow of Newtonianfluids in coaxial rotational viscometers:
h � (M/4ph) (1/Rb2 – 1/Rc
2)
where h is the absolute viscosity; M, the torque on the bob or cup; , theangular velocity of rotating member; h, the length of bob in contact with thefluid; Rb, the radius of the bob; and Rc, the radius of the cup. For a given instru-ment with a given geometry and fill of container this equation reduces to
h � KM/
where K is the instrument constant (1/4ph) (l/Rb2 – l/Rc
2).
Coaxial Rotational Viscometers 243
Figure 6.5 Some Zahnviscometers (dipping orificetype).
Chap-06.qxd 1/12/02 10:40 AM Page 243

The Margules equation is not applicable to flow of non-Newtonian fluids incoaxial rotation viscometers. More complex equations have been derived to represent, or approximately represent, the flow of these complex fluids. The reader is referred to standard texts on viscometry for the development of equations applicable to non-Newtonian fluids (see, e.g. VanWazer et al., 1963; Whorlow, 1980).
This type of viscometer may be divided into two classes.
Class 1. Stormer type. The shear rate is measured under a controlled torque.A constant torque was maintained in the original stormer viscometerby a falling weight attached to a thin cord that passes over a pulley andis wrapped around a drum that is connected to the rotor bob. Modern electronics have rendered obsolete this method of achieving a constant
244 Viscosity Measurement
Bob
Cup
Fluid
Torsion wire
Direction of rotationvelocity
Rb
Rc
h
Figure 6.6 Principle of thecoaxial rotational viscometer.
Chap-06.qxd 1/12/02 10:40 AM Page 244

torque although the stormer viscometer can still be found in some catalogs.
Class 2. MacMichael type. The torque is measured at a controlled shear ratewhich is a function of the number of revolutions per minute of therotating member and the geometry of the test cell. The first successfulviscometer of this type was developed by MacMichael (1915).
The major error that occurs in coaxial viscometers is the ‘end effect,’ whicharises from the drag of the fluid on the ends of the bob. The derivation of theMargules equation (and other similar equations) assumes an infinitely long bobwith no ends. The end effect of the top of the bob is easily eliminated by fillingthe cup to a level below that necessary to cover the bob. Since the top of the bob is not in contact with the liquid there is no drag. The end effect of thebottom of the bob can be determined experimentally by measuring the torque/angular-speed ratio with the cup filled to several different heights. A rectilinear plot should be obtained when the data are plotted (see Fig. 6.7).The plot is extrapolated to zero on the torque/angular-speed ratio axis. The neg-ative intercept on the horizontal axis (ho) gives the end effect in terms of theequivalent length of bob with no ends. In any mathematical exercise the depthof immersion h should be replaced by h � ho in order to account for the endeffect. The effect is practically eliminated when bobs with concave top and bottom are used, because air replaces most of the metal end surfaces of the bob.
Cone and Plate and Parallel PlateViscometers
The fluid is held by its own surface tension between a cone of small angle thatjust touches a flat surface (Fig. 6.8). The torque caused by the drag of the fluidon the cone is measured as one of the members is rotated while the other mem-ber remains stationary. For a Newtonian fluid the following equation applies:
h � 3aM/2pRb3
where h is the absolute viscosity; a, the angle of cone (usually less than 2°);M, the torque; Rb, the radius of the cone; and , the angular velocity of therotating member. For a given instrument with a given geometry this can bereduced to
h � KM/
where K is the instrument constant 3a/2pRb3.
A more detailed analysis of the cone and plate viscometer is given bySlattery (1961).
The special feature of the cone and plate viscometer is that the shear rate isuniform at all points in the fluid, provided that the angle of the cone is small.
Cone and Plate and Parallel Plate Viscometers 245
Depth of immersion (h)
Torq
ue/a
ngul
ar-v
eloc
ity r
atio
( )M
ho0
Figure 6.7 Measurement of theend effect in a coaxial rotationalviscometer. The torque/angular-velocity ratio (M/) is plottedagainst the depth of immersion ofthe bob in the fluid h. The interceptof the extrapolated line on thehorizontal axis gives the numericalvalue of the end effect (ho).
Chap-06.qxd 1/12/02 10:40 AM Page 245

This makes the cone and plate viscometer of particular use for non-Newtonianfluids because the true rate of shear can be obtained comparatively easily.Other features of this type of viscometer are (1) end effects are negligible, (2)a small amount of fluid is needed (usually less than 2 ml), and (3) the thin layerof fluid in contact with temperature-controlled metal base plate enables mea-surements to be made at high rates of shear without the need to compensatefor the heating effect of the high shear rate.
Parallel-plate geometry is used when the presence of suspended matter inthe fluid does not allow representative fluid to enter into the narrowest part ofa cone and plate viscometer.
Because of the small volume of fluid contained in cone-and-plate, and parallel-plate viscometers there can be a problem with evaporation of the solvent which results in a concentration of the nonvolatile components. Thisproblem becomes more acute as the test temperature is increased because thevapor pressure of liquids increases as the temperature increases. This problemcan be ameliorated by enclosing the cone and plate or parallel plate with acage designed to reduce the loss of solvent vapor without interfering with therotation. Some researchers coat the exposed edge of the fluid around theperimeter of the cone and plate with a thin layer of low-viscosity oil to retardevaporation.
Modes of Operation of RotationalViscometers
It has already been explained that there are two types of rotational viscometers.Type 1 measures the shear stress at a controlled shear rate and Type 2 mea-sures the shear rate at a controlled shear stress. Both of these can be operatedin several modes.
Mode 1: Ramp increase. The shear rate (or shear stress) is steadilyincreased and the resultant shear stress (or shear rate) is measured. This gives
246 Viscosity Measurement
a
Rb
Angular velocity
Figure 6.8 Schematic of coneand plate viscometer.
Chap-06.qxd 1/12/02 10:40 AM Page 246

a shear stress–shear rate curve. Usually the shear stress–shear rate curve ismeasured up to the maximum when the test is stopped (ascending curve) butsometimes it continues to be measured as the shear rate (or shear stress) isramped down again to zero (descending curve). An ascending–descendingcurve is needed to measure hysteresis.
Mode 2: Step increase. The shear rate (or shear stress) is steadily increasedby set amounts and the shear stress (or shear rate) is recorded after eachincrease. The test can be performed ascending only, or ascending anddescending.
Mode 3: Continuous operation at a constant setting. The shear stress ismeasured at a constant shear rate or shear rate at constant shear stress over aperiod of time. This mode is used whenever time dependency effects need tobe measured (see pages 92–94).
Mode 4: The rotating member is caused to cycle a small angle, clockwiseand counterclockwise over a period of time. This is small-amplitude oscilla-tion viscometry and is used to measure the storage modulus G, loss modulusG �, and loss tangent, tan Ø (see pages 98, 99).
There are some more exotic geometries that have been used in coaxial rotational viscometers including cone–cone, double cone and plate, coni-cylindrical, and disk. These will not be discussed here as they are not widelyused in the food field.
Other Rotational Viscometers
There are some empirical viscometers in which a paddle, a cylinder, or barsrotate in a container, usually with large clearances between the rotating mem-ber and the wall. The geometry of these viscometers is complex and usually notamenable to rigorous mathematical analysis. These instruments are generallyrugged, moderate in cost, and fairly easy to manipulate. They have their place,particularly for quality control purposes in the plant where detailed mathemat-ical analysis is not needed. They are widely used in industry. Examples of thistype are some Brookfield Viscometers, and the FMC Consistometer.
The Brabender Viscograph is designed specifically to measure the apparentviscosity of starch suspensions and record how the viscosity changes as the temperature of the water–starch slurry is raised past the gelatinizationtemperature, held at this elevated temperature for a period, and then cooledagain.
The FMC Consistometer was originally designed by the Food MachineryCorporation to measure the consistency of cream-style corn. It is now distrib-uted by C. W. Brabender Instruments and has been used for routine qualitycontrol purposes for catsup, tomato paste, strained baby foods, and otherproducts that have a similar consistency. The product is placed in a stainless-steel cup, the paddle is lowered into the cup, the motor is switched on causingthe cup to rotate at a single fixed speed of 78 rpm, and the torque on the
Other Rotational Viscometers 247
Chap-06.qxd 1/12/02 10:40 AM Page 247

paddle is read from a scale on top of the instrument. Four paddles withdifferent dimensions are provided with this instrument. The instrument isapproximately 38 cm high, 26 cm wide, 31 cm long, and weighs about 16 kg;the four paddle sizes available are 2 in. � 1.4 in., 2 in. � 1 in., 2 in. � 0.75 in.and 1.5 in � 1 in.
The Corn Industries Viscometer CIV was once widely used to measurechanges in viscosity of corn syrup and starch pastes, but this instrument is nolonger commercially available.
The Brookfield Dial Reading Viscometer is an instrument that may be heldin the hand or supported on a stand. A synchronous induction type motor givesa series of speeds of rotation that are constant. Various spindles that take theform of cylinders, disks, and T bars are attached to a small chuck. When thespindle is immersed in the liquid and the motor switched on, the viscous dragof the fluid on the spindle is registered as torque on a dial. A Factor Finderscale provided by the manufacturer enables the operator to quickly convert thedial reading into apparent viscosity.
The company can supply a Helipath stand that automatically lowers theBrookfield Viscometer, thus ensuring that the spindle is continuously movinginto previously undisturbed material. This accessory is useful when studyingfluids that exhibit time effects or that have a tendency to settle.
The Brookfield Engineering Laboratories have over 60 years experiencewith viscosity measurement and have a good reputation for helping potentialcustomers identify the precise model of instrument and optimum mode ofoperation for their own applications.
Brookfield Dial Reading Viscometers are widely used in the food field.They have the advantages that they are of moderate cost, portable, simple tooperate, well adapted to many viscosity problems, give results quickly, can beused to measure viscosity in almost any container ranging from a 200-mlbeaker to a 1000-gal tank, can be used on Newtonian and non-Newtonian liquids, can be used to measure time dependency and hysteresis, are notaffected by large particles in suspension, and require minimum maintenance.The disadvantages are that there is a limited range of shear rates, the shear ratecan only be changed stepwise, the shear rate varies across the fluid, there canbe problems in obtaining shear rate and apparent viscosity for non-Newtonianliquids, and the geometry and flow pattern do not lend themselves to rigorousmathematical analysis.
Paddle Viscometry
This type of viscometer consists of two or more paddles attached to a shaftthat is caused to rotate at one or more speeds while the torque resistance ismeasured. They may resemble a flag or a star-shaped geometry. They aresometimes called ‘mixer viscometers’ because the paddles stir and mix theproduct as they rotate. The stirring action makes them particularly useful for
248 Viscosity Measurement
Chap-06.qxd 1/12/02 10:40 AM Page 248

food suspensions containing particulates that settle out. This is an empiricalinstrument; all test conditions must be kept constant to achieve reproducibleresults. Researchers are now analyzing the action of this class of instrumentand extracting useful rheological parameters even though the shear-rate variesfrom point to point around the paddles.
Rao (1975) pointed out that the average shear stress is directly proportionalto the torque and the average shear rate is directly proportional to rotationalspeed. Hence, the slope of the plot of log (torque) versus log (rpm) will givethe value of the flow behavior index n of power law fluids. The consistencyindex K can be found by testing a fluid with known values of K and n underidentical test conditions using the equation:
Mx/My � Kx/Ky
where Mx is the measured torque for the test fluid and My the measured torquefor the fluid whose properties are known, Ky is the consistency index for theknown fluid. Kx can then be computed since Mx, My and Ky are known. Onerestriction for this method is that the flow behavior index n of the known fluidshould be about the same value as is n for the test fluid.
Rao and Cooley (1984) showed that an ‘effective shear rate’ can be experi-mentally determined for flag and star impeller viscometers by comparingmeasurements on a known Newtonian fluid with measurements on a test mate-rial that fits the power law flow behavior. Yoo and Rao (1994) used this proce-dure to study the rheological properties of tomato puree and Missaire et al.(1990) to study the rheology of apple pulps.
Steffe and Ford (1985) used mixer viscometry to study the rheology ofstarch-thickened strained apricot baby food. Castell-Perez et al. (1987) foundgood agreement between a low-cost mixer viscometer and a RheometricsFluids Spectometer for apricot puree and guar gum solution. Briggs and Steffe(1997) used the Mitschka method (Mitschka, 1982) to calculate average shearstress and shear rate of a paddle mounted in a Brookfield RV viscometer andfound the results for banana puree, salad dressing, enchilada sauce and pancake syrup compared favorably with those obtained with a cone and plateviscometer. Castell-Perez and Steffe (1992) provide a good review of the theory and practice of mixer viscometry.
The Rapid Visco-Analyzer is a useful example of mixer viscometry (Rosset al., 1987). It consists of a molded plastic stirring paddle attached to an elec-tric motor whose shaft rotates at constant speed and the current required todrive it is constantly monitored by a microprocessor. A disposable aluminumsample container is filled with 4 g of flour and 25 ml of water and placed tosurround the paddle, and the motor is started. A split copper block at 96°Crapidly heats the mixture through the gelatinization temperature of the starch.The test takes 3 minutes to perform. The power output correlates with theapparent viscosity. This has become a routine screening test to detect sproutdamage to wheat quality when wheat is delivered to grain storage sites.
Paddle Viscometry 249
Chap-06.qxd 1/12/02 10:40 AM Page 249

Falling-Ball Viscometers
This type of viscometer operates on the principle of measuring the time for aball to fall through a liquid under the influence of gravity. The falling ballreaches a limiting velocity when the acceleration due to the force of gravity isexactly compensated for by the friction of the fluid on the ball. Stokes(1819–1903) was one of the first to study the limiting velocity of falling ballsand the following equation is named the ‘Stokes equation’ in his honor:
�V
where h is the viscosity; rs, the density of the falling ball; rl, the density of thefluid; R, the radius of the falling ball; g, gravity; and V, the limiting velocity.
This is a simple type of instrument that is useful for Newtonian fluids but has limited applicability to non-Newtonian fluids. It cannot be used foropaque fluids because the ball cannot be seen. Stokes’ law applies when thediameter of the ball is so much smaller than the diameter of the tube throughwhich it is falling that there is no influence of the wall on the rate of fall of the ball.
A falling-ball viscometer can be easily improvised in the laboratory (seeFig. 6.9). Fill a large graduated glass cylinder with the test fluid and gentlydrop a steel ball in the center of the cylinder. Allow sufficient distance of fallfor the ball to reach the limiting velocity, then time the fall of the ball with astopwatch. Steel ball bearings with a range of precisely controlled diameterscan be obtained from engineering supply houses. The larger the ball, the fasterit falls. Therefore, it is necessary to select a diameter ball that is small enoughto fall at a rate that can be measured with some degree of accuracy with a stop-watch. The lower the density of the ball, the slower it falls. It is possible toobtain balls of material other than steel that have a different density. For exam-ple, glass marbles have a density of about 2.6 compared with 7.8 for steel. A glass marble will fall more slowly than a steel ball of equal size.
The Gilmont Viscometer is a falling-ball viscometer in which a glass orstainless-steel ball falls down a vertical tube slightly larger than the ball. Theinterior of the tube is beaded to ensure that the ball stays centered as it falls.Gilmont (1963) used the theory of flow rotameters with spherical floats toderive the following two equations:
h � K(rf – r)t
where h is the viscosity, rf is the density of ball (2.53 for glass and 8.02 forstainless steel), r is the density of liquid, t is the time for ball to fall betweentwo sets of fiduciary lines etched into the tube as measured by stopwatch, andK is the instrument constant;
KD
LR
R� � �
8802
100
25 2. /f ���
���
h r r� �29
2( )s l gR
250 Viscosity Measurement
Chap-06.qxd 1/12/02 10:40 AM Page 250

Falling-Ball Viscometers 251
Figure 6.9 A falling-ballviscometer improvised in thelaboratory (note the glass marblefalling through the liquid).
where Df is the diameter of falling ball, L is the distance the ball falls betweenfiduciary marks, R � 100(Dt – Df) /Df, and Dt is the tube diameter.
In practice, the value of K is usually obtained by measuring the time ofdescent for a liquid of known viscosity and rearranging the viscosity equationinto the form:
where hs is the viscosity of liquid of known viscosity.The Gilmont Viscometer uses a 10 ml sample. Two sizes of tubes and two
balls (glass and stainless steel) are available. It is suitable for Newtonian liquids in the viscosity range of 0.25–300 mPa�s.
K ts
f
��
�h
r r
Chap-06.qxd 1/12/02 10:40 AM Page 251

A variation of the falling-ball viscometer is the rolling-ball viscometer inwhich a ball falls through the liquid in a tube inclined at an angle of about 10°from the vertical. The tube is only slightly larger in diameter than the ball, andthere is a strong influence of the wall on the ball.
The best-known rolling-ball apparatus is the Hoeppler Viscometer. Theinstrument consists of a heat-resistant chemically inert 20 cm-long glass tubewith a precision bore about 16 mm diam. It is enclosed in an 80 mm-diam.glass tube through which water from a constant temperature bath is circulated.A screw cap at the top of the tube is removed, the tube is filled with sample(about 30 ml), a designated ball is placed in the tube, all air is removed, and the cap is replaced. When the system has reached equilibrium temperature, thetube assembly is inverted and the rate of fall of the ball between markings onthe glass tube is measured with a stopwatch.
Hubbard and Brown (1943) developed general relations between the variables involved in the streamline region of fluid flow for rolling-ball viscometers which led to the equation
where K is a dimensionless correlation factor; d, the diameter of the ball; D, the internal diameter of the tube; V, the terminal rolling velocity of the ball;g, acceleration of gravity; r, the density of the liquid; rs, the density of theball; and u, the angle of inclination of the tube to horizontal.
For a given instrument operating under standard conditions, D, d, u, and Kare constant and the above equation reduces to
h � C(rs – r)/V
where C is the instrument coefficient, which is equal to (5p/42)Kg sin u
D(D � d).By selecting balls of different composition and different diameters it is
possible to measure viscosities over the range of less than 1 mPa�s to about200 Pa�s. The Hoeppler viscometer can give results reproducible to 0.5% orbetter with Newtonian fluids.
Oscillation Viscometry
A vibrating surface in contact with a liquid experiences ‘surface loading’because the shear waves imparted to the liquid are damped at a rate that is a function of the viscosity of the liquid. The power required to maintain a constant amplitude of oscillation is proportional to the viscosity of the fluid. Oscillation viscometers usually take the form of a stainless-steel ballimmersed in the fluid and vibrated at high frequency and low amplitude. Thistype of viscometer has the advantages of high precision, high sensitivity
hr u r r
r�
�� �
��
�5
42
2
Kd g
V
D d
dssin
252 Viscosity Measurement
Chap-06.qxd 1/12/02 10:40 AM Page 252

to small changes in viscosity, rapid accumulation of data, and the equip-ment is easy to clean. The disadvantages are that it operates at one shear rate only.
The size of the test sample is not critical so long as it exceeds that volumebelow which reflection from the walls of the container occurs. This distance isusually less than 5 mm. Roth and Rich (1953) give the following equation for the propagation distance for the amplitude of the shear waves to fall to 1/eof their value in a Newtonian fluid:
d � (2h)½/vr
where d is the propagation distance; h, the viscosity of the fluid; r, the densityof the liquid; and v, the vibrational frequency.
A commercial viscometer of this type is available from the Nametre Com-pany (Fitzgerald and Matusik, 1976; Ferry, 1977). It consists of a -in.-diampolished stainless-steel ball attached to a stainless-steel rod. The ball isimmersed in the liquid and vibrated at a frequency of 646 Hz and an amplitudeof 25 m. A digital readout dial displays the viscosity. A viscosity range fromabout 1 mPa�s to 100 Pa�s can be measured. Minimum sample size is 35 ml upto 10 Pa�s and 70 ml up to 100 Pa�s. The author has not seen reports of the useof this instrument for foods, but it appears to have possibilities for many liquids, including in-line quality control (Oppliger et al., 1975).
The SOFRASER is another type of oscillation viscometer. It immerses athin vibrating rod into the fluid to be tested. A constant power input imparts arapid low-amplitude oscillation to the rod and the damping effect is measuredby the change in amplitude of the vibration. The amplitude decreases as theviscosity of the test fluid increases. The instrument can be customized tomeasure viscosities between 0–10 mPa�s up to 0–1000 Pa�s.
Imperfect Lubricated Squeezing Flow
In this procedure the fluid or semifluid is placed in a wide, shallow container and compressed under a platen mounted in a universal testingmachine. Since this uses a uniaxial compression it is described in Chapter 4(see page 175).
Back Extrusion Viscometry
The principle of the back extrusion test for solids described on page 127 refersto compressing solid foods until they disintegrate sufficiently to flow througha narrow annulus. The same principle can be applied to fluids when it may bedescribed as a ‘back extrusion’ test, but is also often termed ‘annular pump-ing’ by rheologists. In both cases, the food is held in a container that is placed
1 14
Back Extrusion Viscometry 253
Chap-06.qxd 1/12/02 10:40 AM Page 253

on the base of a universal testing machine (UTM), a rod or platen attached tothe UTM crosshead is driven down into the container and the change in forceover time is recorded. There are several differences between back extrusion ofsolids and liquids:
(1) There is no initial packing down for liquids as there is for solids (seesection A–B in Fig. 4.15, page 128).
(2) With solids, the force usually becomes approximately horizontal onceextrusion begins (see section C–D in Fig. 4.15, page 128), whereas,with liquids the force increases linearly as long as the rod continues todescend into the fluid.
(3) A correction for buoyancy force and velocity imparted to the fluidneeds to be made for liquids. These factors are ignored with solidsbecause the force to disintegrate solids is so high.
Steffe and Osorio (1987), and Osorio and Steffe (1987) pointed out that thetotal force on the descending rod is given by the sum of three factors:
FT � 2paLtw � pa2�P � gLpa2
where FT is the total force on the descending rod; a, radius of the rod; L, depth of immersion of the rod in the fluid; tw, shear stress at wall of the rod;�P, pressure at depth L; g, sample density; g, gravity. The first term in the equation is the force due to the shear stress at the wall (2paLtw), the second term is the force responsible for fluid flow in the upward direction(pa2�P) and the third term represents the buoyancy or hydrostatic force(ggLpa2).
If a power-law fluid is tested in a back extrusion cell using two differentspeeds of the descending rod, its flow behavior index n is given by the equation:
�where n is the flow behavior index; Fcb is the force connected for buoyancy; L is the depth of immersion of the rod in the fluid; and V is velocity of travelof the rod. The suffixes 1 and 2 refer to the first and second test.
The consistency coefficient for a power-law fluid is given by the equation:
where K is a consistency coefficient; P, the pressure drop per unit length; �, adimensionless flow rate; R, radius of container; a, radius of the descendingrod, and Vp, velocity of the plunger.
This test procedure, although mathematically complex, has great potentialfor the food industry because the experimental procedure is simple, rapid, anduses robust attachments to a universal testing machine.
KPR R
V R a
n
��
2 2p( )�
�
��
�
��
ln 2
1
V
V
�
���
��nF L
F L�
�
�ln cb
cb
2 1
1 2
�
���
��
254 Viscosity Measurement
Chap-06.qxd 1/12/02 10:40 AM Page 254

Imitative Viscometers
These empirical instruments imitate the flow of non-Newtonian fluid foodsunder practical conditions. They are simple instruments that usually give aone-point measurement. Although they have their limitations they can be use-ful for quality control purposes. Examples of this type of viscometer are theBostwick Consistometer, the Grawemeyer and Pfund Consistometer (alsoknown as the Adams Viscometer), and sag meters. These types were discussedin the previous chapter.
Use of One-Point Measurements for Non-Newtonian Fluids
Throughout this chapter and in Chapter 3 the severe problems associated withattempts to describe a non-Newtonian fluid by means of a one-point measure-ment have been emphasized. However, having expressed these cautions, it is now time to point out that under certain conditions it is possible to use a one-point measurement as a quality control technique for non-Newtonianfluids. In some highly standardized systems the change in viscous propertiesduring processing moves in a reproducible manner along a predetermined path.A one-point measurement may satisfactorily determine the endpoint in such asystem.
An example of this can be found in the concentration of tomato juice to makecatsup. Tomato catsup is essentially tomato puree that has been flavored withsalt, sugar, vinegar, and spices. It is manufactured by adding these ingredientsto tomato juice and boiling until a satisfactory consistency is obtained. Closecontrol of this endpoint consistency is critical. If slightly too thin, the catsupgushes out of the bottle too fast, whereas if slightly too thick, it becomesdifficult to make it flow from the bottle. Figure 6.10 plots the apparent viscos-ity of tomato puree as a function of the solids content in the puree. Although theflow properties of the puree at each concentration are complex (see Rao et al.,1981), the viscous properties do move in a reproducible way along this com-plex path. Hence, a single-point apparent viscosity measurement can be usedsuccessfully to determine the finishing point for tomato catsup.
Suppliers of Rotational Viscometers
Although description of the rotational viscometers most commonly used forfood products was included in the first edition they will not be described inthis edition for several reasons.
(1) Most manufacturers now provide a wide array of viscometer typeswhereas in the past many manufacturers made only one type. One
Suppliers of Rotational Viscometers 255
Total solids (% w/w)0
0
1
2
3
4
5
10 20 30
App
aren
t vi
scos
ity h
a (P
a·s)
Figure 6.10 Apparent viscosityof tomato juice and concentratesas a function of solidsconcentration measured at aconstant shear rate of 100 s�1.Nova cultivar. (From Rao et al.,1981. Reprinted from J. TextureStudies 1122, page 521. Withpermission of Food and NutritionPress Inc.)
Chap-06.qxd 1/12/02 10:40 AM Page 255

manufacturer would specialize in controlled shear rate viscometers,another in controlled shear stress viscometers and yet another wouldconcentrate on designing equipment to measure the normal force. Now-adays most manufacturers provide almost every type of viscometer.
(2) Manufacturers continuously upgrade and expand the number of mod-els available. They also upgrade their software programs on a regularbasis.
(3) Companies are being bought and sold more often. A well-known brand name of viscometer this year may be marketed by a differentCorporation next year.
A list of the suppliers of the rotational viscometers most widely used forfoods is given in Appendix I, pages 341–345. This list is up-to-date at the timeof writing. The reader is encouraged to contact suppliers directly because theycan provide the most up-to-date information on their offerings.
256 Viscosity Measurement
Chap-06.qxd 1/12/02 10:40 AM Page 256

Sensory Methods ofTexture and ViscosityMeasurement
Introduction
Sensory evaluation is the measurement of a product’s quality based on infor-mation received from the five senses: sight, smell, taste, touch, and hearing.Sensory texture measurement is perceived primarily by touch (the tactilesense), although the eyes and ears can provide information on some importantcomponents of the total texture profile of a product. The signals generated atthe nerve endings of the senses are transmitted via the central nervous systemto the brain where they are integrated with past experience, expectations, andother conceptual factors before the opinion of the response is summarized(Amerine et al., 1965; Larmond, 1970).
Sensory methods of measuring food quality may appear to lack the precisionthat is desirable in scientific research because of the variability from person toperson and variability from hour to hour and day to day in likes and dislikes ofeach person. In spite of these obstacles, sensory measurement of texture is a very important aspect of food quality that cannot be ignored. Later in thischapter it will be shown that some sensory testing methodology can be asreproducible and precise as physical tests when properly performed.
Importance of Sensory Evaluation
Instruments are calibrated in absolute units such as newtons force, millimetersdistance, pascal-seconds viscosity, and so on, but these readings mean littleunless correlated with sensory judgments of quality. Correlating measurementsof physical properties with sensory assessments of texture is the subject of thenext chapter. There is no point in measuring properties that are not perceived ornot judged important by the human senses. People will not purchase or consumefood unless it has high acceptability according to their perception of quality.
C H A P T E R
7
Chap-07.qxd 1/10/02 4:15 PM Page 257

Sensory methods are the ultimate method of calibrating instrumental meth-ods of texture measurement. Even though sensory methods are generally time consuming, expensive, and not subject to absolute standards, the factremains that eventually all instrumental measurements have to be calibratedagainst the human senses. We have to face the fact that if the palate sends a value judgment message that says the food has undesirable textural proper-ties, then the texture is undesirable regardless of the readings given by ourinstruments.
There is a large body of literature in which excellent reports of physicaltesting and chemical and biochemical analyses have been matched with sensory testing that was not performed in a scientific manner. It is regrettablethat so much work of potentially high value is of limited use because it waspaired with inadequately designed and poorly executed sensory studies. Themost common deficiencies have been use of untrained or inadequately trainedjudges, use of hedonic scaling instead of intensity scaling, and inadequate or no definition of the exact meaning of the sensory terms presented to thepanel.
Sensory evaluation offers the opportunity to obtain a complete analysis ofthe textural properties of a food as perceived by the human senses. A numberof processes occur while food is being masticated, including deformation,flow, comminution, mixing and hydration with saliva, and sometimes changesin temperature, size, shape, and surface roughness of the food particles. All ofthese changes are recorded with great sensitivity by the human senses, butmany of them are difficult to measure with instruments. The entire complex of events that occurs during mastication cannot be measured completely byinstruments. There is no instrument available that has the sophistication, ele-gance, sensitivity, and range of mechanical motions as the mouth or that canpromptly change the speed and mode of mastication in response to the sensa-tions received during the previous chew.
Sensory evaluation is important for product development. It is the bestmethod for evaluating texture of new types of foods in the early stages ofdevelopment, especially fabricated foods, and for providing a basis on whichinstrumental methods might later be designed for use as a quality measure andproduction control.
Sensory analysis of the textural quality of food has been used in practiceever since the first human being walked on the face of the earth; and foodresearchers have performed sensory texture studies for many decades. However,the comprehensive foundation on which modern sensory texture analysis isbuilt was laid by Dr Szczesniak’s group at the General Foods CorporationTechnical Center in Tarrytown, New York in the early 1960s. (General FoodsCorporation has since become part of Kraft Foods.) Therefore, the sensorytexture profiling procedure developed by that group will be described in detailfirst. Additions, modifications, and spin-offs from the basic procedure willthen be described.
258 Sensory Methods of Texture and Viscosity Measurement
Chap-07.qxd 1/10/02 4:15 PM Page 258

Sensory Texture Profiling
Since texture is a multiparameter attribute, its full description must addressthe identification and quantification of all the textural properties of a food. Themost complete system of sensory texture measurement is the General FoodsSensory Texture Profiling technique (Brandt et al., 1963; Szczesniak et al.,1963; Civille and Szczesniak, 1973; Civille and Liska, 1975). The followingdescription is based on the material in these references. This technique is anextremely powerful tool and is highly recommended. Most other methods forsensory analysis of texture may be viewed as partial texture profile techniques.The best way to learn the procedure and have confidence in it is to do it; it isless satisfactory to describe it because verbal or written descriptions do notgive the sense of the strength, accuracy, flexibility, and reproducibility of thetechnique that is obtained by actually doing it. One might liken this to learn-ing to drive a car by sitting behind a steering wheel and actually driving the carversus learning to drive a car by reading about how to drive cars but neverdriving one.
The major steps in the operation of establishing a sensory texture profile are(1) selection of panel, (2) training the panel, (3) establishing standard ratingscales, (4) establishing a basic texture profile analysis (TPA) score sheet, and(5) developing a comparative TPA score sheet for each commodity. Thesesteps will now be described in sequence.
Selection of Panel Members
A properly trained panel leader is needed to start the sensory texture profiling.It is best for this person to have been trained in a formal training workshopconducted by people who are well experienced with the procedure. The panelleader should possess all the attributes needed for panel members describedbelow and in addition should have (a) the type of personality that puts peopleat ease and encourages them to put forth their best efforts as a group; (b) somescientific training and understanding of the scientific method, although it is notnecessary to have advanced training in these areas; (c) leadership qualities thatwill bring the panel to a consensus of opinion without imposing personal ideas.
The general requirements for texture profile panelists are listed in Table 7.1.At least twice as many persons as needed should be chosen for preliminaryselection because not all persons meeting the requirements in Table 7.1 will befound suitable. A panel normally comprises five to seven persons. In order tohave a complete panel at all times, it is necessary to start with two to threetimes this number to allow for those who cannot pass the preliminary selectiontest and for attrition due to absences, relocations, and retirements.
In the preliminary selection process each candidate is given four consecu-tive samples from the hardness scale presented in random order and asked
Sensory Texture Profiling 259
Chap-07.qxd 1/10/02 4:15 PM Page 259

to grade them in order of increasing hardness. Peanuts, carrot slices, peanutbrittle, and rock candy are easy to obtain, fairly standard in hardness, not highlyperishable, and are a good set to present to the panel. Those persons who canrank these four commodities with complete success in increasing order ofhardness are used for further training. Those who are unsuccessful in this pre-liminary test are excluded from further participation.
Rousset-Akrim et al. (1995) used a series of 20 tests on 25 subjects to findefficient assessors for sensory texture profiling and concluded that the abilityto complete a complex profile could be discerned through simple selectiontests. This study supports the adequacy of the procedure described above.
Training of the Panel
The panel should be located in surroundings that are conducive to concentra-tion: a place that is well lighted (not glary), quiet, and free from odors and distractions that might lower the concentration of the panel from the task athand. Successful sensory texture profiling requires much concentration. Thetemperature of the surroundings should be comfortable. The panel is seatedaround a large table and provided with score sheets as needed, a glass of waterfor rinsing the mouth, and a paper cup for spitting out any material that is nolonger needed for the test. There should be room in the center of the table tohold the samples that are currently being tested. A blackboard, a set of largeflip sheets of paper, or other form of visual display should be available forrecording scores and any comments made by the panel.
260 Sensory Methods of Texture and Viscosity Measurement
Table 7.1 Requirements for Texture Profile Panelistsa
1. Ability to work cooperatively and harmoniously with a group and develop a feeling of team identity with the group.2. Able to spare the time for training (2–3 h a day for several weeks) and the regular operation of the panel for an indefinite period.3. Their supervisor must approve this expenditure of time willingly, not reluctantly.4. Panel members should be very interested in their work, and dedicated to developing a team that can give results with the precision
and reproducibility of a scientific instrument.5. Panel members must have common sense and reasonable intelligence. A high I.Q. is not essential. No special education is neces-
sary. In fact, laboratory technicians and office staff (for example) frequently make the best panel members because they can morereadily spare the time; they are always available; they are less likely to be preoccupied with other matters (as are senior scientistsand administrators), and hence are able to devote their whole interest to the work at hand.
6. Panel members should be able to discuss the tests with the other members of the panel and be able to reach a consensus. Peoplewith a domineering or bossy attitude, and people who are excessively timid or cannot express an opinion are unsuited for panelwork.
7. They should be able to develop a professional attitude toward their work, and take pride in it.8. They should have good dental health and no dentures because false teeth may restrict the perception of some texture attributes.9. People involved in the development of the product to be tested should not be on the panel because they tend to come to the
panel with preconceived ideas of the textural quality of the products to be examined.10. It is desirable to have members of both genders represented, although the panel can comprise predominantly one gender.
Source: Civille and Szczesniak (1973).a The panel leader should possess the above attributes and in addition should have the following: (1) the type of personality that puts people at ease and encourages them to put forth their best efforts as a group; (2) leadership qualities that will bring the panel to a consensus opinion without imposing personal ideas; and (3) some scientific training and understanding of the scientific method.
Chap-07.qxd 1/10/02 4:15 PM Page 260

The first step in the training is to familiarize the panel with the standard rating scales described in detail in the next section. The panel is presentedwith one complete standard rating scale at a time. The panel leader gives a fullexplanation of the scale and then the panel samples each item on the scale inascending order of magnitude. This is followed by discussion of the scale andfurther sampling of the commodities on that scale until the panel feels theyhave mastered the scale. At that time, a food of unknown intensity on the scalebeing considered is presented and the panel is asked to rate it to the nearestquarter point on the scale. The scores are called out to the panel leader whowrites them on the board. When all the scores have been recorded, anydifferences in the scores are discussed, and sampling of the unknown and thestandards is repeated until the entire panel gives a score within �¼ point ofthe mean. The panel should work on each standard rating scale until they canobtain this degree of consistency between panelists. When this has been satis-factorily completed, the panel moves on to the next standard rating scale andrepeats the procedure. This is continued until all of the scales have been cov-ered, and the panel has a clear impression of the type of property being meas-ured in each scale and the intensities that can be experienced in that scaleusing the standard items as anchor points.
When the panel has thoroughly grasped the standard scales, including thegeometrical scales, they develop (as an exercise) a complete texture profile ona simple product such as soda crackers using the basic TPA score sheet, whichis described in detail below. The complete texture profile is developed in onesession without the presence of any of the food items on the standard scales.When it is found that panel members show substantial disagreement in someareas, the exercise is repeated in the following session with the items from thestandard scales available for reference on the disputed points. The panel nowrepeats the evaluation of the disputed points on the scale using the standardscales for reference and continues to do this until they resolve their differencesto within �¼ point. This exercise generally makes the panel realize the valueof having the standard scales for reference as anchor points.
Having successfully developed a reproducible texture profile for a simpleproduct the panel turns its attention to the commodity of interest and developsa texture profile for it. The time required to develop a texture profile for theproduct of interest varies. With a simple product a good profile may be devel-oped in two or three sessions. A difficult product may take a number of sessionsbefore a complete, reproducible, and satisfactory profile is developed.
When the basic texture profile for the commodity of interest has been com-pleted, the panel leader develops the comparative texture profile ballot, whichis discussed on p. 273. The panel then uses the comparative texture profile bal-lot and perfects it by means of discussions between the panel and the leader,and by referring to the standard rating scales when questions or differences ofopinion arise.
The panel has now been trained and is ready for routine work on the com-modity for which the comparative texture profile ballot has been prepared.
Sensory Texture Profiling 261
Chap-07.qxd 1/10/02 4:15 PM Page 261

Whenever a new commodity is to be studied, the panel utilizes the basictraining it has already received. They first develop the basic texture profile for the new product and then move on to develop and perfect the comparativetexture profile for that product.
Establishing Standard Rating Scales
Textural characteristics are divided into three classes (Szczesniak et al., 1963).
Mechanical CharacteristicsThe mechanical characteristics are related to the reaction of the food to stressand are made quantitative by means of standard rating scales, analogous toMohs scale of hardness used by mineralogists. The standard hardness scaleconsists of nine food products ranging from low hardness (Philadelphia creamcheese) to high hardness (rock candy).
Other standard scales are fracturability (originally termed ‘brittleness’) (7 points), chewiness (7 points), gumminess (5 points), adhesiveness (5 points),and viscosity (8 points). The original standard scales are listed in Tables7.2–7.7.
The items selected to be used for the standard rating scales are chosen on thebasis of having that particular textural property as a dominant characteristiccoupled with fairly uniform intervals between points in the desired chara-cteristic. A panel of five to eight people with adequate training can rate themechanical properties of a sample on each of the six standard scales to withinabout one fifth of a point with a high degree of reproducibility.
The items listed in the standard scales shown in Tables 7.2–7.7 were used toconstruct the original scales because they were available in eastern United States.
262 Sensory Methods of Texture and Viscosity Measurement
Table 7.2 Original Hardness Scale
Panelrating Product Brand or type Manufacturer Sample size
1 Cream cheese Philadelphia Kraft foods ½-in.2 Egg white Hard-cooked, 5 min — ½-in. tip3 Frankfurters Large, uncooked, skinless Mogen David Kosher ½-in.
Meat Products Corp.4 Cheese Yellow, American, pasteurized Kraft foods ½-in.
process5 Olives Exquisite, giant size, stuffed Cresca Co. 1 olive6 Peanuts Cocktail type in vacuum tin Planters Peanuts 1 nut7 Carrots Uncooked, fresh — ½-in.8 Peanut brittle Candy part Kraft foods —9 Rock candy — Dryden and Palmer —
Source: Szczesniak et al. (1963); reprinted from J. Food Sci. 28, 398, 1963. Copyright by Institute of Food Technologists.
Chap-07.qxd 1/10/02 4:15 PM Page 262

Sensory Texture Profiling 263
Table 7.3 Original Fracturability Scalea
Panelrating Product Brand or type Manufacturer Sample size
1 Corn muffin Finast First National Stores ½-in.2 Angel puffs Dietetic, heated Stella D’Oro Biscuit Co. 1 puff
for 5 min at190°F (88°C)
3 Graham crackers Nabisco National Biscuit Co. ½-in.cracker
4 Melba toast Inside piece Devonsheer Melba Corp. ½-in.5 Jan Hazel cookies — Keebler Biscuit Co. ½-in.6 Ginger snaps Nabisco National Biscuit Co. ½-in.7 Peanut brittle Candy part Kraft foods ½-in.
aThis was originally known as the ‘brittleness’ scale.Source: Szczesniak et al. (1963); reprinted from J. Food Sci. 28, 399, 1963. Copyright by Instituteof Food Technologists.
Table 7.4 Original Chewiness Scale
Product Average no.rating of chews Product Brand or type Manufacturer Sample size
1 10.3 Rye bread Fresh, center cut Pechter Baking Co. ½-in.2 17.1 Frankfurter Large, uncooked, skinless Mogen David Kosher ½-in.
Meat Products Corp.3 25.0 Gum drops Chuckle Fred W. Amend Co. ½-in.4 31.8 Steak Round, ½-in.-thick broiled — ½-in. square
on each side for 10 min5 33.6 Black crows candy — Mason Candy Corp. 1 piece6 37.3 Peanut chews — Whitman Co. 1 piece7 56.7 Tootsie rolls Midget size Sweets Co. of America 1 piece
Source: Szczesniak et al. (1963); reprinted from J. Food Sci. 28, 399, 1963. Copyright by Institute of Food Technologists.
Table 7.5 Original Gumminess Scale
Panel Samplerating Product Brand or type Manufacturer size
1 40% flour paste Gold Medal General Foods 1 tbs2 45% flour paste Gold Medal General Foods 1 tbs3 50% flour paste Gold Medal General Foods 1 tbs4 55% flour paste Gold Medal General Foods 1 tbs5 60% flour paste Gold Medal General Foods 1 tbs
Source: Szczesniak et al. (1963); reprinted from J. Food Sci. 28, 400, 1963. Copyright by Institute of Food Technologists.
Chap-07.qxd 1/10/02 4:15 PM Page 263

Some of them may not be available in other areas of the United States andmany of them are not available in other countries. Under these conditions sub-stitute commodities must be selected to fill out these scales. Each scale shouldencompass the full range of intensity of that textural characteristic encoun-tered in foods. Other factors to be considered in selection of the standard commodities are:
(1) select well-known brands that have good quality control and give aconsistent quality of the product;
(2) use products that require the minimum amount of preparation in orderto eliminate recipe variables;
264 Sensory Methods of Texture and Viscosity Measurement
Table 7.6 Original Adhesiveness Scale
Panelrating Product Brand or type Manufacturer Sample size
1 Hydrogenated Crisco Procter and ½ tspvegetable oil Gamble Co.
2 Buttermilk biscuit — Pillsbury Mills ¼ biscuitdough
3 Cream cheese Philadelphia Kraft Foods ½ tsp4 Marshmallow Fluff Durkee-Mower ½ tsp
topping5 Peanut butter Skippy, smooth Best Foods ½ tsp
Source: Szczesniak et al. (1963); reprinted by J. Food Sci. 28, 400, 1963. Copyright by Institute of Food Technologists.
Table 7.7 Original Viscosity Scale
Panelrating Product Brand or type Manufacturer Sample size
1 Water Spring Crystal Springs Co. ½ tsp2 Light cream Sealtest Sealtest Foods ½ tsp3 Heavy cream Sealtest Sealtest Foods ½ tsp4 Evaporated milk — Carnation Co. ½ tsp5 Maple syrup Premier 100% Francis H. Leggett ½ tsp
and Co.6 Chocolate syrup — Hershey Chocolate ½ tsp
Corp.7 Mixture: ½ cup Hellman’s Best Foods ½ tsp
mayonnaise and2 tbs heavy cream Sealtest Sealtest Foods
8 Condensed milk Magnolia, Borden Foods ½ tspsweetened
Source: Szczesniak et al. (1963); reprinted from J. Food Sci. 28, 401, 1963. Copyright by Instituteof Food Technologists.
Chap-07.qxd 1/10/02 4:15 PM Page 264

(3) use products that do not change greatly with small temperature varia-tions or with short-term storage.
The reference items should be standardized as much as possible with respectto size, temperature, brand name, and handling to ensure the stability of eachscale point.
With these criteria in mind it is possible to change any commodity in thestandard scales. An example of this is shown in Table 7.8 where the hardnessand viscosity scales developed for a texture profile panel in Colombia areshown and contrasted with the original scales developed by the General FoodsGroup in eastern United States. Similar scales have been developed inColombia for the other mechanical characteristics using different commodi-ties than in eastern United States (Bourne et al., 1975).
When necessary, the scales can be expanded in selected areas to allow for a more precise description of differences between closely related samples. For example, when working with semisolids such as puddings and whipped
Sensory Texture Profiling 265
Table 7.8 Hardness, Gumminess and Viscosity Scales in New York and Bogota
Scale value New Yorka Bogotab
Hardness1 Philadelphia cheese (Kraft) Philadelphia cheese (Alpina)2 Cooked egg white Cooked egg white3 Frankfurters (Mogen David) Cream cheese (Ubaté)4 Processed cheese (Kraft) Frankfurters (Suiza)5 Pickled olives (Cresca) Mozzarella cheese (LaPerfecta)6 Peanuts (Planters) Peanuts (LaRosa)7 Carrot (raw) Carrot (raw)8 Peanut brittle (Kraft) Candied peanuts (Colombina)9 Rock candy Milk candy (Colombina)
Viscosity1 Water Water2 Light cream (Sealtest) 40% sucrose syrup3 Heavy cream (Sealtest) 50% sucrose syrup4 Evaporated milk 60% sucrose syrup5 Maple syrup Maple syrup6 Chocolate syrup (Hershey) 96% sweetened condensed
milk � 4% water7 Mixture: ½ cup mayonnaise and Sweetened condensed milk
2 tbs heavy cream8 Sweetened condensed milk
Gumminess1 40% Gold Medal flour 41% Comapan flour2 45% Gold Medal flour 45% Comapan flour3 50% Gold Medal flour 49% Comapan flour4 55% Gold Medal flour 53% Comapan flour5 — 57% Comapan flour6 60% Gold Medal flour —
Sources: aSzczesniak et al. (1963); bBourne et al. (1975).
Chap-07.qxd 1/10/02 4:15 PM Page 265

toppings the lower end of the scale may require the addition of softer stan-dards than cream cheese, which ranks number one on the standard scale.
The scales can also be expanded between points by adding other selectedfoods to serve as intermediate anchor points. For example, if a given formu-lated food always has a hardness between 3 and 5, then a new hardness scalecan be constructed just for that food using 5 to 10 anchor points. In this casethere is no need to use points 1, 2, 6, 7, 8, and 9 of the standard hardness scalebecause they will never be used for this food.
For panel use, the definitions of the mechanical characteristics are given interms that are closely related to the actual perception.
Hardness is the force required to compress a substance between the molarteeth (in the case of solids) or between the tongue and palate (in the case ofsemisolids). To evaluate the hardness of solid foods, the item is placed betweenthe molar teeth and the panelist bites down evenly, evaluating the force tocompress the food. For semisolids, hardness is measured by compressing thefood against the palate with the tongue.
Fracturability is a parameter that was initially called brittleness. It is theforce with which a sample crumbles, cracks, or shatters; for example, peanutbrittle shatters with greater force than graham crackers. Foods that exhibitfracturability are products that possess low cohesiveness and some degree ofhardness. To evaluate fracturability the food is placed between the molar teethand the panelist bites down evenly until the food crumbles, cracks, or shatters.The degree of fracturability of a food is measured as the horizontal force withwhich a food moves away from the point where the vertical force is applied.Another factor that helps determine fracturability is the suddenness withwhich the food breaks.
Chewiness is the length of time required to masticate a sample at a constantrate of force application to reduce it to a consistency suitable for swallowing.An alternative way to use this scale is to record the actual number of chewsinstead of using the numbers from the scale. To evaluate chewiness the stan-dard is placed in the mouth and masticated at the rate of one chew per second.Chewiness is the number of chews required for a standard-sized piece beforethe product is swallowed. There may be a wide range in the number of chewsfrom person to person, but the average number of chews for the whole panelrepresents a range for each scale value and adjacent ranges should not overlap.Even though there may be a wide range in the number of chews different pane-lists give the same product, each panelist should give the same rank order forthe seven foods in the standard chewiness scale. Note that chewiness shouldbe used for solid foods but not for semisolid foods (Szczesniak, 1995).
Adhesiveness is the force required to remove material that adheres to themouth (generally the palate) during the normal eating process. The techniquefor evaluating adhesiveness is to place the food in the mouth, press it againstthe palate, and evaluate the force required to remove it with the tongue. Sincethe amount of saliva in the mouth affects the degree of adhesiveness, it is desir-able to rinse the mouth with water immediately prior to each evaluation.
266 Sensory Methods of Texture and Viscosity Measurement
Chap-07.qxd 1/10/02 4:15 PM Page 266

Gumminess is the denseness that persists throughout mastication or theenergy required to disintegrate a semisolid food to a state ready for swallowing.The technique for evaluating gumminess is to place the sample in the mouthand move it between the tongue and the palate. The degree of gumminess isjudged as the extent of manipulation required before the food disintegrates.Note that gumminess should be used for semisolid foods and not for solidfoods (Szczesniak, 1995).
Viscosity is the force required to draw a liquid from a spoon over the tongue.The technique for evaluating viscosity is to place the spoon containing the fooddirectly in front of the mouth and draw the liquid from the spoon over thetongue by slurping. The degree of viscosity is measured as the force requiredto draw the liquid over the tongue.
Geometrical CharacteristicsGeometrical characteristics are related to the arrangement of the physical constitutents of the food product such as size, shape, arrangement of particleswithin a food, surface roughness, etc.; they are qualitative and partly quantitative.
These characteristics relate to particle size, shape, orientation, and surfaceroughness. Some standards for geometrical characteristics are given in Table 7.9.Geometrical characteristics do not lend themselves to as clear-cut scaling asdo the mechanical characteristics. They may be divided into two general groupsof qualities: size and shape, and shape and orientation.
(1) Those related to size and shape are perceived as discrete particles that are relatively harder than the surrounding medium or the carrier.
Sensory Texture Profiling 267
Table 7.9 Geometrical Characteristics of Texture
Descriptive term Example
A. Characteristics relating to particle size and shape:Powdery Confectioner’s sugarChalky Raw potatoGrainy Farina, Cream of WheatGritty Pear stone cells, sandLumpy Cottage cheeseBeady Tapioca pudding
B. Characteristics relating to shape and orientation:Flaky Boiled haddockFibrous Base of asparagus shoot,
breast of chickenPulpy Orange sectionsCellular Raw apples, white cakeAerated Chiffon pie filling, milk shakePuffy Puffed rice, cream puffsCrystalline Granulated sugar
Source: Brandt et al. (1963); reprinted from J. Food Sci. 28, 405, 1963. Copyright by Institute of Food Technologists.
Chap-07.qxd 1/10/02 4:15 PM Page 267

This group can be scaled in the same manner as the mechanical characteristics. For example, chalky, gritty, grainy, and coarse comprisea scale of increasing particle size. Note that this is particle size evalu-ation; the hardness of the particles must be evaluated independently.
(2) Characteristics related to shape and orientation represent highly organizedstructures of different geometrical arrangements within each product.For example, a puffy texture is an organization of hard or firm outershells filled with large, often uneven, air pockets (e.g. puffed rice),whereas an aerated texture is a network of relatively small even cellsfilled with air and surrounded by cell walls (e.g. whipped egg white).The geometrical characteristics are sensed primarily by the tongue butmay be sensed to some extent on the palate and on the teeth.
Other CharacteristicsOther characteristics are properties related to the moisture and fat content of the food as perceived by the human senses; they are qualitative and partlyquantitative. These are sometimes called chemical characteristics becausethey measure the factors of moistness, dryness, oiliness, and fattiness. Nostandard scales for these characteristics were published in the original textureprofile method (Brandt et al., 1963), but it should be possible to develop stan-dard scales for these properties. These terms are not the same as moistness orfat content as determined by chemical analysis. For example, two apples mayhave the same moisture content as determined by chemical analysis but in asensory test one might be found to be dry and mealy while the other is moistand juicy. It is possible to have two cuts of beef that have been shown to haveequal moisture contents by chemical analysis, and yet one cut will be termedjuicy because of the sensation of moisture in the mouth while the other cutwill be determined dry because the sensation of moisture is lacking.
It is worth emphasizing that it is the sensation of moistness or oiliness in the mouth that must be assessed. There is often a poor correlation between therelease of oil or moisture during mastication and the amount determined bychemical analysis.
On one occasion the author was training a panel to work on a semiliquidproduct with a high content of emulsified soybean oil. The panel insisted theproduct had a ‘greasy mouthfeel.’ After tasting pure soybean oil (‘oily’) andCrisco shortening (‘greasy’) the panel confirmed the product was greasy. Inthis case the homogenized oil droplets gave the sensory impression of a solidfat even though no solid fat was used in the formula.
Developing the Basic TPA Score Sheet
A systematic method of recording all the texture characteristics of a givenfood is based upon the ‘order of appearance’principle, which relates to the timesequence in which the various attributes of the product appear. Unlike flavor,where the order of appearance of the notes cannot be anticipated, texture
268 Sensory Methods of Texture and Viscosity Measurement
Chap-07.qxd 1/10/02 4:15 PM Page 268

perception follows a definite pattern regarding the order in which the variouscharacteristics are perceived. These are subdivided into initial (first bite), mas-ticatory, and residual phases. The basic texture profile score sheet is shown inFig. 7.1. This should be consulted frequently during the discussion that follows:
1. Initial. In the first bite the product is placed between the molars and a singlebite is made. On this bite the mechanical properties of hardness, fracturability,and viscosity are measured and also geometrical properties and other proper-ties (moistness, oiliness). The mechanical characteristics are graded to within0.2 units on the standard scale, although some particularly sensitive peoplecan grade to within 0.1 of a unit. The geometrical characteristics and othercharacteristics, if present, are listed without assigning a number to them, butadjectives such as slight, moderate, or strong may be appended to these characteristics at this time. There are four potential measures of geometrical properties: (1) number of particles present; (2) size of particles; (3) shape ofparticles; and (4) hardness of the particles. It is worth noting that some char-acteristics may be absent and should be given a score of 0. For example, thefracturability scale and viscosity scale are mutually exclusive. If a food is frac-turable, it is a brittle solid and is not a liquid. A food that has a fracturabilitycomponent will have no viscosity component. Conversely, viscosity refers toliquid foods that have no fracturability, so if a product is given a score on theviscosity scale the fracturability score will be zero.
2. Masticatory. The second or masticatory phase is performed by placing apiece of food between the teeth and chewing at a standard rate, approximately
Sensory Texture Profiling 269
Figure 7.1 The basic textureprofile score sheet. (Courtesy ofDr A. S. Szczesniak.)
BASIC TEXTURE PROFILE BALLOT
Product: Date: Name:
I. INITIAL (perceived on first bite)(a) Mechanical
Hardness (1–9 scale)Fracturability (1–7 scale)Viscosity (1–8 scale)
(b) Geometrical(c) Other characteristics (moistness, oiliness)
II. MASTICATORY (perceived during chewing)(a) Mechanical
Gumminess (1–5 scale)Chewiness (1–7 scale)Adhesiveness (1–5 scale)
(b) Geometrical(c) Other characteristics (moistness, oiliness)
III. RESIDUAL (changes induced during mastication and swallowing)Rate of breakdownType of breakdownMoisture absorptionMouth coating
Chap-07.qxd 1/10/02 4:15 PM Page 269

60 chews per minute, and determining the mechanical properties of gummi-ness, chewiness, and adhesiveness, and also assessing any geometrical andother characteristics that appear during chewing. As noted above, chewinessmay be graded on the 1–7 scale or it can be listed simply as the total numberof chews to swallowing. There will always be a score for chewiness of solidfoods. If gumminess and adhesiveness are absent, they should be given a score of 0.
Chewiness is used for solid foods and gumminess for semisolid foods.However, some foods, e.g. crackers and cake, become semisolid during mas-tication. In these cases, chewiness is reported early, and gumminess late in themasticatory cycle.
3. Residual characteristics. The third or residual phase measures the changesinduced in chemical, mechanical, geometrical, and all the characteristicsthroughout the course of mastication up to the completion of swallowing.These are divided separately into the rate of breakdown, type of breakdown,moisture absorption, and mouth coating. In the two previous phases (initialand masticatory), numbers are used to describe the mechanical characteristicsand words or phrases are used to describe geometrical and chemical charac-teristics. In contrast, in the residual phase, numbers are rarely used but phrasesand short sentences are used to describe these residual characteristics. To theperson who has only read about sensory profiling, the residual characteristicsmay seem to be of minor importance. In fact, the parameters developed in theresidual characteristics are one of the most important aspects of texture profileanalysis. The fact that these parameters cannot have numbers assigned to themshould not be interpreted as a sign of minor importance. These characteristicsare usually impossible to duplicate in instrumental tests. The residual charac-teristics section of the texture profile is the section where textural parametersare least likely to be measured or detected by any instrumental method. It is anessential part of the total texture profile procedure.
When the panel has completed the basic texture profile ballot for a food, theleader asks each person in turn to call out the scores they have written on theirsheet and these scores are written on the board for the rest of the panel to see.Then the leader and the panel examine the scores together. Whenever thescore for any parameter that has a standard rating scale varies by morethan �0.2 of a point, the leader and the panelists discuss the problems thatwere experienced. After discussing the situation with the other panelists andleader, the panelists repeat that section of the ballot and by means of discus-sion and repeated testing generally reach a consensus. For those parametersfor which words, phrases, or sentences are used, the panelists discuss amongthemselves any differences and by tasting and discussion (led by the leader)reach a consensus. The sampling–discussion–reference to standard scales–sampling–discussion sequence continues until a consensus or near consensushas been reached. Occasionally one panelist will not agree with the rest of thepanelists. The score of that panelist is rejected from the final report. At first
270 Sensory Methods of Texture and Viscosity Measurement
Chap-07.qxd 1/10/02 4:15 PM Page 270

glance this seems to be a nonscientific approach to reject some of the data, butsince the texture profile is built around the concept of consensus followingadequate discussion, an out-of-line datum must be rejected if it deviates farfrom the consensus. However, before it is rejected that panelist must beallowed to explain the reason for their odd score. It sometimes happens thatthis person has experienced a sensation that the others have missed, but rec-ognize it after it has been explained, in which case that sensation is added tothe score sheet.
Figure 7.2 shows a basic texture profile ballot for meatballs, and Fig. 7.3shows a basic texture profile ballot for soda crackers, two products withentirely different textures.
The following similarities and differences between these two foods duringthe mastication sequence are found by comparing Figs 7.2 and 7.3.
1. Initial. Mechanical characteristics show that soda crackers have a littlemore hardness than the Swedish meatballs and more fracturability, but viscos-ity is absent in both commodities. Geometrical properties of the crackers areflaky and puffy whereas the meatballs are lumpy with a grainy surface. Othercharacteristics show that the crackers are dry whereas the Swedish meatballsare moist. The surface of the meatball is slippery, but the uncut surface is notslippery.
2. Masticatory. Mechanical characteristics indicate the soda crackers haveno gumminess, whereas the meatballs have a gumminess of 1.2. The numberof chews for mastication is approximately the same for both commodities andboth have a small amount of adhesiveness. The geometrical characteristics ofthe soda crackers continue to be flaky whereas the meatballs are coarse andgrainy and fibrous particles begin to be felt. Other characteristics show thatthe soda crackers continue to be dry and the meatballs continue to be moist.
3. Residual sensations. The rate of breakdown is high for soda crackers.The meatballs break down fast, forming grains that break down at a mediumrate. In the type of breakdown, the crackers break down into little rough sheetsthat change into a smooth dough, whereas the meatballs become a nonhomo-genous paste that is grainy and the grain size steadily decreases; some stringyfibrous grains are present but become more noticeable toward the end andrequire more effort to chew. With moisture absorption, the soda crackersabsorb a lot of saliva at a slow rate and gradually change into a moist dough;the saliva mixes easily with the Swedish meatballs to form a slurry, and thebolus becomes progressively more moist, leaving residual grains that feel dry.With mouth coating little pieces of cracker stick to the mouth and gums; thereis some slight residual oiliness with the meatballs, and a few fibrous particlesstick between the teeth and around the mouth.
These two foods, although very different in nature, have many similaritiesin the texture profile for the initial and masticatory phases. The majordifferences between these two commodities show up in residual sensations,illustrating their importance in the texture profile.
Sensory Texture Profiling 271
Chap-07.qxd 1/10/02 4:15 PM Page 271

272 Sensory Methods of Texture and Viscosity Measurement
BASIC TEXTURE PROFILE BALLOT FOR SODA CRACKERS
Product: Soda Crackers Date: Name:
I. INITIAL (perceived on first bite)(a) Mechanical
Hardness 4.0Fracturability 2.5Viscosity Not applicable
(b) Geometrical Flaky and puffy(c) Other characteristics Dry
II. MASTICATORY (perceived during chewing)(a) Mechanical
Gumminess 0Chewiness 16Adhesiveness 0.7
(b) Geometrical Flaky(c) Other characteristics Dry
III. RESIDUAL (changes induced during mastication and swallowing)Rate of breakdown – High.Type of breakdown – In the beginning it breaks down into little rough sheets, then it changes into a
smooth dough.Moisture absorption – It absorbs a lot of saliva slowly and changes into a moist dough.Mouth coating – Little pieces stick to the mouth and gums.
Figure 7.3 The basic textureprofile score sheet for sodacrackers.
BASIC TEXTURE PROFILE BALLOT FOR MEATBALLS
Product: Swedish meat balls Date: Name:
I. INITIAL (perceived on first bite)(a) Mechanical
Hardness 3.4Fracturability 0.7Viscosity Not applicable
(b) Geometrical Lumps, with a grainy surface(c) Other characteristics Moist, uncut surface is slippery and cut surface is not slippery
II. MASTICATORY (perceived during chewing)(a) Mechanical
Gumminess 1.2Chewiness 17.7 chewsAdhesiveness 1.2
(b) Geometrical Coarse, grainy, some fibrous particles present(c) Other characteristics Moist
III. RESIDUAL (changes induced during mastication and swallowing)Rate of breakdown – Large lumps break down fast. Grains break down at a medium rate.Type of breakdown – Lumps turn into a nonhomogeneous paste that is grainy, and grain size
decreases. Some stringy fibrous grains are present that become more noticeabletowards the end and require more effect to chew.
Moisture absorption – Initially moist. Saliva mixes easily with slurry and the bolus becomes progressively more moist. Residual grains feel dry.
Mouth coating – Slight residual oilness. A few fibrous particles stick between the teeth and around themouth.
Figure 7.2 The basic textureprofile score sheet for meatballs.
Chap-07.qxd 1/10/02 4:15 PM Page 272

Developing the Comparative Texture Profile Analysis Ballot
The final step in texture profile analysis is to develop from the standard scoresheets a comparative texture profile ballot for each commodity. The basic bal-lot can be used for any commodity. Each comparative ballot is especiallydesigned for a particular commodity and enables one to identify and quantifysmall differences in textural properties of similar materials caused bydifferences in quality of ingredients, formulation, storage, or processing. Inthe comparative ballot one material is selected as the ‘target’ material whosetextural properties are desirable to reproduce. It acts as the control and isassigned a score of zero for every textural parameter.
A basic texture profile ballot for arepa is shown in Fig. 7.4, and a compara-tive ballot is shown in Fig. 7.5. These should be referred to frequently in thefollowing discussion. Arepa is a corn-based staple food that is widely used inColombia and other countries in Latin America. The textural properties thathave been identified during the initial, mastication, and residual phases arelisted in the order of appearance and the experimental samples are gradedequal to, less than, or greater than the control sample in that particular qualityfactor. The control in this case was arepa made fresh each day by the tradi-tional village method (Bourne et al., 1975). The grading is made semiquanti-tative by grading from 1 to 5 plus and 1 to 5 minus. One plus means that thesample is slightly greater than the control in that particular textural property;five plus means it is much greater than the control in that particular texturalproperty. The minus score is used to indicate slightly less than to much lessthan the control sample.
The comparative texture profile ballot identifies those formulations andprocessing variables that bring the experimental samples closer to the target.It is definitely the best technique for identifying desirable textural propertiesand eliminating undesirable textural properties in product formulation andmeasuring deviations in texture from a control, standard sample or a competi-tor’s product. A study of Figs 7.4 and 7.5 shows that 28 different textural char-acteristics were derived from the basic texture profile ballot. These figuresshow how complete a texture analysis can be developed by a trained sensorypanel. There is no instrumental method or group of methods available thatcould give as complete an analysis of texture profile as is seen in Fig. 7.5.
Figure 7.6 shows the results from comparative texture profile for meatballsthat was developed from the basic ballot shown in Fig. 7.2. The target productwas Swedish meatballs made from pure ground beef and it was given a score of 0 for every texture note listed in Fig. 7.6. Initial sensations list themechanical properties of hardness and fracturability whereas viscosity doesnot appear. Geometrical properties list lumpiness and scratchiness of the grains;and other characteristics list slipperiness of the uncut surface and moistness.Masticatory sensations list the mechanical properties of gumminess, chewi-ness, and adhesiveness; geometrical properties list coarseness, graininess, and
Sensory Texture Profiling 273
Chap-07.qxd 1/10/02 4:15 PM Page 273

amount of fibrous grains; and other characteristics list moistness. Residualsensations are listed under the rate of breakdown heading, the rate of break-down of the grains, and rate of loss of cohesiveness between the particles;under type of breakdown heading are listed the homogeneity of the bolus,appearance of stringy fibrous grains, and chewiness of the fibrous grains; undermoisture absorption heading are listed dryness of residual grains, and ease ofmixing of saliva and slurry; under the mouth coating heading are listed oilymouth coating, presence of residual fibrous particles, and presence of residualsandy particles.
The right-hand side of Fig. 7.6 plots the texture profiles of fish balls againstmeatballs. Sample X is made from fish instead of beef. Sample O is fish ballsin which 10% of the fish was replaced with textured soy protein. The figureshows that the fish balls have lower hardness, higher fracturability, less lumpi-ness, more scratchiness of the grains, less slipperiness, and more moistnessthan the meatballs in the initial sensations; less gumminess, chewiness, adhe-siveness, and coarseness than the meatballs, more graininess, less amount offibrous grains, and higher moistness in the masticatory phase; a higher rate ofbreakdown of the lumps, a higher rate of breakdown of the grains, a higherrate of loss of cohesiveness between the particles, and a higher homogeneityof the bolus in residual sensations. The fish balls have fewer stringy fibrousgrains, lower chewiness, and less dryness than the meatballs. The fish balls
274 Sensory Methods of Texture and Viscosity Measurement
BASIC TEXTURE PROFILE SHEET FOR AREPA
Product: Arepa de Peto Date: Name:
I. INITIAL (perceived on first bite)(a) Mechanical
Hardness 4.2Fracturability 2.5Viscosity 0
(b) Geometrical Tough skin and coarse center. Sandwich-like structure with thin tough skinand doughy matrix. Black patches are crispy and located only on the surface
(c) Other characteristics Dry surface and moist center
II. MASTICATORY (perceived during chewing)(a) Mechanical
Gumminess 0Chewiness 16Adhesiveness 0.5
(b) Geometrical Surface is coarse and center is doughy with little pieces(c) Other characteristics Dry surface and moist center
III. RESIDUAL (changes induced during mastication and swallowing)Rate of breakdown – Moderate.Type of breakdown – Skin breaks in little sheets. Center breaks in little pieces to form a nonuniform
dough.Moisture absorption – Center absorbs moisture more quickly than the surface. Bolus has some little,
hard and rough pieces.Mouth coating – Little pieces leave a coating in the mouth, especially on the gums and teeth. After
swallowing, the mouth is dry.
Figure 7.4 The basic textureprofile score sheet for arepa.(From Bourne et al., 1975.Reprinted from J. Texture Studies66, page 50, 1975, withpermission of Food andNutrition Press.)
Chap-07.qxd 1/10/02 4:15 PM Page 274

mix with saliva to form a slurry better than the meatballs, have less oily mouthcoating, less residual fibrous particles, but more residual sandy particles.
The product in which 10% of the fish was substituted with soy protein has asimilar texture profile to the one made entirely from fish; however, there are afew exceptions, namely, the substitution of the soy gives a product that hashigher moistness, chewiness, adhesiveness, graininess, and amount of fibrousgrains, and less sandy particles. If this were a project in product development,various other formulations and processing variables would be tried; in eachcase the changes in the texture profile would be noted, particularly whether thechange in formulation or processing brought the experimental sample closerto the target or further away from the target with certain textural properties.
Sensory Texture Profiling 275
COMPARATIVE TEXTURE PROFILE BALLOT FOR AREPAControl
I. Initial Sensation(a) Measure force to: (a) bite off with incisors
(b) pull out with hand(b) Hardness(c) Sideways sliding of center(d) Toughness of skin(e) Doughiness of center(f) Dryness of skin(g) Moistness of center
II. Mastication(a) Chewiness (no. of chews)(b) Adhesiveness(c) Pastiness of center(d) Graininess of center(e) Toughness of skin(f) Roughness of skin pieces(g) Dryness of skin pieces(h) Moistness of center
III. Final Sensations(a) Rate of breakdown of skin(b) Rate of breakdown of center(c) Moistness of paste(d) Graininess of paste(e) Dryness of skin particles(f) Roughness of skin particles(g) Presence of coarse particles other than skin(h) Absorption of moisture by mass(i) Absorption of moisture by pieces of skin(j) Mouthcoating of mass(k) Presence of skin particles around mouth(l) Scratchiness of residual skin particles
Instructions:Put an X in ‘0’ column if sample is equal to control.Put 1 X to 5 X in (�) column if sample is more than control and in (�) column if less than control (X = slightly different; XXXXX = strongly different).
� 0 �
Figure 7.5 Comparativetexture profile score sheet forarepa. (From Bourne et al., 1975,reprinted from J. Texture Studies 66,page 51, 1975, with permissionof Food and Nutrition Press.)
Chap-07.qxd 1/10/02 4:15 PM Page 275

Figure 7.7 shows a texture profile ballot developed for cooked rice. This is a particularly difficult food for TPA, probably because (a) rice is a staple and people become very sensitive to small differences in textural properties of foods that are consumed frequently and in large quantities; (b) rice has abland flavor and bland flavors usually increase the attention given to texturalproperties.
The examples listed above show how the basic texture profile technique canbe extended to cover all commodities by suitable adaptation.
Variations on Sensory Texture ProfileAnalysis
For certain purposes it may not be necessary to use the entire texture profile.The parameter of interest might be simply chewiness, in which case only the chewiness part of the texture profile would be performed. For example,Harrington and Pearson (1962) used a panel to measure chew count for
276 Sensory Methods of Texture and Viscosity Measurement
Figure 7.6 Comparativetexture profile score sheet formeatballs and fish balls.Unpublished data from M. C. Bourne.
COMPARATIVE TEXTURE PROFILE FOR MEATBALLS AND FISH BALLS
I. INITIAL SENSATIONS(a) hardness(b) fracturability(c) lumpiness(d) scratchiness of grains(e) slipperiness (uncut surface)(f) moistness
II. MASTICATORY(g) gumminess(h) chewiness(i) adhesiveness(j) coarseness(k) graininess(l) amount of fibrous grains(m) moisture
III. RESIDUAL SENSATIONS(n) rate of breakdown of lumps(o) rate of breakdown of grains n.a.(p) rate of loss of cohesiveness between particles(q) homogeneity of bolus(r) appearance of stringy, fibrous grains(s) chewiness of fibrous grains x � n.a.(t) dryness of residual grains(u) ease of mixing of saliva and slurry(v) oily mouthcoating(w) residual fibrous particles(x) residual sandy particles
Swedish meatballs were used as control. Sample ‘X’ is fish balls. Sample ‘O’ is fish balls with 10% replacement of fish with soya protein.
�3 �2 �1 0 �1 �2 �3
Chap-07.qxd 1/10/02 4:15 PM Page 276

measuring the tenderness of pork loins with various degrees of marbling andfound a good correlation between chew count and Warner–Bratzler shearreadings. In contrast, Cover et al. (1962) used a panel to evaluate the juicinessof beef and six components of tenderness: softness to the tongue and cheek,softness to tooth pressure, ease of fragmentation across the grain, mealiness,apparent adhesions between fibers, and connective tissue.
Variations on Sensory Texture Profile Analysis 277
COMPARATIVE TEXTURE PROFILE BALLOT FOR COOKED RICEScore
STAGE 1. Place a spoonful of rice in mouth, manipulategently without breaking kernels. Evaluate kernel surface for:
Wetness – Degree of moisture on kernel surface and type of moisture (watery or starchy).
Kernel stickiness – Degree of manipulation required to remove kernels adhering to tongue and roof of mouth.
Roughness – Feel of the kernel surface on the tongue.Uniformity of size – Refers to size and shape of individual
kernels.Clumpiness – Degree to which kernels adhere to one
another.Plumpness – Degree to which the kernel is rounded
and full.
STAGE 2. Place a spoonful of rice in mouth. Chew twicewith molars. Evaluate:
Hardness – Force required to penetrate kernels with the molar teeth on first chew.
Crumbliness – Degree to which kernels fall apart when sheared with the teeth.
Rubberiness – Resistance of the kernel to the teeth prior to shearing.
Gluiness – Degree to which chewed kernels adhere to each other after being sheared and exposed to saliva due to starch paste.
Inner moisture – Amount of moisture inside kernel that is released upon chewing.
STAGE 3. Place a spoonful of rice in mouth. Chew with molars three or more times. Evaluate:
Kernel uniformity – Degree of texture similarity between inside and outside of kernel.
Cohesiveness – Denseness and cohesion of the mass of mass of chewed kernels throughout
mastication.Stickiness – Degree to which kernels adhere to and
pack in the teeth during mastication.Describe breakdown – Includes rate, type, and uniformity.
Also the geometrical characteristics observed during breakdown.
Moisture absorption – Degree to which saliva is absorbed by and mixed with chewed kernels.
Mouth or throat – Degree of coating perceived in the coating mouth or throat after swallowing.
� 0 �
Figure 7.7 Comparativetexture profile score sheet forcooked rice. (Courtesy of Dr A. S. Szczesniak.)
Chap-07.qxd 1/10/02 4:15 PM Page 277

Szczesniak (1979) reported that for fluid foods such as beverages a deeperanalysis is required than that obtained by the single parameter of viscosity thatappears in the standard texture profile analysis. Table 7.10 lists theclassification of sensory mouthfeel terms, typical descriptive words, andexamples, as developed by Szczesniak (1979).
278 Sensory Methods of Texture and Viscosity Measurement
Table 7.10 Classification of Sensory Mouthfeel Terms of Beverages
Responses Typical Beverages that have Beverages that do not have Category (% total) words this property this property
Viscosity-related terms 30.7 Thin Water, iced tea, hot tea Apricot nectar, milk shake, buttermilk
Thick Milk shake, eggnog, tomato juice Club soda, champagne, drink made from dry mix
Feel on soft tissue surfaces 17.6 Smooth Milk, liqueur, hot chocolate —Pulpy Orange juice, lemonade, pineapple juice Water, milk, champagneCreamy Hot chocolate, eggnog, ice cream soda Water, lemonade, cranberry juice
Carbonation-related terms 11.2 Bubbly Champagne, ginger ale, club soda Prune juice, iced tea, lemonadeTingly Ginger ale, champagne, club soda Instant orange, hot tea, coffeeFoamy Beer, root beer, ice cream soda Cranberry juice, lemonade, water
Body-related terms 10.2 Heavy Milk shake, eggnog, liqueur Water, lemonade, ginger aleWatery Bouillon, iced tea, hot tea, drink Milk, V-8 juice, apricot nectar
made from dry mixLight Water, iced tea, canned fruit drink Buttermilk, hot chocolate,
V-8 juiceChemical effect 7.3 Astringent Hot tea, iced tea, lemonade Water, milk, milk shake
Burning Whiskey, liqueur Milk, tea, drink made from dry mix
Sharp Prune juice, pineapple juice Water, hot chocolate, cannedfruit drink
Coating of oral cavity 4.5 Mouth Milk, eggnog, hot chocolate Water, apple cider, whiskeycoating
Clinging Milk, milk shake, ice cream soda, liqueur Water, ginger ale, bouillonResistance to tongue 3.6 Slimy Prune juice, milk, light cream Water, ginger ale, champagne
movement Syrupy Liqueur, apricot nectar, root beer Water, milk, club sodaAfterfeel–mouth 2.2 Clean Water, iced tea, wine Buttermilk, beer, canned fruit
drinkDrying Hot chocolate, cranberry juice WaterLingering Hot chocolate, light cream, milk Water, iced tea, club sodaCleansing Water, hot tea Milk, pineapple juice, V-8 juice
Afterfeel–physiological 3.7 Refreshing Water, iced tea, lemonade Buttermilk, prune juice, hot chocolate
Warming Whiskey, liqueur, coffee Lemonade, champagne, iced teaThirst Coca-Cola, water, drink made from Milk, coffee, cranberry juice
quenching dry mixTemperature-related 4.4 Cold Ice cream soda, milk shake, iced tea Liqueur, hot tea
Cool Iced tea, water, milk EggnogHot Hot tea, bouillon, whiskey Ginger ale, lemonade, iced tea
Wetness-related 1.3 Wet Water Milk, coffee, apple ciderDry Lemonade, coffee Water
Source: Szczesniak (1979); reprinted with permission of Academic Press Inc. (London) Ltd.
Chap-07.qxd 1/10/02 4:15 PM Page 278

In a similar vein, Civille and Liska (1975) developed a sensory textureprofiling technique for semisolid foods (see Table 7.11). They expanded theorder of appearance from three stages into five stages:
Stage 1. Manipulate the semisolid food without compressing and evaluateheaviness, wetness, wetting and slipperiness.
Stage 2. Compress partially against the palate two times and evaluatefirmness, bounciness, gumminess and spread.
Stage 3. Compress completely between the tongue and hard palate andevaluate spread, firmness, airiness and cooling.
Stage 4. Manipulate with the tongue back and forth at one manipulation persecond and evaluate adhesiveness, smoothness, rate of disappearance,
Variations on Sensory Texture Profile Analysis 279
Table 7.11 Sensory Texture Profiling Technique and Definition of Terms for Semisolid Foods
Stage I Place a rounded teaspoonful of product in the mouth; manipulate without compressing or breakingEvaluate for:– Heaviness: weight of product as perceived when the product is first placed on the tongue– Wetness: degree of moisture on the surface (moisture)– Wetting: degree of which the product wets down with saliva (moisture absorption)– Slipperiness: degree to which the tongue can slide under the product (oil/fat, adhesiveness)
Stage II Place a fresh spoonful of product in the mouth; compress partially against the palate, release, and repeatEvaluate for:– Firmness: force to compress partially (hardness)– Bounciness: resilience; degree to which the sample returns to the original shape (elasticity)– Gumminess: degree of cohesiveness (cohesiveness)– Spread: degree to which the product spreads over the tongue (viscosity/gumminess, adhesiveness)
Stage III Place a spoonful of product in the mouth; compress completely between tongue and palateEvaluate for:– Spread: degree to which the product spreads over tongue (viscosity/gumminess, adhesiveness)– Firmness: amount of force required to compress fully (hardness)– Airiness: amount of air in the product perceived as very small bubbles (geometrical-aerated)– Cooling: thermal effect on the tongue (thermal mouthfeeling)
Stage IV Place a spoonful in the mouth; move tongue back and forth at one manipulation per secondEvaluate for:– Adhesiveness: force required to remove the material that adheres to the mouth (adhesiveness)– Smoothness: absence of any particles in the product (geometrical)– Rate of disappearance: time required for breakdown (gumminess, moisture absorption, thermal reaction)– Abruptness of disappearance: manner in which the change from semisolid to liquid occurs; range is from gradual to
abrupt (thermal reaction, moisture absorption, gumminess)– Uniformity of disappearance: degree to which the product remains uniform throughout the breakdown (geometrical)– Type of disappearance: description of changes occurring during the breakdown (description of breakdown)– Mouthcoating: type and degree of coating in the mouth after manipulation (geometrical, fat/oil)
Stage V After manipulation and breakdown; swallow the productEvaluate for:– Ease of swallow: degree to which the broken-down product can be readily swallowed (geometrical, gumminess)– Fluidity: degree to which the product is a thin liquid (gumminess/viscosity)
Source: Civille and Liska (1975). Reprinted from J. Texture Studies 6, page 26. Copyright by Food and Nutrition Press Inc.
Chap-07.qxd 1/10/02 4:15 PM Page 279
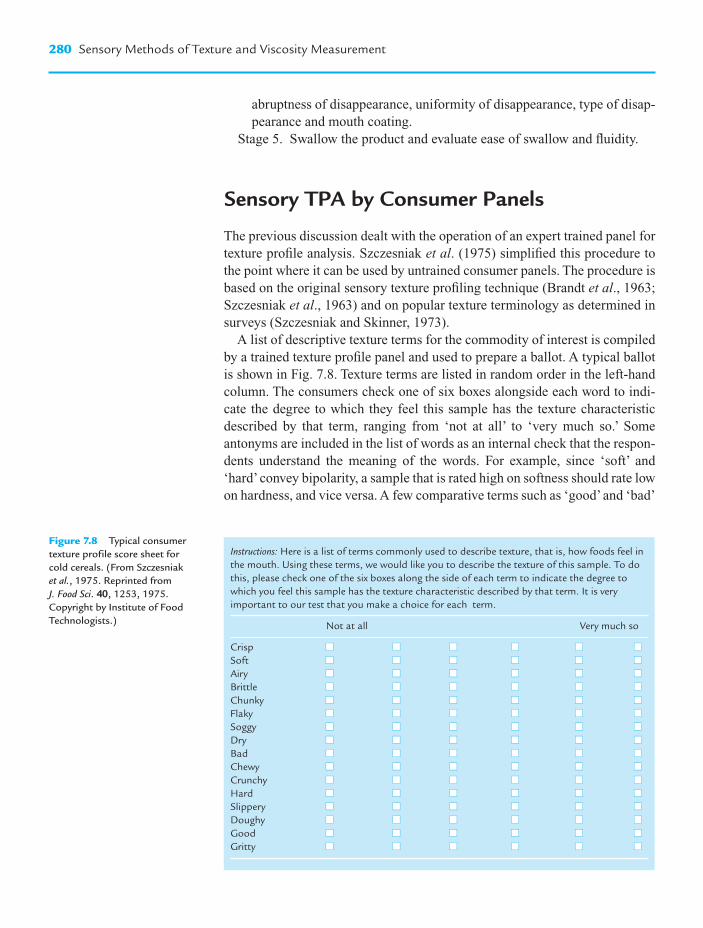
Figure 7.8 Typical consumertexture profile score sheet forcold cereals. (From Szczesniak et al., 1975. Reprinted from J. Food Sci. 4400, 1253, 1975.Copyright by Institute of FoodTechnologists.)
280 Sensory Methods of Texture and Viscosity Measurement
abruptness of disappearance, uniformity of disappearance, type of disap-pearance and mouth coating.
Stage 5. Swallow the product and evaluate ease of swallow and fluidity.
Sensory TPA by Consumer Panels
The previous discussion dealt with the operation of an expert trained panel fortexture profile analysis. Szczesniak et al. (1975) simplified this procedure tothe point where it can be used by untrained consumer panels. The procedure isbased on the original sensory texture profiling technique (Brandt et al., 1963;Szczesniak et al., 1963) and on popular texture terminology as determined insurveys (Szczesniak and Skinner, 1973).
A list of descriptive texture terms for the commodity of interest is compiledby a trained texture profile panel and used to prepare a ballot. A typical ballotis shown in Fig. 7.8. Texture terms are listed in random order in the left-handcolumn. The consumers check one of six boxes alongside each word to indi-cate the degree to which they feel this sample has the texture characteristicdescribed by that term, ranging from ‘not at all’ to ‘very much so.’ Someantonyms are included in the list of words as an internal check that the respon-dents understand the meaning of the words. For example, since ‘soft’ and‘hard’ convey bipolarity, a sample that is rated high on softness should rate lowon hardness, and vice versa. A few comparative terms such as ‘good’ and ‘bad’
Instructions: Here is a list of terms commonly used to describe texture, that is, how foods feel inthe mouth. Using these terms, we would like you to describe the texture of this sample. To dothis, please check one of the six boxes along the side of each term to indicate the degree towhich you feel this sample has the texture characteristic described by that term. It is veryimportant to our test that you make a choice for each term.
Not at all Very much so
Crisp �� �� �� �� �� ��
Soft �� �� �� �� �� ��
Airy �� �� �� �� �� ��
Brittle �� �� �� �� �� ��
Chunky �� �� �� �� �� ��
Flaky �� �� �� �� �� ��
Soggy �� �� �� �� �� ��
Dry �� �� �� �� �� ��
Bad �� �� �� �� �� ��
Chewy �� �� �� �� �� ��
Crunchy �� �� �� �� �� ��
Hard �� �� �� �� �� ��
Slippery �� �� �� �� �� ��
Doughy �� �� �� �� �� ��
Good �� �� �� �� �� ��
Gritty �� �� �� �� �� ��
Chap-07.qxd 1/10/02 4:15 PM Page 280

Figure 7.9 Consumer textureprofile of whipped toppings doneby two separate panels in twolocations. Note the high degreeof reproducibility of the test.(From Szczesniak et al., 1975.Reprinted from J. Food Sci. 4400,1256, 1975. Copyright byInstitute of Food Technologists.)
Repeatability 281
are included in order to obtain an overall measure of textural quality. Thistechnique has proved successful for a variety of foodstuffs in both centrallocation and home use situations (Szczesniak et al., 1975).
Repeatability
With a properly trained panel, the sensory texture profile analysis method pro-duces data than can be reproduced in the same location at different times andin different locations with different panels. Figure 7.9 shows the texture profilefor whipped toppings developed by a panel in Scarsdale, New York and the profile for the same product developed by a different panel in Indiana-polis, Indiana (Szczesniak et al., 1975). The close match between the two
Good
Easy to swallow
Clean
Smooth
Uniform
Cool
Light
Soft
Thick
Spreads
Firm
Airy
Melts
Wet
Dense
Disappears quickly
Heavy
Foamy
Dry
Thin
Slippery
Mouth coating
Warm
Greasy
Sticky
Oily
Bad
TEST 1,
TEST 2,
Scarsdale, NY
Indianapolis, IN
1.0 2.0 3.0 4.0 5.0 6.0
Not at all Very much so
Chap-07.qxd 1/10/02 4:15 PM Page 281

282 Sensory Methods of Texture and Viscosity Measurement
panels clearly demonstrates the reproducibility of the procedure. Szczesniak et al. (1975) also showed that a group can reproduce their score on the sameproduct even when the second test was conducted 16 months after the first test.
The Texture Profile as an Objective Method
Texture profiling is, without question, a sensory method, but this does not nec-essarily mean that it is a subjective method. The word ‘subjective’ has the con-notation that the personal feelings, biases, and previous experiences of thejudge play a major role in the results that are obtained. A subjective methodmeasures an individual’s response to the test material; that is, the data aresome complex combination of the properties of the test material and the per-sonal characteristics of the judge, and both factors carry considerable weightin the results.
In contrast, an objective method is usually thought of as an instrumental orchemical method. This concept of an objective method may not be always cor-rect. The true characteristics of an objective method are (1) that the dataobtained are independent of the individual observer; that is, the result is fair,impartial, factual, and unprejudiced by the personal characteristics of theobserver; (2) that the results are repeatable and verifiable by others; that is,other laboratories can obtain the same results within the limits of experimen-tal error.
The author believes that a properly trained texture profile panel is objective,not subjective, because the texture profile method complies with the two crite-ria of objectivity enunciated above.
(1) Freedom from personal bias. The data obtained are partly quantitativeand partly descriptive, but always objective because the panel is trained to takean analytical approach and use intensity scaling, not acceptability scaling. Themembers of the panel are trained to observe and record data, not allowing theirpersonal likes and dislikes to influence their results.
(2) Repeatability. Results from different panels are reproducible to a highdegree as discussed under the previous heading. The author has seen a panelproduce a texture profile on a product one week and then reproduce thatprofile a week later in the absence of the previous data, on a product they wereled to believe was different but was not. He has personal experience with apanel in Ithaca, New York, and another panel in Bogota, Colombia, who gavesubstantially identical texture profiles for the same food.
The texture profile technique passes the tests of impartiality and repro-ducibility and should, therefore, be considered as an objective method. Ittrains a small group of people to use their mouth as a scientific instrument,similar to a balance or a pH meter. The advantages of the texture profile tech-nique over other objective methods are that this particular scientific instru-ment (the trained mouth) can measure a number of textural parameters that
Chap-07.qxd 1/10/02 4:15 PM Page 282

can be measured by no instrument at the present time, and, in many instances,it can measure a given textural parameter with greater sensitivity than aninstrument.
Modifications to Sensory Texture ProfileAnalysis
Many are under the impression that the original sensory texture profile anal-ysis developed by Dr Szczesniak’s group in the early 1960s is a rigid andunchangeable procedure. This is not correct. It is a flexible method that can beadapted to accommodate different geographical areas, different foods, anddifferent cultures. It can also be expanded to encompass textural sensationsnot described in the original procedure.
In reviewing texture profile analysis ten years after it was first announced,Szczesniak (1975c) noted that some people assume the originally publishedexamples must be adhered to very strictly. She pointed out that although muchwork went into the selection of foods representing various points on the scalesit was realized from the beginning that:
(1) these foods may not be available in other parts of the world;(2) some of them would become unavailable in the future;(3) the intensity of their textural properties may change because of
changes in raw materials or changes in manufacturing processes.
Table 7.8 is an example of how the standard rating scales established in New York were modified for Bogota, Colombia. Mogen David frankfurterswere assigned a hardness scale of 3 in New York, but Suiza frankfurters wereassigned a score of 4 because no frankfurters could be found with similarhardness to Mogen David frankfurters in Bogota. However, a local creamcheese, Ubaté, was assigned a hardness score of 3 in Bogota because it wasfound to be intermediate between cooked egg white and Suiza frankfurters.
For the viscosity scale, sucrose syrups were used in Bogota because thecreams and evaporated milk used in New York were not available. The stan-dard viscosity scale in Bogota was shortened to seven points instead of theeight points used in New York. Mayonnaise was not used in Bogota becausethis is a non-Newtonian fluid with a yield stress and it was thought that thestandard scale would be easier to grasp by the panel if all the standards wereNewtonian fluids.
The standard gumminess scale in New York is a six-point scale that usesmixtures of Gold Medal flour and water ranging from 40% flour � 60% waterto 60% flour � 40% water. When a sample of Gold Medal flour from New Yorkwas taken to Bogota and compared with local flour it was found that the localflour was not quite the same. Therefore, the standard gumminess scale inBogota used the local flour with concentrations ranging from 41% flour
Modifications to Sensory Texture Profile Analysis 283
Chap-07.qxd 1/10/02 4:15 PM Page 283

� 59% water to 57% flour � 43% water in increments of 4% instead of the5% increments used in New York (see Table 7.8, page 265).
Muñoz (1986) gives examples of changes in the foods used in standardscales in New Jersey because some of the items used more than 20 years ear-lier in New York were not available or the textural quality had changed overthe years.
Some standards are likely to be constant from one geographical area toanother. For example, cooked egg whites, peanuts, and carrots that appear inthe original hardness scale are not manufactured products and are unlikely tochange to any great degree over time or place. These make useful internationalreference standards that can help anchor the hardness scale.
Muñoz (1986) added scales for denseness, wetness, adhesiveness to lips,roughness, self-adhesiveness and springiness which are shown in Tables7.12–7.17. Szczesniak and Ilker (1988) formulated a tentative scale for sen-sory juiciness which is shown in Table 7.18.
It should be noted that the size of the samples presented to a panel is part ofthe standard scale and must be kept constant because sample size can affectthe panel’s judgment (Cardello and Segars, 1989).
The sensory texture profiling technique developed by Dr Szczesniak’sgroup at the General Food Corporation was the first all-encompassing methodapplied to texture. It followed the principles developed by the Arthur D. LittleCorp. for flavor profiling. Other programs have since been developed thatinclude texture profiling including Spectrum™ Descriptive Analysis,Quantitative Descriptive Analysis (QDA) which relies heavily on statisticalanalysis, and Free Choice Profiling (Marshall and Kirby, 1988). These meth-ods include evaluation of all attributes including general appearance, color,texture, flavor and aroma.
Sensory texture profiles for a number of other foods are given in the tablesin Appendix IV. These tables demonstrate both the power of the sensory texture profile method and its adaptability to any food or beverage.
284 Sensory Methods of Texture and Viscosity Measurement
Table 7.12 Denseness Reference Scale
Scale Manufacturer/value Product Type/brand distributor Sample size Temperature
0.5 Whipped topping Cool Whip, nondairy General Foods Corp. 1 tsp 40–45°F2.5 Marshmallow topping Fluff Durkee Mower 1 tsp Room4.0 Nougat Three Musketeers, M&M Mars ½-in. cube Room
chocolate cover removed6.0 Malted milk balls Whoppers Leaf Confectionery, Inc. One piece Room9.0 Frankfurter a Beef Franks, cooked 5 min Oscar Mayer Foods Corp. ½-in. slice Room
in boiling water13.0 Fruit jellies Chuckles Nabisco Brands Half a piece Room
Source: Muñoz (1986). Reprinted from J. Sensory Studies 1, page 67. Copyright by Food and Nutrition Press Inc.aArea compressed with molars is parallel to cut.
Chap-07.qxd 1/10/02 4:15 PM Page 284
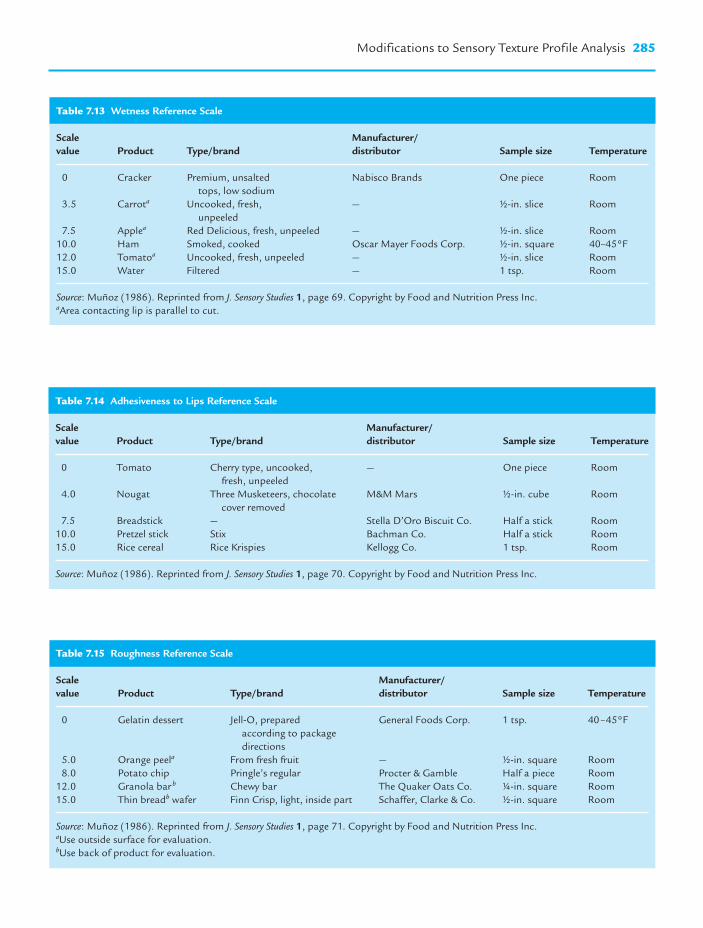
Modifications to Sensory Texture Profile Analysis 285
Table 7.13 Wetness Reference Scale
Scale Manufacturer/value Product Type/brand distributor Sample size Temperature
0 Cracker Premium, unsalted Nabisco Brands One piece Roomtops, low sodium
3.5 Carrota Uncooked, fresh, — ½-in. slice Roomunpeeled
7.5 Applea Red Delicious, fresh, unpeeled — ½-in. slice Room10.0 Ham Smoked, cooked Oscar Mayer Foods Corp. ½-in. square 40–45°F12.0 Tomatoa Uncooked, fresh, unpeeled — ½-in. slice Room15.0 Water Filtered — 1 tsp. Room
Source: Muñoz (1986). Reprinted from J. Sensory Studies 1, page 69. Copyright by Food and Nutrition Press Inc.aArea contacting lip is parallel to cut.
Table 7.14 Adhesiveness to Lips Reference Scale
Scale Manufacturer/value Product Type/brand distributor Sample size Temperature
0 Tomato Cherry type, uncooked, — One piece Roomfresh, unpeeled
4.0 Nougat Three Musketeers, chocolate M&M Mars ½-in. cube Roomcover removed
7.5 Breadstick — Stella D’Oro Biscuit Co. Half a stick Room10.0 Pretzel stick Stix Bachman Co. Half a stick Room15.0 Rice cereal Rice Krispies Kellogg Co. 1 tsp. Room
Source: Muñoz (1986). Reprinted from J. Sensory Studies 1, page 70. Copyright by Food and Nutrition Press Inc.
Table 7.15 Roughness Reference Scale
Scale Manufacturer/value Product Type/brand distributor Sample size Temperature
0 Gelatin dessert Jell-O, prepared General Foods Corp. 1 tsp. 40–45°Faccording to packagedirections
5.0 Orange peela From fresh fruit — ½-in. square Room8.0 Potato chip Pringle’s regular Procter & Gamble Half a piece Room
12.0 Granola bar b Chewy bar The Quaker Oats Co. ¼-in. square Room15.0 Thin breadb wafer Finn Crisp, light, inside part Schaffer, Clarke & Co. ½-in. square Room
Source: Muñoz (1986). Reprinted from J. Sensory Studies 1, page 71. Copyright by Food and Nutrition Press Inc.aUse outside surface for evaluation.bUse back of product for evaluation.
Chap-07.qxd 1/10/02 4:15 PM Page 285

286 Sensory Methods of Texture and Viscosity Measurement
Table 7.16 Self-adhesiveness Reference Scale
Scale Manufacturer/value Product Type/brand distributor Sample sizea Temperature
0 Gummi-bear Haribo Gold bears Haribo GMBH & Co. Two pieces Room2.0 Licorice Shoestring, red laces E. J. Brach & Sons, Inc. Two ½-in. pieces Room7.5 American cheese Velveeta, yellow Kraft Two ¼-in. cubes 40–45°F9.0 Riceb Enriched long grain Pathmark (any local brand) 1 tsp. Room
15.0 Caramel Homemade, light Robinson’s Candies Two ¼-in. cubes Room
Source: Muñoz (1986). Reprinted from J. Sensory Studies 1, page 72. Copyright by Food and Nutrition Press Inc.aSample size refers to amount placed in mouth. For sample serving, cover bottom of container with individual pieces, assuring that eachone is in contact with the other. Repeat procedure with a second layer. Hold product for three hours before evaluation.
bBring 3¼ cups of water and one cup of rice to a boil. Lower heat, cover and simmer for 40 min.
Table 7.17 Springiness Reference Scale
Scale Manufacturer/value Product Type/brand distributor Sample size Temperature
0 Cream cheese Philadelphia Kraft ½-in. cube 40–45°F5.0 Frankfurtera Beef Franks, cooked 5 min Hebrew National Kosher Foods ½-in. slice Room
in boiling water9.0 Marshmallow Miniature Kraft One piece Room
15.0 Gelatin dessertb Jell-O and General Foods Corp. ½-in. cube 40–45°FKnox gelatin Knox Gelatine Inc.
Source: Muñoz (1986). Reprinted from J. Sensory Studies 1, page 73. Copyright by Food and Nutrition Press Inc.aArea compressed betwen tongue and palate is parallel to cut.bOne package of Jell-O and one package of Knox gelatin, dissolved in 1½ cups of hot water. Cover and refrigerate (40–45°F) for 24 h.
Table 7.18 Scale of Sensory Juiciness (10 �� most juicy; all raw)
Product Ranking
Watermelon/Persian melon 10Orange 9Honeydew melon 8Strawberry 7Apple 6Cucumber 5Tomato wedge 4Snap bean 3Mushrooms 2Carrot 1Banana 0
Source: Szczesniak and Ilker (1988). Reprinted from J. Sensory Studies 1, page 70. Copyright byFood and Nutrition Press Inc.
Chap-07.qxd 1/10/02 4:15 PM Page 286

Nonoral Methods of Tactile TextureMeasurement
Although most of the sensing of texture occurs in the mouth and with the lips,it is possible to measure textural properties outside the mouth, most com-monly with the fingers and the hand. It is a common practice to hold foods inthe hand or squeeze them or bend them. The food may be squeezed betweenthe forefinger and the opposed thumb or between two, three, or four fingersand the opposed thumb. It may be squeezed by pressing with the whole palmon top of the food, which is resting on a firm surface such as a table, or the twopalms may be placed at opposite ends of the food and squeezed. The size ofthe object frequently determines the method that is used. The forefinger andopposed thumb are generally used for small objects while the entire hand ortwo hands are used on large objects such as a loaf of bread.
In the squeeze test the fingers sense the distance they move as they apply aforce to that food. The fingers are well suited to perform the squeeze testbecause they are able to sense small distances quite accurately. When thefingers move a greater distance, the food is considered to be soft, and viceversa. Whether firmness is a desirable or undesirable characteristic dependson the food being squeezed. The simple hand squeeze tells a potential cus-tomer that there are more leaves in a firm head of lettuce than in a soft head ofequal size, that the soft marshmallow is fresh whereas the firm marshmallowis older and probably stale. The squeeze test also enables one to determine theripeness of many fruits and some vegetables. For elongated products such aslicorice sticks and green beans the product is grasped at both ends using twohands and the ease of bending or the distance before snapping occurs issensed. For fruits such as apples the thumb is pressed onto the fruit until it‘gives’ which senses the force required to reach the yield point.
Bourne (1967b) measured how firmly people squeeze foods by hand. Someof his results are shown in Fig. 7.10, which plots the force exerted in succes-sive squeezes on two foods by three individuals. The group of lines marked Awere obtained by a young lady squeezing a large fresh cucumber. Notice howuniformly she squeezes each time. This degree of uniformity is unusual. Thislady squeezes quite hard: a little over 4 kg at each squeeze. The group ofcurves marked B shows how hard another person squeezes the same cucum-ber. There is some change in force exerted from one squeeze to the next. Thisamount of variation in force exerted from one squeeze to the next is about nor-mal for most people. Operator B squeezed the cucumber at an average forceof about 2.5 kg. Operator C squeezed the same cucumber but the force exertedin successive squeezes fluctuated widely. The C type of squeezing pattern isless common than the B pattern.
The series of lines marked D were obtained from operator B squeezing afresh loaf of bread. There is still about the same amount of variation from onesqueeze to the next but the average squeezing force drops from about 2.5 kg
Nonoral Methods of Tactile Texture Measurement 287
Chap-07.qxd 1/10/02 4:15 PM Page 287

for the cucumber to about 0.5 kg for the fresh bread. The fresh bread is muchsofter than the fresh cucumber. People generally squeeze soft and spongyfoods more gently than harder foods. The force exerted by the hand in thesqueeze test is, therefore, partly dependent on the person making the test andpartly dependent on the nature of the food.
The measurement of firmness by an objective deformation test was dis-cussed on page 152 where it was shown that a small deforming force gives abetter resolution between similar samples than a high deforming force. Thisprinciple should apply to the sensory deformation test: a gentle squeeze shoulddiscriminate better between the firmness of two samples of food than a hardsqueeze. Squeezing gently has another point in its favor – there is less damageto the food. All the advantages lie with the gentle squeeze.
Peleg (1980) studied the sensitivity of the human tissue in squeeze tests andpointed out that in these types of tests there can be significant deformation ofthe human tissues (e.g. the balls of the fingers) in addition to the deformationof the specimen. He pointed out that the combined mechanical resistance in asqueezing test is given by the equation
Mc � M1Mx�(M1 � Mx) (7.1)
where Mc is the combined mechanical resistance of the sample and the fingers;M1, the resistance of the human tissue; and Mx, the resistance to deformationof the test specimen. This equation provides a simple explanation as to whythere are differences in the sensing range between the fingers and the jaws andwhy the human senses are practically insensitive to hardness beyond certainlevels.
Figure 7.10 Firmness ofsuccessive hand squeezes offoods: A, B, C, from threeindividuals squeezing a wholecucumber; D, individual Bsqueezing a loaf of fresh bread.(From Bourne, 1967b; reprintedwith permission from New YorkState Agricultural ExperimentStation.)
288 Sensory Methods of Texture and Viscosity Measurement
A
B
C
D
5
4
3
2
1
Forc
e (k
g)
Chap-07.qxd 1/10/02 4:15 PM Page 288

There are three different types of responses that can be drawn from thisequation:
Case No. 1: M1 �� Mx. This case occurs when a soft material is deformedbetween hard contact surfaces (e.g. a soft food is deformed between the teeth).Under these conditions Eq. (7.1) becomes Mc � Mx (since M1 � Mx � M1). Inthis situation the sensory response is primarily determined by the properties ofthe test specimen.
Case No. 2: Mx and M1 are of comparable magnitude. In this case theresponse is regulated by both the properties of the test material and the tissueapplying the stress, as given in Eq. (7.1).
Case No. 3: Mx �� M1. This case occurs when a very firm product is com-pressed between soft tissues. For example, pressing a nut in the shell betweenthe fingers. Under these conditions the equation becomes Mc � M1 (becauseM1 � Mx � Mx). In this situation the response is due to the deformation of thetissue and is insensitive to the hardness of the specimen. This appears to beinterpreted as ‘too hard to detect’ or ‘out of range.’
Swyngedau and Peleg (1992) give a pictorial example of these three cases(Fig. 7.11). Practically all the deformation is in the finger in Fig. 7.11abecause the object is so much more rigid than the finger. Figure 7.11b showsboth the object and the finger being deformed. Practically all the deformationis in the object in Fig. 7.11c because it is so much less rigid than the finger.
Swyngedau and Peleg (1992) also showed that the deformability constant ofthe ball of the finger is approximately 2 N mm�1 and for the ball of the thumb0.8 N mm�1.
Voisey and Crête (1973) measured the amount of force and the rate at whichforce is applied to fruits and vegetables by the hands of consumers who werejudging firmness. They found that males generally squeeze harder thanfemales and applied the force more quickly. In squeezing an onion the meanforce for females was 3910 g and for males 5670 g, and for tomatoes the meanforce was 1522 g for females and 1705 g for males. The rate of force applica-tion on onions for females was 11,900 g s�1 and for the males 17,560 g s�1
whereas for tomatoes the rate of force application for females was14,040 g s�1 and for males 5470 g s�1.
Figure 7.11 Three situations in‘hardness’ assessment bycompression with the fingers.(a), practically all thedeformation is in the finger. (b), both object and finger aresubstantially deformed. (c), practically all thedeformation is in the soft object.(From Swyngedau and Peleg,1992. Reprinted from J. Rheology3366, page 46. Copyright bySociety of Rheology.)
Nonoral Methods of Tactile Texture Measurement 289
Chap-07.qxd 1/10/02 4:15 PM Page 289

Stirring a fluid or semifluid food with a spoon or a finger is frequently usedto measure viscosity or consistency. It is possible to use other parts of theanatomy such as cheeks, elbows, and feet to obtain some index of the texturalqualities of foods.
Shama et al. (1973) showed that nonoral assessment of viscosity was per-formed by two different methods that used different shear stress–shear rateconditions.
Method 1. Tilting or shaking the container and observing the rate of flow.The shear rate is the stimulus observed. It ranges from 0.1 to 40 s�1 whilethe shear stress is in the range of 6–60 Pa.
Method 2. Stirring the contents with a spoon. The shear stress is theobserved stimulus. It ranges from 10 to 1000 Pa while the shear rate ismaintained over the narrow range of 90–100 s�1.
290 Sensory Methods of Texture and Viscosity Measurement
Table 7.19 Texture Profile as Modified for Use in Skin-care Product Evaluation
Stage of evaluation Skin-care product attribute and definition Texture profile parameters
PICK-UP, product removed from Thickness – Perceived denseness of product. Viscosity (for lotions)container, product poured or squeezed Evaluated as force required to squeeze between orfrom bottle onto fingertips, or product thumb and forefinger. Rated as thin–medium–thick. Hardness, Cohesiveness (also lifted from jar with forefinger. or Springiness, Adhesiveness)
Consistency – Perceived structure of product. for creamsEvaluated as resistance to deformation and difficulty of lifting from container. Rated as light–medium–heavy.
RUB-OUT (application), spread of Spreadability – Ease of moving product from point Viscosity, Cohesiveness, product over and into skin with of application over rest of face. Evaluated as Springiness, Gumminess,fingertips using gentle circular motion resistance to pressure. Rated, or described, as: Adhesivenessat a rate of two rubs per second for a ‘slips’ – very easy to spread Other characteristics – (oil andspecified period of time, depending on ‘glides’ – moderately easy water content of product)the product. ‘drags’ – difficult to spread
Absorbency – Rate at which product is perceived to beabsorbed into skin. Evaluated by noting changes incharacter of product and in amount of product remaining (tactile and visual) and by changes in skin surface. Rated as slow–moderate–fast.
AFTER-FEEL (and appearance), After-feel – Type and intensity of product residue Other characteristics – (oil and evaluation of skin surface with left on skin; changes in skin feel. Product residue water content)fingertips, visually and kinesthetically is described by type, i.e. film (oily or greasy), Geometrical characteristics –immediately after product application coating (waxy or dry), flaky or powdery particles; (gritty, powdery, etc.)and possibly at varying intervals the amount of such residue is identified as thereafter. slight–moderate–large.
Skin feel is described as dry (taut, pulled, tight); moist (supple, pliant), oily (dirty, clogged).Other sensations are also noted and identified whereapplicable, i.e. clean, stimulated, irritated, etc.
Source: Schwartz (1975). Reprinted from J. Texture Studies 6, page 36. Copyright by Food and Nutrition Press Inc.
Chap-07.qxd 1/10/02 4:15 PM Page 290

Use of Sensory Texture Profile Analysis forNonfood Consumer Products
The principles of the sensory texture profile technique can be applied to non-food consumer items such as creams, lotions, cosmetics, paper tissues, andany other product that is contacted by the skin. In these cases the sensoryprofile is adapted to mimic the manner in which the item is treated by the handor applied to the skin. For example, Schwartz (1975) lists the texture profilefor skin-care products (Table 7.19).
Use of Sensory Texture Profile Analysis for Nonfood Consumer Products 291
Chap-07.qxd 1/10/02 4:15 PM Page 291

Correlation BetweenPhysical Measurementsand SensoryAssessments of Textureand Viscosity
Introduction
It is now generally accepted that texture is a sensory attribute (see thedefinitions on pages 12 to 15). Therefore, only people can measure the texturalproperties of foods. Instruments measure physical properties not sensoryproperties. There are several good reasons for measuring physical (mechani-cal and rheological) properties of foods.
(1) Engineering process design. The flow properties and deformationproperties of foods need to be understood in order to design equipmentfor handling foods. This can be conveyor belts, storage bins, pumps,pipelines, spray devices, heat exchangers and the like. The rate of heattransfer in pasteurizers, and in cans and jars of foods being sterilized ispartly dependent on their rheological properties.
(2) Determination of structure. Some physical measurements provideinformation on the structure of the food or on the conformation, chainlength, degree of branching and intertangling of the macromolecularconstituents in foods.
(3) Texture. The third is to make the measurements that will predict the sen-sory assessment of some of the textural attributes of the product. Basedon these measurements the process or the formula for a given productmay be changed in order to produce a finished product that falls withinthe range of textural parameters that experience has shown to be accept-able to the consumer. Sometimes these measurements are employed toestablish a quality grade used to set a price for the product.
This chapter will discuss only item (3) above. The quality of the correlationbetween sensory and objective measurements of texture is of paramount
C H A P T E R
8
Chap-08.qxd 1/12/02 10:41 AM Page 293

importance. To be of value, instrument readings need to have a high level of predictability of sensory assessments of textural quality. The human assessmentof texture has to be the standard against which instrument readings are calibrated.This concept was clearly enunciated by Brennan (1980) in the following words:
Texture is a sensory attribute, perceived by the senses of touch, sight and hearing. Thus the onlydirect method of measuring texture is by means of one or more of the senses. Nonsensory tech-niques can never be more accurate than sensory methods. The accuracy of the former can onlybe judged by their ability to predict the sensory quality being studied.
Consumers have a rich vocabulary of words relating to quality. Terms such asthin, thick, sticky, smooth, creamy, slimy, slippery, gummy, tough, crisp, and firmhave specific meanings which are very clear in the consumer’s mind (Szczesniakand Kleyn, 1963; Yoshikawa et al., 1970a–c). As scientists we have the task oftranslating these descriptors into scientific principles that can be measured byinstruments. This task is sometimes straightforward and sometimes difficult.
There are a number of solid reasons for using instruments.
(1) Instrument readings cost less than sensory assessments.(2) Most instrument readings are obtained more quickly than sensory
evaluations.(3) Instruments give numbers, which on the surface appear to be more ‘sci-
entific’ than sensory results. Some consider sensory assessments to be‘opinions’ rather than ‘facts,’a view not held by the author (see page 282).
(4) Instruments give reproducible results, whereas each human is differentand even the same person can change from one day to the next.
(5) When correctly calibrated and operated, instruments in different loca-tions should give the same result which offers the potential for settingnational and international standards for textural quality. However, asdiscussed under the heading, ‘Calibration’ in Chapter 9, considerablework will be needed to make this a reality.
It must also be remembered that the number of instruments being used tomeasure food texture or viscosity is much smaller than the number of humanbeings measuring texture. A rough order of magnitude estimate of the numberof mechanical instruments in use worldwide would be about 20,000. In con-trast, the number of human instruments measuring texture exceeds six billion.If there is poor agreement between instrument tests and human assessments oftexture it will be relatively easier to change 20,000 instruments than to attemptto change the opinion of 6,000,000,000 humans.
Two Types of Sensory Assessment
Sensory testing may be divided into two broad classes.
Class 1. Intensity scaling is how much of a property is present in the food.There should be a unidirectional relationship between the sensory score
294 Correlation Between Physical Measurements and Sensory Assessments of Texture and Viscosity
Chap-08.qxd 1/12/02 10:41 AM Page 294

and the physical measurement within the limits of human sensitivity. Thisclass of test is amenable to correlation with instrumental tests.
Class 2. Acceptability scaling, also called ‘hedonic scaling,’ measures thedegree to which people like the food. This class of sensory tests cannot bedirectly measured by instruments because no instrument can express anopinion on how well it likes the texture of the sample it is testing. Anacceptability versus intensity graph usually takes the form of an inverted Uand is known as the Wundt curve after Wilhem Max Wundt (1832–1920),a German psychologist who was a professor at the University of Leipzig,where in 1878 he founded the first laboratory for experimental psychology(Fig. 8.1). The level of acceptance increases at first as the attributeincreases, reaches a maximum, and then decreases. One can have too muchof even a good thing.
The difference between intensity scaling and acceptability scaling is shownfor a real system in Fig. 8.2 where the scores for hardness and ease of spreadability of bentonite–water mixtures are displayed. The sensory panelused monotonically increasing scores for hardness across the whole range of increasing bentonite concentration because this is an intensity scale (Fig. 8.2b). In contrast, the score for spreadability by the same panel rose to amaximum and then declined because this is an acceptability scale (Fig. 8.2a).At low bentonite concentrations the paste is too sloppy to control, at interme-diate concentrations it is ‘just right’ and at high concentrations it is too stiff tospread easily (Lucisano et al., 1989).
Trant et al. (1981) pointed out the fallacy of trying to correlate physical andchemical measurements with hedonic responses. Acceptability scaling is best
Two Types of Sensory Assessment 295
Positivehedonic
value
Negativehedonic
value
Neutral
Blisspoint
Sensory intensity
Region A Region B Region C
FFiigguurree 88..11 Basic relationshipbetween sensory intensity andhedonic response (Wundt curve).(From Cardello, 1996. Reprintedfrom Food Choice Acceptanceand Consumption, Fig. 1.2,page 9. eds Meiselman andMactie. Copyright by BlackwellScience Ltd.)
Chap-08.qxd 1/12/02 10:41 AM Page 295

performed by consumer panels and will not be discussed any further. The restof this chapter refers to correlations between instrument readings and sensoryintensity scaling. However, it is worth noting that once the peak of the Wundtcurve has been identified for a specific textural property for a particular pop-ulation, instrument readings can be used to monitor whether the product isbeing kept within the targeted range if an objective method is available thatcorrelates highly with an intensity scale.
Psychophysical Models
The correlation between an intensity scale and a physical measurement usually follows one of three psychophysical models.
(1) The linear model. There is a direct linear relationship between the stim-ulus (measured by some objective method) and the response which isthe sensory measurement. It can be described by the equation
R � AS � B
where R is the response to stimulus S, and A and B are constants.(2) The Weber–Fechner (semilog) relationship. The sensory response
makes a linear relationship when plotted against the logarithm of thestimulus. It is described by the equation
R � A log S � B
(3) The Power model (log–log relationship). This model is described by theequation
R � CSn
which may be rearranged into the form
log R � n log S � log C
where n and C are constants.
296 Correlation Between Physical Measurements and Sensory Assessments of Texture and Viscosity
5
a
4
3
2
1Spre
adab
ility
sco
re
00 10 20 30 40 50 60 70
Bentonite (%)
4
6
8
10
b
2
0
Har
dnes
s sc
ore
100 20 30 40 50 60 70Bentonite (%)
FFiigguurree 88..22 Bentoniteconcentration vs (a) spreadability(hedonic score) and (b) hardness (intensity score).(From Lucisano et al., 1989.Reprinted from J. Texture Studies2200, pages 306, 307. Copyright byFood and Nutrition Press Inc.)
Chap-08.qxd 1/12/02 10:41 AM Page 296

Each of these psychophysical models has been successfully applied to cer-tain systems. There has been a long debate by psychologists as to which is themost suitable model. The present consensus seems to be that the power modelis the correct one because it satisfactorily describes most situations that arise.In other words, a plot of the logarithm of the objective measurement versus thelogarithm of the subjective measurement will be linear in most circumstances.
The numerical value of the exponent n in the power model is an index of thedegree of compression or expansion of the physical scale by the senses.
(1) When n � 1.0, there is compression of the physical scale; that is, a tenfoldincrease in the stimulus will give less than a tenfold increase in the sen-sory response. This allows a wide stimulus range to be compressed into asmaller and more manageable one for the senses and brain to process.
(2) When n � 1.0, there is no compression or expansion of the scale; a ten-fold increase in stimulus gives a tenfold increase in response.
(3) When n � 1.0, there is expansion of the scale; that is, a tenfold increasein stimulus gives a more than tenfold increase in response.
Some experimentally measured values for the exponent n for human sub-jects are given in Table 8.1. Note that pressure on the palm has a value of 1.1for the exponent n, indicating slight expansion, while tactual roughness has
Psychophysical Models 297
Table 8.1 Measured Exponents and Their Possible Fractional Values for Power FunctionsRelating to Subjective Magnitude to Stimulus Magnitude
Continuum Measured exponent Stimulus condition
Loudness 0.67 3000-Hz toneBrightness 0.33 5° target in darkBrightness 0.5 Very brief flashSmell 0.6 HeptaneTaste 1.3 SucroseTaste 1.4 SaltTemperature 1.0 Cold on armTemperature 1.5 Warmth on armVibration 0.95 60 Hz on fingerVibration 0.6 250 Hz on fingerDuration 1.1 White-noise stimuliFinger span 1.3 Thickness of blocksPressure on palm 1.1 Static force on skinHeaviness 1.45 Lifted weightsForce of handgrip 1.7 Hand dynamometerVocal effort 1.1 Vocal sound pressureElectric shock 3.5 Current through fingersTactual roughness 1.5 Rubbing emery clothsTactual hardness 0.8 Squeezing rubberVisual length 1.0 Projected lineVisual area 0.7 Projected squareAngular acceleration 1.41 5-sec stimulus
Source: Stevens (1970); reprinted with permission from Science. Copyright 1970 by the AmericanAssociation for the Advancement of Science.
Chap-08.qxd 1/12/02 10:41 AM Page 297

a value of 1.5 (great expansion) and tactual hardness has a value of 0.8 (mod-erate compression).
Peleg and Campanella (1988) point out that although the power modelappears to be linear over a wide range of intensities, it does not take intoaccount the existence of a threshold stimulus below which there is no sensoryresponse, nor a saturation stimulus above which the sensory response no longerincreases. That is, there is a low threshold and a high threshold beyond whichthere is no change in sensory response, with changing stimulus. Peleg andCampanella (1988) derived an equation that takes these thresholds into account
R � 1 � exp[�C(S � So)m]
where R is the sensory response; S is the stimulus; So is the threshold stimulusbelow which there is no response, and C and m are constants.
Example of a Successful Correlation
Cutler et al. (1983) studied the oral perception of thickness in fluid foods overa range of almost five orders of magnitude. For Newtonian fluids the logarithmof the perceived thickness (sensory assessment) versus the logarithm of theviscosity (instrument) was rectilinear with a correlation coefficient r � 0.995(Fig. 8.3a). For non-Newtonian fluids made from aqueous solutions of algi-nate, pectin, guar and xanthan gums the correlation coefficient between logapparent viscosity measured at 50 s�1 and perceived thickness was r � 0.933(Fig. 8.3b). These high correlations mean that a viscosity measurement can beconfidently accepted as a reliable indicator of perceived thickness.
Example of a Variable Correlation
The instrument most widely used for measuring the tenderness of meat is theWarner–Bratzler Shear (see page 209). In an extensive review of tenderness of
298 Correlation Between Physical Measurements and Sensory Assessments of Texture and Viscosity
Newtonian fluids Non-Newtonian fluids2.4
2.0
1.2�2 �1
y�0.212x�1.712r�0.995
y�0.243x�1.745r�0.933
0 1
Log viscosity
Log
perc
eive
d th
ickn
ess
Log
perc
eive
d th
ickn
ess
2 3 �2 �1 0 1Log apparent viscosity at 50s�1
2 3
1.6
2.4
2.0
1.2
1.6
a bFFiigguurree 88..33 Sensory thicknessvs (a) viscosity for Newtonianfluids, and (b) apparent viscositymeasured at 50 s�1 for non-Newtonian fluids. Solidcircles, aqueous solutions ofalginate, pectin and guar gums;open circles, solutions of xanthangum. (From Bourne 1992.Reprinted from J. Food Engineering1166, page 160. Copyright 1992with permission of ElsevierScience. Plotted from data ofCutter et al. 1983.)
Chap-08.qxd 1/12/02 10:41 AM Page 298

meat, Szczesniak and Torgeson (1965) summarized 38 studies on beef, fouron pork, and nine on poultry where researchers had listed correlation coeffi-
cients between the Warner–Bratzler Shear and some method of sensory testing and found correlations ranging from r � �0.001 to r � �0.942. Mostof the correlation coefficients were fairly evenly distributed between aboutr � �0.2 and r � �0.9. Reports published subsequent to this early reviewarticle continue to show very wide correlation coefficients between theWarner–Bratzler Shear and sensory measurements of meat texture.
This wide variation in correlation coefficients which ranges from worthlessto very satisfactory (see Table 8.8) raises the question why this happens usingthe same machine on the same type of product (muscle meats). Three types oferror may have occurred in these reports summarized by Szczesniak andTorgeson (1965).
Type 1. Instrument problems
� Is the instrument working properly?� Are the working parts bent, blunt or dented?� Has the force-measuring system been calibrated recently?� Was the right information extracted from the force–time curve?� Did the operator use the instrument correctly?� Are the working parts within specifications? Some instruments that claim
to perform the Warner–Bratzler Shear test use a different shape or thick-ness of the blade or the clearance between the blade and the anvil isdifferent. The correct dimensions for the Warner–Bratzler Shear are givenon page 135.
Type 2. Sensory panel problems
� Was the panel trained and maintained properly?� Did the panel use the correct procedure?� Was the definition of the measured textural property clear to the panel?� Did the panel have standard samples to serve as anchor points?� Is the parameter of interest a combination of characteristics that is not
amenable to description by a single sensory score?� Did other parameters (such as juiciness, appearance, or odor) sway the
panel’s judgment?� Was the panel located in surroundings free from distractions such as
strange odors, bad lighting and distracting noises?
Type 3. Commodity problems
� Was the sample representative of the lot from which it was taken?� Was the sample size large enough and were a sufficient number of repli-
cates used?� Was the sample uniform? Was it free from tough connective tissue and
soft fatty tissue? Meat is notorious for lack of uniformity. Since most tex-ture tests are destructive, a sensory test and an instrumental test cannot beperformed on the same sample.
Example of a Variable Correlation 299
Chap-08.qxd 1/12/02 10:41 AM Page 299

� Was the sample prepared correctly? Degree of cooking affects Warner–Bratzler Shear readings.
� Were all samples tested at the same temperature?� Was the sample presented to the Warner–Bratzler blade in the correct ori-
entation? Samples should be so positioned that the blade cuts through thelongitudinal fibers in the meat.
Had every researcher whose work was summarized in the review bySzczesniak and Torgeson (1965) paid careful attention to all the above problems it is likely that the range of correlation coefficients would be muchnarrower, and also higher than reported.
Matching Sensory Descriptors to Scientific Principles
The meaning of words people use to describe texture is generally not the sameas used by scientists. Hence, the scientist must take the descriptors commonlyused by people and translate them into words with precise scientific meaning.Even then problems arise because people may use the same term for differentscientific principles. For example, Szczesniak and Bourne (1969) studied howpeople measure firmness of foods by nonoral techniques. In this study 128people were presented with pairs of each of nine different foods, and asked toidentify the firmer sample of the pair. For soft foods such as puddings andwhipped toppings people used some kind of viscosity measurement. For prod-ucts such as bread, lettuce, marshmallow and tomatoes, they used the princi-ple of deformation which is the distance the food is compressed when gentlysqueezed in the hand. For firmer foods, such as apples and pears, people meas-ured the force required to push their thumb into the fruit which is the punctureprinciple. Finally, for elongated foods such as a carrot they used the flexingprinciple as the index of firmness (see Fig. 8.4).
In this study the panelists used four entirely different test principles: viscosity, deformation, puncture, and flexure to describe ‘firmness.’ Thus thetype of sensory test used to judge firmness of a food depends on the level of firmness in the test sample. When one test failed to differentiate betweensamples, the subject changed to another principle until a suitable method wasfound. A deformation test should correlate well with the sensory evaluation offirmness of bread or tomato, but can be expected to correlate poorly withfirmness scores for apple or carrot, whereas a puncture test should show a highcorrelation with sensory firmness of apple and a poor correlation withfirmness of bread, and so on. The test principle used in the instrument shouldalways match the test principle that people use for that food.
In a study on nonoral assessment of viscosity of fluid foods Shama et al.(1973) showed that people use two different techniques. The first is to observethe rate of flow when the container is tilted or shaken which uses the sense of
300 Correlation Between Physical Measurements and Sensory Assessments of Texture and Viscosity
Chap-08.qxd 1/12/02 10:41 AM Page 300

sight. The second is to feel the force required to stir the product with a spoonwhich uses the tactile sense.
Some Physical Properties Are Not TexturalProperties
A well-equipped food laboratory has the capability of measuring numerousphysical properties of foods. However, one cannot assume that a physicalproperty is also a textural property. Figure 8.5 shows schematically thatwhereas most textural properties are physical properties, not all physical prop-erties are textural properties. Unless the physical property is detected by thehuman senses it can be dismissed for use as a textural property.
An analogous situation is found in the electromagnetic spectrum. The visiblerange of wavelengths of light is 0.4–0.7 mm whereas the invisible range extendsfrom ultraviolet to x-rays at shorter wavelengths (0.4 mm to 10�14 m) and frominfrared to radio waves (0.7 mm to 104 m) at longer wavelengths than the visible
Some Physical Properties Are Not Textural Properties 301
FlexureCarrots
Apples
Pears
Lettuce
Tomatoes
Marshmallows
BreadFirm
ness
Less
firm
Mor
e fi
rm
Whips
Puddings
Puncture
Deformation
Viscosity/consistency
FFiigguurree 88..44 Sensory tests tomeasure firmness. (FromSzczesniak and Bourne, 1969.Reprinted from J. Texture Studies11, page 59. Copyright by Foodand Nutrition Press Inc.)
Chap-08.qxd 1/12/02 10:41 AM Page 301

region. Food laboratories that use infrared and ultraviolet spectrophotometerswould not even consider using these instruments to measure the color of foodsalthough they have useful purposes. A similar analogy can be found in acousti-cal vibrations that generate notes too low or too high to be heard by the ear. Theaudible range for people with good hearing is about 16–16,000 Hz. The humanear cannot hear sound above about 16,000 Hz (ultrasonic region) or below about16 Hz (subsonic region). As people age they tend to lose the higher frequenciesand their upper audible range may fall well below 10,000 Hz.
In a similar manner, we need to understand that humans are ‘blind’ and‘deaf’ to some physical properties and hence, it is a waste of time to measurethem for textural purposes. For example, Elliott and Ganz (1977) showed thatcommercial mayonnaises and salad dressings exhibit as much as an order ofmagnitude range in some of their rheological properties and concluded thatconsumers have a high tolerance to variation in these properties (Fig. 8.6).
302 Correlation Between Physical Measurements and Sensory Assessments of Texture and Viscosity
Rheological and Mechanical Properties
human senses
detected not detected
Texture Not texture
FFiigguurree 88..55 Rheologicalproperties may or may not betextural properties.
10�2
102
103
104
10�1 1 10
10
Frequency (Radians s�1)
Dyn
cm
�2
FFiigguurree 88..66 Range of dynamicyield stress (shaded area) ofcommercial mayonnaise andsalad dressings. (From Elliott andGanz, 1977. Reprinted from J. Texture Studies 88, page 368.Copyright by Food and NutritionPress Inc.)
Chap-08.qxd 1/12/02 10:41 AM Page 302

It is likely that consumers are ‘blind’ to such rheological properties, just asthey are insensitive to changes in the UV spectrum or ultrasound.
Effect of Compression Speed
Chapter 3 explained the difference between elastic and viscoelastic behavior.For elastic or near-elastic behavior the speed at which a test is performedshould have little effect on the result, whereas for viscoelastic foods the speedmay have a profound effect. Figure 8.7 shows the puncture force of three applecultivars (‘Stark,’ ‘Conrad,’ and ‘Missouri’) with the punch tip mounted in an Instron and operated at speeds ranging from 0.5 to 50 cm min�1. Over ahundred-fold range of speed there is little change in the puncture force.Therefore, it does not matter how fast this test is performed. This is called a ‘strain rate insensitive’ food.
Another example of a strain rate insensitive food is given by Thybo et al.(2000) who performed uniaxial compression tests on ten potato cultivars atspeeds ranging from 20 to 1000 mm min�1 and found no relevant effect of thedeformation rate on the correlation between instrumental measurements andsensory textural profile parameters. Van Hecke et al. (1995) reported thatcrosshead speed from 10 to 50 mm min�1 did not affect the flexural modulusin bending tests on crispy puffed foods. Mancini et al. (1999) found that com-pression speed from 60 to 480 mm min�1 had little effect on the compressionbehavior and relaxation of 1.25% alginate gels. Wium et al. (1997) compressedcylinders of UF-Feta cheese in an Instron at twelve crosshead speeds of
Effect of Compression Speed 303
10
6
Forc
e (k
g)
20.5 2
Stark
Conrad
Missouri
Tip speed (cmmin�1)
5 20 50
FFiigguurree 88..77 Effect of punchspeed on puncture force of threeapple cultivars. (From Bourne,1965a. Reprinted from FoodTechnology 1199, page 117, 1965.Copyright by Institute of FoodTechnologists.)
Chap-08.qxd 1/12/02 10:41 AM Page 303

50–2500 mm min�1 and found the deformation rate had almost no effect onthe correlation between stress at fracture and sensory oral firmness eventhough the maximum stress increased from 45,300 Pa at 50 mm min�1 to80,100 Pa at 2500 mm min�1 compression speed.
In contrast, control of compression speed is critical for some foods. An excel-lent example of the need to select the correct compression speed is given byShama and Sherman (1973a) who compressed two cheeses in an InstronUniversal Testing Machine at various compression speeds. The results areshown in Fig. 8.8. The solid line depicts the force–compression curve forGouda cheese and the dashed line for White Stilton cheese. When compressedat 5 cm min�1, the compression curve for White Stilton cheese always liesabove that of Gouda cheese. This would be interpreted to mean that WhiteStilton cheese is firmer than Gouda cheese. At a compression speed of20 cm min�1 the curve for White Stilton cheese lies above that for Goudacheese from 0 to 30% compression and beyond 60% compression. Between30% and 60% compression the line for White Stilton cheese lies below that ofGouda cheese. At compression speeds of 50 and 100 cm min�1 a similar effectoccurs; the compression curve of White Stilton cheese is above that for Goudaat the beginning then drops below it and then crosses over and lies above it
304 Correlation Between Physical Measurements and Sensory Assessments of Texture and Viscosity
100
90
80
80
0
1
2
3
4
5
6
7
8
9
10
11
70
70
60
60
50
50
40
40
30
30
20
20
10
10 0
Cros
shea
d sp
eed
(cm
min
�1 )
% Compression
Forc
e (k
g)
FFiigguurree 88..88 Three-dimensionalplot of force–degree ofcompression–speed ofcompression for White Stiltonand Gouda cheeses. A sensorypanel always rated Gouda asharder than White Stilton. Thecompression test shows that theGouda cheese is the hardersample only in the dark area.(From Shama and Sherman,1973a. Reprinted from J. TextureStudies 44, page 351, 1973.Copyright by Food and NutritionPress Inc.)
Chap-08.qxd 1/12/02 10:41 AM Page 304

again at high compressions. This graph demonstrates that White Stilton cheesewill be considered to be firmer than Gouda cheese under some test conditionsand softer under other conditions. The dark blue areas in this three-dimensionalplot define the conditions under which Gouda cheese would be considered to befirmer than White Stilton cheese. A sensory panel always rated Gouda cheese asbeing harder than White Stilton cheese. Therefore, the rheological test will cor-relate with the sensory test only when the instrument test conditions fall withinthe dark blue areas shown in Fig. 8.8. This example demonstrates how selectionof the degree of compression and the compression speed is critical for certainfoods if a rheological test is to correlate with a sensory test.
Chapter 2 points out that the speed of movement of the human jaw isapproximately sinusoidal, the compression rate between the third molar(which is closest to the temperomandibular joint) is about one-half the speedof the incisors (which are farthest from the temperomandibular joint). Thereare wide variations in chewing speed from individual to individual (see Table 2.5page 47). In contrast, most compression machines use a constant speed. Thisdisparity between the highly variable and usually high speed compressionbetween the teeth, and the constant and relatively slow compression speed ofmachines probably accounts for some of the low correlations between sensoryand objective tests, especially for strain rate sensitive foods.
Uniformity of Sample
Some foods have a highly uniform texture from point to point within the sam-ple (e.g. most gels) whereas other foods show wide variations from point topoint. For example, Segars et al. (1974) highlighted the inherent variability inbeef by taking five whole muscles from the left hindquarter of a US Goodgrade animal: (1) biceps femoris, (2) gluteus medius, (3) longissimus dorsi,(4) psoas major, and (5) rectus femoris. Each muscle was cut into 2.5 cm thickslices perpendicular to a line drawn from the origin to the insertion end of thatmuscle. The odd-numbered slices from each muscle were tested raw and theeven-numbered slices cooked in a plastic bag until the internal temperaturereached 63°C. As many as possible, 2.5 cm diameter cylinders were cut fromeach slice and compressed 20% in a universal testing machine and the appar-ent modulus of elasticity, Ea, determined from the initial slopes of theforce–distance curves. There is a wide range of mean values for Ea from mus-cle to muscle, and from slice to slice in the same muscle (Table 8.2). The highvalues for the standard deviation of the mean indicate a wide range of Ea valuewithin the slice. This wide inherent variation of textural properties is charac-teristic of many foods, especially native foods.
In the uncooked biceps femoris muscle the mean apparent modulus of elasticity ranged from 64 (slice no. 1) to 338 g cm�2 (slice no. 15) and aftercooking the same muscle it ranged from 195 (slice no. 6) to 1301 g cm�2 (sliceno. 16). In the psoas major muscle the mean Ea for uncooked muscle ranged
Uniformity of Sample 305
Chap-08.qxd 1/12/02 10:41 AM Page 305

from 293 (slice no. 15) to 1289 g cm�1 (slice no. 9) but was somewhat moreuniform after cooking when the Ea ranged from 1900 (slice no. 4) to 2661 g cm�1
(slice no. 6). Even within each slice of meat the variation was sometimes high.The coefficients of variation (100 � standard deviation/mean)% ranged froma low of 2.7% for slice no. 15 of the uncooked psoas major muscle up to155.2% for slice no. 18 of the cooked biceps femoris muscle. Eight of theseslices had a coefficient of variation less than 20%, 43 were between 20% and70% and ten slices were above 70%.
Spanier et al. (2000) also showed major differences in Warner–BratzlerShear force of four beef steaks broiled to 71°C (Table 8.3).
Another example of variation in texture is given by Sigurgisladottir et al.(1999) who performed a cutting–shear test on raw salmon fillets and foundlarge changes in the shear force from head to tail (Fig. 8.9). The lowest shearforce was found in the center of the salmon fillet. It became a little highertowards the head and much higher towards the tail. There was a threefoldchange in shear force within a salmon from head to tail.
Culioli and Sherman (1976) compressed 2 cm high � 2 cm diameter cylin-ders of Gouda cheese in an Instron after the rind had been removed. Cylinderswere taken from the center of the cheese block, at an intermediate location,
306 Correlation Between Physical Measurements and Sensory Assessments of Texture and Viscosity
Table 8.2 Mean Value of Apparent Modulus of Elasticity, Ea in g cm��2 for Each Slice and Standard Deviation of the Mean for Five Beef Muscles
Slice no. Psoas major Longissimus dorsi Gluteus medius Rectus femoris Biceps femoris
Raw1 382.9 � — 256.2 � 57.8 125.5 � 48.4 257.7 � 248.1 63.92 � 6.713 388.7 � — 394.6 � 206.0 280.2 � 150.9 124.4 � 40.5 73.52 � 20.755 809.9 � 92.9 207.5 � 74.1 186.3 � 108.6 268.9 � 119.5 75.91 � 25.417 764.0 � 455.3 194.0 � 108.7 77.94 � 24.33 258.0 � 169.2 69.38 � 27.879 1289 � 593 295.4 � 189.8 243.3 � 261.9 a
11 1179 � 336 235.7 � 368.6 a 134.2 � 73.813 653 � 131 618.1 � 1177.9 a 129.5 � 76.215 293 � 8 338.1 � 371.4 a
17 198.9 � 160.919 209.6 � 88.921 226.0 � 76.7
Cooked2 2433 � — 1443 � 396 2293 � 1018 1845 � 871 322.5 � 144.94 1900 � 111 1413 � 821 2124 � 822 2152 � 1033 229.1 � 84.56 2661 � 749 1434 � 295 1391 � 559 1950 � 889 195.0 � 38.98 2395 � 948 1096 � 432 1561 � 586 1217.6 � 776.8
10 2344 � 270 1045 � 667 814.4 � 582.812 2267 � 453 1158 � 609 585.2 � 260.314 1950 � 149 580.1 � 110.516 1301.4 � 1336.218 724.5 � 1124.120 890.3 � 974.1
Source: Segars et al. (1974). Reprinted from J. Texture Studies 5, page 288. Copyright by Food and Nutrition Press Inc.aContain one extreme sample.
Chap-08.qxd 1/12/02 10:41 AM Page 306

and near the surface. The force required to achieve a given percentage com-pression increased from the center to the edge of the block (Fig. 8.10).
Ponte et al. (1962) showed that the force required to deform slices of breadwas lowest at the ends and highest at the center of the loaf, the center slicesrequiring about 20% more force than the end slices to achieve the same levelof deformation.
This wide range of textures naturally inherent in foods is a common prob-lem. The first step in handling it is to determine the degree of variabilitywithin the product. The examples given above show that the inherent variationcan be very high. For carrots the author found the puncture force of the core tissue (xylem) to be significantly higher than the outside cortex tissue(phloem). However, within the core and cortex tissues of a single carrot the puncture force was very uniform along its length after the 2 cm nearest the
Uniformity of Sample 307
Table 8.3 Average High and Low Shear Force Values of Individual Steaks Obtained fromAlong the Length of Four Beef Strip Loins
Shear force (kg �� SD)a
Strip loin High Low
1 6.74 � 2.34 4.86 � 1.752 5.43 � 3.61 2.71 � 2.743 5.81 � 2.59 4.33 � 3.194 6.45 � 4.21 1.51 � 2.93
Column mean � SD 6.11 � 0.52 3.35 � 1.33
Source: Spanier et al. (2000). Reprinted from J. Muscle Foods 11, page 187, 2000. Copyright byFood and Nutrition Press Inc.aHigh and low shear force refer to the steak along the strip loin with the highest and lowest meanshear force. Shear force determined from a minimum of six cores in each steak along the lengthof a strip loin.
120
100
0
1 2
Location on the fillet
Group 1 (Samples 1–25)Group 2 (Samples 26–50)
Shea
r fo
rce
(N)
3 4 5 6 7
40
60
80
20
FFiigguurree 88..99 Shear force ofsalmon fillets measured bycutting with blade at sevenlocations from the head to thetail. Data are mean and standarddeviation of 25 fish from the firstsampling (1–25) and the secondsampling (26–50). Locations 6and 7 are significantly differentfrom locations 1, 2, 3, 4 and 5.Location 1 is near the head andlocation 7 near the tail. (FromSigurgisladottir et al., 1999.Reprinted from J. Food Science 6644,page 102. Copyright by Instituteof Food Technologists.)
Chap-08.qxd 1/12/02 10:41 AM Page 307

crown and 3 cm nearest the tip had been discarded. The difference betweenpuncture force of xylem and phloem tissue in carrots varies widely from cul-tivar to cultivar. Bourne (1989) found that the ratio of xylem/phloem punctureforce in 17 different carrot varieties ranged from 0.71 to 2.29 depending on thecultivar and the blanch temperature.
The distribution of textures within particulate foods need to be taken intoaccount. For example, Bourne (1972b) punctured cooked bean seeds andfound an approximately normal distribution of puncture forces. However, insome samples there were a few hard beans whose puncture force was aboutfive times greater than the mean puncture force. These hard beans would notbe detected in a texture test that used a large, mixed sample, such as the extru-sion test, but they would be prominent in a sensory test.
Szczesniak (1968) also gives a good example of distribution problems when crushing individual corn flakes. The average force for sample 1 was3.2 lb (1.45 kg) and for sample 2, 2.8 lb (1.27 kg). However, sample 1 exhibiteda relatively narrow distribution whereas sample 2 had a number of very softand very hard flakes. Although the average values were within about 10% ofeach other, the distributions were very different. The less homogeneous samplewould probably show a poorer correlation with sensory assessment thanwould the homogeneous sample.
As noted above, most gels are uniform in texture because they are formedfrom a uniform liquid. Nevertheless it is possible to have a uniform-texture geldisplaying a tough skin because evaporation of moisture from the surfaceincreases the concentration of the gelling agent in the part exposed to the air.
Every effort should be made to obtain a sample that is as uniform as possi-ble. Some techniques that can help are as follows.
308 Correlation Between Physical Measurements and Sensory Assessments of Texture and Viscosity
20,000
15,000
Forc
e (g
)
10,000
5000
10 20 30 40 50 60 70 80
Near surface
Intermediate region
Central region
Compression (%)
FFiigguurree 88..1100 Force–compressiondata of cylinders of mature Goudacheese. (From Culioli andSherman, 1976. Reprinted from J. Texture Studies 77, page 356.Copyright by Food and NutritionPress Inc.)
Chap-08.qxd 1/12/02 10:41 AM Page 308

(1) For products with a noticeably different texture, separate the productinto its two components, e.g. remove the surface skin of a gel. If neces-sary, test the skin separately from the rest of the gel.
(2) For products with a known variation in texture, always take the samplefrom the same location, e.g. take the center slice of a loaf of bread(Ponte et al., 1962); with blocks of cheese take the sample either fromthe center or near the edge, but do not mix edge samples with centersamples (Culioli and Sherman, 1976).
(3) Mincing the product followed by mixing will yield a more uniformmaterial for products such as meat and fish. For example, Borderias et al. (1983) reported that correlations between sensory texture profileand instrumental analysis on fish changed from nonsignificant to significant when minced fish was used in place of fillets. However, theprocess of size reduction may impair the integrity of some of the textural properties that need to be measured.
(4) For products with inclusions with a different texture, each type ofinclusion should be considered as a separate product and tested sepa-rately. For example, a chocolate bar containing nuts, raisins and puffedrice should be treated as four different products and each componenttested separately from the other three.
Even after selecting a sample that is as uniform as can be obtained withoutbiasing the sample, the problem of a high inherent variability still remains formany foods. In these cases it is necessary to replicate the test a number oftimes. The number of replications needed depends on the degree of variabilityin the product, and the degree of certainty needed in the mean value. A statis-tician can help decide how many replicates are needed. This is a case where acompromise must be made between the statistical reliability of the mean andthe amount of material and time that can be afforded to perform the test.
Isotropic Versus Anisotropic Foods
Isotropy and anisotropy were described in Chapter 3, page 103. When a foodis known to be isotropic the direction in which the sample is presented to themachine is immaterial, but anisotropic foods must always be oriented in thesame direction. Some examples of anisotropic foods were given in Chapter 3.Another example is given by Weinrichter et al. (2000) who showed that Tilsitcheese contains lentil-shaped holes because the method of manufacture makesit highly anisotropic. Test specimens cut perpendicular to the flat side of thecheese wheels showed significantly higher stresses and lower Poisson numbersthan specimens taken parallel to the flat side.
Anisotropy can also affect sensory evaluations of texture. On one occasionthe author trained a panel to develop the sensory texture profile of surimi. The panel gave a bimodal distribution of hardness scores with one group
Isotropic Versus Anisotropic Foods 309
Chap-08.qxd 1/12/02 10:41 AM Page 309

consistently giving a score about twice as high as the other group on the nine-point hardness scale. After some discussion it was realized that surimi isanisotropic because of its flaky structure. Panelists who bit into surimi cubeswith the flakes in a vertical direction gave a hardness score around 3 whereasthose who oriented the cubes with the flakes in a horizontal direction gave ahardness score around 6. This problem was resolved by asking the panel togive two hardness scores: (1) with flakes vertical, (2) with flakes horizontalbetween the molars.
Effect of Temperature
It is well known that temperature affects the viscosity of liquid foods. Mostviscometers maintain sample temperature within �0.1°C in the sample toeliminate this variable from the measurement.
Figure 3.10 (page 78) shows the effect of temperature on the viscosity ofsucrose solutions. Figure 8.11 shows how strongly the viscosity of depec-tinized apple juice and concentrates is affected by temperature. Rao (1977)
310 Correlation Between Physical Measurements and Sensory Assessments of Texture and Viscosity
103
102
10
0.3
1.0
10 20 30 40
Temperature ( C̊)
Visc
osity
(ce
ntip
oise
)
30˚BRIX
12˚BRIX
50˚BRIX
75˚BRIX
50 60 70 80
FFiigguurree 88..1111 Effect oftemperature on viscosity ofdepectinized apple juice andthree apple juice concentrates.(From Saravacos, 1970.Reprinted from J. Food Science 3355,page 123. Copyright by Instituteof Food Technologists.)
Chap-08.qxd 1/12/02 10:41 AM Page 310

pointed out that, with few exceptions, the effect of temperature on viscositycan be expressed by the equation:
h � BeE/RT
where h is viscosity, E is the activation energy in kcal gmol�1, R is the gasconstant, T is the absolute temperature in °K, and B is a constant.
Temperature may also affect the nature of flow of non-Newtonian fluids. Forexample, Fig. 8.12 shows that the power law exponent of butter, semisoft but-ter and margarine is about n � 0.4 at 31°C but increases to 1.0 or higher as thetemperature increases to 40°C. These spreads change from a shear thinningfluid (h � 1) to a shear thickening fluid (h � 1) as the temperature rises about10°C.
Many researchers are not aware that temperature also affects the meas-urements on solid food. Bourne (1982) defined a Texture–Temperature Coefficient (TTC) as:
percent texture change per degree temperature change where T1 is the lowesttemperature and T2 the highest temperature over which the texture was meas-ured. This definition assumes linearity between the texture parameter and tem-perature. For foods in which this relationship is not linear, this definition canstill be used if the temperature range is narrowed to an approximately linearsegment and the temperature range over which the TTC applies is specified(see the curve for Morepark apricot in Fig. 8.13).
Bourne (1982) published a lengthy list of TTC values for a number of rawfruits and vegetables. Figure 8.13 shows that over the temperature range0–45°C the firmness of raw fruits and vegetables usually decreases linearlywith temperature. Bourne and Comstock (1986) published a similar list of
TTCtexture at temperature texture at temperature
Texture at = −
−T T
T T T2 1
1 2 1
100�
�( )
Effect of Temperature 311
1.4
1.2
1.0
0.8
0.6
0.4
0.230 32 34 36
Temperature ( C̊)
semisoft buttermargarinebutter
Pow
er la
w e
xpon
ent
38 40 42
FFiigguurree 88..1122 Temperaturedependence of power lawexponents for butter (�),semisoft butter (�) andmargarine (�). (From Brittonand Callaghan, 2000. Reprintedfrom J. Texture Studies 3311, page253. Copyright by Food andNutrition Press Inc.)
Chap-08.qxd 1/12/02 10:41 AM Page 311

TTC values for a number of canned fruits and vegetables and again found alinear relationship between firmness and temperature for most of the productstested. These TTC values for a large number of fruits and vegetables are givenin Appendix II.
Table 8.4 lists texture–temperature coefficients that were calculated frompublished data for a wide variety of foods. Note that in almost every case, themagnitude of the texture measurement decreases as the temperature increases.The minus sign indicates that the TTC is inversely related to the temperature atwhich the measurement was made. The major exception to the inverse rule isthe deformation test measuring the degree to which the food deforms under astandard force. In this test, the softer food gives a higher reading and since theproduct becomes softer with increasing temperature the TTC value is positive(see the curves for deformation of Stanley plum and Nova tomato in Fig. 8.13).
A study of Table 8.4 shows a wide range of TTC values. It becomes veryhigh when the test temperature approaches a temperature-induced phasechange, e.g. fats and gels near their melting point. For example, lard has aTTC of �27.7%/°C between 25 and 30°C (Table 8.4). In contrast most fruitsand vegetables show a TTC between �0.2 and �1.0%/°C although Canogastrawberries show a TTC value of 7.7%/°C (see Appendix II). For water at
312 Correlation Between Physical Measurements and Sensory Assessments of Texture and Viscosity
Peas early sweet 11, size 3, shear press, newtons7
6
5
4
3
2
1
Macintosh apple, Magness–Taylor 7/16in. tip, newtons
Morepark apricot, Magness–Taylor 5/16in. tip, newtons
Nova tomato, deformation, mm
Stanley plum, deformation, mm
Peas, early sweet 11, size 5, maturometer, kN
Stanley plum, back extrusion, kN
0 15 4530
Temperature (̊ C)
0.20.3
0.4
0.5
0.6
1
2
3
4
6
7
8
9
10
40
50
800
900
1000
Firm
ness
FFiigguurree 88..1133 Effect oftemperature on firmness of someraw fruits and vegetables. (FromBourne, 1982. Reprinted from J. Food Science 4477, page 444.Copyright by Institute of FoodTechnologists.)
Chap-08.qxd 1/12/02 10:41 AM Page 312

Effect of Temperature 313
Table 8.4 Effect of Temperature on Texture of Various Foods
Temp range T–T Coefficient Food Test (°C) (% /°C) Reference
Water Viscosity 20–21 �2.5Apple Extrusion 0–45 �0.55 Bourne (1982)Apple Shear press 0–45 �0.43 Bourne (1982)Apple Puncture 0–45 �0.73 Bourne (1982)Beans, green canned Puncture 3–48 �0.02 Bourne and Comstock (1986)Beans, green canned Texture Press 3–48 �0.51 Bourne and Comstock (1986)Beans, green fresh Puncture 0–45 �0.10 Bourne (1982)Beef, cooked Warner–Bratzler Shear 22–50 �0.45 Caparaso et al. (1978)Butter Casson yield 5–15 �7.36 Kawanari et al. (1981)Butter Shear failure 5–15 �5.25 Kawanari et al. (1981)Carrageen gel 1% Puncture 4–24 �4.80 Oakenfull and Scott (1985)Carrageen gel 1% Puncture 24–44 �11.75 Oakenfull and Scott (1985)Carragenan gel Strength 10–20 �1.4 Szczesniak (1975a)Cheese, Cheddar Sliding pin Consistometer 1–20 �3.3 Davey (1986)Cheese, Cheddar Sliding pin Consistometer 20–25 0 Davey (1986)Cheese, Mozzarella Sliding pin Consistometer 1–20 �4.2 Davey (1986)Cheese, Philadelphia cream Sliding pin Consistometer 1–25 �2.5 Davey (1986)Cheese, Cream
Kraft Philly Regular Yield stress 5–22 �3.36 Breidinger and Steffe (2001)Kraft Philly Neufchatel Yield stress 5–22 �3.19 Breidinger and Steffe (2001)Kraft Philly Light Yield stress 5–22 �4.15 Breidinger and Steffe (2001)Kraft Philly Fat Free Yield stress 5–22 �1.29 Breidinger and Steffe (2001)Kraft Philly Whipped Yield stress 5–22 �3.79 Breidinger and Steffe (2001)Store Brand Regular Yield stress 5–22 �3.46 Breidinger and Steffe (2001)Store Brand Neufchatel Yield stress 5–22 �3.27 Breidinger and Steffe (2001)Store Brand Fat Free Yield stress 5–22 �1.91 Breidinger and Steffe (2001)Bruegger’s Regular Yield stress 5–22 �4.46 Breidinger and Steffe (2001)Bruegger’s Light Yield stress 5–22 �4.00 Breidinger and Steffe (2001)
Chocolate Viscosity 38–42 �1.2 to �3.8 Aeschliman and Beckett (2000)Cottonseed oil, hydrogenated Ball penetrometer 10–57 �2.04 Feuge and Guice (1959)Cream, whipped Extrusion 7–24 �3.9 Szczesniak (1975a)Frankfurters Puncture 0–21 �2.6 Simon et al. (1965)Frankfurters Puncture 21–49 0 Simon et al. (1965)Gellan gels Failure stress 2–62 �0.59 to �1.35 Mao et al. (1999)Gellan gels Failure strain 2–62 �0.36 to �0.79 Mao et al. (1999)Gelatin gel Strength 10–20 �6 Szczesniak (1975a)Lard Penetrometer 10–25 16.2 Bailey (1934)Lard Penetrometer 25–30 27.7 Bailey (1934)Mango pulp Yield stress 5–55 �0.51 Bhattacharya et al. (1999)Mango pulp Yield stress 55–80 �2.69 Bhattacharya et al. (1999)Margarine Shear failure stress 3–21 �4.21 Hamann (1983)Peach, canned Extrusion 3–48 �0.66 Bourne and Comstock (1986)Peach, fresh Puncture 0–45 �0.74 Bourne (1982)Pectin (HM) gel Puncture 4–48 �4.40 Oakenfull and Scott (1985)Surimi gel, preset Torsion shear stress 5–65 �0.83 Hamann and MacDonald (1992)Whey protein gel 0% fat Compressive strength 4–40 �0.25 Mor et al. (1999)Whey protein gel 30% fat Compressive strength 4–40 �0.75 Mor et al. (1999)
Chap-08.qxd 1/12/02 10:41 AM Page 313

20°C the TTC value is �2.5%/°C which means that the viscosity at 21°C is2.5% less than at 20°C.
Table 8.4 demonstrates that control of temperature at the time the texture offood is measured is essential if reproducible data are to be obtained. For foodswith a low TTC value the temperature should be controlled to within �2°to �4°C of the target temperature, whereas for foods with a high TTC value itshould be controlled within tighter limits. For many fats the previous temper-ature history can affect the texture. Thus, for this type of food the temperatureneeds to be controlled all the time, not only at the time of testing.
As stated above, for fruits and vegetables that have a low TTC value it isadequate to control the temperature at the time of testing to within �2°to �4°C because the temperature-induced change of texture will not bedetected within the wide variation of textures normally encountered from oneunit to the next. For example, if the TTC value is �0.4%/°C a change of 3°Cwill change the texture reading by 3 � �0.4 � 1.2%, a difference unlikely tobe detected given the high inherent variability from unit to unit. However, achange of 10°C will likely cause a measurable change in reading. For this rea-son, fruits and vegetables should not be tested at room temperature one dayand at refrigerator temperature another day. It is also poor practice to comparetexture measurements made in summertime with those made in wintertime inlocations that have no climate control.
The temperature–texture effect can have commercial implications. If thetexture reading for a food is close to a borderline standard of quality, the read-ing can be made to cross that border by raising or lowering the temperature atwhich the test is performed. For this reason, any food standard that includes atexture test as part of that standard should specify the temperature range atwhich the test should be performed.
Effect of Sample Size
The size of the test sample has little effect for some texture tests and a pro-found effect for others.
� Puncture test. The sample size is immaterial so long as semi-infinitegeometry is maintained (see page 123).
� Warner–Bratzler Shear. The sample size affects the force reading but theexact relationship is unclear (see page 137).
� Back extrusion. The sample size has little effect on the force to beginextrusion but it should be large enough to ensure that true extrusion hasbegun (see page 128).
� Kramer Shear press. For some foods the force is directly proportional tosample weight, for other foods the force increases in a nonlinear mannerwith increasing weight, and for a third class of foods the force is constantafter a certain minimum weight has been exceeded (see Fig. 5.6, page 205).
314 Correlation Between Physical Measurements and Sensory Assessments of Texture and Viscosity
Chap-08.qxd 1/12/02 10:41 AM Page 314

� Deformation. The specimen size and shape has a definite effect on thedeformation reading. The degree of this effect depends both on the shape,size and deformability of the specimen (see pages 156–158).
� Texture profile analysis. The shape and size of the test piece is critical forobtaining reproducible results.
The texture technologist needs to know which test principles are sensitive tosample size and which ones are not. For those tests in which the sample size isimmaterial, it is not necessary to take the time to standardize the amount, sizeand shape before executing the test.
Integrated Texture Notes
Some texture notes appear to be an integration of more than one physicalproperty. For example, Twigg (1963) showed that two different measurementswere needed to specify quality of both fresh and canned sweet corn: (1) theforce to extrude the corn kernels through the slits of the Food TechnologyCorporation Texture Press (‘Kramer Shear Press’); and (2) the volume of freejuice expelled when compressed in a succulometer (Fig. 8.14).
In a similar vein, Daubert et al. (1998) showed that spreadability of prod-ucts such as grape jelly, mayonnaise, and peanut butter was a function of bothyield stress and yield strain. They constructed a ‘spreadability map’ with yieldstress up the ordinate and yield strain along the abscissa and divided the mapinto three regions: (1) easy to spread; (2) mild to spread; (3) hard to spread(Fig. 8.15).
‘Creaminess’ is one of the most highly relished textural attributes in foodsbut has been very difficult to define completely. The consumer has a clear ideaof the property of creaminess and considers it easy to assess whereas the sci-entist finds it very difficult to describe and measure. Wood (1974) showed thatcreaminess is found in soups when the viscosity exceeds 50 mPa�s and the
Integrated Texture Notes 315
Standard
Extra-standard
Fancy
Compression, ml. juice(100g sample)
Shea
r (l
bs fo
rce)
(ful
l she
ar c
ell)
400
600
800
1000
1200
1400
8 10 12 14 16 18 20 22 24 26 28
Extra-standard
Standard
Fancy
Compression, ml. juice(100g sample)
Shea
r (l
bs fo
rce)
(100
g sa
mpl
e)
300
400
500
600
700
8 10 12 14 16 18 20 22 24 26 28
a b FFiigguurree 88..1144 Shear Press forceand Succulometer juice volumeare needed to specify texturalquality of (a) raw and (b) cannedsweet corn. (From Twigg, 1963with permission.)
Chap-08.qxd 1/12/02 10:41 AM Page 315

flow behavior index (n) is about 0.5 mPa�s. Kokini et al. (1984) showed thatthe regression equation:
log creamy � 0.52 log thick � 1.56 log soft � 0.32 log slippery
gave a correlation coefficient r � 0.91 with sensory evaluation of creaminess.Moskowitz and Kapsalis (1974) gave two equations for creaminess:
(1) creaminess � 0.63 � cohesiveness � 0.67 � mushiness� 1.54 (r � 0.71)
(2) creaminess � 0.10 (mushiness)0.86 � (cohesiveness)0.99 (r � 0.71)
Daget et al. (1987) working with model dairy creams found maximumcreaminess at viscosities ranging from 880 to 7480 mPa�s depending on thefat content (Table 8.5). However, Daget and Joerg (1991) found maximum
316 Correlation Between Physical Measurements and Sensory Assessments of Texture and Viscosity
6000
5000
4000
3000
Easy
Yiel
d st
ress
(Pa
)
M (6.5 C̊)
M (19 C̊)
B (19 C̊) WT (�10 C̊)
FWT (�10 C̊)
FCC (8.5 C̊)
PB (7.5 C̊)
PB (22 C̊)
RFPB (7.5 C̊)
RFPB (23 C̊)
B (7.5 C̊)
CC (6.5 C̊)
CC (19.5 C̊)
NSC (6.5 C̊)
SC (6.5 C̊)
FY (6 C̊) GJ (22 C̊) GJ (5.5 C̊)
PCS (19.5 C̊)
2000
1000
00.00 0.10 0.20 0.30 0.40 0.50
Yield strain0.60 0.70 0.80 0.90
Mild
Hard
FFiigguurree 88..1155 Spreadability mapfor elastoplastic foods (barsrepresent standard error;experimental temperatures are inparentheses). PCS, processedcheese spread; PB, peanutbutter; RFPB, reduced fat peanutbutter; GJ, grape jelly; CC, creamcheese; FCC, free cream cheese;M, margarine; B, touch of butter;FY, fat-free plain yogurt; SC,sour cream; NSC, nonfat sourcream; WT, whipped topping;FWT, fat-free whipped topping.(From Daubert et al., 1998.Reprinted from J. Texture Studies2299, page 433. Copyright by Foodand Nutrition Press Inc.)
Table 8.5 Sensory Creaminess of Thickened Dairy Creams a
Optimum Optimum Sensory% Fat viscosity (mPa��s) flow behavior index (n) creamy score
3.5 880 0.15 17.510 1064 0.14 20.520 1808 0.11 22.630 7480 0.04 26.9
Source: Data from Daget et al. (1987). Reprinted from J. Texture Studies 18, page 379. Copyrightby Food and Nutrition Press Inc.aMilk and creams were thickened with xanthan gum.
Chap-08.qxd 1/12/02 10:41 AM Page 316

creaminess in soups at viscosities ranging from 90 to 430 mPa�s depending onthe thickener used (Table 8.6). Richardson et al. (1993) showed that homoge-nized full fat milk was significantly lower in creaminess than nonhomogenizedmilk, but when the milks were thickened with sodium carboxymethylcelluloseto the same viscosity as high fat cream the homogenized product was morecreamy than the nonhomogenized (Table 8.7). However, even when thickenedto the same viscosity as 47% fat cream the thickened milk was perceived asbeing less creamy than real cream, which suggests that the fat content is a factor in the creamy sensation.
So, how does a scientist precisely specify what is ‘creamy’? It appears to be a combination of (1) moderate to high viscosity, (2) non-Newtonian flow(shear thinning), (3) presence of some fat, and (4) other factors whose func-tion is not yet clear. The absence of geometrical properties is probably anothercomponent in the assessment of creaminess. Creamy foods are very smooth,and have to be free from gritty, lumpy, grainy or abrasive particles. The prop-erty of creaminess cannot be described by a single instrumental measurement.
Barreiro et al. (1998) gives another example of an integrated texture note.After an extensive study of apple quality they concluded that ‘mealiness’ ofapples is a negative texture quality factor that cannot be described by a single
Integrated Texture Notes 317
Table 8.6 Conditions for Optimum Creaminess of Soups
Optimum OptimumSoup flavor Thickener viscosity (mPa��s) flow behavior index (n)
Mushroom Galactomannan 352 0.42Leek Galactomannan 273 0.37Leek Xanthan 144 0.32Leek Carboxymethylcellulose 90 0.66–0.81Leek Starch 140 0.38
Source: Data from Daget and Joerg (1991). Reprinted from J. Texture Studies 22, page 172.Copyright by Food and Nutrition Press Inc.
Table 8.7 Creaminess of Milks
Sensory creaminess
Sample Viscosity (mPa��s) 3.5% fat 4.5% fat
Not homogenized 12 75 77Homogenized 13 65 63Thickened, not homogenized 1860 80 82Thickened, homogenized 1860 82 98Double cream 47% fat 1850 140
Source: Data from Richardson et al. (1993).Milks were thickened with carboxymethylcellulose (CMC) to the same viscosity as double cream.
Chap-08.qxd 1/12/02 10:41 AM Page 317

sensory descriptor. It has to be described by four sensory attributes: (1) crisp-ness, (2) floury, (3) first bite juiciness, and (4) juiciness during chewing.
The last example of integrated texture notes is with rice. The palatability ofcooked rice for the Japanese was found to be governed primarily by hardness,stickiness, and the ratio of stickiness to hardness (Okabe, 1979). Rice of highhardness can be palatable if stickiness is also high.
Figure 8.16 indicates zones of acceptability of rice as a function of hard-ness, stickiness, and the hardness/stickiness ratio. This diagram has been usedin Japan to characterize factors affecting the palatability of different varieties,and also storage and processing factors that affect rice quality.
Some Foods Easily Give High Correlations
The textural properties of some foods change in unison and in the same direc-tion during processing or storage. In these cases several types of texture
318 Correlation Between Physical Measurements and Sensory Assessments of Texture and Viscosity
0.1 0.2 0.3 0.4 0.5 0.6 0.7 0.8 0.9
Stickiness
1.0
2.0
3.0
3.4
3.8
4.0
4.2
4.6
5.00.05 0.1
0.3
0.2
0.22
0.13 0.15
Har
dnes
sE1 D1 C1 B1
A1 AA1
AA2
AA3
A2
A3
A4
A5
B2
B3
B4
B5
C2
C3
C4
C5
D2
D3
D4
D5
E2
E3
E4
E5
FFiigguurree 88..1166 Texturogram forcooked rice using the GFTexturometer (from Okabe,1979). Zones of acceptability arebased on hardness (vertical scale0–5), stickiness (horizontal scale0–0.9), and stickiness/hardnessratio (sloping lines, scale0.05–0.3): A, excellent; B, good;C, acceptable; D, poor; and E,unacceptable. Each acceptabilityzone is also ranked in terms ofhardness: for example, A1 is lowhardness, A3 moderate hardness,and A5 high hardness forexcellent quality rice, while E1–E5
covers the hardness range forunacceptable quality rice. The AAzone comprises glutinous riceand some special new ricevarieties. (Reprinted from J. Texture Studies 1100, page 137,1979; with permission of Foodand Nutrition Press.)
Chap-08.qxd 1/12/02 10:41 AM Page 318

measurement will correlate well with other texture test principles and with apanel. An example of this is fruit that softens greatly as it ripens (pears,peaches, bananas). Measuring the changes in firmness of these commodities isfairly straightforward. Each of several different tests will give satisfactoryresults (Fig. 8.17). One can measure the wrong parameter and still get theright answer because of the nature of the interrelationships between the different parameters. In these cases the most convenient instrument and easi-est to perform test principle should be selected. These foods are easy to mea-sure by means of a simple parameter (‘one-point’ measurement) because eachtextural property correlates highly with all the other textural properties.
The textural properties of other foods change in different directions; it maybe necessary to make several different kinds of tests to adequately describe thechanges in textural properties of these foods. Under these conditions one canselect several test principles or use texture profile analysis or an abbreviatedversion of texture profile analysis.
Correlation Graphs
It is useful to make a scatter diagram of the preliminary subjective and objec-tive measurements before calculating the correlation coefficient because thisenables one to see certain aspects of the correlation that may otherwise beoverlooked. Some of the possibilities are shown schematically in Fig. 8.18,which shows nine potential relationships between instrumental tests (I) andsensory scores (S).
Correlation Graphs 319
Days in ripening room4 8 12 16 20 24
Elasticity
Magness–TaylorHardnessBrittleness
GumminessChewiness
FFiigguurree 88..1177 Changes in textureprofile parameters andMagness–Taylor puncture test onpears as they ripen. Notice howall parameters change in thesame direction at approximatelythe same rate. (From Bourne,1968. Reprinted from J. Food Sci.3333, 225, 1968. Copyright byInstitute of Food Technologists.)
Chap-08.qxd 1/12/02 10:41 AM Page 319

The first column on the left-hand side of Fig. 8.18 shows good correlations.The top graph shows a rectilinear relationship with the two desirable factors ofa steep slope over the range of interest and a small degree of scatter. It is a verysatisfactory relationship. The middle graph is just as satisfactory as the oneabove it, the only difference being that it has a negative slope. Three curvilin-ear relationships are shown in the bottom graph, each having the desirable features of low degree of scatter, and a steep slope. (For the sake of clarity, thescatter points are shown for only one line in this graph.) The curve may beconcave or convex and may have a positive or negative slope, but it is very sat-isfactory. The simple correlation coefficient for any one of these three curvesdoes not adequately reflect the goodness of fit of the experimental points to theline because it measures the goodness of fit to a straight line, not to a curve.Under these conditions it is advisable to transform the data in some way tostraighten the curve (e.g. by taking logarithms on one or both axes) before cal-culating the correlation coefficient.
The three graphs in the center column of Fig. 8.18 show a marginal predic-tive relationship. They can be used to correlate instrumental tests with sensoryjudgments but not with the degree of certainty that is desirable. It is worthsome effort to improve these relationships before using them. The top graph inthe center column of Fig. 8.18 has the desirable steep slope, but the degree ofscatter of the points is greater than the top curve in the left-hand column. Thecenter graph in the center column has a good fit of the points to the line, butthe line has a shallow slope which limits the usefulness of the correlation. The
320 Correlation Between Physical Measurements and Sensory Assessments of Texture and Viscosity
I
I
I
S S S
PoorMarginalGoodFFiigguurree 88..1188 Correlationbetween instrumental tests (I)and sensory tests (S).
Chap-08.qxd 1/12/02 10:41 AM Page 320

bottom graph in the center column of Fig. 8.18 has a desirable steep slope,even with its curvature, but an undesirably wide degree of scatter.
The right-hand column in Fig. 8.18 shows relationships between instrumenttests and sensory scores that are so poor that they should not be used for pre-dictive purposes. In the top curve the degree of scatter from the line is toogreat, even though the slope of the line is steep. In the center curve the lowslope of the line coupled with a moderate degree of scatter makes this rela-tionship unsatisfactory for predictive purposes. The bottom right-hand graphin Fig. 8.18 is unsatisfactory because the relationship changes slope. It doesnot matter whether the slope changes from positive to negative or from nega-tive to positive; any relationship in which the direction of the slope changes isunsatisfactory, even when there is a good fit of the data points to the curve.
The use of scatter diagrams as recommended above should not replace ade-quate statistical analysis of the data. Statistical analysis is definitely needed.Since it is outside the scope of this book to cover the analysis of the data, thereader should refer to a good book on statistical analysis or consult with aqualified statistician. The function of the scatter diagrams shown in Fig. 8.18is to enable one to have a better understanding of the relationship beforeembarking on statistical analysis. They can also save unnecessary effort incomputation. For example, if any of the relationships shown in the right-handcolumn of Fig. 8.18 are obtained, it would be better to continue to look for abetter test procedure than to put a lot of effort into sophisticated statisticalanalysis of data that are obviously unsatisfactory.
A useful guide of the suitability of a correlation for quality control purposes,provided that representative samples and adequate sample size have been used,was given by Kramer (1951). When the simple correlation coefficient betweenthe instrument test and sensory score is �0.9 to �1.0, the instrument test is agood one and it can be used with confidence as a predictor of sensory score.When the correlation coefficient lies between �0.8 and �0.9, the test can beused as a predictor but with less confidence; it is worth some effort to improvethe test to bring the correlation coefficient above �0.9. Extending this conceptfurther, when the correlation coefficient lies between �0.7 and �0.8, the test isof marginal use as a predictor; when it is less than �0.7, it is practically worth-less for predictive purposes (Table 8.8).
Correlation Graphs 321
Table 8.8 Instrument–Sensory Correlations
r r 2
Excellent �0.9–�1.0 0.81–1.00Good �0.8–�0.9 0.64–0.81Marginal �0.7–�0.8 0.49–0.64Poor ��0.7 �0.49
Source: After Kramer (1951).
Chap-08.qxd 1/12/02 10:41 AM Page 321

A statistically significant relationship between an instrument test and sen-sory score may be found even with a low correlation coefficient if the samplesize is large enough. For example, a correlation coefficient of 0.3 may be sta-tistically significant, but it is far from adequate for predictive purposes. Oneneeds to distinguish between statistical significance and predictive reliability.
The full textural range that will be encountered under reasonable circum-stances should be used when setting up the preliminary tests. When arestricted range is used, the correlation coefficient will be lower than when thefull range is used. Conversely, the correlation coefficient will be spuriouslyhigh when an excessively wide range is used.
The effect of too narrow or too broad a range on the numerical value of thecorrelation coefficient is demonstrated in Fig. 8.19, which is a hypotheticalexample of comparisons between instrumental and sensory testing of firmnessof a food. The normal range of variability in this commodity is A–B and thecorrelation coefficient r over this range is 0.828. When a narrower range C–Dis covered, the correlation coefficient drops to 0.695. This is a spuriously lowfigure because an unnecessarily narrow range was studied. On the other hand,when an extremely wide range E–F is covered, the correlation coefficientincreases to 0.910. But this is a spuriously high figure because an abnormallywide range was taken.
Texture technologists work hard to obtain high correlation coefficientsbetween physical tests and sensory assessments because a high value of r indi-cates that the physical test will be a good predictor of sensory assessment oftextural quality. Such tests are useful for quality control purposes in the foodfactory. However, a high correlation coefficient does not prove there is acause-and-effect relationship. It only means that the variables are changing inunison. Szczesniak (1968) points out that as fruits ripen they generallybecome softer and sweeter. A high negative correlation is often found between
322 Correlation Between Physical Measurements and Sensory Assessments of Texture and Viscosity
Sensory score
Inst
rum
ent
read
ing
A C D B FE
1
100
200
300
400
500
600
700
800
2 3 4 6 7 8 95 10
r � 0.91r � 0.83r � 0.69
FFiigguurree 88..1199 A hypotheticalcase of instrumental vs sensorymeasurement of firmnessshowing how the range offirmness examined affects thecorrelation coefficient r. A–B,normal range, r � 0.83; C–D,narrow range, r � 0.69; E–F,excessively wide range, r � 0.91.
Chap-08.qxd 1/12/02 10:41 AM Page 322

firmness and sweetness in fruit. This does not mean that the loss of firmnesscauses the increase in sweetness. The depolymerization of the pectin materialand the increase in sugar content are two independent processes that happen tooccur simultaneously.
Figure 8.17 is another example of high correlations that do not mean cause-and-effect. All the textural properties of pears decrease at about the same rateas the pear ripens. However, there is no reason to expect that any of these properties are causing changes in any of the other properties.
Commonsense Helps
Because there are so many different textural properties occurring in foodswith vastly different structures and different chemical compositions that aremeasured by a complex instrument (human body), the reader is cautionedagainst blindly using some test procedure and hoping it will work. It is worthstepping back and reviewing the whole problem including all the points raisedin this chapter. A commonsense overview of the whole procedure is recom-mended. Are there any artifacts? Have unwarranted assumptions been made?Can some modification improve the reliability of the procedure? For example,Szczesniak (1968) measured in a calorimeter the heat absorbed by whippedcream-like products, and related this to the degree of sensory coolnessreported by a sensory panel. Calorimeters express results in calories per gramof product. The correlation between calories per gram and sensory coolnesswas r � 0.62. However, whipped toppings contain entrapped air, and the panelwas given a standard volume of 5 ml, not a constant weight of product. Whenthe correlation was calculated between calories per 5 ml and sensory coolnessthe r was 0.94. Commonsense brought out the fact that sensory coolness isrelated to both heat capacity and density of these products.
Summing Up
Obtaining a high correlation between physical tests and sensory assessmentsof textural quality has been the goal of scientists from many disciplinesincluding food scientists, physicists, sensory scientists, psychologists anddentists. This chapter explains the complexities involved in this search. Muchhas been accomplished, but much more needs to be known. The reader shouldbe aware of the broad ramifications of this subject area, and look for furtheradvances. The final chapter is yet to be written on this subject.
Summing Up 323
Chap-08.qxd 1/12/02 10:41 AM Page 323

Selection of a SuitableTest Procedure
Introduction
The previous chapters have described a large number of methods for measur-ing texture or viscosity of foods. A food technologist can easily become bewil-dered when first faced with the problem of developing a suitable procedure formeasuring the textural properties of a particular food. Where does one begin?The following discussion is intended as a guide for selecting and establishinga texture measurement, particularly for those who are just entering the field.
A number of factors should be considered before setting up a new test procedure, otherwise a good deal of money and time can be wasted. The fol-lowing recommended steps are based on the author’s experience on a wide rangeof problems associated with many different kinds of foods.
The procedure described below can be used to select a suitable instrument.If one already has a universal testing machine the same procedure can be usedto select which test principle is most appropriate for that particular food andwhich attachments are needed to perform the test.
Factors to be Considered
Instrument or Sensory
The first decision is whether to use an instrument or a sensory test. Instrumentsare generally preferred because they are believed to be more reproducible, useless time, and utilize a minimum of labor. On the other hand, there are timeswhen sensory methods are the only way in which adequate information can beobtained. If the decision is made to use sensory methods, the reader is referredback to Chapter 7 because the remainder of this chapter is directed to theselection and use of instrumental methods.
C H A P T E R
9
Chap-09.qxd 1/10/02 4:17 PM Page 325

Nature of Product
The kind of material (liquid, solid, brittle, plastic, homogeneous, heteroge-neous) affects which type of instruments will be selected. Most tests on solidor near-solid foods use some form of uniaxial compression whereas sophisti-cated tests for viscosity generally use some form of rotational motion.
Purpose of Test
Is the test to be used for quality control, for setting legally binding officialstandards, for product development, or for basic research? These questionsshould be answered because they are an essential feature of the selectionprocess. The previous chapters discussed a wide range of instruments rangingfrom simple and inexpensive to highly sophisticated. Each of them has itsplace. In some cases a single-point measurement is adequate; in other cases amultipoint measurement is needed. One is usually prepared to sacrificesophistication for the sake of rapidity for routine quality control purposeswhere a rapid test is essential. On the other hand, difficult problems that arehandled in the research laboratory or in new product development may needmore sophisticated instrumentation.
The difference between simple and sophisticated instruments might belikened to the difference between a $20 and a $500 camera. A $20 camera usu-ally has a fixed focus, is simple to operate, and almost foolproof. The quality of the picture is not as good as that obtained with an expensive camera that has been properly operated, and it is restricted in the conditions of lighting and movement of the subject under which satisfactory pictures can be taken.Nevertheless, a great number of low-cost cameras are sold because the simplic-ity of operation and low cost are of paramount consideration. In contrast, the$500 camera has a better lens, it provides better-quality pictures, and it can beused under a wide range of conditions. However, the person operating the $500camera needs to know something about its operation because of the complexityof the adjustments that need to be made. Novices frequently take poorer pictureswith an expensive camera than with a cheap camera because they do not knowhow to set the adjustments on the expensive camera. A similar situation occurswith texture-measuring instruments. Sophisticated instrumentation has its place,but there is also room for the simple low-cost instruments.
Accuracy Required
Another question that should be resolved is the required accuracy of the results. Greater accuracy is obtained as the number of replications is increased.Generally, a larger sample size gives a result closer to the true mean than asmall sample size, and hence fewer replicate tests are needed to obtain a givendegree of accuracy. But a larger sample size usually means that higher forcesare needed, and the force capacity of the instrument may be exceeded. When
326 Selection of a Suitable Test Procedure
Chap-09.qxd 1/10/02 4:17 PM Page 326

the ‘spread’ of values between individual units is needed, it is preferable to usea small sample size and run a large number of replicates in order to increase theprobability of obtaining the full spread of values.
It comes as a surprise to some researchers to find a large inherent variabil-ity from unit to unit in the same sample lot. This is especially noticeable onmost native foods where coefficients of variation of 10%, 20%, or higher arecommon. This variation is inherent in the commodity and is to be expected. Itis not a defect of the instrument, provided the instrument is correctly operated.When working with a new commodity, it is advisable to run a preliminary testto ascertain the degree of inherent variability in the product and to establishhow large a sample size and number of replicates are necessary to give thedesired degree of confidence in the data. An example of this type of exerciseis shown in Table 9.1. Fairly large numbers of apples are required for reliablereproducible results at harvest time because of the large variation in firm-ness readings within the same lot of apples. A smaller number suffices after 4 months storage because of the reduced fruit-to-fruit variation.
Since this inherent wide variability is the norm for most foods (seepages 305–309), the primary consideration in most texture work is to look foran instrument that can perform tests rapidly, thus allowing a number of repli-cate tests to be made. A high degree of precision is a secondary considerationbecause there is little point in attempting to measure some textural parameterto a precision of 1% when the replicate samples may vary by 20% or more,especially when considerable extra time is required to obtain the high degreeof precision. It is usually preferable to replicate a 1-min test five times than torun a more precise 5-min test only once.
Factors to be Considered 327
Table 9.1 Differences in Magness–Taylor Measurements (lb) on Fresh Apples Required for Evaluating Significance BetweenTreatment Means for Various Sample Sizes
95% Confidence levela 99% Confidence levela
10 20 100 200 10 20 100 200
At harvestRed Delicious 1.9 1.3 0.6 0.4 2.6 1.8 0.8 0.6Golden Delicious 1.1 0.8 0.4 0.3 1.5 1.1 0.5 0.3Rome 1.1 0.8 0.3 0.2 1.4 1.0 0.5 0.3York 2.0 1.4 0.7 0.5 2.8 1.9 0.9 0.6
Stored 4 months at 31°FRed Delicious 0.8 0.5 0.2 0.2 1.0 0.7 0.3 0.2Golden Delicious 0.8 0.6 0.3 0.2 1.1 0.8 0.3 0.2Rome 0.9 0.6 0.3 0.2 1.2 0.8 0.4 0.3York 1.7 1.2 0.5 0.4 2.3 1.6 0.7 0.5
Source: Worthington and Yeatman (1968); reprinted with permission from the Proc. Am. Soc. Hort. Sci. See also Schultz and Schneider (1955).aColumns are set up according to number of apples.
Chap-09.qxd 1/10/02 4:17 PM Page 327

Destructive or Nondestructive
Destructive tests ruin the structure and organization of the sample, renderingit unsuitable for repeating the test. Nondestructive tests should leave the foodin a condition so close to its original state that the test can be repeated and givethe same result as the first time. Both destructive and nondestructive tests havehad their successes and failures (Bourne, 1979a). Because the majority of thetextural parameters of foods are sensed in the mouth and mastication is adestructive process, it seems logical that destructive tests should be the pre-dominant type to be used on foods. Nevertheless, nondestructive tests aresometimes effective, and they offer the advantage that the same piece of foodcan be repeatedly tested, thus eliminating variations in geometry from piece topiece. The deformation test in which a food is gently compressed in a mannerthat imitates the squeezing of the food in the hand is the most widely usednondestructive test. It is a test principle that is likely to be more widely usedin the future.
Costs
How much money can be spent on this test? This includes the initial cost of the instrument, and maintenance and operating costs. An instrument that uses chart paper has an operating cost not found with an instrument in whicha dial reading is taken. The maintenance cost should be considered. Does theinstrument need spare parts and what is their availability and cost? Is theinstrument used occasionally or frequently? Another element is the labor cost.A simple instrument can be operated by unskilled or semiskilled personnelwhereas sophisticated instruments need to be operated by a person with higherqualifications. An automatic instrument costs more than a simple instrumentbut may cost less per test because of reduced labor requirement and lesschance of making errors.
Time
How much time can be spent on the test? Routine quality control tests need aninstrument that gives results rapidly. In contrast, some tests in the researchlaboratory may be so sophisticated that the amount of time required to obtainreliable data is not of great consequence. Research needs may require mea-suring a number of textural parameters, which will take more time than a one-point measurement.
Location
Where will the instrument be operated? Any instrument can be used in a clean,dry laboratory. Instruments used in the plant may need to withstand steam,water, dust, vibration, and other hazards that render some instruments unsuit-able. Instruments using a chart, complex electronic systems or computers are
328 Selection of a Suitable Test Procedure
Chap-09.qxd 1/10/02 4:17 PM Page 328

likely to suffer damage in the steamy atmosphere of a processing plant unlessspecially designed to withstand the poor environment.
Eliminate Unsuitable Tests
Some test principles are obviously unsuitable for the commodity that needs to be tested and should be eliminated from consideration. For example, anextrusion test is unsuited for crackers and bread because these products do notflow; the puncture test works poorly on most brittle foods because they crum-ble or fracture before penetration: a cone penetrometer test is unsuitable forfibrous materials such as meat or raw vegetables; a snapping test will not be effective for flexible or fluid materials. Sometimes the geometry of thesample (size and shape) may impose limitations. For example, a large itemcannot be tested in an instrument that has a small compartment for holding the sample.
Preliminary Selection
The steps described above will reduce the number of instruments or test prin-ciples under consideration. The next step is to narrow the field to the mostpromising two or three test principles. It is advisable to observe what kind oftest principle people use in the sensory evaluation of textural quality becauseone can usually get good clues for the type of objective test to select byobserving how people test the commodity. For example, if people judge tex-tural quality by gently squeezing in the hand, consideration should be given to a test that works on the deformation principle. If people use a bending orsnapping test, then this test principle should be given a high priority. If people bite the product between the incisors, the cutting–shear principleshould be included among the preliminary tests.
The test principles that should be considered are
Puncture Viscosity–consistencyDeformation CrushingExtrusion Indirect methods (e.g. chemical
or sound analysis)Penetration TensileCutting–shear Texture profile analysisSnapping–bending Distance measurementTorsion Volume measurement
Miscellaneous methods
All researchers should be warned about persevering with an instrument just‘because it is there.’ By all means, try out an instrument if it is available and
Preliminary Selection 329
Chap-09.qxd 1/10/02 4:17 PM Page 329

continue to use it if it gives satisfactory results. However, if it fails to give satisfaction after adequate testing, its use should be abandoned and one should look for another instrument that uses a different principle. One can easily spend far more than the cost of another instrument in labor costs by persevering with a test that uses the wrong principle for that particular application.
If you are getting unsatisfactory results with a universal testing machine,consider using another configuration and test principle. Some instrument sup-pliers have built up a library of successful test procedures for a wide range offood types and are willing to share their accumulated experience with theircustomers.
Sometimes none of the established procedures give satisfactory results. Inthese cases the researcher should have the confidence to develop a new testprocedure or apparatus that is suitable for the purpose.
Final Selection
By this time, the number of principles should have been reduced to a smallnumber. It is now time to test each of the remaining principles over the fullrange of textures that will normally be encountered with the food (i.e. excel-lent to poor) and identify the most suitable one. If any principle proves to be ineffective after being given a fair try, do not persevere with it; abandon itand try some other principle. For example, if the Magness–Taylor puncturetest fails to give satisfactory results after a fair trial, then other instrumentsthat work on the puncture principle will probably be unsatisfactory also.Therefore, abandon the puncture test principle and look at instruments that use another principle such as deformation or extrusion. The author hasseen instances where a laboratory has persevered with a single test principlefor a long time hoping it will eventually give satisfactory results when in factan unsuitable test principle was being used that would never be satisfactory forthe commodity under study. In these cases, refining the test is not going tohelp because an inappropriate test principle is being used.
The selection among several principles to identify one that gives the bestresults can be done rather quickly. For example, the author was once facedwith the problem of measuring the firmness of whole potatoes. Having gonethrough the preliminary selection it was agreed that the most suitable testwould be either a puncture test or a deformation test. Three groups of potatoes(soft, medium, hard) were selected by hand with about 10 potatoes in eachgroup. Each of these potatoes was then tested in the Instron using first a defor-mation test and then a puncture test. The mean values were calculated and areplotted in Fig. 9.1. It is obvious from this simple test, which only needed a fewhours to perform, that the puncture principle is unsuitable for measuring thekind of firmness that was being sensed in the hand, but the deformation testshowed promise. Therefore, we concentrated on refining the deformation test
330 Selection of a Suitable Test Procedure
Chap-09.qxd 1/10/02 4:17 PM Page 330

and wasted no more time trying to perfect the puncture test principle for thisparticular application (Bourne and Mondy, 1967).
The needed result from such an exploratory plot of instrument texture read-ing versus sensory texture assessment is a line with a steep slope and a closefit of the data points to that line. The differences between good, marginal andpoor scatter plots are shown in Fig. 8.18 (page 320). If the exploratory plotresembles those shown under the marginal or poor columns in Fig. 8.18 it isbest to abandon that test principle and try a different one. ‘Tweaking’ the con-ditions of the test is unlikely to change a marginal test into a good test.
Even when a plot of instrument texture reading versus sensory textureassessment falls in the ‘good’ column shown in Fig. 8.18, it is possible thattrying several different instruments or test principles will identify one as beingsuperior to the others. For example, Fig. 9.2 shows how the consistency ofchapati dough is affected by the amount of water added to the wheat flour.Three instruments were used to measure the consistency: the farinograph, theGeneral Foods Texturometer and the research water absorption meter(RWAM). Each instrument gave a rectilinear plot when log (instrument read-ing) was plotted against percent (added water). Each instrument gave anexcellent fit of the data points to a straight line. Therefore, it was concludedthat any of these instruments would be satisfactory. However, as explainedbelow they differed in their resolving power.
The resolving power of any measurement is the ability to distinguishbetween two items that are close together. For example, a telescope with alarge lens has greater resolving power than one with a small lens because itwill show a distant point of light as two stars whereas the small telescope will show only one point of light. Figure 9.2 shows that the RWAM gave aslope more than twice as steep as those for the other two instruments (0.0565for RWAM versus 0.0200 for the farinograph and 0.0235 for the GFTexturometer). Therefore, the RWAM will give the strongest separationbetween the samples because it has the strongest resolving power.
Final Selection 331
Sensory potato firmness
Soft
Deformation
Puncture
Obj
ectiv
e m
easu
rem
ent
Medium Firm
Figure 9.1 Two objectivemethods for measuring firmnessof whole potatoes versus sensoryevaluation of firmness of thesame potatoes.
Chap-09.qxd 1/10/02 4:17 PM Page 331

Refine Test Conditions
The final step is to standardize the test conditions such as sample size, test celldimensions, force range, speed of travel of moving parts, chart speed, temper-ature, and perhaps other factors. Several variations of the test conditionsshould be studied to find which gives the best resolution between differentsamples. For example, a small deforming force generally gives a better reso-lution in deformation tests than a high force (see pages 154, 155). The testconditions finally selected should then be recorded for future use.
Some of the questions that should be addressed at this time are:
(1) Does sample size affect the test result? (see page 314).(2) Does the textural property change slightly or greatly as the temperature
changes? (see page 314).(3) Does the rate of compression affect the result, i.e. is the product strain
rate sensitive? (see pages 303–305).(4) Is the product anisotropic? (see pages 103 and 309). When the product
is isotropic it can be presented to the instrument in any direction, but ifit is anisotropic it must always be presented in the same direction.
332 Selection of a Suitable Test Procedure
FarinographSlope � 0.0200
RWAMSlope � 0.0565
GF TexturometerSlope � 0.0235
Water added (% of flour)
601
10
100
Farin
ogra
ph(B
U)
RW
AM
(s)
GF
Text
urom
eter
(kg
V�1 )
Con
sist
ency
1000
65 70 75 80 85
Figure 9.2 Consistency ofchapati dough as a function ofadded water measured by threeinstruments: Farinograph,Research Water AbsorptionMeter (RWAM) and GeneralFoods Texturometer. (FromBourne, 1990. Plotted from dataof Rao et al., 1986. Reprintedfrom Dough Rheology and BakedProducts Texture, eds Faridi andFaubion, Fig. 6.3, page 339. Thismaterial used by permission ofJohn Wiley and Sons, Inc.)
Chap-09.qxd 1/10/02 4:17 PM Page 332

(5) How uniform is the product? A larger sample size or more replicatetests are needed if the product is not uniform (see page 305). Does thetexture vary consistently across the length of the product? If so, alwaystake the sample from the same location (see page 309).
Preparation of the Sample
Adequate sample preparation is an important element in performing food texture measurements. Problems with sample preparation sometimes impelthe researcher to use a particular test principle or instrument. The sampleselected for testing should be representative of the lot from which it wasdrawn. This point is so well known and so important that it should not requirean extended discussion.
The shaping of foods to standard measurements is a practical problem thatis often frustrating and time consuming. Some practical tips that the authorhas found useful are the following (see Fig. 9.3):
(1) A cork borer is useful for cutting out cylinders. A motorized borer ispreferred to a hand-operated borer. Make sure the borer is kept sharp.Apply a light uniform pressure when cutting because an uneven diam-eter is obtained if the pressure is not held steady. Continuous heavypressure will give an hourglass shape instead of a uniform cylinderespecially on highly deformable foods such as meat.
Preparation of the Sample 333
Figure 9.3 Some useful toolsfor shaping foods: 1, cork borers;2, knives; 2a is the preferred type;2b is undesirable because it ishollow ground and has a thickblade; 2c is undesirable becauseit is too small, is hollow groundand has a serrated edge; 3, smallfine-tooth saw; 4, a pair ofscalpels bolted together; 5a, household cheese cutter aspurchased; 5b, cheese cutter withroller removed leaving space tocut samples up to 25 mm thick;6, a large and a small cookiecutter; 7, a miter box with anadjustable slide.
Chap-09.qxd 1/10/02 4:17 PM Page 333

(2) A sharp knife is useful for cutting many foods. A fairly long thin bladethat is not hollow ground and not serrated gives the best results. A back-and-forth sawing motion under gentle pressure gives bettercontrol of dimensions than applying a heavy downward cutting action.It is difficult to get surfaces flat and parallel when using a thick-bladedor hollow ground knife.
(3) A small saw with very fine teeth is useful for cutting hard fracturablematerials to size. We use a saw blade 6 in. long with 32 teeth per inch.
(4) Two scalpels bolted together with spacers between them make animplement that is useful for some applications.
(5) A wire cutter is good for shaping adhesive foods such as soft cheese.An easy way to get one is to buy a household cheese cutter and removethe roller bar.
(6) A circular cookie cutter is helpful for cutting dumbbell shapes suitablefor a tensile test.
(7) A miter box used in conjunction with a sharp knife, a small saw, or awire cutter helps in cutting samples to a standard length and cuttinguniform cubes for texture profile analysis.
Food technologists have to face the fact that some foods cannot be shaped.It is impossible to cut a head of lettuce, a peanut, or a potato chip to a standardgeometry without destroying the integrity of the sample as a whole. In thesecases the best one can do is to select units of as uniform shape and size as pos-sible and be realistic about the fact that the data points will show more scatterthan if pieces of standard size and shape had been available. If possible a non-destructive test should be used for these foods because the same unit can berepeatedly tested as it undergoes the experimental treatments while the geom-etry factor remains constant.
An example of careful selection for size is given by Garruti and Bourne(1985) who performed instrumental texture profile analysis on cooked redkidney beans. The bean seeds were sized on bean sieves the base of whichcomprised a metal sheet containing 3/4 in. long slits with parallel sides andsemicircular ends. In each succeeding member in the set of sieves the slit was1/64 in. wider than the previous member. Ninety-five percent of the beanspassed through the 7/16 in. wide slits and were retained in the 12/64 in. wideslits. However, only those seeds that passed through the 16/64 in. wide slitsand were retained on the 15/64 in. wide slits were used for instrumental texture profile analysis. This meant that the maximum size variation from seedto seed was 1/64 in. (�0.4 mm).
Calibration
In the past, a texture measurement was often considered to be satisfactory solong as it gave consistent results at one location but this attitude is no longer
334 Selection of a Suitable Test Procedure
Chap-09.qxd 1/10/02 4:17 PM Page 334

adequate. Several forces are now building pressure for internationallyaccepted standards of textural quality.
(1) Food corporations became larger and established factories in a numberof different locations and countries, each of which is required to manu-facture a product to consistent standards.
(2) The strength of huge buyers such as supermarket chains and fast foodrestaurant chains who must obtain their foods from various sources yetneed to deliver a consistent quality to their customers.
(3) The need for agreement on textural quality between buyers and sellersof foods and food ingredients.
(4) Great increase in food trade around the world.
Therefore, the calibration and operation of instruments to ensure that thesame quality product receives exactly the same measurement no matter whereit is tested is becoming a matter of increasing importance.
Most of the problems associated with getting high correlations between aninstrument reading and sensory assessment of texture discussed in the previ-ous chapter can also be applied to calibration of instruments and proceduresfor measuring texture and viscosity. (See Instrument Problems, page 299, andCommodity Problems, page 299.) A strong effort should be made to standard-ize every aspect of a test to ensure that results are comparable between labo-ratories. A written protocol should be developed giving every detail.
Unfortunately, the record to date is not an encouraging one. Majordifferences are sometimes found when the same product is tested in differentlaboratories. For example, in a collaborative study involving eight laboratoriesin seven countries the reported viscosity of a sucrose solution ranged from 5.5to 8.4 mPa�s and 5% of the data points lay outside �31% of the mean value(Prentice and Huber, 1983). For a vegetable oil (assumed to be a medium vis-cosity Newtonian fluid) the power equation was used and the reported flowbehavior index (n) values ranged from 0.950 to 1.037 and the consistencyindex (K ) values from 0.0639 to 0.399.
Prentice and Huber (1983) also reported power equation n and K values forother products tested in the same eight laboratories. For an aqueous karayagum solution, n ranged from 0.41 to 0.67 and K from 0.12 to 2.45; for an aqueous carrageenan gum solution, n ranged from 0.43 to 0.81 and K from0.91 to 2.54; and for applesauce, n ranged from 0.25 to 0.58 and K from 16.8to 36.1. The Casson viscosity for one sample of chocolate ranged from 1.67 to4.40 in these laboratories.
Wheeler et al. (1997) compared Warner–Bratzler shear force readings oncooked beef longissimus dorum muscles from 27 steers within and among five meat research laboratories in the United States. In the first study eachinstitution cooked and tested the beef using procedures they normally used. Inthe second study they used a standardized protocol. The results, summarizedin Table 9.2, show substantial differences between these five laboratories. Theauthors concluded there was clearly a need for greater control of thawing
Calibration 335
Chap-09.qxd 1/10/02 4:17 PM Page 335
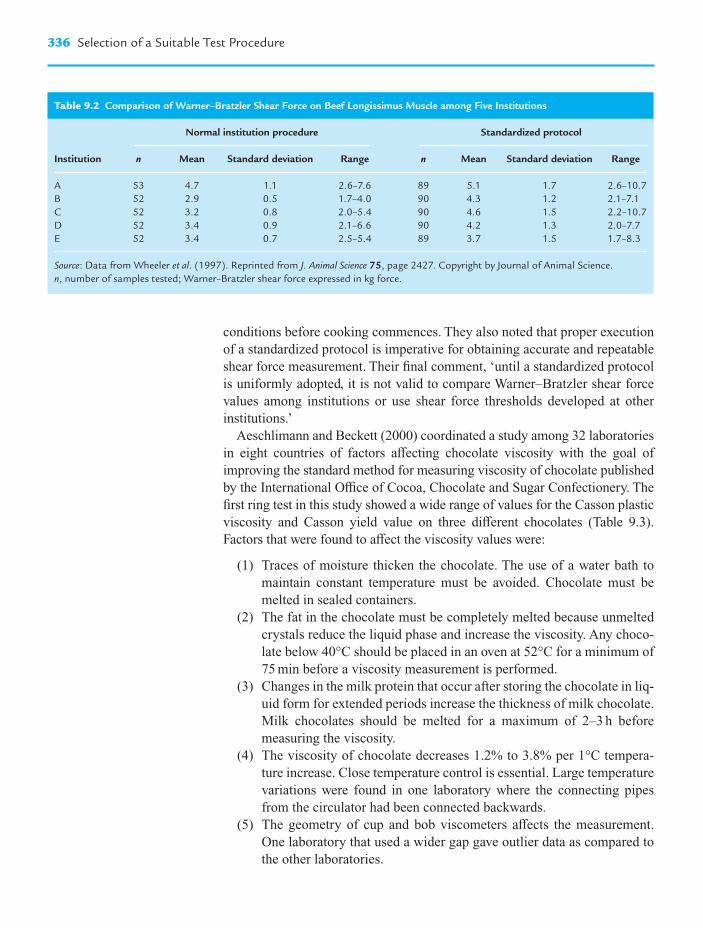
conditions before cooking commences. They also noted that proper executionof a standardized protocol is imperative for obtaining accurate and repeatableshear force measurement. Their final comment, ‘until a standardized protocolis uniformly adopted, it is not valid to compare Warner–Bratzler shear forcevalues among institutions or use shear force thresholds developed at other institutions.’
Aeschlimann and Beckett (2000) coordinated a study among 32 laboratoriesin eight countries of factors affecting chocolate viscosity with the goal ofimproving the standard method for measuring viscosity of chocolate publishedby the International Office of Cocoa, Chocolate and Sugar Confectionery. Thefirst ring test in this study showed a wide range of values for the Casson plasticviscosity and Casson yield value on three different chocolates (Table 9.3).Factors that were found to affect the viscosity values were:
(1) Traces of moisture thicken the chocolate. The use of a water bath tomaintain constant temperature must be avoided. Chocolate must bemelted in sealed containers.
(2) The fat in the chocolate must be completely melted because unmeltedcrystals reduce the liquid phase and increase the viscosity. Any choco-late below 40°C should be placed in an oven at 52°C for a minimum of75 min before a viscosity measurement is performed.
(3) Changes in the milk protein that occur after storing the chocolate in liq-uid form for extended periods increase the thickness of milk chocolate.Milk chocolates should be melted for a maximum of 2–3 h beforemeasuring the viscosity.
(4) The viscosity of chocolate decreases 1.2% to 3.8% per 1°C tempera-ture increase. Close temperature control is essential. Large temperaturevariations were found in one laboratory where the connecting pipesfrom the circulator had been connected backwards.
(5) The geometry of cup and bob viscometers affects the measurement.One laboratory that used a wider gap gave outlier data as compared tothe other laboratories.
336 Selection of a Suitable Test Procedure
Table 9.2 Comparison of Warner–Bratzler Shear Force on Beef Longissimus Muscle among Five Institutions
Normal institution procedure Standardized protocol
Institution n Mean Standard deviation Range n Mean Standard deviation Range
A 53 4.7 1.1 2.6–7.6 89 5.1 1.7 2.6–10.7B 52 2.9 0.5 1.7–4.0 90 4.3 1.2 2.1–7.1C 52 3.2 0.8 2.0–5.4 90 4.6 1.5 2.2–10.7D 52 3.4 0.9 2.1–6.6 90 4.2 1.3 2.0–7.7E 52 3.4 0.7 2.5–5.4 89 3.7 1.5 1.7–8.3
Source: Data from Wheeler et al. (1997). Reprinted from J. Animal Science 75, page 2427. Copyright by Journal of Animal Science.n, number of samples tested; Warner–Bratzler shear force expressed in kg force.
Chap-09.qxd 1/10/02 4:17 PM Page 336

(6) One laboratory whose viscometer was out of calibration also gave outlier data.
(7) When the cylinder and bob were thoroughly defatted using1,1,1,trichloroethane the Casson plastic viscosity decreased 5.5% andthe yield value 6.5%.
(8) A viscometer using cone and plate geometry gave significantly differentresults from viscometers using concentric cylinder geometry.
The three examples cited above demonstrate that meticulous care must betaken in every aspect of a texture test. Nothing should be taken for granted.Regular calibration of the instrument and a standardized procedure for prepar-ing the sample and presenting it to the instrument are critical for reproducibleresults. One should regard compilations of texture data with skepticismbecause much of that data may be wrong and it is difficult to know which dataare reliable and which worthless.
From time to time some group attempts to calibrate instruments against a‘standard product.’ Bourne (1972a) reviewed attempts to find a standard refer-ence material that could be tested in the instrument in the same manner as food.These have included asbestos sheet, solid rubber, foam rubber, silicone rubber,filter paper, blotting paper, foamed plastics, plastic sheets, paraffin wax, metalfoil, a specified brand of cigarettes, resins, ‘Play Do,’ ‘Buz,’ gels, putty, and asingle batch of dried peas canned with calcium chloride. Every one of theseefforts to find a ‘standard product’ has been a failure. Bourne (1972a) predictedthat the search for a standard product to calibrate instruments will continue to beunsuccessful and cited the following reasons:
(1) Textural properties of the standard material generally bear only a faintresemblance to the textural properties of the food for which it is sup-posed to act as standard. Even when it matches one textural property ofthe food, it fails to match the other textural properties.
(2) The manufacturer’s specifications generally take little account of thephysical properties that are of interest to a food rheologist. For example,
Calibration 337
Table 9.3 Casson Yield Values and Plastic Viscosities for Three Chocolates Tested on 22Viscometers in 13 Laboratories
Milk Milk Dark Chocolate 1 Chocolate 2 Chocolate
Casson plastic viscosity (Pa�s)Mean 4.1 3.2 2.6Range 2.7–5.5 2.2–4.6 2.1–3.9
Casson yield value (Pa)Mean 8 12 20Range 4–16 2–18 4–32
Source: Aeschlimann and Beckett (2000). Reprinted from J. Texture Studies 31, page 543.Copyright by Food and Nutrition Press Inc.
Chap-09.qxd 1/10/02 4:17 PM Page 337

paraffin wax and other petroleum fractions are extremely variable mate-rials (Barry and Grace, 1971) and their physical properties change rapidly with temperature.
(3) Suppose some material was found that resembled the textural proper-ties of a food; there is no assurance that the manufacturer would orcould maintain those properties precisely from batch to batch or fromyear to year. Each manufacturer has their own specifications and sincethe product is usually nonfood it would be sheer coincidence if thephysical properties of the product matched those of a food and main-tained that match over a long period of time and under a wide range ofclimate conditions.
(4) The manufacturer is not aware that their product is being used as a stan-dard material by the food industry. Even if they knew, the sales volumefor this purpose would be too small to warrant the special effort to givethe food market the highly standardized product it wanted.
Bourne (1972a) also pointed out that only functions of force, distance, andtime are involved in specifying the textural properties of foods. These func-tions may be numerous and complex in nature, but it is unlikely that any vari-able other than force, distance, or time is involved. The logical approach toinstrument standardization would be to standardize in units of force, distance,time or some combination of these (e.g. work) because they are fundamentalstandards that are completely reproducible at all times.
The main problem in standardizing many instruments is the friction betweenthe moving parts of the test cells and slip in rotational viscometers. The fric-tional error varies from instrument to instrument because of small differencesin dimensions or alignment of the working parts. In a single instrument, thefriction can vary from test to test for several reasons:
(1) Working parts may be bent, twisted, dented, or otherwise misalignedduring a test.
(2) Frictional force is not constant throughout the working stroke.(3) Particles of food, especially skin and fibers, may jam between the
moving parts causing a temporary increase in friction.(4) Liquid exuding from the food may act as a lubricant, causing a
temporary decrease in friction.(5) Food material can build up on the working parts and increase the
friction if these are not thoroughly cleaned after each test.
Hence, the degree of error caused by friction cannot be standardized. Thisis a compelling reason to give preference to test cell geometries in which therecan be no friction between the parts of the test cell.
There is one potential exception to the bleak picture in this search for refer-ence materials – the calibration of viscometers with a Newtonian fluid. Theviscosity of a Newtonian fluid is a physical property that is precisely definedin fundamental units and is completely reproducible. Consequently, the
338 Selection of a Suitable Test Procedure
Chap-09.qxd 1/10/02 4:17 PM Page 338

calibration of a viscometer with a Newtonian fluid may be effective, providedthe material to be tested is also Newtonian. Unfortunately, there are few liquidfoods that exhibit Newtonian behavior and this restricts the applicability of themethod. Even then there is no guarantee of success. The report by Prentice andHuber (1983), discussed earlier, showed poor agreement between eight labo-ratories testing two Newtonian liquids, sugar syrup and vegetable oil. Withrotational viscometers one must always be alert to the possibility of slipbetween the food and the moving surface. Other artifacts often found in rota-tional viscometers are lack of concentricity and inertial effects of the rotatingmember. Some of the viscosity data cited in tables in this book may be unreli-able because of unnoticed slip, lack of concentricity or inertia of the bob.
Bourne (1972a) expressed the opinion that we cannot have satisfactory reference materials until each of the textural properties of foods is defined as rigorously as the viscosity of a Newtonian fluid, and until products that possess each of these properties in pure form can be supplied. Even then, theproblem of friction between moving parts will remain. Food rheologistsshould give up the wild goose chase of searching for a test material that willovercome deficiencies in test cell design and instrument operation. It would bea better procedure to concentrate on designing the friction out of the test cellsand calibrate the instruments in fundamental units of force, distance, or timeand to recalibrate the instruments on a regular basis.
There are a number of organizations around the world, such as the AmericanSociety for Testing and Materials, that are dedicated to establishing writtenprotocols for calibration and operation of instruments and preparation of thesample to ensure that reproducible results are obtained between and amonglaboratories. Texture technologists have much to learn from the many years of experience that has been condensed into official test protocols by these standards organizations.
Calibration 339
Chap-09.qxd 1/10/02 4:17 PM Page 339

Suppliers of Textureand ViscosityMeasuring Instruments
The compilation that follows represents the best information available to theauthor at the time of writing. However, the author takes no responsibility ofthe accuracy of the information. The reader should contact the manufactureror distributor directly for the latest information on hardware, software, acces-sories, availability, delivery and price.
The price ranges are given as a rough guide to cost. Contact the manufac-turer for the latest price quotation. The price designations are as follows:
A less than $1000B $1000 to $5000C $5000 to $25,000D more than $25,000
Since the author resides in the United States it is possible that some instru-ments used in other countries are not on the following list. The author invitesinstrument makers to send him information if their instruments are not listedbelow.
Mail to M. C. Bourne, NYSAS-Cornell University, Geneva, New York14456-0462, USA.
A P P E N D I X
I
Table A I.1
Instrument Supplier Price range
Albumen Height Gauge (see Haugh Meter)
Amylograph C. W. Brabender Instruments, Inc. C50 E. Wesley StSouth Hackensack, NJ 07606, USAwww.cwbrabender.com
Applesauce Consistometer (see USDA Applesauce Consistometer)
(Continued)
App-I.qxd 1/11/02 5:13 PM Page 341

342 Suppliers of Texture and Viscosity Measuring Instruments
Table A I.1 (Continued)
Instrument Supplier Price range
Bostwick Consistometer Cole-Parmer Instrument Company A(Many laboratory supply 625 East Bunker Courthouses carry the Bostwick) Vernon Hills, IL 60061-1844, USA
www.foodtechsource.com
Brookfield Viscometers Brookfield Engineering Laboratories, Inc. B–D240 Cushing StStoughton, MA 02072-2398, USAwww.brookfieldengineering.com
Capillary Glass Viscometers Cannon Instrument Co. A(Most laboratory supply PO Box 16houses carry capillary State College, PA 16804-0016, USAviscometers) www.cannon-ins.com
Cole-Parmer Instrument Company625 East Bunker CourtVernon Hills, IL 60061-1844, USAwww.foodtechsource.com
Chatillon Testers Ametek, Inc. A8600 Somerset DriveLargo, FL 33773, USAwww.ametek.com
Wagner Instruments APO Box 1217Greenwich, CT 06836, USAwww.wagnerforce.com
Consistometer (see Adams. Bostwick, USDA, FMC Consistometers)
Effi-Gi Tester Effi-Gi Fruit Tester Avia Real 6348011 Alfonsine RAItalyemail: fucchini.itaweb.com
The US Distributors: Wagner InstrumentsPO Box 1217Greenwich, CT 06836, USAwww.wagnerforce.com
Wilson International1104 E. MeadYakima, WA 98903, USAwww.wilsonirr.com
Electromyography BioResearch, Inc. C4113 N. Port Washington RoadMilwaukee, WI 53212-1029, USAwww.biojva.com
Extensigraph C. W. Brabender Instruments Co. C50 E. Wesley StSouth Hackensack, NJ 07606, USAwww.cwbrabender.com
(Continued)
App-I.qxd 1/11/02 5:13 PM Page 342

Appendix I 343
Table A I.1 (Continued)
Instrument Supplier Price range
Farinograph C. W. Brabender Instruments Co. C50 E. Wesley StSouth Hackensack, NJ 07606, USAwww.cwbrabender.com
FMC Consistomer C. W. Brabender Instruments Co. B50 E. Wesley StSouth Hackensack, NJ 07606, USAwww.cwbrabender.com
Food Technology Corporation Food Technology Corporation C(FTC) Texture Test System 45921 Maries Road, Suite 120 (all models)(Kramer Shear Press) Sterling, VA 20166, USA
www.foodtechcorp.com
Fruit Firmness Tester BioWorks Inc. B(Firmtech2) 1621 W. University
Stillwater, OK 74074, USAemail: [email protected]
Gel Torsion Gel Consultants C2620 Lizei StRaleigh, NC 27616, USAwww.gelconsultants.com
Gilmont Viscometer Barnant Company A28W092 Commercial AvenueBarrington, IL 60010, USAwww.barnant.com
Haake Viscometers Haake Instruments Inc. B, C53 West Century RoadParamus, NJ 07652, USAwww.thermohaake.com
Haugh Meter B. C. Ames Inc. A78 Stone PlaceMelrose, MA 02176, USAwww.bcamesco.com
Instron Universal Instron Corporation D (Model 5542)Testing Machine 2500 Washington St C (Model 4442)
Canton, MA 02021, USAwww.Instron.com
Kramer Shear Press (see Food Technology Corporation Texture Test System)
Loaf Volumeter National Manufacturing, BA Division of TMCO Inc.507 “J” StLincoln, NE 68508-2935, USA
Lloyd Universal Testing Ametek, Inc. C8600 Somerset DriveLargo, FL 33773, USAwww.ametek.com
Magness-Taylor Pressure (see Puncture testers)Tester
(Continued)
App-I.qxd 1/11/02 5:13 PM Page 343

344 Suppliers of Texture and Viscosity Measuring Instruments
Table A I.1 (Continued)
Instrument Supplier Price range
Mixograph National Manufacturing, CA Division of TMCO Inc.507 “J” StLincoln, NE 68508-2935, USA
Nametre Viscometer Nametre Company C55 Wiggins AvenueBedford, MA 01730, USAwww.nametre.com
Penetrometer Petrolab Company B(Many laboratory supply 874 Albany-Shaker Roadhouses carry Penetrometers) Latham, NY 12110, USA
www.petrolab.com
Cole-Palmer Instrument Company625 East Bunker CourtVernon Hills, IL 60061-1844, USAwww.foodtechsource.com
Puncture Testers (see Ballauf, Chatillon, Effi-Gi,Magness-Taylor, Stevens)
QTS Texture Analysers (see Stevens LFRA Texture Analyser)
Rapid Visco-Analyzer Newport-Scientific Pty. Ltd.29 Gondola RoadNarrabeen (Sydney)New South Wales 2101Australiawww.newport.com.au
The North American Foss Food Technology Corp.Distributor: 10355 W. 70th St
Eden Prairie, MN 55344, USAwww.fossnorthamerica.com
Rheometrics Fluids Rheometrics Inc. ERheometer One Possumtown Road
Piscataway, NJ 08854, USAwww.rheosci.com
Stevens LFRA Texture CNS FarnellAnalyzer 1 Manor Place, Manor Way
BorehamwoodWD6 7WG, UKwww.textureanalysis.com
The US Distributor: Michael Brown & Associates, Inc.14 Locust LaneNewton, PA 18940, USAwww.stevenstextureanalyser.com
Structograph C. W. Brabender Instruments, Inc. C50 E. Wesley StSouth Hackensack, NJ 07606, USAwww.cwbrabender.com
TA.XT2 Texture Analyser Stable Micro Systems CVienna CourtLammas RoadGodalming, SurreyGU7 1YL, UKwww.stablemicrosystems.com
(Continued)
App-I.qxd 1/11/02 5:13 PM Page 344

Appendix I 345
Table A I.1 (Continued)
Instrument Supplier Price range
The North American Texture Technologies Corp.Distributors: 18 Fairview Road
Scarsdale, NY 10583, USAwww.texturetechnologies.com
Tensipresser Taketomo Electronic Co. Ltd. D1-55 Wakamatsu-ChoShinjuku-KuTokyo 162, Japan
Universal Testing Machine see Lloyd, Instron, TA.XT2Tensipresser, Wagner
USDA Applesauce Head, Standardization SectionConsistometer U.S. Department of Agriculture
Agricultural Marketing ServiceFruit and Vegetable ProgramsProcessed Products BranchStop 02471400 Independence Ave 5WWashington, DC 20250-0247, USAwww.ams.usda.gov/fv/ppbweb/
PPBfilecodes/105a15.htm
Viscometers Analytical Process Inc. A–DPO Box 131301Houston, TX 77219-1301, USAwww.analyticalprocess.com
ATS Rheosystems52 Georgetown RoadBordentown, NJ 08505, USAwww.atsrheosystems.com/�ats
Haake Instruments Inc.53 West Century RoadParamus, NJ 07652, USAwww.thermohaake.com
Nametre25 Wiggins AvenueBedford, MA 01730, USAwww.nametre.com
Rheometric Inc.One Possumtown RoadPiscataway, NJ 08854, USAwww.rheosci.com
TA Instruments Inc.109 Lukens DriveNew Castle, DE 19720-2795, USAwww.tainst.com
Wagner Universal Testing Wagner Instruments BMachines PO Box 1217
Greenwich, CT 06836-1217, USAwww.wagnerforce.com
Warner-Bratzler Shear G-R Electric Mfg. Co. BRoute 2Manhattan, KS 66502, USA
(Continued)
App-I.qxd 1/11/02 5:13 PM Page 345

346 Suppliers of Texture and Viscosity Measuring Instruments
Table A I.1 (Continued)
Instrument Supplier Price range
Zahn Viscosimeter Cole-Parmer Instrument Company A(Most laboratory supply 625 East Bunker Courthouses carry Zahn Vernon Hills, IL 60061-1844, USAviscometers in stock.) www.foodsource.com
App-I.qxd 1/11/02 5:13 PM Page 346

Effect of Temperatureon TextureMeasurements
A P P E N D I X
II
Table AII.1 Effect of Temperature on Firmness of Raw Fruits and Vegetables: Literature Values
Temp. range Change per Commodity Type of measurement (°C) 1°C increase Reference
Apple, Idared puncture 7/16 in. diam tip 2–21 force �0.42% Blanpied et al. (1978)Apple, R.I. Greening puncture 7/16 in. diam tip 2–21 force �0.39% Blanpied et al. (1978)Apple, Rome puncture 7/16 in. diam tip 2–21 force �0.61% Blanpied et al. (1978)
Apple, Baldwin puncture 1/4 in. diam tip 2–33 rupture stress �0.44% Fletcher (1975)rupture strain �0.58%rupture energy �0.27%
Blackberry, Erie puncture 0.060 mm diam tip 13–26 force �0.92% Hawkins and Sando (1920)Blackberry, Erie puncture 0.060 mm diam tip 13–27 force �0.83% Hawkins and Sando (1920)Blackberry, Lawton puncture 0.060 mm diam tip 13–28 force �1.07% Hawkins and Sando (1920)Blackberry, Lawton puncture 0.060 mm diam tip 13–25 force �1.52% Hawkins and Sando (1920)Blackberry, Wachuset puncture 0.060 mm diam tip 16–26 force �2.30% Hawkins and Sando (1920)Blackberry, unknown puncture 0.060 mm diam tip 13–26 force �2.01% Hawkins and Sando (1920)
varietyBlackberry, unknown puncture 0.060 mm diam tip 12–27 force �0.90% Hawkins and Sando (1920)
variety
Cherry, Napoleon puncture 2 mm diam tip 0–32.2 force �0.93% Hartman and Bullis (1929)Cherry, Montmerency puncture 0.068 mm diam tip 16–27 force �1.95% Hawkins and Sando (1920)Cherry, Montmerency puncture 0.068 mm diam tip 13–29 force �1.12% Hawkins and Sando (1920)
Pears, Bartlett puncture 1/2 in. diam tip 0.6–36.1 force �0.38% Hartman (1924)
Peas, Admiral size 2 FMC Tenderometer 2–49 �0.30 Tenderometer units Martin et al. (1938)Peas, Admiral size 4 FMC Tenderometer 2–49 �0.31 Tenderometer units Martin et al. (1938)Peas, Alaska size 2 FMC Tenderometer 2–49 �0.46 Tenderometer units Martin et al. (1938)Peas, Alaska size 4 FMC Tenderometer 2–49 �0.48 Tenderometer units Martin et al. (1938)
Peas, Tall Alderman FMC Tenderometer 2–45 �0.48 Tenderometer units, Campbell (1942)early season
Peas, Tall Alderman FMC Tenderometer 2–45 �0.40 Tenderometer units, Campbell (1942)late season
(Continued)
App-II.qxd 1/10/02 3:49 PM Page 347

348 Effect of Temperature on Texture Measurements
Table AII.1 (Continued)
Temp. range Change per Commodity Type of measurement (°C) 1°C increase Reference
Peas, 4 varieties FMC Tenderometer not stated �0.5 Tenderometer units Makower et al. (1953)
Peas, test 1 Ottawa Pea Tenderometer 18–32 �0.27 kg force Voisey and Nonnecke (1972)Peas, test 2 Ottawa Pea Tenderometer 18–32 �0.16 kg force Voisey and Nonnecke (1972)
Raspberry, black puncture 0.121 mm diam tip 14–25 force �2.60% Hawkins and Sando (1920)
Raspberry, red puncture 0.313 mm diam tip 16–27 force �2.20% Hawkins and Sando (1920)Raspberry, red puncture 0.313 mm diam tip 16–28 force �2.16% Hawkins and Sando (1920)
Strawberry, Cooney puncture 0.636 mm diam tip 16–29 force �1.08% Hawkins and Sando (1920)Strawberry, Cooney puncture 0.636 mm diam tip 13–24 force �2.54% Hawkins and Sando (1920)Strawberry, Cooney puncture 0.636 mm diam tip 16–26 force �3.21% Hawkins and Sando (1920)Strawberry, Cooney puncture 0.636 mm diam tip 16–23 force �3.14% Hawkins and Sando (1920)Strawberry, No. 29-5 puncture 0.636 mm diam tip 16–29 force �2.92% Hawkins and Sando (1920)Strawberry, unnamed puncture 0.636 mm diam tip 13–23 force �2.53% Hawkins and Sando (1920)
varietyStrawberry, unnamed puncture 0.636 mm diam tip 16–30 force �1.93% Hawkins and Sando (1920)
variety
Strawberry, Fletcher puncture, Dunkley pitter 2–43.5 force �1.06% Ourecky and Bourne (1968)Strawberry, Fortune puncture, Dunkley pitter 2–43.5 force �1.00% Ourecky and Bourne (1968)Strawberry, Frontenac puncture, Dunkley pitter 2–43.5 force �1.19% Ourecky and Bourne (1968)Strawberry, NY 844 puncture, Dunkley pitter 2–43.5 force �0.67% Ourecky and Bourne (1968)
Strawberry 1928 puncture 1/4 in. diam tip 0–21.1 force �1.36% Rose et al. (1934)Strawberry 1933 deformationa 0–21.1 force �0.29% Rose et al. (1934)Strawberry 1934 deformationa 0–21.1 force �0.32% Rose et al. (1934)
Source: Bourne (1982). Reprinted from J. Food Science 47, page 441. Copyright by Institute of Food Technologists.a This test measured the force in grams to give a combined deformation of 7/8 in. in the fruit and spring scale.
Table AII.2 Effect of Temperature on Firmness of Raw Fruits and Vegetables
Firmness-temp coeffi. (% change in firmness
Commodity Description Type of measurement per 1°C increase)
Apple Golden Delicious, 1972 crop, stored 9 months Back extrusion �0.55Apple Golden Delicious, 1972 crop, stored 9 months Shear Press �0.43Apple Golden Delicious, 1972 crop, stored 9 months Puncture, 1/8 in. tip �0.73
Apple Golden Delicious, 1977 crop, stored 7 months Magness Taylor 7/16 in. tip �0.45Apple Golden Delicious, 1977 crop, stored 7 months Back extrusion �0.19Apple Golden Delicious, 1977 crop, stored 7 months Shear Press �0.04
Apple Idared, stored 7 months Magness Taylor 7/16 in. tip �0.32Apple Idared, stored 7 months Magness Taylor 7/16 in. tip yield point �0.42Apple Idared, stored 7 months Back extrusion �0.90Apple Idared, stored 7 months Shear Press �0.57
Apple Red Delicious, stored 1 week Back extrusion �0.23Apple Red Delicious, stored 1 week Shear Press �0.33
Apple Red Delicious, stored 7 months Magness Taylor 7/16 in. tip �0.20 Apple Red Delicious, stored 7 months Magness Taylor 7/16 in. tip yield point �0.30
(Continued)
App-II.qxd 1/10/02 3:49 PM Page 348

Appendix II 349
Table AII.2 (Continued)
Firmness-temp coeffi. (% change in firmness
Commodity Description Type of measurement per 1°C increase)
Apple Red Delicious, stored 7 months Back extrusion �0.48Apple Red Delicious, stored 7 months Shear Press �0.16
Apple Mclntosh, stored 2 weeks Magness Taylor 7/16 in. tip �0.39Apple Mclntosh, stored 2 weeks Magness Taylor 7/16 in. tip yield point �0.42Apple Mclntosh, stored 2 weeks Back extrusion �0.58Apple Mclntosh, stored 2 weeks Shear Press �0.61
Apple Rome, stored 1 week Magness Taylor 7/16 in. tip �0.08Apple Rome, stored 1 week Magness Taylor 7/16 in. tip yield point �0.12Apple Rome, stored 1 week Back extrusion �0.22Apple Rome, stored 1 week Shear Press �0.07
Apricot Morepark, firm ripe 0–30°C Magness Taylor 5/16 in. tip �0.66Apricot Morepark, firm ripe 30–45°C Magness Taylor 5/16 in. tip �1.65Apricot Morepark, soft ripe Magness Taylor 5/16 in. tip �0.72
Apricot SHA-47 Deformation to 0.3 Newton �0.15a
Apricot Vineland 60081 Deformation to 0.3 Newton �0.29a
Apricot Vineland 60081 Back extrusion �0.44
Beans, snap Early Wax, sieve size 3 Puncture, 1/8 in. tip �0.09Beans, snap Early Wax, sieve size 4 Puncture, 1/8 in. tip �0.10Beans, snap Early Wax, sieve size 5 Puncture, 1/8 in. tip �0.18Beans, snap Slim Green, sieve size 4 Puncture, 1/8 in. tip �0.11Beans, snap Slim Green, sieve size 5 Puncture, 1/8 in. tip �0.06
Beets Detroit Dark Red 2½–3 in. diam Deformation to 1 Newton �0.28a
Beets Detroit Dark Red 2½–3 in. diam Puncture, 1/8 in. tip �0.09
Carrot Chantenary, phloem tissue Puncture, 3/32 in. tip �0.12
Cherry Emperor Francis Dunkley pitter �1.11
Corn, sweet NK199 10–35°C Shear Press �1.34Corn, sweet NK199 10–35°C Back extrusion �0.44Corn, sweet Jubilee 10–35°C Shear Press �1.31Corn, sweet Jubilee 10–35°C Back extrusion �0.82Corn, sweet Deep Gold 10–35°C Shear Press �1.08Corn, sweet Deep Gold 10–35°C Back extrusion �0.35
Cucumber Marketor Deformation to 0.5 Newton �0.27a
Cucumber Marketor 0–30°C Puncture, 1/8 in. tip �0.04Cucumber Marketor 30–45°C Puncture, 1/8 in. tip �0.65
Onion Autumn Keeper 1¾–2 in. diam Deformation to 4 Newtons �0.58a
Onion Autumn Keeper 1¾–2 in. diam Puncture, Magness Taylor 5/16 in. tip �0.18
Peach Baby Gold (clingstone) 9/5/80 Deformation to 1 Newton �0.97a
Peach Baby Gold (clingstone) 9/8/80 Deformation to 1 Newton �0.22a
Peach Hale Haven (freestone) Deformation to 1 Newton �3.37a
Peach Sun Cling (clingstone) Magness Taylor 7/16 in. tip �0.74Peach Bisco (freestone) Magness Taylor 7/16 in. tip �0.75
Pear Bartlett Magness Taylor 5/16 in. tip �0.47Pear Bartlett Deformation to 1.5 Newton �0.12
Peas, green Early Sweet 11, sieve size 3, AIS 11.6% Shear Press �0.32Peas, green Early Sweet 11, sieve size 3, AIS 11.6% Maturometer �0.52Peas, green Early Sweet 11, sieve size 3, AIS 11.6% Back extrusion �0.62
(Continued)
App-II.qxd 1/10/02 3:49 PM Page 349

350 Effect of Temperature on Texture Measurements
Table AII.2 (Continued)
Firmness-temp coeffi. Type of (% change in firmness
Commodity Description measurement per 1°C increase)
Peas, green Early Sweet 11, sieve size 4, AIS 16.0% Shear Press �0.35Peas, green Early Sweet 11, sieve size 4, AIS 16.0% Maturometer �0.30Peas, green Early Sweet 11, sieve size 4, AIS 16.0% Back extrusion �0.12
Peas, green Early Sweet 11, sieve size 5, AIS 18.3% Shear Press �0.22Peas, green Early Sweet 11, sieve size 5, AIS 18.3% Maturometer �0.27Peas, green Early Sweet 11, sieve size 5, AIS 18.3% Back extrusion �0.20
Peas, green Target, sieve size 3, AIS 11.0% Shear Press �0.37Peas, green Target, sieve size 3, AIS 11.0% Maturometer �0.28Peas, green Target, sieve size 3, AIS 11.0% Back extrusion �0.26
Peas, green Target, sieve size 4, AIS 16.9% Shear Press �0.16Peas, green Target, sieve size 4, AIS 16.9% Maturometer �0.15Peas, green Target, sieve size 4, AIS 16.9% Back extrusion �0.07
Plums Stanley, firm ripe Puncture, 1/8 in. tip �0.66Plums Stanley, firm ripe Back extrusion �0.75Plums Stanley, firm ripe Deformation to 1 Newton �0.42a
Plums Severn Cross Deformation to 1 Newton �0.11a
Plums Italian prune Deformation to 1 Newton �0.61a
Plums 30-4-126 Deformation to 1 Newton �0.12a
Potato Katahdin, stored 1 month Magness Taylor 5/16 in. tip �0.02Potato Katahdin, stored 7 months Magness Taylor 5/16 in. tip �0.06Potato Katahdin, stored 1 month Deformation to 0.25 Newton �0.28a
Potato Katahdin, stored 7 months Deformation to 0.25 Newton �0.12a
Potato Monona, stored 1 month Magness Taylor 5/16 in. tip �0.10Potato Monona, stored 7 months Magness Taylor 5/16 in. tip �0.06Potato Monona, stored 1 month Deformation to 0.25 Newton �0.28a
Potato Monona, stored 7 months Deformation to 0.25 Newton �0.35a
Potato Russet Burbank, stored 1 month Magness Taylor 5/16 in. tip �0.06Potato Russet Burbank, stored 7 months Magness Taylor 5/16 in. tip �0.04Potato Russet Burbank, stored 1 month Deformation to 0.25 Newton �0.14a
Potato Russet Burbank, stored 7 months Deformation to 0.25 Newton �0.09a
Strawberry Honeoye, mean size 6.0 g 0–30°C Deformation to 1 Newton �0.46a
Strawberry Honeoye, mean size 6.0 g 30–45°C Deformation to 1 Newton �3.09a
Strawberry Canoga, mean size 6.1 g 0–30°C Deformation to 1 Newton 0a
Strawberry Canoga, mean size 6.1g 30–45°C Deformation to 1 Newton �3.48a
Strawberry Canoga, mean size 12.9 g 0–30°C Deformation to 1 Newton �0.09a
Strawberry Canoga, mean size 12.9 g 30–45°C Deformation to 1 Newton �7.72a
Tomato New Yorker, stem end down, 1973 Deformation to 1 Newton �0.87a
Tomato New Yorker, stem end down, 1978 Deformation to 1 Newton �0.20a
Tomato Nova (plum type), sideways, 1973 Deformation to 1 Newton �0.58a
Tomato Nova (plum type), sideways, 1978 Deformation to 1 Newton �0.17a
Source: Bourne (1982). Reprinted from J. Food Science 47, pages 442, 443. Copyright by Institute of Food Technologists.aSince deformation is a softness measurement a � sign indicates the product decreases in firmness as the temperature rises.
App-II.qxd 1/10/02 3:49 PM Page 350
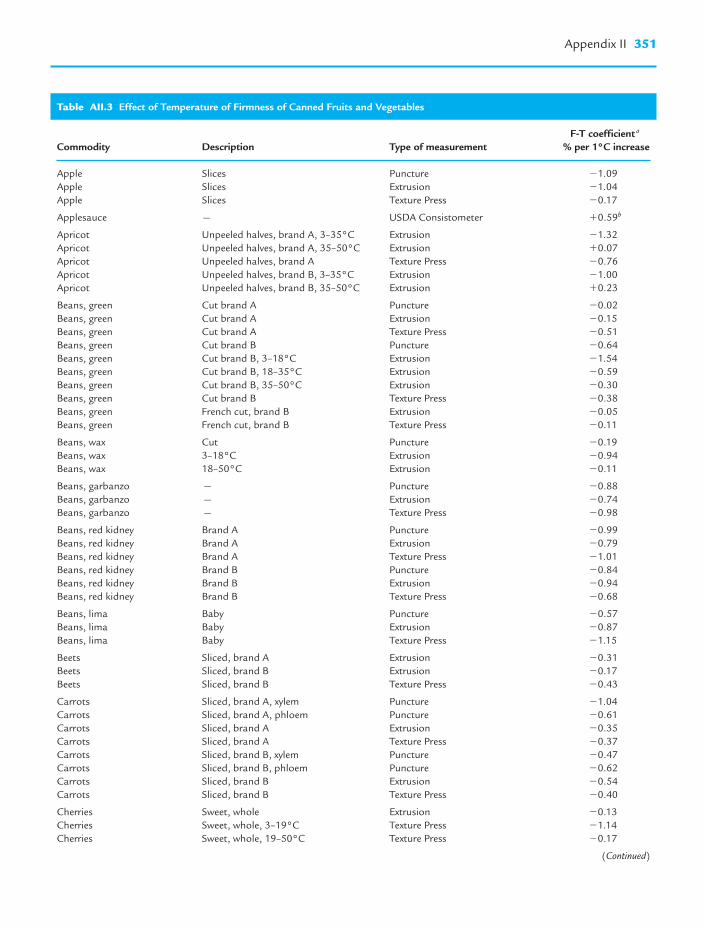
Appendix II 351
Table AII.3 Effect of Temperature of Firmness of Canned Fruits and Vegetables
F-T coefficient a
Commodity Description Type of measurement % per 1°C increase
Apple Slices Puncture �1.09Apple Slices Extrusion �1.04Apple Slices Texture Press �0.17
Applesauce — USDA Consistometer �0.59b
Apricot Unpeeled halves, brand A, 3–35°C Extrusion �1.32Apricot Unpeeled halves, brand A, 35–50°C Extrusion �0.07Apricot Unpeeled halves, brand A Texture Press �0.76Apricot Unpeeled halves, brand B, 3–35°C Extrusion �1.00Apricot Unpeeled halves, brand B, 35–50°C Extrusion �0.23
Beans, green Cut brand A Puncture �0.02Beans, green Cut brand A Extrusion �0.15Beans, green Cut brand A Texture Press �0.51Beans, green Cut brand B Puncture �0.64Beans, green Cut brand B, 3–18°C Extrusion �1.54Beans, green Cut brand B, 18–35°C Extrusion �0.59Beans, green Cut brand B, 35–50°C Extrusion �0.30Beans, green Cut brand B Texture Press �0.38Beans, green French cut, brand B Extrusion �0.05Beans, green French cut, brand B Texture Press �0.11
Beans, wax Cut Puncture �0.19Beans, wax 3–18°C Extrusion �0.94Beans, wax 18–50°C Extrusion �0.11
Beans, garbanzo — Puncture �0.88Beans, garbanzo — Extrusion �0.74Beans, garbanzo — Texture Press �0.98
Beans, red kidney Brand A Puncture �0.99Beans, red kidney Brand A Extrusion �0.79Beans, red kidney Brand A Texture Press �1.01Beans, red kidney Brand B Puncture �0.84Beans, red kidney Brand B Extrusion �0.94Beans, red kidney Brand B Texture Press �0.68
Beans, lima Baby Puncture �0.57Beans, lima Baby Extrusion �0.87Beans, lima Baby Texture Press �1.15
Beets Sliced, brand A Extrusion �0.31Beets Sliced, brand B Extrusion �0.17Beets Sliced, brand B Texture Press �0.43
Carrots Sliced, brand A, xylem Puncture �1.04Carrots Sliced, brand A, phloem Puncture �0.61Carrots Sliced, brand A Extrusion �0.35Carrots Sliced, brand A Texture Press �0.37Carrots Sliced, brand B, xylem Puncture �0.47Carrots Sliced, brand B, phloem Puncture �0.62Carrots Sliced, brand B Extrusion �0.54Carrots Sliced, brand B Texture Press �0.40
Cherries Sweet, whole Extrusion �0.13Cherries Sweet, whole, 3–19°C Texture Press �1.14Cherries Sweet, whole, 19–50°C Texture Press �0.17
(Continued)
App-II.qxd 1/10/02 3:49 PM Page 351

352 Effect of Temperature on Texture Measurements
Table AII.3 (Continued)
F-T coefficient a
Commodity Description Type of measurement % per 1°C increase
Corn Whole kernel, brine, 3–18°C Puncture �0.55Corn Whole kernel, brine, 18–50°C Puncture �0.08Corn Whole kernel, brine, brand A Texture Press �0.48Corn Cream style, kernels, brand A Puncture �0.15Corn Whole Kernel, brand B Extrusion �0.42Corn Whole Kernel, brand B Texture Press �0.49Corn Cream style Extrusion �1.28Corn Cream style TUC Cream Corn Meter �0.33a
Peach Clingstone Extrusion �0.66Peach Clingstone Texture Press �0.75Peach Freestone Extrusion �0.76Peach Freestone, 30–36°C Texture Press �0.38Peach Freestone, 36–50°C Texture Press �1.97
Pears Bartlett Extrusion �0.56Pears Bartlett Texture Press �0.55
Peas Green, brand A Puncture �0.53Peas Green, brand A Extrusion �0.93Peas Green, brand A Texture Press �0.62Peas Green, brand B Puncture �0.65Peas Green, brand B Extrusion �0.67Peas Green, brand B Texture Press �0.79
Pineapple Wedges, brand A Extrusion �0.52Pineapple Wedges, brand A Texture Press �0.06Pineapple Wedges, brand B Texture Press �0.21
Plums Whole Puncture �0.90Plums Whole Extrusion �1.03Plums Whole Texture Press �0.63
Potatoes Small, whole Puncture �0.75Potatoes Small, whole Extrusion �0.81Potatoes Small, whole Texture Press �0.86
Spinach 3–18°C Extrusion �0.43Spinach 18–48°C Extrusion �1.05
Tomatoes Whole, pear shape Extrusion �0.19Tomatoes Whole, pear shape Texture Press �0.32
Source: Bourne and Conistock (1986). Reprinted from J. Food Science 51, pages 532, 533. Copyright by Institute of Food Technologists.a The firmness–temperature coefficient is the percent change in firmness per degree temperature increase.bIn the Consistometer tests a � sign indicates decreasing firmness with increasing temperature.
App-II.qxd 1/10/02 3:49 PM Page 352

Guidelines andConditions for TestingFoods
A P P E N D I X
III
Table AIII.1 Guidelines for Testing Various Foods in the Food Technology Corporation Texture Test Systema
Type of test cell
Shear– Single Meat Test Parameters Commodity compression Universal blade shear Other principle measured
FruitsApples X X Compression–shear Maximum
forcePenetration Puncture Yield point
Applesauce X Compression – Curve peak(s)orifice or back Frequency extrusion and height
Apricots X X Compression–shear Maximum force
Penetration Puncture Yield pointCherries X X Compression–shear Maximum
forcePenetration Puncture Yield point
Fruit cocktail X X Compression–shear Maximum force–curve peaks
Citrus fruit X X Compression–shear Maximum force
Mangoes X X Compression–shear Maximum force
Penetration Puncture Yield pointOlives X Compression–shear Maximum
forcePeaches X X Compression–shear Maximum
forcePenetration Puncture Yield point
Pears X X Compression–shear Maximum force
Penetration Puncture Yield point(Continued)
App-III.qxd 1/12/02 7:13 PM Page 353

354 Guidelines and Conditions for Testing Foods
Table AIII.1 (Continued)
Type of test cell
Shear– Single Meat Test Parameters Commodity compression Universal blade shear Other principle measured
Raisins X Compression–shear Maximum force
Strawberries X X Compression–shear Maximum force
Meat and poultryBeef X Compression–shear Maximum
forceX X Cutting Maximum
forceFrankfurters X Compression–shear Maximum
forceX X Cutting Maximum
forceLamb X Compression–shear Maximum
forceX X Cutting Maximum
forcePork X Compression–shear Maximum
forceX X Cutting Maximum
forceRabbit X Compression–shear Maximum
forceX X Cutting Maximum
forceLuncheon meat X Compression–shear Maximum
forceTension Tensile Maximum
force–curveslope
Thin-slice Tensile Maximum tensile force–curve
slopeChicken X Compression–shear Maximum
forceX X Cutting Maximum
forceTurkey X Compression–shear Maximum
forceX X Cutting Maximum
forcePheasant X Compression–shear Maximum
forceX X Cutting Maximum
forcePoultry bones Bending Breaking force Maximum
forceEggs Compression Breaking force Maximum
force(Continued)
App-III.qxd 1/12/02 7:13 PM Page 354

Appendix III 355
Table AIII.1 (Continued)
Type of test cell
Shear– Single Meat Test Parameters Commodity compression Universal blade shear Other principle measured
MiscellaneousGels and X Compression–shear Maximum
semisolids force–curve such as slopefats, jelly, X Cutting Maximum paste, and force–curve pharmaceuticals slope
Penetration Yield point Maximum force
X Compression – Maximum orifice or force or back extrusion curve slope
and areaCottage cheese X X Compression–shear Maximum
forceMushrooms X X Compression–shear Maximum
forceX X Cutting Maximum
forcePasta X X Compression–shear Maximum
forceRice X Thin bladed Compression–shear Maximum
forcePeanuts X X Compression–shear Maximum
forceSeeds X X Compression–shear Maximum
forceDough X Compression–shear Texture
tensile profileStems of flowers X Compression–shear Maximum
and plant forcematerial X X Cutting Maximum
forceBending Breaking point Maximum
forceCanned tuna fish X Compression–shear Maximum
forceSucculometer Compression Liquid
expressedDry or moist pet X X X Compression–shear Maximum
food forceCanned pet food X X Penetration Puncture Yield pointBread and bread X Compression–shear Maximum
products forceX Cutting Maximum
forceThin-slice Tensile Maximum
tensile force–curve slope(Continued)
App-III.qxd 1/12/02 7:13 PM Page 355
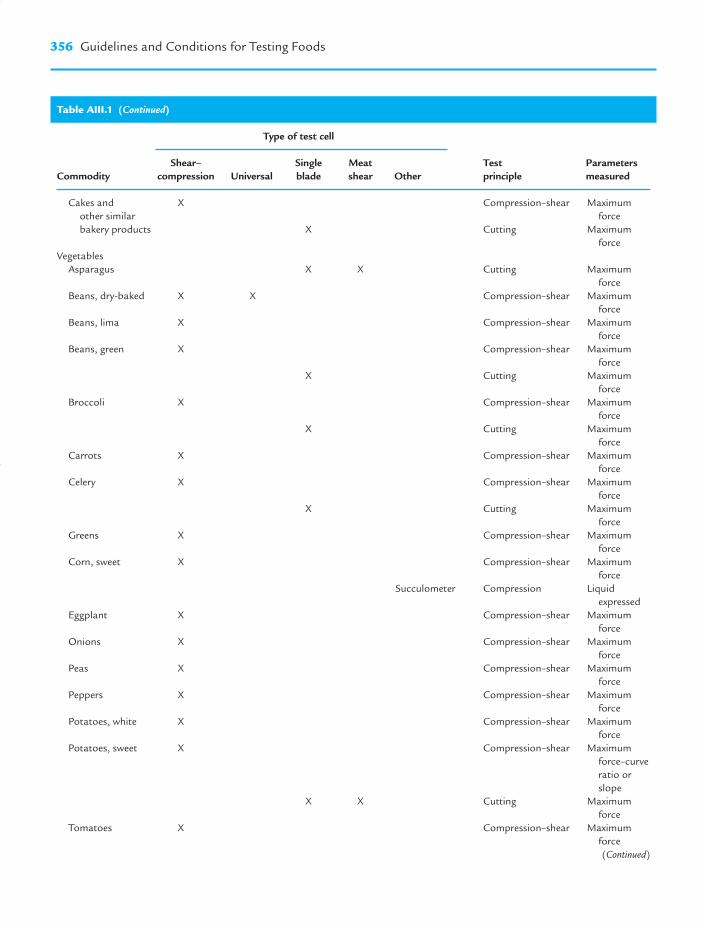
356 Guidelines and Conditions for Testing Foods
Table AIII.1 (Continued)
Type of test cell
Shear– Single Meat Test Parameters Commodity compression Universal blade shear Other principle measured
Cakes and X Compression–shear Maximum other similar forcebakery products X Cutting Maximum
forceVegetables
Asparagus X X Cutting Maximum force
Beans, dry-baked X X Compression–shear Maximum force
Beans, lima X Compression–shear Maximum force
Beans, green X Compression–shear Maximum force
X Cutting Maximum force
Broccoli X Compression–shear Maximum force
X Cutting Maximum force
Carrots X Compression–shear Maximum force
Celery X Compression–shear Maximum force
X Cutting Maximum force
Greens X Compression–shear Maximum force
Corn, sweet X Compression–shear Maximum force
Succulometer Compression Liquid expressed
Eggplant X Compression–shear Maximum force
Onions X Compression–shear Maximum force
Peas X Compression–shear Maximum force
Peppers X Compression–shear Maximum force
Potatoes, white X Compression–shear Maximum force
Potatoes, sweet X Compression–shear Maximum force–curve ratio or slope
X X Cutting Maximum force
Tomatoes X Compression–shear Maximum force(Continued)
App-III.qxd 1/12/02 7:13 PM Page 356

Appendix III 357
Table AIII.1 (Continued)
Type of test cell
Shear– Single Meat Test Parameters Commodity compression Universal blade shear Other principle measured
Tomatoes, paste X Compression – Maximum orifice or force–flow back extrusion rate
Source: Compiled by Dr B. A. Twigg.aNote: Sample size and method of presenting sample (diced, whole, stripped, etc.) will vary within and among commodities, depending on purpose of test, test cell used, and the nature of the commodity. For example, size could be one discreet unit, full cell filled by volume or weighted sample that best accommodates the commodity and test cell. Various sample sizes and methods of presenting sample should be investigated, unless specific working conditions are recommended by the literature or by the manufacturer.
App-III.qxd 1/12/02 7:13 PM Page 357

358G
uidelines and Conditions for Testing Foods
Table AIII.2 Conditions for Testing Foods in the Instron
Crosshead Chart speed Full-scale Parameter Commodity Test principle Test cell speed (cm min��1) (cm min��1) force (N) measured
Agar gel Deformation Flat plate, 14.5 cm diam 0.1 20 2 �D between 1 and 2 NAgar gel Puncture Rectangular punches 30 20 50 Yield point forceApple, whole, skin off Puncture 7/16-in.-diam Magness– 20 20 100–200 Yield point force and
Taylor tip force at 5/16-in. penetration
Apple, slice Back extrusion 10.15-cm i.d., 4-mm 20 20 500–1000 Maximum plateau annulus force
Apple, slice Compression– Standard Kramer Shear cell 20 20 1000–2000 Maximum forceextrusion–shear
Apple, slice Puncture 1/8-in.-diam punch 30 10 10 Maximum forceApple, 1.2 cm cube TPAa Flat plate, 7 cm diam 5 50 50–200 All TPA parametersApple, whole Relaxation, recovery Flat plate, 14.5 cm diam 1 5 500 �F for 2 minApricot, whole Deformation Flat plate, 14.5 cm diam 1 30 1 �D between 0.05 and
0.35 NApricot, skin off Puncture 5/16-in.-diam Magness– 30 10 10–20 Yield point force and
Taylor tip force at 5/16-in. penetration
Banana, skin off Deformation 3/8-in.-diam punch 0.2 50 5 �D between 0.5 and 1.5 N
Beans, pea, red kidney Puncture 1/8-in.-diam punch 30 10 20–50 Maximum forcesoy, cooked
Beans, green, raw Puncture 1/8-in.-diam punch 20 10 50 Maximum forceBeans, green, raw Back extrusion 7.35-cm i.d., 4-mm annulus 20 10 1000–2000 Maximum plateau
forceBeans, green, canned Back extrusion 10.15-cm i.d., 4-mm annulus 30 10 1000 Maximum plateau
forceBeef, cooked, 1-cm cube TPA Flat plate, 7 cm diam 5 50 100–200 Texture profile
parametersBeets, red, canned Back extrusion 10.15-cm i.d., 4-mm annulus 20 20 2000 Maximum plateau
forceBeets, red, whole, raw Deformation Flat plate, 14.5 cm diam 0.5 50 2 �D between 0.1 and
1.1 NBeets, blanched, TPA Flat plate, 7 cm diam 5 50 10 Texture profile
1-cm cube parametersBologna Deformation Flat plate, 14.5 cm diam 1 10 20 �D between 0.5 and
10.5 NBread, roll Deformation Flat plate, 14.5 cm diam 1 10 20 �D between 0.5 and
10.5 NBread, ½-in. cube TPA Flat plate, 7 cm diam 5 50 2 Texture profile
parameters
App-III.qxd 1/12/02 7:13 PM Page 358

Appendix III
359Bun, hamburger Deformation Flat plate, 14.5 cm diam 1 5 20 �D between 0.5 and
10.5 NCandy, rock Deformation Flat plate, 7 cm diam 0.1 50 20 �D between 0.5 and
10.5 NCarrot, raw, cylinders Deformation Flat plate, 7 cm diam 0.2 50 2 �D between 0.05 and
2 mm thick � 1.05 N7.3 mm diam
Carrot, raw Puncture 3/32-in.-diam punch 20 10 20 Yield pointCarrot, raw, TPA Flat plate, 7 cm diam 1 20 100–500 Texture profile
1 cm diam � parameters2 cm high
Carrot, canned Back extrusion 10.15-cm-i.d., 4-mm annulus 30 10 1000 Maximum forceCheese, cream TPA Flat plate, 7 cm diam 5 50 500 Texture profile
parametersCheese, cheddar Puncture Rectangular punches 10 10 20 Maximum forceCherries (sweet and Puncture Single Dunkley pitter 20 5 100 Maximum force
Montmorency)Cherries (sweet and Multiple puncture Array of 30 Dunkley pitters 10 20 1000–2000 Maximum force
Montmorency)Cherries (sweet and Puncture 1/8-in.-diam punch 20 5 10 Maximum force
Montmorency), pittedCherry pie filling Back extrusion 10.15-cm-i.d., 4-mm annulus 10 20 2000 Maximum forceChocolate bars Snap Triple-beam assembly, 4.3 cm 5 50 200 Maximum force
clearance between supporting beams
Cookies, ginger snap Snap Triple-beam assembly, 4.3 cm 5 50 20 Maximum forceclearance between supporting beams
Corn, sweet, cut kernels Back extrusion 10.15-cm-i.d., 4-mm annulus 20 20 5000–20,000 Maximum forceCorn, sweet, on cob Puncture Diameters of 0.052, 20 20 10–20 Maximum force
0.076, 0.101, 0.128 in.Cucumber, whole Deformation 14.5-cm-diam plate 0.5 50 1 �D between 0.05 and
0.55 NCucumber, whole Puncture 1/8-in.-diam punch 20 20 20 Yield pointCustard, egg Puncture 1.13-cm-diam punch 0.5 50 0.2 Yield pointCranberries, raw Deformation 2-cm-diam plate 0.2 50 1 �D between 0.02 and
0.27 NEgg, whole Deformation Flat plate, 7 cm diam 0.05 50 10 �D between 0 and
10 NFrankfurter, beef Deformation Flat plate, 14.5 cm diam 1 10 20 �D between 0.5 and
10.5 NFrankfurter, beef TPA Flat plate, 7 cm diam 5 50 1000 Texture profile
parameters(Continued)
App-III.qxd 1/12/02 7:13 PM Page 359

360G
uidelines and Conditions for Testing Foods
Table AIII.2 (Continued)
Crosshead Chart speed Full-scale Parameter Commodity Test principle Test cell speed (cm min��1) (cm min��1) force (N) measured
Gari TPA Flat plate, 7 cm diam 5 50 20–100 Texture profile parameters
Grapes, single berry Puncture 1/16-in.-diam punch 2 40 5–20 Maximum forceGrapes, single berry Deformation 2-cm-diam plate 2 50 1 �D between 0.05 and
0.65 NLettuce, whole head Deformation Flat plate, 14.5 cm diam 1 10 20 �D between 0.5 and
10.5 NMarshmallow Deformation Flat plate, 7 cm diam 1 10 2 �D between 0.05 and
1.05 NOnions, boiled Puncture 1/8-in.-diam punch 30 30 5–10 Yield pointPeas, green, raw Multiple puncture Matuometer, 143 � 20 10 2000 Maximum force
1/8-in.-diam punchesPeas, green, raw Puncture Single 1/8-in.-diam punch 30 10 20–50 Maximum forcePeas, green, raw Back extrusion 10.15-cm-i.d., 4-mm annulus 20 20 2000–10,000 Maximum forcePeas, green, canned Back extrusion 10.15-cm-i.d., 4-mm annulus 20 20 2000 Maximum forcePeas, green, raw Back extrusion OTMS 20 20 5000 Maximum forcePeaches, raw, sliced Puncture 1/8-in.-diam punch 20 20 5–10 Yield pointPeaches, sliced, Back extrusion 10.15-cm-i.d., 4-mm annulus 20 20 2000–5000 Maximum force
canned or frozenPeaches, whole, raw Puncture 7/16-in.-diam Magness– 20 20 50 Maximum force
Taylor tipPeaches, fresh, TPA Flat plate, 7 in. diam 5 50 20–100 Texture profile
2 cm diam � parameters1 cm high
Pears, whole, raw Deformation Flat plate, 14.5 cm diam 2 50 2 �D between 0.25 and 1.75 N
Pears, fresh, TPA Flat plate, 7 cm diam 5 50 50–200 Texture profile 2 cm diam � parameters1 cm high
Pickle, cucumber slice Puncture 0.086-in.-diam punch 20 10 20 Maximum forcePretzel, large, TPA Flat plate, 7 cm diam 5 50 5000 Texture profile
1-cm-high piece parametersPotato, whole, raw Deformation 0.77-cm-diam punch 0.2 50 1 �D between 0.06 and
with potato nestled 0.26 Nin a bed of sand
Potato chip Deformation 5/16-in.-diam probe, 1 50 2 Slope of initial linechip rests on a 3-cm-ring
Protein foam Puncture 1.25-cm-diam punch 10 50 0.1–0.5 Inflection pointPlums, fresh, pitted Back extrusion 10.15-cm-i.d., 4-mm annulus 20 20 20,000 Maximum forcePlums, fresh, pitted Puncture 1/8-in.-diam punch 20 20 20–50 Yield point
App-III.qxd 1/12/02 7:13 PM Page 360

Appendix III
361Soymeat analog, TPA Flat plate, 7 cm diam 5 50 100 Texture profile
1-cm cube parametersStrawberries, whole, raw Punch Flat face, Dunkley pitter 50 5 20 Maximum forceSauerkraut, 25-g sample Compression Flat plate, compress to 5 40 10,000–20,000 Maximum force
1 mm clearanceTofu (soy curd) Punch 1/8-in.-diam punch 10 10 5 Yield pointTomatoes, raw, whole Deformation Flat plate, 7 cm diam 2 50 5 �D between 0.1 and
1.1 NTurkey, roll, sliced Tensile Clamp at each end 1 5 100–200 Maximum force
Compiled by M. C. Bourne and S. Comstock.a TPA, Texture Profile Analysis.
App-III.qxd 1/12/02 7:13 PM Page 361

362 Guidelines and Conditions for Testing Foods
Table AIII.3 Conditions for Testing Foods Using the TA.XT2 Texture Analyzer
Crosshead Parameter Property Commodity Test principle Probe/Fixture speed (mm s��1) measured measured
Apple, whole Puncture 2 mm diam 1.5 Yield point Bioyield point and cylinder probe force and flesh firmness
distance and mean plateau force
Apple, whole Relaxation, Flat plate/cylinder 0.02 Distance at yield Potential to recovery probe larger than point bruising
sampleApple puree Back extrusion 40 mm diam extrusion 2 Maximum force, Consistency
disk area under positive and negative curve regions
Baking fats Forward extrusion Forward extrusion rig 1 Mean plateau force Ease of with 3 mm annulus extrusion
Beans (bulk), Extrusion Ottawa cell with 5 Mean plateau force Firmnesscooked 17-bladed extrusion
plateBiscuits/cookies/ Bending Three-point bending rig 3 Maximum force Hardness and
crackers, whole and distance at fracturabilitybreak
Biscuit/cookie dough Penetration Dough preparation set 3 Maximum force Firmnessand 6 mm cylinderprobe
Boiled sweets, single Penetration 2 mm diam cylinder 1 Maximum force Hardness and probe and distance at fracturability
maximum forceBreadcrumbs, Compression 35 mm diam cylinder 1 Maximum force Hardness
monolayer probeBread dough Uniaxial tension Kieffer dough 3.3 Maximum force Resistance to
extensibility rig and distance at extension and max. force extensibility
Bread dough Tension Chen–Hoseney 10 Maximum force, Stickiness, work of Dough Stickiness area under curve adhesion and cell and distance to cohesiveness
separationBread, roll Compression Flat plate/cylinder 2 Maximum force Firmness
probe larger than sample
Bread, sliced Penetration Radiused 36 mm 1.7 Force at 25% strain Firmnessdiam cylinder probe (AACC 74-09 standard)
Breakfast cereal, Compression Ottawa cell and 5 Maximum force, Hardness and dry and wet watertight linear distance crispness
base plate and no. of �ve ‘Bowl life’force peaks
Breakfast toaster Shearing Knife blade 1 Peak forces and Pastry firmness pastries, whole mean force of and filling
plateau region softnessbetween peaks
(Continued)
App-III.qxd 1/12/02 7:13 PM Page 362

Appendix III 363
Table AIII.3 (Continued)
Crosshead Parameter Property Commodity Test principle Probe/Fixture speed (mm s��1) measured measured
Butter/margarine – Penetration 5 mm diam 2 Maximum force, Firmness and contained cylinder probe �ve area work of
under curve penetrationButter/margarine – Penetration 45° conical probe 1 Distance moved Firmness
contained during 5 s of applied force
Butter/margarine Penetration/ TTC spreadability rig 3 Maximum �ve Firmness and extrusion force and spreadability
�ve area under curve
Butter/margarine – Shearing Wire cutter 0.5 Mean force over Firmnessblock form plateau region
Cake Compression/ Radiused 36 mm 1 Force at 25% Firmness, stress-relaxation diam cylinder probe strain and ratio springiness
(AACC standard) of forces at (ability to beginning and recover)end of relaxation period
Caramel Penetration 0.75 in. Spherical 5 Maximum �ve Hardness, ball probe force, maximum stickiness and
�ve force and stringinessdistance to separation
Carrot, raw Bending 3-point bending rig 2 Maximum force Firmness and batons and distance flexibility
at breakCarrot, cylinders Compression Flat plate/cylinder 1 Maximum force Hardness
(cooked or raw) probe larger than sample
Cereal bars Shearing 5-bladed Kramer 2 Maximum force Hardnessshear cell
Cheese, cream Penetration 5 mm diam 1 Maximum force Softness(contained) cylinder probe
Cheese, cream Penetration 45° conical probe 1 Maximum force Softness(contained)
Cheese, spread Penetration/ TTC spreadability rig 3 Maximum �ve Firmness and extrusion force and spreadability
�ve area under curve
Cheese, spread Penetration 1 in. spherical probe 2 Maximum �ve Firmness and (contained) force and stickiness
maximum�ve force
Cheese, hard – Shearing Fracture wedge set 2 Maximum force Hardness and cubes and distance brittleness
at breakCherries, single Penetration 2 mm diam cylinder 2 Maximum force Bioyield
probe and distance at point/firmnessmax. force
Chewing gum, Penetration 2 mm diam 1 Mean force over Hardnessbase pellets cylinder probe plateau region
(Continued)
App-III.qxd 1/12/02 7:13 PM Page 363

364 Guidelines and Conditions for Testing Foods
Table AIII.3 (Continued)
Crosshead Parameter Property Commodity Test principle Probe/Fixture speed (mm s��1) measured measured
Chewing gum, Uniaxial tension Tensile grips 1 Maximum force Resistance to bones and distance extension and
at break extensibilityChewing gum, Shearing Craft knife 2 1st peak force, Coating hardness,
dragees force at 7.5 mm interior and �ve area hardness and under curve work of
cutting/toughness
Chewing gum, Uniaxial tension Kieffer dough 2 Maximum force Resistance to rope (of uniform extensibility rig and distance extension and thickness) at break extensibility
Chewing gum, Bending 3-point bending rig 2 Maximum force Strength and stick and distance flexibility
at flexChewing gum, Penetration 2 mm diam 1 Maximum force Hardness
stick cylinder probeChewy Penetration 6 mm diam 2 Maximum �ve Hardness and
confectionery cylinder probe force and stickinessmaximum�ve force
Chicken (bulk), Shearing 5-bladed Kramer 3 Maximum �ve Firmness and fillets/nuggets shear cell force and �ve work of
area under curve shearingChicken, 5 mm core Shearing Warner–Bratzler 3 Maximum force Firmness/bite
blade forceChocolate, bars Penetration 2 mm diam 1.5 Maximum force Hardness
cylinder probeChocolate, bars Shearing Craft knife blade 2 Maximum force Bite forceChocolate spread Penetration/ TTC Spreadability rig 3 Maximum �ve force Firmness and
extrusion and �ve area spreadabilityunder curve
Corn, sweet, kernels Shearing 10-bladed Kramer 2 Maximum force Hardnessshear cell
Corn, sweet, Shearing Volodkevich Bite Jaws 2 Maximum force Hardnesssingle kernel
Croissants Shearing Knife blade 2 Area under curve FirmnessCroutons (bulk) Compression Ottawa cell and 1 Maximum force, Hardness and
watertight linear distance crunchiness base plate and no. of �ve ‘Bowl life’
force peaks
Egg, whole Compression Flat plate/cylinder 0.5 Maximum force Breaking force/ probe larger shell strengththan sample
Extruded snack Compression Ottawa cell with 2 Linear distance, no. Crispness and (bulk) wide blade of major force toughness
extrusion plate peaks and area under curve
Fish, raw Penetration 0.5 in. spherical probe 2 Maximum force FirmnessFondant Penetration 4 mm diam 2 1st peak force and Crust firmness
(contained) cylinder probe 2nd peak force and center firmness
(Continued)
App-III.qxd 1/12/02 7:13 PM Page 364

Appendix III 365
Table AIII.3 (Continued)
Crosshead Parameter Property Commodity Test principle Probe/Fixture speed (mm s��1) measured measured
French fries, Penetration 2 mm diam 3 1st peak force, Crust firmness andsingle cylinder probe force at 4.5 mm interior firmness
Gel (any type) Deformation Flat plate/cylinder 2 Maximum force Firmnessprobe larger than sample
Gel (any type), Puncture Cylinder probe from 2 Yield point force Rupture strength, contained 3 to 20 mm diam and distance elasticity/
at yield brittlenessGel (any type), TPA Flat plate/cylinder 3 Texture profile
cube or disc probe larger parametersthan sample
Gel (Gelatine) Puncture 0.5 in. diam 0.5 Force at 4 mm Bloom strengthISO 9665, cylinder probe penetrationcontained in (radiused)bloom jar
Gel (Gelatine) Puncture 0.5 in. diam 1 Force at 4 mm Bloom strengthGMIA, contained cylinder probe penetrationin bloom jar
Gluten Uniaxial tension Kieffer dough 3.3 Maximum force Resistance to extensibility rig and distance extension and
at max. force extensibilityGluten, disc Compression Flat plate/cylinder 10 Gradient of slope Strength
probe larger over 45 s of hold-than sample ing 100 g force
Gnocchi, testing Compression Flat plate/cylinder 2 Maximum force Firmnessof 3 pieces probe larger
than sampleGrapes, single Penetration 2 mm diam 1 Maximum force Skin strength and
cylinder probe and distance elasticityat max. force
Gummy Compression Flat plate/cylinder 1 Force at 20% strain Firmness, confectionery probe larger and ratio of springiness
than sample forces at beginning (ability to and end of recover)relaxation period
Ham, rectangular Shearing 5-bladed Kramer 2 Maximum force Firmness/shear piece shear cell force
Ice cream Penetration 6 mm diam 2 Maximum force Hardness(contained) cylinder probe
Ice cream Shearing Knife blade 3 Maximum force HardnessKetchup Back extrusion 35 mm diam 1 Maximum �ve Firmness,
(contained) extrusion disk force, �ve area, consistency and maximum �ve cohesivenessforce and�ve area
Lasagne, dry Bending 3-point bending rig 3 Maximum stress, Breaking stress, distance to fracturability break and and stiffnessgradient
Lasagne, cooked Compression and Pasta firmness/ 0.5 Maximum force StickinessTension stickiness rig and area
under curve
(Continued)
App-III.qxd 1/12/02 7:13 PM Page 365

366 Guidelines and Conditions for Testing Foods
Table AIII.3 (Continued)
Crosshead Parameter Property Commodity Test principle Probe/Fixture speed (mm s��1) measured measured
Marmalade Penetration Radiused 1 in. 2 Force at 3 mm, Gel strength, (contained) diam cylinder maximum force, rupture
probe distance at break strength, and �ve area brittleness under curve and
adhesivenessMayonnaise Back extrusion 35 mm diam 1 Maximum �ve Firmness,
(contained) extrusion disk force, �ve area, consistency and maximum �ve cohesivenessforce and�ve area
Mayonnaise Penetration 25 mm diam 1 Maximum force Firmness and (contained) cylinder probe and �ve area work of
under curve penetrationMousse Penetration 25 mm diam 1 Maximum force Firmness
(contained) cylinder probe
Olives (bulk) Shearing 5-bladed Kramer 1.5 Maximum force Firmness and shear cell and �ve area work of shear
under curve
Noodles, Tension Spaghetti tensile grips 3 Maximum force Tensile strengthsingle strand
Noodles, Compression 35 mm diam 2 Maximum �ve Firmness and three strands cylinder probe force and stickiness
max. �ve forceNuts, whole Shearing Craft knife blade 1 Force of 1st peak, Hardness of
distance at exterior, 1st peak, area fracturability to 2 mm and work to
shear
Pancakes Biaxial tension Tortilla/pastry 1 Maximum force Toughness and burst rig and distance extensibility
at breakPasta shapes Shearing 5-bladed Kramer 2 Maximum force Firmness and
(bulk) shear cell and area work of shearunder curve
Pastry, uniform Biaxial tension Tortilla/pastry 0.5 Maximum force Toughness and thickness burst rig and distance extensibilitysheets at break
Pate Penetration 10 mm diam 1.5 Maximum force Firmnesscylinder probe
Peas (bulk), raw Shearing 10-bladed Kramer 2 Maximum force Hardnessshear cell
Peas (18 pieces), Penetration Multiple pea rig 2 1st peak force and Upper and lower raw 2nd peak force skin strength
Peaches, sliced Shearing Knife blade 5 Maximum force FirmnessPears, whole Penetration 2 mm diam 1.5 Maximum force Bioyield point and
cylinder probe and mean force flesh firmnessover plateau region
(Continued)
App-III.qxd 1/12/02 7:13 PM Page 366

Appendix III 367
Table AIII.3 (Continued)
Crosshead Parameter Property Commodity Test principle Probe/Fixture speed (mm s��1) measured measured
Peppers Penetration 3 mm diam 2 Maximum force Skin strength/ cylinder probe bioyield point
Pickle (bulk) Shearing 10-bladed Kramer 3 Maximum force Firmness and shear cell and area work of
under curve shearingPizza, Tension Pizza tensile rig 5 Area under curve Toughness
rectangular section of uniform width
Potato chips Compression Ottawa cell with 2 Linear distance, Crispness and (bulk) wide blade no. of major toughness
extrusion plate force peaks and area under curve
Potato (bulk), Extrusion Ottawa cell with 1.5 Maximum force and Firmness/work of mashed holed plate area under curve extrusion
Potato salad Extrusion Ottawa cell with 1 Area under curve Firmness/work of (bulk) holed plate extrusion
Prawns (bulk) Shearing 5-bladed Kramer 3 Maximum �ve Firmness and shear cell force and work of
�ve area shearingunder curve
Pretzels, single Bending 3-point bending rig 1 Maximum force Hardness and and distance fracturabilityat break
Raspberries Extrusion Ottawa cell with 1.5 Maximum force Firmness/work of (bulk) holed plate and area extrusion
under curveRice, savoury, Compression 35 mm diam 0.5 Maximum �ve Firmness and
three grains cylinder probe force and stickinessmax. �ve force
Rice, pudding Back extrusion 40 mm diam 1 Maximum force Firmness/(contained) extrusion disk consistency
Sausages/ Shearing Warner–Bratzler 2 Maximum force Firmness/frankfurters blade and area toughness/bite
under curve forceSpaghetti, dry Bending Spaghetti flexure rig 2.5 Maximum force Breaking strength
and distance and flexibilityat break
Spaghetti, Shearing 1 mm flat Perspex 0.17 Maximum force Firmness and cooked, blade (AACC and area work of shearfive strands 16–50) under curve
Strawberries Extrusion Ottawa cell with 1.5 Maximum force Firmness/work of (bulk) holed plate and area extrusion
under curveSurimi Shearing Knife blade 2 Maximum strength, Cutting strength/
distance at failure bite force, work and area of shearunder curve
Surimi Penetration 5 mm spherical probe 1.1 Maximum force Breaking force and distance and distance to at max. force rupture
(Continued)
App-III.qxd 1/12/02 7:13 PM Page 367

368 Guidelines and Conditions for Testing Foods
Table AIII.3 (Continued)
Crosshead Parameter Property Commodity Test principle Probe/Fixture speed (mm s��1) measured measured
Syrup (contained) Back extrusion 35 mm diam 1 Maximum force Surface stickiness extrusion disk and distance and stringiness
to separation
Tofu Penetration 0.25 in. spherical probe 2 Maximum force, Skin firmness and mean force over interior plateau region firmness
Tomatoes (bulk) Shearing 5-bladed Kramer 3 Maximum force Firmness/work of shear cell and area shearing
under curveTortilla chips, Bending Crisp fracture rig 1 Maximum force Firmness
individualTortillas, wheat, Uniaxial tension Tensile grips 1 Maximum force Resistance to
rectangular and distance extension and section of at break extensibilityuniform width
Tortillas, wheat Biaxial tension Tortilla/pastry burst rig 1 Maximum force Toughness and and distance extensibilityat break
Yoghurt Back extrusion 35 mm diam 1 Maximum �ve Firmness, (contained) extrusion disk force, �ve consistency and
area, maximum cohesiveness�ve force and�ve area
Compiled by J. Smewing at Stable Micro Systems.
App-III.qxd 1/12/02 7:13 PM Page 368

Examples of SensoryTexture Profiles
A P P E N D I X
IV
Table AIV.1 Raw Apple Texture Definitions and Values. Numbers in parentheses are therange of panel values for this product (0–14 range)
I. First Bite Place bite size piece of apple between molar teeth and evaluate for:Firmness Force required to bring teeth together (5–8)Fracturability Force with which apple breaks apart (3–5)Crispness Degree to which rupture is heard (2–5)Denseness Degree to which sample is compact and not cellular (2–4)Graininess Degree to which granular particles are perceived (4–9)Moisture Release Amount of juice perceived upon biting (4–7)Toothpacking Degree to which apple packs around teeth (1–3)
II. MasticationChewiness Number required to prepare sample for swallow (15–18)Coarseness Degree to which the chewed mass stays in distinct particles the
size of oatmeal or larger throughout mastication (4–7)Pulpiness of Mass Degree to which flesh persists in a soft moist uniform mass (3–9)Graininess Degree to which the chewed mass stays in small particles
throughout mastication (4–10)Moisture Release Degree to which the release of moisture persists throughout
mastication (4–9)Fibers Degree to which fibers are perceived throughout mastication (2–5)
III. After SwallowParticles Amount perceived (7–9)Dry Mouthfeel Degree to which mouth feels dry (3–4)
Source: Diehl and Hamann (1979). Reprinted from J. Texture Studies 10, page 406. Copyright byFood and Nutrition Press Inc.
Raw Apple Example 1
App-IV.qxd 1/10/02 3:50 PM Page 369

370 Examples of Sensory Texture Profiles
Table AIV.2 Texture Profile Panel Characteristics, Procedures and Definitions forRestructured Beef Steaks
I. VisualA. Distortion – Steak is visually evaluated for the degree that the steak has warped or
changed in configuration from its original raw-frozen shape. Macro distortion is degree overall steak has distorted. Micro distortion is the degree to which cooked surfaces look uneven or rough.
B. Fibrousness – Steak is cut in half and the cross section is visually evaluated for the degree that the sample resembles steak or has no disruption of components.
II. Partial compressionA. Springiness – Place a warm 2.54 cm2 piece in the mouth and using the molars against
the cooked surfaces, press lightly five times. Wait 2 s between each press. Springiness is the perceived degree and speed with which the sample returns to original height and thickness.
III. First biteTake a warm 2.54 cm2 piece and place it in the mouth in the same manner as for partial compression and evaluate for:
A. Hardness – Amount of force required to bite through sample.
B. Cohesiveness – The degree to which the sample deforms before shearing.
C. Moisture release – Amount of juiciness perceived during the first bite.
D. Uniformity – The degree to which the force needed to shear the sample is the sameacross the bite area.
IV. MasticationTake one warm 2.54 cm2 sample, make the first incision as for first bite. Then turn the two pieces 90° and take a second bite. Evaluate for:
A. Sample breakdown at two chews – Check the appropriate breakdown category(ies).
Continue chewing and evaluate for:
B. Juiciness – The amount of juice released following seven chews.
C. Size of chewed pieces – The perceived size of clearly separate pieces or pieces held together only by connective tissue web. Evaluated following 10 chews.
D. Gristle – The amount of rubbery particles present following 10 chews.
E. Cohesiveness of mass – The degree to which particles stick together. This is evaluated at its maximum degree between 10 and 35 chews.
F. Uniformity of mass – Degree to which components of the mass are the same. Evaluated following 25 chews.
G. Webbed connective tissue – Amount of connective tissue present just before swallowing.H. Number of chews – Total number of chews to accurately determine the amount of
webbed connective tissue.
I. Overall gristle – Overall impression of the amount of rubbery particles throughout mastication.
J. Overall webbed connective tissue – Amount of firm thread-like connective tissue present throughout mastication.
V. After-swallowA. Tooth pack – Amount of sample remaining in between teeth after swallowing.
B. Mouthcoating – Amount of film residue left on mouth surface following swallowing.
Source: Berry and Civille (1986). Reprinted from J. Sensory Studies 1, page 24. Copyright by Foodand Nutrition Press Inc.
Restructured Beef SteaksExample 2
App-IV.qxd 1/10/02 3:50 PM Page 370

Appendix IV 371
Table AIV.3 Definitions and Evaluation Procedures for the Texture Characterization ofBrownies
SurfaceHold the brownie near the mouth so that the tongue and lips can be passed over the sample.Evaluate for:
Roughness: Degree of abrasiveness on the brownie’s surface, as perceived by the tongue.
Surface moistness: Amount of moisture perceived on the surface of the brownie, when in contact with the upper lip.
Partial compressionBite a piece of the brownie with your incisors and place it between your tongue and palate.Compress slightly without rupturing the structure. Evaluate for:
Springiness: Force with which sample returns to its original size/shape, after partial compression.
First biteBite through the brownie with your incisors by applying a steady force. Evaluate for:
Firmness: Force required to bite completely through the product.
Cohesiveness: Amount of deformation undergone by the material before rupture, when biting completely through the sample.
Uniformity of firmness: Evenness of force (firmness) required to bite through the sample.
First chewTake another bite of the brownie and place the piece between your molars. Bite through thesample completely and evaluate for:
Denseness: Compactness of the cross section.
Stickiness (tooth pull): Force required to separate molars after chew down.
Chew downBite a piece of the brownie and chew it with your molars (8–10 chews). Evaluate for:
Cohesiveness of mass: Degree to which the mass holds together.
Moisture absorption: Amount of saliva absorbed by the sample upon mastication.
Type of breakdown: Description of the brownie’s breakdown (mechanical, salivary).
ResidualExpectorate the product and evaluate for:
Tooth pack: Amount of material left in and around the molar teeth.
Oily mouthcoating: Degree to which the palate surface feels oily.
Source: Muñoz and Civille (1987). Reprinted from Food Reviews International 3, page 304 bycourtesy of Marcel Dekker Inc.
Brownies Example 3
App-IV.qxd 1/10/02 3:50 PM Page 371

372 Examples of Sensory Texture Profiles
Table AIV.4 Sensory Texture Profiling Technique and Definition of Terms for Plain VanillaCookies
Stage I Hold the cookie near the mouth so that the tongue and lips can be passed over the sample.
Evaluate for:Smoothness: degree to which the top and bottom surfaces lack bumps or particles (geometrical)
Stage II Place the whole cookie in the mouth so that incisors are positioned in the center of the sample. Bite through the sample by applying a steady force.
Evaluate for:Hardness: force needed to bite through the cookie (hardness)Fracturability: force with which the cookie shatters (fracturability)
Stage III Break the cookie in half and place one half between molars. Bite through the sample by applying a steady force.
Evaluate for:Fracturability: force with which the cookie shatters (fracturability)Hardness: force required to bite through the piece (hardness)Density: compactness of the cross section (geometrical)Uniformity: degree to which the sample is the same from the outside to the center (geometrical)
Stage IV Chew the whole cookie.
Evaluate for:Dryness (2 chews): degree to which the sample lacks moisture (moisture)Particle description (3–5 chews): describe the size and shape of the particles present in the mouth (geometrical)Rate of moisture absorption: rate with which the sample absorbs saliva (moisture)Adhesiveness: degree to which the chewed material adheres to the mouth surface (adhesiveness)Cohesiveness of the mass: degree to which the mass holds together (gumminess)Description of the mass: description of all the material in the mouth including particles (geometrical)Type of breakdown: description of the changes occurring from the first bite to swallow (description of breakdown)Number of chews to swallow: number of chews required to hydrate the sample and bring it to a state ready for swallowing (moisture absorption, hardness, cohesiveness)
Stage V Swallow the chewed sample.
Evaluate for:Ease of swallow: degree to which the sample can be readily swallowed (gumminess, geometrical)Molar packing: amount of material left in and around the molar teeth (adhesiveness)Mouthcoating: description and amount of material left in the mouth (geometrical)
Source: Civille and Liska (1975). Reprinted from J. Texture Studies 6, page 24. Copyright by Foodand Nutrition Press Inc.
Cookies (Plain Vanilla)Example 4
App-IV.qxd 1/10/02 3:50 PM Page 372

Appendix IV 373
Table AIV.5 Descriptors Used for Sensory Profiling of Dulce de Leche
Manual textureSticky Degree of stickiness to spoonStringy Length of string when lifting spoon from dishPeaks Length of time peaks hold their shapeSoft Degree of softness, as opposed to hardnessFlow rate Rate/speed at which the Dulce de Leche flows off the spoonSmooth Degree of smoothness when spreading the sample against
the side of the bowl with back of spoonSpreadability Ease required to spread the sample over the bottom of the
bowl with back of spoon
Oral textureThinness Ease required to manipulate sample in mouthSmooth Degree of smoothness as opposed to grainy–sandyRate of melting Speed with which the sample melts in the mouthSticks to mouth Degree to which the sample sticks to mouth surface during
manipulationMouthcoating Degree of oily mouthcoating after swallowingEase of swallow Ease with which sample can be completely swallowed
Source: Hough et al. (1992). Reprinted from J. Sensory Studies 7, page 163. Copyright by Foodand Nutrition Press Inc.
Table AIV.6 Sensory Texture Profiling Technique and Definition of Terms for Frankfurters
Stage I Place frankfurter into mouth: feel surface with the tongue and lips
Evaluate for:Surface moisture: degree to which the surface is wet or oily (moisture)Type of moisture: wet or oilySurface smoothness: degree to which the surface is smooth: i.e. not rough or uneven (geometrical)
Stage II Place frankfurter into mouth: compress partially between incisors; release
Evaluate for:Elasticity: degree to which sample returns to original shape after deformation (elasticity)
Stage III Place frankfurter into mouth: bite down with front teeth at ¾ in. from endEvaluate for:Hardness: force required to bite through the sample (hardness)Cohesiveness: degree to which sample deforms before it ruptures (cohesiveness)
(Continued)
Frankfurters
Dulce de Leche (a dairy based confectionerypopular in most Latin American countries)
Example 5
Example 6
App-IV.qxd 1/10/02 3:50 PM Page 373

374 Examples of Sensory Texture Profiles
Table AIV.6 (Continued)
Uniformity: degree to which sample is same from outside to inside (geometrical, mechanical)Moisture release: degree to which sample releases juices (moisture)Denseness: compactness of cross section (geometrical)Coarseness: degree to which mass feels rough (geometrical)Graininess: degree to which sample or juice contain small particles (geometrical)
Stage IV Place ¾ in. section crosswise between molar teeth
Evaluate for:Hardness: force required to bite through cross section (hardness)
Stage V Chewing: Chew a ¾ in. piece with molar teeth
Evaluate for:Chewiness: number of chews necessary to prepare sample for swallowing (chewiness)Moisture release: amount of juices released during chewing (moisture)Oiliness: amount of oil or fat in juices (fat)Moisture absorption: degree to which the sample mixes with saliva (moisture)Cohesiveness of the mass: degree to which mass holds together after 5–7 chews (gumminess)Lumpy: degree to which mass is made up of irregular pieces (geometrical)Grainy: degree to which sample contains small distinct particles (geometrical)Skin: degree to which skin is distinct from mass during the chew (geometrical)Description of breakdown: describe changes occurring during breakdown (description of breakdown)
Stage VI Swallowing: Swallow sample
Evaluate for:Ease of swallow: degree to which the chewed mass can be readily swallowed (geometrical)Mouthcoating:Oiliness: amount of oil or fat coating mouth surfaces (fat)Particles: amount and type of particles left in mouth (geometrical)
Source: Civille and Liska (1975). Reprinted from J. Texture Studies 6, page 21. Copyright by Foodand Nutrition Press Inc.
App-IV.qxd 1/10/02 3:50 PM Page 374

Appendix IV 375
Table AIV.7 Honeydew Melon Texture Definitions and Values. Numbers in parentheses arethe range of panel values for this product (0–14 range)
I. First bite Place half melon ball between molar teeth, bite and measure for:Firmness Force required to bring teeth together (6–10)Moisture release Amount of juice perceived upon biting (7–11)Denseness Degree to which sample is compact and not cellular (5–9)Fibers Amount of fibers perceived including residue left between
teeth (6–9)Cohesiveness Degree to which sample compresses before failure (3–6)
II. MasticationPulpiness of mass Degree to which the flesh persists regardless of whether it
is soft or hard (6–8)Fibers Degree to which fibers are perceived throughout
mastication (8–10)Moisture persistence Degree to which the release of moisture persists
throughout mastication (7–9)
III. ResidualFibers Amount of fibers perceived after swallow (8–10)
Source: Diehl and Hamann (1979). Reprinted from J. Texture Studies 10, page 405. Copyright byFood and Nutrition Press Inc.
Honeydew Melon Example 7
App-IV.qxd 1/10/02 3:50 PM Page 375
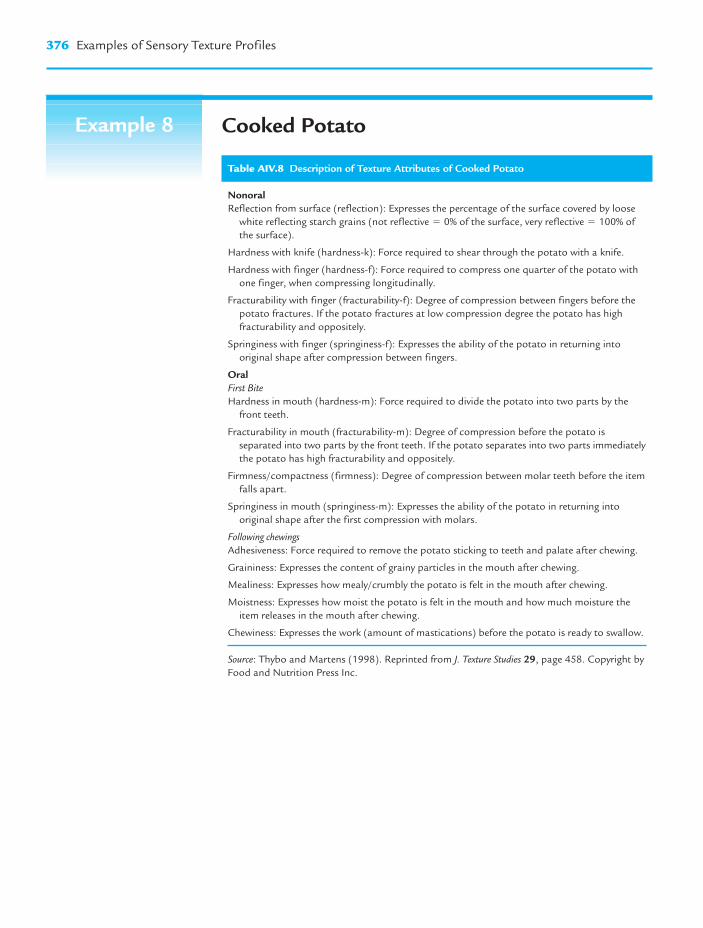
376 Examples of Sensory Texture Profiles
Cooked Potato
Table AIV.8 Description of Texture Attributes of Cooked Potato
NonoralReflection from surface (reflection): Expresses the percentage of the surface covered by loose
white reflecting starch grains (not reflective � 0% of the surface, very reflective � 100% of the surface).
Hardness with knife (hardness-k): Force required to shear through the potato with a knife.
Hardness with finger (hardness-f): Force required to compress one quarter of the potato with one finger, when compressing longitudinally.
Fracturability with finger (fracturability-f): Degree of compression between fingers before the potato fractures. If the potato fractures at low compression degree the potato has high fracturability and oppositely.
Springiness with finger (springiness-f): Expresses the ability of the potato in returning into original shape after compression between fingers.
OralFirst BiteHardness in mouth (hardness-m): Force required to divide the potato into two parts by the
front teeth.
Fracturability in mouth (fracturability-m): Degree of compression before the potato is separated into two parts by the front teeth. If the potato separates into two parts immediatelythe potato has high fracturability and oppositely.
Firmness/compactness (firmness): Degree of compression between molar teeth before the item falls apart.
Springiness in mouth (springiness-m): Expresses the ability of the potato in returning into original shape after the first compression with molars.
Following chewingsAdhesiveness: Force required to remove the potato sticking to teeth and palate after chewing.
Graininess: Expresses the content of grainy particles in the mouth after chewing.
Mealiness: Expresses how mealy/crumbly the potato is felt in the mouth after chewing.
Moistness: Expresses how moist the potato is felt in the mouth and how much moisture the item releases in the mouth after chewing.
Chewiness: Expresses the work (amount of mastications) before the potato is ready to swallow.
Source: Thybo and Martens (1998). Reprinted from J. Texture Studies 29, page 458. Copyright byFood and Nutrition Press Inc.
Example 8
App-IV.qxd 1/10/02 3:50 PM Page 376

Appendix IV 377
Table AIV.9 Texture Profile Panel Notes, Procedure, and Description for Cooked SweetPotatoes
I. Initial perception:Lightly press the end of the sample to the lips and evaluate for:Moistness (I-MOIST): degree to which the sample is moist
Press the sample between the lips and evaluate for:Springiness (I-SPRIN): degree to which the sample returns to its original shape after deformationCohesiveness (I-COH): degree to which the sample deforms before rupture
II. First bite:Use a half of a sample, press the end to the roof of the mouth, using the tongue, and evaluate for: Adhesiveness to palate (B-ADP): the force required to remove the sample from the palate with the tongueBite with the front teeth and evaluate for:Hardness (B-HARD): amount of force necessary to bite completely through the sampleDenseness (B-DNS): degree to which the sample is solid, compactness of the cross sectionMoistness (B-MOIST): degree to which the sample is moist
III. Mastication:Chew at a constant rate of one chew per second and evaluate for:Chewiness (M-CHEW): number of chews required to prepare the sample for swallowingAdhesiveness of the mass (M-ADHE): degree to which the sample adheres or sticks to any of the mouth surfaces such as teeth, gums, palateMoistness of mass (M-MOIST): amount of moisture/wetness perceived in the massFibers (M-FIBER): amount of stringy fibers perceived
IV. Swallow-residual:At the time of and immediately after swallow evaluate for:Ease of swallow (SEOS): ease with which the sample is gathered up and swallowedMouth coating (S-MCT): amount of sample remaining in the mouth after swallowFibers (S-FIBER): amount of stringy fibers perceivedChalkiness (S-CHLK): degree to which the mouth feels chalky; very fine particles, if present, often perceived on the roof of the mouth
Source: Truong et al. (1997). Reprinted from J. Texture Studies 28, page 167. Copyright by Foodand Nutrition Press Inc.
Cooked Sweet Potato Example 9
App-IV.qxd 1/10/02 3:50 PM Page 377

378 Examples of Sensory Texture Profiles
Cooked Red Kidney Beans
Table AIV.10 Sensory Texture Profile Procedure for Cooked Red Kidney Beans. PanelTechnique and Definition of Terms
Stage 1 Place one bean in mouth, manipulate gently with tongue without breaking the bean. Evaluate bean surface for:Smoothness of skin: feel of surface on tongueMoistness of skin: degree of moistness of surface
Stage 2 Chew the bean once between molars. Evaluate:Hardness: force required to crush bean with teethFracturability: degree to which bean crumbles, cracks or shattersStarchiness: feeling of free starch grainsLumpiness: presence of large particles harder than surrounding mediumMoistness: amount of moisture in crushed cotyledon
Stage 3 Place one bean in mouth and chew until ready to swallow. Evaluate for:Chewiness: number of chews to reach final swallowing pointGumminess: denseness and cohesion persisting during masticationStarchiness: as aboveLumpiness: as aboveGrittiness: presence of small harder particles that stand out in the mediumSkin toughness: force to cut skin with incisorsMoistness: as above
Stage 4 Place one bean in mouth, chew and swallow. Evaluate:Rate of breakdown of cotyledonRate of breakdown of skinPastiness of bolus: viscous somewhat sticky sensationLumpiness of bolus (number of lumps)Lumpiness of bolus (hardness of lumps)Grittiness: as aboveToughness of skin pieces: as aboveMoisture absorption by cotyledonMoisture absorption by skinParticles around gums and teeth: degree of coating remaining in mouthIrritation in throat: degree of unpleasant coating in throatBurning on tongue: sense of chemical irritation
Source: Garruti and Bourne (1985). Reprinted from J. Food Science 50, page 1068. Copyright byInstitute of Food Technologists.
Example 10
App-IV.qxd 1/10/02 3:50 PM Page 378

Appendix IV 379
Table AIV.11 Vocabulary for Sensory Texture Attributes of Cooked Rice
Sensory attribute Definition Technique Reference
SurfaceAdhesiveness to lips Degree to which sample Compress sample between lips, Cherry tomato, 0.0; nougat, 4.0;
adheres to lips release, and evaluate breadstick, 7.5; pretzel rod, 10.0First bite
Hardness Force required to Compress or bite through sample Cream cheese, 1.0; egg white, 2.5; compress sample with molars American cheese, 4.5; hot dog,
5.5; olive, 7.0; peanut, 9.5; almond, 11.0; Life Savers, 14.5
ChewdownCohesiveness of mass Amount chewed sample Chew sample with molars 3 or 8 Licorice, 0.0; carrot, 2.0;
after 3 or 8 chews holds together times and evaluate mushroom, 4.0; hot dog, 7.5; American cheese, 9.0; brownie, 13.0
Roughness of mass Amount of roughness Chew sample with molars Jello, 0.0; orange peel, 3.0; cooked, perceived in chewed 8 times and evaluate oatmeal, 6.5sample
Toothpull Force required to separate Chew 3 times and evaluate Clam, 3.5; caramel, 5.0; jaws during mastication Jujubes, 15.0
Particle size Amount of space particle Place sample in mouth and Rice grain, 0.5; Tic Tac, 2.5; M&M, fills in mouth evaluate 4.0; Mike & Ikes, 6.0; Cherry
Bite, 11.0Toothpack Amount of product packed Chew sample 8 times, Captain Crunch, 5.0; Heath
into crowns of teeth expectorate, and feel Bar, 10.0after mastication surface of crowns of
teeth with tongueLoose particles Amount of particles Chew sample 8 times with Carrot, 10.0
remaining in and on molars, swallow, surface of mouth and evaluateafter swallowing
Source: Meullenet et al. (1998). Reprinted from Cereal Chemistry 75, page 715. Copyright by American Association of Cereal Chemists.
Cooked Rice Example 11
App-IV.qxd 1/10/02 3:50 PM Page 379

References
Abbott, J. A., and R. Lu. 1996. Anisotropic mechanical properties of apples. Trans.Am. Soc. Agr. Eng. 39, 1451–1459.
Abbott, J. A., N. F. Childers, G. S. Bachman, J. V. Fitzgerald, and F. J. Matusik. 1968a.Acoustic vibration for detecting textural quality of apples. Proc. Am. Soc. Hortic.Sci. 93, 725–737.
Abbott, J. A., G. S. Bachman, R. F. Childers, J. V. Fitzgerald, and F. J. Matusik. 1968b.Sonic techniques for measuring texture of fruits and vegetables. Food Technol. 22,635–646.
Abbott, J. A., R. Lu, B. L. Upchurch, and R. L. Stroshine. 1997. Technologies for non-destructive quality evaluation of fruits and vegetables. Hort. Rev. 20, 1–120.
Abu-Shakra, A. M., and P. Sherman. 1984. Evaluation of bread firmness by Instroncompression tests. Rheol. Acta 23, 446–450.
Adams, M. C., and E. L. Birdsall. 1946. New Consistometer measures corn consis-tency. Food Ind. 18, 844–846, 992, 994.
Aeschlimann, J.-M., and S. T. Beckett. 2000. International inter-laboratory trials todetermine the factors affecting the measuring of chocolate viscosity. J. Texture Stud.31, 541–570.
Alexander, J. 1906. The grading and use of glues and gelatin. J. Soc. Chem. Ind.,London 25, 158–161.
Alexander, J. 1908. Method of and apparatus for testing jelly. U.S. Patent 882, 731.Aguilera, I. M., and D. W. Stanley. 1999. “Microstructural Principles of Food Processing
and Engineering,” second ed. Aspen Publishers, Gaithersburg, Maryland.Ahmed, E. M., F. G. Martin, and R. C. Fluck. 1973. Damaging stresses to fresh and
irradiated citrus fruits. J. Food Sci. 38, 230–233.Allen, F. W. 1932. Physical and chemical changes in the ripening of deciduous fruits.
Hilgardia 6, 381–441.Alvarez, M. D., D. E. J, Saunders, J. F. V. Vincent, and G. Jeronimidis. 2000. An engi-
neering method to evaluate crisp texture of fruits and vegetables. J. Texture Stud. 31,457–473.
American Association of Cereal Chemists. 1969. “Cereal Laboratory Methods.”American Association of Cereal Chemists, St Paul, Minnesota.
REFERENCE.qxd 1/12/02 7:17 PM Page 381

American Society of Agricultural Engineers. 1998. “ASAE Standards,” 45th ed. St Joseph, Michigan.
Amerine, M. A., R. M. Pangborn, and E. B. Roessler. 1965. “Principles of SensoryEvaluation of Foods.” Academic Press, New York.
Andreotti, R., and R. Agosti. 1965. Perfezionamento del Tenderometro modellostazione sperimentale conserve alimentari. Ind. Conserva 2, 103–106.
Ang, J. K., F. M. Isenberg, and J. D. Hartman. 1960. Measurement of firmness of onionbulbs with a shear press and potentiometric recorder. Proc. Am. Soc. Hortic. Sci. 75,500–509.
Anonymous. 1959. Pectin standardization. Final report of IFT Committee. FoodTechnol. 13, 496–500.
Anonymous. 1963. New research tool acquired by Station. Farm Res. 29(2), 16.Anonymous. 1964. Sensory testing guide for panel evaluation of foods and beverages.
Prepared by the Committee on Sensory Evaluation of the Institute of FoodTechnologists. Food Technol. 18, 1135–1141.
Anonymous. 1966. A new instrument for measuring the texture of potato french fries.Am. Potato J. 43, 175.
Anonymous. 1973. “A Study of Consumer Attitudes Toward Product Quality.” A. C. Nielsen Co., Northbrook, Illinois.
Anzalduá-Morales, A. 1989. “La Evaluación Sensorial en la Teoriá y la Práctica.”Editorial Alhambra, S. A. Mexico City.
Anzalduá-Morales, A. 1990. Spanish words for viscosity and hardness/firmness. J. Texture Stud. 20(4), V–VII0.
AOAC. 2000. “Official Methods of Analysis of AOAC International”, 17th ed. AOACInternational. Gaithersburg, Maryland.
Arnold, P. C., and N. N. Mohsenin. 1971. Proposed techniques for axial compressiontests on intact agricultural products of convex shape. Trans. ASAE 14, 78–84.
Arnott, D. R., H. A. Morris, and W. B. Combs. 1957. Effect of certain chemical factorson the melting quality of process cheese. J. Dairy Sci. 40, 957–963.
Ash, M., and I. Ash. 1995. “Handbook of Food Additives.” Aldershot, Hampshire, UK.Atkin, G., and P. Sherman. 1984. The influence of surface friction on food
firmness evaluation by compression testing. Proc. IX Int. Congress on Rheology4, 123–144.
Babcock, C. J. 1922. The whipping quality of cream. U.S. Dep. Agric. Bull. No. 1075.Babcock, S. M. 1886. “Viscometry.” New York State Agricultural Experiment Station.
Fifth Annual Report, pp. 297–310.Baduí, S. 1988. “Diccionario de Tecnología de Alimentos.” Editorial Alhambra, S. A.
Mexico City.Bagley, E. B., D. D. Christenson, and D. L. Trebacz. 1990. The computation of viscos-
ity and relaxation time of doughs from biaxial extension data. J. Texture Stud. 21,339–354.
Bailey, C. H. 1934. An automatic shortometer. Cereal Chem. 11, 160–163.Ball, C. O., W. E. Claus, and E. F. Stier. 1957. Factors affecting quality of prepackaged
meats. 1B. Loss of weight and study of texture. Food Technol. 11, 281–283.Baltsavias, R., A. Jurgens, and T. Van Vliet. 1997. Factors affecting fracture properties
of short-dough biscuits. J. Texture Stud. 28, 205–219.Barnes, H. A., J. F. Hutton, and K. Walters. 1989. “An Introduction to Rheology.”
Elsevier Science Publishers, New York.
382 References
REFERENCE.qxd 1/12/02 7:17 PM Page 382

Barrett, A. M., M. D. Normand, M. Peleg, and E. Ross. 1992. Characterization of thejagged stress-strain relationships of puffed extrudates using the Fast FourierTransform and Fractal Analysis. J. Food Sci. 57, 227–232, 235.
Barreiro, P., C. Ortiz, M. Ruiz-Altisent, V. deSmeat, S. Schotte, Z. Andani, I. Wakeling, and D. K. Beytes. 1998. Comparison between sensory and instrumen-tal measurements for mealiness assessment in apples. A collaborative test. J. TextureStud. 29, 509–525.
Barrett, A. H., A. V. Cardello, L. Mair, P. Maguire, L. L. Lesher, M. Richardson, J. Briggs, and E. A. Taub. 2000. Textural optimization shelf-stable bread: effects ofglycerol content and dough-forming technique. Cereal Chem. 77, 164–176.
Barringer, S. A., A. T. M. Safiul Azam, B. Heskitt, and S. Sastry. 1998. On-line pre-diction of Bostwick consistency from pressure differential in pipe flow for ketchupand related tomato products. J. Food Preservation Processing 22, 211–220.
Barry, B. W., and A. J. Grace. 1971. Structural, rheological and textural properties ofsoft paraffins. J. Texture Stud. 2, 259–279.
Bechtel, W. G., D. F. Meisner, and W. B. Bradley. 1953. The effect of the crust on thestaling of bread. Cereal Chem. 30, 160–168.
Benbow, J. J. 1971. The dependence of output rate on die shape during catalyst extru-sion. Chem. Eng. Sci. 26(14), 67–73.
Benbow, J. J. 1981. Letter to the Editor. J. Texture Stud. 12, 91–92.Benedito, J., J. A. Cárcel, R. Gonzales, and N. Sanjúan. 2000a. Prediction of instru-
mental and sensory textural characteristics of Mahon cheese from ultrasonic mea-surements. J. Texture Stud. 31, 631–643.
Benedito, J., J. Carcel, G. Clemente, and A. Mulet. 2000b. Cheese maturity assessmentusing ultrasonics. J. Dairy Science 83, 248–254.
Berry, B. W., and G. V. Civille. 1986. Development of a texture profile panel for evalu-ating restructured beef steaks varying in meat particle size. J. Sensory Stud. 1, 15–20.
Bhattacharya, S., S. Bhattacharya, and H. Narasimha. 1999. Uniaxial compressibilityof blackgram doughs blended with cereal flours. J. Texture Stud. 30, 659–675.
Bice, C. W., and W. F. Geddes. 1949. Studies on bread staling. IV. Evaluation of meth-ods for the measurement of changes which occur during bread staling. CerealChem. 26, 440–465.
Bingham, E. C. 1914. A new viscometer for general scientific and technical purposes.Ind. Eng. Chem. 6, 233–237.
Bingham, E. C. 1922. “Fluidity and Plasticity.” McGraw-Hill, New York.Bingham, E. C. 1930. Fundamental definitions of rheology. J. Rheol. 1, 507–516.Bistany, K. C., and J. L. Kokini. 1983. Dynamic viscoelastic properties of foods in
texture control. J. Rheol. 27, 605–620.Blanpied, G. D., W. J. Bramlage, D. H. Dewey, R. L. La Belle, L. M. Massey,
G. E. Mattus., W. C. Stiles, and H. E. Watada. 1978. A standardized method for collecting apple pressure tests. New York’s Food and Life Sciences Bulletin 74.
Bloom, O. T. 1925. Machine for testing jelly strength of glues, gelatins and the like.U.S. Patent 1,540,979.
Bookwalter, G. N., A. J. Peplinski, and V. F. Pfeiffer. 1968. Using a BostwickConsistometer to measure consistencies of processed corn meals and their CSMblends. Cereal Sci. Today 13, 407–410.
Borderias, A. G., M. Lamua, and M. Tejada. 1983. Texture analyses of fish fillets andminced fish by both sensory and instrumental methods. J. Food Technol. 18, 85–95.
References 383
REFERENCE.qxd 1/12/02 7:17 PM Page 383

Borgale, P. C., and J. Irudayaraj. 1995. Mechanical strength and rheological behaviourof barley kernels. Int. J. Food Sci. Technol. 30, 609–623.
Borges, A., and M. Peleg. 1996. Determination of the apparent fractal dimension ofthe force-displacement curves of brittle snacks by four different algorithms. J. Texture Stud. 27, 243–255.
Borker, E., and K. G. Sloman. 1969. Dessert gel (gelatin) strength testing. II.Collaborative study. J. Assoc. Off. Anal. Chem. 52, 657–659.
Borker , E., A. Stefanucci, and A. A. Lewis. 1966. Dessert gel strength testing. J. Assoc.Off. Anal. Chem. 49, 528–533.
Botta, J. R. 1991. Instrument for nondestructive texture measurement of raw Atlanticcod (Gadus morhua) fillets. J. Food Sci. 56, 962–964, 968.
Bourne, M. C. 1965a. Studies on punch testing of apples. Food Technol. 19, 413–415.Bourne, M. C. 1965b. How skin affects apple pressure test. Farm Res 31(2), 10–11.Bourne, M. C. 1966a. A classification of objective methods for measuring texture and
consistency of foods. J. Food Sci. 31, 1011–1015.Bourne, M. C. 1966b. Measurement of shear and compression components of punc-
ture tests. J. Food Sci. 31, 282–291.Bourne, M. C. 1967a. Deformation testing of foods. I. A precise technique for per-
forming the deformation test. J. Food Sci. 32, 601–605.Bourne, M. C. 1967b. Squeeze it gently. Farm Res. 32(4), 8–9.Bourne, M. C. 1968. Texture profile of ripening pears. J. Food Sci. 33, 223–226.Bourne, M. C. 1972a. Standardization of texture measuring instruments. J. Texture
Stud. 3, 379–384.Bourne, M. C. 1972b. Texture measurement of individual cooked dry beans by the
puncture test. J. Food Sci. 37, 751–753.Bourne, M. C. 1973. Use of the Penetrometer for deformation testing of foods. J. Food
Sci. 38, 720–721.Bourne, M. C. 1974. Textural changes in ripening peaches. J. Can. Inst. Food Sci.
Technol. 7, 11–15.Bourne, M. C. 1975a. Is rheology enough for food texture measurement? J. Texture
Stud. 6, 259–262.Bourne, M. C. 1975b. Method for obtaining compression and shear coefficients of
foods using cylindrical punches. J. Texture Stud. 5, 459–469.Bourne, M. C. 1975c. Texture measurements in vegetables. In “Theory, Determination
and Control of Physical Properties of Food Materials” (C. Rha, ed.), pp. 131–162.Reidel Publ., Dordrecht, Netherlands.
Bourne, M. C. 1976. Interpretation of force curves from instrumental texture mea-surements. In “Rheology and Texture in Food Quality” (J. M. deMan, P. W. Voisey,V. F. Rasper, and D. W. Stanley, eds), pp. 244–274. Avi, Westport, Connecticut.
Bourne, M. C. 1977. Compression rates in the mouth. J. Texture Stud. 8, 373–376.Bourne, M. C. 1979a. Rupture tests vs. small strain tests in predicting consumer
response to texture. Food Technol. 33(10), 67–70.Bourne, M. C. 1979b. Theory and application of the puncture test in food texture
measurement. In “Food Texture and Rheology” (P. Sherman, ed.), pp. 95–142.Academic Press, New York/London.
Bourne, M. C. 1980. Texture evaluation of horticultural crops. Hortscience 15(1),(7)–(13).
Bourne, M. C. 1982. Effect of temperature on firmness of raw fruits and vegetables. J. Food Sci. 47, 440–444.
384 References
REFERENCE.qxd 1/12/02 7:17 PM Page 384

Bourne, M. C. 1989. Applications of chemical kinetic theory to the rate of thermalsoftening of vegetable tissue. In “Quality Factors of Fruits and Vegetables.Chemistry and Technology” (J. J. Jen, ed.), American Chemical Society SymposiumSeries No. 405, pp. 98–110. American Chemical Society, Washington, DC.
Bourne, M. C. 1990. Basic principles of food texture measurement. In “DoughRheology and Baked Product Texture” (H. Faridi, and J. M. Faubion, eds), pp. 331–341. Van Nostrand, Reinhold, New York.
Bourne, M. C. 1992. Calibration of rheological techniques used for foods. J. FoodEng. 16, 151–163.
Bourne, M. C., and S. H. Comstock. 1986. Effect of temperature on firmness of thermally processed fruits and vegetables. J. Food Sci. 51, 531–533.
Bourne, M. C., and N. Mondy. 1967. Measurement of whole potato firmness with a universal testing machine. Food Technol. 21, 1387–1406.
Bourne, M. C., and J. C. Moyer. 1968. The extrusion principle in texture measurementof fresh peas. Food Technol. 22, 1013–1018.
Bourne, M. C., and M. A. Rao. 1990. Viscosity measurements of foods. In“Instrumental Methods for Quality Assurance of Food” (D. Y. C. Fung, and R. F. Mathews, eds), pp. 211–229. Marcel Dekker, New York.
Bourne, M. C., J. C. Moyer, and D. B. Hand. 1966. Measurement of food texture by a universal testing machine. Food Technol. 20, 522–526.
Bourne, M. C., A. M. R. Sandoval, M. Villalobos C., and T. S. Buckle. 1975. Traininga sensory texture profile panel and development of standard rating scales inColombia. J. Texture Stud. 6, 43–52.
Brabender, C. W. 1965. Physical dough testing, past, present, future. Cereal Sci. Today10(6), 291–304.
Brandt, M. A., E. Z. Skinner, and J. A. Coleman. 1963. Texture Profile Method. J. FoodSci. 28, 404–409.
Bratzler, L. J. 1932. Measuring the tenderness of meat by means of a mechanical shear.M.S. Thesis, Kansas State Coll., Manhattan.
Bratzler, L. J. 1949. Determining the tenderness of meat by use of the Warner–Bratzlermethod. Proc. Annu. Reciprocal Meat Conf. 2, 117–120.
Breene, W. M. 1975. Application of texture profile analysis to instrumental food texture evaluation. J. Texture Stud. 6, 53–82.
Breidinger, S. L., and J. F. Steffe. 2001. Texture map of cream cheese. J. Food Sci. 66,453–456.
Brennan, J. G. 1980. Food texture measurement. In “Developments in Food AnalysisTechniques – 2” (R.D. King, ed.), pp. 1–78. Applied Science Publishers, Essex.
Brennan, J. G., and M. C. Bourne. 1994. Effect of lubrication on the compressionbehavior of cheese and frankfurters. J. Texture Stud. 25, 139–150.
Brennan, J. G., R. Jowitt, and A. Williams. 1975. An analysis of the action of theGeneral Foods Texturometer. J. Texture Stud. 6, 83–100.
Briggs, J. L., and J. F. Steffe. 1997. Using Brookfield data and the Mitschka method toevaluate power law fluids. J. Texture Stud. 28, 517–522.
Brinton, R. H., and M. C. Bourne. 1972. Deformation testing of foods. 3. Effect of sizeand shape of the test piece on the magnitude of deformation. J. Texture Stud. 3,284–297.
Briskey, E. J., R. W. Bray, W. G. Hoekstra, P. H. Phillips, and R. H. Grummer. 1959.The chemical and physical characteristics of various pork ham muscle classes. J. Anim. Sci. 18, 146–152.
References 385
REFERENCE.qxd 1/12/02 7:17 PM Page 385
Britton, M. M., and P. T. Callaghan. 2000. NMR velocimetry study of the temperaturedependent rheology of butter, semisoft butter and margarine. J. Texture Stud. 31,245–255.
Brochetti, D., M. P. Penfield, and S. B. Burchfield. 1992. Speech analysis techniques:a potential model for the study of mastication sounds. J. Texture Stud. 23, 111–138.
Brovelli, E. A., S. L. Cuppett, and R. D. Uhlinger. 1998. Textural quality of green andwhite asparagus. J. Food Quality 22, 497–504.
Brown, W. 1994. Method to investigate differences in chewing behavior in humans: I. Use of electromyography in measuring chewing. J. Texture Stud. 25, 1–16.
Brown, W., M. Shearn, and H. J. H. MacFie. 1994a. Method to investigate differencesin chewing behavior in humans. II. Use of electromyography during chewing toassess chewing behavior. J. Texture Stud. 25, 17–31.
Brown, W. E., K. R. Langley, A. Martin, and H. J. H. MacFie. 1994b. Characterizationof patterns of chewing behavior in human subjects and their influence on textureperception. J. Texture Stud. 25, 455– 468.
Brown, W. E., D. Eves, M. Ellison, and D. Braxton. 1998. Use of combined elec-tromyography and kinesthesiology during mastication to chart the oral breakdownof foodstuffs: relevance to measurements of food texture. J. Texture Stud. 29, 145–167.
Bruhn C., N. Feldman, C. Garlitz, J. Harwood, E. Ivans, M. Marshall, A. Riley, D. Thurber, and E. Williamson. 1991. Consumer perceptions of food quality: apri-cots, cantaloupes, peaches, pears, strawberries and tomatoes. J. Food Quality 14,187–195.
Brulle, R. 1893. Méthode générale pour l’analyse des beurres. C. R. Hebd. SeancesAcad. Sci. 116, 1255–1277.
Bruns, A. J., and M. C. Bourne. 1975. Effects of sample dimensions on the snappingforce of crisp foods. Experimental verification of a mathematical model. J. TextureStud. 6, 445–458.
Brusewitz, G. H., M. P. Rigney, and A. Anzaldúa-Morales. 1997. Fast Fourier trans-formation analysis of the force-displacement curve as a texture method related tofruit morphology. J. Texture Stud. 28, 503–516.
Bryan, W. L., B. J. Anderson, and J. M. Miller. 1978. Mechanically assisted grading oforanges for processing. Tran. A. S. A. E. 21, 1226–1231.
Burton, R. I., and W. B. Rockwell. 1994. Hand. In “Principles of Surgery,” 6th ed. (S. I. Schwartz, T. Shires, F. C. Spencer, and W. C. Hussem, eds.) McGraw-Hill,New York.
Callister, W. D. 1997. “Materials Science and Engineering: An Introduction.” JohnWiley & Sons, New York.
Campanella, O. H., and M. Peleg. 1987a. Squeezing flow of peanut butter. J. Food Sci.52, 180–184.
Campanella, O. H., and M. Peleg. 1987b. Determination of the yield stress of semi-liquid foods from squeezing flow data. J. Food Sci. 52, 214, 215, 217.
Campanella, O. H., and M. Peleg. 2001. Squeezing flow viscometry for non-elasticsemi-liquid foods – Theory and applications. Crit. Rev. Food Sci. (in press).
Campanella, O. H., L. M. Popplewell, J. R. Rosenau, and M. Peleg. 1987. Elongationalviscosity measurements of melting American process cheese. J. Food Sci. 52,1249–1251.
Campbell, H. 1942. Temperature and Tenderometer. Western Canner & Packer34(Feb), 39; 34(May), 45.
386 References
REFERENCE.qxd 1/12/02 7:17 PM Page 386
Campion, D. R., J. D. Crouse, and M. E. Dikeman. 1975. The Armour Tenderometer asa predictor of cooked meat tenderness. J. Food Sci. 40, 886–887.
Caparaso, F., A. L. Cortovarria, and R. W. Mandigo. 1978. Effects of post-cookingsample temperature on sensory and shear analyses of beef steaks. J. Food Sci. 43,839–841.
Cardello, A. V. 1996a. The role of the human senses in food acceptance. In “FoodChoice, Acceptance and Consumption” (M. L. Meiselman and H. J. H. MacFie,eds), pp. 1–82. Blackie Academic and Professional, New York.
Cardello, A. V. 1996b. The role of the human senses in food behavior. II. Texture.Cereal Foods World 41, 469, 470.
Cardello, A. V., and R. A. Segars. 1989. Effects of sample size and prior mastication ontexture judgment. J. Sensory Stud. 4, 1–18.
Carpenter, Z. L., G. C. Smith, and O. D. Butler. 1972. Assessment of beef tendernesswith the Armour Tenderometer. J. Food Sci. 37, 126–129.
Carpi, S. 1884. Die Entdeckung fremder Oele im Olivenöl. Arch. Pharm. (Weinheim,Ger.) 221, 963; from Ann. Chim. Appl. Farm. Med. 77, No. 3.
Casimir, D. J., R. S. Mitchell, L. J. Lynch, and J. C. Moyer. 1967. Vining proceduresand their influence on yield and quality of peas. Food Technol. 21, 427–432.
Casimir, D. J., G. G. Coote, and J. C. Moyer. 1971. Pea texture studies using a singlepuncture Maturometer. J. Texture Stud. 2, 419–430.
Casiraghi, E. M., E. B. Bagley, and D. D. Christianson. 1985. Behavior of Mozzarella,cheddar and processed cheese spread in lubricated and bonded uniaxial compres-sion. J. Texture Stud. 16, 281–301.
Casson, N. 1959. A flow equation for pigment oil suspensions of the printing ink type.In “Rheology in Disperse Systems” (C. C. Mill, ed.), pp. 84–104. Pergamon,Oxford.
Castell-Perez, M. E., and J. F. Steffe. 1992. Using mixing to evaluate rheological prop-erties. In “Viscoelastic Properties of Foods” (M. A. Rao and J. F. Steffe, eds), pp. 247–284. Elsevier Applied Science, London/New York.
Castell-Perez, M. E., J. F. Steffe, and R. G. Morgan. 1987. Adaptation of a Brookfield(HBTD) viscometer for mixer viscometry studies. J. Texture Stud. 18, 359–365.
Cathcart, W. H., and L. C. Cole. 1938. Wide-range volume measuring apparatus forbread. Cereal Chem. 15, 69–79.
Chatraei, S. H., C. W. Macowsko, and H. H. Winter. 1981. Lubricated squeezing flow:a new biaxial extensional rheometer. J. Rheol. 25, 433–444.
Chen, P., and R. B. Fridley. 1972. Analytical method for determining viscoelastic con-stants of agricultural materials. Trans. Am. Soc. Agr. Eng. 15, 1103–1106.
Chevalley, J. 1975. Rheology of chocolate. J. Texture Stud. 6, 177–196.Chevalley, J. 1991. An adaptation of the Casson equation for the rheology of choco-
late. J. Texture Stud. 22, 219–229.Child, A. M., and M. Baldwell. 1934. Press fluid from heated fish muscle. J. Agric.
Res. 48, 1127–1134.Christel, W. F. 1938. Texturemeter, a new device for measuring the texture of peas.
Cann. Trade 60(34), 10.Christensen, C. M., and Z. M. Vickers. 1981. Relationships of chewing sounds to
judgements of food crispness. J. Food Sci. 46, 574–578.Chu, C. F., and M. Peleg. 1985. The compression behavior of solid food specimens
with small height to diameter ratios. J. Texture Stud. 16, 451–464.
References 387
REFERENCE.qxd 1/12/02 7:17 PM Page 387

Civille, G. V., and I. H. Liska. 1975. Modifications and applications to foods of theGeneral Foods Sensory Texture Profile Technique. J. Texture Stud. 6, 19–32.
Civille, G. V., and A. S. Szczesniak. 1973. Guidelines to training a texture profilepanel. J. Texture Stud. 4, 204–223.
Claassens, J. W. 1958. The adhesion–cohesion, static friction and macrostructure ofcertain butters. I. A method of measuring the adhesion–cohesion of butter. S. Afr.Tydskr. Landbouwet. 1, 457–463.
Claassens, J. W. 1959a. The adhesion–cohesion, static friction and macrostructure ofcertain butters. II. Factors affecting the values recorded with the hesion balance. S. Afr. Tydskr. Landbouwet. 2, 89–118.
Claassens, J. W. 1959b. The adhesion–cohesion, static friction and macrostructure ofcertain butters. V. Friction and hesion measurements on the same test surfaces. S. Afr. Tydskr. Landbouwet. 2, 551–571.
Clark, R. L., and P. S. Shackelford, J. 1976. Resonance and optical properties ofpeaches as related to firmness. In “Quality Detection in Foods” (J. J. Gaffney, ed.),ASAE Publ. No. 1–76, pp. 143–145. Am. Soc. Agric. Eng., St Joseph, Michigan.
Cobb, N. A. 1896. The hardness of the grain in the principal varieties of wheat. Agric.Gaz. N. S. W. 7, 279–298.
Coles, G. D. 1998. Objective estimation of bread visual texture. Chemistry in AustraliaAugust, 13–15.
Cook, L. R. 1982. “Chocolate Production and its Use.” Harcourt Brace Jovanovich,New York.
Cooke, J. R. 1972. An interpretation of the resonant behavior of intact fruits and vegetables. Trans. ASAE 15(6), 1075–1080.
Cooke, J. R., and R. H. Rand. 1973. A mathematical study of resonance in intact fruitsand vegetables using a 3-media elastic sphere model. J. Agric. Eng. Res. 18,141–157.
Corey, H. 1970. Texture in foodstuffs. CRC Crit. Rev. Food Technol. 1, 161–198.Corradini, M. G., R. Engel, and M. Peleg 2000a. Assessment of the extent of consis-
tency loss in semiliquid foods by compression and shear. J. Texture Stud. 31,363–378.
Corradini, M. G., V. Stern, T. Suwonsichon, and M. Peleg. 2000b. Squeezing flow ofsemi-liquid foods between parallel Teflon coated plates. Rheol. Acta 39, 452–460.
Couette, M. M. 1890. Etudes sur le frottement des liquides. Ann. Chim. Phys. 21,433–510.
Coulter, S. T., and W. B. Combs. 1936. A study of the body and texture of butter. Minn.Agric. Exp. Stn., Tech. Bull. No. 115.
Cover, S., S. J. Ritchey, and R. L. Hostetler. 1962. Tenderness of beef. I. The connec-tive tissue component of tenderness. J. Food Sci. 27, 469–475.
Cox, R. E., and R. H. Higby. 1944. A better way to determine the setting power ofpectins. Food Ind. 16, 441–443.
Crean, D. E. C., and D. R. Haisman. 1965. Elasticity coefficients and texture of cookeddried peas. J. Sci. Food Agric. 16, 469–474.
Crossland, L. B., and H. H. Favor. 1950. A study of the effects of various techniqueson the measurement of firmness of bread by the Baker Compressimeter. CerealChem. 27, 15–25.
Culioli, J., and P. Sale. 1981. Spinnability of fababean protein II. Spinnability of dopesand textural properties of protein fibers. J. Texture Stud. 12, 335–350.
388 References
REFERENCE.qxd 1/12/02 7:17 PM Page 388

Culioli, J., and P. Sherman. 1976. Evaluation of Gouda cheese firmness by compres-sion tests. J. Texture Stud. 7, 353–372.
Cutler, A. N., E. R. Morris, and L. J. Taylor. 1983. Oral perception of viscosity inmodel systems. J. Texture Stud. 14, 377–395.
Dacremont, C. 1995. Spectral composition of eating sounds generated by crispy,crunchy or crackly foods. J. Texture Stud. 26, 27–43.
Dagbjartsson, B., and M. Solberg. 1972. A simple method to determine the water-holding capacity of muscle foods. J. Food Sci. 37, 499–500.
Daget, N., and M. Joerg. 1991. Creamy perception II. In model soups. J. Texture Stud.22, 164–190.
Daget, N., M. Joerg, and M. C. Bourne. 1987. Creamy perception I. In model dessertcreams. J. Texture Stud. 18, 367–388.
Damrau, E., and M. Peleg. 1997. Imperfect squeezing flow viscometry of Newtonian liquids – theoretical and practical considerations. J. Texture Stud. 28,187–206.
Daubert, C. R., J. A. Tkachuk, and V. D. Truong. 1998. Quantitative measurement offood spreadability using the vane method. J. Texture Stud. 29, 427–435.
Davey, C. L., and K. V. Gilbert. 1969. The effect of sample dimensions on the cleavingof meat in the objective assessment of tenderness. J. Food Technol. 4, 7–15.
Davey, K. R. 1983. An instrument for the measurement of hardness of fat on sides ofchilled beef. J. Texture Stud. 14, 419–430.
Davey, K. R. 1986. Measurement of the hardness and mouthful of cheese using a slid-ing pin consistometer. J. Texture Stud. 17, 267–274.
Davey, K. R., and P. N. Jones. 1985. Evaluation of a sliding pin consistometer formeasurement of the hardness and spreadability of butter and margarine. J. TextureStud. 16, 75–84.
Davis, C. E. 1921. Shortening: Its definition and measurement. Ind. Eng. Chem. 13,797–799.
Davis, J. G. 1937. The rheology of cheese, butter, and other milk products. J. DairyRes. 8, 245–264.
Davis, S. S. 1973. Rheological properties of semi-solid foodstuffs. J. Texture Stud. 4, 15–40.
Dealy, J. M. 1994. Official nomenclature for material functions describing theresponse of a viscoelastic fluid to various shearing and extensional deformations. J. Rheol. 38, 179–183.
DeBeaukelaer, F. L., J. R. Powell, and E. F. Bahlmann. 1930. Standard methods(revised) for determining viscosity and jelly strength of glue. Ind. Eng. Chem.,Anal. Ed. 2, 348–351.
DeBeaukelaer, F. L., O. T. Bloom, and J. T. DeRose. 1945. Determining jelly strengthof gelatin-dessert jellies. Ind. Eng. Chem., Anal. Ed. 17, 64.
Decker, R. W., J. N. Yeatman, A. Kramer, and A. P. Sidwell. 1957. Modifications of the shear press for electrical indicating and recording. Food Technol. 11, 343–347.
DeLong, J. M., R. K. Prange, P. A. Harrison, and K. B. McRao. 2000. Comparison ofnew apple firmness penetrometer with three standard instruments. Postharvest Biol.Technol. 19, 201–209.
deMan, J. M. 1969. Food texture measurements with the penetration method. J. Texture Stud. 1, 114–119.
deMan, J. M. 1975. Texture of foods. Lebensm.-Wiss. Technol. 8, 101–107.
References 389
REFERENCE.qxd 1/12/02 7:17 PM Page 389

deMan, J. M., and B. S. Kamel. 1981. Instrumental methods of measuring texture ofpoultry meat. In “Quality of Poultry Meat,” Spelderholt Jubilee Symposia, pp. 157–164. Apeldoorn, Netherlands.
Diehl, K. C., and D. D. Hamann. 1979. Relationships between sensory profile param-eters and fundamental mechanical properties for raw potatoes, melons and apples.J. Texture Stud. 10, 401–420.
Diehl, K. C., D. D. Hamann, and J. K. Whitfield. 1979. Structural failure in selectedraw fruits and vegetables. J. Texture Stud. 10, 371–400.
Dikeman, M. E., J. H. Tuma, H. A. Glimp, R. E. Gregory, and D. M. Allen. 1972.Evaluation of the Tenderometer for predicting bovine muscle tenderness. J. Anim.Sci. 34, 960.
Dixon, G. D., and J. V. Parekh. 1979. Use of the cone penetrometer for testing the firmness of butter. J. Texture Stud. 10, 421–434.
Dogan, I. S., and C. E. Walker. 1999. Effects of impingement oven parameters and formulation on sugar snap cookies. Cereal Food World 44, 597–603.
Drake, B. K. 1961. An attempt at a geometrical classification of rheological apparatus.Unpublished manuscript. Göteborg, Sweden.
Drake, B. K. 1963. Food crushing sounds. An introductory study. J. Food Sci. 28,233–241.
Drake, B. K. 1965. Food crushing sounds: Comparison of objective and subjectivedata. J. Food Sci. 30, 556–559.
Drake, B. 1971. A quasi-rheological model element for fracture. J. Texture Stud. 2,365–372.
Drake, B. 1989. Sensory textural/rheological properties – a polyglot list. J. TextureStud. 20, 1–27.
Duizer, L. M., E. A. Gullett, and C. J. Findlay. 1996. The relationship between sensory time-intensity, physiological electromyography and instrumental texture profile analysis measurements of beef tenderness. Meat Science 42,215–224.
Edelman, E. C., W. H. Cathcart, and C. B. Berquist. 1950. The effect of various ingre-dients on the rate of firming of bread crumb in the presence of polyoxyethylene(mono) stearate and glycerylmonostearate. Cereal Chem. 27, 1–14.
Edminster, J. A., and Z. M. Vickers. 1985. Instrumental acoustical measures of crisp-ness in foods. J. Texture Stud. 16, 153–167.
Elliott, J. J., and A. J. Ganz. 1977. Salad dressings – preliminary rheological charac-terization. J. Texture Stud. 8, 359–371.
Ferry, J. D. 1977. Oscillation viscometry – effects of shear rate and frequency. Meas.Control. 11(5), 89–91.
Feuge, R. D., and W. A. Guice. 1959. Effect of composition and polymorphic form onthe hardness of fats. J. Am. Oil. Chem. Soc. 36, 531–534.
Finney, E. E., Jr. 1970. Mechanical resonance within Red Delicious apples and its relation to fruit texture. Trans. ASAE 13, 177–180.
Finney, E. E., Jr. 1971a. Dynamic elastic properties and sensory quality of apple fruit.J. Texture Stud. 2, 62–74.
Finney, E. E., Jr. 1971b. Random vibration techniques for non-destructive evaluationof peach firmness. J. Agric. Eng. Res. 16, 81–87.
Finney, E. E., Jr. 1971c. Vibration technique for testing fruit. Pap. – Am. Soc. Agric.Eng. No. 71–802.
390 References
REFERENCE.qxd 1/12/02 7:17 PM Page 390

Finney, E. E., Jr. 1972. Vibration techniques for testing fruit firmness. J. Texture Stud.3, 263–283.
Finney, E. E. 1973. Elementary concepts of rheology relevant to food texture studies.In “Texture Measurements of Foods” (A. Kramer, and A. S. Szczesniak, eds), pp. 33–70. Reidel Publishing Co., Dordrecht, Holland.
Finney, E. E., Jr., and J. A. Abbott. 1972. Sensory and objective measurements ofpeach firmness. J. Texture Stud. 3, 372–378.
Finney, E. E., Jr., and C. W. Hall. 1967. Elastic properties of potatoes. Trans. ASAE 10,4–8.
Finney, E. E., Jr., and K. H. Norris. 1968. Instrumentation for investigating dynamicmechanical properties of fruits and vegetables. Trans. ASAE 11, 94–97.
Finney, E. E., Jr., I. Ben-Gera, and D. R. Massie. 1968. An objective evaluation ofchanges in firmness of ripening bananas using a sonic technique. J. Food Sci. 32,642–646.
Finney, E. E., Jr., J. A. Abbott, A. E. Watada, and D. R. Massie. 1978. Nondestructivesonic resonance and the texture of apples. J. Am. Soc. Hortic. Sci. 103, 158–162.
Finney, K. F., and M. D. Shogren. 1972. A ten-gram Mixograph for determining and predicting functional properties of wheat flours. Bakers Dig. 46(2), 32–35,38–42, 77.
Fisher, J. D. 1933. Shortening value of plastic fats. Ind. Eng. Chem. 25, 1171–1173.Fitzgerald, J. V., and F. J. Matusik. 1976. Applications of a vibratory viscometer.
Am. Lab. 8(6), 63–68.Fletcher, S. W. 1975. Mechanical damage to the processed fruits and vegetables. In
“Theory, Determination and Control of Physical Properties of Food Materials” (C. Rha, ed.), pp. 163–179. D. Reidel Pub. Co., Dordrecht, Holland.
Freundlich, H., and W. Seifriz. 1923. Über die Elastizität von Solen und Gelen. Z. Phys. Chem., Stoechiom. Verwandschaftsl. 104, 233–261.
Friedman, H. H., J. E. Whitney, and A. S. Szczesniak. 1963. The Texturometer – a newinstrument for objective texture measurement. J. Food Sci. 28, 390–396.
Friend, C. P., R. D. Waniska, and L. W. Rooney. 1993. Effects of hydrocolloids on processing and qualities of wheat tortillas. Cereal Chem. 70, 252–256.
Fujii, K., R. Kajita, M. Kurosawa, and T. Fujii. 2000. Mechanical properties of two-phase disperse agar/gelatin mixed gels. J. Texture Stud. 31, 273–286.
Fukushima, M., and T. Kimura. 1992. “General Dictionary for Milk,” (K. Yamauchi,and K. Yokoyama, eds), p. 88. Asakura Shaten, Tokyo.
Funk, K., M. E. Zabik, and D. A. Elgidaily. 1969. Objective measurements for bakedproducts. J. Home Econ. 61, 119–123.
Gardner, H. A., and A. W. VanHeuckeroth. 1927. Some further applications of aMobilometer. Ind. Eng. Chem. 19, 724–726.
Garruti, R. D.-S., and M. C. Bourne. 1985. Effect of storage conditions of dry beanseeds (Phaseolus vulgaris L.) on texture profile parameters after cooking. J. FoodSci. 50, 1067–1071.
Genovese, D. B., and J. E. Lozano. 2000. Particle size determination of food suspensions: application to cloudy apple juice. J. Food Process Eng. 23, 437–452.
Gillett, T. A., C. L. Brown, R. L. Leutzinger, R. D. Cassidy, and S. Simon. 1978.Tensile strength of processed meats determined by an objective Instron technique.J. Food Sci. 43, 1121–1124, 1129.
Gilmont, R. 1963. A falling-ball viscometer. Instru. Control Sys. 36(9), 121–122.
References 391
REFERENCE.qxd 1/12/02 7:17 PM Page 391

Goh, H. C., and P. Sherman. 1987. Influence of surface friction on the stress relaxationof Gouda cheese. J. Texture Stud. 18, 389–404.
Goldthwaite, N. E. 1909. Contribution on the chemistry and physics of jelly-making.Ind. Eng. Chem. 1, 333.
Goldthwaite, N. E. 1911. The principles of jelly making. Univ. Ill. Bull. 3, No. 7.Gonzalez, J. J., K. L. McCarthy, and M. J. McCarthy. 2000. Textural and structural
changes in cooked lasagna pasta. J. Texture Stud. 31, 93–108.Gould, W. A. 1949. Instruments to quickly reveal quality of snap and wax beans. Food
Packer 30(12), 26–27.Grawemeyer, E. A., and M. C. Pfund. 1943. Line-spread as an objective test for con-
sistency. Food Res. 8, 105–108.Green, H. 1949. “Industrial Rheology and Rheological Structures.” Wiley, New York.Guinee, T. P., and D. J. O’Callaghan. 1997. The use of a simple empirical method for
objective quantification of the stretchability of cheese on cooked pizza pies. J. FoodEng. 31, 147–161.
Guinee, T. P., M. A. E. Auty, and C. Mullins. 1999. Observations on the microstructureand heat-induced changes in the viscoelasticity of commercial cheese. Aust. J.Dairy Technol. 54, 84–89.
Guinee, T. P., M. A. E. Auty, C. Mullins, M. O. Corcoran, and E. O. Mulholland. 2000.Preliminary observations on effects of fat content and degree of fat emulsificationon the structure-functional relationship of cheddar-type cheese. J. Texture Stud. 31,645–663.
Guraya, H. S., and R. T. Toledo. 1996. Microscopical characteristics and compressionresistance as indices of sensory texture in a crunchy snack product. J. Texture Stud.27, 687–701.
Guritno, P., and E. Hague. 1994. Relationship between energy and size reduction ofgrains using a three-roller mill. Am. Soc. Agr. Eng. 37, 1243–1248.
Guthrie, E. S. 1952. A study of the body of cultured cream. Cornell Agric. Exp. Stn.Bull. (Ithaca) No. 880.
Guthrie, E. S. 1963. Further studies of the body of cultured cream. Cornell Agric. Exp.Stn. Bull. (Ithaca) No. 986.
Hack, J. K., Y. K. Byung, and T. H. Yang. 1995. Prediction of failure stress of tofu texture using a delay time of ultrasonic wave. Agr. Chem. Biotechnol. 38,325–329.
Hagberg, S. 1960. A rapid method for determining alpha-amylase activity. CerealChem. 37, 218–222.
Hagberg, S. 1961. Note on a simplified rapid method for determining alpha-amylaseactivity. Cereal Chem. 38, 202–203.
Hagen, G. 1839. Ueber die Bewegung des Wassers in engen zylindrischen Roehren.Pogg. Ann. 46, 423.
Haighton, A. J. 1959. The measurement of hardness of margarine and fats with conepenetrometers. J. Am. Oil Chem. Soc. 36, 345–348.
Haller, M. H. 1941. Fruit pressure testers and their practical applications. U.S. Dep.Agric., Circ. No. 627.
Halmos, A. L. 1997. Food texture and sensory properties of dairy ingredients. FoodAust. 49, 169–173.
Halmos, A. L., and C. Tiu. 1981. Liquid foodstuffs exhibiting yield stress and shear-degradability. J. Texture Stud. 12, 39–46.
392 References
REFERENCE.qxd 1/12/02 7:17 PM Page 392

Halton, P., and G. W. Scott Blair. 1937. A study of some physical properties of flourdoughs in relation to their bread-making properties. Cereal Chem. 14, 201–219.
Hamann, D. D. 1983. Structural failure in solid foods. In “Physical Properties ofFoods” (M. Peleg, and E. B. Bagley, eds), pp. 351–383. Avi Publishing Co. Inc.,Westport.
Hamann, D. D. 1988. Rheology as a means of evaluating muscle functionality ofprocessed foods. Food Technol. 42(6), 66–71.
Hamann, D. D. 1994. Rheological studies of fish proteins. In “Food Hydrocolloids:Structures, Properties and Function” (K. Nishinari, and E. Dol, eds), pp. 225–234.Plenum Press, New York.
Hamann, D. D., and D. E. Carroll. 1971. Ripeness sorting of muscadine grapes by useof low-frequency vibrational energy. J. Food Sci. 36, 1049–1051.
Hamann, D. D., and G. A. MacDonald. 1992. Rheology and texture properties ofsurimi and surimi-based foods. In “Surimi Technology” (T. C. Lanier, and C. M. Lee,eds), pp. 429–500. Marcel Dekker Inc., New York.
Hamann, D. D., L. J. Kushman, and W. E. Ballinger. 1973. Sorting blueberries forquality by vibration. J. Am. Soc. Hortic. Sci. 98, 572–576.
Hamm, R. 1960. Biochemistry of meat hydration. Adv. Food Res. 10, 355–463.Hansen, L. J. 1971. Meat tenderness testing. U.S. Patent 3,602,038 (W. Armour & Co.).Hansen, L. R. 1972. Development of the Armour Tenderometer for tenderness evalua-
tion of beef carcases. J. Texture Stud. 3, 146–164.Harrington, G., and A. M. Pearson. 1962. Chew count as a measure of tenderness of
pork loins with various degrees of marbling. J. Food Sci. 27, 106–110.Harris, P. V. 1975. Meat chilling. CSIRO Food Res. Q. 35, 49–56.Hartman, H. 1924. Studies relating to the harvesting and storage of apples and pears.
Oregon Agr. Exp. Sta. Bull. 206.Hartman, H., and D. E. Bullis. 1929. Investigations relating to the handling of sweet
cherries. Oregon Agr. Exp. Sta. Bull. 247.Hashimoto, Y., T. Fukazawa, R. Niki, and T. Yasui. 1959. Effects of storage conditions
on some of the biochemical properties of meats and on the physical properties of anexperimental sausage. Food Res. 24, 185–197.
Haugh, R. R. 1937. The Haugh unit for measuring egg quality. U.S. Egg Poult. Mag.43, 552–555, 572.
Hawkins, L. A., and C. E. Sando. 1920. Effect of temperature on the resistance towounding of certain small fruits and cherries. USDA Bull. 830.
Hayakawa, M., and J. M. de Man. 1982. Interpretation of cone penetrometer consis-tency of fats. J. Texture Stud. 13, 201–210.
Heath, M. R. 1982. The effect of maximum biting force and bone loss on masticatoryfunction and dietary selection in the elderly. Int. Dent. J. 32, 345–351.
Henrickson, R. L., J. L. Marsden, and R. D. Morrison. 1972. An evaluation of theArmour Tenderometer for an estimation of beef tenderness. J. Food Sci. 37,857–859.
Henry, W. F., and M. H. Katz. 1969. New dimensions relating to the textural quality ofsemi-solid foods and ingredient systems. Food Technol. 23, 822–825.
Henry, W. F., M. H. Katz, F. J. Pilgrim, and A. J. May. 1971. Texture of semi-solidfoods: sensory and physical correlates. J. Food Sci. 36, 155–161.
Herschel, W. H., and C. Bergquist. 1921. The consistency of starch and dextrin pastes.Ind. Eng. Chem. 13, 703–706.
References 393
REFERENCE.qxd 1/12/02 7:17 PM Page 393

Herschel, W. H., and R. Bulkley. 1926. Konsistenzmessungen von gummibenzollö-sungen. Kolloid-Z. 39, 291–300.
Hickson, D. W., C. W. Dill, R. G. Morgan, V. E. Sweat, D. A. Suter, and Z. L. Carpenter.1982. Rheological properties of two heat-induced protein gels. J. Food Sci. 47,783–785, 791.
Hiiemae, K. M., and J. B. Palmer. 1999. Food transport and bolus formation duringcomplete feeding sequences on foods of different initial consistency. Dysphagia 14,31–42.
Hilker, L. D. 1947. A method for measuring the body of cultured cream. J. Dairy Sci.30, 161–164.
Hill, R. L. 1923. A test for determining the character of the curd from cow’s milk andits application to the study of curd and variance as an index to the food value of milkfor infants. J. Dairy Sci. 6, 509–526.
Hill, R. L. 1933. A decade and a half of soft-curd milk studies. Utah Agric. Exp. Stn.Circ. No. 101.
Hinton, C. J. 1970. In “Twenty Years of Confectionery and Chocolate Progress” (C. D. Pratt, E. de H. W. Vadetzky, K. E. Langwill, K. E. McCloskey, and H. W. Schuemann, eds), p. 111. Avi Publishing Co., Westport.
Hogarth, J. 1889. A new or improved mode of and means or appliance for testing and recording the characteristics or properties of flour and dough. U.K. Patent16,389.
Holdsworth, S. D. 1971. Applicability of rheological models to the interpretation offlow and processing behavior of fluid food products. J. Texture Stud. 2, 393–418.
Holt, S. 1999. The satiety index: a new method to measure the filling powers of foods.Food Aust. 51(3), 74, 75.
Hoseney, R. C., and J. Smewing. 1999. Instrumental measurement of stickiness ofdoughs and other foods. J. Texture Stud. 30, 123–136.
Hoseney, R. C., K. H. Hsu, and R. C. Junge. 1979. A simple spread test to measure therheological properties of fermenting dough. Cereal Chem. 56, 141–143.
Hostetler, R. L., and S. J. Ritchey. 1964. Effect of coring methods on shear valuesdetermined by Warner–Bratzler shear. J. Food Sci. 29, 681–685.
Hough, G., N. Bratchell, and D. B. MacDougal. 1992. Sensory profiling of dulce deleche, a dairy based confectionery product. J. Sensory Stud. 7, 157–178.
Houwink, R. 1958. “Elasticity, Plasticity and Structure of Matter.” Dover, New York.Howe, J. R., D. D. Hamann, T. C. Lanier, and J. W. Park. 1994. Fracture of Alaska
pollock gels in water: effects of minced muscle processing and test temperature. J. Food Sci. 59, 777–780.
Howe, P. E., and S. Bull. 1927. A study of factors which influence the quality andpalatability of meat. U.S. Dep. Agric., Natl. Coop. Proj., Bur. Anim. Ind. Rev. ed.
Hubbard, R. M., and G. G. Brown. 1943. The rolling ball viscometer. Ind. Eng. Chem.,Anal. Ed. 15, 212–218.
Huffman, D. L. 1974. An evaluation of the Tenderometer for measuring beef tender-ness. J. Anim. Sci. 38, 287–294.
Hulbert, E. 1913. Improved apparatus for testing the jelly strength of glues. Ind. Eng.Chem. 5, 235.
Hunziker, O. E., H. C. Mills, and G. Spitzer. 1912. Moisture control of butter. IndianaAgric. Exp. Stn., Stn. Bull. No. 159, p. 347, 359.
Hutchings, J. B., and P. L. Lillford. 1988. The perception of food texture – the philos-ophy of the breakdown path. J. Texture Stud. 19, 103–115.
394 References
REFERENCE.qxd 1/12/02 7:17 PM Page 394

Imai, E., K. Saito, M. Hatakeyama, K. Hatae, and A. Shimada. 1999. Effect of physi-cal properties of food particles on the degree of graininess perceived in the mouth.J. Texture Stud. 30, 59–88.
Jack, F. R., and F. Gibbon. 1995. Electropalatography in the study of tongue movementduring eating and swallowing (a novel procedure for measuring texture-relatedbehaviour). Int. J. Food Sci. Technol. 30, 415–423.
Jackman, R. L., and D. W. Stanley. 1992. Area- and perimeter-dependent propertiesand failure of mature-green and red-ripe tomato pericarp tissue. J. Texture Stud. 23,461–474.
Jackman, R. L., and D. W. Stanley. 1995. Creep behaviour of tomato pericarp tissue asinfluenced by ambient temperature ripening and chilled storage. J. Texture Stud. 26,537–552.
Jansen, K. 1961. Hesion and consistency of butter. J. Dairy Res. 28, 15–20.Jauregui, C. A., J. M. Regenstein, and R. C. Baker. 1981. A simple centrifugal method
for measuring expressible moisture, a water-binding property of muscle food. J. Food Sci. 46, 1271, 1273.
Jenkins, G. N. 1978. “The Physiology and Biochemistry of the Mouth.” 4th ed.Blackwell, Oxford.
Jerome, N. W. 1975. Flavor preferences and food patterns of selected U.S. andCaribbean blacks. Food Technol. 29(6), 46.
Jones, D., R. Chinnaswamy, Y. Tan, and M. Hanna. 2000. Physicochemical propertiesof ready-to-eat breakfast cereals. Cereal Chem. 45, 164–168.
Jowitt, R. 1974. The terminology of food texture. J. Texture Stud. 5, 351–358.Ju, J., and G. S. Mittal. 1999. Effect of fat substitutes, fat levels and cooking methods
on quality of fish patties. J. Food Processing Preservation 23, 87–107.Kachru, R. P., N. Kotwaliwale, and D. Balasubramanian. 1995. Physical and mechan-
ical properties of green banana (Musa paradisiaca) fruit. J. Food Eng. 26, 369–378.Kapur, K. K., S. Soman, and A. Yurkstas. 1964. Test food for measuring masticatory
performance of denture wearers. J. Prosthet. Dent. 14, 483–491.Kapur, K. K., H. H. Chauncey, and I. M. Sharon. 1966. Oral physiological factors
concerned with ingestion of food. In “Nutrition in Clinical Dentistry” (A. E. Nizel,ed.), 2nd ed., pp. 296–304. Saunders, Philadelphia, Pennsylvania.
Karacsonyi, L. P., and A. C. Borsos. 1961. An apparatus for measuring the torsionalstrength of macaroni. Cereal Chem. 38, 14–21.
Karmas, E., and K. Turk. 1976. Water binding of cooked fish in combination with various proteins. J. Food Sci. 41, 977–979.
Kastner, C. L., and R. L. Henrickson. 1969. Providing uniform meat cores for mechan-ical shear force measurement. J. Food Sci. 34, 603–605.
Katz, R., A. B. Caldwell, N. D. Collins, and A. E. Hostetter. 1959. A new grain hard-ness tester. Cereal Chem. 36, 393–401.
Katz, R., N. D. Collins, and A. B. Caldwell. 1961. Hardness and moisture content ofwheat kernels. Cereal Chem. 38, 364–368.
Kawanari, M., D. D. Hamann, K. R. Swartzel, and A. P. Hansen. 1981. Rheologicaland texture properties of butter. J. Texture Stud. 12, 483–505.
Kean, C. E. 1958. Method for determining the sub-sieve particle size distribution ofpulverized sugar. Food Res. 23, 677–683.
Kemsley, E. K., J. C. Sprunt, M. Defernz, and A. C. Smith. 2001. Multivariate analy-ses of electromyographic frequency spectra to characterize mastication. Submittedto J. Texture Stud.
References 395
REFERENCE.qxd 1/12/02 7:17 PM Page 395

Kerr, W. L., R. Li, and R. T. Toledo. 2000. Dynamic mechanical analyses of marinatedchicken breast meat. J. Texture Stud. 31, 421–436.
Kertesz, Z. I. 1935. The quality of canned whole kernel corn as determined by the simplified method for alcohol insoluble solids. Canner 80(11), 12–13.
Khan, N., and M. Elahi. 1980. A rapid batter expansion method for testing the bakingquality of wheat flours. J. Food Technol. 15, 43–46.
Khan, A. A., and J. F. V. Vincent. 1993. Compressive stiffness and fracture propertiesof apple and potato. J. Texture Stud. 24, 423–435.
Kilborn, R. H., and C. J. Dempster. 1965. Power-input meter for laboratory doughmixers. Cereal Chem. 42, 432.
Kilcast, D., and C. Roberts. 1998. Perception and measurement of stickiness in sugar-rich foods. J. Texture Stud. 29, 81–100.
Kimball, L. B., and Z. I. Kertesz. 1952. Practical determination of size distribution ofsuspended particles in macerated tomato product. Food Technol. 6, 68–71.
Kissling, R. 1893. Zur Prüfung des Tatelleimes. Chem.-Ztg. 17, 726–727.Kissling, R. 1898. Zur Prüfung der Leimsorten des Handels. Chem.-Ztg. 22, 171–172.Klatsky, M. 1942. Masticatory stresses and their relation to dental caries. J. Dent. Res.
21, 389.Knaysi, G. 1927. Some factors other than bacteria that influence the body of artificial
buttermilk. J. Agric. Res. (Washington, D.C.) 34, 771–784.Kohyama, K., and M. Nishi. 1997. Direct measurement of biting pressures for crack-
ers using a multiple-point sheet sensor. J. Texture Stud. 28, 605–617.Kohyama, K., K. Ohtsubo, H. Toyoshima, and K. Shiozawa. 1998. Electromyographic
study on cooked rice with different amylase contents. J. Texture Stud. 29, 101–113.Kohyama, K., S. Kobayashi, E. Hatakeyama, and T. Suzuki. 2000. Electromyographic
study of mastication of kelp snack. J. Texture Stud. 31, 577–590.Kokini, J. L., and A. Dickie. 1982. A model of food spreadability from fluid mechan-
ics. J. Texture Stud. 13, 211–227.Kokini, J. L., J. B. Kadane, and E. L. Cussler. 1977. Liquid texture perceived in the
mouth. J. Texture Stud. 8, 195–218.Kokini, J. L., M. Poole, P. Mason, S. Miller, and E. F. Stier. 1984. Identification of key
textural attributes of fluid and semi-solid foods using regression analysis. J. FoodSci. 49, 47–51.
Konstance, R. P., C. I. Onwulata, E. D. Strange, D. Lu, M. H. Tunick, P. W. Smith, andV. H. Holsinger. 1999. Variation of corn-soy blends for overseas distribution. CerealFoods World 49, 477–479.
Kosutány, T. 1907. “Der ungarische Weizen und das ungarische Mehl.” Budapest.Cited by D. W. Kent-Jones and A. J. Amos in “Modern Cereal Chemistry,” 6th ed.,1967. Food Trade Press, Ltd. London.
Kramer, A. 1951. Objective testing of vegetable quality. Food Technol. 5, 265–269.Kramer, A. 1973. Food texture – definition, measurement and relation to other
food quality attributes. In “Texture Measurements of Foods” (A. Kramer and A. S. Szczesniak, eds), pp. 1–9. Reidel Publ., Dordrecht, Netherlands.
Kramer, A., and H. R. Smith. 1946. The succulometer, an instrument for measuring thematurity of raw and canned whole kernel corn. Food Packer 27(8), 56–60.
Kramer, A., and B. A. Twigg. 1959. Principles and instrumentation for the physicalmeasurement of food quality with special reference to fruit and vegetable products.Adv. Food Res. 9, 153–220.
396 References
REFERENCE.qxd 1/12/02 7:17 PM Page 396
Kramer, A., R. B. Guyer, and L. E. Ide. 1949. Factors affecting the objective andorganoleptic evaluation in sweet corn. Proc. Am. Soc. Hortic. Sci. 54, 342–356.
Kramer, A., K. Aamlid, R. B. Guyer, and H. Rogers. 1951. New shear-press predictsquality of canned limas. Food Eng. 23(4), 112–113, 187.
Krieger, I. M. 1979. Golden anniversary for rheology. Phys. Today 32(10), 128.Krumel, K. L., and N. Sakar. 1975. Flow properties of gums useful to the food indus-
try. Food Technol. 29(4), 36, 38, 40, 41, 43, 44.La Belle, R. L. 1964. Bulk density – a versatile measure of food texture and bulk.
Food Technol. 18, 879–884.Lamb, F. C. 1967. Collaborative study of capillary viscometer method for
consistency of fruit nectars and fruit juice products. J. Assoc. Off. Anal. Chem. 50,288–292.
Lamb, F. C., and L. D. Lewis. 1959. Consistency measurement of fruit nectars andfruit juice products. J. Assoc. Off. Agric. Chem. 42, 411–416.
Larmond, E. 1970. Methods of sensory evaluation of food. Publ. – Can. Dep. Agric.No. 1284.
Larmour, R. K., E. B. Working, and C. W. Ofelt. 1939. Quality tests on hard red win-ter wheats. Cereal Chem. 16, 733–752.
Lawless, H., M. Vanne, and H. Tuorila. 1997. Categorization of English and Finnish texture terms among consumers and food professionals. J. Texture Stud. 28, 687–708.
Lee, C. M., and K. M. Patel. 1984. Analysis of juiciness of commercial frankfurters. J. Texture Stud. 15, 67–73.
Lee, H. O., H. Luan, and D. G. Daut. 1992. Use of an ultrasonic technique to evaluatethe rheological properties of cheese and dough. J. Food Eng. 16, 127–150.
Lee, S.-J., and M. Peleg. 1992. Imperfect squeezing flow viscometry with a wide plateand a shallow container. J. Texture Stud. 23, 267–278.
Lee, W. E. III, A. E. Derbel, C. T. Glembin, and E. G. Munday. 1988. Analysis of foodcrushing sounds during mastication: frequency-time studies. J. Texture Stud. 19,27–38.
Lee, W. E., and M. A. Camps. 1991. Tracking foodstuff location within the mouth inreal time: A sensory method. J. Texture Stud. 22, 277–287.
Lehmann, K. B. 1907a. Studien über die Zähigkeit des Fleisches und ihre Ursachen.Arch. Hyg. 63, 134–179.
Lehmann, K. R. 1907b. Die Festigkeit (Zähigkeit) vegetabilischer Nahrungsmittel undihre Veränderung durch das Kochen. Arch. Hyg. 63, 180–182.
Leick, A. 1904a. Über Künstliche Doppelbrechung und Elastizität vonGelatineplatten. Ann. Phys. (Leipzig) 14, 139–152.
Leick, A. 1904b. Über Künstliche Doppelchrechung und Elastizität von gelatine-platten. J. Phys. Theor. Appl. 3, 866, 877.
Leighton, A., A. Leviton, and O. E. Williams. 1934. The apparent viscosity of icecream. I. The sagging beam method of measurement. II. Factors to be controlled.III. The effects of milk fat, gelatin and homogenization temperature. J. Dairy Sci.17, 639–650.
Lewis, C. I., A. E. Murneek, and C. C. Cate. 1919. Pear harvesting and storage inves-tigations in Rouge River Valley. Ore. Agric. Exp. Stn., Bull. No. 162.
Lichtensteiger, M. J., R. G. Holmes, M. Y. Hamdy, and J. C. Blaisdell. 1988. Impactparameters of spherical viscoelastic objects and tomatoes. Trans. Am. Soc. Agr. Eng.31, 595–602.
References 397
REFERENCE.qxd 1/12/02 7:17 PM Page 397

Lillford, P. J. 1991. Texture and acceptability of human foods. In “Feeding and theTexture of Foods” (J. F. V. Vincent, and P. L. Lillford, eds), p. 231. CambridgeUniversity Press, New York.
Lindsay, J. B. 1901. Effect of feed on the composition of milk, butter fat, and on theconsistency or body of butter. 13th Annu. Rep., Mass. Hatch Exp. Stn. p. 29.
Lindsay, J. B., E. B. Holland, and P. H. Smith. 1909. Effect of soybean meal and soy-bean oil upon the composition of milk and butter fat, and upon the consistency orbody of butter. 21st Annu. Rep., Mass. Agric. Exp. Stn. Part II, pp. 66–110.
Lipowitz, A. 1861. “Neue Chemisch-Technische Abhandlungen.” Bosselman, Berlin.Locken, L., S. Loska, and W. Shuey. 1960. “The Farinograph Handbook.” Am. Assoc.
Cereal Chem., St Paul, Minnesota.Lorenzo, M. A., C. Gerhayds, and M. Peleg. 1997. Imperfect squeezing flow viscom-
etry of selected tomato products. J. Texture Stud. 26, 543–567.Love, R. M. 1983. Texture and fragility of fish muscle cells. Research at the Torry
Research Station. Review Paper. J. Texture Stud. 14, 323–352.Love, R. M., and E. Mackay. 1962. Protein denaturation in frozen fish.
V. Development of the cell fragility method for measuring cold storage changes in muscle. J. Sci. Food Agric. 13, 200–212.
Love, R. M., and M. Muslemuddin. 1972a. Protein denaturation in frozen fish, XII. The pH effect and cell fragility determinations. J. Sci. Food Agric. 23,1224–1238.
Love, R. M., and M. Muslemuddin. 1972b. Protein denaturation in frozen fish, XIII. A modified cell fragility method insensitive to the pH of the fish. J. Sci. Food Agric.23, 1239–1251.
Low, W. H. 1920. Testing the strength of glue jellies. Ind. Eng. Chem. 12, 355.Lu X.-Y., R. H. MacMillan, R. P. Burrow, G. P. Kadkol, and G. M. Halleran. 1994.
Pendulum test for evaluation of the rupture strength of seed pods. J. Texture Stud.25, 179–189.
Lucey, J. A., P. A. Munro, and H. Singh. 1998. Whey separation in acid skim milk gelsmade with gluconodeltalactone: effects of heat treatment and gelation temperature.J. Texture Stud. 29, 413–426.
Lucisano, M., E. Casiraghi, and C. Pompei. 1989. Optimization of an instrumentalmethod for the evaluation of spreadability. J. Texture Stud. 20, 301–315.
Luyten, H., T. Van Vliet, and P. Walstra. 1992. Comparison of various methods to evaluate fracture phenomena in food materials. J. Texture Stud. 23, 245–260.
Lynch, L. J., and R. S. Mitchell. 1950. The physical measurement of quality in canningof peas. CSIRO Aust. Bull. No. 254.
Lynch, L. J., and R. S. Mitchell. 1952. Short term prediction of maturity and yield ofcanning peas. Food Technol. 6(9), 24, 28, 30.
MacFarlane, P. G., and J. M. Marer. 1966. An apparatus for determining the tendernessof meat. Food Technol. 20, 838–839.
MacMichael, R. F. 1915. A new direct reading viscometer. Ind. Eng. Chem. 7, 961–963.Magness, J. R., and G. F. Taylor. 1925. An improved type of pressure tester for the
determination of fruit maturity. U.S. Dep. Agric. Circ. No. 350.Makower, R. U., M. M. Boggs, H. K. Burr, and H. S. Olcott. 1953. Comparison of
methods of measuring the maturity factor in frozen peas. Food Technol. 7, 43–48.Maleki, M., and W. Siebel. 1972. Uber das Altbackenwerden von Brot. I. Beziehungen
zwischen Sensorik Penetrometer und Panimeter beim Messen des Altbacken wer-dens von Weizenbrot. Getreide Mehl Brot 26, 58.
398 References
REFERENCE.qxd 1/12/02 7:17 PM Page 398

Mancini, M., M. Mores, and R. Rancini. 1999. Uniaxial compression and stress relax-ation tests on alginate gels. J. Texture Stud. 30, 639–657.
Mao, R., J. Tang, and B. G. Swanson. 1999. Texture properties of gellan gels asaffected by temperature. J. Texture Stud. 30, 409–433.
Margules, M. 1881. Ueber die Bestimmung des Reibungs- und Gleitungscoefficientenaus ebenen Bewegungen einer Fluessigkeit. Wien Sitzungsberger, Abt. 2A 83, 588:see also 84, 491 (1882).
Markovitz, H. 1985. Rheology: in the beginning. J. Rheol. 29, 777–798.Marshall, R. J., and S. P. J. Kirby. 1988. Sensory measurement of food texture by free-
choice profiling. J. Sensory Stud. 3, 63–80.Martin, W. McK. 1937. The Tenderometer, an apparatus for evaluating tenderness in
peas. Canner 84(12), 108–112.Martin, W. McK., R. H. Lueck, and E. D. Sallee. 1938. Practical application of the
Tenderometer in grading peas. Cann. Age 19(3), 146–149; (4), 193.Mathevon, E., L. Mioche, W. E. Brown, and J. Culioli. 1994. Texture analysis of meat
cooked at various temperatures by mechanical measurements, sensory assessmentsand masticatory muscle electromyography. J. Texture Stud. 26, 175–192.
Mathevon, E., L. Mioche, W. E. Brown, and J. Culioli. 1995. Texture analysis of meatcooked at various temperatures by mechanical measurements, sensory assessmentsand electromyography recordings. J. Texture Stud. 26, 175–192.
Mathoniere, C., L. Mioche, E. Dransfield, and J. Culioli. 2000. Meat texture charac-terizations comparison of chewing patterns, sensory and mechanical measures. J. Texture Stud. 31, 183–203.
Matsuo, R. R., and G. N. Irvine. 1969. Spaghetti tenderness testing apparatus. CerealChem. 46, 1–6.
Matsuo, R. R., and G. N. Irvine. 1971. Note on our improved apparatus for spaghettitenderness. Cereal Chem. 48, 554–558.
Matz, S. A. 1962. “Food Texture.” Avi. Westport, Connecticut.McCarthy, K. L., and J. D. Seymour. 1993. A fundamental approach for the relation-
ship between Bostwick measurement and Newtonian fluid viscosity. J. Texture Stud.24, 1–10.
McCarthy, O. J. 1987. Large deformation testing of solid foods. Food Technology inNew Zealand July, 40–43.
McClements, D. J. 1997. Ultrasonic characterization of food and drinks: principles,methods and application. Crit. Rev. Food Sci. Nutr. 37, 1–46.
McComber, D. R., R. A. Lohnes, and E. M. Osman. 1987. Double direct shear test forpotato texture. J. Food Sci. 52, 1302–1304, 1307.
Meullenet, J.-F., J. Gross, B. P. Marks, and M. Daniels. 1998. Sensory descriptive texture analyses of cooked rice and its correlation to instrumental parameters usingan extrusion cell. Cereal Chem. 75, 714–720.
Meyer, G. S. 1929. Some critical comments on the methods employed in the expres-sion of leaf saps. Plant Physiol. 4, 103–111.
Meyeringh, W. 1911. Studie over het factoren op het vochgehalte der botter vaninvloed. 51–55. ‘s Gravenhage: De Gebroeders van Cleef. Diss. Delft. (FromMulder, 1953.)
Miles, C. A., G. A. J. Fursey, and R. C. D. Jones. 1985. Ultrasonic estimation ofsolid/liquid ratios in fats, oils and adipose tissue. J. Sci. Food Agric. 36, 215–228.
Mioche, L., and J.-F. Martin. 1998. Training and sensory judgement effects on masti-cation as studied by electromyography. J. Food Sci. 63, 1–5.
References 399
REFERENCE.qxd 1/12/02 7:17 PM Page 399

Missaire, F., C.-G. Qiu, and M. A. Rao. 1990. Yield stress of structured and unstruc-tured food suspensions. J. Texture Stud. 21, 479–480.
Mitchell, R. S., D. J. Casimir, and L. J. Lynch. 1961. The Maturometer – instrumentaltest and redesign. Food Technol. 15, 415.
Mitschka, P. 1982. Simple conversion of Brookfield R.V.T. readings into viscosityfunctions. Rheol. Acta 12, 207–209.
Miyada, D. S., and A. L. Tappel. 1956. Meat tenderization I. Two mechanical devicesfor measuring texture. Food Technol. 10, 142–145.
Mizrach, A., and V. Flitsanov. 1999. Nondestructive ultrasonic determination of avo-cado softening process. J. Food Eng. 40, 139–144.
Mizrach, A., N. Galili, and G. Rosenhouse. 1994. Determining quality of fresh prod-ucts by ultrasonic excitation. Food Technol. 48(12), 68–71.
Mohsenin, N. N., and J. P. Mittal. 1977. Use of rheological terms and correlation ofcompatible measurements in food texture research. J. Texture Stud. 8, 395–408.
Mohsenin, N. N., H. E. Cooper, and L. D. Tukey. 1963. Engineering approach to eval-uating textural factors in fruits and vegetables. Trans. ASAE 6, 85–88, 92.
Montejano, J. G., D. D. Hamann, and T. C. Lanier. 1983a. Comparison of two instru-mental methods with sensory texture of protein gels. J. Texture Stud. 16, 403–424.
Montejano, J. G., D. D. Hamann, and T. C. Lanier. 1983b. Final strengths and rheolog-ical changes during processing of thermally induced fish muscle gels. J. Rheol. 27,557–574.
Mor, Y., C. F. Shoemaker, and M. Rosenberg. 1999. Compressive properties of wheyprotein composite gels containing fractionated milkfat. J. Food Sci. 64, 1078–1083.
Morris, O. M. 1925. Studies in apple storage. Bull.–Wash. Agric. Exp. Stn. No. 193.Morrow, C. T., and N. N. Mohsenin. 1966. Consideration of selected agricultural prod-
ucts as viscoelastic materials. J. Food Sci. 31, 686–698.Morrow, C. T., and N. N. Mohsenin. 1976. Mechanics of a multiple needle
Tenderometer for raw meat. J. Texture Stud. 7, 115–128.Moskowitz, H., and J. Kapsalis. 1974. Towards a general theory of texture
psychophysics. Proc. IV Int. Congr. Food Sci. Technol. 2, 102–120.Mottram, F. J. 1961. Evaluation of pseudoplastic materials by cone penetrometers.
Lab. Prac. 10, 767–770.Mueller, W. S. 1935. A method for the determination of the relative stiffness of cream
during the whipping process. J. Dairy Sci. 18, 177–180.Mulet, A., J. Benedito, J. Bon, and C. Rossello. 1999. Ultrasonic velocity in cheddar
cheese as affected by temperature. J. Food Sci. 64, 1038–1041.Muller, H. G. 1969a. Mechanical properties, rheology and haptaesthesis of food.
J. Texture Stud. 1, 38–42.Muller, H. G. 1969b. Routine rheological tests in the British food industry. J. Food
Technol. 4, 83–92.Muller, H. G. 1973. An introduction to food rheology. Crane Russak, New York.Muñoz, A. M. 1986. Development and application of texture reference scales.
J. Sensory Stud. 1, 55–83.Muñoz, A. M., and G. V. Civille. 1987. Factors affecting perception and acceptance of
food texture by American consumers. Food Rev. Int. 3, 285–322.Munz, E., and C. W. Brabender. 1940. Prediction of baking value from measurements
of plasticity and extensibility of dough I. Influence of mixing and molding treat-ments upon physical dough properties of typical American wheat varieties. CerealChem. 17, 79–100.
400 References
REFERENCE.qxd 1/12/02 7:17 PM Page 400

Murneek, A. E. 1921. A new test for maturity of the pear. Ore. Agric. Exp. Stn. Bull.No. 186.
Murray, D. C., and L. R. Luft. 1973. Low DE corn starch hydrolysates. Food Technol.27(3), 33.
Navarro, A. S., C. Ferrero, and N. E. Zaritsky. 1999. Rheological characterization of“dulce de leche” by dynamic and steady shear. J. Texture Stud. 30, 45–58.
Nemitz, G. 1963. A new apparatus for measuring the course of rigor mortis in fish andmammalian muscle. (In Ger.) Fleischwirtschaft 15, 18, 21.
Nemitz, G., W. Portman, and D. Sharra. 1960. Eine neue method zur Messung der Totenstarre. (A new method for measuring death rigor.) Z. Lebensm.-Unters. -Forsch. 112(4), 261–272.
Nielsen, M., and H. J. Martens. 1997. Low frequency ultrasonics for texture measure-ments on cooked carrots (Daucus carota L.). J. Food Sci. 62, 1167–1170, 1175.
Norton, C. R. T., J. R. Mitchell, and J. M. V. Blanshard. 1998. Fractal determination ofcrisp or crackly textures. J. Texture Stud. 29, 239–253.
Numata, K., H. Saegvsa, and K. Hirose. 1997. Quality of soybean curd prepared fromfine powder. J. Tokyo Food Technol. Center 6, 7–12.
Nussinovitch, A., M. Steffens, P. Chinachoti, and M. Peleg. 1992. Effect of strain leveland storage time on the recoverable work of compressed bread crumb. J. TextureStud. 23, 13–24.
Oakenfull, D. G., and A. G. Scott. 1985. Gelation of high methoxyl pectins. Food Aust.37, 156–158.
Oakes, E. F., and C. E. Davis. 1922. Jell strength and viscosity of gelatin solutions. J. Ind. Eng. Chem. 14, 706–710.
Oka, S. 1960. The principles of rheometry. In “Rheology, Theory and Applications” (F. R. Eirich, ed.), pp. 17–82. Academic Press, New York.
Okabe, T. 1979. Texture measurement of cooked rice and its relationship to eatingquality. J. Texture Stud. 10, 131–152.
Oldfield, R. C. 1960. Perception in the mouth. In “Texture in Foods.” Monograph, No. 7, pp. 3–9. Soc. Chem. Ind., London.
Olorunda, A. O., and M. A. Tung. 1984. Effects of calcium pretreatments and freezingrates on fluid loss in plantain products. J. Food Technol. 19, 133–139.
Omura, A. P., and J. F. Steffe. 2001. Centrifugal slump test to measure yield stress. J. Food Sci. 66, 137–140.
Onozuka, M., K. Watanabe, S. M. Mirbod, S. Ozono, K. Nishiyamo, N. Karasawa, and I. Nagatsu. 1999. Reduced mastication stimulates impairment of spatial memory anddegeneration of hippocampal neurons in aged SAMP8 mice. Brain Res. 826, 148–153.
Onozuka, M., K. Watanabe, S. Nagasaki, Y. Jiang, S. Ozono, K. Nishiyama, T. Kawase,N. Karasawa, and I. Nagatsu. 2000. Impairment of spatial memory and changes inastroglial responsiveness following loss of molar teeth in aged SAMP8 mice.Behav. Res. 108, 145–155.
Oppliger, H. R., F. J. Matusik, and J. V. Fitzgerald. 1975. New technique accuratelymeasures low viscosity on-line. Control Eng. 22(7), 39–40.
Oram, N. 1998. Texture and chemical feeling descriptors that 6–11 year olds andadults associate with food in the mouth. J. Texture Stud. 29, 185–197.
Osorio, F. A., and J. F. Steffe. 1987. Back extrusion of power law fluids. J. Texture Stud.18, 43–63.
Ourecky, D. K., and M. C. Bourne. 1968. Measurement of strawberry texture with anInstron machine. Proc. Am. Soc. Hort. Sci. 93, 317–325.
References 401
REFERENCE.qxd 1/12/02 7:17 PM Page 401

Park, B., A. D. Whitaker, R. K. Miller, and D. S. Hale. 1994. Ultrasonic spectral analy-sis for beef sensory attributes. J. Food Sci. 37, 1583–1589.
Parrish, E. C., Jr., D. G. Olson, B. E. Miner, R. B. Young, and R. L. Small. 1973.Relationship of tenderness measurements made by the Armour Tenderometer tocertain objective, subjective and organoleptic properties of bovine muscle. J. FoodSci. 38, 1214–1219.
Pashias, N., D. V. Bogor, J. Summers, and D. J. Glenister. 1996. A fifty cent rheometerfor yield stress measurement. J. Rheol. 40, 1179–1189.
Pavlov, I. P. 1927. “Conditioned Reflexes. An investigation of the PhysiologicalActivity of the Cerebral Cortex.” Oxford Univ. Press, London. (Eng. trans.)
Pearson, C. A., and D. Raynor. 1975. Comments on article by Peter Voisey. J. TextureStud. 6, 393–394.
Pedrero, D., and R. M. Pangborn. 1989. “Evaluación Sensorial de los AlimentosMétodos Analyticos.” Editorial Alhambra Mexicana, S. A. Mexico City.
Peleg, M. 1974. Determination of fresh papaya’s texture by penetration tests. J. FoodSci. 39, 156–159.
Peleg, M. 1980. A note on the sensitivity of fingers, tongue and jaws as mechanicaltesting instruments. J. Texture Stud. 10, 245–251.
Peleg, M. 1985. Comparison between various correction factors in the calculation ofcreep compliance. J. Texture Stud. 16, 119–127.
Peleg, M. 1993. Do irregular stress-strain relationship of crunchy foods have regularperiodicities? J. Texture Stud. 24, 215–227.
Peleg, M. 1997. Measures of line jaggedness and their use in foods textural evaluation.Crit. Rev. Food Sci. Nutr. 37, 491–518.
Peleg, M., and O. H. Campanella. 1988. On the mathematical form of psychophysicalrelationships with special focus on the perception of mechanical properties of solidobjects. Perception and Psychophysics 44, 451–455.
Peleg, M., and M. D. Normand. 1995. Stiffness assessment from jagged force–deformation relationships. J. Texture Stud. 26, 353–370.
Perkins, A. E. 1914. An apparatus and method for determining the hardness of butter-fat. Ind. Eng. Chem. 6, 136–141.
Personius, C. J., and G. F. Sharp. 1938. Adhesion of potato tuber cells as influenced by temperature. Food Res. 3, 513–514.
Perten, H. 1964. Application of the falling number method for evaluating alpha-amylase activity. Cereal Chem. 41, 127–140.
Perten, H. 1967. Factors influencing falling number values. Cereal Sci. Today 12, 516,518, 519.
Pierson, A., and J. LeMagnen. 1970. Study of food textures by recording and chewingand swallowing movements. J. Texture Stud. 1, 327–337.
Pitman, G. 1930. Further comparison of California and imported almonds. Ind. Eng.Chem. 22, 1129–1131.
Platt, W., and P. D. Kratz. 1933. Measuring and recording some characteristics of testsponge cakes. Cereal Chem. 10, 73–90.
Platt, W., and R. Powers. 1940. Compressibility of bread crumb. Cereal Chem. 17,601–621.
Poiseuille, J. L. M. 1846. Recherches expérimentales sur le mouvement des liquidesdans les tubes de très petits diamètres. Mem. Acad. R. Sci. Inst. Fr. Sci., Math. Phys.9, 433–545. [Eng. trans., Rheol. Mem. 1, No. 1 (1940).]
402 References
REFERENCE.qxd 1/12/02 7:17 PM Page 402

Ponte, J. G., Jr., S. T. Titcomb, and R. H. Cotton. 1962. Flour as a factor in breadfirming. Cereal Chem. 39, 437–444.
Pool. M. F. 1967. Objective measurement of connective tissue tenacity of poultrymeat. J. Food Sci. 32, 550–553.
Pool, M. F., and A. A. Klose. 1969. The relation of force to sample dimensions inobjective measurements of tenderness of poultry meat. J. Food Sci. 34, 524.
Poole, H. J. 1925. The elasticity of gelatin jellies and its bearing on their physicalstructure and chemical equilibria. Trans. Faraday Soc. 21, 114–137.
Porst, E. G., and Moskowitz. 1922. Comparison of the various corn products starchesas shown by the Bingham–Greene Plastometer. Ind. Eng. Chem. 14, 49–52.
Povey, M. J. W., and C. A. Harden. 1981. An application of the ultrasonic pulse echo technique to the measurement of crispness of biscuits. J. Food Technol. 16,167–175.
Povey, M. J. W., and D. J. McClements. 1988. Ultrasonics in food engineering Part I:Introduction and experimental methods. J. Food Eng. 8, 217–245.
Pradipasena, P., and C. Rha. 1977. Pseudoplastic and rheopectic properties of a glob-ular protein (�-lactoglobulin) solution. J. Texture Stud. 8, 311–325.
Prentice, J. H., and D. Huber. 1983. Results of a collaborative study on measuring rheological properties of foodstuffs. In “Physical Properties of Foods” (R. Jowitt, F. Escher, B. Hallstrom, H. F. Th. Meffert, W. E. L. Spiess, and G. Vos, eds), pp. 123–183. Applied Science Publishers, London.
Priel, Z., M. Sasson, and A. Silverberg. 1973. Method for determining the time of flowin a capillary viscometer with an absolute accuracy of 3 � 10�6. Rev. Sci. Instrum.44, 135.
Prinz, J. F., and P. W. Lucas. 2000. Saliva tannin interactions. J. Oral Rehabil. 27,991–994.
Psotka, J. 2001. Digital image analysis of finished food products. Cereal Foods World46, 20–23.
Pszczola, D. 1997. Food Technol. 51(11), 82.Ramirez-Wong, B., V. E. Sweat, P. I. Torres, and L. W. Rooney. 1996. Evaluation of the
rheological properties of fresh corn masa using squeezing flow viscometry. J. Texture Stud. 27, 185–198.
Ramkumar, C., O. H. Campanella, P. J. Watkinson, R. J. Bennett, and L. K. Creamer.1998. The effects of pH and time on rheological changes during early cheese matu-ration. J. Texture Stud. 29, 633–644.
Rao, M. A. 1975. Measurement of flow properties of food suspensions with a mixer. J. Texture Stud. 6, 533–539.
Rao, M. A. 1977. Rheology of liquid foods – A review. J. Texture Stud. 8, 135–168.Rao, M. A., and M. C. Bourne. 1977. Analysis of the Plastometer and correlation of
Bostwich Consistometer data. J. Food Sci. 42, 261–264.Rao, M. A., and H. J. Cooley. 1984. Determination of effective shear rates in rotational
viscometers with complex geometries. J. Texture Stud. 15, 327–335.Rao, M. A., and S. S. M. Rizvi. 1986. “Engineering Properties of Foods.” Marcel
Dekker, New York.Rao, M. A., T. O. Palomino, and L. W. Bernhardt. 1974. Flow properties of tropical
fruit purees. J. Food Sci. 39, 160, 161.Rao, M. A., M. C. Bourne, and H. J. Cooley. 1981. Flow properties of tomato pastes of
high concentrations. J. Texture Stud. 12, 521–538.
References 403
REFERENCE.qxd 1/12/02 7:17 PM Page 403
Rao, P. H., K. Laelavathi, and S. R. Shurpalekar. 1986. Objective measurements of theconsistency of chapati dough using a research water absorption meter. J. TextureStud. 17, 401–420.
Rasper, V. F. 1975. Dough rheology at large deformations in simple tensile mode.Cereal Chem. 52, 24r–41r.
Rasper, V. F., J. Rasper, and J. M. deMan. 1974. Stress strain relationships of chemi-cally improved unfermented doughs. J. Texture Stud. 4, 438–466.
Reiner, M. 1964. The Deborah number. Physics Today January 1964, p. 62.Reyes-Vega, M. I., R. D. Peralta-Rodríguez, A. Anzaldúa-Morales, J. D. Figueroa, and
F. Martínez-Bustos. 1998. Relating sensory textural attributes of corn tortillas tosome instrumental measurements. J. Texture Stud. 29, 361–373.
Reynolds, D. 1883. An experimental investigation of the circumstances which deter-mine whether the motion of water shall be direct or sinuous, and of the law of resis-tance in parallel channels. Philos. Trans. R. Soc. London 174, 935–982.
Rha, C. 1980. Food rheology principles and practice. Lecture notes, Food Mater. Sci.Fabr. Lab., Mass. Inst. Technol., Cambridge, Massachusetts.
Rhodes, D. N., R. C. D. Jones, B. B. Chrystal, and J. M. Harries. 1972. Meat texture II.The relationship between subjective assessments and a compressive test on roastbeef. J. Texture Stud. 3, 298–309.
Richardson, N. J., D. A. Booth, and D. Stanley. 1993. Effect of homogenization and fatcontent on oral perception of low and high viscosity creams. J. Sensory Stud. 8,133–143.
Roark, R. J. 1965. “Formulas for Stress and Strain.” McGraw-Hill, New York.Roberts, H. F. 1910. A quantitative method for the determination of hardness in wheat.
Kans. Agric. Exp. Stn., Bull. No. 167, pp. 371–390.Robertson, G. H., and S. H. Emani. 1974. Liquid jet penetrometry for physical analy-
sis. Application to bread aging. J. Food Sci. 39, 1247–1253.Rogers, L. A., and G. P. Sanders. 1942. Devices for measuring physical properties of
cheese. J. Dairy Sci. 25, 203–210.Rohde, F., M. D. Normand, and M. Peleg. 1993. Characterization of the power spec-
trum of force-deformation relationship of crunchy foods. J. Texture Stud. 24, 45–92.Rohm, H. 1990. Consumer awareness of food texture in Austria. J. Texture Stud. 21,
363–373.Rohm, H., D. Jaros, V. Fischer, and S. Lailach. 1994. Foods associated with descriptive
texture terms. Lebensm.-Wiss. Ui. Technol. 27, 406–414.Rohm, H., D. Jaros, and M. de Haan. 1997. A video-based method for determination
of average stress strain relations in uniaxial compression of selected foods. J. Texture Stud. 20, 245–255.
Rose, D. H., M. H. Haller, and P. L. Harding. 1934. Relation of temperature of fruit tofirmness in strawberries. Proc. Am. Soc. Hort. Sci. 32, 429–431.
Ross, A. S., C. E. Walker, R. I. Booth, R. A. Orth, and C. W. Wrigley. 1987. The RapidViscoAnalyzer: A new technique for estimation of sprout damage. Cereal FoodsWorld 32, 827–829.
Ross, L. R., and W. L. Porter. 1968. Interpretation of multiple-peak shear force curvesobtained on French fried potatoes. Am. Potato J. 45, 461– 471.
Ross, L. R., and W. L. Porter. 1969. Objective measurements of French fried potatoquality. Laboratory techniques for research use. Am. Potato J. 46, 192–200.
Ross, L. R., and W. L. Porter. 1971. Objective measurement of texture variables in rawand processed French fried potatoes. Am. Potato J. 48, 329–343.
404 References
REFERENCE.qxd 1/12/02 7:17 PM Page 404

Ross, L. R., and W. L. Porter. 1976. Textural quality prediction of reheated frozen French fried potatoes by objective testing of raw stock. J. Food Sci. 41,206–208.
Rostagno, W. 1969. Chocolate particle size and its organoleptic influence. TheManufacturing Confectioner May, 81–86.
Rostagno, W. 1974. Rheological properties of chocolate. In “Lebensmittel-Einflussder Rheologie” (D. Behrens and K. Fischbeck, eds), DECHEMA Monograph, Vol. 77, No. 1505–1536, pp. 283–293. Verlag Chemie, Weinheim.
Roth, W., and S. R. Rich. 1953. A new method for continuous viscosity measurement.General theory of the Ultra-Viscoson. J. Appl. Phys. 24, 940–950.
Rousset-Akrim, S., J.-F. Martin, C. Pilandron, and C. Touraite. 1995. Research ofselective tests for discerning “an efficient assessor” in texture profiting. J. SensoryStud. 10, 217–237.
Rovedo, C. O., M. M. Pedrero-Navarro, and R. P. Singh. 1999. Mechanical propertiesof a corn starch product during the post-frying period. J. Texture Stud. 30, 279–290.
Rutgers, G. 1958. The consistency of starch-milk puddings. I. Preparation of puddingsand measurement of consistency. J. Sci. Food Agric. 9, 61–68.
Sachs, F. 1988. The intimate sense. Understanding the mechanisms of touch. TheSciences January, 28–34.
Sakamoto, H., T. Harada, T. Matsukobu, Y. Takaeso, and M. Tazaki. 1989.Electromyographic measurement of textural changes of foodstuffs during chewing.Agric. Biol. Chem. 53, 2421–2433.
Sakurai, Y., M. Fujimaki, and H. Kato. 1993. “Processing and Storage of Foods” 2nded., p. 85. Koseikan, Tokyo.
Saravacos, G. D. 1968. Tube viscometry of fruit purees and juices. Food Technol. 22,1585–1588.
Saravacos, G. D. 1970. Effect of temperature on viscosity of fruit juices and purees. J. Food Sci. 35, 122–125.
Sayre, J. D., and V. H. Morris. 1931. Use of expressed sap in physiologic studies ofcorn. Plant Physiol. 6, 139–148.
Sayre, J. D., and V. H. Morris. 1932. Use of expressed sap in determining the compo-sition of corn tissue. Plant Physiol. 7, 261–271.
Schiffman, S. 1977. Food recognition by the elderly. J. Gerontol. 32, 586–592.Schiffman, S., G. Musante, and J. Conger. 1978. Application of multidimensional scal-
ing to ratings of foods for obese and normal weight individuals. Physiol. Behav. 21,417–422.
Schultz, E. F., Jr., and G. W. Schneider. 1955. Sample size necessary to estimate sizeand quality of fruit growth of trees, and per cent fruit set of apples and peaches.Proc. Am. Soc. Hortic. Sci. 66, 36–44.
Schutz, H. G., and O. L. Wahl. 1981. Consumer perception of the relative importanceof appearance flavor and texture to food acceptance. In “Criteria for FoodAcceptance. How Man Chooses What He Eats” (J. Solms, and R. C. Hall, eds), pp. 97–116. Foster Publishing Ltd, Zurich.
Schwartz, N. D. 1975. Adaptation of the sensory texture profile method to skin careproducts. J. Texture Stud. 6, 35–42.
Schwedoff, T. 1889. Recherches experimentales sur la cohesion des liquides. J. Phys.Theor. Appl. 8, 341–359.
Scott Blair, G. W., and J. Burnett. 1963. A simple method for detecting an early stagein coagulation of rennetted milk. J. Dairy Res. 30, 383–390.
References 405
REFERENCE.qxd 1/12/02 7:17 PM Page 405
Scott Blair, G. W., and F. M. V. Coppen. 1940. An objective measure of the consistencyof cheese curd at the pitching point. J. Dairy Res. 11, 187–195.
Scott Blair, G. W., G. Watts, and H. J. Denham. 1927. Effect of concentration on viscosity of flour suspensions. Cereal Chem. 4, 63–67.
Segars, R. A., H. A. Nordstrom, and J. G. Kapsalis. 1974. Textural characteristics ofbeef muscles. J. Texture Stud. 5, 283–297.
Segars, R. A., G. H. Roger, J. G. Kapsalis, and R. A. Kluter. 1975. A punch and die testcell for determining the textural qualities of meat. J. Texture Stud. 6, 211–225.
Segars, R. A., R. G. Hamel, and J. G. Kapsalis. 1977. Use of Poisson’s ratio for objective–subjective texture correlations in beef. An apparatus for obtaining therequired data. J. Texture Stud. 8, 433–447.
Segnini, S., P. Demjek, and R. Oste. 1999. Reproducible texture analysis of potatochips. J. Food Sci. 64, 309–312.
Seideman, S. C., and L. K. Theer. 1986. Relationships of instrumental textural prop-erties and muscle fiber types to the sensory properties of beef. J. Food Quality 9,251–261.
Shama, F., and P. Sherman. 1973a. Evaluation of some textural properties of foodswith the Instron Universal Testing Machine. J. Texture Stud. 4, 344–353.
Shama, F., and P. Sherman. 1973b. Identification of stimuli controlling the sensoryevaluation of viscosity. II. Oral methods. J. Texture Stud. 4, 111–118.
Shama, F., C. Parkinson, and P. Sherman. 1973. Identification of stimuli controlling thesensory evaluation of viscosity. I. Non oral methods. J. Texture Stud. 4, 102–110.
Sharma, M. G., and N. N. Mohsenin. 1970. Mechanics of deformation of a fruit subjected to hydrostatic pressure. J. Agric. Eng. Res. 15(1), 65–74.
Sheppard, S. E., and S. S. Sweet. 1923. A preliminary study of a plunger type of jelly-strength tester. Ind. Eng. Chem. 15, 571–576.
Sheppard, S. E., S. S. Sweet, and J. W. Scott, Jr. 1920. The jelly strength of gelatins and glues. Ind. Eng. Chem. 12, 1007–1011.
Sherman, P. 1970. “Industrial Rheology.” Academic Press, New York.Sherman, P. 1973. Structure and textural properties of food. In “Texture
Measurements of Foods” (A. Kramer, and A. S. Szczesniak, eds), pp. 52–70. ReidelPublishing Co., Dordrecht, Netherlands.
Showalter, W. R., and G. Christenson. 1998. Toward a rationalization of the slump testfor fresh concrete: Comparisons of calculations with experiments. J. Rheol. 42,865–870.
Sigurgisladottir, S., A. Hafsteinsson, A. Jenssen, O. Lie, R. Nortviet, M. Thomassen,and O. Torrissen. 1999. Textural properties of raw salmon fillets as affected by sam-pling method. J. Food Sci. 64, 99–104.
Simon, S., J. C. Field, W. E. Kramlich, and F. N. Tauber. 1965. Factors affecting frank-furter texture and a method of measurement. Food Technol. 14, 410–413.
Sindall, R. W., and W. Bacon. 1914. The examination of commercial gelatins withregard to their suitability for papermaking. Analyst (London), 39, 20–27.
Skinner, G. H., and Rao, V. N. M. 1986. Linear viscoelastic behavior of frankfurter. J. Texture Studies 17, 421–432.
Slattery, J. C. 1961. Analysis of the cone-plate viscometer. J. Colloid Sci. 16, 431– 437.Smeets, H. S., and H. Cleve. 1956. Determination of conditioning by measuring soft-
ness. Milling Prod. 21(4), 5, 12–13, 16.Smith, C. R. 1920. Determination of jellying power of gelatins and glue by the polar-
iscope. Ind. Eng. Chem. 12, 878–881.
406 References
REFERENCE.qxd 1/12/02 7:17 PM Page 406
Smith, E. S. 1909. Glue-Tester. U.S. Patent 911, 277.Smith, G. C., and Z. L. Carpenter. 1973. Mechanical measurements of meat tender-
ness using the Nip Tenderometer. J. Texture Stud. 4, 196–203.Sohn, C. E. 1893. Simple appliances for testing the consistency of semi-solids, with
a note on a new method of examining butter. Analyst (London) 18, 218–221.Somers, G. F. 1965. Citric-induced loss of rigidity in potato tuber slices. Plant Physiol.
40, 388–395.Sone, T. 1972. “Consistency of Foodstuffs.” Reidel Publ., Dordrecht, Netherlands.Spanier, A. M., B. W. Berry, and M. B. Solomon. 2000. Variation in tenderness of
beef strip loins and improvement in tenderness by use of hydrodynamic pressureprocessing (HDP). J. Muscle Foods 11, 183–196.
Steffe, J. F. 1992. “Rheological Methods in Food Process Engineering.” FreemanPress, East Lansing.
Steffe, J. F., and E. W. Ford. 1985. Rheological techniques to evaluate the shelf-stability of starch-thickened strained apricots. J. Texture Stud. 16, 179–192.
Steffe, J. F., and F. A. Osorio. 1987. Back extrusion of non-Newtonian fluids. FoodTechnol. 41(3), 72–77.
Sterling, C., and M. Simone. 1954. Crispness in almonds. Food Res. 19, 276–281.Stevens, S. S. 1970. Neural events and the psychophysical law. Science 170, 1043–1050.Stewart, F. C. 1923. The relation of moisture content and certain other factors to the
popping of popcorn. Bull. – N.Y. Agric. Exp. Stn. (Geneva) No. 505.Stone, H., and S. Oliver. 1966. Effect of viscosity on the detection of relative sweet-
ness intensity of sucrose solutions. J. Food Sci. 31, 129–134.Studman, C. J., and Yuwana. 1992. Twist test for measuring fruit firmness. J. Texture
Stud. 23, 215–227.Su, C. S., and E. G. Humphries. 1972. Rupture properties of cucumber skin. Pickle
Pak Sci. 2(1), 3–10.Sucharipa, E. 1923. Experimental data on pectin–sugar acid gels. J. Assoc. Off. Agric.
Chem. 7, 57–68.Suhendro, E. L., H. D. Almeida-Dominguez, C. W. Rooney, and R. D. Waniska. 1998.
Objective rollability method for corn tortilla measurement. Cereal Chem. 75,320–324.
Suwonsichon, T., and M. Peleg. 1999a. Rheological characterization of Ricottacheeses by imperfect squeezing flow viscometry. J. Texture Stud. 30, 89–103.
Suwonsichon, T., and M. Peleg. 1999b. Rheological characterization of almost intactand stirred yogurt by imperfect squeezing flow viscometry. J. Sci. Food Agric. 79,911–921.
Suwonsichon, T., and M. Peleg. 1999c. Imperfect squeezing flow viscometry of mustards with suspended particulates. J. Food Eng. 39, 217–226.
Swanson, C. O., and E. B. Working. 1933. Testing the quality of flour by the recordingdough mixer. Cereal Chem. 10, 1–29.
Swyngedau, S., and M. Peleg. 1992. A model for the compressibility of food-finger(s)arrays. J. Rheol. 36, 45–56.
Szczesniak, A. S. 1963a. Classification of textural characteristics. J. Food Sci. 28,385–389.
Szczesniak, A. S. 1963b. Objective measurements of food texture. J. Food Sci. 28,410–420.
Szczesniak, A. S. 1968. Correlations between objective and sensory measurements.Food Technol. 22, 981–985.
References 407
REFERENCE.qxd 1/12/02 7:17 PM Page 407

Szczesniak, A. S. 1971. Consumer awareness of texture and of other food attributes. J. Texture Stud. 2, 196–206.
Szczesniak, A. S. 1972. Consumer awareness of and attitudes to food texture. II.Children and teenagers. J. Texture Stud. 3, 206–217.
Szczesniak, A. S. 1975a. Textural characterization of temperature sensitive foods. J. Texture Stud. 6, 139–156.
Szczesniak, A. S. 1975b. General Foods texture profile revisited – ten years perspec-tive. J. Texture Stud. 6, 5–17.
Szczesniak, A. S. 1979. Classification of mouthfeel characteristics of beverages. In“Food Rheology and Texture” (P. Sherman. ed.), pp. 1–20. Academic Press, New York.
Szczesniak, A. S. 1990. Texture: It is still an overlooked food attribute? Food Technol.44(9), 86, 88, 90, 92, 95.
Szczesniak, A. S. 1995. Texture profile analysis – methodology interpretation clarified.J. Food Sci. 60(6), vii. (Reprinted in J. Texture Stud. 27(6), vi, 1996.)
Szczesniak, A. S. 1997. Effect of storage on texture. In “Food Storage Stability” (I. A. Taub and R. P. Singh, eds), pp. 191–243. CRC Press, New York.
Szczesniak, A. S. and M. C. Bourne. 1969. Sensory evaluation of food firmness. J. Texture Stud. 1, 52–64.
Szczesniak, A. S., and E. Farkas. 1962. Objective characterization of the mouthfeel ofgum solutions. J. Food Sci. 27, 381–385.
Szczesniak, A. S., and B. J. Hall. 1975. Application of the General Foods Texturometerto specific food products. J. Texture Stud. 6, 117–138.
Szczesniak, A. S., and R. Ilker. 1988. The meaning of textural characteristics – juici-ness in plant food stuffs. J. Texture Stud. 19, 61–78.
Szczesniak, A. S., and E. L. Kahn. 1971. Consumer awareness of and attitudes to foodtexture. I. Adults. J. Texture Stud. 2, 280–295.
Szczesniak, A. S., and D. H. Kleyn. 1963. Consumer awareness of texture and otherfoods attributes. Food Technol. 17, 74–77.
Szczesniak, A. S., and E. Z. Skinner. 1973. Meaning of texture words to the consumer.J. Texture Stud. 4, 378–384.
Szczesniak, A. S., and K. Torgeson. 1965. Methods of meat texture measurementviewed from the background of factors affecting tenderness. Adv. Food Res. 14,53–165.
Szczesniak, A. S., M. A. Brandt, and H. H. Friedman. 1963. Development of standardrating scales for mechanical parameters of texture and correlation between theobjective and sensory methods of texture evaluation. J. Food Sci. 28, 397–403.
Szczesniak, A. S., P. R. Humbaugh, and H. W. Block. 1970. Behavior of different foodsin the standard shear compression cell of the shear press and the effect of sampleweight on peak area and maximum force. J. Texture Stud. 1, 356–378.
Szczesniak, A. S., B. J. Loew, and E. Z. Skinner. 1975. Consumer texture profile tech-nique. J. Food Sci. 40, 1253–1256.
Takahashi, J., and F. Nakazawa. 1991a. Palatal pressure patterns of gelatin gels in themouth. J. Texture Stud. 22, 1–11.
Takahashi, J., and F. Nakazawa. 1991b. Effects of viscosity of liquid foods on palatalpressure. J. Texture Stud. 22, 13–24.
Takahashi, J., and F. Nakazawa. 1992. Effects of dimensions of agar and gelatin gelson palatal pressure patterns. J. Texture Stud. 23, 139–152.
408 References
REFERENCE.qxd 1/12/02 7:17 PM Page 408

Tan, J., X. Gao, and F. Hsieh. 1994. Extrudate characterization by image processing. J. Food Sci. 59, 1247–1250.
Tan, J., H. Zhang, and X. Gao. 1997. SEM image processing for food structure analy-sis. J. Texture Stud. 28, 657–672.
Tanaka, M. 1975. General Foods Texturometer applications to food texture research inJapan. J. Texture Stud. 6, 101–116.
Tang, A., O. J. McCarthy, and P. A. Munro. 1995. Effects of pH on whey protein con-centrate gel properties: comparisons between small deformation (dynamic) andlarge deformation (failure) testing. J. Texture Stud. 26, 255–272.
Tarr, L. W. 1926. Fruit Jellies III. Jelly strength measurements. Del. Agric. Exp. Stn.,Bull. No. 142.
Tauti, M., I. Hirose, and H. Wada. 1931. A physical method of testing the freshness ofraw fish. J. Imp. Fish. Inst. (Jpn.) 26, 59–66.
Templeton, H. L., and H. H. Sommer. 1933. Studies on whipping cream. J. Dairy Sci.16, 329–345.
Thompson, J. B., and D. F. Meisner. 1950. The lever system of the Baker compres-simeter. Cereal Chem. 27, 71–73.
Thompson, R. L., H. P. Fleming, and D. D. Hamann. 1992. Delineation of punctureforces for exocarp and mesocarp tissues in cucumber fruit. J. Texture Stud. 23,169–184.
Thybo, A. K., and M. Martens. 1998. Development of a sensory texture profile ofcooked potatoes by multi-variate data analyses. J. Texture Stud. 29, 453–468.
Thybo, A. K., M. Nielsen, and M. Martens. 2000. Influence of uniaxial compressionrate on rheological parameters and sensory texture prediction of cooked potatoes. J. Texture Stud. 31, 25–40.
Tornberg, E., S. F. Jelkner-Modig, H. Ruderus, P.-O. Glantz, K. Randow, and D. Stafford. 1985. Clinically recorded masticatory patterns as related to the sensoryevaluation of meat and meat products. J. Food Sci. 50, 1059–1066.
Tracy, A. F. 1928. A new jelly strength tester and some experiments on gelatin gels. J. Soc. Chem. Ind., London, Trans. Commun. 47, 94T–96T.
Trant, A. S., R. M. Pangborn, and A. C. Little. 1981. Potential fallacy of correlatinghedonic responses with physical and chemical measurements. J. Food Sci. 46,583–588.
Tressler, D. K., and W. T. Murray. 1932. Tenderness of meat. II. Determination ofperiod of aging of grade A beef required to produce a tender quick-frozen product.Ind. Eng. Chem. 24, 890–892.
Tressler, D.K., C. Birdseye, and W. T. Murray. 1932. Tenderness of meat. Ind. Eng.Chem. 24, 242–245.
Truong, V. D., and C. R. Daubert. 2000. Comparative study of large strain methods forassessing failure characteristics of selected food gels. J. Texture Stud. 31, 335–353.
Truong, V. D., W. M. Walter, Jr., and D. D. Hamann. 1997. Relationship betweeninstrumental and sensory parameters of cooked sweet potato texture. J. TextureStud. 28, 163–185.
Tschoegl, N. W., J. A. Rinde, and T. L. Smith. 1970. Rheological properties of wheatflour doughs. I. Method for determining the large deformation and rupture proper-ties in simple tension. J. Sci. Food Agric. 21, 65–70.
Twigg, B. A. 1963. New Shear Press method for measuring quality of raw and cannedsweet corn. The Canning Trade. March 25–April 1.
References 409
REFERENCE.qxd 1/12/02 7:17 PM Page 409

Ulbricht, D., M. D. Normand, and M. Peleg. 1995. Creating typical jagged force-deformation relationship from the irregular and irreproducible compression data ofcrunchy foods. J. Sci. Food Agric. 67, 453–459.
Underwood, J. C., and G. J. Keller. 1948. A method for measuring the consistency oftomato paste. Fruit Prod. J. Am. Food Manuf. 28(4), 103–105.
Vaisey-Genser, M., B. K. Vane, and S. Johnson. 1989. Graininess, crystal size, andfirmness of stored canola oil margarines. J. Texture Stud. 20, 347–361.
Valenta, E. 1909. Neuer Apparat zur Bestimmung der Druckfestigkeit vonLeimgallerten. Chem.-Ztg. 33, 94.
Vanderheiden, G. J. 1970. An instrument for objective characterization of the consis-tency and texture of cheese. Aust. J. Dairy Technol. 25(1), 37, 38.
Van der Reijden, W. A., E. C. I. Veerman, and A. V. Nieuw Amerongen. 1994.Rheological properties of commercially available polysaccharides with potentialuse in saliva substitutes. Biorheol. 31, 631–642.
Van Hecke, E., K. Alla, and J. M. Bouvier. 1995. Texture and structure of crispy-puffedfood products. I. Mechanical properties in bending. J. Texture Stud. 26, 11–25.
VanWazer, J. R., J. W. Lyons, K. Y. Kim, and R. E. Colwell. 1963. “Viscosity and FlowMeasurement. A Laboratory Handbook of Rheology.” Wiley (Interscience), New York.
Vas, K. 1928. Koagulometer zur Beurteilung des Kasebruches. Milchwirtsch. Forsch.6, 231–235.
Velez-Ruiz, J. F., and G. V. Barbosa-Canovas. 1998. Rheological properties of concen-trated milk as a function of concentration, temperature and storage time. J. FoodEng. 35, 177–190.
Venkateswara Rao, G., K. Leelavathi, P. Haridas Rao, and S. R. Shurpalekar. 1986.Changes in quality characteristics of chapati during storage. Cereal Chem. 63,131–135.
Vernon Carter, E. J., and P. Sherman. 1980. Rheological properties and applications ofmesquite tree (Prosopis juliflora) gum. I. Rheological properties of aqueousmesquite gum solutions. J. Texture Stud. 11, 339–344.
Vickers, Z. M. 1985. Crispness and crunchiness – A difference in pitch? J. TextureStud. 15, 157–163.
Vickers, Z. M. 1991. Sound perception and food quality. J. Food Quality 14, 87–96.Vickers, Z. M., and M. C. Bourne. 1976a. Crispness in foods – a review. J. Food Sci.
41, 1153–1157.Vickers, Z. M., and M. C. Bourne. 1976b. A psychoacoustical theory of crispness.
J. Food Sci. 41, 1158–1164.Vincent, A. 1986. World production of food texturizers 1985. Proc. Int. Food Sci.
Technol. 19(3), 107.Vincent, J. F. V., G. Jeronomidis, A. A. Khan, and H. Luyten. 1991. Wedge fracture
test. A new method for measurement of food texture. J. Texture Stud. 22, 45–57.Voisey, P. W. 1971a. Modernization of texture instrumentation. J. Texture Stud. 2,
129–195.Voisey, P. W. 1971b. The Ottawa texture measuring system. Can. Inst. Food
Technol. J. 4, 91–103.Voisey, P. W. 1972. Updating the shear press. Can. Inst. Food Sci. Technol. J. 5, 6–12.Voisey, P. W. 1974. Design and operational details of the Ottawa Tenderometer. Agric.
Can., Eng. Res. Serv. Rep. No. 6820–8.Voisey, P. W. 1975. Reply to C. A. Pearson and D. Raynor. J. Texture Stud. 6, 394–398.
410 References
REFERENCE.qxd 1/12/02 7:17 PM Page 410

Voisey, P. W. 1976. Engineering assessment and critique of instruments used for meattenderness evaluations. J. Texture Stud. 7, 11–48.
Voisey, P. W. 1977a. Examination of operational aspects of fruit pressure tests. Can.Inst. Food Sci. Technol. J. 10, 284–294.
Voisey, P. W. 1977b. Effect of blade thickness on readings from the FTC shear com-pression cell. J. Texture Stud. 7, 433–440.
Voisey, P. W. 1977c. Some applications of the Ottawa Texture Measuring System. Eng.Res. Serv., Agric. Can. Rep. No. 7024–694.
Voisey, P. W., and R. Crête. 1973. A technique for establishing instrumental conditionsfor measuring food firmness to simulate consumer evaluations. J. Texture Stud. 4,371–377.
Voisey, P. W., and J. M. deMan. 1970. An electronic recording viscometer for foodproducts. Can. Inst. Food Technol. J. 3, 130–135.
Voisey, P. W., and J. M. deMan. 1976. Applications of instruments for measuring food texture. In “Rheology and Texture in Food Quality” (J. M. deMan, P. W. Voisey,V. F. Rasper, and D. W. Stanley, eds), pp. 142–242. Westport. Connecticut.
Voisey, P.W. and E. Larmond. 1972. The comparison of textural and other propertiesof cooked spaghetti by sensory and objective methods. Canada AgricultureEngineering Research Service Publication No. 297.
Voisey, P. W., and E. Larmond. 1973. Exploratory evaluation of instrumental tech-niques for measuring some textural characteristics of cooked spaghetti. Cereal Sci.Today 18, 126–143.
Voisey, P. W., and E. Larmond. 1974. Examination of factors affecting performance of the Warner–Bratzler meat shear test. Can. Inst. Food Sci. Technol. J. 7, 243–249.
Voisey, P. W., and E. Larmond. 1977. The effect of deformation rate on the relationshipbetween sensory and instrumental measurements of meat tenderness by theWarner–Bratzler method. Can. J. Food Sci. Technol. 10, 307–312.
Voisey, P. W., and I. L. Nonnecke. 1971. Measurement of pea tenderness. I. Anappraisal of the FMC pea Tenderometer. J. Texture Stud. 2, 348–364.
Voisey, P. W., and I. L. Nonnecke. 1972a. Measurement of pea tenderness. III. Fieldcomparison of several methods of measurement. J. Texture Stud. 3, 329–358.
Voisey, P. W., and I. L. Nonnecke. 1972b. Measurement of pea tenderness. IV.Development and evaluation of the test cell. J. Texture Stud. 3, 459–477.
Voisey, P. W., and I. L. Nonnecke. 1973a. Some observations regarding peaTenderometer standardization. Agric. Can., Eng. Res. Serv., Rep. No. 6820–5.
Voisey, P. W., and I. L. Nonnecke. 1973b. Summary of results. Pea Tenderometer tests.Agric. Can., Eng. Res. Serv., Rep. No. 6820–7.
Voisey, P. W., and I. L. Nonnecke. 1973c. Measurement of pea tenderness. V. TheOttawa Pea Tenderometer and its performance in relation to the Pea Tenderometerand the FTC Texture Test System. J. Texture Stud. 4, 323–343.
Voisey, P. W., D. C. MacDonald, M. Kloek, and W. Foster. 1972. The Ottawa TextureMeasuring System. An operational manual. Agric. Can., Eng. Spec. No. 7024.
Voisey, P. W., E. Larmond, and R. J. Wasik. 1978. Measuring the texture of cookedspaghetti. I. Sensory and instrumental evaluation of firmness. Can. Inst. Food Sci.Technol. J. 11, 142–148.
Voisey, P. W., M. Kloek, K. Summers, and M. Gillette. 1979. A method for testing theease of extrusion of icing marketed in plastic containers. J. Texture Stud. 10,435–448.
References 411
REFERENCE.qxd 1/12/02 7:17 PM Page 411

Volodkevich, N. N. 1938. Apparatus for measurement of chewing resistance or tenderness of foodstuffs. Food Res. 3, 221–225.
Wade, P. 1968. A texture meter for the measurement of biscuit hardness. In “Rheologyand Texture of Foodstuffs,” Monograph No. 27, pp. 225–234. Soc. Chem. Ind.,London.
Warner, K. F. 1928. Progress report of the mechanical test for tenderness of meat.Proc. Am. Soc. Anim. Prod. 114–116.
Washburn, R. M. 1910. Principles and practice of ice cream making. Bull.–Vt. Agric.Exp. Stn. No. 155.
Waugh, F. A. 1901. “Fruit Harvesting, Storing, Marketing,” p. 44. Orange Judd Co.,New York.
Waugh, L. M. 1937. Dental observations among Eskimos. J. Dent. Res. 16, 356.Weinrichter, B., H. Rohm, and D. Jaros. 2000. Mechanical properties of unpressed
semi-hard cheeses by uniaxial compression. J. Texture Stud. 31, 141–152.Weissenberg, K. 1949. Abnormal substances and abnormal phenomena of flow. Proc.
Int. Rheol. Cong., 1st, Scheveningen, Neth., 1948 pp. I-29–I-46.Wender, N. 1895. The viscometer examination of butter for foreign fats. J. Am. Chem.
Soc. 17, 719–723.Wheeler, T. L., S. D. Shackelford, and M. Koohmaraie. 1996. Sampling, cooking and
coring effects on Warner–Bratzler shear force values in beef. J. Anim. Sci. 74,1553–1562.
Wheeler, T. L., S. D. Shackelford, L. P. Johnson, M. F. Miller, R. K. Miller, and M. Koohmaraie. 1997. A comparison of Warner–Bratzler shear force assessmentwithin and among institutions. J. Anim. Sci. 75, 2423–2432.
White, G. W. 1970. Rheology in food research. J. Food Technol. 5, 1–32.White, K., and N. N. Mohsenin. 1967. Apparatus for determination of bulk modulus
and compressibility of materials. Trans. ASAE 10, 670–671.Whittle, K. J. 1973. A multiple sampling technique for use with the cell-fragility
method of determining deteriorative changes in frozen fish. J. Sci. Food Agric. 24,1383–1389.
Whittle, K. J. 1975. Improvement of the Torry–Brown homogenizer for the cellfragility method. J. Food Technol. 10, 215–220.
Whorlow, R. W. 1980. “Rheological Techniques.” Ellis Harwood, Chichester, England.Wilder, H. K. 1947. Measurement of fiber content in canned asparagus. Natl. Canners’
Assoc., Res. Lab Rep. No. 12313B.Wiley, R. C., N. Elehwany, A. Kramer, and F. J. Hager. 1956. The shear press – an
instrument for measuring the quality of foods. IV. Application to asparagus. FoodTechnol. 10, 439–443.
Willard, J. T., and R. H. Shaw. 1909. Analysis of eggs. Kans. Agric. Exp. Stn., Bull. No.159. pp. 143–177.
Willhoft, E. M. A. 1970. An empirical equation describing the firming of the crumb ofbread. Chem. Ind. (London) 1017, 1018.
Willhoft, E. M. A. 1973. Mechanism and theory of staling of bread and baked goods,and associated changes in textural properties. J. Texture Stud. 4, 292–322.
Williamson, R. V. 1929. The flow of pseudoplastic materials. Ind. Eng. Chem. 21,1108–1111.
Wium, H., M. Gross, and K. B. Qvist. 1997. Uniaxial compression of UF-Feta cheeserelated to sensory texture analysis. J. Texture Stud. 28, 455–476.
412 References
REFERENCE.qxd 1/12/02 7:17 PM Page 412

Woll, F. W. 1895. The effect of pasteurization and sterilization on the viscosity and fatglobules of milk and cream. 12th Annual Report, Agricultural Experiment Station,University of Wisconsin. pp. 164–173.
Wood, A. H., and C. L. Parsons. 1891. Hardness of butter. N. H. Agric. Exp. Stn., Bull.No. 13, p. 8.
Wood, F. W. 1974. An approach to understanding creaminess. Die Starke 26, 127–130.Woodruff, S., and H. V. Gilder. 1931. Photomicrographic studies of sucrose crystals.
J. Phys. Chem. 35, 1355–1367.Worthington, J. T., and J. H. Yeatman. 1968. A statistical evaluation of objective mea-
surement of apple firmness. Proc. Am. Soc. Hortic. Sci. 92, 739–747.Xu, Zi, and S. N. Raphaelides. 1998. Flow behavior of concentrated starch dispersions
using a tube rheometer of novel design. J. Texture Stud. 29, 1–13.Yang, Y. M., and N. Mohsenin. 1974. Analysis of the mechanics of the fruit pressure
tester. J. Texture Stud. 5, 213–238.Yoo, B., and M. A. Rao. 1994. Effect of unimodel particle size and pulp content on rhe-
ological properties of tomato puree. J. Texture Stud. 25, 421–430.Yoshikawa, S., S. Nishimaru, T. Tashiro, and M. Yoshida. 1970a. Collection and
classification of words for description and food texture. I. Collection of words. J. Texture Stud. 1, 437–442.
Yoshikawa, S., S. Nishimaru, T. Tashiro, and M. Yoshida. 1970b. Collection andclassification of words for description of food texture. II. Texture profiles. J. TextureStud. 1, 443–451.
Yoshikawa, S., S. Nishimaru, T. Tashiro, and M. Yoshida. 1970c. Collection andclassification of words for description of food texture. III. Classification of multi-variate analysis. J. Texture Stud. 1, 452–463.
Yurkstas, A. A. 1965. The masticatory act. A review. J. Prosthet. Dent. 15, 248–260.Yurkstas, A., and W. A. Curby. 1953. Force analyses of prosthetic appliances during
function. J. Prosthet. Dent. 3, 82–87.Zhang, M., G. S. Mittal, and S. Barbut. 1993. Optimum conditions for determining
water holding capacity of beef by the press method. J. Muscle Foods 4, 255–268.Zimmer, L. A., T. A. Haley, and O. H. Campanella. 2001. A comparative study of
the performance of selected in-line viscometers on Newtonian and shear-thinningfluids. J. Texture Stud. 32, 75–103.
Zorrilla, S. E., C. U. Rovedo, and R. P. Singh. 2000. A new approach to correlate textural and cooking parameters with operating conditions during double-sidedcooking of meat patties. J. Texture Stud. 31, 499–523.
References 413
REFERENCE.qxd 1/12/02 7:17 PM Page 413

Acacia gum 19Acceptability scaling 295Accuracy of measurement 187, 326Accuracy requirements 326, 327Acoustic deformation 158Acoustics 171Adams Consistometer 160, 223Adhesion 142Adhesiveness, TPA 186Aerated 267Agar gel 95, 121, 157Air in food 17Albumen height 220Alcohol insoluble solids 112, 131, 132, 169Alcohol precipitate 170Alginate gels 9, 64, 303Almansi strain 63Almonds 145Alveograph 26American Society for Testing and Materials
238, 339American texture words 5Ampere, definition 104Amylograph 341Anisotropy 103, 309, 332Annular pump viscometer 253Annulus 127, 130, 132AOAC 238Apparent modulus of elasticity 139Apparent viscosity 77, 83Appearance of food 1, 24Apple 3, 69, 70, 103, 109, 120, 121, 123, 133,
140, 144, 147, 155, 194, 197, 267, 285,286, 301, 303, 312, 313, 317, 327, 369
Apple cider 278Apple juice, viscosity 310Apple sauce 90, 143, 213, 242, 249Applesauce Consistometer 160, 223Apricot 8, 197, 312Apricot nectar 278Apricot puree 90, 242, 247, 249
Arabic bread 10Area of punch 117–123Arepa 273–274Armour Tenderometer 200Arnott cheese test 148Articulation of mandible 40Artifacts in tests 229, 323Asparagus 170, 267Australian texture words 6Austrian texture words 5Avocado 172AVS/N viscometer 237
Baby food 213Back extrusion test 128, 206, 314Back extrusion viscometry 253, 254Bagels 10Bailey Shortometer 145Baker Compressimeter 152, 222, 223Ballauf Pressure Tester 189, 190Banana 3, 64, 121, 133, 286Banana puree 90, 242, 249Bandwidth 178Batter volume 168BBIRA Biscuit Tester 166, 226Beady 267Beans, green 133, 286, 313Bean seeds 22, 133, 168, 308, 378Beef 2, 3, 34, 137, 165, 172, 200, 208, 277,
305, 306, 307, 313, 335, 336, 370Beer 278Beer viscosity 238Beets 133, 195Bending, sensory 300Bending test 145Bending, notched test 147Beverages, TPA 278Bifurcated platform 141Bingham flow 82Bioyield point 114Biscuits 147, 166, 172
Index
Index.qxd 1/12/02 7:19 PM Page 415

Bloom Gelometer 198Blueberries 151Body 13, 16Bologna 133Bolus 35Bostwick Consistometer 147, 162, 213–215,
342Bouillon 278Boussinesq equation 115Brabender Viscograph 247Bread 9, 10, 18, 69, 70, 112, 113, 152, 153,
218, 222, 287, 301, 307Breadstick 285Breakdown pathway 46Breakfast cereal 10, 18, 175Brinell hardness 150Brittle Fracture 101Brookfield Viscometers 248, 342Brownies 371Bruns and Bourne equation 146Buckling 154Bulgur 10Bulk compression 63, 140Bulk modulus 69Butter 9, 70, 90, 141, 147, 176, 217, 311, 312,
313, 316Buttermilk 278
Cabbage 3Cake 10, 133, 153, 165Calcium chloride 19Calibration between laboratories 334–339Calorie, definition 106Candela, definition 104Candy 153Canning 18Cantaloupe 8Cantilever beam 145Capillary viscometers 235, 241, 342Capstan shape 145Caramel 286Carboxy methyl cellulose 19Carrageenan 19, 313Carrot 69, 120, 121, 133, 147, 172, 265–286,
301, 307Carrot puree 213Casson equation 89Casson viscosity 335, 337Cauchy strain 62, 144Celery 147Cell fragility test 170, 226Cellular mouthfeel 267Cell walls 22, 23Centrifugal slump test 161Chalky mouthfeel 267Champagne 278Chapaties 138, 332Chatillon testers 190, 191, 342Cheeks 38Cheese 9, 64, 90, 129, 133, 141, 148, 153, 161,
166, 168, 172, 175, 181, 182, 265, 304,306, 308, 313, 316
Cheese curd Torsiometer 143Chemical analysis 169, 170Cherries 168
Chew count 51, 277Chewing 44, 47Chewing gum 47, 49Chewing rate 47, 48, 305Chewing sounds 171Chewing, TPA 186Chewy 5, 16Chicken 137, 165, 267Children of Israel 11, 98Chocolate 9, 39, 83, 309, 313, 335–337Chocolate, hot 278Chocolate syrup 265Christel Texturemeter 200Classification of texture principles 107, 112Coaxial rotational viscometers 242–247Cod 152Coefficient of restitution 151Coefficients 321, 322
commodity problems 299common sense 323easy 318effect of compression speed 303graphs 319instrument problems 299panel problems 299successful model 298uniformity of sample 305variable model 298
Coffee 4, 278Cogswell equation 128Cohesiveness, TPA 186Collagen test 170Comminution 25, 53Common sense 323Compliance 71Compression 63, 138, 139Compression between teeth 48Compession, bulk 140Compression-extrusion test 127Compression speed 303, 332Concentric cylinder viscometers 242–247Concentricity in cup and bob viscometers 339Cone and plate viscometers 245, 266Condensed milk 9, 96, 265Confectionery 9Consistency 17Consistency index (K) 89, 90Consumer panels, TPA 280Contact stress theory 116, 123Cookies 10, 34, 148, 226, 372Cooking, effect on texture 210Corn, cream style 223Corn curl 181Corn Flakes 308Corn Industries Viscometer 248Corn starch gel 64Corn, sweet 165, 170, 315Corn syrup viscosity 80Correlation 293–323Cost of texture measurements 328Cottonseed oil 313Couette Viscometer 242Crackers 9, 10, 226, 272, 285Cracking 101Crackly sounds 171
416 Index
Index.qxd 1/12/02 7:19 PM Page 416

Cranberries 150Cranberry juice 278Cream 82, 143, 215, 265, 313, 316Cream Corn Meter 160Creaminess 315–317Creamy 5Creep 66Creep compliance 71Crisp 5Crispness 171Crosslinking 19Crown, teeth 36Crunchiness 17, 171Crunchy 5Crushing 34, 103Crystalline mouth feel 267Cucumber 3, 133, 147, 286, 287Cusp, tooth 36Cuspid teeth 36Custard 186Cutting 63Cutting-shear test 124, 207
Data acquisition rate 178Deborah number 98Definitions of texture 12–16Deformability modulus 69, 147Deformation 61, 152–158, 314
sensory 300time effects 65–68
Deglutition 35Densification 154Depolymerization 22Descriptive analysis 284Destructive tests 139, 328Dexometer 28Digestion 33, 34Digital image processing 164Dilatant Flow 86Disintegration of food 25, 45Distance measurements 61Diversity of Textures 10Dry Texture 5Dough 141, 148, 167, 168, 211, 212, 332Doughnut 10Donut shape specimen 141Ductile fracture 101Dulce de leche 64, 176, 373Dumbbell shape specimens 141, 145Droopmeter 145Durometer 112, 168Dynamic viscosity 75, 105Dyne, definition 106Dysphagia 12
Effective shear rate 249Effi-Gi Tester 190, 342Eggs 9, 148, 153, 220–222Egg nog 278Egg white 24, 143, 265Elastic deformation 154Elastic modulus 99Elastic solid 97, 303Elasticity 63, 65, 139Electromagnetic spectrum 301
Electromyography 173, 342Electronic pressure tester 198Electropalatography 174Elmender test 138Empirical tests 110, 111Enchilada sauce 249End effect in viscometers 245Energy
definition 105measurement 166
Erg, definition 106Expressible fluid 165Extensograph 212, 342Extrusion test 127, 134, 206
Faba bean protein 137Falling ball viscometer 250–252Falling number test 166Farinograph 26, 143, 211, 332, 343Fast Fourier transform 174Fat hardness 150, 176, 212, 220Fatty mouth feel 5Fiberometer 166Fibrous 267Final selection of test 330Fingers 56, 287Finnish texture words 6Firm, definition 17Firmtech Tester 207, 306, 343Fish 3, 9, 143, 152, 165, 170, 226, 227, 306,
307, 309Fish balls, TPA 275, 276, 309Fish protein concentrate 20Flaky mouth feel 267Flavor 1, 24, 54Flexure, sensory 300Flow 61
laminar 73turbulent 74
Flour 10, 265Flow behavior index (n) 89, 90Flowability 148Fluidity 76FMC Consistometer 247, 343FMC Pea Tenderometer 132, 201Food processing 18–21Food rheology, definition 22Food Technology Corp. Tester 128, 167, 177,
202, 213, 226, 228, 229, 314, 315, 343,353–357
Fondant 39Force, definition 61, 105Force, mastication 50–52Formulated foods 19Fractal analysis 174Fracturability, TPA 186Fracture 101Frankfurter 64, 145, 154, 155, 165, 265, 284,
286, 313, 373Free choice profiling 284Freezing foods 18French fries 145, 205Fresh foods 8Friction 204, 338Frosting 90, 134
Index 417
Index.qxd 1/12/02 7:19 PM Page 417

Fruit 9, 18, 64, 143, 153, 159, 191, 312, 322,347, 352
Fruit firmness tester 343Fruit jelly 28, 153, 174, 215Fruit juice 239, 242Fundamental tests 108, 111F-wedge test 103
Gardner Mobilometer 166Gases in food 17Gel Torsion Tester 343Gelan gel 313Gelatin 19, 95, 102, 198, 285, 286, 313Gels 129, 141, 308, 313General Foods Texturometer 177, 183, 227, 332Geometrical properties 25, 39Geometry of specimens 154Geometry of test cell 107Getaway, definition 17Gilmont Viscometer 250, 343Glassy foods 107Glassy state 102Graininess 39Grainy 267Granola bar 285Grapes 151Grape Jelly 316Grape Juice 242Gratification from chewing 53Gravity current flow 162Grawemeyer and Pfund Consistometer 112, 223Greasy mouthfeel 5Green’s strain 63Grinding 34, 43, 103Guar gum 19, 83, 249Gums 19, 95, 335Gum, chewing 49, 173Gumminess, TPA 186
Haake viscometers 343Haddock 267Hagen–Poiseuille equation 236Ham 285Hand 55–57Haptaesthesis 15, 16Haptic, definition 16Hard 3, 17, 287Hardening in mouth 45Hardness index 149Hardness, TPA 186Haugh egg meter 148, 220–223, 343Health 21Hedonic scaling 295–296Helipath stand 248Hencky strain 62, 144Herschel–Bulkley equation 89Hertz, definition 105Hertz, equation 157Hilker–Guthrie Plumit 148, 215Hill Curd Tester 28Hippocampal neuron loss 21History 26–30Hoeppler Viscometer 252Hooke, Robert 26Hookean elasticity 100
Horticultural crops 19Hot dog 120, 121Houwink yield values 84, 85Hubbard–Brown equation 252Hydroxyproline 170
Ice cream 9, 39, 146Ideal tests 111Imitative tests 111Imperfect lubricated squeezing flow 140, 175Incisor teeth 36Inertial regime 162Inertia of rotational viscometer 339Infrared spectrophotometer 302Injection dye test 148Integrated texture notes 315–318Intensity scaling 294–296Instron 112, 167, 177, 184, 230, 358–361, 343Instruments, reasons for using 294Instrument suppliers 341–345Instruments, value of 294Irradiation 18, 19Isotropy 103, 109Israel, Children of 11, 98Izod test 176
Japanese texture words 5Jaw 40Jelly 316Joule, definition 105Juice, fruit 239, 242Juice volume 112, 165, 226, 315Juicy mouth feel 5
Karaya gum 335Kelvin–Voigt model 100Ketchup, tomato 90Kinematic viscosity 75, 76, 163, 237Kinesthesis 1, 16Kramer Shear Press 112, 128, 133, 202, 315,
343, 353–357
Lamb 3Lamb–Lewis Viscometer 239–240Lamella, middle 22Laminar flow 73, 74Lard 172, 313Lasagna 103Legumes 9, 378Lemon 3Lemonade 278Length, definition 104Length/thickness ratio 147Lettuce 301LFRA Texture Analyser 198Licorice 286Light, visible 301Linear elasticity 63Linear measuring instruments 147Linear psychophysical model 296Linear viscoelasticity 98Lips 38Lloyd Texture Analyser 177, 232, 343Loaf Volumeter 224–226, 343Location of instruments 328
418 Index
Index.qxd 1/12/02 7:19 PM Page 418

Locust bean gum 19Loss factor 99Loss modulus 99Loss tangent 99Lubrication 46, 49, 64, 65Lumpy mouth feel 267
MacMichael viscometer 245Magness–Taylor tester 109, 112, 343Malocclusion 43Mandible 40Mango pulp 242, 313Maple syrup 265Margarine 39, 90, 161, 176, 217, 311, 313, 316Margules equation 243Marius deformation test 153Marshmallow 90, 153, 154, 284, 286, 301Masa, corn 176Mass 61Mass, definition 104Masseter muscle 40Massey Twist TesterMasticate, definition 35Mastication 25, 33, 35, 43, 44, 47, 51, 53, 107Mastication forces 50–52Mastication
electromyography 173electropalatography 174sequence 43performance 47
Matching sensory with science 300–301Materials science 68–71Maturometer 150, 199, 200Maxilla 60Maxwell model 100Mayonnaise 9, 81, 176, 265, 302Mealy 16Measurement units 104Meat 9, 12, 64, 133, 135, 142, 165, 167, 170,
208Meatballs, TPA 271, 275Meat extract 85Mechanical models 100Mechanical resistance 288Melons 144, 172, 286, 375Meltability of cheese 148Melting in mouth 45Mercury bath 141Meter, definition 104Middle lamella 22Milk 9, 174, 265, 317Milk shake 267, 278Milling machine for gels 144Mirinz Tenderometer 137Mixer viscometry 249Mixograph 143, 181, 212, 344Mobilometer 166Modulus of deformability 69Modulus of elasticity 139Molar teeth 36Mole, definition 104Mouthfeel 16, 95Mouthfeel of beverages 278Mucin 49Muffins 10
Multiple point sheet sensor 176Mushroom 286Mustard, prepared 9, 176
Nametre viscometer 253, 344Native foods 9Newton, definition 105Newton, Isaac 26, 73Newtonian fluid 81, 97, 100Nip Tenderometor 137Nomenclature, rheology 60Nondestructive Test 139, 328Nonlinear viscoelasticity 98Nonoral methods 55Noodles 138, 210Normal force 95, 96Notch bending test 147Nougat 284, 285Nozzle extrusion 134Nutrition 1Nuts 126
Obesity 21Occlusion of teeth 37, 42Occlusion analysis 174Oil, viscosity 335Olives 265One-point measurements 255Onions 289Onomatopoeic words 5Optical tests 112, 170, 227Oral cavity 42Oranges 151, 286Orange juice 83, 90Orange peel 125, 285Orifice viscometer 236Oscillation viscometer 252, 253Oscillatory test 98Ostwald–deWael equation 89Ostwald Viscometer 112, 166, 236Ottawa Texture System 128, 206, 229
Paddle viscometer 248, 249Palatal pressure 52Palate 39Pancake syrup 249Papaya 127Papaya puree 242Parallel plate viscometer 245, 246Particle size distribution 163Particulate properties 25, 39Pascal, definition 105Pasta 10, 13, 210Pastry 10Pea Tenderometer 132, 203Peach 8, 69, 109, 194, 197, 301, 303Peach puree 90, 242Peanuts 133, 265Peanut butter 90, 161, 175, 176, 316Pears 81, 69, 194, 197, 201, 301, 319Pear puree 83, 90, 242Peas, green 131, 133, 150, 199, 199–200, 201,
203, 206, 312Pectin 19, 313Pectin grade 215, 216
Index 419
Index.qxd 1/12/02 7:19 PM Page 419

Peleg equation 288Pen response time 178–182Pendulum test 176Penetration 114Penetrometer 112, 148–150, 216–219, 344Penetrometer equations 149Pepper, green 3Pericarp test 170Perimeter of punch 117–123Pharynx 42Physical properties 301Physics 59–106Pickles 9Pies 9, 10, 267Pineapple juice 278Planar penetration 135Plantains 166Plasticity 65Plastometer 28Plums 197, 312Plum puree 90Poise 75Poise, definition 106Poisson ratio 70, 138Pork 3, 137, 172, 208, 277Potato 3, 69, 70, 104, 120, 121, 138, 140, 144,
146, 195, 303, 331, 376Potato chips 147, 171, 285Poultry 165, 208Powdery mouth feel 267Power, definition 105Power equation 89, 296Power grip 57Power, measurement 106Power, model 296Precision grip 57Precision of measurement 187, 188Preliminary selection of test 329Preparation of sample 333Pressometer 165Pressure, definition 105Pressure effect on viscosity 81Pressure testers, fruit 189Pretzel 285Processing food 18Prune juice 278Pseudoplastic flow 86Psychophysics 22Psychophysical models 266–98Psychorheology 23Pterygoid muscle 40Pudding 90, 142, 186, 267, 301Puffy mouthfeel 269Pulverization 25Pumpkin pie filling 160, 166Punches, circular 122Punches, rectangular 118Punch and die test 124Puncture, sensory 300Puncture test 113–126
advantages 120area effect 118, 120equation 117factors affecting 125perimeter effect 119, 120
semi-infinite geometry 123, 314support of sample 124theory 114–123
Puncture testers 189–201, 344Purpose of tests 326
Quality control 335, 337Quantitative Descriptive Analysis 284QTS Texture Analysers 231–232, 344
Raisins 133Rapeseed pods 176Rapid viscoanalyser 249, 344Ratio measurements 167Rebound distance 150, 151Recorder response time 179Recovery 66Reference samples 337–339Refining test conditions 332Relative viscosity 76Relaxation time 67, 98Research Water Absorption Meter 332Resolving power 331Resonance frequency 159Response time 178Restitution coefficient 151Reynolds number 74Rheology 5, 9, 15, 22, 24, 59–68Rheology nomenclature 60Rheology societies 59Rheometrics viscometers 249, 344Rheopexy 93Rice 3, 133, 173, 267, 277, 286, 318, 379Ridgelimeter 148, 152, 215–216Right texture 10Rigor mortis 143Rittinger’s law 103Roark equations 156, 158Rock candy 265Rollability 172Rolling ball viscometer 252Roth–Rich equation 253Roughness perception 25RPC Droopmeter 145Rubbery state 102Rugosity 25Rupture 129Rutabaga 120, 121
SAOT 98Salad dressing 81, 249, 302Saliva 49–50, 53Saliva viscosity 50Salivary glands 40Salmon 306Salt solution viscosity 79Satiety index 21Sausage 143Scatter graphs 320Schreiber melting test 148Scott–Blair, George 29Second, definition 104Selection of test 325–333Semisolid foods, TPA 279SENB geometry 147
420 Index
Index.qxd 1/12/02 7:19 PM Page 420

Sensory descriptors 300Sensory evaluation 257–291
calibration of instruments 258correlation with instruments 293–323importance 257nonfood products 290, 291nonoral methods 287–290skin care products 290
Sensory Texture Profile Analysis 259–282adhesiveness scale 264adhesiveness to lips 285arepa 273, 274basic score sheet 268–271beverages 278chemical characteristics 268chewiness scale 263comparative score sheet 273consumer panels 280crackers 272denseness scale 284fishballs 275fracturability scale 263geometrical characteristics 267gumminess scale 263, 265hardness scale 262, 265initial sensations 269, 271juiciness scale 286masticatory sensations 269, 272meat balls 271, 275modifications to 283–286nonfood consumer products 290–291objective method 282other characteristics 268repeatability 281residual characteristics 270, 272rice 277roughness scale 285selection of panelists 259–260self cohesiveness scale 286semisolid foods 279springiness scale 286standard rating scales 262–267training panel 260–261viscosity scale 264–265wetness scale 285
Serum 166, 214Shear 63Shear failure 135Shear modulus 69Shear rate 75, 77Shear test 134Shear thickening 87, 92, 93Shear thinning 92–95Shellfish 9Shortometer 28Sieving 163, 164Sight 57Simple fracture 101Single edge notched bend test 147Size reduction 33Size of sample 208, 314, 332Skin effect 20, 125, 195, 196, 309Sliding fracture 102Sliding Pin Consistometer 176Slimy mouth feel 95
Slip in viscometer bob 339Slippery mouth feel 5Slump test 160, 161Small amplitude oscillation 98, 247Smetar hardness test 150Smooth mouth feel 5S.I. Units 104Size of sample 137, 208, 314, 332Snapping test 145, 146Snapping equation 146Snapping, notched 147Soda 278SOFRASER viscometer 253Soft 5, 17Softening in mouth 65Solution in mouth 46Soothing effect 49Sound 57, 171, 302Soup 316, 317Spaghetti 138, 143, 210Spanish texture words 6Spectrum Descriptive Analysis 284Specific gravity 112Spread ratio 148Springiness, TPA 186Squash 166, 195Squeezing flow 140Squeezing, sensory 287–289Standards Organizations 339Starch 19Starch dispersions 242Status of texture measurements 11, 12Steak 34Steffe–Osorio equation 254Stevens Texture Analyser 198, 344Stickiness 142Sticky mouth feel 5Stiffness coefficient 109, 160Stimulation from chewing 21Stirring fluids, sensory 290Stoke 76, 106Stoke equation 250Storage modulus 99Stormer viscometer 264Strain, definition 62Strawberry 3, 8, 286Strength of materials 109Stress concentration 102Stress, definition 61, 105Stress distribution 115, 116Stress raisers 102Stringy mouth feel 5Structure 22, 23Structural viscosity 91Structograph 112, 145, 212, 344St. Venant slider 101Succulometer 165, 226Sucrose solution viscosity 76, 77, 78, 79, 83,
335Sucrose syrups 265Sugar 267Summertime 314Surface tension regime 162Surimi 144, 309, 313SURDD Tester 150, 219
Index 421
Index.qxd 1/12/02 7:19 PM Page 421

Suspended matter effect on viscosity 81Swainger’s strain 63Swallowing 43, 45Swallowing threshold 46Sweet corn 165, 170, 226, 315Sweet potato 120, 121, 377Syneresis 213
Tactile sense 1, 34, 35Tarr–Baker Tester 27TA.XT2 Texture Analyser 112, 167, 177, 184,
230–231, 344, 362–368Tea 278Tearing fracture 102Tearing strength 142Teeth 10, 35–38Temperature, definition 104Temperature effect on texture 310–314, 332,
347–352Temperature effect on viscosity 78, 235, 310,
311Temperomandibular joint 40, 41, 48Tender 17Tensile fracture 102Tensile test 140–142Tensipresser 232–233, 344Texture 1
awareness 3body interactions 33–57culture 2defective 7definitions 12–16diversity 8health 21importance 2nomenclature 15overlooked 12processing effects 18–21rheology 22scripted 8storage changes 9temperature coefficient 311time of day 6time to measure 328viscosity 17vocabulary 4words 5, 16–17
Texture Press 128, 133, 200–202, 343Texture Profile Analysis 182–186, 314Texturizing agents 19Texturized proteins 20Thinning in mouth 46Thixotropy 92Thumb 56, 287Time 61Time, definition 104Time of deformation 65–68Time dependency 92Time measuring instruments 166TMJ diseases 41Toast 10Tofu 39, 172Tomatoes 8, 151, 176, 218, 280, 285, 289, 301,
312Tomato juice viscosity 239, 255
Tomato ketchup 176, 213, 255Tomato puree 83, 213, 249, 255Tongue 38Toppings 142, 143, 186Topping mix viscosity 163Torsion tests 142–145, 210Tortillas 9, 132, 146, 171, 172Touch, sense of 24, 34, 35Tough 5Tracking food movements 53, 54Traction failure 101Trigger force 156Triple beam test 145Trituration 25Tube viscometry 241–242TUC Cream Corn Meter 160, 223Turbulent flow 73, 74Turkey 137
Ultrasound test 172Ultraviolet spectrophotometer 302Unctuous foods 107Uniaxial compression 63, 66, 138Uniformity of sample 305, 333Universal testing machines 177, 229–233Unsuitable test principles 329USDA Consistometer 160, 223–224
Variability in foods 305–309Vegetables 9, 18, 19, 153, 191, 194, 312,
347–352Vegetable juices 239Vettori–Manghi Tenderometro 207Vickers hardness test 150Viscometers 345Viscosity 17, 24, 73, 75, 76, 235
apparent 77, 83Bingham 82Casson 89dilatant 86dynamic 75, 105effect of concentration 79effect of molecular weight 80effect of pressure 81effect of suspended matter 81effect of temperature 78, 235factors affecting 78–81general equation 87Herschel–Bulkley 89kinematic 76, 105newtonian 81non newtonian 82–87normal force 95Ostwald–de Wael 89plastic 82power equation 89pseudoplastic 86ratio 76relative 76rheopexy 93sensory 300shear thickening 93shear thinning 92structural 91temperature effect 78, 235, 310, 311
422 Index
Index.qxd 1/12/02 7:19 PM Page 422

units of measurement 75Weissenberg effect 95
Viscosity Measurement 235–255annular pumping 253AVS/N 237back extrusion 253capillary 235–241coaxial types 242–245cone and plate 245end effect 245falling ball 250Gilmont 250Hoeppler 252imitative types 255Lamb–Lewis 239MacMichael 245mixer type 248Nametre 253one-point 255operation modes 246orifice 242oscillatory 252Ostwald 236paddle type 248parallel plate 245Rapid Visco-Analyzer 249rolling ball 252SOFRASER 253standardizing liquids 238Stormer 244tube 241Zahn 242
Viscoelasticity 65, 96, 303Viscoelastic solid 97Viscous modulus 99Viscous mouthfeel 5Viscous regime 162Vocabulary of texture 4–6, 294
Volodkevich wedge 137Volume measurement 164–166, 315
Warner–Bratzler shear 28, 112, 135, 137,207–210, 298, 306, 307, 316, 314, 335,336, 345
Watermelon 171, 286Watery mouthfeel 5Watt, definition 105Wax hardness 220Weakness of materials 109Weber–Fechner model 296Wedge penetration 102Weissenberg effect 95Wetting by saliva 25Wheat 150Wheat–based foods 10Whey 165Whey protein 141, 313Whips 90, 284, 301, 316Whiskey 278Wieners 121, 135Wintertime 314Wire cutting tests 138Wolodkevich wedge 137Work, definition 105Work, measurement 166
Xanthan gum 19, 83Xixona 9
Yeast extract 92Yield point 114Yield stress 82, 83, 84, 85, 89, 160, 16lYogurt 165, 174, 176, 316Young’s modulus 27, 68, 156, 159
Zahn Viscometer 166, 242, 345
Index 423
Index.qxd 1/12/02 7:19 PM Page 423
Copyright © 2022 FDOKUMEN