Kinetic Modeling of the Oxidative Dehydrogenation of Ethane to Ethylene over a MoVTeNbO Catalytic...
14
Kinetic modeling of the oxidative dehydrogenation of ethane to ethylene over a MoVTeNbO catalytic system Gamaliel Che-Galicia a , Roberto Quintana-Solórzano b,⇑ , Richard S. Ruiz-Martínez a , Jaime S. Valente b , Carlos O. Castillo-Araiza a,⇑ a Grupo de Procesos de Transporte y Reacción en Sistemas Multifásicos, Depto. de IPH, Universidad Autónoma Metropolitana – Iztapalapa, Av. San Rafael Atlixco No. 186, C.P. 09340, México D.F., Mexico b Instituto Mexicano del Petróleo, Eje Central Lázaro Cárdenas Norte No. 152, C.P. 07730, México D.F., Mexico highlights We study the kinetics for oxidative dehydrogenation reaction of ethane on MoVNbTeO. We develop four kinetic models based on LHHW and MvK mechanisms. The LHHW mechanism provides the best statistical description of experimental data. Reaction rates are weakly affected by changes in the oxygen partial pressure. CO x are formed out of both ethane and ethylene. graphical abstract article info Article history: Received 5 February 2014 Received in revised form 7 April 2014 Accepted 11 April 2014 Available online 24 April 2014 Keywords: Oxidative dehydrogenation reaction MoVTeNbO catalyst Ethylene Kinetic modeling Langmuir–Hinshelwood–Hougen–Watson Mars–van Krevelen abstract The oxidative dehydrogenation of ethane to ethylene (ODH-Et) is investigated over a high activity–selec- tivity MoVTeNb mixed oxide. Experiments are performed using a mixture of ethane, oxygen and nitrogen as feedstock, at temperatures from 400 to 480 °C, inlet partial pressures of oxygen and ethane from 5.0 to 24.2 kPa, and space–times from 10 to 140 g cat h mol ethane 1 . Ethylene selectivity varies from 76% to 96%, for an ethane conversion range 17–85%. In a set of experiments at 440 °C feeding ethylene instead of ethane, ethylene conversion is from 3% to 14% and CO x are the only reaction products, the CO being the dominant species with a selectivity range 73–79%. Kinetic models based on Langmuir–Hinshelwood–Hougen–Wat- son (LHHW) and Mars–van Krevelen (MvK) formalisms, and combinations of them are developed to describe the ODH-Et. Physicochemical and statistical criteria are employed to contrast the performance of these kinetic approaches. The LHHW kinetics exhibits the best capacity to represent the observations, being a potential model for the conceptual design of ODH-Et reactors in future investigations. Kinetic parameters indicate: (i) ethylene formation is the reaction demanding the lowest activation energy; (ii) total oxidations of ethane are the reactions demanding the largest activation energies; (iii) reaction rates, including that of catalyst oxidation, are weakly affected by changes in the oxygen partial pressure, explaining the high selectivity to ethylene of MoVTeNbO; and (iv) water is the component with the highest affinity to be adsorbed on active sites affecting negatively reaction rates. Ó 2014 Elsevier B.V. All rights reserved. http://dx.doi.org/10.1016/j.cej.2014.04.042 1385-8947/Ó 2014 Elsevier B.V. All rights reserved. Abbreviations: ER, Eley–Rideal; FID, flame ionization detector; GC, gas chromatograph; LHHW, Langmuir–Hinshelwood–Hougen–Watson; MvK, Mars–van Krevelen; MvK–LHHW, Mars–van Krevelen and Langmuir–Hinshelwood–Hougen–Watson; ODEs, ordinary differential equations; ODH-Et, oxidative dehydrogenation of ethane to ethylene; RDS, rate-determining steps; TCD, thermal conductivity detector. ⇑ Corresponding authors. Tel.: +52 55 9175 8530 (R. Quintana-Solórzano). Tel.: +52 55 5804 4648 (C.O. Castillo-Araiza). E-mail addresses: [email protected] (R. Quintana-Solórzano), [email protected] (C.O. Castillo-Araiza). Chemical Engineering Journal 252 (2014) 75–88 Contents lists available at ScienceDirect Chemical Engineering Journal journal homepage: www.elsevier.com/locate/cej
Transcript of Kinetic Modeling of the Oxidative Dehydrogenation of Ethane to Ethylene over a MoVTeNbO Catalytic...

Chemical Engineering Journal 252 (2014) 75–88
Contents lists available at ScienceDirect
Chemical Engineering Journal
journal homepage: www.elsevier .com/locate /cej
Kinetic modeling of the oxidative dehydrogenationof ethane to ethylene over a MoVTeNbO catalytic system
http://dx.doi.org/10.1016/j.cej.2014.04.0421385-8947/� 2014 Elsevier B.V. All rights reserved.
Abbreviations: ER, Eley–Rideal; FID, flame ionization detector; GC, gas chromatograph; LHHW, Langmuir–Hinshelwood–Hougen–Watson; MvK, Mars–van KMvK–LHHW, Mars–van Krevelen and Langmuir–Hinshelwood–Hougen–Watson; ODEs, ordinary differential equations; ODH-Et, oxidative dehydrogenation of eethylene; RDS, rate-determining steps; TCD, thermal conductivity detector.⇑ Corresponding authors. Tel.: +52 55 9175 8530 (R. Quintana-Solórzano). Tel.: +52 55 5804 4648 (C.O. Castillo-Araiza).
E-mail addresses: [email protected] (R. Quintana-Solórzano), [email protected] (C.O. Castillo-Araiza).
Gamaliel Che-Galicia a, Roberto Quintana-Solórzano b,⇑, Richard S. Ruiz-Martínez a, Jaime S. Valente b,Carlos O. Castillo-Araiza a,⇑a Grupo de Procesos de Transporte y Reacción en Sistemas Multifásicos, Depto. de IPH, Universidad Autónoma Metropolitana – Iztapalapa, Av. San Rafael Atlixco No. 186, C.P. 09340,México D.F., Mexicob Instituto Mexicano del Petróleo, Eje Central Lázaro Cárdenas Norte No. 152, C.P. 07730, México D.F., Mexico
h i g h l i g h t s
�We study the kinetics for oxidativedehydrogenation reaction of ethaneon MoVNbTeO.� We develop four kinetic models based
on LHHW and MvK mechanisms.� The LHHW mechanism provides the
best statistical description ofexperimental data.� Reaction rates are weakly affected by
changes in the oxygen partialpressure.� COx are formed out of both ethane
and ethylene.
g r a p h i c a l a b s t r a c t
a r t i c l e i n f o
Article history:Received 5 February 2014Received in revised form 7 April 2014Accepted 11 April 2014Available online 24 April 2014
Keywords:Oxidative dehydrogenation reactionMoVTeNbO catalystEthyleneKinetic modelingLangmuir–Hinshelwood–Hougen–WatsonMars–van Krevelen
a b s t r a c t
The oxidative dehydrogenation of ethane to ethylene (ODH-Et) is investigated over a high activity–selec-tivity MoVTeNb mixed oxide. Experiments are performed using a mixture of ethane, oxygen and nitrogenas feedstock, at temperatures from 400 to 480 �C, inlet partial pressures of oxygen and ethane from 5.0 to24.2 kPa, and space–times from 10 to 140 gcat h molethane
�1 . Ethylene selectivity varies from 76% to 96%, foran ethane conversion range 17–85%. In a set of experiments at 440 �C feeding ethylene instead of ethane,ethylene conversion is from 3% to 14% and COx are the only reaction products, the CO being the dominantspecies with a selectivity range 73–79%. Kinetic models based on Langmuir–Hinshelwood–Hougen–Wat-son (LHHW) and Mars–van Krevelen (MvK) formalisms, and combinations of them are developed todescribe the ODH-Et. Physicochemical and statistical criteria are employed to contrast the performanceof these kinetic approaches. The LHHW kinetics exhibits the best capacity to represent the observations,being a potential model for the conceptual design of ODH-Et reactors in future investigations. Kineticparameters indicate: (i) ethylene formation is the reaction demanding the lowest activation energy;(ii) total oxidations of ethane are the reactions demanding the largest activation energies; (iii) reactionrates, including that of catalyst oxidation, are weakly affected by changes in the oxygen partial pressure,explaining the high selectivity to ethylene of MoVTeNbO; and (iv) water is the component with thehighest affinity to be adsorbed on active sites affecting negatively reaction rates.
� 2014 Elsevier B.V. All rights reserved.
revelen;thane to

Nomenclature
Roman lettersav specific external surface area, m2 m�3
An chromatographic area of the component nA0i natural logarithm of pre-exponential factor,
mmol (g h)�1
Bo Bodenstein numberCn concentration of component n, mol kg�1
C carbon numberd diameter, mdn calibration factor of the component nDn diffusion coefficient for component n, m2 s�1
EA activation energy, kJ mol�1
Fno inlet molar flow rate of the component n, mmol h�1
Fn molar flow rate of the component n, mmol h�1
h heat transfer coefficient between pellet and gas phase,kJ m�2 (K s)�1
kg mass transfer coefficient, m s�1
kn reaction rate coefficient, dep.Kn adsorption equilibrium coefficient for component n,
Pa�1
L catalyst bed length, mm partial reaction order for oxygen, model numberM active sites for MvK mechanismMn molecular mass of the component n, g mmol�1
pn partial pressure of component n, Parn specific reaction rate of reaction n, mmol (g h)�1
R universal gas constant, kJ (mol K)�1
Rn net reaction rate of the component n, mmol (g h)�1
RSS objective functionS active sites for LHHW mechanismSg standard entropy of gas phase molecule, J (mol K)�1
Sn selectivity of component n on carbon basis, %T temperature, Ku velocity, m s�1
wn objective function weight factor of each responseW mass of catalyst, gXHC hydrocarbon conversion on carbon basis, %
Greek lettersa vector of parameters accounted for in the objective
functionb vector of parameters accounted for in the objective
function
DHon standard enthalpy of adsorption for component n,
kJ (mol K)�1
DHr reaction enthalpy, kJ mol�1
DSon standard entropy of adsorption for component n used in
Eq. (30), kJ (mol K)�1
DSon Standard entropy of adsorption for component n,
J (mol K)�1
e void fractionh⁄ fraction coverage of vacant siteshn fraction coverage of component nhOX fraction coverage of oxidized siteshOX–n fraction coverage of component n on oxidized siteshred fraction coverage of reduced siteskp particle conductivity, J (m s K)�1
l viscosity, Pa smi stoichiometric numberq density, kg m3
rj Horiuti number
Subscriptsb bed, bulkcat catalysteff effectiveexp experimentf fluidg gas phaseHC hydrocarboni.s. internal standardn component no inlet, superficialobs observedp particler responses surfacet tubetab tabulatedtot totalw wall
Superscripts^ calculatedo inlet, standard⁄ reference
76 G. Che-Galicia et al. / Chemical Engineering Journal 252 (2014) 75–88
1. Introduction
Ethylene is a basic material for the world’s PetrochemicalIndustry. This olefin is the main raw material for the productionof polyethylene, ethylene oxide and ethylene dichloride, amongothers important chemical products. In 2012, it is reported thatthe global ethylene demand nearly reached 141 million tons andis expected to increase to more than 150 million tons in 2015 [1].Presently, ethylene is mainly produced via the steam cracking ofdiverse hydrocarbon streams, particularly gas oils, naphtha, LPGas well as natural gas and, in a minor grade, via the direct (cata-lytic) dehydrogenation of ethane along with the fluid-catalytic-cracking of gas oils [2]. All the current conventional processes toproduce ethylene, however, exhibit a set of drawbacks related tothermodynamics, energy requirements, catalyst deactivation bycoke deposition, control of conversion/selectivity and productsseparation [3–5]. By reason of all these limitations and considering
the continuous increase in the worldwide demand of ethylene, thedesign of new processes to cope with these industrial deficienciesis clearly mandatory.
The catalytic oxidative dehydrogenation of ethane to ethylene(ODH-Et) appears as an attractive alternative to complement andeven gradually replace the current commercial processes for ethyl-ene production. Nevertheless, there are still some important issuesto be dealt with by academy and industry in order to extend theODH-Et to a commercial scale, the development of a highly activeand selective catalyst being one of the most crucial matters. Eventhough several catalytic systems have been reported in the litera-ture to be active for the ODH-Et [6–12], a multimetallic mixedoxide containing Mo, V, Te and Nb (MoVTeNbO) corresponds toone of the most promising materials in view of its high ofconversion of ethane and selectivity to ethylene, attributed to thepresence of two crystalline phases designated M1 and M2, theformer having the most important contribution to the catalytic

G. Che-Galicia et al. / Chemical Engineering Journal 252 (2014) 75–88 77
performance [13–22]. Specifically, for MoVTeNbO catalysts, it hasbeen proposed that V species are the active sites in ethane activa-tion, the presence of Mo species enhance the catalytic activity of Vatoms, the role of Te species is directly associated with the forma-tion of an active and selective crystalline phase M1 and the Nb spe-cies seem to have a promoter effect enhancing the selectivity toethylene [13,14,23–26]. It is also noteworthy that the MoVTeNbOsystem starts to be active for the ODH-Et at temperatures below400 �C, a value substantially lower compared with the one requiredby the existing commercial thermal processes. Evidently, decreas-ing the operating temperature not only leads to a substantialenergy saving but also decreases the number of side reactions.Also, during the ODH-Et, advantageously, a limited number of reac-tion products (ethylene, carbon dioxide, carbon monoxide andwater) are observed, while the catalyst does not undergo deactiva-tion by coke due to the presence of molecular oxygen in the reac-tion mixture [27–29]. The aforementioned MoVTeNbO catalyticsystem is a high efficiency novel material for the ODH-Et that pre-sents remarkably high values of selectivity to ethylene (>90%) atlevels of ethane conversion ca. 60%, as reported elsewhere[13,14,22]. Therefore, envisaging a possible future application ofthis material formulation on the conceptual design of catalyticreactors, it is necessary to develop its own kinetics.
The number of papers addressing kinetic aspects related to theODH-Et is not large [6,22,30–40]. Some reported kinetics are basedon macroscopic mechanisms such as Langmuir–Hinshelwood–Hougen–Watson (LHHW) [30–35], Eley–Rideal (ER) [36,37],Mars–van Krevelen (MvK) [38,39] or a combination of MvK andLHHW (MvK–LHHW) [40]. Other models based on Power Law(PL) empiricisms have been also reported [22,38]. Even thoughall these models are specific for each catalyst formulation and donot take into consideration elementary steps, some aspects aboutthe macro mechanism can be deduced from them. In fact, concern-ing mechanistic issues, there is no unanimity yet about the macro-scopic mechanisms involved in the ODH-Et [6,30–40]. Thediscussion has been mainly focused on defining the ‘‘type of oxy-gen’’, i.e., lattice oxygen or superficial oxygen adsorbed from thegas phase on the active site is responsible for the ODH-Et leadingto ethylene and total oxidation products. Additionally, it is stillon debate whether the fed ethane reacts in the gas phase or asan adsorbed species on the catalyst surface, and whether the reac-tion products have an influence on the catalyst performance or not.On the basis of a LHHW kinetics over a V2O5/SiO2 reportedelsewhere [30], it was concluded that water has a strong influenceon the rate of ethylene formation and that intermediate oxygen-ated species contribute substantially to the formation of carbonoxides. Another LHHW kinetics obtained over a VOx/c-Al2O3 cata-lyst in the absence of gas phase oxygen [35], demonstrated thatthe competitive adsorption of ethane, ethylene and carbon oxidesoccurred and had a positive effect on the formation of active sitesselective to ethylene production. Besides, an ER formalism, whichconsiders that gas phase ethane reacts with adsorbed oxygen overa (K-doped) V2O5/SiO2 [36], suggested that water adsorbed on thecatalyst surface impacted negatively on both ethane conversionand ethylene selectivity. Likewise, MvK kinetics on a mixedNi–Nb oxide [38] suggested that oxygen in the catalyst latticeproduced two types of active sites, one responsible for the ethyleneformation and ethylene total oxidation, and the other involved inthe ethane total oxidation. Finally, a combination of MvK–LHHWformalisms over a VOx/c-Al2O3 catalyst [40] indicated that theMvK mechanism governs ethylene formation, whereas ethaneand ethylene total oxidations occur in accordance with a LHHWmechanism.
The purpose of this work is, thus, to develop a series of kineticmodels based upon LHHW and MvK formalisms, and combinationsof them, to describe the catalytic ODH-Et. The kinetics are novel as
they characterize the performance of a high activity–selectivityMoVTeNb mixed oxide on the aforementioned reaction. Theparameters associated to the kinetics models are obtained via anonisothermal regression of steady-state catalytic experimentaldata obtained in a laboratory scale fixed-bed reactor. Both physico-chemical and statistical criteria are used to contrast the developedmodels and then select the most suitable one. Apart from obtainingrate equations that can be readily used for the reactor design andscale-up, the combination of experimental issues with kineticinformation can contribute to a better understanding of the macro-scopic mechanism involved in the ODH-Et.
2. Experimental procedures
2.1. Catalyst preparation
A multimetallic mixed oxide with a nominal atomic ratio ofMo:V:Te:Nb equal to 1:0.24:0.24:0.18 was synthesized. The prep-aration procedure comprised a set of steps which are brieflydescribed herein; (i) preparing at 80 �C and continuous stirringan aqueous solution containing tetra-hydrated ammoniumhepta-molybdate (Merck, 99%), telluric acid (Aldrich, 98%), andammonium meta-vanadate (Sigma–Aldrich, 99.5%); (ii) separatelypreparing at 80 �C a second aqueous solution containing niobiumoxalate (ABCR Lab. 99%) and oxalic acid (Aldrich, 98%). Solutionof step (ii) was added to the solution of stage (i) keeping a vigorousand continuous stirring to yield a slurry, which was then cooled toroom temperature. Next, the pH of the aforementioned slurry wasadjusted to 2.5 with the addition of 1 M nitric acid. The acidifiedslurry was later placed in a rotary evaporator operated at 50 �Cand 27 kPa to gradually eliminate the water. The resultant powderwas dried overnight at 100 �C and finally activated by means of athermal treatment at 600 �C for 2 h under nitrogen flow. Someadditional details about the catalyst preparation procedure alongwith a set of important physicochemical properties of the resultingsolid were reported previously [22].
2.2. Kinetic experiments
2.2.1. Experimental setupMeasurements of the catalytic performance were carried out in
a tubular fixed-bed reactor made of quartz with an internal diam-eter of 1.0 � 10�2 m and length of 4.0 � 10�2 m, which was oper-ated isothermally and at atmospheric pressure (ca. 80 kPa). Alltests were performed over a bed consisting of 0.60 g of catalyst,sieved for an average particle size equal to 150 lm prior to beloaded into the reactor. The reaction feedstock was composed ofa mixture of ethane (or ethylene), oxygen and nitrogen with avarying composition depending on the experiment. In order toobtain the data required to calibrate the aforementioned kineticmodels, three sets of experiments were effectuated. In the first setboth temperature and space–time (Wcat�Fethane,o
�1 ) were varied withinthe ranges 400–480 �C for the former, and 23–70 gcat h molethane
�1 ,keeping constant the inlet partial pressure of ethane, oxygen, andnitrogen at 7.0, 5.5, and 65.5 kPa, respectively. The second set ofexperiments was performed at 440 �C varying the inlet partial
pressure of ethane poC2H6
� �at constant inlet partial pressure of oxy-
gen poO2
� �, and vice versa; thus, the inlet partial pressure of each
reactant was spanned from 5.1 to 22.3 kPa resulting in aWcat�Fethane,o
�1 range from 10 to 140 gcat h molethane�1 . The third set of
experiments was carried out feeding into the reactor ethyleneinstead of ethane at the operating conditions used in the secondset of experiments. In the absence of catalyst, no reaction betweenethane and oxygen occurred in a test performed at 480 �C.

78 G. Che-Galicia et al. / Chemical Engineering Journal 252 (2014) 75–88
An assessment of the mass and heat disguises at pellet scalewas performed in accordance with the procedure and criteria out-lined elsewhere [41]. Deviations to the ideal flow pattern of thereactor were also evaluated. Some of the basic parameters usedto assess the referred criteria were the following: catalyst bedlength of 8.5 � 10�3 m, bed porosity of 0.3 m3 m�3; effective diffu-sion coefficient of 2.75 � 10�5 m2 s�1; catalysts tortuosity of5.0 m m�1, specific reaction rate of ethane of 3.44 � 10�6
mol (gcat s)�1, reaction temperature of 480 �C, ethane conversionof 0.85 mol mol�1; and activation energy for ethane oxidativedehydrogenation equal to 90.0 kJ mol�1. Table 1 displays a sum-mary of the assessed kinetic criteria for an experiment performedat the most severe conditions, i.e., those leading to the maximumspecific reaction rate of ethane, which indicate that experimentalobservations were obtained under plug flow conditions and inabsence of internal and external, heat and mass transferresistances.
2.2.2. Analysis of reaction productsThe compositions of the reactor by-pass and the reactor effluent
were analyzed online in an Agilent 7890A Gas Chromatograph(GC). GC’s configuration includes two detectors, a flame ionizationdetector (FID) and a thermal conductivity detector (TCD), as well asan array of three columns, namely, a 30 m � 0.53 mm � 40 lm HPPlot Q, a 30 m � 0.25 mm � 5 lm HP Plot Al2O3/S and a30 m � 0.53 mm � 50 lm molecular sieve. Hydrocarbons werequantified in the FID whereas non hydrocarbons (COx, nitrogen,oxygen, etc.) in the TCD. By applying Eq. (1), the molar outlet flowrate of any component n was calculated by means of the internalstandard method employing chromatographic information:
Fn ¼F i:s:Mi:s:
Ai:s:di:s:� Andn
Mnð1Þ
Fn is outlet molar flow rate, Mn corresponds to the molecular massAn denotes the chromatographic surface area, and dn is the chro-matographic calibration factor. The subscript i.s. is used to denotethe internal standard, nitrogen being utilized.
The conversion of hydrocarbons (ethane or ethylene) denotedby XHC (Eq. (2)) as well as the selectivity to a n product referredto as Sn (Eq. (3)) were based on a carbon mass balance and com-puted as follows:
XHC ¼FHC;in � FHC;out
FHC;in� 100 ð2Þ
Sn ¼FnC
2ðFHC;in � FHC;outÞ� 100 ð3Þ
where FHC is molar flow rate of the hydrocarbon used as reactant, Fn
is outlet molar flow rate of the product n and C is the carbon num-ber of species n.
Table 1Summary of results after assessing the various criteria for plug flow regime as well as con
Criterion Mathematica
1a Assumption plug flow regime 8 < dtdp
1b Assumption plug flow regime 8Bo m ln 1
1�XC2 H6
2 Pressure drop 0:15lf Lð1�ebÞ2
d2pe3
b
uo
3 External mass transfer limitation robskg av CC2 H6 ;b
< 0:0m
4 Internal mass transfer limitation robsDC2 H6 ;eff CC2 H6 ;b
d�
5 External heat transfer limitation robsð�DHrÞdp
6h <0
6 Internal heat transfer limitation robsð�DHrÞd2p
60kp<
0
7 Radial reactor heat transfer limitation robsð�DHrÞð1�ebÞð6h
3. Kinetic modeling
As a first step in the construction of a kinetic model, a globalreaction network based on the experimental observations isproposed, vide Fig. 1. This reaction network includes the speciesdetected by gases chromatography, namely, ethane, ethylene,carbon monoxide and carbon dioxide. As also indicated in Fig. 1,oxygen is present as a second reagent while water is invariably areaction product in all reactions. Both parallel and consecutivereactions are accounted for in which ethylene is produced fromethane (r1), carbon oxides (COx) are formed out of the combustionof ethane corresponding to r2 and r3, and from the secondary com-bustion of ethylene, vide r4 and r5.
Four kinetic models based on different macroscopic mechanis-tic approaches are developed to characterize the ODH-Et overMoVTeNbO catalyst. Specifically, the first model is based on aLHHW formalism, the second model is supported on a MvK formal-ism, while the third and fourth models are constructed on acombination of MvK and LHHW, as will be discussed in detail inSections 3.1 to 3.3. It is important to point out that in the develop-ment of all these models, the effect of the products on catalysts iscaptured indirectly by the estimated effective parameters since forall studied operating conditions products accumulation (ethylene,COx and water) was observed at different levels and, hence, theparameter estimation made use of total products that werecollected at the outlet of the steady-state reactor.
3.1. Langmuir–Hinshelwood–Hougen–Watson model
The kinetic model based on the LHHW formalism is constructedtaking into consideration the next assumptions: (i) there is a singletype of active sites over the whole catalyst surface, (ii) there iscompetitive adsorption of reactants (ethane and oxygen) and prod-ucts (ethylene, carbon oxides and water) for the active sites, (iii)oxygen adsorption is dissociative while that of the other speciesis associative, (iv) surface reaction steps are considered fast takingplace over a finite number of active sites, (v) surface reactions arerate-determining steps (RDS), (vi) all products are susceptible to bere-adsorbed over the active sites, and (vii) adsorption and desorp-tion steps are quasi-equilibrated. In a previous publication [22],apparent reaction orders for both hydrocarbons and oxygen werefound to be positive out of experiments over the MoVTeNbO cata-lyst and, therefore, the adsorption of reagents is discarded as RDS.
Table 2 includes the reaction steps considered for building thekinetics (S represents the active sites); namely, steps A and Bdenotes the adsorption of main reagents (oxygen and ethane),steps 1–5 corresponds to the surface reactions, and steps C to Frepresent the desorption of products. In Table 2, rj is the so-calledHoriuti stoichiometric number used for describing the times thateach adsorption, desorption and reaction steps has to occur inorder to complete a single catalytic cycle comprising the overall
centration and temperature gradients at the pellet scale in the ODH-Et experiments.
l form (A < B) A B
8.0 66
< Ldp
8.0 56
þ 0:00175qf Lð1�ebÞdpe3
bu2
o < 0:2 ptotm
48 95
5 3.1 � 10�4 5.0 � 10�2
p6
�2< 1
12m3.3 � 10�3 8.0 � 10�2
:05RT2f
EA
0.017 2.35
:05RT2f
EA
1.23 � 10�3 2.35
1�bÞd2t <
0:05RT2w
EA
1.3 2.35

Fig. 1. Reaction network describing the ODH-Et.
G. Che-Galicia et al. / Chemical Engineering Journal 252 (2014) 75–88 79
reactions, the latter represented by steps I to V. Notice that theadsorption of molecular O2 (step A) is a crucial stage for the surfacereactions to take place (steps 1–5).
The rate of the five reactions (ri), accounted for in the reactionnetwork of Fig. 1, are expressed by Eqs. (4)–(8). Notice that the cal-culation of ri involves a rate coefficient denoted by ki, an adsorptionequilibrium coefficient for the n-th component represented by Kn,the fraction coverage of active sites designated h�, the partial pres-sure of the reactant n represented by pn, and the reaction orderrelated to the partial pressure of the gas phase denoted by mi:
r1 ¼ k1ðKO2 pO2Þ1=2KC2H6 pC2H6
h2� ð4Þ
r2 ¼ k2ðKO2 pO2Þm2=2KC2H6 pC2H6
hm2þ1� ð5Þ
r3 ¼ k3ðKO2 pO2Þm3=2KC2H6 pC2H6
hm3þ1� ð6Þ
r4 ¼ k4ðKO2 pO2Þm4=2KC2H4 pC2H4
hm4þ1� ð7Þ
r5 ¼ k5ðKO2 pO2Þm5=2KC2H4 pC2H4
hm5þ1� ð8Þ
Since the fraction coverage of different species on the catalyticsurface is conserved all the time, the global balance of the fractionsites corresponds to Eq. (9):
h� þ hO þ hC2H6 þ hC2H4 þ hH2O þ hCO2 þ hCO ¼ 1 ð9Þ
Table 2Reaction steps and catalytic cycles considered for the LHHW model to describe theODH-Et.
Step Elementary reaction step rI rII rIII rIV rV
A O2 + 2S � 2O � S 1 7 5 3 2B C2H6 + S � C2H6 � S 2 2 2 0 01 C2H6 � S + O � S ? C2H4 � S + H2O � S 2 0 0 0 02 C2H6 � S + 7O � S ? 2CO2 � S + 3H2O � S + 3S 0 2 0 0 03 C2H6 � S + 5O � S ? 2CO � S + 3H2O � S + S 0 0 2 0 04 C2H4 � S + 6O � S ? 2CO2 � S + 2H2O � S + 3S 0 0 0 1 05 C2H4 � S + 4O � S? 2CO � S + 2H2O � S + S 0 0 0 0 1C C2H4 � S � C2H4 + S 2 0 0 1 1D CO2 � S � CO2 + S 0 4 0 2 0E CO � S � CO + S 0 0 4 0 2F H2O � S � H2O + S 2 6 6 2 2
I C2H6 + 0.5O2 ? C2H4 + H2OII C2H6 + 3.5O2 ? 2CO2 + 3H2OIII C2H6 + 2.5O2 ? 2CO + 3H2OIV C2H4 + 3.5O2 ? 2CO2 + 2H2OV C2H4 + 2.5O2 ? 2CO + 2H2O
The fraction coverage of a specific component is defined as thenumber of sites occupied by such a species relative to the totalnumber of available sites corresponding to Eq. (10) for oxygenand Eq. (11) for the species different to oxygen:
hO ¼ ðKO2 pO2Þ1=2h� ð10Þ
hn ¼ Knpnh� n ¼ C2H6; C2H4; CO2; CO and H2O ð11Þ
The fraction of free active sites is obtained by combiningEqs. (9)–(11) resulting in Eq. (12):
h� ¼1
1þðKO2 pO2Þ1=2þKC2H6 pC2 H6
þKC2H4 pC2 H4þKH2OpH2 OþKCO2 pCO2
þKCOpCO
ð12Þ
The combination of the specific reaction rates gives the netreaction rate of component n, which is expressed by Eq. (13) [42]:
Rn ¼X5
i¼1
mn;iri ð13Þ
where mn,i is the stoichiometric coefficient of the component n in thei-th reaction (vide steps I to V displayed in Table 2).
3.2. Mars–van Krevelen model
Kinetic models based upon MvK formalism are frequently usedto describe the (partial) oxidation of organic compounds overnoble metals as well as metal oxide catalysts [43,44]. Accordingto the MvK mechanism, the reaction takes place through alternat-ing cyclically the catalyst’s active sites from oxidized to reducedstates [45]. In the reaction, more specifically, the labile oxygen spe-cies from lattice is responsible for ethylene and COx formations,and these oxygen species are restored by gas phase oxygen [46].For the particular case of the ODH-Et studied in this work, Table 3presents the reaction steps accounted for constructing the corre-sponding kinetic model. The reactions involve catalyst’s latticeoxygen as well as gas phase hydrocarbons to produce, as corre-sponds, ethylene, COx and/or water in accordance with steps 1–5.Step O, additionally, represents the re-oxidation of lattice by gasphase oxygen and, hence, catalyst’s reduced sites.
The rate corresponding rate expressions for the MvK modelderived on the basis of the steps displayed in Table 3 are givenby Eqs. (14)–(18):
r1 ¼ k1pC2H6hOX ð14Þ
r2 ¼ k2pC2H6hOX ð15Þ
r3 ¼ k3pC2H6hOX ð16Þ
r4 ¼ k4pC2H4hOX ð17Þ
r5 ¼ k5pC2H4hOX ð18Þ
Table 3Reaction steps and catalytic cycles considered for the MvK model to describe theODH-Et.
Step Elementary reaction step rI rII rIII rIV rV
1 C2H6 + MOX ? C2H4 + H2O + Mred 1 0 0 0 02 C2H6 + MOX ? 2CO2 + 3H2O + Mred 0 1 0 0 03 C2H6 + MOX ? 2CO + 3H2O + Mred 0 0 1 0 04 C2H4 + MOX ? 2CO2 + 2H2O + Mred 0 0 0 1 05 C2H4 + MOX ? 2CO + 2H2O + Mred 0 0 0 0 1O Mred + mO2 ? MOX 1 1 1 1 1
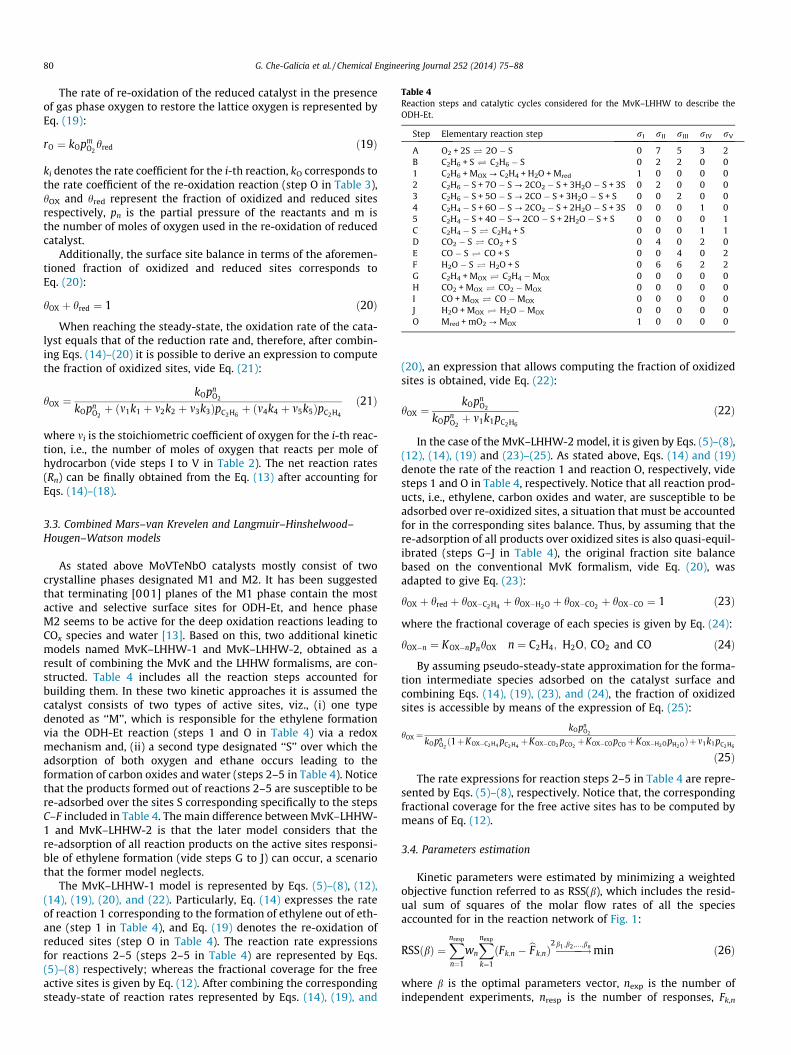
Table 4Reaction steps and catalytic cycles considered for the MvK–LHHW to describe theODH-Et.
Step Elementary reaction step rI rII rIII rIV rV
A O2 + 2S � 2O � S 0 7 5 3 2B C2H6 + S � C2H6 � S 0 2 2 0 01 C2H6 + MOX ? C2H4 + H2O + Mred 1 0 0 0 02 C2H6 � S + 7O � S ? 2CO2 � S + 3H2O � S + 3S 0 2 0 0 03 C2H6 � S + 5O � S ? 2CO � S + 3H2O � S + S 0 0 2 0 04 C2H4 � S + 6O � S ? 2CO2 � S + 2H2O � S + 3S 0 0 0 1 05 C2H4 � S + 4O � S? 2CO � S + 2H2O � S + S 0 0 0 0 1C C2H4 � S � C2H4 + S 0 0 0 1 1D CO2 � S � CO2 + S 0 4 0 2 0E CO � S � CO + S 0 0 4 0 2F H2O � S � H2O + S 0 6 6 2 2G C2H4 + MOX � C2H4 �MOX 0 0 0 0 0H CO2 + MOX � CO2 �MOX 0 0 0 0 0I CO + MOX � CO �MOX 0 0 0 0 0J H2O + MOX � H2O �MOX 0 0 0 0 0O Mred + mO2 ? MOX 1 0 0 0 0
80 G. Che-Galicia et al. / Chemical Engineering Journal 252 (2014) 75–88
The rate of re-oxidation of the reduced catalyst in the presenceof gas phase oxygen to restore the lattice oxygen is represented byEq. (19):
rO ¼ kOpmO2
hred ð19Þ
ki denotes the rate coefficient for the i-th reaction, kO corresponds tothe rate coefficient of the re-oxidation reaction (step O in Table 3),hOX and hred represent the fraction of oxidized and reduced sitesrespectively, pn is the partial pressure of the reactants and m isthe number of moles of oxygen used in the re-oxidation of reducedcatalyst.
Additionally, the surface site balance in terms of the aforemen-tioned fraction of oxidized and reduced sites corresponds toEq. (20):
hOX þ hred ¼ 1 ð20Þ
When reaching the steady-state, the oxidation rate of the cata-lyst equals that of the reduction rate and, therefore, after combin-ing Eqs. (14)–(20) it is possible to derive an expression to computethe fraction of oxidized sites, vide Eq. (21):
hOX ¼kOpn
O2
kOpnO2þ ðm1k1 þ m2k2 þ m3k3ÞpC2H6
þ ðm4k4 þ m5k5ÞpC2H4
ð21Þ
where mi is the stoichiometric coefficient of oxygen for the i-th reac-tion, i.e., the number of moles of oxygen that reacts per mole ofhydrocarbon (vide steps I to V in Table 2). The net reaction rates(Rn) can be finally obtained from the Eq. (13) after accounting forEqs. (14)–(18).
3.3. Combined Mars–van Krevelen and Langmuir–Hinshelwood–Hougen–Watson models
As stated above MoVTeNbO catalysts mostly consist of twocrystalline phases designated M1 and M2. It has been suggestedthat terminating [001] planes of the M1 phase contain the mostactive and selective surface sites for ODH-Et, and hence phaseM2 seems to be active for the deep oxidation reactions leading toCOx species and water [13]. Based on this, two additional kineticmodels named MvK–LHHW-1 and MvK–LHHW-2, obtained as aresult of combining the MvK and the LHHW formalisms, are con-structed. Table 4 includes all the reaction steps accounted forbuilding them. In these two kinetic approaches it is assumed thecatalyst consists of two types of active sites, viz., (i) one typedenoted as ‘‘M’’, which is responsible for the ethylene formationvia the ODH-Et reaction (steps 1 and O in Table 4) via a redoxmechanism and, (ii) a second type designated ‘‘S’’ over which theadsorption of both oxygen and ethane occurs leading to theformation of carbon oxides and water (steps 2–5 in Table 4). Noticethat the products formed out of reactions 2–5 are susceptible to bere-adsorbed over the sites S corresponding specifically to the stepsC–F included in Table 4. The main difference between MvK–LHHW-1 and MvK–LHHW-2 is that the later model considers that there-adsorption of all reaction products on the active sites responsi-ble of ethylene formation (vide steps G to J) can occur, a scenariothat the former model neglects.
The MvK–LHHW-1 model is represented by Eqs. (5)–(8), (12),(14), (19), (20), and (22). Particularly, Eq. (14) expresses the rateof reaction 1 corresponding to the formation of ethylene out of eth-ane (step 1 in Table 4), and Eq. (19) denotes the re-oxidation ofreduced sites (step O in Table 4). The reaction rate expressionsfor reactions 2–5 (steps 2–5 in Table 4) are represented by Eqs.(5)–(8) respectively; whereas the fractional coverage for the freeactive sites is given by Eq. (12). After combining the correspondingsteady-state of reaction rates represented by Eqs. (14), (19), and
(20), an expression that allows computing the fraction of oxidizedsites is obtained, vide Eq. (22):
hOX ¼kOpn
O2
kOpnO2þ m1k1pC2H6
ð22Þ
In the case of the MvK–LHHW-2 model, it is given by Eqs. (5)–(8),(12), (14), (19) and (23)–(25). As stated above, Eqs. (14) and (19)denote the rate of the reaction 1 and reaction O, respectively, videsteps 1 and O in Table 4, respectively. Notice that all reaction prod-ucts, i.e., ethylene, carbon oxides and water, are susceptible to beadsorbed over re-oxidized sites, a situation that must be accountedfor in the corresponding sites balance. Thus, by assuming that there-adsorption of all products over oxidized sites is also quasi-equil-ibrated (steps G–J in Table 4), the original fraction site balancebased on the conventional MvK formalism, vide Eq. (20), wasadapted to give Eq. (23):
hOX þ hred þ hOX�C2H4 þ hOX�H2O þ hOX�CO2 þ hOX�CO ¼ 1 ð23Þ
where the fractional coverage of each species is given by Eq. (24):
hOX�n ¼ KOX�npnhOX n ¼ C2H4; H2O; CO2 and CO ð24Þ
By assuming pseudo-steady-state approximation for the forma-tion intermediate species adsorbed on the catalyst surface andcombining Eqs. (14), (19), (23), and (24), the fraction of oxidizedsites is accessible by means of the expression of Eq. (25):
hOX ¼kOpn
O2
kOpnO2ð1þKOX�C2H4 pC2 H4
þKOX�CO2 pCO2þKOX�COpCOþKOX�H2 OpH2 OÞþm1k1pC2 H6
ð25Þ
The rate expressions for reaction steps 2–5 in Table 4 are repre-sented by Eqs. (5)–(8), respectively. Notice that, the correspondingfractional coverage for the free active sites has to be computed bymeans of Eq. (12).
3.4. Parameters estimation
Kinetic parameters were estimated by minimizing a weightedobjective function referred to as RSS(b), which includes the resid-ual sum of squares of the molar flow rates of all the speciesaccounted for in the reaction network of Fig. 1:
RSSðbÞ ¼Xnresp
n¼1
wn
Xnexp
k¼1
ðFk;n � bF k;nÞ2�����!b1 ;b2 ;...;bn min ð26Þ
where b is the optimal parameters vector, nexp is the number ofindependent experiments, nresp is the number of responses, Fk,n

100
80
60
40
20
0480460440420400
Temperature [ºC]
(a)
Wcat/Fethane,o=23.0 gcat·h·mol ethane-1
Wcat/Fethane,o=46.5 gcat·h·mol ethane-1
Wcat/Fethane,o=70.0 gcat·h·mol ethane-1
100
80
60
40
20
0
Sele
ctiv
ity [
%]
100806040200Ethane conversion [%]
(b)
C2H4
CO CO2
Eth
ane
conv
ersi
on [
%]
Fig. 2. (a) Ethane conversion versus temperature at different values of Wcat�Fethane,o�1 .
(b) Selectivity to ethylene, CO2, and CO versus ethane conversion. (T = 400–480 �C;space–time = 23–70 gcat h molethane
�1 ; nominal inlet molar ratio C2/O2/N2 = 9/7/84).
G. Che-Galicia et al. / Chemical Engineering Journal 252 (2014) 75–88 81
and Fk;n are the n-th experimental and predicted responses for thek-th observation, respectively, and wn is the weight factor assignedto the n-th response.
The molar flow rate of component n was calculated by solving asystem of ordinary differential equations (ODEs) given by Eq. (27),which corresponds to the experimental reactor model equations.Needless to say as that both intra and inter-particle transportlimitations were found to be negligible according to criteria givenin Table 1, Eq. (27) stands for an isobaric, isothermal, one-dimen-sional pseudo-homogeneous continuous integral fixed-bed reactormodel:
dFn
dWcat¼ Rn ð27Þ
With the following initial conditions:
Fn ¼ Fno; when Wcat ¼ 0 ð28Þ
where Fn is the molar flow rate of component n, Fno is the inletmolar flow rate of component n and Wcat is the mass of the catalystloaded into the reactor. The subroutine VODE was used to solve thecorresponding set of ODEs [47]. The initial minimization of theobjective function, vide Eq. (26), in the model regression wascarried out using the Rosenbrock method [48] and then, the ODR-PACK subroutines were called for fitting calculated values to thecorresponding experimental data points [49]. These subroutinescan perform either weighted orthogonal distance regression or non-linear least square problems for explicit and implicit models usingmulti-response data with an implementation of the Levenberg–Marquardt method, as documented elsewhere [50].
In order to obtain activation energies values and pre-exponen-tial factors as well as standard adsorption enthalpies and entropiesduring the parameters estimation procedure, a nonisothermalmulti-response parameter estimation was achieved. Aimed atovercoming the correlation between corresponding parametersboth Arrhenius and Van’t Hoff equations were used in thereparameterized form. Specifically, after reparameterizing theArrhenius equation, the corresponding rate coefficients werecomputed using the expression of Eq. (29):
ki ¼ exp A0i �EA;i
R1T� 1
T�
� �� �ð29Þ
For the i-th reaction, A0i is the natural logarithm of the pre-expo-nential factor, and EA,i is the activation energy, T is the reactiontemperature, T⁄ is the averaged reaction temperature.
The reparameterization of the Van’t Hoff expression leads toEq. (30), which was used to compute the corresponding adsorptioncoefficients:
Kn ¼ expDSo
n
R� DHo
n
R1T� 1
T�
� �� �ð30Þ
DSon is the standard adsorption entropy of component n, DHo
n is thestandard adsorption enthalpy of component n and R is the universalgas constant.
An additional aspect accounted for during the parameter esti-mation was related to statistical issues. For the four kinetic modelsdescribed above, the F-test for the global significance of the regres-sion as well as the individual t-test and the confidence limits forthe estimates were computed. Parity diagrams were also built tovisualize the agreement between experimental observations andmodels predictions. Aside, the parameters correlation betweenpairs of estimated parameters was accounted for by computingthe so-called binary linear correlation coefficients (qij). When thevalue of qij is close to ±1 a strong linear relationship between theestimated parameters i and j occurs.
4. Results and discussion
4.1. Experiments
4.1.1. Temperature and space–time effectThis part of the manuscript deals with the results obtained for
a reactor feedstock containing ethane, oxygen and nitrogen atthe operating conditions specified in Section 2.2. The GC analysesindicated that the reaction products spectra consisted ofethylene, CO2 and CO. Fig. 2a shows the manner ethane conver-sion varies as a function of temperature at three different valuesof Wcat�Fethane,o
�1 [23, 46.5 and 70 gcat h molethane�1 ] and an inlet
molar ratio of ethane to oxygen equal to 1.3. Ethane conversionranges from 17% to 85%, the largest value corresponding to anexperiment performed at 480 �C/70 gcat h molethane
�1 . In fact,ethane conversion increases linearly with augmenting reactionseverity, i.e., temperature and space–time.
Fig. 2b displays the evolution of the selectivity to ethylene, CO2
and CO as a function of the ethane conversion for a set of experi-ments within the region 400–480 �C and 23–70 gcat h molethane
�1 ,feeding a mixture containing ethane, oxygen and nitrogen withan inlet molar ratio ethane to oxygen of 1.3. The selectivity tothe reaction products detected in the reactor effluent decreasesin the following order: ethylene� CO > CO2. At the investigatedconditions, the selectivity ranged from 76% to 96% for ethylene,2.5% to 16.5% for CO and 1.5% to 7.5% for CO2. On the basis of whatwas discussed previously, the region of high ethane conversiondemands operating at large values of temperature and space–time,an scenario at which the selectivity to COx is favored in detriment

80
60
(a)
%]
82 G. Che-Galicia et al. / Chemical Engineering Journal 252 (2014) 75–88
to that of ethylene, as can be observed in Fig. 2b. A previous pub-lication [22] was devoted to study systematically the combinedeffect of temperature and space–time on a set of catalyticresponses over the same catalyst formulation.
40
20
02520151050
Inlet partial pressure of oxygen [kPa]
Wcat/Fethane,o=22.0 gcat·h·mol ethane-1
Wcat/Fethane,o=35.0 gcat·h·mol ethane-1
Wcat/Fethane,o=70.0 gcat·h·mol ethane-1
60
40
ane
conv
ersi
on [
%]
(b)
Eth
ane
conv
ersi
on [
4.1.2. Partial pressure effectThe effect of the inlet partial pressure of the reactants, ethane
and oxygen, on the MoVTeNb mixed oxide for the ODH-Et was alsodealt with. For this end, the inlet partial pressure of one reactantwas systematically varied maintaining constant the inlet partialpressure of the other. Fig. 3 summarizes the effect of the inlet par-tial pressure of the reactants on ethane conversion for a set ofexperiments effectuated at a reaction temperature of 440 �C andspace–time from 10 to 140 gcat h molethane
�1 . It is first detected thatan increase of the inlet partial pressure of ethane and/or oxygenhas a positive effect on ethane conversion. Evidently, the ethaneconversion is appreciably more sensitive to changes in the inletpartial pressure of ethane. More precisely, on the basis of the infor-mation included in Fig. 3a, augmenting po
O2from 5 to 22 kPa leads
to a relatively small increase in the ethane conversion, ca. 8% abso-lute. The data plotted in Fig. 3b shows that after increasing po
C2H6
from 5 to 22 kPa, the augment in the ethane conversion is as highas 20% absolute. All these observations are in agreement with otherpublications in which ODH-Et was performed over vanadium-based catalysts [31,32].
20
0
Eth
2520151050
Inlet partial pressure of ethane [kPa]
Wcat/Fethane,o=35.0 gcat·h·mol ethylene-1
Wcat/Fethane,o=40.0 gcat·h·mol ethylene-1
Wcat/Fethane,o=44.0 gcat·h·mol ethylene-1
Fig. 3. (a) Ethane conversion versus oxygen inlet partial pressure. (b) Ethaneconversion versus ethane inlet partial pressure. (T = 440 �C; ethane (or oxygen) inletpartial pressure ranged from 5.1 to 22.3 kPa; space–time ranged between 10 and140 gcat h molethane
�1 ).
4.1.3. Catalytic reaction feeding ethyleneThe contribution of ethylene to the formation of carbon oxides
in the ODH-Et was assessed by means of a set of experiments usinga feedstock containing ethylene instead of ethane. Such experi-ments are performed at 440 �C, space–time between 10 and130 gcat h molethylene
�1 and inlet molar ratios of ethylene to oxygen0.5–2.0 (vide Section 2.2.1). At these conditions, ethylene conver-sion is 3–14%, the only carbon-containing products detected viachromatographic analyses being CO and CO2. The larger thespace–time, the higher the ethylene conversion is. Systematically,the CO is produced in an appreciably higher amount in comparisonwith CO2, the selectivity to the former ranging 73–78% and theselectivity to the latter ranging 22–27%, vide Fig. 4a. On the basisof the information discussed above, it is evident that (i) part ofthe ethylene formed via oxydehydrogenation converts into COx,(ii) ethylene is more difficultly activated over the MoVTeNbO cat-alyst than ethane is, and (iii) ethylene converts preferentially intoCO.
As in the case of ethane, the effect of varying the inlet partial
pressure of the ethylene poC2H4
� �and oxygen po
O2
� �on ethylene
conversion as well as COx selectivity was also addressed. It canbe observed in Fig. 4b that increasing the inlet partial pressure ofoxygen at a given inlet partial pressure of ethylene has a slightpositive effect on ethylene conversion, a behavior which is alsoobserved in the case of ethane conversion in the first set of exper-iments. Fig. 4c shows that augmenting the inlet partial pressure ofethylene also leads to higher ethylene conversions. ContrastingFig. 4b with c, it is clear that ethylene conversion is appreciablymore sensitive to changes in the inlet partial pressure of ethylenethan in that of oxygen.
The way that the experiments are defined (vide Section 2.2.1)allowed us filtering out the contribution of ethylene conversionto the ethane oxidative dehydrogenation. Thus, it was detectedthat ethane and ethylene are source of both CO2 and CO. For theset of experiments discussed in Section 4.1.2, after removing thecontribution of ethylene, the ratios CO/COx and CO2/COx variedfrom 0.27 to 0.64 and 0.33 to 0.76, respectively, a valuethat appears to be very sensitive to the operating conditions, in
particular, to the hydrocarbon to oxygen ratio in the feedstock con-trary to what is detected in the experiments with ethylene.
4.2. Kinetic modeling
The mathematical procedure for the estimation of the kineticparameters is a crucial step in the construction of kinetic models,which has to be invariably accompanied by a careful assessmentof the model parameters from a physicochemical perspective anda statistical point of view. Kinetic parameters should be not onlycapable to represent adequately the occurred physicochemicalphenomena but also exhibit thermodynamic consistency. Besides,regression results must be statistically tested to verify the modeladequacy and estimate confidence limits. When confronting a setof kinetic models, all this information is of a great utility to definethe best candidate.
4.2.1. Statistical analysis: model adequacy and t-test on parametersFig. 5 shows the so-called parity diagrams for the four kinetic
models described in Section 3. In the case of this work, they areutilized to compare the model computed flow rates with experi-mentally measured ones for all the components accounted for inthe reaction network of Fig. 1. Evidently, the LHHW is the modelthat best represents the experimental observations. It is in factobserved in Fig. 5a, that the LHHW formalism is capable to fitexperimental observations with an error margin below 10% with-out detecting the presence of any undesired statistical trend. Alsonotice that the random error is constant over the range of the

100
80
60
40
20
0
Sele
ctiv
ity [
%]
1614121086420
Ethylene conversion [%]
(a)
CO CO2
20
15
10
5
02520151050
Inlet partial pressure of oxygen [kPa]
(b) Wcat/Fethylene,o=22.0 gcat·h·molethylene-1
Wcat/Fethylene,o=35.0 gcat·h·molethylene-1
Wcat/Fethylene,o=70.0 gcat·h·molethylene-1
10
8
6
4
2
0
Eth
ylen
e co
nver
sion
[%
]
2520151050
Inlet partial pressure of ethylene [kPa]
(c)
Wcat/Fethylene,o=35.0 gcat·h·molethylene-1
Wcat/Fethylene,o=40.0 gcat·h·molethylene-1
Wcat/Fethylene,o=44.0 gcat·h·molethylene-1
Eth
ylen
e co
nver
sion
[%
]
Fig. 4. (a) Selectivity of CO and CO2 versus ethylene. (b) Ethylene conversion versusoxygen inlet partial pressure. (c) Ethylene conversion versus ethylene inlet partialpressure. (T = 440 �C; ethylene (or oxygen) inlet partial pressure ranged from 5.0 to24.2 kPa; space–time ranged between 10 and 130 gcat h molethylene
�1 ).
G. Che-Galicia et al. / Chemical Engineering Journal 252 (2014) 75–88 83
operating variables at which the kinetic data are collected and,therefore, no systematic association of the random error for onedata point with the random error of any other data point isdetected.
The parameter estimation results for LHHW, MvK, MvK–LHHW-1 and MvK–LHHW-2 models are summarized in Tables 5–8. Thebest fitting of the LHHW model compared with the others is con-firmed by contrasting the corresponding F-values. Specifically,the F-value obtained for the LHHW model amounted to 7567, avalue that is 3.7, 12.4 and 9.5 times greater compared with that
achieved for model MvK (2038), MvK–LHHW-1 (609) and MvK–LHHW-2 (796), respectively.
The LHHW kinetic model also exhibits the best statistics relatedto the significance of the parameters estimates, i.e., t-value as wellas confidence intervals, in accordance with the informationincluded in Tables 5–8. As a matter of fact, most of the computedt-values of individual parameters for the LHHW are two orders ofmagnitude higher than the tabulated t-value for a 95% probabilitylevel. Regarding the binary linear correlation coefficients (qij), val-ues exhibited by the model LHHW model are mostly below 0.6,whereas models MvK, MvK–LHHW-1 and MvK–LHHW-2 displayedhigher values, closer to 1.0. On the basis of the set of statistical cri-teria outlined above, it is clear that the LHHW model, which isbased on an adsorption–surface reaction–desorption mechanism,exhibits the best behavior.
4.2.2. Physicochemical assessment of model parametersAfter verifying the statistical consistency of the model parame-
ters, they have to be contrasted with a series of thermodynamiccriteria in order to determine whether they are physically mean-ingful or not. Where the Vant’t Hoff equation parameters (standardadsorption enthalpy and entropy) are concerned, estimated valuesare to be confronted with a set of criteria defined by Boudart [51].Since adsorption is an exothermic process, the adsorption enthalpyhas to satisfy the inequality:
�DHo > 0 ð31Þ
the adsorption entropy must be higher than zero and lower than the
corresponding standard entropy of the gas phase specie Son;g
� �,
namely:
0 < �DSon < So
n;g ð32Þ
where DSon is the standard entropy of adsorption.
The entropy in fact decreases when a gaseous molecule is trans-ferred from a three-dimensional phase, i.e, the gas phase, to a two-dimensional phase, i.e, the catalyst surface. The gas phase standardentropy values of ethane, oxygen, ethylene, CO, CO2 and water arecomputed at 440 �C amounting to 275, 231, 257, 223, 246 and218 J (mol K)�1, respectively, based on reference [52].
An additional criterion to be satisfied during the nonisothermalparameter estimation related to adsorption reaction, relates to thechange in volume that occurs when a gaseous molecule is adsorbedover the surface of a solid. This is specifically expressed in thefollowing form:
41:8 < �DSo < 51:04� 1:4DHo ð33Þ
Related to the Arrhenius equation parameters, the activationenergy should be lower to 210 kJ mol�1 [53] since larger valuesindicate the presence of catalyst deactivation, for instance, bysintering [54]. Besides, the activation energy of the reactions oftotal oxidation is expected to be larger than that of the ethyleneformation from ethane.
4.2.3. Kinetic parameters assessment4.2.3.1. Langmuir–Hinshelwood–Hougen–Watson model. As dis-cussed above in Section 4.2.1 and considering the informationincluded in Fig. 5 and Table 5, the LHHW model, which is repre-sented by Eqs. (4)–(8), (29) and (30), exhibited the best statisticalresults among the developed kinetics. Notwithstanding, a physicalanalysis of the estimated parameters is also compulsory in order toevaluate the absolute adequacy of this model. It is noted in Table 5that activation energy values of the five reactions accounted for inthe network of Fig. 1 are within the range 76–149 kJ mol�1. In par-ticular, the main reaction responsible for ethylene formation out ofethane (r1) is the one demanding the lowest activation energy, i.e.,

50
40
30
20
10
0
F n cal
cula
ted
[mm
ol/h
]
50403020100
+10 %
-10 %
(a) 50
40
30
20
10
050403020100
+10 %
-10 %
(b)
50
40
30
20
10
050403020100
Fn observed [mmol/h]
+10 %
-10 %
(c) 50
40
30
20
10
050403020100
+10 %
-10 %
(d)
Fn observed [mmol/h]
Fn observed [mmol/h]Fn observed [mmol/h]
F n cal
cula
ted
[mm
ol/h
]
F n cal
cula
ted
[mm
ol/h
]F n c
alcu
late
d [m
mol
/h]
Fig. 5. Parity plots comparing experimental with calculated reactor outlet molar flow rates for the four kinetic models: (a) LHHW. (b) MvK. (c) MvK–LHHW-1 and (d) MvK–LHHW-2. The full lines are the first bisector and the dashed lines represent a deviation of 10%.
84 G. Che-Galicia et al. / Chemical Engineering Journal 252 (2014) 75–88
76.6 kJ mol�1. Total oxidation reaction producing CO2 and CO fromethane (r2 and r3), in contrast, are the reactions with the largestactivation energy amounting to 149.6 and 132.0 kJ mol�1, respec-tively. These results also indicate that reaction of COx formationout of ethane are particularly sensitive to temperature changes,
Table 5Kinetic parameters values and corresponding 95% probability confidence intervals ofthe LHHW model used to describe the ODH-Et over the MoVNbTeO catalyst.
Parameter Estimatedvalue
Lowerlimit
Upperlimit
t-Value
A01, mmol (g h)�1 5.04E+00 5.02E+00 5.06E+00 4.71E+02A02, mmol (g h)�1 8.07E�02 8.03E�02 8.10E�02 5.17E+02A03, mmol (g h)�1 1.64E+00 1.63E+00 1.64E+00 4.15E+02A04, mmol (g h)�1 2.96E+00 2.89E+00 3.02E+00 8.99E+01A05, mmol (g h)�1 4.46E+00 4.39E+00 4.52E+00 1.41E+02EA,1, kJ mol�1 7.66E+01 7.62E+01 7.70E+01 3.65E+02EA,2, kJ mol�1 1.49E+02 1.48E+02 1.50E+02 3.05E+02EA,3, kJ mol�1 1.32E+02 1.31E+02 1.33E+02 3.68E+02EA,4, kJ mol�1 1.20E+02 1.17E+02 1.24E+02 6.32E+01EA,5, kJ mol�1 1.09E+02 1.07E+02 1.10E+02 1.51E+02�DSo
O2; J (mol K)�1 4.66E+01 4.63E+01 4.68E+01 3.45E+02
�DSoC2H6
; J (mol K)�1 5.71E+01 5.68E+01 5.73E+01 4.75E+02
�DSoC2H4
; J (mol K)�1 9.01E+01 8.96E+01 9.05E+01 4.20E+02
�DSoH2 O; J (mol K)�1 5.17E+01 5.15E+01 5.18E+01 6.29E+02
�DSoCO2
; J (mol K)�1 6.61E+01 6.58E+01 6.65E+01 3.63E+02
�DSoCO; J (mol K)�1 8.34E+01 8.29E+01 8.39E+01 3.21E+02
�DHoO2; kJ mol�1 4.25E+01 4.22E+01 4.28E+01 3.03E+02
�DHoC2H6
; kJ mol�1 4.27E+01 4.24E+01 4.29E+01 3.28E+02
�DHoC2H4
; kJ mol�1 6.15E+01 6.11E+01 6.20E+01 2.77E+02
�DHoH2 O; kJ mol�1 9.00E+01 8.96E+01 9.04E+01 4.90E+02
�DHoCO2
; kJ mol�1 7.26E+01 7.18E+01 7.33E+01 1.81E+02
�DHoCO; kJ mol�1 8.80E+01 8.70E+01 8.91E+01 1.65E+02
m2 1.42E�01 1.42E�01 1.43E�01 4.26E+02m3 5.49E�01 5.47E�01 5.51E�01 5.41E+02m4 1.30E�01 1.27E�01 1.33E�01 9.31E+01m5 4.92E�01 4.84E�01 5.00E�01 1.19E+02
Note: F value = 7567, Ftab = 2.79, ttab = 1.97 at 1 � a = 0.95 and 388 degrees offreedom.
namely, their relative importance increases at relatively hightemperature operation as observed in Fig. 2. Concerning thereactions of COx out of ethylene, they are less energeticallydemanding compared with total oxidations involving ethane.Ethylene would be, in principle, more easily activated than ethaneto yield total oxidation products. Because kinetic studies for theODH-Et over MoVTeNbO based catalysts are scarce in open litera-ture, the results reported here in are relevant for academy andindustry. Additionally, values of activation energy obtained in thiswork (76–150 kJ mol�1) are in a good agreement with previousreports (50–140 kJ mol�1) [36,55,56]. Besides, pre-exponential fac-tors associated to the total oxidations of ethane to produce COx arelower than those of total oxidations of ethylene, indicating thatactive sites kinetically favor total the oxidation of ethylene whichis in agreement with observations presented in Fig. 4. It is alsoobserved in Table 5 that reaction orders related to the fraction ofsites occupied by oxygen are positive and below 1.0, specifically,between 0.13 and 0.55. This is in agreement with experimental evi-dences concerning the lower dependency of ethane conversion tothe inlet partial pressure of oxygen compared with that ofhydrocarbons.
With respect to the parameters of the Van’t Hoff’s equation,vide Eq. (30), both standard adsorption enthalpy and entropy arephysically consistent according to the criteria given by Boudartet al. [51], vide Eqs. (31)–(33). More specifically, standard adsorp-tion enthalpies are systematically negative while the values ofstandard adsorption entropies are between 41.8 J (mol K)�1 andthe corresponding gas phase molecular standard entropy, vide Sec-tion 4.2.2. Notice that the lowest standard adsorption enthalpystands for water, �90.0 kJ mol�1, while the largest values areexhibited by oxygen and ethane, �42.5 and �42.7 kJ�mol�1,respectively. For CO2 the standard adsorption enthalpy amountedto �72.6 kJ�mol�1. The order of magnitude of the adsorptionenthalpies estimated is, in fact, similar to values reported in the lit-erature [57–60]; namely, the standard adsorption enthalpy of oxy-gen ranged from �19 to �98 kJ�mol�1 [57], that of water on metal

Table 6Kinetic parameters values and corresponding 95% probability confidence intervals of the MvK model used to describe the ODH-Et over the MoVNbTeO catalyst.
Parameter Estimated value Lower limit Upper limit t-Value
A01, mmol (g h Pa)�1 3.45E+00 3.40E+00 3.50E+00 1.35E+02A02, mmol (g h Pa)�1 6.48E�06 6.37E�06 6.59E�06 1.15E+02A03, mmol (g h Pa)�1 1.02E�03 9.98E�04 1.04E�03 8.77E+01A04, mmol (g h Pa)�1 7.79E�04 7.69E�04 7.89E�04 1.50E+02A05, mmol (g h Pa)�1 7.20E�04 7.05E�04 7.36E�04 9.29E+01A0O, mmol Pa�m (g h)�1 4.60E�01 4.54E�01 4.66E�01 1.55E+02EA,1, kJ mol�1 7.76E+01 7.63E+01 7.88E+01 1.21E+02EA,2, kJ mol�1 1.45E+02 1.43E+02 1.47E+02 1.28E+02EA,3, kJ mol�1 1.31E+02 1.29E+02 1.34E+02 1.14E+02EA,4, kJ mol�1 1.22E+02 1.22E+02 1.22E+02 7.68E+02EA,5, kJ mol�1 1.07E+02 1.07E+02 1.08E+02 9.65E+02EA,O, kJ mol�1 9.99E+01 9.83E+01 1.02E+02 1.20E+02m 2.11E�01 2.08E�01 2.13E�01 1.66E+02
Note: F value = 2038, Ftab = 2.79, ttab = 1.97 at 1 � a = 0.95 and 401 degrees of freedom.
Table 7Kinetic parameters values and corresponding 95% probability confidence intervals of the MvK–LHHW-1 model used to describe the ODH-Et over the MoVNbTeO catalyst.
Parameter Estimated value Lower limit Upper limit t-Value
A01, mmol (g h)�1 2.33E+00 2.32E+00 2.35E+00 3.04E+02A02, mmol (g h)�1 5.14E�09 �9.78E�08 1.08E�07 9.82E�02A03, mmol (g h)�1 8.28E�06 7.51E�06 9.05E�06 2.13E+01A04, mmol (g h)�1 2.05E�02 2.03E�02 2.06E�02 3.23E+02A05, mmol (g h)�1 2.13E�01 2.11E�01 2.14E�01 2.94E+02A0O, mmol Pa�m (g h)�1 7.64E�01 7.59E�01 7.69E�01 2.94E+02EA,1, kJ mol�1 7.73E+01 7.65E+01 7.80E+01 1.94E+02EA,2, kJ mol�1 1.55E+02 1.52E+02 1.58E+02 9.81E+01EA,3, kJ mol�1 1.37E+02 1.33E+02 1.41E+02 7.10E+01EA,4, kJ mol�1 1.30E+02 1.30E+02 1.31E+02 3.72E+02EA,5, kJ mol�1 1.04E+02 1.03E+02 1.04E+02 4.02E+02EA,O, kJ mol�1 7.51E+01 7.45E+01 7.56E+01 2.85E+02�DSo
O2; J (mol K)�1 9.54E+01 9.49E+01 9.59E+01 3.76E+02
�DSoC2H6
; J (mol K)�1 2.00E+02 1.99E+02 2.01E+02 4.41E+02
�DSoC2H4
; J (mol K)�1 7.51E+01 7.48E+01 7.55E+01 3.91E+02
�DSoH2 O; J (mol K)�1 5.18E+01 5.18E+01 5.19E+01 4.68E+03
�DSoCO2
; J (mol K)�1 4.87E+01 4.84E+01 4.91E+01 2.83E+02
�DSoCO; J (mol K)�1 4.25E+01 4.23E+01 4.27E+01 3.67E+02
�DHoO2; kJ mol�1 6.43E+01 6.37E+01 6.49E+01 2.14E+02
�DHoC2H6
; kJ mol�1 5.08E+01 5.06E+01 5.11E+01 3.66E+02
�DHoC2H4
; kJ mol�1 1.05E+02 1.04E+02 1.05E+02 3.76E+02
�DHoH2 O; kJ mol�1 5.21E+01 5.17E+01 5.25E+01 2.86E+02
�DHoCO2
; kJ mol�1 7.00E+01 6.95E+01 7.05E+01 2.72E+02
�DHoCO; kJ mol�1 6.68E+01 6.64E+01 6.73E+01 2.77E+02
m2 5.95E�01 5.82E�01 6.07E�01 9.33E+01m3 1.01E+00 9.98E�01 1.03E+00 1.17E+02m4 8.51E�01 8.46E�01 8.55E�01 3.65E+02m5 2.75E�01 2.73E�01 2.77E�01 3.21E+02m 1.45E�01 1.44E�01 1.46E�01 2.86E+02
Note: F value = 609, Ftab = 2.79, ttab = 1.97 at 1 � a = 0.95 and 385 degrees of freedom.
G. Che-Galicia et al. / Chemical Engineering Journal 252 (2014) 75–88 85
oxides are from �36 to �113 kJ mol�1 [58,60] and that of CO2 from�54 to �95 kJ mol�1 [60]. From this end, the fractional coverage ofwater at the outlet of the laboratory-scale reactor varied from38.6% to 73.3%, ethane and oxygen fractional coverage oscillatedfrom 7.5% to 38.0% and 6.5% to 25.2% respectively, and the frac-tional coverage of carbon oxides and ethylene never exceeded1%. Adsorption phenomena involved in LHHW formalism indicatedthat ethane and oxygen are two of the main components alongwith water to be strongly adsorbed on catalyst surface. Neverthe-less, water, being one of the main reaction products in ODH-Et,is, therefore, the main component impacting negatively on reactionrates.
The presence of oxygen is crucial for the oxidative dehydroge-nation of ethane and total oxidations of ethane and ethylene tooccur. Catalytic studies over MoVTeNbO materials suggest thatlattice oxygen participates in the reaction, particularly, oxygencoming from the first layers. Thus the catalyst’s activity strongly
depends on the oxygen’s lability, which is intimately related toits chemical composition and crystalline structure [20,21,61]. Inthis respect, MoVTeNbO catalysts which mainly consist of M1crystalline phase, show a relatively large capacity of oxygenrecombination, in other words, the oxygen is rapidly released fromthe first layers and took from the gas phase. In fact, this may be thereason why the LHHW mechanism adequately represents such akinetic phenomenon instead of the MvK mechanism. Recall thatreaction orders associated to the partial pressure of oxygen werefound to be far below 1.0. This indicates that reaction rates are onlyweakly affected by changes in the oxygen partial pressure, explain-ing the high selectivity to ethylene of MoVTeNb mixed oxidecatalyst [20,21,61].
4.2.3.2. Mars–van Krevelen model. Table 6 displays the main valuesof activation energies as well as reparameterized pre-exponentialfactors with corresponding t-values and 95% probability

Table 8Kinetic parameters values and corresponding 95% probability confidence intervals of the MvK–LHHW-2 model used to describe the ODH-Et over the MoVNbTeO catalyst.
Parameter Estimated value Lower limit Upper limit t-Value
A01, mmol (g h)�1 2.32E+00 2.29E+00 2.35E+00 1.37E+02A02, mmol (g h)�1 5.12E�09 5.06E�09 5.19E�09 1.65E+02A03, mmol (g h)�1 8.29E�06 8.19E�06 8.39E�06 1.64E+02A04, mmol (g h)�1 2.04E�02 2.01E�02 2.07E�02 1.36E+02A05, mmol (g h)�1 2.13E�01 2.10E�01 2.15E�01 1.72E+02A0O, mmol Pa�m (g h)�1� 7.66E�01 7.58E�01 7.74E�01 1.88E+02EA,1, kJ mol�1 7.34E+01 7.29E+01 7.40E+01 2.57E+02EA,2, kJ mol�1 1.66E+02 1.64E+02 1.68E+02 1.71E+02EA,3, kJ mol�1 1.47E+02 1.44E+02 1.49E+02 1.28E+02EA,4, kJ mol�1 1.31E+02 1.29E+02 1.32E+02 1.40E+02EA,5, kJ mol�1 1.04E+02 1.03E+02 1.05E+02 1.75E+02EA,O, kJ mol�1 7.50E+01 7.43E+01 7.57E+01 2.15E+02�DSo
O2; J (mol K)�1 9.54E+01 9.44E+01 9.63E+01 1.98E+02
�DSoC2H6
; J (mol K)�1 1.08E+01 1.06E+01 1.10E+01 1.22E+02
�DSoC2H4
; J (mol K)�1 7.53E+01 7.45E+01 7.60E+01 2.03E+02
�DSoH2 O; J (mol K)�1 4.19E+01 4.15E+01 4.23E+01 2.04E+02
�DSoCO2
; J (mol K)�1 4.88E+01 4.83E+01 4.93E+01 2.01E+02
�DSoCO; J (mol K)�1 4.25E+01 4.20E+01 4.31E+01 1.58E+02
�DHoO2; kJ mol�1 6.45E+01 6.40E+01 6.50E+01 2.62E+02
�DHoC2H6
; kJ mol�1 5.08E+01 5.03E+01 5.13E+01 2.08E+02
�DHoC2H4
; kJ mol�1 1.05E+02 1.04E+02 1.06E+02 1.96E+02
�DHoH2 O; kJ mol�1 4.21E+01 4.15E+01 4.27E+01 1.32E+02
�DHoCO2
; kJ mol�1 6.99E+01 6.92E+01 7.07E+01 1.89E+02
�DHoCO; kJ mol�1 6.73E+01 6.64E+01 6.81E+01 1.55E+02
m2 5.92E�01 5.86E�01 5.98E�01 1.91E+02m3 1.01E+00 9.98E�01 1.03E+00 1.29E+02m4 8.48E�01 8.40E�01 8.57E�01 1.97E+02m5 2.75E�01 2.70E�01 2.80E�01 1.14E+02m 1.45E�01 1.43E�01 1.46E�01 1.64E+02�DSo
C2H4�OX; J (mol K)�1 4.77E+01 4.71E+01 4.83E+01 1.60E+02
�DSoH2 O�OX; J (mol K)�1 6.13E+01 6.07E+01 6.19E+01 1.94E+02
�DSoCO2�OX; J (mol K)�1 6.01E+01 5.93E+01 6.09E+01 1.49E+02
�DSoCO�OX; J (mol K)�1 4.18E+01 4.13E+01 4.23E+01 1.70E+02
�DHoC2 H4�OX; kJ mol�1 7.02E+01 6.91E+01 7.14E+01 1.20E+02
�DHoH2 O�OX; kJ mol�1 5.47E+01 5.37E+01 5.58E+01 1.05E+02
�DHoCO2�OX; kJ mol�1 8.59E+01 8.49E+01 8.69E+01 1.74E+02
�DHoCO�OX; kJ mol�1 7.23E+01 7.13E+01 7.34E+01 1.37E+02
Note: F value = 796, Ftab = 2.79, ttab = 1.97 at 1 � a = 0.95 and 377 degrees of freedom.
86 G. Che-Galicia et al. / Chemical Engineering Journal 252 (2014) 75–88
confidence intervals for the kinetic model denoted as MvK. Beinggiven by Eqs. (14)–(19) and Eq. (29), this model exhibits an appre-ciably lower F-value compared with that of the LHHW model dis-cussed above. Activation energies, however, also exhibited a goodphysicochemical and, in agreement with the LHHW model esti-mates, indicate that the formation of CO2 and CO out of ethanerequires the highest activation energies 145.0 and 131.2 kJ mol�1,respectively. The activation energy of the ethylene oxidation toproduce CO2 and CO from ethylene corresponds to 122.0 and107.4 kJ mol�1, respectively. Besides, ethylene formation requiresthe lowest activation energy to occur, i.e., 77.6 kJ mol�1. Evidently,the values of the activation energy of MvK model for correspondingreactions are very similar to those reported for the LHHW modelabove and, consequently, online with values reported by others[62,63]. Additionally, the activation energy of active site reoxida-tion is, in turn, as high as 100 kJ mol�1, a value that is larger thanthe activation energy of the ethylene formation from ethane andlower than total oxidations. The reaction order of the re-oxidationreaction is also low, amounting to 0.211. As stated above, this orderreaction suggests that oxygen is rapidly released from the first lay-ers of the catalyst and rapidly took from the gas phase. On the basisof this value, the MvK formalism appears to be questionable at thestudied kinetic conditions [64–67]. However, future studies arenecessary to confirm this model-based conclusion.
4.2.3.3. Mars–van Krevelen – Langmuir–Hinshelwood–Hougen–Wat-son models. Tables 7 and 8 contain the main values of Arrhenius
and Van’t Hoff parameters as well as corresponding 95% probabil-ity t-values and confidence limits for kinetic models designatedMvK–LHHW-1 and MvK–LHHW-2. As indicated above, modelsMvK–LHHW-1 and MvK–LHHW-2 displayed a relatively lowcapacity to represent the available experimental data comparedwith the LHHW model on the basis of the corresponding F-valuesand parity plots. Activation energies and Boudart’s criteria exhib-ited, however, kinetic and thermodynamic consistency with resultsthat are close to those found for both LHHW and MvK models.
Since MvK–LHHW-1 and MvK–LHHW-2 models are less signif-icant than LHHW and MvK models from a statistical point of view,they cannot be considered at this stage as suitable models for thestudied catalytic system. Nevertheless, a physicochemical revisionof the kinetic parameters estimated from MvK–LHHW-1, videTable 7, and MvK–LHHW-2, vide Table 8, confirms the resultsobtained with the LHHW model. Namely, oxydehydrogenationethylene is the least energetically demanding reaction; the totaloxidation products (COx) are more easily formed out of ethylenethan out of ethane; and reaction rates, even that of catalyst re-oxi-dation, are weakly affected by changes in the oxygen partialpressure.
5. Conclusions
Four kinetics models based on macroscopic LHHW and MvK for-malisms are built to describe the ODH-Et. For a reaction networkincluding four carbon-content species as well as five reactions,

G. Che-Galicia et al. / Chemical Engineering Journal 252 (2014) 75–88 87
the corresponding rate equations are derived and then used to fitvia a nonlinear regression laboratory scale observations obtainedover a high activity–selectivity MoVTeNb mixed oxide. Experimen-tal results, which demonstrated that ethylene is a primary nonsta-ble product and that COx are formed out of both ethane andethylene, are used to define a consistent reaction network. Reac-tion rates over the MoVTeNbO catalyst are found to be fairly lesssensitive to changes in the partial pressure of oxygen than it is tochanges in the partial pressure of hydrocarbons (ethane and ethyl-ene). This partially justifies the remarkably high activity and selec-tivity of this catalytic system. The resulting kinetic information isused to better understanding of some aspect of the macro reactionmechanism involved in the ODH-Et. Both physicochemical and sta-tistical criteria are employed to compare the performance of theconstructed kinetic models and to define the most suitable one.Although the four models reported, in general, physical meaningfulparameters and consistent statistics, the LHHW model is found toexhibit the best capacity to reproduce the referred the experimen-tal information. An assessment of reaction rate and correspondingparameters indicates that: ethylene formation from ethane is thereaction demanding the lowest amount of energy to proceed whilethe formation of COx and water products is more difficult departingfrom ethane than out of ethylene; and ethane, water and oxygenare the main components adsorbing on catalyst surface. Further-more, since water is the main reaction product adsorbed oncatalyst active sites according to its fraction coverage, this com-pound seems the main factor affecting reaction rates.
Acknowledgments
Consejo Nacional de Ciencia y Tecnología (CONACYT) underproject No. 181104 and Instituto Mexicano del Petróleo. GamalielChe-Galicia also thanks CONACYT for providing a postgraduatefellowship.
References
[1] W.R. True, Global ethylene capacity continues advance in 2011, Oil Gas J. 110(2012) 78–84.
[2] K. Weissermel, H.-J. Arpe, Industrial Organic Chemistry, WILEY-VCH VerlagGmbH & Co. KGaA, Weinheim, 2003.
[3] S. Albonetti, F. Cavani, F. Trifirò, Key aspects of catalyst design for the selectiveoxidation of paraffins, Catal. Rev. 38 (1996) 413–438.
[4] T. Blasco, J.M. López Nieto, Oxidative dehydrogenation of short chain alkaneson supported vanadium oxide catalysts, Appl. Catal. A: Gen. 157 (1997) 117–142.
[5] F. Cavani, N. Ballarini, A. Cericola, Oxidative dehydrogenation of ethane andpropane: how far from commercial implementation?, Catal Today 127 (2007)113–131.
[6] E.M. Thorsteinson, T.P. Wilson, F.G. Young, P.H. Kasai, The oxidativedehydrogenation of ethane over catalysts containing mixed oxides ofmolybdenum and vanadium, J. Catal. 52 (1978) 116–132.
[7] E. Morales, J.H. Lunsford, Oxidative dehydrogenation of ethane over a lithium-promoted magnesium oxide catalyst, J. Catal. 118 (1989) 255–265.
[8] M. Panizza, C. Resini, F. Raccoli, G. Busca, R. Catani, S. Rossini, Oxidation ofethane over vanadia–alumina-based catalysts: co-feed and redox experiments,Chem. Eng. J. 93 (2003) 181–189.
[9] E. Heracleous, A.A. Lemonidou, Ni–Nb–O mixed oxides as highly active andselective catalysts for ethene production via ethane oxidativedehydrogenation. Part I: Characterization and catalytic, J. Catal. 237 (2006)162–174.
[10] Y.B. Zhao, W.W. Tan, H. Li, X.H. Jia, H.L. Wan, Oxidative dehydrogenation ofethane to ethene over a superbase supported LiCl system, Chin. Chem. Lett. 21(2010) 1366–1369.
[11] X. Lin, K.R. Poeppelmeier, E. Weitz, Oxidative dehydrogenation of ethane withoxygen catalyzed by K-Y zeolite supported first-row transition metals, Appl.Catal. A: Gen. 381 (2010) 114–120.
[12] S. Al-Ghamdi, M. Volpe, M.M. Hossain, H. de Lasa, VOx/c-Al2O3 catalyst foroxidative dehydrogenation of ethane to ethylene: desorption kinetics andcatalytic activity, Appl. Catal. A: Gen. 450 (2013) 120–130.
[13] P. Botella, E. García-González, A. Dejoz, J.M. López Nieto, M.I. Vázquez, J.González-García, Selective oxidative dehydrogenation of ethane onMoVTeNbO mixed metal oxide catalysts, J. Catal. 225 (2004) 428–438.
[14] J.M. López Nieto, P. Botella, M.I. Vázquez, A. Dejoz, The selective oxidativedehydrogenation of ethane over hydrothermally synthesized MoVTeNbcatalysts, Chem. Commun. (2002) 1906–1907.
[15] M. Hatano, A. Kayo, Catalytic conversion of alkanes to nitriles, and a catalysttherefor, US Patent 5049692 (1991) assigned to Mitsubishi Kasei Co.
[16] J.M. López Nieto, P. Botella, M.I. Vázquez, A. Dejoz, Method for the oxidativedehydrogenation of ethane, US Patent 7319179 B2 (2008) assigned to CSIC-UPV.
[17] B. Solsona, M.I. Vázquez, F. Ivars, A. Dejoz, P. Concepción, J.M. López Nieto,Selective oxidation of propane and ethane on diluted Mo–V–Nb–Te mixed-oxide catalysts, J. Catal. 252 (2007) 271–280.
[18] B. Deniau, J.M.M. Millet, S. Loridanta, N. Christin, J.L. Dubois, Effect of severalcationic substitutions in the M1 active phase of the MoVTeNbO catalysts usedfor the oxidation of propane to acrylic acid, J. Catal. 260 (2008) 30–36.
[19] P. DeSanto, D.J. Buttrey, R.K. Grasselli, C.G. Lugmair, A.F. Volpe, B.H. Toby,Structural characterization of the orthorhombic phase M1 in MoVNbTeOpropane ammoxidation catalyst, Top. Catal. 23 (2003) 23–38.
[20] M. Aouine, J.L. Dubois, J.M.M. Millet, Crystal chemistry and phase compositionof the MoVTeNbO catalysts for the ammoxidation of propane, Chem. Commun.13 (2001) 1180–1181.
[21] P. Botella, E. García-González, J.M. López Nieto, J.M. González-Calbet,MoVTeNbO multifunctional catalysts: correlation between constituentcrystalline phases and catalytic performance, Solid State Sci. 7 (2005) 507–519.
[22] J.S. Valente, R. Quintana-Solórzano, H. Armendáriz-Herrera, G. Barragán-Rodríguez, J.M. López-Nieto, Kinetic study of oxidative dehydrogenation ofethane over MoVTeNb mixed-oxide catalyst, Ind. Eng. Chem. Res. 53 (2014)1775–1786.
[23] J.M. López Nieto, P. Botella, B. Solsona, J.M. Oliver, The selective oxidation ofpropane on Mo–V–Te–Nb–O catalysts: the influence of Te-precursor, Catal.Today 81 (2003) 87–94.
[24] P. Concepción, P. Botella, J.M. López Nieto, Catalytic and FT-IR study on thereaction pathway for oxidation of propane and propylene on V- or Mo–V-based catalysts, Appl. Catal. A: Gen. 278 (2004) 45–56.
[25] B. Solsona, F. Ivars, P. Concepción, J.M. López Nieto, Selective oxidation ofnbutane over MoV-containing oxidic bronze catalysts, J. Catal. 250 (2007)128–138.
[26] J.S. Valente, H. Armendáriz-Herrera, R. Quintana-Solórzano, P. del Ángel, N.Nava, A. Massó, J.M. López Nieto, Chemical, structural, and morphologicalchanges of a MoVTeNb catalyst during oxidative dehydrogenation of ethane,ACS Catal. 4 (2014) 1292–1301.
[27] F. Cavani, F. Trifirò, The oxidative dehydrogenation of ethane and propane asan alternative way for the production of light olefins, Catal. Today 24 (1995)307–312.
[28] M.M. Bhasin, J.H. McCain, B.V. Vora, T. Imai, P.R. Pujado, Dehydrogenation andoxydehydrogenation of paraffins to olefins, Appl. Catal. A: Gen. 221 (2001)397–419.
[29] M.P. Woods, B. Mirkelamoglu, U.S. Ozkan, Oxygen and nitrous oxide asoxidants: implications for ethane oxidative dehydrogenation over silica–titania-supported molybdenum, J. Phys. Chem. C 113 (2009) 10112–10119.
[30] S.T. Oyama, A.A. Middlebrook, G.A. Somorjai, Kinetics of ethane oxidation onvanadium oxide, J. Phys. Chem. 94 (1990) 5029–5033.
[31] C.-Y. Kao, K.-T. Huang, B.-Z. Wan, Ethane oxydehydrogenation over supportedvanadium oxides, Ind. Eng. Chem. Res. 33 (1994) 2066–2072.
[32] M.D. Argyle, K. Chen, At.T. Bell, E. Iglesia, Ethane oxidative dehydrogenationpathways on vanadium oxide catalysts, J. Phys. Chem. B 106 (2002) 5421–5427.
[33] D. Linke, D. Wolf, M. Baerns, S. Zeyß, U. Dingerdissen, Catalytic partialoxidation of ethane to acetic acid over Mo1V0.25Nb0.12Pd0.0005Ox: II. Kineticmodelling, J. Catal. 205 (2002) 32–43.
[34] S. Gaab, J. Find, T.E. Müller, J.A. Lercher, Kinetics and mechanism of theoxidative dehydrogenation of ethane over Li/Dy/Mg/O/(Cl) mixed-oxidecatalysts, Top. Catal. 46 (2007) 101–110.
[35] S.A. Al-Ghamdi, M.M. Hossain, H.I. de Lasa, Kinetic modeling of ethaneoxidative dehydrogenation over VOx/Al2O3 catalyst in a fluidized-bed risersimulator, Ind. Eng. Chem. Res. 52 (2013) 5235–5244.
[36] R. Grabowski, J. Słoczynski, Kinetics of oxidative dehydrogenation of propaneand ethane on VOx/SiO2 pure and with potassium additive, Chem. Eng. Process.44 (2005) 1082–1093.
[37] F. Rahman, K.F. Loughlin, M.A. Al-Saleh, M.R. Saeed, N.M. Tukur, M.M. Hossain,K. Karim, A. Mamedov, Kinetics and mechanism of partial oxidation of ethaneto ethylene and acetic acid over MoV type catalysts, Appl. Catal. A: Gen. 375(2010) 17–25.
[38] E. Heracleous, A.A. Lemonidou, Ni–Nb–O mixed oxides as highly active andselective catalysts for ethene production via ethane oxidativedehydrogenation. Part II: Mechanistic aspects and kinetic modeling, J. Catal.237 (2006) 175–189.
[39] J. Le Bars, J.C. Vedrine, A. Auroux, Role of surface acidity on vanadia/silicacatalysts used in the oxidative dehydrogenation of ethane, Appl. Catal. A: Gen.88 (1992) 179–195.
[40] F. Klose, M. Joshi, C. Hamel, A. Seidel-Morgenstern, Selective oxidation ofethane over a VOx/c-Al2O3 catalyst – investigation of the reaction network,Appl. Catal. A: Gen. 260 (2004) 101–110.
[41] J. Pérez-Ramírez, R.J. Berger, G. Mul, F. Kapteijn, J.A. Moulijn, The six-flowreactor technology: a review on fast catalyst screening and kinetic studies,Catal. Today 60 (2000) 93–109.

88 G. Che-Galicia et al. / Chemical Engineering Journal 252 (2014) 75–88
[42] G.B. Marin, G.S. Yablonsky, Kinetics of Chemical Reactions: DecodingComplexity, WILEY-VCH Verlag GmbH & Co. KGaA, Weinheim, 2011.
[43] D. Creaser, B. Andersson, Oxidative dehydrogenation of propane over V–Mg–O: kinetic investigation by nonlinear regression analysis, Appl. Catal. A: Gen.141 (1996) 131–152.
[44] J. Haber, W. Turek, Kinetic studies as a method to differentiate betweenoxygen species involved in the oxidation of propene, J. Catal. 190 (2000) 320–326.
[45] P. Mars, D.W. van Krevelen, Oxidations carried out by means of vanadiumoxide catalysts, Chem. Eng. Sci. Spec. Suppl. 3 (1954) 41–59.
[46] J. Kubo, N. Watanabe, W. Ueda, Propane ammoxidation with lattice oxygen ofMo–V–O-based complex metal oxide catalysts, Chem. Eng. Sci. 63 (2008)1648–1653.
[47] P.N. Brown, G.D. Byrne, A.C. Hindmarsh, VODE: a variable-coefficient ODEsolver, SIAM J. Sci. Stat. Comput. 10 (1989) 1038–1051.
[48] H.H. Rosenbrock, An automatic method for finding the greatest or least valueof a function, Comput. J. 3 (1960) 175–184.
[49] P.T. Boggs, J.R. Donaldson, R.H. Byrd, R.B. Schnabel, Algorithm 676 ODRPACK:software for weighted orthogonal distance regression, ACM T. Math. Software15 (1989) 348–364.
[50] D.W. Marquardt, An algorithm for least-squares estimation of nonlinearparameters, J. Soc. Ind. Appl. Math. 11 (1963) 431–441.
[51] M. Boudart, D.E. Mears, M.A. Vannice, Kinetics of heterogeneous catalyticreactions, Ind. Chim. Belg. 32 (1967) 281–284.
[52] http://cccbdb.nist.gov.[53] E. Santacesaria, Kinetics and transport phenomena, Catal. Today 34 (1997)
393–400.[54] C.H. Bartholomew, Mechanisms of catalyst deactivation, Appl. Catal. A: Gen.
212 (2001) 17–60.[55] R. Grabowski, K. Samson, Potassium effect on kinetics of propane
oxydehydrogenation on vanadia–titania catalyst, Pol. J. Chem. 77 (2003)459–470.
[56] D. Wolf, N. Dropka, Q. Smejkal, O. Buyevskaya, Oxidative dehydrogenation ofpropane for propylene production–comparison of catalytic processes, Chem.Eng. Sci. 56 (2001) 713–719.
[57] G. Saracco, F. Geobaldo, G. Baldi, Methane combustion on Mg-doped LaMnO3
perovskite catalysts, Appl. Catal. B: Environ. 20 (1999) 277–288.[58] M. Egashira, S. Kawasumi, S. Kagawa, T. Seiyama, Temperature programmed
desorption study of water adsorbed on metal oxides. I. Anatase and rutile, Bull.Chem. Soc. Jpn. 51 (1978) 3144–3149.
[59] O. Thinon, K. Rachedi, F. Diehl, P. Avenier, Y. Schuurman, Kinetics andmechanism of the water-gas shift reaction over platinum supported catalysts,Top. Catal. 52 (2009) 1940–1945.
[60] M.P. Heynderickx, J.W. Thybaut, H. Poelman, D. Poelman, G.B. Marin, Kineticmodeling of the total oxidation of propane over CuO–CeO2/c-Al2O3, Appl.Catal. B: Environ. 95 (2010) 26–38.
[61] M. Hävecker, S. Wrabetz, J. Kröhnert, L-I. Csepei, R. Naumann d’Alnoncourt,Y.V. Kolen’ko, F. Girgsdies, R. Schlögl, A. Trunschke, Surface chemistry ofphase-pure M1 MoVTeNb oxide during operation in selective oxidation ofpropane to acrylic acid, J. Catal. 285 (2012) 48–60.
[62] M.D. Putra, S.M. Al-Zahrani, A.E. Abasaeed, Kinetics of oxydehydrogenation ofpropane over alumina-supported Sr–V–Mo catalysts, Catal. Commun. 26(2012) 98–102.
[63] R. Grabowski, Kinetics of the oxidative dehydrogenation of propane onvanadia/titania catalysts, pure and doped with rubidium, Appl. Catal. A: Gen.270 (2004) 37–47.
[64] D. Shee, T.V.M. Rao, G. Deo, Kinetic parameter estimation for supportedvanadium oxide catalysts for propane ODH reaction: effect of loading andsupport, Catal. Today 118 (2006) 288–297.
[65] R. Singh, M.A. Bañares, G. Deo, Effect of phosphorous modifier on V2O5/TiO2
catalyst: ODH of propane, J. Catal. 233 (2005) 388–398.[66] K. Routray, K.R.S.K. Reddy, G. Deo, Oxidative dehydrogenation of propane on
V2O5/Al2O3 and V2O5/TiO2 catalysts: understanding the effect of support byparameter estimation, Appl. Catal. A: Gen. 265 (2004) 103–113.
[67] A. Bottino, G. Capannelli, A. Comite, S. Storace, R. Di Felice, Kineticinvestigations on the oxidehydrogenation of propane over vanadiumsupported on c-Al2O3, Chem. Eng. J. 94 (2003) 11–18.


![Reactions of bis[1,2-bis(dialkylphosphino)ethane]-(dihydrogen)hydridoiron(1+) with alkynes](https://static.fdokumen.com/doc/165x107/63146d10c32ab5e46f0ce1ad/reactions-of-bis12-bisdialkylphosphinoethane-dihydrogenhydridoiron1-with.jpg)