Engineering poly (ethylene glycol) diacrylate-based ...
262
Engineering poly (ethylene glycol) diacrylate-based microstructures to develop an in vitro model of small intestinal epithelium Albert Garcia Castaño ADVERTIMENT. La consulta d’aquesta tesi queda condicionada a l’acceptació de les següents condicions d'ús: La difusió d’aquesta tesi per mitjà del servei TDX (www.tdx.cat) i a través del Dipòsit Digital de la UB (diposit.ub.edu) ha estat autoritzada pels titulars dels drets de propietat intel·lectual únicament per a usos privats emmarcats en activitats d’investigació i docència. No s’autoritza la seva reproducció amb finalitats de lucre ni la seva difusió i posada a disposició des d’un lloc aliè al servei TDX ni al Dipòsit Digital de la UB. No s’autoritza la presentació del seu contingut en una finestra o marc aliè a TDX o al Dipòsit Digital de la UB (framing). Aquesta reserva de drets afecta tant al resum de presentació de la tesi com als seus continguts. En la utilització o cita de parts de la tesi és obligat indicar el nom de la persona autora. ADVERTENCIA. La consulta de esta tesis queda condicionada a la aceptación de las siguientes condiciones de uso: La difusión de esta tesis por medio del servicio TDR (www.tdx.cat) y a través del Repositorio Digital de la UB (diposit.ub.edu) ha sido autorizada por los titulares de los derechos de propiedad intelectual únicamente para usos privados enmarcados en actividades de investigación y docencia. No se autoriza su reproducción con finalidades de lucro ni su difusión y puesta a disposición desde un sitio ajeno al servicio TDR o al Repositorio Digital de la UB. No se autoriza la presentación de su contenido en una ventana o marco ajeno a TDR o al Repositorio Digital de la UB (framing). Esta reserva de derechos afecta tanto al resumen de presentación de la tesis como a sus contenidos. En la utilización o cita de partes de la tesis es obligado indicar el nombre de la persona autora. WARNING. On having consulted this thesis you’re accepting the following use conditions: Spreading this thesis by the TDX (www.tdx.cat) service and by the UB Digital Repository (diposit.ub.edu) has been authorized by the titular of the intellectual property rights only for private uses placed in investigation and teaching activities. Reproduction with lucrative aims is not authorized nor its spreading and availability from a site foreign to the TDX service or to the UB Digital Repository. Introducing its content in a window or frame foreign to the TDX service or to the UB Digital Repository is not authorized (framing). Those rights affect to the presentation summary of the thesis as well as to its contents. In the using or citation of parts of the thesis it’s obliged to indicate the name of the author.
-
Upload
khangminh22 -
Category
Documents
-
view
3 -
download
0
Transcript of Engineering poly (ethylene glycol) diacrylate-based ...

Engineering poly (ethylene glycol) diacrylate-based microstructures to develop an in vitro model
of small intestinal epithelium
Albert Garcia Castaño
ADVERTIMENT. La consulta d’aquesta tesi queda condicionada a l’acceptació de les següents condicions d'ús: La difusió d’aquesta tesi per mitjà del servei TDX (www.tdx.cat) i a través del Dipòsit Digital de la UB (diposit.ub.edu) ha estat autoritzada pels titulars dels drets de propietat intel·lectual únicament per a usos privats emmarcats en activitats d’investigació i docència. No s’autoritza la seva reproducció amb finalitats de lucre ni la seva difusió i posada a disposició des d’un lloc aliè al servei TDX ni al Dipòsit Digital de la UB. No s’autoritza la presentació del seu contingut en una finestra o marc aliè a TDX o al Dipòsit Digital de la UB (framing). Aquesta reserva de drets afecta tant al resum de presentació de la tesi com als seus continguts. En la utilització o cita de parts de la tesi és obligat indicar el nom de la persona autora. ADVERTENCIA. La consulta de esta tesis queda condicionada a la aceptación de las siguientes condiciones de uso: La difusión de esta tesis por medio del servicio TDR (www.tdx.cat) y a través del Repositorio Digital de la UB (diposit.ub.edu) ha sido autorizada por los titulares de los derechos de propiedad intelectual únicamente para usos privados enmarcados en actividades de investigación y docencia. No se autoriza su reproducción con finalidades de lucro ni su difusión y puesta a disposición desde un sitio ajeno al servicio TDR o al Repositorio Digital de la UB. No se autoriza la presentación de su contenido en una ventana o marco ajeno a TDR o al Repositorio Digital de la UB (framing). Esta reserva de derechos afecta tanto al resumen de presentación de la tesis como a sus contenidos. En la utilización o cita de partes de la tesis es obligado indicar el nombre de la persona autora. WARNING. On having consulted this thesis you’re accepting the following use conditions: Spreading this thesis by the TDX (www.tdx.cat) service and by the UB Digital Repository (diposit.ub.edu) has been authorized by the titular of the intellectual property rights only for private uses placed in investigation and teaching activities. Reproduction with lucrative aims is not authorized nor its spreading and availability from a site foreign to the TDX service or to the UB Digital Repository. Introducing its content in a window or frame foreign to the TDX service or to the UB Digital Repository is not authorized (framing). Those rights affect to the presentation summary of the thesis as well as to its contents. In the using or citation of parts of the thesis it’s obliged to indicate the name of the author.

1
Tesi doctoral
ENGINEERING POLY (ETHYLENE GLYCOL) DIACRYLATE-BASED
MICROSTRUCTURES TO DEVELOP AN IN VITRO MODEL OF
SMALL INTESTINAL EPITHELIUM
Memòria presentada per
ALBERT GARCIA CASTAÑO
Per a optar al grau de Doctor en Biomedicina
Universitat de Barcelona Departament d’Enginyeries: Secció d’Electrònica
Programa de doctorat en Biomedicina 2012 – 2016
Tesi doctoral dirigida per Tutor de la tesi Dr. Elena Martínez Fraiz Prof. Josep Samitier Martí
Barcelona, 2017


1

2

3
4
Index
ABSTRACT ............................................................................................................................................................. 1
GLOSSARY ............................................................................................................................................................. 5
1. INTRODUCTION .............................................................................................................................................. 7
1.1. Anatomy and biology of small intestine ................................................................................... 9
1.1.1. Small intestine pathology .............................................................................................. 17
1.2. In vitro models of the small intestinal epithelium ........................................................... 19
1.2.1. In situ-in vivo models ....................................................................................................... 19
1.2.2. Explants and intestinal slices ....................................................................................... 20
1.2.3. In vitro models of intestinal epithelia ...................................................................... 22
1.3. Hydrogel materials for the culture of small intestinal epithelial cells ................... 27
1.3.1. Network structure of hydrogels ................................................................................. 29
1.3.2. Poly (ethylene glycol) (PEG)-based hydrogels .................................................... 31
1.4. Free radical photopolymerization of PEGDA ..................................................................... 32
1.5. Microstructuring of hydrogels ................................................................................................... 37
1.5.1. Micromoling ......................................................................................................................... 38
1.5.2. 3D bioprinting ..................................................................................................................... 39
1.5.3. Microfluidics ........................................................................................................................ 40
1.5.4. Stereolithography-based techniques ....................................................................... 41
1.5.5. Photolithography ............................................................................................................... 42
1.6. Complex in vitro models of small intestinal epithelium ................................................ 45
1.6.1. Intestinal organoids ......................................................................................................... 45
1.6.2. Gut-on-a-chip models ...................................................................................................... 46
1.6.3. Three-dimensional models of small intestinal epithelium ............................ 49
2. OBJECTIVES AND HYPOTHESIS ........................................................................................................... 53
3. MATERIALS AND METHODS ................................................................................................................. 57
3.1. Fabrication of PEGDA hydrogels in a closed chip ............................................................. 59
3.1.1. Polymer solution for hydrogel formation .............................................................. 59
3.1.2. PEGDA polymerization set-up ..................................................................................... 59

5
3.1.3. Effect of the photoinitiator concentration on PEGDA
photopolymerization ....................................................................................................... 62
3.1.4. Effects of the exposure time on hydrogel height ................................................ 63
3.2. Fabrication of PEGDA microstructures ................................................................................. 63
3.2.1. Set-up for the fabrication of hydrogel microstructures .................................. 63
3.2.2. Growth dynamics of the hydrogel microstructures.......................................... 65
3.2.3. Effects of the fabrication parameters on the morphology and height of
the microstructured hydrogels ................................................................................... 65
3.2.4. Morphology assessment by scanning electron microscopy (SEM) ........... 66
3.2.5. Morphology assessment by optical microscopy ................................................ 67
3.3. Copolymerization of PEGDA and acrylic acid .................................................................... 68
3.3.1. Polymer solution for PEGDA-acrylic acid hydrogel formation.................... 69
3.3.2. Characterization of PEGDA-acrylic acid copolymerization ........................... 70
3.3.3. Toluidine blue o (TBO) assay to quantify the density of carboxylic
groups ..................................................................................................................................... 70
3.3.4. Mechanical properties of PEGDA – acrylic acid hydrogels ............................ 73
3.3.5. Effect of acrylic acid on the morphology of microstructured
hydrogels ............................................................................................................................... 74
3.4. Protein functionalization of PEGDA –acrylic acid hydrogels ...................................... 75
3.4.1. Characterization of hydrogel functionalization by infrared spectroscopy
(ATR-FTIR) .......................................................................................................................... 76
3.4.2. Protein functionalization as a function of the acrylic acid content ........... 77
3.4.3. Study of the stability of protein functionalization ............................................ 77
3.5. Cell culture and characterization ........................................................................................... 78
3.5.1. Cell culture of NIH-3T3 fibroblasts ........................................................................... 78
3.5.2. Cell culture of Madin-Darby canine kidney (MDCK) cells ............................ 78
3.5.3. Cell culture of human epithelial colorectal adenocarcinoma (Caco-2)
Cells .......................................................................................................................................... 79
3.5.4. Cell seeding strategies ..................................................................................................... 79
3.5.5. NIH-3T3 cells adhesion on microstructured hydrogels ................................. 80
3.5.6. MDCK cells coverage on microstructured hydrogels ....................................... 81
3.5.7. Caco-2 cell polarization on microstructured hydrogels ................................. 83
3.5.8. Immunostaining ................................................................................................................. 84
3.5.9. Analysis of cell nuclei morphology and orientation ........................................ 86
3.6. Transepithelial electrical resistance (TEER) measurements of Caco-2 cell
monolayers ....................................................................................................................................... 88

6
3.6.1. TEER measurements by a Voltohmmeter .............................................................. 88
3.6.2. Total surface area quantification by confocal microscopy ............................ 92
3.6.3. TEER measurements by impedance spectroscopy analysis ......................... 93
3.7. Statistical analysis ......................................................................................................................... 98
4. RESULTS AND DISCUSSION ............................................................................................................... 101
4.1. Preparation and characterization of PEGDA hydrogels in a chip ........................ 103
4.1.1. The concentration of photoinitiator rules the degree of
polymerization in PEGDA hydrogels ..................................................................... 103
4.1.2. UV exposure time enables to control the height of the hydrogels .......... 107
4.1.3. Effects of oxygen in the polymerization of PEGDA hydrogels .................. 110
4.2. Fabrication of microstructured PEGDA hydrogels ..................................................... 112
4.2.1. Growth dynamics of microstructures in PEGDA hydrogels ....................... 114
4.2.2. Determining the factors ruling the polymerization of PEGDA
microstructures ............................................................................................................... 118
4.2.3. Effects of the UV exposure time on hydrogel microstructuring .............. 123
4.2.4. Effects of the molecular weight and polymer concentration on PEGDA
microstructures ............................................................................................................... 127
4.3. Effects of acrylic acid in the fabrication of microstructured PEGDA
hydrogels ........................................................................................................................................ 131
4.3.1. Characterization of the copolymerization of PEGDA and
acrylic acid ......................................................................................................................... 131
4.3.2. Effects of acrylic acid on the mechanical and physicochemical properties
of PEGDA–acrylic acid hydrogels ............................................................................ 136
4.3.3. Effects of acrylic acid on the shape of the microstructures ....................... 138
4.4. Bioactivation of PEGDA - acrylic acid hydrogels ......................................................... 141
4.4.1. Characterization of functionalization process by ATR-FTIR .................... 141
4.4.2. Study of the stability of the functionalization protocol ................................ 144
4.4.3. PEGDA – acrylic acid hydrogels support NIH-3T3 cells growth .............. 147
4.5. Fabrication of microstructured PEGDA-acrylic acid hydrogels support
epithelial-like cell morphology ............................................................................................ 150
4.5.1. Laminin functionalized hydrogels promote the adhesion of
MDCK cells ........................................................................................................................ 150
4.5.2. Microstructured PEGDA-acrylic acid hydrogels allow MDCK
proliferation and promote epithelial morphology ......................................... 152

7
4.6. PEGDA-acrylic acid microstructured hydrogels as a biomimetic model of the
small intestinal epithelium. A proof-of-concept study .............................................. 161
4.6.1. Growth of human epithelial colorectal adenocarcinoma (Caco-2)
cells on microstructured PEGDA-acrylic acid hydrogels .............................. 161
4.7. Transepithelial electrical resistance (TEER) measurements of Caco-2
monolayers on the microstructured hydrogels ............................................................ 168
4.7.1. TEER measurements by a Voltohmmeter ........................................................... 169
4.7.2. Electrical impedance spectroscopy ........................................................................ 173
5. DISCUSSION ............................................................................................................................................... 181
6. CONCLUSIONS ........................................................................................................................................... 193
7. REFERENCES ............................................................................................................................................. 197
8. RESUM EN CATALÀ ................................................................................................................................ 219
9. APPENDIX: JOURNAL ARTICLES ...................................................................................................... 223

8

1
Abstract
Most of the current in vitro cell culture models do not accurately
reproduce the physiological behavior of cells in vivo. Therefore, they do not
represent the functional properties of the corresponding tissues. Increasing
evidences support the hypothesis that, by providing cells with a biomimetic cell
culture environment, physiological characteristics improve, approaching in vivo
situation. Such complex tissue-like microenvironments should approach the 3D
architecture, biochemical and mechanical properties of in vivo tissues. Tissue
engineering based approach combined with microfabrication techniques provide
unprecedented opportunities to go one step beyond the conventional 2D in vitro
tissue culture models and reliably reproduce in vivo tissue microenvironments.
Epithelial barriers protect the body against physical, chemical, and
microbial insults. The small intestinal epithelium is a multicellular tissue with
barrier characteristics, these meaning: cell polarization and limited intercellular
space for effective barrier function. Functional in vitro models of intestinal
epithelium have been pursued for a long time. They are key elements in basic
research, disease modelling, drug discovery, and tissue replacing and have
become prime models for adult stem cell research. In 2D cell cultures, intestinal
epithelial cell lines achieve polarization using Transwell® microporous filters.
However, this simplified model leads to a poor correlation between in vitro and
in vivo drug absorption tests. In vivo, intestinal epithelial cells are organized into
crypt-villus units, finger-like protrusions which are key elements in the
functionality of the tissue and absent in standard 2D models. Therefore, the
development of in vitro 3D tissue equivalents accounting for the dimensions,
architecture, and cell physiology of the in vivo human intestinal tissue still
remains a challenge.
Here we describe a simple and cost-effective method to fabricate soft 3D
villi-like microstructures with the anatomical architecture and dimensions. We
employ poly (ethylene glycol) diacrylated (PEGDA) and acrylic acid that
copolymerize and form soft hydrogels upon crosslinking through UV
photolithography. Hydrogels are networked materials with high water content,
which allow easy diffusion of soluble factors and oxygen. PEG-based hydrogels
possess highly tunable chemical and mechanical properties and have become
trendy materials to mimic and are the extracellular matrix and tissue basement
membranes. To get 3D villi-like microstructures, 2D photomasks were used in a
UV light-dependent polymerization process. During this process, several factors,

2
such as UV exposure time, photoinitiator concentration, and PEGDA molecular
weight and concentration, were studied to understand the mechanisms that allow
the formation of high aspect ratio soft microstructures. Then, these variables
were adjusted to control the microstructure dimensions and to obtain villi-like
microstructures resembling the dimensions, biochemical and mechanical
properties of villi in native tissues.
To allow cell adhesion and growth, we copolymerized PEGDA with
acrylic acid and we took advantage of the exposed carboxylic groups of the acrylic
acid to covalently incorporate laminin through the EDC/NHS coupling reaction.
We have stablished the ratio between PEGDA and acrylic acid to obtain on the one
hand, a successful copolymerization and villi-like structures formation and, on
the other a proper protein functionalization of the hydrogel.
Functionalized villi-like microstructured hydrogels have proven suitable
for epithelial cell growth. MDCK and Caco-2 cells, two epithelial cell lines have
proven to attach, grow and form monolayers of epithelial polarized cells lining
the villi-like microstructured hydrogels. Cell polarization was assessed by cell
morphology (cell columnar shape and position and orientation of the nuclei) and
the expression of polarization markers (villin, ZO-1 and β catenin) at the proper
location. Finally, we used Caco-2 cells to validate the functionality of our construct
as an in vitro model of intestinal epithelium. Caco-2 cells are the standard cells to
model the small intestinal barrier. Measurements of the transepithelial resistance
(TEER) of Caco-2 cell monolayers formed on the villi-like microstructures
showed values closer to in vivo situation than those found in Caco-2 monolayers
cultured on Transwell® inserts. These results are promising toward the use of our
in vitro model in drug absorption and toxicity tests, as well as biological studies
and disease modelling.

3

4

5

6
Glossary
ATR Attenuated total reflectance
Caco-2 Human epithelial colorectal adenocarcinoma (caco-2) c
EDC (1-ethyl-3-(3′-dimethylaminopropyl)-carbodiimide
EDTA ethylenedinitrilo-tetraacetic acid
ECM Extracellular matrix
FTIR Fourier transform infrared spectroscopy
GelMA Methacrylated gelatin
I2959 2 hydroxy-4’-(2-hydroxy-ethoxy)-2-methylpropiophenone
LGR5 Leucine-rich repeat-containing G-protein coupled receptor 5
MDCK Madin-Darby canine kidney
MeHA Methacrylated hyaluronic acid
MES 2-(N-morpholino)ethanesulfonic acid
MUC Mucin
NHS N Hydroxysuccinimide
PBS Phosphate buffered saline
PDMS Polydimethylsiloxane
PEG Poly (ethylene glycol)
PEGDA Poly (ethylene glycol) diacrylate
PEGMA Poly (ethylene glycol) monoacrylate
PI Photoinitiator
PLA Poly (lactic acid)
PLGA Poly (lactic-co- glycolic acid)
PMMA Poly (methyl methacrylate)
PNIPAm Poly (N-isopropylacrylamide)
SEM Scanning electron microscopy
TBO Toluidine blue O
TEER Transepithelial electrical resistance
UV Ultraviolet light
ZO-1 Zonula occludens-1

7

8
Introduction
1

9
10
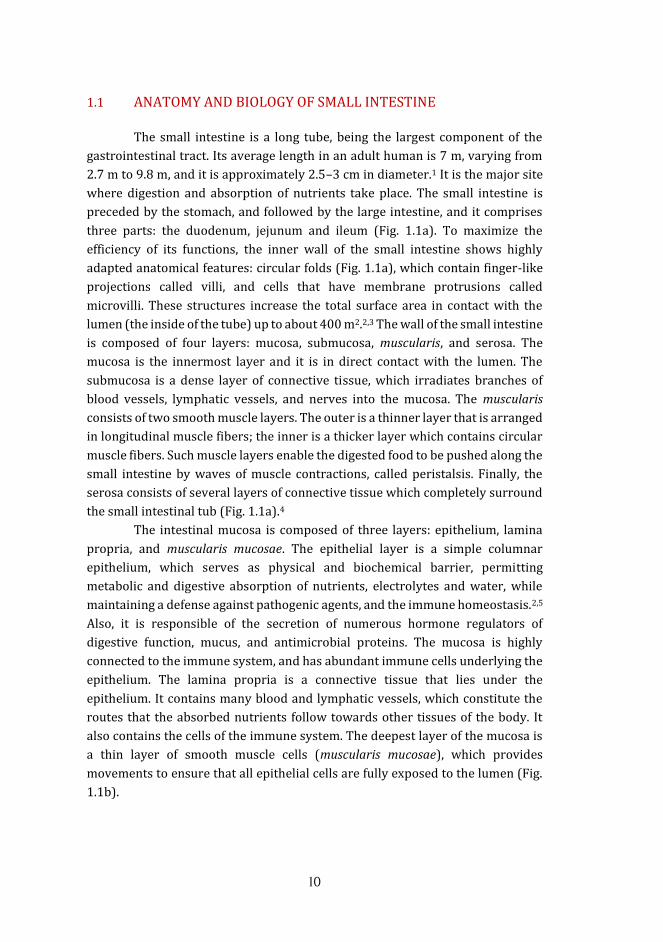
1.1 ANATOMY AND BIOLOGY OF SMALL INTESTINE
The small intestine is a long tube, being the largest component of the
gastrointestinal tract. Its average length in an adult human is 7 m, varying from
2.7 m to 9.8 m, and it is approximately 2.5–3 cm in diameter.1 It is the major site
where digestion and absorption of nutrients take place. The small intestine is
preceded by the stomach, and followed by the large intestine, and it comprises
three parts: the duodenum, jejunum and ileum (Fig. 1.1a). To maximize the
efficiency of its functions, the inner wall of the small intestine shows highly
adapted anatomical features: circular folds (Fig. 1.1a), which contain finger-like
projections called villi, and cells that have membrane protrusions called
microvilli. These structures increase the total surface area in contact with the
lumen (the inside of the tube) up to about 400 m2.2,3 The wall of the small intestine
is composed of four layers: mucosa, submucosa, muscularis, and serosa. The
mucosa is the innermost layer and it is in direct contact with the lumen. The
submucosa is a dense layer of connective tissue, which irradiates branches of
blood vessels, lymphatic vessels, and nerves into the mucosa. The muscularis
consists of two smooth muscle layers. The outer is a thinner layer that is arranged
in longitudinal muscle fibers; the inner is a thicker layer which contains circular
muscle fibers. Such muscle layers enable the digested food to be pushed along the
small intestine by waves of muscle contractions, called peristalsis. Finally, the
serosa consists of several layers of connective tissue which completely surround
the small intestinal tub (Fig. 1.1a).4
The intestinal mucosa is composed of three layers: epithelium, lamina
propria, and muscularis mucosae. The epithelial layer is a simple columnar
epithelium, which serves as physical and biochemical barrier, permitting
metabolic and digestive absorption of nutrients, electrolytes and water, while
maintaining a defense against pathogenic agents, and the immune homeostasis.2,5
Also, it is responsible of the secretion of numerous hormone regulators of
digestive function, mucus, and antimicrobial proteins. The mucosa is highly
connected to the immune system, and has abundant immune cells underlying the
epithelium. The lamina propria is a connective tissue that lies under the
epithelium. It contains many blood and lymphatic vessels, which constitute the
routes that the absorbed nutrients follow towards other tissues of the body. It
also contains the cells of the immune system. The deepest layer of the mucosa is
a thin layer of smooth muscle cells (muscularis mucosae), which provides
movements to ensure that all epithelial cells are fully exposed to the lumen (Fig.
1.1b).

11
Figure 1.1: a) Drawing of the gastrointestinal tract and anatomy of small intestine
(adapted from Encyclopædia Britannica Online).6 b) Detailed illustration of four layers of small intestinal wall: mucosa, submucosa, muscularis, and serosa (http://faculty.southwest.tn.edu).
The small intestinal mucosa is made up of circular folds (plicae
circularis). These folds have many finger-like projections of the mucosa, known
as villi, extending from the luminal surface into de lumen of the small intestine.
Villi play an essential role in increasing the surface area for the absorption of
nutrients (Fig. 1.2a,b).4
Villi
Epithelial layer
Lamina propia
Lymphatic vessel
Musculari layer
Mucosa
Submucosa
Serosa
Muscularis
a)
b)
12
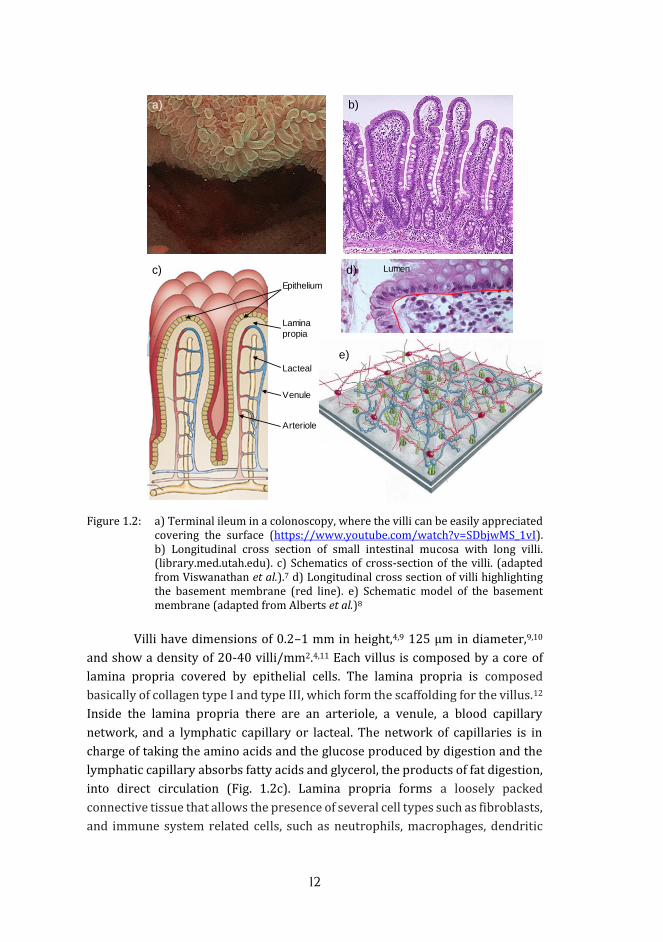
Figure 1.2: a) Terminal ileum in a colonoscopy, where the villi can be easily appreciated
covering the surface (https://www.youtube.com/watch?v=SDbjwMS_1vI). b) Longitudinal cross section of small intestinal mucosa with long villi. (library.med.utah.edu). c) Schematics of cross-section of the villi. (adapted from Viswanathan et al.).7 d) Longitudinal cross section of villi highlighting the basement membrane (red line). e) Schematic model of the basement membrane (adapted from Alberts et al.)8
Villi have dimensions of 0.2–1 mm in height,4,9 125 µm in diameter,9,10
and show a density of 20-40 villi/mm2.4,11 Each villus is composed by a core of
lamina propria covered by epithelial cells. The lamina propria is composed
basically of collagen type I and type III, which form the scaffolding for the villus.12
Inside the lamina propria there are an arteriole, a venule, a blood capillary
network, and a lymphatic capillary or lacteal. The network of capillaries is in
charge of taking the amino acids and the glucose produced by digestion and the
lymphatic capillary absorbs fatty acids and glycerol, the products of fat digestion,
into direct circulation (Fig. 1.2c). Lamina propria forms a loosely packed
connective tissue that allows the presence of several cell types such as fibroblasts,
and immune system related cells, such as neutrophils, macrophages, dendritic
Arteriole
Epithelium
Lamina propia
Venule
Lacteal
Lumen
a) b)
c) d)
e)
Arteriole
Epithelium
Lamina propia
Venule
Lacteal
Lumen
a) b)
c) d)
e)
Arteriole
Epithelium
Lamina propia
Venule
Lacteal
Lumen
a) b)
c) d)
e)

13
cells, and lymphoid cells.13 At the outer part of the lamina propria and underlining
the layer of epithelial cells, there is a thin structure (hundreds of nm) called
basement membrane. This is a specialized form of extracellular matrix (ECM) that
forms stable sheets through self-assembly, which supports and separates the
epithelium from the lamina propria (Fig. 1.2d,e). The basement membrane gives
structural support and reinforces the epithelium and helps it to resist stretching
and tearing. Also, it is important for the anchoring, migration, and differentiation
of epithelial cells and influences their behaviour.14
Attached on the basement membrane, columnar epithelial cells are
arranged in a monolayer. These cells are tightly packed and form a continuous
sheet called columnar epithelium (Fig. 1.2c).8 Once the nutrients are in the small
intestine, epithelial cells contain enzymes that help break down them into
components small enough to be transported into the bloodstream.4 The intestinal
epithelium layer also acts as a permeable barrier, separating luminal contents
from the underlying tissue compartments thanks to strongly joined epithelial
cells and avoiding the free entrance of harmful agents.2
Besides the absorptive and selective barrier functions of the epithelial
cells, intestinal epithelium is the first line of defense to prevent pathogen
invasion. The first barrier pathogens encounter is a highly-hydrated mucus layer
(700 µm in height) (Fig. 1.3a).15 Mucus covers the epithelium surface and protects
the epithelial cells against chemical, enzymatic or microbial harming.16 Under the
mucus layer, the cells have a dense membrane-anchored matrix (30 – 100 nm),
called the glycocalyx (Fig. 1.3b).17 Main mucus and glycocalyx compounds are the
mucins, glycoproteins that are free in the mucus (MUC2) and membrane-bound
in the glycocalyx (MUC1, MUC3, MUC17).18 Bacteria enter into the mucus and can
be trapped in their pores, so they are excluded from the epithelial surface (Fig.
1.3a). In addition, small intestinal epithelial cells express innate immune
receptors and antimicrobial peptides and they can be activated to produce
mediators that recruit, activate and condition cells of the immune system.19 They
also allow colonization for the trillions of commensal bacteria, which are essential
for health.2 Moreover, the epithelium contains T cells (cell-mediated effectors)
located at the basement membrane between epithelial cells at a frequency of
about 1-2 per 20 epithelial cells.20 Also, the lamina propria is a part of the immune
system and contains lymphocytes (B cells and T cells), dendritic cells,
macrophages, eosinophils and mast cells.21 Because of the majority of
immunological processes at the small intestine take place in the mucosa, the lack
of epithelial barrier integrity allows the pass of harmful substances, which can
lead to inflammation, infection, autoimmune diseases or cancer.2,22

14
Figure 1.3: a) Schematics of the anatomy of the intestinal mucosa and its immune
apparatus. Also, it is detailed the location of mucus and bacteria. Intestinal epithelial cells (IECs), antimicrobial peptides (AMPs), intraepithelial lymphocytes, dendritic cells (DC); secretory immunoglobulin A (SIgA). b) schematic detail of the glycocalyx anchored to epithelial cell membranes (adapted from Mowat et al. and McGuckin. et al).21,23
The small intestinal epithelium, in adults, is continuously renewed in a
turnover of around 2-6 days. Proliferative cells are called intestinal stem cells
(ISC) and reside within invaginations at the base of villi known as the crypts of
Lieberkühn (Fig. 1.4a). The intestinal stem cells give rise to several types of
epithelial cells: absorptive cells (enterocytes), Paneth cells, intestinal globet cells,
and enteroendocrine cells. The Paneth cells reside within the stem cell niche at
the bottom of the crypt, while the other three types of intestinal epithelial cells
migrate toward the tip of the villus (1.4b).28-31 These architectural crypt-villi unit
is relevant in the epithelial cell differentiation, and evidences the biochemical
gradients generated along the crypt–villus axis.26 Intestinal stem cells are located
at the bottom of the crypts, where they replicate for continuous self-renewal and
are responsible for cell population maintenance,25,27 generating all lineages of
mature intestinal epithelial cells.28,29
Glycocalyx
a) b)

15
Figure 1.4: The distribution of epithelial cell types in the small intestine epithelium. Intestinal stem cells (ISC) are located near the crypt base and produce transient-amplifying (TA) cells, which proliferate in the mid-crypt and terminally differentiate to produce the different intestinal epithelial cell types. Crypt base columnar (CBC) stem cells are interdigitated with Paneth cells at the crypt base. Quiescent intestinal stem cells (qISCs). (Adapted from Goodell et al. and Crósnier et al.)24,25
Intestinal stem cells can be identified by the expression of leucine-rich
repeat-containing G-protein coupled receptor 5 (LGR5 gene).Recent findings in
stem cell identification and characterization have made possible to obtain crypt–
villus structures and all epithelial cell lineages from culturing single Lgr5+ stem
cells in vitro.30,31 Paneth cells are intercalated among the intestinal stem cells and
are thought to have a role in regulating host–microbial interactions by the
secretion of antibacterial proteins into the lumen, thereby providing protection
for the stem cell niche.32 Goblet cells are balloon-like cells with the nucleus at the
base and the rest of the cytoplasm occupied by secretory granules containing
mucin, the major component of the mucus.24 Enteroendocrine cells comprise
about 1% of cell population in the intestinal epithelium, produce hormones and
peptides in response to various stimuli and release them to initiate digestive
actions and protective responses.24,33
Enterocytes are the dominant cell lineage (90% of total cells).
Enterocytes secrete hydrolytic enzymes to facilitate the efficient breakdown of
digested food and the absorption of nutrients. Enterocytes differentiate and
migrate up the tip where are shed off the villi in about 4 days.24,34 Enterocytes are
Enterocyte
Globet cell
Paneth cell
EnteroendocrineIntestinal stem cell
00a) b)
Enterocyte
Globet cell
Paneth cell
EnteroendocrineIntestinal stem cell
00a) b)
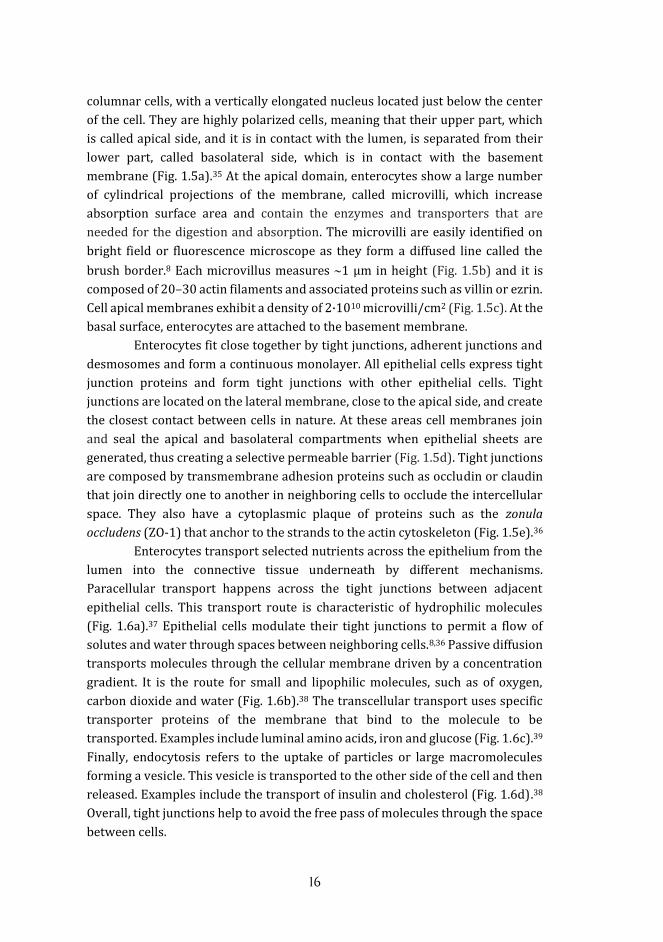
16
columnar cells, with a vertically elongated nucleus located just below the center
of the cell. They are highly polarized cells, meaning that their upper part, which
is called apical side, and it is in contact with the lumen, is separated from their
lower part, called basolateral side, which is in contact with the basement
membrane (Fig. 1.5a).35 At the apical domain, enterocytes show a large number
of cylindrical projections of the membrane, called microvilli, which increase
absorption surface area and contain the enzymes and transporters that are
needed for the digestion and absorption. The microvilli are easily identified on
bright field or fluorescence microscope as they form a diffused line called the
brush border.8 Each microvillus measures 1 µm in height (Fig. 1.5b) and it is
composed of 20–30 actin filaments and associated proteins such as villin or ezrin.
Cell apical membranes exhibit a density of 2·1010 microvilli/cm2 (Fig. 1.5c). At the
basal surface, enterocytes are attached to the basement membrane.
Enterocytes fit close together by tight junctions, adherent junctions and
desmosomes and form a continuous monolayer. All epithelial cells express tight
junction proteins and form tight junctions with other epithelial cells. Tight
junctions are located on the lateral membrane, close to the apical side, and create
the closest contact between cells in nature. At these areas cell membranes join
and seal the apical and basolateral compartments when epithelial sheets are
generated, thus creating a selective permeable barrier (Fig. 1.5d). Tight junctions
are composed by transmembrane adhesion proteins such as occludin or claudin
that join directly one to another in neighboring cells to occlude the intercellular
space. They also have a cytoplasmic plaque of proteins such as the zonula
occludens (ZO-1) that anchor to the strands to the actin cytoskeleton (Fig. 1.5e).36
Enterocytes transport selected nutrients across the epithelium from the
lumen into the connective tissue underneath by different mechanisms.
Paracellular transport happens across the tight junctions between adjacent
epithelial cells. This transport route is characteristic of hydrophilic molecules
(Fig. 1.6a).37 Epithelial cells modulate their tight junctions to permit a flow of
solutes and water through spaces between neighboring cells.8,36 Passive diffusion
transports molecules through the cellular membrane driven by a concentration
gradient. It is the route for small and lipophilic molecules, such as of oxygen,
carbon dioxide and water (Fig. 1.6b).38 The transcellular transport uses specific
transporter proteins of the membrane that bind to the molecule to be
transported. Examples include luminal amino acids, iron and glucose (Fig. 1.6c).39
Finally, endocytosis refers to the uptake of particles or large macromolecules
forming a vesicle. This vesicle is transported to the other side of the cell and then
released. Examples include the transport of insulin and cholesterol (Fig. 1.6d).38
Overall, tight junctions help to avoid the free pass of molecules through the space
between cells.

17
Figure 1.5: a) Schematics of the enterocyte morphology, tight junctions and microvilli.
b) Transmission electron microscopy (TEM) image of microvilli (http://remf.dartmouth.edu). Scale bar = 50 nm. c) Detailed drawing of the microvilli (adapted from Delacour et al., and Alberts et al.).8,40 d) Top view of an epithelial monolayer, where ZO-1 is stained in green). e) Tight junction complex, showing the main protein components. ZO, zona occludens. Scale bar = 20 µm (adapted from Lozovatsky et al.).41 Schematics of tight junction complex (adapted from Neunlist et al.).42
Since the integrity of the epithelial barriers determines their
functionality, many techniques have been developed to quantify the barrier
integrity of epithelial monolayers grown on porous membranes. On the one hand,
permeability for small hydrophilic molecules is measured by sucrose or low
molecular weight fluorescent dyes. On the other hand, transepithelial electrical
Actin Filament Villin
Occludin Actin
ZO-1
Claudin
Basement membrane
Apicaldomain
Basolateraldomain
Tight junction
Adhesion junction
Desmosome
Enterocytesa)
b) c)
d) e)

18
resistance (TEER) is a widely accepted quantitative technique to measure the
integrity dynamics of tight junction.43
Figure 1.6: Mechanisms of transport across intestinal mucosa. a) Paracellular transport,
b) passive diffusion, c) transcellular transport, and d) endocytosis. Tight junctions in red, and active transporter in orange.
1.1.1 SMALL INTESTINE PATHOLOGY
The small intestinal epithelium can be affected by disorders such as
infections, lymphomas and tumors, obstructions, food intolerances, and
inflammatory diseases. These disorders alter the functionality of the epithelium
and its morphology. Alterations of the size and properties of villi produce defects
on the epithelium that have detrimental effects on their functions.44
Enteric infections interfere in the digestion and absorption of food. They
also cause a lot of unpleasant symptoms like diarrhea, bleeding, bloating, nausea,
vomiting, abdominal pain, and obstructions. Gastroenteritis is considered as one
of the leading causes of illness and death in children under 5 years’ age,
worldwide, but especially in developing countries. It caused over one million
deaths in 2010.45,46 In most of the enteric infections, the mucosa suffers
architectural alterations: villi become shorter and blunt and crypts
hypertrophied.47 This is the case of Salmonella typhimurium, as it was found that
villus height and surface area decreased and goblet cell density increased
significantly after 14 days of infection.48 Also Staphylococcus aureus produce a
shortening of villi (20% in height reduction) and the elongation of crypts (35% in
depth increasing).49–51 Other bacteria such as Bacillus cereus and
enteroaggregative Escherichia coli also cause a shortening of villi by the necrosis
in the tip.52–54
Lumena) b) c) d)

19
Food intolerances such as celiac disease also have a relevant prevalence,
affecting more than 1% of the people in Europe, with an increasing incidence of
15% every year.55 Celiac disease is essentially sensitivity to gluten, which is a
component of wheat. It is believed that there is an immunological response to
components of gluten, which results in abnormalities and inflammation of the
lining of the small intestine.56 Villi are shortened or even completely absent
because of the rapid loss of epithelial cells from the villus tip (Figure 1.7a).57,58 As
a result, the mucosa becomes "leaky"; water and salts can leak out of the cells into
the intestinal lumen and they will be lost though diarrhea.
Crohn's disease is classified as an autoimmune disorder. It causes chronic
inflammation of the in the intestinal wall, and results in villus destruction due to
a lymphoid aggregation in villi (Fig. 1.7b).59 Complications of Crohn's disease can
include bowel obstructions, inflamed ulcerous tracts, and fistulas. Most Crohn’s
patients have episodes of disease activity followed by remissions. This stress
leads to the anxiety and social withdrawal of more than 12.7 per 100,000
person/year in Europe.60
Cancers of the small intestine (adenocarcinomas, carcinoid tumors,
lymphoma and sarcoma) are not the most common (0.42% of total cancer cases).
However, colorectal cancer is the third most common cancer worldwide and the
fourth most common cause of death. 1.4 million new cases and almost 694,000
deaths estimated to have occurred in 2012.61,62 Two other diseases that erode villi morphology are lymphangiectasis and
amyloidosis. Lymphangiectasis is an abnormality of lymphatic channels which
cause edema and diarrhea. When lymphatic channels become blocked, they
dilate, break and discharge their contents into the lumen. Characteristic white-
tipped villi together with low and round villi with a normal color illustrate this
disease (Fig. 1.7c).63 Amyloidosis is characterized by the deposition of fibrils
composed of variety of serum proteins, which form the so called amyloid
deposits. Such deposits infiltrate the lining of the intestine interfering cell
function and impeding digestion and absorption. Amyloid deposits infiltrated at
the tip of villi (Fig. 1.7d), erode their morphology and affect epithelium
functions.64
The quality of life in patients who suffer enteric infections, food
intolerances, Crohn’s disease, or intestinal cancers, is severely affected, thus
demanding better therapeutics. Pharmacological treatments and palliative cares
do not benefit patients or elicit diminishing effect over time.65 A better
understanding of epithelium physiology and pathology is required to improve the
treatments, model diseases and investigate in new drug developments. Also,
because the loss of the highly specialized intestinal epithelium is associated with
high morbidity and mortality,66 there is a lot interest in tissue engineering and
20
regenerative medicine applications,67 specially in the case of the short bowel
syndrome, characterized by the loss of more than 70% of the intestinal length.68
For this purposes predictive models of the small intestinal epithelium are
required.69
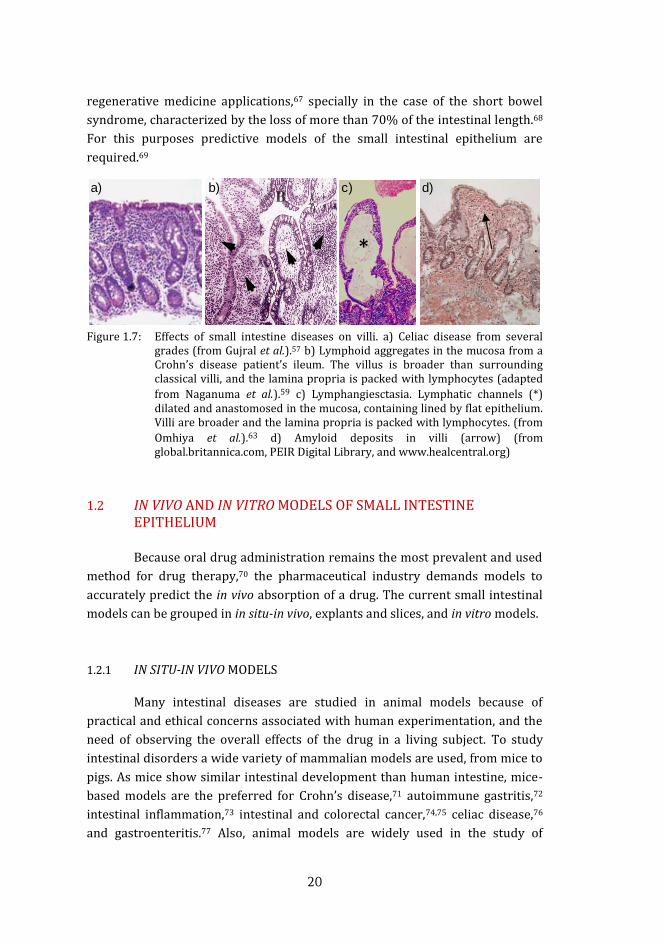
Figure 1.7: Effects of small intestine diseases on villi. a) Celiac disease from several
grades (from Gujral et al.).57 b) Lymphoid aggregates in the mucosa from a Crohn’s disease patient’s ileum. The villus is broader than surrounding classical villi, and the lamina propria is packed with lymphocytes (adapted
from Naganuma et al.).59 c) Lymphangiesctasia. Lymphatic channels (*) dilated and anastomosed in the mucosa, containing lined by flat epithelium. Villi are broader and the lamina propria is packed with lymphocytes. (from
Omhiya et al.).63 d) Amyloid deposits in villi (arrow) (from global.britannica.com, PEIR Digital Library, and www.healcentral.org)
1.2 IN VIVO AND IN VITRO MODELS OF SMALL INTESTINE EPITHELIUM
Because oral drug administration remains the most prevalent and used
method for drug therapy,70 the pharmaceutical industry demands models to
accurately predict the in vivo absorption of a drug. The current small intestinal
models can be grouped in in situ-in vivo, explants and slices, and in vitro models.
1.2.1 IN SITU-IN VIVO MODELS
Many intestinal diseases are studied in animal models because of
practical and ethical concerns associated with human experimentation, and the
need of observing the overall effects of the drug in a living subject. To study
intestinal disorders a wide variety of mammalian models are used, from mice to
pigs. As mice show similar intestinal development than human intestine, mice-
based models are the preferred for Crohn’s disease,71 autoimmune gastritis,72
intestinal inflammation,73 intestinal and colorectal cancer,74,75 celiac disease,76
and gastroenteritis.77 Also, animal models are widely used in the study of
*
a) b) c) d)

21
intestinal drug transport.78 For this purpose, intestinal perfusion and
pharmacokinetic studies of plasma are usually carried out (Fig. 1.8).79
Figure 1.8: Schematic representation of intestinal perfusion and pharmacokinetic studies of plasma (Figure adapted from Singh et al.).80
Animal models are needed to mimic the extremely complex physiology
of the intestinal epithelium and can serve as an important source of in vivo
information. However, due to their complexity, it is not possible to control and
study the independent contributions of the microbiota, intestinal epithelium, and
immune system due to their synergic interactions. The small intestine is a
complex organ and it is inaccessible to experimental manipulation and
observation in vivo. In addition, using numerous live animals is expensive and
have a lot of ethical concerns. On the other hand, drug efficacy and toxicity must
be estimated from in vivo clinical pharmacokinetics. Unfortunately, in vivo data
are usually unavailable at the early stages of drug discovery and development, so
in vitro models have become invaluable tools at these phases.
1.2.2 EXPLANTS AND INTESTINAL SLICES
As an alternative to animal models, the culture of intact small intestine
sections offers the closest scenario to the in vivo conditions. This methodology

22
has the advantages of using the native environment and cell population, and allow
manipulation and observation, hindered when the tissue resides in the body. In
addition, large surface areas are available, and they preserve the mucus layer.
However, the limited diffusion of extracellular molecules into thick tissues
restricts the tissue viability, which could be limited from 2 hours to 14 days.81,82
The everted gut sac is a technique that consists on preparing the
intestinal sac by inverting a segment of the intestine. The segment is turned inside
out, resulting in the epithelium with the villi at the outer part (Fig. 1.9a).
Figure 1.9: Schematic representation of the a) everted explant gut procedure (Figure adapted from Carvalho et al.).83 b) A diagrammatic representation of the intestinal explant culture on air–liquid interface (Figure adapted from Randall et al.)82. c) Schematic representation of the Ussing chamber. Intestinal sections (red) are mounted between two chambers. The two chambers respectively simulate blood stream and gut lumen. The mounted intestinal mucosa actively pumps molecules from one chamber to the other and the resultant molecular gradient between chambers can be measured. Picture of a market Ussing chamber (www.warneronline.com).
Everted gut sac model is used to study the mechanisms and kinetics of
drug absorption.84,85 Another option are the explants formed by biopsies (3 mm
in diameter) that are rapidly placed, mucosal-side up, onto cell culture systems
(Fig. 1.9b).82 The minimal forms of explants are the intestinal slices which are
obtained by precision-cut techniques. Intestinal slices (∼400 µm thick) are
usually prepared by filling rat intestines with liquid agarose following cooling and
cutting and they can be cultured in vitro for 4 hours.86,87 This model is widely used
to test the transport of molecules, metabolism, and toxicology through the
intestinal barrier.88 Intestinal slices are characterized by the so called Ussing
Intestinalsection
Membranetransport
measurements
Samplecollection
Addition substances at apical or basolateral surface
a)
b)
c)
Intestinalsection
Membranetransport
measurements
Samplecollection
Addition substances at apical or basolateral surface
a)
b)
c)
Intestinalsection
Membranetransport
measurements
Samplecollection
Addition substances at apical or basolateral surface
a)
b)
c)
Intestinalsection
Membranetransport
measurements
Samplecollection
Addition substances at apical or basolateral surface
a)
b)
c)
Intestinalsection
Membranetransport
measurements
Samplecollection
Addition substances at apical or basolateral surface
a)
b)
c)
a)
b) c)

23
chambers. Ussing chambers consist of two halves separated by the intestinal
section, which is previously opened as flat sheet.
The sample is placed in such a way that the apical membrane is facing
one half of the chamber, whereas the basolateral is facing the other half, thus
separating the solutions that independently bath each chamber (Fig. 1.9c).89 They
are used to measure the transport of electrolytes, nutrients, and drugs across the
intestinal barrier. A miniaturized version of the Ussing chambers is used, together
with precision-cut intestinal slices, to predict drug absorption, to monitor drug
effects on the function of ion channels, and to measure possible interactions with
the absorption of nutrients.89,90
1.2.3 IN VITRO MODELS OF INTESTINAL EPITHELIA
In vitro culture models are valuable tools for the study of the intestinal
barrier, epithelial cell differentiation, intestinal development, intestinal
pathologies, toxicity testing, drug development, and regenerative medicine. The
most used in vitro model of the small intestinal epithelium relies on culturing
intestinal epithelial cell monolayers in the so-called Transwell® inserts. A
Transwell® insert consist of a permeable porous membrane that separates two
compartments in a cell culture well.91 The upper compartment mimics the
environment of the apical cell side, facing the lumen, while the lower
compartment mimics the basolateral cell side, facing the basement membrane
(Fig. 1.10a). These membranes can contain pores ranging from 0.1 to 12 µm in
diameter to ensure appropriate porosity and permeability for medium and cell
metabolites.92,93 They are made of polycarbonate, polystyrene, polyethylene
terephthalate (PETF), and cellulose derivatives. In addition, membrane surfaces
can be coated by several proteins to enhance cell adhesion, as a mimicking of the
basement membrane. The proteins used most frequently are collagen (type I/III
or IV), laminin, or MatrigelTM, a mixture of ECM proteins that have been extracted
from Englebreth-Holm-Swarm tumors in mice. Cells are seeded and cultured on
the inserts and form, upon their confluence, a barrier between the two
compartments (Fig. 1.10b). This system can be used to quantify the transcellular
transport, both the uptake of molecules into the cells from the apical
compartment and the efflux of molecules from the cells to the basolateral
compartment (Fig. 1.10b). It is also used to determine and monitor transcellular
transport changes upon barrier disruptors, and the electrical properties of the
cell monolayer such as the transepithelial electrical resistance (TEER) (Fig.
1.10b). Permeability and TEER are both indicators of the integrity of epithelial
24
barrier, but they determine different parameters and should not be directly
compared.94
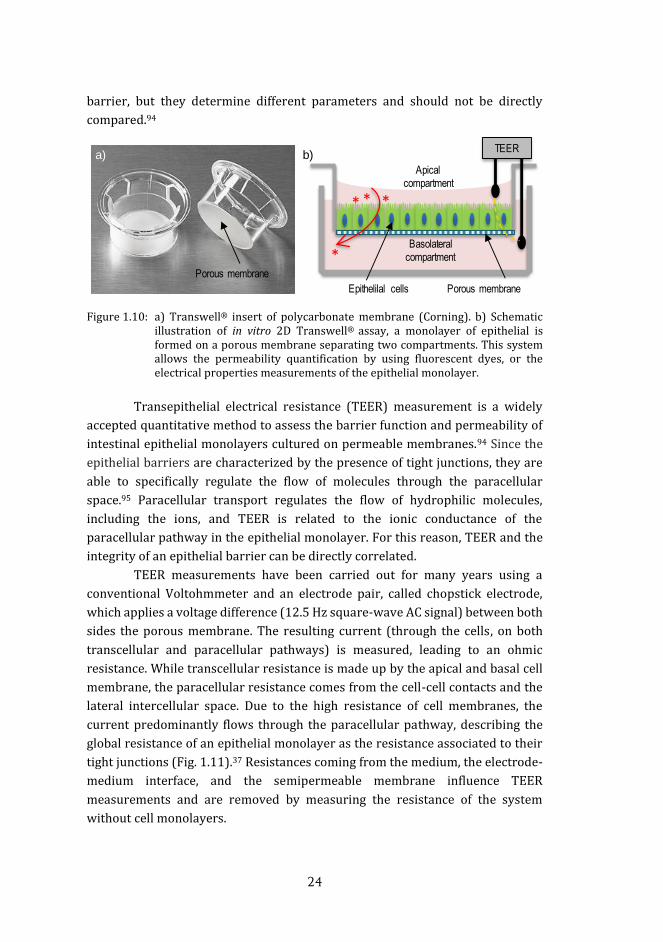
Figure 1.10: a) Transwell® insert of polycarbonate membrane (Corning). b) Schematic illustration of in vitro 2D Transwell® assay, a monolayer of epithelial is formed on a porous membrane separating two compartments. This system allows the permeability quantification by using fluorescent dyes, or the electrical properties measurements of the epithelial monolayer.
Transepithelial electrical resistance (TEER) measurement is a widely
accepted quantitative method to assess the barrier function and permeability of
intestinal epithelial monolayers cultured on permeable membranes.94 Since the
epithelial barriers are characterized by the presence of tight junctions, they are
able to specifically regulate the flow of molecules through the paracellular
space.95 Paracellular transport regulates the flow of hydrophilic molecules,
including the ions, and TEER is related to the ionic conductance of the
paracellular pathway in the epithelial monolayer. For this reason, TEER and the
integrity of an epithelial barrier can be directly correlated.
TEER measurements have been carried out for many years using a
conventional Voltohmmeter and an electrode pair, called chopstick electrode,
which applies a voltage difference (12.5 Hz square-wave AC signal) between both
sides the porous membrane. The resulting current (through the cells, on both
transcellular and paracellular pathways) is measured, leading to an ohmic
resistance. While transcellular resistance is made up by the apical and basal cell
membrane, the paracellular resistance comes from the cell-cell contacts and the
lateral intercellular space. Due to the high resistance of cell membranes, the
current predominantly flows through the paracellular pathway, describing the
global resistance of an epithelial monolayer as the resistance associated to their
tight junctions (Fig. 1.11).37 Resistances coming from the medium, the electrode-
medium interface, and the semipermeable membrane influence TEER
measurements and are removed by measuring the resistance of the system
without cell monolayers.
Epithelilal cells
Apical compartment
Basolateralcompartment
Porous membrane
Porous membrane
a) b)
*
* * *
TEER

25
Figure 1.11: a) Scheme of the electrical resistances associated to the intestinal epithelium. Cell membranes resistances, at the apical (RA) and basal (RBL) location, and the resistance of tight junctions (RTJ) that determines whether the transepithelial resistance is high or low. Theoretically, the lateral intercellular space (RLIS) could contribute a resistance in series with the tight junction, but there is little evidence that this is physiologically significant.96 b) Scheme of the simplified electrical resistance associated to intestinal epithelium contemplated by conventional Voltohmmeter measurements.
Despite the simplicity of the experimental measurements using
Voltohmmeter, measurements depend a lot on the positioning of the chopsticks
and the surface of the inserts. Impedance spectroscopy can be used to determine
TEER in a more robust manner and to have a more complete picture of the
electrical behavior of the system. In impedance spectroscopy the frequency of an
applied AC voltage is swept while measuring the amplitude and the phase of the
resulting AC current.43 This methodology measures the complex ratio of voltage
to current, and includes contributions from resistive, capacitive, and inductive
components of the circuit. It has the advantage of complementing TEER
measurements recording the electric capacitance (at 1 -105 Hz) of the epithelial
cells. Within the considered frequency range, the high resistance of the
membrane causes the current to flow across the capacitor and allows ignoring
the membrane resistance and summarizing the apical and basolateral
membranes in one capacitance (CCl).43 Considering this, the electrical circuit
diagram can be simplified as shown Figure 1.12a. The typical impedance spectra
of epithelial monolayers are characterized by high impedances at mid-range
frequencies, related to TEER and capacitance CCl, and low impedance values at
high frequencies related to the impedance of the medium (Fig. 1.12b). Cell
capacitance provides additional information about the epithelial barrier
properties. For example, the abundance of brush layers, which consist mainly of
microvilli, correlates to a larger capacitance, because it increases the surface area
of the cell membrane.97
TEER
RA
RBL
RTJ
RLIS
a) b)

26
Figure 1.12: a) Diagram of the equivalent circuit describing the contribution of the transcellular and paracellular pathway to the total impedance, of the epithelial monolayer. CCl, capacitance of the cell layer; Rmedium, ohmic resistance of the medium; Rm, ohmic resistance of the membranes. Capacitance of electrodes CE, and ohmic resistance of the medium are also represented. b) Simplified equivalent electrical circuit diagram for an epithelial monolayer. c) Schematic impedance spectrum of a cell monolayer at different frequencies (adapted from Benson et al.).43
The first attempt of culturing intestinal epithelial cells in vitro was done
at the 80s, when Qauroni et al. cultured cells from rat gut.98 Nowadays, primary
intestinal epithelial cells can be obtained with high purity from intestinal tissue,
but cells only survive for short periods of time.99 However, recent publications
have generated stable genetically modified intestinal epithelial cell lines, useful
for testing absorption of drug candidates.100 Alternatively, cell lines derived from
colorectal tumor are a proved effective option for developing enterocyte-like
cultures. Colorectal tumor derived cell lines, mainly Caco-2, are standardized as
preclinical experimental models to study drug transport processes through the
intestinal epithelium.
Caco-2 is a human colon adenocarcinoma-derived cell line that is used as
a model of the human small intestinal mucosa for the high-throughput screening
of drug permeability.101,70 Caco-2 cells are typically cultured on Transwell®
inserts, have a fast proliferation and develop to a confluent differentiated
epithelial cell monolayer. This cell line, when differentiates, establishes tight
junctions, develop microvilli at the apical membrane, and produces enzymes
appearing in normal enterocytes, such as alkaline phosphatase.102 Caco-2 cells are
widely applied for studying intestinal permeability,103 drug absorption,104
intestinal metabolism and transporters,105 and toxicity.106 Caco-2 cells have
shown good correlation and prediction of intestinal permeability of passively
absorbed drugs.107 On the contrary, predictions in the case of drugs that are
absorbed by active transporters have shown low accuracy.104 HT-29 cells show
the typical morphology of epithelial cells, but they do not differentiate to
TEER
Rmedium
TEER
CE
Rm
a) b) c)Rmedium
CE
CCl
CCl

27
enterocyte-like cells and a large portion of them is made up of goblet-like cells;
hence this line produces large amounts of mucin and is used for studying bacterial
adhesion.108 T84 is another cell line from cells of intestinal crypt used for the
study of food proteins.92
Co-cultures are used to improve the in vitro models by adding the diverse
cell population of the small intestinal epithelium. To this end, several cell types
have been co-cultured on Transwell® inserts, such as Caco-2 and HT29 for the
production of a mucus layer.109 Caco-2, dendritic cells and monocytes have been
co-cultured to study immune processes in the inflamed intestinal mucosa.110,111
In addition, co-culture can be compartmentalized by seeding Caco-2 cells on the
upper part of Transwell® and other cell types, such as macrophages112 or
endothelial cells,113 on the basal compartment. In these systems, immune cells,114
and pathogenic and non-pathogenic bacteria can be added.115 On the other hand,
Transwell® insert can be modified to improve cell physiology , like Shen et al.,
who developed a 3D printed insert for hanging culture of Caco-2 cells.116
However, colorectal tumor derived cell lines are not derived from small
intestinal epithelium and have severe limitations. These limitations are related to
their inconsistent expression of transporters and metabolic proteins depending
on the culture conditions.117 In addition, Caco-2 cell monolayers lead to an
“artificial” transepithelial electrical resistance (TEER) values greater than 300
Ω·cm2 compared to the native human small intestine which is 40-90 Ω·cm2.118,119
The absence of small intestinal stem cells and other epithelial cell types limits the
relevance of the physiology and functionality of these standard in vitro models.
Despite many advantages such as easy cell culture and high
reproducibility, conventional in vitro models lack small intestine 3D structural
features, involved in the nutrient absorbance and the epithelium remodeling, and
relevant small intestine epithelial cell types such as goblet cells or stems cells. The
routinely culture platform used, Transwell®, also lacks the environment
complexity and transport activity associated with the native small intestinal
tissue. Porous membranes have flat surfaces, not comparable with the
characteristic 3D villus-crypt units of the small intestine. Even though many
approaches have been adapted to fill the gap between the conventional 2D culture
and native intestine, the complexity of in vivo is not represented in these models.
To overcome the limitations of the standard Caco-2 models cultured on
Transwell® inserts, new trends and emerging strategies have been attempted to
model small intestine in complex constructs, using biomaterials and
microtechnologies. These new models incorporate the mimicking of the
basement membrane, the development of the 3D architecture of the small
intestine, and the development of dynamic environments to apply fluid flow and

28
peristalsis. We will consider the components needed to develop such complex
systems in what follows.
1.3 HYDROGEL MATERIALS FOR THE CULTURE OF SMALL INTESTINE EPITHELIAL CELLS
The extracellular matrix (ECM) is a complex 3D fibrous meshwork, with
hydrogel-like structure composed of fibers and pores made of a variety of
proteins and polysaccharides.8 Its heterogeneous composition provides cell
anchoring support, tissue structure, and directs cell fate.120 The small intestinal
epithelium is anchored to a specialized ECM, the basement membrane. The
basement membrane is a thin layer composed of laminin, collagen
(predominantly collagen IV), proteoglycans, and other structural and adhesive
proteins that create pores of 10 nm in size and small cavities of 1-5 µm in
diameter.14,121,122 The major non-collagenous component, laminin,123,124 forms a
thick and almost continuous line, conformal with the villi architecture, along the
walls of the villi.125 The basement membrane controls the epithelial cell shape,
gene expression, adhesion, migration, proliferation, and apoptosis.126 Thus, an
engineered material for the cell culture of the intestinal epithelium should mimic
the chemical composition and structure of the basement membrane. To this aim,
hydrogels have become the most popular biomaterial.
Hydrogels are composed of hydrophilic polymer chains that form three-
dimensional networks upon cross-linking via covalent bonds or via physical
attraction, either intramolecular or intermolecular. These hydrophilic polymer
networks can absorb high amounts of water (often more than 90%) and swell
without dissolving, increasing their volumes in the swollen state ( up to 103 times,
ratio swollen gel volume / dry gel volume).127 Hydrogels show a wide range of
porosities, from less than 100 Å to more than 10 µm.128 Their porosity facilitates
the transport of nutrients and waste.129 Hydrogels have been widely used for
biological applications due to structural similarities to the native ECM (Fig.
1.13).130–132 Hydrogels can be made using a variety of polymeric materials, which
can be of natural or synthetic origin. Natural polymers have as advantages their
inherent bioactivity, biocompatibility, and biodegradability. They are usually
fabricated from ECM components.
To mimic the basement membrane for epithelial cell cultures the most
used proteins are collagen and MatrigelTM. Collagen matrices are widely used
because of their abundance in the basement membrane.133 MatrigelTM is a mixture
of ECM proteins, mainly laminin, collagen IV and enactin.134 However, MatrigelTM
has limited availability, batch-to-batch variability, pathogen transmission,
immunogenicity, technical challenges in handling, and experimental inertness.135
In addition, other natural-derived materials such as laminin, fibronectin,

29
hyaluronic acid, and chitosan have been used in intestinal tissue engineering.136–
138 Despite several intestinal cell types, including stem cells, have been
successfully cultured on natural hydrogels, it is often difficult to tailor their
mechanical, chemical, and degradation properties.
Figure 1.13: a) Schematic representation of an epithelial cell on the basement membrane
of heterogeneous fibrillar network. b) Synthetic hydrogel, and an illustration of the polymeric network.
Hydrogels from synthetic polymers are attractive materials because they
offer greater control over physicochemical properties, low immunogenicity,
minimized batch-to-batch variations and long-term stability. However, most of
them often fail to recapitulate essential biological features such as
biodegradability or biological recognition.139,140 These hydrogels are made of
monomers or polymers that create a cross-linked network mainly based on poly
(ethylene glycol) (PEG), poly (N-isopropylacrylamide) (PNIPAm), poly (2-
hydroxyethyl methacrylate) (PHEMA), and poly (vinyl alcohol) (PVA) (Fig.
1.14).141,142 These materials are usually combined with natural derived materials
or cell-adhesive ligands to improve their bioactivity.
Figure 1.14: Molecular structures of polymer repeat units used for preparing synthetic hydrogels: a) linear poly (ethylene glycol) (PEG), b) four-arm PEG, c) poly (N-isopropylacrylamide) (PNIPAm), d) poly (2-hydroxyethyl methacrylate) (PHEMA), and e) poly (vinyl alcohol) PVA (adapted from Kharkhar et al.).142
Hydrogel cross-linking strategies are based on chemical (covalent) or
physical (non-covalent) interactions among monomer or polymer chains.
Basement membrane
a) b)
a) PEG b) Multiarm PEG c) PNIPAm d) PHEMA e) PVA
30
Physical cross-links include entangled chains, hydrogen bonding, ionic bonding,
hydrophobic interactions and crystallite formation.142 Even though they are not
permanent junctions, they keep the hydrogel from dissolving in aqueous media.
Natural-derived hydrogels are typically formed by physical cross-links. For
example, MatrigelTM gels with temperature, it forms liquid solutions at low
temperatures and gels at room temperature. Gelatin and collagen form liquid
solutions at high temperatures and gel at low temperatures. Polysaccharides,
such as alginate, form gels in the presence of Ca2+.
Chemical cross-links, on the other hand, are permanent junctions formed
by covalent bonds. One common way to create a covalently cross-linked network
is using chain or step growth polymerization mechanisms, in which end-
functionalized mono/macromers react to form oligomers and long chain
polymers.143 For example, click reactions are a class of reactions to covalently link
two reactants in a straightforward, modular and high-yielding manner, which
have become popular for synthesizing hydrogels. They use highly reactive
functional pairs such as thiol-vinyl, thiol-maleimide, and azide-alkyne. One
attractive feature of this type of cross-linking mechanism is that it does not
require any additional components, such as an initiator, but the gelation rates are
typically slow.142,144 By free radical polymerization, polymers modified with one
or more vinyl groups react, in the presence of a photoinitiator and suitable light
wavelength, to create high-molecular-weight chains that are covalently cross-
linked in the network. Radical chain polymerizations are fast, and happen at time
scales from seconds to several minutes.145
1.3.1 NETWORK STRUCTURE OF HYDROGELS
The chemical properties of the repeating units, monomers (or
macromers), and the method of cross-linking determine the three-dimensional
structure of hydrogels.132 Many of their properties, including the equilibrium
water content, compressive modulus, and diffusivity depend on the hydrogel
cross-linking density (ρx), which refers to the number of chains in a given volume
of hydrogel. Cross-linking density determines important parameters used to
define the network structure of hydrogels: the swelling ratio (Q), the polymer
volume fraction in the swollen state (υ2,s), the average (or effective) molecular
weight between cross-links (Mc), and the network mesh size (ξ). The swelling
ratio is the ratio between the volumes of water-swollen hydrogel to dry volume
and it affects the mechanical properties of the hydrogel. The polymer volume
fraction in the swollen state describes the amount of liquid than can be imbibed
in the hydrogel. The mesh size dictates the diffusivity of molecules through the

31
network.131 For their characterization, hydrogel networks are usually considered
an “ideal” collection of chains between junction points (cross-links), but in reality
these networks contain defects such as loops, physical junctions, entanglements,
and dangling ends (Fig. 1.15).146,147
Figure 1.15: Ideal and real network structure of hydrogel showing cross-links (blue
circles), mesh size (ξ) and molecular weight between cross-links (Mc), physical junctions, entanglements, loops, and dangling ends.
Hydrogel swelling parameters can be determined using the equilibrium
swelling theory proposed by Flory-Rehner.148 The Flory-Rehner equation is
typically employed to relate the hydrogel swelling ratio, which is the inverse of
the polymer volume fraction, to its cross-linking density. Hydrogels can be
assumed as highly swollen systems (Q > 10), and neglecting polymer chain ends,
the Flory-Rehner equation simplifies to:
Q = ρx−3 5⁄ [
1 2⁄ − 2χ1V1
]
3 5⁄
Eq. 1
where V1 is the molar volume of the solvent and χ1 represents the interaction
between the polymer and the solvent. Finally, the mesh size can be estimated
following equation:
ξ = v2,s(−1 3⁄ )
2McCnMr
l Eq. 2
where Mr is the molecular weight of the monomer, Cn is the Flory characteristic
ratio and l the length of the bond along the polymer backbone. Mesh size at the
equilibrium swelling dictates the diffusivity of molecules through the network,
Danglingend
Entanglement
Loop
Physicaljunction
Cross-link
Meshsize
Cross-link
Mc
ξ
Ideal network Real network
32
and can be compared to the hydrodynamic radius of a molecule to determine
whether diffusion would take place (Eq. 3)
Dg
D0= (1 −
rsξ) Eq. 3
Dg is the solute diffusivity in the hydrogel swollen state, D0 is the unhindered
solute diffusivity in the swelling solvent, and rs is the radius of the solute.149
1.3.2 POLY (ETHYLENE GLYCOL) (PEG) -BASED HYDROGELS
Poly (ethylene glycol) (PEG) is one of the most popular synthetic
materials used in biomedical applications, tissue regeneration, cell culture, tissue
models for wound healing, and cancer drug delivery.150,151 Because of its high
hydrophilicity, bioinert structure, lack of toxic or immunogenic response, low
cost, and water solubility is suitable for cell culture applications. In addition, it
has been approved by the food and drug administration (FDA). Also, PEG-based
hydrogels provide adjustable mechanical properties as their elastic modulus can
be tuned over a broad range of values to mimic the moduli of soft tissues (e.g., E
∼ 5 kPa to E ∼ 900 kPa).152 However, PEG-based hydrogels have no bioactive sites
for cells interaction, so they do not support cell adhesion and proliferation. It is
common to incorporate cell adhesive peptides to make them bioactive.139
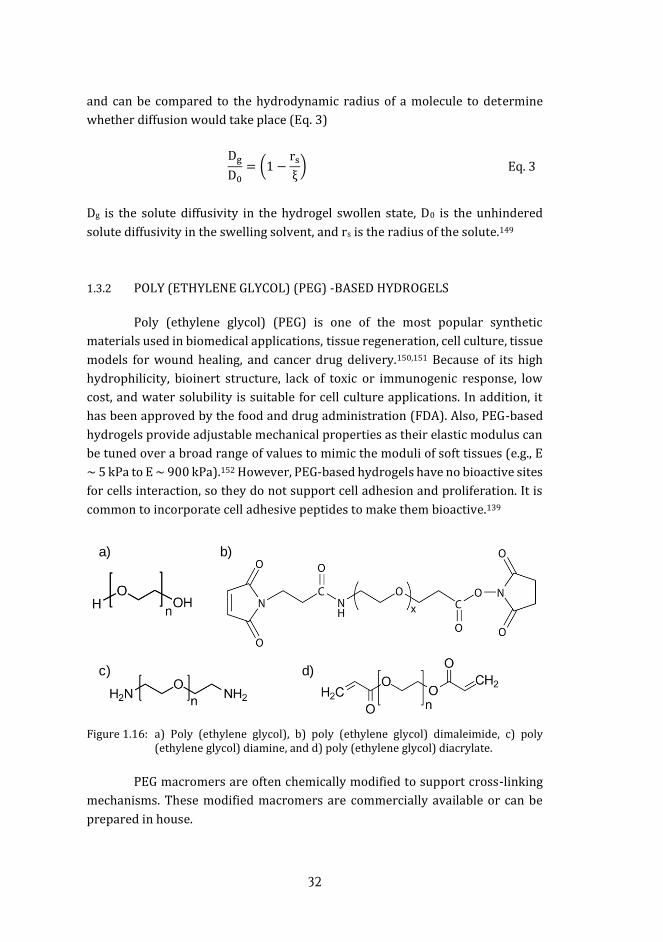
Figure 1.16: a) Poly (ethylene glycol), b) poly (ethylene glycol) dimaleimide, c) poly (ethylene glycol) diamine, and d) poly (ethylene glycol) diacrylate.
PEG macromers are often chemically modified to support cross-linking
mechanisms. These modified macromers are commercially available or can be
prepared in house.
a) b)
c) d)
33
It is common the modification of the hydroxyl end groups by, maleimide,
thiol, amide, azide, sulfovinyl, or acrylate groups that can be cross-linked by click
reactions or free radical polymerization (Fig. 1.16).153 In addition, cell adhesive
molecules can be PEGylated to be anchored in these systems.154
Also, interpenetrating networks of gelatin methacrylate and hyaluronic
acid methacrylate polymerized with polyethylene glycol have been reported to
improve PEG cell adhesion properties. All these engineered PEG hydrogels have
demonstrated to support cell functions such as adhesion, migration, proliferation,
and the regulation of stem cell fate.155–157 In addition, basement membrane-
mimetic PEG hydrogels have been developed to replicate basement membrane
topography,158 the vascular basement membrane to study the neutrophil
extravasation,159 to provide a basement membrane model of the alveolar-
capillary barrier,160 to study the epithelial morphogenesis,161 and as intestinal
basement membranes to assess organoid growth.162
1.4 FREE-RADICAL PHOTOPOLYMERIZATION OF PEGDA
The most common method of cross-linking to form PEG-based hydrogels
is based on the use of PEG-acrylates, especially PEG-diacrylate (PEGDA) through
UV initiated free radical photopolymerization. This reaction has as main
advantage mild reaction conditions. In addition, it provides temporal and spatial
control over the hydrogel formation. Free radical photopolymerization initiates
without the need for high temperatures or extreme pH conditions and in a non-
purged environment.163 Also, in contrast to click reactions that are spontaneous,
photopolymerization can be controlled over time.
Free radical polymerization forms polymers by the addition of free
radical building blocks (Fig. 1.17).164 UV-initiated free radical polymerization is
described by three reaction steps: initiation, propagation, and termination (Table
1.1). It is initiated by the combination of irradiation with the appropriate
wavelength (usually UV) and the presence of a photoinitiator (PI). The
photoinitiator absorbs energy and decomposes with an efficiency f and rate
constant kd into two reactive free radicals (R*) with unpaired electrons. Acrylate
groups of the monomers (M) are sensitive to free radicals and unpaired electron
swipe carbon-carbon double bond (-C=C-) creating a new free radical monomer
(RM*). The constant rate for chain initiation is ki. Free radical monomers
propagate the reaction at a rate kp, creating polymer chains (Pm). These chains
have an unpaired electron and can again serve as free radicals. The last step is the
termination, which occurs when two unpaired electrons find each other creating
stable polymer chains as a rate kt. This reaction is inhibited in the presence of

34
oxygen because it captures the radical species formed from the PI, forming
peroxides and avoiding polymer polymerization. Oxygen reacts with radicals
under the rate constant kO2 .
Figure 1.17: a) Schematics of free radical polymerization reaction (black) and oxygen
inhibiting mechanism (red). Radicals (R*) are generated from photoinitiator molecules (PI) by the UV light. Acrylate monomers (M), react with radicals in free radical monomers (RM*), which create polymer chains (Pm). Oxygen (O2), reacts with radicals creating peroxide molecules (RO2H, RMnO2H). M is the acrylate monomer, and red line represents the new formed bonds.
Description Reaction
1. Initiation:
Decomposition PI
kd → 2fR∗
Chain initiation R∗ +M
ki → RM∗
2. Propagation RMn
∗ +M kp → RMn+1
∗
Termination: RMn
∗ + RMm∗ ktc → Pn+m
PI R*
RO2H
*
O2
M RMnO2HRMn
Pm
UV
PI R*
UV
M M
R*R*
MM
R *
M
R
M
*
b) c)
d)
e)
M
R
M
*n
M
R
Mx
R
M
R
M
*m +
a)

35
Oxygen inhibition
R∗ + O2 kO2 → RO2H
Table 1.1: Kinetics and reaction steps in free radical photopolymerization. Photoinitiator (PI), radicals from photoinitiator (R*), photoinitiator efficiency (f), acrylate monomers (M), free radical monomers (RM*), polymer (Pn), oxygen (O2), peroxide molecules (RO2H, RMnO2H).165
The photoinitiator decomposition kd depends on its quantum yield (ϕ)
(ratio of molecules decomposed to the number of photons absorbed), molar
attenuation coefficient (ε) (or molar absorptivity, ability of a chemical species to
attenuate light at a given wavelength), the intensity of the light absorbed (I) at
given wavelength (), Avogadro’s number (NA), Planck’s constant (h) and the
speed of light (c) (Eq. 4).
kd =(2.303ε)I
NAVhc Eq. 4
The dynamic concentration of all the species in a well-mixed bulk
reaction volume can be defined by a set of differential equations::166
−dPI
dt= kd[PI] Eq. 5
d[R∗]
dt= 2kdf[PI] − kp[R
∗][M] − 2kt[R∗][RM∗] − 2kt[R
∗]2
− kO2[R∗][O2]
Eq. 6
d[M]
dt= −kp[R
∗][M] − kp[R∗][RM∗] Eq. 7
d[RM∗]
dt= kp[R
∗][M] − 2kt[RM∗]2 − 2kt[R
∗][RM∗]
− kO2[RM∗][O2]
Eq. 8
d[P]
dt= 2kt[RM
∗]2 + 2kt[R∗][RM∗] + kO2[RM
∗][O2] Eq. 9
d[O2]
dt= −kO2[RM
∗][O2] − kO2[R∗][O2] Eq. 10
Combining these equations the rate of polymerization Rp can be
estimated by:165
Rp = kp[M]√2fkd[PI]
kt Eq. 11
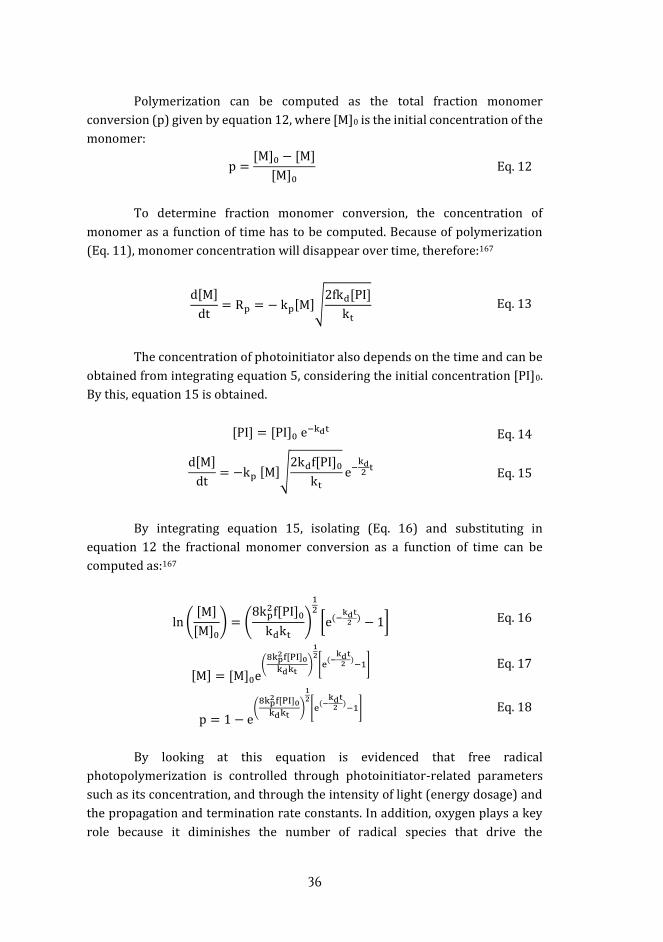
36
Polymerization can be computed as the total fraction monomer
conversion (p) given by equation 12, where [M]0 is the initial concentration of the
monomer:
p =[M]0 − [M]
[M]0 Eq. 12
To determine fraction monomer conversion, the concentration of
monomer as a function of time has to be computed. Because of polymerization
(Eq. 11), monomer concentration will disappear over time, therefore:167
d[M]
dt= Rp = − kp[M]√
2fkd[PI]
kt Eq. 13
The concentration of photoinitiator also depends on the time and can be
obtained from integrating equation 5, considering the initial concentration [PI]0.
By this, equation 15 is obtained.
[PI] = [PI]0 e−kdt Eq. 14
d[M]
dt= −kp [M]√
2kdf[PI]0kt
e−kd2t Eq. 15
By integrating equation 15, isolating (Eq. 16) and substituting in
equation 12 the fractional monomer conversion as a function of time can be
computed as:167
ln ([M]
[M]0) = (
8kp2f[PI]0
kdkt)
12
[e(−kdt2 ) − 1] Eq. 16
[M] = [M]0e(8kp2 f[PI]0kdkt
)
12[e(−kdt2 )−1]
Eq. 17
p = 1 − e(8kp2 f[PI]0kdkt
)
12[e(−kdt2 )−1]
Eq. 18
By looking at this equation is evidenced that free radical
photopolymerization is controlled through photoinitiator-related parameters
such as its concentration, and through the intensity of light (energy dosage) and
the propagation and termination rate constants. In addition, oxygen plays a key
role because it diminishes the number of radical species that drive the

37
polymerization, inhibiting the reaction. To take profit of free radical
polymerization, terminal hydroxyl groups of the PEG can be substituted by
acrylates to from PEG-diacrylate (PEGDA). PEGDA is the type of macromer most
used for photopolymerization. By free-radical polymerization, PEGDA repeating
units, often called monomers even if they are actually macromers, cross-link to
form long branched chains and cross-linked networks (hydrogels). This contrasts
with poly (ethylene glycol) monoacrylate (PEGMA), which creates linear chains
resulting in a soluble polymer network, because PEGDA monomers are
bifunctional and PEGMA are monofunctinal.166,168 PEGDA hydrogels are highly
tunable, by varying their molecular weight or polymer concentration the
mechanical properties can be controlled.169
Figure 1.18: Scheme of free-radical polymerization of PEGDA by the activation of I2959.
a) Cleavage of I2959 into radicals (R*), b) initiation of polymerization by the radicalization of monomers. c) Propagation of the polymerization in d) linear chains or e) branched chains. Red dots relate to unpaired electrons, x and y relate to the size of the poly(acrylate) domains, and n relates to the size of the PEG domains.
a)
b)
c)
d) e)
*
*
R* x
R* R*
UV
(R*)**
*
R *
R

38
For biomedical applications, PEGDA hydrogels are usually fabricated
using 2-hydroxy-4’-(2-hydroxyethoxy)-2-methylpropiophenone, known as
I2959 (Ciba® IRGACURE® 2959, Switzerland) as photoinitiator. Figure 1.18
shows the free-radical photopolymerization reaction described in Figure 1.17
adapted to the PEGDA free-radical polymerization in presence of I2959.
PEGDA and I2959 have been used in mimicking many tissues, such as the
cornea,170 bone,171 cartilage,172 or hair follicle.173 It is a water soluble
photoinitiator with a limited solubility (∼1% w/v)174 and it possesses a high
molar absorption at UV medium-wavelengths (200 – 320 nm). However, its molar
absorptivity spectrum (Fig. 1.19) limits the generation of radicals at wavelengths
up to 370 nm, with a value of 4 M-1 cm-1 at 365 nm.175 At wavelengths below 350
nm, cellular encapsulation is precluded because of its phototoxic and mutagenic
characteristics.176
Figure 1.19: (a) Molar absorptivity of I2959.177 (b) Molar absorptivity at different I2959
concentrations. Absorption spectrum of Ciba® IRGACURE® 2959 as % in acetonitrile.178
1.5 MICROSTRUCTURING OF HYDROGELS
Hydrogels are usually fabricated and used as films or bulk structures.
Some cell engineering applications require the miniaturization of hydrogel
structures and the fine tuning of their architecture. Considering the small
intestinal epithelium, the crypt-villi architecture has proved to be relevant in the
physiology of this tissue. Thus, this three-dimensionality has to be considered
when fabricating a biomimetic hydrogel. Several methods are employed to
microstructure hydrogels and reviews classify them in micromolding,
microfluidics, stereolithography, 3D bioprinting, and photolithography.179–181
The functionality of many tissues is related to their 3D architecture, such
as the spongy part and the canaliculus of bone tissue, the palisades of the corneal
Wavelength (nm)
a) b)
200 250 300 350 400300 325 350 375 400 425 450
400
300
200
100
Mol
ar e
xtin
ctio
n co
effic
ient
( M
-1cm
-1)
0.1%0.01%0.001%
Mol
ar e
xtin
ctio
n co
effic
ient
( a.
u.)
2
1.5
1
0.5
Wavelength (nm)

39
limbus, the compartmentalized hair follicle, and the crypt-villi unit. For all of
them, relevant geometrical features are in the range of tens to hundreds of
micrometers. So, microstructuring techniques must work within this range.
Traditional microfabrication techniques have been extensively used and
optimized for hard materials,182 but the implementation of these methodologies
for soft materials impose specific challenges. The main specific care is the
manipulation, because hydrogels are very soft, and can easily break. Many
hydrogels are sticky, which could also restrict the use of molds.
1.5.1 MICROMOLDING
Micromolding is an extensively used technique based on the use of hard
templates or molds from which the microstructure is transferred to another
material. These molds are usually fabricated by photolithography, soft
lithography (a technique used for replicating structures using elastomeric
molds), etching or laser ablation.183,184 Molds from polydimethylsiloxane (PDMS),
poly(methyl methacrylate) (PMMA), polyurethanes, polyimines, or Teflon have
been employed as templates to produce hydrogels with topographic
features.170,173,185–187 One of the preferred materials used in micromolding is
PDMS due to its inertness, optical transparency and flexibility.188 A variety of
hydrogel shapes, morphologies and sizes can be precisely fabricated on a
template, ranging from less than 1 µm to larger than 500 μm.189,190 Polymeric
solutions are placed on the mold, and after cross-linking, hydrogels replicate the
shape of the template, being a negative of the original mold (Fig. 1.20). In
micromolding, hydrogels are cross-linked by temperature such as agarose, or
light, such as PEGDA, gelatin methacrylate or hyaluronic acid methacrylate.190–193
Figure 1.20: Schematic presentation of hydrogel micromolding using a PDMS template.
The main problem when using molding with hydrogels is demolding, as
they might be sticky or very soft, so microstructures can be deformed or broken.
To overcome this restriction, molds can be coated with other polymers, or anti-
sticking layers. PNIPAAm is a temperature responsive polymer that has been
used as a coating for PDMS molds to demold agarose hydrogel microstructures.194
Hydrogel
Polymer solution
PDMS template
Temperature / UV light

40
An alternative option, useful for high aspect-ratio microstructures, it is proposed
the use of intermediate molds made of soluble materials such as gelatin,195 poly
L-lactic acid,196 agarose,197 or PNIPAAm.198 These intermediate molds are used as
sacrificial layers and are destroyed to demold the hydrogel of interest.
Micromolding is usually costly affordable and allows obtaining large-
surface areas with microstructures but with soft materials sometimes require
several demolding steps to create complex architectures.
1.5.2 3D BIOPRINTING
3D bioprinting is a rapid-prototyping method to create three-
dimensional architectures with high precision due to the accurate deposition of
wide range of materials to a desired location.199–201 In addition, it allows the
printing of multiple cell types previously diluted in the polymer solution. 3D
bioprinting can be performed by inkjet bioprinting, microextrusion bioprinting,
and laser-assisted bioprinting.179
Hydrogels can be made by inkjet bioprinters (Fig. 1.21a), which consist
on a syringe that ejects the polymer solution on a surface where a cross-linking
method is applied.
Figure 1.21: Schematic illustration of the 3D bioprinting approaches. a) Inkjet, b)
microextrusion, and c) laser-assisted bioprinting. Polymer solutions cross-link once they reach the substrate. (adapted from Malda et al.)202
Depending on cross-linking method (temperature or UV light) different
materials can be fabricated such as PEG-based polymers,203 gelatin, alginate and
hyaluronic acid.204,205 This technology reaches resolutions of 50 µm – 1 mm and
is able to work at high speed.206 For temperature-based cross-linking, the time for
hydrogel forming has to be reduced. Additional issues related to the technique
are clogging of the needle and formation of bubbles. Microextrusion bioprinting
uses a piston-dispenser to deposit the material (Fig. 1.21b). Hydrogels cross-link
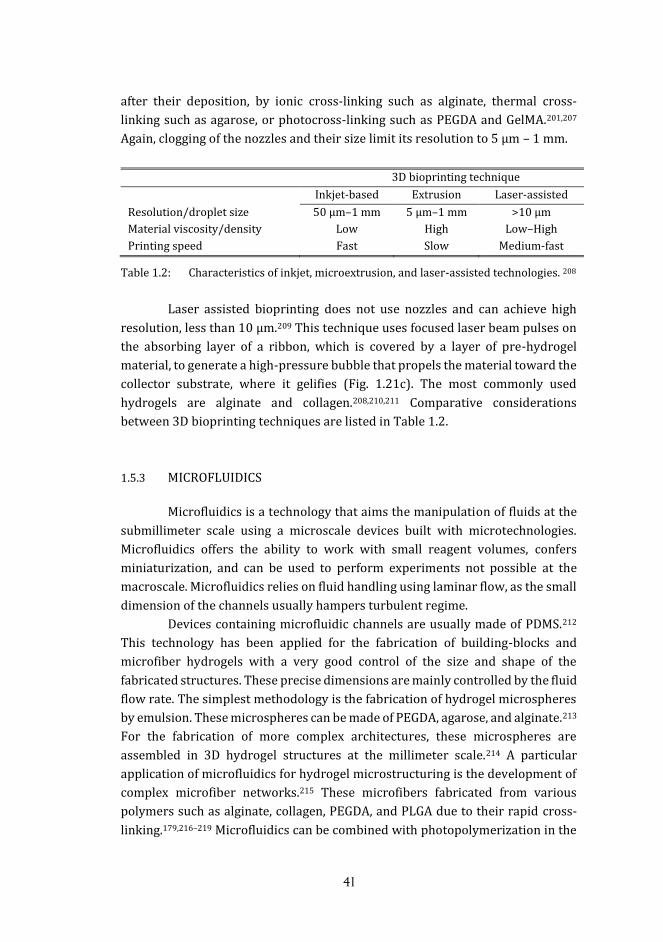
41
after their deposition, by ionic cross-linking such as alginate, thermal cross-
linking such as agarose, or photocross-linking such as PEGDA and GelMA.201,207
Again, clogging of the nozzles and their size limit its resolution to 5 µm – 1 mm.
3D bioprinting technique
Inkjet-based Extrusion Laser-assisted
Resolution/droplet size 50 µm–1 mm 5 µm–1 mm >10 µm
Material viscosity/density Low High Low–High
Printing speed Fast Slow Medium-fast
Table 1.2: Characteristics of inkjet, microextrusion, and laser-assisted technologies. 208
Laser assisted bioprinting does not use nozzles and can achieve high
resolution, less than 10 µm.209 This technique uses focused laser beam pulses on
the absorbing layer of a ribbon, which is covered by a layer of pre-hydrogel
material, to generate a high-pressure bubble that propels the material toward the
collector substrate, where it gelifies (Fig. 1.21c). The most commonly used
hydrogels are alginate and collagen.208,210,211 Comparative considerations
between 3D bioprinting techniques are listed in Table 1.2.
1.5.3 MICROFLUIDICS
Microfluidics is a technology that aims the manipulation of fluids at the
submillimeter scale using a microscale devices built with microtechnologies.
Microfluidics offers the ability to work with small reagent volumes, confers
miniaturization, and can be used to perform experiments not possible at the
macroscale. Microfluidics relies on fluid handling using laminar flow, as the small
dimension of the channels usually hampers turbulent regime.
Devices containing microfluidic channels are usually made of PDMS.212
This technology has been applied for the fabrication of building-blocks and
microfiber hydrogels with a very good control of the size and shape of the
fabricated structures. These precise dimensions are mainly controlled by the fluid
flow rate. The simplest methodology is the fabrication of hydrogel microspheres
by emulsion. These microspheres can be made of PEGDA, agarose, and alginate.213
For the fabrication of more complex architectures, these microspheres are
assembled in 3D hydrogel structures at the millimeter scale.214 A particular
application of microfluidics for hydrogel microstructuring is the development of
complex microfiber networks.215 These microfibers fabricated from various
polymers such as alginate, collagen, PEGDA, and PLGA due to their rapid cross-
linking.179,216–219 Microfluidics can be combined with photopolymerization in the
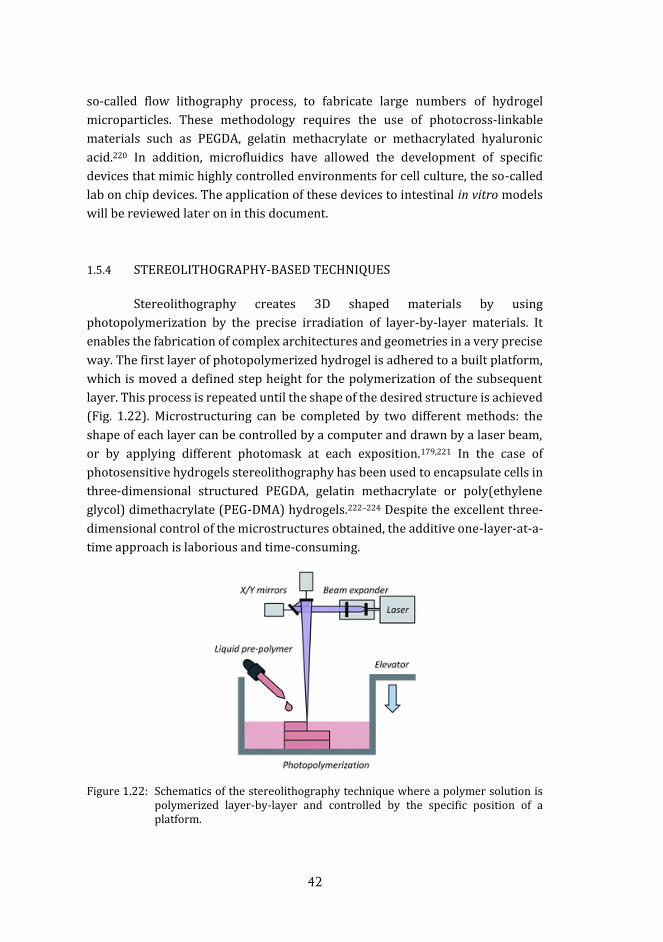
42
so-called flow lithography process, to fabricate large numbers of hydrogel
microparticles. These methodology requires the use of photocross-linkable
materials such as PEGDA, gelatin methacrylate or methacrylated hyaluronic
acid.220 In addition, microfluidics have allowed the development of specific
devices that mimic highly controlled environments for cell culture, the so-called
lab on chip devices. The application of these devices to intestinal in vitro models
will be reviewed later on in this document.
1.5.4 STEREOLITHOGRAPHY-BASED TECHNIQUES
Stereolithography creates 3D shaped materials by using
photopolymerization by the precise irradiation of layer-by-layer materials. It
enables the fabrication of complex architectures and geometries in a very precise
way. The first layer of photopolymerized hydrogel is adhered to a built platform,
which is moved a defined step height for the polymerization of the subsequent
layer. This process is repeated until the shape of the desired structure is achieved
(Fig. 1.22). Microstructuring can be completed by two different methods: the
shape of each layer can be controlled by a computer and drawn by a laser beam,
or by applying different photomask at each exposition.179,221 In the case of
photosensitive hydrogels stereolithography has been used to encapsulate cells in
three-dimensional structured PEGDA, gelatin methacrylate or poly(ethylene
glycol) dimethacrylate (PEG-DMA) hydrogels.222–224 Despite the excellent three-
dimensional control of the microstructures obtained, the additive one-layer-at-a-
time approach is laborious and time-consuming.
Figure 1.22: Schematics of the stereolithography technique where a polymer solution is
polymerized layer-by-layer and controlled by the specific position of a platform.

43
Moreover, cross-linking only occur at the surface of the
photopolymerizable material (within the first few micrometers). In addition, the
lateral resolution is between 150 and 200 µm and the minimum distance between
two adjacent layers is 50 µm, which gives quite a poor resolution in the z-
dimension.225
Two-photon polymerization can be also considered as a
stereolithography technique, and it can be used to create three-dimensional
microstructures in a simple and fast manner. Polymerization occurs in a liquid
based material which receives high power near-infrared (NIR) or infrared (IR)
femtosecond lasers. When two photons provide, simultaneously, sufficient power
at the focal point, free radical polymerization can be initiated into the volume of
the photosensitive material. Instead of the physical movement of a platform, two-
photon technique creates three-dimensional microstructures by changing the
laser focus position (Fig. 1.23). This technique enables the fabrication of
hydrogels with chemical patterns using polymers with different cross-linking end
groups, or cleavage groups. It also has the advantage of creating features as small
as 100 nm.226 As an example, Anseth and coworkers, have developed chemical-
micropatterned and physically microstructured hydrogels (PEG and bis(azide)-
functionalized polypeptides) for cell culture, tissue regeneration, and biological
arrays and/or assays.175,227–229 As drawbacks, this technique is complex,
expensive, and limited to photosensitive materials.
Figure 1.23: Drawing of the stereolithographic (left) and two-photon (right) techniques
(adapted from Koskela et al.).230
1.5.5 PHOTOLITHOGRAPHY
UV light Ultrafast laser pulses
Photo-crosslinkablematerial
Crosslinked hydrogel
Crosslinked hydrogel

44
Photolithography is the microfabrication technique most used in
microelectronics to create integrated circuits. The procedure consists on
depositing a thin layer of a photoresist on the top of the material to be
microstructured. Then, a photomask with a desired pattern, with light opaque
and transparent regions, is placed on top of the photoresist and it is exposed to
UV light through the mask. Photomasks can be made of metal or glass, but also
high-quality acetate sheets can be used if the dimensions of the microstructures
are relatively large (> 50 µm). The illuminated regions become either cross-linked
(negative photoresist) or degraded (positive photoresist), and a replica of the
design in the photoresist is developed with a solvent. At this point etching
techniques are used to transfer the pattern to the underneath material and finally,
the photoresist layer is removed (Fig. 1.24a).231 The technique is parallel in
nature and it allows the microfabrication of large-surface areas in a simple step.
The energy dosage is controlled by the intensity of the light source (usually
prefixed) and by the exposure time. However, the resolution of conventional
photolithographic techniques is limited by light diffraction to be on the order of
half the wavelength of the light employed (< ∼200 nm).
Figure 1.24: a) Schematic representation of conventional photolithography. b) Direct photopolymerization of a hydrogel through a photomask.
a)
b)
Polymer solutionHydrogel
Photomask
PhotoresistStructural material
Development
Etching
Photoresistremoval
Negative photoresist Positive photoresist

45
These diffraction phenomena are differentiated in Fraunhofer
diffraction, which occurs at far-field distances of the slits of the mask, and Fresnel
diffraction, which occurs when the light passes through an aperture and diffracts
in the near field. It occurs due to the short distance in which the diffracted waves
propagate. As example, mask and photoresist are usually separated by an air gap
or glass of some thickness (20 to 200 µm), which affects the transfer of the mask
pattern. This limits the transferable minimal structure sizes at about 1 to 5 µm in
lateral resolution.232
Application Refs.
Cell encapsulation in microscaled hydrogels 190
Photopatterning for guiding cell behavior 233
Cell-laden microgels 220
Cell encapsulation 177
Hydrogel to mimic cartilage 234
Multilayer microfluidic hydrogels 235
Hydrogel stiffness and permeability studies 236
Aggregation of Pancreatic b-Cells 237
Stem Cell Culture and Gene Delivery 238
Cell migration in synthetic extracellular matrices 239
Protein encapsulation 240
Patterned vascular networks 241
Matrix Metalloproteinase-2 Mediated Release 242
Bone tissue engineering scaffold 171
Cornea engineering hydrogel 170
3D hair follicle-like hydrogel 173
Osteogenic differentiation 243
Smooth muscle cell proliferation 244
Vascularization of tissue Constructs 245
In vitro Model for Ductal Carcinoma 246
Table 1.3: Different applications of microstructured PEGDA hydrogels in the field of cell/tissue engineering.
Conventional photolithography resolution is enough for most cell culture
applications, because three-dimensional structures are in the range of tens of
microns to millimeters. To be used with photocross-linkable hydrogels, the

46
photomask is placed on top of the hydrogel solution and UV is exposed through
the photomask. So, only UV irradiated areas will polymerize (Fig. 1.24b).
Exposure time must be precisely controlled because overexposition causes the
polymerization of areas that are under the masked regions, which may create
undesired patterns.220 This technique has been successfully used to produce
microstructures on several hydrogels, mainly those containing acrylate groups in
their backbone, such as PEGDA, methacrylated hyaluronic acid, gelatin
methacrylate, and mixtures of these polymers.247–258 The cells can be cultured on
the hydrogel surface, but more often these materials have been widely used for
cell-laden applications.187,220,257 They have been also used to create chemical
micropatterns on hydrogels.233,259–261 A example of use in tissue engineering, are
honeycomb structures fabricated by several photolithographic steps, which
supported and surrounded individual hepatic microtissues.262 Although
photolithography is a very simple and low-cost process, this approach is not
straightforward when applied to create complex 3D structures on soft and thick
hydrogels. Microstructuring of PEGDA with high aspect ratio shape has been
carried out using pure PEGDA or highly concentrated solutions of PEGDA.263–265
These microfabrication techniques have been extensively used to microstructure
hydrogels, and in particular, they have been applied to PEGDA hydrogels for
biomedical applications (Table 1.3).
The combination of the elements explained in this section (hydrogels and
microstructures) to design new in vitro models of small intestinal epithelium is
reviewed in what follows.
1.6 COMPLEX IN VITRO MODELS OF SMALL INTESTINAL EPITHELIUM
1.6.1 INTESTINAL ORGANOIDS
The identification of small intestinal stem cells by using the Lgr5 gene
marker has recently allowed the formation of intestinal organoids, called mini-
guts, cultured in vitro. Sato et al., developed the generation of long-term culture
of organoids with crypt-villi architecture from small intestine crypts, cultured in
a three-dimensional extracellular matrix (MatrigelTM ) (Fig. 1.25).31,266
These organoids contain all the main intestinal epithelial cell types,
including the stem cells. Intestine-like organoids can be obtained from adult or
neonatal mice small intestine tissue,267 human embryonic stem cells, and induced
pluripotent stem cells.268 Despite organoids serve as a model that mimics the
physiology and functionality of the small intestinal epithelium, they are closed
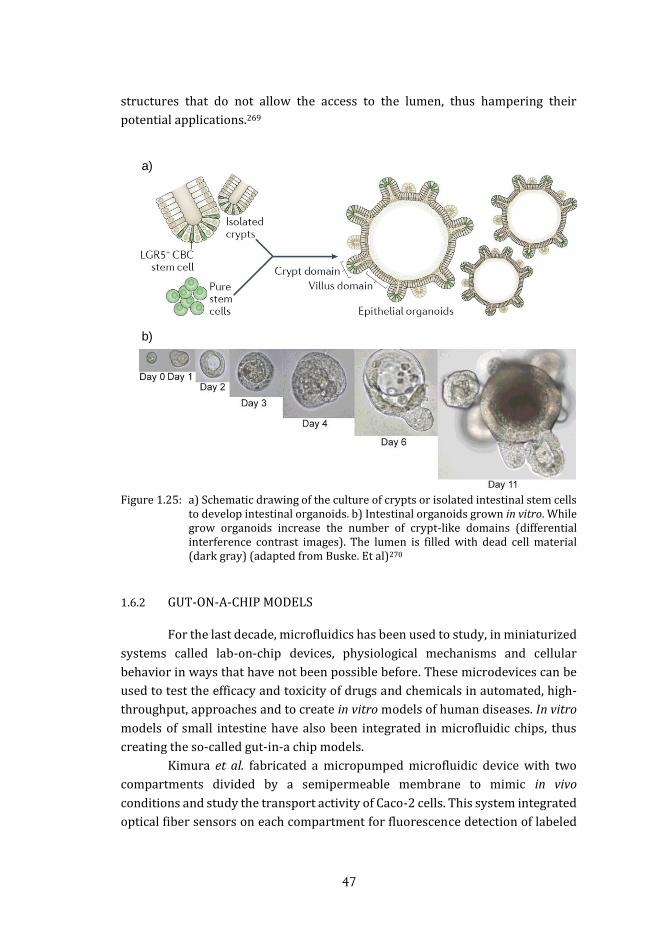
47
structures that do not allow the access to the lumen, thus hampering their
potential applications.269
Figure 1.25: a) Schematic drawing of the culture of crypts or isolated intestinal stem cells
to develop intestinal organoids. b) Intestinal organoids grown in vitro. While grow organoids increase the number of crypt-like domains (differential interference contrast images). The lumen is filled with dead cell material (dark gray) (adapted from Buske. Et al)270
1.6.2 GUT-ON-A-CHIP MODELS
For the last decade, microfluidics has been used to study, in miniaturized
systems called lab-on-chip devices, physiological mechanisms and cellular
behavior in ways that have not been possible before. These microdevices can be
used to test the efficacy and toxicity of drugs and chemicals in automated, high-
throughput, approaches and to create in vitro models of human diseases. In vitro
models of small intestine have also been integrated in microfluidic chips, thus
creating the so-called gut-in-a chip models.
Kimura et al. fabricated a micropumped microfluidic device with two
compartments divided by a semipermeable membrane to mimic in vivo
conditions and study the transport activity of Caco-2 cells. This system integrated
optical fiber sensors on each compartment for fluorescence detection of labeled
a)
b)

48
molecules. By measuring in-situ the labeled molecules, this system provides a
useful platform for drug screening and toxicity testing in dynamic environments
(Fig. 1.26a).271 Kim et al. developed a microfluidic device to mimic peristaltic
motions and intestinal shear stress (Fig. 1.26b). They obtained a confluent layer
of Caco-2 cells on a porous membrane and reported the development of villi-like
structures over long time periods. The permeability of the paracellular way and
Caco-2 differentiation were higher than in conventional 2D models and similar to
in vivo. In addition, they achieved a successful co-culture of commensal bacteria
(Lactobacillus rhamnosus GG) with Caco-2 cells.269 Surprisingly, markers of goblet
cells, mucus production, enteroendocrine cells, and Paneth cells were found on
Caco-2 cells. These findings on gut-on-a chip devices suggest that dynamic
conditions have dramatic effects on cell phenotype and differentiation, and
improve in vitro models of small intestine.272
Other integrated microfluidic platform, called NutriChip, also
reproduced a confluent layer of Caco-2 cells separated from a co-culture of
immune cells by a permeable membrane to mimic the activation of immune cells
in response to the transfer of nutrients across the epithelial layer (Fig. 1.26c). This
system allowed monitoring of the response of immune cells to pro-inflammatory
stimuli by the Caco-2 activation against the pathogen agent LPS
(lipopolysaccharide) and it was observed an increase on the production of
inflammation biomarkers (IL-6).273 Considering the interaction of the intestinal
function with other organs, many authors have attempted to integrate within the
same chip different tissue models. Recently, Esch et al. have fabricated a modular
pumpless device that allowed combining Caco-2 cells with liver tissue (Fig.
1.26d). This system also incorporates transepithelial electrical resistance sensors
to monitor the gut epithelial barrier function.274 Shuler and co-workers
developed a microscale cell culture analog system (µCCA)275 that contained
interconnected compartments (lung, liver, and other tissues) in a chip. Then,
intestinal Caco-2 cell model was integrated (Fig. 1.26e),276 and recently, villi-like
structures have also been incorporated .277
Complex in vitro models, including organoids, 3D synthetic villi and gut-
on-a-chip have proved that the mimicking of physiological features enhance the
cell differentiation processes, and maintain epithelium and commensal bacteria
co-culture. In particular, the mimicking of the crypt-villus architecture small
intestinal epithelium has demonstrated its physiological relevance by the
improvement of paracellular permeability correlation. Microfluidic devices allow
for tight regulation of the cellular microenvironment, including fluid shear and
gradients of biochemical molecules, and offer high-throughput culture and
analysis of 3D tissues. However, for the most part, microfluidic devices remain
similar to 2D cell culture in the fact that the cells are seeded in a monolayer

49
without surrounding support cells or encasement in extracellular matrix.
Moreover, these devices provide a limited space for cell growth and are difficult
to combine with conventional biological testing techniques.
Figure 1.26: a) Photograph of the micropumped microfluidic device reported by Kimura et al. which incorporates optical sensors for the measuring of fluorescent dyes.271 b) The human gut-on-a-chip. Schematic of the gut-on-a-chip device showing the flexible porous ECM-coated membrane lined by gut epithelial cells cross horizontally through the middle of the central microchannel. (Upper right) A photographic image of the gut-on-a-chip device composed of PDMS elastomer that allows providing peristaltic-like motion. Schematic showing transformation of a planar intestinal epithelium into villus structure (from Kim et al.).160 c) Schematic of the NutriChip forming the miniaturized gastrointestinal tract. The device contains epithelial cells and immune cells in different compartments. d) Cross section of modular, pumpless body-on-
Fluorescent detection
Ag/AgCl Electrode
GI Chamber
Porous membraneLiv er Chamber
Porous membrane
Ag/AgCl Electrode
Caco-2 monolay er
Immunecells
In/outlets
In/outlets
a) b)
c) d)
e)

50
a-chip platform for the co-culture of GI tract epithelium and 3D primary liver tissue (from Esch et al.).274 e) Image of the microscale GI tract cell culture analog system consisting in a porous membrane integrated in microfluidic system in contact with other tissue models (from Mahler et al).156
1.6.3 THREE-DIMENSIONAL MODELS OF SMALL INTESTINAL EPITHELIUM
Recent developments in biomaterials and microfabrication methods
have fostered the development of in vitro models that mimic the 3D features of
the small intestinal epithelium.278,279–281 Crypt-like topography has been
produced by photolithography and transferred to poly(dimethylsiloxane)
(PDMS) (Fig. 1.27a). Caco-2 cells cultured on these substrates showed lower
levels of differentiation on the micro-wells compared to flat substrates, attributed
to significant influence of crypt-like topography on intestinal cell phenotype.281
Wang et al. also, fabricated type I collagen membranes with crypt-like micro-well
topography (Fig. 1.27b).280 Slightly lower TEER values were found for Caco-2 cells
cultured on crypt-like micro-well membranes, compared to flat collagen,
suggesting that crypt-like topography affects tight junctions, as in vivo, where on
the crypts permeable tight junctions are found.282 Villi architecture has also been
produced by several techniques. Lee et al. fabricated villi scaffolds made of porous
poly (lactic-co- glycolic acid) (PLGA) by 3D printing.283 However, the technique
resolution did not allow the fabrication of small enough microstructures, which
had considerably larger dimensions (1 mm in width and 700 µm in height) than
villi, and pores of about 100 µm. Even though the scaffold mimics the shape,
dimensions and pore size are far away from the in vivo situation.
Figure 1.27: Crypt and villi architecture reproduced on hard substrates. a) PDMS well and b) collagen membrane with crypt-like topography (Wang et al.).280,281 c) Caco-2 cells cultured on PDMS inserts with villi-like topography, d)
a) b) f)
c) d)
g)
e)
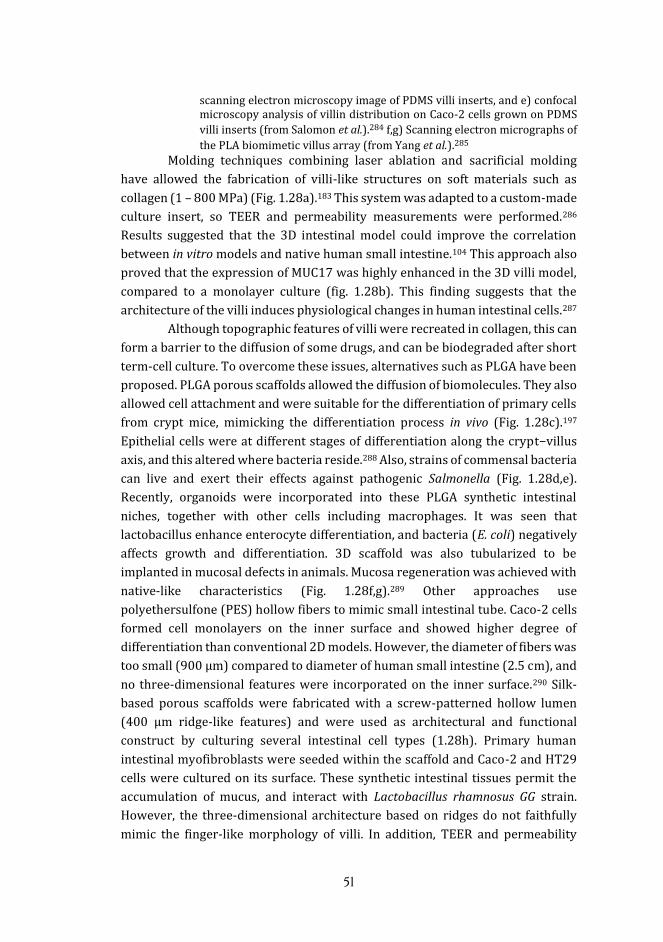
51
scanning electron microscopy image of PDMS villi inserts, and e) confocal microscopy analysis of villin distribution on Caco-2 cells grown on PDMS
villi inserts (from Salomon et al.).284 f,g) Scanning electron micrographs of
the PLA biomimetic villus array (from Yang et al.).285 Molding techniques combining laser ablation and sacrificial molding
have allowed the fabrication of villi-like structures on soft materials such as
collagen (1 – 800 MPa) (Fig. 1.28a).183 This system was adapted to a custom-made
culture insert, so TEER and permeability measurements were performed.286
Results suggested that the 3D intestinal model could improve the correlation
between in vitro models and native human small intestine.104 This approach also
proved that the expression of MUC17 was highly enhanced in the 3D villi model,
compared to a monolayer culture (fig. 1.28b). This finding suggests that the
architecture of the villi induces physiological changes in human intestinal cells.287
Although topographic features of villi were recreated in collagen, this can
form a barrier to the diffusion of some drugs, and can be biodegraded after short
term-cell culture. To overcome these issues, alternatives such as PLGA have been
proposed. PLGA porous scaffolds allowed the diffusion of biomolecules. They also
allowed cell attachment and were suitable for the differentiation of primary cells
from crypt mice, mimicking the differentiation process in vivo (Fig. 1.28c).197
Epithelial cells were at different stages of differentiation along the crypt−villus
axis, and this altered where bacteria reside.288 Also, strains of commensal bacteria
can live and exert their effects against pathogenic Salmonella (Fig. 1.28d,e).
Recently, organoids were incorporated into these PLGA synthetic intestinal
niches, together with other cells including macrophages. It was seen that
lactobacillus enhance enterocyte differentiation, and bacteria (E. coli) negatively
affects growth and differentiation. 3D scaffold was also tubularized to be
implanted in mucosal defects in animals. Mucosa regeneration was achieved with
native-like characteristics (Fig. 1.28f,g).289 Other approaches use
polyethersulfone (PES) hollow fibers to mimic small intestinal tube. Caco-2 cells
formed cell monolayers on the inner surface and showed higher degree of
differentiation than conventional 2D models. However, the diameter of fibers was
too small (900 µm) compared to diameter of human small intestine (2.5 cm), and
no three-dimensional features were incorporated on the inner surface.290 Silk-
based porous scaffolds were fabricated with a screw-patterned hollow lumen
(400 µm ridge-like features) and were used as architectural and functional
construct by culturing several intestinal cell types (1.28h). Primary human
intestinal myofibroblasts were seeded within the scaffold and Caco-2 and HT29
cells were cultured on its surface. These synthetic intestinal tissues permit the
accumulation of mucus, and interact with Lactobacillus rhamnosus GG strain.
However, the three-dimensional architecture based on ridges do not faithfully
mimic the finger-like morphology of villi. In addition, TEER and permeability
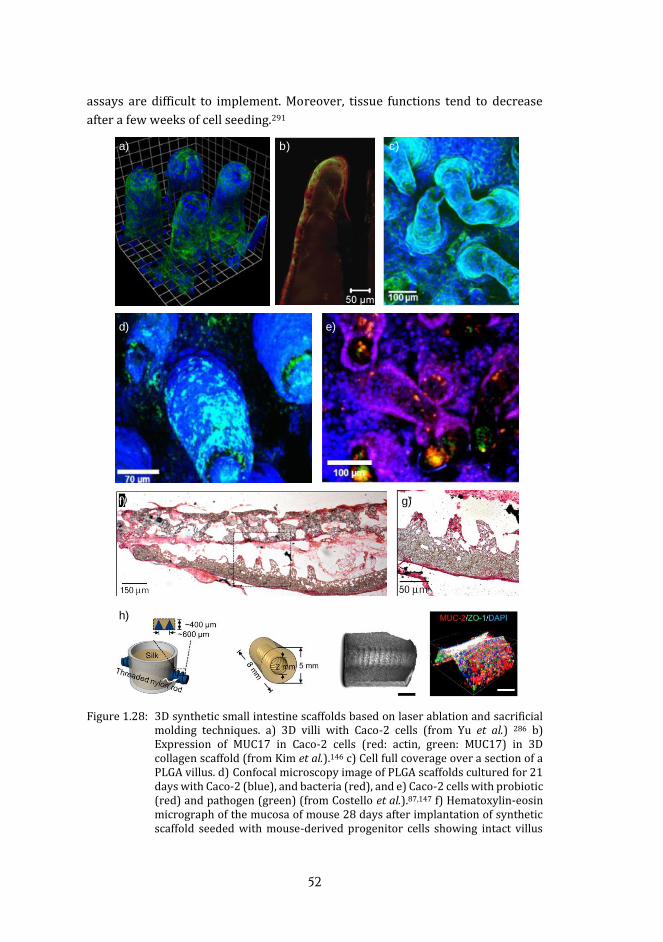
52
assays are difficult to implement. Moreover, tissue functions tend to decrease
after a few weeks of cell seeding.291
Figure 1.28: 3D synthetic small intestine scaffolds based on laser ablation and sacrificial molding techniques. a) 3D villi with Caco-2 cells (from Yu et al.) 286 b)
Expression of MUC17 in Caco-2 cells (red: actin, green: MUC17) in 3D collagen scaffold (from Kim et al.).146 c) Cell full coverage over a section of a PLGA villus. d) Confocal microscopy image of PLGA scaffolds cultured for 21 days with Caco-2 (blue), and bacteria (red), and e) Caco-2 cells with probiotic (red) and pathogen (green) (from Costello et al.).87,147 f) Hematoxylin-eosin micrograph of the mucosa of mouse 28 days after implantation of synthetic scaffold seeded with mouse-derived progenitor cells showing intact villus
a) b) c)
d) e)
f) g)
h)

53
structure. g) Higher magnification of the highlighted area (from Shaffiey et al.).148 h) Fabrication process for silk-based porous scaffolds for 3D human intestine engineering, and a fluorescence image of a cell covered ridge.
The architecture of small intestine has been also captured into in vitro
models using decellularized animal small intestine segments. Native tissue has
been used as a template to generate scaffolds with three-dimensional intestinal
features. Chemical vapor deposition of silica was used to mimic the topography
of the intestinal basement membrane.292 However, due to the fragile nature of
silica, the replicas were unsuitable for cell culture or to serve as molds. Recently
this method has been improved using poly (p-xylylene) polymer, which can serve
as a mold to fabricate PDMS replicas with the tissue architecture used as cellular
growth substrates.293
Overall, microfabrication techniques have proved that better in vitro
epithelial models can be developed by recapitulating the in vivo 3D tissue
architecture. However, to be of practical use in the in vitro modelling of diseases,
the preclinical screening for drug toxicity and the understanding of organ
development, these systems should be easy to fabricate and be compatible with
conventional cell culture and biological characterization techniques. This thesis
aims to further accelerate this shift from 2D to 3D biomimetic models by
providing a new cell culture platform for intestinal epithelial tissue.

54
2 Hypothesis and objectives
2

55
56
In vitro assays are recently shifting from the use of 2D cell monolayers to
the use of organotypic, 3D cell cultures, as it is becoming increasingly evident that
the “flat biology” approach is not predictive of in vivo tissue responses. In
particular, the current in vitro human intestinal models provide data that is not
predictive of the in vivo behavior. Our hypothesis is that, by developing a new
model that recapitulates the 3D architectural features of the native tissue in an
appropriate biomaterial, advanced in vitro models of the intestinal epithelium can
be produced. Therefore, the overall aim of this thesis is to engineer a small
intestinal in vitro model that mimics the villi-like architecture and the mechanical
properties of the intestinal epithelium able to support the growth of a functional
epithelial intestinal cell barrier. Towards this objective, specific objectives are
defined as:
• To fabricate hydrogel microstructures by photolithography, obtaining in
a single-step process self-standing villi-like microstructures resembling
the small intestine 3D architecture. To define the relationships between
the material properties, the process parameters and the obtained 3D
structures.
• To provide the hydrogels with the proper biochemical, mechanical and
physicochemical properties for their successful bioactivity. To
investigate the effects of processing parameters in the formation of the
3D villi-like microstructures.
• To evaluate the interactions between epithelial cells and the
functionalized microstructured hydrogels, analyzing the cell behavior
and the formation of a functional epithelial cell barrier. To determine the
relationship between the fabrication parameters and the epithelial
phenotype. To design and implement engineering processes leading to
interface the new in vitro models with conventional testing approaches.

57

58
3 Materials and Methods
3

59
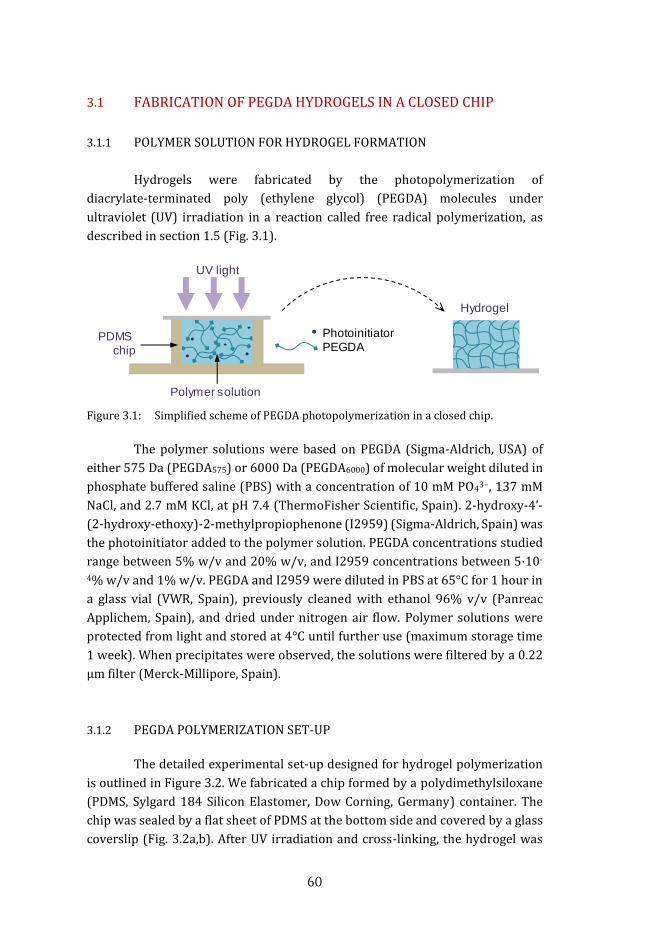
60
3.1 FABRICATION OF PEGDA HYDROGELS IN A CLOSED CHIP
3.1.1 POLYMER SOLUTION FOR HYDROGEL FORMATION
Hydrogels were fabricated by the photopolymerization of
diacrylate-terminated poly (ethylene glycol) (PEGDA) molecules under
ultraviolet (UV) irradiation in a reaction called free radical polymerization, as
described in section 1.5 (Fig. 3.1).
Figure 3.1: Simplified scheme of PEGDA photopolymerization in a closed chip.
The polymer solutions were based on PEGDA (Sigma-Aldrich, USA) of
either 575 Da (PEGDA575) or 6000 Da (PEGDA6000) of molecular weight diluted in
phosphate buffered saline (PBS) with a concentration of 10 mM PO43−, 137 mM
NaCl, and 2.7 mM KCl, at pH 7.4 (ThermoFisher Scientific, Spain). 2-hydroxy-4’-
(2-hydroxy-ethoxy)-2-methylpropiophenone (I2959) (Sigma-Aldrich, Spain) was
the photoinitiator added to the polymer solution. PEGDA concentrations studied
range between 5% w/v and 20% w/v, and I2959 concentrations between 5·10-
4% w/v and 1% w/v. PEGDA and I2959 were diluted in PBS at 65°C for 1 hour in
a glass vial (VWR, Spain), previously cleaned with ethanol 96% v/v (Panreac
Applichem, Spain), and dried under nitrogen air flow. Polymer solutions were
protected from light and stored at 4°C until further use (maximum storage time
1 week). When precipitates were observed, the solutions were filtered by a 0.22
µm filter (Merck-Millipore, Spain).
3.1.2 PEGDA POLYMERIZATION SET-UP
The detailed experimental set-up designed for hydrogel polymerization
is outlined in Figure 3.2. We fabricated a chip formed by a polydimethylsiloxane
(PDMS, Sylgard 184 Silicon Elastomer, Dow Corning, Germany) container. The
chip was sealed by a flat sheet of PDMS at the bottom side and covered by a glass
coverslip (Fig. 3.2a,b). After UV irradiation and cross-linking, the hydrogel was
UV light
PDMS chip
Polymer solution
PhotoinitiatorPEGDA
Hydrogel
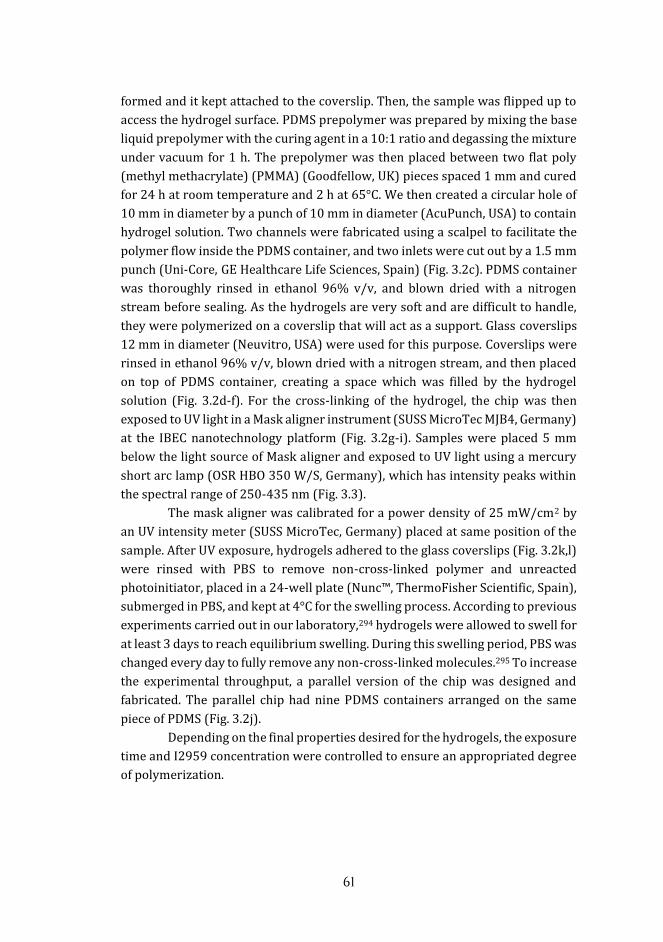
61
formed and it kept attached to the coverslip. Then, the sample was flipped up to
access the hydrogel surface. PDMS prepolymer was prepared by mixing the base
liquid prepolymer with the curing agent in a 10:1 ratio and degassing the mixture
under vacuum for 1 h. The prepolymer was then placed between two flat poly
(methyl methacrylate) (PMMA) (Goodfellow, UK) pieces spaced 1 mm and cured
for 24 h at room temperature and 2 h at 65°C. We then created a circular hole of
10 mm in diameter by a punch of 10 mm in diameter (AcuPunch, USA) to contain
hydrogel solution. Two channels were fabricated using a scalpel to facilitate the
polymer flow inside the PDMS container, and two inlets were cut out by a 1.5 mm
punch (Uni-Core, GE Healthcare Life Sciences, Spain) (Fig. 3.2c). PDMS container
was thoroughly rinsed in ethanol 96% v/v, and blown dried with a nitrogen
stream before sealing. As the hydrogels are very soft and are difficult to handle,
they were polymerized on a coverslip that will act as a support. Glass coverslips
12 mm in diameter (Neuvitro, USA) were used for this purpose. Coverslips were
rinsed in ethanol 96% v/v, blown dried with a nitrogen stream, and then placed
on top of PDMS container, creating a space which was filled by the hydrogel
solution (Fig. 3.2d-f). For the cross-linking of the hydrogel, the chip was then
exposed to UV light in a Mask aligner instrument (SUSS MicroTec MJB4, Germany)
at the IBEC nanotechnology platform (Fig. 3.2g-i). Samples were placed 5 mm
below the light source of Mask aligner and exposed to UV light using a mercury
short arc lamp (OSR HBO 350 W/S, Germany), which has intensity peaks within
the spectral range of 250-435 nm (Fig. 3.3).
The mask aligner was calibrated for a power density of 25 mW/cm2 by
an UV intensity meter (SUSS MicroTec, Germany) placed at same position of the
sample. After UV exposure, hydrogels adhered to the glass coverslips (Fig. 3.2k,l)
were rinsed with PBS to remove non-cross-linked polymer and unreacted
photoinitiator, placed in a 24-well plate (Nunc™, ThermoFisher Scientific, Spain),
submerged in PBS, and kept at 4°C for the swelling process. According to previous
experiments carried out in our laboratory,294 hydrogels were allowed to swell for
at least 3 days to reach equilibrium swelling. During this swelling period, PBS was
changed every day to fully remove any non-cross-linked molecules.295 To increase
the experimental throughput, a parallel version of the chip was designed and
fabricated. The parallel chip had nine PDMS containers arranged on the same
piece of PDMS (Fig. 3.2j).
Depending on the final properties desired for the hydrogels, the exposure
time and I2959 concentration were controlled to ensure an appropriated degree
of polymerization.

62
Figure 3.2: Schematics of the hydrogel fabrication set-up. a) Detailed top view and b)
cross-section of the chip. Photographs of c) a PDMS container, d) coverslip placing on the PDMS container, and e) polymer solution flown inside of the PDMS container. Diagram of the fabrication procedure: once the coverslip is placed on top of the chip, the PDMS container is filled with the polymer solution (f). Then, the chip is exposed to UV light (g). Finally, the coverslip is removed and the disc-shaped hydrogel kept adhered on the coverslip (h). Image of i) the set-up placed on the Mask aligner instrument. j) PDMS array of nine containers. Photographs of k) 6.5% w/v PEGDA6000 and l) 20% w/v PEGDA575 hydrogels. Scale bars = 5 mm.
Hydrogel
PDMS containerInlet
Coverslip Inlet
PDMS
Coverslip
PDMS
Hydrogel
a) b)
c) d) e)
f) g) h)
i) j)
k) l)

63
Figure 3.3: Intensity distribution at the spectral region of the mercury short arc lamp set
in the Mask aligner. Extracted from OSRAM datasheet.296
3.1.3 EFFECT OF THE PHOTOINITIATOR CONCENTRATION ON PEGDA PHOTOPOLYMERIZATION
To study how the amount of photoinitiator affects PEGDA
polymerization, disc-shaped hydrogels were photopolymerized by using
different I2959 concentrations. Solutions of PEGDA575 or PEGDA6000 at 5%, 10%
and 20% w/v in PBS were used for this purpose. These polymeric solutions were
mixed with several concentrations of photoinitiator (5·10-4% w/v, 0.05% w/v,
and 0.5% w/v of I2959) and were exposed to UV light for 150 s. The color
(transparent/white) of hydrogels was used as a parameter to qualitative assess
the polymerization degree. To clarify the relationship between polymerization
degree and the photoinitiator concentration, the fractional monomer conversion
(p) was theoretically estimated using equation 14 (section 1.4).
p = 1 − exp
[ (8kp
2f[PI]0
kdkt)
12
[exp (−kdt
2) − 1]
] Eq. 14
where rate constants of decomposition, propagation and termination are defined
by kd, kp, and kt. The initial photoinitiator concentration [PI]0 and the
photoinitiator efficiency (f) were also considered. The photoinitiator
characteristics are incorporated in the definition and quantification of kd (Eq. 3),
where ϕ is the photoinitiator quantum yield, ε the photoinitiator molar
absorptivity, I the intensity of UV light, NA the Avogadro’s number, h the Planck´s
constant, c the speed of light, and λ the wavelength of initiating light (λ).166

64
kd =(2.303ε)Iλ
NAhc Eq. 3
Taking into account that photoinitiator I2959 shows the highest molar
absorptivity (400 M-1 cm-1) at wavelengths below 340 nm,177 and the spectral
emission of the lamp is centered at 313 nm, this wavelength and ε = 400 M-1 cm-1
were selected for the calculations. In addition, 25 mW/cm2 of UV intensity were
measured with a probe at 365 nm. Then, integrating the area under the intensity
curve between 286 nm and 340 nm (Fig. 3.3), an intensity of 37.5 mW/cm2 was
estimated as total intensity irradiating the sample.
3.1.4 EFFECTS OF THE EXPOSURE TIME ON HYDROGEL HEIGHT
Disc-shaped hydrogels were used to investigate the effects of UV
exposure time on polymerization. For this purpose, 10% w/v PEGDA575, and 10%
w/v PEGDA6000 solutions were prepared in PBS, and 1% w/v I2959 was added as
photoinitiator. Polymer solutions were UV exposed during several times: 10 s, 25
s, 40 s, 100 s, and 150 s. To obtain images of the profile of disc-shaped hydrogels
suitable for height measurements, the imaging set-up of the OCA15 Plus Contact
Angle apparatus (DATAPHYSICS, Germany) was used. After letting the hydrogels
to swell for three days in PBS, wet samples were placed at the center of the contact
angle sample holder and photographs were taken. Then, images were analyzed
by ImageJ free software (http://rsb.info.nih.gov/ij, National Institutes of Health,
USA). The Height was measured describing a line from the coverslip to the top of
the hydrogel and a PDMS piece of 10 mm was used as reference. Data was plotted
and analyzed with OriginPro 8.5 software.
3.2 FABRICATION OF PEGDA MICROSTRUCTURED HYDROGELS
3.2.1 SET-UP FOR THE FABRICATION OF HYDROGEL MICROSTRUCTURES
To produce microstructures on PEGDA hydrogels a photomask was
placed on top of the glass coverslip (Fig. 3.4a). The photomask pattern design
consisted on a 0.5 x 0.5 mm2 array of circular UV-transparent windows. Two
diameters of windows and window spacing were used: 1) a large one of 300 µm
in diameter and spaced 300 µm, which had a density of 4 windows/mm2 (Fig.
3.4b,c) and made easier characterizations. 2) 100 µm in diameter and spaced 100
µm, which had a density of 25 windows/mm2 (Fig. 3.4d,e), based on the
anatomical geometry of human villi (about 125 µm in diameter),9,10 and on villi

65
surface density (20-40 villi/mm2).4 Photomasks were designed using AutoCAD
software (Autodesk) and printed on acetate films (CAD/Art Services, USA). To use
the parallel version of the chip (nine containers arranged on the same piece of
PDMS) photomask designing was also arranged in nine arrays of circular
windows in same photomask.
Figure 3.4: Simplified scheme of the fabrication set-up of the hydrogel microstructures.
(a) Drawing of the photomask design used to microstructure hydrogels. Detail of photomask pattern with UV-transparent windows of 100 µm (b,c) and 300 µm (d,e) in diameter.
Figure 3.5: Schematics of UV exposure alternatives for hydrogel microstructuring. a)
Single UV exposure and b) UV exposure in two steps.
UV light
PDMS container
Hydrogel
Coverslip
Polymer solution
Photomask
a)
b) c) d) e)
5 mm
Ø 100 µm
100 µm
5 mm
Ø 300 µm
300 µm
a) Single UV exposure
b) Double UV exposure
1st UV exposure 2nd UV exposurewithout photomask with photomask
Microstructures
Microstructures
Hydrogel base

66
For hydrogel microstructuring two alternatives were tried: 1) UV light
exposure in a single step, or 2) UV light exposure in two steps. In the first
alternative, hydrogels were exposed once with a photomask resulting in
microstructures that were not connected among them (Fig. 3.5a). The second
alternative was carried out to create a homogeneous hydrogel surface instead of
the dual hydrogel-glass (coverslip) surface of the first one. When performed in
two steps, the chip was UV exposed without photomask to create a thin layer of
hydrogel that we called a base (Fig. 3.5b) and, immediately, a second UV exposure
took place with the photomask for the microstructuring of the hydrogel.
3.2.2 GROWTH DYNAMICS OF THE HYDROGEL MICROSTRUCTURES
To study the growth of microstructures 10% w/v PEGDA575 in PBS was
used as polymer solution. Hydrogels were fabricated using a photomask with
windows 300 µm in diameter to make the analysis easier. Microstructures were
fabricated by single UV exposure, at different exposure times ranging from 70 to
110 s at intervals of 5 s. Then, microstructures were imaged by bright field
microscopy in wet, taking top view captions to measure the diameter of the
microstructures. Five samples were imaged for each exposure time, measuring at
least 100 microstructures per sample. In addition, ten microstructures of each
exposure time were imaged by SEM to compute their height, following the
protocol described in section 3.2.4. Height and diameter values as a function of
the UV exposure time, and the contours of the microstructures as a function of
height and diameter were plotted with OriginPro 8.5 software.
3.2.3 EFFECTS OF THE FABRICATION PARAMETERS ON THE MORPHOLOGY
AND HEIGHT OF THE MICROSTRUCTURED HYDROGELS
Effects of the exposure times used to form the base (ranging 0-15 s) and
the microstructures (ranging 70-150 s) were analyzed by comparing the
resulting morphologies and dimensions of microstructures. Shape and
dimensions were also compared as a function of the PEGDA molecular weight
(575, 6000), and polymer concentration (5%, 7.5%, and 10% w/v). All
experimental conditions are listed in Table 3.1.
After fabrication, microstructures were imaged by optical microscopy
and their morphology and height were assessed following the protocol described
in section 3.2.5. At least three microstructures of two samples were analyzed for
each condition.

67
PEGDA575 PEGDA6000
5% 7.5% 10% 5% 7.5% 10%
Fir
st U
V e
xpo
sure
(H
yd
roge
l bas
e)
+
Seco
nd
UV
exp
osu
re (
Mic
rost
ruct
uri
ng)
0 s + 70 s 0 s + 70 s 0 s + 70 s 0 s + 70 s 0 s + 70 s 0 s + 70 s
0 s + 90 s 0 s + 90 s 0 s + 90 s 0 s + 90 s 0 s + 90 s 0 s + 90 s
0 s + 110 s 0 s + 110 s 0 s + 110 s 0 s + 110 s 0 s + 110 s 0 s + 110 s
0 s + 130 s 0 s + 130 s 0 s + 130 s 0 s + 130 s 0 s + 130 s 0 s + 130 s
0 s + 150 s 0 s + 150 s 0 s + 150 s 0 s + 150 s 0 s + 150 s 0 s + 150 s
5 s + 70 s 5 s + 70 s 5 s + 70 s 5 s + 70 s 5 s + 70 s 5 s + 70 s
5 s + 90 s 5 s + 90 s 5 s + 90 s 5 s + 90 s 5 s + 90 s 5 s + 90 s
5 s + 110 s 5 s + 110 s 5 s + 110 s 5 s + 110 s 5 s + 110 s 5 s + 110 s
5 s + 130 s 5 s + 130 s 5 s + 130 s 5 s + 130 s 5 s + 130 s 5 s + 130 s
5 s + 150 s 5 s + 150 s 5 s + 150 s 5 s + 150 s 5 s + 150 s 5 s + 150 s
10 + 70 s 10 + 70 s 10 + 70 s 10 + 70 s 10 + 70 s 10 + 70 s
10 + 90 s 10 + 90 s 10 + 90 s 10 + 90 s 10 + 90 s 10 + 90 s
10 + 110 s 10 + 110 s 10 + 110 s 10 + 110 s 10 + 110 s 10 + 110 s
10 + 130 s 10 + 130 s 10 + 130 s 10 + 130 s 10 + 130 s 10 + 130 s
10 + 150 s 10 + 150 s 10 + 150 s 10 + 150 s 10 + 150 s 10 + 150 s
15 + 70 s 15 + 70 s 15 + 70 s 15 + 70 s 15 + 70 s 15 + 70 s
15 + 90 s 15 + 90 s 15 + 90 s 15 + 90 s 15 + 90 s 15 + 90 s
15 + 110 s 15 + 110 s 15 + 110 s 15 + 110 s 15 + 110 s 15 + 110 s
15 + 130 s 15 + 130 s 15 + 130 s 15 + 130 s 15 + 130 s 15 + 130 s
15 + 150 s 15 + 150 s 15 + 150 s 15 + 150 s 15 + 150 s 15 + 150 s
Table 3.1. List of UV exposure times and polymer solutions used to study their effects on the morphology of microstructures.
3.2.4 MORPHOLOGY ASSESSMENT BY SCANNING ELECTRON MICROSCOPY
(SEM)
Scanning Electron Microscopy (SEM) was used to image the geometry
and the surface morphology of microstructured hydrogels. As this technique
works under high vacuum, water must be removed from the samples without
affecting their three-dimensional structure. Two preparation methods were
assayed. In a first attempt, freeze-drying technique was used. For this purpose,
hydrogels were first rinsed in Milli-Q water to remove salts. Then, hydrogels were
immersed in liquid nitrogen and freeze-dried for 1 week at -50°C and 0.06 mbar
of pressure (Christ Alpha 1-4 SC, SciQuip, UK). As a second approach, critical point
drying was used. For this purpose, hydrogels were rinsed in Milli-Q water to
remove salts, and dehydration was carried out by their sequential immersion in
graded ethanol solutions in Milli-Q water: 30%, 50%, 70%, 80%, 90%, and 96%
v/v for 5-15 min each and twice for 100% ethanol. Then, samples were placed in
the chamber of a critical point dryer (K850, Quorum technologies, UK), sealed and
cooled. Ethanol was replaced completely by liquid CO2, and by slowly heating. CO2
achieved gas phase equilibrium at 35°C and 85.06 atm to be slowly drained.

68
After either freeze-drying or critical point drying, hydrogels were imaged
by ultra-high resolution scanning electron microscopy (Nova™ NanoSEM 230, FEI
Company, The Netherlands) operating in low vacuum mode (0.5 mbar of water
vapor pressure). No conductive coating was required for imaging. Images were
analyzed by ImageJ free software to obtain microstructure dimensions. To obtain
the height of the microstructures, SEM images of tilted samples were used. The
real height was calculated by considering the tilting angle. In the images, height
was measured as the distance from top of the microstructure to its median (Fig.
3.6b).
Figure 3.6: SEM image processing to measure the height of microstructures. Schematics
of cross-section and top view and of a) non-tilted samples and b) tilted samples. Dash line is the median of the microstructure in the image. Height of microstructures was calculated by measuring the distance between the median and the top of the microstructure. Then, heights were corrected by the tilting angle.
3.2.5 MORPHOLOGY ASSESSMENT BY OPTICAL MICROSCOPY
To analyze the shape and dimensions of the hydrogel microstructures at
equilibrium swelling, samples were imaged by bright field microscope (Nikon
Eclipse Ts2, Japan) or stereoscope microscopy (Leica MZ10, Germany) in wet
conditions. To measure the dimeter, top view images were collected and then
measured. On the other hand, for the complete morphology analysis,
microstructured samples were vertically cross-sectioned and then imaged.
Heightm
a)
b)

69
Figure 3.7: Schematics of the sectioning process of microstructured hydrogels. a,b)
cross-sectioning of the hydrogels. c,d) Cut to obtain a single row of microstructures. e) Height and diameter determination of microstructures, f) when interstitial hydrogel (asterisk) is polymerized between microstructures. Scale bars: b = 1 mm, d = 0.5 mm.
First of all, hydrogels were sectioned in two pieces using a needle of 27G
¾” (0.4 mm in diameter) (BD Microlance, Spain) as a scalpel (Fig. 3.7a,b). Then,
thin slices containing individual rows of microstructures were sectioned with the
same needle and used to image the cross-section of the microstructures (Fig.
3.7c,d). The cutting process was carried out keeping hydrogels submerged in PBS
and was monitored using a stereoscope or bright field microscopy.
The difficulties of this process were based on the manipulation of the
samples to avoid destroying hydrogels using the needle. Rows containing
microstructures with undesired fractures or uncompleted were discarded. One
row of each sample was imaged, containing more than ten microstructures.
ImageJ free software was used to measure the dimensions of the microstructures.
The height was determined by the distance between the tip of microstructures
and the base. When there was hydrogel between the microstructures, the height
was determined as the distance between the tip of microstructure and the profile
of the interstitial hydrogel. The diameter was measured at half of the
microstructure height (Fig. 3.7e,f).
3.3 COPOLYMERIZATION OF PEGDA AND ACRYLIC ACID
PEGDA hydrogels need to be modified to support cell adhesion and
culture. Since PEGDA backbone does not have any functional group that would
Hei
ght
Diameter
Microstructuresrow
Diameter
Hei
ght
*Needle
a) c) e)
b) d) f)
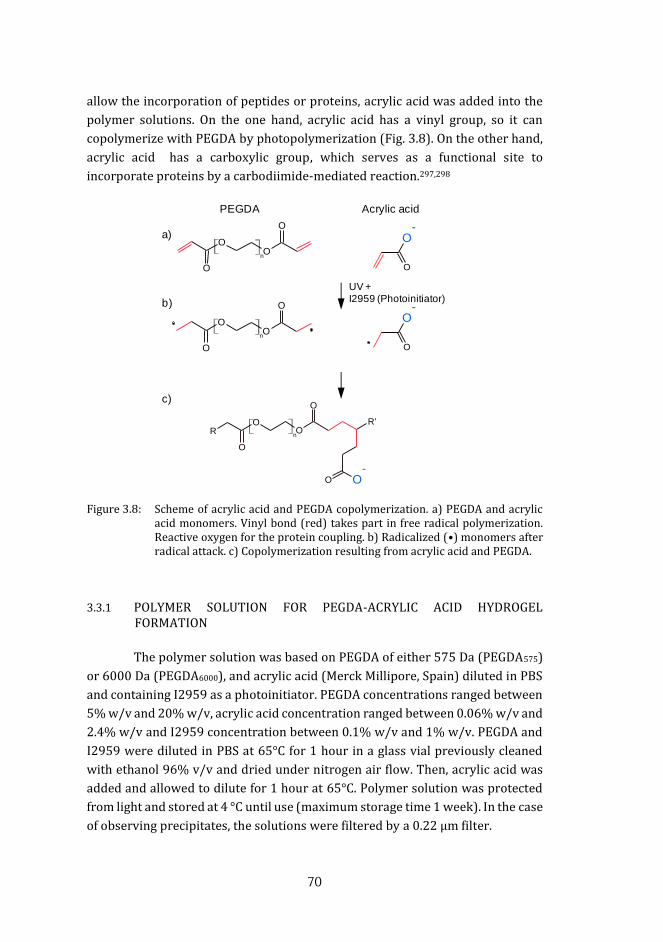
70
allow the incorporation of peptides or proteins, acrylic acid was added into the
polymer solutions. On the one hand, acrylic acid has a vinyl group, so it can
copolymerize with PEGDA by photopolymerization (Fig. 3.8). On the other hand,
acrylic acid has a carboxylic group, which serves as a functional site to
incorporate proteins by a carbodiimide-mediated reaction.297,298
Figure 3.8: Scheme of acrylic acid and PEGDA copolymerization. a) PEGDA and acrylic
acid monomers. Vinyl bond (red) takes part in free radical polymerization. Reactive oxygen for the protein coupling. b) Radicalized (•) monomers after radical attack. c) Copolymerization resulting from acrylic acid and PEGDA.
3.3.1 POLYMER SOLUTION FOR PEGDA-ACRYLIC ACID HYDROGEL FORMATION
The polymer solution was based on PEGDA of either 575 Da (PEGDA575)
or 6000 Da (PEGDA6000), and acrylic acid (Merck Millipore, Spain) diluted in PBS
and containing I2959 as a photoinitiator. PEGDA concentrations ranged between
5% w/v and 20% w/v, acrylic acid concentration ranged between 0.06% w/v and
2.4% w/v and I2959 concentration between 0.1% w/v and 1% w/v. PEGDA and
I2959 were diluted in PBS at 65°C for 1 hour in a glass vial previously cleaned
with ethanol 96% v/v and dried under nitrogen air flow. Then, acrylic acid was
added and allowed to dilute for 1 hour at 65°C. Polymer solution was protected
from light and stored at 4 °C until use (maximum storage time 1 week). In the case
of observing precipitates, the solutions were filtered by a 0.22 µm filter.
a)
b)
c)
PEGDA Acrylic acid
O O-
RO
O
O
O
R'n
NHProtein
O
RO
O
O
O
R'n
O
O-
O
O-
OO
O
O
n
OO
O
O
n
UV + I2959 (Photoinitiator)
71
3.3.2 CHARACTERIZATION OF PEGDA-ACRYLIC ACID COPOLYMERIZATION
To analyze the success of the copolymerization reaction between PEGDA
and acrylic acid, the chemical modifications on the structure of the resulting
hydrogels were monitored by Attenuated total reflectance - Fourier transform
infrared spectroscopy (ATR–FTIR). This technique is based on measuring the
absorption of IR light when its frequency matches the vibrational frequency of
chemical bonds. To reduce water contribution in the recorded spectrum,
hydrogels had to be dried. As hydrogels suffered a dramatic shrinking after drying
because of their high-water content, large pieces of hydrogels were used. Disc-
shaped hydrogels were fabricated using a PDMS container of 2 mm in height and
12 mm in diameter. Polymer solutions containing 10% w/v PEGDA575 or
PEGDA6000, and 0.3% w/v or 1.2% w/v acrylic acid in PBS with 1% w/v I2959
were prepared. PEGDA solutions without acrylic acid were also prepared and
used as a reference. Hydrogels were polymerized by 300 s of UV exposure to
ensure the full cross-linking of the 2 mm in height. After fabrication, hydrogels
were removed from the coverslip and placed in a 12-well plate. Then, hydrogels
were first rinsed thoroughly with Milli-Q water, and then they were allowed to
dry during 24 h in a vacuum desiccator.
Fourier transform spectroscopy was performed on a spectrophotometer
(Nicolet iS 10, ThermoFisher Scientific, Spain) by using an ATR diamond and the
deuterated triglycine sulphate (DTGS) detector. ATR avoids the problem of strong
attenuation of the IR signal in highly absorbing media, such as aqueous solutions.
An average of 16 scans per hydrogel in the range of 500-4000 cm-1 with a
resolution of 4 cm-1 were performed. Raw data was processed and spectra were
plotted as an average of at least two samples per condition with OriginPro 8.5
software.
3.3.3 TOLUIDINE BLUE O (TBO) ASSAY TO QUANTIFY THE DENSITY OF
CARBOXYLIC GROUPS
Toluidine blue (tolonium chloride) is an acidophilic dye that reversibly
binds to acidic molecules (sulfates, carboxylates, and phosphates) in a pH-
dependent manner, and has been previously used in the detection of carboxylic
groups (Fig. 3.9).299,300

72
Figure 3.9: Simplified scheme of the reversible reaction between TBO and carboxylic
groups. a) The TBO molecules in acidic solutions exist as protonated positively-charged species. b) In alkaline solutions, deprotonated forms of TBO and carboxylic groups can react. c) Absorption spectra of free TBO+ in acidic solution that shows an intense peak at about 633 nm (solid line), and the TBO anchored to acid group TBO-R in alkaline solution (dashed line).301
For the quantification of the carboxylic groups in the PEGDA - acrylic acid
copolymerized hydrogels, disc-shaped samples (10 mm in diameter and 1 mm in
height) were prepared. PEGDA575 and PEGDA6000 at 5% w/v or 10% w/v in PBS
solution containing 1% w/v of photoinitiator (I2959) were used. Acrylic acid was
added at concentrations of 0.06% w/v (8.3 mM), 0.12% w/v (16.7 mM), 0.3% w/v
(41.6 mM), 0.6% w/v (83.3 mM), 1.2% w/v (166.5 mM), and 2.4% w/v (333 mM).
PEGDA solutions cross-linked without acrylic acid were used as controls. After
fabrication hydrogels were removed from the coverslip and allowed to swell in
PBS at pH 10 at 4°C in a 12-well plate. To perform the TBO assay three hydrogels
of each condition were incubated overnight in 1.5 mL of a solution containing 15
mM toluidine blue O (Sigma-Aldrich, Spain) in PBS at pH 10 and at room
temperature in a rotating plate (Heidolph Rotomax 120, Spain) set at 100 rpm.
To remove any unbound dye, samples were frequently rinsed with PBS at pH 10
for 3 days. Thereafter, hydrogels were immersed in 2 mL of 50 vol.% glacial acetic
acid (Panreac Applichem, Spain) in Milli-Q water for 2 h. The acidic medium
caused the release of TBO solution from the hydrogel into the solution.300
NH2
N
N
S
R
O
O
NH2
N
N+
S
R
O
OH
TBO
Carboxyl group
basic buffer
acid buffer

73
Figure 3.10: a) Scheme of the TBO assay. After fabrication, hydrogels were left to react
overnight in toluidine blue. Finally, hydrogels were soaked in acetic acid, TBO was released and the absorbance of the resulting solution was measured at 633 nm. b) Calibration curve for the concentration of toluidine blue dye using optical density at wavelength of 633 nm. Detail of linear fitting at the region between 0 and 40 µM.
Finally, the absorbance of the solution at 633 nm was measured with a
plate reader (Tecan infinite M200 PRO Multimode Microplate Reader,
Switzerland) (Fig. 3.10a). To get quantitative date, a calibration curve was
generated using solutions of TBO in 50 vol.% glacial acetic acid in Milli-Q water
with concentrations ranging from 0 to 600 µM. Figure 3.10b shows the light
absorbance of solutions containing a known amount of TBO at a 633 nm. The
linear portion of the graph was confined to the region between 0 and 37.5 µM
TBO. When sample solutions were more opaque than 37.5 µM TBO solution, they
were diluted until absorbance fitted within the range of detection. Then, the
dilution factor was multiplied if necessary to extract the final molarity of the
hydrogel samples. The average number of total COOH moles in the hydrogels was
plotted as a function of the total number of acrylic acid moles in the polymer
0 100 200 300 400 500 6000
1
2
3
abs
AB
S (
63
3)
TBO (uM)
a)
b)
3
2
1
0
0 10 20 30 400,0
0,5
1,0
AB
S (
63
3)
TBO (uM)
R2 = 0.9937
Ab
so
rba
nce
(a.u
.)
Ab
so
rba
nce

74
solution. As a non-parametric study, Mann-Whitney U test and Kruskal Wallis test
were used to perform the statistical analysis.
3.3.4 MECHANICAL PROPERTIES OF PEGDA – ACRYLIC ACID HYDROGELS
To determine the effects of acrylic acid on the stiffness of PEGDA-acrylic
acid hydrogels, their mechanical properties were characterized by a compression
test. Disc-shaped hydrogels of 10 mm in diameter and 2 mm in height were
fabricated for these measurements. The samples tested were fabricated using
6.5% w/v PEGDA6000 solutions in PBS with 1% w/v of I2959 and acrylic acid in
concentrations ranging from 0.06% w/v to 1.2% w/v (Table 3.2). Polymer
solutions without acrylic acid were used as a control. Polymeric solutions were
photopolymerized by exposing them for 150 s under UV light. To ensure a precise
diameter for the mechanical measurements, swollen hydrogels that increased
their diameter were punched to obtain samples 10 mm in diameter.
Acrylic
acid conc.
0% 0.06% w/v 0.12% w/v 0.3% w/v 0.6% w/v 1.2% w/v
0 mM 8.3 mM 16.6 mM 41.6 mM 83.3 mM 166.5 mM
Table 3.2: Acrylic acid concentrations used in the fabrication of hydrogels for the mechanical testing.
Stress-strain curves were obtained in compression mode with a
mechanical testing machine (Zwick-Roell Zwicki Z0.5TN, Germany). This
instrument provides up to 10 N in the load cell and has 30 mm in diameter
compression plates (Fig 3.11a,b). Swelled hydrogels were placed at the center of
the compression plates for the measurements. To avoid loss of hydration during
the test, a few drops of PBS were added just before the beginning of the
measurements. Stress-strain curves were measured under unconfined
compression using a velocity of compression of 2 mm/min. The strain rate was
limited to 1%/min and the maximum strain was limited to 10%, in agreement
with similar procedures found in literature.302,303 A small initial load of 5 mN was
used to promote an adequate contact between the hydrogel samples and the
compression plate. The stress, σ, was calculated by dividing the normal force, F,
over the hydrogel cross-sectional area, A. The strain, ε, was calculated as the
variation in the hydrogel height or plates distance, Δh, divided by the original
height or plate distance, H. Young’s modulus was calculated from the slope of the
linear part of the stress−strain curve, from 0 to 10% strain, where the samples
displayed elastic behavior (Fig. 3.11c). Three independent samples per condition
were used and statistically compared by Kruskal-Wallis test.

75
Figure 3.11: Mechanical testing scheme: a) Picture of the Zwicki testing machine, b)
drawing of uniaxial compression test where F is the normal force applied, A is the hydrogel cross-sectional area, and H the initial height of the hydrogel. c) Typical stress-strain curve followed by Young’s modulus determination (E), where stress is defined by σ and strain by ε.
3.3.5 EFFECT OF ACRYLIC ACID ON THE MORPHOLOGY OF MICROSTRUCTURED HYDROGELS
To determine the effects of acrylic acid on the shape of hydrogel
microstructures, a solution of 6.5% w/v PEGDA6000 in PBS with 1% w/v I2959
was selected. To this solution, acrylic acid was added in concentrations ranging
from 0.06% w/v (8.3 mM) to 1.2% w/v (166.5 mM) (Table 3.3). Polymer
solutions without acrylic acid was used as a control.
Acrylic acid concentration
0% 0.06% w/v 0.12% w/v 0.3% w/v 0.6% w/v 0.9% w/v 1.2% w/v
0 mM 8.3 mM 16.6 mM 41.6 mM 83.3 mM 125 mM 166.5 mM
Table 3.3: Acrylic acid concentrations used in the fabrication of hydrogels for the study of the effects of acrylic acid on the morphology of the hydrogel microstructures.
The solutions were used to fabricate hydrogel microstructures with the
photomasks containing windows of 100 µm in diameter, following the procedure
described in section 3.2. Microstructured hydrogels were fabricated by UV
exposure in two steps, using 10 s of exposure for the formation of the hydrogel
base and 70 s of exposure for the formation of the microstructures. After three
days of swelling, samples were cut into cross sections and the microstructures
were imaged in a bright field or stereoscope microscope. The height of
microstructures was determined between their top and the base as described in
= h/H
a) b) c)
E
F
A
σ=
F/A
H
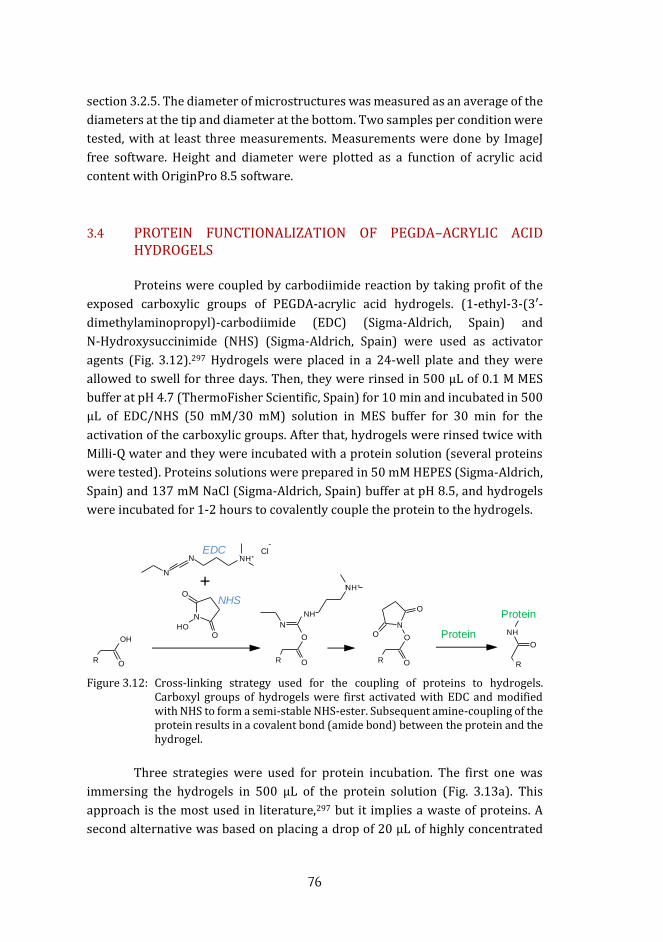
76
section 3.2.5. The diameter of microstructures was measured as an average of the
diameters at the tip and diameter at the bottom. Two samples per condition were
tested, with at least three measurements. Measurements were done by ImageJ
free software. Height and diameter were plotted as a function of acrylic acid
content with OriginPro 8.5 software.
3.4 PROTEIN FUNCTIONALIZATION OF PEGDA–ACRYLIC ACID HYDROGELS
Proteins were coupled by carbodiimide reaction by taking profit of the
exposed carboxylic groups of PEGDA-acrylic acid hydrogels. (1-ethyl-3-(3′-
dimethylaminopropyl)-carbodiimide (EDC) (Sigma-Aldrich, Spain) and
N-Hydroxysuccinimide (NHS) (Sigma-Aldrich, Spain) were used as activator
agents (Fig. 3.12).297 Hydrogels were placed in a 24-well plate and they were
allowed to swell for three days. Then, they were rinsed in 500 µL of 0.1 M MES
buffer at pH 4.7 (ThermoFisher Scientific, Spain) for 10 min and incubated in 500
µL of EDC/NHS (50 mM/30 mM) solution in MES buffer for 30 min for the
activation of the carboxylic groups. After that, hydrogels were rinsed twice with
Milli-Q water and they were incubated with a protein solution (several proteins
were tested). Proteins solutions were prepared in 50 mM HEPES (Sigma-Aldrich,
Spain) and 137 mM NaCl (Sigma-Aldrich, Spain) buffer at pH 8.5, and hydrogels
were incubated for 1-2 hours to covalently couple the protein to the hydrogels.
Figure 3.12: Cross-linking strategy used for the coupling of proteins to hydrogels.
Carboxyl groups of hydrogels were first activated with EDC and modified with NHS to form a semi-stable NHS-ester. Subsequent amine-coupling of the protein results in a covalent bond (amide bond) between the protein and the hydrogel.
Three strategies were used for protein incubation. The first one was
immersing the hydrogels in 500 µL of the protein solution (Fig. 3.13a). This
approach is the most used in literature,297 but it implies a waste of proteins. A
second alternative was based on placing a drop of 20 µL of highly concentrated
a) b)
R O
OH
R O
O
N
NH
NH+
Cl-
N
N NH+
N
O
O
OH
R O
O
NO
O
R
O
NH
Protein
+
R O
O
NO
O
Protein
NHS
EDC
R
Protein
NH+
NH+
OH
NH
HO
R R R
R R
NH
a) b)
R O
OH
R O
O
N
NH
NH+
Cl-
N
N NH+
N
O
O
OH
R O
O
NO
O
R
O
NH
Protein
+
R O
O
NO
O
Protein
NHS
EDC
R
Protein
Protein
Protein
NH+
NH+
OH
NH
HO
R R R
R R
NH
Protein
Protein

77
protein solution (>0.1 mg/mL) on top of hydrogel (Fig. 3.13b). As confinement of
the drop on top of the hydrogels was an issue we used a sliced pipette tip as a
container, filling it with 50 µL of high concentrated protein solution (Fig. 3.13c).
Different proteins were used to functionalize the hydrogels: collagen type I
(Sigma-Aldrich, Spain), Streptavidin Texas Red® (ThermoFisher Scientific,
Spain), fibronectin (Sigma-Aldrich, Spain) and laminin (Sigma-Aldrich, Spain). To
determine the success of the protein coupling reaction, hydrogels were
functionalized with fluorescent-conjugated proteins and imaged.
Figure 3.13: Protein incubation strategies. a) Soaking hydrogels in the solution, b) placing
a drop on top of hydrogel, and c) using of sliced pipette tip as a container. d) Photograph of the sliced pipette tip placing on the hydrogel sample.
3.4.1 CHARACTERIZATION OF HYDROGEL FUNCTIONALIZATION BY INFRARED SPECTROSCOPY (ATR-FTIR)
ATR-FTIR was used to verify each step of the functionalization process
described above. To this end, polymer solutions of 10% w/v PEGDA6000 in PBS
containing 1.2% w/v acrylic acid (166.5 mM) and 1% w/v I2959 were prepared.
Disc-shaped hydrogels of 2 mm in height and 12 mm in diameter were fabricated
by exposing the solutions for 300 s to UV light. Then, hydrogels were activated
with EDC/NHS solutions of two molarities (6 mM/5 mM and 50 mM/30 mM).
After that, the samples activated with 50 mM/30 mM EDC/NHS were
functionalized with 500 µL of protein solutions containing collagen type I at two
concentrations (0.04 and 0.4 mg/mL). A sample of 4 mg/mL collagen type I
solution was analyzed as a reference. Samples were first rinsed thoroughly with
Milli Q water, and then, they were allowed to dry during 24 h in a vacuum
desiccator. IR spectra were acquired by a spectrophotometer (Nicolet iS 10,
ThermoFisher Scientific, Spain). Samples were scanned in the range of 500-4000
cm-1 with a resolution of 4 cm-1. 16 scans were performed per hydrogel and the
average data were collected. Spectra were plotted with OriginPro 8.5 software
and correspond to the average of at least two samples.
Hydrogel
a) b) c) d)
Hydrogel

78
3.4.2 PROTEIN FUNCTIONALIZATION AS A FUNCTION OF THE ACRYLIC ACID CONTENT
To study the effect of acrylic acid content in the amount of protein
coupled to the hydrogel, disc-shaped hydrogels were prepared. The polymer
solution contained 7.5% w/v PEGDA6000 in PBS with 1% w/v I2959, and either
0.12% w/v (16.6 mM) or 0.6% w/v (83.3 mM) acrylic acid. Samples were
activated following the EDC/NHS protocol and then functionalized with 500 µL of
0.05 mg/mL Streptavidin Texas Red® protein solution. As controls to test
unspecific protein adsorption a set of samples without EDC/NHS activation were
also incubated with the protein solution. The amount of coupled protein was
analyzed by fluorescence microscopy. Hydrogels were mounted with
Fluoromont-G (BioNova científica, Spain), and a coverslip was directly placed on
top them. They were imaged with a Nikon Eclipse E1000 microscope (Nikon,
Japan) using the G-2A filter. Ten pictures/sample (magnification: 10X) were
taken keeping same capture parameters of three replicas per condition. Pictures
were processed on ImageJ free software. The mean gray value of each image was
obtained by the sum of gray values of all the pixels in the image divided by the
number of pixels. The intensity average values and standard deviation were
plotted with OriginPro 8.5 software. As a non-parametric study, Mann-Whitney U
test and Kruskal Wallis test were used to perform the statistical analysis
3.4.3 STUDY OF THE STABILITY OF PROTEIN FUNCTIONALIZATION
Fluorescence microscopy was used to determine the robustness of the
protein coupling reaction by evaluating its stability after repeating rinsing. To this
end, disc-shaped hydrogels (10 mm in diameter) were fabricated from a solution
of 10% w/v PEGDA575 and 0.9% w/v acrylic acid (1.25 mM) in PBS containing 1%
w/v I2959. The solution was exposed 150 s under UV light. Then, hydrogels were
functionalized with 500 µL of 0.05 mg/mL Streptavidin Texas Red® protein
solution following the protocol described previously. After the functionalization,
hydrogels were thoroughly rinsed with PBS 1, 3, or 10 times. After these rinsing
cycles the fluorescence of the samples was measured. For this purpose, hydrogels
were mounted with Fluoromont-G, and a coverslip was directly placed on top of
them. Three samples of each condition were prepared and observed on a
fluorescence microscope (Nikon Eclipse E1000, Japan) using the G-2A filter. At
least 5 pictures/sample (magnification: 10X) were taken, keeping same capture
parameters (MetaMorph software, USA). Then, images were analyzed by ImageJ
free software. The mean gray value of each image was obtained by the sum of gray
79
values of all the pixels in the image divided by the number of pixels. The intensity
average values and standard deviation were plotted with OriginPro 8.5 software.
On the other hand, another set of hydrogels were prepared using the
same polymer solutions and fabrication parameters to evaluate the influence of
storage time on the protein functionalization. Hydrogels were stored at 4°C in PBS
for 1, 3, or 7 days, changing the buffer solution every day. The fluorescence of the
samples for each time point was analyzed as described above.
3.5 CELL CULTURE AND CHARACTERIZATION
3.5.1 CELL CULTURE OF NIH-3T3 FIBROBLASTS
NIH-3T3 fibroblasts were purchased from American Type Culture
Collection (ATCC, US). Passages 3 to 5 were expanded in 75 cm2 Nunc™ flasks
(ThermoFisher Scientific, Spain) in low glucose Dulbecco’s Modified Eagle
Medium (DMEM) (Gibco/Brl Life Technologies, Paisley, UK) supplemented with
10% v/v foetal bovine serum (FBS) (Gibco, UK), 1% v/v penicillin/streptomycin
(Invitrogen, CA, USA), 1% v/v L-glutamine (Invitrogen, CA, USA) and 1% v/v
sodium pyruvate (Invitrogen, CA, USA). When cells achieved 90% of confluence
they were detached from the flask by treating them with Trypsin-EDTA (0.25%
w/v) (25200, ThermoFisher Scientific, Spain) and incubating them at 37°C for 5
min. Then, the cell suspension was diluted in cell medium and centrifuged at 1000
rpm. Finally, the supernatant was removed and the cells were resuspended in 5
mL of cell medium. The cell density was adjusted by counting cells in a Neubauer
chamber (Sigma-Aldrich, Spain). Cell seeding on microstructured or flat
hydrogels was carried out by as described in section 3.5.4. After seeding, cells on
hydrogels were maintained in an incubator (Galaxy® 14S, Eppendorf, Spain) at
37°C and 5% CO2 and cell culture medium was exchanged every 2 days.
3.5.2 CELL CULTURE OF MADIN-DARBY CANINE KIDNEY (MDCK) CELLS
MDCK (Madin-Darby canine kidney) cells were a kind gift of the
Integrative cell and tissue dynamics group of IBEC. Passages 2 to 4 were
expanded in 75 cm2 Nunc™ flasks in low glucose Dulbecco’s Modified Eagle
Medium (DMEM) supplemented with 10% v/v foetal bovine serum (FBS), 1% v/v
penicillin/streptomycin, 1% v/v L-glutamine, and 1% v/v sodium pyruvate.
When cells achieved 70% they were treated with Trypsin-EDTA (0.25% w/v)
under incubation at 37°C for 15 min. To stop the effect of the Trypsin-EDTA, cell
suspension was diluted in cell medium and centrifuged for 5 min at 1000 rpm,

80
and supernatant eliminated. Then, the cell pellet resuspended in 5 mL of cell
medium. A Neubauer chamber was used to count cell density and adjust it. The
cell seeding on hydrogels was carried out as described in section 3.5.4. After
seeding, cells on hydrogels were maintained in an incubator at 37°C and 5% CO2
and cell culture medium was exchanged every 2 days.
3.5.3 CELL CULTURE OF HUMAN EPITHELIAL COLORECTAL ADENOCARCINOMA (CACO-2) CELLS.
Caco-2 cells were kindly provided by the Physiology department from
the Faculty of Pharmacy (University of Barcelona). Passages 74 to 77 were
expanded and maintained in 75 cm2 flasks in Dulbecco’s Modified Eagle Medium
with sodium pyruvate, glutamine, and 4.5 g/L glucose (41965 Gibco, Spain)
supplemented with 10% foetal bovine serum (FBS), containing 1% v/v
penicillin/streptomycin, and 1% v/v non-essential amino acids (Gibco, UK). Cells
were maintained in an incubator at 37°C with 5% CO2 with medium exchange
every 2 days. When they achieve confluence values of 50% to 75%304 they were
treated with 0.02 mM Trypsin-0.5 mM EDTA (25300, ThermoFisher Scientific,
Spain) and incubated at 37°C until cells were fully detached (15-20 min). Then,
the cell suspension was diluted in cell medium and centrifuged. Finally, the
supernatant was removed and cells were resuspended in cell medium. Cell
density was adjusted by counting cells in a Neubauer chamber. Cell seeding on
hydrogels was carried out as described in section 3.5.4. Caco-2 cells were seeded
at low (2.5·104 cells/cm2) and high (5·105 cells/cm2) densities. After seeding on
the hydrogels, the samples were also maintained at 37ºC in an incubator with 5%
CO2 with regular medium change every 2 days.
3.5.4 CELL SEEDING STRATEGIES
After fabrication, hydrogels were left to swell at least 3 days in PBS.
Before cell seeding, hydrogels were immersed in 1 mL of 10% v/v
penicillin/streptomycin (Invitrogen, CA, USA) in PBS for 1 h in a new 24-well
plate. UV sterilization was avoided to prevent damaging proteins. Cell seeding
was carried out by adding 1 mL of a cell suspension, at different cell densities as
a function of the cell type and the experiment, on a 24-well plate containing the
hydrogels (Fig. 3.14a) and placing carefully the plate in the incubator to let the
cells deposit homogeneously everywhere. After 1 day of cell culture, hydrogels
were placed in a new sterile 24-well plate. Surface cell seeding density (cell/cm2)
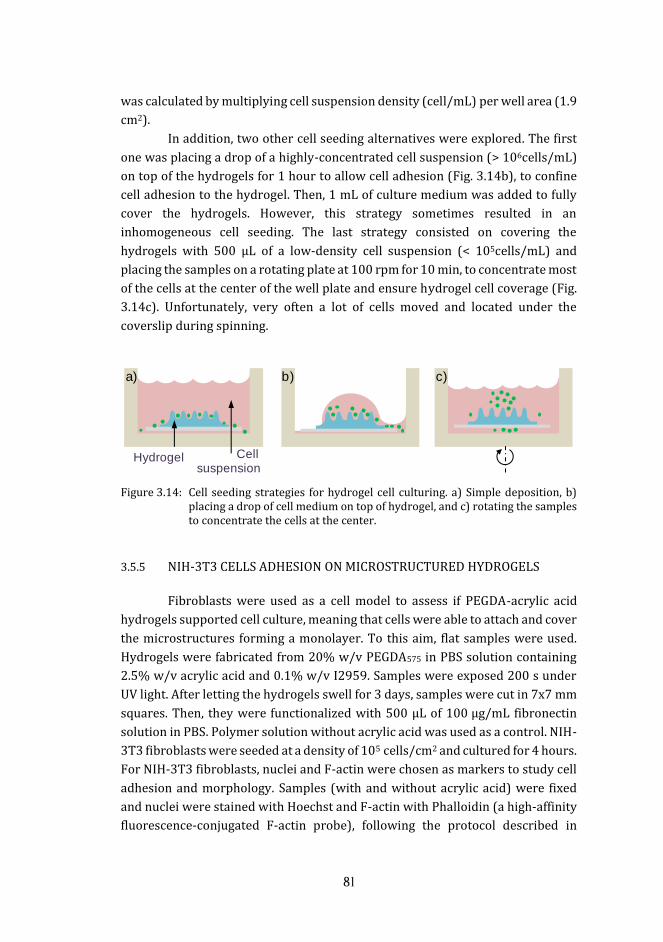
81
was calculated by multiplying cell suspension density (cell/mL) per well area (1.9
cm2).
In addition, two other cell seeding alternatives were explored. The first
one was placing a drop of a highly-concentrated cell suspension (> 106cells/mL)
on top of the hydrogels for 1 hour to allow cell adhesion (Fig. 3.14b), to confine
cell adhesion to the hydrogel. Then, 1 mL of culture medium was added to fully
cover the hydrogels. However, this strategy sometimes resulted in an
inhomogeneous cell seeding. The last strategy consisted on covering the
hydrogels with 500 µL of a low-density cell suspension (< 105cells/mL) and
placing the samples on a rotating plate at 100 rpm for 10 min, to concentrate most
of the cells at the center of the well plate and ensure hydrogel cell coverage (Fig.
3.14c). Unfortunately, very often a lot of cells moved and located under the
coverslip during spinning.
Figure 3.14: Cell seeding strategies for hydrogel cell culturing. a) Simple deposition, b)
placing a drop of cell medium on top of hydrogel, and c) rotating the samples to concentrate the cells at the center.
3.5.5 NIH-3T3 CELLS ADHESION ON MICROSTRUCTURED HYDROGELS
Fibroblasts were used as a cell model to assess if PEGDA-acrylic acid
hydrogels supported cell culture, meaning that cells were able to attach and cover
the microstructures forming a monolayer. To this aim, flat samples were used.
Hydrogels were fabricated from 20% w/v PEGDA575 in PBS solution containing
2.5% w/v acrylic acid and 0.1% w/v I2959. Samples were exposed 200 s under
UV light. After letting the hydrogels swell for 3 days, samples were cut in 7x7 mm
squares. Then, they were functionalized with 500 µL of 100 µg/mL fibronectin
solution in PBS. Polymer solution without acrylic acid was used as a control. NIH-
3T3 fibroblasts were seeded at a density of 105 cells/cm2 and cultured for 4 hours.
For NIH-3T3 fibroblasts, nuclei and F-actin were chosen as markers to study cell
adhesion and morphology. Samples (with and without acrylic acid) were fixed
and nuclei were stained with Hoechst and F-actin with Phalloidin (a high-affinity
fluorescence-conjugated F-actin probe), following the protocol described in
Hydrogel
a) b) c)
Cellsuspension

82
section 3.5.8. Three replicas for both conditions were used, and three images
were taken at 10X magnification for each sample for randomly selected areas
using a fluorescence microscope (Eclipse E1000). Images were analyzed by
ImageJ free software. Cell adhesion was obtained by counting the cell nuclei per
area. Then, the cell adhesion relative to cell seeding density was calculated and
plotted with OriginPro 8.5 software as average of nine pictures. Mann-Whitney U
test was used to perform the statistical analysis.
To determine if fibroblasts covered the microstructures forming a
monolayer, polymer solutions of 10% w/v PEGDA575 in PBS containing 1.25%
w/v and 0.1% I2959 were used. Microstructured hydrogels were fabricated using
a photomask with windows of 300 µm in diameter and a single UV exposure time
of 170 s. Samples were functionalized with 500 µL of 50 µg/mL fibronectin
solution in PBS. Fibroblasts were seeded at a density of 2.5·104 cells/cm2 and
were cultured for 7 days. Then, hydrogels were fixed and nuclei were stained with
Hoechst and F-actin with Phalloidin, following the immunostaining protocol
described 2.5.3, and fluorescence images were taken with a Nikon E1000 and a
Leica SPE microscopes. Cell coverage was calculated by counting of cell nuclei on
three microstructures of three samples, and on the glass coverslip as a control,
and was plotted with OriginPro 8.5 software. In addition, confocal microscopy
(Leica SPE) was used to obtain detailed images of the cells at different sections of
the microstructures.
3.5.6 MDCK CELLS COVERAGE ON MICROSTRUCTURED HYDROGELS
MDCK cells were used as an epithelial cell model to optimize the protein
concentration for cell adhesion on our hydrogels. Cells were seeded on PEGDA-
acrylic acid hydrogels functionalized with several laminin concentrations.
Polymer solutions of 10% w/v PEGDA575 in PBS containing 1.25% w/v acrylic
acid and 1% I2959 were used. Disc-shaped samples of 10 mm in diameter were
fabricated by UV exposure of 150 s. Hydrogels were functionalized with 500 µL
of laminin solutions at concentrations of 10, 50, or 100 µg/mL of laminin. MDCK
cells were seeded at a density of 2·105 cells/cm2 and cultured for 24 h. As control,
MDCK cells were cultured on a 24-well plate without hydrogels. Cell surface
coverage was assessed by bright field microscopy (Leica DM IRBE, Germany). At
least three images of randomly selected areas were taken of three identical
replicas using a 10X magnification. Then, images were analyzed by ImageJ free
software. Cell covered areas were measured and the relative covered surface
areas (cell covered area/image area) were calculated and plotted with OriginPro
8.5 software. Mann-Whitney U test was used to perform the statistical analysis
83
In addition, MDCK cells were used to study cell polarization on the
microstructured hydrogels fabricated with different conditions. First, two
polymer solutions were used to test the influence of polymer concentration on
cell polarization: (1) 5% w/v PEGDA575 and 0.6% w/v acrylic acid in PBS
containing 1% w/v I2959, and (2) 10% w/v PEGDA575 and 1.25% w/v acrylic acid
in PBS containing 1% w/v I2959. Microstructures were fabricated by a single UV
exposure of 170 s, using a photomask with windows of 300 µm in diameter.
Hydrogels were functionalized with 500 µL of 100 µg/mL laminin solution. Then,
MDCK cells were seeded at 2.5·104 cells/cm2 and the cell coverage on
microstructures was checked by bright field microscopy at days 7, and 14. At day
14 samples were imaged by fluorescence and confocal microscopy to evaluate cell
morphology and the presence of epithelial cell markers. For this purpose, cell
nuclei were stained with Hoechst and F-actin with Phalloidin following the same
staining protocol as in the case of fibroblasts. To evaluate cell polarization, the
expression of a tight junction-related protein, ZO-1, and cell-cell adhesion-related
protein, β-catenin, were studied following the immunostaining protocol
described in section 3.5.8.
To test the influence of the microstructure size on the cell coverage,
microstructures were fabricated using two photomasks with windows of 100 µm
and 300 µm in diameter and identical polymer solutions and exposure times
(10% w/v PEGDA575-1.25% acrylic acid, and 5% w/v PEGDA575-0.6% acrylic acid,
exposure time 170 s).
On the other hand, the influence of the hydrogel base on cell coverage
was studied using photomasks with windows of 100 µm in diameter. Polymer
solutions of 5% w/v PEGDA575 and 0.15% w/v acrylic acid in PBS containing 1%
w/v I2959 were microstructured by double UV exposure of 10 s for the formation
of a hydrogel base and 150 s for the formation of the microstructures. These
samples were compared to equivalent microstructures without hydrogel base.
Functionalization was done by placing a drop of 20 µL of a 500 µg/mL laminin
solution on top of microstructures. MDCK cells were seeded at 2.5·104 cells/cm2
and cultured for 21 days. Cell coverage was checked at day 14 and 21 and cell
nuclei and F-actin were analyzed by fluorescence microscopy, and confocal
microscopy.
Finally, to test the influence of PEGDA molecular weight on the cell
coverage, polymer solutions of 10% w/v PEGDA6000 and 0.6% w/v acrylic acid in
PBS containing 1% I2959 were used and compared to microstructured hydrogels
made of PEGDA575. Hydrogels were fabricated using photomasks of 100 µm
windows under UV light exposure of 10 s for the formation of a hydrogel base and
150 s for the microstructuring. Then, hydrogels were functionalized with a 20 µL
drop of 500 µg/mL laminin solution, on top of microstructures. MDCK cells were

84
seeded at 1.5·104 cell/cm2 and cultured for 14 days. Hydrogels were qualitatively
assessed by stereoscope microscopy and cell nuclei and F-actin by confocal
microscopy. Experimental conditions tested are listed in Table 3.4.
Samples were mounted using the holder mounting described in section
3.5.8. Through an inverted confocal microscope, Leica SPE, serial sections at 10X
magnification were taken and stacked to obtain three-dimensional
reconstructions. The size of z-sections varied depending on the sample, ranging
from 1to 5 µm.
Study Polymer Solutions Photomask
window diameter
Polymer concentration
5% w/v PEGDA575 - 0.6% w/v acrylic acid 10% w/v PEGDA575 - 1.25% w/v acrylic acid
300 µm
Microstructure size (diameter)
5% w/v PEGDA575 - 0.6% w/v acrylic acid 10% w/v PEGDA575 - 1.25% w/v acrylic acid
100 µm 300 µm
Hydrogel base 5% w/v PEGDA575 - 0.15% w/v acrylic acid 100 µm
PEGDA molecular weight
10% w/v PEGDA6000 - 0.6% w/v acrylic acid 100 µm
Table 3.4: Experimental conditions for the study of MDCK cells coverage on microstructured hydrogels.
3.5.7 CACO-2 CELL POLARIZATION ON MICROSTRUCTURED HYDROGELS
As Caco-2 cell requirements are different from those of fibroblasts and
MDCK, cell adhesion was tested using two protein concentrations for
functionalization. Disc-shaped hydrogels were fabricated from 6.5% w/v
PEGDA6000 and 0.3% w/v acrylic acid (41.6 mM) in PBS containing 1% I2959.
PEGDA-acrylic acid hydrogels were functionalized in 500 µL of laminin solutions
with concentrations of 50 and 100 µg/mL. Finally, hydrogels were seeded at a
density of 5·105 cells/cm2 and cultured for 24 h. Cell adhesion and spreading
measured as surface coverage was assessed by bright field microscopy (Nikon
Eclipse Ts2).
To study the cell polarization and the coverage of the 3D surface, PEGDA-
acrylic acid hydrogels were microstructured using the polymer solutions and
fabrication parameters producing the shape and dimensions closest to the villi of
native intestinal tissue. Microstructured hydrogels were fabricated from 6.5%
w/v PEGDA6000 and 0.3% w/v acrylic acid (41.6 mM) in PBS containing 1% w/v
I2959. A photomask with windows of 100 µm in diameter was used. The
fabrication process was carried out by 10 s of UV light exposure of 10 s for the

85
formation of the hydrogel base and 70 s of UV exposure for the formation of the
microstructures. Then, the hydrogels were functionalized by using a sliced
pipette tip and a drop of 50 µL of a 250 µg/mL laminin solution placed on top of
the microstructures for 1 h. Cells were seeded at a density of 5·105 cells/cm2. Cell
culture was imaged at 7, 14 and 21 days by bright field microscopy (Nikon Eclipse
Ts2) to determine the cell coverage. Cell polarization was assessed by cell
morphology, so cell nuclei and F-actin were stained and imaged. In addition,
epithelial cell markers, ZO-1, β-catenin, and villin (the major protein associated
with actin in the microfilament core of intestinal microvilli)305 were stained. Cell
markers were analyzed by fluorescence and confocal microscopies. As controls,
Caco-2 cells were cultured on Transwell® inserts of 12 mm in diameter containing
polycarbonate porous membranes of 0.4 µm in pore size (Sigma-Aldrich
CLS3401, Spain). Cells were seeded at same cell density as on hydrogels and
cultured for 21 days.
Samples containing microstructured hydrogels were mounted using a
holder mounting described in section 3.5.8, and samples from Transwell® were
prepared cutting the membranes and mounting them between two coverslips
with mounting medium. Through inverted confocal microscopes (Leica SPE, SP2)
serial sections at 10X magnification were taken and stacked to obtain three-
dimensional reconstructions. The size of z-sections varied depending on the
sample, ranging between 0.5 and 2 µm.
3.5.8 IMMUNOSTAINING
Cell morphology and cell polarization were studied through the
immunostaining of nuclei, filamentous actin (F-actin), and epithelial cell markers
and were performed in the 24-well plates used for cell culture. Cells on hydrogels
were fixed with 500 µL of 4% w/v paraformaldehyde (Sigma-Aldrich, Spain) at
room temperature (RT) for 30 min on a rotating plate set at 100 rpm. Then,
samples were rinsed twice with 500 µL of 50 mM Tris-Cl and 150 mM NaCl buffer
saline (TBS) solution (ThermoFisher Scientific, Spain) at RT for 5 min on a
rotating plate (100 rpm).
To permeabilize the cell membrane, cells were washed with 500 µL of
TBS containing 0.1% v/v Triton X-100 (Sigma-Aldrich, Spain) (T+) at RT for 30
min on a rotating plate (100 rpm). To prevent nonspecific binding of the
antibodies, samples were blocked. Blocking was carried out incubating the
samples in 500 µL of TBS containing 3% v/v donkey serum (Gibco, UK) and 0.3%
v/v Triton X-100 (T++) at RT for 2 hours on a rotating plate (100 rpm). After
blocking, samples were incubated in 500 µL of T++ containing the primary

86
antibodies. Goat anti-ZO-1 (ab190085 Abcam, UK) was used at 2 µg/mL, rabbit
anti-β-catenin (ab2365 Abcam, UK) at 5 µg/mL and mouse anti-villin (ab201989
Abcam, UK) at 1 µg/mL. The incubation was performed for 2 hours at room
temperature on a rotating plate (100 rpm) and overnight at 4°C. Then, the
samples were washed three times with 500 µL T+ for 5 min at 100 rpm. After that,
samples were blocked by the incubation in 500 µL of T++ for 2 hours at room
temperature.
Then, samples were incubated with secondary antibodies or 160 nM
Alexa Fluor® 568 Phalloidin (ThermoFisher Scientific, Spain) in 500 µL of T++ 2
hours at room temperature. Anti-goat Alexa 568 (A11057, ThermoFisher
Scientific, Spain) was used at 2 µg/mL, anti-rabbit Alexa 647 (Jackson
Immunoresearch, USA) was used at 2 µg/mL, and anti-mouse Alexa 488 (A21202,
ThermoFisher Scientific, Spain) at 2 µg/mL. Then, samples were washed three
times in 500 µL of T+ and incubated in 500 µL of T++ containing 16.2 µM Hoechst
33342 (ThermoFisher, Spain) or 300 nM DAPI (ThermoFisher Scientific, Spain),
which stain nucleic acid, for 15 min on a rotating plate (100 rpm) and washed
twice in 500 µL of TBS.
Considering the full height of hydrogels, a mounting holder was designed
and fabricated to prevent the squashing of the microstructures (Fig. 3.15).
Figure 3.15. Schematics of mounting set-up for the microscopy imaging of
microstructured hydrogels. a) Picture of the PDMS ring placed on a coverslip. Cross-section (b) of the mounting. c) Picture of the hydrogel sample mounted in the PDMS ring. d) Illustration of how samples were placed on the confocal microscope.
A PDMS ring of 10 mm in its inner diameter and 1 mm in height was
fabricated and placed on a large coverslip (600 x 24 mm) (Menzel Gläser,
ThermoFisher Scientific, Spain). The PDMS ring and coverslip were sonicated in
HydrogelPDMS
ring
Mounting mediaCoverslip
a) b)
c) d)

87
ethanol 96% v/v for 5 min and then blown dried with a nitrogen stream before
sealing it without any treatment. The container was then filled with Fluoromont-
G and the microstructured hydrogels, which are adhered on a coverslip after
fabrication, were placed on top, embedded in the mounting medium (Fig. 3.14).
This set-up allowed the imaging of the microstructures by confocal microscopy.
3.5.9 ANALYSIS OF CELL NUCLEI MORPHOLOGY AND ORIENTATION
Cell nucleus is deformed and oriented by the spatial disposition of the
cell.306 Therefore, nuclei morphology and orientation with respect to the basal cell
surface could be used as markers for cell polarization. For this purpose, the shape
and orientation of the nucleus of Caco-2 cells cultured for 14 and 21 days on
microstructured hydrogels were analyzed and compared to cells cultured on
Transwell® (0.4 µm pore size polycarbonate membrane) for 21 days (negative
control) and on representative images of a cross section through the center and a
longitudinal cross section of a villous of small intestine (positive control), from
the medical cell biology web site of the Yale School of Medicine.307
Microstructured hydrogels and Transwell® samples were observed
under a Leica SPE and SP2 laser-scanning microscopes. Samples after 14 days (3
replicas) and 21 days (2 replicas) of cell culture were used. Confocal z-stack
images were acquired at 1 µm intervals, and processed using ImageJ to identify
each nucleus individually (Fig. 3.16a). First, the image threshold was adjusted to
isolate the nucleus from the background. Second, thresholded images were
converted to binary (Fig. 3.16b). Finally, nuclei were fitted to ellipses by using the
analyze particles tool (Fig. 3.16c). Aspect ratio (major axis/minor axis) and
orientation (α) of the ellipses in the image framework were measured by default
(ImageJ software). However, such angle (α) does not directly correspond to the
angle described between the nuclei and the surface of the microstructure. To
obtain the normal angle of the nuclei to the hydrogel surface () we proceeded as
follows (Fig. 3.16d). First, the contour and center of the microstructures were
identified for each image. Secondly, the position vectors between the position of
the center of the microstructure and the center of each nucleus (ellipse) were
evaluated. Then, the angle defined by these vectors in the image framework (β)
was measured (Fig. 3.16c). Finally, we could obtain the nuclei orientation on the
surface () by subtracting the angle of the ellipse (α) from the angle of the position
vector (β), as equation shows (Fig. 3.16d). The same procedure was carried out
with the images of cross section through the center of native villi.

88
= β − α Eq. 19
Figure 3.16. Schematic representation of image processing in the nuclei orientation
analysis. a) Confocal stack of microstructured hydrogel, showing the nuclei in blue, b) binary image, and c) ellipse fitting. Microstructure contour is depicted as a dashed red line, and its center as a red dot. The arrow in c) represents a vector from the center of the microstructure to the center of an ellipse (nucleus). d) Drawing of the nuclei angle estimation. Angle of the nuclei major axis (α) and the vector (β) with respect to horizontal axis, and normal nuclei angle with respect to the microstructured surface (). e) Confocal stack of cells on a Transwell®, showing the nuclei in blue. Orthogonal views were used to the ellipse fitting. f) Drawings relating cos2 with nuclei orientation.
In the case of Transwell® (3 replicas) cross sections were obtained by
using the orthogonal view tool (ImageJ) from the confocal reconstructions. Nuclei
were ellipse fitted and the angle of the ellipse orientation (α) was taken as nuclei
orientation, because Transwell® has a flat surface which was aligned with the
cos2 = 1 cos2 = 0 cos2 = -1
a
b
= b-a
a
a) b) b) c)
d) e)
f)

89
horizontal axis. To obtain θ, complementary angle was subtracted (Fig. 3.16e).
The same procedure was carried out with the images of longitudinal cross section
of native villi.
The nuclei aspect ratio of Caco-2 cells cultured on Transwell® and on
hydrogel, were plotted and compared with the aspect ratio of the nuclei from the
images of cross-sectioned native villi. The angle of nuclei respect to the surface
was plotted in a wind rose diagram, and the alignment between the nuclei
orientation and the direction normal to the surface was assessed by the order
parameter <cos 2θ>. If nuclei were perpendicular to the surface, <cos 2θ> value
was 1, whereas if nuclei were parallel to the surface, its value was -1 (Fig. 3.16f).
Graphs were plotted with OriginPro 8.5 software and Mann-Whitney U test and
Kruskal Wallis test were used to perform the statistical analysis.
3.6 TRANSEPITHELIAL ELECTRICAL RESISTANCE (TEER) MEASUREMENTS OF CACO-2 CELL MONOLAYERS
3.6.1 TEER MEASUREMENTS BY A VOLTOHMMETER
Transepithelial electrical resistance (TEER) is a quantitative technique
widely used to measure the integrity of semipermeable cell barriers. TEER of
epithelial monolayers is usually measured in a standardized set-up which
consists on cell monolayers cultured on semipermeable filter inserts
(Transwell®) that creates two separate compartments (upper and lower
compartment) (Fig. 3.17a). An electrode can be introduced in each of the
compartments to measure the electrical resistance between them when the cell
monolayer is formed (Fig. 3.17). At the end, TEER expressed in Ω·cm2, is
calculated as the measured resistance multiplied by the surface area of the cell
monolayer. In the present study, electrical measurements were performed in
collaboration with the Physiology department of the Faculty of Pharmacy (UB).
We used an Epithelial Voltohmmeter (Millicell-ERS system, Merck-Millipore,
Spain), which applies an AC square wave of 20 mV of amplitude at a frequency of
12.5 Hz (Fig. 3.17b). Measurements are carried out using alternating current (AC)
because direct current (DC) can damage both the cells and the electrodes. A pair
of electrodes popularly known as “chopstick” electrodes was used. Each stick of
the electrode pair (4 mm wide and 1 mm thick) contains a silver/silver chloride
pellet to measure voltage and a silver electrode to allow the pass of current.
STX3/“chopstick” silver electrode pair was used, which allows adjusting the
distance between electrodes to avoid sample damaging and inaccurate
measurements (Fig. 3.17c). To use our hydrogels with the standard Transwell®-

90
based approach, we had to be sure that once hydrogels were installed in the upper
compartment all the electrical current was forced to pass through them, as
shortcuts due to bad sealing between the hydrogels and the Transwell® walls
would return false results.
Figure 3.17: Standardized set-up of TEER measurements by voltohmmetry. a) 6-well
plate of Transwell® porous membrane with inserts of 24 mm in diameter. b) Voltohmmeter, and c) STX3/“chopstick” silver electrode pair. d) Scheme of TEER measurements on Transwell® membrane system with a cell monolayer. Pass of current is drawn by a red dash line.
Two experimental approaches were assayed: 1) in situ hydrogel
polymerization and 2) outside polymerization and posterior sealing. In situ
polymerization consisted in filling Transwell® inserts of 12 mm in diameter with
polycarbonate membranes with pores of 0.4 µm in size (Sigma-Aldrich CLS3401,
Cell monolayer
Porous membrane
Transwell
Chopstickelectrode
Upper compartment
Lower compartment
Lowercompartment
Upper compartment
Electrodepair
a) b) c)
d)
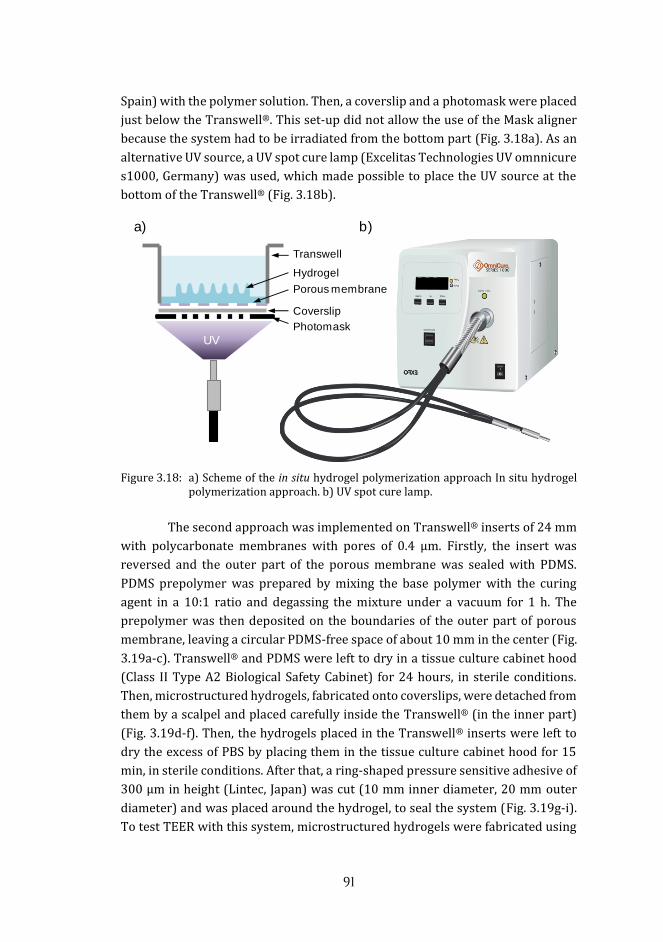
91
Spain) with the polymer solution. Then, a coverslip and a photomask were placed
just below the Transwell®. This set-up did not allow the use of the Mask aligner
because the system had to be irradiated from the bottom part (Fig. 3.18a). As an
alternative UV source, a UV spot cure lamp (Excelitas Technologies UV omnnicure
s1000, Germany) was used, which made possible to place the UV source at the
bottom of the Transwell® (Fig. 3.18b).
Figure 3.18: a) Scheme of the in situ hydrogel polymerization approach In situ hydrogel
polymerization approach. b) UV spot cure lamp.
The second approach was implemented on Transwell® inserts of 24 mm
with polycarbonate membranes with pores of 0.4 µm. Firstly, the insert was
reversed and the outer part of the porous membrane was sealed with PDMS.
PDMS prepolymer was prepared by mixing the base polymer with the curing
agent in a 10:1 ratio and degassing the mixture under a vacuum for 1 h. The
prepolymer was then deposited on the boundaries of the outer part of porous
membrane, leaving a circular PDMS-free space of about 10 mm in the center (Fig.
3.19a-c). Transwell® and PDMS were left to dry in a tissue culture cabinet hood
(Class II Type A2 Biological Safety Cabinet) for 24 hours, in sterile conditions.
Then, microstructured hydrogels, fabricated onto coverslips, were detached from
them by a scalpel and placed carefully inside the Transwell® (in the inner part)
(Fig. 3.19d-f). Then, the hydrogels placed in the Transwell® inserts were left to
dry the excess of PBS by placing them in the tissue culture cabinet hood for 15
min, in sterile conditions. After that, a ring-shaped pressure sensitive adhesive of
300 µm in height (Lintec, Japan) was cut (10 mm inner diameter, 20 mm outer
diameter) and was placed around the hydrogel, to seal the system (Fig. 3.19g-i).
To test TEER with this system, microstructured hydrogels were fabricated using
Porous membrane
Coverslip
Photomask
Transwell
Hydrogel
UV
a) b)

92
polymer solutions of 6.5% w/v PEGDA6000 in PBS containing 0.3% w/v acrylic
acid and 1% w/v I2959. Polymer solutions were exposed at UV for 10 s to form
the hydrogel base, and then 70 s to form the microstructures. After fabrication
and swelling for 3 days, samples were removed from the coverslips and placed in
the Transwell® membranes. Then, functionalization was carried out by placing a
sliced pipette tip as a container on top of hydrogel, and filling with 50 µL of a 250
µg/mL laminin for 1 hour. Caco-2 cells were seeded at 5·105 cells/cm2 and
samples kept at 37°C and 5% CO2 and filled with culture medium, changed every
two days.
Figure 3.19: Overview of hydrogel sealing on Transwell®. a) Top view, and b) cross-
section after PDMS (brown) deposition on the outer part of the porous membrane (dashed line). d) Scheme of hydrogel (blue) placing in the inner part of Transwell® and e) cross-section. g) Scheme of the sealing of the inner part by the use of an adhesive (yellow), and h) cross-section. Modified pictures of Transwell® after c) PDMS deposition f) hydrogel incorporation and i) addition of the adhesive.
TEER measurements were carried out at day 7 and day 21 of culture. To
increase the accuracy of the results, readings were done per triplicate for each
sample. To subtract the effect of hydrogel material on the resistance
measurements, hydrogels without cells were also measured. Transwell® without
cells as a negative control of barrier formation, and Transwell® cultured with
Caco-2 cells as a positive control of barrier formation were also used. In addition,
b) e) h)
PDMS
Hydrogel Adhesivea) d) g)
c) f) i)

93
at day 21 ethylenedinitrilo-tetraacetic acid (EDTA) treatment was applied by
incubating the samples in a 50 µM EDTA solution for 5 min at 37°C, and then
measuring the TEER. Three samples for each condition were used. The
experimental layout is shown below (Fig. 3.20).
Figure 3.20: Experimental layout of the TEER assay on Transwell® inserts. Control
samples (with and without cells) on Transwell® without hydrogels were placed in the same 6-well plate, as the samples with hydrogel (with and without cells) were placed in a different 6-well plate.
The resistance of the cell monolayer (Rmonolayer) was calculated by
subtracting the resistance measured on cell-free inserts (Transwell® or
Transwell® with hydrogel) (Rblank) from the total resistance measured across the
cell monolayer for both the samples with and without hydrogel (Rtotal), see
equation 20. Results were then multiplied by the total surface area of the insert
or hydrogel (estimated from confocal microscopy experiments) to express TEER
in Ω·cm2 (equation 21). Data analysis and plots were carried out with OriginPro
8.5 software. Mann–Whitney U test was used on the statistical comparison of two
conditions.
Rmonolayer = Rtotal − Rblank Eq. 20
TEERmonolayer = Rmonolayer×total surface area Eq. 21
3.6.2 TOTAL SURFACE AREA QUANTIFICATION BY CONFOCAL MICROSCOPY
For the microstructured hydrogels, their total surface area is an
important parameter. Here, we estimated this value by reconstructing 3D images
of the microstructures by fluorescent confocal microscopy z-stacks. After
fabrication, samples were activated and functionalized with 500 µL of
0.05 mg/mL Streptavidin Texas Red® protein solution.
Transwell
w/o cells w/o cells w/o cells
Caco-2 Caco-2 Caco-2
Transwell + Hydrogel
w/o cells w/o cells w/o cells
Caco-2 Caco-2 Caco-2
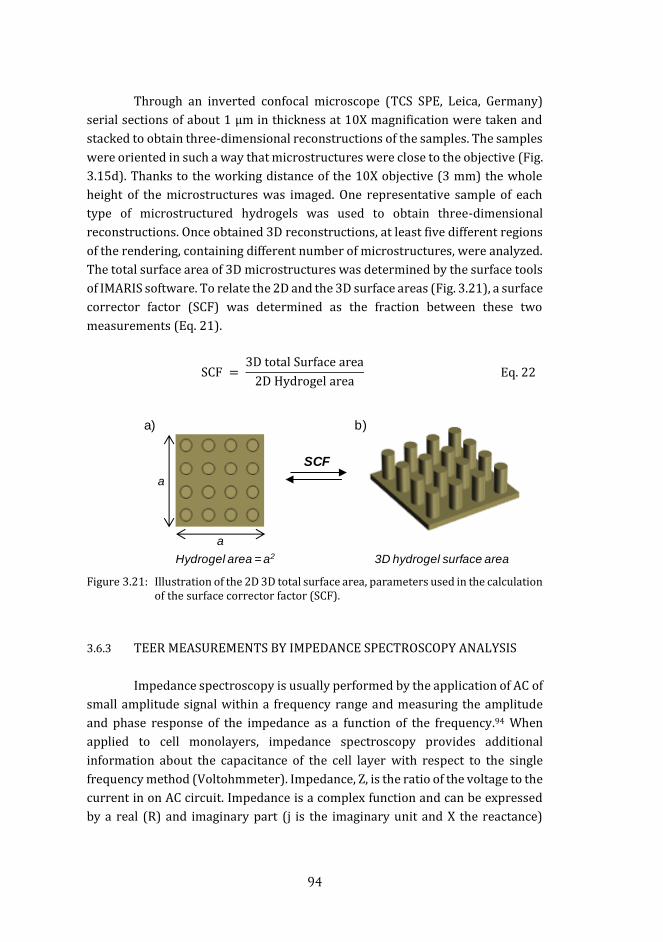
94
Through an inverted confocal microscope (TCS SPE, Leica, Germany)
serial sections of about 1 µm in thickness at 10X magnification were taken and
stacked to obtain three-dimensional reconstructions of the samples. The samples
were oriented in such a way that microstructures were close to the objective (Fig.
3.15d). Thanks to the working distance of the 10X objective (3 mm) the whole
height of the microstructures was imaged. One representative sample of each
type of microstructured hydrogels was used to obtain three-dimensional
reconstructions. Once obtained 3D reconstructions, at least five different regions
of the rendering, containing different number of microstructures, were analyzed.
The total surface area of 3D microstructures was determined by the surface tools
of IMARIS software. To relate the 2D and the 3D surface areas (Fig. 3.21), a surface
corrector factor (SCF) was determined as the fraction between these two
measurements (Eq. 21).
SCF = 3D total Surface area
2D Hydrogel area Eq. 22
Figure 3.21: Illustration of the 2D 3D total surface area, parameters used in the calculation
of the surface corrector factor (SCF).
3.6.3 TEER MEASUREMENTS BY IMPEDANCE SPECTROSCOPY ANALYSIS
Impedance spectroscopy is usually performed by the application of AC of
small amplitude signal within a frequency range and measuring the amplitude
and phase response of the impedance as a function of the frequency.94 When
applied to cell monolayers, impedance spectroscopy provides additional
information about the capacitance of the cell layer with respect to the single
frequency method (Voltohmmeter). Impedance, Z, is the ratio of the voltage to the
current in on AC circuit. Impedance is a complex function and can be expressed
by a real (R) and imaginary part (j is the imaginary unit and X the reactance)
Hydrogel area = a2
a
a
3D hydrogel surface area
a) b)
SCF

95
(equation 23) or, on the polar form, as a modulus |Z| and an angle (θ) that gives
the phase difference between voltage and current (equation 24).
Z = R + jX
Eq. 23
Z = |Z| · ejθ Eq. 24
Impedance spectroscopy measurements were performed in
collaboration with the Biomedical Applications Group from the Centro Nacional
de Microelectrónica (CNM) of the CSIC (Spanish National Research Council). This
group has developed a bioreactor with two chambers and integrated electrodes
for impedance spectroscopy measurements and the electronics for monitoring
the impedance of cell barriers along the time and within a range of frequencies
(Fig. 3.22). This system has been successfully used to perform electrical
impedance spectroscopy (EIS) measurements on a model of blood brain barrier
model.308 This device consists of two plates with interdigitated electrodes that are
sealed together with a porous membrane in between. This sealing creates two
separated compartments in a similar way that a Transwell®. Cells are cultured on
the porous membrane which with the help of two sheets of pressure-sensitive
adhesives (PSA) (Adhesive Research, UK). Silicone gaskets of 0.5 mm in height
define three independent cell culture chambers (4 x 20 mm in size) in a circular
device of 45 mm in diameter (Fig. 3.22).308 To ensure the correct supply of cell
medium while measurements take place, upper and lower plates have a
microfluidic system. To use this system, we adapted the fabrication process to
perform the in-situ polymerization of our hydrogels with and without
microstructures. For this purpose, a porous membrane with two adhesive (PSA)
covers was used instead of a coverslip. The dimensions and layout of the PDMS
container of our fabrication chip were also modified and a new version with three
individual channels of dimensions 7 x 30 mm was produced (Fig. 3.23). In
addition, the photomasks were also redesigned now to contain three areas (7 x
30 mm) of arrays of windows 100 µm in diameter that aligned with the
membrane areas (Fig. 3.23a). The pools created by PDMS were filled with the
polymer solution and exposed under UV light using the Mask aligner instrument.
Three types of membranes were used: polycarbonate of 1 µm pore size
(WHA70604710, Sigma-Aldrich, Spain) and 0.4 µm pore size (HTTP04700,
Merck–Millipore, Spain), and 1 µm pore size polytetrafluoroethylene
(JAWP04700, Merck-Millipore, Spain). A nylon mesh was also used instead of the
porous membrane, and was homemade cut and placed between the adhesive
sheets. To test the influence of the porous membrane on the microfabrication

96
process, UV absorbance of the membranes was measured by a
spectrophotometer (UV-VIS JASCO, Spain) within the range of 260 – 600 nm and
0.1 nm resolution. In addition, the intensity of UV light through membranes was
measured at 365 nm by a UV intensitymeter (Model 100, Suss Microtec, Germany)
and compared to the intensity measured directly under the light source.
Figure 3.22: Schematic set-up for electrical impedance spectroscopy measurements of
cells grown on hydrogels. a) Assembling parts of the bioreactor (modified from Yeste et al.)308 including a schematic decomposition of the b) circular device containing the porous membrane. Experimental set-up procedure for mounting the hydrogels in the chamber. Using circular insert (c), hydrogels (in cyan) are fabricated on the surface of a porous membrane (d), and Caco-2 cells (green dots) are cultured on them (e). Finally, the circular insert was placed within the bioreactor. f) Picture of upper and lower plates where interdigitated electrodes are shown. g) Drawing of cross-section of one of the channels of the device. The porous membrane (violet dash line) fitted by adhesive (PSA) and silicone gaskets to develop cell culture wells. Interdigitated electrodes are represented in yellow, and pass of current in red dash double arrows.
4 mm
20 mm
45 m
m
Interdigitated electrodes
SiliconeGasket
PSA
Porousmembrane
PSA
SiliconeGasket
Low er plate
CellsInterdigitatedelectrodes
Siliconegasket
Siliconegasket
PSAPSA
Upper plate
Hydrogel fabrication
Cellculture
a) b)
c) d) e)
f) g)
Interdigitatedelectrodes

97
Figure 3.23: Hydrogel Fabrication set-up modified for EIS measurements. a) Illustration
of the modified pieces of set-up. PDMS stencil in brown, porous membrane fixed by PSA in gray, and a circular photomask with three arrays of windows. b) Cross-section of the final fabrication device.
After fabrication, the swelling of the hydrogel can make them detach
from the membranes and produce current leakages in TEER measurements. To
keep hydrogels well adhered to the porous membranes, polycarbonate
membranes were silanized using 3-(trimethoxysilyl)propyl methacrylate
(TMSPMA, Sigma-Aldrich, Spain). We selected this silane because polycarbonate
surface can be photo-chemically activated309 by the immobilization of silanes In
addition, TMSPMA has an acrylate group that can bind PEGDA and keep hydrogels
covalently attached. Two protocols were used for the silanization procedure. In
the first one, membranes were dried in the oven at 65°C for 30 minutes. Then,
their surface was activated by placing them in an oxygen plasma cleaner (Harrick
Scientific, Expanded Plasma Cleaner PDC-002, USA) for 2 min. Immediately after
that, the membranes were immersed in the silane solution for 10 min. Silane
solution was made by diluting TMSPMA at 2% v/v in absolute ethanol and 3%
v/v of glacial acetic acid (1:10 acetic acid:Milli-Q water). Then, membranes were
thoroughly rinsed by ethanol absolute and dried in the oven at 65°C for 30 min.
The second protocol was based on the use of an UV cleaner (Bioforce
Nanoscience, UV.TC.220, USA) for 15 min to photo-chemically activate the surface
a)
b)
PDMS spacer
PhotomaskPSA
Porousmembrane
Polymer solution
Photomask
PDMS container
Porous membrane
PSA
Hydrogel

98
of membranes.309 The same silane solution was used and membranes were
immersed for 1 to 2 hours. Then, membranes were thoroughly rinsed by ethanol
absolute and dried in the oven at 65°C for 30 min. Polymerization on PFTE
membranes and nylon mesh was attempted without further modifying these
membrane materials.
Impedance spectroscopy measurements were carried out on 1 µm pore
size polycarbonate membranes silanized by the second protocol. Microstructured
hydrogels were fabricated using polymer solutions of 6.5% w/v PEGDA6000 in PBS
containing 0.3% w/v acrylic acid and 1% w/v I2959. Three channels were filled
with the polymer solution and were exposed at UV for 10 s to form the hydrogel
base, and then 70 s to form the microstructures. The hydrogels attached on
membranes were rinsed in PBS and allowed to swell in PBS for at least 3 days.
Functionalization was done by immersing the porous membranes in 5 mL of 50
µg/mL laminin solution for 1 hour. Caco-2 cells were then seeded on each of the
three individual hydrogels by carefully depositing 250 µL of cell suspension
containing 2.5·106 cells/mL, to achieve a density of approximately
5·105 cells/cm2. To ensure cell attachment at the proper location, membranes
were placed in an incubator but not fully covered by the cell medium for 1 hour.
Then, porous membranes where placed on a 96 mm in diameter TPP petri dish
(Sigma-Aldrich, Spain) covered by cell medium and placed inside an incubator,
changing the cell medium every two days. After 14 days of cell culture,
membranes were placed between two silicon gaskets and then the “sandwich”
was placed in the modular bioreactor closed using screws.
TEER assays were performed by the measurement of impedance spectra
at 20 frequencies, ranging from 100 Hz to 1 MHz, using an a portable 4 wire
bioimpedance meter.310 First, measurements were done in parallel at the three
channels of the circular device and the resulting impedance (of each channel)
across the cell monolayer on the hydrogel Zmeasured was recorded. Then, the
hydrogels containing cells were removed from the porous membrane and the
impedance of the silanized membranes (Zsm) was measured. In addition, the
impedance of the porous membrane alone Zblank was used as a control. To obtain
impedance spectra of cell barriers, the Zsm was subtracted from the Zmeasured and
fitted (using the least-square method in Matlab) to an equivalent electric circuit
that describes the impedance spectra of a cell barrier.43 Equivalent circuit
analysis of the measured impedance spectra was performed to obtain the
electrical parameters that can be applied to characterize the cellular barrier
properties. In this circuit, the current flows through the junctions between cells
(paracellular route) or through the cell membrane of the cells (transcellular
route). The tight junction proteins in the paracellular route contribute to an
ohmic resistance (TEER) in the equivalent circuit.

99
Figure 3.24: Diagram of impedance-based equivalent circuit a cellular monolayer that
includes capacitance of the cell membrane (Cm), resistance of the cell membrane (Rm), resistance of the paracellular route (TEER), resistance of the medium (Rmedium), and electrode capacitance (CE). This circuit can be simplified because high membrane resistance force current through the other paths, total impedance, Z, results in a contribution of transepithelial electric resistance (TEER) of the paracellular electrical pathway, the ohmic resistance of the membranes (Ri), and the capacitance of the constant phase element (b).
The lipid bilayer in the transcellular route contributes to a parallel circuit
consisting of an ohmic resistance (Ri) and an electrical capacitance, modeled by a
constant phase element (CPE), which describes faithfully the dielectric properties
of many cell membranes (Fig. 3.24).311 To obtain TEERmonlayer expressed in Ω·cm2,
the impedance at 100 Hz and surface area of microstructured hydrogel were
multiplied (Eq. 21). Data analysis and plots were carried out with OriginPro 8.5
software.
3.7 STATISTICAL ANALYSIS
All statistical analysis were carried out taking into account the normality
of the samples and their variance to choose between parametric or
nonparametric methods. In the case of parametric methods, for 2 samples
comparison t-test was used, and for more than 2 samples comparison One-Way
ANOVA tests. In the case of non-parametric methods, for 2 samples comparison
Mann-Whitney U test was used, and for more than 2 samples comparison
Kruskal-Wallis test was used. All tests were performed using Matlab 2010
software and OriginPro 8.5 software.
TEER
Rmedium
CP
E
TEER
CE
Cm
Ri Ri
Rm
a) b)
TEER
Rmedium
CP
E
TEER
CE
Cm
Ri Ri
Rm
a) b)

100

101

102
4 Results and Discussion
4

103

104
4.1 PREPARATION AND CHARACTERIZATION OF PEGDA HYDROGELS IN A CHIP
We first validated the experimental set-up designed for the fabrication of
PEGDA hydrogels. As hydrogels are very soft materials, a critical point was
handling after fabrication. To solve this practical issue, we decided to use as cover
on our chip a material to which hydrogels will adhere during polymerization.
Later, this cover with the hydrogel will be retrieved and flipped to work with the
sample. Despite previous works reported the use of silanized glass coverslips to
keep the hydrogel covalently attached on them187,263,312, we found out that
hydrogels adhered well to non-treated coverslips. The chip designed is efficient
and allows the successful polymerization of PEGDA solutions in hydrogels. The
main factors that influence the polymerization process, such as the concentration
of the photoinitiator, the time of UV exposure, and the presence of oxygen are
studied in this section.
4.1.1 THE CONCENTRATION OF PHOTOINITIATOR RULES THE DEGREE OF
POLYMERIZATION IN PEGDA HYDROGELS
PEGDA photopolymerization is initiated by the activation of the
photoinitiator (I2959) under UV light. We first studied the polymerization of
PEGDA as a function of I2959 concentration. To do this, different concentrations
of PEGDA575 and PEGDA6000 were polymerized in the presence of several
concentrations of I2959: 5·10-4% w/v, 0.05% w/v, and 0.5% w/v. Disc-shaped
hydrogels were fabricated by exposing them at 150 s under UV light. Figure 4.1
shows pictures of the hydrogels obtained for each polymerization condition. For
the smallest percentage of photoinitiator used, no polymerization was observed
regardless the polymer concentration of the solution. For the other
concentrations, hydrogels were obtained.
Depending on polymer concentration and photoinitiator concentration
hydrogels showed different opacity. For each PEGDA molecular weight, the most
opaque samples were found with the highest polymer concentrations and largest
values of photoinitiator content. The hydrogel opacity has been reported to
increase with its cross-linking density when using PEGDA solutions with polymer
concentrations of up to 60% w/v.313 This means that for the same UV exposure
time the degree of polymerization depends on the concentration of the
photoinitiator.

105
Figure 4.1: Photographs of photopolymerized PEGDA hydrogels fabricated from
solutions containing several concentrations of photoinitiator (I2959). Note that at smallest photoinitiator concentration no polymerization was observed. Scale bar = 12 mm.
To better understand the role of I2959 concentration on the
photopolymerization process, fractional monomer conversion was theoretically
estimated from equation 18 (section 1.4) and plotted as a function of the exposure
time for increasing I2959 concentrations (Fig. 4.2). Values of constants and
parameters related to I2959 and the UV light source experimentally used are
listed in Table 4.1. Photoinitiator concentration was limited to 1% w/v because it
is reported as the limit of solubility of I2959 in water–based solutions.178
Parameter Value Units Reference
kp 21.65 m3 mol-1 s-1 314–316
kt 2516 m3 mol-1 s-1 314–316
f 0.5 - 317
Φ 0.29 - 318
ε 40 m2 mol-1 12, 13
I 375 Kg s-3 measured
NA 6.022 1023 mol-1 320
h 6.63 10-34 Kg m2 s-1 320
c 3 108 m s-1 320
λ 3,13·10-7 m 15, 16
Table 4.1: Free radical polymerization related parameters used in this work converted to international units.
PEGDA575 PEGDA6000
20 10 5 20 10 50
,5
I29
59
co
nte
nt (
% w
/v)
0,0
50
.00
05
Polymer concentration (% w/v)
Polymer concentration (% w/v)
No polymerization

106
Fractional monomer conversion for the different I2959 concentrations
describes an exponential function that levels off long UV exposure time. This
saturation value depends on the actual I2959 concentration. It does not reach
100% in all cases, just for the highest I2959 concentrations (1% and 0.5% w/v).
The graph also shows that for concentrations of photoinitiator below 0.05% w/v,
fractional monomer conversion saturates at low values, while the time required
for to achieve saturation is out of the experimental range considered.
The relationship between the photoinitiator concentration and UV
exposure time required for the cross-linking of hydrogels, has been previously
reported and it is reproduced in our experimental system.259,321 We observed that
for the smallest photoinitiator concentration assayed (5·10-4% w/v), even if
theoretically the monomer conversion with 150 s of UV exposure is about 10%,
experimental no hydrogel formation was found. This is in agreement with the
results found by Dendukuri et al., who reported that a minimum degree of
monomer conversion is needed to obtain polymer gelation.316 We also observe
from Figure 4.2b that, for the UV exposure time used experimentally (150 s), the
fractional monomer conversion predicted by the theoretical plot agrees with the
less cross-linking in samples fabricated with photoinitiator concentration of
0.05% w/v with respect to 0.5% w/v (Fig. 4.1).
Figure 4.2: a) Theoretical plot of fractional monomer conversion of PEGDA polymer
solutions as a function of UV exposure time. Different I2959 concentrations were used, 1% (black), 0.5% (red), 0.1% (blue), 0.05% (green), 0.005% (magenta), and 5·10-4% (orange). b) Zoom of the time interval of interest.
To experimentally analyze the cross-linking degree in hydrogels, FTIR
measurements were performed. The FTIR spectra of the hydrogels (10% w/v
PEGDA and 1% w/v I2959) were used to study the double bond conversion, using
0 50 100 150
0
20
40
60
80
100
A
0 100 200 300 400 500 6000
20
40
60
80
100
A
Frac
tiona
lmon
omer
conv
ersi
on(%
)
UV exposure time (s)
a) b)
UV exposure time (s)
1%0.5%0.1%
0.05%
0.0005%
Frac
tiona
lmon
omer
conv
ersi
on(%
)
0.005%
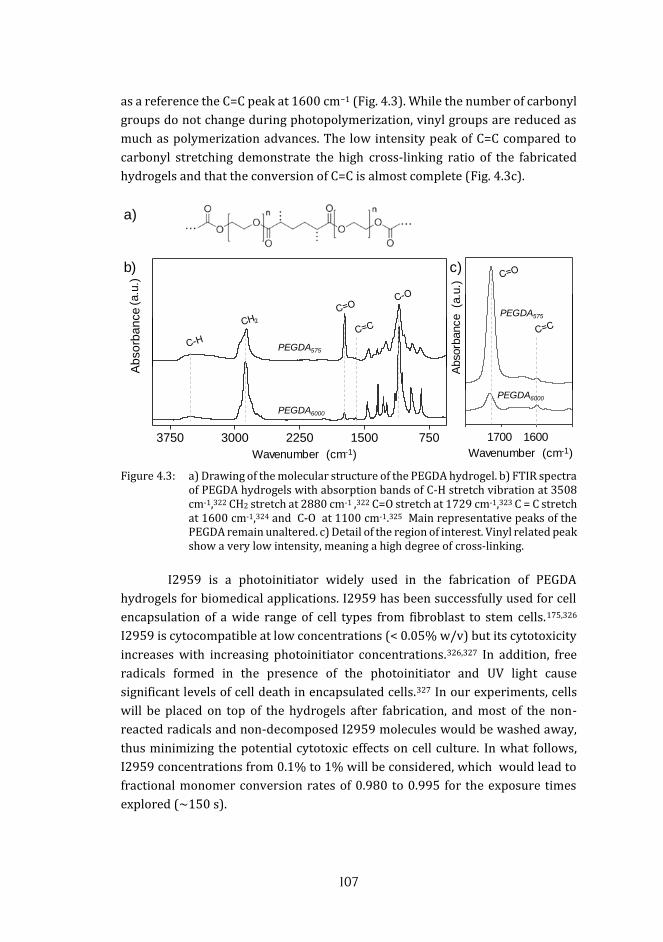
107
as a reference the C=C peak at 1600 cm−1 (Fig. 4.3). While the number of carbonyl
groups do not change during photopolymerization, vinyl groups are reduced as
much as polymerization advances. The low intensity peak of C=C compared to
carbonyl stretching demonstrate the high cross-linking ratio of the fabricated
hydrogels and that the conversion of C=C is almost complete (Fig. 4.3c).
Figure 4.3: a) Drawing of the molecular structure of the PEGDA hydrogel. b) FTIR spectra
of PEGDA hydrogels with absorption bands of C-H stretch vibration at 3508 cm-1,322 CH2 stretch at 2880 cm-1 ,322 C=O stretch at 1729 cm-1,323 C = C stretch at 1600 cm-1,324 and C-O at 1100 cm-1.325 Main representative peaks of the PEGDA remain unaltered. c) Detail of the region of interest. Vinyl related peak show a very low intensity, meaning a high degree of cross-linking.
I2959 is a photoinitiator widely used in the fabrication of PEGDA
hydrogels for biomedical applications. I2959 has been successfully used for cell
encapsulation of a wide range of cell types from fibroblast to stem cells.175,326
I2959 is cytocompatible at low concentrations (< 0.05% w/v) but its cytotoxicity
increases with increasing photoinitiator concentrations.326,327 In addition, free
radicals formed in the presence of the photoinitiator and UV light cause
significant levels of cell death in encapsulated cells.327 In our experiments, cells
will be placed on top of the hydrogels after fabrication, and most of the non-
reacted radicals and non-decomposed I2959 molecules would be washed away,
thus minimizing the potential cytotoxic effects on cell culture. In what follows,
I2959 concentrations from 0.1% to 1% will be considered, which would lead to
fractional monomer conversion rates of 0.980 to 0.995 for the exposure times
explored (∼150 s).
3750 3000 2250 1500 750
Ab
sorb
an
ce
Wavenumber (cm-1)
PEGDA575
PEGDA6000
a)
b) c)
1800 1700 1600 1500
Abs
orba
nce
(a.u
.)
Wavelength (cm-1)
PEG PEG
1800 1700 1600 1500
Abs
orba
nce
(a.u
.)Wavelength (cm-1)
PEG PEG
1700 1600
Wavenumber (cm-1) Wavenumber (cm-1)
(a.u
.)
PEGDA575
PEGDA6000
Abs
orba
nce
(a.u
.)
108
4.1.2 UV EXPOSURE TIME ENABLES TO CONTROL THE HEIGHT OF THE
HYDROGELS
The total energy applied to the polymer solutions controls their
polymerization degree. In our experimental set-up, for a container of 10 mm in
diameter, the energy dose applied is 29.5 mJ/s. To study the effects of UV
exposure time on the fabrication of PEGDA hydrogels, samples were exposed a
set of times ranging from 10 to 150 s. Disc-shaped hydrogels were produced in a
container of 1 mm in height. We found out that the height of the polymerized
hydrogel increased quickly within the range of exposure times employed (Fig.
4.4). This is consistent with the amount of photoinitiator employed in this process
(1% w/v), which, according to Figure 4.2, leads to 80% - 100% of fractional
monomer conversion after just 50 s of UV exposure time. Indeed, the pictures of
the profiles of the hydrogel obtained (Fig. 4.4) and their heights show
polymerized structures achieving the height of the total container after 50 s of UV
exposure (Fig. 4.4c). These results demonstrated that in our set-up UV exposure
time plays a critical role in controlling the height of the hydrogels. This is in
agreement with previous studies of the effects of UV exposure time on PEG
hydrogel thickness, which determined that polymerization depth increases with
the energy dosage and UV exposure time, and strongly depends on photoinitiator
content. 224,321,328
Pictures and measurements of Figure 4.4 correspond to samples in
equilibrium swelling. Hydrogels swell and can retain a significant amount of
water within their structure. The time for equilibrium swelling was determined
in previous experiments as 2 to 3 days for PEGDA6000.294 Due to swelling, the
maximum hydrogel heights reported in Figure 4.4 are higher than the height of
the PDMS container. Swelling ratio for PEGDA6000 (40%) is larger than for
PEGDA575 (16%), being this reflected in the pictures of the hydrogels and their
heights.236 In our case, hydrogels grow from the upper part (glass coverslip),
where the free radical reaction is initiated, toward the bottom part of the
container. Our results, in agreement with previous studies,177,223 suggest that
polymerization takes place differently as a function of depth. To initiate
polymerization, a sufficient amount of photoinitiator need to be activated, which
requires a minimum energy dosage. As the total energy received by the sample
depends on time, short periods of UV exposure will not provide enough energy to
polymerize the whole polymer solution. This is the case of UV exposure of 10 s
(Fig. 4.4).
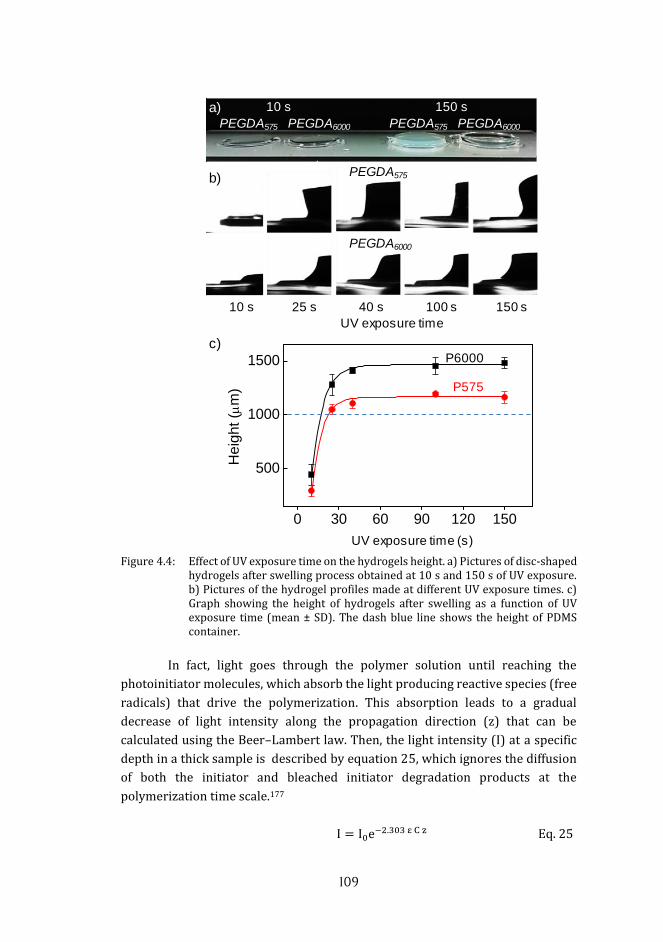
109
Figure 4.4: Effect of UV exposure time on the hydrogels height. a) Pictures of disc-shaped
hydrogels after swelling process obtained at 10 s and 150 s of UV exposure. b) Pictures of the hydrogel profiles made at different UV exposure times. c) Graph showing the height of hydrogels after swelling as a function of UV exposure time (mean ± SD). The dash blue line shows the height of PDMS container.
In fact, light goes through the polymer solution until reaching the
photoinitiator molecules, which absorb the light producing reactive species (free
radicals) that drive the polymerization. This absorption leads to a gradual
decrease of light intensity along the propagation direction (z) that can be
calculated using the Beer–Lambert law. Then, the light intensity (I) at a specific
depth in a thick sample is described by equation 25, which ignores the diffusion
of both the initiator and bleached initiator degradation products at the
polymerization time scale.177
I = I0e−2.303 ε C z Eq. 25
10 s 150 s
10 s 25 s 40 s 100 s 150 s
a)
b)
c)
PEGDA575 PEGDA6000
0 30 60 90 120 150
500
1000
1500
He
ight (
m)
Exposure time (sec)
P6000
P575
PEGDA575 PEGDA6000
PEGDA575
PEGDA6000
UV exposure time (s)
UV exposure time
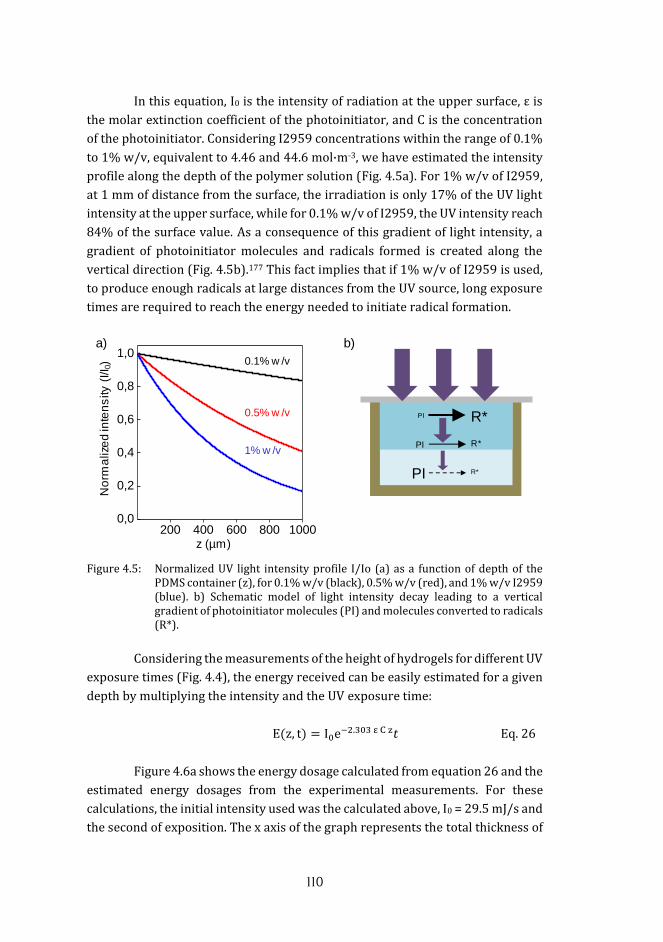
110
In this equation, I0 is the intensity of radiation at the upper surface, ε is
the molar extinction coefficient of the photoinitiator, and C is the concentration
of the photoinitiator. Considering I2959 concentrations within the range of 0.1%
to 1% w/v, equivalent to 4.46 and 44.6 mol·m-3, we have estimated the intensity
profile along the depth of the polymer solution (Fig. 4.5a). For 1% w/v of I2959,
at 1 mm of distance from the surface, the irradiation is only 17% of the UV light
intensity at the upper surface, while for 0.1% w/v of I2959, the UV intensity reach
84% of the surface value. As a consequence of this gradient of light intensity, a
gradient of photoinitiator molecules and radicals formed is created along the
vertical direction (Fig. 4.5b).177 This fact implies that if 1% w/v of I2959 is used,
to produce enough radicals at large distances from the UV source, long exposure
times are required to reach the energy needed to initiate radical formation.
Figure 4.5: Normalized UV light intensity profile I/Io (a) as a function of depth of the
PDMS container (z), for 0.1% w/v (black), 0.5% w/v (red), and 1% w/v I2959 (blue). b) Schematic model of light intensity decay leading to a vertical gradient of photoinitiator molecules (PI) and molecules converted to radicals (R*).
Considering the measurements of the height of hydrogels for different UV
exposure times (Fig. 4.4), the energy received can be easily estimated for a given
depth by multiplying the intensity and the UV exposure time:
E(z, t) = I0e−2.303 ε C z𝑡 Eq. 26
Figure 4.6a shows the energy dosage calculated from equation 26 and the
estimated energy dosages from the experimental measurements. For these
calculations, the initial intensity used was the calculated above, I0 = 29.5 mJ/s and
the second of exposition. The x axis of the graph represents the total thickness of
a) b)
200 400 600 800 10000,0
0,2
0,4
0,6
0,8
1,0
Az (µm)
No
rma
lize
din
ten
sity
(I/I 0
) 0.1% w /v
0.5% w /v
1% w /v
PI
PI
PI
R*
R*
R*

111
the sample (Fig. 4.6). To minimize the errors that might arise from using the
height values measured after swelling, values from PEGDA575 are used because it
shows the lowest swelling ratio (Fig. 4.4). These approximation yields excellent
agreement between theory and experiments. It is noticeable that, while hydrogel
heights are still increasing (10 to 40 s), the estimated energy dosages received at
each of the measured heights remains within the same range (80 – 250 mJ)
without significant differences. One can then infer that such a value is the minimal
energy needed to initiate enough radical formation for the formation of a gel.
Figure 4.6: Plot of energy dosage (a) as a function of depth of the PDMS container (z) for
10 s (dotted line), 25 s (dot-dot-dashed line), 40 s (dot-dashed line), 100 s (dashed line), and 150 s (black line) of UV exposure time. Estimated values from experimental data are in red (mean ± SD). d) Schematic representation of the hydrogel growth progression.
4.1.3 EFFECTS OF OXYGEN IN THE POLYMERIZATION OF PEGDA HYDROGELS
In a free radical polymerization process, the lifetime of radicals is highly
sensitive to the presence of oxygen.316 The reaction rate of PEGDA with radicals
is two orders of magnitude smaller (ki = 106 L mol-1 s-1) than the reaction rate of
oxygen with radicals (kO2 = 108 L mol-1 s-1). As a consequence, oxygen is scavenged
by the radicals, inhibiting polymerization.329,330 Therefore, the initial presence of
oxygen in the polymer solution and the oxygen diffusion within the system must
be considered for the success of polymerization. In the present set-up, an initial
oxygen concentration of 0.27 mM331 is present in the polymer aqueous-based
solution, and oxygen can diffuse through the PDMS walls of the container (oxygen
diffusion ≈ 10-9 m2 s-1)332 and through the air-liquid interfaces created by the
inlets that deliver the polymer solution inside the chip (Fig. 4.7).
250 500 750 1000 1250
100
1000
250 500 750 1000 1250
100
1000
A
B
B
A
En
erg
y d
os
ag
e(J
)
z (µm)
1
0.1
Time
10 s
25 s
> 40 s
a) b)
250 500 750 1000 1250
100
1000
250 500 750 1000 1250
100
1000
A
B
B
A
En
erg
y d
os
ag
e(J
)
z (µm)
1
0.1
Time
10 s
25 s
> 40 s
a) b)

112
Figure 4.7: Schematics of a) top view and b) cross section of the experimental set-up.
Red dash lines illustrate the sources of oxygen diffusion into the polymer solution.
In our system, despite the presence of initial oxygen dissolved within the
polymer solution and the oxygen diffusion, PEGDA photopolymerization takes
place, as it has been demonstrated. The explanation is that oxygen is quickly
consumed by radicals, which are continuously generated by UV irradiation, and
such as local oxygen depletion allows the polymerization.329 However, the oxygen
consumed can be renewed by the oxygen diffusing through the air-liquid
interfaces and PDMS walls. To estimate if such oxygen diffusion has an effect on
PEGDA polymerization in our experimental set-up, we computed the so-called
Damköhler number (Da) to determine the relationship between oxygen diffusion
and oxygen depletion in the system.265 The Damköhler number can be computed
as:
Da = R2 DO⁄
[O2]0 ϕε[PI]I⁄ Eq. 27
Where R is the radius of the region exposed to the UV, DO is the diffusion
coefficient of oxygen within the polymer solution, ϕ is the quantum yield of the
photoinitiator, ε is the molar extinction coefficient of the photoinitiator, [PI] is the
molar concentration of the photoinitiator, I is the intensity of the UV light, and
[O2]0 is the molar concentration of oxygen initially dissolved in the polymer
solution. When Da << 1, the oxygen diffusion in the system is fast, so the oxygen
concentration can be considered as constant, and it is never depleted, therefore
polymerization is inhibited. On the other hand, if Da >> 1, the oxygen diffusion is
slow, so oxygen concentration is locally depleted and polymerization can
occur.265
For a PDMS container of 10 mm in diameter, 0.1% to 1% w/v of
photoinitiator I2959 (Table 4.1), polymer solutions containing between 5% and
20% w/v of PEGDA, and 37.5 mW/cm2 of light intensity (power density), the Da
has been calculated using the values listed in Table 4.2.
a) b)
O2O2
O2 O2
PDMS
Coverslip
Inlet Inlet

113
Parameter Value Units Source
R 5·10-3 m Measured
Do 10-9 m2 s-1 31, 32
[O2]0 0.27 mol m-3 331
[PI] range 4.46 - 44.6 mol m-3 Measured
Φ 0.29 - 318
ε (λ=313 nm) 40 m2 mol-1 12, 13
I (λ=313 nm) 9.75·10-4 mol m-2 s-1 Measured
Table 4.2: Parameters used in the calculation of Damköhler number. Do was approximated by a linear interpolation from the values corresponding to
oxygen diffusion in PEGDA at 40% w/v (DOPEGDA 40% = 10-10 m2 s-1) and in the
buffer without PEGDA (DOPBS = 2·10-9 m2 s-1).333,334 [O2]0 was considered as
the oxygen concentration in water at 1 atm and 20°C.331
With the values of Table 4.2, the Damköhler number was calculated to be
in the range of 4.7·103 to 4.7·104 on the surface of the chip, depending on the
concentration of the photoinitiator, and between 3.9·103 and 9.6·103 at the
bottom of the chip (1 mm of distance). As Da >> 1 with our experimental set-up
and photoinitiator concentration range, oxygen diffusion would not be a limiting
factor for polymerization, even considering amount of the intensity decay at the
bottom of the PDMS container.
4.2 FABRICATION OF MICROSTRUCTURED PEGDA HYDROGELS
Once checked that in our experimental set-up PEGDA solutions
polymerize and form hydrogels, trials were performed to ensure that by the use
of photomasks hydrogels could be polymerized forming microstructures. Several
photomasks containing arrays of UV transparent windows of 500, 300, 200, and
100 µm in diameter were used to polymerize polymer solutions of PEGDA (5%
w/v and 10% w/v). A PDMS container of 2 mm in height was used to avoid being
limited in the vertical size by the spacer of the chip. Figure 4.8 shows the bright
field microscopy images of the microstructures obtained. Microstructures are
arrays of individual, high aspect ratio pillars attached to the glass coverslip. The
pillars were grown at a density of 100, 270, 625, and 2500 pillars/cm2 for UV
transparent windows having 500, 300, 200 or 100 µm in diameter, respectively.
It is remarkable that they show a quite homogeneous shape except at the borders
of the mask area, where microstructures were smaller than the ones outside the
edges (Fig. 4.8e).

114
Figure 4.8: Top view of microstructured hydrogels after fabrication using photomasks
with windows of a-b) 500 µm, c) 300 µm, and d) 200 µm. e) Top view image of an array of microstructures fabricated by using a photomask with windows 300 µm in diameter. The inset shows the boundary where microstructures were smaller. Scale bar: b = 5 mm, c = 1 mm, d = 500 µm, e = 2.5 mm, inset = 300 µm.
These pillars keep standing up and, in addition, when the well plate is
shaken, the pillars move following the direction of the buffer and they even show
a slight bending. This behavior is because they are formed by a very soft material.
In fact, studies carried out at our group showed that hydrogels formed from
polymer solutions with concentration in the range of 5 % to 10% w/v of
PEGDA6000 have elastic modulus values ranging 3 kPa to 11 kPa (Altay, internal
report), in agreement of recently reported measurements (10% w/v PEGDA6000
< 30 kPa).236 Although PEGDA700 with concentrations of 20% w/v have been used
to replicate accurately complex 3D microenvironments to study 3D geometric
and mechanical cues in vitro,222 most of the reports that fabricate PEGDA
microstructures by photolithography use 100% w/v PEGDA or highly
concentrated PEGDA solutions. Such polymers lead to microstructures with
elastic modulus in the range of MPa.335 As an example, Dang et al. fabricated
pillars of 1 mm in height and 500 µm in diameter using pure PEGDA and use this
sample as a mold.263 High aspect ratio microstructures have also been fabricated
from PEGDA250 (microneedles array)264 and PEGDA575.265
We have seen that the fabrication of microstructures with both the high
aspect ratio features and the mechanical properties of the intestinal epithelium is
possible. In what follows, we report the systematic study of the formation of these
microstructures and the factors that rule the polymerization (UV exposure time,
molecular weight and polymer concentration of PEGDA, and the presence of
oxygen) when producing them.
a) b) e)
c) d)

115
4.2.1 GROWTH DYNAMICS OF MICROSTRUCTURES IN PEGDA HYDROGELS
The initial stages of growth of the microstructures were analyzed by
measuring their diameters and heights at the several time points. To do this, 10%
w/v PEGDA575 hydrogels were microstructured by using a photomask with
windows 300 µm in diameter (to facilitate the measurements). The hydrogels
were fabricated by a single UV exposure, exposing samples to times comprised
within 70 s to 110 s, at 5 s intervals. Polymer solutions were prepared in PBS
containing 0.1% w/v of I2959. According to Figure 4.2, these exposure times are
considered to obtain a fractional monomer conversion between 75% and 85%.
For the range of UV exposure times studied, it was found that hydrogel
microstructure height increased as the exposure time also increased (Fig. 4.9). In
agreement with the observations for the non-microstructured hydrogels, pillars
grow from the upper portion of the polymer solution and, when increasing the
UV exposure time (energy dosage), the growth propagates in the vertical
direction. In addition, it was observed that microstructures acquired rounded
caps, and their walls were not vertical, but displaying a biomimetic rounded
profile.
Figure 4.9: Pictures of the hydrogel microstructures at initial stages of growth. Top view
and SEM images of representative microstructures fabricated by a,f) 70 s, b,g) 80 s, c,h) 90 s, d,i) 100 s, and e,j) 110 s of UV exposure. Scale bars: a-e,g,h = 100 µm, f = 50 µm, i,j = 200 µm.
Figure 4.10 shows the experimental measurements of the diameter (by
bright field microscopy) and the height (by SEM) of the microstructures within
the UV exposure time range assayed. We observed that images from optical
microscopy led to values of the pillar diameter that were similar with those
obtained by SEM. Therefore, we assumed that structures were not modified
significantly by SEM sample preparation and used SEM images to get the values
of height for the growing microstructures. The diameter of polymerized
a) b) c) d) e)
f) g) h) i) j)
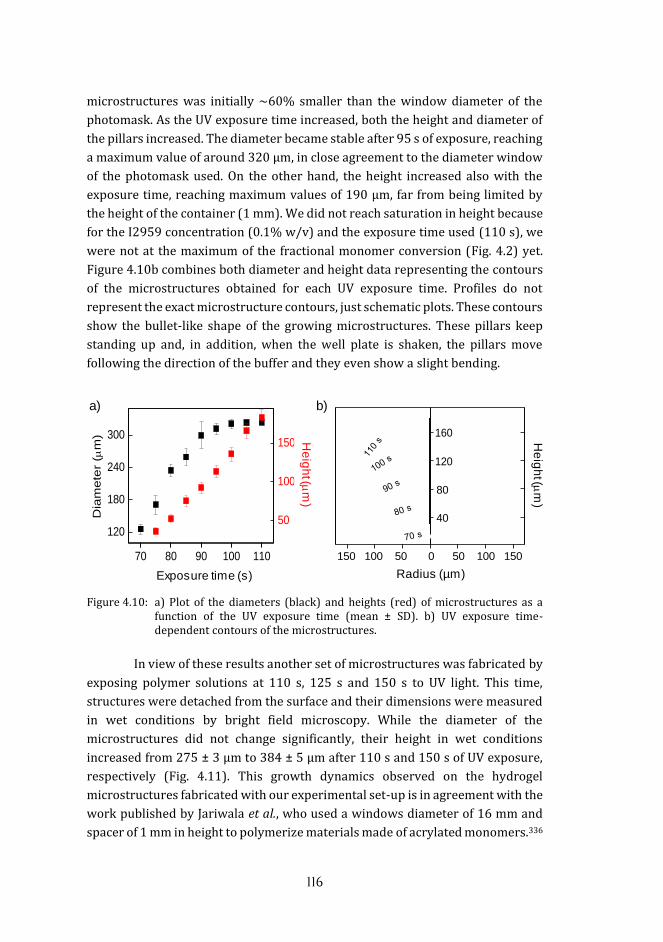
116
microstructures was initially ∼60% smaller than the window diameter of the
photomask. As the UV exposure time increased, both the height and diameter of
the pillars increased. The diameter became stable after 95 s of exposure, reaching
a maximum value of around 320 µm, in close agreement to the diameter window
of the photomask used. On the other hand, the height increased also with the
exposure time, reaching maximum values of 190 µm, far from being limited by
the height of the container (1 mm). We did not reach saturation in height because
for the I2959 concentration (0.1% w/v) and the exposure time used (110 s), we
were not at the maximum of the fractional monomer conversion (Fig. 4.2) yet.
Figure 4.10b combines both diameter and height data representing the contours
of the microstructures obtained for each UV exposure time. Profiles do not
represent the exact microstructure contours, just schematic plots. These contours
show the bullet-like shape of the growing microstructures. These pillars keep
standing up and, in addition, when the well plate is shaken, the pillars move
following the direction of the buffer and they even show a slight bending.
Figure 4.10: a) Plot of the diameters (black) and heights (red) of microstructures as a
function of the UV exposure time (mean ± SD). b) UV exposure time-dependent contours of the microstructures.
In view of these results another set of microstructures was fabricated by
exposing polymer solutions at 110 s, 125 s and 150 s to UV light. This time,
structures were detached from the surface and their dimensions were measured
in wet conditions by bright field microscopy. While the diameter of the
microstructures did not change significantly, their height in wet conditions
increased from 275 ± 3 µm to 384 ± 5 µm after 110 s and 150 s of UV exposure,
respectively (Fig. 4.11). This growth dynamics observed on the hydrogel
microstructures fabricated with our experimental set-up is in agreement with the
work published by Jariwala et al., who used a windows diameter of 16 mm and
spacer of 1 mm in height to polymerize materials made of acrylated monomers.336
-150-100-50050100150
40
80
120
160
Height (m)
Radius (m) -150 -100 -50 0 50 100 150
40
80
120
160H
eig
ht (
m)
Radius (m)
120
180
240
300
70 80 90 100 110
50
100
150
Dia
mete
r (
m)
Exposure time (sec)
Heig
ht (u
m)
a) b)
-150 -100 -50 0 50 100 150
40
80
120
160
He
igh
t (
m)
Radius (m)
-150 -100 -50 0 50 100 150
40
80
120
160
He
igh
t (
m)
Radius (m)
He
igh
t(m
)
He
igh
t(m
)
Radius (µm)
150 100 50 0 50 100 150
Exposure time (s)

117
Figure 4.11: Pictures of the hydrogel microstructures at initial stages of growth. Top view
pictures taken by bright field microscopy after a) 70 s, b) 85 s, and c) 150 s of UV exposure that illustrate the change in size as a function of exposure time. Scale bars =300 µm.
They found that materials grew in diameter and height until reaching the
diameter of the photomask, and from there they were still increasing their height.
In addition, the same growth behavior was published by Li et al., who fabricated
smaller (below 25 µm in height) microstructured PEGDA hydrogels, with a high
aspect ratio (3:1). They reported that the diameter and the height of the
structures increased as a function of the UV exposure time producing pillars with
bullet-like shape contours similar to the ones found here.337 On the other hand,
although we expected fractional monomer conversions close to 100% for the 150
s of UV exposure time and the 0.1 % w/v of photoinitiator concentration
employed (see Fig. 4.2), samples did not reach the total height of the container for
this time. This could be explained because photomask acts a filter absorbing
about 24% of UV light, according to experimental measurements.
Figure 4.12: Effects of the UV exposure time on hydrogel microstructuring. Pictures of the
microstructure profiles fabricated using a 7.5% w/v PEGDA6000 polymer solution and a single UV exposure of a) 90 s, b) 110 s, c) 130 s, and d) 150 s. Scale bar = 300 µm.
To produce hydrogel microstructures with dimensions close to those of
native villi of the intestinal epithelium, we focused our efforts in producing
microstructures from photomasks of windows 100 µm in diameter, using
a) b) c)
a) b) c) d)

118
different polymers solutions of PEGDA575 and PEGDA6000 and 1% w/v of I2959.
Then, we studied the effects of UV exposure time on these microstructures. It can
be observed that isolated pillars are found for 90 s of exposure while for larger
UV exposure times, hydrogel polymerized on regions that are theoretically
unexposed (Fig. 4.12). A closer look-up at this process by SEM microscopy
revealed that microstructures fabricated using photomasks with windows of 300
µm formed a continuous thin film of hydrogel material that covers the surface
surrounding the microstructures (Fig. 4.13).
To visualize this thin layer of hydrogel, the sample was cross-sectioned.
This hydrogel layer was already reported when arrays of PEGDA microstructures
were polymerized using photomasks with windows (1 µm in diameter) too close
(spaced 3 µm).338
Figure 4.13: SEM images of hydrogel microstructures and the hydrogel thin layer. a) A
hydrogel microstructure (M) and the hydrogel extent (arrowheads). b) Inset from image (a) (red square). The dash line marks the limit with the coverslip. Scale bars: a = 100 µm, b = 25 µm.
For exposure times longer than 130 s, this uncontrolled polymerization
filled almost half of the space between the microstructures. At 150 s, on polymer
concentrations above 7.5% w/v, unexposed regions fully polymerized and
resulted in a completely polymerized block of hydrogel (Fig. 4.14). Because of this
uncontrolled polymerization, at some point the effective height of the
microstructures starts to reduce until the upper part becomes flat and their
effective height can be assumed as zero.
Overall, these observations suggest that the morphology of the
microstructures depends on the photomask and the UV exposure time, but there
are other factors affecting the polymerization of the microstructures, which may
also affect their shape and dimensions. This deserves to be understood in our
experimental system for a better control over the morphology of the
microstructures.

119
Figure 4.14: Effects of the interstitial polymerization on the height of the microstructures.
Pictures of the microstructure profiles fabricated by the UV exposure times of 150 s, using a) 10% w/v PEGDA6000, b) 7.5% w/v PEGDA575, and c) 10% w/v PEGDA575 polymer solutions. The M indicates the microstructures formed on the UV exposed region; the U indicates the polymerized hydrogel on unexposed regions, and the arrowheads indicate the boundaries of the polymer formed on the unexposed areas. Scale bar = 400 µm.
4.2.2 DETERMINING THE FACTORS RULING THE POLYMERIZATION OF
PEGDA MICROSTRUCTURES
Light intensity acts as a catalyst in free-radical photopolymerization, so
it is important to determine how the light transmission through the slit apertures
of the binary photomask is. In our set-up, light must go through the acetate mask
and the glass coverslip before reaching the polymer solution. Light passing
through a slit may experience diffraction, and be partially deflected to unexposed
regions. As the diameter of our apertures (windows = 10-4 m) is >> than the
wavelengths of the light passing through, (λ = 3·10-7 m), Franhoufer diffraction
effects can be neglected.339 On the other hand, the edges of the photomask
patterns usually generate diffraction effects, which follow the Fresnel diffraction,
especially if there is a gap between the photomask and polymer solution.
Gumuscu et al. found these effects to be relevant on fabricating PEGDA
microstructures, and tried to solve it by reducing the spacing between the
photomask and polymer solution, and thereby the diffraction of UV light at the
edges of mask patterns.259 In our experimental set-up, a coverslip of a thickness
of 130 – 160 µm is placed between the photomask and the polymer solution. This
distance was found to be enough for producing a 45% width error.340 In addition,
the acetate photomask can produce light scattering before the light exits the slit.
The result is that light might invade unexposed regions near to the slit edge and
polymer solution may cross-link between microstructures, while the opposite
extreme (far away, at the bottom of the PDMS container) is not affected.259,341 The
a) b) c)
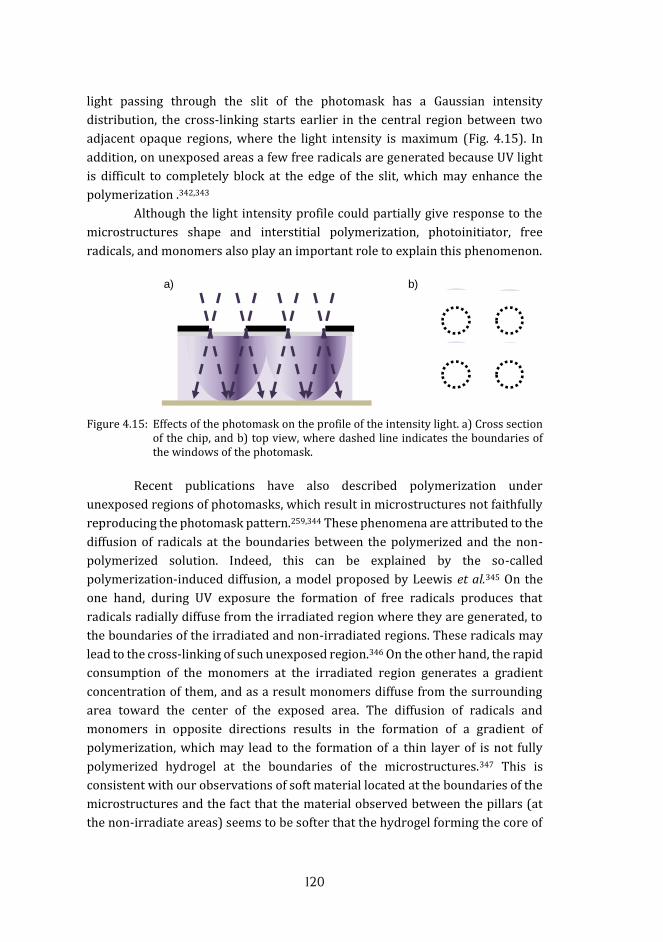
120
light passing through the slit of the photomask has a Gaussian intensity
distribution, the cross-linking starts earlier in the central region between two
adjacent opaque regions, where the light intensity is maximum (Fig. 4.15). In
addition, on unexposed areas a few free radicals are generated because UV light
is difficult to completely block at the edge of the slit, which may enhance the
polymerization .342,343
Although the light intensity profile could partially give response to the
microstructures shape and interstitial polymerization, photoinitiator, free
radicals, and monomers also play an important role to explain this phenomenon.
Figure 4.15: Effects of the photomask on the profile of the intensity light. a) Cross section
of the chip, and b) top view, where dashed line indicates the boundaries of the windows of the photomask.
Recent publications have also described polymerization under
unexposed regions of photomasks, which result in microstructures not faithfully
reproducing the photomask pattern.259,344 These phenomena are attributed to the
diffusion of radicals at the boundaries between the polymerized and the non-
polymerized solution. Indeed, this can be explained by the so-called
polymerization-induced diffusion, a model proposed by Leewis et al.345 On the
one hand, during UV exposure the formation of free radicals produces that
radicals radially diffuse from the irradiated region where they are generated, to
the boundaries of the irradiated and non-irradiated regions. These radicals may
lead to the cross-linking of such unexposed region.346 On the other hand, the rapid
consumption of the monomers at the irradiated region generates a gradient
concentration of them, and as a result monomers diffuse from the surrounding
area toward the center of the exposed area. The diffusion of radicals and
monomers in opposite directions results in the formation of a gradient of
polymerization, which may lead to the formation of a thin layer of is not fully
polymerized hydrogel at the boundaries of the microstructures.347 This is
consistent with our observations of soft material located at the boundaries of the
microstructures and the fact that the material observed between the pillars (at
the non-irradiate areas) seems to be softer that the hydrogel forming the core of
a) b)

121
the pillars. The amount of polymer formed between the microstructures is larger
when using photomasks with windows more densely packed (100 µm vs 300
µm). Because of diffusion takes place from the center to the edges, the
microstructures are much more cross-linked than that interstitial material.
Another consideration is that diffusion is a time-dependent process, and
following our observations, longer exposure times would allow more diffusion
and also more interstitial polymerization than shorter UV exposure times. First,
dense microstructures are created at the center of the UV-exposed areas, with a
thin base around the microstructures. For longer UV exposure times, the space
between microstructures is fully polymerized (Fig. 4.12, Fig.3.13, Fig. 4.14).
Figure 4.16 serves as an illustration of the radical and monomer diffusion theory.
Figure 4.16: Schematic diagram of the polymerization on unexposed areas enhanced by
the radicals (R*) and monomers (m) diffusion. Radical formation after UV light exposure, a) cross section and b) top view. Radical and monomer diffusion creates a lateral concentration gradient, which will result in a dense and thick microstructure at the center of the exposed area, and less dense and thinner layer at the boundary of the microstructure. c) Cross-section and d) top view. The dashed line indicates the boundaries of the windows of the photomask.
In addition, the polymerized material (cross-linked hydrogel) produce
scattering effects. This theory is supported by Orakdogen et al., who reported that
the scattering light intensity from hydrogels is always larger than that from the
polymer solution.348 and the production of radicals attenuates the light intensity
along the light propagation direction, as it has been seen in the fabrication of flat
hydrogels, and generates a gradient of radicals in the z direction (Fig. 4.5). The
convolution of the attenuation effects in z, and the lateral diffusion, may explain
a) b)
R*
R*
R*
R*
R*
R*
R*m
m
m
m
c) d)
R*
R*
R*
R*
R*
R*
m
m
R*
m
m m
m
m
m
m
m
m
m
m
m
m
m
m
m
m
m
m
m
m
m
m
m
m
m
m
mm

122
that the formation of the interstitial material depends on the depth (Fig. 4.17).
This hypothesis is in agreement with reports that showed microstructures with
soft or roundish shapes when photopolymerizing PEGDA or other
hydrogels.259,343,344,349
Figure 4.17: Schematics of the convolution of the attenuation of light (violet arrows), and
the radial diffusion of radicals (R*). Dashed line indicates the boundary of photomask windows.
Even though the pattern of light intensity and the diffusion profile of
reactants may account for the shape of PEGDA microstructures on our
experimental set up, there is still a crucial factor that might affect the
polymerization: the presence of oxygen. As it has been described, oxygen inhibits
polymerization, and our set-up allows the oxygen diffusion through the PDMS
walls and through the air-liquid interfaces created by the chip inlets.
Now, the Damköhler number was again calculated (Eq. 27) considering
the size of the UV transparent windows of the photomasks. Using a photomask of
windows 100 µm in diameter, Da = 4.7 (1% w/v I2959) at the upper region close
to the mask while employing windows of 300 µm in diameter Da = 42 (1% w/v
I2959). Shim and co-workers observed oxygen inhibition effects when Da < 50.265
The Damköhler number was the recalculated considering Beer-Lambert equation
to get information about the oxygen effects with increasing depth (z distance
from the exposed surface). Figure 4.18a shows a plot of Da number as a function
of z when using photomasks with windows of 100 µm or 300 µm compared to
values obtained without photomask (flat hydrogels). Using photomasks, Da
shows values under 50, where polymerization takes place but oxygen inhibition
plays a non-negligible role. Considering windows of 100 µm, at 1 mm far away
from the surface, Da decreases to values lower than 1. This means that a gradient
of oxygen concentration is generated along the vertical direction of the reaction
site and oxygen strongly inhibits the polymerization at such depths, thus limiting
R*
R*
R*
R*
R*
R*
R*
R*
R*

123
the height of the microstructures to values much smaller than the total thickness
of the chip.
Figure 4.18: Oxygen effects on the microstructuring process. Plots of Damköhler number
as a function of depth (z) varying the window diameters (a) and the concentration of I2959 (b). Grey dashed-line indicates Da = 50, the limit where oxygen inhibition effects are not negligible, and red dashed-line (Da = 1) indicates when the oxygen concentration gradient is generated, and oxygen inhibition lead the reaction. c) Cross section and d) top view of the schematic model of microstructures growth. After UV light exposure, diffusion of radicals (R*) enhances the polymerization on unexposed regions. Oxygen inhibition (orange dot arrows) is more prevalent far away from the UV light source. Both radical and oxygen gradients allow the fabrication of rounded shapes with soft boundaries. Dashed line indicates the boundary of photomask windows.
In addition, the effect of oxygen is enhanced when reducing the
photoinitiator concentration (Fig. 4.18b), and becomes important up to the point
of inhibiting polymerization for concentrations smaller than 0.1% w/v. It has to
be considered that, in our experimental set-up, oxygen can diffuse from all
directions except from the upper part of the device, where it is avoided by the
c) d)
200 400 600 800 1000
1
2
3
4
5
DA
200 400 600 800 1000
1
10
100
1000
10000
B
Az (µm)
Da
No photomask
300 µm w indow
100 µm w indow
1% w /v
0.5 % w /v
0.1% w /v
z (µm)D
a
a) b)
R*
R*
R*
R*
R*
R*
R*
R*
R*
R*
O2O2
O2
O2
O2
O2
O2
O2
O2O2
O2
200 400 600 800 1000
1
10
100
1000
10000
B
A200 400 600 800 1000
1
10
100
1000
10000
B
A

124
glass coverslip. Therefore, roundish tips and structure profiles as well as the
presence of soft material at the boundaries between the exposed and non-
exposed regions could be due in part due to oxygen inhibition at the hydrogel
boundaries (Fig. 4.18c) This effect has been reported by Viswanathan and co-
workers, who used a similar experimental system, but poly (hydroxyethyl
methacrylate) (PHEMA) hydrogels instead of PEGDA.344
As a summary, polymerization agents (radicals) show a decreasing
gradient in z and in the radial direction while the inhibition agent (oxygen)
produce gradients from the bottom and the lateral sides of the chip. The
convolution of these factors would explain the formation of bullet-like
microstructures with roundish shapes and smooth profiles.
4.2.3 EFFECTS OF THE UV EXPOSURE TIME ON HYDROGEL
MICROSTRUCTURING
To systematically study the effects of UV exposure time on the
morphology and height of hydrogel microstructures, we selected those fabricated
from photomasks of windows 100 µm in diameter. Polymer solutions of PEGDA
(either 575 or 6000) at different concentrations (from 5% to 10% in w/v) were
used. In these experiments, we used 1% w/v of I2959, so UV exposure times were
selected to lead to fractional monomer conversion ratios of 95% to 100% (Fig.
4.2), so fully cross-linked structures are obtained. Therefore, UV exposure times
ranging from 90 s to 150 s were applied. Figure 4.19a compares the real height of
microstructures and the height of all hydrogel.
Figure 4.19: a) Growth of full hydrogel (red) and the height of microstructures (black) as a function of UV exposure time (mean ± SD) on 7.5% w/v PEGDA6000. Evolution of height of microstructures on b) PEGDA6000, and c) PEGDA575 at 10% w/v (black), 7.5% w/v (red), and 5% w/v (blue).
Hei
ght
(µm
)
Hei
ght
(µm
)
Hei
ght
(µm
)
Exposure time (s) Exposure time (s) Exposure time (s)100 120 140
0
300
600
900
1200
Fun
ctio
nal h
eigh
t (um
)
Exposure time (s)
100 120 1400
125
250
375
He
igh
t (u
m)
Exposure time (s)
100 120 140
500
750
1000
B
B
A
a) b) c)

125
We observed that from a certain exposure time, and while the full height
of the microstructures increases, their effective height does not decrease due to
the interstitial polymerization. Therefore, after a threshold of energy, the extra of
irradiation serves to polymerize the space between microstructures. Even though
the polymer solutions were exposed for 150 s, the full height of the hydrogel only
reached or surpassed the PDMS height (1 mm) in the case of 5% w/v PEGDA6000.
Focusing only on the effective heights of the microstructures, for most of the
experimental conditions studied it was found this value increased up to a
maximum, and then it starts decreasing due to the polymerization at non-exposed
areas. This biphasic behavior was more visible for PEGDA575 than for PEGDA6000
(Fig. 4.19b,c), and also more noticeable for polymer solutions concentrations
equal or higher than 7.5% w/v.
Because of polymerization at unexposed regions, we decided to limit UV
exposure times to the minimum required to achieve almost fully polymerized
structures, which was determined by the maximum height of pillars. This aims to
gain a better control of the shape and dimensions of the pillars fabricated.
However, we found out that isolated pillars did not stand upright in a robust way,
as often they fell, intertwined and stuck to each other. Therefore, we redesigned
our fabrication process to perform two polymerization steps. A double UV
exposure process was used to first create a hydrogel base to keep the hydrogel
microstructures joined together, and then to ultimately produce the
microstructures. To create such a base the first UV exposure was done without
the photomask (Fig. 4.20).
Figure 4.20: Schematic representation of the fabrication of hydrogel microstructures in
two sequential exposures.
Also, and avoid the an anisotropic stiffness of hydrogel glass surfaces,
which has been demonstrated that induce directional epithelial growth and guide
cell migration along the direction of greatest rigidity.350 To evaluate the effects of
the UV exposure time for the base formation, microstructured hydrogels were
fabricated by exposures of 5, 10, and 15 s for the hydrogel base, and 70 s for the
microstructures. As Figure 4.21 shows, higher thicknesses of the hydrogel base
were achieved by increasing the base exposure time. On the other hand,
1st Exposition
Hydrogel base
2nd Exposition
Microstructures growth

126
increasing the hydrogel base lead to shorter microstructures (Fig. 4.21d-f). In
addition, as the total time of UV exposure was increased, the interstitial
polymerization also increased. PEGDA575 showed a biphasic behavior with the
exposure time used for the base, characterized by an increase of the height
followed by a decrease (Fig. 4.21g). Therefore, 5 and 10 s were considered long
enough to keep joined the microstructures while avoiding the base covering
them. Even though 5 s of base exposure resulted in higher microstructures, these
usually bended when using low polymer concentrations. For this reason, 10 s was
also a time considered for further experiments.
Figure 4.21. Effects of the hydrogel base on the effective height of the microstructures.
Images of microstructures fabricated using 5 s, 10 s, and 15 s for the hydrogel base formation, and 70 s of UV exposure for the microstructuring; made of 10 % w/v PEGDA575 (a-c) and 7.5 % w/v PEGDA6000 (d-f). Scale bar = 400 µm. Plots of the microstructure heights, g) PEGDA575, and h) PEGDA6000, (mean ± SD) as a function of UV exposure time for the hydrogel base formation.
5 10 15
200
250
300
7
X1
7
b c
a
UV exp. of base (s)
He
igh
t(µ
m)
UV exp. of base (s)
He
igh
t(µ
m)
5 10 150
150
300
450
600
7
X1
7
d
e
f
a) b) c)
d) e) f)
g) h)

127
Figure 4.22: Effects of the UV exposure time on the hydrogel microstructures fabricated by UV exposure in two steps. a-e) Images of microstructures made of 7.5% PEGDA6000, and exposed 5 s for the base and between 70 to 150 s for the microstructure. Scale bar = 300 µm. Plots of the microstructures height as a function of UV exposure time (mean ± SD): f) 5% w/v PEGDA575, and g) 7.5% w/v PEGDA6000. Plots of microstructures height as a function of UV exposure of all experimental conditions (see Table 3.1 in Materials & Methods) for PEGDA575 (h), PEGDA6000 (i). Regions of interest are represented in grey above the 250 µm in height. 5% w/v PEGDA in blue, 7.5% w/v PEGDA in red, and 10% w/v PEGDA, by using 5, 10 or 15 s for the formation of the hydrogel base (color gradient).
0
250
500
750
70 90 110 130 150Exposure time (s)
He
igh
t(µ
m)
80 100 120 1400
250
500
750
1000
1250
5
Exposure time (s)Exposure time (s)
He
igh
t(µ
m)
0
250
500
750a
b
c d
e
Exposure time (s)70 90 110 130 150
He
igh
t(µ
m)
Exposure time (s)
He
igh
t(µ
m)
80 100 120 140
0
250
500
750
5
Exposure time (s)
a) b) c) d) e)
f) h)
g) i)

128
For a given value of base exposure, the effective height of the
microstructures depended on the second UV exposure time. Interstitial
polymerization was observed, and the effective heights showed a maximum
before decreasing. (Fig. 4.22). Systematic studies allowed to establish optimal
exposure times for each specific polymer solution (PEGDA molecular weight and
polymer percentage). Because we want to mimic in vitro native intestinal villi, we
are interested in microstructures with minimum heights of 250 µm.9,10 With this
in mind, the regions of interest were identified for PEGDA575 and PEGDA6000 (Fig.
4.22h and 4.22i) and experimental conditions within these regions will be further
explored.
4.2.4 EFFECTS OF THE MOLECULAR WEIGHT AND POLYMER
CONCENTRATION ON PEGDA MICROSTRUCTURES
When fabricated in optimal conditions, microstructures made of
PEGDA575 presented bullet-like shapes with sharp tips while microstructures of
PEGDA6000 showed columnar structures with rounded tips (Fig. 4.23). Their
heights also differed: PEGDA575 pillars were significantly shorter than PEGDA6000
pillars within the range studied (Fig. 4.23c,d). These differences in height could
be attributed to factors involved in the polymerization reaction. This might result
in a material that is more absorbent to UV light, so intensity quickly decrease in z
direction and polymerization is not effective. For the same polymer concentration
(weight to volume ratio) the difference in the monomer size between PEGDA575
and PEGDA6000 means that we are comparing solutions of different molarities.
This directly affects the chain propagation rate of the reaction, Rp (Eq. 11).
Rp = kp√2kdf[PI]
kt[M] Eq. 11
Assuming that the photoinitiator concentration [PI], the photoinitiator
efficiency (f), and the rates of decomposition (kd), propagation (kp) and
termination (kt) are the same for both molecular weights,316 Rp depends on the
monomer molarity [M]. For the same weight percentage, molar ratio
(PEGDA575:PEGDA6000) is 10:1 so chain propagation rate would be ten times faster
for PEGDA575 than for PEGDA6000, as more molecules with acrylated ends can
interact. This implies that for the same exposure time, a higher degree of cross-
linking is achieved for the smallest PEGDA molecular weight.234 This higher cross-
linking density results in higher values of the elastic modulus (30 kPa vs. 375
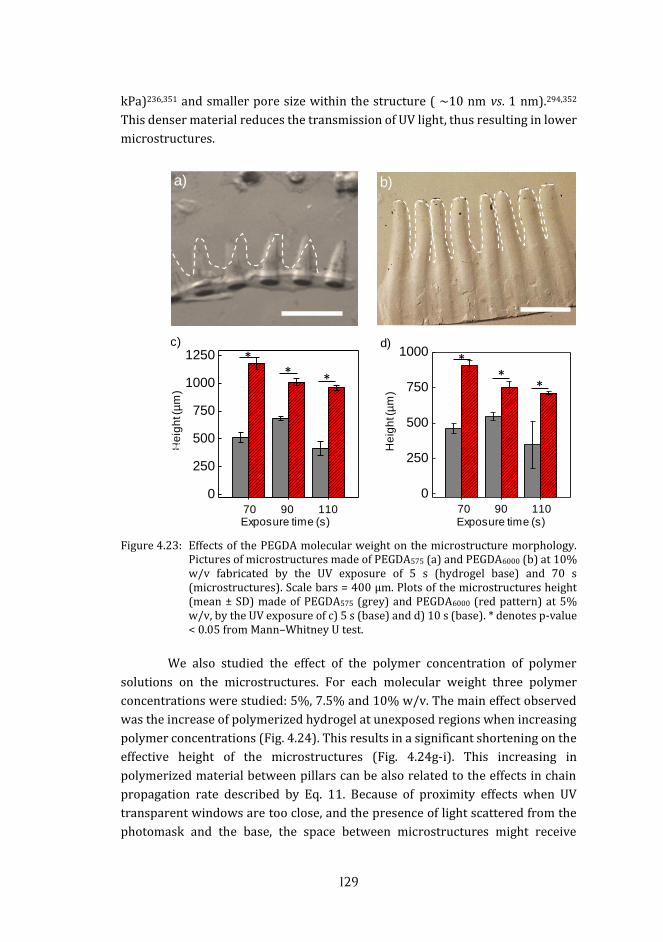
129
kPa)236,351 and smaller pore size within the structure ( ∼10 nm vs. 1 nm).294,352
This denser material reduces the transmission of UV light, thus resulting in lower
microstructures.
Figure 4.23: Effects of the PEGDA molecular weight on the microstructure morphology. Pictures of microstructures made of PEGDA575 (a) and PEGDA6000 (b) at 10% w/v fabricated by the UV exposure of 5 s (hydrogel base) and 70 s (microstructures). Scale bars = 400 µm. Plots of the microstructures height (mean ± SD) made of PEGDA575 (grey) and PEGDA6000 (red pattern) at 5% w/v, by the UV exposure of c) 5 s (base) and d) 10 s (base). * denotes p-value < 0.05 from Mann–Whitney U test.
We also studied the effect of the polymer concentration of polymer
solutions on the microstructures. For each molecular weight three polymer
concentrations were studied: 5%, 7.5% and 10% w/v. The main effect observed
was the increase of polymerized hydrogel at unexposed regions when increasing
polymer concentrations (Fig. 4.24). This results in a significant shortening on the
effective height of the microstructures (Fig. 4.24g-i). This increasing in
polymerized material between pillars can be also related to the effects in chain
propagation rate described by Eq. 11. Because of proximity effects when UV
transparent windows are too close, and the presence of light scattered from the
photomask and the base, the space between microstructures might receive
0
250
500
750
1000
1250
Fu
nct
ion
al h
eig
ht (
um
)
Exposure time (s)
0
250
500
750
1000
Fun
ctio
nal h
eigh
t (um
)
Exposure time (s)70 90 110
He
igh
t(µ
m)
**
*
***
70 90 110Exposure time (s)Exposure time (s)
He
igh
t(µ
m)
a) b)
c) d)
b)
0
250
500
750
1000
1250
Fu
nct
ion
al h
eig
ht (
um
)
Exposure time (s)
0
250
500
750
1000F
unct
iona
l hei
ght (
um)
Exposure time (s)70 90 110
He
igh
t(µ
m)
**
*
***
70 90 110Exposure time (s)Exposure time (s)
He
igh
t(µ
m)
a) b)
c) d)
b)0
250
500
750
1000
1250
Fu
nct
ion
al h
eig
ht (
um
)
Exposure time (s)
0
250
500
750
1000
Fun
ctio
nal h
eigh
t (um
)
Exposure time (s)70 90 110
He
igh
t(µ
m)
**
*
***
70 90 110Exposure time (s)Exposure time (s)
He
igh
t(µ
m)
a) b)
c) d)
b)
0
250
500
750
1000
1250
Fu
nct
ion
al h
eig
ht (
um
)
Exposure time (s)
0
250
500
750
1000
Fun
ctio
nal h
eigh
t (um
)
Exposure time (s)70 90 110
He
igh
t(µ
m)
**
*
***
70 90 110Exposure time (s)Exposure time (s)
He
igh
t(µ
m)
a) b)
c) d)
b)

130
enough UV light to polymerize. When propagation rate is higher due to increasing
polymer concentration, the amount of polymerized material also increases.
Figure 4.24: Effect of polymer concentration on the microstructure morphology.
PEGDA575 microstructures fabricated by UV exposure of 10 s (hydrogel base) and 70 s (microstructures) at a) 5%, b) 7.5%, and c) 10% w/v. PEGDA6000
microstructures fabricated by UV exposure of 5 s (hydrogel base) and 70 s (microstructures) at d) 5%, e) 7.5%, and f) 10% w/v. The dash lines highlight the microstructure profile. Scale bar = 300 µm. Plots of the microstructure height, g) PEGDA575, and h) PEGDA6000. Plot of the microstructures height (mean ± SD) made of polymer concentrations of 10% w/v (grey), 7.5% w/v (red), and 5% w/v (blue) by the UV exposure of 5 s (base) and 70 s (microstructures). * denotes p-value < 0.05 from Mann–Whitney U test.
Thus, PEGDA molecular weight affected the morphology of the
microstructures, making them shorter and sharper when using low molecular
weight, instead the larger and rounded ones when using high molecular weight.
0
300
600
900
1200
15
Exposure time (s)5 10
200
300
400
500
5 10
500
750
1000
1250
AD
1
Hei
ght
(µm
)
Hei
ght
(µm
)
a) b) c)
5 7.5 10Polymer % (w /v)
5 7.5 10Polymer % (w /v)
PEGDA575 PEGDA6000
a) b) c)
d) e) f)
g) h) i)a
b
c
d
ef
Hei
ght
(µm
)
**
***

131
PEGDA concentration has also an intense effect on the amount of polymerized
hydrogel on the unexposed regions, meaning that height of microstructures was
dramatically reduced by increasing the PEGDA concentration. These changes in
the polymerization, depending on the molecular weight and polymer
concentration suggest different implications in the reaction of polymerization.242
Indeed, both factors affect kinetics and lead high rates of propagation, which
made the polymerization on unexposed regions faster and uncontrolled.164 The
low molecular weight and high concentration increase the viscosity of the
polymer solution, which has been reported that reduce the oxygen diffusion,
another factor that would make easier the extent of polymerization on the
unexposed regions.353
Figure 4.25: Combined plots of the heights of the microstructures (mean ± SD) as a
function of the UV exposure time a) PEGDA575 and b) PEGDA6000. Polymer concentrations of 10% w/v (black), 7.5% w/v (red), and 5% w/v (blue).
70 105 140
0
250
500
750
1000
1250
70 105 140 70 105 140 70 105 140
He
igh
t (u
m)
Exposure time (s)
no base 5 s 10 s 15 s
70 105 140
0
250
500
750
1000
1250
70 105 140 70 105 140 70 105 140
He
igh
t (
m)
Exposure time (s)
no base 5 s 10 s 15 s
PEGDA575
PEGDA6000
a)
b)

132
As a summary of the influence of the fabrication parameters on the height
of microstructures, all the assayed conditions are plotted in Figure 4.25. These
plots were used as a reference to select the best fabrication conditions to obtain
microstructures with high aspect ratios (> 5) that would be able to stand up, and
predict their final height.
Therefore, PEGDA6000 seems to be feasible material for developing large
and rounded microstructures which mimic villi. Also, at 5% w/v microstructures
acquired the highest height (up to 1200 µm) by the UV exposure ranging from 5
s to 10 s (base) and 70 s (microstructure). However, these microstructures
eventually fallen, stacked and could be too soft. As an improvement, 6.5% w/v
PEGDA6000 was chosen between 5% and 7.5% w/v to avoid excessive
polymerization on unexposed regions and to ensure that microstructures will
stand up after fabrication.
4.3 EFFECTS OF ACRYLIC ACID IN THE FABRICATION OF MICROSTRUCTURED PEGDA HYDROGELS
4.3.1 CHARACTERIZATION OF THE COPOLYMERIZATION OF PEGDA AND ACRYLIC ACID
To make hydrogels bioactive we need to provide functional groups for
the anchorage of peptides and proteins, which would promote cell adhesion and
growth. For this reason, acrylic acid was added into the polymer recipe. The vinyl
group of the acrylic acid allows its copolymerization with PEGDA by
photopolymerization (Fig. 4.26). The carboxylic groups, now incorporated to the
polymer chains, serve as functional sites to bind proteins by carbodiimide-
mediated reaction (section 3.4).297,298
To determine the successful copolymerization of PEGDA and acrylic acid,
infrared absorption spectra of PEGDA and PEGDA-acrylic acid hydrogels were
analyzed by ATR-FTIR (Fig. 4.26). Two concentrations of acrylic acid were
studied, low (0.3% w/v) and high (1.2% w/v). FTIR spectra displayed absorbance
peaks centered at 1100, 1729, and 2880 cm-1, which correspond to C-O symmetric
stretching, CH2 bending, and C=O stretching from ester bonds. These peaks
correspond to main features found in the infrared spectrum of the PEGDA
backbone (1100, 1730, 2880 cm-1).323,354 Therefore, the addition of acrylic acid at
low or high concentrations did not disrupt the chemical structure of PEGDA
hydrogels. FTIR spectra were then analyzed in detail to determine the successful
copolymerization of PEGDA and acrylic acid (Fig. 4.27). Copolymerized hydrogels
showed a strong absorbance peak at 1576 cm-1, attributed to the asymmetric
vibration of carboxyl groups, while the symmetric band of carboxylic groups
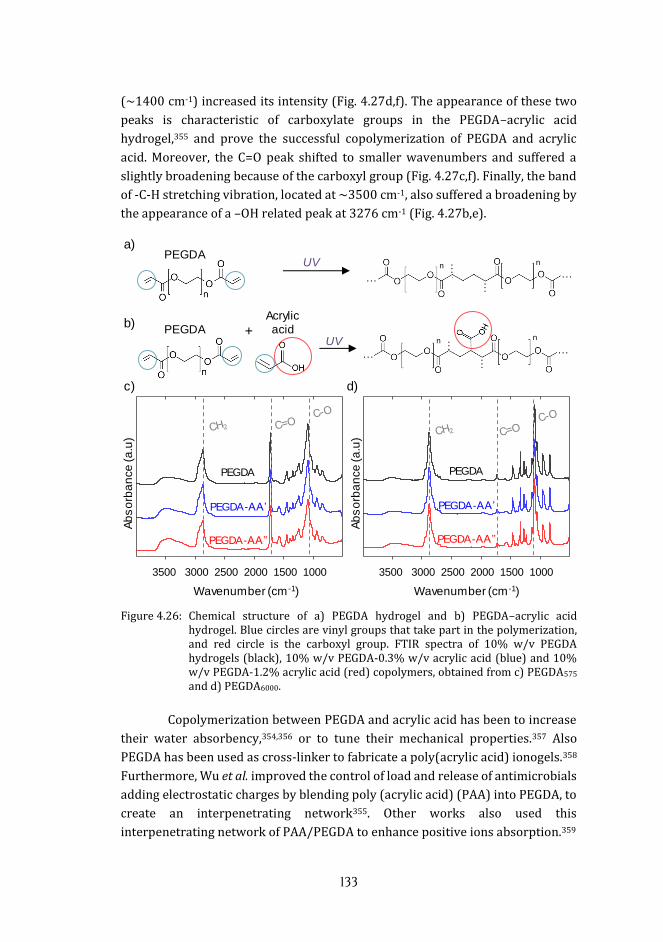
133
(∼1400 cm-1) increased its intensity (Fig. 4.27d,f). The appearance of these two
peaks is characteristic of carboxylate groups in the PEGDA–acrylic acid
hydrogel,355 and prove the successful copolymerization of PEGDA and acrylic
acid. Moreover, the C=O peak shifted to smaller wavenumbers and suffered a
slightly broadening because of the carboxyl group (Fig. 4.27c,f). Finally, the band
of -C-H stretching vibration, located at ~3500 cm-1, also suffered a broadening by
the appearance of a –OH related peak at 3276 cm-1 (Fig. 4.27b,e).
Figure 4.26: Chemical structure of a) PEGDA hydrogel and b) PEGDA–acrylic acid
hydrogel. Blue circles are vinyl groups that take part in the polymerization, and red circle is the carboxyl group. FTIR spectra of 10% w/v PEGDA hydrogels (black), 10% w/v PEGDA-0.3% w/v acrylic acid (blue) and 10% w/v PEGDA-1.2% acrylic acid (red) copolymers, obtained from c) PEGDA575 and d) PEGDA6000.
Copolymerization between PEGDA and acrylic acid has been to increase
their water absorbency,354,356 or to tune their mechanical properties.357 Also
PEGDA has been used as cross-linker to fabricate a poly(acrylic acid) ionogels.358
Furthermore, Wu et al. improved the control of load and release of antimicrobials
adding electrostatic charges by blending poly (acrylic acid) (PAA) into PEGDA, to
create an interpenetrating network355. Other works also used this
interpenetrating network of PAA/PEGDA to enhance positive ions absorption.359
a)
b)
c) d)
PEGDA
AcrylicPEGDA acid
3500 3000 2500 2000 1500 1000
Wavelength (cm-1)
3500 3000 2500 2000 1500 1000
Wavelength (cm-1)
Wavelength (cm-1)
······
···
···
nn
······
nn ···
···
n
n
Ab
so
rba
nce
(a.u
)
3500 3000 2500 2000 1500 1000
······
···
···
nn
······
nn ···
···
n
n
UV
UV
3500 3000 2500 2000 1500 1000
Wavenumber (cm -1)
PEGDA
PEGDA- ’
PEGDA- ’’
PEGDA
PEGDA- ’
PEGDA- ’’
Wavenumber (cm -1)
+
Ab
so
rba
nce
(a.u
)

134
Figure 4.27: a) Schematics of the OH stretch (C-OH), carbonyl stretch (C=O), asymmetric
(νas) and the symmetric vibrational modes (νs) of carboxylic the group. Detailed IR spectra of b) OH stretch, c) carbonyl stretch, and d) asymmetric and symmetric modes of 10% w/v PEGDA575 (black), 10% w/v PEGDA575–0.3% w/v acrylic acid (blue), and 10% w/v PEGDA575-1.2%w/v acrylic acid (red) hydrogels; e) OH stretch, and f) carbonyl stretch, asymmetric and symmetric modes of 10% w/v PEGDA6000 (black), 10% w/v PEGDA6000–0.3% w/v acrylic acid (blue), and 10% w/v PEGDA6000-1.2%w/v acrylic acid (red) hydrogels. The dashed arrows indicate broadening of the peaks.
a)
b) c) d)
e) f)
1700 1600 1500 1400
Wavelength (cm-1)
3600 3400 3200
Wavelength (cm-1)
1600 1500 1400
Wavelength (cm-1)
1397
1576
1600 1500 14001750 1740 1730 1720 1710 1700
Wavelength (cm-1)
1729
1726
1740 1710
Ab
so
rba
nce
(a.u
.)
Wavenumber (cm -1)
3276
~3500
3600 3400 3200
PEGDA575
14121576
1729
1732
1700 1600 1500 1400Wavenumber (cm -1)
3276
~3500
3600 3400 3200
Ab
so
rba
nce
(a.u
.)
PEGDA6000
nC-OH
OOC
H
OOC
H
OOC
OOC
nC=O nas ns
3600 3400 3200
Wavelength (cm-1)
3400-3200 cm -1 1735-1710 cm-1 600-1550 cm -1 1400 cm-1

135
After this qualitative evaluation of the copolymerization reaction,
Toluidine blue (TBO) assay was used for a quantitative evaluation. Disc-shaped
hydrogels made of PEGDA575 and PEGDA6000 at 5% w/v and 10% w/v were
fabricated varying their acrylic acid content in a range from 0.06% w/v (8.3 mM)
to 2.4% w/v (333 mM). After TBO incubation, hydrogels stained differently as a
function of the amount of acrylic acid incorporated to their structure. Blue color
was more intense when increasing the content of acrylic acid (Figure 4.28a-b).
Therefore, the staining corroborates the presence of carboxyl groups and the
successful copolymerization of PEGDA and acrylic acid.
The absorbance values of the solutions measured at 633 nm were
converted in COOH moles using a calibration curve. The total amount of
carboxylic groups in the hydrogels increased when increasing the acrylic acid
amount present in the polymer solutions (Fig. 4.28c,d). This happens for both
PEGDA575 and PEGDA6000 hydrogels. Therefore, the acrylic acid incorporation in
the hydrogel occurred in a concentration-depend manner. On the other hand, the
percentage of acrylic acid incorporation to the PEGDA backbone was low (10%)
for acrylic acid solutions of up to 0.3% w/v. Then, it was increasing until
saturation (60%) for acrylic acid concentrations higher than 0.12% w/v. No
significant differences were found in the incorporation of carboxyl groups
between hydrogels produced from solutions at 5% and 10% w/v concentrations,
meaning that PEGDA concentration did not affect acrylic acid polymerization. In
addition, absorbance values returned statistical significances when comparing
PEGDA575 and PEGDA6000, for 0.3%, 0.6%, and 1.2% w/v acrylic acid
concentrations (Table 4.3) being PEGDA6000 which incorporated more acrylic
acid. Molarity of PEGDA solutions changes one order of magnitude when
comparing PEGDA575 and PEGDA6000. This difference in molarity could explain the
significant differences found.
In summary, results show that PEGDA was successfully copolymerized
with acrylic acid and that the number of carboxylic groups in the hydrogels
depends on the concentration of acrylic acid in the polymer solution. They also
showed that the efficiency of acrylic acid incorporation is maximal for acrylic acid
concentrations higher than ∼1.2% w/v. Poellmann et al., copolymerized
polyacrylamide and acrylic acid with the same intention of protein anchoring, and
reported similar results than us respect to the TBO analysis. They found
significant differences in the amount of released TBO increasing acrylic acid
concentration, but the TBO levels did not show significant differences by
increasing the amount of polymer (polymer concentration).300
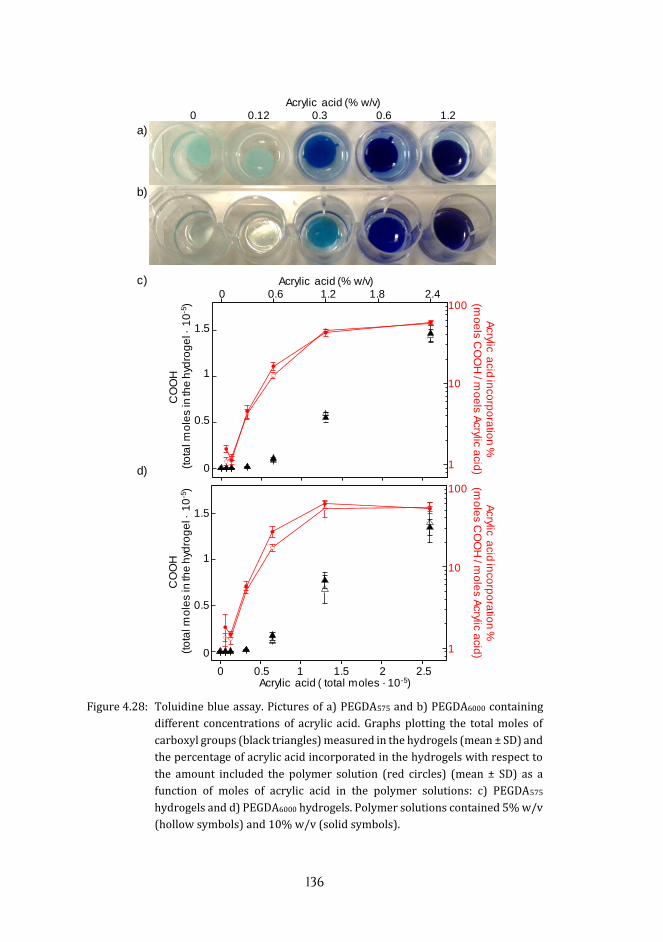
136
Figure 4.28: Toluidine blue assay. Pictures of a) PEGDA575 and b) PEGDA6000 containing
different concentrations of acrylic acid. Graphs plotting the total moles of
carboxyl groups (black triangles) measured in the hydrogels (mean ± SD) and
the percentage of acrylic acid incorporated in the hydrogels with respect to
the amount included the polymer solution (red circles) (mean ± SD) as a
function of moles of acrylic acid in the polymer solutions: c) PEGDA575
hydrogels and d) PEGDA6000 hydrogels. Polymer solutions contained 5% w/v
(hollow symbols) and 10% w/v (solid symbols).
0 0.5 1 1.5 2 2.5
100
10
1
Acrylic acid ( total moles · 10-5)
Acrylic acid (% w/v) 0 0.12 0.3 0.6 1.2
a)
b)
c)
d)
0,0 0,5 1,0 1,5 2,0 2,5
0,0
0,5
1,0
1,5
0,0 0,5 1,0 1,5 2,0 2,5
0,01
0,1
1
5_
5
A
B
A
0,0 0,5 1,0 1,5 2,0 2,5
0,0
0,5
1,0
1,5
0,0 0,5 1,0 1,5 2,0 2,5
0,01
0,1
1
6_
5
A
H1
A
CO
OH
(t
ota
l mo
les
in th
e h
ydro
ge
l · 1
0-5
)
1.5
1
0.5
0
Acrylic a
cid in
corp
ora
tion
%(m
ole
s C
OO
H / m
ole
s A
crylic acid
)
100
10
1
Acrylic a
cid in
corp
ora
tion
%(m
oe
ls C
OO
H / m
oe
ls A
crylic acid
)C
OO
H
(to
tal m
ole
s in
the
hyd
rog
el ·
10
-5)
1.5
1
0.5
0
0 0.6 1.2 1.8 2.4Acrylic acid (% w/v)

137
PEGDA575
5% vs 10%
PEGDA6000
5% vs 10%
PEGDA575
vs PEGDA6000
Acrylic acid (% w/v) p-value p-value p-value
0.06 0.1 0.7 0.6
0.12 0.7 0.4 0.06
0.3 0.7 0.4 0.03
0.6 0.1 0.1 0.02
1.2 0.4 0.4 0.04
2.4 0.7 1 0.2
Table 4.3: Statistical analysis (Mann–Whitney U test) of measurements represented in Figure 4.28c and d.
4.3.2 EFFECTS OF ACRYLIC ACID ON THE MECHANICAL AND PHYSICOCHEMICAL PROPERTIES OF PEGDA–ACRYLIC ACID HYDROGELS
The effects of acrylic acid on the mechanical properties of PEGDA-acrylic
acid hydrogels were studied by determining the Young’s modulus in a
compression assay. Disc-shaped hydrogels were made of 6.5% w/v PEGDA6000
and acrylic acid in concentrations ranging from 0.06% w/v (8 mM) to 1.2% w/v
(166.5 mM). Stress-strain curves measured are plotted in Figure 4.29.
Young’s modulus values were extracted from the slope of the linear
regions comprised between 7% and 10% strain and are plotted in Figure 4.29b.
Young’s modulus mean values increased for small amounts of acrylic acid in the
solution, reached a maximum and decreased again. However, Young’s modulus
values showed only significant differences (by Kruskal-Wallis test (p = 0.014 >
0.05)) between 0.06% w/v and 0.6% w/v (Fig. 4.29b). Despite these differences
when low concentrations of acrylic acid are employed for fabrication, elastic
modulus values do not show significant differences with PEGDA when acrylic acid
concentrations from 0.6 to 1.2% w/v are used. Young’s modulus values remained
within the physiological range reported for small intestine360 for acrylic acid
concentrations up to 1.2% w/v (Fig. 4.29c). In addition, swelling ratio was calculated as the ratio between the
difference in heights of a swollen hydrogel and hydrogel after fabrication, and the
height after fabrication (ΔH/H0) and was plotted as a function of acrylic acid
content (Fig. 4.30). By statistical comparisons, significant differences between
swelling ratios of 6.5% w/v PEGDA6000 hydrogel and 6.5% w/v PEGDA6000–1.2%
w/v acrylic acid hydrogel were found (Kruskal-Wallis test, p < 0.05).
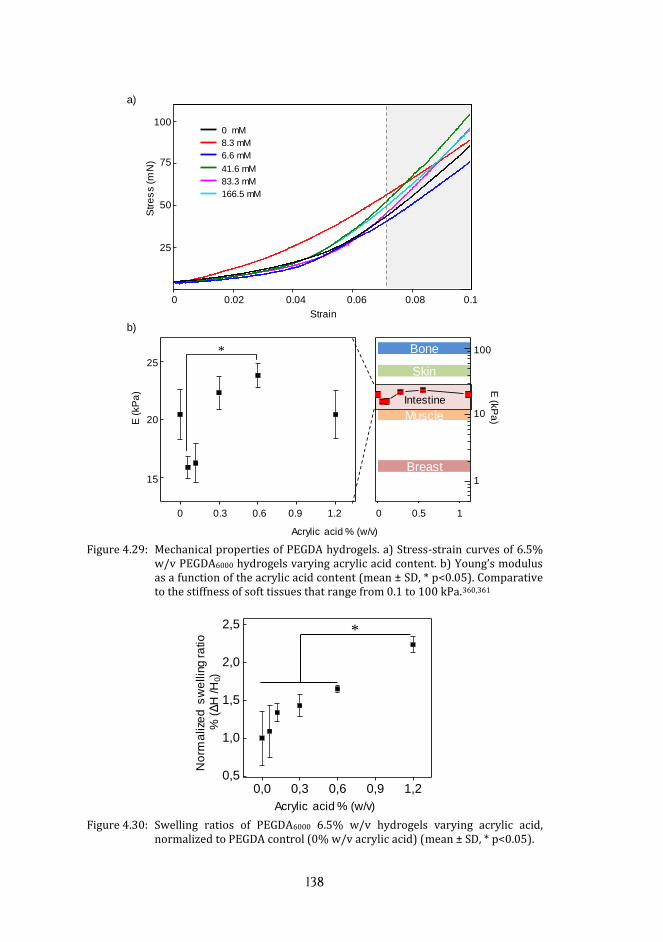
138
Figure 4.29: Mechanical properties of PEGDA hydrogels. a) Stress-strain curves of 6.5%
w/v PEGDA6000 hydrogels varying acrylic acid content. b) Young’s modulus as a function of the acrylic acid content (mean ± SD, * p<0.05). Comparative to the stiffness of soft tissues that range from 0.1 to 100 kPa.360,361
Figure 4.30: Swelling ratios of PEGDA6000 6.5% w/v hydrogels varying acrylic acid,
normalized to PEGDA control (0% w/v acrylic acid) (mean ± SD, * p<0.05).
25
50
75
100
0 2 4 6 8 10
Str
ess
(m
N)
Strain (%)
Skin
Muscle
Bone
Breast
E (
kPa
)
0 0.3 0.6 0.9 1.2
25
20
15
Acrylic acid % (w/v)
*
15
20
25
25
50
75
100
0 2 4 6 8 10
Str
ess
(mN
)
Strain (%)
25
50
75
100
0 2 4 6 8 10
Str
ess
(mN
)
Strain (%)
0 mM8.3 mM6.6 mM
41.6 mM83.3 mM166.5 mM
Strain
0 0.02 0.04 0.06 0.08 0.1
100
75
50
25
Str
es
s (m
N)
0 0.5 1
100
10
1
E (kP
a)
Intestine
0 75 150
1
10
100
Acrylic acid (mM)
a)
b)
0,0 0,3 0,6 0,9 1,20,5
1,0
1,5
2,0
2,5
Acrylic acid % (w/v)
*
No
rma
lize
ds
we
lling
ratio
%
(Δ
H/H
0)

139
Swelling ratio increases, indicating a looser polymeric cross-linked
network formed in the PEGDA–acrylic hydrogels. These changes may be
attributed to changes in the polymerization. Acrylic acid competes with PEGDA
molecules to graft onto PEGDA acrylate groups. As the grafted acrylic acid
increased, the availability of vinyl groups of PEGDA decreased. Since such groups
also serve as the cross-linking site for PEGDA, this reaction unavoidably lowers
the cross-linking density of the PEGDA–acrylic acid hydrogels.171 Taking into
account that the total polymer concentration increases considerably, 20%, when
adding acrylic acid at 1.2% w/v, the stiffness did increase significantly.
4.3.3 EFFECTS OF ACRYLIC ACID ON THE SHAPE OF THE MICROSTRUCTURES
The effects of the acrylic acid on hydrogel microstructuring were studied
on 6.5% PEGDA6000 hydrogels containing acrylic acid concentrations ranging
from 0.06% to 1.2% w/v. The microstructured hydrogels were fabricated by UV
exposure in two steps, 10 s (hydrogel base) and 70 s (microstructures). The
addition of acrylic acid in the polymer solution had a dramatic effect on the
morphology of the microstructures (Fig. 4.31).
Figure 4.31: Effects of acrylic acid on the morphology of the microstructures. Images of
the microstructure profiles highlighting their contours (dash line), corresponding to acrylic acid percentages of a) 0%, b) 0.06%, c) 0.12%, d) 0.3%, e) 0.6%, f) 0.9% and f) 1.2% w/v. Scale bar = 250 µm.
a) b) c)
d) e) f) g)

140
It was observed a substantial reduction in the diameter of the pillars,
leading the progressive sharpening of their tips when increasing the acrylic acid
concentration. The samples with the highest amount of acrylic acid (0.9% and
1.2% w/v) were so strongly affected that some of them start bending (Fig. 4.31f).
The reduction in diameter was also accompanied with a significant reduction of
the interstitial material between pillars within the unexposed areas. As a
consequence, the effective height of the microstructures increased when
increasing acrylic acid content. Contrary, their diameter decreased when
increasing the acrylic acid content (Fig. 4.32). The increase in the acrylic acid
concentration allowed obtaining microstructures with high aspect ratios, pf
about ten height:width. Samples fabricated with acrylic acid concentrations
above 0.3% w/v showed diameters below 100 µm, which compromises the
objectives of mimicking native villi dimensions (125 µm in diameter).9,10
Therefore, 0.3% w/v concentration of acrylic acid was selected as the most
beneficial for fabricating villi-like microstructures.
Figure 4.32: Plot of the diameter (black) and the height (red) of the microstructures as a
function of acrylic acid concentration (mean ± SD).
Thus, for the fabrication parameters tested, acrylic acid reduced
polymerization on unexposed regions and even the dimeter of the
microstructures close to the bottom of the container (z∼1 mm). To determine the
influence of UV exposure times on the PEGDA-acrylic acid microstructuring
process, samples were exposed for 10 s for the hydrogel base formation and 50 s,
70 s, and 90 s for the fabrication of microstructures. The resulting microstructure
Height (µm)
Diameter (µm)
Acr
ylic
aci
d%
(w
/v)
80 100 120
400 600 800 1000
1.2
0.9
0.6
0.3
0
1,2
0,9
0,6
0,3
0,0
80
100
120
AA
% (w
/v)
400
600
800
1000
Height (um)

141
profiles are shown in Figure 4.33. It can be seen that, similar to PEGDA, the height
of PEGDA–acrylic acid microstructures is sensitive to UV exposure time.
Combining 10 s and 50 s was not enough produce long microstructures (Fig.
4.33a). However, the combination of 10 s and 90 s over-polymerized the space
between microstructures, reducing the effective pillar height below 150 µm (Fig
4.33c). Thus, the combination of 10 s and 70 s was the most appropriate for the
fabrication of microstructures with the target dimensions. These combination of
exposure times developed shorter microstructures by using PEGDA (without
acrylic acid), due to the polymerization on exposed regions. Thus, shorter
exposure times would be required for avoid the uncontrolled polymerization,
returning, may be, microstructures no longer enough (Fig. 4.25 and Fig. 4.32).
Figure 4.33: Images of the microstructure profiles made of 6.5% w/v PEGDA6000 and 0.3%
w/v acrylic acid exposed 10 s (hydrogel base) and a) 50 s (microstructures), b) 70 s (microstructures), and c) 90 s (microstructures). The dashed lines highlight the contours of the microstructures. Scale bar = 300 µm.
Overall, high acrylic acid concentrations would be desirable to produce a
high density of anchoring points for the functionalization of the material with
peptides or proteins. Moreover, for hydrogel surfaces it has been shown, that
there is a minimal ligand density needed for an efficient cell adhesion.140,149,362
However, and even though high acrylic acid concentrations reduce the hydrogel
polymerization on unexposed regions and increase microstructures height,
concentrations higher than 0.3% w/v produced a considerable reduction in the
diameter of the microstructures. For acrylic acid concentrations, up to 0.3% w/v
the Young’s modulus of the resulting material and its swelling ratio did not differ
significantly from those corresponding to PEGDA. Experiments performed with
different UV exposure times proved that 10 s for the formation of the base and 70
s for the formation of microstructures were the most appropriate conditions to
obtain pillar structures with dimensions close to the native intestinal villi.
a) b) c)

142
4.4 BIOACTIVATION OF PEGDA - ACRYLIC ACID HYDROGELS 4.4.1 CHARACTERIZATION OF FUNCTIONALIZATION PROCESS BY ATR-FTIR
PEGDA – acrylic acid hydrogels show carboxylic groups that can be used to
bind cell adhesive molecules, such as extracellular matrix proteins or peptides.
Figure 4.34: Chemical structure and of PEGDA–acrylic acid hydrogels, activation with
EDC/NHS and protein conjugation. After activation, PEGDA–acrylic hydrogels contain instable NHS that enhances the covalent conjugation of the amine group of the protein.
Carbodiimide-mediated reaction targets amino group bearing molecules.
Functionalization process was based on the copolymerization of PEGDA and
acrylic acid, the activation of the carboxylic groups of the acrylic acid by EDC/NHS
reaction, and the incorporation of the functional biomolecules (Fig. 4.34). Disc-
shaped hydrogels made of 10% w/v PEGDA6000 and 1.2% w/v acrylic acid were
······
···
···
nn
······
nn ···
···
n
n
······
nn ···
···
n
······
nn ···
···
n
PEGDA
PEGDA – acrylic acid
NHS activated
Proteinfunctionalized

143
used for the qualitative analysis of each functionalization step by ATR-FTIR.
Samples with high contents of acrylic acid was selected for this experiment to
improve signal to noise ratio and facilitate data analysis.
Figure 4.35: FTIR spectra acquired after each step of the functionalization process. a)
Detailed spectra of the region of interest between 4000 and 3000 cm-1. b) Detailed spectra of region of interest between 1900 and 1500 cm-1. PEGDA hydrogels in black, PEGDA–acrylic acid hydrogels in red, EDC/NHS activated hydrogels in blue, and hydrogels functionalized with collagen in green.
After activating the hydrogels in the EDC/HNS solution, the carboxylate
peak of the acrylic acid, located at 1576 cm-1, disappeared due to the
incorporation of NHS molecules through amide bounds (Fig. 4.35b). Two
characteristic peaks of NHS appeared around 1800 cm-1, and a weak band related
to amide I and amide II bounds around 1550 to 1650 cm-1. After protein
incubation, amide peaks became much stronger and NHS peaks showed a
decrease in their absorbance. C=O peaks also suffered a broadening and shifted
to lower wavenumbers due to the amide bounds present in NHS and proteins. In
addition, when binding the protein (Collagen I) the band located around 3500 cm-
1 broadened due to the contribution of the –NH stretch mode (Fig. 4.35a). All main
peaks of the different spectra with their attributed vibrational modes are detailed
in Table 4.4. These results demonstrate the success of our strategy for the
functionalization of PEGDA-acrylic acid hydrogels.
To optimize the functionalization protocol to maximize the amount of
protein incorporated, the activation step was studied for two different
concentrations of EDC/NHS (6 mM/5 mM and 50 mM/30 mM). Also, protein
incubation was performed with two different concentrations of collagen I (0.04
and 0.4 mg/mL). The increasing on EDC/NHS concentration enhanced the
1800 1700 1600
NHS
Amide IAmide II
COO-
C=O
Wavenumber (cm -1)
3750 3500 3250
CH
OH
Wavenumber (cm -1)
NH
Ab
so
rba
nce
(a
.u.)
a) b)
Ab
so
rba
nce
(a
.u.)

144
absorbance of the NHS and amide peaks, and produced higher absorbance and
broadening of the C=O peak (Fig. 4.36a). After protein incubation, the relative
intensity of the amide peaks correlated witht their concentrations. (Fig. 4.36b,c).
Assigned
bond
PEGDA-
Acrylic acid
NHS
activation
Collagen
functionalization
Tabulated
value
-C-H stretch vibration 3508 3508 3508 3445322
–CH2 stretch 2880 2880 2880 2882322
-C=O stretch 1729 1726 1726 1730323
C = C stretch 1600 1600 1600 1600324
C-O 1100 1100 1100 1098325
-OH 3276 3100-3650363
COO asym. vibration 1576 1590363
NHS1 1807 1807 1825363
NHS2 1780 1780 1793363
-NH 3299 3295364
Amide I 1652 1656 1650364
Amide II 1567 1564 1560364
Table 4.4: Peak wavenumbers (cm-1) identified in the experimental spectra of PEGDA-acrylic acid hydrogels during the functionalization. And their assignments.
Figure 4.36: Detailed FTIR spectra of a) PEGDA–acrylic acid hydrogels (red), after
activation by EDC/NHS (6 mM/5mM dashed blue, 50 mM/30mM blue), and b,c) samples activated with 50 mM/30mM after incubation with Collagen type I (0.04 mg/mL dashed green, 0.4 mg/mL green).
The functionalization protocol proved to be sensitive to activation agent and
protein concentrations. Even collagen footprint was already found at 0.04
mg/mL, the increasing of collagen concentration up to 0.4 mg/mL increased the
amount of protein incorporated. Considering these results, EDC/NHS
concentrations of 50 mM/30mM was stablished as satisfactory for the
functionalization process.
1800 1700 1600 15000,0
0,1
Abs
orba
nce
Wavenumber (cm-1)3500 3250 3000
Abs
orba
nce
Wavenumber (cm-1)
a) b) c)
1800 1700 1600 15000,0
0,1
Abs
orba
nce
Wavenumber (cm-1)
C=O
CH2
Amide IAmide II
NHS
Amide I
Amide II
COO-
Amide A
Amide B
Wavenumber (cm -1)
Ab
so
rba
nce
(a.u
.)
Wavenumber (cm -1) Wavenumber (cm -1)
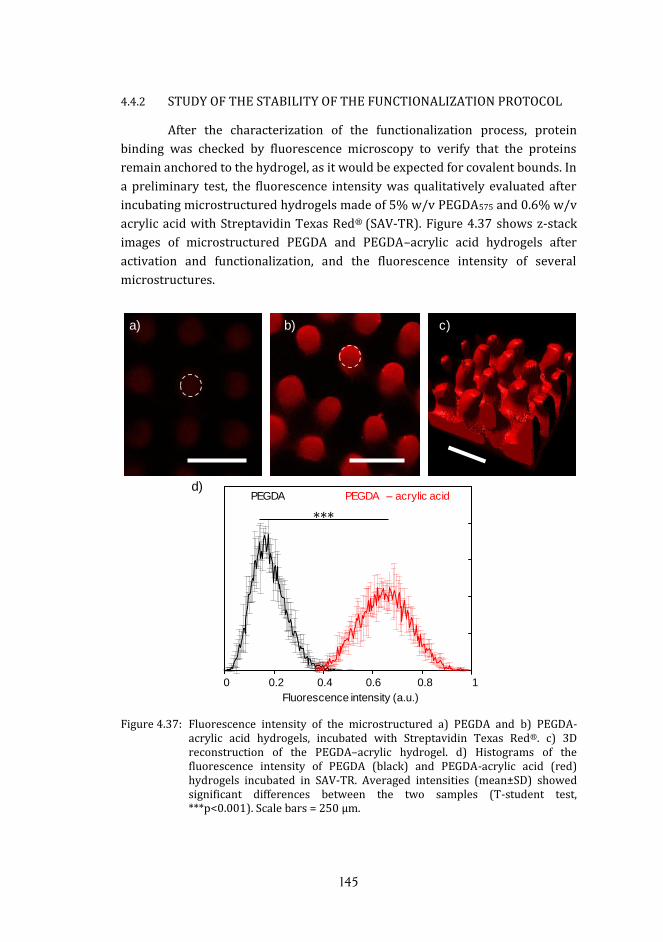
145
4.4.2 STUDY OF THE STABILITY OF THE FUNCTIONALIZATION PROTOCOL
After the characterization of the functionalization process, protein
binding was checked by fluorescence microscopy to verify that the proteins
remain anchored to the hydrogel, as it would be expected for covalent bounds. In
a preliminary test, the fluorescence intensity was qualitatively evaluated after
incubating microstructured hydrogels made of 5% w/v PEGDA575 and 0.6% w/v
acrylic acid with Streptavidin Texas Red® (SAV-TR). Figure 4.37 shows z-stack
images of microstructured PEGDA and PEGDA–acrylic acid hydrogels after
activation and functionalization, and the fluorescence intensity of several
microstructures.
Figure 4.37: Fluorescence intensity of the microstructured a) PEGDA and b) PEGDA-
acrylic acid hydrogels, incubated with Streptavidin Texas Red®. c) 3D reconstruction of the PEGDA–acrylic hydrogel. d) Histograms of the fluorescence intensity of PEGDA (black) and PEGDA-acrylic acid (red) hydrogels incubated in SAV-TR. Averaged intensities (mean±SD) showed significant differences between the two samples (T-student test, ***p<0.001). Scale bars = 250 µm.
0,0 0,2 0,4 0,6 0,8 1,00,0
0,2
0,4
0,6
0,8
1,0
0,0
0,2
0,4
0,6
0,8
1,0 H1
Fluorescence intensity (a.u.)
F
Fluorescence intensity (a.u.)0 0.2 0.4 0.6 0.8 1
PEGDA PEGDA – acrylic acid
***
a) b) c)
d)

146
The fluorescence intensity of the hydrogels containing acrylic acid was
found to be significantly higher (p<0.001) than for those without acrylic acid. The
fluorescence signal in the hydrogels without acrylic acid could be due to the
unspecific adsorption or trapping of some SAV-TR molecules inside the hydrogel.
As controls, PEGDA and PEGDA–acrylic acid hydrogels without EDC/NHS
activation were also incubated with the SAV-TR solution and no fluorescence
signal was detected. This result proves the need of EDC/NHS activation step for
the successful covalently protein binding.
To study the stability of the protein covalently bound to rinsing and
storage time, the fluorescence intensity of disc-shaped hydrogels functionalized
with SAV-TR was employed. Comparing the fluorescence intensity after
increasing storage time (Fig. 4.38a) and number of rinses (Fig. 4.38b), significant
differences were found by one way ANOVA test (p<0.05) only between 1 and 7
days, and between 3 and 10 rinses. However, as a general trend, increasing rinse
number and storage time did not monotonously diminish the fluorescence
intensity. Moreover, all intensity values were kept within a narrow range,
meaning that the protein binding achieved is stable enough. This has implications
in the application of this material to cell culture, the results guarantee that
proteins remain non-degraded for long-term culture periods..
Figure 4.38: Plots of the fluorescence intensity (mean ± SD) of SAV-TR functionalized
hydrogels as a function of a) storage time (black) and b) rinsing number (red). The means and SD plotted correspond to each imaged analyzed.
The acrylic acid content in the hydrogels determined the amount of
exposed carboxylic groups and, therefore, it is expected to quantitatively
correlate such value with the amount of protein bound. To asses this dependence,
disc-shaped hydrogels with different acrylic acid content were incubated with
F1
r1 r3 r10
0,4
0,6
0,8
1,0
d1 d3 d7
d1 D
0,4
0,6
0,8
1,0
0 0.2 0.4 0.6 0.8 1
Flu
ore
sce
nce
inte
nsi
ty(a
.u.)
1
0.8
0.6
0.4
1 3 7 1 3 10
a) b)1
0.8
0.6
0.4
Flu
ore
sce
nce
inte
nsi
ty(a
.u.)*
*
Storage time (days) Rinsing times

147
SAV-TR and their fluorescence intensity was evaluated (Fig. 4.39). The solution
of SAV-TR protein was highly concentrated (500 µg/mL) to ensure that amino
groups exposed by proteins (∼10-4 moles, considering each protein has ∼30
exposed amino groups) will be in excess for the number of carboxylic groups
available (∼10-5 moles).
Figure 4.39: Effect of acrylic acid content in the protein binding. Fluorescence images of
a) PEGDA, b) PEGDA–acrylic acid (0.3% w/v), and c) PEGDA–acrylic acid (0.6% w/v) hydrogels functionalized with SAV-TR. d) Plot of the fluorescence intensity (mean ± SD) as a function of the acrylic acid content of the polymer solutions after EDC/NHS activation (red circles). Non-activated hydrogels were used as controls (black squares) The line is an eye guide. (*** p < 0.001, * p< 0.05).
Increasing the acrylic acid concentration in the polymer solution
significantly increased (p<0.001) the fluorescence intensity of the samples in a
concentration dependent manner for the range of concentrations assayed. Non-
activated hydrogels (control) showed similar low values of fluorescence intensity
for all the different acrylic acid contents. These results proved the need of the
EDC/NHS activation for the success of the functionalization. Thus, acrylic acid
0,7
0,8
0,9
1,0
0,0 0,3 0,6
0,7
0,8
0,9
1,0
AA%
F
*
***
***
Flu
ore
sce
nce
inte
nsi
ty(a
.u.)
1
0.9
0.8
0.7
Acrylic acid content (% w/v)0 0.3 0.6
***
***
a) b) c)
d)
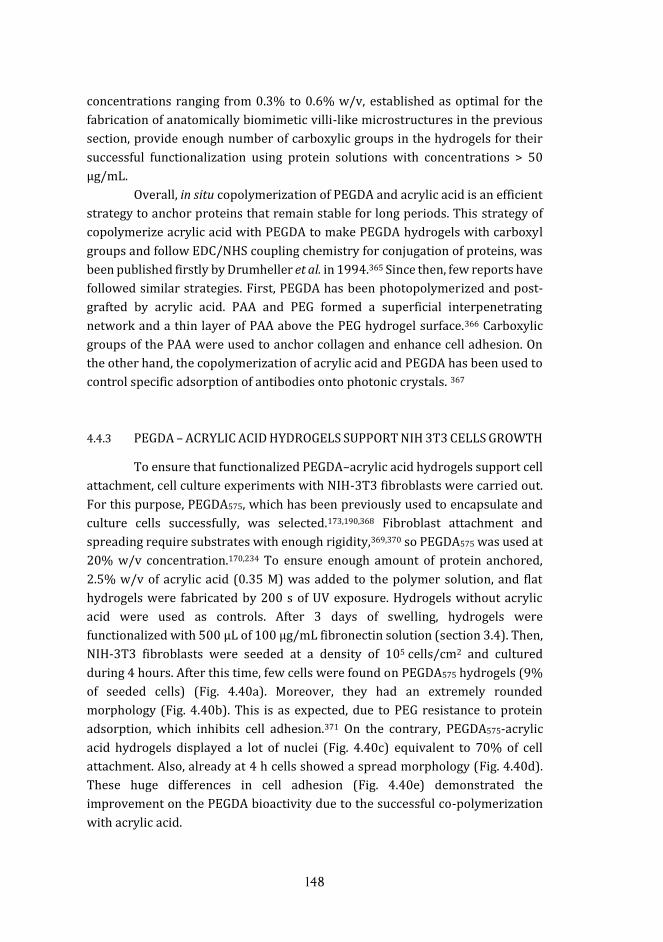
148
concentrations ranging from 0.3% to 0.6% w/v, established as optimal for the
fabrication of anatomically biomimetic villi-like microstructures in the previous
section, provide enough number of carboxylic groups in the hydrogels for their
successful functionalization using protein solutions with concentrations > 50
µg/mL.
Overall, in situ copolymerization of PEGDA and acrylic acid is an efficient
strategy to anchor proteins that remain stable for long periods. This strategy of
copolymerize acrylic acid with PEGDA to make PEGDA hydrogels with carboxyl
groups and follow EDC/NHS coupling chemistry for conjugation of proteins, was
been published firstly by Drumheller et al. in 1994.365 Since then, few reports have
followed similar strategies. First, PEGDA has been photopolymerized and post-
grafted by acrylic acid. PAA and PEG formed a superficial interpenetrating
network and a thin layer of PAA above the PEG hydrogel surface.366 Carboxylic
groups of the PAA were used to anchor collagen and enhance cell adhesion. On
the other hand, the copolymerization of acrylic acid and PEGDA has been used to
control specific adsorption of antibodies onto photonic crystals. 367
4.4.3 PEGDA – ACRYLIC ACID HYDROGELS SUPPORT NIH 3T3 CELLS GROWTH
To ensure that functionalized PEGDA–acrylic acid hydrogels support cell
attachment, cell culture experiments with NIH-3T3 fibroblasts were carried out.
For this purpose, PEGDA575, which has been previously used to encapsulate and
culture cells successfully, was selected.173,190,368 Fibroblast attachment and
spreading require substrates with enough rigidity,369,370 so PEGDA575 was used at
20% w/v concentration.170,234 To ensure enough amount of protein anchored,
2.5% w/v of acrylic acid (0.35 M) was added to the polymer solution, and flat
hydrogels were fabricated by 200 s of UV exposure. Hydrogels without acrylic
acid were used as controls. After 3 days of swelling, hydrogels were
functionalized with 500 µL of 100 µg/mL fibronectin solution (section 3.4). Then,
NIH-3T3 fibroblasts were seeded at a density of 105 cells/cm2 and cultured
during 4 hours. After this time, few cells were found on PEGDA575 hydrogels (9%
of seeded cells) (Fig. 4.40a). Moreover, they had an extremely rounded
morphology (Fig. 4.40b). This is as expected, due to PEG resistance to protein
adsorption, which inhibits cell adhesion.371 On the contrary, PEGDA575-acrylic
acid hydrogels displayed a lot of nuclei (Fig. 4.40c) equivalent to 70% of cell
attachment. Also, already at 4 h cells showed a spread morphology (Fig. 4.40d).
These huge differences in cell adhesion (Fig. 4.40e) demonstrated the
improvement on the PEGDA bioactivity due to the successful co-polymerization
with acrylic acid.
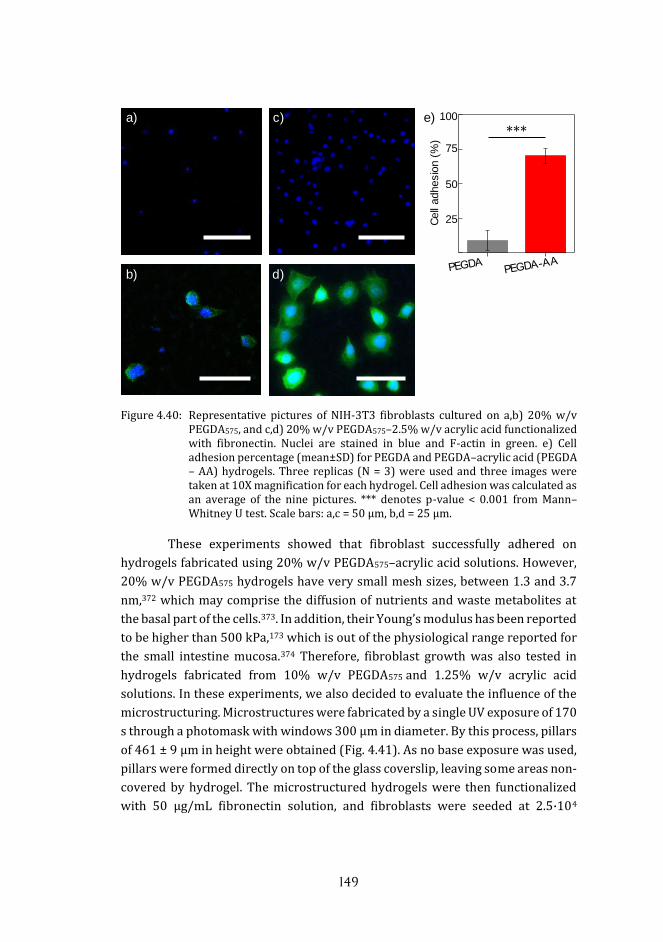
149
Figure 4.40: Representative pictures of NIH-3T3 fibroblasts cultured on a,b) 20% w/v
PEGDA575, and c,d) 20% w/v PEGDA575–2.5% w/v acrylic acid functionalized with fibronectin. Nuclei are stained in blue and F-actin in green. e) Cell adhesion percentage (mean±SD) for PEGDA and PEGDA–acrylic acid (PEGDA – AA) hydrogels. Three replicas (N = 3) were used and three images were taken at 10X magnification for each hydrogel. Cell adhesion was calculated as an average of the nine pictures. *** denotes p-value < 0.001 from Mann–Whitney U test. Scale bars: a,c = 50 µm, b,d = 25 µm.
These experiments showed that fibroblast successfully adhered on
hydrogels fabricated using 20% w/v PEGDA575–acrylic acid solutions. However,
20% w/v PEGDA575 hydrogels have very small mesh sizes, between 1.3 and 3.7
nm,372 which may comprise the diffusion of nutrients and waste metabolites at
the basal part of the cells.373. In addition, their Young’s modulus has been reported
to be higher than 500 kPa,173 which is out of the physiological range reported for
the small intestine mucosa.374 Therefore, fibroblast growth was also tested in
hydrogels fabricated from 10% w/v PEGDA575 and 1.25% w/v acrylic acid
solutions. In these experiments, we also decided to evaluate the influence of the
microstructuring. Microstructures were fabricated by a single UV exposure of 170
s through a photomask with windows 300 µm in diameter. By this process, pillars
of 461 ± 9 µm in height were obtained (Fig. 4.41). As no base exposure was used,
pillars were formed directly on top of the glass coverslip, leaving some areas non-
covered by hydrogel. The microstructured hydrogels were then functionalized
with 50 µg/mL fibronectin solution, and fibroblasts were seeded at 2.5·104
100
75
50
25Cel
ladh
esio
n(%
)
0
25
50
75
100
***a) c) e)
b) d)

150
cells/cm2. Cell culture was stopped after 7 days, when cells were fixed. Cell nuclei
and actin cytoskeleton were stained and imaged.
A top view picture of a sample showing the autofluorescent signal of the
microstructures and the cell nuclei is shown in Figure 4.41a. The microstructures
were fallen due to the sample mounting. Cell-empty round areas refer to the
places that microstructures occupied before falling, and arrows indicate cells
grown on coverslip regions between pillars. After seeding, cells were
homogenously distributed between the pillars. After 7 days, the fibroblasts
adhered and proliferated on both the hydrogel microstructures and the coverslip
areas surrounding them. In terms of cell density, significant differences were not
found between the coverslip areas and the microstructures of the same sample
(Fig. 4.41b). However, cell density on microstructures was highly variable (68%)
in the same sample as the standard deviation in Figure 4.41b shows. Regarding
the position adopted by the cells along the microstructure, cell density was
significantly higher at the upper half of the microstructures from that found at the
bottom half (p<0.01). Statistically significant differences (p<0.05) were also
found comparing cell densities at the upper half of the microstructures and on the
coverslip, being higher again at the tip of the microstructures (Fig. 4.41c). These
differences in cell density also could be observed in higher magnification images
where the tip (Fig. 4.41e) shows a full coverage of spread cells, but not the base
(Fig. 4.41f). In both cases, the cells displayed a well-formed F-actin cytoskeleton
and radial projections or filopodia.
We found that fibroblasts did not create a cell monolayer on the whole
microstructure, but some empty areas were found at the tip and more at the base.
We attribute this to the fact that cells might not had enough time in culture.
Overall, these results showed successful fibroblast proliferation and migration on
microstructured hydrogels.
Considering the results on cell positioning, cells may migrate from the
coverslip to the microstructures. It is extensively reported the preferentially
migration of fibroblasts toward stiffer substrates,369,370,375 but in our case it seems
that cells migrate to the softer hydrogel. Chemical and mechanical stimuli play
significant roles in guiding the direction of fibroblast migration, and Hale et al.
reported similar results when culturing fibroblasts in substrates with dual
chemical-mechanical gradients. Fibroblasts chose as a primary direction of
motion high collagen-low Young’s modulus substrates, instead the low collagen-
high Young’s modulus subtrates.376
151
Figure 4.41: NIH-3T3 fibroblasts on PEGDA-acrylic acid microstructures at day 7 of cell
culture. a) Top view image of fibroblasts cultured on microstructures. Empty holes are the places that microstructures occupied before falling (asterisk), and arrows indicate cells on coverslip. b) Plot of cell density (mean ± SD). Three replicas per condition were used. ** and * denotes p-value < 0.01 and < 0.05 from Mann–Whitney U test. c) Detail of a microstructure where it can be seen the different cell density between the tip and the base. d) Fluorescence microscopy image of a microstructure covered by spread fibroblasts. Detailed images of the base e) and the f) tip of a microstructure, and filopodia (arrowhead). Nuclei in blue, F-actin in green. Scale bar: a= 750 µm, c = 100 µm, d = 125 µm, e, f = 25 µm.
4.5 FABRICATION OF MICROSTRUCTURED PEGDA-ACRYLIC ACID HYDROGELS SUPPORT EPITHELIAL-LIKE CELL MORPHOLOGY
4.5.1 LAMININ FUNCTIONALIZED HYDROGELS PROMOTE THE ADHESION OF MDCK CELLS
Once we saw that the microstructured PEGDA-acrylic acid hydrogels
allowed the proliferation and migration of fibroblasts, Madin-Darby canine
kidney (MDCK) cell line was chosen as a model to study the effects of
PEGDA-acrylic acid hydrogels on their epithelial morphology. MDCK cell line is
widely used as a epithelial cell model because it shows a marked apico-
basolateral polarity, well defined tight junctions, and rapid growth rate.377,378
5
10
15
20
Cel
lden
sity
(104
cell/
cm2)
20
15
10
5
*
**
5
10
15
20
Tip
Base
*
*
*
a) b)) c)
d) e) f)

152
To promote epithelial cell morphology, laminin was chosen as the
protein to functionalize hydrogels. Laminin is the major non-collagenous
component of the basement membrane of epithelial tissues.14 To determine the
minimum amount of laminin that enable MDCK adhesion, disc-shaped hydrogels
made of 10% w/v PEGDA575 and 1.25% w/v acrylic acid were functionalized with
several concentrations of laminin (0, 10, 50 and 100 µg/mL). Then, MDCK cells
were seeded at a density of 2·105 cells/cm2 and cultured during 24 h.
Figure 4.42: Effects of laminin concentration on MDCK adhesion and spreading. Bright
field microscopy images of MDCK cells cultured on 10% w/v PEGDA575–1.25% w/v acrylic acid, functionalized with laminin at a) 0, b) 10, c) 50, d) 100 µg/mL. Scale bar = 500 µm. e) Plot of MDCK surface coverage (mean ± SD) as a function of laminin concentration. Tree images of randomly selected areas were taken of three replicas. ** denotes p-value < 0.01 from Mann–Whitney U test.
No significant cell adhesion and spreading was found on the hydrogels
without laminin (Fig. 4.42a). For the samples with laminin, the extent of cell
adhesion and spreading was dependent on the laminin concentration. Increasing
laminin concentrations produced better cell adhesion and greater coverage of the
hydrogel surfaces (Fig. 4.42b-d). Quantitative measurements of the cell surface
coverage showed that by using 10 µg/mL laminin solutions no significant
improvement was found with respect to the control (Fig. 4.42b), while laminin
concentrations higher than 50 µg /mL allowed MDCK surface coverage with a
statistical relevance (p < 0.01), with respect to the control. No significant
differences were found when employing laminin concentrations of 50 and 100
µg/mL, but the average value was higher for 100 µg/mL (Fig. 4.42e). Therefore,
100 µg/mL laminin was chosen as the minimum concentration to be used in the
functionalization of the hydrogels for the culture of epithelial cells.
0
25
50
75
100
**100
75
50
25S
urf
ace
co
vera
ge
(%)
0 0.01 0.05 0.1
Laminin (mg/mL)
a) b) e)
c) d)

153
4.5.2 MICROSTRUCTURED PEGDA-ACRYLIC ACID HYDROGELS ALLOW MDCK PROLIFERATION AND PROMOTE EPITHELIAL MORPHOLOGY
To evaluate the effects of our engineered PEGDA–acrylic acid hydrogels
on the polarization of MDCK cells, microstructures made of 10% w/v
PEGDA575 and 1.25% acrylic acid (the same tested with fibroblasts) and 5% w/v
PEGDA575 and 0.6% acrylic acid were used. The 5% w/v solution was studied
because it is reported that epithelial tissues are indeed softer than the elastic
modulus provided by the 10% w/v PEGDA575.173,360 The microstructures were
fabricated by a single UV light exposure 170 s. By this process, pillars of 461 ± 9
µm in height were obtained. As no base exposure was used, pillars were formed
directly on top of the glass coverslip, leaving some areas non-covered by
hydrogel. Microstructures were functionalized with 100 µg/mL laminin solution.
Figure 4.43: MDCK cells cultured on the hydrogel microstructures. Top view images of
hydrogels taken by bright field microscopy after a) 4 hours of seeding on 10% w/v PEGDA575–1.25% w/v acrylic acid microstructures, and b-c) 7 days on 5% w/v PEGDA6000–0.6% w/v acrylic acid microstructures. d) Scheme of the microstructured area (grey circles) depicting the areas covered by MDCK cells (green) and not covered (white). Red squares show the approximated position for images e) and f). e,f) Top view images of MDCK cells after 7 days on 10% w/v PEGDA575–1.25% w/v acrylic acid microstructures. White arrows denote cell aggregates on top of microstructures, black arrow denote a microstructure with no cells, asterisks cell covered surfaces, and arrowheads cell edges. Scale bars: a,e,f = 300 µm, b= 500 µm, c = 400 µm.
*
*
*
*
* *
*
f
e
a) b) c)
d) e) f )
g) h) i)

154
MDCK cells were seeded at a density of 2.5·104 cells/cm2, the same as
fibroblasts, and were cultured for 7 and 14 days. After 4 hours of seeding cells
were distributed at the base of the hydrogels, between microstructures (Fig.
4.43a). At day 7, on the 5% w/v PEGDA575 microstructures, some cells were on
the tip of the microstructures, covering small areas forming clusters. Almost no
cells were at the base of the pillars (Fig. 4.43b,c). For 10% w/v PEGDA575, the
culture was not homogeneous over all the microstructured surface. At the center
of the microstructured area, cells started to form aggregates, covered the glass
space between microstructures (Fig. 4.43e), and some cell patches were found on
top of microstructures. The base areas close to the edges of the microstructured
area were fully covered by MDCK cells, while at the center cells partially covered
few microstructures (Fig. 4.43f). To be noticed, cell dense areas appeared around
the microstructures. These bulges seem to be composed by fronts of migrating
cells, which were climbing up the pillar walls.
After 14 days, the cell culture on 5% w/v PEGDA575 microstructures did
not improve, the mass of cells on the top of the microstructures remained with no
significant changes (Fig. 4.44a-c). On the other hand, cells on 10 % w/v PEGDA575
microstructures covered more surface between the microstructures (Fig. 4.44d),
but the surface coverage was not complete. The microstructures were still
surrounded by cell masses and there were also differences in cell coverage
depending on the position within the array. At the center of the microstructured
area almost the 60% of the microstructures had cells on the top. However, they
were only partially covered, from 4 to 60% (30% ± 20%) of their areas (Fig.
4.44e,f). On the boundaries of the microstructured area, where the
microstructures were shorter, MDCK cells fully covered the microstructures and
the space between them forming a full packed monolayer (Fig. 4.44f).
Thus, from these experiments we conclude that MDCK cells attached to
PEGDA–acrylic acid hydrogels and proliferate for 14 days. On microstructures of
300 µm in diameter, migrating cell fronts were observed, which in most cases
stopped at the lowest parts of the pillars. Cell spreading and migration over the
surface was more effective on the microstructures fabricated from polymer
solutions at 10% w/v of PEGDA575. It has been reported that stiffness of the
substrate is an important factor for cell spreading and migration.375 During the
time of cell culture tested (14 days), cells on 10% w/v were increasing their
surface coverage progressively. At day 14, the lowest part of the microstructures
showed cell layers around their bases, and a partial coverage on the pillars while
most of the surface between microstructures (coverslip) was covered. This
progression of the cell culture together with the fact that shorter pillars on the
edges of the microstructured area were fully covered indicates that maybe
increasing cell culture time may lead the formation of a complete monolayer.
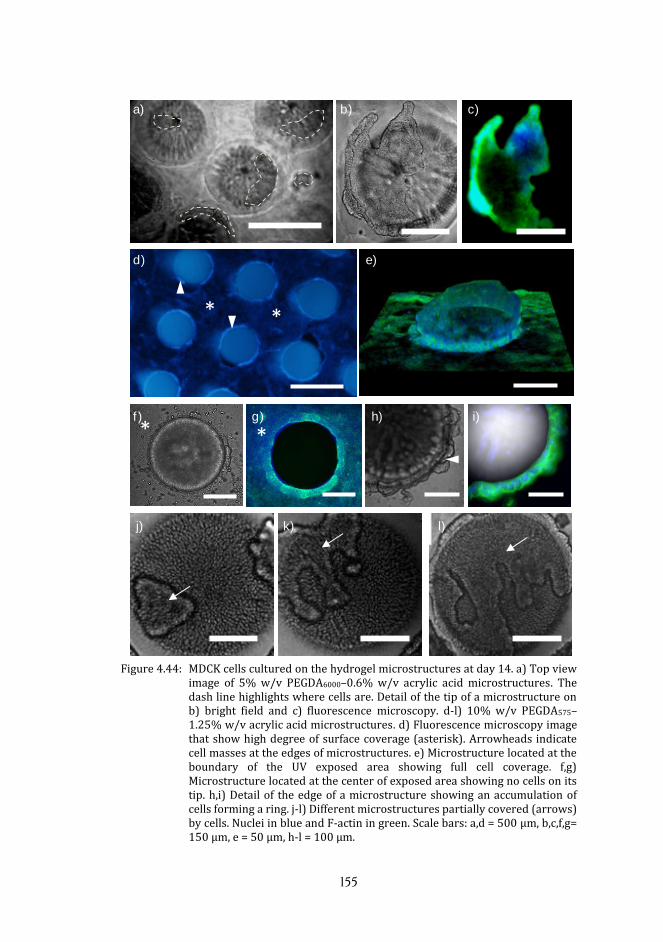
155
Figure 4.44: MDCK cells cultured on the hydrogel microstructures at day 14. a) Top view
image of 5% w/v PEGDA6000–0.6% w/v acrylic acid microstructures. The dash line highlights where cells are. Detail of the tip of a microstructure on b) bright field and c) fluorescence microscopy. d-l) 10% w/v PEGDA575–1.25% w/v acrylic acid microstructures. d) Fluorescence microscopy image that show high degree of surface coverage (asterisk). Arrowheads indicate cell masses at the edges of microstructures. e) Microstructure located at the boundary of the UV exposed area showing full cell coverage. f,g) Microstructure located at the center of exposed area showing no cells on its tip. h,i) Detail of the edge of a microstructure showing an accumulation of cells forming a ring. j-l) Different microstructures partially covered (arrows) by cells. Nuclei in blue and F-actin in green. Scale bars: a,d = 500 µm, b,c,f,g= 150 µm, e = 50 µm, h-l = 100 µm.
**
* *
a) b) c)
d) e)
f ) g) h) i)
j) k) l)
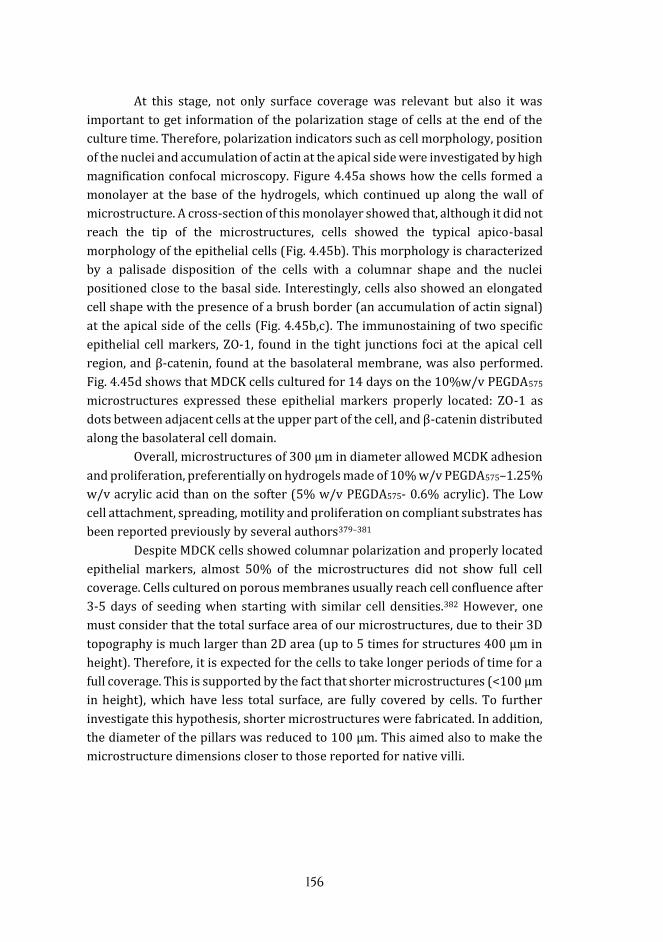
156
At this stage, not only surface coverage was relevant but also it was
important to get information of the polarization stage of cells at the end of the
culture time. Therefore, polarization indicators such as cell morphology, position
of the nuclei and accumulation of actin at the apical side were investigated by high
magnification confocal microscopy. Figure 4.45a shows how the cells formed a
monolayer at the base of the hydrogels, which continued up along the wall of
microstructure. A cross-section of this monolayer showed that, although it did not
reach the tip of the microstructures, cells showed the typical apico-basal
morphology of the epithelial cells (Fig. 4.45b). This morphology is characterized
by a palisade disposition of the cells with a columnar shape and the nuclei
positioned close to the basal side. Interestingly, cells also showed an elongated
cell shape with the presence of a brush border (an accumulation of actin signal)
at the apical side of the cells (Fig. 4.45b,c). The immunostaining of two specific
epithelial cell markers, ZO-1, found in the tight junctions foci at the apical cell
region, and β-catenin, found at the basolateral membrane, was also performed.
Fig. 4.45d shows that MDCK cells cultured for 14 days on the 10%w/v PEGDA575
microstructures expressed these epithelial markers properly located: ZO-1 as
dots between adjacent cells at the upper part of the cell, and β-catenin distributed
along the basolateral cell domain.
Overall, microstructures of 300 µm in diameter allowed MCDK adhesion
and proliferation, preferentially on hydrogels made of 10% w/v PEGDA575–1.25%
w/v acrylic acid than on the softer (5% w/v PEGDA575- 0.6% acrylic). The Low
cell attachment, spreading, motility and proliferation on compliant substrates has
been reported previously by several authors379–381
Despite MDCK cells showed columnar polarization and properly located
epithelial markers, almost 50% of the microstructures did not show full cell
coverage. Cells cultured on porous membranes usually reach cell confluence after
3-5 days of seeding when starting with similar cell densities.382 However, one
must consider that the total surface area of our microstructures, due to their 3D
topography is much larger than 2D area (up to 5 times for structures 400 µm in
height). Therefore, it is expected for the cells to take longer periods of time for a
full coverage. This is supported by the fact that shorter microstructures (<100 µm
in height), which have less total surface, are fully covered by cells. To further
investigate this hypothesis, shorter microstructures were fabricated. In addition,
the diameter of the pillars was reduced to 100 µm. This aimed also to make the
microstructure dimensions closer to those reported for native villi.
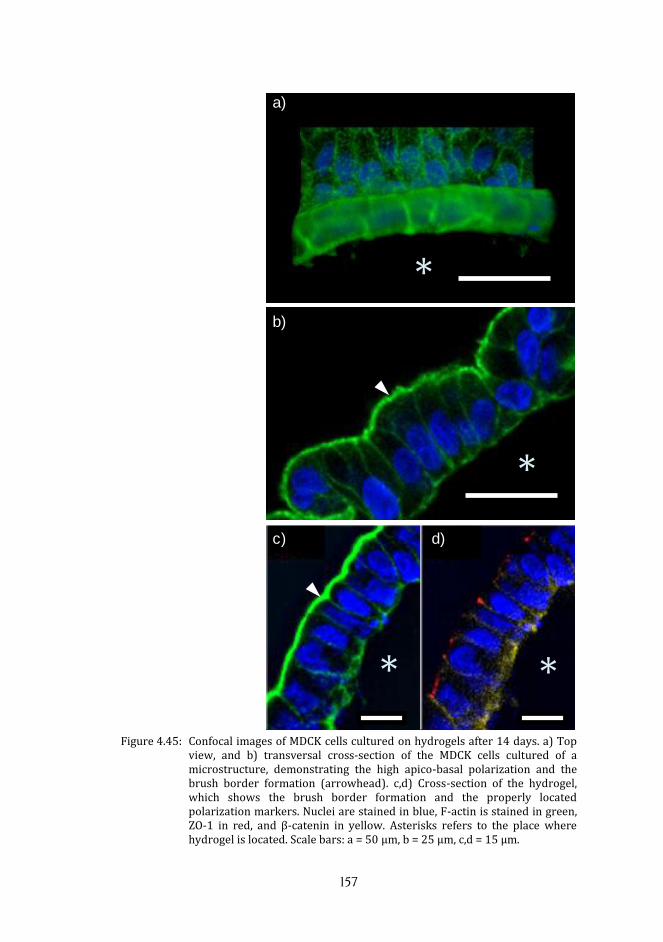
157
Figure 4.45: Confocal images of MDCK cells cultured on hydrogels after 14 days. a) Top
view, and b) transversal cross-section of the MDCK cells cultured of a microstructure, demonstrating the high apico-basal polarization and the brush border formation (arrowhead). c,d) Cross-section of the hydrogel, which shows the brush border formation and the properly located polarization markers. Nuclei are stained in blue, F-actin is stained in green, ZO-1 in red, and β-catenin in yellow. Asterisks refers to the place where hydrogel is located. Scale bars: a = 50 µm, b = 25 µm, c,d = 15 µm.
*
*
*
a)
b)
c) d)
*

158
To study the effects of the microstructure size on MDCK cell coverage,
polymer solutions of 10% w/v PEGDA575-1.25% acrylic acid, and 5% w/v
PEGDA575-0.6% acrylic acid were exposed 170 s using the photomask with
windows 100 µm in diameter. With these fabrication parameters, no pillars were
obtained using 10% w/v solutions due to polymerization of unexposed regions. For 5% w/v solutions, pillars of 213 ± 7 µm in height and 109 ± 8 µm in diameter
were obtained. These sizes represent a reduction of up to 2 times in height, and 3
times diameter (20 in total surface area) with respect of microstructures used in
the previous experiment. The hydrogels were functionalized with 100 µg/mL
laminin solution and MDCK cells were seeded at a density of 2.5·104 cells/cm2 and
cultured for 21 days. Figure 4.46 shows the evolution of MDCK cells over the
period of time in culture. Despite MDCK cells showed a poor evolution on
microstructures of 300 µm in diameter and 400 µm in height, it was found that
on pillars of 100 in diameter and 200 in height MDCK cells covered all the surface
of microstructures at day 14. However, the microstructures were very soft (36
kPa),383 so they bended and stacked at their tips, forming cell aggregations (Fig.
4.46d). In addition, a lot of microstructures detached from the coverslip (Fig.
4.46e), resulting in a mixture of clustered cells and microstructures (Fig. 4.46f).
Figure 4.46: Spatiotemporal distribution of MDCK cells cultured on 5% w/v PEGDA575-0.6% acrylic acid microstructures of 100 µm in diameter. Top view images a) after seeding, b,c) 7 days, d) 14 days, and e,f) 21 days. e) Group of detached microstructures. f) Detail of an isolated microstructure covered by cells. Scale bars: a-c = 200 µm; d = 300 mm; e = 200 µm; f = 50 µm.
a) b) c)
d) e) f)

159
With these promising results, we decided to test microstructures
fabricated with a hydrogel base, which might be useful to avoid the detachment
of the microstructures. To include a base, a set of experiments were designed
where microstructures were fabricated by UV exposure in two steps.
Two polymer solutions were used: 5% w/v PEGDA575-0.15% w/v acrylic
acid, and 10% w/v PEGDA575 - 0.3% w/v acrylic acid. The hydrogels were
fabricated by an exposure of 10 s to form the hydrogel base, and 150 s to grow
the microstructures. With respect to the samples described in the previous
experiments, the amount of acrylic acid was reduced to adjust its concentration
to the ranged described previously. Despite of decreasing acrylic acid
concentrations, the fabrication of microstructures from 10% w/v PEGDA575-0.3%
w/v acrylic acid solutions was unsuccessful, due to polymerization in unexposed
areas. On the other hand, the functionalization of the microstructures fabricated
from 5% w/v polymer solutions was carried out by placing a 50 µL drop of 500
µg/mL laminin solution onto the hydrogels. MDCK cells were seeded at 2.5·104
cells/cm2 and cultured for 14 and 21 days. At day 14 a set of samples were fixed,
and nuclei and F-actin were stained.
Figure 4.47: Confocal images of MDCK cells cultured on microstructures of 100 µm in
diameter fabricated from 5% w/v PEGDA575-0.15% w/v acrylic acid polymer solution at day 14 of culture. a) 3D reconstruction of a z-stack of tilted microstructures. b) 3D reconstruction of a z-stack of a vertical microstructure. c) Sequential z-stacks from two microstructures showing their cross-sections from the base to the tip of the microstructures. Nuclei in blue and F-actin in green. Scale bars: a,c = 100 µm, b = 50 µm.
Figure 4.47 shows a 3D reconstruction of z-stacks of some of the
microstructures at day 14 of culture. The microstructures were almost fully
covered by cells, leaving few cell-free areas. To see in detail the cell morphology
a) b) c)

160
along the z axis of these microstructures, serial cross-sections from the base to
the tip were imaged. It was observed that MDCK cells acquired a columnar shape
and were organized in a palisade disposition around the microstructure.
Figure 4.48: 3D reconstruction of z-stack from confocal images of MDCK cells cultured on
PEGDA575 microstructures of 100 µm in diameter made of 5% w/v PEGDA575-0.15% w/v acrylic acid microstructures. Nuclei in blue and F-actin in green. Scale bars = 200 µm.
At day 21, the microstructured hydrogels made of 5% w/v PEGDA575-
0.15% w/v acrylic acid were still fully covered by the MDCK cells (Fig. 4.48a,b)
and cells show a polarized morphology typical of epithelial monolayers.
Therefore, the use of 5% w/v PEGDA575-0.15% w/v acrylic acid in a two-step
fabrication process produced microstructures that promoted the polarization of
MDCK cells. However, due to the softness of the material produced, it was easy to
find the microstructures partially tilted, fallen, and stacked to their tip.
Therefore, potential improvements on the system were investigated by
using PEGDA solutions of higher molecular weight. As shown in Figure 4.23,
microstructures made of PEGDA6000 develop longer structures with rounded
tips, instead the shorter bullet-like shapes with sharp when using PEGDA575.
Polymer solutions of 10% w/v PEGDA6000 and 0.6% w/v acrylic acid were used
to fabricate microstructured hydrogels using photomasks with windows 100 µm
in diameter. UV exposure took place in two steps: 10 s to form the hydrogel base
and 150 s to grow the microstructures. Despite the presence of polymerized
hydrogel on unexposed regions (Fig. 4.49), microstructures of almost 300 µm in
height were obtained (Fig. 4.49b).

161
Figure 4.49: Stereoscope images of microstructures fabricated from 10% w/v
PEGDA6000 and 0.6% w/v acrylic acid solution after 14 days of MDCK culture. a) Frontal view of the sample. Detail of microstructures b) at the center of microstructured area, and c) at boundaries of the exposed areas (˄) showing polymerized hydrogel on unexposed areas (asterisk), and cells covering the hydrogel (arrowhead). Scale bars: a = 500 µm; b, c = 150 µm.
Hydrogels were functionalized with a 20 µL drop of 500 µg/mL laminin
solution, and MDCK cells were seeded at 1.5·104 cells/cm2. After 14 days of
culture, MDCK cells grew lining the whole surface, forming a monolayer
effectively covering both the base and the microstructures (Fig. 4.49b, Fig. 4.50a).
The cells forming the monolayer displayed a polygonal morphology typical of
epithelial cell layers (Fig. 4.50b). However, a cross-section of cells on
microstructures showed that cells are horizontally elongated, lining on the
microstructure, and showed a high spread morphology instead of the desired
apico-basal columnar elongation (Fig. 4.50c). This fact could be attributed to the
stiffness of the material or that MDCK cells required more time to arrange in a
columnar morphology. It has been well established that MDCK cells become
spherical and even detach, form cell clusters or cysts when culture on soft
substrates, instead the flattened cohesive epithelial monolayers on rigid surfaces,
because of their strong cell-cell adhesion.380,384–386
* *
*
˄ ˄ ˄
a) b)
c)
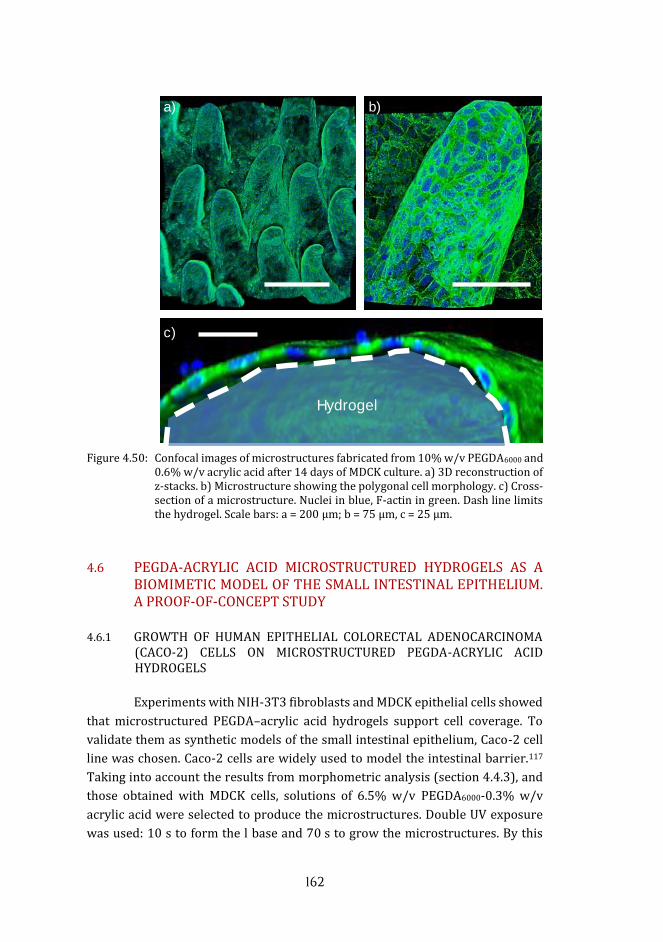
162
Figure 4.50: Confocal images of microstructures fabricated from 10% w/v PEGDA6000 and
0.6% w/v acrylic acid after 14 days of MDCK culture. a) 3D reconstruction of z-stacks. b) Microstructure showing the polygonal cell morphology. c) Cross-section of a microstructure. Nuclei in blue, F-actin in green. Dash line limits the hydrogel. Scale bars: a = 200 µm; b = 75 µm, c = 25 µm.
4.6 PEGDA-ACRYLIC ACID MICROSTRUCTURED HYDROGELS AS A BIOMIMETIC MODEL OF THE SMALL INTESTINAL EPITHELIUM. A PROOF-OF-CONCEPT STUDY
4.6.1 GROWTH OF HUMAN EPITHELIAL COLORECTAL ADENOCARCINOMA (CACO-2) CELLS ON MICROSTRUCTURED PEGDA-ACRYLIC ACID HYDROGELS
Experiments with NIH-3T3 fibroblasts and MDCK epithelial cells showed
that microstructured PEGDA–acrylic acid hydrogels support cell coverage. To
validate them as synthetic models of the small intestinal epithelium, Caco-2 cell
line was chosen. Caco-2 cells are widely used to model the intestinal barrier.117
Taking into account the results from morphometric analysis (section 4.4.3), and
those obtained with MDCK cells, solutions of 6.5% w/v PEGDA6000-0.3% w/v
acrylic acid were selected to produce the microstructures. Double UV exposure
was used: 10 s to form the l base and 70 s to grow the microstructures. By this
Hydrogel
a) b)
c)
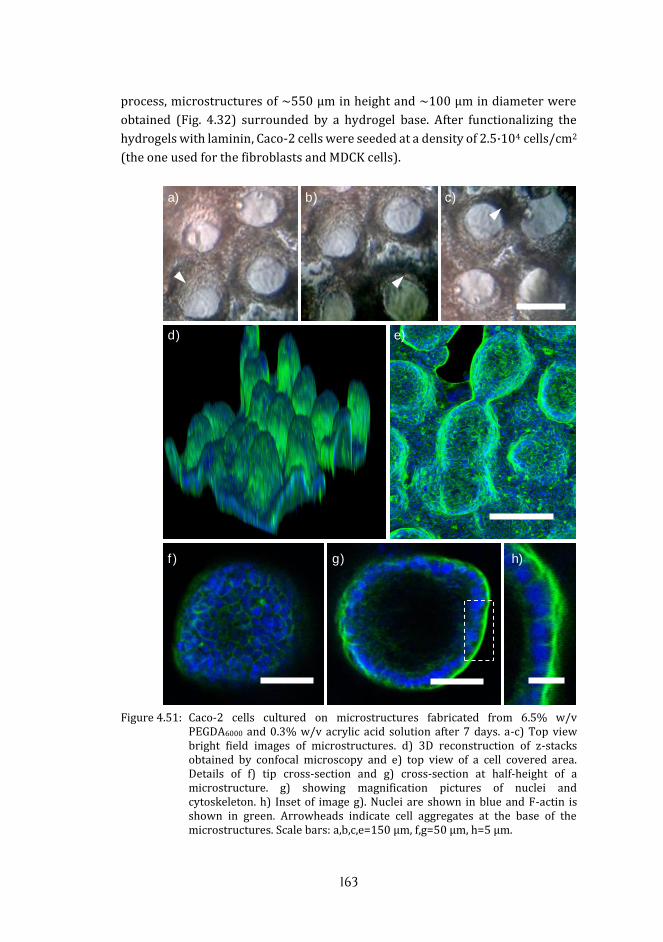
163
process, microstructures of ∼550 µm in height and ∼100 µm in diameter were
obtained (Fig. 4.32) surrounded by a hydrogel base. After functionalizing the
hydrogels with laminin, Caco-2 cells were seeded at a density of 2.5·104 cells/cm2
(the one used for the fibroblasts and MDCK cells).
Figure 4.51: Caco-2 cells cultured on microstructures fabricated from 6.5% w/v
PEGDA6000 and 0.3% w/v acrylic acid solution after 7 days. a-c) Top view bright field images of microstructures. d) 3D reconstruction of z-stacks obtained by confocal microscopy and e) top view of a cell covered area. Details of f) tip cross-section and g) cross-section at half-height of a microstructure. g) showing magnification pictures of nuclei and cytoskeleton. h) Inset of image g). Nuclei are shown in blue and F-actin is shown in green. Arrowheads indicate cell aggregates at the base of the microstructures. Scale bars: a,b,c,e=150 µm, f,g=50 µm, h=5 µm.
a) b) c)
d) e)
f ) g) h)

164
After 2 weeks of culture, no relevant cell coverage occurred nor at the
microstructures neither at the base of hydrogel. Therefore, and in agreement with
literature,287,288,387 cells were seeded at a higher density, 5·105 cells/cm2. At day
7, Caco-2 cells adhered and proliferated at the bottom of the hydrogel, between
the microstructures, in granulate aggregates and surrounding the
microstructures. (Fig. 4.51). Microstructures looked translucent at the bright
field microscope, meaning they were not fully cell covered yet (Fig. 4.51a-c). It
was possible to find small areas where Caco-2 cells already formed a monolayer
on the microstructures (Fig. 4.51d-e). However, although cells showed apparent
brush borders (Fig. 4.51g), cells did not show a columnar morphology. Both cells
and nuclei were spread onto the hydrogel surface with low apico-basal elongation
regardless their position on the microstructures (Fig. 4.51g,h).
After 14 days of culture, it was possible to find samples where cells
extended and covered the whole hydrogel surface (Fig. 4.52a). Now point, Caco-
2 cells showed apico-basal polarity, with an elongated cytoplasm and elongated
nuclei. Z-stacks from confocal imaging show the columnar morphology of Caco-2
cells at different heights of the microstructures (Fig. 4.52b-e). After 21 days of cell
culture, cells still fully covered the microstructures.
Figure 4.52: Caco-2 cells cultured on microstructures fabricated from 6.5% w/v
PEGDA6000 and 0.3% w/v acrylic acid solution after 14 days. a) 3D reconstruction of z-stacks obtained by confocal microscopy of a fully cell covered area. Detailed cross sections of a microstructure going sequentially in z from b) the tip to e) the base. Nuclei are shown in blue and F-actin is shown in green. Scale bars: a = 200 µm, b-e = 50 µm.
By checking the evolution of the cell culture from the seeding time, where
cells are located mostly at the base of the hydrogels, between the microstructures,
it can be assumed that cells proliferate and migrate from the bases to the tip of
a) b) c)
d) e)
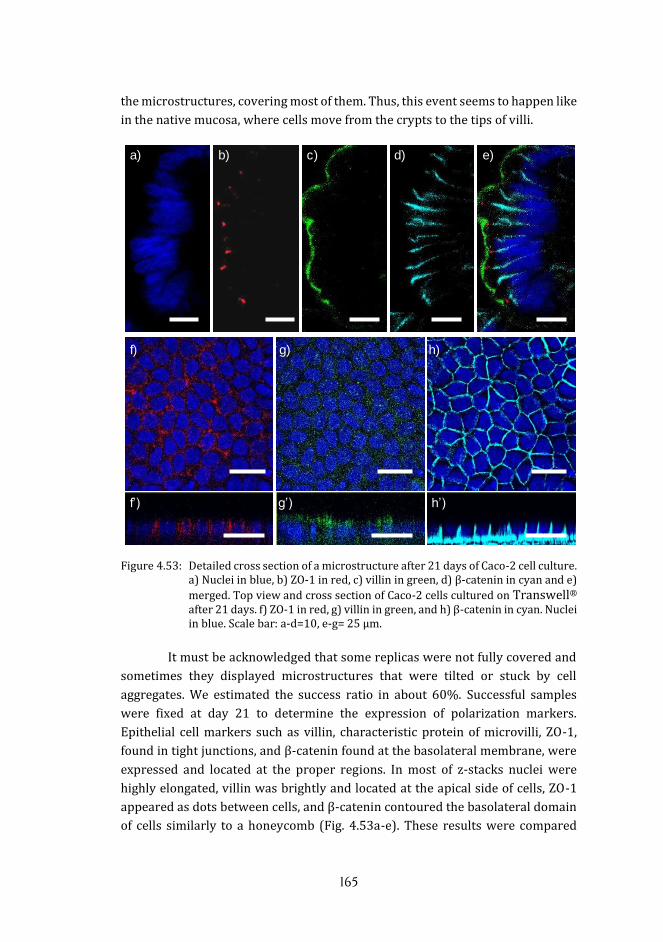
165
the microstructures, covering most of them. Thus, this event seems to happen like
in the native mucosa, where cells move from the crypts to the tips of villi.
Figure 4.53: Detailed cross section of a microstructure after 21 days of Caco-2 cell culture.
a) Nuclei in blue, b) ZO-1 in red, c) villin in green, d) β-catenin in cyan and e)
merged. Top view and cross section of Caco-2 cells cultured on Transwell® after 21 days. f) ZO-1 in red, g) villin in green, and h) β-catenin in cyan. Nuclei in blue. Scale bar: a-d=10, e-g= 25 µm.
It must be acknowledged that some replicas were not fully covered and
sometimes they displayed microstructures that were tilted or stuck by cell
aggregates. We estimated the success ratio in about 60%. Successful samples
were fixed at day 21 to determine the expression of polarization markers.
Epithelial cell markers such as villin, characteristic protein of microvilli, ZO-1,
found in tight junctions, and β-catenin found at the basolateral membrane, were
expressed and located at the proper regions. In most of z-stacks nuclei were
highly elongated, villin was brightly and located at the apical side of cells, ZO-1
appeared as dots between cells, and β-catenin contoured the basolateral domain
of cells similarly to a honeycomb (Fig. 4.53a-e). These results were compared
a) b) c) d) e)
f) g) h)
f’ ’ ’

166
with Caco-2 cells cultured on Transwell,® which is the standard cell culture
platform (Fig. 4.53f-g). In both cases cells are elongated and expressed the
epithelial cell markers properly located. However, Caco-2 cells cultured on the
microstructured hydrogels seem to have more elongated cytoplasm and nuclei.
Polarization and epithelial markers were consistently expressed on all the cells
located along the tip-base vertical axis of the microstructures (Fig. 4.54).
Figure 4.54: Sequential cross-sections from the a) tip to the e) base of a microstructure
after 21 days of Caco-2 cell culture. ZO-1 in red (left), villin in green (center), and β-catenin in cyan (right). Nuclei are shown in blue. Scale bars = 50 µm.
’ a’’ ’’’
’ ’’ ’’’
’ ’’ ’’’
’ ’’ ’’’
’ ’’ ’’’
ZO-1 Villin b-catenin
f)

167
Polarization was also assessed by the analysis of nuclei morphology and
orientation with respect to the surface of the microstructures. Images taken by
confocal microscopy from Transwell® at day 21, and from microstructured
hydrogels at days 14 and 21, were processed by ImageJ software to obtain well
defined nuclei of each stack. In addition, histochemical images from human villi
were used as controls (Fig. 4.55a-f). Then, shape descriptors of nuclei were
calculated: major and minor axis, and angle with respect to the surface. For the
morphology analysis, aspect ratio between the major and the minor axis of nuclei
was used as an elongation or polarization marker. At first sight, Figure 4.55 shows
native villi with highly elongated nuclei in comparison with confocal images of
Transwell® at day 21, and microstructured hydrogels. This agrees with the results
plotted in the Figure 4.56a, where aspect ratio of nuclei on native villi showed
significant higher values than the other two conditions (p<0.001). Aspect ratio of
nuclei on Transwell® after 21 days and on hydrogels after 14 days did not show
significant differences. However, the aspect ratio of nuclei on hydrogels after 21
days was significantly higher than that measured for the hydrogel after 14 days
and Transwell® after 21 days (p < 0.001) and showed a distribution closer to that
found on the native villi.
Figure 4.55: a) Cross section at the middle and b) longitudinal cross section of villi
(http://medcell.med.yale.edu/systems_cell_biology/gi_tract_lab.php). c) 3D rendering and d) cross section from confocal images of Caco-2 cells on a Transwell® after 21 days of cell culture. e) Cross section of a microstructured hydrogel after 14 days and f) after 21 days of Caco-2 cell culture. Scale bar: c,e,f = 50 µm, d=25 µm.
Orientation analysis was performed by comparing nuclei orientation
with respect to the surface. First, angles described by the nuclei were estimated
following the procedure described in section 3.5.9, and plotted in a wind rose
graph (Fig. 4.56b). In the case of native villi, most of nuclei kept positioned above
60° to the surface, basically perpendicular to the surface. However, in the case of
nuclei on Transwell® more than 40% of nuclei were positioned almost parallel to
a) c) e)
f )b)
d)

168
the surface, and about 25% of cells were perpendicular to the surface. On the
other hand, cells cultured on the hydrogels covered the entire range of
orientations with a predominant perpendicularity in the case of hydrogels after
21 days.
Figure 4.56: Nuclei elongation and orientation analysis. Plots of a) nuclei aspect ratio, b)
angle distribution of nuclei orientation, and c) cos2. *** denotes p-value < 0.001 from Mann–Whitney U test.
Native Transwell Hydrogel Hydrogel
-1
0
1
0,0
0,3
90º
60º
30º
0º0,0
0,3
D
Native Transwell Hydrogel Hydrogel
2
4
6
Fr
eque
ncy
0,0
0,1
0,2
0,3
0,490º
60º
30º
0º0,0
0,1
0,2
0,3
0,4
D
0,0
0,1
0,290º
60º
30º
0º0,0
0,1
0,2
B
0,0
0,1
0,290º
60º
30º
0º0,0
0,1
0,2
A
90º60º
30º
0º
90º60º
30º
0º
90º60º
30º
0º
90º60º
30º
0º
Nuclei orientation (º)
Cos
2θ
Native villi Transw ell Microstructured Microstructured21 days hydrogel hydrogel
14 days 21 days
Asp
ectr
atio
6
4
2
*** ******
a)
b)
c)
60º
Native villi Transw ell Microstructured Microstructured21 days hydrogel hydrogel
14 days 21 days
Native villi Transw ell Microstructured Microstructured21 days hydrogel hydrogel
14 days 21 days

169
These results are supported by the cos 2θ graph (Fig. 4.56c), which
returns values close to 1 if nuclei are perpendicular to the surface, and values
close to -1 if nuclei are parallel to the surface. In the case of the microstructured
hydrogels at 21 days, even if all orientations are represented, nuclei positioned in
a perpendicular orientation are predominant. This situation is related to cell
confluence, if cells have enough space they will spread as much as possible;
consequently, nuclei will be positioned in a parallel disposition. On the other
hand, after the cells become confluent they start to compact, positioning their
nuclei perpendicular to the substrate.
Despite Caco-2 cells cultured on Transwell® developed apico-basal
polarization, demonstrated by the expression of epithelial markers (Fig. 4.54),
and show a lot of nuclei perpendicularly positioned (Fig. 4.56), it was also found
a relevant percentage of nuclei that tend to be positioned in a parallel manner
onto the surface. Meanwhile, cells on the hydrogels also showed nuclei positioned
in a wide range of orientations, but after 21 days it was found a tendency to keep
them perpendicular to the surface. Considering that polycarbonate membranes
are stiffer (2 GPa) than the hydrogels (22 kPa), this fact could affect the cell and
nuclei disposition. It was reported that substrate rigidity modulates nuclei shape,
and stiffer substrates promote flattened nuclei compared to more compliant
substrates, which enhance rounded nuclei.388 In addition, DiMarco et al. recently
showed that Caco-2 monolayers cultured on matrices mimicking the low
mechanical stiffness of the small intestinal submucosa (~150 kPa),389 resulted in
more apico-basal elongated cells than those culture on conventional hard
substrates. They attributed this behavior to the modification of cell-cell junctions
through the control of cell-matrix adhesions.390 This supports our hypothesis that
the softness of the hydrogel can influence the morphology of the Caco-2 cells, and
promote a more reliable morphology of the epithelial monolayers.
Overall, we have developed a material and a fabrication method that
allows obtaining substrates that recapitulate the 3D architecture of the intestinal
mucosa. In addition, these synthetic villi promote the formation of Caco-2 cell
monolayers, which show morphologies comparable to the intestinal epithelial
cells, and express specific epithelial markers properly located.
4.7 TRANSEPITHELIAL ELECTRICAL RESISTANCE (TEER) MEASUREMENTS OF CACO-2 MONOLAYERS ON THE MICROSTRUCTURED HYDROGELS
Transepithelial electrical resistance (TEER) measurement is a widely
used method to assess the barrier function of Caco-2 cells.43 In order to perform

170
TEER measurements of the Caco-2 cell monolayers on the microstructured
hydrogels two methods have been used: the conventional method using a
Voltohmmeter and a more novel approach based on impedance spectroscopy
measurements.
4.7.1 TEER MEASUREMENTS BY A VOLTOHMMETER
Conventional TEER measurements of epithelial monolayers are
performed using Transwell® inserts. This allows forming two compartments that,
once the cell monolayer is formed, are separated by the cell barrier (section
1.2.3).92 The two compartments are initially separated by a polymeric
semipermeable membrane. The microstructured hydrogels made by the
experimental set-up described in section 3.2.1, cannot be placed directly inside
Transwell® inserts, because they are adhered on glass coverslips. To solve this
issue, two experimental approaches were tried: 1) hydrogel polymerization in
situ, or 2) outside polymerization and posterior sealing (Fig. 4.57).
The First approach, in situ polymerization, was tried filling the insert
with the polymer solution and placing the photomask and UV light source below.
Unfortunately, several experimental issues hampered the success of this
approach. First, polymer solution leaked through the porous membrane and
polymerized between the outer part of porous membrane and the coverslip.
Second, inside the Transwell®, the polymerization happened in a non-
homogeneous way, microstructuring was not visible and the heterogeneous mass
of hydrogel detached from porous membrane. Thus, this method was discarded.
Figure 4.57: Illustration of the two approaches to adapt the fabrication set-up to
Transwell®, a) in situ polymerization and b) Transwell® sealing.
The second approach was based on placing the microstructured
hydrogels inside Transwell® inserts, which were outerly sealed using a PDMS
layer, and innerly sealed with an adhesive tape (section 3.6.1). Through the
sealing, the electrical current was forced to pass across hydrogels and cells, and
UV
a) b)

171
leakage current was avoided. Proper sealed was not always achieved for all
samples, but at least three samples for each condition had a suitable progress and
were used for TEER measurements using a chopstick electrode. The resistance
measurements as a function of the cell culture time are plotted in Figure 4.58. The
resistance of the Transwell® with hydrogel were higher than Transwell® controls
at each time point for samples with and without cells. Because of the sealing, the
surface of the porous membrane was effectively reduced from 4.5 cm2 to
0.785 cm2, therefore increasing its electrical resistance, R (Eq. 28).
R =ρ×l
Area Eq. 28
where ρ is the resistivity of the membrane, l its thickness and A its area. The
resistance will increase up to 5-fold, from 39 Ω (Fig. 58a) to 223.6 Ω.
Figure 4.58: Measured resistance (mean ± SD) on unmodified Transwell® (gray) and on
Transwell® with hydrogels (red). a) Control samples without cells, and b) with cells. *** denotes p-value < 0.001 from Mann–Whitney U test.
In addition, hydrogels also contributed to increase the resistance.
Transwell® with hydrogels showed resistance values up to 270.9 ± 5.2 Ω, which
result in hydrogel resistances of ~ 47.3 Ω. This low value makes sense because
hydrogels contain a high proportion of water, which will easily allow the pass of
electrical current. On other hand, the resistance measured on samples with cells
was much higher for Transwell® with hydrogels than on Transwell® controls (Fig.
58b), again due to the reduction in the surface area.
Once measured the total resistance values, the resistance of the cell
monolayer was calculated the total resistance from the corresponding cell-free
sample. Then, TEER, expressed in Ω · cm2, was calculated by multiplying Rmonolayer
450
300
150Re
sist
an
ce(W
)
d7 d21 d21+EDTA0
150
300
450
Res
ista
nce
(W)
d7 d21 d21+EDTA0
150
300
450
Tra
nsw
ell +
Cac
o
*** *** *** ***
***
***
d7 d21 d21+EDTA d7 d21 d21+EDTA
a) b)no cells

172
and surface area of the Transwell® or the microstructured hydrogels. For
Transwell®, surface area is 4.5 cm2. For the hydrogels, the area was 0.78 cm2
containing a 0.5 cm x 0.5 cm square of microstructures. This microstructured
hydrogels were fabricated from solutions of 6.5% w/v PEGDA6000-0.3% w/v
acrylic acid by the double UV exposure of 10 s to form the hydrogel base and 70 s
to grow the microstructures. By this process, microstructures of ∼550 µm in
height and ∼100 µm in diameter were obtained.
Confocal microscopy was used to measure the total surface area of
PEGDA-acrylic acid microstructured hydrogels. Hydrogels were functionalized
with SAV-TR to obtain z-stacked images and 3D reconstructions (Fig. 4.59). These
reconstructions were used to calculate surface correction factor, which relates
the 3D total surface area of the microstructured hydrogels to their 2D area using
IMARIS software using their surface tools (Eq. 15).
SCF = 3D total Surface area
2D Surface area Eq. 22
Figure 4.59: 3D reconstruction of microstructured hydrogels of a) PEGDA575 and c)
PEGDA 6000. Scale bars = 200 µm. At least five different regions, containing different number of microstructures, were analyzed to obtain an averaged ratio between the 3D total surface area and the 2D surface area.
For microstructures with heights ranging between 350 and 550 µm, SCF
values were 4.9 ± 0.5 to 8.1 ± 0.9. This procedure was individually employed for
each type of microstructure due to the morphological sensitivity of
microstructures to fabrication conditions.
As shown in Figure 4.60, TEER of Caco-2 cell monolayers on both
Transwell® and hydrogels increased from day 7 to day 21 of cell culture, which is
consistent with the formation of a monolayer that progressively covers the
surface. After 7 days, cells on Transwell® already show a significant increment in
a) b)a) b)
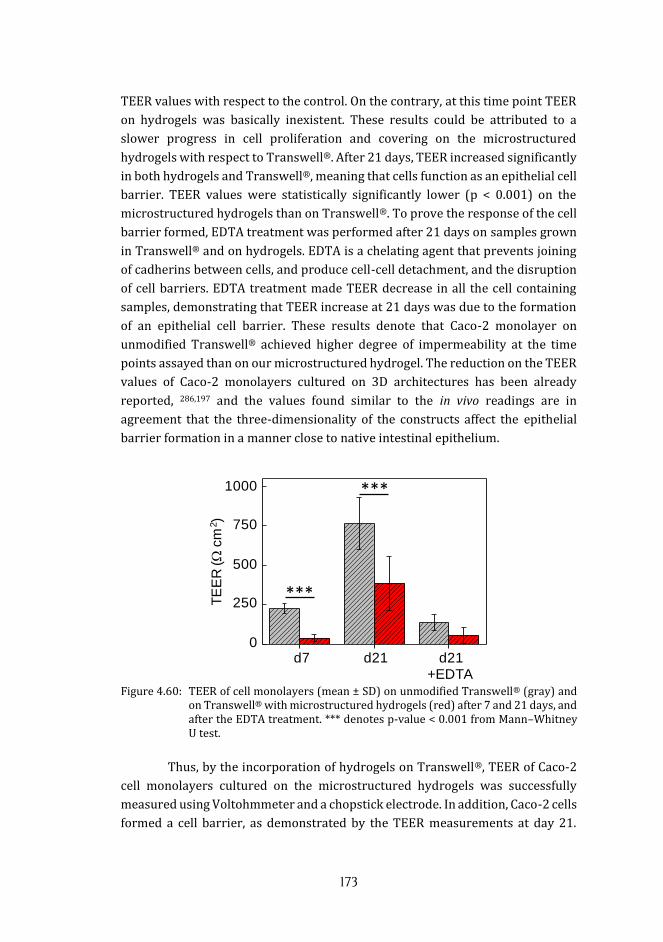
173
TEER values with respect to the control. On the contrary, at this time point TEER
on hydrogels was basically inexistent. These results could be attributed to a
slower progress in cell proliferation and covering on the microstructured
hydrogels with respect to Transwell®. After 21 days, TEER increased significantly
in both hydrogels and Transwell®, meaning that cells function as an epithelial cell
barrier. TEER values were statistically significantly lower (p < 0.001) on the
microstructured hydrogels than on Transwell®. To prove the response of the cell
barrier formed, EDTA treatment was performed after 21 days on samples grown
in Transwell® and on hydrogels. EDTA is a chelating agent that prevents joining
of cadherins between cells, and produce cell-cell detachment, and the disruption
of cell barriers. EDTA treatment made TEER decrease in all the cell containing
samples, demonstrating that TEER increase at 21 days was due to the formation
of an epithelial cell barrier. These results denote that Caco-2 monolayer on
unmodified Transwell® achieved higher degree of impermeability at the time
points assayed than on our microstructured hydrogel. The reduction on the TEER
values of Caco-2 monolayers cultured on 3D architectures has been already
reported, 286,197 and the values found similar to the in vivo readings are in
agreement that the three-dimensionality of the constructs affect the epithelial
barrier formation in a manner close to native intestinal epithelium.
Figure 4.60: TEER of cell monolayers (mean ± SD) on unmodified Transwell® (gray) and
on Transwell® with microstructured hydrogels (red) after 7 and 21 days, and after the EDTA treatment. *** denotes p-value < 0.001 from Mann–Whitney U test.
Thus, by the incorporation of hydrogels on Transwell®, TEER of Caco-2
cell monolayers cultured on the microstructured hydrogels was successfully
measured using Voltohmmeter and a chopstick electrode. In addition, Caco-2 cells
formed a cell barrier, as demonstrated by the TEER measurements at day 21.
d7 d21 d21+EDTA0
250
500
750
1000
TE
ER
(W
·cm
2)
***
***
1000
750
500
250
0d7 d21 d21
+EDTA
TE
ER
(W
cm
2 )

174
These results support the expression of polarization markers, such as ZO-1 that
prove the well-formed tight junctions, which are responsible of the TEER
resistance.
On the other hand, TEER readings were maybe affected by the distance
of electrodes to the area measured (6.5 mm), because are highly dependent on
the electrode position.94 Yeste et al. evidenced that some TEER measurements
resulted in errors when using Transwell® inserts from 6.5 mm, due to the very
low sensitivity.391 They also found that using interdigitated electrodes
configuration the entire cell culture area contributes equally to the measurement.
4.7.2 ELECTRICAL IMPEDANCE SPECTROSCOPY
The second approach to obtain TEER values was performed in
collaboration with the Biomedical Applications Group of the Institut de
Microelectrònica de Barcelona, IMB-CNM (CSIC). This group has developed a
bioreactor chamber with integrated interdigitated electrodes and the electronics
for monitoring the impedance of cell barriers along the time and within a range
of frequencies.308,391,392 The equipment is portable, so it can be transported to cell
culture room. Circular substrates containing three channels with polycarbonate
porous membranes were used to culture Caco-2 cells (Fig. 4.61). These circular
substrates were placed in the bioreactor as the inserts of Transwell® and create
two separated compartments that can be used to perform electrical impedance
spectroscopy measurements.
Figure 4.61: Circular insert containing three channels of polycarbonate membrane, used for cell culture. The insert is placed between two chambers that have integrated electrodes to perform electrical impedance measurements.
To use this system, we adapted the fabrication process to perform an in
situ polymerization of our hydrogels on top of the porous membranes (section
3.6.3). Two types of membranes were chosen: a nylon mesh and porous
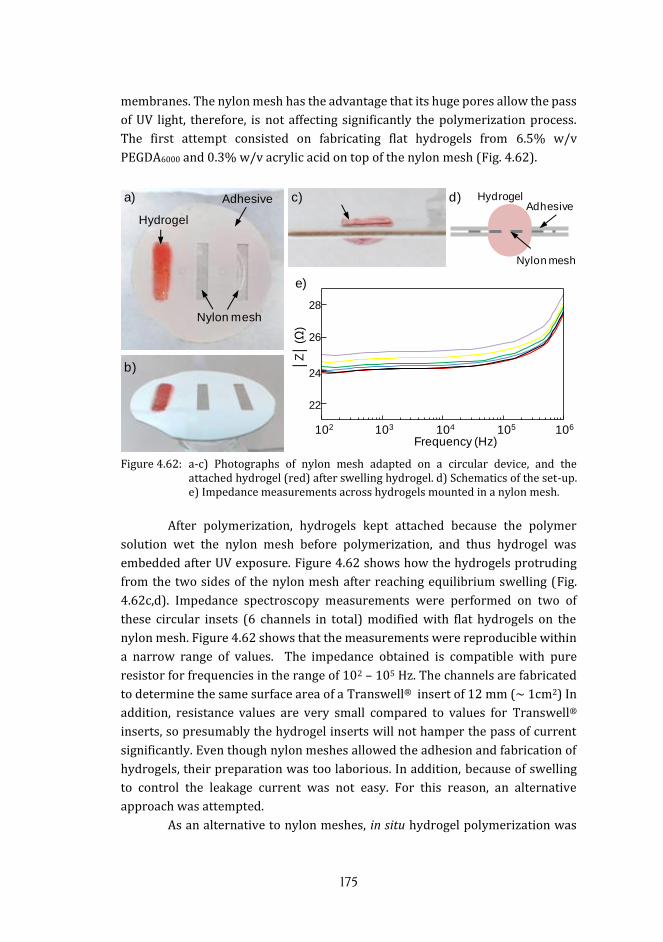
175
membranes. The nylon mesh has the advantage that its huge pores allow the pass
of UV light, therefore, is not affecting significantly the polymerization process.
The first attempt consisted on fabricating flat hydrogels from 6.5% w/v
PEGDA6000 and 0.3% w/v acrylic acid on top of the nylon mesh (Fig. 4.62).
Figure 4.62: a-c) Photographs of nylon mesh adapted on a circular device, and the
attached hydrogel (red) after swelling hydrogel. d) Schematics of the set-up. e) Impedance measurements across hydrogels mounted in a nylon mesh.
After polymerization, hydrogels kept attached because the polymer
solution wet the nylon mesh before polymerization, and thus hydrogel was
embedded after UV exposure. Figure 4.62 shows how the hydrogels protruding
from the two sides of the nylon mesh after reaching equilibrium swelling (Fig.
4.62c,d). Impedance spectroscopy measurements were performed on two of
these circular insets (6 channels in total) modified with flat hydrogels on the
nylon mesh. Figure 4.62 shows that the measurements were reproducible within
a narrow range of values. The impedance obtained is compatible with pure
resistor for frequencies in the range of 102 – 105 Hz. The channels are fabricated
to determine the same surface area of a Transwell® insert of 12 mm (∼ 1cm2) In
addition, resistance values are very small compared to values for Transwell®
inserts, so presumably the hydrogel inserts will not hamper the pass of current
significantly. Even though nylon meshes allowed the adhesion and fabrication of
hydrogels, their preparation was too laborious. In addition, because of swelling
to control the leakage current was not easy. For this reason, an alternative
approach was attempted.
As an alternative to nylon meshes, in situ hydrogel polymerization was
102 103 104 105 106
22
24
26
28
Z (
W)
Freqency (Hz)
28
26
24
22
102 103 104 105 106
Frequency (Hz)
Z
(Ω)
Hydrogel
Nylon mesh
Adhesive Hydrogel
Nylon mesh
Adhesivea) c) d)
e)
b)

176
attempted on polycarbonate porous membranes, which are commonly used in
Transwell® for TEER measurements.43 For this purpose, our established
fabrication set-up was used, adding porous membranes of 1 µm in pore size
between the PDMS stencil and the glass coverslip. A photomask with windows
100 µm in diameter and a polymer solution containing 6.5% w/v PEGDA6000 and
0.3% w/v acrylic acid were used to test the fabrication of microstructures. UV
exposure was performed in two steps 10 s to form the hydrogel base and 70 s to
grow the microstructures. Two types of materials, polycarbonate and PFTE were
selected to study the polymerization and hydrogel attachment on the porous
membranes. Circular devices containing porous membranes were used to
fabricate flat hydrogels made of 6.5% w/v PEGDA6000 and 0.3% w/v acrylic acid,
by a single UV exposure of 150 s. After fabrication, circular devices were kept for
1 week in a PBS solution at 4°C to allow for equilibrium swelling. In the case of
PFTE membranes, although hydrogels polymerized, they detached from PTFE
just after fabrication. On the polycarbonate membranes, the hydrogels kept
attached after polymerization but they detached after some hours. Therefore, two
silanization protocols were assayed to avoid hydrogel detachment during the
swelling procedure (section 3.6.3). Silanization protocol was further optimized,
and ensured hydrogel attachment for long periods of time (more than 7 days).
As polycarbonate membranes, those of 1 µm and 0.4 µm pore size were
tested. Hydrogels fabricated on 0.4 µm pore size looked like a thin layer, while the
ones fabricated on 1 µm pore size showed a thicker layer (Fig. 4.63a,b). To
understand the role played by the pore size of the membranes on the hydrogel
fabrication, the transmittance through the two membranes was measured. Figure
4.63c shows that, at the wavelength range used for the fabrication, the
transmittance (260 – 600 nm) through 0.4 µm pore size membranes was 2%. In
contrast, the transmittance through 1 µm pore size membranes achieved nearly
60%. This translated in a measured transmitted intensity of 80% for the 1 µm
pore size membranes (Fig. 4.63d). Light intensity was also measured through the
polycarbonate membranes including the photomask. Lambert-Beer (Eq. 25) may
explain why hydrogels fabricated on 0.4 µm pore size membranes were much
thinner than ones fabricated from 1 µm pore size membranes (Fig. 4.63a,b).
Attenuation is directly related to the light absorbance of the material, and as has
been in previous sections light attenuation cause the shortening of hydrogels.
Therefore, 1 µm pore size polycarbonate membranes allowed the
photopolymerization of the PEGDA solutions and their microstructuring (Fig.
4.64) and were chosen to perform TEER measurements.

177
Figure 4.63: Effects of the pore size of polycarbonate membranes on the hydrogel
polymerization. Photographs of hydrogels fabricated through polycarbonate membrane of a) 1 µm or b) 0.4 µm pore size. c) Transmittance through polycarbonate porous membrane (red 1 µm or blue 0.4 µm pore size). d) Light intensity measured under polycarbonate membranes with and without photomasks. *** denotes p-value < 0.001 from Mann–Whitney U test.
Figure 4.64: a,b) Top view images of microstructured hydrogels on polycarbonate porous
membranes of 1 µm pore size and c) detail from b. Scale bars: a,b= 1.5 mm, c= 500 µm.
A circular insert with these membranes in each channel was used to
fabricate hydrogel microstructures made from polymer solutions containing
6.5% w/v PEGDA6000-0.3% w/v acrylic acid, and 1% I2959. The photomask had
windows 100 µm in diameter and it was exposed to UV light for 10 s to create the
hydrogel base and 70 s to create the microstructures. With these conditions,
microstructures of 297 ± 8 µm in height were obtained on the porous membrane
(Fig. 4.65). There was a significant reduction on the microstructure heights due
to the light absorption of the membrane (without the membrane these fabrication
conditions resulted in pillars 550 µm in height). However, the resulting
microstructures were considered to be high enough to be representative of the
dimensions of villi in native tissues.
Hydrogel
Wavelength (nm)300 350 400
Tra
ns
mitt
an
ce(%
)
100
75
50
25
0300 350 400
0
25
50
75
100
WavelengthT
ransm
itta
nce (
%)
58.5%
2.1% 5
10
15
20
25
ctr
ol
A
100
80
60
40
20
25
20
15
10
5
Coverslip PC 1 µm PC 0.4 µm
Lig
ht i
nte
ns
ity (
mW
/cm
2 )
Lig
ht in
ten
sity (%
)
***
***
a) c) d)
b)
a) b) c)

178
Figure 4.65: Image of the 6.5% w/v PEGDA6000-0.3% w/v acrylic acid microstructure
profile fabricated using a 1 µm pore size polycarbonate membrane. The dash line highlights the microstructure contour. Scale bar = 300 µm.
The microstructured hydrogels were functionalized with a laminin
solution of 50 µg/mL and Caco-2 cells were seeded at a density of 5·105 cells/cm2.
After 14 days of cell culture, the insert was placed on the bioreactor chamber to
carry out impedance spectroscopy measurements. The measurements were done
in parallel at the three channels of the device (Fig. 4.66). The first channel showed
high impedance values at all frequencies, whereas channel 3 showed very low
values of impedance. These spectra could be attributed to the mounting and the
current leakage, respectively. Channel 2 was the only showing the typical sigmoid
curve of epithelial barriers, characterized by high impedances at mid-range
frequencies that decrease at high frequencies. This channel was selected to
determine the TEER of the monolayer (Fig. 4.66b). After measuring the
impedance values of channel 2 (Zmeasured), the hydrogel with cells on top was
removed to measure the impedance related to that particular silanized
membrane (Zsm). A non-modified inset (polycarbonate membrane) was used as a
control to avoid influences of the mounting into the bioreactor. To calculate TEER,
Zsm was subtracted from Zmeasured and fitted to an equivalent electric circuit that
describes the impedance spectrum of a cell barrier. The plot of Figure 4.66c
shows the typical silhouette of impedance spectrum of a cell monolayer at
different frequencies, where at mid-range frequencies impedance from cell
monolayer are predominant, and at high frequencies the total impedance
converges to the resistance of the medium.43 TEER was obtained by multiplying
impedance at 100 Hz and total surface area of the microstructured hydrogel. The
microstructures fully occupied the porous membrane area (0.8 cm2), and the
microstructures fabricated had a total surface area of 3.68 cm2. Therefore, TEER
value obtained was 73.6 Ω·cm2.

179
Figure 4.66: Impedance spectroscopy data of cell cultured on hydrogels of a) the tree
channels after14 days of Caco-2 culture. Experimental data (symbols) were fitted (lines) according to equivalent electric circuits including TEER, intracellular resistance (Ri), a CPE, and the media resistance. b) Comparison of impedances on channel 2 of hydrogel, silanized membrane and porous membrane. c) Cell monolayer impedance described the typical spectrum of epithelial cell monolayers with high impedances at mid frequencies (102 Hz) and low impedances at high frequencies (106 Hz).
TEER reading by EIS are about ten times lower than the obtained on the
Transwell®. Unfortunately, we do not have enough good experimental data to
assess the consistency of EIS values. At this point, we can only speculate with the
influence of the position of the electrodes on the measurement, which was
significantly different in both experimental approaches.
In any case, TEER values of Caco-2 monolayers grown on the
microstructured hydrogels were significantly lower, on both the Transwell® and
the EIS chamber, than those obtained for Caco-2 monolayers grown on 2D
102 103 104 105 1060
5
10
15
20
Z (
W)
Freqency (Hz)
(Hydrogel + cells) - Silanized membrane
102 103 104 105 10620
40
60
80
100
Z (
W)
Freqency (Hz)
Hydrogel + cellsSilanized membrane
Porous membrane
102 103 104 105 10660
90
120
150
180
Z (
W)
Freqency (Hz)
Channel1Channel2Channel3
a)
b)
c)
Z(Ω
)Z
(Ω)
Z(Ω
)

180
polymer membranes. It has been reported that TEER of Caco2 monolayers grown
in Transwell® is far too high when compared to TEER of the native tissue.286 These
facts have been related to the leakiness of the tight junctions at the tip of
villi.36,95,393 In addition, it has also been reported that cell phenotype (also the
tight junctions) is affected by the physicochemical properties of the substrate.390
Taken all these information together, one can infer that our system, which
replicates 3D villi features on soft materials might provide a model of the
intestinal epithelial monolayer that represents better the in vivo functionality.

181

182
5 Discussion
5

183

184
The functionality of small intestinal epithelium is related with the crypt-
villus unit. First, villi increase the absorptive surface area due to their high aspect
ratio, from 2 to 10 height to width.4,9,10 The 3D architecture of villi is also
important in the spatial distribution of specialized cells along the crypt-villus axis.
Proliferative cells are confined to the crypt domains while differentiated cells
migrate along the villi to the tip, where they shed to the lumen. Cell proliferation,
differentiation and migration are regulated by biochemical gradients generated
along the crypt-villus axis.394 These findings correlate with the gradual
decreasing of the paracellular pore size,395 and the distribution of patterns of
laminin isomorfs396 along the crypt–villus axis. In addition, not only the cell
composition of the epithelium varies, but the lamina propria also show different
immune cell populations along of this axis.397 Thus, mimicking the natural tissue
3D structure is expected to be crucial for the modelling of intestinal epithelial
barrier.
Conventional 2D in vitro models of the intestinal epithelium, based on the
culture of Caco-2 cells on Transwell® inserts, fail to represent small intestinal
microenvironment and lack physiological relevance in some applications.278 Even
if the porous membranes of Transwell® inserts can be coated with various
extracellular matrix proteins, their mechanical properties (2 GPa)398 do not
resemble those of the epithelial basement membrane (3-30 kPa).360,399 In
addition, the flat surface of porous membranes completely lacks 3D villi-like
features. These restrictions have negative effects on the Caco-2 cells phenotype
when compared with the native intestinal tissue: Caco-2 cells show less apico-
basal elongation,390 and form stiffer tight junctions than those found in vivo117 due
to smaller paracellular pores.400 Such characteristics lead to the underestimation
of paracellular absorption.401 TEER readings are also affected and show values 5
-30 fold higher values compared to in vivo.402,403 To address these issues, several
studies have recently reported different strategies and materials to mimic the
three-dimensional architecture of crypt-villus units to improve the in vitro
models of small intestinal epithelium.183,286,197,68,279,284,285,287,288 TEER and
permeability improvements have been reported by culturing Caco-2 cells on the
synthetic villi,286 which also enhanced epithelial cell morphology and
differentiation.197,279 Even though these reports have shown valuable progress
towards improving the accuracy of the in vitro models, complex fabrication
methods, sophisticated or non-tunable materials and experimental set ups not
adapted to the conventional measurements are still hampering the use of these
new systems in standard testing.
The first challenge in the development of biomimetic in vitro epithelial
models is the use of materials that mimic the structure, mechanical properties
and chemical composition of the basement membrane. ECM proteins found in the

185
basement membrane, such as laminin or collagen, should be incorporated. To
provide enough ligand density for the cell-substrate interactions, the material
should allow the control over its physicochemical properties. In addition, it would
be desirable a porous matrix, which will allow the diffusion of oxygen and
nutrients and at the same time does not hamper permeability and TEER
measurements. As the intestinal mucosa is a soft tissue, a material with high-
water content, and mechanical properties within the range of 3-30 kPa is
desirable.
We are not only interested in mimicking the in vivo cell-substrate
interactions, but also in adding the 3D architecture of the in vivo intestinal tissue.
Therefore, it is crucial that the chosen material can be microstructured, giving
rise to high aspect ratio microstructures with dimensions of a few hundreds of
microns in a simple, reliable and reproducible way. In addition, the degradability
of these structures has to be taken into account, because of Caco-2 culturing takes
place for at least 21 days. The constructs also have to be suitable to integrate them
in conventional tests of the epithelial integrity (TEER, permeability) to expand
their applicability in drug absorption tests.
As a widely-used biomaterial, PEGDA hydrogels were chosen as the
material to support the growth on intestinal epithelial cells. PEGDA is highly
hydrophilic, its physicochemical properties can be tuned in a controllable
manner, it is non-biodegradable and it can be easily produced by photocross-
linking.153,236 However, PEGDA hydrogels show low bioactivity, which results in a
non-fouling material. To overcome its low bioactivity, in the present study acrylic
acid is introduced into the material recipe to improve the cell attachment capacity
of PEGDA hydrogels. PEGDA and acrylic acid were copolymerized by
photopolymerization. Acrylic acid not only has a vinyl group to react in the free
radical polymerization but also a carboxyl group, which can be functionalized
with many proteins. This method allowed to obtain hydrogels with controlled
amounts of exposed carboxyl groups, which support their functionalization with
ECM proteins. The strategy of copolymerizing acrylic acid with PEGDA for the
anchoring of proteins was published first by Drumheller et al. in 1994.365 Since
then, few reports have followed similar strategies. Conversely, acrylic acid has
been post-grafted on PEGDA surfaces creating a polyacrylate layer that was
functionalized with collagen to enhance cell adhesion.366 On the other hand, the
copolymerization of acrylic acid and PEGDA has been used to create photonic
crystals and control the specific adsorption of antibodies.367 In this sense, it has
been shown that ligand density plays an important role for cell adhesion on
hydrogel surfaces,140,149,362 and our fabrication method allows to tune the ligand
density in the hydrogels by changing their acrylic acid concentration (Fig. 4.39).
On the contrary, the post-grafting methods do not allow for the fine control over

186
the number of carboxylic groups. In addition, our strategy results advantageous
over other alternatives to improve bioactivity of PEGDA such as the
incorporation of gelatin methacrylate258 or methacrylated hyaluronic acid,404
because of the specific and controlled targeting of the functional carboxyl groups
of the hydrogel.
An appropriate material to develop epithelial barriers requires
physicochemical properties that enable the formation of cell monolayers.
Considering the relevance of the substrate stiffness on the epithelial cell
behaviour,405 it is noticeable that the mechanical properties of PEGDA-acrylic acid
hydrogels can be easily tailored by changing PEGDA concentration.234,236 In our
case, PEGDA-acrylic acid hydrogels were formulated to present mechanical
properties within the physiological range of small intestine. On natural-derived
hydrogels such as Matrigel,TM the control over the mechanical properties is often
not straightforward. Despite MatrigelTM possesses inherent biochemical factors
that enhance cell adhesion and it is widely used for the culture of Caco-2 and
human intestinal cells, its low stiffness (from tens to hundreds of Pa)406 promotes
the formation of cysts instead of monolayers. On the other hand, stiffer synthetic
substrates such as the conventional polycarbonate porous membranes, induced
undesirable changes in the cell phenotype.117,390 Unlike of using collagen or
PLGA,183,197 on our hydrogels the ligand density can be controlled without
changing significantly the mechanical properties of the hydrogels in the range of
the fabrication parameters considered (0.06% - 1.2 % w/v acrylic acid) (Fig.
4.29). To modify the ligand density on collagen or other pure substrates, the
quantity of the material, or they concentration in the pre-gel form, must be
changed. Because of changing the amount of collagen implies changes the
mechanical properties, the chemical and the mechanical contributions cannot be
independently studied.390,407,408 On the contrary, our system allows to decouple
the effects of both parameters and study and optimize their contributions in an
independent way.
A crucial factor when mimicking the basement membrane is the diffusion
within the material as some molecules must be able to go across the basement
membrane synthetic constructs. PEGDA–acrylic acid hydrogels contain a high
amount of water and their mesh size and diffusivity can be tuned by changing the
PEGDA concentrations.294,409 Here, we achieved porosities between 9 and 12
nm,294 which are in the range of those of the basement membrane and allow the
diffusion of metabolites and other biomolecules with hydrodynamic radius below
5 nm.410,411 This is a relevant issue when trying to mimic the in vivo environment,
because the native basement membrane show an important traffic of nutrients
from the digestion to the bloodstream. When considering small intestinal
epithelium in vitro models because, porosity is a key factor, as permeability and

187
TEER measurements should be performed without the interference of the
substrate. Therefore, even though villi-like microstructures that support the
growth of epithelial cell monolayers can be obtained in materials such as PDMS
or dense collagen, these materials do not allow molecule diffusion. For this
reason, alternative materials such as porous PLGA have been proposed..197,288 In
our case, PEGDA-acrylic acid hydrogels fabricated at the polymer concentrations
reported here have a porosity large enough to avoid the hydrogel interfering in
permeability tests or TEER measurements.410,411
Another relevant factor to choose the material for in vitro models of
epithelial tissues is the degradability. Considering that Caco-2 cell cultures take
place for at least 21 days after seeding biomimetic constructs should keep their
integrity for at least 3 weeks. In this regard, although collagen 3D villi-like
scaffolds have shown to promote cell adhesion and proliferation, collagen
degradation hampered the use of the structures for more than two weeks. 197,279,286. PLGA and chemically cross-linked collagen have been investigated as
alternative materials..197,279 In contrast, our approach relies in a non-
biodegradable material that will withstand long term cultures,132,412
Mimicking the 3D architecture of the small intestinal epithelium requires
the fabrication of soft microstructures relatively large (hundreds of microns) and
with high aspect ratios. The development of soft materials with these aspect
ratios imply some technical shortcomings because of the mechanical stability of
these soft hydrogels. The main problem when using molding with hydrogels is
demolding, as they might be sticky or very soft, so microstructures can be
deformed or even broken in this procedure. To overcome this restriction, Yu et al.
fabricated high aspect ratio synthetic villi made of collagen by using sequential
molding-demolding steps, passing through a hard mold, PDMS and agarose as
sacrificial layer.286 Other methods, such as stereolithography and two-photon
polymerization have also been used to create high aspect ratio hydrogels, or
complex scaffolds.222,413 Also, another possible method is 3D bioprinting, which
applies rapid prototyping techniques to model complex living tissues, such as an
arterial bifurcation.414
Here, we take profit of the photocross-linking method used to fabricate
our PEGDA-acrylic acid hydrogels, to create microstructures. Photolithography is
a very simple and low-cost process for the fabrication of microstructures over
large surface areas in a single step. Demolding steps are avoided, and considering
the dimensions to mimic (> 100 µm), high resolution photomasks are not needed,
which in addition reduces the costs. Another advantage of this technique is that
the biomimetic construct can be photopolymerized in-situ in the Transwell®, for
the functional assays, or adapted to non-conventional systems such as
bioreactors or lab-on-chip devices. Following the photolithographic process, we
188
have succeeded in fabricating PEGDA-acrylic acid microstructures that mimic the
3D architecture and the anatomic dimensions of the small intestinal epithelium.
Moreover, adjusting the fabrication parameters (polymer concentration,
molecular weight, photoinitiator concentration and exposure time) allowed us to
control the dimensions of the microstructures. Also, the physicochemical
properties of the microstructured substrates, such as the elastic modulus, the
pore size and the swelling ratio, can be tuned by changing the PEGDA
concentration.409 Several reports used pure or highly concentrated PEGDA
solutions,335 to produce high aspect ratio pillar microstructures by
photolithography.222,263–265 These studies lead to stiff constructs, with elastic
modulus values in the range of ~ MPa. In contrast, in the present study villi-like
microstructured hydrogels have been fabricated from low concentrated
solutions, obtaining in a successful way very soft (3 kPa)415 high aspect ratio
microstructures that are mechanically stable for the intended applications.
Because of the urgency in improving conventional in vitro models of
small intestinal epithelium by incorporating 3D features, quite a lot reports have
addressed this challenge with variable degree of success.68,183,197,279,284–288 A lot of
these studies focused on the microfabrication method used to produce the 3D
architecture. For example, Salomon et al. mimicked the villi architecture
fabricating PDMS pillars through molding. This has the advantage of using a
simple fabrication technique, but t the material is not the most appropriate, as it
lacks crucial features such as porosity.284 Other works developed synthetic villi
using sequential molding, employing rigid materials such as PLGA (1-2 GPa),197
and PLA (3.4 GPa)285 or soluble materials as sacrificial layers.279,286 In contrast
with this multistep methodology, we produce microstructures by a single-step
photolithography technique.
We designed a protocol to produce hydrogel microstructures by a double
UV exposure: first, the hydrogel is exposed without the photomask to create a thin
hydrogel base, and a second exposure with the photomask, which contains
circular UV transparent windows, produces the microstructures. The hydrogel
microstructures acquired bullet-like or pillar-like shapes with a rounded cap and
wider base, and soft boundaries. Interestingly, hydrogel height could be regulated
by changing both the photoinitiator concentration and the UV exposure time
(energy dosage).321 Increasing photoinitiator concentration enhances the
monomer cross-linking at a given energy dosage, and, thus polymer gelation, in
agreement with previous works.316 Taking into account the Beer Lambert law, at
high photoinitiator concentrations light intensity is prominently attenuated
across the light propagation direction. Therefore, in our study, hydrogel height
can be precisely controlled by the exposure time, which limits the formation of

189
radicals down to a certain distance from the UV source. A similar behavior has
been previously reported and modelled in multifunctional acrylate molecules.166
However, with increasing UV exposure time, the height of the
microstructures does not increase in a monotonous trend. On the contrary, it
increases for short exposure times but at certain point it starts decreasing and
might be zero (flat hydrogels) for prolonged exposure times. This is due to the
hydrogel polymerization on the unexposed regions and it has already been
described in the fabrication of PHEMA epidermal topographical features by
photolithography.416 The polymerization on the unexposed regions and the soft
boundaries of the microstructures produced may be attributed to the high
diffusion rates of the radicals into unexposed regions,346,347 leading to the cross-
linking between microstructures. This effect is convoluted with the diffusion of
the PEGDA monomers toward the hydrogel boundaries, where they are depleted.
These effects are attenuated far away from the photomask (1 mm) where the
height of the microstructures and the polymerization on unexposed regions is
limited. At these distances, light intensity is attenuated following the Beer-
Lambert law, implying less radicals to initiate the polymerization, and also more
effect of the oxygen inhibition of the polymerization reaction.316,333 According to
Shim et al.,265 the chemical gradients of radicals and O2 generated along the
propagation direction of light, make possible the fabrication of rigid PEGDA
microstructures (~ MPa)335 with complex shapes that cannot be obtained by any
other fabrication method. We have extended this concept for soft hydrogels and
we have taken advantage of the complex, roundish shapes to produce biomimetic
3D microstructures that faithfully reproduce the geometry and dimensions of
intestinal villi in a single fabrication step.
The use of photolithography to produce microstructures while
copolymerizing PEGDA-acrylic acid to form hydrogels had not been reported
previously to the best of our knowledge. When exploring the effects of adding
acrylic acid to the photolithography cross-linking process, we found out that the
addition of acrylic acid to the polymer solution improves the shape of the
microstructures, diminishing the hydrogel polymerization on unexposed regions
(Fig. 4.31). These changes in morphology may be attributed to changes in the
reaction of polymerization. Acrylic acid competes with other PEGDA molecules to
graft onto the acrylate group of PEGDA. As the grafted acrylic acid increased, the
availability of vinyl groups of PEGDA decreased. Since the vinyl group of PEGDA
also serve as the cross-linking site for PEGDA macromolecules, this reaction
lowers the cross-linking degree of the PEGDA–acrylic acid hydrogels. We are
increasing polymer total concentration (up to 20%) when adding acrylic acid,
however stiffness values of the hydrogels did not show any significant changes.
These results support this theory and the inhibition effect on the unexposed
190
regions, where the polymerization is avoided.171,295 Moreover, the addition of
acrylic acid in the polymer solutions dramatically decreases their viscosity, which
benefits the O2 inhibition.330
PEGDA-acrylic acid hydrogels proved to be suitable for the development
of epithelial monolayers, as evidenced by the culture of MDCK cells. MDCK cells
acquired epithelial-like morphology, and showed polarization markers properly
located. MDCK surface coverage and phenotype was sensitive to the substrate
rigidity (here controlled by the polymer concentration of the initial solution) and
the dimensions of the microstructures, in particular, of their diameter. MDCK cells
attached and proliferated on the most rigid hydrogels (10% w/v, leading to
elastic modulus values of ~ 30 kPa). In contrast, on the more compliant hydrogels
(5% w/v, elastic modulus of ~ 3 kPa) cells tend to show roundish morphologies,
low attachment and proliferation, and form cell aggregates. The fact that
mechanical properties of the substrate can regulate the cell behavior is very well
documented.369,417 It has been well established that MDCK cells become spherical
and even detach, and form cell clusters or cysts when cultured on soft substrates.
MDCK cells cultured on MatrigelTM form cysts with an empty lumen of about 50
µm in diameter after 2-7 days, and reach more than 100 µm after 10 days 418,419
Instead, on rigid surfaces flattened cohesive epithelial monolayers are obtained,
this being attributed to their cell-cell adhesion.380,384–386 Our samples, that differ
one order of magnitude in their mechanical properties, exemplified this behavior.
Regarding the effects of microstructure dimensions, even though MDCK cells
showed notable apico-basal polarization at the base of large microstructures
(300 µm in diameter), they just partially covered them. In contrast, smaller
microstructures (100 µm in diameter) were fully covered after 14 days. These
dramatic differences in behavior resulting from changes in the microstructure
diameter is particularly surprising. It might be possible that the 100 µm
microstructures may keep the cells close enough to promote their mechanical
contact from early time points and allow the progression of the cell culture.
Recently, Yevick et al. studied the monolayer organization on wires of various
diameters. They found that on smaller wires (80 µm in diameter) actin fibers
were highly oriented perpendicular to the wire longitudinal axis, while on larger
wires (170 µm in diameter) actin fibers were randomly oriented.420 These results
may support the hypothesis that microstructures of 100 µm in diameter promote
the formation cell-cell adhesions that keep the cells mechanically connected and
covering the hydrogel.
Caco-2 cells were successfully grown on the hydrogels mimicking the 3D
architecture of villi. We identified PEGDA-acrylic acid formulations suitable for
the fabrication of microstructured hydrogels that, once laminin functionalized,
supported the formation of polarized epithelial Caco-2 monolayers. Caco-2 cells

191
were cultured onto the hydrogels for up to 21 days and they colonized and
covered the microstructures. The overall morphology of the cell-covered
microstructured hydrogels showed a great similarity to the in vivo human villi.
Meanwhile, Caco-2 cells developed apico-basal polarization with elongated nuclei
and well located characteristic epithelial-like markers. We found that nuclei
orientation was more perpendicular on hydrogels than on Transwell®. This may
be related to the mechanical properties of the substrate, as it has been reported
that substrate rigidity modulates nuclei shape and nuclei appear more flattened
on stiffer substrates.388 In addition, force balance between cell–cell and cell–
substrate adhesions regulates cell shape and, therefore, nuclei orientation.421
Thus, the compliance of the hydrogels, in the range of the intestinal epithelium,
shift the balance to a larger contribution of the cell-cell adhesions, which
promotes nuclei elongation and perpendicular orientation with respect to the
surface, in a morphology close to that found in native villi. These considerations
are in agreement with the recent findings of DiMarco et al. who reported cell
phenotype and permeability values closer to in vivo situation when culturing
Caco-2 monolayers in compliant matrices.390
As a proof-of-concept of the functionality of the Caco2 cell monolayers as
actual epithelial barriers, TEER measurements were performed on the cell
monolayers grown on the villi-like microstructures. TEER measurements
performed on modified Transwell® demonstrated the formation of an epithelial
barrier. TEER values obtained were significantly lower than those corresponding
to the monolayers grown on porous membranes. This may be due to the effects
produced by the three dimensional architecture, as it has been reported that cell
tight junctions are weaker at the tips of the villi.36,95,393 It is well known the poor
correlation between TEER values from conventional in vitro intestinal models
and in vivo measurements, that can reach readings 5 -30 fold lower.402,403 The
weak tight junctions at the tip is believed to be the reason behind TEER values
reported in vivo are significantly smaller than those reported for monolayers. In
addition to the architecture, the softness of the material can also affect the
formation of the epithelial barrier. In fact, TEER measurements carried out on
Caco-2 monolayers grown on collagen or PLGA villous scaffolds also shown lower
values than on Transwell® and 2D scaffolds, and were similar to in vivo intestinal
values.286,197 In the present study TEER values of Caco-2 monolayer grown in the
microstructured hydrogels were even closer to in vivo than the ones previously
reported.286,197
Our results are supported by the hypothesis that villous geometry
improves cell physiology and, therefore, barrier function, driving it closer to the
in vivo situation.402 At this point, further efforts are required to engineer a robust
set up compatible with standard Transwell® inserts to perform systematic

192
measurements of permeability and transport. Due to the simplicity and versatility
of the fabrication method designed, microstructured PEGDA-acrylic acid
hydrogels might find uncountable applications. The method can be used to design
more complex models of intestinal mucosa, by incorporating other cell types such
as goblet cells, intestinal stem cells, immune cells and even commensal or
pathogenic bacteria. In addition, because of the PEGDA-acrylic acid tunable
properties, the methodology can be extended to other epithelial tissues
presenting 3D architectures relevant for their functionality such as the cornea,
the esophagus or the skin.

193

194
6 Conclusions
6

195

196
• We have described a simple and cost-effective method to produce
microstructures in soft hydrogels using PEGDA-acrylic acid polymer
solutions and conventional photolithography. The process parameters
affecting the microfabrication (UV exposure time, photoinitiator
concentration, and PEGDA molecular weight and concentration) have
been identified and studied. By properly selecting these parameters,
microstructures with the shape and dimensions of native villi have been
obtained. The particular characteristics of the polymerization reaction in
the experimental set-up designed produced high aspect ratio
microstructures on soft materials with bullet-like shapes and roundish
contours, faithfully resembling the anatomy of villi structures found in
vivo.
• We have demonstrated that PEGDA-acrylic acid can be copolymerized to
form microstructured hydrogels and can be easily further functionalized
with several extracellular matrix proteins. Acrylic acid incorporation
provides control over the ligand density on the hydrogels. In addition,
within the range of experimental conditions tested here, ligand density
can be optimized without a significant modification of the mechanical
properties of the hydrogel. Optimized conditions for the fabrication and
functionalization of villi-like microstructured hydrogels supporting
epithelial cell growth have been established.
• We have proved that functional epithelial cell monolayers are formed on
the villi-like microstructured PEGDA-acrylic acid hydrogels. This has
been tested successfully with two epithelial cell lines, which could adhere,
proliferate forming a monolayer of cells that display cellular and nuclei
epithelial morphology and express epithelial markers (villin, ZO-1, β
catenin) at the proper locations. We have determined that the stiffness of
the produced microstructures (here tuned by the polymer concentration
and polymer molecular weight) is a crucial parameter for the formation
of epithelial monolayers. Substrate stiffness and ligands density
determine the balance between the strength of cell-matrix and cell-cell
contacts, which will result in the formation of monolayers or 3D cysts
structures.
• We have successfully adapted our substrates to standard cell culture
platforms for the measurement of transepithelial electrical resistance
(TEER) of the resulting monolayers. TEER measurements confirmed the
formation of functional epithelial cell barriers displaying TEER values

197
closer to in vivo situation than those measured for conventional
monolayers. Therefore, we have engineered a 3D biomimetic model of the
small intestinal epithelium that, as evidenced the promising results
reported, sets the foundations of a novel in vitro platform to be applied in
drug absorption and toxicity tests, was well as biological studies and
disease modelling.
198
7 References
1. Hall, J. E. & Guyton, A. C. Guyton and Hall Textbook of Medical Physiology. Journal of
Chemical Information and Modeling 53, (2011).
2. Peterson, L. W. & Artis, D. Intestinal epithelial cells: regulators of barrier function and immune homeostasis. Nat. Rev. Immunol. 14, 141–53 (2014).
3. Barrett, K., Barman, S., Boitano, S. & Brooks, H. Ganong’s Review of Medical Physiology, 25e. New York, NY McGraw-Hill 1–32 (2016).
4. Tortora, G. J. & Derrickson, B. Principles of Anatomy and Physiology. Wiley 15, 1127 (2014).
5. Marchiando, A. M., Graham, W. V. & Turner, J. R. Epithelial barriers in homeostasis and disease. Annu. Rev. Pathol. 5, 119–144 (2010).
6. Encyclopedia Britannica. Britannica Online Encyclopedia. Encycl. Br. 1–73 (2014).
7. Viswanathan, V. K., Hodges, K. & Hecht, G. Enteric infection meets intestinal function: how bacterial pathogens cause diarrhoea. Nat. Rev. Microbiol. 7, 110–119 (2008).
8. Alberts, B. et al. Molecular Biology of the Cell. 4th Edition, New York (2002).
9. Louis-Auguste, J. et al. High dose multiple micronutrient supplementation improves villous morphology in environmental enteropathy without HIV enteropathy: results from a double-blind randomised placebo controlled trial in Zambian adults. BMC Gastroenterol. 14, 15 (2014).
10. Kelly, P. et al. Responses of small intestinal architecture and function over time to environmental factors in a tropical population. Am. J. Trop. Med. Hyg. 70, 412–419 (2004).
11. Marsh, M. N. & Swift, J. A. A study of the small intestinal mucosa using the scanning electron microscope. Gut 10, 940–949 (1969).
12. Muñoz-Pinto, D., Whittaker, P. & Hahn, M. S. Lamina Propria Cellularity and Collagen Composition: An Integrated Assessment of Structure in Humans. Ann. Otol. Rhinol. Laryngol. 118, 299–306 (2009).
13. Sun, M., He, C., Cong, Y. & Liu, Z. Regulatory immune cells in regulation of intestinal inflammatory response to microbiota. Mucosal Immunol. 8, 969–978 (2015).
14. Li, A. C. Y. Basement membrane components. J. Clin. Pathol. 56, 885–887 (2003).
15. Atuma, C., Strugala, V., Allen, a & Holm, L. The adherent gastrointestinal mucus gel layer: thickness and physical state in vivo. Am. J. Physiol. Gastrointest. Liver Physiol. 280, G922-9 (2001).
16. Linden, S. K., Sutton, P., Karlsson, N. G., Korolik, V. & McGuckin, M. A. Mucins in the mucosal barrier to infection. Mucosal Immunol. 1, 183–197 (2008).
7
199
17. Soler, M. et al. Adhesion-related glycocalyx study: quantitative approach with imaging-spectrum in the energy filtering transmission electron microscope (EFTEM). FEBS Lett. 429, 89–94 (1998).
18. Kim, Y. S. & Ho, S. B. Intestinal Goblet Cells and Mucins in Health and Disease: Recent Insights and Progress. Curr. Gastroenterol. Rep. 12, 319–330 (2010).
19. Rescigno, M. The intestinal epithelial barrier in the control of homeostasis and immunity. Trends Immunol. 32, 256–264 (2011).
20. Liu, L. & Talmon, G. Quantification of intraepithelial lymphocytes in normal pediatric small intestinal allograft and native ilea. Transplant. Proc. 43, 1831–1835 (2011).
21. Mowat, A. M. & Agace, W. W. Regional specialization within the intestinal immune system. Nat Rev Immunol 14, 667–685 (2014).
22. Round, J. L. & Mazmanian, S. K. The gut microbiota shapes intestinal immune responses during health and disease. Nat. Rev. Immunol. 9, 313–23 (2009).
23. McGuckin, M. A., Lindén, S. K., Sutton, P. & Florin, T. H. Mucin dynamics and enteric pathogens. Nat. Rev. Microbiol. 9, 265–278 (2011).
24. Goodell, M. a, Nguyen, H. & Shroyer, N. Somatic stem cell heterogeneity: diversity in the blood, skin and intestinal stem cell compartments. Nat. Rev. Mol. Cell Biol. 16, 299–309 (2015).
25. Crosnier, C., Stamataki, D. & Lewis, J. Organizing cell renewal in the intestine: stem cells, signals and combinatorial control. Nat. Rev. Genet. 7, 349–359 (2006).
26. Gregorieff, A. Wnt signaling in the intestinal epithelium: from endoderm to cancer. Genes Dev. 19, 877–890 (2005).
27. Barker, N. Adult intestinal stem cells: critical drivers of epithelial homeostasis and regeneration. Nat. Rev. Mol. Cell Biol. 15, 19–33 (2014).
28. Mayhew, T. M. Epithelial integrity, cell death and cell loss in mammalian small intestine. Histology and Histopathology 14, 257–267 (1999).
29. Williams, J. M. et al. Epithelial cell shedding and barrier function: a matter of life and death at the small intestinal villus tip. Vet. Pathol. 52, 445–55 (2015).
30. Barker, N. et al. Identification of stem cells in small intestine and colon by marker gene Lgr5. Nature 449, 1003–1007 (2007).
31. Sato, T. et al. Single Lgr5 stem cells build crypt-villus structures in vitro without a mesenchymal niche. Nature 459, 262–5 (2009).
32. Sato, T. et al. Paneth cells constitute the niche for Lgr5 stem cells in intestinal crypts. Nature 469, 415–8 (2011).
33. Umar, S. Intestinal Stem Cells. Curr. Gastroenterol. Rep. 12, 340–348 (2010).
34. Carulli, A. J., Samuelson, L. C. & Schnell, S. Unraveling intestinal stem cell behavior with models of crypt dynamics. Integr. Biol. 6, 243 (2014).
35. Standring, S. Gray’s Anatomy: The Anatomical Basis of Clinical Practice. Development 2, (2008).
36. Yu, Q. H. & Yang, Q. Diversity of tight junctions (TJs) between gastrointestinal epithelial cells and their function in maintaining the mucosal barrier. Cell Biol. Int. 33, 78–82 (2009).
37. Anderson, J. M. Molecular structure of tight junctions and their role in epithelial transport. News Physiol. Sci. 16, 126–30 (2001).
38. Tortora, G. J. et al. PRINCIPLES OF ANATOMY AND Br yan Derrickson. (2010).
39. Camilleri, M. Integrated Upper Gastrointestinal Response to Food Intake. Gastroenterology 131, 640–658 (2006).
40. Delacour, D., Salomon, J., Robine, S. & Louvard, D. Plasticity of the brush border — the yin and yang of intestinal homeostasis. Nat. Rev. Gastroenterol. Hepatol. 13, 161–174 (2016).

200
41. Lozovatsky, L., Abayasekara, N., Piawah, S. & Walther, Z. CASK Deletion in Intestinal Epithelia Causes Mislocalization of LIN7C and the DLG1/Scrib Polarity Complex without Affecting Cell Polarity. Mol. Biol. Cell 20, 4489–4499 (2009).
42. Neunlist, M. et al. The digestive neuronal–glial–epithelial unit: a new actor in gut health and disease. Nat. Rev. Gastroenterol. Hepatol. 10, 90–100 (2012).
43. Benson, K., Cramer, S. & Galla, H.-J. Impedance-based cell monitoring: barrier properties and beyond. Fluids Barriers CNS 10, 5 (2013).
44. Griffin, B. & Driscoll, C. O. Diseases of the Small Intestine. 34–76 (2007). Available at: http://www.ddc.musc.edu/public/diseases/small-intestine/.
45. Prevalence of enteric pathogen-associated community gastroenteritis among kindergarten children in Gaza. J. Biomed. Res. 61–68 (2015). doi:10.7555/JBR.29.20130108
46. Kirk, M. D. et al. World Health Organization Estimates of the Global and Regional Disease Burden of 22 Foodborne Bacterial, Protozoal, and Viral Diseases, 2010: A Data Synthesis. PLOS Med. 12, e1001921 (2015).
47. Kolling, G., Wu, M. & Guerrant, R. L. Enteric pathogens through life stages. Front. Cell. Infect. Microbiol. 2, 114 (2012).
48. Fasina, Y. O., Hoerr, F. J., McKee, S. R. & Conner, D. E. Influence of Salmonella enterica Serovar Typhimurium Infection on Intestinal Goblet Cells and Villous Morphology in Broiler Chicks. Avian Dis. 54, 841–847 (2010).
49. Benjamin, M. A., Lu, J., Donnelly, G., Dureja, P. & McKay, D. M. Changes in murine jejunal morphology evoked by the bacterial superantigen Staphylococcus aureus enterotoxin B are mediated by CD4+ T cells. Infect. Immun. 66, 2193–2199 (1998).
50. Danielsen, E. M., Hansen, G. H. & Karlsdóttir, E. Staphylococcus aureus enterotoxins A- and B: Binding to the enterocyte brush border and uptake by perturbation of the apical endocytic membrane traffic. Histochem. Cell Biol. 139, 513–524 (2013).
51. Wang, Q. et al. The Bacteriocin Sublancin Attenuates Intestinal Injury in Young Mice Infected With Staphylococcus aureus. Anat. Rec. (Hoboken). 0, 1–8 (2014).
52. Nataro, J. Enteroaggregative Escherichia coli. Emerg. Infect. Dis. 4, 251–261 (1998).
53. Hicks, S., Candy, D. C. A. & Phillips, A. D. Adhesion of enteroaggregative Escherichia coli to pediatric intestinal mucosa in vitro. Infect. Immun. 64, 4751–4760 (1996).
54. Reiter, K., Eggebrecht, S., Drewes, B., Riess, M. & Weyrauch, K. D. Effects of Enterococcus faecium and Bacillus cereus var. toyoi on the morphology of the intestinal mucous membrane in piglets*. Sect. Cell. Mol. Biol. 616, 803–809 (2006).
55. Catassi, C., Gatti, S. & Fasano, A. The new epidemiology of celiac disease. J. Pediatr. Gastroenterol. Nutr. 59 Suppl 1, S7-9 (2014).
56. Agarwal, S., Kovilam, O., Zach, T. L. & Agrawal, D. K. Immunopathogenesis and therapeutic approaches in pediatric celiac disease. Expert Rev. Clin. Immunol. 12, 857–869 (2016).
57. Gujral, N. Celiac disease: Prevalence, diagnosis, pathogenesis and treatment. World J. Gastroenterol. 18, 6036 (2012).
58. Ediger, T. R. & Hill, I. D. Celiac Disease. Pediatr. Rev. 35, 409–416 (2014).
59. Naganuma, M. et al. Characterization of structures with T-lymphocyte aggregates in ileal villi of Crohn’s disease. Am. J. Gastroenterol. 97, 1741–1747 (2002).
60. Molodecky, N. A. et al. Increasing Incidence and Prevalence of the Inflammatory Bowel Diseases With Time, Based on Systematic Review. Gastroenterology 142, 46–54.e42 (2012).
61. World Cancer Research Fundation. Available at: http://www.wcrf.org/.
62. Torre, L. A. et al. Global cancer statistics, 2012. CA. Cancer J. Clin. 65, 87–108 (2015).
63. Ohmiya, N. et al. Classification of Intestinal Lymphangiectasia with Protein-Losing

201
Enteropathy: White Villi Type and Non-White Villi Type. Digestion 90, 155–166 (2014).
64. Ebert, E. C. & Nagar, M. Gastrointestinal manifestations of amyloidosis. American Journal of Gastroenterology 103, 776–787 (2008).
65. Gerson, L. B. & Triadafilopoulos, G. Palliative care in inflammatory bowel disease: An evidence-based approach. Inflamm. Bowel Dis. 6, 228–243 (2007).
66. Wales, P. W. et al. Neonatal Short Bowel Syndrome: Population-Based Estimates of Incidence and Mortality Rates. in Journal of Pediatric Surgery 39, 690–695 (2004).
67. Spurrier, R. G. & Grikscheit, T. C. Tissue Engineering the Small Intestine. Clin. Gastroenterol. Hepatol. 11, 354–358 (2013).
68. Ladd, M. R., Niño, D. F., March, J. C., Sodhi, C. P. & Hackam, D. J. Generation of an artificial intestine for the management of short bowel syndrome. Curr. Opin. Organ Transplant. 21, 1 (2016).
69. Ferrec, E. et al. In Vitro Models of the Intestinal Barrier. Atla 29, 649–668 (2001).
70. Meunier, V., Bourrie, M., Berger, Y. & Fabre, G. The human intestinal epithelial cell line Caco-2; pharmacological and pharmacokinetic applications. Cell Biol. Toxicol. 11, 187–194 (1995).
71. Goyal, N., Rana, A., Ahlawat, A., Bijjem, K. R. V. & Kumar, P. Animal models of inflammatory bowel disease: a review. Inflammopharmacology 22, 219–233 (2014).
72. Alderuccio, F., Sentry, J. W., Marshall, A. C. J., Biondo, M. & Toh, B. H. Animal Models of Human Disease: Experimental Autoimmune Gastritis—A Model for Autoimmune Gastritis and Pernicious Anemia. Clin. Immunol. 102, 48–58 (2002).
73. Jiminez, J. A., Uwiera, T. C., Douglas Inglis, G. & Uwiera, R. R. E. Animal models to study acute and chronic intestinal inflammation in mammals. Gut Pathog. 7, 29 (2015).
74. Johnson, R. L. & Fleet, J. C. Animal models of colorectal cancer. Cancer Metastasis Rev. 32, 39–61 (2013).
75. Jackstadt, R. & Sansom, O. J. Mouse models of intestinal cancer. J. Pathol. 238, 141–151 (2016).
76. Marietta, E. V., David, C. S. & Murray, J. A. Important Lessons Derived from Animal Models of Celiac Disease. Int. Rev. Immunol. 30, 197–206 (2011).
77. Stahl, M. et al. A Novel Mouse Model of Campylobacter jejuni Gastroenteritis Reveals Key Pro-inflammatory and Tissue Protective Roles for Toll-like Receptor Signaling during Infection. PLoS Pathog. 10, e1004264 (2014).
78. Glaeser, H. & Fromm, M. F. Animal models and intestinal drug transport. Expert Opin. Drug Metab. Toxicol. 4, 347–361 (2008).
79. Billat, P.-A., Roger, E., Faure, S. & Lagarce, F. Models for drug absorption from the small intestine: where are we and where are we going? Drug Discov. Today (2017). doi:10.1016/j.drudis.2017.01.007
80. Singh, M., Mensah, G. A. & Bakris, G. Pathogenesis and Clinical Physiology of Hypertension. Cardiol. Clin. 28, 545–559 (2010).
81. Li, M. et al. Excipients enhance intestinal absorption of ganciclovir by P-gp inhibition: Assessed in vitro by everted gut sac and in situ by improved intestinal perfusion. Int. J. Pharm. 403, 37–45 (2011).
82. Randall, K. J., Turton, J. & Foster, J. R. Explant culture of gastrointestinal tissue: A review of methods and applications. Cell Biol. Toxicol. 27, 267–284 (2011).
83. Carvalho, F. C., Bruschi, M. L., Evangelista, R. C. & Gremião, M. P. D. Mucoadhesive drug delivery systems. Brazilian J. Pharm. Sci. 46, 1–17 (2010).
84. Alam, M. A., Al-Jenoobi, F. I. & Al-Mohizea, A. M. Everted gut sac model as a tool in pharmaceutical research: Limitations and applications. J. Pharm. Pharmacol. 64, 326–336 (2012).

202
85. Liu, W. et al. Developments in Methods for Measuring the Intestinal Absorption of Nanoparticle-Bound Drugs. Int. J. Mol. Sci. 17, 1171 (2016).
86. Van De Kerkhof, E. G. et al. Innovative methods to study human intestinal drug metabolism in vitro: Precision-cut slices compared with Ussing chamber preparations. Drug Metab. Dispos. 34, 1893–1902 (2006).
87. De Kanter, R. et al. A new technique for preparing precision-cut slices from small intestine and colon for drug biotransformation studies. J. Pharmacol. Toxicol. Methods 51, 65–72 (2005).
88. Li, M., de Graaf, I. A. M. & Groothuis, G. M. M. Precision-cut intestinal slices: alternative model for drug transport, metabolism, and toxicology research. Expert Opin. Drug Metab. Toxicol. 12, 175–190 (2016).
89. Clarke, L. L. A guide to Ussing chamber studies of mouse intestine. AJP Gastrointest. Liver Physiol. 296, G1151–G1166 (2009).
90. He, L. et al. Use of the Ussing chamber technique to study nutrient transport by epithelial tissues. Front. Biosci. (Landmark Ed. 18, 1266–74 (2013).
91. Membrane, R. T. et al. Transwell ® Permeable Supports Selection and Use Guide. (2007).
92. Grajek, W. & Olejnik, A. EPITHELIAL CELL CULTURES IN VITRO AS A MODEL TO STUDY FUNCTIONAL PROPERTIES OF FOOD. Polish J. Food Nutr. Sci. 13, 5–24 (2004).
93. Benam, K. H. et al. Engineered In Vitro Disease Models. Annu. Rev. Pathol. 10, 195–262 (2015).
94. Srinivasan, B. et al. TEER Measurement Techniques for In Vitro Barrier Model Systems. J. Lab. Autom. 20, 107–126 (2015).
95. Steed, E., Balda, M. S. & Matter, K. Dynamics and functions of tight junctions. Trends Cell Biol. 20, 142–149 (2010).
96. Anderson, J. M. & Van Itallie, C. M. Physiology and Function of the Tight Junction. Cold Spring Harb. Perspect. Biol. 1, a002584–a002584 (2009).
97. Wang, X., Becker, F. F. & Gascoyne, P. R. C. The fractal dimension of cell membrane correlates with its capacitance: A new fractal single-shell model. Chaos An Interdiscip. J. Nonlinear Sci. 20, 43133 (2010).
98. Quaroni, A. Epithelioid cell cultures from rat small intestine. Characterization by morphologic and immunologic criteria. J. Cell Biol. 80, 248–265 (1979).
99. Kaeffer, B. Mammalian intestinal epithelial cells in primary culture: a mini-review. In Vitro Cell. Dev. Biol. Anim. 38, 123–134 (2002).
100. Schwerk, J. et al. Generation of Mouse Small Intestinal Epithelial Cell Lines That Allow the Analysis of Specific Innate Immune Functions. PLoS One 8, (2013).
101. Sambuy, Y. et al. The Caco-2 cell line as a model of the intestinal barrier: Influence of cell and culture-related factors on Caco-2 cell functional characteristics. Cell Biol. Toxicol. 21, 1–26 (2005).
102. Hidalgo, I. J., Raub, T. J. & Borchardt, R. T. Characterization of the human colon carcinoma cell line (Caco-2) as a model system for intestinal epithelial permeability. Gastroenterology 96, 736–749 (1989).
103. Press, B. in 139–154 (2011). doi:10.1007/978-1-61779-191-8_9
104. Artursson, P., Palm, K., Luthmanb, K. & Luthman, K. Caco-2 monolayers in experimental and theoretical predictions of drug transport. Adv. Drug Deliv. Rev. 64, 280–289 (2012).
105. Brück, S., Strohmeier, J., Busch, D., Drozdzik, M. & Oswald, S. Caco-2 cells - expression, regulation and function of drug transporters compared with human jejunal tissue. Biopharm. Drug Dispos. (2016). doi:10.1002/bdd.2025
106. Kang, T. et al. In vitro toxicity of different-sized ZnO nanoparticles in Caco-2 cells. Nanoscale Res. Lett. 8, 496 (2013).

203
107. Lennernäs, H. Human jejunal effective permeability and its correlation with preclinical drug absorption models. J. Pharm. Pharmacol. 49, 627–638 (1997).
108. Martínez-Maqueda, D., Miralles, B. & Recio, I. in The Impact of Food Bioactives on Health 113–124 (Springer International Publishing, 2015). doi:10.1007/978-3-319-16104-4_11
109. Pan, F., Han, L., Zhang, Y., Yu, Y. & Liu, J. Optimization of Caco-2 and HT29 co-culture in vitro cell models for permeability studies. Int. J. Food Sci. Nutr. 66, 680–685 (2015).
110. Leonard, F., Collnot, E. M. & Lehr, C. M. A three-dimensional coculture of enterocytes, monocytes and dendritic cells to model inflamed intestinal mucosa in vitro. Mol. Pharm. 7, 2103–2119 (2010).
111. Bermudez-Brito, M., Faas, M. M. & de Vos, P. Modulation of Dendritic-Epithelial Cell Responses against Sphingomonas Paucimobilis by Dietary Fibers. Sci. Rep. 6, 30277 (2016).
112. Moyes, S. M., Morris, J. F. & Carr, K. E. Macrophages increase microparticle uptake by enterocyte-like Caco-2 cell monolayers. J. Anat. 217, 740–754 (2010).
113. Kuntz, S. et al. Inhibition of low-grade inflammation by anthocyanins from grape extract in an in vitro epithelial-endothelial co-culture model. Food Funct. 6, 1136–1149 (2015).
114. Kleiveland, C. R. in The Impact of Food Bioactives on Health 197–205 (Springer International Publishing, 2015). doi:10.1007/978-3-319-16104-4_18
115. Parlesak, A., Haller, D., Brinz, S., Baeuerlein, A. & Bode, C. Modulation of Cytokine Release by Differentiated CACO-2 Cells in a Compartmentalized Coculture Model with Mononuclear Leucocytes and Nonpathogenic Bacteria. Scand. J. Immunol. 60, 477–485 (2004).
116. Shen, C., Meng, Q. & Zhang, G. Design of 3D printed insert for hanging culture of Caco-2 cells. Biofabrication 7, 15003 (2015).
117. Sun, H., Chow, E. C., Liu, S., Du, Y. & Pang, K. S. The Caco-2 cell monolayer: usefulness and limitations. Expert Opin. Drug Metab. Toxicol. 4, 395–411 (2008).
118. Sjöberg, V. Immune response of the small intestinal mucosa in children with celiac disease - Impact of two environmental factors , resident microbiota and oats. (2013).
119. Takenaka, T. et al. Human Small Intestinal Epithelial Cells Differentiated from Adult Intestinal Stem Cells as a Novel System for Predicting Oral Drug Absorption in Humans. Drug Metab. Dispos. 42, 1947–1954 (2014).
120. Gattazzo, F., Urciuolo, A. & Bonaldo, P. Extracellular matrix: a dynamic microenvironment for stem cell niche. Biochim. Biophys. Acta 1840, 2506–19 (2014).
121. Takeuchi, T. & Gonda, T. Distribution of the pores of epithelial basement membrane in the rat small intestine. J. Vet. Med. Sci. 66, 695–700 (2004).
122. Glentis, A., Gurchenkov, V. & Vignjevic, D. M. Assembly, heterogeneity, and breaching of the basement membranes. Cell Adh. Migr. 8, 236–245 (2014).
123. Verbeke, S. et al. Basement membrane and connective tissue proteins in intestinal mucosa of patients with coeliac disease. J. Clin. Pathol. 55, 440–5 (2002).
124. Mahoney, Z. X., Stappenbeck, T. S. & Miner, J. H. Laminin 5 influences the architecture of the mouse small intestine mucosa. J. Cell Sci. 121, 2493–2502 (2008).
125. Teller, I. C. et al. Laminins in the developing and adult human small intestine: Relation with the functional absorptive unit. Dev. Dyn. 236, 1980–1990 (2007).
126. Kalluri, R. Angiogenesis: Basement membranes: structure, assembly and role in tumour angiogenesis. Nat. Rev. Cancer 3, 422–433 (2003).
127. Gerlach, G. & Arndt, K.-F. Hydrogel Sensors and Actuators. Springer Ser. Chem. Sensors Biosens. 6, 1–15 (2009).
128. Ganji, F., Vasheghani-Farahani, S. & Vasheghani-Farahani, E. Theoretical Description of Hydrogel Swelling: A Review. Iran. Polym. J. 19, 375–398 (2010).
129. Tibbitt, M. W. & Anseth, K. S. Hydrogels as extracellular matrix mimics for 3D cell culture.

204
Biotechnol. Bioeng. 103, 655–663 (2009).
130. Lee, K. Y. & Mooney, D. J. Hydrogels for tissue engineering. Chem. Rev. 101, 1869–1879 (2001).
131. Peppas, N. A. N. a., Hilt, J. Z. Z., Khademhosseini, A. & Langer, R. Hydrogels in biology and medicine: From molecular principles to bionanotechnology. Adv. Mater. 18, 1345–1360 (2006).
132. Hoffman, A. S. Hydrogels for biomedical applications. Adv. Drug Deliv. Rev. 64, 18–23 (2012).
133. Jabaji, Z. et al. Type I Collagen as an Extracellular Matrix for the In Vitro Growth of Human Small Intestinal Epithelium. PLoS One 9, e107814 (2014).
134. Hughes, C. S., Postovit, L. M. & Lajoie, G. A. Matrigel: a complex protein mixture required for optimal growth of cell culture. Proteomics 10, 1886–1890 (2010).
135. Serban, M. A., Liu, Y. & Prestwich, G. D. Effects of extracellular matrix analogues on primary human fibroblast behavior. Acta Biomater. 4, 67–75 (2008).
136. Esposito, A. et al. Hyaluronic acid based materials for intestine tissue engineering: A morphological and biochemical study of cell-material interaction. J. Mater. Sci. Mater. Med. 17, 1365–1372 (2006).
137. Zakhem, E., Raghavan, S., Gilmont, R. R. & Bitar, K. N. Chitosan-based scaffolds for the support of smooth muscle constructs in intestinal tissue engineering. Biomaterials 33, 4810–4817 (2012).
138. Gjorevski, N. et al. Designer matrices for intestinal stem cell and organoid culture. Nat. Publ. Gr. 539, 560–564 (2016).
139. Lutolf, M. P. & Hubbell, J. a. Synthetic biomaterials as instructive extracellular microenvironments for morphogenesis in tissue engineering. Nat. Biotechnol. 23, 47–55 (2005).
140. Zhu, J. & Marchant, R. E. Design properties of hydrogel tissue-engineering scaffolds. Expert Rev. Med. Devices 8, 607–26 (2011).
141. DeForest, C. A. & Anseth, K. S. Advances in bioactive hydrogels to probe and direct cell fate. Annu. Rev. Chem. Biomol. Eng. 3, 421–44 (2012).
142. Kharkar, P. M., Kiick, K. L. & Kloxin, A. M. Designing degradable hydrogels for orthogonal control of cell microenvironments. Chem. Soc. Rev. 42, 7335–72 (2013).
143. Liu, S. Q. et al. Synthetic hydrogels for controlled stem cell differentiation. Soft Matter 6, 67 (2010).
144. Seliktar, D. Designing Cell-Compatible Hydrogels for Biomedical Applications. Science (80-. ). 336, 1124–1128 (2012).
145. Nicodemus, G. D. & Bryant, S. J. Cell Encapsulation in Biodegradable Hydrogels for Tissue Engineering Applications. Tissue Eng. Part B. Rev. 14, 149–165 (2008).
146. Huglin, M. R. Hydrogels in medicine and pharmacy Edited by N. A. Peppas, CRC Press Inc., Boca Raton, Florida, 1986 (Vol. l), 1987 (Vols 2 and 3). Vol. 1 Fundamentals, pp. vii + 180, £72.00, ISBN 0-8493-5546-X; Vol. 2 Polymers, pp. vii + 171, £72.00, ISBN 0-8493-5547-8; Br. Polym. J. 21, 184–184 (1989).
147. Slaughter, B. V., Khurshid, S. S., Fisher, O. Z., Khademhosseini, A. & Peppas, N. A. Hydrogels in Regenerative Medicine. Adv. Mater. 21, 3307–3329 (2009).
148. Flory, P. J. & Rehner, J. Statistical Mechanics of Cross-Linked Polymer Networks II. Swelling. J. Chem. Phys. 11, 521 (1943).
149. Vats, K. & Benoit, D. S. W. W. Dynamic Manipulation of Hydrogels to Control Cell Behavior: A Review. Tissue Eng. Part B Rev. 19, 455–469 (2013).
150. Hutanu, D. Recent Applications of Polyethylene Glycols (PEGs) and PEG Derivatives. Mod. Chem. Appl. 2, (2014).

205
151. Del Bufalo, F. et al. 3D modeling of human cancer: A PEG-fibrin hydrogel system to study the role of tumor microenvironment and recapitulate the in vivo effect of oncolytic adenovirus. Biomaterials 84, 76–85 (2016).
152. Kloxin, A. M., Benton, J. A. & Anseth, K. S. In situ elasticity modulation with dynamic substrates to direct cell phenotype. Biomaterials 31, 1–8 (2010).
153. Zhu, J. Bioactive modification of poly(ethylene glycol) hydrogels for tissue engineering. Biomaterials 31, 4639–4656 (2010).
154. Gonen-Wadmany, M., Goldshmid, R. & Seliktar, D. Biological and mechanical implications of PEGylating proteins into hydrogel biomaterials. Biomaterials 32, 6025–6033 (2011).
155. Tsou, Y.-H., Khoneisser, J., Huang, P.-C. & Xu, X. Hydrogel as a bioactive material to regulate stem cell fate. Bioact. Mater. 1, 39–55 (2016).
156. Lin, L., Zhu, J., Kottke-Marchant, K. & Marchant, R. E. Biomimetic-Engineered Poly (Ethylene Glycol) Hydrogel for Smooth Muscle Cell Migration. Tissue Eng. Part A 20, 140109062102007 (2014).
157. Missirlis, D. & Spatz, J. P. Combined effects of PEG hydrogel elasticity and cell-adhesive coating on fibroblast adhesion and persistent migration. Biomacromolecules 15, 195–205 (2014).
158. Garland, S. P. et al. A Cell Culture Substrate with Biologically Relevant Size-Scale Topography and Compliance of the Basement Membrane. Langmuir 30, 2101–2108 (2014).
159. Lauridsen, H. M. & Gonzalez, A. L. Biomimetic, ultrathin and elastic hydrogels regulate human neutrophil extravasation across endothelial-pericyte bilayers. PLoS One 12, e0171386 (2017).
160. Nishiguchi, A., Singh, S., Wessling, M., Kirkpatrick, C. J. & Möller, M. Basement Membrane Mimics of Biofunctionalized Nanofibers for a Bipolar-Cultured Human Primary Alveolar-Capillary Barrier Model. Biomacromolecules 18, 719–727 (2017).
161. Enemchukwu, N. O. et al. Synthetic matrices reveal contributions of ECM biophysical and biochemical properties to epithelial morphogenesis. J. Cell Biol. 212, 113–124 (2016).
162. Victor, H.-G., Gi Hun, C., Mollie, S., Rebecca, C. & Linda, G. Engineering the intestinal basement membrane microenvironment using PEG-based hydrogels. Front. Bioeng. Biotechnol. 4, (2016).
163. Bowman, C. N. & Kloxin, C. J. Toward an enhanced understanding and implementation of photopolymerization reactions. AIChE J. 54, 275–2795 (2008).
164. Korolev, G. V. & Mogilevich, M. M. Three-dimensional free-radical polymerization: Cross-linked and hyper-branched polymers. Three-Dimensional Free-Radical Polymerization: Cross-Linked and Hyper-Branched Polymers (Springer Berlin Heidelberg, 2009). doi:10.1007/978-3-540-87567-3
165. Su, W.-F. in 137–183 (2013). doi:10.1007/978-3-642-38730-2_7
166. Boddapati, A. Modeling Cure Depth During Photopolymerization of Multifunctional Acrylates. (2010).
167. University of Michigan. Polymerization. 354–383 (2014).
168. Zhao, T. et al. Water soluble hyperbranched polymers from controlled radical homopolymerization of PEG diacrylate. RSC Adv. 5, 33823–33830 (2015).
169. Gunn, J. W., Turner, S. D. & Mann, B. K. Adhesive and mechanical properties of hydrogels influence neurite extension. J. Biomed. Mater. Res. - Part A 72, 91–97 (2005).
170. Yañez-Soto, B., Liliensiek, S. J., Murphy, C. J. & Nealey, P. F. Biochemically and topographically engineered poly(ethylene glycol) diacrylate hydrogels with biomimetic characteristics as substrates for human corneal epithelial cells. J. Biomed. Mater. Res. - Part A 101 A, 1184–1194 (2013).

206
171. Tan, F. et al. Fabrication of positively charged poly(ethylene glycol)-diacrylate hydrogel as a bone tissue engineering scaffold. Biomed. Mater. 7, 55009 (2012).
172. Nguyen, Q. T., Hwang, Y., Chen, A. C., Varghese, S. & Sah, R. L. Cartilage-like mechanical properties of poly (ethylene glycol)-diacrylate hydrogels. Biomaterials 33, 6682–6690 (2012).
173. Pan, J. & Chan, S. Y. Fabrication of a 3D hair follicle‐like hydrogel by soft lithography. … Res. Part A 101, 3159–69 (2013).
174. Fouassier, J.-P., Burr, D. & Wieder, F. Water-soluble photoinitiators: Primary processes in hydroxy alkyl phenyl ketones. J. Polym. Sci. Part A Polym. Chem. 29, 1319–1327 (1991).
175. Bryant, S. J., Nuttelman, C. R. & Anseth, K. S. Cytocompatibility of UV and visible light photoinitiating systems on cultured NIH/3T3 fibroblasts in vitro. J. Biomater. Sci. Polym. Ed. 11, 439–457 (2000).
176. Kappes, U. P., Luo, D., Potter, M., Schulmeister, K. & Rünger, T. M. Short- and long-wave UV light (UVB and UVA) induce similar mutations in human skin cells. J. Invest. Dermatol. 126, 667–675 (2006).
177. Fairbanks, B. D., Schwartz, M. P., Bowman, C. N. & Anseth, K. S. Photoinitiated polymerization of PEG-diacrylate with lithium phenyl-2,4,6-trimethylbenzoylphosphinate: polymerization rate and cytocompatibility. Biomaterials 30, 6702–6707 (2009).
178. Chemicals, C. S. & Segment, C. E. Ciba IRGACURE 2959 Ciba IRGACURE 2959. Coating 2–4 (2001).
179. Yanagawa, F., Sugiura, S. & Kanamori, T. Hydrogel microfabrication technology toward three dimensional tissue engineering. Regen. Ther. 3, 45–57 (2016).
180. Zorlutuna, P. et al. Microfabricated biomaterials for engineering 3D tissues. Adv. Mater. 24, 1782–1804 (2012).
181. Verhulsel, M. et al. A review of microfabrication and hydrogel engineering for micro-organs on chips. Biomaterials 35, 1816–1832 (2014).
182. Leitão, D. C., Amaral, J. P., Cardoso, S. & Reig, C. in Giant Magnetoresistance (GMR) Sensors: From Basis to State-of-the-Art Applications 31–45 (Springer Berlin Heidelberg, 2013). doi:10.1007/978-3-642-37172-1_2
183. Sung, J. H., Yu, J., Luo, D., Shuler, M. L. & March, J. C. Microscale 3-D hydrogel scaffold for biomimetic gastrointestinal (GI) tract model. Lab Chip 11, 389–392 (2011).
184. Xia, Y. N. & Whitesides, G. M. Soft lithography. Annu. Rev. Mater. Sci. 37, 551–575 (1998).
185. Khademhosseini, A. et al. Molded polyethylene glycol microstructures for capturing cells within microfluidic channels. Lab Chip 4, 425–430 (2004).
186. Afrimzon, E. et al. Hydrogel microstructure live-cell array for multiplexed analyses of cancer stem cells, tumor heterogeneity and differential drug response at single-element resolution. Lab Chip 16, 1047–1062 (2016).
187. Occhetta, P. et al. Fabrication of 3D cell-laden hydrogel microstructures through photo-mold patterning. Biofabrication 5, 35002 (2013).
188. Suh, K. Y., Seong, J., Khademhosseini, A., Laibinis, P. E. & Langer, R. A simple soft lithographic route to fabrication of poly(ethylene glycol) microstructures for protein and cell patterning. Biomaterials 25, 557–563 (2004).
189. Rivest, C. et al. Microscale hydrogels for medicine and biology: synthesis, characteristics and applications. J. Mech. Mater. Struct. 2, 1103–1119 (2007).
190. Yeh, J. et al. Micromolding of shape-controlled, harvestable cell-laden hydrogels. Biomaterials 27, 5391–5398 (2006).
191. Jeong, H.-H., Lee, J.-H., Noh, Y.-M., Kim, Y.-G. & Lee, C.-S. Generation of uniform agarose microwells for cell patterning by micromolding in capillaries. Macromol. Res. 21, 534–540 (2013).

207
192. Cuchiara, M. P., Gould, D. J., McHale, M. K., Dickinson, M. E. & West, J. L. Integration of self-assembled microvascular networks with microfabricated PEG-based hydrogels. Adv. Funct. Mater. 22, 4511–4518 (2012).
193. Khademhosseini, A. et al. Micromolding of photocrosslinkable hyaluronic acid for cell encapsulation and entrapment. J. Biomed. Mater. Res. - Part A 79, 522–532 (2006).
194. Tekin, H. et al. Responsive Microgrooves for the Formation of Harvestable Tissue Constructs. Langmuir 27, 5671–5679 (2011).
195. Golden, A. P. & Tien, J. Fabrication of microfluidic hydrogels using molded gelatin as a sacrificial element. Lab Chip 7, 720–725 (2007).
196. Khademhosseini, A. & Langer, R. Microengineered hydrogels for tissue engineering. Biomaterials 28, 5087–5092 (2007).
197. Costello, C. M. et al. Synthetic small intestinal scaffolds for improved studies of intestinal differentiation. Biotechnol. Bioeng. 111, 1222–1232 (2014).
198. Szymanski, J. M. & Feinberg, A. W. Fabrication of freestanding alginate microfibers and microstructures for tissue engineering applications. Biofabrication 6, 24104 (2014).
199. Levato, R. et al. Biofabrication of tissue constructs by 3D bioprinting of cell-laden microcarriers. Biofabrication 6, 35020 (2014).
200. Kolesky, D. B. et al. 3D bioprinting of vascularized, heterogeneous cell-laden tissue constructs. Adv. Mater. 26, 3124–3130 (2014).
201. Wu, Z. et al. Bioprinting three-dimensional cell-laden tissue constructs with controllable degradation. Sci. Rep. 6, 24474 (2016).
202. Malda, J. et al. 25th anniversary article: Engineering hydrogels for biofabrication. Adv. Mater. 25, 5011–5028 (2013).
203. Gao, G., Yonezawa, T., Hubbell, K., Dai, G. & Cui, X. Inkjet-bioprinted acrylated peptides and PEG hydrogel with human mesenchymal stem cells promote robust bone and cartilage formation with minimal printhead clogging. Biotechnol. J. 10, 1568–1577 (2015).
204. Skardal, A. et al. Photocrosslinkable Hyaluronan-Gelatin Hydrogels for Two-Step Bioprinting. Tissue Eng. Part A 16, 2675–2685 (2010).
205. Duan, B., Hockaday, L. A., Kang, K. H. & Butcher, J. T. 3D Bioprinting of heterogeneous aortic valve conduits with alginate/gelatin hydrogels. J. Biomed. Mater. Res. Part A 101A, 1255–1264 (2013).
206. Gudapati, H., Dey, M. & Ozbolat, I. A comprehensive review on droplet-based bioprinting: Past, present and future. Biomaterials 102, 20–42 (2016).
207. Maher, P. S., Keatch, R. P., Donnelly, K., Mackay, R. E. & Paxton, J. Z. Construction of 3D biological matrices using rapid prototyping technology. Rapid Prototyp. J. 15, 204–210 (2009).
208. Murphy, S. V & Atala, A. 3D bioprinting of tissues and organs. Nat. Biotechnol. 32, 773–785 (2014).
209. Guillotin, B. et al. Laser assisted bioprinting of engineered tissue with high cell density and microscale organization. Biomaterials 31, 7250–7256 (2010).
210. Koch, L. et al. Skin tissue generation by laser cell printing. Biotechnol. Bioeng. 109, 1855–1863 (2012).
211. Yan, J., Huang, Y. & Chrisey, D. B. Laser-assisted printing of alginate long tubes and annular constructs. Biofabrication 5, 15002 (2013).
212. Beebe, D. J., Mensing, G. a & Walker, G. M. Physics and applications of microfluidics in biology. Annu. Rev. Biomed. Eng. 4, 261–286 (2002).
213. Wan, J. Microfluidic-Based Synthesis of Hydrogel Particles for Cell Microencapsulation and Cell-Based Drug Delivery. Polymers (Basel). 4, 1084–1108 (2012).

208
214. Matsunaga, Y. T., Morimoto, Y. & Takeuchi, S. Molding Cell Beads for Rapid Construction of Macroscopic 3D Tissue Architecture. Adv. Mater. 23, H90–H94 (2011).
215. Daniele, M. A., Boyd, D. A., Adams, A. A. & Ligler, F. S. Microfluidic Strategies for Design and Assembly of Microfibers and Nanofibers with Tissue Engineering and Regenerative Medicine Applications. Adv. Healthc. Mater. 4, 11–28 (2015).
216. Hwang, C. M., Khademhosseini, A., Park, Y., Sun, K. & Lee, S. H. Microfluidic chip-based fabrication of PLGA microfiber scaffolds for tissue engineering. Langmuir 24, 6845–6851 (2008).
217. Park, D. Y. et al. One-stop microfiber spinning and fabrication of a fibrous cell-encapsulated scaffold on a single microfluidic platform. Biofabrication 6, 24108 (2014).
218. Chaubaroux, C. et al. Cell Alignment Driven by Mechanically Induced Collagen Fiber Alignment in Collagen/Alginate Coatings. Tissue Eng. Part C. Methods 0, 1–8 (2015).
219. Tamayol, A. et al. Fiber-based tissue engineering: Progress, challenges, and opportunities. Biotechnol. Adv. 31, 669–687 (2013).
220. Panda, P. et al. Stop-flow lithography to generate cell-laden microgel particles. Lab Chip 8, 1056 (2008).
221. Skoog, S. A., Goering, P. L. & Narayan, R. J. Stereolithography in tissue engineering. J. Mater. Sci. Mater. Med. 25, 845–856 (2014).
222. Zhang, A. P. et al. Rapid fabrication of complex 3D extracellular microenvironments by dynamic optical projection stereolithography. Adv. Mater. 24, 4266–4270 (2012).
223. Arcaute, K., Mann, B. K. & Wicker, R. B. Stereolithography of three-dimensional bioactive poly(ethylene glycol) constructs with encapsulated cells. Ann. Biomed. Eng. 34, 1429–1441 (2006).
224. Chan, V. et al. Three-dimensional photopatterning of hydrogels using stereolithography for long-term cell encapsulation. Lab Chip 10, 2062 (2010).
225. Stratakis, E., Ranella, A., Farsari, M. & Fotakis, C. Laser-based micro/nanoengineering for biological applications. Progress in Quantum Electronics 33, 127–163 (2009).
226. Ciuciu, A. I. & Cywiński, P. J. Two-photon polymerization of hydrogels – versatile solutions to fabricate well-defined 3D structures. RSC Adv. 4, 45504–45516 (2014).
227. Martens, P., Holland, T. & Anseth, K. S. Synthesis and characterization of degradable hydrogels formed from acrylate modified poly(vinyl alcohol) macromers. Polymer (Guildf). 43, 6093–6100 (2002).
228. Rosales, A. M. & Anseth, K. S. The design of reversible hydrogels to capture extracellular matrix dynamics. Nat. Publ. Gr. 1, 1–16 (2016).
229. Lewis, K. J. R. & Anseth, K. S. Hydrogel scaffolds to study cell biology in four dimensions. MRS Bull 38, 260–268 (2013).
230. Koskela, J. Light-induced biomaterial microfabrication for advanced cell culturing–a comparative study. 103 (2010).
231. Ziaie, B. Hard and soft micromachining for BioMEMS: review of techniques and examples of applications in microfluidics and drug delivery. Adv. Drug Deliv. Rev. 56, 145–172 (2004).
232. Voelkel, R. et al. Advanced mask aligner lithography: new illumination system. Opt. Express 18, 20968–78 (2010).
233. Hahn, M. S. et al. Photolithographic patterning of polyethylene glycol hydrogels. Biomaterials 27, 2519–2524 (2006).
234. Mazzoccoli, J. P., Feke, D. L., Baskaran, H. & Pintauro, P. N. Mechanical and cell viability properties of crosslinked low- And high-molecular weight poly(ethylene glycol) diacrylate blends. J. Biomed. Mater. Res. - Part A 93, 558–566 (2010).
235. Cuchiara, M. P., Allen, A. C. B., Chen, T. M., Miller, J. S. & West, J. L. Multilayer microfluidic PEGDA hydrogels. Biomaterials 31, 5491–5497 (2010).

209
236. Cha, C., Jeong, J. H., Shim, J. & Kong, H. Tuning the dependency between stiffness and permeability of a cell encapsulating hydrogel with hydrophilic pendant chains. Acta Biomater. 7, 3719–3728 (2011).
237. Bernard, A. B., Lin, C.-C., Anseth, K. S., Ph, D. & Anseth, K. S. A Microwell Cell Culture Platform for the Aggregation of Pancreatic β-Cells. Tissue Eng. Part C Methods 18, 583–592 (2012).
238. CHU, C. Engineering Matrix Properties for Stem Cell Culture and Gene Delivery. 107 (2012).
239. Guo, Q. et al. Light activated cell migration in synthetic extracellular matrices. Biomaterials 33, 8040–8046 (2012).
240. McCall, J. D. & Anseth, K. S. Thiol-ene photopolymerizations provide a facile method to encapsulate proteins and maintain their bioactivity. Biomacromolecules 13, 2410–2417 (2012).
241. Miller, J. S. et al. Rapid casting of patterned vascular networks for perfusable engineered three-dimensional tissues. Nat. Mater. 11, 768–774 (2012).
242. Ross, A. E., Tang, M. Y. & Gemeinhart, R. a. Effects of Molecular Weight and Loading on Matrix Metalloproteinase-2 Mediated Release from Poly(Ethylene Glycol) Diacrylate Hydrogels. AAPS J. 14, 482–490 (2012).
243. Nii, M. et al. The effects of interactive mechanical and biochemical niche signaling on osteogenic differentiation of adipose-derived stem cells using combinatorial hydrogels. Acta Biomater. 9, 5475–5483 (2013).
244. Lin, L., Marchant, R. E., Zhu, J. & Kottke-Marchant, K. Extracellular matrix-mimetic poly(ethylene glycol) hydrogels engineered to regulate smooth muscle cell proliferation in 3-D. Acta Biomater. 10, 5106–5115 (2014).
245. Bertassoni, L. E. et al. Hydrogel bioprinted microchannel networks for vascularization of tissue engineering constructs. Lab Chip 14, 2202–11 (2014).
246. Kwag, H. R. et al. A Self-Folding Hydrogel In Vitro Model for Ductal Carcinoma. Tissue Eng. Part C. Methods 22, 398–407 (2016).
247. Revzin, A. et al. Fabrication of Poly(ethylene glycol) Hydrogel Microstructures Using Photolithography. Langmuir 17, 5440–5447 (2001).
248. Leach, J. B., Bivens, K. A., Patrick, C. W. & Schmidt, C. E. Photocrosslinked hyaluronic acid hydrogels: Natural, biodegradable tissue engineering scaffolds. Biotechnol. Bioeng. 82, 578–589 (2003).
249. Hutson, C. B. et al. Synthesis and characterization of tunable poly(ethylene glycol): gelatin methacrylate composite hydrogels. Tissue Eng. Part A 17, 1713–23 (2011).
250. Bencherif, S. A. et al. Influence of the degree of methacrylation on hyaluronic acid hydrogels properties. Biomaterials 29, 1739–1749 (2008).
251. Prado, S. S., Weaver, J. M. & Love, B. J. Gelation of photopolymerized hyaluronic acid grafted with glycidyl methacrylate. Mater. Sci. Eng. C 31, 1767–1771 (2011).
252. Burdick, J. A. & Prestwich, G. D. Hyaluronic acid hydrogels for biomedical applications. Adv. Mater. 23, 41–56 (2011).
253. Kim, P., Jeong, H. E., Khademhosseini, A. & Suh, K. Y. Fabrication of non-biofouling polyethylene glycol micro- and nanochannels by ultraviolet-assisted irreversible sealing. Lab Chip 6, 1432 (2006).
254. Weber, L. M., He, J., Bradley, B., Haskins, K. & Anseth, K. S. PEG-based hydrogels as an in vitro encapsulation platform for testing controlled β-cell microenvironments. Acta Biomater. 2, 1–8 (2006).
255. Benton, J. A., DeForest, C. A., Vivekanandan, V. & Anseth, K. S. Photocrosslinking of Gelatin Macromers to Synthesize Porous Hydrogels That Promote Valvular Interstitial Cell Function. Tissue Eng. Part A 15, 3221–3230 (2009).

210
256. Sahoo, S., Chung, C., Khetan, S. & Burdick, J. A. Hydrolytically Degradable Hyaluronic Acid Hydrogels with Controlled Temporal Structures. Biomacromolecules 9, 1088–1092 (2008).
257. Nichol, J. W. et al. Cell-laden microengineered gelatin methacrylate hydrogels. Biomaterials 31, 5536–5544 (2010).
258. Aubin, H. et al. Directed 3D cell alignment and elongation in microengineered hydrogels. Biomaterials 31, 6941–6951 (2010).
259. Gumuscu, B., Bomer, J. G., Van Den Berg, A. & Eijkel, J. C. T. Photopatterning of Hydrogel Microarrays in Closed Microchips. Biomacromolecules 16, 3802–3810 (2015).
260. Goubko, C. A., Majumdar, S., Basak, A. & Cao, X. Hydrogel cell patterning incorporating photocaged RGDS peptides. Biomed. Microdevices 12, 555–568 (2010).
261. DeForest, C. A. & Anseth, K. S. Photoreversible patterning of biomolecules within click-based hydrogels. Angew. Chemie - Int. Ed. 51, 1816–1819 (2012).
262. Tsang, V. L. et al. Fabrication of 3D hepatic tissues by additive photopatterning of cellular hydrogels. FASEB J. 21, 790–801 (2007).
263. Dang, T.-D., Kim, Y. H., Choi, J. H. & Kim, G.-M. A novel simple preparation method of a hydrogel mold for PDMS micro-fluidic device fabrication. J. Micromechanics Microengineering 22, 15017 (2012).
264. Dardano, P. et al. A photolithographic approach to polymeric microneedles array fabrication. Materials (Basel). 8, 8661–8673 (2015).
265. Shim, T. S., Yang, S.-M. & Kim, S.-H. Dynamic designing of microstructures by chemical gradient-mediated growth. Nat. Commun. 6, 6584 (2015).
266. Sato, T. et al. Long-term expansion of epithelial organoids from human colon, adenoma, adenocarcinoma, and Barrett’s epithelium. Gastroenterology 141, 1762–1772 (2011).
267. Ootani, A. et al. Sustained in vitro intestinal epithelial culture within a Wnt-dependent stem cell niche. Nat. Med. 15, 701–706 (2009).
268. Spence, J. R. et al. Directed differentiation of human pluripotent stem cells into intestinal tissue in vitro. Nature 470, 105–109 (2011).
269. Kim, H. J., Huh, D., Hamilton, G. & Ingber, D. E. Human gut-on-a-chip inhabited by microbial flora that experiences intestinal peristalsis-like motions and flow. Lab Chip 12, 2165–74 (2012).
270. Buske, P. et al. On the biomechanics of stem cell niche formation in the gut - modelling growing organoids. FEBS J. 279, 3475–3487 (2012).
271. Kimura, H., Yamamoto, T., Sakai, H., Sakai, Y. & Fujii, T. An integrated microfluidic system for long-term perfusion culture and on-line monitoring of intestinal tissue models. Lab Chip 8, 741–6 (2008).
272. Kim, H. J. & Ingber, D. E. Gut-on-a-Chip microenvironment induces human intestinal cells to undergo villus differentiation. Integr. Biol. (Camb). 5, 1130–40 (2013).
273. Ramadan, Q. et al. NutriChip: nutrition analysis meets microfluidics. Lab Chip 13, 196–203 (2013).
274. Esch, M. B., Ueno, H., Applegate, D. R. & Shuler, M. L. Modular, pumpless body-on-a-chip platform for the co-culture of GI tract epithelium and 3D primary liver tissue. Lab Chip 16, 2719–29 (2016).
275. Sin, A. et al. The Design and Fabrication of Three-Chamber Microscale Cell Culture Analog Devices with Integrated Dissolved Oxygen Sensors. Biotechnol. Prog. 20, 338–345 (2004).
276. Mahler, G. J., Esch, M. B., Glahn, R. P. & Shuler, M. L. Characterization of a gastrointestinal tract microscale cell culture analog used to predict drug toxicity. Biotechnol. Bioeng. 104, 193–205 (2009).
277. Esch, M. B. et al. On chip porous polymer membranes for integration of gastrointestinal tract epithelium with microfluidic ‘body-on-a-chip’ devices. Biomed. Microdevices 14, 895–
211
906 (2012).
278. Yu, J., Carrier, R. L., March, J. C. & Griffith, L. G. Three dimensional human small intestine models for ADME-Tox studies. Drug Discov. Today 19, 1587–1594 (2014).
279. Wang, Y. et al. A microengineered collagen scaffold for generating a polarized crypt-villus architecture of human small intestinal epithelium. Biomaterials 128, 44–55 (2017).
280. Wang, L., Murthy, S. K., Barabino, G. A. & Carrier, R. L. Synergic effects of crypt-like topography and ECM proteins on intestinal cell behavior in collagen based membranes. Biomaterials 31, 7586–7598 (2010).
281. Wang, L., Murthy, S. K., Fowle, W. H., Barabino, G. A. & Carrier, R. L. Influence of micro-well biomimetic topography on intestinal epithelial Caco-2 cell phenotype. Biomaterials 30, 6825–6834 (2009).
282. Nalle, S. C. & Turner, J. R. Endothelial and epithelial barriers in graft-versus-host disease. Adv. Exp. Med. Biol. 763, 105–131 (2012).
283. Lee, M., Dunn, J. C. Y. Y. & Wu, B. M. Scaffold fabrication by indirect three-dimensional printing. Biomaterials 26, 4281–4289 (2005).
284. Salomon, J. et al. Contractile forces at tricellular contacts modulate epithelial organization and monolayer integrity. Nat. Commun. 8, 13998 (2017).
285. Yang, W. C. et al. Engineering a biomimetic villus array for in vitro three-dimensional culture of intestinal epithelial cells. J. Microelectromechanical Syst. 21, 1418–1425 (2012).
286. Yu, J., Peng, S., Luo, D. & March, J. C. In vitro 3D human small intestinal villous model for drug permeability determination. Biotechnol. Bioeng. 109, 2173–2178 (2012).
287. Kim, S. H. et al. Three-dimensional intestinal villi epithelium enhances protection of human intestinal cells from bacterial infection by inducing mucin expression. Integr. Biol. (Camb). 6, 1122–31 (2014).
288. Costello, C. M. et al. 3-D intestinal scaffolds for evaluating the therapeutic potential of probiotics. Mol. Pharm. 11, 2030–2039 (2014).
289. Shaffiey, S., Jia, H., Keane, T. & Costello, C. Intestinal stem cell growth and differentiation on a tubular scaffold with evaluation in small and large animals. Regenerative 11, 45–61 (2016).
290. Deng, X., Zhang, G., Shen, C., Yin, J. & Meng, Q. Hollow fiber culture accelerates differentiation of Caco-2 cells. Appl. Microbiol. Biotechnol. 97, 6943–6955 (2013).
291. Chen, Y. et al. Robust bioengineered 3D functional human intestinal epithelium. Sci. Rep. 5, 13708 (2015).
292. Pfluger, C. A., McMahon, B. J., Carrier, R. L. & Burkey, D. D. Precise, Biomimetic Replication of the Multi-Scale Structure of Intestinal Basement Membrane using Chemical Vapor Deposition. Tissue Eng. Part A 19, 120926220547002 (2012).
293. Koppes, A. N. et al. Complex, multi-scale small intestinal topography replicated in cellular growth substrates fabricated via chemical vapor deposition of Parylene C. Biofabrication 8, 35011 (2016).
294. Insa, C., Martinez, E. & Altay, G. Characterization of the physicochemical properties of Poly ( ethylene glycol ) diacrylate ( PEGDA ) hydrogels. (2015).
295. Beamish, J. A., Zhu, J., Kottke-Marchant, K. & Marchant, R. E. The effects of monoacrylated poly(ethylene glycol) on the properties of poly(ethylene glycol) diacrylate hydrogels used for tissue engineering. J. Biomed. Mater. Res. - Part A 92, 441–450 (2010).
296. Arc, S., Hbo, L. & Microlithography, F. O. R. M Ercury Short Arc Lamps Hbo ® for Microlithography. Quality (2000).
297. Hermanson, G. T. Bioconjugate Techniques. Bioconjugate Techniques (2013). doi:10.1016/B978-0-12-382239-0.00024-8
298. Poellmann, M. J., Barton, K. L., Mishra, S. & Johnson, A. J. W. Patterned Hydrogel Substrates

212
for Cell Culture with Electrohydrodynamic Jet Printing. Macromol. Biosci. 11, 1164–1168 (2011).
299. Nakajima, N. & Ikada, Y. Mechanism of amide formation by carbodiimide for bioconjugation in aqueous media. Bioconjug. Chem. 6, 123–130 (1995).
300. Poellmann, M. J. & Johnson, A. J. W. Characterizing and patterning polyacrylamide substrates functionalized with n-hydroxysuccinimide. Cell. Mol. Bioeng. 6, 299–309 (2013).
301. Audi, S. H. et al. Pulmonary reduction of an intravascular redox polymer. Am J Physiol Lung Cell Mol Physiol 280, L1290-9 (2001).
302. Fonseca, K. B. et al. Injectable MMP-sensitive alginate hydrogels as hMSC delivery systems. Biomacromolecules 15, 380–390 (2014).
303. Wang, H., Cai, L., Paul, A., Enejder, A. & Heilshorn, S. C. Hybrid elastin-like polypeptide-polyethylene glycol (ELP-PEG) hydrogels with improved transparency and independent control of matrix mechanics and cell ligand density. Biomacromolecules 15, 3421–3428 (2014).
304. Natoli, M., Leoni, B. D., D’Agnano, I., Zucco, F. & Felsani, A. Good Caco-2 cell culture practices. Toxicol. Vitr. 26, 1243–1246 (2012).
305. Bretscher, a & Weber, K. Villin: the major microfilament-associated protein of the intestinal microvillus. Proc. Natl. Acad. Sci. USA 76, 2321–2325 (1979).
306. Versaevel, M., Grevesse, T. & Gabriele, S. Spatial coordination between cell and nuclear shape within micropatterned endothelial cells. Nat. Commun. 3, 671 (2012).
307. No Title. Available at: http://medcell.med.yale.edu/systems_cell_biology/gi_tract_lab.php.
308. Yeste, J., Illa, X., Guimerà, A. & Villa, R. A novel strategy to monitor microfluidic in-vitro blood-brain barrier models using impedance spectroscopy. in (ed. van den Driesche, S.) 95180N (2015). doi:10.1117/12.2180567
309. Lucas-Garrote, B., Morais, S. & Maquieira, Á. Dual signal amplification for highly sensitive hybridization microassays on chemically activated surfaces. Sensors Actuators B Chem. (2016). doi:10.1016/j.snb.2016.10.109
310. Guimerà, A., Gabriel, G., Parramon, D., Calderón, E. & Villa, R. Portable 4 wire bioimpedance meter with bluetooth link. in IFMBE Proceedings 25, 868–871 (2009).
311. Ando, Y., Mizutani, K. & Wakatsuki, N. Electrical impedance analysis of potato tissues during drying. J. Food Eng. 121, 24–31 (2014).
312. Hwang, C. M. et al. Benchtop fabrication of PDMS microstructures by an unconventional photolithographic method. Biofabrication 2, 45001 (2010).
313. Choi, M. et al. Light-guiding hydrogels for cell-based sensing and optogenetic synthesis in vivo. Nat. Photonics 7, 987–994 (2013).
314. Beuermann, S., Paquet, D. A., McMinn, J. H. & Hutchinson, R. A. Determination of Free-Radical Propagation Rate Coefficients of Butyl, 2-Ethylhexyl, and Dodecyl Acrylates by Pulsed-Laser Polymerization. Macromolecules 29, 4206–4215 (1996).
315. Kızılel, S., Pérez-Luna, V. H. & Teymour, F. Mathematical Model for Surface-Initiated Photopolymerization of Poly(ethylene glycol) Diacrylate. Macromol. Theory Simulations 15, 686–700 (2006).
316. Dendukuri, D. et al. Modeling of Oxygen-Inhibited Free Radical Photopolymerization in a PDMS Microfluidic Device Modeling of Oxygen-Inhibited Free Radical Photopolymerization in a PDMS Microfluidic Device. Macromolecules 41, 8547–8556 (2008).
317. Lalevée, J., El-Roz, M., Allonas, X. & Fouassier, J. P. Controlled photopolymerization reactions: The reactivity of new photoiniferters. J. Polym. Sci. Part A Polym. Chem. 45, 2436–2442 (2007).
318. Liu, M., Li, M.-D., Xue, J. & Phillips, D. L. Time-Resolved Spectroscopic and Density Functional Theory Study of the Photochemistry of Irgacure-2959 in an Aqueous Solution. J.
213
Phys. Chem. A 118, 8701–8707 (2014).
319. Chan, V. et al. Multi-material bio-fabrication of hydrogel cantilevers and actuators with stereolithography. Lab Chip 12, 88–98 (2012).
320. The NIST Reference on Constants, Units, and Uncertainty. Available at: http://physics.nist.gov/cuu/index.html. (Accessed: 5th March 2017)
321. Lee, J. H., Prud’homme, R. K. & Aksay, I. a. Cure depth in photopolymerization: Experiments and theory. J. Mater. Res. 16, 3536–3544 (2001).
322. Xiao, Y., He, L. & Che, J. An effective approach for the fabrication of reinforced composite hydrogel engineered with SWNTs, polypyrrole and PEGDA hydrogel. J. Mater. Chem. 22, 8076 (2012).
323. Browning, M. B. & Cosgriff-Hernandez, E. Development of a Biostable Replacement for PEGDA Hydrogels. Biomacromolecules 13, 779–786 (2012).
324. Bäckström, S. et al. Tailoring Properties of Biocompatible PEG-DMA Hydrogels with UV Light. Mater. Sci. Appl. 3, 425–431 (2012).
325. Zhu, J., Tang, C., Kottke-Marchant, K. & Marchant, R. E. Design and Synthesis of Biomimetic Hydrogel Scaffolds with Controlled Organization of Cyclic RGD Peptides. Bioconjug. Chem. 20, 333–339 (2009).
326. Williams, C. G., Malik, A. N., Kim, T. K., Manson, P. N. & Elisseeff, J. H. Variable cytocompatibility of six cell lines with photoinitiators used for polymerizing hydrogels and cell encapsulation. Biomaterials 26, 1211–1218 (2005).
327. Sabnis, A., Rahimi, M., Chapman, C. & Nguyen, K. T. Cytocompatibility studies of an in situ photopolymerized thermoresponsive hydrogel nanoparticle system using human aortic smooth muscle cells. J. Biomed. Mater. Res. Part A 91A, 52–59 (2009).
328. Arcaute, K. et al. Three-dimensional PEG hydrogel construct fabrication using stereolithography. Mater. Res. Soc. Symp. Proc. (2005).
329. Decker, C. & Jenkins, A. D. Kinetic Approach of O2 Inhibition in Ultraviolet and Laser Induced Polymerizations. Macromolecules 1241–1244 (1985). doi:10.1016/j.ab.2011.10.035
330. Ligon, S. C., Husár, B., Wutzel, H., Holman, R. & Liska, R. Strategies to Reduce Oxygen Inhibition in Photoinduced Polymerization. Chem. Rev. 114, 557–589 (2014).
331. No Title. Available at: http://www.molecularhydrogenfoundation.org/concentration-and-solubility-of-h2/.
332. Lin, H. & Freeman, B. D. Gas Permeation and Diffusion in Cross-Linked Poly(ethylene glycol diacrylate). doi:10.1021/ma051686o
333. Krutkramelis, K., Xia, B. & Oakey, J. Monodisperse Polyethylene Glycol Diacrylate Hydrogel Microsphere Formation by Oxygen-Controlled Photopolymerization in a Microfluidic Device. Lab Chip 16, 1457–1465 (2016).
334. Jamnongwong, M., Loubiere, K., Dietrich, N. & Hébrard, G. Experimental study of oxygen diffusion coefficients in clean water containing salt, glucose or surfactant: Consequences on the liquid-side mass transfer coefficients. Chem. Eng. J. 165, 758–768 (2010).
335. Yasar, O. & Inceoglu, S. Compressive Evaluation of Polyethylene (Glycol) Diacrylate (PEGDA) for Scaffold Fabrication. in Volume 2: Materials; Biomanufacturing; Properties, Applications and Systems; Sustainable Manufacturing V002T03A004 (ASME, 2016). doi:10.1115/MSEC2016-8619
336. Jariwala, A. S. et al. Modeling effects of oxygen inhibition in mask-based stereolithography. Rapid Prototyp. J. 17, 168–175 (2011).
337. Li, Y. et al. Fabrication of High-Aspect-Ratio 3D Hydrogel Microstructures Using Optically Induced Electrokinetics. Micromachines 7, 65 (2016).
338. Bae, M., Divan, R., Suthar, K. J., Mancini, D. C. & Gemeinhart, R. a. Fabrication of
214
Poly(ethylene glycol) Hydrogel Structures for Pharmaceutical Applications using Electron beam and Optical Lithography. J. Vac. Sci. Technol. B. Microelectron. Nanometer Struct. Process. Meas. Phenom. 28, C6P24-C6P29 (2010).
339. Born, M. & Wolf, E. Principles of optics. Principles of Optics Electromagnetic Theory of Propagation INterference and Diffraction of Light 2nd edition by Max Born Emil Wolf New York NY Pergamon Press 1964 1–952 (1999). doi:10.1016/S0030-3992(00)00061-X
340. Chuang, Y. J., Tseng, F. G. & Lin, W. K. Reduction of diffraction effect of UV exposure on SU-8 negative thick photoresist by air gap elimination. Microsyst. Technol. 8, 308–313 (2002).
341. Zhang, J., Chan-Park, M. B., Miao, J. & Sun, T. T. Reduction of diffraction effect for fabrication of very high aspect ratio microchannels in SU-8 over large area by soft cushion technology. Microsystem Technologies 11, 519–525 (2005).
342. Guvendiren, M., Burdick, J. A. & Yang, S. Solvent induced transition from wrinkles to creases in thin film gels with depth-wise crosslinking gradients. Soft Matter 6, 5795 (2010).
343. Kim, H. & Lee, S. J. Stomata-Inspired Membrane Produced Through Photopolymerization Patterning. Adv. Funct. Mater. 25, 4496–4505 (2015).
344. Viswanathan, P. et al. Mimicking the topography of the epidermal-dermal interface with elastomer substrates. Integr. Biol. (Camb). 8, 21–9 (2016).
345. Leewis, C. M., de Jong, A. M., van IJzendoorn, L. J. & Broer, D. J. Simulations with a dynamic reaction–diffusion model of the polymer grating preparation by patterned ultraviolet illumination. J. Appl. Phys. 95, 8352–8356 (2004).
346. Vergote, K., Deene, Y. De, Bussche, E. Vanden & Wagter, C. De. On the relation between the spatial dose integrity and the temporal instability of polymer gel dosimeters. Phys. Med. Biol. 49, 4507–4522 (2004).
347. Fuxman, A. M., McAuley, K. B. & Schreiner, L. J. Modelling of polyacrylamide gel dosimeters with spatially non-uniform radiation dose distributions. Chem. Eng. Sci. 60, 1277–1293 (2005).
348. Orakdogen, N. & Okay, O. Correlation between crosslinking efficiency and spatial inhomogeneity in poly(acrylamide) hydrogels. Polym. Bull. 57, 631–641 (2006).
349. Sánchez, C. et al. Photoembossing of periodic relief structures using polymerization-induced diffusion: A combinatorial study. Adv. Mater. 17, 2567–2571 (2005).
350. Saez, A., Ghibaudo, M., Buguin, A., Silberzan, P. & Ladoux, B. Rigidity-driven growth and migration of epithelial cells on microstructured anisotropic substrates. Proc. Natl. Acad. Sci. 104, 8281–8286 (2007).
351. Pan, J. et al. Fabrication of a 3D hair follicle-like hydrogel by soft lithography. J. Biomed. Mater. Res. - Part A 101, 3159–3169 (2013).
352. Lee, A. G., Arena, C. P., Beebe, D. J. & Palecek, S. P. Development of Macroporous Poly(ethylene glycol) Hydrogel Arrays within Microfluidic Channels. Biomacromolecules 11, 3316–3324 (2010).
353. Lee, T. Y., Guymon, C. A., J??nsson, E. S. & Hoyle, C. E. The effect of monomer structure on oxygen inhibition of (meth)acrylates photopolymerization. Polymer (Guildf). 45, 6155–6162 (2004).
354. Xie, J., Liu, X., Liang, J. & Luo, Y. Swelling properties of superabsorbent poly(acrylic acid- co -acrylamide) with different crosslinkers. J. Appl. Polym. Sci. 112, 602–608 (2009).
355. Wu, Y., Liang, J., Horkay, F. & Libera, M. Antimicrobial loading into and release from poly(ethylene glycol)/poly(acrylic acid) semi-interpenetrating hydrogels. J. Polym. Sci. Part B Polym. Phys. 54, 64–72 (2016).
356. Es-Haghi, H., Bouhendi, H., Marandi, G. B., Zohurian-Mehr, M. J. & Kabiri, K. Rheological Properties of Microgel Prepared with Long-Chain Crosslinkers by a Precipitation Polymerization Method. J. Macromol. Sci. Part B 51, 880–896 (2012).
357. Lally, S., Liu, R., Supasuteekul, C., Saunders, B. R. & Freemont, T. Using osmotic deswelling

215
of microgel particles to control the mechanical properties of pH-responsive hydrogel composites. J. Mater. Chem. 21, 17719 (2011).
358. Chen, B. et al. Highly stretchable and transparent ionogels as nonvolatile conductors for dielectric elastomer transducers. ACS Appl. Mater. Interfaces 6, 7840–7845 (2014).
359. Tang, Q., Sun, X., Li, Q., Wu, J. & Lin, J. Synthesis of polyacrylate/polyethylene glycol interpenetrating network hydrogel and its sorption of heavy-metal ions. Sci. Technol. Adv. Mater. 10, 15002 (2009).
360. Liao, D. et al. The effect of epidermal growth factor on the incremental Young’s moduli in the rat small intestine. Med. Eng. Phys. 25, 413–418 (2003).
361. Huang, G. et al. Engineering three-dimensional cell mechanical microenvironment with hydrogels. Biofabrication 4, 42001 (2012).
362. Beer, M. V. Correlation of ligand density with cell behavior on bioactive hydrogel layers. (2011).
363. Wang, W.-H., Dong, J.-L., Baker, G. L. & Bruening, M. L. Bifunctional polymer brushes for low-bias enrichment of mono- and multi-phosphorylated peptides prior to mass spectrometry analysis. Analyst 136, 3595 (2011).
364. de Campos Vidal, B. & Mello, M. L. S. Collagen type I amide I band infrared spectroscopy. Micron 42, 283–289 (2011).
365. Drumheller, P. D. & Hubbell, J. A. Polymer networks with grafted cell adhesion peptides for highly biospecific cell adhesive substrates. Anal. Biochem. 222, 380–8 (1994).
366. Lee, W., Lee, T. G. & Koh, W. G. Grafting of Poly(acrylic acid) on the Poly(ethylene glycol) Hydrogel Using Surface-initiated Photopolymerization for Covalent Immobilization of Collagen. J. Ind. Eng. Chem. 13, 1195–1200 (2007).
367. Matsumoto, Y., Araki, T., Endo, T., Sueyoshi, K. & Hisamoto, H. Hydrogel Based 2D-Photonic Crystal Including Acrylic Acid for Biosensing Apprication. 2038–2040 (2014).
368. Kennedy, R. et al. In situ formed hybrid hydrogels from PEG based multifunctional hyperbranched copolymers: a RAFT approach. Polym. Chem. 5, 1838 (2014).
369. Yeung, T. et al. Effects of substrate stiffness on cell morphology, cytoskeletal structure, and adhesion. Cell Motil. Cytoskeleton 60, 24–34 (2005).
370. Kidoaki, S. & Sakashita, H. Rectified Cell Migration on Saw-Like Micro-Elastically Patterned Hydrogels with Asymmetric Gradient Ratchet Teeth. PLoS One 8, e78067 (2013).
371. Moon, J. J., Hahn, M. S., Kim, I., Nsiah, B. A. & West, J. L. Micropatterning of Poly(Ethylene Glycol) Diacrylate Hydrogels with Biomolecules to Regulate and Guide Endothelial Morphogenesis. Tissue Eng. Part A 15, 579–585 (2009).
372. Lilly, J. L., Romero, G., Xu, W., Shin, H. Y. & Berron, B. J. Characterization of molecular transport in ultrathin hydrogel coatings for cellular immunoprotection. Biomacromolecules 16, 541–549 (2015).
373. Tomić, K., Veeman, W. S., Boerakker, M., Litvinov, V. M. & Dias, A. A. Lateral and rotational mobility of some drug molecules in a poly(ethylene glycol) diacrylate hydrogel and the effect of drug-cyclodextrin complexation. J. Pharm. Sci. 97, 3245–3256 (2008).
374. Handorf, A. M., Zhou, Y., Halanski, M. A. & Li, W.-J. Tissue Stiffness Dictates Development, Homeostasis, and Disease Progression. Organogenesis 11, 1–15 (2015).
375. Kuo, C.-H. R., Xian, J., Brenton, J. D., Franze, K. & Sivaniah, E. Complex Stiffness Gradient Substrates for Studying Mechanotactic Cell Migration. Adv. Mater. 24, 6059–6064 (2012).
376. Hale, N. A., Yang, Y. & Rajagopalan, P. Cell Migration at the Interface of a Dual Chemical-Mechanical Gradient. ACS Appl. Mater. Interfaces 2, 2317–2324 (2010).
377. Rothen-Rutishauser, B., Krämer, S. D., Braun, A., Günthert, M. & Wunderli-Allenspach, H. MDCK cell cultures as an epithelial in vitro model: cytoskeleton and tight junctions as indicators for the definition of age-related stages by confocal microscopy. Pharm. Res. 15,

216
964–71 (1998).
378. Dukes, J. D., Whitley, P. & Chalmers, A. D. The MDCK variety pack: choosing the right strain. (2011). doi:10.1186/1471-2121-12-43
379. Kim, J.-H. & Asthagiri, A. R. Matrix stiffening sensitizes epithelial cells to EGF and enables the loss of contact inhibition of proliferation. J. Cell Sci. 124, 1280–1287 (2011).
380. Imai, M., Furusawa, K., Mizutani, T., Kawabata, K. & Haga, H. Three-dimensional morphogenesis of MDCK cells induced by cellular contractile forces on a viscous substrate. Sci. Rep. 5, 14208 (2015).
381. Leight, J. L., Wozniak, M. a., Chen, S., Lynch, M. L. & Chen, C. S. Matrix rigidity regulates a switch between TGF- 1-induced apoptosis and epithelial-mesenchymal transition. Mol. Biol. Cell 23, 781–791 (2012).
382. Jin, X. et al. Comparison of MDCK-MDR1 and Caco-2 cell based permeability assays for anti-malarial drug screening and drug investigations. J. Pharmacol. Toxicol. Methods 70, 188–194 (2014).
383. Hajjarian, Z. et al. Laser Speckle Rheology for evaluating the viscoelastic properties of hydrogel scaffolds. Sci. Rep. 6, 37949 (2016).
384. Shen, Y., Hou, Y., Yao, S., Huang, P. & Yobas, L. In Vitro Epithelial Organoid Generation Induced by Substrate Nanotopography. Sci. Rep. 5, 9293 (2015).
385. Cerchiari, A. et al. Formation of Spatially and Geometrically Controlled Three-Dimensional Tissues in Soft Gels by Sacrificial Micromolding. Tissue Eng. Part C Methods 21, 541–547 (2015).
386. Millán, J. et al. Adherens junctions connect stress fibres between adjacent endothelial cells. BMC Biol. 8, 11 (2010).
387. Chen, Y. et al. Engineering a biomimetic villus array for in vitro 3-dimensional culture of intestinal epithelial cells. in 2012 7th IEEE International Conference on Nano/Micro Engineered and Molecular Systems (NEMS) 230–233 (IEEE, 2012). doi:10.1109/NEMS.2012.6196763
388. Lovett, D. B., Shekhar, N., Nickerson, J. A., Roux, K. J. & Lele, T. P. Modulation of Nuclear Shape by Substrate Rigidity. Cell. Mol. Bioeng. 6, 230–238 (2013).
389. Roeder, R. et al. small-intestine submucosa ( SIS ), small-diameter vascular grafts. (1999).
390. DiMarco, R. L., Hunt, D. R., Dewi, R. E. & Heilshorn, S. C. Improvement of paracellular transport in the Caco-2 drug screening model using protein-engineered substrates. Biomaterials 129, 152–162 (2017).
391. Yeste, J. et al. Geometric correction factor for transepithelial electrical resistance measurements in transwell and microfluidic cell cultures. J. Phys. D. Appl. Phys. 49, 375401 (2016).
392. Illa, X. et al. A novel modular bioreactor to in Vitro study the hepatic sinusoid. PLoS One 9, 1–5 (2014).
393. Schulzke, J. D., Bentzel, C. J., Schulzke, I., Riecken, E. O. & Fromm, M. Epithelial tight junction structure in the jejunum of children with acute and treated celiac sprue. Pediatric research 43, 435–441 (1998).
394. Pageot, L. P. et al. Human cell models to study small intestinal functions: recapitulation of the crypt-villus axis. Microsc. Res. Tech. 49, 394–406 (2000).
395. Fihn, B. M., Sjöqvist, a & Jodal, M. Permeability of the rat small intestinal epithelium along the villus-crypt axis: effects of glucose transport. Gastroenterology 119, 1029–1036 (2000).
396. Beaulieu, J.-F. Differential expression of the VLA family of integrins along the crypt-villus axis in the human small intestine. J. Cell Sci. 102, 427–36 (1992).
397. Lambolez, F. et al. Characterization of T cell differentiation in the murine gut. J. Exp. Med. 195, 437–449 (2002).
217
398. MITSOMWANG, P., NAGASAWA, S., CHAIJIT, S., FUJIKURA, M. & MUTOH, Y. Effect of Underlay Stiffness on Cutting Profile of Polycarbonate Sheet during Wedge Indentation Process. J. Adv. Mech. Des. Syst. Manuf. 6, 1168–1179 (2012).
399. Johnson, L. A. et al. Matrix stiffness corresponding to strictured bowel induces a fibrogenic response in human colonic fibroblasts. Inflamm. Bowel Dis. 19, 891–903 (2013).
400. Linnankoski, J. et al. Paracellular porosity and pore size of the human intestinal epithelium in tissue and cell culture models. J. Pharm. Sci. 99, 2166–2175 (2010).
401. Li, N. et al. Development of an improved three-dimensional in vitro intestinal mucosa model for drug absorption evaluation. Tissue Eng. Part C. Methods 19, 708–19 (2013).
402. Fleisher, D. in (1999). doi:10.1201/9780203909478.pt2
403. Walter, E., Janich, S., Roessler, B. J., Hilfinger, J. M. & Amidon, G. L. HT29-MTX/Caco-2 Cocultures as an in Vitro Model for the Intestinal Epithelium: In Vitro–in Vivo Correlation with Permeability Data from Rats and Humans. J. Pharm. Sci. 85, 1070–1076 (1996).
404. Ouasti, S. et al. Network connectivity, mechanical properties and cell adhesion for hyaluronic acid/PEG hydrogels. Biomaterials 32, 6456–6470 (2011).
405. Chaudhuri, O. et al. Extracellular matrix stiffness and composition jointly regulate the induction of malignant phenotypes in mammary epithelium. Nat. Mater. 13, 970–978 (2014).
406. Soofi, S. S., Last, J. A., Liliensiek, S. J., Nealey, P. F. & Murphy, C. J. The elastic modulus of Matrigel??? as determined by atomic force microscopy. J. Struct. Biol. 167, 216–219 (2009).
407. Gaudet, C. et al. Influence of Type I Collagen Surface Density on Fibroblast Spreading, Motility, and Contractility. Biophys. J. 85, 3329–3335 (2003).
408. Engler, A. et al. Substrate Compliance versus Ligand Density in Cell on Gel Responses. Biophys. J. 86, 617–628 (2004).
409. Hagel, V., Haraszti, T. & Boehm, H. Diffusion and interaction in PEG-DA hydrogels. Biointerphases 8, 32 (2013).
410. Hulse, W. L. & Forbes, R. T. A nanolitre method to determine the hydrodynamic radius of proteins and small molecules by Taylor dispersion analysis. Int. J. Pharm. 411, 64–68 (2011).
411. Armstrong, J. K., Wenby, R. B., Meiselman, H. J. & Fisher, T. C. The Hydrodynamic Radii of Macromolecules and Their Effect on Red Blood Cell Aggregation. Biophys. J. 87, 4259–4270 (2004).
412. Drury, J. L. & Mooney, D. J. Hydrogels for tissue engineering: Scaffold design variables and applications. Biomaterials 24, 4337–4351 (2003).
413. DeForest, C. A. & Anseth, K. S. Cytocompatible click-based hydrogels with dynamically tunable properties through orthogonal photoconjugation and photocleavage reactions. Nat. Chem. 3, 925–931 (2011).
414. Blaeser, A. et al. Biofabrication Under Fluorocarbon: A Novel Freeform Fabrication Technique to Generate High Aspect Ratio Tissue-Engineered Constructs. Biores. Open Access 2, 374–384 (2013).
415. Altay, G. Engineering a Platform for the Basic Research of Migration and Differentiation of Intestinal Stem Cells. 1–7
416. Viswanathan, P. et al. Mimicking the topography of the epidermal–dermal interface with elastomer substrates. Integr. Biol. (2016). doi:10.1039/C5IB00238A
417. Lo, C.-M., Wang, H.-B., Dembo, M. & Wang, Y. Cell Movement Is Guided by the Rigidity of the Substrate. Biophys. J. 79, 144–152 (2000).
418. Martín-Belmonte, F. et al. Cell-Polarity Dynamics Controls the Mechanism of Lumen Formation in Epithelial Morphogenesis. Curr. Biol. 18, 507–513 (2008).
419. Engelberg, J. A., Datta, A., Mostov, K. E. & Hunt, C. A. MDCK Cystogenesis Driven by Cell
218
Stabilization within Computational Analogues. PLoS Comput. Biol. 7, e1002030 (2011).
420. Yevick, H. G., Duclos, G., Bonnet, I. & Silberzan, P. Architecture and migration of an epithelium on a cylindrical wire. Proc. Natl. Acad. Sci. 112, 5944–5949 (2015).
421. Sim, J. Y. et al. Spatial distribution of cell-cell and cell-ECM adhesions regulates force balance while main taining E-cadherin molecular tension in cell pairs. Mol. Biol. Cell 26, 2456–2465 (2015).
219
8 Resum en Català
La major part dels actuals models de cultiu cel·lular in vitro no
reprodueixen l'anatomia dels teixits i el comportament fisiològic de les cèl·lules
in vivo. A més a més, proporcionen resultats enganyosos quan es comparen amb
el teixit real. Les tecnologies de microfabricació es poden utilitzar per anar un pas
més enllà dels models 2D convencionals, en el camp del cultiu de teixits in vitro i
reproduir de forma fiable els microambients del teixits. Per l'epiteli de l'intestí
prim, aquest enfocament s'ha explorat a través de la fabricació de scaffolds de
col·lagen i poly (lactic-co-glycolic acid) que imiten les vellositats, mitjançant un
procés seqüencial de motlles. Ha estat un enfocament innovador i interessant, i
ha reportat resultats rellevants en quant a la importància del tridimensionalitat
del models in vitro de epiteli intestinal. Tot i així, la naturalesa dels materials
emprats no permet un ajust fi de les propietats del sistema, i el mètode de
fabricació basat en emmotllament és laboriós, requerint diverses etapes de
motlles intermedis.
Aquí es descriu un mètode simple i rendible per fabricar microestructures toves,
que imiten les vellositats amb l'arquitectura 3D anatòmica. Utilitzem poly
(ethylene glycol) diacrylated (PEGDA) i àcid acrílic, que formen hidrogels tous en
copolimeritzar sota la llum UV, mitjançant fotolitografia. Hem demostrat que la
nostra tecnologia permet produir monocapes funcionals de cèl·lules epitelials
(Caco-2) polaritzades.
Els hidrogels són materials en polimèrics que formen xarxes tridimensionals amb
un alt contingut d'aigua, que permet una fàcil difusió de factors solubles i oxigen.
Els hidrogels fets de PEG posseeixen propietats químiques i mecàniques altament
ajustables i s'han convertit en materials molt utilitzats per imitar la matriu
extracel·lular i les membranes basals dels teixits. Per obtenir les
microestructures que imiten la tridimensionalitat de les vellositats, es van
utilitzar màscares binaries. Aquestes màscares presenten uns patrons en els que
8

220
les zones fosques impedeixen el pas de la llum, mentre que les finestres son
transparents. En el nostre cas es van utilitzar màscares amb patrons circulars per
fabricar estructures en forma de pillar, en un procés de polimerització depenent
de la llum UV. Durant aquest procés, diversos factors, com ara el temps
d'exposició UV, la concentració de fotoiniciador i el pes molecular del PEGDA i la
seva concentració, es van estudiar per entendre els mecanismes que permeten la
formació de microestructures toves amb uns valors de relació d’aspecte alts.
Després, aquestes variables es van ajustar per controlar les dimensions de les
microestructures i per tal d’obtenir hidrogels microestructurats que imitin les
dimensions de les vellositats que es troben en l’intestí prim, així com les seves
propietats físico-químiques i mecàniques.
Per permetre l'adhesió cel·lular i el creixement de, el PEGDA, que no és bioactiu i
per tant repèl l’adhesió tan de proteïnes com de cèl·lules, es va copolimeritzar
amb àcid acrílic per així treure profit dels grups carboxílics de l’àcid acrílic per
incorporar-hi covalentment diverses proteïnes de la matriu extracel·lular.
Després de la copolimerització, es va demostrar que els hidrogels mostraven
grups carboxil exposats. A més a més es va confirmar que mitjançant la reacció
d'acoblament per EDC/NHS les proteïnes es mantenen covalentment unides al
hidrogel al llarg del temps. D’altra banda hem establert la relació entre PEGDA i
àcid acrílic que permet obtenir microestructures similars, en dimensions i forma,
a les de les vellositats. A més a més, la funcionalització dels hydrogels amb
proteïnes de la membrana basal va ser adequada. Els nostres resultats mostren
que la quantitat de proteïna unida covalentment al hidrogel depèn de la quantitat
d'àcid acrílic empleat, que ofereix una manera de controlar la densitat de lligant
al hidrogel, independentment de les propietats mecàniques. Tenint en compte
l’espectre de rigidesa del epiteli intestinal, es van aconseguir hydrogels
microestructurats que mostraven propietats mecàniques en aquets rang.
Els hidrogels microestructurats i funcionlaitzats per tal d’imitar les vellositats,
han demostrat ser adequats per al creixement cel·lular. En primer lloc, l'adhesió
cel·lular en els hidrogels es va assajar mitjançant el cultiu de fibroblasts, que van
cobrir les microestructures en 7 dies. A continuació, es van utilitzar cèl·lules
epitelials MDCK per determinar la idoneïtat dels hidrogels microestructurats en
desenvolupar monocapes epitelials. Finalment, hem utilitzat cèl·lules epitelials
del tipus Caco-2 (àmpliament utilitzades en els models de la barrera intestinal)
per validar la funcionalitat del nostre sistema com a model in vitro de l’epiteli
intestinal. Les cèl·lules Caco-2 van ser sembrades en els hidrogels
microestructurats que imiten les vellositats, i es van mantenir en cultiu durant 21
dies. Els nostres resultats mostren que les cèl·lules Caco-2 van ser capaces
d'adherir-s’hi i dividir-se, a més van formar una monocapa epitelial de cèl·lules
polaritzades seguint la línia de les microestructures, d’una manera similar a les
221
vellositats. Aquest resultats es van demostrar per l'expressió de marcadors
epitelials a la part apical de les cèl·lules i la forma, posició i l'orientació dels nuclis
cel·lulars. En comparació amb els cultius tradicionals en membranes 2D, les
monocapes de cèl·lules Caco-2 crescudes sobre els hidrogels microestructurats
van mostrar signes d’una millor polarització cel·lular, semblants a les cèl·lules
epitelials de l’intestí.
També hem estat capaços de transferir amb èxit aquesta plataforma, els hidrogels
microestructurats, sobre les de membranes poroses de policarbonat dels
Transwell®. Amb aquesta tecnologia, actualment estem treballant en la
realització d'assajos de permeabilitat paracel·lular i transcel·lular per avaluar
l'acompliment del nostre sistema en comparació amb l'estàndard de monocapes
epitelials de Caco-2. D’altra banda, hem avaluat la resistència elèctrica
transepithelial (TEER) de les monocapes crescudes sobre els hidrogels
microestructurats, i els nostres resultats de les mesures de TEER han confirmat
la formació de barreres de cèl·lules epitelials funcionals, amb valors de TEER més
propers a la situació in vivo que els mesurats per monocapes convencionals,
evidenciant així els resultats prometedors de la plataforma per ser aplicada en el
camp de l'absorció del fàrmacs, la toxicitat i el modelatge de malalties
Els nostres resultats són compatibles amb la hipòtesi que la geometria de
les vellositats millora la fisiologia cel·lular i, per tant, la funció de barrera. En
aquest punt, es requereixen més esforços per dissenyar un conjunt robust i
compatible amb els models estàndard (Transwell®) per realitzar mesuraments
sistemàtics de la permeabilitat i el transport.
A causa de la simplicitat i la versatilitat del mètode de fabricació dissenyat, els
hidrogels microestructurats fets PEGDA i àcid acrílic poden tenir aplicacions
incomptables. El mètode es pot utilitzar per dissenyar models més complexos de
mucosa intestinal, mitjançant la incorporació d'altres tipus de cèl·lules com ara
les cèl·lules caliciformes, cèl·lules mare intestinals, cèl·lules immunes i fins i tot
bacteris comensals o patògens. A més, a causa de la plasticitat proa l’hora de
modificar les propietats d’aquesta material, la metodologia es pot estendre a
altres teixits epitelials que presenten arquitectures 3D rellevants per la seva
funcionalitat, com ara la còrnia, l’esòfag o la pell.

222

223
9 Appendix: Journal articles
9

224

225
Protein patterning on hydrogels by direct microcontact printing: application to cardiac differentiation RSC ADVANCES Volume: 4 Issue: 55 Pages: 29120-29123 DOI: 10.1039/c4ra03374d Published: 2014
A. G. Castaño,*a V. Hortigüela,ab A. Lagunas,bc C. Cortina,e N. Montserrat,bf J. Samitierbcd and E. Martínezabd
aBiomimetic systems for cell bioengineering, Institute for Bioengineering of Catalonia (IBEC), C/Baldiri Reixac 10-12, 08028 Barcelona, Spain bCentro de Investigación Biomédica en Red en Bioingeniería, Biomateriales y Nanomedicina (CIBER-BBN), C/María de Luna 11, Edificio CEEI, 50018 Zaragoza, Spain cNanobioengineering, Institute for Bioengineering of Catalonia (IBEC), C/Baldiri Reixac 10-12, 08028 Barcelona, Spain dDepartment of Electronics, University of Barcelona, C/Martí i Franquès 1, 08028 Barcelona, Spain eOncology program, Institute for Research in Biomedicine (IRB Barcelona), C/Baldiri Reixac 10, 08028 Barcelona, Spain fCenter of Regenerative Medicine in Barcelona, Barcelona Biomedical Research Park (PRBB), C/Doctor Aiguader, 88, 7a Planta, 08003 Barcelona, Spain
An extended microcontact printing technique to chemically pattern hydrogels is reported. The procedure employs standard polydimethylsiloxane stamps and requires minor pre-processing of the hydrogels by freeze-drying. Micropatterned Matrigel™ and gelatin hydrogels induce NIH-3T3 cell alignment and elongation. Furthermore, human embryonic stem cells cultured on fibronectin-patterned hydrogels display beating foci earlier than those cultured on non-patterned substrates

226
Mesopattern of immobilised bone morphogenetic protein-2 created by microcontact printing and dip-pen nanolithography influence C2C12 cell fate RSC ADVANCES Volume: 4 Issue: 100 Pages: 56809-56815 DOI: 10.1039/c4ra10311d Published: 2014
S. Oberhansl,ac A. G. Castaño,bc A. Lagunas,ac E. Prats-Alfonso,e M. Hirtz,*f F. Albericio,e H. Fuchs,fg J. Samitieracd and E. Martinez*bcd
*Corresponding authors aNanobioengineering group, Institute for Bioengineering of Catalonia (IBEC), 08028 Barcelona, Spain bBiomimetic systems for cell engineering group, Institute for Bioengineering of Catalonia (IBEC), 08028 Barcelona, Spain cCentro de Investigación Biomédica en Red en Bioingeniería, Biomateriales y Nanomedicina, CIBER-BBN, Spain dDepartment of Electronics, University of Barcelona, 08028 Barcelona, Spain eInstitute for Research in Biomedicine (IRB), Department of Organic Chemistry, University of Barcelona, CIBER-BBN, Barcelona Science Park, 08028 Barcelona, Spain fInstitute of Nanotechnology (INT) and Karlsruhe Nano Micro Facility (KNMF), Karlsruhe Institute of Technology (KIT), Eggenstein-Leopoldshafen, Germany gWestfälische Wilhelms-Universität and Center for Nanotechnology (CeNTech), Münster, Germany
Dip-pen nanolithography and microcontact printing were used to fabricate mesopatterned substrates for cell differentiation experiments. A biotin–thiol was patterned on gold substrates and subsequently functionalised with streptavidin and biotinylated bone morphogenetic protein-2 (BMP-2). The feasibility of mesopatterned substrates containing immobilised BMP-2 was proven by obtaining similar differentiation outcomes compared to the growth factor in solution. Therefore, these substrates might be suitable for replacing conventional experiments with BMP-2 in solution.

227
Large-scale dendrimer-based uneven nanopatterns for the study of local arginine-glycine-aspartic acid (RGD) density effects on cell adhesion NANO RESEARCH Volume: 7 Issue: 3 Pages: 399-409 DOI: 10.1007/s12274-014-0406-2 Published: MAR 2014
Anna Lagunas1,2, Albert G. Castaño2,1, Juan M. Artés2,3, Yolanda Vida4,5, Daniel Collado4,5, Ezequiel Pérez-Inestrosa4,5, Pau Gorostiza2,1,6, Silvia Claros7,1, José A. Andrades7,1, and Josep Samitier1,2,8
1Networking Biomedical Research Center in Bioengineering, Biomaterials and Nanomedicine (CIBER-BBN), Spain 2Institute for Bioengineering of Catalonia (IBEC), Baldiri-Reixac 15-21, Barcelona 08028, Spain 3Physical Chemistry Department, University of Barcelona (UB), Martí i Franquès 1-11, Barcelona 08028, Spain 4Andalusian Centre for Nanomedicine and Biotechnology (BIONAND), Severo Ochoa 35, Málaga 29590, Spain 5Organic Chemistry Department, University of Málaga (UMA), Campus Teatinos, Málaga 29071, Spain 6Institució Catalana de Recerca i Estudis Avançats (ICREA), Spain 7Cell Biology, Genetics and Physiology Department, University of Málaga (UMA), Campus Teatinos, Málaga 29071, Spain 8Electronics Department, University of Barcelona (UB), Martí i Franquès 1-11, Barcelona 08028, Spain
Cell adhesion processes are governed by the nanoscale arrangement of the extracellular matrix (ECM), being more affected by local rather than global concentrations of cell adhesive ligands. In many cell-based studies, grafting of dendrimers on surfaces has shown the benefits of the local increase in concentration provided by the dendritic configuration, although the lack of any reported surface characterization has limited any direct correlation between dendrimer disposition and cell response. In order to establish a proper correlation, some control over dendrimer surface deposition is desirable. Here, dendrimer nanopatterning has been employed to address arginine-glycine-aspartic acid (RGD) density effects on cell adhesion. Nanopatterned surfaces were fully characterized by atomic force microscopy (AFM), scanning tunneling microscopy (STM) and X-ray photoelectron spectroscopy (XPS), showing that tunable distributions of cell adhesive ligands on the surface are obtained as a function of the initial dendrimer bulk concentration. Cell experiments showed a clear correlation with dendrimer surface layout: Substrates presenting regions of high local ligand density resulted in a higher percentage of adhered cells and a higher degree of maturation of focal adhesions (FAs). Therefore, dendrimer nanopatterning is presented as a suitable and controlled approach to address the effect of local ligand density on cell response. Moreover, due to the easy modification of dendrimer peripheral groups, dendrimer nanopatterning can be further extended to other ECM ligands having density effects on cells

228
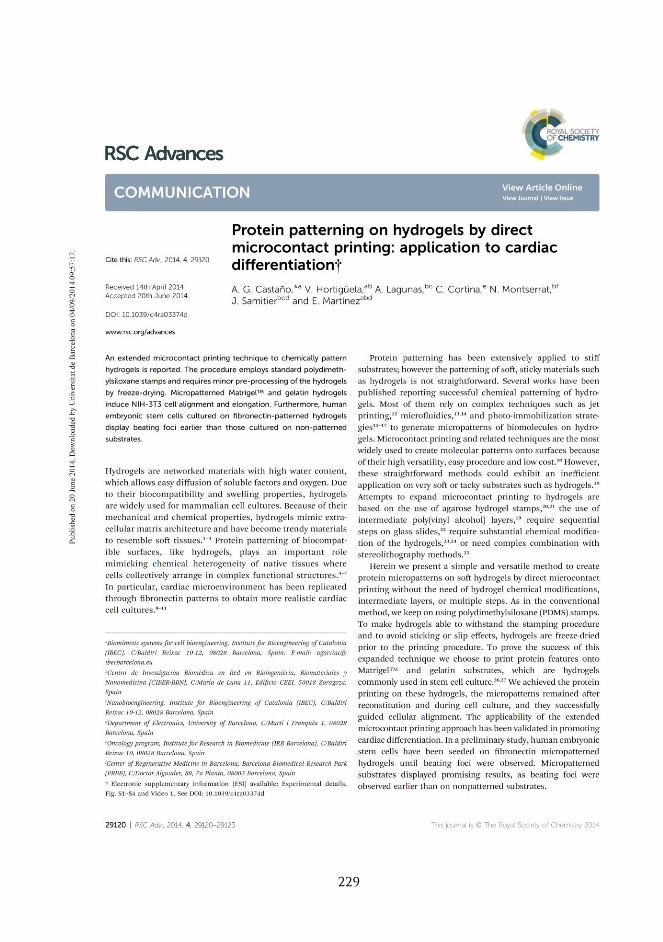
229
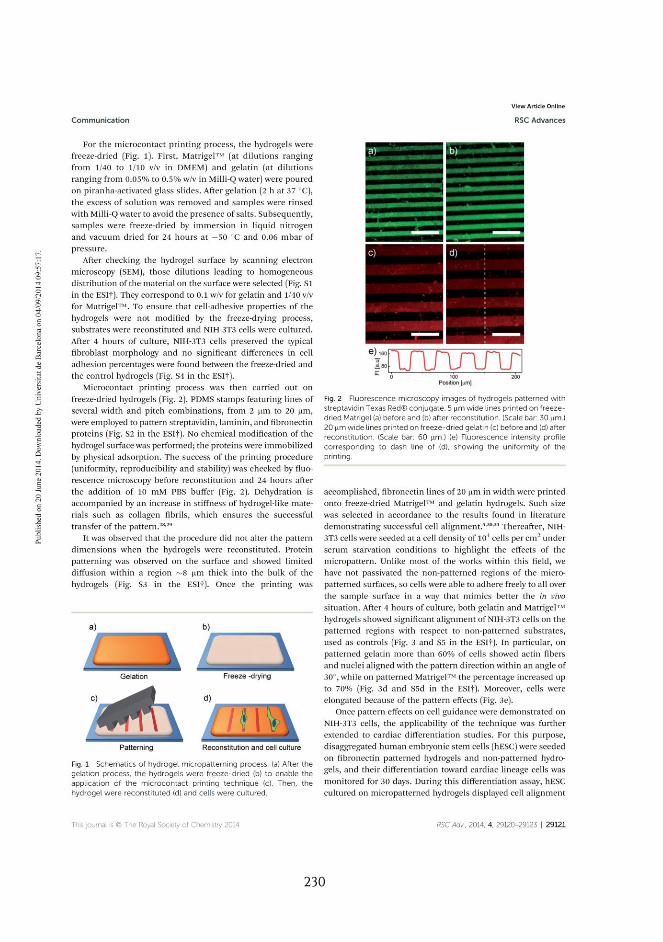
230

231

232

233

234

235
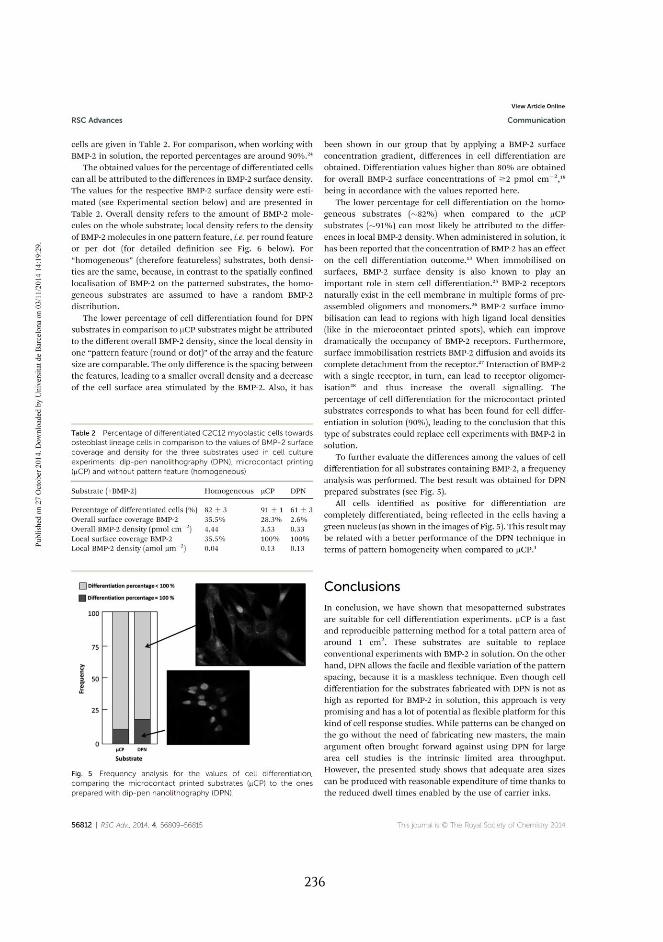
236

237

238

239

240

241
242

243
244
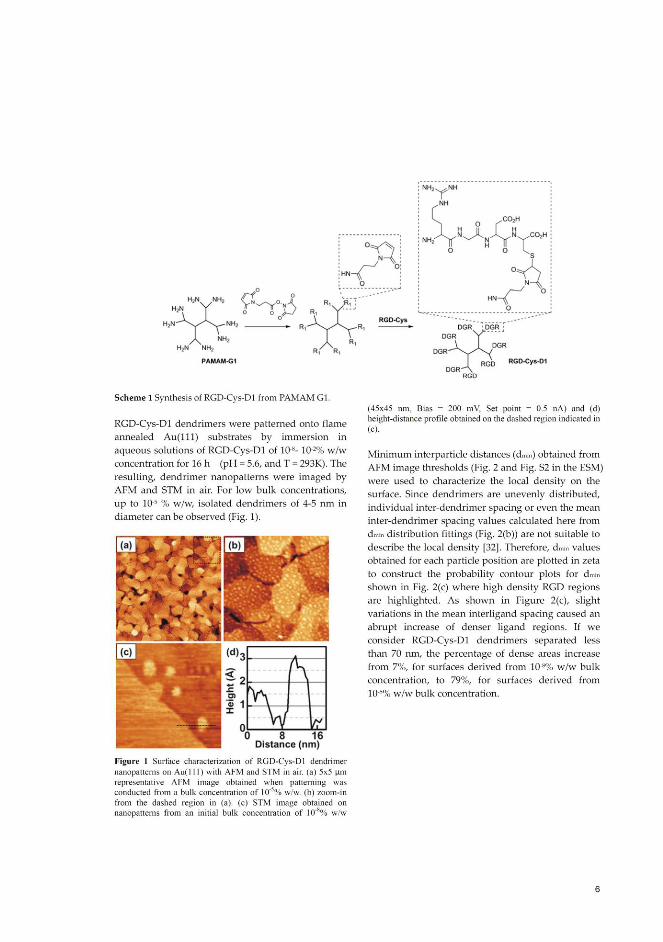
245

246
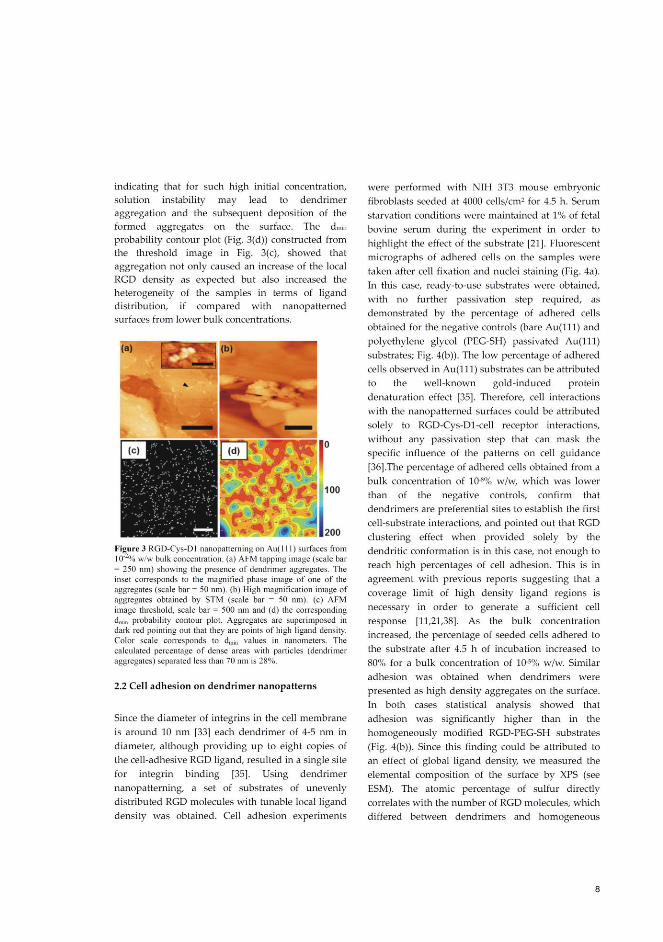
247

248

249

250

251