Ionic Conductivity in Solutions of Poly(ethylene oxide) and Lithium Perchlorate
10
Ionic Conductivity in Solutions of Poly(ethylene oxide) and Lithium Perchlorate Noor Hidaya Abdul Nasir, Chin Han Chan, * Hans-Werner Kammer, Lai Har Sim, Muhd Zu Azahan Yahya Summary: Solution casting technique served to prepare solid solutions of lithium perchlorate and poly(ethylene oxide) (PEO) having different molecular masses. Salt concentrations of solutions were varied between around 2 and 13 wt%. Crystallinity and melting point depression served to determine composition and content of amorphous phase as well as thermodynamic behavior of the solutions. Conductivity as a function of salt concentration in the amorphous phase follows a power law at constant temperature (30 8C). It results that both exponent and mobility of charge carriers increase with ascending molecular mass of PEO. The mobility follows an increase with molecular mass proportional to M 2.8 indicating dependence of mobility on interstitial volume between chain molecules. Deviation of solution from perfect behavior can be evaluated by melting point depression. Accordingly, increase in conductivity is preferably related to approach to perfect solution behavior. Deter- mination of dielectric function allows some conclusion about ion pair formation in the systems under discussion. It turns out that probability of ion pair formation decreases with increasing molecular mass of PEO in agreement with thermodynamic behavior of the solutions. Keywords: dielectric function; ionic conductivity; LiClO 4 ; PEO; solid solutions Introduction Polymer electrolytes formed by polymer- salt solutions attracted a great deal of scientific interest in the past. [1–8] It is related to the hope for applying these systems in new generations of highly efficient bat- teries. Preferably used constituents are poly(ethylene oxide) (PEO) and lithium salts. [9–19] The widely accepted idea is that lithium salts are molecularly dispersed in amorphous regions of the polymer. Dis- solution of the salt is accompanied by solvation of cations by monomer units of the chain molecules. The coordination sphere of the cation may also comprise the associated anion. Properties of those solutions are essentially coined by devel- oping phase morphologies. Constituents are miscible in the molten state, but display immiscibility in the solid state. Below the melting temperature of PEO, one observes phase separation in pure crystalline PEO and an amorphous phase of PEO and salt. Development of these phases is ruled by competition of two rate processes, the rate of phase separation and the rate of crystal- lization. At sufficiently high temperatures, close to the melting temperature of the polymer, the rate of crystallization is low and the rate of phase separation is high. Hence, one observes morphologies close to equilibrium. The opposite situation occurs at low temperatures. A high rate of crystal- lization and a low rate of phase separation lead to non-equilibrium morphologies or freezing in of molten mixtures owing to high viscosity of the mixture. Apart from these morphology developments that influ- ence the homogeneity of salt distribution in Macromol. Symp. 2010, 290, 46–55 DOI: 10.1002/masy.201050406 46 Faculty of Applied Sciences, Universiti Teknologi MARA, 40450 Shah Alam, Malaysia E-mail: [email protected] Copyright ß 2010 WILEY-VCH Verlag GmbH & Co. KGaA, Weinheim
-
Upload
univ-biskra -
Category
Documents
-
view
4 -
download
0
Transcript of Ionic Conductivity in Solutions of Poly(ethylene oxide) and Lithium Perchlorate

Macromol. Symp. 2010, 290, 46–55 DOI: 10.1002/masy.20105040646
Facu
MA
E-m
Cop
Ionic Conductivity in Solutions of Poly(ethylene
oxide) and Lithium Perchlorate
Noor Hidaya Abdul Nasir, Chin Han Chan,* Hans-Werner Kammer, Lai Har Sim,
Muhd Zu Azahan Yahya
Summary: Solution casting technique served to prepare solid solutions of lithium
perchlorate and poly(ethylene oxide) (PEO) having different molecular masses. Salt
concentrations of solutions were varied between around 2 and 13 wt%. Crystallinity
and melting point depression served to determine composition and content of
amorphous phase as well as thermodynamic behavior of the solutions. Conductivity
as a function of salt concentration in the amorphous phase follows a power law at
constant temperature (30 8C). It results that both exponent and mobility of charge
carriers increase with ascending molecular mass of PEO. The mobility follows an
increase with molecular mass proportional to M2.8 indicating dependence of mobility
on interstitial volume between chain molecules. Deviation of solution from perfect
behavior can be evaluated by melting point depression. Accordingly, increase in
conductivity is preferably related to approach to perfect solution behavior. Deter-
mination of dielectric function allows some conclusion about ion pair formation in
the systems under discussion. It turns out that probability of ion pair formation
decreases with increasing molecular mass of PEO in agreement with thermodynamic
behavior of the solutions.
Keywords: dielectric function; ionic conductivity; LiClO4; PEO; solid solutions
Introduction
Polymer electrolytes formed by polymer-
salt solutions attracted a great deal of
scientific interest in the past.[1–8] It is related
to the hope for applying these systems in
new generations of highly efficient bat-
teries. Preferably used constituents are
poly(ethylene oxide) (PEO) and lithium
salts.[9–19] The widely accepted idea is that
lithium salts are molecularly dispersed in
amorphous regions of the polymer. Dis-
solution of the salt is accompanied by
solvation of cations by monomer units of
the chain molecules. The coordination
sphere of the cation may also comprise
the associated anion. Properties of those
solutions are essentially coined by devel-
lty of Applied Sciences, Universiti Teknologi
RA, 40450 Shah Alam, Malaysia
ail: [email protected]
yright � 2010 WILEY-VCH Verlag GmbH & Co. KGaA
oping phase morphologies. Constituents
are miscible in the molten state, but display
immiscibility in the solid state. Below the
melting temperature of PEO, one observes
phase separation in pure crystalline PEO
and an amorphous phase of PEO and salt.
Development of these phases is ruled by
competition of two rate processes, the rate
of phase separation and the rate of crystal-
lization. At sufficiently high temperatures,
close to the melting temperature of the
polymer, the rate of crystallization is low
and the rate of phase separation is high.
Hence, one observes morphologies close to
equilibrium. The opposite situation occurs
at low temperatures. A high rate of crystal-
lization and a low rate of phase separation
lead to non-equilibrium morphologies or
freezing in of molten mixtures owing to
high viscosity of the mixture. Apart from
these morphology developments that influ-
ence the homogeneity of salt distribution in
, Weinheim
Macromol. Symp. 2010, 290, 46–55 47
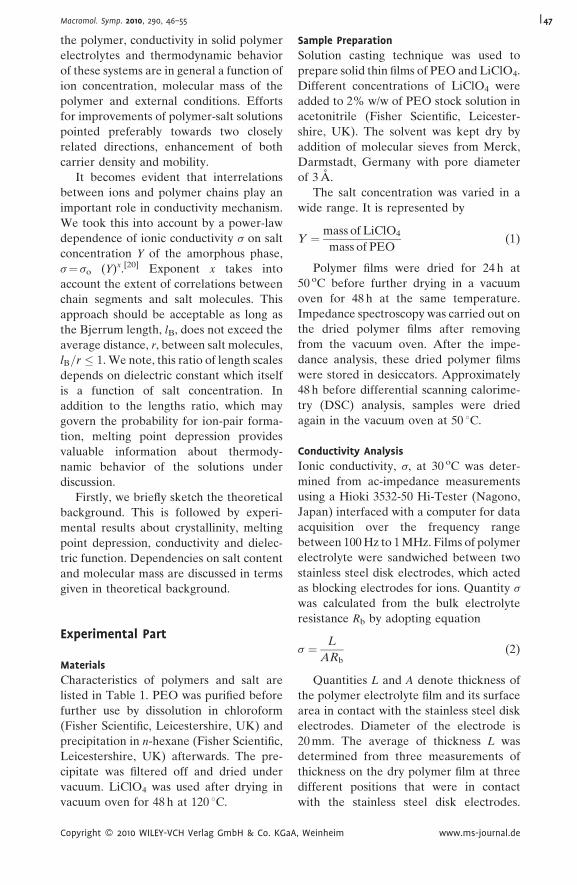
the polymer, conductivity in solid polymer
electrolytes and thermodynamic behavior
of these systems are in general a function of
ion concentration, molecular mass of the
polymer and external conditions. Efforts
for improvements of polymer-salt solutions
pointed preferably towards two closely
related directions, enhancement of both
carrier density and mobility.
It becomes evident that interrelations
between ions and polymer chains play an
important role in conductivity mechanism.
We took this into account by a power-law
dependence of ionic conductivity s on salt
concentration Y of the amorphous phase,
s¼ so (Y)x.[20] Exponent x takes into
account the extent of correlations between
chain segments and salt molecules. This
approach should be acceptable as long as
the Bjerrum length, lB, does not exceed the
average distance, r, between salt molecules,
lB=r � 1.We note, this ratio of length scales
depends on dielectric constant which itself
is a function of salt concentration. In
addition to the lengths ratio, which may
govern the probability for ion-pair forma-
tion, melting point depression provides
valuable information about thermody-
namic behavior of the solutions under
discussion.
Firstly, we briefly sketch the theoretical
background. This is followed by experi-
mental results about crystallinity, melting
point depression, conductivity and dielec-
tric function. Dependencies on salt content
and molecular mass are discussed in terms
given in theoretical background.
Experimental Part
Materials
Characteristics of polymers and salt are
listed in Table 1. PEO was purified before
further use by dissolution in chloroform
(Fisher Scientific, Leicestershire, UK) and
precipitation in n-hexane (Fisher Scientific,
Leicestershire, UK) afterwards. The pre-
cipitate was filtered off and dried under
vacuum. LiClO4 was used after drying in
vacuum oven for 48 h at 120 8C.
Copyright � 2010 WILEY-VCH Verlag GmbH & Co. KGaA
Sample Preparation
Solution casting technique was used to
prepare solid thin films of PEO and LiClO4.
Different concentrations of LiClO4 were
added to 2% w/w of PEO stock solution in
acetonitrile (Fisher Scientific, Leicester-
shire, UK). The solvent was kept dry by
addition of molecular sieves from Merck,
Darmstadt, Germany with pore diameter
of 3 A.
The salt concentration was varied in a
wide range. It is represented by
Y ¼ mass of LiClO4
mass of PEO(1)
Polymer films were dried for 24 h at
50 oC before further drying in a vacuum
oven for 48 h at the same temperature.
Impedance spectroscopy was carried out on
the dried polymer films after removing
from the vacuum oven. After the impe-
dance analysis, these dried polymer films
were stored in desiccators. Approximately
48 h before differential scanning calorime-
try (DSC) analysis, samples were dried
again in the vacuum oven at 50 8C.
Conductivity Analysis
Ionic conductivity, s, at 30 oC was deter-
mined from ac-impedance measurements
using a Hioki 3532-50 Hi-Tester (Nagono,
Japan) interfaced with a computer for data
acquisition over the frequency range
between 100Hz to 1MHz. Films of polymer
electrolyte were sandwiched between two
stainless steel disk electrodes, which acted
as blocking electrodes for ions. Quantity s
was calculated from the bulk electrolyte
resistance Rb by adopting equation
s ¼ L
ARb(2)
Quantities L and A denote thickness of
the polymer electrolyte film and its surface
area in contact with the stainless steel disk
electrodes. Diameter of the electrode is
20mm. The average of thickness L was
determined from three measurements of
thickness on the dry polymer film at three
different positions that were in contact
with the stainless steel disk electrodes.
, Weinheim www.ms-journal.de

Table 1.Characteristics of the PEO samples and lithium perchlorate.
Constituents PEO1 PEO2 PEO3 LiClO4
Mha/g mol�1 600,000 1,000,000 4,000,000
Tmb/8C 67 67 68 236e
Tgc/8C �58 �58 �56
DHref/J g�1 188.3d 272.3f
Molecular Structure
Supplier Aldrich Chemical Co. (St. Louis, MO) Acros, Organics Co. (Geel, Belgium)
aViscosity-average molecular weight provided by the supplier.bMelting temperature during first heating cycle as determined in this work.cGlass transition temperature after quench cooling as determined in this work.dMelting enthalpy of 100% crystalline PEO from ref. [21].eMelting temperature adopted from ref. [22].fMelting enthalpy adopted from ref. [23].
Macromol. Symp. 2010, 290, 46–5548
Thickness was measured by use of Mitu-
toyo Digimatic Caliper. The thickness of
the solid films is in the range of 0.25–
0.40mm. The average of ionic conductivity,
s, was determined after three impedance
analysis. The errors for quantities s are
approximately 3%.
Dielectric constant (e) is calculated from
e vð Þ ¼ �vBZ00
vBð Þ2 Z0ð Þ2þ Z00ð Þ2h i (3)
where Z0 and Z00 denote real and imaginary
part of impedance that result from ionic
conductivity measurements. Quantity B
equals eoA=L with L and A as explained
above, v represents the angular frequency
and eo is the permittivity of free space.
Analogously, the dielectric loss (e00) is givenby
e00 vð Þ ¼ vBZ0
vBð Þ2 Z0ð Þ2þ Z00ð Þ2h i (4)
Differential Scanning Calorimetry
Perkin-Elmer DSC7 (Shelton, CT), cali-
brated with indium and zinc standards, has
been used for the analysis of samples under
nitrogen purge. Sample weights amounted
to around 7mg in DSC experiments.
Samples were heated up from 30 to
Copyright � 2010 WILEY-VCH Verlag GmbH & Co. KGaA
80 oC with a rate of 20Kmin�1. This
heating procedure yielded melting tem-
perature and heat of melting for the as-
prepared samples.
Theoretical Background
We adopt here the approach to ionic
conductivity presented in Ref. [20]. In the
range of low salt concentration, the amor-
phous phase contributes dominantly to
conductivity. It is given by
s ¼ NAem�a�c00S (5)
The symbols have the following mean-
ing: NA –Avogadro number, e – elementary
charge, m�- ion mobility, a� - degree of
dissociation, c00S – molar salt concentration
in the amorphous phase. Quantities m� and
a� are also functions of salt concentration
All concentration dependencies we take
into account by a power law in Y. Accord-
ingly, it follows for Eq. (5)
s ¼ NAemarPMS
Y 00ð Þx (6)
where Y 00 refers also to amorphous phase
Exponent x has to be determined experi-
mentally. Quantities m and a are indepen-
dent of concentration and rP and MS
represent density of the polymer and
, Weinheim www.ms-journal.de
Macromol. Symp. 2010, 290, 46–55 49
molecular mass of the salt molecule, respec-
tively. Properties of these solutions are
strongly governed by interactions between
salt molecules and segments occupying the
volume r3 related to the average distance
between salt molecules. We take correla-
tions approximately into account by the
power law indicated above. For Y it holds
true Y/ (a/r)3 that is it is proportional to the
ratio of monomer volume to the volume
available to a salt molecule. Exponent x
describes the extent of correlations between
salt molecules and segments.
Two length scales in the amorphous
phase of the polymer electrolyte may rule
the behavior of ions: the average distance r
between two ions in the amorphous phase
and the Bjerrum length lB, which gives the
distance between two charges where Cou-
lomb interaction equals thermal energy.
The former quantity can be approximated
by
r � ðNAa�c00SÞ�1=3
where c00S is the molar salt concentration in
the amorphous phase and a�the degree of
dissociation. We approximate a�c00S by Y 00 in
the same way as in Eq. (6). It follows
r ¼ NArPMS
� ��1=3
Y 00ð Þ�x=3(7)
In (7), the degree of dissociation
a� const has been ignored. Bjerrum length
reads in usual terms, lB ¼ e2= 4peoekBTð Þ.As mentioned previously,[20] this length
equals lB¼ 55.13 nm/e at 30 8C. The ratio of
these characteristic length scales reads
with (7)
lBr¼ 55:13 nm
e Yð Þ NArPMS
� �1=3
Y 00ð Þx=3 (8)
We note that dielectric constant e itself isa function of salt concentration. When
distance r exceeds Bjerrum length lB the
probability diminishes for ion pair forma-
tion. In the opposite case, for lB/r> 1, ion
pair formation becomesmore likely. Eq. (8)
shows that large exponents x and high
values of dielectric constant suppress for-
mation of ion pairs.
Copyright � 2010 WILEY-VCH Verlag GmbH & Co. KGaA
When PEO and the Li salt are com-
pletely miscible in the molten state, we may
engage melting point depression of PEO
for estimation of deviations from perfect
behavior. It is given by
Tm ¼ Tom þ
R Tom
� �2DHm
lngP
lnXPþ 1
� �lnXP (9)
where XP represents the mole fraction of
polymer in the molten state and gP the
corresponding activity coefficient. For
small salt concentration, we get lnXP¼�XS.
A plot of Tm versus XS provides information
about activity coefficient gP. This relation-
ship is valid as long as pure PEO crystallizes
out from the molten mixture. We apply Eq.
(9) to the as-prepared samples. Therefore,
quantities Tom and DHm symbolize the
melting temperature of pure PEO and
the melting enthalpy of fully crystalline
polymer; XS denotes the mole fraction of
salt added to the polymer.
Results and Discussion
Crystallinity and Composition of the
Amorphous Phase
During preparation, samples undergo
phase separation in a pure crystalline phase
of PEO and an amorphous mixture of salt
and PEO. The extent of phase separation
can be evaluated by crystallinity. There-
fore, crystallinity was determined for the
as-prepared samples as described in Experi-
mental. DSC thermograms for the heating
cycle of as-prepared neat PEO1 and with
13wt% of salt are presented in Figure 1.
The thermograms for as-prepared neat
PEO2 and PEO3 are not shown due to
the overlapping of the respective thermo-
gram with that of the PEO1. Since only the
amorphous phase contains salt or corre-
sponding ions, only this phase guarantees
electric conductivity at least in the range of
low salt content. Therefore, the composi-
tion of the amorphous phase is an essential
characteristic of the polymer electrolyte.
Degree of crystallinity allows for estimation
of the composition of the amorphous phase.
, Weinheim www.ms-journal.de

Figure 1.
DSC traces of heating cycles for PEO in as-prepared samples comprising mass fraction of salt, WS ¼ 0.13. The DSC
traces are displaced for better identification. (a) neat PEO1; at WS ¼ 0.13: (b) PEO1, (c) PEO2 and (d) PEO3.
Figure 2.
Crystallinity X� of PEO in as-prepared samples versus
concentration of LiClO4; dotted lines represent loci of
constant PEO crystallinity & – PEO1, * - PEO2, ~ -
PEO3.
Macromol. Symp. 2010, 290, 46–5550
Melting enthalpies, selected values are
listed in Table 2, are used to calculate the
degree of crystallinity, X�¼DHm/DHom. We
apply as reference DHom ¼ 188.3 J/g,[21] the
necessary heat for melting of 100% crystal-
line PEO. Figure 2 shows crystallinity
versus salt concentration. We note that
for M¼ const crystallinity of PEO in salt
solutions with low salt content stays con-
stant to a good approximation. It does not
change significantly with molecular mass.
Some scatter occurs at higher salt content.
Only for PEO with the highest molecular
mass, we observe a slight decrease in
crystallinity as compared to samples with
lower molecular mass. Moreover, the
change of crystallinity with salt content
does not depend on molecular mass,
@X�=@WSð ÞM¼ const.
The mass fraction of salt in the amor-
phous mixture, WS00, is related to degree of
Table 2.Selected melting points (Tm) and melting enthalpies (DHm) for as-prepared samples of PEO/LiClO4 solutions.
Y PEO1 PEO2 PEO3
Tm/8C DHm/J g�1 Tm/8C DHm/J g�1 Tm/8C DHm/J g�1
0 70.8 105.0 70.6 100.6 69.4 98.80.05 69.3 98.8 67.1 95.8 66.5 93.20.10 67.9 94.5 65.6 93.1 64.8 86.20.15 66.7 91.9 64.3 90.2 62.1 83.1
Copyright � 2010 WILEY-VCH Verlag GmbH & Co. KGaA, Weinheim www.ms-journal.de
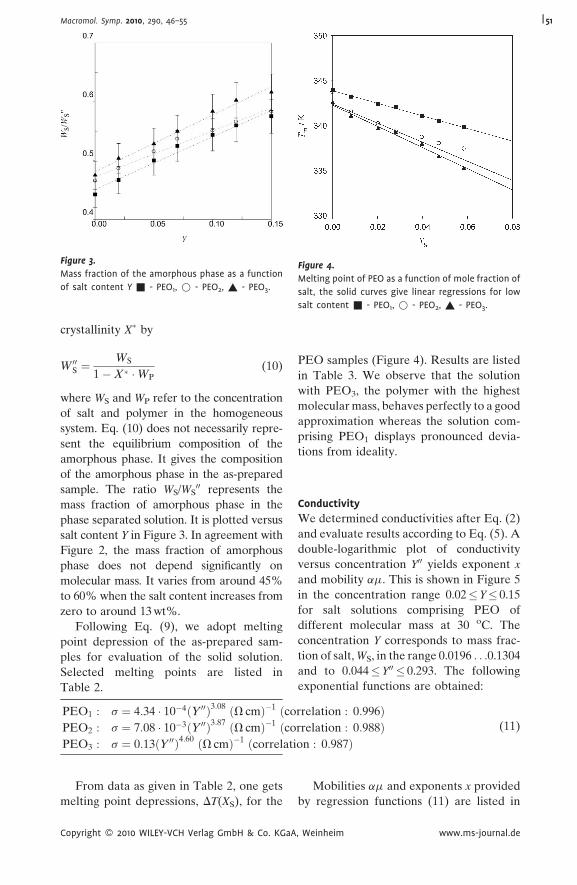
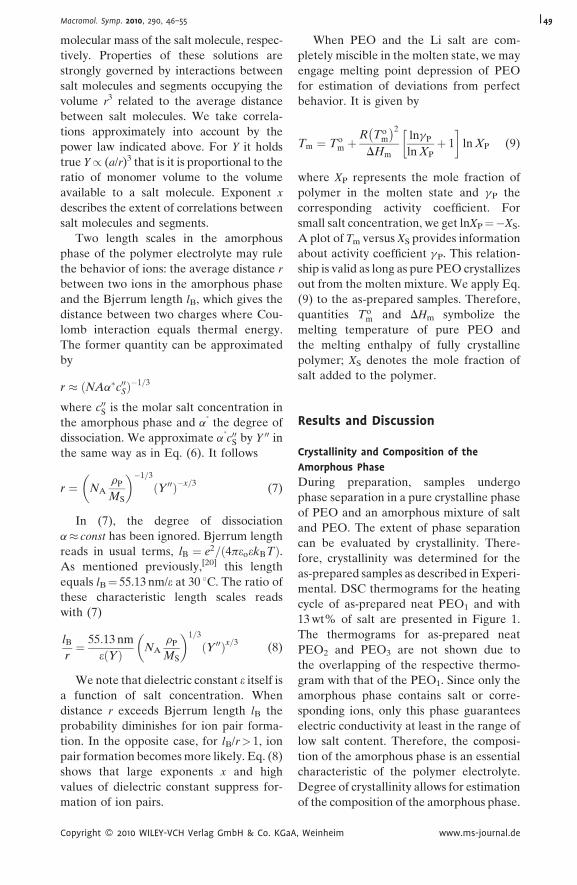
Figure 3.
Mass fraction of the amorphous phase as a function
of salt content Y & - PEO1, * - PEO2, ~ - PEO3.
Figure 4.
Melting point of PEO as a function of mole fraction of
salt, the solid curves give linear regressions for low
salt content & - PEO1, * - PEO2, ~ - PEO3.
Macromol. Symp. 2010, 290, 46–55 51
crystallinity X� by
W 00S ¼ WS
1�X� �WP(10)
where WS and WP refer to the concentration
of salt and polymer in the homogeneous
system. Eq. (10) does not necessarily repre-
sent the equilibrium composition of the
amorphous phase. It gives the composition
of the amorphous phase in the as-prepared
sample. The ratio WS/WS00 represents the
mass fraction of amorphous phase in the
phase separated solution. It is plotted versus
salt content Y in Figure 3. In agreement with
Figure 2, the mass fraction of amorphous
phase does not depend significantly on
molecular mass. It varies from around 45%
to 60% when the salt content increases from
zero to around 13wt%.
Following Eq. (9), we adopt melting
point depression of the as-prepared sam-
ples for evaluation of the solid solution.
Selected melting points are listed in
Table 2.
PEO1 : s ¼ 4:34 � 10�4 Y 00ð Þ3:08 ðV cmÞ�1 ðcorrelation : 0:996ÞPEO2 : s ¼ 7:08 � 10�3 Y 00ð Þ3:87 ðV cmÞ�1 ðcorrelation : 0:988ÞPEO3 : s ¼ 0:13 Y 00ð Þ4:60 ðV cmÞ�1 ðcorrelation : 0:987Þ
(11)
From data as given in Table 2, one gets
melting point depressions, DT(XS), for the
Copyright � 2010 WILEY-VCH Verlag GmbH & Co. KGaA
PEO samples (Figure 4). Results are listed
in Table 3. We observe that the solution
with PEO3, the polymer with the highest
molecularmass, behaves perfectly to a good
approximation whereas the solution com-
prising PEO1 displays pronounced devia-
tions from ideality.
Conductivity
We determined conductivities after Eq. (2)
and evaluate results according to Eq. (5). A
double-logarithmic plot of conductivity
versus concentration Y00 yields exponent x
and mobility am. This is shown in Figure 5
in the concentration range 0.02� Y� 0.15
for salt solutions comprising PEO of
different molecular mass at 30 oC. The
concentration Y corresponds to mass frac-
tion of salt,WS, in the range 0.0196 . . .0.1304
and to 0.044� Y00 � 0.293. The following
exponential functions are obtained:
Mobilities am and exponents x provided
by regression functions (11) are listed in
, Weinheim www.ms-journal.de
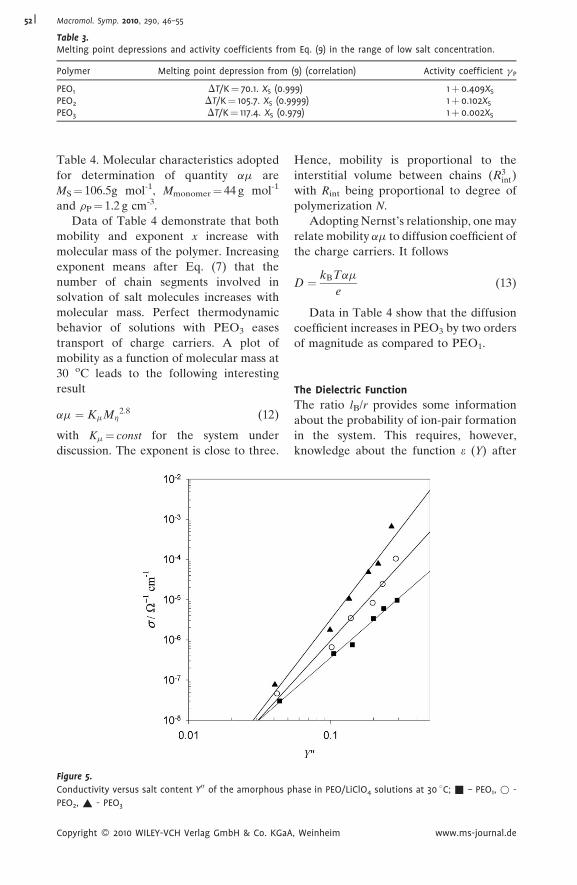
Table 3.Melting point depressions and activity coefficients from Eq. (9) in the range of low salt concentration.
Polymer Melting point depression from (9) (correlation) Activity coefficient gP
PEO1 DT/K¼ 70.1. XS (0.999) 1þ 0.409XS
PEO2 DT/K¼ 105.7. XS (0.9999) 1þ 0.102XS
PEO3 DT/K¼ 117.4. XS (0.979) 1þ 0.002XS
Macromol. Symp. 2010, 290, 46–5552
Table 4. Molecular characteristics adopted
for determination of quantity am are
MS¼ 106.5g mol-1, Mmonomer¼ 44 g mol-1
and rP¼ 1.2 g cm-3.
Data of Table 4 demonstrate that both
mobility and exponent x increase with
molecular mass of the polymer. Increasing
exponent means after Eq. (7) that the
number of chain segments involved in
solvation of salt molecules increases with
molecular mass. Perfect thermodynamic
behavior of solutions with PEO3 eases
transport of charge carriers. A plot of
mobility as a function of molecular mass at
30 oC leads to the following interesting
result
am ¼ KmMh2:8 (12)
with Km¼ const for the system under
discussion. The exponent is close to three.
Figure 5.
Conductivity versus salt content Y00 of the amorphous p
PEO2, ~ - PEO3
Copyright � 2010 WILEY-VCH Verlag GmbH & Co. KGaA
Hence, mobility is proportional to the
interstitial volume between chains (R3int)
with Rint being proportional to degree of
polymerization N.
Adopting Nernst’s relationship, onemay
relate mobility am to diffusion coefficient of
the charge carriers. It follows
D ¼ kBTam
e(13)
Data in Table 4 show that the diffusion
coefficient increases in PEO3 by two orders
of magnitude as compared to PEO1.
The Dielectric Function
The ratio lB/r provides some information
about the probability of ion-pair formation
in the system. This requires, however,
knowledge about the function e (Y) after
hase in PEO/LiClO4 solutions at 30 8C; & – PEO1, * -
, Weinheim www.ms-journal.de
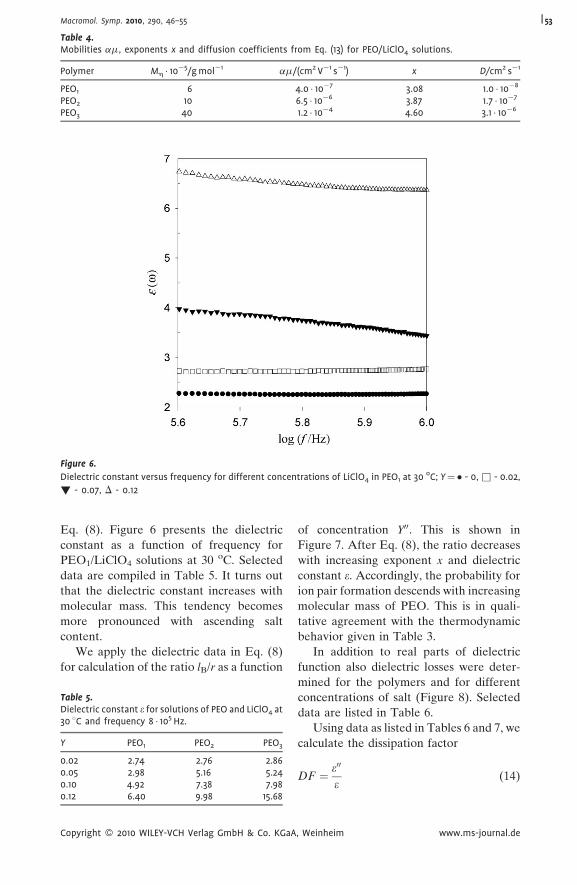
Table 4.Mobilities am, exponents x and diffusion coefficients from Eq. (13) for PEO/LiClO4 solutions.
Polymer Mh � 10�5/g mol�1 am/(cm2 V�1 s�1) x D/cm2 s�1
PEO1 6 4.0 � 10�7 3.08 1.0 � 10�8
PEO2 10 6.5 � 10�6 3.87 1.7 � 10�7
PEO3 40 1.2 � 10�4 4.60 3.1 � 10�6
Figure 6.
Dielectric constant versus frequency for different concentrations of LiClO4 in PEO1 at 30 oC; Y¼� - 0, & - 0.02,
! - 0.07, D - 0.12
Macromol. Symp. 2010, 290, 46–55 53
Eq. (8). Figure 6 presents the dielectric
constant as a function of frequency for
PEO1/LiClO4 solutions at 30 oC. Selected
data are compiled in Table 5. It turns out
that the dielectric constant increases with
molecular mass. This tendency becomes
more pronounced with ascending salt
content.
We apply the dielectric data in Eq. (8)
for calculation of the ratio lB/r as a function
Table 5.Dielectric constant e for solutions of PEO and LiClO4 at30 8C and frequency 8 � 105 Hz.
Y PEO1 PEO2 PEO3
0.02 2.74 2.76 2.860.05 2.98 5.16 5.240.10 4.92 7.38 7.980.12 6.40 9.98 15.68
Copyright � 2010 WILEY-VCH Verlag GmbH & Co. KGaA
of concentration Y00. This is shown in
Figure 7. After Eq. (8), the ratio decreases
with increasing exponent x and dielectric
constant e. Accordingly, the probability for
ion pair formation descends with increasing
molecular mass of PEO. This is in quali-
tative agreement with the thermodynamic
behavior given in Table 3.
In addition to real parts of dielectric
function also dielectric losses were deter-
mined for the polymers and for different
concentrations of salt (Figure 8). Selected
data are listed in Table 6.
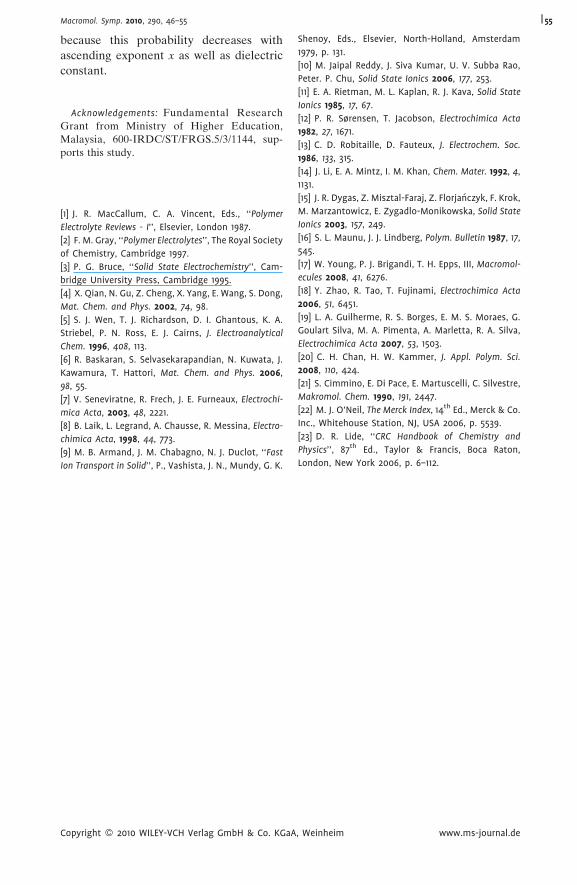
Using data as listed in Tables 6 and 7, we
calculate the dissipation factor
DF ¼ e00
e(14)
, Weinheim www.ms-journal.de
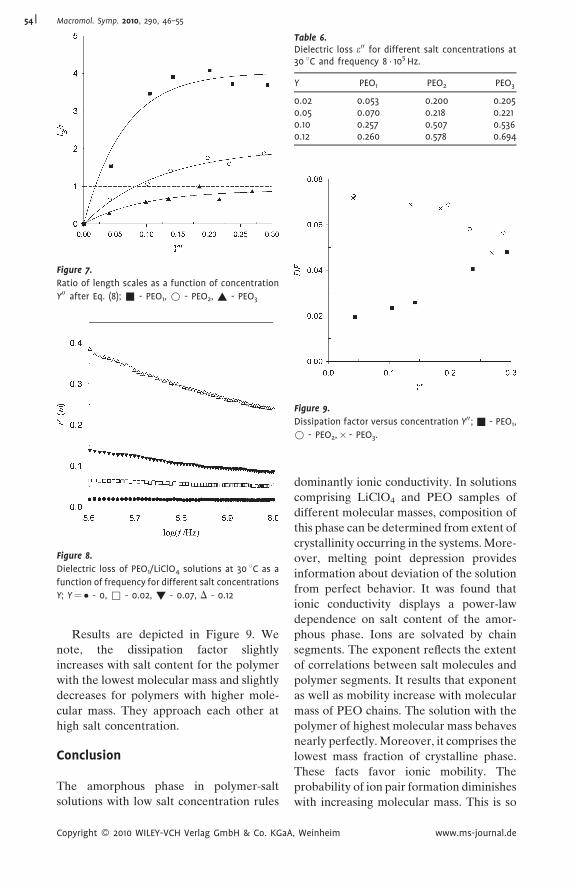
Figure 7.
Ratio of length scales as a function of concentration
Y00 after Eq. (8); & - PEO1, * - PEO2, ~ - PEO3
Figure 8.
Dielectric loss of PEO1/LiClO4 solutions at 30 8C as a
function of frequency for different salt concentrations
Y; Y¼� - 0, & - 0.02, ! - 0.07, D - 0.12
Table 6.Dielectric loss e00 for different salt concentrations at30 8C and frequency 8 � 105 Hz.
Y PEO1 PEO2 PEO3
0.02 0.053 0.200 0.2050.05 0.070 0.218 0.2210.10 0.257 0.507 0.5360.12 0.260 0.578 0.694
Figure 9.
Dissipation factor versus concentration Y00; & - PEO1,
* - PEO2,� - PEO3.
Macromol. Symp. 2010, 290, 46–5554
Results are depicted in Figure 9. We
note, the dissipation factor slightly
increases with salt content for the polymer
with the lowest molecular mass and slightly
decreases for polymers with higher mole-
cular mass. They approach each other at
high salt concentration.
Conclusion
The amorphous phase in polymer-salt
solutions with low salt concentration rules
Copyright � 2010 WILEY-VCH Verlag GmbH & Co. KGaA
dominantly ionic conductivity. In solutions
comprising LiClO4 and PEO samples of
different molecular masses, composition of
this phase can be determined from extent of
crystallinity occurring in the systems.More-
over, melting point depression provides
information about deviation of the solution
from perfect behavior. It was found that
ionic conductivity displays a power-law
dependence on salt content of the amor-
phous phase. Ions are solvated by chain
segments. The exponent reflects the extent
of correlations between salt molecules and
polymer segments. It results that exponent
as well as mobility increase with molecular
mass of PEO chains. The solution with the
polymer of highest molecular mass behaves
nearly perfectly. Moreover, it comprises the
lowest mass fraction of crystalline phase.
These facts favor ionic mobility. The
probability of ion pair formation diminishes
with increasing molecular mass. This is so
, Weinheim www.ms-journal.de
Macromol. Symp. 2010, 290, 46–55 55
because this probability decreases with
ascending exponent x as well as dielectric
constant.
Acknowledgements: Fundamental ResearchGrant from Ministry of Higher Education,Malaysia, 600-IRDC/ST/FRGS.5/3/1144, sup-ports this study.
[1] J. R. MacCallum, C. A. Vincent, Eds., ‘‘Polymer
Electrolyte Reviews - I’’, Elsevier, London 1987.
[2] F. M. Gray, ‘‘Polymer Electrolytes’’, The Royal Society
of Chemistry, Cambridge 1997.
[3] P. G. Bruce, ‘‘Solid State Electrochemistry’’, Cam-
bridge University Press, Cambridge 1995.
[4] X. Qian, N. Gu, Z. Cheng, X. Yang, E. Wang, S. Dong,
Mat. Chem. and Phys. 2002, 74, 98.
[5] S. J. Wen, T. J. Richardson, D. I. Ghantous, K. A.
Striebel, P. N. Ross, E. J. Cairns, J. Electroanalytical
Chem. 1996, 408, 113.
[6] R. Baskaran, S. Selvasekarapandian, N. Kuwata, J.
Kawamura, T. Hattori, Mat. Chem. and Phys. 2006,
98, 55.
[7] V. Seneviratne, R. Frech, J. E. Furneaux, Electrochi-
mica Acta, 2003, 48, 2221.
[8] B. Laik, L. Legrand, A. Chausse, R. Messina, Electro-
chimica Acta, 1998, 44, 773.
[9] M. B. Armand, J. M. Chabagno, N. J. Duclot, ‘‘Fast
Ion Transport in Solid’’, P., Vashista, J. N., Mundy, G. K.
Copyright � 2010 WILEY-VCH Verlag GmbH & Co. KGaA
Shenoy, Eds., Elsevier, North-Holland, Amsterdam
1979, p. 131.
[10] M. Jaipal Reddy, J. Siva Kumar, U. V. Subba Rao,
Peter. P. Chu, Solid State Ionics 2006, 177, 253.
[11] E. A. Rietman, M. L. Kaplan, R. J. Kava, Solid State
Ionics 1985, 17, 67.
[12] P. R. Sørensen, T. Jacobson, Electrochimica Acta
1982, 27, 1671.
[13] C. D. Robitaille, D. Fauteux, J. Electrochem. Soc.
1986, 133, 315.
[14] J. Li, E. A. Mintz, I. M. Khan, Chem. Mater. 1992, 4,
1131.
[15] J. R. Dygas, Z. Misztal-Faraj, Z. Florjanczyk, F. Krok,
M. Marzantowicz, E. Zygadlo-Monikowska, Solid State
Ionics 2003, 157, 249.
[16] S. L. Maunu, J. J. Lindberg, Polym. Bulletin 1987, 17,
545.
[17] W. Young, P. J. Brigandi, T. H. Epps, III, Macromol-
ecules 2008, 41, 6276.
[18] Y. Zhao, R. Tao, T. Fujinami, Electrochimica Acta
2006, 51, 6451.
[19] L. A. Guilherme, R. S. Borges, E. M. S. Moraes, G.
Goulart Silva, M. A. Pimenta, A. Marletta, R. A. Silva,
Electrochimica Acta 2007, 53, 1503.
[20] C. H. Chan, H. W. Kammer, J. Appl. Polym. Sci.
2008, 110, 424.
[21] S. Cimmino, E. Di Pace, E. Martuscelli, C. Silvestre,
Makromol. Chem. 1990, 191, 2447.
[22] M. J. O’Neil, The Merck Index, 14th Ed., Merck & Co.
Inc., Whitehouse Station, NJ, USA 2006, p. 5539.
[23] D. R. Lide, ‘‘CRC Handbook of Chemistry and
Physics’’, 87th Ed., Taylor & Francis, Boca Raton,
London, New York 2006, p. 6–112.
, Weinheim www.ms-journal.de