Synthesis of mesoporous birnessite-MnO2composite as a cathodeelectrode for lithium battery
Upload
khangminh22Category
view
0download
0
TECHNISCHE UNIVERSITÄT MÜNCHEN
Lehrstuhl für Anorganische Chemie mit Schwerpunkt Neue Materialien
Synthesis, Characterization and Reactivity of
Lithium-Containing Silicides, Germanides and Borosilicides
Michael Hermann Zeilinger
Vollständiger Abdruck der von der Fakultät für Chemie der Technischen Universität
München zur Erlangung des akademischen Grades eines
Doktors der Naturwissenschaften (Dr. rer. nat.)
genehmigten Dissertation.
Vorsitzender: Univ.-Prof. Dr. Tom Nilges
Prüfer der Dissertation:
1. Univ.-Prof. Dr. Thomas F. Fässler
2. Univ.-Prof. Hubert Gasteiger, Ph.D.
3. Univ.-Prof. Dr. Wolfgang Scherer
Die Dissertation wurde am 13.02.2014 bei der Technischen Universität München
eingereicht und durch die Fakultät für Chemie am 06.05.2014 angenommen.


I’d put my money on the sun and solar
energy. What a source of power! I hope we don’t
have to wait until oil and coal run out before we
tackle that.
Thomas Edison, 1931


Danken möchte ich
ganz besonders meinem Doktorvater
Prof. Dr. Thomas F. Fässler
für die überaus interessante Themenstellung, die sehr umfangreiche Unterstützung,
Vertrauen, Wohlwollen und wissenschaftliche Freiheiten.
Prof. Dr. Ulrich Häussermann für die jährliche Organisation und den reibungslosen Ablauf
der Forschungsaufenthalte an der ARIZONA STATE UNIVERSITY, der äußerst angenehmen und
fruchtbaren Zusammenarbeit im Rahmen des Projektes „MATERIALS WORLD NETWORK“ sowie
die stete Diskussions- und Hilfsbereitschaft.
dem Fonds der Chemischen Industrie für die Gewährung eines Promotionsstipendiums und
die großzügige Unterstützung meiner Forschungsaufenthalte an der
ARIZONA STATE UNIVERSITY.
meinen Büro- und Laborkollegen Thomas Henneberger, Andrea Hoffmann, Dr. Tobias
Köchner, Ulla Madan-Singh, Maria Müller, Lavinia Scherf und Patrick Woidy für die positive
Arbeitsatmosphäre und ihre Hilfe in vielen Bereichen. Manuela Donaubauer für ihre Hilfe
hinsichtlich organisatorischer Angelegenheiten.
Priv. Doz. Dr. Florian Kraus für sehr viele gute Ratschläge, seine stete Diskussions- und
Hilfsbereitschaft und die Bereitstellung von 6Li. Dr. Alexander Pöthig für die Messerlaubnis
an den Einkristalldiffraktometern der Gruppe Prof. Kühn und wertvolle kristallographische
Tipps. Prof. Dr. Tom Nilges, Dr. Viktor Hlukhyy, Dr. Wilhelm Klein und Dr. Bernhard Wahl für
Ihre Hilfe bei kristallographischen Angelegenheiten.
allen Koautoren für die Mitarbeit an unseren Publikationen.
den Gruppen Fässler, Häussermann, Kraus und Nilges.
meiner Forschungspraktikantin und Masterandin Lavinia Scherf sowie meinen Forschungs-
praktikanten Alexander Hufnagel und Philipp Rheinländer für das rege Interesse, eine her-
vorragende Zusammenarbeit und die Unterstützung meiner Arbeit durch ihre Beiträge.

Danksagung
allen weiteren Beteiligten des Projektes „MATERIALS WORLD NETWORK“, Prof. Dr. Wolfgang
Scherer, Prof. Dr. Otto Sankey, Prof. Dr. John Shumway, Volodymyr Baran, Dr. Daryn Benson,
Daniel Eklöf, Andreas Fischer, Dr. Antti J. Karttunen, Sumit Konar und Dr. Yang Wu für das
Einbringen in viele Diskussionsrunden und sehr hilfreiche Beiträge. Insbesondere Andreas
Fischer, für die sehr angenehme und bestens organisierte Arbeits- und Wohngemeinschaft
während unserer USA-Aufenthalte sowie seine Hilfsbereitschaft. Sumit Konar und Dr. Kati
Puhakainen für ihre Mithilfe bei der Organisation der Forschungsaufenthalte. Dr. Kurt
Leinenweber und Craig Naseyowma für ihre Unterstützung bei Hochdruckexperimenten und
das reibungslose Arbeiten im Hochdrucklabor der ARIZONA STATE UNIVERSITY. ASU Associate
Prof. Dr. Don Seo für die Bereitstellung diverser Laborgeräte und Dr. Thomas Groy für die
Benutzung der Pulver- und Einkristalldiffraktometer an der ARIZONA STATE UNIVERSITY.
Prof. Leo van Wüllen für NMR-Messungen, Andrea Hoffmann für SQUID-Messungen, Katia
Rodewald und Ingrid Werner für diverse EDX-Messungen und REM-Aufnahmen.
meinen Kollegen Dr. Sebastian Baer, Dr. Christian Benda, Manuel Bentlohner, Dr. M. Bele
Boeddinghaus, Dr. Daniel Bräunling, Carina Dressel, Dr. Zoreh Fard, Haiyan He, Alexander
Henze, Laura-Alice Jantke, Dr. Florian J. Kiefer, Dr. Aslihan Kircali, Iryna M. Kurylyshyn,
Dr. Prashanth W. Menezes, Thomas Müller, Stefan Rudel, Dr. Annette Schier, Herta Slavik,
Dr. Sheng Ping Guo, Dr. Lisa Siggelkow, Dr. Saskia Stegmaier, Lorenzo Toffoletti, Dr. Markus
Waibel, Dr. Lei Zhang für ihre Hilfsbereitschaft, die gute Zusammenarbeit, diverse Unterneh-
mungen und eine schöne gemeinsame Zeit.
allen Mitarbeitern der Fakultät für Chemie der Technischen Universität München, die zum
Gelingen dieser Arbeit beigetragen haben.
meinen Freunden.
meiner Freundin Jennifer Ludwig.
meiner Familie für Rückhalt und ihre jahrelange Unterstützung.

Zusammenfassung
Seit einigen Jahren wird der Einsatz von Silicium als Anodenmaterial für Lithium-Ionen-Akku-
mulatoren diskutiert, um den steigenden Leistungsanforderungen durch Erhöhung der Kapa-
zität gerecht zu werden. Im Vergleich zu herkömmlichen, mit Graphit als Anode betriebenen
Akkus kann ein massiver Kapazitätsgewinn durch Bildung der lithiumreichen Phase Li15Si4
erreicht werden, wobei in einigen Fällen auch die Bildung von Li22Si5 oder Li21Si5 postuliert
wird. Ungeachtet der Bedeutung des damit eng in Verbindung stehenden Phasensystems
Li–Si, insbesondere des lithiumreichen Teils, waren bislang grundlegende Charakteristika nur
unzureichend untersucht.
Im Rahmen der vorliegenden Arbeit wurde das Li–Si-Phasendiagramm im Bereich
> 76 at.% Li mittels dynamischer Differenzkalorimetrie neu bestimmt und deutlich verbessert.
Voraussetzung hierfür war die Identifizierung und zweifelsfreie strukturelle Charakterisierung
aller zugehörigen (lithiumreichen) Phasen. Im Einzelnen wurden durch röntgenographische
Untersuchungen an Einkristallen Li13Si4 und Li15Si4, das fehlgeordnete Hochtemperatursilicid
Li16.4Si4 sowie die lithiumreichste Phase des Systems Li17Si4 charakterisiert. Letztere löst das
bislang als lithiumreichstes Silicid beschriebene Li21Si5 (Li16.8Si4) ab. Die Struktur von Li13Si4
wurde auf Grund von Diskrepanzen zwischen berechneten (auf Basis vorheriger Einkristallda-
ten) und experimentellen Röntgenpulverdiffraktogrammen von Li13Si4 neu bestimmt und deut-
lich verbessert. Geeignete Einkristalle, insbesondere im Falle der ersten Einkristalle zur
metastabilen Phase Li15Si4, wurden größtenteils durch Züchtung mittels Metallbadtechnik
(Li-Überschuss bzw. „Li-Flux“) erhalten. Entscheidender Bedeutung zur Revision des Li–Si-
Phasendiagramms wird der Entdeckung der neuen Phase Li16.4Si4 beigemessen. Das thermi-
sche Zersetzungsverhalten der oberhalb von 170 °C nicht mehr stabilen Phase Li15Si4 wurde
zudem eingehend untersucht. Dabei spiegelte die Phasenzusammensetzung der Zerset-
zungsprodukte ab 400 °C den Verlauf des neu etablierten Li–Si-Phasendiagrams exakt wider.
Zwischen 170 °C und 300 °C zersetzt sich Li15Si4 in Li17Si4 und eine teilamorphe, nicht identi-
fizierte Phase. Die Dotierung von Li15Si4 mit geringen Mengen Al im Sinne von Li15−xAlxSi4
(0.4 < x < 0.8) führt jedoch zu thermodynamisch stabilen Produkten, die sich in einem rever-
siblen Prozess ab ca. 700 °C zersetzen. Die Ausweitung der Untersuchungen auf das System
Li–Ge führten zur Charakterisierung der schwereren Homologen Li17Ge4 und Li16.4Ge4 sowie

Zusammenfassung
zur Neubestimmung des Phasendiagramms im Bereich > 79 at.% Li. Im Zuge dessen wurde
auch die Mischbarkeit der isotypen Phasen Li17Si4 und Li17Ge4 untersucht. Hier wurde die
Gültigkeit der Vegard’schen Regel für die festen Lösungen Li17Si4−xGex [x = 2.30(2), 3.08(4),
3.53(3)] gezeigt.
Ein weiterer Fokus dieser Arbeit liegt auf der Synthese neuer Phasen im System
Li–B–Si sowie der Elementmodifikation allo-Si, von denen angenommen wird, dass sie inte-
ressante Charakteristika hinsichtlich ihres Einsatzes als alternative Elektrodenmaterialien be-
sitzen. Die Reproduktion der Synthese des Si-Polymorphs allo-Si durch Oxidation der Phase
Li3NaSi6 führte zu amorphen Produkten (a-allo-Si). Starke Ähnlichkeiten der Pulverröntgen-
beugungsdaten von allo-Si aus früheren Arbeiten und NbSi2 deuten auf eine irrtümliche Pha-
senzuordnung auf Grund einer NbSi2-Verunreinigung hin. NbSi2 kann aus der Reaktion des
Ampullenmaterials Nb mit α-Si bei der Synthese der Vorstufe Li3NaSi6 hervorgehen. Eine Ana-
lyse der Phasenumwandlungstemperaturen (amorph-zu-kristallin) verschiedener a-allo-Si
Proben zeigte eine starke Schwankung in einem Temperaturbereich von 487–565 °C auf. Im
Gegensatz dazu wandelt sich herkömmliches, vollständig amorphes Si (a-Si), hergestellt aus
Li15Si4 durch Li-Extraktion mittels flüssigem Ammoniak, bei höheren Temperaturen um
(~660 °C). Jedoch lässt sich dieser Unterschied auf einen hohen Anteil von α-Si Kristalliten
und damit Kristallisationskeimen in a-allo-Si Proben zurückführen. Nach eingehenden Unter-
suchungen war keine eindeutige Differenzierung zwischen a-allo-Si und a-Si möglich, so dass
die Existenz des Si Polymorphs allo-Si gemäß dem in der Literatur beschriebenen Synthese-
verfahren nicht bestätigt werden konnte. Im Zuge der Untersuchungen von festen Lösungen
Li3Na(Si1−xGex)6 als Vorstufe für allo-Si1−xGex wurde des Weiteren die neue Zintl-Phase
Li18Na2Ge17 röntgenographisch am Einkristall charakterisiert. Li18Na2Ge17 ist eines der wenigen
Beispiele von Zintl-Phasen, welches drei verschiedene Anionensorten in seiner Struktur ver-
eint (Ge4−, [Ge4]4−, [Ge12]12−).
Bei systematischen Untersuchungen des Systems Li–B–Si wurde in einer Reihe von
Hochdruck- und Hochtemperaturexperimenten die Zintl-Phase LiBSi2 synthetisiert. LiBSi2 be-
sitzt ein einzigartiges, geordnetes B–Si Netzwerk bestehend aus zueinander senkrecht ste-
henden, mit Li gefüllten Kanälen. Auf Grund der noch nicht beschriebenen Topologie wurde
das Netz mit „tum“ bezeichnet. Die Einbettung von Li Atomen in die kanalartige Gerüststruk-
tur lassen weiterführende elektrochemische Untersuchungen an LiBSi2 attraktiv erscheinen.

Abstract
In the last years silicon was particularly discussed as new anode material for lithium-ion bat-
teries since it potentially could cope with the increasing demand for enhanced battery capac-
ities. Compared to graphite being universally used in commercially available lithium-ion bat-
teries, a massive capacity extension based on the formation of the lithium-rich phase Li15Si4
can be achieved. In some cases Li22Si5 or Li21Si5 were postulated instead of Li15Si4. Despite
the great significance of the closely related Li–Si phase system, fundamental characteristics
of the Li–Si phase diagram have not been elucidated adequately prior to this work.
In the course of the present thesis, the Li–Si phase diagram (> 76 at.% Li) was redeter-
mined comprehensively and revised considerably by differential scanning calorimetry. This
requested for the identification and unambiguous structural characterization of all phases in
the respective lithium-rich section. In detail, the phases Li13Si4, Li15Si4, the disordered high-
temperature silicide Li16.4Si4, as well as the lithium-richest representative of the Li–Si system
Li17Si4 were characterized by single crystal X-ray diffraction. The latter replaces the previously
reported lithium-richest silicide Li21Si5 (Li16.8Si4). Because of discrepancies between calculated
(on the basis of previous single crystal data) and experimental powder X-ray diffraction data
of Li13Si4, its structure was redetermined and improved markedly. Suitable single crystals, in
particular the first crystals of the metastable phase Li15Si4, were mainly obtained from melt
equilibration experiments (Li excess melts, “Li-flux”). Concerning the revision of the Li–Si
phase diagram, the discovery of the phase Li16.4Si4 is ascribed a key role. Moreover, the ther-
mal behavior of Li15Si4 which is not stable above 170 °C was investigated intensively. Thereby,
the phase compositions of decomposition products exactly follow the newly established
Li–Si phase diagram at temperatures higher than 400 °C. Between 170 and 300 °C, Li15Si4
decomposes into Li17Si4 and an unknown, weakly crystalline phase. However, replacing small
amounts of Li with Al corresponding to Li15−xAlxSi4 (0.4 < x < 0.8) led to thermodynamically
stable phases which possess thermal stability of up to 700 °C. The decomposition process
has proven to be reversible. Extending the studies to the Li–Ge system, the heavier homo-
logues Li17Ge4 and Li16.4Ge4 could be characterized. This led to a rigorous redetermination of
the respective section of the Li–Ge phase diagram (> 79 at.% Li), too. In this regard, the
miscibility of the isotypic phases Li17Si4 and Li17Ge4 was investigated. Accordingly, the solid
solutions Li17Si4−xGex [x = 2.30(2), 3.08(4), 3.53(3)] obey Vegard’s law.

Abstract
Moreover, this work focuses on the synthesis of new phases in the Li–B–Si system as
well as the synthesis of the Si polymorph allo-Si since these might serve as interesting anode
materials. Attempts to reproduce the synthesis of the Si allotrope allo-Si through oxidation of
the ternary phase Li3NaSi6 solely yielded amorphous products which were correspondingly
denoted as a-allo-Si. Moreover, the powder X-ray diffraction data reported for allo-Si bear
striking resemblance with NbSi2 and thus indicate an erroneous phase assignment due to an
NbSi2 impurity. NbSi2 may originate from a reaction of the ampule material Nb with α-Si during
the synthesis of the Li3NaSi6 precursor. An analysis of the amorphous-to-crystalline phase
transition temperatures of a-allo-Si revealed a strong fluctuation between 487 and 565 °C. In
contrast, conventional amorphous Si (a-Si), which was obtained by Li extraction from Li15Si4
using liquid ammonia as solvent for Li, is transformed into α-Si at around 660 °C. However,
the difference between a-Si and a-allo-Si can be attributed to large concentrations of α-Si
crystallites and thus crystallization nuclei in a-allo-Si samples. Since comprehensive investi-
gations did not reveal an unambiguous differentiation between a-allo-Si and a-Si, the exist-
ence of the Si polymorph allo-Si according to the reported synthesis could not be confirmed.
In the course of investigations on the solid solution behavior of Li3Na(Si1−xGex)6 conceived as
precursor for allo-Si1−xGex, the new Zintl phase Li18Na2Ge17 could be identified and character-
ized crystallographically. Li18Na2Ge17 is one of few Zintl phases whose structure comprises of
three different Zintl anions (Ge4−, [Ge4]4−, [Ge12]12−).
Explorative investigations in the Li–B–Si system using a high-pressure high-temperature
synthesis technique led to the discovery of the novel Zintl phase LiBSi2. It possesses a unique
and strictly ordered B–Si open tetrahedral framework comprising mutually orthogonal
channels hosting Li atoms inside. Since its network represents a not yet described topology
it was named “tum”. Owing to the fact that Li atoms are embedded in the channel-like frame-
work structure of LiBSi2, consecutive electrochemical investigations on LiBSi2 seem to be very
attractive.

List of Abbreviations
2b two-bonded
3b three-bonded
4b four-bonded
4c four-connected
A alkaline metal
a-allo-Si amorphous allo-Si
a-Si amorphous silicon
AAS atomic absorption spectroscopy
Ae alkaline earth metal
ATR attenuated total reflectance
bcc body centered cubic
c-Si crystalline silicon
calc. calculated
CCD charge coupled device
ccp cubic close packed
cF face-centered cubic
CIF crystallographic information file
CN coordination number
DFT density functional theory
DSC differential scanning calorimetry
DTA differential thermal analysis
DOS density of states
E p-block (semi)metal
EC ethylene carbonate
EDX energy dispersive X-ray spectroscopy
EF Fermi energy
exp. experimental
FE-SEM field emission scanning electron microscopy
FT-IR Fourier transform infrared spectroscopy
hcp hexagonal close packed

List of Abbreviations
hP primitive hexagonal
ICSD inorganic crystal structure database
ID inner diameter
IPDS imaging plate diffraction system
IR infrared
L length
LIB(s) lithium-ion battery (batteries)
(L)PSD (linear) position-sensitive detector
M (semi)metal
MAS magic angle spinning
nc-Si nanocrystalline silicon
NMR nuclear magnetic resonance
occ. occupancy
OCV open-circuit voltage
OD outer diameter
OTF open tetrahedral framework
PC propylene carbonate
PL photoluminescence
PP polypropylene
(P)XRD (powder) X-ray diffraction
Re rare earth metal
ref. reference(s)
SAED selected area electron diffraction
SEI solid electrolyte interphase
SEM scanning electron microscopy
s.o.f. site occupancy factor
SSM solid state metathesis
SQUID superconducting quantum interference device
SVP sp-valence + polarization
TEM transmission electron microscopy
tI body-centered tetragonal
Tr group 13 (triel) element
Tt group 14 (tetrel) element
TTD TOPOS topological database
VEC valence electron concentration

Table of Contents
1 Introduction 1
1.1 Lithium-Ion Batteries 1
1.2 Lithium-Rich Intermetallics 5
1.3 Zintl Phases and Open Tetrahedral Frameworks 7
1.4 Scope and Outline 9
1.5 References 11
2 Experimental Section 15
2.1 Sample Handling and Preparation 15
2.2 Synthesis 15
2.2.1 Starting Materials 15
2.2.2 Reaction Containers and Sample Storage 16
2.2.3 Furnaces 17
2.2.4 Melt Equilibration Experiments and Isothermal
Melt-Centrifugation 17
2.2.5 Ball-Milling 18
2.2.6 High-Pressure High-Temperature Synthesis 18
2.2.7 Li-Extraction Using Liquid Ammonia 19
2.2.8 Experimental Contributions from Coauthors 21
2.3 Characterization 22
2.3.1 Powder X-ray Diffraction (PXRD) 22
2.3.2 Single Crystal X-ray Diffraction, Structure Solution
and Refinement 22
2.3.3 Differential Scanning Calorimetry (DSC) and Differential
Thermal Analysis (DTA) 23
2.3.4 Scanning Electron Microscopy (SEM) and Energy Dispersive
X-ray Spectroscopy (EDX) 24
2.3.5 Nuclear Magnetic Resonance (NMR) Spectroscopy 24
2.3.6 Transmission Electron Microscopy (TEM) 24
2.3.7 Infrared (IR) and Raman Spectroscopy 25

Table of Contents
2.3.8 Photoluminescence (PL) Spectroscopy 25
2.3.9 Elemental Analysis 25
2.4 Computational Methods 26
2.5 References 26
3 Results and Discussion 29
3.1 Revision of the Li–Tt (Tt = Si, Ge) Phase Diagrams and
New Lithium-Rich Tetrelides 29
3.1.1 Review of Relevant Literature 29
3.1.2 Revision of the Li–Si Phase Diagram: Thermodynamic
Relation of Li17Si4, Li16.42Si4, Li15Si4 and Li13Si4 34
3.1.3 Thermodynamic Stability of Li14.37Al0.63Si4 — an Al-doped
Variant of Li15Si4 44
3.1.4 Revision of the Li–Ge Phase Diagram: Thermodynamic
Relation of Li17Ge4, Li16.38Ge4, and Li15Ge4 45
3.1.5 Solid Solutions Li17Si4−xGex [x = 2.30(2), 3.08(4), 3.53(3)] 47
3.1.6 References 48
3.2 Open Tetrahedral Frameworks (OTFs) 53
3.2.1 Review of Relevant Literature 53
3.2.2 OTF from Silicon: On the Existence of the
Si Polymorph allo-Si 56
3.2.3 Li3Na(Si1−xGex)6 as Precursors for allo-Si1−xGex and the
Discovery of the Zintl Phase Li18Na2Ge17 59
3.2.4 LiBSi2: A Novel Zintl Phase OTF Hosting Li Atoms
Inside Channels 60
3.2.5 References 63
4 Summary and Conclusion 65
5 Publications and Manuscripts 69
5.1 Single Crystal Growth and Thermodynamic Stability of Li17Si4 70
5.2 Revision of the Li–Si Phase Diagram: Discovery and Single Crystal
X-ray Structure Determination of the High-Temperature Phase Li4.11Si 71
5.3 Revision of the Li13Si4 Structure 73
Table of Contents
5.4 Stabilizing the Phase Li15Si4 through Lithium–Aluminum Substitution
in Li15−xAlxSi4 (0.4 < x < 0.8) — Single Crystal X-ray Structure
Determination of Li15Si4 and Li14.37Al0.63Si4 75
5.5 Structural and Thermodynamic Similarities of Phases
in the Li–Tt (Tt = Si, Ge) Systems: Redetermination of the
Lithium-Rich Side of the Li–Ge Phase Diagram and Crystal Structures
of Li17Si4.0−xGex for x = 2.3, 3.1, 3.5, and 4 as well as Li4.1Ge 77
5.6 Allotropism of Silicon: An Experimental Approach toward
Amorphous Si and a-allo-Si Based on Li15Si4 and Li3NaSi6
as well as Theoretical Models for allo-Si 79
5.7 Li18Na2Ge17 — a Compound Demonstrating Cation Effects
on Cluster Shapes and Crystal Packing in Ternary Zintl Phases 127
5.8 LiBSi2: A Tetrahedral Semiconductor Framework from
Boron and Silicon Atoms Bearing Lithium Atoms in the Channels 129

Declaration
This dissertation is written as a publication-based thesis. The bibliographic data of articles
published in peer-reviewed journals is compiled in Chapter 5. In case of unpublished work,
corresponding manuscripts prepared for publication are included. The relevance of this work
for science and research as well as the scope and outline are presented as introductory part
in Chapter 1. The experimental section in Chapter 2 gives details on the synthesis and char-
acterization of materials as well as computational methods. Contributions from coauthors
(name and university affiliation) are explicitly stated therein. The results and discussion are
presented in Chapter 3. The two subsections 3.1 and 3.2 are structured as follows: i) review
of relevant literature, ii) results (summary of articles; in case of joint publications contributions
are stated) and discussion across the respective topics, iii) references. An overall summary
and conclusion is given in Chapter 4.


1
Chapter 1
Introduction
1.1 Lithium-Ion Batteries
“Sustainable development is development that meets the needs of the present without com-
promising the ability of future generations to meet their own needs”.1 This quotation, taken
from the report of the World Commission on Environment and Development (“Our Common
future”, 1987), may certainly be seen as a well-founded definition of “sustainable develop-
ment”. Nowadays, we are confronted with a massively increasing demand for energy which
concomitantly causes severe environmental problems since fossil fuels are still the major
source of energy. Therefore, the citation may better be perceived as an insistent calling for
renewable energy sources, an environmentally compatible production of energy and, in par-
ticular, efficient energy storage. The latter aspect is certainly accommodated by the recent
concept of “electromobility”, which has been intensively funded over the last years. Therein,
research on novel energy storage materials and systems plays a decisive role.
In this field, a main focus is the development of efficient high-capacity lithium-ion bat-
teries (LIBs). Analyzing the electrical energy that can be stored in different battery systems,
i.e. the gravimetric and volumetric energy densities as functions of cell potential and capacity,
it is clear that LIBs receive significant attention (see Figure 1.1). Going back in history of Li
batteries, primary Li cells (non-rechargeable) were already developed more than 50 years ago
in 1962.2,3 One decade later, the first primary lithium-ion battery (Li metal anode, MnO2 cath-
ode, liquid electrolytes) became commercially available by SANYO INC. in 1972.2,3

1 Introduction
2
Figure 1.1. Volumetric and gravimetric energy densities of various battery systems. The figure was
modified on the basis of ref. 2.
Figure 1.2. Functionality of a lithium-ion battery operating with a LiCoO2 cathode, a graphite anode
and a non-aqueous liquid electrolyte (typical lithium-ion secondary battery as introduced by SONY
CORP. in 1991).

1.1 Lithium-Ion Batteries
3
In case of rechargeable Li metal based lithium-ion batteries, the limits were soon encountered.
The combination of Li metal/liquid electrolytes led to an irregular/uneven growth of Li on the
Li metal anode surface after each charge-discharge cycle. The resulting growth of dendrites
and their extension through several charging/discharging processes caused short circuits
leading to cell overheating and battery explosions. The severe safety issues consequently
fueled numerous work in the following years. Finally, this problem could be overcome using
graphite as the new anode material of choice since on the one hand Li can be reversibly
intercalated into the graphite layers at a low potential versus Li/Li+ (0.25 V) and on the other
hand, the formation of dendrites was circumvented.4 Furthermore, the increase in potential
when employing a graphite anode instead of Li metal was compensated by high-voltage
cathode materials (LiMO2 with M = Cr, Co, Ni; LiMn2O4).5 In 1991, SONY CORP. commercialized
the first lithium-ion secondary batteries (graphite anode, LiCoO2 cathode, porous polypropyl-
ene (PP) separator foil, non-aqueous liquid electrolytes, e.g. ethylene carbonate (EC) and pro-
pylene carbonate (PC) as solvent and LiPF6 as conducting salt).2,6 The functionality of such a
battery is depicted in Figure 1.2. Because of the rocking intercalation and deintercalation pro-
cesses, LIBs are commonly known as “shuttle-cock” or “rocking-chair” batteries.2,3 Examples
of different types of commercially available LIBs are shown in Figure 1.3.
Figure 1.3. Schematic drawings of different lithium-ion battery geometries: a) cylindrical, b) coin,
c) prismatic, and d) thin/flat. The figure was adopted from ref. 7.
1 Introduction
4
Regarding the improvements of the lithium-ion battery technology, three main fields
have to be considered inevitably: i) electrolytes, ii) cathode and iii) anode materials. In princi-
pal, desirable cathode and anode materials are those which possess high and low potentials
versus Li metal (i.e. high and low open-circuit voltages (OCVs) when cycled against Li) at high
rate capabilities and high specific capacities (volumetric and gravimetric, see Figure 1.1). Fur-
thermore, Li insertion and extraction should be reversible (cycle life). Concomitantly, it has to
be ascertained that electrolytes are stable within the operating voltage range to prevent their
oxidation or reduction. Safety and toxicity aspects are of further importance. In the following,
developments and viable improvements of anode materials are addressed.
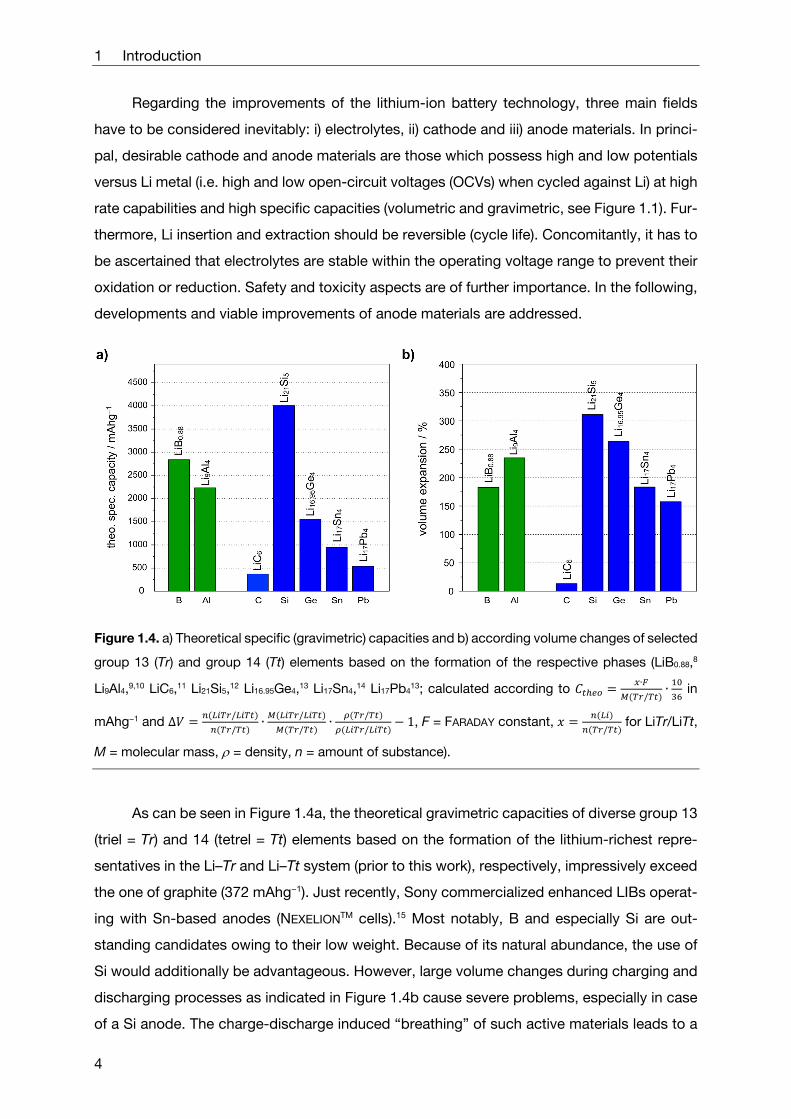
Figure 1.4. a) Theoretical specific (gravimetric) capacities and b) according volume changes of selected
group 13 (Tr) and group 14 (Tt) elements based on the formation of the respective phases (LiB0.88,8
Li9Al4,9,10 LiC6,11 Li21Si5,12 Li16.95Ge4,13 Li17Sn4,14 Li17Pb413; calculated according to
∙
/∙ in
mAhg−1 and ∆/
/∙
/
/∙
/
/1, F = FARADAY constant,
/ for LiTr/LiTt,
M = molecular mass, = density, n = amount of substance).
As can be seen in Figure 1.4a, the theoretical gravimetric capacities of diverse group 13
(triel = Tr) and 14 (tetrel = Tt) elements based on the formation of the lithium-richest repre-
sentatives in the Li–Tr and Li–Tt system (prior to this work), respectively, impressively exceed
the one of graphite (372 mAhg−1). Just recently, Sony commercialized enhanced LIBs operat-
ing with Sn-based anodes (NEXELIONTM cells).15 Most notably, B and especially Si are out-
standing candidates owing to their low weight. Because of its natural abundance, the use of
Si would additionally be advantageous. However, large volume changes during charging and
discharging processes as indicated in Figure 1.4b cause severe problems, especially in case
of a Si anode. The charge-discharge induced “breathing” of such active materials leads to a

1.1 Lithium-Ion Batteries
5
contact loss of metal electrodes, a pulverization of active material and finally massive capacity
fading during the first cycles.16 These problems were countered by several suggestions, e.g.
reducing the voltage range over which the cell is cycled,17,18 employing Si–C composites to
compensate for the large volume changes,19,20 and the use of nanostructured Si anodes.21,22
Besides, a fundamental understanding of processes in Si-based lithium-ion batteries
during charging and discharging is crucial. Limthongkul et al.23,24 have shown that a previously
crystalline Si anode undergoes complete amorphization when cycled against Li. None of the
known thermodynamically stable Li–Si phases, that were Li21Si5,12 Li13Si4,25 Li7Si3,26 Li12Si7,27,28
and LiSi29 by then, were formed directly by alloying Li and Si electrochemically. In 2004,
Obrovac and Hatchard investigated structural changes in silicon anodes and discovered the
new metastable phase Li15Si4 using ex-situ and in-situ X-ray diffraction methods, respec-
tively.18,30 Depending on the applied discharge voltage, Li15Si4 crystallizes from amorphous
Li3.75Si corresponding to a specific capacity of 3579 mAhg−1. Remarkably, the use of nano-
structured Si anodes completely suppressed its crystallization.30 Moreover, Kwon et al.31
demonstrated that the maximum capacity due to the formation of Li21Si5 can be extended to
4008 mAhg−1 at elevated temperatures (T > 100 °C).
Generally, when structural changes in Si anodes during Li insertion/extraction are stud-
ied, conventional methods such as X-ray diffraction due to the electrochemically driven amor-
phization deliver sparse information. Therefore, alternative techniques had to be employed.
To this end, structural changes in Si anodes upon lithiation were monitored using in-situ/ex-
situ solid state NMR techniques.32,33 It was shown that the local structure of amorphous
phases resembles that of crystalline ones (Li12Si7, Li7Si3, Li13Si4, Li15Si4). For that purpose and
because of the complexity of the (de)lithiation processes, an unambiguous structural charac-
terization of Li–Si phases and their assignment in the Li–Si phase diagram is essential.
1.2 Lithium-Rich Intermetallics
As highlighted in the previous chapter, phases of the binary system Li–Si and heavier homo-
logues are of significant importance when novel anode materials for LIBs are discussed. In
general, these phases belong to the family of “intermetallics” or “intermetallic phases” com-
prising of two or more (semi)metallic elements in a homogenous compound possessing either
a certain composition (line phases) or a homogeneity range. Their crystal structures differ from
those of the constituting elements. Consequentially, a slew of different structures may be
obtained from literally endless possible element combinations. Note that more than 80% of
naturally occurring elements in the earth crust are either metals or semimetals and thus the

1 Introduction
6
term “intermetallics” is rather wide-ranging than specific. Except for Zintl phases (see Chapter
1.3), there are no universally valid rules to explain structures and compositions which in most
cases do not correspond to the valences of the involved elements. Some phases can be
classified according to their valence electron concentration (VEC = sum of valence elec-
trons/number of atoms) or composition, i.e. Hume-Rothery- and Laves-phases, respectively.
Lithium-rich phases of the Li–Tt (Tt = Si, Ge, Sn, Pb) systems can be classified more specifi-
cally as polar intermetallics. In general, this class of compounds comprises electropositive
metals and electronegative (semi)metals. Again, structures and compositions cannot be de-
duced from simple electron counting rules and are frequently rather complex (exception: Zintl
phases).
Regarding their use as high-capacity anode materials in LIBs, considerable importance
is ascribed to lithium-rich polar intermetallics providing high specific capacities. In this regard,
the aforementioned representatives of the binary systems Li–Tt (Tt = Si, Ge, Sn, Pb) are very
promising, in particular, lithium-rich phases of the Li–Si system (see Figure 1.4). The Li–Ge
system receives less attention since it is greatly outperformed by the Li–Si system. In terms
of crystal structures, Li silicides and germanides provide an intriguing variety of different
structure motifs. For instance, 3-bonded Si atoms forming a defect diamond structure in LiSi29
(high-pressure phase, isotypic with LiGe34,35 which is obtainable at ambient pressure), planar
Si 4-stars and 5-rings in Li12Si7 (Li12Ge7),27,28 2-, 3-, and 4-bonded Ge atoms in polyanionic
layers 2∞[Ge12]7− of Li7Ge12,36-38 or Si–Si dumbbells in Li7Si3 (Li7Ge3).26,38 With respect to anode
materials, the lithium-richest candidates, Li15Tt418,39,40 and Li21Tt5 (Tt = Si, Ge),12,41 are most
important, though. Their structures exclusively bear isolated Tt atoms embedded in Li matri-
ces. Going from Tt-rich to Li-rich Li–Tt phases, the anionic Tt substructures are closely related
to Li–Tt ratios and compositions, respectively. Li uptake directly translates to successive
bond-breaking and therefore it is clear that highly Li-containing phases solely comprise iso-
lated Tt atoms in their structures.
Remarkably, despite their significance for recent LIB research, properties of lithium-rich
Li–Tt (Tt = Si, Ge) phases at both fundamental and applied levels are not yet conclusively
characterized. Recent examples in literature are surprisingly rare. In particular, the composi-
tions of the lithium-richest representatives are controversially discussed, e.g. Li22Tt5
(Li17.6Tt4),42,43 Li21Tt5 (Li16.8Tt4),12,41 Li20Tt5 (Li16Tt4),38,44 or Li16.95Ge4.13 Additionally, thermodynamic
properties are sparsely investigated, the decomposition characteristics of metastable Li15Si4
are barely studied, older structure reports need to be subject to review, and other phases
even seem to have disappeared. Relating to these aspects, both the Li–Si and Li–Ge phase
diagram, at least at the lithium-rich end, are unreliable and need a fundamental clarification.

1.3 Zintl Phases and OTFs
7
1.3 Zintl Phases and Open-Tetrahedral Frameworks
Another important class of compounds are Zintl phases.45-47 These are formed by electropo-
sitive alkaline, alkaline earth or rare earth metals (A/Ae/Re) and p-block (semi)metals (E). As-
suming a full electron transfer from A/Ae/Re to E, the structures of the “salt-like” compounds
can be explained as follows: i) the number of bonded neighboring atoms in the anionic sub-
structure E follows the 8−N rule (two-center, two-electron bonds), ii) the structures of E cor-
respond to those of elements with the same valence configuration (pseudoelement concept).
In case of cluster compounds, cluster shapes and the electron count can be explained ap-
plying Wade’s rules.48 Thus, various anionic substructures may be realized by Zintl phases,
e.g. isolated atoms (Ca2Si:49 Si4−), Cl2-like dumbbells (BaMg2Si2:50 [Si2]6−), deltahedral clusters
(K12Ge17:51 [Ge4]4−, [Ge9]4−), large cages (Li7RbGe8:52 [Ge4]4−, [Ge12]12−), polyanionic layers
(Li7Ge12:36,37 2∞[Ge12]7−, Li3NaSi6:53 2∞[Si6]4−), or three-dimensional networks (LiSi:29 Si−). Relating
to the Li–Si system, LiSi is the only representative whose structure is in unambiguous agree-
ment with the Zintl concept. For others, a Zintl-conform description is difficult or even impos-
sible.41 Regarding the properties of Zintl phases, they are semiconductors with small band
gaps and represent stoichiometric compounds.
Figure 1.5. Examples of open tetrahedral frameworks realized from Zintl phases and group 14 elements
emphasizing cages and channels. Symbols for nets follow either the zeolite code or the RCSR identi-
fiers.54 The figure was modified on the basis of ref. 55.

1 Introduction
8
Moreover, E atoms in Zintl phases may also realize open tetrahedral frameworks (Zintl
phase OTFs), an intriguing structure family which has received great attention for thermoe-
lectric and superconducting properties of its representatives.56-58 Generally, OTFs possess
large and separated cages (clathratic frameworks) or channels (zeolitic frameworks). Zintl
phase OTFs are composed of tetravalent group 14 elements (Tt = Si, Ge, Sn and mixtures
thereof) and trivalent group 13 elements (Tr) representing tetrahedral nodes (host structure).
The electron deficiency of the latter is balanced by electrons being completely transferred
from electropositive metals (M) which are located in the cavities (guest atoms). Consequently,
OTFs can formally be considered as (4b-Tt)n = (M+)m(4b-Tt)n−m(4b-Tr)m (4b = four-bonded).
The most prominent OTF representatives are clathrate-I (mep54) and clathrate-II (mtn)
structures such as K7B7Si39,59 K8Zn4Sn4260 and A8Na16Si136 (A = Rb, Cs, Ba),61,62 NaxSi136,63 re-
spectively (Figure 1.5). Others are zeolitic frameworks as realized by hP-Na2ZnSn5 (unj),64
tI-Na2ZnSn5 (unj),64 and Eu4Ga8Ge16 (CAS).65 Remarkably, except K7B7Si39, OTFs involving B
and C atoms are not known. Additionally, OTFs enclosing Li atoms at guest positions have
not been described yet since suitably small cages may only be realized by host structures
comprising the aforementioned light second row elements.66 Such phases, however, might
possess interesting physical and chemical properties.67,68 Notably, it was shown just recently
that the clathrate-II compound NaxSi136 (x → 0) can be lithiated electrochemically.69
Beside Zintl phase OTFs, OTFs of group 14 allotropes have always received significant
attention. In particular, the variety of physical and chemical properties of a single element
arising from different element modifications, e.g. the carbon allotropes diamond, graphite,
and fullerenes, fueled a slew of experimental and theoretical studies. For instance, the porous
structure Ge-cF136 (clathrate-II structure) was synthesized via polymerization and oxidation
of [Ge9]4− Zintl anions (Na4Ge9) in ionic liquids.70 Additionally, various mesoporous Ge-based
materials like cubic gyroidal MSU-Ge-1,71 hexagonal MSU-Ge-272 and NU-Ge-173 were ac-
cessible by either a metathesis reaction of the Zintl anions Ge4− (Mg2Ge)/deltahedral cluster
units [Ge9]4− (K4Ge9) with GeCl4 as linking agent or an oxidative polymerization of [Ge9]4− (K4Ge9)
without GeCl4. These reactions were carried out in the presence of structure-directing cationic
surfactants. Hexagonal nanoporous Ge could be prepared from an oxidative coupling of linear
polymer chains 1∞[Ge9]2− (K2Ge9) with ferrocenium hexafluorophosphate in a surfactant/ethy-
lenediamine solution.74 Moreover, the Ge allotrope m-allo-Ge (Figure 1.5) was obtained from
a mild oxidation of Li7Ge12, a phase that possesses two-dimensional polyanionic slabs
2∞[Ge12]7− which are separated by Li atoms.36,37,75 Interstitial Li is deintercalated by treatment of
Li7Ge12 with protic solvents retaining the topology of these layers under interlayer Ge–Ge bond
formation. At temperatures between 150 and 300 °C m-allo-Ge transforms into another

1.4 Scope and Outline
9
allotrope, 4H-Ge (Figure 1.5).36,76 Similar to Ge, an allotropic form of Si named allo-Si origi-
nates from an analogous oxidation of the phase Li3NaSi6 consisting of polyanionic layers
2∞[Si6]6− separated by Li and Na atoms.53 However, the reaction yields poorly crystalline prod-
ucts not allowing a comprehensive structure determination by X-ray diffraction methods. To
date, its structure has remained unknown and some structure models for allo-Si were pro-
posed by quantum chemical calculations.77
1.4 Scope and Outline
The significance of binary lithium-rich tetrelides (LixTty phases, x >> y), open tetrahedral frame-
works (OTFs) involving light elements in the second row of the periodic table, i.e. Li, B and C,
as well as the chemistry of allotropic forms of group 14 elements was highlighted in Chapters
1.1–1.3. These topics, both on fundamental and applied levels, are part of recent research on
cutting-edge materials which are ascribed a high potential for future applications such as
next-generation lithium-ion batteries or thermoelectrics. Despite that fact, essential questions
and issues as briefly commented afore have not been addressed prior to this work and some
intriguing fields are not or rather sparsely investigated.
In this regard, this thesis makes an important contribution and opens further perspec-
tives toward new materials in these fields of research. In detail, despite the great significance
of the Li–Si system for LIB research, in particular of the lithium-richest representatives such
as Li15Si4 and Li21Si5, fundamental questions are still unanswered and a comprehensive
characterization of the lithium-rich section of the Li–Si phase diagram (mole fraction Li
> 76 at.%) is more than overdue. Open issues are the composition of the lithium-richest
phase, the sparsely studied decomposition behavior of metastable Li15Si4 and the influence
of dopants, the (non)existence of a previously proposed phase Li4Si (Zintl phase), a critical
review of structures, and the thermodynamic relation of all involved phases. In this regard, the
compositions, structures and the thermodynamic relation of representatives of the Li–Ge sys-
tem also need a fundamental and comprehensive clarification. Therefore, a rigorous redeter-
mination of the Li–Si and Li–Ge phase diagram was carried out with differential scanning
calorimetry investigations employing samples with systematically different compositions.
Large single crystals of lithium-rich phases for X-ray diffraction studies were grown from equil-
ibrated melts (Li concentrations > 85 at.%, “flux method”) and separated by isothermally cen-
trifuging off excess melt at various temperatures. Powder samples of metastable Li15Si4 were
synthesized by ball-milling and investigated intensively with regard to the thermal behavior of
Li15Si4. The combination of DSC investigations, melt equilibration experiments, structural

1 Introduction
10
characterization by single crystal X-ray diffraction and long-term annealing of various samples
at different temperatures (phase composition analysis by powder X-ray diffraction) allowed a
fundamental revision of the Li–Si (mole fraction Li > 76 at.%) and Li–Ge (mole fraction Li
> 79 at.%) phase diagrams (Chapters 3.1.2 and 3.1.4). The aforementioned methods com-
bined with energy dispersive X-ray and NMR spectroscopy were applied for the characteri-
zation of Al-doped variants of Li15Si4 (Li15−xAlxSi4) and studies on the solid solution behavior of
the lithium-richest representatives of the Li–Tt (Tt = Si, Ge) systems (Chapters 3.1.3 and 3.1.5).
Another focus is set on OTFs realized by Zintl phases and group 14 elements. In detail,
Zintl phase OTFs involving light second row elements and allotropic forms of Si are of
particular interest since they might serve as potential electrode materials in LIBs. Therefore,
the Li–B–Si system was studied and the synthesis of the Si polymorph allo-Si which was first
reported in the 1980’s came under scrutiny in the course of the present thesis. Another moti-
vation for the reinvestigation of the formation of allo-Si is the fact that a structure has not been
determined from X-ray diffraction experiments as yet. Hence, the oxidation of Li3NaSi6 to
allo-Si was performed under inert gas atmosphere at various conditions (e.g. slow or fast
oxidation, different morphologies of the Li3NaSi6 precursor). In comparison, the extraction of
Li from Li15Si4 using liquid ammonia as solvent for Li was also investigated. Products from
both oxidation reactions were characterized comprehensively by powder X-ray diffraction,
differential thermal analysis as well as various spectroscopic and microscopic methods. This
allowed a careful analysis of differences between the products obtained from each reaction
and thus a clear statement on the existence of the Si polymorph allo-Si. According results are
presented in Chapter 3.2.2. Moreover, the miscibility of Ge and Si in Li3NaSi6 corresponding
to Li3Na(Si1−xGex)6 was investigated since such phases were conceived as precursors for
allo-Si1−xGex which might be interesting materials in terms of band gap tuning (Chapter 3.2.3).
Respective products were analyzed by powder and single crystal X-ray diffraction.
Turning to the Li–B–Si system, the boron-rich phase Li2B12Si2 was the only representa-
tive prior to this work. Thus, investigations using standard solid state synthesis techniques
(ambient pressure, high temperature) targeted the discovery of new, and in particular, lithium-
richer phases. However, the accessibility to novel materials turned out to be very limited and
thus, high-pressure high-temperature experiments were performed at the high-pressure fa-
cility of the ARIZONA STATE UNIVERSITY (Tempe, AZ, USA) in a series of research stays. These
investigations yielded a second representative of the ternary system Li–B–Si. The novel phase
was structurally characterized by powder X-ray diffraction, solid state NMR and Raman spec-
troscopy (Chapter 3.2.4).

1.5 References
11
1.5 References
(1) World Commission on Environment and Development, Our Common Future; Oxford
University Press, 1987; p 43.
(2) Nazri, G.-A.; Pistoia, G. Lithium Batteries - Science and Technology 6ed.; Kluwer
Academic Publishers: USA, 2004.
(3) Ozawa, K. Lithium Ion Rechargeable Batteries; 6 ed.; Wiley VCH: Germany, 2009.
(4) Owen, J. R. Chem. Soc. Rev. 1997, 26, 259.
(5) Whittingham, M. S. Chem. Rev. 2004, 104, 4271.
(6) Nagaura, T.; Tozawa, K. Prog. Batteries Solar Cells 1990, 9, 209.
(7) Tarascon, J. M.; Armand, M. Nature 2001, 414, 359.
(8) Wörle, M.; Nesper, R. Angew. Chem. Int. Edit. 2000, 39, 2349.
(9) Hansen, D. A.; Smith, J. F. Acta Crystallogr. B 1968, 24, 913.
(10) Puhakainen, K.; Boström, M.; Groy, T. L.; Häussermann, U. J. Solid State Chem. 2010,
183, 2528.
(11) Juza, R.; Wehle, V. Naturwissenschaften 1965, 52, 560.
(12) Nesper, R.; von Schnering, H. G. J. Solid State Chem. 1987, 70, 48.
(13) Goward, G. R.; Taylor, N. J.; Souza, D. C. S.; Nazar, L. F. J. Alloys Compd. 2001, 329,
82.
(14) Lupu, C.; Mao, J. G.; Rabalais, J. W.; Guloy, A. M.; Richardson, J. W. Inorg. Chem.
2003, 42, 3765.
(15) Sony Corp., Sony's New Nexelion Hybrid Lithium Ion Batteries To Have Thirty-Percent
More Capacity Than Conventional Offering,
http://www.sony.net/SonyInfo/News/Press/200502/05-006E/ (accessed February 10,
2014)
(16) Zhang, W. J. J. Power Sources 2011, 196, 13.
(17) Obrovac, M. N.; Krause, L. J. J. Electrochem. Soc. 2007, 154, A103.
(18) Obrovac, M. N.; Christensen, L. Electrochem. Solid-State Lett. 2004, 7, A93.
(19) Cahen, S.; Janot, R.; Laffont-Dantras, L.; Tarascon, J. M. J. Electrochem. Soc. 2008,
155, A512.
(20) Cakan, R. D.; Titirici, M. M.; Antonietti, M.; Cui, G. L.; Maier, J.; Hu, Y. S. Chem.
Commun. 2008, 3759.
(21) Chan, C. K.; Peng, H.; Liu, G.; McIlwrath, K.; Zhang, X. F.; Huggins, R. A.; Cui, Y. Nat.
Nanotechnol. 2008, 3, 31.
(22) Cui, L.-F.; Ruffo, R.; Chan, C. K.; Peng, H.; Cui, Y. Nano Lett. 2009, 9, 491.
(23) Limthongkul, P.; Jang, Y. I.; Dudney, N. J.; Chiang, Y. M. Acta Mater. 2003, 51, 1103.

1 Introduction
12
(24) Limthongkul, P.; Jang, Y. I.; Dudney, N. J.; Chiang, Y. M. J. Power Sources 2003, 119-
121, 604.
(25) Frank, U.; Müller, W.; Schäfer, H. Z. Naturforsch. B 1975, 30, 10.
(26) von Schnering, H. G.; Nesper, R.; Tebbe, K. F.; Curda, J. Z. Metallkd. 1980, 71, 357.
(27) von Schnering, H. G.; Nesper, R.; Curda, J.; Tebbe, K. F. Angew. Chem. 1980, 92, 1070.
(28) Nesper, R.; von Schnering, H. G.; Curda, J. Chem. Ber. 1986, 119, 3576.
(29) Evers, J.; Oehlinger, G.; Sextl, G. Angew. Chem. Int. Ed. 1993, 32, 1442.
(30) Hatchard, T. D.; Dahn, J. R. J. Electrochem. Soc. 2004, 151, A838.
(31) Kwon, J. Y.; Ryu, J. H.; Oh, S. M. Electrochim. Acta 2010, 55, 8051.
(32) Key, B.; Bhattacharyya, R.; Morcrette, M.; Seznec, V.; Tarascon, J. M.; Grey, C. P. J.
Am. Chem. Soc. 2009, 131, 9239.
(33) Key, B.; Morcrette, M.; Tarascon, J. M.; Grey, C. P. J. Am. Chem. Soc. 2011, 133, 503.
(34) Oleksiv, G. I. Probl. Rozvitku Prirodn. i. Tochn. Nauk, Sb. 1964, 76.
(35) Menges, E.; Hopf, V.; Schäfer, H.; Weiss, A. Z. Naturforsch. B 1969, 21, 1351.
(36) Grüttner, A.; Nesper, R.; von Schnering, H. G. Angew. Chem. Int. Ed. 1982, 21, 912.
(37) Kiefer, F.; Fässler, T. F. Solid State Sci. 2011, 13, 636.
(38) Grüttner, A.; Nesper, R.; von Schnering, H. G. Acta Cryst. 1981, A37, C161.
(39) Johnson, Q.; Smith, G. S.; Wood, D. Acta Cryst. 1965, 18, 131.
(40) Gladyshevskii, E. I.; Kripyakevich, P. I. Kristallografiya 1960, 5, 574.
(41) Nesper, R. Prog. Solid State Chem. 1990, 20, 1.
(42) Gladyshevskii, E. I.; Oleksiv, G. I.; Kripyakevich, P. I. Kristallografiya 1964, 9, 338.
(43) Axel, H.; Schäfer, H.; Weiss, A. Z. Naturforsch. B 1966, 21, 115.
(44) Grüttner, A. Dissertation, Universität Stuttgart: Stuttgart, Germany, 1982.
(45) Zintl, E. Angew. Chem. 1939, 52, 1.
(46) Klemm, W. Proc. Chem. Soc. 1958, 329.
(47) Klemm, W.; Busmann, E. Z. Anorg. Allg. Chem. 1963, 319, 297.
(48) Wade, K. Adv. Inorg. Chem. Radiochem. 1976, 18, 1.
(49) Eckerlin, P.; Wölfel, E. Z. Anorg. Allg. Chem. 1955, 280, 321.
(50) Eisenman.B; Schäfer, H. Z. Anorg. Allg. Chem. 1974, 403, 163.
(51) von Schnering, H. G.; Baitinger, M.; Bolle, U.; Carrillo-Cabrera, W.; Curda, J.; Grin, Y.;
Heinemann, F.; Llanos, J.; Peters, K.; Schmeding, A.; Somer, M. Z. Anorg. Allg. Chem.
1997, 623, 1037.
(52) Bobev, S.; Sevov, S. C. Angew. Chem. Int. Ed. 2001, 40, 1507.
(53) von Schnering, H. G.; Schwarz, M.; Nesper, R. J. Less-Common Met. 1988, 137, 297.

1.5 References
13
(54) Symbols for nets follow either the zeolite code according to ref. 54a or the RCSR iden-
tifiers according to ref. 54b; a) Baerlocher, C.; Meier, W. M.; Olson, D. H. Atlas of Zeolite
Framework Types, 6th rev. ed., Elsevier, Amsterdam, 2007. Data available online at
http://www.iza-structure.org/databases/; (b) O'Keeffe, M.; Peskov, M. A.; Ramsden, S.
J.; Yaghi, O. M. Acc. Chem. Res. 2008, 41, 1782.
(55) Zeilinger, M.; van Wüllen, L.; Benson, D.; Kranak, V. F.; Konar, S.; Fässler, T. F.;
Häussermann, U. Angew. Chem. Int. Ed. 2013, 52, 5978.
(56) Beekman, M.; Nolas, G. S. J. Mater. Chem. 2008, 18, 842.
(57) Nolas, G. S.; Cohn, J. L.; Slack, G. A.; Schujman, S. B. Appl. Phys. Lett. 1998, 73, 178.
(58) Yamanaka, S. Dalton Trans. 2010, 39, 1901.
(59) Jung, W.; Lorincz, J.; Ramlau, R.; Borrmann, H.; Prots, Y.; Haarmann, F.; Schnelle, W.;
Burkhardt, U.; Baitinger, M.; Grin, Y. Angew. Chem. Int. Ed. 2007, 46, 6725.
(60) Baran, V.; Fischer, A.; Scherer, W.; Fässler, T. F. Z. Anorg. Allg. Chem. 2013, 639, 2125.
(61) Bobev, S.; Sevov, S. C. J. Solid State Chem. 2000, 153, 92.
(62) Rachi, T.; Tanigaki, K.; Kumashiro, R.; Winter, J.; Kuzmany, H. Chem. Phys. Lett. 2005,
409, 48.
(63) Ammar, A.; Cros, C.; Pouchard, M.; Jaussaud, N.; Bassat, J. M.; Villeneuve, G.; Duttine,
M.; Menetrier, M.; Reny, E. Solid State Sci. 2004, 6, 393.
(64) Stegmaier, S.; Kim, S. J.; Henze, A.; Fässler, T. F. J. Am. Chem. Soc. 2013, 135, 10654.
(65) Bryan, J. D.; Stucky, G. D. Chem. Mater. 2001, 13, 253.
(66) Liang, Y.; Böhme, B.; Ormeci, A.; Borrmann, H.; Pecher, O.; Haarmann, F.; Schnelle,
W.; Baitinger, M.; Grin, Y. Chem. Eur. J. 2012, 18, 9818.
(67) Ker, A.; Todorov, E.; Rousseau, R.; Uehara, K.; Lannuzel, F. X.; Tse, J. S. Chem. Eur. J.
2002, 8, 2787.
(68) Rey, N.; Munoz, A.; Rodriguez-Hernandez, P.; San Miguel, A. J. Phys.-Condens. Mat.
2008, 20.
(69) Langer, T.; Dupke, S.; Trill, H.; Passerini, S.; Eckert, H.; Pöttgen, R.; Winter, M. J.
Electrochem. Soc. 2012, 159, A1318.
(70) Guloy, A. M.; Ramlau, R.; Tang, Z.; Schnelle, W.; Baitinger, M.; Grin, Y. Nature 2006,
443, 320.
(71) Armatas, G. S.; Kanatzidis, M. G. Nature 2006, 441, 1122.
(72) Armatas, G. S.; Kanatzidis, M. G. Science 2006, 313, 817.
(73) Armatas, G. S.; Kanatzidis, M. G. Adv. Mater. 2008, 20, 546.
(74) Sun, D.; Riley, A. E.; Cadby, A. J.; Richman, E. K.; Korlann, S. D.; Tolbert, S. H. Nature
2006, 441, 1126.
(75) Kiefer, F.; Karttunen, A. J.; Döblinger, M.; Fässler, T. F. Chem. Mater. 2011, 23, 4578.

1 Introduction
14
(76) Kiefer, F.; Hlukhyy, V.; Karttunen, A. J.; Fässler, T. F.; Gold, C.; Scheidt, E. W.; Scherer,
W.; Nylen, J.; Häussermann, U. J. Mater. Chem. 2010, 20, 1780.
(77) Conesa, J. C. J. Phys. Chem. B 2002, 106, 3402.
15
Chapter 2
Experimental Section
2.1 Sample Handling and Preparation
Handling air- and moisture sensitive samples and preparations for solid state reactions were
carried out in a glove box (MBRAUN, Ar atmosphere, H2O and O2 levels < 0.1 ppm). A high-
vacuum all-glass Schlenk line supplied with purified Ar (dried over P2O5, molecular sieve, and
heated (T = 750 °C) titanium sponge) was additionally used for handling air- and moisture
sensitive materials, oxidation reactions in Schlenk tubes under Ar atmosphere or heating
metal ampules and elements under dynamic vacuum (p < 1∙10−3 mbar).
2.2 Synthesis
2.2.1 Starting Materials
Shapes and purities of starting materials are listed in Table 2.1. All elements were stored
inside an Ar-filled glove box. Residual oxides or nitrides on the surface of Li and Na rods were
removed by cutting. Prior to use, Si, Ge and B were heated to 800 °C (Si, Ge) and 1100 °C (B)
under dynamic vacuum (p < 1∙10−3 mbar) for several hours and transferred to the glove box
subsequently. Liquid ammonia was dried over Na using a custom-built high-vacuum all-glass
Schlenk line supplied with purified argon (see Chapters 2.1 and 2.2.7).

2 Experimental Section
16
Table 2.1. Specifications of starting materials.
Element Shape Supplier Purity
Li rods Rockwood Lithium 99%
Li rods Sigma-Aldrich (USA) 99.9%
Li foil (0.5 mm thickness) Rockwood Lithium 99.8%
Na rods Merck 99%
B chunks Chempur 99.95%
Al granules Chempur 99.99%
Si powder Alfa Aesar/Sigma- Aldrich
99.999%
Ge chunks Chempur 99.999%
NH3 gas Westfalen AG 99.98% (dried over Na)
Ethanol liquid - technical grade (dried over Na)
2.2.2 Reaction Containers and Sample Storage
Depending on the batch size of the experiment, Ta (purity > 99.99%) ampules with
OD = 10 mm, ID = 9 mm, L = 5–6 cm or OD = 12.7 mm, ID = 11.7 mm, L = 8–10 cm served
as reaction containers. Prior to use, according Ta tubes and custom-built Ta lids were suc-
cessively cleaned in ethanol, acetic acid, and acetone under ultrasonification and pre-dried
in a drying oven at 120 °C. Subsequently, tubes and lids were transferred to a silica Schlenk
tube and heated at 1000 °C under dynamic vacuum (p < 1∙10−3 mbar) for several hours. Inside
an Ar-filled glove box, lids were pressed onto the tubes and arc-welded (water-cooled arc
furnace, MAM-1, JOHANNA OTTO GmbH). After the accordingly prepared ampules were loaded
with samples or reaction mixtures, they were roughly closed either by crimping the open end
or pressing a lid on top of them. Thereafter, ampules were sealed by arc-welding under cool-
ing and an Ar-pressure of approximately 400–600 mbar. To prevent oxidation of Ta reaction
containers during annealing in furnaces, ampules were encapsulated in silica jackets under
vacuum using a high-vacuum all-glass Schlenk line (see Chapter 2.1).
Due to their extreme sensitivity toward air and moisture, synthesized samples were
stored either in stainless steel (OD = 12.7 mm, ID = 11.7 mm) or glass ampules (OD = 10 mm,
ID = 7 mm). The latter were self-made and prepared for plugging and sealing at a high-
vacuum all-glass Schlenk line supplied with purified Ar (see Chapter 2.1) to guarantee com-
plete exclusion of air and moisture. The sealed ends of glass ampules were additionally
coated with apiezon wax (APIEZON-WAX W).

2.2 Synthesis
17
2.2.3 Furnaces
Reaction mixtures or samples as prepared for annealing according to Chapter 2.2.2 and 2.2.4
were vertically placed into muffle furnaces (Tmax. = 1100 °C, P330 controller, NABERTHERM
GmbH). The monitored temperatures were additionally verified by an external Typ S thermo-
couple.
2.2.4 Melt Equilibration Experiments and Isothermal
Melt-Centrifugation
Melt equilibration experiments (Li–Tt (Tt = Si, Ge) melts with Li concentrations > 85 at.%) were
carried out in specially prepared ampules (OD = 12.7 mm, ID = 11.7 mm) either fabricated
from Ta (purity > 99.99%) or stainless steel (Figure 2.1a). The procedure for cleaning Ta parts
follows the methodology already described in Chapter 2.2.2. Pieces made from stainless steel
were successively cleaned in ethanol and acetone under ultrasonification, pre-dried in a dry-
ing oven at 120 °C, and finally heated at 800 °C inside a silica Schlenk tube under dynamic
vacuum (p < 1∙10−3 mbar) for several hours.
Figure 2.1. a) Specially prepared ampule for melt equilibration experiments according to ref. 1 (1 = top
lid, 2 = sample space, 3 = filter lid with 0.5 mm holes, 4 = centrifugation space, 5 = bottom lid) and
b–e) steps of synthesis.
The procedure of a typically performed melt equilibration experiment is depicted in Fig-
ure 2.1. If Ta ampules were employed, these had to be encapsulated inside silica jackets to
prevent oxidation. Contrary, stainless steel ampules can be used up to 800 °C without

2 Experimental Section
18
additional protection. The experiments were finally terminated by isothermally centrifuging off
excess melt at various temperatures (centrifugation at 3000 rpm for 3 min, model HERAEUS
MEGAFUGE 1.0; see Figure 2.1e).
2.2.5 Ball-Milling
Ball-milling experiments were carried out with a RETSCH PM 100 planetary ball mill. The reac-
tion mixtures were loaded into a stainless steel jar (V = 50 mL, ball charge: 3 pieces with a
diameter of 15 mm) inside an Ar-filled glove box. Subsequently, the jar was hermetically
sealed using a safety closure device and transferred to the ball mill outside the glove box.
Typical ball-milling parameters were 12–24 h duration with intervals of 10 min at 250 rpm
followed by a 2–4 min break and direction reversal. Thereafter, products were recovered in-
side the glove box and obtained as fine powders.
2.2.6 High-Pressure High-Temperature Synthesis
High-pressure high-temperature experiments were performed at the high-pressure facility at
the ARIZONA STATE UNIVERSITY (Tempe, AZ, USA) in a 6–8 Walker-type multi-anvil high-pres-
sure device using an 18/12 assembly developed by Stoyanov et al.2 A NaCl capsule served
as reaction container (ID = 4 mm, OD = 6 mm, L = 8 mm; prepared from NaCl; dried under
vacuum at 250–300 °C). It was loaded with the reaction mixture inside a glove box (MBRAUN,
Ar atmosphere, H2O and O2 levels < 0.1 ppm) and sealed by pressing salt on top of the open
end. Subsequently, the NaCl sample capsules were inserted in the high-pressure cell assem-
bly. 25 mm tungsten carbide cubes truncated to 12 mm edge length were used to pressurize
the samples at rate of about 0.5 GPa∙h−1. After reaching the target pressure (deviations are
+/− 0.3 GPa) specified temperature programs were applied. The temperature was measured
close to the sample using a thermocouple type C (W5%Re – W26%Re wire) in an Al2O3 sleeve.
Usually, the reactions were terminated by quenching the samples through turning off the
power to the furnace (quenching rate ~50 °C∙min−1 at approximately constant pressure).
Thereafter, the pressure was released slowly at a rate of ~0.5 GPa∙h−1 and the samples were
recovered inside the glove box. The different steps of preparing an 18/12 assembly for a
typical high-pressure high-temperature experiment are depicted in Figure 2.2.

2.2 Synthesis
19
Figure 2.2. Steps of preparing an 18/12 assembly for a high-pressure high-temperature experiment in
a 6–8 Walker-type multi-anvil high-pressure device.
2.2.7 Li-Extraction Using Liquid Ammonia
Liquid ammonia (dried over Na, see Chapter 2.2.1) was used for extracting Li from solids. This
was carried out with a custom-built apparatus shown in Figure 2.4a. Prior to extraction cycles,
the solid was filled onto the frit of the extractor inside an Ar-filled glove boxed. Subsequently,
the closed device was connected to a custom-built high-vacuum all-glass Schlenk line sup-
plied with purified argon (see Chapter 2.1) and liquid ammonia (Figure 2.3). For condensing
ammonia onto the sample, the respective part is cooled with a mixture of isopropanol and dry
ice (−78 °C). When closing valve (1) and cooling the reservoir (see Figure 2.4b), liquid ammonia

2 Experimental Section
20
Figure 2.3. High-vacuum all-glass Schlenk line (borosilicate glass) supplied with purified argon. Am-
monia is dried over sodium by condensing it into the sodium-filled cooling-trap. Adopted from ref. 3.

2.2 Synthesis
21
flows into the reservoir. If valve (1) is opened and the sample space is cooled again, the pro-
cedure can be repeated (see Figure 2.4c). At the end of the extraction procedure, liquid am-
monia is evaporated from the reservoir and the product is recovered inside the glove box.
Figure 2.4. a) Custom-built apparatus for extracting Li from solids using liquid ammonia. An example
of an extraction process is shown in (b) and (c): A deep blue color is observed as soon as ammonia is
condensed onto Li15Si4 (b), extracted Li (concentrated metallic bronze solution of Li in NH3) and LiNH2
remains in the reservoir (c). The figure was adopted from Chapter 5.6.
2.2.8 Experimental Contributions from Coauthors
Table 2.2. Experimental contributions from coauthors to respective publications.
Publication Author Contributions
Chapters 5.1, 5.2, 5.3, 5.5
– –
Chapter 5.4 Volodymyr Baran synthesis of various Li15−xAlxSi4 phases, single crystal X-ray diffraction of Li14.37Al0.63Si4
Chapter 5.6 Lavinia M. Scherf investigations on the solid solution behavior of Li3Na(Si1−xGex)6 and Li7(Ge1−ySiy)12 as precursors for allo-Si1−xGex and allo-Ge1−ySiy, respectively.4
Florian J. Kiefer investigations on the synthesis of allo-Si, see also ref. 5
Chapter 5.7 Lavinia M. Scherf (first author)
investigations on the solid solution behavior of Li3Na(Si1−xGex)6, synthesis and characterization of Li18Na2Ge17
Chapter 5.8 Sumit Konar Raman spectra of LiBSi2, support during high-pressure high-temperature experiments

2 Experimental Section
22
2.3 Characterization
2.3.1 Powder X-ray Diffraction (PXRD)
PXRD patterns were recorded on a STOE STADI P diffractometer (Ge(111) monochromator for
CuKα1 radiation, λ = 1.54056 Å) equipped with a DECTRIS MYTHEN DCS 1K solid state detec-
tor. All samples were ground in agate mortars and sealed inside glass capillaries (OD = 0.3,
0.5, 0.7, HILGENBERG GmbH). Measurements (Debye-Scherer geometry) were performed in a
2-range of 5–90° (PSD steps: 0.06–1.50°; time/step: 10–40 s).
Raw data were handled with the STOE WinXPOW software package.6 PXRD patterns
were visualized with the ORIGIN 8.0 software.7 For the phase identification, the SEARCH/MATCH
module as implemented in the WinXPOW software,6 the ICSD (FINDIT),8 and the PEARSON’S
CRYSTAL DATA9 crystallographic databases were used. Rietveld refinements were performed
with the BRUKER software TOPAS 4.0.10 Ab initio structure determination from X-ray powder
diffraction data was done using the parallel tempering algorithm implemented in the software
FOX.11-13 Structure solutions are approached by starting with reasonable “structural building
blocks”. Solutions are finalized by Rietveld refinement applying the final structure model ob-
tained from FOX.
2.3.2 Single Crystal X-ray Diffraction, Structure Solution
and Refinement
Using a microscope installed at an Ar-filled glove box, all single crystals were selected and
cut in perfluoropolyalkylether or grease on a glass slide. The best specimens were placed
inside glass capillaries with glass fibers. Subsequently, the funnels of the capillaries were filled
with grease to guarantee exclusion of air and moisture during flame-sealing outside the glove
box. Finally, the accordingly prepared capillaries were glued to copper pins suitable for
mounting on the goniometer.
Single crystal X-ray diffraction experiments were performed at X-ray diffractometers
from STOE (IPDS 2T), BRUKER and OXFORD DIFFRACTION using the X-AREA,14 APEX2,15 and
CRYSALISRED software packages,16 respectively. The BRUKER devices are equipped with CCD
detectors (APEX II, κ-CCD) and either a fine-focused sealed tube with MoKα radiation
(λ = 0.71073 Å) and a graphite monochromator or a NONIUS FR591 rotating anode (MoKα
radiation) with a Montel mirror. The STOE IPDS 2T is operated with a rotating anode
(λ = 0.71073 Å, MoKα radiation) and a Montel mirror. The OXFORD XCALIBUR3 diffractometer is
equipped with a Sapphire3 CCD detector and a graphite monochromated MoKα radition

2.3 Characterization
23
(λ = 0.71073 Å). Integration, data reduction and absorption correction was done with X-AREA,
X-RED, X-SHAPE (STOE),14,17,18 SAINT, SADABS (BRUKER),19,20 and CRYSALISRED (OXFORD DIF-
FRACTION).16 The space groups were assigned on the basis of the systematic absences and
the statistical analysis of the intensity distributions. The structures were solved with direct
methods (SHELXS21) and refined with full-matrix least squares on F2 (SHELXL22). Difference
Fourier maps Fo−Fc were calculated with JANA 2006.23 Crystallographic information files (CIF)
were generated with enCIFer24 and publCIF25 using the IUCr-CIF template. CIFs were finally
checked with the CHECKCIF routine.26 Structures were visualized with the DIAMOND 3.2d soft-
ware.27
2.3.3 Differential Scanning Calorimetry (DSC) and
Differential Thermal Analysis (DTA)
Differential scanning calorimetry and differential
thermal analysis investigations were performed with
a NETZSCH DSC 404 Pegasus apparatus equipped
with either a DSC or DTA carrier system. Niobium
crucibles for DSC and DTA measurements (Fig-
ure 2.5) were thoroughly cleaned (analogously to
Chapter 2.2.2), heated to 1000 °C under dynamic
vacuum (p < 1∙10−3 mbar) for 2 h and transferred to
an Ar-filled glove box. Crucibles were loaded with
30–50 mg of sample. The open end was crimped
and then sealed by arc-welding inside the glove box
under cooling (see also Chapter 2.2.2). A sealed
crucible without sample served as reference. All
measurements were performed under an Ar-flow of
60–70 mL∙min−1 and a heating/cooling rate of
10 K∙min−1. Samples were recovered after the
measurement by opening the niobium crucibles in-
side an Ar-filled glove box. Data handling was done
with the program PROTEUS THERMAL ANALYSIS.28
The device was calibrated for temperature by determining the melting and crystallization
points of reference materials (In, Sn, Zn, Al, Ag). Note that in most cases the obtained onsets
Figure 2.5. Drawings of cylindrical Nb cru-
cibles used for a) DSC and b) DTA
measurements.
2 Experimental Section
24
of effects assigned to melting and recrystallization were almost identical. Otherwise, differ-
ences were marginal (±1 K) and according values were merged for the calibration curve.
2.3.4 Scanning Electron Microscopy (SEM) and Energy Dispersive
X-ray Spectroscopy (EDX)
A JEOL-JSM 7500F scanning electron microscope (FE-SEM) equipped with an OXFORD X-MAX
EDX analyzer with Mn as internal standard was used to determine elements with atomic num-
bers larger than four. Samples were handled inside an Ar-filled glove box or outside if not air
sensitive and fixed on a graphite platelet which was attached to an aluminum stub. Measure-
ments were performed by Dipl. Min. Katia Rodewald at the INSTITUT FÜR SILICIUMCHEMIE der
TECHNISCHEN UNIVERSITÄT MÜNCHEN (Germany).
2.3.5 Nuclear Magnetic Resonance (NMR) Spectroscopy
Solid state NMR-spectroscopy was carried out by Prof. Dr. Leo van Wüllen (UNIVERSITY OF
AUGSBURG, Germany). 7Li- and 11B-MAS (magic angle spinning) NMR spectra were collected
on a VARIAN VNMRs 500, and 27Al NMR data were acquired on a BRUKER AVANCE III spectrom-
eter. For details, refer to according publications in Chapter 5.4 and 5.8, respectively.
2.3.6 Transmission Electron Microscopy (TEM)
Transmission electron microscopy and selected area electron diffraction (SAED) were per-
formed by Prof. Dr. Lorenz Kienle (UNIVERSITY OF KIEL, Germany) with a PHILIPS CM30 ST
microscope (LaB6 cathode, 300 kV acceleration voltage, Cs = 1.15 mm) equipped with a
GATAN multiscan CCD camera. EDX analysis as part of TEM examinations were carried out
with a NORAN VOYAGER EDX system. For details, refer to the respective manuscript in
Chapter 5.6.

2.3 Characterization
25
2.3.7 Infrared (IR) and Raman Spectroscopy
A VARIAN 670-IR FT-IR spectrometer equipped with a PIKE GladiATR ATR stage was employed
for the acquisition of ATR-FT-IR spectra. The VARIAN RESOLUTION PRO software was used for
data handling.29
Raman spectra data were recorded at the spectroscopy facility of the UNIVERSITY of
STOCKHOLM (Stockholm, Sweden; M. Sc. Sumit Konar) using a LABRAM HR 800 spectrometer
equipped with an 800 mm focal length spectrograph and a back thinned CCD detector. For
sample excitation, an air cooled double frequency Nd:YAG laser (532 nm, 5.6 mW) and an air
cooled intra cavity regulated laser diode with point source (785 nm, 0.88 mW) were used. The
laser was focused using a 50X super long working distance (20.5 mm) Mitutoyo objective with
a numerical aperture of 0.42 and depth of focus of 1.6 mm. More specific experimental details
are described in Chapters 5.6 and 5.8.
2.3.8 Photoluminescence (PL) Spectroscopy
PL-spectroscopy was carried out at the ARIZONA STATE UNIVERSITY (Tempe, AZ, USA;
Dr. Christian Poweleit) using a 532 nm CW doubled Nd:YAG laser for photoexcitation. The
collected energy was energy dispersed through a 0.5 m ACTON spectrometer with and a back-
thinned liquid nitrogen cooled PRINCETON INSTRUMENTS CCD camera. Further details are de-
scribed in Chapter 5.6.
2.3.9 Elemental Analysis
Elemental analysis was provided as service of the micro-analytical laboratory of the
TECHNISCHEN UNIVERSITÄT MÜNCHEN (Germany). The lithium content in samples was deter-
mined by atomic absorption spectroscopy using a VARIAN AA280FS device. C,H, and N con-
tents were obtained from a HEKATECH EURO EA CHNSO-Analyzer.

2 Experimental Section
26
2.4 Computational Methods
Quantum chemical calculations were exclusively performed by coauthors. Relevant publica-
tions (investigated compounds referenced with Chapters), according coauthor names and
employed programs are listed below.
a) LiBSi2 (see Chapter 5.8), Dr. Daryn Benson (ARIZONA STATE UNIVERSITY, Tempe, AZ,
USA): VIENNA AB INITIO SIMULATION PACKAGE (VASP),30,31 Prof. Dr. Leo van Wüllen (UNI-
VERSITY OF AUGSBURG, Germany): WIEN2k32
b) allo-Si (see Chapter 5.6), M.Sc. Laura A. Jantke (TECHNISCHE UNIVERSITÄT MÜNCHEN,
Germany), Dr. Antti Karttunen (UNIVERSITY OF JYVÄSKYLÄ, Finland): CRYSTAL09 software
package33
c) Li15Si4, "Li16Si4" and "Li16.5Si4" (structure models for Li16.42Si4), Li17Si4 (see Chapter 5.1
and 5.2), Dr. Daryn Benson (ARIZONA STATE UNIVERSITY, Tempe, AZ, USA): VIENNA AB
INITIO SIMULATION PACKAGE (VASP),30,31 M. Sc. Iryna M. Kurylyshyn (TECHNISCHE UNIVER-
SITÄT MÜNCHEN, Germany): WIEN2k32
Specific details on the theoretical calculations may be obtained from the publications and
manuscripts as cited above.
2.5 References
(1) Puhakainen, K.; Boström, M.; Groy, T. L.; Häussermann, U. J. Solid State Chem. 2010,
183, 2528.
(2) Stoyanov, E.; Häussermann, U.; Leinenweber, K. High Pressure Res. 2010, 30, 175.
(3) Zeilinger, M. Master's Thesis, Technische Universität München: München, Germany,
2010.
(4) Scherf, L. M. Master's Thesis, Technische Universität München: München, Germany,
2013.
(5) Kiefer, F. Dissertation, Technische Universität München: München, Germany, 2010.
(6) WinXPOW, Version 2.08a; STOE & Cie GmbH: Darmstadt, Germany, 2003.
(7) Origin Pro 8, Version 8.0724; Origin Lab Corp.: Northampton, MA, USA, 2007.
(8) FindIt, Inorganic Crystal Structure Database (ICSD), Version 1.9.2, ICSD-Database
Version 2013-1; Fachinformationszentrum Karlsruhe (FIZ): Karlsruhe, Germany, 2013.

2.5 References
27
(9) Villars, P.; Cenzual, K. Pearson's Crystal Data: Crystal Structure Base for Inorganic
Compounds, Version 1 (Release 2007/8), ASM International: Materilas Park, Ohio,
USA, 2003.
(10) TOPAS - Rietveld Software, Version 4.0; Bruker AXS Inc.: Madison, WI, USA, 2009.
(11) Favre-Nicolin, V.; Cerny, R. J. Appl. Crystallogr. 2002, 35, 734.
(12) Cerny, R.; Favre-Nicolin, V. Powder Diffr. 2005, 20, 359.
(13) FOX program, F.O.X., Free Objects for Crystallography V 1.9.7.0,
http://objcryst.sourceforge.net., 2011.
(14) X-Area, Version 1.26 - Single Crystal Diffraction Software. Stoe & Cie.: Darmstadt
(Germany), 2004.
(15) APEX suite of crystallographic software, APEX 2 Version 2008.4; Bruker AXS Inc.:
Madison, WI, USA, 2008.
(16) CrysalisRED, Version 1.171.33.34d; Oxford Diffraction: UK, 2009.
(17) X-Red, Version 1.26 - Data Reduction Program. Stoe & Cie.: Darmstadt (Germany),
2004.
(18) X-Shape, Version 2.05 - Crystal Optimization for Numerical Absorption Correction.
Stoe & Cie.: Darmstadt (Germany), 2004.
(19) SAINT, Version 7.56a; Bruker AXS Inc.: Madison, WI, USA, 2008.
(20) SADABS, Version 2008/1; Bruker AXS Inc.: Madison, WI, USA, 2008.
(21) Sheldrick, G. M. Shelxs-97 - Program for the Determination of Crystal Structures,
University of Göttingen: Göttingen, Germany, 1997.
(22) Sheldrick, G. M. Shelxl-97 - Program for Crystal Structure Refinement, University of
Göttingen: Göttingen, Germany, 1997.
(23) Petricek, V.; Dusek, M.; Palatinus, L. Jana 2006: The Crystallographic Computing
System, Version 03/15/2013; Institute of Physics: Praha, Czech Rupublic, 2006.
(24) Allen, F. H.; Johnson, O.; Shields, G. P.; Smith, B. R.; Towler, M. J. Appl. Cryst. 2004,
37, 335.
(25) Westrip, S. P. J. Appl. Cryst. 2010, 43, 920.
(26) http://checkcif.iucr.org/
(27) Brandenburg, K. Diamond, Version 3.2d, Crystal Impact GbR: Bonn, Germany, 2012.
(28) Netzsch Proteus Thermal Analysis, Version 4.8.2; Netzsch-Gerätebau GmbH: Selb,
Germany, 2006.
(29) Resolution Pro, Version 5.1.0.822; Varian Inc.: Santa Clara, CA, USA, 2009.
(30) Kresse, G.; Hafner, J. Phys. Rev. B 1993, 48, 13115.
(31) Kresse, G.; Furthmüller, J. Comp. Mater. Sci. 1996, 6, 15.

2 Experimental Section
28
(32) Blaha, P.; Schwarz, K.; Madsen, G. K. H.; Kvasnicka, D.; Luitz, J. WIEN2k: An
Augmented Plane Wave and Local Orbitals Program for Calculating Crystal Properties,
Version 12.0; Technische Universität Wien: Vienna, Austria, 2001.
(33) Dovesi, R.; Orlando, R.; Civalleri, B.; Roetti, C.; Saunders, V. R.; Zicovich-Wilson, C.
M. Z. Kristallogr. 2005, 220, 571.

29
Chapter 3
Results and Discussion
3.1 Revision of the Li–Tt (Tt = Si, Ge) Phase Diagrams and
New Lithium-Rich Tetrelides
3.1.1 Review of Relevant Literature
Discussing new materials for high-capacity lithium-ion batteries, a main focus has always
been set on Li–Si phases because theoretical capacities being almost ten times higher than
for the universally used graphite anodes can be achieved. The severe problems that occur
during charging and discharging processes when Si is employed as electrode material,
suggestions to overcome them and the role of the metastable phase Li15Si4 have already been
addressed in Chapter 1. Furthermore, the possibility of monitoring structural changes in
working LIBs by in-situ/ex-situ solid state NMR spectroscopy and total scattering methods
are described in literature.1,2 These investigations were followed by a detailed structural char-
acterization of Li15Si4, Li13Si4, Li7Si3, Li12Si7, and Li12Ge7 applying NMR techniques.3-5 Due to
the general importance of the Li–Si phase diagram for LIB research it is evident that a com-
prehensive characterization of the lithium-rich section, i.e. the unambiguous determination of
compositions, structures, and thermodynamic relations of relevant phases is essential. Also
the related section of the Li–Ge phase diagram is overdue and has to be revised fundamen-
tally. In the following, the chronicles of Li–Si and Li–Ge phases are briefly highlighted,
composed from ref. 64–67

3 Results and Discussion
30
Figure 3.1. Chronicle of Li–Si phases (highlighted with a blue frame = structurally characterized, shown
in red = ascertained structures). The figure was modified on the basis of ref. 66.
associated recent developments are presented and aspects that were of particular im-
portance for this thesis are elucidated.
The first investigations on phases in the Li–Si system can be assigned to Moissan. In
1902, he reported on the phase Li3Si6 (Figure 3.1). Decades later, however, Klemm and Struck7
postulated the phases Li2Si and Li4Si instead which were confirmed by Pell,8 Böhm,9 Obinata
et al.,10 and Federov and Ioffe11 later on. The 1960’s can be considered as the “era of the
Li–Si system”, mainly due to the work of Schäfer and Weiss. Several phases were character-
ized in this period (Figure 3.1).12-16 In particular, the lithium-richest representative, Li22Si5, was
identified as a new example of the Li22Pb5 structure type by Gladyshevskii et al.17 using
powder X-ray diffraction methods. Axel et al.12 confirmed its existence by a single crystal
X-ray diffraction study shortly after. In the following years, almost all of the phases reported
in the 1960’s were revised (Figure 3.1).18-23 In this regard, the composition of the lithium-richest
representative was discussed controversially ranging from reports on Li20Si524,25 to Li21Si518 and
Li22Si5.12,17 Still today, there are plenty of examples in literature referring to either Li22Si5 or its
revision Li21Si5. Judging from the crystallographic data of Li10Si3,15 this unconfirmed phase
might have been Li22Si5 although its composition is rather different. More interestingly, the
phase Li4Si crystallizing with an orthorhombic base face-centered cell was reported in the
1960’s. Yet, it was neither characterized structurally nor confirmed by subsequent investiga-
tions.13 As a consequence, it was excluded from compilations of the Li–Si phase diagram
(Figure 3.2a).26-29 Although there are some reports on the possible existence of a phase with
a composition Li4Si or close to it,30-32 Li4Si became obscure most likely since other lithium-rich

3.1 Revision of the Li–Tt (Tt = Si, Ge) Phase Diagrams and New Lithium-Rich Tetrelides
31
Figure 3.2. Phase diagram compilation for a) the Li–Si and b) the Li–Ge system according to ref. 27
(phase diagram assessment and calculation of liquidus boundaries) and 33 (phase diagram evaluation),
respectively.
phases with a similar composition were established. Moreover, two further representatives of
the Li–Si system were identified later on, Li15Si434 and LiSi.22,23 The latter was synthesized at
high pressure and metastable Li15Si4 was obtained electrochemically. Interestingly, Li15Si4 was
first obtained from ball-milling the pure elements some years before it could be identified
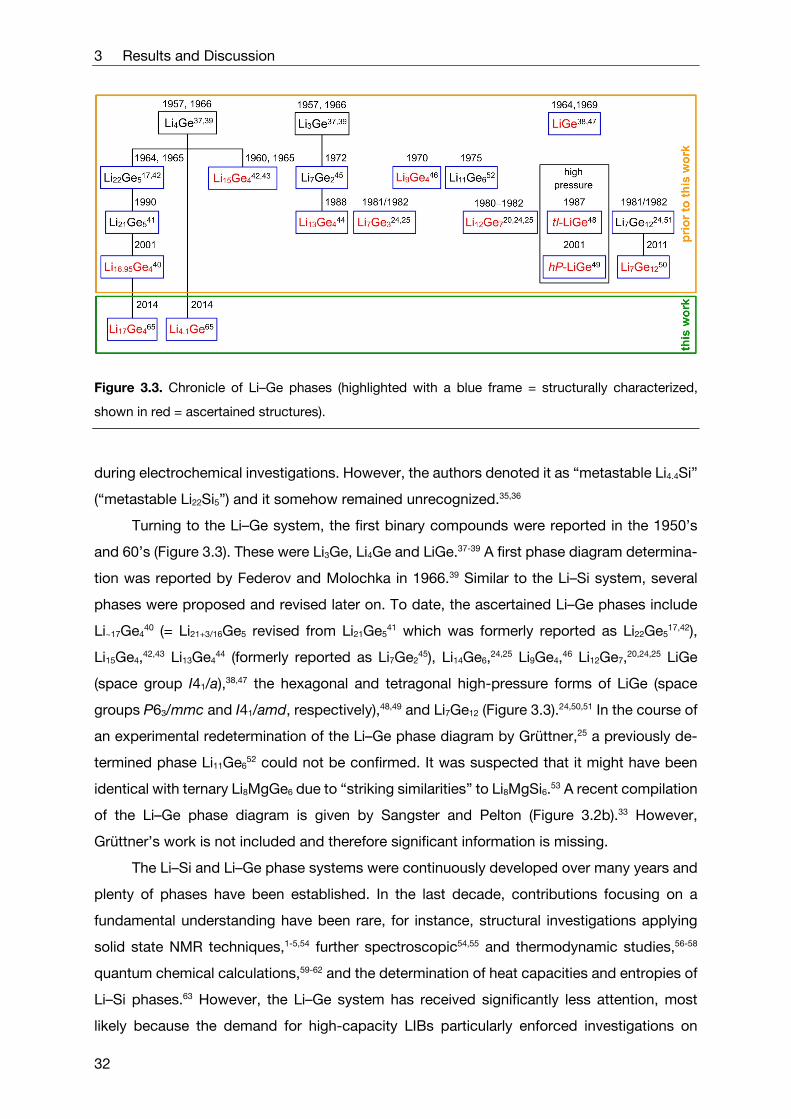
3 Results and Discussion
32
Figure 3.3. Chronicle of Li–Ge phases (highlighted with a blue frame = structurally characterized,
shown in red = ascertained structures).
during electrochemical investigations. However, the authors denoted it as “metastable Li4.4Si”
(“metastable Li22Si5”) and it somehow remained unrecognized.35,36
Turning to the Li–Ge system, the first binary compounds were reported in the 1950’s
and 60’s (Figure 3.3). These were Li3Ge, Li4Ge and LiGe.37-39 A first phase diagram determina-
tion was reported by Federov and Molochka in 1966.39 Similar to the Li–Si system, several
phases were proposed and revised later on. To date, the ascertained Li–Ge phases include
Li~17Ge440 (= Li21+3/16Ge5 revised from Li21Ge5
41 which was formerly reported as Li22Ge517,42),
Li15Ge4,42,43 Li13Ge444 (formerly reported as Li7Ge2
45), Li14Ge6,24,25 Li9Ge4,46 Li12Ge7,20,24,25 LiGe
(space group I41/a),38,47 the hexagonal and tetragonal high-pressure forms of LiGe (space
groups P63/mmc and I41/amd, respectively),48,49 and Li7Ge12 (Figure 3.3).24,50,51 In the course of
an experimental redetermination of the Li–Ge phase diagram by Grüttner,25 a previously de-
termined phase Li11Ge652 could not be confirmed. It was suspected that it might have been
identical with ternary Li8MgGe6 due to “striking similarities” to Li8MgSi6.53 A recent compilation
of the Li–Ge phase diagram is given by Sangster and Pelton (Figure 3.2b).33 However,
Grüttner’s work is not included and therefore significant information is missing.
The Li–Si and Li–Ge phase systems were continuously developed over many years and
plenty of phases have been established. In the last decade, contributions focusing on a
fundamental understanding have been rare, for instance, structural investigations applying
solid state NMR techniques,1-5,54 further spectroscopic54,55 and thermodynamic studies,56-58
quantum chemical calculations,59-62 and the determination of heat capacities and entropies of
Li–Si phases.63 However, the Li–Ge system has received significantly less attention, most
likely because the demand for high-capacity LIBs particularly enforced investigations on

3.1 Revision of the Li–Tt (Tt = Si, Ge) Phase Diagrams and New Lithium-Rich Tetrelides
33
Li–Si phases which offer much higher theoretical specific capacities and because of the great
abundance of Si. Despite the importance of both the Li–Si and Li–Ge system, their character-
ization is still unsatisfying and recent phase diagrams are outdated. In detail, all phases in the
lithium-rich sections of these phase diagrams need to be identified, characterized structurally
and investigated with regard to their thermodynamic properties. In particular, the controversy
regarding the lithium-richest representatives of both systems and the potential existence of
the Zintl phases Li4Tt (Tt = Si, Ge) request for unambiguous clarification. Moreover, despite
its important role in LIB research, little to nothing was known about the decomposition be-
havior of metastable Li15Si4 and the influence of dopants prior to this work.
In the following, the fundamental revision of the lithium-rich sections of the Li–Tt (Tt = Si,
Ge) phase diagrams as well as the synthesis and characterization of Li17Tt4,64,65 Li4.1Tt65,66
(Li16.4Tt4), Li15Si4,67 Li13Si4,68 Li15−xAlxSi467 (0.4 < x < 0.8), and Li17Si4−xGex [x = 2.30(2), 3.08(4),
3.53(3)]65 are presented (see also Figure 3.1 and 3.3).

3 Results and Discussion
34
3.1.2 Revision of the Li–Si Phase Diagram: Thermodynamic
Relation of Li17Si4, Li16.42Si4, Li15Si4 and Li13Si4
see Chapter 5.1 Zeilinger, M.; Benson, D.; Häussermann, U.; Fässler, T. F. Chem. Mater. 2013, 25, 1960.
see Chapter 5.2 Zeilinger, M.; Kurylyshyn, I. M.; Häussermann, U.; Fässler, T. F. Chem. Mater. 2013, 25, 4623.
see Chapter 5.3 Zeilinger, M.; Fässler, T. F. Acta Cryst. 2013, E69, i81. see Chapter 5.4 Zeilinger, M.; Baran, V.; Häussermann, U.; Fässler, T. F. Chem. Mater. 2013, 25, 4113.
Figure 3.4a illustrates the lithium-rich section (> 76 at.% Li) of the Li–Si phase diagram as
reported prior to this work. In the course of the present thesis, this portion of the Li–Si system
was comprehensively reinvestigated and revised fundamentally. The newly established Li–Si
phase diagram section is depicted in Figure 3.4b.
Figure 3.4. a) Li–Si phase diagram for Li concentrations > 76 at.% Li as reported by Okamoto27,29 and
Braga28 and b) its revision based on results from DSC investigations (corresponding cooling traces and
thermal effects are presented in Figure 3.5) and long term annealing experiments of “Li16Si4” sam-
ples.64,66
The phase diagram redetermination was achieved by differential scanning calorimetry
investigations and melt equilibration experiments (LixSi100−x, x > 85) at specific temperatures

3.1 Revision of the Li–Tt (Tt = Si, Ge) Phase Diagrams and New Lithium-Rich Tetrelides
35
where excess melt is removed by isothermal centrifugation. Various melts LixSi100−x (x > 85)
that were equilibrated below 500 °C yielded large crystals of Li17Si4, whereas crystals of the
silicide Li4.11Si (Li16.42Si4) were isolated from excess melt above 500 °C (cf. Figure 3.4b). Con-
sequentially, bulk samples of Li17Si4 and nominal compositions “Li16.5Si4”, “Li16Si4”, and
“Li14Si4” were investigated by DSC. A careful analysis of cooling traces and powder X-ray
diffraction patterns of these samples as well as results from melt equilibration experiments
finally led to the revised version of the Li–Si phase diagram as depicted in Figure 3.4b.
Figure 3.5. DSC cooling traces (recorded from 750 °C) for Li17Si4 and nominal compositions “Li16.5Si4”,
“Li16Si4” and “Li14Si4” (according to ref. 64). Thermal events are labeled and assigned in the updated
Li–Si phase diagram in Figure 3.4. The figure was modified on the basis of ref. 66.
Remarkably, the isotherm at 470–480 °C could not be traced by DSC means due to the slug-
gish peritectoid decomposition of Li16.42Si4 into Li17Si4 and Li13Si4. However, long term anneal-
ing experiments of “Li16Si4” samples manifested Li16.42Si4 as high-temperature phase. Turning

3 Results and Discussion
36
to Li15Si4, it is not included in the phase diagram due to its metastability. Thus far, its decom-
position behavior has been studied sparsely and is widely unknown.1,69-71 Yet, the redetermi-
nation of the Li–Si phase diagram allowed a rigorous investigation of the decomposition be-
havior of Li15Si4 by DSC/DTA and annealing experiments. Above 170 °C Li15Si4 decomposes
into Li17Si4 and an unidentified weakly crystalline phase (Figure 3.6a). The latter might be
considered as “Li13Si4 pre-phase” since, according to the recent Li–Si phase diagram, Li13Si4
would have been expected instead. Above 300 °C, the decomposition products are in line
with the Li–Si phase diagram (Figure 3.6b–d).
Figure 3.6. Evolution of the thermal decomposition of Li15Si4: powder X-ray diffraction patterns of bulk
samples after annealing at 300 °C (a), 400 °C (b), 500 °C (c) and 600 °C (d) for three days (exp. = black;
Li13Si4 calc. = red; Li15Si4 calc. = green; Li4.11Si calc. = blue; Li17Si4 calc. = gray; unknown reflections are
marked with *). Figure and figure caption were adopted from ref. 67.

3.1 Revision of the Li–Tt (Tt = Si, Ge) Phase Diagrams and New Lithium-Rich Tetrelides
37
Of considerable importance for the phase diagram redetermination and the assignment of
phases in powder X-ray diffraction patterns was the identification and unambiguous structural
characterization of all relevant phases by single crystal X-ray diffraction. In the following, the
structure determination and description of the newly established phases Li17Si4,64 Li4.11Si
(Li16.42Si4)66 as well as the first single crystal X-ray diffraction study of Li15Si467 and the structure
revision of Li13Si468 are addressed.
a) Li17Si4
The structure of the lithium-richest representative of the Li–Si phase diagram Li17Si4 was
solved and refined with excellent reliability factors of R1 = 0.028 and wR2 = 0.037 for all data
(-range = 1.89–47.62°). Li17Si4 crystallizes in the cubic space group F43m with
a = 18.6563(2) Å (Z = 20, T = −150 °C). The asymmetric unit contains four Si and 13 Li posi-
tions. All atoms are located on special positions which are fully occupied. Accordingly, the
unit cell of Li17Si4 contains 80 Si and 340 Li atoms in total (cF420). Li17Si4 is isotypic with
Li17Sn4.72 The previously reported phase Li21Si518 (revised from Li22Si512,17) is closely related to
Li17Si4 and only differs in the occupation of one fourfold special position. In detail, the space
group F43m possesses four fourfold special positions 4a–d which are all unoccupied in Li21Si5
corresponding to 80 Si and 336 Li atoms per unit cell. In case of Li17Si4, the 4a site is fully
occupied by Li which translates to 340 Li atoms in the unit cell.
Figure 3.7. a) Difference Fourier map (Fo−Fc, contour lines ±0.075 e∙Å−3) for the plane defined by two
Si2 and two Li1 atoms containing the site 4a and b) the coordination environment of Li13 on 4a in Li17Si4
(Si = gray; Li = white; thermal ellipsoids at a 90% probability level; single crystal data at −150 °C).
Figures were adopted from ref. 64.

3 Results and Discussion
38
In order to demonstrate the fully occupied 4a site, the respective Li atom (Li13) was removed
from the final refinement and a difference Fourier map Fo−Fc based on the newly refined data
was generated (Figure 3.7a). Evidence for a phase with the composition Li22Si5, corresponding
to a full occupancy of all fourfold positions 4a–d,12,17 could not be found. The coordination
environment of Li13 located on the 4a site is illustrated in Figure 3.7b. It centers a (Li1)4 tetra-
hedron resulting in short but reasonable Li–Li distances. Further coordination shells are gen-
erated by a (Si2)4 tetrahedron, a (Li7)6 octahedron, and a (Li12)12 cuboctahedron. Such 26
atom clusters M26 (M = Li + Si) are also centered at void sites 4b–d. Emphasizing the corre-
sponding Si polyhedra, i.e. (Si1)4 at 4c, (Si2)4 at 4a, (Si3)6 at 4b, and (Si4)6 at 4d, the crystal
structure of Li17Si4 can be considered as two interpenetrating ZnS-type lattices as described
in Figure 3.8 (for more details see ref. 64).
Figure 3.8. Crystal structure of Li17Si4: arrangement of Si polyhedra (no Si–Si bonds) which are part of
crystallographically independent M26 (M = Li + Si) atom clusters around the sites 4a–d in the unit cell of
Li17Si4.The figure was modified on the basis of ref. 64.
In order to further analyze the differences between Li21Si5 and Li17Si4, their structures
were computationally relaxed and their equilibrium volume structure parameters determined.
Whereas the experimentally established structure of Li17Si4 was reproduced, the relaxed
structure of Li21Si5 reveals discrepancies to the experimental one regarding the coordination
of position 4a. Furthermore, based on the calculated reaction energy (referring to zero Kelvin)
for Li84Si20 + Li (bcc) = Li85Si20, Li uptake in Li21Si5 yielding Li17Si4 is slightly exothermic

3.1 Revision of the Li–Tt (Tt = Si, Ge) Phase Diagrams and New Lithium-Rich Tetrelides
39
(−0.04 eV). Thus, computational and experimental results cast doubts on the existence of
Li21Si5 and firmly established Li17Si4 as lithium-richest representative in the Li–Si system. How-
ever, the existence of a small homogeneity range Li17−xSi4 (0 < x < 0.2) could not be ruled out
by single crystal X-ray diffraction studies or DSC investigations.
b) Li15Si4
Melt equilibration experiments targeting the single crystal growth of Li17Si4 also yielded few
needle-shaped crystals of metastable Li15Si4 as a side product (Figure 3.9a). This is a surpris-
ing result since samples of Li15Si4 are commonly obtained from either ball-milling the pure
elements1,35,36 (Figure 3.9b,c) or alloying Si with Li electrochemically.34,73 Thus far, its crystal
structure has been determined from powder data applying a Rietveld fit of the Cu15Si4
structure model (see also Figure 3.9b).34,73 As part of this work, the structure of Li15Si4 could
be readily solved and refined from single crystal X-ray diffraction data. Li15Si4 crystallizes in
the cubic space group I43d with a = 10.6322(9) Å (V = 1201.9(2) Å3, Z = 4, T = −150 °C). The
asymmetric unit contains Si on 16c (x, x, x), Li1 on 48e (x, y, z), and Li2 on 12b (½, ¼, ⅛),
corresponding to an overall unit cell content of 16 Si and 60 Li atoms (cI76). Accordingly, the
validity of the previously assigned Cu15Si4 structure model was confirmed resolutely.
Figure 3.9. a) Needle-shaped crystals of Li15Si4 (encircled) grown at the bottom lid of a stainless steel
ampule, b) Rietveld fit of the Cu15Si4 structure model to the powder X-ray diffraction pattern of a Li15Si4
bulk sample (I43d, a = 10.7163(1) Å, V = 1230.66(5) Å3), c) photograph of Li15Si4 bulk sample obtained
from ball-milling (sealed inside a glass ampule). Figures were adopted from ref. 67.

3 Results and Discussion
40
Regarding the structure of Li15Si4, the central motif is the quasi-anticuboctahedral coor-
dination of Si atoms (Figure 3.10a,b). [Si@Li12] pseudo-anticuboctahedra are condensed into
strands by sharing opposite triangular faces (Li1)3. These strands proceed along the threefold
axes of the cubic unit cell as indicated by different colors in Figure 3.10a. Note that the blue
strand is exactly located on the body diagonal. Each [Si@Li12] pseudo-anticuboctahedron is
coordinated by eleven further units sharing common faces and edges (Figure 3.10c). A more
detailed analysis of the complex coordination environment of [Si@Li12] units is illustrated in
Figure 3.10d.
Figure 3.10. Structural motifs of Li15Si4 and Li15−xAlxSi4 (Cu15Si4-type): a) strands of condensed [Si@Li12]
units proceeding in different directions of the unit cell as indicated by different colors, b) stacking of
pseudo-anticuboctahedron units [Si@Li12] emphasizing the skeleton formed by trigonal bipyramids, c)
the connectivity of distorted anticuboctahedron units (shared faces/edges are marked in black), and d)
the coordination of a pseudo-anticuboctahedron (light blue) by eleven neighboring [Si@Li12] units (the
position of the three-fold axis is indicated by its symbol). The figure was modified on the basis of ref. 67.
c) Li4.11Si (Li16.42Si4)
Millimeter-sized crystals of the high-temperature phase Li16.42(1)Si4 were obtained from a melt
“Li85Si15” equilibrated at 510 °C in a Ta ampule. Li4.106(2)Si (referring to Z = 16) crystallizes in the
orthorhombic space group Cmcm with a = 4.5246(2) Å, b = 21.944(1) Å, c = 13.2001(6) Å
(V = 1310.6(1) Å3). For a better comparability to Li17Si4, Li15Si4, and Li13Si4, Li4.106(2)Si/Li16.42(1)Si4

3.1 Revision of the Li–Tt (Tt = Si, Ge) Phase Diagrams and New Lithium-Rich Tetrelides
41
is referred to as Li16.42Si4. Its structure was solved and refined with excellent reliability factors
of R1 = 0.017 and wR2 = 0.029 for all data (-range = 1.86–45.29°). The unit cell contains three
Si and 10 Li positions. All Si and eight Li sites are fully occupied, two Li positions are affected
by occupational disorder. In detail, the sum of occupancies factors for Li4A on 4c (½, y, ¼)
and Li4B on 8g (x, y, ¼) are constrained to one (0.575(3) and 0.425(3), respectively) to prohibit
unreasonably short Li–Li distances (Figure 3.11). The corresponding disordered Li strand pro-
ceeding along the crystallographic a-axis is unique amongst Li–Si phases. The difference
Fourier map (Fo−Fc) in Figure 3.11a emphasizes its strand-like shape. Additionally, a split po-
sition was introduced for Li5 [occupancy ratio 0.848(7)/0.152(7)]. The geometric situation
around the disordered Li strand and an idealized structure model are illustrated in
Figures 3.11b and c. Note that a simultaneous occupation of Li4B and Li5B is excluded as
this would give rise to unreasonably short Li–Li distances.
Figure 3.11. a) Difference Fourier map (Fo−Fc, contour lines ±0.6 e∙Å−3) shown for the ab-plane con-
taining Si1, Si2, and Li1–3 (cell edges are shown in blue; calculated from single crystal data at −173 °C),
b) the disordered Li-strand with view onto the ac-plane emphasizing its structural environment (per-
pendicular to the ab-plane of the difference Fourier map in Figure 3.11a) and c) schematic description
of an idealized disorder model for Li4; thermal ellipsoids are shown at a 90% probability level. The
figure was adopted from ref. 66.

3 Results and Discussion
42
Figure 3.12. SiLin coordination polyhedra and their arrangement in the unit cell of Li16.42Si4 (a, b), Li15Si4
(c–e), and Li17Si4 (f, g). In the structure of Li16.42Si4, SiLin polyhedra (a) of the same kind are condensed
into strands which share common faces, edges and vertices with parallel ones (b); pseudo-anticub-
octahedron units [Si@Li12] in Li15Si4 (c) are condensed to strands and proceed along the 3-fold axes of
the cubic unit cell (d; different directions are indicated by different colors); the relative arrangement of
[Si@Li12] units is depicted in (e) (shared edges and faces in black); in case of Li17Si4, SiLin coordination
polyhedra (f) form supratetrahedra (yellow, red) and supraoctahedra (blue, green) as shown in (g); all
thermal ellipsoids are shown at a 90% probability level. The figure was modified on the basis of ref. 66.
The complex structure of Li16.42Si4 may be visualized by SiLin polyhedra since, similar to
Li17Si4 and Li15Si4, all Si atoms are isolated. The SiLin coordination polyhedra for Si1–3 are
depicted in Figure 3.12a. Whereas Si1 and Si2 are permanently 13-coordinated, due to the
disorder Si3 may attain a coordination of either 12 or 13 depending on whether the Li4A or
Li4B position is occupied. SiLin polyhedra of the same kind are condensed into strands by

3.1 Revision of the Li–Tt (Tt = Si, Ge) Phase Diagrams and New Lithium-Rich Tetrelides
43
sharing opposite faces as shown in Figure 3.12b. As mentioned before, the structures of the
neighboring phases Li15Si4 and Li17Si4 comprise isolated Si atoms as well. Hence, their struc-
tures may also be represented utilizing SiLin coordination polyhedra (Figure 3.11c–g). Remark-
ably, the series Li15Si4 (CN = 12), Li16.42Si4 (CN = 12–13), and Li17Si4 (CN = 13 and 14) demon-
strates the enlargement of SiLin coordination polyhedra with increasing Li content.
In addition, the density of states and band structures for Li17Si4, Li16.42Si4 and Li15Si4 were
calculated. For that purpose, the disorder in Li16.42Si4 was resolved by constructing two struc-
ture models with compositions Li16Si4 (hypothetical Zintl phase, 16 Li+, 4 Si4−) and Li16.5Si4 (for
details see Chapter 5.2). As a result, the density of states and band structures of Li17Si4,
Li16.5Si4, Li16Si4, and Li15Si4 revealed a metallic character. In case of Li15Si4, a pseudo-gap is
located above the Fermi level (see also Chapter 3.1.3).
d) Li13Si4
In the course of the reinvestigation of the Li–Si phase diagram64,66 the crystal structure of
Li13Si4 was redetermined by single crystal X-ray diffraction since experimental and calculated
(on the basis of available structural data)19,62 powder X-ray diffraction patterns of Li13Si4 did
not match. Compared to the first single crystal structure determination,19 the improvements
of the new model are i) the introduction of a split position for one Li site, ii) the anisotropic
refinement of atomic displacement parameters for all atoms, and iii) a significantly more pre-
cise determination of atom positions and thus unit cell parameters. As a result, experimental
and calculated Bragg reflection positions and intensities of Li13Si4 match very well, allowing
Figure 3.13. a) 2×1×2 super cell of orthorhombic Li13Si4 emphasizing the parallel stacking of Si–Si
dumbbells which are embedded in channels formed by b) parallel strands of condensed pseudo-an-
ticuboctahedron units [Si@Li12] proceeding along the crystallographic c-axis. These parallel strands are
connected by sharing common vertices and edges of neighboring ones (c).

3 Results and Discussion
44
an accurate assignment of phases in powder X-ray diffraction patterns of Li13Si4-containing
samples. Regarding the structure of Li13Si4, it consists of isolated Si atoms coordinated by 12
Li atoms in a pseudo-anticuboctahedral fashion (Figure 3.13b). These [Si@Li12] units are con-
densed along the c-direction of the unit cell forming parallel mutually connected strands which
enclose Si-Si dumbbells in the resulting channel-like voids (Figure 3.13a,c).
3.1.3 Thermodynamic Stability of Li14.37Al0.63Si4 — an Al-doped
Variant of Li15Si4
see Chapter 5.4 Zeilinger, M.; Baran, V.; Häussermann, U.; Fässler, T. F. Chem. Mater. 2013, 25, 4113.
As mentioned in Chapter 3.1.2, the band structure of Li15Si4 reveals a pseudo-gap situated
above the Fermi level (Figure 3.14a). Accordingly, an increase of the electron concentration
could shift the Fermi level to the pseudo-gap in the electronic density of states. Thus, regard-
ing Li15Si4 as an electron deficient Zintl phase (15 Li+, 4 Si4−), Al-doping corresponding to
Li15−xAlxSi4 could result in the formation of the Zintl phase Li14.5Al0.5Si4 (x = 0.5; 14.5 Li+, 0.5 Al3+,
4 Si4−). Since melt equilibration experiments are an expedient method for growing large single
crystals of lithium-rich phases, Li83Al13Si4 melts were equilibrated at 450 °C. These experi-
ments almost exclusively yielded large single crystals of Li14.37(1)Al0.63(1)Si4, an Al-doped variant
of Li15Si4 (Figure 3.14b). In contrast, LixSi100−x (x > 85) melts afforded crystals of Li17Si4 as the
main product and only few needle-shaped crystals of Li15Si4.
Figure 3.14. a) Total and partial DOS together with the band structure representation for Li15Si4 and
b) Rietveld fit of the Cu15Si4 structure model to the powder X-ray diffraction pattern of ground single
crystals of Li14.37(1)Al0.63(1)Si4 (I43d, a = 10.66095(3) Å, V = 1211.68(1) Å3). Figures were modified on the
basis of ref. 66 and 67.
3.1 Revision of the Li–Tt (Tt = Si, Ge) Phase Diagrams and New Lithium-Rich Tetrelides
45
The powder X-ray diffraction pattern of ground single crystals of Li14.37(1)Al0.63(1)Si4 was fitted
well using the Cu15Si4 structure model (Figure 3.14b). Comparing the unit cell parameters of
Li15Si4 and Li14.37(1)Al0.63(1)Si4 determined from powder X-ray diffraction data (Rietveld refine-
ments), the unit cell of Li14.37(1)Al0.63(1)Si4 is slightly contracted (a = 10.7163(1) Å vs.
a = 10.66095(3) Å). According to single crystal X-ray diffraction experiments, the two crystal-
lographically independent Li positions in the structure of Li15Si4 are partially substituted by Al
(3.95(7)% and 5.31(9)%). The incorporation of Al was further validated by 27Al-MAS-NMR
spectroscopy and supported by results from X-ray diffraction experiments and EDX investi-
gations. The homogeneity range of Li15−xAlxSi4 could be assessed as xmin. ≈ 0.4 and xmax. ≈ 0.8.
Remarkably, the Zintl phase Li14.5Al0.5Si4 exactly falls in this range and samples corresponding
to Li15−xAlxSi4 (0.4 < x < 0.8) feature diamagnetic behavior which is expected for Zintl phases.
Surprisingly, thermal investigations (DSC) of Li15−xAlxSi4 (0.4 < x < 0.8) revealed thermo-
dynamic stability of up to 700 °C whereas metastable Li15Si4 already decomposes in an exo-
thermal irreversible process at around 170 °C.
3.1.4 Revision of the Li–Ge Phase Diagram: Thermodynamic
Relation of Li17Ge4, Li16.38Ge4, and Li15Ge4
see Chapter 5.5 Zeilinger, M.; Fässler, T. F. Dalton Trans. 2014, DOI:10.1039/C4DT00743C.
The lithium-rich section of the Li–Si phase diagram (> 76 at.% Li) was comprehensively and
unambiguously characterized and a slight modification of Li15Si4 by Al doping led to thermo-
dynamically stable phases Li15−xAlxSi4 (0.4 < x < 0.8). Extending the phase diagram work to the
Li–Ge system, Li17Ge465 (space group F43m) and Li16.38Ge4
65 (space group Cmcm) were iden-
tified as new phases which are isotypic with their Si counterparts Li17Si4 and Li16.42Si4. As
demonstrated in the difference Fourier map in Figure 3.15, the disordered Li-strands apparent
in Li16.42(1)Si4 and Li16.38(2)Ge4 are very similar. Within standard deviations (3), the occupancy
ratios of the respective Wyckoff positions 4c and 8g are identical. Li17Ge4 replaces the closely
related disordered Li16.95Ge440 as lithium-richest phase of the Li–Ge system. The latter can be
regarded as a representative of a small homogeneity range Li17−xGe4 (0 < x < 0.2) where
x = 0.05. This may be enabled by the structural flexibility of the M26-cluster unit (M = Li + Ge)
around the 4a site as already proposed for Li17−xSi4 (0 < x < 0.2).64
Since the structure descriptions of Li16.38Ge4 and Li17Ge4 exactly follows those given for
their isotypic silicides it is referred to Chapters 3.1.2 and 5.5.66 Regarding the determination
of the Li–Ge phase diagram for Li concentrations > 79 at.% Li, the same methodology was

3 Results and Discussion
46
Figure 3.15. Difference Fourier map (Fo−Fc) shown for the layer defined by Tt1, Tt2 and Li2 in a) Li16.42Si4
and b) Li16.38Ge4 (parallel to ab-plane, calculated from single crystal data at −173 °C and −150 °C for
Li16.42Si4 (contour lines ±0.6 e∙Å−3) and Li16.38Ge4 (contour lines ±0.5 e∙Å−3), respectively; cell edges are
shown in blue). Figure and figure caption were adopted from ref. 65.
used as successfully applied for the Li–Si system.64,66 Previously unrecognized work by
Grüttner25 was also considered for these investigations (Figure 3.16a). As a result, the Li–Ge
phase diagram was revised according to Figure 3.16b. Thermal effects that were observed in
the thermograms of Li17Ge4 and samples with nominal compositions “Li16.5Ge4” and “Li16Ge4”
were assigned therein. Starting from different Li–Ge melts, effects (1–3) correspond to cross-
ing the liquidus boundary and effects (4) and (5) are attributed to the peritectic decomposition
of Li17Ge4 (into melt and Li16.38Ge4) and Li16.38Ge4 (into melt and Li15Ge4), respectively. The very
sluggish peritectoid decomposition of Li16.38Ge4 into Li17Ge4 and Li15Ge4 at around 400 °C
could be elucidated by long-term annealing experiments of “Li16Ge4” samples. A concluding
comparison of the Li–Ge phase diagram with the Li–Si system (Figure 3.16c) reveals resem-
blance regarding the thermodynamic stability of Li17Tt4 and Li16.4Tt4. In contrast to Li15Ge4,
which is a thermodynamically stable phase melting congruently at 720 °C,25 isotypic Li15Si4 is
metastable and therefore missing in the Li–Si phase diagram compilation.

3.1 Revision of the Li–Tt (Tt = Si, Ge) Phase Diagrams and New Lithium-Rich Tetrelides
47
Figure 3.16. a) Excerpt of the Li–Ge phase diagram as reported by Grüttner25 (the composition of the
eutectic between Li15Ge4 and Li13Ge4 was not determined), b) its revision based on DSC investigations
and annealing experiments of “Li16Ge4” samples reported herein, and c) the most recent Li–Si phase
diagram for Li concentrations > 76%.66 Figure and figure caption were adopted from ref. 65.
3.1.5 Solid Solutions Li17Si4−xGex [x = 2.30(2), 3.08(4), 3.53(3)]
see Chapter 5.5 Zeilinger, M.; Fässler, T. F. Dalton Trans. 2014, DOI:10.1039/C4DT00743C.
As reported in the previous Chapter, the isotypic phases Li17Si4 and Li17Ge4 were manifested
as the lithium-richest candidates of the Li–Si and Li–Ge system. According to Vegard’s law,74
they should form solid solutions corresponding to Li17Si4−xGex (0 < x < 4). Employing melt
equilibration experiments, crystals of Li17Si4−xGex [x = 2.30(2), 3.08(4), 3.53(3)]65 were grown
and subsequently characterized by single crystal and powder X-ray diffraction. Compositions
obtained from single crystal X-ray diffraction studies were supported by EDX investigations.
As demonstrated in Figure 3.17a, cell volumes of respective solid solutions linearly increase
with increasing concentrations of Ge in Li17Si4−xGex as expected from Vegard’s law.74
Evaluating the distribution of Si and Ge among the four crystallographically different
tetrel positions Tt1–4 (Tt = Si, Ge) in Li17Si4−xGex, the general trend can be observed that Tt2
is slightly preferred by Si (Figure 3.17b). Such a preferential site occupation is also known as
the “coloring problem” and in some cases this phenomenon cannot be explained by simple
chemical reasoning.75 For Li17Si4−xGex, albeit differences are quite small, future quantum

3 Results and Discussion
48
chemical calculations might elucidate the reasons for the different distribution of Si and Ge
among the four crystallographically independent atom positions Tt1–4.
Figure 3.17. a) Trend of cell volumes vs. Ge contents in Li17Si4−xGex (x = 0, 2.30(2), 3.08(4), 3.53(3), 4);
cell parameters were determined from powder X-ray diffraction patterns recorded for ground single
crystals (Rietveld refinements), Ge contents were obtained from single crystal X-ray diffraction data
(error bars are smaller than data point icons) and EDX. b) Distribution of Si and Ge among the four
crystallographically different tetrel positions Tt1–4 (Tt = Si, Ge) in Li17Si4−xGex according to single crystal
X-ray diffraction data (error bars = ±3. Figure 3.17a was adopted from ref. 65.
3.1.6 References
(1) Key, B.; Bhattacharyya, R.; Morcrette, M.; Seznec, V.; Tarascon, J. M.; Grey, C. P. J.
Am. Chem. Soc. 2009, 131, 9239.
(2) Key, B.; Morcrette, M.; Tarascon, J. M.; Grey, C. P. J. Am. Chem. Soc. 2011, 133, 503.
(3) Kuhn, A.; Sreeraj, P.; Pöttgen, R.; Wiemhöfer, H. D.; Wilkening, M.; Heitjans, P. J. Am.
Chem. Soc. 2011, 133, 11018.
(4) Dupke, S.; Langer, T.; Pöttgen, R.; Winter, M.; Passerini, S.; Eckert, H. Phys. Chem.
Chem. Phys. 2012, 14, 6496.
(5) Dupke, S.; Langer, T.; Pöttgen, R.; Winter, M.; Eckert, H. Solid State Nucl. Magn. Reson.
2012, 42, 17.
(6) Moissan, H. C. R. Hebd. Séances Acad. Sci. 1902, 134, 1083.
(7) Klemm, W.; Struck, M. Z. Anorg. Allg. Chem. 1955, 278, 117.
(8) Pell, E. M. Phys. Chem. Solids 1957, 3, 77.
(9) Böhm, H. Z. Metallkd. 1959, 50, 44.
(10) Obinata, I.; Takeuchi, Y.; Kurihara, K.; Watanabe, M. J. Jpn. Inst. Met. 1964, 28, 568.
(11) Federov, P. I.; Ioffe, A. A. Izv. Vyssh. Uchebn. Zaved., Tsvetn. Metall. 1962, 1, 127.

3.1 Revision of the Li–Tt (Tt = Si, Ge) Phase Diagrams and New Lithium-Rich Tetrelides
49
(12) Axel, H.; Schäfer, H.; Weiss, A. Z. Naturforsch. B 1966, 21, 115.
(13) Schäfer, H.; Axel, H.; Weiss, A. Z. Naturforsch. B 1965, 20, 1302.
(14) Schäfer, H.; Axel, H.; Weiss, A. Z. Naturforsch. B 1965, 20, 1010.
(15) Schäfer, H.; Axel, H.; Menges, E.; Weiss, A. Z. Naturforsch. B 1965, 20, 394.
(16) Axel, H.; Schäfer, H.; Weiss, A. Angew. Chem. Int. Ed. 1965, 4, 358.
(17) Gladyshevskii, E. I.; Oleksiv, G. I.; Kripyakevich, P. I. Kristallografiya 1964, 9, 338.
(18) Nesper, R.; von Schnering, H. G. J. Solid State Chem. 1987, 70, 48.
(19) Frank, U.; Müller, W.; Schäfer, H. Z. Naturforsch. B 1975, 30, 10.
(20) von Schnering, H. G.; Nesper, R.; Curda, J.; Tebbe, K. F. Angew. Chem. 1980, 92, 1070.
(21) von Schnering, H. G.; Nesper, R.; Tebbe, K. F.; Curda, J. Z. Metallkd. 1980, 71, 357.
(22) Evers, J.; Oehlinger, G.; Sextl, G. Angew. Chem. Int. Ed. 1993, 32, 1442.
(23) Tang, W. S.; Chotard, J.-N.; Janotz, R. J. Electrochem. Soc. 2013, 160, A1232.
(24) Grüttner, A.; Nesper, R.; von Schnering, H. G. Acta Cryst. 1981, A37, C161. The authors
claimed that "Li20Si5 replaces Li22Si5" and that "four special positions of the "Li22Si5"
structure are not occupied". These four special positions should be 4a–d. However, if
these are unoccupied, the correct composition is Li21Si5. Thus, the formula Li20Si5 might
be attributed to an erroneous calculation of the sum formula.
(25) Grüttner, A. Dissertation, Universität Stuttgart: Stuttgart, Germany, 1982.
(26) Demidov, A. I.; Morachevskii, A. G.; Nikolaev, V. P.; Berenda, N. V. J. Appl. Chem.
(USSR) 1988, 61, 1254.
(27) Okamoto, H. Bull. Alloy Phase Diagrams 1990, 11, 306.
(28) Braga, M. H.; Malheiros, L. F.; Ansara, I. J. Phase Equilib. 1995, 16, 324.
(29) Okamoto, H. J. Phase Equilib. Diff. 2009, 30, 118.
(30) Sharma, R. A.; Seefurth, R. N. J. Electrochem. Soc. 1976, 123, 1763.
(31) Lai, S. C. J. Electrochem. Soc. 1976, 123, 1196.
(32) Nikolaev, V. P.; Morachevskii, A. G.; Demidov, A. I.; Bairachnyi, E. V. J. Appl. Chem.
(USSR) 1980, 53, 1549.
(33) Sangster, J.; Pelton, A. D. J. Phase Equilib. 1997, 18, 289.
(34) Obrovac, M. N.; Christensen, L. Electrochem. Solid-State Lett. 2004, 7, A93.
(35) Tamori, R.; Machida, N.; Shigematsu, T. J. Jpn. Soc. Powder Powder Metall. 2001, 48,
267.
(36) Hashimoto, Y.; Machida, N.; Shigematsu, T. Solid State Ionics 2004, 175, 177.
(37) Pell, E. M. J. Phys. Chem. Solids 1957, 3, 74.
(38) Oleksiv, G. I. Probl. Rozvitku Prirodn. i Tochn. Nauk, Sb. 1964, 76.
(39) Federov, P. I.; Molochka, V. A. Izv. Akad. Nauk. SSSR, Neorg. Mater. 1966, 2, 1870.

3 Results and Discussion
50
(40) Goward, G. R.; Taylor, N. J.; Souza, D. C. S.; Nazar, L. F. J. Alloys Compd. 2001, 329,
82.
(41) Nesper, R. Prog. Solid State Chem. 1990, 20, 1.
(42) Johnson, Q.; Smith, G. S.; Wood, D. Acta Cryst. 1965, 18, 131.
(43) Gladyshevskii, E. I.; Kripyakevich, P. I. Kristallografiya 1960, 5, 574.
(44) Nesper, R. Habilitation, Universität Stuttgart: Stuttgart, Germany, 1988.
(45) Hopf, V.; Müller, W.; Schäfer, H. Z. Naturforsch. B 1972, 27, 1157.
(46) Hopf, V.; Schäfer, H.; Weiss, A. Z. Naturforsch. B 1970, 25, 653.
(47) Menges, E.; Hopf, V.; Schäfer, H.; Weiss, A. Z. Naturforsch. B 1969, 21, 1351. According
to ref. 25, the structures of LiGe reported in ref. 38 and 47 are identical (only two different
cell settings).
(48) Evers, J.; Oehlinger, G.; Sextl, G.; Becker, H. O. Angew. Chem. Int. Ed. 1987, 26, 76.
(49) Evers, J.; Oehlinger, G. Angew. Chem. Int. Ed. 2001, 40, 1050.
(50) Kiefer, F.; Fässler, T. F. Solid State Sci. 2011, 13, 636.
(51) Grüttner, A.; Nesper, R.; von Schnering, H. G. Angew. Chem. Int. Ed. 1982, 21, 912.
(52) Frank, U.; Müller, W. Z. Naturforsch. B 1975, 30, 313.
(53) Nesper, R.; Curda, J.; von Schnering, H. G. J. Solid State Chem. 1986, 62, 199.
(54) Stearns, L. A.; Gryko, J.; Diefenbacher, J.; Ramachandran, G. K.; McMillan, P. F. J. Solid
State Chem. 2003, 173, 251.
(55) Gruber, T.; Thomas, D.; Roder, C.; Mertens, F.; Kortus, J. J. Raman Spectrosc. 2013,
44, 934.
(56) Debski, A.; Gasior, W.; Goral, A. Intermetallics 2012, 26, 157.
(57) Wang, P.; Kozlov, A.; Thomas, D.; Mertens, F.; Schmid-Fetzer, R. Intermetallics 2013,
42, 137.
(58) Debski, A.; Zakulski, W.; Major, L.; Goral, A.; Gasior, W. Thermochim. Acta 2013, 551,
53.
(59) Xu, Y. H.; Yin, G. P.; Zuo, P. J. Electrochim. Acta 2008, 54, 341.
(60) Kubota, Y.; Escano, M. C. S.; Nakanishi, H.; Kasai, H. J. Appl. Phys. 2007, 102, 053704.
(61) Kubota, Y.; Escano, M. C. S.; Nakanishi, H.; Kasai, H. J. Alloys Compd. 2008, 458, 151.
(62) Chevrier, V. L.; Zwanziger, J. W.; Dahn, J. R. J. Alloy Compd. 2010, 496, 25.
(63) Thomas, D.; Abdel-Hafiez, M.; Gruber, T.; Huttl, R.; Seidel, J.; Wolter, A. U. B.; Buchner,
B.; Kortus, J.; Mertens, F. J. Chem. Thermodyn. 2013, 64, 205.
(64) Zeilinger, M.; Benson, D.; Häussermann, U.; Fässler, T. F. Chem. Mater. 2013, 25, 1960.
(65) Zeilinger, M.; Fässler, T. F. Dalton Trans. 2014, DOI:10.1039/C4DT00743C.
(66) Zeilinger, M.; Kurylyshyn, I. M.; Häussermann, U.; Fässler, T. F. Chem. Mater. 2013, 25,
4623.
3.1 Revision of the Li–Tt (Tt = Si, Ge) Phase Diagrams and New Lithium-Rich Tetrelides
51
(67) Zeilinger, M.; Baran, V.; van Wüllen, L.; Häussermann, U.; Fässler, T. F. Chem. Mater.
2013, 25, 4113.
(68) Zeilinger, M.; Fässler, T. F. Acta Cryst. 2013, E69, i81.
(69) Wang, Y. D.; Dahn, J. J. Electrochem. Soc. 2006, 153, A2314.
(70) Chevrier, V. L.; Dahn, H. M.; Dahn, J. R. J. Electrochem. Soc. 2011, 158, A1207.
(71) Profatilova, I. A.; Langer, T.; Badillo, J. P.; Schmitz, A.; Orthner, H.; Wiggers, H.;
Passerini, S.; Winter, M. J. Electrochem. Soc. 2012, 159, A657.
(72) Lupu, C.; Mao, J. G.; Rabalais, J. W.; Guloy, A. M.; Richardson, J. W. Inorg. Chem.
2003, 42, 3765.
(73) Hatchard, T. D.; Dahn, J. R. J. Electrochem. Soc. 2004, 151, A838.
(74) Vegard, L. Z. Phys. 1921, 5, 17.
(75) Miller, G. J. Eur. J. Inorg. Chem. 1998, 523.


53
3.2 Open Tetrahedral Frameworks (OTFs)
3.2.1 Review of Relevant Literature
Lithium-rich tetrelides such as Li17Tt4, Li16.4Tt4 or Li15Tt4 (Tt = Si, Ge) solely comprise isolated,
highly negatively charged tetrel atoms which are embedded in Li matrices. A sound descrip-
tion of their complex structures is achieved by visualizing the arrangement of TtLin coordina-
tion polyhedra. Gradually going to Tt-rich phases, these, for example, contain Tt–Tt dumbbells
(Li7Tt3), clusters such as [Tt4]4− and [Tt9]4− (K12Tt171,2), two-dimensional layers like 2∞[Ge12]7−
(Li7Ge123,4, see also Figure 3.19a) or extended network structures. The latter, in particular Zintl
phases realizing open tetrahedral framework (OTF) structures, have been a focus of the
Fässler group for many years. Recent examples are hP-Na2ZnSn5 and tI-Na2ZnSn5
possessing zeolitic Zn–Sn-frameworks,5 the clathrate-I type Na8Zn4Ge426 and K8Zn4Sn42,7 or
Li2ZnGe3 revealing a hexagonal diamond (2H polytype8) like Zn–Ge network (Figure 3.18a–c).9
In terms of electrode materials for LIBs, light-weight Zintl phase OTFs involving elements of
the second row (Li, B, C) are most interesting. Yet, the synthesis of such phases has long
been unsuccessful. Prior to this work, K7B7Si3910 (Si is partially replaced by B) and
K8LixGe44−x/4 2−3x/411 have been the only representatives (Figure 3.18d). Notably, Li replaces
small amounts of Ge in the Ge host structure of the latter and does not occupy framework
cavities. Additionally, an electrochemical lithiation of the clathrate-II compound NaxSi136
(x → 0) was reported.12 In the Li–B–C system, the completely intercalated heterographite LiBC
(a variant of the AlB2 structure, i.e. LiBC) is the lithium-richest phase (Figure 3.18e).13 How-
ever, it was shown that its performance as a cathode or anode material is very poor.14 The
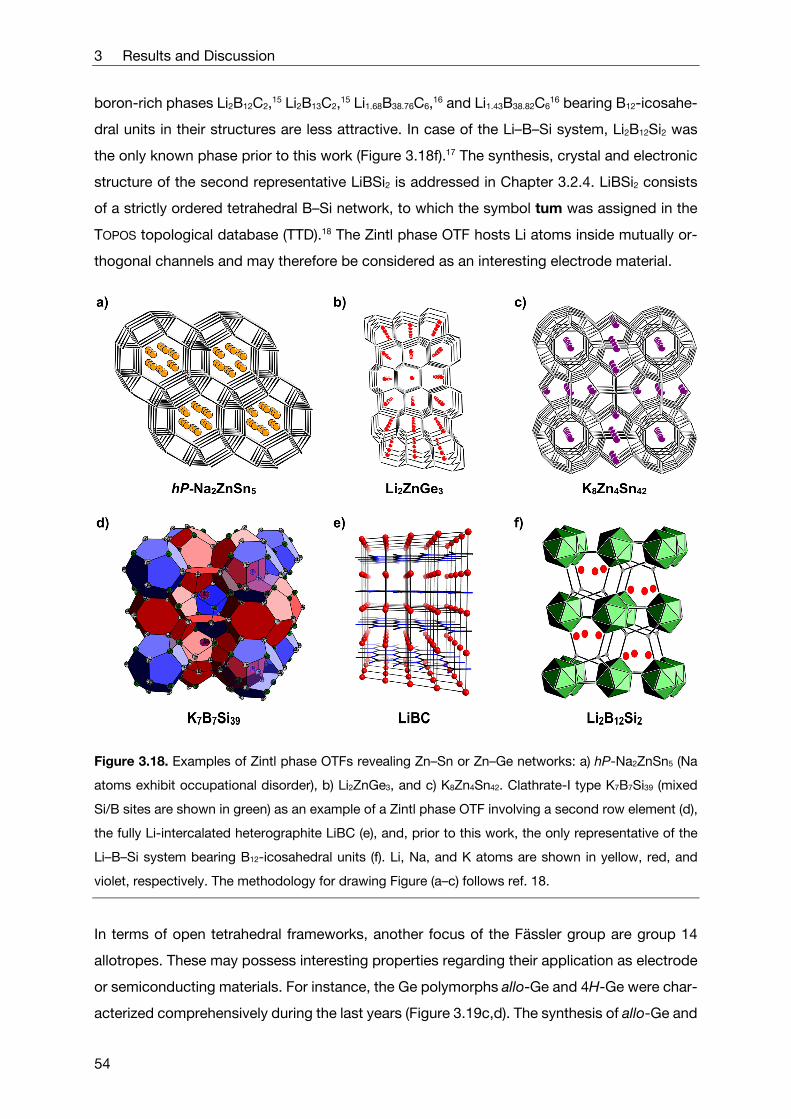
3 Results and Discussion
54
boron-rich phases Li2B12C2,15 Li2B13C2,15 Li1.68B38.76C6,16 and Li1.43B38.82C616 bearing B12-icosahe-
dral units in their structures are less attractive. In case of the Li–B–Si system, Li2B12Si2 was
the only known phase prior to this work (Figure 3.18f).17 The synthesis, crystal and electronic
structure of the second representative LiBSi2 is addressed in Chapter 3.2.4. LiBSi2 consists
of a strictly ordered tetrahedral B–Si network, to which the symbol tum was assigned in the
TOPOS topological database (TTD).18 The Zintl phase OTF hosts Li atoms inside mutually or-
thogonal channels and may therefore be considered as an interesting electrode material.
Figure 3.18. Examples of Zintl phase OTFs revealing Zn–Sn or Zn–Ge networks: a) hP-Na2ZnSn5 (Na
atoms exhibit occupational disorder), b) Li2ZnGe3, and c) K8Zn4Sn42. Clathrate-I type K7B7Si39 (mixed
Si/B sites are shown in green) as an example of a Zintl phase OTF involving a second row element (d),
the fully Li-intercalated heterographite LiBC (e), and, prior to this work, the only representative of the
Li–B–Si system bearing B12-icosahedral units (f). Li, Na, and K atoms are shown in yellow, red, and
violet, respectively. The methodology for drawing Figure (a–c) follows ref. 18.
In terms of open tetrahedral frameworks, another focus of the Fässler group are group 14
allotropes. These may possess interesting properties regarding their application as electrode
or semiconducting materials. For instance, the Ge polymorphs allo-Ge and 4H-Ge were char-
acterized comprehensively during the last years (Figure 3.19c,d). The synthesis of allo-Ge and

3.2 Open Tetrahedral Frameworks
55
Figure 3.19. Crystal structures of a) Li7Ge12 and b) Li3NaSi6 revealing polyanionic layers 2∞[Ge12]7− and
2∞[Si6]4−, respectively, separated by Li (red) and Na (yellow) atoms. A mild oxidation of Li7Ge12, i.e. a Li
deintercalation and concomitant interlayer bond formation (corresponding layers are shown in green),
leads to the formation of m-allo-Ge (c) which transforms into the further allotrope 4H-Ge (d).
Figure 3.19c was modified on the basis of ref. 18.
its transformation to 4H-Ge (isotypic to the 4H polytype of SiC) was first described in the
1980’s.3,19 Accordingly, allo-Ge was obtained through a mild oxidation of Li7Ge12, a phase that
possesses polyanionic slabs 2∞[Ge12]7− which are separated from each other by Li atoms (Fig-
ure 3.19a). By treatment of Li7Ge12 with protic solvents, interstitial Li is removed. Thereby, the
topology of the 2∞[Ge12]7− layers is retained under interlayer Ge–Ge bond formation (topochem-
ical reaction, Scheme 3.1a). However, the oxidation reaction afforded microcrystalline prod-
ucts which did not allow a comprehensive structure determination. Consequently, the struc-
ture model for allo-Ge remained unsatisfying until lately. Applying a combination of selected

3 Results and Discussion
56
area electron diffraction, powder X-ray diffraction, quantum chemical calculations and simu-
lated powder X-ray diffraction patterns, the structure model for m-allo-Ge (microcrystalline
allo-Ge) was improved considerably by Fässler and coworkers.20 Between 150 and 300 °C
m-allo-Ge transforms into 4H-Ge (Figure 3.19d).3,21 Similar to the synthesis of allo-Ge, allo-Si
was obtained from an oxidation of Li3NaSi6 as yet another group 14 polymorph (Scheme 3.1b).
Li3NaSi6 comprises of polyanionic layers 2∞[Si6]4− that are separated by Li and Na atoms
(Figure 3.19b).22,23 The treatment of this phase with protic solvents leads to a topochemical
oxidation reaction where Li and Na atoms are deintercalated under formation of a three-di-
mensional four-connected (4c) Si-network through interlayer bond formation.22,23 However,
this reaction only afforded poorly crystalline products which did not allow a conclusive struc-
ture determination. As yet, the structure of allo-Si is only sketchily described and sparse
successive work is found in literature. Employing quantum chemical calculations, hypothetical
structures for allo-Si24 and other Si allotropes were predicted.25–31
a) Li7Ge12 + 7 ROH 12 allo-Ge + 3.5 H2 + 7 LiOR
b) Li3NaSi6 + 4 ROH 6 allo-Si + 2 H2 + 3 LiOR + NaOR
Scheme 3.1. Oxidation reactions of Li7Ge12/Li3NaSi6 yielding allo-Ge and allo-Si.
In the course of this thesis, the synthesis of the Si polymorph allo-Si came under scrutiny and
comprehensive investigations could not confirm its existence. According results are pre-
sented in Chapter 3.2.2. As part of these studies, the incorporation of Ge into the structure of
Li3NaSi6 (note that Li3NaGe6 is not known) was studied additionally since Li3Na(Si1−xGex)6
phases might serve as a precursors for allo-Si1−xGex. This led to the discovery of the novel
Zintl phase Li18Na2Ge1732 which contains the three Zintl anions Ge4−, [Ge4]4−, and [Ge12]12− in a
1:1:1 ratio (see Chapter 3.2.3).
3.2.2 OTF from Silicon: On the Existence of the Si Polymorph allo-Si
see Chapter 5.6 Zeilinger, M.; Jantke, L. A.; Scherf, L. M.; Kiefer, F. J.; Konar, S.; Kienle, L.; Karttunen, A. J.; Häussermann, U; Fässler, T. F., manuscript for publication.
As briefly addressed in the introduction, the structure of the Ge polymorph m-allo-Ge
(allo-Ge) was elucidated just recently.20 Thereby, quantum chemical calculations on differently
modeled structures played an important role. Since the structure of allo-Ge is directly related
to the polyanionic 2∞[Ge12]7− slabs in Li7Ge12, these models were constructed by connecting

3.2 Open Tetrahedral Frameworks
57
Figure 3.20. Hypothetical oxidation of Li3NaSi6 with alcohols ROH (R = –CH3, –CH2CH3) yielding a
zeolite-type Si open tetrahedral framework (TON, ZSM-22). In the present work, the TON structure was
obtained after a full structural relaxation starting from the Si substructure of Li3NaSi6. Li and Na atoms
are shown in red and yellow, respectively. Figures were adopted from Chapter 5.6.
2∞[Ge12]7− slab units differently.20 Turning to allo-Si, an analogous approach would be reason-
able. However, a phase Li7Si12 has not been described thus far. Considering Li3NaSi6 with its
2∞[Si6]4− layers as a precursor for allo-Si, a full structural relaxation of its Si substructure con-
cluded with the zeolite-type structure TON (Figure 3.20). This strongly fuels the prospect of
obtaining crystalline samples of allo-Si which could facilitate a conclusive structure determi-
nation of the Si polymorph first described in the 1980’s.
As part of this thesis, diverse reactions targeting the synthesis of allo-Si only yielded
amorphous products which were correspondingly denoted as a-allo-Si. Attempts to repro-
duce reports from literature failed. Previously reported reflections for allo-Si (ICSD 41-1111)
were not traced in any of the powder X-ray diffraction patterns recorded for samples that were
synthesized according to Scheme 3.1b. However, it could be shown that the published dif-
fraction pattern of allo-Si bears a striking resemblance to NbSi2. Since the authors employed
Nb ampules for the synthesis of the precursor Li3NaSi6 at relatively high reaction tempera-
tures,22,23 the reflections of allo-Si most likely originated from an NbSi2 impurity. The corre-
sponding reflections may dominate the powder X-ray diffraction pattern after Li3NaSi6 was
fully converted into an amorphous phase. Thus, it seems that the oxidation of Li3NaSi6 with
protic solvents is merely a further method to produce amorphous Si. However, Schwarz et
al.22,23 reported on a phase transition of allo-Si yielding α-Si at 527 °C which is drastically lower
than the amorphous-to-crystalline phase transition of ordinary amorphous Si. This was addi-
tionally supported by temperature-dependent powder X-ray diffraction experiments and

3 Results and Discussion
58
claimed as a “good proof that allo-Si is in fact a new silicon modification”.23 In order to clarify
this issue, amorphous Si (a-Si) was produced by an extraction of Li from the lithium-rich sili-
cide Li15Si4 using liquid ammonia as a solvent for Li (Scheme 3.2).
Li15Si4 15 (1−x) LiNH3 + 4 a-Si + 15 x LiNH2 + 7.5 x H2
Scheme 3.2. Synthesis of amorphous Si (a-Si) starting from Li15Si4 and NH3 as solvent for Li.
Since this reaction produces a mixture of a-Si and LiNH2, the extraction process was
followed by an aqueous treatment of the a-Si/LiNH2 intermediate to remove LiNH2. Subse-
quently, the corresponding products were rigorously characterized by powder X-ray diffrac-
tion, diverse spectroscopic and microscopic methods which provided evidence for a com-
pletely amorphous character, a slight surface oxidation of nano- and micrometer-sized parti-
cles, and virtually no residual Li.
Figure 3.21. First DTA heating traces of thermograms recorded for Li3NaSi6, partially oxidized Li3NaSi6
(Li3NaSi6/a-allo-Si mixture), a-allo-Si, and a-Si obtained from Li15Si4 (Tmax. = 750 °C, ±10 K∙min−1 heat-
ing/cooling rate, heat effects marked with * could not be assigned). Figure and figure caption were
adopted from Chapter 5.6.
As can be recognized from DTA heating traces in Figure 3.21, fully and partially oxidized
samples of Li3NaSi6 corresponding to a-allo-Si and a mixture a-allo-Si/Li3NaSi6, respectively,
NH3

3.2 Open Tetrahedral Frameworks
59
undergo an amorphous-to-crystalline phase transition at 487 and 565 °C (effect 1 and 3),
embracing the reported phase transition temperature of allo-Si (527 °C).22,23 Effect (2) is at-
tributed to the decomposition of Li3NaSi6. In case of a-Si, the phase transition is observed at
658 °C (effect 4) which is markedly higher than found for a-allo-Si. These findings support
previous results on the thermal behavior of allo-Si. However, Raman spectroscopy studies
and powder X-ray diffraction of a-Si and a-allo-Si samples indicate that, in contrast to a-Si,
a-allo-Si contains large concentrations of α-Si crystallites which act as crystallization nuclei.
Note that the formation of α-Si crystallites was also mentioned in previous work.23 Thus, the
different phase transition temperatures in the series Li3NaSi6/a-allo-Si, a-allo-Si, and a-Si can
be explained. Therefore, it is concluded that the oxidation of Li3NaSi6 with protic solvents
according to previous work23 solely leads to the formation of amorphous Si. The difficulties to
synthesize crystalline samples of allo-Si were also explained by quantum chemical calcula-
tions since structures derived from the substructure of hypothetical Li7Si12 are distinctly
favored over those composed of 2∞[Si6]4− layers apparent in Li3NaSi6. Interestingly, some Zintl
phase OTFs (mep, mtn, CAS, unj, tum) were shown to be suitable for Si since these possess
more favorable energies relative to α-Si. This nicely demonstrates that new polymorphs of Si
might be obtainable by employing other precursors or new routes.
3.2.3 Li3Na(Si1−xGex)6 as Precursor for allo-Si1−xGex and the
Discovery of the Zintl Phase Li18Na2Ge17
see Chapter 5.7 Scherf, L. M.; Zeilinger, M.; Fässler, T. F. Inorg. Chem. 2014, 53, 2096.
The oxidation of the ternary lithium sodium silicide Li3NaSi6 solely led to the formation of
amorphous Si. In contrast, Li7Ge12 is transformed into microcrystalline allo-Ge by an oxidative
deintercalation.3,20 For both cases the homologues Li3NaGe6 and Li7Si12 are not known. How-
ever, a limited solubility of the respective tetrel element corresponding to Li7(Si1−xGex)12 and
Li3Na(Si1−xGex)6 may be possible. These phases could then serve as precursors for crystalline
allo-Si1−xGex which might be interesting in terms of band gap tuning. However, the solid solu-
tion behavior is very limited and other phases are formed instead.33 Within investigations on
Li3Na(Si1−xGex)6, the novel Zintl phase Li18Na2Ge17 could be identified and subsequently syn-
thesized from a stoichiometric mixture of the pure elements. As part of the corresponding
joint publication, Li18Na2Ge17 was characterized by single crystal X-ray diffraction. Li18Na2Ge17
crystallizes in the trigonal space group P31m with a = 17.0905(4) Å, c = 8.0783(2) Å and Z = 3.

3 Results and Discussion
60
The non-centrosymmetric structure was readily solved and refined with reliability factors of
R1 = 0.0212 and wR2 = 0.0420 for all data and a flack parameter of 0.01(2). The asymmetric
unit contains 13 Li, three Na, and 12 Ge positions which are all fully occupied. This corre-
sponds to a total unit cell content of 54 Li, six Na, and 51 Ge atoms (hP111). Atomic displace-
ment parameters were refined anisotropically for all atoms.
Li18Na2Ge17 is one of few examples comprising three different Zintl anions in its unit cell
(Figure 3.22a). These are [Ge12]12− centering a Li atom ([Li@Li4Ge12]11−), [Ge4]4−, and Ge4− in a
1:1:1 ratio (Figure 3.22b,c).
Figure 3.22. a) Unit cell of Li18Na2Ge17 with view along the crystallographic c-axis emphasizing the
Friauf polyhedra [Li@Li4Ge12]11− (light blue) and the two crystallographically independent tetrahedra
[Ge4]4− (red and yellow). The coordination environments of [Li@ Li4Ge12]11− units and isolated Ge4− atoms
are depicted in (b) and (c), respectively. Thermal ellipsoids in (b) and (c) are shown at a 90% probability
level (Li = white, Na = green, Ge = dark gray). Figures were adopted from ref. 32.
3.2.4 LiBSi2: A Novel Zintl Phase OTF Hosting Li Atoms
Inside Channels
see Chapter 5.8 Zeilinger, M.; van Wüllen, L.; Benson, D.; Kranak, V. F.; Konar, S.; Fässler, T. F.; Häussermann, U. Angew. Chem. Int. Ed. 2013, 52, 5978.
Turning to OTFs that are realized by Zintl phases, a high-pressure high-temperature experi-
ment employing a 1:1 mixture of LiB and α-Si encapsulated in a salt cylinder yielded the novel
Zintl phase LiBSi2. The thoroughly mixed reactants were pressurized at a maximum pressure
of 10 GPa and subsequently reacted at 900 °C for one hour. The powder X-ray diffraction
pattern of the product corresponded to LiBSi2 and reflections originating from an unknown

3.2 Open Tetrahedral Frameworks
61
phase. Serendipitously, the latter is air and moisture sensitive and could be removed by wash-
ing. In contrast, LiBSi2 is stable in air and toward strong acids. The structure of LiBSi2 could
then be solved from powder X-ray diffraction data using a parallel tempering algorithm.34–36
A rigorous investigation of the formation conditions of LiBSi2 proved that LiBSi2 can be
directly synthesized from a 1:2 mixture of LiB and α-Si. However, an appreciable conversion
is only observed if the educts are reacted at least 90 hours at 900 °C and 10 GPa (Figure 3.23).
Figure 3.23. a) Powder X-ray diffraction pattern of a LiBSi2 sample obtained after reacting a 1:2 mixture
of LiB and α-Si at 900 °C for 90 h at a pressure of 10 GPa. Reducing the dwell time at 900 °C, the
corresponding powder X-ray diffraction patterns (b) reveal drastically higher portions of α-Si (α-Si con-
tents were determined by Rietveld refinement; calculated patterns for LiBSi2 and α-Si are shown in red
and blue, respectively, experimental ones in black, pink, and green).
LiBSi2 crystallizes in the tetragonal space group P42/nmc with a = 6.83225(3) Å,
c = 8.83924(6) Å, V = 412.612(5) Å3, and eight formula units in the unit cell (tP32). The asym-
metric unit contains four crystallographically independent atom positions. Si1 and Si2, being
located on different 8g (¼, y, z) positions, and B on 8f (x, y ,¼) form a strictly ordered open
tetrahedral framework (OTF) that encloses Li atoms (on 8g) inside mutually orthogonal chan-
nels (Figure 3.24a). B atoms are exclusively bonded to Si atoms. Remarkably, LiBSi2 is the
first example that reveals such a strictly ordered B–Si framework. It comprises five-, six-, and
seven-membered rings. The bonding situation can be easily explained with the Zintl concept:
(Li+)(4b-B−)(4b-Si0) where B− is isoelectronic with C and thus four-bonded (4b).
The central motifs in the structure of LiBSi2 are [B4Si24] realgar-like units and Si1–Si1
dumbbells in a 1:2 ratio forming two-dimensional slabs that embed elongated Li4-tetrahedra
(edge lengths: 3.36 and 3.85 Å) as illustrated in Figure 3.24b. These slabs are connected along
the crystallographic c-axis (Figure 3.24a). Since they are related by the n glide perpendicular

3 Results and Discussion
62
Figure 3.24. Crystal structure of LiBSi2. a) 222 supercell with view along the b-axis (Li, B, and Si
atoms are shown in red, blue, and dark gray; isotropic atomic displacement at a 90 % probability level);
b) ab-projection of two consecutive slab building units whose boundaries are indicated by blue planes
in Figure (a). Slab building units comprise realgar-like units that are emphasized by yellow bonds. Elon-
gated Li4-tetrahedra (shown in gray) are embedded in each slab. Symmetry elements (42 and 4 axes)
are indicated by their respective symbols; c) excerpt of a structural building block that results from
connecting three consecutive slab building units. Li atoms are hosted inside six- and seven-membered
orthogonal channels which are recognizable as linear chains and zig-zag chains, respectively (dotted
lines between Li atoms do note indicated interactions). Figures were adopted from ref. 18.
to c (Figure 3.24b), realgar units and Li4-tetrahedra are alternatingly stacked whereas Si1–Si1
dumbbells are situated on top of each other by a 90° rotation. As a result of stacking the two-
dimensional slab building units, Li atoms are hosted inside mutually perpendicular channels.
Interestingly, the arrangement of Li atoms may be described as linear chains and zig-zag
chains when viewing along channels formed from seven-membered and six-membered rings,
respectively (Figure 3.24a,c). These chains run along the a- and b-direction. It is noteworthy
that if parallel channels formed by the seven-membered rings (hosting linear Li chains at dif-
ferent heights), for example recognized in the b-direction, are viewed from the (perpendicular)
a-direction, their side view corresponds to parallel channels formed by six-membered rings
(hosting Li zig zag chains).
The fascinating structure of LiBSi2 which represents a new three periodic, four con-
nected net (it was assigned the symbol tum in the TOPOS topological database) was also
confirmed by Raman and NMR spectroscopy. Additionally, quantum chemical calculations
revealed a band gap of 1.1 eV.

3.2 Open Tetrahedral Frameworks
63
3.2.5 References
(1) von Schnering, H. G.; Baitinger, M.; U. Bolle, U.; Carrillo-Cabrera, W.; Curda, J.; Grin,
Y.; Heinemann, F.; Llanos, J.; Peters, K.; Schmeding, A.; Somer, M. Z. Anorg. Allg.
Chem. 1997, 623, 1037.
(2) Hoch, C.; Wendorff, M.; Röhr, C. J. Alloys Compd. 2003, 361, 206.
(3) Grüttner, A.; Nesper, R.; von Schnering, H. G. Angew. Chem. Int. Ed. 1982, 21, 912.
(4) Kiefer, F.; Fässler, T. F. Solid State Sci. 2011, 13, 636.
(5) Stegmaier, S.; Kim, S. J.; Henze, A.; Fässler, T. F. J. Am. Chem. Soc. 2013, 135, 10654.
(6) Stegmaier, S. Dissertation, Technische Universität München: München, Germany, 2012.
(7) Baran, V.; Fischer, A.; Scherer, W.; Fässler, T. F. Z. Anorg. Allg. Chem. 2013, 639, 2125.
(8) Ramsdell, L. S. Am. Mineral. 1947, 32, 64.
(9) Stegmaier, S.; Fässler, T. F. Inorg. Chem. 2013, 52, 2809.
(10) Jung, W.; Lorincz, J.; Ramlau, R.; Borrmann, H.; Prots, Y.; Haarmann, F.; Schnelle, W.;
Burkhardt, U.; Baitinger, M.; Grin, Y. Angew. Chem. Int. Ed. 2007, 46, 6725.
(11) Liang, Y.; Böhme, B.; Ormeci, A.; Borrmann, H.; Pecher, O.; Haarmann, F.; Schnelle,
W.; Baitinger, M.; Grin, Y. Chem. Eur. J. 2012, 18, 9818.
(12) Langer, T.; Dupke, S.; Trill, H.; Passerini, S.; Eckert, H.; Pöttgen, R.; Winter, M. J.
Electrochem. Soc. 2012, 159, A1318.
(13) Wörle, M.; Nesper, R.; Mair, G.; Schwarz, M.; von Schnering, H. G. Z. Anorg. Allg. Chem.
1995, 621, 1153.
(14) Langer, T.; Dupke, S.; Dippel, C.; Winter, M.; Eekert, H.; Pöttgen, R. Z. Naturforsch. B
2012, 67, 1212.
(15) Vojteer, N.; Hillebrecht, H. Angew. Chem. Int. Ed. 2006, 45, 165.
(16) Vojteer, N. Dissertation, Universität Freiburg/Breisgau: Freiburg, Germany, 2008.
(17) Vojteer, N.; Schroeder, M.; Röhr, C.; Hillebrecht, H. Chem. Eur. J. 2008, 14, 7331.
(18) Zeilinger, M.; van Wüllen, L.; Benson, D.; Kranak, V. F.; Konar, S.; Fässler, T. F.;
Häussermann, U. Angew. Chem. Int. Ed. 2013, 52, 5978.
(19) Grüttner, A.; Nesper, R.; von Schnering, H. G. Acta Cryst. 1981, A37, C161.
(20) Kiefer, F.; Karttunen, A. J.; Döblinger, M.; Fässler, T. F. Chem. Mater. 2011, 23, 4578.
(21) Kiefer, F.; Hlukhyy, V.; Karttunen, A. J.; Fässler, T. F.; Gold, C.; Scheidt, E. W.; Scherer,
W.; Nylen, J.; Häussermann, U. J. Mater. Chem. 2010, 20, 1780.
(22) Schwarz, M. Dissertation, Universität Stuttgart: Stuttgart, Germany, 1988.
(23) von Schnering, H. G.; Schwarz, M.; Nesper, R. J. Less-Common Met. 1988, 137, 297.
(24) Conesa, J. C. J. Phys. Chem. B 2002, 106, 3402.

3 Results and Discussion
64
(25) Zwijnenburg, M. A.; Jelfs, K. E.; Bromley, S. T. Phys. Chem. Chem. Phys. 2010, 12,
8505.
(26) Pickard, C. J.; Needs, R. J. Phys. Rev. B 2010, 81.
(27) Karttunen, A. J.; Fässler, T. F.; Linnolahti, M.; Pakkanen, T. A. Inorg. Chem. 2011, 50,
1733.
(28) Wu, F.; Jun, D.; Kan, E.; Li, Z. Solid State Commun. 2011, 151, 1228.
(29) Zhao, Z.; Tian, F.; Dong, X.; Li, Q.; Wang, Q.; Wang, H.; Zhong, X.; Xu, B.; Yu, D.; He,
J.; Wang, H. T.; Ma, Y.; Tian, Y. J. Am. Chem. Soc. 2012, 134, 12362.
(30) Botti, S.; Flores-Livas, J. A.; Amsler, M.; Goedecker, S.; Marques, M. A. L. Phys. Rev. B
2012, 86.
(31) Zhao, H.-Y.; Wang, J.; Ma, Q.-M.; Liu, Y. Phys. Chem. Chem. Phys. 2013, 15, 17619.
(32) Scherf, L. M.; Zeilinger, M.; Fässler, T. F. Inorg. Chem. 2014, 53, 2096.
(33) Scherf, L. M. Master's Thesis, Technische Universität München: München, Germany,
2013.
(34) FOX program, F.O.X., Free Objects for Crystallography V 1.9.7.0,
http://objcryst.sourceforge.net., 2011.
(35) Favre-Nicolin, V.; Cerny, R. J. Appl. Crystallogr. 2002, 35, 734.
(36) Cerny, R.; Favre-Nicolin, V. Powder Diffr. 2005, 20, 359.

65
Chapter 4
Summary and Conclusion
Efficient and at the same time affordable energy storage has become one of the most im-
portant aspects of the present and future generation. This particularly emerged from an in-
creasing demand for portable electronics and electric vehicles. In this regard, the lithium-ion
battery (LIB) technology is the system of choice since it offers high energy densities at light
weight in combination with a plethora of different battery designs. Enhancing the well-estab-
lished LIB technology in order to meet current requirements is directly associated with the
question of how single components of the system can be viably improved. To this end, a deep
understanding of respective part systems is crucial and inevitable.
In the course of the present thesis, the binary phase diagram Li–Si came under scrutiny
since Si has been regarded as a promising anode material for future LIBs. Theoretically, a Si
anode would offer a specific capacity being almost ten times higher than that of graphite,
which is commercially used as anode material in most LIBs. However, the use of Si is con-
fronted with a massive swelling/contraction of active material during lithiation/delithiation pro-
cesses, contact loss of electrodes and poor cyclability. While various solutions were proposed
to compensate these problems, a fundamental characterization of the Li–Si system, in partic-
ular, the lithium-rich portion, has not been addressed prior to this work. In detail, it was shown
that Li17Si4 is the lithium-richest representative of the Li–Si system replacing the previously
reported phase Li21Si5 (Li16.8Si4). The structures of Li17Si4 and Li21Si5 are closely related and
solely differ in the occupation of one fourfold special position (Figure 4.1a). The existence of
a phase with a composition Li22Si5 (Li17.6Si4) was ruled out and thus the controversy in literature
regarding the composition of the lithium-richest Li–Si phase could be clarified. Remarkably,
these investigations led to the discovery of a new compound. Li16.42Si4 was established as a
high-temperature phase in the Li–Si system and exhibits a structural disorder which is unique
amongst Li–Si phases. Despite their resembling compositions, the structures of Li17Si4 and
Li16.42Si4 are very different (Figure 4.1a,b). The discovery of Li16.42Si4 is ascribed a key role since
this allowed a conclusive revision of the lithium-rich section of the Li–Si system (> 76 at.% Li).
Analogous investigations of the Li–Ge phase system revealed the existence of the heavier
homologues Li17Ge4 and Li16.38Ge4. Consequentially, the lithium-rich section of the Li–Ge sys-
tem (> 79 at.% Li) could be redetermined accordingly. Interestingly, the Li–Ge phase

4. Summary and Conclusion
66
Figure 4.1. Crystal structures of phases which were characterized in the course of the present thesis.
a) cubic unit cell of Li17Tt4 emphasizing the NaTl-type arrangement of Tt-tetrahedra (red, yellow) and
octahedra (blue, green) which correspond to M26 clusters (M = Li + Tt) being centered at Wyckoff po-
sitions 4a, 4c and 4b, 4d, respectively. The 4a position is occupied by Li which centers a M26-cluster;
b) TtLin coordination polyhedra and their strand-like arrangement in the orthorhombic unit cell (211)
of Li16.4Tt4 (Li4.1Tt); c) strands of condensed pseudo-anticuboctahedral units [Si@Li12] proceeding along
the three-fold axes of the cubic unit cell of Li15−xAlxSi4. Different directions of 1∞[Si@Li12] strands are
indicated by different colors; d) 212 super cell of the orthorhombic phase Li13Si4 emphasizing Si–Si
dumbbells and interconnected parallel strands of condensed 1∞[Si@Li12] units (green); e) the Zintl phase
OTF of LiBSi2 hosting Li atoms inside mutually orthogonal channels which are formed by six- and
seven-membered rings. The novel, strictly ordered B–Si framework was assigned the symbol tum in
the TOPOS topological database; Li and Tt (Tt = Si, Ge) atoms in Figures 4.1a,b,d,e are shown in red
and dark gray, respectively.
diagram bears strong resemblance with the Li–Si system regarding the thermodynamic sta-
bilities of Li17Tt4 and Li16.4Tt4. Moreover, melt equilibration experiments employing Li–Si melts
with Li concentrations > 85 at.% surprisingly yielded few single crystals of the metastable
phase Li15Si4. Hitherto, its structural parameters were merely determined from Rietveld fits of

4. Summary and Conclusion
67
the Cu15Si4 structure model to respective powder X-ray diffraction patterns. As part of this
work, the first single crystal diffraction study on Li15Si4 validated the assignment of the Cu15Si4
structure type. Again, the structure of Li15Si4 is very different from Li17Si4 and Li16.42Si4 (Fig-
ure 4.1a–c). Besides, the crystal structure of Li13Si4 (Figure 4.1d) was redetermined by single
crystal X-ray diffraction and improved distinctly in comparison to previous work. The unam-
biguous structural and thermodynamic characterization of all aforementioned phases finally
allowed the elucidation of the decomposition behavior of Li15Si4.
Looking at the series Li13Si4, Li15Si4, Li16.42Si4, and Li17Si4, it is interesting to note that none
of these meet the criteria for a Zintl phase, albeit Li16.42Si4 is very close to it. Hence, the ques-
tion of how a Zintl phase may be formed arises. In this regard, the analysis of the band
structure of Li15Si4 reveals a peculiarity since a pseudo-gap is located above the Fermi level.
Consequently, it can be speculated that an increase of the electron concentration by
replacing small amounts of Li by a suitable dopant could shift the Fermi level toward the
pseudo-gap resulting in the formation of an electron-precise (semiconducting) Zintl phase.
Remarkably, it was shown that substituting small concentrations of Li in Li15Si4 by Al leads to
the formation of Li15−xAlxSi4 (0.4 < x < 0.8) which also include the Zintl phase Li14.5Al0.5Si4
(14.5 Li+, 0.5 Al3+, 4 Si4−). In contrast to Li15Si4, these phases are thermodynamically stable up
to ~700 °C (Li15Si4 irreversibly decomposes at ~170 °C) and reveal a diamagnetic behavior.
Another focus of this thesis was set on open tetrahedral framework (OTF) structures
realized by Zintl phases and group 14 elements. These materials might serve as alternative
electrode materials or could be interesting with respect to semiconducting properties. Re-
garding OTFs realized from elements, the synthesis of the Si polymorph allo-Si was studied
comprehensively. Similar to the Ge allotrope allo-Ge, allo-Si can be obtained from an oxida-
tion of the layer-like phase Li3NaSi6. It bears polyanionic layers 2∞[Si6]4− that are separated by
alkaline metal atoms (allo-Ge: Li7Ge12, 2∞[Ge12]7−). The oxidative deintercalation of Li3NaSi6 with
protic solvents goes along with a concomitant interlayer bond formation leading to a four-
connected network. Contrary to allo-Ge, authors reported on the formation of poorly crystal-
line allo-Si samples that did not allow a conclusive structural characterization. As part of this
work, only amorphous samples of allo-Si were afforded and denoted as a-allo-Si. Further-
more, previous results from powder X-ray diffraction experiments were shown to be ambigu-
ous since the reported allo-Si Bragg reflections most likely originated from an impurity. It
could be proven by thermal investigations that the amorphous-to-crystalline phase transition
temperature of a-allo-Si (into α-Si, 487–565 °C) is markedly lower than the one of ordinary
amorphous Si (a-Si, ~660 °C). For these studies, a-Si was obtained from a new route employ-
ing liquid ammonia as a solvent for Li to extract it from Li15Si4. However, the different phase
transition temperatures of a-Si and a-allo-Si are attributed to large concentrations of α-Si
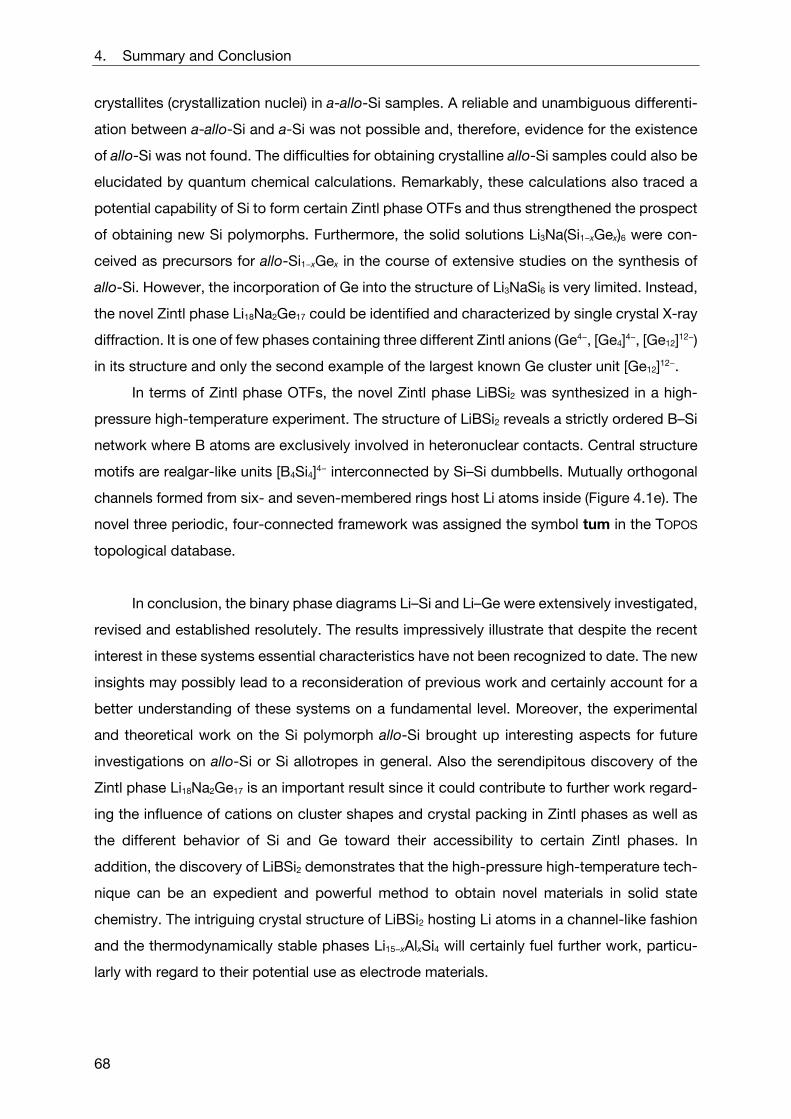
4. Summary and Conclusion
68
crystallites (crystallization nuclei) in a-allo-Si samples. A reliable and unambiguous differenti-
ation between a-allo-Si and a-Si was not possible and, therefore, evidence for the existence
of allo-Si was not found. The difficulties for obtaining crystalline allo-Si samples could also be
elucidated by quantum chemical calculations. Remarkably, these calculations also traced a
potential capability of Si to form certain Zintl phase OTFs and thus strengthened the prospect
of obtaining new Si polymorphs. Furthermore, the solid solutions Li3Na(Si1−xGex)6 were con-
ceived as precursors for allo-Si1−xGex in the course of extensive studies on the synthesis of
allo-Si. However, the incorporation of Ge into the structure of Li3NaSi6 is very limited. Instead,
the novel Zintl phase Li18Na2Ge17 could be identified and characterized by single crystal X-ray
diffraction. It is one of few phases containing three different Zintl anions (Ge4−, [Ge4]4−, [Ge12]12−)
in its structure and only the second example of the largest known Ge cluster unit [Ge12]12−.
In terms of Zintl phase OTFs, the novel Zintl phase LiBSi2 was synthesized in a high-
pressure high-temperature experiment. The structure of LiBSi2 reveals a strictly ordered B–Si
network where B atoms are exclusively involved in heteronuclear contacts. Central structure
motifs are realgar-like units [B4Si4]4− interconnected by Si–Si dumbbells. Mutually orthogonal
channels formed from six- and seven-membered rings host Li atoms inside (Figure 4.1e). The
novel three periodic, four-connected framework was assigned the symbol tum in the TOPOS
topological database.
In conclusion, the binary phase diagrams Li–Si and Li–Ge were extensively investigated,
revised and established resolutely. The results impressively illustrate that despite the recent
interest in these systems essential characteristics have not been recognized to date. The new
insights may possibly lead to a reconsideration of previous work and certainly account for a
better understanding of these systems on a fundamental level. Moreover, the experimental
and theoretical work on the Si polymorph allo-Si brought up interesting aspects for future
investigations on allo-Si or Si allotropes in general. Also the serendipitous discovery of the
Zintl phase Li18Na2Ge17 is an important result since it could contribute to further work regard-
ing the influence of cations on cluster shapes and crystal packing in Zintl phases as well as
the different behavior of Si and Ge toward their accessibility to certain Zintl phases. In
addition, the discovery of LiBSi2 demonstrates that the high-pressure high-temperature tech-
nique can be an expedient and powerful method to obtain novel materials in solid state
chemistry. The intriguing crystal structure of LiBSi2 hosting Li atoms in a channel-like fashion
and the thermodynamically stable phases Li15−xAlxSi4 will certainly fuel further work, particu-
larly with regard to their potential use as electrode materials.

69
Chapter 5
Publications and Manuscripts

5 Publications and Manuscripts
70
5.1 Single Crystal Growth and Thermodynamic Stability of Li17Si4
Reprinted with permission from Zeilinger, M.; Benson, D.; Häussermann, U.; Fässler,
T. F. Chem. Mater. 2013, 25, 1960. Copyright (2013) American Chemical Society.
http://pubs.acs.org/action/showLargeCover?issue=383763680

Single Crystal Growth and Thermodynamic Stability of Li17Si4Michael Zeilinger,† Daryn Benson,‡ Ulrich Haussermann,§ and Thomas F. Fassler*,†
†Department Chemie, Technische Universitat Munchen, Lichtenbergstraße 4, 85747 Garching b. Munchen, Germany‡Department of Physics, Arizona State University, Tempe, Arizona 85287-1504, United States§Department of Materials and Environmental Chemistry, Stockholm University, SE-10691 Stockholm, Sweden
*S Supporting Information
ABSTRACT: Single crystals of Li17Si4 were synthesized frommelts LixSi100−x (x > 85) at various temperatures and isolatedby isothermal centrifugation. Li17Si4 crystallizes in the spacegroup F4 3m (a = 18.7259(1) Å, Z = 20). The highly air andmoisture sensitive compound is isotypic with Li17Sn4. Li17Si4represents a new compound and thus the lithium-richest phasein the binary system Li−Si superseding known Li21Si5(Li16.8Si4). As previously shown Li22Si5 (Li17.6Si4) has beendetermined incorrectly. The findings are supported bytheoretical calculations of the electronic structure, totalenergies, and structural optimizations using first-principlesmethods. Results from melt equilibration experiments and differential scanning calorimetry investigations suggest that Li17Si4decomposes peritectically at 481 ± 2 °C to “Li4Si” and melt. In addition a detailed investigation of the Li−Si phase system at theLi-rich side by thermal analysis using differential scanning calorimetry is given.
KEYWORDS: Li17Si4, lithium ion battery, lithium silicides, lithium−silicon system, Li−Si system, lithium−silicon phase diagram,Li−Si phase diagram, isothermal melt centrifugation, crystal growth
1. INTRODUCTION
Silicon has attracted considerable interest as an anode materialfor high-energy lithium ion batteries. The theoretical specificcapacity is an order of magnitude larger than for graphite. Yet,the use of silicon as anode material is problematic because ofthe drastic volume changes of up to 300% during charging anddischarging, resulting in a contact loss of electrodes.1 Thelithiation and delithiation mechanism of silicon is much morecomplex compared to graphite and far from being understood.Lithiated silicon provides a specific theoretical capacity of3579 mAh g−1 based on the formation of Li15Si4.
2,3 Recently,Kwon et al.4 presented a capacity extension to 4008 mAh g−1
by observing the formation of Li21Si5 (Li16.8Si4) at lithiationtemperatures above 100 °C. However, it was reported that theformation of Li21Si5 is kinetically slow and can only be observedat extended short-circuit times higher than 24 h.The lithitation/delithiation process of Si is obscured by
crystalline-to-amorphous phase transitions and the manifold ofexisting Li−Si phases. A large amount of ex situ, in situ, and inoperando studies have been performed.2,3,5−10 Interesting arethe results from 7Li- and 29Si NMR experiments by Gray et al.identifying Si cluster units as intermediates in the lithitation/delithiation process.11,12 These investigations indicate thatthermodynamic relations between phases in the binary Li−Sisystem may be more complex as earlier thought.We put the focus on reinvestigation of structure and phase
relations in the Li rich part of the binary Li−Si system, whichyielded surprising results. The lithium-richest silicide in the
binary system Li−Si has been reported 50 years ago as Li22Si5(Li4.4Si),
13,14 which has been corrected 25 years ago to Li21Si5.15
Here we report on the stoichiometric phase Li17Si4 (Li4.25Si)which supersedes Li21Si5
15 (Li4.2Si) as the most Li-rich phase inthe binary system. The latter most likely does not exist as astable phase. On the other hand the Li17T4 structure is knownfor T = Ge, Sn,16,17 and the discovery of Li17Si4 demonstratesthat the Li-rich portion of the phase diagram of the threesystems is actually very similar.
2. EXPERIMENTAL SECTIONSynthesis. Single crystals were grown in melts Li−Si. Starting
materials were rods of Li (99.9%, Sigma-Aldrich) and silicon powder(99.999%, Sigma-Aldrich). All steps of synthesis and samplepreparation were carried out in a glovebox (MBraun, Ar-atmosphere,H2O and O2 levels < 0.1 ppm). Reactions targeting the equilibriumbetween melt and the Li-richest phase at a certain temperature wereperformed in tantalum ampules with dimensions L = 80.0 mm, OD =12.7 mm, and ID = 11.7 mm. Prior to use, these ampules werethoroughly cleaned and heated to 1000 °C under dynamic vacuum(p < 1 × 10⁻³ mbar) for at least 2 h. Subsequently a filter was insertedand reactions were prepared according to ref 18. Mixtures withcompositions of 85−95 atom % Li and a total mass of 300 mg wereloaded and sealed in such ampules which were then encapsulated insilica jackets. Finally, silica jackets were placed in a silica wool insulated
Received: February 21, 2013Revised: March 26, 2013Published: March 28, 2013
Article
pubs.acs.org/cm
© 2013 American Chemical Society 1960 dx.doi.org/10.1021/cm400612k | Chem. Mater. 2013, 25, 1960−1967

reaction container made of stainless steel. Reaction mixtures wereheated in a box furnace to 700 °C at a rate of 5 °C min−1, kept at thistemperature for 1 h, and subsequently cooled down with a rate of5 °C h−1 to various temperatures. After a dwell time of 48 h, reactionswere terminated by isothermally centrifuging off the melt. Figure 1
shows the employed Li−Si atomic ratios as well as the targettemperatures before centrifugation. Obtained crystalline products arehighly air and moisture sensitive. The crystal diameters varied from 0.2mm to over 1 cm.Structure Determination. Crystals of Li17Si4 were selected in an
Ar-filled glovebox and sealed in 0.3 mm glass capillaries. Intensity datawas collected at room temperature and −150 °C. For the latter aBruker X-ray diffractometer equipped with a CCD detector (APEX II,κ-CCD), a fine-focused sealed tube with Mo Kα radiation (λ =0.71073 Å), and a graphite monochromator were employed (fordetails on the room temperature experiments see SupportingInformation, Tables S1 and S2). Data collection was controlled withthe Bruker APEX Software Suite.19 Integration, data reduction, andabsorption correction were performed with the packages SAINT20 andSADABS.21 Space group symmetry was assigned on the basis of thesystematic absences and the statistical analysis of the intensitydistributions. In all cases Friedel pairs were not merged as theassigned space group is noncentrosymmetric. The structures weresolved with direct methods (SHELXS-9722) and refined with full-matrix least-squares on F2 (SHELXL-9723). Difference Fourier mapsFo − Fc were calculated with JANA2006.24 Details of the single crystaldata collections and refinements are listed in Table 1. Atom positionparameters and selected interatomic distances are given in Tables 2and 3. Further details of the crystal structure investigations may beobtained as Supporting Information and from Fachinformationszen-trum Karlsruhe, D-76344 Eggenstein-Leopoldshafen, Germany (fax(+49)7247−808−666; e-mail [email protected]) on quotingthe depository numbers CSD-425779 (Li17Si4-123K) and CSD-425780 (Li17Si4-298K).Powder X-ray Diffraction (PXRD). PXRD patterns were recorded
on a Stoe STADI P diffractometer (Ge(111) monochromator for CuKα radiation, λ = 1.54056 Å) equipped with a Detectris MYTHENDCS 1K solid state detector. Single crystals of Li17Si4 and DSC bulksamples were ground in an agate mortar and filled in 0.3 mm glasscapillaries which were sealed. All samples were measured within a 2θrange of 5−90° (PSD steps: 0.06−1.50°; time/step: 15−40 s). TOPAS4.0 was used for Rietveld refinements.25
Differential Scanning Calorimetry (DSC). DSC measurementswere performed with a NETZSCH DSC 404 Pegasus instrument.Cylindrical niobium crucibles (L = 15.0 mm, OD = 6.5 mm, ID = 5.0mm) were thoroughly cleaned and heated to 1000 °C under dynamicvacuum (p < 1 × 10⁻³ mbar) for 2 h and then transferred to an Ar-
Figure 1. Lithium-rich section of the Li−Si phase diagram as publishedby Okamoto42 and applied synthesis scheme: Melts with nominalcompositions Li95Si5, Li90Si10, and Li85Si15 were heated to 700 °C andequilibrated at the dwell temperatures indicated by red circles,followed by isothermal centrifugation of crystalline products.
Table 1. Crystallographic Data and Structure Refinement forLi17Si4
empirical formula Li17Si4
T (K) 123(2)formula weight (g·mol−1) 230.34crystal size (mm3) 0.30 × 0.30 × 0.30crystal color metallic silvercrystal shape blockspace group F43munit cell dimension (Å) a = 18.6563(2)Z 20V (Å3) 6493.5(1)ρ (calc.) (g·cm−3) 1.178μ (mm−1) 0.394F(000) 2140θ range (deg) 1.89−47.62index range hkl −38 < h < 37,
−38 < k < 28,−35 < l < 26
reflections collected 32178independent reflections 2971 (Rint = 0.036)reflections with I > 2σ(I) 2620 (Rσ = 0.021)absorption correction multiscandata/restraints/parameter 2971/0/67goodness-of-fit on F2 1.061final R indices [I > 2σ(I)]a,b R1 = 0.021
wR2 = 0.035R indices (all data)a,b R1 = 0.028
wR2 = 0.037flack 0.49(7)largest diff. peak and hole (e·Å−3) 0.20 and −0.41
aR1 = ∑||Fo| − |Fc||/∑|Fo|.bwR2 = [∑w(Fo
2 − Fc2)2/∑w(Fo
2)2]1/2.
Table 2. Fractional Atomic Coordinates and IsotropicEquivalent Atomic Displacement Parameters for Li17Si4(F43m, Z = 20, T = 123 K, Estimated Standard Deviations inParentheses)
atomWyckoffposition x y z
Ueq(Å2·103)
Si1 16e 0.15976(1) 0.15976(1) 0.15976(1) 6.89(4)Si2 16e 0.91660(1) 0.91660(1) 0.91660(1) 6.26(4)Si3 24f 0.32133(1) 0 0 7.01(4)Si4 24g 0.57031(1) 1/4 1/4 6.81(4)Li1 16e 0.07410(6) 0.07410(6) 0.07410(6) 14.9(3)Li2 16e 0.30284(5) 0.30284(5) 0.30284(5) 12.5(3)Li3 16e 0.41794(7) 0.41794(7) 0.41794(7) 12.7(3)Li4 16e 0.55713(5) 0.55713(5) 0.55713(5) 12.5(3)Li5 16e 0.68687(5) 0.68687(5) 0.68687(5) 12.3(3)Li6 16e 0.83168(6) 0.83168(6) 0.83168(6) 13.5(3)Li7 24f 0.16807(8) 0 0 11.8(3)Li8 24g 0.07492(9) 1/4 1/4 13.9(3)Li9 48h 0.09068(4) 0.09068(4) 0.26186(6) 15.7(3)Li10 48h 0.09013(5) 0.09013(5) 0.76176(6) 16.0(2)Li11 48h 0.15503(4) 0.15503(4) 0.51978(6) 16.1(2)Li12 48h 0.16327(4) 0.16327(4) 0.00286(7) 14.3(3)Li13 4a 0 0 0 10.5(6)
Chemistry of Materials Article
dx.doi.org/10.1021/cm400612k | Chem. Mater. 2013, 25, 1960−19671961
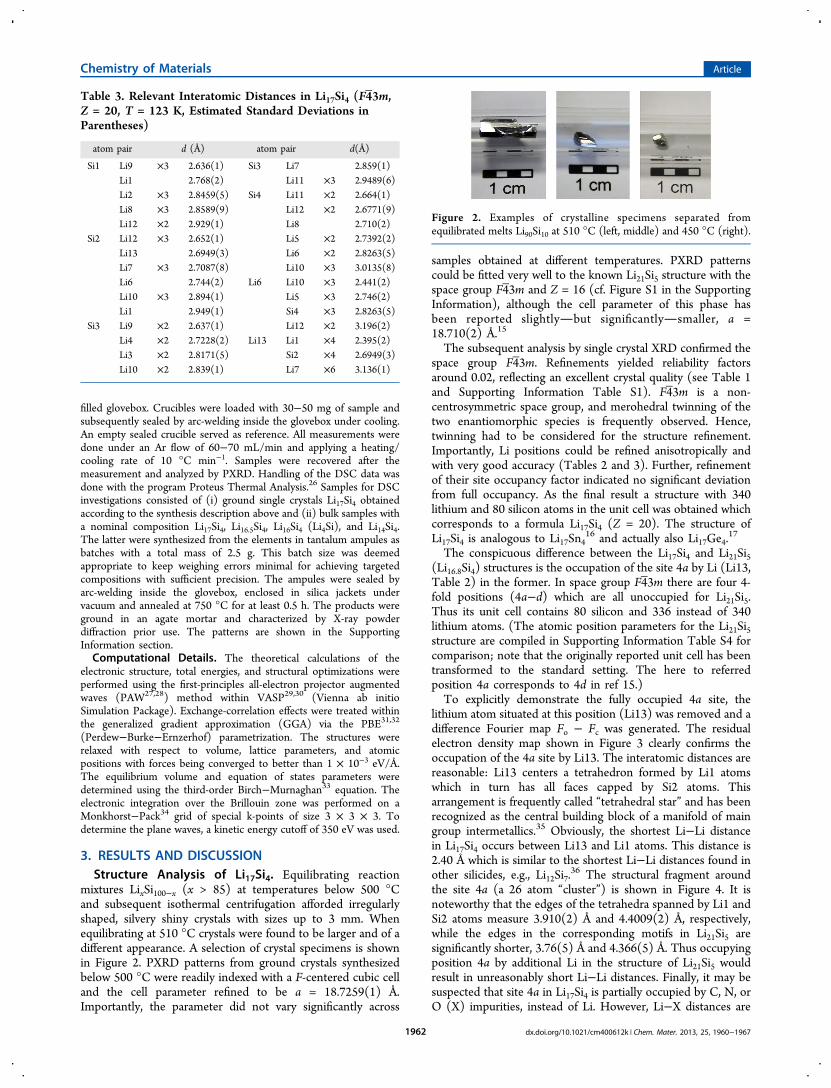
filled glovebox. Crucibles were loaded with 30−50 mg of sample andsubsequently sealed by arc-welding inside the glovebox under cooling.An empty sealed crucible served as reference. All measurements weredone under an Ar flow of 60−70 mL/min and applying a heating/cooling rate of 10 °C min−1. Samples were recovered after themeasurement and analyzed by PXRD. Handling of the DSC data wasdone with the program Proteus Thermal Analysis.26 Samples for DSCinvestigations consisted of (i) ground single crystals Li17Si4 obtainedaccording to the synthesis description above and (ii) bulk samples witha nominal composition Li17Si4, Li16.5Si4, Li16Si4 (Li4Si), and Li14Si4.The latter were synthesized from the elements in tantalum ampules asbatches with a total mass of 2.5 g. This batch size was deemedappropriate to keep weighing errors minimal for achieving targetedcompositions with sufficient precision. The ampules were sealed byarc-welding inside the glovebox, enclosed in silica jackets undervacuum and annealed at 750 °C for at least 0.5 h. The products wereground in an agate mortar and characterized by X-ray powderdiffraction prior use. The patterns are shown in the SupportingInformation section.Computational Details. The theoretical calculations of the
electronic structure, total energies, and structural optimizations wereperformed using the first-principles all-electron projector augmentedwaves (PAW27,28) method within VASP29,30 (Vienna ab initioSimulation Package). Exchange-correlation effects were treated withinthe generalized gradient approximation (GGA) via the PBE31,32
(Perdew−Burke−Ernzerhof) parametrization. The structures wererelaxed with respect to volume, lattice parameters, and atomicpositions with forces being converged to better than 1 × 10⁻³ eV/Å.The equilibrium volume and equation of states parameters weredetermined using the third-order Birch−Murnaghan33 equation. Theelectronic integration over the Brillouin zone was performed on aMonkhorst−Pack34 grid of special k-points of size 3 × 3 × 3. Todetermine the plane waves, a kinetic energy cutoff of 350 eV was used.
3. RESULTS AND DISCUSSIONStructure Analysis of Li17Si4. Equilibrating reaction
mixtures LixSi100−x (x > 85) at temperatures below 500 °Cand subsequent isothermal centrifugation afforded irregularlyshaped, silvery shiny crystals with sizes up to 3 mm. Whenequilibrating at 510 °C crystals were found to be larger and of adifferent appearance. A selection of crystal specimens is shownin Figure 2. PXRD patterns from ground crystals synthesizedbelow 500 °C were readily indexed with a F-centered cubic celland the cell parameter refined to be a = 18.7259(1) Å.Importantly, the parameter did not vary significantly across
samples obtained at different temperatures. PXRD patternscould be fitted very well to the known Li21Si5 structure with thespace group F4 3m and Z = 16 (cf. Figure S1 in the SupportingInformation), although the cell parameter of this phase hasbeen reported slightlybut significantlysmaller, a =18.710(2) Å.15
The subsequent analysis by single crystal XRD confirmed thespace group F4 3m. Refinements yielded reliability factorsaround 0.02, reflecting an excellent crystal quality (see Table 1and Supporting Information Table S1). F43m is a non-centrosymmetric space group, and merohedral twinning of thetwo enantiomorphic species is frequently observed. Hence,twinning had to be considered for the structure refinement.Importantly, Li positions could be refined anisotropically andwith very good accuracy (Tables 2 and 3). Further, refinementof their site occupancy factor indicated no significant deviationfrom full occupancy. As the final result a structure with 340lithium and 80 silicon atoms in the unit cell was obtained whichcorresponds to a formula Li17Si4 (Z = 20). The structure ofLi17Si4 is analogous to Li17Sn4
16 and actually also Li17Ge4.17
The conspicuous difference between the Li17Si4 and Li21Si5(Li16.8Si4) structures is the occupation of the site 4a by Li (Li13,Table 2) in the former. In space group F43m there are four 4-fold positions (4a−d) which are all unoccupied for Li21Si5.Thus its unit cell contains 80 silicon and 336 instead of 340lithium atoms. (The atomic position parameters for the Li21Si5structure are compiled in Supporting Information Table S4 forcomparison; note that the originally reported unit cell has beentransformed to the standard setting. The here to referredposition 4a corresponds to 4d in ref 15.)To explicitly demonstrate the fully occupied 4a site, the
lithium atom situated at this position (Li13) was removed and adifference Fourier map Fo − Fc was generated. The residualelectron density map shown in Figure 3 clearly confirms theoccupation of the 4a site by Li13. The interatomic distances arereasonable: Li13 centers a tetrahedron formed by Li1 atomswhich in turn has all faces capped by Si2 atoms. Thisarrangement is frequently called “tetrahedral star” and has beenrecognized as the central building block of a manifold of maingroup intermetallics.35 Obviously, the shortest Li−Li distancein Li17Si4 occurs between Li13 and Li1 atoms. This distance is2.40 Å which is similar to the shortest Li−Li distances found inother silicides, e.g., Li12Si7.
36 The structural fragment aroundthe site 4a (a 26 atom “cluster”) is shown in Figure 4. It isnoteworthy that the edges of the tetrahedra spanned by Li1 andSi2 atoms measure 3.910(2) Å and 4.4009(2) Å, respectively,while the edges in the corresponding motifs in Li21Si5 aresignificantly shorter, 3.76(5) Å and 4.366(5) Å. Thus occupyingposition 4a by additional Li in the structure of Li21Si5 wouldresult in unreasonably short Li−Li distances. Finally, it may besuspected that site 4a in Li17Si4 is partially occupied by C, N, orO (X) impurities, instead of Li. However, Li−X distances are
Table 3. Relevant Interatomic Distances in Li17Si4 (F43m,Z = 20, T = 123 K, Estimated Standard Deviations inParentheses)
atom pair d (Å) atom pair d(Å)
Si1 Li9 ×3 2.636(1) Si3 Li7 2.859(1)Li1 2.768(2) Li11 ×3 2.9489(6)Li2 ×3 2.8459(5) Si4 Li11 ×2 2.664(1)Li8 ×3 2.8589(9) Li12 ×2 2.6771(9)Li12 ×2 2.929(1) Li8 2.710(2)
Si2 Li12 ×3 2.652(1) Li5 ×2 2.7392(2)Li13 2.6949(3) Li6 ×2 2.8263(5)Li7 ×3 2.7087(8) Li10 ×3 3.0135(8)Li6 2.744(2) Li6 Li10 ×3 2.441(2)Li10 ×3 2.894(1) Li5 ×3 2.746(2)Li1 2.949(1) Si4 ×3 2.8263(5)
Si3 Li9 ×2 2.637(1) Li12 ×2 3.196(2)Li4 ×2 2.7228(2) Li13 Li1 ×4 2.395(2)Li3 ×2 2.8171(5) Si2 ×4 2.6949(3)Li10 ×2 2.839(1) Li7 ×6 3.136(1)
Figure 2. Examples of crystalline specimens separated fromequilibrated melts Li90Si10 at 510 °C (left, middle) and 450 °C (right).
Chemistry of Materials Article
dx.doi.org/10.1021/cm400612k | Chem. Mater. 2013, 25, 1960−19671962

typically shorter (2−2.2 Å). Also, the incorporation ofelectronegative X is expected to reduce interatomic distanceswithin the tetrahedral star unit (Li1)4(Si2)4 with respect toLi21Si5, rather than the observed expansion.At this point it appears that Li17Si4 may not be considered as
a mere structure revision of Li21Si5 but represents a differentphase with a slightly but distinctly different structure. Thesestructural differences may be traced to a (geometrically) flexible(Li1)4(Si2)4 tetrahedral star unit around the site 4a, allowingthe incorporation of additional Li. Before we return to thisissue, we conclude the structure description of Li17Si4 whichwill essentially follow the one given by Nesper and vonSchnering15 for Li21Si5.The cubic F-centered structure of Li21Si5 can be considered
as a 6 × 6 × 6 superstructure of the body centered cubic (bcc)structure (63 × 2 = 432 atoms), with a characteristic defectdistribution corresponding to vacancies at the sites 4a−d (416atoms, i.e., 336 Li and 80 Si). The (defect) sites 4a−d representcenters of 26 atom clusters (M26), and the one around 4a hasalready been shown in Figure 4. The clusters are shown inFigure 5. Each cluster displays an analogue shell structure: theinner shell is represented by a Li4 tetrahedron, capped by eitherfour Si (4a, 4c) or four Li atoms (4b, 4d) (second shell). The
resulting tetrahedral star unit is then surrounded by anoctahedron of six Li (4a, 4c) or six Si atoms (4b, 4d). Finally,all clusters are concluded by a shell of 12 cuboctahedrallyarranged Li atoms. We emphasize the arrangement of Si atomswhich gives the advantage of a clearer presentation of the totalstructure. Importantly M26 clusters are crystallographicallyindependent, and no atom is shared between them. Thecomplete structure represents a NaTl-type arrangement ofcluster units with the sites 4a, 4c (i.e., Si4 tetrahedra) and thesites 4b, 4d (i.e., Si6 octahedra) corresponding to Na and Tlatoms, respectively.To investigate closer the relation between Li17Si4 and Li21Si5
their structures were computationally relaxed and theirequilibrium volume structure parameters determined. Thoseparameters are listed in Tables S4 and S5 (SupportingInformation) in comparison with the experimental ones. As aresult, the Li17Si4 structure was reproduced splendidly(Table 4); maximum deviations in interatomic distances wereat the order of only 1.5%. This is an excellent agreement andsupports strongly the structure model for Li17Si4, thus rulingout the incorporation of impurities. Turning to Li21Si5, theoverall agreement between experimental structure (accordingto ref 15) and the computationally relaxed one is also good,although not to the same degree as for Li17Si4 which may bepartly due to the lower accuracy of the Li21Si5 refinement. Onecan notice a singularly large deviation associated with theatomic position parameter of Li1 (x = 0.071(2) vs 0.0553,Table S4 in the Supporting Information). As a matter of fact,the experimental value is actually rather close to the value forLi17Si4 (x = 0.07410(6)) which indicates that without Li13occupying the site 4a the (Li1)4 tetrahedron should beconsiderably smaller. The edge length in the computationallyrelaxed structure is 2.902 Å which is drastically shorter than theexperimental value of 3.76(5) Å.It is also interesting to compare the atomic position
parameters of the Li atoms situated on the cuboctahedralsites 48h. Those atoms define the outer shell of M26 clusters.We note that the Li12 position representing the boundary ofM26 around the site 4a is distinguished; its position parameters(x, y, z) are very closely corresponding to the situation in theideal bcc structure (1/6, 1/6, 0). The other cuboctahedra(around 4b−d) appear considerably contracted with respect toideal bcc (most pronounced with Li11 around the site 4b). Thisphenomenon is especially also observed in the computationallyrelaxed Li21Si5 structure where all sites 4a−d are unambiguouslyvacant (cf. Table S6 in the Supporting Information). Thus, site4a is distinguished over the other 4-fold sites by beingsurrounded by the largest cuboctahedron. This ensuresgeometrical flexibility of the (Li1)4(Si2)4 tetrahedral star unitaround the site 4a, which enables accommodation of theadditional Li atom. However, whereas this Li incorporationmay be plausible from a structural point of view the deviationbetween experimental and calculated Li21Si5 structure is clearlysuspicious, indicating that the Li13 atom may have beenoverlooked in the earlier refinement. Furthermore whencalculating the reaction energy (referring to zero Kelvin) forLi84Si20 + Li (bcc) = Li85Si20 a slightly exothermic (−0.04 eV)result is obtained. Therefore we conclude that whereas thecomputational investigation of Li17Si4 and Li21Si5 firmlyconfirms the structure of the former it casts doubts on thelatter. A phase Li21Si5 may not be stable in the Li−Si system. Inthe following we describe thermal investigations to furtherelucidate on this issue.
Figure 3. Difference Fourier map (Fo − Fc, contour lines ±0.075e/Å3) for the plane through two Si2 and two Li1 atoms containing thesite 4a (cf. Figure 4; single crystal data at 123 K).
Figure 4. Coordination around the site 4a in Li17Si4 (Si = gray; Li =white; thermal ellipsoids at 90% probability, single crystal data at123 K). Li1 and Si2 atoms form a tetrahedral star unit, Li7 atoms anoctahedron, and Li12 atoms a cuboctahedron.
Chemistry of Materials Article
dx.doi.org/10.1021/cm400612k | Chem. Mater. 2013, 25, 1960−19671963

Thermal Analysis of Li17Si4. Li21Si5 (Li16.8Si4; for reasonsof clarity are all compositions normalized to LiySi4) has beendescribed as an incongruently melting phase which decomposesat 617 °C.15 Additionally, there are several reports prior toref 15 on phases “Li22Si5” (Li17.6Si4) and “Li4Si”(Li16Si4).
13,14,37−41 The latter phase was found to possess ahomogeneity range between 19.2 and 20.1 atom % Si and tooccur in two polymorphic forms.39 However, there are no
consecutive reports supporting those findings. An excerpt of thelithium rich part of the Li−Si phase diagram according toOkamoto42 is shown in Figure 1.Li17Si4 and samples with compositions Li16.5Si4, Li16Si4, and
Li14Si4 were investigated by thermal analysis using differentialscanning calorimetry (DSC). Detected events were foundreversible and appeared on cooling and heating. In heatingcurves events are shifted (by about 20 °C) toward higher
Figure 5. Crystallographically independent M26 atom clusters in the structure of Li17Si4 around the sites 4a−d (Si = gray; Li = white; thermalellipsoids at 90% probability, single crystal data at 123 K). The Si atom arrangement is highlighted as colored polyhedra. The NaTl-type arrangementof clusters in the complete structure of Li17Si4 is shown in the bottom part (view along [110]).
Chemistry of Materials Article
dx.doi.org/10.1021/cm400612k | Chem. Mater. 2013, 25, 1960−19671964

temperatures (cf. Supporting Information, Figure S2 and S3).For Li17Si4, crystal and bulk samples were employed, showingidentical results. Cooling traces of bulk samples are compiled inFigure 6.Upon cooling a melt Li17Si4 from 750 °C the solidus is
reached at 667 °C, and congruently melting Li13Si4 crystallizes.This event, marked as (1) in Figure 6, is unambiguouslyidentified. The solidus shifts to higher temperatures withincreasing Si content of the melt; 672, 678, and 709 °C forLi16.5Si4, Li16Si4, and Li14Si4, respectively, which is in agreementwith the reported phase diagram. On further cooling Li17Si4shows two, just resolved, events at 610 and 618 °C (marked as(2) and (3) in Figure 6), and finally a fourth event (4) at lowtemperature (481 °C). The appearance of three thermal eventsfor melts Li17Si4 after passing the liquidus is surprising. Oneevent should account for the peritectic formation of the phaseLi17Si4 and a second may be associated with a phase Li21Si5(Li16.8Si4). A third peak could then either mean the presence ofan unknown phase with a composition richer in Li than Li13Si4or temperature polymorphism of Li17Si4/Li21Si5. Melts with acomposition Li16.5Si4 also show three events, at similartemperatures as Li17Si4 after having passed the solidus. Sincethis composition is more Si rich than Li21Si5 it can be ruled outthat event (4) at 481 ± 2 °C corresponds to a peritecticformation reaction of Li17Si4 (from Li21Si5). It is however clearfrom our synthesis of Li17Si4 crystals from, e.g., equilibratedmelts Li90Si10 that Li17Si4 is stable and the most Li-rich phase attemperatures below 481 ± 2 °C.Event (4) at low temperatures is absent when cooling melts
with compositions Li16Si4 and Li14Si4. The powder pattern ofsolidified Li16Si4 (shown as Supporting Information, Figure S6)reveals a new phase in the Li−Si system. The composition ofthis phase is Li4.11Si (Li16.42(1)Si4).
a The characterization of itshighly complex structure and detailed thermodynamic proper-ties will be presented in a forthcoming article. In the followingwe refer to this phase as “Li4Si”. With the presence of “Li4Si”,event (4) upon cooling corresponds to the peritectic formationof Li17Si4 (from “Li4Si”). This is in agreement with Li90Si10equilibration experiments that yielded crystals of “Li4Si” attemperatures above 500 °C (cf. Figure 2). The thermal eventsat 619 ± 2 °C (2) and 610 ± 2 °C (3) which are seen for allfour investigated melt compositions are attributed to “Li4Si”.The first event represents the peritectic formation (from Li13Si4upon cooling) of its high temperature form, the latter thetransition into the low temperature form.Thermal analysis of melts with composition Li17Si4, Li16.5Si4,
Li16Si4, and Li14Si4, and the investigation of crystalline products
from equilibrated melts LixSi100−x (x < 85) at differenttemperatures established Li17Si4 as the most Li rich phase inthe Li−Si system. In addition a phase “Li4Si” (Li16.42(1)Si4) wasdetected. “Li4Si” is not included in current Li−Si phasediagrams but its potential existence has been mentioned in theliterature from the 1950s and 1960s.37−41 Its thermodynamicrelation to Li17Si4 and Li13Si4 is just sketched in this work whichfocuses on Li17Si4. Our investigations provide no evidence thatLi21Si5 (Li16.8Si4), which hitherto has been considered as themost Li rich phase, is a stable phase in the Li−Si system.Especially, computational analysis of the crystal structures forLi21Si5 and Li17Si4, which were relaxed with respect to volume,lattice parameters, and atomic position parameters, thussimulating the ideal arrangement of atoms within eachcomposition, finds a decisive discrepancy for Li21Si5.Theoccupation of the 4a position by additional Li may have beenoverlooked in the earlier work.15 This is especially likely if thereis a homogeneity range Li17−xSi4 (0 ≤ x ≤ 0.2) associated withthe occupation of this position, and the site 4a in the crystal of
Table 4. Comparison of Essential Structure Parameters forExperimental and Computational Relaxed Li21Si5 and Li17Si4
Li21Si5 Li17Si4
exp.(ref 15a) calc.
exp.(this workb) calc.
a, Å 18.710(2) 18.5541 18.6563(2) 18.5732d(Li1−Li1), Å 3.76(5) 2.902 3.910(2) 3.940d(Si2−Si2), Å 4.366(5) 4.466 4.4009(2) 4.376d(Si2−Li7), Å 2.77(2) 2.760 2.7087(9) 2.707d(Li13−Li1), Å - - 2.395(2) 2.413d(Li13−Si2), Å - - 2.6949(3) 2.680
aExperimental data refer to room temperature measurement, see TableS4 in Supporting Information. bExperimental data refer to the 123 Kmeasurement, see also Table S5 in Supporting Information.
Figure 6. DSC thermograms recorded in cooling mode (from 750 °C)for Li17Si4 and for the nominal compositions “Li16.5Si4“, “Li16Si4”, and“Li14Si4”(top). Revised sketch of the Li−Si phase diagram with eventsfrom the DSC thermograms indicated (bottom).
Chemistry of Materials Article
dx.doi.org/10.1021/cm400612k | Chem. Mater. 2013, 25, 1960−19671965

ref 15 was only partially occupied. Again, we have no evidencefor such a solid solution behavior, but we cannot rule it out.
4. CONCLUSIONThe reinvestigation of the binary system Li−Si yielded Li17Si4as the most Li-rich phase and casts doubts on the existence ofLi21Si5 (Li16.8Si4). Li17Si4 is isostructural to Li17Sn4
16 and alsoLi17Ge4,
17 which are the Li-richest phases in their respectivesystems. Li17Si4 decomposes peritectically into a phase “Li4Si”and melt at 481 ± 2 °C. “Li4Si” represents either a new orrediscovered phase in the Li−Si system and details about itsactual composition and complex crystal structure will bepresented separately. “Li4Si” decomposes peritectically intoLi13Si4 and melt at temperatures around 618 °C. The discoveryof Li17Si4 and “Li4Si” shows that elementary relations betweenphases and structures in the Li−Si systems are still notcompletely understood. However, a sound understanding of theLi−Si phase diagram is of tremendous significance for researchwith high-energy lithium ion batteries when considering siliconas anode material.
■ ASSOCIATED CONTENT*S Supporting InformationDetails on X-ray single crystal data collection at roomtemperature (Table S1), refinement results (Table S2),equation of states parameters for the computationally relaxedstructures of Li21Si5 and Li17Si4 (Table S3), their comparisonwith experimental data (Tables S4 and S5), idealized atomicposition parameters for Li21Si5 corresponding to the bodycentered cubic structure (Table S6), Rietveld fit to the powderX-ray diffraction data of Li17Si4 employing the Li21Si5 structuremodel (Figure S1), DSC thermograms recorded for Li17Si4 andLi16.5Si4 showing the heating and cooling trace (Figures S2 andS3), powder X-ray diffraction patterns of DSC bulk samplesLi17Si4, “Li16.5Si4”, “Li16Si4”, and “Li14Si4” (Figures S4−S7), andcrystallographic information (CIF format).This material isavailable free of charge via the Internet at http://pubs.acs.org.
■ AUTHOR INFORMATIONNotesThe authors declare no competing financial interest.
■ ACKNOWLEDGMENTSThis work has been funded by Fonds der chemischen Industrie,TUM Graduate School, Swedish Research Council undercontract number 2010-4827, and the Deutsche Forschungsge-meinschaft Project No. FA 198/11-1 as well as the NationalScience Foundation through grant DMR-1007557.
■ ADDITIONAL NOTEaLi4.106(2)Si crystallizes with a = 4.5246(2) Å, b = 21.944(1) Å,c = 13.2001(6) Å (space group Cmcm, Z = 16, T = 100 K);quote depository numbers CSD-425864 (Li4.11Si-100K) andCSD-425865 (Li4.11Si-298K).
■ REFERENCES(1) Zhang, W. J. J. Power Sources 2011, 196 (1), 13−24.(2) Obrovac, M. N.; Christensen, L. Electrochem. Solid-State Lett.2004, 7 (5), A93−A96.(3) Hatchard, T. D.; Dahn, J. R. J. Electrochem. Soc. 2004, 151 (6),A838−A842.(4) Kwon, J. Y.; Ryu, J. H.; Oh, S. M. Electrochim. Acta 2010, 55 (27),8051−8055.
(5) Li, J.; Dahn, J. R. J. Electrochem. Soc. 2007, 154 (3), A156−A161.(6) Misra, S.; Liu, N.; Nelson, J.; Hong, S. S.; Cui, Y.; Toney, M. F.ACS Nano 2012, 6 (6), 5465−5473.(7) Wang, C. M.; Li, X. L.; Wang, Z. G.; Xu, W.; Liu, J.; Gao, F.;Kovarik, L.; Zhang, J. G.; Howe, J.; Burton, D. J.; Liu, Z. Y.; Xiao, X.C.; Thevuthasan, S.; Baer, D. R. Nano Lett. 2012, 12 (3), 1624−1632.(8) Dupke, S.; Langer, T.; Pottgen, R.; Winter, M.; Passerini, S.;Eckert, H. Phys. Chem. Chem. Phys. 2012, 14 (18), 6496−6508.(9) Dupke, S.; Langer, T.; Pottgen, R.; Winter, M.; Eckert, H. SolidState Nucl. Magn. Reson. 2012, 42, 17−25.(10) Langer, T.; Dupke, S.; Trill, H.; Passerini, S.; Eckert, H.;Pottgen, R.; Winter, M. J. Electrochem. Soc. 2012, 159 (8), A1318−A1322.(11) Key, B.; Bhattacharyya, R.; Morcrette, M.; Seznec, V.; Tarascon,J.; Grey, C. P. J. Am. Chem. Soc. 2009, 131, 9239−9249.(12) Key, B.; Morcrette, M.; Tarascon, J. M.; Grey, C. P. J. Am. Chem.Soc. 2011, 133 (3), 503−512.(13) Gladyshevskii, E. I.; Oleksiv, G. I.; Kripyakevich, P. I.Kristallografiya 1964, 9 (3), 338−341.(14) Axel, H.; Schafer, H.; Weiss, A. Z. Naturforsch. 1966, 21b (2),115−117.(15) Nesper, R.; von Schnering, H. G. J. Solid State Chem. 1987, 70(1), 48−57.(16) Lupu, C.; Mao, J. G.; Rabalais, J. W.; Guloy, A. M.; Richardson,J. W. Inorg. Chem. 2003, 42 (12), 3765−3771.(17) Zeilinger, M.; Fa ssler, T. F. Unpublished results. Areinvestigation of the Li-Ge system revealed that Li17Ge4 alsocrystallizes with the Li17Sn4 structure, contrary to previous reportsclaiming Li disorder: Goward, G. R.; Taylor, N. J.; Souza, D. C. S.;Nazar, L. F. J. Alloys Compd. 2001, 329 (1−2), 82−91.(18) Puhakainen, K.; Bostrom, M.; Groy, T. L.; Haussermann, U. J.Solid State Chem. 2010, 183 (11), 2528−2533.(19) APEX Suite of Crystallographic Software, APEX 2 Version 2008.4;Bruker AXS Inc.: Madison, WI, U.S.A., 2008.(20) SAINT, Version 7.56a; Bruker AXS Inc.: Madison, WI, U.S.A.,2008.(21) SADABS, Version 2008/1; Bruker AXS Inc.: Madison, WI,U.S.A., 2008.(22) Sheldrick, G. M. Shelxs-97 - Program for the Determination ofCrystal Structures; University of Gottingen: Gottingen, Germany, 1997.(23) Sheldrick, G. M. Shelxl-97 - Program for Crystal StructureRefinement; University of Gottingen: Gottingen, Germany, 1997.(24) Petricek, V.; Dusek, M.; Palatinus, L. The CrystallographicComputing System; Institute of Physics: Praha, Czech Rupublic, 2006.(25) TOPAS 4.0 - Rietveld Software; Bruker AXS: Madison, WI,U.S.A., 2009.(26) Netzsch Proteus Thermal Analysis V4.8.2, Netzsch-GeratebauGmbH: Selb, Germany, 2006.(27) Blochl, P. E. Phys. Rev. B 1994, 50 (24), 17953−17979.(28) Kresse, G.; Joubert, D. Phys. Rev. B 1999, 59 (3), 1758−1775.(29) Kresse, G.; Hafner, J. Phys. Rev. B 1993, 48 (17), 13115−13118.(30) Kresse, G.; Furthmuller, J. Comput. Mater. Sci. 1996, 6 (1), 15−50.(31) Wang, Y.; Perdew, J. P. Phys. Rev. B 1991, 44 (24), 13298−13307.(32) Perdew, J. P.; Chevary, J. A.; Vosko, S. H.; Jackson, K. A.;Pederson, M. R.; Singh, D. J.; Fiolhais, C. Phys. Rev. B 1992, 46 (11),6671−6687.(33) Birch, F. Phys. Rev. 1947, 71 (11), 809−824.(34) Monkhorst, H. J.; Pack, J. D. Phys. Rev. B 1976, 13 (12), 5188−5192.(35) Haussermann, U.; Svensson, C.; Lidin, S. J. Am. Chem. Soc.1998, 120 (16), 3867−3880.(36) von Schnering, H. G.; Nesper, R.; Curda, J.; Tebbe, K. F. Angew.Chem. 1980, 92, 1070.(37) Klemm, W.; Struck, M. Z. Anorg. Allg. Chem. 1955, 278 (3−4),117−121.(38) Bohm, H. Z. Metallkd. 1959, 50 (1), 44−46.
Chemistry of Materials Article
dx.doi.org/10.1021/cm400612k | Chem. Mater. 2013, 25, 1960−19671966
(39) Federov, P. I.; Ioffe, A. A. Izv. Vyssh. Uchebn. Zaved., Tsvetn.Metall. 1962, 1, 127−131.(40) Obinata, I.; Takeuchi, Y.; Kurihara, K.; Watanabe, M. J. Jpn. Inst.Met. 1964, 28, 568−576.(41) Schafer, H.; Axel, H.; Weiss, A. Z. Naturforsch. 1965, 20b, 1302.(42) Okamoto, H. Bull. Alloy Phase Diagrams 1990, 11, 306−312 andreferences therein.
Chemistry of Materials Article
dx.doi.org/10.1021/cm400612k | Chem. Mater. 2013, 25, 1960−19671967

1
SUPPORTING INFORMATION
Single crystal growth and thermodynamic stability of Li17Si4
Michael Zeilinger†, Daryn Benson
‡, Ulrich Häussermann
‡‡, Thomas F. Fässler
†
†Department Chemie, Technische Universität München, Lichtenbergstraße 4, 85747 Garching b. München,
Germany
‡Department of Physics, Arizona State University, Tempe, Arizona 85287-1504, United States
‡‡Department of Materials and Environmental Chemistry, Stockholm University, SE-10691 Stockholm, Sweden

2
Details on single crystal X-ray data collection for Li17Si4 at room temperature.
Single crystal diffraction of Li17Si4 was performed on a Stoe IPDS IIT diffractometer
equipped with a rotating anode (Bruker AXS, FR591) with MoKα radiation (λ = 0.71073 Å)
and a Montel mirror.
Table S1. Crystallographic data and structure refinement for Li17Si4.
empirical formula Li17Si4
T (K) 298(2)
formula weight (g·mol−1
) 230.34
crystal size (mm³) 0.30 x 0.30 x 0.30
crystal colour metallic silver
crystal shape block
space group F−43m
unit cell dimension (Å)
single crystal data a = 18.7353(3)
powder data a = 18.7259(1)
Z 20
V (Å3) 6576.3(2)
ρ (calc.) (g·cm−3
) 1.163
μ (mm−1
) 0.389
F (000) 2140
θ range (deg) 3.61-29.16
index range hkl ±25, ±25, ±25
reflections collected 46589
independent reflections 935 (Rint = 0.054)
reflections with I > 2σ(I) 930 (Rσ = 0.010)
absorption correction -
data/restraints/parameter 935/0/67
goodness-of-fit on F2 1.255
final R indices [I > 2σ(I)]a, b
R1 = 0.020
wR2= 0.055
R indices (all data)a, b
R1 = 0.021
wR2= 0.055
flack 0.5(3)
largest diff. peak and 0.26 and −0.23

3
hole (e·Å−3
)
a (R1) = ∑││Fo│−│Fc││ ∕ ∑││Fo││;
b wR2 = [∑w(Fo
2−Fc
2)
2/∑w(Fo
2)
2]
1/2
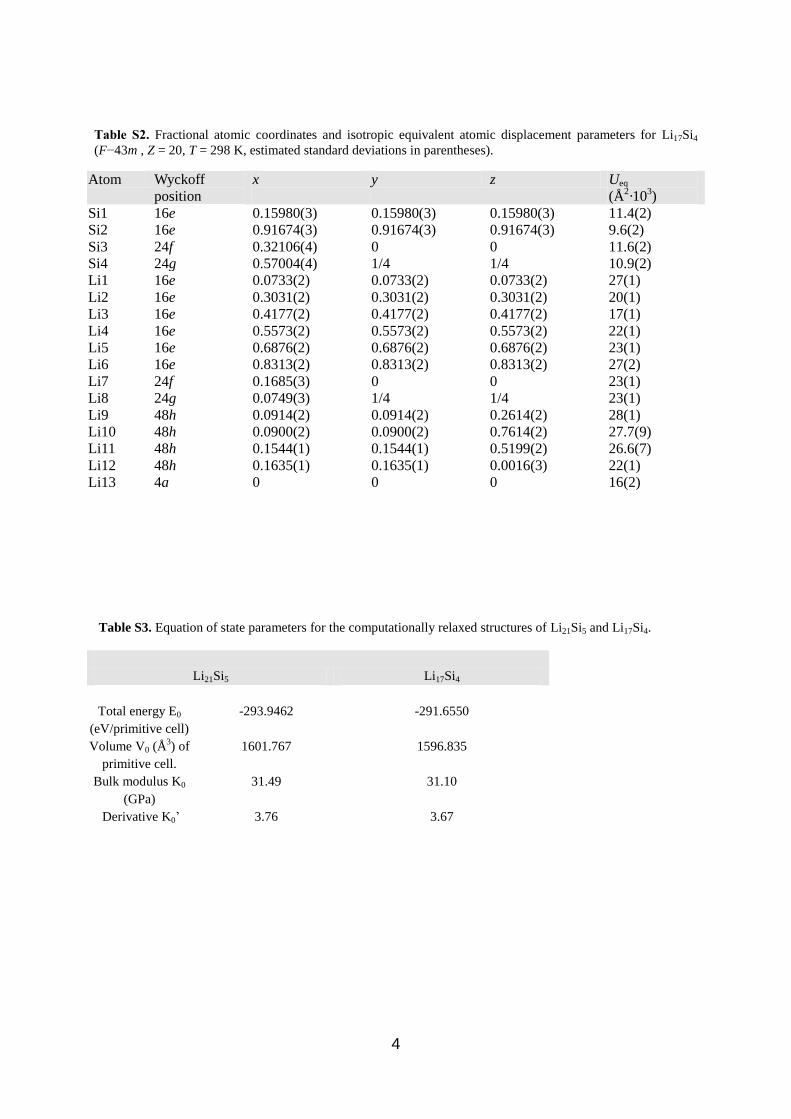
4
Table S2. Fractional atomic coordinates and isotropic equivalent atomic displacement parameters for Li17Si4
(F−43m , Z = 20, T = 298 K, estimated standard deviations in parentheses).
Atom Wyckoff
position
x y z Ueq
(Å2·10
3)
Si1 16e 0.15980(3) 0.15980(3) 0.15980(3) 11.4(2)
Si2 16e 0.91674(3) 0.91674(3) 0.91674(3) 9.6(2)
Si3 24f 0.32106(4) 0 0 11.6(2)
Si4 24g 0.57004(4) 1/4 1/4 10.9(2)
Li1 16e 0.0733(2) 0.0733(2) 0.0733(2) 27(1)
Li2 16e 0.3031(2) 0.3031(2) 0.3031(2) 20(1)
Li3 16e 0.4177(2) 0.4177(2) 0.4177(2) 17(1)
Li4 16e 0.5573(2) 0.5573(2) 0.5573(2) 22(1)
Li5 16e 0.6876(2) 0.6876(2) 0.6876(2) 23(1)
Li6 16e 0.8313(2) 0.8313(2) 0.8313(2) 27(2)
Li7 24f 0.1685(3) 0 0 23(1)
Li8 24g 0.0749(3) 1/4 1/4 23(1)
Li9 48h 0.0914(2) 0.0914(2) 0.2614(2) 28(1)
Li10 48h 0.0900(2) 0.0900(2) 0.7614(2) 27.7(9)
Li11 48h 0.1544(1) 0.1544(1) 0.5199(2) 26.6(7)
Li12 48h 0.1635(1) 0.1635(1) 0.0016(3) 22(1)
Li13 4a 0 0 0 16(2)
Table S3. Equation of state parameters for the computationally relaxed structures of Li21Si5 and Li17Si4.
Li21Si5 Li17Si4
Total energy E0
(eV/primitive cell)
-293.9462 -291.6550
Volume V0 (Å3) of
primitive cell.
1601.767 1596.835
Bulk modulus K0
(GPa)
31.49 31.10
Derivative K0’ 3.76 3.67

5
Table S4. Comparison of experimental and computational relaxed fractional atomic coordinates for Li21Si5.
Experimental data are taken from ref. 15 (a = 18.710(2) Å (T = 298 K), acalc. = 18.55411 Å, F−43m, Z = 16,
estimated standard deviations in parentheses). Singularly most differing Li1 is marked in bold, calculated data in
italic.
Atom Wyckoff
position x y z
Si1 16e 0.1595(2) 0.1595(2) 0.1595(2)
0.1605 0.1605 0.1605
Si2 16e 0.9175(2) 0.9175(2) 0.9175(2)
0.9149 0.9149 0.9149
Si3 24f 0.3220(3) 0 0
0.3219 0 0
Si4 24g 0.5691(3) 1/4 1/4
0.5700 1/4 1/4
Li1 16e 0.071(2) 0.071(2) 0.071(2)
0.0553 0.0553 0.0553
Li2 16e 0.304(1) 0.304(2) 0.304(2)
0.3027 0.3027 0.3027
Li3 16e 0.417(1) 0.417(1) 0.417(1)
0.4189 0.4189 0.4189
Li4 16e 0.559(2) 0.559(2) 0.559(2)
0.5572 0.5572 0.5572
Li5 16e 0.688(2) 0.688(2) 0.688(2)
0.6862 0.6862 0.6862
Li6 16e 0.829(1) 0.829(1) 0.829(1)
0.8301 0.8301 0.8301
Li7 24f 0.174(2) 0 0
0.1725 0 0
Li8 24g 0.073(2) 1/4 1/4
0.0747 1/4 1/4
Li9 48h 0.092(1) 0.092(1) 0.262(1)
0.0910 0.0910 0.2630
Li10 48h 0.088(1) 0.088(1) 0.761(1
0.0905 0.0905 0.7616
Li11 48h 0.153(1) 0.153(1) 0.521(1)
0.1550 0.1550 0.5203
Li12 48h 0.164(1) 0.164(1) 0.000(1)
0.1607 0.1607 0.0068

6
Table S5. Comparison of experimental and computational relaxed fractional atomic coordinates for Li17Si4.
Experimental data are from this work (aexp. = 18.6563(2) Å (T = 123 K), acalc.. = 18.57319 Å, F−43m, Z = 20,
estimated standard deviations in parentheses). Calculated data is marked in italic.
Atom Wyckoff
position x y z
Si1 16e 0.15976(1) 0.15976 (1) 0.15976 (1)
0.1600 0.1600 0.1600
Si2 16e 0.91660(1) 0.91660(1) 0.91660(1)
0.9167 0.9167 0.9167
Si3 24f 0.32133(1) 0 0
0.3215 0 0
Si4 24g 0.57031(1) 1/4 1/4
0.5708 1/4 1/4
Li1 16e 0.07410(6) 0.07410(6) 0.07410(6)
0.0750 0.0750 0.0750
Li2 16e 0.30284(5) 0.30284(5) 0.30284(5)
0.3031 0.3031 0.3031
Li3 16e 0.41794(7) 0.41794(7) 0.41794(7)
0.4180 0.4180 0.4180
Li4 16e 0.55713(5) 0.55713(5) 0.55713(5)
0.5572 0.5572 0.5572
Li5 16e 0.68687(5) 0.68687(5) 0.68687(5)
0.6867 0.6867 0.6867
Li6 16e 0.83168(6) 0.83168(6) 0.83168(6)
0.8311 0.8311 0.8311
Li7 24f 0.16807(8) 0 0
0.1691 0 0
Li8 24g 0.07492(9) 1/4 1/4
0.0750 1/4 1/4
Li9 48h 0.09068(4) 0.09068(4) 0.26186(6)
0.0907 0.0907 0.2616
Li10 48h 0.09013(5) 0.09013(5) 0.76176(6)
0.0900 0.0900 0.7604
Li11 48h 0.15503(4) 0.15503(4) 0.51978(6)
0.1551 0.1551 0.5193
Li12 48h 0.16327(4) 0.16327(4) 0.00286(7)
0.1635 0.1635 0.0029
Li13 4a 0 0 0
0 0 0

7
Table S6. Idealized atomic position parameters for Li21Si5 corresponding to the body centered cubic structure.
Atom Wyckoff
position
x y z
Si1 16e 1/6 (0.1666) 1/6 (0.1666) 1/6 (0.1666)
Si2 16e 11/12 (0.9166) 11/12 (0.9166) 11/12 (0.9166)
Si3 24f 1/3 (0.3223) 0 0
Si4 24g 7/12 (0.5833) 1/4 1/4
Li1 16e 1/12 (0.0833) 1/12 (0.0833) 1/12 (0.0833)
Li2 16e 1/3 (0.3333) 1/3 (0.3333) 1/3 (0.3333)
Li3 16e 5/12 (0.4166) 5/12 (0.4166) 5/12 (0.4166)
Li4 16e 7/12 (0.5833) 7/12 (0.5833) 7/12 (0.5833)
Li5 16e 2/3 (0.6666) 2/3 (0.6666) 2/3 (0.6666)
Li6 16e 5/6 (0.8333) 5/6 (0.8333) 5/6 (0.8333)
Li7 24f 1/6 (0.1666) 0 0
Li8 24g 1/12 (0.0833) 1/4 1/4
Li9 48h 1/12 (0.0833) 1/12 (0.0833) ¼
Li10 48h 1/12 (0.0833) 1/12 (0.0833) ¾
Li11 48h 1/6 (0.1666) 1/6 (0.1666) ½
Li12 48h 1/6 (0.1666) 1/6 (0.1666) 0

8
Figures S1 – S7
Figure S1 Rietveld fit to the powder X-Ray diffraction data of Li17Si4 employing the Li21Si5 structure model.

9
-1 0 1
450
500
550
600
650
700
750
T /
°C
DSC / Vmg-1
Figure S2. DSC thermogram recorded for Li17Si4 showing the heating (red) and cooling (blue) trace.
-2 -1 0 1
450
500
550
600
650
700
750
T /
°C
DSC / Vmg-1
Figure S3. DSC thermogram recorded for Li16.5Si4 showing the heating (red) and cooling (blue) trace.
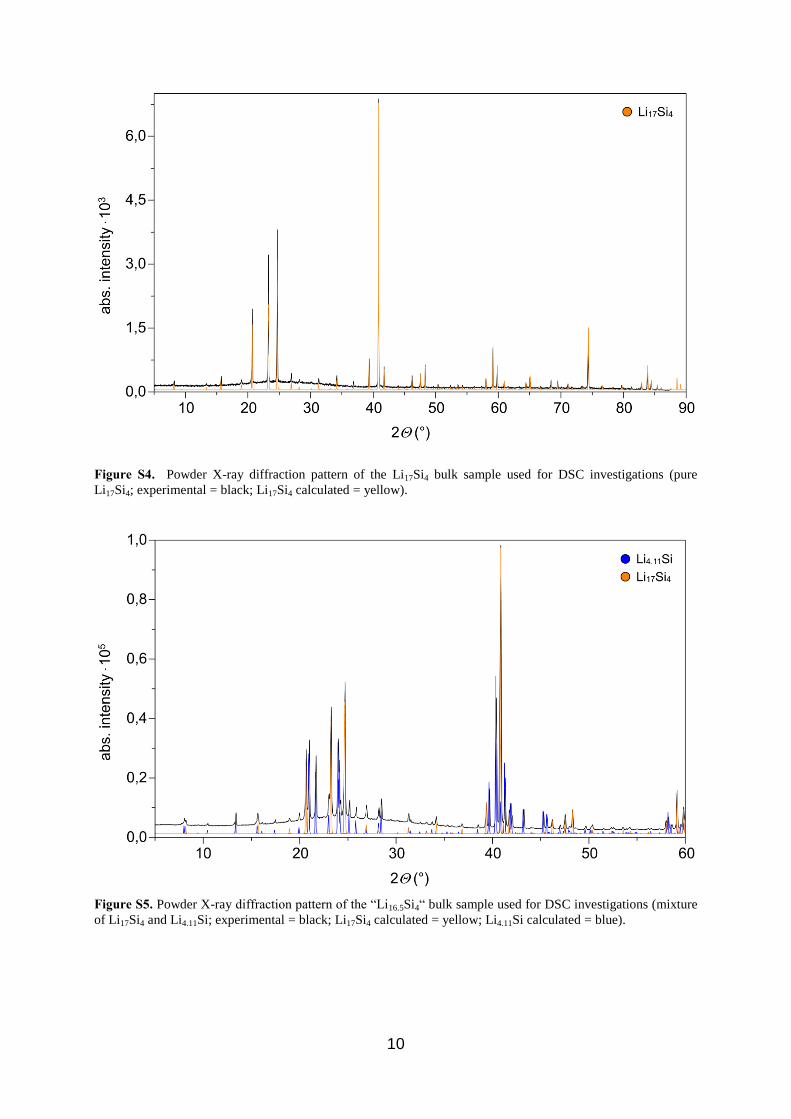
10
Figure S4. Powder X-ray diffraction pattern of the Li17Si4 bulk sample used for DSC investigations (pure
Li17Si4; experimental = black; Li17Si4 calculated = yellow).
Figure S5. Powder X-ray diffraction pattern of the “Li16.5Si4“ bulk sample used for DSC investigations (mixture
of Li17Si4 and Li4.11Si; experimental = black; Li17Si4 calculated = yellow; Li4.11Si calculated = blue).

11
Figure S6. Powder X-ray diffraction pattern of the “Li4Si” bulk sample used for DSC investigations (Li4.11Si and
tiny amounts of Li13Si4; experimental = black; Li4.11Si calculated = blue; Li13Si4 calculated = red).
Figure S7. Powder X-ray diffraction pattern of the “Li14Si4“ bulk sample used for DSC investigations (mixture
of Li13Si4 and Li4.11Si; experimental = black; Li13Si4 calculated = red; Li4.11Si calculated = blue).


5 Publications and Manuscripts
71
5.2 Revision of the Li–Si Phase Diagram: Discovery and Single
Crystal X-ray Structure Determination of the
High-Temperature Phase Li4.11Si
Reprinted with permission from Zeilinger, M.; Kurylyshyn, I. M.; Häussermann, U.;
Fässler, T. F. Chem. Mater. 2013, 25, 4623. Copyright (2013) American Chemical
Society.


Revision of the Li−Si Phase Diagram: Discovery and Single-CrystalX‑ray Structure Determination of the High-Temperature PhaseLi4.11SiMichael Zeilinger,† Iryna M. Kurylyshyn,† Ulrich Haussermann,‡ and Thomas F. Fassler*,†
†Department Chemie, Technische Universitat Munchen, Lichtenbergstraße 4, 85747 Garching b. Munchen, Germany‡Department of Materials and Environmental Chemistry, Stockholm University, 10691 Stockholm, Sweden
*S Supporting Information
ABSTRACT: Silicon has been regarded as a promising anodematerial for future lithium-ion batteries, and Li−Si phases play animportant role. A detailed reinvestigation of the Li-rich part of thebinary Li−Si phase diagram revealed the existence of a new phase,Li4.106(2)Si (Li16.42Si4). Li16.42Si4 forms through the peritecticdecomposition of the Li-richest phase Li17Si4 at 481−486 °C andwas characterized by single-crystal X-ray diffraction (a = 4.5246(2)Å, b = 21.944(1) Å, c = 13.2001(6) Å, space group Cmcm, Z = 16),differential scanning calorimetry, and theoretical calculations.Li16.42Si4 represents a high-temperature phase that is thermody-namically stable above ∼480 °C and decomposes peritectically at618 ± 2 °C to Li13Si4 and a melt. Li16.42Si4 can be retained at roomtemperature. The structure consists of 3 and 10 different kinds ofSi and Li atoms, respectively. Two Li positions show occupational disorder. Si atoms are well-separated from each other and haveonly Li atoms as nearest neighbors. This is similar to Li17Si4 and Li15Si4 compositionally embracing Li16.42Si4. The SiLincoordination polyhedra in the series Li15Si4, Li16.42Si4, and Li17Si4 are compared. Li15Si4 exclusively features coordination numbersof 12, Li16.42Si4 of 12 and 13, and Li17Si4 reveals 13- and 14-coordinated Si atoms. The band structure and density of states ofLi16.42Si4 were calculated on the basis of two ordered model structures with nominal compositions Li16Si4 (a hypothetical Zintlphase) and Li16.5Si4. Both reveal a metallic character that is analogous to Li17Si4. In contrast, the electronic structure of Li15Si4 ischaracteristic of a p-doped semiconductor.
KEYWORDS: Li4Si, Li4.11Si, Li16.42Si4, lithium silicide, thermodynamic stability of silicides, Li−Si phase diagram, Li−Si system,lithium−silicon system, lithium-ion batteries
1. INTRODUCTION
The Li−Si system has been of great interest, particularlybecause silicon is regarded as promising anode material forfuture lithium-ion batteries (LIBs). Although silicon offers ahigh theoretical specific capacity, its use in such systems isaccompanied with several difficulties, such as massive volumeexpansion during Li “insertion” combined with contact loss ofelectrodes and a huge capacity loss during the first cycles.1
Many research groups have been focusing on characterizing theprocesses during charging and discharging of lithium. Naturally,it has been assumed that the known Li−Si phases will play animportant role. Before 2004, those included Li21Si5,
2 Li13Si4,3
Li7Si3,4 Li12Si7,
5 and the high-pressure phase LiSi6,7 (Figure 1).However, none of these phases were observed in a crystallineform during charging and discharging.8,9 In 2004, Obrovac etal.10 and Hatchard et al.11 found a previously unknown silicide,Li15Si4, at discharge voltages below 50 mV by ex-situ/in situ X-ray diffraction experiments, and its structure was confirmedrecently by a single-crystal structure determination.12 The factthat intermediate phases between the fully charged and the
discharged states occur predominately amorphous has fueled anincreasing number of studies based on total scattering and/orNMR techniques.13−17
Although it appears that crystalline lithium silicides may playa minor role in the lithiation/delithiation process of Si anodes,a fundamental understanding of the Li−Si phase diagram andassociated specific thermodynamic relations between lithiumsilicides is of considerable importance for future silicon-basedLIBs. In this respect, only a few investigations have beenperformed. Exemplary work is given in refs 10, 11, and 18−25.Recently, we reported on the new lithium silicide Li17Si4, whichwas obtained by equilibration experiments of Li-rich melts (Liconc. > 85 at. %).25 It is closely related to Li21Si5,
2 which, inturn, was formerly reported as Li22Si5.
26,27 Going further backin history, the first investigation of the Li−Si system can beassigned to Moissan, who, in 1902, claimed the existence of a
Received: September 5, 2013Revised: October 10, 2013Published: October 10, 2013
Article
pubs.acs.org/cm
© 2013 American Chemical Society 4623 dx.doi.org/10.1021/cm4029885 | Chem. Mater. 2013, 25, 4623−4632

phase with the nominal composition Li3Si.28 In 1955, Klemm
and Struck were not able to confirm Moissan’s finding andinstead postulated the phases Li4Si and Li2Si.
29 Thosecompounds were later confirmed by Pell,30 Bohm,31 Obinataet al.,32 and Federov and Ioffe.33 In the 1960s, Schafer andWeiss recognized the complexity of the Li−Si system andidentified several more phases (Figure 1).27,34−37 In this timefalls also the characterization of the phase Li22Si5 from powderX-ray powder diffraction by Gladyshevskii et al.26 and single-crystal X-ray diffraction by Axel et al.27 Later, compositions andstructures of many of the phases proposed in the 1960s wererevised.2−5 However, the phase Li4Si (Figure 1) has never beencharacterized structurally37 or confirmed by later investigationsand has thus disappeared from recent compilations of the Li−Siphase diagram,38−40 despite reports on the possible existence ofphases with the same composition or close to it.41−43
Herein, we report on a detailed analysis of the Li-rich part ofthe Li−Si phase diagram and the single-crystal X-ray structuredetermination as well as the thermodynamic stability of a notyet characterized silicide Li4.11Si. For better comparability withphases of similar composition in this article, Li4.11Si will bereferred to as Li16.42Si4. Its stability is limited to the range of470−618 °C, and thus, Li16.42Si4 represents a high-temperaturephase in the Li−Si phase diagram. Of particular interest are theSi coordination environments and how those change withrespect to other Li-rich silicides. Furthermore, theoreticalcalculations for the disordered structure of Li16.42Si4 wereapproached by two idealized models and their electronicstructures related to those of Li15Si4 and Li17Si4 withcompositions embracing Li16.42Si4.
2. EXPERIMENTAL SECTIONSynthesis. Starting materials were lithium rods (99%, Rockwood-
Lithium) and silicon powder (99.999%, Alfa Aesar). All steps ofsynthesis and sample preparation were carried out in a glovebox(MBraun, Ar atmosphere, H2O and O2 levels < 0.1 ppm). Tantalumampules were thoroughly cleaned, heated to 1000 °C under dynamicvacuum (p < 1 × 10⁻³ mbar) for at least 2 h, and transferred to theglovebox. Heating and handling under inert conditions was done byusing an all-glass Schlenk line supplied with Ar, which is dried overP2O5, a molecular sieve, and a heated titanium sponge (T = 750 °C).Elemental mixtures with nominal compositions Li17Si4, “Li16.5Si4”,
“Li16Si4”, and “Li14Si4” were loaded into tantalum ampules that weresealed by arc-welding inside the glove box. The total mass of samplesamounted to 2.5 g. This batch size was deemed appropriate to keepweighing errors minimal for achieving targeted compositions withsufficient precision.25 Subsequently, ampules were sealed in silicajackets under vacuum and annealed in a muffle furnace. The
temperature was raised to 750 °C at a rate of 10 K·min−1 and heldfor 0.5 h, followed by cooling to 500 °C at a rate of 10 K·min−1. After adwell time of 1 h, ampules were quenched in liquid nitrogen andtransferred back to the glove box. Obtained products were ground inan agate mortar and characterized by powder X-ray diffraction (cf.Figure S1 in the Supporting Information). Millimeter-sized crystals ofLi4.11Si (Li16.42Si4) were obtained from equilibrating a melt with thecomposition “Li85Si15” at 510 °C in a tantalum ampule and subsequentisothermal melt-centrifugation.25
Differential Scanning Calorimetry (DSC). Differential scanningcalorimetry was performed with a NETZSCH DSC 404 Pegasusapparatus. Cylindrical niobium crucibles (L = 15.0 mm, O.D. = 6.5mm, I.D. = 5.0 mm) were thoroughly cleaned, heated to 1000 °Cunder dynamic vacuum (p < 1 × 10⁻³ mbar) for 2 h, and transferred toan Ar-filled glovebox. Crucibles were loaded with 30−50 mg of sample(Li17Si4, “Li16.5Si4”, “Li16Si4”, “Li14Si4”). The open end was roughlyclosed by squeezing and then sealed by arc-welding inside theglovebox under cooling. A sealed niobium crucible without a sampleserved as reference. All measurements were performed under an Ar-flow of 60−70 mL·min−1 and a heating/cooling rate of 10 K·min−1.Samples were recovered after the measurement by opening theniobium crucibles inside an Ar-filled glove box. Data handling wasdone with the program Proteus Thermal Analysis.44
Annealing Experiments. To investigate the thermodynamicstability of Li4.11Si (Li16.42Si4), batches of 100−150 mg of bulk sample“Li16Si4” were sealed in tantalum ampules and annealed in a mufflefurnace at 300, 400, 470, and 500 °C (10 K·min−1 heating rate) for 3days. Thereafter, ampules were quenched in liquid nitrogen andtransferred inside an argon-filled glovebox. Products were ground in anagate mortar and characterized by powder X-ray diffraction (cf. FigureS2 in the Supporting Information).
Single-Crystal X-ray Diffraction and Structure Determina-tion. Crystals of Li4.11Si (Li16.42Si4) obtained from an equilibrated Li−Si melt according to ref 25 were handled in an Ar-filled glovebox,selected under a microscope, and sealed inside 0.5 mm glass capillaries.Intensity data were collected at 100 K on a Bruker X-ray diffractometerequipped with a CCD detector (APEX II, κ-CCD), a fine-focusedsealed tube with Mo Kα radiation (λ = 0.71073 Å), and a graphitemonochromator by using the Bruker APEX Software Suite.45
Integration, data reduction, and absorption correction were donewith SAINT and SADABS.46,47 The space group Cmcm was assignedon the basis of the systematic absences and the statistical analysis ofthe intensity distributions. The structure was solved with directmethods (SHELXS-9748) and refined with full-matrix least-squares onF2 (SHELXL-9749). Difference Fourier maps Fo − Fc were calculatedwith JANA2006.50 Extinction was refined to very small values and,therefore, set to zero. Atom positions were determined on the basis ofsuccessive analysis of difference Fourier maps. Two out of 10 Lipositions display occupational disorder, which is described in moredetail later on. Table 1 lists a summary of the refinement results.Results for room-temperature data are given in Tables S1 and S2 in theSupporting Information. Further data may be obtained from
Figure 1. Chronicle of phases in the Li−Si phase system. Structurally characterized phases are marked with a blue frame, unambiguously ascertainedones are shown in red.
Chemistry of Materials Article
dx.doi.org/10.1021/cm4029885 | Chem. Mater. 2013, 25, 4623−46324624

Fachinformationszentrum Karlsruhe, D-76344 Eggenstein-Leopold-shafen, Germany (Fax: (+49)7247-808-666; E-mail: [email protected]) on quoting the depository numbers CSD-425864(Li4.11Si (Li16.42Si4) 100 K) and CSD-425865 (Li4.11Si (Li16.42Si4)298 K).Powder X-ray Diffraction (PXRD). PXRD patterns were recorded
on a Stoe STADI P diffractometer (Ge(111) monochromator for CuKα radiation, λ = 1.54056 Å) equipped with a Dectris MYTHEN DCS1K solid-state detector. Ground samples were sealed inside 0.3 mmglass capillaries, and measurements were performed in a 2θ range of5−90° (PSD steps: 0.06−1.00°; time/step: 20−40 s). Rietveld analysisof samples was performed with the TOPAS 4.0 software.51
Computational Details. Theoretical studies on Li15Si4, Li16.42Si4,and Li17Si4 were performed within density functional theory (DFT)using the full potential linearized augmented plane-wave (FP-LAPW)method as implemented in WIEN2k.52 Exchange and correlationeffects were treated by the generalized gradient approximation(GGA53,54) using the parametrization according to Perdew−Burke−Ernzerhof (PBE55). Valence configurations were 1s22s1 and 3s23p2 forLi and Si, respectively. RMT was set equal to 2.0 au for all atoms; thevalue used for RMT × Kmax was 8. The disordered structure of Li16.42Si4was approximated by two ordered models with nominal compositionsLi16Si4 (Li4Si) (model A) and Li16.5Si4 (model B). Their designfollowed symmetry considerations (cf. Figure S4 in the SupportingInformation). The models are presented in the structure discussionpart of Li16.42Si4 (Figure 6). Convergence during the SCF iteration wasconsidered to be reached when the total energy of the system wasstable within 10−4 Ry. The k-meshes used for the calculations wereconstructed according to the Monkhorst−Pack scheme56 andcorresponded to a 9 × 9 × 3 grid for model A (Li16Si4), a 5 × 3 ×4 grid mesh for model B (Li16.5Si4), and 3 × 3 × 3 grids for Li15Si4 andLi17Si4.Geometry optimization was performed for models A and B by
exploiting the quadratic approximation as implemented in the
Optimize and Mini routines of WIEN2k. During the minimizationprocedure, forces on all atoms were fully relaxed until residual forcesbecame smaller than 1 mRy·bohr−1 (≈0.026 eV·Å−1). The volume andunit cell metrics of A and B corresponded to the experimentalstructure of Li16.42Si4. Electronic structure calculations were performedfor the relaxed models A and B as well as for Li15Si4
12 and Li17Si425
using their experimental structure parameters. Fermi energy andweight of bands for the band structure calculations and correspondingDOS were computed using a modified tetrahedron method.57 TheXCrySDen code was used for data rendering and analysis.58 Formationenergies were assessed according to ΔE(LixSi) = E(LixSi) − x·E(bcc-Li) − E(α-Si), where E(bcc-Li) and E(α-Si) represent the totalenergies of elemental structures of Li and Si per atom, and E(LixSi) thetotal energy of the considered Li−Si phases per formula unit LixSi.
3. RESULTS AND DISCUSSION
Revision of the Li−Si Phase Diagram and Thermody-namic Stability of Li16.42Si4. First evidence of a not yetidentified phase Li16.42Si4 was obtained from the equilibration ofmelts with compositions “Li85Si15” or “Li90Si10” at temperaturesabove 500 °C.25 These experiments were targeting the crystalgrowth of Li17Si4, which was then established as the Li-richestphase in the Li−Si system. At temperatures around 510 °C,however, the product corresponded to a mixture of crystals ofLi17Si4 and an unknown phase.Figure 2 shows thermograms from bulk samples Li17Si4,
“Li16.5Si4”, “Li16Si4”, and “Li14Si4” recorded in cooling mode.According to PXRD analysis (Figure S1 in the SupportingInformation), these samples correspond to pure-phase Li17Si4, amixture of phases Li17Si4 and Li16.42Si4, and mixtures of phasesLi16.42Si4 and Li13Si4, respectively. When cooling melts with theconsidered compositions from 750 °C, the first thermal effect(labeled as (1), (2), (3), and (4) in Figure 2) is assigned to thecrossing of the liquidus boundary. Li17Si4 forms peritectically at481 ± 2 °C (event (7)) from a melt and Li16.42Si4.
25 Thethermograms of all compositions persistently show thermaleffects at 618 ± 2 °C (event (5)) and 610 ± 2 °C (event (6)).Signal (5) is tentatively assigned to the peritectic formation ofLi16.42Si4. The origin of the second effect at 610 °C is not yetclear. It may be associated with a structural change ofdisordered Li16.42Si4. However, it may be as well that, between610 and 618 °C, a phase with yet another composition (a high-temperature phase) exists, which forms peritectically at 618 °Cand from which Li16.42Si4 forms at 610 °C. An unambiguouselucidation would only be possible by an in situ structural study(e.g., PXRD) covering this temperature range. Long-termannealing experiments of samples “Li16Si4” between 200 and500 °C revealed that, at temperatures below 470 °C, the phaseLi16.42Si4 decomposes into Li17Si4 and Li13Si4. The PXRDpatterns of products of these annealing experiments arecompiled in Figure S2 in the Supporting Information. Wenote that the peritectoid decomposition of Li16.42Si4 into Li17Si4and Li13Si4 proceeds very slowly. A complete decomposition isnot even achieved after 3 days of annealing at 400 °C. Thelong-term annealing experiments manifest Li16.42Si4 as a high-temperature phase, which, however, can be retained at roomtemperature.As a consequence of our DSC and annealing experiments, a
revision of the Li−Si phase diagram according to Figure 3 issuggested. We emphasize that this part (Li conc. > 76 at. %)still contains two uncertainties: first, it is not yet clear whetherLi17Si4 possesses a homogeneity range;25 and second is theassignment of the already discussed isotherms at 610 and 618°C. As mentioned in the Introduction, the existence of a phase
Table 1. Crystallographic Data and Structure Refinement forLi4.11Si
empirical formula Li4.106(2)SiT/K 100(2)formula weight/g·mol−1 56.59crystal size/mm3 0.40 × 0.30 × 0.28crystal color metallic silvercrystal shape blockspace group Cmcmunit cell dimension/Å a = 4.5246(2), b = 21.944(1),
c = 13.2001(6)V/Å3 1310.6(1)Z 16ρ (calcd)/g·cm−3 1.147μ/mm−1 0.390F(000) 421θ range/deg 1.86−45.29index range hkl ±9, ±43, ±26reflns collected 53 893independent reflns 3052 (Rint = 0.020)reflns with I > 2σ(I) 2596 (Rσ = 0.007)data/restraints/param 3052/0/81absorption correction multiscangoodness-of-fit on F2 1.087final R indices [I > 2σ(I)]a,b R1 = 0.012
wR2 = 0.027R indices (all data)a,b R1 = 0.017
wR2 = 0.029largest diff.peak and hole/e Å−3
0.35 and −0.31
aR1 = ∑||Fo| − |Fc||/∑|Fo|.bwR2 = [∑w(Fo
2 − Fc2)2/∑w(Fo
2)2]1/2.
Chemistry of Materials Article
dx.doi.org/10.1021/cm4029885 | Chem. Mater. 2013, 25, 4623−46324625

“Li4Si” has been described in the earlier literature.29−33,59
However, a conclusive characterization has never been
performed and eventually “Li4Si” became obscure, presumablybecause of the several Li−Si phases with a similar composition.We note in passing that our reinvestigation of the Li−Gesystem revealed the existence of a phase Li16.38(2)Ge4 for thissystem as well.60
Determination and Description of the Structure ofLi16.42Si4. Li16.42(1)Si4 crystallizes with the orthorhombic spacegroup Cmcm, with a = 4.5246(2) Å, b = 21.944(1) Å, c =13.2001(6) Å (V = 1310.6(1) Å3), and Z = 16 (referring toLi4.106(2)Si as one formula unit). The unit cell contains 3 distinctSi atom positions (16 Si atoms in total) and 10 Li positions(Table 2). Two of the Li positions (Li4 and Li5) displayoccupational disorder. Whereas the split position of Li5 waseasily extracted from difference Fourier maps, the assignment ofLi4 was somewhat peculiar. Figure 4a shows that significantresidual electron density is located along the a axis in astrandlike shape. The peak maxima correspond to the sites 4c(1/2, y, 1/4) and 8g (x, y, 1/4). Too small interatomicdistances prohibit their simultaneous occupancy (Figure 4b).
Figure 2. DSC thermograms recorded in cooling mode (from 750 °C) for Li17Si4 and nominal compositions “Li16.5Si4”, “Li16Si4”, and “Li14Si4”(according to ref 25). Thermal effects are assigned in an updated Li−Si phase diagram in Figure 3.
Figure 3. Revised Li−Si phase diagram (modified on the basis of ref25) with thermal events from current DSC investigations and long-term annealing experiments of “Li16Si4” samples.
Chemistry of Materials Article
dx.doi.org/10.1021/cm4029885 | Chem. Mater. 2013, 25, 4623−46324626
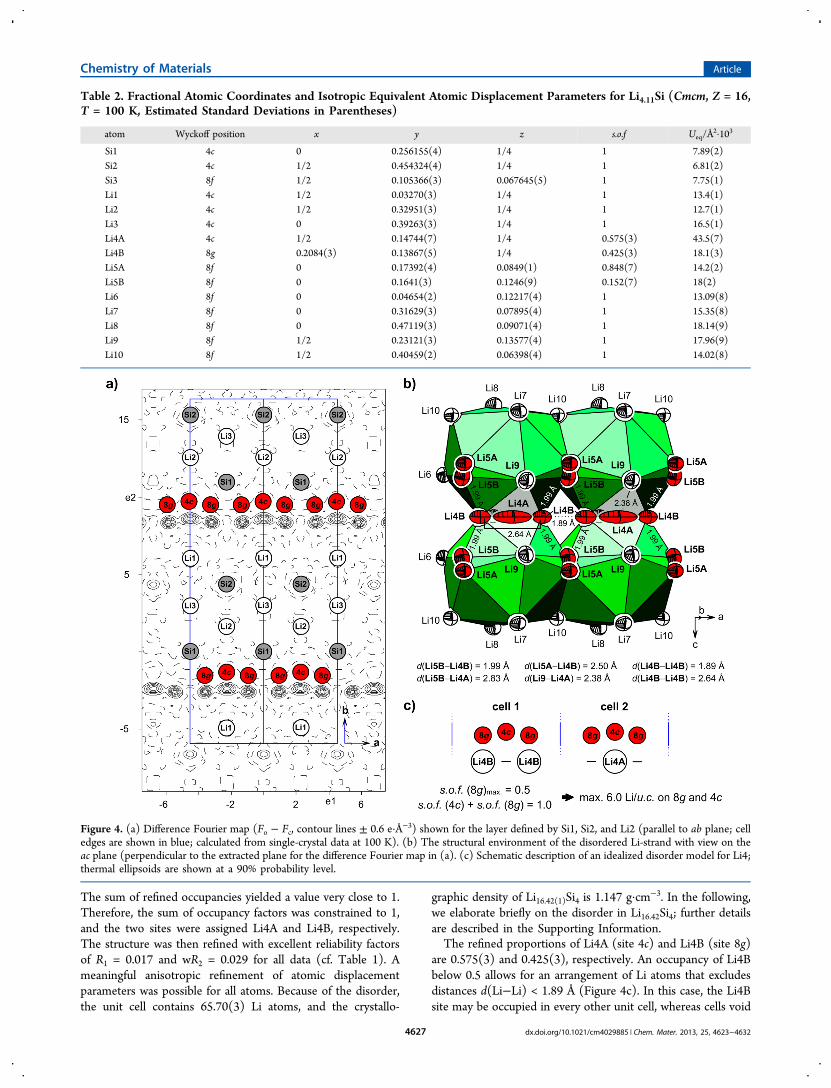
The sum of refined occupancies yielded a value very close to 1.Therefore, the sum of occupancy factors was constrained to 1,and the two sites were assigned Li4A and Li4B, respectively.The structure was then refined with excellent reliability factorsof R1 = 0.017 and wR2 = 0.029 for all data (cf. Table 1). Ameaningful anisotropic refinement of atomic displacementparameters was possible for all atoms. Because of the disorder,the unit cell contains 65.70(3) Li atoms, and the crystallo-
graphic density of Li16.42(1)Si4 is 1.147 g·cm−3. In the following,we elaborate briefly on the disorder in Li16.42Si4; further detailsare described in the Supporting Information.The refined proportions of Li4A (site 4c) and Li4B (site 8g)
are 0.575(3) and 0.425(3), respectively. An occupancy of Li4Bbelow 0.5 allows for an arrangement of Li atoms that excludesdistances d(Li−Li) < 1.89 Å (Figure 4c). In this case, the Li4Bsite may be occupied in every other unit cell, whereas cells void
Table 2. Fractional Atomic Coordinates and Isotropic Equivalent Atomic Displacement Parameters for Li4.11Si (Cmcm, Z = 16,T = 100 K, Estimated Standard Deviations in Parentheses)
atom Wyckoff position x y z s.o.f Ueq/Å2·103
Si1 4c 0 0.256155(4) 1/4 1 7.89(2)Si2 4c 1/2 0.454324(4) 1/4 1 6.81(2)Si3 8f 1/2 0.105366(3) 0.067645(5) 1 7.75(1)Li1 4c 1/2 0.03270(3) 1/4 1 13.4(1)Li2 4c 1/2 0.32951(3) 1/4 1 12.7(1)Li3 4c 0 0.39263(3) 1/4 1 16.5(1)Li4A 4c 1/2 0.14744(7) 1/4 0.575(3) 43.5(7)Li4B 8g 0.2084(3) 0.13867(5) 1/4 0.425(3) 18.1(3)Li5A 8f 0 0.17392(4) 0.0849(1) 0.848(7) 14.2(2)Li5B 8f 0 0.1641(3) 0.1246(9) 0.152(7) 18(2)Li6 8f 0 0.04654(2) 0.12217(4) 1 13.09(8)Li7 8f 0 0.31629(3) 0.07895(4) 1 15.35(8)Li8 8f 0 0.47119(3) 0.09071(4) 1 18.14(9)Li9 8f 1/2 0.23121(3) 0.13577(4) 1 17.96(9)Li10 8f 1/2 0.40459(2) 0.06398(4) 1 14.02(8)
Figure 4. (a) Difference Fourier map (Fo − Fc, contour lines ± 0.6 e·Å−3) shown for the layer defined by Si1, Si2, and Li2 (parallel to ab plane; celledges are shown in blue; calculated from single-crystal data at 100 K). (b) The structural environment of the disordered Li-strand with view on theac plane (perpendicular to the extracted plane for the difference Fourier map in (a). (c) Schematic description of an idealized disorder model for Li4;thermal ellipsoids are shown at a 90% probability level.
Chemistry of Materials Article
dx.doi.org/10.1021/cm4029885 | Chem. Mater. 2013, 25, 4623−46324627

Table 3. Relevant Interatomic Distances in Li4.11Si (Cmcm, Z = 16, T = 100 K, Estimated Standard Deviations in Parentheses)
atom pair d/Å atom pair d/Å atom pair d/Å
Si1 Li5B 2× 2.612(5) Si3 Li7 2.5884(5) Li4B Li1 2.674(1)Li7 2× 2.6152(5) Li8 2.6817(5) Li6 2× 2.797(1)Li4B 2× 2.745(1) Li6 2× 2.7023(3) Li9 2× 2.853(1)Li9 4× 2.7733(3) Li5B 2× 2.710(2) Li5A Li4B 2× 2.498(2)Li2 2× 2.7766(4) Li5A 2× 2.7263(4) Li10 2.613(2)Li5A 2× 2.830(1) Li4B 2× 2.8406(7) Li9 2× 2.6739(5)Li3 2.9948(7) Li10 2× 2.8609(3) Li6 2.838(1)Li4A 2× 3.288(1) Li1 2.8873(4) Li7 3.125(1)
Si2 Li6 2× 2.6348(5) Li9 2.9042(7) Li7 2× 3.137(1)Li3 2× 2.6364(4) Li8 2.9600(7) Li5B Li6 2.579(6)Li10 2× 2.6870(5) Li4A Li9 2× 2.378(1) Li9 2× 2.704(3)Li2 2.7388(7) Li1 2.518(2) Li4A 2× 2.827(7)Li1 2× 2.8419(4) Li5B 4× 2.827(7) Li10 2.910(8)Li8 4× 3.1106(4) Li4B Li5A 2× 2.498(2)
Si3 Li4A 2.5781(6) Li4B 2.639(3)
Figure 5. Structural details of Li16.42Si4 (a, b), Li15Si4 (c−e), and Li17Si4 (f, g). Parallel rods of face-sharing Si coordination polyhedra (a) and theirrelative arrangement in the unit cell of Li16.42Si4 (b). Chains of distorted anticuboctahedron units [Si@Li12] (c) proceeding along the 3-fold axes ofthe cubic unit cell of Li15Si4 (d; different directions are indicated by different colors of the polyhedra) and (e) their relative arrangement (sharededges and faces in black). Clusters of Si centered polyhedra appear in Li17Si4 (f, g) that form supratetrahedra (yellow and red) and supraoctahedra(blue and green); thermal ellipsoids are shown at a 90% probability level.
Chemistry of Materials Article
dx.doi.org/10.1021/cm4029885 | Chem. Mater. 2013, 25, 4623−46324628

of Li4B would contain Li4A. The scenario corresponds to 0.5occupation of each Li4A and Li4B site (i.e., maximal 6 Li atomsper unit cell (u.c.) on 4c and 8g) and is in reasonable closeagreement with the refinement result (5.70(3) Li atoms/u.c. on4c and 8g). The disorder described by Li4A/Li4B has thenconsequences to the split position of Li5 (Li5A/0.848(7) andLi5B/0.152(7)). The presence of a Li5B atom excludes thesimultaneous presence of Li4B in the same cell becausedistances Li4B−Li5B are unreasonably short (1.99 Å, cf. Figure4b).In the structure of Li16.42Si4, the Si atoms are exclusively
coordinated by Li atoms. Nearest-neighbor distances rangefrom 2.38 to 3.29 Å (Table 3) and are well-separated from next-nearest-neighbor ones starting off at 4.07 Å. The SiLincoordination polyhedra for Si1−Si3 are shown in Figure 5a.Disorder affects the coordination of Si1 and Si3 atoms. Si1 andSi2 atoms are 13-coordinated, whereas Si3 atoms attain either a12- or a 13-coordination, depending on whether Li4A or Li4Bis occupied. SiLn polyhedra are further condensed into strandsrunning along the a direction by sharing opposite faces (Figure5b). Strands of polyhedra are connected via sharing vertices,edges, and faces. Similar to Li16.42Si4, the structures of Li15Si4and Li17Si4 can also be built from SiLin coordination polyhedra.All three structures have in common that Si atoms are separatedfrom each other by more than 4.4 Å. In the Li15Si4 structure, Siatoms are exclusively 12-coordinated in a distorted anti-cuboctahedral fashion (Figure 5c).This coordination is closely related to that of atoms in an hcp
packing.12 Similar to Li16.42Si4, polyhedra are condensed intostrands via sharing opposite (triangular) faces (Figure 5d).Strands run parallel to the body diagonals (3-fold axes) in thecubic unit cell and are connected by sharing common edges andfaces (Figure 5e). The four directions of the cubic cell areindicated by different colors in Figure 5d. In the Li-richestphase Li17Si4, two different SiLin coordinations occur, with n =13 and n = 14 (Figure 5f). The Li17Si4 structure is closelyrelated to a 6 × 6 × 6 superstructure of the bcc structure25 inwhich the Si atoms occupy specific positions. Emphasizing theSi atom arrangement, Si4 tetrahedra (Si1 and Si2) and Si6octahedra (Si3 and Si4) appear, which form together with theirLi coordination spheres equal numbers of supratetrahedra (redand yellow) and supraoctahedra (green and blue). The SiLinpolyhedra share vertices, edges, and faces to give thearrangement shown in Figure 5g. One way to interpret theLi17Si4 structure is to consider the arrangement of supra-tetrahedra and supraoctahedra as two interpenetrating supra-diamond structures (corresponding to a hierarchical variant ofthe NaTl structure type) by sharing common edges. Inconclusion, the series Li15Si4, Li16.42Si4, and Li17Si4 shows thegradual enlargement of SiLn coordination polyhedra (n = 12−14) with increasing Li content.The disorder of the Li4A and Li4B atoms in Li16.42(1)Si4 may
be resolved in two alternative ordered models A and B (Figure6). Structure model A excludes Li4B on 8g (x, y, 1/4) butincludes fully occupied Li4A at 4c (1/2, y, 1/4) and Li5Apositions. As a consequence, Si3 coordinates to 12 Li atomsand Si1 to 13 Li atoms. The composition of model A is Li16Si4(Li4Si). Ordered model B includes both sites Li4B on 8g (x, y,1/4) and Li4a on 4c (1/2, y, 1/4), each with 50% occupancy.Model B cannot be realized in the actual space group Cmcm.Two crystallographically independent Li4B positions (i.e., Li4Band Li4B′, Figure 6) are achieved by a symmetry reduction anda larger unit cell (space group P21/m, a = 9.0492(4) Å, b =
13.2001(6) Å, c = 11.2027(5) Å, β = 101.650°, the Li5 positionis presented by Li5A; for the Barnighausen tree, see Figure S4in the Supporting Information). In model B, Si3 alternatelycoordinates to 12 and 13 Li atoms, whereas the Si1coordination polyhedron comprises exclusively 13 Li atoms asin model A. The composition of model B is Li16.5Si4 (Li4.125Si)(Figure 6).
Electronic Structure of Li4.11Si. Theoretical studies onLi16.42Si4 were approached on the basis of the two orderedstructure models A and B. Since these models represent anapproximation to the real structure of Li16.42Si4, Hellmann−Feynman forces on specific atoms are expected. However, aftergeometry optimization, atom positions were found onlymarginally different from their starting values. The formationenergies of the model structures are very different, −0.67 and−1.35 Ry for A and B, respectively, implying that model B ishighly favored over A. Model B has a composition close toLi16.42Si4, and its structure probably also represents a goodapproximation to the experimental crystal structure. Li17Si4, themost rich Li−Si phase, attains a formation energy of −1.78 Ryand metastable Li15Si4 −0.68 Ry, which is very similar to modelA.The results of electronic structure calculations of the three Li
silicides are compiled in Figure 7. We first note their similaroverall electronic structure. The s-bands stemming from Siatoms are only weakly dispersed and confined in the energyrange from −6.5 to −7.5 eV below the Fermi level. Becausethey are not significant to bonding properties, they have beenexcluded in Figure 7. Also, the shape and width of the Si-pbands starting off at around −3 eV and terminating at aroundthe Fermi level are very similar for the four structures. StrongLi−Si bonding interactions are apparent from the significantmixing of Li states into these bands. Interesting are thedifferences around the Fermi level. The DOS of Li15Si4 actually
Figure 6. Two alternative models for Li16.42Si4 with an ordereddistribution of Li atoms. (a) In model A, Li4A and Li5A are fullyoccupied and Li4B and Li5B are void (resulting composition: Li16Si4).(b) Model B includes a fully occupied Li5A position and half occupiedpositions Li4A and Li4B (resulting composition: Li16.5Si4). Si, Li(ordered), and Li (disordered) atoms are shown as gray, white, andred ellipsoids, respectively. All displacement ellipsoids are drawn at a90% probability level.
Chemistry of Materials Article
dx.doi.org/10.1021/cm4029885 | Chem. Mater. 2013, 25, 4623−46324629

shows a small band gap (0.1 eV) just above the Fermi level,separating the Si-p bands from a peculiar narrow band centeredapproximately at 0.7 eV above the Fermi level. The bandstructure is in agreement with earlier reports19 and suggeststhat Li15Si4 could reach a semiconducting state with oneadditional electron per formula unit (assuming a rigid bandbehavior). This would be in agreement with a Zintl phasedescription (Si4−)4.
61 Therefore, Li15Si4 may be considered as ap-doped semiconductor. When turning to the model structuresA and B, however, it is apparent that the Si-p band does notfollow a rigid band behavior for states around the Fermi level.For model A with a composition Li16Si4 appropriate for a Zintlphase, the band gap present in Li15Si4 has closed and the systemrepresents a metallic conductor. The “Li15Si4 gap” is also absentin the DOS and band structure for model B and for Li17Si4.Provided a rigid band behavior, for those systems, this gapshould be situated below the Fermi level. Both systems clearlyreveal a metallic character.In conclusion, among the Li-rich silicides, only Li15Si4
displays an electronic structure that is characteristic of a Zintlphase, yet Li15Si4 is electron-deficient. Interestingly, it has beenshown that a small concentration of Li can be exchanged for Al(Li15−xAlxSi4, x ≈ 0.5),12 which increases the electronconcentration of the system. When going from Li15Si4 tomore Li-rich phases, the electronic structure changes decisively
around the Fermi level. This is attributed to the altered Li−Sibonding interactions.
4. CONCLUSION
The binary lithium silicide Li4.11Si (Li16.42Si4) was synthesized,and its thermodynamic relation with Li17Si4 and Li13Si4 in theLi−Si phase system was firmly established. Li16.42Si4 forms fromthe peritectic decomposition of Li17Si4 and decomposesperitectically at 618 ± 2 °C. The crystal structure is rathercomplex and displays some occupational disorder affecting Lipositions. The accumulation of Li-rich phases in the interval of75−81 at. % Li is characteristic of Li-tetrel (Si, Ge, Sn) systems.It is a consequence of rather strong covalent Li-tetrel bondinginteractions that, in turn, make the application of structure-bonding correlations according to the Zintl−Klemm conceptdifficult or even impossible.62 Among the Li−Si phases, onlythe most Si-rich equimolar LiSi, which is metastable andaccessible through high-pressure techniques or high-energyball-milling,6,7 displays a structure in unambiguous agreementwith the Zintl−Klemm concept. It features a three-dimensionalnetwork of three-bonded Si atoms.6 Reaching the area of the Li-rich side, now various lithium silicides are established in thephase diagram and structurally characterized even thoughcrystalline lithium silicides are considered to play a minor rolein the lithiation/delithiation process of Si anodes. The herereported Li16.42Si4 might not appear during charging/discharg-
Figure 7. Total and partial DOS together with the band structure representation in the range from −4 to 4 eV for (a) Li15Si4, (b) structure model A(Li16Si4), (c) structure model B (Li16.5Si4), and (d) Li17Si4.
Chemistry of Materials Article
dx.doi.org/10.1021/cm4029885 | Chem. Mater. 2013, 25, 4623−46324630

ing processes since it represents a high-temperature phase.However, Li16.42Si4 reveals important structural informationsince it is in line with the description of the Li-rich structurespresented here as SiLin polyhedra with increasing n from 12 to14 going from Li15Si4 to Li17Si4. Interestingly, although Li17Si4,Li16.42Si4, and Li15Si4 are metallic and have very similarcompositions, they appear without significant phase width.
■ ASSOCIATED CONTENT*S Supporting InformationDetails on single-crystal X-ray data collection at roomtemperature of Li16.42Si4 (Table S1), fractional atomiccoordinates and isotropic equivalent displacement parameters(Table S2), PXRD patterns of bulk samples Li17Si4, “Li16.5Si4”,“Li16Si4”, and “Li14Si4” (Figure S1), PXRD patterns of samples“Li16Si4” annealed at different temperatures for 3 days (FigureS2), Rietveld fit to the X-ray powder diffraction pattern ofLi16.42Si4 (Figure S3), Barnighausen tree for generating orderedstructure models of Li16.42Si4 (Figure S4) (PDF), andcrystallographic information (CIF format). This material isavailable free of charge via the Internet at http://pubs.acs.org.
■ AUTHOR INFORMATIONCorresponding Author*E-mail: [email protected] authors declare no competing financial interest.
■ ACKNOWLEDGMENTSThis work has been funded by Fonds der ChemischenIndustrie, the Deutsche Forschungsgemeinschaft projectnumber FA 198/11-1, the Swedish Research Council (ProjectNo. 2010-4827) and the National Science Foundation throughgrant DMR-1007557.
■ REFERENCES(1) Zhang, W. J. J. Power Sources 2011, 196, 13.(2) Nesper, R.; von Schnering, H. G. J. Solid State Chem. 1987, 70,48.(3) Frank, U.; Muller, W.; Schafer, H. Z. Naturforsch. 1975, 30b, 10.(4) von Schnering, H. G.; Nesper, R.; Tebbe, K. F.; Curda, J. Z.Metallkd. 1980, 71, 357.(5) von Schnering, H. G.; Nesper, R.; Curda, J.; Tebbe, K. F. Angew.Chem. 1980, 92, 1070.(6) Evers, J.; Oehlinger, G.; Sextl, G. Angew. Chem., Int. Ed. Engl.1993, 32, 1442.(7) Tang, W. S.; el Chotard, J.-N.; el Janotz, R. J. Electrochem. Soc.2013, 160, A1232.(8) Limthongkul, P.; Jang, Y. I.; Dudney, N. J.; Chiang, Y. M. ActaMater. 2003, 51, 1103.(9) Limthongkul, P.; Jang, Y. I.; Dudney, N. J.; Chiang, Y. M. J. PowerSources 2003, 119−121, 604.(10) Obrovac, M. N.; Christensen, L. Electrochem. Solid-State Lett.2004, 7, A93.(11) Hatchard, T. D.; Dahn, J. R. J. Electrochem. Soc. 2004, 151, A838.(12) Zeilinger, M.; Baran, V.; Haussermann, U.; Fassler, T. F. Chem.Mater. 2013, 25, 4113.(13) Key, B.; Bhattacharyya, R.; Morcrette, M.; Seznec, V.; Tarascon,J. M.; Grey, C. P. J. Am. Chem. Soc. 2009, 131, 9239.(14) Key, B.; Morcrette, M.; Tarascon, J. M.; Grey, C. P. J. Am. Chem.Soc. 2011, 133, 503.(15) Kuhn, A.; Sreeraj, P.; Pottgen, R.; Wiemhofer, H. D.; Wilkening,M.; Heitjans, P. J. Am. Chem. Soc. 2011, 133, 11018.(16) Dupke, S.; Langer, T.; Pottgen, R.; Winter, M.; Passerini, S.;Eckert, H. Phys. Chem. Chem. Phys. 2012, 14, 6496.
(17) Dupke, S.; Langer, T.; Pottgen, R.; Winter, M.; Eckert, H. SolidState Nucl. Magn. Reson. 2012, 42, 17.(18) Stearns, L. A.; Gryko, J.; Diefenbacher, J.; Ramachandran, G. K.;McMillan, P. F. J. Solid State Chem. 2003, 173, 251.(19) Xu, Y. H.; Yin, G. P.; Zuo, P. J. Electrochim. Acta 2008, 54, 341.(20) Chevrier, V. L.; Zwanziger, J. W.; Dahn, J. R. J. Alloys Compd.2010, 496, 25.(21) Debski, A.; Gasior, W.; Goral, A. Intermetallics 2012, 26, 157.(22) Gruber, T.; Thomas, D.; Roder, C.; Mertens, F.; Kortus, J. J.Raman Spectrosc. 2013, 44, 934.(23) Wang, P.; Kozlov, A.; Thomas, D.; Mertens, F.; Schmid-Fetzer,R. Intermetallics 2013, 42, 137.(24) Thomas, D.; Abdel-Hafiez, M.; Gruber, T.; Huttl, R.; Seidel, J.;Wolter, A. U. B.; Buchner, B.; Kortus, J.; Mertens, F. J. Chem.Thermodyn. 2013, 64, 205.(25) Zeilinger, M.; Benson, D.; Haussermann, U.; Fassler, T. F.Chem. Mater. 2013, 25, 1960.(26) Gladyshevskii, E. I.; Oleksiv, G. I.; Kripyakevich, P. I.Kristallografiya 1964, 9, 338.(27) Axel, H.; Schafer, H.; Weiss, A. Z. Naturforsch. 1966, 21b, 115.(28) Moissan, H. C. R. Hebd. Seances Acad. Sci. 1902, 134, 1083.(29) Klemm, W.; Struck, M. Z. Anorg. Allg. Chem. 1955, 278, 117.(30) Pell, E. M. Phys. Chem. Solids 1957, 3, 77.(31) Bohm, H. Z. Metallkd. 1959, 50, 44.(32) Obinata, I.; Takeuchi, Y.; Kurihara, K.; Watanabe, M. J. Jpn. Inst.Met. 1964, 28, 568.(33) Federov, P. I.; Ioffe, A. A. Izv. Vyssh. Uchebn. Zaved., Tsvetn.Metall. 1962, 1, 127.(34) Schafer, H.; Axel, H.; Menges, E.; Weiss, A. Z. Naturforsch.1965, 20b, 394.(35) Axel, H.; Schafer, H.; Weiss, A. Angew. Chem., Int. Ed. Engl.1965, 4, 358.(36) Schafer, H.; Axel, H.; Weiss, A. Z. Naturforsch. 1965, 20b, 1010.(37) Schafer, H.; Axel, H.; Weiss, A. Z. Naturforsch. 1965, 20b, 1302.(38) Demidov, A. I.; Morachevskii, A. G.; Nikolaev, V. P.; Berenda,N. V. J. Appl. Chem. (USSR) 1988, 61, 1254.(39) (a) Okamoto, H. Bull. Alloy Phase Diagrams 1990, 11, 306 andreferences therein. (b) Okamoto, H. J. Phase Equilib. Diffus. 2009, 30,118.(40) Braga, M. H.; Malheiros, L. F.; Ansara, I. J. Phase Equilib. 1995,16, 324 and references therein.(41) Sharma, R. A.; Seefurth, R. N. J. Electrochem. Soc. 1976, 123,1763.(42) Lai, S. C. J. Electrochem. Soc. 1976, 123, 1196.(43) Nikolaev, V. P.; Morachevskii, A. G.; Demidov, A. I.; Bairachnyi,E. V. J. Appl. Chem. (USSR) 1980, 53, 1549.(44) Netzsch Proteus Thermal Analysis, Version 4.8.2; Netzsch-Geratebau GmbH: Selb, Germany, 2006.(45) APEX 2: APEX Suite of Crystallographic Software, Version2008.4; Bruker AXS Inc.: Madison, WI, 2008.(46) SAINT, Version 7.56a; Bruker AXS Inc.: Madison, WI, 2008.(47) SADABS, Version 2008/1; Bruker AXS Inc.: Madison, WI, 2008.(48) Sheldrick, G. M. Shelxs-97: Program for the Determination ofCrystal Structures; University of Gottingen: Gottingen, Germany, 1997.(49) Sheldrick, G. M. Shelxl-97: Program for Crystal StructureRefinement; University of Gottingen: Gottingen, Germany, 1997.(50) Petricek, V.; Dusek, M.; Palatinus, L. Jana 2006: TheCrystallographic Computing System, Version 03/15/2013; Institute ofPhysics: Praha, Czech Rupublic, 2006.(51) TOPAS: Rietveld Software, Version 4.0; Bruker AXS Inc.:Madison, WI, 2009.(52) Blaha, P.; Schwarz, K.; Madsen, G. K. H.; Kvasnicka, D.; Luitz, J.WIEN2k: An Augmented Plane Wave and Local Orbitals Program forCalculating Crystal Properties, Version 12.0; Technische UniversitatWien: Vienna, Austria, 2001.(53) Wang, Y.; Perdew, J. P. Phys. Rev. B 1991, 44, 13298.(54) Perdew, J. P.; Chevary, J. A.; Vosko, S. H.; Jackson, K. A.;Pederson, M. R.; Singh, D. J.; Fiolhais, C. Phys. Rev. B 1992, 46, 6671.
Chemistry of Materials Article
dx.doi.org/10.1021/cm4029885 | Chem. Mater. 2013, 25, 4623−46324631

(55) Perdew, J. P.; Burke, K.; Ernzerhof, M. Phys. Rev. Lett. 1996, 77,3865.(56) Monkhorst, H. J.; Pack, J. D. Phys. Rev. B 1976, 13, 5188.(57) Blochl, P. E.; Jepsen, O.; Andersen, O. K. Phys. Rev. B 1994, 49,16223.(58) Kokalj, A.Comput. Mater. Sci. 2003, 28, 155. Code availabe fromhttp://www.xcrysden.org.(59) An orthorhombic base face-centered orthorhombic cell with a =34.4 ± 0.1 Å, b = 25.0 ± 0.1 Å, c = 4.49 ± 0.01 Å was reported for thecomposition “Li4Si” with the cell volume being approximately 3 timesthat of Li4.11Si.
37 For two reported samples, the densities were 1.19 g·cm−3 (50 Si and 200 Li atoms/u.c.) and 1.18 g·cm−3 (48 Si and 200 Liatoms/u.c.).37 These ratios are similar to Li4.11Si corresponding to 48Si atoms (Z = 48) and 197.1(1) Li atoms/u.c.).(60) Li4.10Ge is isotypic with Li4.11Si and crystallizes with a =4.5511(2) Å, b = 22.0862(7) Å, c = 13.2751(4) Å, V = 1334.37(8) Å3
(single-crystal data, space group Cmcm, Z = 16, T = 123 K).(61) (a) Zintl, E. Angew. Chem. 1939, 52, 1. (b) Klemm, W. Proc.Chem. Soc. 1958, 329. (c) Klemm, W.; Busmann, E. Z. Anorg. Allg.Chem. 1963, 319, 297.(62) Nesper, R. Prog. Solid State Chem. 1990, 20, 1.
Chemistry of Materials Article
dx.doi.org/10.1021/cm4029885 | Chem. Mater. 2013, 25, 4623−46324632

S1
SUPPORTING INFORMATION
Revision of the Li–Si Phase Diagram: Discovery and Single Crystal X-ray
Structure Determination of the High Temperature Phase Li4.11Si
Michael Zeilinger, Iryna M. Kurylyshyn, Ulrich Häussermann, Thomas F. Fässler*
Details on the single crystal X-ray structure refinement of Li4.11Si
As shown in the crystallographic section of this article, the disorder in the Li4.11Si structure
affects Li5 on 8f, Li4A on 4c and Li4B on 8g (Table 2). If the occupancies for Li4A and Li4B are
refined freely, the values converge to 0.577(5) and 0.425(3), respectively, with the sum being
very close to one. Thus, the constrain occ(Li4A) + occ(Li4B) = 1, which excludes a simultaneous
occupancy of both sites, is justified. The variables then converge to 0.575(3) and 0.425(3).
Furthermore, it was demonstrated in the structure discussion part that the maximum occupancy of
Li4B is 0.5, as higher values would give rise to unreasonably short Li–Li distances by
neighboring Li4B–Li4B pairs (Figure 4). An interpretation of the example
occ(Li4A) = occ(Li4B) = 0.5, which represents the maximum accumulation of Li on those sites
(6 Li atoms/u.c.), is highlighted as well.
Furthermore, a careful analysis of residual electron densities during the structure refinement
procedure elucidated further positional disorder for Li5 on 8f. The atom split reveals
occ(Li5A) = 0.848(7) and occ(Li5B) = 0.152(7), respectively (Table 2). Again, a free refinement
delivers equal results (occ(Li5A) = 0.851(8) and occ(Li5B) = 0.155(8)). It might be speculated
that due to the weak scattering power of lithium introducing a split position with a small split
fraction for Li5B is not meaningful. However, when deleting Li5B for the refinement, the
occupancy of Li5 (former Li5A) refines to 0.950(5) and significant residual electron density is
almost exactly located at the former Li5B position (+1.238 e·Å−3
). The reliability factors for all
data are R1 = 0.023 and wR2 = 0.047. Without ignoring the atom split, we obtain markedly lower
R-values of R1 = 0.017 and wR2 = 0.029 for all data and very small (as well as balanced) residual
electron densities (+0.35 e·Å−3
and −0.31 e·Å−3
).

S2
Details on the single crystal X-ray data collection for Li4.11Si at room temperature
Single crystal diffraction of Li4.11Si was performed on a Stoe IPDS IIT diffractometer equipped
with a rotating anode (Bruker AXS, FR591) with MoKα radiation (λ = 0.71073 Å) and a Montel
mirror.
Table S1. Crystallographic data and structure refinement for Li4.11Si at 298 K.
empirical formula Li4.105(6)Si
T / K 298(2)
formula weight / g·mol−1
56.59
crystal size / mm3 0.40 × 0.30 × 0.28
crystal color metallic silver
crystal shape block
space group Cmcm
unit cell dimension / Å a = 4.5467(9), b = 22.065(4), c = 13.240(3)
V / Å3 1328.3(5)
Z 16
ρ (calc.) / g·cm−³ 1.132
μ / mm−1
0.385
F (000) 421
θ range / ° 8.47–30.49
index range hkl ±6, ±31, ±18
reflections collected 15579
independent reflections 1120 (Rint = 0.047)
reflections with I > 2σ(I) 1049 (Rσ = 0.015)
data/restraints/parameter 1120/0/81
absorption correction –
goodness-of-fit on F2 1.206
Final R indices [I > 2σ(I)]a, b
R1 = 0.019
wR2 = 0.031
R indices (all data)a, b
R1 = 0.021
wR2 = 0.032
Largest diff. peak and
hole / e·Å−3
0.15 and −0.14
a R1 = ∑││Fo│−│Fc││ ∕ ∑│Fo│
b wR2 = [∑w(Fo
2−Fc
2)
2/∑w(Fo
2)
2]
1/2

S3
Table S2. Fractional atomic coordinates and isotropic equivalent atomic displacement parameters
for Li4.11Si (Cmcm, Z = 16, T = 298 K, estimated standard deviations in parentheses).
Atom Wyckoff
position
x y z s.o.f Ueq
/ Å2·10
3
Si1 4c 0 0.25634(1) ¼ 1 13.02(6)
Si2 4c ½ 0.45423(1) ¼ 1 12.38(6)
Si3 8f ½ 0.105557(7) 0.06740(1) 1 12.62(5)
Li1 4c ½ 0.03229(8) ¼ 1 25.1(3)
Li2 4c ½ 0.32954(7) ¼ 1 21.7(3)
Li3 4c 0 0.39256(9) ¼ 1 32.1(4)
Li4A 4c ½ 0.1473(2) ¼ 0.58(1) 64(3)
Li4B 8g 0.213(1) 0.1390(2) ¼ 0.42(1) 43(2)
Li5A 8f 0 0.1736(2) 0.0858(6) 0.91(3) 25.5(9)
Li5B 8f 0 0.162(2) 0.128(5) 0.09(3) 22(9)
Li6 8f 0 0.04662(5) 0.12234(9) 1 22.5(2)
Li7 8f 0 0.31628(6) 0.07904(9) 1 27.6(2)
Li8 8f 0 0.47120(7) 0.0909(1) 1 35.5(3)
Li9 8f ½ 0.23095(6) 0.1362(1) 1 27.8(2)
Li10 8f ½ 0.40482(6) 0.06375(8) 1 25.4(2)
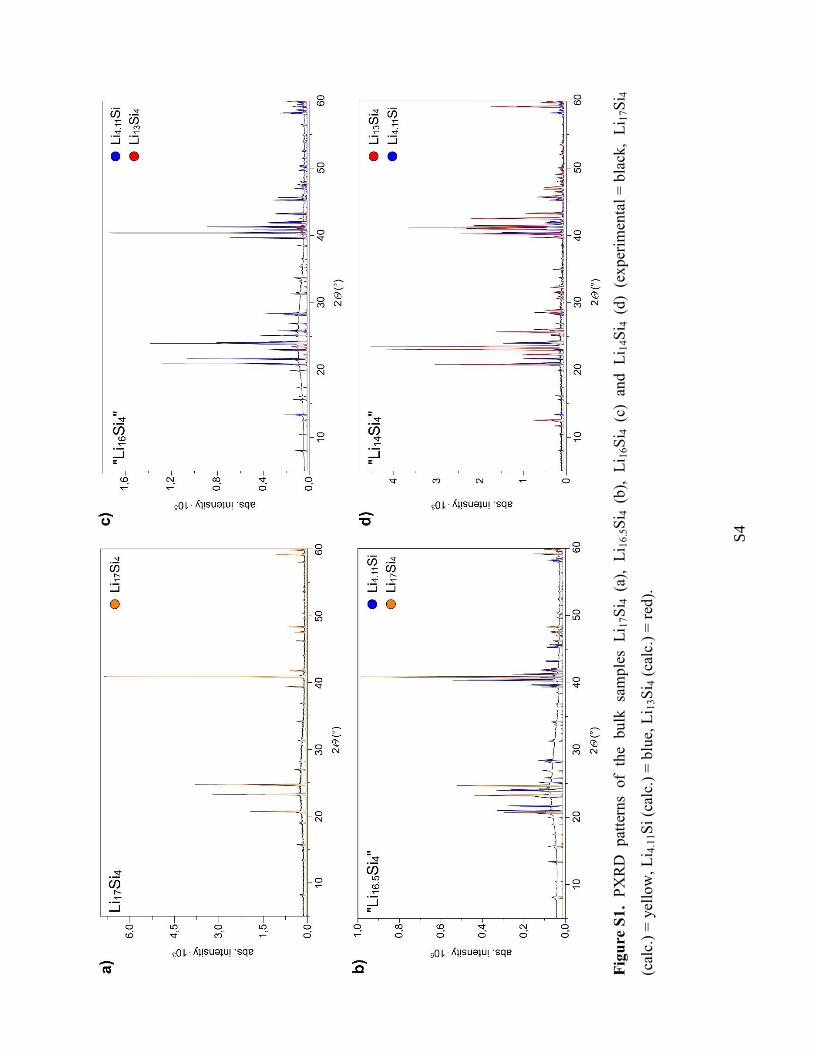
S4
F
igu
re S
1.
PX
RD
pat
tern
s of
the
bulk
sa
mple
s L
i 17S
i 4 (a
),
Li 1
6.5
Si 4
(b
),
Li 1
6S
i 4 (c
) an
d
Li 1
4S
i 4 (d
) (e
xper
imen
tal
= b
lack
, L
i 17S
i 4
(cal
c.)
= y
ello
w,
Li 4
.11S
i (c
alc.
) =
blu
e, L
i 13S
i 4 (
calc
.) =
red
).

S5
Figure S2. PXRD patterns of “Li16Si4” samples annealed at different temperatures for three days
followed by quenching in liquid nitrogen (experimental = black; Li17Si4 calculated = orange;
Li4.11Si calculated = blue; Li13Si4 calculated = red).

S6
Figure S3. Experimental (black) X-ray powder diffraction pattern of Li4.11Si referenced with the
theoretical powder pattern obtained from Rietveld refinement. The difference plot is shown in
blue, Bragg positions in green (up: Li13Si4, down: Li4.11Si). The strongest reflection of Li13Si4
(111) at ~23.5° is labeled with *.

S7
Fig
ure
S4. B
ärnig
hau
sen
1 t
ree
for
gen
erat
ing o
rder
ed s
truct
ure
model
s of
Li 4
.11S
i.
(1)
Bär
nig
hau
sen, H
. M
AT
CH
, C
om
mun.
Math
. C
hem
. 1980, 9, 139.


5 Publications and Manuscripts
73
5.3 Revision of the Li13Si4 structure
Zeilinger, M.; Fässler, T. F. Acta Cryst. 2013, E69, i81. Reproduced with permission
of the International Union of Crystallography (http://journals.iucr.org).


Revision of the Li13Si4 structure
Michael Zeilinger and Thomas F. Fassler*
Department of Chemistry, Technische Universitat Munchen, Lichtenbergstrasse 4,
85747 Garching, Germany
Correspondence e-mail: [email protected]
Received 14 October 2013; accepted 30 October 2013
Key indicators: single-crystal X-ray study; T = 100 K; mean �(Si–Li) = 0.0007 A;
disorder in main residue; R factor = 0.015; wR factor = 0.044; data-to-parameter
ratio = 40.5.
Besides Li17Si4, Li16.42Si4, and Li15Si4, another lithium-rich
representative in the Li–Si system is the phase Li13Si4
(tridecalithium tetrasilicide), the structure of which has been
determined previously [Frank et al. (1975). Z. Naturforsch.
Teil B, 30, 10–13]. A careful analysis of X-ray diffraction
patterns of Li13Si4 revealed discrepancies between experi-
mentally observed and calculated Bragg positions. Therefore,
we redetermined the structure of Li13Si4 on the basis of single-
crystal X-ray diffraction data. Compared to the previous
structure report, decisive differences are (i) the introduction
of a split position for one Li site [occupancy ratio
0.838 (7):0.162 (7)], (ii) the anisotropic refinement of atomic
displacement parameters for all atoms, and (iii) a high
accuracy of atom positions and unit-cell parameters. The
asymmetric unit of Li13Si4 contains two Si and seven Li atoms.
Except for one Li atom situated on a site with symmetry 2/m,
all other atoms are on mirror planes. The structure consists of
isolated Si atoms as well as Si–Si dumbbells surrounded by Li
atoms. Each Si atom is either 12- or 13-coordinated. The
isolated Si atoms are situated in the ab plane at z = 0 and are
strictly separated from the Si–Si dumbbells at z = 0.5.
Related literature
For details of the structural description of Li13Si4, see: Frank et
al. (1975). For structural data for Li13Si4 based on computa-
tional methods, see: Chevrier et al. (2010). For details of the
synthesis, thermodynamic properties and crystal structures of
Li17Si4, Li16.42Si4 and Li15Si4, see: Zeilinger & Benson et al.
(2013); Zeilinger & Kurylyshyn et al. (2013); Zeilinger &
Baran et al. (2013). For further thermodynamic investigations
on the Li–Si system, see: Thomas et al. (2013); Wang et al.
(2013). The behavior of silicon as anode material upon li-
thiation/delithiation is described by Limthongkul et al. (2003)
and Obrovac & Christensen (2004). For in-situ/ex-situ solid
state NMR investigations of structural changes in silicon
electrodes for lithium-ion batteries, see: Key et al. (2009,
2011).
Experimental
Crystal data
Li13Si4Mr = 202.58Orthorhombic, Pbama = 7.9488 (4) Ab = 15.1248 (8) Ac = 4.4661 (2) A
V = 536.93 (5) A3
Z = 2Mo K� radiation� = 0.47 mm�1
T = 100 K0.2 � 0.2 � 0.2 mm
Data collection
Bruker APEXII CCDdiffractometer
Absorption correction: multi-scan(SADABS; Bruker, 2008)Tmin = 0.781, Tmax = 0.818
25938 measured reflections2429 independent reflections2333 reflections with I > 2�(I)Rint = 0.033
Refinement
R[F 2 > 2�(F 2)] = 0.015wR(F 2) = 0.044S = 1.082429 reflections
60 parameters��max = 0.68 e A�3
��min = �0.40 e A�3
Data collection: APEX2 (Bruker, 2008); cell refinement: SAINT
(Bruker, 2008); data reduction: SAINT; program(s) used to solve
structure: SHELXS97 (Sheldrick, 2008); program(s) used to refine
structure: SHELXL97 (Sheldrick, 2008); molecular graphics:
DIAMOND (Brandenburg, 2012); software used to prepare material
for publication: publCIF (Westrip, 2010).
This work has been funded by the Fonds der Chemischen
Industrie and the SolTech (Solar Technologies go Hybrid)
program of the State of Bavaria.
Supplementary data and figures for this paper are available from theIUCr electronic archives (Reference: WM2778).
References
Brandenburg, K. (2012). DIAMOND. Crystal Impact GbR, Bonn, Germany.Bruker (2008). APEX2, SAINT and SADABS. Bruker AXS Inc., Madison,
Wisconsin, USA.Chevrier, V. L., Zwanziger, J. W. & Dahn, J. R. (2010). J. Alloys Compd, 496,
25–36.Frank, U., Muller, W. & Schafer, H. (1975). Z. Naturforsch. Teil B, 30, 10–13.Key, B., Bhattacharyya, R., Morcrette, M., Seznec, V., Tarascon, J. M. & Grey,
C. P. (2009). J. Am. Chem. Soc. 131, 9239–9249.Key, B., Morcrette, M., Tarascon, J. M. & Grey, C. P. (2011). J. Am. Chem. Soc.
133, 503–512.Limthongkul, P., Jang, Y. I., Dudney, N. J. & Chiang, Y. M. (2003). Acta Mater.
51, 1103–1113.Obrovac, M. N. & Christensen, L. (2004). Electrochem. Solid State Lett. 7,
A93–A96.Sheldrick, G. M. (2008). Acta Cryst. A64, 112–122.Thomas, D., Abdel-Hafiez, M., Gruber, T., Huttl, R., Seidel, J., Wolter, A. U. B.,
Buchner, B., Kortus, J. & Mertens, F. J. (2013). J. Chem. Thermodyn. 64, 205–225.
Wang, P., Kozlov, A., Thomas, D., Mertens, F. & Schmid-Fetzer, R. (2013).Intermetallics, 42, 137–145.
Westrip, S. P. (2010). J. Appl. Cryst. 43, 920–925.Zeilinger, M., Baran, V., Haussermann, U. & Fassler, T. F. (2013). Chem. Mater.
25, 4113–4121.
inorganic compounds
Acta Cryst. (2013). E69, i81–i82 doi:10.1107/S1600536813029759 Zeilinger and Fassler i81
Acta Crystallographica Section E
Structure ReportsOnline
ISSN 1600-5368

Zeilinger, M., Benson, D., Haussermann, U. & Fassler, T. F. (2013). Chem.Mater. 25, 1960–1967.
Zeilinger, M., Kurylyshyn, I. M., Haussermann, U. & Fassler, T. F. (2013).Chem. Mater. doi:10.1021/cm4029885.
inorganic compounds
i82 Zeilinger and Fassler � Li13Si4 Acta Cryst. (2013). E69, i81–i82

supplementary materials
sup-1Acta Cryst. (2013). E69, i81–i82
supplementary materials
Acta Cryst. (2013). E69, i81–i82 [doi:10.1107/S1600536813029759]
Revision of the Li13Si4 structure
Michael Zeilinger and Thomas F. Fässler
1. Comment
In the last decade, the demand for high capacity lithium-ion batteries (LIBs) particularly fueled the research on the Li—Si
phase system since as anode material, Si theoretically offers a specific capacity of 3579 mA h g-1 based on the formation
of the metastable phase Li15Si4 (Obrovac & Christensen, 2004). It is well known that Li15Si4 is the only Li—Si phase that
appears in crystalline form during charging and discharging processes in silicon based LIBs at room temperature
(Limthongkul et al., 2003; Obrovac & Christensen, 2004). However, in order to understand the lithiation/delithiation
mechanism, X-ray diffraction methods only provide sparse information and therefore other techniques such as in-situ /
ex-situ solid state NMR are frequently used (Key & Bhattacharyya et al., 2009; Key & Morcrette et al., 2011).
Furthermore, a fundamental understanding of the thermodynamic relation of Li—Si phases, especially in the lithium-
rich section of the phase diagram, is of considerable importance. Exemplary work is given by Zeilinger & Baran et al.
(2013), Zeilinger & Benson et al. (2013), Zeilinger & Kurylyshyn et al. (2013), Thomas et al. (2013) and Wang et al.
(2013). For those studies as well as for NMR investigations it is crucial that all existing Li—Si phases are structurally
well characterized since otherwise a phase identification of model compounds can be difficult (Key & Bhattacharyya et
al., 2009; Thomas et al., 2013). In the course of our investigations on the thermodynamic properties of Li—Si phases, we
identified two new phases, Li17Si4 (Zeilinger & Benson et al., 2013) and Li16.42Si4 (Zeilinger & Kurylyshyn et al., 2013).
The latter is assigned a high temperature phase existing in a temperature range of 743–891 K, the former decomposes
peritectically at 754–759 K. Li16.42Si4 is compositionally embraced by the lithium-richer phase Li17Si4 and the lithium-
poorer phase Li13Si4. Since the determination of the Li—Si phase diagram in the aforementioned section is carried out by
thermal investigations on various samples with different Li concentrations, the structures of the relevant phases have to
be ascertained for an unambiguous assignment of phases in X-ray powder diffraction patterns of those samples. However,
the calculated X-ray diffraction pattern of Li13Si4 based on structural data published by Frank et al. (1975) decisively
differs from the experimentally observed pattern of a Li13Si4 sample (Fig. 1). More recent data based on theoretical
calculations were reported by Chevrier et al. (2010). Yet, the accordingly calculated pattern is slightly but still distinctly
different (Fig. 1).
Therefore, we redetermined the structure of Li13Si4 based on single crystal X-ray diffraction data. As can be seen in Fig.
1, the resulting calculated pattern is in very good agreement with the experimental one. Main differences to the previous
single-crystal X-ray structure determination by Frank et al. (1975) are i) a significantly more precise determination of
atomic positions and unit-cell parameters, respectively (a = 7.99 (2) Å, b = 15.21 (3) Å, c = 4.43 (1) Å compared with a =
7.9488 (4) Å, b = 15.1248 (8) Å, c = 4.4661 (2) Å), ii) an anisotropic refinement of atomic displacement parameters for
all atoms and iii) the introduction of a split position for Li6 (occupancy ratio 0.838 (7):0.162 (7)).
Regarding the structure of Li13Si4 we briefly elaborate on the main structure motifs since this has already been described
in detail by Frank et al. (1975). Contrary to the lithium-richer phases Li17Si4, Li16.42Si4 and Li15Si4 where all Si atoms are
isolated, Li13Si4 contains Si—Si dumbbells beside isolated Si atoms (Fig. 2a). Li—Si distances range from 2.5173 (2) Å

supplementary materials
sup-2Acta Cryst. (2013). E69, i81–i82
to 3.2283 (7) Å and next nearest neighbor distances are clearly separated, starting off from 4.1899 (2) Å. The shortest Li
—Li distance is 2.429 (7) Å and comparable to other Li—Si phases (Zeilinger & Benson et al., 2013). The Si—Si
distance within the Si—Si dumbbells is 2.3852 (2) Å, further Si atoms are separated by distances larger than 4.4661 (2)
Å. Whereas Si1 is coordinated by 12 Li and one Si atom, Si2 is exclusively surrounded by 12 Li atoms. In addition,
dumbbells and isolated Si atoms are strictly separated from each other in a layer like fashion as they are located in
different ab-planes (Figs. 2 b and c).
2. Experimental
In our previous work we reported on thermal investigations by differential scanning calorimetry (DSC) means which
were targeting the determination of the lithium-rich section of the Li—Si phase diagram (Zeilinger & Kurylyshyn et al.
2013). Various samples with different Li—Si compositions (Li17Si4, "Li16.5Si4", "Li16Si4" and "Li14Si4") were synthesized.
Crystals of Li13Si4 could be obtained from a sample with a nominal composition "Li14Si4". For the synthesis of "Li14Si4"
we refer to Zeilinger & Kurylyshyn et al. (2013). Li13Si4 crystals were handled inside an Ar-filled glove box, selected
under a microscope and sealed inside 0.3 mm glass capillaries for X-ray diffraction experiments.
3. Refinement
For better comparison between the first structure refinement and the current redetermination, atomic coordinates and
atom labels were taken from Frank et al. (1975). During the structure refinement procedure the positions of two Si and
seven Li atoms were confirmed. If refined freely, the site occupation factors of all atoms converged to values very close
to full occupancy for the respective sites and were therefore constrained for full occupancy. Extinction was refined to
non-significant values and thus excluded from the refinement. Furthermore, an anisotropic refinement of atomic
displacement parameters was possible for all atoms. This model resulted in R-values of R1 = 0.020 and wR2 = 0.059 for all
data and residual electron densities of +1.223 e Å-3 and -0.740 e Å-3. However, the atomic displacement parameters for
Li6 on Wyckoff position 4h (0.0895 (2), 0.25508 (9), 1/2) indicated a large prolongation in the x-direction. Additionally,
significant residual electron density (+1.22 e Å-3) is located closely to Li6. To account for that, we introduced a split
position for Li6. This resulted in markedly better R-values of R1 = 0.016 and wR2 = 0.044 for all data as well as
acceptable residual electron densities of +0.68 e Å-3 and -0.40 e Å-3. The refined fractions are 0.838 (7) for Li6A and
0.162 (7) for Li6B. An example for a similar introduction of an atom split in lithium-rich Li—Si phases is given by
Zeilinger & Kurylyshyn et al. (2013).
Computing details
Data collection: APEX2 (Bruker, 2008); cell refinement: SAINT (Bruker, 2008); data reduction: SAINT (Bruker, 2008);
program(s) used to solve structure: SHELXS97 (Sheldrick, 2008); program(s) used to refine structure: SHELXL97
(Sheldrick, 2008); molecular graphics: DIAMOND (Brandenburg, 2012); software used to prepare material for
publication: publCIF (Westrip, 2010).

supplementary materials
sup-3Acta Cryst. (2013). E69, i81–i82
Figure 1
(a) Powder X-ray diffraction pattern of a Li13Si4 sample referenced with the theoretical patterns calculated from (b)
single-crystal X-ray data presented herein, previous structural data published by (c) Chevrier et al. (2010) and (d) Frank
et al. (1975).

supplementary materials
sup-4Acta Cryst. (2013). E69, i81–i82
Figure 2
Structure motifs in Li13Si4: (a) perspective view along the crystallographic c-axis of the unit cell of Li13Si4 (atoms of the
asymmetric unit are labeled), (b) isolated Si atoms, and (c) Si—Si dumbbells located in different ab-planes (c = 0, 1 and c
= 1/2, respectively). Ellipsoids are drawn at a 80% probability level (Li = red, Si = blue; only the major component of Li6
is shown).
Tridecalithium tetrasilicide
Crystal data
Li13Si4
Mr = 202.58Orthorhombic, PbamHall symbol: -P 2 2aba = 7.9488 (4) Åb = 15.1248 (8) Åc = 4.4661 (2) Å
V = 536.93 (5) Å3
Z = 2F(000) = 190Dx = 1.253 Mg m−3
Melting point: 995 KMo Kα radiation, λ = 0.71073 ÅCell parameters from 9823 reflections

supplementary materials
sup-5Acta Cryst. (2013). E69, i81–i82
θ = 2.9–57.3°µ = 0.47 mm−1
T = 100 K
Block, metallic silver0.2 × 0.2 × 0.2 mm
Data collection
Bruker APEXII CCD diffractometer
Radiation source: rotating anode FR591MONTEL optic monochromatorDetector resolution: 16 pixels mm-1
φ– and ω–rotation scansAbsorption correction: multi-scan
(SADABS; Bruker, 2008)Tmin = 0.781, Tmax = 0.818
25938 measured reflections2429 independent reflections2333 reflections with I > 2σ(I)Rint = 0.033θmax = 45.3°, θmin = 2.7°h = −13→15k = −28→30l = −8→8
Refinement
Refinement on F2
Least-squares matrix: fullR[F2 > 2σ(F2)] = 0.015wR(F2) = 0.044S = 1.082429 reflections60 parameters0 restraints
Primary atom site location: structure-invariant direct methods
Secondary atom site location: difference Fourier map
w = 1/[σ2(Fo2) + (0.0204P)2 + 0.0373P]
where P = (Fo2 + 2Fc
2)/3(Δ/σ)max = 0.002Δρmax = 0.68 e Å−3
Δρmin = −0.40 e Å−3
Special details
Geometry. All e.s.d.'s (except the e.s.d. in the dihedral angle between two l.s. planes) are estimated using the full covariance matrix. The cell e.s.d.'s are taken into account individually in the estimation of e.s.d.'s in distances, angles and torsion angles; correlations between e.s.d.'s in cell parameters are only used when they are defined by crystal symmetry. An approximate (isotropic) treatment of cell e.s.d.'s is used for estimating e.s.d.'s involving l.s. planes.Refinement. Refinement of F2 against all reflections. The weighted R-factor wR and goodness of fit S are based on F2, conventional R-factors R are based on F, with F set to zero for negative F2. The threshold expression of F2 > σ(F2) is used only for calculating R-factors(gt) etc. and is not relevant to the choice of reflections for refinement. R-factors based on F2 are statistically about twice as large as those based on F, and R-factors based on all data will be even larger.
Fractional atomic coordinates and isotropic or equivalent isotropic displacement parameters (Å2)
x y z Uiso*/Ueq Occ. (<1)
Si1 0.426415 (11) 0.431285 (6) 0.5000 0.00704 (2)Si2 0.415184 (11) 0.160356 (6) 0.0000 0.00617 (2)Li1 0.15083 (11) 0.02778 (6) 0.0000 0.01635 (13)Li2 0.0000 0.5000 0.0000 0.01727 (19)Li3 0.09442 (12) 0.19506 (7) 0.0000 0.0242 (2)Li4 0.27005 (11) 0.34697 (6) 0.0000 0.01476 (13)Li5 0.25998 (11) 0.09271 (6) 0.5000 0.01663 (14)Li6A 0.4138 (3) 0.25535 (7) 0.5000 0.0195 (4) 0.838 (7)Li6B 0.3327 (12) 0.2487 (4) 0.5000 0.0192 (15) 0.162 (7)Li7 0.09281 (10) 0.39330 (6) 0.5000 0.01429 (13)
Atomic displacement parameters (Å2)
U11 U22 U33 U12 U13 U23
Si1 0.00650 (4) 0.00658 (4) 0.00803 (4) −0.00146 (2) 0.000 0.000

supplementary materials
sup-6Acta Cryst. (2013). E69, i81–i82
Si2 0.00659 (4) 0.00652 (4) 0.00541 (4) −0.00044 (2) 0.000 0.000Li1 0.0192 (3) 0.0173 (3) 0.0126 (3) −0.0052 (3) 0.000 0.000Li2 0.0249 (5) 0.0097 (4) 0.0172 (5) −0.0035 (4) 0.000 0.000Li3 0.0129 (3) 0.0169 (3) 0.0427 (6) 0.0034 (3) 0.000 0.000Li4 0.0133 (3) 0.0173 (3) 0.0137 (3) 0.0004 (2) 0.000 0.000Li5 0.0127 (3) 0.0262 (4) 0.0110 (3) −0.0061 (3) 0.000 0.000Li6A 0.0374 (11) 0.0107 (4) 0.0104 (4) 0.0041 (4) 0.000 0.000Li6B 0.019 (4) 0.017 (2) 0.022 (3) 0.003 (2) 0.000 0.000Li7 0.0105 (3) 0.0204 (3) 0.0119 (3) −0.0008 (2) 0.000 0.000
Geometric parameters (Å, º)
Si1—Si1i 2.3852 (2) Li3—Li6Axii 2.7585 (14)Si1—Li6A 2.6628 (12) Li3—Li6Axiii 2.7585 (14)Si1—Li5ii 2.6762 (8) Li3—Li5 3.0191 (9)Si1—Li7 2.7133 (8) Li3—Li5viii 3.0191 (9)Si1—Li1iii 2.7374 (5) Li3—Li6B 3.038 (7)Si1—Li1iv 2.7374 (5) Li3—Li6Bviii 3.038 (7)Si1—Li5iii 2.8559 (9) Li3—Li6Bxii 3.168 (7)Si1—Li4v 2.8561 (5) Li4—Li3ii 2.6556 (13)Si1—Li4 2.8561 (5) Li4—Li6B 2.728 (3)Si1—Li6B 2.860 (7) Li4—Li6Bviii 2.728 (3)Si1—Li1vi 2.9244 (6) Li4—Li7 2.7317 (7)Si1—Li1ii 2.9244 (6) Li4—Li7viii 2.7318 (7)Si2—Li2vii 2.5174 (2) Li4—Li1iv 2.8060 (12)Si2—Li3 2.6031 (9) Li4—Si2xiii 2.8229 (9)Si2—Li3ii 2.6099 (10) Li4—Si1viii 2.8562 (5)Si2—Li6A 2.6554 (6) Li4—Li6Aviii 2.8659 (11)Si2—Li6Aviii 2.6554 (6) Li4—Li6A 2.8659 (11)Si2—Li6Bviii 2.684 (3) Li5—Li6B 2.429 (7)Si2—Li6B 2.684 (3) Li5—Li1v 2.5892 (6)Si2—Li5 2.7487 (5) Li5—Li7ii 2.6540 (12)Si2—Li5viii 2.7487 (5) Li5—Si1xiii 2.6762 (8)Si2—Li7ii 2.7638 (5) Li5—Li6A 2.7472 (18)Si2—Li7ix 2.7638 (5) Li5—Si2v 2.7487 (5)Si2—Li4ii 2.8229 (9) Li5—Si1xi 2.8559 (9)Li1—Li1x 2.5408 (17) Li5—Li3v 3.0191 (9)Li1—Li3 2.5696 (13) Li5—Li7xi 3.2351 (14)Li1—Li5viii 2.5892 (6) Li6A—Si2v 2.6553 (6)Li1—Li5 2.5892 (6) Li6A—Li7ii 2.6605 (16)Li1—Si1vii 2.7374 (5) Li6A—Li3vi 2.7585 (14)Li1—Si1xi 2.7374 (5) Li6A—Li3ii 2.7585 (14)Li1—Li4vii 2.8060 (12) Li6A—Li4v 2.8659 (11)Li1—Li2vii 2.8071 (9) Li6A—Li7 3.296 (2)Li1—Si1xii 2.9244 (6) Li6A—Li3v 3.5021 (19)Li1—Si1xiii 2.9244 (6) Li6B—Si2v 2.684 (3)Li2—Si2xiii 2.5173 (2) Li6B—Li4v 2.728 (3)Li2—Si2iv 2.5174 (2) Li6B—Li7 2.902 (7)Li2—Li1xiii 2.8071 (9) Li6B—Li7ii 2.981 (7)Li2—Li1iv 2.8071 (9) Li6B—Li3v 3.038 (7)

supplementary materials
sup-7Acta Cryst. (2013). E69, i81–i82
Li2—Li7viii 2.8522 (6) Li6B—Li3vi 3.168 (7)Li2—Li7xiv 2.8522 (6) Li6B—Li3ii 3.168 (7)Li2—Li7xv 2.8522 (6) Li7—Li5xiii 2.6540 (12)Li2—Li7 2.8522 (6) Li7—Li6Axiii 2.6605 (16)Li2—Li4xv 3.1567 (9) Li7—Li4v 2.7317 (7)Li2—Li4 3.1567 (9) Li7—Si2xiii 2.7638 (5)Li2—Li5iii 3.2546 (7) Li7—Si2xvi 2.7638 (5)Li2—Li5iv 3.2546 (7) Li7—Li2v 2.8522 (6)Li3—Si2xiii 2.6099 (10) Li7—Li6Bxiii 2.981 (7)Li3—Li4xiii 2.6556 (13) Li7—Li5iii 3.2351 (14)Li3—Li4 2.6884 (13)
Si1i—Si1—Li6A 152.78 (5) Li3ii—Li4—Li7 124.20 (2)Si1i—Si1—Li5ii 68.43 (2) Li3—Li4—Li7 87.21 (3)Li6A—Si1—Li5ii 84.35 (5) Li6B—Li4—Li7 64.21 (14)Si1i—Si1—Li7 131.60 (2) Li6Bviii—Li4—Li7 154.5 (2)Li6A—Si1—Li7 75.63 (5) Li3ii—Li4—Li7viii 124.20 (2)Li5ii—Si1—Li7 159.98 (3) Li3—Li4—Li7viii 87.21 (3)Si1i—Si1—Li1iii 69.231 (19) Li6B—Li4—Li7viii 154.5 (2)Li6A—Si1—Li1iii 121.62 (2) Li6Bviii—Li4—Li7viii 64.21 (14)Li5ii—Si1—Li1iii 107.13 (2) Li7—Li4—Li7viii 109.66 (4)Li7—Si1—Li1iii 83.90 (2) Li3ii—Li4—Li1iv 90.90 (4)Si1i—Si1—Li1iv 69.231 (19) Li3—Li4—Li1iv 161.67 (4)Li6A—Si1—Li1iv 121.62 (2) Li6B—Li4—Li1iv 119.34 (14)Li5ii—Si1—Li1iv 107.13 (2) Li6Bviii—Li4—Li1iv 119.34 (14)Li7—Si1—Li1iv 83.90 (2) Li7—Li4—Li1iv 82.28 (3)Li1iii—Si1—Li1iv 109.32 (3) Li7viii—Li4—Li1iv 82.28 (3)Si1i—Si1—Li5iii 60.62 (2) Li3ii—Li4—Si2xiii 163.90 (4)Li6A—Si1—Li5iii 146.60 (5) Li3—Li4—Si2xiii 56.47 (3)Li5ii—Si1—Li5iii 129.047 (16) Li6B—Li4—Si2xiii 99.3 (2)Li7—Si1—Li5iii 70.97 (3) Li6Bviii—Li4—Si2xiii 99.3 (2)Li1iii—Si1—Li5iii 55.100 (14) Li7—Li4—Si2xiii 59.65 (2)Li1iv—Si1—Li5iii 55.100 (14) Li7viii—Li4—Si2xiii 59.65 (2)Si1i—Si1—Li4v 127.050 (14) Li1iv—Li4—Si2xiii 105.20 (3)Li6A—Si1—Li4v 62.45 (3) Li3ii—Li4—Si1 71.60 (2)Li5ii—Si1—Li4v 111.752 (19) Li3—Li4—Si1 127.412 (15)Li7—Si1—Li4v 58.678 (17) Li6B—Li4—Si1 61.57 (14)Li1iii—Si1—Li4v 60.17 (2) Li6Bviii—Li4—Si1 143.5 (2)Li1iv—Si1—Li4v 141.10 (3) Li7—Li4—Si1 58.048 (18)Li5iii—Si1—Li4v 98.97 (2) Li7viii—Li4—Si1 138.51 (4)Si1i—Si1—Li4 127.051 (14) Li1iv—Li4—Si1 57.815 (16)Li6A—Si1—Li4 62.45 (3) Si2xiii—Li4—Si1 116.896 (19)Li5ii—Si1—Li4 111.752 (19) Li3ii—Li4—Si1viii 71.60 (2)Li7—Si1—Li4 58.678 (17) Li3—Li4—Si1viii 127.413 (15)Li1iii—Si1—Li4 141.10 (3) Li6B—Li4—Si1viii 143.5 (2)Li1iv—Si1—Li4 60.17 (2) Li6Bviii—Li4—Si1viii 61.57 (14)Li5iii—Si1—Li4 98.97 (2) Li7—Li4—Si1viii 138.51 (4)Li4v—Si1—Li4 102.86 (3) Li7viii—Li4—Si1viii 58.048 (18)Si1i—Si1—Li6B 165.72 (19) Li1iv—Li4—Si1viii 57.814 (16)

supplementary materials
sup-8Acta Cryst. (2013). E69, i81–i82
Li6A—Si1—Li6B 12.94 (15) Si2xiii—Li4—Si1viii 116.896 (19)Li5ii—Si1—Li6B 97.30 (19) Si1—Li4—Si1viii 102.86 (3)Li7—Si1—Li6B 62.68 (19) Li3ii—Li4—Li6Aviii 59.80 (4)Li1iii—Si1—Li6B 117.15 (8) Li3—Li4—Li6Aviii 78.11 (4)Li1iv—Si1—Li6B 117.15 (8) Li6B—Li4—Li6Aviii 107.55 (12)Li5iii—Si1—Li6B 133.66 (19) Li6Bviii—Li4—Li6Aviii 13.10 (18)Li4v—Si1—Li6B 57.02 (7) Li7—Li4—Li6Aviii 165.17 (5)Li4—Si1—Li6B 57.02 (7) Li7viii—Li4—Li6Aviii 72.11 (3)Si1i—Si1—Li1vi 61.073 (16) Li1iv—Li4—Li6Aviii 112.45 (4)Li6A—Si1—Li1vi 103.56 (3) Si2xiii—Li4—Li6Aviii 112.31 (5)Li5ii—Si1—Li1vi 54.856 (16) Si1—Li4—Li6Aviii 130.66 (5)Li7—Si1—Li1vi 129.866 (14) Si1viii—Li4—Li6Aviii 55.47 (3)Li1iii—Si1—Li1vi 53.20 (3) Li3ii—Li4—Li6A 59.80 (4)Li1iv—Si1—Li1vi 130.304 (9) Li3—Li4—Li6A 78.10 (4)Li5iii—Si1—Li1vi 97.78 (2) Li6B—Li4—Li6A 13.10 (18)Li4v—Si1—Li1vi 76.29 (2) Li6Bviii—Li4—Li6A 107.55 (12)Li4—Si1—Li1vi 163.14 (2) Li7—Li4—Li6A 72.11 (3)Li6B—Si1—Li1vi 111.30 (11) Li7viii—Li4—Li6A 165.17 (5)Si1i—Si1—Li1ii 61.073 (16) Li1iv—Li4—Li6A 112.45 (4)Li6A—Si1—Li1ii 103.56 (3) Si2xiii—Li4—Li6A 112.31 (5)Li5ii—Si1—Li1ii 54.856 (16) Si1—Li4—Li6A 55.47 (3)Li7—Si1—Li1ii 129.866 (14) Si1viii—Li4—Li6A 130.66 (5)Li1iii—Si1—Li1ii 130.304 (9) Li6Aviii—Li4—Li6A 102.37 (5)Li1iv—Si1—Li1ii 53.20 (3) Li6B—Li5—Li1 116.63 (6)Li5iii—Si1—Li1ii 97.78 (2) Li6B—Li5—Li1v 116.63 (6)Li4v—Si1—Li1ii 163.14 (2) Li1—Li5—Li1v 119.19 (5)Li4—Si1—Li1ii 76.29 (2) Li6B—Li5—Li7ii 71.7 (2)Li6B—Si1—Li1ii 111.30 (11) Li1—Li5—Li7ii 111.36 (3)Li1vi—Si1—Li1ii 99.56 (3) Li1v—Li5—Li7ii 111.36 (3)Li2vii—Si2—Li3 117.17 (2) Li6B—Li5—Si1xiii 111.6 (2)Li2vii—Si2—Li3ii 131.38 (2) Li1—Li5—Si1xiii 67.45 (3)Li3—Si2—Li3ii 111.451 (16) Li1v—Li5—Si1xiii 67.45 (3)Li2vii—Si2—Li6A 121.49 (2) Li7ii—Li5—Si1xiii 176.78 (5)Li3—Si2—Li6A 83.51 (5) Li6B—Li5—Li6A 12.67 (19)Li3ii—Si2—Li6A 63.18 (4) Li1—Li5—Li6A 119.26 (3)Li2vii—Si2—Li6Aviii 121.49 (2) Li1v—Li5—Li6A 119.26 (3)Li3—Si2—Li6Aviii 83.51 (5) Li7ii—Li5—Li6A 58.99 (5)Li3ii—Si2—Li6Aviii 63.18 (4) Si1xiii—Li5—Li6A 124.23 (6)Li6A—Si2—Li6Aviii 114.48 (4) Li6B—Li5—Si2 62.07 (9)Li2vii—Si2—Li6Bviii 123.03 (10) Li1—Li5—Si2 65.853 (16)Li3—Si2—Li6Bviii 70.1 (2) Li1v—Li5—Si2 172.86 (4)Li3ii—Si2—Li6Bviii 73.51 (18) Li7ii—Li5—Si2 61.506 (17)Li6A—Si2—Li6Bviii 115.43 (10) Si1xiii—Li5—Si2 119.680 (19)Li6Aviii—Si2—Li6Bviii 14.03 (17) Li6A—Li5—Si2 57.78 (2)Li2vii—Si2—Li6B 123.03 (10) Li6B—Li5—Si2v 62.07 (9)Li3—Si2—Li6B 70.1 (2) Li1—Li5—Si2v 172.86 (4)Li3ii—Si2—Li6B 73.51 (18) Li1v—Li5—Si2v 65.854 (16)Li6A—Si2—Li6B 14.03 (17) Li7ii—Li5—Si2v 61.506 (17)Li6Aviii—Si2—Li6B 115.43 (10) Si1xiii—Li5—Si2v 119.680 (19)

supplementary materials
sup-9Acta Cryst. (2013). E69, i81–i82
Li6Bviii—Si2—Li6B 112.6 (2) Li6A—Li5—Si2v 57.78 (2)Li2vii—Si2—Li5 76.21 (2) Si2—Li5—Si2v 108.66 (3)Li3—Si2—Li5 68.62 (2) Li6B—Li5—Si1xi 162.5 (2)Li3ii—Si2—Li5 123.840 (16) Li1—Li5—Si1xi 60.12 (2)Li6A—Si2—Li5 61.08 (4) Li1v—Li5—Si1xi 60.12 (2)Li6Aviii—Si2—Li5 151.98 (5) Li7ii—Li5—Si1xi 125.82 (4)Li6Bviii—Si2—Li5 138.7 (2) Si1xiii—Li5—Si1xi 50.954 (16)Li6B—Si2—Li5 53.11 (15) Li6A—Li5—Si1xi 175.18 (6)Li2vii—Si2—Li5viii 76.21 (2) Si2—Li5—Si1xi 123.439 (18)Li3—Si2—Li5viii 68.62 (2) Si2v—Li5—Si1xi 123.440 (18)Li3ii—Si2—Li5viii 123.840 (16) Li6B—Li5—Li3 66.78 (13)Li6A—Si2—Li5viii 151.98 (5) Li1—Li5—Li3 53.88 (3)Li6Aviii—Si2—Li5viii 61.08 (4) Li1v—Li5—Li3 133.34 (4)Li6Bviii—Si2—Li5viii 53.11 (15) Li7ii—Li5—Li3 113.18 (3)Li6B—Si2—Li5viii 138.7 (2) Si1xiii—Li5—Li3 68.76 (2)Li5—Si2—Li5viii 108.66 (3) Li6A—Li5—Li3 74.63 (4)Li2vii—Si2—Li7ii 65.184 (19) Si2—Li5—Li3 53.408 (19)Li3—Si2—Li7ii 124.026 (15) Si2v—Li5—Li3 127.28 (4)Li3ii—Si2—Li7ii 88.12 (3) Si1xi—Li5—Li3 102.25 (3)Li6A—Si2—Li7ii 58.76 (3) Li6B—Li5—Li3v 66.78 (13)Li6Aviii—Si2—Li7ii 147.18 (5) Li1—Li5—Li3v 133.34 (4)Li6Bviii—Si2—Li7ii 160.6 (2) Li1v—Li5—Li3v 53.88 (3)Li6B—Si2—Li7ii 66.34 (14) Li7ii—Li5—Li3v 113.18 (3)Li5—Si2—Li7ii 57.56 (2) Si1xiii—Li5—Li3v 68.76 (2)Li5viii—Si2—Li7ii 140.93 (3) Li6A—Li5—Li3v 74.63 (4)Li2vii—Si2—Li7ix 65.184 (18) Si2—Li5—Li3v 127.28 (4)Li3—Si2—Li7ix 124.026 (15) Si2v—Li5—Li3v 53.408 (19)Li3ii—Si2—Li7ix 88.12 (3) Si1xi—Li5—Li3v 102.25 (3)Li6A—Si2—Li7ix 147.18 (5) Li3—Li5—Li3v 95.40 (4)Li6Aviii—Si2—Li7ix 58.77 (3) Li6B—Li5—Li7xi 145.0 (2)Li6Bviii—Si2—Li7ix 66.34 (14) Li1—Li5—Li7xi 76.56 (3)Li6B—Si2—Li7ix 160.6 (2) Li1v—Li5—Li7xi 76.56 (3)Li5—Si2—Li7ix 140.93 (3) Li7ii—Li5—Li7xi 73.37 (4)Li5viii—Si2—Li7ix 57.56 (2) Si1xiii—Li5—Li7xi 103.41 (3)Li7ii—Si2—Li7ix 107.80 (3) Li6A—Li5—Li7xi 132.36 (5)Li2vii—Si2—Li4ii 72.216 (17) Si2—Li5—Li7xi 100.64 (2)Li3—Si2—Li4ii 170.62 (3) Si2v—Li5—Li7xi 100.64 (2)Li3ii—Si2—Li4ii 59.16 (3) Si1xi—Li5—Li7xi 52.46 (2)Li6A—Si2—Li4ii 91.45 (5) Li3—Li5—Li7xi 129.47 (2)Li6Aviii—Si2—Li4ii 91.45 (5) Li3v—Li5—Li7xi 129.47 (2)Li6Bviii—Si2—Li4ii 105.3 (2) Si2v—Li6A—Si2 114.48 (4)Li6B—Si2—Li4ii 105.3 (2) Si2v—Li6A—Li7ii 62.65 (2)Li5—Si2—Li4ii 115.713 (19) Si2—Li6A—Li7ii 62.65 (2)Li5viii—Si2—Li4ii 115.713 (19) Si2v—Li6A—Si1 122.72 (2)Li7ii—Si2—Li4ii 58.534 (15) Si2—Li6A—Si1 122.72 (2)Li7ix—Si2—Li4ii 58.534 (15) Li7ii—Li6A—Si1 145.53 (10)Li1x—Li1—Li3 99.26 (5) Si2v—Li6A—Li5 61.14 (3)Li1x—Li1—Li5viii 116.21 (3) Si2—Li6A—Li5 61.14 (3)Li3—Li1—Li5viii 71.64 (3) Li7ii—Li6A—Li5 58.76 (3)

supplementary materials
sup-10Acta Cryst. (2013). E69, i81–i82
Li1x—Li1—Li5 116.21 (3) Si1—Li6A—Li5 155.71 (9)Li3—Li1—Li5 71.64 (3) Si2v—Li6A—Li3vi 57.60 (2)Li5viii—Li1—Li5 119.19 (5) Si2—Li6A—Li3vi 145.67 (8)Li1x—Li1—Si1vii 67.17 (2) Li7ii—Li6A—Li3vi 87.22 (5)Li3—Li1—Si1vii 119.07 (2) Si1—Li6A—Li3vi 73.07 (4)Li5viii—Li1—Si1vii 64.776 (18) Li5—Li6A—Li3vi 118.37 (3)Li5—Li1—Si1vii 168.80 (4) Si2v—Li6A—Li3ii 145.67 (8)Li1x—Li1—Si1xi 67.17 (2) Si2—Li6A—Li3ii 57.61 (2)Li3—Li1—Si1xi 119.07 (2) Li7ii—Li6A—Li3ii 87.22 (5)Li5viii—Li1—Si1xi 168.80 (4) Si1—Li6A—Li3ii 73.07 (4)Li5—Li1—Si1xi 64.776 (18) Li5—Li6A—Li3ii 118.37 (3)Si1vii—Li1—Si1xi 109.32 (3) Li3vi—Li6A—Li3ii 108.10 (8)Li1x—Li1—Li4vii 83.64 (4) Si2v—Li6A—Li4 156.71 (9)Li3—Li1—Li4vii 177.10 (5) Si2—Li6A—Li4 66.92 (2)Li5viii—Li1—Li4vii 107.13 (3) Li7ii—Li6A—Li4 128.45 (2)Li5—Li1—Li4vii 107.13 (3) Si1—Li6A—Li4 62.08 (3)Si1vii—Li1—Li4vii 62.011 (17) Li5—Li6A—Li4 104.80 (6)Si1xi—Li1—Li4vii 62.012 (18) Li3vi—Li6A—Li4 134.98 (5)Li1x—Li1—Li2vii 152.08 (6) Li3ii—Li6A—Li4 56.31 (3)Li3—Li1—Li2vii 108.66 (4) Si2v—Li6A—Li4v 66.92 (2)Li5viii—Li1—Li2vii 74.07 (3) Si2—Li6A—Li4v 156.71 (9)Li5—Li1—Li2vii 74.07 (3) Li7ii—Li6A—Li4v 128.45 (2)Si1vii—Li1—Li2vii 98.16 (2) Si1—Li6A—Li4v 62.08 (3)Si1xi—Li1—Li2vii 98.16 (2) Li5—Li6A—Li4v 104.80 (6)Li4vii—Li1—Li2vii 68.44 (3) Li3vi—Li6A—Li4v 56.31 (3)Li1x—Li1—Si2 155.65 (6) Li3ii—Li6A—Li4v 134.98 (5)Li3—Li1—Si2 56.39 (3) Li4—Li6A—Li4v 102.37 (5)Li5viii—Li1—Si2 59.72 (2) Si2v—Li6A—Li7 110.22 (5)Li5—Li1—Si2 59.72 (2) Si2—Li6A—Li7 110.22 (5)Si1vii—Li1—Si2 122.029 (17) Li7ii—Li6A—Li7 161.59 (8)Si1xi—Li1—Si2 122.029 (17) Si1—Li6A—Li7 52.88 (3)Li4vii—Li1—Si2 120.71 (4) Li5—Li6A—Li7 102.83 (7)Li2vii—Li1—Si2 52.269 (16) Li3vi—Li6A—Li7 103.34 (4)Li1x—Li1—Si1xii 59.63 (2) Li3ii—Li6A—Li7 103.34 (4)Li3—Li1—Si1xii 71.64 (2) Li4—Li6A—Li7 52.06 (3)Li5viii—Li1—Si1xii 57.691 (19) Li4v—Li6A—Li7 52.06 (3)Li5—Li1—Si1xii 141.50 (4) Si2v—Li6A—Li3 113.47 (6)Si1vii—Li1—Si1xii 49.695 (9) Si2—Li6A—Li3 47.61 (3)Si1xi—Li1—Si1xii 126.80 (3) Li7ii—Li6A—Li3 99.65 (4)Li4vii—Li1—Si1xii 110.06 (2) Si1—Li6A—Li3 106.70 (5)Li2vii—Li1—Si1xii 129.406 (14) Li5—Li6A—Li3 56.23 (4)Si2—Li1—Si1xii 107.16 (2) Li3vi—Li6A—Li3 164.63 (7)Li1x—Li1—Si1xiii 59.63 (2) Li3ii—Li6A—Li3 86.09 (2)Li3—Li1—Si1xiii 71.64 (2) Li4—Li6A—Li3 48.69 (3)Li5viii—Li1—Si1xiii 141.50 (4) Li4v—Li6A—Li3 109.49 (7)Li5—Li1—Si1xiii 57.691 (19) Li7—Li6A—Li3 66.64 (4)Si1vii—Li1—Si1xiii 126.80 (3) Si2v—Li6A—Li3v 47.61 (3)Si1xi—Li1—Si1xiii 49.695 (9) Si2—Li6A—Li3v 113.47 (6)Li4vii—Li1—Si1xiii 110.06 (2) Li7ii—Li6A—Li3v 99.65 (4)
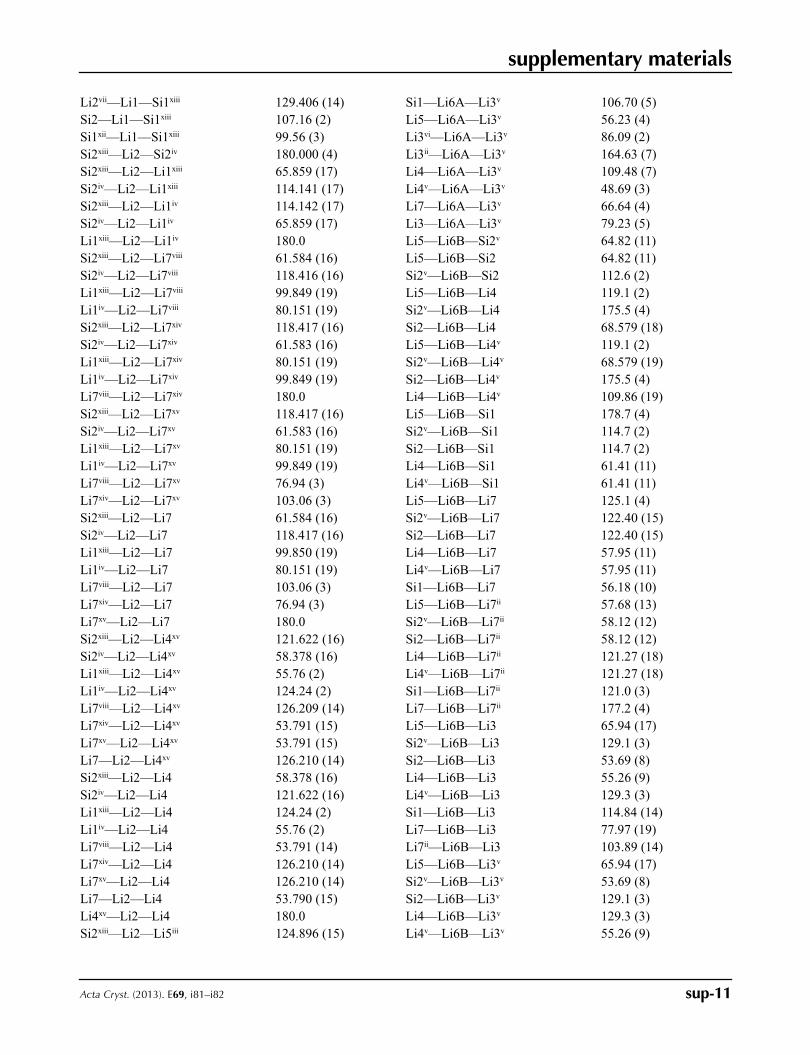
supplementary materials
sup-11Acta Cryst. (2013). E69, i81–i82
Li2vii—Li1—Si1xiii 129.406 (14) Si1—Li6A—Li3v 106.70 (5)Si2—Li1—Si1xiii 107.16 (2) Li5—Li6A—Li3v 56.23 (4)Si1xii—Li1—Si1xiii 99.56 (3) Li3vi—Li6A—Li3v 86.09 (2)Si2xiii—Li2—Si2iv 180.000 (4) Li3ii—Li6A—Li3v 164.63 (7)Si2xiii—Li2—Li1xiii 65.859 (17) Li4—Li6A—Li3v 109.48 (7)Si2iv—Li2—Li1xiii 114.141 (17) Li4v—Li6A—Li3v 48.69 (3)Si2xiii—Li2—Li1iv 114.142 (17) Li7—Li6A—Li3v 66.64 (4)Si2iv—Li2—Li1iv 65.859 (17) Li3—Li6A—Li3v 79.23 (5)Li1xiii—Li2—Li1iv 180.0 Li5—Li6B—Si2v 64.82 (11)Si2xiii—Li2—Li7viii 61.584 (16) Li5—Li6B—Si2 64.82 (11)Si2iv—Li2—Li7viii 118.416 (16) Si2v—Li6B—Si2 112.6 (2)Li1xiii—Li2—Li7viii 99.849 (19) Li5—Li6B—Li4 119.1 (2)Li1iv—Li2—Li7viii 80.151 (19) Si2v—Li6B—Li4 175.5 (4)Si2xiii—Li2—Li7xiv 118.417 (16) Si2—Li6B—Li4 68.579 (18)Si2iv—Li2—Li7xiv 61.583 (16) Li5—Li6B—Li4v 119.1 (2)Li1xiii—Li2—Li7xiv 80.151 (19) Si2v—Li6B—Li4v 68.579 (19)Li1iv—Li2—Li7xiv 99.849 (19) Si2—Li6B—Li4v 175.5 (4)Li7viii—Li2—Li7xiv 180.0 Li4—Li6B—Li4v 109.86 (19)Si2xiii—Li2—Li7xv 118.417 (16) Li5—Li6B—Si1 178.7 (4)Si2iv—Li2—Li7xv 61.583 (16) Si2v—Li6B—Si1 114.7 (2)Li1xiii—Li2—Li7xv 80.151 (19) Si2—Li6B—Si1 114.7 (2)Li1iv—Li2—Li7xv 99.849 (19) Li4—Li6B—Si1 61.41 (11)Li7viii—Li2—Li7xv 76.94 (3) Li4v—Li6B—Si1 61.41 (11)Li7xiv—Li2—Li7xv 103.06 (3) Li5—Li6B—Li7 125.1 (4)Si2xiii—Li2—Li7 61.584 (16) Si2v—Li6B—Li7 122.40 (15)Si2iv—Li2—Li7 118.417 (16) Si2—Li6B—Li7 122.40 (15)Li1xiii—Li2—Li7 99.850 (19) Li4—Li6B—Li7 57.95 (11)Li1iv—Li2—Li7 80.151 (19) Li4v—Li6B—Li7 57.95 (11)Li7viii—Li2—Li7 103.06 (3) Si1—Li6B—Li7 56.18 (10)Li7xiv—Li2—Li7 76.94 (3) Li5—Li6B—Li7ii 57.68 (13)Li7xv—Li2—Li7 180.0 Si2v—Li6B—Li7ii 58.12 (12)Si2xiii—Li2—Li4xv 121.622 (16) Si2—Li6B—Li7ii 58.12 (12)Si2iv—Li2—Li4xv 58.378 (16) Li4—Li6B—Li7ii 121.27 (18)Li1xiii—Li2—Li4xv 55.76 (2) Li4v—Li6B—Li7ii 121.27 (18)Li1iv—Li2—Li4xv 124.24 (2) Si1—Li6B—Li7ii 121.0 (3)Li7viii—Li2—Li4xv 126.209 (14) Li7—Li6B—Li7ii 177.2 (4)Li7xiv—Li2—Li4xv 53.791 (15) Li5—Li6B—Li3 65.94 (17)Li7xv—Li2—Li4xv 53.791 (15) Si2v—Li6B—Li3 129.1 (3)Li7—Li2—Li4xv 126.210 (14) Si2—Li6B—Li3 53.69 (8)Si2xiii—Li2—Li4 58.378 (16) Li4—Li6B—Li3 55.26 (9)Si2iv—Li2—Li4 121.622 (16) Li4v—Li6B—Li3 129.3 (3)Li1xiii—Li2—Li4 124.24 (2) Si1—Li6B—Li3 114.84 (14)Li1iv—Li2—Li4 55.76 (2) Li7—Li6B—Li3 77.97 (19)Li7viii—Li2—Li4 53.791 (14) Li7ii—Li6B—Li3 103.89 (14)Li7xiv—Li2—Li4 126.210 (14) Li5—Li6B—Li3v 65.94 (17)Li7xv—Li2—Li4 126.210 (14) Si2v—Li6B—Li3v 53.69 (8)Li7—Li2—Li4 53.790 (15) Si2—Li6B—Li3v 129.1 (3)Li4xv—Li2—Li4 180.0 Li4—Li6B—Li3v 129.3 (3)Si2xiii—Li2—Li5iii 124.896 (15) Li4v—Li6B—Li3v 55.26 (9)

supplementary materials
sup-12Acta Cryst. (2013). E69, i81–i82
Si2iv—Li2—Li5iii 55.104 (15) Si1—Li6B—Li3v 114.84 (14)Li1xiii—Li2—Li5iii 130.096 (14) Li7—Li6B—Li3v 77.97 (19)Li1iv—Li2—Li5iii 49.904 (14) Li7ii—Li6B—Li3v 103.89 (14)Li7viii—Li2—Li5iii 129.00 (2) Li3—Li6B—Li3v 94.6 (3)Li7xiv—Li2—Li5iii 51.00 (2) Li5—Li6B—Li3vi 114.65 (17)Li7xv—Li2—Li5iii 116.42 (2) Si2v—Li6B—Li3vi 52.18 (10)Li7—Li2—Li5iii 63.58 (2) Si2—Li6B—Li3vi 124.0 (3)Li4xv—Li2—Li5iii 94.745 (17) Li4—Li6B—Li3vi 123.4 (3)Li4—Li2—Li5iii 85.255 (17) Li4v—Li6B—Li3vi 52.90 (9)Si2xiii—Li2—Li5iv 124.896 (15) Si1—Li6B—Li3vi 64.52 (16)Si2iv—Li2—Li5iv 55.104 (15) Li7—Li6B—Li3vi 103.25 (14)Li1xiii—Li2—Li5iv 130.096 (14) Li7ii—Li6B—Li3vi 74.81 (18)Li1iv—Li2—Li5iv 49.904 (14) Li3—Li6B—Li3vi 177.4 (3)Li7viii—Li2—Li5iv 63.58 (2) Li3v—Li6B—Li3vi 87.879 (16)Li7xiv—Li2—Li5iv 116.42 (2) Li5—Li6B—Li3ii 114.65 (17)Li7xv—Li2—Li5iv 51.00 (2) Si2v—Li6B—Li3ii 124.0 (3)Li7—Li2—Li5iv 129.00 (2) Si2—Li6B—Li3ii 52.18 (10)Li4xv—Li2—Li5iv 94.745 (17) Li4—Li6B—Li3ii 52.90 (9)Li4—Li2—Li5iv 85.255 (17) Li4v—Li6B—Li3ii 123.4 (3)Li5iii—Li2—Li5iv 86.65 (2) Si1—Li6B—Li3ii 64.52 (16)Li1—Li3—Si2 68.32 (3) Li7—Li6B—Li3ii 103.25 (14)Li1—Li3—Si2xiii 156.96 (5) Li7ii—Li6B—Li3ii 74.81 (18)Si2—Li3—Si2xiii 134.72 (4) Li3—Li6B—Li3ii 87.879 (16)Li1—Li3—Li4xiii 86.20 (4) Li3v—Li6B—Li3ii 177.4 (3)Si2—Li3—Li4xiii 154.51 (5) Li3vi—Li6B—Li3ii 89.6 (3)Si2xiii—Li3—Li4xiii 70.77 (3) Li5xiii—Li7—Li6Axiii 62.25 (5)Li1—Li3—Li4 138.67 (5) Li5xiii—Li7—Si1 163.20 (4)Si2—Li3—Li4 70.35 (3) Li6Axiii—Li7—Si1 134.55 (6)Si2xiii—Li3—Li4 64.37 (3) Li5xiii—Li7—Li4v 122.31 (2)Li4xiii—Li3—Li4 135.14 (4) Li6Axiii—Li7—Li4v 93.38 (4)Li1—Li3—Li6Axii 111.01 (3) Si1—Li7—Li4v 63.27 (2)Si2—Li3—Li6Axii 124.37 (4) Li5xiii—Li7—Li4 122.31 (2)Si2xiii—Li3—Li6Axii 59.21 (3) Li6Axiii—Li7—Li4 93.38 (4)Li4xiii—Li3—Li6Axii 63.89 (4) Si1—Li7—Li4 63.27 (2)Li4—Li3—Li6Axii 92.17 (4) Li4v—Li7—Li4 109.66 (4)Li1—Li3—Li6Axiii 111.01 (3) Li5xiii—Li7—Si2xiii 60.933 (17)Si2—Li3—Li6Axiii 124.37 (4) Li6Axiii—Li7—Si2xiii 58.58 (2)Si2xiii—Li3—Li6Axiii 59.21 (3) Si1—Li7—Si2xiii 124.156 (15)Li4xiii—Li3—Li6Axiii 63.89 (4) Li4v—Li7—Si2xiii 148.06 (4)Li4—Li3—Li6Axiii 92.17 (4) Li4—Li7—Si2xiii 61.815 (18)Li6Axii—Li3—Li6Axiii 108.10 (8) Li5xiii—Li7—Si2xvi 60.933 (17)Li1—Li3—Li5 54.48 (2) Li6Axiii—Li7—Si2xvi 58.58 (2)Si2—Li3—Li5 57.97 (2) Si1—Li7—Si2xvi 124.156 (15)Si2xiii—Li3—Li5 131.88 (2) Li4v—Li7—Si2xvi 61.815 (18)Li4xiii—Li3—Li5 107.49 (3) Li4—Li7—Si2xvi 148.06 (4)Li4—Li3—Li5 102.23 (3) Si2xiii—Li7—Si2xvi 107.79 (3)Li6Axii—Li3—Li5 164.79 (5) Li5xiii—Li7—Li2v 72.37 (2)Li6Axiii—Li3—Li5 76.55 (4) Li6Axiii—Li7—Li2v 109.87 (3)Li1—Li3—Li5viii 54.48 (2) Si1—Li7—Li2v 97.64 (2)

supplementary materials
sup-13Acta Cryst. (2013). E69, i81–i82
Si2—Li3—Li5viii 57.97 (2) Li4v—Li7—Li2v 68.809 (17)Si2xiii—Li3—Li5viii 131.88 (2) Li4—Li7—Li2v 156.71 (4)Li4xiii—Li3—Li5viii 107.48 (3) Si2xiii—Li7—Li2v 131.80 (3)Li4—Li3—Li5viii 102.23 (3) Si2xvi—Li7—Li2v 53.233 (8)Li6Axii—Li3—Li5viii 76.55 (4) Li5xiii—Li7—Li2 72.37 (2)Li6Axiii—Li3—Li5viii 164.79 (5) Li6Axiii—Li7—Li2 109.87 (3)Li5—Li3—Li5viii 95.40 (4) Si1—Li7—Li2 97.64 (2)Li1—Li3—Li6B 98.86 (11) Li4v—Li7—Li2 156.71 (4)Si2—Li3—Li6B 56.17 (14) Li4—Li7—Li2 68.810 (17)Si2xiii—Li3—Li6B 96.70 (11) Si2xiii—Li7—Li2 53.233 (8)Li4xiii—Li3—Li6B 132.00 (14) Si2xvi—Li7—Li2 131.80 (3)Li4—Li3—Li6B 56.51 (11) Li2v—Li7—Li2 103.06 (3)Li6Axii—Li3—Li6B 147.86 (12) Li5xiii—Li7—Li6B 135.66 (19)Li6Axiii—Li3—Li6B 69.93 (11) Li6Axiii—Li7—Li6B 73.41 (15)Li5—Li3—Li6B 47.28 (10) Si1—Li7—Li6B 61.14 (18)Li5viii—Li3—Li6B 114.13 (14) Li4v—Li7—Li6B 57.84 (5)Li1—Li3—Li6Bviii 98.86 (11) Li4—Li7—Li6B 57.84 (5)Si2—Li3—Li6Bviii 56.17 (14) Si2xiii—Li7—Li6B 96.57 (11)Si2xiii—Li3—Li6Bviii 96.70 (11) Si2xvi—Li7—Li6B 96.57 (11)Li4xiii—Li3—Li6Bviii 132.00 (14) Li2v—Li7—Li6B 126.62 (4)Li4—Li3—Li6Bviii 56.51 (11) Li2—Li7—Li6B 126.62 (4)Li6Axii—Li3—Li6Bviii 69.93 (11) Li5xiii—Li7—Li6Bxiii 50.66 (18)Li6Axiii—Li3—Li6Bviii 147.86 (12) Li6Axiii—Li7—Li6Bxiii 11.59 (14)Li5—Li3—Li6Bviii 114.13 (14) Si1—Li7—Li6Bxiii 146.14 (18)Li5viii—Li3—Li6Bviii 47.28 (10) Li4v—Li7—Li6Bxiii 99.96 (10)Li6B—Li3—Li6Bviii 94.6 (3) Li4—Li7—Li6Bxiii 99.96 (10)Li1—Li3—Li6Bxii 112.27 (10) Si2xiii—Li7—Li6Bxiii 55.54 (4)Si2—Li3—Li6Bxii 134.21 (13) Si2xvi—Li7—Li6Bxiii 55.54 (4)Si2xiii—Li3—Li6Bxii 54.31 (10) Li2v—Li7—Li6Bxiii 103.19 (11)Li4xiii—Li3—Li6Bxii 55.03 (13) Li2—Li7—Li6Bxiii 103.19 (11)Li4—Li3—Li6Bxii 96.40 (11) Li6B—Li7—Li6Bxiii 85.00 (3)Li6Axii—Li3—Li6Bxii 9.86 (10) Li5xiii—Li7—Li5iii 106.63 (4)Li6Axiii—Li3—Li6Bxii 98.97 (16) Li6Axiii—Li7—Li5iii 168.88 (6)Li5—Li3—Li6Bxii 160.95 (12) Si1—Li7—Li5iii 56.57 (2)Li5viii—Li3—Li6Bxii 84.41 (12) Li4v—Li7—Li5iii 93.01 (3)Li6B—Li3—Li6Bxii 148.83 (4) Li4—Li7—Li5iii 93.02 (3)Li6Bviii—Li3—Li6Bxii 79.609 (14) Si2xiii—Li7—Li5iii 117.29 (2)Li3ii—Li4—Li3 107.43 (3) Si2xvi—Li7—Li5iii 117.29 (2)Li3ii—Li4—Li6B 72.1 (2) Li2v—Li7—Li5iii 64.282 (19)Li3—Li4—Li6B 68.24 (17) Li2—Li7—Li5iii 64.281 (19)Li3ii—Li4—Li6Bviii 72.1 (2) Li6B—Li7—Li5iii 117.71 (18)Li3—Li4—Li6Bviii 68.24 (17) Li6Bxiii—Li7—Li5iii 157.29 (18)Li6B—Li4—Li6Bviii 109.86 (19)
Symmetry codes: (i) −x+1, −y+1, −z+1; (ii) x+1/2, −y+1/2, z; (iii) −x+1/2, y+1/2, −z+1; (iv) −x+1/2, y+1/2, −z; (v) x, y, z+1; (vi) x+1/2, −y+1/2, z+1; (vii) −x+1/2, y−1/2, −z; (viii) x, y, z−1; (ix) x+1/2, −y+1/2, z−1; (x) −x, −y, −z; (xi) −x+1/2, y−1/2, −z+1; (xii) x−1/2, −y+1/2, z−1; (xiii) x−1/2, −y+1/2, z; (xiv) −x, −y+1, −z+1; (xv) −x, −y+1, −z; (xvi) x−1/2, −y+1/2, z+1.

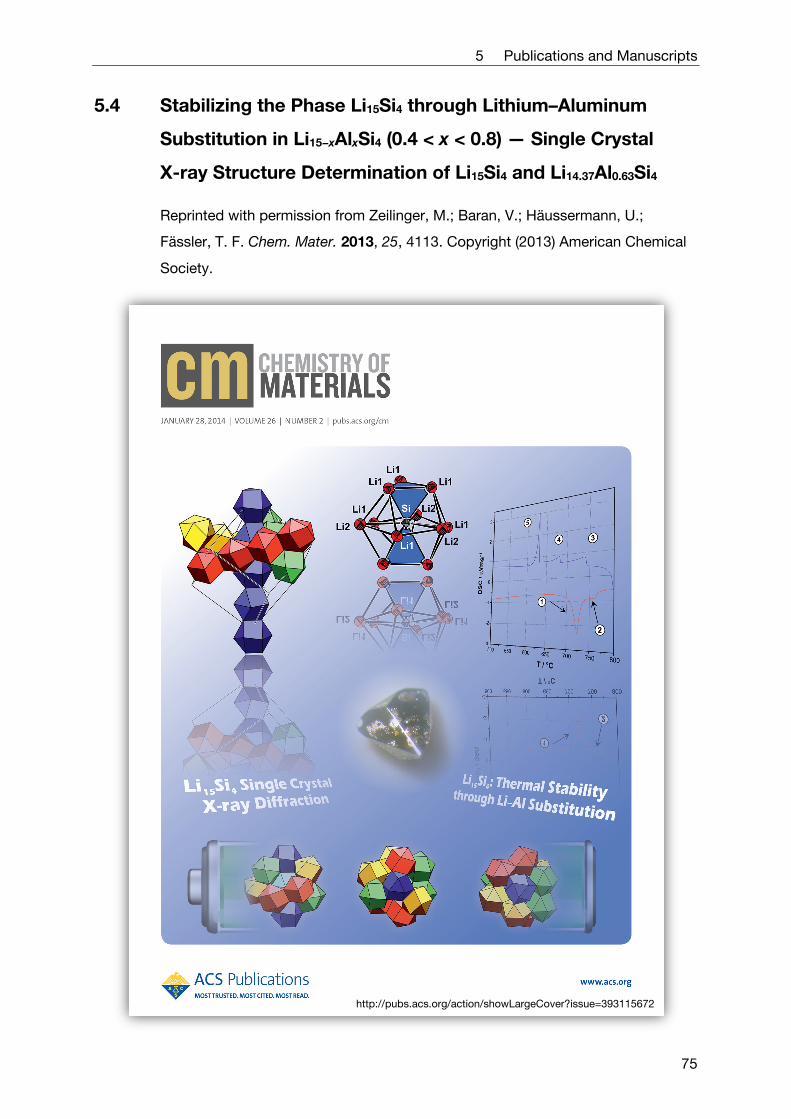
5 Publications and Manuscripts
75
5.4 Stabilizing the Phase Li15Si4 through Lithium–Aluminum
Substitution in Li15−xAlxSi4 (0.4 < x < 0.8) — Single Crystal
X-ray Structure Determination of Li15Si4 and Li14.37Al0.63Si4
Reprinted with permission from Zeilinger, M.; Baran, V.; Häussermann, U.;
Fässler, T. F. Chem. Mater. 2013, 25, 4113. Copyright (2013) American Chemical
Society.
http://pubs.acs.org/action/showLargeCover?issue=393115672


Stabilizing the Phase Li15Si4 through Lithium−AluminumSubstitution in Li15−xAlxSi4 (0.4 < x < 0.8)Single Crystal X‑rayStructure Determination of Li15Si4 and Li14.37Al0.63Si4Michael Zeilinger,† Volodymyr Baran,† Leo van Wullen,‡ Ulrich Haussermann,§ and Thomas F. Fassler*,†
†Department Chemie, Technische Universitat Munchen, Lichtenbergstraße 4, 85747 Garching b. Munchen, Germany‡Department of Physics, University of Augsburg, Universitatsstr. 1, 86159 Augsburg, Germany§Department of Materials and Environmental Chemistry, Stockholm University, SE-10691 Stockholm, Sweden
*S Supporting Information
ABSTRACT: Single crystals of Li15Si4 and Li15−xAlxSi4 (x =0.63(1)) were obtained from equilibrated melts withcompositions Li100−xSix (x = 10, 15) and Li83Al13Si4,respectively, and isolated by isothermal centrifugation. Li15Si4and Li14.37(1)Al0.63(1)Si4 crystallize with the Cu15Si4 structuretype (I43d, ax=0 = 10.6322(9) Å, ax=0.63(1) = 10.6172(4) Å, Z =4, T = 123 K). The incorporation of Al equally affects bothcrystallographically distinguished Li positions in the Li15Si4structure. The replacement of about 4% of Li is firmlyestablished by the refinement of single crystal diffraction dataand NMR spectroscopy. The homogeneity range ofLi15−xAlxSi4 was assessed as 0.4 < x < 0.8 from synthesisexperiments using stoichiometric proportions of the elements.Differential scanning calorimetry studies confirm the metastable character of Li15Si4, decomposing exothermally at temperaturesaround 200 °C. However, the decomposition process of Li15Si4 is sluggish and appreciable rates are not observed beforetemperatures reach 400 °C. In contrast Li15−xAlxSi4 is thermodynamically stable. The decomposition temperature is at about700 °C. It is speculated that the thermodynamic stability of Li15−xAlxSi4 is a consequence of the increased electron concentration,shifting the Fermi level to a pseudo-gap in the electronic density of states. Since metastable Li15Si4 plays an important role duringelectrochemical lithiation of a silicon anode, thermodynamically stable Li15−xAlxSi4 may have interesting properties as anodematerial in lithium ion batteries.
KEYWORDS: Li15Si4, lithium silicides, Li−Si system, lithium−silicon system, Li−Al−Si system, lithium−aluminum−silicon system,thermodynamic stability of lithium silicides
1. INTRODUCTION
Efforts on implementing silicon as anode material in futurelithium ion batteries have fueled numerous investigations of thebinary Li−Si system. The lithitation/delithiation process of Si ishighly complex, involving crystalline-to-amorphous phasetransitions and various amorphous phases.1−6 It has beenshown that the local structure of the amorphous LixSi materialsresembles that of crystalline phases,3,4 and the complexity of the(de)lithitation process of Si probably relates to the complexity ofthe Li−Si phase diagram showing three, or possibly four, stablephases in the narrow range 76.5−81 atom % Li.7
Of particular significance in the (de)lithiation process is thecomposition Li3.75Si (78.9 atom % Li) which is considered to bethe fully lithiated state in a typical electrochemical reaction.1,2
Depending on the applied discharge voltage and the design of theSi anode amorphous Li3.75Si can undergo a transition to acrystalline but metastable phase Li15Si4.
1,2,8 The conditions offormation of crystalline Li15Si4 and the lithiation mechanism insilicon electrodes are topics of extensive current research.9−13
Remarkably, despite its significance, a range of fundamentalproperties of Li15Si4 are still not conclusively characterized.Although metastable, the bulk synthesis of Li15Si4 can beachieved through electrochemical reactions or mechanical ballmilling at room temperature.1−3,14,15 On the basis of powder X-ray diffraction data and theoretical calculations Li15Si4 has beenassigned the cubic Cu15Si4 structure type.
1,2,16−19 This structuremodel may be correct; however, our recent discovery ofinterstitial Li in Li21Si5
20 shows clearly the superiority ofdiffraction data from high quality single crystals for theunambiguous location and refinement of Li atom positions inlithium silicides.7 Further, it was reported that upon annealingmetastable Li15Si4 decomposes into “unknown”,3 “new butunidentified”21 or “unexpected” known phases.22,23 These widelyvarying results are confusing and need clarification. According to
Received: August 12, 2013Revised: September 11, 2013Published: September 16, 2013
Article
pubs.acs.org/cm
© 2013 American Chemical Society 4113 dx.doi.org/10.1021/cm402721n | Chem. Mater. 2013, 25, 4113−4121

latest findings, the Li−Si system contains a previously overlookedphase, Li4.11Si,
7,24 which may play an important role forunderstanding the decomposition behavior of Li15Si4.Herein, we report on the structural characterization of Li15Si4
from single crystal X-ray diffraction data and a detailed analysis ofits thermal decomposition behavior. Additionally, we show thatthe substitution of small concentrations of Li by Al (about 4%) inLi15Si4 leads to a thermodynamically stable system whichdecomposes at around 700 °C.
2. EXPERIMENTAL SECTIONSynthesis.All steps of synthesis and sample preparation were carried
out in a glovebox (MBraun, Ar-atmosphere, H2O and O2 levels <0.1 ppm). Starting materials were rods of Li (99%, Rockwood Lithium),aluminum granules (99.99%, Chempur), and silicon powder (99.999%,Sigma-Aldrich). Li15Si4 bulk material was synthesized by mechanicalball-milling of a stoichiometric mixture of lithium and silicon in aRETSCH PM 100 planetary ball mill. A total amount of 3.0 g of lithiumpieces and silicon powder were loaded into a stainless steel jar (V =50 mL, ball charge: 3 pieces with a diameter of 15 mm) inside an argonfilled glovebox. Using a safety closure device the jar was hermeticallysealed and transferred to the ball mill outside the glovebox. The mixturewas ball milled for 12−16 h (intervals: 10 min at 250 rpm followed by a 4min break and direction reversal). Afterward the jar was transferred backto the glovebox where the Li15Si4 product was recovered. For thepreparation of Li15−xAlxSi4 a fine powder “AlSi” was employed asprecursor. A 1:1 molar mixture of Al and Si with a total amount of 0.7−1.0 g was arc-melted inside the glovebox, subsequently fragmented intosmaller pieces, and finally ball milled for 2−4 h.Single crystals of Li15Si4 were obtained as a byproduct from
experiments aimed at the single crystal growth of Li17Si4 fromequilibrated melts with compositions Li90Si10 and Li85Si15.
7 In contrastto ref 7 the experiments reported here were performed in stainless steel
ampules with dimensions L = 80.0 mm, OD = 12.7 mm, and ID = 11.7mm. Prior to use, ampules were thoroughly cleaned and heated to 750°C under dynamic vacuum (p < 1 × 10⁻³ mbar) for at least 2 h. A filterwas inserted and reactions prepared according to ref 25. Reactionmixtures of Li90Si10 and Li85Si15 with a total mass of 300 mg were loadedand sealed in such ampules which were then placed in silica woolinsulated reaction containers made of stainless steel. The mixtures wereheated in a box furnace to 700 °C at a rate of 5 K min−1, kept at thistemperature for 1 h, and subsequently cooled at a rate of 5 K h−1 to 450°C. After a dwell time of 48 h reactions were terminated by isothermallycentrifuging off the melt. For the synthesis of single crystalsLi14.37(1)Al0.63(1)Si4 a reaction mixture Li83Al13Si4 (where “AlSi” powderand small Al pieces served as Al source) was employed. Additionally,bulk synthesis of Li15−xAlxSi4 was attempted by reacting mixturesLi15−xAlxSi4 with x = 0.25, 0.50, 0.75, and 1.00 (where “AlSi” powderserved as Al source) in tantalum ampules at 700 °C for 1 h, followed bycooling to 450 °C at a rate of 10 K min−1, dwelling for four days, andsubsequent quenching in liquid nitrogen. Samples where then ground inan agate mortar, annealed for one day at 800 °C, and quenched.
Annealing experiments were performed with 150 mg batches ofLi15Si4 powder (obtained by mechanical ball-milling of the elements)which were sealed in tantalum ampules by arc-welding inside theglovebox. Tantalum ampules were enclosed in silica jackets undervacuum, annealed at various temperatures, and quenched in liquidnitrogen after different dwell times.
Single Crystal X-ray Diffraction and Structure Determination.Crystals of Li15Si4 and Li14.37(1)Al0.63(1)Si4 were selected and cut in an Ar-filled glovebox and sealed in glass capillaries. Intensity data was collectedat room temperature and −150 °C. For the latter a Bruker X-raydiffractometer equipped with a CCDdetector (APEX II, κ-CCD), a fine-focused sealed tube with Mo Kα radiation (λ = 0.71073 Å), and agraphite monochromator was employed (for details on the roomtemperature experiments see Supporting Information, Tables S1 andS2). Data collection was controlled with the Bruker APEX Software
Table 1. Crystallographic Data and Structure Refinement for Li15Si4 and Li14.37(1)Al0.63(1)Si4
empirical formula
Li15Si4 Li14.367(9)Al0.633(9)Si4
T, K 123(2) 123(2)formula weight, g·mol−1 216.46 229.14crystal size, mm3 0.30 × 0.30 × 0.30 0.30 × 0.20 × 0.20crystal color metallic silver metallic silvercrystal shape block blockspace group I4 3d I43dunit cell dimension, Å a = 10.6322(9) a = 10.6172(4)V, Å3 1201.9(2) 1196.82(8)Z 4 4ρ(calcd), g·cm−3 1.196 1.272μ, mm−1 0.424 0.474F(000) 404 429θ range, deg 4.70−31.47 4.70−36.24index range hkl ±15, ±15, ±15 ±17, ±17, −15 < l < 17reflections collected 6926 24153independent reflections 335 (Rint = 0.019) 485 (Rint = 0.022)reflections with I > 2σ(I) 335 (Rσ = 0.006) 480 (Rσ = 0.005)absorption correction multiscan multiscandata/restraints/parameter 335/0/15 485/0/17goodness-of-fit on F2 1.145 1.299final R indices [I > 2σ(I)]a,b R1 = 0.010 R1 = 0.006
wR2 = 0.030 wR2 = 0.017R indices (all data)a,b R1 = 0.010 R1 = 0.007
wR2= 0.030 wR2= 0.017Flack parameter −0.2(2) 0.07(7)largest diff. peak and hole, e·Å−3 0.19 and −0.08 0.06 and −0.05
aR1 = ∑||Fo| − |Fc∥/∑|Fo|.bwR2 = [∑w(Fo
2 − Fc2)2/∑w(Fo
2)2]1/2.
Chemistry of Materials Article
dx.doi.org/10.1021/cm402721n | Chem. Mater. 2013, 25, 4113−41214114

Suite.26 Integration, data reduction, and absorption correction wasperformed with the programs SAINT and SADABS.27,28 Space groupsymmetry was assigned on the basis of the systematic absences and thestatistical analysis of the intensity distributions. Friedel pairs were notmerged as the assigned space group (I43d) is noncentrosymmetric.Fractional atomic coordinates and atomic displacement parameters forLi/Al mixed sites were set equal. The structures were solved with directmethods (SHELXS-97) and refined with full-matrix least-squares on F2
(SHELXL-97).29,30 Details of the single crystal data collections andrefinements are listed in Table 1. Further details of the crystal structureinvestigations are supplied as Supporting Information or can beobtained from Fachinformationszentrum Karlsruhe, D-76344 Eggen-stein-Leopoldshafen, Germany (fax: (+49) 7247-808-666; e-mail:[email protected]) on quoting the depository numbers CSD-426034 (Li15Si4-123K), CSD-426035 (Li15Si4-298K), CSD-426037(Li14.37Al0.63Si4-123K), and CSD-426038 (Li14.41Al0.59Si4-298K).Powder X-ray Diffraction (PXRD). PXRD patterns were recorded
on a Stoe STADI P diffractometer (Ge(111) monochromator for Cu Kαradiation, λ = 1.54056 Å) equipped with a Detectris MYTHENDCS 1Ksolid state detector. PXRD patterns were recorded from Li15Si4 andLi15−xAlxSi4 bulk samples, ground single crystals of Li15−xAlxSi4, and theproducts of Li15Si4 annealing experiments, as well as from recoveredsamples of thermal analysis investigation runs (see below). Sampleswere ground in an agate mortar, sealed in glass capillaries, and measuredwithin a 2θ range of 10−90° (PSD steps: 0.06−1.50°; time/step: 15−40s). TOPAS 4.0 was used for Rietveld refinements.31
Differential Scanning Calorimetry (DSC). DSC measurementswere performed with a NETZSCH DSC 404 Pegasus instrument.Cylindrical niobium crucibles (L = 15.0 mm, OD = 6.5 mm, ID = 5.0mm) were thoroughly cleaned and heated to 1000 °C under dynamicvacuum (p < 1 × 10⁻³ mbar) for 2 h and then transferred to an Ar-filledglovebox. Crucibles were loaded with 30−50 mg of sample andsubsequently sealed by arc-welding inside the glovebox under cooling.An empty sealed crucible served as reference. All measurements weredone under an Ar flow of 60−70 mL min−1 and applying a heating/cooling rate of 10 Kmin−1. Handling of the DSC data was done with theprogram Proteus Thermal Analysis.32 Samples for DSC investigationsconsisted of (i) Li15Si4 bulk material, (ii) ground single crystals ofLi14.37(1)Al0.63(1)Si4, and (iii) Li14.25Al0.75Si4 bulk material. The thermalbehavior of Li15Si4 between 25 and 300 °C was additionally studied witha Shimadzu DTA-50 instrument. A total of 15−25 mg of sample wereloaded in stainless steel pans which were sealed airtight. Measurementsare performed analogously to the previous description.Energy Dispersive X-ray Spectroscopy (EDX). A JEOL-JSM
7500F scanning electron microscope equipped with an Oxford X-MaxEDX analyzer withMn as internal standard was used for determining theAl−Si ratio in Li14.37(1)Al0.63(1)Si4. Samples were handled inside an Ar-filled glovebox and fixed on a graphite platelet which was mounted on analuminum stub.Solid State Nuclear Magnetic Resonance (NMR) Spectrosco-
py. Solid State NMR experiments were performed on a Bruker AvanceIII spectrometer operating at 7 T at a resonance frequency of 78.5 MHzfor 27Al. MAS NMR experiments were performed employing a 4 mmBruker MAS NMR probe and spinning frequencies of 12 kHz, using dryN2-gas as the bearing/drive gas. The rotor was packed in an Ar glovebox.Spectra are referenced to the 27Al resonance of a 1M aqueous solution ofAl(NO3)3 at 0 ppm. The repetition delay was set to 5−15 s; an increaseof this delay did not alter the appearance of the spectrum.
3. RESULTS AND DISCUSSIONSynthesis, Structure, and Phase Analysis of Li15−xAlxSi4.
Bulk synthesis by mechanical ball milling of stoichiometricmixtures of lithium and silicon affords Li15Si4 as a fine, dark graypowder consisting of submicrometer sized particles (Figure 1a).High-energy ball milling has been previously applied for thesynthesis of metastable Li15Si4, and our result is in accordancewith earlier investigations.3,14,15
Surprisingly, needle shaped single crystals of Li15Si4 withdimensions 1.5 × 0.3 × 0.3 mm were obtained as a side product
when equilibrating melts with compositions Li90Si10 and Li85Si15at 450 °C. Such melts targeted the crystal growth of Li17Si4
7 andwere regularly accompanied by very few crystals of Li15Si4. Thesecrystals grow at the surface of the bottom lid of the stainless steelampule (Figure 1b) hosting the melt and stay attached to itduring the centrifugation process separating Li17Si4 crystals fromthe melt. Their needle-like appearance is very different from theblock-shaped Li17Si4 crystals. It is not clear why and at whichstage of the melt equilibration Li15Si4 crystals are formed.However, it is apparent that their formation reflects non-equilibrium conditions either by virtue of the melt or thepresence of the iron/iron-silicide surface. It is well-known thatflux reactions can afford metastable materials through a kineticcontrol of reactions, although details often remain specula-tive.33,34
Interestingly, melts Li83Al13Si4 equilibrated at 450 °Cexclusively afford Li15−xAlxSi4, with crystal diameters varyingfrom 0.2 mm to 2.5 mm (Figure 1c). The presence of Alsuppresses completely the formation of Li17Si4 otherwiseobtained from binary Li-rich melts. Melts with the Al-poorercomposition Li87Al4Si9 also yield Li15−xAlxSi4 although with aminor amount of byproduct (cf. Figure S1a, SupportingInformation). The PXRD patterns of Li15−xAlxSi4 obtainedfrom both melts are virtually identical which indicates a verysimilar value of x despite the different composition of the melts.Figure 2a,b show the PXRD pattern of Li15Si4 and ground
single crystals of Li15−xAlxSi4 from a melt Li83Al13Si4. The highcrystallinity of the latter in comparison with Li15Si4 frommechanical ball milling is clearly recognizable. The patterns canbe fit to the Cu15Si4 structure model suggested in the literaturewith excellent reliability factors. The cell parameters are onlyslightly different, a = 10.7163(1) and a = 10.66095(3) Å forLi15Si4 and Li15−xAlxSi4, respectively. Single crystal X-raydiffraction studies confirm unambiguously and resolutely thevalidity of Cu15Si4 structure (space group I4 3d, Z = 4) for bothsystems. The structure refinements concluded with excellentreliability factors (all data) of R1 = 0.010 (wR2 = 0.030) for Li15Si4and R1 = 0.007 (wR2 = 0.017) for Li15−xAlxSi4 and residualelectron densities of virtually zero. Table 1 lists a summary of
Figure 1. Photographs of obtained specimens. (a) Bulk sample of Li15Si4obtained from high-energy mechanical ball milling. (b) Needle-shaped,intergrown crystals of Li15Si4 (encircled) grown at the bottom lid of astainless steel ampule. (c) Representative single crystal ofLi14.37(1)Al0.63(1)Si4 separated from an equilibrated melt with thecomposition Li83Al13Si4 at 450 °C.
Chemistry of Materials Article
dx.doi.org/10.1021/cm402721n | Chem. Mater. 2013, 25, 4113−41214115

refinement results of low temperature data and Table 2 atomicposition parameters (for room temperature data see Table S1and S2, Supporting Information).The cubic Cu15Si4 structure (which is described in more detail
in the next section) is composed of two crystallographicallydifferent metal atoms situated on sites 48e (x, y, z) and 12b (1/2,1/4, 1/8) and one kind of Si atom on site 16c (x, x, x). Therefinement of single crystal diffraction data for Li15−xAlxSi4 showsthat Al substitutes a small amount of Li atoms on both sites, 4%on 48e and 5.3% on 12b, indicating a slight preference for thehigher symmetry position (Table 2). The average replacement is4.2% which results in a total Al content of 3.3 atom % and theformula Li14.37(1)Al0.63(1)Si4 (x = 0.63(1)). Rietveld refinement of(room temperature) PXRD data, which is less accurate, providesa slightly lower value of x = 0.49(1). The Al/(Al + Si) ratioobtained from EDX analysis is 11.8(7) atom %, which translates
to x = 0.54(4) and agrees well with the crystallographicallydetermined composition.The incorporation of Al into Li15Si4, leading to a small
contraction of the unit cell volume (by 1.6%), is clearly aconsequence of Li substitution. In the 27Al MAS NMR spectrum(Figure 3) two different 27Al signals with peak positions of
193 ppm and 120 ppm are discerned. From additionalexperiments at a different B0-field (11.7 T) and the observedfield dependent peak positions35 we estimate the isotropicchemical shift values to 150 ppm and 230 ppm for the downfieldand high field signal, respectively. Due to the limited resolutionand the ill-defined line shape of the signals no attempt wasundertaken to exactly simulate the line shape; we can, howeverusing a set of two Gaussians for the downfield and a singleGaussian for the high field signalapproximate the relativeamounts of the two signals as 3:7, respectively. Thus, the NMRresults of the powdered sample reveal Al in two differentenvironments in a ratio of 2.3:1 and are thus rather close to thefindings from the single crystal X-ray analysis (3:1).For assessing the homogeneity range of Li15−xAlxSi4, bulk
samples with x = 0.25, 0.50, 0.75, and 1.00 were prepared byheating and quenching stoichiometric mixtures of the elements.This procedure resulted in highly crystalline products, which forx = 0.50 and x = 0.75 corresponded to phase pure Li15−xAlxSi4according to PXRD. For x = 0.25 and x = 1.00 PXRD patternsrevealed the presence of other phases next to Li15−xAlxSi4, whichcould not be identified (cf. Figure S2, Supporting Information).It is therefore concluded that Li15−xAlxSi4 has a smallhomogeneity range around x = 0.63, xmin ∼ 0.4 and xmax ∼ 0.8.The composition x ≈ 0.63 of crystals grown in equilibrated Li-rich melts with different compositions is considered as thepreferred, most stable, composition of Li15−xAlxSi4. Earlier
Figure 2.Rietveld fit of the Cu15Si4 structure model to the PXRD data of(a) Li15Si4 (bulk sample; Rp = 3.22, Rwp = 4.21, GOF = 1.37, space groupI4 3d, a = 10.7163(1), V = 1230.66(5)), and (b) Li14.37(1)Al0.63(1)Si4(ground single crystals; Rp = 3.18, Rwp = 4.65, GOF = 3.49, space groupI4 3d, a = 10.66095(3), V = 1211.68(1)).
Table 2. Fractional Atomic Coordinates and Isotropic Equivalent Atomic Displacement Parameters for Li15Si4 andLi14.37(1)Al0.63(1)Si4
a
atom Wyckoff position x y z Ueq, Å2·103 occ.
Si 16c 0.29247(1) 0.29247(1) 0.29247(1) 8.88(8) 10.292808(5) 0.292808(5) 0.292808(5) 11.00(3) 1
Li1 48e 0.34994(8) 0.46209(9) 0.12524(8) 17.0(2) 1Li1|Al1 0.34839(3) 0.46277(3) 0.12354(3) 15.2(1) 0.9605(7)/0.0395(7)Li2 12b 1/2 1/4 1/8 18.7(3) 1Li2|Al2 1/2 1/4 1/8 13.3(2) 0.9469(9)/0.0531(9)
aI4 3d, Z = 4, T = 123 K, estimated standard deviations in parentheses; values for Li14.37(1)Al0.63(1)Si4 are marked bold.
Figure 3. 27Al MAS NMR spectrum of Li14.37(1)Al0.63(1)Si4. Two signalsare identified at 120 ppm and 193 ppm, respectively. The signal atapproximately 1635 ppm indicates the presence of some residualmetallic Al.45
Chemistry of Materials Article
dx.doi.org/10.1021/cm402721n | Chem. Mater. 2013, 25, 4113−41214116

reports on the existence of Li12Al3Si4 with the Cu15Si4 structure(that is x = 3) could not be confirmed.36 Thus Li15−xAlxSi4presented herein is an additional representative of the Li−Al−Siphase system. Further structurally characterized ternary phasesare LiAlSi, Li8Al3Si5, Li7Al3Si4, Li5AlSi2, Li9AlSi3, α-Li5AlSi2, andβ-Li5AlSi2.
37
Description of the Crystal Structure of Li15−xAlxSi4.Li15Si4 and Li15−xAlxSi4 (0.4 < x < 0.8) crystallize with the cubicCu15Si4 structure
16 (space group I43d). This structure type is notvery common among intermetallic compounds. Furtherrepresentatives include Li15Ge4,
38,39 Na15Pb4,40 Na15Sn4,
41
Li15Pd4,42 and Li15Au4.
43 Table 3 lists the interatomic distancesfor Li15Si4 and Li14.37(1)Al0.63(1)Si4, which are very similar. Si (on16c (x, x, x)) is surrounded by 12 Li atoms at distances rangingfrom 2.61 Å to 2.87 Å. There is a clear separation between nearestand next nearest neighbor distances, the latter starting off above4 Å. Li2 (on 12b) is 12-coordinated by 4 Si and 8 Li1 atoms,whereas Li1 (on 48e) is 13-coordinated by 3 Si, 8 Li1, and 2 Li2atoms. The range of interatomic distances defining nearestneighbor coordination of Li atoms extends to 3.4 Å. Theseparation with respect to next nearest neighbors (above 3.9 Å) ismuch less pronounced than with Si.The prominent feature of the Cu15Si4 structure is the quasi
anticuboctahedral coordination of Si atoms. Anticuboctahedraare the basic structural motif of a hexagonal close packing. TheCu15Si4 structure has been interpreted earlier as a topologicalclose packing of atoms of different size by Kripyakevich andGladyshevskii.44 The [Si@Li12] anticuboctahedron in Li15Si4 isshown in Figure 4a,b. The polyhedra are slightly distorted; firstthere is a mutual rotation of (Li1)3 triangles by about 14°, andsecond the six-membered ring situated between the (Li1)3triangle faces (formed by 3 Li1 and 3 Li2 atoms) is slightlypuckered.These polyhedra are condensed into strands by sharing
opposite and parallel triangular faces formed by Li1 atoms(Figure 4a). In Figure 4c these strands are better visualized as askeleton of Si(Li1)3 corner-shared trigonal bipyramids1∞[Si2/2(Li1)3]. Furthermore, Figure 4d shows all
1∞[Si2/2(Li1)3]-strands interpenetrating the unit cell with viewalong [1 1 1]. Thereby, segments of equal directions arerepresented with the same color. It can be seen easily that the
blue strand is exactly situated at a body diagonal of the cubic unitcell whereas the green, red, and yellow segments are arranged inparallel to all residual body diagonals of directions [1 11], [111,]and [111 ]. Finally, Figure 4e shows the connectivity of the [Si@Li12] units. Each polyhedron of a strand having two neighboringpolyhedra is further connected to nine from neighboring strands,three of which share faces and six of which share edges. Thisresults in overall 11 neighboring anticuboctahedra. Figure 4fdepicts the full environment of 11 polyhedra generated from twopolyhedra (4 and 5) of the blue segment that are condensed via(Li1)3 triangle faces above and below, three polyhedra (3, 3′, and3″) and pairs of polyhedra (1 and 2, 1′ and 2′, and 1″ and 2″) thatare fused via triangular sites. There are also 11 anticuboctahedrain an ideal hcp atom packing; however, they share edges andquadratic faces instead of edges and triangle faces (cf. Figure S3,Supporting Information).One may speculate for possible reasons for the existence of
Li15−xAlxSi4. A plausible explanation could be that the exchangeof Li by Al atoms leads to an increase of the electronconcentration and a concomitant shift of Fermi level toward apseudo gap in the electronic density of states. The electronicstructure of Li15Si4 has been recently calculated by Xu et al.18 Itwas found that the Fermi level of Li15Si4 with the Cu15Si4structure is situated below a pseudo gap. Alternatively, in asimplified picture Li15Si4 may be classified as an electron-deficient Zintl phase (Li+)15(Si
4−)4. Within this picture andassuming Al as cation-like (Al3+) in Li15−xAlxSi4, the optimumconcentration of Al would be x = 0.5, which falls in the range ofthe experimentally determined homogeneity range xmin ∼ 0.4and xmax ∼ 0.8. Supportingly, magnetic measurements revealdiamagnetic behavior for a sample with x in this range.
Thermal Analysis of Li15−xAlxSi4. Li15Si4 is a metastablecompound. However, the nature of the decomposition processand products remains largely unknown. Key et al.3 reported adecomposition into a mixture of unidentified phases at hightemperatures. Wang and Dahn investigated phase changes inelectrochemically lithiated silicon at temperatures of up to450 °C.22 Yet, their results are ambiguous, as the decompositionof electrochemically produced Li15Si4 yielded Li13Si4 and Li7Si3 at450 °C whereas Li17Si4 and Li13Si4 would have been expectedaccording to the Li−Si phase diagram. Similar observations have
Table 3. Interatomic Distances in Li15Si4 and Li14.37(1)Al0.63(1)Si4a
atom pair d, Å Atom pair d, Å
Si Li1 3× 2.605(1) Li1|Al1 Li2|Al2 2.7739(4)Si Li1|Al1 3× 2.6143(4) Li1 Li1 2.773(2)
Li1 3× 2.7151(9) Li1|Al1 2.7993(5)Li1|Al1 3× 2.7173(4) Si 2.819(1)Li1 3× 2.819(1) Si 2.8056(3)Li1|Al1 3× 2.8056(3) Li1 2× 3.039(1)Li2 3× 2.8711(2) Li1|Al1 2× 3.0161(5)Li2|Al2 3× 2.8670(1) Li1 2× 3.2503(5)
Li1 Si 2.605(1) Li1|Al1 2× 3.2494(5)Li1|Al1 Si 2.6143(4) Li1 3.407(1)
Li1 2× 2.660(2) Li1|Al1 3.3536(5)Li1|Al1 2× 2.6500(6) Li2 Li1 4× 2.762(1)Si 2.7151(9) Li2|Al2 Li1|Al1 4× 2.7539(4)Si 2.7173(4) Li1 4× 2.7644(9)Li2 2.762(1) Li1|Al1 4× 2.7739(4)Li2|Al2 2.7539(4) Si 4× 2.8711(2)Li2 2.7644(9) Si 4× 2.8670(1)
aI4 3d, Z = 4, T = 123 K, estimated standard deviations in parentheses; values for Li14.37(1)Al0.63(1)Si4 are marked bold.
Chemistry of Materials Article
dx.doi.org/10.1021/cm402721n | Chem. Mater. 2013, 25, 4113−41214117

been made by Chevrier et al.:23 heating of electrochemicallygenerated Li15Si4 to 500 °C only afforded Li13Si4. In both casesthe observed lithium loss might be deduced from a reaction ofresidual amounts of SEI (Solid Electrolyte Interphase)components or binder during the heating.22,23 Profatilova etal.21 reported on the formation of a further but not identifiablephase when they quenched DSC measurements for electro-chemically generated Li15Si4 at temperatures between 230 and300 °C.We attempted diligently to monitor the decomposition of
Li15Si4 (synthesized through mechanical ball-milling) byperforming thermal analysis (both DTA and DSC) experiments.Yet, results were inconclusive. At best, thermal decompositionwas indicated by a very broad signal and only one experiment
showed clear evidence of an exothermic event, occurring around177 °C (Figure 5).As a next step we performed ex situ investigations where
Li15Si4 was annealed for three days (72 h) at various temperaturesand subsequently quenched and analyzed. At 120 °C we foundLi15Si4 unchanged whereas at 200 °C a partial decompositionoccurred. The PXRD patterns after annealing at 200 and 300 °Cwere almost identical, and the one obtained for the product afterannealing at 300 °C is shown in Figure 6a. This pattern containssharp diffraction lines from Li17Si4 and still presents crystallineLi15Si4. Additionally, there is a range of broad peaks indicating apartially amorphous Li−Si phase. The presence of Li17Si4requires the simultaneous formation of a Li poorer phase.According to the Li−Si phase diagram this should be Li13Si4. It
Figure 4. Crystal structure motifs of Li15Si4 and Li15−xAlxSi4 (Cu15Si4 type). (a)1∞[Si@Li12]-strands running in different directions as indicated by
different colors; (b) stacking of distorted anticuboctahedron units [Si@Li12]. The skeleton formed by trigonal bipyramids is emphasized. (c)Arrangement of 1∞[Si@Li12]-strands in (a) shown in the skeleton representation; (d) three-dimensional arrangement of strands of pseudo trigonal-bipyramids with view along [1 11]; (e) connectivity of distorted anticuboctahedron units (shared faces/edges are marked in black); (f) three orientationsshowing the eleven neighboring [Si@Li12] cuboctahedra around a central one (light blue, denoted with 0).
Chemistry of Materials Article
dx.doi.org/10.1021/cm402721n | Chem. Mater. 2013, 25, 4113−41214118

may be suspected that the broad diffraction peaks associate to anamorphous “pre-phase” to Li13Si4. The ex situ experimentsconfirm a very slow kinetics of the decomposition of Li15Si4which explains the difficulties of detecting this event in in situthermal investigations.
The result from the annealing experiment at 400 °C is shownin Figure 6b. Now crystalline Li13Si4 is clearly recognizable in thePXRD pattern. The product corresponds to a mixture of Li17Si4and Li13Si4. After annealing at 500 °C the product consists ofthree crystalline phases, Li17Si4, Li4.11Si, and Li13Si4 (Figure 6c).The amount of Li17Si4 is considerably reduced. This is inaccordance with the recently revised Li−Si phase diagram(Figure 7a): (i) the peritectic decomposition interval of Li17Si4 is481−486 °C (i.e., the amount of Li17Si4 is decreased for T >486 °C)7 and (ii) we recently could identify Li4.11Si as a hightemperature phase in the Li−Si system which forms from a slowperitectoid reaction between Li13Si4 and Li17Si4 at 470−480 °C(i.e., no Li4.11Si phase is observed for T < 470 °C).24 As expected,after annealing at 600 °C the product represents a mixture ofLi4.11Si and Li13Si4 (Figure 6d). In a control experiment a DSCthermogram was recorded for Li15Si4 after heating to 750 °C(cooling curve). This is shown in Figure 7b. The three thermalevents correspond to crossing the liquidus boundary (1), theperitectic formation temperature of Li4.11Si (2), and a proposedhigh temperature phase transition of Li4.11Si (3) which is inagreement with the recent phase diagram.24 The event for theperitectoid decomposition of Li4.11Si around 500 °C is not seenin the thermogram because of its slow kinetics.24
Lastly we performed thermal analysis (DSC) experiments withLi15−xAlxSi4 (x = 0.75) and found a surprisingly different behaviorcompared to Li15Si4. The thermogram is shown in Figure 8. Thefirst event upon heating is detected around 700 °C (1) followedby another one at approximately 760 °C (2). Those signals aretentatively assigned to the decomposition of Li14.25Al0.75Si4followed by a crossing of the liquidus boundary. The coolingtrace reveals then two broad signals at 744 and 683 °C (3, 4) anda sharp one at 631 °C (5). A consecutive second heating−coolingcycle exactly reproduces events (1−5). Also the PXRD pattern ofLi14.25Al0.75Si4 after DSC investigations is unchanged (cf. FigureS4, Supporting Information), which confirms a completereversibility of the thermal processes. Consequently, signals(3−5) are attributed to a stepwise formation of Li14.25Al0.75Si4from the melt. The substitution of about 2.7% of Li by Al (x ≈0.4) transforms metastable Li15Si4 into a stable phase whichdecomposes beyond 650 °C.
4. CONCLUSIONMetastable Li15Si4 is an important phase in the lithiation processof silicon. In this work we were able to obtain single crystals ofLi15Si4 for the first time and to perform a rigorous structurecharacterization based on single crystal X-ray diffraction datawhich unambiguously confirmed the previously assigned Cu15Si4structure type. We further showed that Li15Si4 thermallydecomposes at temperatures above 200 °C. However, thedecomposition process is sluggish and appreciable rates are notobserved before temperatures approach 400 °C. At thesetemperatures the decomposition products are in accordancewith the most recent Li−Si phase diagram (crystalline Li13Si4 andLi17Si4/Li4.11Si).
24 At temperatures between 200 and 300 °Cdecomposition yields amorphous/weakly crystalline products. Asurprising result is the discovery of the solid solution Li15−xAlxSi4(0.4 < x < 0.8), where small concentrations of Li in Li15Si4 arereplaced by Al. Contrary to Li15Si4, Li15−xAlxSi4 is thermodynami-cally stable until about 700 °C. It will be interesting to investigateits potential use as anode material in lithium ion batteries,especially if the Li15−xAlxSi4 phases possess a higher inertnessagainst reactions with electrolyte solution than Li15Si4.Preliminary investigations indeed indicate that Li15−xAlxSi4
Figure 5. DTA thermogram for Li15Si4. The event (1) corresponds toexothermic decomposition.
Figure 6. Evolution of the thermal decomposition of Li15Si4: PXRDpatterns of bulk samples after annealing at 300 °C (a), 400 °C (b), 500°C (c), and 600 °C (d) for three days (experimental = black; Li13Si4calculated = red; Li15Si4 calculated = green; Li4.11Si calculated = blue;Li17Si4 calculated = gray; unknown reflections are marked with *).
Chemistry of Materials Article
dx.doi.org/10.1021/cm402721n | Chem. Mater. 2013, 25, 4113−41214119

exhibits a much lower sensitivity toward air and moisture thancrystalline powders of Li-rich phases such as Li17Si4 and Li4.11Si.
■ ASSOCIATED CONTENT*S Supporting InformationCrystallographic data and structure refinement for Li15Si4 andLi14.42(2)Al0.58(2)Si4 (T = 298 K; Table S1), fractional atomiccoordinates and isotropic equivalent atomic displacementparameters for Li15Si4 and Li14.42(2)Al0.58(2)Si4 (T = 298 K;Table S2), PXRD patterns of ground crystals Li15−xAlxSi4 (x ≈0.63) obtained from equilibrated melts with compositionsLi87Al4Si9 and Li83Al13Si4 (Figure S1), PXRD patterns of bulksamples Li15−xAlxSi4 with x = 0.25, x = 0.50, x = 0.75, and x = 1.00(Figure S2), the relation of distorted anticuboctahedron units inLi15Si4 to an ideal hcp atom arrangement (Figure S3), and PXRDpattern of Li14.25Al0.75Si4 before and after DSC investigation(Figure S4) and Crystallographic Information Files. This
material is available free of charge via the Internet at http://pubs.acs.org.
■ AUTHOR INFORMATIONCorresponding Author*E-mail: [email protected] authors declare no competing financial interest.
■ ACKNOWLEDGMENTSThis work has been funded by Fonds der Chemischen Industrie,TUM Graduate School, the Swedish Resarch Council (ProjectNo. 2010-4827) and the Deutsche Forschungsgemeinschaft(Project No. FA 198/11-1) as well as the National ScienceFoundation through Grant DMR-1007557.
■ REFERENCES(1) Obrovac, M. N.; Christensen, L. Electrochem. Solid-State Lett. 2004,7, A93.(2) Hatchard, T. D.; Dahn, J. R. J. Electrochem. Soc. 2004, 151, A838.(3) Key, B.; Bhattacharyya, R.; Morcrette, M.; Seznec, V.; Tarascon, J.M.; Grey, C. P. J. Am. Chem. Soc. 2009, 131, 9239.(4) Key, B.; Morcrette, M.; Tarascon, J. M.; Grey, C. P. J. Am. Chem.Soc. 2011, 133, 503.(5) Limthongkul, P.; Jang, Y. I.; Dudney, N. J.; Chiang, Y. M. ActaMater. 2003, 51, 1103.(6) Limthongkul, P.; Jang, Y. I.; Dudney, N. J.; Chiang, Y. M. J. PowerSources 2003, 119−121, 604.(7) Zeilinger, M.; Benson, D.; Haussermann, U.; Fassler, T. F. Chem.Mater. 2013, 25, 1960.(8) Li, J.; Dahn, J. R. J. Electrochem. Soc. 2007, 154, A156.(9) Wang, C. M.; Li, X. L.; Wang, Z. G.; Xu, W.; Liu, J.; Gao, F.;Kovarik, L.; Zhang, J. G.; Howe, J.; Burton, D. J.; Liu, Z. Y.; Xiao, X. C.;Thevuthasan, S.; Baer, D. R. Nano Lett. 2012, 12, 1624.(10) Chan, M. K. Y.; Wolverton, C.; Greeley, J. P. J. Am. Chem. Soc.2012, 134, 14362.(11) Gu, M.; Wang, Z.; Connell, J. G.; Perea, D. E.; Lauhon, L. J.; Gao,F.; Wang, C. ACS Nano 2013, 7, 6303.(12) Misra, S.; Liu, N.; Nelson, J.; Hong, S. S.; Cui, Y.; Toney, M. F.ACS Nano 2012, 6, 5465.(13) Radvanyi, E.; De Vito, E.; Porcher, W.; Danet, J.; Desbois, P.;Colin, J. F.; Larbi, S. J. S. J. Mater. Chem. A 2013, 1, 4956.(14) Hashimoto, Y.; Machida, N.; Shigematsu, T. Solid State Ionics2004, 175, 177.(15) Tamori, R.; Machida, N.; Shigematsu, T. J. Jpn. Soc. Powder PowderMetall. 2001, 48, 267.
Figure 7. (a) Portion of the recently updated Li−Si phase diagram (according to refs 7 and 24). (b) DSC thermogram for Li15Si4 recorded in coolingmode (from 750 °C). Thermal events occur according to the Li−Si phase diagram shown in (a).
Figure 8. DSC thermogram for Li14.25Al0.75Si4 (heating−cooling cycle).Thermal events (1) and (2) correspond to a decomposition followed bycrossing the liquidus boundary, whereas (3−5) represent steps offormation of Li14.25Al0.75Si4 from the melt.
Chemistry of Materials Article
dx.doi.org/10.1021/cm402721n | Chem. Mater. 2013, 25, 4113−41214120

(16)Morral, F. R.; Westgren, A. Ark. Kem., Mineral. Geol. B 1934, 11, 1.(17) Kubota, Y.; Escano, M. C. S.; Nakanishi, H.; Kasai, H. J. Appl. Phys.2007, 102, 053704.(18) Xu, Y. H.; Yin, G. P.; Zuo, P. J. Electrochim. Acta 2008, 54, 341.(19) Chevrier, V. L.; Zwanziger, J. W.; Dahn, J. R. J. Alloys Compd.2010, 496, 25.(20) Nesper, R.; von Schnering, H. G. J. Solid State Chem. 1987, 70, 48.(21) Profatilova, I. A.; Langer, T.; Badillo, J. P.; Schmitz, A.; Orthner,H.; Wiggers, H.; Passerini, S.; Winter, M. J. Electrochem. Soc. 2012, 159,A657.(22) Wang, Y. D.; Dahn, J. J. Electrochem. Soc. 2006, 153, A2314.(23) Chevrier, V. L.; Dahn, H. M.; Dahn, J. R. J. Electrochem. Soc. 2011,158, A1207.(24) Zeilinger, M.; Kurylyshyn, I.; Haussermann, U.; Fassler, T. F.Chem. Mater. 2013. submitted.(25) Puhakainen, K.; Bostrom, M.; Groy, T. L.; Haussermann, U. J.Solid State Chem. 2010, 183, 2528.(26) APEX suite of crystallographic software, APEX 2, Version 2008.4;Bruker AXS Inc.: Madison, WI, USA, 2008.(27) SAINT, Version 7.56a; Bruker AXS Inc.: Madison, WI, USA,2008.(28) SADABS, Version 2008/1; Bruker AXS Inc.: Madison, WI, USA,2008.(29) Sheldrick, G. M. Shelxs-97 − Program for the Determination ofCrystal Structures; University of Gottingen: Gottingen, Germany, 1997.(30) Sheldrick, G. M. Shelxl-97 − Program for Crystal StructureRefinement; University of Gottingen: Gottingen, Germany, 1997.(31) TOPAS − Rietveld Software, Version 4.0; Bruker AXS Inc.:Madison, WI, USA, 2009.(32) Netzsch Proteus Thermal Analysis, Version 4.8.2; Netzsch-Geratebau GmbH: Selb, Germany, 2006.(33) Tenga, A.; Lidin, S.; Belieres, J. P.; Newman, N.; Wu, Y.;Haussermann, U. J. Am. Chem. Soc. 2008, 130, 15564.(34) Kanatzidis, M. G.; Pottgen, R.; Jeitschko,W.Angew. Chem., Int. Ed.2005, 44, 6996.(35) Muller, D.; Jahn, E.; Ladwig, G.; Haubenreisser, U. Chem. Phys.Lett. 1984, 109, 332.(36) Pavlyuk, V. V.; Bodak, O. I. Izv. Akad. Nauk. SSSR, Neorg. Mater.1992, 28, 988.(37) (a) Kevorkov, D.; Grobner, J.; Schmid-Fetzer, R. J. Solid StateChem. 2001, 156, 500. (b) Spina, L.; Jia, Y. Z.; Ducourant, B.; Tillard, M.;Belin, C. Z. Kristallogr. 2003, 218, 740. (c) Spina, L.; Tillard, M.; Belin,C. Acta Crystallogr. C 2003, 59, I9. (d) Zurcher, S. SystematicInvestigations on the Transition from Zintl Phases to Intermetallics.Dissertation; ETH Zurich: Zurich, Switzerland, 2001.(38) Gladyshevskii, E. I.; Kripyakevich, P. I. Kristallographiya 1960, 5,574.(39) Johnson, Q.; Smith, G. S.; Wood, D. Acta Crystallogr. 1965, 18,131.(40) Zintl, E.; Harder, A. Z. Phys. Chem., Abt. B 1936, B38, 238.(41) Muller, W.; Volk, K. Z. Naturforsch. 1978, 33B, 275.(42) van Vucht, J. H. N.; Buschow, K. H. J. J. Less-Common Met. 1976,48, 345.(43) Kienast, G.; Verma, J.; Klemm,W. Z. Anorg. Allg. Chem. 1961, 310,143.(44) Kripyakevich, P. I.; Gladyshevskii, E. I. Zh. Strukt. Khim. 1961, 2,573.(45) Lay, M. D. H.; Hill, A. J.; Saksida, P. G.; Gibson, M. A.; Bastow, T.J. Acta Mater. 2012, 60, 79.
Chemistry of Materials Article
dx.doi.org/10.1021/cm402721n | Chem. Mater. 2013, 25, 4113−41214121


S1
SUPPORTING INFORMATION
Stabilizing the Phase Li15Si4 through Lithium-Aluminum Substitution in
Li15−xAlxSi4 (0.4 < x < 0.8) – Single Crystal X-ray Structure Determination of
Li15Si4 and Li14.37Al0.63Si4
Michael Zeilinger, Volodymyr Baran, Leo van Wüllen, Ulrich Häussermann,
Thomas F. Fässler,*
Details on the single crystal X-ray data collection for Li15Si4 and Li15−xAlxSi4 at room
temperature.
Single crystal diffraction measurement of Li14.42(2)Al0.58(2)Si4 was performed on a Stoe IPDS IIT
diffractometer equipped with a rotating anode (Bruker AXS, FR591) with MoKα radiation
(λ = 0.71073 Å) and a Montel mirror. Single crystal data for Li15Si4 was recorded on a Bruker X-
ray diffractometer equipped with a CCD detector (APEX II, κ-CCD), a fine-focused sealed tube
with MoKα radiation (λ = 0.71073 Å) and a graphite monochromator.

S2
Table S1. Crystallographic data and structure refinement for Li15Si4 and Li14.42(2)Al0.58(2)Si4.
empirical formula Li15Si4 Li14.42(2)Al0.58(2)Si4
T / K 298(2) 298(2)
formula weight / g·mol−1 216.46 228.13
crystal size / mm3 0.20 × 0.20 × 0.20 0.20 × 0.20 × 0.15
crystal color metallic silver metallic silver
crystal shape block block
space group I−43d I−43d
unit cell dimension / Å a = 10.687(7) a = 10.664(1)
V / Å3 1221(1) 1212.7(2)
Z 4 4
ρ (calc.) / g·cm−3 1.178 1.250
µ / mm−1 0.418 0.464
F (000) 404 427
θ range / ° 4.67–31.44 4.68–29.18
index range hkl ±15, ±15, ±15 ±14, ±14, ±14
reflections collected 9378 14445
independent reflections 343 (Rint = 0.029) 277 (Rint = 0.058)
reflections with I > 2σ(I) 338 (Rσ = 0.008) 276 (Rσ = 0.009)
absorption correction multi-scan multi-scan
data/restraints/parameter 343/0/15 277/0/17
goodness-of-fit on F2 1.195 1.307
final R indices [I > 2σ(I)]a, b R1 = 0.010 R1 = 0.013
wR2 = 0.027 wR2 = 0.031
R indices (all data)a, b R1 = 0.010 R1 = 0.013
wR2 = 0.027 wR2 = 0.032
Flack parameter −0.2(2) 0.1(2)
largest diff. peak and
hole / e·Å−3
0.12 and −0.06 0.08 and −0.07
a R1 = ∑││Fo│−│Fc││ ⁄ ∑│Fo│;
b wR2 = [∑w(Fo2−Fc
2)2/∑w(Fo2)2]1/2

S3
Table S2. Fractional atomic coordinates and isotropic equivalent atomic displacement parameters
for Li15Si4 and Li14.42(2)Al0.58(2)Si4 (I−43d , Z = 4, T = 298 K, estimated standard deviations in
parentheses; values for Li14.42(2)Al0.58(2)Si4 are marked bold).
Atom Wyckoff
position
x y z Ueq
/ Å2·103
occ.
Si 16c 0.29232(1) 0.29232(1) 0.29232(1) 15.29(7) 1
0.29268(2) 0.29268(2) 0.29268(2) 14.6(1) 1
Li1 48e 0.35029(8) 0.4619(1) 0.12560(9) 26.9(2) 1
Li1│Al1 0.34860(9) 0.4630(1) 0.1243(1) 21.4(4) 0.961(2) / 0.039(2)
Li2 12b ½ ¼ ⅛ 29.8(4) 1
Li2│Al2 ½ ¼ ⅛ 19.4(8) 0.958(3) / 0.042(3)

S4
FIGURES
Figure S1. Rietveld fits of the Cu15Si4 model to PXRD patterns of ground crystals
Li15−xAlxSi4 (x ≈ 0.63) obtained from equilibrated melts with compositions Li87Al4Si9 (a) and
Li83Al13Si4 (b).

S5
Figure S2. Rietveld fits of the Cu15Si4 model to PXRD patterns of bulk samples Li15−xAlxSi4 with
x = 0.25 (a), x = 0.50 (b), x = 0.75 (c) and x = 1.00 (d).

S6
Figure S3. The full environment of eleven anticuboctahedra as they appear in an ideal hcp atom
arrangement.
Figure S4. PXRD pattern of Li14.25Al0.75Si4 before (blue) and after two DSC heating (800 °C) and
cooling cycles (black).

5 Publications and Manuscripts
77
5.5 Structural and Thermodynamic Similarities of Phases in the
Li–Tt (Tt = Si, Ge) Systems: Redetermination of the
Lithium-Rich Side of the Li–Ge Phase Diagram and Crystal
Structures of Li17Si4.0−xGex for x = 2.3, 3.1, 3.5, and 4 as well
as Li4.1Ge
Reproduced from Zeilinger, M.; Fässler, T. F. Dalton Trans. 2014,
DOI:10.1039/C4DT00743C with permission from The Royal Society of Chemistry.


DaltonTransactions
PAPER
Cite this: DOI: 10.1039/c4dt00743c
Received 12th March 2014,Accepted 12th May 2014
DOI: 10.1039/c4dt00743c
www.rsc.org/dalton
Structural and thermodynamic similarities ofphases in the Li–Tt (Tt = Si, Ge) systems:redetermination of the lithium-rich side of theLi–Ge phase diagram and crystal structures ofLi17Si4.0−xGex for x = 2.3, 3.1, 3.5, and 4 as wellas Li4.1Ge†
Michael Zeilinger and Thomas F. Fässler*
A reinvestigation of the lithium-rich section of the Li–Ge phase diagram reveals the existence of two
new phases, Li17Ge4 and Li4.10Ge (Li16.38Ge4). Their structures are determined by X-ray diffraction experi-
ments of large single crystals obtained from equilibrated melts with compositions Li95Ge5 and Li85Ge15.
Excess melt is subsequently removed through isothermal centrifugation at 400 °C and 530 °C, respect-
ively. Li17Ge4 crystallizes in the space group F43m (a = 18.8521(3) Å, V = 6700.1(2) Å3, Z = 20, T = 298 K)
and Li4.10Ge (Li16.38Ge4) in Cmcm (a = 4.5511(2) Å, b = 22.0862(7) Å, c = 13.2751(4) Å, V = 1334.37(8) Å3,
Z = 16, T = 123 K). Both phases are isotypic with their Si counterparts and are further representative of the
Li17Pb4 and Li4.11Si structure types. Additionally, the solid solutions Li17Si4−xGex follows Vegard’s law.
A comparison of the GeLin coordination polyhedra shows that isolated Ge atoms are 13- and 14-co-
ordinated in Li17Ge4, whereas in Li16.38Ge4 the Ge atoms possess coordination numbers 12 and 13.
Regarding the thermodynamic stability, Li16.38Ge4 is assigned a high-temperature phase existing between
∼400 °C and 627 °C, whereas Li17Ge4 decomposes peritectically at 520–522 °C. Additionally, the
decomposition of Li16.38Ge4 below ∼400 °C was found to be very sluggish. These findings are manifested
by differential scanning calorimetry, long-term annealing experiments and the results from melt equili-
bration experiments. Interestingly, the thermodynamic properties of the lithium-rich tetrelides Li17Tt4 and
Li4.1Tt (Li16.4Tt4) are very similar (Tt = Si, Ge). Besides Li15Tt4, Li14Tt6, Li12Tt7, and LiTt, the title compounds
are further examples of isotypic tetrelides in the systems Li–Tt.
Introduction
In the last decade, the demand for high capacity lithium-ionbatteries (LIBs) decisively influenced numerous fields of
research; in particular, the chemistry of group 14 elements(tetrel = Tt) plays an important role in the development ofmore efficient anode materials. Since Si theoretically offers aspecific capacity of 3579 mA h g−1 (based on the formation ofLi15Si4) and thus massively exceeds the capacity of the com-monly used graphite anode (372 mA h g−1, LiC6),
1,2 researchon Li–Si materials has been in focus for many years. As thehigh capacity of Si is associated with several problems such asa large volume expansion of up to 300% upon lithiationaccompanied by contact loss of electrodes and poor cycle life,a large number of these studies target these issues.3 Further,Li–Si phases predominantly occur amorphously during char-ging and discharging, and only at low discharge voltages, crys-talline Li15Si4 is observed.1,2,4,5 However, the processes inworking LIBs can be nicely monitored by in situ/ex situ NMRinvestigations.6,7 Moreover, a fundamental understanding ofthermodynamic properties and an unambiguous structuralcharacterization of Li–Si phases are of considerable impor-
†Electronic supplementary information (ESI) available: Crystallographic data,refinement results, fractional atomic coordinates, and isotropic equivalentatomic displacement parameters for Li17Si4−xGex [x = 2.30(2), 3.08(4), 3.53(3)](Table S1–4), comparison of experimental and computational relaxed fractionalatomic coordinates for both Li21Si5 and Li17Si4 (Table S5), experimental frac-tional atomic coordinates for Li17Si4, Li17Ge4, Li17−εZnεGe4, and Li16.95Ge4(Table S6), comparison of experimental fractional atomic coordinates forLi16.95Ge4 and computational relaxed ones for Li21Si5 (Table S7), PXRD patternsof “Li16Ge4” samples annealed at various temperatures (Fig. S1), Rietveld refine-ment results for Li17Si4−xGex (x = 0, 2.30(2), 3.08(4), 3.53(3), 4) (Fig. S2). See DOI:10.1039/c4dt00743c
Department Chemie, Technische Universität München, Lichtenbergstraße 4, 85747
Garching b. München, Germany. E-mail: [email protected],
[email protected]; Tel: (+49) 89 289 13131
This journal is © The Royal Society of Chemistry 2014 Dalton Trans.
Publ
ishe
d on
13
May
201
4. D
ownl
oade
d by
Tec
hnis
che
Uni
vers
itaet
Mue
nche
n on
05/
06/2
014
14:0
3:37
.
View Article OnlineView Journal

tance. Just recently, we reported on detailed investigations onlithium-rich silicides, including the metastable phase Li15Si4,
8
Li17Si49 and the high-temperature phase Li4.11Si (Li16.42Si4).
10
Further examples are given in ref. 11–17.The heavier tetrel element Ge has received less attention
regarding its use as an anode material due to its low naturalabundance connected with a lower theoretical specific capacitycompared to silicon (1564 mA h g−1 vs. 4056 mA h g−1, basedon the formation of Li16.95Ge4
18 and Li17Si4,9 respectively).
However, the diffusivity of lithium in Ge is approximately 400times larger than in Si at room temperature,19,20 which intrin-sically puts germanium to the foreground. Since some Si ana-logues are not known we put emphasis on the structuralvariety of lithium germanides and their thermodynamicrelation.
Li–Ge phases were first postulated in the 1950s and 1960s(Li3Ge, Li4Ge, LiGe),21–23 fueling numerous investigations inthis field later on. Before 2001, the ascertained Li–Ge represen-tatives included Li21Ge5
24 (formerly described as Li20Ge525,26
and Li22Ge527,28), Li15Ge4,
28,29 Li13Ge430 (formerly reported as
Li7Ge231), Li14Ge6,
25,26 Li9Ge4,32 Li12Ge7,
25,26,33 LiGe (spacegroup I41/a, ambient pressure),22,34 LiGe (space group I41/amd,high pressure),35 and Li7Ge12.
26,36 A previously describedphase Li11Ge6
37 could not be reproduced in the course of theredetermination of the Li–Ge phase diagram by Grüttner,25
and due to the “striking similarity” to Li8MgSi6,38 it might
have been ternary Li8MgGe6. Until then, solely Li21Tt5, Li14Tt6,Li12Tt7, and LiTt (LiSi39 is obtainable from high-pressure syn-thesis) were known for both Si and Ge. We note that Li13Si4and Li13Ge4 are not isotypic and crystallize with their ownstructure types. In the following years new Li–Tt phases werefound and others were revised, e.g. a hexagonal high-pressureform of LiGe (space group P63/mmc),40 metastable Li15Si4
1,2
being isotypic with the congruently melting phase Li15Ge425
(Li15Tt4), Li∼17Ge4 (Li21+3/16Si5 = Li16.95Ge4)18 revised from
Li21Ge5, and the revision of the Li7Ge12 structure.41 The syn-thesis of solid solutions Li15Si4−xGex by mechanical ball-milling was also reported.42 An experimental determination ofthe Li–Ge phase diagram involving most of the aforemen-tioned phases is given by Grüttner in his dissertation.25
We recently reported on the single crystal structures andthermodynamic properties of Li17Si4,
9 the high-temperaturephase Li4.11Si (Li16.42Si4),
10 and metastable Li15Si4.8 The Li–Si
phase diagram was revised accordingly. Consequently, weextended our studies on the Li–Ge system. Herein, we presentthe single crystal X-ray structure determination of Li17Ge4 andLi4.10Ge which crystallize isotypically with their Si counter-parts. Earlier structure reports on Li∼17Ge4 (Li21+3/16Si5 =Li16.95Ge4)
18 involving partially occupied Li sites could not beconfirmed. Solid solutions of the isotypic phases Li17Si4 andLi17Ge4 follow Vegard’s law.43 Due to clarity and a better com-parability, the phase Li4.10Ge is referred to as Li16.38Ge4.Furthermore, the lithium-rich section of the Li–Ge phasediagram (Li concentrations >79 at%) is reinvestigated by differ-ential scanning calorimetry and long-term annealing exper-iments, manifesting Li16.38Ge4 as a high-temperature phase
which possesses a very sluggish decomposition behavior below∼400 °C. Li17Ge4 is peritectically formed at 520–522 °C fromcooling an according melt.
Results and discussionSingle crystal X-ray structure determination of Li17Ge4 andLi16.38Ge4
Large single crystals of Li17Ge4 and Li16.38Ge4 were grown inLi–Ge melts Li95Ge5 and Li85Ge15 at 400 °C and 530 °C,respectively. For Li16.38Ge4, bar-shaped crystals with a size ofup to 0.6 × 0.25 × 0.25 cm3 could be obtained. A representativespecimen is depicted in Fig. 1. Generally, crystals of Li17Ge4grew much smaller in a block-like shape with diameters of0.1 × 0.1 × 0.1 cm3. Those crystals allowed acquisition of highquality single crystal X-ray diffraction data.
The phase Li17Ge4 crystallizes in the space group F43m witha = 18.8521(3) Å (V = 6700.1(2) Å3) and Z = 20. The asymmetricunit consists of 13 Li and four Ge atoms each being located ona special position (Table 1). As already reported for Li17Si4,Li17Sn4, and Li17Pb4,
9,18,44 the Wyckoff position 4a with sym-metry 43m was found to be fully occupied. We note that therefinement of occupancy factors did not indicate significantlylarge deviations from full occupancy and thus they wereregarded as being fully occupied. Accordingly, the cubic unitcell of Li17Ge4 contains 340 Li and 80 Ge atoms (cF420).Further, atomic displacement parameters were refined aniso-tropically with meaningful results for all atoms, revealingexcellent reliability factors of R1 = 0.022 and wR2 = 0.038 (alldata) for the final model (Table 6). The structure of Li17Ge4 isisotypic with Li17Si4, Li17Sn4, and Li17Pb4.
9,18,44
Li16.38(2)Ge4 crystallizes in the space group Cmcm with a =4.5511(2) Å, b = 22.0862(7) Å, c = 13.2751(4) Å (V = 1334.37(8)Å3) and Z = 16 referring to Li4.096(4)Ge as one formula unit. The
Fig. 1 Example of a bar-shaped single crystal of Li16.38Ge4 obtainedfrom a melt Li85Ge15 at 530 °C.
Paper Dalton Transactions
Dalton Trans. This journal is © The Royal Society of Chemistry 2014
Publ
ishe
d on
13
May
201
4. D
ownl
oade
d by
Tec
hnis
che
Uni
vers
itaet
Mue
nche
n on
05/
06/2
014
14:0
3:37
. View Article Online

unit cell contains 10 Li and three Ge atom positions (Table 2)where Li4 and Li5 are disordered. A careful analysis of differ-ence Fourier maps after assigning all Ge and nine Li atompositions (Li1–Li3 and Li5–Li10) revealed occupational dis-order along the crystallographic a-axis like that reported forLi16.42Si4.
10 As can be seen in Fig. 2a and 2b, the differenceFourier maps showing the strand-like residual electron densitywith peak-maxima at Wyckoff positions 4c and 8g are almostidentical for Li16.42(1)Si4 and Li16.38(2)Ge4. Applying the disordermodel as reported for Li16.42(1)Si4,
10 we subsequently obtaineda very similar occupancy ratio of 0.616(8)/0.384(8) for Li4A on4c (1/2, y, 1/4) and Li4B on 8g (x, y, 1/4), respectively, comparedwith 0.575(3)/0.425(3) found in Li16.42(1)Si4. Analogously toLi16.42(1)Si4,
10 a split position for Li5 on 8f (0, x, y) was intro-duced. The split fractions converged to 0.75(4) for Li5A and0.25(4) for Li5B (0.848(7)/0.152(7) in Li16.42(1)Si4;
10 refinement
details and the geometric relevance of the atom split are givenin the ESI†). In case of atoms being uninvolved in disorder,site occupancy factors were refined to values close to full occu-pancy and therefore those positions were constrained to fulloccupancy. Thus, the unit cell contains 65.54(7) Li atoms as aconsequence of the disorder (65.70(3) in Li16.42(1)Si4
10) and 16Ge atoms, resulting in a crystallographic density of 2.011 gcm−3. The structure was finally solved with reliability factors ofR1 = 0.023 and wR2 = 0.027 for all data (Table 6). Li16.38(2)Ge4crystallizes isotypically with Li16.42(1)Si4.
10
Structure description of Li17Ge4 and Li16.38Ge4
In our previous work we reported on the structures of Li17Si4and Li16.42Si4 in detail.9,10 Both phases were comparativelyhighlighted on the basis of SiLin coordination polyhedra andthe disorder in Li16.42Si4 was illustrated with various structuremodels. Hence, we analogously elaborate on the structures ofthe isotypic phases Li17Ge4 and Li16.38Ge4 herein.
The structure of Li17Ge4 is closely related to the previouslyreported phase Li21Ge5
24 (Li16.8Ge4) only differing in the occu-pation of one fourfold special position. In detail, theircommon space group F43m possesses four positions with sitesymmetry 43m (4a–d). Whereas Wyckoff positions 4a–d wereclaimed to be void in Li21Ge5, we found a fully occupied 4a sitein Li17Ge4 with short but reasonable next nearest neighbor dis-tances of 2.397(7) Å for Li1–Li13 (cf. Fig. 3 and Table 4). Wenote that since Li22Si5
27,45 (its composition corresponds to afull occupancy of sites 4a–d) was revised to Li21Si5,
46 heavieranalogues such as Li22Ge5 were supposed to crystallize withthe Li21Si5 structure type as well (Li21Ge5).
24 We have alreadyshown by computational methods that the fully relaxed struc-tures of Li17Si4 and Li21Si5 decisively differ regarding thecoordination environment around the 4a site.9 If this positionis unoccupied, the first coordination shell, which is a (Li1)4tetrahedron (cf. Fig. 3), is markedly contracted, which was notobserved in experimental data of Li21Si5 (Table S5 in the ESI†).Therefore it could be concluded that Li might have been over-seen in the previous structure refinement (most likely a partialoccupancy). Turning to Li17Ge4, the positional parameters arealmost identical with Li17Si4 (Table S6 in the ESI†) and there-fore an equal conclusion is reasonable.
In 2001, Goward et al.18 have already reported on the revi-sion of Li22M5 to Li17M4 (M = Ge, Sn, Pb). However, theirmodel for “Li17Ge4” involved partially occupied Li sites(Table 3), namely Li1A on 16e (3/4 occ.), Li1B on 16e (1/4 occ.),and Li13 on 4a (3/4 occ.) resulting in the compositionLi16.95Ge4 (note that for a better comparability the fractionalatomic coordinates and labels were adapted to Li17Ge4). In thecase of a void 4a site, the surrounding (Li1A)4 tetrahedron(comparable with Li1 in Fig. 3) is slightly contracted to (Li1B)4whose vertices are markedly closer to the 4a center (2.52 Å vs.1.91 Å).18 Interestingly, this scenario is in close agreementwith the computationally relaxed structure of Li21Si5
9 (Table S7in the ESI†) where all fourfold positions are void. Conse-quently, a partial occupancy of the 4a position as reported forLi16.95Ge4 and hence the existence of a small homogeneity
Table 1 Fractional atomic coordinates and isotropic equivalent atomicdisplacement parameters for Li17Ge4 (F43m, Z = 20, T = 298 K, estimatedstandard deviations in parentheses)
Atom Wyckoff position x y z Ueq/Å2·103
Ge1 16e 0.159545(8) x x 13.03(4)Ge2 16e 0.916568(8) x x 11.37(4)Ge3 24f 0.32102(1) 0 0 13.27(5)Ge4 24g 0.57015(1) 1/4 1/4 13.06(4)Li1 16e 0.0734(2) x x 31(1)Li2 16e 0.3031(2) x x 21.6(8)Li3 16e 0.4175(2) x x 22.3(9)Li4 16e 0.5575(2) x x 23(1)Li5 16e 0.6877(2) x x 28(1)Li6 16e 0.8314(2) x x 27(1)Li7 24f 0.1677(3) 0 0 25(1)Li8 24g 0.0743(3) 1/4 1/4 23.1(9)Li9 48h 0.0913(2) x 0.2624(2) 32.0(9)Li10 48h 0.0896(2) x 0.7612(2) 31.1(8)Li11 48h 0.1547(1) x 0.5205(2) 32.5(8)Li12 48h 0.1637(1) x 0.0027(2) 22.5(8)Li13 4a 0 0 0 17(2)
Table 2 Fractional atomic coordinates and isotropic equivalent atomicdisplacement parameters for Li4.096(4)Ge (Cmcm, Z = 16, T = 100 K, esti-mated standard deviations in parentheses)
AtomWyckoffposition x y z s.o.f.
Ueq./Å2·103
Ge1 4c 0 0.256372(6) 1/4 1 7.83(3)Ge2 4c 1/2 0.454314(5) 1/4 1 6.35(3)Ge3 8f 1/2 0.105220(4) 0.067609(6) 1 6.83(2)Li1 4c 1/2 0.0333(1) 1/4 1 14.4(4)Li2 4c 1/2 0.3297(1) 1/4 1 13.5(4)Li3 4c 0 0.3922(1) 1/4 1 17.5(5)Li4A 4c 1/2 0.1476(2) 1/4 0.616(8) 52(3)Li4B 8g 0.210(1) 0.1385(2) 1/4 0.384(8) 21(2)Li5A 8f 0 0.1741(3) 0.0842(7) 0.75(4) 14(1)Li5B 8f 0 0.164(1) 0.123(4) 0.25(4) 24(6)Li6 8f 0 0.04650(7) 0.1225(1) 1 13.9(3)Li7 8f 0 0.31636(9) 0.0788(1) 1 16.5(3)Li8 8f 0 0.47089(9) 0.0908(1) 1 18.7(3)Li9 8f 1/2 0.23155(8) 0.1356(1) 1 19.1(3)Li10 8f 1/2 0.40425(8) 0.0639(1) 1 14.5(3)
Dalton Transactions Paper
This journal is © The Royal Society of Chemistry 2014 Dalton Trans.
Publ
ishe
d on
13
May
201
4. D
ownl
oade
d by
Tec
hnis
che
Uni
vers
itaet
Mue
nche
n on
05/
06/2
014
14:0
3:37
. View Article Online

region Li17−xTt4 (0 < x < 0.2) are indeed meaningful. Morerecently, Lacroix-Orio et al.47 presented a Zn-doped derivativeof the Li17Ge4 compound. They could not find any evidence forpartially occupied Li positions and instead found small con-centrations of Zn being incorporated at the 4a position(Li17−εZnεGe4, ε = 0.005(1)).
Concluding, the fractional atomic coordinates of all Li17Ge4related phases listed in Table 3 are very similar and the scen-
ario of an unoccupied 4a position in Li16.95Ge4 fits the calcu-lated data of the corresponding Li21Si5 structure very well. Thisstrengthens the existence of a homogeneity region Li17−xTt4(0 < x < 0.2) which is deduced from the flexibility of the(Li1)4(Tt2)4 tetrahedral star around the Wyckoff position 4a.9
Accordingly, the herein reported phase Li17Ge4 is regarded asthe lithium-richest representative in the Li–Ge system.
The structure of Li17Ge4 is closely related to a 6 × 6 × 6superstructure of the body centered cubic (bcc) structure.46 Asalready shown by von Schnering and Nesper,46 it can be easilyinterpreted by 26 atom clusters (M26 with M = Tt, Li) centeredat the special positions 4a–d whereas Ge4 tetrahedra and Ge6octahedra (note that Ge atoms are isolated by distances largerthan 4.44 Å) are situated around 4a, 4c and 4b, 4d, respectively,corresponding to the arrangement of Na and Tl atoms in theNaTl structure.46
Yet another possible way of looking at the structure ofLi17Ge4 is the comparison of GeLin coordination polyhedraand their arrangement in the unit cell. This has proven to be aneat method for the comparison of lithium-rich Li–Si phasessolely bearing isolated Si atoms in their structures (Li17Tt4,Li16.4Tt4 and Li15Tt4).
10 As shown in Fig. 4a, Ge1, Ge3 and Ge4are 13-coordinated by Li atoms, whereas Ge2 attains a coordi-nation number (CN) of 14. Corresponding to the first coordi-nation shell of Ge atoms, Li–Ge distances range from 2.659(4) Åto 3.053(3) Å (Table 4). The second Li shell is clearly separatedwith distances larger than 4.2564(3) Å. Interestingly, the poly-hedra around Wyckoff positions 4a, 4c and 4b, 4d either form
Fig. 2 Difference Fourier map (Fo − Fc) shown for the layer defined by Tt1, Tt2 and Li2 in (a) Li16.42Si410 and (b) Li16.38Ge4 (parallel to the ab-plane,
calculated from single crystal data at 100 K and 123 K for Li16.42Si4 (contour lines ±0.6 e Å−3) and Li16.38Ge4 (contour lines ±0.5 e Å−3), respectively;cell edges are shown in blue).
Fig. 3 Coordination environment of Li13 on the Wyckoff position 4a(Ge = black; Li = white; thermal ellipsoids at 70% probability, singlecrystal data at room temperature). The 1st, 2nd, 3rd, and 4th coordi-nation shell is formed by a (Li1)4 and (Ge2)4 tetrahedron as well as a(Li7)6 octahedron and a (Li12)12 cuboctahedron.
Paper Dalton Transactions
Dalton Trans. This journal is © The Royal Society of Chemistry 2014
Publ
ishe
d on
13
May
201
4. D
ownl
oade
d by
Tec
hnis
che
Uni
vers
itaet
Mue
nche
n on
05/
06/2
014
14:0
3:37
. View Article Online

supratetrahedra ([Ge1Li13]4 and [Ge2Li14]4 denoted as (1) and(2)) or supraoctahedra ([Ge3Li13]6 and [Ge4Li13]6 denoted as (3)and (4)), respectively (Fig. 4b). Accordingly, the structure ofLi17Ge4 can be considered as two interpenetrating ccp latticesof (2) and (3), i.e. the NaCl structure, where tetrahedral voidsare filled with (1) and (4).
Besides Li17Ge4 and Li15Ge4, Li16.38Ge4 is yet another repre-sentative exclusively bearing isolated Ge atoms. It is isotypicwith Li16.42Si4
10 which possesses a peculiar structure involvingoccupational and positional disorder along the crystallo-graphic a-axes (cf. Fig. 2). A convenient way of illustrating thedisordered structure of Li16.38Ge4 is the assumption of a sim-plified ordered model which has already been applied for thedescription and band structure calculations of Li16.42Si4.
10 Indetail, the atom positions Li4A, Li4B and Li5A (cf. Table 2)affected by disorder corresponding to the Wyckoff positions 4c
Table 3 Comparison of fractional atomic coordinates for Li17Ge4, Li17−εZnεGe4, and Li16.95Ge4 (space group F43 m (for all phases), Z = 20, estimatedstandard deviations in parentheses). Listed are x values for the special positions 16e (x, x, x), 24f (x, 0, 0), 24g (x, 1/4, 1/4) and x, z pairs for 48h(x, x, z)
At. Wyck. pos. Li17Ge4 Li17−εZnεGe447 Li16.95Ge4
18 At. Wyck. pos. Li17Ge4 Li17−εZnεGe447 Li16.95Ge4
18
Ge1 16e 0.15955(1) 0.15958(2) 0.15952(5) Li8 24g 0.0743(3) 0.0740(6) 0.075(1)Ge2 16e 0.91657(1) 0.91667(3) 0.91684(5) Li9 48h 0.0913(2) 0.0906(3) 0.0907(7)Ge3 24f 0.32102(1) 0.32118(4) 0.32112(7) 0.2624(2) 0.2631(4) 0.2660(8)Ge4 24g 0.57015(1) 0.57020(4) 0.56965(7) Li10 48h 0.0896(2) 0.0904(4) 0.0914(7)Li1A 16e 0.0734(2) 0.0747(6) 0.0775 0.7612(2) 0.7613(4) 0.7597(9)Li1B 16e — — 0.0587 Li11 48h 0.1547(1) 0.1554(3) 0.1540(5)Li2 16e 0.3031(2) 0.3033(3) 0.3032(6) 0.5205(2) 0.5216(4) 0.5216(9)Li3 16e 0.4175(2) 0.4179(5) 0.4169(9) Li12 48h 0.1637(1) 0.1632(3) 0.1625(5)Li4 16e 0.5575(2) 0.5584(4) 0.5579(6) 0.0027(2) 0.0025(5) 0.005(1)Li5 16e 0.6877(2) 0.6864(4) 0.6876(7) Li13 4a 0 0 0Li6 16e 0.8314(2) 0.8331(4) 0.8329(7) Zn1 4a — 0 —Li7 24f 0.1677(3) 0.1678(6) 0.170(1)
Fig. 4 (a) GeLin coordination polyhedra (CN = coordination number) and (b) their relative arrangement in the cubic unit cell of Li17Ge4 (Ge = black;Li = white; thermal ellipsoids at 70% probability, single crystal data at room temperature). Supratetrahedra and supraoctahedra are formed fromGe1Li13, Ge2Li14 and Ge3Li13, Ge4Li13 coordination polyhedra (denoted as 1, 2, 3 and 4).
Table 4 Selected interatomic distances in Li17Ge4 (F43m, Z = 20, T =298 K, estimated standard deviations in parentheses)
Atom pair d(Å) Atom pair d(Å)
Ge1 Li9 ×3 2.659(4) Ge3 Li10 ×2 2.849(4)Li1 2.813(7) Li3 ×2 2.855(2)Li2 ×3 2.884(1) Li7 2.890(5)Li8 ×3 2.898(3) Li11 ×4 2.977(2)Li12 ×3 2.959(4) Ge4 Li12 ×2 2.680(3)
Ge2 Li12 ×3 2.686(3) Li11 ×2 2.709(3)Li13 2.7244(3) Li8 2.723(5)Li7 ×3 2.734(3) Li5 ×2 2.769(4)Li6 2.780(6) Li6 ×2 2.856(2)Li10 ×3 2.933(4) Li10 ×4 3.053(3)Li1 ×3 2.969(4) Li13 Li1 ×4 2.397(7)
Ge3 Li9 ×2 2.673(4) Ge2 ×4 2.7244(3)Li4 ×2 2.760(3) Li7 ×6 3.162(5)
Dalton Transactions Paper
This journal is © The Royal Society of Chemistry 2014 Dalton Trans.
Publ
ishe
d on
13
May
201
4. D
ownl
oade
d by
Tec
hnis
che
Uni
vers
itaet
Mue
nche
n on
05/
06/2
014
14:0
3:37
. View Article Online

(0.616(8) occ.), 8g (0.384(8) occ.) and 8f (0.75(4) occ.), respect-ively, are either regarded as half (Li4A, Li4B) or fully occupied(Li5A) resulting in the composition Li16.5Ge4. An accordinglyordered model with fully occupied atom positions and crystal-lographically independent sites for Li4B′ and Li4B″ (translateto Li4B in Cmcm) can be achieved by symmetry reduction anda cell enlargement (space group P21/m, a = 9.1016(4) Å, b =13.2751(4) Å, c = 11.2744(4) Å, β = 101.643(1)°; for crystallo-graphic details, see ref. 10). The GeLin polyhedra occurring inthe respective model “Li16.5Ge4” are depicted in Fig. 5a.
Similar to Li17Ge4, the first shell of Li atoms surroundingeach Ge atom is clearly separated from the second one withdistances between 2.596(2) Å to 3.309(3) Å and distances above4.103(4) Å (Table 5). Whereas Ge1 and Ge2 are permanently13-coordinated (Ge1Li13/Ge1′Li13 and Ge2Li13 denoted as (1)/(1′) and (2)), Ge3 attains coordination numbers of either 12 or13 (Ge3Li12 and Ge3′Li13 denoted as (3) and (3′)). The differentcoordination of Ge3 is attributed to the varying occupation ofatom positions Li4A, Li4B′ and Li4B″. The arrangement ofGeLin polyhedra in the unit cell of Li16.38Ge4 is achieved bystacking them into strands which proceed along the crystallo-graphic a-axis (Fig. 5b). For the ordered model “Li16.5Ge4”, thestacking sequence is indicated by numbers corresponding tovarious GeLin polyhedra highlighted in Fig. 5a.
Comparing the TtLin coordination polyhedra of all lithium-rich Li–Tt phases, which exclusively comprise isolated Ttatoms in their structures, the coordination numbers consist-ently increase from CN = 12 (Li15Tt4), over CN = 12–13(Li16.4Tt4) to CN = 13–14 (Li17Ge4).
Solid solutions Li17Si4−xGex [x = 2.30(2), 3.08(4), 3.53(3)]
Li17Si4 and Li17Ge4 are isotypic phases that form solid solu-tions. Single crystalline samples of Li17Si4−xGex were obtainedfrom melt equilibration experiments and analyzed by singlecrystal and powder X-ray diffraction as well as energy disper-sive X-ray spectroscopy. The Si–Ge ratios for Li17Si4−xGexsamples obtained from single crystal X-ray diffraction datawere x = 2.30(2), 3.08(4), and 3.53(3). We note that these valuesdeviate from the initial ones x = 1.0, 2.0, and 3.0 corres-ponding to the employed melts “Li90Si7.5Ge2.5”, “Li90Si5Ge5”and “Li90Si2.5Ge7.5” as the Si amount is reduced due to apartial reaction of Si with the stainless steel ampules; thus theSi–Ge ratios in the products are shifted toward higher Ge con-tents. As can be seen in Fig. 6, the cell axes and volumes(determined from PXRD patterns of the respective samples byRietveld refinement, Fig. S2†) linearly increase with increasingGe concentrations in Li17Si4−xGex revealing a perfect behaviorobeying Vegard’s law.43 Additionally, results from EDXmeasurements agree well with the crystallographically deter-mined Si–Ge ratios (impurities originating from the stainlesssteel ampule were not detected).
Analyzing the distribution of Si and Ge on atom positionsTt1–4, the Si–Ge ratios are very similar for Tt1, Tt3, and Tt4,whereas Tt2 on the Wyckoff position 16e (x, x, x) features aslight preference for Si (Table S1–4†). Comparing the coordi-nation environment of Tt2 and Tt1, Tt3, Tt4, the former is
Fig. 5 (a) GeLin coordination polyhedra occurring in an idealized modelfor Li16.38Ge4 with a composition of Li16.5Ge4 (space group P21/m, fullyoccupied and crystallographically independent atom positions Li4B’,Li4B’’ (both correspond to Li4B in Li16.38Ge4), Li4A, and Li5A); (b) stackingof GeLin polyhedra by sharing opposite faces resulting in parallel rodswhich run along the crystallographic a-axis (Ge = black, Li = white,thermal ellipsoids at 90% probability, single crystal data at 100 K). Thepolyhedra stacking in the structure model “Li16.5Ge4” is indicated bynumbers X which correspond to the coordination polyhedra of atomGeX in (a).
Table 5 Selected interatomic distances in Li16.38Ge4 (Cmcm, Z = 16,T = 123 K, estimated standard deviations in parentheses)
Atom pair d(Å) Atom pair d(Å)
Ge1 Li7 ×2 2.631(2) Ge2 Li8 ×4 3.127(1)Li5B ×2 2.64(2) Ge3 Li4A 2.596(2)Li4B ×2 2.772(4) Li7 2.603(2)Li9 ×4 2.790(1) Li8 2.693(2)Li2 ×2 2.792(1) Li6 ×2 2.7188(9)Li5A ×2 2.854(8) Li5B ×2 2.723(8)Li3 3.001(2) Li5A ×2 2.747(3)Li4A ×2 3.309(3) Li4B ×2 2.854(3)
Ge2 Li6 ×2 2.647(2) Li10 ×2 2.875(1)Li3 ×2 2.657(1) Li1 2.896(1)Li10 ×2 2.707(2) Li9 2.932(2)Li2 2.753(2) Li8 2.983(2)Li1 ×2 2.867(2)
Paper Dalton Transactions
Dalton Trans. This journal is © The Royal Society of Chemistry 2014
Publ
ishe
d on
13
May
201
4. D
ownl
oade
d by
Tec
hnis
che
Uni
vers
itaet
Mue
nche
n on
05/
06/2
014
14:0
3:37
. View Article Online

14- and the latter are 13-coordinated by Li atoms with similarGe–Li distances (2.68 Å–2.95 Å vs. 2.65–3.04 Å). The pheno-menon that different crystallographic sites are substituteddifferently is also known as the “coloring problem”.48 In somecases the site preferences cannot be deduced on the basis ofsimple chemical reasoning (e.g. differences in electronegativ-ities) and quantum chemical calculations may give a reason-able explanation.49 Here, the focus is set on experimental workand we note that small differences in the distribution of Si andGe on atom positions Tt2 and Tt1, Tt3, Tt4 were traced.
Thermodynamic stability of Li17Ge4 and Li16.38Ge4
The Li–Ge phase diagram was determined by Federov &Molochka23 in 1966 and later revised by Grüttner25 in his dis-sertation. However, a current compilation of the Li–Gesystem50 did not include Grüttner’s results and, hence, signifi-cant information is missing. Therefore and due to the recentimprovements of the Li–Si phase diagram (>76 at% Li),8–10 adetailed redetermination of the respective portion of the Li–Gesystem is essential.
The lithium-rich section of the Li–Ge phase diagram (>79 at% Li) was studied by DSC investigations of samples with sys-tematically different compositions Li17Ge4, “Li16.5Ge4” and“Li16Ge4”. Accordingly, PXRD patterns correspond to pure-phase Li17Ge4, a mixture of Li17Ge4 and Li16.38Ge4, and amixture of Li16.38Ge4 and Li15Ge4, respectively (Fig. 7).
The thermograms of these samples are depicted in Fig. 7.The first thermal events in these cooling traces (signal 1–3) areassigned to the crossing of the liquidus boundary. Analogouslyto the Li–Si system,10 signals (4) and (5) at 520–522 °C and627 °C are attributed to the peritectic formation temperaturesof Li17Ge4 (481–486 °C for Li17Si4) and Li16.38Ge4 (618 °C forLi16.42Si4), respectively. This is additionally strengthened byour results from melt equilibration experiments (see above)where crystals of Li16.38Ge4 are only afforded above tempera-tures of 520 °C. Note that signal (5) corresponding to the peri-
tectic formation of Li16.38Ge4 from melt and Li15Ge4 issuperimposed by signals (1) and (2) in the cooling traces ofLi17Ge4 and “Li16.5Ge4” (Fig. 7), respectively, but clearly visiblefor the “Li16Ge4” sample. Instead, it can be recognized ataround 630 °C in the respective heating trace, exemplarilyshown for Li17Ge4 (effect 5′). Furthermore, long term anneal-ing experiments of “Li16Ge4” samples (Fig. S1 in the ESI†)established Li16.38Ge4 as a high-temperature phase beingstable above ∼400 °C until 627 °C, just like Li16.42Si4 existingbetween 470 and 618 °C.10 We note that the decomposition be-havior of Li16.38Ge4 is very sluggish and even harder to tracethan in the case of its Si counterpart.
Finally, the recent results from DSC investigations are com-piled in an updated Li–Ge phase diagram (Fig. 8b) which wasrevised from Grüttner’s previously determined one shown inFig. 8a. A comparison with the Li–Si phase diagram (Fig. 8c)reveals similarities to the Li–Ge system. An interesting differ-ence is the stability of Li15Tt4. Whereas Li15Si4 is metastableand decomposes above ∼170 °C,8 Li15Ge4 is thermodynami-cally stable and melts congruently at 720 °C.25 Furthermore,uncertainties regarding the isotherms at 610 °C and 618 °C inthe Li–Si phase diagram10 could not be found for the Li–Gesystem.
Conclusion
The germanides Li17Ge4 and Li16.38Ge4 were established asfurther representatives of the Li–Ge system. The latter isassigned a high-temperature phase which exists between ∼400and 627 °C, the former, the lithium-richest Li–Ge phase,decomposes peritectically at 521 °C into melt and Li16.38Ge4.Li16.38Ge4 can be retained at room temperature if accordingmelts are cooled to the respective temperature region and sub-sequently quenched. Both germanides are isotypic to the sili-cides Li17Si4 and Li16.42Si4 extending the family of isotypiclithium tetrelides to Li17Tt4, Li16.4Tt4, Li15Tt4, Li14Tt6, Li12Tt7,and LiTt (Tt = Si, Ge). The previously reported Li16.95Ge4 canbe regarded as representative of a homogeneity regionLi17−xTt4 (0 < x < 0.2) with Li17Ge4 and Li16.8Ge4 (Li21Ge5) asborder phases only differing in the occupation of the Wyckoffposition 4a. Moreover, the validity of Vegard’s law for the solidsolutions Li17Si4−xGex was confirmed and small differences inthe distribution of Si and Ge to the four crystallographicallyindependent atom positions were observed. Regarding thethermodynamic properties, the regions of stability for Li17Tt4and Li16.42Tt4 are very similar. Interesting are also the thermo-dynamic and structural differences of lithium silicides andgermanides. For instance, whereas Li15Si4 is a metastablephase, Li15Ge4 melts congruently at 720 °C. Further, thephases Li9Ge4 and Li7Ge12 are not known in the Li–Si system.In particular, the synthesis of a hypothetical phase Li7Si12would be an intriguing field of research since it may serve as aprecursor for a new allotrope of Si, just as was reported forLi7Ge12 and its mild oxidation to allo-Ge.36,51
Fig. 6 Trend of cell volumes vs. Ge contents in Li17Si4−xGex (x = 0, 2.30(2),3.08(4), 3.53(3), 4). Cell parameters were determined from respectivePXRD patterns by Rietveld refinement (Fig. S2), and Ge contents wereobtained from either single crystal X-ray diffraction data or EDX (errorbars for a, V, and xsingle crystal (in at%) are smaller than data point icons).
Dalton Transactions Paper
This journal is © The Royal Society of Chemistry 2014 Dalton Trans.
Publ
ishe
d on
13
May
201
4. D
ownl
oade
d by
Tec
hnis
che
Uni
vers
itaet
Mue
nche
n on
05/
06/2
014
14:0
3:37
. View Article Online

Experimental sectionSynthesis
Starting materials were Li rods (99%, Rockwood-Lithium), Sipowder (99.999%, Alfa Aesar) and Ge pieces (99.999%,Chempur). All steps of synthesis and sample preparation werecarried out in a glove box (MBraun, Ar atmosphere, H2O andO2 levels <0.1 ppm). Ta and stainless steel ampules werethoroughly cleaned, heated to 1000 °C (Ta) or 800 °C (stainlesssteel) under dynamic vacuum (p < 1 × 10⁻³ mbar) for at least2 h and transferred to the glove box. An all-glass Schlenk line
supplied with Ar, which is dried over P2O5, molecular sieveand heated titanium sponge (T = 750 °C), was used for heatingand handling under inert conditions.
Large single crystals of Li17Ge4 and Li4.10Ge (Li16.38Ge4) (cf.Fig. 1) were obtained from equilibrating melts with compo-sitions “Li95Ge5” and “Li85Ge15” at temperatures of 400 and530 °C in Ta ampules (slow cooling from 700 °C at a rate of5 K h−1 followed by 48 hours dwelling at specified tempera-tures) and subsequent isothermal melt-centrifugation. Detailsof this procedure have already been described in ref. 9 and 52.Crystals of Li17Si4−xGex [x = 0, 2.30(2), 3.08(4), 3.53(3)] were
Fig. 7 PXRD patterns and corresponding DSC thermograms of bulk samples (a) Li17Ge4, (b) Li16.5Ge4, and (c) Li16Ge4 (PXRD patterns: experimental =black, Li17Ge4 (calc.) = yellow, Li4.10Ge (calc.) = blue, Li15Ge4 (calc.) = red; DSC thermograms: heating and cooling traces are shown in red and blue,respectively, a signal assignment is given in the Li–Ge phase diagram in Fig. 8b).
Paper Dalton Transactions
Dalton Trans. This journal is © The Royal Society of Chemistry 2014
Publ
ishe
d on
13
May
201
4. D
ownl
oade
d by
Tec
hnis
che
Uni
vers
itaet
Mue
nche
n on
05/
06/2
014
14:0
3:37
. View Article Online

grown analogously in stainless steel ampules from melts withcompositions “Li90Si10”, “Li90Si7.5Ge2.5”, “Li90Si5Ge5” and“Li90Si2.5Ge7.5” equilibrated at 450 °C.
Furthermore, elemental mixtures with compositionsLi17Ge4, “Li16.5Ge4” and “Li16Ge4” with a total amount of 2.5 geach were loaded into Ta ampules which were sealed by arcwelding inside the glove box. For achieving targeted compo-sitions with sufficient precision, a batch size of 2.5 g wasdeemed appropriate to keep weighing errors minimal.9,10 Sub-sequently, ampules were sealed in silica jackets under vacuumand annealed in a muffle furnace. The temperature was raised
to 750 °C at a rate of 10 K min−1 and held for 0.5 h followed bycooling to 500–550 °C at a rate of 10 K min−1. After a dwelltime of one hour, ampules were quenched in water and trans-ferred back to the glove box. Obtained products were groundin agate mortars and characterized by powder X-ray diffraction(cf. Fig. 7).
Differential scanning calorimetry (DSC)
Differential scanning calorimetry was carried out with aNetzsch DSC 404 Pegasus apparatus. Cylindrical Nb crucibles(L = 15.0 mm, OD = 6.5 mm, ID = 5.0 mm) were thoroughly
Fig. 8 (a) Excerpt of the Li–Ge phase diagram as reported from Grüttner25 (the composition of the eutectic between Li15Ge4 and Li13Ge4 was notdetermined), (b) its revision based on DSC investigations and annealing experiments of “Li16Ge4” samples reported herein, and (c) the most recentLi–Si phase diagram for Li concentrations >76%.10
Dalton Transactions Paper
This journal is © The Royal Society of Chemistry 2014 Dalton Trans.
Publ
ishe
d on
13
May
201
4. D
ownl
oade
d by
Tec
hnis
che
Uni
vers
itaet
Mue
nche
n on
05/
06/2
014
14:0
3:37
. View Article Online

cleaned, heated to 1000 °C under dynamic vacuum (p < 1 ×10⁻³ mbar) for 2 h and transferred to an Ar-filled glove box.Crucibles were loaded with 30–50 mg of the sample (Li17Ge4,“Li16.5Ge4” and “Li16Ge4”). Subsequently, the open end wasroughly closed by crimping and then sealed by arc-weldinginside the glove box under cooling. A sealed Nb cruciblewithout the sample served as a reference. For all measure-ments an Ar-flow of 60–70 mL min−1 and a heating/coolingrate of 10 K min−1 were used. Samples were recovered after themeasurement inside an Ar-filled glove box. Data were handledwith the program Proteus Thermal Analysis.53
Annealing experiments
In order to further investigate the thermodynamic stability ofLi4.10Ge (Li16.38Ge4), batches of 100–150 mg of “Li16Ge4” bulkmaterial were sealed in Ta ampules and annealed in a mufflefurnace at 200, 400 and 510 °C (10 K min−1 heating rate) forthree days. Thereafter, ampules were quenched in water andtransferred inside an Ar-filled glove box. Products were groundin agate mortars and subsequently characterized by powderX-ray diffraction (Fig. S1†).
Single crystal X-ray diffraction and structure determination
Crystals of Li17Ge4 and Li4.096(4)Ge (Li16.38(2)Ge4) were handledin an Ar-filled glove box, selected under a microscope andsealed inside glass capillaries. For the best specimen, intensitydata were collected at room temperature (Li17Ge4) and 123 K(Li16.38(2)Ge4) on a Bruker X-ray diffractometer equipped with aCCD detector (Apex II, κ-CCD), a fine-focused sealed tube withMoKα radiation (λ = 0.71073 Å) and a graphite monochromatorusing the Bruker Apex2 software.54 Integration, data reductionand absorption correction were done using SAINT andSADABS.55,56 The space groups F43m (Li17Ge4) and Cmcm(Li16.38(2)Ge4) were assigned on the basis of the systematicabsence and the statistical analysis of the intensity distri-butions. For Li17Ge4, Friedel pairs were not merged since theassigned space group is non-centrosymmetric. The Flack57 par-ameter was determined as 0.50(3). The structures were solvedby direct methods (Shelxs-9758) and refined with full-matrixleast squares on F2 (Shelxl-9759). Difference Fourier mapsFo − Fc were calculated with Jana2006.60 All refinement resultsare compiled in Table 6.
Details of the single crystal X-ray structure determination,refinement data, fractional atomic coordinates and isotropicequivalent atomic displacement parameters for Li17Si4−xGex [(x =2.30(2), 3.08(4), 3.53(3)] are given in Table S1–4 in the ESI.†Further data may be obtained from FachinformationszentrumKarlsruhe, D-76344 Eggenstein-Leopoldshafen, Germany (fax:(+49)7247-808-666; e-mail: [email protected]) on quotingthe depository numbers CSD-427231 (Li4.10Ge (Li16.38Ge4)),CSD-427232 (Li17Ge4), CSD-427233 (Li17Si0.47Ge3.53), CSD-427234(Li17Si0.92Ge3.08), and CSD-427235 (Li17Si1.70Ge2.30).
Powder X-ray diffraction (PXRD)
PXRD patterns were recorded on a Stoe Stadi P diffractometer(Ge(111) monochromator for CuKα1 radiation, λ = 1.54056 Å)
equipped with a Dectris Mythen DCS 1 K solid state detector.Investigated samples were (i) single crystals of Li17Si4−xGex (x =0, 2.30(2), 3.08(4), 3.53(3), 4), (ii) bulk samples of Li17Ge4,“Li16.5Ge4” and “Li16Ge4”, and (iii) samples of “Li16Ge4”annealed at different temperatures. These were thoroughlyground in agate mortars, sealed inside 0.3 mm glass capil-laries and measured in a 2θ-range of 5–90° (PSD steps:0.06–1.00°; time per step: 20–40 s).
Energy dispersive X-ray spectroscopy (EDX)
A Jeol-JSM 7500F scanning electron microscope equipped withan Oxford X-Max EDX analyzer with Mn as an internal stan-dard was used for determining the Si–Ge ratios in Li17Si4−xGex[x = 2.30(2), 3.08(4), 3.53(3)]. Samples were handled inside anAr-filled glove box and fixed on a graphite platelet which wasmounted on an aluminum stub.
Acknowledgements
M.Z. thanks the Fonds der Chemischen Industrie for his fellow-ship, the authors thank K. Rodewald for EDX measurements.
Table 6 Crystallographic data and structure refinement for Li17Ge4 andLi4.096(4)Ge
Empirical formula Li17Ge4 Li4.096(4)GeT/K 298(2) 123(2)Formula weight/g·mol−1 408.34 101.01Crystal size/mm3 0.40 × 0.40 × 0.35 0.37 × 0.24 × 0.23Crystal color Metallic silver Metallic silverCrystal shape Block BarSpace group F43m CmcmStructure type Li17Pb4 Li4.11SiUnit cell dimension/Å a = 18.8521(3) a = 4.5511(2)
b = 22.0862(7)c = 13.2751(4)
V/Å3 6700.1(2) 1334.37(8)Z 20 16ρ (calc.)/g cm−3 2.024 2.011μ/mm−1 8.832 8.860F (000) 3580 709θ Range/° 1.87–45.26 1.84–40.25Index range hkl −37 ≤ h ≤ +23 −6 ≤ h ≤ +8
−37 ≤ k ≤ +30 −32 ≤ k ≤ +40−37 ≤ l ≤ +37 −24 ≤ l ≤ +19
Reflections collected 67 542 15 241Independent reflections 2757 (Rint =
0.047)2369 (Rint =0.023)
Reflections with I > 2σ(I) 2547 (Rσ = 0.017) 1920 (Rσ = 0.017)Data/restraints/parameter 2757/0/68 2369/0/82Absorption correction Multi-scan Multi-scanGoodness-of-fit on F2 1.106 1.042Final R indices [I > 2σ(I)]a,b R1 = 0.018 R1 = 0.015
wR2 = 0.037 wR2 = 0.026R indices (all data)a,b R1 = 0.022 R1 = 0.023
wR2 = 0.038 wR2 = 0.027Extinction coefficient 1.59(9) × 10−4 1.52(7) × 10−3
Flack parameter 0.50(3) —Largest diff. peak and hole/eÅ−3
0.46 and −0.69 0.69 and −0.52
a R1 = ∑||Fo|−|Fc||/∑|Fo|.bwR2 = [∑w(Fo
2 − Fc2)2/∑w(Fo
2)2]1/2.
Paper Dalton Transactions
Dalton Trans. This journal is © The Royal Society of Chemistry 2014
Publ
ishe
d on
13
May
201
4. D
ownl
oade
d by
Tec
hnis
che
Uni
vers
itaet
Mue
nche
n on
05/
06/2
014
14:0
3:37
. View Article Online

References
1 M. N. Obrovac and L. Christensen, Electrochem. Solid-StateLett., 2004, 7, A93–A96.
2 T. D. Hatchard and J. R. Dahn, J. Electrochem. Soc., 2004,151, A838–A842.
3 W. J. Zhang, J. Power Sources, 2011, 196, 13–24.4 P. Limthongkul, Y. I. Jang, N. J. Dudney and Y. M. Chiang,
Acta Mater., 2003, 51, 1103–1113.5 P. Limthongkul, Y. I. Jang, N. J. Dudney and Y. M. Chiang,
J. Power Sources, 2003, 119–121, 604–609.6 B. Key, M. Morcrette, J. M. Tarascon and C. P. Grey, J. Am.
Chem. Soc., 2011, 133, 503–512.7 B. Key, R. Bhattacharyya, M. Morcrette, V. Seznec,
J. M. Tarascon and C. P. Grey, J. Am. Chem. Soc., 2009, 131,9239–9249.
8 M. Zeilinger, V. Baran, L. van Wüllen, U. Häussermann andT. F. Fässler, Chem. Mater., 2013, 25, 4113–4121.
9 M. Zeilinger, D. Benson, U. Häussermann and T. F. Fässler,Chem. Mater., 2013, 25, 1960–1967.
10 M. Zeilinger, I. M. Kurylyshyn, U. Häussermann andT. F. Fässler, Chem. Mater., 2013, 25, 4623–4632.
11 M. Zeilinger and T. F. Fässler, Acta Crystallogr., Sect.E: Struct. Rep. Online, 2013, 69, i81–i82.
12 D. Thomas, M. Abdel-Hafiez, T. Gruber, R. Hüttl, J. Seidel,A. U. B. Wolter, B. Büchner, J. Kortus and F. Mertens,J. Chem. Thermodyn., 2013, 64, 205–225.
13 P. Wang, A. Kozlov, D. Thomas, F. Mertens and R. Schmid-Fetzer, Intermetallics, 2013, 42, 137–145.
14 A. Debski, W. Gasior and A. Goral, Intermetallics, 2012, 26,157–161.
15 S. Dupke, T. Langer, R. Pöttgen, M. Winter, S. Passeriniand H. Eckert, Phys. Chem. Chem. Phys., 2012, 14, 6496–6508.
16 S. Dupke, T. Langer, R. Pöttgen, M. Winter and H. Eckert,Solid State Nucl. Magn. Reson., 2012, 42, 17–25.
17 A. Kuhn, P. Sreeraj, R. Pöttgen, H. D. Wiemhöfer,M. Wilkening and P. Heitjans, J. Am. Chem. Soc., 2011, 133,11018–11021.
18 G. R. Goward, N. J. Taylor, D. C. S. Souza and L. F. Nazar,J. Alloys Compd., 2001, 329, 82–91.
19 C. S. Fuller and J. C. Severiens, Phys. Rev., 1954, 96, 21–24.20 J. Graetz, C. C. Ahn, R. Yazami and B. Fultz, J. Electrochem.
Soc., 2004, 151, A698–A702.21 E. M. Pell, J. Phys. Chem. Solids, 1957, 3, 74–76.22 G. I. Oleksiv, Probl. Rozvitku Prirodn. i Tochn. Nauk, Sb.,
1964, 76–77.23 P. I. Federov and V. A. Molochka, Izv. Akad. Nauk. SSSR,
Neorg. Mater., 1966, 2, 1870–1871.24 R. Nesper, Prog. Solid State Chem., 1990, 20, 1–45.25 A. Grüttner, PhD thesis, University of Stuttgart, 1982.26 A. Grüttner, R. Nesper and H. G. von Schnering, Acta Crys-
tallogr., Sect. A: Cryst. Phys., Diffr., Theor. Gen. Cryst., 1981,37, C161.
27 E. I. Gladyshevskii, G. I. Oleksiv and P. I. Kripyakevich, Kris-tallografiya, 1964, 9, 338–341.
28 Q. Johnson, G. S. Smith and D. Wood, Acta Crystallogr.,1965, 18, 131–132.
29 E. I. Gladyshevskii and P. I. Kripyakevich, Kristallografiya,1960, 5, 574–576.
30 R. Nesper, Habilitation, University of Stuttgart, 1988.31 V. Hopf, W. Müller and H. Schäfer, Z. Naturforsch., B:
Anorg. Chem. Org. Chem., 1972, 27, 1157–1160.32 V. Hopf, H. Schäfer and A. Weiss, Z. Naturforsch., B: Anorg.
Chem. Org. Chem., 1970, 25, 653.33 H. G. von Schnering, R. Nesper, J. Curda and K. F. Tebbe,
Angew. Chem., 1980, 92, 1070.34 E. Menges, V. Hopf, H. Schäfer and A. Weiss, Z. Natur-
forsch., B: Anorg. Chem. Org. Chem., 1969, 21, 1351–1352.According to ref. 25, the structures of LiGe reported in ref.22 and 34 are identical (only two different cell settings).
35 J. Evers, G. Oehlinger, G. Sextl and H. O. Becker, Angew.Chem., Int. Ed. Engl., 1987, 26, 76–78.
36 A. Grüttner, R. Nesper and H. G. von Schnering, Angew.Chem., Int. Ed. Engl., 1982, 21, 912–913.
37 U. Frank and W. Müller, Z. Naturforsch., B: Anorg. Chem.Org. Chem., 1975, 30, 313–315.
38 R. Nesper, J. Curda and H. G. von Schnering, J. Solid StateChem., 1986, 62, 199–206.
39 J. Evers, G. Oehlinger and G. Sextl, Angew. Chem., Int. Ed.Engl., 1993, 32, 1442–1444.
40 J. Evers and G. Oehlinger, Angew. Chem., Int. Ed., 2001, 40,1050–1053.
41 F. Kiefer and T. F. Fässler, Solid State Sci., 2011, 13, 636–640.
42 Y. Hashimoto, N. Machida and T. Shigematsu, Solid StateIonics, 2004, 175, 177–180.
43 L. Vegard, Z. Phys., 1921, 5, 17–26.44 C. Lupu, J. G. Mao, J. W. Rabalais, A. M. Guloy and
J. W. Richardson, Inorg. Chem., 2003, 42, 3765–3771.45 H. Axel, H. Schäfer and A. Weiss, Z. Naturforsch., B: Anorg.
Chem. Org. Chem., 1966, 21, 115–117.46 R. Nesper and H. G. von Schnering, J. Solid State Chem.,
1987, 70, 48–57.47 L. Lacroix-Orio, M. Tillard and C. Belin, J. Alloys Compd.,
2008, 465, 47–50.48 G. J. Miller, Eur. J. Inorg. Chem., 1998, 523–536.49 N. Kazem, W. Xie, S. Ohno, A. Zevalkink, G. J. Miller,
G. J. Snyder and S. M. Kauzlarich, Chem. Mater., 2014, 26,1393–1403.
50 J. Sangster and A. D. Pelton, J. Phase Equilib., 1997, 18,289–294 and references therein.
51 F. Kiefer, A. J. Karttunen, M. Döblinger and T. F. Fässler,Chem. Mater., 2011, 23, 4578–4586.
52 K. Puhakainen, M. Boström, T. L. Groy andU. Häussermann, J. Solid State Chem., 2010, 183, 2528–2533.
53 Netzsch Proteus Thermal Analysis, Version 4.8.2, Netzsch-Gerätebau GmbH, Selb, Germany, 2006.
54 APEX suite of crystallographic software, APEX 2 Version2008.4, Bruker AXS Inc., Madison, WI, USA, 2008.
55 SAINT, Version 7.56a, Bruker AXS Inc., Madison, WI, USA,2008.
Dalton Transactions Paper
This journal is © The Royal Society of Chemistry 2014 Dalton Trans.
Publ
ishe
d on
13
May
201
4. D
ownl
oade
d by
Tec
hnis
che
Uni
vers
itaet
Mue
nche
n on
05/
06/2
014
14:0
3:37
. View Article Online
56 SADABS, Version 2008/1, Bruker AXS Inc., Madison, WI,USA, 2008.
57 H. D. Flack, Acta Crystallogr., Sect. A: Fundam. Crystallogr.,1983, 39, 876.
58 G. M. Sheldrick, Shelxs-97 – Program for the Determinationof Crystal Structures, University of Göttingen, Göttingen,Germany, 1997.
59 G. M. Sheldrick, Shelxl-97 – Program for Crystal StructureRefinement, University of Göttingen, Göttingen, Germany,1997.
60 V. Petricek, M. Dusek and L. Palatinus, Jana 2006:The Crystallographic Computing System, Version 03/15/2013, Institute of Physics, Praha, Czech Rupublic,2006.
Paper Dalton Transactions
Dalton Trans. This journal is © The Royal Society of Chemistry 2014
Publ
ishe
d on
13
May
201
4. D
ownl
oade
d by
Tec
hnis
che
Uni
vers
itaet
Mue
nche
n on
05/
06/2
014
14:0
3:37
. View Article Online

S1
SUPPORTING INFORMATION
Structural and Thermodynamic Similarities of Phases in the Li–Tt
(Tt = Si, Ge) Systems: Redetermination of the Lithium-Rich Side of the
Li–Ge Phase Diagram and Crystal Structures of Li17Si4.0−xGex
for x = 2.3, 3.1, 3.5, and 4 as well as Li4.1Ge
Michael Zeilinger and Thomas F. Fässler*
Department Chemie, Technische Universität München, Lichtenbergstraße 4,
85747 Garching b. München, Germany
Details on the structure refinement of Li4.096(4)Ge
The structure of Li16.38(2)Ge4 is isotypic with Li4.11Si (Li16.42(1)Si4) and the disorder model
highlighted in this article corresponds to the one reported for Li16.42(1)Si4. Atom positions Li4A
on 4c (½, y, ¼), Li4B on 8g (x, y, ¼), and Li5 on 8f (0, x, y) are affected by disorder
(cf. Table 2). A free refinement of occupancy factors for Li4A and Li4B delivers values of
0.669(15) und 0.390(8). Within standard deviations (3σ), those values are in agreement with
refinement results using the constraint occ(Li4A) + occ(Li4B) = 1 (0.616(8) and 0.384(8))
which excludes their simultaneous occupancy since otherwise meaningless Li–Li distances are
observed.
For Li5 on 8f (0, x, y), a split position was introduced. The split fractions converged to
0.25(4) and 0.75(4) which is identical with results obtained from a free refinement of
occupancy factors for these positions (0.74(4) and 0.25(4)). The R-values of the final model are
R1 = 0.023 and wR2 = 0.027 for all data and residual electron densities are +0.69 e·Å−3 and
−0.52 e·Å−3. Ignoring the atom split, the reliability factors for all data are slightly higher
(R1 = 0.024 and wR2 = 0.030) but significant residual electron density is almost exactly located
at the former Li5B position (+1.134 e·Å−3).
Regarding the relevance of the atom split for Li5, it demonstrates structural flexibility
which comes along with the disorder of Li4A and Li4B. In detail, if position Li4B is occupied,
a simultaneous occupancy of Li5B is excluded due to unreasonably short Li–Li distances
(2.02(4) Å). In case of an occupied Li4A site, either Li5A or Li5B can be occupied (2.86(3) Å
(Li4A–Li5B), 3.220(7) Å (Li4A–Li5B)).
Electronic Supplementary Material (ESI) for Dalton Transactions.This journal is © The Royal Society of Chemistry 2014

S2
Li17Si4−xGex [x = 2.30(2), 3.08(4), 3.53(3)]: Single Crystal X-ray diffraction and
crystallographic details
The preparation of crystals from Li17Si4−xGex [x = 2.30(2), 3.08(4), 3.53(3)] exactly follows the
procedure described in the main article. For Li17Si4−xGex [x = 2.30(2), 3.08(4)], single crystal
diffraction data were collected at 123 K on an OXFORD XCALIBUR3 diffractometer (SAPPHIRE3
CCD detector) equipped with a graphite monochromated MoKα radition (λ = 0.71073 Å) using
the Oxford CrysAlisRED software.1 Empirical absorption correction was carried out with the
SCALE3 ABSPACK scaling algorithm as implemented in CRYSALISRED. For Li17Si0.47(3)Ge3.53(3),
intensity data were collected at 123 K on a BRUKER X-ray diffractometer equipped with a CCD
detector (APEX II, κ-CCD), a rotating anode (NONIUS, FR591) with MoKα radiation
(λ = 0.71073 Å) and a Montel mirror using the BRUKER APEX Software Suite.2 Integration, data
reduction and absorption correction was done with SAINT and SADABS.3, 4
In case of Li17Si0.92(4)Ge3.08(4), penetration twinning along [1 1 1] was detected (twin
fraction 0.45). Only single reflections of the main domain were used, composite reflections
from both domains were omitted. For all compounds, the space group F43m was assigned on
the basis of the systematic absences and the statistical analysis of the intensity distributions.
Since F43m is non-centrosymmetric, only identical indices were merged. Fractional atomic
coordinates and atomic displacement parameters for Si/Ge mixed sites were set equal. The
structures were solved with direct methods (SHELXS-97) and refined with full-matrix least
squares on F2 (SHELXL-97).5, 6 Table S1–S4 list refinement results, fractional atomic
coordinates, and isotropic equivalent atomic displacement parameters for Li17Si4−xGex
[x = 2.30(2), 3.08(4), 3.53(3)].

S3
Table S1. Crystallographic data and structure refinement for Li17Si4−xGex [x = 2.30(2), 3.08(4), 3.53(3)].
empirical formula Li17Si1.70(2)Ge2.30(2) Li17Si0.92(4)Ge3.08(4) Li17Si0.47(3)Ge3.53(3)
T / K 123(2) 123(2) 123(2)
diffractometer Oxford Xcalibur Oxford Xcalibur Bruker APEX II
formula weight / g·mol−1 332.69 367.44 387.34
crystal size / mm3 0.20 × 0.20 × 0.10 0.10 × 0.10 × 0.10 0.20 × 0.20 × 0.15
crystal color metallic silver metallic silver metallic silver
crystal shape block block block
space group F43m F43m F43m
structure type Li17Pb4 Li17Pb4 Li17Pb4
unit cell dimension / Å a = 18.7125(1) a = 18.7515(2) a = 18.7721(5)
V / Å3 6552.33(6) 6593.4(1) 6615.1(3)
Z 20 20 20
ρ (calc.) / (g·cm−3) 1.686 1.851 1.945
μ / mm−1 5.354 6.995 7.928
F (000) 2968 3249 3410
- range / ° 3.61–30.45 3.07–30.00 2.17–30.03
index range hkl −26 ≤ h ≤ +14,
−26 ≤ k ≤ +26,
−26 ≤ l ≤ +26
−26 ≤ h ≤ +25,
−26 ≤ k ≤ +26,
−26 ≤ l ≤ +26
−26 ≤ h ≤ +18,
−26 ≤ k ≤ +19,
−24 ≤ l ≤ +22
reflections collected 31663 26446 19618
independent reflections 1035 (Rint = 0.032) 952 (Rint = 0.061) 1019 (Rint = 0.041)
reflections with I > 2σ(I) 991 (Rσ = 0.010) 880 (Rσ = 0.021) 1016 (Rσ = 0.015)
data/restraints/parameter 1035/0/72 952/0/72 1019/0/72
absorption correction multi-scan multi-scan multi-scan
goodness-of-fit on F2 1.260 1.000 1.202
Final R indices [I > 2σ(I)]a, b R1 = 0.016 R1 = 0.022 R1 = 0.014
wR2 = 0.036 wR2 = 0.047 wR2 = 0.036
R indices (all data)a, b R1 = 0.017 R1 = 0.025 R1 = 0.014
wR2 = 0.036 wR2 = 0.048 wR2 = 0.037
extinction coefficient 4.4(3)×10−4 2.4(3)×10−4 0.9(1)×10−4
Flack parameter 0.42(3) 0.54(5) 0.54(3)
Largest diff. peak and
hole / e·Å−3
0.45 and −0.28 0.32 and −0.26 0.28 and −0.37
a R1 = ∑││Fo│−│Fc││ ⁄ ∑│Fo│ b wR2 = [∑w(Fo
2−Fc2)2/∑w(Fo
2)2]1/2

S4
Table S2. Fractional atomic coordinates and isotropic equivalent atomic displacement parameters for
Li17Si1.70(2)Ge2.30(2) (F43m, Z = 20, T = 123 K, estimated standard deviations in parentheses).
Atom Wyckoff
position
x y z Ueq
/ (Å2·10−3)
s.o.f.
Si/Ge1 16e 0.15972(2) x x 7.2(2) 0.41(1) / 0.59(1)
Si/Ge2 16e 0.91675(2) x x 6.6(2) 0.522(9) / 0.478(9)
Si/Ge3 24f 0.32154(3) 0 0 7.6(2) 0.39(1) / 0.61(1)
Si/Ge4 24g 0.57001(3) ¼ ¼ 7.8(1) 0.40(1) / 0.60(1)
Li1 16e 0.0743(3) x x 16(2) 1
Li2 16e 0.3027(2) x x 11(1) 1
Li3 16e 0.4187(3) x x 12(1) 1
Li4 16e 0.5573(2) x x 12(1) 1
Li5 16e 0.6882(2) x x 15(1) 1
Li6 16e 0.8325(2) x x 19(2) 1
Li7 24f 0.1686(4) 0 0 19(2) 1
Li8 24g 0.0746(3) ¼ ¼ 10(2) 1
Li9 48h 0.0909(2) x 0.2625(3) 19(1) 1
Li10 48h 0.0907(2) x 0.7609(3) 21(1) 1
Li11 48h 0.1550(2) x 0.5211(2) 21(1) 1
Li12 48h 0.1632(2) x 0.0026(3) 12(1) 1
Li13 4a 0 0 0 13(3) 1

S5
Table S3. Fractional atomic coordinates and isotropic equivalent atomic displacement parameters for
Li17Si0.92(4)Ge3.08(4) (F43m, Z = 20, T = 123 K, estimated standard deviations in parentheses).
Atom Wyckoff
position
x y z Ueq
/ (Å2·10−3)
s.o.f.
Si/Ge1 16e 0.15999(3) x x 9.5(2) 0.22(2) / 0.78(2)
Si/Ge2 16e 0.91708(3) x x 8.6(2) 0.30(2) / 0.70(2)
Si/Ge3 24f 0.32192(4) 0 0 9.6(2) 0.22(2) / 0.78(2)
Si/Ge4 24g 0.56959(4) ¼ ¼ 10.8(2) 0.21(2) / 0.79(2)
Li1 16e 0.0732(5) x x 29(4) 1
Li2 16e 0.3019(3) x x 17(2) 1
Li3 16e 0.4186(5) x x 20(3) 1
Li4 16e 0.5578(3) x x 16(2) 1
Li5 16e 0.6893(4) x x 20(3) 1
Li6 16e 0.8329(5) x x 45(5) 1
Li7 24f 0.1694(7) 0 0 27(5) 1
Li8 24g 0.0755(6) ¼ ¼ 12(4) 1
Li9 48h 0.0910(4) x 0.2622(4) 22(2) 1
Li10 48h 0.0919(5) x 0.7631(6) 41(3) 1
Li11 48h 0.1553(3 x 0.5218(4) 23(2) 1
Li12 48h 0.1636(3) x 0.0031(5) 15(2) 1
Li13 4a 0 0 0 17(6) 1

S6
Table S4. Fractional atomic coordinates and isotropic equivalent atomic displacement parameters for
Li17Si0.47(3)Ge3.53(3) (F43m, Z = 20, T = 123 K, estimated standard deviations in parentheses).
Atom Wyckoff
position
x y z Ueq
/ (Å2·10−3)
s.o.f.
Si/Ge1 16e 0.15962(1) x x 7.5(1) 0.10(1) / 0.90(1)
Si/Ge2 16e 0.91657(1) x x 6.2(1) 0.18(1) / 0.82(1)
Si/Ge3 24f 0.32124(2) 0 0 7.3(1) 0.10(1) / 0.90(1)
Si/Ge4 24g 0.57034(2) ¼ ¼ 7.3(1) 0.11(1) / 0.89(1)
Li1 16e 0.0740(3) x x 20(2) 1
Li2 16e 0.3028(2) x x 14(1) 1
Li3 16e 0.4179(3) x x 14(2) 1
Li4 16e 0.5573(2) x x 14(1) 1
Li5 16e 0.6872(2) x x 15(1) 1
Li6 16e 0.8317(2) x x 18(2) 1
Li7 24f 0.1672(4) 0 0 19(2) 1
Li8 24g 0.0747(3) ¼ ¼ 12(2) 1
Li9 48h 0.0908(2) x 0.2622(3) 22(1) 1
Li10 48h 0.0900(2) x 0.7614(3) 18(1) 1
Li11 48h 0.1553(2) x 0.5197(2) 17.1(9) 1
Li12 48h 0.1633(2) x 0.0018(3) 14(1) 1
Li13 4a 0 0 0 8(3) 1

S7
Table S5.8 Comparison of experimental and computational relaxed fractional atomic coordinates for
Li21Si57, 8 (aexp. = 18.710(2) Å (T = 298 K), acalc. = 18.55411 Å, F43m, Z = 16) and Li17Si4
8
(aexp. = 18.6563(2) Å (T = 123 K) and acalc.. = 18.57319 Å, F43m, Z = 20). Estimated standard
deviations are given in parentheses; most differing Li1 is marked in bold.
Atom Wyck. pos.
x (Li21Si5) x (Li21Si5
calc.) z
(Li21Si5) z (Li21Si5
calc.) x (Li17Si4)
x (Li17Si4
calc.) z (Li17Si4)
z (Li17Si4
calc.) Tt1 16e 0.1595(2) 0.1605 x x 0.15976(1) 0.1600 x x Tt2 16e 0.9175(2) 0.9149 x x 0.91660(1) 0.9167 x x Tt3 24f 0.3220(3) 0.3219 0 0 0.32133(1) 0.3215 0 0 Tt4 24g 0.5691(3) 0.5700 ¼ ¼ 0.57031(1) 0.5708 ¼ ¼ Li1 16e 0.071(2) 0.0553 x x 0.07410(6) 0.0750 x x Li2 16e 0.304(1) 0.3027 x x 0.30284(5) 0.3031 x x Li3 16e 0.417(1) 0.4189 x x 0.41794(7) 0.4180 x x Li4 16e 0.559(2) 0.5572 x x 0.55713(5) 0.5572 x x Li5 16e 0.688(2) 0.6862 x x 0.68687(5) 0.6867 x x Li6 16e 0.829(1) 0.8301 x x 0.83168(6) 0.8311 x x Li7 24f 0.174(2) 0.1725 0 0 0.16807(8) 0.1691 0 0 Li8 24g 0.073(2) 0.0747 ¼ ¼ 0.07492(9) 0.0750 ¼ ¼ Li9 48h 0.092(1) 0.0910 0.262(1) 0.2630 0.09068(4) 0.0907 0.26186(6) 0.2616 Li10 48h 0.088(1) 0.0905 0.761(1) 0.7616 0.09013(5) 0.0900 0.76176(6) 0.7604 Li11 48h 0.153(1) 0.1550 0.521(1) 0.5203 0.15503(4) 0.1551 0.51978(6) 0.5193 Li12 48h 0.164(1) 0.1607 0.000(1) 0.0068 0.16327(4) 0.1635 0.00286(7) 0.0029 Li13 4a - - - - 0 0 0 0
Table S6. Comparison of experimental fractional atomic coordinates for Li17Si48
(a = 18.6563(2) Å,
T = 123 K), Li17Ge4 (a = 18.8521(3) Å, T = 298 K), Li17−εZnεGe49 (a = 18.842(1) Å, T = 173 K), and
Li16.95Ge410
(a = 18.756(2) Å, T = 160 K; space group F43m, Z = 20). Estimated standard deviations
are given in parentheses.
Atom Wyck.
pos. x (Li17Si4) x (Li17Ge4)
x (Li17−εZnεGe4)
x (Li16.95Ge4)
z (Li17Si4) z
(Li17Ge4) z
(Li17−εZnεGe4) z
(Li16.95Ge4) Tt1 16e 0.15976(1) 0.15955(1) 0.15958(2) 0.15952(5) x x x x Tt2 16e 0.91660(1) 0.91657(1) 0.91667(3) 0.91684(5) x x x x Tt3 24f 0.32133(1) 0.32102(1) 0.32118(4) 0.32112(7) 0 0 0 0 Tt4 24g 0.57031(1) 0.57015(1) 0.57020(4) 0.56965(7) ¼ ¼ ¼ ¼
Li1A 16e 0.07410(6) 0.0734(2) 0.0747(6) 0.0775 x x x x Li1B 16e - - - 0.0587 - - - x Li2 16e 0.30284(5) 0.3031(2) 0.3033(3) 0.3032(6) x x x x Li3 16e 0.41794(7) 0.4175(2) 0.4179(5) 0.4169(9) x x x x Li4 16e 0.55713(5) 0.5575(2) 0.5584(4) 0.5579(6) x x x x Li5 16e 0.68687(5) 0.6877(2) 0.6864(4) 0.6876(7) x x x x Li6 16e 0.83168(6) 0.8314(2) 0.8331(4) 0.8329(7) x x x x Li7 24f 0.16807(8) 0.1677(3) 0.1678(6) 0.170(1) 0 0 0 0 Li8 24g 0.07492(9) 0.0743(3) 0.0740(6) 0.075(1) ¼ ¼ ¼ ¼ Li9 48h 0.09068(4) 0.0913(2) 0.0906(3) 0.0907(7) 0.26186(6) 0.2624(2) 0.2631(4) 0.2660(8)
Li10 48h 0.09013(5) 0.0896(2) 0.0904(4) 0.0914(7) 0.76176(6) 0.7612(2) 0.7613(4) 0.7597(9) Li11 48h 0.15503(4) 0.1547(1) 0.1554(3) 0.1540(5) 0.51978(6) 0.5205(2) 0.5216(4) 0.5216(9) Li12 48h 0.16327(4) 0.1637(1) 0.1632(3) 0.1625(5) 0.00286(7) 0.0027(2) 0.0025(5) 0.005(1) Li13 4a 0 0 0 0 0 0 0 0 Zn1 4a - - 0 - - - 0 -

S8
Table S7. Comparison of experimental fractional atomic coordinates for Li16.95Ge410
(a = 18.756(2) Å,
T = 160 K; space group F43m, Z = 20) and computational relaxed ones for Li21Si58
(acalc. = 18.55411 Å, F43m, Z = 16). Estimated standard deviations are given in parentheses.
Atom Wyck. pos.
x (Li16.95Ge4) x (Li21Si5 calc.) z (Li16.95Ge4) z (Li21Si5 calc.)
Tt1 16e 0.15952(5) 0.1605 x x
Tt2 16e 0.91684(5) 0.9149 x x
Tt3 24f 0.32112(7) 0.3219 0 0
Tt4 24g 0.56965(7) 0.5700 ¼ ¼
Li1A 16e 0.0775 0.0553 x x
Li1B 16e 0.0587 - x -
Li2 16e 0.3032(6) 0.3027 x x
Li3 16e 0.4169(9) 0.4189 x x
Li4 16e 0.5579(6) 0.5572 x x
Li5 16e 0.6876(7) 0.6862 x x
Li6 16e 0.8329(7) 0.8301 x 0
Li7 24f 0.1697(12) 0.1725 0 0
Li8 24g 0.0752(12) 0.0747 ¼ ¼
Li9 48h 0.0907(7) 0.0910 0.2660(8) 0.2630
Li10 48h 0.0914(7) 0.0905 0.7597(9) 0.7616
Li11 48h 0.1540(5) 0.1550 0.5216(9) 0.5203
Li12 48h 0.1625(5) 0.1607 0.005(1) 0.0068
Li13 4a 0 - 0 -

S9
Figure S1. PXRD patterns of “Li16Ge4” samples annealed at 200, 400 and 510 °C in tantalum ampules
for three days followed by quenching in water (experimental = black, Li17Ge4 (calc.) = yellow, Li4.10Ge
(calc.) = blue, Li15Ge4 (calc.) = red).

S10
Figure S2. Rietveld11 fits of the Li17Si4 model to PXRD patterns of ground single crystals of
Li17Si4−xGex (x = 0, 2.30(2), 3.08(4), 3.53(3), 4).

S11
REFERENCES
1. CrysalisRED, Version 1.171.33.34d; Oxford Diffraction, UK, 2009.
2. APEX suite of crystallographic software, APEX 2 Version 2008.4, Bruker AXS Inc.,
Madison, WI, USA, 2008.
3. SAINT, Version 7.56a, Bruker AXS Inc., Madison, WI, USA, 2008.
4. SADABS, Version 2008/1, Bruker AXS Inc., Madison, WI, USA, 2008.
5. G. M. Sheldrick, Shelxs-97 — Program for the Determination of Crystal Structures,
University of Göttingen, Göttingen, Germany, 1997.
6. G. M. Sheldrick, Shelxl-97 — Program for Crystal Structure Refinement, University of
Göttingen, Göttingen, Germany, 1997.
7. R. Nesper and H. G. von Schnering, J. Solid State Chem., 1987, 70, 48–57.
8. M. Zeilinger, D. Benson, U. Häussermann and T. F. Fässler, Chem. Mater., 2013, 25,
1960–1967.
9. L. Lacroix-Orio, M. Tillard and C. Belin, J. Alloys Compd., 2008, 465, 47–50.
10. G. R. Goward, N. J. Taylor, D. C. S. Souza and L. F. Nazar, J. Alloys Compd., 2001,
329, 82–91.
11. TOPAS — Rietveld Software, Version 4.0; Bruker AXS Inc., Madison, WI, USA,
2009.


5 Publications and Manuscripts
79
5.6 Allotropism of Silicon: An Experimental Approach toward
Amorphous Si and a-allo-Si Based on Li15Si4 and Li3NaSi6
as well as Theoretical Models for allo-Si
Zeilinger, M.; Jantke, L. A.; Scherf, L. M.; Kiefer, F. J.; Konar, S.; Kienle, L.;
Karttunen, A. J.; Häussermann, U; Fässler, T. F. manuscript for publication.

5 Publications and Manuscripts
80
KEYWORDS
Amorphous silicon, a-Si, allo-Si, a-allo-Si, silicon allotropes, silicon polymorphs, allo-Si
structure models
ABSTRACT
A versatile chemical synthesis of amorphous silicon (a-Si) starting from Li15Si4 powder which
is easily accessible through high-energetic ball-milling is presented. Using a custom-built
extractor, lithium can be extracted from Li15Si4 through liquid ammonia. After a subsequent
aqueous treatment of the intermediate, a mixture of a-Si and LiNH2, a-Si is retained as a black
powder. a-Si samples were characterized by powder X-ray diffraction, infrared, Raman,
photoluminescence, atomic absorption and energy dispersive X-ray spectroscopy,
transmission electron microscopy, selected area electron diffraction as well as differential
thermal analysis. Those characterization methods revealed the presence of micro- and
nanosized particles, a slight surface oxidation after aqueous treatment, an amorphous-to-
crystalline phase transition at around 658 °C and conclusive evidence for the amorphous
nature of the samples. Further, we focused on the synthesis of allo-Si, a silicon allotrope
described in the 1980’s which can be obtained through oxidation of the phase Li3NaSi6.
Previous results from powder X-ray diffraction experiments could not be confirmed and were
shown to be ambiguous. Instead, depending on the crystallinity of the precursor, Li3NaSi6
undergoes a partial or full amorphization after treatment with protic solvents. The reaction
yields amorphous silicon which differs from ordinary a-Si regarding the amorphous-to-
crystalline transformation temperature ranging from 490 to 570 °C. However, the different
phase transition temperatures of a-Si and a-allo-Si are attributable to the large concentration
of α-Si crystallites (crystallization nuclei) in a-allo-Si samples. Conclusive characteristics that
would allow an unambiguous differentiation between a-allo-Si and a-Si were not found. There
are also strong indications that the XRD reflections reported earlier for allo-Si (ICSD-41-1111)
are identical to those of NbSi2. Therefore the results cast doubts on the existence of the silicon
polymorph allo-Si. Besides, quantum chemical calculations confirm that upon oxidation
Li3NaSi6 does not behave analogously to Li7Ge12 which is topotactically converted to
m-allo-Ge. Furthermore, the previously published TON zeolite-type structure (ZSM-22) was
found to be a product of a full structural relaxation starting from the Si substructure of
Li3NaSi6.

5.6 Allotropism of Silicon
81
1. INTRODUCTION
Exploring new allotropes of elements has been a challenging and intriguing field of
research ever since. In particular, the variety of properties of a single element that arises from
different structures are fascinating, such as the carbon allotropes graphite and diamond, the
former a conductive soft material being used as electrode and lubricant and the latter an
insulator and one of the hardest known materials. In general, the chemistry of group 14
elements, primarily silicon and germanium, was fueled by the demand for more efficient solar
cells, thermoelectric and superconducting materials or high-capacity lithium-ion batteries.
In this field a few crystalline phases, amorphous materials and most notably new
allotropes of germanium and silicon have been characterized. In particular, amorphous silicon
(a-Si) is widely used in thin film transistors and regarded as material for future photovoltaic
applications, exploiting its higher optical absorption coefficient for visible light than that of
crystalline silicon (c-Si).1,2 In 2005, McMillan et al.3 reported on a solid state synthesis route
for bulk samples of amorphous and nanocrystalline silicon or germanium. A solid state
metathesis reaction (SSM) between NaSi and NH4Cl at 200–300 °C is used to produce a-Si
beside NaBr, NH3, and H2. NaBr is subsequently removed by washing with water. Recently,
this method was taken on by Wang et al.4 to synthesize P-doped amorphous and
nanocrystalline silicon. Furthermore, bulk amorphous silicon can also be obtained from
crystalline Li–Si phases like Li15Si4 if those are electrochemically delithiated.5
Lastly, the discovery of novel allotropic forms of germanium and silicon decisively
influenced numerous work in the field of semiconducting materials. Examples of crystalline
materials are the clathrate-II-type porous structure Ge-cF136,6 hexagonal Ge (4H-Ge),7,8 and
allo-Ge/m-allo-Ge.7,9 Also mesoporous Ge-based materials have been reported.10-13 In the
case of silicon, the polymorph allo-Si was described briefly.14,15 allo-Si/allo-Ge have attracted
our attention since until lately none of these modifications have been unambiguously and
resolutely characterized regarding their structures. The reasons for that can primarily be
ascribed to their synthesis. m-allo-Ge9 is obtained by mild oxidation of Li7Ge12,7,16 a phase that
consists of two-dimensional polyanionic slabs 2∞[Ge12]7− which are separated by Li atoms
(Figure 1a). After reaction with protic solvents, interstitial Li is deintercalated and the topology
of those layers is retained under interlayer Ge–Ge bond formation. Turning to Si, allo-Si can
be synthesized analogously from Li3NaSi6.14,15 Similarly to Li7Ge12, Li3NaSi6 possesses
polyanionic layers 2∞[Si6]4− which are separated from each other by Li and Na atoms
(Figure 1b).

5 Publications and Manuscripts
82
Figure 1. Structures of a) Li7Ge12 and b) Li3NaSi6 revealing 2∞[Ge12]7− and 2
∞[Si6]4− layers (black),
respectively, that are separated by Li (red) and Na (yellow) atoms.
In the synthesis of both allotropes, microcrystalline (m-allo-Ge) or poorly
crystalline/heavily disordered samples (allo-Si) are afforded that do not allow a comprehensive
structure determination by single crystal X-ray diffraction.7,14,15 Yet, just recently the structure
model for m-allo-Ge could be improved significantly by a combination of selected area
electron diffraction (SAED), powder X-ray diffraction (PXRD), quantum chemical calculations
and simulated powder X-ray diffraction patterns,9 whereas the structure of allo-Si is still
completely unknown.14,15 Employing theoretical means, structure models for allo-Si and
several silicon allotropes were predicted.17-25
Herein, we present an alternative route for bulk amorphous silicon starting from Li15Si4
which is easily accessible through high-energetic ball-milling. A custom-built apparatus is
used to extract Li from Li15Si4 powder with liquid ammonia. a-Si is obtained after subsequent
aqueous treatment of the a-Si/LiNH2 intermediate. The reproduction of the previously reported
formation of allo-Si by the treatment of Li3NaSi6 with protic solvents also leads to an
amorphous phase which we named accordingly (a-allo-Si). However, a careful analysis of its
synthesis reveals strong indications that the reported Bragg reflections of allo-Si (ICSD 41-
1111) originated from NbSi2 which most probably was formed in small amounts during the
synthesis of Li3NaSi6 in Nb ampules. Although the thermal behavior of a-Si considerably
differs from that of a-allo-Si, conclusive evidence for the existence of allo-Si according to
reports in literature could not be found. In addition, the difficulties to obtain crystalline samples
of allo-Si were explained by quantum chemical calculations.

5.6 Allotropism of Silicon
83
2. EXPERIMENTAL SECTION
Synthesis. Starting materials were Li rods (99%, Rockwood-Lithium), Na rods (99%,
Chempur) and Si powder (99.999%, Sigma Aldrich). All steps for solid state synthesis and
preparation of air and moisture sensitive samples were carried out in a glove box (MBraun,
Ar-atmosphere, H2O and O2 levels < 0.1 ppm). Ta ampules were thoroughly cleaned, heated
to 1000 °C under dynamic vacuum (p < 1×10⁻³ mbar) for at least 2 h and transferred to the
glove box. Heating and handling under inert conditions was done using an all-glass Schlenk
line supplied with Ar which is dried over P2O5, molecular sieve and heated titanium sponge
(T = 750 °C).
Li12Si7, NaSi, Li15Si4 and Li3NaSi6. The binary precursors Li12Si7 and NaSi were
synthesized from stoichiometric mixtures of the elements with a total mass of 2.0 g each. The
reactions were carried out in Ta ampules which were encapsulated in silica jackets under
vacuum. Sample annealing was carried out in a muffle furnace. In case of Li12Si7, the
temperature was raised to 750 °C at 5 K∙min−1, followed by one hour dwelling, cooling to
400 °C at a rate of 0.5 K∙min−1, dwelling for six hours and subsequent quenching. For NaSi,
the temperature was raised stepwise to 600 °C (5 K∙min−1 to 500 °C, one hour dwelling,
5 K∙min−1 to 600 °C). After a dwell time of 30 hours a cooling rate of 5 K∙min−1 was applied.
Samples were recovered inside the glove box.
Li3NaSi6 was subsequently synthesized from a 1:4:13 molar mixture of Li12Si7, NaSi
(Figure S1), and α-Si (cf. Scheme 1) with a total mass of 0.5 g. Reactants were thoroughly
homogenized in an agate mortar, pressed to a pellet and sealed in a Ta ampule which was
then encapsulated in a silica jacket under vacuum.
Li12Si7 + 4 NaSi + 13 Si 4 Li3NaSi6
Scheme 1. Peritectoid reaction of Li12Si7, NaSi and α-Si yielding pure-phase Li3NaSi6.
The ampule was annealed in a muffle furnace applying a heating rate of 5 K∙min−1 to a
target temperature of 550 °C, allowing a dwell time of one day. After a slow cooling at
0.075 K∙min−1 the pure-phase sample is recovered inside the glove box. A sample of Li3NaSi6
containing a marginal α-Si impurity was synthesized from a 1:5:26 molar mixture of Li15Si4,
Na, and α-Si with a total mass of 2.0 g (Figure S7a). The reactants were homogenized by ball-
milling in a stainless steel jar using a RETSCH PM 100 planetary ball mill (duration: 70 min,
250 rpm, ball charge: 3, ball size: 15 mm diameter) and subsequently sealed in a Ta ampule
which was encapsulated in a silica jacket under vacuum thereafter. Annealing was carried out
in a muffle furnace as follows: 4 K∙min−1 to 600 °C, seven days dwelling, cooling to room

5 Publications and Manuscripts
84
temperature at a rate of 0.075 K∙min−1. The synthesis of Li15Si4 bulk material by ball-milling of
a stoichiometric mixture of Li and Si using a RETSCH PM 100 planetary ball mill follows the
description in ref. 26.
All synthesized samples were ground in agate mortars and analyzed by powder X-ray
diffraction. The PXRD patterns in Figure S1, S2 and 3a correspond to pure-phase Li12Si7, NaSi,
Li3NaSi6, and Li15Si4, respectively. A reaction of Si with the ampule material forming TaSi2 was
circumvented by comparatively low reaction temperatures and short reaction times.
a-Si. 0.5 g of Li15Si4 were loaded into a custom-built extractor for liquid ammonia
(Figure 2). Using liquid ammonia (WESTFALEN AG; dried over Na), Li was extracted from Li15Si4
under inert conditions at a special high-vacuum glass line which is supplied with purified Ar
(see above). The extraction process was stopped after the color of the liquid ammonia solution
had turned from deep to light blue after approximately 40 extraction cycles. After evaporating
ammonia from the extractor, the solid black product consisting of a-Si and LiNH2 (Scheme 2)
was recovered in the glove box.
Figure 2. Custom-built apparatus (a) for extracting Li from Li15Si4 with liquid NH3. Li15Si4 powder is
loaded onto the frit inside the glove box. If NH3 is condensed onto it (sample space is cooled, −78 °C),
a deep blue color is observed. Closing valve (1) and cooling the reservoir (b), the extract is transported
therein. By opening valve (1) and cooling the sample space, NH3 can be recondensed onto the solid
(c). Thereafter, Li/LiNH2 remains in the reservoir (c). The color is characteristic for a concentrated
metallic bronze solution of Li in NH3 denoted as Li(NH3)x.27
To produce amorphous silicon (a-Si), 140 mg of the intermediate (a-Si/LiNH2 mixture),
were filled into a Schlenk flask. Subsequently, 40 ml of ethanol (dried over Na and distilled)
were added and stirred shortly. Afterwards the black suspension (pH > 10) is handled under
air and transferred into an Erlenmeyer flask where 200 ml of an 1:1 ethanol-water mixture (V/V)
and few milliliters of acetic acid were added to adjust the pH-value (pH ~ 5). After 5 min of

5.6 Allotropism of Silicon
85
NH3 (l)
stirring a black solid was separated via centrifugation, washed with 20 ml ethanol three times
and finally dried under vacuum for several hours. This procedure yielded 30–40 mg of a black
amorphous product.
Li15Si4 15 (1−x) LiNH3 + 4 a-Si + 15 x LiNH2 + 7.5 x H2
Scheme 2. Reaction equation for the synthesis of a-Si starting from Li15Si4.
The O content of large sample areas was determined as 11.77 ± 1.87 at.% (EDX, cf.
Figure S5). Furthermore, traces of Na (< 1 at.%) were detected. The residual Li content in
a-Si was determined by AAS and amounts to ~1 wt.%, whereas the a-Si/LiNH2 intermediate
contained 21.9(1) wt.% of Li (48.1 wt.% Li in Li15Si4). C–H–N impurities of a-Si samples are
marginal (C, H, N < 1.2 wt.%).
a-allo-Si (amorphous allo-Si). Fully oxidized samples of Li3NaSi6 could be obtained by
the following procedure: i) ball-milling 400 mg pure-phase Li3NaSi6 in a hermetically sealed
stainless steel jar (RETSCH PM 100 planetary ball; duration: 8 hours, 300 rpm, ball charge: 3,
ball size: 15 mm diameter), ii) reacting 135 mg of ball-milled Li3NaSi6 with 30 ml ethanol
(Scheme 3) under inert conditions and adding 4 ml concentrated HCl solution subsequently,
iii) separating the black solid by centrifugation, iv) washing the product repeatedly (3–4 times)
with 30 ml of a 1:1 ethanol-water mixture (V/V) each and drying it under vacuum.
Li3NaSi6 + 4 ROH 6 a-allo-Si + 2 H2 + 3 LiOR + NaOR
Scheme 3. Reaction of Li3NaSi6 with protic solvents.
Powder X-Ray Diffraction (PXRD). PXRD patterns were recorded on a STOE STADI P
diffractometer (Ge(111) monochromator for CuKα1 radiation, λ = 1.54056 Å) equipped with a
DECTRIS MYTHEN DCS 1K solid state detector. Samples were ground, sealed inside 0.3 mm
glass capillaries and measurements performed in a 2 range of 5–90° (PSD steps: 0.06–1.00°;
time/step: 10–40 s). Rietveld refinements were carried out with the TOPAS 4.0 software.28
Differential Thermal Analysis (DTA). Differential thermal analysis was performed with
a NETZSCH DSC 404 Pegasus apparatus equipped with a DTA carrier system. Custom-built
Nb crucibles were thoroughly cleaned, heated to 1000 °C under dynamic vacuum
(p < 1×10⁻³ mbar) for 2 h and transferred to an Ar-filled glove box. Crucibles were loaded with
20–30 mg of sample. The open end was roughly closed by crimping and then sealed by arc-
welding inside the glove box under cooling. A sealed Nb crucible without sample served as

5 Publications and Manuscripts
86
reference. All measurements were performed under an Ar-flow of 60–70 mL∙min−1 and a
heating/cooling rate of 10 K∙min−1. Samples were recovered after the measurement by
opening the Nb crucibles inside the glove box. Data was handled with the PROTEUS THERMAL
ANALYSIS program.29
Transmission Electron Microscopy (TEM). Transmission electron microscopy and
selected-area electron diffraction (SAED) were performed with a PHILIPS CM30ST microscope
(300 kV, LaB6 cathode, Cs = 1.15 mm) which is equipped with a multiscan CCD camera
(GATAN). EDX analysis as part of the TEM examinations were carried out using a NORAN
VOYAGER EDX system. A sample of a-Si was suspended in n-butanol and subsequently coated
on a perforated carbon/copper net. All images were evaluated (including Fourier filtering) with
the program DIGITAL MICROGRAPH 3.6.1 (GATAN).
Infrared (IR) and Raman Spectroscopy. ATR-FT-IR spectra were recorded on a
VARIAN 670 IR FT-IR spectrometer equipped with a PIKE GLADIATR ATR stage. The VARIAN
RESOLUTION PRO software was used for data handling.30 Raman spectra for a-Si and a-allo-Si
were measured using a LABRAM HR 800 spectrometer. The instrument is equipped with an
800 mm focal length spectrograph and an air cooled (−70 °C), back thinned CCD detector.
Samples were sealed in 0.7 mm glass capillaries. The capillaries were placed on a glass slide
and samples were excited with an air cooled double frequency Nd:YAG laser (532 nm). The
laser was focused onto the sample using a 50X super long working distance (WD = 20.5 mm)
MITUTOYO objective. The laser power was adjusted by a software controlled filter wheel with
6 ND filters. Spectra were collected with an exposure time of 60 s (10 accumulations) and
using a grating of 600 lines/mm. All spectra were calibrated and normalized. The spatial
resolution of the instrument is specified as 1 μm in diameter.
Photoluminescence Spectroscopy (PL). PL measurements were performed using a
532 nm CW doubled Nd:YAG laser for photoexcitation. The excitation was in a backscatter
microscope configuration focusing through a 100X objective with a 1 m spot size. The
collected energy was energy dispersed through a 0.5 m ACTON spectrometer with an
1800 g∙mm−1 grating and a back-thinned liquid nitrogen cooled PRINCETON INSTRUMENTS CCD
camera.
Elemental Analysis. A JEOL-JSM 7500F scanning electron microscope equipped with
an OXFORD X-Max EDX (Energy-Dispersive X-ray Spectroscopy) analyzer with Mn as internal
standard was used to determine elements with atomic numbers larger than four. Samples
were handled inside an Ar-filled glove box or outside if not air sensitive and fixed on a graphite

5.6 Allotropism of Silicon
87
platelet which was attached to an aluminum stub. The Li content determination was carried
out by atomic absorption spectroscopy using a VARIAN AA280FS device. C–H–N contents
were determined by a HEKATECH EURO EA CHNSO-Analyzer.
Computational Details. Quantum chemical calculations with the Perdew-Burke-
Ernzerhof hybrid density functional method (DFT-PBE0)31,32 were performed using the
CRYSTAL09 software package.33 For energetic comparisons, the structures of Conesa17 were
included and labeled as in the original publication. Sp-valence + polarization (SVP) quality
basis sets were applied for all elements: The basis set for Si was taken from ref. 20 and for
Na and Li the split-valence level basis sets were derived from the molecular def-SVP basis
set34 (see Supporting Information). Both the lattice and the atomic parameters were allowed
to relax within the constraints imposed by the space group symmetry for structural
optimization. The shrinking factor (SHRINK) used for the generation of a Monkhorst-Pack-
type grid of k-points in reciprocal space was 4 for lattice sizes larger 10 Å, 8 for lattices smaller
or equal 10 Å, but larger 5 Å and 16 for smaller lattice parameters. Tight tolerance factors of
8, 8, 8, 8, and 16 were used for the evaluation of the Coulomb and exchange integrals
(TOLINTEG). Default optimization convergence thresholds and an extra-large integration grid
(XLGRID) for the density-functional part were applied in all calculations. For the full structural
relaxation of the Si substructure of Li3NaSi6, the published structure of Li3NaSi614 was first fully
optimized, after which the Si substructure was investigated in further calculations (atomic
parameters are in the Supporting Information). As a first step, the initial lattice and atomic
parameters of Li3NaSi6 without the alkalides were taken to optimize the structure without any
symmetry constraints at DFT-PBE31/SVP level of theory. At this point the system was metallic
and the Fermi surface was smeared with a width of 0.02 a.u.. For the evaluation of the
tolerance and exchange integrals (TOLINTEG), tight criteria of 7, 7, 7, 7 and 14 were used and
for the density-functional part, a large integration grid (LGRID) was applied. The geometry
optimization starting from the Si substructure in Li3NaSi6 naturally resulted in large changes
in the geometry, and the optimization process had to be carried out carefully and restarted
several times. The resulting minimum structure was subsequently optimized at the DFT-
PBE0/SVP level of theory and the stricter computational parameters discussed above for all
Conesa structures. The space group of the minimum structure was determined to be Cmcm
(63) with FINDSYM.35 The structure is identical to Conesa’s SD structure. The type of
stationary point was found to be a minimum for all optimized structures applying frequency
calculations.36,37

5 Publications and Manuscripts
88
3. RESULTS AND DISCUSSION
Synthesis and characterization of the precursors. In accordance with earlier
literature reports,26,38-40 Li15Si4 is obtained from mechanical ball-milling of a stoichiometric
mixture of Li and Si. The respective PXRD pattern is depicted in Figure 3a and corresponds
to pure-phase Li15Si4. In order to obtain single-phase Li3NaSi6, a peritectoid reaction of Li12Si7,
NaSi and α-Si was performed at 550 °C just below the decomposition temperature of Li3NaSi6
at 600 °C (Figure S2). Li3NaSi6 was alternatively synthesized from the elements14,15 or a mixture
of Li15Si4, Na and α-Si yielding α-Si as byproduct, though.
Synthesis and Characterization of a-Si. In silicon based lithium-ion batteries (cycling
Si against Li), an amorphization of the previously crystalline Si anode is observed when the
“Li-inserted” anode (discharged state) is again fully “de-inserted” (charged state).5,41,42
Crystalline metastable Li15Si4 was found to be present at discharge voltages below 50 mV.5,41
Thus, in a simplified view the “charged” and “discharged” states correspond to a-Si and
Li15Si4, respectively. Therefore, we investigated the formation of a-Si by chemical delithiation
through Li extraction from Li15Si4, a phase consisting of isolated Si atoms, using liquid
ammonia as solvent for Li. The extraction procedure was established with a custom-built
apparatus shown in Figure 2a. The blue color of liquid ammonia when condensed onto Li15Si4
powder clearly indicates the formation of solvated electrons (Figure 2b). The formation of a
metallic bronze solution as shown in Figure 2c typically indicates that Li is extracted.27 After
several extraction cycles solely LiNH2 was identified as crystalline phase in the PXRD pattern
of the product (Figure 3b). Additionally, an IR spectrum (Figure S4a) only shows NH stretching
and HNH deformation modes43 at 3259 cm−1 and 1560 cm−1/1538 cm−1, respectively. Si–O
vibrational modes that typically occur at around 800–1100 cm−1 indicating O impurities4 are
not observed. In a further step, LiNH2 is removed by sequential treatment with ethanol and an
ethanol/water mixture. Acetic acid is used to adjust to acidity as silicon dissolves under
alkaline conditions. Alternatively, a buffered solution could be used to remove LiNH2.

5.6 Allotropism of Silicon
89
Figure 3. PXRD patterns of a) Li15Si4 bulk material, the sequential products after b) Li-extraction with
liquid ammonia, c) subsequent aqueous treatment, and d) differential thermal analysis (calculated
patterns for Li15Si4, LiNH2, and α-Si are shown in green, red and blue, respectively; * corresponds to
the (111)-reflection of Li2SiO3).
As can be seen from the PXRD pattern in Figure 3c, the dried black product after aqueous
treatment is fully amorphous. However, IR spectroscopic investigations of several samples
clearly reveal Si–O vibrational modes, in particular the Si–O stretching mode at around
1069 cm−1 (Figure S4b), indicating a slight partial surface oxidation.4 This is additionally
strengthened by EDX examinations and EDX nanoprobe analysis as part of TEM
investigations (Figure 4b,c and S5). Furthermore, TEM images illustrate that a-Si samples
consist of micro- and nanosized particles (Figure 4a–c). In accordance with X-ray diffraction

5 Publications and Manuscripts
90
experiments, the SAED image (Figure 4d) does not show any diffraction, revealing a fully
amorphous character. Concomitantly, the absence of a PL band (Figure S6) and the Raman
mode at 466 cm−1 (Si–Si stretching mode), which is observed at markedly lower wave
numbers than in case of crystalline α-Si (521 cm−1), are characteristic for amorphous silicon.3
Figure 4. TEM images of a-Si (a–c) and results from concomitant EDX nanoprobe investigations (b, c).
The SAED (selected area electron diffraction) image (d) clearly reveals a complete amorphous character
of the sample.
Figure 5. Various Raman spectra of a-Si. The Si–Si stretching mode can be recognized as a broad
band at 466 cm−1.

5.6 Allotropism of Silicon
91
Synthesis and Characterization of a-allo-Si. The phases Li7Ge12 and Li3NaSi6 both
reveal polyanionic layers 2∞[Ge12]7− and 2∞[Si6]4−, respectively, which are separated by Li and Na
atoms (Figure 1).7,14,16 A treatment of these precursors with protic solvents induces a strictly
topochemical oxidation reaction in which slabs are connected through interlayer bond
formation under retention of their two-dimensional topology. The corresponding products are
identified as m-allo-Ge and allo-Si.7,9,14,15 Whereas the synthesis of Li7Ge12, the subsequent
oxidation to m-allo-Ge and its phase transition to 4H-Ge are well established,8,9,16 the structure
of allo-Si has only been described sketchily.
Referring to the previously reported synthesis of allo-Si, hydrogen is exclusively evolved
during the reaction of Li3NaSi6 with protic solvents. Silanes were not detected by mass
spectroscopy.14,15 Reacting Li3NaSi6 with water, an almost complete conversion (97 %) to
allo-Si was observed.14,15 Beside allo-Si, α-Si crystallites are formed concomitantly. However,
due to heavily disordered products a structure could not be proposed. The poor crystal quality
only allowed the determination of cell parameters (orthorhombic, a = 13.29 Å, b = 3.79 Å,
c = 12.63 Å).15 Though, the reflection positions calculated from these parameters decisively
differ from the ones reported in the database entry for allo-Si (ICSD 41-1111).
We diligently tried to reproduce and closely investigated the reaction of Li3NaSi6 with
protic solvents in a series of experiments. Generally, consistent with earlier reports,14,15 we
found that the reactivity of Li3NaSi6 strongly depends on its crystallinity. For instance, a
thoroughly powdered crystalline sample of Li3NaSi6 (Figure S7a) was allowed to react with
ethanol for 15 days. Thereafter, reflections from Li3NaSi6 were still recognizable in the PXRD
pattern and the increased background indicates the presence of an amorphous phase
(Figure S7b). Additionally, infrared and energy dispersive X-ray spectroscopy revealed a low
O-content excluding the formation of significant quantities of SiO2 (Figure S9). Even after
treatment of such samples with concentrated HCl the PXRD pattern did not change
considerably. In order to fully oxidize a sample of Li3NaSi6, it was ball-milled prior to oxidation
to increase the surface area and thus its reactivity (Figures S8a,b). Thereafter, an intense
reaction of the ball-milled sample with ethanol was observed. The respective PXRD pattern
shows an increased background as well as Bragg reflections of α-Si and Na8Si46 (Figure S8c).
The latter phase most probably originates from the initial reactant Li3NaSi6 although it is not
recognizable in the according PXRD pattern. The formation of α-Si crystallites was also
reported in previous work. Note that traces of NaSi in the Li3NaSi6 precursor may be oxidized
to Na8Si46 with H2O.44 Regardless of a slow, fast, partial or full oxidation of Li3NaSi6, we never
observed the reflections that are reported for allo-Si (ICSD-41-1111).45 Instead, an increased
background at 2 values of ~30° and ~55° is characteristic for the respective PXRD patterns
indicating the formation of an amorphous phase. In order to account for the amorphous

5 Publications and Manuscripts
92
product being obtained in analogy to allo-Ge, it is named a-allo-Si (cf. Scheme 3). We note
that annealing partially oxidized samples of Li3NaSi6 at 300 °C for two weeks did not give rise
to any new reflections (Figure S10). The formation of α-Si crystallites which are embedded in
an amorphous Si matrix is also strengthened by Raman spectroscopy. The Raman spectra of
a-allo-Si in Figure 6 show characteristic modes for amorphous and nanocrystalline Si.
Figure 6. Various Raman spectra of a-allo-Si showing the characteristic Si–Si stretching mode for
amorphous (a-Si:3 ~450 cm−1) and nanocrystalline Si (nc-Si:3 ~490–507 cm−1).
Analyzing the reflection pattern of allo-Si (ICSD 41-1111) more critically, it shows
strong analogies to NbSi2 (Figure S11). A possible explanation could be that the reported
synthesis of Li3NaSi6 was carried out in Nb ampules reaching temperatures of up to 800 °C
over a longer period allowing for the formation of NbSi2.14 Minor portions of NbSi2 may not be
recognizable in the diffraction patterns of Li3NaSi6 but can dominate the PXRD pattern in an
amorphous product.45 This is a reasonable explanation for the absence of the reported
allo-Si Bragg reflections in our PXRD patterns and casts doubts on former powder X-ray
investigations.
DTA investigations on a-Si and a-allo-Si. It was shown in the previous section that Li
can be removed from Li15Si4 and Li3NaSi6 by various methods yielding amorphous Si and a
mixture of amorphous Si and α-Si (nano)crystallites, respectively. As yet, it is not clear whether
it is justified to identify both products as a-Si or if a-allo-Si possesses a different amorphous
nature. Since a-allo-Si is obtained from Li3NaSi6 by a strictly topochemical reaction, a
resemblance of the local structure of a-allo-Si would be reasonable. We investigated the
amorphous-to-crystalline phase transition of both materials (a-Si/allo-Si to α-Si) by differential

5.6 Allotropism of Silicon
93
thermal analysis since for allo-Si a significantly lower transformation temperature was
reported and claimed as good “proof that allo-Si is in fact a new silicon modification”.14
Figure 7 shows the first heating traces of thermograms recorded for (i) Li3NaSi6,
(ii) partially oxidized Li3NaSi6 (virtually a mixture of Li3NaSi6 and a-allo-Si), (iii) a-allo-Si, and (iv)
a-Si. Li3NaSi6 decomposes at around 600 °C (effect 2) into Li12Si7, NaSi, and α-Si (Figure S3).
For the Li3NaSi6/a-allo-Si mixture, an additional exothermic effect is observed at 487 °C
(effect 1). Comparing the PXRD patterns of both the pure-phase Li3NaSi6 sample and the
Li3NaSi6/a-allo-Si mixture after DTA investigations, the latter clearly reveals higher portions of
α-Si (Figure S3 and S7c). Additionally, the heating trace of the a-allo-Si sample exclusively
contains an irreversible exothermic effect that is markedly shifted to higher temperatures
(effect 3 at 565 °C). The subsequently recorded PXRD pattern corresponds to α-Si
(Figure S8d). Thus, effect (1) and (3) are attributed to the transformation of a-allo-Si into α-Si.
In case of a-Si, the phase transition is found at 658 °C (effect 4) and consistent with previous
reports (cf. Figure 3d and 7).46,47
Figure 7. First DTA heating traces of thermograms recorded for Li3NaSi6, partially oxidized Li3NaSi6
(Li3NaSi6/a-allo-Si mixture), a-allo-Si, and a-Si (Tmax. = 750 °C, ±10 K∙min−1 heating/cooling rate, heat
effects marked with * could not be assigned).

5 Publications and Manuscripts
94
Compared to a-Si, a-allo-Si samples possess lower amorphous-to-crystalline phase
transition temperatures due to a large concentration of α-Si (nano)crystallites serving as
crystallization nuclei. For a-Si, the concentration of such particles is very low and the
nucleation has to be induced prior to the transition. Thus, the phase transition temperature of
a-Si is higher than that of a-allo-Si. In case of previous work on allo-Si,14,15 the formation of
α-Si crystallites was reported as well and the phase transition of allo-Si at 527 °C is in line
with our findings.14,15
Concluding, our experimental results show that a clear differentiation between a-allo-Si
and a-Si is not possible and that the oxidation of Li3NaSi6 according to earlier work solely
leads to the formation of amorphous products.
Model Structures for a-allo-Si derived from Li3NaSi6. As shown in the previous
chapter, the existence of an allotropic form of silicon obtained from Li3NaSi6 according to
reports in literature is disputable. Attempts to obtain microcrystalline samples of allo-Si
(m-allo-Si) failed up to now and its synthesis still remains challenging. Similarly to m-allo-Ge,
a close resemblance of the m-allo-Si structure to the two-dimensional slabs in Li3NaSi6
remains reasonable. Yet, the Si substructure of Li3NaSi6 significantly differs from the Ge
substructure of Li7Ge12. A calculation of Conesa’s structures17 at the DFT-PBE0/SVP level of
theory shows that for Si, most of the allotropic structures derived from a hypothetical Li7Si12
structure (isotypic with Li7Ge12; “G-structures”) are favored in total energy over structures
derived from Li3NaSi6 (“S-structures”; Figure 8 and 10, Table S1).
Conesa’s G structures (Figure 8) are divided into four groups: GA are structures in which
the tetrel layers are connected to result in 7-membered rings. The tetrel layers are stacked as
they appear in the reactant phase Li7Ge12 (opposite orientation by inversion). Group GB is also
characterized by a stacking of these opposing layers, resulting in 6- and 8-membered rings.
Groups GC and GD represent stacking of layers with the same orientation, GC structures are
linked to yield 7-membered rings and GD contain 6- and 8-membered rings. Therefore, the
latter two groups are just hypothetical. For group G, the favored structure for Si is GAa4
(distances: 2.32 Å–2.46 Å, angles: 92.6–126.8°, crystallographic density: 2.220 g∙cm−3). This
is the same result as obtained for the Ge counterpart.9 The difference in energy per atom to
α-Si is 8.0 kJ∙(mol∙Si)−1 (optimized structure: distances 2.36 Å, angles 109.4°, crystallographic
density: 2.290 g∙cm−3). The hypothetical structure GDd1 has the highest total energy of this
group (distances: 2.33–2.46 Å, angles: 90.0–137.7°, crystallographic density: 2.098 g∙cm−3)
with a difference of 16.2 kJ∙mol−1 (Figure 8).

5.6 Allotropism of Silicon
95
Figure 8. Comparison of the total energies in kJ∙(mol∙Si)−1 in networks optimized on the basis of
Conesa’s G-type structures (derived from the Ge substructure of Li7Ge12). The single groups GA (red),
GB (green), GC (orange), and GD (blue) refer to different ways of layer connections.17
The two dimensional slabs 2∞[Si6]4− in Li3NaSi6 are built of four- (4b), three- (3b), and two-
bonded (2b) Si atoms, respectively (cf. Figure 9: 4b = black, 3b = light and dark blue, 2b = red).
Based on this structure, Conesa’s S group is derived which can also be divided into four
smaller structure groups. The SA group is built by connecting 2b-Si atoms (red) of neighboring
layers and bonding them to 3b-Si atoms of their own layers (dark blue). The light blue 3b-Si
atoms are bonded to the light blue ones of the neighboring layer. SB is a connection of red
Si2− atoms (2b) with light blue Si− atoms (3b) of the neighboring layer and dark blue Si− atoms
(3b) of their own layer. For structures SC, the 2b-Si2− atoms are connected to dark blue
3b-Si− atoms and to the red Si2− of the neighboring layer. The 3b-Si− atoms (light blue) are
connected to the same kind of the next layer. For each of these types four structure variations
exist. The fourth group SD is built by connecting red Si2− atoms (2b) to both Si− atoms (3b) of
the next layer. For such a network, only one structure type is possible, the TON48 zeolite-type
network (ZSM-22).
0
2
4
6
8
10
12
14
16
18
GAa1
GAa2
GAa3
GAa4
GAa5
GAb1
GAb2
GAb3
GAb4
GAc1
GAc2
GAc3
GAc4
GAc5
GAd1
GAd2
GAd3
GAd4
GBa1
GBa2
GBa3
GBb1
GBb2
GBb3
GBc1
GBc2
GBc3
GBd1
GBd2
GBd3
GCa1
GCa2
GCb1
GCb2
GDa1
GDa2
GDb1
GDb2
GDc1
GDc2
GDd1
GDd2
kJ/m
ol per atom
Structures based on Li7Ge12

5 Publications and Manuscripts
96
Figure 9. Si substructure in the phase Li3NaSi6. The four- (Si0), three- (Si−) and two-bonded (Si2−) Si
atoms are shown in black, light/dark blue, and red, respectively. For the four different groups of allo-Si
networks derived from this layered structure, the charged atoms are connected differently.
A comparison of total energies (Figure 10) shows that SD is the favored structure with an
energy difference to α-Si of 13.7 kJ∙(mol∙Si)−1 (Si–Si distances: 2.34–2.40 Å, angles:
90.7–142.9°, crystallographic density: 2.011 g∙cm−3, Figure 11a). Its structure has the lowest
density of all G and S group networks and is equivalent to the zeolite network TON.48 As
shown in Figure 11a it contains 10-, 6-, and 5-membered rings which form parallel channels
proceeding along the c-axis. The diameter of the largest channel ranges from 6.6 to 7.4 Å. In
energy, this framework is followed by SC1 (Figure 11b) with a relative energy of
14.0 kJ∙(mol∙Si)−1. Si–Si distances vary from 2.31 to 2.43 Å and angles range from 92.0 to
128.4°. The crystallographic density of this structure is 2.292 g∙cm−3 and therefore almost the
same as for α-Si (even slightly higher). The SC group is the one with the highest densities at
around 2.290 g∙cm−3, the density of α-Si (all crystallographic densities are listed in Table S1).
SC1 is also a one dimensional channel system bearing 6- and 5-membered rings in a direction
(Figure 11b). We note that overall the S group shows higher relative energies than the G group.
The total energies per atom of the two most stable phases of the S group, SD and SC1, are
5.7 kJ∙(mol∙Si)−1 and 6.0 kJ∙(mol∙Si)−1 larger than GAa4, the most stable structure of the
G group.

5.6 Allotropism of Silicon
97
Figure 10. Energies relative to α-Si for Conesa’s S-type structures (derived from the Si substructure of
Li3NaSi6). The four different network classes are colored differently; SA in red, SB in green, SC in orange
and SD in blue. To show the energy difference to well-known open tetrahedral frameworks (OTFs),
these are depicted as well (violet). All relative energies are also listed in Table S1.
As Li3NaSi6 has a well-ordered and layered Si substructure and is therefore a reasonable
reactant phase for the synthesis of allo-Si, we also carried out a full structural relaxation of
the Si substructure in the optimized structure of Li3NaSi6. This resulted in a true local minimum
being the TON structure, which was also the favored of all “handmade” structures of
Conesa,17 highlighting the key role of this network. Furthermore, the structure with the
smallest density is favored in the present structural relaxation without any initial specification
of Si–Si bonds. We note that we performed this full structural relaxation in space group P1 to
avoid any restrictions caused by symmetry. The open tetrahedral frameworks (OTFs) which
may also be formed in reactions toward allo-Si, have more favorable relative energies than
the structures derived from Li3NaSi6. The relative energies compared to α-Si range from
7.7 kJ∙(mol∙Si)−1 (unj) to 10.7 kJ∙(mol∙Si)−1 (CAS). Also, the crystallographic densities are lower
and range from 1.979 g/cm3 (mtn) to 2.180 g∙cm−3 (tum) (Table S1).
0
5
10
15
20
25
30
35
SA1 SA2 SA3 SA4 SB1 SB2 SB3 SB4 SC1 SC2 SC3 SC4 SD mep mtn CAS unj tum
kJ/m
ol per atom
Structures based on Li3NaSi6 and OTFs

5 Publications and Manuscripts
98
Figure 11. a) The most stable network (SD) derived from the Si substructure of Li3NaSi6 with view along
the c-direction emphasizing the one dimensional channel structure built from 10-, 6-, and 5-membered
rings; b) Network of the structure SC1 with view along the a-direction. It is built of 6- and 5-membered
rings.
Figure 12. Band structure of SD showing an indirect band gap of 1.74 eV and a direct band gap of
1.85 eV, respectively. The band gap in z-direction is significantly larger with a value of 3.4 eV. The zero
energy level corresponds to the top of the valence bands.
The band gaps of all calculated structures range from 0.73 (SB4) to 3.01 eV (mtn)
(Table S1). The most stable structures, GAa4, SD and SC1 possess gaps of 2.23 eV, 1.74 eV,
and 1.50 eV, respectively. For both relevant structures derived from Li3NaSi6 (SD and SC1),
the bands are flat (Figures 12 and S12). Still, these are no direct band gap materials. SD has
a narrow gap in the x and y directions, whereas it is significantly larger in z direction. This goes
along with the channels in the z direction as well, here the gap is 3.4 eV. For the structure
SC4, there is no band gap at all since it is highly strained (Si–Si bonds: 2.28–2.50 Å, angles:
88.7 to 136.5°).

5.6 Allotropism of Silicon
99
4. CONCLUSION
In the course of our investigations on allotropic forms of silicon we focused on the previously
reported modification allo-Si. Hitherto, its structure is unknown and attempts to obtain
crystalline samples from an oxidation of the precursor Li3NaSi6 failed. Furthermore, our
studies revealed ambiguities regarding the X-ray diffraction pattern reported for allo-Si since
a strong resemblance to NbSi2 is recognizable. Reactions targeting the synthesis of allo-Si
solely yielded amorphous products. However, the reported amorphous-to-crystalline
transformation temperature of 527 °C is drastically lower than that of ordinary amorphous Si
which transforms to α-Si at ~660 °C. In order to clarify this issue, differences between
amorphous allo-Si (a-allo-Si) and amorphous silicon (a-Si) were elucidated. The latter was
obtained from Li15Si4 by a delithiation process employing liquid ammonia as solvent for Li.
Thermal investigations confirmed that a-allo-Si recrystallizes at markedly lower temperatures
than a-Si. However, the lower phase transition temperatures of a-allo-Si samples are a
consequence of large concentrations of α-Si crystallites that serve as crystallization nuclei.
These results call the existence of allo-Si into question and maybe other routes could lead to
the formation of allo-Si. Nevertheless, diverse hypothetical structures for allo-Si were
approached by quantum chemical investigations on the basis of the Si substructures of
Li3NaSi6 and a hypothetical phase Li7Si12. The latter is isotypic with Li7Ge12 which transform
into the well characterized Ge polymorph m-allo-Ge upon oxidation. Remarkably, structures
derived from Li7Si12 are distinctly favored over those obtained from Li3NaSi6. On a theoretical
level, this is a reasonable explanation for the difficulties to obtain crystalline samples of
allo-Si. Yet, other phases may also serve as precursors for new Si allotropes since Si network
structures conceived of known tetrahedral frameworks were proven to possess considerably
more favorable energies relative to α-Si.

5 Publications and Manuscripts
100
Supporting Information. PXRD patterns of Li12Si7, NaSi (Figure S1) and Li3NaSi6 (Figure S2),
PXRD pattern of Li3NaSi6 after DTA investigations (Figure S3), ATR-FT-IR spectra of an
a-Si/LiNH2 mixture after Li extraction from Li15Si4 and a subsequently synthesized a-Si sample
(Figure S4), results from EDX investigations of a-Si (Figure S5), PL-spectrum of a-Si
(Figure S6), PXRD patterns of Li3NaSi6, the product after partial oxidation with ethanol and
subsequent DTA-investigation (Figure S7), PXRD patterns of Li3NaSi6 before and after ball-
milling, the product after aqueous treatment and subsequent DTA investigation (Figure S8),
ATR-FT-IR spectra of partially und fully oxidized Li3NaSi6 through aqueous treatment
(Figure S9), PXRD pattern of Li3NaSi6 after reaction with ethanol and subsequent annealing at
300 °C for two weeks (Figure S10), PXRD pattern of a NbSi2 sample referenced with the
database entry for allo-Si and NbSi2 (Figure S11), band structure of SC1 (Figure S12), DFT-
PBE0 results in tabular format (Table S1), and basis set listings for Na and Li.
Corresponding Author Note. *E-mail: [email protected]
Notes. The authors declare no competing financial interest.
Acknowledgement. This work has been funded by the Deutsche Forschungsgemeinschaft
project number FA 198/11–1, Academy of Finland (grant 138560/2010), as well as the National
Science Foundation through grant DMR-1007557. M.Z., L. A. J. and L. M. S. thank the Fonds
der Chemischen Industrie, the Christiane Nüsslein-Volhard Stiftung and the Deutsche
Studienstiftung, respectively, for their fellowships. They appreciate the support by the TUM
Graduate School. M.Z. thanks F. Kraus for providing the custom-built extractor.
5. REFERENCES
(1) Street, R. A. Technology and Applications of Amorphous Silicon; Springer: New York,
2000.
(2) Rech, B.; Wagner, H. Appl. Phys. A 1999, 69, 155.
(3) McMillan, P. F.; Gryko, J.; Bull, C.; Arledge, R.; Kenyon, A. J.; Cressey, B. A. J. Solid
State Chem. 2005, 178, 937.
(4) Wang, J.; Ganguly, S.; Sen, S.; Browning, N. D.; Kauzlarich, S. M. Polyhedron 2013, 58,
156.
(5) Obrovac, M. N.; Christensen, L. Electrochem. Solid-State Lett. 2004, 7, A93.

5.6 Allotropism of Silicon
101
(6) Guloy, A. M.; Ramlau, R.; Tang, Z.; Schnelle, W.; Baitinger, M.; Grin, Y. Nature 2006,
443, 320.
(7) Grüttner, A.; Nesper, R.; von Schnering, H. G. Angew. Chem. Int. Ed. 1982, 21, 912.
(8) Kiefer, F.; Hlukhyy, V.; Karttunen, A. J.; Fässler, T. F.; Gold, C.; Scheidt, E. W.; Scherer,
W.; Nylen, J.; Häussermann, U. J. Mater. Chem. 2010, 20, 1780.
(9) Kiefer, F.; Karttunen, A. J.; Döblinger, M.; Fässler, T. F. Chem. Mater. 2011, 23, 4578.
(10) Armatas, G. S.; Kanatzidis, M. G. Science 2006, 313, 817.
(11) Armatas, G. S.; Kanatzidis, M. G. Nature 2006, 441, 1122.
(12) Sun, D.; Riley, A. E.; Cadby, A. J.; Richman, E. K.; Korlann, S. D.; Tolbert, S. H. Nature
2006, 441, 1126.
(13) Armatas, G. S.; Kanatzidis, M. G. Adv. Mater. 2008, 20, 546.
(14) von Schnering, H. G.; Schwarz, M.; Nesper, R. J. Less-Common Met. 1988, 137, 297.
(15) Schwarz, M. Dissertation, Universität Stuttgart: Stuttgart, Germany, 1988.
(16) Kiefer, F.; Fässler, T. F. Solid State Sci. 2011, 13, 636.
(17) Conesa, J. C. J. Phys. Chem. B 2002, 106, 3402.
(18) Zwijnenburg, M. A.; Jelfs, K. E.; Bromley, S. T. Phys. Chem. Chem. Phys. 2010, 12,
8505.
(19) Pickard, C. J.; Needs, R. J. Phys. Rev. B 2010, 81.
(20) Karttunen, A. J.; Fässler, T. F.; Linnolahti, M.; Pakkanen, T. A. Inorg. Chem. 2011, 50,
1733.
(21) Wu, F.; Jun, D.; Kan, E.; Li, Z. Solid State Commun. 2011, 151, 1228.
(22) Zhao, Z.; Tian, F.; Dong, X.; Li, Q.; Wang, Q.; Wang, H.; Zhong, X.; Xu, B.; Yu, D.; He,
J.; Wang, H. T.; Ma, Y.; Tian, Y. J. Am. Chem. Soc. 2012, 134, 12362.
(23) Botti, S.; Flores-Livas, J. A.; Amsler, M.; Goedecker, S.; Marques, M. A. L. Phys. Rev. B
2012, 86.
(24) Zhao, H.-Y.; Wang, J.; Ma, Q.-M.; Liu, Y. Phys. Chem. Chem. Phys. 2013, 15, 17619.
(25) Öhrström, L.; O'Keeffe, M. Z. Kristallogr. 2013, 228, 343.
(26) Zeilinger, M.; Baran, V.; van Wüllen, L.; Häussermann, U.; Fässler, T. F. Chem. Mater.
2013, 25, 4113.
(27) Zurek, E.; Edwards, P. P.; Hoffmann, R. Angew. Chem. Int. Ed. 2009, 48, 8198.
(28) TOPAS - Rietveld Software, Version 4.0; Bruker AXS Inc.: Madison, WI, USA, 2009.
(29) Netzsch Proteus Thermal Analysis, Version 4.8.2; Netzsch-Gerätebau GmbH: Selb,
Germany, 2006.
(30) Resolution Pro, Version 5.1.0.822; Varian Inc.: Santa Clara, CA, USA, 2009.
(31) Perdew, J. P.; Burke, K.; Ernzerhof, M. Phys. Rev. Lett. 1996, 77, 3865.
(32) Adamo, C.; Barone, V. J. Phys. Chem. 1999, 110, 6158.

5 Publications and Manuscripts
102
(33) Dovesi, R.; Orlando, R.; Civalleri, B.; Roetti, C.; Saunders, V. R.; Zicovich-Wilson, C. M.
Z. Kristallogr. 2005, 220, 571.
(34) Schäfer, A.; Horn, H.; Ahlrichs, R. J. Chem. Phys. 1992, 97, 2571.
(35) Stokes, H. T.; Hatch, D. M. J. Appl. Cryst. 2005, 38, 237.
(36) Zicovich-Wilson, C. M.; Pascale, F.; Roetti, C.; Saunders, V. R.; Orlando, R.; Dovesi, R.
J. Comput. Chem. 2004, 25, 1873.
(37) Pascale, F.; Zicovich-Wilson, C. M.; Gejo, F. L.; Civalleri, B.; Orlando, R.; Dovesi, R. J.
Comput. Chem. 2004, 25, 888.
(38) Key, B.; Bhattacharyya, R.; Morcrette, M.; Seznec, V.; Tarascon, J. M.; Grey, C. P. J.
Am. Chem. Soc. 2009, 131, 9239.
(39) Hashimoto, Y.; Machida, N.; Shigematsu, T. Solid State Ionics 2004, 175, 177.
(40) Tamori, R.; Machida, N.; Shigematsu, T. J. Jpn. Soc. Powder Powder Metall. 2001, 48,
267.
(41) Hatchard, T. D.; Dahn, J. R. J. Electrochem. Soc. 2004, 151, A838.
(42) Limthongkul, P.; Jang, Y. I.; Dudney, N. J.; Chiang, Y. M. Acta Mater. 2003, 51, 1103.
(43) Bohger, J. P. O.; Essmann, R. R.; Jacobs, H. J. Mol. Struct. 1995, 348, 325.
(44) Böhme, B.; Guloy, A.; Tang, Z.; Schnelle, W.; Burkhardt, U.; Baitinger, M.; Grin, Y. J.
Am. Chem. Soc. 2007, 129, 5348.
(45) Kiefer, F. Dissertation, Technische Universität München: München, Germany, 2010.
(46) Neiner, D.; Kauzlarich, S. M. Chem. Mater. 2010, 22, 487.
(47) Shen, T. D.; Koch, C. C.; McCormick, T. L.; Nemanich, R. J.; Huang, J. Y.; Huang, J. G.
J. Mater. Sci. 1995, 10, 139.
(48) Barri, S. A. I.; Smith, G. W.; White, D.; Young, D. Nature 1984, 312, 533.

5.6 Allotropism of Silicon
103
SUPPORTING INFORMATION
Zeilinger et al.
Figure S1. PXRD patterns of Li12Si7 and NaSi referenced with their theoretical patterns (Li12Si7 = blue,
NaSi = green).

5 Publications and Manuscripts
104
Figure S2. PXRD pattern of Li3NaSi6 synthesized from a mixture of Li12Si7, NaSi and α-Si (calculated
pattern for Li3NaSi6 = orange).
Figure S3. Rietveld fit to the PXRD pattern of Li3NaSi6 after DTA investigations (Tmax. = 700 °C,
±10 Kmin−1 heating/cooling rate; α-Si (pink), NaSi (green), Li12Si7 (blue), Li3NaSi6 (orange),
corresponding weight fractions are given).

5.6 Allotropism of Silicon
105
Figure S4. ATR-FT-IR spectra recorded for a) an a-Si/LiNH2 mixture after Li extraction from Li15Si4,
and b) an a-Si sample obtained from aqueous treatment of the a-Si/LiNH2 intermediate (*self-
absorption of diamond).

5 Publications and Manuscripts
106
Figure S5. Results from EDX investigations of a-Si retained from Li15Si4 (data acquisition: 60 s
exposure time at 7.00 kV for each spectrum).

5.6 Allotropism of Silicon
107
Figure S6. Photoluminescence (PL) spectrum of a-Si produced from Li15Si4 through Li-extraction with
liquid ammonia and subsequent treatment with ethanol. The PL-band position expected for α-Si is
indicated by a dotted line.

5 Publications and Manuscripts
108
Figure S7. PXRD patterns of a) Li3NaSi6 (synthesized from Li15Si4, Na and α-Si), b) the product after
partial oxidation with ethanol (15 days reaction time), and c) subsequent DTA-investigation
(Tmax. = 700 °C, ±10 Kmin−1 heating/cooling rate; calculated patterns for Li3NaSi6, α-Si, NaSi, and
Li12Si7 are shown in orange, red/pink, green and blue). For the PXRD pattern shown in (c), a Rietveld
fit was applied giving the weight fractions of all components.

5.6 Allotropism of Silicon
109
Figure S8. PXRD patterns of Li3NaSi6 before (a) and after ball-milling (b), the product after aqueous
treatment (c) and subsequent DTA investigation (d; Tmax. = 700 °C, ±10 Kmin−1 heating/cooling rate;
calculated patterns for Li3NaSi6, α-Si, and Na8Si46 are shown in orange, blue, and green). Note that
M8Si46 (M = Na, K) are known to decompose around 600 °C (see ref. 44).

5 Publications and Manuscripts
110
Figure S9. ATR-FT-IR spectra of partially und fully oxidized Li3NaSi6 through aqueous treatment
(samples correspond to a mixture of Li3NaSi6 / a-allo-Si, and a-allo-Si, respectively). EDX results for
both samples are given below. Artifacts labeled with (*) arise from the self-absorption of diamond.
Figure S10. PXRD pattern of Li3NaSi6 after reaction with ethanol (15 days) and subsequent annealing
at 300 °C for two weeks (calculated pattern for Li3NaSi6 = orange).

5.6 Allotropism of Silicon
111
Figure S11. PXRD pattern of a NbSi2 sample referenced with the database entry for α-Si (red), allo-Si
(ICSD 41-1111, blue), and NbSi2 (green). The Bragg reflection at ~68° which should be observed for
NbSi2 is not matched by the allo-Si pattern.

5 Publications and Manuscripts
112
Computational Part
Figure S12. Band structure of SC1 showing an indirect band gap of 1.50 eV and a direct band gap of
2.47 eV, respectively. The zero energy level corresponds to the top of the valence bands.
Table S1. Comparison of all calculated Si networks
name ρ/g·cm−3 ΔE/kJ·mol−1 band
gap/eV
name ρ/g·cm−3 ΔE/kJ·mol−1 band
gap/eV
GAa1 2.124 11.60 2.30 GCa1 2.158 9.87 2.59
GAa2 2.167 10.13 2.47 GCa2 2.165 9.81 2.60
GAa3 2.190 10.01 2.00 GCb1 2.162 10.55 2.45
GAa4 2.220 7.96 2.23 GCb2 2.154 8.74 2.61
GAa5 2.132 10.74 2.58 GDa1 2.183 13.09 2.03
GAb1 2.171 9.74 2.48 GDa2 2.095 15.89 1.86
GAb2 2.199 9.38 2.08 GDb1 2.104 14.80 2.24
GAb3 2.129 11.09 2.00 GDb2 2.166 14.16 1.55
GAb4 2.171 9.74 2.48 GDc1 2.169 14.59 1.64
GAc1 2.120 9.77 2.45 GDc2 2.093 14.21 2.03
GAc2 2.160 10.19 2.31 GDd1 2.098 16.23 2.13
GAc3 2.129 11.70 2.38 GDd2 2.177 12.13 1.61
GAc4 2.194 10.61 1.92 SA1 2.239 20.30 0.85
GAc5 2.200 8.22 1.78 SA2 2.238 19.49 1.62
GAd1 2.162 11.25 2.22 SA3 2.227 19.77 0.97
GAd2 2.196 9.79 2.04 SA4 2.233 29.07 0.77
GAd3 2.123 11.07 2.43 SB1 2.148 19.95 1.07
GAd4 2.161 9.02 2.22 SB2 2.146 15.94 1.74
GBa1 2.139 13.29 2.22 SB3 2.153 21.02 1.12
GBa2 2.144 12.64 2.56 SB4 2.167 30.32 0.73
GBa3 2.150 11.96 2.80 SC1 2.292 14.00 1.50
GBb1 2.139 12.80 2.33 SC2 2.303 16.13 1.50
GBb2 2.145 12.45 2.62 SC3 2.294 15.42 1.78
GBb3 2.152 12.07 2.69 SC4 2.286 27.23 -
GBc1 2.140 11.27 2.50 SD 2.011 13.66 1.74
GBc2 2.141 12.24 2.61 mep 2.004 9.40 2.78
GBc3 2.143 13.07 2.60 mtn 1.979 8.06 2.83
GBd1 2.140 11.26 2.73 CAS 2.127 10.66 1.84
GBd2 2.140 12.50 2.62 unj/NGS 2.105 7.70 3.01
GBd3 2.140 13.69 2.34 tum 2.180 9.76 2.54
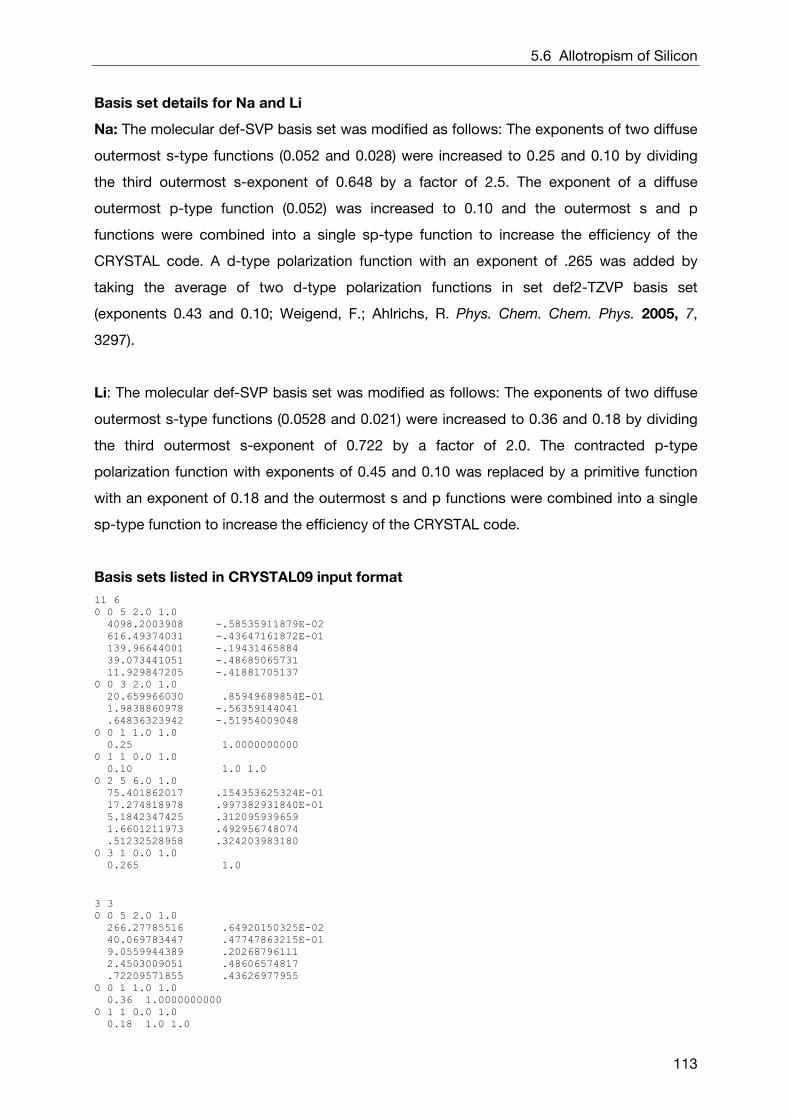
5.6 Allotropism of Silicon
113
Basis set details for Na and Li
Na: The molecular def-SVP basis set was modified as follows: The exponents of two diffuse
outermost s-type functions (0.052 and 0.028) were increased to 0.25 and 0.10 by dividing
the third outermost s-exponent of 0.648 by a factor of 2.5. The exponent of a diffuse
outermost p-type function (0.052) was increased to 0.10 and the outermost s and p
functions were combined into a single sp-type function to increase the efficiency of the
CRYSTAL code. A d-type polarization function with an exponent of .265 was added by
taking the average of two d-type polarization functions in set def2-TZVP basis set
(exponents 0.43 and 0.10; Weigend, F.; Ahlrichs, R. Phys. Chem. Chem. Phys. 2005, 7,
3297).
Li: The molecular def-SVP basis set was modified as follows: The exponents of two diffuse
outermost s-type functions (0.0528 and 0.021) were increased to 0.36 and 0.18 by dividing
the third outermost s-exponent of 0.722 by a factor of 2.0. The contracted p-type
polarization function with exponents of 0.45 and 0.10 was replaced by a primitive function
with an exponent of 0.18 and the outermost s and p functions were combined into a single
sp-type function to increase the efficiency of the CRYSTAL code.
Basis sets listed in CRYSTAL09 input format
11 6 0 0 5 2.0 1.0 4098.2003908 -.58535911879E-02 616.49374031 -.43647161872E-01 139.96644001 -.19431465884 39.073441051 -.48685065731 11.929847205 -.41881705137 0 0 3 2.0 1.0 20.659966030 .85949689854E-01 1.9838860978 -.56359144041 .64836323942 -.51954009048 0 0 1 1.0 1.0 0.25 1.0000000000 0 1 1 0.0 1.0 0.10 1.0 1.0 0 2 5 6.0 1.0 75.401862017 .154353625324E-01 17.274818978 .997382931840E-01 5.1842347425 .312095939659 1.6601211973 .492956748074 .51232528958 .324203983180 0 3 1 0.0 1.0 0.265 1.0
3 3 0 0 5 2.0 1.0 266.27785516 .64920150325E-02 40.069783447 .47747863215E-01 9.0559944389 .20268796111 2.4503009051 .48606574817 .72209571855 .43626977955 0 0 1 1.0 1.0 0.36 1.0000000000 0 1 1 0.0 1.0 0.18 1.0 1.0

5 Publications and Manuscripts
114
Structural Parameters
All structural parameters and atomic coordinates are listed in the CRYSTAL09 input format
as follows:
Space group number Minimal set of lattice parameters a, b, c, α, β, γ Number of non-equivalent atoms in the assymetric unit <atomic number> <fractional x> < fractional y> < fractional z>
α-Si
227 5.45503610 5.45503610 5.45503610 90.000000 90.000000 90.000000 1 14 1.250000000000E-01 1.250000000000E-01 1.250000000000E-01
GAa1
51 11.51968402 7.60210801 7.99343475 90.000000 7 14 2.500000000000E-01 0.000000000000E+00 3.336306420909E-01 14 2.500000000000E-01 5.000000000000E-01 3.358211129809E-01 14 2.500000000000E-01 2.554225539019E-01 1.602651561979E-01 14 -9.716186319573E-02 0.000000000000E+00 4.544689545843E-01 14 -9.839815176519E-02 5.000000000000E-01 4.662949034080E-01 14 -1.477049689831E-01 -2.559722310182E-01 3.045386908748E-01 14 -1.003273320247E-01 -3.390758160078E-01 2.995589950820E-02
GAa2
6 7.95492313 7.53697027 11.44136475 90.030957 22 14 -3.308570690944E-01 1.185735531344E-21 2.512564781479E-01 14 -3.307143575920E-01 5.000000000000E-01 2.115755298555E-01 14 -4.567366428087E-01 1.185735542298E-21 -4.129105831114E-01 14 -4.625037369079E-01 5.000000000000E-01 -4.249541371376E-01 14 -1.545829148461E-01 -2.479291033927E-01 2.290482249716E-01 14 3.074829605624E-01 -2.565855541145E-01 3.338479321754E-01 14 3.266059259271E-02 -3.399192051343E-01 3.806010482918E-01 14 -4.410515326580E-01 1.185735547712E-21 -1.096843392947E-01 14 -4.703027360977E-01 -5.000000000000E-01 -1.189239300664E-01 14 3.037558758881E-01 -2.373519759800E-01 1.291255811344E-01 14 2.774089339692E-02 -1.646773157259E-01 6.966900818622E-02 14 3.350195629936E-01 1.185735522207E-21 -2.575190594118E-01 14 3.377085729811E-01 5.000000000000E-01 -2.734869698881E-01 14 4.486247504013E-01 1.185735550446E-21 3.938362953050E-01 14 4.799100701424E-01 5.000000000000E-01 3.744542745197E-01 14 1.597315330547E-01 -2.568125929163E-01 -2.631744294154E-01 14 -3.022823035631E-01 -2.566097714812E-01 -3.685895714783E-01 14 -2.747480612895E-02 -3.368014325965E-01 -4.169901208292E-01 14 4.832009635135E-01 1.185735553911E-21 8.788461276686E-02 14 4.400596392568E-01 5.000000000000E-01 7.383454354127E-02 14 -2.975098087572E-01 -2.607247673881E-01 -1.630832310750E-01 14 -2.184076426449E-02 -3.338415735472E-01 -1.027557995745E-01
GAa3
59 11.43732402 7.46648355 7.94834712 90.000000 7 14 -5.000000000000E-01 0.000000000000E+00 3.308634430102E-01 14 -5.000000000000E-01 -5.000000000000E-01 3.336502288773E-01 14 -5.000000000000E-01 2.577688215275E-01 1.527536060586E-01 14 1.537619332775E-01 0.000000000000E+00 4.723801417456E-01 14 1.503059970699E-01 -5.000000000000E-01 4.493102626383E-01 14 1.026528996772E-01 2.387486104244E-01 3.010401792182E-01 14 1.628198749591E-01 1.679123108520E-01 2.572478686383E-02
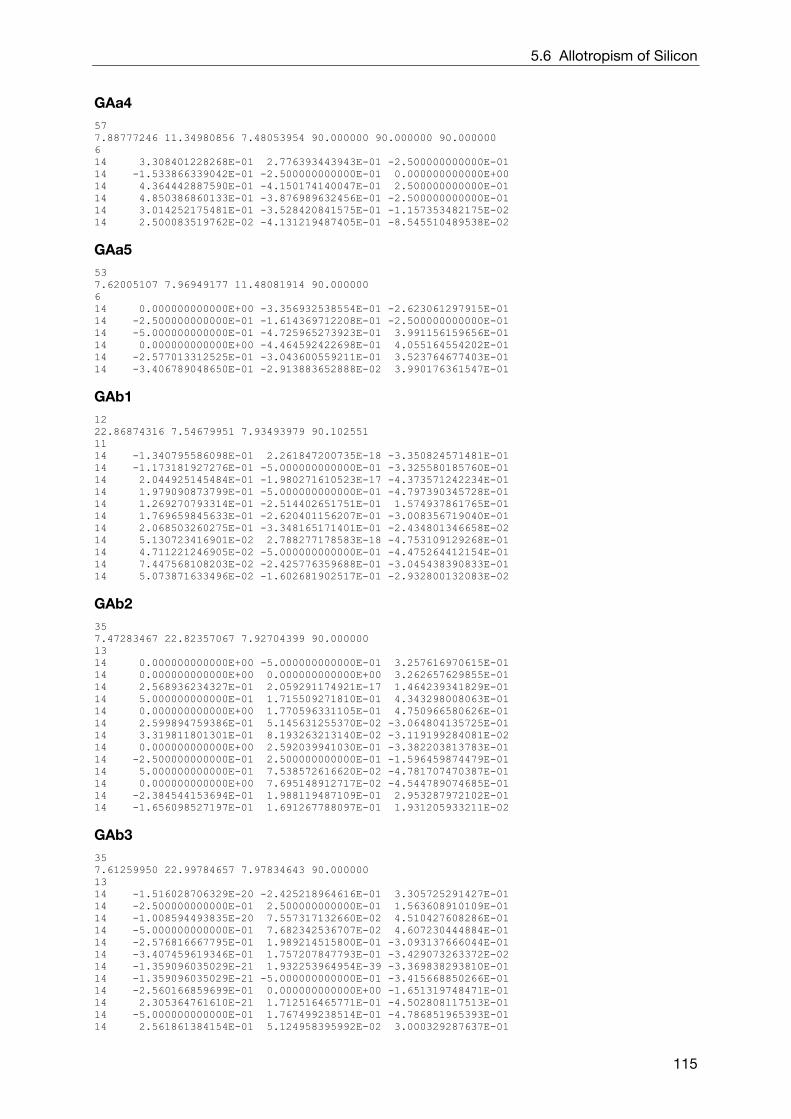
5.6 Allotropism of Silicon
115
GAa4
57 7.88777246 11.34980856 7.48053954 90.000000 90.000000 90.000000 6 14 3.308401228268E-01 2.776393443943E-01 -2.500000000000E-01 14 -1.533866339042E-01 -2.500000000000E-01 0.000000000000E+00 14 4.364442887590E-01 -4.150174140047E-01 2.500000000000E-01 14 4.850386860133E-01 -3.876989632456E-01 -2.500000000000E-01 14 3.014252175481E-01 -3.528420841575E-01 -1.157353482175E-02 14 2.500083519762E-02 -4.131219487405E-01 -8.545510489538E-02
GAa5
53 7.62005107 7.96949177 11.48081914 90.000000 6 14 0.000000000000E+00 -3.356932538554E-01 -2.623061297915E-01 14 -2.500000000000E-01 -1.614369712208E-01 -2.500000000000E-01 14 -5.000000000000E-01 -4.725965273923E-01 3.991156159656E-01 14 0.000000000000E+00 -4.464592422698E-01 4.055164554202E-01 14 -2.577013312525E-01 -3.043600559211E-01 3.523764677403E-01 14 -3.406789048650E-01 -2.913883652888E-02 3.990176361547E-01
GAb1
12 22.86874316 7.54679951 7.93493979 90.102551 11 14 -1.340795586098E-01 2.261847200735E-18 -3.350824571481E-01 14 -1.173181927276E-01 -5.000000000000E-01 -3.325580185760E-01 14 2.044925145484E-01 -1.980271610523E-17 -4.373571242234E-01 14 1.979090873799E-01 -5.000000000000E-01 -4.797390345728E-01 14 1.269270793314E-01 -2.514402651751E-01 1.574937861765E-01 14 1.769659845633E-01 -2.620401156207E-01 -3.008356719040E-01 14 2.068503260275E-01 -3.348165171401E-01 -2.434801346658E-02 14 5.130723416901E-02 2.788277178583E-18 -4.753109129268E-01 14 4.711221246905E-02 -5.000000000000E-01 -4.475264412154E-01 14 7.447568108203E-02 -2.425776359688E-01 -3.045438390833E-01 14 5.073871633496E-02 -1.602681902517E-01 -2.932800132083E-02
GAb2
35 7.47283467 22.82357067 7.92704399 90.000000 13 14 0.000000000000E+00 -5.000000000000E-01 3.257616970615E-01 14 0.000000000000E+00 0.000000000000E+00 3.262657629855E-01 14 2.568936234327E-01 2.059291174921E-17 1.464239341829E-01 14 5.000000000000E-01 1.715509271810E-01 4.343298008063E-01 14 0.000000000000E+00 1.770596331105E-01 4.750966580626E-01 14 2.599894759386E-01 5.145631255370E-02 -3.064804135725E-01 14 3.319811801301E-01 8.193263213140E-02 -3.119199284081E-02 14 0.000000000000E+00 2.592039941030E-01 -3.382203813783E-01 14 -2.500000000000E-01 2.500000000000E-01 -1.596459874479E-01 14 5.000000000000E-01 7.538572616620E-02 -4.781707470387E-01 14 0.000000000000E+00 7.695148912717E-02 -4.544789074685E-01 14 -2.384544153694E-01 1.988119487109E-01 2.953287972102E-01 14 -1.656098527197E-01 1.691267788097E-01 1.931205933211E-02
GAb3
35 7.61259950 22.99784657 7.97834643 90.000000 13 14 -1.516028706329E-20 -2.425218964616E-01 3.305725291427E-01 14 -2.500000000000E-01 2.500000000000E-01 1.563608910109E-01 14 -1.008594493835E-20 7.557317132660E-02 4.510427608286E-01 14 -5.000000000000E-01 7.682342536707E-02 4.607230444884E-01 14 -2.576816667795E-01 1.989214515800E-01 -3.093137666044E-01 14 -3.407459619346E-01 1.757207847793E-01 -3.429073263372E-02 14 -1.359096035029E-21 1.932253964954E-39 -3.369838293810E-01 14 -1.359096035029E-21 -5.000000000000E-01 -3.415668850266E-01 14 -2.560166859699E-01 0.000000000000E+00 -1.651319748471E-01 14 2.305364761610E-21 1.712516465771E-01 -4.502808117513E-01 14 -5.000000000000E-01 1.767499238514E-01 -4.786851965393E-01 14 2.561861384154E-01 5.124958395992E-02 3.000329287637E-01

5 Publications and Manuscripts
116
14 3.393132608228E-01 7.507441292378E-02 2.512612790983E-02
GAb4
12 22.86831111 7.54631619 7.93466666 89.898170 11 14 -1.173162858903E-01 -5.000000000000E-01 3.325862857015E-01 14 -1.340682369037E-01 -4.445273715588E-17 3.350196293937E-01 14 5.131247315794E-02 6.679809623087E-18 4.753211287382E-01 14 4.711229292678E-02 5.000000000000E-01 4.475108632253E-01 14 1.269372204135E-01 2.514813166892E-01 -1.574690417449E-01 14 7.447846296758E-02 2.425718035937E-01 3.045255063905E-01 14 5.073881123783E-02 1.602720064215E-01 2.931140850500E-02 14 2.044776993101E-01 -4.229657275404E-18 4.374281674220E-01 14 1.979154293482E-01 5.000000000000E-01 4.797493713033E-01 14 1.769645890401E-01 2.620275014843E-01 3.008707488997E-01 14 2.068533289797E-01 3.348195006807E-01 2.439487768602E-02
GAc1
63 7.67033413 15.86240204 11.52902569 90.000000 7 14 5.000000000000E-01 -1.563434594731E-01 -2.500000000000E-01 14 0.000000000000E+00 -1.771758565861E-01 -2.500000000000E-01 14 2.359779368353E-01 8.057260000981E-02 2.500000000000E-01 14 0.000000000000E+00 2.399270933515E-01 -4.005535232688E-01 14 0.000000000000E+00 -2.798383265381E-01 -4.036143125005E-01 14 2.384183851412E-01 1.530644509859E-01 -3.522113430500E-01 14 1.571626211551E-01 1.512684972447E-02 -3.998934582414E-01
GAc2
8 15.90655125 7.54915599 11.46071405 90.026562 22 14 -1.659747257477E-01 5.000000000000E-01 2.513693253843E-01 14 -1.440924600222E-01 -2.215848872839E-17 2.526062384774E-01 14 2.780364647864E-01 2.938403236946E-17 -4.005944076960E-01 14 -2.169378025776E-01 1.350635576160E-17 -3.964237347542E-01 14 -6.743806173531E-02 -2.662404567391E-01 2.496475513448E-01 14 1.637162728157E-01 2.608298738608E-01 3.547809724436E-01 14 2.643580300174E-02 3.406233847177E-01 4.035929050738E-01 14 2.829344968645E-01 1.351430628542E-17 -9.411202188344E-02 14 -2.198040438826E-01 -1.879973527147E-18 -9.278811523899E-02 14 1.618371771266E-01 2.622754334891E-01 1.496668225228E-01 14 2.419245194127E-02 3.358351965944E-01 8.883102451039E-02 14 1.769428910899E-01 5.000000000000E-01 -2.375644014387E-01 14 1.787753912587E-01 4.434381159996E-18 -2.515440110697E-01 14 2.332153153769E-01 -1.451977931512E-17 4.058267228394E-01 14 -2.490409025385E-01 -5.971255987272E-20 4.036617605200E-01 14 8.975577653030E-02 2.473409679996E-01 -2.426493970969E-01 14 -1.410403662426E-01 -2.548483767646E-01 -3.478276711894E-01 14 -3.661878110983E-03 -3.376996062203E-01 -3.944936761957E-01 14 2.318285953005E-01 1.131335588558E-18 9.765475232969E-02 14 -2.500010567451E-01 -3.112949208385E-17 1.050663445082E-01 14 -1.394054317599E-01 -2.453197188619E-01 -1.428894906207E-01 14 -1.832825148330E-03 -1.679738162261E-01 -8.325326678168E-02
GAc3
64 7.59110323 16.01372881 11.49003408 90.000000 6 14 -5.000000000000E-01 1.677657393491E-01 2.578999759794E-01 14 2.500000000000E-01 8.065073927843E-02 2.500000000000E-01 14 0.000000000000E+00 -2.721773036127E-01 -3.993640725212E-01 14 0.000000000000E+00 2.314958964385E-01 -4.051875598673E-01 14 -2.456293564192E-01 1.517380201210E-01 -3.524503268273E-01 14 -1.613365185025E-01 1.468844377344E-02 -3.991011230994E-01

5.6 Allotropism of Silicon
117
GAc4
64 7.44740202 15.92651865 11.42654329 90.000000 6 14 -5.000000000000E-01 -8.441695590100E-02 2.557604547938E-01 14 2.500000000000E-01 -1.738812231366E-01 2.500000000000E-01 14 5.000000000000E-01 -1.721191595594E-02 -4.018750616111E-01 14 0.000000000000E+00 -2.138430954586E-02 -4.018575237245E-01 14 2.552877887534E-01 -9.955603273772E-02 -3.525282886114E-01 14 -1.692747071907E-01 2.632524699805E-01 -4.121409513935E-01
GAc5
63 7.51336682 15.76884262 11.40574050 90.000000 7 14 5.000000000000E-01 9.708832510940E-02 -2.500000000000E-01 14 0.000000000000E+00 7.256071752163E-02 -2.500000000000E-01 14 2.307579956379E-01 -1.733670236419E-01 2.500000000000E-01 14 0.000000000000E+00 -2.808080668871E-02 -4.053803751846E-01 14 5.000000000000E-01 -1.057152891076E-02 -3.989557190020E-01 14 -2.616447265754E-01 -9.895900672270E-02 -3.528341428131E-01 14 1.639327882210E-01 2.632184695324E-01 -4.145208531868E-01
GAd1
12 15.97468510 7.51335364 13.97321350 124.903903 11 14 -4.552396378288E-02 -2.125092300497E-18 2.448146802978E-01 14 -3.648184340956E-02 5.000000000000E-01 2.581030947573E-01 14 7.147830599262E-02 -2.458188264567E-17 -4.025116318239E-01 14 -4.331916184505E-01 -8.366756564251E-18 -4.024229292956E-01 14 -4.822765631250E-02 2.472179353111E-01 -2.532556027169E-01 14 -3.268988144364E-01 2.446115347914E-01 -3.533352657203E-01 14 -2.194706671648E-01 1.684011018444E-01 -4.128590207199E-01 14 2.197924519322E-01 -2.749629249132E-17 -9.573838383623E-02 14 -2.795318362484E-01 3.689755503755E-18 -1.008457734123E-01 14 -2.260714755083E-01 -2.542933587715E-01 -1.483923295199E-01 14 -6.539516701884E-02 3.369232552332E-01 -1.011621571080E-01
GAd2
42 22.85553701 7.49812251 15.80198454 90.000000 13 14 0.000000000000E+00 -3.139961861997E-17 -1.656096975158E-01 14 0.000000000000E+00 5.000000000000E-01 -1.404125105905E-01 14 0.000000000000E+00 -2.307388899743E-01 -6.460659735280E-02 14 -1.727993131672E-01 6.280917598545E-17 2.795995431036E-01 14 -1.750206326666E-01 -1.570488440399E-17 -2.184555033887E-01 14 5.130618903346E-02 2.381895668954E-01 1.628579597942E-01 14 8.211143254135E-02 -1.639880161808E-01 2.517074188874E-02 14 2.453278174297E-01 2.747577606313E-17 1.765030899008E-01 14 -2.500000000000E-01 -2.500000000000E-01 8.762164822057E-02 14 -7.799477862238E-02 -3.139908759761E-17 -2.669736538520E-01 14 -7.337386297788E-02 3.142209542669E-17 2.522252845071E-01 14 1.987801858812E-01 -2.550038998487E-01 -1.396093839386E-01 14 1.687968074605E-01 3.315155714438E-01 -1.720671287193E-03
GAd3
42 23.04554151 7.64227689 15.90204450 90.000000 13 14 -2.524490477796E-01 -4.192196157339E-21 -1.638594986435E-01 14 -2.500000000000E-01 -2.500000000000E-01 -7.710665601062E-02 14 7.676093679912E-02 -2.053824811723E-20 2.827384005768E-01 14 7.503590552973E-02 -2.704777918438E-20 -2.348104008724E-01 14 -1.988874547527E-01 2.454596926519E-01 1.561858433279E-01 14 -1.758464716042E-01 -1.607951061293E-01 1.855376846119E-02 14 0.000000000000E+00 -8.736885265302E-21 1.810151920605E-01 14 0.000000000000E+00 5.000000000000E-01 1.607968759359E-01 14 0.000000000000E+00 2.359980648966E-01 8.463109658581E-02 14 1.740093573094E-01 -2.723787462468E-20 -2.697748666672E-01 14 1.732159211573E-01 -1.857177967917E-20 2.365883361796E-01

5 Publications and Manuscripts
118
14 -5.114230336473E-02 -2.392999289423E-01 -1.486515050672E-01 14 -7.530878851271E-02 1.576218887930E-01 -1.086182929526E-02
GAd4
12 15.83112051 7.58543777 13.92366345 124.611090 11 14 -2.717676555532E-02 -5.000000000000E-01 -2.453736257825E-01 14 -5.288787944307E-02 -1.191159455779E-18 -2.507569950352E-01 14 2.321001711716E-01 1.770852553607E-17 4.054474907005E-01 14 2.072854819979E-01 -5.000000000000E-01 3.972050402193E-01 14 -4.852044945427E-02 2.331662621515E-01 2.454925014840E-01 14 2.725221988499E-01 -2.606831013570E-01 3.511081845864E-01 14 -6.580750244005E-02 1.586675127916E-01 3.992454030486E-01 14 7.580868458738E-02 6.095918184642E-18 9.475002957414E-02 14 6.191916789540E-02 -5.000000000000E-01 9.967252532011E-02 14 1.720500537468E-01 2.617945136152E-01 1.460189645837E-01 14 -2.206146781438E-01 1.632778918450E-01 8.473735556635E-02
GBa1
11 7.50768768 11.67031708 7.93400123 90.405423 10 14 1.226052793064E-01 -2.500000000000E-01 4.174032163198E-01 14 -3.727285076445E-01 -2.500000000000E-01 4.170450262641E-01 14 -1.198992235383E-01 -2.500000000000E-01 -4.070511528300E-01 14 3.717879786897E-01 -2.500000000000E-01 -4.075777388064E-01 14 1.207958781465E-01 -9.865440495299E-02 2.246270017454E-01 14 -3.698252989899E-01 -9.999163152596E-02 2.044210418223E-01 14 1.150234054224E-01 1.505544089351E-01 -4.668196506009E-02 14 -3.644115321988E-01 1.473911305826E-01 -5.769283656006E-02 14 3.708022829628E-02 9.490077683004E-02 2.303290224265E-01 14 -2.904640717571E-01 9.564678547020E-02 2.249289927922E-01
GBa2
3 7.52041460 7.91436660 11.64968695 90.068657 18 14 -1.375502660084E-36 -4.049346519515E-01 0.000000000000E+00 14 -5.000000000000E-01 -4.046822938487E-01 0.000000000000E+00 14 -2.458130347341E-01 4.199737672524E-01 -9.744016624059E-04 14 2.468164585656E-01 2.116775971957E-01 3.463068637762E-01 14 -2.436519471677E-01 2.435198828764E-01 3.531968689049E-01 14 2.387957018350E-01 -4.327476337487E-02 1.082684770004E-01 14 -2.407503410234E-01 -3.676539380398E-02 9.374848236063E-02 14 1.616492655958E-01 2.389148118166E-01 1.543829044454E-01 14 -1.653107384141E-01 2.417595612513E-01 1.553747282788E-01 14 -2.475366755268E-01 4.306100898873E-01 -4.860389664234E-01 14 -1.084202172486E-19 -3.938232100860E-01 -5.000000000000E-01 14 -5.000000000000E-01 -3.951911230093E-01 -5.000000000000E-01 14 -6.440677660826E-03 -2.119190991167E-01 1.516294788356E-01 14 -4.953206388950E-01 -1.917944450558E-01 1.503900746391E-01 14 -9.118783363616E-03 6.010035726075E-02 4.007054889541E-01 14 -4.884728454206E-01 7.091694247485E-02 3.976743197906E-01 14 -9.064680200223E-02 -2.171151511272E-01 3.455730458414E-01 14 -4.136208489557E-01 -2.117735180888E-01 3.462277261175E-01
GBa3
14 7.89277567 11.62356723 7.53554381 90.390618 8 14 4.181580594609E-01 2.355793770366E-01 -3.767326467415E-01 14 -4.073406444375E-01 2.512544003909E-01 -1.256684624017E-01 14 -1.985806417380E-01 -9.568279485757E-02 3.709550818782E-01 14 -2.312387312652E-01 -1.030312487842E-01 -1.177059286281E-01 14 5.705914946373E-02 1.418408744049E-01 3.620268857579E-01 14 4.961926559686E-02 1.564461870561E-01 -1.170554403365E-01 14 -2.256907886647E-01 9.634386350654E-02 2.828862373657E-01 14 -2.289039891908E-01 9.530539274734E-02 -3.921506324302E-02

5.6 Allotropism of Silicon
119
GBb1
13 23.29685296 7.93232395 12.27226127 17.843820 9 14 -5.000000000000E-01 -4.166300973316E-01 -2.500000000000E-01 14 -2.775557561563E-17 -4.201418897328E-01 -2.500000000000E-01 14 2.536764634918E-01 4.067597355660E-01 2.395731501838E-01 14 4.285495638368E-01 2.240156325251E-01 2.398436670755E-01 14 -8.121986844578E-02 2.065596146343E-01 2.642923961663E-01 14 3.066317530315E-01 -5.080406885744E-02 2.281771398459E-01 14 -2.042669784508E-01 -5.627134483975E-02 2.691135561743E-01 14 4.132207164350E-01 2.266293894226E-01 7.533011254131E-02 14 -2.588727919742E-01 2.258888308557E-01 4.247386417974E-01
GBb2
8 7.52518207 23.28413238 7.90955733 90.456101 18 14 2.522523948323E-01 -1.540743955510E-33 -3.966817952767E-01 14 -2.411002435750E-01 -2.018558256493E-17 -3.939324003501E-01 14 -5.651595889631E-04 -1.971248297356E-19 4.282297182280E-01 14 -4.905049627374E-01 1.540743955510E-33 4.309565749289E-01 14 -3.463844570479E-03 -1.776277673991E-01 2.545279631771E-01 14 -4.907008008834E-01 -1.722680088860E-01 2.186905600036E-01 14 -5.345119360126E-03 -5.002544160141E-02 -2.318660291786E-02 14 -4.848032019303E-01 -5.117763877431E-02 -3.819647503789E-02 14 -8.293483994214E-02 -7.895103555189E-02 2.541070973004E-01 14 -4.077944278726E-01 -7.582100804695E-02 2.449219785851E-01 14 4.685366134633E-03 2.583493687914E-01 4.398690971722E-01 14 2.557869361963E-01 -2.483510148299E-01 -3.857297397794E-01 14 2.484100389903E-01 -7.457998719302E-02 -1.838701488867E-01 14 -2.405890332468E-01 -7.667217507796E-02 -2.016488029204E-01 14 2.412582820949E-01 -1.948728751710E-01 7.866093960621E-02 14 -2.373566988638E-01 -2.043980974883E-01 7.155351586878E-02 14 1.651840158407E-01 -1.717525589894E-01 -2.048583560921E-01 14 -1.580326870526E-01 -1.744135513952E-01 -2.057470748440E-01
GBb3
13 23.26527697 7.88633680 12.24148553 162.089846 9 14 5.551115123126E-17 4.099262984061E-01 2.500000000000E-01 14 5.000000000000E-01 4.063162094375E-01 2.500000000000E-01 14 2.448492124631E-01 -4.173906536576E-01 -2.431624780413E-01 14 -3.323751319196E-01 2.323476049395E-01 2.300050715683E-01 14 1.731622850653E-01 1.965071481868E-01 2.529741337068E-01 14 -4.571184570254E-01 -4.472675549684E-02 2.358876449565E-01 14 6.504091622742E-02 -6.041255179964E-02 2.782051109943E-01 14 4.900739083163E-01 2.328228542854E-01 7.265644929330E-02 14 1.641433761235E-01 2.234837519548E-01 4.272718225120E-01
GBc1
11 8.66677409 11.67118177 7.56979337 65.133505 10 14 -1.037761682431E-01 2.500000000000E-01 4.370097383711E-01 14 -5.898026630138E-02 2.500000000000E-01 -9.943158876504E-02 14 8.214886777477E-02 2.500000000000E-01 1.040029666026E-01 14 1.005598330066E-01 2.500000000000E-01 -4.352343411944E-01 14 2.651672478786E-01 -1.009002174400E-01 1.600669824242E-03 14 3.063557744891E-01 -9.869890436694E-02 4.658623544045E-01 14 -4.579035478662E-01 1.503816417396E-01 -1.354291110749E-01 14 -4.359296357174E-01 1.476233518170E-01 3.257997792526E-01 14 2.646445742743E-01 9.385841892323E-02 8.379772978969E-02 14 2.799900387630E-01 9.502296200378E-02 3.954541355577E-01
GBc2
5 7.53763698 15.81223377 11.65174918 89.650278 18 14 3.117713003799E-17 -3.011839721123E-01 0.000000000000E+00 14 -1.558856501899E-17 2.201417296287E-01 0.000000000000E+00

5 Publications and Manuscripts
120
14 -2.353744904740E-01 -2.038439945826E-01 2.180138713933E-03 14 2.442709457102E-01 -1.052072287719E-01 -3.539096781139E-01 14 -2.425959397989E-01 -1.089093024260E-01 -3.450620532195E-01 14 -2.354658256189E-01 2.632292176078E-02 -8.969221652541E-02 14 2.371044364583E-01 2.772630470721E-02 -1.122558840512E-01 14 1.613248363817E-01 -1.140107007209E-01 -1.589730976965E-01 14 -1.593324165873E-01 -1.120162105481E-01 -1.511461092341E-01 14 -2.446930352738E-01 -2.091411098347E-01 -4.905479615936E-01 14 6.158268339718E-17 -2.993003862537E-01 -5.000000000000E-01 14 -3.209238430557E-17 2.068229071157E-01 -5.000000000000E-01 14 -4.936208527949E-01 9.759324469761E-02 -1.512791206408E-01 14 -4.654126419475E-03 1.173381149357E-01 -1.496034017994E-01 14 -4.923695332292E-01 -3.028669973814E-02 -3.977416617996E-01 14 -5.197397081012E-03 -2.181742479372E-02 -4.004447650968E-01 14 -4.124984738800E-01 1.105474769731E-01 -3.463268962269E-01 14 -8.734105521930E-02 1.169744691525E-01 -3.448428612807E-01
GBc3
14 8.77580703 11.62939017 7.51063379 64.804899 8 14 4.184560977152E-01 2.404677882972E-01 -8.226828174646E-02 14 -4.070112863368E-01 2.523194869420E-01 8.063233118433E-02 14 -2.110633201787E-01 -1.035358610872E-01 4.721249627912E-01 14 -2.184170824256E-01 -9.453762790406E-02 -1.353051839225E-02 14 5.430825246051E-02 1.378373710884E-01 3.445419853685E-01 14 5.197246373771E-02 1.601447468772E-01 -1.415848594938E-01 14 -2.278248381097E-01 9.262408335898E-02 4.025762489968E-01 14 -2.240362443623E-01 1.001375909167E-01 7.480160623443E-02
GBd1
15 23.31004099 15.74882190 12.23354769 161.979260 9 14 0.000000000000E+00 -3.013150886029E-02 2.500000000000E-01 14 5.000000000000E-01 -5.063746250088E-02 2.500000000000E-01 14 -2.650495893375E-01 4.613645737666E-02 -2.786519301401E-01 14 -8.001912986068E-02 1.335898442016E-01 -2.598459105700E-01 14 4.297979936088E-01 1.516205624480E-01 -2.401145287221E-01 14 2.835050500837E-01 -2.244590895330E-01 -2.759092188907E-01 14 -1.821254751307E-01 -2.219766369090E-01 -2.232146328894E-01 14 4.193236477330E-01 1.368206653298E-01 -6.829890445032E-02 14 -2.628949810755E-01 1.362120865220E-01 -4.302386078743E-01
GBd2
8 7.53251971 23.31904907 8.78935269 64.150537 18 14 -5.033601794929E-02 1.540743955510E-33 -4.046984464523E-01 14 4.403077028279E-01 0.000000000000E+00 -3.647825481466E-01 14 2.933485746542E-01 0.000000000000E+00 4.480451145360E-01 14 -2.282576577972E-01 2.015535775916E-17 4.352037449339E-01 14 -1.257864066929E-01 -1.755959747778E-01 2.417817766605E-01 14 3.777804179741E-01 -1.737732244832E-01 2.541444040719E-01 14 6.318377769970E-04 -5.142275882289E-02 -2.639799568013E-02 14 -4.802400314429E-01 -4.967023899119E-02 -1.251472344700E-02 14 4.594163538815E-01 -7.723772231652E-02 2.644903425468E-01 14 -2.160336378247E-01 -7.797057415409E-02 2.561506671697E-01 14 -2.260753980266E-01 2.529335426284E-01 4.518516864841E-01 14 4.353670661507E-01 2.490653449042E-01 -3.736120733983E-01 14 -1.552833053431E-01 -7.520309279061E-02 -1.986706465436E-01 14 3.388360258104E-01 -7.531918231976E-02 -1.634591217577E-01 14 -2.976852572897E-01 -2.035873142310E-01 8.354009386840E-02 14 2.134485322277E-01 -1.956056008244E-01 8.872767875556E-02 14 4.342952858101E-01 -1.720986534006E-01 -1.932465200971E-01 14 -2.375227838793E-01 -1.734154528433E-01 -1.943045010686E-01
GBd3
15 7.49563277 15.88947064 12.24114924 107.669141 9 14 5.551115123126E-17 -2.011985516124E-01 -2.500000000000E-01 14 5.000000000000E-01 -2.063539472313E-01 -2.500000000000E-01 14 -2.575543551420E-01 2.086577033066E-01 -2.557410111790E-01

5.6 Allotropism of Silicon
121
14 3.327086972727E-01 -1.100301426678E-01 4.025036973140E-01 14 -1.800194064824E-01 -1.040987995372E-01 3.992128521818E-01 14 4.563110202346E-01 2.291609287399E-02 -3.491856508882E-01 14 -5.889764383178E-02 2.900397488350E-02 -3.525960836208E-01 14 -1.620000901152E-01 -1.117557629972E-01 -4.048176451530E-01 14 -4.900715284773E-01 -1.154250115981E-01 -4.033479594156E-01
GCa1
5 12.11953109 7.97220424 7.53190587 108.780110 9 14 3.351173003643E-22 -3.420864099329E-01 -8.495002510058E-23 14 1.387778780781E-17 -3.388084300156E-01 -5.000000000000E-01 14 1.651133490462E-03 -1.635109540398E-01 2.437808361144E-01 14 -1.546691245689E-01 4.641871118796E-01 -7.166713440931E-02 14 3.497601015777E-01 -5.636497786533E-02 4.143337570341E-01 14 8.831247972003E-02 2.944633804878E-01 -1.942064035719E-01 14 1.164536415398E-01 2.988411242899E-01 3.007484461508E-01 14 1.523638152470E-01 2.431403243509E-02 -8.507486130570E-02 14 1.581335699761E-01 1.968770278711E-02 2.428421456268E-01
GCa2
5 12.10087582 7.94450060 7.52897198 108.431755 9 14 1.677897628787E-02 -3.450186979728E-01 -2.446906641658E-01 14 -1.670477943808E-52 -1.708605248248E-01 -3.370431415997E-36 14 5.551115123126E-17 -1.657794115091E-01 -5.000000000000E-01 14 3.408406006485E-01 -6.607057332144E-02 1.745187088107E-01 14 -1.461490964442E-01 4.653990827291E-01 -3.308645425737E-01 14 1.043665726588E-01 2.966802219096E-01 6.184291781082E-02 14 9.982838959599E-02 2.870901042167E-01 -4.574772804000E-01 14 1.525156007571E-01 1.667266386960E-02 1.633433492839E-01 14 1.574404322246E-01 1.710216673621E-02 4.901335672851E-01
GCb1
9 8.82983478 11.45727996 7.51075752 115.183551 8 14 -3.437756783375E-01 -7.681978042536E-03 -4.210688174929E-01 14 -1.671363416680E-01 7.862004057199E-04 -8.287903789743E-02 14 4.486977410626E-01 1.519473356473E-01 4.675460605776E-01 14 -4.808859897596E-02 -3.465884365455E-01 -1.571536125013E-02 14 2.950004578101E-01 -1.142026605491E-01 1.516239995888E-01 14 2.898132005683E-01 -9.051373531018E-02 -3.580392166728E-01 14 1.775695215641E-02 -1.548309523265E-01 9.634636555307E-02 14 2.009226738420E-02 -1.539776431918E-01 4.249860075939E-01
GCb2
8 8.84543352 11.50786176 7.57899918 116.548640 10 14 -3.464373806147E-01 -5.722986677374E-21 -4.181877523083E-01 14 -3.007644145348E-01 -8.086554703648E-22 8.975248392929E-02 14 -1.390221277931E-01 1.444405574873E-21 -8.679177377935E-02 14 -1.584987445156E-01 -2.610939613677E-21 4.368483996958E-01 14 -1.099655222971E-02 -3.498770490935E-01 -2.101067628104E-02 14 4.494803759442E-01 1.540517487608E-01 4.776381002802E-01 14 3.005937304937E-01 -1.003749271848E-01 -3.463395746437E-01 14 3.247645814207E-01 -1.038654566828E-01 1.419982623181E-01 14 2.943543847441E-02 -1.564258018990E-01 -4.002454849150E-01 14 4.558375962588E-02 -1.561656932603E-01 -7.224130552724E-02
GDa1
28 7.43782109 5.83111545 7.84977267 90.000000 6 14 2.500000000000E-01 3.400292707726E-02 -3.330294922002E-01 14 1.618016316139E-36 0.000000000000E+00 -1.556087681541E-01 14 -2.500000000000E-01 -3.130777913942E-01 4.466119562843E-01 14 2.500000000000E-01 -2.841970016451E-01 4.773247388183E-01 14 -1.012987358375E-02 1.996923286910E-01 2.972511220710E-01

5 Publications and Manuscripts
122
14 -8.301039798873E-02 3.233874261032E-01 1.755966055483E-02
GDa2
25 7.57049563 5.90188979 7.93923492 90.000000 90.000000 90.000000 7 14 3.179993157838E-36 0.000000000000E+00 -3.317755115224E-01 14 -5.000000000000E-01 0.000000000000E+00 -3.314607784709E-01 14 -2.540328419967E-01 0.000000000000E+00 -1.579479917192E-01 14 3.179993157838E-36 -2.979853028507E-01 4.554141035298E-01 14 -5.000000000000E-01 -2.999627393408E-01 4.754017175112E-01 14 2.590927888692E-01 1.986179653488E-01 3.060703246884E-01 14 3.385911708657E-01 2.980604297874E-01 2.746233314896E-02
GDb1
35 7.59541431 11.78051366 7.89549016 90.000000 6 14 0.000000000000E+00 2.642005531346E-01 3.302794401611E-01 14 -2.500000000000E-01 2.500000000000E-01 1.571668848929E-01 14 0.000000000000E+00 -1.026992514975E-01 -4.850260810050E-01 14 5.000000000000E-01 -9.901998071532E-02 -4.480312177424E-01 14 -2.399029541396E-01 1.508919669789E-01 -3.077034648807E-01 14 -1.593408583616E-01 1.013855755626E-01 -2.834104827259E-02
GDb2
35 7.43144955 11.69900794 7.89262403 90.000000 7 14 -2.143692597877E-22 -2.919150072659E-23 3.308389861378E-01 14 -2.143692597877E-22 -5.000000000000E-01 3.253973587588E-01 14 -2.425957962051E-01 -5.978546026366E-22 1.498959020619E-01 14 7.387083006208E-22 1.510403570648E-01 -4.752164457752E-01 14 5.000000000000E-01 1.477707544546E-01 -4.594846137887E-01 14 2.402298817750E-01 -9.985686855409E-02 -3.028550744134E-01 14 1.688159009659E-01 -1.615324449463E-01 -2.401643305973E-02
GDc1
39 5.84848658 7.41715198 15.79905490 90.000000 6 14 -1.638960994073E-02 2.500000000000E-01 1.659092170796E-01 14 8.236518084953E-36 6.530358532011E-21 7.701019242520E-02 14 -3.065101594993E-01 -2.500000000000E-01 -2.341674137868E-01 14 -2.908437149519E-01 2.500000000000E-01 -2.286131248455E-01 14 -1.993882547451E-01 -4.926285748986E-01 -1.492044483476E-01 14 -3.219448837099E-01 -4.197745848825E-01 -9.929987088677E-03
GDc2
38 5.90505566 7.63274399 15.76074160 90.000000 7 14 0.000000000000E+00 -5.000000000000E-01 1.633551210513E-01 14 0.000000000000E+00 0.000000000000E+00 1.837944206252E-01 14 0.000000000000E+00 2.366205252542E-01 8.788958846703E-02 14 -2.990400303232E-01 0.000000000000E+00 2.859247368472E-01 14 -2.982252297083E-01 0.000000000000E+00 -2.345099525256E-01 14 -1.984835899147E-01 -2.368544151286E-01 -1.452892739785E-01 14 -2.985062921606E-01 -1.578563086331E-01 -5.445297834880E-03
GDd1
42 7.55498438 11.79093278 15.91157524 90.000000 6 14 0.000000000000E+00 -2.443818206969E-01 -1.644112182880E-01 14 2.500000000000E-01 -2.500000000000E-01 -7.760586014860E-02 14 0.000000000000E+00 -1.012890196698E-01 2.315704157406E-01 14 0.000000000000E+00 -9.985055217040E-02 -2.639652661515E-01 14 2.548567174531E-01 1.508153076484E-01 1.540219825233E-01 14 -3.378965268707E-01 1.013157871508E-01 1.538898190048E-02

5.6 Allotropism of Silicon
123
GDd2
42 7.48047459 11.67321414 15.64376015 90.000000 7 14 -5.000000000000E-01 -3.048897875608E-21 -1.614652827886E-01 14 5.410694421563E-22 -5.270635310155E-21 -1.863372786197E-01 14 -2.310807450650E-01 1.005559707372E-17 -8.598569531774E-02 14 -7.183121700806E-21 1.470044077851E-01 2.322037977478E-01 14 -1.996396385265E-21 1.521803269252E-01 -2.858765281339E-01 14 -2.373100507738E-01 -1.001332952628E-01 1.411610666961E-01 14 1.643876186964E-01 -1.632072200375E-01 1.246286507922E-03
SA1
14 3.79879281 9.41123660 15.15656702 113.199478 6 14 -1.603403382562E-01 5.528069091711E-02 4.241669445307E-01 14 -4.736236411331E-01 3.865406673053E-01 1.974468854905E-01 14 -4.243474896960E-01 -4.475032883607E-01 -4.249135015291E-01 14 -1.937908961109E-01 -4.776811351979E-01 3.384545419622E-01 14 -3.044180218588E-01 -1.997939978661E-01 -3.922820236252E-01 14 -8.382466762014E-02 -2.579346748415E-01 2.778453059092E-01
SA2
14 3.79869550 14.10610184 11.13781830 123.426255 6 14 3.683449455740E-01 -4.253832417074E-01 4.418030349303E-01 14 -3.178694411755E-01 -1.991886760511E-01 1.112948730396E-01 14 1.628932350954E-01 -4.257430584313E-01 4.859707997928E-02 14 -4.438067354189E-01 -3.397499480721E-01 -2.350288260082E-02 14 -3.828638700633E-01 -3.896355015967E-01 2.988436513015E-01 14 4.150060650640E-01 -2.226741738843E-01 2.564720948725E-01
SA3
18 9.39598538 14.01473043 3.80171951 6 14 4.453422003931E-01 -4.235405429278E-01 -4.515913973191E-01 14 -1.132457671427E-01 1.991621066607E-01 -3.907613275706E-01 14 5.233821669146E-02 -4.245762023756E-01 1.615104031575E-01 14 2.300920498117E-02 3.391588444943E-01 -3.230827691275E-01 14 3.003727264150E-01 -3.917297080764E-01 6.900940524734E-02 14 2.426061537846E-01 2.770633709954E-01 -1.245392590196E-01
SA4
34 9.59482095 13.83278547 3.76180196 6 14 5.482681157093E-02 -4.226024838344E-01 3.220324694481E-01 14 -3.876911643296E-01 1.929027382053E-01 -4.706171583443E-01 14 5.243645698824E-02 7.584062907597E-02 4.274258592031E-01 14 4.826576693596E-01 3.363302474130E-01 4.379605688431E-01 14 2.044264521411E-01 -3.909117741787E-01 -1.371627835988E-01 14 2.564035480674E-01 2.787844308194E-01 -4.957889555512E-01
SB1
14 3.79989848 9.64283210 14.32576473 98.535761 6 14 1.363089844485E-01 1.755289331525E-01 -8.954560585153E-02 14 9.563659279328E-02 -3.524838414482E-01 1.993585768733E-01 14 2.389743664257E-01 3.063741801752E-01 -4.246732848300E-01 14 2.314736557236E-01 -2.785753155109E-01 -1.559763954978E-01 14 3.649211850020E-01 -3.909874256413E-02 1.253878326440E-01 14 3.806449339260E-01 4.974918969217E-01 -2.118023021040E-01
SB2
14 3.81270689 14.20064425 9.77893864 101.079965

5 Publications and Manuscripts
124
6 14 1.975074421173E-01 -8.868899509884E-02 -1.723172920195E-01 14 -2.224358671803E-01 1.981412707425E-01 3.537067490716E-01 14 -1.400350365655E-01 -4.244768548383E-01 -3.061776131758E-01 14 3.993656546724E-01 -1.563669289772E-01 2.739332854793E-01 14 2.497672102629E-01 1.277939097620E-01 3.969545377438E-02 14 -3.504554523411E-01 -2.102462068422E-01 -4.979459241721E-01
SB3
19 14.15329843 3.79872004 9.63300000 6 14 4.110585307345E-01 6.265447812573E-02 -4.259581893984E-01 14 3.017203441350E-01 -1.198521092120E-01 3.972371989129E-01 14 -4.246261052909E-01 1.371703923170E-01 -4.433164968064E-01 14 -1.567885586052E-01 3.424877111639E-01 -2.793794598029E-02 14 1.256814287275E-01 4.231941616351E-01 2.097826819046E-01 14 -2.111356173939E-01 1.419332122004E-01 -2.511695484783E-01
SB4
33 14.03013049 9.76773911 3.75479302 6 14 4.093518045758E-01 3.236125958836E-01 4.919883079051E-01 14 -3.050015990135E-01 -1.513056278887E-01 -3.199325850540E-01 14 7.471806210964E-02 1.974903254819E-01 -4.300932441695E-01 14 3.416455050974E-01 -2.225622167174E-01 -4.154491128509E-01 14 -3.755166387735E-01 -4.665199285237E-01 -4.749005335711E-01 14 2.885243322777E-01 4.959727502980E-03 -3.434328322596E-01
SC1
14 3.79536940 10.22995946 12.58083537 95.078688 6 14 -7.473113983735E-02 1.143926747060E-01 6.426269046737E-03 14 -1.779641440326E-01 1.766526967948E-01 1.851927143976E-01 14 4.110011185519E-01 4.392990383896E-01 -7.666270313764E-02 14 1.363890977741E-01 -1.296507582974E-02 -3.183659047397E-01 14 3.991916541821E-01 2.086289046087E-01 -7.482807905567E-02 14 3.179556636571E-01 1.985229197387E-01 -2.636924476369E-01
SC2
14 3.65875 12.1079 10.43006 108.04197 6 14 -0.00569 0.49341 -0.38837 14 0.13920 0.68374 -0.67654 14 0.88608 0.57690 -0.06232 14 0.41225 0.81688 -0.51684 14 0.58121 0.57399 -0.29048 14 0.53426 0.76413 -0.29998
SC3
18 10.25118222 12.51361424 3.78814918 6 14 3.843057392786E-01 4.904036133204E-01 -6.448589038786E-02 14 3.192240026298E-01 3.131803413243E-01 1.138044813728E-01 14 6.293182797120E-02 -4.227496518740E-01 3.231941482269E-01 14 -4.851210002322E-01 -1.822605756148E-01 1.873069782155E-01 14 2.914250385330E-01 -4.270923930651E-01 4.189154776264E-01 14 3.052910441773E-01 -2.382031637309E-01 3.735148735192E-01
SC4
34 10.32789655 12.60145959 3.74789243 6 14 -3.860299534978E-01 -4.869681535342E-01 3.931844219766E-01 14 3.232716076693E-01 3.159150034130E-01 1.036010732916E-01 14 -6.390159720445E-02 4.235233939973E-01 2.432256938691E-02

5.6 Allotropism of Silicon
125
14 4.829513370260E-01 1.814991524737E-01 3.269178147935E-02 14 -2.913688680667E-01 4.250805873289E-01 -6.975745673560E-02 14 -3.025462324739E-01 2.384715450045E-01 7.638761060111E-02
SD
63 10.32789655 12.60145959 3.74789243 6 14 -3.860299534978E-01 -4.869681535342E-01 3.931844219766E-01 14 3.232716076693E-01 3.159150034130E-01 1.036010732916E-01 14 -6.390159720445E-02 4.235233939973E-01 2.432256938691E-02 14 4.829513370260E-01 1.814991524737E-01 3.269178147935E-02 14 -2.913688680667E-01 4.250805873289E-01 -6.975745673560E-02 14 -3.025462324739E-01 2.384715450045E-01 7.638761060111E-02
mep
223 10.21628464 3 14 0.000000000000E+00 3.080457631353E-01 1.170622392585E-01 14 1.836328729915E-01 1.836328729915E-01 1.836328729915E-01 14 2.500000000000E-01 0.000000000000E+00 -5.000000000000E-01
mtn
227 14.72399514 3 14 -1.250000000000E-01 -1.250000000000E-01 -1.250000000000E-01 14 -2.169943502463E-01 -2.169943502463E-01 -2.169943502463E-01 14 3.174641942200E-01 -1.825358057800E-01 1.295011757420E-01
CAS
63 3.83423475 10.74044913 12.72663951 3 14 -3.049695997126E-17 2.570866137000E-01 -5.511620526110E-02 14 -7.624239992815E-18 7.133361706975E-02 -1.573697463423E-01 14 -5.000000000000E-01 -2.898655627853E-02 -9.052835284157E-02
NGS
178 5.47157777 5.10710666 1 14 -2.322685208250E-01 2.322685208250E-01 4.166666666667E-01
tum
137 7.45563568 9.20081520 3 14 -1.946318569050E-02 1.946318569050E-02 2.500000000000E-01 14 2.500000000000E-01 -8.703908518123E-02 -4.156697554256E-01 14 2.500000000000E-01 4.142344254555E-01 3.688471736737E-01


5 Publications and Manuscripts
127
5.7 Li18Na2Ge17 — a Compound Demonstrating Cation Effects on
Cluster Shapes and Crystal Packing in Ternary Zintl Phases
Reprinted with permission from Scherf, L. M.; Zeilinger, M.; Fässler, T. F. Inorg.
Chem. 2014, 53, 2096. Copyright (2014) American Chemical Society.


Li18Na2Ge17A Compound Demonstrating Cation Effects on ClusterShapes and Crystal Packing in Ternary Zintl PhasesLavinia M. Scherf, Michael Zeilinger, and Thomas F. Fassler*
Department Chemie, Technische Universitat Munchen, Lichtenbergstraße 4, 85747 Garching b. Munchen, Germany
*S Supporting Information
ABSTRACT: The novel ternary Zintl phase Li18Na2Ge17 wassynthesized from a stoichiometric melt and characterized crystallo-graphically. It crystallizes in the trigonal space group P31m (No. 157)with a = 17.0905(4) Å, c = 8.0783(2) Å, and V = 2043.43(8) Å3 (finalR indices R1 = 0.0212 and wR2 = 0.0420 for all data). The structurecontains three different Zintl anions in a 1:1:1 ratio: isolated anionsGe4−, tetrahedra [Ge4]
4−, and truncated, Li-centered tetrahedra [Li@Ge12]
11−, whose hexagonal faces are capped by four Li cations,resulting in the Friauf polyhedra [Li@Li4Ge12]
7−. According to theZintl−Klemm concept, Li18Na2Ge17 is an electronically balanced Zintlphase, as experimentally verified by its diamagnetism. The compoundis structurally related to Li7RbGe8, which also contains [Ge4]
4− and[Li@Li4Ge12]
7− in its anionic substructure. However, exchanging the heavier alkali metal cation Rb for Na in the mixed-cationgermanides leads to drastic changes in stoichiometry and crystal packing, demonstrating the great effects that cations exert onsuch Zintl phases through optimized cluster sheathing and space filling.
■ INTRODUCTION
Zintl phases are commonly defined as saltlike intermetalliccompounds with highly heteropolar bonds. Formally, they canbe described by a complete valence electron transfer fromelectropositive elements such as alkali or alkaline-earth metalsto the more electronegative p-block metals of groups 13−16.Resulting Zintl anions typically behave like elements with thesame number of valence electrons N according to the octet (8− N) rule.1 Just like the corresponding elements, Zintl anionsmay take the form of extensive polymeric structures as well asfew-atom clusters or isolated atoms. Ge cluster anions rangefrom Br2-like [Ge2]
6− dumbbells in BaMg2Ge22 and P4-
analogous [Ge4]4− tetrahedra in A4Ge4 (A = Na, K, Rb, Cs)3
to truncated tetrahedra [Ge12]12− in Li7RbGe8.
4 Some examplesof such Ge Zintl anions are depicted in Figure 1. Isolated Ge4−
anions with noble-gas configurations are frequently observed aswell: for example, in compounds E2Ge (E = Mg, Ca, Sr, Ba).5
Examples of polymeric germanides are CaGe2 (3∞[Ge
−], Asgraystructure),6 CaGe (1∞[Ge
2−], polymeric Se structure),7 Li7Ge12(2∞[Ge24
14−]),8 and clathrate-type compounds Ba6Ge25,9
AxGe46 (A = K, Rb, Cs, Ba),10 and AxGe136 (A = Na, K, Rb).11
The formation of the novel allotrope m-allo-Ge as amicrocrystalline bulk material14 in a topotactic reaction ofLi7Ge12 triggered our interest in looking for other allotropes ofGe and Si.15 In the course of our investigations, we consideredLi3NaSi6 as a potential precursor because it has a two-dimensional Si substructure similar to that of Li7Ge12 and atopotactic conversion to allo-Si has been reported.16 During ourattempts to synthesize a solid solution Li3NaSi6/Li3NaGe6 as a
precursor of a new modification of binary Si−Ge, weserendipitously obtained the new compound Li18Na2Ge17.A single-crystal X-ray structure determination shows that the
novel Zintl phase Li18Na2Ge17 contains the largest knownanionic cluster unit, [Ge12]
12−, which has been observed in onlyone other compoundthe structurally related Li7RbGe8.
4
Moreover, Li18Na2Ge17 features three different Ge Zintl anions.Reports of compounds comprised of three or more differentZintl anions are extremely rare. The few examples includeBa6Mg10.8Li1.2Si12 (Si4−, [Si2]
6− dumbbells, bent [Si3]7.4−
chains),17 E31Sn20 (E = Ca, Sr, Yb; Sn4−, [Sn2]6− dumbbells,
linear [Sn5]12− chains),18 Yb36Sn23 (Sn4−, [Sn2]
6− dumbbells,linear [Sn6]
14− chains)19 and Na23K9Tl15.3 (Tl5−, linear [Tl3]
7−
chains, [Tl4]8− tetrahedra, trigonal-bipyramidal [Tl5]
7−).20
Rather complex Zintl phases with various anions of differentsizes require an equally complex and efficient coordination bycations. Corbett described the concepts and effects of thiscluster “solvation” in detail.21 In short, surrounding cationsstabilize anionic clusters by bridging and separating them.Stable Zintl phases require an optimized balance of specificcluster sheathing and efficient space filling. Interestingly, someGe Zintl anions (e.g., [Ge2]
6− in BaMg2Ge2,2 [Ge12]
12− inLi7RbGe8
4) have only been obtained in ternary compoundswith mixed cations. Others (e.g., [Ge4−Na−Ge4]7− in A7NaGe8with A = K, Rb)22 show packing schemes very different fromthose of their binary analogues. These examples along withextensive studies on mixed cation trielides performed by Dong
Received: October 27, 2013Published: January 31, 2014
Article
pubs.acs.org/IC
© 2014 American Chemical Society 2096 dx.doi.org/10.1021/ic4027046 | Inorg. Chem. 2014, 53, 2096−2101

and Corbett20,23 demonstrated that mixing cations of differentsizes can be a very useful tool for achieving this balance.21 Abinitio calculations on the structural differences in NaTl andKTl24 as well as Li2AuBi and Na2AuBi
25 support the frequentlyobserved structure-directing effect of cations in Zintlcompounds. The new Zintl phase Li18Na2Ge17 presented hereclearly illustrates the influence of cations on cluster shapes andcrystal packing in ternary Zintl phases.
■ EXPERIMENTAL SECTIONSynthesis of Li18Na2Ge17. All steps of synthesis and sample
preparation were carried out in an Ar-filled glovebox (MBraun, H2Olevel <0.1 ppm, O2 level <0.1 ppm). Li18Na2Ge17 was prepared fromthe pure elements (99% Li rods, Rockwood-Lithium; 99% Na rods,Chempur; 99.999% Ge pieces, Chempur) in a tantalum ampule. Thesealed ampule containing the stoichiometric reaction mixture with atotal mass of 1 g was placed inside a silica reaction container, whichwas then evacuated and heated to 750 °C for 1 h. The resulting meltwas cooled at a rate of 0.5 °C min−1 to 300 °C, at which temperatureannealing of the reaction product was allowed for 3 h.Single-Crystal Structure Determination. Crystals of
Li18Na2Ge17 were selected in an Ar-filled glovebox and sealed in 0.3mm glass capillaries. For the best specimen, intensity data werecollected at 123 K using a Bruker AXS X-ray diffractometer equippedwith a CCD detector (APEX II, κ-CCD), a rotating anode FR591 withMo Kα radiation (λ = 0.71073 Å), and a MONTEL opticmonochromator. Data collection was controlled with the BrukerAPEX software package.26 Integration, data reduction, and absorptioncorrection were performed with the SAINT27 and SADABS28
packages. The structure was solved with direct methods (SHELXS-97) and refined with full-matrix least squares on F2 (SHELXL-97).29
Details of the single-crystal data collection and refinement are given inTable 1. Further details on the crystal structure investigation may beobtained as Supporting Information (atomic coordinates and isotropicdisplacement parameters in Table S1, CIF file) and fromFachinformationszentrum Karlsruhe, 76344 Eggenstein-Leopoldsha-fen, Germany (fax (+49)7247-808-666; e-mail [email protected]; http://www.fiz-karlsruhe.de/request_for_deposited_data.html) onquoting the deposition number CSD-426692.Powder X-ray Diffraction Analysis. A PXRD pattern of
Li18Na2Ge17 was recorded using a Stoe STADI P diffractometerequipped with a Ge(111) monochromator for Cu Kα radiation (λ =1.54056 Å) and a Dectris MYTHEN DCS 1K solid-state detector. Acrystalline sample of a Li18Na2Ge17 synthesis product was ground in anagate mortar and filled into a 0.3 mm glass capillary, which was thensealed. The sample was measured within a 2θ range of 5−89° (PSDsteps, 0.075°; time/step, 45 s). The diffraction pattern is shown inFigure S2 in the Supporting Information.Magnetic Measurements. Using a Quantum Design MPMS 5
XL SQUID magnetometer, the magnetization of 39 mg of aLi18Na2Ge17 synthesis product was measured at applied fields of5000 and 10000 Oe over the temperature range 2−300 K. The datawere corrected for the sample holder and for ion-core diamagnetismusing Pascal’s constants.30 The molar susceptibility Xm is negative in
the range of −(1.44−1.55) × 10−3 emu mol−1 and temperatureindependent, as expected for a diamagnetic compound. Thecorresponding graph is shown in Figure S3 in the SupportingInformation.
■ RESULTS AND DISCUSSIONStructure of Li18Na2Ge17. Li18Na2Ge17 was serendipitously
identified from a reaction intended to yield Li3NaSi3Ge3, aderivative of the known Zintl phase Li3NaSi6.
16 Subsequently,the air- and moisture-sensitive compound was synthesizeddirectly from the pure elements and characterized crystallo-graphically. Li18Na2Ge17 crystallizes in the trigonal space groupP31m (No. 157) with a = 17.0905(4) Å, c = 8.0783(2) Å. and Z
Figure 1. Selected Ge cluster anions from left to right: [Ge2]6− dumbbell (BaMg2Ge2),
2 butterfly-shaped [Ge4]6− (β-Ba3Ge4),
12 [Ge4]4− tetrahedron
(A4Ge4; A = Na, K, Rb, Cs),3 monocapped-quadratic-antiprismatic [Ge9]4− (K4Ge9),
13 truncated-tetrahedral [Ge12]12− (Li7RbGe8).
4
Table 1. Crystallographic Data and Structure Refinement forLi18Na2Ge17
T (K) 123(2)formula wt 1404.93cryst size (mm3) 0.11 × 0.13 × 0.28cryst color metallic blackcryst shape blockspace group P31munit cell dimens (Å)
a 17.0905(4)c 8.0783(2)
Z 3V (Å3) 2043.43(8)ρ(calcd) (g cm−3) 3.425μ (mm−1) 18.459F(000) 1860θ range (deg) 2.38−33.16index range −26 ≤ h ≤ 26
−25 ≤ k ≤ 23−12 ≤ l ≤ 12
no. of rflns collected 47691no. of indep rflns 5466 (Rint = 0.0407)no. of rflns with I > 2σ(I) 5150 (Rσ = 0.0250)abs cor multiscanno. of data/restraints/params 5466/1/191goodness of fit on F2 1.041final R indices (I > 2σ(I))a,b
R1 0.0185wR2 0.0412
R indices (all data)a,b
R1 0.0212wR2 0.0420
Flack param 0.01(2)largest diff peak, hole (e Å−3) 0.88, −0.99aR1 = ∑||Fo| − |Fc||/∑|Fo|.
bwR2 = [∑w(Fo2 − Fc
2)2/∑w(Fo2)2]1/2.
Inorganic Chemistry Article
dx.doi.org/10.1021/ic4027046 | Inorg. Chem. 2014, 53, 2096−21012097

= 3. All atoms were refined anisotropically with final reliabilityfactors of R1 = 0.0212 and wR2 = 0.0420 for all data (Table 1).Interestingly, the structure of Li18Na2Ge17 incorporates three
different Zintl anions in a 1:1:1 ratio: truncated Ge tetrahedra[Ge12]
12−, Ge tetrahedra [Ge4]4−, and isolated Ge anions Ge4−
(Figure 2a). Thus, to the best of our knowledge, it is the firstgermanide containing three different Zintl anions with each ofthem observing the (8 − N) rule. In addition, the new Zintlphase Li18Na2Ge17 is only the second compound containing thelargest known anionic Ge cluster unit, [Ge12]
12−. Such[Ge12]
12− truncated tetrahedra have been reported once beforein the related Zintl phase Li7RbGe8, in which they occur next totetrahedral [Ge4]
4−.4 Similar [Sn12]12− clusters are observed in
ENa10Sn12 (E = Ca, Sr).31 Larger Ge polyanions have only beenisolated via soluble [Ge9]
4−, with [Ge45]12− being the largest
example of covalently linked Ge atoms.32
The shape of the large [Ge12]12− unit, a polyhedron with four
triangular and four hexagonal faces, derives from a largetetrahedron with truncated vertices. Four Li atoms cap thehexagonal faces of the truncated tetrahedron and thusconstitute the 16-vertex Friauf33 polyhedron [Li4Ge12]
8−. Inaddition, the Friauf polyhedron is centered by one Li atom(Figure 3). Due to the lower crystal symmetry, Ge−Ge bondlengths (2.4840(5)−2.6948(5) Å) vary in a greater range thanin Friauf polyhedra in Li7RbGe8 (2.505(2)−2.603(2) Å).4
However, average Ge−Ge bond lengths are identical (2.567(1)Å for Li18Na2Ge17, 2.569(2) Å for Li7RbGe8). Similarly, theaverage interatomic distances of Ge and capping Li atoms(2.91(1) Å for Li18Na2Ge17, 2.96(2) Å for Li7RbGe8) as well asthe interatomic distances of centering Li1 to all 16 surroundingatoms (2.99(1) Å for Li18Na2Ge17, 3.02(2) Å for Li7RbGe8) fallin the same ranges (Table 2). In addition, the Friaufpolyhedron [Li@Li4Ge12]
7− is coordinated by another 30alkali-metal cations, forming an approximately spherical“solvation” environment (Figure S1 in the SupportingInformation).The four capping Li atoms link the Friauf polyhedron to
neighboring Zintl anions (Figure 3). Li2 is coordinated by atriangular face of a neighboring Friauf polyhedron along c,whereas Li4 coordinates one edge of crystallographicallydistinguishable tetrahedra A and Li3 coordinates a face of thesecond tetrahedron type B.Ge tetrahedra A and B (ratio 2:1) are both located on 3-fold
rotation axes (Figure 2a) and differ in their relative orientations
as well as their coordination environments (Figure 4a,b).Nevertheless, their Ge−Ge bond lengths of 2.5610(5)−2.5818(6) Å agree well with those in A4Ge4 (A = Na, K, Rb,Cs).3 Tetrahedron A has a coordination environment similar tothat of [Ge4]
4− tetrahedra in Li7RbGe8,4 containing 12 Li and 2
Na atoms (Figure 4a; Ge−Li distances 2.575(5)−3.114(6) Å,Ge−Na distances 2.980(2)−3.320(2) Å). In contrast, tetrahe-dron B is coordinated by 15 Li and 2 Na atoms (Figure 4b;Ge−Li distances 2.703(7)−3.095(6) Å, Ge−Na distances3.020(3)−3.335(2) Å). For both tetrahedron types, Li atomscap trigonal faces or bridge edges or coordinate exo at vertices.These coordination modes commonly occur in Zintl clustersheathing.21
The isolated Ge atom Ge1 is coordinated by nine Li atomsand Na1 (Figure 4c) with a Ge−Na distance of 2.877(2) Å.Coordinating Li atoms (Ge−Li distance 2.514(6)−2.903(5) Å)are clearly differentiated from next-nearest neighbors with Ge−Li distances >4.8 Å. All relevant interatomic distances inLi18Na2Ge17 are given in Table 2.
Figure 2. (a) Projection of the structure of Li18Na2Ge17 onto the ab plane (Li, white; Na, green; Ge, gray; thermal ellipsoids at 90% probability at123 K). The anionic Ge clusters are highlighted as colored polyhedra (truncated tetrahedra [Ge12]
12−, blue; crystallographically different tetrahedra[Ge4]
4− (A) red, (B) yellow). The hexagonal primitive packing of truncated tetrahedra is indicated by red lines. (b) Projection of the structure ofLi7RbGe8
4 onto the ab plane (Li, white; Rb, green; Ge, gray). The anionic Ge clusters are highlighted as colored polyhedra (truncated tetrahedra[Ge12]
12−, blue; tetrahedra [Ge4]4−, orange).
Figure 3. Structure of the Li-centered Friauf polyhedron [Li@Li4Ge12]
7− (Li, white; Ge, gray; truncated tetrahedron [Ge12]12−, blue;
crystallographically different tetrahedra [Ge4]4− (A) red, (B) yellow;
thermal ellipsoids at 90% probability at 123 K). Ge−Ge bonds aremarked in black, whereas capping Li atoms are connected with graylines. Interactions of capping Li atoms with edges (A) or triangularfaces (B and [Li@Li4Ge12]
7−) of neighboring clusters are shown withbroken lines. Relevant interatomic distances are given in Table 2.
Inorganic Chemistry Article
dx.doi.org/10.1021/ic4027046 | Inorg. Chem. 2014, 53, 2096−21012098

Electron Count. According to the Zintl−Klemm con-cept,1a,34 the truncated Ge tetrahedron may be viewed as a[Ge12]
12− anion with one negative charge for every three-connected Ge atom. Adding the four capping Li atoms and Li1in the center with one positive charge each results in an overallelectron count of −7 for [Li@Li4Ge12]
7−. Li18Na2Ge17 containsthe Friauf polyhedron, tetrahedral [Ge4]
4−, and isolated Ge4− ina 1 : 1 : 1 r a t i o . T h u s , ( L i + ) 1 3 ( N a + ) 2 [ L i @Li4Ge12]
7−[Ge4]4−(Ge4−) is an appropriate notation for this
novel Zintl phase, in which all Zintl anions obey the (8 − N)
rule. A magnetic measurement of Li18Na2Ge17 clearly revealsdiamagnetism of the metallic black and brittle compound(Figure S3 in the Supporting Information), which is consistentwith a semiconducting Zintl phase.
Cation Effects. The crystal structure of Li18Na2Ge17 isclosely related to the structure of Li7RbGe8.
4 In bothcompounds, the Li-centered Friauf polyhedra [Li@Li4Ge12]
7−
arrange in a hexagonally primitive fashion, as demonstrated inFigure 2. The resulting voids are filled by [Ge4]
4− tetrahedraand in the case of Li18Na2Ge17 also by isolated Ge anions.
Figure 4. Coordination environments of (a) the Ge tetrahedron A, (b) the Ge tetrahedron B, (c) and the isolated Ge atom Ge1 (Li, white; Na,green; Ge, gray; thermal ellipsoids at 90% probability at 123 K). Relevant interatomic distances are given in Table 2.
Table 2. Relevant Interatomic Distances in Li18Na2Ge17 (P31m, Z = 3, Estimated Standard Deviations in Parentheses)
atom pair atom pair atom pair
d (Å) d (Å) d (Å)
Ge1 Li6 2.514(6) Ge6 Ge6 2.4883(5) Ge9 Li8 2.856(4)Li11 × 2 2.543(5) Ge9 2.5980(4) Li13 2.921(5)Li9 2.560(7) Ge7 2.6596(4) Li3 2.935(3)Li13 × 2 2.643(5) Li11 2.708(4) Li4 2.978(4)Li7 2.709(7) Li7 2.740(3) Li1 3.058(3)Na1 2.877(2) Li8 2.752(3) Na1 3.161(1)Li10 × 2 2.902(5) Li5 2.836(6) Ge10 Ge11 2.4840(5)
Ge2 Ge2 × 2 2.5610(5) Li3 2.906(6) Ge8 × 2 2.5596(4)Ge3 2.5753(4) Li2 2.974(6) Li13 × 2 2.826(5)Li13 2.575(5) Li1 2.995(6) Li4 × 2 2.946(4)Li4 2.854(5) Ge7 Ge8 2.4952(4) Na1 2.978(2)Li4 2.885(5) Ge9 2.5651(4) Li1 3.042(6)Li12 2.924(5) Li11 2.618(5) Ge11 Ge10 2.4839(5)Li12 2.932(5) Ge6 2.6596(4) Li6 2.585(6)Li10 3.114(6) Li10 2.767(5) Ge12 × 2 2.5921(4)Na2 3.335(2) Li4 2.882(5) Li4 × 2 2.871(5)
Ge3 Ge2 × 3 2.5753(4) Li12 2.951(6) Li12 × 2 2.903(5)Li12 × 3 2.862(5) Li2 2.980(4) Li2 2.960(8)Li10 × 3 2.975(6) Li1 2.997(4) Li1 2.964(7)Na2 2.980(2) Ge8 Ge7 2.4952(4) Ge12 Ge9 2.5000(4)
Ge4 Ge5 2.5688(6) Ge10 2.5597(4) Li11 2.567(5)Ge4 × 2 2.5818(6) Li6 2.659(5) Ge11 2.5921(4)Li9 2.703(7) Ge8 2.6948(5) Ge12 2.5992(5)Li5 × 2 2.823(6) Li10 2.768(5) Li5 2.766(6)Li7 2.902(7) Li4 2.851(5) Li4 2.857(5)Li3 × 2 3.035(6) Li12 2.912(6) Li3 2.875(6)Li8 3.095(6) Li2 2.916(6) Li12 2.942(5)Na3 3.320(2) Li1 2.969(6) Li1 2.945(7)
Ge5 Ge4 × 3 2.5688(6) Ge9 Ge12 2.5000(4) Li2 3.018(7)Li8 × 3 2.770(6) Ge7 2.5651(4) Li1 Li2 2.94(1)Li3 × 3 2.838(6) Ge6 2.5980(4) Li3 2.981(9)Na3 3.020(3) Li9 2.855(4) Li4 × 2 3.009(6)
Inorganic Chemistry Article
dx.doi.org/10.1021/ic4027046 | Inorg. Chem. 2014, 53, 2096−21012099

Alkali-metal cations Li+ as well as Na+ and Rb+, respectively,stabilize the Zintl anions by counterbalancing the negativecharge, filling voids and providing cluster sheathing that keepsclusters separated.Although the heavier alkali-metal content in the two ternary
germanides only amounts to 5.41 (Li18Na2Ge17) and 6.25 atom% (Li7RbGe8), the exchange of the heavier alkali-metal cationinduces a dramatic difference in the crystal structures. Acomparison of cell dimensions of the hexagonally primitiveframework of Friauf polyhedra in both compounds shows aslight cell contraction upon utilization of Na instead of Rb(Table 3), changing the requirements for effective space filling.
An isolated Ge4− anion replaces one of the two [Ge4]4−
tetrahedra in each primitive cell. However, the isolated anion,which has the same 4-fold negative charge as the larger [Ge4]
4−
tetrahedron, cannot encompass the same number of cations inits coordination environment. Therefore, [Ge4]
4− tetrahedronB accommodates three additional Li cations, resulting indecreased overall symmetry and a greater a parameter. Thelowered symmetry is accompanied by a slight distortion of thehexagonally primitive Friauf polyhedron framework inLi18Na2Ge17. Whereas the distances of one Friauf polyhedroncenter to the centers of each of the six neighboring polyhedra inthe ab plane are all equal in Li7RbGe8 (9.8946(7) Å, room-temperature single-crystal data), these center-to-center dis-tances slightly differ in Li18Na2Ge17 (4 × 9.931(6) Å, 2 ×9.742(6) Å, 123 K single-crystal data).
In addition, the introduction of Na as the heavier alkali-metalcation evokes a drastic change of the crystal packing along the cdirection (Figure 5). In Li7RbGe8, two [Ge4]
4− tetrahedra areseparated by two Rb cations and Friauf polyhedra are staggereddue to a 63 screw axis. However, in Li18Na2Ge17 a single Nacation alternates with each tetrahedron and isolated Ge anion,respectively. Concomitantly, the length of the c axis is halved(Table 3) because [Li@Li4Ge12]
7− clusters stack in an eclipsedmanner in the lower symmetry.
■ CONCLUSIONS
Mixing cations of different size or even different charge insyntheses of Zintl phases has been shown to be an efficient toolto stabilize rare cluster shapes. The novel compoundLi18Na2Ge17 presented here and the related Li7RbGe8
4 illustratethis concept well. Although the heavier alkali-metal contentonly amounts to 5−6 atom % in these compounds, theexchange of Rb by Na introduces a dramatic structuraldifference. In the case of Li18Na2Ge17 an intriguing structurewith three different Zintl anions is obtained. It is therefore easyto imagine that many more novel structures may be stabilizedas mixed-cation compounds which are not available in binarysystems. Thus, cation ratios must be carefully selected in orderto obtain electronically balanced structures with favorablecluster sheathing and efficient space filling. However, owing tothe multitude of Zintl anion geometries and countless possiblecombinations thereof, predicting new ternary Zintl phasesremains difficult.
■ ASSOCIATED CONTENT
*S Supporting InformationAtomic coordinates and isotropic displacement parameters ofLi18Na2Ge17 (Table S1), coordination environment of theFriauf polyhedron [Li@Li4Ge12]
7− in Li18Na2Ge17 (Figure S1),a powder X-ray diffraction pattern of Li18Na2Ge17 (Figure S2),results of magnetic susceptibility measurements (Figure S3),and a CIF file giving crystallographic data. This material isavailable free of charge via the Internet at http://pubs.acs.org.
Table 3. Cell Dimensions a′, c′, and V′ of the HexagonallyPrimitive Friauf Polyhedron Framework in Li18Na2Ge17(Room-Temperature Powder Data; a′ = (1/3)1/2a; c′ = c; V′= (1/3)1/2V) and Li7RbGe8 (Room-Temperature Single-Crystal Data;4 a′ = a; c′ = (1/2)c; V′ = (1/2)V)
Li18Na2Ge17 Li7RbGe8
a′ (Å) 9.899(2) 9.8946(7)c′ (Å) 8.100(1) 8.135(2)V′ (Å3) 679.74(4) 689.74(2)
Figure 5. Fragments of the structures of (a) Li18Na2Ge17 (Na, green, Ge, gray; truncated tetrahedra [Ge12]12−, blue; crystallographically different
tetrahedra [Ge4]4− (A) red, (B ) yellow) and (b) Li7RbGe8
4 (Rb, green; Ge, gray; truncated tetrahedra [Ge12]12−, blue; tetrahedra [Ge4]
4−, orange),demonstrating the packing of Zintl anions and Na and Rb cations, respectively, along c. The main symmetry elements are indicated by their symbols.Li atoms are omitted for enhanced clarity.
Inorganic Chemistry Article
dx.doi.org/10.1021/ic4027046 | Inorg. Chem. 2014, 53, 2096−21012100

■ AUTHOR INFORMATIONCorresponding Author*E-mail for T.F.F.: [email protected] authors declare no competing financial interest.
■ ACKNOWLEDGMENTSThe authors thank A. V. Hoffmann for the SQUID measure-ment and for financial support from the SolTech (SolarTechnologies go Hybrid) program of the State of Bavaria.L.M.S. is further grateful to the Studienstiftung des DeutschenVolkes for her fellowship.
■ REFERENCES(1) (a) Zintl, E. Angew. Chem. 1939, 52, 1−6. (b) Zintl Phases:Principles and Recent Developments; Fassler, T. F., Ed.; Springer-Verlag:Heidelberg, Germany, 2011; Structure and Bonding Vol. 139.(2) (a) Eisenmann, B.; May, N.; Muller, W.; Schafer, H.; Weiss, A.;Winter, J.; Ziegleder, G. Z. Naturforsch., B 1970, 25, 1350−1352.(b) Eisenmann, B.; Schafer, H. Z. Anorg. Allg. Chem. 1974, 403, 163−172.(3) (a) Witte, J.; von Schnering, H. G.; Klemm, W. Z. Anorg. Allg.Chem. 1964, 327, 260−273. (b) Busmann, E. Z. Anorg. Allg. Chem.1961, 313, 90−106.(4) Bobev, S.; Sevov, S. C. Angew. Chem. 2001, 113, 1555−1558;Angew. Chem., Int. Ed. 2001, 40, 1507−1510.(5) (a) Zintl, E.; Kaiser, H. Z. Anorg. Allg. Chem. 1933, 211, 113−131. (b) Eckerlin, P.; Wolfel, E. Z. Anorg. Allg. Chem. 1955, 280, 321−331. (c) Eisenmann, B.; Schafer, H.; Turban, K. Z. Naturforsch., B1975, 30, 677−680. (d) Turban, K.; Schafer, H. Z. Naturforsch., B1973, 28, 220−222.(6) (a) Wallbaum, H. J. Naturwissenschaften 1944, 32, 76. (b) Tobash,P. H.; Bobev, S. J. Solid State Chem. 2007, 180, 1575−1581.(7) Eckerlin, P.; Meyer, H. J.; Wolfel, E. Z. Anorg. Allg. Chem. 1955,281, 322−328.(8) (a) Kiefer, F.; Fassler, T. F. Solid State Sci. 2011, 13, 636−640.(b) Gruttner, A.; Nesper, R.; von Schnering, H. G. Angew. Chem. 1982,94, 933; Angew. Chem., Int. Ed. Engl. 1982, 21, 912−913.(9) (a) Fukuoka, H.; Iwai, K.; Yamanaka, S.; Abe, H.; Yoza, K.;Haming, L. J. Solid State Chem. 2000, 151, 117−121. (b) Kim, S.-J.;Hu, S.; Uher, C.; Hogan, T.; Huang, B.; Corbett, J. D.; Kanatzidis, M.G. J. Solid State Chem. 2000, 153, 321−329. (c) Carrillo-Cabrera, W.;Curda, J.; von Schnering, H. G.; Paschen, S.; Grin, Y. Z. Kristallogr.-New Cryst. Struct. 2000, 215, 207−208.(10) (a) Cros, C.; Pouchard, M.; Hagenmuller, P. J. Solid State Chem.1970, 2, 570−581. (b) Liang, Y.; Bohme, B.; Ormeci, A.; Borrmann,H.; Pecher, O.; Haarmann, F.; Schnelle, W.; Baitinger, M.; Grin, Y.Chem. Eur. J. 2012, 18, 9818−9822. (c) Veremchuk, I.; Wosylus, A.;Bohme, B.; Baitinger, M.; Borrmann, H.; Prots, Y.; Burkhardt, U.;Schwarz, U.; Grin, Y. Z. Anorg. Allg. Chem. 2011, 637, 1281−1286.(11) (a) Simon, P.; Tang, Z.; Carrillo-Cabrera, W.; Chiong, K.;Bohme, B.; Baitinger, M.; Lichte, H.; Grin, Y.; Guloy, A. M. J. Am.Chem. Soc. 2011, 133, 7596−7601. (b) Bobev, S.; Sevov, S. C. J. Am.Chem. Soc. 1999, 121, 3795−3796.(12) Zurcher, F.; Nesper, R. Angew. Chem. 1998, 110, 3451−3454;Angew. Chem., Int. Ed. 1998, 37, 3314−3318.(13) Ponou, S.; Fassler, T. F. Z. Anorg. Allg. Chem. 2007, 633, 393−397.(14) Kiefer, F.; Karttunen, A. J.; Doblinger, M.; Fassler, T. F. Chem.Mater. 2011, 23, 4578−4586.(15) (a) Karttunen, A. J.; Fassler, T. F.; Linnolahti, M.; Pakkanen, T.A. Inorg. Chem. 2011, 50, 1733−1742. (b) Karttunen, A. J.; Fassler, T.F. ChemPhysChem 2013, 14, 1807−1817.(16) von Schnering, H. G.; Schwarz, M.; Nesper, R. J. Less-CommonMet. 1988, 137, 297−310.(17) Wengert, S.; Nesper, R. Z. Anorg. Allg. Chem. 2000, 626, 246−252.
(18) Ganguli, A. K.; Guloy, A. M.; Leon-Escamilla, E. A.; Corbett, J.D. Inorg. Chem. 1993, 32, 4349−4353.(19) Leon-Escamilla, E. A.; Corbett, J. D. Inorg. Chem. 1999, 38,738−743.(20) Dong, Z.-C.; Corbett, J. D. Inorg. Chem. 1996, 35, 3107−3112.(21) Corbett, J. D. Struct. Bonding (Berlin) 1997, 87, 157−194.(b) Corbett, J. D. Angew. Chem. 2000, 112, 682−704; Angew. Chem.,Int. Ed. 2000, 39, 670−690.(22) Llanos, J.; Nesper, R.; von Schnering, H. G. Angew. Chem. 1983,95, 1026−1027; Angew. Chem., Int. Ed. Engl. 1983, 22, 998.(23) (a) Dong, Z.-C.; Corbett, J. D. J. Am. Chem. Soc. 1994, 116,3429−3435. (b) Dong, Z. C.; Corbett, J. D. J. Am. Chem. Soc. 1995,117, 6447−6455. (c) Cordier, G.; Muller, V. Z. Naturforsch., B 1994,49, 935−938.(24) Wang, F.; Miller, G. J. Inorg. Chem. 2011, 50, 7625−7636.(25) Wang, F.; Miller, G. J. Eur. J. Inorg. Chem. 2011, 2011, 3989−3998.(26) APEX 2: APEX Suite of Crystallographic Software, 2008.4; BrukerAXS Inc., Madison, WI, USA, 2008.(27) SAINT; Bruker AXS Inc., Madison, WI, USA, 2001.(28) SADABS; Bruker AXS Inc., Madison, WI, USA, 2001.(29) Sheldrick, G. M. Acta Crystallogr. 2008, A64, 112−122.(30) Bain, G. A.; Berry, J. F. J. Chem. Educ. 2008, 85, 532−536.(31) Bobev, S.; Sevov, S. C. Inorg. Chem. 2001, 40, 5361−5364.(32) (a) Scharfe, S.; Kraus, F.; Stegmaier, S.; Schier, A.; Fassler, T. F.Angew. Chem. 2011, 123, 3712−3754; Angew. Chem., Int. Ed. 2011, 50,3630−3670. (b) Spiekermann, A.; Hoffmann, S. D.; Fassler, T. F.;Krossing, I.; Preiss, U. Angew. Chem. 2007, 119, 5404−5407; Angew.Chem., Int. Ed. 2007, 46, 5310−5313.(33) Friauf, J. B. J. Am. Chem. Soc. 1927, 49, 3107−3114.(34) (a) Klemm, W. Proc. Chem. Soc. 1958, 329−341. (b) Klemm,W.; Busmann, E. Z. Anorg. Allg. Chem. 1963, 319, 297−311.
Inorganic Chemistry Article
dx.doi.org/10.1021/ic4027046 | Inorg. Chem. 2014, 53, 2096−21012101

S1
SUPPORTING INFORMATION
Li18Na2Ge17 – a Compound Demonstrating Cation Effects on Cluster Shapes and Crystal Packing in Ternary Zintl Phases
Lavinia M. Scherf, Michael Zeilinger, Thomas F. Fässler*
Table S1. Fractional atomic coordinates and equivalent isotropic atomic displacement parameters for Li18Na2Ge17 (P31m, Z = 3, T = 123 K, estimated standard deviations in parentheses).
atom Wyckoff position x y z Ueq /Å2·103
Ge1 3c 0.33940(2) 0 0.20480(5) 9.55(7) Ge2 6d 0.58056(2) 0.24642(1) 0.97870(4) 10.08(5) Ge3 2b 2/3 1/3 0.23971(5) 9.61(9) Ge4 3c 0.08722(2) 0 0.02877(6) 9.46(7) Ge5 1a 0 0 0.76979(8) 9.2(1) Ge6 6d 0.23988(2) 0.15581(2) 0.48856(3) 7.70(5) Ge7 6d 0.41951(2) 0.24371(2) 0.49600(3) 8.40(5) Ge8 6d 0.50333(2) 0.41229(2) 0.49809(3) 8.29(5) Ge9 6d 0.32803(1) 0.15256(2) 0.74800(3) 8.43(5) Ge10 3c 0.49594(2) 0 0.74910(4) 9.31(6) Ge11 3c 0.41729(2) 0.41729(2) 0.99578(4) 8.84(6) Ge12 6d 0.32997(1) 0.24217(2) 0.99415(3) 8.68(5) Na1 3c 0.3462(1) 0 0.5607(2) 26.6(4) Na2 2b 2/3 1/3 0.6086(3) 43.1(7) Na3 1a 0 0 0.3960(3) 28.5(6) Li1 3c 0.3291(3) 0.3291(3) 0.6799(9) 17(2) Li2 3c 0.3333(3) 0.3333(3) 0.316(1) 15(1) Li3 3c 0.1651(4) 0.1651(4) 0.8062(9) 15(1) Li4 6d 0.4944(3) 0.3294(3) 0.8091(7) 16(1) Li5 3c 0.1726(4) 0.1726(4) 0.1776(9) 16(1) Li6 3c 0.4855(3) 0 0.2409(8) 13(1) Li7 3c 0.1897(4) 0 0.3152(8) 19(1) Li8 3c 0.1556(4) 0 0.6740(8) 16(1) Li9 3c 0.2423(4) 0 0.9634(9) 18(1) Li10 6d 0.4987(3) 0.1619(4) 0.3216(7) 18(1) Li11 6d 0.3382(3) 0.1476(3) 0.2332(6) 14.0(9) Li12 6d 0.5013(3) 0.3324(3) 0.1786(7) 17(1) Li13 6d 0.4331(3) 0.0943(3) 0.9449(7) 19(1)

S2
Figures S1 – S3
Figure S1. Coordination sphere of the Friauf polyhedron [Li@Li4Ge12]7− (blue) in Li18Na2Ge17 (Li = white, Na =
green, Ge = grey; thermal ellipsoids at 90 % probability at 123 K).
Figure S2. Experimental X-ray powder diffraction pattern of Li18Na2Ge17 (black) referenced with its theoretical powder pattern (red; † = LiGe, * = unknown compound).

S3
Figure S3. Molar susceptibilities Χm of Li18Na2Ge17 at field intensities H of 5 000 Oe (black) and 10 000 Oe (red) over the temperature range of 2–300 K. The data were corrected for the sample holder and for ion-core diamagnetism using Pascal’s constants.1 Slight deviations from ideal diamagnetic behavior at low temperatures are caused by small sample impurities.
REFERENCES
1. Bain, G. A.; Berry, J. F. J. Chem. Educ. 2008, 85, 532–536.

5 Publications and Manuscripts
129
5.8 LiBSi2: A Tetrahedral Semiconductor Framework from Boron
and Silicon Atoms Bearing Lithium Atoms in the Channels
Reprinted with permission from Zeilinger, M.; van Wüllen, L.; Benson, D.; Kranak,
V. F.; Konar, S.; Fässler, T. F.; Häussermann, U. Angew. Chem. Int. Ed. 2013, 52,
5978. Copyright (2013) WILEY-VCH Verlag GmbH & Co. KGaA, Weinheim.


Zintl PhasesDOI: 10.1002/anie.201301540
LiBSi2: A Tetrahedral Semiconductor Framework from Boron andSilicon Atoms Bearing Lithium Atoms in the Channels**Michael Zeilinger, Leo van W�llen, Daryn Benson, Verina F. Kranak, Sumit Konar,Thomas F. F�ssler,* and Ulrich H�ussermann*
Dedicated to Prof. Dr. Dr. h. c. mult. Wolfgang A. Herrmann on the occasion of his 65th birthday
The crystalline open frameworks of zeolites and clathrates arebased on three-periodic, four-connected nets with tetrahedralnodes and have long attracted attention for their uniquephysical properties and great significance to fundamentalcrystal chemistry.[1] Such open tetrahedral frameworks(OTFs) enclose interstitial volumes in the form of large andseparated cages (clathratic frameworks) or channels (zeoliticframeworks). While they most commonly occur with oxidematerials, using oxygen to bridge the tetrahedral nodes,intermetallic Zintl phases may realize OTFs where the edgesof nets correspond to covalent two-center, two-electron bonds(direct links).[2] Tetrahedral nodes in Zintl-phase OTFs aretypically represented by the tetravalent Group 14 element(Tt) atoms Si, Ge, and Sn or mixtures of Tt atoms andtrivalent Group 13 element (Tr) atoms (sp3 hybridized atoms).For the latter systems, the apparent electron deficiency isbalanced by electrons of the less electronegative metalssituated in cavities in the OTF (guest species), which becomesnominally charged, that is, (4c-Tt)n = (A+)m(4c-Tt)n�m(4c-Tr�)m (4c = four-connected, A = alkaline-earth metal) andthus shows a strong analogy to the charge distribution inaluminosilicates.
Among Zintl-phase OTFs the clathrate-I and -II type ofstructures with the nets mtn and mep, respectively,[3] are mostprominent (Scheme 1). They occur for numerous composi-
tions and have received considerable attention for theirthermoelectric and superconducting properties.[4] Guest spe-cies in cages (i.e. Na–Cs, Sr, Ba, Eu atoms) play an importantrole in determining and tuning electric and thermal transportproperties.[2a] Other OTFs include zeolitic frameworks such asthe chiral net unj which is the basis of the structures ofNaInSn2, NaGaSn2, and NaGaSn5 as well as hP-Na2ZnSn5 andtI-Na2ZnSn5,
[5] and CAS which describes the topology of theframeworks of Eu4Ga6Si16 or ASi6 (A = Ca, Sr, Ba).[6]
Notably, compared with silicates the topological variety ofZintl-phase OTFs is very limited[3a, 7] and especially attemptsto achieve Zintl-phase OTFs with Li as the guest species havelong been unsuccessful,[8] although interesting properties forsuch materials were predicted.[9] For clathratic frameworks it
Scheme 1. Open tetrahedral frameworks realized by Zintl phases andGroup 14 elements.[3]
[*] M. Zeilinger, Prof. Dr. T. F. F�sslerDepartment of Chemistry, Technische Universit�t M�nchen, Lich-tenbergstrasse 4, 85747 Garching/M�nchen (Germany)E-mail: [email protected]
Prof. Dr. L. van W�llenDepartment of Physics, University of Augsburg, Universit�tsstrasse1, 86159 Augsburg (Germany)
D. BensonDepartment of Physics, Arizona State University, Tempe, Arizona85287-1504 (USA)
V. F. Kranak, S. Konar, Prof. Dr. U. H�ussermannDepartment of Materials and Environmental Chemistry, StockholmUniversity, SE-10691 Stockholm (Sweden)E-mail: [email protected]
[**] This work was supported by Fonds der Chemischen Industrie, TUMGraduate School, Deutsche Forschungsgemeinschaft FA 198/11-1,the Swedish Research Council under contract number 2010-4827,and the National Science Foundation through grant DMR-1007557.
Supporting information for this article (including further details onthe synthesis procedure, the analysis of products, and thecomputational procedure) is available on the WWW under http://dx.doi.org/10.1002/anie.201301540.
.AngewandteCommunications
5978 � 2013 Wiley-VCH Verlag GmbH & Co. KGaA, Weinheim Angew. Chem. Int. Ed. 2013, 52, 5978 –5982

is believed that cages would be too large for Li atoms.[8] Theencapsulation of Li atoms (in a stable compound) willprobably require the OTF to consist of a large fraction oflight elements from the second row, that is, B and C atoms.Thus far, the only known OTF involving a second rowelement is found in K7B7Si39,
[10] where a comparatively smallfraction of the Si atoms in a clathrate-I structure are replacedby B atoms. Although this produced the smallest latticeparameter among Zintl phases with the clathrate-I structurecage, the size remained far too large for Li atoms.
Herein, we report on LiBSi2 displaying a zeolitic frame-work with a new topology based on a unique strictly ordered
distribution of B and Si atoms. This B-Si OTF has mutuallyorthogonal channels that host Li atoms.
LiBSi2 was obtained as a dark gray, microcrystalline,powder from reaction mixtures LiB:Si = 1:1 that had beenpressurized to 10 GPa and heated at 900 8C. LiBSi2 is air andmoisture stable, and also inert to strong acids. Its thermalstability exceeds 800 8C. The structure of LiBSi2 depicted inFigure 1 was solved from powder X-ray diffraction data usinga parallel tempering algorithm and subsequently finalized byRietveld refinement.[11]
LiBSi2 crystallizes with the tetragonal space group P42/nmc and contains eight formula units in the unit cell
Figure 1. a) Crystal structure of tetragonal LiBSi2 (2 � 2 � 2 supercell) viewed approximately along the [100] direction. Atoms are displayed asellipsoids at a 90% probability (Li red, B blue, Si dark gray). Boundaries of two slab-like building units are marked by light blue planes. b) Twoconsecutive slab building units projected along the [001] direction. Bonds of the realgar-like [B4Si24] structural unit are drawn in yellow. Elongatedtetrahedra produced by the arrangement of Li atoms are highlighted. The position of 42 and 4 axes are indicated by their symbol. c) Section of theLiBSi2 structure showing the consequence of connecting slab building units: six- and seven-membered rings are introduced defining orthogonalchannels that host the Li atoms. Within seven-ring channels Li atoms are arranged as linear chains, within six-ring channels as zigzag chains.Connecting lines between Li atoms do not indicate interactions, they are only meant to emphasize structural features. d) Natural tiling for the nettum formed by B and Si atoms in LiBSi2. There are four different kinds of tiles, three four-faced tiles and one six-faced. (A tile is characterized bya face symbol [Mm.Nn…] indicating that there are m faces that are M-rings, n faces that are N-rings, and so on). Left: Arrangement of 4-faced tiles[54] (green), [74] (yellow), and [52.72] (pink) not sharing faces. Middle: Arrangement of four-faced tiles within slab building blocks (Figure 1b).Right: Complete natural tiling of tum including also the six-faced “Li tiles” [52.62.72] (blue). Li tiles share common six-ring faces which emphasizesthe six-ring channel system (hosting Li zigzag chains) in zeolitic LiBSi2 (seen at the bottom of the figure). e) Coordination environment around Liatoms within a [52.62.72] tile.
AngewandteChemie
5979Angew. Chem. Int. Ed. 2013, 52, 5978 –5982 � 2013 Wiley-VCH Verlag GmbH & Co. KGaA, Weinheim www.angewandte.org

(Figure 1a). The B-Si ordered OTF is built from three distinctcrystallographic positions—one B site (8f) and two Si sites(Si1 and Si2, both on 8g)—and thus corresponds to a trinodalnet. Li atoms are situated on an 8g site and occupy channels inthe B-Si OTF.
The tetrahedral B-Si framework can be divided into[B4Si24] realgar-like units and Si1-Si1 dumbbells which occurin a 1:2 ratio and are arranged in two-dimensional slabs(Figure 1b). The realgar-like unit represents a cage, which isenclosed by four five-membered rings. Its linkage with theSi12 dumbbell units creates additional five-membered rings.The slab also contains eight-membered rings, which, however,become part of seven-membered rings upon connecting slabsand thus do not represent strong rings in the three-periodicframework.[12] Finally, a slab hosts mutually perpendicularlinear chains of Li atoms at two different heights (corre-sponding to the thickness of a slab; Figure 1a) running alongthe a and b directions. Distances in a linear chain arealternating short (3.36 �) and long (3.47 �), and the arrange-ment of short distances corresponds to elongated Li4 tetrahe-dra surrounded by eight-membered rings.
In the three-periodic net, slabs are stacked along the cdirection, related by the n glide perpendicular to c (Fig-ure 1b). As a consequence, realgar and Li4 tetrahedral unitsare situated alternating on top of each other and (Si1)2
dumbbells are stacked mutually rotated by 908.[13] Theconnection of slabs introduces six- and seven-memberedrings, which define the channels hosting the Li atoms (Fig-ure 1c, compared to Figure 1a). In channels embraced byseven-membered rings, Li atoms are arranged as the linearchains mentioned above; in channels embraced by six-membered rings, Li atoms form zigzag chains where theyare equidistantly separated at 3.66 � (Figure 1c). Thisdistance corresponds to the separation of Li4 tetrahedra, oralternatively the distance between parallel linear chains atdifferent heights. Both kinds of channels run along the a and bdirections and are mutually converted by a 908 rotationaround the c axis.
The outcome of the ordering of B and Si atoms is thatB atoms are exclusively bonded to Si atoms with dSi-B = 2.05and 2.08 � whereas Si atoms utilize two homoatomic bondswith distances dSi-Si = 2.44, 2.47, and 2.51 �. Different B�Siand Si�Si bond lengths induce distorted tetrahedral coordi-nation environments (](Si�B�Si) = 91.078–124.528 ; ](B�Si�B) = 106.418, 117.308 ; ](Si�Si�B) = 100.948–116.968 ; ]-(Si�Si�Si) = 112.338).
The OTF formed by B and Si atoms in LiBSi2 consistsexclusively of five-, six-, and seven-membered rings andrepresents a not yet described topology for a three-periodic,four-connected net. It has been assigned the symbol tum inthe TTD topological database.[14] We note that tum is also thenet of the orthorhombic framework of the recently discoveredintermetallic compounds Na5M2+xSn10�x (x� 0.5, M = Zn, Hg)where it is formed by the M and Sn atoms.[15]
The natural tiling associated with tum is shown inFigure 1d. A tiling is the filling of space by generalizedpolyhedra (tiles) that share faces.[16] A tile represents theinterior of a cage with typically curved faces that are rings ofthe net. Thus a tiling carries a net formed by the vertices and
edges of tiles. According to a set of rules, natural tilings areunique and provide an unambiguous way to partition space bythe net. This in turn enables convenient identification andanalysis of the size and location of cavities and channels. Fortum there are four kinds of tiles: one corresponds to the[B4Si24] realgar-like cage centered at the Wyckoff site 2a andhas the face symbol [54], indicating that there are four facesthat are five-membered rings. Another tile with face symbol[74] is located at the center of the Li4 tetrahedron (position 2b)and a third tile with the face symbol [52.72] is centered at site4d, in between two Si12 dumbbells stacked along the cdirection. The fourth tile is enclosed by six faces (face symbol[52.62.72]) and is centered at a position approximatelycorresponding to the location of the Li atoms (Figure 1e).
This partitioning appears chemically meaningful; thethree four-faced tiles do not share common faces but aretetrahedrally surrounded by Li tiles, which in turn areoctahedrally connected to two [52.72] tiles (through a seven-and a five-membered ring face, respectively), one realgar [54]tile, one [74] tile, and two other Li tiles (sharing six-sidedfaces). The face sharing of Li tiles defines the relevantchannels (Figure 1 f), which, interestingly, are those that areembraced by six-membered rings and host zigzag chains ofLi atoms rather than the ones embraced by seven-memberedrings that host linear chains. Li atoms in LiBSi2 attain a clearlydefined coordination by two B and nine Si atoms (Figure 1e).Distances range from 2.34 � (Li-B) to 2.86 � (Li-Si1) and arewell separated from the next nearest neighbor distancesstarting off at 3.34 � (Li-B). However, the tile (cage)associated with Li is larger (14 vertices) and Li is positionedquite off-centered in its tile.
The structure was further confirmed by the Ramanspectrum of LiBSi2 (Figure 2). The rather complex structuregives rise to 31 Raman-active modes,[17] of which about 20 areobserved. Excitation with a green laser (l = 532 nm) yieldsbetter resolved high-frequency modes, whereas red-laserexcitation (l = 785 nm) results in better resolved low-fre-quency modes. The assignment of bands was assisted by first-principles zone center phonon calculations. The modes withlowest and highest wave number were calculated at 168 and683 cm�1, respectively, which is in good agreement with thespan of wave numbers of the observed spectrum. The bands inthe wave number region 600–700 cm�1 correspond to B-Sivibrations (modes 14–19; Figure 2) and are detached from thebulk of modes between 150 and 470 cm�1. The latter range ofwave numbers is typical for Si-Si stretching and bendingvibrations in silicide clathrates,[18] however, for LiBSi2 we findthat bands from Si-Si and Li-Si vibrations appear at similarwave numbers. In fact, mode 13 at around 467 cm�1 corre-sponds to a Li-Si vibration, whereas the first Si-Si stretchingmode (12) is at around 430 cm�1. This indicates a stronginteraction between Li and the host OTF. Also, the opticalmode with the lowest wave number involves displacementcontributions from all atoms and is not, as perhaps expected,dominated by Li atoms.
The electronic structure of LiBSi2 has been calculated andthe density of states (DOS) is shown in Figure 3. LiBSi2 isa semiconductor with a band gap of 1.1 eV. Because DFT-calculated band gaps are known to be underestimated, the
.AngewandteCommunications
5980 www.angewandte.org � 2013 Wiley-VCH Verlag GmbH & Co. KGaA, Weinheim Angew. Chem. Int. Ed. 2013, 52, 5978 –5982

experimental band gap may approach 2 eV. The occurrence ofa band gap is in agreement with an electron precise B-Si OTFwhere Li acts as an electron donor, as expected for a Zintlphase. However, the site-projected DOS reveals that the Li
and B states contribute almost equally and homogenously tothe valence band throughout its range of dispersion. Such anintimate admixture of states from the less electronegative—electron-donating—component to the occupied valence bandis not typical of a Zintl phase and is also indicative of strongLi-OTF interactions. Preliminary 7Li- and 11B-MAS-NMRinvestigations (chemical shift of 7Li: �0.35 ppm) reveal thediamagnetic character. Further details on the NMR-spectro-scopic investigations are given in the Supporting Information.
Apart from its new topology, the B-Si net in LiBSi2 is alsochemically unique: it represents the first example where Band Si atoms form an ordered common framework structurewith boron exclusively engaged in heteronuclear B-Si con-tacts. Typically frameworks of borosilicides are characterizedby either segregated B and Si structural entities or separatedB12 icosahedra and Si4 rhomboid rings as in b-SiB3
[19] or theoccurrence of B/Si disorder as manifested in mixed occupiedpositions as, for example, in a-SiB3, Na8B74.5Si17.5,
[20] and theearlier mentioned K7B7Si39.
[10] Since the tum net exclusivelyconsists of four-connected nodes it additionally enlarges thenumber of models for novel tetrel allotropes, such as therecently predicted Si allotrope[21] or the experimentallyestablished m-allo-Ge.[22]
In conclusion, we have shown that high-pressure reactionsbetween LiB and Si afford LiBSi2 with a novel intermetallicB-Si OTF dubbed tum. Unique to this compound is theencapsulation of small-sized Li as the guest species and thetopology of the OTF, based on a strictly ordered distributionof B and Si atoms. Owing to the low density and its openframework structure, doped LiBSi2 may be the basis for usefulelectrode materials.[9c] Also, tum may be an interesting modelfor a low-density allotrope of Group 14 elements. The searchfor such allotropes has recently become a very active field ofresearch.[7, 21] LiBSi2 is predicted to be a semiconductor witha band gap exceeding 1 eV. Vibrational properties and thecalculated electronic structure indicate that the Li guestspecies interacts strongly with the OTF host. The physicalproperties, the detailed formation conditions of LiBSi2, aswell as an analysis of the NMR-spectroscopic investigationswill be presented in a forthcoming paper.
Experimental SectionIn a typical synthesis a mixture of LiB and Si (80–100 mg, molar ratio1:1) were sealed in a salt capsule. The capsules were compressed ina multi-anvil device[23] to a pressure of 10 GPa and subsequentlyheated to 900 8C at a rate of 5 8C min�1. After equilibrating samples attheir target temperature for one hour, the temperature was quenchedand the pressure released at a rate of approximately 0.5 GPa per hour.The preparation of salt capsules and their recovery after high-pressure, high-temperature treatment was performed in an Ar-filledglove box. Thereafter, the product was treated with half concentratedHCl and washed several times with water and ethanol followed bydrying in air. A synthesis run typically yielded 40–50 mg product.Products were analyzed by powder X-ray diffraction (PXRD),Raman, and 7Li- and 11B-MAS NMR spectroscopy.
Samples were ground, loaded into 0.3 mm capillaries, andmeasured on a STOE STADI P diffractometer (Ge-(111) monochro-mator for CuKa radition, l = 1.54056 �) equipped with a linearposition-sensitive detector (PSD). Tetragonal unit cell: a =6.83225(3) �, c = 8.83924(6) � and space group P42/nmc. Further
Figure 2. Raman spectrum of LiBSi2 recorded with excitation wave-lengths 532 and 785 nm. Values listed are wavenumbers (cm�1) of thelabeled bands (1–20). The origin of band 20 in the lower spectrum isnot known.
Figure 3. Electronic density of states for LiBSi2 and the site projectedcontributions from Li, B, and Si atoms. The Fermi level (EF) is set at0 eV at the top of the valence band (dotted line).
AngewandteChemie
5981Angew. Chem. Int. Ed. 2013, 52, 5978 –5982 � 2013 Wiley-VCH Verlag GmbH & Co. KGaA, Weinheim www.angewandte.org

details on the crystal structure may be obtained from the Fachinfor-mationszentrum Karlsruhe, 76344 Eggenstein-Leopoldshafen, Ger-many (fax: (+ 49)7247-808-666; e-mail: [email protected]),by quoting the depository number CSD-425643 (LiBSi2).
Raman spectra were recorded on powder samples placed ona glass slide using a LabRAM HR 800 spectrometer with a back-thinned CCD detector and lasers at 532 and 785 nm as excitationsources. 7Li- and 11B-MAS (magic angle spinning) NMR spectra(Supporting Information, Figures S3,S4) were collected on a VarianVNMRs 500 spectrometer, operating at 160.37 MHz and 194.24 MHzfor 11B and 7Li, respectively. MAS was performed at spinning speedsof 15–40 kHz with a Varian 1.6 mm triple resonance T3-MAS probe.Theoretical calculations were performed in the framework of thefrozen core all-electron projected augmented wave (PAW) method, asimplemented in the program VASP.[24]
Received: February 22, 2013Published online: April 22, 2013
.Keywords: open tetrahedral frameworks · silicon · zeolites ·Zintl phases
[1] a) J. V. Smith, Chem. Rev. 1988, 88, 149; b) M. O�Keeffe, B. G.Hyde, Crystal Structures I: Patterns and Symmetry, Monograph,Mineralogical Assoc. of America, Washington DC, 1996 ; c) O.Delgado Friedrichs, A. W. M. Dress, D. H. Huson, J. Klinowski,A. L. Mackay, Nature 1999, 400, 644.
[2] a) “Zintl Clathrates”: A. V. Shevelkov, K. Kovnir in ZintlPhases: Principles and Recent Developments, Vol. 139 (Eds.:D. M. P. Mingos, T. F. F�ssler), Springer, Heidelberg 2011, p. 97;b) “Structural Relationships Between Intermetallic Clathrates,Porous Tectosilicates and Clathrate Hydrates”: D. Santamaria-Perez, F. Libeau in Inorganic 3D Structures: The Extended Zintl-Klemm Concept, Vol. 138 (Eds.: D. M. P. Mingos, A. Vegas),Springer, Heidelberg 2011, p. 1.
[3] Symbols for nets follow either the zeolite code according toref. [3a] or the RCSR identifiers according to ref. [3b]; a) C.Baerlocher, W. M. Meier, D. H. Olson, Atlas of Zeolite Frame-work Types, 6th rev. ed., Elsevier, Amsterdam, 2007. Dataavailable online at http://www.iza-structure.org/databases/;b) M. O�Keeffe, M. A. Peskov, S. J. Ramsden, O. M. Yaghi,Acc. Chem. Res. 2008, 41, 1782.
[4] a) M. Beekman, G. S. Nolas, J. Mater. Chem. 2008, 18, 842;b) G. S. Nolas, J. L. Cohn, G. A. Slack, S. B. Schujman, Appl.Phys. Lett. 1998, 73, 178; c) S. Yamanaka, Dalton Trans. 2010, 39,1901.
[5] a) W. Blase, G. Cordier, R. Kniep, R. Schmidt, Z. Naturforsch. B1989, 44, 505; b) J. T. Vaughey, J. D. Corbett, J. Am. Chem. Soc.1996, 118, 12098; c) W. Blase, G. Cordier, Z. Naturforsch. B 1988,43, 1017; d) S. Stegmeier, S.-J. Kim, A. Henze, T. F. F�ssler,unplublished results.
[6] a) J. D. Bryan, G. D. Stucky, Chem. Mater. 2001, 13, 253; b) W.Carrillo-Cabrera, S. Paschen, Y. Grin, J. Alloys Compd. 2002,333, 4; c) A. Wosylus, Y. Prots, U. Burkhardt, W. Schnelle, U.Schwarz, Sci. Technol. Adv. Mater. 2007, 8, 383; d) A. Wosylus, Y.Prots, U. Burkhardt, W. Schnelle, U. Schwarz, Y. Grin, Z.Naturforsch. B 2006, 61, 1485; e) S. Yamanaka, S. Maekawa, Z.Naturforsch. B 2006, 61, 1493.
[7] a) M. M. J. Treacy, I. Rivin, E. Balkovsky, K. H. Randall, M. D.Foster, Microporous Mesoporous Mater. 2004, 74, 121; b) A. J.Karttunen, T. F. F�ssler, M. Linnolahti, T. A. Pakkanen, Inorg.Chem. 2011, 50, 1733.
[8] Li replaces small amounts of Ge in the clathrate-I host structure.See: Y. Liang, B. Bohme, A. Ormeci, H. Borrmann, O. Pecher, F.Haarmann, W. Schnelle, M. Baitinger, Y. Grin, Chem. Eur. J.2012, 18, 9818.
[9] a) A. Ker, E. Todorov, R. Rousseau, K. Uehara, F. X. Lannuzel,J. S. Tse, Chem. Eur. J. 2002, 8, 2787; b) N. Rey, A. Munoz, P.Rodriguez-Hernandez, A. San Miguel, J. Phys. Condens. Matter2008, 20, 215218; c) A recent report gives evidence that Li can beinserted electrochemically into Si clathrate-II and may havepotential as a novel electrode material for lithium-ion batteries,see: T. Langer, S. Dupke, H. Trill, S. Passerini, H. Eckert, R.Pçttgen, M. Winter, J. Electrochem. Soc. 2012, 159, A1318.
[10] W. Jung, J. Lorincz, R. Ramlau, H. Borrmann, Y. Prots, F.Haarmann, W. Schnelle, U. Burkhardt, M. Baitinger, Y. Grin,Angew. Chem. 2007, 119, 6846; Angew. Chem. Int. Ed. 2007, 46,6725.
[11] a) F.O.X., Free Objects for Crystallography V 1.9.7.0, http://objcryst.sourceforge.net, 2011; b) R. Cerny, V. Favre-Nicolin,Powder Diffr. 2005, 20, 359; c) V. Favre-Nicolin, R. Cerny, J.Appl. Crystallogr. 2002, 35, 734; d) TOPAS 4.0—Rietveld Soft-ware, Bruker AXS, Madison (Wisconsin, USA), 2009.
[12] Strong rings are defined as rings that are not the sum of anynumber of smaller cycles, see: O. Delgado-Friedrichs, M.O�Keeffe, J. Solid State Chem. 2005, 178, 2480.
[13] Realgar and Li4 tetrahedral units have �4m2 symmetry. Notethat the 42 screw axis runs through the centers of gravity of the(Si1)2 units.
[14] a) V. A. Blatov, D. M. Proserpio, Acta Crystallogr. Sect. A 2009,65, 202; b) V. A. Blatov, IUCr CompComm. Newsletter 2006, 7,4; c) TOPOS Topological Databases and Topolgical TypesObserved, http://www.topos.ssu.samara.ru.
[15] S. Ponou, S. J. Kim, T. F. F�ssler, J. Am. Chem. Soc. 2009, 131,10246.
[16] a) V. A. Blatov, O. Delgado-Friedrichs, M. O�Keeffe, D. M.Proserpio, Acta Crystallogr. Sect. A 2007, 63, 418; b) O. Delgado-Friedrichs, M. O�Keeffe, O. M. Yaghi, Phys. Chem. Chem. Phys.2007, 9, 1035; c) V. A. Blatov, M. O�Keeffe, D. M. Proserpio,CrystEngComm 2010, 12, 44.
[17] E. Kroumova, C. Capillas, S. Ivantchev, H. Wondratschek, PhaseTransitions 2003, 76, 155.
[18] a) G. S. Nolas, C. A. Kendziora, J. Gryko, J. Dong, C. W. Myles,A. Poddar, O. F. Sankey, J. Appl. Phys. 2002, 92, 7225; b) D.Machon, P. Toulemonde, P. F. McMillan, M. Amboage, A.Munoz, P. Rodriguez-Hernandez, A. San Miguel, Phys. Rev. B2009, 79, 184101.
[19] J. R. Salvador, D. Bilc, S. D. Mahanti, M. G. Kanatzidis, Angew.Chem. 2003, 115, 1973; Angew. Chem. Int. Ed. 2003, 42, 1929.
[20] a) B. Magnusson, C. Brosset, Acta Chem. Scand. 1962, 16, 449;b) H. F. Rizzo, L. R. Bidwell, J. Am. Ceram. Soc. 1960, 43, 550;c) H. Morito, B. Eck, R. Dronskowski, H. Yamane, Dalton Trans.2010, 39, 10197.
[21] a) M. A. Zwijnenburg, K. E. Jelfs, S. T. Bromley, Phys. Chem.Chem. Phys. 2010, 12, 8505; b) C. J. Pickard, R. J. Needs, Phys.Rev. B 2010, 81, 014106.
[22] a) A. Gr�ttner, R. Nesper, H. G. von Schnering, Angew. Chem.1982, 94, 933; Angew. Chem. Int. Ed. Engl. 1982, 21, 912; b) F.Kiefer, A. J. Karttunen, M. Dçblinger, T. F. F�ssler, Chem.Mater. 2011, 23, 4578.
[23] E. Stoyanov, U. H�ussermann, K. Leinenweber, High PressureRes. 2010, 30, 175.
[24] a) P. E. Blçchl, Phys. Rev. B 1994, 50, 17953; b) G. Kresse, D.Joubert, Phys. Rev. B 1999, 59, 1758; c) G. Kresse, J. Hafner,Phys. Rev. B 1993, 48, 13115; d) G. Kresse, J. Furthm�ller,Comput. Mater. Sci. 1996, 6, 15.
.AngewandteCommunications
5982 www.angewandte.org � 2013 Wiley-VCH Verlag GmbH & Co. KGaA, Weinheim Angew. Chem. Int. Ed. 2013, 52, 5978 –5982


Supporting Information
� Wiley-VCH 2013
69451 Weinheim, Germany
LiBSi2: A Tetrahedral Semiconductor Framework from Boron andSilicon Atoms Bearing Lithium Atoms in the Channels**Michael Zeilinger, Leo van W�llen, Daryn Benson, Verina F. Kranak, Sumit Konar,Thomas F. F�ssler,* and Ulrich H�ussermann*
anie_201301540_sm_miscellaneous_information.pdf

1
Supporting Information Synthesis. Starting materials were rods of Li (99 %, Rockwood-Lithium), boron chunks (99.95 %, ChemPur) and silicon powder (99.999%, Sigma-Aldrich). All steps for synthesis and sample preparation were carried out in a glove box (MBraun, Ar-atmosphere, H2O and O2 levels < 0.1 ppm). Stainless steel ampoules were thoroughly cleaned, heated to 700 °C under dynamic vacuum (p < 110-3 mbar) for at least 1 h and transferred to the glove box. Heating and handling under inert conditions was done by using an all-glass Schlenk line supplied with Ar, which is dried over phosphorous pentoxide, molecular sieve and heated titanium sponge (T = 750 °C). LiB: Lithium and boron were filled into a stainless steel ampoule with a molar ratio of 1:1 and a total mass of 0.5 g. The ampoule was sealed by arc-welding inside the glove box and then encapsulated in a silica jacket under vacuum. After annealing at 470 °C in a muffle oven for three days pure LiB is obtained (Figure S1). For further synthesis steps LiB was ground inside an agate mortar. LiBSi2: High pressure syntheses were performed in a 6-8 Walker-type multi-anvil high pressure device using an 18/12 assembly developed by Stoyanov et al..[1] Mixtures of powdered LiB and Si with a molar ratio of 1:1 and a total amount between 80 and 100 mg were compacted and placed inside a NaCl capsule (inner diameter: 4 mm, outer diameter: 8 mm, length: 8 mm; prepared from NaCl dried under vacuum at 250-300 °C). Subsequently, capsules were sealed and transferred outside the glove box. To prepare the high pressure cell assembly NaCl sample capsules were positioned in a graphite furnace which in turn was placed together with a Zircon thermal insulating sleeve (0.57 mm wall thickness, 7.77 mm OD, 10.80 mm length) in a magnesia octahedron with 18 mm edge length. Samples were pressurized at a rate of about 0.5 GPa/h with 25 mm tungsten carbide cubes truncated to 12 mm edge length. After reaching the target pressure of 10 GPa the samples were heated. Deviations from the target pressure are estimated as +/– 0.3 GPa. The temperature was measured close to the sample using a thermocouple type C (W5%Re – W26%Re wire) in an Al2O3 sleeve. The samples were heated to 900 °C within 3 h. After applying a dwelling time of 1 h samples were quenched by turning off the power to the furnace (quench rate ~50 °C/min and at approximately constant pressure). Afterwards, the pressure was released at a rate of approximately 0.5 GPa/h and the samples were recovered in the glove box. Thereafter, the product was treated with diluted HCl and washed several times with water and ethanol followed by drying in air. The product was obtained as a fine, grey colored, powder. According to powder X-Ray diffraction it corresponds to crystalline LiBSi2 and a minor amount of an unidentified crystalline impurity (Figure 2, reflections at 2 ~21o and ~28o). Solid state NMR investigations (see below) revealed the presence of an amorphous byproduct next to crystalline LiBSi2, which most likely is associated with the excess of LiB employed in the high pressure synthesis.

2
Figure S1. Experimental X-ray powder diffraction pattern of LiB (black) referenced with its theoretical powder pattern (red). Powder X-ray diffraction. X-ray powder diffraction patterns were recorded on a STOE STADI P diffractometer (Ge-(111) monochromator for CuKα radiation, λ = 1.54056 Å) equipped with a linear PSD. Samples were ground in an agate mortar, sealed in 0.3 mm glass capillaries and measured within a 2θ range of 5-90° using two measurement runs, each with a PSD step width of 0.05° and an exposure time of 40 sec per step. Structure determination. The structure of LiBSi2 was determined ab initio from X-ray powder diffraction data by using the parallel tempering algorithm implemented in the software FOX.[2] The X-ray diffraction pattern could be indexed with a tetragonal cell a = 6.83225(3) Å, c = 8.83924(6) Å and the space group P42/nmc was assigned after Le Bail profile fitting. As the main idea of the FOX program is to approach structure solutions by starting with “structural building blocks” several structure motifs having B-B bonds could be excluded because Raman spectroscopy clearly showed the absence of those. Consequently, the idea of a tetrahedral B-Si network arose and resulted in a successful structure solution with acceptable reliability factors (Rwp = 0.067, GOF = 1.24). The final structure is provided by Rietveld refinement which was done with the program TOPAS 4.0.[3] The results of the refinement are presented in Figure S2 and Tables 1-3. Further data may be obtained from Fachinformationszentrum Karlsruhe, D-76344 Eggenstein-Leopoldshafen, Germany (fax: (+49)7247-808-666; e-mail: [email protected]) on quoting the depository numbers CSD-425643 (LiBSi2).

3
Figure S2. Experimental X-ray powder diffraction pattern of LiBSi2 (black) referenced with the theoretical powder pattern based on Rietveld refinement (red). The difference plot is shown in blue. Table 1. Crystallographic data of LiBSi2 from Rietveld refinement (P42/nmc, Z = 8, origin at –1 (choice 2); estimated standard deviations in parentheses) empirical formula LiBSi2 formula weight (g·mol−1) 73.92 space group P42/nmc unit cell dimension a = 6.83225(3) Å,
c = 8.83924(6) Å, V = 412.612(5) Å3
Z 8 ρ (calc.) (g/cm³) 2.38 μ (mm−1) 11.60 Rp / Rwp / GOF 3.83 / 4.96 / 1.35

4
Table 2. Fractional atomic coordinates, isotropic equivalent atomic displacement parameters and side occupancy factors for LiBSi2 (P42/nmc, Z = 8, origin at –1 (choice 2); estimated standard deviations in parentheses). Atom Wyckoff
position x y z s.o.f. Uiso
(Å2·103) Li 8g 1/4 0.5042(9) 0.0784(5) 1 12(2) B 8f 0.5095(3) 0.4905(3) 1/4 1 6(1) Si1 8g 1/4 0.0690(1) 0.3632(1) 1 5.4(4) Si2 8g 1/4 0.5665(1) 0.6181(1) 1 5.8(4) Table 3. Interatomic distances in LiBSi2 (P42/nmc, Z = 8, origin at –1 (choice 2); estimated standard deviations in parentheses). Atom pair d(Å) Atom pair d(Å) Li- B 2x 2.335(3) Si1- B1 2x 2.076(2) Si1 2.567(4) Si2 2.436(1) Si2 2x 2.722(5) Si1 2.474(1) Si2 2x 2.796(4) Li 2.567(4) Si1 2x 2.799(4) Li 2x 2.799(5) Si1 2x 2.857(5) Li 2x 2.857(4) B- Si2 2x 2.052(2) Si2- B 2x 2.052(2) Si1 2x 2.076(2) Si1 2.436(1) Li1 2x 2.335(5) Si2 2.507(1) Li 2x 2.722(4) Li 2x 2.796(5) Raman spectroscopy. Raman spectra were collected using a LabRAM HR 800 spectrometer. The instrument is equipped with an 800 mm focal length spectrograph and an air cooled (–70oC), back thinned CCD detector (pixel size 26x26 microns). The fine powdered sample was placed on a glass slide and the laser was focused onto the sample using a 50X super long working distance (WD=20.5 mm) Mitutoyo objective with a numerical aperture of 0.42 and depth of focus of 1.6 mm. The sample was excited using an air cooled double frequency Nd:YAG laser (532 nm, 5.6 mW) and an air cooled intra cavity regulated laser diode with point source (785 nm, 0.88 mW). The spectrum was collected with an exposure time of 60 sec, accumulation number of 10 and grating of 600 lines/mm. Differential Scanning Calorimetry. Differential scanning calorimetry (DSC) measurements were performed with a NETZSCH DSC 404 Pegasus apparatus under an Ar gas flow of ~60 ml/min. About 5 mg of powder sample LiBSi2 were sealed in a niobium crucible by arc-welding in an Ar-filled glove box. An empty niobium crucible served as reference. The scanning range was from room temperature to 800 oC with a heating/cooling rate of 10 K/min. The sample was recovered after the measurement and investigated by PXRD. Handling of DSC data was done with the program Proteus Thermal Analysis.[4] From the DSC trace and PXRD pattern of the recovered sample it could be concluded that LiBSi2 does not decompose in the investigated temperature range.

5
Solid State Nuclear Magnetic Resonance (NMR) Spectroscopy. The 7Li- and 11B-MAS (magic angle spinning) NMR spectra (Figure S3 and S4) were collected on a Varian VNMRs 500 spectrometer operating at 160.37 MHz and 194.24 MHz for 11B and 7Li, respectively. MAS was performed at spinning speeds of 15 - 40 kHz employing a Varian 1.6 mm triple resonance T3-MAS probe. LiBSi2 appears as the only crystalline product beside an amorphous byproduct. The 7Li MAS NMR spectrum exhibits a signal at 0.95 ppm, accompanied by a set of spinning sidebands. From the positions of the outermost spinning sidebands a quadrupolar coupling constant CQ = 0.18 MHz is estimated. At longer relaxation delays (up to 2h), a second contribution at -0.35 ppm adds to the signal. In the 11B-MAS NMR spectrum, a broad NMR signal appears centered around -0.5 ppm, with spinning sidebands covering a range of ± 0.8 MHz. In addition to this, a second contribution is found at -30.8 ppm, which exhibits a rather long relaxation time and but a small number of spinning sidebands. The quadrupolar coupling constants for these two components are estimated to CQ= 1.6 MHz for the signal at -0.5 ppm and CQ = 0.3 MHz for the narrow signal at -30.8 ppm. We tentatively assign the two signals with the long relaxation times (7Li: -0.35 ppm; 11B: -30.8 ppm) to LiBSi2.
Figure S3: 7Li-MAS NMR spectrum of LiBSi2. Exp. details: RF = 113.6 kHz; MAS = 15 kHz; relaxation delay: 3600 s.

6
Figure S4: 11B MAS NMR spectrum of LiBSi2. Exp. details: RF = 68.5 kHz; MAS = 35 kHz; relaxation delay: 8000 s. Insert: sideband pattern for the broad component, from which a quadrupolar coupling constant CQ = 1.6 MHz can be estimated (for I = 3/2, CQ is identical to the overall width of the spectrum). Computational details. Theoretical calculations of the electronic structure were performed using the first principles all-electron projected augmented wave (PAW) method[5] as implemented by the Vienna Ab Initio Simulation Package (VASP[6]). Exchange-correlation effects were treated within the generalized gradient approximation (GGA[7]) using the Perdew-Burke-Ernzerhof (PBE[8]) parameterization. The LiBSi2 structure was relaxed with respect to volume, lattice parameters, and atom positions and using experimental parameters as starting values. Forces were converged to better than 1×10⁻³ eV/Å. The equilibrium volume was obtained by fitting to a third order Birch-Murnaghan equation of state.[9] The integration over the Brillion Zone (BZ) was done on a grid of special k-points with size 11×11×11 (6×6×6 for the equation of state) determined according to the Monkhorst-Pack scheme[10] and using the tetrahedron method with Blöchl correction.[11] The energy cutoff was set to 500 eV. Zone-centered phonon calculations were performed using VASP’s density functional perturbation theory (DFPT) approach. The decomposition of the density of state (DOS) into atomic contributions is based on spheres with radii Li = 1.5 Å, Si = 1.25 Å, B = 0.8 Å, exceeding slightly the covalent radii of B and Si, and the ionic radius of Li (extrapolated to a coordination number 11). The structure parameters after relaxation and equations of states (EOS) parameters are specified in Tables S4 and S5. Note that the agreement with the experimental structure parameters is excellent (cf. Tables 1 and 2).

7
Table S4. Computationally relaxed structure parameters for LiBSi2. Space group P42/nmc, a = 6.8328 Å, c = 8.8524 Å Atom Wyckoff
position x y z
Li 8g 1/4 0.5037 0.0766 B 8f 0.5080 0.4920 1/4 Si1 8g 1/4 0.0691 0.3637 Si2 8g 1/4 0.5663 0.6206 Table S5. Computed equation of states parameters: E0 (eV/fu) V0 (Å
3/fu) B0 (GPa) B0’ Li2BSi2 -20.0308 51.702 103.7 4.1 References for Supporting Information [1] E. Stoyanov, U. Häussermann, K. Leinenweber, High Pressure Res. 2010, 30, 175. [2] a) F.O.X., Free Objects for Crystallography V 1.9.7.0, http://objcryst.sourceforge.net,
2011; b) R. Cerny, V. Favre-Nicolin, Powder Diffr. 2005, 20, 359; c) V. Favre-Nicolin, R. Cerny, J. Appl. Crystallogr. 2002, 35, 734.
[3] TOPAS 4.0 - Rietveld Software, Bruker AXS, Madison (Wisconsin, USA), 2009. [4] Netzsch, Proteus Thermal Analysis V4.8.2, Netzsch-Gerätebau GmbH, Selb, Germany,
2006. [5] a) P. E. Blöchl, Phys. Rev. B 1994, 50, 17953; b) G. Kresse, D. Joubert, Phys. Rev. B
1999, 59, 1758. [6] a) G. Kresse, J. Hafner, Phys. Rev. B 1993, 48, 13115; b) G. Kresse, J. Furthmüller,
Comp. Mater. Sci. 1996, 6, 15. [7] a) Y. Wang, J. P. Perdew, Phys. Rev. B 1991, 44, 13298; b) J. P. Perdew, J. A. Chevary,
S. H. Vosko, K. A. Jackson, M. R. Pederson, D. J. Singh, C. Fiolhais, Phys. Rev. B 1992, 46, 6671.
[8] J. P. Perdew, K. Burke, M. Ernzerhof, Phys. Rev. Lett. 1996, 77, 3865. [9] F. Birch, Phys. Rev. 1947, 71, 809. [10] H. J. Monkhorst, J. D. Pack, Phys. Rev. B 1976, 13, 5188. [11] P. E. Blöchl, O. Jepsen, O. K. Andersen, Phys. Rev. B 1994, 49, 16223.


Copyright © 2022 FDOKUMEN