Zinc Inhibits Hedgehog Autoprocessing: Linking Zinc Deficiency with Hedgehog Activation
Upload
independentCategory
view
3download
0
P. V. KEDDY et al.: Thermopower Studies of Lithium-Zinc Mixed Ferrites 439
phys. stat. sol. (a) 127, 439 (1991)
Subject classification: 72.15; 61.60; S11.2
Department of Physics, Osmuniu Unhwrsity, Hyderubird’
Thermopower Studies of Lithium-Zinc Mixed Ferrites
BY P. V. REDDY, V. D. REDDY, and D. RAVINDER
A series of Li-Zn mixed ferrites with composition formula -,,,,Zn,Fe,,, -o.5x04 is prepared by the solid-state reaction method. The variation of lattice parameter with composition is explained on the basis of tetrahedral ionic radius. Thermopower studies are undertaken over a temperature range 300 to 750K by the differential method. From the Seebeck coefficient S, the values of charge carrier concentration n and mobility pe are computed. The values of n are found to decrease while those of p e are increasing continuously with increasing temperature. On the basis of these results, a mechanism for the conduction in Li--Zn ferrites is suggested.
Mittels Festkorperreaktionsmethode wird eine Rejhe von Li-Zn-Mischferriten mit der Zusammen- setzung Lio.5 _,,,,Zn,Fe,,, -o,5x04 hergestellt. Die Anderung des Gitterparameters mit der Zusammen- setzung wird auf der Grundlage tetraedrischer Ionenradien erklart. Thermospannungsuntersuchungcn werden im Temperaturbereich von 300 bis 750 K mittels Differentialmethode durchgefuhrt. Aus den Werten des Seebeck-Koeflizienten S werden die Werte der Ladungstragerkonzentration n und Bewcglichkeit pe berechnet. Es wird gefunden, daB mit steigender Temperatur die Werte von n abnehmen, wahrend die von pe kontinuierlich zunehmen. Auf der Grundlage dieser Ergcbnisse wird ein Mechanismus fur die Leitfahigkeit in Li-Zn-Ferriten vorgeschlagen.
1. Introduction
Diamagnetic Zn’ + ion substitution in lithium ferrite is known to have tremendous influence on several of its magnetic properties such as magnetisation, initial permeability, B-H loop parameters, Curie temperature, etc. Zn2 + also has considerable effect on the other properties of lithium ferrite like resonance line-width, gCff, B-site ordering, dielectric behaviour, electrical resistivity, etc. In view of this, Zn-substituted lithium ferrites have attracted the attention of several researchers in recent past. As such, with a view to understand firstly the behaviour of thermopower in the neighbourhood of T, and secondly to get an insight into the mechanism of charge transport in Li--Zn mixed ferrites, a systematic study of thermopower as a function of composition and temperature has been undertaken and the results of such a study are presented in this paper.
2. Experimental
2.1 Matevials
The ferrite samples used in the present investigation have the compositional formula
Li0. 5 - 0.5xZnxFeZ.s - 0 . 5 8 4 , where x ranges from 0.2 to 1.0 in steps of 0.2 and were prepared by the well-known double sintering process. Lithium carbonate (BDH, 99.9% pure), zinc oxide (BDH, 99.9% pure),
’) Hyderabad 500007, India.
29 physica (a) 127/?

440 P. V. REDDY, V. D. REDDY, and D. RAVINDER
and ferric oxide (Sarabai, 99.9% pure) have been used as starting materials for the preparation of the samples. One batch of samples was sintered at 12OO0C, the other at 1300 "C. X-ray diffraction studies have been undertaken to confirm the formation of the spinel structure of the materials.
2.2 Measurements
Thermopower studies were carried out over a temperature range 300 to 750K by the differential method. The sample holder for measuring thermo-e.m.f. consists of two non-magnetic copper electrodes between which the sample is firmly fixed. An auxiliary heating coil is fixed to the upper electrode for additional heating in order to maintain a temperature gradient of about 10 K between the two sides of the sample. It was found that the value of Seebeck coefficient (S) does not depend on the temperature gradient between two electrodes when its value is less than 10 K. The temperature of the two faces of the sample was measured by two chromel-alumel thermocouples which are kept very close to the sample. Thermo-e.m.f. was measured with the help of a digital microvoltmeter. The error in the measurements of the Seebeck coefficient is about i 3%.
3. Results and Discussion
3.1 Variation of lattice parameter with composition
The values of the lattice parameter for each composition have been calculated using the d-spacing values. In the present investigation the value of lattice parameter obtained in the case of ZnFe,O, is 0.8441 nm which is in agreement with the value 0.84440 nm reported by Pran Kishan et al. [l] and Josyulu and Sobhanadri [2]. No data on the lattice parameters are available in the literature to compare with the values of other Li-Zn ferrites. Further, the lattice parameter of these samples is found to vary linearly with increasing zinc concentration, thereby indicating that the Li-Zn mixed ferrite solid solution system is obeying Vegard's law [3]. Now, the variation of lattice parameter with composition can be explained on the basis of the variation of the tetrahedral ionic radius as outlined below.
- 0842- E L
i
i
Q
0054 0058 0062 0066 0070
1
Fig. 1. A plot of latticc parameter and _j tetrahedral ionic radius 0074

Thermopowcr Studies of Lithiuin-Zinc Mixed Ferrites 441
Table 1 Experimental data on lithium zinc mixed ferrites
sample ferrite sintering temperature sintering temperature No 1200 "C 1300 "C
S at 90 "C Tc TI S at 90 "C Tc TF (PV/K) (K) (K) tPV/K) W) ( K )
LZ I Li,.4Zno.,Fe, 4 0 4 -41 728 720 - 59 688 678 LZ TI Li" 3Zn* 4Fe2 3 0 4 - 26 565 578 - 39 520 512 LZ 111 Lio.2Zno,6Fe,.,O4 - 24 456 445 - 19 448 452 LZ IV Li" 1Zno 8% 1 0 4 - 22 420 415 - 29 370 346
- - LZ v ZnFe204 - 34 - -31 -
The cation distribution of lithium ferrite having the inverse spinel structure is given by
(Fe3+) [Lii,,Fe:,:]O, ,
where the parenthesis ( ) and the brackets [ ] indicate the tetrahedral and octahedral sites, respectively. Starting from lithium ferrite, when a non-magnetic ion, Zn2 +, is substituted it is known to occupy preferably the tetrahedral site [4] replacing Fe3' ions. As such, the cation distribution of Li-Zn ferrites can be written as
(Fe - xZnx) [Li:, ,Fe: ,:I02 . The ionic radius of Fe3+ and ZnZ+ is 0.049 nm and 0.074 nm, respectively. When Z n Z C with larger ionic radius replaces Fe3+ on tetrahedral site having smaller ionic radius, the lattice parameter is expected to increase continuously. Now, the relationship between tetrahedral ionic radius and the lattice parameter can be arrived at as follows.
For a given composition x, the mean ionic radius per molecule of the tetrahedral site may be defined as [ 5 ]
Ytctra = (1 - XI 'telra(Fe3+) + X'tetra(Me2 + I 3 where Me2 + denotes the substituted divalent metal. Using this formula, the mean tetrahedral ionic radius for each composition has been computed. A plot of lattice parameter versus
1; X I 1300'"C \
0 02 04 06 08 10 Zn content (moll -
Fig. 2 . Variation of Secbeck coefficient with zinc content
29*

442 P. V. REDDY, V. D. REDDY, and D. RAVINDER
-40
- 30
- 20
-10
0 3 0
I I
b
-18 -
-14 - I 1 I ,
0
-40
-30% 1
v, 3
-20 1 - 10
0 300 360 460 540 620 700 760
T (K)-
Fig. 3a-c
Thermopower Studies of Lithium-Zinc Mixed Ferrites 443
-35
-30
-25
-20
-45
7
k 1 -35 .3
1 -25
v)
-15
- 5
I
d
I r 330 350 370 390 e
- I
260 340 420 500 580 T ( K I A
Fig. 3d, e
-320
-. k
-240 2 3 v,
- 160
- 80
0 1
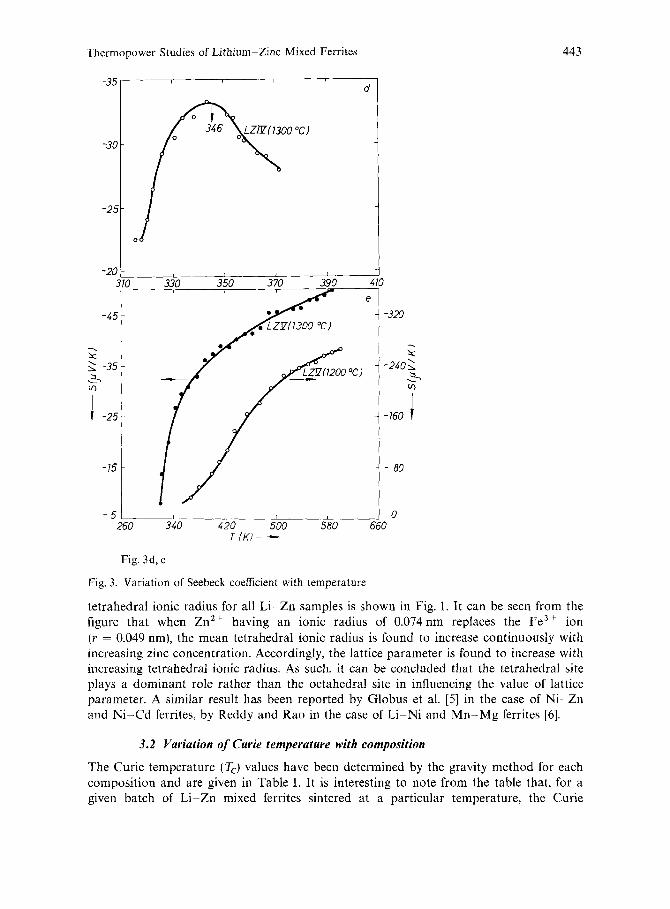
Fig. 3. Variation of Seebeck coefficient with temperature
tetrahedral ionic radius for all Li-Zn samples is shown in Fig. 1. It can be seen from the figure that when Zn2+ having an ionic radius of 0.074nm replaces the Fe3 ' ion ( r = 0.049 nm), the mean tetrahedral ionic radius is found to increase continuously with increasing zinc concentration. Accordingly, the lattice parameter is found to increase with increasing tetrahedral ionic radius. As such, it can be concluded that the tetrahedral site plays a dominant role rather than the octahedral site in influencing the value of lattice parameter. A similar result has been reported by Globus et al. [5] in the case of Ni-Zn and Ni-Cd ferrites, by Reddy and Rao in the case of Li-Ni and Mn-Mg ferrites [6].
3.2 Variation of Curie temperature with composition
The Curie temperature (T,) values have been determined by the gravity method for each composition and are given in Table 1. It is interesting to note from the table that, for a given batch of Li-Zn mixed ferrites sintered at a particular temperature, the Curie

444 P. V. REDDY, V. D. REDDY, and D. RAVINDER
I I I I
300 3 80 460 540 620 700 I 1 , I I
58 b -
I 5 7 - - ?? s R 0 5 6 - L
C
55 - I 1 I I
I 320 440 480 520
C
.... C
28 , 360 4 00 440 4 80 520
I I I
d
LZ IF11300 "C/ , , 0 -.- C
2 6 310 330 350 3 70 390 410
38
36 t F- 5
3 4 L
C
3 2
0
0 2 5
2 4 I 7;
2 3 % - L
C
22 0
T (KI -
Fig. 4a - d

Thermopower Studies of Lithium- Zinc Mixed Ferrites 445
3.7 1
il
64
--. 5 6 3
40
2.9 I L I
260 340 420 500 580 660 T IKl -
Fig. 4e
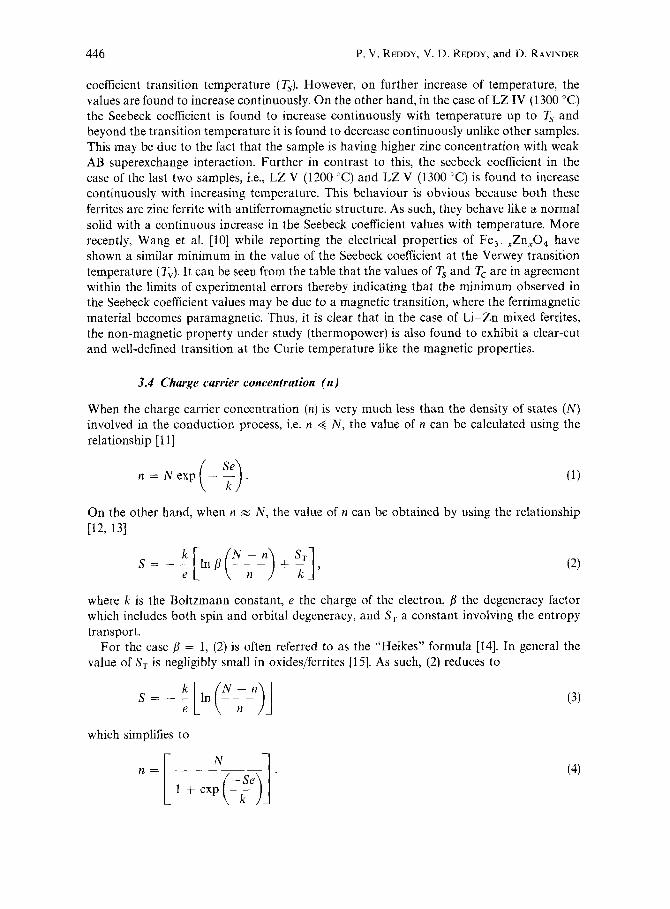
Fig. 4. A plot of charge carrier concentration and temperature
temperature is found to decrease continuously with increase of zinc content. This is expected because a nonmagnetic Zn2+ ion is replacing a magnetic Fe3+ ions continously. Further, it can also seen from the table that for a given composition the Curie temperature values are found to decrease with increase of sintering temperature. This may be explained as follows.
It is generally assumed that there are appreciable amounts of oxygen and lithium losses when lithium and substituted lithium ferrite samples are sintered in air at a temperature > 1000 "C. It was pointed out by Pointon and Saul1 [7] and others [XI that loss of lithium results in a considerable decrease in the value of magnetic moment. A decrease in magnetic moment indicates a considerably weakening of the A 3 exchange interaction thereby decreasing the Curie temperature [9]. In the present investigation also, as the samples were fired in air (> 1000 "C), the amount of lithium loss for the samples sintered at 1300 "C is more than that for the samples sintered at 1200 "C. As such for a given sample, a decrease in the values of T, with increasing sintering temperature is expected.
3.3 Seebeck coefficient (S)
The values of Seebeck coefficient for each composition have been calculated from the experimental values of thermo-e.m.f. and are given in Table 1. It can be seen from the table that the sign of the Seebeck coefficient for all the samples is negative indicating that the predominant conduction mechanism in these ferrites is of n-type. The composition dependence of the Seebeck coefficient for all samples is shown in Fig. 2. It is clear from the figure that the Seebeck coefficient in both cases is found to decrease up to 0.6 mol of zinc, while it is found to increase on further increase of zinc content.
The temperature variation of the Seebeck coefficient for all the samples under study is shown in Fig. 3a to e. It is clear from the figures that the amount of the Seebeck coefficient is found to decrease continuously with increasing temperature for all the samples [with the exception ofLZ IV (1300 "C)] up to a particular temperature, hereafter referred to as Seebeck
446 P. V. REDDY, V. D. REDDY, and D. RAVINDER
coefficient transition temperature (q). However, on further increase of temperature, the values are found to increase continuously. On the other hand, in the case of LZ IV (1300 "C) the Seebeck coefficient is found to increase continuously with temperature up to T, and beyond the transition temperature it is found to decrease continuously unlike other samples. This may be due to the fact that the sample is having higher zinc concentration with weak AB superexchange interaction. Further in contrast to this, the seebeck coefficient in the case of the last two samples, i.e., LZ V (1200 "C) and LZ V (1300 "C) is found to increase continuously with increasing temperature. This behaviour is obvious because both these ferrites are zinc ferrite with antiferromagnetic structure. As such, they behave like a normal solid with a continuous increase in the Seebeck coefficient values with temperature. More recently, Wang et al. [lo] while reporting the electrical properties of Fe,-,Zn,O, have shown a similar minimum in the value of the Seebeck coefficient at the Verwey transition temperature (T"). It can be seen from the table that the values of T, and T, are in agreement within the limits of experimental errors thereby indicating that the minimum observed in the Seebeck coefficient values may be due to a magnetic transition, where the ferrimagnetic material becomes paramagnetic. Thus, it is clear that in the case of Li-Zn mixed ferrites, the non-magnetic property under study (thermopower) is also found to exhibit a clear-cut and well-defined transition at the Curie temperature like the magnetic properties.
3.4 Charge carrier concentration ( n )
When the charge carrier concentration (a) is very much less than the density of states ( N ) involved in the conduction process, i.e. n << N , the value of n can be calculated using the relationship [ 111
On the other hand, when n z N , the value of II can be obtained by using the relationship ~ 2 , 1 3 1
where k is the Boltzmann constant, e the charge of the electron, p the degeneracy factor which includes both spin and orbital degeneracy, and S , a constant involving the entropy transport.
For the case p = 1, (2) is often referred to as the "Heikes" formula [14]. In general the value of S , is negligibly small in oxides/ferrites [15]. As such, (2) reduces to
which simplifies to

Thermopower Studies of Lithium-Zinc Mixed Ferrites 447
In the case of low mobility semiconductors like ferrites having exceedingly narrow bands orlocalisedlevels, the value ofN, the density ofstates,can be takenas 10" [ll, 16,171.
Further, if Vis the volume of the sample under study (3) can be written as
The values of charge carrier concentration/unit volume have been calculated for all ' the samples at each temperature by using the values of the Seebeck coefficient. The variation of charge carrier concentration with temperature is shown in Fig. 4a to e. It can be seen from the figures that n is found to decrease continously with increase of temperature up to Tc However, beyond T, the carrier concentration is increasing continuously while for the zinc ferrite samples, i.e. LZ V (1200 "C) and LZ V (1300 "C), the charge carriers are found to increase continuously with increase of temperature.
3.5 Charge carrier mobility (p,)
If the conduction in the ferrite semiconductors under study is assumed to be predominantly due to only one type of charge carriers, i.e. electrons, the mobility (11,) of the charge carriers is given by the well-known relation
CF = nepe (A $=- P A >
where cr is the electrical conductivity of the specimen at a given temperature. The dc conductivity values of the samples under investigation have been studied by the well-known two-probe method and the results are being published separately. Using the values of electrical conductivity and charge carrier concentration, the mobility of charge carriers of all the samples has been calculated. The values of mobility are found to be very low when compared to normal semiconductors. But such low values have been reported earlier by several researchers [18, 191. Further, the variation of mobility with temperatures for each sample is shown in Fig. 5a to d. From the plots, it can be seen that the mobility is found to increase continuously with increase of temperature for all the samples including zinc ferrites.
3.6 Conduction mechanism
The increase of mobility with increasing temperature suggests that (i) The mechanism responsible for the conduction in Li-Zn ferrites is hopping of charge
carriers from Fe3+ to Fez+ ions on octahedral sites rather than the band mechanism. (ii) The charge carriers responsible for the conduction process may be small polarons
rather than electrons. This is possible because in solids with large coupling constant and a narrow conduction band, small polaron formation is more probable [20]. In oxides of iron group metals, the overlap of 3d wave functions between the neighbouring metal ions is relatively small. In such a case, there is a strong experimental evidence for the existence of small polarons and the hopping process 1211. Based on these experimental observations, it can be concluded that the conduction in the Li-Zn mixed ferrites used in the present investigation at low temperatures may proceed via thermally activated hopping motion of

448
t 40- - 2
%'
5 3 0 - $. 0 % L
2 0 -
10 -
P. V. REDDY, V. D. REDDY, and D. RAVINDER
0 300 ; 340 380 420 460 500
T IKI ---c
Fig. 5a, b
strongly correlated polarons. On the other hand, at higher temperatures, the weakly activated hopping motion of polarons might degenerate in Brownian-like motion resulting in tunneling instead of hopping of polarons. Thus, such a phenomenon is responsible for the conduction at higher temperatures.
A close examination of Fig. 4 and 5 reveals that for a given temperature difference the change in charge carrier mobility ( p e ) is greater than that in carrier concentration (n) indicating that the increase of conductivity is essentially influenced by the mobility rather than the carrier concentration. This could be due to the fact that the charge carriers are localised at ions or vacant sites. Due to the lattice vibrations, the ions occasionally come close enough for the transfer of charge carriers and the conduction is therefore induced by lattice vibrations, and as a result the carrier mobility shows an exponential temperature dependence with an activation energy. For such a process of jumping charge carriers, the

Thermopower Studics of Lithium-Zinc Mixed Ferrites 449
I I
340 420 460 500 54 0
LZ L!Z(1300 'Cl
d
260 300 340 380 420 460 T (K)-
Fig. 5c, d
Fig. 5. Variation of mobility with temperature
general expression for the hopping mobility is given by
cd'w exp ( - E / k T ) kT P = - ---,
where tl is the electron charge, d jump length = 1/4a 1/z, w ihe maximum frequency of the transition between two neighbouring octahedral sites, E the average activation energy, A the Boltzmann constant, and T the absolute temperature.
Acknowledgements
The authors are grateful to Prof. A. A. Kamal and Prof. K. Rama Reddy, Department of Physics, 0. U. for their constant encouragement in the present work.

450 P. V. REDDY ct al.: Thermopower Studies of Lithium-Zinc Mixed Ferrites
References
[ l ] PRAN KISHAN, D. R. SAGAR, and PREMSWARUP, J. less-common Metals 108, 345 (1985). [2] 0. S. JOSYULU and J . SOBHANADRI, phys. stat. sol. (a) 59, 323 (1980). [3] L. VEGARD, Z. Phys. 5, 17 (1921). [4] E. J. W. VERWEY and E. L. HEILMANN, J. chem. Phys. 15, 174 ( 1 947). [5] A. GLOBUS, H. PASCARD, and V. CAGAN, J . Physique, Suppl. No. 4, 38, C1- 163 (1977). [6] P. VENUGOPAL REDDY and T. S. RAO, J . less-common Metals 75, 255 (1980). [7] A. J . POINTON and R. C. SAULL, J. Amer. Ceram. SOC. 52, 157 (1969). [8] G. BANDYOPADHYAY and R. M. FULRATH, J. Amer. Ceram. SOC. 57 483 (1974). [9] USIIA VARSHNEY and RAIENDER K. PURI, IEEE Trans. Magnetics 25, 3109 (1989).
[IO] P. WANG, Z. KAKOL, M. WITTENAUER, and J . M. HONIG, Phys. Letters B 42, 4553 (1990). [I 11 F. J. MORIN and T. H. GEBELLE, Phys. Rev. 93, 467 (1955). [I21 14. L. TULLER and A. S. NOWICK, J. Phys. Chem. Solids 38, 859 (1977). [13] C. G. Vu, S. KUMAR KRISHNAN, and T. 0. MASON, J. Solid State Chem. 37, 144 (1981). [I41 R. R. HEIKES, Phys. Rev. 99, 1232 (1955). 1151 C. G. VU and T. 0. MASON, J. Amer. Ceram. Soc. 64, 520 (1981). [I61 A. A. SAMOKHVALOV and A. G. RUSTAMOV, Soviet Phys. - Solid State 4, 749 (1964). [I71 F. J . MORIN. Phys. Rev. 93, 433 (1970). [18] G. GILLOT and F. JEMMALI, phys. stat. sol. (a) 76, 601 (1983). [I91 J . A. KULAKARNI, K. MURALIDHARAN, J . K. SRIVASTAVA, V. R. MARATHE, V. S. DARSHANE,
[20] G. K. JOSHI, A. Y. KHOT, and S. R. SAWANTH, J . Mater. Sci. 22, 1694 (1987). 1211 M. I. KLINGER, J. Phys. C 8, 3595 (1975).
C. R. K. MURTHY, and VIJAYA RAGHAVAN, J. Phys. C 18, 2593 (1985).
(Received Februury 7, 1991: in revisedform July 16, 1991)
Copyright © 2022 FDOKUMEN