A Comparative Study of Spinel ZnFe2O4 Ferrites Obtained via ...
Upload
independentCategory
view
1download
0
CERAMICSINTERNATIONAL
Available online at www.sciencedirect.com
0272-8842/$ - se
http://dx.doi.or
nCorrespond
E-mail addr
Ceramics International 39 (2013) 6681–6688
www.elsevier.com/locate/ceramint
Carboxylic acids and polyethylene glycol assisted synthesisof nanocrystalline nickel ferrites
A.S. Nikolica, N. Jovicb, J. Roganc, A. Kremenovicb,d, M. Ristice, A. Medenf, B. Anticb,n
aFaculty of Chemistry, University of Belgrade, Studentski trg 12–16, 11000 Belgrade, SerbiabThe ‘‘Vinca’’ Institute of Nuclear Sciences, University of Belgrade, POB 522, 11001 Belgrade, SerbiacFaculty of Technology and Metallurgy, University of Belgrade, Karnegijeva 4, 11000 Belgrade, Serbia
dLaboratory of Crystallography, Faculty of Mining and Geology, University of Belgrade, Djusina 7, 11001 Belgrade, SerbiaeDivision of Materials Chemistry, RuXer Boskovic Institute, POB 180, HR-10002 Zagreb, CroatiafUniversity of Ljubljana, Faculty of Chemistry and Chemical Technology, 1000 Ljubljana, Slovenia
Received 18 November 2012; received in revised form 25 November 2012; accepted 29 January 2013
Available online 10 February 2013
Abstract
Different synthesis methods for the preparation of nanocrystalline nickel ferrites are reported: the thermal decomposition of
precursors, made of: (i) metal-nitrate salts with carboxylic acids (citric, malonic and tartaric), and (ii) metal-nitrate salts and
polyethylene glycol (PEG), in the presence of potassium chloride as a capping agent. The as-prepared gel precursors were characterized
by TGA/DTA, while the samples obtained after annealing at 450 1C were investigated by FTIR, FESEM, XRD and Mossbauer
spectroscopy. Regardless of the type of carboxylic acid used, nanocrystallites prepared by (i) method are similar in size (11–16 nm),
while the method (ii) gives crystallites �33 nm in size with negligible microstrain. The differences in the lattice parameter, ranging from
8.3369(2) to 8.3574(2) A, result from cation distribution, nonstoichiometry and structural imperfections in the nickel ferrite
nanoparticles. The Mossbauer spectra analysis indicates existence of large distortions of tetrahedral and octahedral sites in these
spinel compounds.
& 2013 Elsevier Ltd and Techna Group S.r.l. All rights reserved.
Keywords: D. Ferrite; Nanoparticles; Synthesis; Characterization
1. Introduction
Recently the great effort has been done to invent new,and to modify existing synthesis procedure in order toproduce nanomaterials with improved performances. Thisbecomes important for industrial ceramics where someneeds are required (e.g. high magnetization, resistivity,coercivity, etc.). Concerning biomedical application ofmagnetic nanomaterials it is important to have narrowparticle size distribution, superparamagnetic behaviour atroom temperature and Currie temperature of cc. 40 1C (forhyperthermia treatment) [1]. The relationship betweensynthesis and applications is based on the fact thatsynthesis procedure determines structural and microstructural
e front matter & 2013 Elsevier Ltd and Techna Group S.r.l. A
g/10.1016/j.ceramint.2013.01.106
ing author. Tel./fax: þ381118065829.
ess: [email protected] (B. Antic).
characteristics of materials such as cation distribution,particle size, microstrain, kinds of defects. These structuralcharacteristics further have favorable influence in physical(magnetical, electrical, optical) properties of the appliedmaterials.Having in mind an extremely wide range of their
application [2], in this paper we studied nanosized nickelferrites. These soft ferrites are usually used in magneticrecording media, catalyst, for microwave applications,pigment, etc. [2]. They crystallize in spinel structure (spacegroup Fd-3m), where cations are distributed betweentetrahedral (8a) and octahedral (16d) sites. This distribu-tion critically determines magnetic behavior because ofsuperexchange mechanism based on interactions betweenmagnetic ions via oxygen [3]. The distribution is usuallypresented by the structural formula (Ni2þ1�aFe
3þa )8a
[Fe3þ2�aNi2þa ]16d,where a is denoted as the degree of
ll rights reserved.
A.S. Nikolic et al. / Ceramics International 39 (2013) 6681–66886682
inversion. Different synthetic routes to prepare nanocrys-talline NiFe2O4 were described in the literature so far.A combustion method using various amounts of alanine asfuel has been reported by Prabhakaran et al. [4]. The roleof the D,L-alanine as fuel was found to be significant in thesize control and phase purity of nanocrystalline samples.Chen et al. [5] used a gel-assistant hydrothermal procedureto prepare NiFe2O4 hollow nanospheres with low satura-tion magnetization and high coercivity. The effects ofsynthetic conditions on particle sizes and magnetic proper-ties were investigated by Li et al. [6]. The authors usedhydrothermal method and pointed out the influence of thepH value, temperature and time on magnetization andcoercivity.
The aim of our investigation was to study how variationof methods of synthesis influences microstructural/struc-tural and magnetic properties of nanocrystalline nickelferrite nanoparticles. The methods of synthesis employedin our work were based on thermal decomposition ofprecursors made of: (i) metal-nitrate salts with carboxylicacids (citric, malonic and tartaric), and (ii) metal-nitratesalts and polyethylene glycol (PEG) in the presence ofpotassium chloride as a capping agent. The as-prepared gelprecursors were investigated by TGA/DTA, while thesamples obtained after annealing at 450 1C were charac-terized by FTIR, FESEM, XRD and Mossbauer spectro-scopy.
2. Experimental
2.1. Synthesis of NiFe2O4 by thermal decomposition of a
precursor made of metal-nitrate salts with carboxylic acids
(citric, malonic and tartaric)
After a mixture containing 0.005 mol Ni(NO3)2 � 6H2O(Merck) and 0.01 mol Fe(NO3)3 � 9H2O (Fluka AG) wasdissolved in 100 ml of deionised water, 0.04 mol of car-boxylic (citric – C; malonic – M; tartaric – T; Sigma-Aldrich) acid was added (the molar ratio of carboxylic acidper nitrate ion ions was 1:1). A 0.01 mol of KCL wasfinally added and the mixture was stirred at 60 1C for 2 h.The mixture first turned brown, and after that a viscous gelwas formed. The solvent from the gel was evaporated at110 1C and the gel was heated on air until self-ignited.Precursors materials obtained by this procedure werelabeled as PC, PM and PT, where the subscripts denotecorresponding acids. Precursors materials obtained by thisprocedure were labeled as PC, PM and PT, where thesubscripts denote corresponding acids. The obtained pre-cursor materials were heated in furnace up to 450 1C with aheating rate of 10 1C min�1. Resulting powder sampleswere repeatedly suspended in redistilled water followed bycentrifugation in order to remove residual salts. The finalproduct was filtered and dried at 105 1C for 2 h. Precursorsmaterials obtained by this procedure were labeled asNiFeC, NiFeM and NiFeT, where the subscripts denotecorresponding acids.
2.2. Synthesis of NiFe2O4 by thermal decomposition of a
precursor made by a reaction of metal-nitrate salts and
polyethylene glycol (PEG)
Ferric oxide powders were synthesized by a slightlymodified method previously described in the literature[7]. A mixture containing 0.002 mol Ni(NO3)2 � 6H2O(Merck) and 0.004 mol Fe(NO3)3 � 9H2O (Fluka AG) wasdissolved in 50 ml of deionised water, and 0.006 mol ofPEG 1550 (Fluka AG) was added in the solution. Finally,0.018 mol of KCl was added, and the resulting transparentsolution was thoroughly stirred by a magnetic mixer at70 1C until a homogenous sol-like mixture was formed.The solvent from the mixture was evaporated at 110 1C for2 h, and the resulting gel was heated in air until self-ignited. The obtained precursor material, labeled as Pp,was gradually heated in furnace up to 450 1C with aheating rate of 10 1C min�1. Resulting powder was freedfrom residual salt by suspending in redistilled waterfollowed by centrifuging. Final product was obtained byfiltrating and drying at 105 1C for 2 h. Final product wasobtained after filtration, and drying at 105 1C for 2 h. Theobtained sample was labeled as NiFePEG.
2.3. Experimental methods
In order to reveal degradation behavior of the as-prepared precursors, they were studied by simultaneousthermogravimetric (TGA) and differential thermal (DTA)analysis in the range 30–800 1C using a SDT Q600 TGA/DSC instrument (TA Instruments). The heating rates were20 1C min�1 and the sample masses were below 10 mg.The furnace atmosphere consisted of dry air at a flow rateof 100 cm3min�1.The FTIR spectra of samples (KBr pellets) were
recorded in the range of 400–4000 cm�1 and 200–700 cm�1 using a Fourier transform infrared spectrometer(FTIR, model 2000, Perkin Elmer) in transmission mode ata resolution of 4 cm�1. The spectra were processed usingthe IRDM (IR Data Manager) program.FESEM images were recorded using a thermal field-
emission scanning electron microscope, JSM-7000 F, JeolLtd, Japan. The FE SEM was coupled with an energy-dispersive X-ray analyzer, EDS/INCA 350, Oxford Instru-ments, England. The inspected samples were not coatedwith conductive layer.X-ray powder diffraction (XRPD) data were collected
on a PANalytical X’pert PRO diffractometer equippedwith Anton Paar HTK-1200 N using CuKa radiation.Data were collected in the 2y range from 15.019 to119.9411 in steps of 0.0671 and the total integration timeof 1000 s per step (full range of the 128-channel linearRTMS detector was used, so that each channel integratedthe intensity for about 7.8 s at each step).The Mossbauer spectra were collected in a transmission
configuration, in constant acceleration mode with theradioactive source of 57Co embedded in Rhodium matrix.

A.S. Nikolic et al. / Ceramics International 39 (2013) 6681–6688 6683
Room temperature spectrum of a-iron foil was used forspectrometer calibration.
3. Results and discussion
3.1. Sample formation
3.1.1. The TGA/DTA of the as-prepared gel precursors
In order to study the synthesis of NiFe2O4 nanoparticlesby thermolysis of corresponding precursors, simultaneousthermogravimetric (TGA) and differential thermal (DTA)analysis of the prepared precursors from ambient tem-perature to 800 1C were performed. The TGA and DTAcurves of the as-prepared precursors PC, PM, PT and PP areshown in Fig. 1 a–d.
According to the previously proposed mechanism [8]decomposition of the citrate precursor (PC) is expected tooccur in three major steps: dehydration, decomposition ofthe anhydrous precursor to acetonedicarboxylate complexand decomposition of acetonedicarboxylate complex tonickel ferrite. The dehydration occurs in two not well-resolved steps (TGA curve, Fig. 1a) up to 127 and 164 1Cwith weight losses found 12.8 and 15.2%, respectively. TheDTA curve for PC (Fig. 1a) shows a broad endothermicpeak at 125 1C due to dehydration. After dehydration,three steps in the decomposition of anhydrous precursor
Fig. 1. TG and DTA curves of decomposition process of the citr
were observed: evolution of CO occurs up to 212 1Cresulting in the formation of the acetonedicarboxylatecomplex Ni3Fe6O4(C5H6O6)8 (weight loss found 20.0%).The next step corresponds to the evolution of acetone andCO2 and takes place up to 287 1C. The residue at this stageprobably has a structure related to the nickel ferrite withtrapped CO2, Ni3Fe6O12(CO2)3 [8]. Decomposition of theNi3Fe6O12(CO2)3 up to 383 1C reveals the formation of theNiFe2O4 with corresponding exothermic effect at 365 1C inDTA curve due to the formation of the NiFe2O4.TGA curve of the malonato precursor (PM) (Fig. 1b)
shows that the dehydration is finished up to 142 1C (weightloss found 5.6%) with corresponding endothermic DTApeak at 122 1C. Further decomposition step of theanhydrous precursor occurs up to 287 1C (weight lossfound 33.0%) and probably corresponds to the formationof iron(III)- and nickel(II) malonate intermediates [9].After that,three decomposition steps up to 402, 512and 605 1C have been observed in TGA curve (Fig. 1b)(weight losses found 21.4, 6.8 and 4.0%, respectively).These steps are accompanied with three exothermic peaksin DTA curve at 339, 462 and 566 1C, suggestingthe formation of the mixture of oxide phases, i.e. NiOand a-Fe2O3 up to 402 1C (total weight loss about 60%),NiFe2O4 and NiO phases up to 512 1C and traceof the NiO in the mixture of NiFe2O4 and NiO up to
ate (a), malomato (b), tartarato (c) and PEG (d) precursors.

A.S. Nikolic et al. / Ceramics International 39 (2013) 6681–66886684
605 1C. This is similar to the already proposed decomposi-tion mechanism [9].
The decomposition of the tartarato precursor (PT)(Fig. 1c) starts with dehydration from room temperatureup to 170 1C (weight loss found 9.5%) with correspondingendothermic peak in DTA curve at 167 1C due to thedehydration process. Immediately after the dehydration,two overlapped steps up to 248 and 275 1C (weight lossesfound 38.6 and 20.5%, respectively) could be seen in TGAcurve. According to Yang et al. [10], the first stepcorresponds to the decomposition of iron(III) tartarate,while the second one matches to the decomposition ofnickel(II) tartarate. Next, a sharp DTA exothermic peak at286 1C together with the weight loss of 14.4% from 275 to371 1C was observed in TGA curve, which implies theformation of some intermediates, such as a-Fe2O3 andNiO. This data is in agreement with the decompositionmechanism described by Yang et al. [10]. The TGA curve(Fig. 1c) clearly shows that the temperature of 371 1Ccorresponds to the complete decomposition of the pre-cursor PT to NiFe2O4 with the residual mass of about 16%at 800 1C.
The dehydration of the PEG precursor (PP) (Fig. 1d) is atwo steps process, where gel losses 1.9 and 3.9% up to 87and 217 1C, respectively. Further decomposition of theanhydrous PP occurs in three non-well resolved stepsresulting in three overlapped steps shown in TGA curve.The first step dominates in the range 217–384 1C (weightloss found to be 64.2%). In the subsequent two steps, PP
losses 11.9 and 2.8% of its mass, up to 425 and 505 1C,respectively. These three decomposition steps correspondto the broad exothermic peak in DTA curve (Fig. 1d) withthe maxima at 389 1C.
3.1.2. FTIR spectra
FTIR spectra of nickel ferrite powders obtained bycombustion of carboxylic (C, M and T) acid precursorsand degradation of metal nitrate salts in the presence ofPEG were shown in Fig. 2. The presence of adsorbed H2Ocaused the appearance of a strong and broad n(O–H)
Fig. 2. The FTIR spectra of nickel ferrites: (a) NiFeC, (b) NiFeM, (c) Ni
wavelength range.
stretching band in the 3450-3430 cm�1 region in the FTIRspectra of all investigated samples (Fig. 2a–d). Twoshoulders at about 2920 and 2850 cm�1 are assigned ton(C–H) vibrations of the citrato and the tartarato ligand,as well as of PEG in NiFeC, NiFeT and NiFePEG spectra,respectively. Two strong and broad bands at about 1630and 1380 cm�1 are assigned to the asymmetric, nas(COO),and symmetric, ns(COO), stretching vibrations of the COOgroups [11] are clearly seen in the FTIR spectra of NiFeCand NiFeM (Fig. 2a and b). A band at around 1630 cm�1
in spectra are associated with d(HOH) vibrations of thehydroxyl group [8]. Some weak but distinct bands in therange 1000–830 cm�1 are assigned to n(C–O), n(C–C) andn(O–H) bending modes (Fig. 2). Two broad and charac-teristic bands in the 606–586 and 397–417 cm�1 regioncorrespond to the vibrations of metal-oxygen bond [11] ina spinel phase.
3.2. Structure/microstructure of nickel ferrite nanoparticles
3.2.1. FESEM and EDS analysis
Morphology, particle size and agglomeration of theparticles were investigated by FESEM, Fig. 3a–d. In theNiFeC sample two types of particles are observed: smaller,spherical nanoparticles and bigger, cubic-like ones(Fig. 3a). Particle size distribution is pretty narrow in thissample. In sample NiFeM (Fig. 3b) small spherical nano-particles form big agglomerates. However, a significantportion of organic phase is also observed in this sample.Nanoparticles found in the sample NiFeT are smaller thanthose in NiFeC and NiFeM (Fig. 3c). They are spherical inshape and very homogeneous in size and morphology. Inthe sample NiFePEG (Fig. 3d), apart from smaller nano-particles, presence of bigger ones, �100 nm in size, wasobserved.The samples were analyzed by EDS. The EDS spectra of
two selected samples, NiFeT and NiFePEG, are shown inFig. 4. When the point EDS analysis was performed,average atomic ratio of Ni to Fe is found to be very closeto 1:2. The EDS analysis carried out from the surface
FeT and (d) NiFePEG, over 4000–400 (left), and 700–350 cm�1 (right)

Fig. 3. FESEM images of nickel ferrites: (a) NiFeC, (b) NiFeM, (c) NiFeT and (d) NiFePEG.
Fig. 4. EDS spectra for nickel ferrites, NiFeT and NiFePEG.
A.S. Nikolic et al. / Ceramics International 39 (2013) 6681–6688 6685

A.S. Nikolic et al. / Ceramics International 39 (2013) 6681–66886686
pointed out an excess of iron ions in the samples NiFeC,NiFeM and NiFePEG, but not in the sample NiFeT. Theexcess of iron ions can indicate trace of an additionalphase, probably elemental iron. Such an assumption issupported by the fact that the X-ray diffraction patternsshow a slight contamination of the samples by iron(Section 3.2.2.).
3.2.2. X-ray diffraction analysis
The X-ray diffraction patterns of NiFeC, NiFeM, NiFeTand NiFePEG showed broad reflections due to theirnanocrystalline structure, Fig. 5. All reflections wereindexed in the spinel type of the crystal structure (spacegroup Fd-3m). An additional reflection of small intensity,belonging to Fe at position 44.51 2y denoted as acontamination in all samples.
The collected X-ray diffraction data were analyzed byFullProf program by using profile matching mode [12].The profile of diffraction peaks was described byThompson-Cox-Hastings approximation of Voigt functioncomprising the size and strain calculations based onintegral breadths [13]. The instrumental Full Width atHalf Maximum (FWHM) was derived from XRPD pat-tern of standard LaB6 powder sample for microstructureanalysis. From the X-ray line broadening analysis theapparent crystallite sizes and strains were calculated foreach reflection using the formula:
App2size¼1
bsize
ðAÞ ð1Þ
App2strain¼1
2bstraindhkl ð10
24Þ ð2Þ
The bsize is obtained from the size parameters contribut-ing to the FWHM:
FWHMðLorentzian2sizeÞ ¼HLZ ¼Y
cos yð3Þ
Fig. 5. X-ray diffraction patterns of nickel ferrites prepared by different
routes (see text).
The bstrain is obtained from the strain parameterscontributing to the FWHM:
FWHM2ðGaussianstrainÞ ¼H2GS ¼ ðUþð1xÞ
2D2ST ðaDÞÞtan
2y
ð4Þ
FWHMðLorentzian2strainÞ ¼HLS ¼ ðXþxDST ðaDÞÞtan y
ð5Þ
Both bsize and bstrain are deduced from TCH parametersaccording to the procedure described previously [14]. Thestandard deviations appearing in the global averageapparent size and strain is calculated using the differentreciprocal lattice directions.The values of cell parameters and microstructure (appar-
ent crystallite size and average microstrain) are summar-ized in Table 1. Crystallite size was found to be between 11and 16 nm for samples NiFeC, NiFeM, and NiFeT, and33 nm for NiFePEG. No significant variation in crystallitesize with change of carboxylic acid (C, M and T) inprecursor material was observed, but samples prepared inthe presence of PEG yielded larger crystallites, Table 1. Asexpected, average strain decreases as the crystallite sizeincreases.Significant differences in lattice parameters (Table 1)
result from changes in cation distribution, nonstoichiome-try and presence of structural imperfections in nickelferrite nanoparticles. The distribution of cations at thecrystallographic positions (8a and 16d in the spinelstructure type) in the nanocrystalline nickel ferrite is mixedas it was already reported by many authors [15]. The Fe3þ
and Ni2þ ions have no exclusive preference for tetrahedralor octahedral sites, and can fill both sites. However, thedifferences in ionic radii of cations are significant whenthey populate octahedral (16d) and tetrahedral (8a) posi-tions. Therefore, specific cationic distribution affects thecation–anion distances and therefore the lattice parametervalues.
3.3. Mossbauer spectra analysis
The 57Fe Mossbauer measurements were performed onthe samples, NiFeM, NiFeT and NiFePEG. Mossbauerspectra of nickel ferrite nanopowders (Fig. 6) show asuperposition of two sextet lines (refer to a magneticcontribution) and a quadrupole doublet (characteristic ofa paramagnetic phase) [16]. The refined hyperfine para-meters of samples are reported in Table 2. According to
Table 1
Unit cell, apparent crystallite size and average strain for nickel ferrites.
Estimated standard deviations are in parentheses.
Sample Lattice parameter (A) Crystallite Size (nm) Strain (104)
NiFeC 8.3574 (2) 15 18
NiFeM 8.3417 (2) 11 12
NiFeT 8.3369 (2) 16 9
NiFePEG 8.3408 (1) 33 1
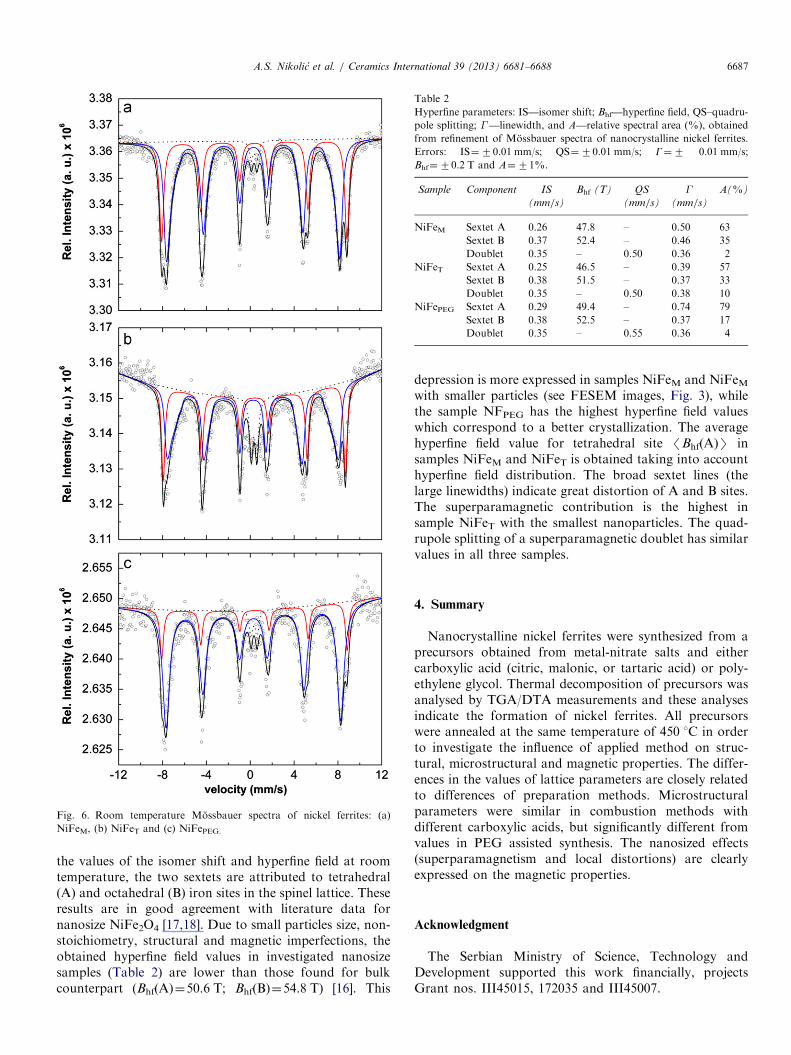
Fig. 6. Room temperature Mossbauer spectra of nickel ferrites: (a)
NiFeM, (b) NiFeT and (c) NiFePEG.
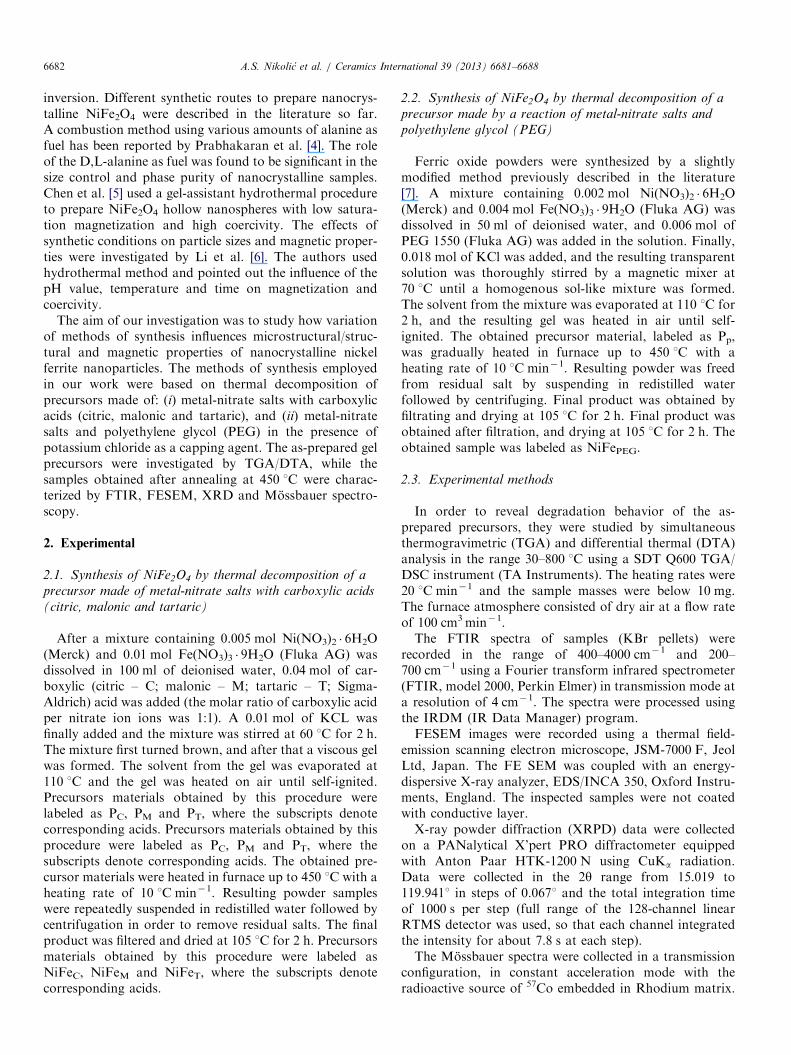
Table 2
Hyperfine parameters: IS—isomer shift; Bhf—hyperfine field, QS–quadru-
pole splitting; !—linewidth, and A—relative spectral area (%), obtained
from refinement of Mossbauer spectra of nanocrystalline nickel ferrites.
Errors: IS¼70.01 mm/s; QS¼70.01 mm/s; G¼7 0.01 mm/s;
Bhf¼70.2 T and A¼71%.
Sample Component IS
(mm/s)
Bhf (T) QS
(mm/s)
!(mm/s)
A(%)
NiFeM Sextet A 0.26 47.8 – 0.50 63
Sextet B 0.37 52.4 – 0.46 35
Doublet 0.35 – 0.50 0.36 2
NiFeT Sextet A 0.25 46.5 – 0.39 57
Sextet B 0.38 51.5 – 0.37 33
Doublet 0.35 – 0.50 0.38 10
NiFePEG Sextet A 0.29 49.4 – 0.74 79
Sextet B 0.38 52.5 – 0.37 17
Doublet 0.35 – 0.55 0.36 4
A.S. Nikolic et al. / Ceramics International 39 (2013) 6681–6688 6687
the values of the isomer shift and hyperfine field at roomtemperature, the two sextets are attributed to tetrahedral(A) and octahedral (B) iron sites in the spinel lattice. Theseresults are in good agreement with literature data fornanosize NiFe2O4 [17,18]. Due to small particles size, non-stoichiometry, structural and magnetic imperfections, theobtained hyperfine field values in investigated nanosizesamples (Table 2) are lower than those found for bulkcounterpart (Bhf(A)¼50.6 T; Bhf(B)¼54.8 T) [16]. This
depression is more expressed in samples NiFeM and NiFeMwith smaller particles (see FESEM images, Fig. 3), whilethe sample NFPEG has the highest hyperfine field valueswhich correspond to a better crystallization. The averagehyperfine field value for tetrahedral site /Bhf(A)S insamples NiFeM and NiFeT is obtained taking into accounthyperfine field distribution. The broad sextet lines (thelarge linewidths) indicate great distortion of A and B sites.The superparamagnetic contribution is the highest insample NiFeT with the smallest nanoparticles. The quad-rupole splitting of a superparamagnetic doublet has similarvalues in all three samples.
4. Summary
Nanocrystalline nickel ferrites were synthesized from aprecursors obtained from metal-nitrate salts and eithercarboxylic acid (citric, malonic, or tartaric acid) or poly-ethylene glycol. Thermal decomposition of precursors wasanalysed by TGA/DTA measurements and these analysesindicate the formation of nickel ferrites. All precursorswere annealed at the same temperature of 450 1C in orderto investigate the influence of applied method on struc-tural, microstructural and magnetic properties. The differ-ences in the values of lattice parameters are closely relatedto differences of preparation methods. Microstructuralparameters were similar in combustion methods withdifferent carboxylic acids, but significantly different fromvalues in PEG assisted synthesis. The nanosized effects(superparamagnetism and local distortions) are clearlyexpressed on the magnetic properties.
Acknowledgment
The Serbian Ministry of Science, Technology andDevelopment supported this work financially, projectsGrant nos. III45015, 172035 and III45007.

A.S. Nikolic et al. / Ceramics International 39 (2013) 6681–66886688
References
[1] G.F. Goya, V. Grazu, M.R Ibarra, Magnetic nanoparticles for
cancer therapy, Current Nanoscience 4 (2008) 1–16.
[2] A. Goldman, Modern Ferrite Technology, Marcel Dekker, Inc., New
York, 1993.
[3] J.G. Na, T.D. lee, S.J. Park, Y. Tang, H.L. Luo, Effects of cation
distribution on superexchange interaction in cobalt ferrites, IEEE
Transactions on Magnetics 31 (1995) 3970–3972.
[4] T. Prabhakaran, J. Hemalatha, Combustion synthesis and character-
ization of highly crystalline single phase nickel ferrite nanoparticles,
J. All. Compd. 509 (2011) 7071–7077.
[5] L. Chen, H. Dai, Y Shen, J. Bai, Size-controlled synthesis and
magnetic properties of NiFe2O4 hollow nanospheres via a gel-
assistant hydrothermal route, J. All. Compds. 491 (2010) L33–L38.
[6] H. Li, H-z. Wu, G-x. Xiao, Effects of synthetic conditions on particle
size and magnetic properties of NiFe2O4, Powder Technology 198
(2010) 157–166.
[7] J. Song, Z-Y. Ma, C. Li, R-J. Wu, Synthesis of ferric oxide
nanoparticles with controllable crystal phases by salt-assisted com-
bustion method, Journal of Inorganic Materials 25 (7) (2010)
780–784.
[8] N.S. Gajbhiye, S. Prasad, Thermal decomposition of hexahydrated
nickel iron citrate, Thermochimica Acta 285 (1996) 325–336.
[9] B.S. Randhawa, J. Singh, H. Kaur, M. Kaur, Preparation of nickel
ferrite from thermolysis of nickel tris(malonato)ferrate(III) heptahy-
drate precursor, Ceramics International 36 (2010) 1993–1996.
[10] J.M. Yang, W.J. Tsuo, F.S. Yen, Preparation of Ultrafine nickel
ferrite powders using mixed Ni and Fe tartartes, Journal of Solid
State Chemistry 145 (1999) 50–57.
[11] K. Nakamoto, Infrared and Raman Spectra of Inorganic and
Coordination Compounds, Part B, Applications in Coordination,
Organometallic and Bioinorganic Chemistry, 5th ed., John Wiley &
Sons, New York, 1997.
[12] J. Rodriguez-Carvajal, FullProf computer program /http://www.ill.
eu/sites/fullprof/S (2009).
[13] J. Rodrıguez-Carvajal, Recent developments of the program FULL-
PROF, in commission on powder diffraction (IUCr), Newsletter 26
(2001) 12–19.
[14] /http://www-llb.cea.fr/fullweb/fp2k/fp2k_divers.htmS.
[15] A. Ahlawat, V.G Sathe, V. . Reddy, A. Gupta, Mossbauer, Raman
and X-ray diffraction studies of superparamagnetic NiFe2O4 nano-
particles prepared by sol–gel auto-combustion method, Journal of
Magnetism and Magnetic Materials 323 (2011) 2049–3054.
[16] N.N. Greenwood, T.G. Gibb, Mossbauer Spectroscopy, Chapman
and Hall, London, 1971, p. 266.
[17] S. Prasad, N.S. Gajbhiye, Magnetic studies of nanosized nickel ferrite
particles synthesized by citrate precursor technique, Journal of Alloys
and Compounds 265 (1998) 87–92.
[18] C.N. Chinnasamy, A. Narayanasamy, N. Ponpandian,
K. Chattopadhyay, K. Shinoda, B. Jeyadevan, K. Tohji,
K. Nakatsuka, T. Furubayashi, I. Nakatani, Mixed spinel structure
in nanocrystalline NiFe2O4, Physical Review B 63 (2001)
184108 (6 pp).
Copyright © 2022 FDOKUMEN