Solubility of carboxylic acids in a matrix of uncross-linked polystyrene
12
Solubility of carboxylic acids in a matrix of uncross-linked polystyrene Gabriel Bernardo, Drahosh Vesely * Department of Materials, Oxford University, Parks Road, Oxford, Oxon OX1 3PH, UK Received 27 June 2007; received in revised form 31 August 2007; accepted 11 September 2007 Available online 19 September 2007 Abstract Solubility diagrams of a series of carboxylic acids in a matrix of linear polystyrene have been measured using a gravi- metric method on samples immersed in solvent, as reported earlier [Bernardo G, Vesely D. Eur Polym J 2007;43:938–48]. The results show that the amount of solvent, swelling the polymer, reaches an equilibrium saturation which has a unique and reproducible value for each system and temperature. An analysis based on Flory–Huggins theory shows that all data presented here can be well interpreted with an interaction parameter in a simple form: v = a +(b/T). An excellent fit can also be obtained using the van’t Hoff equation. An analysis based on total and partial (Hansen) solubility parameters has also been investigated. Ó 2007 Elsevier Ltd. All rights reserved. Keywords: Diffusion; Solubility; Polystyrene; Carboxylic acids 1. Introduction Diffusion and swelling are important properties of polymers for their engineering applications from packaging to electronics, from blending to stabilisa- tion. Solubility is an integral part of the diffusion process and it is essential to understand its princi- ples by obtaining as much systematic data as possi- ble, particularly that which is not currently available in the literature. It has been shown previously [1] that the equilib- rium solubility in a polymer–solvent system can be attained by controlled diffusion. Any solvent misci- ble with the polymer diffuses into the matrix until it reaches a constant saturated swelling [1–6]. This is also valid for non-cross-linked polymers, as explic- itly stated by some authors [1,7–9]. It means that in a given temperature range the polymer is not dissolving even after a prolonged exposure to the solvent but attains a constant con- centration, characteristic for a given system and temperature. This very reproducible value can be accurately measured, e.g. by gravimetric technique, as we have shown previously [1]. This technique is simple, non-destructive, sensitive and fast. There is no need to speculate on the diffusion process, as we are only interested in the full and stable satura- tion, regardless how quickly it has been achieved. In the present work, we have applied this method to measure the solubility diagrams of a series of 0014-3057/$ - see front matter Ó 2007 Elsevier Ltd. All rights reserved. doi:10.1016/j.eurpolymj.2007.09.007 * Corresponding author. Tel.: +44 01494727691. E-mail address: [email protected] (D. Ve- sely). Available online at www.sciencedirect.com European Polymer Journal 43 (2007) 4983–4994 www.elsevier.com/locate/europolj EUROPEAN POLYMER JOURNAL
Transcript of Solubility of carboxylic acids in a matrix of uncross-linked polystyrene
Available online at www.sciencedirect.comEUROPEAN
European Polymer Journal 43 (2007) 4983–4994
www.elsevier.com/locate/europolj
POLYMERJOURNAL
Solubility of carboxylic acids in a matrix ofuncross-linked polystyrene
Gabriel Bernardo, Drahosh Vesely *
Department of Materials, Oxford University, Parks Road, Oxford, Oxon OX1 3PH, UK
Received 27 June 2007; received in revised form 31 August 2007; accepted 11 September 2007Available online 19 September 2007
Abstract
Solubility diagrams of a series of carboxylic acids in a matrix of linear polystyrene have been measured using a gravi-metric method on samples immersed in solvent, as reported earlier [Bernardo G, Vesely D. Eur Polym J 2007;43:938–48].The results show that the amount of solvent, swelling the polymer, reaches an equilibrium saturation which has a uniqueand reproducible value for each system and temperature. An analysis based on Flory–Huggins theory shows that all datapresented here can be well interpreted with an interaction parameter in a simple form: v = a + (b/T). An excellent fit canalso be obtained using the van’t Hoff equation. An analysis based on total and partial (Hansen) solubility parameters hasalso been investigated.� 2007 Elsevier Ltd. All rights reserved.
Keywords: Diffusion; Solubility; Polystyrene; Carboxylic acids
1. Introduction
Diffusion and swelling are important propertiesof polymers for their engineering applications frompackaging to electronics, from blending to stabilisa-tion. Solubility is an integral part of the diffusionprocess and it is essential to understand its princi-ples by obtaining as much systematic data as possi-ble, particularly that which is not currently availablein the literature.
It has been shown previously [1] that the equilib-rium solubility in a polymer–solvent system can beattained by controlled diffusion. Any solvent misci-
0014-3057/$ - see front matter � 2007 Elsevier Ltd. All rights reserved
doi:10.1016/j.eurpolymj.2007.09.007
* Corresponding author. Tel.: +44 01494727691.E-mail address: [email protected] (D. Ve-
sely).
ble with the polymer diffuses into the matrix until itreaches a constant saturated swelling [1–6]. This isalso valid for non-cross-linked polymers, as explic-itly stated by some authors [1,7–9].
It means that in a given temperature range thepolymer is not dissolving even after a prolongedexposure to the solvent but attains a constant con-centration, characteristic for a given system andtemperature. This very reproducible value can beaccurately measured, e.g. by gravimetric technique,as we have shown previously [1]. This technique issimple, non-destructive, sensitive and fast. There isno need to speculate on the diffusion process, aswe are only interested in the full and stable satura-tion, regardless how quickly it has been achieved.
In the present work, we have applied this methodto measure the solubility diagrams of a series of
.
Table 1Carboxylic acids used in this work
Melting and boiling points of carboxylic acids
Name Chemical formula m.p.(�C)a
b.p.(�C)a
Acetic acid CH3–COOH 16.7 117.9Propionic acid CH3–CH2–COOH �20.7 141.2Butyric acid CH3–(CH2)2–COOH �5.2 163.3Iso-butyric
acidCH3–CH(COOH)–CH3 �46.0 154.7
2-ethyl-butyricacid
CH3–CH2–CH(COOH)–CH2–CH3
�15.0 193.8
Hexanoic acid CH3–(CH2)4–COOH �3.0 205.7Heptanoic acid CH3–(CH2)5–COOH �7.3 223.0Octanoic acid CH3–(CH2)6–COOH 16.5 239.7Decanoic acid CH3–(CH2)8–COOH 31.6 270.0Lauric acid CH3– (CH2)10–COOH 43.8 298.7Myristic acid CH3–(CH2)12–COOH 54.2 326.2Palmitic acid CH3–(CH2)14–COOH 62.8 351.0
All of them have been used in their liquid states, i.e. at temper-atures between their corresponding melting and boiling points.
a Values taken from Daubert et al. [13].
4984 G. Bernardo, D. Vesely / European Polymer Journal 43 (2007) 4983–4994
carboxylic acids in polystyrene. Due to the fact thatcarboxylic acids are corrosive, difficult to handleand not commonly used as solvents in organic chem-istry, they have been so far largely neglected in stud-ies of polymer swelling and polymer–solvent phasediagrams. As a consequence, the information in theliterature concerning their solubility parameters andtheir interaction parameters with polymers is veryscarce. In fact we could not find any paper in the lit-erature dealing with the diffusion and swelling of car-boxylic acids in polystyrene. This lack of data in theliterature as well as our desire to apply our previouslyreported gravimetric method of measuring solubilitydiagrams [1] to other classes of organic compoundshave been the main motivations for our presentstudy. We also aim at better understanding ofthe effect of solvent chain length on polymer swelling.
2. Experimental
2.1. Polymer
Polystyrene granules were purchased fromSigma–Aldrich with following specifications:
PS, catalogue number 43,010-2 (Mw = 230,000g/mol, Mn = 140,000 g/mol, MFI = 7.5 g/10 min,Tg = 94 �C).
2.2. Solvents
Carboxylic acids of different molecular weightswere purchased from Sigma Aldrich and had puri-ties P99%. The functional group (–COOH) waseither at the end of a linear (CH2)n chain or attachedto a C atom in intermediate positions along a linear(CH2)n chain. The carboxylic acids used in thisstudy have been selected as follows: acetic acid, pro-pionic acid, butyric acid, iso-butyric acid, hexanoicacid, 2-ethyl-butyric acid, heptanoic acid, octanoicacid, decanoic acid, lauric acid, myristic acid andpalmitic acid. The temperature ranges used to studytheir corresponding solubilities in polystyrene havebeen determined by the experimental convenience(melting point, boiling point, rate of diffusion,degree of swelling). Their corresponding meltingand boiling points are all listed in Table 1.
2.3. Calculation of solubilities
Different theories are using different expressionfor the amount of solvent in the polymer matrix.The following will be used in this work:
(i) Percentage mass of solvent in total mass XL
X L ¼mL
mL þ mPS
� �� 100 ð1Þ
where mL is the mass of liquid penetrant (g),mPS is the mass of dry polystyrene (g),
(ii) Volume fraction of solvent in total volume U1
U1 ¼mL
dL
mL
dL
� �þ mPS
dPS
� � ð2Þ
where mL is the mass of liquid penetrant (g),mPS is the mass of dry polystyrene (g), dL isthe density of liquid (g cm�3), dPS is the densityof polystyrene (g cm�3), both at a particulartemperature
(iii) Millimoles of solvent per gram of polymer
mmol
1 g PS¼
1000mL
MwL
mPS
ð3Þ
where mL is the mass of liquid penetrant (g),mPS is the mass of dry polystyrene (g), andMwL
is the molecular weight of the liquid pene-trant (g mol�1).
The volume fractions in Eq. (2) were calculatedusing an assumption that there is no volume changeon mixing. This assumption has been used previouslyby other authors (e.g. [10–12]). All our attempts toevaluate the volume changes experimentally havefailed. We therefore consider this assumption to be
G. Bernardo, D. Vesely / European Polymer Journal 43 (2007) 4983–4994 4985
reasonable and the volume changes well within theexperimental error.
A straightforward calculation shows that bothquantities, U1 and mmoles L/1 g PS, can beobtained from XL using the equations
U1 ¼1
1þ ð100�X LÞdL
X LdPS
andmmol
1 g PS¼ 1000 X L
ð100� X LÞMwL
ð4Þ
2.4. Temperature dependence of densities
In order to calculate the volume fraction fromthe mass fraction (obtained by weighing), the densi-ties of both the polymer and the solvent must beaccurately known for each temperature used. Densi-ties dL for carboxylic acids used in this work arelisted in Table 2, expressed in g cm�3 (data accord-ing to Daubert et al. [13]).
Temperature dependence of polystyrene density,dPS, above its Tg can be calculated using a polyno-mial [14,15]
dPSðg cm�3Þ ¼ 1:0865–ð6:19� 10�4T Þ þ ð1:36� 10�7T 2Þð5Þ
Table 2Densities of carboxylic acids for different temperatures, as used in this
T (�C) 35 45 55 65
Acetic 1.0318 1.0214 1.0108 1.Propionic 0.9781 0.9680 0.9577 0.Butyric 0.9430 0.9343 0.9254 0.Iso-butyric 0.9367 0.9272 0.9176 0.Hexanoic 0.9124 0.9064 0.8968 0.2-Ethyl-butyric 0.9104 0.9012 0.8920 0.Heptanoic 0.9052 0.8968 0.8883 0.Octanoic – – 0.8818 0.Decanoic – – – 0.Lauric – – – –Myristic – – – –Palmitic – – – –
115 125 135 14
Acetic 0.9429 0.9306 – –Propionic – – – –Butyric – – – –Iso-butyric 0.8668 0.8561 – –Hexanoic 0.8473 0.8385 0.8297 –2-Ethyl-butyric 0.8343 0.8242 0.8140 –Heptanoic 0.8354 0.8263 0.8169 0.Octanoic 0.8349 0.8367 0.8184 0.Decanoic 0.8280 0.8206 0.8131 0.Lauric 0.8220 0.8147 0.8073 0.Myristic 0.8217 0.8147 0.8077 0.Palmitic 0.8181 0.8114 0.8047 0.
From Daubert et al. [13].
Alternatively [16,17], changes in density of poly-styrene with temperatures are given by
dðdPSÞ=dT ðg cm�3 K�1Þ ¼ 2:65� 10�4 T < T g
ð6ÞdðdPSÞ=dT ðg cm�3 K�1Þ ¼ �6:05� 10�4 T > T g
ð7Þ
Tg of our polystyrene is 94 �C (Aldrich catalogue).Using Eq. (5), the density of polystyrene at 94 �Cis d = 1.0295 g cm�3. We can therefore derive from(6) and (7) the following equations to calculate thedensity of polystyrene:
dPS ðg cm�3Þ ¼ ð1:0295þ ð2:65� 10�4ð94� T ÞÞT < T g ð8Þ
dPS ðg cm�3Þ ¼ ð1:0295–ð6:05� 10�4ðT � 94ÞÞT > T g ð9Þ
Using Eq. (8) to calculate the density at 25 �C, weobtain the value; d = 1.0478 g cm�3 which is inagreement with the values 1.047/1.05 g cm�3, re-ported in the literature at 25 �C (Aldrich catalogueor [18]). Eqs. (5) and (9) give identical results
work
75 85 95 105
0000 0.9891 0.9779 0.9665 0.95489472 0.9366 0.9257 – –9164 0.9072 0.8978 0.8883 –9077 0.8978 0.8876 0.8773 0.86688888 0.8808 0.8726 0.8643 0.85588826 0.8732 0.8636 0.8540 0.84428797 0.8711 0.8623 0.8535 0.84458742 0.8665 0.8588 0.8509 0.84298637 0.8568 0.8497 0.8426 0.8353
0.8503 0.8433 0.8363 0.8292– 0.8421 0.8353 0.8285– – 0.8314 0.8248
5 155 165 175 185
– – – –– – – –– – – –– – – –– – – –– – – –
8075 – – – –8100 – – – –8055 – – – –7999 – – – –8006 0.7935 0.7862 – 0.77147978 0.7909 0.7839 – 0.7696
4986 G. Bernardo, D. Vesely / European Polymer Journal 43 (2007) 4983–4994
at Tg and very similar results at high temperatures(e.g. at 150 �C: 0.9967 from (5) and 0.9956 from(9)).
2.5. Experimental procedure
Polystyrene granules have been tested for thepossible presence of cross-linking in some strongsolvents. Complete dissolution, with apparently notraces of gel content, has been achieved in 4-hepta-none, cyclohexanone, THF, cyclohexane and ben-zene, indicating that our polystyrene has anundetectable level of cross-linking.
PS samples have been prepared from the granulesby compression molding on a laboratory press (Spe-cac with temperature controlled heated platens) toform discs 30 mm in diameter. Three different thick-nesses were selected 0.45, 0.85 and 1.70 mm, and theuniformity of the thickness was checked with amicrometer. Beakers with solvents, sealed with analuminium foil to reduce loss of solvent throughevaporation, were placed in the oven (Galencamplaboratory oven). The aluminium foil was looselywrapped on the beaker, maintaining the vapourpressure equal to atmospheric. The amount of sol-vent used for immersion was always more than tentimes the volume of the samples to assure that thereis constantly a sufficient amount of solvent for fullimmersion. Samples were immersed in the solventafter a selected temperature had stabilised. Temper-
0 1000 2000 3000 4000 5000 6000 70
5
10
15
20
25
30
35
40
45Diffusion of carboxylic acids int
Perc
enta
ge o
f aci
d, in
mas
s (X
L)
Time (minutes)
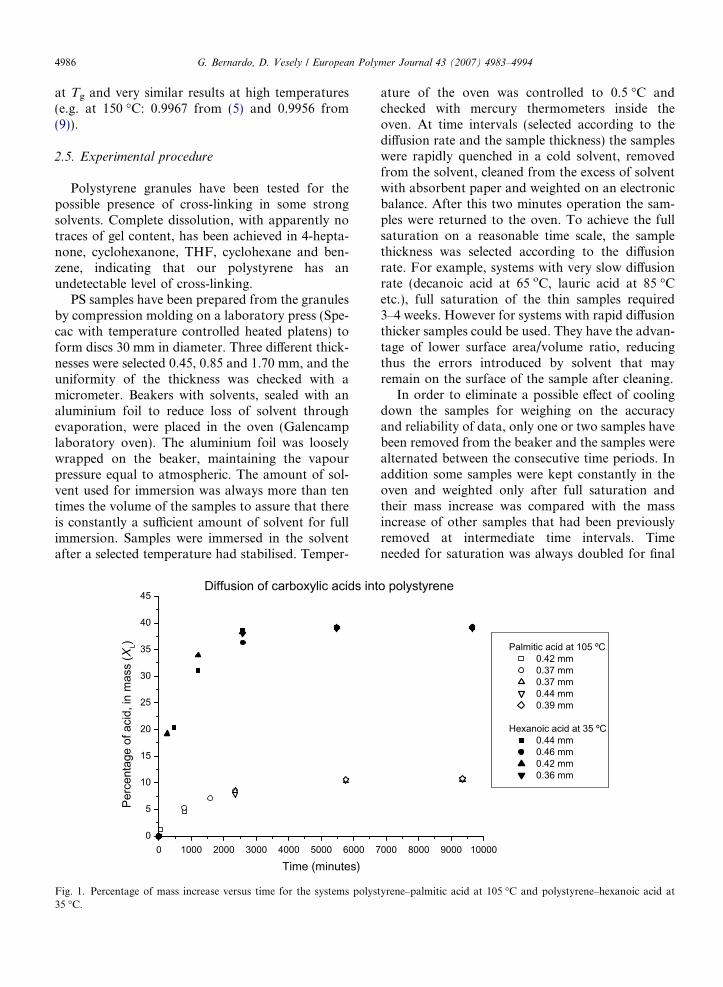
Fig. 1. Percentage of mass increase versus time for the systems polys35 �C.
ature of the oven was controlled to 0.5 �C andchecked with mercury thermometers inside theoven. At time intervals (selected according to thediffusion rate and the sample thickness) the sampleswere rapidly quenched in a cold solvent, removedfrom the solvent, cleaned from the excess of solventwith absorbent paper and weighted on an electronicbalance. After this two minutes operation the sam-ples were returned to the oven. To achieve the fullsaturation on a reasonable time scale, the samplethickness was selected according to the diffusionrate. For example, systems with very slow diffusionrate (decanoic acid at 65 oC, lauric acid at 85 �Cetc.), full saturation of the thin samples required3–4 weeks. However for systems with rapid diffusionthicker samples could be used. They have the advan-tage of lower surface area/volume ratio, reducingthus the errors introduced by solvent that mayremain on the surface of the sample after cleaning.
In order to eliminate a possible effect of coolingdown the samples for weighing on the accuracyand reliability of data, only one or two samples havebeen removed from the beaker and the samples werealternated between the consecutive time periods. Inaddition some samples were kept constantly in theoven and weighted only after full saturation andtheir mass increase was compared with the massincrease of other samples that had been previouslyremoved at intermediate time intervals. Timeneeded for saturation was always doubled for final
000 8000 9000 10000
o polystyrene
Palmitic acid at 105 ºC 0.42 mm 0.37 mm 0.37 mm 0.44 mm 0.39 mm
Hexanoic acid at 35 ºC 0.44 mm 0.46 mm 0.42 mm 0.36 mm
tyrene–palmitic acid at 105 �C and polystyrene–hexanoic acid at
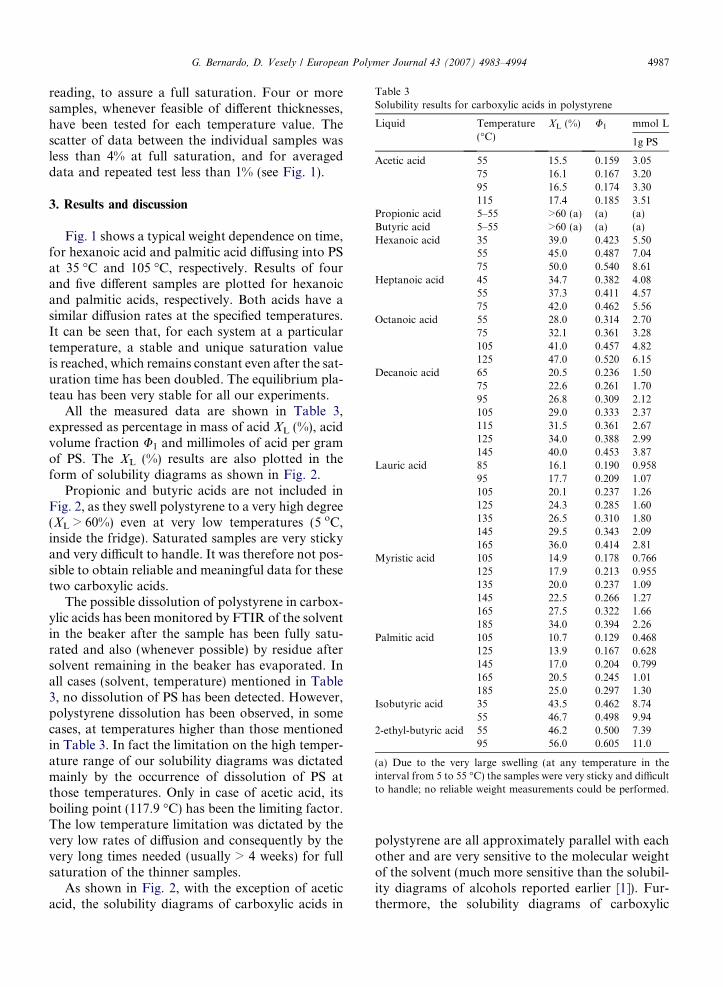
Table 3Solubility results for carboxylic acids in polystyrene
Liquid Temperature(�C)
XL (%) U1 mmol L
1g PS
Acetic acid 55 15.5 0.159 3.0575 16.1 0.167 3.2095 16.5 0.174 3.30115 17.4 0.185 3.51
Propionic acid 5–55 >60 (a) (a) (a)Butyric acid 5–55 >60 (a) (a) (a)Hexanoic acid 35 39.0 0.423 5.50
55 45.0 0.487 7.0475 50.0 0.540 8.61
Heptanoic acid 45 34.7 0.382 4.0855 37.3 0.411 4.5775 42.0 0.462 5.56
Octanoic acid 55 28.0 0.314 2.7075 32.1 0.361 3.28105 41.0 0.457 4.82125 47.0 0.520 6.15
Decanoic acid 65 20.5 0.236 1.5075 22.6 0.261 1.7095 26.8 0.309 2.12105 29.0 0.333 2.37115 31.5 0.361 2.67125 34.0 0.388 2.99145 40.0 0.453 3.87
Lauric acid 85 16.1 0.190 0.95895 17.7 0.209 1.07105 20.1 0.237 1.26125 24.3 0.285 1.60135 26.5 0.310 1.80145 29.5 0.343 2.09165 36.0 0.414 2.81
Myristic acid 105 14.9 0.178 0.766125 17.9 0.213 0.955135 20.0 0.237 1.09145 22.5 0.266 1.27165 27.5 0.322 1.66185 34.0 0.394 2.26
Palmitic acid 105 10.7 0.129 0.468125 13.9 0.167 0.628145 17.0 0.204 0.799165 20.5 0.245 1.01185 25.0 0.297 1.30
Isobutyric acid 35 43.5 0.462 8.7455 46.7 0.498 9.94
2-ethyl-butyric acid 55 46.2 0.500 7.3995 56.0 0.605 11.0
(a) Due to the very large swelling (at any temperature in theinterval from 5 to 55 �C) the samples were very sticky and difficultto handle; no reliable weight measurements could be performed.
G. Bernardo, D. Vesely / European Polymer Journal 43 (2007) 4983–4994 4987
reading, to assure a full saturation. Four or moresamples, whenever feasible of different thicknesses,have been tested for each temperature value. Thescatter of data between the individual samples wasless than 4% at full saturation, and for averageddata and repeated test less than 1% (see Fig. 1).
3. Results and discussion
Fig. 1 shows a typical weight dependence on time,for hexanoic acid and palmitic acid diffusing into PSat 35 �C and 105 �C, respectively. Results of fourand five different samples are plotted for hexanoicand palmitic acids, respectively. Both acids have asimilar diffusion rates at the specified temperatures.It can be seen that, for each system at a particulartemperature, a stable and unique saturation valueis reached, which remains constant even after the sat-uration time has been doubled. The equilibrium pla-teau has been very stable for all our experiments.
All the measured data are shown in Table 3,expressed as percentage in mass of acid XL (%), acidvolume fraction U1 and millimoles of acid per gramof PS. The XL (%) results are also plotted in theform of solubility diagrams as shown in Fig. 2.
Propionic and butyric acids are not included inFig. 2, as they swell polystyrene to a very high degree(XL > 60%) even at very low temperatures (5 oC,inside the fridge). Saturated samples are very stickyand very difficult to handle. It was therefore not pos-sible to obtain reliable and meaningful data for thesetwo carboxylic acids.
The possible dissolution of polystyrene in carbox-ylic acids has been monitored by FTIR of the solventin the beaker after the sample has been fully satu-rated and also (whenever possible) by residue aftersolvent remaining in the beaker has evaporated. Inall cases (solvent, temperature) mentioned in Table3, no dissolution of PS has been detected. However,polystyrene dissolution has been observed, in somecases, at temperatures higher than those mentionedin Table 3. In fact the limitation on the high temper-ature range of our solubility diagrams was dictatedmainly by the occurrence of dissolution of PS atthose temperatures. Only in case of acetic acid, itsboiling point (117.9 �C) has been the limiting factor.The low temperature limitation was dictated by thevery low rates of diffusion and consequently by thevery long times needed (usually > 4 weeks) for fullsaturation of the thinner samples.
As shown in Fig. 2, with the exception of aceticacid, the solubility diagrams of carboxylic acids in
polystyrene are all approximately parallel with eachother and are very sensitive to the molecular weightof the solvent (much more sensitive than the solubil-ity diagrams of alcohols reported earlier [1]). Fur-thermore, the solubility diagrams of carboxylic
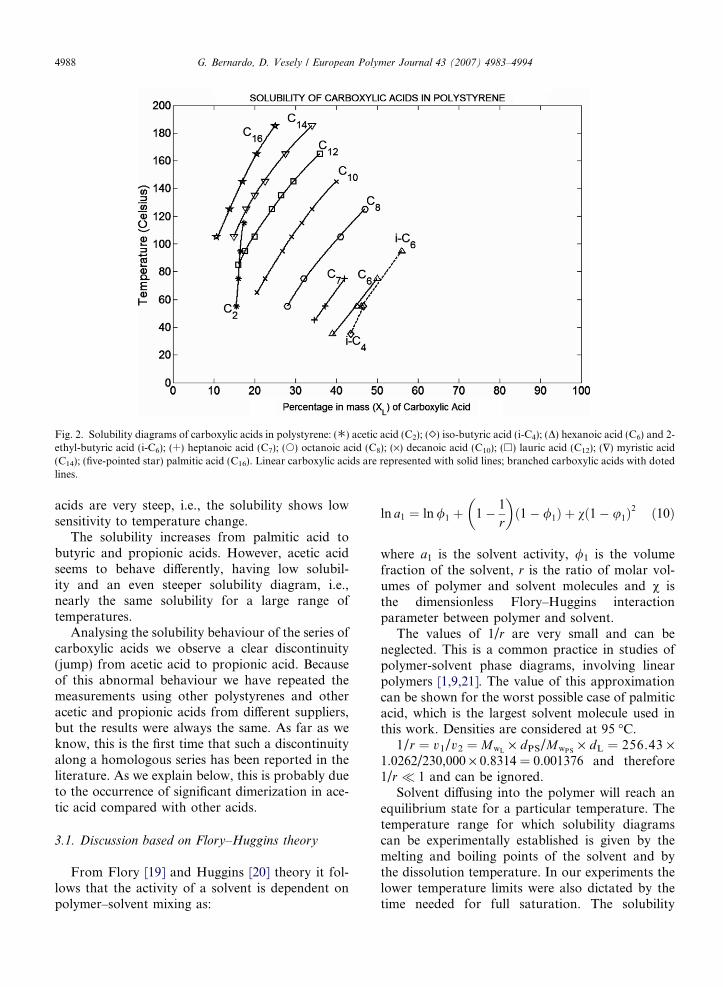
Fig. 2. Solubility diagrams of carboxylic acids in polystyrene: (�) acetic acid (C2); (�) iso-butyric acid (i-C4); (D) hexanoic acid (C6) and 2-ethyl-butyric acid (i-C6); (+) heptanoic acid (C7); (s) octanoic acid (C8); (·) decanoic acid (C10); (h) lauric acid (C12); ($) myristic acid(C14); (five-pointed star) palmitic acid (C16). Linear carboxylic acids are represented with solid lines; branched carboxylic acids with dotedlines.
4988 G. Bernardo, D. Vesely / European Polymer Journal 43 (2007) 4983–4994
acids are very steep, i.e., the solubility shows lowsensitivity to temperature change.
The solubility increases from palmitic acid tobutyric and propionic acids. However, acetic acidseems to behave differently, having low solubil-ity and an even steeper solubility diagram, i.e.,nearly the same solubility for a large range oftemperatures.
Analysing the solubility behaviour of the series ofcarboxylic acids we observe a clear discontinuity(jump) from acetic acid to propionic acid. Becauseof this abnormal behaviour we have repeated themeasurements using other polystyrenes and otheracetic and propionic acids from different suppliers,but the results were always the same. As far as weknow, this is the first time that such a discontinuityalong a homologous series has been reported in theliterature. As we explain below, this is probably dueto the occurrence of significant dimerization in ace-tic acid compared with other acids.
3.1. Discussion based on Flory–Huggins theory
From Flory [19] and Huggins [20] theory it fol-lows that the activity of a solvent is dependent onpolymer–solvent mixing as:
ln a1 ¼ ln /1 þ 1� 1
r
� �ð1� /1Þ þ vð1� u1Þ
2 ð10Þ
where a1 is the solvent activity, /1 is the volumefraction of the solvent, r is the ratio of molar vol-umes of polymer and solvent molecules and v isthe dimensionless Flory–Huggins interactionparameter between polymer and solvent.
The values of 1/r are very small and can beneglected. This is a common practice in studies ofpolymer-solvent phase diagrams, involving linearpolymers [1,9,21]. The value of this approximationcan be shown for the worst possible case of palmiticacid, which is the largest solvent molecule used inthis work. Densities are considered at 95 �C.
1/r = v1/v2 = MwL· dPS/MwPS
· dL = 256.43 ·1.0262/230,000 · 0.8314 = 0.001376 and therefore1/r � 1 and can be ignored.
Solvent diffusing into the polymer will reach anequilibrium state for a particular temperature. Thetemperature range for which solubility diagramscan be experimentally established is given by themelting and boiling points of the solvent and bythe dissolution temperature. In our experiments thelower temperature limits were also dictated by thetime needed for full saturation. The solubility

G. Bernardo, D. Vesely / European Polymer Journal 43 (2007) 4983–4994 4989
diagrams measured within these limits are shown inFig. 2.
At equilibrium, the activity of the solvent in thepolymer matrix equals that of the surrounding puresolvent, i.e. unity. Consequently, the chemicalpotential of the solvent in the polymer equates tozero. From Eq. (10), the thermodynamic equilib-rium condition may be written as
ln /1 þ ð1� /1Þ þ vð1� /1Þ2 ¼ 0 ð11Þ
The interaction parameter can therefore be calcu-lated as
v ¼ � ln /1 þ ð1� /1Þð1� /1Þ
2
!ð12Þ
The volume fractions (and therefore v) are depen-dent on temperature. The calculated values of vare listed in Table 4, together with the correspond-ing temperatures (in brackets, �C) and plotted inFig. 3 for each solvent on 1/T scale. The lineardependence suggests the following relationship:
v ¼ aþ bT
ð13Þ
The values of a and b were determined by fitting thevalues of v to straight lines using the least squaresmethod. For each system, a correspond to the inter-cept on the origin, and b corresponds to the slope ofthe corresponding straight line. The resulting valuesare listed in Table 5.
Our results indicate that the contribution of b(enthalpic) to v is always positive, reflecting a netrepulsion between polymer and solvent and thusunfavourable to mixing. The contribution of a
Table 4Interaction parameters of carboxylic acids with polystyrene at different
Organic liquid Values of v at different temperatures (in �C)
Acetic acid 1.4108 (55) 1.3788 (75) 1.3524 (95)Propionic acid (a) – – –Butyric acid (a) – – –Hexanoic acid 0.8512 (35) 0.7846 (55) 0.7381 (75)Heptanoic acid 0.9016 (45) 0.8652 (55) 0.8091 (75)Octanoic acid 1.0038 (55) 0.9303 (75) 0.8142 (105)Decanoic acid 1.1649 (65) 1.1064 (75) 1.0124 (95)Lauric acid 1.2966 (85) 1.2377 (95) 1.1624 (105)Myristic acid 1.3379 (105) 1.2262 (125) 1.1624 (135)Palmitic acid 1.5514 (105) 1.3788 (125) 1.2525 (145)Iso-butyric acid 0.8091 (35) 0.7744 (55) –2-ethyl-butyric acid 0.7726 (55) 0.6892 (95) –
(a) No reliable values could be obtained.
(entropic) is always negative (with the exception ofacetic, iso-butyric and 2-ethyl-butyric acids) andthus favours mixing.
We can see from Table 5 that the entropic a com-ponent of the interaction parameter decreases pro-gressively with increasing molecular weight, andthe enthalpic component b increases. Therefore,what appears to be an anomaly for the acetic acidis in fact a smooth transition. It is possible thatthe observed trend is due to the fact that inside apolystyrene environment, which is probably hostileto an isolated acid group, the carboxylic acids tendto cluster and this is more difficult for the largermolecules compared with the smaller ones. There-fore, the absorption process is entropically morefavourable (more negative values of a) in the caseof the larger molecules. The positive values of a
obtained for acetic, iso-butyric and 2-ethyl-butyricacids may be due to several different reasons. Inthe case of acetic acid it most likely reflects a com-plicated ‘‘dimer’’ associated state. In the case ofiso-butyric and 2-ethyl-butyric acids there is alsothe additional explanation that branched moleculesrequire greater space and therefore their solubility isentropically less favourable.
3.2. Discussion based on van’t Hoff equation
Following what has been previously done byother authors [22–27], in studies of diffusion oforganic solvents into polymer matrices, we analysenow our solubility results using the popular van’tHoff equation. This equation is derived from chem-ical equilibrium thermodynamics and correlates theamount of solvent uptake with temperature.
temperatures (in brackets)
1.3134 (115) – – –– – – –– – – –– – – –– – – –0.7549 (125) – – –0.9724 (105) 0.9303 (115) 0.8938 (125) 0.8184 (145)1.0568 (125) 1.0107 (135) 0.9569 (145) 0.8617 (165)1.0956 (145) 0.9903 (165) – –1.1429 (165) – – –– – – –– – – –
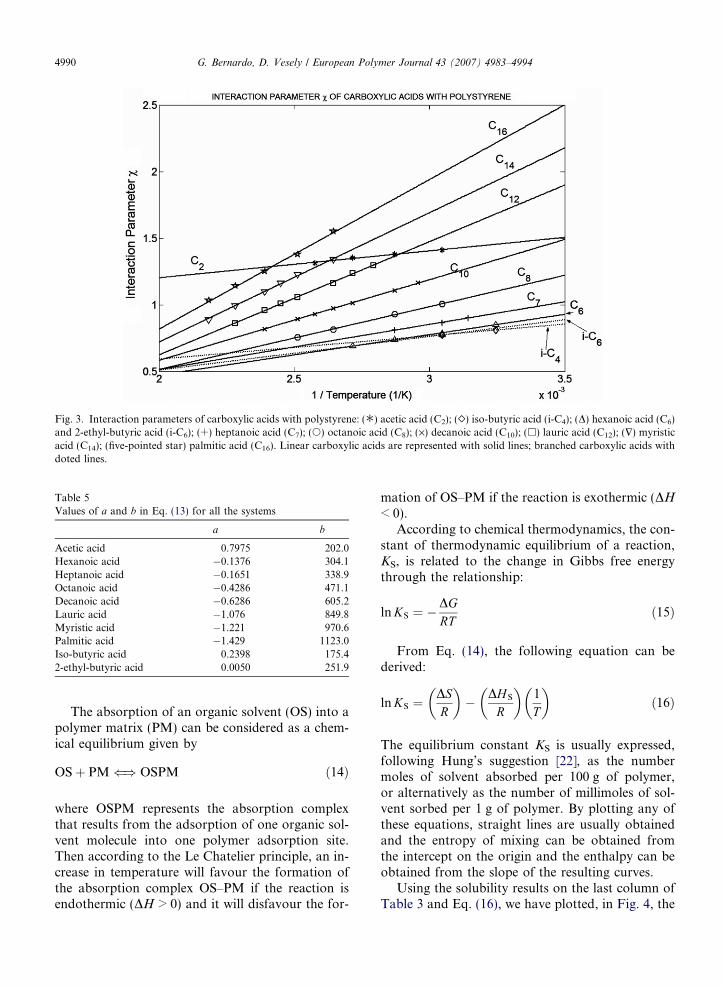
Fig. 3. Interaction parameters of carboxylic acids with polystyrene: (�) acetic acid (C2); (�) iso-butyric acid (i-C4); (D) hexanoic acid (C6)and 2-ethyl-butyric acid (i-C6); (+) heptanoic acid (C7); (s) octanoic acid (C8); (·) decanoic acid (C10); (h) lauric acid (C12); ($) myristicacid (C14); (five-pointed star) palmitic acid (C16). Linear carboxylic acids are represented with solid lines; branched carboxylic acids withdoted lines.
Table 5Values of a and b in Eq. (13) for all the systems
a b
Acetic acid 0.7975 202.0Hexanoic acid �0.1376 304.1Heptanoic acid �0.1651 338.9Octanoic acid �0.4286 471.1Decanoic acid �0.6286 605.2Lauric acid �1.076 849.8Myristic acid �1.221 970.6Palmitic acid �1.429 1123.0Iso-butyric acid 0.2398 175.42-ethyl-butyric acid 0.0050 251.9
4990 G. Bernardo, D. Vesely / European Polymer Journal 43 (2007) 4983–4994
The absorption of an organic solvent (OS) into apolymer matrix (PM) can be considered as a chem-ical equilibrium given by
OSþ PM() OSPM ð14Þ
where OSPM represents the absorption complexthat results from the adsorption of one organic sol-vent molecule into one polymer adsorption site.Then according to the Le Chatelier principle, an in-crease in temperature will favour the formation ofthe absorption complex OS–PM if the reaction isendothermic (DH > 0) and it will disfavour the for-
mation of OS–PM if the reaction is exothermic (DH
< 0).According to chemical thermodynamics, the con-
stant of thermodynamic equilibrium of a reaction,KS, is related to the change in Gibbs free energythrough the relationship:
ln KS ¼ �DGRT
ð15Þ
From Eq. (14), the following equation can bederived:
ln KS ¼DSR
� �� DHS
R
� �1
T
� �ð16Þ
The equilibrium constant KS is usually expressed,following Hung’s suggestion [22], as the numbermoles of solvent absorbed per 100 g of polymer,or alternatively as the number of millimoles of sol-vent sorbed per 1 g of polymer. By plotting any ofthese equations, straight lines are usually obtainedand the entropy of mixing can be obtained fromthe intercept on the origin and the enthalpy can beobtained from the slope of the resulting curves.
Using the solubility results on the last column ofTable 3 and Eq. (16), we have plotted, in Fig. 4, the
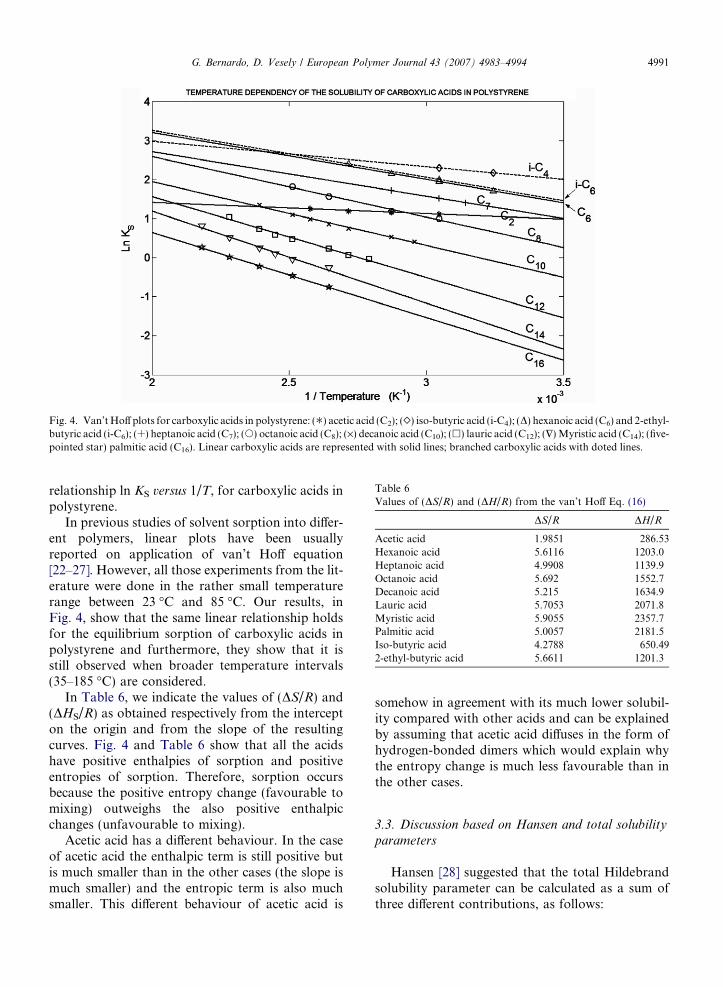
Fig. 4. Van’t Hoff plots for carboxylic acids in polystyrene: (�) acetic acid (C2); (�) iso-butyric acid (i-C4); (D) hexanoic acid (C6) and 2-ethyl-butyric acid (i-C6); (+) heptanoic acid (C7); (s) octanoic acid (C8); (·) decanoic acid (C10); (h) lauric acid (C12); ($) Myristic acid (C14); (five-pointed star) palmitic acid (C16). Linear carboxylic acids are represented with solid lines; branched carboxylic acids with doted lines.
Table 6Values of (DS/R) and (DH/R) from the van’t Hoff Eq. (16)
DS/R DH/R
Acetic acid 1.9851 286.53Hexanoic acid 5.6116 1203.0Heptanoic acid 4.9908 1139.9Octanoic acid 5.692 1552.7Decanoic acid 5.215 1634.9Lauric acid 5.7053 2071.8Myristic acid 5.9055 2357.7Palmitic acid 5.0057 2181.5Iso-butyric acid 4.2788 650.492-ethyl-butyric acid 5.6611 1201.3
G. Bernardo, D. Vesely / European Polymer Journal 43 (2007) 4983–4994 4991
relationship ln KS versus 1/T, for carboxylic acids inpolystyrene.
In previous studies of solvent sorption into differ-ent polymers, linear plots have been usuallyreported on application of van’t Hoff equation[22–27]. However, all those experiments from the lit-erature were done in the rather small temperaturerange between 23 �C and 85 �C. Our results, inFig. 4, show that the same linear relationship holdsfor the equilibrium sorption of carboxylic acids inpolystyrene and furthermore, they show that it isstill observed when broader temperature intervals(35–185 �C) are considered.
In Table 6, we indicate the values of (DS/R) and(DHS/R) as obtained respectively from the intercepton the origin and from the slope of the resultingcurves. Fig. 4 and Table 6 show that all the acidshave positive enthalpies of sorption and positiveentropies of sorption. Therefore, sorption occursbecause the positive entropy change (favourable tomixing) outweighs the also positive enthalpicchanges (unfavourable to mixing).
Acetic acid has a different behaviour. In the caseof acetic acid the enthalpic term is still positive butis much smaller than in the other cases (the slope ismuch smaller) and the entropic term is also muchsmaller. This different behaviour of acetic acid is
somehow in agreement with its much lower solubil-ity compared with other acids and can be explainedby assuming that acetic acid diffuses in the form ofhydrogen-bonded dimers which would explain whythe entropy change is much less favourable than inthe other cases.
3.3. Discussion based on Hansen and total solubility
parameters
Hansen [28] suggested that the total Hildebrandsolubility parameter can be calculated as a sum ofthree different contributions, as follows:

4992 G. Bernardo, D. Vesely / European Polymer Journal 43 (2007) 4983–4994
d2 ¼ d2D þ d2
P þ d2H ð17Þ
where dD, dP and dH are respectively the dispersion,polar and hydrogen-bonding partial components ofthe total solubility parameter. These values can berepresented as vectors in three dimensions withcoordinates 2dD, dP and dH. Each compound istherefore represented by a single point (or vector)composed of dispersion, polar and hydrogen bond-ing components. Solubility of a polymer is charac-terized by a spherical region surrounding thesolubility parameter point (i.e. by a vector that indi-cates the centre of a sphere and by an interactionradius, R0 [28]).
The distance from the centre of a polymer solu-bility sphere to any solvent is given by the equation
Ra ¼ffiffiffiffiffiffiffiffiffiffiffiffiffiffiffiffiffiffiffiffiffiffiffiffiffiffiffiffiffiffiffiffiffiffiffiffiffiffiffiffiffiffiffiffiffiffiffiffiffiffiffiffiffiffiffiffiffiffiffiffiffiffiffiffiffiffiffiffiffiffiffiffiffiffiffiffiffiffiffiffiffiffiffiffiffiffiffiffi4ðdD2 � dD1Þ2 þ ðdP2 � dP1Þ2 þ ðdH2 � dH1Þ2
qð18Þ
where the indices 1 and 2 are used to represent sol-vent and polymer, respectively. In general, a solventdissolves a particular linear polymer only if its dis-tance, Ra, to the centre of that polymer solubilitysphere is less than the radius of the sphere, R0, orstated in other way, dissolution occurs only when(Ra/R0) < 1.
The values of Hansen solubility parameters (at25 �C) that are available in the literature [28,29]for carboxylic acids are listed in Table 7, togetherwith corresponding values of total Hildebrand solu-bility parameters, as calculated using Eq. (17). Inthe last column there are the total Hildebrand solu-bility parameters taken from the compilation ofDaubert et al. [13]. It is apparent that there are largediscrepancies between the values of total solubility
Table 7Parcial and total solubility parameters from the literature
Carboxylic acids dD (MPa)1/2 (a) dP (MPa)1/2 (a)
Acetic acid 14.5 8.0Propionic acid 14.7 5.3Butyric acid 14.9 4.1Iso-butyric acid – –Hexanoic acid – –2-ethyl-butyric acid – –Heptanoic acid – –Octanoic acid 15.1 3.3Decanoic acid – –Lauric acid – –Myristic acid – –Palmitic acid – –
(a) From Refs. [28,29]. (b) Calculated using Eq. (17) and the partial so
parameters reported by different literature sources,particularly in the case of acetic acid, butyric acidand octanoic acid. Furthermore, we could only findHansen solubility parameters for acetic, propionic,butyric and octanoic acids. This is certainly a conse-quence of the fact that carboxylic acids have been,so far, largely ignored in polymer swelling and solu-bility studies.
The solubility parameter of a polymer dependsnot only on the chemical structure of its basic build-ing block, but also, to a small extent, on other fac-tors such as the molecular weight and degree ofcross-linking. For that reason, as we have alreadymentioned in our previous paper [1], there is alsosome discrepancy between the values of the Hansenand total solubility parameters of polystyrene, takenfrom different literature sources. Therefore, for thesame reasons that we have mentioned before [1],in the following short discussion we have decidedto consider the following values for polystyrene (inMPa1/2), which have been suggested by Hansen[28] dD = 18.50, dP = 4.50, dH = 2.90, dT = 19.3and Ra = 5.30.
If we compare the values of total solubilityparameters of the acids from Refs. [28,29] and Eq.(17) with the value of dT = 19.3 reported by Hansen[28] for polystyrene, a good qualitative agreement isobtained. In fact, the value of dT = 19.3 for polysty-rene is well between the values of dT = 18.7 anddT = 19.9 for butyric and propionic acids respec-tively and differs considerably from the values ofdT = 21.4 for acetic acid and dT = 17.5 for octanoicacid.
However, as we discuss below, the correlationwith Hansen solubility parameters is less satisfac-tory. Using these Hansen solubility parameters
dH (MPa)1/2 (a) d (MPa)1/2 (b) d (MPa)1/2 (c)
13.5 21.4 19.06012.4 19.9 19.49010.6 18.7 20.180– – 23.157– – 21.670– – 21.734– – 22.7908.2 17.5 22.240
– – 20.930– – 20.380– – 19.790– – 17.959
lubility parameters from Refs. [28,29] (c) From Ref. [13].
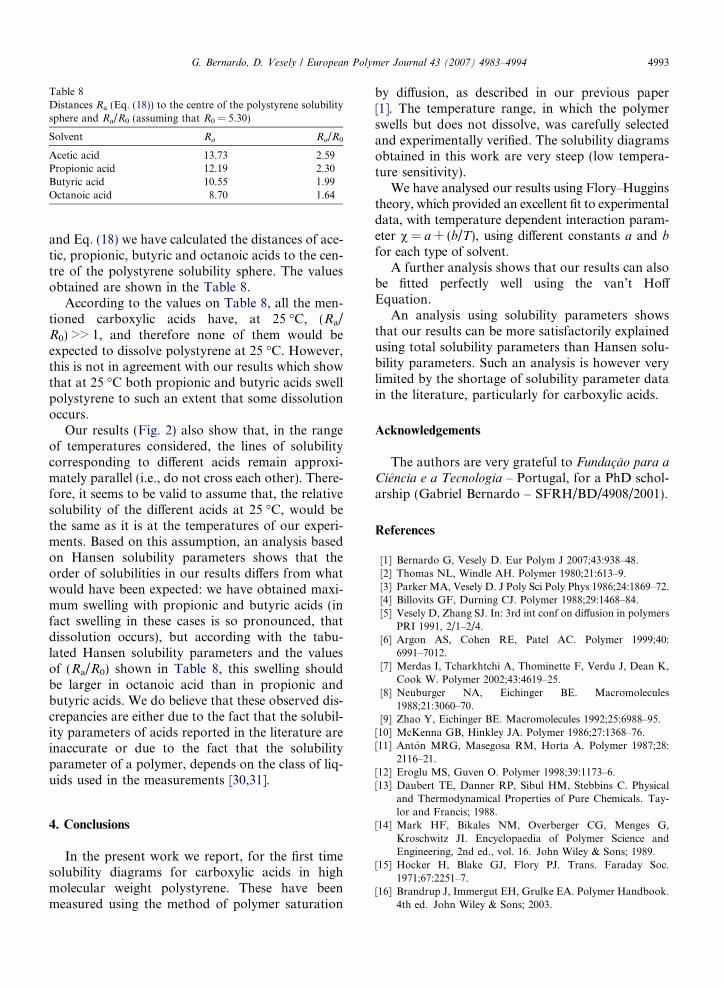
Table 8Distances Ra (Eq. (18)) to the centre of the polystyrene solubilitysphere and Ra/R0 (assuming that R0 = 5.30)
Solvent Ra Ra/R0
Acetic acid 13.73 2.59Propionic acid 12.19 2.30Butyric acid 10.55 1.99Octanoic acid 8.70 1.64
G. Bernardo, D. Vesely / European Polymer Journal 43 (2007) 4983–4994 4993
and Eq. (18) we have calculated the distances of ace-tic, propionic, butyric and octanoic acids to the cen-tre of the polystyrene solubility sphere. The valuesobtained are shown in the Table 8.
According to the values on Table 8, all the men-tioned carboxylic acids have, at 25 �C, (Ra/R0) >> 1, and therefore none of them would beexpected to dissolve polystyrene at 25 �C. However,this is not in agreement with our results which showthat at 25 �C both propionic and butyric acids swellpolystyrene to such an extent that some dissolutionoccurs.
Our results (Fig. 2) also show that, in the rangeof temperatures considered, the lines of solubilitycorresponding to different acids remain approxi-mately parallel (i.e., do not cross each other). There-fore, it seems to be valid to assume that, the relativesolubility of the different acids at 25 �C, would bethe same as it is at the temperatures of our experi-ments. Based on this assumption, an analysis basedon Hansen solubility parameters shows that theorder of solubilities in our results differs from whatwould have been expected: we have obtained maxi-mum swelling with propionic and butyric acids (infact swelling in these cases is so pronounced, thatdissolution occurs), but according with the tabu-lated Hansen solubility parameters and the valuesof (Ra/R0) shown in Table 8, this swelling shouldbe larger in octanoic acid than in propionic andbutyric acids. We do believe that these observed dis-crepancies are either due to the fact that the solubil-ity parameters of acids reported in the literature areinaccurate or due to the fact that the solubilityparameter of a polymer, depends on the class of liq-uids used in the measurements [30,31].
4. Conclusions
In the present work we report, for the first timesolubility diagrams for carboxylic acids in highmolecular weight polystyrene. These have beenmeasured using the method of polymer saturation
by diffusion, as described in our previous paper[1]. The temperature range, in which the polymerswells but does not dissolve, was carefully selectedand experimentally verified. The solubility diagramsobtained in this work are very steep (low tempera-ture sensitivity).
We have analysed our results using Flory–Hugginstheory, which provided an excellent fit to experimentaldata, with temperature dependent interaction param-eter v = a + (b/T), using different constants a and b
for each type of solvent.A further analysis shows that our results can also
be fitted perfectly well using the van’t HoffEquation.
An analysis using solubility parameters showsthat our results can be more satisfactorily explainedusing total solubility parameters than Hansen solu-bility parameters. Such an analysis is however verylimited by the shortage of solubility parameter datain the literature, particularly for carboxylic acids.
Acknowledgements
The authors are very grateful to Fundacao para a
Ciencia e a Tecnologia – Portugal, for a PhD schol-arship (Gabriel Bernardo – SFRH/BD/4908/2001).
References
[1] Bernardo G, Vesely D. Eur Polym J 2007;43:938–48.[2] Thomas NL, Windle AH. Polymer 1980;21:613–9.[3] Parker MA, Vesely D. J Poly Sci Poly Phys 1986;24:1869–72.[4] Billovits GF, Durning CJ. Polymer 1988;29:1468–84.[5] Vesely D, Zhang SJ. In: 3rd int conf on diffusion in polymers
PRI 1991, 2/1–2/4.[6] Argon AS, Cohen RE, Patel AC. Polymer 1999;40:
6991–7012.[7] Merdas I, Tcharkhtchi A, Thominette F, Verdu J, Dean K,
Cook W. Polymer 2002;43:4619–25.[8] Neuburger NA, Eichinger BE. Macromolecules
1988;21:3060–70.[9] Zhao Y, Eichinger BE. Macromolecules 1992;25:6988–95.
[10] McKenna GB, Hinkley JA. Polymer 1986;27:1368–76.[11] Anton MRG, Masegosa RM, Horta A. Polymer 1987;28:
2116–21.[12] Eroglu MS, Guven O. Polymer 1998;39:1173–6.[13] Daubert TE, Danner RP, Sibul HM, Stebbins C. Physical
and Thermodynamical Properties of Pure Chemicals. Tay-lor and Francis; 1988.
[14] Mark HF, Bikales NM, Overberger CG, Menges G,Kroschwitz JI. Encyclopaedia of Polymer Science andEngineering, 2nd ed., vol. 16. John Wiley & Sons; 1989.
[15] Hocker H, Blake GJ, Flory PJ. Trans. Faraday Soc.1971;67:2251–7.
[16] Brandrup J, Immergut EH, Grulke EA. Polymer Handbook.4th ed. John Wiley & Sons; 2003.
4994 G. Bernardo, D. Vesely / European Polymer Journal 43 (2007) 4983–4994
[17] Patnode W, Scheiber WJ. J Am Chem Soc 1939;61:3449–51.[18] van Krevelen DW. Properties of polymers: their correlation
with chemical structure, their numerical estimation andprediction from additive group contributions. Elsevier; 1990.
[19] Flory PJ. J Chem Phys 1942;10:51–61.[20] Huggins ML. Ann NY Acad Sci 1942;43:1–32.[21] Prager S, Bagley E, Long FA. J Am Chem Soc 1953;75:
2742–5.[22] Hung GWC. Microchem J 1974;19:130–52.[23] Kwan KS, Subramaniam CNP, Ward TC. Polymer 2003;44:
3061–9.[24] Kwan KS, Subramaniam CNP, Ward TC. Polymer 2003;44:
3071–83.
[25] Aminabhavi TM, Khinnavar RS. Polymer 1993;34:1006–18.[26] Aithal US, Aminabhavi TM. Polymer 1990;31:1757–62.[27] Aithal US, Aminabhavi TM, Cassidy PE. J Membr Sci
1990;50:225–47.[28] Hansen CM. Hansen solubility parameters: a users hand-
book. Boca Raton: CRC Press; 2000.[29] Hansen CM, Beerbower A. Solubility parameters. In:
Standen A, editor. Kirk-Othmer Encyclopedia of ChemicalTechnology. New York: Interscience; 1971. p. 889–910.Suppl. vol.
[30] Blackadder DA, Le Poidevin GJ. Polymer 1976;17:387–94.[31] Errede LA. Macromolecules 1986;19:1522–5.