Static and dynamic mechanical properties of expanded polystyrene
11
Static and dynamic mechanical properties of expanded polystyrene Wensu Chen a,⇑ , Hong Hao a , Dylan Hughes b , Yanchao Shi c , Jian Cui c , Zhong-Xian Li c a Tianjin University and Curtin University Joint Research Center of Structure Monitoring and Protection, School of Civil and Mechanical Engineering, Curtin University, Kent Street, Bentley, WA 6102, Australia b School of Civil, Environmental and Mining Engineering, The University of Western Australia, 35 Stirling Highway, Crawley, WA 6009, Australia c Tianjin University and Curtin University Joint Research Center of Structure Monitoring and Protection, School of Civil Engineering, Tianjin University, China article info Article history: Received 12 August 2014 Accepted 8 December 2014 Available online 5 January 2015 Keywords: Expanded polystyrene Construction material Experimental tests Dynamic material properties abstract Expanded polystyrene (EPS) is commonly used in a variety of applications because of its features of light weight, good thermal insulation, moisture resistance, durability, acoustic absorption and low thermal conductivity. It has been increasingly used in building constructions as core material of structural insu- lated panels (SIP). Some of those structures during their service life may be subjected to dynamic loads such as accidental or hostile explosion loads and windborne debris impacts. Understanding the dynamic material properties of EPS is essential for reliable predictions of the performances of the structural insu- lated panels with EPS foam core material. This paper presents static and dynamic compressive and tensile test data of EPS with density 13.5 kg/m 3 and 28 kg/m 3 at different strain rates. The dynamic strength, Young’s modulus and energy absorption capacities of the two EPS foams at different strain rates are obtained and presented in the paper. Based on the testing data, some empirical relations are derived, which can be used to model EPS properties in numerical simulations of dynamic responses of structural insulated panels with EPS foam core subjected to impact and blast loads. Ó 2014 Elsevier Ltd. All rights reserved. 1. Introduction Structural insulated panel (SIP) is a high-performance light- weight engineered building structural component that is used in a wide range of residential, industrial and light commercial con- struction. It can be used in the building envelopes as a principal load bearing component such as exterior wall, framing, partition wall, roof, floor and structural framing. SIP is recognized as an effi- cient panel in the construction industry due to its advantages of being environmentally sustainable, economical, easy to install, ultra-lightweight, high strength to weight ratio, thermal insulated, moisture resistant, acoustic insulated, termite resistance, and flame retardant. Structural insulated panel consists of insulating polymer foam sandwiched by two layers of structural skins [1,2]. Expanded polystyrene (EPS), as the most common polymeric foam, is widely used as the insulation core in the structural insulated panels. EPS is a rigid and tough, recyclable, closed-cell cellular plas- tics material, which has been used in a variety of applications including impact mitigation packaging, protective helmet, struc- tural crashworthiness, construction material filling road embank- ments, insulated concrete form (ICF) structures as well as lightweight EPS foamed concrete [3]. Structural insulated panel with EPS foam core might be sub- jected to dynamic loads such as accidental or hostile explosion loads and windborne debris impact during its service life [4]. Some researchers have conducted experimental tests of sandwich panels subjected to dynamic loads. Mines et al. [5] found that increasing energy absorption capacity of the core material leads to the increased capacity of the sandwich panel. Wen et al. [6] found that the core material does not increase energy absorption significantly within a certain strain rate while the core material with higher density increases energy absorption. These experimental tests clearly demonstrate the significant influence of core material on sandwich panel responses. Therefore, it is essential to understand the material mechanical properties, especially the dynamic mate- rial properties of EPS for reliable predictions of the performances of the structural insulated panels subjected to the loads from low velocity impact to blast loading. The dynamic properties can be obtained by using various test- ing facilities including conventional servo-hydraulic system (rates between 10 4 and 1 1/s), high rate servo-hydraulic system, INSTRON Ò machine, Split Hopkinson Pressure Bar (SHPB) or Kolsky bars, drop weight impact machine, gas gun and pendulum impact system, etc [7–10]. Split Hopkinson Pressure Bar (SHPB) has been used to investigate the rate-dependent properties of foams with http://dx.doi.org/10.1016/j.matdes.2014.12.024 0261-3069/Ó 2014 Elsevier Ltd. All rights reserved. ⇑ Corresponding author. Tel.: +61 8 92669468. E-mail addresses: [email protected], [email protected] (W. Chen). Materials and Design 69 (2015) 170–180 Contents lists available at ScienceDirect Materials and Design journal homepage: www.elsevier.com/locate/matdes
Transcript of Static and dynamic mechanical properties of expanded polystyrene
Materials and Design 69 (2015) 170–180
Contents lists available at ScienceDirect
Materials and Design
journal homepage: www.elsevier .com/locate /matdes
Static and dynamic mechanical properties of expanded polystyrene
http://dx.doi.org/10.1016/j.matdes.2014.12.0240261-3069/� 2014 Elsevier Ltd. All rights reserved.
⇑ Corresponding author. Tel.: +61 8 92669468.E-mail addresses: [email protected], [email protected] (W.
Chen).
Wensu Chen a,⇑, Hong Hao a, Dylan Hughes b, Yanchao Shi c, Jian Cui c, Zhong-Xian Li c
a Tianjin University and Curtin University Joint Research Center of Structure Monitoring and Protection, School of Civil and Mechanical Engineering, Curtin University,Kent Street, Bentley, WA 6102, Australiab School of Civil, Environmental and Mining Engineering, The University of Western Australia, 35 Stirling Highway, Crawley, WA 6009, Australiac Tianjin University and Curtin University Joint Research Center of Structure Monitoring and Protection, School of Civil Engineering, Tianjin University, China
a r t i c l e i n f o
Article history:Received 12 August 2014Accepted 8 December 2014Available online 5 January 2015
Keywords:Expanded polystyreneConstruction materialExperimental testsDynamic material properties
a b s t r a c t
Expanded polystyrene (EPS) is commonly used in a variety of applications because of its features of lightweight, good thermal insulation, moisture resistance, durability, acoustic absorption and low thermalconductivity. It has been increasingly used in building constructions as core material of structural insu-lated panels (SIP). Some of those structures during their service life may be subjected to dynamic loadssuch as accidental or hostile explosion loads and windborne debris impacts. Understanding the dynamicmaterial properties of EPS is essential for reliable predictions of the performances of the structural insu-lated panels with EPS foam core material. This paper presents static and dynamic compressive and tensiletest data of EPS with density 13.5 kg/m3 and 28 kg/m3 at different strain rates. The dynamic strength,Young’s modulus and energy absorption capacities of the two EPS foams at different strain rates areobtained and presented in the paper. Based on the testing data, some empirical relations are derived,which can be used to model EPS properties in numerical simulations of dynamic responses of structuralinsulated panels with EPS foam core subjected to impact and blast loads.
� 2014 Elsevier Ltd. All rights reserved.
1. Introduction ments, insulated concrete form (ICF) structures as well as
Structural insulated panel (SIP) is a high-performance light-weight engineered building structural component that is used ina wide range of residential, industrial and light commercial con-struction. It can be used in the building envelopes as a principalload bearing component such as exterior wall, framing, partitionwall, roof, floor and structural framing. SIP is recognized as an effi-cient panel in the construction industry due to its advantages ofbeing environmentally sustainable, economical, easy to install,ultra-lightweight, high strength to weight ratio, thermal insulated,moisture resistant, acoustic insulated, termite resistance, andflame retardant. Structural insulated panel consists of insulatingpolymer foam sandwiched by two layers of structural skins [1,2].Expanded polystyrene (EPS), as the most common polymeric foam,is widely used as the insulation core in the structural insulatedpanels. EPS is a rigid and tough, recyclable, closed-cell cellular plas-tics material, which has been used in a variety of applicationsincluding impact mitigation packaging, protective helmet, struc-tural crashworthiness, construction material filling road embank-
lightweight EPS foamed concrete [3].Structural insulated panel with EPS foam core might be sub-
jected to dynamic loads such as accidental or hostile explosionloads and windborne debris impact during its service life [4]. Someresearchers have conducted experimental tests of sandwich panelssubjected to dynamic loads. Mines et al. [5] found that increasingenergy absorption capacity of the core material leads to theincreased capacity of the sandwich panel. Wen et al. [6] found thatthe core material does not increase energy absorption significantlywithin a certain strain rate while the core material with higherdensity increases energy absorption. These experimental testsclearly demonstrate the significant influence of core material onsandwich panel responses. Therefore, it is essential to understandthe material mechanical properties, especially the dynamic mate-rial properties of EPS for reliable predictions of the performancesof the structural insulated panels subjected to the loads from lowvelocity impact to blast loading.
The dynamic properties can be obtained by using various test-ing facilities including conventional servo-hydraulic system (ratesbetween 10�4 and 1 1/s), high rate servo-hydraulic system,INSTRON� machine, Split Hopkinson Pressure Bar (SHPB) or Kolskybars, drop weight impact machine, gas gun and pendulum impactsystem, etc [7–10]. Split Hopkinson Pressure Bar (SHPB) has beenused to investigate the rate-dependent properties of foams with
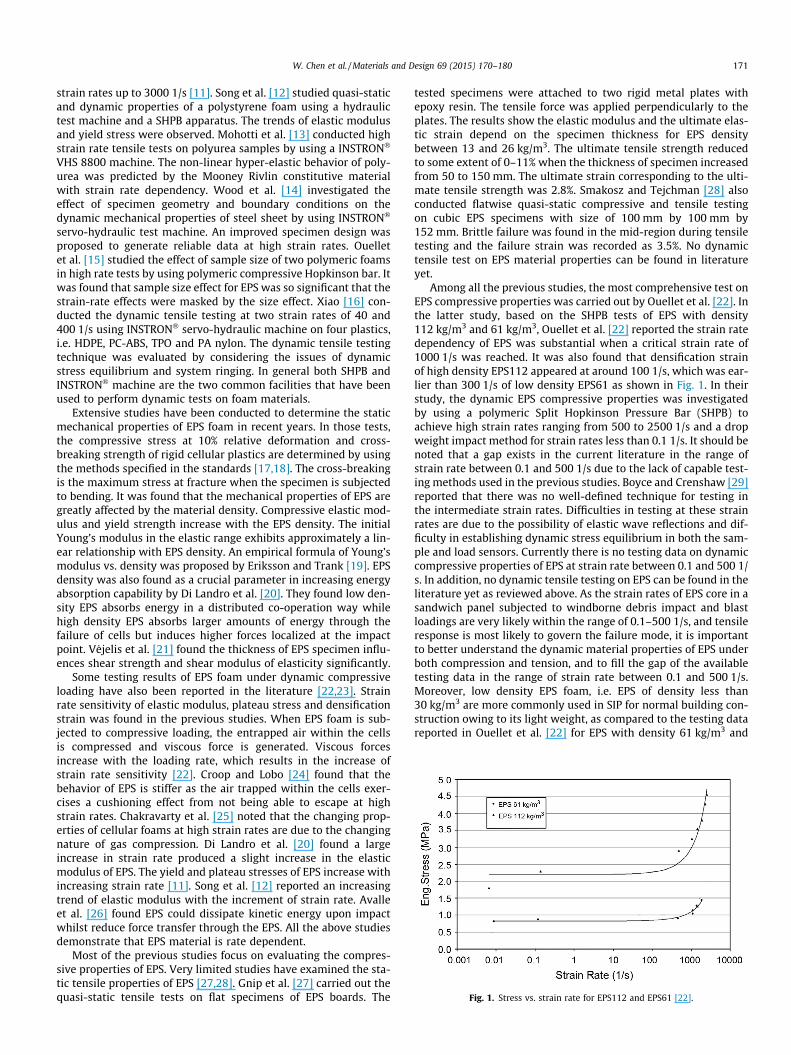
Fig. 1. Stress vs. strain rate for EPS112 and EPS61 [22].
W. Chen et al. / Materials and Design 69 (2015) 170–180 171
strain rates up to 3000 1/s [11]. Song et al. [12] studied quasi-staticand dynamic properties of a polystyrene foam using a hydraulictest machine and a SHPB apparatus. The trends of elastic modulusand yield stress were observed. Mohotti et al. [13] conducted highstrain rate tensile tests on polyurea samples by using a INSTRON�
VHS 8800 machine. The non-linear hyper-elastic behavior of poly-urea was predicted by the Mooney Rivlin constitutive materialwith strain rate dependency. Wood et al. [14] investigated theeffect of specimen geometry and boundary conditions on thedynamic mechanical properties of steel sheet by using INSTRON�
servo-hydraulic test machine. An improved specimen design wasproposed to generate reliable data at high strain rates. Ouelletet al. [15] studied the effect of sample size of two polymeric foamsin high rate tests by using polymeric compressive Hopkinson bar. Itwas found that sample size effect for EPS was so significant that thestrain-rate effects were masked by the size effect. Xiao [16] con-ducted the dynamic tensile testing at two strain rates of 40 and400 1/s using INSTRON� servo-hydraulic machine on four plastics,i.e. HDPE, PC-ABS, TPO and PA nylon. The dynamic tensile testingtechnique was evaluated by considering the issues of dynamicstress equilibrium and system ringing. In general both SHPB andINSTRON� machine are the two common facilities that have beenused to perform dynamic tests on foam materials.
Extensive studies have been conducted to determine the staticmechanical properties of EPS foam in recent years. In those tests,the compressive stress at 10% relative deformation and cross-breaking strength of rigid cellular plastics are determined by usingthe methods specified in the standards [17,18]. The cross-breakingis the maximum stress at fracture when the specimen is subjectedto bending. It was found that the mechanical properties of EPS aregreatly affected by the material density. Compressive elastic mod-ulus and yield strength increase with the EPS density. The initialYoung’s modulus in the elastic range exhibits approximately a lin-ear relationship with EPS density. An empirical formula of Young’smodulus vs. density was proposed by Eriksson and Trank [19]. EPSdensity was also found as a crucial parameter in increasing energyabsorption capability by Di Landro et al. [20]. They found low den-sity EPS absorbs energy in a distributed co-operation way whilehigh density EPS absorbs larger amounts of energy through thefailure of cells but induces higher forces localized at the impactpoint. Vejelis et al. [21] found the thickness of EPS specimen influ-ences shear strength and shear modulus of elasticity significantly.
Some testing results of EPS foam under dynamic compressiveloading have also been reported in the literature [22,23]. Strainrate sensitivity of elastic modulus, plateau stress and densificationstrain was found in the previous studies. When EPS foam is sub-jected to compressive loading, the entrapped air within the cellsis compressed and viscous force is generated. Viscous forcesincrease with the loading rate, which results in the increase ofstrain rate sensitivity [22]. Croop and Lobo [24] found that thebehavior of EPS is stiffer as the air trapped within the cells exer-cises a cushioning effect from not being able to escape at highstrain rates. Chakravarty et al. [25] noted that the changing prop-erties of cellular foams at high strain rates are due to the changingnature of gas compression. Di Landro et al. [20] found a largeincrease in strain rate produced a slight increase in the elasticmodulus of EPS. The yield and plateau stresses of EPS increase withincreasing strain rate [11]. Song et al. [12] reported an increasingtrend of elastic modulus with the increment of strain rate. Avalleet al. [26] found EPS could dissipate kinetic energy upon impactwhilst reduce force transfer through the EPS. All the above studiesdemonstrate that EPS material is rate dependent.
Most of the previous studies focus on evaluating the compres-sive properties of EPS. Very limited studies have examined the sta-tic tensile properties of EPS [27,28]. Gnip et al. [27] carried out thequasi-static tensile tests on flat specimens of EPS boards. The
tested specimens were attached to two rigid metal plates withepoxy resin. The tensile force was applied perpendicularly to theplates. The results show the elastic modulus and the ultimate elas-tic strain depend on the specimen thickness for EPS densitybetween 13 and 26 kg/m3. The ultimate tensile strength reducedto some extent of 0–11% when the thickness of specimen increasedfrom 50 to 150 mm. The ultimate strain corresponding to the ulti-mate tensile strength was 2.8%. Smakosz and Tejchman [28] alsoconducted flatwise quasi-static compressive and tensile testingon cubic EPS specimens with size of 100 mm by 100 mm by152 mm. Brittle failure was found in the mid-region during tensiletesting and the failure strain was recorded as 3.5%. No dynamictensile test on EPS material properties can be found in literatureyet.
Among all the previous studies, the most comprehensive test onEPS compressive properties was carried out by Ouellet et al. [22]. Inthe latter study, based on the SHPB tests of EPS with density112 kg/m3 and 61 kg/m3, Ouellet et al. [22] reported the strain ratedependency of EPS was substantial when a critical strain rate of1000 1/s was reached. It was also found that densification strainof high density EPS112 appeared at around 100 1/s, which was ear-lier than 300 1/s of low density EPS61 as shown in Fig. 1. In theirstudy, the dynamic EPS compressive properties was investigatedby using a polymeric Split Hopkinson Pressure Bar (SHPB) toachieve high strain rates ranging from 500 to 2500 1/s and a dropweight impact method for strain rates less than 0.1 1/s. It should benoted that a gap exists in the current literature in the range ofstrain rate between 0.1 and 500 1/s due to the lack of capable test-ing methods used in the previous studies. Boyce and Crenshaw [29]reported that there was no well-defined technique for testing inthe intermediate strain rates. Difficulties in testing at these strainrates are due to the possibility of elastic wave reflections and dif-ficulty in establishing dynamic stress equilibrium in both the sam-ple and load sensors. Currently there is no testing data on dynamiccompressive properties of EPS at strain rate between 0.1 and 500 1/s. In addition, no dynamic tensile testing on EPS can be found in theliterature yet as reviewed above. As the strain rates of EPS core in asandwich panel subjected to windborne debris impact and blastloadings are very likely within the range of 0.1–500 1/s, and tensileresponse is most likely to govern the failure mode, it is importantto better understand the dynamic material properties of EPS underboth compression and tension, and to fill the gap of the availabletesting data in the range of strain rate between 0.1 and 500 1/s.Moreover, low density EPS foam, i.e. EPS of density less than30 kg/m3 are more commonly used in SIP for normal building con-struction owing to its light weight, as compared to the testing datareported in Ouellet et al. [22] for EPS with density 61 kg/m3 and
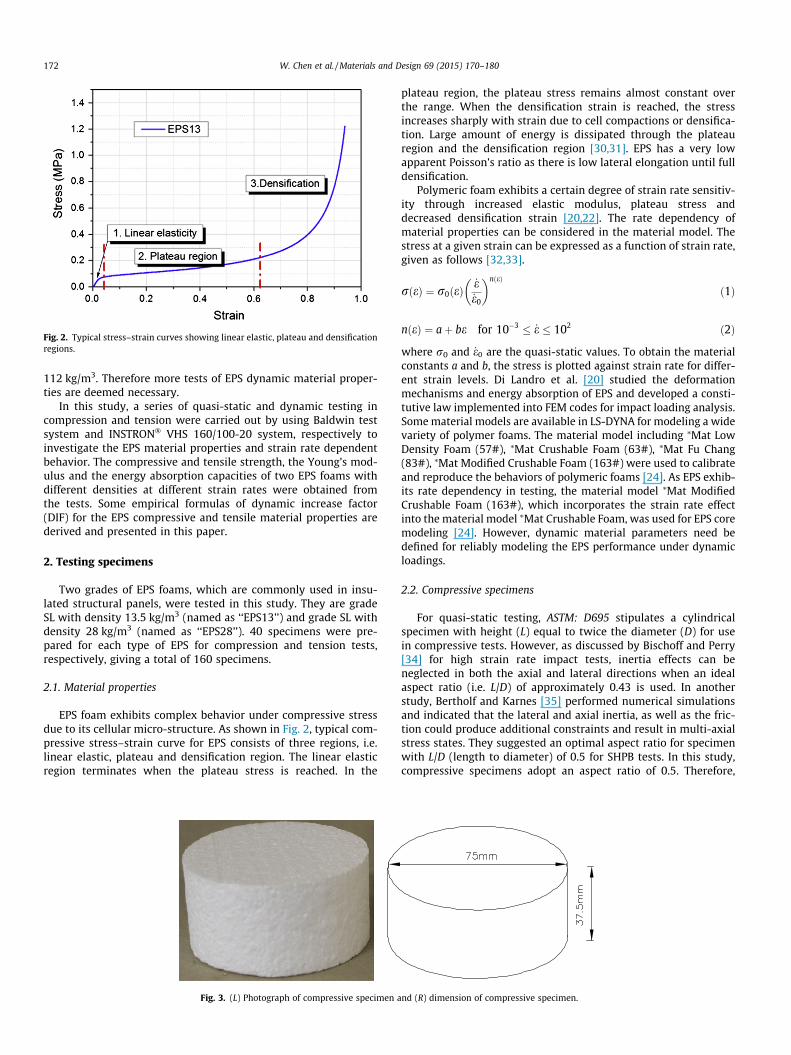
Fig. 2. Typical stress–strain curves showing linear elastic, plateau and densificationregions.
172 W. Chen et al. / Materials and Design 69 (2015) 170–180
112 kg/m3. Therefore more tests of EPS dynamic material proper-ties are deemed necessary.
In this study, a series of quasi-static and dynamic testing incompression and tension were carried out by using Baldwin testsystem and INSTRON� VHS 160/100-20 system, respectively toinvestigate the EPS material properties and strain rate dependentbehavior. The compressive and tensile strength, the Young’s mod-ulus and the energy absorption capacities of two EPS foams withdifferent densities at different strain rates were obtained fromthe tests. Some empirical formulas of dynamic increase factor(DIF) for the EPS compressive and tensile material properties arederived and presented in this paper.
2. Testing specimens
Two grades of EPS foams, which are commonly used in insu-lated structural panels, were tested in this study. They are gradeSL with density 13.5 kg/m3 (named as ‘‘EPS13’’) and grade SL withdensity 28 kg/m3 (named as ‘‘EPS28’’). 40 specimens were pre-pared for each type of EPS for compression and tension tests,respectively, giving a total of 160 specimens.
2.1. Material properties
EPS foam exhibits complex behavior under compressive stressdue to its cellular micro-structure. As shown in Fig. 2, typical com-pressive stress–strain curve for EPS consists of three regions, i.e.linear elastic, plateau and densification region. The linear elasticregion terminates when the plateau stress is reached. In the
Fig. 3. (L) Photograph of compressive specimen a
plateau region, the plateau stress remains almost constant overthe range. When the densification strain is reached, the stressincreases sharply with strain due to cell compactions or densifica-tion. Large amount of energy is dissipated through the plateauregion and the densification region [30,31]. EPS has a very lowapparent Poisson’s ratio as there is low lateral elongation until fulldensification.
Polymeric foam exhibits a certain degree of strain rate sensitiv-ity through increased elastic modulus, plateau stress anddecreased densification strain [20,22]. The rate dependency ofmaterial properties can be considered in the material model. Thestress at a given strain can be expressed as a function of strain rate,given as follows [32,33].
rðeÞ ¼ r0ðeÞ_e_e0
� �nðeÞ
ð1Þ
nðeÞ ¼ aþ be for 10�3 � _e � 102 ð2Þ
where r0 and _e0 are the quasi-static values. To obtain the materialconstants a and b, the stress is plotted against strain rate for differ-ent strain levels. Di Landro et al. [20] studied the deformationmechanisms and energy absorption of EPS and developed a consti-tutive law implemented into FEM codes for impact loading analysis.Some material models are available in LS-DYNA for modeling a widevariety of polymer foams. The material model including ⁄Mat LowDensity Foam (57#), ⁄Mat Crushable Foam (63#), ⁄Mat Fu Chang(83#), ⁄Mat Modified Crushable Foam (163#) were used to calibrateand reproduce the behaviors of polymeric foams [24]. As EPS exhib-its rate dependency in testing, the material model ⁄Mat ModifiedCrushable Foam (163#), which incorporates the strain rate effectinto the material model ⁄Mat Crushable Foam, was used for EPS coremodeling [24]. However, dynamic material parameters need bedefined for reliably modeling the EPS performance under dynamicloadings.
2.2. Compressive specimens
For quasi-static testing, ASTM: D695 stipulates a cylindricalspecimen with height (L) equal to twice the diameter (D) for usein compressive tests. However, as discussed by Bischoff and Perry[34] for high strain rate impact tests, inertia effects can beneglected in both the axial and lateral directions when an idealaspect ratio (i.e. L/D) of approximately 0.43 is used. In anotherstudy, Bertholf and Karnes [35] performed numerical simulationsand indicated that the lateral and axial inertia, as well as the fric-tion could produce additional constraints and result in multi-axialstress states. They suggested an optimal aspect ratio for specimenwith L/D (length to diameter) of 0.5 for SHPB tests. In this study,compressive specimens adopt an aspect ratio of 0.5. Therefore,
nd (R) dimension of compressive specimen.
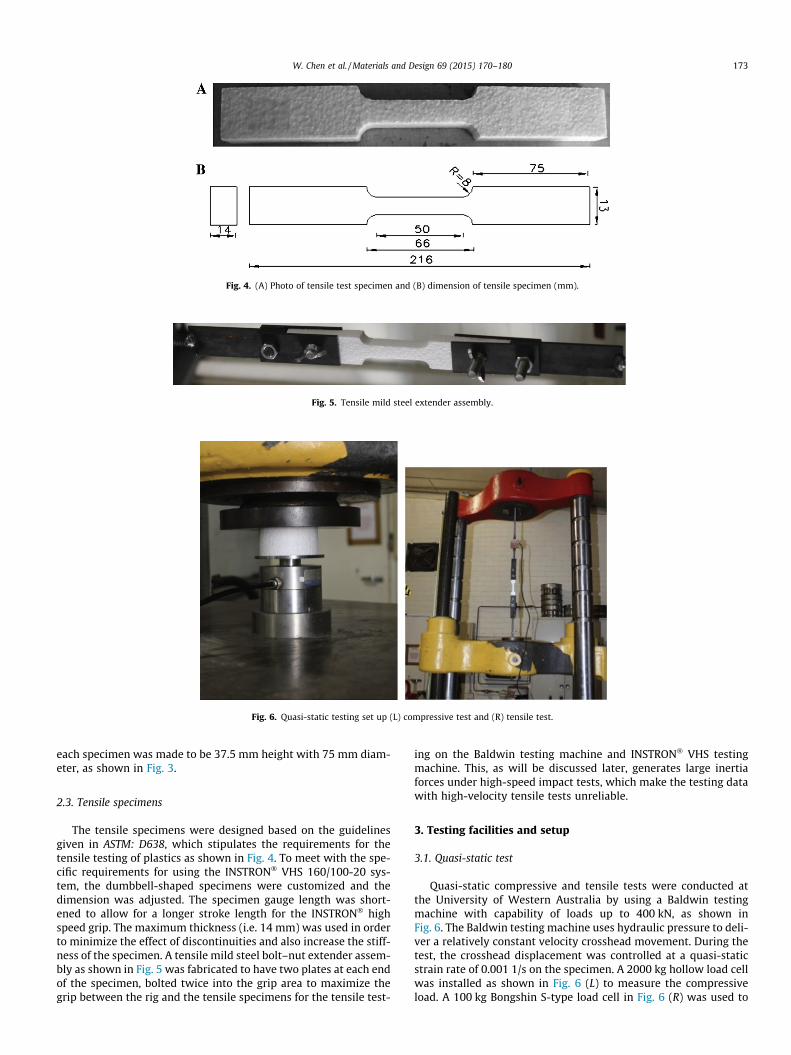
Fig. 4. (A) Photo of tensile test specimen and (B) dimension of tensile specimen (mm).
Fig. 5. Tensile mild steel extender assembly.
Fig. 6. Quasi-static testing set up (L) compressive test and (R) tensile test.
W. Chen et al. / Materials and Design 69 (2015) 170–180 173
each specimen was made to be 37.5 mm height with 75 mm diam-eter, as shown in Fig. 3.
2.3. Tensile specimens
The tensile specimens were designed based on the guidelinesgiven in ASTM: D638, which stipulates the requirements for thetensile testing of plastics as shown in Fig. 4. To meet with the spe-cific requirements for using the INSTRON� VHS 160/100-20 sys-tem, the dumbbell-shaped specimens were customized and thedimension was adjusted. The specimen gauge length was short-ened to allow for a longer stroke length for the INSTRON� highspeed grip. The maximum thickness (i.e. 14 mm) was used in orderto minimize the effect of discontinuities and also increase the stiff-ness of the specimen. A tensile mild steel bolt–nut extender assem-bly as shown in Fig. 5 was fabricated to have two plates at each endof the specimen, bolted twice into the grip area to maximize thegrip between the rig and the tensile specimens for the tensile test-
ing on the Baldwin testing machine and INSTRON� VHS testingmachine. This, as will be discussed later, generates large inertiaforces under high-speed impact tests, which make the testing datawith high-velocity tensile tests unreliable.
3. Testing facilities and setup
3.1. Quasi-static test
Quasi-static compressive and tensile tests were conducted atthe University of Western Australia by using a Baldwin testingmachine with capability of loads up to 400 kN, as shown inFig. 6. The Baldwin testing machine uses hydraulic pressure to deli-ver a relatively constant velocity crosshead movement. During thetest, the crosshead displacement was controlled at a quasi-staticstrain rate of 0.001 1/s on the specimen. A 2000 kg hollow load cellwas installed as shown in Fig. 6 (L) to measure the compressiveload. A 100 kg Bongshin S-type load cell in Fig. 6 (R) was used to
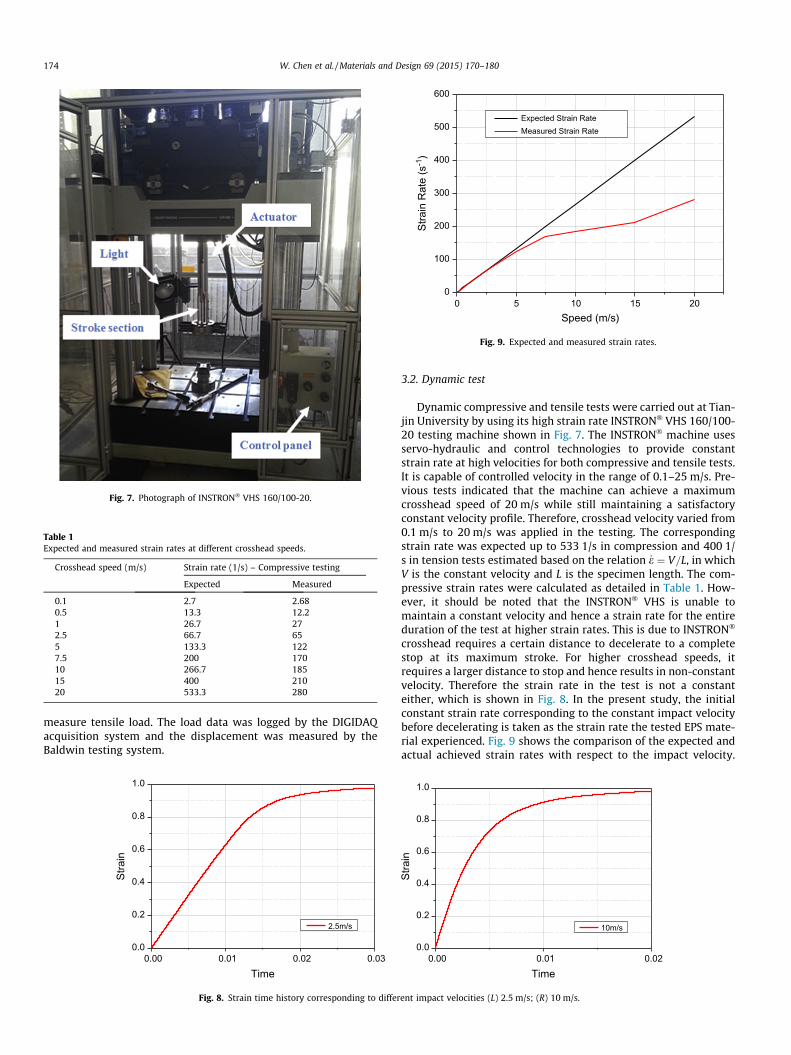
Fig. 7. Photograph of INSTRON� VHS 160/100-20.
Table 1Expected and measured strain rates at different crosshead speeds.
Crosshead speed (m/s) Strain rate (1/s) – Compressive testing
Expected Measured
0.1 2.7 2.680.5 13.3 12.21 26.7 272.5 66.7 655 133.3 1227.5 200 17010 266.7 18515 400 21020 533.3 280
0 5 10 15 200
100
200
300
400
500
600
Stra
in R
ate
(s-1
)
Speed (m/s)
Expected Strain Rate Measured Strain Rate
Fig. 9. Expected and measured strain rates.
174 W. Chen et al. / Materials and Design 69 (2015) 170–180
measure tensile load. The load data was logged by the DIGIDAQacquisition system and the displacement was measured by theBaldwin testing system.
0.00 0.01 0.02 0.030.0
0.2
0.4
0.6
0.8
1.0
Stra
in
Time
2.5m/s
Fig. 8. Strain time history corresponding to differ
3.2. Dynamic test
Dynamic compressive and tensile tests were carried out at Tian-jin University by using its high strain rate INSTRON� VHS 160/100-20 testing machine shown in Fig. 7. The INSTRON� machine usesservo-hydraulic and control technologies to provide constantstrain rate at high velocities for both compressive and tensile tests.It is capable of controlled velocity in the range of 0.1–25 m/s. Pre-vious tests indicated that the machine can achieve a maximumcrosshead speed of 20 m/s while still maintaining a satisfactoryconstant velocity profile. Therefore, crosshead velocity varied from0.1 m/s to 20 m/s was applied in the testing. The correspondingstrain rate was expected up to 533 1/s in compression and 400 1/s in tension tests estimated based on the relation _e ¼ V=L, in whichV is the constant velocity and L is the specimen length. The com-pressive strain rates were calculated as detailed in Table 1. How-ever, it should be noted that the INSTRON� VHS is unable tomaintain a constant velocity and hence a strain rate for the entireduration of the test at higher strain rates. This is due to INSTRON�
crosshead requires a certain distance to decelerate to a completestop at its maximum stroke. For higher crosshead speeds, itrequires a larger distance to stop and hence results in non-constantvelocity. Therefore the strain rate in the test is not a constanteither, which is shown in Fig. 8. In the present study, the initialconstant strain rate corresponding to the constant impact velocitybefore decelerating is taken as the strain rate the tested EPS mate-rial experienced. Fig. 9 shows the comparison of the expected andactual achieved strain rates with respect to the impact velocity.
0.00 0.01 0.020.0
0.2
0.4
0.6
0.8
1.0
Stra
in
Time
10m/s
ent impact velocities (L) 2.5 m/s; (R) 10 m/s.
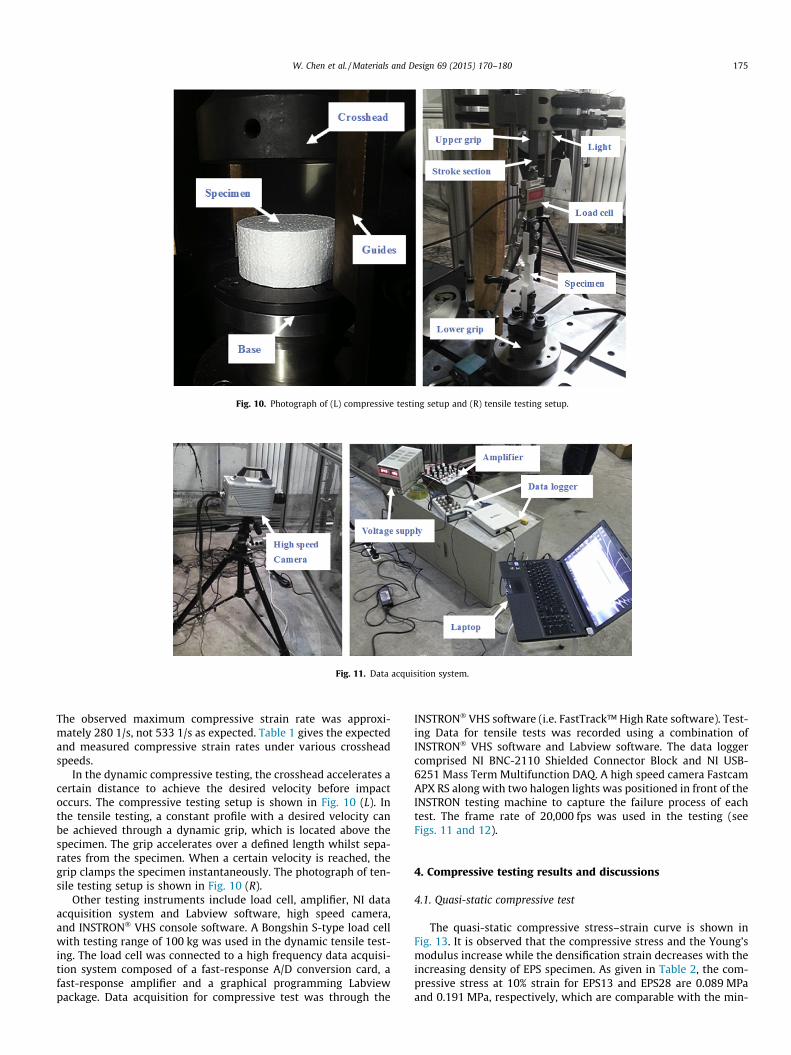
Fig. 10. Photograph of (L) compressive testing setup and (R) tensile testing setup.
Fig. 11. Data acquisition system.
W. Chen et al. / Materials and Design 69 (2015) 170–180 175
The observed maximum compressive strain rate was approxi-mately 280 1/s, not 533 1/s as expected. Table 1 gives the expectedand measured compressive strain rates under various crossheadspeeds.
In the dynamic compressive testing, the crosshead accelerates acertain distance to achieve the desired velocity before impactoccurs. The compressive testing setup is shown in Fig. 10 (L). Inthe tensile testing, a constant profile with a desired velocity canbe achieved through a dynamic grip, which is located above thespecimen. The grip accelerates over a defined length whilst sepa-rates from the specimen. When a certain velocity is reached, thegrip clamps the specimen instantaneously. The photograph of ten-sile testing setup is shown in Fig. 10 (R).
Other testing instruments include load cell, amplifier, NI dataacquisition system and Labview software, high speed camera,and INSTRON� VHS console software. A Bongshin S-type load cellwith testing range of 100 kg was used in the dynamic tensile test-ing. The load cell was connected to a high frequency data acquisi-tion system composed of a fast-response A/D conversion card, afast-response amplifier and a graphical programming Labviewpackage. Data acquisition for compressive test was through the
INSTRON� VHS software (i.e. FastTrack™ High Rate software). Test-ing Data for tensile tests was recorded using a combination ofINSTRON� VHS software and Labview software. The data loggercomprised NI BNC-2110 Shielded Connector Block and NI USB-6251 Mass Term Multifunction DAQ. A high speed camera FastcamAPX RS along with two halogen lights was positioned in front of theINSTRON testing machine to capture the failure process of eachtest. The frame rate of 20,000 fps was used in the testing (seeFigs. 11 and 12).
4. Compressive testing results and discussions
4.1. Quasi-static compressive test
The quasi-static compressive stress–strain curve is shown inFig. 13. It is observed that the compressive stress and the Young’smodulus increase while the densification strain decreases with theincreasing density of EPS specimen. As given in Table 2, the com-pressive stress at 10% strain for EPS13 and EPS28 are 0.089 MPaand 0.191 MPa, respectively, which are comparable with the min-
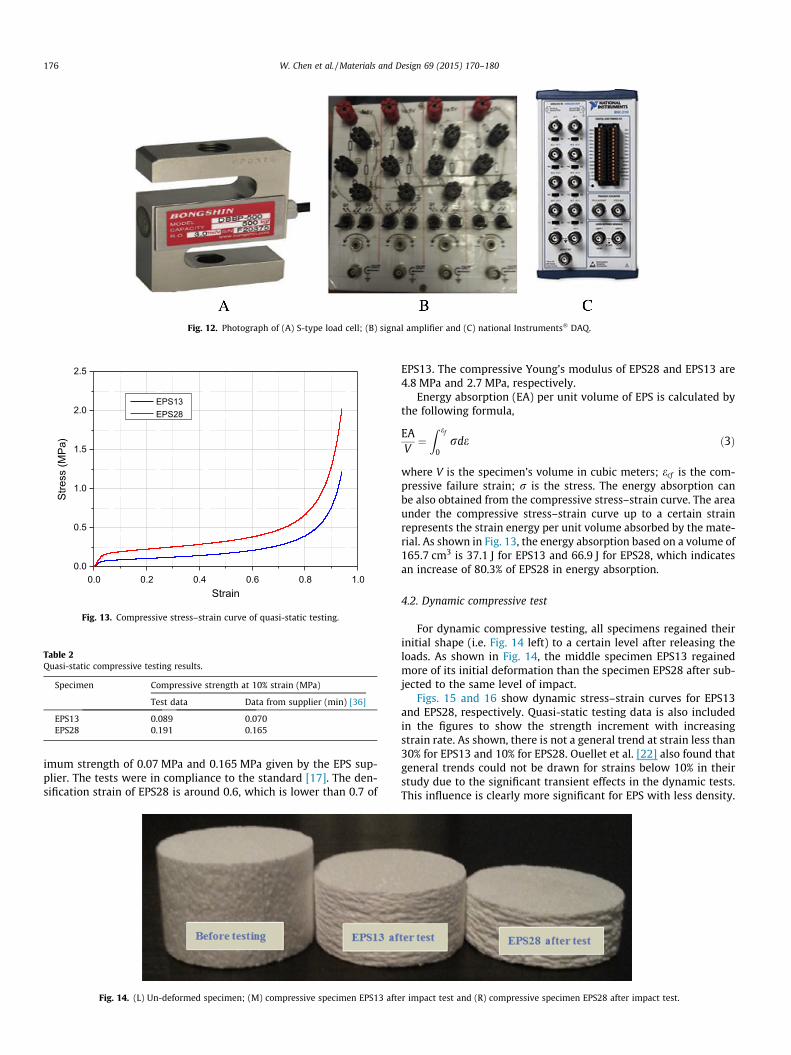
Fig. 12. Photograph of (A) S-type load cell; (B) signal amplifier and (C) national Instruments� DAQ.
0.0 0.2 0.4 0.6 0.8 1.00.0
0.5
1.0
1.5
2.0
2.5
Stre
ss (M
Pa)
Strain
EPS13EPS28
Fig. 13. Compressive stress–strain curve of quasi-static testing.
Table 2Quasi-static compressive testing results.
Specimen Compressive strength at 10% strain (MPa)
Test data Data from supplier (min) [36]
EPS13 0.089 0.070EPS28 0.191 0.165
176 W. Chen et al. / Materials and Design 69 (2015) 170–180
imum strength of 0.07 MPa and 0.165 MPa given by the EPS sup-plier. The tests were in compliance to the standard [17]. The den-sification strain of EPS28 is around 0.6, which is lower than 0.7 of
Fig. 14. (L) Un-deformed specimen; (M) compressive specimen EPS13 afte
EPS13. The compressive Young’s modulus of EPS28 and EPS13 are4.8 MPa and 2.7 MPa, respectively.
Energy absorption (EA) per unit volume of EPS is calculated bythe following formula,
EAV¼Z ef
0rde ð3Þ
where V is the specimen’s volume in cubic meters; ecf is the com-pressive failure strain; r is the stress. The energy absorption canbe also obtained from the compressive stress–strain curve. The areaunder the compressive stress–strain curve up to a certain strainrepresents the strain energy per unit volume absorbed by the mate-rial. As shown in Fig. 13, the energy absorption based on a volume of165.7 cm3 is 37.1 J for EPS13 and 66.9 J for EPS28, which indicatesan increase of 80.3% of EPS28 in energy absorption.
4.2. Dynamic compressive test
For dynamic compressive testing, all specimens regained theirinitial shape (i.e. Fig. 14 left) to a certain level after releasing theloads. As shown in Fig. 14, the middle specimen EPS13 regainedmore of its initial deformation than the specimen EPS28 after sub-jected to the same level of impact.
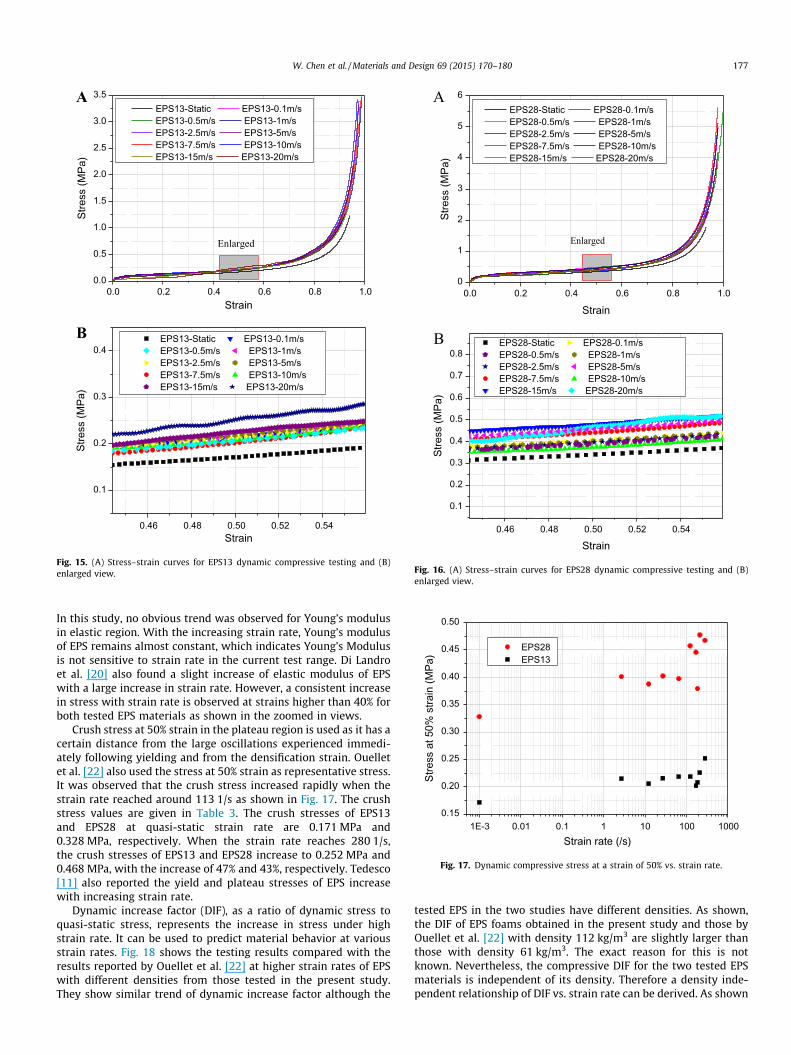
Figs. 15 and 16 show dynamic stress–strain curves for EPS13and EPS28, respectively. Quasi-static testing data is also includedin the figures to show the strength increment with increasingstrain rate. As shown, there is not a general trend at strain less than30% for EPS13 and 10% for EPS28. Ouellet et al. [22] also found thatgeneral trends could not be drawn for strains below 10% in theirstudy due to the significant transient effects in the dynamic tests.This influence is clearly more significant for EPS with less density.
r impact test and (R) compressive specimen EPS28 after impact test.
A
B
0.0 0.2 0.4 0.6 0.8 1.00.0
0.5
1.0
1.5
2.0
2.5
3.0
3.5St
ress
(MPa
)
Strain
EPS13-Static EPS13-0.1m/sEPS13-0.5m/s EPS13-1m/sEPS13-2.5m/s EPS13-5m/sEPS13-7.5m/s EPS13-10m/sEPS13-15m/s EPS13-20m/s
0.46 0.48 0.50 0.52 0.54
0.1
0.2
0.3
0.4EPS13-Static EPS13-0.1m/sEPS13-0.5m/s EPS13-1m/sEPS13-2.5m/s EPS13-5m/sEPS13-7.5m/s EPS13-10m/sEPS13-15m/s EPS13-20m/s
Stre
ss (M
Pa)
Strain
Enlarged
Fig. 15. (A) Stress–strain curves for EPS13 dynamic compressive testing and (B)enlarged view.
A
B
0.0 0.2 0.4 0.6 0.8 1.00
1
2
3
4
5
6
Stre
ss (M
Pa)
Strain
EPS28-Static EPS28-0.1m/sEPS28-0.5m/s EPS28-1m/sEPS28-2.5m/s EPS28-5m/sEPS28-7.5m/s EPS28-10m/sEPS28-15m/s EPS28-20m/s
0.46 0.48 0.50 0.52 0.54
0.1
0.2
0.3
0.4
0.5
0.6
0.7
0.8
Stre
ss (M
Pa)
Strain
EPS28-Static EPS28-0.1m/sEPS28-0.5m/s EPS28-1m/sEPS28-2.5m/s EPS28-5m/sEPS28-7.5m/s EPS28-10m/sEPS28-15m/s EPS28-20m/s
Enlarged
Fig. 16. (A) Stress–strain curves for EPS28 dynamic compressive testing and (B)enlarged view.
1E-3 0.01 0.1 1 10 100 10000.15
0.20
0.25
0.30
0.35
0.40
0.45
0.50
Stre
ss a
t 50%
stra
in (M
Pa)
Strain rate (/s)
EPS28 EPS13
Fig. 17. Dynamic compressive stress at a strain of 50% vs. strain rate.
W. Chen et al. / Materials and Design 69 (2015) 170–180 177
In this study, no obvious trend was observed for Young’s modulusin elastic region. With the increasing strain rate, Young’s modulusof EPS remains almost constant, which indicates Young’s Modulusis not sensitive to strain rate in the current test range. Di Landroet al. [20] also found a slight increase of elastic modulus of EPSwith a large increase in strain rate. However, a consistent increasein stress with strain rate is observed at strains higher than 40% forboth tested EPS materials as shown in the zoomed in views.
Crush stress at 50% strain in the plateau region is used as it has acertain distance from the large oscillations experienced immedi-ately following yielding and from the densification strain. Ouelletet al. [22] also used the stress at 50% strain as representative stress.It was observed that the crush stress increased rapidly when thestrain rate reached around 113 1/s as shown in Fig. 17. The crushstress values are given in Table 3. The crush stresses of EPS13and EPS28 at quasi-static strain rate are 0.171 MPa and0.328 MPa, respectively. When the strain rate reaches 280 1/s,the crush stresses of EPS13 and EPS28 increase to 0.252 MPa and0.468 MPa, with the increase of 47% and 43%, respectively. Tedesco[11] also reported the yield and plateau stresses of EPS increasewith increasing strain rate.
Dynamic increase factor (DIF), as a ratio of dynamic stress toquasi-static stress, represents the increase in stress under highstrain rate. It can be used to predict material behavior at variousstrain rates. Fig. 18 shows the testing results compared with theresults reported by Ouellet et al. [22] at higher strain rates of EPSwith different densities from those tested in the present study.They show similar trend of dynamic increase factor although the
tested EPS in the two studies have different densities. As shown,the DIF of EPS foams obtained in the present study and those byOuellet et al. [22] with density 112 kg/m3 are slightly larger thanthose with density 61 kg/m3. The exact reason for this is notknown. Nevertheless, the compressive DIF for the two tested EPSmaterials is independent of its density. Therefore a density inde-pendent relationship of DIF vs. strain rate can be derived. As shown
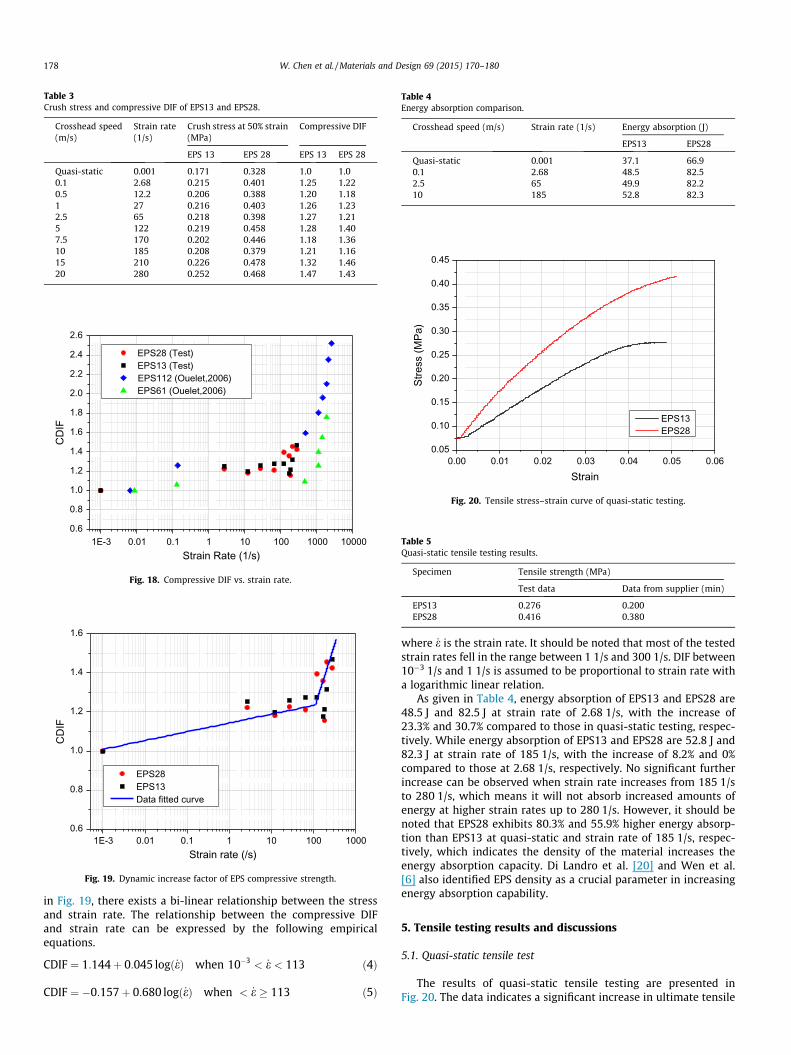
Table 3Crush stress and compressive DIF of EPS13 and EPS28.
Crosshead speed(m/s)
Strain rate(1/s)
Crush stress at 50% strain(MPa)
Compressive DIF
EPS 13 EPS 28 EPS 13 EPS 28
Quasi-static 0.001 0.171 0.328 1.0 1.00.1 2.68 0.215 0.401 1.25 1.220.5 12.2 0.206 0.388 1.20 1.181 27 0.216 0.403 1.26 1.232.5 65 0.218 0.398 1.27 1.215 122 0.219 0.458 1.28 1.407.5 170 0.202 0.446 1.18 1.3610 185 0.208 0.379 1.21 1.1615 210 0.226 0.478 1.32 1.4620 280 0.252 0.468 1.47 1.43
1E-3 0.01 0.1 1 10 100 1000 100000.6
0.8
1.0
1.2
1.4
1.6
1.8
2.0
2.2
2.4
2.6
EPS28 (Test) EPS13 (Test)EPS112 (Ouelet,2006)
EPS61 (Ouelet,2006)
CD
IF
Strain Rate (1/s)
Fig. 18. Compressive DIF vs. strain rate.
1E-3 0.01 0.1 1 10 100 10000.6
0.8
1.0
1.2
1.4
1.6
EPS28 EPS13 Data fitted curve
CD
IF
Strain rate (/s)
Fig. 19. Dynamic increase factor of EPS compressive strength.
Table 4Energy absorption comparison.
Crosshead speed (m/s) Strain rate (1/s) Energy absorption (J)
EPS13 EPS28
Quasi-static 0.001 37.1 66.90.1 2.68 48.5 82.52.5 65 49.9 82.210 185 52.8 82.3
0.00 0.01 0.02 0.03 0.04 0.05 0.060.05
0.10
0.15
0.20
0.25
0.30
0.35
0.40
0.45
Stre
ss (M
Pa)
Strain
EPS13EPS28
Fig. 20. Tensile stress–strain curve of quasi-static testing.
Table 5Quasi-static tensile testing results.
Specimen Tensile strength (MPa)
Test data Data from supplier (min)
EPS13 0.276 0.200EPS28 0.416 0.380
178 W. Chen et al. / Materials and Design 69 (2015) 170–180
in Fig. 19, there exists a bi-linear relationship between the stressand strain rate. The relationship between the compressive DIFand strain rate can be expressed by the following empiricalequations.
CDIF ¼ 1:144þ 0:045 logð _eÞ when 10�3 < _e < 113 ð4Þ
CDIF ¼ �0:157þ 0:680 logð _eÞ when < _e � 113 ð5Þ
where _e is the strain rate. It should be noted that most of the testedstrain rates fell in the range between 1 1/s and 300 1/s. DIF between10�3 1/s and 1 1/s is assumed to be proportional to strain rate witha logarithmic linear relation.
As given in Table 4, energy absorption of EPS13 and EPS28 are48.5 J and 82.5 J at strain rate of 2.68 1/s, with the increase of23.3% and 30.7% compared to those in quasi-static testing, respec-tively. While energy absorption of EPS13 and EPS28 are 52.8 J and82.3 J at strain rate of 185 1/s, with the increase of 8.2% and 0%compared to those at 2.68 1/s, respectively. No significant furtherincrease can be observed when strain rate increases from 185 1/sto 280 1/s, which means it will not absorb increased amounts ofenergy at higher strain rates up to 280 1/s. However, it should benoted that EPS28 exhibits 80.3% and 55.9% higher energy absorp-tion than EPS13 at quasi-static and strain rate of 185 1/s, respec-tively, which indicates the density of the material increases theenergy absorption capacity. Di Landro et al. [20] and Wen et al.[6] also identified EPS density as a crucial parameter in increasingenergy absorption capability.
5. Tensile testing results and discussions
5.1. Quasi-static tensile test
The results of quasi-static tensile testing are presented inFig. 20. The data indicates a significant increase in ultimate tensile
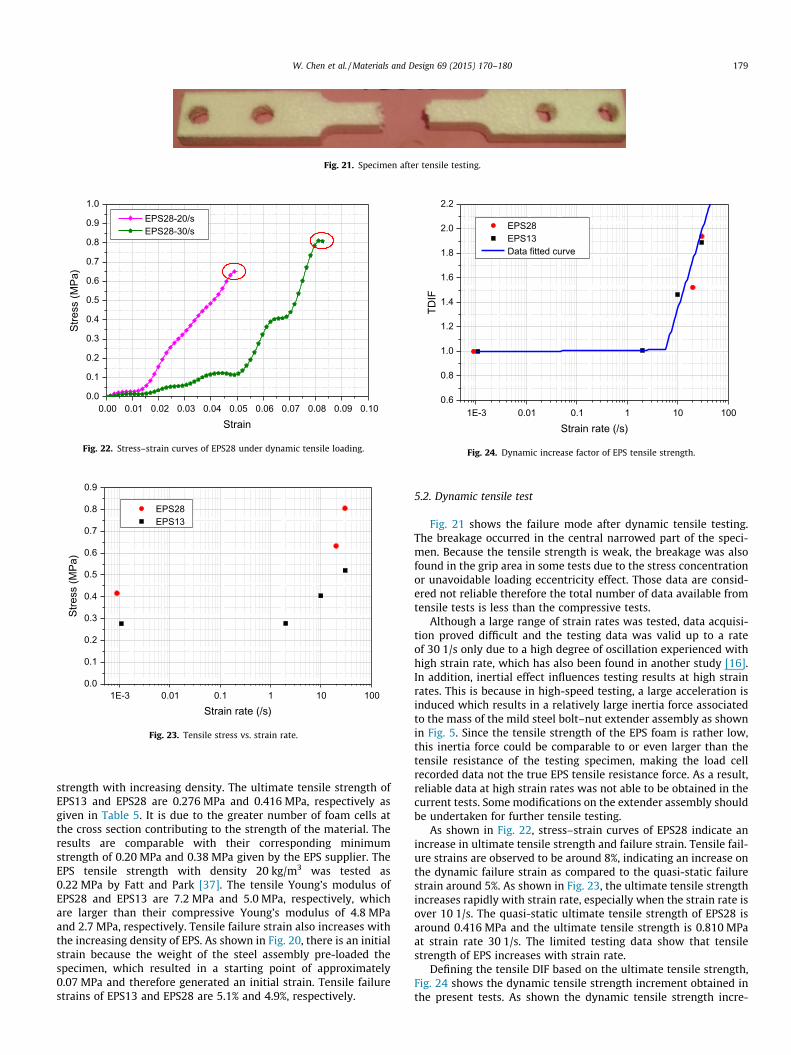
Fig. 21. Specimen after tensile testing.
0.00 0.01 0.02 0.03 0.04 0.05 0.06 0.07 0.08 0.09 0.100.0
0.1
0.2
0.3
0.4
0.5
0.6
0.7
0.8
0.9
1.0EPS28-20/sEPS28-30/s
Stre
ss (M
Pa)
Strain
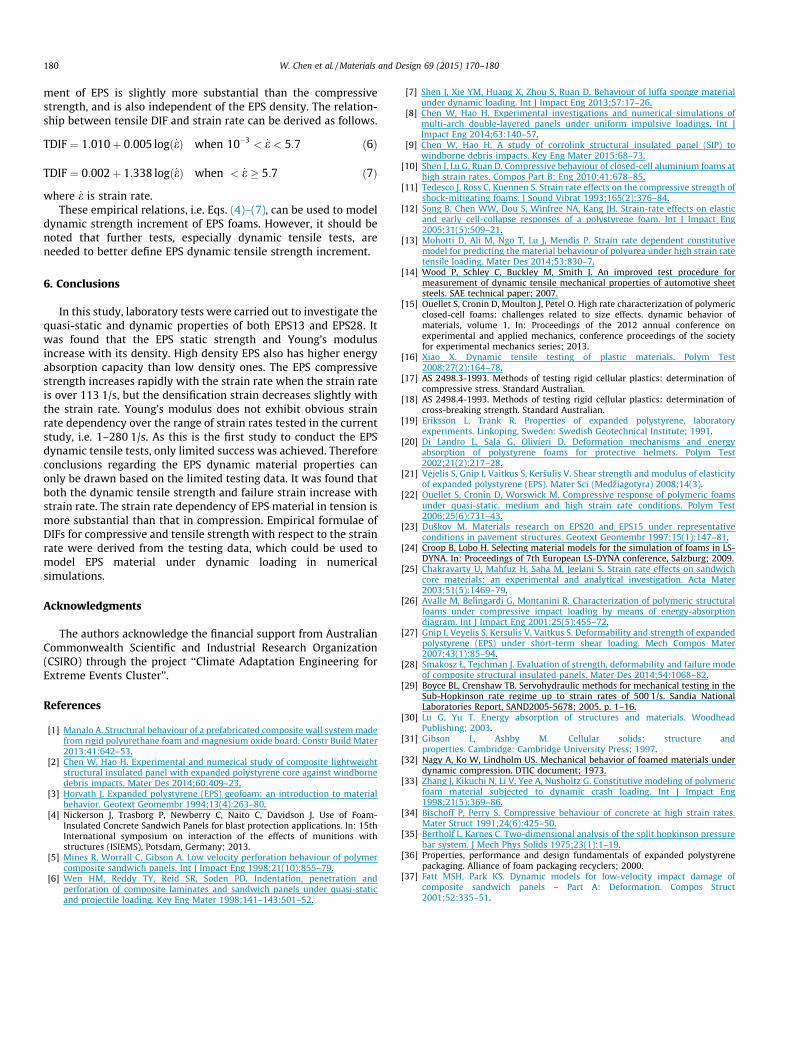
Fig. 22. Stress–strain curves of EPS28 under dynamic tensile loading.
1E-3 0.01 0.1 1 10 1000.0
0.1
0.2
0.3
0.4
0.5
0.6
0.7
0.8
0.9
EPS28 EPS13
Stre
ss (M
Pa)
Strain rate (/s)
Fig. 23. Tensile stress vs. strain rate.
1E-3 0.01 0.1 1 10 1000.6
0.8
1.0
1.2
1.4
1.6
1.8
2.0
2.2
EPS28 EPS13 Data fitted curve
TDIF
Strain rate (/s)
Fig. 24. Dynamic increase factor of EPS tensile strength.
W. Chen et al. / Materials and Design 69 (2015) 170–180 179
strength with increasing density. The ultimate tensile strength ofEPS13 and EPS28 are 0.276 MPa and 0.416 MPa, respectively asgiven in Table 5. It is due to the greater number of foam cells atthe cross section contributing to the strength of the material. Theresults are comparable with their corresponding minimumstrength of 0.20 MPa and 0.38 MPa given by the EPS supplier. TheEPS tensile strength with density 20 kg/m3 was tested as0.22 MPa by Fatt and Park [37]. The tensile Young’s modulus ofEPS28 and EPS13 are 7.2 MPa and 5.0 MPa, respectively, whichare larger than their compressive Young’s modulus of 4.8 MPaand 2.7 MPa, respectively. Tensile failure strain also increases withthe increasing density of EPS. As shown in Fig. 20, there is an initialstrain because the weight of the steel assembly pre-loaded thespecimen, which resulted in a starting point of approximately0.07 MPa and therefore generated an initial strain. Tensile failurestrains of EPS13 and EPS28 are 5.1% and 4.9%, respectively.
5.2. Dynamic tensile test
Fig. 21 shows the failure mode after dynamic tensile testing.The breakage occurred in the central narrowed part of the speci-men. Because the tensile strength is weak, the breakage was alsofound in the grip area in some tests due to the stress concentrationor unavoidable loading eccentricity effect. Those data are consid-ered not reliable therefore the total number of data available fromtensile tests is less than the compressive tests.
Although a large range of strain rates was tested, data acquisi-tion proved difficult and the testing data was valid up to a rateof 30 1/s only due to a high degree of oscillation experienced withhigh strain rate, which has also been found in another study [16].In addition, inertial effect influences testing results at high strainrates. This is because in high-speed testing, a large acceleration isinduced which results in a relatively large inertia force associatedto the mass of the mild steel bolt–nut extender assembly as shownin Fig. 5. Since the tensile strength of the EPS foam is rather low,this inertia force could be comparable to or even larger than thetensile resistance of the testing specimen, making the load cellrecorded data not the true EPS tensile resistance force. As a result,reliable data at high strain rates was not able to be obtained in thecurrent tests. Some modifications on the extender assembly shouldbe undertaken for further tensile testing.
As shown in Fig. 22, stress–strain curves of EPS28 indicate anincrease in ultimate tensile strength and failure strain. Tensile fail-ure strains are observed to be around 8%, indicating an increase onthe dynamic failure strain as compared to the quasi-static failurestrain around 5%. As shown in Fig. 23, the ultimate tensile strengthincreases rapidly with strain rate, especially when the strain rate isover 10 1/s. The quasi-static ultimate tensile strength of EPS28 isaround 0.416 MPa and the ultimate tensile strength is 0.810 MPaat strain rate 30 1/s. The limited testing data show that tensilestrength of EPS increases with strain rate.
Defining the tensile DIF based on the ultimate tensile strength,Fig. 24 shows the dynamic tensile strength increment obtained inthe present tests. As shown the dynamic tensile strength incre-
180 W. Chen et al. / Materials and Design 69 (2015) 170–180
ment of EPS is slightly more substantial than the compressivestrength, and is also independent of the EPS density. The relation-ship between tensile DIF and strain rate can be derived as follows.
TDIF ¼ 1:010þ 0:005 logð _eÞ when 10�3 < _e < 5:7 ð6Þ
TDIF ¼ 0:002þ 1:338 logð _eÞ when < _e � 5:7 ð7Þ
where _e is strain rate.These empirical relations, i.e. Eqs. (4)–(7), can be used to model
dynamic strength increment of EPS foams. However, it should benoted that further tests, especially dynamic tensile tests, areneeded to better define EPS dynamic tensile strength increment.
6. Conclusions
In this study, laboratory tests were carried out to investigate thequasi-static and dynamic properties of both EPS13 and EPS28. Itwas found that the EPS static strength and Young’s modulusincrease with its density. High density EPS also has higher energyabsorption capacity than low density ones. The EPS compressivestrength increases rapidly with the strain rate when the strain rateis over 113 1/s, but the densification strain decreases slightly withthe strain rate. Young’s modulus does not exhibit obvious strainrate dependency over the range of strain rates tested in the currentstudy, i.e. 1–280 1/s. As this is the first study to conduct the EPSdynamic tensile tests, only limited success was achieved. Thereforeconclusions regarding the EPS dynamic material properties canonly be drawn based on the limited testing data. It was found thatboth the dynamic tensile strength and failure strain increase withstrain rate. The strain rate dependency of EPS material in tension ismore substantial than that in compression. Empirical formulae ofDIFs for compressive and tensile strength with respect to the strainrate were derived from the testing data, which could be used tomodel EPS material under dynamic loading in numericalsimulations.
Acknowledgments
The authors acknowledge the financial support from AustralianCommonwealth Scientific and Industrial Research Organization(CSIRO) through the project ‘‘Climate Adaptation Engineering forExtreme Events Cluster’’.
References
[1] Manalo A. Structural behaviour of a prefabricated composite wall system madefrom rigid polyurethane foam and magnesium oxide board. Constr Build Mater2013;41:642–53.
[2] Chen W, Hao H. Experimental and numerical study of composite lightweightstructural insulated panel with expanded polystyrene core against windbornedebris impacts. Mater Des 2014;60:409–23.
[3] Horvath J. Expanded polystyrene (EPS) geofoam: an introduction to materialbehavior. Geotext Geomembr 1994;13(4):263–80.
[4] Nickerson J, Trasborg P, Newberry C, Naito C, Davidson J. Use of Foam-Insulated Concrete Sandwich Panels for blast protection applications. In: 15thInternational symposium on interaction of the effects of munitions withstructures (ISIEMS), Potsdam, Germany; 2013.
[5] Mines R, Worrall C, Gibson A. Low velocity perforation behaviour of polymercomposite sandwich panels. Int J Impact Eng 1998;21(10):855–79.
[6] Wen HM, Reddy TY, Reid SR, Soden PD. Indentation, penetration andperforation of composite laminates and sandwich panels under quasi-staticand projectile loading. Key Eng Mater 1998;141–143:501–52.
[7] Shen J, Xie YM, Huang X, Zhou S, Ruan D. Behaviour of luffa sponge materialunder dynamic loading. Int J Impact Eng 2013;57:17–26.
[8] Chen W, Hao H. Experimental investigations and numerical simulations ofmulti-arch double-layered panels under uniform impulsive loadings. Int JImpact Eng 2014;63:140–57.
[9] Chen W, Hao H. A study of corrolink structural insulated panel (SIP) towindborne debris impacts. Key Eng Mater 2015:68–73.
[10] Shen J, Lu G, Ruan D. Compressive behaviour of closed-cell aluminium foams athigh strain rates. Compos Part B: Eng 2010;41:678–85.
[11] Tedesco J, Ross C, Kuennen S. Strain rate effects on the compressive strength ofshock-mitigating foams. J Sound Vibrat 1993;165(2):376–84.
[12] Song B, Chen WW, Dou S, Winfree NA, Kang JH. Strain-rate effects on elasticand early cell-collapse responses of a polystyrene foam. Int J Impact Eng2005;31(5):509–21.
[13] Mohotti D, Ali M, Ngo T, Lu J, Mendis P. Strain rate dependent constitutivemodel for predicting the material behaviour of polyurea under high strain ratetensile loading. Mater Des 2014;53:830–7.
[14] Wood P, Schley C, Buckley M, Smith J. An improved test procedure formeasurement of dynamic tensile mechanical properties of automotive sheetsteels. SAE technical paper; 2007.
[15] Ouellet S, Cronin D, Moulton J, Petel O. High rate characterization of polymericclosed-cell foams: challenges related to size effects. dynamic behavior ofmaterials, volume 1, In: Proceedings of the 2012 annual conference onexperimental and applied mechanics, conference proceedings of the societyfor experimental mechanics series; 2013.
[16] Xiao X. Dynamic tensile testing of plastic materials. Polym Test2008;27(2):164–78.
[17] AS 2498.3-1993. Methods of testing rigid cellular plastics: determination ofcompressive stress. Standard Australian.
[18] AS 2498.4-1993. Methods of testing rigid cellular plastics: determination ofcross-breaking strength. Standard Australian.
[19] Eriksson L, Trank R. Properties of expanded polystyrene, laboratoryexperiments. Linkoping, Sweden: Swedish Geotechnical Institute; 1991.
[20] Di Landro L, Sala G, Olivieri D. Deformation mechanisms and energyabsorption of polystyrene foams for protective helmets. Polym Test2002;21(2):217–28.
[21] Vejelis S, Gnip I, Vaitkus S, Keršulis V. Shear strength and modulus of elasticityof expanded polystyrene (EPS). Mater Sci (Medziagotyra) 2008;14(3).
[22] Ouellet S, Cronin D, Worswick M. Compressive response of polymeric foamsunder quasi-static, medium and high strain rate conditions. Polym Test2006;25(6):731–43.
[23] Duškov M. Materials research on EPS20 and EPS15 under representativeconditions in pavement structures. Geotext Geomembr 1997;15(1):147–81.
[24] Croop B, Lobo H. Selecting material models for the simulation of foams in LS-DYNA. In: Proceedings of 7th European LS-DYNA conference, Salzburg; 2009.
[25] Chakravarty U, Mahfuz H, Saha M, Jeelani S. Strain rate effects on sandwichcore materials: an experimental and analytical investigation. Acta Mater2003;51(5):1469–79.
[26] Avalle M, Belingardi G, Montanini R. Characterization of polymeric structuralfoams under compressive impact loading by means of energy-absorptiondiagram. Int J Impact Eng 2001;25(5):455–72.
[27] Gnip I, Veyelis S, Kersulis V, Vaitkus S. Deformability and strength of expandedpolystyrene (EPS) under short-term shear loading. Mech Compos Mater2007;43(1):85–94.
[28] Smakosz Ł, Tejchman J. Evaluation of strength, deformability and failure modeof composite structural insulated panels. Mater Des 2014;54:1068–82.
[29] Boyce BL, Crenshaw TB. Servohydraulic methods for mechanical testing in theSub-Hopkinson rate regime up to strain rates of 500 1/s. Sandia NationalLaboratories Report, SAND2005-5678; 2005. p. 1–16.
[30] Lu G, Yu T. Energy absorption of structures and materials. WoodheadPublishing; 2003.
[31] Gibson L, Ashby M. Cellular solids: structure andproperties. Cambridge: Cambridge University Press; 1997.
[32] Nagy A, Ko W, Lindholm US. Mechanical behavior of foamed materials underdynamic compression. DTIC document; 1973.
[33] Zhang J, Kikuchi N, Li V, Yee A, Nusholtz G. Constitutive modeling of polymericfoam material subjected to dynamic crash loading. Int J Impact Eng1998;21(5):369–86.
[34] Bischoff P, Perry S. Compressive behaviour of concrete at high strain rates.Mater Struct 1991;24(6):425–50.
[35] Bertholf L, Karnes C. Two-dimensional analysis of the split hopkinson pressurebar system. J Mech Phys Solids 1975;23(1):1–19.
[36] Properties, performance and design fundamentals of expanded polystyrenepackaging. Alliance of foam packaging recyclers; 2000.
[37] Fatt MSH, Park KS. Dynamic models for low-velocity impact damage ofcomposite sandwich panels – Part A: Deformation. Compos Struct2001;52:335–51.