Effects of Water and 50% Ethylene-Glycol Coolant ... - J-Stage
Upload
independentCategory
view
2download
0
FUNDAMENTAL AND APPLIED TOXICOLOGY 7,547-565 (1986)
Chronic Toxicity and Oncogenicity Studies of Ethylene Glycol in Rats and Mice’
LINVAL R. DEPASS,*,* ROBERT H. GARMAN,* MURRAY D. WOODSIDE,* W. ELLIS GIDDENS,~?~ ROBERT R. MARONPOT,*,~ AND CARROL S. WEIL*
*Bushy Run Research Center, Mellon Institute-Union Carbide Corporation, Export, Pennsylvania 15632; and TBiomed Research Laboratories, Seattle, Washington 98195
Chronic Toxicity and Oncogenicity Studies of Ethylene Glycol in Rats and Mice. DEPASS,
L. R., GARMAN, R. H., WOODSIDE, M. D., GIDDENS, W. E., MARONPOT, R. R., AND WEIL, C. S.
(1986). Fundam. Appl. Toxicol. 7,547-565. These studies were performed to assess the chronic toxicity and oncogenicity of ethylene glycol (EG) in rats and mice. Groups of 130 Fischer 344 rats and 80 CD-l mice per sex were fed diets yielding approximate dosages of 1.0,0.2, or 0.04 g/kg/day of EG. Two separate control groups in each study received no EG. Mortality rate was increased in high-dose male rats all of which died by 475 days. The following effects were also observed in high dose male rats: reduced body weight gain, increased water intake, increased blood urea nitrogen and creatinine, reduced erythrocyte count, reduced hematocrit and hemo- globin, increased neutrophil count, increased urine volume, reduced specific gravity and pH. Urinary calcium oxalate crystals and increased kidney weight were seen in all high-dose rats. Uric acid crystals were seen in the urine of high-dose female rats at 18 and 24 months. Histopath- ologic changes in high-dose male rats included tubular cell hype@.& tubular dilation, peritu- bular nephritis, parathyroid hyperplasia, and generalized soft tissue mineralization. Fatty change of the liver was seen in high- and intermediate-dose female rats. No clinical signs, or gross or microscopic evidence of toxicity was seen in mice at the dosages used. Water intake and clinical pathologic parameters were not measured in the mouse study. In these studies there was no evidence of an oncogenic effect of EG in rodents. 0 1986 society of Toxicology.
Ethylene glycol (EG) is an important indus- trial chemical which has been used as an anti- freeze and coolant for motor vehicles, in heat exchangers, hydraulic fluids, and as an inter- mediate in the production of glycol esters, ethers and other products. Due to its low vol- atility, there is relatively little potential vapor hazard at ordinary temperatures. However, because of its use in antifreeze mixtures, as a
hydraulic fluid and as a heat exchanger, it may be encountered as a vapor or mist, par- ticularly at elevated temperatures. Oral expo- sure by deliberate or accidental ingestion has also occurred (Balazs et al., 1982; Parry and Wallach, 1974) and is considered a severe problem for veterinarians. Production of EG in the United States in 1980 was estimated to be 4.4 billion pounds (U.S. International Trade Commission, 198 1).
’ Presented in part at the 24th Annual Meeting of the Numerous studies have been performed to
Society of Toxicology in San Diego, March 18-22,1985. determine the potential toxicity of EG and to ’ Present address: Svntex Research, 3401 Hillview elucidate the mechanisms involved (Balazs et
Ave., Palo Alto, Calif. 94304. al., 1982; Parry and Wallach, 1974). The po- 3 Present address: Division of Animal Medicine,
School of Medicine, University of Washington, Seattle, tentia.l chronic toxicity and carcinogenicity
Wash. 98 195. have been assessed in at least four published
4 Present address: National Institute of Environmental studies (Morris et al., 1942; Blood et al., Health Sciences, Research Triangle Park, N.C. 27709. 1962; Blood, 1965; Mason et al., 197 1). Al-
541 0272-0590186 $3.00 Copyri&t 8 1986 by the Society of Toxichw. All rights of qmduction in my form reserved.

548 DE PASS ET AL.
though none of these studies provided evi- dence of carcinogenic activity, there have been more recent reports of mutagenic activ- ity in plants (Bose and Naskar, 1975; Alam et al., 198 1) and mammalian cells (Conan et al., 1979; Brown et al., 1980).
The present studies were performed to more definitively assess the potential oncoge- nicity and chronic toxicity of EG by using much larger numbers of rats than had been used in the previous studies with this species (Morris et al., 1942; Blood, 1965; Mason et al., 197 1). In addition, a second species (the mouse) was used which had not been tested in previous studies.
METHODS
Ethylene glycol. Fifty-five gallons of polyester grade EG were supplied by Union Carbide Corporation, Hahn- ville, Louisiana. The sample was analyzed to be 99.93% EG at the time of shipment, which was approximately 1 year prior to the start ofthe rat study and 2 1 months prior to the start of the mouse study. The diethylene glycol concentration was less than 0.005% by weight. The sam- ple was analyzed again after approximately 38 months of storage at the laboratory. Silylation gas chromatography revealed that the sample contained 99.82% EC and 0.18% diethylene glycol.
Diet preparation. Ethylene glycol was added to ground Purina Laboratory Chow 5008 at concentrations pro- jected to produce dosages of 1.0, 0.2, or 0.04 g/kg/day. Dietary EG concentration was adjusted every 2 weeks for the first 438 or 580 days in the mouse and rat studies, respectively, according to the most recent group mean body weight and diet consumption data. The stability of EG in the test diets was demonstrated using standard gas chromatographic procedures. No significant degradation was observed after 73 days of storage.
Animals and husbandry Young adult Fischer 344 rats and Charles River CrlCOBS CD 1 (ICR)BR mice from Charles River Breeding Laboratories, Wilmington, Mas- sachusetts, were used in these studies. The rats were approximately 38 days old at study initiation. The mice were approximately 42 days of age at the start of the study. Rats were housed in suspended stainless-steel wire front and bottom cages, three males or five females per cage. Mice were housed in similar cages, two per cage for the first year and singly thereafter. Water was provided by an automatic system with demand controlled valves in each cage. Ground diet was supplied ad libitum in opal glass jars for the rats and in stainless-steel feeders for the mice. Animals were identified by toe clips.
Experimental design and observations. One hundred thirty rats and eighty mice of each sex were assigned ran- domly to each of five treatment groups. Two untreated control groups were used in each study in addition to the three EG-treated groups to provide an estimate of the variation between two groups treated alike. The animals were examined daily for clinical condition, and weighed every 2 weeks for the first year and monthly thereafter. Food consumption was recorded every 2 weeks for 16 cages in each group until the body weights stabilized and dietary concentration of EG was held constant. Rat water consumption was measured at 12,18, and 24 months for 10, 20, and 10 animals/sex/group, respectively. Except for the 24-month sacrifice, these animals were chosen randomly at the start of the study and were not replaced by others when deaths occurred.
Blood samples were collected by retroorbital sinus puncture under methoxyflurane anesthesia. Clinical chemistry and hematology measurements were per- formed only on the rats. Evaluated were 10, 10, 20, and 10 rats/sex/group from the 6-, 12-, 18-, and 24-month sacrifices, respectively. Total bilirubin, serum urea nitro- gen, glucose, alkaline phosphatase, serum glutamic oxa- loacetic transaminase (SGOT), serum glutamic pyruvic transaminase (SGPT), serum albumin, cmatinine, and calcium were measured using the Centrifichem centrifu- gal analyzer (Baker Instruments, Pleasantville, N.Y.). Hematologic measurements and calculations included RBC count, hematocrit, hemoglobin, mean corpuscular volume, mean corpuscular hemoglobin, mean corpuscu- lar hemoglobin concentration, total WBC, and differen- tial counts performed on a Coulter Counter S-Plus (Coulter Electronics, Inc., Hialeah, Fla.).
Urinalysis included measurements of urine volume, pH, specific gravity, protein, glucose, ketones, biirubin, occult blood, and nitrate. Specific gravity was deter- mined with a clinical refractometer (American Optical Co., Buffalo, N.Y.). The other measurements were made with the Ames Multistix Reagent Strip read on the Clini- tek (Ames Division, Miles Laboratories, Elkhart, hid.). Samples were also examined grossly for color and turbid- ity, and microscopically for phosphate, calcium oxalate, uric acid, and amorphous crystals, as well as for blood and epithelial cells, spermatozoa, bacteria, and yeast. The types of crystals were identified by standard morpho- logic criteria (McNeely, 1980).
The duration of each study was 24 months. Ten rats per sex per group were sacrificed at 6 and 12 months and 20 per sex per group were sacrificed at 18 months. Twenty mice per sex per group were sacrificed at 80 weeks of treatment. Complete necropsies were per- formed on all animals except when precluded by autoly- sis or cannibalism. Weights of the liver, kidneys, spleen, heart, brain, lung, and testes were recorded in the rat study from all animals at the interim and terminal sacri- fices. Tissues were preserved in 10% neutral buffered For- malin and processed (paraffin technique) for histologic

examination. Microscopic examination was performed on tissues from ail major organs in the high-dose and control groups plus gross lesions and target tissues from the intermediate- and low-dose groups. The list of tissues evaluated histologically included pituitary, thyroid, para- thyroids, adrenals, heart, spleen, mesenteric lymph node, trachea, lungs, ovaries, oviduct, submandibular salivary gland, esophagus, stomach, duodenum, jejunum, ileum, colon, liver, pancreas, brain, spinal cord (lumbar), uterus, testes, epididymides, prostate, kidneys, urinary bladder, eyes, skin, skeletal muscle, femur, sternum, and gall bladder (in mice). All tissues were examined from animals that died or were sacrificed moribund during the study.
TABLE 1
WATER CONSUMPTION DATA (MEANS + SD)
OF MALE RATS AT 12 MONTHS
Dosage of ethylene glycol Volume Wg/day) (ml/rat/dw)
1.0 41.6 f 6.8“ 0.2 17.7 + 3.8 0.04 15.1 -t_ 3.8 O.OA 16.8 + 3.8 O.OB 20.3 + 2.8
Statistical analyses. For continuous data, the analysis Note. O.OA and O.OB, control groups.
of variance (AOV) validated by Bartlett’s test for homo- ’ Significantly different from controls (p < 0.001).
geneity of variances was used. If AOV was significant, differences from control groups were evaluated by Dun- can’s multiple range test if variances were homogeneous or by appropriate t tests, if variances were heterogeneous. Water Consumption Frequency data were evaluated by x2 or Fisher’s exact tests. Mortality and tumor incidence were evaluated by There was no significant difference be- life-table techniques (Sachs, 1959; Mantel, 1966; Bres- low, 1970). When comparisons were made between indi-
tween the water intake of EG-treated female
vidual dose groups and control groups, the latter were rats and their controls at any time. However, almost always considered as separate groups without at the first measurement (at 12 months), the pooling of the control data. Exceptions are mentioned in high-dose male rats drank approximately the text or tables. twice as much as the controls (Table 1). All
high-dose males had died by the 18-month measurement period. The water consump-
RESULTS tion of male rats that received 0.2 or 0.04 g/ kg/day of EG was not affected by EG treat- ment at any time.
Dosage and Diet Consumption
Body Weights The dosage of EG calculated from the body
weight and diet consumption data using the The weight gain of EG-treated mice was nominal concentrations of EG in the diet similar to that of controls throughout the were always within 10% of the dosage goals. study. As shown in Table 2, the weight gain There were no significant differences between of male rats was normal for the first 6 months the diet consumption of the EG-treated and of the study. However, by the end of the first the control rats or mice at any time. year the high-dose males had gained substan-
The nominal concentrations of EG in the tially less weight than either control group. test diets ranged from 0.01 to 0.05, 0.07 to This difference continued until the death of 0.24, and 0.35 to 1.27% in the low-, mid-, and the last surviving high-dose male in the 15th high-dose groups, respectively, in the mouse month of the study. study. The concentrations used in the rat In contrast to the males, average weight study were substantially higher with values of gain among the high-dose female rats was sta- 0.1, 0.5, and 2.5% for the low-, mid-, and tistically higher than that of the controls at six high-dose groups, respectively, during the last and at 12 months into the study. However, 5 months of the study when the concentra- the relatively small difference from the con- tions were constant. trol means and the absence of a clear dose-
TOXICITY OF ETHYLENE GLYCOL IN BATS AND MICE 549

550 DE PASS ET AL.
TABLE 2
MEANS + SD OF BODY WEIGHT GAIN IN MALE AND FEMALE RATS
Dosage of ethylene glycol k/k/day) 6 Months
Weight gain (g)
12 Months 18 Months 24 Months
Male rats 1.0 0.2 0.04
O.OA O.OB
Female rats 1.0 0.2
0.04 O.OA O.OB
284k29 298+48' -e - 288k30 356+31 386+46 383+56 281k32 351+47 386+41 385+50 280+20 353k21 387+34 391+34 281+2-l 349+33 381245 381~~54
118~10" 153k18' 199230 23O-t30 116 + 13 146k 19 198232 231+34
117-tl3 153f22d 202k31 234-t31 114+ 10 145 k 15 193k22 226+41 115+ 9 1462 15 192 f 25 224k32
Note. O.OA and O.OB, control groups. ’ p < 0.0 1 vs control A; p < 0.05 vs control B. ’ p < 0.00 1 vs both control groups. ’ p < 0.00 1 vs control A; p <: 0.0 1 vs control B. d p < 0.0 1 vs both control groups. e Last male died before 18 months.
response relationship suggest that the differ- ence observed was adventitious.
Hematology
Hematology data for female rats revealed no changes of physiological importance.
TABLE 3
TWELVE-MONTH BLEND UREA NITR~CEN (BUN) AND CREATNNE DATA (MEANS + SD) OF MALE RATS
Dosage of ethylene glycol
WWW Creatinine
@g/W
1.0 82+65" 2.2 t 1.8' 0.2 20+ 1 0.4 + 0.2 0.04 20* 1 0.4to.1 O.OA 20* 1 0.4 f 0.2
O.OB 20+ 2 0.6 50.1
Note. O.OA and O.OB, control groups. n Significantly different from both control groups (p
<0.05).
Among the males, statistically significant changes in RBC count (p < 0.0 I), hematocrit (p < 0.05), hemoglobin concentration (p < 0.05), and neutrophil count (p < 0.05) oc- curred in the high-dose group at 12 months. The high-dose means for these parameters were 6.0 X 10⁶/mm3, 32.7’S, 14.0 g/dl, and 3239, respectively, compared with control averages of 7.1 X 10⁶/mm3, 38.6%, 16.6 g/dl, and 2004 (combined control data). No effects were seen at the lower dose levels or in any other hematologic parameter at any dose level at any time.
Serum Chemistry
No changes occurred in female rats, but in high-dose males, urea nitrogen and creati- nine showed fourfold mean increases com- pared to controls after 12 months of treat- ment (Table 3). No changes were observed at the lower dose levels or in any other clinical chemistry measurement at any dose level at any time.

TOXICITY OF ETHYLENE GLYCOL IN RATS AND MICE 551
Urinalysis
No treatment-related changes occurred at 6 months, but at 12 months there were statis- tically significant increases in urine volume (p < 0.001) and reductions in urine specific gravity (p < 0.001) and pH (p < 0.01) in the high-dose male rats. High-dose means were 29.0 ml/rat/day, 1 .016, and 6.0, respectively, for the variables listed compared with 7.0 ml/ rat/day, 1.063, and 7.1 for the controls. The only change Seen in female rats at 12 months was a reduction in mean pH at the highest dose level, 7.0 versus 7.4 in controls (p < 0.05). No treatment-related effects were re- corded at 18 months, but at 24 months, high- dose female rats had significantly lower mean urine volume (p < 0.01) and higher specific gravity (p < 0.05) than controls. The high- dose means were 6.7 ml/rat/day and 1.048, respectively, for the variables listed versus 12.2 ml/rat/day and 1.038 for the controls. The toxicologic significance of the 24-month female rat data is questionable in that the control means were much higher than the means of those parameters at earlier time in- tervals, including 18 months. No EG-related changes were seen in these parameters at lower dosages or in any other parameter ex- cept for a slight reduction (p < 0.05) in urine specific gravity in male rats that received 0.2 g/kg/day of EG. The mean was 1.044 for the EG-treated group versus the control mean of 1.052 at the 24-month interval.
Microscopic examination of rat urine sam- ples for crystals yielded the following results (Table 4). After 12 months of treatment, urine samples from high-dose male rats con- tained no triple phosphate crystals in contrast to the samples from all other dose groups which had many such crystals. Calcium oxa- late crystals were found in urine samples from all but one of the high-dose animals of both sexes. Oxalate crystals were not found in samples from most of the other animals on study. At 18 and 24 months, all but one of the high-dose female specimens contained calcium oxalate crystals. There was also an
increased incidence and amount of uric acid crystals in high-dose females at those times. At 0.2 g/kg/day, there was an increased inci- dence and amount of oxalate crystals at 24 months in animals of both sexes.
Mortality
Mortality curves for male and female rats and mice are presented in Fig. 1. Among the female rats and mice of both sexes, the mor- tality rate was equivalent for all dose groups. However, the high-dose male rats had a statis- tically significant (p < 0.00 1) increase in mor- tality rate from the 9th through the 16th month of the study (Fig. 1). The last high- dose male rat died after 474 days of study.
Organ Weights
Rat kidney and liver weights were affected by EG treatment at various times during the study. At the 6-month sacrifice, male and fe- male rat absolute and relative (to body weight) kidney weights in the high-dose group were significantly higher than those of the controls (Table 5). At the 12-month sacri- fice, the high-dose males were still affected but the females were not. In addition, abso- lute and relative liver weights were reduced in the high-dose males compared to controls. At the l&month sacrifice, there were no effects in the males at 0.2 and 0.04 g/kg/day, but the high-dose female kidney weights were higher than those of their controls. Although the or- gans were weighed at the 24-month sacrifice, no statistical comparisons were made be- cause of the relatively large numbers of tu- mors present. There were no biologically sig- nificant changes in the weights of the other organs at any time.
Histopathology
Rats. Nonneoplastic histopathologic le- sions are presented in Table 6. This is a sum-

552 DE PASS ET AL.
TABLE 4
RESULTS OF EXAMINATION OF RAT URINARY CRYSTALS AT 12,18, AND 24 MONTHS
Triple phosphate Calcium oxalate Uric acid Dosage
h&/day) 12 18 24 12 18 24 12 18 24
Male rats” 1.0 O(O)b -c -c +I (9) - - O(0) - - 0.2 +3(10) +2(19) 0 (3) 0 (4) 0 (0) +I (6) 0 (0) 0 (0) 0 (0) 0.04 +3 (10) +2 (20) +1(7) O(l) 0 (0) 0 (2) 0 (0) 0 (0) 0 (0) O.OA +3 (IO) +2 (20) +1(b) O(l) 0 (0) 0 (2) 0 (0) 0 (0) 0 (0) O.OB +3 (9) +2 (18) +I (6) 0 (0) 0 (0) 0 (2) 0 (0) 0 (0) 0 (0)
Female rats 1.0 +3 (10) +1(18) +1(b) +2 (10) +3 (20) +3 (9) 0 (0) +1(13) +l (8) 0.2 +3(10) +2 (20) +1 (6) 0 (0) O(l) +1(b) 0 (0) 0 (0) 0 (0) 0.04 +2 (10) +2 (18) +1(9) 0 (0) 0 (0) O(l) 0 (0) 0 (0) 0 (0) O.OA +3 (10) +2(18) +I@) 0 (0) 0 (0) 0 (0) 0 (0) 0 (0) 0 (0) O.OB +3 (10) +2(18) +1(8) 0 (0) 0 (0) 0 (0) 0 (0) 0 (0) 0 (0)
Note. O.OA and O.OB, control groups. a Ten specimens per sex per group were examined at 12 and 24 months, 20 at 18 months. bThe first number in each column is the median amount of crystals present on a scale of 0 to +3; +I = few,
+2 = moderate number, f3 = numerous; numbers in parentheses are the number of animals showing crystals. c There were no high-dose male survivors at the 18 and 24 month periods.
mary of the most important lesions observed in the rats that were sacrificed at 6, 12, 18, and 24 months plus those that died or were sacrificed moribund during the study. For ease of presentation the data are not listed by time of appearance of the lesion. However, the time of appearance will be discussed in the text of this section.
At the 6-month sacrifice, the incidence of the following renal lesions was significantly increased in the high-dose males: tubular hy- perplasia, tubular dilation, peritubular ne- phritis, and calcium oxalate crystalluria. Not statistically significant but interesting be- cause of their rarity were two cases of granu- lomatous nephritis; also, in two high-dose males calcium oxalate crystals were present in the urinary bladder. These conditions were absent in the other male dose groups and in females. Among females there was an in- creased incidence of granulomatous myelitis of the femoral marrow at the highest dose level. Special staining indicated the absence of collagen, reticulin, or calcium oxalate. Finely granular periodic acid-Schiff positive
deposits were observed in many of the le- sions. This condition was not present in EG- treated animals sacrificed later in the study.
At the 1Zmonth sacrifice all high-dose males had chronic nephritis with calcium ox- alate crystalluria and 50% had oxalate crys- tals in the urinary bladder. The term “chronic nephritis” is used to indicate the presence of multiple severe histopathologic changes in- cluding tubular dilation and proteinosis, glo- men&r shrinkage, tubular cell hyperplasia, and chronic interstitial nephritis. These find- ings were not present in males at the lower dose levels or in females.
By the time of the 1 S-month sacrifice, all of the high-dose males had died or were sacri- ficed moribund. In most ofthese animals, oxa- late nephrosis was the primary cause of death. Kidneys from these animals had tubular ob- struction by large birefiingent crystals with secondary tubular dilation and degeneration. Calculi were sometimes found within the re- nal pelvic space, ureters, and urinary bladder, often with an associated (secondary) hydrone- phrosis. Associated extrarenal lesions in-

MAL
E R
ATS
FEM
ALE
RAT
S
1.0
0.2
0.04
O
-A
O-S
-
e-v
-m-v
_-
---
1.0
0.2
0.04
O
-A
O-B
0
0 5
20
25
MAL
E M
ICE
1.0
0.2
0.04
O
-A
O-B
- ---
---
- ---
- .
5 10
15
20
25
Mon
ths
of
Expo
sure
Mon
ths
of
Expo
sure
~~~~
__
_ FE
MAL
E M
lCE
1.0
0.2
0.04
O
-A
O-B
- --
- -_
_-
---_
- .
. .
..I.
100
r P 6
60
%
2 5 %
6o
f 3 _” E’
40
a
20
-
10
15
Mon
ths
of
Expo
sure
20
25
WI
FIG
. 1.
Cum
ulat
ive
mor
talit
y cu
rves
of m
ale
and
fem
ale
rats
and
mic
e ex
pose
d to
die
tary
eth
ylen
e gl
ycol
for
2 y
ears
. Sur
viva
l of
the
1 .O g/
kg/d
ay
dose
mal
e ra
ts w
as
sign
ifica
ntly
dec
reas
ed c
ompa
red
to th
e co
ntro
l gr
oups
(p
i 0.
001)
. Fe
mal
e ra
ts a
nd m
ice
of b
oth
sexe
s had
mor
talit
y ra
tes
com
para
ble
to c
ontro
ls.
554 DEPASSETAL.
TABLE5
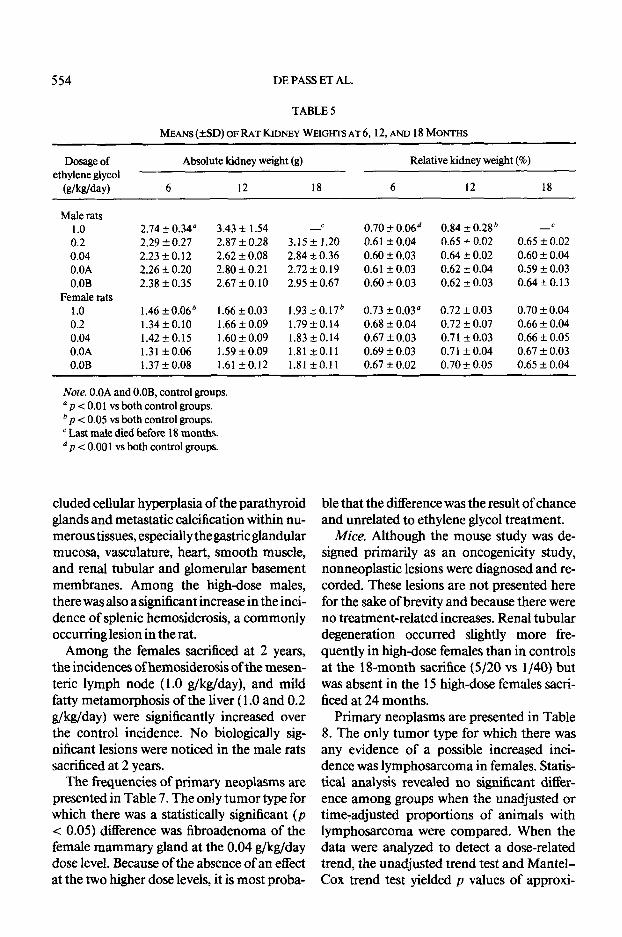
MEANS (*SD) OF RAT KIDNEY WEIGHTS AT 6,12, AND 18 MONTHS
Dosage of ethylene glycol
WWW
Absolute kidney weight (g) Relative kidney weight (%)
6 12 18 6 12 18
Male rats 1.0 2.74 kO.34" 3.43 f 1.54 -c 0.70 + 0.06d 0.84 f 0.28' -c 0.2 2.29 kO.27 2.87 k 0.28 3.15 +- 1.20 0.61 kO.04 0.65 + 0.02 0.65 too.02 0.04 2.23 kO.12 2.62 kO.08 2.84 k0.36 0.6OkO.03 0.64 kO.02 0.6OkO.04 O.OA 2.26 kO.20 2.80 k0.21 2.72kO.19 0.61 +0.03 0.62 kO.04 0.59 -to.03 O.OB 2.38 kO.35 2.67 20.10 2.95 kO.67 0.60 20.03 0.62 f 0.03 0.64 zkO.13
Female rats 1.0 1.46 k 0.06” 1.66 20.03 1.93 kO.176 0.73 f 0.03@ 0.72 kO.03 0.70 +0.04 0.2 1.34kO.10 1.66 kO.09 1.79 kO.14 0.68 kO.04 0.72 +0.07 0.66 +0.04 0.04 1.42kO.15 1.60 + 0.09 1.83 20.14 0.67 kO.03 0.7 1 f 0.03 0.66 rto.05 O.OA 1.31 kO.06 1.59 *0.09 1.81 20.11 0.69 kO.03 0.71 +0.04 0.67 f 0.03 O.OB 1.37 kO.08 1.61 kO.12 1.81 kO.11 0.67 kO.02 0.70*0.05 0.65 +- 0.04
Note. O.OA and O.OB, control groups. ’ p -c 0.0 1 vs both control groups. b p -C 0.05 vs both control groups. ’ Last male died before 18 months. dp < 0.001 vs both control groups.
eluded cellular hyperplasia of the parathyroid glands and metastatic calcification within nu- merous tissues, especially the gastric glandular mucosa, vasculature, heart, smooth muscle, and renal tubular and glomerular basement membranes. Among the high-dose males, there was also a significant increase in the inci- dence of splenic hemosiderosis, a commonly occurring lesion in the rat.
Among the females sacrificed at 2 years, the incidences of hemosiderosis of the mesen- teric lymph node (1.0 g/kg/day), and mild fatty metamorphosis of the liver (1 .O and 0.2 g/kg/day) were significantly increased over the control incidence. No biologically sig- nificant lesions were noticed in the male rats sacrificed at 2 years.
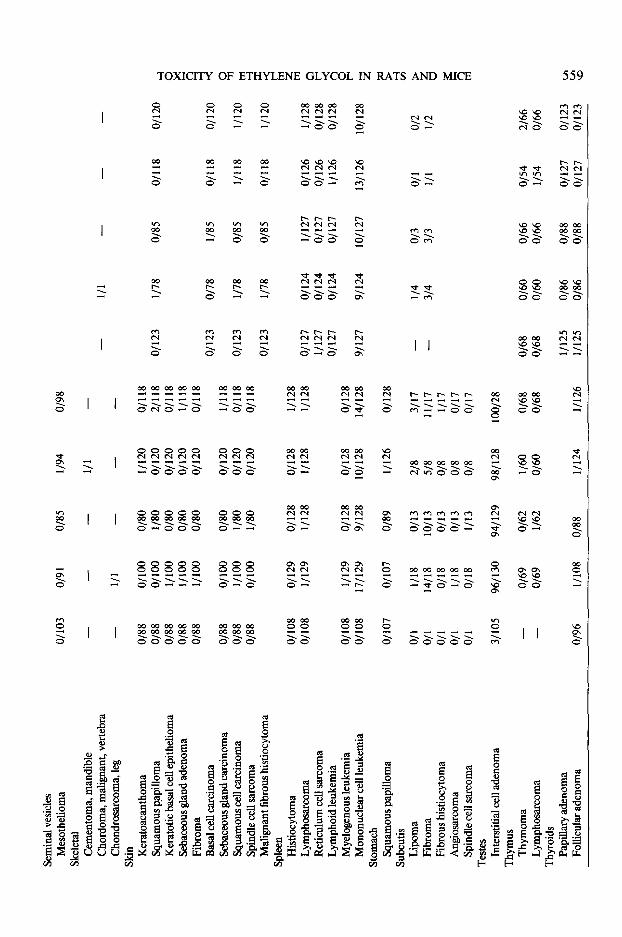
The frequencies of primary neoplasms are presented in Table 7. The only tumor type for which there was a statistically significant (p < 0.05) difference was fibroadenoma of the female mammary gland at the 0.04 g/kg/day dose level. Because of the absence of an effect at the two higher dose levels, it is most proba-
ble that the difference was the result of chance and unrelated to ethylene glycol treatment.
Mice. Although the mouse study was de- signed primarily as an oncogenicity study, nonneoplastic lesions were diagnosed and re- corded. These lesions are not presented here for the sake of brevity and because there were no treatment-related increases. Renal tubular degeneration occurred slightly more fre- quently in high-dose females than in controls at the 1 g-month sacrifice (5/20 vs l/40) but was absent in the 15 high-dose females sacri- ficed at 24 months.
Primary neoplasms are presented in Table 8. The only tumor type for which there was any evidence of a possible increased inci- dence was lymphosarcoma in females. Statis- tical analysis revealed no significant differ- ence among groups when the unadjusted or time-adjusted proportions of animals with lymphosarcoma were compared. When the data were analyzed to detect a dose-related trend, the unadjusted trend test and Mantel- Cox trend test yielded p values of approxi-

TABL
E 6
F~EO
UENC
Y O
F SE
LECT
ED
NONN
EOPL
ASTI
C LE
SIO
NS
IN F
344
RATS
Ethy
lene
gly
col
in d
iet
(g/k
g/da
y)
Org
an/fi
ndin
g 1.
0 0.
2
Mal
es
0.04
Fem
ales
0.0
(A)
0.0
(B)
1.0
0.2
0.04
0.
0 (A
) 0.
0 (B
)
Adre
nals
Cel
lula
r hy
perp
lasi
a, m
edul
la”
Bone
mar
row
(fem
oral
) G
ranu
lom
atou
s m
yelit
is
Hea
rt M
iner
aliza
tion,
ve
ssel
s M
iner
aliza
tion,
m
uscl
e Ki
dney
s Tu
bula
r hy
perp
lasi
a Pe
ritub
ular
ne
phrit
is Tu
bula
r di
latio
n G
ranu
lom
atou
s ne
phrit
is H
ydro
neph
rosi
s O
xala
te n
ephr
osis
Cal
cium
ox
alat
e cr
ysta
lluria
G
lom
erul
onep
hros
is Li
ver
Fatty
met
amor
phos
is
Mon
onuc
lear
ce
ll in
hhra
tes
Hep
atic
gra
nulo
mas
/his
tiocy
tosi
s Lu
ngs
Min
eral
izatio
n,
inte
rstit
ial
Mes
ente
ric l
ymph
nod
e H
emos
ider
osis
Pa
rath
yroi
ds
Cel
lula
r hy
perp
lasi
a St
omac
h M
iner
aliza
tion
Vasc
ular
M
iner
aliza
tion
70/l
lob
l/l10
51/l
10”
O/l
10
10/l
16
1011
29
6/l
16
7112
9 10
/116
” l/l2
9 2/
l 16
O
/l29
72/l
16”
3112
9 95
/l 16
’ O
/l29
16/l
166
O/1
29
5/l
16
1071
129
2189
21
89
lo/l2
9 41
129
O/1
29
O/l2
9 O
/129
O
/129
O
/129
10
3/12
9
65/1
09b
l/113
l/8
9
4519
06
3/10
1 31
84
7211
07’
l/l07
l/89
5817
8 b
2175
21
71
l/l28
O/1
28
lo/l2
8 21
128
O/l2
8 O
/l28
l/128
O
/l28
O/l2
8 10
6112
8
l/127
l/l13
l/l26
o/9
1
l/127
O
/127
1 l/1
28
4112
8 O
/l28
O/1
28
4/ 1
28
O/l2
8 O
/128
10
6112
8
l/127
l/l15
2112
8
o/90
8112
6 25
185’
61
89
7112
6 51
127
8147
31
20
4123
41
5 1
4155
2112
8 l/l2
5 91
128
9112
5 O
/l28
O/l2
5 O
/l28
O/1
25
3112
8 21
125
2112
8 O
/l25
O/1
28
O/1
25
1041
128
9611
25
7112
9 lo
/129
O
/129
O
/l29
O/1
29
O/l2
9 O
/l29
9411
29
4112
8 81
128
O/l2
8 O
/l28
2112
8 O
/128
O
/128
10
0/12
8
O/1
28
7112
8 O
/l28
O/1
28
2112
8 O
/l28
O/1
28
9911
28
35/1
2gd
3511
28’
10/1
28’
2711
25
1611
29
2911
25
2011
29
3112
5 10
/129
’
17/1
28
1711
28
1711
28
3011
28
2112
8 O
/l28
1211
28
O/8
0 61
84
6/11
8 51
121
Not
e. A
and
B, c
ontro
l gr
oups
. ,I
Num
erat
or
equa
ls nu
mbe
r of
rats
with
sp
ecifi
ed f
indi
ng.
Den
omin
ator
eq
uals
num
ber
of ra
ts f
or w
hich
sp
ecifi
ed o
rgan
was
exa
min
ed.
b p <
0.0
01; ‘
p <
0.05
; dp
< 0.
0 1.
Pro
babi
lity
valu
es w
ere
obta
ined
us
ing
the
com
bine
d co
ntro
l da
ta.

Org
an/fi
ndin
g
TABL
E 7
FREQ
UENC
V OF
PRI
MAR
Y NE
OPLA
SMS
OBS
ERVE
D IN
F34
4 RA
TS
Ethy
lene
giy
col
in d
iet
(g/k
g/da
y)
Mal
es
Fem
ales
1.0
0.2
0.04
0.
0 (A
) 0.
0 (B
) 1.
0 0.
2 0.
04
0.0
(A)
0.0
(B)
Abdo
min
al
cavi
ty (s
ee a
lso p
erito
neum
) Pa
raga
nglio
mas
Le
iom
yosa
rcom
a C
arci
nom
a,
poor
ly d
iffer
entia
ted
Sarc
oma,
poo
rly d
iffer
entia
ted
Adip
ose
tissu
e Li
pom
a Ad
rena
ls C
ortic
al a
deno
ma
Cor
tical
car
cinom
a Ph
eoch
rom
ocyt
oma
Pheo
chro
moc
ytom
a,
mal
igna
nt
Neu
robl
asto
ma
Gan
ghon
euro
ma
Brai
n Gra
nula
r ce
ll tu
mor
G
liom
a/As
trocy
tom
a C
ervi
x C
ervi
cal
poly
p C
litora
l gl
and
Aden
oma
Car
cinom
a H
eart Schw
anno
ma/
neur
ilem
oma/
ne
urof
ibro
ma
Inte
stin
es
Duo
denu
m
Leio
myo
ma
Jeju
num
Le
iom
yom
a
2122
"
O/11
6
O/l1
6 O
/l16
O/l1
6 O
/l16
O/l0
4
O/l
10
- - - -
414
719
l/109
l/8
7
2311
09
1218
7
o/10
9 l/8
7 O
/l09
l/87
o/10
9 O/
87
O/l2
8 31
129
2111
0 l/8
9
O/l
l/l
6129
4112
2
2411
22
l/122
o/
122
o/12
2
O/l2
8
O/l2
8
6128
3112
4
18J1
24
O/l2
4 O
/l24
l/l24
l/l27
O/l2
7
O/l l/l
8/27
1211
26
O/12
6 31
126
l/l26
l/l27
O
/l27
l/72
l/2
l/2
3112
8
o/12
1
l/l24
O/1
O
/l
O/3
6185
l/8
5
8185
Of85
O/12
3 O
/l23
l/69
2/2
012
l/85
O/80
O/83
O/l
O/l
ll/ll
1218
9 O/
89
3189
O/89
O/12
6 O
/l26
O/72
4J4
O/4 l/89
O/87
O/86
l/l
O/l
4124
9112
6 l/l
26
3112
6
l/l26
O/12
6 31
126
O/69
l/l
O/l
l/l27
O/l2
2
o/12
0
- - 8130
Fz
7112
7 ;r!
O/12
7 g
IO/1
27
i O
/l27
’
0112
7 Of
127
O/66
w
o/2
l/l27
l/l21
o/12
2

Leio
myo
sarc
oma
Ileum
C
arcin
oid
Aden
ocar
cinom
a C
ecum
H
eman
giop
eric
ytom
a C
olon
Ad
enoc
arcin
oma
Kidn
eys
Embr
yona
l ne
phro
ma
Tera
toid
ne
phm
ma
Tubu
lar
aden
oma
Aden
ocar
cinom
a Tr
ansit
iona
l ce
ll ca
rcin
oma
Squa
mou
s ce
ll ca
rcin
oma
Lipo
sarc
oma
Lacr
imal
gl
and,
ext
raor
bita
l Ly
mph
oepi
thel
iom
a Ad
enom
a Li
ver
Neo
plas
tic n
odul
es
Hep
atoc
ellu
lar
aden
oma
Hep
atoc
ellu
lar
carc
inom
a Lu
ngs
Pulm
onar
y ad
enom
a Al
veol
ar
cell
carc
inom
a Ad
enoc
arcin
oma/
carc
inom
a C
hord
oma,
m
etas
tatic
Ly
mph
nod
es, b
ronc
hial
Ly
mph
angi
oma
Lym
ph n
odes
, cer
vica
l Sa
rcom
a, p
oorly
diff
eren
tiate
d Ly
mph
osar
com
a Ly
mph
nod
es, m
esen
teric
Ly
mph
angi
oma
Hem
angi
oma,
ca
vern
ous
Mam
mar
y gl
and
Aden
oma
Fibr
oma
Fibr
oade
nom
a
Of96
O
/l06
l/85
o/12
1 O
/l24
O/96
O/
106
l/85
l/121
O/
124
O/28
O/
78
o/7
1 O
/l 1
l/74
O/l0
3 O
/l03
l/81
O/l
15
o/12
1
O/l
16
O/l2
9 O
/l29
l/l28
Of12
8
O/l1
6 O
/l29
O/12
9 O
/l28
l/l28
O
/l 16
l/l
29
O/l2
9 O
/l28
O/l2
8
O/l
16
l/l29
O
/l29
O/l2
8 l/l
28
Of11
6 O
/l29
O/12
9 O
/l28
2112
8 O
/l16
l/129
O/
129
O/12
8 O
/l28
- - o/11
0 21
129
o/11
0 31
129
O/I
10
l/129
o/10
9
o/10
9 l/1
09
o/10
9
O/68
O/86
o/27
o/
21
l/27
O/4
O/
4 11
2 11
2
o/11
3 o/
113
o/11
3 o/
113
O/l2
9 91
128
5112
8 21
129
O/l2
8 21
128
O/12
9 3/
128
2112
8
l/89
l/l27
O/
127
O/89
l/1
27
Of12
1
3/89
O/
127
2/12
1 O/
89
l/l21
l/l
27
o/95
l/l
9
O/98
Of
19
l/69
O/62
O/
69
O/62
l/6
9 41
62
O/10
2
o/11
3
O/5
5 l/5
5 3/
55
O/l2
8 O
/l25
O/l2
9 O
/l28
l/l28
O/l2
8 l/l
25
O/l2
9 O
/l28
O/l2
8
o/2
012
l/128
O/
125
O/l2
9 O/
128
l/128
l/128
O
/l25
O/l2
9 O
/l28
O/l2
8
l/128
o/
90
l/91
l/l27
O
/l25
l/l28
O/
90
o/91
o/
121
l/l25
O
/l28
l/90
l/91
l/l27
O
/l25
O/12
3 l/8
0 O/
84
O/l1
8 o/
121
l/l03
O
/l16
Of7
7 O/
87
l/l07
O
/l13
O/l1
6 o/
77
O/81
21
101
l/113
O/l2
3 l/8
0 O/
84
O/l1
8 O
/l21
l/l16
O/62
2/
101
l/77
l/84
2110
0 O/
89
O/62
o/
101
Of7
7 O/
84
2110
0 O/
89
Of62
13
/101
13
/v 21
184
12/1
00
9189
O/l2
4 l/8
3 O/
86
O/l2
0 O
/l22

Org
an/fi
ndin
g 1.
0 0.
2
TABL
E l-C
ontin
ued Et
hyle
ne g
lyco
l in
diet
(g/
kg/d
ay)
Mal
es
Fem
ales
0.04
0.
0 (A
) 0.
0 (B
) 1.
0 0.
2 0.
04
0.0
(A)
0.0
(B)
Aden
ocar
cinom
a N
asal
cav
ity
Aden
oma,
po
lypo
id
Cho
ndro
ma,
na
sal t
urbi
nate
Sa
rcom
a, p
oorly
diff
eren
tiate
d O
ral
cavi
ty
Squa
mou
s pa
pillo
ma,
to
ngue
Sq
uam
ous
papi
llom
a,
phar
ynx
Ova
ries
Gra
nulo
sa
cell
tum
or
Panc
reas
D
uct
aden
oma,
pap
illary
Ad
enom
a,
exoc
rine
Isle
t ce
ll ad
enom
a Is
let
cell
carc
inom
a Pa
rath
yroi
ds
Aden
oma
Perit
oneu
m
Mes
othe
liom
a Pl
eura
M
esot
helio
ma
Pitu
itary
Ad
enom
a C
arcin
oma
Prep
utia
l gl
and
Aden
oma
Aden
ocar
cinom
a/ca
rcin
oma
Saliv
ary
glan
d, p
arot
id
Aden
oma
Aden
ocar
cinom
a Sa
rcom
a, p
oorly
diff
eren
tiate
d
o/10
4 O
/104
o/
104
O/9
0
O/8
5 O
/85
111
O/l
O/6
5 O
/98
O/6
5 l/9
8
o/71
o/
7 1
l/72
Of7
2 o/
79
o/79
l/l
- -
l/l07
O/1
07
5110
7
O/8
9 l/8
9 31
89
o/12
1 o/
121
6/12
1
o/10
1 l/8
4
212
o/11
3
515
- l/l
-
19/1
03
l/103
15
188
O/8
8 15
1127
O
/127
415
516
5/6
l/5
0th
116
O/8
1
O/8
1 O
/87
O/8
7
o/7
1 l/7
1 -
o/74
-
O/6
9 -
O/1
26
219
1
O/1
23
O/1
23
3112
3
l/l
15
313
l/126
l/l2
6
o/11
3
l/83
O/8
3
l/78
-
2211
27
36/1
25
3718
9 31
127
2112
5 l/8
9
313
O/3
l/95
o/95
4/10
1
O/9
6
l/77
O/7
6
2184
-
o/73
O/9
2
l/86
O/8
6
O/7
6
4319
3 l/9
3
O/8
4
3110
0 l/8
9
l/l
l/69
-
Of6
8
O/1
24
O/1
23
l/l23
O/1
23
l/120
l/l23
Of1
23
o/10
4
4611
25
4511
25
2112
5 l/1
25
l/96
o/10
1
Sem
inal
ves
icle
s M
esot
helio
ma
Skel
etal
C
emen
tom
a,
man
dibl
e C
hord
oma,
m
alig
nant
, ve
rtebr
a C
hond
rosa
rcom
a,
leg
Skin
Ke
rato
acan
thom
a IS
quam
ous
papi
llom
a Ke
rato
tic
basa
l cel
l epi
thel
iom
a Se
bace
ous g
land
ade
nom
a Fi
brom
a Ba
sal c
ell c
arcin
oma
Seba
ceou
s gla
nd c
arcin
oma
Squa
mou
s ce
ll ca
rcin
oma
Spin
dle
cell
sarc
oma
Mal
igna
nt
fibro
us h
istio
cyto
ma
Sple
en
His
tiocy
tom
a Ly
mph
osar
com
a R
etic
ulum
ce
ll sa
rcom
a Ly
mph
oid
leuk
emia
M
yelo
geno
us
leuk
emia
M
onon
ucle
ar
cell
leuk
emia
St
omac
h Sq
uam
ous
papi
llom
a sl
lbcu
tis
Lipo
ma
Fibr
oma
Fibr
ous
hist
iocy
tom
a An
gios
arco
ma
Spin
dle
cell
sarc
oma
Test
es
Inte
rstit
ial
cell
aden
oma
Thym
us
Thym
oma
Lym
phos
arco
ma
Thyr
oids
Pa
pilla
ry
aden
oma
Fohi
cula
r ad
enom
a
O/l0
3
O/8
8 O
/88
O/8
8 O
/88
O/8
8
O/8
8 O
/88
O/8
8
O/1
08
O/l0
8
O/l0
8 O
/108
o/10
7
O/l
O/l
O/l
O/l
O/l 3110
5
o/9
1
- l/l
o/10
0 o/
100
l/l00
l/l00
l/l00
o/10
0 l/l0
0 o/
100
O/1
29
l/l29
l/l29
1711
29
O/l0
7
l/l8
14/1
8 O
/l8
l/l8
O/l8
9611
30
O/6
9 O
f69
l/l08
O/8
5
- - Of8
0 l/8
0 O
/80
O/8
0 O
/80
O/8
0 l/8
0 l/8
0
O/1
28
l/l28
O/l2
8 91
128
O/8
9
o/13
10
/13
o/13
o/
13
l/13
9411
29
O/6
2 l/6
2
O/8
8
l/94
l/l - l/i20
o/12
0 O
/l20
O/l2
0 o/
120
o/12
0 O
/l20
O/l2
0
O/1
28
l/l28
O/l2
8 lo
/128
l/l26
218
518
O/8
O
/8
O/8
9811
28
l/60
O/6
0
l/l24
O/9
8
- - O/l1
8 21
118
O/l1
8 l/1
18
O/l1
8
l/l18
O/l1
8 O
/118
l/128
l/1
28
O/l2
8 14
1128
O/l2
8
3117
1 l
/l7
l/l7
o/17
o/
17
1001
28
O/6
8 O
/68
l/l26
- O/l2
3
O/l2
3
O/l2
3
O/1
23
o/12
7 l/l2
7 O
/127
9112
7
- - O/6
8 O
/68
l/l25
l/l25
l/l
l/78
O/7
8
l/78
l/78
O/l2
4 O
/l24
O/1
24
9112
4
l/4
314
O/6
0 O
/60
O/8
6 O
/86
- O/8
5
l/85
O/8
5
O/8
5
l/l27
O/l2
7 O
/l27
1011
27
O/3
31
3
O/6
6 O
/66
O/8
8 O
/88
-
O/l1
8
O/l1
8
l/l18
O/1
18
O/l2
6 O
/l26
l/l26
1311
26
O/l II1
o/54
l/5
4
Of1
27
O/l2
7
- l/l28
O/l2
8 O
/l28
lo/1
28
2/66
O
/66
O/l2
3 O
/l23

Org
an/fi
ndin
g 1.
0 0.
2
TABL
E l--
Con
tinue
d Ethy
lene
gly
col
in d
iet
(g/k
g/da
y)
Mal
es
Fem
ales
0.04
0.
0 (A
) 0.
0 (B
) 1.
0 0.
2 0.
04
0.0
(A)
0.0
(B)
Follic
ular
ad
enoc
arcin
oma
Para
follic
ular
ce
ll ad
enom
a Pa
rafo
llicul
ar
cell
carc
inom
a U
rinar
y bl
adde
r Pa
pilla
ry
carc
inom
a Le
iom
yosa
rcom
a Sa
rcom
a, p
oorly
diff
eren
tiate
d M
esot
helio
ma
Ute
rus
Ute
rine
poly
p Le
iom
yom
a Po
lypo
id
aden
oma
Endo
met
rial
carc
inom
a En
dom
etria
l st
rom
al s
arco
ma
Leio
myo
sarc
oma
Vagi
na
Vagi
nal
poly
p Zy
mba
l’s B
land
Ad
enom
a Ad
enoc
arcin
oma
O/9
6 2/
108
O/8
8 O
/124
21
126
2112
5 O/
96
13/1
08
1218
8 91
124
1111
26
o/12
5 O
/96
l/l08
O/88
l/1
24
4112
6 21
125
O/1
21
o/12
1 l/1
21
o/10
1 O
/105
O/
86
l/119
o/
121
2011
26
Of1
26
O/12
6 31
126
l/126
O
f126
2122
- O
J64
Of67
l/6
5 l/7
0 l/6
8 O
/68
O/86
1 l
/86
O/8
6
O/84
O
/84
Of8
4
2019
8 l/9
8 O
J98
l/98
O/9
8 O
f98
Of3
l/67
l/67
l/88
6188
l/8
8
O/88
O
/88
O/8
8
2219
3 o/
93
l/93
o/93
o/
93
o/93
O/4
l/67
O/67
O/1
27
1111
27
l/127
l/121
l/1
21
o/12
1
1811
26
1211
26
O/1
26
O/12
6 O
/126
O/
126
l/126
21
126
O/1
26
l/126
2J
126
O/1
26
l/25
Of6
4 Of
64
O/1
23
11/1
23
l/123
o/12
0 o/
120
o/12
0
l/21
Of6
3 O
/63
Not
e. A
and
B, c
ontro
l gr
oups
. LI
Num
erat
or
equa
ls nu
mbe
r of
rats
with
tum
or.
Den
omin
ator
eq
uals
num
ber
of ra
ts f
or w
hich
sp
ecifi
ed o
rgan
was
exa
min
ed
mic
rosc
opic
ally
.

TOXICITY OF ETHYLENE GLYCOL IN RATS AND MICE 561
mately 0.2. However, The Gehan-Breslow trend test yielded a p value of 0.047. The lat- ter test gives greater weight to tumors de- tected early in the study than does the Man- tel-Cox test.
The lymphosarcomas in the highdose fe- males did occur somewhat earlier than those in the control groups. The median times to death with tumor of the high-dose, control A, and control B groups were 546,694, and 567 days, respectively. When the controls were combined the median was 687 days.
Since lymphosarcomas were detected only at death or sacrifice, a dose-related increase in mortality rate unrelated to the presence of lymphosarcoma (if present) could have ac- counted for an apparent reduction in the time to tumor observation. However, there was no evidence of an increase in the mortal- ity rate of ethylene glycol-treated female mice (Fig. 1). In addition, lymphosarcoma, when present, was always considered to be the cause of death, except for one high-dose animal.
DISCUSSION
The present studies were designed to evalu- ate the chronic toxicity and potential oncoge- nicity of ethylene glycol administered in the diet of rats and mice. Male rats were affected far more severely than female rats or mice. The early demise of the high-dose male rats was not expected from the results of 7-day and 90-&y studies (unpublished), which were performed to set dose levels for the pres- ent studies. Our preliminary data showed the presence of mild renal toxicity in male rats after 90 days of treatment with a dose similar to the highest dose used in these studies. In selecting dose levels, we were aware of the sex difference in sensitivity from our data as well as other previously published data. It was our expectation that the highest dose would pro- duce substantial toxicity in male rats, hope- fully without causing excessive mortality, while also causing a lesser degree of toxicity
in female rats and mice of both sexes. At the time these studies were designed, the use of different dose levels for males and females in the same study was not considered scientih- tally sound, although this procedure is now being used by the National Toxicology Pro- gram (Melnick, 1984).
At the highest dose level (1 .O g/kg/day), there was substantial renal toxicity in male rats due, at least in part, to the accumulation of calcium oxalate crystals and calculi in the kidneys. Deposition of oxalate in the kidneys of EG-treated rats and other changes indica- tive of renal toxicity have previously been re- ported (Morris et al., 1942; Blood, 1965; Mel- nick, 1984). The greater susceptibility of males to EG-induced renal toxicity was also reported in the studies cited, and may be the result of more efficient conversion of EG to toxic metabolites including oxalate in male rats (Richardson, 1965), as well as to the more rapid progression of spontaneous ne- phropathy in the male (Elema and Arends, 1975; Bolton et al., 1976). Since the high- dose female rats had significant amounts of urinary oxalate crystals at 12, 18, and 24 months, conversion of EG to oxalate clearly occurred in females. High-dose females also had increased kidney weights at 6 and 18 months. These results suggest that although renal effects of EG were observed in females, the critical factor responsible for the more se- vere nephrotoxicity and lethality in male rats was probably the greater incidence and sever- ity of spontaneous nephropathy in the male.
The deposition of oxalate calculi and the associated chronic nephritis accounted for the increased mortality rate seen in the high- dose male rats. Ultimately these animals lost the ability to concentrate the urine as indi- cated by the polyuria and secondary polydip- sia seen at 12 months. The high-dose males also had generalized soft tissue minerahza- tion which may be explained in part by in- creased loss of calcium as oxalate followed by compensatory parathyroid hyperplasia (ob- served), hypersecretion of parathyroid hor- mone, and increased resorption of calcium

Org
an/fi
ndin
g
TABL
E 8
FREQ
UEN
CY O
F PR
IMAR
Y NE
OPL
ASM
S O
BSER
VED
IN A
LL M
ICE
[Cd-
CO
BS
CD
- 1 (
ICR
) BR
] E
Ethy
lene
gly
col i
n di
et
Mal
es
Fem
ales
1.0
0.2
0.04
0.
0 (A
) 0.
0 (B
) 1.
0 0.
2 0.
04
0.0
(A)
0.0
(B)
Adre
nal
Aden
oma
Pheo
chro
moc
ytom
a Bo
ne
Ost
eom
a O
steo
sarc
oma
Bone
mar
row
Mye
losa
rcom
a H
arde
rian
glan
d C
ysta
deno
ma
Aden
ocar
cinom
a H
eart Und
iffer
entia
ted
sarc
oma
Hem
angi
osar
com
a Li
ver
Hep
atoc
ellu
lar
aden
oma
Hep
atoc
ellu
lar
carc
inom
a H
epat
ocel
lula
r ne
opla
sms
(tota
l) H
eman
giom
a H
eman
gios
arco
ma
Lung
Al
veol
ogen
ic
tum
or
Car
cinom
a Ly
mph
oret
icul
ar
Lym
phos
arco
ma
His
tiocy
tic
sarc
oma
Plas
ma
cell
tum
or
Und
iffer
entia
ted
sarc
oma
Mam
mar
y gl
and
Aden
oma
O/4
5”
O/4
6 l/4
3 o/
47
1144
O/7
7 o/
41
l/57
I/79
0173
3176
l/4
8 21
53
1116
5113
21
38
4149
31
15
l/65
5169
O/4
8 o/
47
l/51
o/53
o/
49
22/8
0 2O
j67
2711
6 19
/80
1917
6 26
180
2516
7 26
176
3618
0 25
116
4818
0 45
161
5317
6 55
180
4417
6 O
/80
l/67
O/l6
O
/80
O/7
6
2318
0 O
f80
2116
9 O
/69
l/78
O/l8
61
46
O/4
6
1517
0 l/7
0
lOl5
7 o/
57
2318
0 l/8
0 23
176
l/i’6
5118
51
16
O/l8
21
76
o/75
l/49
o/73
2171
l/7
1
O/l8
4179
31
19
7179
o/
79
o/19
1317
8 O
/78
1511
9 11
79
o/79
o/
79
o/57
O/4
2
011
o/44
3140
o/
40
O/4
6
O/5
0 l/5
0 I/5
0 O
/50
l/50
1015
8 O
/58
5152
l/5
2 O
/52
O/5
2
I/21
o/44
o/
15
014
O/4
6
o/49
21
15
O/5
0 O
/50
3175
o/
15
l/51
O/8
0
O/5
6 41
56
4/56
l/5
6 O
/56
2180
l/8
0 31
80
O/8
0 O
/80
1416
6 19
180
O/6
6 21
80
4155
o/
55
o/55
o/
55
O/3
8
1417
9 31
79
o/19
11
79
o/57
l/76
O/6
0
o/72
w
5175
$
o/15
g z
0178
p
4117
31
17
7171
o/
71
o/n
1317
8 O
/l8
9176
31
16
l/l6
l/76
2/50

TOXICITY OF ETHYLENE GLYCOL IN RATS AND MICE 563

564 DE PASS ET AL.
from bone (Rajagopal et al., 1977). Phos- phate retention, resulting from the oxalate nephropathy, would also be expected to have contributed to the development of hypocal- cemia, with these same compensatory ho- meostatic changes.
The observed reductions in erythroid pa- rameters in high-dose males at 12 months have been previously reported (Patemi et al., 1956). These reductions may have been the result of decreased erythropoietin production by the damaged kidneys.
With regard to primary neoplasms, there was only one tumor type for which there was any evidence of a treatment-related increase in either study. The time-adjusted incidence of lymphosarcoma in female mice was sig- nificantly increased (p < 0.05) according to one of three trend tests. However, compari- sons among groups for differences in tumor proportions indicated that the observed re- sults could easily have occurred by chance alone (p > 0.05).
Because of the difficulty in accurately diag- nosing lymphoreticular tumors, all lesions suggestive of marked hyperplasia or neopla- sia in the mouse study were reviewed by a panel of three experienced pathologists. The results presented here represent a consensus of the original pathologists (J. Boyce and E. Giddens) plus those who later reviewed the slides.
Since there was only one finding of possible equivocal significance for one tumor type among the many tissues that were examined in both studies, it is fair to conclude that this result could have occurred by chance alone and that there was no definitive indication of an oncogenic effect of EG. The difference in time to detection of lymphosarcomata proba- bly reflects the variability in latency in the population studied as suggested by the difference between the two control groups.
The lack of oncogenicity in these large, well-controlled bioassays is consistent with the results of Morris et al. (1942), Blood ( 1965) and Mason et al. (197 1) in the rat and
Blood et al. (1962) in the monkey. Thus, no carcinogenic activity of EG has been demon- strated in any of the three species (rat, mouse, or monkey) studied.
ACKNOWLEDGMENTS
The authors acknowledge the efforts of Dr. J. Boyce for performing part of the histopathology for the mourn study and of Dr. J. M. Ward, Dr. R. A. Squire, and Dr. C. Frith in reviewing the lymphoreticular lesions. We also thank Dr. B. Ballantyne, Dr. W. M. Snellings, and Dr. C. M. Troup for reviewing the manuscript and Sandy Turner for typing it. These studies were funded by the Union Carbide Corporation.
REFERENCES
ALAM, S., KHAN, M. R., AND BANU, K. ( 198 1). Cytologi- cal changes in wheat by chemical mutagens. Bun- gladesh J. Agric. Sci. 8,63-68.
BALAZS, T., JACKSON, B., ANDHITE, M. (1982). Nephro- toxicity of ethylene glycols, cephalosporins and diuret- ics. Monogr. Appl. Toxicol. 1,481-491.
BLOOD, F. R. (1965). Chronic toxicity of ethylene glycol in the rat. Food Cosmet. Toxicol. 3,229-234.
BLOOD, F. R., ELLIOTT, G. A., AND WRIGHT, M. S. (1962). Chronic toxicity of ethylene glycol in the mon- key. Toxicol. Appl. Pharmacol. 4,48649 1.
BOLTON, W. K., BENTON, F. R., MACLAY, J. G., AND STURGILL, B. C. (1976). Spontaneous glomerular scle- rosis in aging Sprague-Dawley rats. Amer. J. Puthol. 85,217-302.
BOSE, S., AND NASKAR, S. K. (1975). Effect of dimethyl sulfoxide, ethylene glycol, hydroxylamine and trietha- nolamine in M 1 generation in cluster bean. Bull. Bot. Sot. Bengal 29,49-52.
BRESLOW, N. (1970). A generalized Kruskal-Wallis test for comparing samples subject to unequal patterns of censorship. Biometrics 57,579-594.
BROWN, A. M., BRUCH, C., DEMPSEY, J., ANDPAGE, B. (1980). In vitro detection of gaseous mutagens by L5 178Y mouse cells. Proc. Amer. Assoc. Cancer Res. 21,74.
CONAN, L., FOUCAULT, B., Bou, G., CHAIGNEAU, M., AND LE MOAN, G. (1979). Research contributions mutagenic activity of ethylene oxide, ethylene glycol, and 2-chloroethanol residues in plastic materials steri- lized with ethylene oxide. Ann. Falsif: Expert. Chim. 72,141-151.
ELEMA, J. D., AND ARENDS, A. (1975). Focal and seg-

TOXICITY OF ETHYLENE GLYCOL IN RATS AND MICE 565
mental glomerular hyalinosis and sclerosis in the rat. Lab. Invest. 33,554-56 1.
MANTEL, N. (1966). Evaluation of survival data and two rank order statistics arising in its consideration. Cancer Chemother. Rep. 50,163- 170.
MASON, M. M., CATE, C. C., AND BAKER, J. ( 197 1). Tox- icology and carcinogenesis of various chemicals used in the preparation of vaccines. Clin. Toxicol. 4, 185- 204.
MCNEELY, M. D. (1980). Urinalysis. In Gradwohl’s Clinical Laboratory Methods and Analysis (A. C. Son- nenwirth and L. Jarett, eds.), pp. 478-503. Mosby, St. Louis.
MELNICK, R. L. ( 1984). Toxicities of ethylene glycol and ethylene glycol monoethyl ether in Fischer 344/N rats and B6C3Fl mice. Environ. Health Perspect. 57, 147- 155.
MORRIS, H. J., NELSON, A. A., AND CALVERY, H. 0. ( 1942). Observations on the chronic toxicities of pro- pylene glycol, ethylene glycol, diethylene glycol, etbyl- ene glycol mono-ethyl-ether and diethylene glycol
mono-ethyl-ether. J. Pharmacol. Exp. Ther. 74,266- 273.
PARRY, M. F., AND WALLACH, R. (1974). Ethylene gly- co1 poisoning. Amer. J. Med. 57, 143-150.
PATERNI, L., DOTTA, F., AND SAPPA, M. (1956). Ethyl- ene glycol poisoning in rats with special attention to the hematologic effects. Folia Med. 39,242-259.
RAJAGOPAL, G., VENKATESAN, K., RANGANATHAN, P., AND RAMAKRISHNAN, S. (1977). Calcium and phos- phorus metabolism in ethylene glycol toxicity in rats. Toxicol. Appl. Pharmacol. 39,543-547.
RICHARDSON, K. E. (1965). Endogenous oxalate synthe- sis in male and female rats. Toxicol. Appl. Pharmacol. 7,507-515.
SACHS, R. ( 1959). Life table technique in the analysis of response-time data from laboratory experiments on animals. Toxicol. Appl. Pharmacol. 1,203-227.
U.S. International Trade Commission. (1981). Synthetic Organic Chemicals: United States Production and Sales, 1980. USITC Publication No. 1183. U.S. Gov- ernment Printing Office, Washington, D.C.
Copyright © 2022 FDOKUMEN