Ceramic composites with improved thermo-mechanical properties

lable at ScienceDirect
Polymer Degradation and Stability 94 (2009) 1849–1859
Contents lists avai
Polymer Degradation and Stability
journal homepage: www.elsevier .com/locate/polydegstab
Poly (ethylene terephthalate) thermo-mechanical and thermo-oxidativedegradation mechanisms
Wanderson Romao a, Marcos F. Franco a, Yuri E. Corilo b, Marcos N. Eberlin b,Marcia A.S. Spinace a, Marco-A. De Paoli a,*
a Laboratorio de Polımeros e Reciclagem, Instituto de Quımica, Universidade Estadual de Campinas, Caixa Postal 6154, 13084-971 Campinas, SP, Brazilb Laboratorio ThoMSom de Espectrometria de Massas, Instituto de Quımica, Universidade Estadual de Campinas, 6154, 13084-971 Campinas, SP, Brazil
a r t i c l e i n f o
Article history:Received 26 December 2008Received in revised form16 April 2009Accepted 22 May 2009Available online 30 May 2009
Keywords:Poly(ethylene terephthalate)Thermo-oxidative degradationThermo-mechanical degradationDiethylene glycol1H NMRMALDI-TOF MS
* Corresponding author. Tel.: þ55 19 3521 3075; faE-mail address: [email protected] (M.-A.
0141-3910/$ – see front matter � 2009 Elsevier Ltd. Adoi:10.1016/j.polymdegradstab.2009.05.017
a b s t r a c t
1H NMR and MALDI-TOF MS measurements were used to study the thermo-mechanical and thermo-oxidative degradation mechanisms of bottle-grade PET (btg-PET). In the thermo-oxidative degradation, theconcentration of low molar mass compounds increased with time and the main products were cyclic andlinear di-acid oligomers. In the thermo-mechanical degradation, the main-chain scission reactions affect thestability of the cyclic oligomers. One of the most important bottle-grade PET co-monomers is diethyleneglycol (DEG), which is a ‘‘reactive site’’ in the thermal degradation of btg-PET. The DEG co-monomer wasshown to be the precursor to colour changes in btg-PET, owing to the attack by molecular oxygen on themethylenic protons adjacent to the ether oxygen atoms of DEG. This behaviour was observed in the thermo-oxidative degradation process in which the degradation of DEG causes the release of hydroxyl radicals in thepolymeric matrix, thereby producing mono- and di-hydroxyl substituted species. This was also observed inthe thermo-mechanical degradation process.
� 2009 Elsevier Ltd. All rights reserved.
1. Introduction
Owing to its extensive use over the past two decades, poly(-ethylene terephthalate), PET, is considered to be one of the mostimportant polymers. Its excellent properties, such as: tensile andimpact strength, chemical resistance, clarity, processability, colour-fastness and reasonable thermal stability [1]; promoted its use ina variety of applications. The global production of PET at the end ofthe 1990s was ca. 24 million tons used mainly for production oftextile fibres (67%), followed by blow-moulded bottles (24%), engi-neering polymers (9%) and biaxially oriented films [2].
A variety of co-monomers are used to tailor the PET polymerproperties for specific applications. For example, bottle-grade PET(PET-btg) is produced using a low concentration of co-monomers todecrease the thermal crystallization rate and improve ductility,processability and clarity. Some of the more common co-mono-mers used are: diethylene glycol (DEG), isophthalic acid (IA) andcyclohexanedimethylene glycol [3]. DEG is the main co-monomerused in PET-btg production and its ether groups provide moreflexibility to the relatively stiff PET backbone, thereby slowing
x: þ55 19 3521 3023.De Paoli).
ll rights reserved.
down its thermal crystallization rate. This type of copolymerizationreduces the hazing observed upon cooling of blow-moulded objectssuch as PET bottles [4–7]. These co-monomers can also be formedas a by-product during processing. The DEG is a by-product of PETmanufacture and, depending upon the polymerization conditions,the concentration of DEG in the final polymer changes from 1 to4 mol% [6–11].
The concentration of DEG has important consequences forboth chemical and barrier properties of the PET polymer. Thebarrier properties are very important for PET bottles. Hartwig[12] and Hiltner et al. [13,14] reported that gas permeabilitydecreases with the increase in the crystallinity degree of btg-PETowing to the lack of free volume in the crystalline structure.Crystallinity is not a desirable property during the processing ofthe PET bottle. To produce pre-forms with the desired clarity, thethermal crystallization rate during the injection stage should beminimized.
DEG units are known to be reactive sites along the PET chain,leading to the thermal and thermo-oxidative degradation of PET.Studies [2,15] showed that the thermo-oxidative degradationoccurs preferentially at the ether link of DEG, leading to a possiblepathway to colour formation in PET. The ether links are first affectedby the thermal oxidation, forming hydroxyl radicals (�OH). Theseradicals react with the aromatic groups yielding di-hydroxyl
1
ppm (t1)4.05.06.07.08.0
0
50
100
pm (t1)7.508.08.509.0
00.0
05.0
10.0
15.0
20.0
25.0
30.0
2
3 4
5
6
7
1
C
O
O CH2CH2OC
O
HH
H H
C
O
O CH2CH2OC
O
C
O
O CH2CH2OCH2CH2O C
OH
H H
H
H
HHm on
H
2 3 4
5
6 6
7
ppm
100 104
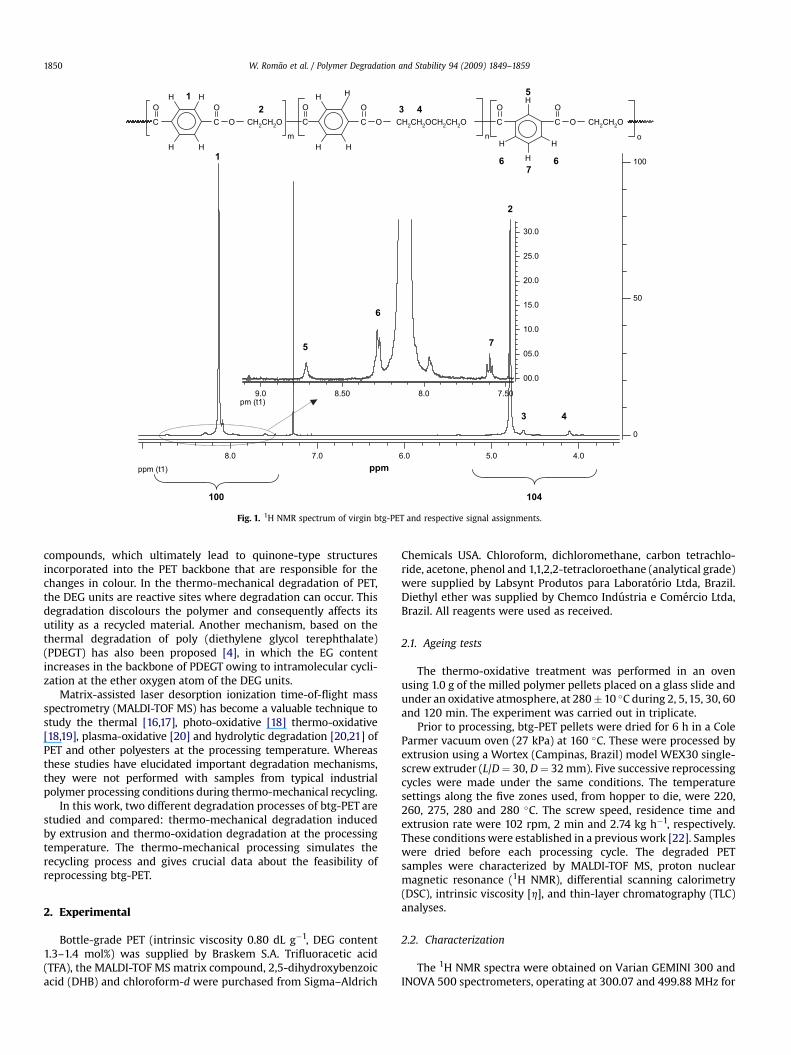
Fig. 1. 1H NMR spectrum of virgin btg-PET and respective signal assignments.
W. Romao et al. / Polymer Degradation and Stability 94 (2009) 1849–18591850
compounds, which ultimately lead to quinone-type structuresincorporated into the PET backbone that are responsible for thechanges in colour. In the thermo-mechanical degradation of PET,the DEG units are reactive sites where degradation can occur. Thisdegradation discolours the polymer and consequently affects itsutility as a recycled material. Another mechanism, based on thethermal degradation of poly (diethylene glycol terephthalate)(PDEGT) has also been proposed [4], in which the EG contentincreases in the backbone of PDEGT owing to intramolecular cycli-zation at the ether oxygen atom of the DEG units.
Matrix-assisted laser desorption ionization time-of-flight massspectrometry (MALDI-TOF MS) has become a valuable technique tostudy the thermal [16,17], photo-oxidative [18] thermo-oxidative[18,19], plasma-oxidative [20] and hydrolytic degradation [20,21] ofPET and other polyesters at the processing temperature. Whereasthese studies have elucidated important degradation mechanisms,they were not performed with samples from typical industrialpolymer processing conditions during thermo-mechanical recycling.
In this work, two different degradation processes of btg-PET arestudied and compared: thermo-mechanical degradation inducedby extrusion and thermo-oxidation degradation at the processingtemperature. The thermo-mechanical processing simulates therecycling process and gives crucial data about the feasibility ofreprocessing btg-PET.
2. Experimental
Bottle-grade PET (intrinsic viscosity 0.80 dL g�1, DEG content1.3–1.4 mol%) was supplied by Braskem S.A. Trifluoracetic acid(TFA), the MALDI-TOF MS matrix compound, 2,5-dihydroxybenzoicacid (DHB) and chloroform-d were purchased from Sigma–Aldrich
Chemicals USA. Chloroform, dichloromethane, carbon tetrachlo-ride, acetone, phenol and 1,1,2,2-tetracloroethane (analytical grade)were supplied by Labsynt Produtos para Laboratorio Ltda, Brazil.Diethyl ether was supplied by Chemco Industria e Comercio Ltda,Brazil. All reagents were used as received.
2.1. Ageing tests
The thermo-oxidative treatment was performed in an ovenusing 1.0 g of the milled polymer pellets placed on a glass slide andunder an oxidative atmosphere, at 280� 10 �C during 2, 5,15, 30, 60and 120 min. The experiment was carried out in triplicate.
Prior to processing, btg-PET pellets were dried for 6 h in a ColeParmer vacuum oven (27 kPa) at 160 �C. These were processed byextrusion using a Wortex (Campinas, Brazil) model WEX30 single-screw extruder (L/D¼ 30, D¼ 32 mm). Five successive reprocessingcycles were made under the same conditions. The temperaturesettings along the five zones used, from hopper to die, were 220,260, 275, 280 and 280 �C. The screw speed, residence time andextrusion rate were 102 rpm, 2 min and 2.74 kg h�1, respectively.These conditions were established in a previous work [22]. Sampleswere dried before each processing cycle. The degraded PETsamples were characterized by MALDI-TOF MS, proton nuclearmagnetic resonance (1H NMR), differential scanning calorimetry(DSC), intrinsic viscosity [h], and thin-layer chromatography (TLC)analyses.
2.2. Characterization
The 1H NMR spectra were obtained on Varian GEMINI 300 andINOVA 500 spectrometers, operating at 300.07 and 499.88 MHz for

Table 1Molar percentage of the EG, DEG and IA units versus heating time during thermo-oxidative degradation.
Heating time (min) EG (% mol) DEG (% mol) IA (% mol)
0 47.60 � 0.09 1.66 � 0.04 1.69 � 0.102 47.57 � 0.11 1.66 � 0.04 1.69 � 0.205 47.48 � 0.02 1.58 � 0.08 1.28 � 0.0215 47.48 � 0.08 1.47 � 0.06 1.53 � 0.3330 47.49 � 0.09 0.86 � 0.04 1.69 � 0.1060 47.18 � 0.19 0.81 � 0.10 1.79 � 0.10120 47.20 � 0.20 0.71 � 0.06 1.63 � 0.11
Heating time (min)
Weig
ht rem
ain
in
g (%
)
a b
0 20 40 60 80 100 120
86
88
90
92
94
96
98
100
0 20 40 60 80 100 1200.960.970.980.991.001.011.021.031.041.05
Pro
to
n ratio
(R
P)
meth
ylen
e / aro
matic
Heating time (min)
Fig. 2. (a) Variation of proton ratio (PR) of methylene and aromatic groups and (b) remaining weight versus thermo-oxidative degradation time for btg-PET samples.
W. Romao et al. / Polymer Degradation and Stability 94 (2009) 1849–1859 1851
1H. Spectra were done with ca. 30 mg mL�1 solutions with a probetemperature of 298 K. A CF3COOH/CDCl3 mixture (1:4 v/v) was usedas solvent. Measurements were done in triplicate.
The sample preparations for MALDI-TOF MS measurementswere done using an extraction method of oligomers, where thesoluble faction was analyzed [19,21]. Briefly, 0.1 g of virgin ordegraded PET samples were dissolved in 1 mL of TFA. The solutionwas diluted with 8 mL of chloroform and the polymer was precip-itated by the addition of 2 mL of acetone. The mixture was stirredduring precipitation. The PET solution was separated from theprecipitated polymer by vacuum filtration. The samples extractedwere spotted (1 mL) directly into the MALDI plate and dried. Afterdrying, a freshly prepared matrix solution of DHB was added to thespots. MALDI-TOF MS in the positive ion mode were performedusing a Micromass MALDI-TOF mass spectrometer (Manchester,UK) equipped with a pulsed (4 ns) nitrogen laser emitting at337 nm. The spectra were recorded in the reflection mode. Thepulse voltage was set to 2400 V. To obtain the best spectral reso-lution, the laser intensity was set at high levels.
The TLC was performed on TLC-PET foils (silica gel, withfluorescent indicator 254 nm; layer thickness 0.25 mm; mediumpore diameter 60 Å; 4 � 8 cm foils, Fluka) using the same samplingmethod applied for MALDI-TOF MS. The linear oligomers extractedwere separated using a solvent mixture of dichloromethane/chlo-roform/carbon tetrachloride/acetone 3/9/1/1 (v/v). In another TLCexperiment the cyclic oligomers extracted were separated usinga solvent mixture of chloroform/diethyl ether 9/1 (v/v) [19]. Afterseparation, the oligomer spots were revealed using a 254 nm UVlamp. Samples of virgin and degraded (five reprocessing cycles)btg-PET were extracted with chloroform using a Soxhlet apparatusand the weight loss was determined.
Differential scanning calorimetry studies were performed ona TA Instrument 2100 analyser under nitrogen flow (100 mL min�1).For each measurement, the sample was heated from 30 to 300 �C ata rate of 10 �C min�1. After heating, the sample was cooled to 30 �Cat 10 �C min�1, and the values of the enthalpy of crystallization(DHc) and crystallization temperature (Tc) were calculated. Finally,it was scanned again to 300 �C at the same heating rate. From thisscan, the melting temperature (Tm) and enthalpy of fusion (DHm)were calculated. The degree of crystallinity was calculated fromEquation (1), where DHc is the enthalpy of crystallization and DHo isthe enthalpy of crystallization of PET with 100% crystallinity,120 J g�1 [23,24].
Xc ¼ DHc=DHo (1)
Intrinsic viscosity ([h]) was measured according to ASTM D 4603[25] using a mixture of phenol and 1,1,2,2-tetracloroethane (60/40 wt%) at 30 �C. Measurements were done in duplicate and [h] was
calculated using Equation (2), where hr ¼ relative viscosity andC ¼ polymer solution concentration (g dL�1).
½n� ¼ 0:25ðnr � 1þ 3 ln nrÞ
C(2)
Weight-average molar mass values (Mw/g mol�1) were obtainedusing Equation (3), according to the Berkowitz relation [26].
Mw ¼ 6:58� 10�4½n�1;54 (3)
3. Results and discussion
3.1. Thermo-oxidative degradation
Fig. 1 shows the 1H NMR spectra of virgin btg-PET. The higherintensity peaks at 8.13 (s, 1) and 4.80 ppm (s, 2) are attributed to theethylene glycol (EG) and terephthalic acid (TPA) repeating units,respectively. The spectrum shows that two co-monomers are alsopresent in btg-PET at lower concentration: isophthalic acid (IA),d (ppm): 8.71 (s, 5), 8.29 (d, 6) and 7.60 (t, 7), and diethylene glycol,d (ppm): 4.64 (s, 3) and 4.13 (s, 4). These results are in agreementwith reported values [27–29].
The relative concentration of aromatic and aliphatic protons canbe calculated from the 1H NMR spectrum. Fig. 2a shows the varia-tion of the proton ratio (PR) of the TPA and EG units versus heatingtime, the initial value at t¼ 0 being 1.04. The TPA and EG monomershave the same number of protons (4:4), but the increased quantityof protons observed in the aliphatic region (z4%) is due to theincreased number of the DEG groups which have a PR higher thanthat of the aromatic region of the PET backbone (8:4). The curveshows an exponential behaviour, where the PR decreases withheating time. The PR change, from 1.04 to 0.97 (t ¼ 120 min),corresponds to a decrease of 7%, which indicates a small loss ofmethylenic units, because EG groups are less resistant to oxidativeattack than the aromatic protons.

C
O
C
O
O CH2CH2OCH2CH2O
3 4
5.0 4.8 4.6 4.4 4.2ppm
In
ten
sity (%
)
43
C
O
C
O
O CH2COCH2CH2O
O 56
6
5
C
O
OCH2CH2CO
O
H
5
7
7
Compound B1 Compound B2
a Virgin btg-PET
b 30 min
c 60 min
Fig. 3. 1H NMR spectra and respective signal assignments for virgin and degraded btg-PET samples in the region attributed to the DEG units: thermo-oxidative degradationsfor 0, 30 and 60 min.
W. Romao et al. / Polymer Degradation and Stability 94 (2009) 1849–18591852
Fig. 2b shows the remaining weight versus heating time, indi-cating an exponential behaviour, where the PET sample degradedfor 60 min shows a high weight loss (13 wt%). The observed weightloss change can be attributed to formation of low molar masscompounds, such as acetaldehyde [16]. The formation of acetal-dehyde can occur through three different routes: a) from thehydroxyl end-group, b) from the vinyl end-group and c) and frommid-polymer chain-scission, which generates acetaldehyde vianewly formed vinyl end-groups. The exponential behaviour ofcurves 2a and 2b can be due to the first two sources of acetaldehydegeneration, the rates of which should decrease with time, leavingbehind the third chain-scission source, since this mechanism doesnot generate acetaldehyde directly [30]. This result is in good
C
O
C
O
O
_
CO
CO
O CH2COCH2CH2OO
CO
CO
O
(3)
Compound B1
_ .H
Fig. 4. Thermo-oxidative degradation
agreement with viscosity measurements, Table 4. The [h] valueschange from 0.80 (t¼ 0 seg) to 0.15 dL g�1 (t¼ 60 min) and remainsconstant until finishing the process. Other degradation mecha-nisms are also occurring in the thermo-oxidative degradation,giving rise to other volatile products [31].
1H NMR analysis has been used [16,17] to estimate the relativeweight loss observed during thermal degradation, since the degra-dation products were already known and there was a directrelationship between the weight loss and the PR changes of aromaticand methylenic groups. In this work, this analysis was not possiblebecause the thermo-oxidative degradation occurs in both, thearomatic and aliphatic parts of the polymeric chain. The formation ofquinone species, for example, decreases the proton amount attrib-uted to the aromatic rings, directly affecting the change in the PRvalue between aromatic and aliphatic groups [31]. Samperi et al. [16]showed that, when PET is degraded under an inert atmosphere athigh temperatures (285–370 �C) a high PR change is observed(z0.3). When PR value is converted into weight loss, good agree-ment with TGA results was observed (z14 wt%). In this work, a smallPR loss (z0.08) was observed, but associated with a high weight loss(13 wt%). Consequently, without knowing the identity of thedegradation products, it seems not possible to make a direct relationbetween PR and weight loss for this kind of degradation process.
Table 1 shows the molar percentages of the EG, DEG and IAmonomer units as a function of the heating time, calculated through1H NMR measurements. Predictably, the percentages of EG and DEGunits decrease with longer heating times. The subtle decrease ofEG units (from 47.60 � 0.09 mol% at t ¼ 0 to 47.20 � 0.20 mol% att ¼ 120 min) can be mainly related to the mechanism of acetalde-hyde formation, as previously discussed. The DEG units suffera larger decrease (1.66� 0.04% to 0.71�0.06%). These results are inaccordance with those obtained by Ciolacu et al. [15] and supportthe idea that ether bonds of the DEG co-monomer decrease thethermo-oxidative stability of PET by reaction with oxygen. Gener-ally, IA units molar percentage do not decrease as a function ofheating time. The signals due to the degradation products in thisspectral region preclude an exact calculation of the correspondingmolar percentage of IA, Table 1.
CH2CHOCH2CH2O
OOH
OH
CH2CHOCH2CH2OO
(4)
C
O
C
O
OH
+
Compound B2
C
O
OCH2CH2CO
O
H
(2)
(1)
mechanism for the DEG units.

30 min
A5
F4
E4
E5
A6
A5 I5
G4
C5
B5
H4
D5J4 F5 I6G5
C6
B6
H5
C5 C6
950 1000 1050 1100 1150 1200
500
1000
1500
2000
970 975 980 985 990 995 1000 1005 1010 1015 10200
973.3
983.3979.3
1019.4995.3 1001.3 1015.41005.4
F4
C5 C5A5 B5 H4
I5G4
m/z
60 min
F4
E4
E5
A6
A5 I5
G4
C5
B5
H4
D5J4
F5
G5
C6
B6I6A6
H5
A5
C5
1000
2000
3000
12001150110010501000950
Virgin btg-PET
A5
A5
A6
A6
B5
B5
B6
B6
C5 C5D5
10501000950 1100 1150 1200
200
400
600
Counts
a
b
c
Fig. 5. MALDI-TOF MS in the m/z 940–1220 range of (a) oligomers extracted from virgin and degraded btg-PET after thermo-oxidative processes at (b) 30 min and (c) 60 min.
W. Romao et al. / Polymer Degradation and Stability 94 (2009) 1849–1859 1853
1H NMR analysis (from 5 to 4 ppm) was performed to study the‘‘selective attack’’ by oxygen on the DEG units, Fig. 3. In the spec-trum of virgin btg-PET, the signals at 4.63 ppm (s, 3) and 4.13 ppm(s, 4) correspond to the methylenic protons adjacent to the esteroxygen and the methylenic protons adjacent to the ether oxygen,respectively. The quartet at 4.46 ppm is due to residual ethanolused to wash the NMR tubes. The intensity ratio of the signals dueto methylenic protons adjacent to the ester oxygen (4.63 ppm, 3) tothe methylenic protons adjacent to the ether oxygen (4.13 ppm, 4)increases with longer heating times (results not shown). Therefore,the oxidation occurs preferentially with the methylenic protonsadjacent to the ether oxygen (4), producing compounds with neworganic groups. After 30 min of degradation, four new singlets wereobserved at 4.42, 4.54, 4.66, and 4.87 ppm, with a chemical shiftvery close to those of the methylenic protons adjacent to the ester
oxygen (3). Similar behaviour was reported by Botellho et al.[28], who studied the thermo-oxidation degradation of poly(ether–ester) using diethylene glycol dibenzoate as a model compound.Similar degradation products are observed (compounds B1 and B2,Fig. 3), where signals with the same shift were obtained.
Fig. 4 illustrates the proposed DEG unit degradation mechanism.Once formed, the carbon radicals are attacked by oxygen yieldingperoxylic radicals, which abstract a hydrogen from the ether carbonof the polymeric chain of PET (propagation step), thus generatinghydroperoxide (reaction (1)). The hydroperoxide decomposes andthe alkoxy radicals formed remain in the polymeric chain (reaction(2)). The alkoxy radicals can produce two new degradation prod-ucts (B1 and B2). B1 is formed after the release of a hydrogen radicalwith the formation of a carbonyl bond, producing groups with threeester functions (reaction (3)); B2 is produced via a b-scission
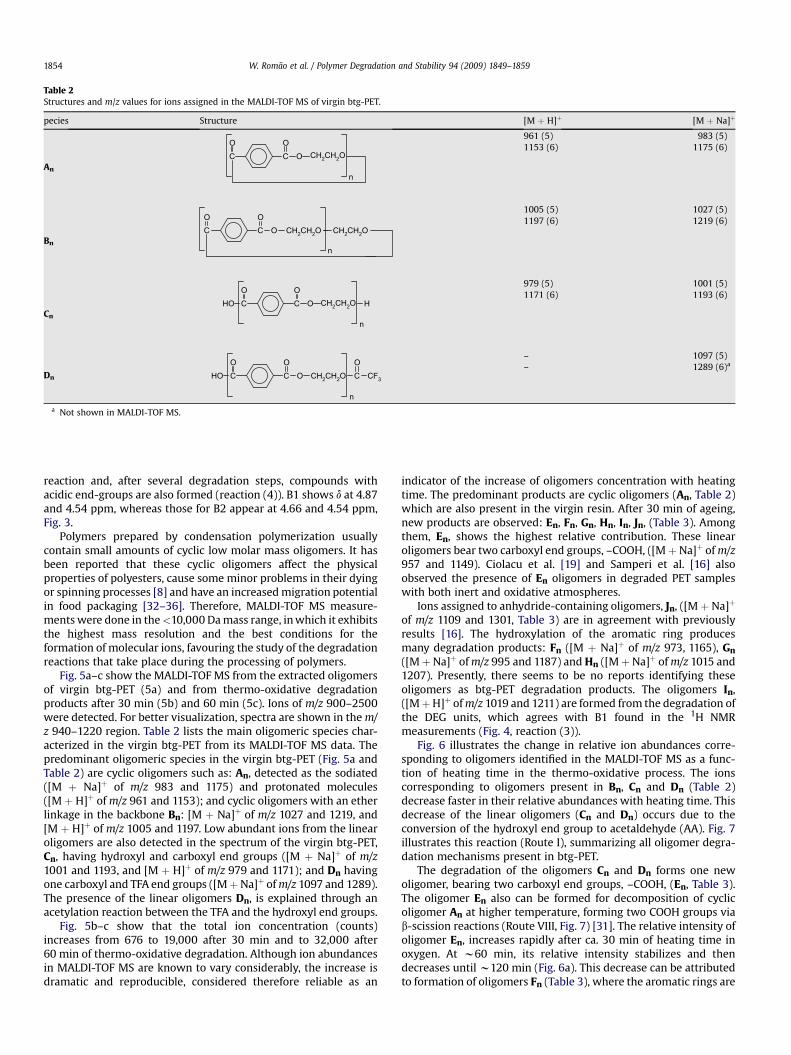
Table 2Structures and m/z values for ions assigned in the MALDI-TOF MS of virgin btg-PET.
pecies Structure [M þ H]þ [M þ Na]þ
An
CO
OCO
n
CH2CH2O
961 (5) 983 (5)1153 (6) 1175 (6)
Bn
CO
O CH2CH2OCO
CH2CH2O
n
1005 (5) 1027 (5)1197 (6) 1219 (6)
Cn
CO
OCO
HO H
n
CH2CH2O
979 (5) 1001 (5)1171 (6) 1193 (6)
Dn CO
O CH2CH2OCO
HO CO
CF3
n
– 1097 (5)– 1289 (6)a
a Not shown in MALDI-TOF MS.
W. Romao et al. / Polymer Degradation and Stability 94 (2009) 1849–18591854
reaction and, after several degradation steps, compounds withacidic end-groups are also formed (reaction (4)). B1 shows d at 4.87and 4.54 ppm, whereas those for B2 appear at 4.66 and 4.54 ppm,Fig. 3.
Polymers prepared by condensation polymerization usuallycontain small amounts of cyclic low molar mass oligomers. It hasbeen reported that these cyclic oligomers affect the physicalproperties of polyesters, cause some minor problems in their dyingor spinning processes [8] and have an increased migration potentialin food packaging [32–36]. Therefore, MALDI-TOF MS measure-ments were done in the<10,000 Da mass range, in which it exhibitsthe highest mass resolution and the best conditions for theformation of molecular ions, favouring the study of the degradationreactions that take place during the processing of polymers.
Fig. 5a–c show the MALDI-TOF MS from the extracted oligomersof virgin btg-PET (5a) and from thermo-oxidative degradationproducts after 30 min (5b) and 60 min (5c). Ions of m/z 900–2500were detected. For better visualization, spectra are shown in the m/z 940–1220 region. Table 2 lists the main oligomeric species char-acterized in the virgin btg-PET from its MALDI-TOF MS data. Thepredominant oligomeric species in the virgin btg-PET (Fig. 5a andTable 2) are cyclic oligomers such as: An, detected as the sodiated([M þ Na]þ of m/z 983 and 1175) and protonated molecules([M þ H]þ of m/z 961 and 1153); and cyclic oligomers with an etherlinkage in the backbone Bn: [M þ Na]þ of m/z 1027 and 1219, and[M þ H]þ of m/z 1005 and 1197. Low abundant ions from the linearoligomers are also detected in the spectrum of the virgin btg-PET,Cn, having hydroxyl and carboxyl end groups ([M þ Na]þ of m/z1001 and 1193, and [M þ H]þ of m/z 979 and 1171); and Dn havingone carboxyl and TFA end groups ([MþNa]þ of m/z 1097 and 1289).The presence of the linear oligomers Dn, is explained through anacetylation reaction between the TFA and the hydroxyl end groups.
Fig. 5b–c show that the total ion concentration (counts)increases from 676 to 19,000 after 30 min and to 32,000 after60 min of thermo-oxidative degradation. Although ion abundancesin MALDI-TOF MS are known to vary considerably, the increase isdramatic and reproducible, considered therefore reliable as an
indicator of the increase of oligomers concentration with heatingtime. The predominant products are cyclic oligomers (An, Table 2)which are also present in the virgin resin. After 30 min of ageing,new products are observed: En, Fn, Gn, Hn, In, Jn, (Table 3). Amongthem, En, shows the highest relative contribution. These linearoligomers bear two carboxyl end groups, –COOH, ([Mþ Na]þ of m/z957 and 1149). Ciolacu et al. [19] and Samperi et al. [16] alsoobserved the presence of En oligomers in degraded PET sampleswith both inert and oxidative atmospheres.
Ions assigned to anhydride-containing oligomers, Jn, ([M þ Na]þ
of m/z 1109 and 1301, Table 3) are in agreement with previouslyresults [16]. The hydroxylation of the aromatic ring producesmany degradation products: Fn ([M þ Na]þ of m/z 973, 1165), Gn
([MþNa]þ of m/z 995 and 1187) and Hn ([MþNa]þ of m/z 1015 and1207). Presently, there seems to be no reports identifying theseoligomers as btg-PET degradation products. The oligomers In,([MþH]þ of m/z 1019 and 1211) are formed from the degradation ofthe DEG units, which agrees with B1 found in the 1H NMRmeasurements (Fig. 4, reaction (3)).
Fig. 6 illustrates the change in relative ion abundances corre-sponding to oligomers identified in the MALDI-TOF MS as a func-tion of heating time in the thermo-oxidative process. The ionscorresponding to oligomers present in Bn, Cn and Dn (Table 2)decrease faster in their relative abundances with heating time. Thisdecrease of the linear oligomers (Cn and Dn) occurs due to theconversion of the hydroxyl end group to acetaldehyde (AA). Fig. 7illustrates this reaction (Route I), summarizing all oligomer degra-dation mechanisms present in btg-PET.
The degradation of the oligomers Cn and Dn forms one newoligomer, bearing two carboxyl end groups, –COOH, (En, Table 3).The oligomer En also can be formed for decomposition of cyclicoligomer An at higher temperature, forming two COOH groups viab-scission reactions (Route VIII, Fig. 7) [31]. The relative intensity ofoligomer En, increases rapidly after ca. 30 min of heating time inoxygen. At w60 min, its relative intensity stabilizes and thendecreases until w120 min (Fig. 6a). This decrease can be attributedto formation of oligomers Fn (Table 3), where the aromatic rings are

Table 3Structures and m/z values for ions assigned in MALDI-TOF MS of degraded btg-PET.
Species Structure [M þ H]þ [M þ Na]þ
En
CO
O CH2CH2OCO
HO CO
CO
OH
n
– 957 (4)– 1149 (5)
Fn
CO
O CH2CH2OCO
HO CO
CO
OH
OH
n
– 973 (4)– 1165 (5)
GnCCOO
OO OH CCOO
O- Na+
OH
nCH2CH2
– 995 (4)– 1187 (5)
Hn
C
O
O CH2CH2OC
O
C
O
C
O
O
HO
OH
CH2CH2 O
CC
O O
O CH2CH2O CC
O O
O CH2CH2O
OH
CCO O
O CH2CH2O
OH
n-
n-
1
– 1015 (4)– 1207 (5)
In
CO
O CH2CH2OCO
CCH2OO
n
1019 (5) –1211 (6) –
Jn CO
O CH2CH2OCO
CO
CO
O
n
1109 (5) –1301 (6)a –
a Not shown in spectra MALDI-TOF MS.
a b
0 30 60 90 120
0
10
20
30
40
50
60
In
ten
sity (%
)
Heating Time
An BnCn
Dn EnFn
Gn HnIn
Jn
600 30 90 120
0
2
4
6
8
10
12
14 Cn Dn FnGn Hn InJn
In
ten
sity (%
)
Heating Time
Fig. 6. a) Normalized abundance changes corresponding to ions in the MALDI-TOF MS of btg-PET samples versus time for thermo-oxidative degradation at 280 �C; b) magnificationof the region from 0 to 15%.
W. Romao et al. / Polymer Degradation and Stability 94 (2009) 1849–1859 1855

An -H2O
CO
O CH2CH2OHCO
OCO
O CH2CH2OCO
CO
O CH2CH2OCO
O [PET]
+
C
O
O CH2COCH2CH2OOO
HCOCH2CH2O
OO
B1
B2Bn
O2+
Fn e Gn
C
O
O CH2CH2OC
OOH
Hn
C
O
O CH2CH2OC
OOH
HO
CO
O CH2CH2OC
O
HO CO
C
O
OH
En
Release of OH
-AAII
II
III
IV
V
VI
IV
C
O
C
O
OC
O
Jn
+ 2
VII
VIII
C
O
OH
+
OO
IX
X
C
O
O CH2CH2OC
O
CH2CH2OIn
. OH. OH
. OH
C
C
n
n n
n
n
Fig. 7. Proposed mechanisms of oligomer degradation.
W. Romao et al. / Polymer Degradation and Stability 94 (2009) 1849–18591856
hydroxylated, thus yielding chromophoric species responsible forthe colour changes of the material (Route II, Fig. 7).
The 1H NMR results showed that DEG units are preferentiallydegraded during the thermo-oxidative process. This behaviour isalso shown by the MALDI-TOF MS measurements, where a sharpdecrease of relative intensity of the ions assigned to oligomers Bn
was observed after 30 min of ageing, Fig. 6. These DEG units act as acatalyst, increasing the release of hydroxyl radicals in the polymericmatrix. Therefore, many mono- and di-hydroxyl substituted speciesare formed (Fn, Gn, Hn in Table 3) and (Route II, III and IV in Fig. 7).The oligomers In arise from the decomposition of the DEG units(oligomers Bn). These results are in agreement with 1H NMRmeasurements (Route V, Fig. 7).
In Fig. 6b, the relative intensity of In and Fn are higher than theother oligomers. This behaviour supports high initial concentrationof Bn and En (after 0 min for Bn and 30 min for En) that areresponsible for their formation. The presence of B2, identified fromthe 1H NMR spectra, was not observed in the MALDI-TOF MSmeasurements; however, its presence cannot be excluded. The 1HNMR samples were prepared from polymer solutions, whereas theMALDI-TOF MS were performed after extraction of the oligomers,where products were analyzed in the m/z ¼ 940–2500 range.
The decrease in relative intensity of cyclic oligomer An (Table 2)as a function of heating time is mainly due to the formation of newdegradation products, such as En. However, the absolute abundancein the MS spectra (Fig. 5) allows for an alternative interpretation,assuming that these groups are formed from intermolecular
Table 4Melting temperatures (Tm), melting enthalpies (DHm), crystallization temperatures (Tc), cbtg-PET from the thermo-oxidative process.
Heating time (min) Tm (�C) DHm (J g�1) Tc (�C) D
0 247 27 164 25 250 43 173 315 245 45 193 530 242 46 180 560 242 45 170 4120 240 45 168 4
reactions between esters and ether groups, as reported byGoodman [37] (route VII, Fig. 7), or to linear oligomer cyclizationreactions (Cn and Dn, Table 2), that release water as a by-product.
Note that btg-PET submitted to high temperatures can undergomain-chain scission reactions. Via these reactions, vinyl esterterminated and two carboxyl end groups oligomers (En, route VIII)can be formed. However, compounds with vinyl ester end groupswere not observed. They have low stability and can either undergohydrolysis to produce two carboxyl end group oligomers, En, orrecombine with carboxylic acid groups producing anhydride-con-taining oligomers, (Jn, Table 3), (Route IX, Fig. 7) [30]. Samperi et al.[16] observed the presence of Jn when btg-PET was heated at340 �C under an inert atmosphere, and suggested that anhydridebonds can be formed from either intra- or intermolecular reactionsin the btg-PET chain (Route VI, Fig. 7). As a result, the values of [h]were reduced after 120 min of heating (Table 3), indicatingb-scission reactions (Route VIII, Fig. 7). An alternative route toexplain Jn formation was reported by Samperi et al. [16].
The parameters Tm, DHm, Tc, DHc and % Xc were obtained fromthe DSC curves and are shown together with the intrinsic viscosityresults, [h], and weight-average molar mass, Mw, in Table 4. It isobserved that by increasing the heating time, the values of % Xc,DHm and DHc generally increase. This behaviour seems to resultfrom thermo-oxidative degradation which facilitates the formationof crystallites with low molar mass cyclic and linear oligomers. Asa consequence Tm decreases by 10 �C after 120 min of heating. Forbtg-PET produced by another industry, Spinace and De Paoli [38]
rystallization enthalpies (DHc), and crystallinity degrees (Xc) of virgin and degraded
Hc (J g�1) Xc (%) [h] (dL g-1) Mw � 103 (g mol�1)
4 20 0.7985 � 0.0028 46.76 30 0.4257 � 0.0001 17.71 43 0.2661 � 0.0189 8.60 41 0.2738 � 0.0206 9.09 41 0.1512 � 0.0194 3.67 39 0.1582 � 0.0073 3.9
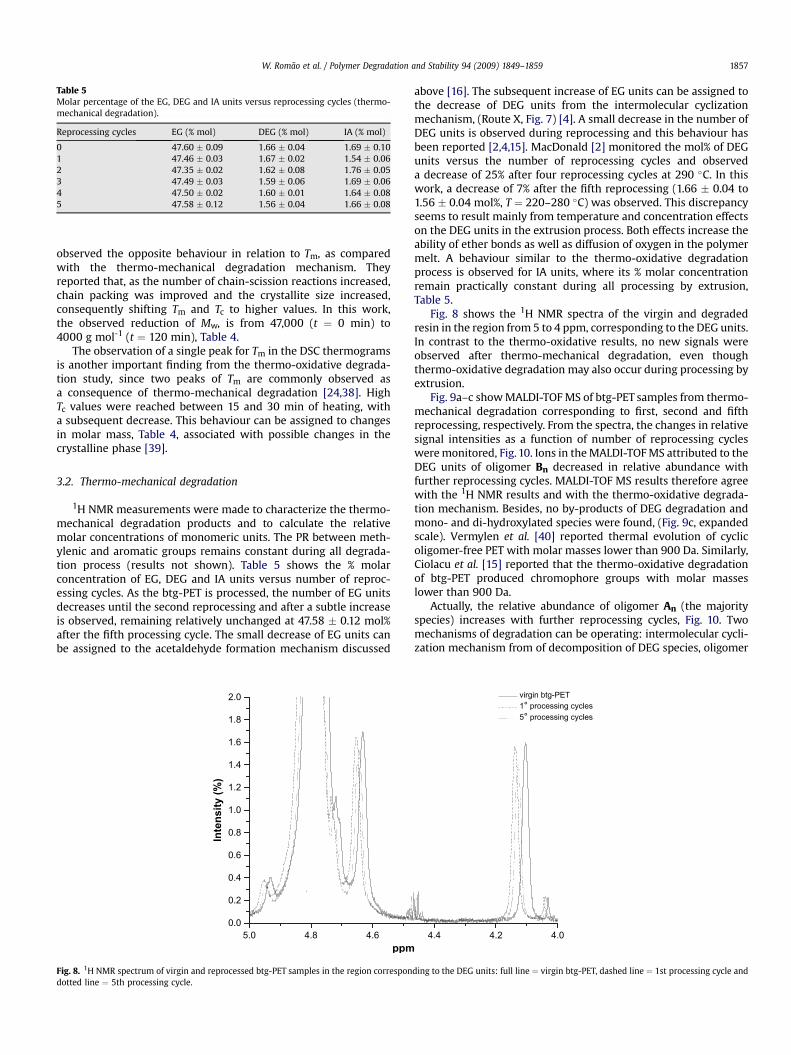
Table 5Molar percentage of the EG, DEG and IA units versus reprocessing cycles (thermo-mechanical degradation).
Reprocessing cycles EG (% mol) DEG (% mol) IA (% mol)
0 47.60 � 0.09 1.66 � 0.04 1.69 � 0.101 47.46 � 0.03 1.67 � 0.02 1.54 � 0.062 47.35 � 0.02 1.62 � 0.08 1.76 � 0.053 47.49 � 0.03 1.59 � 0.06 1.69 � 0.064 47.50 � 0.02 1.60 � 0.01 1.64 � 0.085 47.58 � 0.12 1.56 � 0.04 1.66 � 0.08
W. Romao et al. / Polymer Degradation and Stability 94 (2009) 1849–1859 1857
observed the opposite behaviour in relation to Tm, as comparedwith the thermo-mechanical degradation mechanism. Theyreported that, as the number of chain-scission reactions increased,chain packing was improved and the crystallite size increased,consequently shifting Tm and Tc to higher values. In this work,the observed reduction of Mw, is from 47,000 (t ¼ 0 min) to4000 g mol-1 (t ¼ 120 min), Table 4.
The observation of a single peak for Tm in the DSC thermogramsis another important finding from the thermo-oxidative degrada-tion study, since two peaks of Tm are commonly observed asa consequence of thermo-mechanical degradation [24,38]. HighTc values were reached between 15 and 30 min of heating, witha subsequent decrease. This behaviour can be assigned to changesin molar mass, Table 4, associated with possible changes in thecrystalline phase [39].
3.2. Thermo-mechanical degradation
1H NMR measurements were made to characterize the thermo-mechanical degradation products and to calculate the relativemolar concentrations of monomeric units. The PR between meth-ylenic and aromatic groups remains constant during all degrada-tion process (results not shown). Table 5 shows the % molarconcentration of EG, DEG and IA units versus number of reproc-essing cycles. As the btg-PET is processed, the number of EG unitsdecreases until the second reprocessing and after a subtle increaseis observed, remaining relatively unchanged at 47.58 � 0.12 mol%after the fifth processing cycle. The small decrease of EG units canbe assigned to the acetaldehyde formation mechanism discussed
4.85.0 4.60.0
0.2
0.4
0.6
0.8
1.0
1.2
1.4
1.6
1.8
2.0
In
ten
sity (%
)
ppm
Fig. 8. 1H NMR spectrum of virgin and reprocessed btg-PET samples in the region correspondotted line ¼ 5th processing cycle.
above [16]. The subsequent increase of EG units can be assigned tothe decrease of DEG units from the intermolecular cyclizationmechanism, (Route X, Fig. 7) [4]. A small decrease in the number ofDEG units is observed during reprocessing and this behaviour hasbeen reported [2,4,15]. MacDonald [2] monitored the mol% of DEGunits versus the number of reprocessing cycles and observeda decrease of 25% after four reprocessing cycles at 290 �C. In thiswork, a decrease of 7% after the fifth reprocessing (1.66 � 0.04 to1.56 � 0.04 mol%, T ¼ 220–280 �C) was observed. This discrepancyseems to result mainly from temperature and concentration effectson the DEG units in the extrusion process. Both effects increase theability of ether bonds as well as diffusion of oxygen in the polymermelt. A behaviour similar to the thermo-oxidative degradationprocess is observed for IA units, where its % molar concentrationremain practically constant during all processing by extrusion,Table 5.
Fig. 8 shows the 1H NMR spectra of the virgin and degradedresin in the region from 5 to 4 ppm, corresponding to the DEG units.In contrast to the thermo-oxidative results, no new signals wereobserved after thermo-mechanical degradation, even thoughthermo-oxidative degradation may also occur during processing byextrusion.
Fig. 9a–c show MALDI-TOF MS of btg-PET samples from thermo-mechanical degradation corresponding to first, second and fifthreprocessing, respectively. From the spectra, the changes in relativesignal intensities as a function of number of reprocessing cycleswere monitored, Fig. 10. Ions in the MALDI-TOF MS attributed to theDEG units of oligomer Bn decreased in relative abundance withfurther reprocessing cycles. MALDI-TOF MS results therefore agreewith the 1H NMR results and with the thermo-oxidative degrada-tion mechanism. Besides, no by-products of DEG degradation andmono- and di-hydroxylated species were found, (Fig. 9c, expandedscale). Vermylen et al. [40] reported thermal evolution of cyclicoligomer-free PET with molar masses lower than 900 Da. Similarly,Ciolacu et al. [15] reported that the thermo-oxidative degradationof btg-PET produced chromophore groups with molar masseslower than 900 Da.
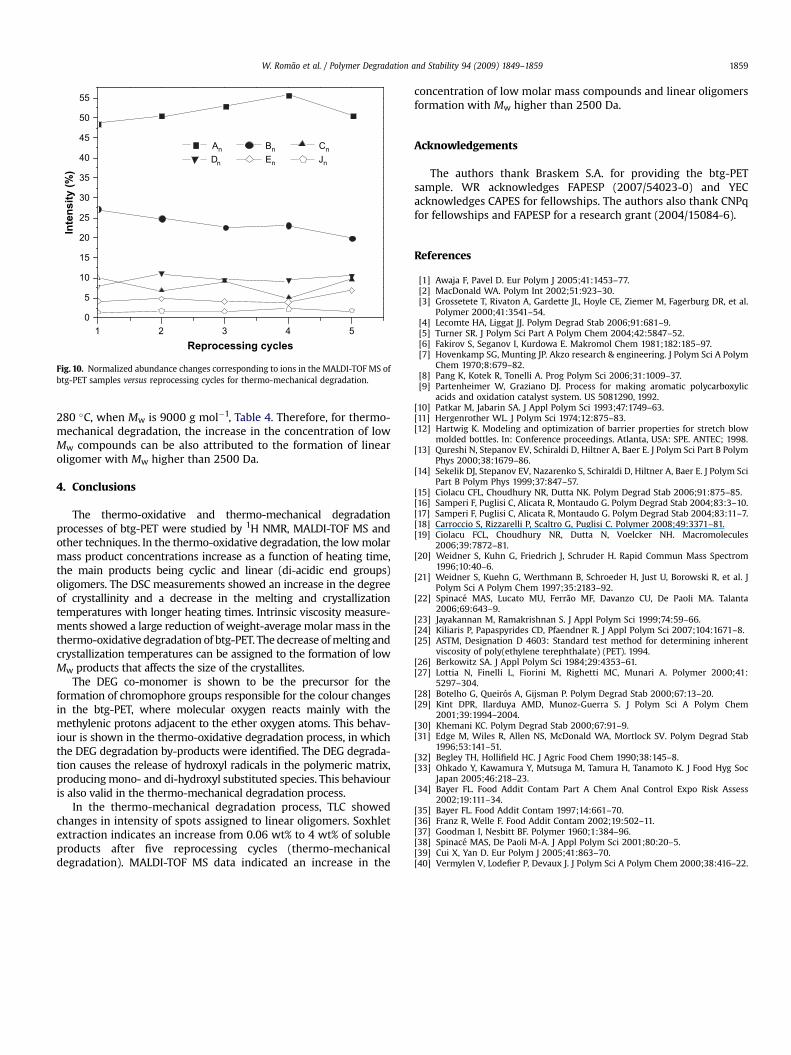
Actually, the relative abundance of oligomer An (the majorityspecies) increases with further reprocessing cycles, Fig. 10. Twomechanisms of degradation can be operating: intermolecular cycli-zation mechanism from of decomposition of DEG species, oligomer
4.4 4.2 4.0
5° processing cycles 1° processing cycles virgin btg-PET
ding to the DEG units: full line ¼ virgin btg-PET, dashed line ¼ 1st processing cycle and

m/z
1° reprocessing
2° reprocessing
5° reprocessing
A5
A5 D5
A6
B6
B5
C5 C6
A5D5
A6
B6
B5
C5 C6
A6
E5E4 C6
B6D5
A5
A5
C5
B5
B5
A6
A6
B6
A6
J4
J4
J4
A5100 A5
970 975 980 985 990 995 1000 1005 1010 1015 10200
%
983.3
1005.41001.3
B5C5
E4 E5
E5
A5
E4
950 1000 1050 1100 1150 1200
950 1000 1050 1100 1150 1200
950 1000 1050 1100 1150 1200
Counts
300
600
900
500
1000
1500
1000
2000
3000
a
b
c
Fig. 9. MALDI-TOF MS in the m/z 940–1220 range of oligomers extracted from aged btg-PET after the thermo-mechanical process for the (a) first, (b) second, and (c) fifthreprocessing cycles.
W. Romao et al. / Polymer Degradation and Stability 94 (2009) 1849–18591858
Bn, (Route X, Fig. 7) or intermolecular reactions between estersand ether groups [37], as observed in the thermo-oxidative degra-dation (Route VII, Fig. 7). The oligomers An can also undergodegradation reactions, like those observed in the thermo-oxidativedegradation mechanism (Route VIII, Fig. 7). The relative abundancesof its related ions decrease after 4 reprocessing cycles, improving theproduction of linear acidic oligomers En (Fig. 10). The relativeconcentration of oligomers Cn, Dn and Jn remained practicallyconstant during all thermo-mechanical processing.
Thin-layer chromatography was also performed on virgin andextruded btg-PET using the same sampling method applied for theMALDI-TOF MS measurements. The results provided evidence forthe presence of cyclic oligomers in virgin and all thermo-mechan-ically degraded btg-PET samples. There were no changes in spots
intensity as a function of the number of reprocessing cycles. Forlinear oligomer extracts, a change in spot intensity was observed,which indicate their increase in concentration as a function of thenumber of reprocessing cycles.
After soxhlet extraction a mass reduction of 0.06% was observedfor the virgin btg-PET. This value increased to 4 wt% for the samplesubmitted to five reprocessing cycles, indicating a significantincrease in concentration of chloroform-soluble low molar masscompounds. Spinace and De Paoli [38] reported that the thermo-mechanical reprocessing of btg-PET caused a decrease of Mw from44,000 to 21,000 g mol�1 after of 5 reprocessing cycles. In this work,the MALDI-TOF MS data for samples submitted to thermo-oxidativedegradation show the presence of abundant ions assigned to acidicend-group oligomers in the m/z 900 to 2500 range, after 30 min at
1 2 3 4 50
5
10
15
20
25
30
35
40
45
50
55
In
ten
sity (%
)
Reprocessing cycles
An Bn CnDn En Jn
Fig. 10. Normalized abundance changes corresponding to ions in the MALDI-TOF MS ofbtg-PET samples versus reprocessing cycles for thermo-mechanical degradation.
W. Romao et al. / Polymer Degradation and Stability 94 (2009) 1849–1859 1859
280 �C, when Mw is 9000 g mol�1, Table 4. Therefore, for thermo-mechanical degradation, the increase in the concentration of lowMw compounds can be also attributed to the formation of linearoligomer with Mw higher than 2500 Da.
4. Conclusions
The thermo-oxidative and thermo-mechanical degradationprocesses of btg-PET were studied by 1H NMR, MALDI-TOF MS andother techniques. In the thermo-oxidative degradation, the low molarmass product concentrations increase as a function of heating time,the main products being cyclic and linear (di-acidic end groups)oligomers. The DSC measurements showed an increase in the degreeof crystallinity and a decrease in the melting and crystallizationtemperatures with longer heating times. Intrinsic viscosity measure-ments showed a large reduction of weight-average molar mass in thethermo-oxidative degradation of btg-PET. The decrease of melting andcrystallization temperatures can be assigned to the formation of lowMw products that affects the size of the crystallites.
The DEG co-monomer is shown to be the precursor for theformation of chromophore groups responsible for the colour changesin the btg-PET, where molecular oxygen reacts mainly with themethylenic protons adjacent to the ether oxygen atoms. This behav-iour is shown in the thermo-oxidative degradation process, in whichthe DEG degradation by-products were identified. The DEG degrada-tion causes the release of hydroxyl radicals in the polymeric matrix,producing mono- and di-hydroxyl substituted species. This behaviouris also valid in the thermo-mechanical degradation process.
In the thermo-mechanical degradation process, TLC showedchanges in intensity of spots assigned to linear oligomers. Soxhletextraction indicates an increase from 0.06 wt% to 4 wt% of solubleproducts after five reprocessing cycles (thermo-mechanicaldegradation). MALDI-TOF MS data indicated an increase in the
concentration of low molar mass compounds and linear oligomersformation with Mw higher than 2500 Da.
Acknowledgements
The authors thank Braskem S.A. for providing the btg-PETsample. WR acknowledges FAPESP (2007/54023-0) and YECacknowledges CAPES for fellowships. The authors also thank CNPqfor fellowships and FAPESP for a research grant (2004/15084-6).
References
[1] Awaja F, Pavel D. Eur Polym J 2005;41:1453–77.[2] MacDonald WA. Polym Int 2002;51:923–30.[3] Grossetete T, Rivaton A, Gardette JL, Hoyle CE, Ziemer M, Fagerburg DR, et al.
Polymer 2000;41:3541–54.[4] Lecomte HA, Liggat JJ. Polym Degrad Stab 2006;91:681–9.[5] Turner SR. J Polym Sci Part A Polym Chem 2004;42:5847–52.[6] Fakirov S, Seganov I, Kurdowa E. Makromol Chem 1981;182:185–97.[7] Hovenkamp SG, Munting JP. Akzo research & engineering. J Polym Sci A Polym
Chem 1970;8:679–82.[8] Pang K, Kotek R, Tonelli A. Prog Polym Sci 2006;31:1009–37.[9] Partenheimer W, Graziano DJ. Process for making aromatic polycarboxylic
acids and oxidation catalyst system. US 5081290, 1992.[10] Patkar M, Jabarin SA. J Appl Polym Sci 1993;47:1749–63.[11] Hergenrother WL. J Polym Sci 1974;12:875–83.[12] Hartwig K. Modeling and optimization of barrier properties for stretch blow
molded bottles. In: Conference proceedings. Atlanta, USA: SPE. ANTEC; 1998.[13] Qureshi N, Stepanov EV, Schiraldi D, Hiltner A, Baer E. J Polym Sci Part B Polym
Phys 2000;38:1679–86.[14] Sekelik DJ, Stepanov EV, Nazarenko S, Schiraldi D, Hiltner A, Baer E. J Polym Sci
Part B Polym Phys 1999;37:847–57.[15] Ciolacu CFL, Choudhury NR, Dutta NK. Polym Degrad Stab 2006;91:875–85.[16] Samperi F, Puglisi C, Alicata R, Montaudo G. Polym Degrad Stab 2004;83:3–10.[17] Samperi F, Puglisi C, Alicata R, Montaudo G. Polym Degrad Stab 2004;83:11–7.[18] Carroccio S, Rizzarelli P, Scaltro G, Puglisi C. Polymer 2008;49:3371–81.[19] Ciolacu FCL, Choudhury NR, Dutta N, Voelcker NH. Macromolecules
2006;39:7872–81.[20] Weidner S, Kuhn G, Friedrich J, Schruder H. Rapid Commun Mass Spectrom
1996;10:40–6.[21] Weidner S, Kuehn G, Werthmann B, Schroeder H, Just U, Borowski R, et al. J
Polym Sci A Polym Chem 1997;35:2183–92.[22] Spinace MAS, Lucato MU, Ferrao MF, Davanzo CU, De Paoli MA. Talanta
2006;69:643–9.[23] Jayakannan M, Ramakrishnan S. J Appl Polym Sci 1999;74:59–66.[24] Kiliaris P, Papaspyrides CD, Pfaendner R. J Appl Polym Sci 2007;104:1671–8.[25] ASTM, Designation D 4603: Standard test method for determining inherent
viscosity of poly(ethylene terephthalate) (PET). 1994.[26] Berkowitz SA. J Appl Polym Sci 1984;29:4353–61.[27] Lottia N, Finelli L, Fiorini M, Righetti MC, Munari A. Polymer 2000;41:
5297–304.[28] Botelho G, Queiros A, Gijsman P. Polym Degrad Stab 2000;67:13–20.[29] Kint DPR, Ilarduya AMD, Munoz-Guerra S. J Polym Sci A Polym Chem
2001;39:1994–2004.[30] Khemani KC. Polym Degrad Stab 2000;67:91–9.[31] Edge M, Wiles R, Allen NS, McDonald WA, Mortlock SV. Polym Degrad Stab
1996;53:141–51.[32] Begley TH, Hollifield HC. J Agric Food Chem 1990;38:145–8.[33] Ohkado Y, Kawamura Y, Mutsuga M, Tamura H, Tanamoto K. J Food Hyg Soc
Japan 2005;46:218–23.[34] Bayer FL. Food Addit Contam Part A Chem Anal Control Expo Risk Assess
2002;19:111–34.[35] Bayer FL. Food Addit Contam 1997;14:661–70.[36] Franz R, Welle F. Food Addit Contam 2002;19:502–11.[37] Goodman I, Nesbitt BF. Polymer 1960;1:384–96.[38] Spinace MAS, De Paoli M-A. J Appl Polym Sci 2001;80:20–5.[39] Cui X, Yan D. Eur Polym J 2005;41:863–70.[40] Vermylen V, Lodefier P, Devaux J. J Polym Sci A Polym Chem 2000;38:416–22.
Copyright © 2022 FDOKUMEN