A Thesis Entitled Chemical Recycling of Poly (Ethylene ...
131
i A Thesis Entitled Chemical Recycling of Poly (Ethylene Terephthalate) and its Co-polyesters with 2, 5- Furandicarboxylic Acid using Alkaline Hydrolysis by Keerthi Vinnakota Submitted to the Graduate Faculty as partial fulfillment of the requirements for the Master of Science Degree in Chemical Engineering ________________________________________ Dr. Maria Coleman, Committee Chair ________________________________________ Dr. Joseph Lawrence, Committee Member ________________________________________ Dr. Sridhar Viamajala, Committee Member ________________________________________ Dr. Amanda Bryant-Friedrich, Dean College of Graduate Studies The University of Toledo August 2018
-
Upload
khangminh22 -
Category
Documents
-
view
4 -
download
0
Transcript of A Thesis Entitled Chemical Recycling of Poly (Ethylene ...

i
A Thesis
Entitled
Chemical Recycling of Poly (Ethylene Terephthalate) and its Co-polyesters with 2, 5-
Furandicarboxylic Acid using Alkaline Hydrolysis
by
Keerthi Vinnakota
Submitted to the Graduate Faculty as partial fulfillment of the requirements for the
Master of Science Degree in
Chemical Engineering
________________________________________ Dr. Maria Coleman, Committee Chair ________________________________________ Dr. Joseph Lawrence, Committee Member ________________________________________ Dr. Sridhar Viamajala, Committee Member ________________________________________
Dr. Amanda Bryant-Friedrich, Dean
College of Graduate Studies
The University of Toledo
August 2018

ii
Copyright 2108, Keerthi Vinnakota
This document is copyrighted material. Under copyright law, no parts of this document may be reproduced without the expressed permission of the author.

iii
An Abstract of
Chemical Recycling of Poly (Ethylene Terephthalate) and its Co-polyesters with 2, 5-
Furandicarboxylic Acid using Alkaline Hydrolysis
by
Keerthi Vinnakota
Submitted to the Graduate Faculty as partial fulfillment of the requirements for the
Master of Science Degree in Chemical Engineering
The University of Toledo
August 2018
The large increase in the generation of post-consumer plastic in past few decades
has led to an increased interest in eco-friendly recycling technologies. Polyethylene
terephthalate (PET) is a highly valued packaging material with broad applications because
it is strong, lightweight, non-reactive, non-toxic and shatterproof. To extend its
applications, the packaging industry adds co-monomers, additives, multilayered structures
and forms polymer blends to improve the mechanical and barrier properties of the base
polyester. These additives can pose challenges to the mechanical recycling methods that
are commonly used in the industry. While mechanical recycling is economical and broadly
commercially used, the recycled PET (RPET) tends to have reduced molecular weight and
can degrade in the presence of impurities (i.e. polyvinyl chloride (PVC)). Chemical
recycling is an attractive alternative approach that results in recovery of monomers and
other chemical constituents that can be used as precursors for new polymers. Several
chemical recycling methods were reported in literature to address the end-of-life PET

iv
waste, but little work was done on co-polyesters that are of interest to the packaging
industry. The focus of this thesis is to investigate alkaline hydrolysis of traditional PET
and a co-polyester (will be referred to as PETF20) containing ethylene glycol, 80%
terephthalic acid (TPA) and 20% 2,5-furan dicarboxylic acid (FDCA). Studies on
chemical/mechanical recycling of PETF20 were not reported in the literature.
Alkaline hydrolysis of PET and PETF20 was investigated at atmospheric pressure
and a range of temperatures (≤ 150℃) using sodium hydroxide solution (1.1 M) to recover
TPA and FDCA. The impact of time, temperature, co-solvent (i.e. γ- Valero lactone) and
impurity (i.e. PVC) on conversion of PET was investigated at ≤ 150℃, rate of
depolymerization and impact of co-solvents (γ-Valero lactone, γ- butyral lactone, ethylene
glycol diacetate, propylene glycol diacetate and triglycerol) on PET and PETF20 were
studied at 90℃. The chemical structure of the products was confirmed via FTIR and NMR.
The conversion of PET obtained at 150℃ and 180 min with and without impurity
(PVC) is approximately 81%. PETF20 flakes exhibited high conversions of 88% compared
to PET i.e. 42% at 90℃. Addition of triglycerol to PET flakes resulted in high TPA yields
of 63% while the other co-solvents resulted in either lower or same yields as that of base
NaOH solution. PETF20 with and without co-solvents resulted in the same yields.
Research was extended to separate TPA from FDCA using precipitation, 20 wt.% water in
DMSO solution exhibited promising results with 68.3% recovery of diacid from 20:80
molar fraction of TPA and FDCA.
Keywords: Alkaline hydrolysis, Co-polyesters of PET with FDCA, Co-solvents, Co-
monomer separation

v
To the memory of my brother Sarath Kumar Vinnakota, this is for you.
March 1995 – September 2016
&
To my parents for encouraging me and being my biggest strength.

vi
Acknowledgements
Firstly, I would like to express my sincere gratitude to my advisors Dr. Maria R
Coleman and Dr. Joseph Lawrence for the continuous support in my research and my life,
for the motivation, immense knowledge and encouragement. Their guidance helped me in
all the times of research and writing the thesis and gave me the chance to gain new
experiences during my education.
Besides my advisors, I would like to express my special thanks to Dr. Constance
Schall for rendering her help during the initial stages of my research and allowing me to
use the reactor setup throughout my research. I am also grateful to my committee member
Dr. Sridhar Viamajala for his invaluable comments and support.
I am thankful to Anup Joshi and Elizabeth Heil for their help and contribution to
my research. I am thankful to Niloofar Aliporaisabi and Chinedu Okeke for their constant
support. I thank my fellow lab mates for all the fun we had and the memories we have
created in the last two years.
Last but not the least; I would like to thank my family: my parents, my brother,
Abhishek Varma Pachunuri and friends for supporting me throughout my life in general.

vii
Table of Contents
Abstract ........................................................................................................................ iii - iv
Acknowledgements ............................................................................................................ vi
Table of Contents ........................................................................................................ vii - ix
List of Tables ......................................................................................................................x
List of Figures ............................................................................................................ xi - xiv
List of Abbreviations .........................................................................................................xv
List of Symbols ................................................................................................................ xvi
1 Introduction .................................................................................................... 1 - 8
1.1 Recycling methods ....................................................................................... 3 - 8
2 Chemical depolymerization methods ............................................................... 9 - 37
2.1 Background on synthesis of PET and copolymers/ renewable polyesters .........9
2.1.1 Synthesis of PET ........................................................................ 9 - 12
2.1.2 Commercial o-monomers .......................................................... 13 - 15
2.1.3 Renewable polyesters................................................................ 15 - 17
2.2 Recycling methods .................................................................................. 17 - 37
2.2.1 Methanolysis ............................................................................. 19 - 22
2.2.2 Glycolysis ................................................................................. 23 - 26
2.2.3 Hydrolysis ................................................................................ 27 - 34

viii
2.2.4 Ammonolysis ...................................................................................36
2.2.5 Aminolysis .......................................................................................36
3 Experimental section ...................................................................................... 38 - 52
3.1 Materials ................................................................................................ 39 - 40
3.1.a Polyethylene terephthalate powder and flakes .................................39
3.1.b 20% co-polyester of PET and PEF flakes (PETF20) .......................40
3.2 Methods ................................................................................................ 40 - 48
3.2.1 Experimental setup for chemical recycling of PET and PETF20 flakes
.......................................................................................................41
3.2.2 Procedure for alkaline hydrolysis of PET ................................ 42 - 48
3.2.2.a PET powder .......................................................................43
3.2.2.b PET Flakes ........................................................................44
3.2.2.c Impact of impurities-PVC ......................................... 44 - 45
3.2.2.d Impact of co-solvents ................................................ 45 - 48
3.3 Analysis of results ................................................................................... 49 - 52
3.3.1 Quantitative analysis ........................................................................49
3.3.2 Confirmation of structure of products ...................................... 50 - 52
4 Results and discussion .................................................................................. 53-102
4.0 Reaction mechanism of alkaline hydrolysis of PET with NaOH ..... 54 - 55
4.1 Hydrolysis of Polyethylene terephthalate ......................................... 56 - 81
4.1.1 Effect of time ........................................................................ 56 - 58
4.1.2 Impact of temperature on hydrolysis ..................................... 59 - 61
4.1.3 Kinetic model ........................................................................ 62 - 66

ix
4.1.4 Effect of impurities ................................................................ 67 - 69
4.1.5 Effect of green solvents (γ-Valero Lactone) .......................... 70 - 73
4.1.6 Characterization of monomer TPA .......................................... 74-81
4.1.6.a FTIR spectroscopy .................................................... 74 - 75
4.1.6.b Solution Nuclear Magnetic Resonance Spectroscopy
................................................................................................ 76 - 81
4.2 Hydrolysis of co - polyester of PET and PEF ................................... 81 - 97
4.2.1 PET vs PETF20 flakes .......................................................... 80 - 83
4.2.2 Impact of co-solvents on PET and PETF20 flakes ................ 84 - 87
4.2.3 Characterization .................................................................... 87 - 90
4.2.3.a FTIR spectroscopy ..................................................... 87 - 88
4.2.3.b Solution Nuclear Magnetic Resonance Spectroscopy
................................................................................................ 89 - 91
4.2.3.c Thermal transition and crystallinity of residue polymer flake
using DSC ................................................................... 91 - 97
4.3 Separation of TPA and FDCA .............................................................. 97 - 102
4.3.a Solubility of TPA and FDCA in DMSO water system . 97 - 98
4.3.b Recovery of TPA from FDCA in DMSO water system
.............................................................................................. 99 - 102
5 Conclusions and future work .................................................................... 103 - 105
References .............................................................................................................. 106 - 111
A Miscellaneous data .................................................................................... 112 - 115

x
List of Tables
2.1 List of commercial co-monomers used in PET synthesis ......................................14
3.1 Reaction conditions for alkaline hydrolysis of PET in Parr system ......................43
3.2 Reaction conditions for alkaline hydrolysis of PET flake/PVC in Parr system ....45
3.3 Co-solvents used for alkaline hydrolysis of PET and PETF20 ..............................47
3.4 Reaction conditions for alkaline hydrolysis of PET and PETF20 in oil bath .......48
3.5 FTIR data of monomers obtained from hydrolysis of PET and PETF20 .............51
3.6 NMR data of monomers obtained from hydrolysis of PET and PETF20 .............52
4.1 Reaction rate constants of PET flakes, depolymerization in1.1M NaOH ............65
4.2 Data of hydrolysis reaction using GVL as co-solvent at 150℃ and 90 min in NaOH
solution. .................................................................................................................74
4.3 Data of hydrolysis reaction using co-solvent at 90℃ and 3 days in 1.1 M NaOH
solution ...................................................................................................................95

xi
List of Figures
1 - 1 Schematic for mechanical recycling of post consumer PET waste ........................4
2 - 1 Synthesis of PET using TPA and EG route ..........................................................11
2 - 2 Synthesis of PET using DMT and EG route ..........................................................12
2 - 3 Reaction mechanism for polymerization of PEF ...................................................16
2 - 4 Reaction mechanism for copolymerization of PET with PEF ...............................17
2 - 5 Reaction mechanism for methanolysis of PET using excess methanol .................20
2 - 6 Schematic of methanolysis process .......................................................................21
2 - 7 Reaction mechanism for glycolysis of PET using excess EG ...............................24
2 - 8 Reaction mechanism for alkaline hydrolysis of PET using NaOH........................28
2 - 9 Reaction mechanism for acid hydrolysis of PET using sulphuric acid .................32
2 - 10 Reaction mechanism for neutral hydrolysis of PET using water ...........................34
2 - 11 Reaction mechanism for ammonolysis of PET using ammonia ............................35
2 - 12 Reaction mechanism for aminolysis of PET using amines ....................................36
3 - 1 Randcastle microtruder # RC - 0250 ....................................................................39
3 - 2 Structure of polyethylene terephthalte (PET) .......................................................40
3 - 3 Structure of co-polyester of PET and PEF (PETF) ...............................................40
3 - 4 Parr bench top reactor ............................................................................................41

xii
3 - 5 Reaction setup using oil bath @ 90°C ...................................................................41
3 - 6 Sketch on surface reaction of PET with NaOH and solvent ..................................46
4 - 1 Reaction mechanism of alkaline hydrolysis of PET with NaOH solution ............55
4 - 2 Effect of time on PET hydrolysis at 150°C in 1.1M sodium hydroxide solution
.......................................................................................................57
4 - 3 Unconverted residue (from left) A) 90min, B) 120min, c) 150min, D) 180min, E)
240min, F) 300min.................................................................................................58
4 - 4 Effect of temperature and time on hydrolysis of PET powder @ 120℃, 150℃ for
30, 60 and 90 minutes in Parr reactor A) % PET conversion, B) % TPA yield ....59
4 - 5 Effect of temperature and time on hydrolysis of PET flakes @ 90℃, 120℃ and
150℃ for 30, 60 and 90 minutes in Parr reactor A) % PET conversion, B) % TPA
yield ........................................................................................................60
4 - 6 Effect of temperature and time on hydrolysis of PET powder and flakes @ 90℃,
120℃ and 150℃ for 30, 60 and 90 minutes in Parr reactor .................................61
4 - 7 Plot of ln(1-X) vs t for data of PET flakes in 1.1M NaOH solution at 90℃, 120℃
and 150℃ at a time range of 0-90 minutes ...........................................................65
4 - 8 Arrhenius plot of the apparent kinetic rate constant for the aqueous sodium
hydroxide solution ................................................................................................66
4 - 9 Effect of PVC on PET hydrolysis at 150°C for 180℃ minutes, % TPA yield, %
PET conversion in Parr reactor .............................................................................69
4 - 10 Comparison of percentage yield of PET flakes vs PET flakes+5 wt.% PVC at 150°C
at different times ranging from 30 – 180 min in Parr reactor ...............................70

xiii
4 - 11 Hydrolysis of PET flakes with GVL at different molar compositions (0.5-10
mole%) at 150°C and 90min .................................................................................72
4 - 12 Infrared spectroscopy of precipitate monomer TPA and IPA ..............................75
4 - 13.a Proton NMR spectrum of recovered TPA from hydrolysis at 150°C, 90min in 1.1M
NaOH ........................................................................................................77
4 - 13.b 13 C NMR of precipitate from hydrolysis using I)1.1.25 M NaOH solution,
II) 5 wt.% PVC as impurity in 1.1 M NaOH solution, III) 1 mole% GVL in 1.1 M
NaOH solution ......................................................................................................78
4 - 13.c Possibility of spin-spin splitting of neighboring protons .....................................79
4 - 14 Percentage conversion and diacid yield of PET vs PETF20 flake after alkaline
hydrolysis with 1.1M NaOH solution for 3 days at 90℃ .....................................83
4 - 15 A) PET flakes residue from Parr reactor B) Fresh PET flake vs flake residue from
oil bath C) Fresh PETF20 flake vs flake residue from oil bath. ...........................84
4 - 16 Percentage yield of PET flake after alkaline hydrolysis in the presence of 1 mole%
co-solvents for 3 days at 90℃ at 13 pH.................................................................86
4 - 17 Percentage yield of PETF20 flake after alkaline hydrolysis in the presence of 1
mole% co-solvents for 3 days at 90℃ at 13 pH ....................................................87
4 - 18 Infrared spectroscopy of precipitate from PET and PETF20 alkaline hydrolysis in
NaOH solution for 3 days and 90℃ .....................................................................89
4 - 19a. 1H NMR of recovered TPA and FDCA from PETF20 flakes .............................90
4 - 19b. 13C NMR of recovered TPA and FDCA from PETF20 flakes .............................91
4 - 20.a. DSC curve of fresh PET flakes and PET flakes residue following reaction in 0-10
mole% GVL in NaOH solution at 150℃ and 90 minutes ....................................93

xiv
4 - 20.b. DCS curves of PET flake after hydrolysis using different co-solvents (1 mole%)
for 3 days at 90°C in NaOH solution ....................................................................94
4 - 20.c DSC curve of PETF20 flake after hydrolysis using different co-solvents (1
mole
%) for 3 days at 90°C in NaOH solution ..............................................................96
4 - 21 Schematics of alkaline hydrolysis of PETF20 using NaOH solution ...................97
4 - 22 Solubility of TPA and FDCA in DMSO water system at various wt - % water....99
4 - 23 Proposed separation method for recovery of TPA from FDCA using DMSO and
water system ......................................................................................................100
4 - 24 TPA percentage recovery vs water added in weight percentage for A) 20:80, B)
10:90, C) 5:95, D) 0: 100 molar ratios of FDCA to TPA solutions in DMSO ....101
4 - 25 Infrared spectroscopy of precipitate (TPA + FDCA) from 20:80 molar ratio of
FDCA and TPA in DMSO solution using 20 wt.% water. .................................102
A - 1 US waste generation by category .........................................................................112
A - 2 RPET used by product category in 2016 (MMlbs) as per NAPCOR report
.....................................................................................................113
A - 3 PET material flow in US(MMlbs) as per NAPCOR 2016 report
.....................................................................................................113
A - 4 Proton NMR spectrum of Pure TPA ....................................................................114
A - 5 Carbon NMR spectrum of Pure TPA ...................................................................114
A - 6 Proton NMR spectrum of Pure FDCA .................................................................115
A - 7 Carbon NMR spectrum of Pure FDCA ................................................................115

xv
List of Abbreviations
BHET .........................Bis (2-Hydroxyethyl Terephthalate) CHDM .......................Cyclo Hexane Di Methanol DEG ..........................Di Ethylene Glycol DSC ............................Differential Scanning Calorimetry DMT ..........................Dimethyl Terephthalate DMSO ........................Dimethyl Sulfoxide EG ..............................Ethylene Glycol EGDA ........................Ethylene Glycol Diacetate FDCA .........................Furan Dicarboxylic Acid FTIR ...........................Fourier Transformation Infra-Red spectroscopy GVL ...........................Gamma Valero Lactone GBL............................Gamma Butyral Lactone IPA .............................Iso Phthalic Acid NAPCOR ..................National Association for PET Container Resources NMR ..........................Nuclear Magnetic Resonance PET ............................Poly (Ethylene Terephthalate) PEF .............................Poly Ethylene Furanoate PVC ............................Poly Vinyl Chloride PETF20 .....................20% co-polyester of PET with PEF PGDA .........................Propylene Glycol Diacetate RPET ..........................Recycled Polyethylene Terephthalate TPA ...........................Terephthalic Acid USEPA ......................United States Environmental Protection Agency

xvi
List of Symbols
℃ ...............................Degree centigrade % ................................Percentage K .................................Degrees kelvin M ................................Molarity μ .................................Micron ρ..................................Density t ..................................Reaction time b..................................Constant δ ..................................Solubility parameter Ø .................................Diameter K1 ...............................Rate constant Ea ................................Activation energy R .................................Universal gas constant A .................................Frequency factor T .................................Absolute temperature in Kelvin X .................................Conversion g..................................Gram m ................................Meter cm ...............................Centi meter mm .............................Milli meter ml ...............................Milli liter atm..............................Atmospheric pressure ∆Hm ............................Enthalpy of melting
∆Hc ............................Enthalpy of crystallization
∆H°m...........................Enthalpy of fusion NA ...............................Number of moles of reactant
NAo .............................Initial number of moles of reactant CA ...............................Alkali concentration of ester CB ...............................Alkali concentration of solution V0 ...............................Volume of solution As ................................Surface area of flake A0 ...............................Initial surface area of flake

1
Chapter - 1
Introduction
The global market for polyethylene terephthalate (PET) has expanded and demand
has increased in sectors like food and beverage, health care, textiles, cosmetics, housing,
and other consumer products [1] because of the ability to offer light weight options and
unique container designs as a semi crystalline polymer [2]. PET characteristics such as high
clarity, medium rigidity, food contact safety, chemical resistance, gas and moisture barrier,
temperature resistance and high impact strength [3] have allowed a wide range of
applications boosting the growth of this polymer in the packaging industry. Further,
because of its contamination resistance properties, PET is extensively used in the food and
beverage industry.
With the growing demand for carbonated soft drinks, bottled water and other light
weight packaging, the global production of PET is growing. Production was 50 MMT in
2016 and is estimated to reach 88.16 MMT in 2022 at a compounded annual growth rate
of 9.17% [4]. The packaging industry continues to seek improvements in the barrier
properties of PET to provide longer shelf life for the packaged products [5]. Further,
manufacturers expect faster production rates and material designs that favor higher speed
production without compromising PET quality. To meet the industry needs and

2
specifications, formulators use various compatibilizers like co-monomers and small
molecule additives [5]. While the additives and co-monomers can improve the properties,
the more complex PET formulations pose challenges to polymer recycling, especially when
using traditional mechanical recycle processes.
According to a 2016 report from the United States Environmental Protection
Agency (EPA) [6], plastic waste is typically a mixture of PET, high-density polyethylene,
low-density polyethylene, polypropylene, polystyrene, poly vinyl chloride, acrylonitrile
butyl styrene, nylon, Teflon and fiber reinforced plastic. The primary interest of this work
is to develop methods to recycle packaging materials with comonomers. Extensive
research continues in our lab (the Polymer Institute at the University of Toledo) to improve
the properties of PET, and recently we have focused on using various bio-based co-
monomers for PET. Therefore, focus of this work is to recycle the PET and its co-
polyesters. Although, PET is the most recycled polymer with plastic resin identification
code number one, its recycling rates are still low (< 30%) because of a) disposal of post-
consumer waste after first use due to lack of awareness, b) costs associated with recycling,
c) limitations of mechanical recycling methods for co-monomers and additives which
affect the properties of recycled material.
The recycling rate of PET in United States according to the National Association
for PET Container Resource (NAPCOR) (refer appendix A) report from 2016 [7] was
28.4%, while the rest was disposed. Around 6,172 MMlbs of PET bottles were sold out of
which 1,753 MMlbs were collected for recycling. Of these recycled PET, 1,526 MMlbs
were purchased by US reclaimers for mechanical recycling and 379 MMlbs were exported.

3
Most of the post-consumer waste was exported to China for recycling, but the recent ban
by China on several recycle imports [8] and more stringent contamination standards (< 1.5
% impurities) on allowed imports could further restrict the extent of PET recycling [9].
This adds to the unrecycled post-consumer PET waste. Therefore, developing recycling
methods to handle impurity-containing heterogeneous waste is an imminent need in the
PET industry [9].
The broad focus of this thesis is to investigate chemical recycling methods which
can handle co-polyesters with high co-monomer concentrations and impurities and
ultimately recover the feedstock monomers to allow reuse in the production of the base
polymer. If successful, this approach would decrease waste disposal into landfills and
oceans and also lower petroleum consumption to produce new feed stock material. Several
recycling methods are described in detail and a method that meets the above requirements
was selected for use with co-polyester feed.
1.1 Recycling Methods
The following three primary methods of recycling can be used to manage PET
waste 1) mechanical recycling 2) chemical recycling and 3) pyrolysis to produce fuel oil
[10]. Incineration of PET waste is also possible for energy recovery, but with possible risks
of release of air-born toxins.
Mechanical recycling was commercialized during the 1970’s [11] to produce
pellets for reuse; it is relatively a cheap and simple method. Mechanical recycling of a

4
homo-polymer results in similar grade PET pellets as that of virgin PET and can be easily
re-used in manufacturing processes. Post-consumer waste undergoes several steps during
mechanical recycling [11] as listed below:
Cutting/shredding - Large-sized plastics are chopped into small flakes
Contaminant’s separation - Impurities are separated using a cyclone separator
Floating – Plastic flakes are separated in floating tank depending on variation in density
Milling - Similar-density polymers are milled together
Washing and drying – Chemical washing is used to remove the glue from plastic flake
Agglomeration - Product is stored, mixed with additives or sent for further processing
Extrusion/pelletizing; Plastic is extruded into strands and made into pellets before it is
sold to market. By doing so, a clear grade PET of high quality is produced which can
compete with virgin PET. In some cases, solid stating is used to upgrade the molecular
weight of the recycled PET pellets.
Fig 1-1. Schematic for mechanical recycling of post consumer PET waste
Post- consumer PET waste
Cutting and
shredding
Sorting (PVC &
other waste)
Floating
Extrusion /pelletizing
(Re-use)
Agglomeration
Chemical washing &
drying
Milling

5
While, mechanical recycling is economical and produces high quality polymer, increasing
heterogeneity of the plastic waste, as described earlier in this chapter, has become a major
issue for the mechanical recycling industry. For example, blending the polyamide MXD6
with PET increases the shelf-life of the container, but on mechanical recycling the result is
lower molecular weight polymer and an undesirable yellow color. The presence of
impurities, particularly PVC at as little as 50 ppm concentration in a post-consumer PET
stream has negative impacts on mechanical recycling leading to reduction in molecular
weight and color generation as discussed later in chapter-2 [12]. Employment of heat
during the process results in photo-oxidation and mechanical stresses, which deteriorates
the product properties and leads to undesirable yellowness in the product that increases in
intensity with each recycle [13]. This ultimately results in a low grade polymer with
degraded properties that can end up in landfills [14]. Overall, mechanical recycling offers
PET pellets that can potentially be applied directly in polymer processing, but the products
may have limitations on color, transparency and intrinsic viscosity that restrict the
applicability.
The combined effect of mechanical recycling on PET color and properties together
with the increasing use of copolymer or blended polymer products has prompted interest
in alternative recycling methods. Hence, chemical recycling became the subject of interest
to recycle contaminated or waste streams with end product recovered monomer or value
added compounds [14].
Chemical recycling is a process, which either totally decomposes the
polymer using chemical reagents and catalysts to obtain the original monomers or partially

6
decomposes the polymer to form oligomers and other industrial chemicals. Products are
formed with potential high value applications such as chemicals, monomers and new
polymers. Chemical recycling is broadly categorized into methanolysis, glycolysis,
hydrolysis, amminolysis and ammonolysis based on the chemical reagents used to
depolymerize the polymer. As PET is a polyester, chain scission occurs when in contact
with reagents like water, alcohol, acids, glycols and amines. PET is formed by an
equilibrium limited poly-condensation reaction discussed in chapter 2, which means if
reaction is pushed to the opposite direction by addition of a condensation product,
monomers and oligomers are expected to be formed. These chemical recycling methods
will be discussed in more detail in chapter 2.
Pyrolysis can convert plastic waste into fuels and other organic chemicals.
This process accepts almost any type of plastic waste including thermosets like natural
rubbers. The product obtained is liquid oil with high calorific value compared to
commercial oils [10].
As we compare these recycling methods, mechanical recycling is
inexpensive and an industrially popular process. Pyrolysis recovers oils which could serve
as feedstock for monomer synthesis, but not monomers. Considering the drawbacks of
pyrolysis and mechanical recycling in delivering low quality product with undesirable
color on increase in heterogeneity of waste, a viable option was to use chemical recycling
methods as it produces the raw material that PET is originated from.
This work addresses the issues of chemical recycling of co-polyesters by
selecting a process which uses low reaction times, temperatures and minimal amount of

7
catalyst to recover industrially used feed stock material for PET synthesis. Methanolysis
and glycolysis processes are industrially well established. These two processes were not
used in the study because the monomer dimethyl terephthalate produced from methanolysis
is currently not of industrial interest and glycolysis leads to production of oligomers which
will not isolate comonomers. Therefore, alkaline hydrolysis process was selected as model
system for chemically recycling PET from copolymers and contaminated waste streams.
In a broad sense this method can be applied to recycle nylons and mixed waste streams to
selectively recover monomers with some development.
Objectives of this work were to:
1) Study the effects of the presence of co-monomer furan dicarboxylic acid (FDCA) on the
rate of depolymerization of a 20% co-polyester of PET and polyethylene furanoate (PEF)
using alkaline hydrolysis and examine the possibility of selective recovery of the co-
monomers.
2) Assess the improvement of monomer yield after alkaline hydrolysis of PET or 20% co-
polyester in the presence of co-solvents.
3) Investigate the impact of the presence of PVC (up to 5 wt.% relative to PET) on the
hydrolysis of PET.
A simple method to recycle PET using 1.1M NaOH solution was selected
from the literature and the reactions were performed over a range of temperatures (90℃ -
150℃) [15]. Phase-I of the research was focused on studying the impact of reaction
parameters and the presence of PVC up to 5 wt% at 150℃ to make sure the results agree
with previous literature. After analyzing the results, it was understood that it took 5 h for

8
the PET flake to completely depolymerize during the reaction. The hypothesis was that by
adding a co-solvent to the NaOH solution, it swells the polymer matrix and there would be
an increase in the rate of conversion of PET. Therefore, a co-solvent, γ- valero lactone
(GVL) at molar compositions of 1-10 mole% relative to the NaOH solution was studied on
PET flakes at 150℃ and 90 min to improve the yield of the monomer terepthalic acid
(TPA) which was not reported in the literature. Also, research on co-polyesters using
alkaline hydrolysis was not reported in the literature.
Therefore, using the same method phase-II of the research was focused on
comparing alkaline hydrolysis of 20% co-polyester flakes of PET and PEF (PETF20)
relative to PET-only flake at 90℃ using a simple reaction system. Based on the outcomes
of PET flakes at 150℃ and 90 min with GVL as co-solvent, a 1.0 mole% of co-solvent
relative to NaOH solution was used to study the impact of other co-solvents i.e. GVL, γ-
butyral lactone, ethylene glycol diacetate, propylene glycol diacetate and triglycerol on
both PETF20 and PET flakes. PETF20 was expected to react faster than PET flake because
of the affinity of the furan towards water resulting in higher yields. Co-solvents were
expected to improve the yields of both PET and PETF20 flakes.
Study on selective recovery of monomers TPA and FDCA obtained from
hydrolysis of PETF20 was done using DMSO/water system to selectively precipitate
monomer components. Based on the solubility limits reported in the literature, TPA and
FDCA were expected to be selectively recovered by varying the composition of water from
0-20 wt.% in the DMSO solution containing TPA and FDCA at different molar ratios.

9
Chapter - 2
Chemical Depolymerization methods
2.1 Background on synthesis of PET and its copolymers / renewable polymers
The focus of this thesis is to investigate chemical depolymerization of polyester
with emphasis on PET based co-polyesters. Therefore, the synthesis of PET is discussed in
detail to highlight the reactions of interest to depolymerization. Also, the synthesis method
for the renewable polyethylene furanoate (PEF) polymer, which has gained the attention
of the packaging industry, is explained. Finally, industrially used co-monomers and the
properties that they impart to the final copolymer are discussed in detail. A renewable co-
monomer FDCA, which is used in the production of polyethylene furanoate (PEF) is the
subject of interest to this work. Therefore, synthesis of 20% co-polyesters of PET and PEF
(PETF20) is discussed in this section.

10
2.1.1 Synthesis of PET
Polyethylene terephthalate shown in Fig 2.1 is produced by either esterification or
transesterification reactions. Esterification reaction uses ethylene glycol and terephthalic
acid as raw materials and are conducted at moderate pressures between 2.7 – 5.5 bar and
high temperatures of 220-260℃ [16, 17]. In the first step bis (2-hydroxyethyl terephthalate)
(BHET) ester is formed in the presence of excess ethylene glycol (EG). The repeating unit
of this ester results in the formation of polyethylene terephthalate. The water formed during
this reaction and excess EG are eliminated continuously by vacuum distillation [16]. The
reaction is shown in Fig 2-1.
Transesterification reaction uses dimethyl terephthalate and excess ethylene glycol
along with basic catalyst as raw materials for production of PET as shown in Fig 2-2. First
step of the reaction is between 150 - 200℃, to drive the reaction forward methanol is
removed by distillation and excess ethylene glycol is distilled off at higher temperature
under vacuum. Poly-condensation step takes place at 270 - 280℃ with continuous
distillation of ethylene glycol [16, 18, 19]. The monomer bis (2-hydroxyethyl)
terephthalate is the intermediate product formed during both esterification and
transesterification reactions after the removal of water in former and methanol in the later
reactions. This monomer is condensed to form the polymer PET with EG as by product.

11
Fig 2-1. Synthesis of PET using TPA and EG route.

12
Fig 2-2. Synthesis of PET using DMT and EG route.

13
2.1.2 Commercial Co-monomers
The commercial co-monomers which are of interest to the packaging industry are
discussed in detail in this section. The nature of these monomers is of interest to recycling
because their presence can affect the properties of the final recycled materials.
Additionally, many of these co-monomers are of higher cost that TPA and their selective
recovery may be economically attractive. By adding these co-monomers to PET, the final
co-polyester of PET exhibits improved properties including controlled crystallization rate,
increase in glass transition temperature (Tg), low melting point and improved barrier
properties [20]. This increases the range of commercial applications of PET in packaging
markets. Table.2.1 provides the structure and advantages of each co-monomer when added
to PET homopolymer.

14
Table. 2.1. List of commercial co-monomers used in PET synthesis.
Co-monomer Advantage
Cyclohexane dimethanol (CHDM)
Lowers melting temperature
Isophthalic acid (IPA)
Disturbs crystallinity and reduces rate,
improve Barrier
Diethylene Glycol (DEG)
Disturbs crystallinity and reduces rate and lower
melting point
2,5-Furan dicarboxylic acid (FDCA)
Enhances barrier properties and increase
Tg

15
IPA improves the barrier properties which increases the shelf-life of the packaging
container. CHDM and DEG interfere with crystallization and lower polymer melting
temperature which helps in reducing processing temperatures. If only small amounts of co-
monomer is used, crystallization is slowed but not prevented entirely. As a result, bottles
that are both clear and crystalline enough to be an adequate barrier to aromas and even
gases, such as carbon dioxide in carbonated beverages can be obtained via stretch blow
molding "SBM", [3]. As will be discussed in section 2.1.3, mechanical recycling is limited
to pure PET or co-polyesters of PET with no more than 10% co-monomers because of the
deficiencies such as low molecular weight, low crystallinity of the products obtained after
mechanical recycling with high compositions of co-monomers [21]. This limits the range
of properties achievable through copolymerization of PET with high value co-monomers.
As a co-polyester of PET and PEF was synthesized in-house to improve the properties of
PET, the effect of co-monomer FDCA on the rate of depolymerization of PET using
chemical recycling methods was studied in this work.
2.1.3 Renewable polyesters
Polyethylene furanoate (PEF), a renewable polyester has attracted the attention of
the packaging industry, it is formed by polymerization of 2,5-Furandicarboxylic acid
(FDCA) and EG as shown in Fig 2-3. Though it is expensive to make, PEF is of interest
as replacement for PET because of better properties. PEF exhibits a tenfold improvement
in O2 and fivefold increase in CO2 barrier relative to PET [22]. This would allow longer

16
lasting packaging of carbonated drinks and shelf life for O2 sensitive products. PEF has
high glass transition temperature, which gives opportunity to extend temperature range of
operation and low melting temperature for easy processing. Economic production of FDCA
would make PEF a promising option to petroleum based TPA. Given the economic
challenges in replacing TPA with FDCA and limited availability of FDCA, one approach
that is being pursued by our group is copolymerizing PET and PEF.
Fig 2-3. Reaction mechanism for polymerization of PEF
Also for packaging application, bio-based FDCA was proven to be a major potential
feedstock monomer and bio based compounds are of interest for copolymers [20].
Therefore, a copolymer of PET and PEF was synthesized in-house by Anup Joshi, a PhD
candidate from University of Toledo [20], was used in this research to extend recycling
process for pure PET. This work explored the utility of chemical recycling to selectively

17
recover monomers from co-polyesters. A 20% co-polyester of PET/PEF flake was used for
the research as shown in Fig 2-4.
Fig 2-4. Reaction mechanism for copolymerization of PET with PEF
2.2 Recycling methods
Mechanical recycling is commonly used commercially to recycle PET and produce
pellets for further processing. Because of high temperature and sheer of mechanical
recycling, there is degradation of polymers structure and loss of molecular weight.
Additionally, it is hard to isolate value added monomers and additives during this process.

18
Moreover, impurities present in the post-consumer waste make it difficult to recycle
PET using mechanical recycling methods. Major impurities that can affect the recycling
efficiency are [23]: 1) polymer cross contamination i.e. PVC, 2) additives, and 3) non-
polymer impurities such as metal caps, labels etc., will have negative impacts on
mechanical recycling. PVC is of specific concern because as little as 50 ppm of PVC in
PET recycling stream can lead to degradation during mechanical recycling. PVC enters the
waste stream of PET in four different ways: a) PVC bottles (hard to identify and separate
from the PET bottles, trained individuals are required for manual separation of PVC bottles
from PET bottles), b) PVC used as lining for bottle labels, c) PVC present as liner for bottle
caps and 4) safety seals for bottles. PVC present in the waste stream forms acids that break
down PET resin both physically and chemically causing the PET plastic to become brittle
and yellowish in color. In addition, density of PVC is close to PET, which makes it hard to
separate using density flotation techniques. Similar problem would be encountered while
sorting PEF from the PET waste stream. Density follows the order PET < Poly vinyl
chloride (PVC) < Polyethylene furanoate (PEF) i.e. 1.38 < 1.39 < 1.43 g/cm3 [3, 24, 25].
Therefore, trace PVC present in PET/PEF mixed streams would be difficult to separate
using conventional mechanical recycling techniques.
To overcome these problems, this study focuses on selecting a recycling method to
treat contaminants and heterogeneous plastic waste. A chemical recycling method to
handle contamination through impurities (up to 5% PVC) and more than 10% co-monomer
is investigated which will be discussed in detail in chapter-4. Chemical recycling results in
depolymerization which can be used to selectively recover monomers for polymerization

19
to reproduce virgin polymer. Chemical recycling process has the advantage of recovering
monomers which can be used to manufacture synthetic chemicals or reproduce polymers.
While it is a technically feasible process, it has not gained much economic interest in the
industry because the cost of recycled monomer is higher than the cost of petrochemical
feed stock. However, use of recycled feedstock contributes in reducing the use of fossil
fuels and potentially the volume of polymers in landfill and environment.
The initial step for this work was to select a method out of the available methods,
develop a feasible process at low temperatures, atmospheric pressures and uses
environmentally beneficial solvents for de-polymerization. As a first step a literature
survey was conducted of the following five chemical recycling methods: 1) methanolysis,
2) glycolysis, 3) hydrolysis, 4) ammonolysis and 5) amminolysis. These classifications are
based on the type of reagent used for depolymerization. Each of the processes are described
in detail describing various methods reported in literature. Finally, a feasible process which
resulted in TPA and EG, handle co-polyesters and PVC was selected.
2.2.1 Methanolysis
Methanolysis was first reported in the patents of the late 1950’s. This process was
industrially established by the prime manufacturers of PET including Hoechst, Eastman-
Kodak, DuPont and other small companies. Methanol was used as a reagent for solvolysis
of post-consumer PET waste at high temperatures and pressure with addition of catalyst in
an autoclave as shown in Fig 2.5. The products are two raw materials that were used in

20
synthesis of PET i.e. dimethyl terephthalate and ethylene glycol [26]. Note that current
commercial PET processes do not use DMT because of issue with color in resulting
polymer. Therefore, DMT must be converted to TPA using hydrolysis reaction which adds
cost to the process.
Fig 2.5. Reaction mechanism for methanolysis of PET using excess methanol
Methanolysis was performed at temperatures from 160-300℃ and pressure up to 7
MPa, typical transesterification catalysts like zinc acetate, magnesium acetate, cobalt
acetate were used along with arylsulfonic acid salts for degradation. However, the catalyst

21
must be deactivated after completion of reaction; otherwise, it results in loss of DMT with
possible transesterification with EG. Reaction mixture obtained was cooled and DMT was
precipitated and optionally distilled [26].
Fig 2-6. Schematic of methanolysis process
The flow chart of a typical methanolysis process is shown in Fig 2-6 which was
reported by Spychaj et al [26]. Both continuous and batch processes were feasible except
the fact that cost associated with continuous process are higher because raw materials must
be continuously supplied into a pressurized reactor. The same steps can be used for both
processes i.e. autoclave, crystallizer, centrifuge and distillation system to obtain DMT.
Reaction products of methanolysis are a complex mixture of glycol, alcohols and phthalate
derivatives because of which the conversion was limited to 90%. Substantial amounts of

22
ethylene glycol formed during degradation can be distilled and fed back to the system to
produce PET [26].
Methanolysis is an expensive process that tolerates higher levels of contamination
so that higher chemical processing costs are offset by low feed stock costs [26]. It is rather
sensitive to the presence of water and causes problems associated with catalyst poisoning
and formation of azeotropes. Usually costs of DMT recovery are higher than virgin DMT
[26].
New technologies developed by Eastman-Kodak and DuPont were economically
more advantageous than the conventional processes [26]. Process used by industries were
well established with around 99% conversion rates. For example, in 2003 Mitsubishi
Heavy Industries Ltd [27] was issued a patent that used supercritical and subcritical
methanolysis. A high reaction velocity PET depolymerization process was developed for
use with existing DMT hydrolysis technique for converting PET into TPA. Supercritical
methanolysis was conducted at a temperature of 300℃, pressure of 15 MPa with a reaction
time of 10 min. Subcritical methanolysis was conducted at a temperature of 230℃,
pressure of 6.5 MPa with a reaction time of 5 h. Neither process required use of catalyst.
Therefore, reaction was simplified and the separation of catalyst was not necessary [27].
After the depolymerization, the mixture of DMT, EG and excess methanol were sent to
lower boiling product separation and separated into DMT and EG/excess methanol, which
in turn were sent to further purification section to recover purified EG and methanol by
distillation. Purified DMT monomer was converted to TPA in the hydrolysis section. EG
was purified from EG/excess in a purification section. Finally, purified TPA and EG were

23
then delivered into existing PET resin production plants to form an ideal recycling system.
Purity of DMT was around 99.9% and EG was 99.0% [28]. Methanolysis process
recovered DMT which was hydrolyzed to produce TPA (Yields were not reported).
2.2.2 Glycolysis
Glycolysis is a de-polymerization process that occurs via transesterification
between PET ester groups and a diol, in the presence of a transesterification catalyst.
Typically, EG is used in excess to obtain monomer BHET as shown in Fig 2-7. In this
process ester linkages are broken to form hydroxyl terminals. Glycolysis process cannot
achieve complete de-polymerization of PET to BHET. With time, in addition to the
monomer, oligomers were also formed which makes recovery of BHET difficult [26].
Glycolysis was first reported in 1965 by MacDowell et al [29], from then it has
been the subject of interest for various researchers of PET to improve process that
minimizes use of catalyst, requires less amount of glycol and optimizes reaction parameters
such as time, temperature, PET/catalyst ratio or PET/glycol ratio [30]. Variables affecting
glycolysis were studied in detail and reported by Vaidya et al [30].
Frequently used glycols were ethylene glycol, propylene glycol, diethylene glycol,
di-propylene glycol, 1-4 butane diol etc. Typical catalysts used in glycolysis were
hydrotalcites, ionic liquids, enzyme’s, amines, alkoxides and metal salts of acetic acid.
Reaction proceeds under normal or high pressures at 180 - 250℃ in the presence of catalyst
for 3 – 8 hours depending on the glycol used. Reaction should be carried out under nitrogen

24
purge to avoid the degradation of polyols [26]. Reaction mechanism along with formation
of side products are shown in Fig 2-7.
Fig 2-7. Reaction mechanism for glycolysis of PET using excess ethylene glycol

25
BHET is a solid that cannot be easily purified using conventional process.
According to the report of Scheirset et al, it is purified using melt filtration under pressure
[31]. Recovered BHET can be easily mixed with the fresh BHET used in PET production
plants.
Glycolysis process can be characterized as: 1) solvent assisted glycolysis, 2) super
critical glycolysis, 3) Microwave-irradiated glycolysis, and 4) catalyzed glycolysis. Many
industries use glycolysis process to recycle the PET from in plant scrap according to
Simonaitis et al [32] as it provides BHET for mixing with fresh BHET in PET synthesis.
Glycolysis process [33] using sub and supercritical ethylene glycol produce high
yields of BHET from PET flake in less time; super critical reaction was performed at 450℃
and 15.3 MPa while subcritical reactions were carried out at 350℃ and 2.49 MPa or 300℃
and 11 MPa. Monomer yield in the form of BHET was observed to be high i.e. 94% for
the subcritical conditions. According to Imran et al this method is useful for processes
requiring high throughput for short reaction times [33]. Note that operating at elevated
temperatures and pressures increases operating costs and may not be feasible for thermally
sensitive compounds including FDCA.
Microwave irradiation assisted glycolysis was invented to effectively
recycle PET in short times [34, 35]. Microwave irradiation was used at various controlled
temperatures, 2 MPa pressure, 90 – 120 min reaction time and catalyst to obtain BHET
monomer and ethylene glycol as products along with diethylene glycol as degradation
products. Pingale et al says that the microwaves couples with molecules and promote rapid
but controllable rise of temperature based on two fundamental mechanisms i.e. dipole

26
rotation and ionic conduction. Comparing the results, the time required for the reaction is
reduced drastically but there was no change in the yield. Pingale et al. reported that the rate
of de-polymerization of amorphous PET was high compared to the crystalline PET[34].
Many catalysts like hydrotalcites, ionic liquids, enzymes, amines,
alkoxides, metal salts of acetic acid, zeolites, metal oxides impregnated on different forms
of silica nano and micro particles were studied by Al-sabagh et al [28]. The key challenge
according to Al-sabagh et al was to use these catalysts, as it is a difficult process to recover
the catalyst from oligomers/BHET mixture after depolymerization. Most used metal
catalyst was zinc acetate but because of toxic nature it is not preferred. Use of eco-friendly
metal catalysts such as sodium carbonate, sodium bicarbonate will be more acceptable
industrially, but the PET/catalyst ratio required during the reaction will be higher compared
to zinc acetate.
An interesting hybrid process using simultaneous glycolysis with EG and
hydrolysis with water in the presence of xylene and an emulsifier was reported by Guclu
et al [36]. Guclu et al carried the reactions between 170 and 190℃ and lower pressures
compared to usual methods. Xylene and ethylene glycol were immiscible solvents which
make this process unique, reaction products after extraction with boiling water yields water
soluble crystallizable fraction (WSCF) which has the product BHET and mono
hydroxyethyl terephthalate (MHT) and water insoluble fraction (WIF) has dimer. With an
increase in water content formation of MHT was increased to 47%. The product was
characterized by determining the acid value (AV) and hydroxyl value (HV). Based on the
literature reported methods, it seems that it’s better to use green solvents to reduce the

27
harmful effect on environment. Glycolysis method used several catalysts and high
temperature (>170℃ - 450℃) and pressures (2- 15.3 MPa) and recovers BHET which
should be hydrolyzed to recover TPA.
2.2.3 Hydrolysis
Hydrolysis process uses aqueous reaction medium that can be alkaline, acid
or neutral without use of catalyst or neutralizers [37-41]. This process was reported in
patents during the period of 1959-1962. Each bond cleavage of polymer chain in hydrolysis
process consumes one water molecule to form the carboxylic and hydroxyl functional
groups. The reaction operates at moderate temperatures and pressures to obtain terephthalic
acid and ethylene glycol monomers. Reaction time usually takes less than 30 minutes at
elevated temperatures and pressures. This method has not been broadly applied industrially
compared to glycolysis and methanolysis because of the high costs associated with
purification of TPA. However, majority of the industries are using the monomer TPA as
raw material for synthesis of PET because of its commercial availability. For this reason,
now-a-days hydrolysis has gained importance over other chemical recycling methods.
Alkaline hydrolysis was carried out using alkaline solutions like sodium
hydroxide, potassium hydroxide and ammonium hydroxide solutions. This process can
recycle highly contaminated PET waste stream. The reaction is shown in Fig 2-8, reactions
with sodium hydroxide solution as reaction medium were run at temperatures of 100-
250℃, 1-2 MPa pressure and 3-20 wt.% alkaline concentrations. Various catalysts were
used in this process to promote the rate of reaction [26]. TPA showed good solubility with

28
alkaline hydroxides, because it forms a salt i.e. TPA-Na+2 in NaOH solution. Addition of
a mineral acid reproduces the TPA as precipitate, which is shown in Fig 2-8.
Fig 2-8. Reaction mechanism for alkaline hydrolysis of PET using NaOH.

29
Patent for 18-wt% solution of NaOH to recycle PET was reported [42]. This method
uses PET/NaOH weight ratio of 1:20 at 100℃ for about 2 hours. Reaction mixture
undergoes acidification with a mineral acid to precipitate TPA from the solution.
Recovered TPA was filtered, rinsed and dried for further use. The filtrate containing
ethylene glycol is sent back to the process as reaction medium with addition of NaOH.
When EG concentration in the solution increases, vacuum distillation can be done for its
recovery.
A process to recover monomers from PET/Polyamide-6 blend was studied
by Lazarus et al [43] using sodium hydroxide and potassium hydroxide solutions.
Monomer yield for this process was studied for temperature range from 180-320℃ and
pressures of 150-350 PSI. It takes about 3-5 hours if the reaction proceeds with hydroxide
solutions of 3-10 wt.% for the reaction to complete. PET/alkaline weight ratios of 1:2 or
1:3 were described to be the most feasible on an industrial scale. Quantity of alkaline
solution depends on the number of polyester blends present in the PET waste. Final product
i.e. dicarboxylic acid was precipitated out by acidification. Caprolactam and EG obtained
were distilled or salted out using NaCl.
Commercial process to recover highly contaminated PET was used in USA
under the trade name UnPETTM, in France under trade name RECOPETTM. This process
uses a rotary kiln, condenser and a centrifuge which is a low capital investment process
compared to established processes like glycolysis and methanolysis. Reaction mixture
containing TPA and EG was allowed to heat up to 340℃ to distill off the EG, later TPA

30
was purified under normal pressures at 100℃. Impure organic compounds were converted
into CO2 and water [26].
Many interesting approaches to use alkaline hydrolysis for PET recycling
were studied [15, 37, 38, 44, 45]. PET which was pre-heated at elevated temperatures in
methyl benzoate, undergoes alkaline metal hydroxide (2 - 7 wt.%) hydrolysis for 30 min at
100℃ to yield TPA and benzoic acid. Another approach to convert green color PET to
colorless TPA and oxalic acid was reported [46]. This process uses high molar (27M)
NaOH solution, elevated temperatures of 250℃ and oxygen partial pressure as 5 MPa. A
process using dioxane as co-solvent in alcohol to recycle PET accelerated the reaction [47].
With the addition of dioxane reaction time was 40 min at 60℃ whereas without dioxane
reaction completes in 7 hours. Study on depolymerization using mixer-extruder at 100-
200℃ was reported with a conversion of 97% [48]. This process uses solid NaOH to
recycle PET and the EG formed was distilled off under reduced pressure eliminating the
cost to separate EG and water. Salt of TPA was obtained in powder form.
From the processes described above alkaline hydrolysis can be done at
temperatures below 100℃ and atmospheric pressure. Using this process polymer blends
were recycled. Therefore, this process can handle contaminated post-consumer PET waste
stream. This can be a simple and cost-effective process compared to methanolysis and
glycolysis [15].
Acid hydrolysis was carried out using sulfuric acid, nitric acid and
phosphoric acid [15, 46, 49]. Among these, H2SO4 was of interest because it facilitated

31
reaction at low temperatures and pressures. Chemical reaction is shown in Fig 2-9.
Reaction can be carried with <100℃ or without external heating supply. If 87 wt.% of
H2SO4 was added into the PET waste reaction takes place below 100℃ under atmospheric
pressure for about 30 minutes, post reaction mixture contains sodium salt of TPA and
ethylene glycol in viscous form. It is neutralized to pH~7 using a base mostly NaOH
solution. This neutral mixture contains EG, sodium hydroxide, TPA as sodium salt, sodium
sulphate and insoluble impurities which undergo first filtration to remove the impurities
[50]. Color in the filtrate can be removed using ion-exchange method. Later, filtrate was
acidified to a range of pH (0-3, 2.5-3, 6-6.5) using H2SO4 or HCl to re-precipitate TPA
with >99% purity followed by filtration, washing with water and drying. EG can be
recovered either by extraction [51] with organic solvents or by salting-out.
The drawbacks of high corrosivity and inorganic salt formation were tried
to minimize by Yoshika T et al using low concentration H2SO4 at 150℃ with use of dilute
solution of sulphuric acid ( <67 wt.%) [49]. In this process sulphuric acid can be recovered
and reused. 5 M NH4OH was used to neutralize post-reaction mixture and PET and TPA
salt were filtered off. Recovered sulphuric acid was used to precipitate out TPA. This
process requires large reactor volumes because of dilute solution which was not cost
effective. However, it reduces the corrosive effect, waste inorganic salts and aqueous
wastes. Another process was studied to obtain oxalic acid with 40% yield after 72 h [46]
which was more expensive than TPA and EG. Separation of EG from acid and corrosion
of the equipment were the two main drawbacks of acidic hydrolysis as mentioned [26].

32
Fig 2-9. Reaction mechanism for acid hydrolysis of PET using sulphuric acid

33
Neutral hydrolysis has gained prominence over the other two hydrolysis methods
over the last two decades[40, 41]. It lacks the primary draw backs of alkaline and acid
hydrolysis i.e. formation of organic salts and alkaline or acid waste, corrosion problems,
also it is environmentally beneficial. Chemical reaction was shown in Fig 2-10. Neutral
hydrolysis takes place at elevated temperatures of 200-300℃ and neutral pH. After the
reaction, pH will be 3.5-4.0 because of the formation of TPA monoglycol ester. PET in
molten state depolymerizes faster than the one in solid state. Hence, reaction temperature
of more than 245℃ would be more advantageous [52]. Commercial PET was made using
catalysts like zinc acetate, manganese acetate, calcium acetate and antimony oxide. The
presence of these catalysts increased the rate constant about 20% relative to the base system
and favors the neutral hydrolysis process [53].
A mono ester of glycol and terephthalic acid was formed between 95-100℃
which was soluble in the reaction mixture at this temperature. TPA was practically
insoluble at this temperature and can be separated easily. Monoester formation can be
controlled through adjusting process parameters. A five-step process was reported by
Tustin et al. to recover TPA and EG from PET. Initially PET was heated at 200-280℃,
post reaction mixture was cooled to 70-100℃, solid product was dried at 25-199℃. Dried
product was heated with water at 310-370℃ to obtain TPA, yield as not reported. Ethylene
glycol obtained from the first step was recovered using two stage distillation process [54].
Though the neutral hydrolysis lacks in primary drawbacks of the alkaline
and acid hydrolysis, main drawback is the mechanical impurities present in PET are left in

34
TPA which needs a sophisticated purification process to recover the pure TPA.
Fig 2-10. Reaction mechanism for neutral hydrolysis of PET using water

35
2.2.4 Ammonolysis
Ammonolysis process uses anhydrous ammonia to depolymerize PET and
form terephthalamide [26]. This was converted to terephthalic acid nitrile and further to
para-xylene diamine or 1,4- bis aminomethyl cyclohexane. Chemical reaction is shown in
Fig 2-11. Reaction was carried at about 1 MPa pressures and 120-180℃ temperature for
1-7 hours. Post-reaction mixture was filtered to collect the amide product, washed and dried
at 80℃. High yields ~90% are observed for the mentioned reaction conditions with 99%
purity. A low-pressure degradation method of ammonia in ethylene glycol medium was
reported.
Fig 2-11. Reaction mechanism for ammonolysis of PET using ammonia[26].

36
2.2.5 Amminolysis
Amminolysis process uses primary amines in aqueous phase, gaseous phase
for partial surface modification of PET fiber [26]. Amminolytic surface modification was
a selective degradation process which allows to control fiber morphology. Chemical
reaction is shown in Fig 2-12. In this process amorphous region in a semi crystalline
polymer was rapidly degraded whereas crystalline regions are stable to amines. Typical
amines used in amminolysis process were methylamine, ethylamine, butylamine,
ethanolamine, ethylene diamine, triethylene tetra amine. This process improves the dye
ability and other end use properties of the fibers.
Fig 2-12. Reaction mechanism for amminolysis of PET using amines[26].
37
From all these processes, methanolysis and glycolysis are used on commercial
scale, former process recovers the monomer DMT and the later process recovers BHET.
As TPA has become the common raw material in the production of PET, the monomer
formed after methanolysis and glycolysis must be hydrolyzed to recover TPA monomer.
This becomes a problem when co-polyesters are recycled, both the processes cannot
recover the required co-monomers without using hydrolysis as final step. Ammonolysis
and amminolysis processes have not gained much industrial interest because of the
products recovered after recycling i.e. monomers of amides and imides. Therefore, as
hydrolysis recovers TPA and EG from PET, considering all the drawbacks of other
processes alkaline hydrolysis was selected to perform the experiments throughout the
research and it is expected to selectively recover the co-monomers present in PETF20 i.e.
TPA and FDCA.

38
Chapter - 3
Experimental section
As discussed in chapter-2, several methods have been developed for chemical
recycling of PET waste. Hydrolysis is the most feasible method to recover the co-
monomers for co-polyesters [26]. The focus of the research was to screen hydrolysis
reaction of pure PET considering economic and environmental factors. To choose a better
process among alkaline, acid and neutral hydrolysis, based on the data provided on
hydrolysis in chapter-2, considering the drawbacks of all the three processes, alkaline
hydrolysis was selected. A method used by Karayiannis’s et al. was selected to perform
further reactions as it is a simple method and uses 1.1 M NaOH solution, temperatures
below 150℃ which is low compared to other methods which are reported in chapter-2.
PET flakes with PVC, co-monomers were hydrolyzed individually using this method to
precipitate the respective monomers and study their effect on PET conversion. This method
was extended to use with a model co-polyester of PET and PEF.

39
Materials and methods
3.1 Materials
Sodium hydroxide pellets (CAS grade), H2SO4 (certified, 72% (w/w), 24.0N, ±0.1N
(12M)), Whatman ™ filter paper (4, Qualitative, circles, 55mm Ø) were supplied by Fisher
Scientific. Sigma Aldrich supplied other materials and solvents. Distilled water was used
for reactions and washings.
3.1.a Poly (ethylene terephthalate) powder and flakes
Polyethylene terephthalate (Fig 3-2) pellets containing 2.5% IPA (LASER+® from
DAK Americas) were ground into powder (<250μm) using cryogenic grinder (IKA A10).
The PET powder was vacuum dried at 110⁰C to remove any
moisture present in the sample which can degrade the polymer
while extrusion. Films were processed from PET powder
using a single screw extruder (Randcastle, RC-0250
microtruder shown in Fig 3-1). The films were chopped into
6mm X 6mm flakes, washed with isopropyl alcohol followed
by water and dried under vacuum @ 80⁰C overnight. PET
powder and flakes were used to screen hydrolysis process.
Fig. 3-1. Randcastle microtruder # RC-0250

40
Fig 3-2. Structure of polyethylene terephthalate (PET)
3.1.b 20% Co-polyesters of poly (ethylene terephthalate) and poly (ethylene
furanoate) (PETF20) flakes
Lower molecular weight, 20% co-polyester (Fig 3-3) of PET with FDCA was
prepared in-house [20] was grounded into powder using a cryogenic grinder. The co-
polyester powder was solid stated (a method to increase molecular weight of the polymer)
in a vacuum oven at 210℃ to increase the molecular weight of PETF20 for 24 h. Solid
stated powder of PETF20 was processed into films using a microtruder shown in Fig 3-1.
The films were chopped into 6mm X 6mm flakes, washed with isopropyl alcohol followed
by water and dried under vacuum @ 80⁰C overnight.
Fig 3-3. Structure of Co-polyester of PET and PEF (PETF)

41
3.2 Methods
3.2.1 Experimental setup for chemical recycling of PET and PETF20 flakes
Parr bench top pressure reactor (100mL) shown in Fig 3-4 was used for high
temperature hydrolysis reactions of PET up to 150℃. The Parr reactor is equipped with a
mixer to ensure mixing in the solution.
Reactions at low temperatures (90℃) were performed in sealed glass vials to screen
the impact of reaction conditions on depolymerization of PETF20 and PET. Glass oil bath
shown in Fig 3-5 with a thermometer to measure the temperature of the oil, glass vials with
lid to hold the reaction mixture were used. Note that reaction mixture was not stirred in
glass vials.
Fig. 3-4. Parr bench top reactor
Fig. 3-5. Reaction setup using oil bath @ 90℃

42
3.2.2 Procedure for alkaline hydrolysis of PET
Hydrolysis of PET flakes and powder was conducted at 120⁰C and 150⁰C in the
Parr reactor using method reported in the literature by Karayiannis’s et al. [15]. NaOH
solution of 1.1 M was prepared by dissolving (0.033mol, 1.35g) NaOH pellets into 30ml
water. NaOH solution (30 mL) and PET powder/flakes (3 g, 0.0156mol) were added to the
reaction vessel and heated to reaction temperature of 120℃ or 150℃. The system pressure
was recorded from the reading of pressure gauge present on the reactor which changes
according to the vapor pressure of NaOH solution at reaction temperature (120℃ ~ 2.5 bar,
150℃~5 bar). Hydrolysis of PET was run for up to three hours. The TPA-Na+2 product
formed is soluble in NaOH solution with the EG. After a specified reaction time, the
reaction vessel was separated from the setup and allowed to cool for 5 min under running
water. Once the reaction mixture reached room temperature, it was neutralized to pH~6.5
with H2SO4 and vacuum filtered to remove unreacted PET solids. The resulting filtrate was
precipitated to form TPA and Na2SO4 salt by acidification with H2SO4 to a pH of 2.5.
Acidified mixture was vacuum filtered using Whatman ™ filter paper to recover monomer
TPA, with the ethylene glycol remaining in aqueous solution. TPA was washed with
methanol to remove any impurities, salts and trace amounts of EG. Solid TPA was dried
under vacuum at 80⁰C, weighed on an analytical balance to estimate the monomer molar
yield as shown in eq.3.3.1. The structure of the product was confirmed using NMR and
FTIR as discussed in section.3.3 [15]. Experiments were performed for time intervals from

43
0.5 minutes to 5 hours at temperatures from 90⁰C, 120⁰C and 150⁰C, as outlined in
Table.3.1.
Table 3.1: Reaction conditions for alkaline hydrolysis of PET in Parr system
Parameters Units Powder Flakes
Temperature °C 120, 150 90, 120, 150
Pressure Atm VP of solution @ reaction temperature
VP of solution @ reaction temperature
Reaction time Min 30-90 30-300
Polymer g 3 3
NaOH solution ml 30 30
3.2.2.a PET powder
Initial experiments were performed using powder form of PET to observe the
reaction kinetics as a function of particle size. Since polymer chain scission is dependent
on surface area, the particle size and shape play an important role during depolymerization.
According to this hypothesis, powder should take less time to depolymerize than polymer
flakes. The powder was hydrolyzed at 150⁰C for reaction times ranging from 0.5 to 1.5
hours at 30-minute intervals. Reactions were performed on the PET powder with respect
to the reaction conditions provided in Table 3.1.

44
3.2.2.b PET Flakes
Flakes are typically available form of PET used in recycling. Therefore, the bulk of
hydrolysis experiments used PET, PETF20 flakes. Typical industrial flake size ranges
from 4-18mm. Therefore, a representative size of 6mm X 6mm was used for conducting
the experiments. Since rate of depolymerization is dependent on particle size and flake
thickness (0.03-0.09 mm), the reaction conditions chosen range from 0.5 to 5 hours at
varying time intervals as shown in Table 3.1.
3.2.2.c Impact of impurities -PVC
To study the impact of major impurity which is PVC on PET depolymerization,
hydrolysis experiments were conducted at reaction conditions shown in Table.3.2 for times
ranging from 0.5 to 3 hours at 150°C and system pressure of 5 bar. In mechanical recycling,
as little as 50 ppm of PVC can cause damage to the recycled PET and degrades the RPET
properties [12]. Keeping this in mind to test the impact of PVC on chemical recycling of
PET, up to 5 wt.% PVC was added along with PET during hydrolysis. At elevated
temperatures and long times, PVC degrades and reacts with PET, our hypothesis was that
PVC would not have a major effect on PET recycling at low reaction times and
temperatures i.e. 150℃ and 180 min.

45
Table 3.2: Reaction conditions for alkaline hydrolysis of PET flake/PVC in Parr system
Parameters Units Conditions
Temperature °C 150
Pressure Atm 5 bar
Reaction time min 30-180
PET flake g 3
NaOH solution ml 30
PVC wt.% PVC /wt.% PET 1,3,5
3.2.2.d Impact of co-solvents
Reports and literature indicated that it takes 5 h to completely depolymerize PET
flakes at 150℃, which is energy consuming. Therefore, impact of co-solvents was
investigated to improve the rate of reaction. For the reaction to occur faster within the
polymer matrix, a co-solvent is required to penetrate into the matrix, swell the polymer and
facilitate chain scission of PET (see Fig 3-6). Solvent with Hansen solubility parameters
(δ) close to PET (20.5 MPa1/2) would be acceptable. A green solvent γ-Valero lactone
shown in Table. 3.3, with Hansen solubility parameters , δ=23.1 MPa1/2 [55] was selected
as a model co-solvent. This is because compounds with similar Hansen solubility
parameters are miscible with one another.

46
As discussed in Chapter-2, swelling of PET matrix is mass transfer limited, the
initial trials were conducted on PET flakes using co-solvent γ- Valero lactone which was
screened at reaction time 1.5 h for varying the mole% in a Parr stainless steel isolated
system at 150°C and 5 bar. Molar compositions were selected based on the outcomes of
GVL and used to screen other co-solvents with Hansen solubility parameters close to PET.
The effect of co-solvent on alkaline hydrolysis at 90℃ was studied for both PET and PETF
20 flakes using five co-solvents shown in Table. 3.3.
Fig 3-6. Sketch on surface reaction of PET with NaOH and solvent.

47
Table 3.3: co-solvents used for alkaline hydrolysis of PET and PETF 20
Solvent Structure Parameters Solubility
Gamma
Valero
Lactone
ρ – 1.0465 g/ml
BP – 270°C
δ-23.1 MPa1/2 [55]
38%
Gamma
Butyral
lactone
ρ – 1.13 g/ml
BP – 270°C
δ-26.2MPa1/2 [56]
60-70%
Ethylene
Glycol
Diacetate
ρ – 1.104 g/ml
BP – 187.2°C
δ-23.3MPa1/2 [56]
18-20%
Propylene
Glycol
diacetate
ρ – 1.05 g/ml
BP – 191°C
δ-18.4 MPa1/2 [57]
5-7%
Triglycerol
ρ – 1.3 g/ml
δp<18.3 MPa1/2
3-4%

48
Table 3.4: Reaction conditions for alkaline hydrolysis of PET and PETF 20 in oil bath
Parameters Units Conditions
Temperature °C 90
Pressure Atm Atmospheric pressure
Reaction time Days 3 days
PET flake g 1
NaOH solution ml 10
Co-solvent Mole % 1
It is not possible to observe the ongoing reaction in the stainless-steel Parr reactor.
Therefore, a simple system was set up using glass oil bath with a thermometer to measure
the temperature of the oil, a glass vial with lid. Considering the boiling point of water, a
reaction temperature of 90℃ was selected to eliminate the possibility of pressure buildup
in the vial. PET flakes and PETF 20 copolymer flakes were screened at 90℃ using sodium
hydroxide solutions and co-solvents were shown in Table.3.3 at conditions listed in
Table.3.4.
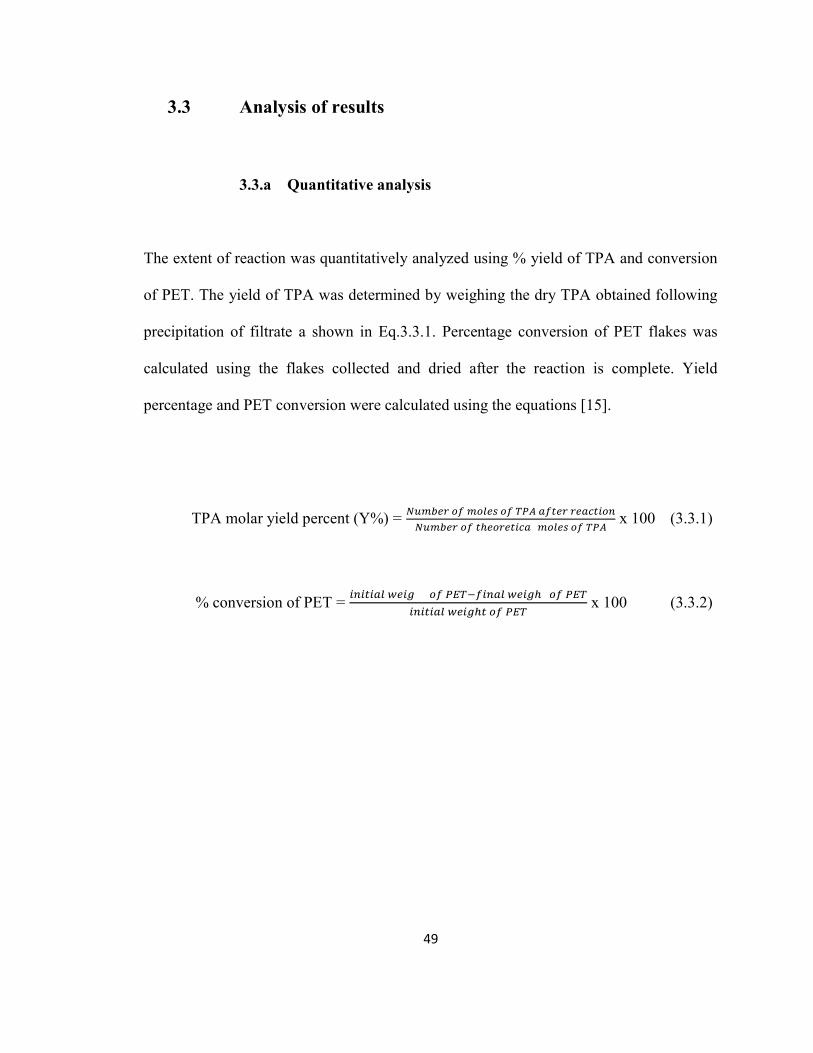
49
3.3 Analysis of results
3.3.a Quantitative analysis
The extent of reaction was quantitatively analyzed using % yield of TPA and conversion
of PET. The yield of TPA was determined by weighing the dry TPA obtained following
precipitation of filtrate a shown in Eq.3.3.1. Percentage conversion of PET flakes was
calculated using the flakes collected and dried after the reaction is complete. Yield
percentage and PET conversion were calculated using the equations [15].
TPA molar yield percent (Y%) =
ⅹ 100 (3.3.1)
% conversion of PET =
ⅹ 100 (3.3.2)

50
3.3.b Confirmation of Structure of products
Chemical structure of the monomers obtained from hydrolysis of PET and PETF20
flakes i.e. TPA and FDCA were analyzed. FTIR spectroscopy was used to give the
information based on the vibrational states of the specific bond C-O, C=O, C=C and –OH
stretching’s as shown in Table.3.5, spectrum will be discussed in detail in chapter-4 (FTS
4000 FTIR with microscope model UMA 600, Digi lab Excalibur series). 1H NMR and 13C
NMR (Table.3.6) (Bruker Avance III 600Mhz spectrometer with Cryoprobe and a Z
gradient) was used to determine the molecular structures of TPA as discussed in section-
4.1.6. The proton and carbon spectrum of the monomer mixture obtained after hydrolysis
of PETF20 was used to confirm the presence of both pure TPA and FDCA as discussed in
section-4.2.3. To check if the PET flake is crystallizing during the reaction, DSC (DSC
Equipment, Perkin-Elmer Diamond DSC) was used for thermal analysis where, PET flakes
were heated to 300℃ at a heating rate of 10℃/min. first heating ramp was used to calculate
the crystallinity of the flake. The DSC curves will be discussed in section-4.2.3

51
Table: 3.5. FTIR data of monomers obtained from hydrolysis of PET and PETF20
Polymer Structure Peak (cm-1) Assignment
Terephthalic acid
3065 C-H st
1280 C-O st
1676 C=O st
1136-1020 C-C st
Isophthalic Acid
2300-3300 Carboxyl acid
1698 C=O
1486, 1612 C=C
1287 C-O
720 Oop meta
subst
2,5-Furan
dicarboxylic acid
3120 C-H st
1580 C=C st

52
Table: 3.6. NMR data of the monomers obtained from hydrolysis of PET and PETF20.
Structures Proton peaks (ppm) Carbon peaks (ppm)
Terephthalic Acid (TPA)
8.03
Aromatic ring 129.5
C-C
attachment 134.8
-COOH 166.7
Isophthalic acid (IPA)
Protons of meta
connected benzene
ring: 8.47, 8.16, 7.63
-COOH 166.58
Aromatic ring
[58]
133.32
131.28
130.02
129.02
2,5-furan dicarboxylic acid (FDCA)
7.2
Furan ring 118.48
C-C
attachment 147.07
-COOH 158.9

53
Chapter - 4
Results and discussion
The focus of this thesis was to perform alkaline hydrolysis of a co-polyester of 80%
PET and 20% PEF (PETF20). Alkaline hydrolysis reaction was chosen for
depolymerization of PET and its co-polyesters because it can tolerate highly contaminated
waste [15] and can handle major impurities in the PET waste stream including PVC [59].
Sodium hydroxide solution was used as reaction medium to perform depolymerization
reactions. As described in chapter -2, alkaline hydrolysis results in formation of TPA and
EG which can be converted back to PET. This is of interest to our work, as it allows the
potential to isolate co-monomers or value-added compounds from co-polyesters.
Phase-I of the work focused on the hydrolysis of PET flake at 120℃ and 150℃
using 1.1 M NaOH solution. Several experiments were performed to evaluate the impact
of time, temperature and PVC on PET to confirm that our results were in reasonable
agreement with the literature. The impact of a green co-solvent (γ-Valero lactone (GVL))
on the conversion of PET flakes was studied.
Phase two of the project focused on alkaline hydrolysis of PETF20 co-polyester
using the same method to potentially prove that chemical recycling can selectively recover

54
co-monomers. In addition, effect of several co-solvents on alkaline hydrolysis of both PET
and PETF20 flakes was studied to improve the yield of the monomer. All the experiments
were replicated at least twice.
4.0 Reaction mechanism of alkaline hydrolysis of PET with NaOH
Chemical degradation of PET typically starts with scission of polymer chains,
which are subsequently depolymerized to oligomers and further to monomers. This
requires that reactants access the polymer chain, therefore both surface area of the polymer
and reaction kinetics affect the rate of conversion. Since the polymer is insoluble in the
reaction media, the reaction occurs in the near surface layer and surface area is critical to
determining reaction rate as shown in chapter 3, Fig 3-6. Swelling of the polymer matrix
is a slow process as the alkaline solution has limited solubility in PET. In the reaction, the
metal catalyst (in this case sodium cation) activates the carbonyl group and forms a
coordination complex, this reduces the electron density and facilitates the nucleophilic
attack of hydroxyl group (OH-) on positively polarized carbon atoms. This results in the
cleavage of the polymer chains, which gives rise to the disodium salt of monomer TPA as
shown in Fig 4.1. PET samples with greater surface area per volume react faster with the
aqueous reaction medium. Disodium salt of monomer formed would be dissolved in the
aqueous reaction medium to which sulphuric acid was added. The H+ ions react with the
carbonyl oxygen and the SO42- reacts with the sodium attached to the carbonyl oxygen to
produce terephthalic acid (TPA) and the sodium sulphate. Precipitated TPA can be
recovered via filtration. The residual sodium sulphate was dissolved in the filtrate. In case

55
of co-polyesters, the diacids formed can be selectively recovered from solution and
purified.
Fig 4.1: Reaction mechanism of alkaline hydrolysis of PET with NaOH solution.

56
4.1 Hydrolysis of Polyethylene terephthalate (PET)
4.1.1 Effect of time
Initial studies focused on investigation of the conversion of PET flakes during
alkaline hydrolysis as a function of time. Separate reactions were conducted at each time
interval i.e. 15 min, 30 min, 60 min, 90 min, 120 min, 150 min, 180 min, 240 min and 300
min) to observe the reaction kinetics of PET in 1.1 M NaOH solution at 150℃. After each
experiment, the reaction mixture was precipitated using known amounts of sulphuric acid
to recover the monomer TPA. As the PET used for this work was copolymer with 2.5%
isophthalic acid (IPA), it was expected that the recovered monomer would contain trace
amounts of IPA.
A plot of percentage yield of TPA and conversion of PET flakes during alkaline
hydrolysis as function of time up to 300 minutes is shown in Fig 4-2. The yield of TPA is
the ratio of TPA recovered to mass of TPA available at complete conversion of PET. The
yields of TPA and conversions of PET were calculated using the equations 3.3.1 and 3.3.2.
Yield % of TPA were approximately equal to the PET conversion which is consistent with
expectations for case with limited secondary reactions. Percentage yield increased with
increasing reaction time from 15 min to 300 min i.e. 40% to 89.9% which is the same case
with conversions of PET. Due to the solubility limitation of water in PET, the conversion
of PET flake in the first 10 min was very low as there is not enough time for the alkaline
medium to swell the surface of PET flake. But the bulk of conversion of PET to TPA and
EG occurred within the first 30 minutes, with slight increase at longer reaction times. The

57
% crystallinity of the flakes before and after alkaline hydrolysis reactions were measured
using differential scanning calorimetry which will be discussed in section 4.2.2. There is a
scope of improving the rate of conversion of PET flake by reducing the crystallinity of the
flake during the reaction. Reasonable conversions were observed between 60 – 180
minutes. Based on this data, further experiments to study the impact of temperature and
impurities were conducted in this time range.
Fig 4-2. Effect of time on PET hydrolysis of flakes at 150°C in 1.1M sodium hydroxide
solution, where ♦ is % TPA yield and ■ % PET conversion.
0
10
20
30
40
50
60
70
80
90
100
0 50 100 150 200 250 300
Perc
enta
ge (%
)
Reaction time (minutes)

58
Fig 4-3. Unconverted residue (from left) A) 90min, B) 120min, C) 150min, D) 180min, E)
240min and F) 300min.
The experiments performed to study the impact of time exhibited similar results
observed in the literature [15] where PET conversion increased up to 89% with increasing
reaction time up to 6 hours at 150°C.
Fig 4-3 shows the PET residue following reaction for 90 min, 120 min, 150 min,
180 min and monomer at 240 min and 300 min from left to right at 150°C. Reaction at 90,
120, 150 and 180 minutes resulted in conversions below 79.4% as shown in Fig 4-2, the
disodium salt of monomer formed was dissolved in the solution, unreacted PET was ] in
the flake form. Unreacted PET was collected and dried below 80℃ to determine the %
conversion and % crystallinity. Reactions conducted for more than 240 minutes resulted in
complete depolymerization of PET flakes and the product formed was dissolved in the
solution which was precipitated to recover the monomer as shown in the Fig 4-3.
A B C D E F

59
4.1.2 Impact of temperature on alkaline hydrolysis of PET
PET Powders
PET in powder form of 250μm diameter was hydrolyzed using sodium hydroxide solution
at temperatures 120℃ and 150℃ for 30, 60 and 90 minutes. As expected, the PET
conversion was low at 120℃ compared to the conversion at 150℃ over full time range.
PET powder exhibited interesting results with a conversion of 98% for 90 minutes at 150℃
as shown in Fig 4-4.
Fig 4-4. Effect of temperature and time on hydrolysis of PET powder @ ■ 120℃, ♦ 150℃
for 30, 60 and 90 minutes in Parr reactor. a) % PET conversion, b) % TPA yield.
0
20
40
60
80
100
0 50 100
% P
ET
Con
vers
ion
Time (min)
0
20
40
60
80
100
0 50 100
% T
PA y
ield
Time (min)

60
PET Flakes (6mm X 6mm)
PET in flake form was hydrolyzed at 90℃, 120℃ for up to 90 minutes and 150℃
for a time range of 30 – 300 minutes to study the kinetics as shown in Fig 4-5 and Fig 4-2.
Rate of depolymerization was very slow at 90℃, a conversion of 21% was observed at
120℃ and 90 minutes. However, reaction at 150℃ exhibited good results within 30
minutes. The rate of de-polymerization increased with increase in temperature as shown in
Fig 4-4 and Fig 4-5
Fig 4-5 Effect of temperature and time on hydrolysis of PET flake @ ♦ 90℃, ■ 120℃ and
▲ 150℃ for 30, 60 and 90 minutes in Parr reactor. A) % PET conversion, b) % TPA yield.
0102030405060708090
100
0 10 20 30 40 50 60 70 80 90
% C
onve
rsio
n
Time (min)
0102030405060708090
100
0 10 20 30 40 50 60 70 80 90
% T
PA Y
ield
Time (min)

61
Fig 4-6 Effect of temperature and time on hydrolysis of ■ PET powder and ♦ PET flakes
at 90℃, 120℃ and 150℃ for 30, 60 and 90 minutes in the Parr reactor.
Hydrolysis of PET powder exhibited higher conversions i.e. around 98 % when
compared to PET flakes i.e. 72 % at 90 minutes as shown in Fig 4-6. This confirms the
importance of particle size, shape and surface area per volume during the depolymerization
process. As discussed in detail below, the much smaller spherical powder exhibited much
faster kinetics than the PET flakes which is consistent with surface dependent reaction.
The reaction is dependent on surface area and temperature. To discuss the surface
area dependency on the reaction, surface area to volume ratio of powder with < 0.25 μm Ø
and flakes with length*width*height of 6mm*6mm*0.09mm were estimated. Depending
on the shape of the material, the surface area to volume ratio of powder was 38:1 and flake
is 23:1. Based on the theory, small particles with larger surface area exhibit improved
reaction kinetics. Therefore, PET powder exhibited high conversions compared to flakes.
0
20
40
60
80
100
0 50 100
% P
ET
Con
vers
ion
Time (minutes)
0
20
40
60
80
100
0 50 100
% T
PA Y
ield
Time (minutes)

62
Though the powder was crystallized during the reaction like flakes, powder exhibited high
conversion because of its large surface area and the fact that the surface area was increasing
as the reaction progressed. Therefore, it is confirmed that size and shape of PET affect
reaction kinetics along with temperature and reaction time.
To confirm the chemical structure of the recovered monomer and its purity, 1H NMR
and 13C NMR were performed. Proton and carbon spectrum confirmed the recovered
monomer has TPA and IPA. These results will be discussed in more detail in section 4.1.6.
4.1.3 Kinetic model
A simple model derived by Karayiannis’s et al. [15] was modified to predict the
conversion of PET and determine the rate constant. As the monomer TPA formed during
the reaction was dissolved in the solution, reaction was considered irreversible. Since mass
transfer into the polyester matrix must occur prior to the chemical reaction, derivation of
the mathematical model was complicated. If the reaction takes place in the swollen near
surface of the PET flake and alkaline hydrolysis of esters can be considered first order in
the ester and alkaline concentration, a surface reaction model was derived using method
developed by Karayiannis’s et al.
The reaction rate equation can be expressed as:
= -kAsCACB ............................................................................................................ (4.2)

63
Where k is the rate constant ((dm3)/(mol.cm2.min), NA is the number of moles of ester
bonds remaining after reaction (mol/dm3), t is the reaction time (min), As is the surface area
of the PET flake (cm2), and CA and CB are the ester and alkali concentrations in solution
(mol/dm3).
On the assumption that reaction takes place on the surface of the flake, CA can be
considered constant for certain period. CB0 is considered as the initial concentration of the
alkaline solution, which is constant because excess OH- ions are present during reaction.
The number of moles of reactant (NA) and conversion (X) are defined below:
NA = NA0 (1-X) ............................................................................................................... (4.3)
X= .................................................................................................................... (4.4)
The rate expression can be expressed in terms of conversion combining eq.4.2-4.4.
= CB0 (1-X) ......................................................................................................... (4.5)
The model assumes that the concentration of active ester groups is proportional to area.
therefore, the surface area is (As) is directly proportional to the degree of unreacted PET.
Therefore, As = A0(1-X)b, where b is a constant (0 ≤ b ≤ 1) [15]. If the surface area of the
PET flake is constant during the reaction and PET depolymerization is lamellar, then b =
0. For these experiments, the PET flakes of even size with dimensions 6mm*6mm*0.09mm

64
were used, the surface area will not change in a substantive with conversion as shown in
Fig 3-6. Therefore, b=0 was considered as a best fit for flakes.
= k CB0 (1-X)(b+1) = = k CB0 (1-X) ............................................................... (4.6)
Integrating the equation (4.6) with limits X=0 and t=0:
Ln (1-X) = k1 t .............................................................................................................. (4.7)
Where
k1 = k CB0 ................................................................................................................... (4.8)
A plot of ln(1-X) vs t would be linear if surface area was independent of conversion as
expected for the PET flakes. The reaction kinetics for PET in NaOH solution as shown in
Fig 4-5 are plotted in terms of % conversion using eq-4.7 in Fig 4-7. Note that the data at
low times for conversions were very low and are within measurement error as shown in
Fig 4-5. Therefore, model was fit to the data in the linear region to find k. Rate constants
(k1) were calculated for each temperature (90, 120 and 150℃) using the slopes of each line
from the Fig 4-5. The model fit is linear for all temperatures and the experimental values
are in good agreement with the theory from Fig 4-5 and Fig 4-7.

65
Table.4.1: Reaction rate constants of PET flakes when depolymerized in 1.1M NaOH
Temperature (℃) Rate constant (K) [*10-5 ((dm3)/(mol.cm2.min)]
90 4.3
120 13.6
150 25.9
Fig 4-7. Plot of ln(1-X) vs t for data of PET flakes in 1.M NaOH solution at ♦ 150℃, ▲
120℃ and ■ 90℃ at a time range of 0-90 minutes.
0.0
0.5
1.0
1.5
2.0
2.5
3.0
3.5
4.0
4.5
0 20 40 60 80 100
-LN
(1-X
)
TIME (MIN)
150 120 90

66
Arrhenius equation is expressed as;
K = A * e(-Ea/RT) ............................................................................................................ (4.9)
Where K is the rate coefficient, A is Arrhenius constant, Ea is the activation energy, R is
the universal gas constant and T is the temperature in kelvin.
Fig 4-8 Arrhenius plot of the apparent kinetic rate constant for the aqueous sodium
hydroxide solution.
1/T (K-1)

67
The rate constants were fit to Arrhenius equation and plotted as apparent rate constants
(K1) vs 1/T as shown in Fig 4-8. The rate constants fall into a straight line and their value
increases with increase in temperate as shown in Table 4.1, which agree with the Arrhenius
equation 4.9, the calculated activation energy (Ea) was 40.16 KJ/ mol. k. As the temperature
chosen were 90℃, 120℃ and 150℃ and molarity of NaOH solution is 1.1M, the activation
energies were slightly lower than the reported activation energies i.e. 69 KJ/mol for
hydrolysis reactions at 120℃, 140℃ and 160℃ in 1-4 M KOH solution [60], 75.4 – 92.1
KJ/mol [39] in a hydrochloric acid solution at 150℃, 170℃ and 190℃.

68
4.1.4 Effect of impurities
After studying and understanding the impact of temperature and time on PET flakes, focus
was shifted to the impact of a common impurity that is a challenge for mechanical
recycling. The presence of as little as 50 ppm of polyvinyl chloride (PVC) in a PET waste
stream is a major concern as it can damage the recycled stream. PVC can form hydrochloric
acid that break down the PET resin both physically and chemically causing the PET to
become brittle and yellowish in color. Also, PVC when present in PET stream is hard to
separate using density flotation techniques because of similar densities of these polymers.
Alkaline hydrolysis of PET flakes was performed in the presence of PVC at 1, 3 and 5
wt.% relative to wt.% of PET at 150℃ for 180 minutes. The results for PET conversion
and yield of TPA during alkaline hydrolysis in the presence of PVC confirmed that the
PVC as impurity up to 5% did not affect PET de-polymerization (see Fig 4-9). It did not
show any effect on kinetics of alkaline hydrolysis of PET and no by products were formed
because of de-chlorination. As discussed in section 4.1.6 the TPA and EG were recovered
with trace amounts of IPA with no byproducts or PVC degradation products.

69
Fig 4-9. Effect of PVC on PET hydrolysis at 150°C for 180 minutes, ♦ % TPA yield, ■ % PET conversion in Parr reactor.
A similar study was done by Kumagai et al. [59] using PVC coated PET
fiber to recover PVC and monomers simultaneously using alkaline hydrolysis. According
to his report, TPA and EG were recovered and PVC was separated as residue along with
unconverted PET. With increase in reaction time de-chlorination had a noticeable effect in
the method used by Kumagai et al. It requires 48 h to obtain 1% de-chlorination rate at
120℃ and 24 h to obtain 9% de-chlorination rate at 150℃.
50556065707580859095
100
0 1 2 3 4 5
Per
cen
tage
(%
)
% PVC

70
Fig 4-10. Comparison of percentage yield of TPA from ♦ PET flakes vs ■ PET flake+5%
PVC at 150°C at different times ranging from 30 min-180 min in Parr reactor.
Present experiment at 150℃ for 180 min did not have de-chlorination as the reaction time
was less. It requires some time for hydroxide ion (OH-) to penetrate into the PVC matrix
and diffuse chloride ion (Cl-) from the bulk PVC [59]. As the reaction time was short, OH-
did not degrade PVC significantly and had no effect on rate of PET depolymerization. The
reaction of PET flakes in the presence of 5 wt.% PVC was performed for the times from
30 min to 180 min at 150℃ and the kinetics are plotted in Fig 4-10. It shows the comparison
of percentage yield of PET flakes and PET flakes + 5 wt.% PVC impurity. Observed
percentage yield was consistent for both PET flakes and PET flakes with 5 wt.% PVC
impurity because of less reaction times and temperatures as opposed to the high reaction
conditions used in literature [59]. No trace of PVC was identified in the recovered
0102030405060708090
100
0 50 100 150 200
% T
PA Y
ield
Time (min)

71
monomer, which was confirmed by FTIR and NMR analysis which will be discussed later
in section 4.1.6
4.1.5 Effect of green solvent γ-Valero Lactone (GVL)
Based on the kinetic study of PET flakes using NaOH solution as the reaction
medium and literature reports indicate that diffusion of reaction medium into the flake is
important rate limiting step to hydrolysis of PET to TPA and EG. A key goal of this work
was to investigate the use of co-solvents on reaction rate. Co-solvent may accelerate the
diffusion rate or expand layer in which reaction occurs by swelling the polymer and allow
the sodium hydroxide solution to break the bonds. To study the impact of a co-solvent on
the depolymerization process, a model green solvent γ-Valero lactone (GVL), was selected
because it has been identified as good solvent for polymers [61]. The effect of GVL on the
alkaline hydrolysis of PET was investigated for concentrations from 0.5 to 10 mole% GVL
relative to NaOH solution. The reaction conditions used for this screening were 150℃ and
90 min.
Eq-4.1

72
Addition of GVL at concentrations from 0.5 – 2.5 mole% resulted in an increase in
the monomer yield compared to the base NaOH solution. Further increasing GVL
concentration in the NaOH solution resulted in lower monomer yields compared to the base
NaOH solution as shown in Fig 4-11.
Fig 4-11. Hydrolysis of PET Flakes with GVL at different molar compositions (0.5-10
mole%) at 150℃ and 90 min.
The increase in PET conversion and yield of TPA might be because of two reasons:
1) pH of the solution remained constant up to addition of 2.5 mole% as the ability of the
buffer to resist changes to the addition of acid or alkali was not crossed. 2) GVL increased
swelling of the PET matrix, which was offset by the crystallization of PET.
0
10
20
30
40
50
60
70
80
90
100
0 0.5 1 2.5 5 10
% T
PA Y
ield
Mole % GVL in NaOH solution

73
When 5-mole% GVL was added, the pH dropped to 12, while 10- mole% GVL
resulted in a pH drop to 7.5 as shown in Table.4.2. The GVL at 10 mole% composition
reacted with NaOH solution resulting in formation of a white substance in noticeable
quantity according to eq.4-1 [62]. According to Wong et al the white substance formed was
the salt of 4-hydroxyvalarate (4-HVA) because of the ring opening reaction of GVL with
NaOH [62]. The OH- and Na+2 ions present in the solution reacts with the GVL resulting
in the ring opening and reduces the concentration of the NaOH solution by forming the salt
of 4-HVA [62]. Because of this the pH of the NaOH solution was reduced from 13 – 7.5.
This solution was added as reaction medium to the PET flakes, reaction mixture after the
reaction at 150℃ for 90 min was observed to have opaque PET flakes resulting in 0.04%
TPA yield. The rate of hydrolysis is proportional to the concentration of alkaline solution.
Addition of 10 mole% GVL to the NaOH solution reduced the concentration of the OH-
ions in the solution which, resulted in lower conversions of PET flakes. The pH remained
constant at low concentration of GVL from a range of 0.5 – 2.5 mole%, as these
compositions are below the buffer strength limit of the NaOH solution. This avoided the
formation of secondary products like 4-HVA and improved the swelling of polymer matrix
resulting in high yields compared to base NaOH solution.
Exposure of PET to co-solvent can result in solvent induced crystallization at
surface [63]. This crystallization may reduce swelling and negatively affect the surface
reaction if it is excessive. Therefore, the % crystallinity of PET residue (taken after 90
minutes from each reaction media) was determined by differential scanning calorimetry
which is discussed in detail in section 4.2.2. Percentage crystallinity of PET flakes after

74
hydrolysis reaction with and without addition of GVL are shown in the Table 4.2. This
indicates that PET flakes taken from reactions after addition of GVL ≤ 2.5 mole% have
low crystallinity compared to the flake taken from the reaction medium of the base NaOH
solution. Therefore, adding GVL increased the swelling of PET matrix improving the rate
of depolymerization of the PET flake. Whereas, GVL ≥ 5 mole% there was an increase in
the crystallinity of PET flake during the reaction due to surface induced crystallization and
resists depolymerization rate.
Table 4.2. Data of hydrolysis reaction using GVL as co-solvent at 150℃ and 90 min in
NaOH solution.
Mole% GVL in
NaOH solution
pH of the
solution
% TPA Yield % conversion
of PET
% crystallinity
of PET flake
after reaction
0 13 73 71 26.8
0.5 13 92.9 85.67 19.02
1.0 13 88.0 77 20.21
2.5 13 80.2 69 26.00
5.0 12-13 54.7 49.33 38.05
10 7.5 1.5 0 47.01
Crystallinity of fresh PET flake before reaction was 6.5%

75
Observed percentage yield at 0.5, 1 mole% of GVL as shown in Fig 4-11 was 92% and
87% respectively which was 21% greater than the yield of TPA obtained from base NaOH
solution i.e. 71%.
4.1.6 Characterization of monomer TPA
FTIR and NMR was used to analyze the precipitated product following filtration
of reaction mixture. FTIR confirmed the presence of functional groups consistent with
TPA and IPA. In addition, traces of BHET, which is an intermediate degradation
product, were not observed. NMR was used to qualitatively confirm the presence of co-
monomer and potential TPA vs BHET.
4.1.6.a FTIR spectroscopy
Fig 4-12. Infrared spectroscopy of precipitate monomer TPA (- - -) and IPA (-----).

76
The FTIR spectra of the precipitate is shown in Fig 4-12. The absorptions at 3065, 1676,
1280 cm-1 are typical for aromatic dicarboxylic acids (C-H, C=O, C-O). The vibrations
specific to 1,4-distributed benzene ring are at 1136, 1020 cm-1. The absorptions at 2300-
3300 are typical for carboxylic acid, 1698, 1486 and 1612, 1287, 720 cm-1 are related to
the co-polymer Isophthalic acid (IPA) [58]. The absorptions peaks for IPA and TPA are
similar because of the similarity in the structure. Absorption related to BHET oligomer
(3400, 3000-2800, 1750 and 1100 cm-1 indicates the –OH, C-H, C=O and C-O
stretching’s) and PVC (1720 cm-1, 1190 cm-1 indicating C=O, C-O) were not present in
the precipitate. FTIR gives the qualitative proof that the recovered precipitate has TPA and
IPA monomers.

77
4.1.6.b. Solution Nuclear Magnetic Resonance Spectroscopy
a) 1H NMR of precipitate from hydrolysis of PET at 150℃ and 90 min in 1.1M NaOH.

78
b) 13 C NMR of precipitate from hydrolysis using I)1.1.25 M NaOH solution, II)5% PVC
as impurity in 1.1 M NaOH solution and III) 1 mole% GVL in 1.1 M NaOH solution.
Fig 4-13. Nuclear Magnetic resonance analysis of recovered monomer from PET flakes
and PET flakes+5%PVC impurity at 180 minutes and 150°C using methyl sulfoxide
99.5% purity with d6.
The composition of precipitate obtained from hydrolysis of PET flake, PET flake+PVC
and PET flake in presence of co-solvents were analyzed using 1H NMR and 13 C NMR to

79
detect the presence of impurities in the product. NMR of the precipitate are consistent with
NMR for reference TPA spectrum (Appendix-A). 1H NMR for hydrolysis product for pure
PET at 150℃ is illustrated in the Fig 4-13.a. The signal at 8.03 ppm (s, 4H) (peak a)
indicates the presence of four phenyl protons. The signal at 8.47 ppm (peak b), 8.16 ppm
(peak c) and 7.63 ppm (peak d) indicates the presence of protons of meta connected
benzene ring of IPA, which was used as a co-monomer along with TPA during the
production of PET (2.5% IPA/97.5% TPA). Triplets at 7.6 ppm (peak d) corresponds to
the spin-spin splitting of the protons [64]. Consider a proton which has two neighboring
protons, if the magnetic field of the neighboring protons was in the direction or opposite to
the external magnetic field, depending on the energy difference between the external and
effective magnetic fields, chemical shift of the proton will either increase, decrease or
remains same appearing as the split peaks in the spectrum.
Fig 4-13.c. Possibility of spin- spin splitting of neighboring protons.

80
There are three possibilities for the alignment of neighboring protons with the external
magnetic field. From Fig 4-13.c, first possibility illustrates that both the neighboring
protons would be in the direction of external magnetic field, this adds up energy to the
external magnetic field increasing the effective magnetic field because of the energy
difference and results in increase in the chemical shift of the proton. The second possibility
illustrates that the two neighboring protons may align in different directions, which makes
external magnetic field equal to the effective magnetic field and the chemical shift stays in
the expected position. Third possibility illustrates that the protons would be in opposite
direction to the external magnetic field, which decreases the effective magnetic field
resulting in lower energy difference causing decrease in the chemical shift. Overall, triplets
are formed one for each spin [64]. Therefore, the H NMR is consistent with presence of
both IPA and TPA in the polymer and the much larger concentration of the TPA.
13 C NMR spectrum for the products are illustrated in Fig 4-13.b. The peaks at 129.5
ppm (peak e) indicate the presence of unsubstituted carbons of the aromatic ring, peak at
134.8 ppm (peak f) indicates the presence of the carbons of the aromatic ring to which the
carbonyl groups are attached, signal at 166.7 ppm (peak g) represents the carbonyl
resonances (COOH group). This was same for both IPA and TPA. Examining the NMR
spectrum, the presence of PVC (peaks at 3.34 ppm, 4.4 ppm, 47 ppm, 57 ppm) or impurities
formed because of the presence of co-solvent were not observed and there is no noticeable
change to TPA structure. This confirms that PVC was not present in the recovered
monomer and conversion of PET was not affected with presence of PVC. BHET was not
present in the precipitate as the peaks corresponding to BHET were not present in the

81
proton (8.12 ppm, 4.3 ppm, 3.7 ppm, 4.9 ppm) or carbon NMR (58.9 ppm, 67.06 ppm,
129.5 ppm, 133.7 ppm and 165.1 ppm). Impurities were not observed in either FTIR or
NMR analysis of the precipitate obtained from experiments conducted at reaction
temperatures 90°C, 120℃ and 150°C.
Therefore, alkaline hydrolysis in the presence of co-solvents was successfully applied to
depolymerization of PET. The conversion of PET at 150℃ and 300 min was 89.9% and
there was no PVC/co-solvent present in the TPA product. The next section will focus on
applying alkaline hydrolysis to co-polyester of PET/PEF with emphasis on screening co-
solvents.
4.2 Hydrolysis of co-polyesters of PET and PEF
4.2.1 PET vs PETF20 flakes
There is increasing interest in incorporating co-monomers in PET to moderate the
overall properties. For example, FDCA is a bio-based monomer that can be used as diacid
in production of furan analogue of PET known as PEF. The PEF exhibits a 10-fold lower
oxygen permeability than PET which is attractive for packaging applications but is
available in limited volumes at high cost. Copolymer of PET and PEF would provide a
bridge to transition to bio-sourced polyester. While copolymers exhibit improved
properties relative to the pure PET, mechanical recycling is limited to copolymers of PET
with less than 10% co-monomers [65, 66].

82
The alkaline hydrolysis of model co-polyester of 20% FDCA and 80% TPA
(PETF20) was investigated using the same experimental conditions for PET. Alkaline
hydrolysis of co-polyesters of PET and PEF have not been reported in the literature. Since
a 20% co-polyester was used, both the diacids TPA and FDCA were expected to be present
in the precipitated monomer. A modified reaction system was used for screening the
available samples and observation of polymer flakes during the experiment. This allowed
observation of transition from clear to opaque films that indicate the onset of solvent
induced crystallization. The simple system discussed in chapter-3 consisting of oil bath,
glass vails, holder and thermometer was used for reactions performed at 90℃ to avoid high
pressure in vials.
PETF20 flakes were subjected to alkaline hydrolysis at 90°C for 3 days using 1.1
M NaOH solution in a simple oil bath setup shown in Fig 3-5. After 3 days the conversion
of PET flakes and PETF20 flakes and the yield of diacid (TPA+FDCA) as shown in Fig 4-
14 were 42% and 88% respectively indicating a large difference in reactions of the co-
polyesters.

83
Fig 4-14. % Conversion ■ and % diacid Yield ▲ of PET vs PETF20 flake after alkaline
hydrolysis with 1.1M NaOH solution for 3 days at 90℃.
The conversion of PETF20 flake is higher than PET flake in NaOH solution. % conversion
and yield of PET and PETF20 are shown in Fig 4-14. Possible reasons for the high
conversions of PETF20 are: 1) PET has a benzene ring and PETF20 has both benzene and
furan rings, presence of oxygen in the structure of furan increases the solubility of PETF20
in ethylene glycol and water relative to the benzene of TPA. 2) PETF20 has low %
crystallinity (fresh flake - 4.5 %, reacted flake – 24.3) than the PET flake (fresh flake - 6.5
%, reacted flake – 26.8) which will be discussed in detail in section 4.2.3. 3) Glass
transition temperature of PETF20 is 77.7℃ which is lower than the PET flake Tg= 87.2℃,
0
10
20
30
40
50
60
70
80
90
100
PET PETF 20
Per
ecnt
age
(%)
Polymers

84
which means PETF20 will be in rubbery state and PET will be in the glassy state. This
allows the reaction medium to react fast with PETF20 than PET. PET flakes before and
after the reaction were collected, which were shown in Fig 4-15. Surface of PET flakes
after reaction at 90℃, 120℃ and 150℃ in NaOH solution, with 5% and 10% GVL in
NaOH solution at 150℃ are shown in Fig 4-15A. Comparison of surface area of fresh PET
flake with flakes in 1.0 mole% EGDA, PGDA, GVL, GBL and triglycerol in NaOH
solution for 3 days at 90℃ is shown in Fig 4-15B. Comparison of surface area of fresh
PETF20 flake in 1.0 mole% GVL, GBL and triglycerol in NaOH solution for 3 days at
90℃ is shown in Fig.4-15C. It can be understood that PET has the same surface area after
reaction but PETF20 almost degraded after 3 days at 90℃. All these factors favored the
high conversions of PETF20 at 90℃.
Fig: 4-15. A) PET flakes residue from Parr reactor B) Fresh PET flake vs flake residue
from oil bath C) Fresh PETF20 flake vs flake residue from oil bath.
A B C

85
4.2.2 Impact of co-solvents on PET vs PETF20 flakes
After studying the effect of GVL co-solvent on PET flakes at 150℃ and 90
minutes, a series of co-solvents with Hansen solubility parameters (HSP) close to PET were
selected to screen PET and PETF20. Generally, HSP’s are used to determine solvent-
polymer interactions. Based on the idea that like dissolves like, two compounds with
similar solubility parameters dissolve in one another and form a solution[56]. As shown in
Table 3.4 solvents used for this study were, Gamma butyral lactone (GBL), ethylene glycol
diacetate(EGDA); propylene glycol diacetate (PGDA) and triglycerol. For each case 1.0
mole% co-solvent in 1.1 M NaOH solution at 90℃ were used for hydrolysis experiments.
Reactions were conducted using the modified system to study the effect of co-solvents and
to observe the onset of solvent induced crystallization specifically.
Reactions were conducted in the oil bath by placing 5 glass vials, charged with 1.0
mole% of co-solvent relative to NaOH solution, 1.0 gm of PET flakes and 1.1M NaOH
solution. Reaction took place for 3 days since depolymerization of PET takes longer
reaction times at low temperatures. The yield of TPA for PET flakes following hydrolysis
at 90℃ in presence of co-solvents are shown in Fig 4-16. The results at 90℃ for
degradation of PET in 1.1M NaOH was compared for Parr reactor and glass vials. The
decrease in degradation after 3 days in glass vial is likely due to lack of mixing in the
system. Interestingly adding GVL did not improve the reaction kinetics at 90℃ in a way
that it did at 150℃. The GVL and GBL systems exhibited a similar rate of
depolymerization with 42% yield of TPA. The addition of PGDA and EGDA sharply

86
reduced the depolymerization rate relative to base NaOH solution. Triglycerol gave good
results with 63% yield at 90℃.
Fig 4-16. % yield of PET flake after alkaline hydrolysis in the presence of 1 mole% co-
solvents for 3 days at 90℃ at 13 pH.
It is interesting to note that at 90℃ from Fig 4-16, the compounds of similar structure had
similar outcomes. A) EGDA and PGDA had relatively low kinetics, b) GVL and GBL
exhibited similar intermediate effect, c) Triglycerol exhibited the highest yield of TPA.
Similarly, PETF20 was subjected to hydrolysis using co-solvents to test the effect
on the depolymerization rate of co-polyester. The co-solvents were selected based on the
0
10
20
30
40
50
60
70
80
90
100%
TPA
Yie
ld
1.0 mole % Co-solvents in NaOH solution

87
outcomes of hydrolysis of PET flakes. The PGDA and EGDA were not used for co-
polyesters because of poor results for PET flake.
Fig 4-17. % Yield of PETF20 flake after alkaline hydrolysis with 1 mole% co-solvents in
NaOH solution for 3 days at 90℃ at 13 pH.
Results from Fig 4-16 suggest that co-solvents GVL, GBL and triglycerol exhibited good
results when used for PET flakes at 90℃ relative to base NaOH. In the case of PET flakes,
selecting a proper solvent with suitable composition helps to facilitate depolymerization of
the PET flake with high yields. Interestingly these co-solvents did not facilitate hydrolysis
of the PEFT-20. In the case of co-polyesters, the experiments with co-solvents should be
conducted at shorter times to better understand the impact. As discussed in section 4.2.1,
0102030405060708090
100
No-solvent GVL Triglycerol GBL
% (T
PA+F
DCA
) Yie
ld
1 mole % co-solvents in NaOH solution

88
because of the oxygen present in the furan ring, PETF20 reacted faster than PET flake and
exhibited high conversions even in the absence of co-solvents in 3 days. It is possible that
the longer times used for this experiment mask any impact of the co-solvents. It is
recommended that future studies expand to kinetics of PETF20 in presence of co-solvents
at short times to study their impact.
4.2.3 Characterization
The precipitated product was analyzed by FTIR and proton and carbon NMR. The
FTIR confirmed the presence of functional groups consistent with TPA and FDCA. NMR
was used to qualitatively confirm the presence of co-monomers TPA and FDCA.
The PET and co-polyester flakes turned from clear to opaque after the reaction in
NaOH solution with and without use of co-solvents. The surface area of the flakes remained
constant, but the thickness has reduced with time as shown in Fig 4-15 indicating that the
surface reaction was occurring during hydrolysis as discussed in section.3.3. To study the
behavior of the flakes, PET and PETF20 flakes in the residue following the reaction were
washed and dried under vacuum below 80℃ to avoid crystallization while drying.
Differential scanning calorimetry was used for the analysis with heating rates of 10℃/min
up to 300℃ and immediate quenching to 40℃ at 20℃/min. The DSC scans were analyzed
to understand how the reaction is occurring.

89
4.2.3.a FTIR Spectroscopy
Fig 4-18. Infrared spectroscopy of precipitate (TPA - - -, FDCA ) from a) PETF20 and
b) PET alkaline hydrolysis in NaOH solution for 3 days and 90℃.

90
The FTIR spectra for dried precipitate of PET and PETF20 following alkaline hydrolysis
are compared in Fig 4-18a. The absorptions at 3120, 1580 cm-1 are specific to C-H, C=C
stretch of furan ring present in the structure of 2,5-furan dicarboxylic acid (FDCA). The
characteristic bands obtained specific to TPA were same as shown in the Fig 4-18b. This
confirms that the recovered monomer from alkaline hydrolysis of PETF20 has both TPA
and FDCA.
4.2.3.b Nuclear Magnetic Resonance Spectroscopy
a) 1H NMR of recovered TPA and FDCA from PETF20 flakes

91
b) 13C NMR of recovered TPA and FDCA from PETF20 flakes
Fig 4-19. Nuclear Magnetic resonance analysis of recovered monomer (TPA+FDCA)
from PETF20 flakes at 90°C and 3days using methyl sulfoxide 99.5% purity with d6
solvent.
The diacid precipitate obtained from PETF20 hydrolysis was analyzed using 1H
NMR and 13C NMR to detect the presence of oligomers and confirm the presence of both
TPA and FDCA (Refer appendix-A for NMR of pure compounds). Figure 4-19a shows
that the 1H NMR has signal at 8.03 ppm (peak a) that indicate the presence of four phenyl

92
protons of TPA, signal at 7.2 ppm (peak h) that indicates the presence of protons associated
with the furan ring of FDCA. The co-polyester was 20% FDCA and 80% TPA. From the
calculation of area under the curve of the carbonyl peaks (peak ‘g’ and peak ‘k’) of the
NMR spectrum, recovered precipitate has 17.6% FDCA and remaining TPA as monomers.
1H NMR spectrum of recovered mixture of TPA and FDCA resembles with the reference
spectrum of TPA and FDCA. Fig 4-19b shows 13 C NMR spectrum. The signal at 129.5
ppm (peak e), 134.8 ppm (peak f) and 166.7 ppm (peak g) indicates the presence of carbons
associated with the chemical structure of TPA. The signal at 118.48 ppm (peak I) indicates
the carbon on the furan ring, signal at 147.07 ppm (peak J) indicates the carbon present in
the furan ring attached to carbonyl group, signal at 158.9 ppm (peak K) indicates the carbon
in the carboxyl group. Both proton and carbon spectrum confirmed the presence of TPA
and FDCA in the recovered monomer.
4.2.3.a Thermal transition and crystallinity of residue polymer flake using DSC.
To observe the behavior of both PET and PETF20, dried flakes before and after the
reaction were thermally analyzed using DSC. Fig 4-20. a illustrates the first heating ramp
of DSC scans of PET and PETF20 flakes before and after reaction. Glass transition
temperature (87℃), crystalline temperature (156℃), melting temperature (246℃) were
observed for raw PET flake.

93
Fig 4-20. a DSC curves of fresh PET flakes and PET flakes residue following reaction in
0 – 10 mole% GVL in NaOH solution at 150℃ and 90 minutes.
The PET flake which was recovered after reaction in 1.12M NaOH solution did not
exhibit glass transition or crystallization peak but had a melting peak at 246℃. This
indicates that samples were all semi crystalline. The % crystallinity was calculated from
the first heating ramp using the enthalpy of melting (ΔHm), enthalpy of crystallization
(ΔHc) and enthalpy of fusion (ΔH⁰m=84.9 joules/gm) per gram of a perfect crystal of PET
of infinite size [67].
% crystallinity =
⁰∗ 100

94
The % crystallinity of PET before reaction was 6.5 and after reaction was 26.8 in NaOH
solution. This confirms significant crystallization of PET flake during the reaction. Similar
results were observed for all co-solvents at 90℃ following 3 days reaction as shown in Fig
20.b.
Fig 4-20. b DSC curves of PET flake after hydrolysis using different co-solvents (1
mole%) for 3 days at 90℃ in NaOH solution.
The % crystallinity of PET and PETF20 flakes following hydrolysis reaction for 3
days and 90℃ in the presence of 0-1.0 mole% of co-solvents are shown in Table 4.3. Fresh

95
flakes have <7% crystallinity, whereas the crystallinity increased following the reaction in
NaOH solution.
Table.4.3. Data of hydrolysis reaction using co-solvent at 90℃ and 3 days in 1.12M NaOH
solution.
Co-solvent in 1.12M NaOH solution pH of the solution % crystallinity of flakes
PET PETF20
Reference flake -- 6.54 4.5
NaOH solution 13 26.8 24.3
1 mole% EGDA 13 37.2 --
1 mole% PGDA 13 31.9 --
1 mole% GVL 13 32.2 27.4
1 mole% GBL 13 39.5 22.4
1 mole% Triglycerol 13 30.9 24.6
The glass transition temperature (77℃), crystalline temperature (153℃), melting
temperature (214℃) observed for raw PETF20 flake is shown in Fig 4-20. c. PETF20 flake
following hydrolysis in 1.12M NaOH solution were crystallized during the reaction as
shown in Table 4.3, melting peak at 212℃ was observed for all the residue flakes. Flakes
following reaction in co-solvent/NaOH solution exhibited a second melting peak at 128℃
indicating that the polymer is converting to oligomer and then monomer with time. %

96
crystallinity of PETF20 before reaction was 4.5 and was 24.6 following reaction in NaOH
solution. This confirms the significant crystallization of PET flake during the reaction.
Fig 4-20.c DSC curve of PETF20 flake after hydrolysis using different co-solvents (1
mole%) for 3 days at 90℃ in NaOH solution.
DSC scan curves from Fig 4-20. b confirms that PET flake was crystallized even after
adding co-solvent to the reaction medium for the co-solvents depending on the
concentration. From this DSC scans it was evident that addition of co-solvents clearly did
not affect significantly the rate of crystallization during reaction. The % crystallinity was
calculated for the unreacted PET and PETF20 flakes. Average value of % crystallinity of
PET and PETF20 flakes were 30 % and 24.6 % after the reaction. The lower level of
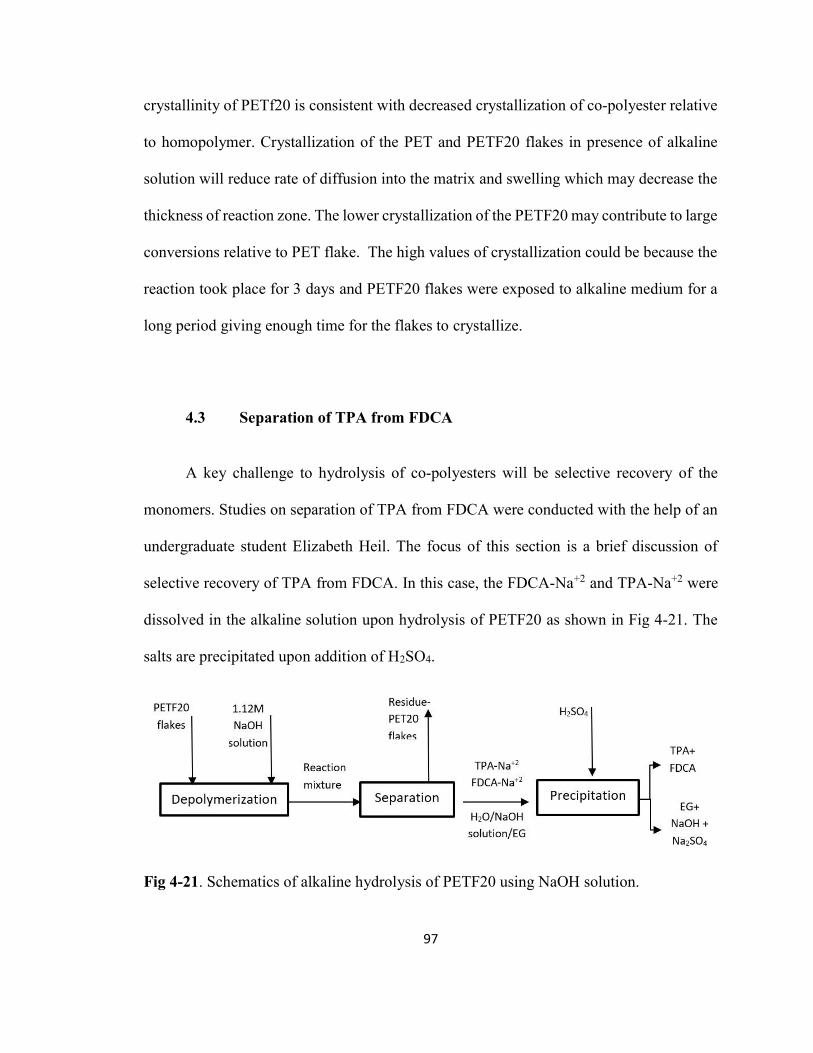
97
crystallinity of PETf20 is consistent with decreased crystallization of co-polyester relative
to homopolymer. Crystallization of the PET and PETF20 flakes in presence of alkaline
solution will reduce rate of diffusion into the matrix and swelling which may decrease the
thickness of reaction zone. The lower crystallization of the PETF20 may contribute to large
conversions relative to PET flake. The high values of crystallization could be because the
reaction took place for 3 days and PETF20 flakes were exposed to alkaline medium for a
long period giving enough time for the flakes to crystallize.
4.3 Separation of TPA from FDCA
A key challenge to hydrolysis of co-polyesters will be selective recovery of the
monomers. Studies on separation of TPA from FDCA were conducted with the help of an
undergraduate student Elizabeth Heil. The focus of this section is a brief discussion of
selective recovery of TPA from FDCA. In this case, the FDCA-Na+2 and TPA-Na+2 were
dissolved in the alkaline solution upon hydrolysis of PETF20 as shown in Fig 4-21. The
salts are precipitated upon addition of H2SO4.
Fig 4-21. Schematics of alkaline hydrolysis of PETF20 using NaOH solution.

98
The solubilities of these two monomers were tested in multiple solvents and co-
solvents, to explore relative solubilities as mentioned in monomer separation. Solvents
tested in this study include, water, sodium hydroxide solution, ethylene glycol, and
dimethyl sulfoxide (DMSO). The behavior of pure components in each solvent was
evaluated to determine the ability of the solvent to selectively dissolve and precipitate the
two components. Dissolving a mixture of TPA and FDCA in DMSO followed by
precipitation of TPA using water was determined to be the viable option for separating
TPA from FDCA.
4.3. a Solubility of TPA and FDCA in DMSO water system
The solvent system that showed promise for the separation of TPA from FDCA was water
and DMSO system. From literature, solubility limits of FDCA and TPA were reported as
55 wt.% [68] and 19 wt.% in DMSO [69]. Because of the potential to selectively dissolve
FDCA in the presence of TPA using DMSO, the behavior of TPA and FDCA with varying
weight percentages of water in DMSO from 0-20 wt.% water was investigated in
collaboration with Elizabeth Heil.
To determine the solubility of TPA in DMSO, known amounts of TPA was placed
in a vial at room temperature. A water and DMSO solution was prepared and weighed.
DMSO solution with up to 20% water was added drop wise to the vial containing TPA,
after each drop the vial was capped and stirred well. This process was repeated until the
TPA completely dissolved. The remaining solution of water and DMSO was weighed, final

99
weight was subtracted from the initial weight to determine the mass of co-solvent added to
the TPA. To determine the solubility limit of the solution in weight percentage, mass of
TPA was divided by mass of co-solvent added to TPA. The same method was repeated to
determine the solubility of FDCA in DMSO water system.
The experimental solubility’s of TPA i.e. 18 wt.% and FDCA i.e. 45 wt.% were
close to the values reported in the literature[68]. Solubility limit for TPA and FDCA
decreased with increasing water content as shown in Fig 4-22. Interestingly at all water
concentrations the FDCA exhibited much better solubility than TPA. Therefore, it is
possible to use these differences in solubility to design process to selectively recover the
TPA and FDCA.
Fig 4-22 Solubility of TPA and FDCA in DMSO water system at various wt.% water. ■
TPA, literature, ● FDCA, literature, ▲ TPA, ■ FDCA.

100
4.3. b Recovery of TPA from FDCA in DMSO water system
DMSO dissolves the monomers TPA and FDCA but addition of water can be used
to selectively precipitate TPA. Considering the solubility limits i.e.19% and 55% in pure
DMSO, water has a large effect on TPA than FDCA due to initial higher solubility of
FDCA in DMSO. Combining the solubility effects of water and DMSO, a method to
precipitate out TPA while leaving FDCA in the solution was proposed as shown in Fig 4-
23.
Solutions of four possible product mixtures i.e., 20:80, 10:90, 5:95, and 0:100
molar ratios of FDCA to TPA were analyzed. Initially, TPA, DMSO, and FDCA were
placed in vials. To be consistent 1.00 g of TPA was added to the vial containing DMSO,
appropriate weights of FDCA was added depending on the molar ratios of the batch. All
four vials were capped, shaken well and allowed to sit for 24 hours to allow complete
dissolution of products.
Fig 4-23. Proposed separation method for recovery of TPA from FDCA using DMSO and
water system.

101
Fig 4-24. TPA percentage recovery vs water added in weight percentage for A) 20:80, B)
10:90, C) 5:95, D) 0:100 molar ratio of FCDA to TPA solutions in DMSO.
Water was added to each vial to make solutions that were 5-20 weight% water. All
the vials were capped, stirred well and allowed to sit for 24 hours to allow contact time for
the solution to reach equilibrium. Later, samples were filtered using gravimetric filtration.
Solid collected on the filter paper was dried at 80℃ and 30-psig vacuum for 24 hours.
Percentage diacid recovery was calculated by dividing dried solid collected on filter paper
by the initial mass of diacid. From Fig 4-24, maximum TPA product recovery of 68.3%
was observed for the reaction mixture of 20:80 molar fraction of FDCA to TPA where 20
wt.% water was added to the solution. FTIR analysis was done on the samples of 0:100

102
and 20:80 molar fraction of TPA and FDCA as there is highest chance of precipitating
FDCA along with TPA in 20:80 molar fraction. The results indicated that the absorption
spectrum of the 0:100 molar fraction of TPA and FDCA was like the FTIR spectrum of the
precipitate obtained following alkaline hydrolysis of PET i.e. TPA as shown in Fig 4-25.
The absorption spectrum of 20:80 molar fraction of TPA and FDCA was similar to the
FTIR spectrum of the precipitate obtained following hydrolysis of PETF20 i.e. TPA and
FDCA. This indicates that some amount of FDCA was precipitated along with TPA. To
separate TPA from FDCA further work should be done to explore a best method to
precipitate TPA leaving FDCA in the solution. Therefore, future work should include
further analysis of the solid product.
Fig 4-25. Infrared spectroscopy of precipitate (TPA - - -, FDCA ) from 20:80 molar
ratio of FDCA and TPA in DMSO solution using 20 wt.% water.

103
Chapter - 5
Conclusions and future work
Chemical recycling of PET flakes and co-polyesters (PETF20) was carried out by
alkaline hydrolysis using 1.1 M NaOH solution to selectively recover the monomers. The
effect of operational parameters such as time, temperature, presence of PVC and co-
solvents on the hydrolysis of PET flakes were investigated. Results indicated that PET
conversion increased with increase in reaction time and temperature. Moderate conversions
of 71 % were observed at 150℃ and 90 min which increased to 89.8 % by 300 min.
Alkaline hydrolysis of PET flakes was not affected by up to 5 wt.% PVC/wt.% PET. There
was no dichlorination of PVC or effect0020on the PET conversion at 150℃ and 180 min.
Modeling results are consistent with a reaction on surface or a thin swollen region
near surface. Therefore, co-solvents were used to improve swelling of polymer matrix to
increase degradation rates. Studies using GVL and PET are similar, studies using GVL as
co-solvent to increase the rate of depolymerization of PET have not been reported in the
literature. Therefore, the effect of GVL at 0-10 mole% in NaOH solution on hydrolysis
was investigated at 150℃ and 90 min. Presence of 1 mole% GVL resulted in a conversion
of 85.7%, with a percentage increase of 20.7 compared to the conversion of base NaOH
solution i.e. 71%.

104
Chemical recycling of co-polyesters of PET and PEF was investigated for the first
time using alkaline hydrolysis. Experiments on PET flakes and PETF20 flakes at 90℃ for
3 days were compared. PETF20 flakes exhibited 88% conversion, which is higher than the
conversion of PET flakes i.e. 42%. Impact of various co-solvents including gamma butyral
lactone, ethylene glycol diacetate, propylene glycol diacetate and triglycerol along with
GVL were studied at 1mole% composition in NaOH solution. In the case of PET flakes,
triglycerol exhibited a TPA yield of 63% while the other co-solvents resulted in either
lower or same yields as that of base NaOH solution. Ethylene glycol diacetate and
propylene glycol diacetate were excluded in the reactions of PETF20 flakes because of the
low reaction rate observed during the reactions of PET flakes. None of the selected solvents
improved the conversions of PETF20 flakes which may be because the long reaction times
used masked the effect of co-solvents.
FTIR and NMR analysis confirmed the presence of TPA, IPA and FDCA in the
precipitates, confirming that the precipitate obtained from hydrolysis of PETF20 flakes has
17.6% FDCA and PET flakes has 2.5% IPA along with TPA. Therefore, monomers can be
selectively recovered from polyesters and co-polyesters using alkaline hydrolysis process.
This potentially addresses the problem of recycling PET with impurities, co-polyesters,
polymer blends, complex layered material and contributes to the plastic waste problem
resulting in the monomer TPA which is used in industrial production of PET.
Finally, separation of TPA from FDCA was studied using DMSO water system. A
method to dissolve TPA and FDCA in DMSO followed by addition of water to selectively
precipitate TPA while leaving the FDCA in the solution resulted in highest recovery of

105
68.3% diacid. DSC scans confirmed the crystallization of residue of PET and PETF20
flakes. This residue can be melted and made into pellets which can be reused on
commercial scale in PET synthesis. The major by product, sodium sulphate formed can be
sold separately [15].
For future work, studying the effect of temperature on PET conversion using
triglycerol as co-solvent at various compositions is an interesting topic. Study on
crystallinity of PET flakes and its effects on the rate of depolymerization would help in
understanding the reason for crystallization of PET flakes during reaction with sodium
hydroxide solution. Also, GVL and GBL resisted the rate of depolymerization at low
temperatures by crystallizing the polymer which is an interesting work to be looked at.
Effect of co-solvents on PETF20 should be investigated at shorter time intervals and
different temperature ranges. In addition, a method for recovering 100% FDCA and TPA
should be investigated. As solubility is temperature dependent, investigating DMSO water
system at increasing temperatures could be valuable. Analysis of the components present
in the filtrate of hydrolysis would be an interesting work to be done.
106
References
1. Nester, R., Global Polyethylene Terephthalate (PET) market analysis & opportunity outlook 2021. 2018.
2. Schloss, F., Amber PET bottles: recycling challenges and opportunities. 2017,
Plastics today. 3. Wikipedia, Polyethylene terephthalate. 4. Woods, L., Global Polyethylene Terephtalate Market Report 2017 - By End-Use
Industries, Products & Regions - Research and Markets. 2017: business wire. 5. Larsen, D.Å., Extended shelf-life biopolymers for sustainable and multifunctional
food packaging solutions. 2016. 6. USEPA, Advancing sustainable materials management: 2014 fact sheet, EPA,
Editor. 2016, EPA: online. 7. NAPCOR, NAPCOR-APR-2016 rate report. 2016. 8. Staff, r.t., Two dozen types of scrap imports banned by China in 2018, in
recycling today. 2017. 9. O'Sullivan, M., China trash ban creates crisis for us recyclers, in. 2018. 10. Anuar Sharuddin, S.D., et al., A review on pyrolysis of plastic wastes. Energy
Conversion and Management, 2016. 115: p. 308-326. 11. Al-Salem, S.M., P. Lettieri, and J. Baeyens, Recycling and recovery routes of
plastic solid waste (PSW): a review. Waste Management, 2009. 29(10): p. 2625-43.
12. Machine, P.r., PVC in PET bottle recycling. 13. Kim*, S.H.P.a.S.H., Poly (ethylene terephthalate) recycling for highvalue added
textiles. 2014.

107
14. Aguado, A., et al., Chemical depolymerisation of PET complex waste: hydrolysis vs. glycolysis. Journal of Material Cycles and Waste Management, 2013. 16(2): p. 201-210.
15. Karayannidis, G.P., Chatziavgoustis, A. P., Achilias, D. S., Poly (ethylene
terephthalate) recycling and recovery of pure terephthalic acid by alkaline hydrolysis. Advances in Polymer Technology, 2002. 21(4): p. 250-259.
16. Kaminsky, H.K.M.S.W.B.J.R.W., Polyesters. Wiley Online Library, 15 June
2000. 17. Karayannidis, G.P., Roupakias, C. P., Bikiaris, D. N., Achilias, D. S., Study of
various catalysts in the synthesis of poly (propylene terephthalate) and mathematical modeling of the esterification reaction. Polymer, 2003. 44(4): p. 931-942.
18. Logakis, E., Pissis, Polycarpos, Pospiech, Doris, Korwitz, Andreas, Krause,
Beate, Reuter, Uta, Pötschke, Petra, Low electrical percolation threshold in poly (ethylene terephthalate)/multi-walled carbon nanotube nanocomposites. European Polymer Journal, 2010. 46(5): p. 928-936.
19. Di Serio, M., Tesser, R., Ferrara, A., Santacesaria, E., Heterogeneous basic
catalysts for the transesterification and the polycondensation reactions in PET production from DMT. Journal of Molecular Catalysis, 2004. 212(1): p. 251-257.
20. Joshi, A.S., Coleman, Maria R, Lawrence, Joseph G, Co-polyesters of
polyethylene terephthalate and polyethylene 2, 5-furandicarboxylate. 21. Seymour, T.J.P.J.M.L.W., Process for the preparation of polyesters with high
recycle content. 2013. 22. Pierce, L.M., PEF will not oust PET for beverage bottles anytime soon. 2014:
Packaging digest. 23. Zhao, M., PVC in PET Bottle Recycling till date: plastic recyling machine. 24. Wikipedia, Polyethylene 2,5-furandicarboxylate. 25. box, T.e.t., Densities of common solids. 26. T.Spychaj, Chemical recycling of PET: methods and products. 2002.

108
27. Minoru Genta, F.Y., Yuichi Kondo, Wataru Matsubara, Setsuo Oomoto, Development of chemical recycling process for post-consumer PET bottles by methanolysis in supercritical methanol. 2003.
28. Al-Sabagh, A.M., et al., Greener routes for recycling of polyethylene
terephthalate. Egyptian Journal of Petroleum, 2016. 25(1): p. 53-64. 29. J.T. MacDowell, N.C.K., US Patent 3,222,999. 1965. 30. U.R. Vaidya, V.M.N., J. Appl. Polym. Sci. 35 Polyester polyols for polyurethanes
from pet waste: Kinetics of polycondensation. 1988. 31. Scheirs, R., Recycling of PET, in Polymer Recycling: Science, Technology and
Application. J Wiley &; Sons, Chichester, 1998. pp. 119-182. 32. Simonaitis.T, B., R., Jankauskaitė, V., Adhesive composition with poly (ethylene
terephthalate) waste. 2005. 33. Imran, M., Kim, Bo-Kyung, Han, Myungwan, Cho, Bong Gyoo, Kim, Do Hyun,
Sub- and supercritical glycolysis of polyethylene terephthalate (PET) into the monomer bis(2-hydroxyethyl) terephthalate (BHET). Polymer Degradation and Stability, 2010. 95(9): p. 1686-1693.
34. Pingale, N.D., Shukla, S. R., Microwave assisted ecofriendly recycling of poly
(ethylene terephthalate) bottle waste. European Polymer Journal, 2008. 44(12): p. 4151-4156.
35. Nazari, M.M.A.N.F., Microwave‐assisted depolymerization of poly (ethylene
terephthalate) [PET] at atmospheric pressure. 2007. 24(4). 36. Güçlü, G., et al., Simultaneous glycolysis and hydrolysis of polyethylene
terephthalate and characterization of products by differential scanning calorimetry. Polymer, 2003. 44(25): p. 7609-7616.
37. J Dasa, A.B.H., Alkaline hydrolysis of poly (ethylene terephthalate) in presence
of a phase transfer catalyst. Indian Journal of Chemical Technology, 2007. 14. 38. Abdelaal, M.Y., T.R. Sobahi, and M.S.I. Makki, Chemical Degradation of Poly
(Ethylene Terephthalate). International Journal of Polymeric Materials, 2008. 57(1): p. 73-80.
39. Yoshioka, T., Kinetics of Hydrolysis of PET Powder in Nitric Acid by a Modified
Shrinking-Core Model. 1998.

109
40. Santos, A.S., Agnelli, J. A., Manrich, S., Evaluation of sub-critical water as an extraction fluid for model contaminants from recycled PET for reuse as food packaging material. 2010. 27(4): p. 567-73.
41. Cata, A., Chemical recycling of polyethylene terephthalate (pet) waste using sub-
and supercritical water. 2015. 42. J. Pitat, V.H., M. Bacak, A method of processing waste of polyethylene
terephthalate by hydrolysis. 1959. 43. S.D. Lazarus, J.C.T., O.E. Snider, US Patent 3,317,519. 1967. 44. Kozlow, N., Korotusko, GP, Kashinskii, AV, Gavrilenco, ND, Preparation of
terephthalic and benzoic acid by simultaneous alkaline hydrolysis of wastes from PET and methyl benzoate. Vesti Acad Nauk BSSR, Ser Khim Nauk, 1984. 5: p. 91-93.
45. A.Liarou, environmentally friendly chemical recycling of polyesters (pet, ppt)
using alkaline hydrolysis under microwave irradiation. 46. Yoshioka T, O.N.a.O.A., Simultaneous hydrolysisoxidation mechanism of waste
PET powder in nitric acid solutions. 1996. 47. Oku, A., Hu, L.-C., Yamada, E. J Applied Polymer Science 1997, 63, 595. 1997. 48. Benzaria J, D.-V.B., Dawans F and Gaillard J B Process for recovery of alkali
metal or alkali earth metal terephthalate and alkylene glycol from alkylene polyterephthalates, EP 597 751. 1994.
49. Yoshioka T, S.T.a.O.A., Hydrolysis of waste PET by sulfuric acid at 15O0C for a
chemical recycling, J Appl Polym Sei 52:1353-1355. 1994. 50. F, P.S., Method for recovery of terephthalic acid from polyester scrap, US Patent
4,355,175. 1982. 51. C, B.G.B.J.a.O.B.R., Method for recovering terephthalic acid and ethylene glycol
from polyester materials, US Patent 3,952,053. 1976. 52. A, M., Poly (ethylene terephthalate) waste utilization by hydrolysis in neutral
environment, Ekoplast 2:52-59. 1993. 53. Campanelli J R, K.M.R.a.C.D.G., A kinetic study of the degradation of poly
(ethylene terephthalate) at high temperatures, J Appl Polym Sd 48:443-451. 1993.

110
54. Tustin G C, P.T.M.J., Jenkins U A and Jernigan M T, recovery and purification of terephthalic acid and ethylene glycol from poly(ethylene terephthalate), US Patent 5,413,681. 1995.
55. Le, H.Q., Solubility of organosolv lignin in γ-valerolactone/water binary
mixtures. 2016. 56. Halterman, D., Hansen Solubility Parameters (Esters and Derivatives). 57. Dow, Dowanol™ PGDA Propylen glycol diacetate 58. Spectrum 1: Isophthalic acid (R2, C1). 59. Kumagai, S., et al., Alkaline hydrolysis of PVC-coated PET fibers for
simultaneous recycling of PET and PVC. Journal of Material Cycles and Waste Management, 2018. 20(1): p. 439-449.
60. Ben-Zu Wan, †, Kinetics of Depolymerization of Poly (ethylene terephthalate) in
a Potassium Hydroxide Solution. 2001. 61. Wong, C.Y.Y., Choi, Alex Wing-Tat, Lui, Matthew Y., Fridrich, Bálint, Horváth,
Attila K., Mika, László T., Horváth, István T., Stability of gamma-valerolactone under neutral, acidic, and basic conditions. Structural Chemistry, 2016. 28(2): p. 423-429.
62. Wong, C.Y.Y., Choi, Alex Wing-Tat, Lui, Matthew Y., Fridrich, Bálint, Horváth,
Attila K., Mika, László T., Horváth, István T., Stability of gamma-valerolactone under neutral, acidic, and basic conditions. Structural Chemistry, 2017. 28(2): p. 423-429.
63. J. G. Poulakis, C.D.P., Dissolution/reprecipitation: A model process for pet bottle
recycling. 2000. 64. Libre. Spin-spin splitting in ¹H NMR spectra. 2016. 65. Holger, A.B.F.K.O.K.D.K., Use of biaxially stretched film comprising polyester,
whose diol component is cyclohexanedimethanol and dicarboxylic acid component is benzene- and/or naphthalene dicarboxylic acid, as electrical insulating filler. 2011.
66. Kasai, T.T., Polyester resin copolymerized with isosorbide and 1,4- cyclohexane
dimethanol and preparing method. 2002.

111
67. Luboš Běhálek, M.M., Petr Lenfeld, Jiří Habr, Jiří Bobek, Martin Seidl, Study of crystallization of polylactic acid composites and nanocomposites with natural fibres by DSC method. 2013.
68. Gajula, S., 2017. Fructose dehydration to 5-hydroxymethylfurfural: Remarkable solvent influence on recyclability of Amberlyst-15 catalyst and regeneration studies, Elsevier, Volume -37, Pg. 41-44.
69. National Center for Biotechnology Information, U.S.N.L.o.M., Terephthalic Acid.

112
Appendix - A
Miscellaneous data
Fig. A-1. US Waste Generation by category.

113
Fig. A-2. RPET used by product category in 2016 (MMlbs) as per NAPCOR report.
Fig. A-3. PET material flow in US(MMlbs) as per NAPCOR 2016 report.

114
Fig A-4. Proton NMR spectrum of Pure TPA.
Fig A-5. Carbon NMR spectrum of Pure TPA.

115
Fig A-6. Proton NMR spectrum of Pure FDCA.
Fig A-7. Carbon NMR spectrum of Pure FDCA.