A Thesis entitled Development and Optimization of ...
127
A Thesis entitled Development and Optimization of Dextromethorphan HBr-2-Hydroxy Propyl ß-Cyclodextrin Inclusion Complex Based Orally Disintegrating Tablets Using Response Surface Methodology by Saugat Adhikari Submitted to the Graduate Faculty as partial fulfillment of the requirements for the Master of Science Degree in Pharmaceutical Sciences, Industrial Pharmacy _________________________________________ Kenneth S. Alexander, PhD, Committee Chair _________________________________________ Sai Hanuman Sagar Boddu, PhD, Committee Member _________________________________________ Jerry Nesamony, PhD, Committee Member _________________________________________ Amanda Bryant-Friedrich, PhD, Dean College of Graduate Studies The University of Toledo August 2016
-
Upload
khangminh22 -
Category
Documents
-
view
0 -
download
0
Transcript of A Thesis entitled Development and Optimization of ...

A Thesis
entitled
Development and Optimization of Dextromethorphan HBr-2-Hydroxy Propyl
ß-Cyclodextrin Inclusion Complex Based Orally Disintegrating Tablets Using Response
Surface Methodology
by
Saugat Adhikari
Submitted to the Graduate Faculty as partial fulfillment of the requirements for the
Master of Science Degree in
Pharmaceutical Sciences, Industrial Pharmacy
_________________________________________
Kenneth S. Alexander, PhD, Committee Chair
_________________________________________
Sai Hanuman Sagar Boddu, PhD, Committee
Member
_________________________________________
Jerry Nesamony, PhD, Committee Member
_________________________________________
Amanda Bryant-Friedrich, PhD, Dean
College of Graduate Studies
The University of Toledo
August 2016

Copyright 2016, Saugat Adhikari
This document is copyrighted material. Under copyright law, no parts of this document
may be reproduced without the expressed permission of the author.

iii
An Abstract of
Development and Optimization of Dextromethorphan HBr-2-Hydroxy Propyl
ß-Cyclodextrin Inclusion Complex Based Orally Disintegrating Tablets Using Response
Surface Methodology
by
Saugat Adhikari
Submitted to the Graduate Faculty as partial fulfillment of the requirements for the
Master of Science Degree in
Pharmaceutical Sciences, Industrial Pharmacy
The University of Toledo
August 2016
The focus of this present investigation was to access the utility of various characterization
techniques in the evaluation of Dextromethorphan HBr (DXM HBr) inclusion complex
with 2-Hydroxy propyl ß-cyclodextrin (2-HPßCD). This techniques confirms the
formation of the inclusion complex and explores the mode of complexation between
DXM HBr and 2-HPßCD. It also predicts the ability of 2-HPßCD to mask the bitter taste
of DXM HBr and explain its taste masking mechanism. In aqueous solution, the inclusion
complex was studied utilizing the phase solubility method. The solubility of DXM HBr
increased as a function of 2-HPßCD concentration. The solubility profile was classified
as AL type: indicating the formation of a 1:1 stoichiometric inclusion complex. In solid
state, the inclusion complex was prepared using lyophilization (freeze drying technique)
and characterized by Differential Scanning Calorimetry (DSC), Fourier Transform
Infrared (FT-IR), Scanning Electron Microscopy (SEM), powder X-ray Diffraction
(pXRD), proton nuclear magnetic resonance (1HNMR) spectroscopy and 2D-NMR

iv
rotating Over Hauser effect spectroscopy (ROESY). FT-IR showed no interaction
between DXM HBr and 2-HPßCD and confirmed the formation of the complex. DSC and
SEM studies further confirmed the inclusion complex formation. pXRD analysis
indicated that the crystallinity of the inclusion complex reduced significantly. NMR
spectroscopy elucidated the mode of complex formation. The subsequent incorporation of
the inclusion complex into orally disintegrating tablets (ODTs) was done to develop the
formulation. This results in patient adherence and convenience and enhances the
dissolution rate by rapid absorption of drug through oral mucosa. Response surface
methodology with central composite design was employed in the optimization of the
formulation factors, such as concentration of croscarmellose sodium (CCS) and
microcrystalline cellulose (MCC), to obtain ODTs within the range of 3.5 to 5.5 kp
hardness, 6.3 to 45 second disintegration time and 1.2 to 6.06 minutes mean dissolution
time (MDT). The results indicated selected factors which have a strong influence on
properties of the ODTs. The optimum concentration of CSS and MCC predicted by the
model was 5.168 mg (2.5%) and 81.814 mg (40%), respectively for preparing a DXM
HBr-2-HPßCD inclusion complex based ODT with a hardness of 4.5 kp, disintegration
time of 10 seconds and MDT of 1.341 minutes. Thus, this approach exhibited the ability
of masking the bitter taste of DXM HBr when complexed with 2-HPßCD, which resulted
in ODTs formulations with improved patient adherence and acceptability.

v
Acknowledgements
This project is not the result of one individual’s effort, but is the product of collective
experience of all those who have shared their views for this work. I would like to express
my deep sense of gratitude to my major advisor Dr. Kenneth S. Alexander for his
valuable guidance, suggestions, thought-provoking discussions and constructive criticism
which always inspired me to work diligently.
I would like to thank my thesis committee members: Dr. Sai Hanuman Sagar Boddu and
Dr. Jerry Nesamony for their advice, encouragement and support over the last two years.
I am sincerely thankful to Dr. Caren Steinmiller for serving as a graduate faculty
representative for my thesis defense. I would also like to thank Dr. Pannee Burckel for
helping me with the scanning electron microscopy and X-ray diffraction studies. I thank
Roquette America Inc. for providing me with samples of 2-Hydroxy Propyl ß-
cyclodextrin. I also thank JRS Pharma for providing me with the tablet excipients
samples. My sincere thanks to the Department of Pharmacy Practice, The University of
Toledo for providing me with financial support throughout the tenure of my study. Over
these years in Toledo, I have come across many individuals for whom I have great
regard. A special thank you to my friends and colleagues who have stood by me in all my
efforts for successfully completing this work. My deepest gratitude goes to my family for
their unflagging love and support throughout my life. I would like to thank all of you in
making this project a worthy endeavor.

vi
Table of Contents
Abstract .............................................................................................................................. iii
Acknowledgements ..............................................................................................................v
Table of Contents .............................................................................................................. .vi
List of Tables .................................................................................................................. xii
List of Figures .................................................................................................................. xiii
1. Introduction…. .........................................................................................................1
1.1 Pediatric Medication ........................................................................................1
1.1.1 Problems associated with pediatric medications.................................2
1.1.2. Formulation challenges of the pediatric dosage forms ......................4
1.1.3. Bitter tasting pediatric drug: Dextromethorphan hydrobromide .......6
1.1.3.1. Physiochemical properties of dextromethorphan…............7
1.1.3.2. Pharmacology of dextromethorphan. ..................................8
1.1.3.3. Safety and dosage of dextromethorphan…. ........................8
1.1.3.4. The problem: Bitter taste of dextromethorphan…. .............8
1.1.3.5. The problem: Formulation challenges of
dextromethorphan ..............................................................9
1.2. Cyclodextrins as drug carrier ..........................................................................10
1.2.1. ß-cyclodextrin ..................................................................................12
1.2.2. 2-Hydroxy Propyl ß-cyclodextrin ....................................................13

vii
1.2.3. Cyclodextrin Inclusion Complexes: Requirements for complex
formation ........................................................................................14
1.2.3.1. Geometric Compatibility ..................................................14
1.2.3.2. Polarity and Charge...........................................................15
1.2.3.3. Binding forces of the complexes.......................................15
1.2.4. Cyclodextrin complexes and phase solubility ..................................16
1.2.5. Mechanism of drug release from the inclusion complex .................19
1.2.6. Preparation of inclusion complexes using a Freeze Drying
Technique (Lyophilization) ..........................................................20
1.2.7. Characterization of inclusion complex in solid state .......................21
1.2.7.1. Powder X-ray diffraction ..................................................21
1.2.7.2. Infra-red spectroscopy ......................................................22
1.2.7.3. Thermo-analytical method: Differential Scanning
calorimetry .......................................................................22
1.2.7.4. Scanning electron microscopy ..........................................23
1.2.8. Characterization of inclusion complex in liquid state ..................... 23
1.2.9. Advantages of cyclodextrin inclusion complexes............................24
1.2.9.1. Enhancement of solubility ................................................24
1.2.9.2. Enhancement of bioavailability ........................................25
1.2.9.3. Improvement of stability ...................................................25
1.2.9.4. Reduction in drug irritation ...............................................26
1.2.9.5. Taste masking of bitter API’s by formulation of inclusion
complex ............................................................................26

viii
1.3. Cyclodextrin based oral drug delivery systems for pediatric patients ............27
1.3.1. Increase in oral bioavailability resulting from inclusion complex ...27
1.3.2. Masking of bitter taste and reducing irritation of oral
formulations ...................................................................................28
1.3.3. Increase in mucosal drug permeability resulting from inclusion
complex ..........................................................................................28
1.3.4. Safety concerns of using cyclodextrin in oral formulation ..............28
1.4. Alternative forms of cyclodextrin based oral drug delivery systems for
pediatric patients ........................................................................................29
1.4.1. Limitations with conventional oral dosage forms for pediatrics .....29
1.4.2. Orally disintegrating tablets (ODTs) ...............................................30
1.4.2.1. Advantages of ODTs.........................................................31
1.4.2.2. Formulation of ODTs ........................................................31
1.4.2.3. Direct compression method for preparing ODTs ..............33
1.4.2.4. Drug-cyclodextrin inclusion complexes based ODTs
(Modified ODTs) ...........................................................33
1.5. Response Surface Methodology (RSM): A statistical tool for optimizing
formulations ...............................................................................................34
1.5.1. Central composite design (CCD) based RSM for optimization of
process variables ............................................................................35
1.5.2. Application of CCD based RSM in ODTs formulation ...................37
2. Significance of the thesis research .........................................................................39

ix
3. Development and optimization of Dextromethorphan HBr-2-Hydroxy Propyl
ß-cyclodextrin inclusion complex based orally disintegrating tablets using
response surface methodology ...............................................................................41
3.1. Abstract………. ..............................................................................................42
3.2. Introduction .....................................................................................................43
3.3. Materials and methods ....................................................................................47
3.3.1. Materials ..........................................................................................47
3.3.2. Phase solubility study ......................................................................47
3.3.3. Preparation of the inclusion complex in the solid state ...................48
3.3.4. HPLC analysis .................................................................................49
3.3.5. Analysis of drug content in the inclusion complex ..........................50
3.3.6. In-vitro release study from the inclusion complex ..........................50
3.3.7. Characterization of the inclusion complex ......................................51
3.3.7.1. Differential Scanning Calorimetry (DSC) .......................51
3.3.7.2. Fourier Transform Infrared (FT-IR) spectroscopy ...........51
3.3.7.3. Powder X-ray Diffraction (pXRD) ..................................52
3.3.7.4. Scanning Electron Microscopy (SEM) ............................52
3.3.7.5. Proton Nuclear Magnetic resonance (1HNMR) studies and
2D-NMR ROESY ............................................................53
3.3.8. Tablet compression of inclusion complex .......................................54
3.3.8.1. Design of Experiment (DOEs) .........................................54
3.3.8.2. Tablet Manufacturing........................................................55
3.3.9. Evaluation of prepared ODTs ..........................................................56

x
3.3.9.1. Weight Variation ...............................................................56
3.3.9.2. Thickness ..........................................................................57
3.3.9.3. Friability ............................................................................57
3.3.9.4. Drug content......................................................................57
3.3.9.5. Hardness ............................................................................58
3.3.9.6. Wetting time and water absorption ratio ...........................58
3.3.9.7. In-vitro disintegration test .................................................58
3.3.9.8. In-vitro dissolution test .....................................................59
3.3.10. Statistical analysis and Optimization .............................................59
3.4. Results and Discussion ...................................................................................60
3.4.1. Phase solubility study ......................................................................60
3.4.2. Drug content in the inclusion complex ............................................62
3.4.3. Characterization of inclusion complex ............................................63
3.4.3.1. Differential Scanning Calorimetry (DSC) .......................63
3.4.3.2. Fourier Transform Infrared (FT-IR) spectroscopy ...........64
3.4.3.3. Powder X-ray Diffraction (pXRD) ..................................66
3.4.3.4. Scanning Electron Microscopy (SEM) ............................67
3.4.3.5. Proton Nuclear Magnetic resonance (1HNMR) studies and
2D-NMR ROESY ............................................................69
3.4.4. Dissolution studies from inclusion complex ....................................74
3.4.5. Orally disintegrating tablets characterization and evaluation ..........75
3.4.5.1. Mathematical modelling of data obtained from
experimental design ........................................................81

xi
3.4.5.2. Analysis of the fitted data .................................................86
3.4.5.3. Dissolution rate from ODTs..............................................90
3.4.6. Validation of Model and Optimization of process variables
for DXM HBr ODTs ......................................................................91
3.5. Conclusions .....................................................................................................95
3.6 Acknowledgements ..........................................................................................96
References……………. .....................................................................................................97
xii
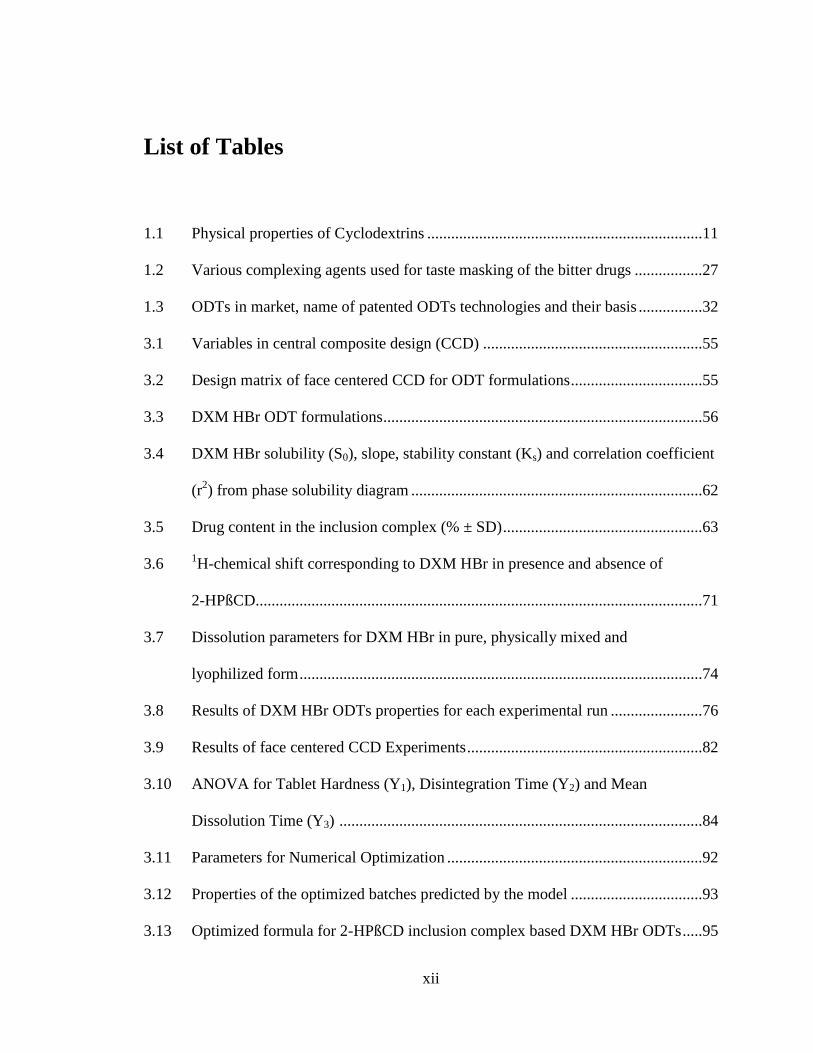
List of Tables
1.1 Physical properties of Cyclodextrins .....................................................................11
1.2 Various complexing agents used for taste masking of the bitter drugs .................27
1.3 ODTs in market, name of patented ODTs technologies and their basis ................32
3.1 Variables in central composite design (CCD) .......................................................55
3.2 Design matrix of face centered CCD for ODT formulations .................................55
3.3 DXM HBr ODT formulations ................................................................................56
3.4 DXM HBr solubility (S0), slope, stability constant (Ks) and correlation coefficient
(r2) from phase solubility diagram .........................................................................62
3.5 Drug content in the inclusion complex (% ± SD) ..................................................63
3.6 1H-chemical shift corresponding to DXM HBr in presence and absence of
2-HPßCD................................................................................................................71
3.7 Dissolution parameters for DXM HBr in pure, physically mixed and
lyophilized form .....................................................................................................74
3.8 Results of DXM HBr ODTs properties for each experimental run .......................76
3.9 Results of face centered CCD Experiments ...........................................................82
3.10 ANOVA for Tablet Hardness (Y1), Disintegration Time (Y2) and Mean
Dissolution Time (Y3) ...........................................................................................84
3.11 Parameters for Numerical Optimization ................................................................92
3.12 Properties of the optimized batches predicted by the model .................................93
3.13 Optimized formula for 2-HPßCD inclusion complex based DXM HBr ODTs .....95

xiii
List of Figures
1.1 Mechanism of taste ..................................................................................................3
1.2 Structure of Dextromethorphan HBr .......................................................................7
1.3 Structural features of cyclodextrins .......................................................................10
1.4 Location of secondary and primary hydroxyl groups in β-cyclodextrin ...............12
1.5 Structure of Hydroxyl propyl β-cyclodextrin ........................................................14
1.6 Schematic of 1:1 drug-cyclodextrin complex formation ......................................16
1.7a Type-A diagrams ...................................................................................................18
1.7b Type-B diagrams ....................................................................................................18
1.8a Response surface plot ............................................................................................35
1.8b Contour plot ...........................................................................................................35
1.9 Layout of central composite design (CCD) for 2 variables at 2 levels ..................37
3.1 Phase solubility diagram of DXM HBr-2-HPßCD inclusion complex ..................61
3.2 DSC thermograms of pure DXM HBr, pure 2-HPßCD, 1:1 physical mixture and
1:1 lyophilized DXM HBr-2-HPßCD inclusion complex .....................................64
3.3 FTIR spectra of pure DXM HBr, pure 2-HPßCD, 1:1 physical mixture and 1:1
lyophilized DXM HBr-2-HPßCD inclusion complex ............................................65
3.4 X-ray diffraction patterns of pure DXM HBr, pure 2-HPßCD, 1:1 physical
mixture and 1:1 lyophilized DXM HBr-2-HPßCD inclusion complex .................67

xiv
3.5 Scanning electron microphotographs of pure DXM HBr, pure 2-HPßCD, 1:1
physical mixture and 1:1 lyophilized DXM HBr-2-HPßCD inclusion complex ...68
3.6 NMR spectra of pure DXM HBr, pure 2-HPßCD, 1:1 physical mixture and 1:1
lyophilized DXM HBr-2-HPßCD inclusion complex ............................................70
3.7 Structure of Dextromethorphan HBr with labelling of proton...............................71
3.8 2D-NMR ROESY spectrum of DXM HBr-2-HPßCD inclusion complex showing
the intermolecular NOEs between protons of DXM HBR and H- protons of 2-
HPßCD ...................................................................................................................72
3.9 Proposed mechanism of complexation/ mechanism for taste masking of DXM
HBr-2-HPßCD complex.........................................................................................73
3.10 Dissolution profiles at pH 6.8 of pure DXM HBr 1:1 physical mixture and 1:1
lyophilized complex ...............................................................................................75
3.11 Effect of formulation factors (CSS and MCC) on characteristic response variables
of DXM HBr ODTs ...............................................................................................78
3.12 Relationship between wetting time and disintegration time ..................................80
3.13 Water absorption ratio of DXM HBr-2-HPßCD ODTs .........................................81
3.14 Response surface plot showing effect of CCS and MCC concentration on tablet
hardness, disintegration time and mean dissolution time ......................................88
3.15 Contour plot showing effect of CCS and MCC concentration on tablet hardness,
disintegration time and mean dissolution time ......................................................89
3.16 Dissolution profile of DXM HBr ODTs formulations ...........................................91
3.17 Comparison of predicted values from the model and observed values
for ODTs ................................................................................................................92

xv
3.18 Overlay plot for the optimization parameters with design space (yellow area) to
obtain DXM HBr ODTs.........................................................................................93
3.19 Response surface plot for CCS and MCC concentration desirability in design
space .......................................................................................................................94

1
Chapter 1
Introduction
1.1. Pediatric Medications
Most children face difficulties in taking prescribed medications. Many active
pharmaceutical ingredients (API’s) are bitter in taste and unpleasant for children and
adults as well. API’s can be encapsulated to reduce the bitter taste and increase patient
adherence in adults. However, it is still problematic for many children as they will not
swallow encapsulated medications or pills easily [1, 2]. Even though children suffer from
the same kind of diseases as adults and the same drug is used for the treatment of those
diseases, pediatric formulations need to be revised and modified to achieve better safety
and efficacy of the dosage form in children [3]. Formulations which are child unfriendly,
provide a high risk of adverse consequences with alteration in medication regimen and
suboptimal dosing [2]. Children may also fail to adhere to the medication regimen and
may cause serious adverse effects. The absence of critical safety and efficacy information
for pediatric formulations have significant risks to children [4].

2
1.1.1. Problems associated with Pediatric Medications
The formulation development of pediatric medications is an area with many challenges
and problems for a research scientist. The bad taste of medications and pediatric
formulation challenges have been a major problems associated with children’s medicine
[5].
Bitter taste of the API
One of the most important requirements that the pediatric formulation must meet is
palatability. Bitter taste of the API’s makes medications unpalatable [6]. Children will no
doubt reject this unpalatable medicine. Many of the pharmaceutical API’s by nature have
very bitter taste. This bitter taste can be attributed to the sensory expression of its
pharmacologic activity. An increase in bitterness will increase the extent that the
medication will be rejected by the child [5].
Mechanism of the bitter taste
Food molecules interact with the saliva and bind to the taste receptor. Sensation of taste is
due to the presence of taste receptors in the mouth [7].
The main sensory organ for gustation is the taste bud which is comprised of 50-100
epithelial cells and some of which are receptors. When the receptor proteins are
expressed in the epithelial cells, they stimulate the receptor cells. Saliva also plays a
significant role in the activation of the receptor cells and is responsible for the reduction
of the extent of bitterness [2, 6]. The pathway of the gustatory signals through the brain is
responsible to produce the taste signals. Taste signals can also be modulated along the

3
central gustatory pathway and not only in the periphery. The front of the tongue increases
perceived bitterness as compared to the back of the tongue, probably due to prevention of
the inhibition from the anterior lingual taste signals [7].
There are two different classes of taste receptor mechanisms, the G-protein coupled
receptor (GPCR) is responsible for sweet, bitter and umami taste and the ion channels
receptor is responsible for salt and sour taste [8]. If the activities and transduction
intermediates of these receptors are thermally sensitive, temperature can also be used for
modulating the taste of the medicine. The GPCR share transduction intermediates in taste
receptor cells which releases the neurotransmitter. The T2R family of taste receptors
consists of about 25 GPCR receptors for modulating the bitter taste. The T2R receptors
mainly bind with different bitter tasting ligands and activate them. The temporary
deactivation of the GPCR transduction signaling components can help in reduction of the
bitterness of the medicine and increases its palatability [2, 7].
Figure 1.1: Mechanism of taste
Modified from https://en.wikipedia.org/wiki/Taste

4
The mechanism of the bitter taste is due to the signaling from the taste receptor [2].
However, with many bitter tasting compounds it is not possible to reduce the bitterness at
the receptor level because the drug may stimulate multiple receptors which requires its
own antagonist [7]. Several components of the bitter taste transduction signaling pathway
are shared with those meditating sweet taste and it may create the problem to reduce the
perceived bitterness. Hence, temporary non selective blocking of these bitter taste
transduction signaling pathways can increase the palatability of the medicine [2, 5].
1.1.2. Formulation challenges of the pediatric dosage forms
Children are not just small humans, but they are small from a biological and
pharmacological development perspective. Physiology (biology) of children, age, size
and treatment requirements are the challenges in formulating safe and effective
medications for them [5]. Inadequate drug formulations may cause problems in children’s
which are not observed in adults. These include a difficulty in swallowing conventional
size tablets, excipient interactions, safety issues and patient adherence problems due to
palatability [8]. The lack of attention regarding age appropriate medication therapy gives
rise to ethics related problems where adult medicines are used off-label in children which
carries additional risks [9].
Non-adherence to the medication is mostly due to the pain, discomfort and unnecessary
burden on children during drug administration [10]. The matter of taste in pediatric oral
formulations can cause patient non-adherence. The low tolerance of children for
disagreeable taste influences the loss of medication from spillage or spitting [11].

5
The selection of preservatives, sweeteners, fillers and solvents is challenging as there
have been some evidence that suggests excipients commonly used in adult medication
may cause elevated toxicity and safety issues in children [9, 12].
Aspartame is used as a sweetener in beverages, food products and pharmaceutical
preparations. It can mask the taste of the bitter drugs and helps in formulating pediatric
medications with a pleasant taste. However, a number of adverse events have been
reported associated with hyperactivity in children due to the aspartame consumption [13].
Poorly soluble drugs normally prepared as oral suspensions use various surfactants to aid
the wetting and dissolution of the drugs. Surfactants such as docusate sodium and
polysorbates produce a series of adverse events in children if their concentration level is
not controlled in pediatric medications [14].
Buffering agents, anti-oxidants and preservatives are used for physical, chemical and
microbiological stability. However, preservatives such as benzyl alcohol and sodium
benzoate have produced fatal adverse events in pediatric populations [15, 16].
The crucial importance is to mask the unpleasant taste of formulations with sweeteners
and flavors. Oral liquid flavors that usually mask the taste of drugs are complimented
with colorants which may cause allergic reactions and hypersensitivity in children [3].
When this is not achievable, sophisticated formulation approaches such as encapsulation
and complexation should be prepared which also increases technical challenges and
lengthens the process thus making the formulation expensive [4].
Conventional oral solid dosage forms such as tablets are associated with the risk of
choking and have limited dose flexibility [17]. Liquid formulations may possess the

6
problems of palatability and dose uniformity. In addition, stability (chemical, physical
and microbiological) is another major problem with liquid formulations. Liquid
formulations can be bulky and have difficulties during handling and shipping [3, 9].
Even with medications which have been approved and dosing regimens authorized for
children, the availability of appropriate dosage forms is limited [11]. Cleary these
formulation challenges focus the need that more research and development are required.
1.1.3. Bitter tasting pediatric drug : Dextromethorphan Hydrobromide
Many of the active pharmaceutical ingredients either during or immediately after oral
absorption exhibit undesirable characteristics such as bitter taste. Acetaminophen,
azithromycin, ampicillin, chlorpheniramine, dextromethorphan, diphenhydramine,
ibuprofen, penicillin, pseudoephedrine, ranitidine, spironolactone and theophylline are
among a few of the API’s or medicinal agents that have characteristic bitter taste [18, 19].
Dextromethorphan (3-methoxy-N-methylmorphinan) is one of the most commonly used
antitussive drug (cough suppressant) in children. Dextromethorphan has an opioid like
structure. However, being the d-isomer it does not possesses the analgesic/addictive
properties of opioids. Dextromethorphan was approved as a non-prescription cough
medication in 1958 by the FDA [20]. In current scenarios, dextromethorphan can be
found in more than 125 OTC cough and cold patented products. It is available as pills,
gels, caps, lozenges, liquids and syrups but its availability as a solid dosage form is
limited. It is given either alone or in combination with analgesics (acetaminophen),
expectorants (guaifenesin) and/or antihistamines (brompheniramine, chlorpheniramine

7
and diphenhydramine). It’s mainly active against the dry cough and is used in
combination with expectorants to have significant effects for productive cough [21].
1.1.3.1. Physiochemical properties of dextromethorphan
Figure 1.2: Structure of Dextromethorphan HBr
Chemical name: Dextromethorphan hydrobromide
Molecular formula: C18H25NO.HBr.H20
Molecular weight: 370.3
CAS Registry: 6700-34-1 (Dextromethorphan Hydrobromide, monohydrate)
A white crystalline powder, with faint odor
Soluble in 65 parts of water (USP) and 1 in 10 parts alcohol; freely soluble in chloroform
and practically insoluble in ether [20].

8
1.1.3.2. Pharmacology of dextromethorphan
After oral administration, dextromethorphan hydrobromide is rapidly absorbed from the
GIT. The onset of action is between 15-30 minutes and the peak serum level is achieved
within 2.5 hrs. It undergoes rapid first pass metabolism. The metabolism involves the
oxidative enzyme cytochrome P4502D6/ CYP2D. Elimination half-life of the drug is
about 2-4 hours in the majority of individuals but it may be 24-72 hours in slow
metabolizers [20, 22].
1.1.3.3. Safety and dosage of dextromethorphan
The oral dose of dextromethorphan in adults is 10- 20 mg every four hours, 30 mg every
6-8 hours, with a maximum of 120 mg in 24 hours. Children from 6-12 years are given 5-
15 mg every 4-8 hours to the maximum of 60 mg in 24 hours. Children from 2-6 years of
age are given 2.5-5 mg every 4 hours, 7.5 mg every 6-8 hours to the maximum of 30 mg
in 24 hours [21].
Clinical studies show that a single dose of 120mg/day may produce some adverse effects.
Ingestion of 10 mg/kg or less is unlikely to produce toxicity in child. There is a greater
potential for toxicity in children with long acting preparations [22].
1.1.3.4. The problem: Bitter taste of the dextromethorphan
Dextromethorphan in cough and cold syrups provides the main problem of bitterness
which leads to patient non-adherence, especially in children. There are various oral

9
solid/liquid dosage forms which contain dextromethorphan as the active ingredient and
are bitter in taste [23, 24]. Due to the presence of the amine functional group in
dextromethorphan hydrobromide, the drug has an obnoxious taste. The amino functional
group in its molecular structure is responsible for the characteristic bitter taste [24]. There
have been some studies which show that the amine functional group can be blocked by
the formation of a complex and results in reduction in the bitterness of the product.
However, there are no detailed studies or data which show the blockage of the amine
group during the formation of the complex.
1.1.3.5. The problem: Formulation challenges of dextromethorphan
Dextromethorphan hydrobromide is readily absorbed in the upper GIT and has short
biological half-life. It belongs to BCS- class II drugs and exhibits low solubility and high
permeability. Because of these reasons, the bioavailability of the drug is drastically low
in conventional oral solid/liquid preparations [19]. In addition, most of the commercial
formulation available for dextromethorphan are oral liquid formulations (syrups and
suspensions) e.g. Deslym® [18, 19, 23]. These oral liquid dosage forms are bulky and the
stability of these formulations can be key issues. Also, with the oral liquid formulations
we face patient non-adherence and dosing problems, especially with pediatric
formulations of dextromethorphan [18, 25].

10
1.2. Cyclodextrins as drug carrier
Designing advanced dosage forms requires suitable carrier materials to overcome the
undesirable properties of drug molecules. Cyclodextrins (CDs) can alter the physical
chemical and biological properties of the guest molecules through the preparation of
inclusion complexes [25]. They are pharmaceutical excipients that can solubilize various
poorly water soluble drugs by forming water soluble drug cyclodextrin complexes [26].
Chemisty
The α-cyclodextrin, β-cyclodextrin, γ-cyclodextrin are widely used natural cyclodextrins,
consisting of six, seven and eight D-glucopyranose residues, respectively, linked by -1,4
glycosidic bonds into a macrocycle [27-29]. The structure is shown in Figure 1.3. X-ray
investigation of cyclodextrin molecules revealed that due to the presence of primary and
secondary hydroxyl groups as well as due to its hydrophopic cavity each cyclodextrin has
its own ability to form inclusion complexes with specific guests, which depends on a
proper fit of the guest molecule into the hydrophobic cyclodextrin cavity [25].
Figure 1.3: Structural features of cyclodextrins [27, 30]

11
The most common pharmaceutical application for cyclodextrins is to enhance solubilty,
stability and bioavailability of drug molecules, and to mask the unpleasant taste of drugs
[31]. However, natural cyclodextrins have relatively low solubility in water and organic
solvents, thus restricting their use in pharmaceutical formulations [32, 33]. Recently,
various types of cyclodextrin derivatives have been prepared to improve their
physicochemical properties and inclusion capacity of natural cyclodextrins as novel drug
carriers [34].
Physical Properties
The dimension of the cyclodextrin changes with the change in the number of glucose
units. Because of the difference in internal cavity diameters, each cyclodextrin shows a
different capability of inclusion complex formation with differently sized guest molecules
[30, 35]. Table 1.1 lists the dimensional sizes as well as important physicochemical
characteristics of the different types of cyclodextrins.
Table 1.1: Physical properties of the cyclodextrins [25, 29, 35]
Sr.
No
Characteristics α-cyclodextrin β-cyclodextrin γ-cyclodextrin
1 Number of glucose unit 6 7 8
2 Molecular weight 972 1135 1297
3 Central cavity diameter (A0) 4.7-5.3 6.0-6.5 7.5-8.3
4 Water solubility(g/100ml at
RT)# 14.5 1.85 23.2
5 Optical rotation (α)D25°C
150+0.5 162.5+0.5 177.4+0.5

12
6 Cavity diameter (A0) 4.7-5.3 6.0-6.5 7.5-8.5
7 Height of torus (A0) 7.9±0.9 7.9±0.9 7.9±0.9
8 Diameter of outer periphery
(A0)
14.6+0.4 15.4+0.4 17.5+0.4
9 Approximate volume of cavity
(A0) 174 262 427
10 Approximate volume of cavity
in 1 mol-cyclodextrin(ml) 10 157 250
11 Melting point 275 280 275
# Aqueous solubility in grams per 100 ml of water at ambient temperature
1.2.1. β-cyclodextrin
The structure of β-cyclodextrin is shown in Figure 1.3. As a consequence of C1
confirmation of -D-glycopyranosyl residues and lack of free rotation around glycosidic
bonds, the compounds are not cylindrical but somewhat cone-shaped [36]. The secondary
hydroxyl groups (on the C-2 and C-3 atoms of the glucose units) are situated on one edge
of the ring and all primary hydroxyls on other and this makes the cyclodextrin exterior
hydrophilic [27]. It is shown in Figure 1.4.
Figure 1.4: Location of secondary and primary hydroxyl groups in β-cyclodextrin [35]

13
The main properties of β-cyclodextrin include less irritation to GIT compared other types
of cyclodextrins, less absorption in the upper GIT and metabolized by bacteria present in
colon [37]. Currently, ß-cyclodextrin is the most common type of cyclodextrin in
pharmaceutical formulation. β-cyclodextrin has low solubility in water compared to its
derivatives. Many intermolecular hydrogen bonds exist between secondary hydroxyl
groups. These intermolecular hydrogen bonds help in stabilizing the macrocycle of the
cyclodextrin molecule and turn the β-cyclodextrin molecule into a rigid structure [34].
These intermolecular hydrogen bonds also prevent hydration of the cyclodextrin
molecule, which may be the cause for the low solubility of β-cyclodextrin [30].
1.2.2. 2-Hydroxy Propyl β-cyclodextrin
2- Hydroxyl propyl β-cyclodextrin (HP βCD) is a hydroxyalkyl derivative, an alternative
to α, β and γ-cyclodextrin which has improved water solubility properties and reduced
toxicity to humans [38]. Its structure is shown in Figure 1.5. The following combined
characteristic features of HP βCD offers huge formulation opportunities [39, 40]:
a. HP βCD has high aqueous solubility and is infinitely soluble in water at room
temperature.
b. The process of complexation is much facilitated compared with native
cyclodextrins
c. The safe biological profile of HP βCD permits for wider use and
administrative routes.

14
Figure 1.5: Structure of Hydroxyl propyl β-cyclodextrin [41]
HP βCD can be found in several marketed drug formulations with oral dosing of up to 8 g
HP βCD /day and intravenous dosing of up to 16 g HP βCD /day (Itraconazole®) [35,
38]. HP βCD has been shown to be well tolerated in humans. The oral bioavailability of
HP βCD in humans is between 0.5 to 3.3% with 50 to 65% of the oral dose excreted
intact in the feces with the remainder mainly being metabolized by the intestinal
microflora [37].
1.2.3. Cyclodextrin Inclusion Complexes: Requirements for complex formation
1.2.3.1. Geometric Compatibility
Cyclodextrins feature an ability to form inclusion complexes by trapping the various
guest molecules into its cavity. The minimum requirement for this inclusion complex
formation is that the guest molecule must fit entirely or at least partially, into the
cyclodextrin cavity. Stable complexes will not be formed with guest molecules which are
too small to be enclosed by the cyclodextrin molecules because they will slip out of the

15
cavity. Complex formation is also impossible with molecules which are too bulky to
penetrate into the cyclodextrin cavity. However if certain groups or side chains of the
bulky molecule can penetrate into the cyclodextrin cavity, complex formation remains
possible [42]. Most frequently the host-to-guest ratio is 1:1 for molecular encapsulation.
However 2:1, 1:2, 2:2 or even more complicated associations and higher equilibria can
exist [33] .
1.2.3.2. Polarity and Charge
Hydrophobic molecules or residues have higher affinity than hydrophilic molecules for
the cyclodextrin cavity in aqueous solution. Hydration of a hydrophobic guest is
generally favored as compared to separate hydration of the components. This
hydrophobic interaction is due to the intrinsic cohesion of the water molecules and not to
the mutual attraction of the two components [43].
1.2.3.3. Binding forces of the Complexes
Cyclodextrin complexes are stabilized by various intermolecular forces such as [44]:
a. Van der waals interaction between the guest and host. The Van der waals forces
here include both permanent induced-dipole-dipole interactions and London
dispersion forces.
b. Hydrogen bonding between the guest and host.

16
c. Release of high-energy water molecules in complex formation. Inclusion complex
formation replace these high enthalpy water molecules by guest compounds,
resulting in a favorable enthalpy change.
d. Release of strain energy in the macromolecular rings of the cyclodextrin. It causes
the change in high energy conformation of the cyclodextrin-water complex to the
lower energy conformation of the cyclodextrin-guest complex.
1.2.4. Cyclodextrin complexes and Phase Solubility
Cyclodextrins can form inclusion complexes with the guest molecule in aqueous solution
by engulfing the lipophilic moiety of the drug molecule into the hydrophobic central
cavity of cyclodextrin [31]. This is seen in Figure 1.6. In aqueous solution, drug
molecules within the cyclodextrin cavity are in dynamic equilibrium with free drug
molecules and there are no covalent bonds formed or broken during the formation of the
complex. This is a diffusion controlled mechanism and drug cyclodextrin complexes are
continuously being formed and dissociated [36].
Cyclodextrin Cavity Drug Molecule 1:1 Drug-CD complex
Figure 1.6: Schematic of 1:1 drug-cyclodextrin complex formation

17
The affinity for the drug to cyclodextrins in the formation of the complex is given by the
stability constant (equilibrium constant) K. The K-value is determined by titrating
changes in the physicochemical properties of the drug molecule within the cyclodextrin
and analyzing the concentration dependencies [45]. Physicochemical properties of guest
molecules such as aqueous solubility, stability, molar absorptivity, NMR chemical shifts,
pka values and HPLC retention times can be studied [35].
The most commonly used method to study the inclusion complexation is the phase
solubility method described by Higuchi and Connors. This method studies the effect of
solubilizer CD (ligand) on drug molecule being solubilized (substrate). Phase solubility
diagrams are generally categorized as two types [45]:
a. Type A diagrams
b. Type B diagrams
Type A diagrams:
Type A curves indicate the formation of the soluble inclusion complexes. They are
further sub-divided into;
AL type: linear increase in drug solubility as the function of CD concentration
AP type: positively deviating isotherms
AN type: negatively deviating isotherms [45]
This is shown in Figure 1.7a. Chemically modified cyclodextrins, such as HPßCD, which
usually have higher solubility, produce the soluble complexes and give Type-A diagrams
[28, 46].

18
Figure 1.7a: Type-A diagrams
Type B diagrams:
Type B curves suggest the formation of inclusion complexes with poor solubility. The
BS-type diagram represents the complexes with limited solubility and BI-curves indicate
the formation of insoluble complexes. This is shown in Figure 1.7b. Native ß- CD, due to
its limited solubility, gives rise to B-type diagrams [29, 32].
Figure 1.7b: Type-B diagrams
In the case of 1:1 complexes, the stability constant (equilibrium constant) K1:1 can be
expressed as the slope of the linear portion of the curve.

19
It is given by [45];
𝐾1:1 = 𝑠𝑙𝑜𝑝𝑒
𝑆0 (1−𝑠𝑙𝑜𝑝𝑒)……………………………………Eqn. (1.1)
where S0 is the intrinsic solubility of the drug molecule.
1.2.5. Mechanism of Drug Release from the Inclusion Complex
Equilibrium binding of the drug and CD complexes (1:1 complex) is represented by [28,
29];
𝐷𝑟𝑢𝑔 + 𝐶𝐷 ↔ 𝐷𝑟𝑢𝑔: 𝐶𝐷 𝑐𝑜𝑚𝑝𝑙𝑒𝑥……………………Eqn. (1.2)
For 1:1 inclusion complex, the magnitude of binding constant K 1:1 is given by [28];
𝐾1:1 = [𝑑𝑟𝑢𝑔]𝑐𝑜𝑚𝑝𝑙𝑒𝑥
[𝑑𝑟𝑢𝑔]𝑓𝑟𝑒𝑒[𝑐𝑦𝑐𝑙𝑜𝑑𝑒𝑥𝑡𝑟𝑖𝑛]𝑓𝑟𝑒𝑒……………….…Eqn. (1.3)
where 𝑑𝑟𝑢𝑔𝑐𝑜𝑚𝑝𝑙𝑒𝑥 represents concentration of the drug in complex;
[𝑑𝑟𝑢𝑔]𝑓𝑟𝑒𝑒 represents free drug concentration; and
[𝑐𝑦𝑐𝑙𝑜𝑑𝑒𝑥𝑡𝑟𝑖𝑛]𝑓𝑟𝑒𝑒 represents the concentration of free cyclodextrin.
Intrinsic drug solubility is given by [28, 46];
[𝑑𝑟𝑢𝑔]𝑡𝑜𝑡𝑎𝑙 = [𝑑𝑟𝑢𝑔]𝑖𝑛𝑡𝑟𝑖𝑛𝑠𝑖𝑐 + 𝐾1:1[𝑑𝑟𝑢𝑔]𝑖𝑛𝑡𝑟𝑖𝑛𝑠𝑖𝑐[𝑐𝑦𝑐𝑙𝑜𝑑𝑒𝑥𝑡𝑟𝑖𝑛]𝑡𝑜𝑡𝑎𝑙
𝐾1:1[𝑑𝑟𝑢𝑔]𝑖𝑛𝑡𝑟𝑖𝑛𝑠𝑖𝑐 + 1 ..Eqn. (1.4)
where [𝑑𝑟𝑢𝑔]𝑡𝑜𝑡𝑎𝑙 represents total drug solubility;

20
[𝑑𝑟𝑢𝑔]𝑖𝑛𝑡𝑟𝑖𝑛𝑠𝑖𝑐 represents intrinsic solubility;
[𝑐𝑦𝑐𝑙𝑜𝑑𝑒𝑥𝑡𝑟𝑖𝑛]𝑡𝑜𝑡𝑎𝑙 represents total molar concentration of cyclodextrin in
solution.
Depending upon the phase solubility behavior of the system, the ratio of free to
complexed drug upon the dilution of drug-CD complexes can be determined. When the
relationship between the drug solubility and cyclodextrin concentration is linear, 1:1
inclusion complex dilution will not result in the precipitation of the drug. However,
precipitation may occur if the relationship between drug solubility and CD concentration
is non-linear [45]. Hence, dilution effects the release of the drug from the inclusion
complex.
Hence, the drug release from the cyclodextrin inclusion complex is based on the
relationship between intrinsic drug solubility, the magnitude of the binding constant
(stability constant) for the inclusion complex and dilution effects.
1.2.6. Preparation of Inclusion complexes using a Freeze Drying Technique
(Lyophilization)
This research implemented a solvent evaporation method using a freeze drying technique
for the formulation of the complex. The drug and the host molecule are dissolved in a
common solvent and the solvent is removed by freeze drying. The solvent system from
the solution is eliminated through primary freezing and subsequent drying of the solution
containing both drug and CD at the reduced pressure. Lyophilization techniques offer the

21
advantage of getting porous amorphous powder with a high degree of interaction between
drug and CD. This method is useful for the complexation of thermolabile drugs. The only
limitation of this process is the poor flow properties of the powdered product as well as it
being a time consuming process [47, 48].
Other commonly used methods for the preparation of a complex in a laboratory includes
co-precipitation, neutralization precipitation method, kneading, spray-drying technique,
hot-melt extrusion, co-grinding/ milling, microwave technique and supercritical
antisolvent technique [49].
1.2.7. Characterization of the Inclusion Complexes in Solid State
Characterization techniques implemented for the determination of the inclusion complex
in this research is briefly discussed below:
1.2.7.1. Powder X-Ray Diffraction (p-XRD)
Powder X-Ray Diffraction (p-XRD) can be used to detect the inclusion complexation in
the solid state. A comparison of the diffractogram of the guest compound, host molecule
and complex is made. The difference in the patterns indicates the formation of
complexes. Comparison is only valid if the host, as well as the guest molecule, is treated
under the identical conditions. This is due to the fact that the process of preparation of the
complex may change the crystallinity of the pure substances and this may cause
differences in the diffraction patterns. The diffraction peaks are also used to determine

22
the chemical decomposition of the formed complex. The complexation changed the
crystallinity of the drugs which alters the diffraction pattern [50, 51]. Formation of the
crystalline complex in pXRD leads to sharpening of the existing peaks, appearance of
new peaks or shifting of the certain peaks. On the other hand, formation of the
amorphous complex leads to disappearance of a few peaks or peaks are less sharp than
those of the pure molecule or physical mixture [52].
1.2.7.2. Infra-red (IR) Spectroscopy
Infra-Red (IR) spectroscopy can be used to identify the interaction between the
cyclodextrin and the guest molecule in the solid state. The cyclodextrin band may change
slightly upon the formation of the complex. If the fraction of the guest molecule is
included, it can be easily masked by the band of spectrum of the cyclodextrin. IR is
constricted to the drug molecule having some characteristic bands such as carbonyl or
sulphonyl groups. IR spectral studies give information regarding the cleavage of
hydrogen bonds due to the inclusion complexation, shifting the absorbance bands to a
higher frequency [51, 53].
1.2.7.3. Thermo-analytical method: Differential Scanning Calorimetry (DSC)
Thermal analytical methods help in determining the thermal change before the
degradation of cyclodextrin. The change as melting decomposition, oxidation, and
polymeric transition of the guest molecules indicates the formation of the complexes

23
[51]. For analysis by these techniques, the guest molecule must have a characteristic
melting or boiling temperature below about 300C, the temperature at which cyclodextrin
decomposes. The effect seen in the DSC thermograms may be appearing, disappearing
and/or broadening of the peaks. The weak interaction between the drug and the excipients
is represented by small shifts in the endothermic peak. The changes in heat flow with
respect to temperature are recorded by DSC. The DSC is useful as a quantitative tool for
characterization [50, 54].
1.2.7.4. Scanning Electron Microscopy (SEM)
Scanning Electron Microscopy (SEM) is used to study and compare the surface
morphology or the microscopic aspects of pure cyclodextrin, pure drug and the formed
inclusion complex. The difference in the morphology/ crystallization state of the CD
complexes compared to pure CD represents the formation of the inclusion complex [51].
1.2.8. Characterization of the Inclusion Complexes in Liquid State
Nuclear Magnetic Resonance (NMR) Spectroscopy
Nuclear Magnetic Resonance (NMR) Spectroscopy research implements the use of 1D-
1HNMR (proton NMR) and 2D-NMR ROESY (Rotating frame Over-Hauser Effect
Spectroscopy) as the ultimate characterization tools to elucidate the mode of
complexation of the formed inclusion complexes. Along with information concerning the

24
formation of the inclusion complex, NMR also gives the information about the direction
of the penetration of the guest molecule inside the cyclodextrin cavity. As the
environment around the hydrogen atoms in the cavity changes resulting from
complexation with the guest molecule, there is a change in chemical shifts in the peak of
cyclodextrin. It is expected that there is a significant change in the chemical shift of the
H-3 and H-5 atoms of the cyclodextrin directed towards the interior if the complex is
formed. The H-1, H-2 and H-4 atoms which are located towards the exterior of the cavity
only show small changes in chemical shifts [51, 55]. A chemical shift in peaks can be
observed for both the cyclodextrin and guest molecule. Similarly 13
C-NMR, 15
F-NMR,
19F-NMR,
31P-NMR and 2-D-NMR like COSY, TOCSY, and ROESY can be used as
methods for detection of complexes as well as elucidating the mode of complexation
[56].
1.2.9. Advantages of Cyclodextrin Inclusion complexes
CD is mainly used as a complexing agent in order to increase the solubility, stability and
bioavailability of drug molecules [57]. The complexation helps in improving the
physicochemical properties of the existing drug molecules. Some of the major benefits
associated with forming cyclodextrin inclusion complexes is outlined below:
1.2.9.1. Enhancement of Solubility
Inclusion complexes between drug molecule and cyclodextrins can increase the solubility
of poorly water soluble drugs. The formed complex will have the hydrophobic functional
group towards the interior of the cavity and hydrophilic functional groups towards the

25
exterior of the cavity which remains exposed to the environment. This makes the drug-
cyclodextrin complex water soluble [31, 32, 58].
1.2.9.2. Enhancement of Bioavailability
Complexation reduces active recrystalization of drugs, which may help to increase their
aqueous solubility [50]. The release of the formulation from the dissolved drug governs
absorption of the orally administered drugs. When drug is complexed with cyclodextrin,
enhancement of the solubility occurs, hence dissolution rate and absorption are enhanced
as well. Cyclodextrins also increase the permeability of hydrophopic drugs by making
drug available at the surface of the biological barrier such as skin, mucosa, etc. In the
case of hydrophilic drugs, CD increases the drug permeability by direct action on
mucosal membranes and enhances drug absorption and bioavailability [31, 59].
1.2.9.3. Improvement of stability
Cyclodextrin complexes help to improve chemical, physical and thermal stability of
drugs [50]. When the drug molecule gets complexed inside the cyclodextrin cavity, it is
difficult for the reactants to react with the guest molecule inside the cavity [27]. This
prevents the drug molecule from degradation that occurs via oxidation, hydrolysis,
chemical reaction, radiation or heat, photodecomposition, etc. This helps to improve the
shelf life of the drug molecule. Cyclodextrin complexes insulate the drug molecule at the
molecular level and thus insulates them against various degradation processes [58].

26
1.2.9.4. Reduction in drug irritation
Drugs, which are irritants to the mucus membrane of GIT and skin, are complexed with
cyclodextrins to minimize the irritation [37, 38]. Complexation keeps the local irritancy
of the drugs below the threshold level. As the complex gets dissociated and the free drug
is released, absorption occurs simultaneously so the free drug concentration level always
remains below the threshold that might be less irritating to the mucosa [59].
1.2.9.5. Taste masking of bitter API’s by formulation of inclusion complex
Cyclodextrins are sweet, non-toxic cyclic oligosaccharides obtained from starch [60]. The
complexation of the drug molecule with cyclodextrin helps to mask the bitter taste of the
drug as well as any unpleasant odor [61, 62]. The functional groups that are responsible
for causing the bitter taste are hidden inside the cavity and remain hidden from the
sensory receptors of taste when complexed with cyclodextrin [55, 63]. Cyclodextrin is
capable of masking the bitter taste by either decreasing its oral solubility upon ingestion
or decreasing the amount of the drug particles exposed to taste buds [64]. The possible
mechanism may be that the CD entraps the bad tasting molecule (inclusion complex
formation), impeding its interaction with the taste buds, or the CD interacts with the gate-
keeper proteins of the taste buds, paralysing them [60]. The resulting complexes have no
or a little bit of taste and odor and are easily accepted by patients, especially pediatric
populations.
Some of the bitter drugs that were taste masked by the inclusion complexation approach
are shown in Table 1.2.

27
Table 1.2: Various complexing agents used for taste masking of the bitter drugs [61, 62]
Drug Category Dosage form Complexing Agent Used
Zinc acetate
dehydrate
Recover zinc
deficiency
Anethol-β-cyclodextrin
complex and saccharin
Carbapentane
citrate Local anaesthetic Oral liquid Cyclodextrins
Ibuprofen NSAID Solution Hydroxypropyl β-
cyclodextrin
Gymnema sylvestre Anti-diabetic Oral liquid β-cyclodextrin,
Dioscin CVS disorders β-cyclodextrin,
Benexate HCl Anti -Ulcer Granules β-cyclodextrin,
Metronidazole
Benzoate Anti-bacterial
γ -cyclodextrin
Hexitidine Anti-bacterial β-cyclodextrin
Zipeprol Anti tussive β-cyclodextrin
Guaiacol Anti diarrhetic β-cyclodextrin
Levosulpiride Anti-psychotic β-cyclodextrin
1.3. Cyclodextrin based oral drug delivery systems for pediatric patients
The oral route is the most popular and convenient route for designing drug delivery
systems. Multifunctional characteristics of cyclodextrins (higher dissolution rate and taste
masking ability when combined with oral drug delivery approach) enable the
development of an effective formulation for pediatric patients [65-67].
1.3.1. Increase in Oral Bioavailability resulting from inclusion complex
Cyclodextrin, when complexed with a drug molecule, increases its solubility [68, 69].
Hence, there is an increase in oral bioavailability resulting from the cyclodextrin
complexation. Previous reviews [70-73] suggest that bioavailabilty of the cyclodextrin

28
complexes and uncomplexed drug molecules were equivalent, however the absorption
rate was much faster from the cyclodextrin based oral dosage forms.
1.3.2. Masking of bitter taste and reducing irritation of oral formulations
When the drug-cyclodextrin inclusion complex is formed, a smaller amount of free drug
is available at the taste receptor sites. Most of the drug is enclosed inside the cavity which
may help in masking the objectionable taste of the oral formulations [74]. CD
complexation based oral formulations were also found to decrease the drug induced local
irritation of GIT, thus modifying the time of drug release during GI transit [75].
1.3.3. Increase in mucosal drug permeability resulting from inclusion complex
Because of the formation of the inclusion complex, free drug that is available at the
absorptive mucosal surface increases [76, 77]. Cyclodextrin complexation provides
uniform absorption, enhancing mucosal drug permeability. This also enhances the drug
activity upon oral administration. CD complexes enhance the dissolution rate of poorly
water soluble drugs delivered via buccal or sublingual mucosa and have been used for
oral formulations administered by the sublingual and buccal route [78-80].
1.3.4. Safety concerns for using cyclodextrins complexes in oral formulations
In regard to formulating drug-cyclodextrin inclusion complexes, relative safety and
efficacy in terms of complexation, cost and acceptance needed to be considered. The
reviews [38, 81] show that hydroxyl-propyl ß-cyclodextrins have a better safety profile as

29
compared to native ß-cyclodextrins and other parent cyclodexrtrins. Due to the lack of
absorption of CDs through the GIT, all CDs are considered practically non-toxic for oral
administration [82]. Also the safety profile depends on the drug dose used in drug-CD
complexes. The Unites States Pharmacopoeia (USP) and National Formularies (NF)
provide information concerning the optimum use of ß-CDs for forming drug complexes
to be used in oral formulations. Modified CDs, such as HP ß-CD, can be used when their
specific properties are required in formulations.
1.4. Alternative forms of Cyclodextrin based oral drug delivery systems for
pediatric patients:
1.4.1. Limitation with conventional oral dosage forms for pediatrics
Swallowing of the solid oral dosage form is one of the greatest challenges in optimizing
pediatric medications for oral drug delivery [83]. Pediatric patients may suffer ingestion
problems as a result of underdeveloped muscular and nervous control [84]. Alteration of
the oral tablets to develop a formulation suitable for children is always tried.
Crushing tablets, mixing them with food and/or water making the medication suitable for
easy administration to children have been tried [85]. However, the problem with this
approach is the slow rate or extent of drug absorption. Cutting the tablets into small
pieces is another common practice in administering pediatric medicine. The problem with
this practice is the considerable dose variation. It can induce toxicity in some cases with

30
the drugs having a very narrow therapeutic index [86]. A preparation of pharmaceutical
oral suspensions is another approach to ease the administration of the medicine to the
pediatric population. However, the primary concern with this is in regard to the stability
of the formulations. Oral liquid formulations are more reliable as ready to use
preparations for children but they are less stable than solid dosage forms and the
bioequivalence with solid oral dosage forms is not assured [87].
These are the problems most commonly encountered during the administration of the
medicine to children. This highlights the need for the development of new formulations
that are easy to administer to the pediatric population and capable of maintaining the
therapeutic plasma drug concentrations. An alternative oral drug delivery approach is the
orally disintegrating tablet which is suited for children who are unable to swallow solid
oral dosage forms such as tablets and capsules [88].
1.4.2. Orally Disintegrating Tablets
Orally Disintegrating Tablets (ODTs) are tablets designed to dissolve within one minute
in the presence of saliva. The primary advantage is that no water is needed to swallow the
medicine [89]. ODTs can be considered as a useful alternative for geriatric and pediatric
populations who have difficulty swallowing tablets and capsules [90]. Orapred ODT®
(ODT of prednisolone) has been effective in pediatric patients with asthma and allergic
conditions [88]. The taste of the bitter drugs are usually difficult to mask in oral liquid
products Delysm® (dextromethorphan hydrobromide oral suspension). The cyclodextrin-
drug complex based ODT products minimizes the bitter taste of the formulation and

31
enhances the permeability for absorption through the oral mucosa and bioavailability.
Zofran ODT ® (Ondansetron ODT) is used for the treatment of nausea and vomiting in
pediatric population [88].
1.4.2.1. Advantages of ODTs
The major advantage for ODTs is that they provide the convenience of solid oral dosage
forms (tablets and capsules), at the same time they also allow ease of swallowing as
found with liquid oral formulations (suspensions and solutions) [91].
Other advantages include, water or other liquids are not required to swallow the
medication, easily disintegrates into saliva within few seconds, pleasing taste, accuracy in
dosing compared to liquid oral formulations and rapid onset of action because of
increased rate of absorption and dissolution. [89, 92]
1.4.2.2. Formulations of ODTs
Selection of active pharmaceutical ingredients (API’s) is one of the most important
parameters to consider. The API should have low dose, small molecular weight and
adequate solubility, non-ionized and should be absorbed via the oral mucosa. Excipient
selection is important for the immediate disintegration of the tablets and masking the
bitter taste of the API’s. Disintegrants, binders, glidants, lubricants, sweeteners, flavors,
taste making agents are some of the main excipients in the preparation of ODTs [93].
There are various technologies used for the formulation of ODTS that have been

32
patented. WOWTAB®, ORASOLV®, DURASOLV®, EFVDAS®, FLASHTAB®
(main approach is conventional tablet processes with modifications), ZYDIS®, LYOC®,
QUICKSOLV® (main approach is freeze drying method) and FLASHDOSE® (main
approach is floss formation) are some of the patented technologies [92]. Some of the
marketed ODTs and their manufacturing technologies, and major advantages are given
below in Table 1.3.
Table 1.3: ODTs in market, name of patented ODTs technologies, their basis [89, 94, 95]
Active
Ingredients
Local
Brand
Name
Category Manufacturing
Technology
Technological basis
Loratadine Claritin Antihistaminic Zydis® Lyophilization
Mirtazapine Remeron Antidepressant Orasolv® Compressed tablets
Olanzapine Zyprexa Antipsychotic Zydis® Lyophilization
Ondansetron Zofran Antiemetic Zydis® Lyophilization
Risperidone Risperdal Antipsychotic Zydis® Lyophilization
Zolmitriptan Zomig Antimigraine DuraSolv® Compressed tablets
Most of the above mentioned ODTs are for adolescents and adults. There are some ODTs
that have been formulated for pediatric patients such as Children's Tylenol® Meltaways.
These are grape punch or bubble gum flavored tablets, designed for children and may be
chewed or allowed to melt in the mouth [88].

33
1.4.2.3. Direct Compression method for preparing ODTs:
This is the simplest and most cost effective tablet manufacturing technique. Direct
compression is the most favored method for formulation of ODTs. The index of good
compression for oro-dispersible tablets is determined by the factors such as dimensions,
compressibility, powder flow ability, lubricity, etc [96]. There are many medications
which have potential to benefit children but are not available since the formulation which
is appropriate for them has not been developed. New alternatives or drug delivery
technology that suits the pediatric population are continuously being researched. The
ability to ease the administration of pediatric medications through ODTs can ease
medication therapy for pediatric patients. Modified ODTs (drug-cyclodextrin inclusion
complex based ODTs) are among one of the innovations in drug delivery technology that
can have substantial impact on the pediatric medicine delivery technology.
1.4.2.4. Drug-cyclodextrin inclusion complexes based orally disintegrating tablets
(Modified ODTs)
CD complexes to be used in oral formulation makes it suitable for children by masking
the bitter and obnoxious taste [29]. Orally disintegrating tablets comprising of drug-CD
complexes along with other excipients are ideally suited for pediatric patients who are
unable to swallow tablets that are usually bitter in taste. The drug-cyclodextrin complex
also enhances the permeability of the oral mucosa [84] which is the absorption site for the
ODTs which rapidly increases the absorption rate and hence bioavailability.

34
This approach makes the formulations acceptable to children by
a. Eliminating the bitter taste of the medication through formation of the drug-CD
inclusion complex.
b. Enabling the easy administration of the medicine without swallowing through
development of orally disintegrating tablets.
1.5. Response Surface Methodology (RSM): A statistical tool for optimizing
formulations
Response Surface Methodology (RSM) is a statistical method that allows us to
investigate the interaction and relationships between the independent variables with one
or more responses [97]. This provides the idea concerning the shape of the response
surface we are investigating. This method is useful in finding the optimal process setting
and helps to make the product or manufacturing process robust (insensitive to external
influences) [98]. The main purpose for RSM is to find the optimum response. The other
purpose for RSM is to evaluate how the response changes to a given desirable direction
by adjusting the process or design variables.
The statistical method enables one to optimize the responses (dependent variables) which
are influenced by various factors (independent variables). An experiment is conducted
with a series of tests, called runs, where independent variables are changed in order to
determine the reasons for change in the response or dependent variables. Utilizing this
method, operation variables are evaluated that may or may not have significant effect in
the response [99, 100].

35
In RSM, response can be represented graphically, either in a three-dimensional space or
as counter plots which mainly helps in visualizing the shape of the response surface.
Hence, the function of f(x1, x2) is plotted vs. the levels of x1 and x2 as shown in Figure
1.8a-b. [101]
Figure 1.8a: Response Surface Plot Figure 1.8b: Contour Plot
In Figure 1.8a, each value of x1 and x2 gives a y-value. This 3D-graph showing the
response surface from the side is a response-surface plot. Figure 1.8b is the contour plots
and it can show contour lines of x1 and x2 pairs that have the same response value y.
1.5.1. Central Composite Design (CCD) based RSM for optimization of process
variables
In order to employ RSM in experimental optimization, it requires an experimental design
to fit the mathematical function and to evaluate the quality of the fitted model and its
accuracy. The central composite design is the symmetrical second order experimental
design most utilized for the optimization of the manufacturing process and process

36
variables in pharmaceuticals [102]. The CCD consists of factorial points, central points
and axial points. It develops through sequential experimentation. Basically, they are first
order (2k) designs augmented by additional center and axial points which helps in
estimating the parameter of the second order model [103].
The design consists of three types of components: factorial design components, axial
components and center point components. The factorial design component of CCD is 2k
factorial where k is the number of factors or independent variables. Each of the variable
is taken at two levels representing high and low numeric value. The coding of the levels
are done as -1 and +1 for low and high numeric values respectively. The geometrical
representation of the factorial can be assumed as square in which each corner represents
the interaction of the factors. Therefore, four interactions are to be evaluated when
processing two variables to determine their significance in final response [104].
The axial components of CCD are the points that are equidistant from the center of the
square formed for the factorial design. The radius α determines the geometry of the
design region. If α is 1 it represents the square design geometry. As the value of α
increase, the axial point extends beyond the faces of the square and the design region
becomes more spherical. The α-value is calculated from the equation: α = (2k)
1/4, where k
is the number of processing variables in the factorial design. Thus for 4 interactions or 2
variables/factors α = 1.41 [104, 105]
The central point component is the average of the high and low value in the factorial
design. The central point or the zero point is the region where the optimum conditions are
met [104].

37
Figure 1.9: Layout of Central Composite Design (CCD) for 2 variables at 2 levels
The selection of process variables using CCD as Design of Experiments (DoEs) helps
determine which factor may or may not have an important effect in the final response
[99]. The use of CCD design has been limited to optimization for 2 variables because its
efficiency is very limited for higher number of variables. However, box-behnken design
offers more flexibility in terms of optimizing higher numbers of process variables and in
designing the response surfaces. They are 3k factorial designs accompanied by other
block designs [106].
1.5.2. Application of CCD based RSM in ODTs formulation
RSM based optimized design helps in reducing the cost of the expensive manufacturing
process and to solve process associated problems. RSM generates the large amount of
information from the small number of experiments and also gives the wide range of

38
possibilities of in evaluating the interaction effect between the process variables in the
response. [97]
The optimization of concentration of the superdisintegrants and diluents are the important
steps in the development of the ODTs formulation [107]. This process variable using
RSM implies the evaluation of hardness, disintegration time, dissolution profile, swelling
index etc. in ODTs formulations [108, 109]. In this study hardness, disintegration time
and dissolution of the tablet are evaluated as responses to determine the effect of various
concentrations of superdisintegrants and diluents.

39
Chapter 2
Significance of thesis research
Dextromethorphan HBr (DXM HBr), an antitussive agent, is most commonly used as
cough supressant among the pediatric population, alone or in combination with other
expectorants, to produce the significant effect. It is a non-prescription cough medication
available as conventional tablets, logenzes, liquid and syrups. However, its availability as
an effective solid oral dosage form is limited, especially in children. The drug is
extremely bitter in taste due to the presence of the amino moiety in its molecular structure
and this leads to poor patient adherance in pediatrics. Most of the marketed formulations
of DXM HBr for children are available as oral liquid formulations (syrups and
suspensions). Stability, dosing problems and patient non-adherance are the key issues
with oral liquid formulations for children.
A cyclodextrin based drug delivery system for DXM HBr utilizes cyclodextrin as the
carrier material that has the ability to form water soluble drug-cyclodextrin inclusion
complexes. This inclusion complex alters the physico-chemical characteristics of the drug
molecule to overcome its undesirable properties. The 2-Hydroxy propyl ß-cyclodextrin
(2- HPßCD) has multifunctional characteristics. These include masking the bitter taste of

40
the oral formulations, increasing oral bioavailability and increasing the mucosal drug
permeability resulting from inclusion complex. The bitter taste of DXM HBr remains
unmasked or difficult to mask in oral liquid preparations. Hence, 2- HPßCD - DXM HBr
inclusion complex will minimize the bitter taste of DXM HBr in the formulation while
enhancing the permeability for absorption through the oral mucosa.
Orally disintegrating tablets (ODTs) are designed to disintegrate within one minute in the
presence of saliva. They will be best suited for pediatric populations who are unable to
swallow conventional tablets of DXM HBr which is usually bitter in taste. These ODTs
are rapidly absorbed through the oral mucosa because the tablets are comprised of DXM
HBr -2- HPßCD inclusion complex that enhances the permeability of the oral mucosa.
This work is primarily directed towards formulating the orally disintegrating tablets of
DXM HBr acceptable to childern by using a three-step approach:
i. Prepare a DXM HBr -2- HPßCD inclusion complex which minimizes/eliminates
the bitter taste of DXM HBr preventing the interaction between drug and taste
receptors while increasing the oral absorption by enhancing the permeability of
the oral mucosa;
ii. Develop an orally disintegrating tablets comprised of DXM HBr -2- HPßCD
inclusion complex that enables the easy administration this medication to
pediatrics without swallowing;
iii. Use response surface methodology for the optimization of process variables to
investigate the relationship between factors and response which explores the
design space for formulating ODTs with desired response.

41
Chapter 3
Development and Optimization of Dextromethorphan HBr-2-Hydroxy Propyl ß-
Cyclodextrin Inclusion Complex Based Orally Disintegrating Tablets Using
Response Surface Methodology
Saugat Adhikari1, Kenneth S. Alexander*
1
1College of Pharmacy and Pharmaceutical Sciences, The University of Toledo Health
Science Campus, Toledo, OH, 43614
KEYWORDS: Dextromethorphan HBr, 2-hydroxy propyl beta-cyclodextrin, inclusion
complex, orally disintegrating tablets, response surface methodology, central composite
design
Figures: 19
Tables: 13
*Corresponding Author
Kenneth S. Alexander, Ph.D.
Professor
Department of Pharmacy Practice
The University of Toledo HSC, College of Pharmacy and Pharmaceutical Sciences
3000 Arlington Ave. (MS #1013)
Toledo, OH 43614
Phone: 419.383.1988
Fax: 419.383.1950
Email: [email protected]

42
3.1. ABSTRACT
The focus of this present investigation was to access the utility of various characterization
techniques in the evaluation of Dextromethorphan HBr (DXM HBr) inclusion complex
with 2-Hydroxy propyl ß-cyclodextrin (2-HPßCD). This techniques confirms the
formation of the inclusion complex and explores the mode of complexation between
DXM HBr and 2-HPßCD. It also predicts the ability of 2-HPßCD to mask the bitter taste
of DXM HBr and explain its taste masking mechanism. In aqueous solution, the inclusion
complex was studied utilizing the phase solubility method. The solubility of DXM HBr
increased as a function of 2-HPßCD concentration. The solubility profile was classified
as AL type: indicating the formation of a 1:1 stoichiometric inclusion complex. In solid
state, the inclusion complex was prepared using lyophilization (freeze drying technique)
and characterized by Differential Scanning Calorimetry (DSC), Fourier Transform
Infrared (FT-IR), Scanning Electron Microscopy (SEM), powder X-ray Diffraction
(pXRD), proton nuclear magnetic resonance (1HNMR) spectroscopy and 2D-NMR
rotating Over Hauser effect spectroscopy (ROESY). FT-IR showed no interaction
between DXM HBr and 2-HPßCD and confirmed the formation of the complex. DSC and
SEM studies further confirmed the inclusion complex formation. pXRD analysis
indicated that the crystallinity of the inclusion complex reduced significantly. NMR
spectroscopy elucidated the mode of complex formation. The subsequent incorporation of
the inclusion complex into orally disintegrating tablets (ODTs) was done to develop the
formulation. This results in patient adherence and convenience and enhances the
dissolution rate by rapid absorption of drug through oral mucosa. Response surface

43
methodology with central composite design was employed in the optimization of the
formulation factors, such as concentration of croscarmellose sodium (CCS) and
microcrystalline cellulose (MCC), to obtain ODTs within the range of 3.5 to 5.5 kp
hardness, 6.3 to 45 second disintegration time and 1.2 to 6.06 minutes mean dissolution
time (MDT). The results indicated selected factors which have a strong influence on
properties of the ODTs. The optimum concentration of CSS and MCC predicted by the
model was 5.168 mg (2.5%) and 81.814 mg (40%), respectively for preparing a DXM
HBr-2-HPßCD inclusion complex based ODT with a hardness of 4.5 kp, disintegration
time of 10 seconds and MDT of 1.341 minutes. Thus, this approach exhibited the ability
of masking the bitter taste of DXM HBr when complexed with 2-HPßCD, which resulted
in ODTs formulations with improved patient adherence and acceptability.
3.2. INTRODUCTION
Although oral solid dosage forms as conventional tablets and capsules are most widely
used because of dosing uniformity, ease of administration and high stability compared to
liquid oral preparations. Many patients, particularly the pediatric population, suffer from
ingestion problems and find the dosage form difficult to swallow [92, 110]. This can
prolong the duration for treatment and cause patient non-adherance. Altering the
conventional oral tablets to develop the formulation suitable for children has been tried.
A phamaceutical oral suspension is another the another approach to ease the
administration of the drug to pediatrics. However, stabilty of pharmaceutical suspensions
have been a concern [111]. Orally disintegrating dosage forms that disperse or dissolve in

44
saliva within a minute and then swallowed without water can address the issues and is
most suitable for children. ODTs have been investigated for their potential to increase the
bioavailability by increasing absorption through oral mucosa and enhancing the
dissolution rate [78, 79, 112].
ODTs are generally prepared by a direct compression method since it is the simplest and
most cost effective method for production [113]. Selection of the excipients is one of the
important parameters that governs the properties of ODTs. Disintegrants, binders,
glidants, lubricants, sweetners, flavors, taste masking agents are excipients mainly used
in its preparation. The solubility of diluents affects the dissolution and disintegration
mechanism [114]. The concentration of the disintegrant and diluent is the key factor that
affects the disintegration time and dissolution process. The optimization of the tablets
disintegration time can be achieved by determining the optimal ratio and concentration of
disintegrants and diluents. Below the critical concentration, disntegration time is
inversely propotional to the disintegrant concentration and above it disintegration time
remains approximately constant [115]. Hence, optimization of the ratio and
concentrations of the diluents and disintegrats in an ODTs formulation will impact their
attributes.
Natural cyclodextrins are cyclic oligosaccharides having six (α-cyclodextrin), seven (ß-
cyclodextrin) or eight (γ-cyclodextrin) glucopyranose units linked by α- 1,4 glycosidic
bonds into the macrocycle [27, 116]. It has a hydrophilic outer face and a hydrophopic
cavity. Due to the presence of primary and secondary hydroxyl groups and a hydrophobic
cavity, cyclodextrins are able to form inclusion complexes with various drug molecules.
The physiochemical properties of the guest molecule or the included substance are altered

45
upon complexation and these inclusion complexes are used for improving stability,
solubility, dissolution rate and biovailability [35, 117]. They can also minimize the bitter
taste of extremely bitter drugs by enclosing the functional group responsible for the bitter
taste inside the cavity. Inclusion complexation with bitter tasting drugs prevents the
interaction between the bitter tasting functional group of the drug molecule with the taste
receptors [118]. ß-cyclodextrin is widely used for complexation due to its price
availabilty and cavity dimension. The ß-cyclodextrin cavity size is suitable for drugs with
a molecular weight between 200 to 800 g/mol [119]. However, its low water solubility is
a barrier to its wider utilization. Since natural cyclodextrins have relatively slow solubilty
in water and organic solvents, derivatives are synthesized by chemical modification of
the hydroxyl group as 2- Hydroxy propyl ß-cyclodextrin (2-HPßCD) which improves
their solubilty, ability to dissolve hydrophobic compounds and is well tolerated with
reduced toxicity [38, 120].
Dextromethorphan Hydrobromide (DXM HBr) is an antitussive agent, used as a cough
supressant. It is over the counter (OTC) medication and available as syrups, lozenges,
gels but its availability is limited in children as solid oral dosage forms [121]. This
dosage form has poor compliance with pediatric patients because of its bitter taste due to
the presence of amino moiety in its structure and is difficult for swallowing [122]. The
dosage form faces challenges to overcome the bitter taste of the DXM HBr and the lack
of its ability to ease the administration of the dosage form to the pediatric population.
Drug-cyclodextrin inclusion complex based ODTs can ease medication therapy for
pediatric patients and offer a solution to overcome the above mentioned challenges. In
this regard, modifed ODTs (drug cyclodextrin inclusion complex based ODTs) are

46
among one of the newer drug delivery technology innovations that have had a substantial
impact on medicine delivery technology for pediatrics.
Response surface methodology (RSM) is the widely used statistical aapproach that
enables one to optimize the responses (dependent variables) which are influenced by
various factors (independent variables). RSM is based on the priciple of design of
experiments (DoEs) and encompasses techniques for designing experiments, building
models, evaluating the effect of factors, generation of the polynomial equation, mapping
of the response over the experimental domain to search for the optimum formulations
[123, 124]. This statistical method predicts the desirable optimum response from
minimum number of experiments and is far more effective than conventional methods of
formulating dosage forms [123]. Experiments were performed using two-factor, three
level face-centered central composite design. This design explores the quadratic response
surfaces and allows the development of a polynomial model. Central composite design
offers to estimate second-order and third-order effects, to identify the inter-relationships
between factors and to locate the response optima [125].
In this present investigation, Dextromethorphan HBr – 2- Hydroxy Propyl ß-cyclodextrin
inclusion complex based orally disintegrating tablets were proposed. The inclusion
complex minimizes the bitter taste of DXM HBr in formulation while enhancing the
permeabilty for absorption through the oral mucosa. Oral mucosa is the site of absorption
for ODT fomulations. These inclusion complex based ODTs best suits the pediatric
populations who face difficulty in swallowing bitter tasting conventional tablets of DXM
HBr. In this study, central composite design based response surface methodology was
employed to investigate the effects of two independent variables (factors) (i.e.

47
concentration of diluent microcrystalline cellulose and concentration of superdisintegrant
croscarmellose sodium) on hardness, disintegration time and mean dissolution time of
ODTs and to find the optimal value for attaining the desired response.
3.3. MATERIALS AND METHODS
3.3.1. Materials
Dextromethorphan Hydrobromide monohydrate was purchased from Spectrum Chemical
Mfg. Corp. (New Brunswick, NJ, USA). The 2-HPßCD (Kleptose HPB-parental grade)
and mannitol (PEARLITOL® 200 SD) were obtained from Roquette America Inc.
(Keokuk, IA, USA). The following materials were obtained from JRS Pharma
(Rosenberg, Germany) and used as received: croscarmellose sodium (VIVASOL®),
silicified microcrystalline cellulose (PROSLOV SMCC®- 90M) and sodium steryl
fumarate (PRUV®). Orange Flavor powder was supplied from Monsanto Flavor/Essence
Inc. (Montvale, NJ, USA). All other reagents and solvents used were of analytical grade.
Deionized water was used throughout the experiments.
3.3.2. Phase solubility study
The phase solubility study was carried out according to the method previously reported
by Higuchi and Connors, 1965 [45]. The phase solubility diagram was obtained at 37ºC
in water (pH 7). An excess amount of Dextromethorphan HBr (200 mg) was added to 10

48
ml of water in screw-cap glass vials containing increased amount of 2-HPßCD (ranging
from 0 to 0.025M). The vials were protected from light, sonicated for 10 min, placed in a
thermo-shaker (Thermo Fisher Scientific, USA) and shaken at 500 rpm continuously at
37 ± 0.5ºC. The suspensions were shaken for 48 hours after which equilibrium was
reached. After equilibrium attainment, the sample solutions were filtered through a 0.20
µm membrane filter (EMD Millipore®, Fisher Scientific) and appropriately diluted. The
solubilized DXM HBr in various concentrations of 2-HPßCD solution was determined by
an HPLC method described below and studies were performed in triplicate. Previous
determinations showed that 2-HPßCD did not interfere with HPLC determination at the
employed concentration [126].
The stability constant (Ks) was calculated from the phase solubility diagram, with the
assumption of 1:1 stoichiometry (as the slope is smaller than 1), according to the equation
[45]:
𝐾𝑠 = 𝑠𝑙𝑜𝑝𝑒
𝑆0(1−𝑠𝑙𝑜𝑝𝑒)…………………………..…Eqn. (3.1)
where S0 is the DXM HBr solubility at 37ºC in absence of 2-HPßCD.
3.3.3. Preparation of the inclusion complex in the solid state
Lyophilized inclusion complex was prepared by dissolving exact amounts (1:1 molar
ratios) of DXM HBr and 2-HPßCD in deionized water at room temperature (25±1ºC).
The resulting solution was frozen and freeze-dried over 48 hours (LABCONCO, Freeze
Dry System Freezone 2.5® MO, USA) at -50ºC and about 0.03 mbar. The inclusion

49
complex was milled and sieved through 60 mesh sieve and stored in a desiccator
protected from light until further analysis. Physical mixture was also prepared by careful
mixing of the exact amounts (1:1 molar ratios) of DXM HBr and 2-HPßCD and
homogeneous blending in a ceramic mortar for 10 minutes, powder of both components
previously sieved.
3.3.4. HPLC Analysis
Dextromethorphan HBr was quantified from the lyophilized inclusion complex and
ODTs by using the High Performance Liquid Chromatography (HPLC) method. A HPLC
(Waters Alliance 2695 separation module, Milford, MA) equipped with a Zorbax C18
column (250 X 4.6 mm, 5µm packing) and photodiode array (Waters 2998) detector was
used for analysis. The column temperature was maintained at 25˚C. The mobile phase
consisted of phosphate buffer (20mM) pH 3.0 (adjusted using ortho-phosphoric acid):
acetonitrile (25: 75) and was pumped isocratically at the flow rate of 0.5 ml/min.
Injection volume was set to 20 µl. The retention time of DXM HBr (λ = 278 nm) was
found to be 8.3 minutes. Different calibration standards of DXM HBr were prepared in
methanol. For the calibration curve, each standard was analyzed in triplicate and the
average peak area was plotted against concentration. The drug content was determined
quantitatively by plotting a calibration curve. The assay method was found to be linear in
the range of 0-100 µg/ml with a correlation coefficient of 0.9998.

50
3.3.5. Analysis of drug content in the inclusion complex
Physical mixture and lyophilized inclusion complex was evaluated for content uniformity
of DXM HBr. Powder equivalent to 10 mg of DXM HBr was accurately weighed and
transferred to a 10 ml volumetric flask to which 10 ml methanol was added. The
suspension was sonicated in the sonicator bath for 10 min. After complete dissolution, the
appropriate dilution was made and the samples were filtered through a 0.20 µm
membrane filter (EMD Millipore®, Fisher Scientific) and analyzed for content of DXM
HBr using HPLC method described above.
3.3.6. In-vitro release study from the inclusion complex
The in-vitro release from the inclusion complex and physical mixture was performed by a
horizontal shaker method [127] using phosphate buffer pH 6.8 as the dissolution medium
at 75 oscillations/min and 37ºC. The physical mixture and inclusion complex equivalent
to 10 mg of DXM HBr each was transferred into a beaker containing 100 ml of phosphate
buffer and a 2 ml aliquot was withdrawn at 2, 4, 6, 8, 10, 15, 20 and 30 min. The medium
was replaced with 2 mL of fresh buffer. The samples were filtered and analyzed for the
amount of DXM HBr released into the medium by the HPLC method described above.
The dissolution profiles were evaluated by dissolution parameters i.e. drug dissolved at 4
minutes (DD4min) and dissolution efficiency at 10 minutes (DE10min) calculated from the
area under the dissolution curve as reported by P. Costa et. al [128].

51
3.3.7. Characterization of the inclusion complex
3.3.7.1. Differential Scanning Calorimetry (DSC)
Differential Scanning Calorimetry (DSC) measurements for pure DXM HBr, pure 2-
HPßCD, 1:1 physical mixture and 1:1 inclusion complex were carried out using a DSC
822e Mettler Toledo instrument (Mettler Toledo GmbH, Schwerzenbach, CH) fitted with
a TSO801RO sample robot and a TSO800GCI Gas control attached to a Nitrogen gas
cylinder. The DSC analysis studied the change in the rate of heat absorbed by DXM HBr
after complexation with 2-HPßCD. A Star e software® V8.10 was used to obtain the
scans. The samples (3-5 mg) were placed and sealed in aluminum pans using the Mettler
MT 5 microbalance. The thermal behavior was studied by heating the sample from 25-
150ºC at the rate of 10ºC/min and under a nitrogen flow of 20 ml/min, using an empty
pan sealed as reference.
3.3.7.2. Fourier Transform Infrared (FT-IR) spectroscopy
FT-IR spectra of pure DXM HBr, pure 2-HPßCD, 1:1 physical mixture and 1:1 inclusion
complex were obtained using a FTS 4000 FTIR spectrometer (Varian Excalibur Series
UMA 600 FTIR, Digilab, USA) equipped with germanium crystal. Spectra acquisitions
were performed directly in powder samples with the application of 64 scans at a
resolution of 2 cm-1
over the range of 4000 to 400 cm-1
.

52
3.3.7.3. Powder X-ray Diffraction (pXRD)
Powder X-ray diffraction (pXRD) patterns of DXM HBr, 2-HPßCD, 1:1 physical mixture
and 1:1 inclusion complex were collected using X-ray diffractometer (PANanlytical's
X'pert Pro®, Tokyo, Japan) equipped with X'Celerator high speed detector and CuKα
source with a voltage of 45 kV, and a current of 40 mA. The samples were crushed,
placed in an aluminum sample holder, and packed smoothly using a glass slide. The
diffractograms were recorded in the 2θ angle range between 5° to 50° and the instrument
was operated with continuous scanning speed of 4°/min. Crystallinity was determined by
comparing some of the representative peak heights in the diffraction patterns of inclusion
complex with a reference. The results were evaluated using the X-Pert Data collector
version 2.1 software.
3.3.7.4. Scanning Electron Microscopy (SEM)
The surface morphology of pure DXM HBr, pure 2-HPßCD, 1:1 physical mixture and 1:1
inclusion complex were examined by using Hitachi S-4800 High Resolution Scanning
Electron Microscope (Hitachi High-Technologies Corp., Tokyo, Japan). The samples
were fixed on a brass stub using double-sided tape and then made electrically conductive
by spray coating in a vacuum with a thin layer of gold at 0.6 kV for 10 seconds. The
photographs were taken at an excitation voltage of 5 kV and magnification factors of 400.

53
3.3.7.5. Proton Nuclear Magnetic Resonance (1HNMR) Studies and 2D-NMR ROESY
The ability of 2-HPßCD to form inclusion complex with drug molecules in order to
increase solubility, bioavailability, dissolution rate and taste masking have been studied
in large extent [26, 32, 54]. Most important information are obtained on physico-
chemical properties of drug and solid phase structure of the inclusion complex via X-ray
analysis, thermal analysis, Fourier transform infrared spectroscopy, surface
morphological studies etc. and have been reported in numerous research work by various
authors [129-131]. Although these characterization techniques provide vital information
on complex formation and changes in physiochemical properties, the exact mechanism of
complexation could not be deduced. The use of 1HNMR has proven to hold promises for
such purposes. In this study, the 1HNMR technique has been used as an important tool for
investigating the mode of complexation of the most favored complexes and obtaining a
better knowledge on interaction between guest and cyclodextrin molecules.
Pure DXM HBr and pure 2-HPßCD solutions (10mM) were prepared in DMSO-d6 in 5
mm NMR tubes. DXM HBr and 2-HPßCD solutions were mixed in a 1:1 molar ratio in
the 5 mm NMR tubes. All the samples were subjected to NMR analysis. The 1HNMR
spectra of the pure components and their respective mixtures were obtained at 295 K on a
Varian Unity Inova 600 MHz instrument with a Penta probe. Typical acquisition
parameters consist of sweep width of 8000 Hz, acquisition time of 3 seconds, and number
of transients of 16. A Rotational Overhauser Enhancement SpectroscopY (ROESY)
experiment for the detection of intermolecular nuclear Overhauser effects (NOEs)
between DXM HBr and 2-HPßCD was acquired for the 1:1 molar ratio at 295K using the
same probe. The ROESY spectrum consisted of a 2048 (t2, complex) by 750 (t1, real)

54
matrix covering a 4500-Hz sweep width. Gaussian weighting functions were used in both
dimensions to improve the signal to noise ratio and zero filling to 4096 × 4096 was
applied before Fourier transformation. The 1HNMR spectroscopy (one dimensional-1D)
and 2D NMR Rotational Overhauser Enhancement SpectroscopY (ROESY) was used as
ultimate characterization tools for the elucidation of the mode of complexation of DXM
HBr and 2-HPßCD that predicted the taste masking mechanism of the formed inclusion
complex.
3.3.8. Tablet Compression of Inclusion Complex
3.3.8.1. Design of Experiments (DOEs)
The central composite design consists of imbedded factorial or fractional factorial design
with center points that are augmented with the group of axial points (star points) that
allows the estimation of curvature [132, 133]. In face-centered central composite design,
star points are at the center of factorial design points or each face of the factorial space
[133]. Two factors, three levels face centered central composite design was used to
optimize the factors i.e. diluent microcrystalline cellulose, MCC (X1) and
superdisntegrant croscarmellose sodium, CCS (X2) concentrations. The factors were
evaluated at three levels high, medium and low (+1, 0, and -1) as shown in Table 3.1.
Tablet hardness (Y1), disintegration time (Y2) and mean dissolution time-MDT (Y3)
formed the responses. These are the critical quality attributes that affect the performance
of ODTs. A total of 13 experimental trials were designed by the software with five center
points, four axial and four factorial design points shown in Table 3.2.

55
Table 3.1: Variables in Central Composite Design (CCD)
Independent variables
(Factors) Design Level Coded Level
Croscarmellose Sodium –
CCS, X1 (mg) A
0 low -1
6 medium 0
12 high +1
Microcrystalline Cellulose
–MCC, X2 (mg) B
0 low -1
60 medium 0
120 high +1
Dependent Variables
(response)
Tablet hardness (Y1) - kp
Disintegration Time (Y2) - sec
Mean Dissolution Time-MDT (Y3) - min
Table 3.2: Design matrix of face centered CCD for ODT formulations
Formulation No. Coded levels of Independent Variables
Factor X1: CSS Factor X2: MCC
F1 -1 +1
F2 -1 0
F3 0 +1
F4 0 0
F5 0 0
F6 0 -1
F7 +1 -1
F8 +1 +1
F9 0 0
F10 +1 0
F11 0 0
F12 -1 -1
F13 0 0
3.3.8.2. Tablet Manufacturing
All tablet formulations were manufactured by direct compression. The composition of the
tablet formulations is displayed in Table 3.3. DXM HBr-2-HPßCD inclusion complex

56
was sieved through #40 mesh sieve before mixing. All other excipients were accurately
weighed and mixed altogether with DXM HBr-2-HPßCD inclusion complex in a
Turbulant® mixer (Chemi Pharm, 260 West Broadway, NY, USA) for 10 minutes.
Sodium stearyl fumarate was added to the blend and lubricated for 5 more minutes in the
mixer. The tablets were compressed by a single station tablet press machine (Emil Korsh
Maschinen Fabrik, Berlin, Germany) using 0.375 inch round and flat punch and die set.
The compression force was kept constant throughout the study. The targeted tablet
weight (die volume) was kept constant around 200 mg. Formulations were prepared
according to the matrix of the face-centered CCD varying the level of factors i.e.
concentration of CCS (0, 6. 12 mg) and concentration of MCC (0, 60, 120 mg) as shown
in Table 3.3.
Table 3.3: DXM HBr ODT formulations
Ingredients Weighta (mg)
DXM HBr-2-HPßCD inclusion complex
(Lyophilized powder)
10*
Croscarmellose Sodium (CCS) 0 / 6 / 12
Microcrystalline Cellulose (MCC) 0 / 60 / 120
Sodium stearyl fumarate 2
Orange flavor 2
Mannitol q.s. 200 aTotal tablet weight = 200 mg
* Inclusion complex powder equivalent to 10 mg of DXM HBr
3.3.9. Evaluation of prepared ODTs
3.3.9.1. Weight Variation
Weight variation for each batch of ODTs was assessed. Twenty tablets from each batch
were individually weighed and average weight and standard deviation were reported.

57
3.3.9.2. Thickness
Preweighed 10 tablets from each batch were tested. A micrometer (Mitutoyo, Plymouth,
MI, USA) was used to measure the average thickness and standard deviation was
reported.
3.3.9.3. Friability
Twenty tablets of the formulation were weighed and measured in a roche type friabilator
(Erweka, Germany). Rotation speed was set to 25 rpm for 4 minutes, and the tablets were
re-weighed. The percentage friability was calculated using the equation:
% 𝑓𝑟𝑖𝑎𝑏𝑖𝑙𝑖𝑡𝑦 = 𝑊𝐼−𝑊𝐹
𝑊𝐼× 100%……………………..…Eqn. (3.2)
where WI and WF are initial and final tablet weights, respectively.
3.3.9.4. Drug Content
Three tablets were weighed individually for each batch and crushed in a ceramic mortar.
An accurately weighed quantity of powdered tablets (600 mg) was extracted with pH 6.8
phosphate buffer and the sample solutions were filtered through a 0.20 µm membrane
filter (EMD Millipore®, Fisher Scientific) and estimated by HPLC method described
previously. The studies were done in triplicate and average values and standard
deviations were reported.

58
3.3.9.5. Hardness
Ten tablets of each batch with known weight and thickness were examined for tablet
hardness using a hardness tester (type H1 T, Sotax, MA, USA). The average hardness and
standard deviation for each batch were reported.
3.3.9.6. Wetting time and water absorption ratio
This was carried out using the method reported by Bi et. al [134]. A tissue paper of size
15 × 15 cm was folded twice and was placed in the petri dish (9 cm diameter) containing
6 ml of water. Tablet was placed on top of the tissue paper and time required for the
water to reach the upper surface of the tablet was noted as wetting time. Experiment was
performed in triplicate. The tablets were weighed before and after wetting. Water
absorption ratio (R) was determined using the following equation:
𝑅 = 𝑊𝑎−𝑊𝑏
𝑊𝑏 × 100%……………………..…Eqn. (3.3)
where Wb and Wa are the weights before and after water absorption respectively.
3.3.9.7. In-vitro Disintegration Test
In-vitro disintegration test was performed as per USP requirements for immediate release
tablets. Six tablets were put in each tube disintegration apparatus (Erweka, Germany) and

59
the tablets were immersed in distilled water maintained at 37±1ºC. Times for complete
disintegration of each of the tablets were recorded. The studies were done in triplicate
and the average value and standard deviation were reported.
3.3.9.8. In-vitro Dissolution Test
ODTs were evaluated for dissolution behavior. Dissolution tests were performed as per
USP requirements for immediate release dosage forms using USP II apparatus paddle
method (AT 7, Sotax, MA, USA). Dissolution was carried out in 500 ml of phosphate
buffer pH 6.8 at 75 rpm and 37±0.5ºC. The dissolution in pH 6.8 was chosen to simulate
the pH conditions of saliva fluid. A 2 ml sample was withdrawn at 2, 4, 6, 8, 10, 15, 20,
30 minutes. It was then passed through a 0.20 µm Millipore filter and injected in the
HPLC for estimation of DXM HBr into the medium. The experiment was performed in
triplicate.
3.3.10. Statistical Analysis and Optimization
Statistical models with interaction terms were derived to evaluate the effect of the two
factors (X1 and X2) on response variables: tablet hardness (Y1), disintegration time (Y2)
and mean dissolution time-MDT (Y3). Polynomial models were generated for all the
response variables. In this study a linear model was used to determine the relationship
between factors and response variables (Y1) and quadratic models for determining the
relationship between factors and response variables (Y2) / (Y3). Each experimental

60
response (Y) in the CCD model can be represented by an equation of the response surface
represented by;
Y = β0 + β1X1+ β2X2 + β3X1X2 (Linear Model)…………….………………… (Eqn. 3.4)
Y = β0 + β1X1+ β2X2 + β3X1X2 + β4X12 + β5X2
2 + β6X1
2X2 + β7X1X2
2 (Quadratic Model)
… (Eqn. 3.5)
Where, Y is the response variable, β0 is an intercept, and β1 to β7 are regression
coefficients, X1 and X2 are the factors studied. The polynomial equations from this
optimization technique were used to predict the tablet hardness (Y1), disintegration time
(Y2) and mean dissolution time-MDT (Y3) values for ODTs. Comparison of predicted
values for Y1, Y2 and Y3 with actual experimental values was used to test the validity of
the response surface models.
3.4. RESULTS AND DISCUSSION
3.4.1 Phase Solubility Study
The phase solubility diagram was obtained at 37ºC by plotting the apparent solubility of
DXM HBr against increasing concentration of 2-HPßCD as reported in Figure 3.1. It was
observed that the solubility of DXM HBr from the complex increased linearly as a
function of 2-HPßCD concentration, over the entire concentration range studied. The
phase solubility profile (linear plot) was classified as AL type. These AL type curves
indicate the formation of water soluble complexes between the substrate (DXM HBr) and
the ligand (2-HPßCD) and a first order dependency of interactions on the 2-HPßCD

61
concentration [45]. This linear substrate-ligand correlation with a slope value less than 1
suggested the formation of first order soluble complexes, i.e. formation of 1:1
stoichiometric inclusion complex.
Figure 3.1: Phase solubility diagram of DXM HBr-2-HPßCD inclusion complex (n=3)
Note: Error bars are too small for visualization
The apparent stability constant (Ks), DXM HBr solubility (S0), slope and correlation
coefficient (r2) of phase solubility diagram are given in Table 3.4. The calculated Ks
value was dependent on the initial solubility of the drug (S0). The Ks value of 1:1
complex was calculated according to the equation given by Higuchi and Connors, 1965
[45]. The Ks value reflects the favorable positioning of DXM HBr inside the cyclodextrin
cavity demonstrated that hydrophobicity of the guest molecule and steric factors between
guest and host molecules were responsible for these interactions [126, 135]. We found Ks
value to be 92.3 M-1
and this indicates that the DXM HBr interacts strongly with 2-
y = 0.8002x + 0.0434 R² = 0.9901
0
0.01
0.02
0.03
0.04
0.05
0.06
0.07
0 0.005 0.01 0.015 0.02 0.025 0.03
Co
nce
ntr
atio
n o
f D
XM
HB
r (M
)
Concentration of 2-HPßCD (M)

62
HPßCD in water. Similar results were obtained by Marques et al. (1990) [126] and F.
Veiga et al. (1996) [117]. In phase solubility studies for ß-cyclodextrin and methyl-beta
cyclodextrin performed by Marques et al. the solubility curves shows almost similar
patterns and Ks value of 68.9 M-1
and 82.7 M-1
, respectively, indicating the strong
interaction between guest and host molecule [126]. F. Veiga et al. (1996) calculated Ks of
HPßCD in water to be 144.8 M-1
[117]. G. Zingone reported increased Ks value for
warfarin at pH 7.4 followed by the decreased Ks value at lower pH 1.2 [131]. They
explained that the strength of complexation between drug and cyclodextrin depends on
pH and is greater at pH 7.4 than the acidic pH of 1.2. We obtained a similar Ks value of
92.3 M-1
in water (pH 7) and results are almost coincident. This suggested that 2-HPßCD
formed the stable inclusion complex in water (pH 7) with DXM HBr.
Table 3.4: DXM HBr solubility (S0), slope, stability constant (Ks) and correlation
coefficient (r2) from phase solubility diagram
Medium Water
S0±SD 0.0434
Slope 0.8002
Ks (M-1
) 92.30
r2 0.9901
3.4.2. Drug Content in the inclusion complex
The actual drug content in the physical mixture and lyophilized complex was determined.
The results are reported in Table 3.5. As seen in the table, both physical mixture and
lyophilized complex showed a good agreement between theoretical and actual drug
content.

63
Table 3.5: Drug content in the inclusion complex (% ± SD)
Theoretical % % ± SD
Physical Mixture 100 95.83±0.76
Lyophilized Complex 100 96.5±1.08
3.4.3. Characterization of inclusion complex
3.4.3.1. Differential Scanning Calorimetry (DSC)
The DSC curves for DXM HBr, 2-HPßCD, 1:1 physical mixture (C) and 1:1 lyophilized
(D) DXM HBr-2-HPßCD inclusion complex studied are reported in Figure 3.2. DXM
HBr showed the typical behavior of an anhydrous crystalline drug, exhibiting the sharp
endothermic peak at 120.3ºC, corresponding to the melting point of the drug. The DSC
curve of 2- HPßCD showed a very broad endothermal phenomenon between 55ºC to
110ºC, due to the release of water molecules [131]. The physical mixture of DXM HBr
with 2- HPßCD showed the endothermic peak at 120ºC but with decreased enthalpy of
reaction. The cyclodextrin dehydration peak was also present in the DSC curve for the
physical mixture since the thermogram was the combination of the components analyzed
separately. Thus, weak interaction between drug and 2- HPßCD can be postulated in such
a system. The complete disappearance of the DXM HBr endothermic peak was observed
for lyophilized DXM HBr-2-HPßCD inclusion complex indicating the encapsulation of
drug molecule inside the cavity or formation of the amorphous complex or both [129].
The results obtained were in good agreement with those previously reported [136, 137].
Some evidence of inclusion complexation was obtained from thermal analysis.

64
Figure 3.2: DSC thermograms of pure DXM HBr (A), pure 2-HPßCD (B), 1:1 physical
mixture (C) and 1:1 lyophilized (D) DXM HBr-2-HPßCD inclusion complex
3.4.3.2. Fourier Transform Infrared (FT-IR) spectroscopy
FTIR spectroscopy investigated the functional groups of DXM HBr involved in the
complexation providing supportive evidence of complex formation. The FTIR spectra of
all the samples are presented in Figure 3.3. In DXM HBr spectra characteristic band of
aromatic C-H stretch at 3277 cm-1
, C=C stretching at 1608 cm-1
, C-N stretching at 1445
cm-1
and methoxy (CH3-O-) stretch at 2921 cm-1
was observed [138] and used to
determine the interaction between 2-HPßCD and DXM HBr in solid state. FTIR spectra
for 2-HPßCD showed O-H stretching at 3290 cm-1
[138]. Spectra for both the physical
mixture and lyophilized complex did not show new peaks indicating that no chemical
bonds were created in the formed complex however, shifting of the characteristic peak at
1445 cm-1
towards a lower wave number (1358 cm-1
) in lyophilized the inclusion

65
complex was observed. This suggests the formation of hydrogen bonds between the
amino group of DXM HBr and the hydroxyl groups of the cyclodextrin cavity [129]. The
amino group of DXM HBr is responsible for the bitter taste of the drug [24]. From these
findings, it can be postulated that complexation of the bitter tasting amino functional
group inside the cavity drastically reduces the bitterness of DXM HBr. In the physical
mixture, characteristic peaks of DXM HBr were still detected but with low intensity
which indicates that a weak interaction occurs between drug and cyclodextrin for forming
the inclusion complex. The disappearance of the DXM HBr characteristic peak at 3277
cm-1
, 1608 cm-1
and 1445 cm-1
in the lyophilized complex can be attributed to inclusion
of these functional groups inside the 2-HPßCD cavity. These findings are in full
agreement with other authors [130, 139].
Figure 3.3: FTIR spectra of pure DXM HBr (A), pure 2-HPßCD (B), 1:1 physical
mixture (C) and 1:1 lyophilized (D) DXM HBr-2-HPßCD inclusion complex

66
3.4.3.3. Powder X-ray Diffraction (pXRD)
The XRD pattern for the pure DXM HBr presented several diffraction peaks indicating
the crystalline nature of the drug as shown in Figure 3.4. In contrast, 2-HPßCD was
present in an amorphous form. The 1:1 physical mixture also exhibited a typical
crystalline diffraction pattern but of less intensity compared to the diffraction pattern for
the pure drug. This confirmed the presence of DXM HBr in its crystalline form in the 1:1
physical mixture and no inclusion complex was formed. It also showed a weak
interaction between drug and cyclodextrin in the physical mixture confirming the DSC
results. DXM HBr-2-HPßCD inclusion complex displayed diffuse diffraction patterns
(identical to that of 2-HPßCD without drug peaks), suggesting the entirely amorphous
nature of DXM HBr in 1:1 lyophilized complex. These results are attributed to the
interaction between DXM HBr and 2-HPßCD indicating the possibility of complexation
of DXM HBr inside the cyclodextrin cavity and the formed inclusion complex is
amorphous in nature [129].

67
Figure 3.4: X-ray diffraction patterns of DXM HBr (A), 2-HPßCD (B), 1:1 physical
mixture (C) and 1:1 lyophilized (D) DXM HBr-2-HPßCD inclusion complex
3.4.3.4. Scanning Electron Microscopy (SEM)
SEM microphotographs of the DXM HBr, 2-HPßCD, 1:1 physical mixture and 1:1
lyophilized DXM HBr-2-HPßCD inclusion complex are shown in Figure 3.5. DXM HBr
appeared as irregular shaped crystalline particles while 2-HPßCD was a spherical particle
with amorphous character. The 1:1 physical mixture consisted of a bulky particle (2-
HPßCD) with characteristic DXM HBr crystals adhered on its surface. The surface
morphology was evident of the presence of unmodified particles of 2-HPßCD covered by
drug crystals and was clearly detectable in the microphotograph of the 1:1 physical
mixture. Thus, no interaction took place in the physical mixture in the solid state.

68
However, a drastic change in the structural morphology of the lyophilized complex was
seen and is indicative of the presence of the new solid phase confirming the formation of
the inclusion complex. This also suggests that the new solid phase is the product of the
homogenous distribution of the two components which could be responsible for the
increased dissolution rate of the drug [127].
Figure 3.5: Scanning electron microphotographs of DXM HBr (A), 2-HPßCD (B), 1:1
physical mixture (C) and 1:1 lyophilized (D) DXM HBr-2-HPßCD inclusion complex

69
3.4.3.5. Proton Nuclear Magnetic Resonance (1HNMR) Studies and 2D-NMR ROESY
Physico-chemical characterization studies such as FT-IR, thermal analysis, X-ray analysis
and surface morphology studies indicate only nominal information concerning the
formation of the complex. However, 1HNMR studies relate to the functional group
involved in the complexation and the chemical shift values in 1HNMR depict the
mechanism of complexation [56, 140]. The proton chemical shift between pure DXM
HBr and its inclusion complex with 2-HPßCD was observed and compared to determine
the interaction between the drug and 2-HPßCD. An amino-functional group is responsible
for the bitter taste of DXM HBr [122]. The structural elucidation using 1HNMR showed
inclusion of the amino functional group inside the 2-HPßCD cavity which predicted the
taste masking mechanism of DXM HBr when complexed with 2-HPßCD. Pure DXM
HBr, pure 2-HPßCD and 1:1 DXM HBr-2-HPßCD lyophilized inclusion complex were
analyzed for 1HNMR studies (Figure 3.6).

70
Figure 3.6: NMR spectra of DXM HBr (A), 2-HPßCD (B) and 1:1 lyophilized DXM
HBr-2-HPßCD inclusion complex (C)

71
Figure 3.7: Structure of Dextromethorphan HBr with labelling of proton (denoted as a-d)
In 1HNMR studies of the interaction between DXM HBr and 2-HPßCD,
1H-chemical
shift changes of DXM HBr protons resonance were analyzed (shown by arrow in Figure
3.6c). The chemical structure of DXM HBr with labelling of proton (denoted as a-d) is
shown in Figure 3.7 and corresponding chemical shift values of the protons are listed in
Table 3.6.
Table 3.6: 1H-chemical shift corresponding to DXM HBr in presence and absence of 2-
HPßCD
DXM HBr proton Chemical Shift δ (ppm) Change in δ (ppm)
δ(free) δ(complex) ∆δ
a 3.77 3.77 0
b 6.90 6.89 -0.02
c 3.38 3.31 -0.07
The insertion of the DXM HBr molecule into the HP-ßCD cavity was clearly
demonstrated by changes in 1HNMR proton chemical shift values. There was no change
in the chemical shift value of methoxy proton (proton a) while there was a significant
change in the value of the tertiary amine (proton c) of DXM HBr (Table 3.6). These

72
results indicated that the tertiary amine group of DXM HBr becomes enclosed inside the
HPßCD cavity. This can be well correlated with the FT-IR findings that postulated the
complexation of the amino functional group inside the cavity.
Figure 3.8: 2D-NMR ROESY plot of DXM HBr-2-HPßCD inclusion complex showing
the intermolecular NOEs between protons of DXM HBR and H- protons of 2-HPßCD
In this study, the approach for preparing the drug cyclodextrin inclusion complex was to
reduce or mask the bitter taste of DXM HBr and this complex will be used in the
preparation of pediatric ODT fomulations. The 1HNMR spectra results indicated the
possible taste masking mechanism may be that the amino functional group of DXM HBr

73
gets enclosed inside the cavity and reduces/masks the bitterness. The postulated taste
masking mechanism needed to be confirmed. The 2D-NMR ROESY (two dimensional)
was carried out and serves the purpose to evaluate and confirm the mode of complexation
and spatial arrangement between the host and guest atoms obtained from 1HNMR studies.
Cross-peaks of DXM HBr-2-HPßCD inclusion complex in 2D-NMR ROESY is shown in
Figure 3.8. These cross peaks in two dimensional plot displayed the intermolecular
Nuclear Over-hauser Effects (NOEs) between the amino protons (proton c) and H atoms
of 2-HPßCD. Thus, 2D-NMR confirmed the result that was obtained with 1HNMR which
suggested the interaction between the amino group of DXM HBr with the hydrogen atom
of 2HPßCD. Thus, we propose that the taste masking mechanism (shown in Figure 3.9),
which predicts the complexation of the amino functional group, becomes enclosed inside
the 2-HPßCD cavity and the bitter taste of DXM HBr is truly being masked.
Figure 3.9: Proposed mechanism of complexation/ mechanism for taste masking of
DXM HBr-2-HPßCD complex

74
3.4.4. Dissolution studies from inclusion complex
Dissolution profiles of pure DXM HBr, 1:1 physical mixture and 1:1 lyophilized complex
are shown in Figure 3.10. All the formulations dissolved approximately 90% of the DXM
HBr in 10 minutes. Dissolution parameters, dissolution efficiency after 10 minutes
(DE10min) and percentage of drug dissolved after 4 minutes (DD4min) were measured for
all formulations as illustrated in Table 3.7.
Table 3.7: Dissolution parameters for DXM HBr in pure, physically mixed and
lyophilized form
DXM HBr
DXM HBr:2- HPßCD inclusion complex
1:1 physical mixture ±
SD
1:1 lyophilized complex ±
SD
DD4min (%) 43.67 ± 3.51 71.11 ± 8.00 91.58 ± 5.93
DE10min (%) 56.08 67.27 83.502
SD- Standard Deviation
There were significant differences in the dissolution profiles for pure drug, physical
mixture and lyophilized complex. Considering the DE10min values, the dissolution rate of
DXM HBr was increased in the order: pure drug < 1:1 physical mixture < 1:1 lyophilized
complex suggesting that the dissolution rate was influenced by the lyophilization method
used to prepare the inclusion complex. After 4 minutes, the percentage of pure drug
dissolved was 43.67% however, the percentage drug dissolved from the physical mixture
and lyophilized complex were 71.11% and 91.5% respectively, after complexation with
2-HPßCD. The increase in the dissolution of DXM HBr in the physical mixture and
lyophilized complex is due to the high solubility of 2-HPßCD in water. This can be
explained as the result of better wettability of the drug particles and solubilizing effect of

75
cyclodextrin [131]. Subsequently, the interaction between the DXM HBr and
hydrophobic cavity of 2-HPßCD resulted in the formation of the readily soluble
complexes [141]. A very high increase in the drug dissolution rate observed in
lyophilized complex as compared to physical mixture is attributed to amorphization of
DXM HBr in lyophilized complex and the amorphous form of the substance has a higher
dissolution rate than its crystalline form [142].
Figure 3.10: Dissolution profiles at pH 6.8 of pure DXM HBr (◊), 1:1 physical mixture
(□) and 1:1 lyophilized complex (∆)
3.4.5. Orally disintegrating tablets characterization and evaluation
Tablet formulations were prepared according to the design matrix shown in Table 3.2
based on the formulae mentioned in Table 3.3. DXM HBr ODT’s properties such as
weight, thickness, friability, wetting time and water absorption ratio and drug content
uniformity are shown in Table 3.8. All the tablet formulations met the requirements in
terms of weight variation, thickness, friability, wetting time and water absorption ratio.
Drug content uniformity ranged from 97.3% to 103.7% and was within the acceptable
limits.
0102030405060708090
100110
0 2 4 6 8 10 12 14 16 18 20 22 24 26 28 30 32
DX
M H
Br
Rel
ease
d (
%)
Time (min)
Drug
Physical Mixture (1:1)
Lyophilized Complex (1:1)

76
Table 3.8: Results of DXM HBr ODTs properties for each experimental run
SD - Standard Deviation
Formulation
No.
Weight
(mg ± SD)
Thickness
(mm ± SD)
Wetting time
(sec ± SD)
Water absorption
ratio ( %± SD)
Friability
(%)
Drug Content
Uniformity
% RSD
F1 200.85 ± 4.43 3.29 ± 0.014 4.41 ± 0.51 105.80 ± 5.63 0.929 102.11 2.61
F2 201.90 ± 3.40 2.50 ± 0.012 133.18 ± 7.44 58.25 ± 8.9 0.105 100.68 2.62
F3 200.55 ± 2.30 3.32 ± 0.018 4.20 ± 0.27 131.48 ± 2.97 0.965 100.91 1.16
F4 199.20 ± 1.67 2.56 ± 0.008 47.87 ± 5.49 56.38 ± 14.09 0.651 98.96 2.52
F5 200.45 ± 3.30 2.57 ± 0.013 51.51 ± 2.81 42.62 ± 3.34 0.571 102.93 1.92
F6 200.40 ± 4.00 2.44 ± 0.020 104.48 ± 4.89 17.13 ± 1.98 0.877 103.71 1.32
F7 201.10 ± 4.72 2.26 ± 0.017 131.28 ± 8.71 19.94 ± 8.09 0.601 98.89 1.21
F8 195.95 ± 1.57 3.94 ± 0.017 2.41 ± 0.41 156.47 ± 9.33 1.062 97.33 0.96
F9 201.10 ± 3.24 3.20 ± 0.012 5.42 ± 1.16 80.15 ± 3.95 0.542 99.41 2.30
F10 197.40 ± 2.39 3.24 ± 0.008 7.00 ± 0.51 96.98 ± 3.05 0.962 98.77 2.92
F11 201.90 ± 3.72 3.22 ± 0.082 11.67 ± 3.95 84.55 ± 3.43 0.525 100.74 2.89
F12 201.85 ± 2.30 2.28 ± 0.020 214.29 ± 7.46 18.41 ± 6.01 0.354 100.95 2.75
F13 201.45 ± 3.34 2.93 ± 0.013 18.14 ± 3.19 75.26 ± 7.57 0.661 102.47 1.08

77
The DOE was adopted to optimize the critical formulation factors based on their effect on
characteristic responses that affect the performance of orally disintegrating tablets. The
characteristic responses include tablet hardness, disintegration time and mean dissolution time
(MDT).
From this study, tablet hardness varied from 1.5 to 10.8 kp, disintegration time ranged from 6.3
to 230 seconds and mean dissolution time (MDT) from 1.20 to 6.06 min (Table 3.9 and Figure
3.11a-c).
0
2
4
6
8
10
12
F1 F2 F3 F4 F5 F6 F7 F8 F9 F10 F11 F12 F13
Hard
nes
s (k
p)
Formulations
(a)

78
Figure 3.11: Effect of formulation factors (CSS and MCC) on characteristic response variables
of DXM HBr ODTs
0
20
40
60
80
100
120
140
160
180
200
220
240
260
F1 F2 F3 F4 F5 F6 F7 F8 F9 F10 F11 F12 F13
Dis
inte
gra
tio
n T
ime
(Sec
)
Formulations
0
1
2
3
4
5
6
7
F1 F2 F3 F4 F5 F6 F7 F8 F9 F10 F11 F12 F13
MD
T (
min
)
Formulations
(c)
(b)

79
In Figure 3.11a, F7 (formulation with low CCS concentration and without MCC) and F12
(formulation without CCS and MCC) were found to have maximum hardness when compressed
into tablets. Mannitol was used as filler and these formulations had high concentrations of
mannitol due to the absence of CCS and MCC. These results are in agreement with Sherif
Badawy et. al who reported an increase in tablet hardness and compactability with an increase in
the concentration of mannitol [143].
In Figure 3.11b, Formulations F2, in the absence of CCS showed an increase in disintegration
time. Formulation F6 and F7, in the absence of MCC, showed similar effects. In addition, the
formulation F12 (in absence of both MCC and CSS) also increased the disintegration time. This
shows that the concentration of CCS and MCC combined or alone has a strong influence on the
disintegration time. Formulation F1 with a high concentration of MCC and an absence of CCS,
showed a disintegration time within one minute. This can be attributed to the disintegrant
properties of MCC at higher concentrations [144]. All other formulations in the presence of CCS
and MCC showed disintegration of tablets within one minute. The disintegration mechanism of
CCS and MCC can be explained by their ability to increase the porosity of tablets, pulling water
into the pores reducing the physical bonding between the particles (wicking) and cause the
particle to swell and break up from within (swelling) [134]. It concludes from the above findings
that tablet disintegration is affected by swelling ability, hydrophilicity, porosity and inter-particle
force.

80
Table 3.8 shows the time required for complete wetting of all formulations. F2 (formulation
having medium concentration of MCC) and F6, F7, F12 (formulations without MCC) showed an
increase in wetting time as compared to the other formulations. These findings can be attributed
to the properties of MCC to decrease the wetting time by means of wicking and swelling of the
tablet matrix by widening the tablet pores [134, 144].
The relationship between the wetting time and disintegration time is shown in Figure 3.12. A
linear correlation (R2 = 0.9515) was seen suggesting the strong relationship between them and
that wetting is the important step for the disintegration process.
Figure 3.12: Relationship between wetting time and disintegration time
Table 3.8 illustrates the water absorption ratios for all formulations. F1, F3 and F8 have high
MCC concentrations; similarly F6, F7 and F12 are without MCC in the formulations. All other
R² = 0.9515
0
50
100
150
200
250
0 50 100 150 200 250
Dis
inte
gra
tion
tim
e
Wetting time

81
formulations have intermediate concentrations of MCC. The water absorption ratio increased as
a function of increasing MCC concentration. This is shown in Figure 3.13, the higher absorption
of water decreases the disintegration time (compare Figure 3.13 with Figure 3.11b) as a result of
a strong linear relationship (R2 = 0.9515) between wetting time and disintegration time (Figure
3.12).
Figure 3.13: Water absorption ratio of DXM HBr-2-HPßCD ODTs
3.4.5.1 Mathematical modelling of data obtained from experimental design
Thirteen experiments were conducted to optimize the concentration of croscarmellose sodium
(X1) and microcrystalline cellulose (X2) on the tablet hardness (Y1), disintegration time (Y2) and
mean dissolution time (Y3). Data for the CCD experimental runs are presented in Table 3.9. The
measured responses are illustrated in Figure 3.11 (a-c) and shows that a selected formulation
factor has a strong influence on the selected responses.
0
20
40
60
80
100
120
140
160
180
F1 F2 F3 F4 F5 F6 F7 F8 F9 F10 F11 F12 F13
Wate
r ab
sorp
tion
rati
o
Formulations
High MCC concentration
Intermediate MCC concentration
No MCC

82
Table 3.9: Results of face centered CCD Experiments
Formulation
No.
Croscarmellose
Sodium-CCS
(mg)
Microcrystalline
Cellulose-MCC
(mg)
Tablet
Hardness-Y1
(kp ± SD)
Disintegration
Time- Y2
(sec ± SD)
MDT-Y3
(min)
F1 0 120 4.02 ± 0.48 12.83 ± 1.38 3.17
F2 0 60 8.15 ± 0.73 106.2 ± 5.80 6.06
F3 6 120 3.73 ± 0.35 9.17 ± 0.17 1.52
F4 6 60 7.05 ± 0.24 29.35 ± 4.16 1.40
F5 6 60 7.15 ± 1.04 25.90 ± 0.51 1.27
F6 6 0 6.76 ± 0.38 132.7 ± 4.47 4.17
F7 12 0 10.37 ± 0.92 140.7 ± 3.14 4.54
F8 12 120 1.51 ± 0.25 6.30 ± 0.69 1.20
F9 6 60 2.22 ± 0.13 11.40 ± 0.54 1.36
F10 12 60 2.07 ± 0.13 9.80 ± 0.39 1.30
F11 6 60 2.41 ± 0.24 13.65 ± 0.59 1.28
F12 0 0 10.87 ± 0.31 230.0 ± 5.97 5.78
F13 6 60 4.18 ± 0.20 14.80 ± 1.83 1.30
SD - Standard Deviation

83
ANOVA was applied to determine the significance level and magnitude of the effects of
the process variables (factors) and interaction between the variables. The results confirm
the adequacy of the model (P < 0.05) as shown in Table 3.10. The model identified the
significant factors (X1 and X2) that affect the responses (Y1, Y2 and Y3) of DXM HBr
ODTs. In hardness of ODTs, concentration of microcrystalline cellulose (MCC) was
significant; however the concentration of croscarmellose sodium (CCS) was not
significant. In disintegration times and mean dissolution times for ODTs, the
concentration of both CCS and MCC were significant. The interaction between the main
variables (X1X2) was significant for disintegration time (Y2); however the interaction
between MCC and CCS were not significant for tablet hardness (Y1) and MDT (Y3).

84
Table 3.10: ANOVA for Tablet Hardness (Y1), Disintegration Time (Y2) and Mean Dissolution Time (Y3)
Source Sum of Squares
Degree of Freedom
(df) F value p – value Prob > F
Y1 Y2 Y3 Y1 Y2 Y3 Y1 Y2 Y3 Y1 Y2 Y3
Model 72.37 61261.32 36.65 2 7 5 7.40 119.30 10.32 0.0107* <
0.0001* 0.0040*
X1 - CSS 13.78 4651.94 10.55 1 1 1 2.82 63.41 14.86 0.1242 0.0005* 0.0063*
X2 - MCC 58.58 7640.13 12.35 1 1 1 11.98 104.15 17.39 0.0061* 0.0002* 0.0042*
X1X2 - 1711.06 0.13 - 1 1 - 23.32 0.18 - 0.0048* 0.6834
X12
- 3002.52 7.26 - 1 1 - 40.93 10.22 - 0.0014* 0.0151*
X22 - 5822.99 1.70 - 1 1 - 79.38 2.39 - 0.0003* 0.1658
X12X2 - 908.57 - - 1 - - 12.39 - - 0.0169* -
X1X22 - 785.86 - - 1 - - 10.71 - - 0.0221* -
Residual 48.92 366.79 4.97 10 5 7 - - - - - -
Lack of Fit 25.78 107.99 4.96 6 1 3 0.74 1.67 543.56 0.6459 0.2660 <
0.0001*
Pure Error 23.14 258.80 0.012 4 4 4 - - - - - -
Cor total 121.29 61628.11 41.62 12 12 12 - - - - - -
* represents significant model terms with P-value < 0.05
The final mathematical models obtained from the design for the analysis of each response variable are as follows:
𝑌1 = 5.43 − 1.52 𝑋1 − 3.12 𝑋2……………………………………………………………………………………….. (Eqn. 3.6)
𝑌2 = 20.75 − 48.23 𝑋1 − 61.81 𝑋2 + 20.68 𝑋1𝑋2 + 32.97 𝑋12 + 45.92 𝑋2
2 − 26.10 𝑋12𝑋2 + 24.28 𝑋1𝑋2
2…….. (Eqn. 3.7)
𝑌3 = 1.53 − 1.33 𝑋1 − 1.43 𝑋2 − 0.18 𝑋1𝑋2 + 1.62 𝑋12 + 0.78 𝑋2
2 …………………………………………...….. (Eqn. 3.

85
The above equations were derived by the best fit method and were used to make predictions
about the response for given levels of each factor. Equations 3.6, 3.7 and 3.8 were used to
describe the main effect of factors (X1 and X2) and their interaction (X1X2) on the responses (Y1,
Y2 and Y3). The coefficient values (regression coefficients) of X1 and X2 determine the effect of
these variables on the response. Coefficients with more than one factor in the above equation
represented either an interaction effect between both factors (X1X2) or quadratic relationships
between factors indicated by higher order terms (X12, X2
2, X1
2X2 and X1X2
2). The relative
impacts of the factors can be determined by comparing the factor coefficients. A positive sign
indicates the synergistic effect while a negative sign reflects the antagonistic effect.
Equation 3.6 illustrates that both variables X1 and X2 have an antagonistic effects on tablet
hardness (Y1). Tablet hardness decreases with an increase in concentration of CSS and MCC.
The antagonistic effect of CCS was not significant (p > 0.05) whereas the antagonistic effect of
MCC was significant (p < 0.05) (Table 3.10).
Equation 3.7 illustrates that both variable X1 and X2 have significant (p < 0.05) antagonistic
effects on the disintegration time (Y2) with significant (p < 0.05) synergistic interaction effect.
Disintegration time decreases with an increase in concentration of CCS and MCC, however it
increases with an increase in the interaction between CCS and MCC. The equation also shows
significant (p < 0.05) synergistic quadratic effects (X12, X2
2, X1X22) and significant (p < 0.05)
antagonistic quadratic effects (X12X2). The quadratic effects are reflected by the curvature in the
response surface and contour plot.
Equation 3.8 illustrates that both variable X1 and X2 have significant (p < 0.05) antagonistic
effects on the mean dissolution time (MDT) with an insignificant (p > 0.05) antagonistic

86
interaction effect. MDT decreases with an increase in concentration of CCS and MCC and their
interaction. Equation 3.8 also shows significant (p < 0.05) synergistic quadratic effect (X12) and
an insignificant (p > 0.05) synergistic quadratic effect (X22) indicated by the curvature in
response surface and contour plot.
The antagonistic effects of X1 and X2 were minor with respect to tablet hardness (Y1) and mean
dissolution time (MDT) (Y3) as compared to disintegration time (Y2). The interaction effect
between X1 and X2 and quadratic effects were minor with respect to (MDT) (Y3) as compared to
disintegration time (Y2).
3.4.5.2. Analysis of the fitted data
The contour plots and 3D-response surface plots explained the effects of CSS and MCC
concentration on tablet hardness, disintegration time and mean dissolution time of DXM HBr
ODTs. Figures 3.14a and 3.15a presents the effects of CSS and MCC concentration on tablet
hardness. It can be seen that an increase in concentration of both CCS and MCC resulted in a
decrease in tablet hardness. The optimum range of hardness was obtained at a decreased CSS
concentration and an increased MCC concentration. Figures 3.14b and 3.15b present the effects
of CSS and MCC concentrations on disintegration time. It can be seen that an increase in
concentrations of CSS, in the absence of MCC, shows the quadratic effect (i.e. disintegration
time of the tablet decreases to reach its minimum at 6 mg of CCS and then starts increasing). The
optimum disintegration time was obtained at a decreased CCS concentrations and mid-range
concentrations of MCC. Similarly, an optimum mean dissolution time was observed at mid to
high level concentrations of both CCS and MCC as presented in Figures 3.14c and 3.15c.

87
(a)
(b)

88
Figure 3.14: Response surface plot showing effect of CCS and MCC concentration on tablet
hardness (a), disintegration time (b) and mean dissolution time (c)
(c)
(a)

89
Figure 3.15: Contour plot showing effect of CCS and MCC concentration on tablet hardness (a),
disintegration time (b) and mean dissolution time (c)
(b)
(c)

90
3.4.5.3. Dissolution rate from ODTs
Figure 3.16 shows the in-vitro dissolution profiles of the DXM HBr ODT formulations. The
mean dissolution time (MDT) for the formulations varied from 1.2 to 6.06 minutes (Table 3.9).
Formulations F3, F4, F5, F8, F9, F10, F11, and F13 (with mid to high level concentrations of
both CSS and MCC) showed MDTs in the range of 1.2 to 1.52 minutes. F1 and F2, in the
absence of CCS, showed MDTs of 3.17 and 6.06 minutes, respectively. The decrease in MDT in
the presence of CCS can be attributed to properties of the super disintegrants in rapidly
disintegrating the tablets and facilitating dissolution [145]. Between formulation F1 and F2,
higher concentrations of MCC decreased the MDTs. F6 and F7, in the absence of MCC, showed
higher MDTs of 4.17 and 4.54 minutes, respectively. MCC is used as a diluent to ease the tablet
compaction. However in addition to its dry binding properties, MCC is self-disintegrating with a
low lubricant requirement due to its extremely low coefficient of friction and its very low
residual die wall pressure and serves as a disintegrant as well [144]. This may be the reason that
higher concentrations of MCC enhance tablet disintegration and improves dissolution. Similarly,
F12 (in the absence of both CCS and MCC) showed a higher MDT of 5.78 minutes.
Formulations with a higher concentration of mannitol (F6, F7, and F12) decreased the
dissolution rates of the drug from the tablets since mannitol increases tablet hardness and
compactability.

91
Figure 3.16: Dissolution profile of DXM HBr ODTs formulations
3.4.6. Validation of model and Optimization of process variables for DXM HBr ODTs
Validation of the regression equation or models was done by setting the checkpoint of CSS-X1
and MCC-X2 at 6mg and 60 mg, respectively (Crosshair window, Figure 3.13a-c). The values
predicted by the model for tablet hardness (Y1), disintegration time (Y2) and MDT (Y3) for the
ODTs at the given checkpoint were in close agreement with the values observed which is
illustrated in Figure 3.17.
0
10
20
30
40
50
60
70
80
90
100
110
0 2 4 6 8 10 12 14 16 18 20 22 24 26 28 30 32
% D
XM
HB
r re
lesa
sed
Time (min)
F1
F2
F3
F4
F5
F6
F7
F8
F9
F10
F11
F12
F13

92
Figure 3.17: Comparison of predicted values from the model and observed values for ODTs
Numerical optimization was done using Design EXPERT Version 10.0 software. The parameters
for optimization presented in Table 3.11 were chosen based on the analysis and results obtained
for the response surface plots and contour plots.
Table 3.11: Parameters for Numerical Optimization
Constraints
Name Goal Lower
Limit
Upper
Limit
X1 :CCS is in range 0 12
X2 :MCC is in range 0 120
Hardness is target = 4.5 3.5 5.5
Disintegration Time is target = 10 6.3 45
MDT minimize 1.20822 6.06005
Figure 3.18 is an overlay plot with the design space (yellow area) for obtaining cyclodextrin
based DXM HBr ODTs formulations.
0
5
10
15
20
25
Hardness (kp) Disintegration
Time (sec)
MDT (min)
Predicted
Observed

93
Figure 3.18: Overlay plot for the optimization parameters with design space (yellow area) to
obtain DXM HBr ODTs
Table 3.12 shows the concentration of CCS and MCC, and properties for the optimum batches
that the model predicted for achieving above goal set (Table 3.11). The optimum batch was
selected based on the highest desirability of achieving the targeted or desired responses (i.e.
tablet hardness, disintegration time, MDT) (Table 3.12).
Table 3.12: Properties of the optimized batches predicted by the model
Optimized
batch CCS MCC Hardness
Disintegration
Time MDT Desirability
1 5.168 81.814 4.500 10.000 1.341 0.991 Selected
2 10.869 54.161 4.500 10.000 1.687 0.966
3 0.000 119.912 3.821 15.090 4.010 0.488

94
Optimized batch yield results within the design space and thus confirmed the reliability of the
numerical optimization process. Response surface plots showing the desirability of the CCS and
MCC concentrations in the design space is shown in Figure 3.19.
Figure 3.19: Response surface plot for CCS and MCC concentration desirability in design space
The optimum conditions for the ODT formulations predicted by the model are 5.168 mg (2.5%)
of CCS and 81.814 mg (40%) of MCC (Table 3.12) to obtain the target hardness of 4.5 kp
(between the range of 3.5to 5.5 kp hardness), target disintegration time of 10 seconds (between
the range of 6.3 to 45 seconds) and minimum mean dissolution time (MDT) of 1.341 minutes.
Table 3.13 shows the optimized formula for 2-HPßCD inclusion complex based ODTs.

95
Table 3.13: Optimized formula for 2-HPßCD inclusion complex based DXM HBr ODTs
Ingredients Weighta (mg)
DXM HBr-2-HPßCD inclusion complex
(Lyophilized powder)
10*
Croscarmellose Sodium (CCS) 5.16 mg (2.5%)
Microcrystalline Cellulose (MCC) 81.81 mg (40%)
Sodium stearyl fumarate 2
Orange flavor 2
Mannitol q.s. 200 aTotal tablet weight = 200 mg
* Inclusion complex powder equivalent to 10 mg of DXM HBr
3.5. CONCLUSIONS
In the present study, we developed a novel ODT formulation for Dextromethorphan HBr.
Dextromethorphan HBr is a cough suppressant and its formulation is widely used in pediatrics to
relieve cough. While targeting the pediatric population, it is necessary to mask the bitter taste of
the drug and develop a formulation suitable for children. The lyophilized inclusion complex of
Dextromethorphan HBr with 2- hydroxyl propyl beta cyclodextrin enhanced the dissolution rate
and showed the ability to mask the bitter taste of the drug which is vital for preparation of orally
disintegrating tablets for pediatric use. The taste masking ability and mechanism of inclusion
complex was proposed based on the characterization of the lyophilized inclusion complex
powder using NMR spectroscopy and 2D-NMR ROESY as ultimate characterization tool. DXM
HBr ODTs were successfully prepared using the DXM HBr-2HPßCD lyophilized complex
powder. The ODTs were prepared using the direct compression method. There are several
factors that affect the properties of DXM HBr ODTs prepared from inclusion complex.
Concentration of the diluent and superdisntegrant are among the major factors affecting the
ODTs properties. The composition of the diluent (MCC) and superdisintegrant (CSS) could be

96
optimized using response surface methodology with central composite design so as to obtain
rapid dissolution and disintegration with acceptable tablet hardness and friability. This could
enhance the drug absorption of ODTs from the oral mucosa producing a rapid relief from cough,
ultimately resulting in improved patient adherence and convenience.
3.6. ACKNOWLEDGEMENTS
The authors would like to acknowledge Dr. Pannee Burckel, Chemical Instrumentation Scientist
at University of Toledo for her help with Scanning Electron Microscopy and X-ray diffraction
studies. We would like to thank Roquette America Inc. for providing samples of KLEPTOSE
HPB (parenteral grade) used in this research. We would also like to thank JRS Pharma for
providing samples of the tablet excipients.

97
References
1. Mennella, J.A. and G.K. Beauchamp, Optimizing oral medications for children. Clin
Ther, 2008. 30(11): p. 2120-32.
2. Mennella, J.A., et al., The bad taste of medicines: overview of basic research on bitter
taste. Clin Ther, 2013. 35(8): p. 1225-46.
3. Ivanovska, V., et al., Pediatric drug formulations: a review of challenges and progress.
Pediatrics, 2014. 134(2): p. 361-72.
4. Ernest, T.B., et al., Developing paediatric medicines: identifying the needs and
recognizing the challenges. J Pharm Pharmacol, 2007. 59(8): p. 1043-55.
5. Nunn, T. and J. Williams, Formulation of medicines for children. Br J Clin Pharmacol,
2005. 59(6): p. 674-6.
6. Glendinning, J.I., Is the bitter rejection response always adaptive? Physiol Behav, 1994.
56(6): p. 1217-27.
7. Meyerhof, W., et al., Human bitter taste perception. Chem Senses, 2005. 30 Suppl 1: p.
i14-5.
8. Mennella, J.A., M.Y. Pepino, and G.K. Beauchamp, Modification of bitter taste in
children. Dev Psychobiol, 2003. 43(2): p. 120-7.
9. Khan, M.A., challanges in development of pediatric formulatiuons. 2012, US-FDA.
10. Pawar, S. and A. Kumar, Issues in the formulation of drugs for oral use in children: role
of excipients. Paediatr Drugs, 2002. 4(6): p. 371-9.

98
11. Schirm, E., et al., Lack of appropriate formulations of medicines for children in the
community. Acta Paediatr, 2003. 92(12): p. 1486-9.
12. Roberts, R., et al., Pediatric drug labeling: improving the safety and efficacy of pediatric
therapies. Jama, 2003. 290(7): p. 905-11.
13. Butchko, H.H. and F.N. Kotsonis, Acceptable daily intake vs actual intake: the
aspartame example. J Am Coll Nutr, 1991. 10(3): p. 258-66.
14. Guidotti, J.L., Laxative components of a generic drug. Lancet, 1996. 347(9001): p. 621.
15. Gershanik, J., et al., The gasping syndrome and benzyl alcohol poisoning. N Engl J Med,
1982. 307(22): p. 1384-8.
16. McCloskey, S.E., et al., Toxicity of benzyl alcohol in adult and neonatal mice. J Pharm
Sci, 1986. 75(7): p. 702-5.
17. Madhusudhan Malladi, R.J., Radhmi Nair, Sanjay Wagh, Hari Shanjer Padakanti, Ashok
Mateti, Design and evaluation of tasted masked dextromethorphan hydrobromide oral
disintegrating tablets. Acta Pharm, 2010. 60: p. 267-280.
18. Shaikh Sana, A.R., Nadkar Sumedha and Bharati Mahesh, Formulation and Evaluation
of taste masked oral suspension of Dextromethorphan Hydrobromide. International
Journal of Drug Development and Research, 2012. 4(2): p. 159-172.
19. Samprasit, W., et al., Preparation and evaluation of taste-masked dextromethorphan oral
disintegrating tablet. Pharm Dev Technol, 2012. 17(3): p. 315-20.
20. (WHO), W.H.O. Dextromethorphan Pre-Review report. in Expert Committe on Drug
Dependence (ECDD). 2012. Hammamet, Tunisia.
21. Bem, J.L. and R. Peck, Dextromethorphan. An overview of safety issues. Drug Saf, 1992.
7(3): p. 190-9.

99
22. Admisnistration, U.-F.a.D., FDA warns against Abuse of Dextromethorphan (DXM), in
FDA Talk Paper. 2005, US- Food and Drug Administration (FDA).
23. C, S.S., Formulation and Evaluation of Dextromethorphan Hydrobromide Controlled
Release Hollow Microspheres Using Natural Polymer. Indonesian Journal of Pharmacy,
2014. 25(3): p. 181.
24. Karaman, R., Prodrugs for Masking the Bitter Taste of Drugs. 2014.
25. Laza-Knoerr, A., R. Gref, and P. Couvreur, Cyclodextrins for drug delivery. Journal of
drug targeting, 2010. 18(9): p. 645-656.
26. Chaudhary, V. and J. Patel, Cyclodextrin inclusion complex to enhance solubility of
poorly water soluble drugs: A review. International Journal of Pharmaceutical Sciences
and Research, 2013. 4(1): p. 68.
27. Bender, M.L. and M. Komiyama, Cyclodextrin chemistry. Vol. 6. 2012: Springer Science
& Business Media.
28. Challa, R., et al., Cyclodextrins in drug delivery: an updated review. Aaps Pharmscitech,
2005. 6(2): p. E329-E357.
29. Del Valle, E.M., Cyclodextrins and their uses: a review. Process biochemistry, 2004.
39(9): p. 1033-1046.
30. Szejtli, J., Introduction and general overview of cyclodextrin chemistry. Chemical
reviews, 1998. 98(5): p. 1743-1754.
31. Uekama, K., F. Hirayama, and H. Arima, Recent aspect of cyclodextrin-based drug
delivery system. Journal of inclusion phenomena and macrocyclic chemistry, 2006. 56(1-
2): p. 3-8.

100
32. Brewster, M.E. and T. Loftsson, Cyclodextrins as pharmaceutical solubilizers. Advanced
drug delivery reviews, 2007. 59(7): p. 645-666.
33. Szejtli, J., Cyclodextrins and their inclusion complexes. 1982: Akademiai Kiado.
34. Szejtli, J., Past, present and futute of cyclodextrin research. Pure and Applied Chemistry,
2004. 76(10): p. 1825-1845.
35. Loftsson, T. and M.E. Brewster, Pharmaceutical applications of cyclodextrins: basic
science and product development. J Pharm Pharmacol, 2010. 62(11): p. 1607-21.
36. Rajewski, R.A. and V.J. Stella, Pharmaceutical applications of cyclodextrins. 2. In vivo
drug delivery. Journal of pharmaceutical sciences, 1996. 85(11): p. 1142-1169.
37. Frömming, K.-H. and J. Szejtli, Pharmacokinetics and toxicology of cyclodextrins, in
Cyclodextrins in Pharmacy. 1994, Springer. p. 33-44.
38. Gould, S. and R.C. Scott, 2-Hydroxypropyl-β-cyclodextrin (HP-β-CD): a toxicology
review. Food and Chemical Toxicology, 2005. 43(10): p. 1451-1459.
39. Loftsson, T. and M. Masson, Cyclodextrins in topical drug formulations: theory and
practice. International Journal of Pharmaceutics, 2001. 225(1): p. 15-30.
40. Yaksh, T.L., et al., The utility of 2-hydroxypropyl-β-cyclodextrin as a vehicle for the
intracerebral and intrathecal administration of drugs. Life sciences, 1991. 48(7): p. 623-
633.
41. MAJEED, M.S.C., et al., Process for preparing water soluble diterpenes and their
applications. 2012, Google Patents.
42. Cramer, F., W. Saenger, and H.-C. Spatz, Inclusion compounds. XIX. 1a The formation of
inclusion compounds of α-cyclodextrin in aqueous solutions. Thermodynamics and
kinetics. Journal of the American Chemical Society, 1967. 89(1): p. 14-20.

101
43. Bergeron, R.J., M.A. Channing, and K.A. McGovern, Dependence of cycloamylose-
substrate binding on charge. Journal of the American Chemical Society, 1978. 100(9): p.
2878-2883.
44. Buvári, A. and L. Barcza, Complex formation of phenol, aniline, and their nitro
derivatives with β-cyclodextrin. Journal of the Chemical Society, Perkin Transactions 2,
1988(4): p. 543-545.
45. Higuchi, T. and A. Connors, Phase-solubility techniques. 1965.
46. Loftsson, T. and M.E. Brewster, Cyclodextrins as functional excipients: methods to
enhance complexation efficiency. J Pharm Sci, 2012. 101(9): p. 3019-32.
47. Giri, T.K., et al., A novel and alternative approach to controlled release drug delivery
system based on solid dispersion technique. Bulletin of Faculty of Pharmacy, Cairo
University, 2012. 50(2): p. 147-159.
48. Tiwari, R., et al., Extended release promethazine HCl using acrylic polymers by freeze-
drying and spray-drying techniques: formulation considerations. Brazilian Journal of
Pharmaceutical Sciences, 2009. 45(4): p. 829-840.
49. JS, P., et al., INCLUSION COMPLEX SYSTEM; A NOVEL TECHNIQUE TO IMPROVE
THE SOLUBILITY AND BIOAVAILABILITY OF POORLY SOLUBLE DRUGS: A
REVIEW.
50. Baghel, S., H. Cathcart, and N.J. O'Reilly, Polymeric Amorphous Solid Dispersions: A
Review of Amorphization, Crystallization, Stabilization, Solid-State Characterization,
and Aqueous Solubilization of Biopharmaceutical Classification System Class II Drugs. J
Pharm Sci, 2016.
51. Singh, R., et al., Characterization of cyclodextrin inclusion complexes—a review.

102
52. Liu, L. and S. Zhu, Preparation and characterization of inclusion complexes of prazosin
hydrochloride with β-cyclodextrin and hydroxypropyl-β-cyclodextrin. Journal of
pharmaceutical and biomedical analysis, 2006. 40(1): p. 122-127.
53. Rajagopalan, N., S.C. Chen, and W.-S. Chow, A study of the inclusion complex of
amphotericin-B with γ-cyclodextrin. International journal of pharmaceutics, 1986. 29(2):
p. 161-168.
54. Koontz, J.L., et al., Cyclodextrin inclusion complex formation and solid-state
characterization of the natural antioxidants alpha-tocopherol and quercetin. J Agric
Food Chem, 2009. 57(4): p. 1162-71.
55. Stojanov, M., R. Wimmer, and K.L. Larsen, Study of the inclusion complexes formed
between cetirizine and alpha-, beta-, and gamma-cyclodextrin and evaluation on their
taste-masking properties. J Pharm Sci, 2011. 100(8): p. 3177-85.
56. Inoue, Y., NMR Studies of the Structure and Properties of Cyclodextrins and Their
Inclusion Complexes, in Annual Reports on NMR Spectroscopy, G.A. Webb, Editor.
1993, Academic Press. p. 59-101.
57. Szejtli, J., The cyclodextrins and their applications in biotechnology. Carbohydrate
Polymers, 1990. 12(4): p. 375-392.
58. Tiwari, G., R. Tiwari, and A.K. Rai, Cyclodextrins in delivery systems: Applications.
Journal of Pharmacy and Bioallied Sciences, 2010. 2(2): p. 72.
59. Vyas, A., S. Saraf, and S. Saraf, Cyclodextrin based novel drug delivery systems. Journal
of Inclusion Phenomena and Macrocyclic Chemistry, 2008. 62(1-2): p. 23-42.

103
60. Szejtli, J. and L. Szente, Elimination of bitter, disgusting tastes of drugs and foods by
cyclodextrins. European Journal of pharmaceutics and biopharmaceutics, 2005. 61(3): p.
115-125.
61. Sohi, H., Y. Sultana, and R.K. Khar, Taste masking technologies in oral
pharmaceuticals: recent developments and approaches. Drug development and industrial
pharmacy, 2004. 30(5): p. 429-448.
62. Tripathi, A., et al., Taste masking: a novel approach for bitter and obnoxious drugs.
JPSBR, 2011. 1(3): p. 36-142.
63. Karaman, R., Prodrugs for Masking the Bitter Taste of Drugs. Application of
Nanotechnology in Drug Delivery, 2014: p. 399-445.
64. Jijo, A. and M. Flowerlet, Taste masking of peadiatric formulation: a review on
technologies, recent trends and regulatory aspects. Int J Pharm Pharm Sci, 2014. 6: p.
12-19.
65. Ann, H.J., et al., Effects of cyclodextrin derivatives on bioavailability of ketoprofen. Drug
development and industrial pharmacy, 1997. 23(4): p. 397-401.
66. Choi, H.-G., et al., Terfenadine–β-Cyclodextrin Inclusion Complex with Antihistaminic
Activity Enhancement. Drug development and industrial pharmacy, 2001. 27(8): p. 857-
862.
67. Tuleu, C. and J. Breitkreutz, Educational paper: formulation-related issues in pediatric
clinical pharmacology. European journal of pediatrics, 2013. 172(6): p. 717-720.
68. Castillo, J., et al., Preparation and characterization of albendazole β-cyclodextrin
complexes. Drug development and industrial pharmacy, 1999. 25(12): p. 1241-1248.

104
69. Latrofa, A., et al., Complexation of phenytoin with some hydrophilic cyclodextrins: effect
on aqueous solubility, dissolution rate, and anticonvulsant activity in mice. European
journal of pharmaceutics and biopharmaceutics, 2001. 52(1): p. 65-73.
70. KAUKONEN, A.M., H. LENNERNÄS, and J.P. MANNERMAA, Water‐soluble β‐
Cyclodextrins in Paediatric Oral Solutions of Spironolactone: Preclinical Evaluation of
Spironolactone Bioavailability from Solutions of β‐Cyclodextrin Derivatives in Rats.
Journal of pharmacy and pharmacology, 1998. 50(6): p. 611-619.
71. Arima, H., et al., Comparative studies of the enhancing effects of cyclodextrins on the
solubility and oral bioavailability of tacrolimus in rats. Journal of pharmaceutical
sciences, 2001. 90(6): p. 690-701.
72. Narshima Reddy, D., et al., Evaluation of piroxicam oral and transdermal preparations.
INDIAN JOURNAL OF PHARMACEUTICAL SCIENCES, 1992. 54: p. 152-152.
73. Choudhury, S. and K.F. Nelson, Improvement of oral bioavailability of carbamazepine by
inclusion in 2-hydroxypropyl-β-cyclodextrin. International journal of pharmaceutics,
1992. 85(1): p. 175-180.
74. Miyaji, T., et al., Improvement of oral bioavailability of fenbufen by cyclodextrin
complexations. Acta pharmaceutica nordica, 1991. 4(1): p. 17-22.
75. Nervetti, A., U. Ambanelli, and G. Ugolotti, Assessment of gastric mucosal damage by a
new inclusion complex of piroxicam with β-cyclodextrin: a functional study by a
scintigraphic method. J Drug Dev, 1991. 4(Suppl. 1): p. 39-42.
76. Loftsson, T., et al., Effects of cyclodextrins on drug delivery through biological
membranes. Journal of pharmaceutical sciences, 2007. 96(10): p. 2532-2546.

105
77. Zuo, Z., et al., Flutamide-hydroxypropyl-ß-cyclodextrin Complex: formulation, physical
characterization, and absorption studies using the caco-2 in vitro model. J. Pharm.
Pharmaceut. Sci, 2000. 3(2): p. 220-227.
78. Pitha, J., E.J. Anaissie, and K. Uekama, γ‐cyclodextrin: Testosterone complex suitable for
sublingual administration. Journal of pharmaceutical sciences, 1987. 76(10): p. 788-790.
79. Badawy, S.I.F., M.M. Ghorab, and C.M. Adeyeye, Bioavailability of danazol-
hydroxypropyl-β-cylodextrin complex by different routes of administration. International
journal of pharmaceutics, 1996. 145(1): p. 137-143.
80. Jain, A.C., B.J. Aungst, and M.C. Adeyeye, Development and in vivo evaluation of
buccal tablets prepared using danazol–sulfobutylether 7 β‐cyclodextrin (SBE 7)
complexes. Journal of pharmaceutical sciences, 2002. 91(7): p. 1659-1668.
81. YOSHIDA, A., et al., Improvement of chemical instability of digitoxin in aqueous
solution by complexation with. BETA.-cyclodextrin derivatives. Chemical and
pharmaceutical bulletin, 1988. 36(10): p. 4075-4080.
82. Szejtli, J., Utilization of cyclodextrins in industrial products and processes. Journal of
Materials Chemistry, 1997. 7(4): p. 575-587.
83. Meltzer, E., M. Welch, and N. Ostrom, Pill swallowing ability and training in children 6
to 11 years of age. Clinical pediatrics, 2006. 45(8): p. 725-733.
84. Battu, S.K., et al., Formulation and evaluation of rapidly disintegrating fenoverine
tablets: effect of superdisintegrants. Drug development and industrial pharmacy, 2007.
33(11): p. 1225-1232.

106
85. Best, B.M., et al., Pharmacokinetics of lopinavir/ritonavir crushed versus whole tablets
in children. Journal of acquired immune deficiency syndromes (1999), 2011. 58(4): p.
385.
86. Shah, R.B., et al., Tablet splitting of a narrow therapeutic index drug: a case with
levothyroxine sodium. Aaps Pharmscitech, 2010. 11(3): p. 1359-1367.
87. Cassio, A., et al., Comparison between liquid and tablet formulations of levothyroxine in
the initial treatment of congenital hypothyroidism. The Journal of pediatrics, 2013.
162(6): p. 1264-1269. e2.
88. Buck, M.L. and C. Health, Alternative forms of oral drug delivery for pediatric patients.
Pediatr Pharmacol, 2013. 19: p. 1-6.
89. Abay, F. and T. Ugurlu, Orally disintegrating tablets: a short review. Journal of
Pharmaceutics & Drug Development, 2015. 3(3): p. 1.
90. Breitkreutz, J. and J. Boos, Paediatric and geriatric drug delivery. Expert Opinion on
Drug Delivery, 2007. 4(1): p. 37-45.
91. Schiermeier, S. and P.C. Schmidt, Fast dispersible ibuprofen tablets. European journal of
pharmaceutical sciences, 2002. 15(3): p. 295-305.
92. Badgujar, B.P. and A.S. Mundada, The technologies used for developing orally
disintegrating tablets: a review. Acta pharmaceutica, 2011. 61(2): p. 117-139.
93. Bhowmik, D., et al., Fast dissolving tablet: an overview. Journal of chemical and
pharmaceutical research, 2009. 1(1): p. 163-177.
94. Sastry, S.V., J.R. Nyshadham, and J.A. Fix, Recent technological advances in oral drug
delivery - a review. Pharm Sci Technolo Today, 2000. 3(4): p. 138-145.

107
95. Yapar, E.A., Orally disintegrating tablets: an overview. Journal of Applied
Pharmaceutical Science, 2014. 4(2): p. 118-125.
96. Manivannan, R., Oral disintegrating tablets: A future compaction. Drug Invention
Today, 2009. 1(1): p. 61-65.
97. Khuri, A.I. and S. Mukhopadhyay, Response surface methodology. Wiley
Interdisciplinary Reviews: Computational Statistics, 2010. 2(2): p. 128-149.
98. Bezerra, M.A., et al., Response surface methodology (RSM) as a tool for optimization in
analytical chemistry. Talanta, 2008. 76(5): p. 965-977.
99. Baş, D. and İ.H. Boyacı, Modeling and optimization I: Usability of response surface
methodology. Journal of Food Engineering, 2007. 78(3): p. 836-845.
100. Myers, R.H., et al., Response surface methodology: a retrospective and literature survey.
Journal of quality technology, 2004. 36(1): p. 53.
101. Montgomery, D.C., et al., The hierarchy principle in designed industrial experiments.
Quality and reliability engineering international, 2005. 21(2): p. 197-201.
102. Wu, W., G. Cui, and B. Lu, Optimization of multiple evariables: application of central
composite design and overall desirability. CHINESE PHARMACEUTICAL JOURNAL-
BEIJING-, 2000. 35(8): p. 530-532.
103. Aslan, N., Application of response surface methodology and central composite rotatable
design for modeling and optimization of a multi-gravity separator for chromite
concentration. Powder Technology, 2008. 185(1): p. 80-86.
104. Myers, R.H., Response surface methodology. Edwards brothers. Ann Arbor, MI, 1976.

108
105. Myers, R.H., D.C. Montgomery, and C.M. Anderson-Cook, Response surface
methodology: process and product optimization using designed experiments. 2016: John
Wiley & Sons.
106. Ferreira, S.C., et al., Box-Behnken design: An alternative for the optimization of
analytical methods. Analytica chimica acta, 2007. 597(2): p. 179-186.
107. Iskandarani, B., et al., Simultaneous optimization of capsule and tablet formulation using
response surface methodology. Drug development and industrial pharmacy, 1993. 19(16):
p. 2089-2101.
108. Cantor, S.L., M.A. Khan, and A. Gupta, Development and optimization of taste-masked
orally disintegrating tablets (ODTs) of clindamycin hydrochloride. Drug development
and industrial pharmacy, 2015. 41(7): p. 1156-1164.
109. Rahman, Z., A. Siddiqui, and M.A. Khan, Orally disintegrating tablet of novel salt of
antiepileptic drug: formulation strategy and evaluation. European Journal of
Pharmaceutics and Biopharmaceutics, 2013. 85(3): p. 1300-1309.
110. Ahmed, I.S. and M.H. Aboul-Einien, In vitro and in vivo evaluation of a fast-
disintegrating lyophilized dry emulsion tablet containing griseofulvin. European journal
of pharmaceutical sciences, 2007. 32(1): p. 58-68.
111. Late, S.G., Y.-Y. Yu, and A.K. Banga, Effects of disintegration-promoting agent,
lubricants and moisture treatment on optimized fast disintegrating tablets. International
Journal of Pharmaceutics, 2009. 365(1): p. 4-11.
112. Rauck, R.L., et al., Efficacy and long-term tolerability of sublingual fentanyl orally
disintegrating tablet in the treatment of breakthrough cancer pain. Current medical
research and opinion, 2009. 25(12): p. 2877-2885.

109
113. Shangraw, R.F., Compressed tablets by direct compression. Pharmaceutical dosage
forms: Tablets, 1989. 1: p. 195-246.
114. Bandelin, F.J., Compressed tablets by wet granulation. Pharmaceutical dosage forms:
tablets, 1989. 1(2): p. 173-175.
115. Ringard, J. and A. Guyot-Hermann, Calculation of disintecrant critical concentration in
order to optimize tablets disintegration. Drug Development and Industrial Pharmacy,
1988. 14(15-17): p. 2321-2339.
116. Saenger, W., Cyclodextrin inclusion compounds in research and industry. Angewandte
Chemie International Edition in English, 1980. 19(5): p. 344-362.
117. Veiga, F., et al., Inclusion complexation of tolbutamide with β-cyclodextrin and
hydroxypropyl-β-cyclodextrin. International Journal of Pharmaceutics, 1996. 129(1): p.
63-71.
118. Ono, N., et al., Reduction of bitterness of antihistaminic drugs by complexation with β‐
cyclodextrins. Journal of pharmaceutical sciences, 2011. 100(5): p. 1935-1943.
119. Waleczek, K., et al., Phase solubility studies of pure (−)-α-bisabolol and camomile
essential oil with β-cyclodextrin. European Journal of Pharmaceutics and
Biopharmaceutics, 2003. 55(2): p. 247-251.
120. Figueiras, A., et al., Solid-state characterization and dissolution profiles of the inclusion
complexes of omeprazole with native and chemically modified β-cyclodextrin. European
Journal of Pharmaceutics and Biopharmaceutics, 2007. 67(2): p. 531-539.
121. Samprasit, W., et al., Preparation and evaluation of taste-masked dextromethorphan oral
disintegrating tablet. Pharmaceutical development and technology, 2012. 17(3): p. 315-
320.

110
122. Malladi, M., et al., Design and evaluation of taste masked dextromethorphan
hydrobromide oral disintegrating tablets. Acta pharmaceutica, 2010. 60(3): p. 267-280.
123. Singh, B., S.K. Chakkal, and N. Ahuja, Formulation and optimization of controlled
release mucoadhesive tablets of atenolol using response surface methodology. AAPS
PharmSciTech, 2006. 7(1): p. E19-E28.
124. Muthuvelayudham, R. and T. Viruthagiri, Application of central composite design based
response surface methodology in parameter optimization and on cellulase production
using agricultural waste. International Journal of Chemical and Biological Engineering,
2010. 3(2): p. 97-104.
125. Late, S.G. and A.K. Banga, Response surface methodology to optimize novel fast
disintegrating tablets using β cyclodextrin as diluent. AAPS PharmSciTech, 2010. 11(4):
p. 1627-1635.
126. Marques, H.C., J. Hadgraft, and I. Kellaway, Studies of cyclodextrin inclusion complexes.
I. The salbutamol-cyclodextrin complex as studied by phase solubility and DSC.
International Journal of Pharmaceutics, 1990. 63(3): p. 259-266.
127. Rahman, Z., A.S. Zidan, and M.A. Khan, Risperidone solid dispersion for orally
disintegrating tablet: its formulation design and non-destructive methods of evaluation.
International journal of pharmaceutics, 2010. 400(1): p. 49-58.
128. Costa, P. and J.M.S. Lobo, Modeling and comparison of dissolution profiles. European
journal of pharmaceutical sciences, 2001. 13(2): p. 123-133.
129. Fernandes, C.M., M.T. Vieira, and F.J.B. Veiga, Physicochemical characterization and
in vitro dissolution behavior of nicardipine–cyclodextrins inclusion compounds.
European journal of pharmaceutical sciences, 2002. 15(1): p. 79-88.

111
130. Williams III, R.O., V. Mahaguna, and M. Sriwongjanya, Characterization of an inclusion
complex of cholesterol and hydroxypropyl-β-cyclodextrin. European journal of
pharmaceutics and biopharmaceutics, 1998. 46(3): p. 355-360.
131. Zingone, G. and F. Rubessa, Preformulation study of the inclusion complex warfarin-β-
cyclodextrin. International journal of pharmaceutics, 2005. 291(1): p. 3-10.
132. Giunta, A.A., S.F. Wojtkiewicz, and M.S. Eldred. Overview of modern design of
experiments methods for computational simulations. in Proceedings of the 41st AIAA
aerospace sciences meeting and exhibit, AIAA-2003-0649. 2003.
133. Neter, J., et al., Applied linear statistical models. Vol. 4. 1996: Irwin Chicago.
134. Bi, Y., et al., Preparation and evaluation of a compressed tablet rapidly disintegrating in
the oral cavity. Chemical and pharmaceutical bulletin, 1996. 44(11): p. 2121-2127.
135. Uekama, K., et al., Inclusi on complexations of steroid hormones with cyclodextrins in
water and in solid phase. International Journal of Pharmaceutics, 1982. 10(1): p. 1-15.
136. Jun, S.W., et al., Preparation and characterization of simvastatin/hydroxypropyl-β-
cyclodextrin inclusion complex using supercritical antisolvent (SAS) process. European
Journal of Pharmaceutics and Biopharmaceutics, 2007. 66(3): p. 413-421.
137. Ruan, L.-P., et al., Improving the solubility of ampelopsin by solid dispersions and
inclusion complexes. Journal of Pharmaceutical and Biomedical analysis, 2005. 38(3): p.
457-464.
138. Coates, J., Interpretation of infrared spectra, a practical approach. Encyclopedia of
analytical chemistry, 2000.
139. Hiremath, S., et al., Dissolution enhancement of gliclazide by preparation of inclusion
complexes with [beta]-cyclodextrin. Asian journal of Pharmaceutics, 2008. 2(1): p. 73.

112
140. Veiga, F.J.B., et al., Molecular Modelling and 1H-NMR: Ultimate Tools for the
Investigation of Tolbutamide:. BETA.-Cyclodextrin and Tolbutamide: Hydroxypropyl-.
BETA.-Cyclodextrin Complexes. Chemical and pharmaceutical bulletin, 2001. 49(10): p.
1251-1256.
141. Ahmed, S., et al., Comparative dissolution characteristics of bropirimine-β-cyclodextrin
inclusion complex and its solid dispersion with PEG 6000. International journal of
pharmaceutics, 1993. 96(1-3): p. 5-11.
142. Wang, S., Y. Ding, and Y. Yao, Inclusion complexes of fluorofenidone with β-
cyclodextrin and hydroxypropyl-β-cyclodextrin. Drug development and industrial
pharmacy, 2009. 35(7): p. 808-813.
143. Badawy, S.I., et al., Effect of spray-dried mannitol on the performance of
microcrystalline cellulose-based wet granulated tablet formulation. Pharmaceutical
development and technology, 2010. 15(4): p. 339-345.
144. Thoorens, G., et al., Microcrystalline cellulose, a direct compression binder in a quality
by design environment—A review. International Journal of Pharmaceutics, 2014. 473(1–
2): p. 64-72.
145. Balasubramaniam, J. and T. Bee, The influence of superdesintegrant choice on the rate of
drug dissolution. Pharm Technol, 2009. 21: p. S1-S2.