Edited Thesis
219
Gene regulation via alternative splicing and nonsense-mediated mRNA decay by Richard Edward Green B.S. (University of Georgia) 1997 A dissertation submitted in partial satisfaction of the requirements for the degree of Doctor of Philosophy in Molecular and Cell Biology in the GRADUATE DIVISION of the UNIVERSITY of CALIFORNIA at BERKELEY Committee in charge: Associate Professor Steven Brenner, Chair Professor Jasper Rine Professor Thomas Cline Assistant Professor Kimmen Sjölander Spring 2005
-
Upload
khangminh22 -
Category
Documents
-
view
1 -
download
0
Transcript of Edited Thesis

Gene regulation via alternative splicing and nonsense-mediated mRNA decay
by
Richard Edward Green
B.S. (University of Georgia) 1997
A dissertation submitted in partial satisfaction of the
requirements for the degree of
Doctor of Philosophy
in
Molecular and Cell Biology
in the
GRADUATE DIVISION
of the
UNIVERSITY of CALIFORNIA at BERKELEY
Committee in charge:
Associate Professor Steven Brenner, Chair Professor Jasper Rine
Professor Thomas Cline Assistant Professor Kimmen Sjölander
Spring 2005

The dissertation of Richard Edward Green is approved: _________________________________________________________ Steven Brenner, Chair Date _________________________________________________________ Jasper Rine Date _________________________________________________________ Thomas Cline Date _________________________________________________________ Kimmen Sjölander Date
University of California, Berkeley
Spring 2005

Gene regulation via alternative splicing and nonsense-mediated mRNA decay
Copyright (2005) All rights reserved
by
Richard Edward Green

Abstract
Gene regulation via alternative splicing and nonsense-mediated mRNA decay
by
Richard Edward Green
Doctor of Philosophy in Molecular and Cell Biology
University of California, Berkeley
Professor Steven Brenner, Chair
1
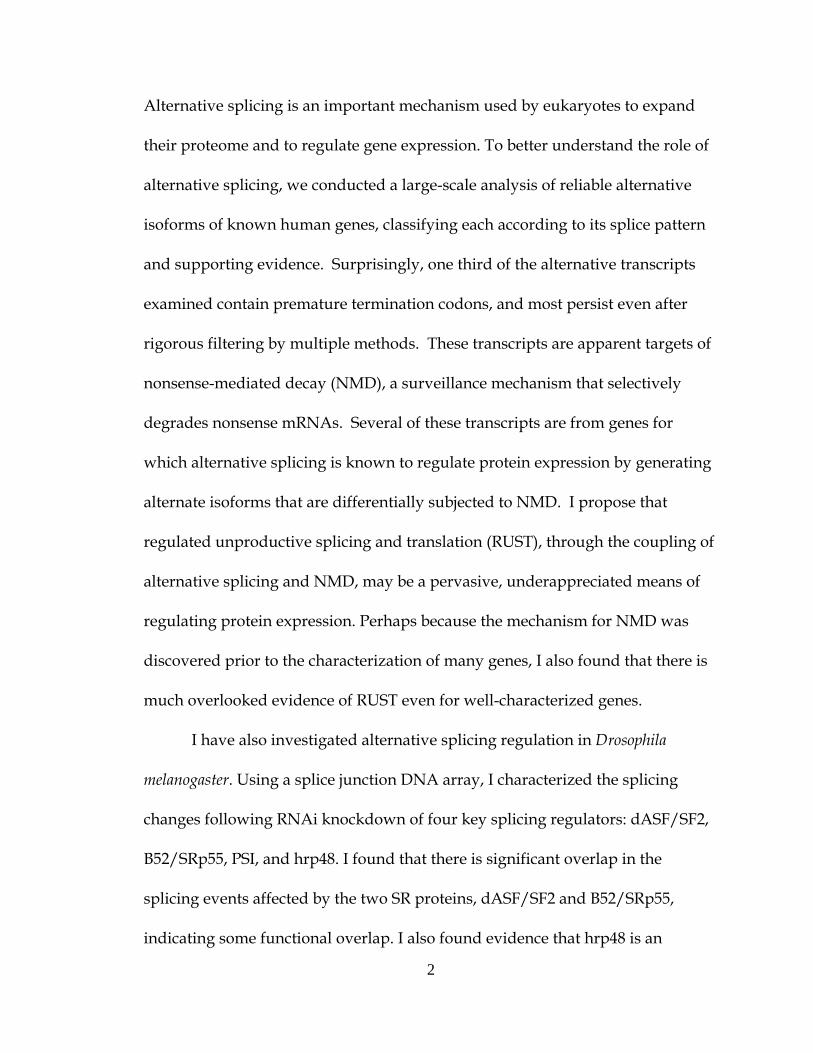
Alternative splicing is an important mechanism used by eukaryotes to expand
their proteome and to regulate gene expression. To better understand the role of
alternative splicing, we conducted a large-scale analysis of reliable alternative
isoforms of known human genes, classifying each according to its splice pattern
and supporting evidence. Surprisingly, one third of the alternative transcripts
examined contain premature termination codons, and most persist even after
rigorous filtering by multiple methods. These transcripts are apparent targets of
nonsense-mediated decay (NMD), a surveillance mechanism that selectively
degrades nonsense mRNAs. Several of these transcripts are from genes for
which alternative splicing is known to regulate protein expression by generating
alternate isoforms that are differentially subjected to NMD. I propose that
regulated unproductive splicing and translation (RUST), through the coupling of
alternative splicing and NMD, may be a pervasive, underappreciated means of
regulating protein expression. Perhaps because the mechanism for NMD was
discovered prior to the characterization of many genes, I also found that there is
much overlooked evidence of RUST even for well-characterized genes.
I have also investigated alternative splicing regulation in Drosophila
melanogaster. Using a splice junction DNA array, I characterized the splicing
changes following RNAi knockdown of four key splicing regulators: dASF/SF2,
B52/SRp55, PSI, and hrp48. I found that there is significant overlap in the
splicing events affected by the two SR proteins, dASF/SF2 and B52/SRp55,
indicating some functional overlap. I also found evidence that hrp48 is an
2

obligate partner for PSI. Finally, I found enrichment of previously defined cis
binding sites for the SR proteins near the splice sites flanking splicing events that
require dASF/SF2 or B52/SRp55.
Database search methods are of central importance in computational
molecular biology. I have enhanced the standard method for evaluating database
search methods by adding normalization and bootstrapping. These
enhancements help neutralize a known defect in the evaluation scheme and
allow statistical testing of results. Finally, a collaborator and I implemented a
database search method that considers sequence context when generating and
scoring alignments. Using the evaluation scheme mentioned above, we found
that this extra information does not improve remote homolog detection.
3
TABLE OF CONTENTS
Abstract
Preface 1
Chapter 1: Introduction to alternative splicing and nonsense-mediated mRNA
decay
Alternative splicing 4
Nonsense-mediated mRNA decay 8
Chapter 2: Alternative splicing often generates isoforms with premature
termination codons
Background 17
Results and Discussion 20
Materials and Methods 26
Chapter 3: Even curated databases contain protein isoform sequences derived
from mRNAs likely degraded by NMD
Background 33
Results and Discussion 37
Conclusions 50
Materials and Methods 52
Chapter 4: Discussion of regulated unproductive splicing and translation and
future directions
RUST implications on alternative splicing 59
RUST implications on NMD 66
i

Future directions 67
Chapter 5: A microarray platform for investigating alternative splicing
regulation in Drosophila melanogaster
Background 70
Results 71
Discussion 92
Materials and Methods 95
Chapter 6: Bootstrapping, Bayesian bootstrapping, and normalization for
enhanced pairwise sequence evaluation
Introduction 102
Methodology 107
Results 123
Discussion 134
Chapter 7: Pairwise alignment incorporating dipeptide covariation
Introduction 136
Results 139
Discussion 146
Materials and Methods 149
Chapter 8: Discussion and future directions of development and evaluation of
remote homology detection methods
Appendix A – Human swiss-prot isoforms derived from PTC+ mRNAs 165
ii

Appendix B – Correlation between swiss-prot structural domains and
alternatively spliced regions 169
References 173
iii

LIST OF FIGURES
Figure 1.1 Recognition of premature termination codons 12
Figure 2.1 Analysis of human EST-inferred exon deletion and insertion
alternative splicing 19
Figure 2.2 Alternative splice detection and classification 22
Figure 3.1 Many human alternative isoforms in SWISS-PROT derive from PTC+
mRNAs 38
Figure 3.2 SWISS-PROT entries with multiple isoforms amenable to analysis
generate more PTC+ isoforms 41
Figure 3.3 Published expression levels of calpain-10 are consistent with NMD
prediction 43
Figure 3.4 Splicing to generate a premature termination codon is evolutionarily
conserved in CLKs 45
Figure 3.5 Cycloheximide increases abundance of CLK1 PTC+ isoforms 48
Figure 3.6 LATD/TNFRSF12/DR3/Apo3 expression correlates with PTC+ status
51
Figure 4.1 Correlation between identifiable structural domains and annotated
spliced regions of SWISS-PROT isoforms 61
Figure 5.1 Experimental design and clustering results 72
Figure 5.2 Experimental filters for intra-array consistency and target specific
knockdown 75
iv

Figure 5.3 Global microarray analysis at 2.0 standard deviations 77
Figure 5.4 Pairwise scatter plots of microarray results 83
Figure 5.5 Global microarray analysis at 1.5 standard deviations 85
Figure 5.6 RT-PCR validation of selected targets 87
Figure 5.7 RT-PCR validation of selected targets 88
Figure 5.8 B52/SRp55 binding motifs near B52/SRp55 uniquely affected splice
junctions 90
Figure 5.9 ASF binding sites near ASF uniquely affected splice junctions 91
Figure 6.1 Inferences from sequence similarity 103
Figure 6.2 SCOP hierarchy sample 110
Figure 6.3 Training and test databases 112
Figure 6.4 Generating coverage versus errors per query (CVE) plots 114
Figure 6.5 Normalization schemes 116
Figure 6.6 Standard and Bayesian bootstrap procedures 120
Figure 6.7 Demonstration of difference between standard and Bayesian bootstrap
122
Figure 6.8 Coverage versus errors per query (CVE) plots results 127
Figure 6.9 Superfamily size distribution in test database 128
Figure 6.10 Observed error rate versus statistical score 130
Figure 6.11 Growth of SCOP/ASTRAL databases 133
Figure 7.1 BLOSUM65 singlet and selected elements of doublet substitution
matrix 140
v
Figure 7.2 Inter-sequence mutual information of homologs encoded in inter-site
correlations at increasing separation 142
Figure 7.3 CVE plot of doublet versus Smith-Waterman 145
Figure 7.4 Comparison of Smith-Waterman and doublet sequence alignment
155
vi

LIST OF TABLES
Table 5.1 – Previously identified target genes of PSI and B52 are re-identified in
this microarray analysis 80
Table 6.1 – Pairwise methods evaluated 124
Table 6.2 – Substitution matrix and gap parameter space explored and optimums
126
vii

LIST OF ABBREVIATIONS
DSE: Downstream sequence element
CVE: Coverage versus errors per query
PTC: Premature termination codon
RUST: Regulated unproductive splicing and translation
AS: Alternative splicing
NMD: Nonsense-mediated mRNA decay
CVE: Coverage versus errors per query
viii

ix

x

11

PREFACE
This thesis is divided into two somewhat disconnected themes. The first, major
theme (Chapters 1 through 5) is alternative splicing, its impact on proteome
diversity and gene regulation, and especially nonsense-mediated mRNA decay
of alternative mRNA isoforms. Chapter 1 is a general introduction to alternative
splicing and nonsense-mediated mRNA decay. Subsequent chapters detail the
contributions I made in understanding alternative splicing as a mode of gene
regulation. As my main subject, these chapters are followed by a chapter of
discussion. This section ends with a chapter describing a microarray project for
investigating alternative splicing regulation in fly.
The second major theme (Chapters 6 through 8) is development and
evaluation of database search methods. While this material is conceptually far
removed from the first 4 chapters, I have chosen not to banish it to appendices.
An introduction to this section is provided in Chapter 6.
Finally, the appendices provide data and documentation that are of
interest only to some readers.
While there are other reasonable ways to organize disconnected themes
in a single thesis, I chose this way because it allows me the most room to explore
and explain all my work. The two main sections each have their own
introduction and discussion. Despite some effort, I was unable to find a useful
conceptual connection between the two themes.
1

2

CHAPTER 1
Introduction to Alternative Splicing and Nonsense-Mediated mRNA Decay
3

Alternative splicing
As recently as the mid-1990s, prevailing wisdom held that alternative splicing
was a rare, but interesting phenomenon. Perhaps because it was first
experimentally explored in the transcripts of mobile genetic elements like P-
element transposon and adenovirus, alternative splicing was believed to affect
only “…a few percent” (166) of genes in general. Following the sequencing of
the human genome, however, it became clear that alternative splicing was much
more prevalent. EST-based analyses have shown that half or more of all human
transcripts are subject to alternative splicing (137, 197). Furthermore,
widespread alternative splicing is not unique to humans (154). Analysis of
several eukaryotes, including mouse, fly, and worm, showed levels of
alternative splicing in these organisms comparable to that in humans (41). The
theme that emerges from these recent studies is that where there is splicing,
there will be alternative splicing.
Since its discovery, alternative splicing research has focused on
answering several fundamental questions. What are the biological roles of
alternative splicing and of alternative isoforms? How is alternative splicing
regulation carried out? How do genes evolve to become alternatively spliced?
As awareness of the prevalence of alternative splicing has increased, finding
answers to these questions has taken on new importance.
Concerning the biological role of alternative splicing, two general classes
of result emerged early on. First, alternative splicing was recognized as an
4

on/off switch for gene expression (27, 282). Exemplified by P-element and Sxl in
Drosophila melanogaster, alternative splicing can be used to generate both
functional and non-functional protein isoforms, thereby regulating the effective
amount of gene product expressed in a cell. Second, alternative splicing is often
used to generate a functionally diverse set of protein isoforms from a single
genetic locus (20, 21, 96, 145, 201, 238). These isoforms may differ subtly or
dramatically in function. In this way, alternative splicing acts as a multiplier on
the gene content within a genome, generating a larger number of gene products
from a limited number of genes. There are now many well-characterized
examples in both categories. It is firmly established that evolution has
repeatedly harnessed alternative splicing for multiple roles.
One of the most active areas of alternative splicing research involves
understanding the biochemical processes that control alternative splicing.
Because many alternative splicing factors can also function as general splicing
factors, understanding alternative splicing also requires an understanding of
splicing in general, which is largely a problem of understanding the
interactions between the cis elements within pre-mRNAs and the trans factors
that associate with them.
The size and complexity of splicing regulation has been gauged in several
ways. One observation is the physical size of the cellular apparatus that carries
it out. The spliceosome is massive, approximately 40 x 60 nm (225, 291). Within
this large complex are at least 145 distinct protein and ribonucleoprotein
5

factors, as recently shown via a mass-spec analysis of purified human
spliceosomes, making the spliceosome the most complex cellular machine
characterized to date (290). Genome wide analyses have revealed that more than
3% of the protein-coding genetic endowment of humans is devoted to RNA
metabolism (15). A recent RNAi screen in flies showed that 47 of the 250 RNA-
binding proteins that were tested can function as splicing regulators (215). This
ratio is almost certainly an underestimate as the screen was set up to detect
splicing changes in only two genes. Therefore, given the sheer number of factors
involved, it is reasonable to expect that the complexity underlying splicing
regulation is considerable.
Splicing regulators can function by attracting, diverting, or repelling the
spliceosome from specific splice sites. One way this is achieved is through
binding cis elements present within pre-mRNAs. These elements can be found
in both exons and introns and can activate or inhibit nearby splice sites.
Discovery of the identities and activities of cis splicing elements has been the
focus of much investigation. Traditional SELEX (56), functional SELEX (70, 172),
genomic SELEX (142), mutagenic screens, and computational sequence analysis
have all been used to discover binding sites for splicing regulators. However, in
many cases knowledge of the binding site for a given splicing regulator is
insufficient to predict splicing effects. Deciphering the inputs and outputs of
splicing regulation has turned out to be similar to deciphering transcriptional
regulation: the mere presence of a single transcription factor binding site or
6

splicing factor binding site is often not predictive of an in vivo role for the factor
in question. In fact, the signals important for splicing regulation of RNA may be
even more difficult to decode than the signals responsible for DNA transcription
due to the increased capacity of RNA to form secondary structure relative to
DNA. Deciphering the cis regulatory splicing code, therefore, remains a major
challenge.
How genes have evolved to become alternatively spliced remains an
interesting and open question. Comparative genomics analyses have identified
several genes whose patterns of alternative splicing have been conserved
through millions of years of evolution (52, 191, 221). For example, the CLK
family of protein kinases show a pattern of alternative splicing that is conserved
from human, to mouse, to the sea-squirt, C. intestinalis (122). Presumably,
splicing regulation of the CLKs evolved hundreds of millions of years ago in the
common ancestor of chordates and has persisted to the present. However, recent
large-scale surveys have shown that most human alternative splice events are
not observed even in mouse (196, 212, 280). These observations indicate that, at
least in humans, most observed alternative splicing events are more recently
evolved. In the background of mostly non-conserved alternative splicing,
instances of conserved alternative splicing are likely to be functional.
Furthermore, this observation calls into question the assumption that all
observed alternative mRNA isoforms are functional. Perhaps some represent
7

biochemical noise of the splicing apparatus which is only occasionally
harnessed to generate functional, regulated alternative splicing (147, 148).
Nonsense-mediated mRNA decay (NMD)
It has been known for nearly a quarter-century that nonsense mutations and
frameshift mutations that induce premature termination codons can destabilize
mRNA transcripts (75, 146, 161). First investigated in yeast and humans, NMD
was subsequently observed in a wide range of eukaryotes and is now thought to
occur in all eukaryotes (98). Although there is a common core of trans-effectors
of NMD—Upf1, Upf2, and Upf3—there are important and dramatic differences
in several aspects of NMD amongst eukaryotes. For example, the Upf1-null
(NMD-null) has non-lethal phenotypes in several species such as a respiratory
defect in yeast (161) and male-specific morphological defects in worm (123).
However, NMD appears vital in mammals: NMD-null mouse embryos resorb
shortly after implantation. Furthermore, NMD-null blastocysts isolated 3.5 days
post-coitum undergo apoptosis in culture after a brief growth period (186). Also,
the mechanism cells use to distinguish premature termination codons from
normal termination codons differs from yeast to flies to mammals. The
mechanisms outside human and mouse are not well established, and it is not
clear which mechanism was ancestral or when over evolutionary history it has
changed. These mechanisms have been the subject of intense investigation.
8

Mammalian NMD model
Important details have emerged that establish the following framework for
NMD in mammals (reviewed in (186)). During pre-mRNA processing, the
spliceosome removes intron sequences. As this occurs, a protein complex called
the exon-junction complex is deposited 20-24 nucleotides upstream of the sites
of intron removal (156-158, 178, 226). The growing list of identified components
of this complex includes REF1/Aly, RNPS1, SRm160, Y14, DEK, UAP56, magoh,
and eIF4a3 (59, 94, 156, 211, 242, 266). The exon-junction complex acts as a mark
to label the gene structure, after splicing. After or co-incident with (or possibly
before! (43)) export to the cytoplasm, the mature mRNA undergoes a first
pioneering round of translation (63, 130, 164). According to the current model,
as the ribosome traverses the mRNA, it displaces all the exon-junction
complexes in its path (181). For normal mRNAs, when the ribosome reaches the
termination codon it will have displaced all exon-junction complexes. If any
exon-junction complexes remain, a series of interactions ensues that leads to the
decapping and degradation of the mRNA (Figure 1.1a). These interactions
involve the well-conserved Upf proteins, the translation release factors eRF1
and eRF3 (266) and a decapping complex (176). Thus, a normal termination
codon is distinguished from a premature termination codon by whether it is
positioned so as to allow the ribosome to displace all exon-junction complexes.
This cell-biological model provides the mechanistic basis for the “50 nucleotide
rule” for NMD in mammals (Figure. 1.1b): If the translational termination
9

codon lies greater that about 50 nucleotides upstream of the final exon-exon
boundary, the transcript is recognized and degraded by NMD (181, 204).
This translation and splicing dependent model of NMD is supported by
several lines of evidence (reviewed in (183)), including the following. At and
before the pioneering round of translation, the mRNPs are distinguishable by
their association with the nuclear cap binding protein complex CBP80/20 and
not the cytoplasmic eIF4E (130, 164). Intronless transcripts are generally
immune to NMD (42, 184, 288). Tethering of any of several of the components
of the exon-junction complex or Upf proteins to the 3’ end of a normal mRNA is
sufficient to elicit NMD (177, 178). A central component of the exon-junction
complex is eIF4AIII (59, 94, 211, 242), which was previously identified as a
translation factor (77). Chemical inhibitors of translation and cis-element
inhibitors of translation are potent inhibitors of NMD (23, 54). And, finally,
there appears to be strong selective pressure on eukaryotic genes to keep the
termination codon sufficiently far downstream to avoid NMD (167, 204).
The initial genetic studies in yeast identified three genes, UPF1, UPF2,
and UPF3, that are required for NMD (161, 162). Subsequent studies in C.
elegans found NMD to require the worm orthologs of UPF1-3, called smg2, smg3,
and smg4 in worms, plus the products of four additional genes, smg1 and smg-5-
smg-7 (49, 223). Human orthologs for all of these have been identified and
characterized (26, 64, 81, 188, 210, 240, 254). In humans, both isoforms of UPF3
associate with spliced RNA through interactions with components of the EJC.
10

UPF2 interacts with both UPF1 and UPF3 and localizes around the nucleus. In
yeast, translation termination factors eRF1 and eRF3 interact with UPF1 (76).
The additional factors that are required in worm and are present in humans are
responsible for phosphorylating and dephosphorylating UPF1. It is likely that
these extra factors carry out NMD regulation, but little is known of the inputs or
outputs of this regulation.
11
Gm AAAAA
StartStart StartStartStopStop StopStop
Gm AAAAARibo-some
Ribosome displaces allexon-junction complexes
Exon-junctioncomplex
Gm AAAAA
Gm AAAAARibo-some
Ribosome does not displaceall exon-junction complexes;release factors interact withthe exon-junction complex
More than50 nucleotides
Gm AAAAANMD degradation
Multiple rounds of normal translation
(a) Stop codon is on last exon (b) Stop codon is premature
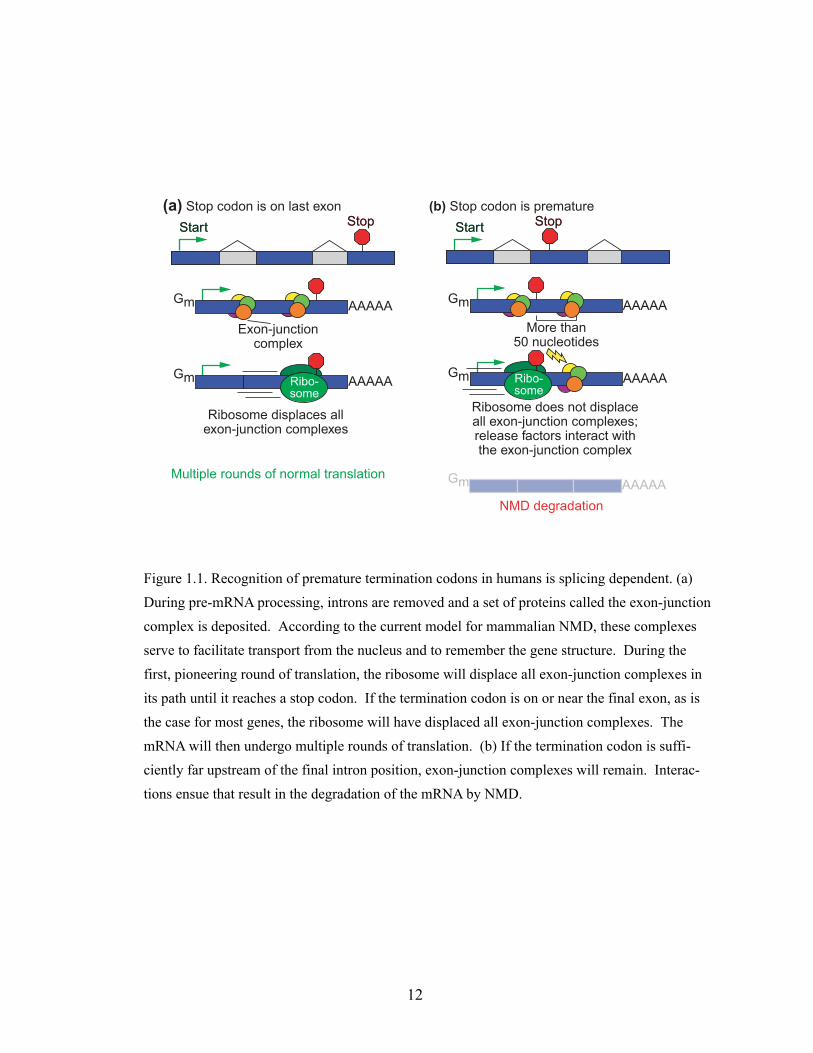
Figure 1.1. Recognition of premature termination codons in humans is splicing dependent. (a) During pre-mRNA processing, introns are removed and a set of proteins called the exon-junction complex is deposited. According to the current model for mammalian NMD, these complexes serve to facilitate transport from the nucleus and to remember the gene structure. During the first, pioneering round of translation, the ribosome will displace all exon-junction complexes in its path until it reaches a stop codon. If the termination codon is on or near the final exon, as is the case for most genes, the ribosome will have displaced all exon-junction complexes. The mRNA will then undergo multiple rounds of translation. (b) If the termination codon is suffi-ciently far upstream of the final intron position, exon-junction complexes will remain. Interac-tions ensue that result in the degradation of the mRNA by NMD.
12

Variations in NMD recognition of Premature termination codons (PTCs)
The mechanism for distinguishing premature from normal termination codons
differs from yeast to flies to mammals (182). The yeast and mammal systems
have been characterized by the presence of a mark which targets the transcript
for NMD, if found downstream of the stop codon. In yeast, this mark has been
reported to be a cis-element called the downstream sequence element (DSE)
bound by Hrp1p (107, 289), though this model is not universally accepted (19,
121, 182). Hrp1p bound to the DSE is reported to be analogous to the
mammalian mark, the exon-junction complex. One key difference is that in the
mammalian NMD system, the mark is splicing dependent, while it is not
necessarily so in yeast. Recent data from the Izaurralde lab has shown that
NMD in flies is different than in yeast and in mammals, and it appears to be
splicing independent for at least some genes (101). This important result
suggests that the mechanism of PTC recognition may vary more widely than
was previously thought. How PTCs are differentiated from normal termination
codons in flies and in other organisms is now an interesting, important, and
open question.
Besides these differences among NMD in yeast, flies, and humans, there is
evidence that the core model for NMD in mammals may have several wrinkles.
For example, there is indirect evidence from human disease-associated
mutations that NMD efficiency may vary among individuals, explaining
variable phenotypes from identical dystrophin mutations (141); and among
13

tissues, as appears to be the case in Schmid metaphyseal chondrodysplasia (22).
Furthermore, PTCs in different positions in the Factor VIII gene may lead to
varying degrees of NMD degradation, as reflected in immunotolerance to
exogenous Factor VIII in patients with Hemophilia A (78). There are also a
handful of exceptions to the 50nt rule. There is evidence that there are sequence
elements in humans that are functionally equivalent to a splicing event by
serving as a binding platform for an EJC-like complex (144, 224, 260). There are
also instances of apparent NMD evasion by PTC+ mRNAs (16, 206, 231).
Interestingly, some transcripts that would otherwise be targeted for NMD have
been shown to interact with specific factors that protect them from NMD in a
regulated manner (62, 160).
The central observation of my thesis, that alternative splicing often
generates mRNA isoforms that are degraded by NMD, was made possible by a
key result in the NMD field and the availability of a few key data sources.
Establishing the mechanistic framework for NMD in mammals put the 50nt rule
on solid footing and allowed it to be used as a predictive tool. The availability of
the complete human genome sequence and public EST libraries allowed the
large-scale EST mapping necessary for alternative splicing inference. Prior to
publication of the human genome sequence, predictions of the number of
protein-coding human genes were consistently and dramatically higher than
those afterward. The reduction came largely from reassigning many distinct EST
clusters to alternative isoforms instead of discrete gene loci. Armed with a large
14

set of inferred alternative isoforms and a basis for classifying mRNA isoforms as
PTC+, we set about answering the question: how often does alternative splicing
divert gene expression into the NMD degradation pathway?
15

CHAPTER 2
Alternative splicing often generates isoforms with premature termination codons
Note: Much of the material presented in this chapter was included in the publication: Lewis BP, Green RE, and Brenner SE (2003). Evidence for the widespread coupling of alternative splicing and nonsense-mediated mRNA decay in humans Proc. Natl Acad Sci. 100 (1): 189-192. This chapter also includes indication of my contribution and some previously unpublished results that motivated the subsequent analyses.
16

Background
Alternative splicing plays a major role in modulating gene function by
expanding the diversity of expressed mRNA transcripts (40, 108, 115, 195). An
extreme example in Drosophila is the alternative splicing of the Dscam gene,
which may generate over 38,000 distinct mRNA isoforms (237)—more than
twice the number of predicted genes in the entire genome (3)—to mediate
formation of neuronal cell-cell contacts. Moreover, alternative splicing of genes
with just a few isoforms may nonetheless yield profound regulatory effects.
This is exemplified by human bcl-x, whose products include two isoforms with
markedly different activities: Bcl-x(L) is an anti-apoptotic factor, whereas Bcl-
x(S) can induce apoptosis (34). Seeking to understand alternative splicing and
the protein repertoire encoded by the human genome, many groups have
undertaken studies to infer and enumerate alternative mRNA isoforms (40, 45,
120, 127, 136, 192).
Standard analyses, however, may not provide a full appreciation of how
alternative splicing modulates gene function. Due to the limitations of the ESTs
from which alternative splicing information is commonly derived (259),
researchers sometimes cautiously restrict their analyses to exon skipping and
mutually exclusive exon usage (40, 120). Similarly, researchers commonly
dismiss alternative transcripts that code for apparent early translational
termination, since those mRNAs are deemed incapable of generating a
17

functional product. A more complete understanding of alternative splicing
requires an unbiased consideration of all reliable alternative mRNA isoforms.
Ben Lewis and I undertook such an analysis using the publicly available
EST sequences within the dbEST database and the recently published human
genome sequence. We aligned RefSeq genes to the genome sequence to infer
their gene structures. Then, we aligned EST sequences to the RefSeq loci and
inferred patterns of alternative splicing from these alignments. We interpreted
these patterns of alternative splicing with respect to changes in the gene
structure and with respect to NMD.
My contributions to this project were as follows. First, I performed an
analysis of human alternative splicing data compiled by Brett and co-workers
(40). This analysis showed that alternative splicing often generates isoforms that
induce changes in reading frame or directly insert premature termination
codons (Figure 2.1). Furthermore, it is difficult to interpret the functional
implication of these alternative splicing events with respect to protein coding
potential as the slight bias against alternative splicing interrupting structural
domains is removed when one only considers those alternative splicing events
that change the reading frame or insert a termination codon. These data strongly
suggested that a larger-scale, direct investigation into the link between
alternative splicing and NMD was warranted. Second, I devised an outline of
the experimental protocol for the direct investigation and helped refine it during
18

0190 127
497691
183
695
1220
0200400600800
100012001400
Ins erted s topcodon
Left readingframe intact
C hanged R F,s tops
ups tream
C hanged R F,s tops
downs tream
INS
INS
DE
L
DE
L
3996
925434
0
1000
2000
3000
4000
5000
5' UTR 3' UTR ORFN
um. A
S ev
ents
1195691
1717
0500
100015002000
Did notaffect
readingframe
Inserted stopcodon
Changedreadingframe
Num
. AS
even
ts
0100020003000400050006000
Doesnot
cross
Doescross
Doesnot
cross
Doescross
Num
ber o
f dom
ain
alig
nmen
ts
In frameTruncations and
reading frame changers
OB
SE
RV
ED
RA
ND
OM
OB
SE
RV
ED
RA
ND
OM
Num
. AS
even
ts
a b
c
d
Figure 2.1 Analysis of human EST-inferred exon deletion and insertion alternative splicing (AS) events from Brett et al (40). (a) Mapping the AS events relative to coding sequence revealed that most affected the protein coding open reading frame (ORF). (b) Of the AS events that affected the ORF, but not the start codon directly, most either inserted a stop codon or changed the reading frame. (c) Exon deletions (DEL) were more likely than exon insertions (INS) to leave the reading frame intact. (d) The previously reported slight bias against AS events interupting structural domains was only present for AS events that left the reading frame intact.
19
implementation. Finally, Ben Lewis and I collaborated to analyze the data and
prepare the final published manuscript.
Results and Discussion
We mapped all ESTs from dbEST onto the gene loci sequences of all RefSeq
genes and found that 3127 canonical RefSeq mRNAs were found to have 6884
alternative splice pairs and 5693 alternative mRNA isoforms. We categorized
the alternative mRNAs according to exon and splice site usage (Figure 2.2b ,d).
Each canonical and alternative isoform is described in a table published as
supporting material for the PNAS publication.
We found that many alternative mRNA isoforms have premature
termination codons that render them apparent targets for nonsense-mediated
decay (NMD). Recent work has elucidated the following model for mammalian
NMD (53, 143, 178, 193). During mRNA processing, exon-exon splice junctions
are marked with exon junction complexes that serve the dual purpose of
facilitating export to the cytoplasm and remembering gene structure (157). As
translation occurs, the ribosome displaces all exon junction complexes in its
path. If a complex remains after a pioneering round of translation (130), a series
of reactions ensue, leading to transcript degradation. Thus, transcripts that
contain
premature termination codons—that is, termination codons more than 50
nucleotides 5’ of the final exon (121, 130, 143, 157, 177, 178, 204, 266)—are
candidates for NMD. As Wagner and Lykke-Anderson report, “NMD is a
20

critical process in normal cellular development” (266). NMD has been shown to
occur in all eukaryotes tested and, though it has variable efficiency (112),
eukaryotic mRNAs containing premature termination codons are almost always
degraded rapidly (204). Further supporting this idea, we observed that only
4.3% of mRNAs from the reviewed category of Refseq are NMD candidates,
with stop codons located more than 50 nucleotides upstream of the final exon.
In contrast, we discovered that in 34% of these sequences, the start codon
occurred downstream of the first exon.
35% of the EST-suggested alternative isoforms in our study contain
premature termination codons (Figure 2.2f). For a subset comprising 74% of
these NMD-candidate mRNA isoforms, EST alignments cover a premature
termination codon and a splice junction more than 50 nucleotides downstream.
In these cases, there is no possibility that additional, undetected splicing events
might remove 3’ exons, thereby preventing termination from being premature.
Furthermore, within this subset of NMD-candidates, 83% have premature
termination codons occur in all three reading frames, thus precluding the
possibility that an upstream splicing event changed the reading frame from that
of the canonical form to prevent incorporation of a premature termination
codon. Finally, we found that the distribution of predicted polyadenylation
signals in NMD candidate splices is biased against regions just downstream of
premature termination codons, undermining the likelihood that alternative
polyadenylation stabilizes many of the NMD-candidate transcripts.
21

Alternative splice pairs, by mode and coverage
TOTAL
Canonical
Alternative
d
ESTCoverage
7654321
Isoforms of alternatively-splicedRefSeq-coding genes
f
All isoforms, including canonicalAlternative isoforms
NMDcandidates 1989 (35% of 5693)
56938820
ESTsindicatingsplice pairs
Exon inclusioninferred isoform
c Alternative isoform inferencefrom splice pairs
Splice pair junctions& coverage
RefSeq
3 4 42
StopStart
StopStart
Alternative splice pairs generating NMD candidates, by mode and coverageSplice
sitesintroduced
Splicesiteslost
Codingregionchange
Imperfectexon skip 1 or 2 2 + & -
2 alternate sites 2 2 + & -
Exon inclusion 2 0 +
Perfect exon skip 0 2 -
Intra-exon splice 2 0 -Canonical
Alternative
TOTAL
1 alternate site 1 1 + or -
26% 28%
25% 28%
28% 30%
17% 21%
40% 39%
38% 41%
33% 32%
eb Splice mode classification
Percent of alternative splicesat coverage 2 and 1
generating NMD candidates12
Alignment to genomic sequence
a
Genomic Sequence
RefSeq sequence Start Stop
PrematureStop
Alternatively spliced EST Stop
NMD-candidate alternatively spliced EST
Canonical (RefSeq) spliced EST Stop
SKIP
RefSeq exon, canonicalEST exon, canonical
EST exon, alternateRefSeq exon,not observed in EST
>50 nt
Genomic sequence
SC35-like UTR spliced EST (not considered) Premature
Stop
>50 nt
Intron retention (not considered)
Stop - not premature
Noncoding regions are in lighter tones
Splice inference
Number of alternative splice pairs
Number of alternative splice pairs
0 500 1000 1500 2000 2500
0 100 200 300 400 500 600 700 800
0 1000 2000 3000 4000 5000 6000 7000 8000
1234567
0 500 1000 1500 2000 2500
1234567
0 2000 4000 6000 8000 10000
22

Figure 2.2. Alternative splice detection and classification. a, Splice inference. Coding regions of RefSeq mRNAs were aligned to genomic sequence to determine canonical splicing patterns. EST alignments to genomic sequence confirmed the canonical splices and indicated alternative splices. Canonical (RefSeq) splices are indicated above the exons, while alternative splices are indicated below the exons. When an alternative splice introduced a stop codon more than 50 nucleotides upstream of the final exon-exon splice junction of an inferred mRNA isoform, the stop codon was classified as a premature termination codon and the corresponding mRNA isoform was labeled a NMD candidate. In the example shown, an exon skip caused a frameshift, resulting in the introduction of a premature termination codon. Restricting the analysis to coding regions assured high alignment quality, but this excluded alternative splicing in non-coding regions, such as occurs with splicing factor SC35. Intron retentions were also excluded, since ESTs indicating intron retention are indistinguishable from incompletely-processed transcripts, a common dbEST contaminant. b, Splice mode classification. Alternative splices were categorized according to splice site usage and effects on the coding sequence. Splice sites introduced shows the number of splice donor/acceptor sites that were observed in the alternative splice, but were not included in the canonical splice. Splice sites lost shows the number of splice donor/acceptor sites that were included in the canonical splice and absent in the alternative splice. Coding region change indicates whether an alternative splice added (red) or subtracted (green) coding sequence to the alternative isoform relative to the canonical isoform. By our method, mutually-exclusive exon usage appears as exon inclusion. Our analysis excluded intron retentions, which would be classified as: 0 splice sites introduced, 2 sites lost, and addition of coding sequence. c, Alternative isoform inference from splice pairs. Splice pairs are splice donor/acceptor sites (▲) inferred from the alignments. Alternative splice pairs are those indicated by ESTs, but not by a RefSeq mRNA. The exon composition of an isoform was determined from EST-demonstrated splice pairs, which may be covered by multiple ESTs. Coverage of splice pairs is indicated in each ▲. Coverage for a complete isoform is not meaningful because of variability in coverage of its splice pairs. d, Alternative splice pairs by mode and coverage. The total number of alternative splice pairs associated with each splicing mode is shown at various levels of EST coverage. The distance from the y-axis to the right edge of each box corresponds to the total number of splice pairs with coverage greater than or equal to the number indicated. Note that each exon inclusion event involves two splice pairs. e, Alternative splice pairs generating NMD candidates, by mode and coverage. The subset of alternative splice pairs producing premature termination codons is involved in generating NMD-candidate mRNA isoforms. Numbers of splice pairs are displayed as in d. Also shown are the NMD-candidate splice pairs at coverage ≥1 and ≥2 as a percentage of all alternative splice pairs for each splicing mode. f, Isoforms of alternatively-spliced RefSeq-coding genes. Shown are the total numbers of isoforms of the RefSeq-coding genes for which alternative isoforms were found. These are subdivided into the following categories: all isoforms including canonical; alternative isoforms (i.e., all isoforms excluding canonical); and NMD candidates.
23

Our analysis identified 1106 genes that undergo alternative splicing to
generate 1989 alternative mRNA isoforms that are apparent targets for NMD.
Such widespread coupling of alternative splicing and NMD may indicate that
the cell possesses a large number of irrelevant mRNA isoforms that must be
eliminated. A more compelling alternative, which has been investigated in
analyses of smg mutations in C. elegans, is that the deliberate coupling of
alternative splicing and NMD plays a functional role in regulating protein
expression levels (108, 194, 199). Supporting this view, our analysis turned up
several genes known to be regulated by generating isoforms targeted for NMD,
including GA (151), and FGFR2 (133). We also found alternatively spliced NMD
candidates for six other splicing factors. Besides these, the splicing factor SC35
has been shown to auto-regulate its expression through RUST by generating
NMD-targeted isoforms (255), though it is excluded from our analysis because
its alternative splicing does not affect its coding sequence (Figure 2.2a).
Additionally, we found that the human genes for 5 translation factors
and 11 ribosomal proteins generate NMD-candidate isoforms. Intriguingly, C.
elegans homologs of three of these ribosomal genes—RP3, RP10a, and RP12—
generate splice forms that are cleared by NMD (194), suggesting that this mode
of regulating ribosomal protein expression is evolutionarily conserved.
Experimental work will be necessary to further characterize the role of coupled
alternative splicing and NMD in the expression of the genes we have identified.
24

Since EST libraries are naturally biased against less stable transcripts, mRNAs
subjected to NMD should have lower coverage than stable alternative splice
forms of the same gene. Therefore, it is striking that many NMD candidates are
indicated by multiple ESTs (Figure 2.2e). Within non-normalized, non-diseased-
cell libraries, the fraction of splices that generate NMD candidates with coverage
one is slightly reduced, and this fraction drops precipitously at higher coverage,
rendering the quantitation of these data uninterpretable. In light of transcript
biases in dbEST and the fact that splicing in the RefSeq 3’ UTR (e.g., in SC35) is
excluded from our analysis, we suspect that alternative splicing of NMD-
targeted transcripts might be more prevalent than our data suggest.
The coupling of alternative splicing and NMD is easily incorporated into
existing models of gene regulation. It allows use of the intrinsic alternative
splicing machinery to regulate protein expression in a developmental stage- and
cell-specific manner. Moreover, the transcription of genes that will yield
unproductive mRNAs is no more wasteful than the transcription of introns, and
particularly for genes that require a long time to be transcribed (e.g., dystrophin,
which takes 16 hours (258)), post-transcriptional regulation of this sort could
provide temporal control unattainable by transcription factors. In light of our
findings, we reason that the contribution of alternative splicing to proteome
diversity may be balanced by an as-yet unappreciated regulatory role in gene
expression.
25

Materials and Methods
Alternative Isoform Inference
We examined the alternative mRNAs suggested by EST alignments, using a
protocol designed to comprehensively identify maximally-reliable sequences
that are alternatively spliced (Figure 2.2a). To exclude errors from genome
sequencing and assembly, and to simplify the task of determining reading frame
for each transcript, our analysis employed 16163 well-characterized human
mRNAs from RefSeq and LocusLink (222). This set excludes the computational
genome annotation Refseq category, as well as 617 mRNAs containing
premature termination codons (see below, Analysis of premature termination
codons in RefSeq mRNAs). First, we mapped the mRNAs to the human
genome, requiring that an mRNA align to genomic sequence over the full length
of the coding sequence, without gaps in the exons. We further required 98%
identity between the coding sequences, favoring RefSeq sequence in cases of
nucleotide mismatch. When multiple RefSeq mRNAs aligned to the same
region of genomic sequence, we used only the mRNA containing the largest
number of exons. To detect alternative isoforms, we aligned 4.6 million EST
sequences from dbEST (33) to the genomic sequence and used TAP (136) to infer
alternative mRNA splice forms from these alignments (Figure 2.2c). Since we
used known genes, the reading frame of each canonical mRNA isoform (i.e., the
RefSeq mRNA) was known. So that the reading frame could be determined for
all EST-suggested alternative isoforms, we excluded ESTs whose 5’ end aligned
26

to regions of the genomic sequence that did not correspond to coding exons of
the RefSeq mRNA. We also excluded cases of intron retention, as these are
indistinguishable from incompletely processed transcripts, a common dbEST
contaminant. After applying these filters for reliability, this protocol identified
3127 RefSeq mRNAs whose genes undergo alternative splicing to generate 8820
distinct mRNAs. Within this set, we have higher confidence in splicing events
with coverage by multiple ESTs, as these are less likely to result from
experimental artifacts in dbEST. The overall process involved the following
steps:
Mapping RefSeq mRNAs to the Human Genome
Annotations from the August 2002 version of LocusLink (222) were used to
associate 16163 human mRNAs from the August 2002 version of RefSeq (222)
with contig sequences from the NCBI human genome build 30 (153). The
coding regions of the RefSeq mRNAs were aligned against the corresponding
contig sequences with the mRNA alignment tool SPIDEY (272) (Figure 2.2a).
Because the untranslated regions of the RefSeq mRNAs often aligned poorly to
the genomic sequence, we constructed alignments for only the coding portions
of the RefSeq mRNAs. Cases where alternative splicing affects the untranslated
regions of RefSeq-coding genes (e.g., in SC35 (255)) were thus excluded (Figure
2.2a).
Aligning EST sequences to genomic sequences.
Repetitive elements in the genomic template sequences were masked with
27

RepeatMasker (246). Using WU-BLAST 2.0MP-WashU [07-Jun-2002] (104), we
searched the 4.6 million EST sequences from dbEST (33) version 280802 for
matches to the coding exons of the RefSeq mRNA as well as the intervening
intron sequences in the human genome. The EST sequences with p-value < 10-30
were aligned to the genomic sequences using SIM4 1.4 (97). Only EST
alignments with >92% identity were used.
Alternative isoform inference.
We used TAP (136) to infer alternative mRNA splice forms from the EST
alignments.
Alternative Isoform Analysis
Alternative isoforms were inferred, analyzed, and further filtered as follows:
Analysis of canonical and alternative splice pairs
Alternative splice pairs are defined as EST-inferred splice junction donor and
acceptor sites that differ from those in the canonical RefSeq mRNAs (Figure
2.2a). To avoid erroneous alternative splice pair predictions resulting from
ambiguity in the alignments surrounding splice junctions, we rejected putative
alternative splice pairs found less than 7 bp from a canonical splice pair. Each
aligned EST may indicate multiple alternative and canonical splice pairs.
Alternative splice pairs within the same mRNA isoform may have varying
levels of EST coverage (Figure 2.2c). Whenever a splice in an alternative isoform
was not covered by ESTs, it was assumed to be canonical.
Classification of alternative splice pairs
28

Each EST-inferred alternative splice pair was classified according to EST
coverage (Figure 2.2c), effect on the coding region of the underlying genomic
sequence, and exon and splice site usage (Figure 2.2d). By this method,
mutually exclusive exon usage appeared as exon inclusion. Note that two
alternative splice pairs are associated with a single exon inclusion event. Also,
exon inclusion may be viewed as exon skipping from the perspective of the
alternative isoform.
Classification of alternative splicing modes
Alternative splices were categorized according to splice site usage and effects on
the coding sequence (Figure 2.2b), as described in the legend to Figure 2.2.
Identification of premature termination codons
Premature termination codons are stop codons that occur more than 50
nucleotides upstream of the final splice junction (121, 130, 143, 157, 177, 178, 204,
266). When an inferred mRNA isoform was found to contain a premature
termination codon, that isoform was labeled as an NMD candidate. The
tendency for alternative splicing to introduce premature termination codons
may be viewed at the level of alternative splice pairs (Figure 2.2e) or alternative
mRNA isoforms (Figure 2.2f).
Analysis of polyadenylation signals
POLYADQ (256) was used to search the alternative mRNAs for polyadenylation
sites. On average, a predicted polyadenylation signal occurred once every 2646
nucleotides in the coding exons of the RefSeq mRNAs and the intervening
29
introns. Regions spanning from a premature termination codon to the first splice
junction more than 50 nucleotides downstream contained predicted
polyadenylation signals once every 3187 nucleotides.
Analysis of premature termination codons in RefSeq mRNAs
To determine whether premature termination codons exist in experimentally-
identified mRNA transcripts, we examined the occurrence of premature
termination codons in the set of reviewed Refseq mRNAs from the August 2002
version of RefSeq (222). All Refseq mRNAs that are identified as reviewed
Refseq records have been individually examined by NCBI staff. Thus, these
sequences represent the most reliable segment of Refseq. The position of the
termination codon in each reviewed RefSeq mRNA was taken from the RefSeq
annotation. The position of the final splice junction was determined using
spidey (272) to align the mRNA to a NCBI human genome build 30 contig
sequence that had been associated using LocusLink (222). If the stop codon of
the RefSeq mRNA was found more than 50 nucleotides upstream of the final
splice junction, then the stop codon was identified as a premature termination
codon.
Selection of non-normalized, non-diseased-cell EST libraries
We used UniLib library annotations to construct a restricted set of EST libraries
(129). The keyword “protocol”, type “non-normalized” was used to search the
classification hierarchy for non-normalized libraries. The keyword “histology”,
type “normal” was used to identify libraries constructed by sequencing non-
30

diseased tissue. We took ESTs in the intersection of these two subsets as being
from non-normalized, non-diseased-cell libraries.
31

CHAPTER 3
Even curated databases contain protein isoform sequences derived from mRNAs likely degraded by NMD
Note: Much of the material presented in this chapter was included in the publication: Hillman RT, Green RE, and Brenner SE (2004). An unappreciated role for RNA surveillance Genome Biology. 5(2):R8.
32
Background
Alternative pre-mRNA splicing endows genes with the potential to produce a
menagerie of protein products. After pre-mRNA is transcribed, a complex
system of regulation determines which one of several possible versions of
mature mRNA will be produced (reviewed in 29). Alternative splicing is
particularly important in human gene expression, as it affects half or more of
human genes (137, 195). The diversity-generating capacity of alternative
splicing can be staggering: one notable example, the dscam gene of Drosophila
melanogaster, is hypothetically capable of producing 38,016 unique alternative
isoforms (58). However, functional roles for most alternative isoforms remain
undiscovered.
It has been known for more than a decade that nonsense and frameshift
mutations that induce premature termination codons can destabilize mRNA
transcripts in vivo (146, 161). First investigated in yeast and humans, NMD was
subsequently observed in a wide range of eukaryotes and is now thought to
occur in all eukaryotes (98). How cells manage to distinguish a premature
termination codon from a normal termination codon has been the subject of
intense investigation. Important details have emerged that establish the
following mechanistic framework model for NMD in mammals.
During pre-mRNA processing, the spliceosome removes intron
sequences. As this occurs, a set of proteins called the exon-junction complex is
deposited 20-24 nucleotides upstream of the sites of intron removal (157, 158,
33

178, 226). The components of this complex serve the dual roles of facilitating
export of the mature mRNA to the cytoplasm and remembering the gene
structure (156). According to the current model, as a ribosome traverses the
mRNA in its first pioneering round of translation, it displaces all exon-junction
complexes in its path (43, 84, 130, 181). For normal mRNAs, whose termination
codons are on or near the final exon, the ribosome will have displaced all
exon-junction complexes. If any exon-junction complexes remain, a series of
interactions ensues that leads to the decapping and degradation of the mRNA.
This model explains the basis of the “50 nucleotide rule” for mammalian NMD:
if a termination codon is more than about 50 nucleotides upstream of the final
exon, it is a PTC and the mRNA that harbors it will be degraded (204). The
mechanisms for NMD differ amongst yeast (107), flies (101), and mammals—
and may be different still in other eukaryotes.
Degradation of PTC+ mRNAs is generally thought to occur as a quality-
surveillance system—preempting translation of potentially dominant-negative,
C-terminal truncated proteins (48). PTC+ transcripts are aberrantly produced in
several ways. The somatic recombination that underlies immune system
diversity frequently generates recombined genes whose transcripts contain a
PTC (169). Inefficient or faulty splicing will often generate a frameshift in the
resulting mRNA, inducing a PTC to come into frame. Also, high processivity of
RNA polymerase yields a relatively high error rate, 1 in 10,000 bases (4, 35),
commonly introducing premature stops. DNA mutations are a source of
34

potentially heritable PTCs. It is estimated that 30% of inherited disorders in
humans are caused by a PTC (266). The numerous diseases whose pathogeneses
have been linked to NMD-inducing PTC mutations include aniridia from the
PAX6 gene (265), Duchenne Muscular Dystrophy from the Dystrophin gene
(141), and Marfan syndrome from the FBN1 gene (128).
In addition to its quality-control role in degrading aberrantly produced
PTC+ mRNAs, NMD has also been experimentally shown to act on a handful of
wild-type PTC+ mRNAs (152, 155, 165, 194, 199, 255, 274). In C. elegans, for
example, expression of the ribosomal proteins L3, L7a, L10a, and L12 and the SR
proteins SRp20 and SRp30b are regulated post-transcriptionally via the coupling
of alternative splicing and NMD (194, 199). In each case productive isoforms
were shown to be produced in vivo, as well as unproductive isoforms with a
PTC. Regulated splicing to generate the unproductive isoforms is used as a
means to down-regulate protein expression, as these mRNA isoforms are
degraded by NMD rather than translated to make protein. This system, which
we have termed regulated unproductive splicing and translation (RUST) is also
used in humans (152, 255, 274). For example, the SR-protein SC35 has been
shown to auto-regulate its own expression using RUST (255). When levels of
SC35 protein are elevated, SC35 binds its own pre-mRNA, inducing the
production of PTC+ SC35 mRNA. The PTC+ SC35 mRNA is destabilized by
NMD, resulting in lower levels of SC35 protein. A similar auto-regulatory rust
system was also recently discovered to control production of PTB (275).
35

In a previous study, we found that 35% of reliable EST-inferred human
mRNA alternative isoforms are PTC+, rendering them apparent targets of NMD
(110, 168). Therefore, many wild-type alternative mRNA isoforms may not be
translated into functional protein, but instead are targeted for degradation by
NMD. The vast majority of PTC+ isoforms identified in that study represent
previously unrecognized potential targets of NMD. However, EST databases
contain expressed sequence for many isoforms that are otherwise
uncharacterized. Therefore, it was not obvious how many of the isoforms
identified in that study as PTC+ were functionally relevant or even previously
known. It was also not obvious to what extent those PTC+ isoforms represented
instances of rust regulation or simply errors in pre-mRNA processing.
Regardless, it is clear that NMD has a vital role in regulating mammalian gene
expression, since inhibition of NMD is embryonic lethal for mouse (186).
To understand the biological significance of PTC+ isoforms and the
prevalence of NMD on wild-type transcripts, it is necessary to expand beyond
existing isolated rust examples, while retaining a focus on functionally
characterized genes. For this reason, we analyzed the human alternative
isoforms described in the SWISS-PROT database. Common routes for gene
isoform sequences to be determined and entered into databases include the
cloning of intronless mini-genes and the sequencing of unexpected PCR bands.
By either method, gene structure can not be directly observed, and therefore
PTCs may be overlooked. Further computational and experimental analyses
36

will also often be oblivious to these features. Because the cloning and
characterization of many isoforms predates our current understanding of NMD
action, we hypothesized that unrecognized potential targets of NMD may be
present even in curated databases like SWISS-PROT. We found that many of these
alternative protein isoforms derive from PTC+ mRNAs. This is particularly
surprising as SWISS-PROT is a heavily curated database of expressed protein
sequences. According to the current NMD model, these PTC+ mRNAs should
be degraded and therefore the protein isoforms should not be expressed at high
abundance. To resolve this apparent conflict, we examined existing
experimental evidence and found that, in several cases, results described in the
scientific literature are readily explained by NMD action.
This project grew out of a desire to identify high interest targets for
experimental verification. Tyler Hillman and I initially began by manually
perusing SWISS-PROT for experimentally described isoforms that were likely
targets of NMD that were also of scientific or medical interest. Tyler and I jointly
conceived of the protocol outlined in Figure 3.1 and jointly implemented it. I
performed the cross-species analysis of CLKs and we jointly authored the
manuscript.
Results and Discussion
We examined the human alternative isoforms described in the SWISS-PROT
database (32) to determine if any derive from PTC+ mRNA (see Materials and
Methods). For each alternative human protein isoform sequence in SWISS-PROT,
37

Assemble alternativehuman isoform
protein sequences
SWISS-PROTv.41
AssembleSWISS-PROT
humanproteinsisoforms
Assembled 4,556 isoforms,representing 1,636
SWISS-PROT genes
Mapped 2,742 isoforms,representing 1,463 genes,
to mRNAs andcoding sequences
2,483 isoforms,representing 1,363genes, producedhigh-confidence
SPIDEY alignments
SPIDEY todetermine
genestructure
Genomic sequenceHumangenome
Match SWISS-PROT isoforms to conceptuallytranslated protein sequences
in RefSeq or GenPept database( 99% identity and no gaps)
GenPeptproteins
GenBankmRNAs
Look upcorresponding
mRNAsequenceRefSeq
mRNAs
Look upcorresponding
mRNAsequence
GenBank/RefSeqmRNAs
RefSeqproteins
SWISS-PROTprotein
isoforms
STOPProteincDNA/mRNA
STOP
PTC+? If so,NMD candidate
144 isoforms (5.8% of 2,483), spread across 107 unique SWISS-PROT entries (7.9% of 1,363),
contain premature termination codons (PTCs)
Manual inspection
(a)
(b)
(c)
(d)
Proteins
38
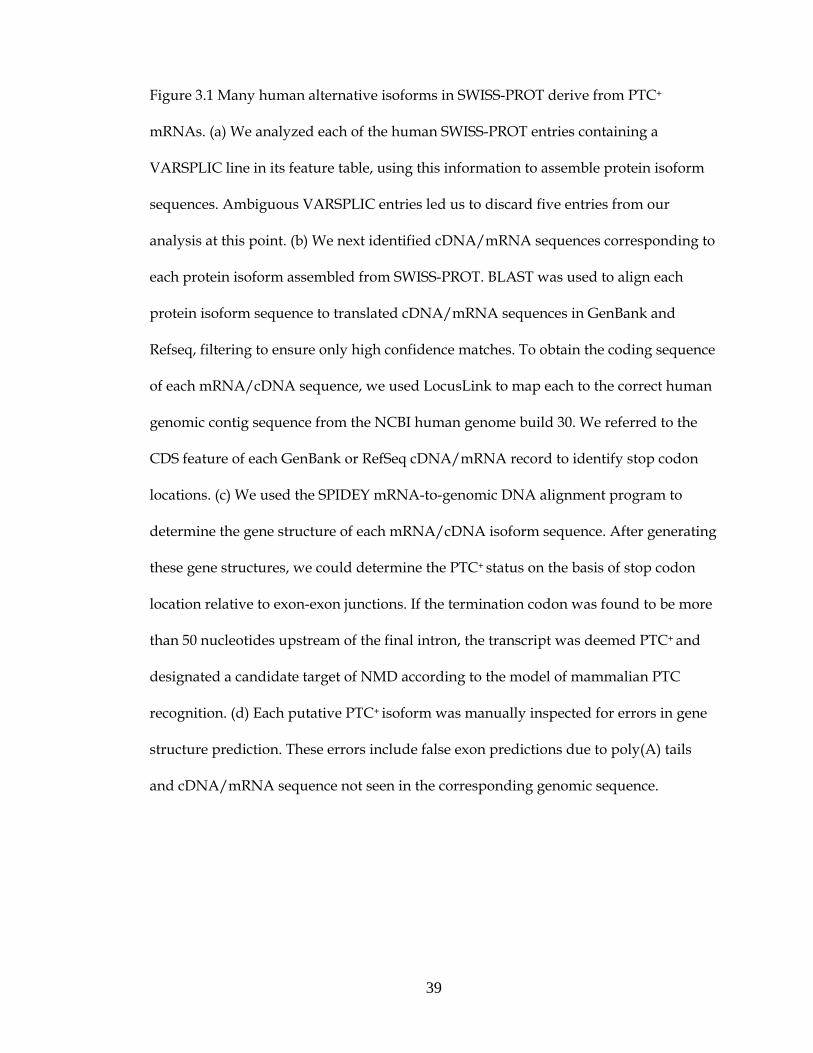
Figure 3.1 Many human alternative isoforms in SWISS-PROT derive from PTC+
mRNAs. (a) We analyzed each of the human SWISS-PROT entries containing a
VARSPLIC line in its feature table, using this information to assemble protein isoform
sequences. Ambiguous VARSPLIC entries led us to discard five entries from our
analysis at this point. (b) We next identified cDNA/mRNA sequences corresponding to
each protein isoform assembled from SWISS-PROT. BLAST was used to align each
protein isoform sequence to translated cDNA/mRNA sequences in GenBank and
Refseq, filtering to ensure only high confidence matches. To obtain the coding sequence
of each mRNA/cDNA sequence, we used LocusLink to map each to the correct human
genomic contig sequence from the NCBI human genome build 30. We referred to the
CDS feature of each GenBank or RefSeq cDNA/mRNA record to identify stop codon
locations. (c) We used the SPIDEY mRNA-to-genomic DNA alignment program to
determine the gene structure of each mRNA/cDNA isoform sequence. After generating
these gene structures, we could determine the PTC+ status on the basis of stop codon
location relative to exon-exon junctions. If the termination codon was found to be more
than 50 nucleotides upstream of the final intron, the transcript was deemed PTC+ and
designated a candidate target of NMD according to the model of mammalian PTC
recognition. (d) Each putative PTC+ isoform was manually inspected for errors in gene
structure prediction. These errors include false exon predictions due to poly(A) tails
and cDNA/mRNA sequence not seen in the corresponding genomic sequence.
39

we attempted to identify a corresponding cDNA/mRNA sequence in GenBank
(25) or RefSeq (222). As shown in Figure 3.1, 2742 isoform sequences from 1463
SWISS-PROT entries could be reliably mapped to a cDNA/mRNA sequence.
Next, we aligned each cDNA/mRNA sequence to the corresponding region of
genome sequence using the SPIDEY program (272). The SPIDEY output was
analyzed to identify the position of introns in each gene. To determine which
cDNA/mRNA sequences have PTCs according to the 50 nucleotide rule for
NMD, the position of the termination codon as reported in each GenBank or
RefSeq file was compared to the position of the introns. Of 2483 alternative
isoforms from 1363 SWISS-PROT entries that passed quality filters, 144 isoforms
(5.7% of 2483) from 107 entries (7.9% of 1363) were found to have PTCs, making
them candidate targets of NMD. We also found that SWISS-PROT entries that
contain multiple alternative isoforms amenable to our analysis were more likely
to contain at least one PTC+ isoform (Figure 3.2). The complete list of PTC+
alternative isoforms we identified in this analysis, along with their SWISS-PROT
accession numbers and cDNA/mRNA identifiers, are shown in Appendix A. In
the supplementary information to the Genome Biology manuscript, we have
provided the spidey alignment for each of the isoforms we identified as PTC+.
Next, we examined existing reports for experimental evidence that would
refute or support action of NMD on these PTC+ isoforms. We found that
published descriptions of these PTC+ isoforms sometimes do describe the
isoforms as containing premature termination codons. However, these articles
40

0 20 40 60 80 100
Total numberof entries
664
438
113
55
21
9
5
2
2
1
3
1
1
0
0
0
0
0
0
0
0
0
0
0
1
1
1
1
1
1
1
2
2
2
2
2
3
3
5
0 4
4
6
SWISS-PROT entrieswith indicated number of PTC+ isoforms (%)
1
2
3
4
5
6
7
8
9
10
11
12
16
smrofosi fo reb
m uN
si syla na ot elbanema
All isoformsamenable toanalysiswere PTC+
0 1 3 4 5 62
Scale of number ofPTC+ isoforms
Figure 3.2 SWISS-PROT entries with multiple isoforms amenable to analysis generate more PTC+ isoforms. We categorized SWISS-PROT entries by the number of isoforms that are amenable to our analysis and then determined how many contained at PTC. Each bar shows the number of PTC+ isoforms generated for all SWISS-PROT entries that had the indicated number of isoforms amenable to analysis. Bar components indicate how many entries had a given number of PTC+ isoforms. For example, the bar labeled ‘3’ contains data for the 113 SWISS-PROT entries that had 3 isoforms amenable to analysis. 86% of these had no PTC+ isoforms, 10% had one PTC+ isoform, and 4% had 2 PTC+ isoforms. The bar components outlined in green were SWISS-PROT entries for which all amenable isoforms had a PTC. Entries with multiple isoforms amenable to analysis were more likely to produce at least one PTC+ isoform. This study only considered entries with at least two isoforms in the SWISS-PROT database. For many entries only a single isoforms is amenable to analysis, however.
41

almost universally lack any mention of NMD, even as they often describe data
that is suggestive of NMD action. Amongst the many well-characterized
proteins found in our study to have at least one PTC+ splice variant, three
examples demonstrate how previously published experimental results may be
interpreted in light of NMD degradation of alternative mRNA isoforms.
Calpain-10
Calpain-10 is an ubiquitously expressed protease that is alternatively spliced to
produce eight mRNA isoforms (125), found in SWISS-PROT as Q9HC93. Calpain-
10 is an intensely studied gene because a polymorphism in its third intron,
UCSNP-43, has been linked to Type-II diabetes in several populations. Because
this polymorphism lies in intronic sequence it does not directly affect the coding
potential of any isoform of Calpain-10. It was shown that homozygosity of
UCSNP-43 leads to reduced levels of total Calpain-10 transcript and is co-
incident with insulin resistance in skeletal muscle (17). Previous investigations
into how this polymorphism affects transcript abundance have centered on
transcriptional regulation (125, 279). In an expression study, Horikawa et al.
found four of the eight isoforms to be “less abundant.” It is these same four
mRNA isoforms that we found in our survey of swiss-prot to be PTC+,
suggesting that NMD may be responsible for this experimental observation
(Figure 3.3). This introduces the possibility that UCSNP-43 may affect the
regulation of Calpain-10 alternative splicing, favoring production of one or
more of the PTC+ isoforms.
42

0 3,200 6,400 9,600 12,800 32,000
NM_021251.2
Start Stop
NM_023083.1
Start Stop
NM_023084.1
Start
NM_023085.1
Start Stop
NM_023086.1
Start
NM_023087.1
StartPremature
stop
NM_023088.1
Start
NM_023089.1
Start Stop
0 3,200 6,400 9,600 12,800
Found inhigher
abundanceby Horikawa
et al. [43]
Calpain-10 (Q9HC93) gene structures
Isoform H
Isoform A(original)
Isoform B
Isoform C
Isoform D
Isoform E
Isoform F
Isoform G
UCSNP-43
Prematurestop
Prematurestop
Prematurestop
Nucleotides
ContainsPTC
(a) (b)
Figure 3.3 Published expression levels of calpain-10 isoforms are consistent with NMD predic-tion. (a) A report from Horikawa and co-workers found eight alternative isoforms of calpain-10, of which four are expressed in low abundance. Our analysis found this exact set of four low abuncance isoforms to contain PTCs. (b) Gene structures of alternative mRNA isoforms of calpain-10 show the patterns of alternative splicing and indicate locations of PTCs. Also shown is the position of UCSNP-43, an intronic polymorphism that has been statistically linked to type II diabetes susceptibility in a variety of populations.
43

CDC-like Kinases CLK1, CLK2, and CLK3
CLK1, CLK2, and CLK3—three members of the CDC-like kinase family (also
known as LAMMER kinases and STY kinases; SWISS-PROT entries P49759,
P49760, P49761)—were found to have at least one PTC+ splice variant. CLKs are
thought to be high-level regulators of alternative splicing, as CLK1 has been
shown to activate a set of SR-proteins by phosphorylating them (86, 87, 190).
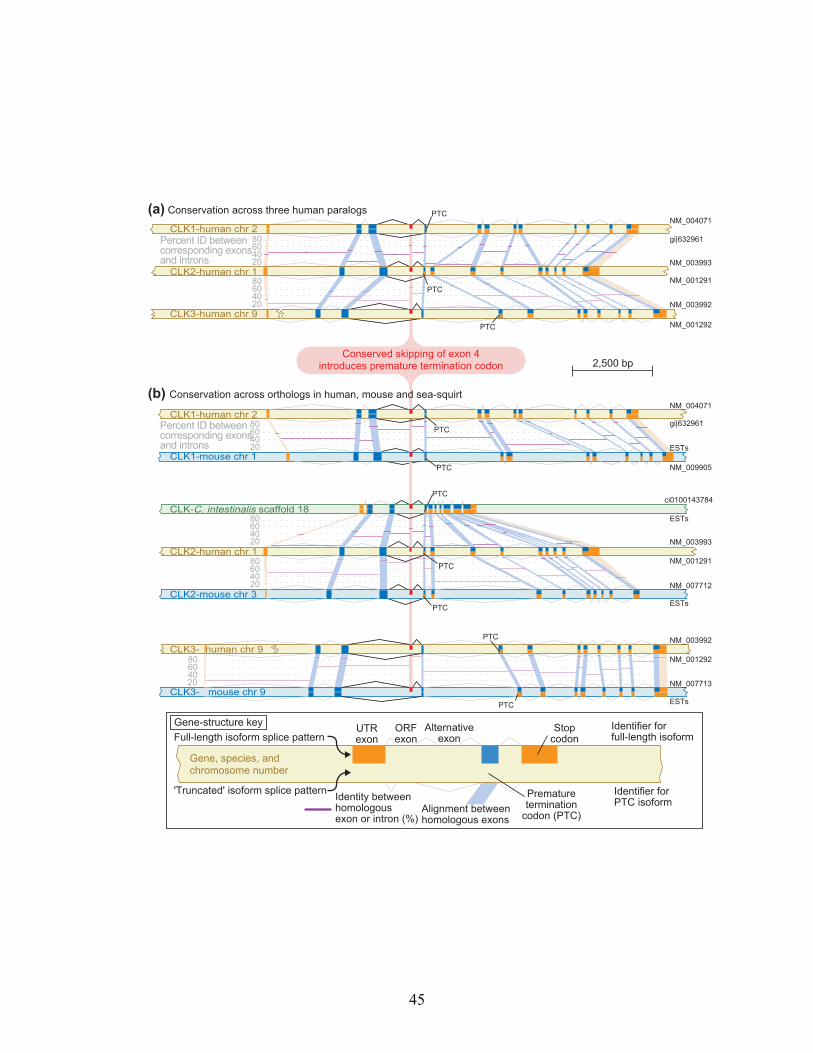
The pattern of alternative splicing of each CLK paralog was found to be the
same: a full-length isoform, and an isoform that skips exon 4 (113). We found
that in each case, skipping exon 4 induces a frameshift that creates a PTC
(Figure 3.4a). The conceptual translations of these PTC+ isoforms, described as
“truncated,” lack most of the coding region including the kinase domain.
Having observed conservation amongst the human paralogs, we
examined the gene structures of the mouse orthologs of each CLK (Figure 3.4b)
to determine if the pattern was shared across species. We identified mouse
orthologs via existing RefSeq database annotation. EST evidence of alternative
splicing showed that all three mouse CLK orthologs showed the same pattern of
alternative splicing, skipping exon 4 to induce a PTC, as seen in the human
CLKs. The significance of this evolutionary conservation is underscored by the
recent finding that alternative exons are “mostly not conserved” between
human and mouse (196). For the CLK genes, the alternative exons and the
introns flanking them are amongst the most highly similar regions of these
genes (Figure 3.4).
44
ci0100143784
ESTs
NM_004071
gi|632961PTC
ESTsCLK1-mouse chr 1
PTC
Percent ID betweencorresponding exonsand introns 40
6080
20
NM_003993
NM_001291
NM_007712
ESTsCLK2-mouse chr 3
CLK-C. intestinalis scaffold 18
2,500 bp
NM_003992
NM_001292
NM_007713
ESTsCLK3- mouse chr 9
NM_004071CLK1-human chr 2
PTC
CLK2-human chr 1
NM_003992CLK3-human chr 9
Conserved skipping of exon 4introduces premature termination codon
Conserved skipping of exon 4introduces premature termination codon
406080
20
406080
20
Percent ID betweencorresponding exonsand introns
Identifier forfull-length isoform
Identifier forPTC isoformAlignment between
homologous exons
UTRexon
Alternativeexon
Identity betweenhomologousexon or intron (%)
Gene, species, andchromosome number
NM_003993
NM_001291
NM_001292
gi|632961
(a) Conservation across three human paralogs
(b) Conservation across orthologs in human, mouse and sea-squirt
Gene-structure key
CLK1-human chr 2
CLK2-human chr 1
CLK3- human chr 9
406080
20
406080
20
406080
20
PTC
PTC
PTC
PTC
PTC
PTC
PTC
NM_009905
Full-length isoform splice pattern
'Truncated' isoform splice pattern
ORFexon
Stopcodon
Prematuretermination
codon (PTC)
45

Figure 3.4 Splicing to generate a premature termination codon is evolutionarily
conserved in CLKs. The CDC-like kinases (CLKs) are splicing regulators that affect
splicing decisions through the phosphorylation of SR proteins. (a) Our screen of
SWISS-PROT revealed that human CLK1, CLK2 and CLK3 paralogs all generate PTC+
alternative isoforms. The splicing pattern that generates these isoforms, skipping exon
4, is conserved in each. This splicing pattern causes a frameshift and a PTC. The percent
identities from global alignments between corresponding exons and introns are shown
in purple. (b) CLKs were identified in mouse through existing annotation and in the
predicted genes of the sea squirt C. intestinalis using an HMM constructed with
annotated CLKs from a variety of organisms. An EST analysis revealed that the
alternative splicing pattern that generates PTC+ alternative isoforms was conserved in
all three sets of orthologs in human and mouse. The same splicing pattern was also
found in the only C. intestinalis homolog. A relatively high degree of sequence
similarity was found to be present in the introns flanking the alternative exon.
46

We next searched for evidence of more distant conservation of CLK
alternative splicing. We identified the single sea squirt CLK homolog by using a
hidden Markov model of CLKs to search the C. intestinalis genome (see
Materials and Methods). EST evidence clearly indicated that the same
alternative splicing pattern seen in human and mouse is also conserved in C.
intestinalis. We were not able to observe a set of similar splicing patterns in
Drosophila melanogaster (data not shown).
Menegay and co-workers “tested whether expression of CLK1 splice
products was subject to regulation by cellular stressors” (190). They found that
“UV exposure or high salt conditions had no effect on the ratio of full-length to
truncated splice forms of CLK1. Cycloheximide however had a large effect,
changing the ratio dramatically in favor of the truncated kinase-less form of
mRNA” (Figure 3.5). Cycloheximide, a chemical inhibitor of translation, is
known to inhibit NMD (54), because NMD is a translation-dependent process.
Indeed, cycloheximide is now a commonly used reagent for NMD-inhibition
experiments (e.g., 152, 163, 207). Combined with our finding that the
“truncated” mRNA isoform possesses a PTC, the results of Menegay et al. can
be readily explained: the increased abundance of the “truncated,” PTC+ isoform
following cycloheximide treatment is likely the result of inhibiting NMD, which
normally degrades it.
CLK1 has been shown to indirectly affect its own splicing (86): the
presence of high levels of CLK1 protein favors generation of the “truncated,”
47

STOPFull-length isoform
560453
GAPDH
Reproduced withpermission from (190)
CLK1
edimixeholcy
C
lortnoC
PTC+ isoform
Terminationcodon
Constitutiveexon
Alternativeexon
(a) CLK1 gene structures (b)
STOP
STOP
Figure 3.5 Cycloheximide increases abundance of CLK1 PTC+ isoform. (a) Gene structures of CLK1 full-length and PTC+ isoforms as determined by ouranalysis. (b) Menegay et al. (190) performed the RT-PCR analysis of CLK1 isoforms; Figure 8 of that analysis [48] is reproduced here with permission (© Company of Biologists Ltd.). The 560 bp fragment corresponds to thefull-length CLK1 isoform; the 453 bp fragment corresponds to the PTC+ CLK1 isoform. The analysis shows that cycloheximide, but not UV irradiation or high salt (data not shown), increased the relative abundance of the CLK1 isoform containing a premature termination codon. As cycloheximide is a potent inhibiter of NMD (see, for example, [28,51-53]), this result suggests that the CLK1 PTC+ isoform is degraded by NMD. Menegay et al. [48] describe their figure as follows: "Shift in PCR products of splice forms with cycloheximide. Control or PC12 cells treated with 10 μg/ml cycloheximide for 60 minutes were harvested, RNA was extracted, and RT-PCR was performed. [...] PCR products of the 560 bp full-length form or the 453 kinase-less form of CLK1 message shown. [...] PCR of GAPDH controls from each sample to control for RNA loading."
48
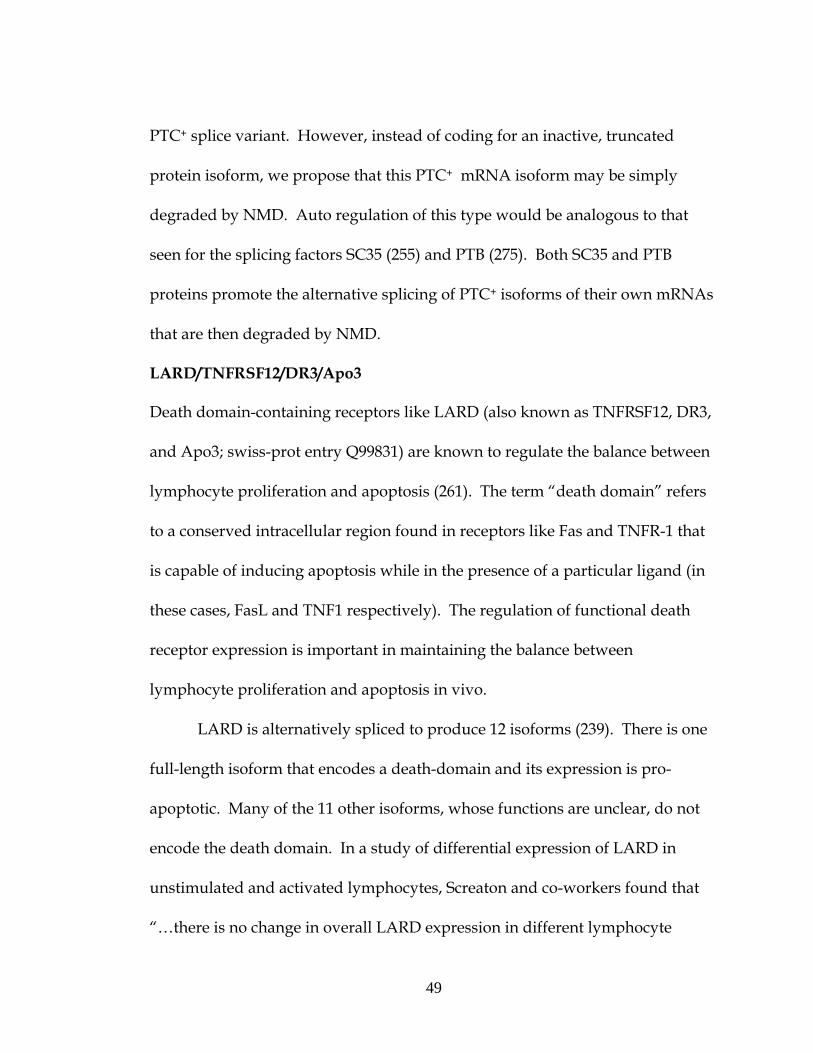
PTC+ splice variant. However, instead of coding for an inactive, truncated
protein isoform, we propose that this PTC+ mRNA isoform may be simply
degraded by NMD. Auto regulation of this type would be analogous to that
seen for the splicing factors SC35 (255) and PTB (275). Both SC35 and PTB
proteins promote the alternative splicing of PTC+ isoforms of their own mRNAs
that are then degraded by NMD.
LARD/TNFRSF12/DR3/Apo3
Death domain-containing receptors like LARD (also known as TNFRSF12, DR3,
and Apo3; swiss-prot entry Q99831) are known to regulate the balance between
lymphocyte proliferation and apoptosis (261). The term “death domain” refers
to a conserved intracellular region found in receptors like Fas and TNFR-1 that
is capable of inducing apoptosis while in the presence of a particular ligand (in
these cases, FasL and TNF1 respectively). The regulation of functional death
receptor expression is important in maintaining the balance between
lymphocyte proliferation and apoptosis in vivo.
LARD is alternatively spliced to produce 12 isoforms (239). There is one
full-length isoform that encodes a death-domain and its expression is pro-
apoptotic. Many of the 11 other isoforms, whose functions are unclear, do not
encode the death domain. In a study of differential expression of LARD in
unstimulated and activated lymphocytes, Screaton and co-workers found that
“…there is no change in overall LARD expression in different lymphocyte
49

subsets” (239). Although total expression levels were unchanged, the pattern of
alternative splicing changed dramatically (Figure 3.6). Unstimulated
lymphocytes expressed five “truncated” isoforms, but very little of the full-
length isoform. They found that, “After lymphocyte activation, there is a
complete switch in splicing that will expose PHA-blasted [activated] cells to the
risk of apoptosis triggered through LARD…. The splicing pattern reverses after
PHA blasting when isoforms encoding the truncated molecules are much
reduced and LARD-1 predominates.”
We found that the five “truncated” LARD mRNA isoforms expressed in
unstimulated lymphocytes all have PTCs (isoforms 2, 3, 4, 5, and 6). [Note:
SWISS-PROT uses a different numbering scheme in which isoforms 2-6 are known
as 12, 3, 5, 6, and 7, respectively.] Only the full-length apoptosis-promoting
isoform 1, expressed in activated lymphocytes, is free of a PTC. Though there is
presently no evidence of transcript degradation, this precise correlation between
PTC-containing isoform expression and lymphocyte activation suggests that
alternative splicing’s role in regulating lymphocyte apoptosis may be mediated
by NMD.
Conclusions
We found that 144 of the human alternative isoforms described in SWISS-PROT
derive from mRNAs that contain PTCs. These mRNAs are apparent targets for
NMD, and we expect that most are degraded by this system. In many cases,
existing experimental evidence is consistent with this expectation. Because our
50

NO
+
Reproduced withpermission
Figure 3.6 LARD/TNRRSF12/DR3/Apo3 expression correlates with PTC+ status. LARD is an alternatively spliced death-domain-containing member of the tumor necreosis factor receptor family (TNFR). However, only the major splice variant (isoform 1) contains the death domain and is capable of inducing apoptosis. The splicing distribution of LARD isoforms has been shown to change on lymphocyte activation, suggesting that alternative splicing may be a control point regulating lymphocyte proliferation. (a) Screaton et al. showed that, before lymphocyte activation, only LARD isoforms 2, 3, 4, 5 and 6 are expressed. Primary blood lymphocytes treated with an activating agent were found instead to express the major, apoptosis-promoting splice variant(isoform 1) almost exclusively. This panel is reproduced with permission from Figure 6a of (239) (© National Academy of Sciences). Screaton et al. (239) describe their figure as follows: "South-ern blots of reverse transcriptase-PCR of LARD cDNA with primers F LARD Kpn and R LARD Xba probed with 32P-labeled primer F LARD Xba. Lanes: 1, CD4+ cells; 2, CD8+ cells; 3, B cells; 4 PHA-blasted PBL; 5, negative control." (b) LARD isoforms 2, 3, 4, 5 and 6 were found in our analysis of SWISS-PROT to have PTCs, rendering them potential targets of NMD. The precise correlation between LARD isoform expression and PTC+ status hints that there may be a role for alternative-splicing-induced NMD. Here, the gene structures of these five isoforms are shown alongside that of the full-length LARD isoform (isoform 1). In each case, the location of the stop codon has been labeled and, where appropriate, isoforms have been denoted as PTC+.
51

analysis was restricted to only human entries and many SWISS-PROT records
could not be reliably analyzed, it is likely that there remain more unidentified
putative NMD targets. We are beginning a collaborative project with SWISS-PROT
to identify and suitably annotate these entries. The relevance of this effort is
highlighted by the many instances in which existing experimental data can be
explained in light of NMD action.
Materials and Methods
SWISS-PROT isoform extraction and assembly
We analyzed each of the 1641 SWISS-PROT v.41 human entries containing a
VARSPLIC line in its feature table (32). Information contained in each VARSPLIC
line was used to assemble protein isoform sequences for 4556 isoforms from
1636 unique SWISS-PROT entries. 5 entries could not be analyzed due to
ambiguous VARSPLIC annotation.
Identification of corresponding cDNA/mRNA sequences
Although SWISS-PROT contains cross-references to cDNA/mRNA sequences for
major protein isoforms, cross references do not exist for many alternative
isoforms. To find the cDNA/mRNA sequence corresponding to each SWISS-
PROT protein isoform, we used BLAST version 2.2.4 (12) to align each protein
isoform sequence to translated cDNA/mRNA sequences from all GenBank (25)
and RefSeq cDNA/mRNA sequences in these databases as of 22 March 2003
(222). In these alignments, we required ≥99% identity over the full length of the
52
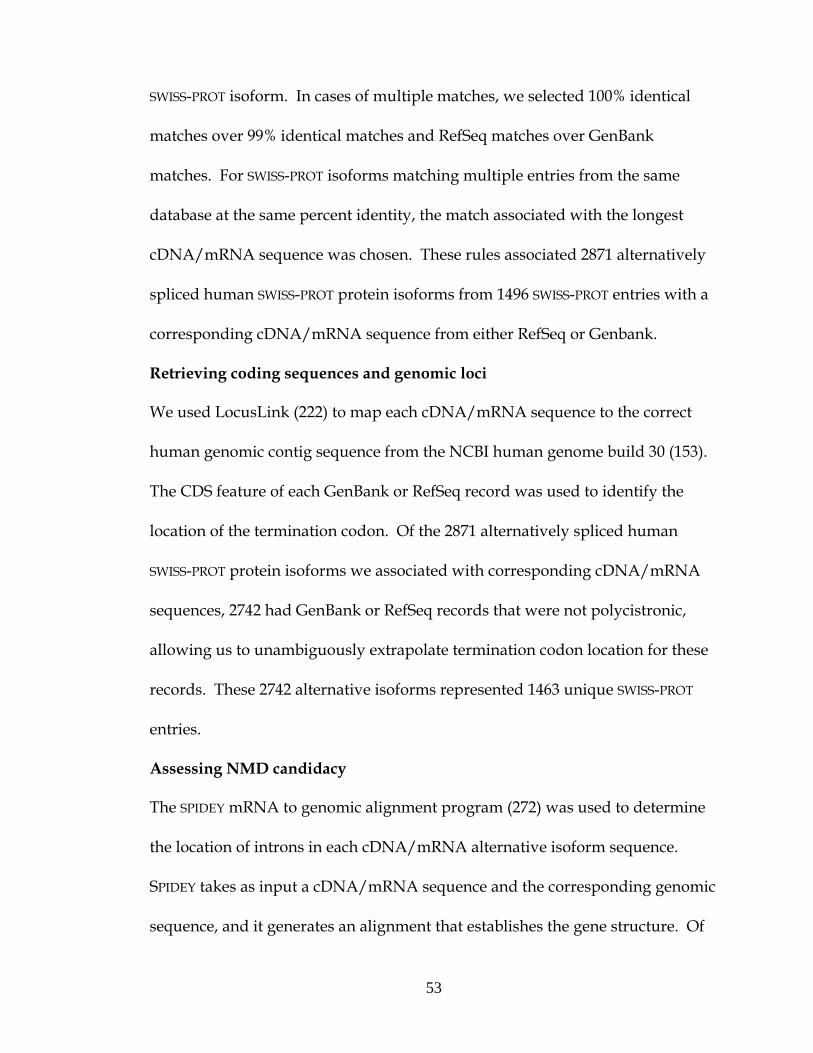
SWISS-PROT isoform. In cases of multiple matches, we selected 100% identical
matches over 99% identical matches and RefSeq matches over GenBank
matches. For SWISS-PROT isoforms matching multiple entries from the same
database at the same percent identity, the match associated with the longest
cDNA/mRNA sequence was chosen. These rules associated 2871 alternatively
spliced human SWISS-PROT protein isoforms from 1496 SWISS-PROT entries with a
corresponding cDNA/mRNA sequence from either RefSeq or Genbank.
Retrieving coding sequences and genomic loci
We used LocusLink (222) to map each cDNA/mRNA sequence to the correct
human genomic contig sequence from the NCBI human genome build 30 (153).
The CDS feature of each GenBank or RefSeq record was used to identify the
location of the termination codon. Of the 2871 alternatively spliced human
SWISS-PROT protein isoforms we associated with corresponding cDNA/mRNA
sequences, 2742 had GenBank or RefSeq records that were not polycistronic,
allowing us to unambiguously extrapolate termination codon location for these
records. These 2742 alternative isoforms represented 1463 unique SWISS-PROT
entries.
Assessing NMD candidacy
The SPIDEY mRNA to genomic alignment program (272) was used to determine
the location of introns in each cDNA/mRNA alternative isoform sequence.
SPIDEY takes as input a cDNA/mRNA sequence and the corresponding genomic
sequence, and it generates an alignment that establishes the gene structure. Of
53
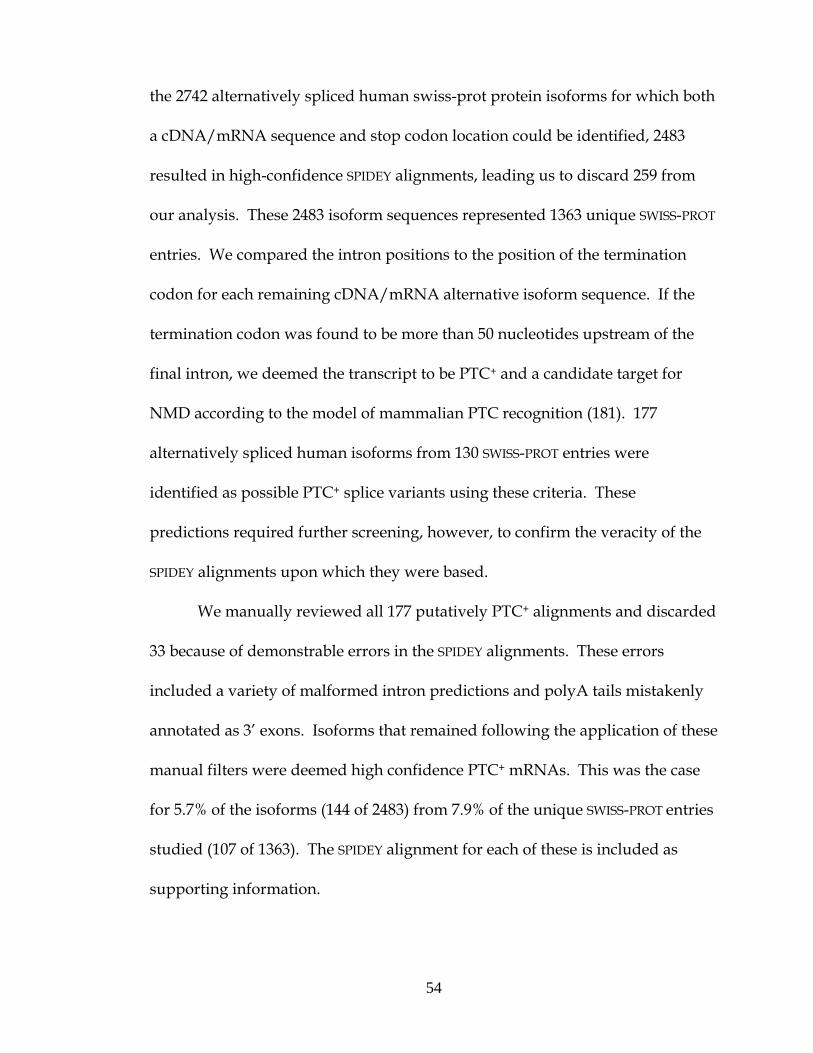
the 2742 alternatively spliced human swiss-prot protein isoforms for which both
a cDNA/mRNA sequence and stop codon location could be identified, 2483
resulted in high-confidence SPIDEY alignments, leading us to discard 259 from
our analysis. These 2483 isoform sequences represented 1363 unique SWISS-PROT
entries. We compared the intron positions to the position of the termination
codon for each remaining cDNA/mRNA alternative isoform sequence. If the
termination codon was found to be more than 50 nucleotides upstream of the
final intron, we deemed the transcript to be PTC+ and a candidate target for
NMD according to the model of mammalian PTC recognition (181). 177
alternatively spliced human isoforms from 130 SWISS-PROT entries were
identified as possible PTC+ splice variants using these criteria. These
predictions required further screening, however, to confirm the veracity of the
SPIDEY alignments upon which they were based.
We manually reviewed all 177 putatively PTC+ alignments and discarded
33 because of demonstrable errors in the SPIDEY alignments. These errors
included a variety of malformed intron predictions and polyA tails mistakenly
annotated as 3’ exons. Isoforms that remained following the application of these
manual filters were deemed high confidence PTC+ mRNAs. This was the case
for 5.7% of the isoforms (144 of 2483) from 7.9% of the unique SWISS-PROT entries
studied (107 of 1363). The SPIDEY alignment for each of these is included as
supporting information.
54
CLK analysis
Human CLK1, CLK2, and CLK3 (swiss-prot IDs P49759, P49760, and P49761)
were among those SWISS-PROT entries we selected for further examination. They
were mapped to RefSeq and GenBank entries, as shown in Figure 3.1.
LocusLink was used to associate each CLK gene sequence to its corresponding
genomic contig. For each gene, SPIDEY version 1.35 was run twice, using the
vertebrate splice-site setting, to align it with its contig sequence and determine
its gene structure. This first SPIDEY alignment was used to define the extent of
each gene’s locus: the region containing all the coding sequence, introns, and
1000 nucleotides of flanking sequence on each side. The second SPIDEY
alignment was made using just this locus. Custom scripts (available from the
authors on request), GFF2PS (1), and manual editing were used to generate the
graphical representations of the gene structures shown in Figure 3.4. Intron and
exon sequences were then extracted using the SPIDEY results to delineate exon
and intron boundaries. Corresponding exons and introns were globally aligned
using ALIGN version 2.0u (203) with default parameters.
Mouse CLKs were identified using RefSeq annotation (NM_009905—
which skipped exon 4 and had a PTC, NM_007712, and NM_007713). Genomic
loci sequences were generated and gene structures determined for each mouse
CLK gene using SPIDEY, as above. The loci sequences were then used to search
the mouse ESTs from dbEST (1 May 2003) (33) using WU-BLAST 2.0mp [23-May-
2003] (103) with default parameters. Hits with E-values of 10-30 or better were
55
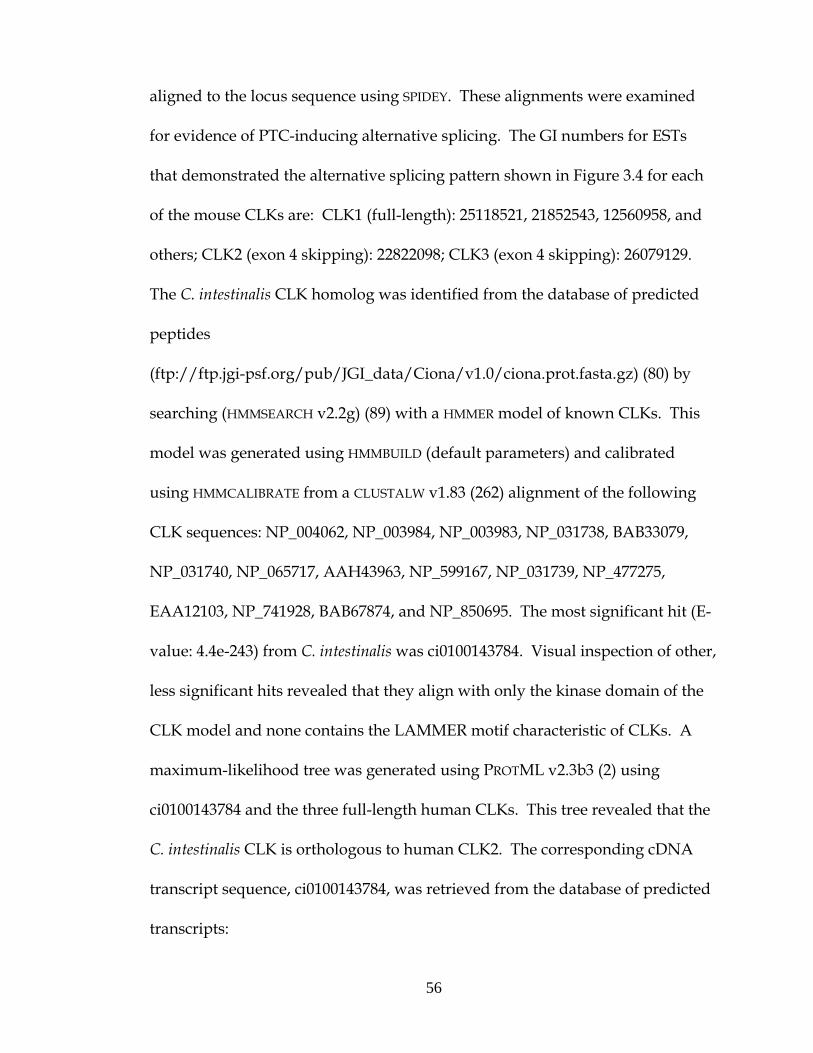
aligned to the locus sequence using SPIDEY. These alignments were examined
for evidence of PTC-inducing alternative splicing. The GI numbers for ESTs
that demonstrated the alternative splicing pattern shown in Figure 3.4 for each
of the mouse CLKs are: CLK1 (full-length): 25118521, 21852543, 12560958, and
others; CLK2 (exon 4 skipping): 22822098; CLK3 (exon 4 skipping): 26079129.
The C. intestinalis CLK homolog was identified from the database of predicted
peptides
(ftp://ftp.jgi-psf.org/pub/JGI_data/Ciona/v1.0/ciona.prot.fasta.gz) (80) by
searching (HMMSEARCH v2.2g) (89) with a HMMER model of known CLKs. This
model was generated using HMMBUILD (default parameters) and calibrated
using HMMCALIBRATE from a CLUSTALW v1.83 (262) alignment of the following
CLK sequences: NP_004062, NP_003984, NP_003983, NP_031738, BAB33079,
NP_031740, NP_065717, AAH43963, NP_599167, NP_031739, NP_477275,
EAA12103, NP_741928, BAB67874, and NP_850695. The most significant hit (E-
value: 4.4e-243) from C. intestinalis was ci0100143784. Visual inspection of other,
less significant hits revealed that they align with only the kinase domain of the
CLK model and none contains the LAMMER motif characteristic of CLKs. A
maximum-likelihood tree was generated using PROTML v2.3b3 (2) using
ci0100143784 and the three full-length human CLKs. This tree revealed that the
C. intestinalis CLK is orthologous to human CLK2. The corresponding cDNA
transcript sequence, ci0100143784, was retrieved from the database of predicted
transcripts:
56

(ftp://ftp.jgi-psf.org/pub/JGI_data/Ciona/v1.0/ciona.mrna.fasta.gz).
As above, the locus for this gene was extracted from the genomic contig
sequence, Scaffold18, and used to search the database of C. intestinalis ESTs. The
following ESTs showed the full-length pattern with no PTC: 24144377, 24820603,
24627564, 24627468, 24866887, and 2482449. The following ESTs showed the
alternatively-spliced pattern that generates a PTC: 24888181, 24606693,
24823992, and 24893089.
The C. intestinalis CLK gene was found to have only 11 exons while
human and mouse CLK2 have 13. To determine which exons were homologous,
we generated a CLUSTALW multiple-sequence alignment of the known CLK
protein sequences listed above and C. intestinalis CLK and we used this
alignment to identify corresponding regions of DNA sequence. This
unambiguously indicated the exon to exon alignment shown in Figure 3.4.
57

CHAPTER 4
Discussion of regulated unproductive splicing and translation and future directions
58

In the time since we published evidence describing the widespread
coupling of alternative splicing and NMD, the implications of these results in
the fields of alternative splicing and NMD have begun to be explored. In this
chapter, I will summarize some of this work and describe some promising areas
for future exploration.
For alternative splicing, one major ramification is that all observed
mRNA isoforms can no longer be safely assumed to code for significant levels of
protein, as they often were previously. Regarding NMD, our result supports the
view that NMD is not always simply a quality control mechanism on pre-
mRNA processing. Rather, proper regulation of many genes requires NMD and
this may explain the lethal UPF1-null phenotype in mammals. Finally,
awareness of RUST has impacted theories of the evolution of alternative splicing
and the evolve-ability of spliced genes. A new view has emerged in which NMD
provides a backstop against which alterations in pre-mRNA processing can be
safely explored by evolution with muted negative fitness effects.
RUST implications on alternative splicing
Many scientific advances do not answer existing questions, but rather cause us
to ask different questions. The realization that scores of alternative mRNA
isoforms are shunted into the mRNA degradation pathway is one such case. It is
now reasonable to ask, for any given mRNA isoform, whether its role is to code
for protein or not. More generally, given the amount of splicing that appears to
be futile in the sense that it generates unproductive mRNA isoforms, it now
59

seems reasonable to ask which and how many specific mRNA isoforms
represent functional forms, either as protein-coding mRNA or as unproductive
isoforms, and which are simply the product of the biochemical noise inherent in
splicing. These questions are beginning to be addressed now and should
continue to be the foci of future work.
Assessing the functional impact of alternative splicing
Several large-scale studies have been carried out, both before and after the
publication of our RUST model, to assess the impact of alternative splicing at
the protein-coding level. One major goal of these surveys is to discover any
large-scale trends in genes that are alternatively spliced. Specifically, does
alternative splicing occur more or less often in any specific classes of genes? Or,
are there any recognizable trends in the effects of alternative splicing in domain
architecture?
We performed an analysis of this type of alternative isoforms described
in the SWISS-PROT database. After mapping regions of alternative splicing and
structural domains onto alternative isoforms, we assessed whether there was
overlap in these regions beyond what one would expect by chance (see
Appendix B). Interestingly, we found that alternative splicing is biased against
interrupting structural domains (Figure 4.1) as alternatively spliced regions
overlap structural domains less often than would be expected if the two were
arranged independently. This result was subsequently corroborated and
published (149). Although the effect does not appear to be strong, it is consistent
60

02000400060008000
10000
0300060009000
1200015000
ASTRAL structural domains identified by BLAST
SUPERFAMILY structural domains identified by HMMER
AS andSD do
not cross
SDwithin
AS
ASwithin
SD
SDcrosses
AS
Observed Expected underrandom model
Figure 4.1 Correlation between identifiable structural domains and annotated alternatively spliced regions of SWISS-PROT isoforms. (a) The ASTRAL database of structural domain sequences was aligned to all alternative isoform sequences in SWISS-PROT. Alignments of E-value of 1x10⁻⁴ or less were used to define regions of the SWISS-PROT isoforms that are structural domains. Regions that do not map to a structural domain may be structural domains for which no similar ASTRAL sequence is present or may be linker or unordered sequence. The SWISS-PROT annotation of alternative regions was compared to the structural domains to classify each struc-tural domain as non-overlapping, contained within, containing, or overlapping alternative regions. There is a slight bias for alternative splicing to avoid affecting structural domains compared to the random model. The random model values were generated by placing structural domains randomly along each isoform sequence. (b) The bias is also present when structural domains are identified using a more sensitive method: HMMER searches with theSUPERFAMILY database of structurally defined Profile Hidden Markov Models.
a
b
Num
ber o
f S
D a
lignm
ents
Num
ber o
f S
D a
lignm
ents
61

with the presumption that alternative splicing often generates functionally
distinct protein products by altering the domain constituents present within
isoforms. In light of our PTC analysis of human SWISS-PROT isoforms, it will be
interesting to see if the correlation between structural domains and alternatively
spliced regions is changed when only productive isoforms are considered.
Perhaps many unproductive mRNA isoforms, whose only function is to be
degraded by NMD or that have no function, are introducing noise into this
analysis. These isoforms should be under no constraint with respect to the
alternately spliced regions/domain boundaries correlation.
Large scale analyses of the impact of alternative splicing on the
functionality of isoforms have also been carried out. In several cases conclusions
were made that should be reconsidered in light of the RUST model. The RIKEN
analysis of 60,770 mouse cDNAs is one such example (208). The RIKEN team of
curators found that many cases of alternative splicing generated truncated
isoforms (286, 287). They reckoned the role of these mRNAs was to code for
either inactive or dominant negative protein products. They also observed
significant amounts of alternative splicing within 3’ UTR regions, which were
not explored further. These isoforms may be PTC+ and the expression of these
genes may be under RUST regulation. The current set of 103,000 mouse cDNAs
has been analyzed for PTC+ forms and many were found to be PTC+ (data not
shown).
62

A large scale study of which domains are affected by alternative splicing
was recently carried out by Liu and Altman (173). Using gene ontology (GO)
annotations they found that several classes of domain were more likely to be
impacted by alternative splicing. Among these were protein kinase, caspase,
and tyrosine phosphatase domains. Interestingly, they found that in 28% of the
instances they analyzed, these domains were removed by alternative splicing
events that induce a frameshift and truncate the open reading frame. Obviously,
many of these would also contain a PTC. For the PTC+ isoforms, interpreting
biological function based on the protein coding potential may lead to false
conclusions.
Thankfully, recent studies have largely been mindful of our new
understanding of the role of NMD in alternative splicing. In addition to our own
work, analyses of alternative splicing effect on transmembrane regions (278),
domain composition (228) and domain composition of brain-expressed genes
(124) have been published that take account of the potential for RUST
regulation. Additionally, we were asked to participate in the most recent RIKEN
mouse cDNA analysis: FANTOM III. Using the gene structure models
determined upstream in the analysis, we checked the PTC status of all cDNAs
amenable to analysis. We found the level of PTC incorporation in this set to be
comparable to mouse GenBank isoforms in general.
63

Assessing alternative splicing for functionality
Because many mRNA isoforms are likely targets for degradation by NMD, the
possibility exists that many of these may be irrelevant, non-functional forms. To
determine if a feature of a gene or its expression is functional, it is often
instructive to use inter-species comparative analysis with the simple rationale
that conserved features are more likely to be functional than those that are not.
This approach has been brought to bear in the field of alternative splicing with
several surprising results.
Kan and co-workers analyzed EST-inferred alternative splice events in
human and found that less than 30% were conserved in mouse (137). The least
conserved alternative splicing events were intron retentions. This is not
surprising for two reasons. First, intron retention alternative splicing is
indistinguishable from incomplete pre-mRNA processing, a common EST
database contaminant. Therefore, many of these may not be genuine spliced
mRNAs but rather forms caught somewhere in the splicing pathway. Also, the
resultant isoforms of mRNAs with retained introns are the most likely to contain
a PTC and to be degraded by NMD. Therefore, any selective pressure against
expression of these isoforms should be mitigated. In other words, NMD may
make these forms invisible to purifying selection, allowing them to drift into
and out of existence randomly through evolutionary time.
Several subsequent analyses reiterated the observation that many human
alternative splicing events are not observed in mice (196, 212, 280). These
64

subsequent studies also showed that conserved alternative splicing is
distinguishable from non-conserved alternative splicing by several features.
Conserved events are more likely to affect the protein coding sequence, more
likely to preserve the reading frame, and more likely to use the same stop codon
(250). They involve exons that are more similar between species and that contain
specific intronic and exonic elements implicated in splicing (280). Out of these
efforts, several useful criteria for discriminating functional from non-functional
alternative splicing were generated.
The picture that emerges is one in which many observed alternative
isoforms may be non-functional and perhaps neutrally evolving. Since these
isoforms derive from functional sequence, they are left to explore new
combinations of coding sequence that have already proved to be useful. So long
as the original isoform is still encoded at the required levels and these isoforms
do not produce deleterious gain of function protein, evolution can freely explore
this potentially advantageous isoform space. Further, as prematurely
terminating isoforms may be more likely to encode dominant negative,
truncated versions of the original protein, NMD can be used to close off this
dangerous isoform space. Consistent with this picture, it was recently shown
that both diploidy and alternative splicing are associated with increased
occurrence of PTC+ isoforms (278).
65

RUST implications on NMD
One of the most important implications of the RUST model in the field of NMD
is that it provides a potential explanation for the severe UPF1-null phenotype in
mammals (186). If the only role for NMD is quality control of occasionally
aberrant gene expression, then it would be hard to imagine why mice need
UPF1 function early in development and, further, why cultured mouse cells
require UPF1 function. However, the mouse-knockout phenotype must be
interpreted in light of recent evidence that UPF1 may also function in other
cellular processes (144, 187, 273).
Recent microarray analyses in yeast and human cultured cells underscore
the importance of NMD in regulating gene expression. In yeast, rougly 10% of
genes whose expression was assayed showed increased abundance in the
absence of UPF1, UPF2, or UPF3 (165) gene product. A human expression array
found several hundred genes influenced by NMD (189). Interestingly, the yeast
microarray analysis found largely overlapping sets of transcripts controlled by
any of the three NMD effectors. In the human experiments, however, this was
not the case. Although many genes were similarly increased or reduced in
abundance following RNAi knockdown of each human UPF gene, the level of
non-overlap was much increased compared with that seen in the human study.
This result indicates that each human UPF protein may have evolved new
function(s) in metazoan evolution.
66

Future directions
The intersection of alternative splicing and NMD is a busy one. Among the key
open questions are those involving the regulation of both processes. It is known
that the NMD pathway in human cells requires a cycle of phosphorylation and
dephosphorylation of the key NMD effector, UPF1. The extra NMD effectors in
metazoans (the smg genes) relative to S. Cerevisiae encode products responsible
for this cycle, including a PI3K-related kinase, smg1 that phosphorylates UPF1.
However, little is known about how, when, or where these effectors work. Is
NMD, itself, regulated through phosphorylation of UPF1 or is UPF1
phosphorylation/dephosphorylation necessary simply for some mundane
biochemical aspect of PTC recognition or mRNA degradation? If NMD is
regulated in this way, under what developmental or physiological conditions
does this occur and why? Are the PTC+ isoforms we observe in EST libraries
derived from tissue in which NMD is deactivated?
Another open question is the fate of the protein product of the pioneer
round of translation. Some very recent evidence indicates that this product may
be present and stable (85), for at least some PTC+ mRNAs. If this is generally the
case, RUST may be used to turn down, but not turn off gene expression.
The consequences of NMD on alternative splicing and vice versa raise
interesting questions about the evolutionary histories of both processes. For
example, if NMD first evolved as a quality control mechanism for aberrant gene
expression before alternative splicing, then what we know as alternative
67

splicing may have existed for a long time before any functional isoforms existed.
This scenario would also be more likely to have generated regulated alternative
splicing that resulted in RUST. However, if alternative splicing was first
established, it could have been the case that it provided an increased need for
the quality control functions of NMD. Sorting out these issues should keep us
busy for some time.
The initial EST-analysis we performed was limited in several ways by the
data available to us at the time. Because we were using an early draft of the
human genome sequence, we restricted our inference of alternative isoforms to
coding regions only. The refinement of the human genome sequence and the
associated RefSeq annotation of human genes should allow future analyses to
include entire gene sequences, including untranslated regions. Additionally, the
mouse, rat, chicken, and sea-squirt genomes can be used in subsequent analyses
to determine the level of conservation of NMD-inducing alternative splicing.
This should help partition such cases by whether they are likely to be instances
of RUST or quality control.
Finally, new array technology (55, 132, 267), some of which is described
in the next chapter, has been developing that enables global monitoring of
splicing and alternative splicing. One exciting avenue of future investigation
will be to follow changes in splicing after NMD inhibition.
68

CHAPTER 5
A microarray platform for probing alternative splicing
regulation in Drosophila melanogaster
Note: Much of the material presented in this chapter was included in the publication: Blanchette M, Green RE, Brenner SE, and Rio DC (2005). Global analysis of positive and negative pre-mRNA splicing regulators in Drosophila. Genes & Development (in press).
69

Background
Higher eukaryotes exploit alternative pre-mRNA splicing to diversify their
proteome, and to regulate gene expression with developmental stage-and
tissue-specificity(180). Therefore, a comprehensive understanding of an
organism’s gene expression program must include an understanding of
alternative splicing (28). Toward this end, a well-conserved core of pre-mRNA
splicing regulatory factors has been identified in all metazoan organisms (135,
198). However, the majority of the interactions between these regulators and
their target pre-mRNAs remain unknown.
Historically, it has been challenging to identify genes specifically
regulated by individual splicing factors. Despite tremendous effort, several
years separated the initial identification of the hnRNP proteins PSI and hrp48 as
regulators of the P-transposase pre-mRNA (245) and the identification of a
single additional targeted cellular gene (46, 150). Recent advances in microarray
technology now permit monitoring of various aspect of RNA processing and
maturation (159). In particular, high density microarrays have been successfully
used to monitor pre-mRNA processing events in yeast (44, 66), to identify new
instances of alternative splicing in human and Drosophila (126, 132, 253, 267) and
to monitor alternative splicing levels of cassette exons in different mouse and
human tissues (213, 227). Here we describe the development of a new Drosophila
microarray platform and its use to monitor all the annotated pre-mRNA splicing
junctions specifically controlled by four canonical splicing regulators, the
70

hnRNPs PSI and hrp48 as well as the SR proteins dASF/SF2 and dSRp55/B52.
This study identified tens to hundreds of distinct splice events modulated by
each of these splicing factors and reveals the amount of co-regulation and
antagonism between each.
This project was a collaboration between Marco Blanchette and me.
Marco did the experimental work (RNAi knockdown of the splicing factors,
RNA extraction, labeling, and hybridization, and RT-PCR confirmation of array
results) while I designed the microarrays, did the array data analysis, and the
binding motif analysis.
Results
A microarray for monitoring alternative splicing in Drosophila melanogaster
In order to rapidly and efficiently identify target genes and specific splicing
events regulated by specific splicing factors, we have developed a microarray
for monitoring changes of all the known alternatively spliced transcripts in
Drosophila melanogaster. From the 13,472 genes in the GadFly 3.2 annotation,
(http://flybase.bio.indiana.edu/annot/download_sequences.html), 2931 were
found to have cDNA (EST) evidence of alternative splicing and generate 8315
different alternatively spliced mRNAs (57). In order to monitor the complete set
of annotated alternatively spliced transcripts, the single custom microarray
contains probes spanning all the Drosophila annotated alternative splice
junctions regardless of the specific alternative splicing pattern (Probes labelled
“a” in Figure 5.1A, ; 9868 probes), and, up to two probes for constitutive splice
71
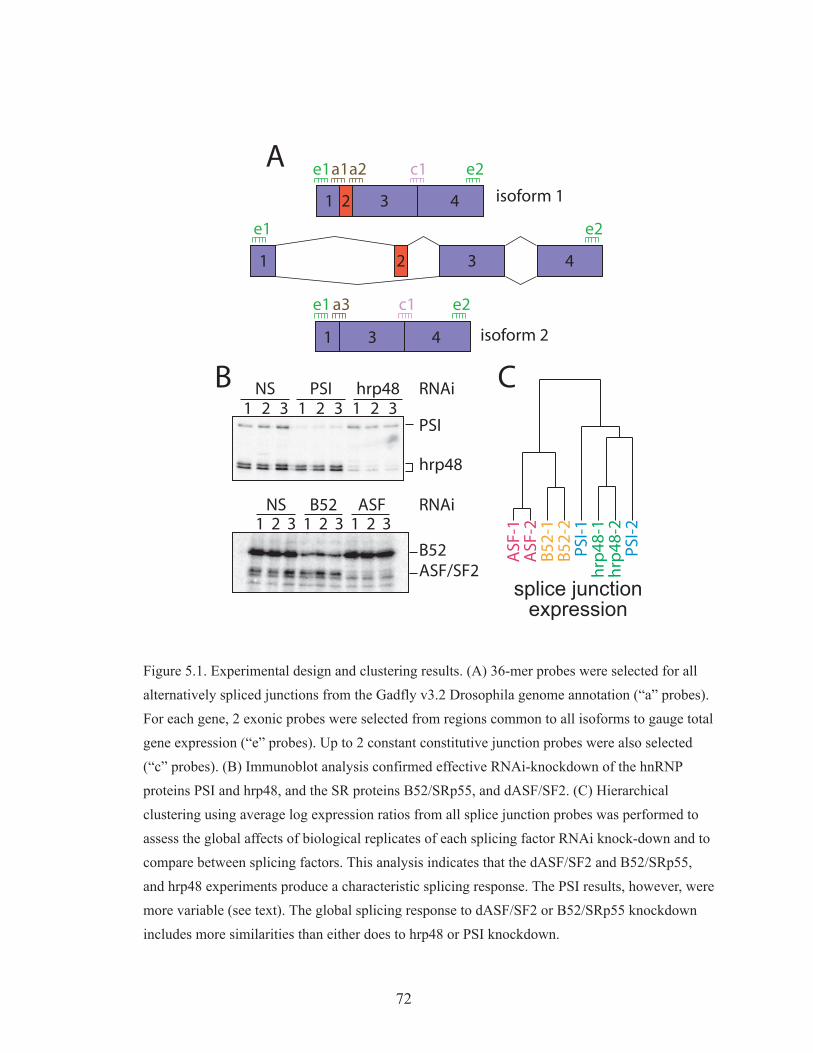
PSI
hrp48
1 2 3 1 2 3 1 2 3NS PSI hrp48 RNAi
B52ASF/SF2
1 2 3 1 2 3 1 2 3NS B52 ASF RNAi
B C
ASF
-1A
SF-2
B52
-1
hrp
48-1
hrp
48-2
PSI-
1
PSI-
2
B52
-2
splice junctionexpression
e1
e1
e2
e2a1a2 c1
isoform 1
e1 e2a3 c1
isoform 2
A1 2 3 4
1 2 3 4
1 3 4
Figure 5.1. Experimental design and clustering results. (A) 36-mer probes were selected for all alternatively spliced junctions from the Gadfly v3.2 Drosophila genome annotation (“a” probes). For each gene, 2 exonic probes were selected from regions common to all isoforms to gauge total gene expression (“e” probes). Up to 2 constant constitutive junction probes were also selected (“c” probes). (B) Immunoblot analysis confirmed effective RNAi-knockdown of the hnRNP proteins PSI and hrp48, and the SR proteins B52/SRp55, and dASF/SF2. (C) Hierarchical clustering using average log expression ratios from all splice junction probes was performed to assess the global affects of biological replicates of each splicing factor RNAi knock-down and to compare between splicing factors. This analysis indicates that the dASF/SF2 and B52/SRp55, and hrp48 experiments produce a characteristic splicing response. The PSI results, however, were more variable (see text). The global splicing response to dASF/SF2 or B52/SRp55 knockdown includes more similarities than either does to hrp48 or PSI knockdown.
72

junctions (probes labelled “c” in Figure 5.1A; 4377 probes) for each of the
alternatively spliced genes. Since it is known that there are many alternative
mRNA isoforms yet to be annotated as such (253), some of the junctions labeled
constitutive may actually be alternative. Two common exon probes spanning
segments present in all isoforms of each gene (probes labelled “e” in Fig. 1A;
5650 probes) were also selected for monitoring overall expression levels of the
alternatively spliced mRNAs. This feature of the design allows potential
changes in transcription level, or secondary effects, to be separated from effects
on splicing patterns for a given gene.
Genome wide monitoring of alternative splicing
Using our array, we monitored splicing profile changes in Drosophila SL2 cells
following RNAi-knockdown of four splicing regulators: the SR proteins
dASF/SF2 and B52/SRp55, and the hnRNP proteins PSI and hrp48 (Figure 5.2).
Each of these four well characterized splicing regulators is highly expressed in
SL2 cells and several of them have known pre-mRNA targets. Following
treatment with double-stranded RNA (dsRNA) against each splicing factor,
efficient protein reduction was confirmed by immunoblot analysis using
antibodies specific for each protein (Figure 5.1B). RNAi-knockdown of each of
these splicing factors generated no obvious morphological or growth phenotype
in SL2 cells, despite the fact that in Drosophila PSI, hrp48, and B52/Srp55 are
essential and dASF/SF2 is likely to be essential (268) (269) (175). From each
RNAi-treated sample and from control cells treated with non-specific dsRNA,
73

total RNA was extracted, cDNA prepared, and labeled using a protocol
developed to give good coverage over the entire-length of all mRNAs (132) (55).
Following standard hybridization, scanning, and data extraction each
experiment and each probe signal was filtered for consistency and RNAi target
specificity. Expression ratios (red/green ratios) of RNAi knockdown of each
splicing factor versus no knockdown control were computed for each probe.
Biochemical experiments demonstrate that B52/SRp55 and PSI associate with,
and presumably modulate splicing of, at least dozens and perhaps hundreds of
distinct pre-mRNAs (150) (142). This is also likely the case for dASF/SF2 and
hrp48. Therefore, reduction of any of these factors may impede or deregulate
pre-mRNA processing severely and inconsistently, rendering the array data
undecipherable or irreproducible. To address this possibility, we carried out
multiple RNAi knockdown experiments for each splicing factor and compared
the effect of experiments using simple hierarchical clustering (92). Clustering
experiments using data aggregated for each locus, each isoform, or each splice
junction (see Materials and Methods) generated nodes specific for the
dASF/SF2, B52/SRp55, and hrp48 experiments (data not shown and Figure
5.1C). This indicates that the global expression patterns and splicing responses
assayed on this array are largely distinct for the splicing factor that has been
knocked down. The results of this high-level analysis support the notion that
knock-down of each of these splicing factors results in a characteristic,
interpretable, and reproducible splicing response. Interestingly, the PSI
74
Green processedsignal
Green processedsignal
Red processedsignal
Red processedsignalRed processed
signal
ASF/SF2Experiment 1
ASF/SF2Experiment 2
ASF/SF2Experiment 3
Expr
essi
on a
t arr
ay p
ositi
on 1
Expression at array position 2
R=0.997
R=0.997
R=0.996
R=0.997
R=0.997
R=0.996
Green processedsignal
Green processedsignal
Green processedsignal
Red processedsignal
Red processedsignalRed processed
signal
PSIExperiment 1
PSIExperiment 2
PSIExperiment 3
Expr
essi
on a
t arr
ay p
ositi
on 1
Expression at array position 2
R=0.987
R=0.990
R=0.986
R=0.990
R=0.991
R=0.995
Green processedsignal
Green processedsignal
Green processedsignal
Red processedsignal
Red processedsignalRed processed
signal
B52Experiment 1
B52Experiment 2
B52Experiment 3
Expr
essi
on a
t arr
ay p
ositi
on 1
Expression at array position 2
R=0.984
R=0.984
R=0.994
R=0.994
R=0.992
R=0.997
Green processedsignal
Green processedsignal
Green processedsignal
Red processedsignal
Red processedsignalRed processed
signal
hrp48Experiment 1
hrp48Experiment 2
hrp48Experiment 3
Expr
essi
on a
t arr
ay p
ositi
on 1
Expression at array position 2
R=0.977
R=0.984
R=0.995
R=0.994
R=0.998
R=0.998
Green processedsignal
100101102103104105
100 101 102 103 104 105 106
106
100101102103104105106
100101102103104105106
100101102103104105106
100101102103104105106
100101102103104105106
100101102103104105106
100101102103104105106
100101102103104105106
100101102103104105106
100101102103104105106
100101102103104105106
100101102103104105106
100101102103104105106
100101102103104105106
100101102103104105106
100101102103104105106
100101102103104105106
100101102103104105106
100101102103104105106
100101102103104105106
100101102103104105106
100101102103104105106
100101102103104105106
100 101 102 103 104 105 106 100 101 102 103 104 105 106
100 101 102 103 104 105 106 100 101 102 103 104 105 106 100 101 102 103 104 105 106
100 101 102 103 104 105 106 100 101 102 103 104 105 106 100 101 102 103 104 105 106
100 101 102 103 104 105 106 100 101 102 103 104 105 106 100 101 102 103 104 105 106
B
PSI knockdown
-0.40-0.35-0.30-0.25-0.20-0.15-0.10-0.050.000.050.100.150.200.250.300.35
-0.8-0.7-0.6-0.5-0.4-0.3-0.2-0.10.00.10.2
-0.25-0.20-0.15-0.10-0.050.000.050.100.150.200.25
-0.10
-0.05
0.00
0.05
0.10
0.15
0.20
hrp48 knockdown
ASF/SF2 knockdown
B52 knockdown
PSI hrp48 ASF/SF2
B52 not on array
Exp 1 Exp 2 Exp 3
Exp 1 Exp 2 Exp 3
Exp 1 Exp 2 Exp 3
Exp 1 Exp 2 Exp 3
log
expr
essi
on ra
tiolo
g ex
pres
sion
ratio
log
expr
essi
on ra
tiolo
g ex
pres
sion
ratio
A
Experiment filtered due to inexplicable inconsistency
in red channel
Experiments filtered due to insufficient reduction of target or too much reduction of non-target
Figure 5.2 Experimental filters for intra-array consistency and target specific knockdown. (A) Scatter plot of green and red channel signal for each probe. Each probe sequence is printed on the array in two locations. For each probe, its two independent, normalized expression values form each single x, y point. If all probes are exactly consistent between experiments, the x=y line would result. More noise is seen at low expression values. Also shown is the Pearson correlation coefficient, R, for each dataset. The thrid B52 experiment showed a strange inconsistency and was therefore filtered from later analyses. (B) The average log expression ratio for exon and constitutive probes for each of the splicing factors was calculated. B52 knock-down could not be evaluated as it was not included on the array. Experiments were filtered is the average log-ratio of the knockdown target was not <= -0.1 (ASF experiment 1) or if one of the non-target splicing factors was reduced more than one-fourth the amount of the specific target (hrp48 experiment 2 and PSI experiment 3).
75

replicates were more variable in this analysis. This is likely due to the relatively
small number of PSI-affected splicing events (see below). Despite this
variability, PSI experimental replicates did identify several mRNAs that were
previously found to be associated with PSI in an embryonic nuclear RNP
fraction and whose expression was deregulated in PSI-mutant flies (150).
RNAi knock-down of each splicing factor causes a general decrease in
processed mRNA
Five distinct, exogenous and heterologous in vitro-transcribed positive control
RNAs were amplified and labeled along with the SL2 total cellular RNA to
provide an independent assessment of any global changes in gene expression
that would otherwise be masked by the normalization procedure. Following a
standard assumption, we normalized the expression data from each array so
that the average log expression ratio is zero, i.e., no net change in expression
(see Materials and Methods). Interestingly, after normalization, the average log
expression ratio of RNAi to control of nearly all positive control RNAs in each
sample, across the range of expression intensities, was positive (Figure. 5.3A).
Since identical amounts of the positive control RNAs were introduced in both
the reference and experimental samples, these observations indicate an average
reduction of the detectable, expressed genes on the array following knockdown
of any of these four splicing factors. It is unclear to what extent this represents a
biologically direct effect or a secondary consequence of target gene transcript
reduction. Anecdotally, a previous screen identifying four B52/SRp55 target
76

105
ASF B52 PSIHRP48
21422
85 28 62 9 34
Constitutive junctionsup down
Alternative junctionsup down
ASF & HRP48
ASF & PSI B52 & HRP48
B52 & PSI
HRP48 & PSIASF & B52
2 (1.25)1 (0.50)
1 (0.52)1 (0.10) 3 (0.56)2 (0.10)
0 (0.01) 2 (0.19)
2 (0.04) 5 (0.21)5 (0.33) 17 (1.54)
0.0
0.5
1.0
1.5
2.0
Num
ber o
fsp
lice
even
ts
Freq
uenc
y(a
ll ex
perim
ents
)
00
2000
4000
6000
8000
10000
12000
-0.5
0.5
Mean = -0.01Std. dev. = 0.33
-1.0
1.0
Net probe expression
Up(>= 2.0
standarddeviations)
Down(<= -2.0standard
deviations)
ObservedExpected underrandom model
ASFUpDown
C A C A C A C A C A C A C A C A C A C A C A C APSIB52 H48 PSIASF H48 PSIASF B52 H48ASF B52
B52 HRP48 PSI
-3
-2
-1
0
1
2
3
0 100,000 200,000 300,000 400,000
Expression (Red + Green)
Average Log(ratio R/G)
PSI-1 PSI-2hrp48-1 hrp48-2B52-1 B52-2ASF-1 ASF-2
BA
C
D
EObs. (Exp) Obs. (Exp) Obs. (Exp) Obs. (Exp)
Figure 5.3. Global microarray analysis. (A) Plot of total expression values versus log expression ratio of each positive control probe reveals a strong positive skew. Equal amounts of each positive control RNA were added to control and experimental samples. (B) The distribution of the net expression for each splice junction probe across all experiments is shown in the histo-gram. Cutoffs for up or down regulation were set at 2 standard deviations from unchanged. (C) Size of the sets of alternative and constitutive junctions that are strongly and consistently up and down regulated following knockdown of each splicing factor. dASF/SF2 affects the largest number of splicing events; PSI affects the smallest number. (D) Number of splicing events strongly and consistently affected by RNAi knockdown of each of two splicing factors. In parentheses are the expected sizes of each set assuming that each splicing factor affects indepen-dent sets of splicing events. For each combination except B52 and PSI, the number of affected events is larger than expected by chance. (E) Antagonistically affected splice junctions. The number of splice events that were increased following knockdown of one splicing factor and decreased following knockdown of another are shown. Also shown are the number expected under the random model in which each splicing factor’s affects are independent of the affects of the other splicing factors.
77

pre-mRNAs showed that the predominant effect of B52/SRp55 deletion was a
reduction in target gene mRNA levels (142).
Each splicing factor affects a distinct set of splice junctions
Following data extraction and normalization, we computed log expression
ratios for each probe in experimental versus control experiments. In order to
determine which splicing events are affected by knockdown of which splicing
factors, we calculated a value we call the net expression for each splicing
junction (see Materials and Methods). The net expression for each splicing
junction is the log expression ratio for that splice junction minus the average log
expression ratio for all other probes on the isoforms containing that junction.
This value indicates the increase or decrease in abundance of the specific
splicing junction in question above and beyond any increase or decrease in
abundance of the isoforms that contain the splice junction and is designed to
highlight individual splice junction changes by removing any differences in
isoform expression or overall RNA levels. Because each splice junction is
considered separately, this strategy should be minimally affected by incomplete
data about which isoforms exist. The net expression value was calculated for all
alternative and all constitutive junctions using the same formula. The
distribution of the net expression values in all experiments (Figure 5.3B) was
used to generate cut-offs for classifying the affect of knock-down of each
splicing factor on each splice junction.. In order to find pre-mRNA splicing
events that were strongly and consistently affected following knock-down of
78

each splicing factor, net expression differences for each junction were compared
in the biological replicates (see Materials and Methods).
The splicing events that were strongly (≥2 standard deviations) and
consistently (in both replicates) affected by knock-down of each splicing factor
were identified. The knock-down of dASF/SF2 affected the largest number of
splicing events (319 events) while PSI affected the smallest number of splicing
events (43 events, Figure 5.3C). This result is consistent with the notion that
dASF/SF2 is a general regulator of alternative splicing, affecting a large number
of targets, and that PSI is a more specialized regulator of alternative splicing.
B52/SRp55 and hrp48 affected intermediate numbers of splice events (107 and
90 events respectively). Interestingly, several of the splicing events detected for
B52/SRp55 and for PSI were on genes previously found to interact with these
splicing regulators (Table 5.1).
The lists of splicing events consistently affected by each splicing factor
were examined across experiments to determine which are significantly affected
by knockdown of more than one of these splicing factors (Figure 5.3D). The
number of such splicing events was then compared to the number that would be
expected by chance under a random model, i.e., assuming the splice junctions
affected by one splicing factor are chosen independently of the splice junctions
affected by any other splicing factor. The combination of dASF/SF2 and
B52/SRp55 produced the most striking result: 22 splicing events were similarly
affected by knock-down of either SR protein compared to 1.87 expected by
79

Previously identified PSI targets Gene Name Gene Expression
Labourier et. Al.(150) This report
CG7439 Up NE CG9381 down NOA CG9281 Up NC CG5654 yps Very down NOA CG16747 guf down NE CG5650 Pp1-87B down NOA CG12101 Hsp60 Very Up NE CG3943 kraken Up NOA CG17791 (CG16901)
sqd Very down T
CG7590 scylla down T CG15112 enb Up NC CG17610 grk down NOA CG8293 lap2 Up NE CG12157 Tom40 Up NC CG1404 ran Up NC CG4551 smi35A Up T CG1088 Vha26 down NC CG4084 I(2)not 1.60 Up NOA CG7623 sll Up NOA CG1668 Pbprp2 down NC CG3644 bic down NC CG3161 Vha16 Up T CG12345 Cha Up NE CG6575 glec down NOA CG1691 Imp Very down T CG5887 desat1 Very down T
80

Previously identified B52 targets CG ID Gene Name This report Kim et al.(142) CG1765 Ecdysone receptor (EcR) NC CG6570 ladybird late (lbl) NOA CG3646 frizzled (fz) NOA CG10772 Furin 1 (Fur1) T CG12052 longitudinals lacking (lola) T CG10052 Rx NOA * CG13219 skiff (skf) NOA CG18362 Mix interactor (Mio) NC * CG31762 Arrest NC CG7122 RhoGAp16F T * CG17716 faint sausage NOA CG10497 Syndecan T CG11760 NC CG5228 NOA CG14796 NOA CG5953 NE CG15593 NC CG9080 NOA CG3950 NOA CG14670 NOA * NC = No change, NE = not expressed, NOA = Not on array (not alternatively spliced), T = target (gene containing splice event whose net expression change is >= 1.0 in both biological replicates), * = splicing defect shown by RT-PCR by Kim et al
Table 5.1. Previously identified target genes of PSI and B52 are re-identified in this
microarray analysis. Labourier et al. (150) identified genes found in complexes with
wild-type PSI and genes whose expression was altered in PSIΔAB mutants. The PSIΔAB
gene product does not associate with U1 snRNP. 6 of the 13 genes from this list that are
on our array and were expressed in the PSI experiments were found to have an affected
splicing event in both biological replicates with a net expression change of magnitude
>= 1.0 (p-value 0.08), including all of the most dramatically affected previously
identified PSI targets. Kim et al. (142) identified genes associated with B52 using a
“genomic SELEX” method. This method starts with genomic fragments whose
transcripts bind B52. 4 of the 13 genes that are on our array and expressed showed
reproducible splicing changes in our experiments (p-value 0.23). This genomic SELEX
likely generates many false-positives as Kim et al. were unable to confirm splicing
defects for many of these genes via RT-PCR.
81

chance (P-value ≤ 0.00001). This result is particularly interesting considering
that, in vitro, SR proteins can complement one another for activity on several
RNA targets (285) (99). Since dASF/SF2 and B52/SRp55 are the closest
Drosophila SR protein paralogs (data not shown), this functional overlap is
perhaps not surprising. However, the unique character of each SR protein is
demonstrated by the fact that the majority of the splicing events strongly and
consistently affected by RNAi of either dASF/SF2 or B52/SRp55 alone are not
strongly or consistently affected by the other alone (22 shared targets out of 319
dASF/SF2 and 127 B52/SRp55 affected targets respectively; Figure 5.3C and
Figure 5.3D).
PSI and hrp48 are known to co-regulate alternative splicing of the P-
element transposase pre-mRNA by binding to an exonic splicing silencer (243,
245). This analysis suggests their partnership may extend beyond P-element
splicing. Of the 43 consistent and strong PSI-targets, 7 were found to also be
strongly and consistently under the control of hrp48, whereas only 0.257 would
be expected under the random model of independent effect (P-value ≤ 0.00017).
Furthermore, for the 25 splice events that were consistently and strongly
decreased following PSI knockdown, 21 were reduced following hrp48
knockdown by an average of -1.93 standard deviations (Figure 5.4). Similarly,
for the 18 splice events that were consistently and strongly increased following
PSI knockdown, 14 were increased following hrp48 knockdown by an average
of 1.30 standard deviations (Figure 5.4). Therefore, nearly all of the splicing
82

S = 0.147R = 0.089
S = 0.224R = 0.142
S = 0.781R = 0.594
S = 0.886R = 0.582
S = 0.551R = 0.205
S = 0.138R = 0.053
S = 0.582R = 0.240
-6
-5
-4
-3
-2
-1
0
1
2
3
4
5
6
-6 -5 -4 -3 -2 -1 0 1 2 3 4 5 6
hrp48 (Z score)
B52 (Z score)
S = 1.365R = 0.660
-6
-5
-4
-3
-2
-1
0
1
2
3
4
5
6
-6 -5 -4 -3 -2 -1 0 1 2 3 4 5 6
hrp48 (Z score)
PSI (Z score)
S = -0.265R = -0.135

events under the control of PSI are similarly controlled by hrp48 - suggesting
that hrp48 may be an obligate partner for PSI. Interestingly, PSI does not appear
to be an obligate partner for hrp48 as there are many hrp48 splicing events not
similarly affected by PSI (Figure 5.4).
Traditionally, SR proteins and hnRNP proteins have been viewed as
antagonistic partners, regulating in opposite directions, many of the same
alternative splicing units (28, 247). One of the best studied models of
antagonistic regulation is the HIV pre-mRNA in which binding of hnRNP
proteins to cis-acting splicing silencer elements can be counter-acted by binding
of SR proteins to nearby enhancer elements to regulate utilization of adjacent
splice sites (50, 51, 131, 284, 292). We analyzed antagonistic regulations by
looking at splicing events that were increased following knockdown of one
splicing factor and decreased following knockdown of a different splicing factor
(Figure 5.3E). Surprisingly, very few splicing events were found to be
consistently and strongly regulated in an antagonistic relationship by any
combination of these splicing factors. At a cut off of 2.0 standard deviations,
only dASF/SF2 and hrp48, which are the Drosophila homologs of the two
canonical antagonistic splicing factors ASF/SF2 and hnRNP A1 (47, 185) are
found in more than a single antagonistic splicing event (Figure 5.3E). At a more
permissive cut off, 1.5 standard deviations, more such antagonistic affects can be
seen (Figure 5.5). These data indicate that antagonism between SR proteins and
84
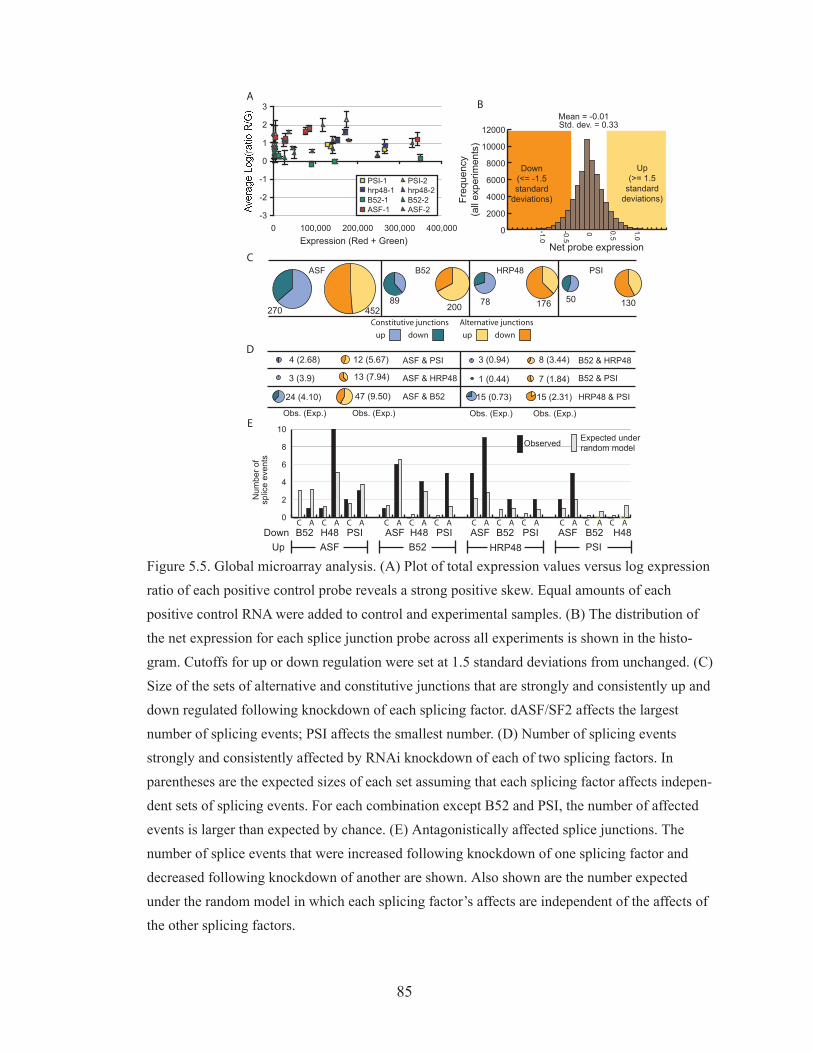
270
ASF B52 PSIHRP48
ASF & HRP48
ASF & PSI B52 & HRP48
B52 & PSI
HRP48 & PSI
45289
200 78 176 50 130
ASF & B52
13 (7.94)3 (3.9)
12 (5.67)4 (2.68) 8 (3.44)3 (0.94)
1 (0.44) 7 (1.84)
15 (0.73) 15 (2.31)24 (4.10) 47 (9.50)
Constitutive junctions
up down
Alternative junctions
up down
0
2
4
6
8
10
Num
ber o
fsp
lice
even
ts
Observed Expected underrandom model
ASFUpDown
C A C A C A C A C A C A C A C A C A C A C A C APSIB52 H48 PSIASF H48 PSIASF B52 H48ASF B52
B52 HRP48 PSI
Freq
uenc
y(a
ll ex
perim
ents
)
00
2000
4000
6000
8000
10000
12000
-0.5
0.5
Mean = -0.01Std. dev. = 0.33
-1.0
1.0
Net probe expression
Up(>= 1.5
standarddeviations)
Down(<= -1.5standard
deviations)
-3
-2
-1
0
1
2
3
0 100,000 200,000 300,000 400,000Expression (Red + Green)
PSI-1 PSI-2hrp48-1 hrp48-2B52-1 B52-2ASF-1 ASF-2
BA
C
D
EObs. (Exp.) Obs. (Exp.) Obs. (Exp.) Obs. (Exp.)
85
Figure 5.5. Global microarray analysis. (A) Plot of total expression values versus log expression ratio of each positive control probe reveals a strong positive skew. Equal amounts of each positive control RNA were added to control and experimental samples. (B) The distribution of the net expression for each splice junction probe across all experiments is shown in the histo-gram. Cutoffs for up or down regulation were set at 1.5 standard deviations from unchanged. (C) Size of the sets of alternative and constitutive junctions that are strongly and consistently up and down regulated following knockdown of each splicing factor. dASF/SF2 affects the largest number of splicing events; PSI affects the smallest number. (D) Number of splicing events strongly and consistently affected by RNAi knockdown of each of two splicing factors. In parentheses are the expected sizes of each set assuming that each splicing factor affects indepen-dent sets of splicing events. For each combination except B52 and PSI, the number of affected events is larger than expected by chance. (E) Antagonistically affected splice junctions. The number of splice events that were increased following knockdown of one splicing factor and decreased following knockdown of another are shown. Also shown are the number expected under the random model in which each splicing factor’s affects are independent of the affects of the other splicing factors.

hnRNPs appears to be highly specific for both interacting partners (Figure 5.4)
and somewhat uncommon.
RT-PCR validates the microarray results
A validation of the microarray results was performed on several individual
genes by RT-PCR designed to amplify the different affected mRNA isoforms.
From the analysis described above, six genes were chosen on the basis that they
were previously unknown targets of any of the four factors tested and whose
structure was amenable to RT-PCR analysis using a single pair of primers for
each target (Figure 5.6 and Figure 5.7). All the selected targets confirmed the
microarray results with differences in expressed isoforms ranging from less than
two-fold (PSI-specific target CG4912, Figure 5.6C) to twenty five-fold
(B52/SRp55 specific target CG6084, Figure 5.6C).
B52 binding sites are over-represented around the 5’ splice site of the B52-
affected splicing junctions
Any observed change in pre-mRNA splicing in the experiments may be due to a
direct interaction between the splicing factor and pre-mRNA in question or to
an indirect effect. One feature of direct targets for each splicing factor may be
the presence of a cis-acting element within the pre-mRNA near the affected
splice site. The assembled lists of splicing events specifically affected by
reduction of each of these four splicing factors were used to identify potential
binding elements for these factors. While many SELEX and other biochemical
studies have been conducted to characterize the RNA binding preferences for
86

A
B-3-2-101234
NS PSI hrp48 B52 ASF
Log
2(A/B
)
B
A
A
CG6143 (Pep)
1 2 1 2 1 2 1 2 1 2NS PSI Hrp48 B52 ASF RNAi
CG6084
1 2 1 2 1 2 1 2 1 2NS PSI Hrp48 B52 ASF RNAi
1 2 1 2 1 2 1 2 1 2NS PSI Hrp48 B52 ASF RNAi
A
B-2.5
-1.5
-0.5
0.5
1.5
2.5
NS PSI hrp48 B52 ASFLo
g2(A
/B)
Microarraydata
B
A
B
A
B
CG4912
-0.5
0
0.5
1
1.5
NS PSI hrp48 B52 ASF
Log
2(A/B
)
B
A
C
0 1.0-1.0
0 1.0-1.0
log-expressionratio scale
Microarraydata
log-expressionratio scale
Microarraydata
log-expressionratio scale
0 1.0-1.0
Figure 5.6. RT-PCR validation of selected targets. Shifts in alternatively spliced isoforms predicted from the microarray analysis were monitored by RT-PCR for 3 different targets using oligonucleotides flanking the affected alternative splice sites. Together with the RT-PCR gel analysis, the alternative spliced junction expression computed from the microarray data are shown (bottom panel). The densitometry of the gels are shown on the left expressed as a log2 ratio of the 2 measured isoforms. (A) CG6084 is a predicted target of the SR protein B52/SRp55. B52/SRp55 knock-down promoted skipping of the alternative cassette exon. (B) CG6143 (PEP) is a predicted B52/SRp55 target whose cassette exon is included upon knock-down of B52/SRp55. (C) CG4912 is a predicted target of the hnRNP protein PSI. The knock-down of PSI promotes skipping of the alternative cassette exon.
87

Figure 5.7 RT-PCR validation of selected targets. Shifts in alternatively spliced isoforms predicted from the microarray analysis were monitored by RT-PCR for 3 different targets using oligonucleotides flanking the affected alternative splice sites. Together with the RT-PCR gel, the alternative spliced junction expression computed from the microarray data are shown (bottom panel). The densitometry of the gels are shown on the left expressed as a log2 ratio of the measured isoforms. (A) CG6395 is a predicted target of the hnRNP proteins PSI and hrp48. Both PSI and hrp48 knock-down promoted inclusion of an intron in the mature mRNA. (B) CG8295 is a predicted target of the SR protein ASF and the hnRNP protein hrp48 affecting different splicing events of the same alternatively spliced region. The products label * are uncharacterized RT-PCR products. (C) CG31641 is a predicted target of the SR protein ASF. The knock-down of ASF promotes skipping of the alternative cassette exon.
Microarraydata
1 2 3 4 5 6 7 8 9 10
A
C
*
*
B
1 2 1 2 1 2 1 2 1 2NS PSI Hrp48 B52 ASF RNAi
CG8295
-3.5-3
-2.5-2
-1.5-1
-0.50
NS PSI hrp48 B52 ASF
Log
2(A/[
B+
C])
C
B
A
1 2 3 4 5 6 7 8 9 10
A
B
1 2 1 2 1 2 1 2 1 2NS PSI Hrp48 B52 ASF RNAi
CG6395
-1.5-1
-0.50
0.51
1.5
NS PSI hrp48 B52 ASF
Log
2(A/B
)
Microarraydata
B
A
A
B
CG31641
1 2 1 2 1 2 1 2 1 2RNAiNS PSI Hrp48 B52 ASF
A
B
1 2 3 4 5 6 7 8 9 100
1
2
3
4
5
NS PSI hrp48 B52 ASF
Log
2(A/B
)
Microarraydata
B
A
C
0 1.0-1.0
log-expressionratio scale
0 1.0-1.0
log-expressionratio scale
0 1.0-1.0
log-expressionratio scale
88

splicing factors, the results have been limited in their ability to predict in vivo
splicing affects on specific targets. However, one particularly informative study
identified a sequence that likely forms a stem-loop structure that binds
Drosophila B52/SRp55 tightly in vivo (241). A position weight matrix model of
this sequence was used to search for similar sequences in a database composed
of sequences around either 3’ or 5’ splice sites that were either reduced or
increased specifically upon B52/SRp55 knockdown (Figure 5.8; see Materials
and Methods). For comparison, a search was performed using a database of 3’
or 5’ splice site regions found to be affected by RNAi against any of the other
three (non-B52/SRp55) splicing factors, but not affected by B52 knockdown. The
fraction of 3’ splice site regions that contain two strong matches to this sequence
motif is similar to the fraction found in the comparison database search (Figure
5.8B). However, the regions around the 5’ splice site in the B52/SRp55 knock-
down-reduced junctions were specifically enriched for pairs of this motif
compared with the corresponding non-B52/SRp55 set (Figure 5.8B). A similar
search using the SELEX-defined motif recognized by the human ASF/SF2
homolog (257) also shows an overrepresentation near the 5’and 3’ splice site
regions regulated by the Drosophila ASF/SF2 homolog in our experiments
(Figure 5.9). Although suggestive, this analysis has the caveat of being
performed using human-derived SELEX sites. Although the human and
Drosophila orthologs are very similar (62% identical with 10% additional
89

A
B
0.00
0.05
0.10
0.15
0.20
0.25
0.30
0.35
0.40
4 6 8 10Motif score (bits)
Fraction of sequences
0.00
0.05
0.10
0.15
0.20
0.25
0.30
4 6 8 10Motif score (bits)
Fraction of sequences
B52 upASF/PSI/hrp48 up
B52 downASF/PSI/hrp48 down
Figure 5.8. B52/SRp55 binding motifs near B52/SRp55 uniquely affected splice junctions. (A) Sequence logo of the previously identified B52/SRp55 binding motif (Shi et al. 1997). Lines connecting residues indicate predicted base-pairing interactions. Stars underneath residues indicate B52/SRp55 footprint contacts (Shi et al. 1997). (B) Pairs of motifs similar to the previ-ously identified B52/SRp55 binding motif (Shi et al. 1997) are over-represented around 5’ splice sites that are down-regulated when B52/SRp55 is knocked-down relative to the 5’ splice sites affected in the other experiments. No significant difference is seen in 5’ splice site regions around up-regulated junctions or in either up- or down-regulated 3’ splice site regions. Error bars are determined analytically using the binomial distribution and correspond to one standard deviation: sqrt( np( 1-p ) )/n where n is the number of sequences searched and p = observed probability of having sites of given score.
90

Figure 5.9 ASF binding motifs near ASF uniquely affected splice junctions. (A) Sequence logo of the previously identified human ASF binding motif (Tacke and Manley, 1995). (B) Triplets of motifs similar to the previously identified human ASF/SF2 binding motif are over-represented around 5’ and 3‘ splice sites that are down-regulated when ASF is knocked-down relative to the splice sites affected in the other experiments. No significant difference is seen in 5’ or 3‘ splice site regions around up-regulated junctions ASF or by the other splicing factors. Error bars are determined analytically using the binomial distribution and correspond to one standard deviation: sqrt( np( 1-p ) )/n where n is the number of sequences searched and p = observed probability of having sites of given score.
A
B
ASF up Control up ASF down Control down
0
1
2
bit
s
5?
1
C
T
GA
2
C
G
3
TGA
4
TC
GA
5
TCAG
6
GA
7
GA
8
TC
3?
0.000.100.200.300.400.500.600.700.800.901.00
2 4 6 8
Motif score
Fraction of sequences
0.000.100.200.300.400.500.600.700.800.901.00
2 4 6 8
Motif score
Fraction of sequences
0.000.100.200.300.400.500.600.700.800.901.00
2 4 6 8
Motif score
Fraction of sequences
0.000.100.200.300.400.500.600.700.800.901.00
2 4 6 8
Motif score
Fraction of sequences
91

similarity, data not shown), their RNA binding specificities may have diverged.
Similar analyses using known binding site motifs for hrp48 and PSI failed to
show enrichment around the affected splice junctions (data not shown).
However, these negative results may be due to imprecise or inaccurate
definition of the PSI and hrp48 binding site motifs: both proteins bind very
degenerate sites derived from very limited binding data.
Discussion
This study represents the first genome-wide identification of alternative splicing
events modulated by the four splicing factors, dASF/SF2, B52/SRp55, hrp48,
and PSI. Traditionally, thorough genetic or in vitro biochemical analyses have
been required to identify splicing events controlled by specific splicing factors
(28). This difficulty accounts for the paucity of well-defined systems for
studying alternative splicing. Although genome-wide analyses involve
substantial risk of false positives and false negatives, this new splice junction
platform provides the ability to rapidly identify many splicing events regulated
by individual splicing factors and provides the basis for more focused searches
for corresponding RNA regulatory motifs.
Analysis of the array results allows us to characterize the extent to which
alternative splicing events require multiple splicing factors. The significant
overlap between dASF/SF2 targets and B52/SRp55 targets reinforces earlier
biochemical characterizations that indicate partial functional overlap between
these factors (99, 285). However, as many splicing events were found to be
92

uniquely affected by either factor individually, these data also demonstrate their
discrete characteristics. It remains to be determined whether the observed
functional overlap is due to similar RNA-binding specificities, the presence of
unique binding sites for dASF/SF2 and B52/SRp55 in target pre-mRNAs, or to
other properties of these factors such as interaction with a common binding
partner already present on target pre-mRNAs.
Hrp48 and PSI were also found to regulate many of the same splicing
events. As nearly every identified target of PSI was similarly affected by hrp48
knockdown, these data suggest that hrp48 may be an obligate partner for PSI
action. However, since many of the hrp48-affected splicing events were not
similarly affected by PSI knockdown, the reverse does not appear to be the case,
i.e., hrp48 does not appear to require PSI to regulate splicing.
Several antagonistic relations were also defined in this analysis,
especially between dASF/SF2 and the hnRNPA1 homolog, hrp48. However, the
absence of an overall negative correlation between dASF/SF2 knockdown and
hrp48 knockdown supports a model in which their antagonism is mediated
through cis elements present in target pre-mRNAs rather than through direct
interaction between these proteins. That is, dASF/SF2 and hrp48 appear to be
antagonistic only for a subset of splice sites that bind both factors and
apparently most target pre-mRNAs of both do not.
While computational searches for the high affinity B52/SRp55 SELEX
motif (241) showed an enrichment near some of the affected junctions on the
93
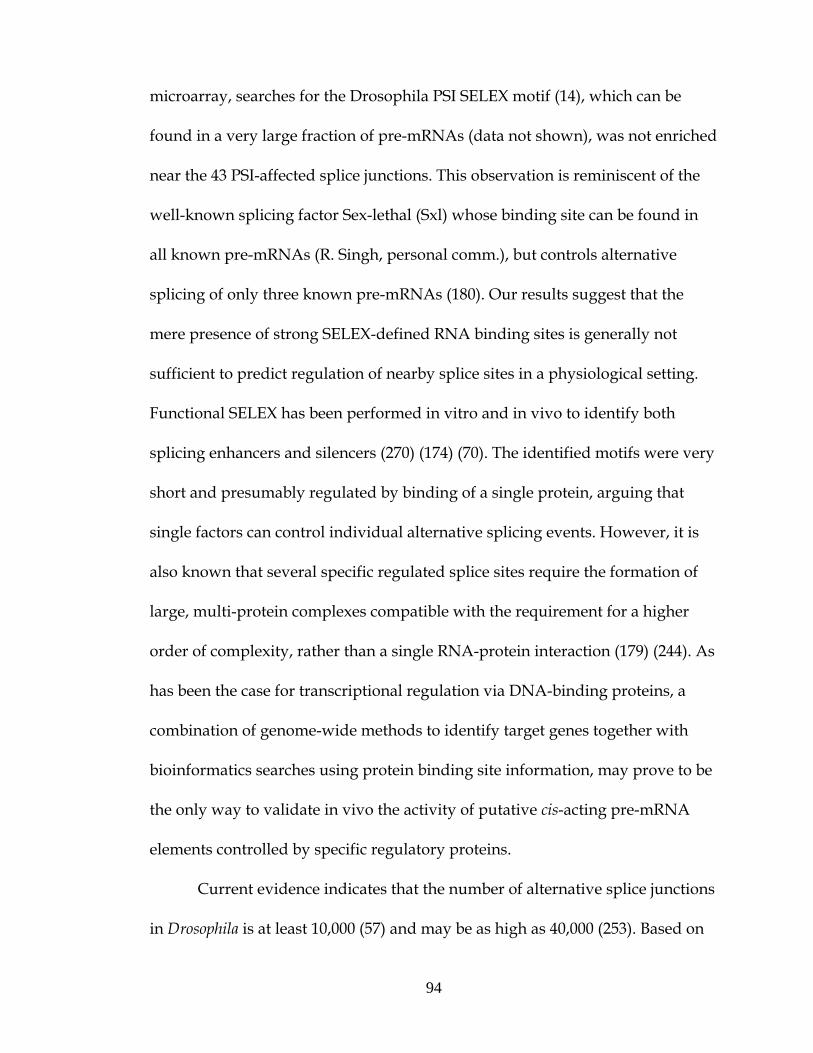
microarray, searches for the Drosophila PSI SELEX motif (14), which can be
found in a very large fraction of pre-mRNAs (data not shown), was not enriched
near the 43 PSI-affected splice junctions. This observation is reminiscent of the
well-known splicing factor Sex-lethal (Sxl) whose binding site can be found in
all known pre-mRNAs (R. Singh, personal comm.), but controls alternative
splicing of only three known pre-mRNAs (180). Our results suggest that the
mere presence of strong SELEX-defined RNA binding sites is generally not
sufficient to predict regulation of nearby splice sites in a physiological setting.
Functional SELEX has been performed in vitro and in vivo to identify both
splicing enhancers and silencers (270) (174) (70). The identified motifs were very
short and presumably regulated by binding of a single protein, arguing that
single factors can control individual alternative splicing events. However, it is
also known that several specific regulated splice sites require the formation of
large, multi-protein complexes compatible with the requirement for a higher
order of complexity, rather than a single RNA-protein interaction (179) (244). As
has been the case for transcriptional regulation via DNA-binding proteins, a
combination of genome-wide methods to identify target genes together with
bioinformatics searches using protein binding site information, may prove to be
the only way to validate in vivo the activity of putative cis-acting pre-mRNA
elements controlled by specific regulatory proteins.
Current evidence indicates that the number of alternative splice junctions
in Drosophila is at least 10,000 (57) and may be as high as 40,000 (253). Based on
94

the present study using an arbitrary cut off of 2 standard deviations, each
splicing factor regulates a few hundred (43 for PSI to 319 for dASF/SF2)
alternative splicing events in a given cell type. Since there are around 200
putative splicing factors in the Drosophila genome (57, 135), the observed range
of splicing junctions regulated by individual splicing factors is within the
expected order of magnitude to account for the level of splicing complexity of
the fly transcriptome. These splicing microarray experiments demonstrate on a
genomic scale the unique character of each of these four splicing factors and
give a first glimpse into the network of interactions regulating alternative
splicing. Similar experiments using this technology should lead to an
understanding of how the genes involved in RNA processing interact to
regulate the tens of thousands alternative splicing events in metazoans (41).
Materials and Methods
Drosophila melanogaster alternative splicing array design
All transcript sequences from the Gadfly version 3.2 Drosophila melanogaster
genome annotation (dmel_all_transcript_r3.2.0.fasta) (57) were mapped to the
masked genome sequence (whole_genome_masked_genomic_dmel_RELEASE3-
1.FASTA) using SPIDEYv.1.40 (272). Transcripts that overlapped on the same
strand were clustered into loci. Only loci with multiple, unique transcripts
(alternatively spliced loci) were considered further. For each of these loci, each
splice junction was labeled “constitutive” if it was found in all transcripts from
that locus and “alternative” otherwise. Note that some alternative isoforms
95

contain only alternative transcriptional initiation or termination regions and,
therefore, may not be alternatively spliced in the strict sense. For each locus,
junction probes were selected that are complementary to the 18 exon nucleotides
on each side of the junction. Junction probes were selected for each alternative
junction and up to two constitutive junctions per locus. Two exon probes for
each locus were selected such that they avoid splice junctions and to have at
least three mismatches when compared to any other transcribed Drosophila
sequence. Five unique probes from each of five exogenous genes were included
as positive controls and the same number as negative controls. All probe
features were included on two locations on the array for consistency checking.
RNAi, RNA extraction, RNA labelling and array hybridization
Production of dsRNA and RNAi was as described (67). RNAi were done for 4
days by incubating 10µg of the different dsRNA with 0.5 X 10⁶ serum-free
adapted Schneider SL2 cells (Invitrogen) with addition of 10 µg of dsRNA after
48 hour. At day 4, 10% of the cells were recovered and lysed in protein gel
loading buffer while the remaining cells were used for total RNA extraction
using the Qiagen mRNA Easy purification kit with on column DNAse digestion
following the manufacturer’s protocol. In vitro transcribed RNAs of the human
U17, U19, 7Sk small RNA as well as the human and tetrahymena telomerase
RNA (300, 100, 10, 2.5 and 25 fmol each respectively) were added as internal
quality and sensitivity control to 10 µg of total RNA and were amplified, labeled
and hybridized as described (55) on a 44k custom Agilent oligonucleotide array.
96

Array analysis
After hybridization, arrays were scanned and images analyzed following the
manufacturer’s recommendation (Agilent). Linear-LOWESS dye normalization
was performed using all probes except for negative controls. The Pearson
correlation co-efficient was computed for all probe expression values using the
two instances of each probe on the array as the x and y values and found to be
>0.97 for all experiments. One B52/SRp55 experiment was removed from the
analysis on the basis of a non-consistent effect in the red channel (Figure 5.2A).
Array data from each experiment were then analyzed to determine the extent of
specific knock-down of each target. Experiments that failed to yield a strongly
negative log expression ratio for probes of the each RNAi target (log-ratio ≤ -0.2)
or that also yielded a strongly negative log expression ratio for probes of a
different RNAi target were discarded (Figure 5.2B). This removed the first PSI
experiment, the second hrp48 experiment, and the first ASF/SF2 experiment.
Remaining for further analysis were two experiments of each splice factor
target. Since each probe occurs twice on the array, a single expression average
was computed. Any probe whose expression at one position in either red or
green channels was more than 150% of its expression in that channel at its other
position was removed from the analysis. Hierarchical clustering of experiments
using average linkage clustering was performed. A single average expression
value for each locus, each isoform, or each junction was generated. Locus and
97

isoform averages were computed by taking the average log expression ratio of
all probes from each locus or from each isoform.
To separate gene-level or isoform-level expression changes from splicing
changes, the average log expression ratio of all junctions for each isoform was
subtracted from the expression ratio of each junction. This value, which we call
the net expression of each junction, is given by the formula: log expression ratio
(x) – average of log expression ratios (y) where x is the splice probe in question
and y is the set of all probes that are on all isoforms that contain junction x. This
approach deemphasizes changes in splicing events that are correlated with
other splicing events of the same transcript. However, it makes minimal
assumptions about the set of isoforms present for a given locus. Therefore, it is
unharmed by missing transcript isoform models since each splicing event is
considered individually. The distribution of the net expression was found for
each experiment and for all experiments and was found to be similar (data not
shown). Therefore, we used the data compiled for all experiments to generate
statistical cut-offs.
For each splicing junction probe, the net expression was compared
between biological replicates of each splice factor knockdown experiment. Bona
fide targets of each splicing factor are expected to be consistently affected in
biological replicates whereas noise is expected to vary among replicates.
Therefore, splicing junction net expression values were used to filtered for those
within 2 standard deviations of the net-expression value of each other. We
98
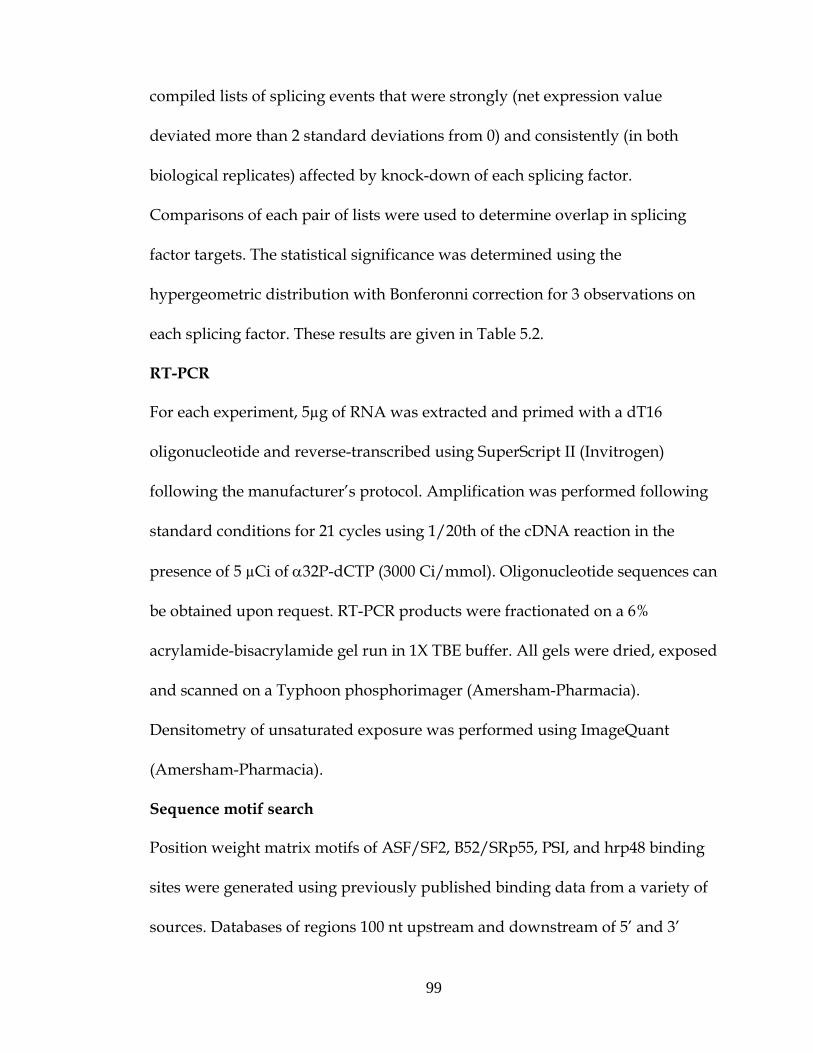
compiled lists of splicing events that were strongly (net expression value
deviated more than 2 standard deviations from 0) and consistently (in both
biological replicates) affected by knock-down of each splicing factor.
Comparisons of each pair of lists were used to determine overlap in splicing
factor targets. The statistical significance was determined using the
hypergeometric distribution with Bonferonni correction for 3 observations on
each splicing factor. These results are given in Table 5.2.
RT-PCR
For each experiment, 5µg of RNA was extracted and primed with a dT16
oligonucleotide and reverse-transcribed using SuperScript II (Invitrogen)
following the manufacturer’s protocol. Amplification was performed following
standard conditions for 21 cycles using 1/20th of the cDNA reaction in the
presence of 5 µCi of α32P-dCTP (3000 Ci/mmol). Oligonucleotide sequences can
be obtained upon request. RT-PCR products were fractionated on a 6%
acrylamide-bisacrylamide gel run in 1X TBE buffer. All gels were dried, exposed
and scanned on a Typhoon phosphorimager (Amersham-Pharmacia).
Densitometry of unsaturated exposure was performed using ImageQuant
(Amersham-Pharmacia).
Sequence motif search
Position weight matrix motifs of ASF/SF2, B52/SRp55, PSI, and hrp48 binding
sites were generated using previously published binding data from a variety of
sources. Databases of regions 100 nt upstream and downstream of 5’ and 3’
99

splice sites were constructed using the splice junctions found to be uniquely
affected for each splicing factor knockdown. The comparison databases for each
factor were composed of the sequences uniquely affected by any of the three
other splicing factors not under examination. The motif was used to scan each
position on each sequence in the database and high-scoring positions were
counted and shown in Figure 5.8 and Figure 5.9. The error bars shown indicate
the standard deviation for a single test. No correction for multiple testing was
done.
100
CHAPTER 6
Bootstrapping, Bayesian bootstrapping, and normalization for enhanced
pairwise sequence evaluation
Note: Much of the material presented in this chapter was included in the publications: Green RE, and Brenner SE (2002). Bootstrapping and normalization for enhanced evaluation of pairwise sequence comparison Proc. IEEE. 90 (12): 1834-1847. Price G, Crooks GE, Green RE, and Brenner SE (2005). Statistical Evaluation of Pairwise Sequence Comparison with the Bayesian Bootstrap Bioninformatics (submitted). The analyses have been updated with current versions of the databases and current database search programs.
101

Introduction
The explosive growth of biological sequence databases provides great
opportunity for molecular and computational biologists. High-throughput
sequencing projects have generated complete genome sequence for hundreds of
microbes and several eukaryotes (24), including humans (153). Biologists use
these comprehensive data in their attempt to discover the biological functions of
genes and the proteins they encode. For many proteins it is possible to make
inferences of function based simply on recognizable similarity with previously
characterized sequences. Current technology allows between one third to one
half of the genes within newly sequenced genomes to be annotated on the basis
of recognizable sequence similarity to genes of other organisms (252).
Furthermore, as more genomes are sequenced and more genes are
characterized, greater fractions of new genomes can be annotated in this way
(95).
The ability to make useful inferences based on sequence similarity is
based on the relationships between protein sequence, structure, and function –
all of which revolve around homology (Figure 6.1). Homologous proteins are
those that had a common evolutionary ancestor. The most common means of
inferring homology is by sequence comparison: experience has demonstrated
that significant sequence similarity is a reliable indicator of homology. Because
protein structure evolves very slowly, with cores being exceptionally well
conserved over billions of years of evolution, homology between two proteins
102

SequenceSimilarity
StructuralSimilarity
FunctionalSimilarityHomology
Fig.ure 6.1 Inferences from sequence similarity. Detectable similarity between two protein sequences implies a common origin, homology. This, in turn, implies a common 3-dimensional structure. Other inferences are less reliable, indicated by lighter arrows.
103
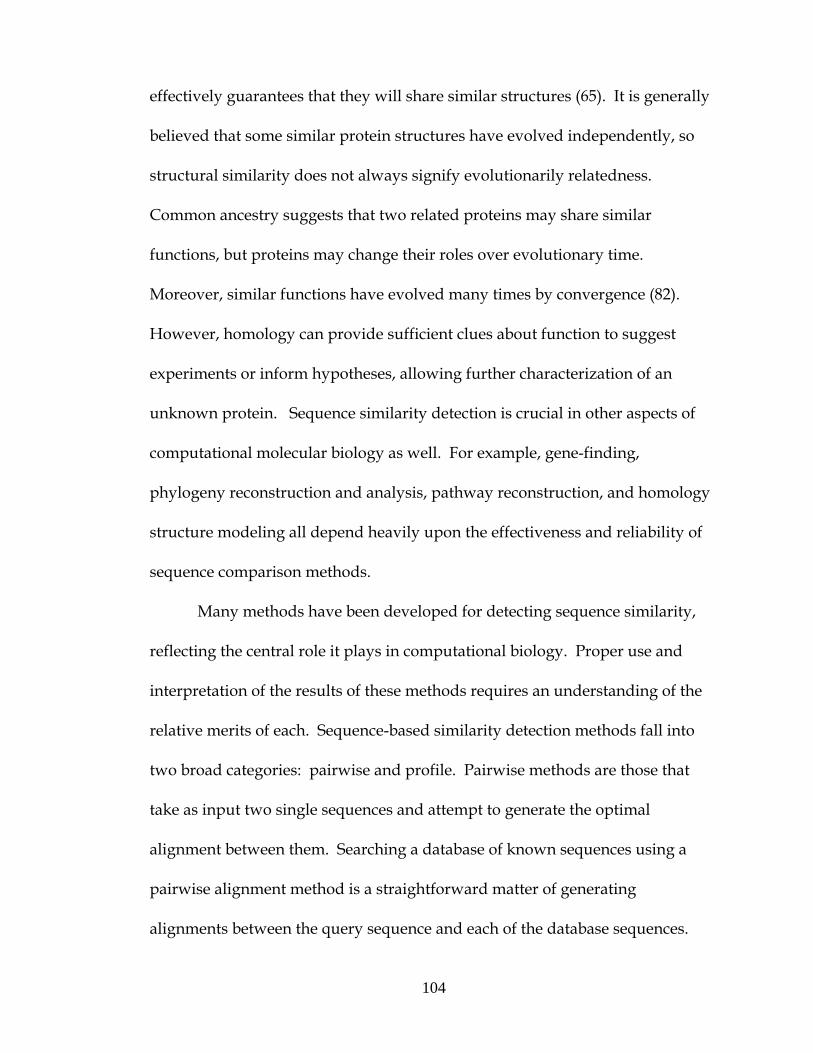
effectively guarantees that they will share similar structures (65). It is generally
believed that some similar protein structures have evolved independently, so
structural similarity does not always signify evolutionarily relatedness.
Common ancestry suggests that two related proteins may share similar
functions, but proteins may change their roles over evolutionary time.
Moreover, similar functions have evolved many times by convergence (82).
However, homology can provide sufficient clues about function to suggest
experiments or inform hypotheses, allowing further characterization of an
unknown protein. Sequence similarity detection is crucial in other aspects of
computational molecular biology as well. For example, gene-finding,
phylogeny reconstruction and analysis, pathway reconstruction, and homology
structure modeling all depend heavily upon the effectiveness and reliability of
sequence comparison methods.
Many methods have been developed for detecting sequence similarity,
reflecting the central role it plays in computational biology. Proper use and
interpretation of the results of these methods requires an understanding of the
relative merits of each. Sequence-based similarity detection methods fall into
two broad categories: pairwise and profile. Pairwise methods are those that
take as input two single sequences and attempt to generate the optimal
alignment between them. Searching a database of known sequences using a
pairwise alignment method is a straightforward matter of generating
alignments between the query sequence and each of the database sequences.
104

Alignments with the best scores are then examined. Profile methods, on the
other hand, generate a statistical model, or profile, of a sequence family and
then compare the profile to a given sequence. Using a profile method, therefore,
involves both constructing profiles and using them to detect similar sequences.
Although profile methods have proven to be more sensitive than pairwise
methods, their use requires prior knowledge of the sequence family in question
– knowledge that typically derives from pairwise methods.
Sequence similarity detection using pairwise methods generally requires
two steps, the first of which is generating the alignment between the sequences.
Current pairwise-alignment algorithms for database searching are derivatives of
the Needleman-Wunsch dynamic programming algorithm (205) as modified for
local alignment by Smith and Waterman (248). The Smith-Waterman algorithm
guarantees the optimal alignment under a given scoring scheme, and the
SSEARCH program (216) provides a full implementation. Heuristics that speed
up pairwise alignment have been introduced in BLAST (12) and FASTA (220), the
two most popular algorithms. WU-BLAST and NCBI BLAST are both
implementations of the BLAST algorithm, differing in the way score statistics are
generated as well as some heuristics. WU-BLAST implements and reports Karlin
and Altschul sum statistics (11, 139) by default.
Alignments are generated using a scoring scheme that includes a
substitution matrix and gap parameters. Substitution matrices for protein
sequence alignments are 20x20 matrices that give scaled, log-odds scores for the
105

pairing of any two aligned amino acid residues in an alignment (5). The score of
a given alignment is simply the sum of the matrix values for each position in the
alignment, minus the penalty for gaps within the alignment. The optimal
alignment is the one that generates the highest score in this way. For local
alignments, this may not include all of either sequence.
The second step in pairwise similarity detection is generating a statistical
score for the alignment. It has been shown analytically for ungapped alignments
(5, 138) and empirically for gapped (9, 69, 249) alignments that optimal
alignment scores follow an extreme value distribution (EVD). Therefore,
generating a statistical significance score for an alignment is really a problem of
finding appropriate EVD parameters for the raw score in question. The BLAST
programs have pre-computed EVD data for several sets of scoring parameters
based on large scale computational experiments with simulated data (8). The
FASTA package programs (FASTA and SSEARCH), by default, generate empirical
EVD parameters for a given alignment by curve-fitting the distribution of
alignment scores generated during the database search in question (219). By
either method, once the EVD parameters are derived, an E-value can be
generated that represents the significance of the alignment in the context in
which it was generated (7). Statistical scores have proven to be far superior to
other measures of alignment quality (37, 219).
106
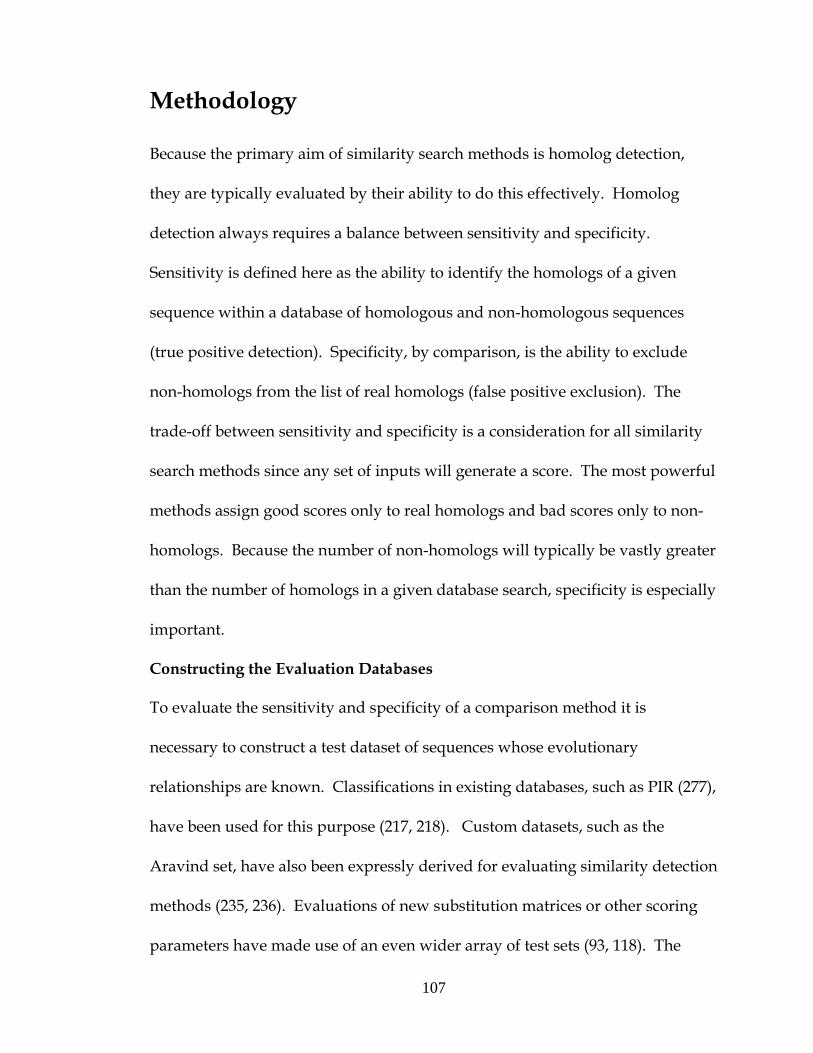
Methodology
Because the primary aim of similarity search methods is homolog detection,
they are typically evaluated by their ability to do this effectively. Homolog
detection always requires a balance between sensitivity and specificity.
Sensitivity is defined here as the ability to identify the homologs of a given
sequence within a database of homologous and non-homologous sequences
(true positive detection). Specificity, by comparison, is the ability to exclude
non-homologs from the list of real homologs (false positive exclusion). The
trade-off between sensitivity and specificity is a consideration for all similarity
search methods since any set of inputs will generate a score. The most powerful
methods assign good scores only to real homologs and bad scores only to non-
homologs. Because the number of non-homologs will typically be vastly greater
than the number of homologs in a given database search, specificity is especially
important.
Constructing the Evaluation Databases
To evaluate the sensitivity and specificity of a comparison method it is
necessary to construct a test dataset of sequences whose evolutionary
relationships are known. Classifications in existing databases, such as PIR (277),
have been used for this purpose (217, 218). Custom datasets, such as the
Aravind set, have also been expressly derived for evaluating similarity detection
methods (235, 236). Evaluations of new substitution matrices or other scoring
parameters have made use of an even wider array of test sets (93, 118). The
107

power of a given similarity search method is then assessed by its ability to
predict known relations while avoiding spurious matches. Naturally, the
knowledge of which sequences are related should be derived independently of
the method being evaluated. Because a large percentage of sequence database
annotation derives from sequence similarity detection, it is not desirable to use
this annotation as the basis for constructing evaluation databases. This will miss
the truly homologous sequences that have yet to be correctly annotated.
Additionally, false annotations which currently corrupt databases will be
included (31, 36). Consequently, using sequence-based classifications leads to a
circularity and tests consistency with existing methods rather than absolute
accuracy.
A solution to this problem is to use structure as a means of inferring
evolutionary relationships between pairs of sequences. Because structure
evolves more slowly than sequence, structural similarity can be used as a “gold-
standard” for determining whether any two sequences are related. To this end,
analyses frequently use the classifications in the SCOP (37, 38, 140, 171, 202) and
CATH (30, 102, 209) databases as well as direct structural similarity (234).
The SCOP: Structural Classification Of Proteins database provides a hierarchical
classification of the structural domains of all solved protein structures. Domains
are classified at the level of class, fold, superfamily, and family. ASTRAL (60, 61)
provides sequence sets of SCOP domains, filtered at various levels of identity.
These domain sequences, along with their SCOP classification information, can
108

be used as test sequences for any similarity detection method, since their
relationships are known.
Protein domains are the unit of classification within SCOP, and by
extension, ASTRAL, because these are the fundamental units of protein evolution
and structure. Using domain sequences, rather than whole proteins, allows us
to unequivocally identify which domains are involved in any pairwise
alignment. This can be difficult to do when using multi-domain sequences or
sequences whose domain organization is unknown. An unfortunate
consequence of using isolated domain sequences is that more global methods
and parameters may be favored; each sequence is a complete structural and
evolutionary unit, pairs of which will have similar lengths with meaningful
alignments over their entire lengths. By contrast, most typical database queries
require identification of regions of similarity within sequence pairs that have
both related and unrelated regions.
Within the SCOP hierarchy (Figure 6.2), it is widely acknowledged that
domains of the same superfamily are descendants of a common ancestor.
Domains of different folds are believed to be evolutionarily unrelated. Domains
of the same fold but different superfamily currently lack evidence of homology.
If such evidence eventually becomes available, superfamilies can be coalesced to
reflect this new understanding. We evaluated similarity detection methods and
scoring parameter sets by their ability to generate good scores for all the truly
homologous sequences, i.e., those within the same superfamily, while
109

scop Root
α β α/β α+β Class
Familyβ-Glucanase α-Amylase(N) β-Amylase
FoldTIM β/α-barrel NAD(P)-binding Rossman Cellulases
SuperfamilyTIM PLP-binding barrel(Trans)glycosidases
PDBDomains
1e43(a:1-393)d1e43a2
1e3x(a:1-393)d1e3xa2
1e3z(a:1-393)d1e3za2 R
elat
ed b
yh
om
olo
gy
Det
erm
ined
by
stru
ctu
reFigure 6.2 SCOP hierarchy sample. The two top levels of SCOP, class and fold, are purely based on structural similarity. Domains of the same superfamily rely upon common structure and other features as evidence of homology. The superfamily level and all those below are based on homology. The superfamily level is unique in being based on structural information andindicating homology.
110

simultaneously generating poor scores for all sequences of different folds.
Domains classified in the same fold but different superfamilies are treated as
undetermined and not considered in our benchmarking.
Our test databases (Figure 6.3) were constructed from the genetic domain
sequences within the ASTRAL database based on SCOP release 1.67 (and previous
versions where noted). These sequences were filtered at 40% sequence identity
to make the test specific for remote homolog detection, as sequences with
greater than 40% sequence identity are easily identifiable as similar (232). After
masking low-complexity regions with SEG (276) (using parameters –w 12 –t 1.8 –
e 2.0) this database was partitioned into two similarly sized databases. Each
contained all sequences of every-other sequence fold; there are no sequences in
the intersection of the two sets. One dataset, with 3431 sequences, can then used
as a training database to determine optimal search parameters (substitution
matrix, matrix scaling, gap penalties) for any of the pairwise search methods.
Hereafter, it will be referred to as the training database. The other database,
with 3169 sequences, was used as the test database. Comparisons are performed
against this database using the optimal parameters found on the training
database. Separating the original ASTRAL set in this way ensures that we do not
simply evaluate a particular algorithm’s ability to be optimized for the database
in question.
111
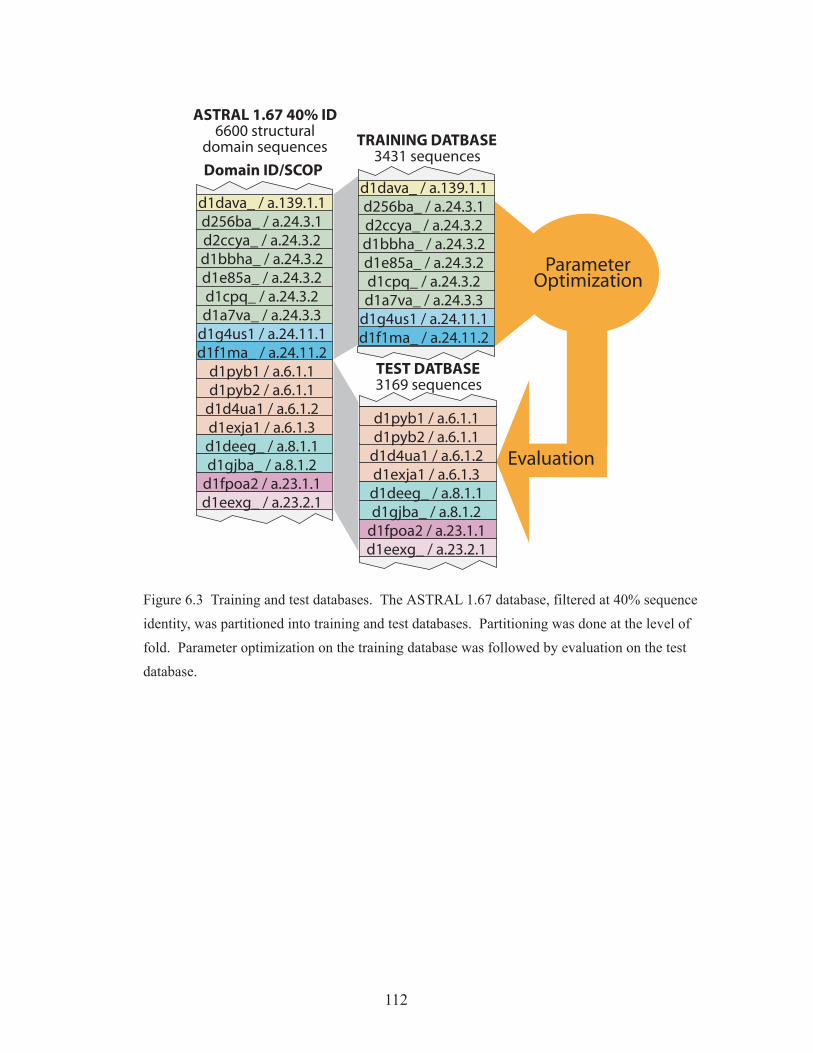
d1dava_ / a.139.1.1
d1g4us1 / a.24.11.1d1f1ma_ / a.24.11.2
d256ba_ / a.24.3.1d2ccya_ / a.24.3.2d1bbha_ / a.24.3.2d1e85a_ / a.24.3.2d1cpq_ / a.24.3.2d1a7va_ / a.24.3.3
TEST DATBASE3169 sequences
ParameterOptimization
Evaluation
d1dava_ / a.139.1.1
d1fpoa2 / a.23.1.1d1eexg_ / a.23.2.1
d1g4us1 / a.24.11.1d1f1ma_ / a.24.11.2
d1deeg_ / a.8.1.1d1gjba_ / a.8.1.2
d256ba_ / a.24.3.1d2ccya_ / a.24.3.2d1bbha_ / a.24.3.2d1e85a_ / a.24.3.2d1cpq_ / a.24.3.2d1a7va_ / a.24.3.3
d1pyb1 / a.6.1.1d1pyb2 / a.6.1.1
d1d4ua1 / a.6.1.2d1exja1 / a.6.1.3
ASTRAL 1.67 40% ID6600 structural
domain sequences
Domain ID/SCOP
TRAINING DATBASE3431 sequences
d1fpoa2 / a.23.1.1d1eexg_ / a.23.2.1
d1deeg_ / a.8.1.1d1gjba_ / a.8.1.2
d1pyb1 / a.6.1.1d1pyb2 / a.6.1.1
d1d4ua1 / a.6.1.2d1exja1 / a.6.1.3
Figure 6.3 Training and test databases. The ASTRAL 1.67 database, filtered at 40% sequence identity, was partitioned into training and test databases. Partitioning was done at the level of fold. Parameter optimization on the training database was followed by evaluation on the test database.
112

Summarizing database homolog detection search results: The CVE plot
As mentioned previously, the ability of a similarity detection method to report
truly homologous sequence matches must be balanced against its ability to
refrain from reporting matches between unrelated sequences. This sensitivity
versus specificity tradeoff can be rendered graphically via the coverage versus
errors per query (CVE) plot (37). CVE plots are related to ROC plots (37, 111,
293) and SPEC-SENS (114, 229) curves, but present the data in an way that is
directly interpretable. A CVE plot is generated by performing a database versus
database search and ordering the results by significance score (Figure 6.4).
Then, each reported match pair, from most significant to least significant, is
evaluated by its SCOP classification information to be homologous, non-
homologous, or undetermined. At each significance threshold, a point on the
CVE plot is generated. The x-coordinate of the point is coverage; that is the
number of detected homolog pairs divided by the total number of pairs that
exist (true positives / number of homolog pairs). The y-coordinate of the point
is errors per query (EPQ), namely the number of non-homolog pairs reported
divided by the size of the query database (false positives / number of queries).
The CVE results generated from a perfect homolog detection method would be
a single point at the lower right hand corner (Figure 6.4).
There are benefits of depicting the error rate in this way that allow
analyses not possible by other methods. First, EPQ rates are comparable
between experiments, even when the databases are not the same. This is
113

Query Target Score Related? Coverage Errors perquery
d256ba_ d2ccya_ 1.5e-8 YES 0.08 0
d256ba_ d1bbha_ 2.5e-7 YES 0.082 0
d1bbha_ YES 0.083 0d256ba_ 2.1e-7
d1bbha_ NO 0.083 0.001d1dava_ 9.1e-4
YES 0.084 0.001d1g4us1 d1f1ma_ 6.6e-3
0.001
0.01
0.1
1
10
0 0.1 0.2 0.3 0.4 0.5 0.6 0.7 0.8 0.9 1
Erro
rs P
er Q
uery
Coverage
WORST
PERFECT
d1dlwa_ YES 0.091 0.009d1d1a_ 2.1e-2
d1dlwa_ NO 0.091 0.010d1ctj__ 2.0e-2
YES 0.092 0.010d1ctj__ d1c53__ 1.6e-1
d1coja1 NO 0.348 9.998d1neu__ 4.3
d1neu__ YES 0.349 9.998d1eaja_ 4.4
NO 0.349 9.999d1i0ha1 d1qfoa_ 4.5
Database search results Analysis
Figure 6.4 Generating coverage versus error per query (CVE) plots. Results of a database versus database search are ordered by significance (columns 1-3). Using SCOP, each match is classified as having identified related sequences, unrelated sequences, or sequences whose relationship is not known (not shown). If the matched sequences are related, the coverage is increased. If the matched sequences are not related, then an error was made and the errors per query increases. A point on the CVE plot is generated for each significance level in the list, from most significance to least significant. Note that the significance scores themselves are not shown on the CVE plot. A perfect similarity detection method would correctly identify all the relations within the database before making any errors. This would be represented as a single point in the lower right-hand corner of the CVE plot.
114

because the distribution of false positive scores from a database search is largely
independent of the database searched. Also, using EPQ allows the direct
evaluation of significance scoring schemes (such as E-values) because EPQ and
significance scores share the same scale. EPQ reports the number of false
positives observed per database query whereas significance scores report the
number of false positives expected per database query. The EPQ axis in a CVE
plot is log-scaled to show performance over a wide error range allowing, in
particular, consideration of performance at very low error rates.
Superfamily size normalization
On CVE plots, the 100% coverage level is defined by the number of homologous
relations between members of all superfamilies. The number of these relations
within a given superfamily grows quadratically with superfamily membership.
Therefore, any representational biases present within the database are
exacerbated, and large families dominate the overall results. There are well-
known biases within the database of solved structures and, by extension, within
scop and astral. Proteins that are more amenable to structure determination or
are deemed more interesting research subjects are over-represented. Because of
this bias, performance evaluation may be skewed to favor those methods that
detect similarity between members of the larger superfamilies.
We took two approaches to neutralizing this effect (Figure 6.5). Both
approaches assign a weight to each correctly identified relation that is a function
of the size of the superfamily in which it occurs. Under quadratic normalization
115

d1f
po
a2
d1e
exg
_
d1d
eeg
_
d1g
jba_
d1p
yb1
d1p
yb2
d1e
xja1
d1d
4ua1
d1fpoa2
d1eexg_
d1deeg_
d1gjba_
d1pyb1
d1pyb2
d1d4ua1
d1exja1
d1f
po
a2
d1e
exg
_
d1d
eeg
_
d1g
jba_
d1p
yb1
d1p
yb2
d1d
4ua1
d1e
xja1
d1fpoa2
d1eexg_
d1deeg_
d1gjba_
d1pyb1d1pyb2
d1d4ua1d1exja1
d1fpoa2
d1eexg_
d1deeg_
d1gjba_
d1pyb1d1pyb2
d1d4ua1d1exja1
d1f
po
a2
d1e
exg
_
d1d
eeg
_
d1g
jba_
d1p
yb1
d1p
yb2
d1d
4ua1
d1e
xja1
NO NORMALIZATION LINEARNORMALIZATION
QUADRATICNORMALIZATION
a b
c
True positive False positive
Undetermined Self
Figure 6.5 Normalization schemes. For each normalization scheme, the size of each matrix element represents the weight given to each relation. (a)The number of correct superfamily level relations, shown in blue, is naturally dominated by large superfamiles. (b)Linear normalization weights each superfamily in linear proportion to the number of sequences it contains. (c)Under quadratic normalization, each superfamily is weighted equally.
116
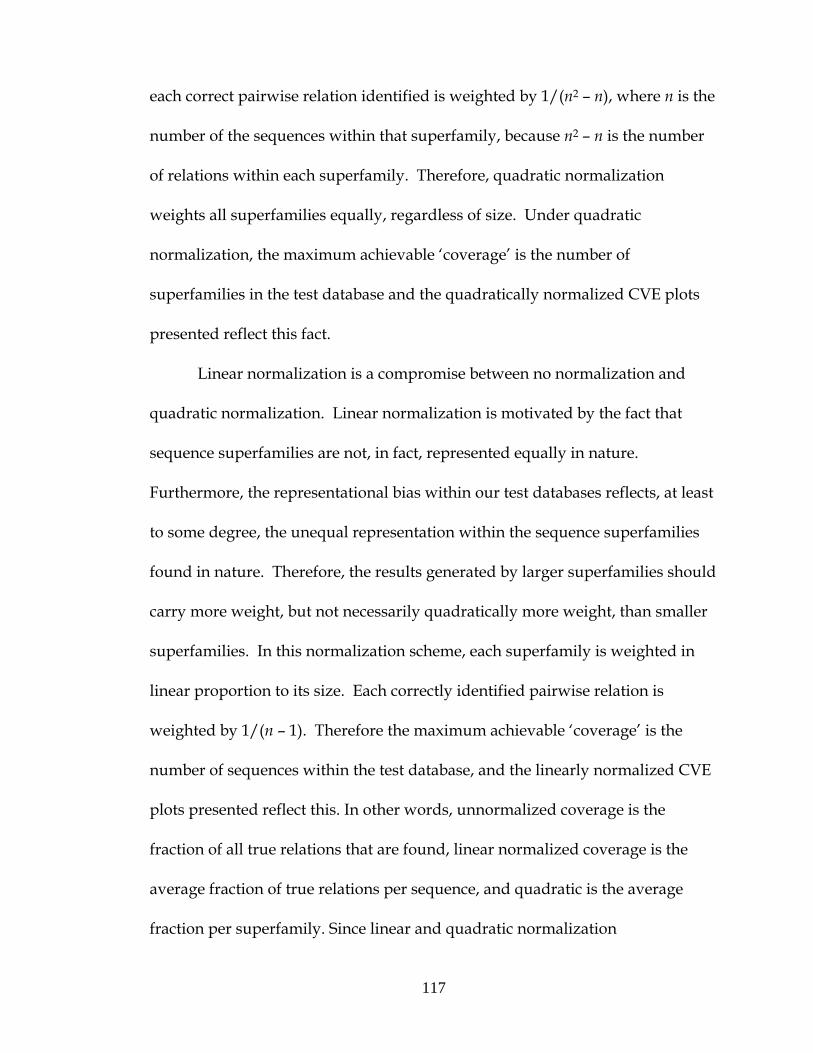
each correct pairwise relation identified is weighted by 1/(n2 – n), where n is the
number of the sequences within that superfamily, because n2 – n is the number
of relations within each superfamily. Therefore, quadratic normalization
weights all superfamilies equally, regardless of size. Under quadratic
normalization, the maximum achievable ‘coverage’ is the number of
superfamilies in the test database and the quadratically normalized CVE plots
presented reflect this fact.
Linear normalization is a compromise between no normalization and
quadratic normalization. Linear normalization is motivated by the fact that
sequence superfamilies are not, in fact, represented equally in nature.
Furthermore, the representational bias within our test databases reflects, at least
to some degree, the unequal representation within the sequence superfamilies
found in nature. Therefore, the results generated by larger superfamilies should
carry more weight, but not necessarily quadratically more weight, than smaller
superfamilies. In this normalization scheme, each superfamily is weighted in
linear proportion to its size. Each correctly identified pairwise relation is
weighted by 1/(n – 1). Therefore the maximum achievable ‘coverage’ is the
number of sequences within the test database, and the linearly normalized CVE
plots presented reflect this. In other words, unnormalized coverage is the
fraction of all true relations that are found, linear normalized coverage is the
average fraction of true relations per sequence, and quadratic is the average
fraction per superfamily. Since linear and quadratic normalization
117

systematically down-weight larger superfamilies relative to small superfamilies,
and because finding correct relations in larger superfamilies is more difficult,
quadratic coverage is generally larger than linear coverage, which in turn is
larger than unnormalized coverage.
Bootstrapping Provides Significance of Coverage Versus Error
The CVE line for any two search method/parameter set pairs will likely differ.
Therefore, to determine which method is superior at a given error rate, it is a
straightforward matter to pick a suitable error rate and rank methods by the
coverage generated. However, the significance of any difference between two
coverage levels is not immediately apparent. In order to address the question of
performance difference significance, we implemented the bootstrap strategy
described in Figure 6.6a. In brief, the database in question is sampled randomly
with replacement n times, where n is the number of sequences in the database.
Based on the results of this sampling a new, bootstrap database is constructed in
which each sequence is represented 0, 1, or more than 1 times.
The alignment results between the two methods being compared are then
recomputed, but restricted to only those sequences that were sampled and
repeated if the sequence was sampled multiple times. The difference in coverage
between methods is calculated for each bootstrap replicate to generate a
distribution of this statistic. If there is a consistent difference between methods
in an overwhelming majority of the bootstrap replicates, then we can conclude
that this difference is significant. We use a 95% confidence interval to declare
118

that two methods vary in their ability to detect homologs at the error rate under
consideration.
An interesting consequence of using the standard bootstrap is that the
original coverage versus EPQ line, i.e., the line that corresponds to sampling
each sequence once and only once, invariably falls toward the higher coverage
end of the bootstrap distribution in normalized results (Figure 6.6a). We
determined that this is the case because during bootstrap sampling, by chance,
some of the smaller superfamilies are not sampled or sampled only once. When
this happens, no relations remain for that superfamily. Since the easier relations
to detect are primarily within the smaller superfamilies, the effect of eliminating
them will be felt more emphatically when results are normalized by superfamily
size. As a consequence of this bootstrap artifact, the bootstrap average of
coverage at a given error rate is not in agreement with the coverage at the same
error rate in the underlying data.
A solution to this problem was subsequently developed by Gavin
Crooks, Gavin Price and me. This solution is an implementation of the Bayesian
bootstrap (233), a Bayesian resampling procedure that is operationally similar to
the standard nonparametric bootstrap (Figure 6.6b). In the standard bootstrap,
resampling with replacement in effect assigns to each sequence integer weights
that are drawn from a multinomial distribution. In the Bayesian bootstrap, the
sequences are assigned continuously varying weights drawn from a Dirichlet
distribution. Because the sequence weights are continuously varying there is a
119
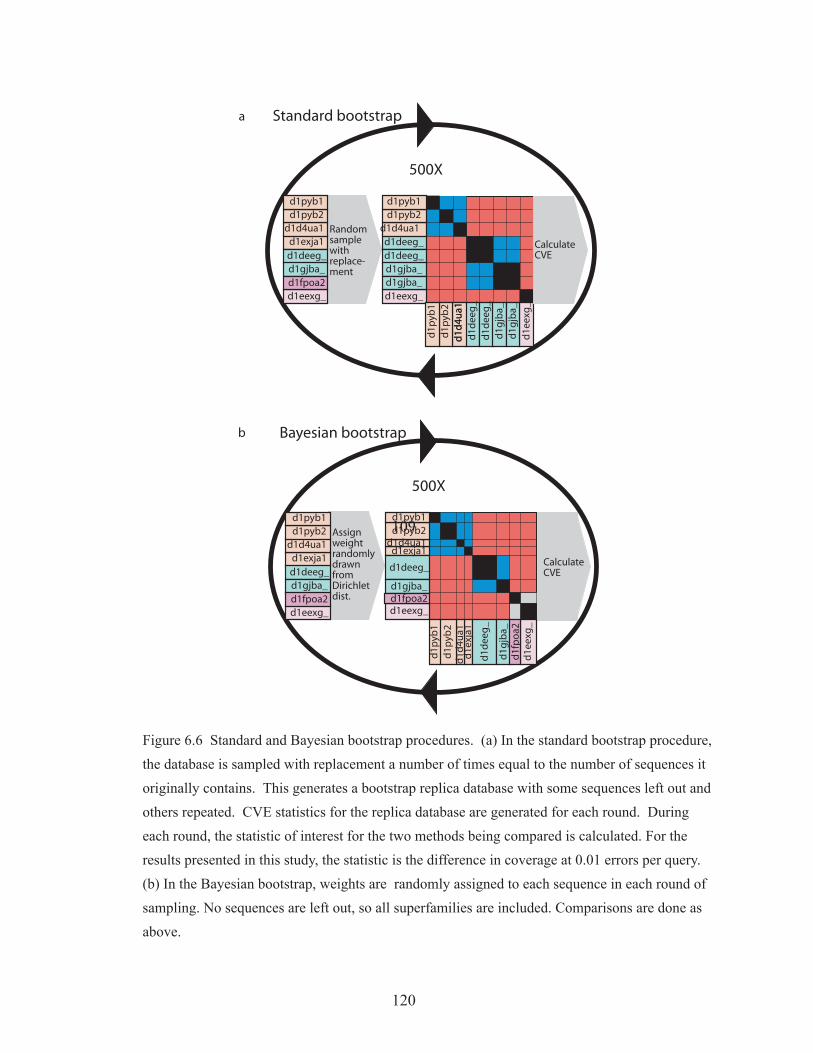
d1fpoa2d1eexg_
d1deeg_d1gjba_
d1pyb1d1pyb2
d1d4ua1d1exja1
d1eexg_
d1deeg_d1gjba_
d1pyb1d1pyb2
d1d4ua1
d1gjba_
d1deeg_
d1e
exg
_
d1d
eeg
_d
1gjb
a_
d1p
yb1
d1p
yb2
d1d
4ua1
d
1d4u
a1
d1g
jba_
d1d
eeg
_
Randomsamplewithreplace-ment
CalculateCVE
500X
a
d1fpoa2d1eexg_
d1deeg_d1gjba_
d1pyb1d1pyb2
d1d4ua1d1exja1
AssignweightrandomlydrawnfromDirichletdist.
CalculateCVE
500X
d1fpoa2d1eexg_
d1deeg_
d1gjba_
d1pyb1d1pyb2
d1d4ua1d1exja1
d1f
po
a2d
1eex
g_
d1d
eeg
_
d1g
jba_
d1p
yb1
d1p
yb2
d1d
4ua1
d1e
xja1
Bayesian bootstrap
Standard bootstrap
b
Figure 6.6 Standard and Bayesian bootstrap procedures. (a) In the standard bootstrap procedure, the database is sampled with replacement a number of times equal to the number of sequences it originally contains. This generates a bootstrap replica database with some sequences left out and others repeated. CVE statistics for the replica database are generated for each round. During each round, the statistic of interest for the two methods being compared is calculated. For the results presented in this study, the statistic is the difference in coverage at 0.01 errors per query. (b) In the Bayesian bootstrap, weights are randomly assigned to each sequence in each round of sampling. No sequences are left out, so all superfamilies are included. Comparisons are done as above.
109
120

vanishingly small chance of assigning a zero weight to any sequence.
Consequentially, the Bayesian bootstrap does not undersample small
superfamilies and we do not expect, and do not observe, the strong replica bias
exhibited by the standard bootstrap (Figure 6.7). In addition, this Bayesian
bootstrap procedure has a clear interpretation. The Dirichlet distribution is
conjugate to the multinomial and consequentially is frequently used as the prior
and posterior distribution for multinomial sampling with replacement.
Therefore, we can think of the ensemble of Bayesian bootstrap replicas, and the
distribution of statistics derived from them, as samples from Bayesian posterior
distributions (88). One further, critical refinement was implemented in the
Bayesian bootstrap procedure. Instead of comparing the difference of the means
of two bootstrap distributions, we now use the mean of the differences. This is
necessary because the performance of one method on a given bootstrap replicate
is not independent of the performance of a second method. In other words, a
difficult replicates for one method is likely to be a difficult replicate for another
method. Procedurally, this requires that any given comparison of methods be
performed together on the same ensemble of Bayesian bootstrap database
replicates, as was done.
Similarity Search Methods Evaluated
We set out to evaluate several of the most commonly used pairwise search tools
(Table 6.1). All were downloaded from the source given in Table 6.1, compiled
121

Figure 6.7 Demonstration of the difference between a standard and Bayesian bootstrap using the optimal parameter settings for the BLOCKS 13+ BLOSUM matrix family and the test dataset. (a) The standard bootstrap preferentially selects sequences from larger, more diverse superfamilies where the correct sequence relationships are harder to discover. Thus, when each superfamily possesses the same amount of possible coverage (quadratic normalization), the bootstrap is biased towards the left because smaller superfamilies often drop out of the analysis entirely. Linear normalization displays a less severe effect. Since larger superfamily relationships are harder to discover, when the superfamilies have equal total weight (quadratic normalization) the coverage is much higher than with no normalization. To a lesser degree, the same effect is observable with linear normalization. The bottom graph makes clear that the standard bootstrap also over-predicts the variance under normalization. (b) As the Bayesian bootstrap assigns non-integer weights to each sequence, smaller superfamilies will not drop out of the analysis. This eliminates the bias and over-predicted variance of the standard bootstrap.
122

and installed per documented instructions, and run on Linux systems using
default options, except where otherwise noted.
Results
Parameter Optimization and Pairwise Method Evaluation
In order to conduct as unbiased a test as possible, we partitioned our test
database into two, non-overlapping databases (Figure 6.3). Each pairwise
method was then evaluated on the training database using a range of
substitution matrices and gap parameters. The training phase was conducted
by searching gap opening and gap extension parameter space around the values
found previously to be optimal (109). For each pairwise search method, we
chose the parameter set that generated the highest coverage at 0.01 EPQ under
linear normalization for further evaluation. These matrices and parameters
explored and the optimal parameter sets are given in Table 6.2. It is worth
noting that the highest coverage yielding parameter set at 0.01 errors per query
may not necessarily be best at other error rates. However, in all cases, the top
scoring parameter set at 0.01 errors per query was among the best at errors per
query rates in the range of 0.001 to 10.
To determine the significance of the performance differences of each of
the four pairwise search methods, we performed database-versus-database
searches using the test database and the optimal parameter sets listed in Table
6.2. Results were compiled and are presented as CVE plots in Figure 6.8 in
unnormalized, linearly normalized, and quadratically normalized format. It is
123

Pairwise search method
Version Location
NCBI BLAST
2.2.10 [Oct-19-2004]
ftp://ftp.ncbi.nlm.nih.gov/blast/executables/
WU-BLAST
2.0MP-WashU [06-Apr-2005]
http://blast.wustl.edu/
FASTA3 3.4t25 Nov 12, 2004
http://fasta.bioch.virginia.edu/
SSEARCH3 3.4t25 Nov 12, 2004
http://fasta.bioch.virginia.edu/
Table 6.1. Pairwise methods evaluated. The version number and download source for
each program is also given.
124

interesting that when the results are normalized for superfamily size, the
coverage invariably increases. This indicates that for any of these methods it is
more difficult to detect the relations within larger superfamilies; de-
emphasizing larger superfamilies increases coverage. As expected, the SSEARCH
algorithm, which fully explores the alignment space, finds the most
relationships over most error rates. The popular NCBI BLAST, finds the fewest.
The relative order of performance between these four methods is largely
unchanged under each normalization scheme across the range of error rates.
We bootstrap sampled the CVE data from the pairwise alignment results 200
times. SSEARCH outperforms the heuristic methods under each normalization
scheme, and the difference is significant. Interestingly, the differences between
each method do not vary much under the various normalization schemes,
indicating that the large superfamily bias affects each method roughly equally.
We examined the size distribution of superfamilies within our test dataset to
further investigate the correlation between superfamily size and ability to detect
remote homologs. Figure 6.9a shows the distributions of superfamilies, by size,
within the test database. Note that the most populous superfamily size is one.
These superfamilies are important in that there are no relations to detect within
them. Therefore, they serve only as decoys within these experiments, i.e., they
can contribute to the errors but not to the coverage. There is a strong negative
correlation between superfamily size and number of superfamilies. That is,
there are more smaller superfamilies and fewer larger superfamilies. This trend
125
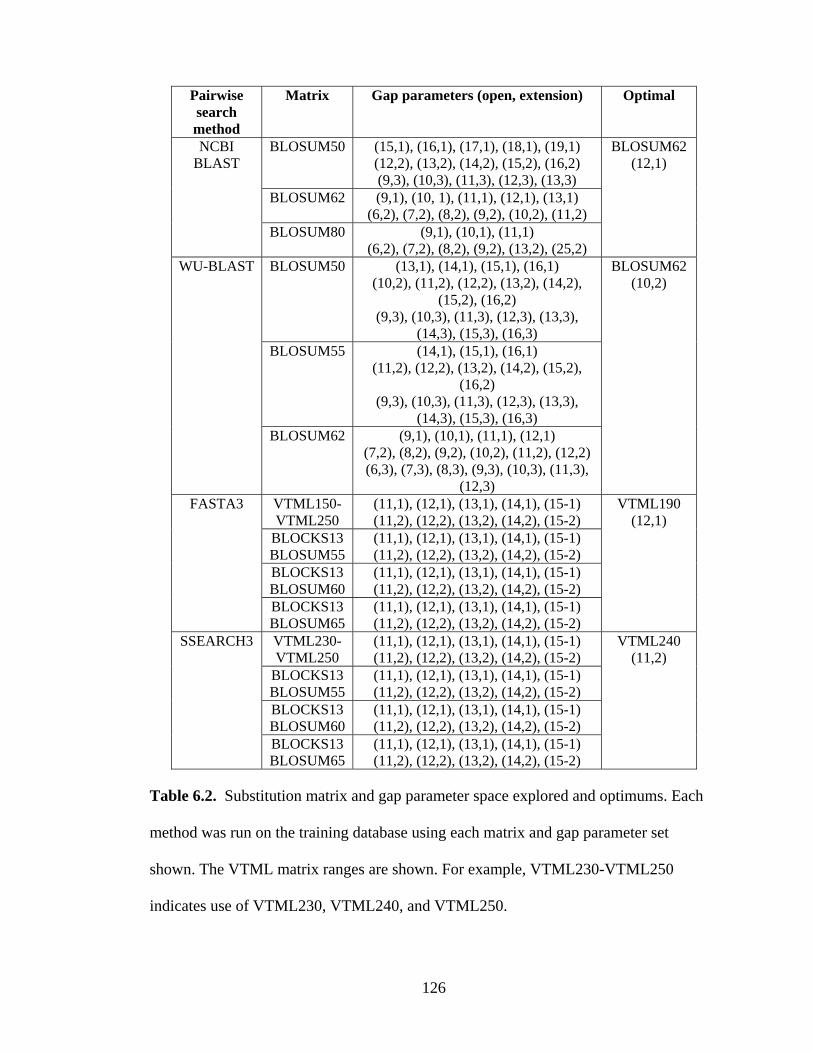
Pairwise search method
Matrix Gap parameters (open, extension) Optimal
BLOSUM50 (15,1), (16,1), (17,1), (18,1), (19,1) (12,2), (13,2), (14,2), (15,2), (16,2) (9,3), (10,3), (11,3), (12,3), (13,3)
BLOSUM62 (9,1), (10, 1), (11,1), (12,1), (13,1) (6,2), (7,2), (8,2), (9,2), (10,2), (11,2)
NCBI BLAST
BLOSUM80 (9,1), (10,1), (11,1) (6,2), (7,2), (8,2), (9,2), (13,2), (25,2)
BLOSUM62 (12,1)
BLOSUM50 (13,1), (14,1), (15,1), (16,1) (10,2), (11,2), (12,2), (13,2), (14,2),
(15,2), (16,2) (9,3), (10,3), (11,3), (12,3), (13,3),
(14,3), (15,3), (16,3) BLOSUM55 (14,1), (15,1), (16,1)
(11,2), (12,2), (13,2), (14,2), (15,2), (16,2)
(9,3), (10,3), (11,3), (12,3), (13,3), (14,3), (15,3), (16,3)
WU-BLAST
BLOSUM62 (9,1), (10,1), (11,1), (12,1) (7,2), (8,2), (9,2), (10,2), (11,2), (12,2) (6,3), (7,3), (8,3), (9,3), (10,3), (11,3),
(12,3)
BLOSUM62 (10,2)
VTML150-VTML250
(11,1), (12,1), (13,1), (14,1), (15-1) (11,2), (12,2), (13,2), (14,2), (15-2)
BLOCKS13 BLOSUM55
(11,1), (12,1), (13,1), (14,1), (15-1) (11,2), (12,2), (13,2), (14,2), (15-2)
BLOCKS13 BLOSUM60
(11,1), (12,1), (13,1), (14,1), (15-1) (11,2), (12,2), (13,2), (14,2), (15-2)
FASTA3
BLOCKS13 BLOSUM65
(11,1), (12,1), (13,1), (14,1), (15-1) (11,2), (12,2), (13,2), (14,2), (15-2)
VTML190 (12,1)
VTML230-VTML250
(11,1), (12,1), (13,1), (14,1), (15-1) (11,2), (12,2), (13,2), (14,2), (15-2)
BLOCKS13 BLOSUM55
(11,1), (12,1), (13,1), (14,1), (15-1) (11,2), (12,2), (13,2), (14,2), (15-2)
BLOCKS13 BLOSUM60
(11,1), (12,1), (13,1), (14,1), (15-1) (11,2), (12,2), (13,2), (14,2), (15-2)
SSEARCH3
BLOCKS13 BLOSUM65
(11,1), (12,1), (13,1), (14,1), (15-1) (11,2), (12,2), (13,2), (14,2), (15-2)
VTML240 (11,2)
Table 6.2. Substitution matrix and gap parameter space explored and optimums. Each
method was run on the training database using each matrix and gap parameter set
shown. The VTML matrix ranges are shown. For example, VTML230-VTML250
indicates use of VTML230, VTML240, and VTML250.
126

1e-04
0.001
0.01
0.1
1
10
0 0.2 0.4 0.6 0.8 1
Err
ors
per q
uery
Coverage
FASTASSEARCH
WU-BLASTNCBI BLAST
QU
ADR
ATIC
LIN
EAR
UN
NO
RM
ALIZ
ED
Figure 6.8 Coverage versus errors per query (CVE) plot comparison of pairwise database search methods. Each program was used with optimal parameters to search the test database. The CVE lines are shown for unnormalized, linearly normalized, and quadratically normalized data. SSEARCH finds the most pairwise relations for most error rates, including 0.01 errors per qery. NCBI BLAST finds the fewest. For all methods, normalizing the results gives increasedcoverage, indicating that relations in larger superfamilies are more difficult to detect.
127

1
10
100
1000
0 5 10 15 20 25 30 35 40
Num
ber o
f sup
erfa
mili
es
Superfamily size
Superfamily size distribution
0
0.2
0.4
0.6
0.8
1
0 5 10 15 20 25 30 35 40
Cov
erag
e at
0.0
1 E
PQ
Superfamily size
Coverage versus superfamily size
a
b
Figure 6.9 Superfamily size distribution in test database. (a) The number of superfamilies of increasing number of members is shown. Superfamilies with only a single member, the most numerous group, have no evolutionary relationships to detect. Not shown are the several super-families with more than 40 members. (b). The fraction of correctly identified relations at 0.01 errors per query is shown as a function of superfamily size. Generally, the relations within larger superfamilies are more difficult to detect than those within smaller superfamilies. These data were generated using the SSEARCH program with optimal parameters.
128

is also present within the training database (data not shown). Also, not shown in
Figure 6.9a are the few very large superfamilies present within the test database.
The largest superfamily within the test database is the NAD(P)-binding
Rossmann-fold, containing 132 members. Within this superfamily, there are
17292 relations, as compared to the 662 relations within all the 331 superfamilies
of size 2, representing 662 sequences, in the test database.
To further investigate the general effect of apparently poor homolog
detection within larger superfamilies, we broke down the results of the
pairwise-test database search using SSEARCH with optimal parameters (Figure
6.9b). As expected from the normalization trend, there is a general negative
correlation between superfamily size and percentage of relationships identified.
Statistical Score Evaluation
In addition to being able to differentiate between related and non-related
sequences, similarity detection methods should also give the user a reliable
estimation of the significance of any similarity detected. This is especially
important when a newly discovered sequence is used as a query and the user
can not be sure that it has any homologs within the search database. Each of the
pairwise methods evaluated is capable of generating E-value statistical
significance scores. The interpretation of an E-value is the number of matched
pairs one would expect by random chance that are as good as or better than the
one reported, given the database search performed to find it.
129

1e-05
1e-04
0.001
0.01
0.1
1
10
1e-05 1e-04 0.001 0.01 0.1 1 10
Obs
erve
d er
rors
per
que
ry
E-value
Errors per query versus E-value
FASTASSEARCH
WU-BLA
ST
NCBI BLAST
Ideal line
Figure 6.10 Observed error rate versus statistical score. If the statistical scores reported by a database search method are correct, at each E-value there will be as many errors (false positives) as there are alignment pairs at that significance level (red Ideal line). The SSEARCH, FASTA, and NCBI BLAST scoring routines estimate the statistical significance of alignments mostly correctly. The WU-BLAST program, however, underestimates significance. That is, for a given significance score, it is generating fewer false positives than it reports it is.
130

To determine the reliability of the E-value significance scores generated
by each method, we further analyzed the results of the database searches
performed by each method using optimized search parameters. For each
incorrectly identified relationship (false positive) we plotted the E-value at
which it was reported. One should expect to find, for example, one false
positive at E-value one per database query. The results of this experiment are
shown in Figure 6.10. The E-values generated by SSEARCH, FASTA, and NCBI -
BLAST are remarkably close to the ideal line. WU-BLAST, on the other hand,
consistently underestimates the significance of the database hits it generates.
Also of note, at higher error ranges, each method converges on a line
nearly parallel with the idealized score. While some methods consistently
overstate or understate the significance of their results, all methods generate E-
values that are at least in direct linear proportion to the number of false
positives generated. This beautiful statistical result may be, in part, due to the
composition of the database sequences used for this evaluation. ASTRAL
sequences are all single domain sequences of known structure – typically
soluble and globular, and thus generally well-behaved.
Database Growth
It is intuitively unclear how database growth will affect the performance of
similarity detection methods. As databases grow, it becomes more likely that
there will be present at least a single related sequence for any given query.
131

However, the most useful statistical score, the E-value, can be adversely affected
by database growth (251). Even though the raw alignment score for any pair of
sequences will not change as databases grow, the E-value significance does.
This is because E-values are calculated as a function of the size of the database
that was searched.
Figure 6.11a shows the growth of the number of solved structures within
the PDB compared with the number of superfamilies within recent SCOP releases.
The number of solved structures is growing at a faster rate than the number of
superfamilies. This means that newly solved domain structures are more often
being classified into existing superfamilies than they are defining new
superfamilies. For this reason, many superfamilies are growing and, as shown
in Figure 6.9b, this has a negative impact on the ability to detect all true
homologs at a given error rate. It was previously shown that with each
subsequent release of SCOP and ASTRAL, from version 1.35 to version 1.57, the
coverage at all errors rates decreased (109). To determine if this trend still holds,
NCBI-BLAST searches using default parameters were done to generate CVE plots
from the ASTRAL databases, filtered at 40% sequence identity, corresponding to
each of the last six SCOP releases. As shown in Figure 6.11b, the relationships
within each subsequent astral database release are more difficult to detect than
those of the previous database, up to version 1.61 which continues the trend
evident since the first SCOP release (109). However, starting at version 1.63, the
trend has reversed. It is not clear to what this reversal is attributable, though.
132

0
10000
20000
30000
40000
50000
60000
70000
0 500 1000 1500 2000 2500 0
1000
2000
3000
4000
5000
6000
7000
Num
ber
Time (days)
PDB entriesSCOP domainsASTRAL 40 entrie
s
SCOP superfamiles
Num
ber
SC
OP
1.39
SC
OP
1.48
SC
OP
1.50
SC
OP
1.53
SC
OP
1.55
SC
OP
1.57
SC
OP
1.59
SC
OP
1.61
SC
OP
1.63
SC
OP
1.65
SC
OP
1.67
SC
OP
1.37
0.0001
0.001
0.01
0.1
1
10
0 0.05 0.1 0.15 0.2 0.25 0.3 0.35 0.4
Err
ors
per q
uery
Coverage
1.571.591.611.631.651.67
SCOP/ASTRALVersion
a
b
Figure 6.11 Growth of SCOP/ASTRAL databases and effect on ability to detect remotehomologs. (a) Growth in number of SCOP domains and PDB entries (left axis) and ASTRAL40 and number of SCOP superfamilies (right axis). ASTRAL40 is the database of ASTRAL sequences filtered at 40% sequence identity. (b) Unnormalized and linearly normlized CVE lines generated by searching with NCBI BLAST against the six most recent versions of the ASTRAL40 databases. The trend of degrading coverage, observed for version 1.35 through 1.57 ends with 1.61.
UN
NO
RM
ALIZ
ED
LINE
ARLY
NORM
ALIZ
ED
133

One possibility is that there has been a shift in emphasis in what structures are
being solved and therefore, in what sequences are added to these structure-
derived databases. Another possibility is that SCOP itself has changed. The SCOP
release notes for versions 1.63 and 1.65 mention that several parts of the SCOP
classification have been restructured.
Discussion
The power, speed, and accessibility of pairwise sequence comparison
programs have made them some of the most important methods – experimental
or computational – for biological discovery. We have evaluated the merits of
the latest versions of several of these programs and found that using the latest
versions of tools that address the effect of database compositional bias and
allow the significance of performance differences to be measured.
The rigourous SSEARCH program detects a significantly greater fraction of
the relations between remote homologs than any of the heuristic methods.
Further, the significance scores reported by SSEARCH are remarkably reliable.
However, the price for these benefits is a significant time penalty.
134

CHAPTER 7
Pairwise alignment incorporating dipeptide covariation
Note: Much of the material presented in this chapter was included in the publications: Crooks, GE, Green RE, and Brenner SE. Pairwise alignment incorporating dipeptide covariation Bioinformatics. (submitted).
135

Introduction
Among the most commonly used tools in computational biology are the
pairwise protein sequence alignment methods, such as SSEARCH, FASTA and
BLAST (12, 220, 248). These algorithms are elegant, efficient and effective
methods of detecting similarity between closely related protein sequences.
However, the ability of fast pairwise methods to detect homology deteriorates
as the divergence between the sequences increases. Past the “twilight zone” (20-
30% pairwise sequence identity), only a small fraction of related proteins can be
found (37, 83, 234). Therefore, in order to make better use of the vast and
increasing amount of available biological sequence data, there is an immediate
need for more sensitive, fast database search methods.
For the sake of computational efficacy, current pairwise alignment
methods make several simplifying assumptions. First, amino acid substitutions
are assumed to be homogeneous between protein families. The most commonly
used substitution matrices (BLOSUM (117) and PAM (79)) are thus generic
models of protein sequence evolution across all protein sequence families at
various evolutionary distances. Second, substitutions at a given site are
assumed to be uncorrelated with those on neighboring sites. That is, the
likelihood of substituting an amino acid, X, for amino acid Y is assumed to be
independent of the sequence context of X. It is known that both of these
simplifying assumptions introduce errors into homology searching. Relaxing
the assumption of homogeneous substitution across protein families can
136

significantly improve the performance of pairwise alignment methods (281).
Furthermore, alignment methods that remove the assumption of homogeneity
among different positions in the sequence, and instead model the heterogeneity
of the given protein family, have been found to be dramatically superior for
remote homology detection (R. E. Green and S. E. Brenner, unpublished
data)(214). Unfortunately, these profile methods (PSI-BLAST (13), HMMER
(90), SAM (140), etc.) are not tractable for all query sequences. They require the
presence, identification, and correct alignment of homologous sequences in
order to generate a model of the query sequence's family. Therefore, the fast,
easy to use, and universally applicable pairwise methods remain widely used
for database searching, despite their lower sensitivity.
One proposed strategy for increasing the sensitivity of pairwise
alignment is to use a more sophisticated scoring function for amino acid
substitutions, namely one that is sensitive to the sequence context in which the
residue reside. For example, amino acid sequences are correlated with
secondary structural features, such as helixes and loops, which can directly lead
to structure (and therefore sequence) dependent substitution patterns (105, 263,
264). Similarly, one might intuitively expect structurally and functionally
important residues, such as cystines and prolines, to be more or less conserved
depending on their local sequence environment and the prevalence of particular
motifs.
137

The first large-scale exploration of the effect of sequence context on
amino acid evolution was performed by Gonnet and co-workers (106), who
examined the frequencies of dipeptide substitutions, and compared them to the
dipeptide substitution frequencies expected assuming no sequence dependent
correlations. Despite the fact that nearly half of the elements of the 400 X 400
observed dipeptide matrix were vacant (due to the sparsity of data) several
interesting patterns were evident.
More recently, Jung and Lee (134) have taken advantage of the large
increase in available data to reexamine trends in dipeptide evolution. They
used the observed patterns of substitution within a large set of structure-based
alignments to generate dipeptide substitution matrices. Furthermore, they
developed an extension to the standard Smith-Waterman alignment algorithm
that incorporates a term from these dipeptide matrices. By using sequence and
structure context information, they show some improvement in homolog
detection in a limited test set. However, their method could not be extensively
tested, or practically utilized, because an efficient dynamic programming
method for finding the optimal alignment was not known to the authors.
Instead, they adopted a heuristic search that is not guaranteed to find optimal
alignments.
In this study, Gavin Price and I have extended the work described above
by examining the strength of local, dipeptide substitution correlations using the
massive amount of alignment data within the BLOCKS database. We have also
138

extended the standard Smith-Waterman algorithm to include local dipeptide
correlation information over a user-defined distance. Like Smith-Waterman,
this new polynomial time algorithm, doublet, finds the optimal alignment under
the scoring scheme described. Using a standard remote homolog detection
evaluation strategy, we have tested doublet against the Smith-Waterman
algorithm to measure the impact of including this extra information. Perhaps
surprisingly, we found that incorporating doublet substitution correlations
leads to a statistically insignificant difference in homology detection. Gavin was
responsible for deriving the doublet substitution matrices. I performed the
remote homolog evaluation. We jointly conceived and designed the doublet
algorithm.
Results
Doublet Substitution Correlations
Various trends are evident within the doublet score matrix, as illustrated in
Figure 7.1. Notably, exact conservations, such as AA↔AA, AD↔AD and
DD↔DD, etc., generally have positive scores. In other words, conserved
residues are more likely to be located near other conserved residues than would
be expected from uncorrelated substitutions. Also notable is that many (but far
from all) exact swaps, such as DA↔AD, are significantly more likely than
expected. Possibly, this is because the effect of a deleterious mutation X→Y can
sometimes be ameliorated by the occurrence of the corresponding mutation
Y→X, in the immediate sequence neighborhood. Partial swaps, where only one
139

A R N D C Q E G H I L K M F P S T W Y V B Z XA 6 -1 -2 -2 -2 -1 -1 0 -2 -2 -2 -2 0 -2 -1 1 0 -3 -3 0 -2 -1 -1R -1 7 0 -1 -4 2 1 -3 0 -3 -3 3 -2 -3 -2 -1 -1 -2 -2 -3 0 1 -1N -2 0 8 2 -3 1 0 0 1 -3 -3 0 -2 -3 -1 1 0 -2 -2 -2 5 0 -1D -2 -1 2 9 -4 1 3 -1 -1 -4 -4 0 -3 -4 -1 0 -1 -3 -3 -3 6 2 -1C -2 -4 -3 -4 16 -4 -4 -4 -3 -3 -3 -4 -2 -2 -4 -2 -3 -3 -3 -2 -3 -4 -3Q -1 2 1 1 -4 6 3 -2 0 -3 -2 2 -1 -3 -1 0 0 -2 -2 -2 1 4 0E -1 1 0 3 -4 3 7 -3 -1 -3 -3 1 -2 -4 0 -1 -1 -3 -3 -3 2 5 -1G 0 -3 0 -1 -4 -2 -3 9 -3 -5 -5 -2 -3 -4 -2 0 -2 -3 -4 -4 -1 -2 -2H -2 0 1 -1 -3 0 -1 -3 13 -4 -4 0 -3 -2 -2 -1 -2 -2 1 -3 0 0 -1I -2 -3 -3 -4 -3 -3 -3 -5 -4 6 3 -3 2 1 -3 -3 -1 -2 -2 4 -4 -3 -1L -2 -3 -3 -4 -3 -2 -3 -5 -4 3 6 -3 3 2 -3 -3 -2 0 -1 1 -4 -3 -1K -2 3 0 0 -4 2 1 -2 0 -3 -3 7 -2 -3 -1 -1 -1 -2 -2 -3 0 2 -1M 0 -2 -2 -3 -2 -1 -2 -3 -3 2 3 -2 7 1 -3 -2 -1 0 -1 1 -3 -2 -1F -2 -3 -3 -4 -2 -3 -4 -4 -2 1 2 -3 1 9 -3 -3 -2 3 4 0 -3 -3 -1P -1 -2 -1 -1 -4 -1 0 -2 -2 -3 -3 -1 -3 -3 11 0 -1 -2 -3 -2 -1 -1 -1S 1 -1 1 0 -2 0 -1 0 -1 -3 -3 -1 -2 -3 0 5 2 -2 -2 -2 0 0 0T 0 -1 0 -1 -3 0 -1 -2 -2 -1 -2 -1 -1 -2 -1 2 6 -1 -2 0 0 0 0W -3 -2 -2 -3 -3 -2 -3 -3 -2 -2 0 -2 0 3 -2 -2 -1 16 4 -2 -3 -2 -1Y -3 -2 -2 -3 -3 -2 -3 -4 1 -2 -1 -2 -1 4 -3 -2 -2 4 11 -2 -2 -2 -1V 0 -3 -2 -3 -2 -2 -3 -4 -3 4 1 -3 1 0 -2 -2 0 -2 -2 6 -3 -2 -1B -2 0 5 6 -3 1 2 -1 0 -4 -4 0 -3 -3 -1 0 0 -3 -2 -3 6 1 -1Z -1 1 0 2 -4 4 5 -2 0 -3 -3 2 -2 -3 -1 0 0 -2 -2 -2 1 5 -1X -1 -1 -1 -1 -3 0 -1 -2 -1 -1 -1 -1 -1 -1 -1 0 0 -1 -1 -1 -1 -1 0
1 2 3 4 5
AA AA 2 0 2 1 0AD AD 2 2 1 1 1AD DA 4 3 3 3 2DA DA 1 1 2 3 2DD DD 0 3 3 3 2
CA AD 3 0 1 2 0CA AC 7 3 5 2 3CA AQ 3 -1 0 1 -1
PI LF 1 -1 0 -1 -1PI LP 5 4 3 2 0PI LS 2 3 1 1 0
RA AA 0 1 -2 -2 -1RA AR 2 1 2 2 2RA AN 0 -1 0 1 1
PC CG 10 6 6 16 2PC CL 8 4 4 8 3PC CK 14 3 6 14 -5PC CP 15 4 4 13 1
1 2 3 4 5
CC CA -3 -1 -9 -1 0CC CR 0 2 -4 -1 2CC CN -1 0 -11 -3 1CC CD -1 -1 -10 -3 0CC CC 2 0 -3 -1 -2CC CQ -2 0 -4 -3 1CC CE 0 0 -7 -3 0CC CG -3 -2 -9 -3 -1CC CH -4 -1 -5 -2 -1CC CI -1 -2 -13 -2 -2CC CL -3 -2 -10 1 -2CC CK -1 3 -9 -1 3CC CM -2 0 -13 2 -1CC CF -4 -2 -16 7 -2CC CP 0 -4 -12 -3 -1CC CS -2 -2 -10 -1 0CC CT -1 -2 -10 1 1CC CW -4 -2 -11 2 -3CC CY -5 1 -2 6 0CC CV -2 -4 -8 -2 -2
1 2 3 4 5
ET AA 0 0 -1 -1 0ET AR 0 -1 1 1 1ET AN 1 -2 0 1 0ET AD 1 0 1 1 1ET AC 1 1 2 0 2ET AQ 1 -1 0 1 0ET AE 2 0 1 2 1ET AG 0 0 -1 -2 -1ET AH 0 0 -1 0 0ET AI 0 -1 0 0 -1ET AL 0 1 -1 -1 0ET AK -1 -2 0 2 0ET AM 0 -1 -2 -1 -2ET AF 0 0 0 -1 -1ET AP 1 0 0 0 0ET AS -1 -1 0 0 1ET AT 0 1 -1 -1 -1ET AW -1 0 -2 -1 -1ET AY -1 0 0 1 1ET AV 0 -1 0 1 0
BLOSUM65 (from BLOCKS 13+)
Singlet Substitutions
Doublet Substitutions (Selected entries)L L L
Figure 7.1 BLOSUM65 singlet substitution matrix derived from the BLOCKS 13+ database (above), and selected elements of the corresponding doublet substitution matrices (below). Scores are in 1/4 bit units, rounded to the nearest integer. The average standard statistical error is about 1/4 bits (i.e. about 1 unit) for the doublet scores, and essentially insignificant for the singlet scores, as judged by bootstrap resampling. The singlet scores are the log odds of observing the given substitution; positive scores are more likely, and negative score less likely to be observed than would be expected for uncorrelated sequences (Eq. 3). Similarly, the doublet scores represent the log odds for observing pairs of substitutions, at various sequence separations, relative to the singlet substitutions likelihood (Eq. 6). For example, the L=3 column for ET AV (bottom right) indicates a score of zero for the alignment of ExxT in one sequence to AxxV in the other.
140

of the substitution pair is conserved, are also often positive. This might reflect
alignment errors in the original dataset. The most highly positive scores (and
therefore those events that are most over-represented in the data relative to
uncorrelated substitutions) are associated with the substitutions PC↔Cx, i.e. a
translocation of a cystine, replacing a proline. The most relatively uncommon
substitutions involve the mutation of one cystine in the cystine pair CxxC
(second column), a widespread and important motif found, for example, in the
thioredoxin family. However, these interesting particular cases are atypical.
Most of the doublet substitution matrix is similar to the ET↔Ax substitutions
displayed in the third column; the majority of the scores are not significantly
different from zero, indicating that most possible substitution doublets are
essentially uncorrelated.
We can place the above observations on a quantitative footing by considering
the inter-sequence mutual information, a measure of the correlation strength
between aligned homologous sequences. The first order contribution is equal to
the average singlet score, which is 0.31 bits per aligned residue for BLOSUM65
(BLOCKS13+) (117, 119). The corresponding average doublet score, the
additional information encoded in inter-site substitution covariation, is around
0.04 bits at modest sequence separations (illustrated in Figure 7.2). Thus, the
inter-site substitution correlations carry relatively little information. However,
these correlations appear to persist to non-local neighbors, suggesting that the
total information from interactions at all sequence separations is
141

-0.02
0
0.02
0.04
0.06
1 2 3 4 5 6
L
Mutual Information (bits)
Total Doublet Information
Conserved
Swap
Partial Swap
Partial Conservation
Unconserved
Figure 7.2 The inter-sequence mutual information of homologs encoded in inter-site correlations at increasing separation, L. In other words, the average doublet substitution scores (Eq. 7). The top, dark line is the total information at various sequence separations. For comparison, the information encoded in the corresponding singlet substitutions (the average singlet matrix score) is 0.31 bits per residue. The remaining lines illustrate the relative contributions of different substitutions classes to this total information; these are exact conservation XY XY, partial conservation XY XZ, swaps XY YX, partial swaps XY ZX, and unconserved, double substitutions XY ZU.
142

substantial. However, Figure 7.2 also displays the contributions to this total
information from various categories of substitution. The largest contribution,
and the only contribution to persist above a sequence separation of 4 residues,
represents exactly conserved pairs of residues. This is a rather trivial correlation
(it simply indicates that conserved residues cluster), and its persistence suggests
that, in large part, these correlations may simple be an artifact of the way in
which the BLOCKS sequence alignments have been generated. All other
substitution classes, summing over all sequence separations, contribute no more
than 0.1 bits per residue. This is not entirely insignificant, but it is still small
compared to the singlet mutual information. Thus non-trivial correlations
between substitutions are relatively weak.
Homology Detection
The primary use for pairwise alignment methods is to search databases of
previously characterized biological sequences for homologs of the sequence of
interest. Therefore, the most powerful methods will perform this task most
effectively by assigning true homologs significant statistical scores and
assigning unrelated sequences low statistical scores. Our assessment
methodology compares database search methods on this criteria.
We compared the doublet alignment algorithm against the standard
Smith-Waterman algorithm. To perform a fair test, we converted raw scores to
statistical scores for both algorithms using the same length normalized
maximum likelihood EVD parameter determination method (18). Optimal
143

parameters for gapping, matrix scaling, and distance over which to consider
dipeptide correlations were found using the training database described above.
Then, the algorithms were evaluated by comparing the relative ability to detect
remote homologs within the test dataset, using the parameters optimized on the
training dataset (Figure 7.3).
The results of a database search for Smith-Waterman and doublet, using
only nearest neighboring dipetide covariations, are shown in Figure 7.3a. Both
the Smith-Waterman and doublet methods performed remarkably similarly
over all error rates and normalization schemes. The linearly normalized
coverage at 0.01 errors per query was slightly higher for Smith-Waterman than
doublet (Figure 7.3). From this, we conclude that including dipeptide
covariation information does not improve remote homology detection and, in
fact, slightly degrades performance at this error rate. We also performed the
same coverage versus errors per query analysis using only sequences with less
than 30% sequence identity (Figure 7.3b), as it was previously reported that
dipeptide covariation information may be useful only for detecting these
extremely remote evolutionary relationships (134). Our results, however, show
that even at this evolutionary distance, dipeptide covariation scoring does not
improve homology detection.
We used Bayesian bootstrap resampling to estimate statistical errors, and to
determine if the observed coverage difference was statistically significant. We
144

0.0001
0.001
0.01
0.1
1
10
0 0.2 0.4 0.6 0.8 1
Err
ors
per q
uery
Coverage
Smith-WatermanDoublet
Coverage versus errors per query< 40% sequence identity remote homologs
Unn
orm
aliz
ed
Line
arly
norm
aliz
edQ
uadr
atic
ally
norm
aliz
ed
Error rate at whichbootstrap test was performed
0.0001
0.001
0.01
0.1
1
10
0 0.2 0.4 0.6 0.8 1
Err
ors
per q
uery
Coverage
Smith-WatermanDoubletU
nnor
mal
ized
Line
arly
norm
aliz
edQu
adra
tical
ly
norm
alize
d< 30% sequence identity remote homologs
Figure 7.3. These coverage versus errors per query plots show that including dipeptide covaria-tion information in alignment determination (Doublet) does not improve remote homolog detec-tion. (a) Optimized matrix, gap and look-back parameters were used to search the test database with the doublet and Smith-Waterman algorithms. This database contains no sequence pairs that share more than 40% sequence identity. The number of correctly identified homologs is shown as a function of the number of errors made. Smith-Waterman outperforms doublet over all but extremely low error-rates. (b) Remote homolog test using only sequence pairs with less than 30% sequence identity. As above, Smith-Waterman correctly identifies more remote homologs than the doublet algorithm. Insert: Optimal matrix scale parameter, gap parameters, and corresponding linearly normalized homology detection coverage at 0.01 EPQ, as a function of the covariation distance considered, L.
LMatrix scalegopengextCoverage (0.01EPQ)
065172
0.236
160172
0.229
260182
0.225
360201
0.223
145

found that a 95% confidence interval for the coverage difference at 0.01 errors
per query comfortably contained zero difference. Therefore, we cannot
distinguish between the remote homolog detection abilities of Smith-Waterman
and doublet.
We also evaluated the effect of including covariation information over
larger sequence separations. As can be seen in the table of Figure 7.3,
incorporating this additional information into alignment scores actually results
in a slow degradation of homology detection efficacy.
Discussion
We have developed, implemented, and tested an alignment algorithm, doublet,
that generates the optimal pairwise protein sequence alignment under a scoring
scheme that includes dipeptide covariation information. Perhaps surprisingly,
and in marked contrast to previous reports, we found that using this
information provides no benefit to remote homolog detection. The performance
of the doublet algorithm for detecting remote homologs is statistically
indistinguishable from the standard Smith-Waterman algorithm.
The underlying explanation for this indifference of alignment to
dipeptide covariation is that substitution correlations are weak on the average
(Figures 7.1 and 7.2). Therefore, the average effect of these interactions is
insignificant and including covariation in sequence alignment makes very little
material difference to remote homology detection.
146

We might reasonably question if the training data is at fault. Indeed, the
slight degradation of homology detection as more distant correlations are
included (Figure 7.3) does indicate that the doublet substitution matrices
contain anomalies, perhaps due to the training or alignment of the BLOCKS
sequences, or perhaps because of the different sampling of sequences included
in BLOCKS compared to those included in SCOP. The BLOCKS database that
we use to train the doublet substitution matrices contains ungapped alignments,
many of shorter length than the average SCOP protein domain. Fikami-
kobayashi and co-workers showed that the covariation signal is strongest within
single secondary structure elements (100). The poor performance of doublet,
then, may be due to its applying the covariation model too bluntly across entire
protein sequences when it is only applicable within secondary structure
elements. However, we note that the BLOCKS database has been used to derive
very effective singlet substitution matrices (109), and therefore it is implausible
that the substitution signals within the BLOCKS database are substantially
erroneous. Rather, the observed degradation simply reinforces the idea that
neighboring substitutions are weakly correlated, particularly when compared to
single substitutions correlations, and therefore the doublet signal is readily
degraded by minor anomalies in the data.
Another line of evidence comes from examining the inter-site amino acid
correlation of single protein sequences (72, 74, 271). Neighboring amino acids
are almost entirely uncorrelated; the nearest neighbor mutual information has
147

been estimate as only 0.006 bits (72). This lack of sequence correlation is
consistent with (but does not require) small inter-site substitution correlations.
In should be emphasized, however, that the observation of weak average
dipeptide covariation does not negate the possibility of strong, interesting
covariation in particular instances, such as CP↔Cx, or within particular
families. Moreover, it is conceivable that covariation information could be used
more judiciously, thereby improving alignment results. For example, as
previously discussed, one might include doublet-type scoring information only
for residue pairs that are likely to be within the same secondary structural
element. Similarly, one might examine the covariation of residues that are
proximate in the tertiary structure, rather than along the sequence (170, 230).
However, residues that are proximate in space are also weakly correlated (68,
74), and the inter-residue mutual information is not improved by
foreknowledge of the local structure environment (72, 74). Therefore, we suspect
that such approaches will also not have dramatic effects on protein sequence
alignment.
In conclusion, the ubiquitous assumption that neighboring sites along a
protein sequence evolve independently is generally appropriate. This leads to
fast, elegant and effective algorithms for protein sequence alignment and
homology detection.
148
Materials and Methods
Quantifying substitution correlations
Consider two aligned, ungapped sequences, x = x1, x2, …, xn, and y = y1, y2, …, yn,
both of length n, where each element represents one of the 20 canonical amino
acid, and corresponding positions are considered aligned and homologous. We
wish to use the patterns of conservation and variation between these sequences
to estimate the probability P(hom|x,y) that the sequences are homologous – i.e.,
that both sequences have descended from a common ancestor. By Bayes'
theorem, we can re-express this probability as
)y()x()y;x((hom))y,x|(hom
ppqPP = (1)
Here, p(x) is the background probability of the given amino acid segment and q(x;y) is
the target probability of observing the pair of segments in diverged homologous
sequences (5). By taking logarithms and dropping the additive constant log
P(hom) we generate an additive score, S, a measure of sequence similarity due
to homology,
),...,,(),...,,(),...,,;,...,,(log
2121
12 21
nn
nn
yyypxxxpyyyxxxqS = (2)
Except for very short segments, the background and target probability
distributions are large and cannot be directly measured. Therefore, Eq. 2 is
typically simplified by assuming that substitutions probabilities are
homogeneous (independent of the location in the fragment) and that both the
149

substitutions and the sequence themselves are uncorrelated from one position to
the next. Consequentially, the total similarity score is now a sum of independent
parts,
)()();(log);(,);(jpip
jiqjisyxsSk
kk =≈ ∑ (3)
The log odds of residue replacement, s(i, j ), is an element of a standard singlet
substitution matrix, of the type widely used in pairwise sequence alignment (5).
This approximation of the full similarity by a sum of singlet substitution scores
requires that we neglect all inter-site correlations. We can perform a more
controlled approximation by noting that a homogeneous multivariate
probability can be expanded into a product of single component distributions,
pairwise correlations, triplets correlations, and so on.
∏ ∏∏< <<
××=ji kji kjkiji
jkikji
ji
ji
i
inzzPzzPzzP
zPzPzPzzzPzPzP
zzPzPzzzP K),(),(),(
)()()(),,()()(
),()(),...,,( 21 (4)
If we assume that substitution probabilities are independent of the location
within the fragment, then we can apply this expansion to the segment homology
score (Eq. 2).
∑∑∑=
−
=
++
=
++=L
l
Ln
k
lkklkkl
n
k
kk yyxxdyxsS1 11
),;,();( K (5)
The first term of this expansion represents single residue replacements, as in Eq.
3. The next term defines the doublet substitution scores,
)';'();()',()',(
)',;',(log)',;',( jisjisjjpiip
jjkiqjjiidll
ll −−= (6)
150

Here, i and i' are residues separated by a distance l along one amino acid chain,
while j and j' are the corresponding aligned residues on the putative
homologous sequence; ql(i,i';j,j') is the target probability of observing this
aligned quartet, and pl(i,i') is the background probability of this residue pair in
protein sequences. These DOUBLET scores represent the additional similarity due
to correlations between substitutions.
By truncating the expansion of the full similarity score at doublet terms (Eq. 5),
we are assuming that triplet and higher order correlations between substitutions
are relatively uninformative. For reasons discussed below, this is probably a
reasonable approximation. Furthermore, the most important inter-site
correlations are between residues neighboring on the chain (Fig. 7.2). Therefore,
we can restrict the maximum distance over which doublet interactions are
scored without serious error.
The average similarity score is the inter-homolog mutual information, I
(71), a measure of the inter-sequence correlations. A high mutual information
value indicates strong correlation, whereas a mutual information value of zero
indicates uncorrelated variables. Mutual information has various advantages as
a correlation measure: it is firmly grounded in information theory, it is additive
for independent contributions and it has consistent, intuitive units (bits).
∑= )y()x()y,x(log)y,x()y;x( 2
ppqqI (7)
The average singlet score is the inter-homolog mutual information per residue,
under the assumption that replacements are uncorrelated. This is frequently
151

reported as the "relative entropy" of the substitution matrix. The average
doublet score is the first order correction to the inter-sequence mutual-
information due to inter-site correlations. Consequentially, we may evaluate the
comparative importance of singlet and doublet contributions to the sequence
similarity by examining the average contributions of these different components
to the full inter-homolog mutual information.
The preceding analysis applies to contiguously aligned sequence
segments. However, in addition to substitutions, protein sequences are modified
by the insertion and deletion of residues. Since it is not obvious how to capture
the existence of indels in doublet scores, in the following discussion we assume
that dipeptide correlations do not extend across gaps, and we adopt the simple
and standard affine model of gap lengths.
Alignment algorithm
We have extended the standard Smith-Waterman optimal local sequence
alignment algorithm (248) to incorporate doublet substitution scores (See Figure
7.4). The time complexity of Smith-Waterman is O(nm), where n and m are the
lengths of the two sequences. Adding doublet scores increases the complexity
to O(nmL), where L is the distance over which substitution correlations are
scored. This efficient dynamic programming alignment is possible because,
although we are scoring correlations between residues that are not directly
aligned, these correlations are local along the chain. The space complexity of our
152

implementation is also O(nmL); this could be improved using standard
techniques (88).
The additional similarity score associated with adding the final match
pair xi, yj to the alignment contains singlet (S) doublet (D) substitution scores;
),,(),( ji yxsjiS = (8)
.),;,(),,(1∑=
−−=r
l
jljilil yyxxdrjiD (9)
Here, r is the length of the preceding contiguous segment of aligned residues, or
the maximum sequence separation over which doublet correlations are scored,
whichever is less. Deletions of length k are weighted with the affine penalty
-(gopen + (k-1) gext), where gopen and gext are positive constants. This standard
affine gap length model is both computationally efficient and surprisingly
effective (10, 248, 283).
The optimal, highest scoring alignment between two sequences
(x=x1,x2,…, xn and y=y1,y2,…, ym) is found by populating a series of score tables,
also known as dynamic programming matrices. The entries of the match table,
M(i,j,r), are the maximum alignment score for an alignment that terminates with
an ungapped segment of length r, ending at the ith position of x, and the jth
position of y. Similarly, the gap tables Gx(i,j) and Gy(i,j) contain the maximum
alignment similarity given that the alignment ends with xi or yj gapped.
The entries of these tables can be efficiently computed starting from the
following boundary conditions: M(i,0,l), M(0,j,l), Gx(i,0), Gx(0,j), Gy(i,0) , Gy(0,j) =
153

-∞. A single aligned amino acid pair may signal the beginning of a new local
alignment, or it may occur immediately after any alignment gap.
⎪⎩
⎪⎨
⎧
−+−+=
)1,(),(),1(),(
),(max)1,,(
jiGjiSjiGjiS
jiSjiM
y
x (10)
In standard Smith-Waterman this is the only necessary match score table.
However, in doublet we require additional match tables so that we may keep
track of match scores over extended, contiguously aligned regions. Of necessity,
longer ungapped segments occur only after shorter segments. We restrict the
maximum distance L over which doublet correlations are scored, since we
expect that the useful information that can be extracted from doublet
correlations will decay rapidly with sequence separation (See Figure 7.2).
Consequentially, we do not need to explicitly consider ungapped segments of
length greater than L+1.
⎩⎨⎧
+−−−−
++=+
−−−+−+=≤≤
)1,1,1(),1,1(
max),,(),()1,,(
)1,1,1()1,,(),()2,,(
LjiMLjiM
LjiDjiSLjiM
rjiMrjiDjiSLrjiM (11)
Gaps in the alignment are either preceded by a match or they extend an existing
gap.
⎩⎨⎧
−−−−−
=
⎩⎨⎧
−−−−−
=
=
=
ext
open
,1
ext
open
,1
),1(),1,1(
max),(
),1(),1,1(
max),(
gjiGgrjiM
jiGy
gjiGgrjiM
jiGx
Lr
xLr
(12)
154

M(i, j,3)
M(i, j,1)
M(i, j,2)
F I R E D S T S Q
F I R S T S Q
F I R S T S Q
F I R S T S
F I R E D S T S Q
F I R E D S T S Q
Q
GAP
(b) Doublet
FIRSTSQ
F I R E D S T S Q
GAP
i
j
(a) Smith-WatermanM(i-1, j-1)
Gx(i-1, j)
Gy(i, j-1)
FIREDSTSQFIR--STSQ
i
jGx(i-1, j)
Gy(i, j-1)
i
j
M(i-1,j-1,1)
i
j
M(i-1,j-1,2)
M(i-1, j-1,3)
Figure 7.4. A comparison of Smith-Waterman and doublet sequence alignment. (a) A Smith-Waterman match table, with the optimal alignment highlighted. In value of each cell is the maximum of 1. the singlet match score (this is the start of an alignment ), 2. the singlet score plus the match score from the previous cell along the diagonal (this extends an aligned region), or 3. the singlet score plus the optimal score from a gap score table (the previous residue was not aligned) (b) For doublet, multiple match tables are used (Eqs. 10-12). The number of match tables is the distance over which dipeptide correlation information is considered (in this example, 2) plus 1. Again, the optimal alignment is highlighted. The top table corresponds to the starts of aligned regions, the middle table corresponds to aligned regions of at least 2 consecutive residues and the bottom table corresponds aligned regions of at least 3 consecutive residues. The align-ment path through these tables falls through to lower tables in regions of conecutive aligned residues and begins again in the top table following gaps. To extend dipeptide context scoring over longer distances requires additional match tables.
155

The largest score within the match table marks the last aligned position of the
optimal alignment. The full alignment can be found by backtracking through
the table, according to the choices previously made during the scoring step.
We used the method of Bailey and Gribskov (18) to fit an extreme value
distribution to the results of aligning a query sequence against a database of
possible homologs. The maximum likelihood parameters are then used to assign
E-values to each alignment.
Doublet BLOcks Substitution Matrix
A doublet substitution matrix (Eq. 6) contains 204 = 160,000 entries, of which
202x(202+1)=80,200 are unique due to the underlying symmetry,
dl(i,i';j,j')=dl(j,j';i,i'). To accurately estimate these scores we require a very large
collection of reliably aligned protein sequences. The BLOCKS database is one
such resource (116, 117). Each database block consists of a reasonably reliable,
ungapped multiple sequence alignment of a core protein region. BLOCKS
version 13+ contains 11,853 blocks, containing, on average, 56 segments of
average length 26 residues. Overall, about 109 pairwise amino acid comparisons
are available for study.
The widely used canonical BLOcks SUbstitution Matrices (BLOSUM)
were generated from version 5 of the BLOCKS database (117). In order to
generate a series of matrices representing different evolutionary divergences,
the sequences in each block are clustered at a given level of sequence identity
and the inter-cluster sequence correlations are collected. Thus BLOSUM100
156

(where only 100% identical sequences are clustered) represents a wide range,
including low levels, of evolutionary divergence, whereas BLOSUM30
represents only correlations between very diverged sequences.
In principle, we should match the divergence inherent in the substitution
matrix to the divergence of the pair of sequences we wish to align (6). However,
this is computationally expensive, and, in practice, a single matrix is chosen
based on its ability to align remote homologs, on the grounds that matching
close homologs is relatively easy (37, 73). In a recent evaluation of remote
pairwise homology detection efficacy (109, 283), we discovered that the
BLOSUM65 substitution matrix, re-parameterized from the BLOCKS 13+
database, was more effective than any other reparameterized BLOSUM
(BLOCKS 13+), classic BLOSUM (BLOCKS 5) or PAM (79) substitution matrix,
and was comparable to the most effective VTML matrix (200). Consequentially,
we have used the BLOCKS 13+ database at 65% clustering to build singlet and
doublet BLOSUM substitution matrices. This provides approximately 107 - 108
independent aligned doublets, depending on the sequence separation l.
The estimated doublet target frequencies ql(i,i' ; j,j') were smoothed and
regularized by adding a pseudocount α(i,i';j,j') to the raw count data, n(i,j';j,j').
The pseudocounts are taken to be proportional to the marginal singlet target
probabilities, ql(i;j)ql(i',j').
NAjjiinjjiijjiiql
+≈
)',;',(_)',;',()',;',( α (13)
)';'();()',;',( jiqjiqAjjii ×=α (14)
157

where N is the total number of counts. Thus, if no data are available (the total
number of counts is zero, N=0), then all doublet scores would be zero, as can be
seen from Eq. 6. Here, A is a scale parameter that determines how much data is
required to overcome the prior probability inherent in the pseudocount.
Typically, such scale factors are picked empirically. However, in this case, we
performed a full Bayesian analysis, and determined that for doublet
substitutions reasonable values of A are about 2 x 10⁶, which can be compared to
the 107 to 108 actual observations. The full details are given in the supplemental
materials of this publication, and a representative subset of a doublet
substitution matrix is shown in Figure 7.2.
Standard statistical errors were estimated by non-parametric Bayesian
bootstrap resampling on sequence blocks (91, 233). Instead of assigning equal
weight to every sequence block, each block is instead given a random weight
drawn form a Dirichlet distribution. This random reweighting induces random
changes is the estimated scores, thereby providing an estimate of the statistical
errors caused by the finite size and inhomogeneity of the training data.
Evaluation of remote homology detection
We have previously developed and applied a sensitive strategy for evaluation of
database search methods (37, 109, 283). In our approach, each sequence is
aligned against every other sequence, and the alignment scores are used to
determine putative homologs. We then consider the proportion of correctly
identified homologs as a function of erroneous matches. The collection of
158

related sequences is derived from the Structural Classification Of Proteins
(SCOP) database (202). We use the ASTRAL compendium (39, 60) of
representative subsets of SCOP release 1.61 (Sept. 2002), filtered so that no two
domains share more than 40% sequence identity. We partition every other
SCOP fold into separate test and training subsets of approximately equal size,
each containing about 550 superfamilies, 2500 sequences, and 50,000
homologous sequence pairs. To avoid over-fitting, adjustable parameters are
optimized using the training set. Results of an all-versus-all comparison of the
test set, using these optimized parameters, are reported as a plot of coverage
(fraction of true relations found) versus errors per query (EPQ), the total
number of false relations divided by the number of sequences (See Figure 7.3).
The raw, unnormalized coverage is the fraction of all true relations that are
found.
Since the number of relations within a superfamily scales as the square of
the size of the superfamily, and because SCOP superfamilies vary greatly in
size, this reported coverage is dominated by the ability to detect relations within
the largest superfamilies. To compensate for this unwarranted dependence, we
also report the average fraction of true relations per sequence (linear
normalization) and the average fraction of true relations per superfamily
(quadratic normalization). In general, large superfamilies are more diverse, and
the relationships within them are harder to discover (109). Thus, unnormalized
coverage is typically less than the linearly normalized coverage, which in turn is
159

less than quadratically normalized coverage. One important point of
comparison for search results is 0.01 errors per query rate for linearly
normalized results, the average fraction of true relations per database query at a
false positive rate of 1 in 100. We report the observed difference in coverage of
two methods at this selected EPQ, and determine standard statistical errors and
confidence intervals using Bayesian bootstrap resampling (see Chapter 6).
160

CHAPTER 8
Discussion and future directions of development and evaluation of remote
homology detection methods
161

As sequence and structure databases continue to grow, there will be an ever-
present need to improve and evaluate the computational methods that are used
to identify the relationships between entries in these databases. Furthermore, as
the more sensitive profile based methods like PSI-BLAST and HMMER are refined
and gain acceptance, there will be an increasing need to understand their
strengths and weaknesses. Therefore, the field of evaluating remote homolog
detection methods should grow and adapt. Several ideas to improve evaluation
of the existing pairwise methods have been offered and I will summarize them
here.
In our current scheme, we use single domain sequences whose
evolutionary relationships have been defined. However, many of these domains
are found in nature only in the context of multi-domain proteins. Further,
databases that one might use to search for homologs, like SWISS-PROT or
GenBank, typically contain a mix of single and multi-domain sequences. In this
way, our evaluation scheme, which contains only single domain sequences, is
different than most real-world database search scenarios. This difference may
favor methods and parameters that generate more global alignments. This
shortcoming could be addressed by embedding each of our test domain
sequences within a sequence context that is similar or identical to that which it is
found in real protein sequences. This fix would slightly complicate the
evaluation protocol because not all alignments would be relevant, i.e., an
alignment between the query sequence and the contextual sequence would need
162

to be ignored. Regardless, this improvement should be fairly simple to
implement.
Another improvement would be to consider a more natural
normalization scheme than the two currently used. Normalizing by the size of
the superfamily that a sequence belongs to reduces or eliminates an unwanted
effect wherein large superfamilies dominate the overall results. However, in the
databases that biologists use to identify homologs (as in nature), certain
superfamilies are more prevalent than others. Therefore, favoring a database
search method that is superior in identifying homologs within superfamilies
that are naturally more numerous may be warranted. This rationale suggests a
strategy to normalize database search results by the prevalence of each
superfamily. The prevalence could be measure within complete genomes as a
proxy for measuring their prevalence in nature or, more pragmatically, in the
large, non-redundant databases used for homolog detection.
Alignment quality is an evaluation criterion that could also be improved.
Our current scheme only evaluates methods for their ability to detect remote
homologs. A related use for database search methods is to generate an accurate
alignment that correctly matches homologous residues within each sequence. A
correct alignment is critically important in homology modeling, profile
generation, and phylogenetics. Structurally derived test databases for evaluating
alignment quality have been generated, but no consensus method or set is
available. This is likely because the problem is more difficult than that of remote
163

homolog test database generation. To determine if two structures are
homologous, an expert assesses many features of the two structures, both global
and local, and renders one verdict: either they are homologous or they or not.
Generating a correct alignment based on structural information can be
indeterminate. Insertions and deletions within each sequence can make exact
residue-to-residue assignments ambiguous. In other words, although the
sequences as a whole may both derive from a common ancestor, often not all of
the parts of each sequence have.
Finally, there is a need to develop an evaluation methodology for profile
database search methods. These programs are fundamentally different from
pairwise search methods in that they search sequence databases with a
statistical model of a sequence family rather with an individual instance, i.e. a
sequence, of that family. Because model generation is part of the process of
using a profile method, there are two steps to evaluate: model generation and
model searching. Put another way, a profile method could fail because it
incorrectly models a sequence family, perhaps by trying to model a “family” of
sequences that are not evolutionarily related. Or, it could fail because it does not
compare the model to each database in a sensitive way. An ideal profile
evaluation scheme should disentangle these issues.
164

Appendix A
Human SWISS-PROT isoforms derived from PTC+ mRNAs
165

Accession. SWISS-PROT ID
Isoform name Gene name(s) cDNA/mRNA
P78314 3BP2_HUMAN SHORT SH3BP2; 3BP2; RES4-23 AB000463 P05023 A1A1_HUMAN SHORT ATP1A1 U16798 Q9NSE7 ABCD_HUMAN 2 ABCC13 AF418600 3 NM_138726 O75078 AD11_HUMAN SHORT ADAM11; MDC NM_021612 Q9P0K1 AD22_HUMAN 2 ADAM22; MDC2 NM_021722 Q9Y6N9 AI75_HUMAN 3 USH1C; AIE75 AF039699 Q92667 AKP1_HUMAN 2 AKAP1; AKAP149 NM_139275 P20594 ANPB_HUMAN SHORT NPR2; ANPRB NM_000907 P18847 ATF3_HUMAN 2 ATF3 NM_004024 Q9H6X2 ATR1_HUMAN MAJOR ANTXR1; ATR; TEM8 NM_032208 Q9NY97 B3G7_HUMAN 2 B3GNT1; B3GALT7 AF288209 Q9HB09 BC12_HUMAN 2 BCL2L12; BPR NM_052842 P13497 BMP1_HUMAN BMP1 6 BMP1 NM_006130 BMP1 5 NM_006131 BMP1 4 NM_006132 Q9HB55 C343_HUMAN 4 CYP3A43 AF280111 P01258 CAL0_HUMAN 2 CALCA; CALC1 M64486 Q9HC96 CANA_HUMAN B CAPN10; KIAA1845 NM_023084 D NM_023086 E NM_023087 F NM_023088 P28907 CD38_HUMAN 2 CD38 D84277 Q08722 CD47_HUMAN OA3 305 CD47 BC037306 O15519 CFLA_HUMAN 9 CFLAR; CLARP; MRIT; CASH AF009617 Q9H2X0 CHRD_HUMAN 3 CHRD AF209930 4 AF283325 O43526 CIQ2_HUMAN 3 KCNQ2 NM_004518 Q9NYG8 CIW4_HUMAN 2 KCNK4; TRAAK NM_016611 P49759 CLK1_HUMAN SHORT CLK1; CLK L29222 P49760 CLK2_HUMAN SHORT CLK2 NM_001291 P49761 CLK3_HUMAN 2 CLK3 NM_001292 Q13286 CLN3_HUMAN 4 CLN3; BTS AF077963
Q99788 CML1_HUMAN MAJOR CMKLR1; DEZ; CHEMR23 U79526
P27815 CN4A_HUMAN 2 PDE4A AF069491 Q9H9E3 COG4_HUMAN 2 COG4 AB088369 Q9Y215 COLQ_HUMAN VII COLQ NM_080543 Q96SM3 CPXM_HUMAN 2 CPXM BC032692 Q9BZJ0 CRN1_HUMAN 4 CRNKL1; CRN AF318304 5 AF318305 Q9BUV8 CT24_HUMAN 4 C20ORF24 BC004446 P57077 CU07_HUMAN B C21ORF7 AF269162 C AF269163 Q9NVD3 CU18_HUMAN B C21ORF18 AF391112 Q92879
CUG1_HUMAN
MAJOR
CUGBP1; BRUNOL2; CUGBP; NAB50 AF248648
O76075 DFFB_HUMAN BETA DFFB; DFF2; DFF40; CAD AB028911
GAMMA AB028912 DELTA AB028913 P25686 DJB2_HUMAN 3 DNAJB2; HSJ1; HSPF3 NM_006736 MAJOR S37374 Q09013 DMK_HUMAN 11 DMPK; MDPK L19268 Q9NYP3 DONS_HUMAN 2 DONSON; C21ORF60 NM_145794 3 NM_145795
166

Accession. SWISS-PROT ID
Isoform name Gene name(s) cDNA/mRNA
Q9NY33 DPP3_HUMAN 2 DPP3 NM_130443 O60941 DTNB_HUMAN 3 DTNB NM_033147 P29320 EPA3_HUMAN MAJOR EPHA3; ETK1; ETK; HEK NM_005233 O75616 ERAL_HUMAN HERA B ERAL1; HERA AF082658 Q92731 ESR2_HUMAN 3 ESR2; NR3A2; ESTRB BC024181 O00507 FAFY_HUMAN SHORT USP9Y; USP10; DFFRY Y13619 P24071 FCAR_HUMAN B DELTA S2 FCAR; CD89 NM_133280 P41439 FOL3_HUMAN SHORT FOLR3 Z32633 O95954 FTCD_HUMAN E FTCD AF289024 P59103 G72_HUMAN MAJOR G72 AY138546 2 NM_172370 Q9UBA6 G8_HUMAN MAJOR C6ORF48; G8 NM_016947 Q9UBS5 GBR1_HUMAN 1E GABBR1 NM_021905 Q9BSJ2 GCP2_HUMAN 2 TUBGCP2; GCP2 BC005011 P56159 GDNR_HUMAN 2 GFRA1; GDNFRA; TRNR1; RETL1 NM_145793 O94925 GLSK_HUMAN GAC GLS; KIAA0838 AF158555 Q969S8 HD10_HUMAN 4 HDAC10 AL022328 Q30201 HFE_HUMAN MAJOR HFE; HLAH NM_000410 Q9NRM6 I17S_HUMAN 2 IL17RB; IL17BR; EVI27 NM_172234 Q14790 ICE8_HUMAN 7 CASP8; MCH5 NM_033357 Q92851 ICEA_HUMAN B CASP10; MCH4 NM_001230 C NM_032976 Q92985 IRF7_HUMAN C IRF7 NM_004030 Q01638 IRL1_HUMAN C IL1RL1; ST2; T1; DER4 NM_173459 O14713 ITP1_HUMAN MAJOR ITGB1BP1; ICAP1 NM_004763 2 NM_022334 Q9HCP0 KC11_HUMAN 1S CSNK1G1 NM_022048 P20151 KLK2_HUMAN 3 KLK2 AF188745 Q9H2R5 KLKF_HUMAN 2 KLK15 NM_023006 Q9UJU2 LEF1_HUMAN B LEF1 AF294627 P19256 LFA3_HUMAN SHORT CD58; LFA3 X06296 P53667 LIK1_HUMAN 3 LIMK1; LIMK NM_016735 Q99698 LYST_HUMAN MAJOR CHS1; LYST; CHS NM_000081 P49641 M2A2_HUMAN SHORT MAN2A2; MANA2X NM_006122 O95405 MADI_HUMAN 2 MADHIP; SARA NM_007324 P11137 MAP2_HUMAN MAJOR MAP2 NM_002374 MAP2C NM_031845 P27816 MAP4_HUMAN 2 MAP4 BC015149 P25912 MAX_HUMAN 3 MAX NM_145113 Q15759 MK11_HUMAN BETA 2 MAPK11; PRKM11; SAPK2 NM_002751 O15438 MRP3_HUMAN 3A ABCC3; CMOAT2; MRP3; MLP2 NM_020037 3B NM_020038 P21757 MSRE_HUMAN II MSR1 NM_002445 Q9H1B4 NXF5_HUMAN MAJOR NXF5; TAPL1 NM_032946 B NM_033152 C NM_033153 D NM_033154 E NM_033155 Q96QS1 PHMX_HUMAN 5 PHEMX; TSSC6 NM_139023 4 NM_139024 O14829 PPE1_HUMAN 2 PPEF1; PPEF; PPP7C NM_152225 Q9UMR5 PPT2_HUMAN 2 PPT2 NM_138934 Q9NQW5 PRD7_HUMAN MAJOR PRDM7; PFM4 NM_052996 O14818 PSA7_HUMAN 4 PSMA7 NM_152255
167

Acc. SWISS-PROT ID
Isoform name Gene name(s) cDNA/mRNA
P55036 PSD4_HUMAN RPN10E PSMD4; MCB1 NM_153822 P49768 PSN1_HUMAN I 374 PSEN1; PSNL1; AD3; PS1 NM_007319 P23468 PTPD_HUMAN MAJOR PTPRD NM_002839 O75771 R51D_HUMAN 2 RAD51L3; RAD51D NM_133627 Q93062 RBMS_HUMAN MAJOR RBPMS NM_006867 P78563 RED1_HUMAN MAJOR ADARB1; RED1; DRADA2 NM_015833 O15126 SCA1_HUMAN 2 SCAMP1; SCAMP NM_052822 Q13243 SFR5_HUMAN SRP40 2 SFRS5; SRP40; HRS NM_006925 O60902 SHX2_HUMAN MAJOR SHOX2; SHOT; OG12X NM_006884 Q13425 SNB2_HUMAN 2 SNTB2; SNT2B2 NM_130845 Q9Y5W8 SNXD_HUMAN 2 SNX13; KIAA0713 NM_015132 P18583
SON_HUMAN
E
SON; NREBP; DBP5; C21ORF50; KIAA1019
NM_058183
C NM_138926 Q15528 SUR5_HUMAN SURF5A SURF5; SURF-5 NM_006752
O14763 T10B_HUMAN MAJOR TNFRSF10B; DR5; TRAILR2; TRICK2; KILLER; ZTNFR9 NM_003842
SHORT NM_147187 Q9BZY9 TM31_HUMAN BETA TRIM31 NM_052816 P25445 TNR6_HUMAN 4 TNFRSF6; APT1; FAS; FAS1 NM_152873 5 NM_152875 3 NM_152876 2 NM_152877 P00750 TPA_HUMAN SHORT PLAT NM_000931 Q93038
TR12_HUMAN
12
TNFRSF25; TNFRSF12; WSL1; WSL; APO3; DR3; DDR3
NM_148968
4 NM_148969 3 NM_148971 5 NM_148972 6 NM_148973 7 NM_148974 Q9BYM8 U7I3_HUMAN 4 UBCE7IP3; C20ORF18; XAP4 NM_031227 2 NM_031228 P58418 USH3_HUMAN B USH3A NM_174880 Q9NP71 WS14_HUMAN 5 WBSCR14; MIO NM_032994 Q02040
XE7_HUMAN
SHORT
(XE7X; XE7; DXYS155E); (XE7Y; XE7; DXYS155E)
NM_005088
Q9Y493 ZAN_HUMAN 1 ZAN NM_173055 2 NM_173056 4 NM_173057 5 NM_173058
168

Appendix B
Correlation between SWISS-PROT structural domains
and alternatively spliced regions
169

My initial investigation into alternative splicing was motivated by the
hypothesis that alternative splicing may correlate with in some way with the
domain organization encoded in genes that are alternatively spliced. The
rationale was that if evolution has bothered to set up a system of alternative
splicing, then it likely affected regions that had some function and these would
more likely than not be the structural (and functional) domains. If this
hypothesis could be confirmed, then perhaps alternative splicing could be used
to discover the domain organization in newly sequenced genes.
To investigate this possibility I wrote several programs that may be of
use for others. In this appendix, I describe these programs.
varprot.pl
This perl program generates takes as input the complete SWISS-PROT database, in
SWISS-PROT format and outputs a FASTA format database that contains complete
entries for all annotated alternative isoforms. It uses the BIOPERL SWISS-PROT
parser to extract the ALTERNATIVE PRODUCTS section from each SWISS-PROT
entry, described in section 3.11.2 of the SWISS-PROT user manual
(http://us.expasy.org/sprot/userman.html). Each entry in the output database
contains information in its header that describes which regions are alternatively
spliced. The format of the header line is:
>SWISS-PROTID-# NAME [M|V START END] [M|V START END]…
Where SWISS-PROTID-# is the Isoform ID and name is the name given in the
ALTERNATIVE PRODUCTS section. These are followed by a variable number
170

of bracketed descriptions of the variably spliced regions. Each region has three
components. The first is either an M or a V. M indicates that this region is
missing (deleted) in some other isoform(s). V indicates that this region is
variable (different sequence) in some other isoforms. The last two components
are the start and end coordinates on the sequence given in this entry.
res2altsp.pl
This perl program generates and outputs a data structure that contains
information about structural domain hits against sequences in a specified
database. The database can be either a FASTA database containing the variable
region descriptions given by VARPROT.PL or it can be an entire SWISS-PROT
database in SWISS-PROT format. The other input is a database containing BLAST or
HMMER hits against the sequences in the named database.
ASDOMTypes.pl
Takes as input the data structure ouput by RES2ALTSP.PL. Classifies each
SWISS-PROT isoform by the spatial relationships between its alternatively spliced
(AS) regions and its structural domains (SDs). There are eight categories:
(0) No identifiable structural domain (SD) regions
(1) All SDs do not overlap alternatively spliced (AS) regions
(2) Single AS region contains SD
(3) Single SD contains single AS region
171
(4) There is overlap between an AS region and a SD
(5) SD contains multiple AS regions
(6) There is overlap between SD and multiple AS regions
(7) SD contains AS region(s) and is overlapped by an AS region
Along with the observed number of each category, the number in each category
that would be expected if SDs were placed within the database sequences
randomly with respect to AS regions is output.
ASDOMTypesByDom.pl
Takes the same inputs as ASDOMTYPES.PL, but classifies each domain rather
than each isoform. Also generates output for each domain identifier seen.
172
References
1. Abril JF, Guigo R. 2000. gff2ps: visualizing genomic annotations.
Bioinformatics 16: 743‐4
2. Adachi J, Hasegawa M. 1996. MOLPHY version 2.3: programs for molecular
phylogenetics based on maximum likelihood. Tokyo: Institute of Statistical
Mathematics
3. Adams MD, Celniker SE, Holt RA, Evans CA, Gocayne JD, et al. 2000. The
genome sequence of Drosophila melanogaster. Science 287: 2185‐95
4. Alberts B, Johnson A, Lewis J, Raff M, Roberts K, Walter P. 2002. Molecular
Biology of the Cell. New York: Garland Science. 1463 pp.
5. Altschul SF. 1991. Amino acid substitution matrices from an information
theoretic perspective. J Mol Biol 219: 555‐65
6. Altschul SF. 1993. A protein alignment scoring system sensitive at all
evolutionary distances. J Mol Evol 36: 290‐300
7. Altschul SF, Boguski MS, Gish W, Wootton JC. 1994. Issues in searching
molecular sequence databases. Nat Genet 6: 119‐29
8. Altschul SF, Bundschuh R, Olsen R, Hwa T. 2001. The estimation of statistical
parameters for local alignment score distributions. Nucleic Acids Res 29: 351‐61
9. Altschul SF, Erickson BW. 1986. A nonlinear measure of subalignment
similarity and its significance levels. Bull Math Biol 48: 617‐32
10. Altschul SF, Erickson BW. 1986. Optimal sequence alignment using affine gap
costs. Bull Math Biol 48: 603‐16
11. Altschul SF, Gish W. 1996. Local alignment statistics. Methods Enzymol 266:
460‐80
12. Altschul SF, Gish W, Miller W, Myers EW, Lipman DJ. 1990. Basic local
alignment search tool. J Mol Biol 215: 403‐10
173

13. Altschul SF, Madden TL, Schaffer AA, Zhang J, Zhang Z, et al. 1997. Gapped
BLAST and PSI‐BLAST: a new generation of protein database search
programs. Nucleic Acids Res 25: 3389‐402
14. Amarasinghe AK, MacDiarmid R, Adams MD, Rio DC. 2001. An in vitro‐
selected RNA‐binding site for the KH domain protein PSI acts as a splicing
inhibitor element. Rna 7: 1239‐53
15. Anantharaman V, Koonin EV, Aravind L. 2002. Comparative genomics and
evolution of proteins involved in RNA metabolism. Nucleic Acids Res 30: 1427‐
64
16. Asselta R, Duga S, Spena S, Santagostino E, Peyvandi F, et al. 2001.
Congenital afibrinogenemia: mutations leading to premature termination
codons in fibrinogen A alpha‐chain gene are not associated with the decay of
the mutant mRNAs. Blood 98: 3685‐92
17. Baier LJ, Permana PA, Yang X, Pratley RE, Hanson RL, et al. 2000. A calpain‐
10 gene polymorphism is associated with reduced muscle mRNA levels and
insulin resistance. J Clin Invest 106: R69‐73
18. Bailey TL, Gribskov M. 2002. Estimating and evaluating the statistics of
gapped local‐alignment scores. J Comput Biol 9: 575‐93
19. Baker KE, Parker R. 2004. Nonsense‐mediated mRNA decay: terminating
erroneous gene expression. Curr Opin Cell Biol 16: 293‐9
20. Basi GS, Boardman M, Storti RV. 1984. Alternative splicing of a Drosophila
tropomyosin gene generates muscle tropomyosin isoforms with different
carboxy‐terminal ends. Mol Cell Biol 4: 2828‐36
21. Basi GS, Storti RV. 1986. Structure and DNA sequence of the tropomyosin I
gene from Drosophila melanogaster. J Biol Chem 261: 817‐27
22. Bateman JF, Freddi S, Nattrass G, Savarirayan R. 2003. Tissue‐specific RNA
surveillance? Nonsense‐mediated mRNA decay causes collagen X 174

haploinsufficiency in Schmid metaphyseal chondrodysplasia cartilage. Hum
Mol Genet 12: 217‐25
23. Belgrader P, Cheng J, Maquat LE. 1993. Evidence to implicate translation by
ribosomes in the mechanism by which nonsense codons reduce the nuclear
level of human triosephosphate isomerase mRNA. Proc Natl Acad Sci U S A
90: 482‐6
24. Benson DA, Karsch‐Mizrachi I, Lipman DJ, Ostell J, Rapp BA, Wheeler DL.
2002. GenBank. Nucleic Acids Res 30: 17‐20
25. Benson DA, Karsch‐Mizrachi I, Lipman DJ, Ostell J, Wheeler DL. 2003.
GenBank. Nucleic Acids Res 31: 23‐7
26. Bhattacharya A, Czaplinski K, Trifillis P, He F, Jacobson A, Peltz SW. 2000.
Characterization of the biochemical properties of the human Upf1 gene
product that is involved in nonsense‐mediated mRNA decay. Rna 6: 1226‐35
27. Bingham PM, Chou TB, Mims I, Zachar Z. 1988. On/off regulation of gene
expression at the level of splicing. Trends Genet 4: 134‐8
28. Black DL. 2003. Mechanisms of Alternative Pre‐Messenger RNA Splicing.
Annu Rev Biochem
29. Black DL. 2003. Mechanisms of alternative pre‐messenger RNA splicing.
Annu Rev Biochem 72: 291‐336
30. Blake JD, Cohen FE. 2001. Pairwise sequence alignment below the twilight
zone. J Mol Biol 307: 721‐35
31. Bocs S, Danchin A, Medigue C. 2002. Re‐annotation of genome microbial
CoDing‐Sequences: finding new genes and inaccurately annotated genes.
BMC Bioinformatics 3: 5
32. Boeckmann B, Bairoch A, Apweiler R, Blatter MC, Estreicher A, et al. 2003.
The SWISS‐PROT protein knowledgebase and its supplement TrEMBL in
2003. Nucleic Acids Res 31: 365‐70 175

33. Boguski MS, Lowe TM, Tolstoshev CM. 1993. dbEST‐‐database for ʺexpressed
sequence tagsʺ. Nat Genet 4: 332‐3
34. Boise LH, Gonzalez‐Garcia M, Postema CE, Ding L, Lindsten T, et al. 1993.
bcl‐x, a bcl‐2‐related gene that functions as a dominant regulator of apoptotic
cell death. Cell 74: 597‐608
35. Bregeon D, Doddridge ZA, You HJ, Weiss B, Doetsch PW. 2003.
Transcriptional mutagenesis induced by uracil and 8‐oxoguanine in
Escherichia coli. Mol Cell 12: 959‐70
36. Brenner SE. 1999. Errors in genome annotation. Trends Genet 15: 132‐3
37. Brenner SE, Chothia C, Hubbard TJ. 1998. Assessing sequence comparison
methods with reliable structurally identified distant evolutionary
relationships. Proc Natl Acad Sci U S A 95: 6073‐8
38. Brenner SE, Hubbard T, Murzin A, Chothia C. 1995. Gene duplications in H.
influenzae. Nature 378: 140
39. Brenner SE, Koehl P, Levitt M. 2000. The ASTRAL compendium for protein
structure and sequence analysis. Nucleic Acids Res 28: 254‐6
40. Brett D, Hanke J, Lehmann G, Haase S, Delbruck S, et al. 2000. EST
comparison indicates 38% of human mRNAs contain possible alternative
splice forms. FEBS Lett 474: 83‐6
41. Brett D, Pospisil H, Valcarcel J, Reich J, Bork P. 2002. Alternative splicing and
genome complexity. Nat Genet 30: 29‐30
42. Brocke KS, Neu‐Yilik G, Gehring NH, Hentze MW, Kulozik AE. 2002. The
human intronless melanocortin 4‐receptor gene is NMD insensitive. Hum Mol
Genet 11: 331‐5
43. Buhler M, Wilkinson MF, Muhlemann O. 2002. Intranuclear degradation of
nonsense codon‐containing mRNA. EMBO Rep 3: 646‐51
176
44. Burckin T, Nagel R, Mandel‐Gutfreund Y, Shiue L, Clark TA, et al. 2005.
Exploring functional relationships between components of the gene
expression machinery. Nat Struct Mol Biol 12: 175‐82
45. Burke J, Wang H, Hide W, Davison DB. 1998. Alternative gene form
discovery and candidate gene selection from gene indexing projects. Genome
Res 8: 276‐90
46. Burnette JM, Hatton AR, Lopez AJ. 1999. Trans‐acting factors required for
inclusion of regulated exons in the Ultrabithorax mRNAs of Drosophila
melanogaster. Genetics 151: 1517‐29
47. Cáceres JF, Stamm S, Helfman DM, Krainer AR. 1994. Regulation of
alternative splicing in vivo by overexpression of antagonistic splicing factors.
Science 265: 1706‐9
48. Cali BM, Anderson P. 1998. mRNA surveillance mitigates genetic dominance
in Caenorhabditis elegans. Mol Gen Genet 260: 176‐84
49. Cali BM, Kuchma SL, Latham J, Anderson P. 1999. smg‐7 is required for
mRNA surveillance in Caenorhabditis elegans. Genetics 151: 605‐16
50. Caputi M, Mayeda A, Krainer AR, Zahler AM. 1999. hnRNP A/B proteins are
required for inhibition of HIV‐1 pre‐mRNA splicing. Embo J 18: 4060‐7
51. Caputi M, Zahler AM. 2002. SR proteins and hnRNP H regulate the splicing
of the HIV‐1 tev‐specific exon 6D. Embo J 21: 845‐55
52. Carstens RP, Wagner EJ, Garcia‐Blanco MA. 2000. An intronic splicing
silencer causes skipping of the IIIb exon of fibroblast growth factor receptor 2
through involvement of polypyrimidine tract binding protein. Mol Cell Biol
20: 7388‐400
53. Cartegni L, Chew SL, Krainer AR. 2002. Listening to silence and
understanding nonsense: exonic mutations that affect splicing. Nat Rev Genet
3: 285‐98 177

54. Carter MS, Doskow J, Morris P, Li S, Nhim RP, et al. 1995. A regulatory
mechanism that detects premature nonsense codons in T‐cell receptor
transcripts in vivo is reversed by protein synthesis inhibitors in vitro. J Biol
Chem 270: 28995‐9003
55. Castle J, Garrett‐Engele P, Armour CD, Duenwald SJ, Loerch PM, et al. 2003.
Optimization of oligonucleotide arrays and RNA amplification protocols for
analysis of transcript structure and alternative splicing. Genome Biol 4: R66
56. Cavaloc Y, Bourgeois CF, Kister L, Stevenin J. 1999. The splicing factors 9G8
and SRp20 transactivate splicing through different and specific enhancers.
Rna 5: 468‐83
57. Celniker SE, Rubin GM. 2003. The Drosophila melanogaster genome. Annu
Rev Genomics Hum Genet 4: 89‐117
58. Celotto AM, Graveley BR. 2001. Alternative splicing of the Drosophila Dscam
pre‐mRNA is both temporally and spatially regulated. Genetics 159: 599‐608
59. Chan CC, Dostie J, Diem MD, Feng W, Mann M, et al. 2004. eIF4A3 is a novel
component of the exon junction complex. Rna 10: 200‐9
60. Chandonia JM, Hon G, Walker NS, Lo Conte L, Koehl P, et al. 2004. The
ASTRAL Compendium in 2004. Nucleic Acids Res 32: D189‐92
61. Chandonia JM, Walker NS, Lo Conte L, Koehl P, Levitt M, Brenner SE. 2002.
ASTRAL compendium enhancements. Nucleic Acids Res 30: 260‐3
62. Chester A, Somasekaram A, Tzimina M, Jarmuz A, Gisbourne J, et al. 2003.
The apolipoprotein B mRNA editing complex performs a multifunctional
cycle and suppresses nonsense‐mediated decay. Embo J 22: 3971‐82
63. Chiu SY, Lejeune F, Ranganathan AC, Maquat LE. 2004. The pioneer
translation initiation complex is functionally distinct from but structurally
overlaps with the steady‐state translation initiation complex. Genes Dev 18:
745‐54 178

64. Chiu SY, Serin G, Ohara O, Maquat LE. 2003. Characterization of human
Smg5/7a: a protein with similarities to Caenorhabditis elegans SMG5 and
SMG7 that functions in the dephosphorylation of Upf1. Rna 9: 77‐87
65. Chothia C, Lesk AM. 1986. The relation between the divergence of sequence
and structure in proteins. Embo J 5: 823‐6
66. Clark TA, Sugnet CW, Ares M, Jr. 2002. Genomewide analysis of mRNA
processing in yeast using splicing‐specific microarrays. Science 296: 907‐10
67. Clemens JC, Worby CA, Simonson‐Leff N, Muda M, Maehama T, et al. 2000.
Use of double‐stranded RNA interference in Drosophila cell lines to dissect
signal transduction pathways. Proc Natl Acad Sci U S A 97: 6499‐503
68. Cline MS, Karplus K, Lathrop RH, Smith TF, Rogers RG, Jr., Haussler D. 2002.
Information‐theoretic dissection of pairwise contact potentials. Proteins 49: 7‐
14
69. Collins JF, Coulson AF, Lyall A. 1988. The significance of protein sequence
similarities. Comput Appl Biosci 4: 67‐71
70. Coulter LR, Landree MA, Cooper TA. 1997. Identification of a new class of
exonic splicing enhancers by in vivo selection [published erratum appears in
Mol Cell Biol 1997 Jun;17(6):3468]. Mol Cell Biol 17: 2143‐50
71. Cover TM, Thomas JA. 1991. Elements of Information Theory: Wiley
72. Crooks GE, Brenner SE. 2004. Protein secondary structure: entropy,
correlations and prediction. Bioinformatics 20: 1603‐11
73. Crooks GE, Brenner SE. 2005. An alternative model of amino acid
replacement. Bioinformatics 21: 975‐80
74. Crooks GE, Wolfe J, Brenner SE. 2004. Measurements of protein sequence‐
structure correlations. Proteins 57: 804‐10
179

75. Culbertson MR, Underbrink KM, Fink GR. 1980. Frameshift suppression
Saccharomyces cerevisiae. II. Genetic properties of group II suppressors.
Genetics 95: 833‐53
76. Czaplinski K, Ruiz‐Echevarria MJ, Paushkin SV, Han X, Weng Y, et al. 1998.
The surveillance complex interacts with the translation release factors to
enhance termination and degrade aberrant mRNAs. Genes Dev 12: 1665‐77
77. Dahl HH, Blair GE. 1979. Purification of four eukaryotic initiation factors
required for natural mRNA translation. Methods Enzymol 60: 87‐101
78. David D, Santos IM, Johnson K, Tuddenham EG, McVey JH. 2003. Analysis of
the consequences of premature termination codons within factor VIII coding
sequences. J Thromb Haemost 1: 139‐46
79. Dayhoff MO, Schwartz RM, Orcutt BC. 1978. A model of evolutionary change
in proteins. Matrices for detecting distant relationships. In Atlas of Protein
Sequence and Structure, pp. 345‐58. Washington DC: National Biomedical
Research Foundation
80. Dehal P, Satou Y, Campbell RK, Chapman J, Degnan B, et al. 2002. The draft
genome of Ciona intestinalis: insights into chordate and vertebrate origins.
Science 298: 2157‐67
81. Denning G, Jamieson L, Maquat LE, Thompson EA, Fields AP. 2001. Cloning
of a novel phosphatidylinositol kinase‐related kinase: characterization of the
human SMG‐1 RNA surveillance protein. J Biol Chem 276: 22709‐14
82. Dodson G, Wlodawer A. 1998. Catalytic triads and their relatives. Trends
Biochem Sci 23: 347‐52
83. Doolittle RF. 1992. Stein and Moore Award address. Reconstructing history
with amino acid sequences. Protein Sci 1: 191‐200
84. Dostie J, Dreyfuss G. 2002. Translation is required to remove Y14 from
mRNAs in the cytoplasm. Curr Biol 12: 1060‐7 180

85. Dreumont N, Maresca A, Boisclair‐Lachance JF, Bergeron A, Tanguay RM.
2005. A minor alternative transcript of the fumarylacetoacetate hydrolase
gene produces a protein despite being likely subjected to nonsense‐mediated
mRNA decay. BMC Mol Biol 6: 1
86. Duncan PI, Stojdl DF, Marius RM, Bell JC. 1997. In vivo regulation of
alternative pre‐mRNA splicing by the Clk1 protein kinase. Mol Cell Biol 17:
5996‐6001
87. Duncan PI, Stojdl DF, Marius RM, Scheit KH, Bell JC. 1998. The Clk2 and Clk3
dual‐specificity protein kinases regulate the intranuclear distribution of SR
proteins and influence pre‐mRNA splicing. Exp Cell Res 241: 300‐8
88. Durbin R, Eddy SR, Krogh A, Mitchison GJ. 1998. Biological Sequence Analysis:
Probabilistic Models of Proteins and Nucleic Acids. Cambridge, UK: Cambridge
University Press
89. Eddy SR. 2001. HMMER: Profile hidden Markov models for biological
sequence analysis.
90. Eddy SR. 2001. HMMER: Profile hidden Markov models for biological
sequence analysis. http://hmmer.wustl.edu.
91. Efron B, Robert JT. 1993. An Introduction to the Bootstrap. Boca Raton:
Chapman & Hall/CRC
92. Eisen MB, Spellman PT, Brown PO, Botstein D. 1998. Cluster analysis and
display of genome‐wide expression patterns. Proc Natl Acad Sci U S A 95:
14863‐8
93. Falquet L, Pagni M, Bucher P, Hulo N, Sigrist CJ, et al. 2002. The PROSITE
database, its status in 2002. Nucleic Acids Res 30: 235‐8
94. Ferraiuolo MA, Lee CS, Ler LW, Hsu JL, Costa‐Mattioli M, et al. 2004. A
nuclear translation‐like factor eIF4AIII is recruited to the mRNA during
181

splicing and functions in nonsense‐mediated decay. Proc Natl Acad Sci U S A
101: 4118‐23
95. Fischer D, Eisenberg D. 1999. Predicting structures for genome proteins.
Current Opinion in Structural Biology 9: 208‐11
96. Fisher LA, Kikkawa DO, Rivier JE, Amara SG, Evans RM, et al. 1983.
Stimulation of noradrenergic sympathetic outflow by calcitonin gene‐related
peptide. Nature 305: 534‐6
97. Florea L, Hartzell G, Zhang Z, Rubin GM, Miller W. 1998. A computer
program for aligning a cDNA sequence with a genomic DNA sequence.
Genome Res 8: 967‐74
98. Frischmeyer PA, Dietz HC. 1999. Nonsense‐mediated mRNA decay in health
and disease. Hum Mol Genet 8: 1893‐900
99. Fu XD, Mayeda A, Maniatis T, Krainer AR. 1992. General splicing factors SF2
and SC35 have equivalent activities in vitro, and both affect alternative 5ʹ and
3ʹ splice site selection. Proc Natl Acad Sci U S A 89: 11224‐8
100. Fukami‐Kobayashi K, Schreiber DR, Benner SA. 2002. Detecting
compensatory covariation signals in protein evolution using reconstructed
ancestral sequences. J Mol Biol 319: 729‐43
101. Gatfield D, Unterholzner L, Ciccarelli FD, Bork P, Izaurralde E. 2003.
Nonsense‐mediated mRNA decay in Drosophila: at the intersection of the
yeast and mammalian pathways. Embo J 22: 3960‐70
102. Geetha V, Di Francesco V, Garnier J, Munson PJ. 1999. Comparing protein
sequence‐based and predicted secondary structure‐based methods for
identification of remote homologs. Protein Eng 12: 527‐34
103. Gish W. 1996‐2003. wu‐blast.
104. Gish WR. 1996‐2002. WU‐BLAST. St. Louis: Washington University
182

105. Goldman N, Thorne JL, Jones DT. 1998. Assessing the impact of secondary
structure and solvent accessibility on protein evolution. Genetics 149: 445‐58
106. Gonnet GH, Cohen MA, Benner SA. 1994. Analysis of amino acid
substitution during divergent evolution: the 400 by 400 dipeptide substitution
matrix. Biochem Biophys Res Commun 199: 489‐96
107. Gonzalez CI, Ruiz‐Echevarria MJ, Vasudevan S, Henry MF, Peltz SW.
2000. The yeast hnRNP‐like protein Hrp1/Nab4 marks a transcript for
nonsense‐mediated mRNA decay. Mol Cell 5: 489‐99
108. Graveley BR. 2001. Alternative splicing: increasing diversity in the
proteomic world. Trends Genet 17: 100‐7
109. Green RE, Brenner SE. 2002. Bootstrapping and normalization for
enhanced evaluations of pairwise sequence comparison. Proc IEEE 90: 1834‐47
110. Green RE, Lewis BP, Hillman RT, Blanchette M, Lareau LF, et al. 2003.
Widespread predicted nonsense‐mediated mRNA decay of alternatively‐
spliced transcripts of human normal and disease genes. Bioinformatics 19
Suppl 1: I118‐I21
111. Gribskov M, Robinson NL. 1996. Use of receiver operating characteristic
(ROC) analysis to evaluate sequence matching. Computers & Chemistry 20: 25‐
33
112. Gudikote JP, Wilkinson MF. 2002. T‐cell receptor sequences that elicit
strong down‐regulation of premature termination codon‐bearing transcripts.
Embo J 21: 125‐34
113. Hanes J, von der Kammer H, Klaudiny J, Scheit KH. 1994.
Characterization by cDNA cloning of two new human protein kinases.
Evidence by sequence comparison of a new family of mammalian protein
kinases. J Mol Biol 244: 665‐72
183

114. Hargbo J, Elofsson A. 1999. Hidden Markov models that use predicted
secondary structures for fold recognition. Proteins 36: 68‐76
115. Harrison PM, Kumar A, Lang N, Snyder M, Gerstein M. 2002. A question
of size: the eukaryotic proteome and the problems in defining it. Nucleic Acids
Res 30: 1083‐90
116. Henikoff JG, Greene EA, Pietrokovski S, Henikoff S. 2000. Increased
coverage of protein families with the blocks database servers. Nucleic Acids
Res 28: 228‐30
117. Henikoff S, Henikoff JG. 1992. Amino acid substitution matrices from
protein blocks. Proc Natl Acad Sci U S A 89: 10915‐9
118. Henikoff S, Henikoff JG. 1993. Performance evaluation of amino acid
substitution matrices. Proteins 17: 49‐61
119. Henikoff S, Henikoff JG, Pietrokovski S. 1999. Blocks+: a non‐redundant
database of protein alignment blocks derived from multiple compilations.
Bioinformatics 15: 471‐9
120. Hide WA, Babenko VN, van Heusden PA, Seoighe C, Kelso JF. 2001. The
contribution of exon‐skipping events on chromosome 22 to protein coding
diversity. Genome Res 11: 1848‐53
121. Hilleren P, Parker R. 1999. Mechanisms of mRNA surveillance in
eukaryotes. Annu Rev Genet 33: 229‐60
122. Hillman RT, Green RE, Brenner SE. 2004. An unappreciated role for RNA
surveillance. Genome Biol 5: R8
123. Hodgkin J, Papp A, Pulak R, Ambros V, Anderson P. 1989. A new kind of
informational suppression in the nematode Caenorhabditis elegans. Genetics
123: 301‐13
184
124. Homma K, Kikuno RF, Nagase T, Ohara O, Nishikawa K. 2004.
Alternative splice variants encoding unstable protein domains exist in the
human brain. J Mol Biol 343: 1207‐20
125. Horikawa Y, Oda N, Cox NJ, Li X, Orho‐Melander M, et al. 2000. Genetic
variation in the gene encoding calpain‐10 is associated with type 2 diabetes
mellitus. Nat Genet 26: 163‐75
126. Hu GK, Madore SJ, Moldover B, Jatkoe T, Balaban D, et al. 2001.
Predicting splice variant from DNA chip expression data. Genome Res 11:
1237‐45
127. Huang YH, Chen YT, Lai JJ, Yang ST, Yang UC. 2002. PALS db: Putative
Alternative Splicing Database. Nucleic Acids Research 30: 186‐90
128. Hutchinson S, Furger A, Halliday D, Judge DP, Jefferson A, et al. 2003.
Allelic variation in normal human FBN1 expression in a family with Marfan
syndrome: a potential modifier of phenotype? Hum Mol Genet 12: 2269‐76
129. Information NCfB. http://www.ncbi.nlm.nih.gov/UniLib/.
130. Ishigaki Y, Li XJ, Serin G, Maquat LE. 2001. Evidence for a pioneer round
of mRNA translation: mRNAs subject to nonsense‐mediated decay in
mammalian cells are bound by CBP80 and CBP20. Cell 106: 607‐17
131. Jacquenet S, Mereau A, Bilodeau PS, Damier L, Stoltzfus CM, Branlant C.
2001. A second exon splicing silencer within human immunodeficiency virus
type 1 tat exon 2 represses splicing of Tat mRNA and binds protein hnRNP
H. J Biol Chem 276: 40464‐75
132. Johnson JM, Castle J, Garrett‐Engele P, Kan Z, Loerch PM, et al. 2003.
Genome‐wide survey of human alternative pre‐mRNA splicing with exon
junction microarrays. Science 302: 2141‐4
185

133. Jones RB, Wang F, Luo Y, Yu C, Jin C, et al. 2001. The nonsense‐mediated
decay pathway and mutually exclusive expression of alternatively spliced
FGFR2IIIb and ‐IIIc mRNAs. J Biol Chem 276: 4158‐67
134. Jung J, Lee B. 2000. Use of residue pairs in protein sequence‐sequence and
sequence‐structure alignments. Protein Sci 9: 1576‐88
135. Jurica MS, Moore MJ. 2003. Pre‐mRNA splicing: awash in a sea of
proteins. Mol Cell 12: 5‐14
136. Kan Z, Rouchka EC, Gish WR, States DJ. 2001. Gene structure prediction
and alternative splicing analysis using genomically aligned ESTs. Genome Res
11: 889‐900
137. Kan Z, States D, Gish W. 2002. Selecting for functional alternative splices
in ESTs. Genome Res 12: 1837‐45
138. Karlin S, Altschul SF. 1990. Methods for assessing the statistical
significance of molecular sequence features by using general scoring schemes.
Proc Natl Acad Sci U S A 87: 2264‐8
139. Karlin S, Altschul SF. 1993. Applications and statistics for multiple high‐
scoring segments in molecular sequences. Proc Natl Acad Sci U S A 90: 5873‐7
140. Karplus K, Barrett C, Hughey R. 1998. Hidden Markov models for
detecting remote protein homologies. Bioinformatics 14: 846‐56
141. Kerr TP, Sewry CA, Robb SA, Roberts RG. 2001. Long mutant dystrophins
and variable phenotypes: evasion of nonsense‐mediated decay? Hum Genet
109: 402‐7
142. Kim S, Shi H, Lee DK, Lis JT. 2003. Specific SR protein‐dependent splicing
substrates identified through genomic SELEX. Nucleic Acids Res 31: 1955‐61
143. Kim VN, Kataoka N, Dreyfuss G. 2001. Role of the nonsense‐mediated
decay factor hUpf3 in the splicing‐dependent exon‐exon junction complex.
Science 293: 1832‐6 186

144. Kim YK, Furic L, Desgroseillers L, Maquat LE. 2005. Mammalian Staufen1
recruits Upf1 to specific mRNA 3ʹUTRs so as to elicit mRNA decay. Cell 120:
195‐208
145. King CR, Piatigorsky J. 1983. Alternative RNA splicing of the murine
alpha A‐crystallin gene: protein‐coding information within an intron. Cell 32:
707‐12
146. Kinniburgh AJ, Maquat LE, Schedl T, Rachmilewitz E, Ross J. 1982.
mRNA‐deficient beta o‐thalassemia results from a single nucleotide deletion.
Nucleic Acids Res 10: 5421‐7
147. Kondrashov FA, Koonin EV. 2001. Origin of alternative splicing by
tandem exon duplication. Hum Mol Genet 10: 2661‐9
148. Kondrashov FA, Koonin EV. 2003. Evolution of alternative splicing:
deletions, insertions and origin of functional parts of proteins from intron
sequences. Trends Genet 19: 115‐9
149. Kriventseva EV, Koch I, Apweiler R, Vingron M, Bork P, et al. 2003.
Increase of functional diversity by alternative splicing. Trends Genet 19: 124‐8
150. Labourier E, Blanchette M, Feiger JW, Adams MD, Rio DC. 2002. The KH‐
type RNA‐binding protein PSI is required for Drosophila viability, male
fertility, and cellular mRNA processing. Genes Dev 16: 72‐84
151. Labow BI, Souba WW, Abcouwer SF. 2001. Mechanisms governing the
expression of the enzymes of glutamine metabolism‐‐glutaminase and
glutamine synthetase. J Nutr 131: 2467S‐74S; discussion 86S‐7S
152. Lamba JK, Adachi M, Sun D, Tammur J, Schuetz EG, et al. 2003. Nonsense
mediated decay downregulates conserved alternatively spliced ABCC4
transcripts bearing nonsense codons. Hum Mol Genet 12: 99‐109
153. Lander ES, Linton LM, Birren B, Nusbaum C, Zody MC, et al. 2001. Initial
sequencing and analysis of the human genome. Nature 409: 860‐921 187
154. Lareau LF, Green RE, Bhatnagar RS, Brenner SE. 2004. The evolving roles
of alternative splicing. Curr Opin Struct Biol 14: 273‐82
155. Le Guiner C, Gesnel MC, Breathnach R. 2003. TIA‐1 or TIAR is required
for DT40 cell viability. J Biol Chem 278: 10465‐76
156. Le Hir H, Gatfield D, Izaurralde E, Moore MJ. 2001. The exon‐exon
junction complex provides a binding platform for factors involved in mRNA
export and nonsense‐mediated mRNA decay. Embo Journal 20: 4987‐97
157. Le Hir H, Izaurralde E, Maquat LE, Moore MJ. 2000. The spliceosome
deposits multiple proteins 20‐24 nucleotides upstream of mRNA exon‐exon
junctions. Embo J 19: 6860‐9
158. Le Hir H, Moore MJ, Maquat LE. 2000. Pre‐mRNA splicing alters mRNP
composition: evidence for stable association of proteins at exon‐exon
junctions. Genes & Development 14: 1098‐108
159. Lee C, Roy M. 2004. Analysis of alternative splicing with microarrays:
successes and challenges. Genome Biol 5: 231
160. Lee MH, Schedl T. 2004. Translation repression by GLD‐1 protects its
mRNA targets from nonsense‐mediated mRNA decay in C. elegans. Genes
Dev 18: 1047‐59
161. Leeds P, Peltz SW, Jacobson A, Culbertson MR. 1991. The product of the
yeast UPF1 gene is required for rapid turnover of mRNAs containing a
premature translational termination codon. Genes Dev 5: 2303‐14
162. Leeds P, Wood JM, Lee BS, Culbertson MR. 1992. Gene products that
promote mRNA turnover in Saccharomyces cerevisiae. Mol Cell Biol 12: 2165‐
77
163. Lei XD, Chapman B, Hankinson O. 2001. Loss of cyp1a1 messenger rna
expression due to nonsense‐mediated decay. Mol Pharmacol 60: 388‐93
188

164. Lejeune F, Ishigaki Y, Li X, Maquat LE. 2002. The exon junction complex is
detected on CBP80‐bound but not eIF4E‐bound mRNA in mammalian cells:
dynamics of mRNP remodeling. Embo J 21: 3536‐45
165. Lelivelt MJ, Culbertson MR. 1999. Yeast Upf proteins required for RNA
surveillance affect global expression of the yeast transcriptome. Mol Cell Biol
19: 6710‐9
166. Lewin B. 1994. GENES V. Oxford: Oxford University Press
167. Lewis BP, Green RE, Brenner SE. 2002. Evidence for the widespread
coupling of alternative splicing and nonsense‐mediated mRNA decay in
humans. Proc Natl Acad Sci U S A
168. Lewis BP, Green RE, Brenner SE. 2003. Evidence for the widespread
coupling of alternative splicing and nonsense‐mediated mRNA decay in
humans. Proc Natl Acad Sci U S A 100: 189‐92
169. Li S, Wilkinson MF. 1998. Nonsense surveillance in lymphocytes?
Immunity 8: 135‐41
170. Lin K, Kleinjung J, Taylor WR, Heringa J. 2003. Testing homology with
Contact Accepted mutatiOn (CAO): a contact‐based Markov model of protein
evolution. Comput Biol Chem 27: 93‐102
171. Lindahl E, Elofsson A. 2000. Identification of related proteins on family,
superfamily and fold level. J Mol Biol 295: 613‐25
172. Liu HX, Zhang M, Krainer AR. 1998. Identification of functional exonic
splicing enhancer motifs recognized by individual SR proteins. Genes Dev 12:
1998‐2012
173. Liu S, Altman RB. 2003. Large scale study of protein domain distribution
in the context of alternative splicing. Nucleic Acids Res 31: 4828‐35
174. Liu Y, George CX, Patterson JB, Samuel CE. 1997. Functionally distinct
double‐stranded RNA‐binding domains associated with alternative splice site 189

variants of the interferon‐inducible double‐stranded RNA‐specific adenosine
deaminase. J Biol Chem 272: 4419‐28
175. Longman D, Johnstone IL, Caceres JF. 2000. Functional characterization of
SR and SR‐related genes in Caenorhabditis elegans. Embo J 19: 1625‐37
176. Lykke‐Andersen J. 2002. Identification of a human decapping complex
associated with hUpf proteins in nonsense‐mediated decay. Mol Cell Biol 22:
8114‐21
177. Lykke‐Andersen J, Shu MD, Steitz JA. 2000. Human Upf proteins target an
mRNA for nonsense‐mediated decay when bound downstream of a
termination codon. Cell 103: 1121‐31
178. Lykke‐Andersen J, Shu MD, Steitz JA. 2001. Communication of the
position of exon‐exon junctions to the mRNA surveillance machinery by the
protein RNPS1. Science 293: 1836‐9
179. Lynch KW, Maniatis T. 1996. Assembly of specific SR protein complexes
on distinct regulatory elements of the Drosophila doublesex splicing
enhancer. Genes Dev 10: 2089‐101
180. Maniatis T, Tasic B. 2002. Alternative pre‐mRNA splicing and proteome
expansion in metazoans. Nature 418: 236‐43
181. Maquat LE. 2002. Nonsense‐mediated mRNA decay. Curr Biol 12: R196‐7
182. Maquat LE. 2004. Nonsense‐mediated mRNA decay: a comparative
analysis of different species. Current Genomics 5: 175‐90
183. Maquat LE. 2004. Nonsense‐mediated mRNA decay: splicing, translation
and mRNP dynamics. Nat Rev Mol Cell Biol 5: 89‐99
184. Maquat LE, Li X. 2001. Mammalian heat shock p70 and histone H4
transcripts, which derive from naturally intronless genes, are immune to
nonsense‐mediated decay. Rna 7: 445‐56
190
185. Mayeda A, Krainer AR. 1992. Regulation of alternative pre‐mRNA
splicing by hnRNP A1 and splicing factor SF2. Cell 68: 365‐75
186. Medghalchi SM, Frischmeyer PA, Mendell JT, Kelly AG, Lawler AM,
Dietz HC. 2001. Rent1, a trans‐effector of nonsense‐mediated mRNA decay, is
essential for mammalian embryonic viability. Hum Mol Genet 10: 99‐105
187. Mendell JT, ap Rhys CM, Dietz HC. 2002. Separable roles for rent1/hUpf1
in altered splicing and decay of nonsense transcripts. Science 298: 419‐22
188. Mendell JT, Medghalchi SM, Lake RG, Noensie EN, Dietz HC. 2000. Novel
Upf2p orthologues suggest a functional link between translation initiation
and nonsense surveillance complexes. Mol Cell Biol 20: 8944‐57
189. Mendell JT, Sharifi NA, Meyers JL, Martinez‐Murillo F, Dietz HC. 2004.
Nonsense surveillance regulates expression of diverse classes of mammalian
transcripts and mutes genomic noise. Nat Genet 36: 1073‐8
190. Menegay HJ, Myers MP, Moeslein FM, Landreth GE. 2000. Biochemical
characterization and localization of the dual specificity kinase CLK1. J Cell Sci
113 (Pt 18): 3241‐53
191. Minovitsky S, Gee SL, Schokrpur S, Dubchak I, Conboy JG. 2005. The
splicing regulatory element, UGCAUG, is phylogenetically and spatially
conserved in introns that flank tissue‐specific alternative exons. Nucleic Acids
Res 33: 714‐24
192. Mironov AA, Fickett JW, Gelfand MS. 1999. Frequent alternative splicing
of human genes. Genome Res 9: 1288‐93
193. Mitchell P, Tollervey D. 2001. mRNA turnover. Curr Opin Cell Biol 13: 320‐
5
194. Mitrovich QM, Anderson P. 2000. Unproductively spliced ribosomal
protein mRNAs are natural targets of mRNA surveillance in C. elegans. Genes
Dev 14: 2173‐84 191

195. Modrek B, Lee C. 2002. A genomic view of alternative splicing. Nat Genet
30: 13‐9
196. Modrek B, Lee CJ. 2003. Alternative splicing in the human, mouse and rat
genomes is associated with an increased frequency of exon creation and/or
loss. Nat Genet 34: 177‐80
197. Modrek B, Resch A, Grasso C, Lee C. 2001. Genome‐wide detection of
alternative splicing in expressed sequences of human genes. Nucleic Acids Res
29: 2850‐9
198. Moore MJ, Query CC, Sharp PA. 1993. Splicing of Precursors to Messenger
RNAs by the Spliceosome. In The RNA World, ed. RF Gesteland, JF Atkins, pp.
303‐57. Cold Spring Harbor, N.Y.: Cold Spring Harbor Laboratory Press
199. Morrison M, Harris KS, Roth MB. 1997. smg mutants affect the expression
of alternatively spliced SR protein mRNAs in Caenorhabditis elegans. Proc
Natl Acad Sci U S A 94: 9782‐5
200. Muller T, Spang R, Vingron M. 2002. Estimating amino acid substitution
models: a comparison of Dayhoffʹs estimator, the resolvent approach and a
maximum likelihood method. Mol Biol Evol 19: 8‐13
201. Murray BA, Hemperly JJ, Prediger EA, Edelman GM, Cunningham BA.
1986. Alternatively spliced mRNAs code for different polypeptide chains of
the chicken neural cell adhesion molecule (N‐CAM). J Cell Biol 102: 189‐93
202. Murzin AG, Brenner SE, Hubbard T, Chothia C. 1995. SCOP: a structural
classification of proteins database for the investigation of sequences and
structures. J Mol Biol 247: 536‐40
203. Myers EW, Miller W. 1989. Approximate matching of regular expressions.
Bull Math Biol 51: 5‐37
192

204. Nagy E, Maquat LE. 1998. A rule for termination‐codon position within
intron‐containing genes: when nonsense affects RNA abundance. Trends
Biochem Sci 23: 198‐9
205. Needleman SB, Wunsch CD. 1970. A general method applicable to the
search for similarities in the amino acid sequence of two proteins. J Mol Biol
48: 443‐53
206. Neu‐Yilik G, Gehring NH, Hentze MW, Kulozik AE. 2004. Nonsense‐
mediated mRNA decay: from vacuum cleaner to Swiss army knife. Genome
Biol 5: 218
207. Noensie EN, Dietz HC. 2001. A strategy for disease gene identification
through nonsense‐mediated mRNA decay inhibition. Nat Biotechnol 19: 434‐9
208. Okazaki Y, Furuno M, Kasukawa T, Adachi J, Bono H, et al. 2002. Analysis
of the mouse transcriptome based on functional annotation of 60,770 full‐
length cDNAs. Nature 420: 563‐73
209. Orengo CA, Michie AD, Jones S, Jones DT, Swindells MB, Thornton JM.
1997. CATH‐‐a hierarchic classification of protein domain structures.
Structure 5: 1093‐108
210. Pal M, Ishigaki Y, Nagy E, Maquat LE. 2001. Evidence that
phosphorylation of human Upfl protein varies with intracellular location and
is mediated by a wortmannin‐sensitive and rapamycin‐sensitive PI 3‐kinase‐
related kinase signaling pathway. Rna 7: 5‐15
211. Palacios IM, Gatfield D, St Johnston D, Izaurralde E. 2004. An eIF4AIII‐
containing complex required for mRNA localization and nonsense‐mediated
mRNA decay. Nature 427: 753‐7
212. Pan Q, Bakowski MA, Morris Q, Zhang W, Frey BJ, et al. 2005. Alternative
splicing of conserved exons is frequently species‐specific in human and
mouse. Trends Genet 21: 73‐7 193

213. Pan Q, Shai O, Misquitta C, Zhang W, Saltzman AL, et al. 2004. Revealing
global regulatory features of mammalian alternative splicing using a
quantitative microarray platform. Mol Cell 16: 929‐41
214. Park J, Karplus K, Barrett C, Hughey R, Haussler D, et al. 1998. Sequence
comparisons using multiple sequences detect three times as many remote
homologues as pairwise methods. J Mol Biol 284: 1201‐10
215. Park JW, Parisky K, Celotto AM, Reenan RA, Graveley BR. 2004.
Identification of alternative splicing regulators by RNA interference in
Drosophila. Proc Natl Acad Sci U S A 101: 15974‐9
216. Pearson WR. 1991. Searching protein sequence libraries: comparison of the
sensitivity and selectivity of the Smith‐Waterman and FASTA algorithms.
Genomics 11: 635‐50
217. Pearson WR. 1995. Comparison of Methods for Searching Protein‐
Sequence Databases. Protein Science 4: 1145‐60
218. Pearson WR. 1996. Effective protein sequence comparison. In Computer
Methods for Macromolecular Sequence Analysis, pp. 227‐58
219. Pearson WR. 1998. Empirical statistical estimates for sequence similarity
searches. J Mol Biol 276: 71‐84
220. Pearson WR, Lipman DJ. 1988. Improved tools for biological sequence
comparison. Proc Natl Acad Sci U S A 85: 2444‐8
221. Philipps DL, Park JW, Graveley BR. 2004. A computational and
experimental approach toward a priori identification of alternatively spliced
exons. Rna 10: 1838‐44
222. Pruitt KD, Maglott DR. 2001. RefSeq and LocusLink: NCBI gene‐centered
resources. Nucleic Acids Res 29: 137‐40
223. Pulak R, Anderson P. 1993. mRNA surveillance by the Caenorhabditis
elegans smg genes. Genes Dev 7: 1885‐97 194

224. Rajavel KS, Neufeld EF. 2001. Nonsense‐mediated decay of human HEXA
mRNA. Mol Cell Biol 21: 5512‐9
225. Reed R, Griffith J, Maniatis T. 1988. Purification and visualization of
native spliceosomes. Cell 53: 949‐61
226. Reichert VL, Le Hir H, Jurica MS, Moore MJ. 2002. 5ʹ exon interactions
within the human spliceosome establish a framework for exon junction
complex structure and assembly. Genes Dev 16: 2778‐91
227. Relogio A, Ben‐Dov C, Baum M, Ruggiu M, Gemund C, et al. 2005.
Alternative splicing microarrays reveal functional expression of neuron‐
specific regulators in Hodgkin lymphoma cells. J Biol Chem 280: 4779‐84
228. Resch A, Xing Y, Modrek B, Gorlick M, Riley R, Lee C. 2004. Assessing the
impact of alternative splicing on domain interactions in the human proteome.
J Proteome Res 3: 76‐83
229. Rice DW, Eisenberg D. 1997. A 3D‐1D substitution matrix for protein fold
recognition that includes predicted secondary structure of the sequence. J Mol
Biol 267: 1026‐38
230. Rodionov MA, Johnson MS. 1994. Residue‐residue contact substitution
probabilities derived from aligned three‐dimensional structures and the
identification of common folds. Protein Sci 3: 2366‐77
231. Romao L, Inacio A, Santos S, Avila M, Faustino P, et al. 2000. Nonsense
mutations in the human beta‐globin gene lead to unexpected levels of
cytoplasmic mRNA accumulation. Blood 96: 2895‐901
232. Rost B. 1999. Twilight zone of protein sequence alignments. Protein Eng 12:
85‐94
233. Rubin DB. 1981. The Bayesian Bootstrap. Annals of Statistics 9: 130‐4
234. Sander C, Schneider R. 1991. Database of homology‐derived protein
structures and the structural meaning of sequence alignment. Proteins 9: 56‐68 195
235. Schaffer AA, Aravind L, Madden TL, Shavirin S, Spouge JL, et al. 2001.
Improving the accuracy of PSI‐BLAST protein database searches with
composition‐based statistics and other refinements. Nucleic Acids Res 29: 2994‐
3005
236. Schaffer AA, Wolf YI, Ponting CP, Koonin EV, Aravind L, Altschul SF.
1999. IMPALA: matching a protein sequence against a collection of PSI‐
BLAST‐constructed position‐specific score matrices. Bioinformatics 15: 1000‐11
237. Schmucker D, Clemens JC, Shu H, Worby CA, Xiao J, et al. 2000.
Drosophila Dscam is an axon guidance receptor exhibiting extraordinary
molecular diversity. Cell 101: 671‐84
238. Schwarzbauer JE, Tamkun JW, Lemischka IR, Hynes RO. 1983. Three
different fibronectin mRNAs arise by alternative splicing within the coding
region. Cell 35: 421‐31
239. Screaton GR, Xu XN, Olsen AL, Cowper AE, Tan R, et al. 1997. LARD: a
new lymphoid‐specific death domain containing receptor regulated by
alternative pre‐mRNA splicing. Proc Natl Acad Sci U S A 94: 4615‐9
240. Serin G, Gersappe A, Black JD, Aronoff R, Maquat LE. 2001. Identification
and characterization of human orthologues to Saccharomyces cerevisiae Upf2
protein and Upf3 protein (Caenorhabditis elegans SMG‐4). Mol Cell Biol 21:
209‐23
241. Shi H, Hoffman BE, Lis JT. 1997. A specific RNA hairpin loop structure
binds the RNA recognition motifs of the Drosophila SR protein B52. Mol Cell
Biol 17: 2649‐57
242. Shibuya T, Tange TO, Sonenberg N, Moore MJ. 2004. eIF4AIII binds
spliced mRNA in the exon junction complex and is essential for nonsense‐
mediated decay. Nat Struct Mol Biol 11: 346‐51
196

243. Siebel CW, Admon A, Rio DC. 1995. Soma‐specific expression and cloning
of PSI, a negative regulator of P element pre‐mRNA splicing. Genes Dev 9:
269‐83
244. Siebel CW, Fresco LD, Rio DC. 1992. The mechanism of somatic inhibition
of Drosophila P‐element pre‐mRNA splicing: multiprotein complexes at an
exon pseudo‐5ʹ splice site control U1 snRNP binding. Genes Dev 6: 1386‐401
245. Siebel CW, Kanaar R, Rio DC. 1994. Regulation of tissue‐specific P‐
element pre‐mRNA splicing requires the RNA‐binding protein PSI. Genes Dev
8: 1713‐25
246. Smit AFA, Green P. 1996‐2001. P RepeatMasker.
247. Smith CW, Valcarcel J. 2000. Alternative pre‐mRNA splicing: the logic of
combinatorial control. Trends Biochem Sci 25: 381‐8
248. Smith TF, Waterman MS. 1981. Identification of common molecular
subsequences. J Mol Biol 147: 195‐7
249. Smith TF, Waterman MS, Burks C. 1985. The statistical distribution of
nucleic acid similarities. Nucleic Acids Res 13: 645‐56
250. Sorek R, Shamir R, Ast G. 2004. How prevalent is functional alternative
splicing in the human genome? Trends Genet 20: 68‐71
251. Spang R, Vingron M. 2001. Limits of homology detection by pairwise
sequence comparison. Bioinformatics 17: 338‐42
252. Stein L. 2001. Genome annotation: from sequence to biology. Nat Rev Genet
2: 493‐503
253. Stolc V, Gauhar Z, Mason C, Halasz G, van Batenburg MF, et al. 2004. A
gene expression map for the euchromatic genome of Drosophila
melanogaster. Science 306: 655‐60
254. Sun X, Perlick HA, Dietz HC, Maquat LE. 1998. A mutated human
homologue to yeast Upf1 protein has a dominant‐negative effect on the decay 197

of nonsense‐containing mRNAs in mammalian cells. Proc Natl Acad Sci U S A
95: 10009‐14
255. Sureau A, Gattoni R, Dooghe Y, Stevenin J, Soret J. 2001. SC35
autoregulates its expression by promoting splicing events that destabilize its
mRNAs. Embo J 20: 1785‐96
256. Tabaska JE, Zhang MQ. 1999. Detection of polyadenylation signals in
human DNA sequences. Gene 231: 77‐86
257. Tacke R, Manley JL. 1995. The human splicing factors ASF/SF2 and SC35
possess distinct, functionally significant RNA binding specificities. Embo J 14:
3540‐51
258. Tennyson CN, Klamut HJ, Worton RG. 1995. The human dystrophin gene
requires 16 hours to be transcribed and is cotranscriptionally spliced. Nat
Genet 9: 184‐90
259. Thanaraj TA. 1999. A clean data set of EST‐confirmed splice sites from
Homo sapiens and standards for clean‐up procedures. Nucleic Acids Res 27:
2627‐37
260. Thomas H, Badenberg B, Bulman M, Lemm I, Lausen J, et al. 2002.
Evidence for haploinsufficiency of the human HNF1alpha gene revealed by
functional characterization of MODY3‐associated mutations. Biol Chem 383:
1691‐700
261. Thome M, Tschopp J. 2001. Regulation of lymphocyte proliferation and
death by FLIP. Nat Rev Immunol 1: 50‐8
262. Thompson JD, Higgins DG, Gibson TJ. 1994. CLUSTAL W: improving the
sensitivity of progressive multiple sequence alignment through sequence
weighting, position‐specific gap penalties and weight matrix choice. Nucleic
Acids Res 22: 4673‐80
198

263. Thorne JL, Goldman N, Jones DT. 1996. Combining protein evolution and
secondary structure. Mol Biol Evol 13: 666‐73
264. Topham CM, Srinivasan N, Blundell TL. 1997. Prediction of the stability of
protein mutants based on structural environment‐dependent amino acid
substitution and propensity tables. Protein Eng 10: 7‐21
265. Vincent MC, Pujo AL, Olivier D, Calvas P. 2003. Screening for PAX6 gene
mutations is consistent with haploinsufficiency as the main mechanism
leading to various ocular defects. Eur J Hum Genet 11: 163‐9
266. Wagner E, Lykke‐Andersen J. 2002. mRNA surveillance: the perfect
persist. J Cell Sci 115: 3033‐8
267. Wang H, Hubbell E, Hu JS, Mei G, Cline M, et al. 2003. Gene structure‐
based splice variant deconvolution using a microarray platform.
Bioinformatics 19 Suppl 1: i315‐22
268. Wang J, Takagaki Y, Manley JL. 1996. Targeted disruption of an essential
vertebrate gene: ASF/SF2 is required for cell viability. Genes Dev 10: 2588‐99
269. Wang J, Xiao SH, Manley JL. 1998. Genetic analysis of the SR protein
ASF/SF2: interchangeability of RS domains and negative control of splicing.
Genes Dev 12: 2222‐33
270. Wang Z, Rolish ME, Yeo G, Tung V, Mawson M, Burge CB. 2004.
Systematic Identification and Analysis of Exonic Splicing Silencers. Cell 119:
831‐45
271. Weiss O, Jimenez‐Montano MA, Herzel H. 2000. Information content of
protein sequences. J Theor Biol 206: 379‐86
272. Wheelan SJ, Church DM, Ostell JM. 2001. Spidey: a tool for mRNA‐to‐
genomic alignments. Genome Res 11: 1952‐7
273. Wilkinson MF. 2005. A new function for nonsense‐mediated mRNA‐decay
factors. Trends Genet 21: 143‐8 199

274. Wilson GM, Sun Y, Sellers J, Lu H, Penkar N, et al. 1999. Regulation of
AUF1 expression via conserved alternatively spliced elements in the 3ʹ
untranslated region. Mol Cell Biol 19: 4056‐64
275. Wollerton MC, Gooding C, Wagner EJ, Garcia‐Blanco MA, Smith CW.
2004. Autoregulation of polypyrimidine tract binding protein by alternative
splicing leading to nonsense‐mediated decay. Mol Cell 13: 91‐100
276. Wootton JC, Federhen S. 1996. Analysis of compositionally biased regions
in sequence databases. Methods Enzymol 266: 554‐71
277. Wu CH, Huang H, Arminski L, Castro‐Alvear J, Chen Y, et al. 2002. The
Protein Information Resource: an integrated public resource of functional
annotation of proteins. Nucleic Acids Res 30: 35‐7
278. Xing Y, Xu Q, Lee C. 2003. Widespread production of novel soluble
protein isoforms by alternative splicing removal of transmembrane anchoring
domains. FEBS Lett 555: 572‐8
279. Yang X, Pratley RE, Baier LJ, Horikawa Y, Bell GI, et al. 2001. Reduced
skeletal muscle calpain‐10 transcript level is due to a cumulative decrease in
major isoforms. Mol Genet Metab 73: 111‐3
280. Yeo GW, Van Nostrand E, Holste D, Poggio T, Burge CB. 2005.
Identification and analysis of alternative splicing events conserved in human
and mouse. Proc Natl Acad Sci U S A 102: 2850‐5
281. Yu YK, Wootton JC, Altschul SF. 2003. The compositional adjustment of
amino acid substitution matrices. Proc Natl Acad Sci U S A 100: 15688‐93
282. Zachar Z, Chou TB, Bingham PM. 1987. Evidence that a regulatory gene
autoregulates splicing of its transcript. Embo J 6: 4105‐11
283. Zachariah MA, Crooks GE, Holbrook SR, Brenner SE. 2005. A generalized
affine gap model significantly improves protein sequence alignment
accuracy. Proteins 58: 329‐38 200

284. Zahler AM, Damgaard CK, Kjems J, Caputi M. 2004. SC35 and
heterogeneous nuclear ribonucleoprotein A/B proteins bind to a juxtaposed
exonic splicing enhancer/exonic splicing silencer element to regulate HIV‐1
tat exon 2 splicing. J Biol Chem 279: 10077‐84
285. Zahler AM, Lane WS, Stolk JA, Roth MB. 1992. SR proteins: a conserved
family of pre‐mRNA splicing factors. Genes Dev 6: 837‐47
286. Zavolan M, Kondo S, Schonbach C, Adachi J, Hume DA, et al. 2003.
Impact of alternative initiation, splicing, and termination on the diversity of
the mRNA transcripts encoded by the mouse transcriptome. Genome Res 13:
1290‐300
287. Zavolan M, van Nimwegen E, Gaasterland T. 2002. Splice variation in
mouse full‐length cDNAs identified by mapping to the mouse genome.
Genome Res 12: 1377‐85
288. Zhang J, Sun X, Qian Y, LaDuca JP, Maquat LE. 1998. At least one intron is
required for the nonsense‐mediated decay of triosephosphate isomerase
mRNA: a possible link between nuclear splicing and cytoplasmic translation.
Mol Cell Biol 18: 5272‐83
289. Zhang S, Ruiz‐Echevarria MJ, Quan Y, Peltz SW. 1995. Identification and
characterization of a sequence motif involved in nonsense‐mediated mRNA
decay. Mol Cell Biol 15: 2231‐44
290. Zhou Z, Licklider LJ, Gygi SP, Reed R. 2002. Comprehensive proteomic
analysis of the human spliceosome. Nature 419: 182‐5
291. Zhou Z, Sim J, Griffith J, Reed R. 2002. Purification and electron
microscopic visualization of functional human spliceosomes. Proc Natl Acad
Sci U S A 99: 12203‐7
201
292. Zhu J, Mayeda A, Krainer AR. 2001. Exon identity established through
differential antagonism between exonic splicing silencer‐bound hnRNP A1
and enhancer‐bound SR proteins. Mol Cell 8: 1351‐61
293. Zweig MH, Campbell G. 1993. Receiver‐operating characteristic (ROC)
plots: a fundamental evaluation tool in clinical medicine. Clin Chem 39: 561‐77
202