Re edited draft
30
Impact of Municipal effluent on the water quality of receiving rivers: A case of River Aturukuku in Tororo district, Eastern Uganda. Julius Matsiko, Jolocam Mbabazi and Muhammad Ntale* Department of Chemistry, Makerere University P.O Box 7060 Kampala Abstract Physicochemical parameters (electrical conductivity, pH, temperature, chemical oxygen demand, total suspended solids, hardness, nitrate, nitrite, phosphate) were determined in water samples collected from River Aturukuku in Tororo District, Eastern Uganda. Selected heavy metals (Zinc, Copper, Lead and Cadmium) were also determined using Atomic Absorption Spectrophotometry. The aim was to study the effect of Tororo municipal effluent on the water quality of River Aturukuku. These determinations were made for both the dry (January 2011) and the rainy (May 2011) seasons. The results from both dry and rainy seasons were compared to determine the extent of pollution for either season. In addition, the levels of pollution upstream and downstream were also compared. Generally, lead was not detected from most of the samples. Cadmium was not detected in all the samples for all seasons. Results of a t – test showed that there was a significant difference (p= 0.020 < 0.05) between the dry 1
Transcript of Re edited draft

Impact of Municipal effluent on the water quality ofreceiving rivers: A case of River Aturukuku in Tororo
district, Eastern Uganda.Julius Matsiko, Jolocam Mbabazi and Muhammad Ntale*
Department of Chemistry, Makerere University P.O Box 7060 Kampala
Abstract
Physicochemical parameters (electrical conductivity, pH,
temperature, chemical oxygen demand, total suspended solids,
hardness, nitrate, nitrite, phosphate) were determined in water
samples collected from River Aturukuku in Tororo District,
Eastern Uganda. Selected heavy metals (Zinc, Copper, Lead and
Cadmium) were also determined using Atomic Absorption
Spectrophotometry. The aim was to study the effect of Tororo
municipal effluent on the water quality of River Aturukuku. These
determinations were made for both the dry (January 2011) and the
rainy (May 2011) seasons. The results from both dry and rainy
seasons were compared to determine the extent of pollution for
either season. In addition, the levels of pollution upstream and
downstream were also compared. Generally, lead was not detected
from most of the samples. Cadmium was not detected in all the
samples for all seasons. Results of a t – test showed that there
was a significant difference (p= 0.020 < 0.05) between the dry1

and rainy seasons for the physico chemical parameters and the
nutrients. The implication is that the river was more polluted in
the rainy season than dry season. Results for most parameters
were within the standard allowable limits such as those of WHO,
NEMA and USEPA and FMENV.
Key words; Tororo, Effluent, Water quality, River Aturukuku
INTRODUCTION
Many streams and rivers that are an important means of livelihood
for numerous communities have been converted into slow-moving,
polluted drains (Mbabazi et al., 2010 ). Most sewage (wastewater of
mainly domestic origin, containing among others, human excreta)
from urban areas and industrial wastewaters are discharged from
point sources. Industrial effluents account for several point
sources of water pollution (Awomeso et al., 2010). On the other
hand, runoff from large urban or agricultural catchments carrying
loads of sediments and nutrients is one of the examples of non-
point sources of water pollution. Virtually all categories of
water use contribute to pollution (Walakira, 2011).
2
*Corresponding author; [email protected]

The effect of Tororo municipal effluent on the water quality of
River Aturukuku, Eastern Uganda was investigated in this study.
The increase in population over the years has led to an increase
in the anthropogenic processes for example metal works, increase
in motor traffic, paintings with increase in building
construction, increase in car batteries’ disposal, electrical
wiring, waste water discharges from homes and increase in calcium
from limestone deposits. Nevertheless, the sources of domestic
water have remained constant, if not diminished.
With the rapid expansion of population and industrialization in
the town, Tororo is presently faced with mounting untreated
polluted effluent entering the receiving River Aturukuku. The
municipality is traversed by a network of underground pipes of
running water and piped water is pumped from River Malaba, around
eight to ten kilometres east of the town centre. Knowledge of the
current state of the quality of water at specific points in the
township was therefore essential, especially with regard to the
soluble and invisible inorganic pollutants, notably heavy or
trace metals. The study was therefore developed to make an
assessment in order to evaluate the prevailing situation and
3

provide accurate information on the water quality of River
Aturukuku using pollution indicators that would give basis for
appropriate waste-water management practices. Sewage treatment
takes place in the waste stabilisation ponds located one
kilometre along Mbale Road and the effluent is discharged
directly into a nearby River Aturukuku which is one of the easily
accessed sources of water for the rural population of Tororo.
The general objective of this investigation was to establish the
extent to which the water quality of River Aturukuku is affected
by Tororo municipal effluent both in dry and rainy seasons, as a
result of the increasing municipal industrial and anthropogenic
effluent wastewaters draining directly into the water-way.
Specifically, physicochemical parameters (Electrical conductivity
(EC), Temperature, pH, Total suspended solids (TSS), Chemical
oxygen demand (COD), nitrite, nitrate, ammonia nitrogen,
phosphate calcium (Hardness) and four selected heavy metals
(Cadmium, Lead, Zinc and Copper), were determined. Comparison of
the levels of pollution of the river water in the dry season with
the rainy season and upstream levels with downstream levels of
the physical chemical parameters was also done.
4

The need to establish the extent to which River Aturukuku is
polluted is because the effluents which are discharged therein
consist of many wastes which pose serious threat to the
environment, including human health risks. Therefore there is
need to control pollution of the availability of adequate
quantity of good quality water. Literature survey indicates that
no analytical work has been done on this river yet a bigger
percentage of the population in the district depends on its water
for domestic use. From the above information, it is obvious that
data on the quality of water in this stream is needed. The
findings of this study are expected to provide information that
will assist the district administrators and policy makers in
arriving at new and effective decisions about the management of
this river, create awareness among the natives of the land on how
to ensure that they use safe water despite the pollution and
provide analytical data on some of the river water parameters
upon which further research on the stream can be based.
MATERIALS AND METHODS
Study area
5

This study was carried out in River Aturukuku in the district ofTororo in eastern Uganda.
Figure 1: The schematic map of Tororo municipality with samplingpoints indicated in black.
Sampling procedure
One sample was collected up stream before the river enters the
municipality; other ten (10) samples were collected from ten (10)
points 200 metres apart as the river traverses through the
6
US
J
A

municipality. These samples were collected in triplicate both in
the dry and rainy seasons in order to get meaningful results for
all the parameters to be determined. The collection containers
(1000 ml each) were rinsed with the appropriate sample before the
final sample collection was made. The containers were tightly
closed and put in a bag after which they were taken to Makerere
University, Department of Chemistry and Department of Geology for
laboratory analyses. A few drops of concentrated nitric acid were
added to measured volumes to preserve the metals and also to
avoid precipitation.
Analytical methods
Analytical grade reagents bought from BDH (British Drug Houses)
Laboratory Suppliers and Westford Laboratory Supplies, Kampala
were used and double distilled water was used for preparation of
solutions.
Electrical conductivity was determined by a conductivity meter.
Temperature was determined by using the thermometric method. pH
was measured by a pH meter which was calibrated first by standard
buffer solutions. The total suspended solids in the water samples7

were determined by pouring carefully measured volumes of the
water (typically 100ml) through a pre-weighed Whatman No.40
filter paper. The filter paper and its contents were then dried
at 105 0 C. The gain in weight was taken to be the dry weight
measure of the particulates present in the water sample. Total
suspended matter was then determined by the following formula.
TSS mg/l = (final weight – initial weight)/volume of sample x
1000. (Anon, 1992). COD was determined using potassium dichromate
in the presence of concentrated sulphuric acid, mercury (II)
sulphate and silver sulphate catalysts. Nitrite, nitrate, ammonia
and phosphate concentrations were determined using the methods
described in the Wagtech manual. Hardness was determined by EDTA
titration (Harris, 2003). Heavy metal concentration was
determined using three methods so as to obtain values that would
yield more meaningful and representative results. In the first
case, the filtered samples were analysed directly without any
treatment (Kisamo, 2003), in the second case, to 250 ml of the
filtered water sample 5 ml of concentrated hydrochloric acid was
added and evaporated to 25 ml. The concentrate was then
transferred to a 50 ml flask and diluted to the mark with
8

distilled water. Metal contents were determined using the FAAS
(Olowu et al., 2010) to determine the presence of copper, zinc,
cadmium and lead. In the third case, at the time of analysis, 0.2
litres of the water samples from each site were evaporated to
dryness. To the residue, the acid system, namely concentrated
nitric acid (10 ml) and perchloric acid (2 ml) was then added.
The mixture was reheated to dryness. and the final residue was
then reconstituted in 2 ml of hydrochloric acid (2M),
transferred to a 25 ml volumetric flask and made up to the mark
with distilled water. The solution was analysed for copper, zinc,
cadmium and lead, using a flame atomic absorption
spectrophotometer, FAAS (Perkin_Elmer GmbH, Uberlingen, Germany.
Model 2380) and in each case, a read-out from the screen was
taken as the concentration of the selected metals. Data was
analysed by using Microsoft Excel, General Statistics and SPSS to
determine the level of significance.
9

RESULTS AND DISCUSSION
After the analyses, the results were obtained as shown in the tables 1 and 2 below for both the dry and rainy seasons.
Table 1: Average Levels of physicochemical parameters of the water samples in the dry season.
EC/ 302 246 284 284 292 288 314 362 662 279 250μS/cm ±0.82 ±1.63 ±0.82 ±0.8
2±0.82 ±1.63 ±2.4
5±0.82 ±1.63 ±2.49 ±1.63
Temp/ 24.7 24.5 24.5 24.6 24.7 24.7 24.5 24.5 24.6 24.7 24.50C ±.082 ±.082 ±.047 ±.08
2±.163 ±.082 ±.08
2±.082 ±.047 ±.082 ±.082
PH 6.96 7.12 7.12 7.24 7.33 7.45 7.51 7.42 7.32 7.49 7.56± 0.004
70.0082
0.0082
0.0047
0.0082
0.0082
0.0082
0.0124
0.0082
0.0082
0.0047
TSS/ 0.046 0.024 0.031 0.037
0.019 0.035 0.007
0.0077
0.014 0.0013
0.0013
mg/l± 0.0008
0.0008
0.0008
0.0008
0.0008
0.0013
0.0008
0.0012
0.0008
0.0005
0.0005
COD 100.00
30.00 23.33 23.33
26.67 103.33
23.33
140.00
143.33
96.67 20.00
mg/l ±8.16 ±8.16 ±4.71 ±4.71
±9.43 ±12.47
±4.71
±8.16 ±4.71 ±4.71 ±0.00
NH3 0.050 0.023 0.050 0.043
0.047 0.037 0.090
0.013 18.03 0.043 0.010
mg/l± 0.0082
0.0047
0.0082
0.0047
0.0047
0.0047
0.0082
0.0047
0.1248
0.0047
0.0000
NO3- 0.177 0.117 0.217 0.16 0.129 0.073 0.23 0.227 0.527 0.671 0.052
10
9 7mg/l± 0.000
820.00082
0.00082
0.0013
0.00082
0.0017
0.0012
0.0016
0.0013
0.00082
0.00047
NO2- 0.008
00.0013
0.0003
0.0003
0.0080
0.0003
0.0003
0.0013
0.0090
0.0003
0.0000
mg/l± 0.00082
0.00047
0.00040
0.00040
0.00082
0.00040
0.00040
0.00047
0.00082
0.00040
0.00000
PO43- 2.213 1.560 2.220 1.51
72.710 1.310 2.01
02.410 2.900 2.517 1.553
mg/l± 0.0125
0.0082
0.0163
0.0125
0.0082
0.0082
0.0082
0.0082
0.0082
0.0125
0.0047
HardnesS
92.00 95.00 94.00 97.00
88.33 100.70
113.00
132.33
157.00
154.00
91.00
mg/l ±0.82 ±0.82 ±0.82 ±0.82
±0.47 ±0.94 ±0.82
±0.47 ±0.82 ±0.82 ±0.82
Stations
A B C D E F G H I J US
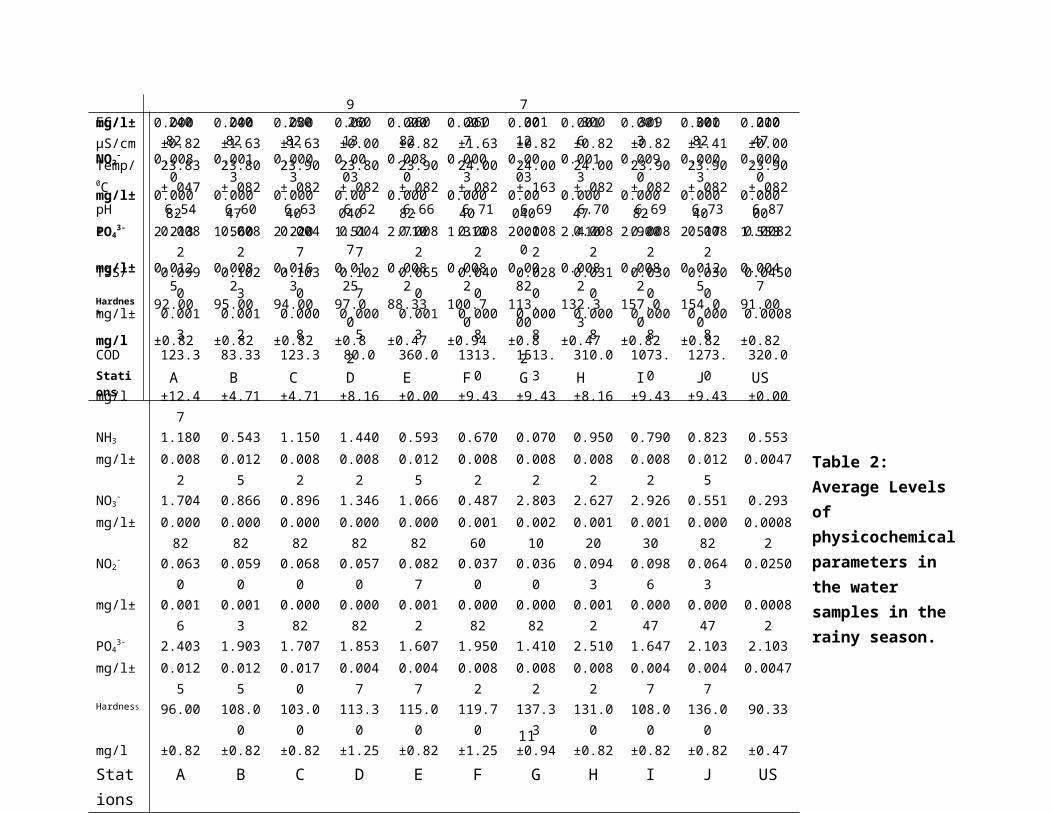
Table 2: Average Levels of physicochemicalparameters in the water samples in the rainy season.
11
EC/ 240 240 250 260 260 260 301 300 309 301 210μS/cm ±0.82 ±1.63 ±1.63 ±0.00 ±0.82 ±1.63 ±0.82 ±0.82 ±0.82 ±1.41 ±0.00Temp/ 23.83 23.80 23.90 23.80 23.90 24.00 24.00 24.00 23.90 23.90 23.900C ±.047 ±.082 ±.082 ±.082 ±.082 ±.082 ±.163 ±.082 ±.082 ±.082 ±.082pH 6.54 6.60 6.63 6.62 6.66 6.71 6.69 6.70 6.69 6.73 6.87± 0.008
20.0082
0.0047
0.0047
0.0082
0.0082
0.0082
0.0082
0.0082
0.0082
0.0082
TSS/ 0.0990
0.1023
0.1030
0.1027
0.0650
0.0400
0.0280
0.0310
0.0300
0.0300
0.0450
mg/l± 0.0013
0.0012
0.0008
0.0005
0.0013
0.0008
0.0008
0.0008
0.0008
0.0008
0.0008
COD 123.3 83.33 123.3 80.0 360.0 1313.0
1513.3
310.0 1073.0
1273.0
320.0
mg/l ±12.47
±4.71 ±4.71 ±8.16 ±0.00 ±9.43 ±9.43 ±8.16 ±9.43 ±9.43 ±0.00
NH3 1.180 0.543 1.150 1.440 0.593 0.670 0.070 0.950 0.790 0.823 0.553mg/l± 0.008
20.0125
0.0082
0.0082
0.0125
0.0082
0.0082
0.0082
0.0082
0.0125
0.0047
NO3- 1.704 0.866 0.896 1.346 1.066 0.487 2.803 2.627 2.926 0.551 0.293
mg/l± 0.00082
0.00082
0.00082
0.00082
0.00082
0.00160
0.00210
0.00120
0.00130
0.00082
0.00082
NO2- 0.063
00.0590
0.0680
0.0570
0.0827
0.0370
0.0360
0.0943
0.0986
0.0643
0.0250
mg/l± 0.0016
0.0013
0.00082
0.00082
0.0012
0.00082
0.00082
0.0012
0.00047
0.00047
0.00082
PO43- 2.403 1.903 1.707 1.853 1.607 1.950 1.410 2.510 1.647 2.103 2.103
mg/l± 0.0125
0.0125
0.0170
0.0047
0.0047
0.0082
0.0082
0.0082
0.0047
0.0047
0.0047
HardnesS 96.00 108.00
103.00
113.30
115.00
119.70
137.33
131.00
108.00
136.00
90.33
mg/l ±0.82 ±0.82 ±0.82 ±1.25 ±0.82 ±1.25 ±0.94 ±0.82 ±0.82 ±0.82 ±0.47Stations
A B C D E F G H I J US

12
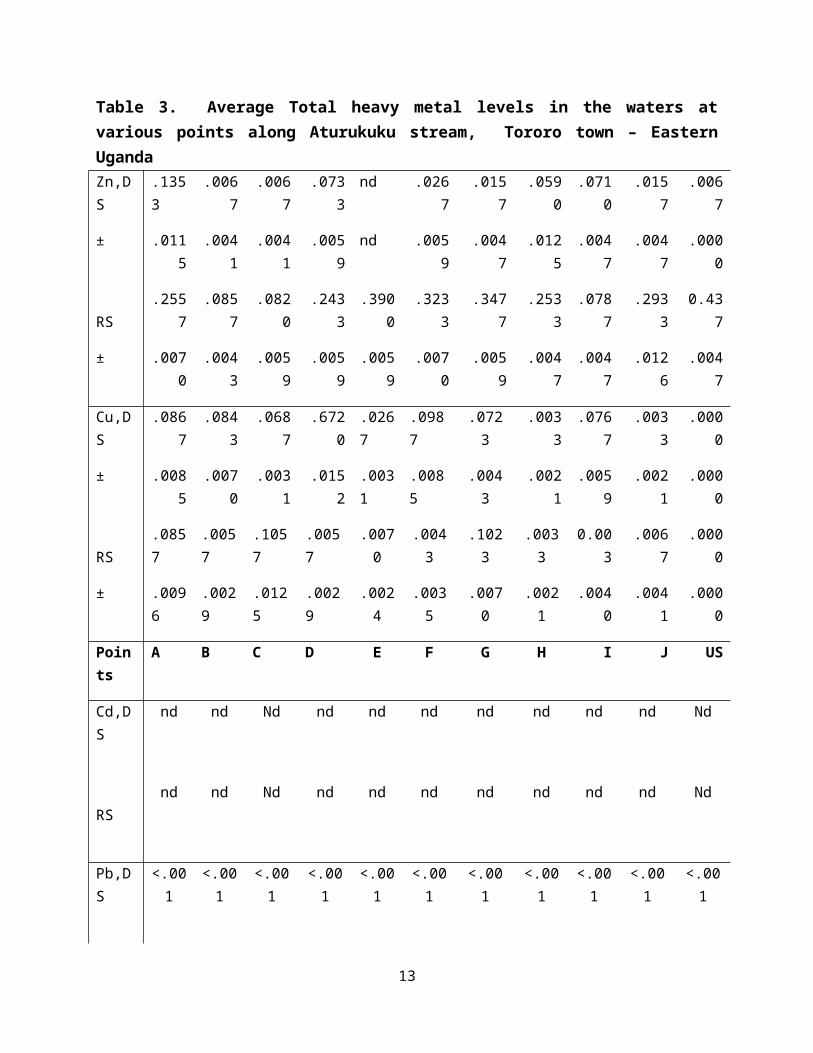
Table 3. Average Total heavy metal levels in the waters atvarious points along Aturukuku stream, Tororo town – EasternUgandaZn,DS
.1353
.0067
.0067
.0733
nd .0267
.0157
.0590
.0710
.0157
.0067
± .0115
.0041
.0041
.0059
nd .0059
.0047
.0125
.0047
.0047
.0000
RS
.2557
.0857
.0820
.2433
.3900
.3233
.3477
.2533
.0787
.2933
0.437
± .0070
.0043
.0059
.0059
.0059
.0070
.0059
.0047
.0047
.0126
.0047
Cu,DS
.0867
.0843
.0687
.6720
.0267
.0987
.0723
.0033
.0767
.0033
.0000
± .0085
.0070
.0031
.0152
.0031
.0085
.0043
.0021
.0059
.0021
.0000
RS
.0857
.0057
.1057
.0057
.0070
.0043
.1023
.0033
0.003
.0067
.0000
± .0096
.0029
.0125
.0029
.0024
.0035
.0070
.0021
.0040
.0041
.0000
Points
A B C D E F G H I J US
Cd,DS
nd nd Nd nd nd nd nd nd nd nd Nd
RS
nd nd Nd nd nd nd nd nd nd nd Nd
Pb,DS
<.001
<.001
<.001
<.001
<.001
<.001
<.001
<.001
<.001
<.001
<.001
13

RS
<.001
<.001
<.001
<.001
<.001
<.001
<.001
<.001
<.001
<.001
<.001
Table 4: Averages of the average parameter values compared withupstream average levelsParameter/Nutrient
Average of averageparameter values
Average Up stream levels
Dry season Rainyseason
Dry season Rainyseason
EC/µcm-1 323.88±1.41 266.45±0.95 250.00±1.63 210.00±0.00Temp/0C 24.60±0.083 23.90±0.086 24.50±0.086 23.90±0.082pH 7.32±0.0076 6.68±0.0076 7.56±0.0047 6.87±0.0082TSS/mgl-1 0.0203±0.00
08
0.0615±0.00
09
0.0013±0.00
05
0.045±0.000
8COD/mgl-1 of
02
66.36±6.36 597.48±6.90 20.00±0.00 320±0.000
Ammonia/mgl-1 0.0406±0.00 0.797±0.009 0.01±0.0000 0.553±0.004
14

53 1 7Nitrate/mgl-1 0.2361±0.00
11
1.4149±0.00
11
0.0523±0.00
05
0.2930±0.00
08Nitrite/mgl-1 0.00199±0.0
0049
0.0623±0.00
094
nd 0.0025±0.00
082Phosphate/
mgl-1
2.084±0.009
8
1.927±0.008
1
1.553±0.004
7
2.103±0.004
7COD/mgl-1 of
02
110.40±0.77 114.33±0.88 91.00±0.82 90.33±0.47
Physicochemical parameter levels of water samples collected from River Aturukuku in both dry and rainy seasons are displayed in tables 1 and 2 respectively.
Electrolytical conductivities were comparatively high, with
values ranging between 246 ± 1.63 and 362 ± 0.82 μS cm -1 in the
dry season (Table 1) and between 210 and 309 ± 0.82 μS cm -1 in
the rainy season, more than 6000 fold that of pure distilled
deionised water. This suggested a presence of more soluble ionic
substances, among them; metallic hydroxides, carbonates and
hydrogen carbonates that would in turn tend to buffer the waters
against excessive intrusive acidities and alkalinities. A higher
value of electrical conductivity (662 ± 1.63μScm-1) was observed
at sampling station I in the dry season implying that the
concentration of the dissolved inorganic substances in ionized15
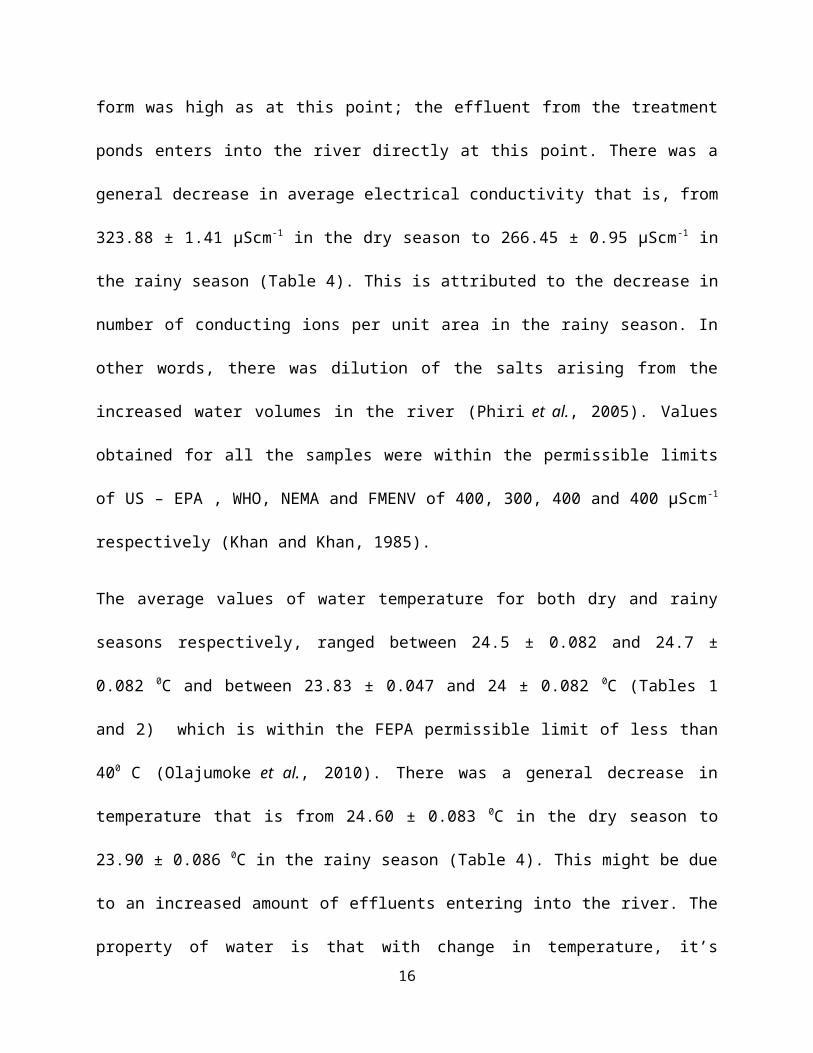
form was high as at this point; the effluent from the treatment
ponds enters into the river directly at this point. There was a
general decrease in average electrical conductivity that is, from
323.88 ± 1.41 μScm-1 in the dry season to 266.45 ± 0.95 μScm-1 in
the rainy season (Table 4). This is attributed to the decrease in
number of conducting ions per unit area in the rainy season. In
other words, there was dilution of the salts arising from the
increased water volumes in the river (Phiri et al., 2005). Values
obtained for all the samples were within the permissible limits
of US – EPA , WHO, NEMA and FMENV of 400, 300, 400 and 400 μScm-1
respectively (Khan and Khan, 1985).
The average values of water temperature for both dry and rainy
seasons respectively, ranged between 24.5 ± 0.082 and 24.7 ±
0.082 0C and between 23.83 ± 0.047 and 24 ± 0.082 0C (Tables 1
and 2) which is within the FEPA permissible limit of less than
400 C (Olajumoke et al., 2010). There was a general decrease in
temperature that is from 24.60 ± 0.083 0C in the dry season to
23.90 ± 0.086 0C in the rainy season (Table 4). This might be due
to an increased amount of effluents entering into the river. The
property of water is that with change in temperature, it’s16

density varies and it becomes less with warming up and more with
cooling (Murhekar, 2011). Temperature readings for all the
samples were above the WHO standard value of 12 0C.
The pH of the filtered water samples at 25°C was in the range
6.963 ± 0.0047 to 7.557± 0.0047 in the dry season and 6.54 ±
0.0082 to 6.87 ± 0.0082 in the rainy season (Table 1 and 2) which
was indicative of the relative neutrality, in spite of the direct
seepage of the untreated municipal effluent, into the stream
waters. These ranges are in line with the FEPA/FMENV(Federal
Environmental Protection Agency /Federal Ministry of Environment,
1991), permissible limit (Olajumoke et al., 2010), WHO, US – EPA
and NEMA of 6.5 – 8.5, 6.5 – 9.2, 6.0 – 8.5 and 6.0 – 8.0
respectively. There was a general decrease in pH that is from
7.32±0.0076 in the dry season to 6.68±0.0076 in the rainy season
(Table 4). The relatively lower values of pH in the rainy season
could be due to a combined effect of the effluent and some
incoming fertilizers such as ammonium nitrate and urea from the
farming areas due to run off (Phiri et al., 2005).
17

Despite the relative neutrality of the waters, water samples in
the rainy season were acidic implying that they may not be
favourable to the existence of bacteria in the river (Aremu et al.,
2011).
The levels of the Total suspended solids (TSS) (Tables 1 and 2)
were in the range of 0.0013±0.0005 to 0.046±0.0008 mgl-1 in the
dry season and 0.028±0.0008 to 0.1027±0.0005 mgl-1 in the rainy
season. There was a general increase in the levels of the Total
suspended solids (TSS) that is from 0.0203±0.00083 mgl-1 in the
dry season to 0.0615±0.0009 mgl-1 in the rainy season (Table 4).
The values obtained for all the samples were within WHO and FMENV
limits of 5 and 0 – 5 mg/l. Water containing high levels of TSS
is not suitable for aquatic life (Olajumoke et al., 2010) and
human consumption. In the dry season, the levels of the total
suspended solids were lower and this can be attributed to the
fact that the water was free from materials that could be brought
into the river through runoff (Phiri et al., 2005). In the rainy
season, the degree of runoff is high and this is the reason for
the increased levels of total suspended solids (TSS).
18

The values of COD (Tables 1 and 2) ranged from 23.33±4.71 to
143.3±4.71 mgO2l-1 in the dry season and from 80±8.16 to
1513.3±9.43 mgO2l-1 in the rainy season. There was a sharp
increase in COD values from 66.36 ±6.36 in the dry season to
597.48±6.90 mg(O2) l-1 (Table 4). For all the water samples the
values of COD obtained are above the maximum allowable limits
according to WHO and US – EPA of 10 – 20 and 10 mg/l. However
some samples for example at points A,B.C,D,E,J and US in the dry
season and points B and D in the rainy season were within the
limits of NEMA drinking water standard of 100 mg/l. High values
of COD make the water to have objectionable odour, render the
water unfit for domestic purpose and reduce oxygen available for
aquatic organisms.
The values of ammonia (Tables 1 and 2) obtained ranged from 0.01
to 0.09±0.0082 mgl-1 in the dry season and from 0.07±0.0082 to
1.44±0.0082 mgl-1 in the rainy season. There was a sharp increase
in the concentration of ammonia that is from 0.0406±0.0053 to
0.797±0.0091 mgl-1 in the rainy season (Table 4). In the rainy
season, runoff from the municipality increased in which a lot of
19

nitrogen containing compounds were entering directly into the
river.
The levels of nitrate concentration (Tables 1 and 2) ranged from
0.0523±0.00047 to 0.671±0.00082 mgl-1 in the dry season and from
0.293±0.00082 to 2.8027±0.0021 mgl-1 in the rainy season. There
was a general increase in nitrate average concentration that is
from 0.2361±0.0011 in the dry season to 1.4149±0.0011 mgl-1 in
the rainy season (Table 4). For all the samples, the values
obtained were within the WHO and US – EPA permitted limits for
drinking water of 45 and 100 mg/l. In the dry season, the
concentration of the nitrate was at a lower level possibly
because there was little or no run - off at all. In the rainy
season, the concentration of the nitrate increased possibly as a
result of water run – off through the application of fertilizers
and pesticides (Phiri et al., 2005; Aremu et al., 2011) by the host
communities since farming is carried out along and around the
river.
Nitrite concentration (Tables 1 and 2) ranged between 0.000 to
0.009±0.00082 mgl-1 in the dry season and from 0.025±0.00082 to
20

0.0986±0.00047 mgl-1 in the rainy season. There was a sharp
increase in average nitrite concentration that is from
0.00199±0.00049 mgl-1 in the dry season to 0.0623±0.00094 mgl-1 in
the rainy season (Table 4). The results obtained for all the
samples were within the limits of NEMA maximum allowable value of
3 mg/l. In the rainy season, run off from the municipality, farms
and from other water channels increases and all the effluent
enters the river directly. This is responsible for the elevated
concentration of the nitrite.
The concentration levels of the phosphate (Tables 1 and 2) ranged
from 1.31±0.0082 to 2.90±0.0082 mgl-1 in the dry season and from
1.41±0.0082 to 2.51±0.0082 mgl-1 in the rainy season. There was a
slight decrease in phosphate concentration that is from
2.084±0.0098 mgl-1 in the dry season to 1.927±0.0081 mgl-1 in the
rainy season (Table 4). The concentration levels of phosphate in
the dry and rainy seasons are almost the same probably because
the contamination with phosphate was equally likely in both
seasons and this could be attributed to atmospheric phosperous.
21

The levels of hardness (Tables 1 and 2) were in the range of
91±0.82 to 157±0.82 mgCaCO3l-1 in the dry season and 90.333±0.47
to 137.33±0.47 mgCaCO3l-1 in the rainy season as compared with the
WHO and US – EPA permissible limit of 100 mgCaCO3l-1. People with
kidney and bladder stones should avoid high content of calcium
and magnesium in water (Olajumoke et al., 2010). Water has been
classified on the basis of hardness as follows: water having (0 –
75) mgCaCO3l-1 as soft, for (75 – 150) mgCaCO3l-1 as hard and for >
300 mgCaCO3l-1 as totally hard (Adeyeye and Abulude, 2004).
Therefore basing on this, water in River Aturukuku varied between
moderately soft and slightly hard for almost all the water
samples apart from the samples at point I in the dry season where
the level of hardness was 157±0.82 mgCaCO3l-1(water was moderately
hard). There was a slight increase in the levels of hardness that
is from 110.40±0.77 mgCaCO3l-1 in the dry season to 114.33±0.88
mgCaCO3l-1 (Table 4). Activities such as farming, bathing and
washing of clothes by villagers along and around the river could
also account for the relatively high levels of hardness.
The levels of trace metals determined in the water samples aredisplayed in Table 3. The total concentration, in mg l−1, of the
22

metals in all the samples decreased in the order: Zn > Cu> Pb >>Cd.
The total average zinc concentration (Table 3) in the filtered
water was found to be the highest in all the samples. It ranged
from nd to 0.1353±0.0115 mgl-1 in the dry season and from 0.0787
±0.0047 to 0.3900±0.0059 mgl-1 in the rainy season. There was a
sharp increase in the concentration of zinc that is from
0.0379±0.0058 mgl-1 in the dry season to 0.2536±0.0064 mgl-1 in
the rainy season. Values obtained for all the samples were in
line with the WHO, NEMA, USEPA and FMENV limits of 5,5, 5 and <1
mg/l. Whereas zinc is a naturally occurring metal and was
expected to be present in low levels in river water, its notable
presence in the river is most probably due to several major
factors. Currently, the building construction industry has
increased tremendously in the town, with an extraordinary demand
for wall and roof paints, most of which are zinc-based. The
result is an increased release of zinc into the urban
environment, which finds its way into the municipality’s major
drainage system and then to the river. Zinc-coated corrugated
iron sheets, the commonest roofing material in the country, on
23
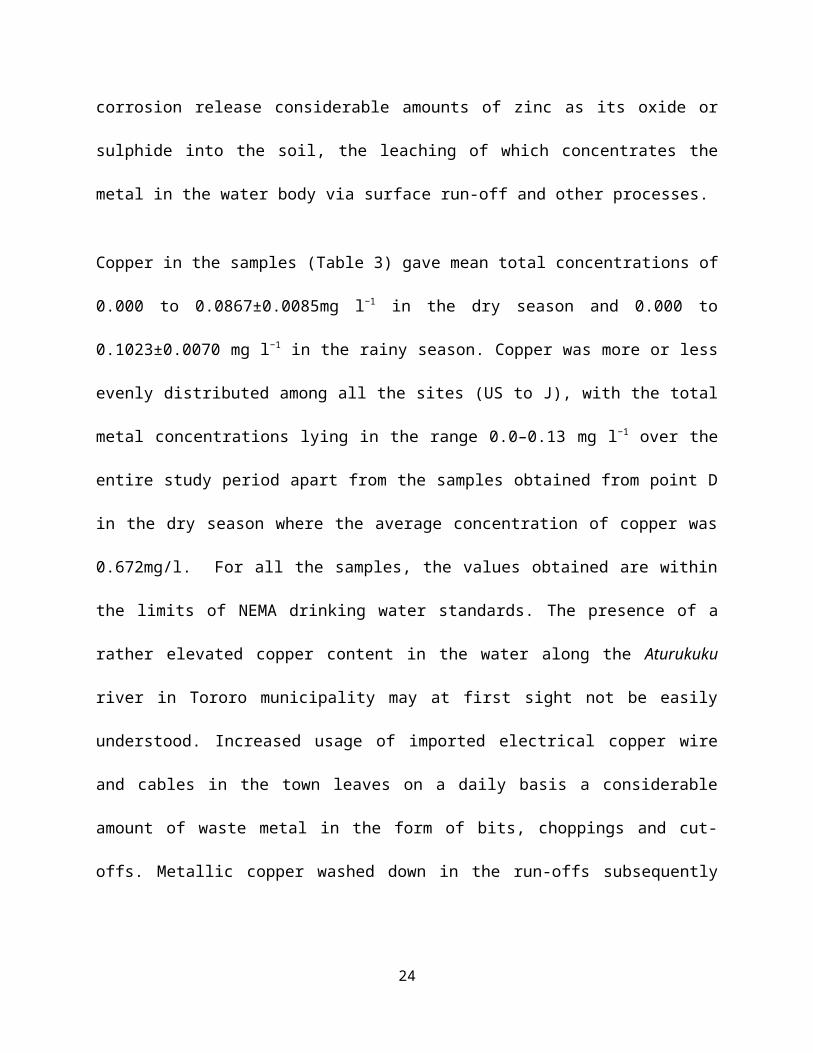
corrosion release considerable amounts of zinc as its oxide or
sulphide into the soil, the leaching of which concentrates the
metal in the water body via surface run-off and other processes.
Copper in the samples (Table 3) gave mean total concentrations of
0.000 to 0.0867±0.0085mg l−1 in the dry season and 0.000 to
0.1023±0.0070 mg l−1 in the rainy season. Copper was more or less
evenly distributed among all the sites (US to J), with the total
metal concentrations lying in the range 0.0–0.13 mg l−1 over the
entire study period apart from the samples obtained from point D
in the dry season where the average concentration of copper was
0.672mg/l. For all the samples, the values obtained are within
the limits of NEMA drinking water standards. The presence of a
rather elevated copper content in the water along the Aturukuku
river in Tororo municipality may at first sight not be easily
understood. Increased usage of imported electrical copper wire
and cables in the town leaves on a daily basis a considerable
amount of waste metal in the form of bits, choppings and cut-
offs. Metallic copper washed down in the run-offs subsequently
24

dissolves in the fluctuating acidities and alkalinities of the
effluent.
The total lead concentrations in the samples (Table 3) were in
the range 0.000 – 0.001 mg l−1. In fact, the findings from the
study showed that lead was not detected from most of the samples
both in the dry and the rainy seasons. However, for some samples
the maximum concentration was 0.001mgl-1 which is within the WHO
and FMENV permissible limits of 0.05 mg/l. The presence of this
toxic metal in the river waters either as free cations or as
associations with organic matter could be attributed to several
factors, which include the continued use of lead-based paints for
face-lifting buildings in the town and their inappropriate
disposal. In addition, there is poor management of industrial and
municipal waste. Car washing and emptying of dead lead-acid
accumulators regularly takes place directly along the streams and
channels leading to the river (Mbabazi et al., 2010 ) and even
along the river itself especially on a bridge which is along
Mbale road, 1km from the town centre. The untreated lead laden
effluent discharges directly into the river waters. From the turn
25

of the century, the volume of motor vehicles on Tororo roads has
greatly increased on the busy streets, especially the Tororo High
Street. Although unleaded petrol is available at fuel pump
stations in the country, a number of operators and drivers do not
insist on it. The gradual shift to the use of unleaded petrol
should lead to a reduction or elimination of the release of lead
into the urban atmosphere.
Cadmium was not detected in all the samples for all seasons. This
probably can be attributed to the fact that the activities of
small-scale metal works in the town, which process even scrap
metal and run their untreated effluent directly into the drainage
channels could still be at a stage where the amount of cadmium is
still below the detectable limits. Traces of cadmium embedded in
the scrap iron and steel are released to the environment in the
effluent and run-off. If this continues, soon cadmium levels will
soon be detected. Further, cadmium is widely used in paints, and,
owing to the booming construction in the town, there is a
considerable release of the metal into the environment via the
associated painting and face-lifting of buildings. Cadmium has
been blamed for large-scale poisoning incidents in industrial
26

workplaces, particularly where any ore is being processed or
smelted and among welders who have unsuspectingly welded on
cadmium-containing alloys or working with silver.
Conclusions
Tororo town relies partly on River Aturukuku for its drainage of
wastewater, runoff and industrial or other effluent. The
analytical results obtained show that the levels of heavy metals
in the river water are on the rise, which is reflective of the
growing anthropogenic pollution problem in the town. The results
further suggest that effluents being discharged into the river
have considerable negative effects on the water quality in the
river though the values obtained are in the acceptable ranges for
most of the parameters. A comparison of upstream and downstream
levels indicates that pollution levels increase as the river
traverses the municipality. This poses a big threat to this
reliable source of fresh water for domestic and industrial use.
Acknowledgements.
27

Authors are grateful to DAAD and Carnegie Corporation for funding
this research project.
REFERENCES
Anon. (1992). Standard methods of water and wastewater examination (18
ed.): American Public Health Association, NW, Washington,
DC.
Aremu M. O., Gav B. L., Opaluwa O. D., Atolaiye B. O., Madu P.
C., & Sangari D. U. (2011). Assessment of Physicochemical
Contaminants in Waters and Fishes from Selected Rivers in
Nasarawa State, Nigeria. Research Journal of Chemical Sciences, 1(4),
6-17.
Awomeso J. A., Taiwo A. M., Gbadebo A. M., & Adenowo J. A.
(2010). Studies on the Pollution of Waterbody by Textile
Industry Effluents in Lagos, Nigeria. Journal of Applied Sciences in
Environmental Sanitation, 5(4), 353 - 359.
Harris D. C. ( 2003). Quantitative Chemical Analysis 6th ed. pp.
259-267, 272-277.
Kisamo D. S. (2003). Environmental hazards associated with heavy
metals in lake Victoria Basin (East Africa), Tanzania. Afr
Newslett on Occup Health and Safety . 13, 67–69.
28
Mbabazi, Kwetegyeka J., Ntale M., & Wasswa J. (2010 ).
Ineffectiveness of Nakivubo wetland in filtering out heavy
metals from untreated Kampala urban effluent prior to
discharge into Lake Victoria, Uganda. African Journal of
Agricultural Research, 5(24), 3431-3439.
Mbabazi, Twinomuhwezi H., Wasswa J., Ntale M., Mulongo G.,
Kwetegyeka J., et al. (2010). Speciation of heavy metals in
water from the Uganda side of Lake Victoria. International
Journal of Environmental Studies, 67(1), 9-15.
Murhekar G. H. (2011). Assessment of Physico-Chemical Status of
Ground Water Samples in Akot city. Research Journal of Chemical
Sciences, 1(4), 117-124.
Olajumoke A., Oluwatosin A., Olumuyiwa O., & Abimbola F. ( 2010).
Impact Assessment of Brewery Effluent on Water Quality in
Majawe, Ibadan, Southwestern Nigeria. Researcher, 2(5), 21 -
28.
Olowu R. A., Ayejugo O. O., Adewuyi G. O., Adejoro I. A., Denloye
A. A. B., Babatunde A. O., et al. (2010). Determination of
heavy metals in Fish Tissues, water and sediment from Epe
29

and Badagry lagoons, Lagos, Nigeria. E- Journal of Chemistry, 7(1),
215 - 221.
Phiri O., Mumba P., Moyo B. H. Z., & Kadewa W. (2005). Assessment
of the impact of industrial effluents on water quality of
receiving rivers in urban areas of Malawi. Int. J. Environ. Sci.
Tech, 2(3), 237-244.
Richard L. A. (1954). Diagnoses and improvement of saline and alkali soils.
Agriculture Hand Book 60: : USDA, USA.
USEPA. (2002). United States Environmental Protection Agency.
Current Drinking Water Standards.Office of Groundwater and
Drinking Water: Government Printing Office, Washington, DC.
35-54.
Walakira P. (2011). Impact of Industrial Effluents on water Quality of Receiving
Streams in nakawa - Ntinda, Uganda., Thesis report, Makerere
University, Kampala.
WHO. (1993). World Health organisation; Guidelines for Drinking-Water Quality,
(2nd ed.). Geneva.
30