
HUMURA edited report
78
1 NATIONAL UNIVERSITY FACULTY OF SCIENCE DEPARTEMENT OF CHEMISTRY ACADMIC YEAR 2013-2014 OPTION: Environmental Chemistry BACC 4 Presented by: HUMURA Emmanuel UG:11111416 SUPERVISION: NKURANGA Jean Bosco INTERNSHIP REPORT CARRIED OUT IN ENERGY WATER AND SANITATION AUTORITY AT GIHUMA WATER TREATMENT PLANT
Transcript of HUMURA edited report

1
NATIONAL UNIVERSITY
FACULTY OF SCIENCE
DEPARTEMENT OF CHEMISTRY
ACADMIC YEAR 2013-2014
OPTION: Environmental
Chemistry
BACC 4
Presented by: HUMURA Emmanuel
UG:11111416
SUPERVISION: NKURANGA Jean Bosco
INTERNSHIP REPORT CARRIED OUT IN ENERGYWATER AND SANITATION AUTORITY AT GIHUMAWATER TREATMENT PLANT

2
Done at HUYE on 30/10/2013

i
ACKNOWLEDGEMENT
First of all I am very grateful to my only God for his continuous
help during my all studies from my birth up to now. But, all my
studies would not have been possible without the assistance of
numerous individuals and institutions. So, I honored and obliged
to extend my appreciation to the people and institutions
contributions to my education career in general and especially in
this internship.
I would like to thank a lot the lectures of chemistry department
in NUR who help me day by day for my studies development. I would
like to thanks also the Head of GIHUMA WATER TREATMENT PLANT for
his guidance, support, encouragements, and advices that help me
during my internalship.
I wish also to express my thanks to all employees of GIHUMA WATER
TREATMENT PLANT for their help during this period of
internalship.
I express my appreciation to my parents, brothers, sisters and
other students for their advices, and support .
ii
ABSTRACT
The EWSA and NUR have a good collaboration between them. So ,the
NUR send their students especially chemistry department ,to
develop their knowledge and do the practice on the field in
order to think well what they have learned in the class.
The report focuses primarily on the water treatment that is
realized in different steps .The purpose of this report is to
explain what we did, how we do it, materials and reagents used
and other possible reagents which can be used.
The report is also a requirement for the partial fulfillment of
NUR and the Department of chemistry. This training has the aim to
assess the water quality before and after water treatment that is
related to our field of Environmental Management and Water
Technology. The report comprises various numbers of comments,
manipulations, conclusion and recommendations on the attachment
work.

iii
TABLE OF CONTENTS
ACKNOWLEDGEMENT................................................i
ABSTRACT......................................................ii
TABLE OF CONTENTS............................................iii
LISTS OF FIGURES...............................................v
LISTS OF TABLES...............................................vi
GENERAL INTRODUCTION...........................................1
CHAPTER 1.GIHUMA WATER TREATMENT PLANT BACKGROUND..............2
1. GIHUMA WATER TREATMENT PLANT OVERVIEW......................2
1.1. LOCATION...............................................2
1.2. HISTORY................................................2
CHAPTER 2.WATER TREATMENT PROCESS..............................4
2.1. PRETEATMENT PROCESS......................................4
2.1.1. ROUGHING FILTERS.....................................4
2.1.3. OFF-STREAM STORAGE...................................5

iv
2.1.4 BANK INFILTRATION.....................................5
2.1.5.AERATION..............................................6
2.2. TREATMEN ROCESS..........................................8
2.2.1.COAGULATION AND FLOCULATION...........................8
2.2.2.TYPE OF COAGULANTS....................................9
2.2.3. FACTORS INFLUENCING COAGULATION.....................13
2.2.3. JAR TESTING.........................................14
2.3. SEDIMENTATION...........................................22
2.3.1. SEDIMENTATION BASIN.................................23
2.3.2.BASIN TYPES..........................................23
2.4 FILTRATION...............................................24
2.4.1. OPERATION...........................................24
.2.4.5. IMPORTANCE OF FILTER BACKWASH......................25
2.5.DISINFECTION.............................................25
2.6.WATER STORAGE AND WATER DISTRIBUTION.....................27
2.6.1. WATER QUALITY.......................................28
CHAP 3.PHYSICO-CHEMICAL ANALYSIS..............................29
3.1.pH.......................................................29
3.2 TURBIDITY................................................29
3.3 ALKALINITY...............................................29
3.4 TOTAL HARDNESS...........................................31
THE OBJECTIVE OF THE EXPERIENCE..............................31

v
THE MATERIALS AND THE REAGENTS TO BE USED....................32
3.5. DETERMINATION OF ANIONS AND CATIONS PRESENT IN WATER....34
3.6. EXAMPLE OF SOME ELEMENT MEASURED USING SPECTROPHOTOMETER
.............................................................34
3.6.1 Free chlorine........................................34
3.6.2. Aluminium...........................................35
3.6.3.Cobalt...............................................35
3.7. RESULTS AND INTERPRETATION..............................36
CHAPTER.4.CONCLUSION AND RECOMMENDATION.......................37
REFERENCES....................................................38

vi
LISTS OF FIGURESFigure 1:Gihuma Water Treatment Plant................................3
Figure 2: Aeration tanks.............................................7
Figure 3: Coagulation and flocculations..............................8
Figure 4 :Floculation chamber........................................9
Figure 5: Stirring machine..........................................16
Figure 6: Formation of flocs........................................19
Figure 7 :Observation of flocs......................................19
Figure 8: Turbidimetre..............................................21
Figure 9: Sedimentation tank........................................23
Figure 10: Filtration tanks.........................................24

vii
LISTS OF TABLESTable 1: TABLE OF COAGULANT AID AND PRIMARY COAGALANT...............10
Table 2:TABLE OF DOSAGE FOR JAR TESTING.............................17
Table 3:TABLE OF RESULT OF JAR TEST.................................21
Table 4:TABLE OF RESULT OF PHYSICO-CHEMICAL ANALYSIS................36

1
GENERAL INTRODUCTION
Water to be supplied for public use must be potable i.e.,
satisfactory for drinking purposes from the standpoint of its
chemical, physical and biological characteristics. Drinking water
should, preferably, be obtained from a source free from
pollution. The raw water normally available from surface water
sources is, however, not directly suitable for drinking purposes.
The objective of water treatment is to produce safe and potable
drinking water. The treatment processes may need pretreatment
like pre-chlorination and aeration prior to conventional
treatment. The type and degree of treatment are strongly
dependent upon the source and intended use of the water. Water
for domestic use must be thoroughly disinfected to eliminate
disease-causing microorganisms, but may contain appreciable
levels of dissolved calcium and magnesium (hardness). Water to be
used in boilers may contain bacteria but must be quite soft to
prevent scale formation. Wastewater being discharged into a large
river may require less rigorous treatment than water to be reused
in an arid region. As world demand for limited water resources
grows, more sophisticated and extensive means will have to be
employed to treat water.

2
CHAPTER 1.GIHUMA WATER TREATMENT PLANT BACKGROUND
1. GIHUMA WATER TREATMENT PLANT OVERVIEW
1.1. LOCATION
GIHUMA Water Treatment Plant is located in the Southern Province;
District of MUHANGA in NYAMABUYE Sector and supplies potable
water to the people of MUHANGA city and its neighborhood. The
Plant has the related connection of pumping stations: Mbare,
Munyinya and Kimanama (Ruhango) which reinforce the water treated
at the plant allowing the water accessibility to the population
far from the town.
1.2. HISTORY
According to the history of this plant the activities of
construction started in 1984 and ended in 1988 and its capacity
in debit was small compared to that of today.

3
Figure 1:Gihuma Water Treatment Plant
The capitation of raw water of this plant comes from MIGURAMO
River and MUHANGA dam. The plant is designed such that the
treatment will be easily and well performed. The installations
are constructed in chain according to the activities that are
carried out in each installation

4
CHAPTER 2.WATER TREATMENT PROCESS
2.1. PRETEATMENT PROCESS
Pretreatment can broadly be defined as any process to modify
microbial water quality before, or at the entry to, the treatment
plant. Pretreatment of surface water includes processes such as
bank side filtration, presedimentation, off-river storage,
roughing filters, micro strainers, and aeration. Many
pretreatment processes are natural processes, enhanced by design
to improve water quality. Pretreatment options may be compatible
with a variety of water treatment processes ranging in complexity
from simple disinfection to membrane processes. Pretreatment is
used to reduce, and/or to stabilize variations in the microbial,
natural organic matter and particulate load.
2.1.1. ROUGHING FILTERS A roughing filter is a coarse media (typically rock or gravel)
filter used to reduce turbidity levels before processes such as
slow sand filtration, diatomaceous earth (DE) or membrane
filtration. The American Water Works Association Research
Foundation (AWWARF) has reviewed design variables Association
Research for roughing filters. Such filters typically have a
filter box divided into multiple sections containing gravel beds
of decreasing particle size, inlet and outlet structures, and
flow-control devices. Roughing filters have achieved peak
turbidity removals ranging from 60 to90%; generally, the more

5
turbid the water initially, the greater the reduction that can be
achieved. These filters can achieve similar reductions of
coliform bacteria.
.2.1.2. MICROSTRAINERS
Microstrainers are fabric meshes woven of stainless steel or
polyester wires, with apertures ranging from 15 to 45 μm (usually
30–35 μm). Such meshes are useful for removing algal cells and
large protozoa , but have no significant impact on bacteria or
viruses. Microstrainers generally remove about 40–70% of algae
and, at the same time, about 5–20% of turbidity. The performance
of microstrainers for specific applications varies, depending on
the type of algae present. Although microstrainers can reduce the
amount of coagulant needed they do not remove smaller species or
reproductive forms of algae...
2.1.3. OFF-STREAM STORAGE
Off-stream storage refers to a storage reservoir that directly or
indirectly feeds a potable water intake. The effects of off-
stream storage are difficult to generalize because important
physical, biological and chemical processes are influenced by
hydrological and limnological characteristics of the reservoir.
For example, ‘round’ reservoirs and lowland impoundments
influenced by strong winds can be represented as homogeneous
biotypes because they are mixed effectively. On the other hand,
long reservoirs whose depth increases with length are best

6
represented as a series of interconnected individual bas. The
characteristics of reservoirs created by construction of a dam
will differ from those of a natural or artificial lake.
2.1.4 BANK INFILTRATION
Bank infiltration refers to the process of surface water seeping
from the bank or bed of a river or lake to the production wells
of a water treatment plant. During the water’s passage through
the ground, its quality changes due to microbial, chemical and
physical processes, and due to mixing with groundwater. The
process can also be described as ‘induced infiltration,’ because
the well-field pumping lowers the water table, causing surface
water to flow into the aquifer under a hydraulic gradient. Bank
infiltration can be accomplished through natural seepage into
receiving ponds, shallow vertical or horizontal wells placed in
alluvial sand and gravel deposits adjacent to surface waters, and
infiltration galleries. Variations on the underground passage
concept include soil aquifer treatment, injection of surface
water for underground passage and aquifer recharge. The
efficiency of the process depends on a number of factors: the
quality of the surface water. (Turbidity, dissolved organic
matter, oxygen, ammonia and nutrients), the composition and
porosity of the soil, the residence time of the water in the soil
and. the temperature. This efficiency can vary over time,
depending on the difference in level between the source water
(e.g. river stage) and groundwater. This difference can influence
7
the degree of groundwater mixing and the residence time of the
infiltrated surface water.
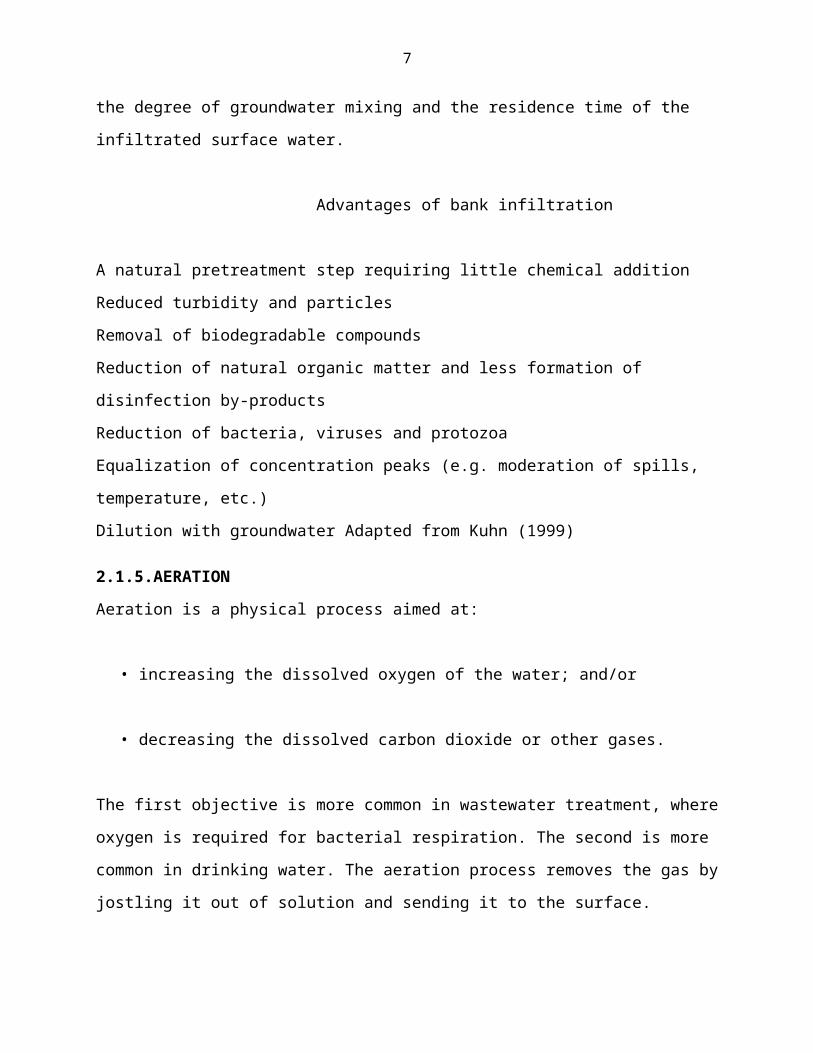
Advantages of bank infiltration
A natural pretreatment step requiring little chemical addition
Reduced turbidity and particles
Removal of biodegradable compounds
Reduction of natural organic matter and less formation of
disinfection by-products
Reduction of bacteria, viruses and protozoa
Equalization of concentration peaks (e.g. moderation of spills,
temperature, etc.)
Dilution with groundwater Adapted from Kuhn (1999)
2.1.5.AERATION
Aeration is a physical process aimed at:
• increasing the dissolved oxygen of the water; and/or
• decreasing the dissolved carbon dioxide or other gases.
The first objective is more common in wastewater treatment, where
oxygen is required for bacterial respiration. The second is more
common in drinking water. The aeration process removes the gas by
jostling it out of solution and sending it to the surface.

8
Surface water such as stream or river water already has a high
dissolved oxygen and low dissolved carbon dioxide content.
However, this is not usually the case with groundwater.
When surface water goes underground, it often carries organic
material with it. This material decays over time, adding to the
carbon dioxide content. This is not toxic or even distasteful,
lemonade contains very high levels! The problem with carbon
dioxide is that it reacts with the water to form carbonic acid,
lowering the pH of the water. the following problems may occur
.
•The water will dissolve iron and manganese and, potentially,
other metals from the ground itself. These metals stay in
solution as long as the pH is low; higher pH levels will
normally see them precipitate out as unsightly red, brown or
black slimes or encrustations. This pH lift occurs at a tap
when the pressure is released and the carbon dioxide comes
out of solution
• Metallic fittings, particularly copper, zinc (in brass), and
iron will be corroded. This may affect people’s health,
especially in the case of copper, as well as causing bitter
tastes and staining of basins, baths and pans.
.

9
Figure 2: Aeration tanks

10
2.2. TREATMEN ROCESS
2.2.1.COAGULATION AND FLOCULATION
Coagulation/flocculation is a process used to remove turbidity,
color, and some bacteria from water. In the flash mix chamber,
chemicals are added to the water and mixed violently for less
than a minute. These coagulants consist of primary coagulants
and/or coagulant aids. Then, in the flocculation basin, the
water is gently stirred for 30 to 45 minutes to give the
chemicals time to act and to promote floc formation. The floc
then settles out in the sedimentation basin.
Coagulation removes colloids and suspended solids from the
water. These particles have a negative charge, so the positively
charged coagulant chemicals neutralize them during coagulation.
Then, during flocculation, the particles are drawn together by
van der Waal's forces, forming floc. The
coagulation/flocculation process is affected by pH, salts,
alkalinity, turbidity, temperature, mixing, and coagulant
chemicals.

11
.
Figure 3: Coagulation and flocculations
Figure 4 :Floculation chamber
2.2.2.TYPE OF COAGULANTS
Coagulant chemicals come in two main types - primary coagulants
and coagulant aids. Primary coagulants neutralize the electrical
charges of particles in the water which causes the particles to
clump together. Coagulant aids add density to slow-settling

12
flocs and add toughness to the flocs so that they will not break
up during the mixing and settling processes.
Primary coagulants are always used in the
coagulation/flocculation process. Coagulant aids, in contrast,
are not always required and are generally used to reduce
flocculation time.
Chemically, coagulant chemicals are either metallic salts (such
as alum) or polymers. Polymers are man-made organic compounds
made up of a long chain of smaller molecules. Polymers can be
either cationic (positively charged), anionic (negatively
charged), or nonionic (neutrally charged.) The table below shows
many of the common coagulant chemicals and lists whether they are
used as primary coagulants or as coagulant aids.
Different sources of water need different coagulants, but the
most commonly used are alum and ferric sulfate.

13
Chemical Name
Chemical
Formula
Primary
Coagulant
Coagulant
Aid
Aluminum sulfate
(Alum)
Al2(SO4)3 · 14
H2O
X
Ferrous sulfate FeSO4 · 7 H2O X
Ferric sulfate Fe2(SO4)3 · 9
H2O
X
Ferric chloride FeCl3 · 6 H2O X
Cationic polymer Various X X
Calcium hydroxide
(Lime)
Ca(OH)2 X* X
Calcium oxide
(Quicklime)
CaO X* X
Sodium aluminate Na2Al2O4 X* X
Bentonite Clay X
Calcium carbonate CaCO3 X
Sodium silicate Na2SiO3 X
Anionic polymer Various X
Nonionic polymer Various X
Table 1: TABLE OF COAGULANT AID AND PRIMARY COAGALANT
Alum

14
There are a variety of primary coagulants which can be used in a
water treatment plant. One of the earliest, and still the most
extensively used, is aluminum sulfate, also known as alum. Alum
can be bought in liquid form with a concentration of 8.3%, or in
dry form with a concentration of 17%. When alum is added to
water, it reacts with the water and results in positively charged
ions.
Coagulant Aids
Nearly all coagulant aids are very expensive, so care must be
taken to use the proper amount of these chemicals. In many
cases, coagulant aids are not required during the normal
operation of the treatment plant, but are used during emergency
treatment of water which has not been adequately treated in the
flocculation and sedimentation basin. A couple of coagulant aids
will be considered below.
Lime is a coagulant aid used to increase the alkalinity of the
water. The increase in alkalinity results in an increase in ions
(electrically charged particles) in the water, some of which are
positively charged. These positively charged particles attract
the colloidal particles in the water, forming floc.

15
Bentonite is a type of clay used as a weighting agent in water
high in color and low in turbidity and mineral content. This
type of water usually would not form floc large enough to settle
out of the water. The bentonite joins with the small floc,
making the floc heavier and thus making it settle more quickly
Coagulants and Polymers
The coagulation process includes using primary coagulants and may
include the addition of coagulant and/or filter aids. The
difference between these two categories is as follows:
1. Primary coagulants: Primary coagulants are used to cause
particles to become destabilized and begin to clump
together. Examples of primary coagulants are metallic salts,
such as aluminum sulfate (referred to as alum), ferric
sulfate, and ferric chloride. Cationic polymers may also be
used as primary coagulants.
2. Coagulant Aids and Enhanced Coagulants: Coagulant aids and
enhanced coagulants add density to slow-settling floc and
help maintain floc formation. Organic polymers, such as
polyaluminum hydroxychloride (PACl), are typically used to
enhance coagulation in combination with a primary coagulant.
The advantage of these organic polymers is that they have a
high positive charge and are much more effective at small

16
dosages. Even though they may be more expensive, a smaller
amount may be needed, thereby saving money. Organic polymers
also typically produce less sludge.
Typical coagulants and aids are discussed in further detail
below:
Chemicals commonly used for primary coagulants include aluminum
or iron salts and organic polymers. The most common aluminum salt
used for coagulation is aluminum sulfate, or alum.
Alum may react in different ways to achieve coagulation. When
used at relatively low doses (<5 mg/L), charge neutralization
(destabilization) is believed to be the primary mechanism
involved.
At higher dosages, the primary coagulation mechanism tends to be
entrapment. In this case, aluminum hydroxide (Al(OH)2)
precipitates forming a “sweepfloc” that tends to capture
suspended solids as it settles out of suspension. The pH of the
water plays an important role when alum is used for coagulation
because the solubility of the aluminum species in water is pH
dependent. If the pH of the water is between 4 and 5, alum is
generally present in the form of positive ions (i.e., Al(OH)2+,
Al8(OH)4+, and Al3+). However, optimum coagulation occurs when

17
negatively charged forms of alum predominate, which occurs when
the pH is between 6 and 8.
When alum is used and charge neutralization is the primary
coagulation mechanism, effective flash mixing is critical to the
success of the process. When the primary mechanism is entrapment,
effective flash mixing is less critical than flocculation.
Ferric chloride (FeCl3) is the most common iron salt used to
achieve coagulation. Its reactions in the coagulation process are
similar to those of alum, but its relative solubility and pH
range differ significantly from those of alum.
Both alum and ferric chloride can be used to generate inorganic
polymeric coagulants. These coagulants are typically generated by
partially neutralizing concentrated solutions of alum or ferric
chloride with a base such as sodium hydroxide prior to their use
in the coagulation process. The resulting inorganic polymers may
have some advantages over alum or ferric chloride for turbidity
removal in cold waters or in low-alkalinity waters.
Organic polymers tend to be large molecules composed of chains of
smaller “monomer” groups. Because of their large size and charge
characteristics, polymers can promote destabilization through
bridging, charge neutralization, or both. Polymers are often used
in conjunction with other coagulants such as alum or ferric
chloride to optimize solids removal.

18
Cost may be a consideration when selecting chemicals. The system
should perform an economic analysis when comparing chemicals and
not just compare unit cost. For instance, a polymer may cost more
per unit than alum, but fewer polymers may be needed than alum.
Therefore, the total cost for polymer may not be much different
than the total cost for alum. The following issues may be
evaluated as options to consider for treatment process
enhancement.
2.2.3. FACTORS INFLUENCING COAGULATION
In a well-run water treatment plant, adjustments are often
necessary in order to maximize the coagulation/flocculation
process. These adjustments are a reaction to changes in the raw
water entering the plant. Coagulation will be affected by
changes in the water's pH, alkalinity, temperature, time,
velocity and zeta potential.
The effectiveness of a coagulant is generally pH dependent. Water
with a color will coagulate better at low pH (4.4-6) with alum.
Alkalinity is needed to provide anions, such as (OH) for forming
insoluble compounds to precipitate them out. It could be
naturally present in the water or needed to be added as
hydroxides, carbonates, or bicarbonates. Generally 1 part alum
uses 0.5 parts alkalinity for proper coagulation.

19
The higher the temperature, the faster the reaction, and the more
effective is the coagulation. Winter temperature will slow down
the reaction rate, which can be helped by an extended detention
time. Mostly, it is naturally provided due to lower water demand
in winter.
Time is an important factor as well. Proper mixing and detention
times are very important to coagulation.
The higher velocity causes the shearing or breaking of floc
particles, and lower velocity will let them settle in the
flocculation basins. Velocity around 1 ft/sec in the flocculation
basins should be maintained.
Zeta potential is the charge at the boundary of the colloidal
turbidity particle and the surrounding water. The higher the
charge the more is the repulsion between the turbidity particles,
less the coagulation, and vice versa. Higher zeta potential
requires the higher coagulant dose. An effective coagulation is
aimed at reducing zeta potential charge to almost 0.
2.2.3. JAR TESTING
Coagulation/flocculation is the process of binding small
particles in the water together into larger, heavier clumps which
settle out relatively quickly. The larger particles are known as
floc. Properly formed floc will settle out of water quickly in

20
the sedimentation basin, removing the majority of the water's
turbidity.
In many plants, changing water characteristics require the
operator to adjust coagulant dosages at intervals to achieve
optimal coagulation. Different dosages of coagulants are tested
using a jar test, which mimics the conditions found in the
treatment plant. The first step of the jar test involves adding
coagulant to the source water and mixing the water rapidly (as it
would be mixed in the flash mix chamber) to completely dissolves
the coagulant in the water.
Then the water is mixed more slowly for a longer time period,
mimicking the flocculation basin conditions and allowing the
forming floc particles to cluster together. Finally, the mixer
is stopped and the floc is allowed to settle out, as it would in
the sedimentation basin.
The type of source water will have a large impact on how often
jar tests are performed. Plants which treat groundwater may have
very little turbidity to remove are unlikely to be affected by
weather-related changes in water conditions. As a result,
groundwater plants may perform jar tests seldom, if at all,
although they can have problems with removing the more difficult
small suspended particles typically found in groundwater.
Surface water plants, in contrast, tend to treat water with a
high turbidity which is susceptible to sudden changes in water
quality. Operators at these plants will perform jar tests

21
frequently, especially after rains, to adjust the coagulant
dosage and deal with the changing source water turbidity.
Materials
Volumetric flask (1,000 mL)
Analytical balance
Coagulants and coagulant aids
Magnetic stirrer (optional)
A stirring machine with six paddles capable of variable
speeds from 0 to 100 revolutions per minute (RPM)
Beakers (1,000 mL)
Pipets (10 mL)
Watch or clock
Turbidometer and sample tubes
Figure 5: Stirring machine

22
Procedure
1. Decide on six dosages of the chemical(s). You should use the
chemicals in use at the treatment plant you visit. These
chemicals may include coagulants, coagulant aids, and lime.
The dosages should be in a series with the lowest dosage
being lower than the dosage currently used in the plant and
the highest dosage being higher than the dosage currently
used in the plant. Insert the six dosages into your data
sheet.
If pre-lime has to be fed, it is usually best to hold the
amount of lime constant and vary the coagulant dosage.
2. Prepare a stock solution of the chemical(s). It is not
necessary to know the purity (strength) of the chemicals you
use since the strength will be the same for plant operation.
All results of the jar tests are in parts per million or
milligrams per liter. (1 ppm = 1 mg/L).
You will need to prepare a stock solution for each type of
chemical used. The strength of the stock solution will
depend on the chemical dosages which you decided to use in
step 1. The table below shows what strength stock solution
you should prepare in each circumstance.

23
Approximate dosage
required, mg/L
Stock solution
concentration, mg/L
1 mL added to 1 L
sample equals
1-10 mg/L 1,000 mg/L 1 mg/L
10-50 mg/L 10,000 mg/L 10 mg/L
50-500 mg/L 100,000 mg/L 100 mg/L
Table 2:TABLE OF DOSAGE FOR JAR TESTING
For example, if all of your dosages are between 1 and 10 mg/L,
then you should prepare a stock solution with a concentration of
1,000 mg/L. This means that you could prepare the stock solution
by dissolving 1,000 mg of the chemical in 1 L of distilled
water. However, this would produce a much larger quantity of
stock solution than you need and would waste chemicals. You will
probably choose instead to dissolve 250 mg of the chemical in 250
mL of distilled water.
Once you decide on the strength and volume of stock solution to
prepare, the procedure is as follows:
1. Weigh out the proper quantity of the chemical using the
analytical balance. Put an empty weigh boat on the
balance and tare it. Then add the chemical slowly to
the weigh boat until the desired weight has been
achieved. It is much easier to add chemical to the

24
weigh boat than to remove it, add the chemical very
slowly and carefully.
2. Measure out the proper quantity of distilled water in
the volumetric flask.
3. Add the chemical to the distilled water.
4. Mix well. If lime is used, it is best to use a magnetic
stirrer since lime is not completely soluble in water.
In other cases, magnetic stirrers can still be useful.
5. Collect a two gallon sample of the water to be tested. This
should be the raw water.
6. Measure 1,000 mL of raw water and place in a beaker. Repeat
for the remaining beakers.
6. Place beakers in the stirring machine.
7. With a measuring pipet, add the correct dosage of lime
and then of coagulant solution to each beaker as
rapidly as possible. The third column of the table in
step 2 shows the amount of stock solution to add to
your beaker. Two examples have been explained below.
If you have prepared a 1,000 mg/L stock solution, then
1 mL of the stock solution added to your 1,000 mL

25
beaker will result in a concentration of 1 mg/L. So, if
you wanted to have a chemical concentration in your
beaker of 4mg/L, you would add 4 mL of stock solution.
If you prepared a 100,000 mg/L stock solution and
wanted to achieve a chemical dosage of 150 mg/L, then
you would need to add 1.5 mL of stock solution to your
beaker.
8. With the stirring paddles lowered into the beakers,
start the stirring machine and operate it for one
minute at a speed of 80 RPM. While the stirrer
operates, record the appearance of the water in each
beaker. Note the presence or absence of floc, the
cloudy or clear appearance of water, and the color of
the water and floc. The stirring equipment should be
operated as closely as possible to the conditions in
the flash mix and/or flocculation facilities of the
plant. Mixing speed and time may vary at your plant
from the times and speeds listed in this and the
following step. Record any alterations on your data
sheet.

26
Figure 6: Formation of flocs
9. Reduce the stirring speed to 20 RPM and continue
stirring for 30 minutes. Record a description of the
floc in each beaker 5, 10, 15, 20, 25, and 30 minutes
after addition of the chemicals.
10. Stop the stirring apparatus and allow the samples
in the beakers to settle for 30 minutes. Record a
description of the floc in each beaker after 15 minutes
of settling and again after 30 minutes of settling.

27
Figure 7 :Observation of flocs
11. Determine which coagulant dosage has the best
flocculation time and the most floc settled out. This
is the optimal coagulant dosage. A hazy sample
indicates poor coagulation. Properly coagulated water
contains floc particles that are well-formed and dense,
with the liquid between the particles clear.
12. Test the turbidity of the water in each beaker
using a turbidometer. Pipet water out of the top of the
first beaker and place it in a sample tube, making sure
that no air bubbles are present in the sample. (Air
bubbles will rinse while turbidity will sink.)
Carefully wipe the outside of the sample tube clean.
Place the sample tube in a calibrated turbidometer and
read the turbidity. Repeat for the water from the other
beakers.

28
The least turbid sample should correspond to the
optimal coagulant dosage chosen in step 10.
13. If lime or a coagulant aid is fed at your plant in
addition to the primary coagulant, you should repeat
the jar test to determine the optimum dosage of lime or
coagulant aid. Use the concentration of coagulant
chosen in steps 10 and 11 and alter the dosage of lime
or coagulant aid.
14. Using the procedure outlined in step 11, measure
the turbidity of water at three locations in the
treatment plant - influent, top of filter, and filter
effluent..
.
Figure 8: Turbidimetre

29
TABLE1 RESULTS
REAGENT(ppm) 1 2 3 4 5 6
Al2SO4 20 25 30 35 40 45Ca(OH)2. 15 20 25 30 35 40Polymer. 0.1 0.1 0.1 0.1 0.1 0.1PH before
flocculation
6.5 6.5 6.5 6.5 6.5 6.5
PH after
flocculation.
7 7 6.5 6.5 6.5 6.5
Turbidity
before
flocculation.
29.6 29.6 29.6 29.6 29.6 29.6
Turbidity after
flocculation
8.9 6.27 5.71 4.64 3.04 1.42
Table 3:TABLE OF RESULT OF JAR TEST
RESULTS INTERPRETATION
The good result has been obtained on 6rd where 45ppm of Al2 (SO4)3
and 40 ppm of Ca (OH) 2 have been taken.
The obtained results are: .Turbidity: 1.42NTU
.PH:6.5
Then calculate the debut of reagents q= QT/ C
For Aluminium sulphate: q=9×10 7 ml/h×45 = 81000ml/h
50×1000

30
. For calcium hydroxide: q= 9×10 7 ml× 40=72000ml/h
50×1000
2.3. SEDIMENTATION
Sedimentation is thus defined as the removal of suspended
particle by gravity
Figure 9: Sedimentation tank.
2.3.1. SEDIMENTATION BASIN
The Basin can be divided into four zones.
Inlet zone

31
Settling zone
Sludge zone
Outlet zone
For more details a reference may be made to the Manual on “Water
Supply and Treatment”
published by Ministry of Urban Development. (1999 edition).
2.3.2.BASIN TYPES
The basins may be of the following types:
Rectangular basins.
Circular and square basins.
High Rate Settlers (Tube Settlers).
Solid Contact Units (Up-flow solid-contact clarification and up-
flow sludge blanket.
2.4 FILTRATION
The purpose of filtration is the removal of particulate
impurities and floc from the water being treated. In this regard,
the filtration process is the final step in the solids removal
process which usually includes the pretreatment processes of
coagulation, flocculation and sedimentation. The degree of
treatment applied prior to filtration depends on the quality of
water.

32
/
Figure 10: Filtration tanks
2.4.1. OPERATION
Filter Operation: A filter is usually operated until just before
clogging or breakthrough occurs or a specified time period has
passed (generally 24 hours).
Backwashing: After a filter clogs or breakthrough occurs or a
specified time has passed the filtration process is stopped and
the filter is taken out of service for cleaning or Backwashing.
Surface Wash: In order to produce optimum cleaning of the filter
media during backwashing and to prevent mud balls, surface wash
(supplemental scouring) is usually required. Surface. wash
systems provide additional scrubbing action to remove attached
floc and other suspended solids from the filter media.

33
.2.4.5. IMPORTANCE OF FILTER BACKWASH
When solids accumulate within a filter bed, they create a
resistance to flow. This resistance is measured as loss of head
(pressure increase) for the filter bed. The filter is backwashed,
usually with finished water, to remove the accumulated particles.
The need for backwashing may be determined using various criteria
— a terminal head loss, a fixed time interval, or a
Breakthrough of solids (measured as turbidity or particle
counts). Options for disposal of the spent filter backwash water
may include discharge to a sewer or a receiving stream. Because
backwash water may contain. Disinfectants and other chemicals
that may be harmful to the biological life of a stream, direct
discharge to streams may be restricted. Similarly, discharge to
sewers may be restricted, based on the constituents and total
quantity of the backwash water. For many water treatment plants,
particularly in arid or water-scarce areas with limited raw water
resources, it is often necessary to reuse backwash water. When
the water is recycled, accumulation of microbial and algal
contaminants is a concern. For example, algal toxins may be
released is a concern. For example, algal toxins may be released
from stored treatment sludges when the overlying water is
recycled. Because of the resistance of oocysts to conventional
disinfectants, Cryptosporidium has been a major concern for the
handling and operation of recycled process streams. The level of
treatment required for spent filter backwash water before recycle
will vary from site to site depending on the treatment process

34
and water-quality objectives. Equalization of the recycle flow
and sedimentation of the backwash solids, aided by the addition
of a polymer coagulant, is sufficient to reduce cyst
concentrations to raw water levels in most cases (Cornwell & Lee,
1993; Arora, Di Giovanni & LeChevallier, 1999; McTigue et al.,
2000).
2.5.DISINFECTION
Disinfection is carried out to kill harmful microorganisms that
may be present in the water supply and to prevent microorganisms
regrowing in the distribution systems.
Good public health owes a lot to the disinfection of water
supplies. Without disinfection, waterborne disease becomes a
problem causing high infant mortality rates and low life
expectancy.This remains the situation in some parts of the world.
Key factors considered by a water authority in selecting
disinfection system are:
.Effectivenes in killing a range of microorganisms
.Potential to form possibly harmful disinfection by products
.Ability of disinfection agent to remain effective in the
water throughout the distribution system.
.Safely and ease of handling chemicals and equipment.
.Cost effectiveness.
CHLORINE

35
Mode of action
Chlorine gas and water react to form HOCl and hydrochloric acid
(HCl). In turn, the HOCl dissociates into the hypochlorite ion
(OCl–) and the hydrogen ion(H+), according to the following
reactions:
1) Cl2+ H2O↔ HOCl+HCl
Inactivation (disinfection) process
2) HOCl↔ H+ + OCl-
The reactions are reversible and pH dependent:
• between pH 3.5 and 5.5, HOCl is the predominant species
• between about pH 5.5 and 9.5, both HOCl and OCl- species exist
in various proportions
• above pH 8, OCl- predominates. The OCl predominates. The OCl– and HOCl species are commonly referred to as free
chlorine, which extremely reactive with numerous components of
the bacterial cell. HOCl can produce oxidation, hydrolysis and
deamination reactions with a variety of emical substrates, and
produces physiological lesions that may affect several cellular
processes. Baker (1926) theorized that chlorine destroys mi
croorganisms by combining with proteins to form N-chloro

36
compounds. Chlorine was later found to have powerful effects on
sulfhydryl groups of proteins and to convert several -amino
acids by oxidation into a mixture of corresponding nitriles and
aldehydes. The exact product of e reaction depends on chlorine
concentration and pH . Cytochromes, iron-sulfur proteins and
nucleotides are highly vulnerable to oxidative degradation by
HOCl, suggesting that chlorine causes physiological damage
primarily to the bacterial cell membranes . Respiration, glucose
transport and adenosine triphosphate levels all decrease in
chlorine-treated bacteria .Electron microscopy of chlorinated
bacteria has demonstrated morphological changes in the cell
membrane. In addition, chlorination can kill microbes by
disrupting metabolism and protein synthesis or by modifying
purine and pyrimidine bases and thus causing genetic
defects .Nearly 100 years of chlorination for disinfection of
drinking-water has demonstrated the effectiveness of this process
for inactivation of microbial pathogens, with the notable
exception of Cryptosporidium
2.6.WATER STORAGE AND WATER DISTRIBUTION
After treatment drinking water is distributed via large trunk
main to water storage reservoir.From these reservoirs water is
reticulated to each houseld through a network of small water
mains.
In some urban water systems the water supply is obtained directly
from river or onother body of freshwater.In other, rivers are

37
dammed and the water supply is distributed from artificial
storage, such as reservoirs.
Dams are built across rivers and streams to reservoirs to
collect water from catchment to ensure sufficient supply will be
available when needed.Dams also have been built for a range of
purposes besides water supply.Such as agriculture and
hydroelectricity generation.
Water may also be released from a reservoir a an” environmental
flow’ to maintain the health of the ecosystem downstram of the
reservoir. It is estimated that significant reservoirs builts
around the world store five megalitres of water.
The water mains and pipes beneath the streets of a community are
described as the water supply distribution system or reticulation
system.A part of this system strategically located service
reservoirs are often large covered tanks in a elevated position.
Pumps and valves also form an important part of distribution
system.The end points of the system are the consumers taps.
After water has been treated to protected public health improve
aesthetics by removing colour and adour as required ,it is ready
to be delivered to consumers.The system of mains and pipes used
to deliver the water is known as the distribution,or reticulation
systems.

38
Treated water may be held at a treatment plant or immediately
discharged into the system of mains and pipes that will transport
it to consumers taps.on the way it may be held in short_ term
storage,which are located as close as possible to where the water
be used.
Sufficient water is required in local area to supply periods of
high demand,as on a hot summer day.
From a design perspective,the needs of fire service usually
determines the capacity of the system.
An important characteristic of a drinking water distribution
system is that is closed,to prevent contamination by birds,animal
or people.In contrast,irrigation water is usually delivered in
open channels or aqueducts.
A significant part of the water supply system lie buried
underground.Out of the public eye.Such infrastructure can be
overlooked.It is easy to forget how valuable and essential water
distribution systems are the community.In terms of money spent on
supplying water in Australia, most of it has been invested in
the mains and pipes buried under the streets of towns and suburbs
across the country.
Most distribution systems have developed and expanded as arban
areas have grown Map of water distribution system would show a
complex mixture of tree like and looped pipe networks,together
with valves and pumps.
Distribution systems require regular cleaning(flushing and
scouring)maintenance and a program to replace pipes and other
39
equipment as they near the end of their useful lives.Water mains
can be expected to have a usuful of 40 to 100 years.Many of the
pipes under the older parts of our cities may be towards the
upper end of this range.
2.6.1. WATER QUALITY
Water quality essential to human life and to the health of the
environment.As a valuable natural resourse, it comprise marine,
estuaire, freshwater (river and lakes) and grounder water
environenment,accros coostals and inland areas.Water has two
dimensions that are closely linked quality and quantity. Water
quality is commoly defined by its physical, chemical, biological
and aesthetic (appareance and smell) characteristics.A healthy
environment is one in which water quality support a rich and
varied community of organisms and protect public health.
Water quality in body of water influence the way in wich
communities use the water for activities such as drinking,
swimming or commercial purpose
CHAP 3.PHYSICO-CHEMICAL ANALYSIS
Physico-chemical parameters affecting the quality of water that
we analyse in the labalatory of Gihuma Treatment Plant
are:pH,TH(total hardness),Alkalnity including TA(alcalimetric
titration) , TAC (complete alcalimetric titration) ,and TCa
(calcic

40
titre ),turbiditity,nitrites(NO2),nitrates(NO3),chlorine(Cl-),man
ganese(Mn2+),fer,aluminium and other ions.
3.1.pH
The measures of pH is calculated with the pH-meters showing the
values of pH.The pH is the measure of acidity of water.The
naturally water have the pH between 6and 8.The lower value of
pH,the solution is called acide.The some aquatiques species such
as fish and others aquatiques organismes can not live in water of
high acidity.The atmospherique pollution and the acids rain are
sources of acidity in water.pH of water does not change because
water has tampon solution with the presence of the ions HCO3- and
CO3-.
3.2 TURBIDITY
Turbidity is the measure of suspended solids present in water
such as organic matter, Limons, algae and particulate load. The
turbidity is measured with the instrument called turbidimetre.
3.3 ALKALINITY
The capacity of water to accept H+ ions (protons) is called
alkalinity. Alkalinity is important in water treatment and in the
chemistry and biology of natural waters. Frequently, the
alkalinity of water must be known to calculate the quantities of
chemicals to be added in treating the water. Highly alkaline
water often has a high pH and generally contains elevated levels
of dissolved solids. These characteristics may be detrimental for

41
water to be used in boilers, food processing, and municipal water
systems. Alkalinity serves as a pH buffer and reservoir for
inorganic carbon, thus helping to determine the ability of water
to support algal growth and other aquatic life, so it can be used
as a measure of water fertility. Generally, the basic species
responsible for
Alkalinity in water is bicarbonate ion, carbonate ion, and
hydroxide ion.
HCO3- + H+→CO2+ H2O
CO3
2- + H+→HCO3-
OH-+ H+→H20
ALICALIMETRIC TITRATION (TA)
The alcalimetric titre is measured when the PH is greater
than8.2. The raison why we didn’t’ measure it, the PH is above
8.2 for raw water and for treated wate
COMPLETE ALCALIMETRIC TITRE (TAC)
T.A.C = OH- + CO32- +HCO3
-.
The measurement of water alkalinity is based on the
neutralization of the bases by using strong diluted acid which is
sulfuric acid (H2SO4) represented in the following reactions.

42
OH- + H3O+→ H2O
CO32− + H3O+ →HCO3
− + H2O
HCO3− + H3O+ →CO3
2− +2H2O
THE OBJECTIVE OF THE EXPERIMENT
The main objective of this experiment is to know the alkalinity
of water due to the presence of carbonates (CO32-), bicarbonates
(HCO3) that are weak base and we have also free base which is
strong base OH- of Ca, Mg and Na.
REAGENTS TO BE USED
. 100ml of sample
. 5 drops of methyl orange
. Sulfuric acid
MATERIALS TO BE USED
- Erlenmeyer flask
- Burette
- Dropper
PROCEDURE:
.Taking 100ml of sample in Erlenmeyer flask
.Adding 5drops of methyl orange as indicator, then we has to agitate
until the mixture will attain blue-green color.
.Filling the burette with sulfuric acid solution

43
.Titrate with sulfuric acid by pouring drop by drop in agitating to
homogenize the solution till the mixture will attain the persistent
pink.
.After all those process we have to read on the volume indicated
by the burette; normal our result is in ml that will be converted
in ppm by multiply by 10.
3.4 TOTAL HARDNESS
The presence of the cations Ca2+,Fe2+,Sr2+,Zn2+,Mn2+and Mg2+ are
responsible for total hardness,but,the ions Mg2+ and Ca2+ are the
only ions present in water with the significatif
concentration .The reason why total hardiness is considered as
sum of 2 cation (Ca2+ and Mg2+)
TOTAL HARDINESS=[Ca2+]+[Mg2+]
THE OBJECTIVE OF THE EXPERIENCE
The objective of
this experiment is to determine the hardness of water caused by calcium
and magnesium ions.
THE MATERIALS AND THE REAGENTS TO BE USED
Reagents:
.10ml of sample of raw water
.10ml of sample of treated water
.Buffer hardness solution

44
.EDTA
.Manver (indicator)
Materials:
-Erlenmeyer flask
-Burette
-Dropper
-Beaker
-Graduated cylinder
-spatula
PROCEDURE:
-Measuring 10ml of sample in graduated cylinder
-Pouring these in a flask of 250ml
-Adding 4drops of buffer hardness solution
-Adding 5ml of Manver with spatula
-Then filling the burette the titrant solution (EDTA)
-Starting the titration by pouring drop by drop of EDTA in
agitating until we reach to the equivalent point; the color
will change from red-violet.
-Then after all those we have to read the volume indicated to
the burette then multiply the result we have gotten by ten to
get accuracy result.

45
-After the experiment we have gotten 3.1ml multiply by 10
to get accuracy result which is equal to 31mg/l.
CALCIC TITRE (TCa)
OBJECTIVE OF THIS EXPERMENRT
The aim of this experiment is to determine the concentration of
calcium ions present in raw water and treated water.
Reagents:
.100ml of sample
.Sodium hydroxide
.EDTA 0.02N
.Murexide (indicator)
Materials:
-Erlenmeyer flask
-Burette
-Spatula
-Dropper
-Graduated cylinder

46
PROCEDURE:
-Measuring 10ml of sample in graduated cylinder
-Pouring these in a flask of 250ml
-Adding 2drops of sodium hydroxide
-Adding 5ml of Murexide with spatula
-Then filling the burette the titrant solution (EDTA)
-Starting the titration by pouring drop by drop of EDTA in
agitating until we reach to the equivalent point.
-Then after all those we have to read the volume indicated to the
burette then multiply
by 10 to get accuracy result in ppm.
Ca2+=TCa×0.4
3.5. DETERMINATION OF ANIONS AND CATIONS PRESENT IN WATER
Before treating water we have to know the quantity of anions and
cations present in raw water. Each cation and anion have its
specific reactif used for its determination and we may know the
quality of water treated according to the result obtained. The
instrument using for determining those parameters is called
SPECTROPHOTOMETER.

47
3.6. EXAMPLE OF SOME ELEMENT MEASURED USING SPECTROPHOTOMETER
3.6.1 Free chlorine
Take 10ml of sample,
- Add reagent for free chlorine DPD (N, N-diethyl-p-phenylene
diammine)
- Shack for 20 seconds to homogenize the solution, we can have
rose color in the presence free chlorine and then measure its
quantity.
Free chlorine is an oxidant agent which is hard and instable in
natural water. It reacts rapidly with many inorganic compounds
and oxidizes slowly those compounds.
Some factors that influence the presence of free chlorine in
water:
.concentration of reagent,Sun ,PH,Temperature and Salinity
Free chlorine is present in the sample as hypochlorite ion and
reacts immediately with indicator DPD to produce rose color
proportionally to the concentration of chlorine.
Total chlorine
Take 10ml of sample
- Add reagent for total chlorine DPD
- Shack for20 second to homogenize the solution
-Then wait for 3minutes of reaction

48
- Measure the quantity of total chlorine present.
Total chlorine is present in the form of monochlorammine,
dichlorammine, and nitrogen trichloride and halogen derivatives.
It oxidizes iodide of reagent in iodine. It reacts with indicator
DPD to produce red color proportionally to the concentration of
total chlorine.
3.6.2. Aluminium
-Take 10ml of sample
- Mixed with ascorbic acid reagent
- Return many times to homogenize
-Add reagent Alu ver.3, red-orange color can appear in the
presence of aluminium, then measure aluminum present.
The indicator alumino is combined with aluminium to form red-
orange color. The intensity of coloration is proportional to
concentration of aluminum. Ascorbic acid is added to avoid.
3.6.3.Cobalt
Take 10ml of sample,
-Add phthalate-phosphate
-Add 0.5ml of indicator PAN0.3%, return many times to homogenize
the solution
Wait for 3minutes of reaction, the color can vary from green to
red.

49
-Then add EDTA
- Shack to dissolve and measure the quantity of cobalt present.
After form a buffer with the sample and mask the iron (Fe3+) with
pyrophosphate the indicator 1-(2-pyridylazo)-2 naphtol is
added, form a complex with most metals present. After developing
the color EDTA is added to destroy metal complexes-PAN except
those of Nickel and Cobalt.
3.7. RESULTS AND INTERPRETATION
The water analysis was realized in laboratory two times in each
week. The table 1 gives the quantity/level of each element. This
resultants take from analyze physicochemistry
Date
05/08/20
13
05/08/20
13
19/08/20
13
22/08/20
13
Guidel
ine
Elem
ent
uni
ty
RW TW RW TW RW TW RW TW
pH 7 6.5 6.
5
6.5 6.7 6.5 6.5 6 6.5-
8.5TURB NTU 22.
3
5.3
4
31
.8
3.0
1
37.
1
3.7
7
37.
8
6.7
7
5
TMg Mg/
l
31 23 29 20 15 20 0.0 0.0

50
TAC Mg/
l
60 90 74 100 35 20 60 30
TH Mg/
l
45 43 53 25 50 100 40 150
TCa Mg/
l
14 20 24 25 35 80 35 60
Ca2+ Mg/
l
5.6 8 28 32 14 28 14 24
NO3+ Mg/
l
0.8 2.6 0.
1
0.2 0.2 1.2 1.0 1.6
Mn Mg/
l
0.2
53
0.2
49
-
0.
11
0.1
89
0.2
06
0.0
29
0.1
73
0.1
19
0.1
Co Mg/
l
0.0
5
0.0
1
0.
06
0.0
4
0.0
7
0.0
3
0.0
6
0.0
0
0.1
Al Mg/
l
-
0.0
8
-
0.3
3
-
0.
09
-
0.3
7
0.1
60
0.1
12
0.0
46
0.2
27
0.2
Fe Mg/
l
2.8 0.8
2
2.
67
0.1
6
3.1
0
0.3
2
- 1.8
Free
Cl2
Mg/
l
0.0
4
5.1
8
0.
03
0.0
7
0.0
2
1.9
1
0.0
9
0.9
5Tot.
Cl2
Mg/
l
0.0
4
40.
79
0.
02
0.5
7
0.0
2
2.7
9
0.1
1
1.2
5I2 Mg/
l
0.1
4
3.1
3
0.
50
0.0
9
0.0
8
9.9
2
0.3
7
4.3
4
5
Br2 Mg/ 0.0 13. 0. 0.1 0.0 5.5 0.2 2.8 5

51
l 7 93 27 0 9 6 4 6Table 4:TABLE OF RESULT OF PHYSICO-CHEMICAL ANALYSIS
From the table above the results show their level to be within
the permissible limit except for the elements, Turbidity,
Bromine, Iodine, Aluminium,Iron,Cobalt, Manganese and other
elements no analysed in laboratory,
CHAPTER.4.CONCLUSION AND RECOMMENDATION
Gihuma Water Treatment Plant produces a quantity of water and
supplied to the population in term of drinking and washing
water.The quantity of water produced at the plant has been
reinforced by pumping station for increasing the quantity and try
to satisfy the water demand users.
The water quantity consisted on raw water received for treatment,
water supplied, water treated and water used by the plant
itself.These quantities were depending in both stopping and
working time.However the works of maintanance,reparation of
some equipment, instability of raw water quantity and
availability of electrical energy have influenced on the working
time.
According to the raw water quality and the experience done in the
laboratory.Gihuma wate Treatment Plant can use the small quantity
of reactifs such as aluminium sulfate, polymer and hydroxide of
calcium.

52
REFERENCES
.Manahan, Stanley E."FRONTMATTER" Environmental Chemistry
Boca Raton: CRC Press LLC, 200
Alabama Department of Environmental Management. 1989.
Water Works Operator Manual.
Mark W Lechevalier and Kwok-Keung Au,Water treatment and
pathogen control,2004

53

54
..
.

55

56

57

58

59

60

61

62

63

64

65

66

67
.

68

69
..