Thesis fulltext
108
MEETING THE LEARNING NEEDS OF INDIVIDUAL CHILDREN IN THE MAINSTREAM CLASSROOM A dissertation submitted in partial fulfilment of the requirements for the Degree of Master of Education in the University of Canterbury by Melanie S. Patterson University of Canterbury February 2008
-
Upload
independent -
Category
Documents
-
view
3 -
download
0
Transcript of Thesis fulltext

MEETING THE LEARNING NEEDS OF INDIVIDUAL
CHILDREN IN THE MAINSTREAM CLASSROOM
A dissertation
submitted in partial fulfilment
of the requirements
for the Degree of
Master of Education
in the University of Canterbury
by Melanie S. Patterson
University of Canterbury
February 2008

2
CONTENTS
PAGE
LIST OF TABLES 5
LIST OF FIGURES 6
ACKNOWLEDGEMENTS 7
ABSTRACT 8
CHAPTER 1 INTRODUCTION 9
Two Classifications of Behaviour Difficulties and Learning Difficulties 10
Traditional Diagnostic Procedures 15
Functional Assessment 19
Review of Previous Research 30
Aims of the Present Research 38
CHAPTER 2 GENERAL METHOD 39
Subjects and Setting 39
Functional Assessment 41
CHAPTER 3 CASE EXPERIMENT 1: ANDY 44
Subject and Setting 44
Functional Assessment 44
Intervention 46
Results 49
Discussion 52
CHAPTER 4 CASE EXPERIMENT 2: KYLE AND TIM 55
Subjects and Setting 55
Functional Assessment 55

3
Results and Discussion 58
CHAPTER 5 CASE EXPERIMENT 3: ERICK AND JACK 61
Subjects and Setting 61
Functional Assessment 61
Intervention 64
Results 67
Discussion 72
CHAPTER 6 CASE EXPERIMENT 4: KATIE 75
Subject and Setting 75
Functional Assessment 75
Intervention 77
Results 78
Discussion 80
CHAPTER 7 GENERAL DISCUSSION 81
Issues Facing Teachers in Mainstream Classrooms 85
Limitations of this Study 90
Conclusions 90
REFERENCES 91
APPENDICES 100
Appendix 1: University Of Canterbury Human Ethics Committee Approval Letter 100
Appendix 2: Teacher’s Weekly Reflection Sheet 101
Appendix 3: Recording Sheet for Weekly Hand Results 102
Appendix 4: Williams’ Phonemic Segmentation Test 103
Appendix 5: Canterbury Decoding Fluency Test 104
Appendix 6: Children’s Copy of the Canterbury Decoding Fluency Test 105
4
Appendix 7: List of the 60 Practice Words 106
Appendix 8: Example of Children’s Practice Flip Cards 107
Appendix 9: Standard Copying Task Given To Class 108

5
LIST OF TABLES
TABLE PAGE
1. Overview of Empirical Studies Involving Teachers Attempting Functional
Assessments with Children with Behaviour or Learning Difficulties in Mainstream
Classrooms. 32
2. Reward Criteria and Points Achieved by Andy in Weeks 2 to 4. 50
3. The Percentage of Kyle’s and Tim’s Antisocial Behaviour and the Percentage of
Negative Responses from the Teacher. 59
4. Results of the Assessment of Component Reading Skills and Reading Levels for
Erick and Jack. 63
5. Summary of the Findings of Case Experiments 1 to 4. 81

6
LIST OF FIGURES
FIGURE PAGE
1. Percentage of Andy’s on-task behaviour during self-selected reading activities. 51
2. Percentage of Andy’s on task behaviour during self selected maths activities. 51
3. Number of correct responses per minute on the decoding fluency test by Erick. 68
4. Achieved running record level on the PM Benchmark test by Erick. 69
5. Number of correct words read per minute from daily reading book by Erick. 70
6. Number of correct responses per minute on the decoding fluency test by Jack. 70
7. Achieved running record level on the PM Benchmark test by Jack. 71
8. Number of correct words read per minute from daily reading book by Jack. 72
9. Number of correct letters copied per minute for a Year 2 class. 76
10. Number of correct letters copied per minute from a level 12 reading book by Katie
(filled circles) and number of letters copied per minute from standard copying task
(open circles). 79
11. Number of correct alphabet letters copied per minute by Katie. 79

7
ACKNOWLEDGMENTS
My appreciation and thanks to my research supervisor, Dr John Church who has given me
so much of his time and knowledge while guiding me through the process of writing this
dissertation. I am grateful for his expertise and his patience over the last year.
I would like to thank the principal, classroom teacher, parents and children from the
participating school for their agreement to help me carry out my project. In particular, I am
very grateful to the teacher who welcomed me into her classroom and to the children who
worked so hard.
My appreciation goes to my friends Brynlea Collin and Lisa MacKenzie who have been
so helpful and supportive over the last year. I would also like to recognise my colleague Stacey
Timmins who has worked alongside me and given me some understanding of the complex role
of a teacher in a classroom.
I would like to thank my family Peter, Wendy, Anne and Amanda and my grandfather
Thomas Burson Nuttall for their support, encouragement and prayers for me over my years of
study.
Finally, I would like to acknowledge and thank my wonderful husband Anthony
Patterson, who has been so considerate and caring over the past year and who has tirelessly
supported me every day.

8
ABSTRACT
A teacher in a mainstream classroom identified six children with behaviour difficulties or
learning difficulties who were not receiving any assistance outside of the classroom. The
teacher was to independently complete a functional assessment of each child to reach a
hypothesis about the cause of the difficulty, and then choose and implement an appropriate
intervention. Treatment integrity was monitored throughout the interventions to ensure correct
implementation. It became apparent that the teacher was unable to complete adequate
functional assessments or maintain appropriate interventions because of the time constraints
associated with being in a classroom and her lack of specialist knowledge.

9
CHAPTER 1
INTRODUCTION
The introduction of inclusive education to schools in the late twentieth century has
significantly changed classrooms both in New Zealand and internationally. The main principle
of inclusive education is that children with special educational needs (SEN) are entitled to be
educated in mainstream classrooms (Lindsay, 2004; Macfarlane, 2007). The inclusion of
children with special educational needs in mainstream classrooms is seen as a way of removing
barriers to learning, improving learning outcomes and decreasing discrimination (Lindsay,
2004). The consequence of inclusive education policies is that mainstream classes now have to
cater to a more diverse range of students (Wearmouth, 2004). More specifically, the teachers of
today’s mainstream classrooms have to manage groups of children with an increased diversity
of teaching needs (Macfarlane, 2007; Prochnow, Kearney, & Carroll-Lind, 2000).
The term ‘special educational needs’ encompasses a wide range of teaching needs. In
New Zealand, the Ministry of Education’s policy on SEN includes various types of learning
difficulties, communication difficulties, behaviour difficulties and sensory and physical
disabilities within the category of special educational needs (Ministry of Education, 2007). The
Ministry provides a number of resources designed to help the teachers of mainstream classes
support children with special educational needs. These include “specialist support, therapy,
staffing, equipment and other materials, property modification and transport, as well as advice
and specialist support” (Ministry of Education, 2007).
Prochnow et al. (2000) found that even with the additional support provided by Group
Special Education, special education grants, Resource Teachers: Learning and Behaviour
(RTLB) and Resource Teachers: Literacy (RT:Lit), approximately half of all teachers report not
receiving the support needed in order to meet the needs of children with special educational

10
needs in their classrooms. Behaviour difficulties and learning difficulties were the two areas of
concern most often identified as needing extra support. Behaviour difficulties include
hyperactivity, attention deficit problems, social skills deficits and aggression (Cowley, 2006).
Children with behaviour difficulties disrupt the classroom, which results in decreased
opportunities for learning both for the child concerned and for other children in the classroom
(Sterling-Turner, Robinson, & Wilczynski, 2001). Learning difficulties include delays in
learning to read, write and spell, delays in language and delays in mathematical development.
Children with learning difficulties may display behaviour difficulties in order to escape
academic tasks which they find too difficult. (Ervin et al., 2001; Sasso, Conroy, Stichter, & Fox,
2001). Difficulties faced by children with behaviour difficulties and learning difficulties can
easily compound and further affect the child’s academic development.
The question raised by these issues is how teachers are to manage these behaviour and
learning needs in addition to teaching the other 20 to 30 children in a mainstream classroom? It
is important that these children get the help and support they require early on so their education
is disrupted as little as possible. It therefore is necessary to correctly identify these children and
to diagnose their area of difficulty so that the appropriate intervention can be provided (Brahm,
2007).
Two Classifications of Behaviour Difficulties and Learning Difficulties
Diagnostic and Statistical Manual of Mental Disorders
The most extensively used classification of behaviour difficulties and learning difficulties
is that which is set out in the American Psychiatric Association’s Diagnostic and Statistical
Manual of Mental Disorders (DSM). The DSM is a medical classification that aims to define
disorders for the purpose of research and treatment and for the prediction of outcome (Parnas &

11
Zahavi, 2002). The DSM-IV-TR (American Psychiatric Association, 2000), defines behaviour
and learning disorders in the categories listed below.
Attention-Deficit and Disruptive Behaviour Disorders. This group includes Attention-
Deficit/Hyperactivity Disorder (ADHD), Conduct Disorder (CD) and Oppositional Defiant
Disorder (ODD), as well as two subtypes. The first of the three main categories, ADHD is
defined by the major ongoing symptoms of inattention and/or hyperactivity-impulsivity. The
second, CD is described as recognisable by ongoing behaviour that infringes on the rights of
others or breaks age-appropriate societal norms or rules. The third, ODD is defined by the
presence of ongoing negativistic, hostile, and defiant behavior (American Psychiatric
Association, 2000).
Learning disorders. The learning disorders listed in the DSM–IV-TR are Reading
Disorder, Mathematics Disorder, Disorder of Written Expression and Learning Disorder Not
Otherwise Specified. These are identified by the presence of academic performance that is
significantly below the expected level given the child’s education, chronological age and
intelligence test score (American Psychiatric Association, 2000).
Critique. The DSM represents a consensus across the psychiatric profession and provides
uniformity in classification, diagnosis and research. However, there are a number of difficulties
with this classification system. First, behaviour and learning difficulties are seen as medical
“disorders” that originate from within the child. The diagnosis ignores the effects of the child’s
social environment upon his or her behaviour and development (Mash & Dozois, 2003).
Second, each disorder is identified by the presence of a set of behavioural indicators that does
not take into account the aetiology of the disorder (Brahm, 2007). The behaviour displayed by
different children may be the same, but it may have come about for completely different
reasons. Writing problems may occur because the child has poor fine motor skills, has received
insufficient instruction or has not had sufficient opportunity to practice writing. Each of these

12
writing problems will require a different intervention if they are to be overcome (Brahm, 2007).
A third difficulty with the DSM is that it makes categorical distinctions between disorders
where there appears to be a lot of overlap (Mash & Dozois, 2003). This results frequently in a
diagnosis of co-morbidity for the child, which once again leads to difficulties in selecting an
appropriate intervention. A common co-morbidity is ADHD and CD, yet the treatment for each
disorder is different (Church, 2003).
Educational Classification
The educational classification of behaviour difficulties and learning difficulties attempts
to overcome the shortcomings of the medical model by acknowledging the social and
educational context of behaviour difficulties and learning difficulties (Brahm, 2007). This
search for environmental and contextual causes redirects practitioner attention towards changes
which may help the child overcome the difficulty.
Behaviour difficulties. In the United States of America, behaviour difficulties are referred
to as emotional and behavior disorders (EBD) and defined as behaviours which are
“significantly different from appropriate age, cultural or ethnic norms to the extent that the
responses adversely affect educational performance” (Kavale and Forness, as cited in Church,
2003, p. 52). One benefit of this description is that it acknowledges the importance of cultural
expectations and developmental age. A disadvantage is the continued use of the term ‘disorder’
and its implications.
In the United Kingdom, behaviour difficulties are referred to as emotional and behavioral
difficulties and are defined to include children who display a range of emotional and behavioral
difficulties, including isolation, disruption and hyperactivity (Church, 2003). This definition is
careful to specify that emotional and behaviour difficulties are not mental disorders.
In New Zealand (NZ) the term “child with severe behaviour difficulties” is used to refer
to children who engage in behaviour which poses a danger to him or herself, to others or to

13
property, or which restricts the child’s access to normal settings or effects his or her educational
achievement (O’Brien & Ryba, 2005).
Critique. Educational classifications of children with behaviour problems also create
diagnostic difficulties as they are based only on the observed behaviour of the child. Although
the United Kingdom and New Zealand have moved away from the medical model of ‘disorders’
the diagnostic focus is still very much a focus on behavioral symptoms and not on behaviour-
and-purpose or behaviour-and-consequences. Diagnoses of behavioral difficulties made in the
UK and NZ still ignore environmental impacts (Mitchell, 1999). The same behaviour can be
used for different purposes. A preschool child saying a swear word in class will most likely be
repeating a word that he or she has just heard, while a teenager swearing is more likely to be
engaging in an aggressive act.
It is also problematic to focus solely on the child’s behaviour without reference to their
development as there are differences in the behaviour expected from different age groups
(Church, Tyler-Merrick, & Hayward, 2006). Additionally, a child refusing to look a teacher in
the eye when spoken to might be considered disrespectful in most New Zealand schools and yet
for Maori children, looking at the floor when an adult is talking is a sign of respect. So certain
behaviours can be judged to be inappropriate in specific social environments and not in others
(Macfarlane, 2007). Educational classifications are just beginning to take into account the fact
that children with behaviour difficulties are not a homogenous group (Brahm, 2007).
Learning difficulties. Learning difficulties have proven difficult to classify. This is
because of the multidisciplinary nature of the educational system, the lack of specific
identification criteria and the use of the broad labels such as ‘learning disabilities’ (Lyon, 1996).
Most definitions of learning difficulties are exclusionary, in that they cannot be the consequence
of many of the conditions that hinder learning (Lyon et al., n.d.). As a result, children with

14
learning disabilities are often diagnosed not on the basis of what they can do, but rather of what
they cannot do.
Learning difficulties are called ‘learning disabilities’ in the United States of America and
are dealt with under the Individuals with Disabilities Education Act (Lyon, 1996). This act
specifies that the “term does not apply to children who have learning problems that are
primarily the result of visual, hearing, or motor disabilities, of mental retardation, or emotional
disturbance, or of environmental, cultural, or economic disadvantage” (Code of Federal
Regulations as cited in Lyon, 1996, p. 55). In the United Kingdom, the term ‘learning
difficulty’ is used to refer to problems that might arise due to medical, emotional or language
problems, whereas ‘learning disability’ is used to indicate an overall intellectual or functional
impairment (British Institute of Learning Disabilities, n.d., p.2). In New Zealand, the preferred
terms are ‘learning difficulties’ or ‘specific learning difficulties’ as these do not imply that the
learning problems are based on a physiological disability (Tunmer & Chapman, 2005).
Critique. The biggest problem with the definition used in the United States of America is
that children whose learning difficulties arise from environmental, cultural or economic
disadvantage are excluded. Yet these are the main risk factors for underachievement (Lyon et
al., n.d.). In the definitions from the United Kingdom and New Zealand there is still the
implication that the difficulty resides within the child and not within the educational
environment. Mitchell (1999, p. 205) states that the term used by the Ministry of Education,
“students with special education needs”, implies that the student is the problem and suggests
that it should be replaced with “learners who experience barriers to learning”. This term still
allows that the child requires help but does not place the source of the difficulty within the
child. Adequate definitions of learning difficulties and behaviour difficulties are needed to
ensure that all children are able to acquire the skills needed for a productive life.

15
Traditional Diagnostic Procedures
Behaviour Difficulties
Teacher nomination. Teacher nomination is the most commonly used means of
identifying children with severe behaviour difficulties (Parrish, 2002). Church (1996) found
that although teachers were mostly accurate in their identification of non-compliant or antisocial
children, they nominated one-third more than were identified by a well developed rating scale.
Teacher nominations are subject to bias depending on each teacher’s experience, knowledge
and tolerance levels. A teacher who has had much experience of children with behaviour
difficulties will be less likely to refer a child with moderate difficulties for specialist help,
whereas a teacher with little experience of children with behaviour problems is much more
likely to refer the child.
Diagnostic interviews. The parents of children with behaviour difficulties are often
interviewed using a structured interview. The most commonly used one is the Diagnostic
Interview Schedule for Children (DISC) (Church, 2003). This can be used by lay interviewers
in most settings but it does present a number of problems. The practicality of this interview has
been questioned due to the length of time it takes to administer, and its reliability and validity
has yet to be tested for all ages of children with behaviour difficulties.
Checklists and rating scales. Behaviour difficulties can also be diagnosed through the use
of checklists and rating scales (Sasso et al., 2001). These are used as screening tools for
children with severe behaviour problems, and diagnoses are often linked to the DSM
classifications. Three of the most commonly used scales are the Child Behaviour Checklist
(CBCL), Conners’ Rating Scales and the Strengths and Difficulties Questionnaire. These are
quicker to use than a full diagnostic interview, and are normally completed by the child’s
teacher and/or caregiver.

16
There is currently no standardized screening instrument specifically designed for New
Zealand students (Church, 2003). The revised version of the Canterbury Social Development
Scale is designed to identify children with behaviour difficulties in New Zealand. It consists of
30 items, 15 of which refer to antisocial behaviour and the other 15 which refer to social skills
(Church et al., 2006).
Direct observation. Direct observation of child behaviour was initially used for research
but has also been used in New Zealand classrooms for diagnostic purposes (Church, 2003).
There are two ways of making direct observations: one is narrative recording in which the
observer writes a descriptive account of the child’s behaviour and the antecedents and
consequences of this and the other is measuring the frequency of occurrence of categories of
behaviour. Direct observation tends rarely to be used for diagnosis because of the time and
expense involved. However, this is the only procedure that can be used to check the accuracy
of decisions made on the basis of data collected through interviews and rating scales.
Critique. Checklists and rating scales are the most commonly used tools for identifying
children with behaviour difficulties because they take less time than diagnostic interviews and
are more accurate than teacher nominations. However, they still generate a number of problems.
The correlation between teacher and parent ratings is often low, as is test–retest reliability. This
lack of reliability probably occurs as a result of differences in the interpretation of the category
definitions, different attitudes towards the child, different beliefs regarding the causes of a
child’s misbehavior, and different levels of individual tolerance for misbehavior (Hinshaw &
Zupan, 1997). In order for a diagnostic procedure to accurately reflect a child’s experience it
must measure and record behaviour frequency and function and do so with adequate accuracy
(Evans & Paewai, 1999). Most checklists have only a 3 to 5 point scale, and are therefore
severely limited in their capacity to assess frequency of occurrence (Sasso et al., 2001). This is
true for the assessment of both behaviour difficulties and learning difficulties. The behaviour of

17
two children might be similar, but where one child displays the behaviour 10 times during the
day for the other it may only occur twice. When assessing reading difficulty we must be able to
differentiate between a child reading at 50 words per minute and a child reading at 60 words per
minute, as this can be the difference between not understanding the text and reading with
comprehension.
A second weakness of this technique is that it is very difficult to obtain an accurate
measure of the relative frequency with which particular behaviours produce particular
consequences when using a rating scale. A child can be non-compliant for different reasons:
because he or she is bored, the work is too difficult or because he or she wants to avoid
interacting with the teacher. A child may have difficulty reading because he or she can not see
the words clearly, because English is a second language, or because he or she wants attention
from the teacher.
An additional problem with the checklists and rating scales is that most are based on the
DSM classification and its underlying assumptions that behaviour difficulties and learning
difficulties can be diagnosed on the basis of child behaviour alone.
Multiple gating procedures. The Systematic Screening for Behaviour Disorders (SSBD)
was designed to answer some of the above criticisms of diagnostic tests (Church et al., 2006). It
aims to identify children at primary school with emotional behaviour disorder by using a
multiple gating procedure to screen at risk children. It consists of a teacher nomination,
followed by two rating scales and then direct observation done in the classroom by a
professional other than the teacher. The direct observations include recording time on-task in
the classroom for 15 minutes over two different occasions and then social behaviour in the
playground over two 15 minute sessions. However, when Church et al. (2006) developed a
multiple gating procedure to use within New Zealand they found that the direct observations
that were recommended in the SSBD were insufficient to accurately identify the function and
18
frequency of the antisocial behaviour. Function was unable to be identified as the observations
were primarily designed to produce a measure of on-task behaviour. Frequency was unable to
be identified as the observations only took place for 15 minutes over two occasions.
Learning Difficulties
Psychometrics. The most common procedure for identifying children with learning
difficulties has been to look for an IQ-achievement discrepancy (Lyon, 1996). This procedure
is based on the assumption that IQ scores are a good predictor of a child’s ability to learn (Lyon
et al., n.d.). A marked discrepancy between a child’s IQ and his or her achievement in a
particular academic subject is assumed to indicate a learning disability.
Curriculum based measures. Curriculum based measures (CBM) can be used to identify
children with emerging academic learning problems (Alonzo, Ketterlin-Geller, & Tindal, 2007).
As a screening device CBM compares a child’s performance with that of same-aged peers, and
as a diagnostic tool it can provide information about specific skills deficits. CBM differs from
psychometric achievement testing in a number of ways. Hosp, Hosp, & Howell (2007) argue
that CBM is more closely aligned with the classroom curriculum, that it has proven reliability
and validity, that it uses criterion-referenced measures and standardized procedures, and that its
results are easily summarized for decision making. Curriculum based measures are quick to
administer and can be administered by the classroom teacher following relatively brief training
(Alonzo et al., 2007).
Critiques. It is now argued by many in the field that IQ-achievement discrepancies are a
poor way of identifying learning difficulties (Lyon et al, n.d.). First, IQ-achievement
discrepancy tests make the incorrect assumption that IQ scores can predict learning potential.
Second, to compare IQ scores with academic achievement scores can lead to many conceptual
and statistical problems as there are many different ways of calculating the discrepancy and
different decision rules that can be operated when a discrepancy is identified. Another problem

19
is that the IQ-achievement discrepancy procedures makes the early identification of learning
difficulties unlikely, as children need to initially fail academically in order to be recognised and
get the necessary help (Lyon et al, n.d.). Psychometric testing is also deficit oriented, in that the
difficulty is seen to be within the child. This means that the possibility of instructional failure is
ignored (Bourke & Mentis, 2007).
Functional Assessment
There have been a number of attempts to solve the problems posed by conventional
diagnostic measures and procedures. One recent development is called functional assessment
(Carr, 1994; Ervin et al., 2001; Iwata, Dorsey, Slifer, Bauman, & Richman, 1994).
Description of Functional Assessment
A functional assessment is designed to collect enough evidence to generate hypotheses
regarding the function of problem behaviour within a specific social environment (Church,
2003; Evans & Paewai, 1999; Smith & Sugai, 2000). Functional assessment is often followed
by a functional analysis in which selected environmental variables are manipulated to test the
existence of a causal relationship between the environment and the problem behaviour
(Anderson, English, & Hendrick, 2006; Horner, 1994; Roberts, Marshall, Nelson, & Albers,
2001). Functional assessment aims to discover why a person engages in problematic behaviour.
Functional assessment then seeks to change behaviour so that an effective intervention can be
designed.
History of Functional Assessment
Functional assessment was initially used in an attempt to identify the different causes of
problem behaviour for children with intellectual disabilities (Carr, 1994). At times the
challenging behaviours of children with intellectual disabilities, such as self-injury and
aggression, were potentially dangerous to themselves (Carr, 1994; Iwata et al., 1994; Smith &

20
Churchill, 2002). The severity of these problem behaviours demanded a quick intervention
rather than one that examined the environmental variables that maintained the behaviour (Iwata
et al., 1994). Early treatments attempted to superimpose strong reinforcing or punishing
contingencies over the existing, but often unknown, reinforcement contingencies (Gresham
et.al., 2004; Hanley, Iwata, & McCord, 2003; Mace, 1994). However because this method
disregarded the relationship between problem behaviour and the environmental conditions
maintaining it, it resulted in interventions involving much trial and error (Carr, 1994). In order
to find an effective intervention it is important to understand the cause of the individual’s
behaviour, and this means examining the positive and negative contingencies that are
maintaining the problem behaviour (Mace, 1994). It then becomes important to collect
sufficient data on environmental conditions to establish what these reinforcers are.
Carr (1977) reviewed the literature related to self-injury and found that there appeared to
be five commonly supported hypotheses regarding the motivation behind this behaviour. Carr
(1977) also concluded that motivation was determined by multiple factors. Carr’s initial five
hypotheses were later refined to four: “attention seeking, escape from tasks, the generation of
sensory reinforcement and access to tangible items or events” (Carr, 1994, p. 393). Iwata et al.
(1994) used a method that overcame the difficulties of the risky behaviours to test these four
hypotheses on nine participants who had developmental delays and showed self-injurous
behaviours. Iwata et al. (1994) advocates for the use of an environment that is well-controlled
and defined. This allows for greater control over how the behaviour is exhibited and over the
amount of time required for establishing a baseline (Iwata et al., 1994).
Functional assessment was mainly used in clinical settings where variables were able to
be tightly controlled by a supervising psychologist or therapist (Hoff, Ervin, & Friman, 2005;
Finkel, Derby, Weber, & McLaughlin, 2003). This was at times problematic as children did not
always engage in the expected problem behaviour in the clinical setting, possibly due to limited

21
exposure to the necessary variables (Ervin et al., 2001; Finkel et al., 2003). Functional
assessment was therefore moved to the classrooms of the children requiring intervention. More
recently, functional assessment has been extended to help normally developing children with
behaviour difficulties and learning difficulties (Ervin et al., 2001; Sasso et al., 2001). Doing
functional assessments in the classroom makes observation and analysis more difficult as there
are multiple antecedents and consequences for children’s responses. The research literature on
functional assessment has expanded alongside these new developments, but there are still
questions regarding the generalisability of the procedure across subjects, settings and
experimenters (Gresham et al., 2004).
Functional Assessment of Behaviour Difficulties
The 1997 amendment to America’s Individuals with Disabilities Education Act (IDEA)
required that functional behavioural assessment and positive behavioural supports and
interventions be used in schools for children who were at risk of expulsion or dismissal as a
result of their antisocial behaviour. This was reconfirmed by the reauthorised Individual with
Disabilities Education Act in 2004 (US Department of Education, n.d.). This legislation has
played an important part in ensuring the ongoing use and further development of functional
assessment (Gresham et al., 2004). However, functional assessments and analyses have only
recently been expanded to include assessment of normally developing children with behaviour
problems (e.g., Grandy & Peck, 1997; Ervin et al., 2001; Sasso et al., 2001). Ervin et al. (2001)
found that 70 per cent of school-based functional assessments involved children with cognitive
disabilities, compared to 18 per cent for children with behaviour difficulties and no cognitive
disability.
Step by step functional assessment and analysis for behavioural difficulties. Functional
assessment research for behaviour difficulties in the mainstream classroom does not yet have an
established set of fully researched and tested procedures (Hanley et al., 2003). There have been

22
a number of manuals on functional assessment published, and while they differ with respect to
details, they describe a common set of procedures (O’Neill et al., 1997; Umbreit, Ferro,
Liaupsin, & Lane, 2007; Watson & Steege, 2003). This common procedure has been described
by Church (2007b). It consists of both indirect and direct measures of behaviour. The aim is to
list the physical contexts in which the problem behaviours occur and to identify the required
replacement behaviours. A prioritising interview explores with the teacher which of the
behaviours needs to be worked on first. Once this is established, direct observations are made in
at least two different settings with a view to recording the frequency of occurrence of the
referred behaviour and the replacement behaviour. Observations start with a narrative recording
in order to identify the antecedents and consequences of the child’s behaviour. This can take
the form of an Antecedents, Behaviour and Consequences (ABC) Record Form. Once the
antecedents and consequences are known then it is important to measure how frequent the
child’s behaviour is so that when an intervention is implemented it can be determined whether
or not it is successful by measuring the frequency again. There are numerous behaviours that
can be recorded and the decision of which one to measure depends on the results of the
prioritising interview with the teacher. If inattention is the problem then permanent products
(e.g. assignments completed or number of words written) are counted. If the child’s antisocial
behaviour is the main problem then positive, negative, and neutral social responses to others are
recorded. The observer also records the consequences of the behaviour for the child, and
evaluates whether antisocial behaviours are reinforced or punished. This is followed by
functional analysis that addresses the following questions: Is this a performance or a learning
problem? Does the child actually know how, when and where to perform the replacement
behaviour? Is the child simply reacting to the aversive conditions which he or she is
experiencing in a particular context, or is it a case of early onset antisocial development? Once
these questions are answered, primary and secondary hypotheses can be generated regarding the

23
causes and maintenance of the child’s misbehaviour. To test these hypotheses, an intervention
plan is developed. The intervention is implemented for several days, and the child’s reaction to
the changed circumstances is used to support or negate the initial hypothesis.
Typical findings of functional assessments for behaviour difficulties. It has been found
through functional assessments that the most common motivations for inappropriate behaviour
in normally developing children are teacher attention, peer attention and escape from school
work (Broussard & Northup, 1997; Doggett, Edwards, Moore, Tingstrom, & Wilczynski,
2001).
Typical interventions suggested by functional assessments for behaviour difficulties.
Where the functional assessment indicates that the misbehaviour is maintained by teacher
attention the intervention required is to advise teachers to attend to appropriate behaviour and
ignore misbehaviour. There have been many demonstrations of rapid child behaviour change
following this intervention (Doggett et al., 2001; Grandy & Peck, 1997; Smith & Sugai, 2000).
Broussard and Northup (1997) and Sterling-Tuner et al. (2001) found that if peer attention is the
factor maintaining inappropriate behaviour in the classroom, then this can be used to shape
appropriate behaviour. Where the functional assessment indicates that the misbehaviour is
maintained by the negative reinforcement of escape from school work, there needs to be an
assessment made of the work to ensure it is not too hard. Among other positive reinforcements,
rewards can be given for completed work and materials can be swapped for more appropriate
ones (Hoff et al., 2005; Umbreit, 1995). Sometimes interventions can be self-managed
(Gumbel & Golan, 2000). Smith and Sugai (2000) found that a functional assessment and the
consequent use of a self-management strategy were successful in increasing on-task behaviour
for a 13 year old boy with behaviour difficulties. Grandy and Peck (1997) also used a self-
management intervention and found that it helped to teach the child to self-regulate by
removing the need for external reinforcers and that it used less of the teacher’s time. Other

24
benefits of a self-management system are that it is less inclined to extinction when the
intervention is removed and that it is portable to other settings (Grandy & Peck, 1997; Smith &
Sugai, 2000).
Functional Assessment with Learning Difficulties
There is an obvious link between behaviour and learning difficulties, in that if a child is
inattentive or failing to follow directions or complete tasks then they are unlikely to be learning.
This is one possible cause of a lack of academic progress. Another possible cause is the
selection of learning tasks which are either too easy or too difficult (Daly, Witt, Martens, &
Dool, 1997). Hence it is not sufficient simply to assess the child’s academic skills or simply to
observe the child’s behaviour in class. Both must be assessed in order to identify the cause of
the child’s learning difficulties and to pinpoint the best intervention for the child. Kern, Childs,
Dunlap, Clarke, & Falk (1994) found that a boy with emotional and behavioural difficulties was
using inappropriate behaviour to escape doing class work. By changing the curriculum slightly
to allow him to use a computer instead of handwriting, which he found difficult, escape-
motivated behaviour was reduced and the child began to complete his academic work.
Functional assessment to improve academic performance is an area of recent interest that
has yet to be fully developed (Ervin et al., 2001). The problem with extending the functional
assessment from behaviour difficulties to learning difficulties is that the cause of misbehaviour
lies in operant contingencies (performance deficits), which can be identified quickly, whereas
with learning difficulties the problem can lie in skills deficits which are more difficult to
identify and subsequently fix (Daly, et al., 1997). A functional approach to understanding
variations in academic progress is to relate achievement and/or failure to the instructional
contingencies which have been and are being provided (Daly et al., 1997).
Step by step functional assessment and analysis for learning difficulties. Work on the
functional assessment of learning difficulties is in the early stages of development. One

25
systematic approach has been described by Church (2007b). The functional assessment begins
with diagnostic testing designed to identify the level of development that has been achieved
with respect to necessary component skills. For children with reading delays this includes the
ability to discriminate between different letters and phonemes and knowing an age appropriate
number of letter-sound relations (Church, 2005). Decoding fluency and a large enough site-
word vocabulary are the next components to be evaluated. For the children with writing delays
a similar assessment is undertaken including phoneme discrimination and reading level
(Church, 2007a). This is followed by an assessment of handwriting and/or typing fluency and
phoneme to grapheme conversion fluency. A good level of knowledge of morphemes is
important for progress in spelling as is an age appropriate level of grammatical understanding.
Once these have been assessed the missing skills most urgently needing intervention can be
prioritised. Following this, direct observations are made of these skills being taught in the
classroom. During this time, the observer records when the child is (a) working on and (b)
avoiding working on the target skills. The observer also records the number of learning
opportunities that the child is experiencing for each of the missing skills and the immediate
consequences of the child’s correct and incorrect answers. The direct observational data is used
to address the following questions (Church, 2007b, p. 58): “Is the student currently receiving
instruction in each of the targeted component skills?” “Is this instruction sufficiently intensive
to ensure that the child will catch up to his or her peers?” “Is the practice which is being
received in each of the target skills the type of practice which is designed to build these skills to
fluency?” “Is the teaching which is being provided of sufficient quality to keep the error rate on
practice tasks below 15% and/or to produce improvements from session to session?” “Is the
student on-task for 90% of the time when working on learning and practice activities involving
the target skills?” “Is there a probe testing and recording procedure in place with respect to
each of the target skills so that the teacher can see the rate of progress that the child is making?”

26
“Have mastery criteria been specified for each of the target skills so that the learner can move
immediately to the next skill on the list as soon as one of the target skills has been mastered?”.
The answers to these questions allow primary and secondary hypotheses to be generated
regarding the potential causes of the learning difficulties. An intervention plan can then be
created to test these hypotheses. At this point Curriculum Based Management can be used to
find the child’s frustration level versus instructional level, and then the curriculum can be
manipulated to generate learning tasks at the right level of difficulty (Roberts et al., 2001). The
intervention can be implemented for three to four weeks and the hypotheses checked against the
child’s progress.
Typical findings of functional assessments for learning difficulties. Functional assessment
and analysis of learning difficulties tends to identify factors external to the child (Daly et al.,
1997). The four most commonly observed causes of learning difficulties are that the child does
not want to do the work, that he or she has not spent enough time practising the missing skill,
that there has not been sufficient instruction on how to perform practice tasks or that the
practice tasks are too difficult (Daly et al., 1997).
Types of interventions which result from functional assessment of learning difficulties.
There are many different interventions that are recommended for learning difficulties. Walberg
(as cited in Daly et al., 1997) reviewed 8000 studies of academic performance and concluded
that two interventions produced the largest overall effect in improving performance: providing
shaping and comprehensive feedback, and giving incentives to work quickly and accurately.
Roberts et al. (2001) listed a number of interventions which have research support and which
result in improvements in the rate of learning. These include direct instruction and practice, self-
instructional strategies such as ‘cover, copy compare’ and rewards for accuracy and completion.

27
The Treatment Integrity of Functional Assessments Undertaken by Classroom Teachers
The early extensions of functional assessment for normally developing children with
behaviour difficulties and learning difficulties in mainstream classrooms were directed and
controlled by psychologists, therapists and researchers. Ervin et al. (2001) state that the 1997
Amendments to the Individuals with Disabilities Act required school personnel in America to
be trained in the skills of functional assessment. The interesting question is whether or not
teachers can learn the functional assessment procedures, and if so, whether or not teachers can
learn to make good or effective intervention decisions based on the functional assessment data
they have collected.
Treatment integrity refers to the extent to which a procedure, which has been shown to be
effective under well-controlled research conditions, can be implemented in a real life setting
with the same degree of fidelity as it was in the well-controlled settings (Gresham, MacMillan,
Beebe-Frankenberger, & Bocian, 2000; Lane, Bocian, MacMillan, & Gresham, 2004).
In a review of the functional assessment literature from 1980 to 1999, Ervin et al. (2001)
found that it was the experimenter who was most likely to complete functional assessment.
School personnel performed this task only 21 per cent of the time without assistance. School
personnel managed the interventions without assistance 23 per cent of the time. Treatment
integrity was measured for manipulated variables and/or treatment conditions in 57 per cent of
studies. Treatment integrity was reported to be high in most of the studies in which data was
collected.
Gansle & McMahon (1997) used 21 teachers and 49 students within those teachers’
classrooms to test the importance of treatment integrity. They did this by monitoring the effects
of differing levels of treatment integrity (100, 83.3 or 66.7 per cent) on targeted positive and
negative classroom behaviours. It was expected that the highest level of behaviour
improvements would occur with the 100 per cent treatment integrity level. However, even with

28
92 per cent treatment integrity relative to the teacher’s assigned level of treatment integrity, the
results showed similar levels of improved behaviour across all intensities of treatment integrity.
It is important to point out here that in terms of assessment the teachers were told to choose one
positive and one negative behaviour that they felt had the most adverse effect on the students'
educational success and these became the target behaviours for the intervention. This method
does not meet criteria for being a functional assessment and the minimal progress made across
the differing levels of treatment integrity intensity could well be due to the intervention
chosen (tangible rewards) not being the intervention which was actually required.
Research within the area of treatment integrity has highlighted the importance of correct
implementation of interventions in order to achieve the desired results (Gresham et al., 2000;
Lane et al., 2004).
Critiques and Some Preliminary Answers
Functional assessment is a useful tool to use within the classroom as it seeks to discover
the causes of behaviour difficulties and learning difficulties. Functional assessment then uses
this information to construct the most appropriate intervention given the circumstances. The
procedure does, however, pose a number of potential difficulties for teachers trying to
implement it within their classroom (Hoff et al., 2005; Iwata et al., 2000).
One potential limitation of functional assessment is that it requires the long term
observation of behaviour and consequences, so is impractical for behaviours that are low-
frequency but high-intensity like fighting, possession of weapons and occasional truancy. In
these situations indirect measures such as teacher and parent interviews and rating scales may
be more practical than direct observation (Mitchell, 2008; Sasso et al., 2001).
It is important to ask whether classroom teachers can learn the functional assessment
procedure. Functional assessments require many skills that a teacher may not have, such as
knowing how to make direct observations and design fluency tests (Hoff et al., 2005). The

29
assessment procedure also requires knowledge that the teacher may not have, such as
knowledge of behavioural function and the effects of contingencies of reinforcement and
punishment (Hoff et al., 2005). Iwata et al. (2000) claim that the basic skills needed for
conducting a functional analysis can be taught within two hours. If this is so then many
teachers could soon be instructed in functional assessment and so acquire the ability to identify
the causes of behaviour difficulties and learning difficulties.
Other research suggests that functional assessment within the classroom requires an
extensive time commitment that teachers may not feel they can afford (Hoff et al., 2005). This
is a real problem as most classrooms contain 20 to 30 students. However, if functional
assessment is the best available diagnostic and intervention tool available for children with
behaviour difficulties or learning difficulties then this time issue needs to be further examined.
Kern et al. (1994) advocate that the analysis and intervention should be feasible and practical in
order for teachers to be willing to implement it. Riley-Tillman and Chafouleas (2003) say that
the best way to introduce new practices is by initially requiring small adaptations to the
classroom teacher’s system. These smaller changes are more likely to be implemented correctly
and maintained allowing for gradual implementation of the whole programme.
When faced with a question of the form “Will the teacher be able to…?” we need to use a
particular kind of research method. We need to work with individual teachers in an attempt to
find out (a) which parts of the procedures they can apply, (b) which parts they need assistance
with and (c) which parts of the procedure are too difficult to apply. Since each struggling child
has a different set of teaching needs this kind of research can only be undertaken on a case-by-
case basis.

30
Review of Previous Research
The aim of this review was to locate studies that involved teachers who were attempting
to implement functional assessments in mainstream classrooms.
To select articles for possible inclusion, the PsycINFO electronic database was scanned
for the following terms: treatment integrity (or treatment fidelity, treatment reliability,
procedural integrity, procedural fidelity and procedural reliability), teacher* and functional
assessment (or functional analysis*). These searches were limited by: (a) publication type: peer
reviewed journals; (b) language = English; and (c) type = children aged 2 to 17 years old. Other
articles were also found by reading through the reference section of articles selected from the
electronic database search and articles read on functional assessment and analysis.
Empirical studies which met the following criteria were included in the review:
• Teachers attempted the functional assessment and functional analysis, with or
without support from others
• With children who had been referred with behaviour and/or learning difficulties
that could not be attributed to intellectual or physical impairment
• In a mainstream classroom setting.
Results
The literature search produced six investigations in which the teacher implemented
interventions based on the results of a functional assessment for children with behaviour and/or
learning difficulties in a mainstream classroom. These studies are described in Table 1.
From Table 1, it can be seen that there exists only a small number of experiments that have
examined what happens when teachers attempt to implement functional assessment and
interventions with normally developing children in mainstream classrooms. Most of these
studies are very recent. Five of these studies involved children with behavioral difficulties and
one involved children with learning difficulties. In all cases the analysis and interventions were

31
guided by consultants. There appear to be no naturalistic studies of teachers completing
functional assessments and implementing interventions without consultation or assistance.
The treatment integrity of teachers’ interventions appears to have been rarely measured, as can
be seen by the limited number of article reports found for review. The results indicate that the
teacher’s implementation of an individualized intervention may deteriorate after the consultant
is no longer overseeing it but that this can be reduced by providing performance feedback.

32
Tab
le 1
. Overview of Empirical Studies Involving Teachers Attempting Functional Assessments with Children with Behaviour or Learning
Difficulties in Mainstream Classrooms
Auth
or(
s)
Num
ber
of
childre
n in
gen
eral
educa
tion
settin
g a
nd oth
er
sele
ctio
n c
rite
ria
Funct
ional
asse
ssm
ent done
by:
Funct
ional
anal
ysi
s
des
igned
by:
Imple
men
tation
of
inte
rven
tion
done
by:
Res
ults
Witt, N
oel
l,
LaFle
ur,
&
Mort
enso
n
(1997)
- T
each
ers
= 4
- C
hildre
n =
4 b
oys
with p
erfo
rman
ce
def
icits.
Consu
ltan
t did
asse
ssm
ent in
3
phas
es: per
form
ance
def
icit s
cree
nin
g,
rew
ard p
refe
rence
surv
ey &
anal
ogue
trea
tmen
t as
sess
men
t.
Consu
ltan
t did
an a
nal
ogue
test
of
a fa
iled
work
shee
t an
d a
rew
ard
pre
fere
nce
.
Tea
cher
N
one
of
teac
her
s m
ainta
ined
tre
atm
ent
inte
gri
ty a
bove
80%
for
more
than
2 d
ays
afte
r tr
ainin
g, but post
-per
form
ance
feed
bac
k tre
atm
ent in
tegri
ty w
as h
igher
.
The
level
of
trea
tmen
t in
tegri
ty a
ffec
ted the
acad
emic
outc
om
e of
the
childre
n.

33
Tab
le 1
(co
ntinued
). Overview of Empirical Studies Involving Teachers Attempting Functional Assessments with Children with Behaviour or
Learning Difficulties in Mainstream Classrooms
Auth
or(
s)
Num
ber
of
childre
n in
gen
eral
educa
tion
settin
g a
nd oth
er
sele
ctio
n c
rite
ria
Funct
ional
asse
ssm
ent done
by:
Funct
ional
anal
ysi
s
des
igned
by:
Imple
men
tation
of
inte
rven
tion
done
by:
Res
ults
Noel
l, W
itt,
Gilber
tson,
Ran
ier,
&
Fre
elan
d
(1997)
- T
each
ers
= 3
- C
hildre
n =
3 w
ith
acad
emic
per
form
ance
def
icits
1 g
irl, 3
rd g
rade,
mat
hs.
1 b
oy, 3
rd g
rade,
mat
hs
1 b
oy, 3
rd g
rade,
read
ing.
Consu
ltan
t did
asse
ssm
ent in
3
phas
es: per
form
ance
def
icit s
cree
nin
g,
rew
ard p
refe
rence
surv
ey &
anal
ogue
trea
tmen
t.
Consu
ltan
t did
an a
nal
ogue
test
of
a fa
iled
work
shee
t an
d a
rew
ard
pre
fere
nce
.
Tea
cher
T
reat
men
t in
tegri
ty s
tead
ily d
eclined
over
tim
e until per
form
ance
fee
dbac
k p
rovid
ed.
Then
moder
ate
to h
igh lev
els
of
trea
tmen
t
inte
gri
ty. T
wo o
f th
e th
ree
childre
n’
gra
des
impro
ved
fro
m p
retr
eatm
ent to
mai
nte
nan
ce. It
is
unknow
n w
hy the
3rd
child’s
per
form
ance
did
not in
crea
se, but it
could
be
due
to h
er h
igh r
ate
of
abse
nce
(23%
).

34
Tab
le 1
(co
ntinued
). Overview of Empirical Studies Involving Teachers Attempting Functional Assessments with Children with Behaviour or
Learning Difficulties in Mainstream Classrooms
Auth
or(
s)
Num
ber
of
childre
n in
gen
eral
educa
tion
settin
g a
nd oth
er
sele
ctio
n c
rite
ria
Funct
ional
asse
ssm
ent done
by:
Funct
ional
anal
ysi
s
des
igned
by:
Imple
men
tation
of
inte
rven
tion
done
by:
Res
ults
Muel
ler,
Edw
ards,
&
Tra
han
t
(2003)
-Tea
cher
s = 1
-Childre
n =
1 m
et
criter
ia (
out of
3 in the
study)
boy, 7yrs
, w
ith
pro
ble
m b
ehav
iour.
Consu
ltan
t did
indir
ect as
sess
men
t
via
inte
rvie
w o
f
teac
her
and then
funct
ional
anal
ysi
s
usi
ng d
irec
t
obse
rvat
ion.
Consu
ltan
t an
d
teac
her
found
that
pro
ble
m
beh
avio
ur
mai
nta
ined
by
esca
pe
from
task
.
Tea
cher
T
he
child’s
lev
el o
f pro
ble
m b
ehav
iour
was
low
er d
uri
ng the
imple
men
ted inte
rven
tion
of
dif
fere
ntial
rei
nfo
rcem
ent of
alte
rnat
ive
beh
avio
ur
than
it had
bee
n d
uri
ng b
asel
ine.
The
teac
her
im
ple
men
ted the
inte
rven
tion
with 9
0-1
00%
tre
atm
ent in
tegri
ty.

35
Tab
le 1
(co
ntinued
). Overview of Empirical Studies Involving Teachers Attempting Functional Assessments with Children with Behaviour or
Learning Difficulties in Mainstream Classrooms
Auth
or(
s)
Num
ber
of
childre
n in
gen
eral
educa
tion
settin
g a
nd oth
er
sele
ctio
n c
rite
ria
Funct
ional
asse
ssm
ent done
by:
Funct
ional
anal
ysi
s
des
igned
by:
Imple
men
tation
of
inte
rven
tion
done
by:
Res
ults
Zin
tl (
2005)
- T
each
ers
= 3
-Childre
n =
10, ag
ed
8 –
9yrs
, w
ith r
eadin
g
dif
ficu
ltie
s.
Consu
ltan
t did
com
ponen
t sk
ills
test
ing.
Consu
tant
Tea
cher
allo
cate
d tim
e
and p
eer
tuto
r
& c
onsu
ltan
t
monitore
d
imple
men
tation.
For
9 o
ut of
the
10 c
hildre
n, th
eir
mea
n
dec
odin
g f
luen
cy d
ouble
d a
nd h
ad a
64%
impro
vem
ent in
pro
se r
eadin
g f
luen
cy. O
ne
teac
her
did
not fi
nd tim
e duri
ng 2
nd &
3rd
wee
k to a
lloca
te p
ract
ice
tim
e an
d
impro
vem
ent re
ached
a p
late
au f
or
his
childre
n.

36
Tab
le 1
(co
ntinued
). Overview of Empirical Studies Involving Teachers Attempting Functional Assessments with Children with Behaviour or
Learning Difficulties in Mainstream Classrooms
Auth
or(
s)
Num
ber
of
childre
n in
gen
eral
educa
tion
settin
g a
nd oth
er
sele
ctio
n c
rite
ria
Funct
ional
asse
ssm
ent done
by:
Funct
ional
anal
ysi
s
des
igned
by:
Imple
men
tation
of
inte
rven
tion
done
by:
Res
ults
Sta
ge
et a
l.
(2006)
- T
each
ers
= 1
- C
hildre
n =
1 m
et
critre
ria
(out of
3 in
the
study),
boy, 4yrs
,
with p
roble
m
beh
avio
ur.
Consu
ltan
t did
indir
ect as
sess
men
ts
that
rep
ort
ed s
ettings,
ante
ceden
ts, pro
ble
m
beh
avio
urs
and
conse
quen
ces.
Consu
ltan
t
des
igned
anal
ysi
s to
tes
t
gai
nin
g tea
cher
atte
ntion a
nd
esca
pe
from
task
.
Tea
cher
In
appro
pri
ate
beh
avio
r dro
pped
to b
elow
20%
when
the
child w
as tau
ght to
req
ues
t
hel
p inst
ead o
f at
tention s
eekin
g in o
ther
way
s w
hic
h o
ccurr
ed 2
0-4
0%
of
the
tim
e in
bas
elin
e. T
each
er s
how
ed 1
00%
inte
gri
ty in
imple
men
ting inte
rven
tion.

37
Tab
le 1
(co
ntinued
). Overview of Empirical Studies Involving Teachers Attempting Functional Assessments with Children with Behaviour or
Learning Difficulties in Mainstream Classrooms
Auth
or(
s)
Num
ber
of
childre
n in
gen
eral
educa
tion
settin
g a
nd oth
er
sele
ctio
n c
rite
ria
Funct
ional
asse
ssm
ent done
by:
Funct
ional
anal
ysi
s
des
igned
by:
Imple
men
tation
of
inte
rven
tion
done
by:
Res
ults
Wood,
Um
bre
it,
Lia
upsi
n, &
Gre
sham
(2007)
- T
each
ers
= 1
- C
hildre
n =
1 b
oy,
8yrs
, w
ith b
ehav
iour
dif
ficu
ltie
s
Consu
ltan
t did
an
inte
rvie
w w
ith
teac
her
and c
hild a
nd
des
crip
tive
dir
ect
obse
rvat
ion.
Consu
ltan
t T
each
er
When
tre
atm
ent in
tegri
ty w
as h
igh, on-t
ask
beh
avio
ur
occ
urr
ed in 9
1%
of
inte
rval
s.
When
tre
atm
ent in
tegri
ty w
as low
, on-t
ask
beh
avio
ur
occ
urr
ed in 9
% o
f in
terv
als.
O
n-
task
beh
avio
ur
was
show
n to d
irec
tly r
efle
ct
the
teac
her
’s tre
atm
ent in
tegri
ty.

38
Aims of the Present Study
The aim of the present study was to extend the limited research on the practicality of
teachers completing functional assessments and interventions within mainstream classrooms.
Previous research has shown that teachers tend to be more involved at the intervention stage
than at the functional assessment and analysis stage. The present study addresses the questions
of whether (a) teachers can perform functional assessments of the apparent behaviour difficulty
or learning difficulty and (b) design and implement an intervention appropriate for children with
behaviour difficulties or learning difficulties.

39
CHAPTER 2
GENERAL METHOD
Subjects and Setting
The participants for the present study included one primary school teacher and six
children from her Year 2 class in a Decile 3 urban primary school. The classroom teacher had a
Bachelor of Teaching and Learning (Primary) and was studying for her Masters degree. She
was in her second year of teaching and had taught Year 2 in her previous year also. The six
children were all aged 6 to 7 years of age. The children included five boys and one girl. At the
time of the study, the class contained 25 students. The class was taught by just one teacher
except during her release time on Wednesday mornings. A regular release teacher taught the
class during this time.
The teacher was enrolled in a Masters course which included the requirement to complete
a functional assessment of a child with behaviour difficulties or learning difficulties in the
classroom. The teacher welcomed the suggestion that further research be done within her
classroom on this same subject.
An application for this project was submitted to the University’s Human Ethics
Committee and was approved, provided that all identifying details of the school, teacher and
children remained anonymous; the teacher approved all assessments and interventions; and the
parents and children gave their informed consent. Appendix 1 gives the ethical approval letter.
During the approval process, a letter was sent to the school principal requesting permission to
approach the participating teacher. Once approval had been received from both the University’s
Human Ethics Committee and the principal, a letter was sent out to the teacher and later to
selected parents/caregivers. The letter sent to the teacher had a consent form attached for her to
complete, as did the letter sent to the parents/caregivers that asked for approval for their child to

40
participate in the study. A verbal explanation of the study was read out to the children and any
further questions that they had were answered before proceeding with any assessment.
The children were selected by the classroom teacher following a request to identify
children who had behaviour difficulties or learning difficulties and who were not currently
receiving help from outside their own teacher and classroom. Six children were identified. The
teacher was asked to identify any disabilities that could be causing the behavioural or learning
difficulties. No children were removed from the sample for this reason. Children who had
prescription glasses were checked to ensure that they wore these when required.
The writer met with the teacher a number of times before meeting any of the children or
observing in the classroom. The teacher expressed no preference regarding times that the writer
visited the classroom. The writer arranged to email the teacher 24 hours before each intended
visit.
The classroom was very neat with lots of examples of the children’s art work on the wall.
The class was well managed and ran to time most days. During the day the teacher set a
mixture of individual and group tasks in different subjects. Children were taught by the teacher
from the mat, at the children’s desks, or in small groups at the ‘jellybean table’. This was a
table in one corner of the room that the teacher used for teaching small groups. During reading
and mathematics times different tasks were set that were appropriate for the various levels of
ability in the classroom. These were to be completed by the children individually at their desk
while the teacher worked with a small group of children at the jellybean table. When the
academic task was finished the children were expected to work or play quietly at the different
reading or mathematics activities provided in the classroom.
The teacher addressed misbehaviour in appropriate ways. She tried not to reward
attention seeking behaviour and tried to ensure that other children were not subjected to
inappropriate behaviour. The teacher used an effective behaviour management programme that

41
included positive reinforcement (an individual sticker reward system) as well as positive and
negative punishment (being sent to the principal and removal of privileges). One difficulty with
the classroom was that it was in an L shape and this meant that if the teacher was at her desk or
the jellybean table, she could not scan the whole classroom without moving.
The teacher was required to do a certain amount of assessment with her class. This
consisted of a reading running record for each child every term and a normed mathematics
assessment. Other assessments were more informal and consisted of regular checks of the
children’s work.
Functional Assessment
For the functional assessments within the classroom, indirect and direct assessment
procedures were used. These included behaviour rating scales, systematic observation using an
interval recording procedure, and narrative description.
The behaviour rating scale used was the Social Development Scale (SDS). This estimates
the frequency of occurrence of antisocial behaviour displayed by the child in the classroom.
The SDS consists of 30 items, is completed by the classroom teacher, and takes approximately 8
minutes to do. Form B, for children in Years 1 to 4, was used in the present study. If the
teacher referred a child for behaviour problems, she was given one of these rating scales to
complete. The SDS has been found to identify children with antisocial behaviour with 95 per
cent accuracy. Scores below 105 out of a possible total of 150 indicate antisocial development
(Church et al., 2006).
During the direct observations the writer tried to not stand out in the classroom
environment, since it is known that an additional person within the environment can affect the
child’s behaviour (Liberty, Clark, & Solomon, 2000). Direct observations were used to collect
information regarding time on-task and the ratio of positive to negative social interactions with

42
others in the classroom. The interval recording procedure for time on-task consisted of
counting the proportion of 5 second intervals that the child was on-task. On-task behaviour was
defined as attending to an assigned task for at least 3 of 5 seconds and was recorded by marking
a tick in the appropriate box of the recording form. Off-task behaviour was defined as attending
to tasks or behaviours other than those which are set or permitted by the teacher and was
recorded with a cross. The recording procedure for measuring the proportion of pro-social and
antisocial behaviour was the Antisocial Development Screen (ADS). In the ADS, Social
interactions (both initiations and responses) are coded as ether positive, neutral or negative
(Church & Tyler-Merrick, 2007). Positive and neutral interactions include all interactions and
attempts to interact with anyone else other than those coded as negative. Negative interactions
are coded into one of six subcategories. The first is non-compliance/defiance, which is defined
as the child not complying with a specific instruction given to the class or individual within 25
seconds. The second subcategory is verbal abuse/swearing at someone. This is defined as
derogatory verbal behaviour directed towards another person. The third is negative verbal
behaviour. This is defined as all negative verbal behaviour that does not fall into the above two
categories and this can include behaviours like whining and threats. Inappropriate physical
behaviour is defined as all pushing and hitting type actions. The fifth subcategory, dangerous
physical, includes all attempts to intentionally hurt the other person. The final subcategory is
other antisocial behaviour and is defined as behaviour that is unacceptable within the setting but
which does not fall into one of the above subcategories. Additionally, the behavioural response
of the teacher and other children to the observed child is coded. These responses are coded as
positive or negative. A positive response is defined in one of three ways. A continuance is
when someone else complies with a request, answers a question or continues the conversation.
A positive reaction is when someone else responds with some form of positive verbal or non-
verbal action, like a smile. A reward is the third type of positive response. Negative responses

43
are defined in two ways. The first is a negative verbal reaction which includes a reprimands,
warnings or reminders of a rule. The second is punishment. This includes planned ignoring,
time out, loss of privilege and so on.
Samples of completed academic work were collected for the six children involved in the
case experiments. These samples included writing and mathematics. The teacher also assessed
the reading level and mathematical level of each participating child.
The classroom teacher completed a Weekly Reflection sheet which asked about the extra
work required by the assessments and interventions that were being implemented, whether the
teacher was receiving any assistance and whether she wanted any additional support during
implementation. The Weekly Reflection sheet appears in Appendix 2.

44
CHAPTER 3
CASE EXPERIMENT 1: ANDY
Subject and Setting
Andy was a 6-year old boy. According to a reading assessment previously completed by
the classroom teacher Andy’s reading age was 10.5 years and his mathematics level was above
the national average for his age. His teacher also reported that he had a group of friends with
whom he socialised in the playground without any reported disruptions.
During reading and mathematics time, the classroom teacher worked with a group of
children while the other children were expected to work or play quietly at the different reading
or mathematics activities provided in the classroom. The classroom teacher had observed that
Andy rarely started or followed through on an activity that was not prescribed by her. The
teacher also reported that Andy often appeared to be involved in distracting others from their
chosen tasks.
Andy scored 109 on the Canterbury Social Development Scale. Church et al. (2006)
reports that children who score less than 105 out of a possible 150 are at risk of antisocial
development.
Functional Assessment
In order to determine if Andy was on-task at an equivalent frequency to his peers, the
classroom teacher made a number of interval recordings. The teacher observed and recorded
Andy’s on/off-task behaviour and a variety of other children during different times of the day at
different activities. Her records showed that his on-task behaviour ranged from 0 to 70 per cent
when working in a group situation during self-selected reading and mathematics. His peers
were on-task in the same situations from 70 to 100 per cent of the time. Interval recording of

45
Andy during independent activities set by the classroom teacher showed a range of 60 to 99 per
cent on task behaviour. The results suggested that Andy was finding it difficult to stay on task
when working with a group on a self selected activity but was able to stay on-task when
assigned work to do on his own by the teacher.
The teacher then did some narrative observations of Andy during self-selected reading
and mathematics. These showed that Andy struggled to engage in group activities and often
lost interest soon after he began. He then distracted others from their chosen activities. In order
to determine how often Andy displayed antisocial behaviour and how his peers reacted to it, the
writer made observations of Andy using the Antisocial Development Screen (Church et al.,
2006). Child behaviour was coded, as described in Chapter 2, as an initiation or response that is
either socially neutral, positive or negative. The classroom’s and teacher’s response to Andy’s
behaviour was coded as either a positive or negative response. These were made during self-
selected group activities in reading and mathematics sessions. Andy appeared to struggle
particularly with playing board games and often cheated by throwing the dice out of turn, re-
rolling to get a higher number, changing the rules of the game to suit himself, or leaving the
game entirely if he was not winning. His peers did not seem to react to his cheating or his
attempts to distract them from their activities.
The ADS observations were made during both self-selected reading and mathematics
activities. During self-selected reading, Andy displayed positive or neutral social interactions 34
per cent of the time. Out of the remaining time, in which he displayed negative social
interactions, his peers responded positively 98 per cent of the time. During self-selected
mathematics, Andy displayed positive or neutral social interactions 61 per cent of the time and
in the remainder of the time he had a positive response from his peers 69 per cent of the time.
These results indicated that Andy’s negative social interactions were often responded to with
positive social reactions from his peers. Andy’s most common negative social interactions were

46
cheating at a game and initiating and continuing negative verbal interactions. It was observed
that the other children with whom Andy was playing either did not recognise or see his cheating
or did not know how to respond to it.
Andy appeared to respond well to direction from the teacher and worked well on his own,
but struggled to initiate and maintain self-selected group activities with his peers. He engaged
in antisocial behaviour like cheating and arguments rather than risk losing a game. With
Andy’s antisocial behaviour being continually reinforced by his peers it seemed likely that it
would continue.
The two hypotheses were that Andy was capable of being on-task during self-selected
group activities in reading and mathematics sessions and that his antisocial behaviour was being
reinforced by his peers.
Intervention
Goals Set by the Classroom Teacher
The teacher set Andy the following goals. During a reading or mathematics lesson with
self-selected group activities, Andy will start looking for an activity within 5 seconds, use kind
and quiet words, use kind hands and feet, play fair, and tidy up for each session over three
weeks.
The teacher defined off task behaviour to include delaying the start of an activity,
cheating while playing a game, inappropriate negative verbal or physical exchanges and not
packing up the equipment correctly at the end of the session. Cheating was defined as looking
at others’ cards, rolling the dice twice in a row, not waiting to take turns, controlling the game in
some way in order to win or giving up before completion to avoid losing. On-task behaviour
was defined as Andy achieving the goal set by his classroom teacher.

47
Recording Procedures
The teacher and the writer made recordings at 5 second intervals for 20 minutes during
self-selected reading and mathematics sessions to record Andy’s on/off task behaviour.
Observations were mainly done independently by the classroom teacher or the writer over the
four weeks, but 20 per cent of the recordings across all phases of the case experiment were done
simultaneously by both the classroom teacher and the writer to assess inter-observer agreement.
Inter-rater agreement was calculated by dividing the total number of interval agreements by the
total number of intervals and multiplying by 100. The intervals were signalled to the observers
by an automated beep generated by the classroom computer through ear phones. When both
observers were recording simultaneously the computer generated signal was delivered through
the computer speakers. Initially these signals proved a bit of a distraction for the children in the
classroom, but they quickly came to be ignored.
Observations were made on Monday, Tuesday, Wednesday and Thursday for reading
sessions and on Monday, Tuesday, Thursday and Friday for mathematics sessions. Mean inter-
rater reliability was 96 per cent (range 96 to 97 per cent) for on-task behaviour during self-
selected reading and 96 per cent (range 87 to 100 per cent) for on-task behaviour during self-
selected mathematics activities.
Intervention Strategies Selected by the Classroom Teacher
The teacher decided to use a self- and peer-monitoring programme with fixed ratio
reinforcement in order to test the hypotheses (a) that Andy’s off-task behaviour was due to his
choosing not to work and (b) that his negative social behaviour was being reinforced by his
peers. The intervention included an environmental change and a self-management contract.
The environmental change was that the other students in the class were made aware of Andy’s
contract and agreed to support Andy when working as part of his group during the self-selected
activity sessions. The classroom teacher presented a small teaching session that involved

48
discussing the different aspects of fair play, what it looks like, what it does not look like and
how to respond to children who are not behaving appropriately. The self-management contract
required Andy, along with his peers and the classroom teacher, to evaluate his behaviour at the
end of each session. Twice a day, four times a week, the classroom teacher gathered all of the
children together on the mat and asked first Andy and then his classmates if he had achieved the
five goals that he had been set.
The evaluation consisted of a laminated printed hand on which smiley faces could be
drawn to indicate that one of the five goals (one for each finger) had been meet. If one of the
goals had not been consistently achieved throughout the session then no smiley face was drawn
on that finger. At the end of the evaluation, Andy had a possible total of five smiley faces
drawn on the hand. A separate evaluation took place for reading and for mathematics, so there
was a total of eight opportunities over the week for Andy’s achievement of his goals to be
assessed. The number of smiley faces was recorded after each session on a weekly tally sheet
(Appendix 3). In Intervention 1, if Andy had reached the required number of smiley faces for
that session he was rewarded. The reward was given immediately. The reward was chosen by
Andy from a list that included 10 minutes on the computer or in the playground with a friend, 3
stickers on his sticker chart, or time in Room 5 where his favourite teacher taught. The sticker
chart was part of a pre-existing token economy programme within the classroom where 20
stickers resulted in a prize from ‘the box’.
Intervention Procedures
Week 1 – Baseline. Andy was observed during self-selected reading and mathematics
activities before an intervention was implemented in order to get a baseline of his behaviour
during these times. Andy was not informed that he was being observed for this purpose.
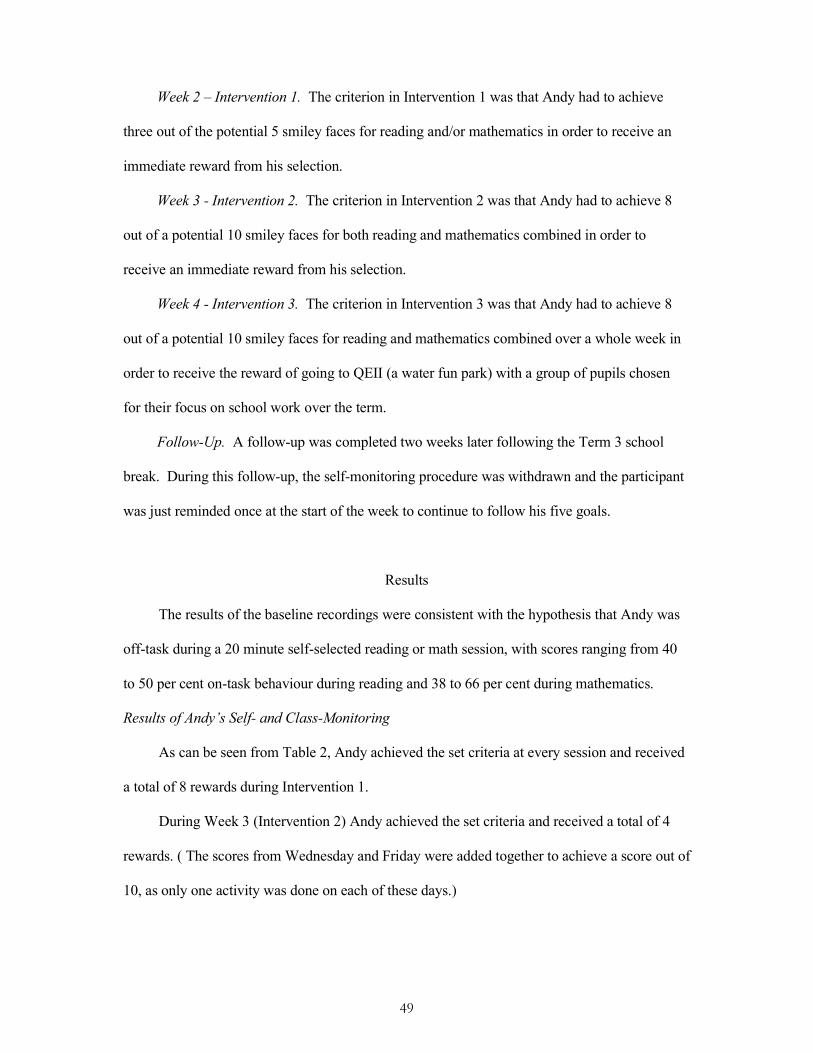
49
Week 2 – Intervention 1. The criterion in Intervention 1 was that Andy had to achieve
three out of the potential 5 smiley faces for reading and/or mathematics in order to receive an
immediate reward from his selection.
Week 3 - Intervention 2. The criterion in Intervention 2 was that Andy had to achieve 8
out of a potential 10 smiley faces for both reading and mathematics combined in order to
receive an immediate reward from his selection.
Week 4 - Intervention 3. The criterion in Intervention 3 was that Andy had to achieve 8
out of a potential 10 smiley faces for reading and mathematics combined over a whole week in
order to receive the reward of going to QEII (a water fun park) with a group of pupils chosen
for their focus on school work over the term.
Follow-Up. A follow-up was completed two weeks later following the Term 3 school
break. During this follow-up, the self-monitoring procedure was withdrawn and the participant
was just reminded once at the start of the week to continue to follow his five goals.
Results
The results of the baseline recordings were consistent with the hypothesis that Andy was
off-task during a 20 minute self-selected reading or math session, with scores ranging from 40
to 50 per cent on-task behaviour during reading and 38 to 66 per cent during mathematics.
Results of Andy’s Self- and Class-Monitoring
As can be seen from Table 2, Andy achieved the set criteria at every session and received
a total of 8 rewards during Intervention 1.
During Week 3 (Intervention 2) Andy achieved the set criteria and received a total of 4
rewards. ( The scores from Wednesday and Friday were added together to achieve a score out of
10, as only one activity was done on each of these days.)
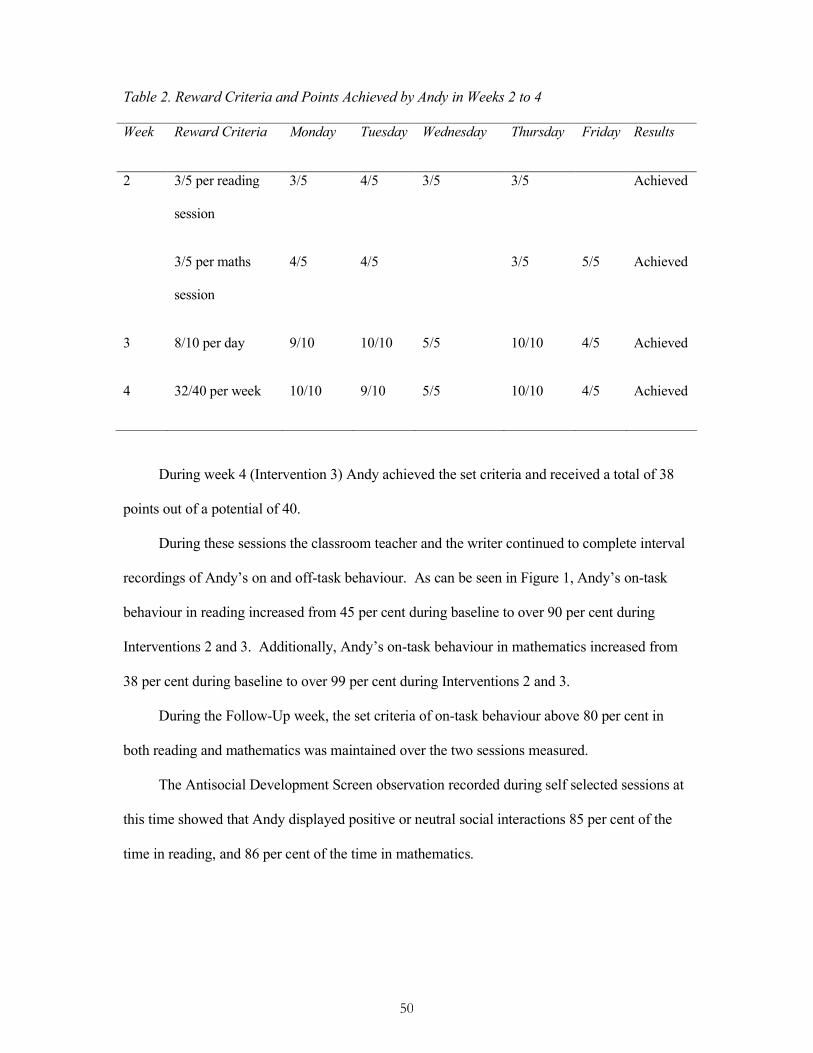
50
Table 2. Reward Criteria and Points Achieved by Andy in Weeks 2 to 4
During week 4 (Intervention 3) Andy achieved the set criteria and received a total of 38
points out of a potential of 40.
During these sessions the classroom teacher and the writer continued to complete interval
recordings of Andy’s on and off-task behaviour. As can be seen in Figure 1, Andy’s on-task
behaviour in reading increased from 45 per cent during baseline to over 90 per cent during
Interventions 2 and 3. Additionally, Andy’s on-task behaviour in mathematics increased from
38 per cent during baseline to over 99 per cent during Interventions 2 and 3.
During the Follow-Up week, the set criteria of on-task behaviour above 80 per cent in
both reading and mathematics was maintained over the two sessions measured.
The Antisocial Development Screen observation recorded during self selected sessions at
this time showed that Andy displayed positive or neutral social interactions 85 per cent of the
time in reading, and 86 per cent of the time in mathematics.
Week Reward Criteria Monday Tuesday Wednesday Thursday Friday Results
3/5 per reading
session
3/5 4/5 3/5 3/5 Achieved 2
3/5 per maths
session
4/5 4/5 3/5 5/5 Achieved
3 8/10 per day 9/10 10/10 5/5 10/10 4/5 Achieved
4 32/40 per week 10/10 9/10 5/5 10/10 4/5 Achieved
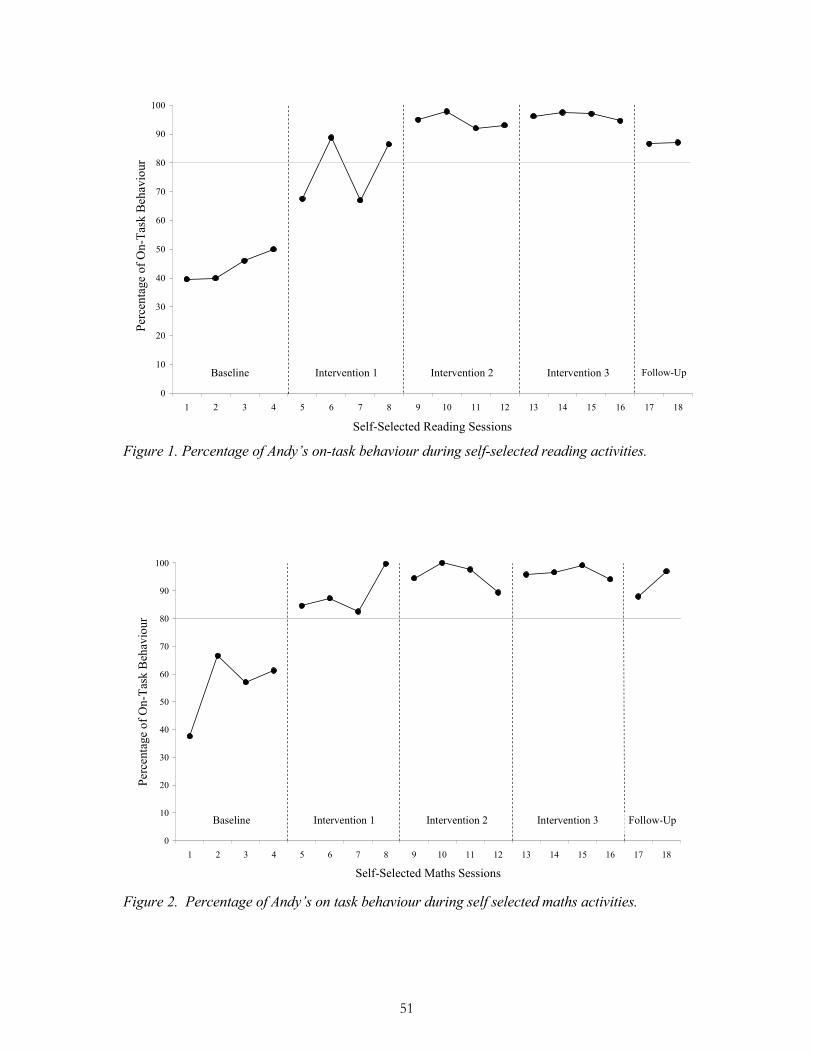
51
0
10
20
30
40
50
60
70
80
90
100
1 2 3 4 5 6 7 8 9 10 11 12 13 14 15 16 17 18
Self-Selected Reading Sessions
Per
centa
ge
of
On-T
ask B
ehav
iour
Baseline Intervention 1 Intervention 2 Intervention 3 Follow-Up
Figure 1. Percentage of Andy’s on-task behaviour during self-selected reading activities.
0
10
20
30
40
50
60
70
80
90
100
1 2 3 4 5 6 7 8 9 10 11 12 13 14 15 16 17 18
Self-Selected Maths Sessions
Per
centa
ge
of
On-T
ask B
ehav
iour
Baseline Intervention 1 Intervention 2 Intervention 3 Follow-Up
Figure 2. Percentage of Andy’s on task behaviour during self selected maths activities.

52
Andy’s behaviour in Week 1 (Baseline) was off-task and antisocial towards his peers.
During Week 2 and Week 3 (Intervention 1 to 3) there was an increase in his on-task behaviour
and in his positive social behaviour towards the other children. Only twice during Week 2 did
Andy’s behaviour drop below the 80 per cent on-task rate that was required and only during
reading. The second occasion was when the release teacher was teaching the classroom on
Wednesday morning.
The teacher completed Weekly Reflection sheets for Interventions 1 to 3 (Weeks 2 to 4).
On all three Weekly Reflection sheets for the first question, the teacher listed 5 minutes at the
end of each session to write up the contract as the extra work that she had done. Additionally,
the teacher added on the first Weekly Reflection sheet that she had spent 1 hour creating a
contract and 45 minutes setting it up with the children and running a social skills session. The
second question inquired if the teacher had received any assistance in implementing the
intervention to which she said “Another classroom teacher has been part of the reward system”
as Andy had chosen to go to another classroom as one of his rewards. For the third question,
asking the teacher to list any additional supports that would have assisted her in implementing
the intervention, she wrote on the first Weekly Reflection sheet “Perhaps someone to complete
2 or 3 sessions on cheating/fair play, positive interactions etc.”. No Weekly Reflection sheets
were completed for the Baseline Phase (Week 1).
Discussion
The aim of Case Experiment 1 was for the teacher to implement an intervention that
would improve Andy’s engagement with classroom activities. The intervention was designed
by the teacher and was based on a functional assessment undertaken by the teacher.
The information that was collected through the functional assessment by both the teacher
and the writer indicated a number of things about Andy’s off-task behaviour during group self-

53
selected reading and mathematics activity times. First, the level at which Andy was performing
in both reading and mathematics indicated that he did not have an academic skill deficit.
Second, his ongoing good relations with his peer group during playground time indicated that
he did not have a social skill deficit. Andy’s ability to focus during independent activities set by
the classroom teacher indicated that he could attend to classroom activities when necessary.
Descriptive measures indicated additionally that Andy was reluctant to play with other children
unless he was winning the game that was being played. This meant that Andy either refused to
play with the other children or else cheated, and it was his cheating that caused the arguments
noticed by the teacher.
The intervention introduced by the teacher demonstrated that Andy was capable of
staying on-task during self-selected group activities in reading and mathematics sessions when
this was positively reinforced, and that he was also capable of not cheating when playing by the
rules was reinforced. The teacher faded out the intervention after three weeks. The changes
were maintained the first week after the positive reinforcement was removed and the teacher
had ceased to check in with the other children.
The intervention implemented by the teacher was successful, indicating that the functional
assessment had been correct in identifying that Andy was capable of being on task and that his
cheating was being maintained by his peers not acknowledging it. The Weekly Reflection
sheets show that apart from the first week, this intervention took approximately 5 minutes per
session to complete, or 40 minutes over the whole week. This amount of time spent on one
intervention for one child is excessive when taking into consideration how many other children
may require extra assistance within the classroom. Unfortunately a Weekly Reflection sheet
was not completed prior to the Baseline Phase (Week 1) as it was during this week that the
teacher had spent a lot of time collecting observation data at different times of the day and
during different activities. The teacher also collected interval recordings of Andy during Weeks

54
1 to 4 but as this was a requirement of her Masters course, these were not recorded on the
Reflection Sheet.

55
CHAPTER 4
CASE EXPERIMENT 2: KYLE AND TIM
Subjects and Setting
Kyle and Tim were boys aged 6 years and 8 months and 7 years and 3months
respectively. They were both identified by the classroom teacher as children who displayed
antisocial behaviour on a fairly regular basis. The classroom teacher explained that Kyle was
fine in her classroom and mainly displayed antisocial behaviour in the playground, where he
often played with his older brother and his older brother’s friends. The teacher described his
academic work as being above average. Tim was described as a child who constantly called
out, was off task and could be violent towards his peers in the classroom. The teacher indicated
that she had tried a number of interventions with both to improve their behaviour but that
nothing seemed to work. A set of observations were therefore planned to assess the specific
nature of the antisocial behaviour, its frequency of occurrence and its consequences.
Kyle obtained a score of 87 on the Social Development Scale and Tim obtained a score of
70. Such scores are usually indicative of antisocial development.
Functional Assessment
The Antisocial Development Screen was used to record the positive, neutral and negative
responses of each child to other children and the classroom teacher. These observations were
undertaken in the classroom. Observations alternated between Kyle and Tim: one was observed
for 10 seconds and his behaviour recorded for five seconds, and then the other child was
observed and recorded in the same way. The aim was to complete observations for 30 minute.
Child behaviour was coded, as described in Chapter 2, as an initiation or response that is
either socially neutral, positive or negative. The classroom teacher’s response to Kyle’s and

56
Tim’s behaviour was coded as either a positive or negative response. The observations were
made at different times and during a range of classroom activities.
Observations
At the teacher’s request the writer observed Kyle and Tim for six days in preparation for
her implementing a functional analysis and intervention. The first observation of social
interaction was undertaken while the children were on the mat with the classroom teacher and
then moved to their desks. Kyle was observed for approximately one hour while engaged first
in a solo activity at his desk and then in a self-selected activity on the mat. The classroom
teacher awarded him a sticker for being the first child on task. Within a few minutes, Kyle
started to make some guttural noises, and when the children sitting opposite him protested he
repeated them a number of times. The classroom teacher asked the class to work more quietly,
and less than a minute after this Kyle started singing out loud. The classroom teacher then
clapped, requiring the children to copy her, and even when the pattern was repeated Kyle did
not respond. He spent the next 5 to10 minutes ignoring his own work and reading over the
shoulders of two girls. When the children were told they could move to the mat and choose an
activity, Kyle struggled to choose one. Eventually he settled at the puzzles and worked for 10
minutes consistently, receiving another sticker.
Tim was observed for approximately 50 minutes while doing an individual art project.
The task involved sitting at a table with four others and making a hand puppet. The children
were allowed to talk quietly in their groups while completing their project. Tim was friendly in
his conversation and showed initiative in helping others when they were struggling with their
puppets. He had no trouble sharing the resources with other children. When the teacher asked
for everything to be packed up Tim did not appear to hear, but when she repeated her
instructions he started immediately.

57
The record of on-task and off-task behaviour revealed that Kyle had been on task 70 per
cent of the time and Tim 80 per cent of the time. As the teacher’s behaviour was going to be
one of the variables tested, it was not appropriate that she be involved in the collection of
further data for the functional assessment.
The first joint ADS observation - Writing on mat with classroom teacher and then at
desks. During this observation Kyle was off-task for almost the entire 47 minutes and wrote
only four lines for his story. His antisocial behaviour included hitting other children, climbing
under the desks and looking up girls’ skirts, and not complying with the classroom teacher’s
requests. He received two negative verbal responses from the classroom teacher. Tim was on-
task for the duration of the 47 minutes and completed over one page of written work for his
story. His antisocial behaviour consisted of non-compliance with regard to continually sitting
on his knees instead of his bottom as requested by the teacher while on the mat and at his desk.
During this observation, Kyle engaged in antisocial behaviour during 32 per cent of
intervals and the classroom teacher responded negatively to this behaviour 13 per cent of the
time. Tim engaged in antisocial behaviour during 8.5 per cent of intervals and the classroom
teacher responded to antisocial behaviour on 75 per cent of occasions.
Second ADS observation – Maths on mat with classroom teacher and then activity at desk.
As shown in Table 3, Kyle displayed no antisocial behaviour during the 22 minutes of
mathematics that the class spent on the mat and then at their desks. Tim engaged in antisocial
behaviour in 2.3 per cent of intervals. This involved talking once when the teacher had
requested silence. This was not responded to by the teacher.
Third ADS observation - Reading on mat with classroom teacher. Both children
displayed very little antisocial behaviour. Kyle was asked by the teacher to sit still and
immediately wriggled, and Tim pulled a face at another child. Neither received a reprimand.

58
Fourth ADS observation – Reading on mat with classroom teacher and then self-selected
reading activity. Only one negative verbal comment said by Tim was observed. This was not
responded to by the teacher.
Fifth ADS observation – Reading self selected activity and then on the mat with the
classroom teacher for a story. During the reading activity Tim had completed a jigsaw with
other children and wanted to show the teacher. The class had been asked several times to tidy
up and when other children began to rip up the jigsaw, Tim became slightly frantic that the
classroom teacher had not seen it. Kyle was non-compliant in that he did not help with the
tidying up.
Sixth ADS observation – Phonics on mat with class teacher and then writing at desks. No
antisocial behaviour from Tim was observed, but Kyle was occasionally observed as showing
antisocial behaviour. Kyle did almost no writing again, and when he finished and went to get a
reading book as supposedly finished, the classroom teacher asked to see his writing book and
told him to do more. He pretended to do so for a while, and then went back to reading books in
the library corner. At one point he was also banging his hips hard into the child in front of him
when they were released from the mat to go and get their writing books. The teacher responded
to his antisocial behaviour with a negative response on 44 per cent of occasions.
Results and Discussion
Direct observations of both Kyle’s and Tim’s classroom performance across a range of
activities failed to confirm the teacher’s belief that both boys frequently engaged in
unacceptable behaviour and that Tim engaged in antisocial behaviour more often than Kyle.
The results relevant to the teachers concerns are given in Table 3. These include the total
percentage of time each child spent engaging in antisocial behaviour and the percentage of
occasions that this was responded to negatively or positively by the classroom teacher.

59
Table 3. The Percentage of Kyle’s and Tim’s Antisocial Behaviour and the Percentage of
Negative Responses from the Classroom Teacher
Kyle Tim
Observation
Observation
length Antisocial
behaviour
Negative
response from
teacher
Antisocial
behaviour
Negative
response from
teacher
1 47mins 31.91% 13.33% 8.51% 75%
2 22mins 0% 2.27% 0%
3 19mins 2.63% 0% 2.63% 0%
4 30mins 0% 1.72% 0%
5 13mins 38.5% 0% 15.38% 50%
6 30mins 15% 44.44% 0%
During the first observation Kyle displayed more antisocial behaviour than Tim. More
importantly, this was the only time that either Kyle or Tim displayed a significant amount of
antisocial behaviour. This led to the conclusion that neither a functional analysis nor an
intervention was warranted in this case. The writer did, however show the teacher the
observational results which indicated that her responses to Tim’s behaviour were more often
negative than were her responses to Kyle’s behaviour. When this finding was presented to the
teacher, she was surprised at the difference between her reactions to the two boys and
determined to give Tim more positive attention.

60
The teacher did not complete the Weekly Reflection sheets as she was not involved in the
functional assessment and there was no intervention. The only additional work that she was
involved in for this case experiment was that she completed the Social Development Scale form
for both boys, a task which she said took minimal time.

61
CHAPTER 5
CASE EXPERIMENTS 3: ERICK AND JACK
Subjects and Setting
The classroom teacher stated that she believed that a number of the Year 2 children in her
class were behind their peers in learning to read. These children were given a Running Record
Test in order to ascertain their prose reading level. Two children were significantly below the
norm for their age. Both these children were in the lowest reading group of the class and
according to the teacher struggled to make progress. Erick and Jack were aged 6 years and 11
months and 6 years and 5 months. All testing and subsequent interventions took place in an
empty classroom or office, the staff room or the foyer between Rooms 1 and 2.
Functional Assessment
To get an overall picture of both Erick’s and Jack’s reading abilities, an assessment of the
component skills required for reading were required. The teacher was unsure how to go about
this so the writer got together the necessary resources and completed them as it was not possible
for the teacher to do them. Each boy’s oral language was listened to while they were talking to
their peers and to the teacher in the classroom. Phonemic segmentation skills were tested using
Williams Phonemic Segmentation Test (Williams, 2002) (Appendix 4). Decoding fluency was
tested using the Canterbury Decoding Fluency Test (Zintl, 2005) (Appendix 5) and level of
achievement in learning to read was tested using the PM Benchmark reading test (Nelley &
Smith, 2000).
Williams’ Phonemic Segmentation Test was administered to the participants to assess
phonemic awareness as part of the screening procedure. This test is an adaptation of the
phonemic segmentation test in the Queensland Inventory of Literacy, a standardised Australian

62
test which assesses phonological awareness in school aged children (Dodd, Holm, Oerlemans &
McCormick, 1996, as cited in Williams, 2002). The test includes 16 words, of which 7 are
pseudowords that are presented orally to the participant. The participant then repeats the word
back to the assessor, emphasising its specific phonemic segments. There are a total of 60
segments for all 16 words and the final score is the total number out of 60 segments that are
correctly reproduced. In this instance, the child was given the option of ‘roboting’ the sounds
by moving their arms to each sound segment. The assessor illustrated this by ‘roboting’ the
separate segments of the word “it”. The participants were then asked to ‘robot’ five practice
items and, if required, further practice was provided. When the participant had understood the
requirements of the test, the assessor presented the 16 test words.
The Canterbury Decoding Fluency Test was used to measure the participants’ decoding
fluency. The test is a one page document that has 45 single syllable words repeated twice, in a
different order, to make a total of 90 words. The 45 words contain the most common
graphemes in the English language. If a word contains more than one grapheme, the specific
grapheme that is being tested is underlined in order to be clearly identified by the assessor. The
participants are required to read out loud as many of the words as they can in one minute, and
they are scored according to the number of correctly pronounced graphemes. Each participant
was told to say “pass” and to carry on with the next word if he or she did not recognise a word.
On the original Canterbury Decoding Fluency Test, the typed words are small and so the words
were re-typed in the same formation but in larger font to make it easier for the children to read
(Appendix 6).
The PM Benchmark programme consists of two kits, each containing 30 prose reading
books that represent 30 progressive reading levels (Nelley & Smith, 2000). The books are
read aloud by the participant and the administrator marks words as correct or incorrect. At the
end of the book the participant is asked a small number of questions about the content to check

63
their comprehension. The PM Benchmark kit provides percentiles and age equivalent scores for
reading accuracy and comprehension.
The first running record was conducted at the level suggested by the class teacher. If the
participant was able to read at this level with at least 91% accuracy then this level was deemed
to be correct for the participant. If the participant read with less than 91% accuracy then the
next level down was attempted. If the child read with above 94 per cent accuracy then the level
above was attempted. If between 91-94 per cent was scored at any level then the level with the
score above 94 per cent was selected. Each level is associated with a different set of reading
books that are distinguished by colour.
Narrative observations were also made of the two boys while they were reading in the
classroom. These observations consisted of watching them read books assigned by the teacher
and read books of their own selection from the library.
Assessment Results
The oral language of both Erick and Jack was satisfactory, and each appeared to have
sufficient vocabulary to communicate his needs and wants within the classroom setting. Both
children scored above the required 30 correct responses on the Phonemic Segmentation Test;
however their Decoding Fluency Scores were well below that of the 60 per minute required for
satisfactory progress in learning to read. These results are displayed in Table 4.
Table 4. Results of the Assessment of Component Reading Skills and Reading Levels for Erick
and Jack
Phonemic segmentation
score
Decoding fluency score
correct responses/min
PM Running Record
level
Erick 50/60 10/min 11
Jack 41/60 15/min 7

64
The results of the narrative observations were that when the two boys were reading books
assigned by the teacher the boys completed reading the book almost without distraction.
However, when reading a book of their own selection from the library, they would rarely finish
it and were easily distracted. The reading books assigned by the teacher were at the right level
of difficulty for the boys.
Intervention
Following a discussion of possible interventions, the classroom teacher decided to use
peer tutors to provide practice in decoding and to build improved decoding fluency. Peer
tutoring was selected as she herself did not have the time to implement the intervention. Peer
tutoring is best used to promote fluency rather than teaching new skills and has been found to
benefit not only the tutee but also the tutor through increased practice and self-confidence
(Mitchell, 2008). Peer tutoring requires the tutors to be willing, well trained, motivated and
supervised. The teacher chose three peer tutors from the class, one for each of the participants,
and an additional one in case the others were not available. The peer tutors were from the same
class, of above average reading ability and were judged by the teacher to be responsible. The
three children selected as peer tutors were trained to use the Pause, Prompt, Praise tutoring
procedure (Glynn, 1995) and to administer the fluency tests.
It was decided by the teacher and the writer that the intervention would be terminated
either at the end of the academic year or when the participants reached a decoding fluency of 60
correct graphemes per minute on the Decoding Fluency Test. This is the number determined by
Williams (2002) to be the minimum level required to be a proficient reader.

65
Recording Procedure
The Canterbury Decoding Fluency Test was used to assess progress during the
intervention. The starting point was varied every time the test was administered in order to
control for any practice effect that might occur.
Timed running records were also collected once a week throughout the experiment to
measure for any generalisation, from improved decoding fluency to improved prose reading
fluency. The teacher was requested to administer these as per the PM Benchmark instructions
with the addition of timing them.
The teacher had already assigned the children into groups for reading, and so over the
nine-week intervention she would decide whether or not to change their reading level based on
the results of the running record and their current reading ability relative to that of others in their
group. The reading books in these groups were the ones from which the participants’ prose
reading measurements were taken. The measurements were taken by timing reading for one
minute and then counting the number of correct words.
Teaching Materials
The 60 words used for the practice materials were those used by Zintl (2005) and
contained fifty commonly occurring graphemes in initial, medial and terminal positions. The 60
words were split into two matched lists (List A and List B). Each of the two lists contained
each grapheme between one and three times in the initial or medial position. Each list was then
divided into two matched subsets of 15 words. These lists are labelled A1, A2, B1 and B2 (see
Appendix 7). They constituted the four practice lists. Each set of 15 words was presented in
black ink on individual flashcards 4 x 16 cm and put on a ring (see Appendix 8). The peer
tutors were also provided with a form on which to record the date, the number of words
practised, the time it took to run through them at speed and the total number of practice words
correct.

66
Teaching Procedures
The training of the peer tutors and participants in what was required during their practice
sessions together took approximately 45 minutes.
First, the writer took the peer tutors through the first 15 flash cards using the Pause,
Prompt, Praise method (Glynn, 1995). This method involves waiting for the child to attempt
the unknown word, then prompting them by sounding the first syllable and then praising them
when they say the word. If a word was unknown or not understood, they were taught what it
was and meant and then the word was practised. When the words were learnt and understood
the peer tutors were asked to progress to a time trial and read the words as fast as they could,
while the writer flipped the cards and timed them. They were to say pass if they came to a word
that they did not understand. The two primary peer tutors were asked to repeat the above
procedure with their assigned tutee and the third peer tutor with the writer. The peer tutors
repeated the procedure until they were able to perform it correctly.
Practice Procedures
The peer tutors were instructed to follow the above instructions with the first set of 15
flashcards, labelled Week 1, every day for the upcoming week. The peer tutors recorded on a
table how long it took the tutee to read the 15 words. Each subsequent week for the following
three weeks they used the corresponding set from the four sets of flashcards. They were told
that they had permission to leave the classroom and do this in the foyer between Room 1 and 2
every day during reading time.
Two to four times a week the writer travelled to the school to observe the process, and
twice a week administered the Canterbury Decoding Fluency Test and measured the
participants’ prose reading fluency on their current reading book. On the last set one of the
participants achieved 15 words in 15 seconds (60 words per minute) the criterion set by Zintl
(2005) to determine fluency. However, neither participant reached the required 60 graphemes

67
per minute on the Decoding Fluency Test during the five weeks of testing. In Week 4, the
participants were tested only twice by their peer tutors so they were tested again on the same 15
words in Week 5 to ensure that there had been at least three practices.
Following the initial five weeks, the writer went into the school three times a week for
four weeks to carry on the intervention instead of the peer tutors. The teacher was unable to
provide the necessary supervision to ensure that the practice sessions were occurring at least
three times a week. Additionally, the peer tutors were not able to provide the necessary
intensity during the practice time. During these four weeks, all 60 words were laid out on a
table and any words that the participant was unsure of, or had got wrong the previous time, were
practised. The participant was then instructed to read the words as fast as he could and to say
pass if he came to a word that he could not read. The Decoding Fluency Test was administered,
and then the participants read their prose reading book aloud for one minute and the number of
correct words was recorded. The teacher was asked to complete a running record every week of
the nine week intervention. However this proved to be too difficult and the writer took over this
role most weeks. Follow-up testing was not possible due to the intervention finishing one week
before the end of term.
Results
Erick
As can be seen from Figures 3 and 4, Erick started with a pre-test score of 10 correct
graphemes per minute on the Decoding Fluency Test, and a running record level of 11.
A pre-test was not run for prose reading or for the 60 practice words. Erick was generally
easily distracted and his peer tutor occasionally had trouble getting him to focus on the day’s
practice words. If Erick was not sufficiently focused before he started then his performance

68
0
10
20
30
40
50
60
70
1 2 3 4 5 6 7 8 9 10 11 12 13 14 15 16 17 18 19 20 21 22 23
Trials
Corr
ect re
sponse
s per
min
ute
Test Week 1 Week 2 Week 3 Week 4 & 5 Week 6 Week 7 Week 8 Week 9
Intervention 1 Intervention 2
Figure 3. Number of correct responses per minute on the Decoding Fluency Test by Erick.
suffered. His peer tutor was given extra assistance and suggestions on how to get him to focus
on the task at hand. Erick particularly struggled to differentiate between the words “short” and
“shoot”, which were both in the second set, and when all 60 words were tested together he also
confused these with the word “shirt”. These were practised several times, but were never all
reproduced correctly. As can be seen from Figure 3, Erick’s highest level of decoding fluency
was 33 correct graphemes per minute in the initial five weeks. This increased to 59 in the
subsequent four weeks while practising with 60 words instead of 15, and with the writer instead
of a peer tutor.
From running records taken by the teacher in Terms One and Two and by the writer in
Term Three we know that Erick had progressed through six reading levels in 23 academic
weeks. In the time between the running record in Term Three and the end of the nine week
intervention Erick went up 7 levels in 14 academic weeks. This can be seen in Figure 4.

69
0
2
4
6
8
10
12
14
16
18
20
Term 1 Term 2 Term 3 Week 1 Week 2 Week 3 Week 4 Week 5 Week 6 Week 7 Week 8 Week 9
Time Tested
Runnin
g R
ecord
Lev
el
Figure 4. Achieved running record level on the PM Benchmark test by Erick.
In the initial five weeks of Erick’s prose reading results, shown in Figure 5, not much
fluency progress was made. During the subsequent four weeks there is a more stable increase in
his fluency even though he had been moved up some reading levels by his teacher during this
time. As was expected, Erick’s number of correct practice words per minute varied every week
for the first five weeks while he was learning a new set of words each week; however during the
subsequent four weeks he made steady progress until he achieved 46 per minute on the last trial.
Jack
Jack was generally focused on what was asked of him and he worked hard to improve.
He was initially slow and needed lots of encouragement to go faster. As can be seen from
Figure 6, Jack started with a pre-test score of 15 correct responses per minute on the Decoding
Fluency Test. During the first five weeks of Intervention 1 Jack’s highest level of decoding
fluency was 19 correct graphemes per minute. This increased to 44 in the subsequent four
weeks while practising with 60 words instead of 15 and with the writer instead of a peer tutor.

70
0
10
20
30
40
50
60
70
80
90
100
1 2 3 4 5 6 7 8 9 10 11 12 13 14 15 16 17 18 19
Trials
Num
ber
of
corr
ect w
ord
s per
min
ute
Week 1 Week 2 Week 3 Weeks 4 & 5 Week 6 Week 7 Week 8 Week 9
Figure 5. Number of correct words read per minute from daily reading book by Erick.
0
10
20
30
40
50
60
70
1 2 3 4 5 6 7 8 9 10 11 12 13 14 15 16 17 18 19 20 21 22 23
Trials
Corr
ect re
sponse
s per
min
Week 6 Week 7 Week 8 Week 9
Intervention 1 Intervention 2
Week 1 Week 2 Week Test Week 4 & 5
Figure 6. Number of correct responses per minute on the Decoding Fluency Test by Jack.

71
As can be seen from Figure 7, prior to Intervention Jack was on PM Benchmark level 7.
From running records completed by the teacher in Terms One and Two and the writer in Term
Three we know that Jack went up six reading levels in 23 academic weeks. Between the
running record in Term Three and the end of the nine week intervention he progressed through
a further 9 levels in 14 academic weeks.
0
2
4
6
8
10
12
14
16
18
20
Term 1 Term 2 Term 3 Week 1 Week 2 Week 3 Week 4 Week 5 Week 6 Week 7 Week 8 Week 9
Time Tested
Runnin
g R
ecord
Lev
els
Figure 7. Achieved running record level on the PM Benchmark test by Jack.
A pre-test was not run for prose reading or for the 60 practice words. In the first five
weeks of Jack’s prose reading, shown in Figure 8, performance was very variable. He achieved
60 correct words per minute in the third week and then 88 correct words per minute in the
fourth week. During the subsequent four weeks, Jack’s reading level increased and his fluency
was less variable. However it remained above 60 correct words on the final week. Jack’s
number of correct practice words varied every week for the first five weeks while he was
learning a different set of 15 words each week. However during the subsequent four weeks he
made steady progress until he achieved 55 per minute on the last trial.

72
0
10
20
30
40
50
60
70
80
90
100
1 2 3 4 5 6 7 8 9 10 11 12 13 14 15 16 17 18 19
Trials
Num
ber
of
corr
ect w
ord
s per
min
ute
Week 9Week 8Week 7Week 6Weeks 4 & 5Week 3Week 2Week 1
Figure 8. Number of correct words read per minute from daily reading book by Jack.
The teacher completed Weekly Reflection sheets for each week of Erick and Jack’s
intervention. On the first sheet the teacher responded that the introduction of the intervention
required no extra work as the writer did the assessment required, created all the necessary
resources, and completed the training of the peer tutors. On the third question the teacher stated
that the running records that were completed as part of the assessment take time to complete
and help in administrating these would be appreciated. All the rest of the Weekly Reflection
sheets repeated that she had not had to do any extra work except for the running records which
she was supposed to complete weekly but after failing to do so for Week 1 and 2, as she was too
busy, the writer took over this task.
Discussion
The aim of the intervention in Case Experiment 3 was to see if the classroom teacher
could implement a functional assessment for learning difficulties and then an appropriate
intervention. The teacher was unable to complete the functional assessment as she did not have

73
the required knowledge of what skills needed to be tested, nor the time to necessary to do the
testing. The appropriate intervention for Erick’s and Jack’s learning difficulties was to increase
the number of graphemes that the children could instantly recognise so that progress in learning
to read would be accelerated as reported by Zintl (2005). The intervention selected was peer
tutoring with a set of flashcards. The tutors and tutees were to leave the classroom a minimum
of four times a week for 5 to 10 minutes during self-selected reading in order to practice the
weekly words. The initial enthusiasm for the tutoring peers was good and in the initial week,
the tutoring occurred five times. During the next three weeks, the tutoring times decreased until
by the third week it was occurring just once or twice and only when the writer was there to
remind the children. Otherwise both the children and the teacher forgot about doing the tutoring
in the general course of the day. Erick and Jack made some progress during the first five weeks
but not nearly as much progress as the children studied by Zintl (2005). Given the relatively
slow progress it was decided that the writer would take over the tutoring and practice of the 60
words three times per week. Intensity is required to ensure that academic interventions are
successful and the peer tutoring did not work as the intensity was not sufficient.
As a result of the increased practice during Intervention 2 accelerated progress in
decoding fluency was observed in both children. The extent to which this generalized to prose
reading can be seen in Figures 6 and 9. The number of words read correctly per minute by both
Erick and Jack continued to increase during the final four weeks even although they were being
promoted to more difficult books by the teacher. Unfortunately the teacher kept no record of
when each boy was promoted from level to level. The two children appeared to be progressing
through the book levels more quickly than they had during the previous term. However because
the teacher was too busy, no running records were obtained during the first two weeks of the
intervention and it is unclear what level they were on when they started the intervention. The
decoding fluency test was one measure which was obtained throughout both phases of the

74
intervention and this provides the best measure of their progress. Erick’s scores in the first
intervention, Week 1 to Week 5 ranged from 10 to 33 correct graphemes per minute, whereas in
the second phase, Week 6 to Week 9, Erick’s scores ranged from 27 to 59 correct responses per
minute, more than double that observed during the first intervention. Jack’s scores in the first
intervention, Week 1 to Week 5 ranged from 8 to 19 correct graphemes per minute, whereas in
the second phase, Week 6 to Week 9, Jack’s scores ranged from 18 to 44 correct responses per
minute, once again more than double that observed during the first intervention.

75
CHAPTER 6
CASE EXPERIMENT 4: KATIE
Subject and Setting
Katie was a 7-year old girl. The classroom teacher was concerned with Katie’s slow
writing speed. According to the teacher, Katie was taking so long in writing each individual
letter that she was completing far less work than the other children in the class, especially
during writing and spelling.
Functional Assessment
The writer asked the classroom teacher if she had any ideas on why Katie’s writing was
slow and what could help Katie to write more quickly, but she said that she did not know as she
had already tried a number of interventions. These included telling Katie that her writing did
not have to be neat and that she was allowed to make some spelling mistakes, and keeping her
in during morning tea and lunch time to finish her story. According to the teacher, none of
these interventions had had any effect in encouraging Katie to write faster. The teacher had
concluded that Katie had a fine motor deficit that prevented her from writing more quickly. The
fastest way to discover if a child has a performance or motivation problem is to offer them a
desired reward for succeeding (Noell et al., 1997; Witt et al., 1997). The writer asked the
teacher if she thought that Katie might respond to verbal encouragement to write faster or a
small reward for working faster but she indicated that these were unlikely to work. When asked
to identify a reward which Katie might work hard to achieve, the classroom teacher suggested
anything that was purple or ballet themed.

76
Direct Observation
The writer observed the class during a phonics lesson and found that Katie was not able to
finish the writing set by the teacher during the given time. Katie’s writing was always neat and
legible. However, she spent much time rubbing out and rewriting individual letters. Katie also
had a habit of stopping her writing to push back her hair from her face even though it was not
necessary and pushing her cuffs up her arm, even if they were not in the way.
All of the children in the class were given a standard copying task consisting of a sheet of
A4 paper with some text and blank lines on it, and were instructed to copy as much of the text
as they could within one minute. This copying task is reproduced in Appendix 9. The results of
this test are shown in Figure 9. A class average of 25 letters per minute was established from
this, and this became Katie’s aim. Katie’s writing rate was the lowest in the class at 13 letters
per minute.
0
1
2
3
4
5
6
7
8
1-5 6-10 11-15 16-20 21-25 26-30 31-35 36-40 41-45
Words per minute
Num
ber
s of
chil
dre
n
Figure 9. Number of correct letters copied per minute for a Year 2 class.
The four most common causes of learning difficulties outlined by Daly et al. (1997) are
that the child does not want to do the work, that he or she has not spent enough time practising

77
the missing skill, that he or she has not had enough instruction on how to perform practice tasks
or that practice tasks are too difficult. The writer’s observations suggested that Katie did not
object to writing and did any writing task asked by the teacher immediately, so the first cause
was discounted. From general observations of the classroom it appeared that there was
sufficient instruction as to how to write, so the third cause was discounted. Katie was able to
write very well, so it is unlikely that the tasks were too hard for her and the fourth cause was
discounted. What remainted was the hypothesis that Katie had not spent enough time practising
writing fast and was not motivated to write fast. Katie appeared to want to keep her writing
neat so she wrote slowly with lots of rewrites. This meant that she was not practising as many
letters in any one writing session as her classmates.
Intervention
The writer decided to test this hypothesis first by instructing Katie to write faster and then
by motivating her by putting in some reinforcement to write faster.
Baseline
The writer tested Katie’s speed at copying the alphabet and some lines from a reading
book one level below her current reading level. This level was chosen to ensure that she would
know the words. Katie was instructed to write as fast as she was able without worrying too
much about neatness. It took Katie 2 minutes and 13 seconds to copy the alphabet (an average
rate of 12 letters per minute), and she managed to write 14 letters from the reading book in 1
minute.
Week 1 – Instruction Only
During the next week, Katie met with the researcher three times and each time was
encouraged to write faster when copying the alphabet and writing from the different reading
books provided each time.

78
Week 2 – Incentive for Writing Faster
The following week, Katie once again met with the writer three times and each time was
encouraged to write more quickly when copying the alphabet and the text from the reading
books provided. This time she was offered a reward of two purple pencils and a matching pen
if she was able to achieve the required goal of 25 letters per minute.
Week 3 – Follow-Up
The third week Katie met with the writer once and was encouraged again to write as fast
as she could the alphabet and the original standard copying text to assess her progress.
Results
The change in Katie’s writing fluency is shown in Figures 10 and 11. As can be seen
from these figures Katie’s results improved during both interventions; however it was only
during the incentive intervention that Katie reached the target of 25 letters per minute. During
the instruction only intervention, Katie improved her writing speed when copying the alphabet
letters and showed a slight initial improvement when copying prose. It is not known whether
she would have reached the required target if the instruction only intervention had continued for
a longer period of time. However, her writing speed increased and reached the required target
of 25 letters per minute in writing both the alphabet and the prose during the incentive
intervention. Katie did not like the fact that her writing was messier during these sessions;
however she was pleased that she was reaching the required target. A week after the
interventions were finished, Katie’s progress was followed up and she wrote the alphabet at a
rate of 31 letters per minute. Additionally, she copied 27 letters in 1 minute, compared with her
original 13 letters per minute from the standard copying task sheet that had previously been
used to establish the class average. Katie also copied 26 letters in 1 minute from the prose book
from which she had originally copied only 14.

79
0
5
10
15
20
25
30
35
40
1 2 3 4 5 6 7 8
Sessions
Num
ber
of
lett
ers
wri
tten
per
min
ute
Testing
PhaseWeek 1
Instruction only
Week 2
Incentive
Follow-
Up
Figure 10. Number of correct letters copied per minute from a level 12 reading book by Katie
(filled circles) and number of letters copied per minute from the standard copying task (open
circles).
0
5
10
15
20
25
30
35
40
1 2 3 4 5 6 7 8
Sessions
Num
ber
of
lett
ers
wri
tten
Testing
Phase
Week 1
Instruction onlyWeek 2
Incentive
Follow
Up
Figure 11. Number of correct alphabet letters copied per minute by Katie.

80
The teacher noted on the Weekly Reflection sheet for Week 1 of Katie’s intervention that
the dictation done with the whole class “took approximately 6 minutes – none of my time was
required to mark these”. Additionally the teacher wrote “[The writer] has introduced a
programme and is working with [Katie] herself”.
Discussion
The aim of this Case Experiment was for the teacher to identify the probable cause of
Katie’s slow writing speed and then to find an intervention that increased her writing fluency till
she was able to write at the average speed of her classmates. The teacher was not able to be
involved as she said that she could not spare the time from her general teaching. A functional
analysis was performed, showing that Katie was able to write faster when provided with one on
one attention and a target to achieve. A second week of intervention when Katie was offered a
positive reinforcement brought about even greater gains in her writing speed. The hypothesis in
this case was that Katie had not had sufficient practice in writing fast. She liked her writing
being neat and had acquired some hand gestures, both of which impeded her ability to write
fast. Katie needed some motivation to try to go faster and then the opportunity to continue
practicing writing faster. The instruction and reward incentives allowed this to happen. Katie’s
slow writing speed was therefore due to a lack of motivation and not to a performance deficit.
The Weekly Reflection sheets illustrate that the classroom teacher was happy for Katie to
be taken out of the classroom 3 times a week for 10 minutes but she was not able to do the
intervention herself.

81
CHAPTER 7
GENERAL DISCUSSION
The individual results of the four case experiments, summarised in Table 5, provide an
answer to the questions addressed by this investigation: Can teachers complete functional
assessments and interventions for children with behaviour difficulties and learning difficulties,
and then choose and implement an appropriate intervention? The results showed that a
classroom teacher can implement both functional assessments and the appropriate interventions
when given the necessary training. However, teachers often struggle to initiate a functional
assessment and then struggle to maintain an intervention for a variety of reasons.
Table 5. Summary of the Findings of Case Experiments 1 to 4
Case
Experiments
Description of
children
Functional
assessment
done by:
Functional analysis
design and
intervention
implementation
done by:
Results
Case
Experiment
1: Andy
-Children = 1,
boy, 6 yrs,
with
behaviour
difficulties.
Teacher Teacher Andy’s on-task behaviour increased
and was maintained at over 80%.
Intervention was implemented after
each self-selected reading and maths
session with 100% integrity.
Case
Experiment
2: Kyle &
Tim
-Children = 2,
boy, 6 & 7
yrs, with
behaviour
difficulties.
Writer Intervention did not occur because the
claimed behaviour difficulties were
not observed.

82
Table 5 (continued). Summary of the Findings of Case Experiments 1 to 4
Case
Experiments
Description of
children
Functional
assessment
done by:
Functional analysis
design and
intervention
implementation
done by:
Results
Case
Experiment
3: Erick &
Jack
-Children = 2,
boy, 7 & 6yrs,
with learning
difficulties.
Writer &
Teacher
Writer & Teacher The reading fluency scores of both
children increased modestly during
the first intervention with peer tutors,
but treatment integrity decreased
substantially over the 4 weeks.
Greater progress was made by the two
children when the intended
intervention was implemented by the
researcher.
Case
Experiment
4: Katie
-Children = 1,
girl, 7 yrs,
with learning
difficulties.
Writer Writer The intervention was successful. No
treatment integrity was measured as
the teacher was unable to introduce an
intervention due to time constraints.
In Case Experiment 1, it was observed that teachers can complete a functional assessment
but will not necessarily use this as a first option or even attempt it without it being required by
an external agent. The teacher in this study needed guidance to know how and when to identify
the antecedents and consequences of Andy’s behaviour. She was able to do some interval
recording of his on-task behaviour as well as some ABC narrative recordings. However, the
discovery that Andy was cheating in games, and not being reprimanded, only occurred when the

83
writer used the more detailed Antisocial Development Screen to observe Andy’s specific
antisocial behaviour and the responses to it. The intervention chosen by the teacher was
complex in its management and fading procedure. Overall, the functional assessment identified
the factors maintaining Andy’s behaviour and the intervention was successful, but it is doubtful
that this would have been the case if the writer had not been available as a research consultant.
In Case Experiment 2, it was observed that teachers can sometimes misinterpret or
misidentify problem behaviour. The teacher had made a number of assumptions about two
boys behaving in particular ways without ensuring that she was correctly identifying the type or
frequency of their behaviour. A functional assessment would have highlighted to the teacher
that their behaviours were not high frequency and at times were dependent upon the way that
she interacted with each of them.
In Case Experiment 3, it is possible to see how lack of knowledge, skill and time
prevented the teacher implementing a functional assessment and intervention. The teacher did
not know how to go about completing the functional assessment of the reading difficulties
experienced by Erick and Jack. She knew from her phonics programme that they were not as
quick as most of the others in the class, but she had no formal way of testing their phonemic
knowledge. The teacher also did not know the other component skills required for proficient
reading. The writer therefore implemented the functional assessment and then analysed the
data. The writer recommended the intervention used in the Zintl (2005) study to increase the
boys’ grapheme recognition fluency. The teacher chose to implement this through peer tutoring
as she was too busy to do it herself.
Peer tutoring turned out to be relatively ineffective for a number of reasons. Initially the
tutors were open to the novel idea of peer tutoring and applied themselves to their training and
then to the tutoring, but they started to lose their interest and motivation for the intervention
after the first week. This could have been due to their young age (6 to 7 years) or to a lack of

84
supervision from the teacher. The teacher had not noticed that the peer tutoring sessions had
not occurred and had not observed any improvement in Erick and Jack’s reading. The writer
took over the implementation of the intervention and met with Erick and Jack three times a
week. The writer found that they both responded well when encouraged to better their
individual scores. From observations made when the peer tutors were implementing the
intervention, Erick and Jack were both more focused and eager to please with an adult than they
were with their peers. In order for the intervention to be successful, the practice words needed to
be practised at least three times a week and more intensely than had been done with the peer
tutors. At the end of the intervention, the teacher expressed her surprise at the number of
reading levels that both boys had been promoted to.
Finally, in Case Experiment 4, it was observed how lack of time can prevent the
implementation of a functional assessment and intervention. The teacher told the writer that
Katie wrote less than half of what the other children were writing in a session. The teacher had
unsuccessfully tried a number of interventions and had come to the conclusion that the problem
was a fine motor skill deficit. However, she had not and did not know how to explore this idea
further. The writer spent some time completing observations of Katie while she was writing,
and then measured the speed of all children in the class to determine what writing speed should
be set as an aim for Katie. The writer’s observations were presented to the teacher, but the
teacher was unable to suggest any interventions that she had not already tried. When the writer
proposed a number of interventions, they were judged by the teacher as likely to be ineffective.
This meant that no intervention was actually introduced by the teacher but left instead to the
writer.
The findings from the case experiments are confirmed by the studies reviewed in Chapter
1, on functional assessments and interventions done in mainstream classrooms for children with
behaviour difficulties and learning difficulties (Mueller et al., 2003; Noell et al., 1997; Stage et

85
al., 2006; Witt et al., 1997; Wood et al., Zintl, 2005). None of these studies had the teachers
performing the functional assessment or analysing the results to form a hypothesis. In all the
studies the research consultants suggested the appropriate intervention which the teacher then
received training in how to implement. When implemented correctly, the interventions were all
successful. However, in four of the six studies reviewed, when the intervention was poorly
implemented the children’s results were adversely affected (Noell et al., 1997; Witt et al., 1997;
Wood et al., Zintl, 2005). This was particularly seen in Wood et al. (2007) when the teacher
implemented the intervention poorly, the boy was only on-task 9 per cent of the time, but when
the intervention was implemented with high integrity, the boy was on-task 91 per cent of the
time. Treatment integrity was only improved in these four studies by research consultants
providing performance feedback to the teacher, or in the case of Zintl (2005), doing the
intervention themselves. Two of these studies, Noell et al. (1997) and Witt et al. (1997), state
that one of the limitations of their study was that the teacher knew that they were measuring the
integrity of their implementation of the intervention and so they question if treatment integrity
may have been lower if the teachers were unaware of this. In the remaining two studies, where
treatment integrity appeared to remain consistent, the interventions were performed at over 90
per cent integrity (Mueller et al., 2003; Stage et al., 2006). There are many interventions that
are known to be effective when implemented with integrity within the classroom (Church,
2003, 2005, 2007a). It may not, however, be practical or realistic for an individual teacher in a
mainstream classroom to implement them.
Issues Facing Teachers in Mainstream Classrooms
Prior to registration, classroom teachers acquire a wide range of teaching skills spanning a
range of curriculum areas and children. They learn how to teach, to set routines and timetables,
to manage behaviour, to make resources, to organise lessons, and to keep children safe both

86
physically and culturally. However, classroom teachers often struggle to manage the behaviour
or to meet the specific learning needs of individual children in their classes (Prochnow et al.,
2000).
Ability to Identify Children with Special Needs
Research into the application of functional assessment within classrooms, indicates that
teachers are able to identify children with special teaching needs with some accuracy. Zintl
(2005) asked the teachers participating in the study to refer children who were significantly
behind their class peers in learning to read. In Class Y, three out of the four children referred by
the teacher met the criteria required by the study, in Class Z1, two out of three children referred
met the criteria and in Class Z2, five out of the seven children referred met the criteria. Church
et al. (2006) reported that teachers were accurate in classifying individual children as antisocial
or not antisocial in 92.3 per cent of cases. Teachers did, however, have more of a tendency to
over-identify children with antisocial behaviour rather than to under-identify them. This was
seen in Case Experiment 2, where two boys were identified by the teacher as having severe
behaviour problems but who, when observed, were found to engage in minimal misbehaviour.
In the other case experiments in this study, the teacher was able to recognise that there was a
problem and to describe the problem in general terms (i.e. off-task, reading fluency, and writing
speed). Teachers appear to be reasonably skilled at identifying children with special needs and
occasionally in identifying the specific nature of those special needs.
Ability to Implement Functional Assessment Procedures
The literature on functional assessment suggests that teachers rarely implement functional
assessments within mainstream classrooms without assistance (Ervin et al., 2001). Most
published reports indicate that it is the research consultant that implements the functional
assessment (Mueller et al., 2003; Noell et al., 1997; Stage et al., 2006; Witt et al., 1997; Wood
et al., Zintl, 2005). Research teams often consist of one or more research consultants, some

87
research assistants and the classroom teacher. The research team collects and analyses data
over several days. A teacher on his or her own may not have the time or the knowledge to
complete the type of functional assessment described in the research literature.
The present study suggests the classroom teacher may implement functional assessments
and interventions erratically and then monitor them poorly, if at all. It is not uncommon for a
teacher to stop individual interventions as soon as there are improvements in the child’s
behaviour or academic work. Church (1999) found that a behavioural intervention worked
within a classroom but, that in some cases, it needed to be continued for up to four months for
the behaviour changes to become permanent. This means that there is a need for continuing
practice of the new skills for the child to achieve a permanent change.
The second common response of teachers is to simplify the intervention. If an
intervention is time consuming or there is no rapid improvement in the child’s behaviour or
progress, then the implementation tends to fade out after time as teachers resort to more
customary classroom practices. Zintl (2005) found that the teacher from Room Z2 was not able
to oversee the peer tutoring for two weeks during the study and the writer needed to visit to
ensure that the peer tutoring occurred regularly.
Functional assessments and interventions for children with behaviour difficulties appear
to be more popular than functional assessment for children with learning difficulties. Possibly
this is because problem behaviour is more disruptive to the functioning of the class as a whole.
Behaviour interventions are also more widely known and more likely to be a part of existing
classroom routines.
The case experiments in this study illustrate these observations. They show that a teacher,
even one who has been specifically trained in functional assessment, may experience difficulty
in implementing a functional assessment to a degree that allows for an appropriate intervention
to be chosen. Even when a teacher has identified the probable cause of a problem behaviour or

88
lack of progress, they may still not be able to identify the appropriate remedial action. In the
present investigation, the teacher struggled to think of an effective intervention that she had not
already tried and already judged to be unsuccessful for that particular child in Case Experiments
3 and 4. In these case experiments it was the writer who finally chose the intervention as the
teacher was unable to do so.
What appears to be needed is better training in solving these kinds of instructional
problems. Problem solving is required in order to select an intervention which is likely to be
effective. Then, if interventions fail to work and provide positive change for the child, problem
solving is needed to modify the intervention to increase its effectiveness. Problem solving to
repair interventions means being able to discover why the intervention is not working and then
to create an intervention that will work. In Case Experiment 3, Erick and Jack were not
progressing in their grapheme fluency at the rate observed by Zintl (2005) even although similar
materials and procedures were being used. An analysis of the intervention showed that the
amount of practice was decreasing week to week. Erick and Jack were simply not getting
enough practice. The teacher might have been able to recognise that practice had been
decreasing if she had been keeping a tally, but as she was not able to make time to observe the
practice she did not see the decrease in the numbers of sessions or the declining motivation
experienced by both the tutors and the children being tutored. While the teacher might have
taken over the intervention herself, she was not able to take 5 to 10 minutes of her class
teaching time to spend with just two children. This raises issues regarding the nature of
teachers’ work.
The Nature of Teachers’ Work
The nature of the work required of classroom teachers is one of the central reasons why
teachers do not implement individualised functional assessments or interventions with the
integrity required for effective change. In New Zealand, one teacher will generally be

89
responsible for motivating and teaching 20 to 30 children for five hours a day, five days a week.
This can only be achieved using group activities. In order to provide a general programme of
lessons appropriate for all children, teachers already use time outside of the allocated school
hours in order to prepare appropriate lessons. Teachers also have to create their own resources.
To individualise work for even one or two children and then monitor their progress involves
more work than can be fitted into the time available. There is little time outside of the school
day allocated for creating resources for an individual child and there is even less time during a
school day to work one-on-one with a child. One on one work is sometimes done by a teacher
aide, but none of the children in the present study had needs severe enough to qualify for
teacher aide time. In comparison to a teacher, a teacher aide is relatively unskilled and may be
facing a need to deal with persistent behaviour and learning difficulties that they have not been
trained to deal with.
Teachers become very good at the routine of teaching and managing groups of children
within the classroom. What is not well covered in the training of teachers is the ability to work
outside of well-used practices and come up with research based solutions for how to teach
children with special needs.
It is difficult to see how this problem is to be solved. Smaller classes are not practical due
to cost. Increasing teacher competence is a possibility but may be relatively expensive and
ineffectual given the results of the present case studies where even a highly trained teacher
struggled to implement the necessary assessments and interventions. Better materials might
solve some learning difficulties, but are unlikely to solve behaviour problems which are usually
a response to the behaviour of others, especially the teacher’s moment-to-moment responses to
child misbehaviour. Peer tutoring may solve practice problems, but a peer tutor is not able to
teach new concepts and may lose motivation as in Case Experiment 3. Teacher aides may
increase one-on-one time but teacher aides are unable to engage in specialist teaching and
90
generally have no training in functional assessment. Some problems can be solved by good
resources (i.e. worksheets). These can be used to occupy the class while working with
individual children, but the quantity required can be expensive and this type of material is
generally not available in New Zealand schools.
Limitations of this Study
There is a limitation to this study that needs to be identified. Given that one of the main
aims of this study was to observe whether teachers in mainstream classrooms are able to
perform functional assessments and then follow up with effective interventions, the fact that the
present investigation examined the work of only one teacher and six children means that the
findings are not yet generalisable to other teachers and situations.
Conclusions
Research into functional assessment shows us how to identify the factors which are
responsible for different kinds of behaviour difficulties and learning difficulties. The research
on what works for children with behaviour difficulties and learning difficulties is also very
informative, because it shows what is possible in the treatment of these children, at least under
well-controlled conditions. The problem of how teachers might use these assessment
procedures and effective interventions in busy mainstream classrooms remains to be solved.
What is required now is research into how best to provide teachers with the information, the
skills and the resources necessary to manage behavior and accelerate learning in children with
special educational needs in a class of 20 to 30 children.

91
REFERENCES
Alonzo, J., Ketterlin-Geller, L.R., & Tindal, G. (2007). Curriculum-based measurement in
reading and math: Providing rigorous outcomes to support learning. In L. Florian (Ed.),
The SAGE handbook of special education (pp. 307-318). London: SAGE Publications.
American Psychiatric Association. (2000). Diagnostic and statistical manual of mental
disorders (Fourth Edition-Text Revision, DSM-IV-TR). Washington, DC: American
Psychiatric Association.
Anderson, C. M., English, C. L., & Hendrick, T. M. (2006). Use of the structured descriptive
assessment with typically developing children. Behavior Modification, 30, 352-378.
Bourke, R., & Mentis, M. (2007). Self-assessment as a lens for learning. In L. Florian (Ed.),
The SAGE handbook of special education (pp. 317-330). London: SAGE Publications.
Brahm, N. (2007). Categories of special educational needs. In L. Florian (Ed.), The SAGE
handbook of special education (pp. 55-66). London: SAGE Publications.
British Institute of Learning Disabilities (n.d.). Fact sheet – learning disabilities. Retrieved
January 31, 2008, from http://www.bild.org.uk /docs/05faqs/Factsheet%20Learning
%20Disabilities.pdf
Broussard, C. & Northup, J. (1997). The use of functional analysis to develop peer
interventions for disruptive classroom behaviour. School Psychology Quarterly, 12, 65-
76.
Carr, E. G. (1977). The motivation of self-injurious behavior: A review of some hypotheses.
Psychological Bulletin, 84, 800-816.
Carr, E. G. (1994). Emerging themes in the functional analysis of problem behaviour. Journal
of Applied Behavior Analysis, 23, 147-185.

92
Church, R. J. (1996). The prevalence of children with behaviour disorders in Canterbury
primary schools. Christchurch, New Zealand: University of Canterbury, Education
Department in association with the Canterbury Primary Principals’ Association.
Church, R.J. (1999). Project Early second evaluation report: 1996-1997 . Christchurch, New
Zealand: University of Canterbury, Education Department.
Church, R. J. (2003). The definition, diagnosis and treatment of children and youth with severe
behaviour difficulties: A review of research. Christchurch, New Zealand: University of
Canterbury, Education Department.
Church, R. J. (2005). The origins and treatment of delayed development in learning to read.
Paper presented to the annual conference of the New Zealand Association for Research in
Education, Dunedin, New Zealand.
Church, R. J. (2007a). Accelerating the development of expressive writing skills in low
achieving children: A review of research. Paper presented to the annual conference of the
New Zealand Association for Research in Education, Christchurch, New Zealand.
Church, R. J. (2007b). EDUC 621: Practical Work Manual. Christchurch, New Zealand:
University of Canterbury, School of Educational Studies and Human Development.
Church, R. J., & Tyler-Merrick, G. (2007). Observers’ Manual: Observing behaviour in the
classroom and early childhood centre. Christchurch, New Zealand: University of
Canterbury, School of Educational Studies and Human Development.
Church, R. J., Tyler-Merrick, G., & Hayward, H.M. (2006). Identifying antisocial development
in New Zealand children. Phase 1: development of the screening procedure.
Christchurch, New Zealand: University of Canterbury, Education Department.
Cowley, S. (2006). Getting the buggers to behave. London: Continuum International
Publishing Group.

93
Daly, E. J., III, Witt, J. C., Martens, B., & Dool, E. J. (1997). A model for conducting a
functional analysis of academic performance problems. School Psychology Review, 26,
554-574.
Doggett, R. A., Edwards, R. P., Moore, J. W., Tingstrom, D. H., & Wilczynski, S. M. (2001).
An approach to functional assessment in general education classroom settings. School
Psychology Review, 30, 313-328.
Ervin, R. A., Radford, P. M., Bertsch,K., Piper, A. L., Ehrhardt, K. E., & Poling, A. (2001). A
descriptive analysis critique of the empirical literature on school-based functional
assessment. School Psychology Review, 30, 139-210.
Evans, I. M., & Paewai, M. K. (1999). Functional analysis in a bicultural context. Behaviour
Change, 16, 20-36.
Finkel, A. S., Derby, K. M., Weber, K. P., & McLaughlin, T. F. (2003). Use of choice to
identify behavoral function following an inclonclusive brief functional analysis. Journal
of Positive Behaviour Interventions, 5, 112-121.
Gansle, K. A., & McMahon, C. M. (1997). Component integrity of teacher intervention
management behavior using a student self-monitoring treatment: An experimental
analysis. Journal of Behavioral Education, 7, 405-419.
Glynn, T. (1995). Pause, prompt, praise: Reading tutoring prcedures for home and school
partnerships. In S. Wofendale and K. Topping (Eds.), Parent involvement in literacy:
Effective partnerships in education (pp. 33-44). London: Cassell.
Grandy, S. E., Peck, S. M. (1997). The use of functional assessment and self-management with
a first grader. Child & Family Behavior Therapy, 19, 29-43.
Gresham, F. M., McIntyre, L. L., Olson-Tinker, H., Dolstra, L., McLaughlin, V., & Van, M.
(2004). Relevance of functional behavioral assessment research for school-based

94
interventions and positive behavioral support. Research in Developmental Disabilities,
25, 19-37.
Gresham, F. M., MacMillan, D. L., Beebe-Frankenberger, M. E., & Bocian, K. M. (2000).
Treatment integrity in learning disabilities intervention research: Do we really know how
treatments are implemented? Learning Disabilities Research & Practise, 15, 198-205.
Gumbel, T. P., & Golan, H. (2000). Teaching game-playing social skills using a self-
monitoring treatment package. Psychology in the Schools, 37, 253-261.
Hanley, G. P., Iwata, B. A., & McCord, B. E. (2003). Functional analysis of problem
behaviour: a review. Journal of Applied Behavior Analysis, 36, 147-185.
Hinshaw, S. P., & Zupan, B. A. (1997). Assessment of antisocial behaviour in children and
adolescents. In D. M. Stoff, J. Breiling, J. D. Maser (Eds.). Handbook of antisocial
behaviour (pp. 36-50). Hoboken: John Wiley & Sons Inc.
Hoff, K. E., Ervin, R. A., & Friman, P. C. (2005). Refining functional behavioural assessment:
analyzing the separate and combined effects of hypothesized controlling variables during
ongoing classroom routines. School Psychology Review, 34, 45-57.
Horner, R. H. (1994). Functional assessment: Contributions and future directions. Journal of
Applied Behavior Analysis, 27, 401-404.
Hosp, M. K., Hosp, J. L., & Howell, K. W. (2007). The ABCs of CBM: A practical guide to
curriculum-based measurement. New York: The Guilford Press.
Iwata, B. A., Dorsey, M. F., Slifer, K. J., Bauman, K. E., & Richman, G. S. (1994). Toward a
functional analysis of self-injury. Journal of Applied Behavior Analysis, 27, 197-209.
Iwata, B. A., Wallace, M. D., Kahng, S., Lindberg, J. S., Roscoe, E. M., Conners, J., et al.
(2000). Skill acquisition in the implementation of functional analysis methodology.
Journal of Applied Behavior Analysis, 33, 181-194.

95
Kern, L., Childs, K. E., Dunlap, G., Clarke, S., & Falk, G. D. (1994). Using assessment-based
curricular intervention to improve the classroom behavior of a student with emotional and
behavioral challenges. Journal of Applied Behavior Analysis, 27, 7-19.
Lane, K. L., Bocian, K. M., MacMillan, D. L., & Gresham, F. M. (2004). Treatement integrity:
An essential – but often forgotten – component of school-based interventions. Preventing
School Failure, 48, 36-43.
Liberty, K., Clark, B., & Solomon, C. (2000, November). Ecological assessment and children
on the borderline. Paper presented at the 2000 New Zealand Association for Research in
Education, Hamilton, New Zealand.
Lindsay, G. (2004). Inclusive education: a critical perspective. In J. Wearmouth, T. Glynn, R.
C. Richmond & M. Berryman (Eds.), Inclusion and behaviour management in schools:
Issues and challenges (pp. 266-285). London: David Fulton Publishers Ltd.
Lyon, G. R., Fletcher, J. M., Shaywitz, S. E. , Shaywitz, B. A., Torgesen, J. K. , Wood, F. B.,
Schulte, A., & Olson, R. (n.d.). Rethinking learning disabilities. Retrieved January 30,
2008, from http://www.ndol.org/documents/SpecialEd_ch12.pdf
Lyon, G. R. (1996). Learning disabilities. The Future of Children, Spring, 54-76.
Mace, F. C. (1994). The significance and future of functional analysis methodologies. Journal
of Applied Behavior Analysis, 24, 385-392.
Macfarlane, A. H. (2007). Discipline, democracy, and diversity: working with students with
behaviour difficulties. Wellington: NZCER Press.
Mash, E. J., & Dozois, D. J. A. (2003). Child psychopathology: A developmental systems
perspective. In E. J. Mash & R. A. Barkley (Eds.), Child Psychopathology (2nd
ed.) (pp.3-
71). New York: The Guilford Press.

96
Ministry of Education (2007). Special Education Policy. Retrieved January 24, 2008, from
http://www.minedu.govt.nz/index.cfm?layout=document&documentid=7327&indexid
=7954&indexparentid=6871
Mitchell, D. (1999). Special education in New Zealand: A decade of change. New Zealand
Journal of Educational Studies, 34, 199-210.
Mitchell, D. (2008). What really works in special and inclusive education. London:
Routledge.
Mueller, M. M., Edwards, R. P., & Trahant, D. (2003). Translating multiple assessment
techniques into an intervention selection model for classrooms. Journal of Applied
Behavior Analysis, 36, 563-573.
Nelley, E., & Smith, A. (2000). PM Benchmark kit. Cheltenham: Nelson Thorns Ltd.
Noell, G. H., Witt, J. C., Gilbertson, D. N., Ranier, D. D., & Freeland, J. (1997). Increasing
teacher intervention implementation in general education settings through consultation
and performance feedback. School Psychology Quarterly, 12, 77-88.
O’Brien, P., & Ryba, K. (2005). Policies and systems in special education. In B. Fraser, R.
Moltzen, & K. Ryba (Eds.), Learners with special needs in Aotearoa New Zealand
(pp. 22-48). Palmerston North: Dunmore Press.
O’Neill, R. E., Horner, R. H., Albin, R. W., Sprague, J. R., Storey, K., & Newton, J. S. (1997).
Functional assessment and program development for problem behavior (2nd
ed.).
Pacific Grove: Brooks/Cole Publishing Company.
Parnas, J., & Zahavi, D. (2002). The role of phenomenology in psychiatric diagnosis and
classification. In M. Maj, W. Gaebel, J. J. López-Ibor, & N. Sartorius (Eds.),
Psychiatric diagnosis and classification (pp. 137-162). Hoboken: John Wiley & Sons
Inc.

97
Parrish, J. M. (2002). Promoting adaptive behavior while addressing challenging behavior. In
M. L. Batshaw (Ed.), Children with disabilities (5th ed.) (pp. 607- 628). Baltimore:
Paul H Brookes Publishing Co.
Prochnow, J. E., Kearney, A. C., & Carroll-Lind, J. (2000). Successful inclusion: What do
teachers say they need? New Zealand Journal of Educational Studies, 35, 157-177.
Riley,-Tillman, T. C., & Chafouleas, S. M. (2003). Using interventions that exist in the natural
environment to increase treatment integrity and social influence in consultation.
Journal of educational and psychological consultations, 14, 139-156.
Roberts, M. L., Marshall, J., Nelson, J. R., & Albers, C. A. (2001). Curriculum-based
assessment procedures embedded within functional behavioral assessment: identifying
escape-motivated behaviors in a general education classroom. School Psychology
Review, 30, 264-277.
Sasso, G. M., Conroy, M. A., Stichter, J. P., & Fox, J. J. (2001). Slowing down the bandwagon:
The misapplication of functional assessment for students with emotional or behavioural
disorders. Behavioral Disorders, 26, 282-296.
Smith, R. G., & Churchill, R. M. (2002). Identification of environmental determinants of
behaviour disorders through functional analysis of precursor beahviors. Journal of
Applied Behavior Analysis, 35, 125-136.
Smith, B. W., & Sugai, G. (2000). A self-management function assessment-based behavior
support plan for a middle school student with EBD. Journal of Positive Behavior
Interventions, 2, 208-217.
Stage, S. A., Jackson, H. G., Moscovitz, K., Erickson, M. J., Thurman, S. O., Jessee, W et al.
(2006). Using multimethod-multisource functional behavioural assessment for students
with behavioural disabilities. School Psychology Review, 35, 451-471.

98
Sterling-Turner, H. E., Robinson, S. L., & Wilczynski, S. M. (2001). Functional assessment of
distracting and disruptive behaviors in the school setting. School Psychology Review, 30,
211-226.
Tunmer, W. E., & Chapman, J. W. (2005). Students with learning difficulties and reading
problems. In D. Fraser, R. Moltzen, & K. Ryba (Eds.), Learners with special needs in
Aotearoa New Zealand (pp. 244-268). Palmerston North: Dunmore Press.
Umbreit, J. (1995). Functional analysis of disruptive behaviour in an inclusive classroom.
Journal of Early Intervention, 20, 18-29.
Umbreit, J., Ferro, J., Liaupsin, C., & Lane, K. L. (2007). Functional behavioural assessment
and function-based intervention. New Jersey: Pearson Education Inc.
US Department of Education. (n.d.). Building the legacy: IDEA 2004. Retrieved February 21,
2008, from http://idea.ed.gov/explore/view/p/%2Croot%2Cdynamic %2CTopicalArea
%2C6%2C
Watson, T. S., & Steege, M. W. (2003). Conducting school-based function behavioural
assessments. New York: The Guilford Press.
Wearmouth, J. (2004). Inclusion and behaviour management in schools: Issues and challenges.
In J. Wearmouth, T. Glynn, R. C. Richmond & M. Berryman (Eds.), Inclusion and
behaviour management in schools:Iissues and challenges (pp. ix-xi). London: David
Fulton Publishers Ltd.
Williams, D. (2002). Phonemic awareness and decoding fluency in 8- to 9-year old normal
progress and low progress readers (M.Ed Dissertation). Christchurch, N.Z.: University
of Canterbury, Education Department.
Witt, J. C., Noell, G. H., LaFleur, L. H., & Mortenson, B. P. (1997). Teacher use of
interventions in general education settings: Measurement and analysis of the independent
variable. Journal of Applied Behavior Analysis, 30, 693-696.

99
Wood, B. K., Umbreit, J., Liaupsin, C. J., & Gresham, F. M. (2007). A treatment integrity
analysis of function-based intervention. Education and Treatment of Children, 30, 105-
120.
Zintl, S. (2005). Building decoding fluency in 8- to 9- year old low progress readers (M.Ed
Dissertation). Christchurch, N.Z.: University of Canterbury, School of Education.

100
APPENDIX 1
UNIVERSITY OF CANTERBURY HUMAN ETHICS COMMITTEE APPROVAL LETTER
HEC Ref: 2007/101
23 August 2007
Ms Melanie Robinson
School of Educational Studies & Human Development
UNIVERSITY OF CANTERBURY
Dear Melanie
The Human Ethics Committee advises that your research proposal “Meeting the learning needs
of individual children in the mainstream classroom” has been considered.
Thank you for your replies to points 1, 3 4 and 5 raised by the Committee which we accept.
Regarding the second point i.e. following the initial assessment being made parents and
caregivers of the child selected for the detailed section of the project should consent to the
specifics of the project, while the Committee understand your argument in this regard, we
recommend that you as a researcher send the necessary information to the parents. This is to
ensure that they are clear that this stage of the project is associated with your University
research project and has University of Canterbury Human Ethics clearance.
I am pleased to advise that your proposal has been approved with the above in mind and subject
to the incorporation of the amendments you have provided in your email of 15 August 2007.
Yours sincerely
Dr Michael Grimshaw Chair, Human Ethics Committee

101
APPENDIX 2
TEACHER’S WEEKLY REFLECTION SHEET
Meeting the learning needs of individual children in the mainstream
classroom
Date: _____________
Teacher: _____________
Child: _____________
Weekly Reflection
Please complete the following questions for each of the participating children in your classroom at
the end of each week, with regard to their current individualised education programmes.
1. Has the introduction of (child’s name)’s individualised education programme involved you
in any extra work? If yes, please describe.
_____________________________________________________________________________
_____________________________________________________________________________
_____________________________________________________________________________
2. Have you received any assistance or support in implementing (child’s name) individualised
education programme? If yes, please describe.
_____________________________________________________________________________
_____________________________________________________________________________
_____________________________________________________________________________
3. Please list any additional support that would assist you to implement the individualised part
of this child’s current classroom programme?
_____________________________________________________________________________
_____________________________________________________________________________
_____________________________________________________________________________

102
APPENDIX 3
RECORDING SHEET FOR WEEKLY HAND RESULTS
Hands on Goal Tracking Sheet
Name: _______________________________
Start Kind
&
quiet
words
Kind
hands
&
feet
Play
fair
Tidy
up
Total Reward
criteria
Monday 3/5
Tuesday 3/5
Wednesday 3/5
Thursday 3/5
Friday 3/5
Start Kind
&
quiet
words
Kind
hands
&
feet
Play
fair
Tidy
up
Total Reward
criteria
Monday 3/5
Tuesday 3/5
Wednesday 3/5
Thursday 3/5
Friday 3/5
Goal Reading /4 Maths /4
Start
Kind & gentle words
Kind hands & feet
Play fair
Tidy up

103
APPENDIX 4
WILLIAMS’ PHONEMIC SEGMENTATION TEST

104
APPENDIX 5
CANTERBURY DECODING FLUENCY TEST
Date: _____________ Tester: __________________ Participant: __________________
Graphemes Correct: ________ Errors: _______ Correct Graphemes per Minute: _____
pa in to eat ka
on far shoo er do 10
oil bee hay lee so
ed the vee oat jar 20
eel no at we urn
quit aim me oo go 30
or zoo boy why irk
coo cha owl ha art 40
ra up ox out you
shoo eat eel bee pa 50
to in hay jar urn
the aim ka boy do 60
oo me er go cha
vee out coo owl far 70
at up irk ha oil
lee oat zoo ra or 80
we quit so ed why
on art ox no you 90

105
1 pa in to eat ka
2 on far shoo er do
3 oil bee hay lee so
4 ed the vee oat jar
5 eel no at we urn
6 quit aim me oo go
7 or zoo boy why irk
8 coo cha owl ha art
9 ra up ox out you
10 shoo eat eel bee pa
11 to in hay jar urn
12 the aim ka boy do
13 oo me er go cha
14 vee out coo owl far
15 at up irk ha oil
16 lee oat zoo ra or
17 we quit so ed why
18 on art ox no you
APPENDIX 6
CHILDREN’S COPY OF CANTERBURY DECODING FLUENCY TEST

106
APPENDIX 7
LIST OF THE 60 PRACTICE WORDS
Practice List A1 Practice List A2 Practice List B1 Practice List B2
fly boil her coin
nice teeth tune video
kick shoot rain queen
chase sharp dark porch
wait say cuff boot
cute girl loan town
yes term then loud
run road way that
van down feet Roy
Ken mouth zip church
quiz short cake zoom
prize cheap get shirt
not hurt size job
chain weed wide year
box joy six my

107
APPENDIX 8
EXAMPLE OF CHILDREN’S PRACTICE FLIP CARDS
fly
nice
kick
chase
wait

108
APPENDIX 9
STANDARD COPYING TASK GIVEN TO CLASS
A big cat is looking down at a little hole.
The mice are inside the hole.
The cat sits by the hole.
The mice can see her.
The mice will stay inside the hole where they are safe.
The cat stays by the hole.