Diploma Thesis
92
GRAZ UNIVERSITY OF TECHNOLOGY D I P L O M A T H E S I S INSTITUTE OF HIGH VOLTAGE AND SYSTEM MANAGEMENT
-
Upload
khangminh22 -
Category
Documents
-
view
0 -
download
0
Transcript of Diploma Thesis

GRAZ UNIVERSITY OF TECHNOLOGY
D I P L O M A T H E S I S
INSTITUTE OF HIGH VOLTAGE AND
SYSTEM MANAGEMENT

1
Analysis of electrical, thermal and
mechanical characteristics of various Mica
papers in high voltage insulation systems
Untersuchung elektrischer, thermischer und
mechanischer Eigenschaften verschiedener
Glimmerpapiere in
Hochspannungsisolationssystemen
Diploma Thesis
From
Zornitsa Holzbauer
Graz, February 2013
In cooperation with
Isovolta AG Company
Supervisor TU Graz: Univ.-Doz. Dipl.-Ing. Dr.techn. Christof Sumereder
Supervisor ISOVOLTA AG: Dipl.-Ing. Werner Grubelnik

2
Acknowledgement
I want to sincerely thank the people who supported me throughout this work:
Special thanks to my supervisor and mentor at the TU Graz: Univ.-Doz. Dipl.-Ing.
Dr.techn. Christof Sumereder, for his great patience and his valuable guidance.
I am very grateful for the chance and opportunity that Isovolta AG gave me to write my
thesis there.
Many thanks are owed to my mentor there Dipl.-Ing. Werner Grubelnik, for giving me
directions and for discuss everything with me.
To all my colleagues from Isovolta, many thanks for their time and help during the
measurements of this diploma thesis.
I am also indebted to my husband who was always a precious support to me and gave
me motivation to finish my work, for all the hours spent with me over this paper and his
kindness.

3
Kurzfassung
Diese Diplomarbeit präsentiert Resultate aus experimentellen Tests, durchgeführt an
speziellem Hochspannungsglimmerpapier. Die Untersuchungen wurden vorgenommen
um Unterschiede zwischen verschiedenen Produkten aus Glimmerpapier und dessen
charakteristischen Eigenschaften festzustellen.
Untersuchte Produkte:
Kalzinierte Mica (drei verschiedene Bänder)
Unkalzinierte Mica (zwei verschiedene Bänder)
Die Untersuchung wurde an Produkten mit verschiedenen Materialstärken
(unterschiedlichem Glimmeranteil pro m²) durchgeführt. Es wurden drei verschiedene
Bänder aus kalziniertem Mica (0,12mm, 0,18mm und 0,21mm Stärke) und zwei
verschiedene Bänder aus unkalziniertem Mica (0,18mm und 0,28mm Stärke) getestet.
Das Hauptziel dieser Diplomarbeit ist es, Informationen über die Eigenschaften von
kalziniertem und unkalziniertem Glimmerpapier für Hochspannungsanwendungen zu
erlangen. Bisherige Tests an Glimmerprodukten geben nicht genügend Information über
Vor- und Nachteile von unterschiedlichen Glimmeranteilen in den Bändern, sowie wenig
klare Aussagen über die Unterschiede zwischen kalzinierten und unkalzinierten
Glimmerprodukten.
Im Rahmen dieser Diplomarbeit wurden verschiedene Tests durchgeführt um die
Durchschlagspannung zu ermitteln, und um thermische und mechanische Eigenschaften
zu untersuchen.
Für jede Materialprobe wurden so viele Bandstücke (Layers) zusammen gepresst damit
eine Materialstärke von ca. 0.5 mm erreicht wurde. Zwei Probenhalter wurden speziell
entwickelt um mehrere Proben in Transformatoröl gleichzeitig mit Spannung belasten zu
können. Bei bisherigen Tests wurde die Durchschlagfestigkeit nur an ganzen Stäben

4
aus Metall oder Kupfer in Glimmerbänder eingewickelt, und unter Hochspannung
getestet. Das Ziel war jetzt, Resultate aus Messungen ohne die Einwirkung andere
Materialien wie Metall oder Kupfer zu erhalten.
Im Laufe der Untersuchungen hat sich herausgestellt, dass es mit den vorhandenen
Ressourcen nicht möglich war, Proben herzustellen die mit ausreichender Genauigkeit
die gleichen Materialstärken aufweisen. Durch die leicht unterschiedlichen Dicken der
Proben waren sie unterschiedlichen elektrischen Feldstärken ausgesetzt, was einen
deutlichen Einfluss auf die Messergebnisse hatte.
Durch den Vergleich von Proben die ähnlichen elektrischen Feldstärken ausgesetzt
waren lassen sich folgende Aussagen treffen.
Unkalziniertes Mica scheint unter besagten Testbedingungen eine leicht höhere
Durchschlagfestigkeit zu besitzen, solange es nicht thermisch belastet wird. Nach
thermischer Belastung zeigte es ein wesentlich schlechteres Verhalten wo hingegen
kalziniertes Mica kaum Unterschiede in der Durchschlagfestigkeit zeigte. Es konnte kein
signifikanter Unterschied zwischen Materialen mit verschiedener Anzahl von Schichten
festgestellt werden.
Die Resultate sind sehr abhängig von dem Herstellungsprozess, Bänderzustand sowie
dem Probenpressprozess.

5
Abstract
This diploma thesis presents results of experimental tests performed on mica paper for
high voltage equipment applications. The investigation was made to recognize
differences between different mica products and their characteristics.
These are:
Calcined mica band (three types)
Uncalcined mica band (two types)
Investigation was specified on different thicknesses of the products, which means the
quantity of mica parts per square metre differs. From the first product which is mica band
based on calcined mica paper, three different thicknesses of material are taken
(0,12mm; 0,18mm and 0,21mm). From the second product, which is mica band based
on uncalcined mica paper, two different thicknesses were taken (0,18mm and 0,28mm).
The fundamental aim of this thesis is to provide information about the behaviour of
calcined and uncalcined mica for high voltage equipment usage. Previous tests do not
give enough information about advantages or disadvantages of thin or thick roles of
mica products.
Within this diploma thesis a variety of tests were applied in order to clarify the point of
breakdown voltage, thermal and mechanical behaviour.
In order to achieve 0.5 mm thickness of the samples, there were several layers of
material pressed together at high temperatures in conditions near that of industrial ones.
Two special sample holders were invented in order to test several samples
simultaneously under even voltage in an oil environment. In previous tests this was
made by testing a whole bar rolled in material and put under high voltage. The goal of
the current procedure is to look at the results without considering additional presence of
other material like copper or iron.

6
In the course of the investigation it became clear that to produce samples with the exact
material thickness under the present conditions was not possible. Due to slight thickness
differences, the samples were put into different electrical field strengths which
significantly affected the results of the measurements.
Due to the comparison made between samples exposed to similar electrical field
strengths, the following statements can be made:
Uncalcined mica tape seems to have higher dielectric strength under these test
conditions and as long as there is no thermal load applied. Uncalcined mica tape in
comparison to calcined mica has achieved worse results after a thermal load was
applied. No significant difference between materials with different numbers of insulation
layers could be stated.
The results are very dependent on the manufacturing conditions and process, mica roles
condition, and pressing methods.

7
Content: Acknowledgement ......................................................................................................................................... 2
Kurzfassung ................................................................................................................................................... 3
Abstract ......................................................................................................................................................... 5
1. Introduction ........................................................................................................................................... 9
2. Insulation Systems ............................................................................................................................... 10
2.1. Application in rotating machines ................................................................................................ 11
2.2. Mica ............................................................................................................................................. 15
2.2.1. What is Mica ........................................................................................................................ 15
2.2.2. Mica splittings...................................................................................................................... 16
2.2.3. Mica mineral ........................................................................................................................ 17
2.2.4. Manufacturing of mica paper .............................................................................................. 18
2.2.4.1. Uncalcined mica pulping process ................................................................................ 18
2.2.4.2. Calcined mica pulping process .................................................................................... 19
2.2.4.3. Features of calcined and uncalcined mica paper: ....................................................... 21
2.2.4.4. Applications of calcined and uncalcined mica paper for high voltage insulating
materials: ..................................................................................................................................... 22
2.2.5. Mica products ...................................................................................................................... 22
3. Requirements for insulation systems .................................................................................................. 24
3.1. TEAM-stresses ............................................................................................................................. 24
3.1.1. Aging stresses ...................................................................................................................... 24
3.1.2. Thermal Stress ..................................................................................................................... 25
3.1.3. Electrical stress .................................................................................................................... 25
3.1.4. Ambient stress ..................................................................................................................... 26
3.1.5. Mechanical stress ................................................................................................................ 27
4. VPI Technology .................................................................................................................................... 28
4.1. Main characteristics of Vacuum Pressure Impregnation (VPI).................................................... 28
4.2. Porous tapes for VPI – processes ................................................................................................ 30
4.3. Supportive Materials by VPI Tapes .............................................................................................. 31
4.3.1. Glass- cloth .......................................................................................................................... 31
4.3.2. PET- film ............................................................................................................................... 32
4.4. VPI Comparison ........................................................................................................................... 32

8
4.5. Impregnating Resins .................................................................................................................... 33
4.6. Additional Materials .................................................................................................................... 34
5. Resin Rich Technologies ...................................................................................................................... 36
5.1. Conventional RR Process ............................................................................................................. 37
6. Test procedure and choice of mica bands ........................................................................................... 39
6.1. Test samples preparation ............................................................................................................ 39
6.2. Pressing conditions ...................................................................................................................... 40
6.3. High Voltage Endurance Tests ..................................................................................................... 41
6.3.1. Test setup ............................................................................................................................ 42
6.3.2. Test results .......................................................................................................................... 46
6.3.3. Weibull distribution ............................................................................................................. 50
6.3.4. Test Analysis ........................................................................................................................ 56
6.4. Resin content ............................................................................................................................... 58
6.5. Dynamic-Mechanical Analysis ..................................................................................................... 60
6.5.1. Measurements .................................................................................................................... 63
6.6. Thermal-load tests:...................................................................................................................... 65
6.6.1. Weibull Distribution results ................................................................................................. 67
6.6.2. Data Analysis ....................................................................................................................... 73
6.6.2.1. Calmicaglass®0893 ...................................................................................................... 75
6.6.2.2. Calmicaglass®0409 ...................................................................................................... 75
6.7. Specific resistance ....................................................................................................................... 76
7. Summary.............................................................................................................................................. 79
8. Conclusion and Outlook ...................................................................................................................... 81
9. References ........................................................................................................................................... 83
10. List of figures ....................................................................................................................................... 84
11. Attachment .......................................................................................................................................... 86

9
1. Introduction
For many years, micas have been used in the insulation systems of high-voltage rotating
machines. The two forms of mica most commonly used are muscovite and phlogopite for
the electrical industry. They differ mainly in colour, hardness, cleavability and calcination
temperature Micas possess a combination of chemical, physical, electrical, thermal, and
mechanical properties not found in any other product. This has made them an important
component of high-voltage insulation systems. While micas are resilient and
incompressible, they are also easily sliced into thin films, which can be colourless and
transparent. This ability to be easily split into very thin sections while maintaining a
robust strength through the other two axes gives mica its unique properties and makes it
so easy to handle. These properties result from the structural arrangement of the atoms
(1)

10
2. Insulation Systems
Insulating material plays a main role in the high voltage machinery. A more precise
definition is given like this:
The dielectric strength of an insulating material can be defined as the maximum electric
stress the dielectric material can withstand without breakdown. (2)
Insulation material has more than one parameter of importance for how the breakdown
strength reacts. Those are for instance the pressure, surrounding condition like humidity,
temperature, the test electrodes, etc. One of the most common reasons for insulation
breakdown is the partial discharge either on the insulation surface or in between its
layers. Another cause would be some thermal, mechanical or electro-thermal load.
In many types of electrical machines, there are separate parts which operate at different
voltage stages at the same time. That is why solid dielectric materials are used in order
to avoid shortcuts which lead to early aging of the system. Liquids and gasses normally
have lower breakdown strength than a solid does. To be guaranteed that an insulation
system would work failure free, it should be necessary to have high mechanical strength,
small dielectric losses, be resistant to moisture and thermally stable.
When solid insulation gets damaged (ex. breakdown) it stays that way permanently. In
liquids or gasses it recovers when the electric field is removed. There are few
mechanisms for breakdown in a solid insulation system which can be determined:
Electro-mechanical breakdown
Breakdown due to treeing
Thermal breakdown
Electro-chemical breakdown
Partial discharges (internal or on the surface)
Intrinsic or ionic breakdown

11
2.1. Application in rotating machines
Electric rotating machines divide generally into two categories. High voltage
machines are operating at voltages above 1000V and low voltages below that value.
The greater the value of the applied voltage, the more difficult it gets to be electrically
isolated. That is why machines that work with voltage above 22kV are rarely built.
There are some classifications about the insulation for rotating machines. The most
common classes are:
Class E (low voltage)
Class E insulation consists of materials or combinations of materials, which by
experience or tests can be shown to be capable of operation at Class E
temperature (materials possessing a degree of thermal stability allowing them
to be operated at a temperature 15 Centigrade degrees higher than Class A
materials).
Maximum allowed temperature: (IEC60034-1 only): 120C, 248F.
Class F (high voltage), replaces even class B
Class F insulation consists of materials or combinations of materials such as
mica, glass fiber, asbestos, etc., with suitable bonding, impregnating or
coating substances, as well as other materials or combinations of materials,
not necessarily inorganic, which by experience or tests can be shown to be
capable of operation at the Class F temperature (materials possessing a
degree of thermal stability allowing them to be operated at a temperature 25
Centigrade degrees higher than Class B materials).
Maximum allowed temperature: (IEC60034-1 & NEMA MG1-12.43): 155C,
311F.
Class H (for special insulation from expensive materials)
Class H insulation consists of materials such as silicone elastomer and
combinations of materials such as mica, glass fibre, asbestos etc., with
suitable bonding, impregnating or coating substances such as appropriate

12
silicone resins. Other materials or combinations of materials may be included
in this class if by experience or tests they can be shown to be capable of
operation at the Class H temperature.
Maximum allowed temperature: (IEC60034-1 & NEMA MG1-12.43): 180C,
356F. (3)
Class F is defined as the class of the future because of its wide application
possibilities. Class H is mainly applied on small machines and under special
conditions like heavy loads in big motors, because the costs for the materials like
Teflon or Silicone are normally very high.
One of the top products for producing insulation is Mica. It has been used since
ancient times and its excellent isolating abilities are known since the very beginning.
At first it was applied in the form of thin splittings. Together with some carrying and
binding materials, like glass cloth and resins, it turned to be the most common
insulation for rotating machines. Thin sheets of those three components are called
“micanite”. Mica has transformed nowadays to products like mica paper and mica
bands. Sizes of mica scales differ from big to small in many variations. Some new
methods were developed to cultivate mica in a way that it could be applied to
unreachable places and also to bring it to a form which allows more freedom of
application. Of course mica alone would be difficult or impossible to manage. It has
to be supported by carrying materials such as paper or glass, and together with
some epoxy resins it builds up a completely new product. Resins as a binding agent
is widely used in both, low and high voltage machines. In other systems it might be
used instead of resins which additionally fill the air/gas gaps. This prevents the
system from partial discharges, and seals it against moisture. This varnish film
should stay flexible but still should cover the whole insulation. In addition the solvent,
which is normally in the varnish, must not chemically react with the insulation.
Mica has very good ohmic resistance. Machines are often exposed to high voltages
and therefore an electrical insulation needs to stay reliable for many cycles.

13
As mica is a natural product and it splits easily, it must be supported to stay stable
and avoid delamination. That is why it is normally produced in the form of bands or
tapes. Together with the carrier and binder it could be finally wound onto a
conductive bar. Some changes into the structure of the adhesive could lead to either
delamination or dry the varnish out, which causes air gaps to occur.
Picture 1: Natural Mica (4)
Mechanical and thermal stability are also very important for the reliability of an
insulation system. Sometimes there are vibrations or other parameters that could
disrupt the working conditions of the machine, so thermal and mechanical properties
of the insulation are of great importance.
Nowadays the most reliable mica insulations consist of three main components
where the binder is a resin. Bitumen-based adhesives have more substantial
properties in the presence of high temperature and remain flexible. In addition to that,
this type of resin binder allows application of Vacuum Pressure Impregnation, a
method used for mica tapes to be impregnated directly on the conductive bars. Not
all the resins are appropriate for VPI, because some build up gas gapes where
partial discharge then takes place.
Mica tapes with lower content of resin are normally used for VPI process. They are
wounded onto the windings and then placed in vacuum. After that VPI vessel is filled
with resin and heated again so that the bars can be fully impregnated with resin.

14
Resin Rich (RR) method base on mica tapes, which consist of higher amounts of
resin. They are then wound directly on the conductive parts/bars and after heating
and pressing processes, the rest of the resin together with the air, are carried out and
it cures.
With the passage of time mica tapes become more stable, build up a variety of
different needs, and are specialized according to the areas that need to be isolated.
Glass clothes and glass-fiber are playing the role of the carrier and it provides more
stability at higher temperatures. It is also less chemically active so it matches better
than paper. Glass fibers are very strong and they are hard to wear out so winding is
now easier. Resin combined with polyester improves the electrical and thermal
conductivity. Now insulation systems in big and powerful motors like wind motors and
once in power plants will provide reliability for many years. This generation of mica
tapes is the new age. They allow the producers of electrical machines the possibility
to impregnate due to either VPI process or RR process.
The advantages of new technologies due to these two methods are reducing the
sizes of the machines while increasing their capabilities. The more the materials and
its properties are being studied, the more the total capability can be increased.
The conventional understanding of the breakdown of mica-based insulation systems
has been that thermally induced mechanical stresses in the rotating machines cause
the mica “sheets” to delaminate or results in separation of the mica and resin binder,
and that thermal stresses cause degradation of the resin mica interface. These voids,
or cracks, can then support electrical discharges, which produce more destructive
defects, known as trees. Trees grow through the insulating materials at a rate
dependent upon various stress factors but lead, eventually, to insulation system
breakdown and plant failure (5)

15
2.2. Mica
2.2.1. What is Mica
Mica has been used since the beginning of mankind. It was popular in the form of
powder because of its sparkles and mainly used in cosmetics. This characteristic
is even nowadays applied into different paintings and cosmetics. Also because of
its ability to resist against heat, mica was widely used in forms of glasses for coal
or wooden ovens. Some rare other application was implemented by the Russians
as they made portholes for warships out of it. This type of mica was then called
“muscovite” after the city of Moscow. (6)
Mica is a layer-type dielectric (mica films are obtained by splitting mica blocks).
The extended two-dimensionally layered strata of mica prevent the formation of
conductive pathways across the substance, resulting in a high dielectric strength.
It has excellent thermal stability and, because of its inorganic nature, is highly
resistant to partial discharges. It is used in sheet, plate, and tape forms in rotating
machines and transformer coils. (7)
Mica is a sheet silicate which has very good cleavage. It consists of an octahedral
layer between two tetrahedral layers. (6)

16
Picture 2: Tetrahedral mica structure (4)
2.2.2. Mica splittings
Mica has been won as chunks. After that it is cut and transformed so that it can
be manually separated for the final shape.
Most mica comes from India, Brazil and Madagascar. There are sources of mica
splittings also in the United States where it is used in the electrical industry. It has
lots of applications such as electronic capacitors, microwave glasses, vacuum
tubes, etc. Mica scraps combined with some additional bondage are used in the
insulation of rotating machines. Mica is then transformed in thin sheets called
mica paper.

17
Picture 3: Mica splittings (4)
2.2.3. Mica mineral
There 28 known species of the mica silicate group but for the production of mica
paper only two types are relevant.
Muscovite is the most widespread mineral. The name comes from the city of
Moscow. Large deposits were used nearby to make windows. It is considered the
best mica for electrical devices. The mechanical properties are better than those
of Phlogopite.
Muscovite: KAl2 (Si3AlO10) (OH) 2
Picture 4: Muscovite (4)
Phlogopite: KMg3 (Si3AlO10) (OH) 2

18
Phlogopite contains Magnesium and is dark in appearance. It is softer than
muscovite and can withstand higher temperatures.
Picture 5: Phlogopite (4)
Muscovite starts to calcine at 550°C; whereas the calcination temperature of
Phlogopite is 750°C.
There is also synthetic mica which is synthesized by melting blends of industrial
chemicals and minerals at high temperature. It has excellent heat endurance (-
1100 °C).
2.2.4. Manufacturing of mica paper
Mica paper looks like real paper and it consist only of mica scales with no binding
component at all. A slowly running paper machine produces it from hydrous pulp.
By the usage of water, mica flakes can be disintegrated without destroying the
surface force. The flakes are subjected to size gradation in vibrating screens.
Disintegrated, fine mica flakes, in bulk form (aqueous pulp) are fed at a definite
consistency on a paper mill, where continuous sheets of mica paper are reeled.
2.2.4.1. Uncalcined mica pulping process
Hydro –mechanically processed mica paper

19
In this process pieces of natural mica are put into distilled water and exposed
to a higher pressure water-jet and thereby split up into fine particles, which
immediately are supplied to a machine. The bonding between the mica scales
in this case are achieved by the electrostatic forces, which appear on fresh cut
mica. Mica is fed into a kiln at 650 ˚C where organic contamination is
eliminated. This mica paper is usually used in VPI tapes to aid with
impregnation of resins.
2.2.4.2. Calcined mica pulping process
Thermo-chemically processed mica paper
For manufacturing of calcined mica paper, it is put at a temperature of about
1600˚C so that the crystal water in the mineral structure is damped away.
Mica scales Mica conveyor belt
Mica is heated at 550˚C -650˚C into a kiln
20
Picture 6: Mica Pulping Process a) (6)
After this calcination process the mica is soaked with diluted acids and colloid
silicic acid is developed by dissolving alkali from the surface. This silicic acid is
the binder for the production of mica paper. This process makes much smaller
(up to 6 times smaller) and softer mica flakes which produce a tighter more
flexible paper, usually used for resin rich tapes.
Mica slurry is disintegrated into smaller thinner flakes. One per cent solid
slurry is formed into a flat sheet at the head box and then transferred to a
screen belt called fourdriner to form the paper.
Picture 7: Mica Pulping Process b) (6)
Water is removed by vacuums pulling the water through the screen leaving a
wet paper mat on top.
Picture 8: Mica Pulping Process c) (6)

21
The wet sheet is too weak to support its own weight and must be carried by
belts through an infrared oven to start drying. The paper is then transferred
over steam filled drums to completely dry the paper.
Picture 9: Mica paper process (6)
Paper weight and profile is continuously monitored with an inline basis weight
meter. Mica paper is wound on cores. Mica paper is laminated to glass fabric
and film to create flexible insulating materials.
Picture 10: Mica roles process (6)
2.2.4.3. Features of calcined and uncalcined mica paper:
The two types of mica differ mainly in the optical appearance, in the
mechanical properties and porosity. Uncalcined mica paper is very shiny and
the splittings character is visible, while the calcined mica paper is duller.
Concerning mechanical properties calcined mica paper has a better bonding
between the mica scales and therefore shows higher tensile strength but

22
lower porosity. Uncalcined mica paper has a lower tensile strength and tends
to lose more mica dust but has a high porosity.
2.2.4.4. Applications of calcined and uncalcined mica paper for high voltage
insulating materials:
In the development and production of insulating materials the different
physical properties of calcined mica paper are used to produce tailor made
insulating tapes with distinctive working features. The uncalcined mica paper
is largely used for VPI insulating materials, it is important that the resin does
not drain out of the mica tapes during storage and handling. In this respect
calcined mica paper is more advantageous. Of course both mica paper types
can also be used for either application method with advantages and
disadvantages.
2.2.5. Mica products
Block mica: Blocks of mica with an area 1-14 square inches or higher.
Mica scrap: Irregular lumps of mica with an area 1, 25 - 3, 81 square centimetres
mostly used for production of mica paper.
Mica thins: Mica blocks with a thickness of 2-7 mm.
Mica splitting: Mica splittings consist of thin layers split from mica block.
Thickness /10 sheets ≤ 12mm.
Mica splittings are generally produced manually with sharp knives to the required
thickness. (6)

23
Figure 1: Mica process technology (6)
Mica paper has excellent electrical characteristics. Some of them are:
High dielectric strength
High mechanical strength
Corona resistant
Chemically inert
High temperature stability
Reasonable thermal conductivity (0,3-0,7 Wm-1K-1)
(6)

24
3. Requirements for insulation systems
Each insulation system is exposed to different stresses during its operating time. Some
can affect its functionality and lead to early aging or even to serious damages and
breakdown. The four main stresses are thermal, electrical, mechanical and ambient. A
short description is given below.
3.1. TEAM-stresses
Thermal stress – should provide good heat dissipation. Leads to
degradation/aging of insulating materials
Electrical stress partial discharges, inverter-fed-drives
Ambient stress moisture, oil, particles, radiation
Mechanical stress short-circuits forces, magnetic forces, centrifugal forces,
transient forces
3.1.1. Aging stresses
Aging stresses show how the lifetime of the insulation can be calculated.
Therefore it can be roughly divided to two main types:
Constant stresses
Transient stresses
Constant stresses show how failure that occurs with the time can be calculated.
There is a coherency between the time to failure and the number of the operating
hours. It is proportional to one another. (8)
Transient stresses on the other hand show the coherency between the time to
failure and number of the transients of the machine experiences. It is proportional

25
to one another. (6)
3.1.2. Thermal Stress
Delamination of the insulation is normally an effect that results after a thermal
load has been applied. When a higher temperature is constantly applied to
isolated parts of the machine it provides a variety of chemical reactions into the
insulation. Due to oxidation of the layers of the insulation it easily gets breakable
and mechanically unstable. Hence layers separate from each other or from the
ground walls and the material will lose its strength.
3.1.3. Electrical stress
To calculate the insulation thickness which will be needed to insulate the windings
it is necessary to know the applied voltage. If a high electrical field is constantly
applied to a material that could lead to aging and also phenomenon called partial
discharges could appear. Partial discharge (PD) is dielectric breakdown which
can occur within the material layers of the insulation system (in gaseous, liquid or
solid systems). It can be either on the surface or inside the material, but it does
not bridge the space between two conductors. If the PD is protracted it could
erode and eventually lead to breakdown of the insulation system. (2)
Binding materials like resins are normally organic and therefore weak. They can
be destroyed after a certain time of being under high voltage. And so, they could
chemically “fall apart”- delaminate. After more time has passed a tiny canal will be
“dug” through the layers and so it causes an electrical breakdown.

26
3.1.4. Ambient stress
Ambient stress comes with factors from the environment which can affect the
motor or the generator and lead to insulation failure. Some of these factors are:
Moisture condensed on the windings
Oil from the bearings or oil seal system in hydrogen-cooled machines
High humidity
Aggressive chemicals
Abrasive particles in the cooling air or hydrogen
Particles from brake shoe wear (if fitted) or carbon brush wear (if fitted) within
the machine
Dirt and debris brought into the machine from the environment
Radiation
(8)
Of course it should not be a combination of all environmental factors, but together
with some of the other stresses it could lead to machine failure or aging.

27
3.1.5. Mechanical stress
Unlike thermal and electrical stresses, there are no well-accepted models to
describe the relationship between vibration amplitude and life. Although models
do describe the amount of abrasion that may occur, they are not practical and
none have become the basis for standard accelerating aging tests under
vibration.
No model exists to relate the transient level to the number of the transients that
can be withstood. Instead, manufacturers calculate the forces that could occur
under various transient current situations, and determine if a single transient can
be withstood. Aging is usually not considered. (8)
Other criteria for mechanical stress are bending, pressure and tension. Normally
insulation is guaranteed by the producers up to 20-30 years (for big high voltage
motors or generators). It is therefore very difficult for the manufacturers to test
such a long time and wait for products. Accelerating aging tests provide the
possibility to predict failures in a much shorter time. They speed up the aging
process when test stresses are higher than the normal, such as higher
temperature, higher voltage or combinations of them.

28
4. VPI Technology
At the moment there are two methods for the manufacturing of insulation for high voltage
rotating machines - Vacuum Pressure Impregnation (VPI) and Resin Rich (RR).
4.1. Main characteristics of Vacuum Pressure
Impregnation (VPI)
The impregnation of the winding insulation can be subdivided into two different
methods, either the single bars are impregnated separately (individual VPI) or the
bars are first assembled in the machine and the stator or rotor is impregnated as a
whole (global VPI). Mica tapes used for the VPI-process have a resin content of 5 –
15 %. Prior to the impregnation for both VPI types, the material is dried. In this
procedure, the bar (or machine) is placed into a vessel as shown in Figure 2-6 and
heated for 6 – 12 hours at 80 –120 °C. Next, the insulation is set under the vacuum
at < 1 mbar for 1 – 2 hours to remove the air from the cavities of the insulation.
Afterwards resin flows from a storage tank into the vessel and impregnates the
winding insulation. After a soak time of 1 – 3 hours, the vessel is pressurized for 1 –
4 hours at 4 bar. Finally, the residual resin is removed from the vessel, put back into
a storage tank, and the insulation is cured for 8 – 12 hours at 140 – 170 °C. The
whole VPI process takes between 17 and 33 hours. (9)
VPI bars have a resin content of about 30 % after processing. When the bars are
impregnated individually, they can be pressed after impregnation in order to have a
rectangular form so that the bars fit into the slot of the iron core. The advantages of
VPI insulation are that the mica tapes are not sharply bent during the impregnation
process. When applying the global VPI, the whole machine is impregnated and
cavities between the insulation bars and the slot of the machine are also filled with
resin. Both VPI-processes are very suitable to impregnate bars with a complex form.
As the resin impregnates the insulation layer by layer, the impregnation of windings
with a large thickness can be imperfect and the resin may not impregnate all parts of
the insulation homogeneously. A further disadvantage of the global VPI-process is its

29
requirements for large and expensive equipment. The global VPI bars do not have
such a precise rectangular shape since they are not pressed. Furthermore at global
VPI, the machine can only be tested after it was impregnated as a whole. Any failure
in the insulation means a failure of the whole machine. (10) (11)
Picture 11: VPI- vessel (12)
Advantages:
Easy assembling
Parallel impregnation of all Roebel bars into the vessel
High operating field-strength possible
Insulating Tape Composition for High Voltage Machines
Mica
Carrier (glass, film, fleece)
Binding resin

30
Picture 12: Winding machines (Isovolta AG) – automatic (6)
4.2. Porous tapes for VPI – processes
For the manufacturing of insulation systems of rotating machines there are some
different tapes which are used in order to insulate separate different parts of the
stator for the exposition on variety of influence parameters of the machine and its
surroundings.
Composition of Porous Tapes
Uncalcined Mica paper
Carrier
o Glass cloth
o PET - film
o Kapton

31
Binder (resin)
o For the mica paper
o For the bonding of carrier and mica (13)
4.3. Supportive Materials by VPI Tapes
Mica paper itself is very unstable and therefore it should be supported by a carrier.
This carrier allows the insulation to be easily rolled.
4.3.1. Glass- cloth
As mica flakes are not very flexible and can easily lose their isolating function if
not placed properly, there is a need of a carrier that will support mica on difficult
and complex places.
Glass fibers perfectly match the requirements for a carrier of mica. Its
characteristics are given below:
conventional (twisted)
optimum thermo-mechanical stability: very good bonding allows thermal
overstress up to 200°C without delaminating
fast impregnation
up to 21 kV in global VPI systems, high mica content
problematic in high humidity (water absorption)
(13)

32
4.3.2. PET- film
PET – films are also used in the VPI mica tapes as carriers. Some of their
characteristics are:
highly economic, cheap
high breakdown voltage
prolonged impregnation 2-3 times
up to 10 kV
(13)
4.4. VPI Comparison
In the high voltage machines it could be differed between two impregnating
processes:
Single Bar VPI
Global VPI
Some of the advantages and disadvantages are given in the table below:

33
Table 1: Comparison Single Bar VPI and Global VPI (6)
4.5. Impregnating Resins
The main purpose of the binder resin is to fill voids within the insulation that occur
during manufacturing of the bars. In addition, it is used to provide mechanical
strength, improve heat transfer, and provide electrical, thermal and environmental
resistance of the mica paper. (10)
During manufacture, from the single components to the final winding insulation,
binder resin is applied at three stages. First, it is used to keep the mica flakes
together when applied to mica paper. Secondly, it is used to hold the mica paper and
Disadvantages
• No single bar testing
possible
• Difficult removal of
defective coils
• Large amount of resin
used
Disadvantages
• Economic only for high
volumes
Advantages
• High operating field
strength
• Hermetic sealing of stator
• Good thermal contact
Advantages
• High operating field
strength
• Single bar testing possible
Global VPI Single Bar VPI

34
the support material together when manufactured to mica tapes and finally, it is used
for impregnation of the whole insulation. (9)
For mica paper and mica tapes, binders of epoxy resin are used. (11)
Epoxy is a thermosetting plastic. It will therefore not melt, but burn and degrade
when heated past its melting temperature. The binders are used in combination with
catalysts that reduce the curing time of the epoxy after application of the tape.
Various factors of the insulation are determined by the binder resin, such as thermal
stability, fabrication process, fabrication time, electrical strength and price. (10)
Resins are binding components which play a significant role for the mica tapes. They
can be of different types according to the needs of the insulation system.
Epoxy-resins without accelerator (Bisphenol-A Resin/Hardener system)
Epoxy-resins with accelerator
Polyester-modified epoxy-resins
Polyesterimide-resins
Silicone-resins
(13)
4.6. Additional Materials
To guarantee a good insulation for the entire system, additional materials were
implemented. They have special functionality and provide good corona protection.
Winding insulations in machines with voltage levels > 3 kV must be protected from
corona discharges. (10)
Corona discharges may occur in the slot of the machine or at the end windings.
Discharges in the slot occur in small air filled gaps between uneven surfaces of the

35
winding insulation and the laminated core. These discharges are very harmful for the
material since they have a high energy and may destroy the surface of the insulation
material .Corona protection in the slot is made of conductive tape and/or paint. (10)
(11)
Figure 2: Conductive and Stress Grading Tapes – Isovolta AG; (13)
Figure 3: Additional Materials (13) (13)

36
5. Resin Rich Technologies
By applying the resin-rich method, the insulation bar of the high-voltage electrical
machine is wrapped in a material which has high resin content (about 40-45% of the
total band weight). The insulation is then put under pressure and high temperatures in a
special press-machine. A special oven which is heated to 160°C is prepared. The bar is
put into the oven under some light pressure so that the desired temperature is achieved.
After heated to a certain point, the resin becomes liquid and then a pressure of around
100 Bars is applied on the bar. The pressure is normally applied from the middle to the
ends of the bar. (9)
Right after that curing process follows. During pressing a certain amount of resin comes
out, carrying out the air. The bar is taken out of the oven after one hour. The curing
process takes around 4 hours in a 160 °C heated oven. Each insulation bar is pressed
separately. (6).
The advantages of resin rich bars are an almost rectangular shape, a tight arrangement
of the mica tapes, and that the whole cross section of the insulation is impregnated with
similar quality that comes due to the pressing process. Since every insulation bar is
produced separately, the electrical tests can be taken separately before the bars are
assembled in the machine, which is a further advantage. (10) (11)
Picture 13: Resin Rich Press (12)

37
5.1. Conventional RR Process
Underneath are given step by step the conventional RR process.
1) Loop of wire – copper is put into a loop shape
(6)
2) Pre-consolidation
Material VOTAFIX E 2102; 15 – 20 min. / 160°C is applied.
(6)
3) Pull into diamond shape (shape needed for the end placement in the stator).
(6)
4) Overhang Insulation Feinmicaglas; Calmicaflex

38
5) Straight part Calmicaglass
6) Corona Protection
7) Pressing 1 hour / 160° C in a special RR press
8) Voltage test
9) Sealing
10) Isoseal P 0713 – Material needed to seal all the insulation layers and for
humidity protection.
11) Assembling into stator
12) Post-curing > 3 hours / 160° C – to obtain final form.
(6)
EGSB
2969 Contafel
Figure 4 (6)

39
6. Test procedure and choice of mica bands
Two Resin-Rich bands were selected for the experiment.
Calmicaglass®0409, which consist of mica paper based on calcined muscovite, a glass
cloth carrier and thermosetting epoxy Novolac.
Also Calmicaglass®0893, which consists of mica paper based on uncalcined
muscovite, glass cloth and thermosetting epoxy Novolac.
Both materials are set in the insulation of coils and bars for high voltage electrical
machines.
Calmicaglass®0409 is used for the insulation of bars and coils of motors and generators
up to highest output and nominal voltage. Calmicaglass®0409 is a very flexible glass
mica paper combination, which can be easily wrapped in full width by hand or taped on
automatic taping machines. After curing in a hot press, insulation with excellent
dielectric, thermal, mechanical, and chemical properties is obtained.
Calmicaglass®0893 can be used for manufacturing of moulded parts such as
commutation caps or wound tubes and cylinders. Calmicaglass®0893 is supplied
interleaved to prevent sticking of layers. Calmicaglass®0893 is a very flexible glass mica
paper combination, which can be taped even on tight bends. Excellent dielectric,
thermal, mechanical, and chemical properties are obtained after pressing. (14)
6.1. Test samples preparation
For testing the quality characteristics of the materials, samples with initial size and
thickness were prepared. For this matter and in order to achieve the nominal
thickness of 1mm and 8 layers as it is applied on the electrical machines, samples of
material are cut and laid down over each other.
The transformer in the high voltage cell could achieve a maximum voltage of 30 kV.
During the preparation for the voltage endurance test with samples of 1mm

40
thickness, it was clear that it would take a very long time to have a breakdown. For
more efficiency of the aging tests it was preferred a preparation of samples with
nominal thickness of 0,5mm which is just half of the original size of 1mm. In this way
the time to breakdown will be shorter but the conditions will stay very near to the
reality.
The number of the applied layers varies depending on the nominal thickness of the
mica band.
From each one of the materials an appropriate number of layers is taken and
pressed together in a press machine under the even conditions.
6.2. Pressing conditions
Test samples are made of large sheets (1 square meter) of mica rolls because the
pressing conditions were not suitable for manufacturing of small samples.
Afterwards, final test samples (8,5cm x 8,5cm) were cut out manually. Conditions in
the press machine:
155 °C and ~110 Bars pressure for 70 minutes.
Depending on the nominal thickness of the mica tape, a different number of layers (2,
3, 4 or 6) were taken for producing the test samples. The goal was, after the pressing
process, to achieve the thickness of 0,5mm samples.
Calmicaglass®0409 – Band thickness 0,12mm -> 6 layers;
Calmicaglass®0409 – Band thickness 0,18mm -> 4 layers;
Calmicaglass®0409 – Band thickness 0,21mm -> 3 layers;
Calmicaglass®0893 – Band thickness 0,18mm -> 4 layers;
Calmicaglass®0893 – Band thickness 0,28mm -> 2 layers;

41
After pressing, the sheets are led into the press machine to cool down to room
temperature. The thickness of the prepared samples varies between 0,35mm to
0,65mm. In the middle of the big sheet (1m2), the applied pressure is higher and
therefore the sheet thickness there is below 0,5mm. The applied pressure at the
edges of the sheet is lower than in the middle, therefore the sheet thickness in this
area is higher. Thickness in the middle of each sample is measured again more
accurately and was written down on each test sample.
This kind of pressing cannot be applied directly on Roebel bars because the
thickness of the test samples varies, while during the more precise pressing phase of
Resin Rich method, insulation thickness remains constant all over the bar.
6.3. High Voltage Endurance Tests
To examine the dielectric strength of different materials a voltage endurance test has
been made. Materials were put under constant voltage load until a breakdown
occurred.
Picture 14: Calmicaglass®0409 after breakdown and a couple of hours under 45kV.
Silver paste for
better
conductivity
Damage
caused by
breakdown

42
Samples of both the materials Calmicaglass®0409 with nominal thickness of
0,12mm; 0,18mm and 0,21mm and Calmicaglass®0893 with nominal thickness of
0,18mm and 0,28mm are tested under two different voltages to compare the lifetime
of the samples.
6.3.1. Test setup
The samples were put in plastic vans filled with transformer oil. The samples were
placed between a pair of two electrodes and connected to high-voltage in a
special high voltage cell.
Figure 5: Test Constellation
43
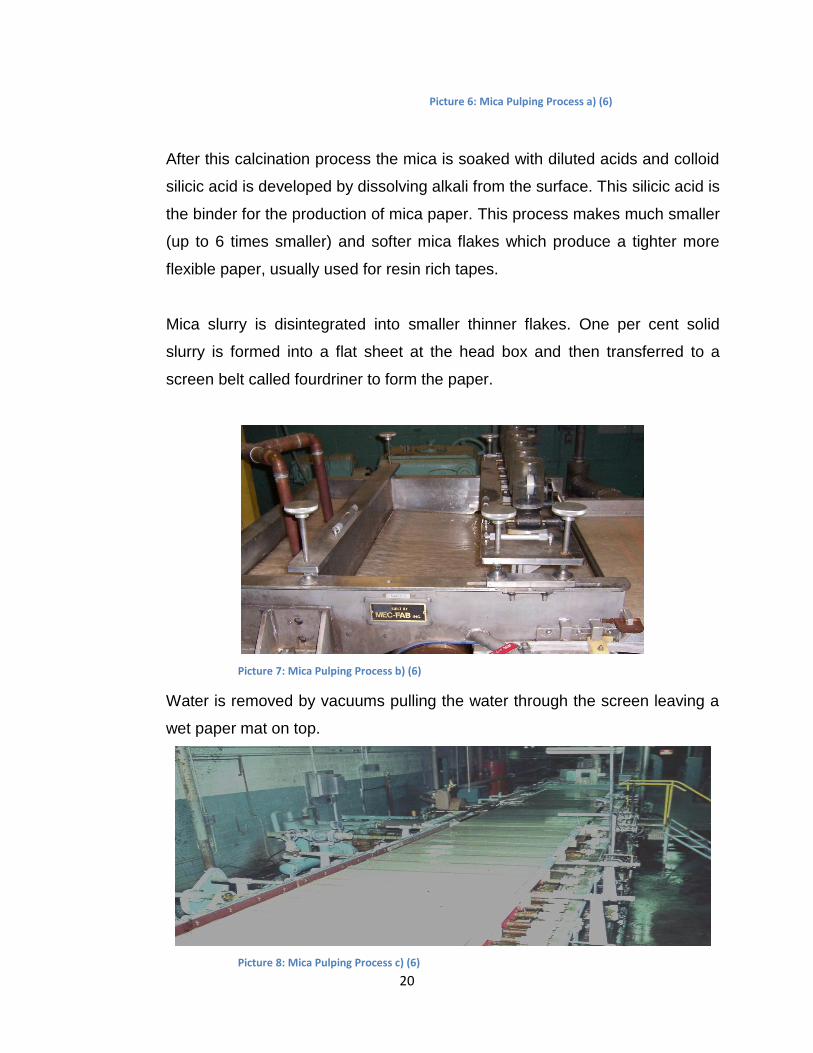
Picture 15: High voltage cell for sample test
When such tests are held into insulating liquids, like mineral transformer oil, they
should equate and respond to the Standard IEC 60296 (fig.6). It is necessary to
ensure adequate dielectric strength of the liquid to avoid flashovers.
Contamination, which reduces the electric strength of the oil or other liquid, may
increase the measured electric strength of the test sample.

44
Figure 6: Electrode arrangements
Test samples are put in oil because of its great insulating characteristics. The
electrodes have cylindrical form which is the common form of electrodes for tests
over solid bodies in transformer oil (Standard IEC 60263-1). In figure 6, the
geometry of the electrodes could be seen according to the IEC Standard.

45
Picture 16: Van with mineral oil and test samples between electrodes
The conductor part of the experimental device, which holds the electrodes is put
additionally over two insulating plates, so that the plastic bucket is completely
isolated from the metal floor in the high voltage cell. Parallel sides of the
electrode-holders are made of aluminium which is very conductive. Two non-
conductive plates connect the aluminium sides. At one of the conductive sides a
high voltage cable is switched on, and on the other conductive side a ground
cable is connected. High-voltage is taken from a transformer with 30kV capacity.
Test samples are stuck manually between two electrodes. The sample size is big
enough, so that no flashovers can occur, only breakdowns. In order to load
exactly this field between the electrodes, a conductive silver paste is put on both
side of the sample where the electrodes are placed. In this way the silver area is
under direct contact with the applied voltage on the electrodes. The way that the
current will have to make is defined. It has no other options but to try to get
through the layers of the material, destroying the insulation.
Conductive part
Non-conductive part
Test samples
High-voltage cable
Ground cable
Insulation plates
Electrodes
Mineral oil

46
6.3.2. Test results
The time to breakdown has been taken for every single sample. (see attachment)
Figure 7: Calmicaglass®0409 thickness 0,12mm
Figure 8: Calmicaglass®0409 thickness 0,18mm
Figure 9: Calmicaglass®0409 thickness 0,21mm
10
100
1000
0 5 10 15 20 25
Tim
e o
f b
reakd
ow
n
[min
ute
s ]
Samples
Calmicaglass 0409 Thickness 0,12 Lifetime 26 KV
Lifetime 22 KV
1
10
100
1000
0 5 10 15 20 25Tim
e o
f b
reakd
ow
n
[min
ute
s ]
Samples
Calmicaglass 0409 Thickness 0,18 Lifetime 26 KV
Lifetime 22 KV
1
10
100
1000
0 5 10 15 20 25
Tim
e o
f b
reakd
ow
n
[min
ute
s ]
Samples
Calmicaglass 0409 Thickness 0,21 Lifetime 26 KV
Lifetime 22 KV

47
Figure 10: Calmicaglass®0893 thickness 0,18mm
Figure 11: Calmicaglass®0893 thickness 0,28mm
As predicted all materials have shown same behaviour: Lower voltage – longer
lifetime and higher voltage – shorter lifetime.
Because of the two different test voltages and the slight difference of the
thickness of the samples, the applied electrical field strength E [kV/mm] for
each sample differs.
The thicknesses of the samples have been noted down separately (see
attachment) therefore it was possible to calculate the electrical field strength E for
each probe.
For further investigations of the connection between E and time to breakdown all
data for all materials was put into a diagram (Figure 12).
10
100
1000
10000
0 5 10 15 20
Tim
e o
f b
reakd
ow
n
[min
ute
s ]
Samples
Calmicaglass 0893 Thickness 0,18 Lifetime 20 KV
Lifetime 18 KV
10
100
1000
10000
0 5 10 15 20 25Tim
e o
f b
reakd
ow
n
[min
ute
s ]
Samples
Calmicaglass 0893 Thickness 0,28 Lifetime18 KV
Lifetime 16 KV

48
Due to the fact that showing all samples led to confusing curves, average values
for field strength ranges of 1 kV/mm where taken. This reduces the number of
shown points to a descriptive form.
Calmicaglass®0409 0,12mm
Calmicaglass®0409 0,18mm
Calmicaglass®0409 0,21mm
E [kV/mm]
Average time [min]
Number of Samples
E [kV/mm]
Average time [min]
Number of Samples
E [kV/mm]
Average time [min]
Number of Samples
38 44 1
37 329 7
41 154 1
39 189 1
38 213 4
42 340 5
40 276 4
39 226 3
43 389 4
41 239 4
40 352 4
44 222 4
42 133 5
41 133 6
45 132 4
43 208 5
42 80 3
46 221 1
44 123 4
43 55 2
47 171 1
45 122 4
44 167 1
48 131 1
46 63 3
46 52 2
49 92 2
47 51 2
49 11 1
50 82 4
48 64 3
50 31 6
52 21 3
49 20 2
52 64 1
53 29 7
50 41 1
Calmicaglass®0893 0,18mm
Calmicaglass®0893 0,28mm
E [kV/mm]
Average time [min]
Number of Samples
E [kV/mm]
Average time [min]
Number of Samples
35 3069 1
33 4468 1 36 1594 4
34 3467 2
37 970 1
35 4795 3 38 866 4
36 6357 1
39 630 1
37 1209 2 40 908 7
38 2546 3
41 332 2
39 1695 1 42 409 4
40 1109 5
43 466 1
41 867 1 44 248 2
42 829 3
45 276 4
43 371 4 46 35 1
44 217 2
45 363 2
47 304 3
48 177 2
50 157 2
51 36 1
52 13 1
Table 2

49
Figure 12: Time of breakdown / E [kV/mm]
Figure 12: Time of breakdown / E [kV/mm] shows a strong dependency of breakdown
time on electrical field strength for all materials. Higher electrical field strength
leads to a dramatic reduction of time to breakdown.
Because of different sample thicknesses it is difficult to compare different
materials regarding time to breakdown.
A correct comparison of materials would only be valid for the same field strengths
for all samples. Different sample thicknesses make this impossible.
To have the chance to compare the materials one has to choose a small range of
field strength.
For all further investigations the electrical field strength range from 41kV/mm to
47kV/mm was taken. In this range all materials provide data. Samples out of this
range stay unconsidered.
10
100
1000
10000
34 39 44 49 54
Tim
e o
f b
reakd
ow
n [
min
ute
s]
E [kV/mm]
Calmicaglass 08930,18mmCalmicaglass 08930,28mmCalmicaglas 04090,12mmCalmicaglass 04090,18mmCalmicaglass 04090,21mm
50
6.3.3. Weibull distribution
The Weibull distribution is one of the most widely used lifetime distributions in
reliability engineering. In probability, theory and statistics, the Weibull
distribution is a continuous probability distribution. It is named after Waloddi
Weibull who described it in detail in 1951, although it was first identified by
Fréchet (1927) and first applied by Rosin & Rammler (1933) to describe the size
distribution of particles. (2)
The software program Visual XSel 12.0 was used for the following graphics. The
graphics below show the Weibull distribution of breakdown probability at 63.2%.

51
Figure 13: Weibull Calmicaglass®0409 0,12mm
Willi
Anw
ende
r41
KV
_47K
V.v
xg13
.02.
2013
Sei
te 1
Parameter : Least Square Y Vertrauensb.: 95 %
T1
70
,93
91
=b
1,6
1=
H10
0%
1e
t T b
-
-
·=
t 10 =
42,
329
R²
= 0
,983
min
ute
s
Tim
e t
o b
rea
kdo
wn
30
40
50
60
80
10
02
00
%
Probability of breakdown
0,0
1
0,0
2
0,0
4
0,1
0,2
0,4124
10
20
40
60
99
,99
170,9391
Ca
lmic
ag
las
s 0
40
9
0,1
2m
m
41
kV
/m
m -
47
kV
/m
m
Willi
Anw
ende
r41
KV
_47K
V.v
xg13
.02.
2013
Sei
te 1
Parameter : Least Square Y Vertrauensb.: 95 % Parameter : Least Square Y Vertrauensb.: 95 %
min
ute
s
Tim
e t
o b
rea
kdo
wn
30
40
50
60
80
10
02
00
%
Probability of breakdown
0,0
1
0,0
2
0,0
4
0,1
0,2
0,4124
10
20
40
60
99
,99
170,9391
Ca
lmic
ag
las
s 0
40
9
0,1
2m
m
41
kV
/m
m -
47
kV
/m
m

52
Figure 14: Weibull Calmicaglass®0409 0,18mm
Willi
Anw
ende
r41
KV
_47K
V.v
xg12
.02.
2013
Sei
te 2
Parameter : Least Square Y Vertrauensb.: 95 %
T1
20
,13
26
=b
1,3
7=
H10
0%1
e
t T b
-
-
·=
t 10 =
23,
324
R²
= 0
,897
min
ute
s
Tim
e t
o b
rea
kdo
wn
10
20
30
40
50
60
80
10
0
%
Probability of breakdown
0,0
1
0,0
2
0,0
4
0,1
0,2
0,4124
10
20
40
60
99
,99
120,1326
Ca
lmic
ag
las
s 0
40
9 0
,18
mm
41
KV
/m
m -
47
KV
/m
m
Willi
Anw
ende
r41
KV
_47K
V.v
xg12
.02.
2013
Sei
te 2
Parameter : Least Square Y Vertrauensb.: 95 % Parameter : Least Square Y Vertrauensb.: 95 %
min
ute
s
Tim
e t
o b
rea
kdo
wn
10
20
30
40
50
60
80
10
0
%
Probability of breakdown
0,0
1
0,0
2
0,0
4
0,1
0,2
0,4124
10
20
40
60
99
,99
120,1326
Ca
lmic
ag
las
s 0
40
9 0
,18
mm
41
KV
/m
m -
47
KV
/m
m

53
Figure 15: Weibull Calmicaglass®0409 0,21mm
Willi
Anw
ende
r41
KV
_47K
V.v
xg12
.02.
2013
Sei
te 3
Parameter : Least Square Y Vertrauensb.: 95 %
T3
02
,62
=b
1,5
7=
H100%
1e
t T b
-
-
·=
t 10 =
72,1
38
R²
= 0
,956
min
ute
s
Tim
e t
o b
rea
kdo
wn
50
60
80
10
02
00
30
04
00
50
0
%Probability of breakdown
0,0
1
0,0
2
0,0
4
0,1
0,2
0,4124
10
20
40
60
99
,99
302,62
Ca
lmic
ag
las
s 0
40
9
0,2
1m
m
41
KV
/m
m -
47
KV
/m
m
Willi
Anw
ende
r41
KV
_47K
V.v
xg12
.02.
2013
Sei
te 3
Parameter : Least Square Y Vertrauensb.: 95 % Parameter : Least Square Y Vertrauensb.: 95 %
min
ute
s
Tim
e t
o b
rea
kdo
wn
50
60
80
10
02
00
30
04
00
50
0
%Probability of breakdown
0,0
1
0,0
2
0,0
4
0,1
0,2
0,4124
10
20
40
60
99
,99
302,62
Ca
lmic
ag
las
s 0
40
9
0,2
1m
m
41
KV
/m
m -
47
KV
/m
m

54
Figure 16: Weibull Calmicaglass®0893 0,18mm
Willi
Anw
ende
r41
KV
_47K
V.v
xg12
.02.
2013
Sei
te 4
Parameter : Least Square Y Vertrauensb.: 95 %
T4
37
,23
36
=b
0,6
2=
H100%
1e
t T b
-
-
·=
t 10 =
11,3
2
R²
= 0
,899
min
ute
s
Tim
e t
o b
rea
kdo
wn
12
34
61
02
03
05
01
00
20
04
00
%
Probability of breakdown
0,0
1
0,0
2
0,0
4
0,1
0,2
0,4124
10
20
40
60
99
,99
437,2336
Ca
lmic
ag
las
s 0
89
3
0,1
8m
m
41
KV
/m
m -
47
KV
/m
m
Willi
Anw
ende
r41
KV
_47K
V.v
xg12
.02.
2013
Sei
te 4
Parameter : Least Square Y Vertrauensb.: 95 % Parameter : Least Square Y Vertrauensb.: 95 %
min
ute
s
Tim
e t
o b
rea
kdo
wn
12
34
61
02
03
05
01
00
20
04
00
%
Probability of breakdown
0,0
1
0,0
2
0,0
4
0,1
0,2
0,4124
10
20
40
60
99
,99
437,2336
Ca
lmic
ag
las
s 0
89
3
0,1
8m
m
41
KV
/m
m -
47
KV
/m
m

55
Figure 17: Weibull Calmicaglass®0893 0,28mm
Willi
Anw
ende
r41
KV
_47K
V.v
xg12
.02.
2013
Sei
te 5
Parameter : Least Square Y Vertrauensb.: 95 %
T5
36
,48
72
=b
1,3
7=
H10
0%
1e
t T b
-
-
·=
t 10 =
104
,15
R²
= 0
,905
min
ute
s
Tim
e t
o b
rea
kdo
wn
20
03
00
40
05
00
60
08
00
%
Probability of breakdown
0,0
1
0,0
2
0,0
4
0,1
0,2
0,4124
10
20
40
60
99
,99
536,4872
Ca
lmic
ag
las
s 0
89
3 0
,28
mm
41
KV
/m
m -
47
KV
/m
m
Willi
Anw
ende
r41
KV
_47K
V.v
xg12
.02.
2013
Sei
te 5
Parameter : Least Square Y Vertrauensb.: 95 % Parameter : Least Square Y Vertrauensb.: 95 %
min
ute
s
Tim
e t
o b
rea
kdo
wn
20
03
00
40
05
00
60
08
00
%
Probability of breakdown
0,0
1
0,0
2
0,0
4
0,1
0,2
0,4124
10
20
40
60
99
,99
536,4872
Ca
lmic
ag
las
s 0
89
3 0
,28
mm
41
KV
/m
m -
47
KV
/m
m

56
6.3.4. Test Analysis
Besides the time to breakdown at 63,2% (received by Weibull Distribution), the
amount of mica of each sample, could also be a matter of interest.
The amount of mica for each one of the 5 materials was calculated in order to find
a possible dependency between time to breakdown and mica content.
Mica paper :
Material Mica content
[g/m²] Material
Mica content [g/m²]
Calmicaglass®0409 0,12mm
75 Calmicaglass®0893
0,18mm 120
Calmicaglass®0409 0,18mm
120 Calmicaglass®0893
0,28mm 250
Calmicaglass®0409 0,21mm
150
Table 3: Mica content
(13)
A sample has a size of 8,5 cm x 8,5 cm. That makes area of 0,0072 m².
One layer of the sample from Calmicaglass®0409 with 0,12mm thickness has
then:
75g/m² x 0,0072 m² = 0,54g Mica
The samples from this material consist of totally 6 layers total
0,54g x 6 = 3,24g Mica.
57
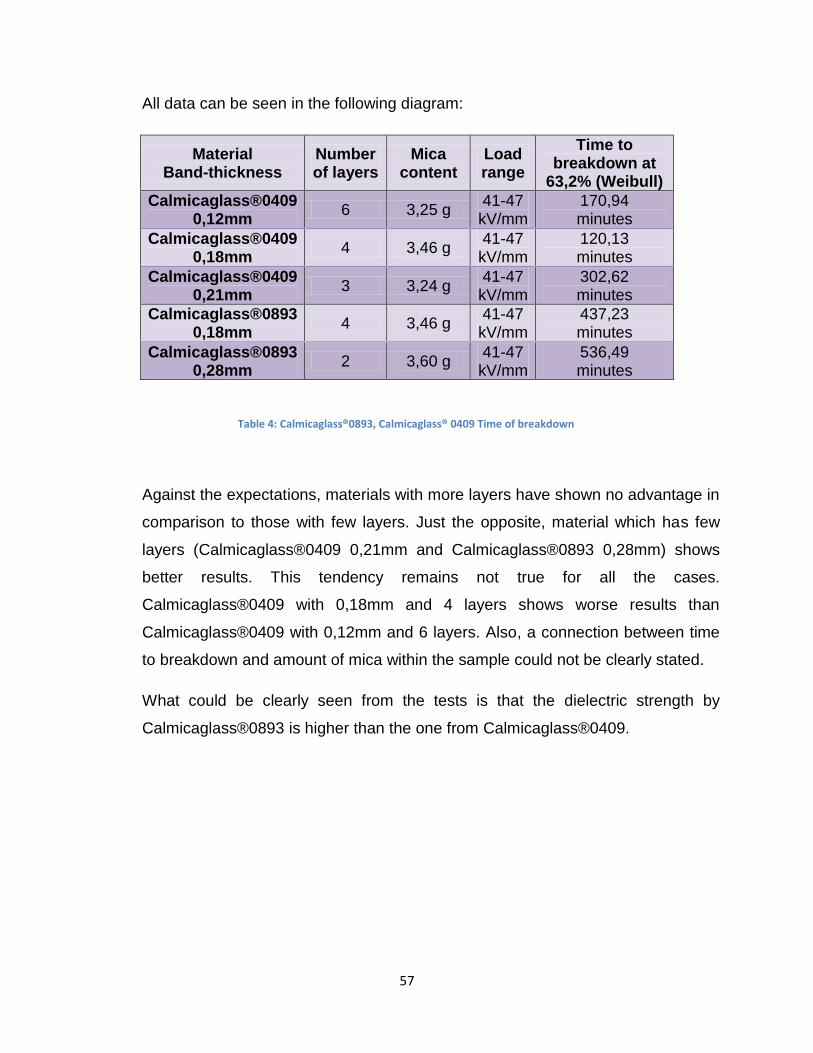
All data can be seen in the following diagram:
Material Band-thickness
Number of layers
Mica content
Load range
Time to breakdown at
63,2% (Weibull)
Calmicaglass®0409 0,12mm
6 3,25 g 41-47 kV/mm
170,94 minutes
Calmicaglass®0409 0,18mm
4 3,46 g 41-47 kV/mm
120,13 minutes
Calmicaglass®0409 0,21mm
3 3,24 g 41-47 kV/mm
302,62 minutes
Calmicaglass®0893 0,18mm
4 3,46 g 41-47 kV/mm
437,23 minutes
Calmicaglass®0893 0,28mm
2 3,60 g 41-47 kV/mm
536,49 minutes
Table 4: Calmicaglass®0893, Calmicaglass® 0409 Time of breakdown
Against the expectations, materials with more layers have shown no advantage in
comparison to those with few layers. Just the opposite, material which has few
layers (Calmicaglass®0409 0,21mm and Calmicaglass®0893 0,28mm) shows
better results. This tendency remains not true for all the cases.
Calmicaglass®0409 with 0,18mm and 4 layers shows worse results than
Calmicaglass®0409 with 0,12mm and 6 layers. Also, a connection between time
to breakdown and amount of mica within the sample could not be clearly stated.
What could be clearly seen from the tests is that the dielectric strength by
Calmicaglass®0893 is higher than the one from Calmicaglass®0409.

58
6.4. Resin content
To get more information about the organic part in the samples after pressing the
mica sheets, some resin content tests are additionally made. Five test samples, with
thickness around 0,5mm, are taken from each material. They were weighted two
times: before and after burning into an oven at 700 °C for 90 minutes. At this
temperature all organic components are burnt out, so that only inorganic components
like glass and mica stay. In this way it is possible to find out how much resin was left
in the sample.
Picture 17: Oven for burning out the organic parts
The table below shows the weight of the samples before and after the burning test
using the example of Calmicaglass0409 0,18mm.

59
Sample 1 2 3 4 5 Average value [g]
Weight before
[g]
6,835
6,895
6,887
6,229
7,074
6,784
Weight after
[g]
4,260
4,300
4,289
4,260
4,371
4,296
Difference
[g]
2,575
2,595
2,598
1,969
2,703
2,488
Sample thickness
[mm]
0,54
0,54
0,54
0,51
0,54
Calmicaglass 0409; Band Thickness- 0,18mm; Number of Layers pressed – 4;
The average weight before burned for this example: 6,784g
The average reduction of weight (resin burned): 2,488g.
Using formula one, percentage amount of resin for the samples after pressing can be
calculated:
Formula 1

60
This calculation was made for all the materials and can be seen in table 5.
Material Resin in the sample after pressing [%] (Calculation)
Calmicaglass®0409 0,12mm
39,2
Calmicaglass®0409 0,18mm
36,67
Calmicaglass®0409 0,21mm
40,7
Calmicaglass®0893 0,18mm
36,09
Calmicaglass®0893 0,28mm
38,08
Table 5: Resin content after pressing process and after burning out at high temperature
The calculated values differ not too much from the datasheet values for resin
content. This is because the amount of lost resin during pressing is not very high.
If these values were compared with the results of the voltage endurance test, it
can be observed that within the material more resin in the sample means longer
operating hours. It should be considered that because of the small number of
samples this dependency happens by chance.
6.5. Dynamic-Mechanical Analysis
With Dynamic Mechanical Analysis (DMA) it is possible to make a quantitative
determination of the mechanical properties of sample under an oscillating load and
as a function of temperature, time and frequency. (15)
Most materials are both elastic (stiff) and viscous (damping behavior), i.e. they are
viscoelastic. Thus they yield to an applied load, partially through viscous flow, with a

61
permanent deformation. At the same time, the mechanical behavior is a function of
temperature, time, degree and type of load. Structural transformations (e.g. glass
transitions, secondary relaxations, cross-linking) are seen in considerable changes in
the thermal and mechanical properties, which are demonstrated with the DMA.
Dynamic-mechanical analysis provides the user with extensive, practical information:
(15)
Operable temperature ranges for application and processing (glass transition
temperature, onset of softening and brittleness)
Design data concerning stiffness and damping properties (modulus values,
damping factor)
Data on the composition and structure of polymers and polymer blends
(compatibility)
Curing, Vulcanization
Ageing
DMA is significant and dependable information for:
Research and development
Quality control
Quality assurance
Failure analysis
Tests run in the temperature range from -170°C to 600°C provide an important data
on the material. Dynamic, isothermal and stepwise temperature control makes it
possible to design flexible temperature programs suited to a particular problem. The
sample is subjected to a defined, forced oscillation. A sinusoidal force (input
signal) affects a deformation of the viscoelastic sample (output signal). This also
produces sinusoidal, but phase shifted, oscillation which is then recorded. These
oscillations are reduced to a signal of extremely low noise level in the DMA controller
by means of FOURIER-Analysis.

62
The frequency range of 0.01 Hz to 100 Hz includes up to 25 fixed frequencies, which
can be selected individually or in any combination (multiple frequency). The
deformation amplitude (approx. 0.1 μm to 240 μm) as well as the sample position is
controlled independently from one another. Thereby, constant contact between the
push rod and the sample is guaranteed, even when the material softens greatly. (15)
Thermal:
The rectangular cross section of the furnace is fit to the sample geometry, such
that the sample is heated constantly and homogeneously. The temperature
gradient is minimized to + 1°C over a sample length of 60 mm. The sample
temperature is registered by a sample thermocouple and precisely controlled via
the STC function (Sample Temperature Control). (15)
Mechanical:
In three-point bending the dynamic force is superimposed by a static preliminary
force. Thus, even with great changes in the modulus, secure positioning of the
sample is guaranteed. (15)

63
Figure 18: DMA device – construction (15)
6.5.1. Measurements
On the graphics below is shown that both of the materials have similar value of
the loss factor tan δ and elasticity module curves.

64
Figure 19: Calmicaglass®0893 (up) and Calmicaglass®0409 (down)
Figure 20
Both samples have 4 layers of material with nominal band thickness 0,18mm.

65
The test shows that by Calmicaglass®0893 the characteristic curve of loss factor
tan δ has a bit higher peak than the one from Calmicaglass®0409. That means
this material is a little bit “softer” in mechanical meaning than the other one. After
both the materials are made with the same resin (Novolac) and the difference is
only in the amount of quantity in the band a big difference with this device could
not be detected. Conditions like oven temperature, oscillating frequency, force
and duration have been kept the same.
6.6. Thermal-load tests:
Additional thermo-cycling test are made in order to determine the lifetime of the
material after being heated.
Samples from Calmicaglass®0893 and Calmicaglass®0409 with nominal band
thickness 0,18mm and 4 layers are chosen for this test. The thickness of the sample
is about 0,5mm – 0,6mm. 15 test samples from each one of the material are put in an
oven at 200 °C for a time as follows:
5 Sample Calmicaglass®0893 and 5 Sample Calmicaglass®0409 for 50 hours.
5 Sample Calmicaglass®0893 and 5 Sample Calmicaglass®0409 for 100 hours.
5 Sample Calmicaglass®0893 and 5 Sample Calmicaglass®0409 for 150 hours.
While rising the voltage to 18kV some of the first samples from Calmicaglass® 0893
tested after thermal load, had an immidiate breakdown. These are:
2 samples Calmicaglass®0893 with 50 hours thermal load
2 samples Calmicaglass®0893 with 100 hours thermal load
1 sample Calmicaglass®0893 with 150 hours thermal load
That is why a voltage of 16kV was taken for Calmicaglass® 0893 and the samples
with breakdown stay unconsidered.

66
Test conditions were as follows:
Calmicaglass®0409 samples are tested under nominal voltage of 22kV, and
Calmicaglass®0893 samples under nominal voltage of 16kV. That means there is a
load between 35 and 37 kV/mm on each sample of Calmicaglass®0409 and
respectively between 29 and 37 kV/mm for Calmicaglass®0893 samples.
The samples are then tested under high voltage under same conditions as before, in
transformer oil.
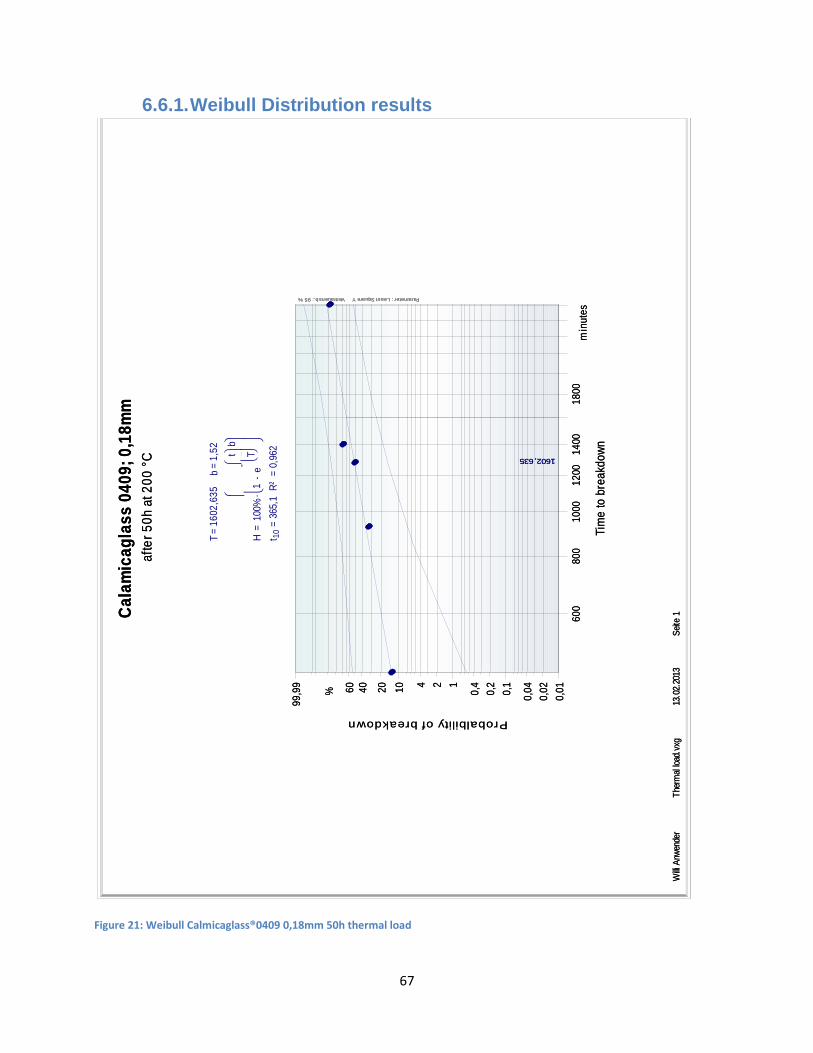
67
6.6.1. Weibull Distribution results
Figure 21: Weibull Calmicaglass®0409 0,18mm 50h thermal load
Parameter : Least Square Y Vertrauensb.: 95 %
T1
60
2,6
35
=b
1,5
2=
H10
0%1
e
t T b
-
-
·=
t 10 =
365
,1
R²
= 0
,962
min
ute
s
Tim
e t
o b
rea
kdo
wn
60
08
00
10
00
12
00
14
00
18
00
%Probalbility of breakdown
0,0
1
0,0
2
0,0
4
0,1
0,2
0,4124
10
20
40
60
99
,99
1602,635
Ca
lam
ica
gla
ss
04
09
; 0
,18
mm
aft
er
50
h a
t 2
00
°C
Willi
Anw
ende
rT
herm
al lo
ad.v
xg13
.02.
2013
Sei
te 1
Parameter : Least Square Y Vertrauensb.: 95 % Parameter : Least Square Y Vertrauensb.: 95 %
min
ute
s
Tim
e t
o b
rea
kdo
wn
60
08
00
10
00
12
00
14
00
18
00
%Probalbility of breakdown
0,0
1
0,0
2
0,0
4
0,1
0,2
0,4124
10
20
40
60
99
,99
1602,635
Ca
lam
ica
gla
ss
04
09
; 0
,18
mm
aft
er
50
h a
t 2
00
°C
Willi
Anw
ende
rT
herm
al lo
ad.v
xg13
.02.
2013
Sei
te 1

68
Figure 22: Weibull Calmicaglass®0409 0,18mm 100h thermal load
Parameter : Least Square Y Vertrauensb.: 95 %
T1
19
5,3
42
=b
1,2
5=
H100%
1e
t T b
-
-
·=
t 10 =
197,8
6
R²
= 0
,956
min
ute
s
Tim
e t
o b
rea
kdo
wn
40
06
00
80
01
000
12
00
16
00
%
Pobability of breakdown
0,0
1
0,0
2
0,0
4
0,1
0,2
0,4124
10
20
40
60
99
,99
1195,342
Ca
lam
ica
gla
ss
04
09
; 0
,18
mm
aft
er
10
0h
at
20
0 °
C
Willi
Anw
ende
rT
herm
al lo
ad.v
xg13
.02.
2013
Sei
te 2
Parameter : Least Square Y Vertrauensb.: 95 % Parameter : Least Square Y Vertrauensb.: 95 %
min
ute
s
Tim
e t
o b
rea
kdo
wn
40
06
00
80
01
000
12
00
16
00
%
Pobability of breakdown
0,0
1
0,0
2
0,0
4
0,1
0,2
0,4124
10
20
40
60
99
,99
1195,342
Ca
lam
ica
gla
ss
04
09
; 0
,18
mm
aft
er
10
0h
at
20
0 °
C
Willi
Anw
ende
rT
herm
al lo
ad.v
xg13
.02.
2013
Sei
te 2

69
Figure 23: Weibull Calmicaglass®0409 0,18mm 150h thermal load
Parameter : Least Square Y Vertrauensb.: 95 %
T1
12
6,8
14
=b
1,2
8=
H100%
1e
t T b
-
-
·=
t 10 =
193,8
5
R²
= 0
,959
min
ute
s
Tim
e t
o b
rea
kdo
wn
30
04
00
50
06
00
70
08
00
10
00
12
00
%Probability of breakdown
0,0
1
0,0
2
0,0
4
0,1
0,2
0,4124
10
20
40
60
99
,99
1126,814
Ca
lam
ica
gla
ss
04
09
; 0
,18
mm
aft
er
15
0h
at
20
0 °
C
Willi
Anw
ende
rT
herm
al lo
ad.v
xg13
.02.
2013
Sei
te 3
Parameter : Least Square Y Vertrauensb.: 95 % Parameter : Least Square Y Vertrauensb.: 95 %
min
ute
s
Tim
e t
o b
rea
kdo
wn
30
04
00
50
06
00
70
08
00
10
00
12
00
%Probability of breakdown
0,0
1
0,0
2
0,0
4
0,1
0,2
0,4124
10
20
40
60
99
,99
1126,814
Ca
lam
ica
gla
ss
04
09
; 0
,18
mm
aft
er
15
0h
at
20
0 °
C
Willi
Anw
ende
rT
herm
al lo
ad.v
xg13
.02.
2013
Sei
te 3

70
Figure 24: Weibull Calmicaglass®0893 0,18mm 50h thermal load
Parameter : Least Square Y Vertrauensb.: 95 %
T4
69
,99
73
=b
3,6
=
H10
0%1
e
t T b
-
-
·=
t 10 =
251
,33
R²
= 0
,936
min
ute
s
Tim
e t
o b
rea
kdo
wn
32
03
40
36
03
80
40
04
20
44
04
60
%
Probability of breakdown
0,0
1
0,0
2
0,0
4
0,1
0,2
0,4124
10
20
40
60
99
,99
469,9973
Ca
lam
ica
gla
ss
08
93
; 0
,18
mm
aft
er
50
h a
t 2
00
°C
Willi
Anw
ende
rT
herm
al lo
ad.v
xg13
.02.
2013
Sei
te 4
Parameter : Least Square Y Vertrauensb.: 95 % Parameter : Least Square Y Vertrauensb.: 95 %
min
ute
s
Tim
e t
o b
rea
kdo
wn
32
03
40
36
03
80
40
04
20
44
04
60
%
Probability of breakdown
0,0
1
0,0
2
0,0
4
0,1
0,2
0,4124
10
20
40
60
99
,99
469,9973
Ca
lam
ica
gla
ss
08
93
; 0
,18
mm
aft
er
50
h a
t 2
00
°C
Willi
Anw
ende
rT
herm
al lo
ad.v
xg13
.02.
2013
Sei
te 4

71
Figure 25: Weibull Calmicaglass®0893 0,18mm 100h thermal load
Parameter : Least Square Y Vertrauensb.: 95 %
T4
50
,48
27
=b
1,6
8=
H10
0%1
e
t T b
-
-
·=
t 10 =
117
,7
R²
= 0
,953
min
ute
s
Tim
e t
o b
rea
kdo
wn
25
03
00
35
04
00
45
05
00
%
Probability of breakdown
0,0
1
0,0
2
0,0
4
0,1
0,2
0,4124
10
20
40
60
99
,99
450,4827
Ca
lam
ica
gla
ss
08
93
; 0
,18
mm
aft
er
10
0h
at
20
0 °
C
Willi
Anw
ende
rT
herm
al lo
ad.v
xg13
.02.
2013
Sei
te 5
Parameter : Least Square Y Vertrauensb.: 95 % Parameter : Least Square Y Vertrauensb.: 95 %
min
ute
s
Tim
e t
o b
rea
kdo
wn
25
03
00
35
04
00
45
05
00
%
Probability of breakdown
0,0
1
0,0
2
0,0
4
0,1
0,2
0,4124
10
20
40
60
99
,99
450,4827
Ca
lam
ica
gla
ss
08
93
; 0
,18
mm
aft
er
10
0h
at
20
0 °
C
Willi
Anw
ende
rT
herm
al lo
ad.v
xg13
.02.
2013
Sei
te 5

72
Figure 26: Weibull Calmicaglass®0893 0,18mm 150h thermal load
All data originals can be found in the attachments.
Parameter : Least Square Y Vertrauensb.: 95 %
T4
36,
706
8=
b1
,62
=
H10
0%1
e
t T b
-
-
·=
t 10 =
108
,86
R²
= 0
,823
min
ute
s
Tim
e t
o b
rea
kdo
wn
25
03
00
35
04
00
45
05
00
55
0
%Probability of breakdown
0,01
0,02
0,040,
1
0,2
0,4124
10
20
40
60
99,9
9
436,7068
Ca
lam
ica
gla
ss
08
93
; 0
,18
mm
afte
r 1
50
h at
20
0 °
C
Willi
Anw
ende
rT
herm
al lo
ad.v
xg13
.02.
2013
Sei
te 6
Parameter : Least Square Y Vertrauensb.: 95 % Parameter : Least Square Y Vertrauensb.: 95 %
min
ute
s
Tim
e t
o b
rea
kdo
wn
25
03
00
35
04
00
45
05
00
55
0
%Probability of breakdown
0,01
0,02
0,040,
1
0,2
0,4124
10
20
40
60
99,9
9
436,7068
Ca
lam
ica
gla
ss
08
93
; 0
,18
mm
afte
r 1
50
h at
20
0 °
C
Willi
Anw
ende
rT
herm
al lo
ad.v
xg13
.02.
2013
Sei
te 6

73
6.6.2. Data Analysis
For the precise analysis of the times to breakdown, with and without thermal load,
samples with simular electric field strength should be compared. That condition
was heavy for realization because the sampes from Calmicaglass®0409 used for
thermal load test were thicker and therefore the electric field strength was lower.
Additionally the samples from Calmicaglass®0893were tested under lower
nominal voltage.So finally an adequate test data for thermally unloaded samples
was chosen.
Figure 27: Calmicaglass®0893 0,18mm 35,3kV/mm - 36,7 kV/mm
Willi Anwender noname.vxg Seite 1
Pa
ram
ete
r :
Le
as
t S
qu
are
Y
T 2259,78= b 1,19=
H 100% 1 e
t
T
b-
-·=
t10 = 341,13 R² = 0,953
m inutes
Time to breakdown
600 800 1000 1200 1600 2000
%
Pro
ba
bilit
y o
f b
rea
kd
ow
n
0,01
0,02
0,04
0,1
0,2
0,4
1
2
4
10
20
40
60
99,99
2259,7
8
Calmicaglass 0893 0,18mm
35,3 - 36,7 kV/ mm
Willi Anwender noname.vxg Seite 1
Pa
ram
ete
r :
Le
as
t S
qu
are
YP
ara
me
ter
: L
ea
st
Sq
ua
re Y
minutes
Time to breakdown
600 800 1000 1200 1600 2000
%
Pro
ba
bilit
y o
f b
rea
kd
ow
n
0,01
0,02
0,04
0,1
0,2
0,4
1
2
4
10
20
40
60
99,99
2259,7
8
Calmicaglass 0893 0,18mm
35,3 - 36,7 kV/ mm

74
The tables below present the dependancy between the time to breakdown and
the thermal load they were exposed to.
Calmicaglass®0409 0,18mm
Breakdown time with thermal load (Weibull)
Breakdown time without thermal load
50h at 200 °C 1602,6 minutes 36,1 -
37,3 kV/mm no data
100h at 200 °C 1195,3 minutes 36,1 -
37,3 kV/mm no data
150h at 200 °C 1126,8 minutes 35,5 -
37,3 kV/mm no data
Table 6 Calmicaglass®0409 0,18mm breakdown time
It is very good shown that both the Calmica tapes with the same number of layers
and amount of mica in it, have shorter lifetimes after being exposed to such
thermal conditions.
Lifetime of the samples is shorter this may be because of layer delamination after
thermal load. Some air gaps occur between the separate layers so that partial
discharge process takes place and leads to a faster breakdown.
Calmicaglass®0893 0,18mm
Breakdown time with thermal load (Weibull)
Breakdown time without thermal load
50h at 200 °C
470 minutes 34,8 - 37,2 kV/mm
2259 minutes 35,3 - 36,7 kV/mm
100h at 200 °C
450,5 minutes 29,6 - 34,8 KV/mm
no data
150h at 200 °C 436,7 minutes
30,7 - 35,6 KV/mm 3069 minutes
bei 35,29 kV/mm
Table 7 Calmicaglass®0893 0,18mm breakdown time

75
Picture 18: A sample after temperature loading test.
Lighter spots can be observed on the picture above. Mica layers delaminate and
“age”. Increasing the hours under temperature load, the lifetime of the sample
sinks.
6.6.2.1. Calmicaglass®0893
The comparison that was made with samples with no exposure to thermal
load (Table 7) shows that Calmicaglass®0893 is much more stressed and age
faster. It could be possibly explained by the fact that uncalcined mica tapes
are normally used in VPI process because of its physical characteristics. It has
lower tensile strength but higher porosity.
6.6.2.2. Calmicaglass®0409
In comparison to that, Calmicaglass®0409 shows better results when put
under thermal load. Data for samples in this electric field strength is
unfortunately absent so a direct comparison with and without thermal load,
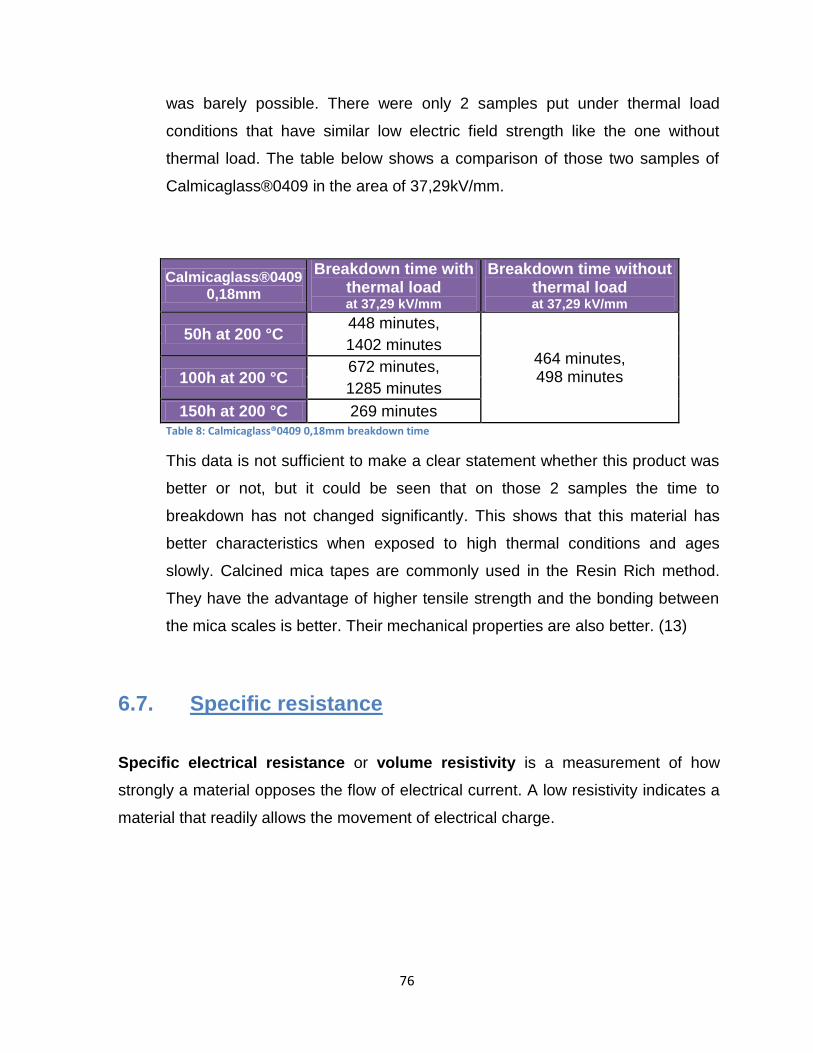
76
was barely possible. There were only 2 samples put under thermal load
conditions that have similar low electric field strength like the one without
thermal load. The table below shows a comparison of those two samples of
Calmicaglass®0409 in the area of 37,29kV/mm.
Calmicaglass®0409 0,18mm
Breakdown time with thermal load
at 37,29 kV/mm
Breakdown time without thermal load
at 37,29 kV/mm
50h at 200 °C 448 minutes,
464 minutes, 498 minutes
1402 minutes
100h at 200 °C 672 minutes,
1285 minutes
150h at 200 °C 269 minutes Table 8: Calmicaglass®0409 0,18mm breakdown time
This data is not sufficient to make a clear statement whether this product was
better or not, but it could be seen that on those 2 samples the time to
breakdown has not changed significantly. This shows that this material has
better characteristics when exposed to high thermal conditions and ages
slowly. Calcined mica tapes are commonly used in the Resin Rich method.
They have the advantage of higher tensile strength and the bonding between
the mica scales is better. Their mechanical properties are also better. (13)
6.7. Specific resistance
Specific electrical resistance or volume resistivity is a measurement of how
strongly a material opposes the flow of electrical current. A low resistivity indicates a
material that readily allows the movement of electrical charge.

77
Electrical resistivity ρ is defined by:
, where is the static resistivity (measured in volt-
metres per ampere, V m/A);
is the magnitude of the electric field (measured
in volts per metre, V/m);
is the magnitude of the current density (measured
in amperes per square metre, A/m²).
A test for volume resistivity has been made to check out if there are differences
between the materials. On the table below the results and the values for
Calmicaglass®0409 and Calmicaglass®0893 can be seen.
Table 9: Specific Resistance
This test was realized by Keithley Resistivity Test Fixture 8009 device, a laptop and
Keithley Electrometer. Special software was applied via the laptop on the device and
a sample with size 8,5cm x 8,5cm was put inside. Parameters such as measurement
time, iterations of the measurement and voltage can be given. On the picture below a
typical measurement of a sample can be seen.
Calmicaglass®0409 Sample-thickness
100V 200V 400V 800V
ρ [V m/A]
0,62-0,64 mm
2,932x1015 2,882x1015 2,720x1015 2,388x1015
Calmicaglass®0893 Sample-thickness
100V 200V 400V 800V
ρ [V m/A]
0,48-0,58 mm
2,616x1015 2,586x1015 2,480x1015 2,293x1015

78
Picture 19: Measurement of a Volume resistivity
Differences between Calmicaglass®0409 and Calmicaglass®0893 cannot be really
observed. Both materials show very good isolating qualities. With increasing the
voltage from 100V to 800V some polarization effects take place and the values of the
resistivity sinks are minimal. Both products behave similarly in this test. Probes and
conditions were kept the same.

79
7. Summary
The aim of this thesis was to compare the results from an aging, thermal, and
mechanical test realised on mica-resin-glass insulation systems in cooperation with
Isovolta AG Company. Mica bands were selected and given to make an investigation
which shows whether calcined or uncalcined mica tape has better isolating
characteristics and also if the number of insulation layers plays a main role in its abilities.
For this purpose, it was a new method invented to test only insulation material without
the influence of the conductive part such as metal or copper bars.
The difficult part of the task was to prepare samples out of mica tape which are going to
give trustful results. For the test, there were two tapes selected which are both used in
the Resin Rich method for insulation of windings of high voltage machines. Additionally,
those two tapes have separated to different band thickness, which means they have a
different amount of mica. Respectively, from the first material there are 2 different
thicknesses picked out and from the second material there are 3 different thicknesses
picked out. Finally there are 5 separate materials which were put under a series of tests.
All samples were put under even pressing conditions. Since the press was not meant for
such purposes and for that delicate and precise pressing, there are still some
differences like resin flow and thickness.
The original idea was to have samples prepared with a thickness of 1mm like for real
machines. After some pre-tests, it was clear that it would have taken too long time until a
failure occurs. So it was decided that samples be prepared with half of the original
thickness (0,5 mm) and results to be measured in a much shorter period of time.
The number of sample layers varies between 2 and 6 dependant on the nominal
thickness of the mica tape.
By the voltage endurance test, the dielectric strength of the materials was evaluated by
the time to breakdown of the sample, which was noted down for each sample. A
comparison between the materials was made that is based on the test results. To make
a conclusion is very difficult because of the slight differences of the sample thicknesses

80
which have influence for the number of operating hours (lifetime). That is why the data
was gathered according to the applied electric field and then only samples with even or
similar electric load were compared.
Because of the limited number of samples that was possible to be compared it should be
taken into consideration that there is an element of uncertainty about the measured
results.
By the evaluation of the results with Weibull distribution (which is normally applied for
lifetime investigations), it seems that Calmicaglass®0893 has a bit higher dielectric
strength than Calmicaglass®0409. Although, the materials with the fewest layers
Calmicaglass®0893 with 0,28mm (2 Layers) und Calmicaglass®0409 with 0,21mm (3
Layers) gave the best results, a direct correlation between the number of layers and
operating hours cannot be made.
In the thermal load test the same experiment was repeated but additionally the samples
were exposed to high temperature (200 °C) for 50, 100 and 150 hours. Because of the
even smaller number of samples during this test it is almost impossible to make any
trustful conclusions out of the measurements. The results out of this experiment were
plausible, as the samples with thermal load have shown lower number of operating
hours than the ones which were not exposed to thermal load. Calmicaglass®0409 has
shown barely a degradation of its isolating performance while Calmicaglass®0893 had a
significant degradation shown.
A mechanical test in form of a test procedure with the Dynamical Mechanical Analysis
device was applied on samples from Calmicaglass®0409 and Calmicaglass®0893 with
0,18mm thickness and 4 layers of material. The test shows the value of loss factor tan
delta at rising temperatures and applied mechanical voltage. According to this test, the
samples of both the materials show similar value for tan delta which means that,
mechanically speaking, both the materials act the same.

81
8. Conclusion and Outlook
The usage of mica paper for insulation of high voltage machines is necessary because
of its good electrical and thermal characteristics. The investigated mica tapes cover the
need in all areas from low to high voltage machines. They can be both manually and
automatically applied and also available for the different needs of the client. Both
methods of application of wound coils and bars (resin rich or VPI method) are possible
and the materials have the specifications required for each one. According to its
application, the tapes vary in thickness, mica, resin, and glass cloth amount. Even
difficult and complex areas and shapes are reachable thanks to very good tape
flexibility.
The method described in this thesis gives a possibility for testing very delicate
differences. For more precise results, it is necessary that all the conditions such as
preparing the samples, pressing, and curing be more accurate and possibly remain the
same for all samples. A larger number of samples with exact thickness is also necessary
so that results can be compared and give a failure distribution in a better defined range.
Before choosing the press conditions, there were many trials on different presses and it
should be noticed that the results were different. The pressure must remain constant
during the press time and also calculated so that only the amount of resin which is
normally pressed out by the manufacturing process flows away. Other pressing methods
are required in order to obtain the process of getting samples which are going to give
trustful results for continuous tests.
The high voltage cell, where the tests took place, is especially made for testing bars with
insulation and their lifetime under working and extreme conditions. It covers all
standards and requirements for realising such measurements. All measurement devices
were approved and present exact data.
The test electrodes of the oil van are also built following the norm IEC 60296.
Disadvantages and possible loss may come from the manual turning of the electrodes.
After the samples were with 0.5 mm thickness, it was not possible to be sure that after

82
putting the sample between the electrodes, they were fully contacting the sample face
and also differ each time from one another. This could be obtained if electrodes are
connected to springs which will guarantee the exact pressure against the sample walls.
Observing the pressing conditions and trying to remain same for all the prepared
samples, there were some difficulties achieving the thickness of 0.5 mm. That is why
samples with few layers became thinner than ones with many layers. That plays a main
role later when nominal voltage was applied. In reality, by the process of manufacturing
of insulated bars, this is easier to prevent because pressing conditions are different (RR
presses or VPI barrels).
To make a clear view which mica paper (calcined or uncalcined) has better electrical
characteristics and also at which thickness the best results can be reached, specific
methods should be developed for the accurate preparing of the test samples.

83
9. References
1. D.M Hepburn, I.J. Kemp, A.J Shield. Department of Engineering, GlasgowCaledonian University.
2. Wikipedia. [Online]
3. Classification of Insulation Systems AEMT- Association of Electrical and Mechanical Trades.
4. Google.
5. M S Naidu, V Kamaraju. High Voltage Engineering Second Edition.
6. Gsellmann, Dr. H. From Natural Mica to Insulated Bars and Coils.
7. AC Power Systems Handbook, Chapter 1.
8. G. Stone 2.1.
9. Vogelsang. The relationship between microscopic properties and time to breakdown of high voltage
winding insulations at various manufacturing qualities temperatures and mechanical.
10. Schaumburg, H. Werkstoffe und Bauelemente der Elektrotechnik: Polymere. Stuttgart : Verlag B.G.
Teubner, 1997.
11. Von Roll, Isola. Electrical Insulating Materials, Technical data sheets. Switzerland : s.n., 2002.
12. Senn, Florian. Glimmerisoliersysteme, Einführung und Zersetzungsmechanismen.
13. Isovolta AG . documentary.
14. Isovolta AG. Datasheets Calmicaglass® 0409, Calmicaglass® 0893.
15. NETZSCH- Datasheet.

84
10. List of figures
Picture 1: Natural Mica (4) .......................................................................................................................... 13
Picture 2: Tetrahedral mica structure (4) .................................................................................................... 16
Picture 3: Mica splittings (4) ........................................................................................................................ 17
Picture 4: Muscovite (4) .............................................................................................................................. 17
Picture 5: Phlogopite (4) .............................................................................................................................. 18
Picture 6: Mica Pulping Process a) (6) ......................................................................................................... 20
Picture 7: Mica Pulping Process b) (6) ......................................................................................................... 20
Picture 8: Mica Pulping Process c) (6) ......................................................................................................... 20
Picture 9: Mica paper process (6) ................................................................................................................ 21
Picture 10: Mica roles process (6) ............................................................................................................... 21
Picture 11: VPI- vessel (12) .......................................................................................................................... 29
Picture 12: Winding machines (Isovolta AG) – automatic (6) ..................................................................... 30
Picture 13: Resin Rich Press (12) ................................................................................................................. 36
Picture 14: Calmicaglass®0409 after breakdown and a couple of hours under 45kV. ............................... 41
Picture 15: High voltage cell for sample test ............................................................................................... 43
Picture 16: Van with mineral oil and test samples between electrodes ..................................................... 45
Picture 17: Oven for burning out the organic parts .................................................................................... 58
Picture 18: A sample after temperature loading test. ................................................................................ 75
Picture 19: Measurement of a Volume resistivity ....................................................................................... 78
Formula 1..................................................................................................................................................... 59
Table 1: Comparison Single Bar VPI and Global VPI (6) ............................................................................... 33
Table 2 ......................................................................................................................................................... 48
Table 3: Mica content .................................................................................................................................. 56
Table 4: Calmicaglass®0893, Calmicaglass® 0409 Time of breakdown ....................................................... 57
Table 5: Resin content after pressing process and after burning out at high temperature ....................... 60
Table 6 Calmicaglass®0409 0,18mm breakdown time ................................................................................ 74
Table 7 Calmicaglass®0893 0,18mm breakdown time ................................................................................ 74
Table 8: Calmicaglass®0409 0,18mm breakdown time ............................................................................... 76
Table 9: Specific Resistance ......................................................................................................................... 77

85
Figure 1: Mica process technology (6) ........................................................................................................ 23
Figure 2: Conductive and Stress Grading Tapes – Isovolta AG; (13) ........................................................... 35
Figure 3: Additional Materials (13) (13) ..................................................................................................... 35
Figure 4 (6)................................................................................................................................................... 38
Figure 5: Test Constellation ......................................................................................................................... 42
Figure 6: Electrode arrangements ............................................................................................................... 44
Figure 7: Calmicaglass®0409 thickness 0,12mm ......................................................................................... 46
Figure 8: Calmicaglass®0409 thickness 0,18mm ......................................................................................... 46
Figure 9: Calmicaglass®0409 thickness 0,21mm ......................................................................................... 46
Figure 10: Calmicaglass®0893 thickness 0,18mm ....................................................................................... 47
Figure 11: Calmicaglass®0893 thickness 0,28mm ....................................................................................... 47
Figure 12: Time of breakdown / E [kV/mm] ................................................................................................ 49
Figure 13: Weibull Calmicaglass®0409 0,12mm .......................................................................................... 51
Figure 14: Weibull Calmicaglass®0409 0,18mm .......................................................................................... 52
Figure 15: Weibull Calmicaglass®0409 0,21mm .......................................................................................... 53
Figure 16: Weibull Calmicaglass®0893 0,18mm .......................................................................................... 54
Figure 17: Weibull Calmicaglass®0893 0,28mm .......................................................................................... 55
Figure 18: DMA device – construction (15) ................................................................................................. 63
Figure 19: Calmicaglass®0893 (up) and Calmicaglass®0409 (down) ........................................................... 64
Figure 20 ...................................................................................................................................................... 64
Figure 21: Weibull Calmicaglass®0409 0,18mm 50h thermal load ............................................................. 67
Figure 22: Weibull Calmicaglass®0409 0,18mm 100h thermal load ........................................................... 68
Figure 23: Weibull Calmicaglass®0409 0,18mm 150h thermal load ........................................................... 69
Figure 24: Weibull Calmicaglass®0893 0,18mm 50h thermal load ............................................................. 70
Figure 25: Weibull Calmicaglass®0893 0,18mm 100h thermal load ........................................................... 71
Figure 26: Weibull Calmicaglass®0893 0,18mm 150h thermal load ........................................................... 72
Figure 27: Calmicaglass®0893 0,18mm 35,3kV/mm - 36,7 kV/mm ............................................................ 73

86
11. Attachment
Calm
icagla
ss 0
893 T
hic
kness 0
,18
Calm
icagla
ss 0
893 T
hic
kness 0
,18
ID
Ma
teri
al
Th
ick
ne
ss
[mm
]
Vo
ltag
e
[kV
]
E
[kV
/mm
]
Tim
e t
o
bre
ak
do
wn
Tim
e
[min
]ID
Ma
teri
al
Th
ick
ne
ss
[mm
]
Vo
ltag
e
[kV
]E [
kV
/mm
]
Tim
e t
o
bre
ak
do
wn
Tim
e
[min
]
B33re
893
0,4
320
46,5
10:3
5:0
435
R36re
893
0,4
18
45,0
00:0
1:2
11
B30li
893
0,4
520
44,4
41:2
6:5
387
R39re
893
0,4
218
42,8
61:4
9:2
0109
R31re
893
0,4
720
42,5
52:1
8:5
3139
B37li
893
0,4
18
45,0
02:4
9:2
3169
R25re
893
0,4
920
40,8
22:2
9:2
0149
R44li
893
0,4
718
38,3
03:0
3:1
9183
B29re
893
0,4
720
42,5
52:5
1:2
7171
R35m
i893
0,4
18
45,0
04:1
0:1
7250
B28re
893
0,4
820
41,6
73:0
8:2
2188
B50li
893
0,5
18
36,0
06:4
8:3
7409
B21re
893
0,5
220
38,4
63:1
6:4
5197
B38re
893
0,4
118
43,9
07:4
6:1
8466
R22m
i893
0,5
220
38,4
64:1
8:5
7259
R42m
i893
0,4
618
39,1
310:2
9:4
3630
R27re
893
0,4
920
40,8
25:3
8:4
5339
R34li
893
0,4
18
45,0
011:2
2:4
9683
B23re
893
0,5
20
40,0
05:4
9:5
6350
R46m
i893
0,4
818
37,5
016:1
0:0
9970
B32li
893
0,4
520
44,4
46:4
8:2
1408
B48li
893
0,5
18
36,0
017:0
0:0
61020
R20re
893
0,4
820
41,6
77:5
5:4
1476
R40re
893
0,4
218
42,8
620:1
5:3
61216
B24 li
893
0,4
920
40,8
28:2
0:1
5500
B43li
893
0,4
518
40,0
029:1
4:5
81755
R26m
i893
0,4
920
40,8
223:5
9:3
81440
B41li
893
0,4
418
40,9
130:2
2:2
31822
R47re
893
0,4
918
36,7
332:3
4:3
21955
R45re
893
0,4
718
38,3
047:0
3:0
42823
B49re
893
0,5
18
36,0
049:5
4:2
72994
B51m
i893
0,5
118
35,2
951:0
9:0
23069
0,0
0
5,0
0
10
,00
15
,00
20
,00
25
,00
30
,00
35
,00
40
,00
45
,00
50
,00
050
010
00
15
00
20
00
25
00
30
00
35
00
E [kV/mm]
tim
e [m
in]
Ele
ktr
isc
he
Fe
lds
tärk
e - 0
,18
08
93-2
0kV
08
93-1
8kV

87
Calm
icagla
s 0
409 T
hic
kness 0
,12
Calm
icagla
ss 0
409 T
hic
kness 0
,12
ID
Ma
teri
al
Th
ick
ne
ss
[mm
]
Vo
ltag
e
[kV
]
E
[kV
/mm
]
Tim
e t
o
bre
ak
do
wn
Tim
e
[min
]ID
Ma
teri
al
Th
ick
ne
ss
[mm
]
Vo
ltag
e
[kV
]E [
kV
/mm
]
Tim
e t
o
bre
ak
do
wn
Tim
e
[min
]
B14re
409
0,5
326
49,0
60:1
8:4
219
R15m
i409
0,5
222
42,3
10:4
3:4
344
R13li
409
0,5
426
48,1
50:2
0:2
520
B17re
409
0,5
222
42,3
11:2
3:1
283
R15li
409
0,5
326
49,0
60:2
0:3
421
R1li
409
0,5
422
40,7
41:3
2:0
692
R21m
i409
0,5
726
45,6
10:2
1:3
322
R9li
409
0,4
922
44,9
1:4
6:2
3106
R1li
409
0,5
626
46,4
30:3
6:5
737
R2m
i409
0,5
422
40,7
41:5
8:3
6119
B4li
409
0,5
526
47,2
70:4
0:1
240
B8li
409
0,4
922
44,9
2:0
6:3
2127
B16li
409
0,5
226
50
0:4
1:0
341
B10re
409
0,5
22
44
2:2
2:0
8142
B7li
409
0,5
426
48,1
50:4
3:3
344
B4li
409
0,5
322
41,5
12:3
4:3
7155
B12li
409
0,6
726
38,8
10:4
4:1
844
R3re
409
0,5
422
40,7
42:4
8:1
6168
R3re
409
0,5
626
46,4
30:5
1:0
951
B14re
409
0,5
222
42,3
12:5
2:4
8173
B10li
409
0,6
26
43,3
30:5
8:1
058
B13re
409
0,5
122
43,1
43:0
4:4
7185
B5re
409
0,5
526
47,2
71:0
2:1
562
R6li
409
0,5
622
39,2
93:0
8:3
4189
B19li
409
0,6
226
41,9
41:0
9:4
770
R16m
i409
0,5
222
42,3
13:4
9:3
3230
R20re
409
0,5
726
45,6
11:4
1:0
3101
R12m
i409
0,5
122
43,1
44:2
7:0
0267
R2m
i409
0,5
626
46,4
31:4
1:4
5102
B11re
409
0,5
122
43,1
46:3
7:3
7398
B9re
409
0,5
926
44,0
71:5
7:2
0117
B5re
409
0,5
322
41,5
16:5
4:5
3415
R6li
409
0,5
426
48,1
52:0
7:3
0128
R7m
i409
0,5
522
40
12:0
5:3
2726
R11m
i409
0,6
26
43,3
32:1
3:1
4133
B17re
409
0,6
126
42,6
22:1
3:4
7134
R8re
409
0,5
726
45,6
12:5
9:2
0179
R22m
i409
0,5
726
45,6
13:0
4:2
0184
R18li
409
0,6
226
41,9
45:1
5:0
0315
0
10
20
30
40
50
60
0100
200
300
400
500
600
700
800
E kV/mm
tim
e [m
in]
Ele
ktr
isch
e F
eld
stä
rke
- 0
,12
40
9-2
6kV
40
9-2
2kV

88
Calm
icagla
ss 0
409 T
hic
kness 0
,21
Calm
icagla
ss 0
409 T
hic
kness 0
,21
ID
Ma
teri
al
Th
ick
ne
ss
[mm
]
Vo
ltag
e
[kV
]
E
[kV
/mm
]
Tim
e t
o
bre
ak
do
wn
Tim
e
[min
]ID
Ma
teri
al
Th
ick
ne
ss
[mm
]
Vo
ltag
e
[kV
]E [
kV
/mm
]
Tim
e t
o
bre
ak
do
wn
Tim
e
[min
]
8409
0,5
22
44
0:4
1:4
442
17
409
0,4
926
53,0
60:0
4:0
84
7409
0,4
822
45,8
30:4
7:2
047
10
409
0,5
26
52
0:0
9:2
69
2409
0,5
122
43,1
42:0
9:5
5130
3409
0,4
926
53,0
60:1
3:2
313
11
409
0,4
822
45,8
32:0
0:5
5121
13
409
0,4
926
53,0
60:1
6:4
017
14
409
0,5
322
41,5
12:3
3:4
3154
9409
0,5
26
52
0:2
5:3
626
18
409
0,4
822
45,8
32:4
2:5
2163
14
409
0,4
926
53,0
60:2
6:3
227
20
409
0,4
922
44,9
2:4
6:4
6167
11
409
0,5
26
52
0:2
8:0
728
3409
0,4
622
47,8
32:5
0:4
2171
8409
0,5
126
50,9
80:3
2:4
733
5409
0,4
822
45,8
33:1
6:5
0197
5409
0,5
226
50
0:3
4:3
635
16
409
0,5
222
42,3
13:3
0:4
3211
4409
0,5
226
50
0:3
5:5
536
4409
0,4
722
46,8
13:4
0:3
6221
18
409
0,4
926
53,0
60:3
7:1
737
1409
0,5
122
43,1
44:1
9:1
1259
16
409
0,4
926
53,0
60:3
9:0
539
10
409
0,5
222
42,3
15:1
7:0
7317
12
409
0,5
126
50,9
80:4
7:0
047
19
409
0,4
922
44,9
5:3
0:1
7330
15
409
0,4
926
53,0
61:0
5:0
065
15
409
0,5
222
42,3
15:4
0:0
2340
6409
0,5
326
49,0
61:1
6:2
476
6409
0,5
22
44
5:4
9:2
5349
19
409
0,5
126
50,9
81:2
3:0
083
12
409
0,5
122
43,1
45:5
8:0
7358
1409
0,5
326
49,0
61:4
7:1
9107
9409
0,5
222
42,3
16:0
8:3
1369
2409
0,5
426
48,1
52:1
1:0
4131
17
409
0,5
222
42,3
17:4
5:2
8465
7409
0,5
126
50,9
82:4
5:2
3165
13
409
0,5
122
43,1
413:2
9:1
5809
0
10
20
30
40
50
60
010
020
030
040
050
060
070
080
090
0
E kV/mm
tim
e [m
in]
Ele
ktr
isch
e F
eld
stä
rke
- 0
,21
40
9-2
2kV
40
9-2
6kV

89
Calm
icagla
ss 4
09 T
hic
kness 0
,18
Calm
icagla
ss 4
09 T
hic
kness 0
,18
ID
Ma
teri
al
Th
ick
ne
ss
[mm
]
Vo
ltag
e
[kV
]
E
[kV
/mm
]
Tim
e t
o
bre
ak
do
wn
Tim
e
[min
]ID
Ma
teri
al
Th
ick
ne
ss
[mm
]
Vo
ltag
e
[kV
]E [
kV
/mm
]
Tim
e t
o
bre
ak
do
wn
Tim
e
[min
]
20
409
0,6
26
43,3
0:0
9:0
99
4409
0,5
322
41,5
11:3
8:3
899
4409
0,5
326
49,0
60:1
0:5
111
6409
0,5
622
39,2
92:0
5:5
1126
1409
0,5
126
50,9
80:1
2:3
613
18
409
0,5
722
38,6
2:0
9:1
0129
2409
0,5
226
50
0:1
3:2
913
19
409
0,5
422
40,7
43:1
3:5
8194
3409
0,5
126
50,9
80:2
1:3
522
9409
0,5
822
37,9
33:1
8:5
6199
7409
0,5
226
50
0:3
2:5
633
8409
0,5
722
38,6
3:2
6:2
6206
6409
0,5
226
50
0:4
7:3
948
7409
0,5
722
38,6
3:3
2:1
2212
9409
0,5
626
46,4
30:5
0:3
951
15
409
0,5
822
37,9
33:4
6:2
6226
15
409
0,6
126
42,6
20:5
2:4
253
3409
0,5
422
40,7
43:5
4:4
1235
10
409
0,5
626
46,4
30:5
4:1
954
1409
0,5
322
41,5
14:1
7:3
0258
11
409
0,5
226
50
0:5
8:4
259
17
409
0,5
622
39,2
94:2
2:3
3263
5409
0,5
26
52
1:0
4:0
064
12
409
0,5
822
37,9
34:4
6:0
0286
16
409
0,6
126
42,6
21:0
5:5
466
10
409
0,5
822
37,9
34:4
7:3
2288
13
409
0,6
226
41,9
41:2
4:3
685
20
409
0,5
622
39,2
94:4
9:1
6289
19
409
0,6
226
41,9
41:3
1:1
091
16
409
0,5
722
38,6
5:0
5:4
9306
12
409
0,6
226
41,9
41:3
5:3
696
11
409
0,5
822
37,9
35:4
0:5
2341
14
409
0,6
26
43,3
1:4
1:2
0101
5409
0,5
522
40
6:2
6:0
0386
17
409
0,6
126
42,6
22:0
0:0
3120
14
409
0,5
922
37,2
97:4
3:4
0464
8409
0,5
826
44,8
32:4
7:0
1167
13
409
0,5
922
37,2
98:1
7:3
9498
18
409
0,6
326
41,2
72:4
8:0
9168
2409
0,5
422
40,7
49:5
3:1
5593
0
10
20
30
40
50
60
010
020
030
040
050
060
070
0
E kV/mm
tim
e [m
in]
Ele
ktr
isch
e F
eld
stä
rke
- 0
,18
40
9-2
2kV
40
9-2
6kV

90
Calm
icagla
ss 0
893 T
hic
kness 0
,28
Calm
icagla
ss 0
893 T
hic
kness 0
,28
ID
Ma
teri
al
Th
ick
ne
ss
[mm
]
Vo
ltag
e
[kV
]
E
[kV
/mm
]
Tim
e t
o
bre
ak
do
wn
Tim
e
[min
]ID
Ma
teri
al
Th
ick
ne
ss
[mm
]
Vo
ltag
e
[kV
]E [
kV
/mm
]
Tim
e t
o
bre
ak
do
wn
Tim
e
[min
]
1893
0,3
418
52,9
40:1
2:4
013
17
893
0,3
516
45,7
11:4
0:5
2101
2893
0,3
518
51,4
30:3
6:1
936
13
893
0,3
716
43,2
42:3
9:0
6159
6893
0,3
718
48,6
51:4
2:1
4102
16
893
0,3
616
44,4
43:1
4:4
1195
19
893
0,4
818
37,5
2:2
3:1
8143
18
893
0,3
416
47,0
63:3
0:1
5210
4893
0,3
618
50
2:2
8:0
4148
15
893
0,3
616
44,4
43:5
9:3
8240
3893
0,3
618
50
2:4
5:4
8166
14
893
0,3
716
43,2
44:3
3:4
7274
11
893
0,4
118
43,9
3:2
1:4
9202
12
893
0,3
816
42,1
19:1
7:0
4557
7893
0,3
818
47,3
73:3
1:2
0211
10
893
0,4
16
40,0
013:4
6:1
9826
5893
0,3
718
48,6
54:1
0:5
2251
11
893
0,3
816
42,1
119:5
4:0
51194
8893
0,3
818
47,3
78:0
9:1
5489
9893
0,4
116
39,0
228:1
4:4
31695
14
893
0,4
418
40,9
110:1
6:0
4616
8893
0,4
216
38,1
033:4
9:1
02029
9893
0,4
18
45
10:2
5:5
2626
7893
0,4
316
37,2
137:5
4:1
72274
12
893
0,4
218
42,8
612:1
7:1
9737
5893
0,4
516
35,5
640:3
7:2
02437
10
893
0,4
118
43,9
14:0
9:1
6849
3893
0,4
516
35,5
671:4
1:3
04302
16
893
0,4
518
40
14:2
3:5
9864
1893
0,4
816
33,3
374:2
7:4
44468
13
893
0,4
318
41,8
614:2
6:5
8867
19
893
0,4
216
38,1
075:1
4:2
24514
18
893
0,4
718
38,3
18:1
3:4
61094
2893
0,4
716
34,0
486:5
5:4
45216
17
893
0,4
518
40
19:4
5:4
91186
6893
0,4
416
36,3
6105:5
7:0
76357
20
893
0,5
218
34,6
228:3
8:1
71718
4893
0,4
516
35,5
6127:2
5:5
47646
15
893
0,4
518
40
34:1
3:4
72054
0
10
20
30
40
50
60
010
00
20
00
30
00
40
00
50
00
60
00
70
00
80
00
90
00
E kV/mm
tim
e [m
in]
Ele
ktr
isch
e F
eld
stä
rke
- 0
,28
89
3-1
8kV
89
3-1
6kV

91
Thermal Load
Calamicaglas 409; 0,18mm after 50h at 200 °C
ID Material Thickness [mm] Voltage [kV] E [kV/mm] Time [h:m]
1 409 0,59 22 37,29 7:28
2 409 0,59 22 37,29 23:22
3 409 0,6 22 36,67 21:20
4 409 0,6 22 36,67 15:29
5 409 0,61 22 36,07 47:00
Calamicaglas 409; 0,18mm after 100h at 200 °C
ID Material Thickness [mm] Voltage [kV] E [kV/mm] Time [h:m]
6 409 0,59 22 37,29 11:12
7 409 0,59 22 37,29 21:25
8 409 0,6 22 36,67 4:44
9 409 0,6 22 36,67 9:44
10 409 0,61 22 36,07 39:56
Calamicaglas 409; 0,18mm after 150h at 200 °C
ID Material Thickness [mm] Voltage [kV] E [kV/mm] Time [h:m]
11 409 0,59 22 37,29 4:29
12 409 0,6 22 36,67 26:25
13 409 0,61 22 36,07 7:38
14 409 0,62 22 35,48 28:19
15 409 0,62 22 35,48 13:23
Calamicaglas 893; 0,18mm after 50h at 200 °C
ID Material Thickness [mm] Voltage [kV] E [kV/mm] Time [h:m]
1 893 0,43 16 37,21 8:23
2 893 0,43 16 37,21 7:37
3 893 0,46 16 34,78 5:08
4 893 0,54 18 29,63 0:00
5 893 0,5 18 32 0:00
Calamicaglas 893; 0,18mm after 100h at 200 °C
ID Material Thickness [mm] Voltage [kV] E [kV/mm] Time [h:m]
6 893 0,43 18 37,21 0:00
7 893 0,43 18 37,21 0:00
8 893 0,46 16 34,78 3:25
9 893 0,54 16 29,63 10:25
10 893 0,5 16 32 5:14
Calamicaglas 893; 0,18mm after 150h at 200 °C
ID Material Thickness [mm] Voltage [kV] E [kV/mm] Time [h:m]
11 893 0,43 18 37,21 0:00
12 893 0,45 16 35,56 3:26
13 893 0,47 16 34,04 6:17
14 893 0,52 16 30,77 3:32 15 893 0,5 16 32 11:19