
FINAL THESIS EDITED
77
A COL Microbial Cellula ( Phenology and G Populations A Thesis submitted to the in partial fulfillment of th ADDIS ABABA UNIVERSITY LLEGE OF NATURAL SCIENCE ar and Molecular Biology Prog (Applied Genetics Stream) Genetic Diversity of Boswellia papyrifera (D s of Metema District as Revealed by ISSR M e School of Graduate Studies, Addis Ab he requirements for the Degree of Mast Biology (Applied Genetics) By Abush Zinaw gram Unit Del.) Hochst. Markers. baba University, ter of Science in June, 2012
-
Upload
khangminh22 -
Category
Documents
-
view
2 -
download
0
Transcript of FINAL THESIS EDITED
ADDIS ABABA UNIVERSITY
COLLEGE OF NATURAL SCI
Microbial Cellular and
(
Phenology and Genetic
Populations of Metema
A Thesis submitted to the School of Graduate Studies, Addis Ababa University,
in partial fulfillment of the requirements for the Degree of Master of Science in
ADDIS ABABA UNIVERSITY
COLLEGE OF NATURAL SCIENCE
Cellular and Molecular Biology Program
(Applied Genetics Stream)
Phenology and Genetic Diversity of Boswellia papyrifera (Del.) Hochst.
Populations of Metema District as Revealed by ISSR Markers.
A Thesis submitted to the School of Graduate Studies, Addis Ababa University,
in partial fulfillment of the requirements for the Degree of Master of Science in
Biology (Applied Genetics)
By
Abush Zinaw
rogram Unit
(Del.) Hochst.
as Revealed by ISSR Markers.
A Thesis submitted to the School of Graduate Studies, Addis Ababa University,
in partial fulfillment of the requirements for the Degree of Master of Science in
June, 2012

i
ACKNOWLEDGEMENTS
I am very grateful to my advisors Dr. Kifle Dagne, Dr. Kassahun Tesfaye and Dr. Wubalem
Tadesse for their professional supports and due concerns from the very start of designing the
research proposal up to thesis write up. I am very much indebted to them for the amount of work
they put into this task, which made the study to be completed successfully.
I would like to thank Center for International Forestry Research (CIFOR) for sponsoring the
reproductive biology part of this study without which the completion of this study would not
have been possible in such a successful way. Grateful acknowledgements are extended to the
enumerators for their co-operation and to the sample respondents and key informants who co-
operated with me in supplying relevant information in addition to their hospitality during the
period of data collection.
Ministry of Education is highly acknowledged and appreciated for offering me the opportunity to
pursue this study, and Addis Ababa University for hosting me and Genetics research laboratory
for providing laboratory facility and supplies. In addition, I am very indebted to Biruk Getnet
and Shimekt Tadele for their impressive support especially during laboratory work.

ii
Table of Content
Contents pages
ACKNOWLEDGEMENTS ............................................................................................................. i
List of Figures ................................................................................................................................ iv
List of Tables ................................................................................................................................... v
LIST OF ABBREVIATION .......................................................................................................... vi
ABSTRACT ................................................................................................................................. viii
1. INTRODUCTION ....................................................................................................................... 1
2. LITRATURE REVIEW .............................................................................................................. 4
2.1 Botanical Description and Ecological Distribution ............................................................... 4
2.2 Reproductive Biology............................................................................................................ 5
2.3 Important Uses of Boswellia papyrifera ............................................................................... 6
2.3.1 Frankincense Production ................................................................................................ 6
2.3. 2 Uses of frankincense ..................................................................................................... 8
2.3.3 Uses of wood, leaves and flowers ................................................................................ 10
2.3.4 Environmental functions .............................................................................................. 10
2.4 Important issues and ecological concerns ........................................................................... 11
2.5 Genetic markers for diversity analysis ................................................................................ 12
2.5.1 Morphological markers ................................................................................................ 14
2.5.2 Biochemical markers .................................................................................................... 14
2.5.3 Molecular markers ........................................................................................................ 15
2.5.3.1. Non-PCR based techniques ...................................................................................... 16
2.5.3.2 PCR arbitrary priming ............................................................................................... 17
2.5.3.3 Targeted-PCR and Sequencing ................................................................................. 20
2.6 Genetic diversity study in Boswellia ................................................................................... 22
3. OBJECTIVES ........................................................................................................................... 23
3.1 General objective ................................................................................................................. 23
3.2 Specific objectives ............................................................................................................... 23

iii
4. MATERIALS AND METHOD ................................................................................................ 24
4.1 Plant material ....................................................................................................................... 24
4.2 DNA extraction ....................................................................................................................... 24
4.3 Primer selection and optimization ....................................................................................... 26
4.4 PCR and gel electrophoresis................................................................................................ 27
4.5 Data management and statistical analysis ........................................................................... 27
4.6 Phenological observations ................................................................................................... 29
4.7 Pollinator activity ................................................................................................................ 29
5. RESULTS .................................................................................................................................. 29
5.1 Banding patterns of the ISSR primers used......................................................................... 29
5.2 Polymorphism based percent polymorphism .................................................................. 31
5.3 Genetic diversity.................................................................................................................. 32
5.4 Analysis of molecular variance ........................................................................................... 33
5.5 Clustering analysis .............................................................................................................. 34
5.6 PCO analysis ....................................................................................................................... 38
5.7 Phenology ............................................................................................................................ 39
5.8 Pollinator activity ................................................................................................................ 41
6. DISCUSSION ........................................................................................................................... 43
6.1. Molecular diversity............................................................................................................. 43
6.2 Phenology and pollinator activity........................................................................................ 46
7. CONCLUSION ......................................................................................................................... 48
8. RCOMMENDATIONS ............................................................................................................. 50
9. REFERENCES .......................................................................................................................... 51
10. APPENDICES ......................................................................................................................... 64

iv
List of Figures
Figure 1. Administrative woredas of Metema Zone showing sites where the Boswellia
population used in this study were collected.. ........................................................................ 25
Figure 2ISSR fingerprint generated using primer 818 ........................................................................... 31
Figure 3. UPGMA based dendrogram for five Metema Zone Boswellia papyrifera populations
using 5 ISSR primers ................................................................................................................. 35
Figure 4. UPGMA based dendrogram for 64 individuals of Boswellia papyrifera using five ISSR
primers. The UPGMA algorithm is based on Jaccard’s coefficients obtained after pair
wise comparison of the presence-absence fingerprint. .......................................................... 36
Figure 5 Neighbor-joining analysis of 64 individuals based on 39 PCR bands amplified by five
primers. The neighbor joining algorithm is based on Jaccard’s coefficients obtained
after pair wise comparison of the presence-absence fingerprint. .......................................... 37
Figure 6. Two dimensional representation of principal coordinate analysis of genetic
relationships among 64 individuals of five Metema populations. .......................................... 38
Figure 7. Three dimensional representation of principal coordinate analysis of genetic
relationships among 64 individuals of five Metema populations. .......................................... 39
Figure 8. Various phenoevents in Boswellia papyrifera ........................................................................ 40
Figure 9 Figure showing flowers of B. papyrifera being visited by honey bees. ................................... 42
v
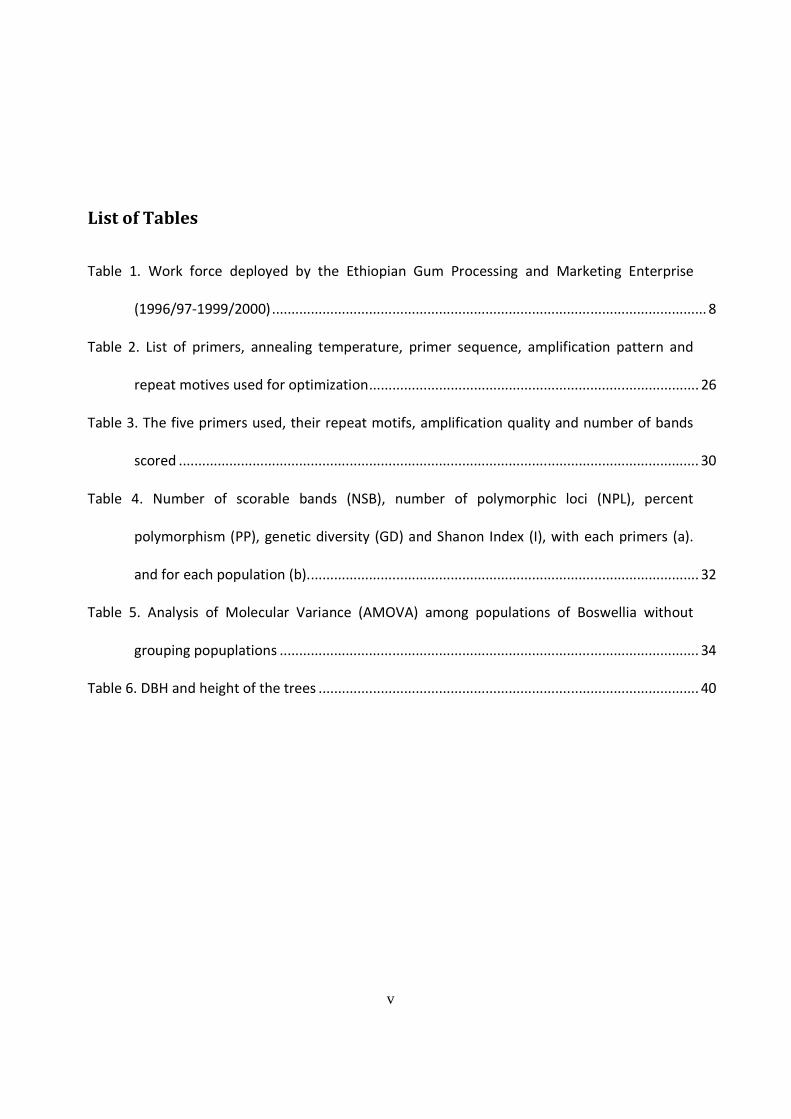
List of Tables
Table 1. Work force deployed by the Ethiopian Gum Processing and Marketing Enterprise
(1996/97-1999/2000) ................................................................................................................ 8
Table 2. List of primers, annealing temperature, primer sequence, amplification pattern and
repeat motives used for optimization ..................................................................................... 26
Table 3. The five primers used, their repeat motifs, amplification quality and number of bands
scored ...................................................................................................................................... 30
Table 4. Number of scorable bands (NSB), number of polymorphic loci (NPL), percent
polymorphism (PP), genetic diversity (GD) and Shanon Index (I), with each primers (a).
and for each population (b). .................................................................................................... 32
Table 5. Analysis of Molecular Variance (AMOVA) among populations of Boswellia without
grouping popuplations ............................................................................................................ 34
Table 6. DBH and height of the trees .................................................................................................. 40

vi
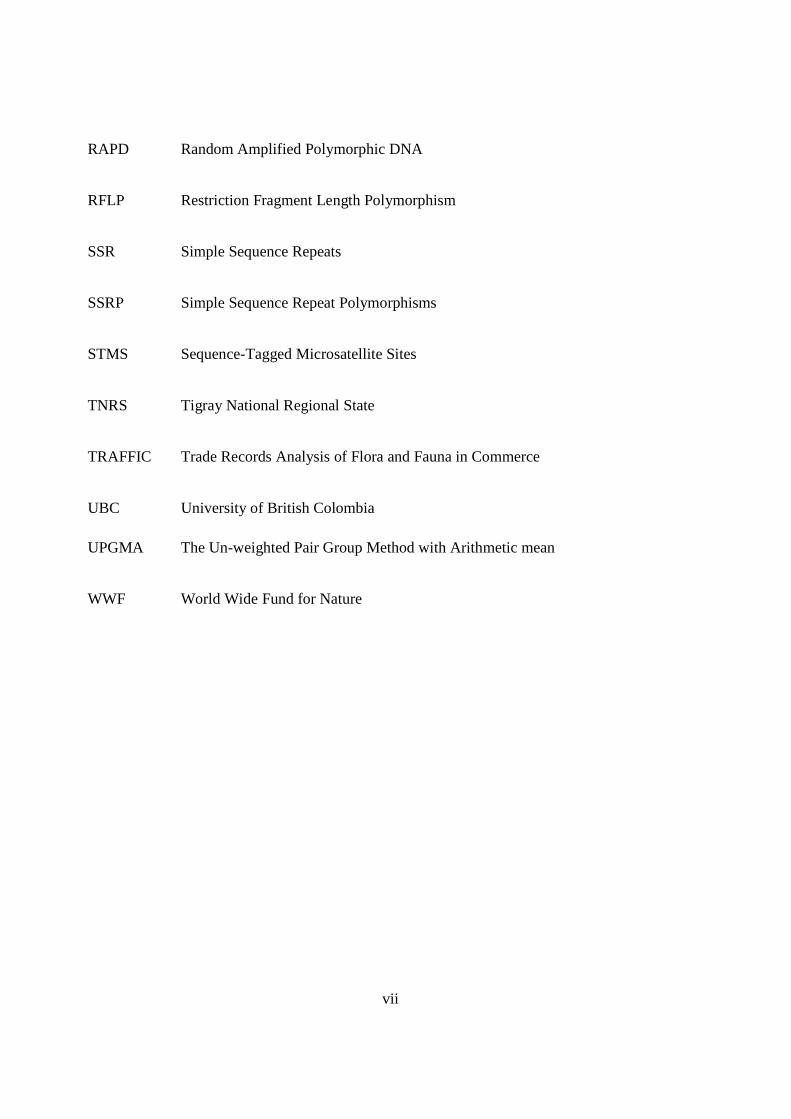
LIST OF ABBREVIATION
AFLP Amplified Fragment Length Polymorphism
AMOVA Analysis of molecular variance
ANRS Amhara National Regional State
CTAB Cetyltrimethyl Ammonium Bromide
DBH Diameter at Breast Height
EDTA Ethylene Diamine Tetra Acetic acid
FAO Food and Agriculture Organization
GD Gene diversity
IPGRI International Plant Genetic Resource Institute
ISSR Inter Simple Sequence Repeats
IUCN International Union for Conservation of Nature
NJ Neighbor Joining
NPL Number of polymorphic loci
PCO Principal Coordinate Analysis
PCR Polymerase Chain Reaction
PP Percent Polymorphism
vii
RAPD Random Amplified Polymorphic DNA
RFLP Restriction Fragment Length Polymorphism
SSR Simple Sequence Repeats
SSRP Simple Sequence Repeat Polymorphisms
STMS Sequence-Tagged Microsatellite Sites
TNRS Tigray National Regional State
TRAFFIC Trade Records Analysis of Flora and Fauna in Commerce
UBC University of British Colombia
UPGMA The Un-weighted Pair Group Method with Arithmetic mean
WWF World Wide Fund for Nature

viii
ABSTRACT
Boswellia papyrifera (Del.) Hochst. (family Burseraceae), is one of the key plant species in the
drylands of the Horn of Africa. Unregulated extraction of gums and resins and land use change
are among the main factors that threatened this dry land forest. This plant is a culturally and
ecologically relevant species that is showing symptoms of decline due to anthropogenic factors.
The study was done on five populations of B. papyrifera from Metema zone, Northern Ethiopia.
Inter-Simple Sequence Repeat markers (ISSR) were used to estimate genetic diversity among
and within five populations of Boswellia papyrifera collected from Zebach Bahir, Das Gundo,
Gubay, Shinfa and Agam Wuha sites. Five selected ISSR primers yielded 39 reproducible bands
from 64 individuals studied. All the loci were found to be polymorphic. The total genetic
diversity (GD) and Shannon’s diversity information index (I) for entire populations showed
fairly high to medium values, 0.42, and 0.60, respectively. The individuals from Zebach Bahir
site showed the highest level of gene diversity, 0.42; while the least variability showed by Agam
Wuha populations with 0.25. Analysis of Molecular Variance showed that the within populations
variation was higher (76%) than among population variation (24%). UPGMA analysis revealed
one major group and two outliers (Gubay and Agam Wuha). This major cluster again forked into
two sub-groups, one group containing Das Gundo while the second group contained Zebach
Bahir and Shinfa populations. NJ analysis, based on individuals of Boswellia, showed three
distinct clusters and two sub-clusters within the second and third major clusters. In 3D, most of
Agam wuha and Gubay individuals tended to form their own separate grouping, while
individuals from Zebach Bahir, Das Gundo and Shinfa were inter-mixed and formed a separate
group from the other populations. Studies were carried out on the phenology, and pollination
ecology of B. papyrifera. The trees remain leafless during the entire period of flowering and
fruiting. The inflorescence is a terminal raceme and produces 8-15 bisexual flowers, but it might
produce up to 60 flower buds. Moreover, during maximum flowering period on average 14.5
inflorescences per branch were recorded. Flowers offer nectar and pollen as rewards to floral
visitors. The honey bee is found to be the effective and frequent pollinator. Each flower is visited
by an average number of 6.35 insect visitors every 15 minutes and, on average, each insect
visitor spents 5.8 seconds on a flower. High to moderate level of variation was observed with
populations of Metema, this indicated the needs for urgent conservation attention.
Key words: Boswellia papyrifera, genetic diversity, ISSR, phenology, pollination ecology

1
1. INTRODUCTION
Boswellia papyrifera (Del.) Hochst. belongs to the Burseraceae family, which contains about 600
species in 17 genera (Fichtl and Admasu, 1994). Among the twenty species of the tropical genus
Boswellia Roxb. (Burseraceae), B. papyrifera is known since antiquity for the production of
fragrant gums and resins that are burned as incense (Coppi et al., 2010). Boswellia papyrifera is
a small deciduous tree that grows in a savanna belt that stretches from northern Nigeria
eastwards to the highlands of Eritrea and Ethiopia (Rigkers et al., 2006).
Boswellia papyrifera is one of the key plant species in the drylands of the Horn of Africa. Its
aromatic resin frankincense constitutes one of the export items providing considerable foreign
currency for Ethiopia, Sudan and Eritrea. It is also known to ameliorate soils, produce nutritious
and palatable livestock fodder, and provides various wood products for local uses and income for
poor households through involvement in frankincense production (Abeje et al., 2005). The
frankincense is prepared from irregular lumps of yellowish brown gum exuded by the trunk of
the trees and was already used medicinally and for fumigation by the ancient Egyptians. Since
ancient times, Ethiopia has been involved in the production of this resin, and its trading
flourished for many centuries (Kindeya et al., 2003).
In Ethiopia, B. papyrifera occurs within the Acacia – commiphora woodlands in the northwest,
north east and southeast parts of the country at elevations ranging from 300-1800 m. a. s. l.
(Vollesen, 1989). It grows on degraded sites with very shallow soils, steep rocky slopes, lava
flows or sandy river valleys, within the 950–1,800 m a.s.l. altitudinal range (Fitchl and Admasu,
1994). These lands are rapidly being degraded through population growth, overgrazing, cropping
in marginal lands, inappropriate irrigation and deforestation. The populations of B. papyrifera

2
are dwindling and its natural regeneration is severely hampered due to a number of
anthropogenic and natural factors. Several population assessments in Ethiopia, Eritrea and
Sudan reported a serious lack of recruitment through natural regeneration even in areas protected
against grazing and fire. Unless effective conservation measures are taken significant amounts of
genetic erosion will occur mainly due to the destruction of ecosystems and habitats by human
activities (Tilahun, 1997; Ogbazghi, 2001; Abeje, 2002).
The information on the amount of total genetic variation and its partitioning among and within
populations is considered of crucial importance in modern conservation program and breeding of
endangered or economically important species. The selection of the stands to be protected in the
wild and/ or the germplasm to be collected and propagated ex situ are often based on genetic
evidence (Frankel et al.,1995; Holsinger and Gottlieb, 1991). Accordingly, we performed a
molecular study to analyze amount and distribution of inter- and intra-population genetic
diversity and differentiation using Inter Simple Sequence Repeats markers (ISSRs). ISSR is a
PCR-based fingerprinting technique that involves amplification of DNA segment between two
inversely oriented and closely spaced microsatellites repeat regions (Bornet and Branchard, 2001;
Reddy et al., 2002), and is widely used in plant populations genetics thanks to the reliability and
reproducibility of the results (Rakoczy Trojanowska and Bolibok, 2004). In particular, the
technique has been applied to assess genetic variation and population differentiation in a number
of endangered angiosperm or gymnosperm species from different areas and climates (Hatcher et
al., 2004; Ge et al., 2005a, b; Pe´rez-Collazos and Catala´n, 2007; Li and Jin 2007; Luo et al.,
2007).
The phenological cycle of the species is largely controlled by the rainfall regime, which is
characterized by a long dry season from mid-September to mid-June. After leaf fall in September,
3
floral buds develop at the end of the branches and flowering takes place in November and
December. Fruits mature in January and February, and new leaves start to develop at the
beginning of the small rains in late March. Tapping starts in the beginning of the dry season,
before the emergence of floral buds, and coincides with the whole sexual reproductive cycle
(Rijkers et al., 2006). Chromosome number and ploidy level of Ethiopian Boswellia populations
are unknown. Likewise, no literature data are available on the reproductive biology and
pollination systems of the species.
This study focuses on the genetic diversity and relationships in a geographically representative
population sample of the frankincense tree, B. papirifera, from Metema District, which is one of
the major location with large population of B. papyrifera, with the ultimate goal of contributing
useful data that may assist with the identification and selection of the genetic material to be
conserved and propagated for ecological and economic purposes, and also on the phenology and
pollination ecology of B. papyrifera.

4
2. LITRATURE REVIEW
2.1 Botanical Description and Ecological Distribution
Boswellia papyrifera (Del.) Hochst. belongs to the Burseraceae family, which contains up to 600
species in 17 genera (Fichtl and Admasu, 1994). The family is distinguished by the presence of
resin ducts in the bark (Groom, 1981) and production of aromatic oils or resins (Fichtl and
Admasu, 1994). This aromatic and volatile oil had and still has great value in ceremonies of
worship and in medicinal use (Van Beek, 1960; Groom, 1981; Tucker, 1986). B. papyrifera is
one of the 20 species in the genus Boswellia Roxb. Two new species, i.e. B. bullata and B.
dioscoridis, were recently identified in Yemen (Thulin, 2001). B. papyrifera is found in Ethiopia,
Nigeria, Cameroon, Central African Republic, Chad, Sudan, Uganda and Eritrea (Vollesen, 1989,
Hepper, 1969). It mainly occurs in the Sudanian regional centre of endemism and the Sahel
regional transition zone (White, 1983). The centre of geographic distribution of the genus
Boswellia is located in north-eastern parts of Africa where more than 75% of its species are
endemic to the area (Vollesen, 1989).
Boswellia papyrifera can be as tall as 12 m with a rounded crown and a straight regular bole. The
bark is whitish to pale brown, peeling off in large flakes; and the slash is red brown, exuding a
fragrant resin. The bark contains schizogenous oleo-gumresin pockets (Verghese, 1988). Leaves
are deciduous, large, compound, arranged on long stalks with 11 to 29 leaflets, which are
narrowly ovate to oblong, and waved or toothed along the margin. B. papyrifera is a bi-sexual
flower species with sweet scented flowers, which are white to pink, arranged on long red flower
stalks, in loose panicles at the end of branches. Fruits are obtetrahedral with red capsules about 2
cm long, usually containing three tapered seeds (Vollsen, 1989).

5
In Ethiopia, B. papyrifera occurs in dry Acacia-Commiphora woodlands in Gonder, Gojam,
Shewa and Tigray (Vollesen, 1989). It grows on degraded sites with very shallow soils, steep
rocky slopes, lava flows or sandy river valleys, within the 950-1800 m a.s.l. altitudinal range
(Fichtl and Admasu, 1994). Although no national inventory has been carried out, preliminary
mapping and assessments show that the frankincense resource is found in eight Regional States
of Ethiopia covering an area of about 2.9 million ha (Abeje et al., 2005).
2.2 Reproductive Biology
B. papyrifera is a bisexual species with sweet scented flowers which are white to pink, arranged
on long red flower stalks, in loose panicles at the end of branches. Fruits are obtetrahedral with
red capsules about 2 cm long, usually containing three tapered seeds (Vollesen, 1989; Kindeya et
al., 2003).
The pink sweet smelling flowers of B. papyrifera are frequently visited by honeybees for pollen
and nectar. The long flowering period, from October to February is helpful for bee colony
maintenance (Kindeya et al., 2003). Fitchl and Admasu (1994) recommended planting of the
species to increase honey production in lowland areas. Areas where B. papyrifera grows are
often known for their good quality honey (Kindeya et al., 2003).
Phenology is the study of the periodicity or timing of recurring biological events, in relation to
short-term climatic change. In canopy trees, phenology and reproduction are expected to be
particularly important since they provide a significant resource of leaves, flowers and fruits.
Recent studies indicate that phenology patterns are selected to optimize pollination, seed
dispersion and seedling survivorship (Kudo, 2006).
6
Chromosome number and ploidy level of Ethiopian Boswellia populations are unknown.
Likewise, no literature data are available on the reproductive biology and pollination systems of
the species
2.3 Important Uses of Boswellia papyrifera
2.3.1 Frankincense Production
The use of frankincense has a long history in human civilisation (Van Beek, 1960). The natural
oil content and pleasant smell of frankincense made it desirable to burn as an incense in temple
rituals and to use as a base for perfumes and for medicinal purposes since ancient times (Groom,
1981). The first recorded mention of frankincense was found on a 15th century B.C. tomb in
Egypt (Abercrombie, 1985). Frankincense is mentioned 22 times in the Bible; 16 times for
religious worship, twice as a tribute of honour, once as an article of merchandise, and three times
as a product of the royal gardens of Solomon (Moldenke, 1952, cited in Tucker, 1986). These
gifts were not only of the greatest value at the time but also symbolised Christ's life: gold for
royalty, frankincense for divinity and myrrh for suffering.
Boswellia papyrifera is the main source of Ethiopian frankincense in the world market. When the
bark of a B. papyrifera tree is incised, white oleo-gum-resin exudates is produced. This emulsion
of aromatic oil and resin later dries into globular, pear or club shaped tears, known as
frankincense. The amount of exudates varies depending on the diameter of the tree, site
productivity and season. Annually, between 100 and 1000 grams of frankincense can be
collected from a tree (Wubalem et al., 2002). B. papyrifera can continue producing frankincense
up to the age of 50-60 years (Tilahun, 1997).
7
The use of natural gums for commercial purpose is an age old activity in Ethiopia (Abeje et a1.,
2005). Ethiopia was, and still is, one of the major producers and exporters of natural gums from
different indigenous tree species of Boswellia, Commiphora and Acacia that are found in
different agro-ecological zones of the country (Vollesen, 1989; Mulugeta and Demel, 2003;
Wubalem et al., 2002). Virtually all the frankincense resource is found in and harvested from the
natural woodlands.
In Ethiopia frankincense yield ranges from 0.1-1 kg/tree/year or 1-3 kg/tree/year. The annual
production volume for the country, for the period 1992-1999, varied between about 248 and
3,215 tons. The total amount of oleo-gum resin, including frankincense, exported annually
through official routes varied between 147 and 1925 tons, generating foreign currency earnings,
from 451,000.00 to 2,603,000.00 US$ during the period 1992/93-1998/99 (Abeje etal., 2005).
Incence collection offers off-farm employement for many farmers. In western Tigray alone,
annually about 7000 seasonal labores are employed; among which 31% are women. A taper can
collect about 10-15 quintals of incense per annum and receives a net income of US $ 100 to 150
(Aregawi, 1997). In Ethiopia, enterprises involved in frankincense international trade, are
recently focusing more on ensuring quality by offering high price to collectors of export grades
(Wubalem et al., 2002).
8
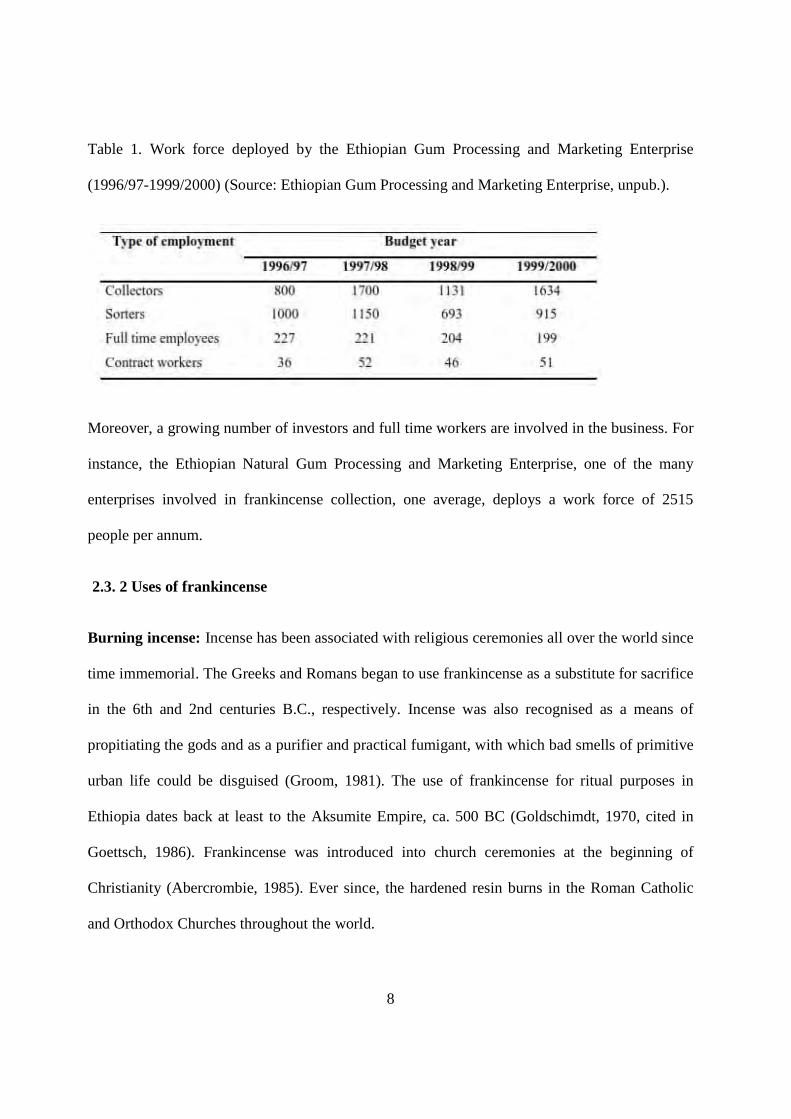
Table 1. Work force deployed by the Ethiopian Gum Processing and Marketing Enterprise
(1996/97-1999/2000) (Source: Ethiopian Gum Processing and Marketing Enterprise, unpub.).
Moreover, a growing number of investors and full time workers are involved in the business. For
instance, the Ethiopian Natural Gum Processing and Marketing Enterprise, one of the many
enterprises involved in frankincense collection, one average, deploys a work force of 2515
people per annum.
2.3. 2 Uses of frankincense
Burning incense: Incense has been associated with religious ceremonies all over the world since
time immemorial. The Greeks and Romans began to use frankincense as a substitute for sacrifice
in the 6th and 2nd centuries B.C., respectively. Incense was also recognised as a means of
propitiating the gods and as a purifier and practical fumigant, with which bad smells of primitive
urban life could be disguised (Groom, 1981). The use of frankincense for ritual purposes in
Ethiopia dates back at least to the Aksumite Empire, ca. 500 BC (Goldschimdt, 1970, cited in
Goettsch, 1986). Frankincense was introduced into church ceremonies at the beginning of
Christianity (Abercrombie, 1985). Ever since, the hardened resin burns in the Roman Catholic
and Orthodox Churches throughout the world.

9
Perfume industry: Frankincense has been used in cosmetics since ancient times. Essential oil
from frankincense is obtained from the crude resin by steam distillation and then used directly
for flavouring and fragrance (Coppen, 1995). This oil from frankincense can take up to six hours
to evaporate completely, making it an important ingredient in many perfumes. The essential oil
of frankincense from B. papyrifera in Ethiopia consists of mainly n-Octyl acetate (56%), octanol
(8%) and limonene (6.5%) (Aman et al., 1999). The essential oil is used in the Oriental bases,
“powder” perfumes, floral perfumes, citrus colognes, spice blends, violet perfumes, male
fragrances, and other scented preparations. It blends well with spice oils, mimosa, neroli, muguet
bases, woody notes, and other balsamic notes (Tucker, 1986). Hence, frankincense is included in
the formulations of a number of modern perfumes. Examples include “Replique” by Colonia,
“Me!” By Frances Denney, “Mennen Millionaire” by Mennen, “Nino Cerruti Pour Homme” by
Uniperf, “Onna” by Gary Farn, “Sculptura” by Jovan, “Volcan d’AmourI” by Diane von
Furstenburg, “Paul Sebastian V.S.O.P.” by Sebastian, and “Gambler” by Jovan (Fragnance
Foundation, 1983, cited in Tucker, 1986).
Medicinal uses: The traditional medicinal uses by local people indicate the potential and
opportunity for the use of B. papyrifera for the pharmaceutical industry as well. China imports
frankincense mainly for preparing traditional medicines (Coppen, 1995). In aromatherapy,
frankincense oil, steam distilled or alcohol extracted, is believed to have effects on the
respiratory system (Wilson, 1995), to reduce anxiety, asthma, bronchitis, extreme coughing,
stress and stretch marks (Lawless, 1995). Boswellic acid (which constitutes about 50-70% of the
oil) extracted from B. serrata in India is used as an anti-arthritic and anti-inflammatory
pharmacological agent. Extracts from B. serrata was found to be more beneficial, less toxic, and
10
more potent than standard anti-inflammatory drugs (Bucco, 1998). It is used as a laxative
ingredient in pharmaceutical industries (Tilahun, 1997).
2.3.3 Uses of wood, leaves and flowers
The wood of B. papyrifera is light and relatively soft. It is used for fencing, household furniture,
matchboxes, splints, particleboard, pencils, plywood, picture frames and veneers (Tilahun, 1997).
Various parts and products are used in traditional and modern medicine. The leaves and roots are
used against lymphadenopathy while the resin is used as a febrifuge (Fichtl and Admasu, 1994).
The bark of B. papyrifera is chewed to treat stomach disturbances. Frankincense is burnt as a
mosquito repellent in the tropics and also chewed to quench thirst during hot days (Tilahun,
1997). In China, imported frankincense was once used as a medicine to treat leprosy (Tucker,
1986). The pink sweet smelling flowers of B. papyrifera the species are frequently visited by
honeybees for pollen and nectar. The long flowering period from October to February is helpful
for bee colony maintenance. B. papyrifera growing in lowland areas are often known for their
good quality honey. Fichtl and Admasu, (1994) recommended the species for planting to
increase honey production. The leaves and seeds of B. papyrifera are highly valued as fodder for
goats, camels and other livestock. The succulent stem is also used as a fodder during the dry
season.
2.3.4 Environmental functions
B. papyrifera grows in dry and rocky sites where other tree species often fail. In Northern
Ethiopia, where the majority of the soils (60-80%) are only about 20 cm in depth (Hurni, 1988).
B. papyrifera trees are found on these shallow soils and steep slopes with an average gradient of
30-40%. The species makes economic use of the marginal areas, on which other species could

11
not grow. In those sites, it provides plant cover and produces biomass and hence protects the soil
and provides shade. The non-destructive extraction of frankincense maintains continued presence
of trees to protect the land (Mulugeta et al., 2003). If growing this species can be kept
economically and socially attractive, it can increase the attention for the protection of degraded
areas.
2.4 Important issues and ecological concerns
The decline in the population of B. papyrifera in eastern Africa has become an ecological
concern (Tilahun, 1997; Marshall, 1998; Ogbazghi, 2001). In Tigray (northern Ethiopia) more
than 177,000 ha of B. papyrifera forests were destroyed in the last 20 years. In the late 1970's,
about 510,000 ha of land were covered by B. papyrifera in Tigray (Wilson, 1977) as compared to
the existing 330,000 ha. Besides, the existing population consists of mainly mature trees, thus
highlighting the problems of natural regeneration. For instance more than 76% of the existing
Boswellia trees in western Tigray are greater than 30 cm DBH (Kindeya, et al. 2002). In Eritrea,
frankincense export has dropped from 2000 tonnes in 1974 to 400 tonnes in 1998 (Ogbazghi,
2001). It is, therefore, appropriate that B. papyrifera is listed by TRAFFIC (wildlife trade
monitoring program of WWF and IUCN) among the endangered species that need priority in
conservation (Marshall, 1998). The decline in the population of B. papyrifera is related to several
factors. As is the case in many tropical areas, there has been increased population pressure in the
B. papyrifera growing parts of Eastern Africa, which has resulted in the conversion of Boswellia
woodlands to agricultural lands. Unregulated free range grazing has damaged natural
regeneration of B. papyrifera as its seeds and seedlings are preferred by livestock and wild life
for grazing and browsing. They also suffer trampling while being grazed and browsed. Grazing
on B. papyrifera seedlings result in the total removal of all vegetative parts, because of its

12
shallow root (Kindeya et al., 2002). It is not uncommon to see over-tapping and use of
inappropriate tapping methods by unskilled labourers. There is little supervision during tapping.
More accessible trees are often tapped continuously with no resting periods. As a consequence,
the natural regeneration and health of trees is affected. Seeds from tapped stands in Eritrea have
a low germination rate (14% and 16%) when compared to seeds from un-tapped stands (94% and
80%) (Ogbazghi, 2001). According to Abeje (2002), the proportion of trees damaged by an
unidentified worm was higher in tapped as compared to untapped stands in Gonder. To avoid
such problems, some resting period is necessary for wound healing.
Genetic diversity is a key parameter in evaluating and planning the sustainable management of
forest ecosystems. An understanding of the degree of diversity within and between the
populations of a species is required to support the continuously rising plantation programs and to
provide information for the conservation of the species’ genetic resources, since geographically
separated populations are expected to have different genetic compositions (Parasharami and
Thengane, 2012). Within each tree species, amount and distribution of genetic variation is crucial
for long-term stability of forest ecosystems (Sharma et al., 2002). Genetic diversity is of prime
importance for the species’ persistence, since the evolutionary adaptive potential of populations
depends on genetic variation patterns (Siregar, 2000; Finkeldey and Hattemer, 2007). Moreover
the amount of genetic variation available within species also determines the potential for
improving species through breeding programs.
2.5 Genetic markers for diversity analysis
A genetic marker is any visible character or otherwise assayable phenotype, for which alleles at
individual loci segregate in a Mendelian manner (Weising et al., 2005). Genetic markers can be

13
used to study the genetics of organisms, including trees, at the level of single genes (Spooner et
al., 2005). Genetic markers are used to study the genetics of natural and domesticated
populations of trees and the forces that bring about change in these populations. Some of the
more important applications of genetic markers include: (1) Describing mating systems, levels of
inbreeding, and temporal and spatial patterns of genetic variation within stands (2) Describing
geographic patterns of genetic variation (3) Inferring taxonomic and phylogenetic relationships
among species (4) Evaluating the impacts of domestication practices, including forest
management and tree improvement, on genetic diversity (5) Fingerprinting and germplasm
identification in breeding and propagation of populations (6) Constructing genetic linkage maps
and (7) Marker assisted breeding (Adams et al., 2007).
Now a day’s several genetic markers are available, each of which has different attributes that
make it more or less desirable to use in certain applications (Karp et al., 1997a&b). Some of the
desirable attributes of a given type of genetic marker are that it be: (1) Inexpensive to develop
and apply; (2) Unaffected by environmental and developmental variation; (3) Highly robust and
repeatable across different tissue types and different laboratories; (4) Polymorphic, i.e. reveal
high levels of allelic variability; and (5) Co dominant in its expression (spooner et al., 2005).
This markers fall into one of the three broad classes: those based on visually assessable traits
(morphological and agronomic traits), those based on gene product (biochemical markers), and
those relying on a DNA assay (molecular markers) (Karp et al., 1997a&b). Genetic markers are
widely used by breeders and conservationists to study genetic diversity.

14
2.5.1 Morphological markers
Traditionally, diversity within and between populations was studied by assessing differences in
the morphology, such as morphometric traits which are observable characters of the individual
and are the result of genetic differences in loci distributed throughout the genome (Kermali,
1994). These measures have the advantage of being readily available, do not require
sophisticated equipment and are the most direct measure of phenotype, thus they are available
for immediate use. However, morphological determinations need to be taken by an expert in the
species, they could be subject to changes due to environmental factors and may vary at different
developmental stages; moreover, their number is limited (De Vicente and Fulton, 2003).
The detection of regional and local patterns of phenotypic variation offers an effective method of
stratifying and sampling variation in germplasm collection (Peeters et al., 1989) and assist in the
formulation of conservation priorities (Maxted et al., 1995). The results of these works can
specifically be used in the planning of future collection missions (Bennett and Maxted, 1997),
creating core collections (Tohme et al., 1995) and identifying possible sources of parental
material for breeding programs. Furthermore, the assessment of phenotypic variation is also
useful for studying phylogeny and habitat adaptations of species and varieties (Hedenäs and
Kooijman, 1996).
2.5.2 Biochemical markers
To overcome the limitations of morphological traits, other markers have been developed at both
the protein level (phenotype) and the DNA level (Karp et al., 1997a&b). Protein markers are
usually named biochemical markers. These are also termed isozyme/allozyme markers or simply
protein markers. Allozymes are allelic variants of enzymes encoded by structural genes (Adams

15
et al., 2007). Enzymes are proteins consisting of amino acids, some of which are electrically
charged. As a result, enzymes have a net electric charge, depending on the stretch of amino acids
comprising the protein (Karp et al., 1997a). When a mutation in the DNA results in an amino
acid being replaced, the net electric charge of the protein may be modified, and the overall shape
(conformation) of the molecule can change. Because changes in electric charge and
conformation can affect the migration rate of proteins in an electric field, allelic variation can be
detected by gel electrophoresis and subsequent enzyme-specific stains that contain substrate for
the enzyme, cofactors and an oxidized salt (Devine et al., 2003).
Isozyme analysis is, in principle, a robust and reproducible method (Adams et al., 2007). In
addition, isozymes are codominant markers and are suitable for estimating all population
genetics parameters and for genetic mapping. The major limitation of isozyme analysis is the low
number of markers (Karp et al., 1997a). Consequently, the percentage of genome coverage is
inadequate for a thorough study of genetic diversity (De Vicente and Fulton, 2003). Another
disadvantage of isozyme analysis lies in the markers being based on phenotype. As such, they
may be influenced by environmental factors, with differences in expression confounding the
results interpretation. Since differential expression of the genes may occur at different
developmental stages, or in different tissues, the same type of material must be used for all
experiments (De Vicente and Fulton, 2003).
2.5.3 Molecular markers
DNA polymorphisms can be detected in nuclear and organelles DNA, which is found in
mitochondria and chloroplasts. Molecular markers concern the DNA molecule itself and, as such,
are considered to be objective measures of variation. They are not subject to environmental
16
influences; tests can be carried out at any time during plant development; and, they have the
potential of existing in unlimited numbers, covering the entire genome (De Vicente and Fulton,
2003; De Vienne et al., 2003).
Due to the rapid developments, in the field of molecular genetics, a variety of different
techniques have emerged to analyze genetic variation during the last few decades (Whitkus et al.,
1994; Karp et al., 1996, 1997a, b; Parker et al., 1998; Schlötterer, 2004). These techniques may
differ with respect to important features, such as genomic abundance, level of polymorphism
detected, locus specificity, reproducibility, technical requirements and financial investment. No
marker is superior to all others for a wide range of applications (Spooner et al., 2005).
These Marker techniques could be divided into three broad categories with respect to basic
strategy (Karp and Edwards, 1997):
I. Non-PCR based approaches;
II. PCR Arbitrary priming;
III. Targeted-PCR and sequencing.
These techniques are very fruitful tools in diversity assessment on the level of DNA sequences
which became important method in studying plant genetics (Gebhardt et al., 1991).
2.5.3.1. Non-PCR based techniques
a. Restriction Fragment Length Polymorphism (RFLP)
RFLP analysis was one of the first molecular techniques used for enabled the detection of
polymorphisms at the sequence level. The principle behind the technology rests on the possibility
17
of comparing band profiles generated after restriction enzyme digestion in DNA molecules of
different individuals. These differences in fragment lengths can be seen after gel electrophoresis,
blotting the fragments to a filter and hybridizing probes and visualization (Karp and Edwards,
1997).
RFLP analysis was used extensively in the construction of genetic maps and has been
successfully applied to genetic diversity assessments, particularly in cultivated plants, but also in
populations and wild accessions (Sinclair et al., 1999). As a technique for diversity studies, there
are three important advantages which should be considered (Karp and Edwards, 1997): RFLPs
are highly reproducible between laboratories and the diversity profiles generated can be reliably
transferred, RFLPs are co-dominant markers, enabling heterozygotes to be distinguished from
homozygotes and no sequence-specific information is required and the approach can be applied
immediately for diversity screening in any system. There are serious limitations in RFLP
technique such as it needs large amount of DNA, can not be automated, needs a suitable probe
library, and consumes time and costly.
2.5.3.2 PCR arbitrary priming
With the advent of PCR, a number of techniques became available for the screening of genetic
diversity. These require no prior sequence-specific information and can, therefore, be applied
directly to any organism. Three main techniques fall within the category of PCR-based markers
using arbitrary primers: RAPD, DAF and AP-PCR (Caetano-Anollés et al., 1992). The
techniques are based on the use of a single 'arbitrary' primer, which may be purchased from
commercial companies, in a PCR reaction on genomic DNA and result in the amplification of
several discrete DNA products.

18
a. Randomly Amplified Polymorphic DNA (RAPD)
The most commonly used is RAPD analysis in which the primers are usually 10-mer or 20-mers
and in which the amplification products are separated on agarose gels in the presence of ethidium
bromide and visualized under ultraviolet light (Williams et al., 1990). Polymorphisms are
detected as the presence or absence of bands and result from sequence differences in one or both
of the primer binding sites. RAPD techniques played an important role in characterizing the plant
genetic resources around the world (Lee et al., 2001). This technique helped also in genetic
relatedness assessment (Cabrita et al., 2001).
b. Amplified Fragment Length Polymorphism (AFLP)
Vos et al. (1995) described the AFLP technique as being based on the detection of restriction
fragments by PCR amplification and argued that the reliability of the RFLP technique is
combined with the power of the PCR technique. AFLPs are DNA fragments (80–500 bp)
obtained from digestion with restriction enzymes, followed by ligation of oligonucleotide
adapters to the digestion products and selective amplification by the PCR. This technique is
essentially involves both RFLPs and PCR, in that the first step is restriction digestion of the
genomic DNA but this is then followed by selective rounds of PCR amplifications of the
restricted fragments that are then separated by polyacrylamide gel electrophoresis. This
technique can be analyzed on automatic sequencers using fluorescent labeled primers and,
therefore, high throughput can be achieved (Winfield et al., 1998).
The strengths of AFLPs lie in their high genomic abundance, considerable reproducibility, the
generation of many informative bands per reaction, their wide range of applications, and the fact
that no sequence data for primer construction are required. AFLP is a widely valued technology

19
for gene mapping studies (Vos et al., 1995). The key feature of AFLP is its capacity for the
simultaneous screening of many different DNA regions distributed randomly throughout the
genome (Mueller & Wolfenbarger, 1999). Disadvantages of AFLP include the need for purified,
high molecular weight DNA, the dominance of alleles, and the possible non-homology (Spooner
et al., 2005).
c. Inter Simple Sequence Repeats (ISSR)
ISSRs are DNA fragments of about 100–3000 bp located between adjacent, oppositely oriented
microsatellite regions. The technique is based on PCR amplification of inter-microsatellite
sequences. ISSRs are amplified by PCR using, as primers (16-18 bp), an oligonucleotide
sequence typical of the microsatellite repeats ending with few selective nucleotides which
anchors the primers into the adjacent non-repeat regions. About 10–60 fragments from multiple
loci are generated simultaneously, separated by gel electrophoresis and scored as presence or
absence of fragments of particular size. The ISSR primers are used to detect the variation in a
given DNA sample include one of these highly variable microsatellite sequences and arbitrary
pair of bases at the 3’end (Zietkiewicz et al., 1994).
The main advantage of ISSRs are: (i) no sequence data for primer construction are needed, (ii)
the analytical procedures include PCR, hence only low quantities of template DNA are required
(5–50 ng per reaction), (iii) are randomly distributed throughout the genome, and (iv) the
variation within unique regions of the genome may be found at several loci. Furthermore, it is
very useful marker for DNA profiling, especially for closely related species. Since ISSR is a
multilocus technique, disadvantages include the possible non-homology of similar sized
fragments, and ISSR is dominant marker. Moreover, ISSR, like RAPD, can have reproducibility
20
problems but more reproducible than RAPD (Spooner et al., 2005). ISSR analysis can be applied
in studies involving genetic identity, parentage, clone and strain identification, and taxonomic
studies of closely related species. In addition, ISSRs are considered useful in gene mapping
studies (Zietkiewicz et al., 1994).
2.5.3.3 Targeted-PCR and Sequencing
a. Microsatellites, Simple Sequence Repeats (SSRs)
Microsatellites, also called Simple Sequence Repeats (SSRs) and, occasionally, Sequence-
Tagged Microsatellite Sites (STMS) or Simple Sequence Repeat Polymorphisms (SSRPs),
represent short tandem repeats (1–10 base pairs) (Hearne et al., 1992). If nucleotide sequences in
the flanking regions of the microsatellite are known, specific primers (generally 20–25 bp) can
be designed to amplify the microsatellite by PCR. Microsatellites and their flanking sequences
can be identified by constructing a small-insert genomic library. This type of repeated DNA is
common in eukaryotes, the number of repeated units varying widely among organisms (Spooner
et al., 2005, Weising et al., 2005). These polymorphisms are identified by constructing PCR
primers homologous to the DNA sequences flanking the microsatellite region. PCR product size
variation is caused by differences in the number of microsatellite repeat units. SSR
polymorphisms can be visualized by agarose or polyacrylamide gel electrophoresis.
Microsatellite alleles can be detected, using various methods: ethidium bromide, silver staining,
radioisotopes or fluorescence. Since microsatellite analysis is, in principle, a single-locus
technique, multiple microsatellites may be multiplexed during PCR or gel electrophoresis if the
size ranges of the alleles of different loci do not overlap (Dean et al., 1999).
21
The advantages of microsatellites include their codominance, high genomic abundance in
eukaryotes and random distribution throughout the genome, with preferential association in low-
copy regions (Morgante et al., 2002). Because the technique is PCR based, only low quantities
(10–100 ng per reaction) and not necessarily high quality DNA are required. Due to the use of
long PCR primers, the reproducibility of microsatellites is high. This decreases significantly the
analytical costs. Furthermore, the screening of microsatellite variation can be automated, if the
use of automatic sequencers is an option. One of the main microsatellite disadvantages is their
high development costs if adequate primer sequences for the species of interest are unavailable,
making them difficult to apply to unstudied groups. Although microsatellites are in principle
codominant markers, mutations in the primer annealing sites may result in the occurrence of null
alleles (no amplification of the intended PCR product), which may lead to errors in genotype
scoring. A very common observation in microsatellite analysis is the appearance of stutter bands
which are artifacts products that occur by DNA slippage during PCR amplification. These can
complicate the interpretation of the band profiles because size determination of the fragments is
more difficult and heterozygotes may be confused with homozygotes.
Simple sequence repeats (SSRs) have become important molecular markers for a broad range of
applications, such as genome mapping and characterization, phenotype mapping, marker assisted
selection of crop plants and a range of molecular ecology and diversity studies (Robinson et al.,
2004). Microsatellites are also considered ideal markers in gene mapping studies (Hearne et al.,
1992).
22
2.6 Genetic diversity study in Boswellia
The conservation and sustainable use of Boswellia genotypes is mainly depends on proper
characterization of the Boswellia genetic resources. For aiding the breeding program in
Boswellia it is imperative to study genetic diversity of the existing sesame germplasms through
systematic evaluation and characterization and making the information available to the
researchers. Only few studies have done on genetic diversity of Boswellia previously. Coppi et
al., 2010, used DNA sequences from the ITS region of the nuclear genome and Inter-Simple
Sequence Repeat markers (ISSR) to estimate genetic diversity among and within populations of
the Frankincense tree Boswellia sacra from Dhofar, Oman. They found 511 bp long ITS
sequences with low (6.4%) variation among geographically different populations. In addition
total genetic diversity and average heterozygosity within populations using four ISSR primers
resulted fairly low (0.22 and 0.136, respectively). Moreover, analysis of Molecular Variance
showed that differentiation among populations was relatively high (38.1%), possibly due to the
reduced gene flow between the largely isolated stands of Boswellia (Nm= 0.39). Genetic
distances and AMOVA analysis was suggested a clear differentiation between the eastern and
western coastal populations (Copii et al., 2010).
ISSR marker, in addition to its suitability to genetic diversity study, is highly polymorphic,
reproducible,and cost effective and requires no prior information of the sequence. In
economically important forest trees such as Boswellia this marker is used to study the patterns
and level of diversity. Hence, the ISSR marker assay has been chosen to study the level of
diversity and patterns of distribution of Boswellia genetic resources in Metema.
23
3. OBJECTIVES
3.1 General objective
� The general objective of the study was to investigate the reproductive biology and
genetic variability among Boswellia papyrifera populations of Metema, Northern
Ethiopia.
3.2 Specific objectives
� To assess molecular genetic diversity present among B. papyrifera populations
found in Matema, Northern Ethiopia.
� To identify populations of Metema with higher diversity for Boswellia
improvement and conservation.
� To determine the phonological pattern of Boswellia populations of Metema
� To study the pollination ecology of Boswellia populations of Metema
24
4. MATERIALS AND METHOD
4.1 Plant material
The study site was selected in relatively homogenous B. papyrifera natural stands of North
Gondar, Metama Woreda, which is one of the major frankincense producing area in the country
with coverage of 68, 000 ha. The altitude of Metema ranges from as low as 550 to 1608 m asl
while the minimum annual temperature ranged between 220C and 280C. Daily temperature
becomes very high during the months of March to May, where it may get to as high as 430 C.The
mean annual rainfall for the area ranges from 850 to 1100 mm (Report on Metema pilot learning
site diagnosis and program design (unpb.), 2005).
Five populations were selected based on their population size and relative distances with each
other. Those are, Das Gundo (15,855 ha), Gubay (6,186 ha), Zebach Bahir (3,050 ha), Shinfa
(2,088 ha) and Agam Wuha (1,932 ha), respectively (Report on Metema pilot learning site
diagnosis and program design (unpb.), 2005). Except Zebach Bahir (12) each population were
represented with 13 individual tree and totally 64 individuals were sampled. Four to five young
leaves were collected from each tree and dried in silica gel.
4.2 DNA extraction
Total genomic DNA was extracted from silca-dried leaf-tissue by using Cetyl Trimethyl
Ammonium Bromide (2% Cetyltrimethyl ammonium Bromide, 1% polyvimylpyrolidone,
100mMTris: PH=8, 20mM EDTA, 1.4M NaCl, 0.2% beta-Mercapto-ethanol) extraction protocol
based on Borsch et al., (2003) with minor modifications. Approximately equal amounts (ca. 0.2g)

25
of the dried leaf samples were ground with pistle and mortar. Total genomic DNA were isolated
from about 0.2 g of the pulverized leaf sample.
For ISSR-PCR analysis, two extractions for each sample was run out on agarose gel at 0.98%
concentration to check the presence and quality of genomic DNA and then to select between
extraction on the basis of quality and concentration. From stock solution, 5µl of genomic DNA
and 2µl of 6x loading dye was used and applied by adding 5 µ ethidium bromide on the gel in 1x
TBE solution running buffer and then electrophoresed at 80 volt constant for 45 min. For
comparisons, 100bp DNA ladder with known concentration was used. The gel picture was
further examined and used to make selection of good quality DNA extract. Genomic DNA from
the second extractions was found to be promising and was selected for ISSR-PCR analysis.
Key: - Locatons where the samples were collected
Figure 1. Administrative woredas of Metema Zone showing sites where the Boswellia population
used in this study were collected. Source: Tefera, (2011).

26
4.3 Primer selection and optimization
The ISSR marker assay was conducted at Genetics Research Laboratory of the Microbial,
Cellular and Molecular Biology Department, Addis Ababa University. A total of nine primers
were used for the initial testing of primers variability and reproducibility. One individual was
selected from each population to screen the primers with 1:10 dilutions. Same procedure
described under section 4.4, next page, was followed in the screening process. A total of five
polymorphic and reproducible ISSR primers were selected after testing and screenings. Table 2
shows the list of primers used and tested, their annealing temperature with respective sequences
and other properties.
Table 2. List of primers, annealing temperature, primer sequence, amplification pattern and
repeat motives used for optimization (Source: UBC).
Primer Annealing
temperature
Primer Sequence1 Amplification
pattern
Repeat motives
810 450C GAGAGAGAGAGAGAGAT Good Dinucleotide
812 450C CTCTCTCTCTCTCTCTA Good Dinucleotide
818 480C CACACA CAC ACA CAC AG Good Dinucleotide
824 450C CTCTCTCTCTCTCTCTRA Not reproducible Dinucleotide
834 450C AGAGAGAGAGAGAGAGYT Good Dinucleotide
844 450C GAGAGAGAGAGAGAGAYT Not polymorphic Dinucleotide
873 450C GACAGACAGACAGACA Not polymorphic Dinucleotide
878
880
450C
480C
GGATGGATGGATGGAT
GGAGAGGAGAGGAGA
Not polymorphic
Good
Tetranucleotide
Pentanucleotide
1 Single-letter abbreviations for mixed base positions: R = (A, G) Y = (C, T)
27
4.4 PCR and gel electrophoresis
The polymerase chain reaction was conducted in Biometra 2000 T3 Thermo cycler. PCR
amplification was carried out in a 25 µl reaction mixture containing 1µl template DNA, 11.05µl
H20, 5.6µl dNTP (1.25mM), 2.6µl Taq buffer (10xThermopol reaction buffer), 1.25µl MgCl2
(2mM), 2.4µl beitein, 0.6µl primer (20pmol/µl) and 0.2µl Taq Polymerase (5u/µl). The
amplification program was 4 minutes preheating and initial denaturation at 940C, then 40 x 15
seconds at 940C, 1 minute primer annealing at (450C/ 480C) based on primers used, 1.30 minutes
extension at 720C and the final extension for 7 minutes at 720C. The PCR reactions were stored
at 40C until loading on gel for electrophoresis. The amplification products were differentiated by
electrophoresis using an agarose gel (1.67% agarose with 100 ml 1xTBE) and 8µl amplification
product of each sample with 2µl loading dye (6 times concentrated) was loaded on gel. DNA
marker 100 bp was used to estimate molecular weight and size of the fragments. Electrophoreses
were run for 3 hours at constant voltage of 100V. The DNA was stained with 30µl (10mg/ml)
ethidum bromide which were mixed with 450 ml distilled water for 30 minutes and washed with
distilled water for 30 minutes.
4.5 Data management and statistical analysis
ISSR fingerprint profiles were scored manually for each individual sample from the gel
photograph. The bands were recorded as discrete characters, presence ‘1’ or absence ‘0’ and ‘?’
for missing data. Based on recorded bands different software’s were used for analysis.
POPGENE version1.32 software (Yehe et al., 1999) was used to calculate genetic diversity for
each population as number of polymorphic loci, percent polymorphism, gene diversity and
Shannon–Weaver diversity index (H). Analysis of molecular variance (AMOVA) was used to

28
calculate variation among and within population using Areliquin version 3.01 (Excoffier et al.,
2006).
NTSYS- pc version 2.02 (Rohlf, 2000) and Free Tree 0.9.1.50 (Pavlicek et al., 1999) software’s
were used to calculate Jaccard’s similarity coefficient which is calculated with the formula:-
cba
aSij ++
=
Where,
'a ' is the total number of bands shared between individuals i and j,
'b' is the total number of bands present in individual i but not in individual j and
'c' is the total number of bands present in individual j but not in individual i.
The Unweighted Pair Group Method with Arithmetic mean (UPGMA) (Sneath and Sokal, 1973)
was used to analyze and compare individual sample and population, and generates phenogram
using NTSYS- pc version 2.02 (Rohlf, 2000). The Neighbor Joining (NJ) method (Saitou and
Nei, 1987; Studier and Keppler, 1988) was used to compare individual genotypes and evaluate
patterns of genotype clustering using Free Tree 0.9.1.50 Software (Pavlicek et al., 1999).
To further examine the patterns of variation among individual samples on 3D (three dimension),
a principal coordinated analysis (PCO) was performed based on Jaccard’s coefficient (Jaccard,
1908). The calculation of Jaccard’s coefficient was made with PAST software version 1.18
(Hammer et al.,2001). The first three axes were used to plot the three dimensional PCO with
STATISTICA version 6.0 software (Hammer et al., 2001; Sta. soft, Inc.2001).

29
4.6 Phenological observations
Ten trees were selected and tagged for diameter at breast height (DBH) and their height
measurements were taken. Flushing, flowering and fruiting percentages of crown in each
individual tree were estimated visually. The numbers of inflorescences per branch were counted
from selected branches per tree. The number of flower buds/flowers per inflorescence were
recorded for each selected tree (Sunnichan et al., 2005). Observations were carried out weekly
from September 2010 to March 2011. Selected individuals were observed throughout the
flowering and fruiting season and visual estimate were taken to assess the extent of flowering
and fruiting. This was initiated in the flower bud stage and continued until the end of flowering
season.
4.7 Pollinator activity
Observations on floral visitors were made between dawn and dusk for 15 min every hour
(Sunnichan et al., 2005). The observations were made on a single flower on a single branch of a
tree once at a time. Therefore, the number of floral visits made by an insect and the time spent on
each flower were recorded using a stop watch.
5. RESULTS
5.1 Banding patterns of the ISSR primers used
Out of the nine primers tested initially, five which gave relatively clear banding pattern (four di-
nucleotide and one penta-nucleotide) were selected and used in this study (Table 3). The
molecular weight of the bands amplified using the primers were in the range of 300 bp to 700 bp.

30
A total of 39 clear and reliable bands were scored. The least polymorphic bands (six) were
scored from primer 834 and the highest polymorphic bands (ten) were scored from primer 880.
Both primers 810 and 818 show equal polymorphic bands (eight) and the remaining primer, 812,
show seven polymorphic bands. Average number of both bands and polymorphic bands per
primer were 7.8. Figure 2 shows the amplification pattern of primer 818.The other primers gel
pictures used in this study along with tested non-polymorphic primers are presented in appendix
1.
Table 3. The five primers used, their repeat motifs, amplification quality and number of bands
scored
Primers Repeat motif1 Amplification pattern Number of
scored bands
810 (CA)8G Good 8
812 (GA)8 A Good 7
818 (CA)8G Good 8
834 (AG)8YT Good 6
880 (GGAGA)3 Good 10
Total 39
1 Single-letter abbreviations for mixed base positions: Y = (C,T)

Figure 2ISSR fingerprint generated using primer 818
5.2 Polymorphism based percent polymorphism
In all populations or individuals
to ten for primer 880. All 39 loci scored
the entire populations as one group
were ranged from 97.4% (Zebach Bahir)
unique bands were observed for either the
all the primers showed 100 per cent polymorphism
group.
Among the Boswellia populations
obtained for samples from Zebach Bahir
(82.1), while samples from Agam Wuha
5.2b).
31
ISSR fingerprint generated using primer 818
percent polymorphism
In all populations or individuals, the number of polymorphic loci ranges from
loci scored were observed to be polymorphic
the entire populations as one group. The percent polymorphism for all the populations
(Zebach Bahir) to 59% (Agam Wuha), respectively
unique bands were observed for either the individuals or the populations. As to the primers used,
primers showed 100 per cent polymorphism considering the entire popul
populations evaluated the highest percentage polymorphic loci was
Zebach Bahir (P = 97.6%), followed by samples from
Agam Wuha (59%) showed the least percent polymorphic loci
the number of polymorphic loci ranges from six for primer-834
were observed to be polymorphic (100%) considering
for all the populations studied
to 59% (Agam Wuha), respectively (Table5.2b). No
As to the primers used,
considering the entire populations as one
evaluated the highest percentage polymorphic loci was
%), followed by samples from Das Gundo
showed the least percent polymorphic loci (Table

32
5.3 Genetic diversity
Genetic diversity expressed as gene diversity value showed higher variability for Zebach Bahir
population with 0.42, followed by Das Gundo population with 0.33 values. Agam Wuha
population was observed to be the least diverse with gene diversity value of 0.25. The total
diversity index values for the total populations were found to be 0.60 (Table 4b).
The same diversity patterns were also observed for Shannon diversity index, whereby Zebach
Bahir and Das Gundo populations showed the highest value with 0.60 and 0.48, respectively.
The least variability was showed by Agam Wuha population.
Table 4. Number of scorable bands (NSB), number of polymorphic loci (NPL), percent
polymorphism (PP), genetic diversity (GD) and Shanon Index (I), with each primers (a). and for
each population (b).
(a)
Primers NSB NPL PP GD+SD I+SD
810 8 8 100.00 0.37+0.13 0.55+0.15
812 7 7 100.00 0.41+0.08 0.60+0.08
818 8 8 100.00 0.41+0.13 0.59+0.15
834 6 6 100.00 0.42+0.09 0.61+0.10
880 10 10 100.00 0.46+0.05 0.65+0.05
33
(b)
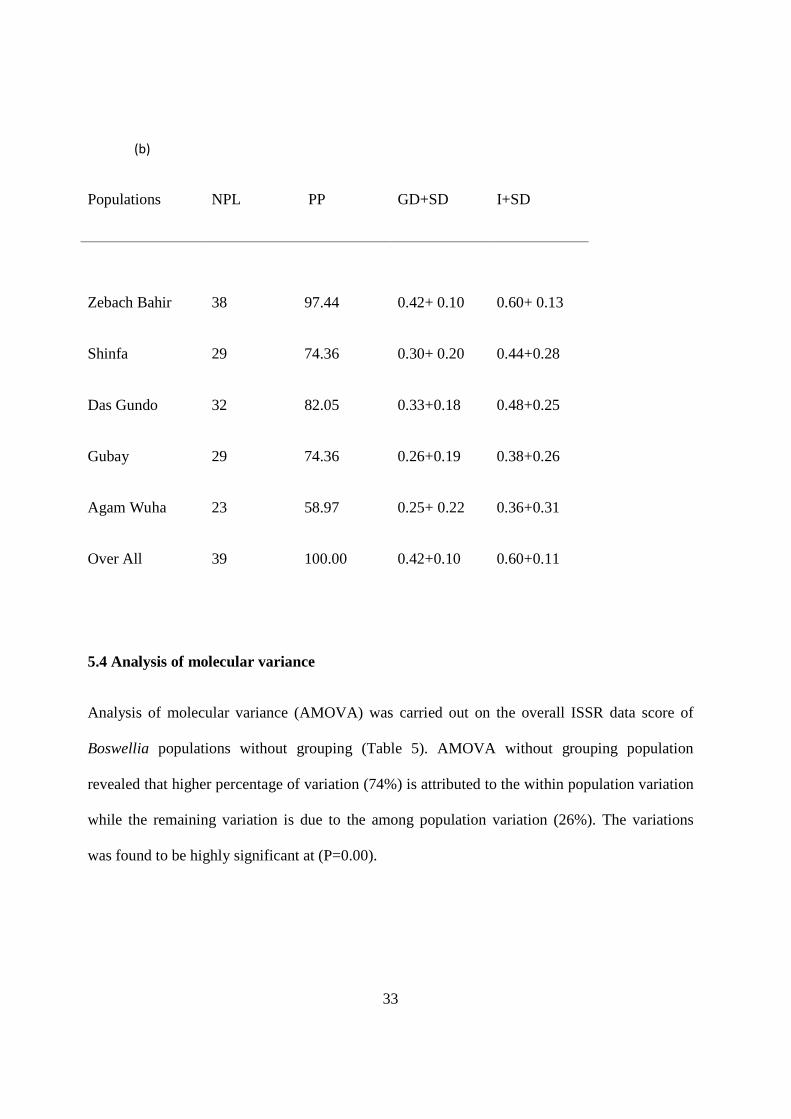
Populations NPL PP GD+SD I+SD
Zebach Bahir 38 97.44 0.42+ 0.10 0.60+ 0.13
Shinfa 29 74.36 0.30+ 0.20 0.44+0.28
Das Gundo 32 82.05 0.33+0.18 0.48+0.25
Gubay 29 74.36 0.26+0.19 0.38+0.26
Agam Wuha 23 58.97 0.25+ 0.22 0.36+0.31
Over All
39 100.00 0.42+0.10 0.60+0.11
5.4 Analysis of molecular variance
Analysis of molecular variance (AMOVA) was carried out on the overall ISSR data score of
Boswellia populations without grouping (Table 5). AMOVA without grouping population
revealed that higher percentage of variation (74%) is attributed to the within population variation
while the remaining variation is due to the among population variation (26%). The variations
was found to be highly significant at (P=0.00).

34
Table 5. Analysis of Molecular Variance (AMOVA) among populations of Boswellia without
grouping popuplations
------------------------------------------------------------------------
Source of Sum of Variance Percentage Significance
variation squares components variation
------------------------------------------------------------------------
Among
populations 120.815 1.93572 26.00 0.00
Within
populations 324.140 5.51064 74.00
------------------------------------------------------------------------
Total 444.954 7.44636
------------------------------------------------------------------------
5.5 Clustering analysis
UPGMA and neighbor joining analysis was used to construct dendrogram for the five
populations and 64 individuals based on 39 PCR bands amplified by four di-nucleotides (810,
812, 818, 834) and one penta nucleotides (880) ISSR primers. The dendrogram derived from
neighbor-joining analysis of the whole ISSR data showed three distinct clusters and two sub-
clusters within the second and third major cluster (Figure 5). Most individuals from all
populations were tended to form their own cluster while only few of the individuals distributed
all over the tree. Among the five populations Gubay (major cluster III, sub-cluster II), Agam
Wuha (major cluster III, sub-cluster II) and Das Gundo (major cluster III, sub-cluster I) showed
clear grouping. UPGMA analysis of Metema Boswellia populations revealed one major cluster
and two outliers (Gubay and Agam Whuha). The major cluster again forked into two sub groups

35
the first containing Das Gundo populations, while the second containing Zebach Bahir and
Shinfa, which are highly related populations (Figure 3). On the other hand, individual based
UPGMA clustering of an overall analysis showed strong clustering of individuals with respect to
their populations except few intermixed individuals from other population (Figure 4). This result
is similar to that of individual based NJ. Grouping based on the origins of individuals is the
dominant pattern observed on NJ and UPGMA trees.
Figure 3. UPGMA based dendrogram for five Metema Zone Boswellia papyrifera populations
using 5 ISSR primers
.
Key:
� Zb – Zebach Bahir
� Sh - Shinfa
� Dg – Das Gundo
� Aw – Agam Wuha
� Gu - Gubay
36
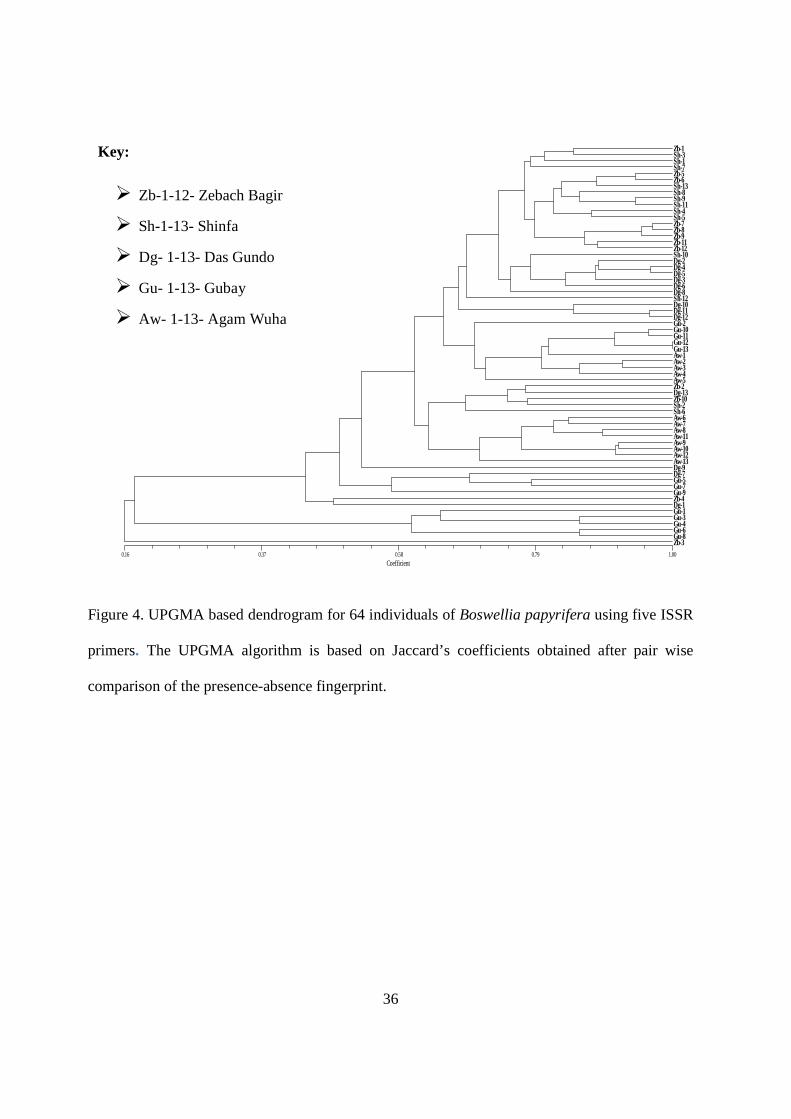
Figure 4. UPGMA based dendrogram for 64 individuals of Boswellia papyrifera using five ISSR
primers. The UPGMA algorithm is based on Jaccard’s coefficients obtained after pair wise
comparison of the presence-absence fingerprint.
Coefficient0.16 0.37 0.58 0.79 1.00
Zb-1 Sh-3 Sh-1 Sh-7 Zb-5 Zb-6 Sh-13 Sh-8 Sh-9 Sh-11 Sh-4 Sh-5 Zb-7 Zb-8 Zb-9 Zb-11 Zb-12 Sh-10 Dg-2 Dg-4 Dg-5 Dg-3 Dg-6 Dg-8 Sh-12 Dg-10 Dg-11 Dg-12 Gu-2 Gu-10 Gu-11 Gu-12 Gu-13 Aw-1 Aw-2 Aw-3 Aw-4 Aw-5 Zb-2 Dg-13 Zb-10 Sh-2 Sh-6 Aw-6 Aw-7 Aw-8 Aw-11 Aw-9 Aw-10 Aw-12 Aw-13 Dg-9 Dg-7 Gu-5 Gu-7 Gu-9 Zb-4 Dg-1 Gu-1 Gu-3 Gu-4 Gu-6 Gu-8 Zb-3
Key:
� Zb-1-12- Zebach Bagir
� Sh-1-13- Shinfa
� Dg- 1-13- Das Gundo
� Gu- 1-13- Gubay
� Aw- 1-13- Agam Wuha

37
Figure 5 Neighbor-joining analysis of 64 individuals based on 39 PCR bands amplified by five
primers. The neighbor joining algorithm is based on Jaccard’s coefficients obtained after pair
wise comparison of the presence-absence fingerprint.
Key:
� Zb-1-12- ZebachBagir
� Sh-1-13- Shinfa
� Dg- 1-13- DasGundo
� Gu- 1-13- Gubay
� Aw- 1-13-AgamWuha

38
5.6 PCO analysis
All the data obtained using the five ISSR primers were used in PCO plotting. The analysis was
carried out using Past and Statistica softwares by employing Jaccard’s coefficients of similarity.
The first three coordinates of the PCO having eigenvalues of 5.24, 3.69 and 3.59 with variance of
12.6%, 8.9% and 8.6%, respectively used to reveal the grouping of individuals using two and
three coordinates (Figure 6 and Figure 7). In 3D most of Agam wuha and Gubay individuals
tended to form their own grouping. Individuals from Zebach Bahir, Das Gundo and Shinfa were
inter-mixed with each other and made separate group from the other populations. Using two
coordinates (Figure 6) almost similar result was observed like that of three coordinates.
Key- Zb-1-12-Zebach Bahir, Sh-1-13-Shinfa, Gu-1-13Gubay, Aw-1-13-Agam Wuha and Dg-1-13-Das Gunda
Figure 6. Two dimensional representation of principal coordinate analysis of genetic
relationships among 64 individuals of five Metema populations.
Zb-1
Zb-2
Zb-3
Zb-4
Zb-5Zb-6
Zb-7Zb-8Zb-9
Zb-10
Zb-11Zb-12
Sh-1
Sh-2
Sh-3
Sh-4Sh-5
Sh-6
Sh-7Sh-8
Sh-9Sh-10Sh-11
Sh-12
Sh-13
Dg-1
Dg-2Dg-3
Dg-4Dg-5
Dg-6Dg-7Dg-8
Dg-9
Dg-10Dg-11Dg-12
Dg-13
Gu-1Gu-2
Gu-3Gu-4
Gu-5
Gu-6
Gu-7
Gu-8
Gu-9
Gu-10Gu-11Gu-12Gu-13
Aw-1
Aw-2Aw-3
Aw-4Aw-5
Aw-6
Aw-7
Aw-8
Aw-9Aw-10
Aw-11
Aw-12
Aw-13
-0.8 -0.7 -0.6 -0.5 -0.4 -0.3 -0.2 -0.1 0 0.1 0.2 0.3 0.4Coordinate 1
-0.2
-0.1
0
0.1
0.2
0.3
0.4
0.5
0.6
0.7
Co
ord
inat
e 2

39
Zb-1
Zb-2
Zb-3Zb-4
Zb-5Zb-6
Zb-7Zb-8
Zb-9
Zb-10
Zb-11Zb-12
Sh-1
Sh-2
Sh-3Sh-4Sh-5
Sh-6
Sh-7
Sh-8
Sh-9
Sh-10
Sh-11
Sh-12
Sh-13
Dg-1
Dg-2Dg-3Dg-4Dg-5Dg-6
Dg-7
Dg-8
Dg-9
Dg-10Dg-11Dg-12
Dg-13
Gu-1
Gu-2
Gu-3Gu-4
Gu-5
Gu-6
Gu-7
Gu-8
Gu-9Gu-10Gu-11Gu-12Gu-13Aw-1
Aw-2Aw-3
Aw-4Aw-5
Aw-6Aw-7
Aw-8
Aw-9Aw-10
Aw-11
Aw-12
Aw-13
Key- Zb-1-12-Zebach Bahir, Sh-1-13-Shinfa, Gu-1-13Gubay, Aw-1-13-Agam Wuha and Dg-1-13-Das Gunda
Figure 7. Three dimensional representation of principal coordinate analysis of genetic
relationships among 64 individuals of five Metema populations.
5.7 Phenology
Diameter at breast height (DBH) and height of the ten trees are characterized in table 6.
Leaf fall starts at the end of September and continue to the mid of November. After the leaf fall
was completed, it was observed that the trees produced new leaves which are green and small in
size than the primary leaves. The trees remain leafless for 2–3 weeks prior to flowering and
during the entire period of flowering and fruiting.
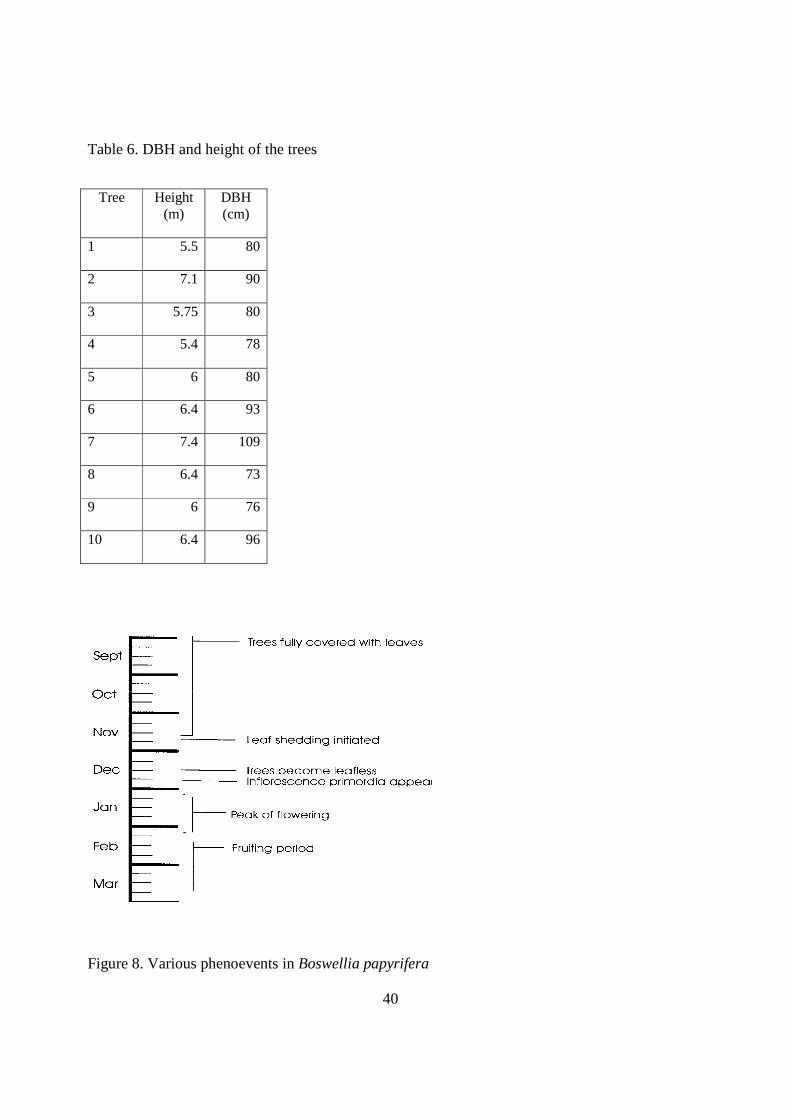
40
Table 6. DBH and height of the trees
Tree Height (m)
DBH (cm)
1 5.5 80
2 7.1 90
3 5.75 80
4 5.4 78
5 6 80
6 6.4 93
7 7.4 109
8 6.4 73
9 6 76
10 6.4 96
Figure 8. Various phenoevents in Boswellia papyrifera

41
Flower initiation begins after 1 week to 3 weeks of leaf fall is completed and the trees remain
leafless throughout the remaining period ( period of flowering and fruiting ). Flower initiation
started at the end of November and continued up to January. During flower initiation the tip of
the branch became green and produced flower buds in cluster. However, the flower initiation and
flowering was not uniform throughout the population. During observation, flowering was highly
variable, there was about one to two weeks gaps of flowering period between trees and within
trees (between branches).
During phenological observations, B. papyrifera carried 8-15 flowers per inflorescence.
However, in some cases, flower buds could increase up to 60 flower buds under optimum
environmental conditions. Moreover, during maximum flowering period, on average, 14.5
inflorescences per branch was recorded. After the female flower received pollen, the flower
become closed and start fruiting. Fruiting starts late January and continues to end of March.
5.8 Pollinator activity
In this study, it was observed that the flowers of B. papyrifera are frequently visited by
honeybees and rarely by wasps.

42
Figure 9 Figure showing flowers of B. papyrifera being visited by honey bees. Photo by Abush
Zinaw, 2011.
It was found that a flower is visited by an average number of 6.35 insect visitors every 15
minutes. Maximum number of visitors recorded was nine and minimum number was 4 per 15
minutes, respectively. On average, each insect visitor spent 5.8 seconds on a flower.

43
6. DISCUSSION
6.1. Molecular diversity
Genetic diversity is essential to the long-term survival of species; without it, species cannot adapt
to environmental changes and are more susceptible to extinction. The amount of genetic
variation available within species also determines the potential for improving species through
breeding and selection programs. Knowledge of pattern of genetic variability is useful for
defining heterotic patterns in hybrid breeding and for relating the observed pattern with presence
of certain economically important traits. Such information can be used to design effective
germplasm conservation and for setting germplasm collection mission as well as to estimate or
predict the risk of genetic erosion in certain area. Pattern of genetic variability can be studied by
morphological, isosyme or molecular markers. Among the molecular markers ISSR markers are
important to study genetic variations in plant species, as they are effective in detecting very low
levels of genetic variation (Zietkiewicz et al., 1994).
The present study provides the first estimates of genetic diversity of the frankincense tree
population of B. papyrifera of Ethiopia. Five populations from Metema area of Amhara region,
northern Ethiopia were analysed by five ISSR primers yielding 39 scorable and reproducible
bands. Under the assumption that each fragment represents a genetic locus, it was possible to
estimate allelic frequency and therefore to proceed further into estimating classical population
parameters.
ISSR primers have high resolution power in fingerprinting and diversity analysis of Boswellia
(Coppi et al., 2010). The present study also confirms that ISSR markers are efficient in detecting
polymorphism within and among populations of Boswellia. All the 39 scored fragments

44
generated from five primers were polymorphc. This result is in agreement with previous studies,
(Coppi, et al. 2010), whom reported 97.9% polymorphism using ISSR marker. The genetic
diversity parameters: percent polymorphic loci, gene diversity (GD), and Shannon’s diversity
index (I) indicated that the genetic diversity in the Boswellia populations of Zebach Bahir and
Das Gundo is indeed high. Shannon diversity index result showed that populations of Boswellia
from Zebach Bahir were more diverse (0.60) than populations from Das Gundo area (0.48).
Similarly, gene diversty result indicates that Boswellia population from Zebach Bahir (0.42) has
higher genetic diversity than from that of Das Gundo (0.33). The overall total Nei’s gene
diversity and Shanon’s diversity index were high, 0.42 and 0.60, respectively. This result is in
agreement with other woody species from tropical, subtropical or warm temperate regions that
have been recently studied with ISSR markers, such as Hagenia. abyssinica (GD=0.40, Tileye et
al., 2007), Eucalyptus grandis (GD=0.338, Okun et al., 2008) and Asparagus acutifolius L.
(GD=0.262, Sica et al., 2005).
The success of a tree-improvement programme largely depends on the availability and
knowledge of the genetic resources in a germplasm collection. In the present study, all the
diversity parameters confirm that there is medium to high gene diversity in Metema populations
of B. papyrifera. Even though the small area representing the Ethiopian Boswellia population
thinking one of the largest populated areas is the Metema area this fact would give us some hint
on the diversity of Ethiopian populations. Since areas of high genetic diversity contribute more
accessions than those with a low diversity for further and future collection, breeding and
conservation activities high priority should be given to areas with high genetic diversity. The
result of this study show among the five areas higher genetic diversity is shown by the
individuals coming from the Zebach bahir area.
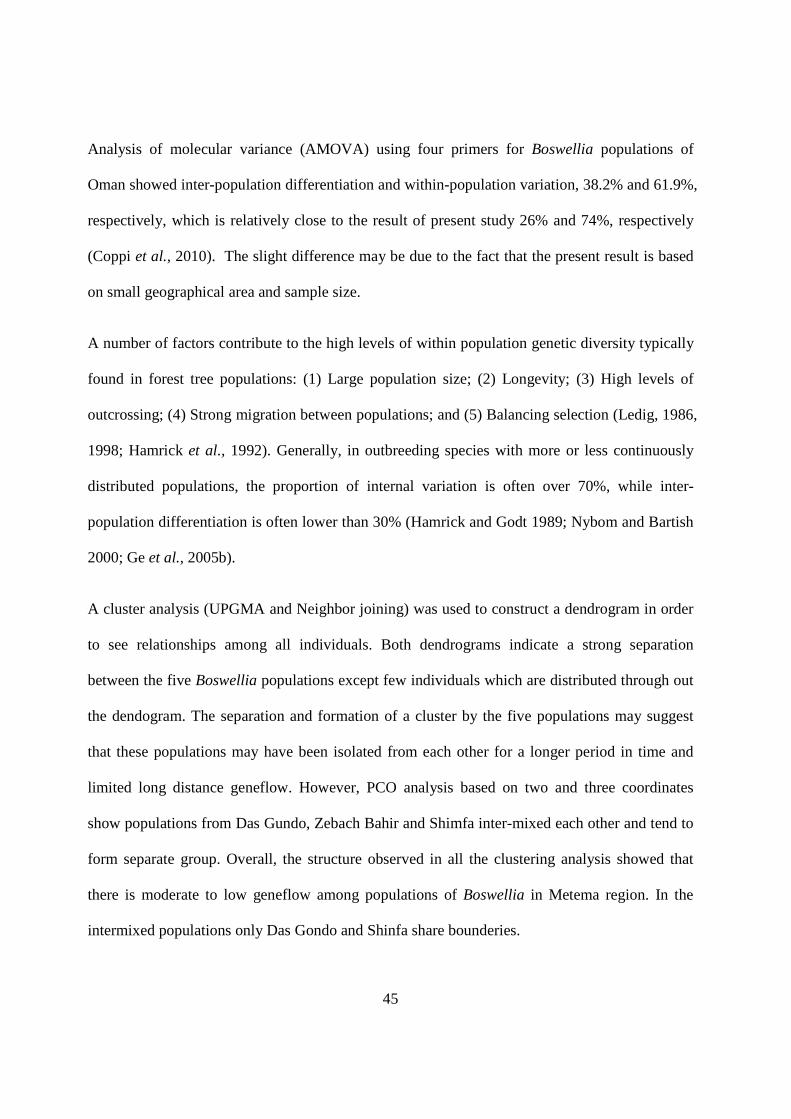
45
Analysis of molecular variance (AMOVA) using four primers for Boswellia populations of
Oman showed inter-population differentiation and within-population variation, 38.2% and 61.9%,
respectively, which is relatively close to the result of present study 26% and 74%, respectively
(Coppi et al., 2010). The slight difference may be due to the fact that the present result is based
on small geographical area and sample size.
A number of factors contribute to the high levels of within population genetic diversity typically
found in forest tree populations: (1) Large population size; (2) Longevity; (3) High levels of
outcrossing; (4) Strong migration between populations; and (5) Balancing selection (Ledig, 1986,
1998; Hamrick et al., 1992). Generally, in outbreeding species with more or less continuously
distributed populations, the proportion of internal variation is often over 70%, while inter-
population differentiation is often lower than 30% (Hamrick and Godt 1989; Nybom and Bartish
2000; Ge et al., 2005b).
A cluster analysis (UPGMA and Neighbor joining) was used to construct a dendrogram in order
to see relationships among all individuals. Both dendrograms indicate a strong separation
between the five Boswellia populations except few individuals which are distributed through out
the dendogram. The separation and formation of a cluster by the five populations may suggest
that these populations may have been isolated from each other for a longer period in time and
limited long distance geneflow. However, PCO analysis based on two and three coordinates
show populations from Das Gundo, Zebach Bahir and Shimfa inter-mixed each other and tend to
form separate group. Overall, the structure observed in all the clustering analysis showed that
there is moderate to low geneflow among populations of Boswellia in Metema region. In the
intermixed populations only Das Gondo and Shinfa share bounderies.
46
6.2 Phenology and pollinator activity
Phenological patterns in tropical plants are key factors in understanding their reproductive
strategies, and therefore, fluctuations in resource availability that directly affect demographic
dynamics and reproductive cycles in herbivores (Van Schaik et al., 1993). The present study is
the first study on the reproductive biology of B. papyrifera of Ethiopia. The trees remain leafless
during the whole of the flowering and fruiting period. The reproductive phases in the phenology
of B. papyrifera are constrained to the dry season in the study site, a trait shared by many other
tree species from the tropical forest (Sunnichan et al., 2005). The absence of leaves on the tree
during the entire period of flowering and fruiting might be the trees have to utilize limited water
available and resources stored in the stem for fruit and seed loading (Baker et al., 1983).
Variation in the abundance and availability of pollinators influences the reproductive success of
plants. For example, under continuous pollen limitation because of low pollinator activity or
availability, autogamous selfing may be advantageous by providing reproductive assurance
(Kalisz and Vogler, 2003; Moeller, 2006). In contrast, preferential fertilization with outcross-
pollen in a mixed-mating system and obligate outcrossing due to self-sterility are common for
plants with frequent pollinator visits. However, the effectiveness of these mating systems should
vary if the activity and availability of pollinators fluctuate spatially and temporally. Even under
high pollinator activity, geitonogamous pollination may result in the abundant production of
inbred seeds and a decrease in siring success due to pollen discounting in mixedmating plants (de
Jong et al., 1993). Therefore, pollinator activity may cause large variations in reproductive
success among populations, depending on the mating system of individual plants. In this study
the flowers of Boswellia are largely visited by honey bees only. This result is in agreement with
Sunnichan et al. (2005), whom worked on B. serata of India. Authors like Wilson (1977) and

47
Kindeya et al., (2002) reported lack of regeneration in Boswellia which contribute to the
dwindling of Boswellia populations, may be due to only few pollinaters are available for
pollination.
48
7. CONCLUSION
The present study was conducted with the main objective of assessing the extent of genetic
diversity among Metema population of B. papyrifera using Inter Simple Sequence Repeat
marker.
This study shows that ISSR markers are important for genetic diversity study in boswella. The
present analysis of genetic variation could provide a basis for its term conservation and
sustainable use of B. papyrifera. In general, all the five populations showed high to moderate
genetic diversity, which will be valuable for the future collection, conservation and improvement
strategies. Zebach Bahir population shows relatively high level of genetic diversity whereas
Agam Wuha population shows lower genetic diversity. Hence, conservation effort should start
from Zebach Bahir and then consider the most threatened populations.
Clustering and PCO analysis for the Metema populations suggest that there was a strong
association between individuals and their geographic origin. The most likely important factor for
this strong association is; either these populations were separate for long time, or lack of seed
and pollen flow.
Analysis of molecular variance for the populations studied showed that the highest proportion of
genetic variation was attributed to within population than among population. This is also further
confirmed with the result of the clustering analysis.
Phenological observation study showed that there is strong association between phonological
pattern and seasonal variation. Flowering and fruiting of Boswellia trees lack leaves and takes

49
place during dry season. In this study it was observed honey bee is the major pollinator agent for
Boswellia trees.
50
8. RCOMMENDATIONS
� This study is the first attempt to address the genetic diversity of Boswellia population
along with its phenology. However, the current study has a limitation that only
populations from Metema were studied. Therefore, boswellia genetic diversity and
phylogeography of Ethiopian populations from different agro-ecology should be studied
in detail.
� Analysis of genetic diversity in forest tree species using more than one methods helps to
better understand the levels of genetic variation, the genetic structure of populations and
determine migration root; when compared to the results obtained using only one method.
Analysis with co-dominant markers system, like microsatellites, needs to be conducted
to better understand and estimate the gene flow, and determine the size of a population
and levels of inbreeding.
� Similar to genetic diversity study, reproductive biology study is also important for
breeding programs and conservation. Thus, detail reproductive biology study should be
done to understand floral structures, stigma receptivity, pollen flow, seed dispersal, etc.
� B. papyrifera has a great potential both from economic and ecological perspectives. But
continued pressure on the dry forests through unregulated use has affected the population
status of the species. Therefore, researchers, policy makers and other stakeholders need
to come-up with sustainable use and conservation strategies.

51
9. REFERENCES
Abeje Eshete (2002). Regeneration Status, Soil Seed Banks and Socio-economic Importance of B.
papyrifera in Two Woredas of North Gonder Zone, Northern Ethiopia. MSc thesis,
Swedish University of Agricultural Sciences, Skinnskatteberg, Sweden.
Abeje Eshete, Demel Teketay and Hulten, K. (2005). The socio-economic importance and status
of populations of B. papyrifera (Del.) Hochst. in northern Ethiopia: The case of North
Gondar Zone. Forest, Trees and Livelihoods. 15:55-74.
Abercrombie, T. (1985). Arabia’s frankincense trail. Nat. Geog. 168:474513.
Adams, W. T., White, T. L. and Neale, D. B. (2007). Forest Genetics. CABI, London, UK.
Aman Dekebo., Medihn Zewdu. and Ermias Dagne (1999). Volatile oils of Frankincense from
Boswellia papyrifera. Bulletin of Chemical Society of Ethiopia. 13 (1): 93-96.
Aregawi Berhe (1997). Preliminary Survey on Forest Products Utilization and Marketing in
Tigray. Tigray Bureau of Agricultural Development and Natural Resources, Mekelle,
Ethiopia. 67 pp. Unpub.
Baker, H. G., Bawa, K. S. and Opler, P. A. (1983). Reproductive biology of plants in tropical
forests. In: Ecosystems of the World: Tropical Rain Forest Ecosystems: Structure and
Function. (Golley, F. B. ed.). Elsevier, New York.
Bennett, S. J. and Maxted, N. (1997). An ecogeographic analysis of the Vicia narbonensis
complex. Genet. Res. Crop Evol. 44: 411-428.
Bornet, B. and Branchard, M. (2001). Nonanchored inter simple sequence repeat (ISSR) markers:
reproducible and specific tools for genome fingerprinting. Plant. Mol. Biol. Rep.
19:209–215

52
Borsch, T., Hilu, K. W., Quandt, D., Wilde, V., Neinhuis, C. and Barthlottm, W. (2003).
Noncoding plastid trnT-trnF sequences reveal a well resolved phylogeny of basal
angiosperms. Evol. Biol. 16:558-576
Bucco, G. (1998). Joint Relief Herbs for Health Magazine, Nov/Dec. 1998.
Cabrita, L., Elisiário, P., Leitão, J. and Guerreiro, A. (2001). Assessment of the genetic
relationships among citrus species and varieties by Isozyme and RAPD Markers. Acta.
Hort. 546:177-181.
Caetano-Anollés, G., Bassam, B. J. and Gresshoff, P. M. (1992). DNA fingerprinting: Mapping
out a RAPD redefinition? Biotechnology 10 (9):937.
Coppen, J. (1995). Flavours and Fragrances of Plant Origin. Food and Agriculture Organization
of the United Nations (FAO), Rome, Italy. 63 pp.
Coppi, A., Raffaelli, M., Cecchi, L. and Selvi, F. (2010). The Frankincense tree (Boswellia sacra,
Burseraceae) from Oman: ITS and ISSR analyses of genetic diversity and implications
for conservation. Genet Resour. Crop. Evol. 57:1041–1052.
de Jong, Waser, T. J. and Klinkhamer, P. G. L. (1993). Geitonogamy: the neglected side of
selfing. Tren. Eco. Evol. 8:321–325.
De Vicente, M. C. and Fulton, T. (2003). Using molecular marker technology in studies on plant
genetic diversity. Illus. Nelly Giraldo. IPGRI, Rome, Italy.
De Vienne, D., Santoni, S. and Falque, M. (2003). Principal sources of molecular markers. In:
Molecular Markers in Plant Genetics and Biotechnology (De Vienne, D., ed.).
Springler, England.

53
Dean, R. E., Dahlberg, J. A., Hopkins, M. S., Mitchell, S. E. and Kresovich, S. (1999). Genetic
redundancy and diversity among 'Orange' accessions in the U.S. national sorghum
collection as assessed with Simple Sequence Repeat (SSR) markers. Crop Sci.
39:1215-1221.
Excoffier, L. (2006). An Integrated Soft Ware Package for Population Genetics Data Analysis.
Computational and Molecular population Genetics Lab.(MPG), Institute of
Zoology, University of Bern, Switzerland.
Fichtl, R. and Admasu Adi (1994). Honeybeef Flora of Ethiopia. Margraf Verlag, Weikersheim.
Finkeldey, R. and Hattemer, H. H. (2007). Genetics of tropical forests. In Tropical Forest
Genetics (Finkeldey, R. and Hattemer, H. H. eds.). Springer, Berlin, Heidelberg.
Frankel, O. H., Brown, A. H., Burdon, J. J. (1995). The Conservation of Plant Biodiversity.
Cambridge University Press, Cambridge.
Ge, X. J., Yu, Y., Yuan, Y., Huang, H. and Yan, C. (2005a). Genetic diversity and geographic
differentiation in endangered Ammopiptanthus (Leguminosae) populations in desert
regions of northwest China as revealed by ISSR analysis. Ann. Bot. 95:843–851
Ge, X. J., Zhang, L. B., Yuan, Y. M., Hao, G. and Chiang, T. Y. (2005b). Strong genetic
differentiation of the East-Himalayan Megacodon stylophorus (Gentianaceae) detected
by inter-simple sequence repeats (ISSR). Biodiver. Conserv. 14:849–861.
Gebhardt, C., Ritter, E., Barone, A., Debener, T., Walkemeier, B., Schachtschabel, U.,
Kaufmann, H., Thompson, R. D., Bonierbale, M. W., Ganal, M. W., Tanksley, S. D.
and Salamini, F. (1991). RFLP maps of potato and their alignment with the
homeologous tomato genome. Theor. Appl. Genet. 83:49–57.
54
Goettsch, E. (1986). Traditional aromatic and perfume plants in Central Ethiopia (a botanical and
ethno-historical survey). J. Ethiopian Studies 19: 81-90.
Groom, N. (1981). Frankincense and Myrrh: A Study of The Arabian Incense Trade. Longman,
London and New York.
Hammer, O., Harper, D. and Ryan, P. (2001) PAST: Paleontological statistics software
for education and data analysis. Paleontología Electrónica 4: 1-9.
Hamrick, J. L. and Godt, M. J. W. (1989). Allozyme diversity in plant species. In: Plant
Population Genetics, Breeding and Genetic Resources (Brown, A. H. D., Clegg, M. T.,
Kahler A. L. and Weir B. S. eds). Sinauer, Sunderland.
Hamrick, J. L., Godt, M. J. W. and Sherman-Broyles, S. L. (1992). Factors influencing levels of
genetic diversity in woody plant species. New Forests 6:95-124.
Hatcher, P. E., Wilkinson, M. J., Albani, M. C. and Hebbern, C. A. (2004). Conserving marginal
populations of the food plant (Impatiens noli-tangere) of an endangered moth
(Eustroma reticulatum) in a changing climate. Biol. Conserv. 116:305–317
Hearne, C. M., Ghosh, S. and Todd, J. A. (1992). Microsatellites for linkage analysis of genetic
traits. Tren. Genet. 8:288–294.
Hedenäs, L. and Kooijman, A. M. (1996). Phylogeny and habitat adaptations within a
monophyletic group of wetland moss genera Amblystegiaceae. Plant Syste. Evol. 199:
33–52.
Hepper, F. N. (1969). Arabian and African frankincense trees. Egy. Ecol. 18:166-171
Holsinger, K. E., and Gottlieb, L. K. (1991). Conservation of rare and endangered plants:
Principle and Prospect. In: Genetics and Conservation of Rare Plants (Falk, D. A. and
Holsinger, K. E., eds.). Oxford University Press, New York.

55
Hurni, H. (1988). Degradation and conservation of the resources in the Ethiopian highlands.
Mount. Res. Develop. 8(2/3):123-130.
Jaccard, (1908). Nouvelles researchers Sur la distribution florale. Bull. Soc. Vaud. Sci. Nat.
44:223 – 270.
Kalisz, S. and Vogler, D. W. (2003). Benefits of autonomous selfing under unpredictable
pollinator environments. Ecol. 84:2928–2942.
Karp, A., Seberg, O. and Buiatti, M. (1996). Molecular techniques in the assessment of botanical
diversity. Ann. Bot 78:143–149.
Karp, A. and Edwards, K. J. (1997). Molecular techniques in the analysis of the extent and
distribution of genetic diversity. In: Molecular Genetic Techniques for Plant Genetic
Resources (Ayad, W. G., Hodgkin, T., Jaradat, A. and Rao, V. R., eds.). IPGRI, Rome,
pp. 11–22
Karp, A., Edwards, K. J, Bruford, M., Funk, S., Vosman, B., Morgantem, M., Seberg, O.,
Kremer, A., Boursot, P., Arctander, P., Tautz, D. and Hewitt, G. M. (1997a). Molecular
technologies for biodiversity evaluation: opportunities and challenges. Nat. Biotec.
15:625–628.
Karp, A., Kresovich, S., Bhat, K. V., Ayad, W. G. and Hodgkin, T. (1997b). Molecular tools in
plant genetic resources conservation: a guide to the technologies. IPGRI Technical
Bulletin No. 2. IPGRI, Rome, Italy.
Kermali, I. R. (1994). Morphometric Diversity in Short-season Maize (Zea mays L.) germplasm.
Ph.D thesis, University of Guelph.

56
Kindeya Gebrehiwot, Muys, B., Miteku Haile and Mitloehner, R. (2002). B. papyrifera (Del.)
Hochst: a tropical key species in northern Ethiopia. Conference on International
Agricultural Research for Development October 9-11. Deutscher Tropentag,
Witzenhausen.
Kindeya Gebrehiwot, Muys, B., Mitiku Haile and Mitloehner, R. (2003). Introducing B.
papyrifera (Del.) Hochst and its non-timber forest product, frankincense. Intern. Fores.
Rev. 5:348–353.
Kudo, G. (2006). Flowering phenologies of animal-pollinated plants: reproductive strategies and
agents of selection, p. 139-158. In: Ecology and Evolution of Flowers (Harder, L. D
and Barrett, S. C. eds). Oxford University Press, Oxford, England.
Lawless, J. (1995). The Illustrated Encyclopaedia of Essential Oils: The Complete Guide to the
Use of Oils in Aromatherapy and Herbalism. Rockport, MA. Element Books.
Ledig, F. T. (1986). Heterozygosity, heterosis, and fitness in outbreeding plants. In:
Conservation Biology (Soule, M. E. ed.). Sinauer Associates, Sunderland.
Ledig, F. T. (1998). Genetic variation in Pinus. In: Ecology and Biogeography of Pinus
(Richardson, D. M. ed.). Cambridge University Press, Cambridge, UK.
Lee, A., Suh, J. K., Roh, M. S. and Slovin, J. P. (2001). Analysis of Genetic Relationships of
Ardisia spp. Using RAPD Markers. Tektran, United State Department of Agriculture,
Agricultural Research Service
Li, J. and Jin, Z. (2007). Genetic variation and differentiation in Torreya jackii Chun, an
endangered plant endemic to China. Plant. Sci. 172:1048–1053
Luo, X., Zhuang, X.and Yang, Y. (2007). Genetic diversity of Camellia changii Ye (Theaceae)
using ISSR markers. J. Trop. Subtrop. Bot. 15(2):93–100
57
Marshal, N. (1998). Searching for a cure: Conservation of medicinal wildlife resources in East
and Southern Africa. A Species Endangered Report, Nairobi, Kenya.
Maxted, N., Van Slageren, M. W. and Rihan, J. R. (1995). Ecogeographic surveys. In: Collecting
Plant Genetic Diversity (Guarino, L., Ramanatha, V. and Reid, R., eds.). CABI.
Metema Pilot Learning site Diagnosis and program (2005). Improving Productivity and Market
Succes (IPMS) of Ethiopia Farmer, team report. Canadian International Development
Agency (CIDA).
Moeller, D. A. (2006). Geographic structure of pollinator communities, reproductive assurance,
and the evolution of self-pollination. Ecol. 87:1510–1522.
Morgante, M., Hanafey, H. and Powell, W. (2002). Microsatellites are preferentially associated
with nonrepetitive DNA in plant genome. Nat. Genet. 30:194–200.
Mueller, U. G. and Wolfenbarger, L. L. (1999). AFLP genotyping and fingerprinting. Tren. Ecol.
Evol. 14:389–394.
Mulugeta Lemenih and Demel Teketay (2003). Frankincense and myrrh resources of Ethiopia: II.
Medicinal and industrial uses. SINET: Ethiopian J. Sci. 26(2):161-172
Mulugeta Lemenih, Tarekegn Abebe and Olsson, M. (2003). Gum-resins from some Acacia,
Boswellia and Commiphora species and their economic contributions in Liban zone,
Ethiopia. J. Ari. Envir. 55:465–482.
Nybom, H. and Bartish, I. (2000). Effects of life history traits and sampling strategies on genetic
diversity estimates obtained with RAPD markers in plants. Perspect. Plant Ecol. Evol.
Syst. 3(2):93–114.

58
Okun, D. O., Kenya, E. U., Oballa, P. O., Odee, D. W. and Muluvi, G. M. (2008). Analysis of
genetic diversity in Eucalyptus grandis (Hill ex Maiden) seed sources using inter
simple sequence repeats (ISSR) molecular markers. Afr. J. Biotec. 7(13):2119–2123.
Oqbazghi, W. (2001). The Distribution and Regeneration of Boswellia papyrifera (Del.) Hochst.
in Eritrea. PhD thesis, Wageningen University and Research Centre, Wageningen.
Parasharami, V. A. and Thengane, S. R. (2012). Inter population genetic diversity analysis using
ISSR markers in Pinus roxburghii (Sarg.) from Indian provenances. Int. J. Biodiv.
Cons.4(5):219-227.
Parker, P. G., Snow, A. A., Schug, M. D., Booton, G. C. and Fuerst, P. A. (1998). What
molecules can tell us about populations: choosing and using a molecular marker. Ecol.
79:361–382.
Pavlicek, A., Hrda, S and Flegr, J (1999). Free-tree-freeware program for construction of
phylogenetic trees on the basis of distance data and bootstrap/jackknife analysis of the
tree robustness. Application in the RAPD analysis of genus Frenkelia. Folia Biol.
(Praha) 45: 97-99.
Peeters, J. P. and Martinelli, J. A. (1989). Hierarchical cluster analysis as a tool to manage
variation in germplasm collections. Theore. Appl. Genet. 78:42–48.
Perez-Collazos, E. and Catalan, P. (2007). Genetic diversity analysis and conservation
implications for the Iberian threatened populations of the irano turanian relict
Krascheninnikovia ceratoides (Chenopodiaceae). Biol. Linn. Soc. 92:419–429.

59
Rakoczy-Trojanowska, M. and Bolibok, H. (2004). Characteristics and comparison of three
classes of microsatellite-based markers and their application in plants. Cell Mol. Biol.
Lett. 9:221–238
Reddy, M. P., Sarla, N. and Siddiq, E. A. (2002). Inter simple sequence repeat (ISSR)
polymorphism and its application in plant breeding. Euphytica 128:9–17
Rijkers, T., Ogbazghi, W., Wessel, M. and Bongers, F. (2006). The effect of tapping for
frankincense on sexual reproduction in Boswellia papyrifera. J. Appl. Ecol.43:1188–
119
Robinson, A. J., Love, C. G., Batley, J., Barker, G. and Edwards, D. (2004). Simple sequence
repeat marker loci discovery using SSR primer. Bioinformatics. 20(9):1475–1476
Rohlf, F. J. (2000). NTSYS-pc ver 2.11T. Exter Software, Setauket, New York.
Saitou, N. and Nei, M. (1987). The neighbor-joining method: A new method for
reconstructing phylogenetic trees. Mol. Biol. Evol. 4:406-425.
Schlötterer, C. (2004). The evolution of molecular markers—just a matter of fashion?. Nat. Rev.
Genet. 5:63–69.
Sharma, K., Degan, B., Wuehlisch, G. V.and Singh, N. B. (2002). Allozyme variation in eight
natural population of Pinus roxburghii Sarg. in India. Silvae. Genet.51:246-253.
Sica, M., Gamba, G., Montieri, S., Gaudio, L. and Aceto, S. (2005). ISSR markers show
differentiation among Italian populations of Asparagus acutifolius L. Genet. 6:17.

60
Sinclair, W. T., Morman, J. D. and Ennos, R. A. (1999). The postglacial history of Scots pine
(Pinus sylvestris L.) in western Europe: evidence from mitochondrial DNA variation.
Mol. Ecol. 8:83-88.
Siregar, I. Z. (2000). Genetic Aspects of the Reproduction System of Pinus merkusii Jungh. et de
Vriese in Indonesia. Ph.D thesis, George-August University of Gottingen. Germany
Sneath, P. H. A. and Sokal, R. R. (1973). Numerical Taxonomy. Freeman, Sanfrancisco.
Spooner, D., van Treuren, R. and de Vicente, M. C. (2005). Molecular markers for genebank
management. IPGRI Technical Bulletin No. 10. IPGRI, Rome, Italy.
Stat soft. Inc. (2001). Statistica data analysis system, Statistica software.
Studier, J. A. and Keppler, K. L. (1988). A note on the neighbor-joining algorithm of
Saitou and Nei. Mol. Biol. Evol. 5:729-731.
Sunnichan, V. G., Mohan, Ram, H. Y. and Shivanna, K. R. (2005). Reproductive biology of
Boswellia serrata, the source of salai guggul, an important gum-resin. Bot. J. Linn. Soc.
147:73–82.
Tefera Mengistu (2011). Physiological Ecology of the Frankincesce Tree. MSc Thesis,
Wageningen University.
Thulin, M. (2001). Two new species of frankincense trees (Boswellia, Burseraceae) from
Socotra. Kew Bulletin 56 (4): 983-988.
Tilahun G. (1997). Boswellia papyrifera (Del.) Hochst. from Western Tigray: Opportunities,
Constraints and Seed Germination Responses. MSc thesis. Swedish University of
Agricultural Sciences. Faculty of Forestry, Sweden.

61
Tileye Feyissa, Nybom, H., Bartish, I. V. and Welander, M. (2007). Analysis of genetic diversity
in the endangered tropical tree species Hagenia abyssinica using ISSR markers. Genet.
Resour. Crop. Evol. 54:947–958.
Tohme, J., Jones, P., Beebe, S. and Iwanaga, M. (1995). The combined use of agroecological and
characterization data to establish the CIAT Phaseolus vulgaris core collection. In: Core
Collections Genetic Resources (Hodgkin, T., Brown, A. H. D., van Hintum, Th. J. L.
and Morales, E. A. V. eds.). John Wiley and Sons, Chichester, UK.
Tucker, A. (1986). Frankincense and myrrh. Econ. Bot. 40 (4): 425-433.
Van Schaik, C. P., Terborgh, J. W. and Wright, S. J. (1993). The phenology of tropical forests:
adaptive significance and consequences for primary consumers. Ann. Rev. Ecol. Syst.
24: 353-377.
Van Beek ,G. (1960). Frankincense and Myrrh. Bibli. Archaeol. 23 (3): 7095.
Verghese, J. (1988). Olibanum in focus. Perfumer and Flavorist 13 (1): 1-12.
Vollesen, K. (1989). Burseraceae. In: Flora of Ethiopia, Volume 3 (Hedberg, I. and Edwards, S.,
eds.). National Herbarium, Addis Abeba University, Addis Abeba and Uppsala
University, Uppsala. pp. 442-478.
Vos, P., Hogers, R., Bleeker, M., Reijans, M., Van De Lee, T., Hornes, M., Frijters, A., Pot, J,
Peleman, J., Kuiper, M. and Zabeau, M. (1995). AFLP: a new technique for DNA
Fingerprinting. Nucl. Aci. Res. 23: 4407-4414.
Weising, K., Nybom, H., Wolff, K. and Kahl, G. (2005). DNA Fingerprinting in Plants,
Principles, Methods, and Applications. Taylor & Francis Group, USA.
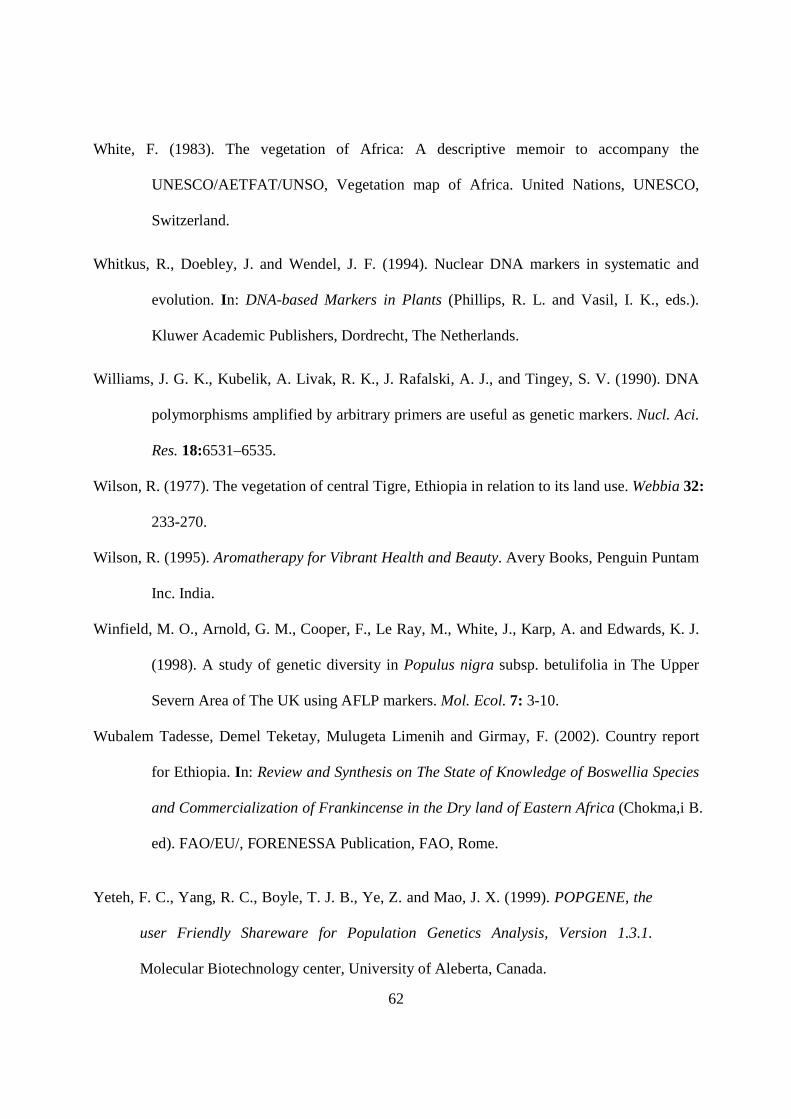
62
White, F. (1983). The vegetation of Africa: A descriptive memoir to accompany the
UNESCO/AETFAT/UNSO, Vegetation map of Africa. United Nations, UNESCO,
Switzerland.
Whitkus, R., Doebley, J. and Wendel, J. F. (1994). Nuclear DNA markers in systematic and
evolution. In: DNA-based Markers in Plants (Phillips, R. L. and Vasil, I. K., eds.).
Kluwer Academic Publishers, Dordrecht, The Netherlands.
Williams, J. G. K., Kubelik, A. Livak, R. K., J. Rafalski, A. J., and Tingey, S. V. (1990). DNA
polymorphisms amplified by arbitrary primers are useful as genetic markers. Nucl. Aci.
Res. 18:6531–6535.
Wilson, R. (1977). The vegetation of central Tigre, Ethiopia in relation to its land use. Webbia 32:
233-270.
Wilson, R. (1995). Aromatherapy for Vibrant Health and Beauty. Avery Books, Penguin Puntam
Inc. India.
Winfield, M. O., Arnold, G. M., Cooper, F., Le Ray, M., White, J., Karp, A. and Edwards, K. J.
(1998). A study of genetic diversity in Populus nigra subsp. betulifolia in The Upper
Severn Area of The UK using AFLP markers. Mol. Ecol. 7: 3-10.
Wubalem Tadesse, Demel Teketay, Mulugeta Limenih and Girmay, F. (2002). Country report
for Ethiopia. In: Review and Synthesis on The State of Knowledge of Boswellia Species
and Commercialization of Frankincense in the Dry land of Eastern Africa (Chokma,i B.
ed). FAO/EU/, FORENESSA Publication, FAO, Rome.
Yeteh, F. C., Yang, R. C., Boyle, T. J. B., Ye, Z. and Mao, J. X. (1999). POPGENE, the
user Friendly Shareware for Population Genetics Analysis, Version 1.3.1.
Molecular Biotechnology center, University of Aleberta, Canada.

63
Zietkiewicz, E., Rafalski, A. and Labuda, D. (1994). Genome fingerprinting by simple sequence
repeat (SSR)-anchored polymerase chain reaction amplification. Genomics 20:176-183.
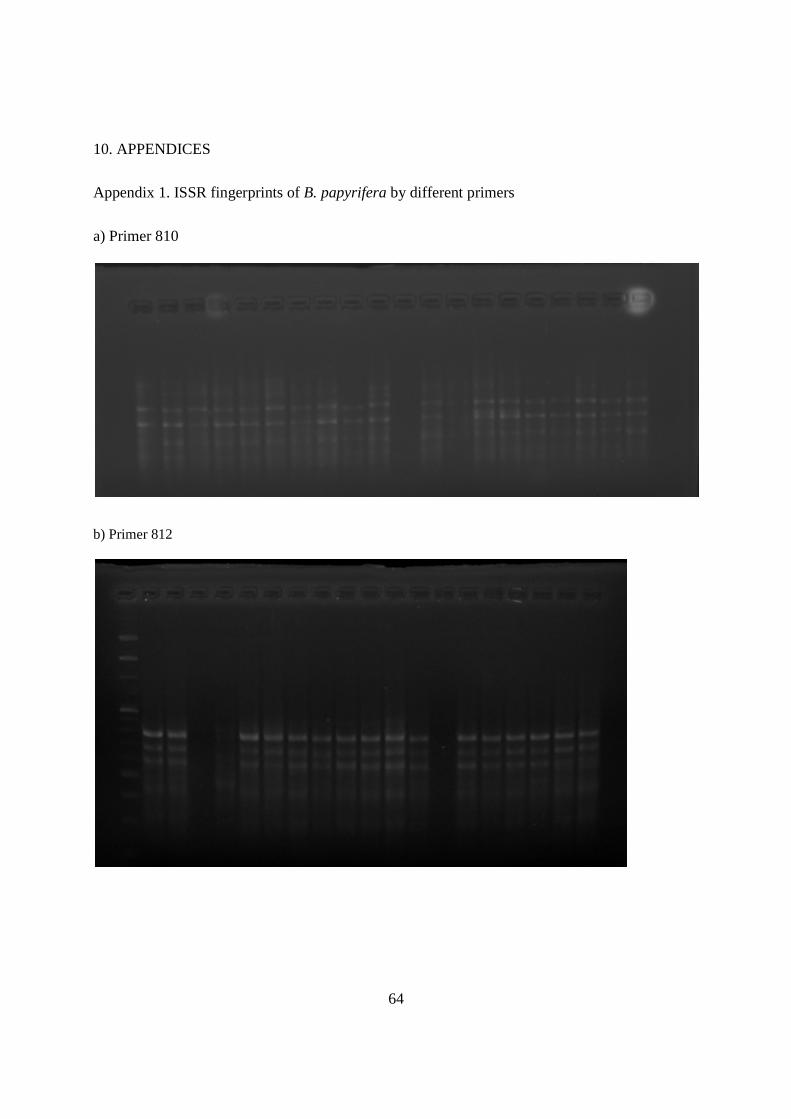
64
10. APPENDICES
Appendix 1. ISSR fingerprints of B. papyrifera by different primers
a) Primer 810
b) Primer 812

65
c) Primer 818
d) Primer 834

66
e) Primer 880
Appendix 2. Boswellia tree at different stages
a. Before leaf fall b. After leaf fall

67
c. Branches showing flower buds d. Branches with different flowering stages
e. Trees at maximum flowering stage f. branches showing closed flower
Apendix 3. Boswellia fruit

Declaration
I, the undersigned declared that this Thesis is my original work and that all sources of material
used for the thesis have been correctly acknowledge.
Name: Abush Zinaw
Signature__________
Date of submission____________
Advisors: Dr. Kassahun Tesfaye
Signature___________
Date ___________
Dr. Kifle Dagne
Signature___________
Date___________