Final Thesis Salonika - NC State Repository
258
ABSTRACT AGGARWAL, SALONIKA. Novel Supercritical Carbon dioxide Drying and Extraction Process for Industrial, Energy & Biocomposites Applications (Under the direction of Dr. Marko Hakovirta). The objective of this research was to investigate industrial, energy and wider applications of supercritical carbon dioxide (sCO2), which includes the drying of different biomasses, extraction of natural sources and other applications. Drying is an important unit operation, which is a highly energy-intensive process. There are challenges associated with drying such as a change in properties and Volatile Organic Compound (VOC) emissions during drying. There is a demand for an innovative, sustainable, environmentally friendly, and less energy-intensive drying technology. It is important to note that national energy consumption for drying operations at an industrial level ranges from 10% to 15% for almost every country. The focus of this research was to develop a sustainable and industrially viable drying technology that leads to minimal impact on the environment at the low capital and operating costs. The commercial applications of supercritical carbon dioxide (sCO2) include drying aerogels, and extracting different compounds such as decaffeination. The sCO2 has been explored for power generation and it has a high potential for clean coal technologies. Supercritical carbon dioxide (sCO2) could be one approach towards the industrial green process and limitation of some of the pollutants. The unique capabilities of sCO2 motivated us to study this technology as a sustainable alternative for conventional energy-intensive thermal drying. The major part of the work was devoted to optimizing the conditions to develop supercritical CO2 as drying technology for different biomasses. This initial phase of this research used sCO2 to dry wood chips and wood flakes, which removed both water and extractives from wood chips and flakes with no change in surface properties that could impact its interaction with
-
Upload
khangminh22 -
Category
Documents
-
view
1 -
download
0
Transcript of Final Thesis Salonika - NC State Repository

ABSTRACT
AGGARWAL, SALONIKA. Novel Supercritical Carbon dioxide Drying and Extraction Process for Industrial, Energy & Biocomposites Applications (Under the direction of Dr. Marko Hakovirta). The objective of this research was to investigate industrial, energy and wider applications
of supercritical carbon dioxide (sCO2), which includes the drying of different biomasses,
extraction of natural sources and other applications. Drying is an important unit operation, which
is a highly energy-intensive process. There are challenges associated with drying such as a change
in properties and Volatile Organic Compound (VOC) emissions during drying. There is a demand
for an innovative, sustainable, environmentally friendly, and less energy-intensive drying
technology. It is important to note that national energy consumption for drying operations at an
industrial level ranges from 10% to 15% for almost every country.
The focus of this research was to develop a sustainable and industrially viable drying
technology that leads to minimal impact on the environment at the low capital and operating costs.
The commercial applications of supercritical carbon dioxide (sCO2) include drying aerogels, and
extracting different compounds such as decaffeination. The sCO2 has been explored for power
generation and it has a high potential for clean coal technologies. Supercritical carbon dioxide
(sCO2) could be one approach towards the industrial green process and limitation of some of the
pollutants. The unique capabilities of sCO2 motivated us to study this technology as a sustainable
alternative for conventional energy-intensive thermal drying.
The major part of the work was devoted to optimizing the conditions to develop
supercritical CO2 as drying technology for different biomasses. This initial phase of this research
used sCO2 to dry wood chips and wood flakes, which removed both water and extractives from
wood chips and flakes with no change in surface properties that could impact its interaction with

resin. Water was removed by displacement rather than the evaporation. sCO2 treatment is
potentially much more cost-effective than thermal drying from both capital and operational
perspectives.
The research continued with dewatering of the coal using sCO2 especially taking into
consideration the value of extractives & micropollutants removed. Supercritical CO2 dewatered
coal through two mechanisms. Below the water’s solubility limits in the sCO2 the dewatering is
dominated by dissolution of water as seen in the bituminous coal. The excess water that is seen in
the case of lignite water prominently was displaced by pressurized sCO2. Hence, sCO2 dewatering
will be highly efficient for Low-Rank Coals (LRC), which are the cheapest and readily available
source of energy worldwide. It was found that sCO2 also removes toxic volatiles and organic sulfur
along with the dewatering of the coal. GC-MS and FTIR analysis substantiate that sCO2 can
remove micropollutants such as polyaromatic hydrocarbons (PAHs) and Polychlorinated
biphenyls (PCB), and organic sulfur along with the water. Removal of volatiles before combustion
would increase the fuel efficiency for energy production.
The advanced phase of this research was continued with using sCO2 to dry municipal
sewage sludge. Effective drying is an important unit operation to exploit the sludge for energy
applications. The valorization of municipal sewage sludge for energy use is a major opportunity
for sustainable energy applications. Higher heating value (HHV) of the sCO2 treated sludge was
notice to be greater than that of brown coal with a similar moisture level. sCO2 extraction reduced
the moisture content (MC) of the sludge from 89% to 53% in 15 min making this dewatering
process considerably less energy-intensive than conventional thermal and other drying processes.
The better HHV of sludge makes it a potential source of energy. The succeeding plan is to valorize
the sludge as an energy source along with the LRC. This is achievable through co-combustion coal

and sludge, which needs the extraction using sCO2. Here we have explored energy application of
coal-sludge blend with the different percentages of sludge in coal. The aim is to have these belnds
be EPA compliant because of removal of micropolluanants by sCO2.
Another advanced application of sCO2 was studied to extract bioactive compounds from
natural sources such as Grapefruit seeds (GSE), which has the antimicrobial properties and
reconnoitering the novel applications for those extractives such as 3D printing. Novel
biocomposite of diatoms with Polylactic acid (PLA) was formulated for the biomedical application
of bioactive extractive. Diatoms have unique properties such as high porosity and surface area.
Based on these properties, extractives are planned to be used on abovementioned biocomposites
for applications such as 3D printed antimicrobial surgical tools.

© Copyright 2020 by Salonika Aggarwal
All Rights Reserved

Novel Super Critical Carbon dioxide Drying and Extraction Process for Industrial, Energy & Biocomposites Applications
by Salonika Aggarwal
A dissertation submitted to the Graduate Faculty of North Carolina State University
in partial fulfillment of the requirements for the degree of
Doctor of Philosophy
Forest Biomaterials
Raleigh, North Carolina 2020
APPROVED BY:
_______________________________ _______________________________ Dr. Marko Hakovirta Dr. Daniel Salonika Committee Chair _______________________________ _______________________________ Dr. Ilona Peszlen Dr. Sunkyu Park
______________________________ Dr. Ayyoub Momen External Member

ii
DEDICATION
To my parents (Mr. Anil Aggarwal and Mrs. Sushma Aggarwal) for their endless support
and sacrifices and the little angel, my niece (Anaisha Sharma).

iii
BIOGRAPHY
Salonika Aggarwal was born in Kurukshetra, Haryana, India. She completed her whole
schooling while staying with her parents. After completing high school, she went to Kurukshetra
University to study Bachelor of Technology in Biotechnology. During her Bachelors's, apart from
studies, she participated in many extracurricular activities. After completing her undergraduate,
she went to the Indian Institute of Technology, Roorkee for her masters in Pulp and Paper
Technology in 2011. In her masters, she received the MHRD (Ministry of Human Resources)
fellowship for two years. After her masters, she had teaching experience as an Assistant Professor
for one year. Later she joined the Food Corporation of India (FCI), a government organization in
India that had the biggest distribution channel in whole Asia. She worked in FCI for almost 4
years. She likes to travel and spending time with friends.

iv
ACKNOWLEDGMENTS
First, I am immensely grateful to my mentor Dr. Marko Hakovirta for providing me with
the wonderful opportunity to carry out this doctoral work and grow under his able guidance. Dr.
Hakovirta’s encouragement, support, trust, and patience throughout my doctoral studies have been
commendable. The freedom of thinking and sense of responsibility which Dr. Hakovirta, has given
me contributed so much to my professional and personal development that I will appreciate
forever. Whenever I found myself in trouble during writing or explaining the concepts of detailed
mechanisms, Dr. Hakovirta was always there for me. I am thankful to Dr. Hakovirta for sharing
his enormous amount of knowledge and inspiring me to constantly think about the new research
ideas. I acknowledge, Dr. Saloni for sharing his enormous knowledge in 3D printing and ideas
during my all research projects. I would like to thank Dr. Ilona Peszlen for her encouragement and
for sharing her expertise in wood science ans microscopy. During the later phase of my Ph.D., Dr.
Peszlen supported me a lot personally and professionally. I acknowledge Dr. Sunkyu park for
sharing his enormous knowledge in analytical techniques which was a big part of my research. I
acquainted with Dr. Ayyoub Momen recently but he always motivated me through his
extraordinary work in the field of drying and reading his work helped me to get new ideas.
I would like to thank Dr. Sujit Banerjee for sharing his enormous knowledge in drying and
supercritical carbon dioxide technology. Though I never met him, but still he was always shring
his knowledge and expertise with me. I would like to thank Dr. Bhima Sastri for his support and
funding opportunity.
I thank all the graduate students at Forest Biomaterials without whom, this journey would
have been much harder. I would like to thank especially Preeti for her unconditional support at
every step. I would like to thank Sachin for enduring me and helping me out every time whenever

v
needed that. I thank my friends Juliana, Carolina, Shelly, Ramakrishna, Mritika, Joseph, Darlene,
Matt, Marielis, Salem. I like to thank all the staff members at Forest biomaterials: Barbara,
Melissa, Beverly, Ambre, Maggie, Leena. I would like to thank my roommate, Sabiha for being
supportive all the time.I thank all the AIF lab managers and research associates especially Chuck,
Phillips, who helped me doing all the characterization parts and teaching me the techniques. I
would also like to acknowledge friends like family (Pikaso, Preeti, Rajnish, Leena, Sachin, Sonali,
Juliana, and Ramakrishna) in the USA without whom the stay in the USA would not be as
wonderful. I would like to thank my roommate Sabiha for being very supportive and caring.
Finally, I am grateful to my whole family especially my parents for their immense
sacrifices, support, and trust in me. I am so grateful to my parent's sacrifice that they sent me away
from home to have a better education. Their constant commitment and sacrifices for our education
has been inspiring and never can be repaid. I have been lucky to have a princess, my niece
(Anaisha) in my life during this journey whom I consider my Lucky Charm. I have been lucky to
have a mother like sister Isha Aggarwal who was always supportive for me and always available
for me whenever I needed her. I thank my brother Abhishek Aggarwal who is more like a friend
to me and always encouraged me and motivated me., I also thank my brother-in-law. Lalit Sharma
who always teases me but always there for me whenever I need him. Without their support, it
would have been very difficult for me to come to the U.S in a short period. I also thank my sister-
in-law, Sanjeeta Biswas to be more like a friend and always tried to ease me whenever I felt low
or demotivated.

vi
TABLE OF CONTENTS
LIST OF TABLES…...…………………………………………………………………………..xii LIST OF FIGURES ..................................................................................................................... xiv LIST OF PUBLICATIONS…...………………………………………………………………...xvi
: Drying and Scientific principles of drying .................................................................. 1
Introduction ........................................................................................................................... 1 Mechanism of Drying ........................................................................................................... 3 External Conditions .............................................................................................................. 6 Internal Conditions ................................................................................................................ 9 Classification of Dryers ...................................................................................................... 11 Energy, Economic, Safety and Environmental Factors ...................................................... 12
: Extraction Processes .................................................................................................. 15
Introduction ......................................................................................................................... 15 Extraction Methods ............................................................................................................. 20 2.2.1 Solvent Extraction Methods ......................................................................................... 21 2.2.2 Steam Distillation Methods .......................................................................................... 22 2.2.3 Headspace Techniques ................................................................................................. 22 2.2.4 Sorptive Extraction techniques .................................................................................... 23 Comparison of different extraction methods ...................................................................... 24 Limitations of Different Extraction Methods ..................................................................... 25 2.4.1 Accelerated Solvent Extraction (ASE) ........................................................................ 25 2.4.2 Simultaneous Distillation Extraction (SDE) Poor extraction of polar compounds ..... 25 2.4.3 Solvent Assisted Flavor Evaporation(SAFE) .............................................................. 25 2.4.4 (Supercritical Fluid Extraction (SFE) .......................................................................... 26 Modern Extraction Techniques ........................................................................................... 26 2.5.1 Microwave-Assisted Solvent Extraction (MWASE) ................................................... 26 2.5.2 Ultrasound-Assisted Extraction (UAE) ....................................................................... 26 2.5.3 Pulsed Electric Field (PEF) Extraction ........................................................................ 27 2.5.4 Enzyme Assisted Extraction (EAE) ............................................................................. 27
: Supercritical Carbon dioxide: Adequately Sole Solvent ........................................... 28
Introduction ......................................................................................................................... 28 Physical and Chemical Properties of CO2 .......................................................................... 30

vii
Applications of supercritical CO2 ....................................................................................... 32 Factors affecting extraction using sCO2 ............................................................................. 33 The polar attribute of sCO2 ................................................................................................. 34 Special Configurations of sCO2 .......................................................................................... 35 sCO2 as a Solvent .................................................................................................................. 35 sCO2 as an Anti-Solvent ........................................................................................................ 35 sCO2 as a Solute .................................................................................................................... 36 sCO2 as a Co-Solute .............................................................................................................. 36 Advantages and Disadvantages of sCO2 ............................................................................. 36 Conclusion .......................................................................................................................... 37
: Wood structure and drying ........................................................................................ 39
Structure of Wood ............................................................................................................... 39 4.1.1 Formation of Wood ...................................................................................................... 39 4.1.2 Tissue and Cellular Structure of Wood ........................................................................ 41 4.1.3 Chemical Composition ................................................................................................. 43 4.1.4 Reaction Wood ............................................................................................................. 44 4.1.5 Implications for the Drying Process ............................................................................ 45 Moisture Distribution in Wood ........................................................................................... 46 4.2.1 Free Water .................................................................................................................... 46 4.2.2 Bound water ................................................................................................................. 47 Drying Process of Wood ..................................................................................................... 48 4.3.1 Drying at Low temperature .......................................................................................... 48 4.3.2 Drying at High Temperature ........................................................................................ 49 Issues associated with Conventional Drying ...................................................................... 50 4.4.1 Defects ......................................................................................................................... 50 4.4.2 Environmental Issues ................................................................................................... 52 Removal of Water and Extractives from Softwood with Supercritical Carbon Dioxide .... 55 4.5.1 Introduction .................................................................................................................. 56 4.5.2 Materials and Methods ................................................................................................. 57 4.5.3 Results & Discussion ................................................................................................... 58 4.5.4 Economics. ................................................................................................................... 62 Conclusions ......................................................................................................................... 65
: Coal structure and its drying ..................................................................................... 66
Introduction ......................................................................................................................... 66

viii
Coal Drying ......................................................................................................................... 67 Difficulties during Coal Drying .......................................................................................... 68 Moisture Distribution in Coal ............................................................................................. 69 Parameters responsible for LRC Drying ............................................................................. 70 5.5.1 Parameters about drying media .................................................................................... 70 5.5.2 Parameters about Coal ................................................................................................. 72 5.5.3 Drying Method ............................................................................................................. 74 Design of Dryers ................................................................................................................. 75 Latest Developments and Innovation .................................................................................. 77 Emerging Drying Technologies .......................................................................................... 78 Dewatering coal with supercritical Carbon Dioxide ........................................................... 80 5.9.1 Introduction .................................................................................................................. 80 5.9.2 Materials and Methods ................................................................................................. 81 5.9.3 Results and Discussion ................................................................................................ 82
Simultaneous Dewatering and Removal of Hazardous Hydrocarbons from Coal using Supercritical Carbon dioxide ................................................................................... 87
5.10.1 Introduction ................................................................................................................ 87 5.10.2 Materials & Methods ................................................................................................. 89 5.10.3 Results & Discussion ................................................................................................. 90
Conclusion ........................................................................................................................ 93
: Supercritical CO2 Drying of Sludge: Drying to Biofuel ........................................... 95 Introduction ......................................................................................................................... 95 Wastewater Treatment Process and Sludge Production ...................................................... 95 Stabilization ........................................................................................................................ 98 6.3.1 Alkaline (Lime) Stabilization ...................................................................................... 98 6.3.2 Anaerobic Digestion .................................................................................................... 99 6.3.3 Aerobic Digestion ........................................................................................................ 99 6.3.4 Composting .................................................................................................................. 99 Moisture Distribution in sludge ........................................................................................ 100 Sludge Drying ................................................................................................................... 103 6.5.1 Solar Energy Drying .................................................................................................. 103 6.5.2 Thermal Drying Fundamentals .................................................................................. 103 6.5.3 Other Sludge Dryers .................................................................................................. 107 6.5.4 Other Innovations in Sludge Drying .......................................................................... 108 Related Issues .................................................................................................................... 111

ix
Supercritical Carbon dioxide Dewatering and Drying of Municipal Sewage Sludge. Novel Waste-to-Energy Valorization Pathway ............................................................... 112
6.7.1 Introduction ................................................................................................................ 112 6.7.2 Materials and Methods ............................................................................................... 114 6.7.3 Results and Discussion .............................................................................................. 115 Conclusion ........................................................................................................................ 126
: Co-combustion of Municipal Sewage Sludge and Coal after drying them
together with supercritical carbondioxide – Simultaneous Removal of Hazardous Micropollutants. ...................................................................................... 128
Introduction ....................................................................................................................... 129 Materials and Methods ...................................................................................................... 132 Results and Discussion ..................................................................................................... 133 7.3.1 Extraction of Water using supercritical carbon dioxide ............................................ 133 7.3.2 Elemental Analysis .................................................................................................... 136 7.3.3 Higher heating value calculation ............................................................................... 137 7.3.4 Thermogravimetric Analysis (TGA) .......................................................................... 138 7.3.5 Gas Chromatography-Mass Spectrometry (GC/MS) ................................................. 145 7.3.6 Fourier Transform Infrared Spectroscopy (FTIR) analysis ....................................... 147 Conclusion ........................................................................................................................ 148
: Novel Application of Extractives extracted out from Natural Products using
Supercritical Carbon dioxide .................................................................................... 150 Introduction ....................................................................................................................... 150 Grapefruit seed extraction ................................................................................................. 150 Composition of extractives ............................................................................................... 151 Novel application of grapefruit seed extract: Antimicrobial 3D Printed
Surgical Tools ................................................................................................................. 151 Novel 3D Printing filament composite using diatomaceous earth and polylactic acid
for materials properties and cost improvement ............................................................... 152 8.5.1 Introduction ................................................................................................................ 152 8.5.2 Materials and Methods ............................................................................................... 154 8.5.3 Results and Discussions ............................................................................................. 156 8.5.4 Conclusions ................................................................................................................ 163
: Future Plan ............................................................................................................... 164
Chapter 4, 5 & 6 ................................................................................................................ 164 Chapter 6 ........................................................................................................................... 164

x
Chapter 7 ........................................................................................................................... 165 Chapter 8 ........................................................................................................................... 165
References ................................................................................................................................. 167 Appendix A ................................................................................................................................. 214

xi
LIST OF TABLES
Table 1.1 Parameters for Selection of Industrial Dryers. .......................................................... 14
Table 3.1 Characteristic values of gas, liquid, and supercritical state ...................................... 30
Table 3.2 Physical Properties of CO2. ........................................................................................ 31
Table 3.3 Diverse Applications of sCO2. .................................................................................... 33
Table 4.1 Typical Wood Composition. ........................................................................................ 44
Table 4.2 Typical values of Moisture Content Found in Greenwood. ........................................ 46
Table 4.3 Removal of Water and Extractives from Pine Chips by sCO2. ................................... 59
Table 4.4 Effect of sCO2/Wood Mass Ratio on Water Removal. ................................................ 61
Table 5.1 Conventional dryers used for coal drying. ................................................................. 76
Table 5.2 Conventional dryers used for coal drying (continued). .............................................. 77
Table 5.3 New emerging drying technologies for coal. .............................................................. 79
Table 5.4 Effect of contact time on water removal from coal. .................................................... 83
Table 6.1 Removal of water from sludge by sCO2 ................................................................... 116
Table 6.2 Concentration of Carbon, Hydrogen, and Nitrogen in sludge. ................................ 119
Table 6.3 Higher Heating Value (HHV) of untreated and treated sludge. ............................... 120
Table 7.1 Removal of water from a coal-sludge blend by sCO2. .............................................. 135
Table 7.2 Concentration of Carbon, Hydrogen, Nitrogen & Sulfur in sludge. ........................ 137
Table 7.3 Higher Heating Value (HHV) of untreated and treated sludge. ............................... 138
Table 8.1 Filament Tensile Testing results. .............................................................................. 158
Table 8.2 Tensile Strength of 3D Printed dog bones. ............................................................... 160
Table 8.3 Thermal Properties of 3D printed PLA-DE filament and dogbones. ....................... 163
Table A.1 Covariance between Pressure vs % Moisture loss at 60˚C (keeping other parameters same) ..................................................................................................... .217 Table A.2 Corelation between Pressure vs % Moisture loss at 60˚C (keeping other parameters same) .................................................................................................... 217
Table A.3 Covariance between Time vs % Moisture loss at 60˚C (keeping other parameters same). ..................................................................................................... 217
Table A.4 Corelation between Time vs % Moisture loss at 60˚C (keeping other parameters same). ..................................................................................................... 218
Table A.5 Covariance between Mass ratio vs % Moisture loss at 60˚C (keeping other parameters same). ................................................................................................... 218
Table A.6 Corelation between Mass ratio vs % Moisture loss at 60˚C (keeping other parameters same). ................................................................................................... 218

xii
Table A.7 t-Test: Two-Sample Assuming Equal Variances between 15minutes vs 5*5*5 sequential shot. ....................................................................................................... 219
Table A.8 t-Test: Two-Sample Assuming Equal Variances between 5 min vs 10 min. ........... 219
Table A.9 t-Test: Two-Sample Assuming Equal Variances between 15 min vs 10 min. ......... 220
Table A.10 Covariance between time vs % water loss at 2500Psi & 75˚C. .............................. 220
Table A.11 Corelation between time vs % water loss at 2500Psi & 75˚C. ............................... 221
Table A.12 Covariance between time vs % water loss at 2500Psi & 75˚C (90:10 Coal: sludge). .............................................................................................. 221
Table A.13 Correlation between time vs % water loss at 2500Psi & 75˚C (90:10 Coal: sludge). .............................................................................................. 221
Table A.14 Covariance between time vs % water loss at 2500Psi & 75˚C (75:25 Coal: sludge). .............................................................................................. 222
Table A.15 Correlation between time vs % water loss at 2500Psi & 75˚C (75:25 Coal: sludge). .............................................................................................. 222
Table A.16 Covariance between time vs % water loss at 2500Psi & 75˚C (50:50 Coal: sludge). .............................................................................................. 222
Table B. 17 Correlation between time vs % water loss at 2500Psi & 75˚C (50:50 Coal:sludge). ............................................................................................... 222
Table A.18 Covariance between sludge concentration vs % water loss at 2500Psi & 75˚C, 5min............................................................................................................... 223
Table A.19 Corelation between sludge concentration vs % water loss at 2500Psi & 75˚C, 5min............................................................................................................... 223
Table A.20 Covariance between sludge concentration vs % water loss at 2500Psi & 75˚C, 15min............................................................................................................. 223
Table A.21 Correlation between sludge concentration vs % water loss at 2500Psi & 75˚C,15min.............................................................................................................. 223
Table A.22 Covariance between sludge concentration vs % water loss at 2500Psi & 75˚C,25min.............................................................................................................. 224
Table A.23 Correlation between sludge concentration vs % water loss at 2500Psi & 75˚C,25min.............................................................................................................. 224
Table A.24 t-Test: Two-Sample Assuming Equal Variances coal: sludge 90:10 ratio (b/w 5 minutes & 15 minutes. ................................................................................. 225
Table A.25 t-Test: Two-Sample Assuming Equal Variances coal: sludge 90:10 ratio (b/w 15 minutes & 25 minutes. ............................................................................. 225
Table A.26 t-Test: Two-Sample Assuming Equal Variances 5minutes (b/w 90:10 &. 75:25 (coal: sludge)). ............................................................................................ 226
Table A.27 t-Test: Two-Sample Assuming Equal Variances 5minutes (b/w 75:25 & 50:50 (coal: sludge)). ........................................................................................... 226

xiii
Table A. 28 t-Test: Two-Sample Assuming Equal Variances 5minutes (b/w 90:10 & ........ 50:50 (coal: sludge)). ............................................................................................ 227
Table A.29 t-Test: Two-Sample Assuming Equal Variances 15minutes (b/w 90:10 & 75:25 (coal: sludge). ............................................................................................. 228
Table A.30 t-Test: Two-Sample Assuming Equal Variances 15minutes (b/w 75:25 & 50:50 (coal: sludge)). .............................................................................................. 228
Table A.31 t-Test: Two-Sample Assuming Equal Variances 15minutes (b/w 90:10 & 50:50 (coal: sludge)). ............................................................................................ 229
Table A.32 t-Test: Two-Sample Assuming Equal Variances 25minutes (b/w 90:10 & 75:25 (coal: sludge)). .............................................................................................. 229
Table A.33 t-Test: Two-Sample Assuming Equal Variances 25minutes (b/w 75:25 & 50:50 (coal: sludge)). ............................................................................................ 230
Table A.34 t-Test: Two-Sample Assuming Equal Variances 15minutes (b/w 90:10 & 50:50 (coal: sludge)). ............................................................................................ 231
Table A.35 Conclusion table Table B. 26 - Table B. 34. ........................................................... 231
Table A.36 t-Test: Two-Sample Assuming Equal Variances Ultimate Stess (b/w 100% PLA & 95% PLA/5% D.E.). ............................................................... 232
Table A.37 t-Test: Two-Sample Assuming Equal Variances Ultimate Stess (b/w 95% PLA/5% D.E. & 90% PLA/10% D.E.). ................................................. 233
Table A.38 t-Test: Two-Sample Assuming Equal Variances Ultimate Stess (b/w 90% PLA/10% D.E. & 85% PLA/15% D.E.). .............................................. 233
Table A.39 t-Test: Two-Sample Assuming Equal Variances Modulus (b/w 100% PLA & 95% PLA/5% D.E.). ............................................................... 234
Table A.40 t-Test: Two-Sample Assuming Equal Variances Modulus (b/w 100% LA & 90% PLA/10% D.E.). .................................................................. 234
Table A.41 t-Test: Two-Sample Assuming Equal Variances Modulua (b/w 100% PLA & 85% PLA/15% D.E.). ............................................................... 235
Table A.42 t-Test: Two-Sample Assuming Equal Variances Modulus (b/w 90% PLA/10% D.E. & 95% PLA/5%). ........................................................... 236
Table A.43 t-Test: Two-Sample Assuming Equal Variances Modulus (b/w 90% PLA/10% D.E.& 85% PLA/15% D.E.). .................................................. 236
Table A.44 Anova Single factor : Stress. ................................................................................... 237
Table A.45 Anova Single factor: Modulus. .............................................................................. 238

xiv
LIST OF FIGURES
Figure 1.1 Typical drying rate curve. ........................................................................................... 4
Figure 3.1 Supercritical state for a pure component. ................................................................. 29
Figure 3.2 Phase diagram of carbon dioxide. ............................................................................. 32
Figure 4.1 Cross-section of a tree showing the internal structure of the stem. Growth rings can also be observed: light parts are earlywood and dark parts are latewood. Due to this stem geometry, three material directions: longitudinal (L), radial (R), and tangential (T) can be defined at each location. ............................... 40
Figure 4.2 Model of the cell wall structure, ML = middle lamella, P = primary wall .............. 44
Figure 4.3 Section deformations depending on the sawing pattern. The shape after drying results from the anisotropy ratio between radial and tangential shrinkage. These deformations exist even when the equilibrium is achieved and with a uniform moisture content throughout section. 52
Figure 4.4 Moisture loss (dry basis) profiles from flakes. .......................................................... 61
Figure 4.5 SEM images of surfaces of oven-dried wood (left) and SCF treated wood (right). .. 62
Figure 5.1 Types of Coal. ............................................................................................................ 67
Figure 5.2 Different forms of water associated with coal .......................................................... 70
Figure 5.3 Weight loss from sCO2 extraction of lignite. ............................................................. 84
Figure 5.4 Weight loss from sequential sCO2 extraction of lignite at a low sCO2: coal ratio. ... 84
Figure 5.5 Weight loss from sequential sCO2 extraction of bituminous coal. ............................ 85
Figure 5.6 GC-MS Spectra of extract from bituminous coal. ..................................................... 91
Figure 5.7 GC-MS Spectra of extract from Lignite Coal. ........................................................... 91
Figure 5.8 FTIR Spectrograph of bituminous and lignite coal. .................................................. 93
Figure 6.1 Typical wastewater treatment process. ..................................................................... 97
Figure 6.2 Sludge generation points and a typical sludge management scheme. ....................... 98
Figure 6.3 Drying curve: types of water in sludge. ................................................................... 101
Figure 6.4 Typical drying rate curve. ....................................................................................... 104
Figure 6.5 Water loss (%) from sludge. Sequential three shots of 5 min. is indicated by (■). . 117
Figure 6.6 Different water types and distribution in sludge. .................................................... 117
Figure 6.7 SEM micrograph of untreated sludge (x10,000 magnification). ............................. 121
Figure 6.8 SEM micrograph of treated sludge (x10,000 magnification). ................................. 121
Figure 6.9 FTIR spectrogram of untreated and treated sludge. ............................................... 122
Figure 6.10 Drying curve of untreated municipal sludge sample. ............................................. 124
Figure 6.11 Drying curve of sCO2 treated municipal sludge sample. ....................................... 125

xv
Figure 7.1 Water loss (%) from coal: sludge blend. ................................................................. 135
Figure 7.2 Microscopic Structure of (a) & (b) untreated sludge; (c) & (d) untreated coal; (e) & (f) untreated coal-sludge blend; (g) & (h) treated coal-sludge blend. .......... 136
Figure 7.3 TG and DTG curves for (a) coal and (b) sludge. .................................................... 139
Figure 7.4 TG and DTG curves for (a) untreated and (b) treated 90:10 coal: sludge blend. .. 141
Figure 7.5 TG and DTG curves for (a) untreated and (b) treated 75:25 coal: sludge blend. .. 143
Figure 7.6 TG and DTG curves for (a) untreated and (b) treated 50:50 coal: sludge blend. .. 145
Figure 7.7 GC-MS Spectra of an extract of coal: sludge blend. ............................................... 146
Figure 7.8 FTIR spectrogram of coal-sludge blend extractives. .............................................. 148
Figure 8.1 Stress-strain curve for PLA-DE filament. ............................................................... 158
Figure 8.2 Stress-strain curve for PLA-DE 3D printed material. ............................................. 160
Figure 8.3 Dog bone samples before the tensile tests. .............................................................. 162
Figure 8.4 SEM micrograph from PLA-DE filament cross-section. ......................................... 162

xvi
LIST OF PUBLICATIONS
1. S. Aggarwal, S. Johnson, M. Hakovirta, S. Banerjee, B. Sastri, (2019) “Removal Of Water
And Extractives From Softwood With Supercritical Carbon Dioxide” Industrial & Engineering
Chemistry Research DOI:10.1021/acs.iecr.8b05939.
2. S. Aggarwal, S. Johnson, D. Saloni, M. Hakovirta, (2019) “Novel 3d Printing Filament
Composite Using Diatomaceous Earth And Polylactic Acid For Materials Properties And Cost
Improvement” Composites Part B 177(2019)107310.
3. S.Banerjee, B.Sastri, S.Aggarwal, M.Hakovirta, (2020) “Dewatering Coal With Supercritical
Carbon dioxide” International Journal of Coal Preparation and Utilization, DOI:
10.1080/19392699.2020.1715962.
4. J.Sagues, A.Jain, D.Brown, S. Aggarwal, A.Suarez, M.Kollman, S.Park, D.Argyropoulos,
(2019) “Are Lignin-Derived Carbon Fibers Graphitic Enough” Green Chemistry,
2019,21,4253.
5. S. Aggarwal, M. Hakovirta (2020) “Supercritical Carbon dioxide Dewatering and Drying of
Municipal Sewage Sludge – Novel Waste-to-Energy Valorization Pathway, This paper has
been submitted to “Journal of Clean Production”.
6. S. Aggarwal, M. Hakovirta (2020) “Simultaneous Dewatering and Removal of Hazardous
Hydrocarbons from Coal using Supercritical Carbon, This paper has been submitted to
“International Journal of Coal Preparation & Utilization.

1
: Drying and Scientific principles of Drying
Introduction
Drying is usually defined as a mass transfer process with the removal of water or other
solvents 1 by evaporation from a solid, semi-solid, or liquid. It is the process of removing volatile
substances (moisture) thermally to finally yield a solid product 2. Moisture can be present as a
liquid solution within the solid, as loose chemical combination or even trapped in the
microstructure of the solid. During thermal drying, two processes occur simultaneously 2:
a) Evaporation of the surface moisture by the transfer of heat/energy from the surrounding
environment. This process depends on several factors mainly external conditions of
temperature, pressure, air humidity, and flow, and area of the exposed surface.
b) Internal moisture gets a transfer to the surface and then subsequent evaporation following
the first process. This process is a function of the physical nature of the solid, its moisture
content, and the temperature.
The drying rate is governed by the rate at which these two abovementioned processes proceed.
Although both of these processes proceed simultaneously, anyone of these processes can be the
limiting factor leading the drying rate in a drying operation.
Drying broadly defines as the process which evaporates liquid into a vapor phase from
solid, semi-solid, or liquid feedstock through the application of heat and converts this feedstock
into the solid end product. This definition, however, excludes the mechanical dewatering processes
such as filtration, centrifugation, supercritical extraction of water, drying through molecular sieves,
and even converting liquid into a more concentrated liquid. Freeze drying is also an exception to
this definition where solid phase sublimates directly into the liquid phase. Drying is one of the
oldest, most common, and most diverse chemical engineering unit operations. It is essential in

2
numerous industries such as pulp and paper, food, agriculture, biotechnology, wood processing
industries, etc.
The drying process is a highly energy-intensive process because of the high latent heat of
vaporization and the inefficiency of drying medium. It has been reported that national energy
consumption for drying operations at an industrial level ranges from 10% to 15% for United States,
Canada, France, and the U.K. to 20%-25% for Denmark and Germany 2–6. Major costs for dryers
are spent on their operation rather than the initial investment costs 3,6.
Drying is an important process for several reasons which makes the feedstock easy to handle,
reduce the transportation cost, preserve or inhibit microbial decay, storage, sanitation requirements
such as in sludge, for achieving the desired quality of the product.
Heat in drying operation can be supplied by convection, conduction, and radiation.
a) Convection, where heat is provided to the wet feedstock by using dry media such as hot air
or hot combustion gases. Dryers that work on the principle of convection are usually known
as “Direct dryers”. Over 85% of dryers are of this type.
b) Conduction, where hot surface or wall provides the heat to the wet material. Dryers worked
on the principle of conduction are known as indirect dryers.
c) Radiation or Dielectric drying, where wet material volumetrically is placed in a microwave
or radiofrequency (RF) electromagnetic field. Radiofrequency or microwaves are being
absorbed inside the material.
Conduction and convection, heat is supplied at the boundaries of the drying object and then
heat is diffused to the interior of material by conduction. Then the liquid is transported from the
interior to the surface and gets removed or evaporated and transported away by a carrier gas or by
application of vacuum.

3
Moisture is transported within the solid by using one or more of the following mechanisms of mass
transfer 2:
• Liquid Diffusion. Water is diffused from inside to surface when the wet feedstock is at a
temperature below the boiling point of the liquid
• Vapor Diffusion: Diffuses as vapor only when liquid vaporizes within the material
• Knudsen Diffusion: When drying takes place at low temperatures and pressures, e.g. in
freeze-drying
• Hydrostatic pressure differences: When the internal vaporization rate exceeds the rate of
transport of vapor from solid to the surroundings.
• Combination of above mechanisms.
Mechanisms of moisture transfer change with time as the physical structure of the drying
material subject to change during drying. There are several other non-evaporative ways of drying
that are also available such as freeze-drying, supercritical drying, and natural air drying. Drying is
a complex process involves the transfer of heat and mass along with several rate processes.
Physical or chemical transformation may cause changes in mechanisms of heat or mass transfer
and also changes in product quality. Physical changes involve shrinking (wood/timber),
crystallization, and formation of crust (sludge), and glass transitions. Chemical or biochemical
reactions lead to changes in texture, odor, color, or other properties of a solid product.
Mechanism of Drying
Water in a solid could be retained in capillaries, a solution with the solid, solution in cellular
structures, or chemical or physical adsorption on the surface of the solid. Water other than the
bound water is known as unbound water. Unbound moisture is usually removed by evaporation
and vaporization. Evaporation is done by raising the temperature of the moisture to the boiling

4
point and it occurs when the vapor pressure of the moisture on the solid surface is equal to the
atmospheric pressure. Moisture from heat-sensitive material could be removed by vacuum
evaporation where the boiling point could be lowered by lowering the pressure. Drying is finally
carried out by convection that is passing the warm air over the product where moisture is
transferred to the air by the product and air gets cooled and carried away the moisture. Saturation
vapor pressure is less than the atmospheric pressure in vaporization. The typical drying behavior
of solids is characterized by measuring the moisture content loss as a function of time 1,2,7.
Figure 1.1 Typical drying rate curve.
Figure 1.1 depicts the typical drying rate curve of a hygroscopic solid qualitatively. Different solids
behave differently on drying based on several parameters especially according to their moisture
content. During the first stage of the drying, the drying rate is constant where mostly free water
from the surface gets vaporized. This might result in some physical changes such as shrinkage
because the moist surface gets back to a solid surface. The Rate-controlling step in the constant
drying rate stage is the diffusion of the water vapor across the air-moisture interface and the rate

5
at which the surface for diffusion is removed. Moisture has to be transported from the inside of the
solid to the surface by capillary forces toward the end of the constant rate period 2.
Further drying causes the appearance of dry spots on the surface after reduction of the
surface film of moisture by evaporation when average moisture content has reached the critical
moisture content Xcc. The drying rate falls because the rate is calculated concerning the overall
solid surface area even though per unit wet solid surface area remains constant. Then the second
drying stage or first falling rate period begins and is continued till the entire surface liquid film is
evaporated.
The third stage or second falling rate occurs on further drying where the controlling step is
the rate at which moisture may move through the solid as a result of concentration gradients
between deeper parts and the surface 2. Heat is transmitted to transfer heat to the surface and heat
conduction within the product. In this stage, the drying rate is greatly influenced by the heat
conduction because the average depth of the moisture level increases progressively and dry
external zones have very small heat conductivity. Moisture bound by sorption is removed during
this stage and the rate is controlled by diffusion of moisture from the inside to the surface and then
mass transfer from the surface. With time, moisture concentration decreases, and hence the rate of
internal movement of moisture decreases. There would be a rapid fall in the drying rate and
continues until the moisture content reaches the equilibrium value for the prevailing air humidity
and then drying stops.
Different solids have different moisture content and there would be a different requirement
of moisture in the product, then physical changes such as shrinkage in case of timber or caseharden
that is the formation of hard impermeable skin on the surface and other factors determine the drying

6
characteristic of the wet feedstock and has a direct influence on the drying rate. Hence air humidity,
temperature, moisture content, material thickness, and bed depth all are important factors.
The normalized variables, the characteristic drying rate f, and the characteristic moisture content
Φ are defined as follows 2:
𝑓 = 𝑁!𝑁"
1.1
and
Ø = #$%#∗
#"%#∗
1.2
where
Nv is the rate of drying for a unit surface
NW is the rate when the body is fully saturated or the initial drying rate
X is the average moisture content in the body
Xcr. is the corresponding critical point value
X* is the equilibrium moisture content
External Conditions
The external variables/parameters responsible for drying efficiency/drying rate are
temperature, humidity, rate and direction of airflow, the physical form of the solid, the desirability
of agitation, and the method of supporting the solid during the drying operation 7. During the initial
stages of drying, external drying conditions are especially important when unbound surface
moisture is removed. Over drying and excessive shrinkage cause high tension within the material,
resulting in cracking and warping. Surface evaporation is controlled by the diffusion of vapor from
the surface of the solid to the surrounding atmosphere through a thin film of air in contact with the
surface 2.

7
When a liquid is exposed to dry gas, the liquid evaporates, that is, forms vapor and passes
into the gaseous phase. If mw is the mass of vapor in the gaseous phase, then this vapor exerts
pressure over the liquid, the partial pressure, which, assuming ideal gas behavior for the vapor, is
given by 2
PWV = '#(#
RT or PWVw = RT
1.3
The maximum value of PW that can be reached at any temperature is the saturated vapor pressure
PW0. At constant pressure, the Clausius–Clapeyron equation relates the slope of the vapor pressure-
temperature curve to the latent heat of vaporization through the relation 8
)*#$
)+ = ,-#
+(!%%!&)
1.4
where
VW and VL are the specific molar volumes of saturated vapor and saturated liquid, respectively
ΔHW is the molar latent heat of vaporization
Enthalpy H contains both internal energy (U) and the flow work (PV) per unit mass together. The
enthalpy is defined by the expression and has the units of energy per unit mass (J/kg or N m/kg).
𝐻 = 𝑈 + 𝑃𝑉 1.5
The heat capacity is defined as the heat required to raise the temperature of a unit mass of a
substance by a unit temperature. For a constant pressure process, the heat capacity CP is given by
the enthalpy of the pure substance can be estimated from its heat capacity by 8.
Cp = (010+
)P 1.6
H=�̅�Pθ 1.7
where θ denotes the temperature difference or excess over the zero enthalpy reference state.
8
Humid air is a mixture of water vapor and gas, composed of a mass mw of water vapor and mass
mG of gas (air). The moisture content or absolute humidity can be expressed as
Y = '#''
1.8
Using Dalton’s law of partial pressures,
P = Pw + PG 1.9
Y = '#''
1.10
When the partial pressure of the vapor in the gas equals the vapor pressure of the liquid, an
equilibrium is reached and the gas is said to be saturated with vapor. The ideal saturated absolute
humidity is then
𝑌 = Pw
𝑃 − Pw𝑀2
𝑀3 1.11
𝑌4 =Pw
𝑃 −𝑃25𝑀2
𝑀3 1.12
The relative humidity ψ of a vapor–gas mixture is a measure of its fractional saturation with
moisture and is defined as the ratio of the partial pressure of the vapor PW to the saturated pressure
PW0 at the same temperature. Thus ψ is given by
𝛹 =Pw𝑃25
1.13
𝑌 = 𝛹Pw
𝑃 −𝛹𝑃25𝑀2
𝑀3 1.14
The temperature of a vapor–gas mixture as ordinarily determined by the immersion of a
thermometer in the mixture is called Dry-bulb temperature 2.

9
The temperature at which a vapor–gas mixture becomes saturated when cooled at a constant total
pressure out of contact with a liquid (i.e., at constant absolute humidity) called Dew Point 2.
The humid volume VH of a vapor–gas mixture is the volume in cubic meters of 1 kg of dry gas and
its accompanying vapor at the prevailing temperature and pressure. The volume of an ideal gas or
vapor at 273 K and 1 atm (101.3 kPa) is 22.4 m3/kg mol. For a mixture with an absolute humidity
Y at TG (K) and P (atm), the ideal gas law gives the humid volume as
𝑉- = (1𝑀3
+𝑌𝑀2
)22.4𝑇
273.141𝑃 1.15
𝑉- = 0.082(1𝑀3
+𝑌𝑀2
)𝑇𝑃 1.16
The enthalpy is an extensive property, it could be expected that the enthalpy of a humid gas is the
sum of the partial enthalpies of the constituents and a term to take into account the heat of mixing
and other effects. The humid enthalpy IG is defined as the enthalpy of a unit mass of dry gas and
its associated moisture 2. With this definition of enthalpy,
IG=HGG+YHGW+ΔHGM 1.17
where
HGG is the enthalpy of dry gas
HGW is the enthalpy of moisture
ΔHGM is the residual enthalpy of mixing and other effects
Internal Conditions
Moisture Content of Solids
The moisture contained in a wet solid or liquid solution exerts a vapor pressure to an extent
depending upon the nature of moisture, the nature of solid, and the temperature. A wet solid
exposed to a continuous supply of fresh gas continues to lose moisture until the vapor pressure of

10
the moisture in the solid is equal to the partial pressure of the vapor in the gas. The solid and gas
are then said to be in equilibrium, and the moisture content of the solid is called the equilibrium
moisture content under the prevailing conditions. Further exposure to this air for indefinitely long
periods will not bring about any additional loss of moisture. The moisture content in the solid could
be reduced further by exposing it to the air of lower relative humidity. Solids can best be classified
as follows 9:
Nonhygroscopic capillary-porous media, such as sand, crushed minerals, nonhygroscopic
crystals, polymer particles, and some ceramics.
Hygroscopic-porous media, such as clay, molecular sieves, wood, and textiles.
Colloidal (nonporous) media, such as soap, glue, some polymers (e.g., nylons), and various
food products.
The moisture content of a solid is usually expressed as the moisture content by weight of
bone-dry material in the solid, X. Sometimes a wet basis moisture content W, which is the
moisture–solid ratio based on the total mass of wet material, is used. The two moisture contents
are related by the expression
𝑋 = 𝑊
1 −𝑊 1.18
Water may become bound in a solid by retention in capillaries, solution in cellular
structures, a solution with the solid, or chemical or physical adsorption on the surface of the solid.
Unbound moisture in a hygroscopic material is the moisture above the equilibrium moisture
content corresponding to saturation humidity. All the moisture content of a nonhygroscopic
material is unbound moisture. Free moisture content is the moisture content removable at a given
temperature and may include both bound and unbound moisture. Near the interface between free
water and vapor, the vapor pressure at equilibrium is the saturated vapor pressure. Further removal

11
of water finally results in the surface of the product dried. Water now exists only in the interior in
very small capillaries, between small particles, between large molecules, and bound to the
molecules themselves. This binding produces a considerable lowering of vapor pressure. Such a
product can, therefore, be in equilibrium only with an external atmosphere in which the vapor
pressure is considerably decreased 10.
A dry product is called hygroscopic if it can bind water with a simultaneous lowering of
vapor pressure. Different products vary widely in their hygroscopic properties. The reason for this
is their molecular structure, their solubility, and the extent of reactive surface. Sorption isotherms
measured experimentally under isothermal conditions are used to describe the hygroscopic
properties of a product 11.
The equilibrium moisture content of a product may be different depending on whether the
product is wetted (sorption or absorption) or dried (desorption) known as Sorption–Desorption
Hysteresis 11. The explanation is that contraction and swelling are superimposed on the drying and
wetting processes, producing states of tension in the interior of the products and leading to varying
equilibrium moisture contents depending on whether desorption or absorption is in progress.
Classification of Dryers
The end moisture content requirement of the product determines the type of dryer needed
and drying conditions are largely dictated by storage and stability requirements. The end moisture
content determines the drying time and conditions required for drying. Dryer classification based
on the physical form of the feed has also been done 12, Thermal sensitivity, as well as efficiency
and dryer size, depend to a major extent on the thermal conditions the product is exposed to within
the dryer
The three principal factors that could be utilized in classifying dryers 2,13:

12
1. How heat is supplied to the material
2. Temperature and pressure of operation (high, medium, or low temperature; atmospheric or
vacuum drying)
3. How the material is handled within the Dryer
Energy, Economic, Safety and Environmental Factors
Escalating energy costs and increasingly stringent legislation on pollution, working
conditions, and safety have a direct bearing on the design as well as a selection of industrial dryers.
the following possible scenarios of conflict:14
1. Explosion vents could be a hygiene problem.
2. Dust in recycling streams fouls heat exchanger surfaces or causes difficulties indirect
combustion systems.
3. Thermal expansion joints or fire-extinguishing equipment can cause product buildup and
hence a fire hazard.
4. High product collection efficiency for particulate dryers means high-pressure drop and
increased fan noise. Unnecessarily stringent product specifications can cause a significant
increase in dryer costs, both capital, and operations.
In selecting energy-saving drying systems, it is important to note the following 2.
1. When handling a thermally sensitive product, recycled exhaust must be free of the product
if the stream is to pass through or near a burner.
2. Recycling increases the humidity level in drying, which may increase the equilibrium
moisture content to unacceptable levels in some cases.
3. To avoid passing dust in recycled gas through air heaters, if fresh makeup air is heated and
mixed with recycled gas, to obtain high mixture temperature (say, 400°C), the fresh gas must

13
be heated to a temperature too high for simple materials of construction. Exotic metals or
refractories are needed, which can cause product contamination or a source of ignition if it
reaches high enough temperatures.
4. In multiple-stage drying, the heat economy requires that the first-stage drying give a partially dried
product, which is sometimes too sticky to handle.
As a minimum, the following quantitative information is necessary to arrive at a suitable dryer 2:
• Dryer throughput; mode of feedstock production (batch/continuous)
• Physical, chemical, and biochemical properties of the wet feed as well as desired product
specifications; expected variability in feed characteristics
• Upstream and downstream processing operations
• The moisture content of the feed and product
• Drying kinetics; moist solid sorption isotherms
• Quality parameters (physical, chemical, biochemical)
• Safety aspects, e.g., fire hazard and explosion hazards, Toxicity
• Value of the product
• Need for automatic control
• Toxicological properties of the product
• Turndown ratio, flexibility in capacity requirements
• Type and cost of fuel, cost of electricity
• Environmental regulations
• Space in plant
A typical checklist for all the parameters required in the selection of dryers 2 shown in Table 1.1

14
New dryers are developed continuously as a result of industrial demands. Over 250 U.S. patents
are granted each year related to dryers (equipment) and drying (process); in the European
Community, about 80 patents are issued annually on dryers 2.
Table 1.1 Parameters for Selection of Industrial Dryers. Ref: 2
The physical form of wet feedstock
• Granular, particulate, sludge, crystalline, liquid, pasty, suspension, solution, continuous sheets, planks, odd-shapes (small/large)
Average throughput • Sticky, lumpy • kg/h (dry/wet); continuous • kg per batch (dry/wet)
Fuel choice • Oil • Gas • Electricity
For particulate feed products
• Mean particle size • Size distribution • Particle density • Bulk density • Rehydration properties
Inlet–outlet moisture content
• Dry basis • Wet basis
Heat sensitivity • Melting point • Glass transition temperature
Drying time • Drying curves • Effect of process variables
Special requirements • Effect of process variables Special requirements • Material of construction • Corrosion • Toxicity • Nonaqueous solution • Flammability limits • Fire hazard • Color/texture/aroma requirements (if any)
The footprint of the drying system
• Space availability for dryer and ancillaries

15
: Extraction Processes
Introduction
In chemistry, extraction is defined as a separation process that is separating a substance
from a matrix. It is the first step to separate the desired products from the raw materials 15. The
distribution of a solute between two phases is an equilibrium condition described by partition
theory. Based on how analytes move from the initial solvent into the extracting solvent. Even
washing could be considered as extraction where impurities are extracted from the matrix
containing the desired compounds. The extraction progressed through the following stages 15:
• Solvent penetrates the solid matrix
• The solutes dissolve in the solvents
• The solute is diffused out of the matrix
• Extracted solutes separated or collected from the extracted solvent
In the solvent extraction where samples in a solution/matrix are transferred from one liquid
to another liquid where equilibrium established quite rapidly 16. For a simple equilibrium involving
a component j distributed between two non-miscible liquid phases A and B, the equilibrium
between two immiscible liquid phases jB and jA is characterized by the constant KBA,j (distribution
constant) with the expression16:
𝐾67,9 =𝐶9,7𝐶9,6
2.1
where cj,A is the molar concentration of compound j in phase A and cj,B is its molar concentration
in phase B. There is another way of characterization which is a calculation of extracted fraction Ej

16
𝐸9 =
𝑞:𝑞;<;=>
= 𝐶:𝑉:
𝐶:𝑉: +𝐶2 𝑉2=
𝐾9𝛽1 +𝐾9𝛽
= 1 −𝐾9𝛽
1 +𝐾9𝛽
2.2
where qo is the amount of the extracted solute in the organic phase;
qtotal is the total amount of solute
Vo and Vw are the volumes of an organic and aqueous phase, respectively
β is the phase ratio and is given by β = Vo/Vw
co is the molar concentration of the analyte in the organic phase
cw is the concentration in water
Kj is the equilibrium constant
The other factor which can also be used for characterization is Enrichment Factor, F16. This
parameter shows the ratio of the concentration of compound j in organic phase versus the initial
concentration of the compound in the aqueous solution cw,init.
𝐹 = 𝐶:
𝐶2,?@?;=𝐸9
1𝛽 2.3
Enrichment ratio depends on both Ej and β and F is larger when Ej is closer to 1 (maximum possible
value) and when Vo is smaller and Vw is larger (smaller β).
When a chemical is present as different chemical species in equilibrium, analyte j is present in
equilibria represented by j1, j2,…., jn. In that case, it is characterized by the distribution coefficient,
Dj.
𝐷𝑗 =𝐶9A,7 + 𝐶9B,7+. . +𝐶9@,7𝐶9A,6 + 𝐶9B,6+. . +𝐶9@,6
2.4
Thermodynamically, there is another parameter that characterized the solvent extraction that is
thermodynamic partition constant, Kjtherm.

17
𝐾𝑗𝑡ℎ𝑒𝑟𝑚 =
𝑎𝑗,𝐴𝑎𝑗,𝐵
= exp[−µ𝑗,𝐴0 − µ𝑗,𝐵
0
𝑅𝑇 ]
2.5
where µ9,7< and µ9,6< are the standard chemical potentials of compound j, aj, A, and aj, B is the
activities of compound j in the two phases A and B, respectively; T is absolute temperature, and R
is the gas constant.
The extraction can be increased by enhancing the diffusivity and solubility 15,17.
Diffusivity is a rate of diffusion, a measure of the rate at which particles or heat or fluids can
spread. Diffusivity can be thermal diffusivity and mass diffusivity. Thermal diffusivity is
the thermal conductivity divided by density and specific heat capacity at constant pressure 18 It
measures the rate of transfer of heat of material from the hot end to the cold end. It has the SI
derived unit of m²/s. The formula is 19:
𝛼 = 𝑘𝜌𝐶L
2.6
where
k is the thermal conductivity (W/(m.K))
CMis the specific heat capacity (J/(kg.K))
ρ is the density (kg/m2), ρCMcan be considered the volumetric heat capacity (J/(m³·K)).
Diffusivity, Mass diffusivity, or diffusion coefficient is a proportionality constant between
the molar flux due to molecular diffusion and the gradient in the concentration of the species (or
the driving force for diffusion). Diffusivity is encountered in Fick's law and numerous other
equations of physical chemistry.

18
The diffusivity is generally prescribed for a given pair of species and pairwise for a multi-species
system. The higher the diffusivity (of one substance with respect to another), the faster they diffuse
into each other.
Fick's first law relates the diffusive flux to the concentration under the assumption of a steady-
state. It postulates that the flux goes from regions of high concentration to regions of low
concentration, with a magnitude that is proportional to the concentration gradient (spatial
derivative), or in simplistic terms the concept that a solute will move from a region of high
concentration to a region of low concentration across a concentration gradient. In one (spatial)
dimension, the law can be written in various forms, where the most common form is in a molar
basis 20:
J = -DNONP
2.7
Where J is the flux ( mol m-2 s-1) and is defined by the number of particles that are moving past a
given region divided by the area of that region multiplied by the time interval.
D represents the diffusion coefficient with units m2 s and
c is the concentration of the gradient with units molecules m-3.
Diffusion also depends on the temperature of the system, the Arrhenius equation 20.
D = [D]Qe%RSTU 2.8
D is the diffusion coefficient (in m2/s),
D0 is the maximal diffusion coefficient (at infinite temperature; in m2/s),
EA is the activation energy for diffusion (in J/mol),
T is the absolute temperature (in K),

19
R is the universal gas constant, 8.31446 J/(mol⋅K)
Diffusion constant also depends on the viscosity by the Stokes-Einstein relation 20:
D = kT6πηa 2.9
Where a is the radius of the molecule and η is the coefficient of viscosity, k is the Boltzmann
constant (8.617 x 10⁻⁵ eV K-1) 20.
η = ηVe%RSTU 2.10
The properties of the extraction solvent, the particle size of the raw materials, the
solvent-to-solid ratio, the extraction temperature, and the extraction duration will affect the
extraction efficiency 15,20–23. The selection of the solvent is critical for solvent extraction which
includes several factors that need to be considered such as selectivity, solubility, cost, and safety
21. Based on the law of similarity and intermiscibility (like dissolves like), solvents with a polarity
value near to the polarity of the solute are likely to perform better and vice versa.
It was observed that the finer the particle size is, the better result the extraction achieves. The
extraction efficiency will be enhanced by the small particle size due to the enhanced penetration
of solvents and diffusion of solutes 17,21–23.
High temperatures increase the solubility and diffusion. Temperatures that too high,
however, may cause solvents to be lost, leading to extracts of undesirable impurities and the
decomposition of thermolabile components 21–23.
The extraction efficiency increases with the increase in extraction duration in a certain time range.
Increasing time will not affect the extraction after the equilibrium of the solute is reached inside
and outside the solid material. The greater the solvent-to-solid ratio is, the higher the extraction
20
yield is; however, a solvent-to-solid ratio that is too high will cause excessive extraction solvent
and requires a long time for concentration 21–23.
Solubility is the property of solid, liquid, or gas as a substance (solute) to dissolve in a
solid, liquid, or gaseous solvent. The solubility of a substance fundamentally depends on the
physical and chemical properties of the solute and solvent as well as on temperature, pressure, and
presence of other chemicals (including changes to the pH) of the solution. The extent of the
solubility of a substance in a specific solvent is measured as the saturation concentration, where
adding more solute does not increase the concentration of the solution and begins to precipitate
the excess amount of solute. There are several factors on which solubility depends such as
temperature, pressure, and polarity 24. Solubility is commonly expressed as a concentration; for
example, as g of solute per kg of solvent, milarity, molality or mole fraction etc. The maximum
equilibrium amount of solute that can dissolve per amount of solvent is the solubility of that solute
in that solvent under the specified conditions. Solubility value can be related to the free energy of
solvation 25
log 𝑆 =𝛥𝐺4<>W=;?<@−2.303𝑅𝑇 2.11
where 𝛥𝐺4<>W=;?<@ is the free energy of solvation.
Extraction Methods
Many studies have been published that compare results obtained with different methods
either have used real samples or model solutions 26–34. Based on the principle of different extraction
techniques, extraction or sample preparation methods for sample analysis can be broadly grouped
into solvent extraction methods, steam distillation methods, headspace techniques, and sorptive
techniques 35.

21
2.2.1 Solvent Extraction Methods
This method uses the solvents such as hexane or ethanol to extract the extractives out of
the matrix Solvent extraction is based on the transfer of extractives from the solid or liquid sample
to the organic solvent which further allows the separation and collection of the solvent phase. The
solvent must have a low boiling point and also must be able to extract both polar and non-polar
components. Extraction of an aqueous solution with an organic solvent which may be complicated
by emulsion formation. Solid-phase extraction (SPE) and Solid-phase disc extraction (SPDE)
could be a possible solution to prevent emulsion formation 36–38. For extraction in case of solid
samples, either sample can be used as it is or dissolved in water and get an aqueous solution. Other
techniques for solid samples are supercritical fluid extraction (SFE), accelerated extraction, and
soxhlet extraction 35.
In Soxhlet extraction, a porous thimble is used to place the sample in it and low boiling
organic solvent continuously flows through it, and extracts come out along with non-volatile
compounds 34,39. In accelerated solvent extraction (ASE), pressure-tight cell packed with sample
and then topped with solvent, subjected to a high temperature and pressure. The extract is collected
in collection vial after purging the cell with nitrogen gas. A small amount of solvent is used in
ASE but high volatile compounds can be lost at high temperature or volatiles can get precipitated,
thus clogging the line.40–42 Solvent, as mentioned in ASE, can be elevated to high temperature
using microwave energy, and then microwave energy has an interaction with a solvent that would
have an impact on the extraction. This technique has more scope for environmental applications
43,44.
Supercritical fluid extraction (SFE) uses the solvent such as CO2 at or above its critical
point. The extracting power of the supercritical fluid can be improved by changing its pressure
during the extraction.31,45–50. SFE uses the non-toxic solvents, short extraction time and extraction

22
is also selective. The solvent can be recycled. This extraction is a bit time consuming and difficult
to balance temperature, pressure, and flow rate.
Solvent assisted flavor evaporation (SAFE) is an extraction technique used to overcome
some of the disadvantages of solvent extraction techniques. In SAFE techniques, the collected
extract is cryogenically cooled with liquid nitrogen. It could be used for aqueous foods such as
milk or fruit pulps but it has complicated set-up and time-consuming cleaning 29,51,52.
2.2.2 Steam Distillation Methods
Steam distillation is the use of steam and generates an aqueous extract. If this aqueous
extract further extracted with a solvent, then there is a new technique called simultaneous
distillation extraction (SDE) comes out where the final product is solvent extract.29,32,53–55 The
SDE can be carried out under reduced pressure 56.
2.2.3 Headspace Techniques
Headspace collection is a technique that is simple and convenient and could be used for all
kinds of materials. It is probably the easiest way to capture and detect volatile compounds. There
could be static headspace and dynamic headspace. In dynamic headspace, volatiles above the
sample is swept away by a carrier gas such as nitrogen and helium, using porous polymer i.e.
entrapped then onto a trap or using the vacuum33,57 Although it is simple and quick it would not
be that accurate as analysis profile is dependent on the sampling temperature.57–59 Direct thermal
desorption is a technique where samples are placed in a thermal desorption tube which is a place
in a thermal desorption unit and connected directly to the Gas Chromatography (GC). It is a one-
step process as desorbed volatiles are transferred directly into the GC. Volatiles are derived into
the column as a sample subjected to control heating in a flow of inert carrier gas by the desorber
51,60.

23
2.2.4 Sorptive Extraction techniques
The requirement of rapid, solventless extraction and pre-concentration of volatile
compounds gave the sorptive techniques which include solid-phase microextraction (SPME),
headspace sorptive extraction (HSSE) and stir bar sorptive extraction (SBSE). This technique
works on the principle that there is a partitioning of organic components either in aqueous or vapor
phase and thin polymeric films. For the analysis of volatile compounds, solid-phase
microextraction (SPME) has been widely used 61,62. SPME holder has the polymer fiber which is
the stationary phase. These polymers can be divinylbenzene (DVB), polydimethylsiloxane
(PDMS), polyacrylate (PA), and carbowax-polyethylene glycol (PEG). These polymers can be
used in the fiber on their own or mixed in combination with carboxen (CAR) 63. These fibers can
be polar, non-polar, or mixed and used according to the sample. SPME works on the principle of
absorption or adsorption. It works when the equilibrium is reached between the volatile
compounds/aqueous extract and stationary phase 29,32,59,61,63,64 Hence sensitivity, length and other
parameters play a crucial role in the selection of the time of extraction. For instance, temperature
and agitation results to reach the equilibrium faster but the number of analytes extracted will be
compromised 63. SPME is a quick and easy to use, solventless technique. Problems like sensitivity
and loss of volatile analytes can be overcome by other sorptive techniques like headspace sorptive
extraction (HSSE) and stir bar sorptive extraction (SBSE) 65. Stir bar consisting of magnetic core
encapsulated in glass-covered outside by a thick layer of polymer PDMS is used in both HSSE,
SBSE techniques. HSSE used above the sample by suspending into the headspace but SBSE is
immersed in the liquid sample and continuously stir to collect the volatile compounds 65–67. It has
a major disadvantage that polar chemicals would be discriminated against due to the use of PDMS
that is a non-polar coating. After equilibration and extraction, the stir bar has to be removed and
placed into the glass thermal desorption tube in the thermal desorption unit. The thermal desorption

24
unit has to be mounted on GC-MS for analysis of volatile compounds which is not the case with
SPME 65.
Comparison of different extraction methods
Reviewing the different literature and comparing different techniques in respect of
efficiency gave some insight. Better results were observed in SPME extraction compared to SDE
from mustard seeds as SDE lacked the sensitivity and convenience. SPME was a fast, accurate
determination of volatile compounds.26. SPME compared to SAFE and SDE allows identification
of low boiling compounds in GC/MS analysis which were coeluting with solvents29. Sun-Neo Lee
et al also compared different techniques and found that SPME has better results in the extraction
of volatile compounds from garlic and has several other advantages. That is solvent-free, with no
thermal degradation, less laborious32. Compared to SDE, supercritical fluid extraction, SFE has
better results in yielding spice aroma components and even avoid the thermal degradation.68. The
type of fiber used in SPME would improve the results manifold69. SFE considers as the most
attractive technique for large- scale industrial processes 52.
SFE allows extraction at low temperatures, no thermal degradation, no toxic solvents. SFE
extracts essential oils along with aromatic flavor compounds. Carbon Dioxide even can fractionate
highly volatile compounds from the complex mixture of compounds 46. Vanillin, one of the most
important flavors has been extracted out more efficiently by SFE. Yield up to 97% can be attained
by sCO2 extraction compared to 61 % in the case of conventional methods. SPME has been proved
as useful for analysis of low molecular weight and high volatility alcohols and hydrocarbons
compared to SDE 28. In ASE, Preheating required for samples containing less volatile compounds
but the loss of more volatile compounds. Volatile compounds get trapped with prefill and preheat.
Thermal degradation observed at an elevated temperature of 40. Aditi et. al. has proved that SFE

25
extraction produces more fresh flavor from onion compared to the cooked flavor of the extract by
SDE 31
Limitations of Different Extraction Methods
There are several limitations associated with different extraction method40,41,22,45,60,,61,62,36,39,58,63
2.4.1 Accelerated Solvent Extraction (ASE)
• Very volatile compounds lost during elevated temperature
• Extractives precipitation and clogging the line
• Needs fresh solvent to maintain concentration Gradient.
• Volatile compounds trapped with prefill and preheat
• Thermal degradation observed
• Semi-solids need support
2.4.2 Simultaneous Distillation Extraction (SDE) Poor extraction of polar compounds
• Not good for fresh materials
• Thermal degradation
• Less quantitative extracts
• Problem of foaming
• Difficult to balance the boiling of two flasks
2.4.3 Solvent Assisted Flavor Evaporation(SAFE)
• Mainly for concentrating the extract
• Distillation unit is complex
• Time-consuming
• High-fat content cause skewing of a flavor profile

26
2.4.4 Supercritical Fluid Extraction (SFE)
• Clogging of line with extraction material
• Difficult in balancing temperature, pressure, and flow rate.
Modern Extraction Techniques
2.5.1 Microwave-Assisted Solvent Extraction (MWASE)
Microwaves can be used for heating materials. Microwaves/radiation are absorbed by the
material followed by dissipation as the heat of the accumulated energy. The solvent used in the
technique must have polar components such as water, methanol, etc.because microwave radiations
are not absorbed by nonpolar materials. It is a more efficient extraction process as it may lead to
shorter extraction times and minimal solvent usage 16. Microwave-assisted extraction has been
used to extract Polycyclic aromatic hydrocarbons (PAHs) from the solid environmental matrices
(soils and sediments) 44,74. This has been developed to extract various types of compounds such as
terpenes, cocaine, withanolides, and carotenoids from the soil, seeds, foods, etc 44,74–80.
2.5.2 Ultrasound-Assisted Extraction (UAE)
This extraction technique uses ultrasonic wave energy in the extraction and also known as
ultrasonic extraction or sonication. Solvent produces the cavitation which accelerates the
dissolution and diffusion of the solute. There will be heat transfer also because of the ultrasonic
wave energy which would increase the extraction efficiency. There will be shorter extraction time
and a reduction in temperature. Low consumption of solvent and energy. This technique is well
suitable for thermolabile and unstable compounds 15. This technique has been experimented to
extract antioxidant bioactive compounds from winery wastes 81. Ultrasound-assisted extraction
(UAE) has been able to extract food ingredients and products, nutraceuticals, cosmetic,
pharmaceutical, and bioenergy applications 82.

27
2.5.3 Pulsed Electric Field (PEF) Extraction
This extraction technique uses the electric field which destroys the membrane structure to
increase the mass transfer. The extraction yield increases significantly and extraction time
decreases. Several parameters determine the extraction includes field strength, specific energy
input, and temperature, and pulse number. It is suitable for thermolabile compounds because it is
a non-thermal method and minimizes the degradation 15. It has been used to extract glycosides and
polyphenols from natural products 83,84.
2.5.4 Enzyme Assisted Extraction (EAE)
The treatment of cells with high temperatures causes the coagulation and denaturation of
proteins and other polymers which is the main hindrance in the extraction of these biopolymers.
Hydrolytic nature of the enzymes could be utilized to extract the polymers which are the principle
behind EAE. The facilitation of the release of natural products is incurred by the action of enzymes
on the components of cell wall and membrane and macromolecules inside the cell. Commonly
used enzymes in EAE are cellulose, amylase, and pectinase 15. This technique has been used to
extract various thermolabile polymers/compounds such as carotenoids, chlorogenic acid from
natural products 85–87.
28
: Supercritical Carbon dioxide: Adequately Sole Solvent
Salonika Aggarwala, and Marko Hakovirtaa*
aDepartment of Forest Biomaterials, North Carolina State University, Raleigh
*Corresponding author: [email protected]
Abstract
There is an enormous need to replace hazardous industrial solvents whose recycling are
not economically viable. Supercritical carbon dioxide (sCO2) could be a potential alternative for
replacing the hazardous solvent. This could be one aspect of essential drive towards green
chemistry. This review article provides fundamentals of supercritical fluid (SCF) science
particularly supercritical carbon dioxide (sCO2). This review paper provides a concise review of
the applications of supercritical carbon dioxide (sCO2), factors affecting the extraction using
supercritical carbon dioxide (sCO2), special configurations of supercritical carbon dioxide (sCO2),
and ultimately advantages & disadvantages of supercritical carbon dioxide (sCO2) for industrial
applications.
Introduction
Sustainability and Renewability are mottos to this day and era. This includes focus within
the scientific community inspiring the development of products to eliminate the use of hazardous
substances 88. The incessant need for effective and efficient drying/extraction technology which
would be able to maintain the specific requirements of the products such as high quality, no
physical alterations, thermosensitivity, etc. leads to diverse R & D, especially in drying. This has
developed the supercritical fluid-assisted technology as an alternative to conventional drying or
extraction technology which can sustain the above mentioned specific requirements of the product.
Supercritical fluid-assisted drying uses the supercritical fluid as the drying medium instead of hot

29
air or hot combustion gases at high temperatures. This technique has been developed in recent
years 89–92.
Any component considered to be supercritical fluid at or above its critical conditions that
is when temperature and pressure reach the critical value (Tc and Pc, respectively) 89,93 as shown
in Figure 3.1. Supercritical fluids exhibit the unique properties which are densities and solubility
are similar to liquids whereas compressibility and diffusivity are similar to that of the gases 89–
91,93,94 as shown in Table 3.1. One of the key features there is no requirement of liquid-gas phase
change and no collapse of the solid structure during drying due to the no surface tension effects
93,95.
Supercritical fluids are even termed as a compressed liquid, near-critical fluid, an expanded
liquid, or a highly compressed gas 93. Two supercritical fluids have gained particular importance
which is water (H2O) and carbon dioxide (CO2). Water has a critical temperature of 373.85˚C and
a critical pressure of 22.1 MPa due to its high polarity which is way much higher than the CO2.
CO2 has a critical temperature of 31.1˚C and a critical pressure of 7.4 MPa 93.
Figure 3.1 Supercritical state for a pure component.

30
Table 3.1 Characteristic values of gas, liquid, and supercritical state Ref: 89–91,93,94
State of the fluid Density (g/cm3) Diffusivity (cm2/s) Viscosity (g/cm/s)
Gas (0.6–2.0) x 10-3 0.1–0.4 (0.1–3.0) x 10-4
Liquid 0.6–1.6 (0.2–2.0) x 10-5 (0.2–0.3) x 10-2
Supercritical fluid P ≥ Pc; T ≥ Tc 0.2-0.5
0.7 x 10⁻³ (1–3) x 10-4
CO2 is more preferable to use as supercritical fluid because of its low critical values and it
is inflammable, non-toxic, and low environmental impact 88,91,95. It is miscible with different
organic solvents and can be easily recovered. It is a good drying medium as it diffuses faster than
other liquids because of its smaller and linear molecule 93
Physical and Chemical Properties of CO2
CO2 appears as colorless and odorless gas at atmospheric temperature and pressures. It is
heavier than air and nontoxic and noncombustible. It is slightly acidic 96. Physical Properties of
CO2 93 can be referred from
Table 3.2. CO2 can exist as solid, liquid, gas, or supercritical fluid depending upon temperature
and pressure, referred from Figure 3.2Error! Reference source not found.. CO2 exists
simultaneously as solid, liquid and gas at triple point (216.55 K; 5.18 bars) but at its critical point
(304.25 K; 73.82 bars) CO2 exists as liquid, gas and supercritical fluid, with density, enthalpy, and
entropy equal to 467.9kg/m3, 634.3 kJ/kg, and 3.552 kJ/(kg) respectively. CO2 exists only as a
supercritical fluid at temperatures and pressures greater than the values at the critical point 93. CO2
has a very low viscosity which makes the mass transfer to face no resistance. The diffusion

31
coefficient ranges from 0.1 to 3.3 x 10⁻⁴ cm2/s. Thus, diffusion of solutes is better in supercritical
fluids than in other liquids. In drying mechanisms, the diffusion rate is critical to simultaneous
heat-mass transfer 93
Table 3.2 Physical Properties of CO2. Ref: 93,97–99
Molecular Weight 44.01 g/mol
The density of gas at 21.1˚C and 1atm 1.833 kg/m3
Critical temperature 31.1˚C
Critical pressure 7381.8 kPa
Critical density 468 kg/m3
Latent heat of vaporization 276.8 kJ/kg
Latent heat of fusion 199 kJ/kg
Latent heat of sublimation 571 kJ/kg
Specific heat of the gas at 25˚C and 1 atm
Cp at constant pressure
Cv at constant volume
0.850 kJ/(kg) (˚C)
0.657 kJ/(kg) (˚C)
Solubility in water, vol/vol at 20˚C 0.90
Viscosity at saturated liquid 0.000119 Pa.s
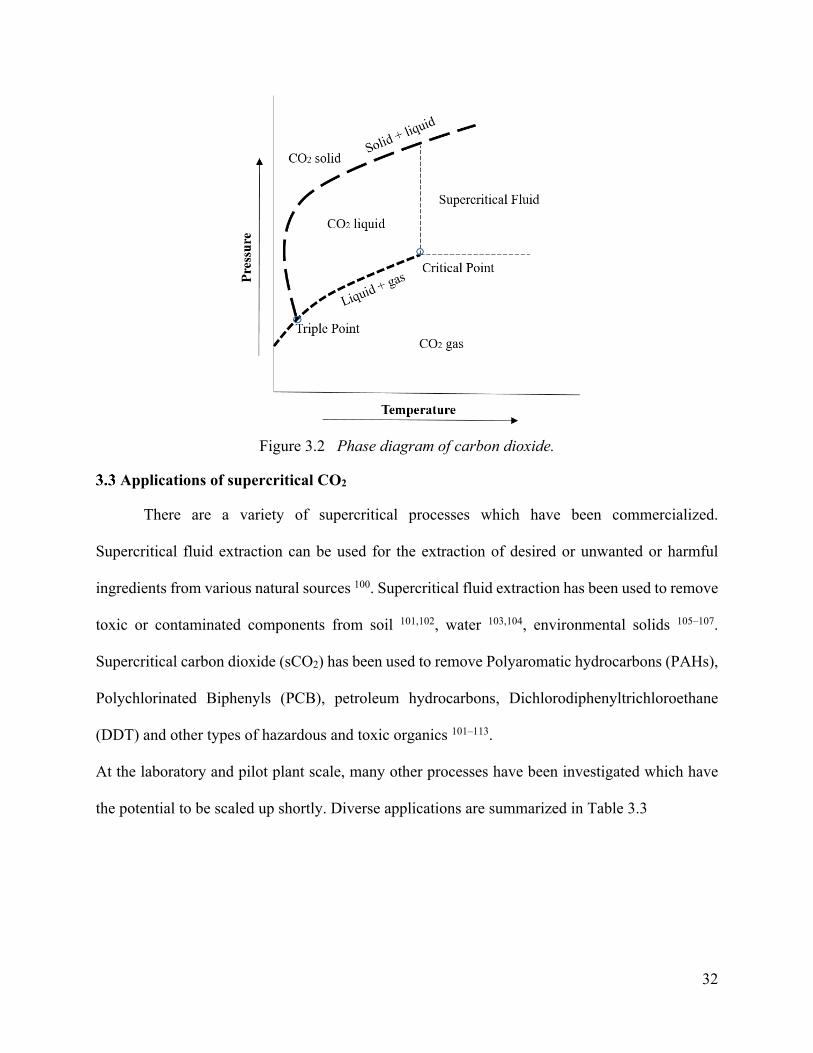
32
Figure 3.2 Phase diagram of carbon dioxide.
Applications of supercritical CO2
There are a variety of supercritical processes which have been commercialized.
Supercritical fluid extraction can be used for the extraction of desired or unwanted or harmful
ingredients from various natural sources 100. Supercritical fluid extraction has been used to remove
toxic or contaminated components from soil 101,102, water 103,104, environmental solids 105–107.
Supercritical carbon dioxide (sCO2) has been used to remove Polyaromatic hydrocarbons (PAHs),
Polychlorinated Biphenyls (PCB), petroleum hydrocarbons, Dichlorodiphenyltrichloroethane
(DDT) and other types of hazardous and toxic organics 101–113.
At the laboratory and pilot plant scale, many other processes have been investigated which have
the potential to be scaled up shortly. Diverse applications are summarized in Table 3.3

33
Factors affecting extraction using sCO2
The solubility of different compounds is different in sCO2. Solubility is determined by the
equation mentioned below 159
C = dkexp(a/T + b) 1.1
where c is the concentration of a solute in gas in g/L, d is the density of a gas in g/L, k is an
association number, a = ΔH/R, and b = In (MA + kMB) + q - k In MB. MA and MB are the
molecular weights of the solute and the gas, correspondingly. ΔH = ΔHS + AHvap and q = qs +
qv , ΔHS is the heat of solvation, and qs is a constant. ΔHvap is the heat of vaporization of the
solute, and qv is a constant. K is the number of molecules of gas. The solubility of various
components changes with the temperature and pressure 159.
Table 3.3 Diverse Applications of sCO2.
Field Applications
Drying Bioactive ingredients 114–117, Aerogels 92,118–
127, nanomaterials 128, Dry cleaning 129, Softwood 130, Coal 131
Agri-food Decaffeination of coffee and tea 132,133 Extraction of fragrances and flavoring components 89,90,95,134 Microorganisms Inactivation and sterilization 135–137
Pharmaceuticals Replacement for toxic liquid solvents 91 Extraction of steroids 90,138,139
Materials Production of aerogels 92,118–127,140,141 Dyeing 142–144
Fuels Desulfurization of coal 100 Chemistry & Biochemistry Photochemical reactions 145, polymerization
reactions 146, and enzymatic reactions 147–149 Working Fluid Domestic water heat pumps and refrigeration
150,151 Power Generation Sterilization
Generate electricity using desk size turbine and could power the whole town 152–155 Kills the pathogens 156–158

34
Similarly, diffusivity and internal mass transfer are connected as shown in the equation below 160.
ki = 2Ω3𝐷𝑒𝑓𝑓𝑑p (asymptoticvalue, t → ∞) 3.2
ki = x
𝐷𝑒𝑓𝑓𝛱𝑡 (initialvalue, t → 0)
3.3
ki is the internal mass transfer coefficient, Deff is effective diffusivity, dp is the particle diameter,
Ω is shape constant and t is the time.
Different researchers have studied the SFE of different materials at different operating
conditions. Fiori 160 studied the SFE of sunflower at different conditions of pressure, temperature,
and solvent flow rate, the mass of substrate, and particle size. Kiriamiti 161 also observed the change
in the yield of oil extracted from sunflower seeds using sCO2 with the change in different
parameters. It was observed, the yield was not dependent on the flow rate at the beginning and this
was due to the process controlled by solubility in the beginning and at the end, extraction becomes
mass transfer controlled. Smaller the particle size more is the yield 160,161. An increase in
temperature also increases the yield. The flow direction of the solvent also influences the yield.
Some researchers 162,163 pointed that downward laminar flow promotes better mass transfer
coefficients than upward but Kiriamiti 161 did not observe any change with downward and upward
flow.
The polar attribute of sCO2
CO2 is considered as non-polar because of its zero dipole moment and low dielectric
constant. CO2 has a considerable charge separation in its molecular structure with significant
nonzero bond dipole moments which results in significant quadrupole moment 164,165. Hence CO2
is described as a quadrupole solvent. CO2 can act as both weak Lewis acid (LA) as well as a Lewis

35
Base (LB). This has been suggested that CO2 can solubilize several dipolar and nondipolar
molecular systems. The solubility of CO2 in water can illustrate the polar nature of CO2 166.
Special Configurations of sCO2
Supercritical carbon dioxide has been used for obtaining polymer and composite
microparticles. Extensive research has been done on this. Conventional methods used for
producing microparticles and polymers require high temperature and use of organic solvents which
are toxic, flammable, environmentally hazardous, and expensive 167. Production of micro- and
nanoparticles using supercritical fluids could be of big interest especially by pharmaceutical
companies because of many challenges such as bioavailability of low soluble molecules,
development of controlled release powdery formulations, effecting a less-intrusive release 168,169.
SCF-assisted micronization can be categorized based on the role played by the supercritical fluid
that could be as a solvent, and solvent, solute, or a co-solute 93,167,168,170.
sCO2 as a Solvent
The process commonly uses the sCO2 as a solvent known as Rapid expansion supercritical
solutions (RESS) where the material to be processed is dissolved into SCF, followed by rapid
depressurizing of the solution through a nozzle or capillary which causes the rapid nucleation of
the solid into highly dispersed product 167,169. A special type of RESS is CSS (Crystallisation from
supercritical solutions) where substances are formulated into fine particles that were soluble in
supercritical solvents 138.
sCO2 as an Anti-Solvent
The antisolvent mode is similar to the traditional recrystallization using the classic solvents
such as ethanol, acetone depending on the nature of applications. The substance to be processed is
first dissolved in a classic solvent and then treated with sCO2 which triggers the precipitation. The

36
organic solvent used to dissolve the solute must have a good affinity for sCO2 and perfectly
miscible. The principle is based on bidirectional mass transfer of solvent to sCO2 and vice versa.
After the evaporation of the solvent, the solute will be concentrated and reach the supersaturation
level. With the dissolution of sCO2 in the organic phase, decreases its density and solvent power.
The precipitation of solute will begin and microparticles are formed. The solutes should have low
solubility in sCO2 and another solvent should have high solubility in sCO2 93,167.
sCO2 as a Solute
sCO2 is dissolved in the liquefied compound in this process. The gas-saturated mixture is
decompressed through the nozzle causes the precipitation and the formation of particles in the
atomization region. Substances to be treated not soluble in SCF but absorb a large amount of gas
which would either swell the substrate or decrease the melting point. This process is known as a
particle from gas-saturated solution (PGSS) 167,171,172.
sCO2 as a Co-Solute
In this process, sCO2 acts as a co-solute but the substrate of interest is not soluble in SCF.
The goal is to saturate the solution containing the solute on interest with sCO2 at high pressure
using a static mixer. This facilitates the atomization of the solution into a spray of fine droplets 93.
Advantages and Disadvantages of sCO2
There are numerous advantages of supercritical carbon dioxide which are mentioned as
follow89,93,167,170:
• During micronization, better control of particle size, morphology, and particle size
distribution.
• Process parameters such as temperature, pressure, nozzle diameter, depressurization rate
can be controlled

37
• No use of an organic solvent which avoids the toxicity and environmental harm
• Operating temperature is very low offers the possibility of processing thermolabile
compounds.
• Supercritical-assisted CO2 drying could be suitable for thermosensitive materials to avoid
thermal degradation because of low critical temperature
• The water solubility of dried products could be enhanced which would foster the powder
formulation process.
• Less-energy intensive process
• CO2 can be recycled, thus leads to greener technology
• During drying, no emissions of Volatile Organic Compounds (VOC)
Besides listed advantages, there are two main disadvantages of Supercritical Fluid extraction are
high investment costs and high pressure requirement89,93,167,170.
Conclusion
There have been significant developments concerning the use of supercritical carbon
dioxide over the last 20 years. This could be as an alternative green solvent to other hazardous
volatile organic compounds as well as efficient in enhancing carbon capturing and sequestration
technique. Supercritical carbon dioxide (sCO2) would be a best option to replace hazardous
solvents because of its low critical temperature, low critical pressure, non-toxicity, inflammability,
cheap, and recyclable. Supercritical carbon dioxide can be used to enhance the performance of
traditional drying processes dealing with thermosensitive and sticky materials through extensive
research and a series of innovations. sCO2 are already being used for extracting compounds from
natural materials, polymer processing, or biocatalysis. Extraction of hop constituents and spices
and decaffeination of tea and coffee by sCO2 are already performed on an industrial scale. sCO2 is

38
replacing traditional compounds, hazardous to health, and the environment. The sCO2 extraction
methods allow lower energy consumption compared to traditional technologies. sCO2 drying is
used in the production of aerogels. sCO2 also found application in the field of energy production
because of the excellent heat transfer properties such as supercritical Rankine and Brayton cycles,
to reduce the cost of electricity. Supercritical drying is one of the most efficient drying alternatives
for any industrial application. Further, more research is needed to understand the techno-economic
aspects of this technology for industrial applications. This technology could be considered as on
step forward towards the green chemistry.

39
: Wood structure and drying
Structure of Wood
Wood is a naturally formed organic material which is mainly formed of elongated tubular
elements which are arranged in parallel manner 173. These elements are hollow, elongate, spindle-
shaped cells which are arranged parallel to each other along the trunk of a tree 174. It is defined as
the secondary xylem in the stem of trees. Wood is a fibrous and porous tissue found in stems and
roots of trees and other woody plants. The fibrous nature of wood strongly influences the ultimate
usage of the wood 174. Wood provides support to the trees enabling them to grow, used for fuel, to
transport the nutrients and water from roots to leaves, as construction material, tools and weapons
manufacturing, furniture and paper manufacturing, wood engineered materials, wood-derived
products such as cellulose and its derivatives such as cellophane and cellulose acetate 173–178. Now
a day’s wood has been used even at the nanoscale such as nano cellulose and its numerous
applications 179.
4.1.1 Formation of Wood
In trees or woody plants, there are two types of growth- primary growth and secondary
growth. Primary growth is responsible for elongation of stem and branches, secondary growth is
responsible for the thickening of elements achieved through cambium activity 178.
The features which are present in the wood from the core to the outer region 178:
• Pith, originates from primary growth of the plant present in a core of tissue in the middle
of a tree’s stem or branches
• Woody material, most important part of mature trees. This part is differentiated into
sapwood and heartwood. Sapwood is present in the outer region, where sap transports from

40
roots to leaves. Heartwood is the inner and darker region is not the living part and not used
for sap transport.
• Bark, differentiated into the outer corky dead part and thin inner living part (below the
cambium zone) helps in the transport of food from the leaves to the other growing elements.
Branches, part of primary growth initiated by the lateral bud development. Bases of branches are
known as knots, have been covered as the trees grow laterally. The trunk continues to increase in
diameter and surrounds the knot portion after the die of branches. The xylem of trunk and branches
become continuous if the knot is alive and knot fits tightly into the wood. No anatomical
connection present between knot and trunk xylem after branch die and, a knot will fall out of wood
as the knot is nonadhesive and leaves knothole behind.
Figure 4.1 Cross-section of a tree showing the internal structure of the stem. Growth rings can also be observed: light parts are earlywood and dark parts are latewood. Due to this stem geometry, three material directions: longitudinal (L), radial (R), and tangential
(T) can be defined at each location. Ref. 178

41
4.1.2 Tissue and Cellular Structure of Wood
The thickness of wood and bark is grown by the division of the cells in the cambium. New
wood cells are formed inside of the cambium and new bark cells are formed outside of the
cambium. Immature cells in the cambium region differentiate into various kinds of mature xylem
(wood) and phloem (inner bark). Maturation along with the enlargement and elongation allows the
woody material to be developed 175.
In temperate climates, most of the species produce the concentric contours or rings
which are known as growth rings as shown in Figure 4.1. Wood in the growth rings that are formed
in a growing season is known as earlywood and that formed later in the season known as latewood.
Growth rings remain unchanged once they are formed and these rings are responsible for the
increase in the size of the branch and trunk diameter. The age of the trees is usually determined by
counting the growth rings 178.
Wood consists of a variety of cells of different shapes and sizes which are connected to
form the structural wood material. A major type of wood cells are elongated and pointed at the
ends. Trees are divided into two broad classes which are softwoods and hardwoods. Softwoods or
gymnosperms are usually cone-bearing trees or coniferous trees (e.g. pine, spruce, and fir). These
trees do not have ovary and hence have naked seeds. Xylem mainly contains tracheids around
90%. Tracheids are elongated cells with a length between 2 and 8 mm and diameter around 40 µm.
Tracheids are used in sap flow via bordered pits present on the radial cells and also provides the
mechanical strength. Earlywood in softwoods have cells with thin walls and large radial diameters
with large cavities whereas in contrary latewood cells have thicker walls and smaller radial
diameters result in smaller cavities. Some softwoods also have resin canals which are basically
voids or spaces can be present axially and radially where resins are secreted by the surrounding
parenchyma cells 178,180. Axial or radial resin canal complex term is referred to resin canals and all

42
the associated parenchyma cells 175. There are formation and deposition of heartwood chemicals
by the living cells (parenchyma cells) at the border between heartwood and sapwood. These
chemicals are known as extractives. Extractives are used for the protection of plant and are exuded
into adjacent cells through pits 175.
The other types of parenchyma cells present in softwoods are ray parenchyma cells thatare
align in the rays. In some softwoods, rays can have ray tracheid cells as well in addition to ray
parenchyma cells. Rays are thin and barely visible in softwoods, and appear as dark lines running
radially on cross section. These cells are rectangular or brick-shaped which are helpul in synthesis,
storage, and lateral transport of biochemical and water to a lesser extent 175.
Hardwood or angiosperms are the species where seeds are covered and enclosed inside the ovaries.
Biologically evolution wise, hardwoods are more advanced than softwood with cells are adapted
to meet specific requirements 174,175,178
• Fibers are elongated(about 1-2 mm in length, 20-40 µm in diameter) and thick-walled
cells,sparsely pitted, and provide mechanical support to the trees by making them dense
and stronger. There are two types of fibers : fiber tracheidswith bordered pits assisting in
water transport besides supporting the trees, and libriform fibers serve in support.
• Vessels, also known as pores, are large in diameter and used for upward sap flow in the
trees. Vessels are formed by the open ended vessel elements, arranged in longitudinal
direction and connected via simple, scalariform, or foraminate perforation plates.
• Parenchyma cells in the longitudinal direction are used in the storage of food.
Rays in hardwoods are composed of parenchyma cells that can be either procumbent or upright
and wider and more visible than in softwoods.Heartwood pores of some hardwood species (e.g.

43
white oak) are plugged with tyloses which are sac like intrusions of ray parenchyma cells into the
vessel to make the wood impenetrable to liquids 175,181.
There are thousands of hardwood species that exist with their unique anatomical structure.
Two main types of hardwood species are ring-porous species and diffuse-porous species. Ring-
porous species have very large vessels (up to 500 µm in diameter) in the earlywood and much
smaller vessels in the latewood. Diffuse-porous species have the smaller size vessels (50-100 µm
in diameter)throughout the entire growth ring. .
4.1.3 Chemical Composition
Wood is an organic material composed of three main elements: carbon, hydrogen, and
oxygen. There are other inorganic elements such as nitrogen, sodium, calcium is present which are
essential and are involved in the metabolism of living cells during wood formation 182. The
complex structure of the cell wall is composed of a network of cellulose microfibrils
interconnected by hemicellulose chains and covered by pectins and proteins 183. Cellulose is a
linear homopolymer whereas hemicellulose is a branched heteropolymer. These two together form
the microfibrils. The cell wall of matured dead cells (fibers & tracheids) gets impregnated by lignin
which makes these walls impervious to water. Lignin binds different cells together known as
cementing agent 184,185. The cell wall is made of several layers: primary cell wall, secondary cell
wall, and tertiary cell wall. The secondary cell wall has three zones: S1, S2, and S3 (Figure 4.2).
Adjacents cells are bind to each other by lignin which forms the middle lamella. Lignin content
significantly decreases from 90% in the middle lamella to 20% of the S2 layer 186.

44
Figure 4.2 Model of the cell wall structure, ML = middle lamella, P = primary wall
S, S2, S3 =secondary wall. Ref 175
Hardwood and softwood has a different composition of polymers 187 as shown in Table 4.1
Table 4.1 Typical Wood Composition. Ref: 187
Content (%)
Compound Softwoods Hardwoods Cellulose 42 ± 2 45 ± 2
Hemicelluloses 27 ± 2 30 ± 5 Lignin 4 28 ± 3 20 ± 4
4.1.4 Reaction Wood
Trees form the reaction wood to adapt to their environments such as wind effects and slope.
In softwood trees, compression wood is formed on the lower side of the leaning stem, has smaller
growth stresses and smaller tensile levels. On the other hand, in hardwood trees,tension wood is
formed on the upper side of the leaning stem, has a higher growth stress level188.

45
Compression wood has shorter tracheid with thicker cell wall,, higher lignin and
hemicellulose content,lower cellulose content, and 10-20 % higher density compared to normal
wood. The cell wall consists of ML, P, S1, and S2 layers. Whereas tension wood has increased
cellulose content and lower lignin density, and 5-10% higher density compared to normal wood.
Tension wood fibers have thicker , can contain gelatinous layer (G layer), which is almost pure
cellulose and loosely connected to the secondary wall impacting the mechanical properties 189.
4.1.5 Implications for the Drying Process
The menisci present in the leaf stomata pull up water to prompt the ascent of sap in the tree. The
absolute liquid pressure in the sap column must be negative because of the height of trees which
results in no gaseous phase. The implications for the drying process developed by the vascular
system of tees190.
• The wood material is strongly anisotropic because of the growth and orientation of the
woody cells designed to support the tree and provide thelongitudinal sap flow from the
roots to the canopy.
• Bordered pits or vessel-to-vessel pits in the vascular system support a gas invasion because
of negative pressure
• Permeability in heartwood gets reduced due to metabolite deposition, aspiration or closure
of bordered pits, or tylose by one or several orders of magnitude.
• The wood in the sapwood part of logs gets fully saturated whereas the heartwood zone is
generally only partly saturated.

46
Table 4.2 Typical values of Moisture Content Found in Greenwood. Ref: 178
Moisture Content Dry Basis (%)
Wood Type Sapwood Heartwood
Softwoods 150–200 40–80
Hardwoods 80–120 60–100
Table 4.2 shows the typical values of moisture content present in different greenwood 178. The
maximum moisture content in the sapwood which is fully saturated, assuming that the entire pore
volume of filled with water by the equation below.
X =
фρt(1 − ф)ρs whereф = 1 −
ρ0ρs
4.1
Where ф is the porosity, ρ0 is the basic density (oven-dry mass/green volume), ρs is the cell wall
substance density (~1530kg/m3) and ρt is the sap density (ρt = 1000kg/m3).
Moisture Distribution in Wood
The moisture content (dry basis) is defined by the ratio as follow:
X = Massofwater
Oven − drymass 4.2
There are two types of moisture present in the wood: free water and bound water.
4.2.1 Free Water
Free water is the liquid sap that is not attached to the cell lumens. The liquid sap flows
through the vascular system, present in the cell cavities is referred to as “free water” because of its
properties similar to pure water such as saturated vapor pressure, density, viscosity 178,191.
Free water is tied to the solid matrix through capillary forces. There is a pressure difference exists
between the liquid and gaseous phase because of the surface energy of the interface between liquid

47
and gas (surface tension) along with the contact angle between the woody matrix and the interface.
The pressure difference obeys Laplace’s law 178,191.
The curvature of the interface impacts the saturated vapor pressure as per the Kelvin equation 192.
ln 𝜑 = �𝑃W𝑃W4� = −𝜎(
1𝑟A+
1𝑟B)𝑀W
𝜌;𝑅𝑇 4.3
where Pvs is the saturated vapor pressure
Pv is the equilibrium vapor pressure at the curved interface
σ is the surface tension
r1 and r2 are the two principal radii of the surface
Mv is the molar mass of water
The quantity φ is known as the relative humidity
4.2.2 Bound water
The hygroscopic nature of the wood defines the presence of bound water. Bound water is
the water molecules that are in the cell walls. To define the hygroscopic behavior of wood, there
is a term used to define the maximum sorptive moisture content, known as fiber saturation point
(FSP). FSP broadly defined as the amount of free water present in the wood and above which is
mostly bound water but scientifically FSP is defined as the equilibrium moisture content (EMC)
in an environment of 99% relative humidity. For most commercial species, this value ranges
between 30-32% at room temperature 178,191.
The cell wall has the sorbed water which has lower enthalpy than liquid water and enthalpy
of bound water increases with an increase in moisture content up to FSP and after this value or
above it, the enthalpy is similar to that of water due to the free water content above the FSP 191.

48
𝛥ℎ4 = −
𝑅𝑀W
𝑑(𝑙𝑛 𝑃W𝑃W4
)
𝑑(1𝑇)
4.4
Differential heat of sorption can be calculated using Clausius Clapeyron equation 191
Drying Process of Wood
4.3.1 Drying at Low temperature
The widest spread industrial process for seasoning wood in kilns using low-temperature
convective drying. Two phases of drying may be distinguished: (1) a constant drying-rate period
and (2) a decreasing drying-rate period.
The Constant Drying-Rate Period is rarely seen with wood but common in a porous
material. The exposed surface of the wood/board is above the FSP during this period. The vapor
pressure at the surface is equal to the saturated vapor pressure and is a function of the surface
temperature only. Coupled heat and vapor transfer occur across the boundary layer. The heat flux
supplied by the airflow is used solely for transforming the liquid water into vapor. During this
stage, the drying rate is constant and depends only on the external conditions (temperature, relative
humidity, velocity, and flow configuration). The temperature at the surface is equal to the wet-
bulb temperature. Moreover, because no energy transfer occurs within the medium during this
period, the whole temperature of the board remains at the wet-bulb temperature. The exposed
surface is supplied with liquid water coming from the inside of the board by capillary action; the
liquid migrates from regions with high moisture content (liquid-gas interfaces within large pores)
toward regions with low moisture content (liquid-gas interfaces within small pores). The constant
drying-rate period duration depends strongly on the drying conditions (magnitude of the external
flux) and the medium properties 178,193–195.

49
The Decreasing Drying-Rate Period
The vapor pressure is smaller than the saturated vapor pressure after the surface attained
the hygroscopic range. The heat flux supplied to the medium is temporarily greater than what is
necessary for liquid evaporation and the external vapor flux is reduced. The energy in excess is
used to heat the board, the surface at first, and then the inner part by conduction. The surface vapor
pressure, hence the external vapor flow, depends on both temperature and moisture content. To
maintain the energy balance, the surface temperature increases as the surface moisture content
decreases. This leads to a decreasing drying rate (the heat supplied by the airflow becomes smaller
and smaller). A two-zone process develops inside the wood: (1) an inner zone, where liquid
migration prevails, and (2) a surface zone, where both bound-water and water-vapor diffusion take
place. During this period, a conductive heat flux must exist inside the board to increase the
temperature and to evaporate the liquid driven by gaseous diffusion. The region of liquid migration
naturally reduces as the drying progresses and finally disappears. The process is finished when the
temperature and the moisture content attain the outside air temperature and the EMC, respectively
178,193–195.
4.3.2 Drying at High Temperature
To reduce the drying time without decreasing the quality of the dried product, the drying
conditions must be such that the temperature of the product is above the boiling point of water.
Such conditions ensure that an overpressure exists within the material, which implies that a
pressure gradient drives the moisture (liquid or vapor) toward the exchange surfaces 196,197. At
normal atmospheric pressure, the boiling point of water equals 100°C. Consequently, to obtain an
internal overpressure, the temperature of the porous medium must be above that level during at
least one part of the process. This is the aim of convective drying at high temperature (moist air or

50
superheated steam) and a possible aim of contact drying or drying with an electromagnetic field
(microwave or radiofrequency). However it is possible to reduce the boiling point of water by
decreasing the external pressure and, consequently, to obtain a high-temperature effect with
relatively moderate drying conditions 198–200.
This is the principle of vacuum drying, particularly useful for lumber that would be
damaged by high-temperature levels 198,200. Whenever an overpressure exists inside a board, the
large anisotropy ratios imply intricate transfer mechanisms. Heat is often supplied in the thickness
direction while, despite the length, the effect of the pressure gradient on gaseous (important for
low moisture content) or liquid migration (important for high moisture content) takes place in the
longitudinal direction. This is a result of the anatomical features of the wood. In the case of very
intensive internal transfer, the end piece can be fully saturated and, sometimes, moisture can leave
the sample in the liquid state.
Issues associated with Conventional Drying
4.4.1 Defects
Drying defects are the most common form of degradation 201. There are two types of drying
defects,
1. Non uniform drying results in the rupture of the wood tissue, such as checks (surface, end
and internal), end splits, honey-combing, and case hardening202. Physical flattening of
fibers above the fiber saturation point resuls in a defect called collapse.
2. Defects from shrinkage anisotropy, resulting in warping: cupping, bowing, twisting,
crooking, spring, and diamonding.
The standard organizations in Australia and New Zealand (AS/NZS 4787, 2001)203 have developed
a standard for timber quality. The five measures of drying quality include:

51
1. Moisture content gradient and presence of residual drying stress (case-hardening);
2. Surface, internal and end checks;
3. Collapse;
4. Distortions;
5. Discoloration caused by drying.
Shrinkage 1,176,178,189,204,205
Sorbed water which makes the cell wall in trees fully swollen when removed from the cell
wall, reduces the distance between the chains by making new hydrogen bonds between the
hydroxyl groups of the molecular chains. The longitudinal shrinkage is usually negligible because
of dimension variation in a direction normal to the microfibril direction. In the transverse
directions, the dimensional variations plotted against bound water content are very close to a
straight line.
Shrinkage can then be defined by the total shrinkage (variation of dimension between the
green state and the oven-dry condition) or in terms of a shrinkage coefficient (variation of
dimension divided by the variation in moisture content). The tangential shrinkage is about twice
the radial shrinkage for most species. The cell arrangement of tissues, the difference between
earlywood and latewood, and the presence of ray cells can explain this observation. The
extrapolation of length values against moisture content to the original unshrinking length yields
the so-called shrinkage intersection point (SIP). Normally, this moisture content is a little higher
than the FSP, but often the two moisture content values are assumed to be the same. Shrinkage
occurs after sawing because logs are sawn in the green state. The shape of the section changes and
the reduction in size by shrinkage caused by the tangential or radial anisotropy in shrinkage (Figure
4.3) 204:

52
a. Only the quarter sawn sections without the pith keep their rectangular shape
b. Flatsawn sections cup into a trough-like shape.
c. Quartersawn sections near the pith, the thickness shrinks along the radial direction because
of non-uniform thickness once dried.
d. A squared section cut along the grain direction becomes rectangular after drying
e. A diamond shape is obtained if the grain direction is along the diagonal.
Figure 4.3 Section deformations depending on the sawing pattern. The shape after drying results from the anisotropy ratio between radial and tangential shrinkage. These
deformations exist even when the equilibrium is achieved and with a uniform moisture content throughout section.
Ref: 204
4.4.2 Environmental Issues
Environmental impacts from lumber drying originate chiefly from two factors: energy
consumption and volatile organic compound (VOC) emissions. Lumber drying is the most energy-
consuming process in the manufacturing of many wood products; for example, drying represents
more than 80 % of the total energy inputs in lumber production 206. VOCs are carbon-based
compounds that are present in wood and released during drying, are harmful to the environment
and health, and their release should be regulated 206,207.

53
Energy Use
Lumber/Board drying requires energy to (1) initiate driving forces, (2) evaporate water,
and (3) remove water from the lumber surface 200. Energy is needed to heat the material, cover
energy losses, and move the air. Factors responsible for energy efficiency are a type of species
(lower for spruce and highest for beech), initial MC (highest for high initial MC), and initial power
applied (higher for higher initial power) 208. Energy costs grew exponentially with decreasing
efficiency and linearly with initial MC and decreased slowly with increasing absorbed energy
density (kW/m3), but below 2.5 kWh/m3, energy costs increase rapidly 209.
VOC Emissions
Emissions from biomass drying as an important issue needs to be carefully considered 210–
212. The amount of VOCs released during conventional wood drying varies widely with species;
for example, red oak drying releases about 13.74 lb per thousand board feet (lb/MBF, or 2642 g/m3
), while that figure is 0.71 lb/MBF (137 g/m3 ) for yellow poplar 213 and 1.42 lb/MBF (273 g/m3 )
for southern pine 214. The amount of VOCs released is also positively correlated with drying
temperatures and emissions of VOCs are significantly higher for high-temperature drying 214.
VOCs required treatment before discharge, as it contained high levels of toxic compounds 215.
Sources for emissions in biomass drying are fine particulates entrained, vaporization of VOCs in
the biomass, and thermal degradation of the biomass. The most volatile components consist of
monoterpenes, which are naturally emitted from wood at ambient temperatures, and the emission
rate increases with temperature, particularly above 100°C. They are strong-smelling irritants
whose presence becomes annoying in the long run. The condensable category consists of
components such as fatty acids, resin acids, diterpenes, and triterpenes. They are responsible for

54
the formation of blue-haze, a blue-grey discoloration of the exhaust gas from the wood drier. The
visual nuisance caused by blue haze has to date been the source of greatest concern regarding
emissions from dryers, and the phenomenon can also cause odor problems 210–214.
Thermal degradation products, such as formic and acetic acids, alcohols, aldehydes,
furfurals, and carbon dioxide, are released at higher drying temperatures (200°C or higher) when
prepyrolysis occurs. Some of the degradation components have a strong smell and are even
suspected carcinogens. Emission is affected by many factors that may be grouped into dryer type,
drying medium characteristics and biomass characteristics. Biomass particle size and its
distribution are important for particulate emissions. Wider size range may result in smaller
particles being over dried, leading to excessive thermal degradation as well as a propensity to be
entrained in the exiting gas flow 178,211,212,214.
Control of the Emissions in Biomass Drying
There has been development to reduce emissions from drying of biomass including
improvement of dryer design, optimization of drying conditions, and development of technology
to condense the emissions. There are filters such as control (solid), filters, baghouse filters, and
multistage cyclone especially for particulate emissions 178,211,212.
Liquid scrubbing is commonly used for the treatment of gas emissions by using a liquid
solvent to absorb particular gas component(s), but the capital costs for the solvent scrubbing can
be slightly higher than for the filter treatment. Both particulate and gas emissions can be treated
by regenerative thermal oxidization by feeding the exhaust gas stream to a high temperature (above
1300˚C) incinerator and needs a specially designed incinerator that can handle such high
temperatures 178,211,212.

55
Superheated steam drying has been used to reduce the VOC emissions with the addition of
a heat recovery system from the exhaust drying air. Using superheated steam as a drying medium
instead of air has advantages such as drying larger particles, no fire or explosion risk, and higher
drying efficiency if the exhaust steam is reutilized. The limitations of using superheated steam are
that the system and its operation are more complex. Leaks are prohibited as non-condensable gases
cause problems with energy recovery from the exhaust steam 178,216,217.
Fire and Explosion Risk
Fire or explosion in the biomass drying can arise when hot air is used as a drying medium,
which may start with the ignition of a dust cloud brought about by the presence of a large
proportion of fines in the material, and with the ignition of the combustible gaseous emissions
from the drying material. If significant quantities of fines are present, not only is there a risk of
dust ignition, but the release of the combustible products of thermal degradation may increase to
dangerous levels. Both causes of ignition require the presence of sufficient oxygen and a
sufficiently high temperature of 178,205,210.
Removal of Water and Extractives from Softwood with Supercritical Carbon Dioxide
Salonika Aggarwal, Shelly Johnson, Marko Hakovirta, Bhima Sastri, and Sujit Banerjee
This paper was published in Industrial & Engineering Chemistry Research, 58:3170-75
Abstract Supercritical CO2 (sCO2) removes both water and extractives from wood chips and flakes
at 60 °C. The water appears to be mostly displaced by sCO2 because its nominal concentration in
sCO2 exceeds its solubility limit. SEM imaging and contact angle measurements show no major
differences in surface properties between sCO2-treated and thermally dried flakes, which suggests
that their interaction with resin should be similar. An economic analysis for the removal of water

56
and extractives from pine flakes for the manufacture of oriented strand board shows that sCO2
treatment is potentially much more cost-effective than thermal drying from both capital and
operational perspectives. The main reasons are that the water is removed by displacement rather
than through evaporation, environmental control costs are drastically reduced, and the extractives
removed represent a value stream instead of pollutants whose emissions need to be controlled.
Because the sCO2 is largely recirculated, the process is greener than conventional direct dryers that
generate CO2 from the combustion of wood fines used as a fuel.
4.5.1 Introduction
Wood drying for the manufacture of oriented strand board and other engineered woods is
a major component of the overall product cost. Apart from the capital and energy costs of drying,
there are environmental control costs, requiring equipment such as electrostatic precipitators and
regenerative thermal or catalytic oxidizers. The VOCs (volatile organic compounds) released from
softwood is typically terpenes 218,219 and hazardous air pollutants such as formaldehyde and
methanol.220 These latter components arise principally from the thermal breakdown of wood tissue
and largely derive from the fines fraction of the furnish, which tends to reach higher temperatures
in the dryer 220
Supercritical carbon dioxide (sCO2) extraction of agricultural products such as coffee and
cannabis is well-known. sCO2 is a benign solvent whose solvating power can be tuned by
modulating pressure, temperature, and cosolvents. Solutes are dissolved at high sCO2 pressure and
are subsequently recovered when the sCO2 is decompressed. Applications of sCO2 to date have
been at a relatively small scale, certainly in comparison with large operations such as wood flake
drying for the manufacture of oriented strand board (OSB).

57
The Office of Fossil Energy at the U.S. Department of Energy (DOE) supports research
and development of sCO2 power cycles that surpass the performance of advanced, ultra-
supercritical steam. Current projects are leading to the development of direct-fired oxy-fuel
combustion as a heat source for sCO2 power cycles 221. This new technology not only is a promising
method for providing the needed thermal energy input but also can produce high-purity sCO2 for
use/reuse or storage. Typically, large volumes of sCO2 are used for enhanced oil recovery, an
economic alternative for recovering oil from depleted fields by injecting sCO2 into wells. This
paper explores another economic opportunity where sCO2 from the second cooling stage of the
power cycle is used to dry wood flakes. Our preliminary research shows that the technical aspects
and first-cut economics are surprisingly attractive. Of course, sCO2 flake drying is not necessarily
linked to sCO2 from power cycles; any source of sCO2 can potentially be used.
4.5.2 Materials and Methods
Pine chips were obtained from International Paper’s New Bern, North Carolina mill. The
dry-basis moisture content was 32 ± 1%. Pine flakes were collected from the Georgia-Pacific
Brookneal, Virginia, facility. The samples were collected directly from the chipper or strander and
kept refrigerated. No changes were observed during storage. The lignin was a commercial
“lignoboost” sample. The sCO2 extractor was an OCO Laboratories Super C unit run at 60 °C. The
scanning electron microscope (SEM) used was an FEI Verios 460L instrument. Contact angles of
deionized water on wood were measured from three locations on the wood surface with an SEO-
Phoenix 150/300 instrument, where 50 images were captured every 0.25 s from each location. The
contact angles decreased rapidly over a few seconds; only the initial contact angles are reported.
Green chips and flakes were cut into 20 × 15 × 2 mm and 60 × 15 × 1 mm subsamples,
respectively. Samples (5−14 g) were extracted with sCO2. The sCO2/wood mass ratio was obtained

58
by calculating the volume of dry wood using a density of 0.5. This volume was subtracted from
the reactor volume of 120 mL. The remaining volume was occupied by sCO2 whose density and
mass were determined from the equation of state of Span and Wagner 222. The quantity of
extractives removed was calculated as the residual from subtracting the amount of water lost from
the total weight loss. The uncertainty is large because it was obtained as the difference from the
subtraction of two much larger quantities. Chemical analysis of sCO2 condensates was done at the
Renewable Bioproducts Institute at Georgia Tech.
4.5.3 Results & Discussion
Chips: Results from sCO2 extraction of pine chips are provided in
Table 4.3. As expected from the work of Franich et al 223 on green radiata pine sapwood, increasing
sCO2 pressure at a constant run time increased water removal, which increased with increasing
sCO2/wood ratios. Insight into the mechanism of the process can be obtained by considering the
solubility of water in sCO2. The mole fraction solubility (x) of water in sCO2 at 60 °C and 20 MPa
is 0.013 224, which is similar to the value reported by others 225 obtained under slightly different
conditions. The average x value for all the data in Table 4.3 is 3 fold higher at 0.04 ± 0.01, which
has mechanistic implications that will be considered in our discussion of flakes.
GC/MS analysis of the oily extracts released during sCO2 depressurization showed that
most of the material was di- and triglycerides and fatty acids such as octanoic and decanoic acid.
Volatile terpenes such as α- and β-pinene were also found, although some of this volatiles likely
flashed off during sCO2 depressurization. Spectra from a sCO2 extract of lignin isolated from
pulping liquor showed a very similar profile, which confirms that the extracted components from
the flakes are associated with the lignin fraction. The organic carbon content of the oily condensate

59
from the flakes and that from lignin was 56% and 62%, respectively, which reinforces the
similarity of their components.
Unlike water removal which occurred under all the conditions used, extractives were only
removed at pressures above 13.8 MPa. This dependence on pressure is similar to that noted by
McDonald et al 226 where the yield of resin and fatty acids extracted from pine chips by sCO2
increased from 0.1% to 2.1% when the pressure rose from 10 to 21 MPa.
Table 4.3 Removal of Water and Extractives from Pine Chips by sCO2.
pressure (MPa)
run time (h)
percent moisture lossa
percent extractives
lossa
final MC (%)
mass ratio sCO2/wooda
13.8 1 16.7 0 15 5.2 13.8 1 18.6 0 13 7.5 13.8 2 25.9 0 11 7.9 13.8 1 19.8 0 12 16 13.8 2 21.4 0.09 8.0 16 17.2 1 18.3 2.0 14 9.2 17.2 1 15.8 2.7 11 13 20.7 1 19.3 1.6 13 10 20.7 1.5 21.3 0.6 10 12 24.1 1 21.6 1.3 11 25 27.6 1 21.4 2.1 12 15 27.6 1 21.4 1.4 11 24 27.6 1 17.3 1.4 11 12 27.6 2 21.3 3.2 8.8 11 a Dry basis
Attard et al.227 confirmed the increase in yield with increasing pressure. The low extractives loss
at 13.8 MPa in Table 4.3 is surprising at first because the solubility of components such as octanoic
acid is relatively high at x = 3.4 × 10⁻³ at 60 °C and 20 MPa 228,229. However, solubility is not the
only consideration here because the hydrophobic extractives will be strongly associated with the
hydrophobic lignin in wood, which would impede the release of the extractives to water. The

60
attraction of hydrophobic components to lignin is well known 230. The strong dependence on
extractives loss on pressure has been reported by Sparks et al.;228 the solubility of octanoic acid
rises by 62% when the pressure is raised from 20 to 27 MPa at 60 °C.
Flakes. The water removed from wood flakes by sCO2 over time is illustrated in Figure
4.4. Each measurement was made with the same mass of wood to keep the sCO2/wood mass ratio
constant for each of the two pressures used. The curve appears to plateau at about 70% water loss.
The fiber saturation point of softwood is about 30% water14 below which the moisture is bound to
the cell walls. Hence, the residual water corresponding to the plateau region in Figure 4.4 should
be bound water. The curve flattens out because bound water is more difficult to remove than free
water. Consider the results in Table 4.4 where water removal after 1 h is expressed as a function
of the sCO2/wood mass ratio.Increasing the amount of sCO2 increases the amount of water
removed. For sCO2 at 50 °C and 20 MPa, the mole fraction solubility of water is about 0.013 224,225.
The average value from all the runs made between 45 and 90 min (where most of the water should
have been removed) is 0.05, which is close to the value of 0.04 obtained for chips. These values
also include other extracted material, but the quantity of extractives is negligible compared to that
of water. In any case, if water was removed through diffusion alone, its concentration in the bulk
sCO2 should have been lower than the solubility limit of 0.013 to preserve a concentration gradient
across the flake. In fact, it is almost four times higher.

61
Figure 4.4 Moisture loss (dry basis) profiles from flakes.
Table 4.4 Effect of sCO2/Wood Mass Ratio on Water Removal
.
The ratio of free water to bound water in wood is only slightly lower at 2.3,231 which
suggests that the sCO2 displaces most of the free water. Liquid and supercritical CO2 are known to
displace water in subsurface geological structures 232,233. Thomas et al. 234 have proposed that the
dissolution of gaseous CO2 into saline aquifers can lead to the development of buoyancy-driven
convection in the brine which enhances the efficiency of CO2 transfer. A related mechanism may
also apply to our situation. The unexpectedly high concentration of water in sCO2 is a boon from
an engineering perspective because it allows for a smaller reactor than would be projected from
solubility considerations alone. Also, the displacement of water from wood requires much less
energy than evaporative removal.
pressure (MPa)
masssCO2/masswood moisture loss (%)a
20.7 24 58
47 66
27.6 31 77
a Dry basis.
61 ∼100

62
For the manufacture of products such as OSB, the interaction between resins such as pMDI
(polymeric diphenylmethane diisocyanate) and wood contribute to bond strength. The contact
angle of water on the flake surface is one indication of the resin spread and its penetration into
wood. Initial contact angles of water on flakes dried at 105 °C and with sCO2 were very similar at
83° and 81°, respectively, suggesting that their surface properties were also similar and that no
differences should exist in the interaction between wood and resin. These contact angles compare
well with those reported earlier by Martino et al. 205
Representative SEM images (x 1,000) of flakes dried at 105 °C and with sCO2 are
compared in Figure 4.5. The pore structure of the sCO2 seems to be more open and the surface is
less glazed than the thermally dried flakes. Increasing temperature is known to increase the degree
of surface glazing probably by increasing the presence of extractives on surface 205. The differences
observed in Figure 4.5 are not picked up in the contact angle measurements, which implies that
their effect on the interaction between resin and wood is small. Overall, no major differences in
surface character are observed between sCO2 and thermally dried flakes.
Figure 4.5 SEM images of surfaces of oven-dried wood (left) and SCF treated wood (right).
4.5.4 Economics.
The economics provided here are very preliminary and are only meant to determine
whether or not sCO2 drying deserves commercial consideration. Many of the parameters necessary

63
for a cost/benefit analysis are unknown. For example, operating at a higher temperature should
increase the yield of extractives but it could also increase the rate of corrosion because of the
presence of water and wood acids. We assume that the OSB facility will be co-located with the
power plant that generates the sCO2. This will eliminate the cost of sCO2 and will reduce the cost
of compressors. On the other hand, the spent sCO2 will require some processing, e.g., to remove
residual water before it is recompressed and returned for power generation.
For the manufacture of OSB, flakes are dried in conventional dryers in less than 10 min.
Most mills are trending toward pMDI resin, where the flakes are processed at slightly less than
10% moisture. For sCO2 extraction, the temperature should be as high as possible to maximize
extractives removal but should be low enough to prevent the evaporation of water, which would
then require a condenser. In any case, the temperature dependence of water removal is probably
quite low. Franich et al. 223 found the effect of temperature between 38 and 58 °C on the removal
of extractives to be small. The pressure should also be as high as possible, but this will also increase
the cost of the pressure reactor. We have selected 35 MPa because commercial vessels rated at this
pressure are attractively priced. The cycle time should approach that of thermal drying under these
conditions.
Worley 235 estimates that the current capital costs of an OSB dryer system, which consists
of dryer, furnace, and pollution control equipment, such as thermal oxidizers and electrostatic
precipitators, is $10 million for a 650 ton/day operation. Installation costs are not included because
our supercritical system will also require installation. According to Parks et al. 236, an estimate for
a 3.6 m3 cylinder rated at 35 MPa is $18000. If the sCO2/wood volume ratio is assumed to be 10,
then processing 650 tons of wood daily in 30 min cycles will require a reactor volume of about
134 m3. The corresponding reactor cost would be $680000. There will be additional costs for the

64
evaporator and the collection system, which will likely raise this value by several multiples, but
the capital costs should still be lower than those for an OSB dryer.
The operating costs for thermal dryers are about 4 MMBTU/h for the RTO. There is also a
power demand of 1000 hp from the RTO and the ESP. These costs will amount to about $1500/day
assuming a cost of 7 ¢/kwh for electricity and $3/MMBTU for natural gas. Pumping and other
power costs are not considered because they will also be needed for the supercritical system. The
extractives are roughly equivalent to tall oil, which is priced at $600/ton 237. Our extractives should
be more valuable because they will be sulfur-free. Assuming we can recover the extractives at 2%
of the wood mass, the value derived from the extractives would be $7800 for an overall swing of
$9300/day. Hence, the economics favor the supercritical process from both CAPEX and OPEX
considerations. The above analysis was done for the batch configuration used in the laboratory. In
practice, the sCO2 will likely be circulated though the flakes, which will reduce the equipment
footprint and costs and increase the recovery of the extractives. There are also other benefits from
the sCO2 process. In conventional drying, the flakes are blown through the dryer, which generates
fines and causes flake fragmentation. This will not be an issue in supercritical drying. The reduced
flake attrition should lead to resin savings and increased yield. There should also be a green
premium for the avoided use of natural gas and power. sCO2 drying will greatly reduce the
emission of hazardous air pollutants such as methanol and formaldehyde because these compounds
are mostly a product of thermal degradation of wood.3
As a final note, there is always the possibility of CO2 release from the high-pressure vessel,
which would lead to safety issues. Because CO2 is heavier than air, fatalities from asphyxiation
have occurred when it has entered confined spaces such as tanks, sumps, or cellars at high

65
concentrations. However, there are over 100 facilities worldwide, e.g., in the food industry, that
safely use sCO2 for extraction and purification.
Conclusions
Extracting wood with sCO2 removes most of the water and some of the extractives. The
free water fraction is mainly displaced by sCO2, which is very much more energy-efficient than
thermal drying; the bound water is removed by diffusion. The extractives can be recovered when
the sCO2 is decompressed. An application to drying wood flakes for the manufacture of oriented
strand board is evaluated. The extraction does not appear to affect the surface properties of the
flakes, so product quality should not be compromised. A preliminary economic analysis shows
that supercritical treatment is more cost-effective than thermal drying from both CAPEX and
OPEX perspectives because the extractives are recovered as byproducts and are not treated as
pollutants that need to be controlled. Also, there is a green value attached to our sCO2 approach,
where the sCO2 is mostly recirculated. Conventional flake dryers use wood fines as fuel, thereby
generating CO2.

66
: Coal structure and its drying
Introduction
Among all the fossil fuels present, coal is the most abundant and important fossil fuel. Coal
is a combustible black or brownish-black sedimentary rock with a high amount of carbon,
hydrocarbons, and other elements: chiefly hydrogen, sulfur, oxygen, and nitrogen 238,239. Coal is
responsible for about a quarter of the world’s primary energy and two-fifths of electricity 240. 71%
of the world’s steel is produced using coal 241. There are varieties of coal which are classified into
four main types based on the types and amount of carbon present and heat energy coal can produce.
These four types are 239,241:
Anthracite: contains 86%-97% carbon and has the highest heating value of all ranks of coal. It
occurs less than 1 % of the coal mined in the United States in 2018. Anthracite is mainly used by
the metals industry.
Bituminous: contains 45%-86% carbon. The most abundant rank of coal found in the United
States and accounted for 47% of total U.S coal production in 2018. It is used to generate electricity
and used as raw material for iron and steel manufacturing.
Subbituminous contains 355-45% carbon and has a lower heating value than bituminous. About
45% of total U.S coal production in 2018.
Lignite contains 25-35% carbon and has the lowest heating value of all coal ranks. It has not
exposed to extreme heat and pressure and tends to be relatively young. Accounted for 8% of U.S.
coal production in 2018.
The degree of change occurred in the coal as it matures from peat to anthracite is known as
coalification 241.

67
Figure 5.1 Types of Coal.
Ref: 241 Low- Rank Coal (LRC) is low in sulfur and nitrogen content which makes them primarily used
for power generation where emissions are an issue 242,243. Figure 5.1 shows the different types of
coal 241.
Coal Drying
Low-Rank coal such as lignite is one of the cheapest sources of energy 244,245 but contains
high moisture content (up to 65%, wet basis) which limits its availability 246. Drying of LRC is
needed to increase its calorific value and facilitate transportation 247. The moisture in coal causes
several problems such as storage, handling, transportation, milling, and combustion 248,249. An
important part of energy during the coal combustion is consumed to evaporate the moisture inside
the coal 249–251. Moisture in coal causes several problems during combustion such as insufficient
combustion, additional energy combustion, and additional exhaust discharge 246. To increase the
quality of the coal and to decrease the transportation costs and energy losses, it is necessary to dry
the Low-Rank Coals (LRC) to the required moisture level 252,253. Different processes such as

68
briquetting, coking, gasification, low-temperature carbonization, liquid fuel synthesis, and others
need coal drying. The final coal moisture content requirement depends on the process for which it
is needed. In case of hard coal, coking needs moisture <8%, briquetting needs <4%, carbonization,
and hydrogenation need 0%, coal combustion needs <2%. In case of brown coal, briquetting
process needs 8%-18%, gasification needs 5%-15%, carbonization needs <15%, hydrogenation
needs 0%, combustion process needs 12%-15% final moisture content 247,254. Moisture may be
present as surface or hygroscopic moisture in the coal. Coal type does not determine the surface
moisture because it depends on the soaking process during storage and transport and also depends
on washing and classification processes performed in the coal mine 247. Hygroscopic moisture
decreases with the age of coal because it depends on the rank of coal. Surface moisture evaporates
at a constant drying rate and hygroscopic moisture evaporates at a falling drying rate 247.
Evaporative drying which is the most common method of LRC drying has both heat and mass
transfer mechanisms. Temperature, sample thickness, particle size, and the drying media flow rate
are the effective parameters for the drying of LRC 251,255,256. It has been estimated that 6% moisture
reduction of LRC in coal creek plant, North Dakota using waste heat results in annual savings of
$1.3 million. Considering this number, if it would implement to all U.S. lignite power stations,
savings would be $19 million annually. Monash University in Australia has demonstrated that
reduction of moisture from brown coal can reduce greenhouse gas emissions by 30% 254.
Difficulties during Coal Drying
There are many problems which are associated with the drying of coal such as moisture
reabsorption, dust formation, and spontaneous combustion, hence safety issues 257. Coal needs to
utilize soon after the drying as coal is more susceptible to moisture reabsorption if not stored

69
properly 248,257. It was also reported that there was an increase in particle size up to 20% during
drying, which results in faster moisture absorption due to more surface area get exposed 257,258.
Another concern is spontaneous combustion because of the reactive nature of LRC which causes
self-heating. The wetting of coal during storage results in an exothermic reaction and chances of
spontaneous combustion increases when LRCs get dried to hygroscopic LRCs and particle size
gets smaller. The tendency for spontaneous combustion increases with finer the particles get as it
is a surface phenomenon 247,258.
Another problem associated with LRC drying is the loss of volatiles during drying.
Evaporative drying which uses very high temperatures can result in loss of useful volatile matter
and further reduces the calorific value and increases the fire risk. Indirect drying or use of low
temperatures can reduce the risk of spontaneous combustion but lowers the drying rate also. Hence
safety is an important concern at high temperatures 247,258.
Moisture Distribution in Coal
The different types of water present in the coal 254,259 as shown in Figure 5.2. Types of water are
described as follows:
1) Interior adsorption water is present in microcapillaries and micropores within each coal
particle which is deposited during the formation.
2) Surface adsorption water or free water forms a layer of water molecules on the surface of
coal particles
3) Inherent or capillary water is present in the pores of each particle also known as intra-
particle moisture.
4) Interparticle water is present in capillaries and small cervices found between two or more
particles.

70
5) Adhesion water forms the layer on the surface of an individual or agglomerated particles.
Figure 5.2 Different forms of water associated with coal.
Surface or free water can be removed by mechanical dewatering devices such as
centrifuges and vacuum filters. Inherent water can be removed by thermal drying processes but it
is inefficient to remove all forms of water. Other forms of water or bound water can be removed
by high-temperature heating or evaporation.254. It has been reported that LRC has more inherent
moisture than surface water which could increase its fluidization. High-Rank Coals have more
surface water which makes them easy to dry by providing less energy 242.
Parameters responsible for LRC Drying
There are three broad effective parameters on which drying efficiency depends which are: (1)
drying media parameters, (2) coal parameters, and (3) drying method 246.
5.5.1 Parameters about drying media
The different parameters about drying media which affect the drying of LRC are a type of drying
media, temperature, pressure, velocity, and relative humidity 246.
5.5.1.1.1 Drying media
Four drying media are normally used for coal-drying which are mentioned in the literature.
The four types of drying media used in the coal drying are: Air 248,249,252,260–263, Steam248,252,262,264–

71
267, Exhaust Gases 250,264, Nitrogen 266,268,269. Air or exhaust gases are used in conventional dryers
at very high temperatures (700-900˚C) 254 but these may cause some problems such as loss of the
volatiles and spontaneous combustion of the coal 258,270. Superheated steam has many advantages
over air and exhaust gases to be used as drying media such as energy consumption in superheated
steam drying is less than air drying 266, the risk of oxidation and fire is highly unlikely in
superheated steam drying because of oxygen-free atmosphere 271,272. Thus with superheated steam,
the drying temperature can be achieved and the drying rate also increases 254. Heat can also be
recovered by condensation in case of superheated steam as the exhaust is pure steam 266 and
superheated steam drying has been reported more effective than others 249. Nitrogen as the drying
media is used in conjunction with the exhaust gases 246.
The drying rate for air drying and superheated steam drying was compared and it was
reported that final moisture content for air drying was nearly zero but for superheated steam, drying
was 0.7kg/(kg db) at the same temperature (120,140 and 160˚C). The drying rate increases as
temperature increases but air drying is faster at temperature 120˚C but steam drying is faster at the
temperature of 140 and 160˚C 246. The temperature above which drying rate for superheated steam
drying is greater than air drying is known as inversion temperature 273.
5.5.1.1.2 Temperature
The drying temperature is one of the most important parameters and it affects the drying
rate and drying time. High-temperature increases the drying rate by shortening the drying time but
high-temperature is not applicable for the coal drying because of loss of volatiles and spontaneous
combustion 258. LRC has reactive nature 274 which is responsible for spontaneous combustion. Air
and exhaust gases comprise oxygen which could be responsible for spontaneous combustion and

72
fire 246. High-temperature usage also losses important volatiles from coal which decreases the
calorific value of coal 258 and even can cause fire also.
5.5.1.1.3 Pressure
The pressure is also an important parameter for the drying of the LRC. The heat transfer
coefficient gets improved by increasing the pressure and higher pressure results in high equilibrium
moisture content 275. An increase in pressure can also result in faster drying 275.
5.5.1.1.4 Velocity
Drying rate increases with an increase in the drying media velocity although drying rate
does not get significantly affected by velocity in the latter stage of drying 276. It has also been
reported that heat transfer rate and solid mixing increases with an increase in fluid velocities in
fluidized bed dryers 277.
5.5.1.1.5 Relative Humidity
The drying of LRC also gets affected by relative humidity. Evaporation rate depends on
the water vapor difference between the coal surface and the drying media at the surface of coal.
With an increase in humidity, the water vapor pressure of the drying media also increases which
in turn decreases the drying rate. With the increase in relative humidity, the equilibrium moisture
content of the coal particles also increases 278.
5.5.2 Parameters about Coal
The characteristics of different types of coal and the particle size of the coal are the
important parameters that affect the drying. The different characteristics of the different types of
coal which determine the drying are initial moisture content, porosity, equilibrium moisture
content, volatile matter, ash content, grind ability, and the heating value 260. In evaporative drying,
heat is provided to heat the particle, for evaporating the water and for overcoming the binding

73
forces (both the physical and the chemical) between the water and the coal 260,275. Evaporation
easily removes the surface water but more energy is required to remove other types of moisture as
the heat of desorption increases with the decrease in the moisture content after a critical moisture
value 279. Binding force changes and the binding enthalpy increases with a decrease in moisture
content for different coal types 280. Pores in the lignite have the highest amount of water 257.
Therefore, the number, size, distribution, and shape of pores in LRC are very important to
determine drying efficiency as it is very difficult to remove water from smaller pores 246.
5.5.2.1.1 Type of Coal
Many studies have done to investigate the effects of the coal types on drying 250,251,263,281–
284. Different coal types have different drying characteristics 246. LRC has more hygroscopic
moisture whereas high-rank coals have more surface moisture which is responsible for varying
drying characteristics of different types of coal254. The porosity of coal also has an impact on the
drying behavior of coal. It is assumed that 20% of water which is strongly bound to lignite is
because of the hydrogen bonding 270. This hydrogen bonding tends to happen in the fine pore
structure 285. Pores in lignite are larger of over 30mm diameter despite overall porosity is similar
to bituminous coal about 0.1 mL/g 254.
5.5.2.1.2 Particle size
Particle size is an important parameter in the drying process. In the superheated steam
fluidized bed dryer, it has been reported that the heat transfer coefficient gets affected by the size
of the lignite particles 275. Drying rate increases with a decrease in the particle size as smaller
particles have larger surface area exposed 286 and moisture transport distance also decreases as
the particle size decreases.

74
5.5.3 Drying Method
Different drying technologies are used for drying the coal. Common conventional drying
systems which have been used for drying the coal are rotary dryer, shaft dryer, fluidized bed dryer,
bed dryer, etc. 247. All the different drying methods have both advantages and disadvantages.
The fluidized bed method which has been used to dry the wet particulate and the granular materials
247,276. Better gas-drying medium contact, high thermal efficiency, and drying rates are the
advantages of fluidized bed method 255 and it has disadvantages also such as non-uniform moisture
in the output products and high pressure drops 246. The low- grade waste heat can also be used in
low-temperature fluidized bed drying method 260,287 which decreases the risk of fire but still has
the possibility of spontaneous combustion in air-drying 246.
One of the promising methods for coal drying is the superheated steam fluidized bed-drying
technology especially for the high capacities power plants 275. This method may increase the
efficiency of the process significantly and even exhaust which is pure steam can be recycled 246,247.
The microwave drying is also one of the methods to dry the coal 251,266 but it has not been studied
in wide scope as other methods. The advantages of microwave drying are more uniform heating
and high heating rates compared to other conventional drying methods 251,271. Microwave heating
is an expensive method for LRC drying as it uses only electricity as the energy source. Researchers
have suggested using it by integrating it with another conventional drying system 288 because it is
possible to remove the water inside the coal using the microwave which was difficult to do using
other methods.
The flash drying or pneumatic drying is one of the widely used drying technologies 288.
The air, steam and exhaust gases can be used as the drying medium but need the medium at high
velocities to transport particles. The particle size range is between 0.01-0.5mm 288, hence cannot
be applied to larger particle sizes.

75
Large capacities can be dried by using the packed moving bed dryer which uses exhaust gases at
the temperature of 150˚C with controlled oxygen content 289 which has the potential of waste heat
recovery. This method also decreases the risk of spontaneous combustion.
There has not been much study done on the fixed-bed drying technology which can be used to dry
the coarse lignite particles 290 which are usually greater than 10mm.
Design of Dryers
Several factors determine the type of dryer and extent of drying required, hence there is
not any single drying process that could be considered as a universal drying application for wet
coal. The type of process will be dictated by the needs of the end-user 254. Both direct and indirect
dryers are used for coal drying 247. The most conventional drying method is evaporative drying
where hot air, combustion gases, or superheated steam could be used as the heating medium 254.
Dryers used for coal drying could be direct or indirect, fixed and fluid bed, rotary kiln, and
entrained system 254. Different types of conventional dryers used for coal drying are summarized
in Table 5.1

76
Table 5.1 Conventional dryers used for coal drying.
Dryers Characteristics of Drying method
Rotary 247,254,258,291,292
Coal and coal muds, cocurrent mode to avoid the ignition. Hot air or combustion gases as drying medium. Modifications in devices could be used for different forms of coals. Inlet Drying medium temperature 700-900˚C and after dryer temperature 60-120˚C. Heat consumption around 3700 kJ/kg H2O and drying time 15-40min. High drying rate. Low O2 as a drying medium to eliminate a fire hazard. 15% of the feed coal lost as coal dust along with combustion gases which need to be handled either by using cyclones or electrostatic precipitators. Needs High maintenance
Rotary Tube 247,254,258,291,292
Indirect dryers heated by saturated steam (0.15-0.55MPa), coal drying in brown coal briquetting plants, hard coals drying, Heat consumption is around 2950-3100 kJ/kg H2O. Dryers are heated by exhaust steam from the briquetting machines. Outlet coal temperature, 80˚C, vapor temperature 90˚C. Good efficiency, no fire hazard. Highly Capital intensive. High impurities. Need of trichloroethylene to remove impurities
Chamber 247,254 Used for drying of flotation concentrates, equipped with stirrers, operates in concurrent mode, use hot combustion gases, stirrers are used to break sintered coal, inlet combustion gas temperature 700˚C, outlet combustion gas temperature 110˚C, heat consumption ~ 3150kJ/kg H2O. High efficiency, Avoid cake formation during drying. Loss of coal. High maintenance, High temperature
Pneumatic247,254,258 For drying, coal, and flotation concentrate. Combustion gases or hot air as the drying medium flows from the bottom to the top in the vertical tube. Conditioned by drying gas velocity with the coal grain size. Inlet heating medium temperature is 550˚C-700˚C and outlet medium temperature is 70˚C-170˚C. Short drying time. Pressure drop leads to clogging of a tube, Operational only at optimum flow velocity, Attrition
Fluid-Bed 247,254,258 Intense drying due to good mixing, high-temperature heating and fluidizing medium, high porosity of fluidized bed. Inlet drying gas temperature 300˚C-700˚C and fluidized bed temperature is 70˚C-80˚C. Heat consumption is 3100-4000kJ/kg H2O. Simple design High capacity. Intense drying. High-pressure drop, High maintenance. Attrition
Spouted Bed 247,254,258
Used for drying of fine-grained coal or coal mud., Drying medium temperature is around 200˚C. Low-temperature use, Efficient heat, and mass transfer rates. Scaling up is difficult, Particle size limited

77
Table 5.2 Conventional dryers used for coal drying (continued). Vibratory 247,254,258,292,293
For drying hard and brown coals, combine coal transport, proportioning and drying operations, combustion gases, and hot air passing through the vibrating coal layer. Inlet drying medium temperature ~ 400˚C. It also cools the coal. Heat requirement is much lower, Better utilization of drying medium, Energy efficient, Low-velocity requirement for fluidization. Difficulties with proper distribution of the heating medium for long dryers, Moving parts
Mill-type 247,254 Combine grinding and drying operations, used generally in power plants using steam boilers fired by pulverized coal. Hot air or combustion gases used as drying mediums. Grinding and drying simultaneously. The mixture of dust-air can be feed directly to the boiler furnace. High maintenance because of wear and tear, Not applicable for high moisture content samples. High electricity consumption, High metal requirement for balls and beaters,
Shaft 247,254 Used for drying coal coke, have rotating shafts fitted with paddles, has both drying and cooling zone, combustion gases as drying medium, exhaust gas temperature is 60˚C-70˚C from inlet temperature 650˚C. High energy efficiency. Used for coal coke, High-pressure drop, High maintenance
Moving Bed For drying of coal and quick coke, modification of shaft dryer Heat consumption 2800-3500 kJ/kg H2O. Applicable for quick coke which has high porosity and strong abrasive properties, Compact construction and simple design, the possibility of full automation Drying rate per unit volume is high, low-temperature waste combustion gases can be used as drying media. Reduces danger of ignition, no abrasion
Superheated steam Drying 254,255,258,292,294–296
Exhaust steam from the power plant can be used as a drying medium. Saturated steam at high pressure (400-500kPa) is used to dry raw brown coal. The fluidized bed is also operated at high pressure to avoid air leakage. Wierbelshicht-Trocknungmit-interner Abwarmenut-zung (WTA) is a recent advancement in superheated steam drying which further increases the energy efficiency. No fire or explosion hazard, faster drying rates, small equipment size, High thermal efficiency, energy-efficient. Applicable for high capacity continuous operation, exhaust energy should be used efficiently
Latest Developments and Innovation
Coal Creek Station, a North Dakota Power Plant of Great River Energy (GRE). They have
invented a process known as the DryFining fuel enhancement process or Lignite Fuel
Enhancement System (LFES), a trademark of Great River Energy where waste heat around the

78
power plant was used to “pre-dry” the coal to design specifications. This process was successful
in drying the lignite using low-temperature heat and special attention was paid to avoid DE
volatilization (removal of volatile organic compounds) along with the water vapors removal. Fuel
stability and moisture reabsorption were also considered. This fuel enhancement has been
commercialized and able to dry the lignite from 38% to 29% and higher heating value increased
from 6.200 to more than 7.000 BTU/lb using waste heat from the plant. U.S. Department of Energy
helped to commercialize this process under its Clean Coal Power Initiative (CCPI) Program. 243,297
Superheated steam dryers can be in a continuous form where steam exhausted from one dryer stage
acts as carrier steam for another stage yielding a steam economy of 1.9 for a triple-effect dryer.
The fluidized bed (FB) dryer (0.3 x 0.3 x0.3 (high)) with four bubble caps to distribute steam was
used to dry Victoria brown coal. Both horizontal and vertical tube bundles were tried 298. Part of
superheated steam can be used indirectly also by using internal heat exchanger tubes immersed
within the steam fluidized bed 294,298.
There has been industrial installation for drying carbon pellets reduces the moisture content
to 2% (dry basis) from the initial moisture content of 50%. The inlet steam temperature is 300˚C
and outlet discharged steam temperature is 150˚C and this discharged steam is used to preheat the
feed. The installation cost of the steam dryer was 40% lower than that of the conventional air
dryer295.
Emerging Drying Technologies
Some of the recent emerging drying methods are shown in Table 5.3. Numerous other
drying methods had been used for coal drying a long time back such as hot oil drying, hot water
drying, Fleissner process, and still numerous new drying methods that are in the process such as
nonthermal biomass dryer, combined grinding and drying 247,258. There is always a need for R &

79
D in the field of drying to overcome the problems of energy, economics, environmental, and safety
concerns. This thesis project is an attempt to look out for one of the possible solutions/ drying
methods to overcome these problems.
Table 5.3 New emerging drying technologies for coal.
Dryer Characteristics of the drying method
Screw Conveyor 247,258,299
Jacketed conveyor in which material is simultaneously heated and dried, the heating medium is usually hot water, steam or other heat transfer medium, applicable for a large variety of solid particles, compact size, high thermal efficiency, fewer chances of fire hazard, could be a part of the multi-stage drying system
Microwave Drying 247,258,300
Volumetric heating, faster drying rates, intermittent exposure of wet solids to microwaves, reduction of impurities. DBAGlobal, Australia developed process Drycol to improve coal quality using the microwave.
Impinging Stream Drying 247,258,301
Alternatives to flash dryers for particulate materials. Creation of the zone by the intensive collision of opposed streams which results in huge heat, mass, and momentum transfer. A rapid removal of surface water, smaller footprints, high robustness. Huge throughputs and scale of velocities could be possible limitations in the case of coal drying
Novel Fluidized Bed Dryers 247,258,302
The quality of fluidization which normally depends on the size or shape of particles can be improved either by mechanical agitations, vibrations, or pulsating flow of fluidizing gas. These modifications improve the performance and eliminate the problems of channeling and slugging.
Coldry Process 247,258,292
Coal is sheared and attrition results in particle size reduction and physically bound or surface water evaporated at or near ambient temperature. It is based on brown coal densification which even can also help to remove chemically bound water by this process. No self-ignition
Renewable source of energy 247,258,303
Renewable sources of energy can be used to dry the LRC such as solar drying especially during road transport from the mine site to barge port. Ambient air drying during storage or conveying. Wind energy and hydrothermal energy. Have constraints such as climatic conditions and large space requirements.

80
Dewatering coal with supercritical Carbon Dioxide
Sujit Banerjee, Bhima Sastri, Salonika Aggarwal & Marko Hakovirta
This paper was published in the International Journal of Coal Preparation and Utilization, DOI:
10.1080/19392699.2020.1715962
Abstract
Supercritical CO2 (sCO2) dewaters coal through two mechanisms. For bituminous coal of
9.5% average moisture content, the water is dissolved out of the coal and the concentration of
water in the bulk sCO2 approximates its solubility limit. For lignite (54% average moisture content)
the water extracted by the sCO2 exceeds its solubility limit in sCO2, which implies that a part of
the water is displaced from, rather than dissolved out of the coal. Thus, there is a clear distinction
between wet coals where most of the water is displaced, as compared to drier coals where the water
is dissolved out. Hence, sCO2 dewatering will be especially efficient for high-moisture coals where
there is significant free water available for displacement. The precedent for this process is available
from the dewatering of wood flakes.
5.9.1 Introduction
Coal contains moisture, which can be an appreciable amount depending on the rank of the
coal. The moisture content (MC) of the coal impacts the efficiency of boiler operations, which is
why many power generation facilities attempt to dry the coal before it is combusted in the boiler.
Energy from various heat recovery systems at the power station as well as from other sources is
used for dewatering coal 304. This is especially true of low-rank coal whose moisture content (MC)
can be in the 50% range 258. This paper demonstrates the possibility of dewatering coal using
supercritical carbon dioxide (sCO2). A potential source of sCO2 is the direct-fired oxy-fuel
combustion of syngas from coal, where sCO2 is not only the working fluid to generate power but
is also a byproduct that can be used for Enhanced Oil Recovery (EOR) and other purposes 305. In
81
EOR operations the sCO2 is directly injected into depleted oil wells to rejuvenate production 306.
This paper explores an additional intermediate opportunity where the excess sCO2 from the power
cycle can be used to dry coal.
The solvating power of sCO2 can be tuned by modulating pressure and temperature and by
adding cosolvents. Solutes are dissolved at high sCO2 pressure and are subsequently recovered
when the sCO2 is expanded. Applications to date have been made on a relatively small scale, e.g.
for extraction of components of agricultural products 307. We have recently shown that sCO2 can
be used to dewater wood flakes for the manufacture of oriented strand board 130. An unexpected
finding was that the water was removed at concentrations much higher than its solubility limit in
sCO2, which implied that sCO2 mechanically displaced some of the water from the wood structure.
We have now studied the sCO2 dewatering of two coals and we demonstrate that the process is
technically viable. Moreover, the displacement of water by sCO2 seen in wood dewatering also
occurs for coal. We are not the first to study coal dewatering by sCO2. This application has been
reported by 130,308,309 in a flow-through system, but the conditions used are not industrially relevant.
In that study, only about 0.3 g of water was removed from wet coal with 0.65 kg of sCO2 at 15
Mpa and 313 °K over 20 hours.
5.9.2 Materials and Methods
Pulverized lignite was obtained from the Freedom, ND, mine at an MC of 54% (dry basis).
Bituminous coal of 9.5% MC was collected from the Pulverizer conical hoppers at the Duke Power
Marshall Steam Station. The standard particle size for these coals is 200 mesh 310. Samples were
extracted with sCO2 with an OCO Labs Super C unit. CO2 is considered to be supercritical above
its critical temperature of 31.1 °C and its critical pressure of 7.39 Mpa. The extraction process was
straightforward. The extraction chamber was packed with coal and then exposed to sCO2 at various

82
pressure-temperature-time combinations. The sCO2: coal mass ratio was obtained by calculating
the volume of dry coal using a specific gravity of 1.4 for pulverized coal 311. The results are
insensitive to small changes in specific gravity. The volume of coal was subtracted from the reactor
volume of 120 ml. The remaining volume was assumed to be occupied by sCO2 whose density and
mass were determined from the equation of state of Span and Wagner (1996) 222.
5.9.3 Results and Discussion
Extraction of Water from Coal
Separate batches of lignite were treated with sCO2 at 75 °C and 13.8 MPa for various
periods. The results are listed in Table 1. The moisture content (MC) drops from its initial value
of 54% to 28% over 5 minutes. It is likely that the bulk water and readily accessible water are
removed first through simple dissolution in sCO2 because the mole fraction concentration of water
in sCO2 (xwater) approximates its interpolated solubility limit of 0.019 (Wang et al. 2018). The
rate slows down after about 5 minutes and the xwater values rise correspondingly and exceed the
solubility limit. The slower rate implies that pore water is now being removed, and the solubility
exceedance requires that some of the water be mechanically displaced (rather than dissolved) out
of coal by sCO2.
Corresponding results for bituminous coal are included in Table 5.4. Again, water removal
is initially relatively rapid with the MC falling from 9.5% to 3.3% in the first 5 minutes. However,
the concentration of water in sCO2 is slightly lower than the solubility limit, suggesting that the
water is dissolved out by the sCO2. The displacement mechanism does not apply here because
bituminous coal has a lower starting moisture content and there is insufficient free water in the
coal structure for displacement to occur.

83
The extraction of water under varying temperatures and pressure is illustrated in Figure
5.3. The weight loss is relatively independent of temperature and pressure within the range used.
The rate tapers off after 15 minutes of contact presumably because the labile water has been
removed and the pore water is more recalcitrant. This finding that water extraction has a relatively
small dependence on pressure is of practical importance because the cost of an extraction vessel
increases sharply with the applied pressure.
Table 5.4 Effect of contact time on water removal from coal.
Run time (min) Final MC (%) xwater massCO2:coal
Lignite 5 28.4 0.021 22.0 10 28.2 0.019 16.7 15 17.6 0.034 23.6 20 15.1 0.037 23.4 25 16.4 0.034 24.0
Bituminous coal 5 3.31 0.015 10.3 10 3.20 0.017 10.5 15 3.41 0.016 10.0 20 3.09 0.015 12.0 25 3.20 0.015 11.8
Sequential Extraction of Water from Coal
For the above results, the volume of sCO2 used greatly exceeded that of coal. It follows that
circulating a much smaller volume of sCO2 through the coal with intermediate
expansion/recompression steps to drop out the water would reduce the reactor volume, and,
therefore, the capital cost. Accordingly, lignite was extracted with sequential shots of sCO2. The
sCO2 was not recirculated; fresh sCO2 was used for each shot as our only interest was to determine
the water extracted by each shot. A coal sample was removed after 5 minutes, weighed, and
returned to the reactor, which was then contacted with fresh sCO2 for another 5minutes, and so

84
forth. The massCO2: coal value was about four. The results are illustrated in Figure 5.4. The rate of
water loss is lower than that seen in Figure 5.3.
Figure 5.3 Weight loss from sCO2 extraction of lignite.
Figure 5.4 Weight loss from sequential sCO2 extraction of lignite at a low sCO2: coal ratio.

85
The likely reason is that the lower volume of sCO2 used in each sequence was able to dissolve less
of the free water. Corresponding results for sequential sCO2 extraction of bituminous coal are
provided in
Figure 5.5. The rate of weight loss is much lower than that of lignite because the starting MC was
only 9.5%. As noted above, most of the water probably resided in the pores and, would, therefore,
be more difficult to remove.
Mechanistic Aspects One of our intriguing findings is that the concentration of water in sCO2 exceeds its
solubility limit in some instances. Because a similar situation arises during wood dewatering 130,
the phenomenon appears to be general. One possibility is the water is pushed out of coal by the
invading sCO2. The entry of sCO2 into coal has been discussed by several authors 312. Viscous
fingering plays an important role 313; the process derives from Darcy’s law, which, for one-
dimensional steady flow can be written as
Figure 5.5 Weight loss from sequential sCO2 extraction of bituminous coal.

86
dP/dx = - μU/K + Δρg 5.1
where P, x, µ, U, K, and ρ represent pressure, length, viscosity, velocity, permeability, and specific
gravity, respectively 314. Consider the displacement of water by sCO2, an immiscible liquid of
much lower viscosity. It follows that
δP = PsCO2 – Pwater = [(μwater – μsCO2) U/K)] δx 5.2
If δP is positive, then a small change in δP will amplify to a much larger change in δx because
(µwater – µsCO2) >> 16]. The degree of fingering depends on pore size and gradient 315. The root
cause is that the less viscous fluid (sCO2) has greater mobility, which could displace some of the
water.
A second possibility Is that the sCO2 blows out liquid water from the coal during the
depressurization stage. This type of behavior is well known in paper dewatering during a procedure
known as impulse drying. Here, a wet paper sheet is forced through a nip with a heated top roll.
The steam pressure generated at the roll-sheet interface expels some of the water from the sheet in
liquid form. An analogous mechanism could apply to coal dewatering when the reactor is vented;
the expanding sCO2 could expel liquid water. However, we consider this mechanism to be less
likely than the viscous fingering pathway discussed above because the ΔP generated during sCO2
expansion may not be high enough.

87
Simultaneous Dewatering and Removal of Hazardous Hydrocarbons from Coal using
Supercritical Carbon dioxide
Salonika Aggarwal, Marko Hakovirta
This paper has been submitted to “International Journal of Coal Preparation & Utilization”
Abstract Carbon dioxide (CO2) has gained worldwide attention and has been a focus of Carbon
Capture and Storage (CCS) as a solution for mitigation purposes. In this study sCO2 extraction was
used for dewatering the coal and to analyze the extractives collected during the process. Coal
contains volatiles which are considered as micropollutants and released during the combustion
which has to be treated using Electrostatic Precipitator (ESP) and other cleaning techniques. It was
found that sCO2 also removes toxic volatiles and organic sulfur along with the dewatering of the
coal. GC-MS and FTIR analysis substantiate that sCO2 can remove micropollutants such as
polyaromatic hydrocarbons (PAHs) and Polychlorinated biphenyls (PCB), and organic sulfur
along with the water. Removal of volatiles before combustion would increase the fuel efficiency
for energy production.
5.10.1 Introduction
Supercritical fluid extraction is used for the extraction of desired ingredients as well as the
removal of harmful or undesired ingredients from various natural sources 100. Supercritical fluid
extraction has been used to extract toxic or contaminated components from soil 101,102, water 103,104,
environmental solids 105–107. Supercritical carbon dioxide (sCO2) has been used to remove
Polyaromatic hydrocarbons (PAHs), Polychlorinated Biphenyls (PCB), petroleum hydrocarbons,
Dichlorodiphenyltrichloroethane (DDT) and other types of hazardous and toxic organics 101,102,111–
113,103–110. Coal is the important fossil fuel to meet the energy demand globally 316. Coal also

88
contains volatile organic compounds (VOCs) such as PAH, PCB which needs to be cleaned up
using cleaning techniques during the combustion of coal 317–319. Coal contains organic or inorganic
sulfur which needs to be removed and various cleaning techniques have been developed for the
removal of sulfur in coal 320. Environmental regulations impose rigorous limits for sulfur levels,
which further demands to develop methods to remove sulfur from various fossil fuels 321.
It has been found that sCO2 removes organic matter from the coal 322,323. Research has
recently been done to show that sCO2 can be used to dewater wood flakes for the manufacturing
of oriented strand board 324 and dewatering of coal 131. It was observed that along with the removal
of water, there are extractives also collected during sCO2 dewatering conceptually.
The direct-fired oxy-fuel combustion of syngas from coal could be a potential source of
sCO2. sCO2 would be the working fluid to generate power as well as the byproduct that can be used
for Enhanced Oil Recovery (EOR) and other purposes 305,319. In EOR operations, production can
be rejuvenated by directly injecting the sCO2 into depleted oil wells 306. In this particular system,
released CO2 after the combustion of coal can be recycled and transformed into its supercritical
phase to dewater the fuel as well as for the removal of hazardous hydrocarbons along with the
power generation using sCO2 in the direct-fired oxy-fuel combustion of the coal. This would make
the whole system a closed system with the generation of CO2 and utilizing it for power generation
which makes it greener, sustainable and also decreases the carbon footprint.
This paper investigates the possibility of the removal of toxic organics from the coal using
excess sCO2 from the power cycle. It was found that sCO2 can help to remove the toxic organics
such as PAHs, PCB, and also organic sulfur from the coal simultaneously with dewatering the coal
to increase the overall energy efficiency of the fuel.

89
5.10.2 Materials & Methods
Bituminous coal of 9.5% (dry basis) moisture content (MC) was collected from Duke
Power Marshall Steam Station and pulverized lignite was collected from the Freedom, ND, mine
at an MC of 54% (dry basis). The standard particle size for these coals is 200 mesh 310. OCO Labs
Super C unit was used for extraction using sCO2. CO2 is considered to be supercritical above its
critical temperature of 31.1 °C and its critical pressure of 7.39 Mpa. The 10 g of coal samples were
placed in the extraction chamber and then exposed to sCO2 at the required pressure-temperature-
time. Two extractive samples (one from bituminous and another lignite) were collected using the
cold bath around the collection vessel during the extraction. The extractives were collected at 17.2
Mpa and 75˚C after sequential extraction that was done 10 times each with a 5min run. After 5min
run of each cycle, sCO2 was depressurized and again compressed to reach at the set parameters.
Fresh CO2 was used for each cycle not recirculated. 131.
Collected extractives were analyzed using Gas Chromatography-Mass Spectrometry (GC-
MS) and Fourier Transform Infrared Spectroscopy (FTIR). GC/MS was performed using an
Agilent instrument operating in electron ionization (EI, 70 eV) mode. The separation was achieved
using a 30 m × 0.25 mm i. d., 0.25 μm capillary column. The initial oven temperature was set at
60 °C and held for 1 min at this temperature, and then the temperature was increased at 3 °C/min
to 90 °C (held for 1 min), increased at 3 °C/min to 170 °C (held for 1 min), and then increased at
3 °C/min to 300 °C (held for 8 min). The carrier gas flow rate in the column was 1 mL/min. The
GC injector temperature was set at 300 °C, with a split ratio of 20:1. The ion source temperature
was set at 230 °C. The spectrometer was set to scan between mass to charge ratio (m/z) 30 and
500. The injected volume of the sample was 0.4 μL318. The FTIR spectra of coal extractives were
measured using Frontier FTIR Spectrometer

90
5.10.3 Results & Discussion
The final MC of bituminous coal was 3.2% (dry basis) and of lignite was 24 % (dry basis)
after sequential extraction. Figure 5.6 & Figure 5.7 show the GC-MS spectra of extractives from
bituminous & lignite coal respectively. Both the spectra have four main peaks at retention times
of 72, 76, 80, and 83 min. It was found that bituminous and lignite coal extractives included several
compounds. It was observed that there was the removal of organic sulfur (1-Naphthalene-sulfonic
acid, Thiazole, 4-ethyl-2-propyl-) from both lignite and bituminous coal which has been reported
similar to other authors work316,320. The coal also contained silicon (1,1,3,3,5,5- hexamethyl-
cyclohexasilane) similarly as observed by others316. Polycyclic aromatic hydrocarbons (PAHs)
such as 1-Naphthoic acid, Sarcosine, N-(1-naphthyl)-, octyl ester, and 2-Methyl-5H-
dibenz[b,f]azepine considered as organic pollutants were also found which extracted during
supercritical extraction 317,325,326.
sCO2 also extracted the hydrocarbons such as 3,5-difluorophenyl ethyl ester which are of
biological toxicity reported by other authors also 319,323,325. There is also the removal of agricultural
toxic substances such as 3-fluorophenyl ester and other toxic substances such as 1-Naphthalene-
sulfonic acid and some of these substances are considered carcinogenic also326. Selective
desulfurization up to 31.8% reduction as well as the reduction of other volatiles has been reported
by other authors using supercritical fluid extraction 327. Chromatographic analysis of volatile
extracts of coal analyzed by other researches also showed the presence of polycyclic aromatic
hydrocarbons, partially hydrogenated polycyclic aromatic hydrocarbons, benzo derivatives of
acenaphthene, fluorene, dibenzothiophene, dibenzofuran, 90arbazole, and pyridine, as well as
methyl derivatives of all groups of mentioned compounds & free alkanes, phenols, naphthalenes,
fluorenes, anthracenes,phenanthrenes317–319. Supercritical CO2 extracts four-ring and five-ring

91
PAHs, dibenzothiophene (DBT), and perdeuterated PAH surrogate compounds at elevated
temperature325.
Figure 5.6 GC-MS Spectra of extract from bituminous coal.
Figure 5.7 GC-MS Spectra of extract from Lignite Coal.

92
FTIR Figure 5.8 shows the FTIR spectrograph of extractives from bituminous and lignite coal.
Both the samples have almost similar functionalities similar to the same observed in
chromatograms. The functionalities found in the IR spectra328 are per the compounds identified by
gas chromatography/mass spectrometry, i.e., polycyclic aromatic hydrocarbons, certain polycyclic
heteroaromatic compounds and some of their methyl derivatives 329. Absorbance at 3050 cm-
1shows the sharp band due to aromatic C-H stretching vibrations, and 2920 cm-1 arises from the
saturated C-H stretching vibrations of alkyl substituents. The weak broad band in the region of
3000 to 2700 cm-1 was overlayed by a broad absorption band at 3300 cm-1 because the presence of
NH groups and intensity of band is small because of the small total amount of nitrogen present 330.
The overlapping bands in the spectral region between 3100 and 2800 cm-1 shows band in the
aromatic C−H region and aliphatic C−H region related to the stretching vibration of at about 1300
cm-1 (C—O) could be assigned to esters in which the ester group is attached to a phenyl group 326.
The band at 1700 (1715) cm-1 could be assigned to lactams or thiol esters like observed in the
chromatogram. CH2 in the alkyl substituents in the aromatic rings showed the band at 1455 cm−1
and CH2 in the hydroaromatic rings showed the absorbance band at 1440 cm−1 perhaps due to
isolated CH2 groups (including methylene bridge between aromatic rings) 326,330. CH3 and CH2
groups. In spectra, the presence of compounds with cumulated C=C=C bonds showed the weak
absorbance at 1925 cm−1 326. The absorbance band at about 1720 cm-1 (C=0), which is associated
with the band C = O stretching present at 1251 cm-1 because of the ethers 330. A band at about 880
cm-1 suggests the presence of substituted aromatic rings containing isolated C-H bonds. In the
spectral region between 900 and 700 cm−1 and bands between this range are called aromatic bands
330, several out-of-plane C−H deformation bands are observed indicating sparsely substituted

93
aromatic rings 317. The absorbance corresponds to the bands between 900 and 700 cm-1 (out-of-
plane vibration of aromatic C-H bonds), 2920 cm-1 (saturated stretching vibrations), and 3466 cm-
1 (NH stretching vibration) 317,319.
Figure 5.8 FTIR Spectrograph of bituminous and lignite coal.
Conclusion
Lignite and bituminous coal can be dewatered with sCO2. For the relatively dry bituminous
coal with limited free water, the sCO2 dissolves the water up to its solubility limit. A major finding
of this study is that the solubility limit is exceeded for the higher moisture content lignite because
the sCO2 can displace some of the pore water. Hence, dewatering efficiency will be especially high
for lignite and other coals that have significant free water available for displacement.
Supercritical CO2 can be used to dewater the coal which decreases the significant amount of
moisture in a very short period. Along with the moisture loss, sCO2 can also be used to remove
hazardous volatiles from coal such as Polyaromatic Hydrocarbons (PAHs), organic sulfur which
is considered as micropollutants and decreases the energy efficiency because separate cleaning
050010001500200025003000350040004500wave number (cm-1)
BituminousLignite

94
techniques has to be developed to clean the volatiles or sulfur before releasing them to the
atmosphere. GC-MS and FTIR analysis verify the presence of PAHs, PCB, and other organic
sulfur in the extractives collected from coal using sCO2. Drying can theoretically increase the
energy efficiency depending on the coal energy plant and utilization on coal type and removal of
volatiles along with water loss will reduce the need for cleaning techniques during combustion.
These findings correspond to the concept of sCO2 used for direct-fired oxy-fuel combustion of coal
for power generation and this process could be a source for sCO2 for dewatering and removal of
hazardous VOCs simultaneously proceeding to the closed cycle of the whole system. More
research will be needed for the techno economic aspects of this proposed conceptual approach.

95
: Supercritical CO2 Drying of Sludge: Drying to Biofuel
Introduction
With the increasing population and urbanization growth, waste management issues and
environmental challenges have been intensified. This has resulted in igniting the global interest in
sustainable strategies for waste management and energy utilization. The Clean Water Act states
that communities should treat their wastewater to recycle this resource to the environment and
produces the sludge 331. Sludge is a muddy or slushy mass, deposit, or sediment as water and
sewage treatment processes produced precipitated solid matter, mud from the drill hole, steam
boiler’s muddy sediments, coal washers waste and industrial processes produced precipitated or
settled solid matter 332. Sludge is a residual, semi-solid nutrient-rich by-product of the wastewater
treatment plant. There are two types of sludge based on the sources which are municipal sludge or
industrial sludge. Biosolids are a term that is used as a synonym for sewage sludge but it is more
related to the reuse of sewage solids after sewage sludge treatment 333. According to the U.S.
Environmental Protection Agency (EPA), 6.9 million tons of biosolids were generated in 1998 331.
It has been reported that the total amount of 10.1 million tons of biosolids were produced in EU-
27 countries in 2012 334. Sludge or biosolids are currently used in agriculture, landfills, landfill
cover, composting, incineration, and even energy production 333. Biosolids used to dump in the sea
but sea dumping has been banned by many countries 332. Before usage of biosolids, it has to be
treated as untreated municipal sludge could be regarded as hazardous waste material due to its high
organic and metallic content.
Wastewater Treatment Process and Sludge Production
Sludge is the byproduct of the waste treatment process. The typical wastewater treatment
plant is shown in Figure 6.1. There are several types of sludge are produced through wastewater

96
treatment, but the important ones are primary sludge (PS), secondary (or biological), chemical,
and digested sludge as shown in Figure 6.2. As sludge generation points 335. Primary sludge is
produced after primary treatment which normally involves the removal of suspended solids. This
step uses the sedimentation tank in which suspended solids are separated from liquids by
gravitational forces. Chemicals include lime, aluminum, and iron compounds can also be added to
increase the efficiency of primary sludge, and generated sludge is called chemical sludge. PS has
a strong offensive odor, generally gray and contains numerous pathogens including Salmonella,
Shigella, Campylobacter, Yersinia, Leptospira, E.Coli strains, Enteroviruses and even eggs of
Helminth parasites (e.g. Taenia, Ancylostoma, Necator) because of their size and density, thus
largely concentrated in sludges 336. Breakdown of the organic materials by specially provided
decomposers in wastewater after primary treatment produce the secondary sludge (Figure 6.2) or
wasted activated sludge (was) is usually brownish and has an inoffensive earth odor 335. WAS has
lesser pathogens compared to PS and 90% of virus particles are transferred to sludge 336. There are
temperature- resistant protozoan cysts such as Entamoeba histolytica, Giardia cysts are removed
during secondary treatment and become concentrated in sludge 336. There is also a tertiary
treatment that produces the sludge which involves the biological and chemical precipitation using
lime, polymers, iron, or aluminum salts which sometimes produces alkaline biosolids also 331.
There are some standards for the use or Disposal of sewage sludge which is included in title 40 of
the Code of Federal Regulations [CFR], part 503 331. There are new regulations limit imposed for
persistent organic pollutants (POPs) in addition to the conventional organic indicators 337,338. There
are micropollutants such as polycyclic aromatic hydrocarbons (PAHs), polychlorinated biphenyls
(PCBs), nonylphenol, dioxins, pesticides and heavy metals present in sludge which exhibit
endocrine-disrupting effects and environmental health risks 337–342. There are other hazardous

97
compounds are also present such as Linear alkylbenzene sulfonate (LAS), AOX, Di-2-(ethyl-
hexyl)-phthalate (DEHP) most common of phthalate esters used in plastic softeners which can be
toxic to soil organisms which restrict the use of sludge for agriculture.
Figure 6.1 Typical wastewater treatment process.
Ref: 334
Because of the aforementioned pollutants and hazardous microbes present in sludge, the
use and disposal of sludge either in landfills, agriculture, and incineration have regulations limit
as per EPA regulations. Only biosolids that meet regulatory requirements for pathogens, vector
attraction reduction, and metal content can be land applied or as compost and even biosolids that
are merely disposed of rather than any other application must meet regulatory requirements 331.
Most of the biosolids have to undergo the treatments (Figure 6.2) on-site before they are used or
disposed of to meet regulatory requirements to protect the environment, public health, and
facilitate handling and reduce costs.
Biosolids treatment includes the two most common processes which are stabilization and
dewatering.
Stabilization includes alkali (lime) stabilization, aerobic & anaerobic digestion,
composting, and heat drying which reduce pathogen levels, odor, and volatile solids content.

98
Dewatering is the most important process which removes the excess water before biosolids are
landfilled, composted, or incinerated.
Figure 6.2 Sludge generation points and a typical sludge management scheme. Ref: 335
Stabilization
6.3.1 Alkaline (Lime) Stabilization
Historically, quicklime (CaO) or hydrated lime (Ca(OH)2) were used to use for alkaline
stabilization before dewatering. This is also known as thickening. This generally reduces
pathogens and odors, capable of more efficient handling operations and even lime can be used to
help neutralize acid soils. This permits the use of biosolids as per EPA regulations. In recent years,
chemical additives have replaced the lime partly or fully using similar biosolids handling and
mixing equipment as traditional lime stabilization. These modifications reduce the mobility of
heavy metals, increase solid contents and granularity, pathogen reduction, increase agricultural
lime value, and long term stability 331.

99
6.3.2 Anaerobic Digestion
Anaerobic digestion one of the most widely used stabilization process where anaerobic
bacteria that thrive in the oxygen-free environment and consumes organic content of biosolids to
convert it to carbon dioxide, methane (which can be recovered and used for energy), and ammonia
in a closed tank. It reduces the organic content, pathogen content, mass, and odor. It is generally
operated at 35˚C but temperature can be increased till 55˚C to reduce solids and pathogens of
stabilized solids 331.
6.3.3 Aerobic Digestion
Aerobic digestion uses aerobic bacteria in an open or closed vessel or lagoon to convert
organic solids to carbon dioxide, water, and nitrogen. Pathogen and odor are reduced. It is
generally operated at high temperatures to reduce pathogens and higher solid contents 331.
6.3.4 Composting
The decomposition of organic matter by microorganisms with environmental conditions
that control the size and porosity of pile is called composting, facilitating an increase in
temperature (typically to about 55˚ to 60˚C) to destroy most pathogens. Moisture and oxygen levels
of the process can also be controlled to reduce processing odors. Biosolids are degraded to a
hummus-like material reducing the mobility of metals and has excellent soil conditioning
properties at a pH range of 6.5 to 8. Composting involves mixing dewatered biosolids with a
bulking agent such as wood chips, bark, rice hulls, straw or previously composted material, and
allows the biosolids mixture to decompose aerobically. The bulking agent increases biosolids
mass, lowers the moisture content, increases porosity, and add a source of carbon. Composting
usually takes 1-2 months but varies with the method used 331. Biosolid compost has various
applications includes landscaping projects, nursery operations, landfill cover, application of golf

100
courses, erosion control, and wetland restoration. In 1997, 198 biosolids composting facilities were
in operation in the United States.
Moisture Distribution in sludge
The moisture in sludge can be as high as 99%. The following forms of water distribution
343 are present (1) free water not attached to the sludge particles which can be removed by
gravitational settling; (2) interstitial moisture which exists in the capillaries of dewatered cake or
trapped within the flocs of solids, can be removed by strong mechanical forces; (3) surface
moisture that is present on the surface of the solid particles by adsorption and adhesion; and (4)
intercellular and chemically bound moisture. Mechanical dewatering usually removes the “free
water” and remaining left termed as “bound water” which states that the theoretical limit of
mechanical dewatering is the bound water content 344. In a broad sense, free water includes truly
the free, interstitial, and the surface water partially whereas bound water includes partial surface
moisture and the chemically bound water 332.
The bound water can be determined by various methods such as vacuum filtration and
expression 345–347, dilatometric determination 348,349, drying 343,350, and thermal analysis 351–353.
Bound water content varies with different analytical methods 349,351,353. This variation must be
dependent on the bond strength between water molecules and the solid particles 353 and be related
to the mechanical force applied 332. Figure 5.3 shows that the free water removed during the
constant drying- rate period, interstitial moisture removed during the first falling rate period,
surface moisture removed during the second falling-rate period and finally bound water which is
chemically bound not removed by drying experiments 354,355

101
Figure 6.3 Drying curve: types of water in sludge. Ref: 355
Dewatering is the most important process of sludge treatment especially before drying as
sludge drying is a highly energy-intensive process. It reduces the biosolids volume by reducing
water content. Dewatering is necessary before composting, heat drying, and even preparing
biosolids for any land application 331. Before sludge dewatering, digested sludge is usually
conditioned through different ways to generate flocs which makes it easy to filtrate 332. Chemical
conditioning which usually uses polyelectrolytes, lime and these chemicals either act as coagulants
or flocculants 332. Simple heating of wet air oxidation is a common method of thermal conditioning
(reference needed). Freezing/thawing is an effective method especially in cold regions which will
end up with a dewatered sludge of more than 20% solid content 356,357. There are numerous ways
of mechanical dewatering of sludge which include vacuum filters, belt filter presses, membrane
filter presses, and centrifuges. Vacuum filters are among the earliest mechanical dewatering
processes. It was replaced by more energy-efficient belt filters and even modified further by rotary
belt vacuum filter 332. In the rotary drum vacuum filter, the filter medium belt is wrapped around

102
the drum rather than fixed to it which makes it different from belt vacuum filter. The advantage is
continuous belt washing and efficient cake discharge.
Belt filter presses are similar to pressing in papermaking. After getting drained under
gravity, the conditioned sludge is sandwiched between two endless filtering belts. Water will
squeeze out of the sludge because of the pressure from the tensioned belts. The discharged cake
will have solid content at about 15%-25% from the initial feeding concentration of 2%-5%. There
are some advanced or modified filter presses such as plate and – frame filter presses and rotary
press which is the latest development works by pumping the biosolids into peripheral channels.
These channels have walls made up of rotating filter elements. The liquid is forced through the
filter elements because of the compression which is created by the rotation of the system. The cake
can be extruded from the interior channel 332. Belt filter presses can be modified or enhanced by
electric osmotic technique 358 or acoustics 359.
Centrifugal dewatering separates the sludge solids from the liquids using the centrifugal
forces which are developed by spinning the basket or bowl. There are various types of centrifuges
such as disc, basket, and solid bowl centrifuges among which solid bowl is the most common 332.
Cocurrent or countercurrent flow designs 360 are available in solid bowl centrifuge. Centrifuge
dewatering can help to achieve solid contents of 25%-35% which normally has two operating
zones: a submerged zone and a drainage zone.
Modified filter presses with automatic cloth washing, inflatable membrane systems,
controlled filling techniques, dual-speed plate separation, and automatic discharge called as
membrane filter presses 361. There is no simple single method that is best for the dewatering of
wastewater treatment plants. There is always a requirement of R&D and improvement in sludge

103
dewatering technology which is considered as a function of sludge treatment and disposal along
with the operations and maintenance 362.
Sludge Drying
Different types of sludge have different drying profiles due to the significant differences in
their moisture distribution and organic composition, drying potentials of primary sludge, waste
activated sludge and mixed sludge are significantly different 335.
6.5.1 Solar Energy Drying
It is necessary to thermally dry the dewatered sludge for any particular applications such
as fertilizer production, efficient incineration, landfilling. Viruses can also be deactivated by
thermal drying 363. Thermal drying is a very energy-intensive process. Hence to replace the energy-
intensive process, the first natural choice that comes in is solar energy 364. Solar energy collectors
can decrease the drying time by increasing the drying rate at some locations but at other locations,
it has limited applications 365,366. Asphalt drying beds or sand beds with grid confined systems have
been used 332,367 for solar drying but there are various innovative bed designs are available for solar
drying 368. The formation of thin surface layers hinders the drying of the sludge 369. Open drying
beds decrease the insect populations, increase the drying rate by periodical turning of the sludge,
and results in increased aeration, reduces odor problem and disturbed incubation of insects 370.
6.5.2 Thermal Drying Fundamentals
Solar drying has its disadvantages such as the requirement of large land, odor problems,
applicable to areas with high solar energy. This led to the use of thermal drying and which has
been used for a long time which makes it major sludge drying technology 371. Thermal drying of
sludge follows the basic drying rate pattern as shown in Figure 6.4 which depicts that sludge

104
thermal drying undergoes drying rate at constant, then follows the first falling rate and followed
by second fall rate 355 which has also shown in Figure 6.3.
Free water is removed during the constant drying rate period, interstitial water is believed
to remove during the first falling rate and surface water is removed during the second falling rate.
The remaining water is believed to be chemically bound water which is retained within sludge and
amount depends on the type of sludge and the drying conditions 355. The physical status also
changes from wet zone to sticky zone to granulation based on the solid content 371.
Figure 6.4 Typical drying rate curve.
Ref: 355
There are numerous dryers available commercially which claim to dry the sludge.
Available dryers in terms of heat and mass transfer can be classified as 332:
a) Direct drying systems,
b) Indirect drying systems, and
c) Hybrid/ combined/ other dryers
Indirect dryers, vapors released from the sludge during drying have to be separated from
the drying medium, especially when the drying medium is to be recycled to save energy even
though direct dryers are simple in design 335. There are minimal amounts of vapor production in

105
indirect drying systems and is therefore easy to manage 372. Because of high-temperature
operations, the drying rate of direct dryers is higher than that of indirect dryers 332.
6.5.2.1.1 Direct Sludge Dryers
There are numerous types of direct dryers such as rotary-drum, flash, moving-belt dryers,
or centridryer. There is a rotary drum dryer, where inlet temperature can reach up to 1000˚C
without the risk of ignition. The water evaporation rate can range from 800kg/h to 50,000kg/h.
The thermal efficiency of the dryer can be improved by recycling of the vent gas 332. In Japan,
rotary-drum dryers are equipped with a disintegration device which has antenna-like bars and
rotates at 200-400 rpm and gives the evaporation rate of 100-5000kg/h 373.
Another option is the usage of perforated tubes which is used to introduce the hot gas into
the rotary drum to ensure uniform gas distribution and there are spiral flights on the drum wall for
sufficient mixing 374. The triple-pass rotary drum, which has one large outer cylinder included two
concentric cylinders inside all rotates at the same speed. Sludge is exposed to the highest gas
temperature in the innermost cylinder, then exposed to lower gas temperatures and velocities as
sludge is moved to outer cylinders by a fan. Evaporation rate can range from a few hundred kg/h
to more than 25,000kg/h depending on the hot gas temperatures and air velocities 332.
There is another drying system, the cage mill system type of flash drying system uses
disintegration. In the cage-mill, turbulence and retention time can be increased by agitating the
feed in the hot gas stream. The circular motion of the rotor improves the drying by moving the
sludge. In flash drying, energy efficiency can be improved by heat recovery either by using vent
gas recirculation, by using a deodorizing preheater as a heat exchange or accompanying the steam-
generating boiler directly with a flash drying system that can incinerate the dried sludge 332.
Drymeister (DMR), a recent development in flash dryers where high-speed dispersion rotor

106
generates the strong impact force and air turbulence improves the feed material dispersion in the
drying chamber. Particle size and moisture content of the product can be regulated by adjusting
the classifying rotor present at the top. Such dryers have an evaporation rate of up to 6000-
8000kg/h and are adhesion-free also 332. There is also another flash dryer, hot gas grinder dryer
operates similarly to drymeister with only one difference that drymeister operates with wet sludge
and hot gas grinder dryer with dried sludge of moisture content of 20%-30% 373. There is also
another flash drying system with a rotating coaxially placed stirrer know as a spin flash dryer 375.
Other types of direct dryers are belt dryers that are available in open, semi-open, and closed-loop
systems. The Closed-loop system recirculates the heated air. The drying gas itself is reconditioned
by reducing its moisture in a separate circuit and is returned to the start of the process. The gas-
drying agent (a hygroscopic material) is regenerated by withdrawing moisture 376. The belt press
dryers with Infrared (IR) heating using the IR heaters 377. There are moving-belt sludge dryers that
have cellular pockets on the belt. Both convection and conduction are used for heat transfer.
Multiple runs are possible 378. The belt dryers with stacked heating chambers which increases the
thermal efficiency. It uses both convection and radiation as heat transfer mode 379. There are new
innovative dryers that are also present such as spray dryer 380, cyclone dryer 381, centridry 382.
Centridryer combines dewatering and drying.
6.5.2.1.2 Indirect Sludge Dryers
In indirect dryers, heat is usually transferred from a heated surface. Most of the indirect
dryers are closed-loops with the objective of either recovering the heat or removing the odor and
indirect dryers generate less gas. Handling interfacial behaviors of heated surface and wet sludge
is a concern. Mechanical agitation is needed to prevent the heating surface to get fouled as there is
no airflow. There are single or two-stage indirect drying systems are available depending on the

107
requirement of the final moisture content 332. There is single-stage thin-film evaporator which can
produce the product with a solid content of 65% and can be used if sludge is required for burning
purpose as in an incinerator. This has been used for drying the different products 371,383. Rotary
paddle or disc dryers either alone or in combination with thin-film evaporator as the second stage
can be used if higher final solid content is needed. It has scrapers and agitators. The heating surface
can be self-cleaned because of frictional forces created from rotor motion and adequate mixing by
agitators and scrapers 355,384. Sterilization is an important issue because of the plug flow of sludge
through consecutive chambers. Numerous types of indirect dryers are available which even claims
to lower the moisture content to less than 10% 332. Another indirect dryer is a vertical multistage
tray dryer which has dryer trays hollow and heated by thermal oil or steam. The feed is provided
from the top and moves in a zig-zag path from one heated tray to another and finally exits as dried
and pelletized with 95% solid content at the bottom 385,386. More uniform drying can be achieved
in the case of vertical multistage tray dryer because of the uniform spread of wet sludge on the
heated surface 332.
6.5.3 Other Sludge Dryers
Other than direct and indirect dryers, some systems use either different drying medium or
combined conduction and convection heat transfer such as fluidized bed dryer. Hot surfaces of
thermal oil tubes provide the heat for water evaporation. Sludge granules stay fluidized because of
the heated air of about 85˚C to enhance the heat transfer between the hot surface and wet sludge
and dry the sludge to 5% moisture content 382. There are fluidized bed dryers that use superheated
steam, wet sludge is suspended by the superheated steam provides by superheater and super-heated
steam blown through the perforated base plate by the impeller. Wet sludge is fed into one of the
cells around the superheater and partially dried sludge passes through each cell before finally it

108
gets discharged as dried product387. There is also another innovative way of combining sludge
drying with incineration, where heated sand is used and mixed with wet sludge in a rotary kiln.
The dried sludge produces the flue gases which get used to heat the sand in the fluidized burner
388. This drying system is very popular in Japan because of its high energy efficiency and
compactness with no bad odors. This can help to achieve the temperature of about 800˚C and
because of combustion and rapid evaporation reduces the sludge to micro size particles 358. There
are other advancements in sludge drying such as Multistage Carver-Greenfield, where evaporation
of water is very energy efficient with ease, and handling the liquids 389. There is another innovative
way that is impulse drying where the operating temperature exceeds 200˚C and is even able to
increase the solid content of belt presses sludge which makes it an energy-efficient process. It
expresses a part of the water from the sludge in liquid form because of the pressure 390. This has
led to other innovative drying method known as multi-nip impulse drying 391,392.
6.5.4 Other Innovations in Sludge Drying
Agitated Bed Dryers
Sludge has poor fluidization quality due to the presence of lumped particles or wide size
distribution of particle size because of dewatering. This results in the need for agitation using
mechanical action such as a mixing device. The heat supply is mainly through the jacket, flight
paddles, or thorough agitator shaft indirectly. Water is removed either by applying negative
pressure or through a small column of air flowing in velocity near to solid’s fluidization velocity.
Physical properties of the material determined the design of mixing devices which can be paddle,
screw or ribbon type, or a combination. It has an advantage of good heat transfer, removal of
hazardous pollutants through vaporization during thermal treatment by using a vacuum or small

109
volume of drying medium 335. There are agitated dryers available for sludge with or without
vacuum 393.
Impinging Stream Drying
Novel alternatives to flash dryers are impinging stream dryers (ISDs). Opposite streams
have an intensive collision that creates the high mass, heat, and momentum transfer zone 393,394.
No moving parts are present, hence smaller footprints and high robustness and removal of surface
moisture are rapid. Design especially feeding arrangements and impinging streams are important
as it affects the heat transfer coefficient and water evaporation rate. Air, superheated steam, and
flue gas can be used as a drying medium in ISD which gives high heat transfer coefficient.
Multistage 2-Dimensional ISD used for sludge. Significant R &D is required in designing and
scaling up of ISD units because of its high complexity. Superheated steam can be used in ISD for
the drying of sludge because of energy efficiency and emission control 332.
Superheated Steam Drying
There would be minimum net energy consumption if superheated steam is used as a drying
medium as exhaust steam can be reused. No risk of fire and explosion, higher drying rates under
certain conditions. No dispersion of pollutants in the atmosphere because they would be
concentrated in the condensate of exhaust stream due to vaporization during thermal drying.
Thermal energy input can be recovered and reused to maintain operating temperature 332,393
Pulse Combustion Dryer
Solid, liquid, and gaseous fuels are combusted in an intermittent process known as pulse
combustion that creates high temperature, pressure, and velocity waves from pulsed combustor
results in high mass and heat transfer and ultimately increasing the drying rates. There can be
single or multiple pulse combustors to dry wet materials by producing high-temperature and

110
velocity pulsating jets. There are several advantages of these pulse combustion dryers such as high
energy efficiency, short drying time, environmentally friendly operation, and improved product
quality. It has few limitations such as scale-up issues and noise problems and despite that, it has
been applied to dry various sludges such as paper and sewage sludge 332,393
Paddle Dryers
Paddle dryers are a type of indirect dryers which worked similar to agitated bed dryers such
as using the mechanical agitation to overcome stickiness problem. Different shapes of paddles can
be used attached to either a single or double rotating shafts, paddles improve the heat transfer rates
by providing uniform heating. Two shafts rotate in opposite directions in case of double shaft
paddle dryers to avoid the adhesion of powder to paddle wedge by overlapping of shafts with each
other. Other than jacket heating, more heat can be provided by hollow shafts and paddles to
circulate the heating medium, results in large heat transfer area per volume and reduces the size of
dryer. Nara paddle dryer, GMF-Gouda paddle dryer, and Stord dryer are the most famous dryers
used for sludge drying 332.
Fry Drying
Deep fry drying normally used for drying the food products has recently been used for
drying the biomasses such as timber and sludge. Moist material is immersed in hot oil and
convection plays the role to transfer the heat to the outer surface and then to the core by conduction
until the removal of most of the water 332. This technique has been applied for sludge drying and
even it has been reported that 90% of initial water can be removed from sludge at 160˚C 393.
Internal heat and the mass transfer rate is an important parameter for drying rate as dried crust
forms on the surface as soon as sludge immersed in hot oil. For deep fry drying of sewage sludge,
recycled food oils can be used which makes it sustainable 332.

111
Other innovative techniques have been used for sludge drying such as thermal jet dryer
which uses the thermal jet to disintegrate the sludge but has some limitations 393. Although there
are many types of dryers are available in the market but there is always a demand for more
innovative drying technologies with lower emissions, less operating cost, and high thermal
efficiencies.
Related Issues
There are various issues related to sludge handling such as pathogens and viruses which
must be handled properly. Thermal sterilization can be achieved by thermal drying as per US EPA
requirements. The odor is another concern and exhaust gases. In indirect dryers, exhaust gases are
much lesser than direct dryers. There is always a risk of explosion especially in direct drying
because of high solid contents at high temperatures.
Presence of heavy metal contaminants and organic pollutants other than the known
nutrients and carbon sources that limit its applications. The high operating cost includes the cost
of dewatering as well as drying and which varies depending on the final moisture content
requirement. Vent gas generates the waste heat and proper use of this waste heat can significantly
save the drying cost and increases energy efficiency also.

112
Supercritical Carbon dioxide Dewatering and Drying of Municipal Sewage Sludge-
Novel Waste-to-Energy Valorization Pathway
Salonika Aggarwal, Marko Hakovirta This paper has been submitted to “Journal of Clean Production”
Abstract
The supercritical CO2 extraction process was investigated for the purpose of drying
municipal sewage sludge. Eighty percent of the world’s wastewater is discharged back into nature
without reuse and further treatment and solid byproduct of wastewater is either spread on land or
landfilled. The valorization of municipal sewage sludge for energy use is a major opportunity for
sustainable energy applications. This includes effective dewatering and drying of the sludge in
addition to producing biogas during the anaerobic digestion. Remarkably our results showed that
after sCO2 processing the higher heating value (HHV) of sludge at wet basis moisture content of
52% was 14MJ/kg and thus higher than the HHV of brown coal with similar moisture level
(12MJ/Kg). Our research also shows that under specific conditions sCO2 extraction reduces the
moisture content of the municipal sludge from 89% to 53% in 15 min. Evidently this dewatering
process is considerably less energy intensive than conventional thermal and other drying processes.
An additional major benefit is earlier reported extraction of micro pollutants by sCO2 treatment
and thus making the dried sludge more usable in energy applications per regulations. Our results
show an alternative and novel pathway for highly effective dewatering and drying of municipal
and other types of sludge for sustainable energy applications.
6.7.1 Introduction
The major concern in the wastewater treatment plants (WWTPs) is the usage of high energy
processing and drying technologies and sludge disposal. The sludge production is also increasing
drastically due to population growth and urbanization 395. This increasing sludge production has

113
significant impact on environmental, energy consumption and economic factors which making it
one of the largest challenges in wastewater management 396. Low ratio of solid to liquid matter
requires thickening and mechanical dewatering which increases the solids concentration from 3
wt. % to 10-25 wt. % 397. This is primarily done by neutralizing suspended solid particles using
positively charged coagulant molecules such as aluminum sulphate. The next step is done by
adding polymer chemicals such as polyacrylamide-based polymers to the wastewater. The purpose
of the polymers is to further bridge the flocculants from micro to macro size for improved solid
mass removal.
After the removal of large particles including sand, stone, sludge is settled in sedimentation
tank using gravitational force which makes the primary sludge 398,399. Sludge is usually stabilized
by biological (composting or digestion), physical or chemical methods which results in destruction
of pathogens, odor elimination and reduction of volatile contents 400,401. The secondary sludge
produced after stabilization process can be used as fertilizer and harnessing the biogas produced
from the digester 402. Thermal treatment is required to reduce pathogen content and volume, and
to increase the heating value but normally it results in the production of ash or char rather than
having the original sludge 288. Thermal treatment is highly energy intensive and economically
feasible only when excess or waste heat is available 403. In order to overcome the problem of high
energy requirement, numerous new technologies have been experimented. These technologies
include utilization of solar energy for drying of sludge in order to compensate the high energy
intensive thermal drying process9,11,12 infrared (IR) heating 404,405, microwave heating 406,407, fry
technology408,409 , however, all these technologies might change the properties of the sludge due
to the high temperature applied in these processes. There are some standards for the use or disposal
of sewage sludge as per Code of Federal Regulations (CFR), part 503 331. Further, there are micro

114
pollutants such as polycyclic aromatic hydrocarbons (PAHs), polychlorinated biphenyls (PCBs),
dioxins and heavy metals which limit the use of sludge as per new regulations 337–341. This paper
demonstrates the possibility of drying sludge using super critical CO2 with a potential source of
CO2 coming from the biogas produced from sludge during anaerobic digestion. Research has
recently been done to show that sCO2 can be used to dewater wood flakes for the manufacturing
of Oriented Strand Board 130 and dewatering of coal 131. It was found that sCO2 mechanically
displaces the water rather than evaporating the water and even removes the water in concentration
much higher than its solubility limit in sCO2. In this work, it was found that sCO2 can easily remove
the free water and interstitial water from the sludge. Drying efficiency or solvating power of sCO2
can be changed or improved by modulating the temperature and pressure. This same technique has
earlier only been reporter to extract and determine the particular compounds present in sludge 410–
412. These compounds can be micro pollutants such as PCBs 412 and PAHs 411,412 which can be
extracted out during sCO2 treatment and can make the sludge to use in any application as per
regulations. This creates an additional benefit for the use of sCO2 for drying of the sludge. Other
than drying and reducing the volume of landfilled sludge, this research aims at producing an
attractive alternative biofuel with the potential of being considered as a impactful renewable
energy resource 397,402,413.
6.7.2 Materials and Methods
The municipal sludge used in this study was obtained from Neuse River Resource
Recovery Facility (NRRRF), Raleigh, North Carolina. The sludge used was a not stabilized
dewatered cake and was a domestic wastewater sludge. The sludge has a very high bacterial
content in addition to high hydrogen sulfide content therefore we took appropriate precautions for
handling (such as personal protective equipment and use of fume hoods for ventilation). The

115
NRRRF dewatered cake is comprised mostly of raw influent wastewater solids that settle out in
the primary clarifiers. It also has a portion of waste biological solids from biological nutrient
removal (BNR) process that is directed to the primary clarifiers. The primary solids are pumped
to a temporary holding tank followed by dewatering. The dewatering process uses belt filter
presses and one centrifuge. A polymer is also added to the solids to aid with dewatering
performance. The received dewatered cake had a wet basis moisture content (MC) of 83±5%. The
sCO2 extractor used for the experiments was SuperC unit from OCO labs. The samples were
collected from a 5 liter container by random selection using 3-5 g sample size. Two approaches
for sCO2 extraction and drying processing were used: dynamic flow of sCO2 and the sequential
shots of sCO2. The scanning electron microscope (SEM) used was a FEI Verios 460L. The
elemental analyses were conducted by using Perkin Calmer Corporation’s model 2400, series II
elemental analyzer and Perkin Elmer FTIR Spectrometer Frontier was used for FTIR spectroscopy
measurements. Thermogravimetric Analysis was performed by using TA-TGAQ500 equipment
and thermographs were recorded with sludge sample of 20-22 mg. Pure N2 was used as carrying
gas and the temperature of analyzer was heated from 25˚C to 80˚C with the ramping rate of
10˚C/min and kept stable at 80˚C for 50min 353.
6.7.3 Results and Discussion
Extraction of Water using sCO2 The results from sCO2 extractions of sludge are summarized in
Table 6.1 and are average values based on three measurements. Remarkably we observed the
moisture drop from 89% (wet basis) to 53% (wet basis) over 15 minutes at 75˚C and using the
extraction pressure of 17.2 MPa. All percentage moisture loss versus time results are illustrated in

116
Table 6.1. The same sample size of sludge was used to keep sCO2/sludge mass ratio constant. It is
evident that the moisture loss is increasing with time at 17.2 Mpa. In addition, the easily accessible
water was removed through simple dissolution in sCO2 which approximates the solubility limit of
water in sCO2 at 0.019 224. This readily accessible water includes the free water, which is not
attached to the sludge particles and can be easily removed 288,332 and interstitial water, which is
usually present in the capillaries or even trapped within flocs of solids. Below moisture content of
50% (wet basis), surface water, is present on the surface of solid particles and bound either by
adsorption and adhesion. In addition, bound water is present intracellularly and even chemically
bound to the particles as shown in Figure 6.6
Table 6.1 Removal of water from sludge by sCO2
Pressure (Mpa) Run time (min) Initial MC (%)a
Final MC (%)a Water loss (%)a
17.2
5 89 79 23 10 89 73 28 15 88 53 65
5+5+5 88 77 39 30 86 69 47
24.1 15 82 61 39 a Wet basis

117
Figure 6.5 Water loss (%) from sludge. Sequential three shots of 5 min. is indicated by (■).
Figure 6.6 Different water types and distribution in sludge.
Supercritical CO2 treatment removes free and interstitial water through simple dissolution
of water. After the solubility limit is reached the dewatering of the sludge becomes mechanical.
The remaining free water is displaced by sCO2 which makes it more energy efficient than thermal
drying. We propose that the remaining interstitial water is removed by diffusion and therefore also
0
10
20
30
40
50
60
70
0 5 10 15 20 25 30 35
Moi
stur
e lo
ss (%
)
Time (min.)

118
takes time. This is evidenced by the fact that the sequential three shots of 5 min. intervals produced
less dewatering than the direct 15 min. processing using the same conditions. In sequential shots,
where the fresh sCO2 was provided after 5 min. run, the sCO2 was depressurized and then again
raised to desired pressure. This phenomenon is most likely explained by the fact that in each
sequence interstitial water did not have sufficient time to diffuse through the matrix. The same
finding was observed during dewatering of coal 131. Unexpectedly increasing the sCO2 processing
pressure did not increase the water removal unlike what was observed in case of wood 130 and coal
131. This may be associated with the fact that due to the material composition and structural
difference there is less pressure related water removal available. That is the sludge used may have
more surface water, intracellular or chemically bound water in its structure. Municipal wastewater
treatment sludge is a heterogeneous mixture of several components in its complex matrix. This
material consists of organic fibers, filamentous bacteria, extracellular polymer substances,
microorganisms, larger of smaller inorganic particles and ions 414. We hypothesize that this
complex structure is one of the reasons for some of the observed irregular pattern in drying.
Consequently, in order to see if the cellular structures have any impact on the drying properties of
the sludge, we used soft wood pulp as a cellulosic fibrous reference. The pulp was wetted to the
same moisture level and dewatered using sCO2. In total four 15 min. measurements were made
using 17.2 Mpa and 75˚C. The average moisture loss percent for pulp was 35% (wet basis), with
initial moisture content of 86% (wet basis) and final moisture of 73% (wet basis). Wood pulp has
different water distribution as compared to sludge due to its more defined fibrous structure and
homogeneous materials composition. Pulp also shows the phenomenon of hornification (stiffening
of the polymer structure) upon drying and original water-swollen state is not regained upon
resuspension in water. There is thus decrease in water retention value 415. It is worth noting that

119
thermal sludge drying demands agitation to prevent fouling of heating surface and increase of the
stickiness 332. It may be also possible that increased time or pressure also increases the stickiness
which may cause selective removal of water from outer surface creating a surface crust that
potentially slows the removal of water from inner core. Some form of agitation or mechanical
action along with sCO2 treatment can potentially help in removing these possible intrinsic
inefficiencies in water removal.
Elemental Analysis
As a control to observe if any chemical changes occurred to the treated sludge, elemental
analyses were conducted and showed that there is no change in the weight percentage of carbon,
hydrogen and nitrogen after the sCO2 treatments of municipal sewage sludge (Table 6.2).
Supercritical CO2 processes are delicate to the processed material and clearly the low temperature
(75Co) used during the extractions did not causes to release of any volatiles.
Table 6.2 Concentration of Carbon, Hydrogen, and Nitrogen in sludge.
Higher heating value calculation The Higher Heating Value of dried sludge was calculated using Dulong’s formula 416. The
results shown in Table 6.3 depicts that there is a slight increase in HHV value of the sCO2 treated
sludge compared to untreated sludge. This is most likely because of extracting out some extractives
during the processing and therefore increasing the other elements weight % values (Table 6.2).
This leads to a slight increase in HHV value (14MJ/Kg) similar as reported by S. Werle et. Al. 417
Sample Carbon (wt. %) Hydrogen (wt. %)
Nitrogen (wt. %)
Untreated sludge 43.64 4.50 5.62 sCO2 treated continuous 43.16 5.34 5.55 sCO2 treated sequential 43.59 4.56 5.31

120
. Our results show that the HHV of the treated sludge is almost equivalent to the HHV value of
brown coal 418. This illustrates that sludge can be used to supply bioenergy in energy value
equivalent to low grade coal. Remarkably using sCO2 sludge can be used as a fuel bearing the
potential of being considered as renewable bioenergy source. Apart from this, it has been reported
by other authors that sCO2 treatment can extract PAHs 411,412 and PCBs412 to do the quantitative
estimation. New regulations limit the use of sludge either as landfilling or incineration in power
plants because of the presence of these micro pollutants. It is thus proposed that if sCO2 treatment
can extract out these micro pollutants from sludge and improve the HHV to at par to brown coal,
it widened the application areas of treated sludge especially in energy sector as per U.S. Code of
Federal Regulations (CFR) 331.
Table 6.3 Higher Heating Value (HHV) of untreated and treated sludge.
SEM Images
Scanning Electron Microscopy (SEM) micrographs were produced to see the sludge
structure before and after the sCO2 treatments. The results show difference between untreated and
treated dried sludge. Fiber like structures were visible in both cases, however in the untreated
samples the details were less refined. The similar structure has been observed by others using
comparable sludge and at different moisture values 419. Higher magnification (x 10,000) revealed
more differences between untreated and treated sludge. Figure 6.7 and Figure 6.8 show the SEM
micrographs of untreated and treated sludge at 5µm scale. It is noticeable that there were small
Sample Higher Heating Value (MJ/Kg)
Untreated Sludge 12.92 sCO2 treated sludge continuous 14.01 sCO2 treated sludge sequential 12.94

121
round shaped particles in treated sludge. These particles are potentially the flocculants created
during sludge processing for the solids removal and dewatering or from stabilization process. The
difference is most likely because of sCO2 treatment has displaced fibers from the surface of
flocculants or coagulants and made them more evident than untreated sludge. Other investigators
have also noted flocculants after sludge pre-treatment 420. It has also been reported to witness
bacteria clump together and form flocculants 414.
Figure 6.7 SEM micrograph of untreated sludge (x10,000 magnification).
Figure 6.8 SEM micrograph of treated sludge (x10,000 magnification).
5μm

122
Fourier Transform Infrared Spectroscopy (FTIR) Fourier Transform Infrared Spectroscopy (FTIR) was used to further investigate if there
were any changes in the chemical composition of the sludge material before and after the sCO2
treatment 421. This technique is widely used to analyze different types of compounds which are
present in sludge including aromatics, sulfoxides, halides, amides, carboxylic acids, alcohols and
phenols 411,412,422. Figure 6.9 shows the spectrogram of untreated and treated sludge. It is evident
that there is no change in the composition after sCO2 extraction. These results reconfirm that sCO2
treatment does not change the properties of sludge unlike the thermal treatments. It is also
interesting to note that we did not observe any chloride bonds. It can expected that sCO2 treatment
would have extracted out the chloride compounds which are usually present in sludge as part of
PCB traces observed by others 412.
Figure 6.9 FTIR spectrogram of untreated and treated sludge.
80
82
84
86
88
90
92
94
96
98
100
500 1000 1500 2000 2500 3000 3500 4000 4500
Tra
nsm
ittan
ce (%
)
Wavenumber (cm-1)
Untreated Treated Continous Treated Discontinous
S-O
N-HC=C
C-HO-H
O-HN-H
C-X

123
Thermogravimetric Analysis (TGA)
Thermogravimetric Analysis (TGA) was used to infer the weight loss during drying for the
sludge samples. Figure 6.10 and Figure 6.11 shows the drying curve of untreated and treated sludge
indicating the percentage decrease of the initial weight of the sample and the first derivative weight
loss curve as a function of time. Figure 6.10 shows the untreated sample thermograph with a
continuous weight loss as a result of the increase in the temperature. During the measurements of
the untreated sample the weight % curve plateaus at approximately 20% of the original weight.
Temperature was increased from 25˚C to 80˚C and kept isothermal at 80˚C for 50 min. First
derivative of weight loss curve shows that the maximum weight loss has occurred between 6-7
min. TGA thermographs of different types of sludge have also been observed by others 423,424.
Specifically similar thermograph have evidenced that moisture decreased till it reaches an
equilibrium point and water after that point is considered as immobilized since it is very difficult
to remove even thermally 354. This generally considered as immobilized ort hard to remove water
425.
Figure 6.11 shows the same thermographs with the sCO2 treated sludge however with a
clear difference that the weight % curve reaches a plateau at 30% of the original weight of the
sample. This difference is anticipated and relates to the fact that the initial moisture level for two
samples before the TGA thermograph measurement was different. We also propose that the
untreated sample had free and interstitial water available unlike the sCO2 treated sample. This
water is evidently easier to remove. In case of the treated sample this water is already dewatered
during supercritical treatment. Evidently this is the reason why the untreated sample lost more
weight from its initial weight until it reaches the constant or equilibrium point. The Derivative
thermogravimetry (DTG) peak height at any temperature gives the rate of mass loss (dm/dT in

124
mg/min unit). The first derivative of the weight loss curve is almost the same for both treated and
untreated one. The maximum weight loss occurred between 6-7 min and maximum rate of mass
loss for untreated was at 9.2 % / min and for treated at 8.3 %/ min and reached the point when
there was no change in weight and rate of mass loss is zero. Both the samples showed maximum
rate of mass loss when temperature reaches to 80˚C. The maximum temperature Tmax is the
temperature where maximum mass loss occurs. Tmax for untreated sample was 81˚C and for treated
sample 80˚C.
Figure 6.10 Drying curve of untreated municipal sludge sample.
-2
0
2
4
6
8
10
0102030405060708090
100
0 10 20 30 40 50 60
Der
ivat
ive
wei
ght l
oss (
%/m
in.)
Wei
ght l
oss (
%)
Time (min.)
Weight loss (%) Derivative weight loss (%/min.)

125
Figure 6.11 Drying curve of sCO2 treated municipal sludge sample.
Based on TGA, Differential Thermal Analysis (DTA), it has been reported that bond strength
(KJ/Kg) between moisture and solid phase is directly related to the energy requirement for drying
353.
HB = HS −HW
Where, HW is the evaporation heat of pure water at 80°C.
High bonding strength of surface water and bound water could be the reason why extracting the
sludge with sCO2 for longer time did not improve the dewatering of the sludge. sCO2 extraction
could only remove the free and interstitial water but needs more energy to remove surface and
bound water to decrease the moisture content below the 50% 353. By providing additional energy
such as temperature or mechanical energy in to the sCO2 extraction process, a potentially more
-2
0
2
4
6
8
10
0102030405060708090
100
0 10 20 30 40 50 60
Der
ivat
ive
wei
ght l
oss (
%/m
in.)
Wei
ght l
oss (
%)
Time (min.)
Weight loss (%) Derivative weight loss (%/min.)

126
effective energy efficient solution in surface water as well as bound water removal could be
achieved.
Conclusion
The municipal sewage sludge is a highly potential resource for renewable energy
applications and a major opportunity in solving some of the global energy challenges. Drying is a
major component for the economically acceptable cost level for the sludge utilization in energy
use. The required moisture level demands thermal drying which is a highly energy intensive
process. The use of high temperatures also leads to charring, or even combustion of the sludge. In
additional, environmental and safety concerns have to be addressed while looking at acceptable
pathways to sludge drying. For example, micro pollutants limit the usage of sludge as per new
regulations. Hence both energy and environmental aspects should be considered when developing
novel technologies for sludge drying. The supercritical CO2 drying process is a highly potential
technology as it takes into consideration all the sustainability aspects. Extracting sludge with sCO2
was found to remove most of the free and interstitial water. It was found that free water is displaced
by sCO2 and interstitial water is removed mainly by diffusion. Based on our results the sCO2
extraction does not change the chemical composition nor the heating value which makes the
process also more attractive than the thermal treatment. The best drying efficiency was achieved
using extraction pressure of 17.2 Mpa, 75oC temperature and 15 min. processing time. Our
findings show that we were able to dry the sludge down to 53% moisture (wet basis) which is
sufficient for bioenergy energy applications. Supercritical CO2 treatment has also been shown to
help in the removal of micro pollutants during the treatment which makes it more highly
competitive solution as per new regulations. Future work will include adding more energy to the

127
system in to the sCO2 extraction process. This will potentially create even more effective solution
in surface water as well as bound water removal.

128
: Co-combustion of Municipal Sewage Sludge and Coal after
Drying them together with Supercritical Carbondioxide – Simultaneous
Removal of Hazardous Micropollutants.
Salonika Aggarwal, Ilona Peszlen, Marko Hakovirta Abstract Supercritical Carbon dioxide extraction process was investigated for co-combustion of
municipal sewage sludge and coal after drying them together and removal of hazardous
compounds simultaneously. Disposal of biosolids has always been a major concern as per the
environmental perspective and the presence of volatiles and sulfur and high moisture content in
low-grade coal limits its utilization. Combustion of sludge has been widely used as a method of
disposal but co-combustion of sludge with coal could be a better method for sludge disposal as
well as for energy production. sCO2 was used to dewater the sludge and coal together at 75˚C and
17.2 MPa Remarkably our results showed that after sCO2 processing the higher heating value
(HHV) of 90:10, 75:25 & 50:50 coal: sludge blends at the wet basis moisture content of 30, 39 &
50% were 17, 16 & 13MJ/kg respectively and higher than the HHV of brown coal with the
moisture content of 40 % (14MJ/Kg). Our research also shows that there was upto 50% water loss
in 25 min under specific conditions using sCO2 extraction. This mechanical dewatering process is
considered to be less energy-intensive than conventional thermal drying process.
Thermogravimetric analysis of coal-sludge blends has been carried out. It was observed that the
interaction took place between the two fuels during the devolatilization and combustion phase
which happened to decrease the combustion temperature of the mixed fuel. Extractives from the
different blends were analyzed by Gas Chromatography (GC) and Fourier Transform Infrared
Spectroscopy (FTIR) and it was found that the extractives have several compounds including the

129
Polyaromatic Hydrocarbons (PAHs) and organic sulfur which are considered as micropollutants
and needs to be cleaned using cleaning techniques during the combustion and eventually impacts
the energy efficiency. Our results show the novel pathway for highly effective dewatering and
drying of biosolids and coal together for sustainable energy applications.
Keywords: sludge, supercriticalCO2, higher heating value, moisture content, micropollutants
Introduction
The major concern in the wastewater treatment plants (WWTPs) is the usage of high energy
processing and drying technologies and sludge disposal. The sludge production is also increasing
drastically due to population growth and urbanization 395. This increasing sludge production has a
significant impact on the environment, energy consumption, and economic factors which make it
one of the largest challenges in wastewater management 396. Thickening and mechanical
dewatering require to increase the low ratio of solid to liquid matter from 3 wt. % to 10-25 wt. %
397. The neutralization of suspended solid particles using coagulant molecules and the addition of
polymer chemicals that work as flocculants are done to increase the solid concentration. The sludge
is settled in a sedimentation tank using gravitational force after the removal of large sand particles
398,399 followed by the stabilization of sludge for the destruction of pathogens, odor elimination,
and reduction of volatile contents through biological (composting or digestion), physical or
chemical methods 400,401. After the stabilization process, the secondary sludge produced can be
used as fertilizer and biogas produced from the digester can also be harnessed 402. To increase the
heating value and reduce pathogen content and volume, thermal treatment is done which normally
results in the production of ash or char rather than having the original sludge 288. Thermal treatment
is highly energy-intensive and only when excess or waste heat is available can make it
economically feasible 403. The numerous new technologies have experimented to overcome the

130
high energy requirement such as solar energy 9,11,12 infrared (IR) heating 404,405, microwave heating
406,407, fry technology408,409, however, the high temperature used in all these technologies might
change the properties of the sludge similar to the conventional thermal treatment process. Some
standards need to be followed for the use or disposal of sewage sludge as per Code of Federal
Regulations (CFR), part 503 331. There are also micropollutants such as polycyclic aromatic
hydrocarbons (PAHs), polychlorinated biphenyls (PCBs), dioxins, and heavy metals which restrict
the use of sludge as per new regulations 337–341, 426,427. Inattentive dumping of sludge will cause
serious secondary pollution 427. Combustion of sewage sludge has been a widely used solution for
its treatment and disposal. However, a support fuel with high HHV such as coal could be a better
option to compensate for the high moisture content of sludge
Coal is the most abundant and important fossil fuel among all the fossil fuels present which
accounts for about a quarter of the world’s primary energy and two-fifths of electricity 240. Low-
Rank Coal (LRC) such as lignite contains high moisture content (up to 65%, wet basis) which
confines its availability 246 although it is one of the cheapest sources of energy 244,245. Hence drying
of LRC is needed to increase its calorific value and ease transportation 247. Cleaning techniques
are needed to clean volatile organic compounds (VOCs) such as PAH, PCB which released during
the combustion of coal 317–319. Various cleaning techniques have been developed for the removal
of organic sulfur present in coal 320 because environmental regulations impose rigorous limits for
sulfur levels 321.
Co-combustion of sludge and coal has attracted extensive attention from researchers in
recent years. It has already brought into being that co-firing 10% sludge with a moisture content
ranging from 40% to 56% in an existing coal-fired utility is optimal with the remarkable annual
profit 428. It was also found out that co-combustion of coal and sludge could be beneficial in

131
reducing Polyaromatic hydrocarbons (PAH) emissions and PAH toxic equivalent (TEQ)
concentrations 429. It has been concluded that during the co-combustion process, sludge acts as a
catalyst for coal because of the large number of inorganic salts contained in the sludge which
makes co-combustion of coal and sludge more efficient than the single burning of the two fuels
430. Ecological and exploitation requirements are two important points in the co-combustion of
sludge with coal in fired boilers. The emission of harmful substances with flue gas limits the
sludge/coal ratio which should meet the environmental regulations. Other factors are influencing
the co-combustion process are physical and thermal properties of the fuel: heating value, moisture
content and ash composition which ultimately influences the thermal output of the boiler, the
volume of flue gases the amount requirement of air for combustion, and concentration of dust and
particle distribution 426.
This paper investigates the possibility of dewatering the sludge and LRC together at
different concentrations using the supercritical carbon dioxide (sCO2) extraction system and
increase the energy efficiency by decreasing the energy required to dry the most conventional
energy source (coal) and extremely potential biofuel (sludge) together rather than separately and
explore the opportunities aimed at co-combustion of two fuels for the production of energy with
the least likelihood of emissions of harmful volatiles.
There has been research done to show that sCO2 can be used to dewater wood flakes for
the manufacturing of Oriented Strand Board 130 and dewatering of coal 131. It was found that sCO2
mechanically displaces the water rather than evaporating the water which would probably make it
less energy-intensive than thermal treatment. This same technique has earlier only been reported
to extract and determine the particular compounds such as PCBs 412 and PAHs 411,412 present in
sludge 410–412 and sCO2 also removes organic matter from the coal 322,323. This research utilizes the

132
benefit of sCO2 to dewater the coal-sludge blend as well as the removal of micropollutants which
would widen the application areas, especially for the energy sector. The potential source of CO2 coming from the biogas produced from sludge during
anaerobic digestion or the direct-fired oxy-fuel combustion of syngas from coal. sCO2 would be
the working fluid to generate power as well as the byproduct that can be used for Enhanced Oil
Recovery (EOR) and other purposes 305,319. It would be like a closed system with the generation of
CO2 and utilizing it for power generation which makes it greener, sustainable, and also decreases
the carbon footprint. This research aims at producing an attractive alternative biofuel with the
potential of being considered as an impactful renewable energy resource 397,402,413.
Materials and Methods
The municipal sludge used in this study was obtained from the Neuse River Resource
Recovery Facility (NRRRF), Raleigh, North Carolina. The domestic wastewater sludge was used
which was dewatered but not stabilized. The NRRRF dewatered cake is comprised of raw influent
wastewater solids, a portion of waste biological solids from biological nutrient removal (BNR)
process, and also polymers added to the solids to aid with dewatering performance. The received
dewatered cake had a wet basis moisture content (MC) of 83±5%. Pulverized lignite was collected
from the Freedom, ND, mine at an MC of 40% (wet basis). The standard particle size for these
coals is 200 mesh 310. Different concentrations of sludge sample and coal were blended manually
to obtain three types of the blend which are 90:10, 75:25, and 50:50 (coal: sludge). The sCO2
extractor used for the experiments was the SuperC unit from OCO labs.
Optical microscopic images were captured using microscope Nikon SMZ800 and Nikon
ECLIPSE E200. The elemental analyses were conducted by using Perkin Calmer Corporation’s
model 2400, series II elemental analyzer. Thermogravimetric Analysis was performed by using

133
TA-TGAQ500 equipment and thermographs were recorded with samples of approx. 10 mg. Pure
N2 was used as carrying gas and the temperature of the analyzer was heated from 25˚C to 1000˚C
with the ramping rate of 30˚C/min and kept isothermal for 10 minutes 37. Tests were carried out
for sludge, coal, untreated 90:10, 75:25, 50:50(coal: sludge), and treated 90:10, 75:25, 50:50 (coal:
sludge).
Collected extractives were analyzed using Gas Chromatography-Mass Spectrometry (GC-
MS) and Fourier Transform Infrared Spectroscopy (FTIR). GC/MS was performed using an
Agilent instrument operating in electron ionization (EI, 70 eV) mode. The separation was achieved
using a 30 m × 0.25 mm i. d., 0.25 μm capillary column. The initial oven temperature was set at
60 °C and held for 1 min at this temperature, and then the temperature was increased at 3 °C/min
to 90 °C (held for 1 min), increased at 3 °C/min to 170 °C (held for 1 min), and then increased at
3 °C/min to 300 °C (held for 8 min). The carrier gas flow rate in the column was 1 mL/min. The
GC injector temperature was set at 300 °C, with a split ratio of 20:1. The ion source temperature
was set at 230 °C. The spectrometer was set to scan between mass to charge ratio (m/z) 30 and
500. The injected volume of the sample was 0.4 μL318. The FTIR spectra of coal extractives were
measured using Frontier FTIR Spectrometer.
Results and Discussion
7.3.1 Extraction of Water using supercritical carbon dioxide
The results from sCO2 extraction of coal-sludge blends are summarized in Table 7.1 and
are average values based on three measurements. There has been remarkable moisture drop
especially with 90:10 (coal: sludge) blend from 45% (wet basis) to 30% (wet basis) over 25
minutes at 75˚C and using the extraction pressure of 17.2 MPa. All percentage weight loss versus
time results is illustrated inFigure 7.1. The same sample size of coal: sludge was used to keep
sCO2/sludge mass ratio constant. The moisture loss is increasing with time at 17.2 MPa with all

134
the concentrations. There is a positive correlation between time & % water loss for all the types of
the blend but there is a negative correlation between sludge concentration in the blend and % water
loss which means with the increase in sludge concentration, % water loss decreases. Though
statistically there is no difference in % water loss in case of all types of blends at lower time run
(i.e. 5 & 15 min), these values are different for longer runs. This might be because, in the shorter
run, the easily accessible water was removed through simple dissolution in sCO2 which
approximates the solubility limit of water in sCO2 at 0.019 224. This readily accessible water
includes the free water or surface water which is not attached to the sludge particles and coal
particles and can be easily removed 288,332. For longer runs, sCO2 has to remove bound water which
could be intercellular or chemically bound water in case of sludge 288,332 and capillary or
interparticle water in case of coal 254,259. Supercritical CO2 treatment removes free water through
the simple dissolution of water. After the solubility limit is reached the dewatering of the sludge:
the coal blend becomes mechanical. The remaining free water is displaced by sCO2 which makes
it more energy-efficient than thermal drying. It is also proposed that remaining accessible water is
removed by diffusion and therefore also takes time. The increase in sludge concentration decrease
% water loss, this could be possible because municipal sewage sludge is a heterogeneous mixture
of several components in its complex matrix.
This material consists of organic fibers, filamentous bacteria, extracellular polymer
substances, microorganisms, larger of smaller inorganic particles, and ions 414 as shown in Figure
7.2(a,b). We hypothesize that this complex structure is one of the reasons for the observed pattern
in drying because of this heterogeneity, it becomes more difficult to remove bound water from
sludge compared to coal. It is worth noting that thermal sludge drying demands agitation to prevent
fouling of heating surface and increase of the stickiness 332. Figure 7.2(c,d) shows the microscopic

135
structure of untreated coal which has few fibers like structure but has a simple structure as
compared to sludge. Figure 7.2(e,f) shows the untreated 75:25 coal: sludge blend where fibrous
structures are visible in the undried state. Figure 7.2(g,h) shows the treated 75:25 coal: sludge
blend where fibrous structures seemed dried and there is an unknown structure that could be a
wood particle that makes the blend complex and heterogeneous.
Table 7.1 Removal of water from a coal-sludge blend by sCO2.
Figure 7.1 Water loss (%) from coal: sludge blend.
0
10
20
30
40
50
60
0 10 20 30
% W
ater
Los
s
Time (min)
90:1075:2550:50
Pressure (MPa) Run time (min) Initial MC (%)a Final MC (%)a Water loss (%)a 90:10 (Coal: Sludge)
17.2
17.2
5 45 40 22 15 45 35 36 25 45 30 50
75:25 (Coal: Sludge) 5 51 46 18
15 51 44 30 25 51 39 40 50:50 (Coal: Sludge)
5 59 55 14 17.2 15 59 53 25
25 59 50 35 a Wet basis

136
The filaments or bacterial structures are visible in sludge as shown in Figure 7.2(a,b) as shown by
others as well 414 but these structures were not visible in treated samples. It has been reported that
sCO2 can kill the pathogens 156–158 because of the high pressure but this needs more experimental
research to prove it in this case.
Figure 7.2 Microscopic Structure of (a) & (b) untreated sludge; (c) & (d) untreated coal; (e) & (f) untreated coal-sludge blend; (g) & (h) treated coal-sludge blend.
7.3.2 Elemental Analysis
As a control to observe if any chemical changes occurred to the treated coal: sludge blends
and to estimate the change in the higher heating value (HHV), elemental analyses were conducted
and showed that there is a pattern change in the weight percentage of carbon, hydrogen, nitrogen,
and sulfur after the sCO2 treatments of the blends as shown inTable 7.2. Coal has a high weight
percentage of carbon, hydrogen, and sulfur whereas less weight percentage of nitrogen compared
to sludge. In the case of coal: sludge blends, supercritical CO2 extraction process increasing the
weight percentage of carbon, hydrogen, nitrogen, and sulfur compared to untreated coal: sludge
blends. Other than this, there is not any major change in the elemental composition of the blends.

137
Table 7.2 Concentration of Carbon, Hydrogen, Nitrogen & Sulfur in sludge.
7.3.3 Higher heating value calculation
The Higher Heating Value of coal: sludge blend was calculated using Jenkins formula 431–
433. The results shown in Table 7.3depicts that there is an increase in the HHV value of the sCO2
treated coal: sludge blends compared to untreated coal: sludge. This is most likely because of the
dewatering of the coal: sludge blends as shown in Table 7.1. The HHV value of 75:25 coal: sludge
is slightly higher than the value of coal has the same moisture content. There is an increase in the
HHV value in 90:10 coal: sludge blend after sCO2 treatment compared to low-grade coal. These
HHV values are quite similar as reported by S. Werle et. al.417. Our results show that the HHV of
the coal: sludge blends are almost equivalent to the HHV value of brown coal 418. This elucidates
that coal: sludge blends can be used as the source of bioenergy equivalent in energy value to low-
grade coal. Coal: sludge blends are the potential fuels of being considered as a renewable bioenergy
source. It has been reported that a 10% substitution of coal with sludge can increase the annual
profit of power plants by 31% 428. Table 7.3 illustrates even 75:25 coal: sludge blends can be used
as the potential fuel having the HHV value slightly higher than the HHV value of coal with the
same moisture content which would be more economically advantageous for the power plants.
Sample Carbon (wt. %)
Hydrogen
(wt. %)
Nitrogen (wt. %)
Sulfur (wt.%)
Coal 33.32 2.81 0.51 1.32 Sludge 9.17 1.32 1.09 0.27
Untreated 90:10 Coal: Sludge 30.16 2.66 0.76 1.32 Treated 90:10 Coal: Sludge 38.97 3.14 0.72 1.39
Untreated 75:25 Coal: Sludge 35.49 2.87 0.62 1.28 Treated 75:25 Coal: Sludge 35.49 2.91 0.77 1.52
Untreated 50:50 Coal: Sludge 20.92 1.93 0.87 0.64 Treated 50:50 Coal: Sludge 24.07 2.18 1.00 0.88

138
Table 7.3 Higher Heating Value (HHV) of untreated and treated sludge.
7.3.4 Thermogravimetric Analysis (TGA)
Thermogravimetric Analysis (TGA) was used to infer the thermal characteristics of coal,
sludge & coal: sludge blends. Figure 7.3 shows the TG & DTG curve of coal & sludge. The whole
temperature-programmed process of all the samples can be divided into three phases. The first
phase of DTG curves shows the weight loss peak because of moisture loss. The high maximum
weight loss rate of sludge compared to coal is because of the high moisture content of sludge than
coal. The second phase is known as devolatilization and the combustion period begins at around
180˚C and ends at around 450˚C in case of sludge. The peaks in this phase represent the
devolatilization of the main organic components in the sludge. The corresponding weight loss rate
of sludge due to volatile content is 3.6%/min. The combustion period of coal which is different
from sludge begins at 300 ̊ C and ends at around 650˚C. Both of these temperatures are higher than
that of the sludge, which indicates the higher temperature is required for the combustion of coal
compared to the combustion of sludge. The only peak shown in the combustion phase has the
maximum weight loss rate of 2.8%/min at 460˚C in case of coal whereas maximum weight loss
rate of 4.1%/min occurred at 377˚C in case of sludge. The third phase is known as the burnout
Sample Higher Heating Value (MJ/Kg)
Coal 14.80 Sludge 8.35
Untreated 90:10 Coal: Sludge 13.96 Treated 90:10 Coal: Sludge 16.27
Untreated 75:25 Coal: Sludge 15.33 Treated 75:25 Coal: Sludge 15.34
Untreated 50:50 Coal: Sludge 11.43 Treated 50:50 Coal: Sludge 12.28

139
phase, where there are no peaks in the case of both coal & sludge indicates there are almost no
reactions.
Figure 7.3 TG and DTG curves for (a) coal and (b) sludge.
Figure 7.4 shows the TG and DTG curves of untreated and treated 90:10 coal: sludge
blends. Similar to the case of sludge and coal, the first phase or period represents the weight loss
because of the moisture content. The weight loss rate of moisture in the case of treated samples is
higher than that of untreated samples with the value between the value of sludge and coal. This
might be because of the interaction between coal and sludge during the sCO2 extraction process as
shown by other authors 430. In the second phase which is devolatilization and combustion period,
there is only one peak begins at around 200˚C and ends at 650˚C in the case of both untreated and
-4
-3
-2
-1
0
1
0102030405060708090
100
0 200 400 600 800 1000
DTG
(%/m
in)
TG (%
)
Temperature (˚C)
TG (%)
DTG
(a)
-19-17-15-13-11-9-7-5-3-11
0102030405060708090
100
0 200 400 600 800 1000
DTG
(%/m
in)
TG (%
)
Temperature (˚C)
TG (%)
DTG (%/min)
(b)

140
treated samples. This peak begins at a temperature close to the one shown in the case of sludge
and ends at a temperature close to coal. The blend requires a higher temperature for combustion
similar to coal. The only difference between the two is the temperature where is maximum weight
loss rate of 2.6%/min occurred at the temperature of 447˚C and 486˚C for untreated and treated
samples respectively. In the third phase which is the burnout period, there is a major difference to
be observed between the DTG curve of untreated and treated sample is the presence of a peak in
the case of treated samples which might be because of the decomposition of calcium carbonate
which may present in the sludge. This peak is observed at 910˚C with a weight loss rate of
1.2%/min and the temperature is very close to the decomposition temperature of pure calcium
carbonate which is 880˚C. A similar observation has been reported by other authors 430 which has
proved the interaction between sludge and coal during co-combustion. sCO2 treatment might be
responsible for some sort of reaction between sludge and coal which results in the interaction
between the two.

141
Figure 7.4 TG and DTG curves for (a) untreated and (b) treated 90:10 coal: sludge blend.
Figure 7.5 shows the TG and DTG curves of untreated and treated 75:25 coal: sludge
blends. The first phase or period represents the weight loss because of the moisture content. The
weight loss rate of moisture in the case of the untreated sample is higher than that of treated
samples with a value between the value of sludge and coal. This might be because of the presence
of a higher amount of sludge compared to 90:10 coal: sludge blend and also because of interaction
and more uniform mixing between coal and sludge during the sCO2 extraction process as shown
by other authors as well 430. In the second phase which is devolatilization and combustion period,
-4
-3
-2
-1
0
1
0102030405060708090
100
0 200 400 600 800 1000
DTG
(%/m
in)
TG (%
)
Temperature (˚C)
TG (%)
DTG (%/min)
(a)
-6
-5
-4
-3
-2
-1
0
0102030405060708090
100
0 200 400 600 800 1000
DTG
(%/m
in)
TG (%
)
Temperature (˚C)
TG (%)
DTG (%/min)
(b)

142
there are two peaks begins at around 300˚C and ends at 600˚C in case of the untreated sample but
begins at 180˚C and ends at 600˚C in case of treated samples. These two peaks might be because
of the decomposition of organic compounds present in coal and sludge which has different
decomposition temperatures. The two peaks have a weight loss rate of 1.9%/min and 2.2%/min at
392˚C and 445˚C respectively in case of untreated sample whereas two peaks has a maximum
weight loss rate of 4.1%/min and 2.1%min at 381˚C and 417˚C respectively. These two peaks are
observed at the temperatures close to the temperature observed in the case of coal and sludge.
Absence of these two peaks in the case of 90:10 coal: sludge blend might be because of the less
amount of sludge present compared to 75:25 coal: sludge blend where sludge amount is
considerable. It can be inferred that the mixing of two fuels makes the combustion quicker than
the combustion of coal solely. Other authors have inferred that sludge can act as a catalyst for coal
during the co-combustion process 430. In the third phase which is the burnout period, there is no
difference between the two samples and there is no peak unlike treated 90:10 coal: sludge blend
which might be because of a heterogeneous mixture of sludge and the particular portion of the
sample did not have calcium carbonate because samples were taken randomly from the single
batch.

143
Figure 7.5 TG and DTG curves for (a) untreated and (b) treated 75:25 coal: sludge blend.
Figure 7.6 shows the TG and DTG curves of untreated and treated 50:50 coal: sludge
blends. The first phase or period represents the weight loss because of the moisture content. The
weight loss rate of moisture in the case of untreated samples is lesser than that of treated samples
like 75:25 coal: sludge blend. In the second phase which is devolatilization and combustion period,
there are two peaks begins at around 273˚C and ends at 600˚C in case of an untreated sample but
begins at 180˚C and ends at 600˚C in case of treated samples. These two peaks might be because
of the decomposition of organic compounds present in coal and sludge which has different
decomposition temperatures. The two peaks have a weight loss rate of 2.4%/min and 1.2%/min at
-14
-12
-10
-8
-6
-4
-2
0
0102030405060708090
100
0 200 400 600 800 1000
DTG
(%/m
in)
TG (%
)
Temperature (˚C)
TG (%)
DTG (%/min)
(a)
-5
-4
-3
-2
-1
0
1
0
10
20
30
40
50
60
70
0 200 400 600 800 1000D
TG (%
/min
)
TG (%
)
Temperature (˚C)
TG (%)
DTG (%/min)
(b)

144
492˚C and 588˚C respectively in case of untreated sample whereas two peaks have a maximum
weight loss rate of 2.7%/min and 1.9%min at 362˚C and 550˚C respectively. The untreated sample
shows a more similar pattern like coal whereas the treated sample shows the pattern between coal
and sludge. This might be because of interaction and more uniform mixing between coal and
sludge during the sCO2 extraction process as shown by other researchers 430. It can be inferred that
the mixing of two fuels makes the combustion quicker than the combustion of coal solely. Other
authors have inferred that sludge can act as a catalyst for coal during the co-combustion process
430. In the third phase which is the burnout period, there is no difference between the two samples
and there is no peak unlike treated 90:10 coal: sludge blend which might be because of a
heterogeneous mixture of sludge and the particular portion of the sample did not have calcium
carbonate because samples were taken randomly from the single batch.

145
Figure 7.6 TG and DTG curves for (a) untreated and (b) treated 50:50 coal: sludge blend.
7.3.5 Gas Chromatography-Mass Spectrometry (GC/MS)
Figure 7.7 shows the GC-MS spectra of extractives from coal-sludge blends. It was found
that all the extractives included several compounds. It was observed that there was the removal of
organic sulfur (gamma.-oxo-, Naphthalene-2-sulfonamide, 4-Bromo-2-[difluoro[2-(2,4-
difluorophenyl)-2-oxiranyl]methyl] thiazole, 2-[5-(3-Bromo-phenyl)-[1,3,4]oxadiazol-2-
ylsulfanyl]-1-naphthalen-1-yl-ethanone, N-methyl-1,2,5,6-tetrahydropyridine-2-thione ) from all
the types of extractives similar to reported by others 33,59,65. Extractive from 90:10 coal: sludge
blend has more organic sulfur than other blends, this might be because coal contains more sulfur
-3
-2
-1
0
1
0
10
20
30
40
50
60
70
0 200 400 600 800 1000
DTG
(%/m
in)
TG (%
)
Temperature (˚C)
TG (%)
DTG (%/min)
(a)
-15
-13
-11
-9
-7
-5
-3
-1
1
0102030405060708090
100
0 200 400 600 800 1000
DTG
(%/m
in)
TG (%
)
Temperature (˚C)
TG (%)
DTG (%/min)
(b)

146
weight percentage than sludge (Table 7.2).Table 7.2 Concentration of Carbon, Hydrogen,
Nitrogen & Sulfur in sludge Polycyclic aromatic hydrocarbons (PAHs) such as 1-Naphthoic acid,
4-Cyanocinnoline, Azobenzene, 4,4'-dibromo-, naphthalene, Sarcosine, N-(1-naphthyl)-, octyl
ester, and 2-Methyl-5H-dibenz[b,f]azepine considered as organic pollutants were also found which
were extracted during supercritical process 317,325,326,410–412,429. sCO2 also extracted hydrocarbons
such as 1-Ethylhexyl propylphosphonofluoridate which are of biological toxicity reported by other
authors also 319,323,325. There is also the removal of substances that are considered as agriculturally
toxic substances such as 3-fluorophenyl ester and carcinogenic such as 1-Naphthalene-sulfonic
acid 326. Polycyclic aromatic hydrocarbons and their derivatives have been shown in the
chromatographic analysis of volatile extracts of coal and sludge by other researchers also 317–319,410–
412.
Figure 7.7 GC-MS Spectra of an extract of coal: sludge blend.

147
7.3.6 Fourier Transform Infrared Spectroscopy (FTIR) analysis
Figure 7.8 shows the FTIR spectrograph of extractives from coal: sludge blends. The
samples have almost similar functionalities similar to the same observed in chromatograms. The
functionalities found in the IR spectra 328 are per the compounds identified by gas
chromatography/mass spectrometry, i.e., polycyclic aromatic hydrocarbons, their derivatives 329.
Three spectrograms have not much difference similarly as observed in the chromatogram. The
broad band in the region of 3000 to 2700 cm-1 is because of the presence of NH groups 330,338,399.
The bands in the spectral region between 3100 and 2800 cm-1 show the aliphatic C−H region and
aromatic C−H region which is related to the stretching vibration of at about 1300 cm-1 (C—O)
could be assigned to esters in which the ester group is attached to a phenyl group 326. The band at
1700 (1743) cm-1 could be assigned to thiol esters like observed in the chromatogram. CH2 in the
alkyl substituents in the aromatic rings showed the band at 1459 cm−1 and 1418 cm−1 perhaps due
to isolated CH2 groups (including methylene bridge between aromatic rings) 326,330. The
absorbance band at 1245 cm-1 is associated with the C = O stretching because of the ethers 330. In
the spectral region between 900 and 650 cm−1 and bands show the aromatic bands 330,317. The
absorbance corresponds to the bands 3472 cm-1 (NH stretching vibration) 317,319. The band at 580
cm-1 shows the presence of bromide similarly observed in the chromatogram.

148
Figure 7.8 FTIR spectrogram of coal-sludge blend extractives.
Conclusion
Supercritical CO2 can be used to dewater the coal & sludge together which decreases the
significant amount of moisture in a very short time. sCO2 removes the water by displacement or
diffusion rather than the evaporation. It was found that 90:10 & 75:25 coal: sludge blends have a
higher heating value (HHV) greater than the HHV value of brown coal at the same moisture
content. This would make the municipal sewage sludge as a highly potential resource for
renewable energy applications and a major opportunity in solving some of the global energy
challenges. TG analysis of coal and sludge show that they have different combustion
characteristics but TG analysis of coal-sludge blends show that there is an interaction between coal
and sludge during the devolatilization and combustion phase. GC-MS and FTIR analysis
substantiate the presence of Polyaromatic hydrocarbons (PAHs) which are considered as
micropollutants, and organic sulfur in the extractives collected from coal-sludge using sCO2 during
0
5
10
15
20
25
30
35
050010001500200025003000350040004500
% T
rans
mitt
ance
Wavenumber cm-1
90-10 75-25 50-50

149
the dewatering process. Drying can theoretically increase energy efficiency and removal of
volatiles along with water loss will reduce the need for cleaning techniques during combustion.
sCO2 used for direct-fired oxy-fuel combustion of coal for power generation could be a potential
source for sCO2 for dewatering and removal of hazardous VOCs simultaneously proceeding to the
closed cycle of the whole system. More research will be required for the techno-economic
characteristics of this planned conceptual approach. Therefore supercritical CO2 drying process is
a highly potential technology as it takes into consideration all the sustainability aspects.
Acknowledgment The authors would like to thank Ms. Erika Bailey and the Neuse River Resource Recovery
Facility (NRRRF), Raleigh, North Carolina for their kind support in providing us the sludge
samples and giving us general advice. Special thanks to Danielle Lehman from Department of
Chemistry & Lisa Lentz from Department of Soil Science, North Carolina State University for
availing their Gas Chromatography and Elemental Analysis facilities considering this pandemic.
The authors would also like to thank Chemical Analysis and Spectroscopy Laboratory (CASL),
North Carolina State University for their support and facilities.

150
: Novel Application of Extractives extracted out from Natural
Products using Supercritical Carbon dioxide
Introduction
Grapefruit (Citrus Paradisi) is a citrus fruit. Grapefruit seed extract (GSE), is a liquid
extract derived from the seeds, pulp, and white membranes of grapefruit. It is also known as citrus
seed extract. GSEs which are sold to consumers commercially are made from the seed, pulp, and
blended with glycerin 434. Several types of research have found out that GSE has antimicrobial
activity against various infectious agents 434–436. Reagor et.al. 435 has reported that GSE is
antibacterial against 67 distinct biotypes. Heggers et.al.436 have out found out that GSE is effective
against more than 800 bacterial and viral strains. It was also reported that GSE could be toxic to
human cells at high concentration but at 1:512 dilution, GSE won’t be toxic but bactericidal 436.
Some researchers have claimed that GSE does not have any antibacterial activity 437. GSE contains
polyphenolic compounds, flavonoids (naringin), citric acid, ascorbic acid, tocopherol, limonoid,
and other trace compounds 438. pure ethanolic extract of grapefruit seed and pulp exhibited strong
antimicrobial activity against Salmonella enteritidis and other pathogenic or non-pathogenic
microorganisms 439.
Grapefruit seed extraction
5lb of grapefruit was bought from Costco, Raleigh, North Carolina. Seeds from grapefruits
were collected and ground in the blender. These ground seeds were used to extract the oil.
Approximate 5g of ground seeds were put in the SuperC extractor for supercritical CO2 extraction.
Extraction was done at 17.2MPa and 75˚C for 30 min. Oil was collected in the collection vessel.
The extracted oil will be used analysis and determination of antimicrobial activity. SFE has been
used to extract limonoids and naringin from grapefruit seeds using sCO2. The results demonstrated

151
environmentally friendly, practical application of supercritical CO2 extraction of limonoids and
flavonoids from grapefruit seeds 440,441.
Composition of extractives
Extractives have been collected but GC-MS analysis will have to be done to know the
composition of the extractives. This analysis will provide us the information about what
compounds SFE has been able to extract from the seeds. SFE would have been able to extract the
compounds which are responsible for antimicrobial activity of the GSE.
Due to coronavirus pandemic, this research has been put on hold. Antimicrobial
activity of grapefruit seed extract.
Several kinds of research have reported that GSE has an antimicrobial effect of 435,436. GSE
which has been sold as a dietary supplement can also be used to fight against infections especially
against different bacteria. The extractives collected from SFE extraction have been sent to the
Department of Biotechnology, NCSU but due to coronavirus pandemic, this work has been
put on hold.
Novel application of grapefruit seed extract: Antimicrobial 3D Printed Surgical Tools
The proposed plan for this research is to find out the novel application of GSE extract other
than using it as a dietary supplement or consumed it orally. The plan is to first test the antimicrobial
activity of the extractives collected from SFE extraction of grapefruit seeds. In the instance of
extractives would show the antimicrobial activity, then these extractives will be used as an
important component to manufacture antimicrobial 3D printed surgical tools. To intensify the
probability of adsorption of antimicrobial extractives on the surface of 3D printed surface, novel
biocomposites have already been formulated using diatomaceous earth(D.E.) and polylactic acid
(PLA). ThesePLA was used because it is biodegradable and most used material from 3D printing.

152
D.E was used because of its porous structure which increases the surface area and adsorption
capacity. When extractives will be used on the surface of the 3D printed tool, D.E. will increase
the adsorption of those extractives due to its peculiar properties.
Novel 3D Printing filament composite using diatomaceous earth and polylactic acid for
materials properties and cost improvement
Salonika Aggarwal, Shelly Johnson, Daniel Saloni, Marko Hakovirta
This paper was published in Composites Part B 177 (2019) Abstract There is a large variety of different materials currently used for producing 3D printing
filaments. In this paper, we are investigating the utilization of diatomaceous earth as a potential
component for polylactic acid-based 3D printing composite materials. The results clearly show
that with the only minor deterioration of the basic mechanical properties of the 3D printed material
at least 10 wt% of the polylactic acid usage can be reduced and replaced by diatomaceous earth.
Our thermal analysis also shows nucleation and chain mobility phenomena in the presence of
diatomaceous earth particles. The results also show that we can engineer 3D printing surfaces with
diatomaceous earth protruding from the composite structure and thus allowing us to create a high
surface area on the 3D printed objects surface. With this research, we have shown for the first time
an opportunity for cost reduction compared to using pure polylactic acid filaments and a pathway
to immobilizing chemical sensing, antibacterial and antiviral agents on 3D printed objects for many
applications such as biomedical. 8.5.1 Introduction
The commercial applications of 3D printing started already in 1984 442. The main
applications being in rapid prototyping related applications. Since then, 3D printing or a more

153
recently used term, additive manufacturing has evolved tremendously reaching also home-used
consumer applications 443. The developments in additive manufacturing have also become a novel
industrial growth area from several applications point of view. The technology is used for specific
parts and final product manufacturing in areas where simplification of assembly, waste
minimization, and mass customization are important. Industries, where 3D printing is already
commonly used, include aerospace, orthopedic and medical research, defense, and jewelry 444. The
role of 3D printing filaments has become analogous to the inkjet printing market. That is the price
of the thermoplastic filaments is one of the main sources of revenue and profitability for the
industry. In this space, conventional materials used for 3D printing filaments include for example
acrylonitrile butadiene styrene (ABS), high impact polystyrene (HIPS), polylactic acid (PLA),
thermoplastic elastomer (PCTPE), transparent polycarbonate and nylon. It is forecasted that this
filament market will reach $6.6 billion by 2026 445.
Depending on the applications the traditional filament materials have so far been
thermoplastics, metal powders, and photopolymers. Also, the future direction is in including
materials such as ceramics, biomaterials, graphene, carbon fibers, binders for metals, sand, and
plaster 446. In this paper, we are looking at the more conventional materials and specifically PLA
(polylactic acid). PLA is biodegradable and made usually of starch, potato, or sugarcane. The cost
of PLA is currently quite high and ranges from $19 to $175 per kg 447,448. In addition to its relatively
high price, some of the concerns in its wide use are the moisture resistance and VOC emissions
including iso-butanol, methyl-methacrylate (MMA) during 3D printing 449–451. To address the cost
issue and also a new value-added feature to the applications a novel filament composite alternative
is presented. Diatomaceous earth is naturally occurring fossilized remains of diatoms that are types
of algae with a hard-shell structure. Traditionally diatoms have been used in paper-based materials,

154
for example, filler in papermaking, filtration media, mild abrasive, absorbent material, and a
thermal insulator. Perhaps its most famous application is for the stabilization material for dynamite
452–454. The cost of diatomaceous earth per kilo is relatively low and on average $0.3 per kg 455.
The impetus for this research is to use diatomaceous earth as an additive to the filament material
and by doing so to create a composite with the primary benefit of reducing the use of PLA and
therefore the additive manufacturing cost. Other benefits potentially include the ability of diatoms
to absorb water. Improved moisture resistance may slow down the process of decomposition of
the filament material. Besides, the structure of the diatoms is critical for any surgical instruments
and while PLA is extruded at temperatures well above the 120 C, steam sterilization, or even high-
temperature dry heat sterilization (170 C) is recommended 456,457. The reported approach to 3D
printing filaments could eliminate the detrimental effects of sterilization on PLA materials
performance.
8.5.2 Materials and Methods
Polylactic Acid (PLA) 3D850 supplied by NatureWorks was purchased for this project as
it exhibits a faster crystallization rate and can develop improved heat-resistance in 3D printed parts.
We used food-grade shell flour DE that contains 89% Silicon Dioxide. PLA pellets were slowly
mixed with Diatomaceous Earth (DE) using Xplore® extruder and maintained at temp. of 175 C
and 120 rpm. After compounding was completed, filaments were extruded for further processing.
These extruded filaments were ground in a professional blender (Blendtec) until the material was
broken down into small particles and then sieved using 0.132 in mesh size (Hogentogler & CO.,
ASTM E 11). This procedure was followed for making 5 different masterbatches at the following
concentrations: 0 wt %; 5 wt %, 10 wt %, and 15% wt. DE in PLA. PLA-DE Composites were
converted into 1.75 mm filaments at 170 C using a vertically mounted extruder made by Filastruder

155
version 2 0.1 with a barrel and feed screw and a cooling fan. Filaments produced were tested for
consistency and quality for appropriateness for 3D printing. We used a Fusion3 F306 (Fused
Filament Fabrication (FFF)) system for 3D printing. All the 3D printed parts were done with a print
speed of 50 mm/s, 2 perimeter walls, and rectilinear infill pattern. Print speed refers to the
maximum speed of the hot end during printing. The perimeter walls are the outer sections of the
part that follow its contour. The rectilinear infill pattern consists of lines drawn at alternating 45
angles based on the layer of the part. This infill fills the space between the perimeters walls. Testing
samples were printed based on the needs and tests to be performed, thus, the tensile samples were
printed at 100% infill. Before each print, the printer bed was cleaned and a thin layer of polyvinyl
alcohol (PVA) based glue stick was applied to the print area. This allows the parts to be easily
removed after printing as well as improves the adhesion of the first layer onto the build platform.
The filament was loaded using the filament load function built into the printer. The bed was leveled
using the directions in the printer manual and several trials were made to ensure that the machine
was properly calibrated and function. Filament from the compound (PLA and DE) was 3D printed
at a speed of 100 mm/s. Nozzle size of 0.4 mm was used and the extrusion width was 0.45 mm and
the nozzle temperature was 215˚C. The printing bed temperature was at 60 C. Simplify3D Creator
software was used to design and process the parts. The Standard used to design the dog bones were
ASTM 3039/D3039M 17 (Standard Test Method) for Tensile Properties of Polymer Matrix
Composites Materials). All dog bone parts were printed using a 45 raster orientation angle
commonly found to be the strongest specimen 458. For thermal analysis, the filament samples and
the 3D printed components were analyzed using DSC (Differential Scanning Calorimetry) Q2000
by TA Instruments. Melting and crystallization curves were measured to see the melting and
crystallization behavior of filaments production and 3D printing. Scanning Electron Microscopy

156
(model Hitachi S3200 N) was used for analyzing the surface of the 3D printed objects and to
investigate the diatom-PLA boundaries in the filaments. The tensile tests of the 3D printed
specimen were performed using MTS Insight electromechanical device. Tensile strength was
tested by following the ASTM D638-14 standard using the Type V specimen and a testing speed
of 1.3 mm/min. Following this standard, the samples had their width and thickness measured at the
center of each part to calculate the cross-sectional area of the sample. The MTS Insight uses a load
cell to measure the force as it pulls the sample apart. Tensile testing of filaments was also done by
using Instron tensile tester. It is important to note that tensile testing of the 3D printed parts test
the strength of the layer adhesion instead of the material strength, the reason why the tensile
strength of the filament was also performed. Work done by previous authors 459 discussed that
while analyzing and characterizing 3D printed components, results obtained should be treated as
structural properties instead of material properties. It is because 3D printed samples are anisotropic.
8.5.3 Results and Discussions
In order To reduce the cost of 3D printing using bio-based PLA filaments the additive
material used should not add any considerable detrimental effect nor dramatically reduce materials
properties of the 3D printed composite materials. Besides, the 3D printability of the composite
filament should not be affected. The results from our Tensile strength tests for filaments produced
using different percentages of diatomaceous earth were tested using Instron tensile tester with a
load of 65 kN and preset length of a filament of 100 mm. All samples were measured according to
ASTM standard- ASTM D638 (Standard Test Method for Tensile Properties of Plastics). In total
five specimens were made for each test and the average of the results are reported in Table 8.1 and
Figure 8.1. Tensile strength of 3D printed dog bones with 0%, 5%, and 10% of diatomaceous earth
were tested using MTS Insight electromechanical machine. Specimens containing 15% diatoms
157
were produced but the filaments were too brittle to be used for further processing and printing. The
average of the results for the five specimen tests per sample type is reported in Error! Reference s
ource not found.. Tensile testing data for both measurements (filament and dog bones) are
presented in Figure 8.1 & Figure 8.2 and dogbone samples prior to tensile testing in Figure 8.3.
The results of the filament tensile testing can be seen in Figure 8.1 and show similar average
values for PLA 100% filaments 460–462. On the other hand, adding diatomaceous earth to the PLA
generated a reduction in the mechanical properties of the filaments. With 5 wt% of diatomaceous
earth, the results in Yield point showed about a 19% reduction. Looking at the 10 wt % sample we
see only 3% points additional drop in the Yield point compared to the 5 wt% sample. With the 15
wt% sample, we see a large drop in all the properties except for the Modulus of Elasticity that is
quite similar to all samples and represents the tendency of an object to deform along its axes. It can
be therefore concluded that the PLA-DE adhesion and interphase properties create the observed
degradation of materials properties. The diatoms used were pre-washed and as they are the
freshwater type they have a particular consistent tubular shape. The frustules of this type have high
porosity, mean particle size below about 12 μm (i.e., food-grade), and large surface area of about
26.4 m2/g measured by Brunauer-Emmett-Teller (BET) surface area analysis. It is possible that
further purification and calcination of diatoms prior to the extrusion process could give an
improvement to the interphase properties of the composite. It can be inferred that some of the
particles of the diatomaceous earth might migrate to the surface affecting the adhesion between
consecutive layers, and therefore, reducing the strength of the part when subjected to a tensile test.
With the 15 wt% samples, we only reached the elastic limit that is the lowest stress point at which
permanent deformation could be measured. These samples, therefore, showed no plastic behavior

158
and were extremely brittle and difficult to handle for 3D printing purposes. Eventually, we were
not able to print dog bones from these filaments as stated before.
Table 8.1 Filament Tensile Testing results.
Sample type [wt. %]
Ultimate Stress (MPa)
Standard Error Stress
Elongation at Break (mm)
Modulus of Elasticity (GPa)
Yield Point (MPa) at 0.2% offset
PLA 100% 56.14 0.68 4.18 2.25 52.92 PLA 95%/DE 5% 44.46 0.66 3.67 2.16 43.08
PLA 90%/ DE 10% 42.05 0.46 3.23 2.16 41.19
PLA 85%/ DE 15% 23.99 1.12 1.41 2.67 –
Figure 8.1 Stress-strain curve for PLA-DE filament.
0
10
20
30
40
50
60
0.00 0.01 0.02 0.03 0.04 0.05 0.06
Stre
ss(M
Pa)
Strain(mm/mm)100% PLA 95%PLA/5%D.E 90%PLA/10%D.E

159
Since the filament is going through another extrusion process during 3D printing, the
mechanical properties are likely to change in the case of the dog bone samples. Table 8.2 and
Figure 8.2 shows the test results with 100 wt % PLA, 5 wt % DE, and 10% wt. DE. With an
increase in the percentage of diatomaceous earth in PLA, the color change was also observed. The
increased amount of diatoms made the components darker as can be seen in
Figure 8.3.
Tensile tests for dog bones made of 100% PLA were found to be similar to work from other
authors 460–462. The results show that in the case of 5 wt% of diatoms the ultimate stress, and yield
point have only changed 7% and 11% respectively. Yield point with 10 wt % did not change much
relative to 5 wt % sample. The melting and recrystallization in the actual 3D printing process seem
to create curing and movement of the diatoms within the composite matrix. The observed outcome
is that the degradation of the material compared to 100 wt% PLA dog bones is considerably smaller
than what the filament results would indicate. For future work, we will look at other compounding
methods for the diatoms so we could achieve a more homogeneous distribution. An SEM
micrograph (Figure 8.4) shows a cross-section of filament to see the dispersion and distribution of
the diatoms. From the image, it is also clear to see the interphase and boundaries of diatoms in the
PLA-DE matrix. Interestingly the diatoms frustules seem to be filled by PLA evidencing potential
for good adhesion in the matrix structure.
Thermal analysis for the filament samples and the 3D printed components were analyzed
using standard DSC procedure. Crystallization and melting curves were obtained by heating about
5–10 mg mass of our composites (filaments and 3D printed objects) in an aluminum pan. DSC
scans were obtained with heat-cool modulation. Samples were equilibrated at 30˚C and maintained
at the isothermal condition for 5 min. For each run, the temperature was increased from 30˚C to

160
180˚C at a heating rate of 10˚C/min followed by cooling to 30˚C. The measurements were done
using nitrogen as purging gas.
Table 8.2 Tensile Strength of 3D Printed dog bones.
Figure 8.2 Stress-strain curve for PLA-DE 3D printed material.
0
5
10
15
20
25
30
35
40
45
0.00 0.01 0.02 0.03 0.04 0.05 0.06 0.07
Stre
ss (M
Pa)
Strain (mm/mm)PLA 100% PLA95%/D.E. 5% PLA90%/D.E. 10%
Sample type [wt. %]
Ultimate Stress (MPa)
Error (stress)
Strain at Break (mm/ mm)
Modulus of Elasticity (Mpa)
Yield Point (MPa) at 0.2% offset
PLA 100% 41.69 0.11 0.059 941.61 40.99
PLA 95%/ DE 5%
38.65 0.21 0.056 990.40 36.66
PLA 90%/ DE 10%
37.60 0.31 0.054 1115.28 35.02

161
The crystallization temperature on the filament composites shows a clear shift towards
lower Tcc for PLA-DE filaments compared to the 100% PLA. Also, the ΔHcc value for a 5 wt%
sample was 100% higher. According to these results, an explanation to the observed phenomena
is that diatomaceous earth can act as nucleating agents in the PLA matrix and this effect enhances
crystallization. With higher diatom content the chain mobility may be hindered and possibly we
experience reduced nucleating efficiency of crystallization. The data shows double melting peaks
with PLA-DE samples and in case of the filament the ΔHm for 5% wt. DE is 50% lower than for
100% PLA sample. Similarly, 10% wt. DE sample showed a decrease of 65% compared to the
PLA filament. This behavior has been observed for many semi-crystalline polymers and their
multiple melting behavior 463–470. The double melting peak may occur because of the melting of
two types of the lamella, the lower peak could have been contributed by the melting of small
lamellae formed by secondary crystallization and higher peak formed by melting of larger crystals
formed in the primary crystallization 466. There is a possibility that multiple peaks in the DSC curve
due to loss of mass in diatoms 468. Food grade diatoms have some surface water since they are not
calcined, however, it would not entirely explain the changes in peak positions and shapes with
varying amounts of diatoms. An interesting observation comes from looking at the dog bones
showing a large gap in ΔHm between 5% wt. and 10% wt. composites. One plausible explanation
this might be related to surface water that was absorbed during the 3D printing process where the
filament material is extruded into a 0.4 mm diameter line exposing the diatoms. This will
incorporate some moisture which can be seen as double melting peaks such as our results show
(Table 8.3).

162
Figure 8.3 Dog bone samples before the tensile tests.
Figure 8.4 SEM micrograph from PLA-DE filament cross-section.

163
Table 8.3 Thermal Properties of 3D printed PLA-DE filament and dogbones.
8.5.4 Conclusions
In summary, our results show that diatomaceous earth can be used as a filler for PLA to
create a composite material for 3D printing filaments. The resulting PLA-DE composite material
shows no major material property degradation after 3D printing and thus has merit and potential
for lowering the cost of PLA filaments by 5–10%. It was observed that diatomaceous earth can act
as nucleating agents in the PLA matrix and this effect enhances crystallization. With higher diatom
content the chain mobility seemed to be hindered and we observed reduced nucleating efficiency
of crystallization. In future work, we will look into the observed crystallization phenomena and try
to see if we can further improve the material properties by eliminating, for example, the risk of
surface water effects and improve the dispersion of the diatoms in the PLA-DE matrix. According
to the SEM micrographs we also see the interesting potential for the surface functionalization of
the diatoms for applications related to immobilizing chemical sensing, antibacterial and antiviral
agents on 3D printed objects for biomedical applications.

164
: Future Plan
Chapter 4, 5 & 6
During supercritical Extraction, extractives along with the water were collected. There are
several separation techniques which can be used to separate water from rest of the extractives.
Collected water can be treated in wastewater treatment plant and can be reused. During the longer
run of extraction there were removal of upto 55% water loss. This would be huge amount of water
available to use. Reuse of the water after removing it from the extractives collected. Treat the
removed water in waster treatment plant and use for several purposes.
Chapter 6
The municipal sludge was dried using sCO2 up to 52% moisture content from 89%. The
future work is directed towards coupling/integrating the two supercritical extractions with
ultrasonics together to get more efficient new innovative technology. This could be a novel
technology to dry the different materials which will be more energy efficient by utilizing less
energy and much faster than thermal drying. It has been planned to attach ultrasonic transducers
to the sCO2 extraction system to further increase the drying efficiency as well as the drying rate.
The approach would be attaching an ultrasonic transducer to the outside of the extraction tube of
sCO2 extractor. We have the results of drying the sludge after merely treating it with sCO2 which
was able to remove the free and interstitial water and reach the final moisture content to 53% (w.b)
from 89 % (w.b). The hypotheses are that ultrasonic would be able to remove the surface as well
as bound water by providing energy to break the bonds between water and the particles. Ultrasonic
will also provide the agitation for uniform moisture loss. It was observed that there was crust
formation on the surface during sCO2 treatment but ultrasonic would avoid this crust formation
and there would be moisture loss even from the inner core. Ultrasonic would be able to disrupt the

165
cells which have been reported by other researchers which would help to remove the chemically
bound water. The hypothesis is that if sCO2 dewatering is coupled/integrated with a mechanism
such as ultrasonic agitation we would be able to create a process in which additional agitation
energy would be sufficient to remove surface and bound energy.
Chapter 7
Waste handling is a concern in all pulp and paper mills. Generation of pulp and paper
(P&P) sludge is inherent to the paper industry though the quality of sludge produced varies
according to mill size, paper making process, paper grade, etc 471.. On average, 35% of the material
entering pulp and paper mills becomes residue in forms of rejects. Currently, some of these
residues provide 56% of the energy needs of the industry. The disposal of the remainder of this
material has put a great burden on the pulp and paper industry, which must handle this material
ecologically and economically.
After getting remarkable results regarding co-combustion of municipal sewage sludge and
coal, Our novel approach is to dewater the Paper Mill sludge and the Low-Rank Coal (LRC),
lignite together using the “Supercritical CO2 drying technology”. This co-combustion of paper mill
sludge and coal is widely used technique in Europe but emission of harmful volatiles is still a
major concern.
Chapter 8
The novel biocomposite has been formulated using Polylactic acid (PLA) and
diatomaceous earth (D.E.) with no material property degradation. Future work is planned to extract
antimicrobial compounds from natural resources using supercritical carbon dioxide. Those
extractives will be used in surgical tools, manufactured using the biocomposite of PLA-D.E. The
hypothesis is that surgical tools from biocomposite just need to get sprayed/dipped into the

166
extractives to become antimicrobial. There will be no need for sterilization. Diatoms are highly
porous structure with high surface area increases the adsorption of antimicrobial extractive on the
surface of the tool. Drying and cleaniness of diatoms using supercritical carbon dioxide would be
recommended to increase the adhesion and immobilization efficiency of diatoms.

167
References
1. Drying. McGraw-Hill Dictionary of Scientific & Technical Terms (2003).
2. Mujumdar, A. S. Principles, Classification, and Selection of Dryers. in Handbook of
Industrial Drying, Fourth Edition 34–60 (2014). doi:10.1201/b17208.
3. Kudra, T. Energy aspects in drying. Dry. Technol. 22, 917–932 (2004).
4. McMillan, C. et al. Generation and Use of Thermal Energy in the US Industrial Sector and
Opportunities to Reduce its Carbon Emissions. Contract (2016).
5. Ananias, R. A. et al. Energy Consumption in Industrial Drying of Radiata Pine. Dry.
Technol. 30, 774–779 (2012).
6. Czesław, S., Jones, P. L. & Zyłła, R. Energy Aspects in Drying. Dry. Technol. 33, 1534–
1540 (2015).
7. Williams-Gardner, A. Industrial Drying. (Leonard Hill, London, U.K., 1971).
8. Treybal, R. . Mass Transfer Operations. (McGraw Hills, 1968).
9. van Brackel, J. Mass transfer in convective drying. in Advances in Drying 217–268
(Hemisphere, 1980).
10. Vu, H. T. & Tsotsas, E. Mass and Heat Transport Models for Analysis of the Drying Process
in Porous Media: A Review and Numerical Implementation. Int. J. Chem. Eng. 2018,
(2018).
11. Kessler, H. . G. Food Engineering and Dairy Technology. vol. 34 (Freising, Germany,
1981).
12. Nonhebel, G. & Moss, A. A. . Drying of Solids in the Chemical Industry. (Butterworths,
London, U.K., 1971).
13. Keey, R. . Introduction to Industrial Drying Operations. (Pergamon, 1978).

168
14. Lang, R. . No Title. in Proceedings of the First International Drying Symposium, Montreal,
Science Press, Princeton, NJ, (1978).
15. Zhang, Q. W., Lin, L. G. & Ye, W. C. Techniques for extraction and isolation of natural
products: A comprehensive review. Chinese Med. (United Kingdom) 13, 1–26 (2018).
16. Moldoveanu, S. & David, V. Solvent Extraction. Modern Sample Preparation for
Chromatography (2015). doi:10.1016/b978-0-444-54319-6.00006-2.
17. Sparks, B. D. & Meadus, F. W. A study of some factors affecting solvent losses in the
solvent extraction - spherical agglomeration of oil sands. Fuel Process. Technol. 4, 251–
264 (1981).
18. David R. Lide. CRC Handbook of Chemistry and Physics. in CRC Handbook of Chemistry
and Physics 2–65 (CRC Press, 2009). doi:10.1021/ja025295q.
19. Bird, R. B., Stewart, W. E. . & Lightfoot, E. N. Transport Phenomena. (John Wiley & Sons,
Ltd, 1961). doi:10.1021/ed038pa640.
20. Diffusion. Chemistry, LibreTexts
https://chem.libretexts.org/Bookshelves/Physical_and_Theoretical_Chemistry_Textbook_
Maps/Supplemental_Modules_(Physical_and_Theoretical_Chemistry)/Kinetics/Diffusion
#Fick.E2.80.99s_First_Law_of_Diffusion.
21. Li, P. et al. Simultaneous determination of eight flavonoids and pogostone in pogostemon
cablin by high performance liquid chromatography. J. Liq. Chromatogr. Relat. Technol. 37,
1771–1784 (2014).
22. Du, G., Zhao, H., Song, Y., Zhang, Q. & Wang, Y. Rapid simultaneous determination of
isoflavones in Radix puerariae using high-performance liquid chromatography-triple
quadrupole mass spectrometry with novel shell-type column. J. Sep. Sci. 34, 2576–2585

169
(2011).
23. Yi, Y. et al. Simultaneous quantification of major flavonoids in ‘bawanghua’, the edible
flower of Hylocereus undatus using pressurised liquid extraction and high performance
liquid chromatography. Food Chem. 135, 528–533 (2012).
24. Hefter, G. T. & Tomkins, R. P. T. The Experimental Determination of Solubilities. (Wiley,
2003).
25. Palmer, D. S., McDonagh, J. L., Mitchell, J. B. O., Van Mourik, T. & Fedorov, M. V. First-
principles calculation of the intrinsic aqueous solubility of crystalline druglike molecules.
J. Chem. Theory Comput. 8, 3322–3337 (2012).
26. Cai, J., Liu, B. & Su, Q. Comparison of simultaneous distillation extraction and solid-phase
microextraction for the determination of volatile flavor components. 930, 1–7 (2001).
27. Stashenko, E. E., Jaramillo, B. E. & Mart, J. R. Analysis of volatile secondary metabolites
from Colombian Xylopia aromatica ( Lamarck ) by different extraction and headspace
methods and gas chromatography. 1025, 105–113 (2004).
28. Riu-Aumatell, M. et al. Characterisation of volatile composition of white salsify
(Tragopogon porrifolius L.) by headspace solid-phase microextraction (HS-SPME) and
simultaneous distillation-extraction (SDE) coupled to GC-MS. Food Chem. 129, 557–564
(2011).
29. Majcher, M. & Jeleń, H. H. Comparison of suitability of SPME, SAFE and SDE methods
for isolation of flavor compounds from extruded potato snacks. J. Food Compos. Anal. 22,
606–612 (2009).
30. Da Costa, N. C. & Eri, S. Identification of Volatile Compounds in Shiitake Mushrooms
Using Modern Extraction Techniques. 163–175 (2009) doi:10.1021/bk-2006-0926.ch011.

170
31. Dron, A., Guyer, D. E., Gage, D. A. & Lira, C. T. Yield and quality of onion flavor oil
obtained by supercritical fluid extraction and other methods. J. Food Process Eng. 20, 107–
124 (1997).
32. Lee, S., Kim, N. & Lee, D. Comparative study of extraction techniques for determination
of garlic flavor components by gas chromatography – mass spectrometry. 749–756 (2003)
doi:10.1007/s00216-003-2163-z.
33. TANCHOTIKUL, U. & HSIEH, T. C. ‐. Analysis of Volatile Flavor Components in
Steamed Rangia Clam by Dynamic Headspace Sampling and Simultaneous Distillation and
Extraction. J. Food Sci. 56, 327–331 (1991).
34. Ozel, M. Z. & Kaymaz, H. Superheated water extraction, steam distillation and Soxhlet
extraction of essential oils of Origanum onites. Anal. Bioanal. Chem. 379, 1127–1133
(2004).
35. Chemistry and Technology of Flavors and Fragrances. (Blackwell Publishing).
36. Kula, J. Solid Phase Extraction In Food Analysis. Food Chem. Biotechnol. 72, (1029).
37. Mangas, J. J., González, M. P., Rodríguez, R. & Blanco, D. Solid-Phase extraction and
determination of trace aroma and flavour components in cider by GC-MS.
Chromatographia 42, 101–105 (1996).
38. Kumar Pandey, S. & Kim, K. H. Evaluation of the solid-phase extraction (SPE) cartridge
method in combination with thermal desorption-gas chromatography-mass spectrometry
(TD-GC-MS) for the analysis of different VOCs in liquid matrices in varying pH conditions.
J. Sep. Sci. 35, 1914–1921 (2012).
39. Burits, M. & Bucar, F. Antioxidant activity of Nigella sativa essential oil. Phyther. Res. 14,
323–328 (2000).

171
40. Richter, B. E. et al. Accelerated solvent extraction: A technique for sample preparation.
Anal. Chem. 68, 1033–1039 (1996).
41. Cho, S. K., El-Aty, A. M. A., Choi, J. H., Kim, M. R. & Shim, J. H. Optimized conditions
for the extraction of secondary volatile metabolites in Angelica roots by accelerated solvent
extraction. J. Pharm. Biomed. Anal. 44, 1154–1158 (2007).
42. Vichi, S. et al. Volatile and semi-volatile components of oak wood chips analysed by
Accelerated Solvent Extraction (ASE) coupled to gas chromatography-mass spectrometry
(GC-MS). Food Chem. 102, 1260–1269 (2007).
43. Letellier, M. & Budzinski, H. Original articles Microwave assisted extraction of organic
compounds. October 259–271 (1999).
44. Valeèrie Camel. Microwave-assisted solvent extraction of environmental samples. Trends
Anal. Chem. 19, 229–248 (2000).
45. Hawthorne, S. B., Krieger, M. S. & Miller, D. J. Analysis of Flavor and Fragrance
Compounds Using Supercritical Fluid Extraction Coupled with Gas Chromatography. Anal.
Chem. 60, 472–477 (1988).
46. Capuzzo, A., Maffei, M. E. & Occhipinti, A. Supercritical fluid extraction of plant flavors
and fragrances. Molecules 18, 7194–7238 (2013).
47. Roy, B. C., Goto, M. & Hirose, T. Extraction of ginger oil with supercritical carbon dioxide:
experiments and modeling. Ind. Eng. Chem. Res. 35, 607–612 (1996).
48. Nguyen, K., Barton, P. & Spencer, J. S. Supercritical carbon dioxide extraction of vanilla.
J. Supercrit. Fluids 4, 40–46 (1991).
49. King, J. W. Supercritical fluid extraction: Present status and prospects. Grasas y Aceites 53,
8–21 (2008).

172
50. Eller, F. J. & King, J. W. Supercritical carbon dioxide extraction of cedarwood oil: A study
of extraction parameters and oil characteristics. Phytochem. Anal. 11, 226–231 (2000).
51. Engel, W., Bahr, W. & Schieberle, P. Solvent assisted flavour evaporation – a new and
versatile technique for the careful and direct isolation of aroma compounds from complex
food matrices. 237–241 (1999).
52. Turner, C. Overview of Modern Extraction Techniques for Food and Agricultural Samples.
3–19 (2009) doi:10.1021/bk-2006-0926.ch001.
53. Blanch, G. P., Tabera, J., Herraiz, M. & Reglero, G. Preconcentration of volatile
components of foods: optimization of the steam distillation-solvent extraction at normal
pressure. J. Chromatogr. A 628, 261–268 (1993).
54. Ferhat, M. A., Tigrine-Kordjani, N., Chemat, S., Meklati, B. Y. & Chemat, F. Rapid
Extraction of Volatile Compounds Using a New Simultaneous Microwave Distillation:
Solvent Extraction Device. Chromatographia 65, 217–222 (2007).
55. Chaintreau, A. Simultaneous distillation-extraction: From birth to maturity - Review.
Flavour Fragr. J. 16, 136–148 (2001).
56. Maignial, L., Pibarot, P., Bonetti, G., Chaintreau, A. & Marion, J. P. Simultaneous
distillation-extraction under static vacuum: isolation of volatile compounds at room
temperature. J. Chromatogr. A 606, 87–94 (1992).
57. Jansson, T. et al. Volatile component profiles of conventional and lactose-hydrolyzed UHT
milk - A dynamic headspace gas chromatography-mass spectrometry study. Dairy Sci.
Technol. 94, 311–325 (2014).
58. Güntert, M., Krammer, G., Sommer, H. & Werkhoff, P. The Importance of the Vacuum
Headspace Method for the Analysis of Fruit Flavors. 38–60 (2009) doi:10.1021/bk-1998-

173
0705.ch004.
59. Akiyama, M. et al. Characterization of headspace aroma compounds of freshly brewed
arabica coffees and studies on a characteristic aroma compound of Ethiopian coffee. J. Food
Sci. 73, (2008).
60. Grimm, C., Spanier, A., Miller, J. & Lloyd, S. The Analysis of Food Volatiles Using Direct
Thermal Desorption. Flavor, Fragrance, Odor Anal. 59–79 (2010)
doi:10.1201/9780203908273.ch3.
61. Adahchour, M. et al. Application of solid-phase micro-extraction and comprehensive two-
dimensional gas chromatography (GC x GC) for flavour analysis. Chromatographia 55,
361–367 (2002).
62. Kataoka, H., Lord, H. L. & Pawliszyn, J. <BR45_8.pdf>. 880, 35–62 (2000).
63. Schmidt, K. & Podmore, I. Solid Phase Microextraction (SPME) Method Development in
Analysis of Volatile Organic Compounds (VOCS) as Potential Biomarkers of Cancer. J.
Mol. Biomark. Diagn. 06, (2015).
64. Yan, F. A. N. et al. Analyzing the Flavor Compounds in Chinese Traditional Fermented
Shrimp Pastes by HS-SPME-GC / MS and Electronic Nose. 16, 311–318 (2017).
65. Sandra, P., David, F. & Vercammen, J. New developments in sorptive extraction for the
analysis of flavours and fragrance. Adv. Flavours Fragrances 27–38 (2007)
doi:10.1039/9781847550071-00027.
66. Bicchi, C., Cordero, C., Iori, C., Rubiolo, P. & Sandra, P. Headspace Sorptive Extraction
(HSSE) in the headspace analysis of aromatic and medicinal plants. HRC J. High Resolut.
Chromatogr. 23, 539–546 (2000).
67. Bicchi, C., Iori, C., Rubiolo, P. & Sandra, P. Headspace sorptive extraction (HSSE), stir bar

174
sorptive extraction (SBSE), and solid phase microextraction (SPME) applied to the analysis
of roasted Arabica coffee and coffee brew. J. Agric. Food Chem. 50, 449–459 (2002).
68. Díaz-Maroto, M. C., Pérez-Coello, M. S. & Cabezudo, M. D. Supercritical carbon dioxide
extraction of volatiles from spices: Comparison with simultaneous distillation-extraction. J.
Chromatogr. A 947, 23–29 (2002).
69. Snyder, J. M., King, J. W. & Zhang, Z. Comparison of Volatile Analysis of Lipid-
Containing and Meat Matrices by Solid Phase Micro- and Supercritical Fluid-Extraction.
107–115 (2009) doi:10.1021/bk-1998-0705.ch010.
70. Guan, X. et al. Chemical Composition and Antimicrobial Activities of Artemisia argyi Lévl.
et Vant Essential Oils Extracted by Simultaneous Distillation-Extraction, Subcritical
Extraction and Hydrodistillation. Molecules 24, 483 (2019).
71. Rettinger, K. et al. Chirospecific analysis of 2‐alkyl‐branched alcohols, acids, and esters:
Chirality evaluation of 2‐methylbutanoates from apples and pineapples. Phytochem. Anal.
2, 184–188 (1991).
72. Elmore, J. S. Extraction techniques for analysis of aroma compounds. Flavour
Development, Analysis and Perception in Food and Beverages (Elsevier Ltd., 2014).
doi:10.1016/b978-1-78242-103-0.00002-3.
73. Hartati, Salleh, L. M., Mohd Yunus, A. C. & Aziz, A. A. Optimization of supercritical
Co2extraction of Swietenia mahagoni seed by response surface methodology. J. Teknol.
(Sciences Eng. 67, 15–20 (2014).
74. Budzinski, H., Letellier, M., Garrigues, P. & Le Menach, K. Optimisation of the microwave-
assisted extraction in open cell of polycyclic aromatic hydrocarbons from soils and
sediments. Study of moisture effect. J. Chromatogr. A 837, 187–200 (1999).

175
75. Brachet, A., Christen, P. & Veuthey, J. L. Focused microwave-assisted extraction of cocaine
and benzoylecgonine from coca leaves. Phytochem. Anal. 13, 162–169 (2002).
76. Carro, N., Garcia, C. M. & Cela, R. Microwave-assisted extraction of monoterpenols in
must samples. Analyst 122, 325–329 (1997).
77. Dean, J. R. Microwave extraction: A NOVEL SAMPLE PREPARATION METHOD FOR
CHROMATOGRAPHY. J. Chromatogr. 371, 299–306 (1986).
78. Kaufmann, B., Christen, P. & Veuthey, J. L. Parameters affecting microwave-assisted
extraction of withanolides. Phytochem. Anal. 12, 327–331 (2001).
79. Csiktusnádi Kiss, G. A. et al. Optimisation of the microwave-assisted extraction of
pigments from paprika (Capsicum annuum L.) powders. J. Chromatogr. A 889, 41–49
(2000).
80. Kaufmann, B. & Christen, P. Recent extraction techniques for natural products: Microwave-
assisted extraction and pressurised solvent extraction. Phytochem. Anal. 13, 105–113
(2002).
81. Barba, F. J., Zhu, Z., Koubaa, M., Sant’Ana, A. S. & Orlien, V. Green alternative methods
for the extraction of antioxidant bioactive compounds from winery wastes and by-products:
A review. Trends Food Sci. Technol. 49, 96–109 (2016).
82. Chemat, F. et al. Ultrasound assisted extraction of food and natural products. Mechanisms,
techniques, combinations, protocols and applications. A review. Ultrason. Sonochem. 34,
540–560 (2017).
83. Hou, J. et al. A method of extracting ginsenosides from Panax ginseng by pulsed electric
field. J. Sep. Sci. 33, 2707–2713 (2010).
84. Bouras, M., Grimi, N., Bals, O. & Vorobiev, E. Impact of pulsed electric fields on

176
polyphenols extraction from Norway spruce bark. Ind. Crops Prod. 80, 50–58 (2016).
85. Strati, I. F., Gogou, E. & Oreopoulou, V. Enzyme and high pressure assisted extraction of
carotenoids from tomato waste. Food Bioprod. Process. 94, 668–674 (2015).
86. Liu, T. et al. Application of ionic liquids based enzyme-assisted extraction of chlorogenic
acid from Eucommia ulmoides leaves. Anal. Chim. Acta 903, 91–99 (2016).
87. Chen, H., Zhou, X. & Zhang, J. Optimization of enzyme assisted extraction of
polysaccharides from Astragalus membranaceus. Carbohydr. Polym. 111, 567–575 (2014).
88. Peach, J. & Eastoe, J. Supercritical carbon dioxide: A solvent like no other. Beilstein J. Org.
Chem. 10, 1878–1895 (2014).
89. Brunner, G. Supercritical fluids: Technology and application to food processing. J. Food
Eng. 67, 21–33 (2005).
90. Darani, K. K. & Mozafari, M. R. Supercritical fluids technology in bioprocess industries:
A review. J. Biochem. Technol. 2, 144–152 (2009).
91. Munshi, P. & Bhaduri, S. Supercritical CO2: A twenty-first century solvent for the chemical
industry. Curr. Sci. 97, 63–72 (2009).
92. Shimoyama, Y., Ogata, Y., Ishibashi, R. & Iwai, Y. Drying processes for preparation of
titania aerogel using supercritical carbon dioxide. Chem. Eng. Res. Des. 88, 1427–1431
(2010).
93. Benali, M. & Boumghar, Y. Supercritical Fluid-Assisted Drying. in Handbook of Industrial
Drying, Fourth Edition vol. 4th 1261–1270 (2014).
94. Ingrosso, F. & Ruiz-López, M. F. Modeling Solvation in Supercritical CO2.
ChemPhysChem 18, 2560–2572 (2017).
95. Manjare, S. D. & Dhingra, K. Supercritical fluids in separation and purification: A review.

177
Mater. Sci. Energy Technol. 2, 463–484 (2019).
96. National Center for Biotechnology Information. PubChem Database. Carbon dioxide,
CID=280,.
97. Aschenbrenner, O. & Styring, P. Comparative study of solvent properties for carbon dioxide
absorption. Energy Environ. Sci. 3, 1106–1113 (2010).
98. Kennedy, J. T. & Thodos, G. The transport properties of carbon dioxide. AIChE J. 7, 625–
631 (1961).
99. Vesovic, V. et al. The transport properties of carbon dioxide. J. Phys. Chem. Ref. Data 19,
(1990).
100. Marcus, Y. Some advances in supercritical fluid extraction for fuels, bio-materials and
purification. Processes 7, (2019).
101. Dooley, K. M., Ghonasgi, D., Knopf, F. C. & Gambrel, R. P. Contaminated Soils and
Sediments. Environ. Prog. 9, 197–203 (1990).
102. Andrews, A. T., Ahlert, R. C. & Kosson, D. S. Supercritical fluid extraction of aromatic
contaminants from a sandy loam soil. Environ. Prog. 9, 204–210 (1990).
103. Roop, R. K., Akgerman, A., Irvin, T. R. & Stevens, E. K. Supercritical extraction of creosote
from water with toxicological validation. J. Supercrit. Fluids 1, 31–36 (1988).
104. Ghonasgi, D., Gupta, S., Dooley, K. M. & Knopf, F. C. Supercritical CO2 extraction of
organic contaminants from aqueous streams. AIChE J. 37, 944–950 (1991).
105. Groves, F. R., Brady, B. & Knopf, F. C. State-of-the-art on the supercritical extraction of
organics from hazardous wastes. Crit. Rev. Environ. Control 15, 237–274 (1985).
106. Hawthorne, S. B. & Miller, D. J. Extraction and Recovery of Polycyclic Aromatic
Hydrocarbons from Environmental Solids Using Supercritical Fluids. Anal. Chem. 59,

178
1705–1708 (1987).
107. Gabarra, P. et al. Supercritical fluid process for removal of polychlorodibenzodioxin and
dibenzofuran from fly ash. Environ. Prog. 18, 40–49 (1999).
108. Nagpal, V. & Guigard, S. E. Remediation of flare pit soils using supercritical fluid
extraction. J. Environ. Sci. 4, 307–318 (2005).
109. Brignole, E. A., Andersen, P. M. & Fredenslund, A. Supercritical Fluid Extraction of
Alcohols from Water. Ind. Eng. Chem. Res. 26, 254–261 (1987).
110. Capriel, P., Haisch, A. & Khan, S. U. Supercritical Methanol: An Efficacious Technique
for the Extraction of Bound Pesticide Residues from Soil and Plant Samples. J. Agric. Food
Chem. 34, 70–73 (1986).
111. Dooley, K. M., Kao, C. ping, Gambrell, R. P. & Knopf, F. C. The Use of Entrainers in the
Supercritical Extraction of Soils Contaminated with Hazardous Organics. Ind. Eng. Chem.
Res. 26, 2058–2062 (1987).
112. Brady, B. O., Kao, C. ping C., Dooley, K. M., Knopf, F. C. & Gambrell, R. P. Supercritical
Extraction of Toxic Organics from Soils. Ind. Eng. Chem. Res. 26, 261–268 (1987).
113. Chen, P., Zhou, W. & Tavlarides, L. L. Remediation of polychlorinated biphenyl
contaminated soils/sediments by supercritical fluid extraction. Environ. Prog. 16, 227–236
(1997).
114. Cape, S. P. et al. Preparation of active proteins, vaccines and pharmaceuticals as fine
powders using supercritical or near-critical fluids. Pharm. Res. 25, 1967–1990 (2008).
115. De Paz, E., Martín, Á. & Cocero, M. J. Formulation of β-carotene with soybean lecithin by
PGSS (Particles from Gas Saturated Solutions)-drying. J. Supercrit. Fluids 72, 125–133
(2012).

179
116. Meterc, D., Petermann, M. & Weidner, E. Drying of aqueous green tea extracts using a
supercritical fluid spray process. J. Supercrit. Fluids 45, 253–259 (2008).
117. LIM, S. & RIZVI, S. S. H. Continuous Supercritical Fluid Processing of Anhydrous Milk
Fat in a Packed Column. J. Food Sci. 60, 889–893 (1995).
118. Bisson, A., Rigacci, A., Lecomte, D., Rodier, E. & Achard, P. Drying of Silica Gels to
Obtain Aerogels:Phenomenology and Basic Techniques. Dry. Technol. 21, 593–628 (2003).
119. Laudise, R. A. & Johnson, D. W. Supercritical drying of gels. J. Non. Cryst. Solids 79, 155–
164 (1986).
120. Abecassis-Wolfovich, M. et al. Texture and nanostructure of chromia aerogels prepared by
urea-assisted homogeneous precipitation and low-temperature supercritical drying. J. Non.
Cryst. Solids 318, 95–111 (2003).
121. Job, N. et al. Carbon aerogels, cryogels and xerogels: Influence of the drying method on the
textural properties of porous carbon materials. Carbon N. Y. 43, 2481–2494 (2005).
122. Shimoyama, Y., Ogata, Y., Ishibashi, R. & Iwai, Y. Drying processes for preparation of
titania aerogel using supercritical carbon dioxide. Chem. Eng. Res. Des. 88, 1427–1431
(2010).
123. Masmoudi, Y., Rigacci, A., Ilbizian, P., Cauneau, F. & Achard, P. Diffusion during the
supercritical drying of silica gels. Dry. Technol. 24, 1121–1125 (2006).
124. Namatsu, H., Yamazaki, K. & Kurihara, K. Supercritical drying for nanostructure
fabrication without pattern collapse. Microelectron. Eng. 46, 129–132 (1999).
125. Novak, Z., Kotnik, P. & Knez, Ž. Preparation of WO3 aerogel catalysts using supercritical
CO 2 drying. J. Non. Cryst. Solids 350, 308–313 (2004).
126. Estella, J., Echeverría, J. C., Laguna, M. & Garrido, J. J. Effects of aging and drying

180
conditions on the structural and textural properties of silica gels. Microporous Mesoporous
Mater. 102, 274–282 (2007).
127. Brown, Z. K., Fryer, P. J., Norton, I. T. & Bridson, R. H. Drying of agar gels using
supercritical carbon dioxide. J. Supercrit. Fluids 54, 89–95 (2010).
128. Milburn, D. R., Adkins, B. D., Sparks, D. E., Srinivasan, R. & Davis, B. H. Applications of
Supercritical Drying in Catalyst Preparation. Adv. Catal. Nanostructured Mater. 117–142
(1996) doi:10.1016/b978-012508460-4/50007-3.
129. Pallado, P. Dry-cleaning with liquid carbon dioxide. Industrial Chemistry Library vol. 9
(Elsevier B.V., 2001).
130. Aggarwal, S., Johnson, S., Hakovirta, M., Sastri, B. & Banerjee, S. Removal of Water and
Extractives from Softwood with Supercritical Carbon Dioxide. Ind. Eng. Chem. Res. 58,
(2019).
131. Banerjee, S., Sastri, B., Aggarwal, S. & Hakovirta, M. Dewatering coal with supercritical
Carbon Dioxide. Int. J. Coal Prep. Util. 00, 1–7 (2020).
132. Lee, S., Park, M. K., Kim, K. H. & Kim, Y. S. Effect of supercritical carbon dioxide
decaffeination on volatile components of green teas. J. Food Sci. 72, (2007).
133. Chen, Y. et al. Supercritical CO2 Decaffeination of Unroasted Coffee Beans Produces
Melanoidins with Distinct NF-κB Inhibitory Activity. J. Food Sci. 76, 182–186 (2011).
134. Coelho, J. P. et al. Extraction of volatile oil from aromatic plants with supercritical carbon
dioxide: Experiments and modeling. Molecules 17, 10550–10573 (2012).
135. Choi, Y. M. et al. Effects of supercritical carbon dioxide treatment for sterilization purpose
on meat quality of porcine longissimus dorsi muscle. LWT - Food Sci. Technol. 41, 317–
322 (2008).

181
136. Yuk, H. G., Geveke, D. J. & Zhang, H. Q. Efficacy of supercritical carbon dioxide for
nonthermal inactivation of Escherichia coli K12 in apple cider. Int. J. Food Microbiol. 138,
91–99 (2010).
137. White, A., Burns, D. & Christensen, T. W. Effective terminal sterilization using
supercritical carbon dioxide. J. Biotechnol. 123, 504–515 (2006).
138. Tabernero, A., Martín del Valle, E. M. & Galán, M. A. Supercritical fluids for
pharmaceutical particle engineering: Methods, basic fundamentals and modelling. Chem.
Eng. Process. Process Intensif. 60, 9–25 (2012).
139. Girotra, P., Singh, S. K. & Nagpal, K. Supercritical fluid technology: A promising approach
in pharmaceutical research. Pharm. Dev. Technol. 18, 22–38 (2013).
140. Schaefer, D. W., Pekala, R. & Beaucage, G. Origin of porosity in resorcinol-formaldehyde
aerogels. J. Non. Cryst. Solids 186, 159–167 (1995).
141. Tamon, H., Ishizaka, H., Mikami, M. & Okazaki, M. Porous structure of organic and carbon
aerogels synthesized by sol-gel polycondensation of resorcinol with formaldehyde. Carbon
N. Y. 35, 791–796 (1997).
142. Long, J. J. et al. A novel plant for fabric rope dyeing in supercritical carbon dioxide and its
cleaner production. J. Clean. Prod. 65, 574–582 (2014).
143. Long, J. J. et al. Dyeing of cotton fabric with a reactive disperse dye in supercritical carbon
dioxide. J. Supercrit. Fluids 69, 13–20 (2012).
144. Abou Elmaaty, T. M., El-Taweel, F. M. & Elsisi, H. G. Water-free dyeing of polyester and
nylon 6 fabrics with novel 2-oxoacetohydrazonoyl cyanide derivatives under a supercritical
carbon dioxide medium. Fibers Polym. 19, 887–893 (2018).
145. Yul Park, Y., Harada, M., Tomiyasu, H. & Ikeda, Y. Photochemical reaction of

182
bis(1,1,1,5,5,5-hexafluoro-2,4-pentanedionato) (tetrahydrofuran)dioxouranium(vi) in
supercritical carbon dioxide. J. Nucl. Sci. Technol. 40, 405–409 (2003).
146. Ajzenberg, N., Trabelsi, F. & Recasens, F. What’s new in industrial polymerization with
supercritical solvents? A short review. Chem. Eng. Technol. 23, 829–839 (2000).
147. Romero, M. D. et al. Enzymatic synthesis of isoamyl acetate with immobilized Candida
antarctica lipase in supercritical carbon dioxide. J. Supercrit. Fluids 33, 77–84 (2005).
148. Zhao, H. Enzymatic polymerization to polyesters in nonaqueous solvents. Methods in
Enzymology vol. 627 (Elsevier Inc., 2019).
149. Matsuda, T., Watanabe, K., Harada, T. & Nakamura, K. Enzymatic reactions in supercritical
CO2: Carboxylation, asymmetric reduction and esterification. Catal. Today 96, 103–111
(2004).
150. Ma, Y., Liu, Z. & Tian, H. A review of transcritical carbon dioxide heat pump and
refrigeration cycles. Energy 55, 156–172 (2013).
151. Cao, X. L., Rao, Z. H. & Liao, S. M. Laminar convective heat transfer of supercritical CO2
in horizontal miniature circular and triangular tubes. Appl. Therm. Eng. 31, 2374–2384
(2011).
152. Persichilli, M., Kacludis, A., Zdankiewicz, E. & Held, T. Supercritical CO 2 Power Cycle
Developments and Commercialization: Why sCO 2 can Displace Steam Ste am. Power-Gen
India Cent. Asia 1–15 (2012).
153. Fleming, D., Kruizenga, A., Pasch, J., Conboy, T. & Carlson, M. Corrosion and erosion
behavior in supercritical CO2 power cycles. Proc. ASME Turbo Expo 3B, (2014).
154. Dodge, E. Supercritical Carbon Dioxide Power Cycles Starting to Hit the Market. Breaking
Energy https://breakingenergy.com/2014/11/24/supercritical-carbon-dioxide-power-

183
cycles-starting-to-hit-the-market/ (2014).
155. Talbot, D. Desk-Size Turbine Could Power a Town. MIT Technology Review
https://www.technologyreview.com/2016/04/11/161060/desk-size-turbine-could-power-a-
town/#/set/id/601246/ (2016).
156. Cooper, P. Carbon dioxide hits bacteria with bad acid. Nature
https://www.nature.com/news/1999/990909/full/news990909-6.html#:~:text=Supercritical
fluids can penetrate the,the death of the bacteria. (1999) doi:doi:10.1038/news990909-6.
157. Perrut, M. Sterilization and Virus Inactivation by Supercritical Fluids (A Review). J.
Supercrit. Fluids (2012)
doi:https://www.researchgate.net/deref/http%3A%2F%2Fdx.doi.org%2F10.1016%2Fj.sup
flu.2011.07.007?_sg%5B0%5D=Ucz388nj2wi1opLsdsgut0oAlNrY3vtRFKhkJR-
4F019wdlmJiQLfQGPCbVywnQIE0cgQ9_aCaOFDj36S46VcLIEtQ.fKMD4P9bTXNa14
9BcGXDXE78HD-FSKoiH8mu1RCBbBXYHvNN05bJ3-2SPJuKP-PXb5EQrz2U9v-
tZDjeUvZiVw.
158. ARREOLA, A. G. et al. Supercritical Carbon Dioxide Effects on Some Quality Attributes
of Single Strength Orange Juice. J. Food Sci. 56, 1030–1033 (1991).
159. Chrastil, J. Solubility of solids and liquids in supercritical gases. J. Phys. Chem. 86, 3016–
3021 (1982).
160. Fiori, L. Supercritical extraction of sunflower seed oil: Experimental data and model
validation. J. Supercrit. Fluids 50, 218–224 (2009).
161. Kiriamiti, H. K., Rascol, E., Marty, A. & Condoret, J. S. Extraction rates of oil from high
oleic sunflower seeds with supercritical carbon dioxide. Chem. Eng. Process. 41, 711–718
(2002).

184
162. Stüber, F., Vázquez, A. M., Larrayoz, M. A. & Recasens, F. Supercritical fluid extraction
of packed beds: External mass transfer in upflow and downflow operation. Ind. Eng. Chem.
Res. 35, 3618–3628 (1996).
163. Puiggené, J., Larrayoz, M. A. & Recasens, F. Free liquid-to-supercritical fluid mass transfer
in packed beds. Chem. Eng. Sci. 52, 195–212 (1997).
164. Reynolds, L., Gardecki, J. A., Frankland, S. J. V., Horng, M. L. & Maroncelli, M. Dipole
solvation in nondipolar solvents: Experimental studies of reorganization energies and
solvation dynamics. J. Phys. Chem. 100, 10337–10354 (1996).
165. Kauffman, J. F. Quadrupolar solvent effects on solvation and reactivity of solutes dissolved
in supercritical CO2. J. Phys. Chem. A 105, 3440–3442 (2001).
166. Raveendran, P., Ikushima, Y. & Wallen, S. L. Polar attributes of supercritical carbon
dioxide. Acc. Chem. Res. 38, 478–485 (2005).
167. Knez et al. Industrial applications of supercritical fluids: A review. Energy 77, 235–243
(2014).
168. Pham, M., Pollak, S. & Petermann, M. Micronisation of poly(ethylene oxide) solutions and
separation of water by PGSS-Drying. J. Supercrit. Fluids 64, 19–24 (2012).
169. Jung, J. & Perrut. Michel. Particle design using supercritical fluids: Literature and patent
survey. J. Supercrit. Fluids 20, 179–219 (2001).
170. Yeo, S. Do & Kiran, E. Formation of polymer particles with supercritical fluids: A review.
J. Supercrit. Fluids 34, 287–308 (2005).
171. Knez, Z. & Weidner, E. Particles formation and particle design using supercritical fluids.
Curr. Opin. Solid State Mater. Sci. 7, 353–361 (2003).
172. Knez, s. & Weidner, E. 9.8 Precipitation of solids with dense gases. Industrial Chemistry

185
Library vol. 9 (Elsevier B.V., 2001).
173. Green, D. W. et al. Wood. in Marks’ Standard Handbook for Mechanical Engineers 6.115-
6.131 (McGraw Hills, 2006).
174. Miller, R. B. Structure of Wood. Wood Handb. wood as an Eng. Mater. Madison, WI
USDA For. Serv. For. Prod. Lab. 1999. Gen. Tech. Rep. FPL GTR-113, 2.1-2.4 (1999).
175. Wood Handbook: Wood as an Emgineering Material. General Technical Report FPL–
GTR–190 (2010) doi:10.1161/01.RES.39.4.523.
176. Tsoumis, G. T. Wood. https://www.britannica.com/science/wood-plant-tissue.
177. PARHAM, R. A. & GRAY, R. L. Formation and Structure of Wood. Chem. Solid Wood 3–
56 (1984) doi:10.1021/ba-1984-0207.ch001.
178. Keey, R. & Perre´, P. Drying of Wood. in Handbook of Industrial Drying, Third Edition
797–846 (2006). doi:10.1201/9781420017618.ch36.
179. Habibi, Y. Key advances in the chemical modification of nanocelluloses. Chem. Soc. Rev.
43, 1519–1542 (2014).
180. Carlquist, S. Wood and Bark Anatomy of Salvadoraceae : Ecology , Relationships ,
Histology of Interxylary Phloem Author ( s ): Sherwin Carlquist Source : The Journal of the
Torrey Botanical Society , Vol . 129 , No . 1 ( Jan . - Mar ., 2002 ), Published by : Torrey
Bot. 129, 10–20 (2020).
181. Sachs, I., Kuntz, J., Ward, J., Nair, G. & Schultz, N. Tyloses structure. Wood Fiber Sci. 3,
259–268 (1970).
182. Bosshard, H. H. Wood Science: Biology, Physics and Chemistry of Wood. (1984).
183. Mark, R. Cell wall mechanics of tracheids. (Yale University Press, New Haven, CT, 1967).
184. Chandrasekaran, S. R., Hopke, P. K., Rector, L., Allen, G. & Lin, L. Chemical composition

186
of wood chips and wood pellets. Energy and Fuels 26, 4932–4937 (2012).
185. Curling, S. F., Clausen, C. A. & Winandy, J. E. Relationships between mechanical
properties, weight loss, and chemical composition of wood during incipient brown-rot
decay. For. Prod. J. 52, 34–39 (2002).
186. Fengel, D. & Wegener, G. Wood: Chemistry, Ultrastructure, Reactions. (De Gruyter, 1984).
187. Walker, J. C. . Primary Wood Processing: Principles and Practice. (Chapman & Hall,
London, 1993).
188. Carlquist, S. Comparative Wood Anatomy. (Springer Berlin Heidelberg, 2001).
189. Barnett, J. R. & Jeronimidis, G. Wood quality and its biological basis. (Blackwell
Publishing, 2003).
190. Zimmerman, M. . Xylem Structure and the Ascent of Sap. (Springer Berlin Germany, 1983).
191. Skaar, C. Wood–Water Relations. (Springer Berlin Germany, 1988).
192. Dullien, F. A. . Fluid Transport and Pore Structure. (Academic Press, 1992).
193. Perré, P. The numerical modelling of physical and mechanical phenomena involved in wood
drying: An excellent tool for assisting with the study of new processes. in Proceedings of
the Fifth International IUFRO Wood Drying Conference 9–38 (1996).
194. Perré, P. Drying with Internal Vaporisation: Introducing the Concept of Identity Drying
Card (IDC). Dry. Technol. 13, 1077–1097 (1995).
195. Gereke, T. & Niemz, P. A Numerical Study on the Influence of the Bond Line Diffusivity
on Moisture-Related Stresses and Deformations of Three-Layered Spruce Cross-Laminates.
in 11th IUFRO Wood Drying Conference: Recent Advances in the Field of Wood Drying
117–122 (2010).
196. Kamke, F. A. & Wolcott, M. P. Fundamentals of flakeboard manufacture: wood-moisture

187
relationships. Wood Sci. Technol. 25, 57–71 (1991).
197. Hood, J. P., Kamke, F. A. & Fuller, J. Permeability of oriented strandboard mats. For. Prod.
J. 55, 194–199 (2005).
198. Turner, I. W. & Perré, P. Vacuum Drying of Wood with Radiative Heating: II. Comparison
between Theory and Experiment. AIChE J. 50, 108–118 (2004).
199. Skaar, C. & Thomas, W. C. MATHEMATICAL MODEL FOR CONTROL OF HIGH
TEMPERATURE DRYING OF SOUTHERN YELLOW PINE DIMENSION LUMBER
by Luiz Carlos de S . Oliveira Dissertation submitted to the Faculty of the Virginia
Polytechnic Institute and State University in partial fulfillment of th. (1985).
200. Espinoza, O. & Bond, B. Vacuum Drying of Wood—State of the Art. Curr. For. Reports
2, 223–235 (2016).
201. Desch, H. E. & Dinwoodie, J. M. Timber: Structure, Properties, Conversion and Use.
(Macmillan Press Ltd, 1996).
202. Innes, T. Improving Seasoned Hardwood Timber Quality with Particular Reference to
Collapse. (University of Tasmania, Australia, 1996).
203. Standard TM Timber — Assessment of drying quality. Australian / New Zealand (AS/NZS)
4787. Sydney. 24 (2001).
204. Aléon, D., Chanrion, P., Négrié, G. & Perré, P. FormaXylos 4—Le séchage. in Training in
Wood Science: Drying vol. 4 (2003).
205. Martino, C. J., Shrauti, S., Banerjee, S., Otwell, L. P. & Price, E. W. Flake drying
temperature affects mat properties during pressing. Holzforschung 56, 558–562 (2002).
206. FOOD AND AGRICULTURE ORGANIZATION OF THE UNITED Nstiond. FAO
Forestry Paper - Energy conservation in the mechanical forest industries.

188
http://www.fao.org/3/T0269E/T0269E00.htm (1990).
207. Beakler, B. W., Blankenhorn, P. R., Brown, N. R., Scholl, M. S. & Stover, L. R.
Quantification of the VOCs released during kiln-drying red oak and white oak lumber. For.
Prod. J. 57, 27–32 (2007).
208. Leiker, M. & Adamska, M. A. Energy efficiency and drying rates during vacuum
microwave drying of wood. Holz als Roh - und Werkst. 62, 203–208 (2004).
209. Avramidis, S. & Zwick, R. Radio frequency/vacuum drying of B.C. softwoods; preliminary
experiments. in In 43rd Western Dry Kiln Association Meeting (1992).
210. Brammer, J. G. & Bridgwater, A. V. Drying technologies for an integrated gasification bio-
energy plant. Renewable & sustainable energy reviews vol. 3 (1999).
211. Spets, J. P. & Ahtila, P. Reduction of organic emissions by using a multistage drying system
for wood-based biomasses. Dry. Technol. 22, 541–561 (2004).
212. Pang, S. Emissions From Kiln Drying of Pinus radiata Timber: Analysis, Recovery, and
Treatment. Dry. Technol. 30, 1099–1104 (2012).
213. Rice, R. W. & Erich, M. S. Estimated VOC losses during the drying of six eastern hardwood
species. For. Prod. J. 56, 48–51 (2006).
214. Milota, M. & Mosher, P. Emissions of hazardous air pollutants from lumber drying. For.
Prod. J. 58, 50–55 (2008).
215. Paul, A. & Robert, L. Characterization and treatment of condensates generated from
softwoods that h ... (1996).
216. Pang, S. & Dakin, M. Drying rates and temperature profile for superheated steam vacuum
drying and moist air drying of softwood lumber. Dry. Technol. 17, 1135–1148 (1999).
217. Mujumdar, A. S. Superheated steam drying. Handb. Ind. Drying, Fourth Ed. 421–432

189
(2014) doi:10.1201/b17208.
218. Banerjee, S. Mechanisms of Terpene Release during Sawdust and Flake Drying.
Holzforschung 55, 413–416 (2001).
219. Granström, K. M. & Månsson, B. Volatile organic compounds emitted from hardwood
drying as a function of processing parameters. Int. J. Environ. Sci. Technol. 5, 141–148
(2008).
220. Otwell, L. P. et al. HAPs release from wood drying. Environ. Sci. Technol. 34, 2280–2283
(2000).
221. ASME. Oil and Gas Applications; Supercritical CO2 Power Cycles; and Wind Energy. In
Proceedings of the ASME Turbo Expo. in ASME Turbo Expo 2017: Turbomachinery
Technical Conference and Exposition, Charlotte, North Carolina, USA 26–30.
222. Span, R. & Wagner, W. A new equation of state for carbon dioxide covering the fluid region
from the triple-point temperature to 1100 K at pressures up to 800 MPa. J. Phys. Chem. Ref.
Data 25, 1509–1596 (1996).
223. Franich, R. A., Gallagher, S. & Kroese, H. Dewatering green sapwood using carbon dioxide
cycled between supercritical fluid and gas phase. J. Supercrit. Fluids 89, 113–118 (2014).
224. Wang, Z., Zhou, Q., Guo, H., Yang, P. & Lu, W. Determination of water solubility in
supercritical CO2 from 313.15 to 473.15 K and from 10 to 50 MPa by in-situ quantitative
Raman spectroscopy. Fluid Phase Equilib. 476, 170–178 (2018).
225. Sabirzyanov, A. N., Il’in, A. P., Akhunov, A. R. & Gumerov, F. M. Solubility of water in
supercritical carbon dioxide. High Temp. 40, 203–206 (2002).
226. McDonald, E. C., Howard, J. & Bennett, B. Chemicals from forest products by supercritical
fluid extraction. Fluid Phase Equilib. 10, 337–344 (1983).

190
227. Attard, T. M. et al. Impact of supercritical extraction on solid fuel wood pellet properties
and off-gassing during storage. Green Chem. 18, 2682–2690 (2016).
228. Sparks, D. L., Estévez, L. A., Hernandez, R., McEwen, J. & French, T. Solubility of small-
chain carboxylic acids in supercritical carbon dioxide. J. Chem. Eng. Data 55, 4922–4927
(2010).
229. Maheshwari, P., Nikolov, Z. L., White, T. M. & Hartel, R. Solubility of fatty acids in
supercritical carbon dioxide. J. Am. Oil Chem. Soc. 69, 1069–1076 (1992).
230. Severtson, S. J. & Banerjee, S. Sorption of chlorophenols to wood pulp. Environ. Sci.
Technol. 30, 1961–1969 (1996).
231. Forest Products Laboratory. The Fiber Saturation Point of Wood. Technical Note 252;
United States Forest Service: (1944).
232. Levine, J. S. et al. Relative permeability experiments of carbon dioxide displacing brine and
their implications for carbon sequestration. Environ. Sci. Technol. 48, 811–818 (2014).
233. Zhang, C., Oostrom, M., Grate, J. W., Wietsma, T. W. & Warner, M. G. Liquid CO 2
displacement of water in a dual-permeability pore network micromodel. Environ. Sci.
Technol. 45, 7581–7588 (2011).
234. Thomas, C., Dehaeck, S. & De Wit, A. Convective dissolution of CO2 in water and salt
solutions. Int. J. Greenh. Gas Control 72, 105–116 (2018).
235. Worley, M. Biomass Drying Technology Update. in In Proceedings of the BioPro Expo &
Marketplace, Atlanta, GA 36 (2011).
236. Parks, G., Boyd, R., Cornish, J. & Remick, R. Hydrogen Station Compression, Storage, and
Dispensing Technical Status and Costs: Systems Integration. Relat. Inf. Indep. Rev. Publ.
U.S. Dep. Energy Hydrog. Fuel Cells Progr. Medium: ED; Size: 74 pp. (2014).

191
237. Peltonen, J. Tall oil: Unlocking Opportunities for Pulp Mills in the Bioeconomy.
http://www. poyry.com/news/articles/tall-oil-unlocking-opportunities-pulp-
millsbioeconomy. (2016).
238. Charon, O., Kang, S. & Graham, K. Variation in coal composition. A computational
approach to study the mineral composition of individual coal particles. Argonne National
Laboratory http://www.osti.gov/energycitations/product.biblio.jsp?osti_id=5113223
(2011).
239. U.S. Energy Information Administration. Coal explained. www.eia.gov
https://www.eia.gov/energyexplained/coal/ (2019).
240. World Energy Balances Database Documentation. International Energy Administration
(2019).
241. Coal. World Coal Association.
242. Power 101: Flue Gas Heat Recovery in Power Plants, Part II. Power (2010).
243. Lignite Drying: New Coal-Drying Technology Promises Higher Efficiency Plus Lower
Costs and Emissions. Power (2007).
244. Kozłowski, Z. Present situation and prospects for lignite in the Polish power-generation
industry. Appl. Energy 74, 323–329 (2003).
245. Kavouridis, K. Lignite industry in Greece within a world context: Mining, energy supply
and environment. Energy Policy 36, 1257–1272 (2008).
246. Pusat, S., Akkoyunlu, M. T. & Erdem, H. H. Evaporative Drying of Low-Rank Coal. in
Intech vol. i 13 (2012).
247. Mujumdar, A. S., Jangam, S. V. & Pikoń, J. Drying of coal. in Handbook of Industrial
Drying, Fourth Edition 999–1022 (2014). doi:10.1201/b17208.

192
248. LI, X. et al. Experimental study on drying and moisture re-adsorption kinetics of an
Indonesian low rank coal. J. Environ. Sci. 21, S127–S130 (2009).
249. Pakowski, Z., Adamski, R., Kokocińska, M. & Kwapisz, S. Generalized desorption
equilibrium equation of lignite in a wide temperature and moisture content range. Fuel 90,
3330–3335 (2011).
250. Ross, D., Doguparthy, S., Huynh, D. & McIntosh, M. Pressurised flash drying of Yallourn
lignite. Fuel 84, 47–52 (2005).
251. Tahmasebi, A., Yu, J., Li, X. & Meesri, C. Experimental study on microwave drying of
Chinese and Indonesian low-rank coals. Fuel Process. Technol. 92, 1821–1829 (2011).
252. Chen, Z., Agarwal, P. K. & Agnew, J. B. Steam drying of coal. Part 2. Modeling the
operation of a fluidized bed drying unit. Fuel 80, 209–223 (2001).
253. Kakaras, E., Ahladas, P. & Syrmopoulos, S. Computer simulation studies for the integration
of an external dryer into a Greek lignite-fired power plant. Fuel 81, 583–593 (2002).
254. Karthikeyan, M., Zhonghua, W. & Mujumdar, A. S. Low-rank coal drying technologies -
Current status and new developments. Dry. Technol. 27, 403–415 (2009).
255. Diamond, N. C., Magee, T. R. A. & McKay, G. The effect of temperature and particle size
on the fluid bed drying of Northern Ireland lignite. Fuel 69, 189–193 (1990).
256. Srinivasa Kannan, C., Thomas, P. P. & Varma, Y. B. G. Drying of Solids in Fluidized Beds.
Ind. Eng. Chem. Res. 34, 3068–3077 (1995).
257. Karthikeyan, M., Kuma, J. V. M., Hoe, C. S. & Ngo, D. L. Y. Factors affecting quality of
dried low-rank coals. Dry. Technol. 25, 1601–1611 (2007).
258. Jangam, S. V., Karthikeyan, M. & Mujumdar, A. S. A critical assessment of industrial coal
drying technologies: Role of energy, emissions, risk and sustainability. Dry. Technol. 29,

193
395–407 (2011).
259. Le Roux, M. & Campbell, Q. P. An investigation into an improved method of fine coal
dewatering. Miner. Eng. 16, 999–1003 (2003).
260. Sarunac, N. et al. A novel fluidized bed drying and density segregation process for
upgrading low-rank coals. Int. J. Coal Prep. Util. 29, 317–332 (2009).
261. Pusat, S., Akkoyunlu, M. T., Erdem, H. H. & Daʇdaş, A. Drying kinetics of coarse lignite
particles in a fixed bed. Fuel Process. Technol. 130, 208–213 (2015).
262. Stokie, D., Woo, M. W. & Bhattacharya, S. Comparison of superheated steam and air
fluidized-bed drying characteristics of Victorian brown coals. Energy and Fuels 27, 6598–
6606 (2013).
263. Wang, W. C. Laboratory investigation of drying process of Illinois coals. Powder Technol.
225, 72–85 (2012).
264. Liu, M., Yan, J. J., Chong, D. T., Liu, J. P. & Wang, J. S. Thermodynamic analysis of pre-
drying methods for pre-dried lignite-fired power plant. Energy 49, 107–118 (2013).
265. Chen, Z., Wu, W. & Agarwal, P. K. Steam-drying of coal. Part 1. Modeling the behavior of
a single particle. Fuel 79, 961–974 (2000).
266. Tahmasebi, A., Yu, J., Han, Y., Zhao, H. & Bhattacharya, S. A kinetic study of microwave
and fluidized-bed drying of a Chinese lignite. Chem. Eng. Res. Des. 92, 54–65 (2014).
267. Pakowski, Z., Adamski, R. & Kwapisz, S. Effective diffusivity of moisture in low rank coal
during superheated steam drying at atmospheric pressure. Chem. Process Eng. - Inz. Chem.
i Proces. 33, 43–51 (2012).
268. Li, Y. H. & Skinnert, J. L. Development and Validation of a Process Simulator for Drying
Subbituminous Coal. Chem. Eng. Commun. 49, 99–118 (1986).

194
269. Vorres, K. S. Effect of Temperature, Sample Size, and Gas Flow Rate on Drying on Beulah-
Zap Lignite and Wyodak Subbituminous Coal. Energy and Fuels 8, 320–323 (1994).
270. Allardice, D. J., Chaffee, A. L., Jackson, W. R. & Marshall, M. Water in Brown Coal and
Its Removal. Adv. Sci. Vic. Brown Coal (2004) doi:10.1016/B978-008044269-3/50004-2.
271. Wang, Z. H. & Chen, G. Theoretical study of fluidized-bed drying with microwave heating.
Ind. Eng. Chem. Res. 39, 775–782 (2000).
272. Suvarnakuta, P., Devahastin, S., Soponronnarit, S. & Mujumdar, A. S. Drying kinetics and
inversion temperature in a low-pressure superheated steam-drying system. Ind. Eng. Chem.
Res. 44, 1934–1941 (2005).
273. Harkin, T., Hoadley, A. & Hooper, B. Process integration analysis of a brown coal-fired
power station with CO2 capture and storage and lignite drying. Energy Procedia 1, 3817–
3825 (2009).
274. Karthikeyan, M. Minimization of moisture readsorption in dried coal samples. Dry.
Technol. 26, 948–955 (2008).
275. Hoehne, O., Lechner, S., Schreiber, M. & Krautz, H. Drying of lignite in a pressurized steam
fluidized bed—theory and experiments. Dry. Technol. 28, 5–19 (2010).
276. Calban, T. & Ersahan, H. Drying of a Turkish lignite in a batch fluidized bed. Energy
Sources 25, 1129–1135 (2003).
277. Tahmasebi, A., Yu, J., Han, Y. & Li, X. A study of chemical structure changes of Chinese
lignite during fluidized-bed drying in nitrogen and air. Fuel Process. Technol. 101, 85–93
(2012).
278. Kim, H. S. et al. Fluidized bed drying of Loy Yang brown coal with variation of
temperature, relative humidity, fluidization velocity and formulation of its drying rate. Fuel

195
105, 415–424 (2013).
279. Allardice, D. J. & Evans, D. G. The-brown coal/water system: Part 2. Water sorption
isotherms on bed-moist Yallourn brown coal. Fuel 50, 236–253 (1971).
280. Allardice, D. J. & Evans, D. G. The brown-coal/water system: Part 1, The effect of
temperature on the evolution of water from brown coal. Fuel 50, 201–210 (1971).
281. Zhang, K. & You, C. Experimental and numerical investigation of lignite particle drying in
a fixed bed. Energy and Fuels 25, 4014–4023 (2011).
282. Zhang, K. & You, C. Experimental and numerical investigation of convective drying of
single coarse lignite particles. Energy and Fuels 24, 6428–6436 (2010).
283. Bongers, G. D., Jackson, W. R. & Woskoboenko, F. Pressurised steam drying of Australian
low-rank coals Part 2. Shrinkage and physical properties of steam dried coals, preparation
of dried coals with very high porosity. Fuel Process. Technol. 64, 13–23 (2000).
284. Bongers, G. D., Jackson, W. R. & Woskoboenko, F. Pressurised steam drying of Australian
low-rank coals Part 1. Equilibrium moisture contents. Fuel Process. Technol. 57, 41–54
(1998).
285. Evans, D. G. The brown-coal/water system, Part 4-Shrinkage on drying. Fuel 52, 186
(1973).
286. Wang, Z. H. & Chen, G. Heat and mass transfer in batch fluidized-bed drying of porous
particles. Chem. Eng. Sci. 55, 1857–1869 (2000).
287. Bullinger, C. W. LIGNITE FUEL ENHANCEMENT- Final Technical Report. (2010).
288. Mujumdar, A. S. Handbook of Industrial Drying Fourth Edition. Drying Technology vol. 6
(CRC Press, Taylor & Francis Group, 2014).
289. Pang, S. & Mujumdar, A. S. Drying of woody biomass for bioenergy: Drying technologies

196
and optimization for an integrated bioenergy plant. Dry. Technol. 28, 690–701 (2010).
290. Pusat, S., Akkoyunlu, M. T., Erdem, H. H. & Teke, I. Effects of bed height and particle size
on drying of a Turkish lignite. Int. J. Coal Prep. Util. 35, 196–205 (2015).
291. Sai, P. S. T. Drying of Solids in a Rotary Dryer. Dry. Technol. 31, 213–223 (2013).
292. Osman, H., Jangam, S. V., Lease, J. D. & Mujumdar, A. S. Drying of low-rank coal (LRC)-
A Review of recent patents and innovations. Dry. Technol. 29, 1763–1783 (2011).
293. Daud, W. R. W. Fluidized Bed Dryers — Recent Advances. Adv. Powder Technol. 19, 403–
418 (2008).
294. Beeby, C. & Potter, O. E. Proceedings of the Fourth International Drying Symposium. in
(1984).
295. Faber, E. F., Heydenrych, M. D., Seppa, R. V. . & Hicks, R. E. A Techno-economic
compression of air and steam drying. Drying 2, 588–594 (1986).
296. Klutz, H. J., Moser, C. & Block, D. WTA fine grain drying— Module for lignite-fired power
plants of the future. (2006).
297. Broekema, S. Innovative coal drying process benefits power plant. Processing (2017).
298. Potter, O. E., Guang, L. X. & Et.al. Some design aspects of steamfluidized heated dryers.
in Proceedings of the Sixth International Drying Symposium IDS (1988).
299. Waje, S. S., Thorat, B. N. & Mujumdar, A. S. Screw conveyor dryer: Process and equipment
design. Dry. Technol. 25, 241–247 (2007).
300. Binner, E. et al. A review of microwave coal processing. J. Microw. Power Electromagn.
Energy 48, 35–60 (2014).
301. Choicharoen, K., Devahastin, S. & Soponronnarit, S. Comparative evaluation of
performance and energy consumption of hot air and superheated steam impinging stream

197
dryers for high-moisture particulate materials. Appl. Therm. Eng. 31, 3444–3452 (2011).
302. Li, Z., Su, W., Wu, Z., Wang, R. & Mujumdar, A. S. Investigation of Flow Behaviors and
Bubble Characteristics of a Pulse Fluidized Bed via CFD Modeling. Dry. Technol. 28, 78–
93 (2009).
303. Wilson, W. G., Young, B. C. & Irwin, W. Low-rank coal drying advances. Coal 97, 24–27
(1992).
304. Nikolopoulos, N. et al. Report on comparison among current industrial scale lignite drying
technologies (A critical review of current technologies). Fuel 155, 86–114 (2015).
305. Shelton, W., Weiland, N., White, C., Plunkett, J. E. & Gray, D. Oxy-coal-fired circulating
fluid bed combustion with a commercial utility-size supercritical CO2 power cycle. in The
5th International Supercritical CO2 Power Cycles Symposium (2016).
306. Carbon Dioxide Enhanced Oil Recovery. National Energy Technology Laboratory (2010).
307. De Melo, M. M. R., Silvestre, A. J. D. & Silva, C. M. Supercritical fluid extraction of
vegetable matrices: Applications, trends and future perspectives of a convincing green
technology. J. Supercrit. Fluids 92, 115–176 (2014).
308. Iwai, Y., Amiya, M., Murozono, T., Arai, Y. & Sakanishi, K. Drying of coals by using
supercritical carbon dioxide. Ind. Eng. Chem. Res. 37, 2893–2896 (1998).
309. Iwai, Y. et al. Low temperature drying of low rank coal by supercritical carbon dioxide with
methanol as entrainer. J. Supercrit. Fluids 23, 251–255 (2002).
310. Li, X. et al. Effects of pulverized coal particle size on flame structure in a methane-assisted
swirl burner. Fuel 242, 68–76 (2019).
311. Stanton, R. W. & Survey, U. S. G. Determination of the True Density of Pulverized Coal
Samples. 1–18 (1982).

198
312. Chang, C., Kneafsey, T. J., Zhou, Q., Oostrom, M. & Ju, Y. Scaling the impacts of pore-
scale characteristics on unstable supercritical CO2-water drainage using a complete
capillary number. Int. J. Greenh. Gas Control 86, 11–21 (2019).
313. Berg, S. & Ott, H. Stability of CO2-brine immiscible displacement. Int. J. Greenh. Gas
Control 11, 188–203 (2012).
314. Homsy, G. M. VISCOUS FINGERING IN POROUS MEDIA. Annu. Rev. Fluid Mech. 36,
271–331 (1987).
315. Rabbani, H. S. et al. Suppressing viscous fingering in structured porous media. Proc. Natl.
Acad. Sci. U. S. A. 115, 4833–4838 (2018).
316. Ahamed, M. A. A., Perera, M. S. A., Matthai, S. K., Ranjith, P. G. & Dong-yin, L. Coal
composition and structural variation with rank and its influence on the coal-moisture
interactions under coal seam temperature conditions – A review article. J. Pet. Sci. Eng.
180, 901–917 (2019).
317. Guillén, M. D., Domínguez, A., Iglesias, M. J. & Blanco, C. G. Semiquantitative gas
chromatographic analysis of the volatile fraction in several extracts obtained by treatment
of coal tar pitches with different organic solvents. Fuel 74, 233–240 (1995).
318. Sun, M. et al. Separation and Composition Analysis of GC/MS Analyzable and
Unanalyzable Parts from Coal Tar. Energy and Fuels 32, 7404–7411 (2018).
319. Kolak, B. J. J., Burruss, R. C. & Survey, U. S. G. A Geochemical Investigation into the
Effect of Coal Rank on the Potential Environmental Effects of CO 2 Sequestration in Deep
Coal Beds U . S . Department of the Interior. (2004).
320. Mi, J. & Wei, R. Microwave applied in coal desulfurization process. Appl. Mech. Mater.
71–78, 2122–2126 (2011).

199
321. Saikia, B. K., Khound, K. & Baruah, B. P. Extractive de-sulfurization and de-ashing of high
sulfur coals by oxidation with ionic liquids. Energy Convers. Manag. 81, 298–305 (2014).
322. Zhang, K., Cheng, Y., Li, W., Wu, D. & Liu, Z. Influence of supercritical CO2 on pore
structure and functional groups of coal: Implications for CO2 sequestration. J. Nat. Gas Sci.
Eng. 40, 288–298 (2017).
323. Zhang, D., Gu, L., Li, S., Lian, P. & Tao, J. Interactions of supercritical CO2 with coal.
Energy and Fuels 27, 387–393 (2013).
324. Aggarwal, S., Johnson, S., Hakovirta, M., Sastri, B. & Banerjee, S. Removal of Water and
Extractives from Softwood with Supercritical Carbon Dioxide. Ind. Eng. Chem. Res. 58,
3170–3174 (2019).
325. Kolak, J. J. & Burruss, R. C. The use of solvent extractions and solubility theory to discern
hydrocarbon associations in coal, with application to the coal-supercritical CO2 system.
Org. Geochem. 73, 56–69 (2014).
326. Kuznetsov, P. N., Kamenskiy, E. S. & Kuznetsova, L. I. Comparative Study of the
Properties of the Coal Extractive and Commercial Pitches. Energy and Fuels 31, 5402–5410
(2017).
327. Vasllakos, N. P., Dobbs, J. M. & Parisi, A. S. Solvent Effects in Supercritical Extraction of
Coal. Ind. Eng. Chem. Process Des. Dev. 24, 121–128 (1985).
328. Palvia, D. L., Lampman, G. M., Kriz, G. S. & Vyvyan, J. R. Introduction to Spectroscopy.
(2012). doi:10.1201/b12949-2.
329. Guillén, M. D., Iglesias, M. J., Domínguez, A. & Blanco, C. G. Semiquantitative FTIR
Analysis of a Coal Tar Pitch and Its Extracts and Residues in Several Organic Solvents.
Energy and Fuels 6, 518–525 (1992).

200
330. Cooke, N. E., Fuller, O. M. & Gaikwad, R. P. FT-i.r. spectroscopic analysis of coals and
coal extracts. Fuel 65, 1254–1260 (1986).
331. U.S. Environmental Protection Agency. Biosolids generation, use, and disposal in the
United States; U.S. Environmental Protection Agency: Washington, DC. (1999).
332. Chen, G., Yue, P. L. & Mujumdar, A. S. Sludge dewatering and drying. Dry. Technol. 20,
883–916 (2002).
333. States, U. United States environmental protection agency. Filtr. Sep. 36, 41 (1999).
334. Kelessidis, A. & Stasinakis, A. S. Comparative study of the methods used for treatment and
final disposal of sewage sludge in European countries. Waste Manag. 32, 1186–1195
(2012).
335. Tuncal, T., Jangam, S. V. & Mujumdar, A. S. Physiochemical aspects of Sludge Drying. in
Handbook of Industrial Drying, Fourth Edition (ed. Mujumdar, A. S.) 883–894 (CRC Press,
Taylor & Francis Group, 2015).
336. Bitton, G. Wastewater Microbiology. (WILEY-LISS, A JOHN WILEY & SONS, INC.,
PUBLICATION, 2005).
337. Laturnus, F., Von Arnold, K. & Grøn, C. Organic contaminants from sewage sludge applied
to agricultural soils false alarm regarding possible problems for food safety? Environ. Sci.
Pollut. Res. 14, 53–60 (2007).
338. Venkatesan, A. K., Pycke, B. F. G. & Halden, R. U. Detection and occurrence of N -
nitrosamines in archived biosolids from the targeted national sewage sludge survey of the
U.S. environmental protection agency. Environ. Sci. Technol. 48, 5085–5092 (2014).
339. Manoli, E. & Samara, C. Occurrence and Mass Balance of Polycyclic Aromatic
Hydrocarbons in the Thessaloniki Sewage Treatment Plant. J. Environ. Qual. 28, 176–187

201
(1999).
340. Tunçal, T., Jangam, S. V. & Günes, E. Abatement of organic pollutant concentrations in
residual treatment sludges: A review of selected treatment technologies including drying.
Dry. Technol. 29, 1601–1610 (2011).
341. Mailler, R., Gasperi, J., Chebbo, G. & Rocher, V. Priority and emerging pollutants in
sewage sludge and fate during sludge treatment. Waste Manag. 34, 1217–1226 (2014).
342. Commission, E. Sludge_Pollutants_Xsum. papers2://publication/uuid/546D275B-33DD-
4C10-BBC5-343B7B40F6F4 (2001).
343. Tsang, K. R. & Vesilind, P. A. Moisture distribution in sludges. Water Sci. Technol. 22,
135–142 (1990).
344. Erdincler, A. & Vesilind, P. A. Effect of sludge cell disruption on compactibility of
biological sludges. Water Sci. Technol. 42, 119–126 (2000).
345. Classification, C., Moisture, O. F., In, C. & Sludges, A. Activated Sludges. 123, 253–258
(1997).
346. Lee, D. ‐J. Measurement of bound water in waste activated sludge: Use of the centrifugal
settling method. J. Chem. Technol. Biotechnol. 61, 139–144 (1994).
347. Matsuda, A., Kawasaki, K. & Mizukawa, Y. Measurement of bound water in excess
activated sludges and effect of freezing and thawing process on it. J. Chem. Eng. Japan 25,
100–103 (1992).
348. Heukelekian, H. & Weisberg, E. Bound water and activated sludge bulking. Sewage Ind.
Waste. 28, 558–574 (1956).
349. Robinson, J. & Knocke, W. R. Use of dilatometric and drying techniques for assessing
sludge dewatering characteristics. Water Environ. Res. 64, 60–68 (1992).

202
350. Kopp, J. & Dichtl, N. Influence of the free water content on the dewaterability of sewage
sludges. Water Sci. Technol. 44, 177–183 (2001).
351. Lee, D. ‐J & Lee, S. F. Measurement of bound water content in sludge: The use of
differential scanning calorimetry (DSC). J. Chem. Technol. Biotechnol. 62, 359–365
(1995).
352. Katsiris, N. & Kouzeli-Katsiri, A. Bound water content of biological sludges in relation to
filtration and dewatering. Water Res. 21, 1319–1327 (1987).
353. Deng, W. et al. Moisture distribution in sludges based on different testing methods. J.
Environ. Sci. 23, 875–880 (2011).
354. Smollen, M. Evaluation of municipal sludge drying and dewatering with respect to sludge
volume reduction. Water Sci. Technol. 22, 153–161 (1990).
355. LOWE, P. Developments in the Thermal Drying of Sewage Sludge. Water Environ. J. 9,
306–316 (1995).
356. Martel, J. C. DEVELOPMENT AND DESIGN OF SLUDGE FREEZING BEDS. J.
Environ. Eng. 115, 799–808 (1990).
357. Martel, C. J. Fundamentals of sludge dewatering in freezing beds. Water Sci. Technol. 28,
29–35 (1993).
358. Hasatani, M., Kobayashi, N. & Li, Z. Drying and dewatering R&D in Japan. Dry. Technol.
19, 1223–1251 (2001).
359. Golla, P. S., Johnson, H. W., Hardy, E. & Senthilnathan, P. R. Pharmaceutical Sludge. 11,
(1992).
360. MacConnell, G., Ds, H., Kirby, K., Lee, H. & Mousavipour, F. Centrifuges vs. dissolved
air flotation. Waster Environment & Technology 60–65 (1991).

203
361. Lowe, P. & Shaw, D. Development of the membrane filter press for the processing of
sewage sludge. Water Sci. Technol. 25, 297–305 (1992).
362. Smith, J. J. & Semon, J. Dewatering municipal sewage sludges selecting a process. in
Environmental Engineering (1989).
363. Brashear, D. A. & Ward, R. L. Inactivation of Indigenous Viruses in Raw Sludge by Air
Drying. Appl. Environ. Microbiol. 45, 1943–1945 (1983).
364. Carpenter, L. V. Sludge Drying on Open and Covered Drying Beds. Sewage Work. J. 10,
503–512 (1938).
365. Hossam, A. A., Saad, S. G., Mitwally, H. H., Saad, L. M. & Noufal, L. Solar energy for
sludge drying in Alexandria Metropolitan Area: Case study in Egypt. Water Sci. Technol.
22, 193–204 (1990).
366. El-Ariny, A. S. & Miller, H. I. Utilization of solar energy for sludge drying beds. 106, 351–
357 (1983).
367. US-EPA. Sludge Drying Bed Design Review. (1986).
368. US-EPA. Innovations in Sludge Drying Beds: A Practical Technology. (1987).
369. Marklund, S. Dewatering of sludge by natural methods. Water Sci. Technol. 22, 239–246
(1990).
370. Wang, L. K., Li, Y., Shammas, N. K. & Sakellaropoulos, G. P. Biosolids Treatment
Processes. Biosolids Treat. Process. (2007) doi:10.1007/978-1-59259-996-7.
371. Gruter, H., Matter, M., Oehlmann, K. H. & Hicks, M. D. Drying of sewage sludge - An
important step in waste disposal. Water Sci. Technol. 22, 57–63 (1990).
372. Hudson, J. A. & Lowe, P. Current Technologies for sludge treatment and disposal. 436–441
(1994).

204
373. Imoto, Y., Hasatani, M. & Kasakura, T. The State of the Art of Sludge Drying in Japan.
Dry. Technol. 11, 1495–1522 (1993).
374. North, R. D. Revolving drum drying apparatus and method. (1997).
375. Gelter, J. Process and an apparatus for producing a powdered product by spin flash drying.
376. Rutz, A. Method and Apparatus for drying sewage sludge with a drying gas that is itself
dried and recirculated.
377. Minnie, C. O. & Warren, S. D. Sludge Drying Apparatus. 0–2 (1984).
378. Bein, D. . Two stage sludge drying apparatus and method. (1994).
379. Nugent, J. E. Multi pass, continous drying apparatus. 1–3 (1997).
380. Cusidó, J. A. & Cremades, L. V. Atomized sludges via spray-drying at low temperatures:
An alternative to conventional wastewater treatment plants. J. Environ. Manage. 105, 61–
65 (2012).
381. Crews, R. S. Cyclone dryer and method of drying. vol. 92660 1–15 (2002).
382. Fouhy, K. & Moore, S. Raking money from muck. Chem. Eng. (New York) 101, 33–37
(1994).
383. Najder, L. E. Thin Film Evaporation. Ind. Eng. Chem. 56, 26–30 (1964).
384. Dausman, J. & Avent, R. J. Apparatus and process for forming uniform, pelletizable sludge
product. (1985).
385. Girovich, M. J. Simultaneous Sludge Drying and Pelletizing. (1990).
386. Girovich, M. J. INDIRECT HEAT DRYING AND SIMULTANEOUS PELLETIZATION
OF SLUDGE. 6 (1991).
387. Jensen, A. S. Industrial experience in pressurized steam drying of beet pulp, sewage sludge
and wood chips. Dry. Technol. 13, 1377–1393 (1995).

205
388. Isheim, M. C. Sludge drying with sand recycle. (1981).
389. Greenfeld, C. Process for dehydrating waste solids concentrates. 2–5 (1966).
390. Mahmood, T., Zawadzki, M. & Banerjee, S. Pilot study of impulse drying industrial sludge.
Environ. Sci. Technol. 32, 1813–1816 (1998).
391. Banerjee, S. Method and Apparatus for Multi-Nip Impulse Drying. vol. 1 (2001).
392. Banerjee, S. Apparatus for Multi-Nip Impulse Drying. vol. 1 (2001).
393. U.S. Environmental Protection Agency. Sewage Sludge; use or disposal standards; Dioxin
or dioxin like compounds; numeric concentration limits. Fed. Regist. 64, (1999).
394. Hsu, J. P., Tao, T., Su, A., Mujumdar, A. S. & Lee, D. J. Model for sludge cake drying
accounting for developing cracks. Dry. Technol. 28, 922–926 (2010).
395. Kelessidis, A. & Stasinakis, A. S. Comparative study of the methods used for treatment and
final disposal of sewage sludge in European countries. Waste Manag. 32, 1186–1195
(2012).
396. Fytili, D. & Zabaniotou, A. Utilization of sewage sludge in EU application of old and new
methods-A review. Renew. Sustain. Energy Rev. 12, 116–140 (2008).
397. Oladejo, J., Shi, K., Luo, X., Yang, G. & Wu, T. A review of sludge-to-energy recovery
methods. Energies 12, 1–38 (2019).
398. Syed-Hassan, S. S. A., Wang, Y., Hu, S., Su, S. & Xiang, J. Thermochemical processing of
sewage sludge to energy and fuel: Fundamentals, challenges and considerations. Renew.
Sustain. Energy Rev. 80, 888–913 (2017).
399. Harrison, E. Z., Oakes, S. R., Hysell, M. & Hay, A. Organic chemicals in sewage sludges.
Sci. Total Environ. 367, 481–497 (2006).
400. Mulchandani, A. & Westerhoff, P. Recovery opportunities for metals and energy from

206
sewage sludges. Bioresour. Technol. 215, 215–226 (2016).
401. Vaxelaire, J. & Cézac, P. Moisture distribution in activated sludges: A review. Water Res.
38, 2215–2230 (2004).
402. Winkler, M. K. H., Bennenbroek, M. H., Horstink, F. H., van Loosdrecht, M. C. M. & van
de Pol, G. J. The biodrying concept: An innovative technology creating energy from sewage
sludge. Bioresour. Technol. 147, 124–129 (2013).
403. Di Fraia, S., Massarotti, N., Vanoli, L. & Costa, M. Thermo-economic analysis of a novel
cogeneration system for sewage sludge treatment. Energy 115, 1560–1571 (2016).
404. Dawson, P. E. A. United States Patent (19). (1992).
405. Zhou, Y. & Jin, Y. Mathematical Modeling of Thin-layer Infrared Drying of Dewatered
Municipal Sewage Sludge (DWMSS). Procedia Environ. Sci. 31, 758–766 (2016).
406. Heath, M. S., Wirtel, S. A. & Rittmann, B. E. Research Journal of the Water Pollution
Control Federation. Water Environ. Fed. 62, 185–192 (2015).
407. Mawioo, P. M. et al. A pilot-scale microwave technology for sludge sanitization and drying.
Sci. Total Environ. 601–602, 1437–1448 (2017).
408. Ohm, T. I., Chae, J. S., Kim, J. E., Kim, H. kyum & Moon, S. H. A study on the dewatering
of industrial waste sludge by fry-drying technology. J. Hazard. Mater. 168, 445–450
(2009).
409. Jeppsson, J. Emerging technologies. Industrial Engineer vol. 43 (2011).
410. Xu, Z. R., Zhu, W. & Li, M. Influence of moisture content on the direct gasification of
dewatered sludge via supercritical water. Int. J. Hydrogen Energy 37, 6527–6535 (2012).
411. Xu, Z. R., Zhu, W., Li, M., Zhang, H. W. & Gong, M. Quantitative analysis of polycyclic
aromatic hydrocarbons in solid residues from supercritical water gasification of wet sewage

207
sludge. Appl. Energy 102, 476–483 (2013).
412. Berset, J. D. & Holzer, R. Quantitative determination of polycyclic aromatic hydrocarbons,
polychlorinated biphenyls and organochlorine pesticides in sewage sludges using
supercritical fluid extraction and mass spectrometric detection. J. Chromatogr. A 852, 545–
558 (1999).
413. Smoliński, A., Karwot, J., Bondaruk, J. & Bak, A. The bioconversion of sewage sludge to
bio-fuel: The environmental and economic benefits. Materials (Basel). 12, 1–9 (2019).
414. David Jenkins, Michael G. Richard, G. T. D. Manual on the causes and control of activated
sludge bulking, foaming, and other solids separation problems. (LEWIS, 2004).
415. Fernandes Diniz, J. M. B., Gil, M. H. & Castro, J. A. A. M. Hornification - Its origin and
interpretation in wood pulps. Wood Sci. Technol. 37, 489–494 (2004).
416. Simsir, H., Eltugral, N. & Karagoz, S. Hydrothermal carbonization for the preparation of
hydrochars from glucose, cellulose, chitin, chitosan and wood chips via low-temperature
and their characterization. Bioresour. Technol. 246, 82–87 (2017).
417. Werle, S. & Dudziak, M. Analysis of organic and inorganic contaminants in dried sewage
sludge and by-products of dried sewage sludge gasification. Energies 7, 462–476 (2014).
418. Search, C. Fuels - Higher and Lower Calorific Values Higher and lower calorific values ( =
heating values ) for some common fuels - coke , oil , wood , hydrogen and others. 1–7
(2018).
419. Wang, W., Li, A. & Zhang, X. DSC and SEM analysis on bound water characteristics in
sewage sludge. Adv. Mater. Res. 347–353, 2085–2089 (2012).
420. Smoczyński, L., Ratnaweera, H., Kosobucka, M. & Smoczyński, M. Image analysis of
sludge aggregates. Sep. Purif. Technol. 122, 412–420 (2014).

208
421. Spectroscopy, I. w w w m . c w w. 15–104.
422. Aznar, M., Anselmo, M. S., Manyà, J. J. & Murillo, M. B. Experimental study examining
the evolution of nitrogen compounds during the gasification of dried sewage sludge. Energy
and Fuels 23, 3236–3245 (2009).
423. Lin, Y., Ma, X., Ning, X. & Yu, Z. TGA-FTIR analysis of co-combustion characteristics of
paper sludge and oil-palm solid wastes. Energy Convers. Manag. 89, 727–734 (2015).
424. Yanfen, L. & Xiaoqian, M. Thermogravimetric analysis of the co-combustion of coal and
paper mill sludge. Appl. Energy 87, 3526–3532 (2010).
425. Park, S. Characterization of Bound Water in Fibers using Thermogravimetric Analysis.
(2006).
426. Nadziakiewicz, J. & Kozioł, M. Co-combustion of sludge with coal. Appl. Energy 75, 239–
248 (2003).
427. Werther, J. & Ogada, T. Sewage sludge combustion. Prog. Energy Combust. Sci. 25, 55–
116 (1999).
428. Tan, P. et al. Co-firing sludge in a pulverized coal-fired utility boiler: Combustion
characteristics and economic impacts. Energy 119, 392–399 (2017).
429. Han, J. et al. Emission of polycyclic aromatic hydrocarbons from coal and sewage sludge
co-combustion in a drop tube furnace. Waste Manag. Res. 30, 875–882 (2012).
430. Chen, W., Wang, F. & Kanhar, A. H. Sludge acts as a catalyst for coal during the co-
combustion process investigated by thermogravimetric analysis. Energies 10, (2017).
431. Sheng, C. & Azevedo, J. L. T. Estimating the higher heating value of biomass fuels from
basic analysis data. Biomass and Bioenergy 28, 499–507 (2005).
432. Han, J. et al. A method for estimating higher heating value of biomass-plastic fuel. J. Energy

209
Inst. 90, 331–335 (2017).
433. Demirbas, A., Ak, N., Aslan, A. & Sen, N. Calculation of higher heating values of
hydrocarbon compounds and fatty acids. Pet. Sci. Technol. 36, 712–717 (2018).
434. Von Woedtke, T., Schlüter, B., Pflegel, P., Lindequist, U. & Jülich, W. D. Aspects of the
antimicrobial efficacy of grapefruit seed extract and its relation to preservative substances
contained. Pharmazie 54, 452–456 (1999).
435. REAGOR, L., GUSMAN, J., McCOY, L., CARINO, E. & HEGGERS, J. P. The
effectiveness of processed grapefruit-seed extract as an antibacterial agent: II. Mechanism
of action and in vitro toxicity. J. Altern. Complement. Med. 8, 333–340 (2002).
436. Heggers, J. P. et al. The effectiveness of processed grapefruit-seed extract as an antibacterial
agent: II. Mechanism of action and in vitro toxicity. J. Altern. Complement. Med. 8, 333–
340 (2002).
437. Gravura, S. Not natural, not safe: Grapefruit Seed Extract. Science-based Medicine
https://sciencebasedmedicine.org/not-natural-not-safe-grapefruit-seed-extract/ (2016).
438. Kanmani, P. & Rhim, J. W. Antimicrobial and physical-mechanical properties of agar-based
films incorporated with grapefruit seed extract. Carbohydr. Polym. 102, 708–716 (2014).
439. Cvetnić, Z. & Vladmir-Knežević, S. Antimicrobial activity of grapefruit seed and pulp
ethanolic extract. Acta Pharm. 54, 243–250 (2004).
440. Yu, J., Dandekar, D. V., Toledo, R. T., Singh, R. K. & Patil, B. S. Supercritical fluid
extraction of limonoids and naringin from grapefruit (Citrus paradisi Macf.) seeds. Food
Chem. 105, 1026–1031 (2007).
441. Yu, J., Dandekar, D. V., Toledo, R. T., Singh, R. K. & Patil, B. S. Supercritical fluid
extraction of limonoid glucosides from grapefruit molasses. J. Agric. Food Chem. 54, 6041–

210
6045 (2006).
442. Hull, C. W., Arcadia & Calif. APPARATUS FOR PRODUCTION OF THREE-
DMENSONAL OBJECTS BY STEREO THOGRAPHY. 16 (1984).
443. https://all3dp.com/1/useful-cool-things-3d-print-ideas-3d-printer-projects-stuff/.
444. Top 5 Ways 3D Printing Is Changing the Medical Field. https://www.asme.org/topics-
resources/content/top-5-ways-3d-printing-changing-medical-field
https://www.asme.org/topics-resources/content/top-5-ways-3d-printing-changing-medical-
field.
445. Filament Tapes Market on Track to US $6.6 Bn by 2026.
http://www.digitaljournal.com/pr/3890037. http://www.digitaljournal.com/pr/3890037.
446. Jian-Yuan, L., An, J. & Kai, C. C. Fundamentals and applications of 3D printing for novel
materials. Appl. Mater. Today 7, 120–133 (2017).
447. https://www.3ders.org/pricecompare.
448. https://www.plasticsinsight.com/resin-intelligence/resin-prices/polylactic-acid/. Polylactic
Acid Properties, Production, Price, Market and Uses. Plastic Insight
https://www.plasticsinsight.com/resin-intelligence/resin-prices/polylactic-acid/.
449. Lam, C. X. F., Mo, X. M., Teoh, S.-H. & Hutmacher, D. Scaffold development using 3D
printing with a starch-based polymer. Mater. Sci. Eng. C 20, 49–56 (2002).
450. Steinle, P. Characterization of emissions from a desktop 3D printer and indoor air
measurements in office settings. J. Occup. Environ. Hyg. 13, 121–132 (2016).
451. Davis, A., Black, M., Zhang, Q., Wong, J. P. S. & Weber, R. J. Fine particulate and chemical
emissions from desktop 3D printers. Int. Conf. Digit. Print. Technol. 121–123 (2016).
452. Hakovirta, M., Aksoy, B. & Hakovirta, J. Self-assembled micro-structured sensors for food

211
safety in paper based food packaging. Mater. Sci. Eng. C 53, 331–335 (2015).
453. Smol, J. P. & Eugene F. Stoermer. The Diatoms: Applications for the Environmental and
Earth Sciences. Q. Rev. Biol. 75, (2000).
454. https://www.nobelprize.org/alfred-nobel/alfred-nobel-his-life-and-work/.
455. https://www.usgs.gov/centers/nmic/diatomite-statistics-and-information.
456. Fedorovich, N. E., Alblas, J., Hennink, W. E., Öner, F. C. & Dhert, W. J. A. Organ printing:
the future of bone regeneration? Trends Biotechnol. 29, 601–606 (2011).
457. Rozema, F. et al. The effects of different steam-sterilization programs on material properties
of poly(L-lactide). J. Appl. Biomater. 23, (1991).
458. Sanchez, F. A. C., Lanza, S., Boudaoud, H., Hoppe, S. & Camargo, M. Polymer Recycling
and Additive Manufacturing in an Open Source context: Optimization of processes and
methods. in Annual International Solid Freeform Fabrication Symposium 1591–1600
(2015). doi:10.36535/0235-5019-2019-11-7.
459. Divyathej, M. V., Varun, M. & Rajeev, P. Analysis of mechanical behavior of 3D printed
ABS parts by experiments. Int. J. Sci. Eng. Res. 7, 116–124 (2016).
460. Raj, S. A., Muthukumaran, E. & Jayakrishna, K. A Case Study of 3D Printed PLA and Its
Mechanical Properties. Mater. Today Proc. 5, 11219–11226 (2018).
461. SoÈdergaÊrd, A. & Mikael Stolt. Properties of polylactic acid fiber based polymers and
their correlation with composition. Prog. Polym. Sci. 27, 1123–1163 (2002).
462. Middleton, J. C. & Tipton, A. J. Synthetic biodegradable polymers as orthopedic devices.
Biomaterials 21, 2335–2346 (2000).
463. Tan, S., Su, A., Yang, X. & Zhou, E. Crystallization and melting behavior of amorphous
poly(iminosebacoyl iminodecamethylene). J. Appl. Polym. Sci. 77, 993–1002 (2000).

212
464. Yasuniwa, M., Tsubakihara, S., Sugimoto, Y. & Nakafuku, C. Thermal analysis of the
double-melting behavior of poly(L-lactic acid). J. Polym. Sci. Part B Polym. Phys. 42, 25–
32 (2004).
465. Tang, Z., Chang, C., Liu, X. & Zhu, J. The crystallization behavior and mechanical
properties of polylactic acid in the presence of a crystal nucleating agent. J. Appl. Polym.
Sci. 25, (2012).
466. Su, Z., Li, Q., Liu, Y., Hu, G.-H. & Wu, C. Multiple Melting Behavior of Poly(lactic acid)
Filled with Modified Carbon Black. J. Polym. Sci. Part B Polym. Phys. 47, 1971–1980
(2009).
467. Mustapa, I. R., Shanks, R. A. & Kong, I. Melting Behaviour and Dynamic Mechanical
Properties of Poly(lactic acid)-Hemp-Nanosilica Composites. Asian Trans. Basic Appl. Sci.
3, 29–37 (2013).
468. Meradi, H. et al. Characterization by Thermal Analysis of Natural Kieselguhr and Sand for
Industrial Application. Energy Procedia 74, 1282–1288 (2015).
469. Fukushima, K., Tabuani, D., Abbate, C., Arena, M. & Rizzarelli, P. Preparation,
characterization and biodegradation of biopolymer nanocomposites based on fumed silica.
Eur. Polym. J. 47, 139–152 (2011).
470. Wen, X. et al. Thermomechanical and Optical Properties of Biodegradable Poly(L-
lactide)/Silica Nanocomposites by Melt Compounding Xin. J. Appl. Polym. Sci. 114, 3379–
3388 (2009).
471. Kudra, T., Gawrzynski, Z., Glaser, R., Stanislawski, J. & Poirier, M. Drying of pulp and
paper sludge in a pulsed fluid bed dryer. Dry. Technol. 20, 917–933 (2002).
472. Navaee-Ardeh, S., Bertrand, F. & Stuart, P. R. Emerging biodrying technology for the

213
drying of pulp and paper mixed sludges. Dry. Technol. 24, 863–878 (2006).
473. Glen Stephanie. Www.Statisticshowto.Com. ‘Welcome to Statistics How To!’
http://www.statisticshowto.com/verification-bias/.
474. Kilkenny, C. et al. Survey of the Quality of Experimental Design, Statistical Analysis and
Reporting of Research Using Animals. PLoS One 4, (2009).
475. Statistical analysis. www.thesishub.org/statistical-
analysis/#:~:text=Statistical%20analysis%20is%20a%20mathematical,without%20an%2
0assumed%20mathematical%20background.
476. Spricer, K. A Statistical Analysis of Heart Tissue Perforations. (2009).
477. Ali, Z. & Bhaskar, S. B. Basic statistical tools in research and data analysis. Indian J.
Anaesth. 60, 662–669 (2016).
478. Tavşancil, E., Erdem, D., Yalçin, N., Yildirim, Ö. & Bilican, S. Examination of data
analyses used for master’s theses in Educational Sciences. Procedia - Soc. Behav. Sci. 9,
1467–1474 (2010).

214
APPENDIX

215
A.1 Statistical Analysis
Statistical analysis is the science of collecting data and uncovering patterns and trends.
After the collection of data, analysis is done for 473,474:
• Summarizing the data.
• Finding the key measures of location by calculating the mean or average.
• Calculating the spread which tells how much the data is tightly clustered or more spread
out such as standard deviation .
• Make future predictions based on past behavior.
• Testing an experiment’s hypothesis. Collecting data from an experiment only tells a story
when you analyze the data. This part of statistical analysis is more formally called
“Hypothesis Testing.
Statistical tests can be either parametric tests or non-parametric tests 475,476.
Parametric tests are for those data where sample population follows the normal distribution
which means data has less tendency to produce unusually extreme values. Where non-parametric
tests are for those sample population does not follow normal distribution and values may be off
the scale that is too high or too low.
Parametric tests include 475–478:
Mean: Mean is commonly called as the average where average of all values of sample population
is taken.
Standard Deviation: The standard deviation measures the spread of the data about the mean
value.
T-test: The t-test is useful whenever there is need of comparing the means of two groups of data.
It assesses whether the means of two groups are statistically different from each other.

216
Analysis of Variance (ANOVA): It is similar as t-test where is used to test the hypothesis about
the differences between two or more means but analysis of variance will be more useful to test the
differences for significance in case of more than two means without increasing the error rate.
Pearson correlation: This is used to measure the correlation between two variables which varies
between +1 and -1. A correlation of +1 means there is perfect positive linear relationship between
variables and -1 means that there is perfect negative linear relationship between the variables.
Regression: This analysis technique is useful for modelling and analysis of numerical data. This
can be used for prediction, inference, and hypothesis testing and modelling of casual relationships.
This tells whether the relationship will be linear or non-linear.
Another term to be considered in statistical analysis is the confidence interval and the confidence
level. The confidence interval is an interval estimate of a population parameter that is the plus or
minus figure reported. The confidence level depicts the surety level of correctness of any inference.
Most researchers use the 95% confidence level.

217
A.2 Statistical Analysis of Softwood/ OSB Flakes samples
Table A.1 Covariance between Pressure vs % Moisture loss at 60˚C (keeping other parameters same).
Pressure % MC loss(dry basis)
Pressure 722222.2
% MC loss(dry basis) 419.2982 0.67737 Positive value of covariance means time and % moisture loss vary together and directly
related to each other
Table A.2 Corelation between Pressure vs % Moisture loss at 60˚C (keeping other parameters same).
Pressure % MC loss(dry basis)
Pressure 1
% MC loss(dry basis) 0.59948 1 Correlation coefficient of 0.59 not so close to +1 shows the positive but not too strong
relationship between the two variables.
Table A.3 Covariance between Time vs % Moisture loss at 60˚C (keeping other parameters same).
Time % MC loss(dry basis)
Time 394
% MC loss(dry basis) 393.8294 427.3078 Positive value of covariance means time and % moisture loss vary together and directly
related to each other

218
Table A.4 Corelation between Time vs % Moisture loss at 60˚C (keeping other parameters same).
Time % MC loss(dry basis)
Time 1 % MC loss(dry basis) 0.95982 1
Correlation coefficient of 0.95 close to +1 shows the strong positive relationship between
the two variables.
Table A.5 Covariance between Mass ratio vs % Moisture loss at 60˚C (keeping other parameters same).
Mass Ratio sCO2/wood % MC loss(dry basis)
Mass Ratio sCO2/wood 22.41954
% MC loss(dry basis) 5.158427 1.501777 Positive value of covariance means mass ratio and % moisture loss vary together and
directly related to each other.
Table A.6 Corelation between Mass ratio vs % Moisture loss at 60˚C (keeping other parameters same).
Mass Ratio sCO2/wood % MC loss(dry basis)
Mass Ratio sCO2/wood 1
% MC loss(dry basis) 0.888999 1 Correlation coefficient of 0.89 close to +1 shows the strong positive relationship between
the two variables.

219
A.3 Statistical Analysis of sludge samples
Table A.7 t-Test: Two-Sample Assuming Equal Variances between 15minutes vs 5*5*5 sequential shot.
15minutes 5*5*5 Mean 65.20830263 39.2584371 Variance 37.67004487 78.48248 Observations 3 3 Pooled Variance 58.07626243 Hypothesized Mean Difference 0 df 4 t Stat 4.170435534 P(T<=t) one-tail 0.007013125 t Critical one-tail 2.131846786 P(T<=t) two-tail 0.01402625 t Critical two-tail 2.776445105
Since P value is less than 0.05 (95% Confidence interval), hence reject the null hypothesis
(mean 1= mean 2) which depicts mean 1 is not equal to mean 2. Two variables are
statiscally different.
Table A.8 t-Test: Two-Sample Assuming Equal Variances between 5 min vs 10 min.
5 min 10 min Mean 23.38240992 28.25231667 Variance #DIV/0! 0.698938707 Observations 3 3 Pooled Variance 0.698938707 Hypothesized Mean Difference 0 df 4 t Stat -4.7561492 P(T<=t) one-tail 0.065965132 t Critical one-tail 6.313751515 P(T<=t) two-tail 0.131930265 t Critical two-tail 12.70620474

220
Since P value is greater than 0.05 (95% CI) hence can’t reject the null hypothesis which is
mean 1 = mean 2. This depicts these two variables are not statiscally different
Table A.9 t-Test: Two-Sample Assuming Equal Variances between 15 min vs 10 min.
15 min 10 min Mean 65.20830263 28.25231667 Variance 37.67004487 0.698938707 Observations 3 3 Pooled Variance 25.34634282 Hypothesized Mean Difference 0 df 4 t Stat 8.041142606 P(T<=t) one-tail 0.002008266 t Critical one-tail 2.353363435 P(T<=t) two-tail 0.004016532 t Critical two-tail 3.182446305
Since P value is less than 0.05 (95% Confidence interval), hence reject the null hypotheis
(mean 1= mean 2) which depicts mean 1 is not equal to mean 2.
Table A.10 Covariance between time vs % water loss at 2500Psi & 75˚C.
Time % water loss Time 16.66667 % water loss 69.70982 348.7629102
Positive value of covariance means time and % water loss vary together and directly
related to each other

221
Table A.11 Corelation between time vs % water loss at 2500Psi & 75˚C.
Time % Water loss
Time 1 % water loss 0.914333 1
Correlation coefficient of 0.91 close to +1 shows the strong positive relationship between
the two variables.
A.4 Statistical Analysis of sludge-coal blend samples
Table A.12 Covariance between time vs % water loss at 2500Psi & 75˚C (90:10 Coal: sludge).
Time % water loss
Time 66.66666667 % Water loss 92.55712896 128.511801
Table A.13 Correlation between time vs % water loss at 2500Psi & 75˚C (90:10 Coal: sludge).
Time % water loss
Time 1
% Water loss 0.999963156 1 Positive value of covariance means time and % water loss vary together and directly related
to each other. Correlation coefficient of 0.99 close to +1 shows the strong positive relationship
between the two variables.

222
Table A.14 Covariance between time vs % water loss at 2500Psi & 75˚C (75:25 Coal: sludge).
Time % water loss
Time 66.666667
% Water loss 73.1 80.28762222
Table A.15 Correlation between time vs % water loss at 2500Psi & 75˚C (75:25 Coal: sludge).
Time % water loss
Time 1 % Water losss 0.9991684 1
Positive value of covariance means time and % water loss vary together and directly related
to each other. Correlation coefficient of 0.99 close to +1 shows the strong positive relationship
between the two variables.
Table A.16 Covariance between time vs % water loss at 2500Psi & 75˚C (50:50 Coal: sludge).
Time % water loss Time 66.6666667 % Water loss 70.4666667 74.536622
Table B. 17 Correlation between time vs % water loss at 2500Psi & 75˚C (50:50 Coal: sludge).
Time % water loss Time 1 % Water loss 0.99964202 1
Positive value of covariance means time and % water loss vary together and directly related
to each other. Correlation coefficient of 0.99 close to +1 shows the strong positive relationship
between the two variables.

223
Table A.18 Covariance between sludge concentration vs % water loss at 2500Psi & 75˚C, 5min.
Sludge
Conc. % water loss
Sludge conc 272.2222222
% water loss -50.10637469 9.34096441
Table A.19 Corelation between sludge concentration vs % water loss at 2500Psi & 75˚C.
Sludge Conc. % water loss Sludge conc 1 % water loss -0.993654344 1
Negative value of covariance means sludge conc. and % water loss vary together and
inversely related to each other. Correlation coefficient of -0.99 close to -1 shows the strong
negative relationship between the two variables which means if one variable is increasing,
other is decreasing.
Table A.20 Covariance between sludge concentration vs % water loss at 2500Psi & 75˚C, 15min.
Sludge Conc. % water loss
Sludge conc 272.2222222 % water loss -66.8555556 17.042756
Table A.21 Correlation between sludge concentration vs % water loss at 2500Psi & 75˚C,
15min.
Sludge Conc. % water loss Sludge conc 1 % water loss -0.98153504 1
Negative value of covariance means sludge conc. and % water loss vary together and
inversely related to each other. Correlation coefficient of -0.98 close to -1 shows the strong

224
negative relationship between the two variables which means if one variable is increasing,
other is decreasing.
Table A.22 Covariance between sludge concentration vs % water loss at 2500Psi & 75˚C, 25min.
Sludge Conc. % water loss Sludge conc 272.222222 % water loss -91.483333 34.383267
Table A.23 Correlation between sludge concentration vs % water loss at 2500Psi & 75˚C, 25min.
Sludge Conc. % water loss Sludge conc 1 % water loss -0.9455982 1
Negative value of covariance means sludge conc. and % water loss vary together and
inversely related to each other. Correlation coefficient of -0.94 close to -1 shows the strong
negative relationship between the two variables which means if one variable is increasing,
other is decreasing.

225
Table A.24 t-Test: Two-Sample Assuming Equal Variances coal: sludge 90:10 ratio (b/w 5 minutes & 15 minutes.
5minutes 15 minutes Mean 21.4025844 35.23025263 Variance 16.2793361 7.100322273 Observations 4 3 Pooled Variance 12.6077305 Hypothesized Mean Difference 0 df 5 t Stat -5.09884835 P(T<=t) one-tail 0.00188691 t Critical one-tail 2.01504837 P(T<=t) two-tail 0.00377383 t Critical two-tail 2.57058184
Since P value is less than 0.05 (95% Confidence interval), hence reject the null hypothesis
(mean 1= mean 2) which depicts mean 1 is not equal to mean 2.
Table A.25 t-Test: Two-Sample Assuming Equal Variances coal: sludge 90:10 ratio (b/w 15 minutes & 25 minutes.
25 min 15 min Mean 49.320261 35.230253 Variance 7.465603 7.1003223 Observations 3 3 Pooled Variance 7.2829626 Hypothesized Mean Difference 0 df 4 t Stat 6.3944446 P(T<=t) one-tail 0.0015354 t Critical one-tail 2.1318468 P(T<=t) two-tail 0.0030708 t Critical two-tail 2.7764451
Since P value is less than 0.05 (95% Confidence interval), hence reject the null hypotheis
(mean 1= mean 2) which depicts mean 1 is not equal to mean 2.

226
Table A.26 t-Test: Two-Sample Assuming Equal Variances 5minutes (b/w 90:10 & 75:25 (coal: sludge)).
90:10 coal: sludge 75: 25 coal: sludge
Mean 21.552861 18.010692
Variance 24.283505 20.626922
Observations 3 3
Pooled Variance 22.455213 Hypothesized Mean Difference 0 df 4 t Stat 0.9154957 P(T<=t) one-tail 0.2058647 t Critical one-tail 2.1318468 P(T<=t) two-tail 0.4117293
t Critical two-tail 2.7764451 Since P value is greater than 0.05 (95% CI) hence can’t reject the null hypothesis which is
mean 1 = mean 2. This depicts these two variables are not statiscally different
Table A.27 t-Test: Two-Sample Assuming Equal Variances 5minutes (b/w 75:25 & 50:50 (coal: sludge)).
75: 25 coal: sludge 50: 50 coal: sludge Mean 18.010692 14.071068 Variance 20.626922 1.0115076 Observations 3 3 Pooled Variance 10.819215 Hypothesized Mean Difference 0 df 4 t Stat 1.4669069 P(T<=t) one-tail 0.1081481 t Critical one-tail 2.1318468 P(T<=t) two-tail 0.2162962 t Critical two-tail 2.7764451
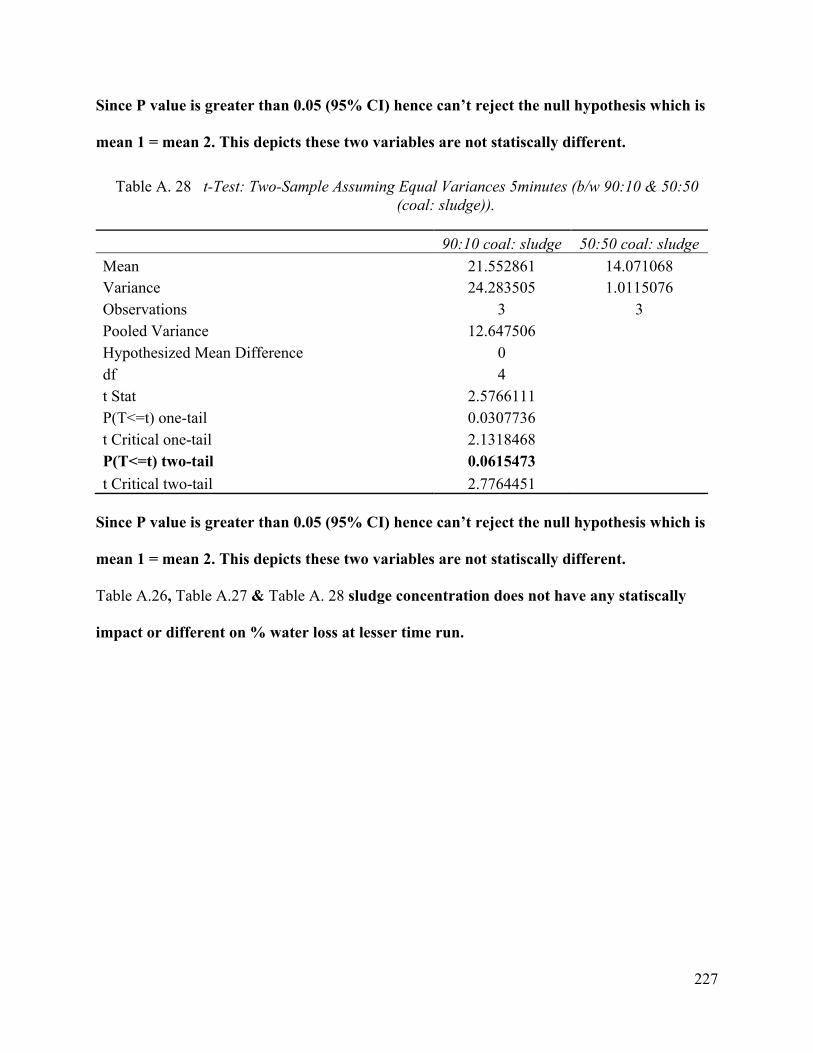
227
Since P value is greater than 0.05 (95% CI) hence can’t reject the null hypothesis which is
mean 1 = mean 2. This depicts these two variables are not statiscally different.
Table A. 28 t-Test: Two-Sample Assuming Equal Variances 5minutes (b/w 90:10 & 50:50 (coal: sludge)).
90:10 coal: sludge 50:50 coal: sludge Mean 21.552861 14.071068 Variance 24.283505 1.0115076 Observations 3 3 Pooled Variance 12.647506 Hypothesized Mean Difference 0 df 4 t Stat 2.5766111 P(T<=t) one-tail 0.0307736 t Critical one-tail 2.1318468 P(T<=t) two-tail 0.0615473 t Critical two-tail 2.7764451
Since P value is greater than 0.05 (95% CI) hence can’t reject the null hypothesis which is
mean 1 = mean 2. This depicts these two variables are not statiscally different.
Table A.26, Table A.27 & Table A. 28 sludge concentration does not have any statiscally
impact or different on % water loss at lesser time run.

228
Table A.29 t-Test: Two-Sample Assuming Equal Variances 15minutes (b/w 90:10 & 75:25 (coal: sludge).
90:10 coal: sludge 75:25 coal: sludge Mean 35.23025263 29.754839 Variance 7.100322273 10.694125 Observations 3 3 Pooled Variance 8.897223726 Hypothesized Mean Difference 0 df 4 t Stat 2.248202 P(T<=t) one-tail 0.043909953 t Critical one-tail 2.131846786 P(T<=t) two-tail 0.087819906 t Critical two-tail 2.776445105
Since P value is greater than 0.05 (95% CI) hence can’t reject the null hypothesis which is
mean 1 = mean 2. This depicts these two variables are not statiscally different.
Table A.30 t-Test: Two-Sample Assuming Equal Variances 15minutes (b/w 75:25 & 50:50 (coal: sludge)).
75:25 coal: sludge 50:50 coal: sludge Mean 29.754839 25.129601 Variance 10.694125 2.1969415 Observations 3 3 Pooled Variance 6.4455334 Hypothesized Mean Difference 0 df 4 t Stat 2.2312604 P(T<=t) one-tail 0.0447428 t Critical one-tail 2.1318468 P(T<=t) two-tail 0.0894856 t Critical two-tail 2.7764451
Since P value is greater than 0.05 (95% CI) hence can’t reject the null hypothesis which is
mean 1 = mean 2. This depicts these two variables are not statiscally different.

229
Table A.31 t-Test: Two-Sample Assuming Equal Variances 15minutes (b/w 90:10 & 50:50 (coal: sludge)).
75:25coal: sludge 50:50 coal: sludge
Mean 29.754839 25.129601
Variance 10.694125 2.1969415
Observations 3 3
Pooled Variance 6.4455334
Hypothesized Mean Difference 0
df 4
t Stat 2.2312604
P(T<=t) one-tail 0.0447428
t Critical one-tail 2.1318468
P(T<=t) two-tail 0.0894856
t Critical two-tail 2.7764451 Since P value is greater than 0.05 (95% CI) hence can’t reject the null hypothesis which is
mean 1 = mean 2. This depicts these two variables are not statiscally different.
Table A.32 t-Test: Two-Sample Assuming Equal Variances 25minutes (b/w 90:10 & 75:25 (coal: sludge)).
90:10 coal: sludge 75:25 coal: sludge Mean 49.320261 39.943683 Variance 7.465603 20.237477 Observations 3 3 Pooled Variance 13.85154 Hypothesized Mean Difference 0 df 4 t Stat 3.0856093 P(T<=t) one-tail 0.0183653 t Critical one-tail 2.1318468 P(T<=t) two-tail 0.0367307 t Critical two-tail 2.7764451

230
Since P value is less than 0.05 (95% CI) hence can reject the null hypothesis which depicts
mean 1 is not equal to mean 2. This depicts these two variables are statiscally different.
Table A.33 t-Test: Two-Sample Assuming Equal Variances 25minutes (b/w 75:25 & 50:50 (coal: sludge)).
75:25 coal: sludge 50:50 coal: sludge
Mean 39.943683 35.212059
Variance 20.237477 22.325787
Observations 3 3
Pooled Variance 21.281632
Hypothesized Mean Difference 0
df 4
t Stat 1.2561846
P(T<=t) one-tail 0.1387064
t Critical one-tail 2.1318468
P(T<=t) two-tail 0.2774127
t Critical two-tail 2.7764451 Since P value is greater than 0.05 (95% CI) hence can’t reject the null hypothesis which is
mean 1 = mean 2. This depicts these two variables are not statiscally different.

231
Table A.34 t-Test: Two-Sample Assuming Equal Variances 15minutes (b/w 90:10 & 50:50 (coal: sludge))./
90:10 coal: sludge 50:50 coal: sludge Mean 49.320261 35.2121 Variance 7.465603 22.3258 Observations 3 3 Pooled Variance 14.895695 Hypothesized Mean Difference 0 df 4 t Stat 4.4769981 P(T<=t) one-tail 0.0055076 t Critical one-tail 2.1318468 P(T<=t) two-tail 0.0110152 t Critical two-tail 2.7764451
Since P value is less than 0.05 (95% CI) hence can reject the null hypothesis which depicts
mean 1 is not equal to mean 2. This depicts these two variables are statiscally different.
Table A.35 Conclusion table Table A.26 - Table A.34.
Time, coal : sludge 5 minutes 90:10 vs 75:25
P value greater than 0.05 (95% CI) hence can't reject the null hypothesis which is mean 1 = mean 2
5 minutes 75:25 vs 50:50 P value greater than 0.05, can't reject the null hypothesis 5 minutes 90:10 vs 50:50
P value greater than 0.05, hence can't reject the null hypothesis of equal mean
15 minutes 90:10 vs 75:25 P value greater than 0.05, can't reject the null hypothesis 15 minutes 75:25 vs 50:50 Greater than 0.05, hence can't reject the null hypothesis of equal mean 15 minutes 90:10 vs 50:50 Less than 0.05, hence reject the null hypothesis of equal mean 25 minutes 90:10 vs 75:25 P value less than 0.05, so reject the null hypothesis 25 minutes 75:25 vs 50:50 Greater than 0.05, hence can't reject the null hypothesis of equal mean 25 minutes 90:10 vs 50:50 P value less than 0.05, so reject the null hypothesis

232
Based on the information in Table A.35, which depicts that at smaller run time there is not
statiscally any difference in the % water loss with increase in sludge concentration with coal
but at longer run, they are statistically different and coa;: sludge blend concentration has
impact on % water loss.
A.5 Statistical Analysis of Diatomaceous Earth & Polylactic acid (PLA) biocomposites
Table A.36 t-Test: Two-Sample Assuming Equal Variances Ultimate Stess (b/w 100% PLA & 95% PLA/5% D.E.).
100 % PLA 95% PLA/5% D.E.
Mean 56.1432 44.4618 Variance 13.0826162 5.7953092 Observations 5 5 Pooled Variance 9.4389627 Hypothesized Mean Difference 0 df 8 t Stat 6.011775648 P(T<=t) one-tail 0.00015959 t Critical one-tail 1.859548038 P(T<=t) two-tail 0.00031918 t Critical two-tail 2.306004135
Since P value is less than 0.05 (95% CI) hence can reject the null hypothesis which depicts
mean 1 is not equal to mean 2. This depicts these two variables are statiscally different.

233
Table A.37 t-Test: Two-Sample Assuming Equal Variances Ultimate Stess (b/w 95% PLA/5% D.E. & 90% PLA/10% D.E.).
95% PLA/5% D.E. 90% PLA/5% D.E. Mean 44.4618 42.0482 Variance 5.7953092 2.4354397 Observations 5 5 Pooled Variance 4.11537445 Hypothesized Mean Difference 0 df 8 t Stat 1.88118117 P(T<=t) one-tail 0.048364812 t Critical one-tail 1.859548038 P(T<=t) two-tail 0.096729623 t Critical two-tail 2.306004135
Since P value is greater than 0.05 (95% CI) hence can’t reject the null hypothesis which is
mean 1 = mean 2. This depicts these two variables are not statiscally different.
Table A.38 t-Test: Two-Sample Assuming Equal Variances Ultimate Stess (b/w 90% PLA/10% D.E. & 85% PLA/15% D.E.).
90% PLA/5% D.E. 85% PLA/5% D.E. Mean 42.0482 19.9585 Variance 2.4354397 36.898633 Observations 5 4 Pooled Variance 17.20537969 Hypothesized Mean Difference 0 df 7 t Stat 7.938737289 P(T<=t) one-tail 4.78659E-05 t Critical one-tail 1.894578605 P(T<=t) two-tail 9.57318E-05 t Critical two-tail 2.364624252
Based on information from Table A.36 - Table A.38, it depicts that changing the concentration
of PLA from 100 % to 90 shows the change statiscally but further change to 90 % does not

234
show any statistically difference but further change in concentration shows the change.
Ultimate stress at 90 and 95 % PLA are statiscally same byt different from 100 % PLA.
Table A.39 t-Test: Two-Sample Assuming Equal Variances Modulus (b/w 100% PLA & 95% PLA/5% D.E.).
100 % PLA 95% PLA/5% D.E. Mean 2250.7642 2158.5292 Variance 66534.49558 113142.038 Observations 5 5 Pooled Variance 89838.26681 Hypothesized Mean Difference 0 df 8 t Stat 0.486558511 P(T<=t) one-tail 0.319810195 t Critical one-tail 1.859548038 P(T<=t) two-tail 0.639620391 t Critical two-tail 2.306004135
Since P value is greater than 0.05 (95% CI) hence can’t reject the null hypothesis which is
mean 1 = mean 2. This depicts these two variables are not statiscally different.
Table A.40 t-Test: Two-Sample Assuming Equal Variances Modulus (b/w 100% LA & 90% PLA/10% D.E.).
90% PLA/5% D.E. 100 % PLA Mean 2162.1334 2250.7642 Variance 68326.75045 66534.49558 Observations 5 5 Pooled Variance 67430.62302 Hypothesized Mean Difference 0 df 8 t Stat -0.53966728 P(T<=t) one-tail 0.302059275 t Critical one-tail 1.859548038 P(T<=t) two-tail 0.60411855 t Critical two-tail 2.306004135

235
Since P value is greater than 0.05 (95% CI) hence can’t reject the null hypothesis which is
mean 1 = mean 2. This depicts these two variables are not statiscally different.
Table A.41 t-Test: Two-Sample Assuming Equal Variances Modulua (b/w 100% PLA & 85% PLA/15% D.E.).
100 % PLA 85% PLA/5% D.E. Mean 2250.7642 2358.38425 Variance 66534.49558 765358.2136 Observations 5 4 Pooled Variance 366030.3747 Hypothesized Mean Difference 0 df 7 t Stat -0.265172431 P(T<=t) one-tail 0.399257911 t Critical one-tail 1.894578605 P(T<=t) two-tail 0.798515822 t Critical two-tail 2.364624252
Since P value is greater than 0.05 (95% CI) hence can’t reject the null hypothesis which is
mean 1 = mean 2. This depicts these two variables are not statiscally different.

236
Table A.42 t-Test: Two-Sample Assuming Equal Variances Modulus (b/w 90% PLA/10% D.E. & 95% PLA/5%).
90% PLA/10% D.E. 95% PLA/5%D.E.
Mean 2162.1334 2158.5292
Variance 68326.75 113142.038
Observations 5 5
Pooled Variance 90734.394 Hypothesized Mean Difference 0 df 8 t Stat 0.0189188 P(T<=t) one-tail 0.4926846 t Critical one-tail 1.859548 P(T<=t) two-tail 0.9853692 t Critical two-tail 2.3060041
Since P value is greater than 0.05 (95% CI) hence can’t reject the null hypothesis which is
mean 1 = mean 2. This depicts these two variables are not statiscally different.
Table A.43 t-Test: Two-Sample Assuming Equal Variances Modulus (b/w 90% PLA/10% D.E. & 85% PLA/15% D.E.).
90% PL/10%D.E. 85% PLA/15% D.E. Mean 2162.1334 2358.38425 Variance 68326.75045 765358.2136 Observations 5 4 Pooled Variance 367054.5204 Hypothesized Mean Difference 0 df 7 t Stat -0.482880871 P(T<=t) one-tail 0.321958015 t Critical one-tail 1.894578605 P(T<=t) two-tail 0.64391603 t Critical two-tail 2.364624252

237
Since P value is greater than 0.05 (95% CI) hence can’t reject the null hypothesis which is
mean 1 = mean 2. This depicts these two variables are not statiscally different.
Based on the information in Table A.39 - Table A.43, modulus does not seem to be statiscally
different and does not depend on the concentration of PLA and diatoms blend.
Table A.44 Anova Single factor : Stress.
Groups Count Sum Average Variance 100% PLA 5 280.716 56.1432 13.0826 95% PLA/5% D.E. 5 222.309 44.4618 5.79531 90% PLA/10% D.E. 5 210.241 42.0482 2.43544 85% PLA/15% D.E. 4 79.834 19.9585 36.8986 ANOVA Source of Variation SS df MS F P-value F crit Between Groups 2972.51 3 990.837 75.849 2.71213E-09 3.28738 Within Groups 195.949 15 13.0633 Total 3168.46 18
Since P value is less than 0.05 (95% CI) hence can reject the null hypothesis which depicts
mean 1 is not equal to mean 2. This depicts these two variables are statiscally different

238
Table A.45 Anova Single factor: Modulus.
Groups Count Sum Average Variance 100% PLA 5 11253.82 2250.7642 66534.496 95% PLA/5% D.E. 5 10792.65 2158.5292 113142.04 90% PLA/10% D.E. 5 10810.67 2162.1334 68326.75 85% PLA/15% D.E. 4 9433.537 2358.3843 765358.21
ANOVA Source of Variation SS df MS F P-value F crit Between Groups 116324 3 38774.787 0.1768876 0.91039 3.28738 Within Groups 3288088 15 219205.85 Total 3404412 18
Since P value is greater than 0.05 (95% CI) hence can’t reject the null hypothesis which is
mean 1 = mean 2. This depicts these two variables are not statiscally different.