
etd.pdf - NC State Repository
159
ABSTRACT NOGHABAEI, MOJTABA. Visual and Behavioral Data Analytics in Immersive Virtual Environments for Enhancing Construction Safety, Planning, and Control. (Under the direction of Dr. Kevin Han). With recent advances in Building Information Modeling (BIM), Virtual Reality (VR) and Augmented Reality (AR) technologies have many synergistic opportunities for the Architecture, Engineering, and Construction (AEC) industry. Moreover, a combination of VR technologies with biometric sensors or motion trackers enables new ways to improve construction safety, planning and controls. The overall objective of this study is to improve construction safety, planning, and control by leveraging the emerging VR and AR technologies. The first aim of this study is about leveraging VR technologies to understand workers' cognitive behaviors in the presence of construction hazards. The second aim leverages VR and AR technologies in remote inspection and improve human interactions in immersive virtual environments through advances in computer vision and motion tracking technologies. Additionally, the output of this research can be used to potentially reduce rework and effectively assist practitioners in utilizing VR technology for virtual assembly and inspection applications. This thesis concludes with discussion on future applications in construction that can branch out to two future studies.
-
Upload
khangminh22 -
Category
Documents
-
view
0 -
download
0
Transcript of etd.pdf - NC State Repository

ABSTRACT
NOGHABAEI, MOJTABA. Visual and Behavioral Data Analytics in Immersive Virtual
Environments for Enhancing Construction Safety, Planning, and Control. (Under the direction of
Dr. Kevin Han).
With recent advances in Building Information Modeling (BIM), Virtual Reality (VR) and
Augmented Reality (AR) technologies have many synergistic opportunities for the Architecture,
Engineering, and Construction (AEC) industry. Moreover, a combination of VR technologies
with biometric sensors or motion trackers enables new ways to improve construction safety,
planning and controls. The overall objective of this study is to improve construction safety,
planning, and control by leveraging the emerging VR and AR technologies. The first aim of this
study is about leveraging VR technologies to understand workers' cognitive behaviors in the
presence of construction hazards. The second aim leverages VR and AR technologies in remote
inspection and improve human interactions in immersive virtual environments through advances
in computer vision and motion tracking technologies. Additionally, the output of this research
can be used to potentially reduce rework and effectively assist practitioners in utilizing VR
technology for virtual assembly and inspection applications. This thesis concludes with
discussion on future applications in construction that can branch out to two future studies.

© Copyright 2021 by Mojtaba Noghabaei
All Rights Reserved

Visual and Behavioral Data Analytics in Immersive Virtual Environments for Enhancing
Construction Safety, Planning, and Control
by
Mojtaba Noghabaei
A dissertation submitted to the Graduate Faculty of
North Carolina State University
in partial fulfillment of the
requirements for the degree of
Doctor of Philosophy
Civil Engineering
Raleigh, North Carolina
2021
APPROVED BY:
_______________________________ _______________________________
Kevin Han Edward Jaselskis
Committee Chair
_______________________________ _______________________________
Alex Albert Benjamin Watson

ii
DEDICATION
Dedicated to my family for all their support in my life.

iii
BIOGRAPHY
Mojtaba Noghabaei is a doctoral candidate in the Department of Civil, Construction, and
Environmental Engineering at North Carolina State University. He received a master’s degree in
Civil Engineering from NC State University with an emphasis on Computing and Systems, and a
bachelor’s degree in Civil Engineering from University of Tehran, Tehran, Iran.
His research examines the issues related to construction safety, planning, and control, and
developing computer vision and AI-based solutions to support the building of the next generation
of safe and smart infrastructure. His research has been published in various journals including
the ASCE Journal of Construction Engineering and Management and Elsevier’s Automation in
Construction.

iv
ACKNOWLEDGMENTS
This Dissertation would not have been possible without the immense help and support from my
advisor Dr. Kevin Han. It was Dr. Han who introduced me to the world of computer vision. He
was a great mentor and my most trusted advisor. I am sincerely grateful to him for his support
throughout my graduate study at NC State. I deeply appreciate his efforts in guiding me and
preparing me for my future career. I could not have asked for better advisor who is so invested in
the success of his students as Dr. Han is.
I would like to thank Dr. Edward Jaselskis for his guidance. He has been a role model to me and
has provided me with his advice whenever I needed one. I would also like to thank Dr. Benjamin
Watson for being in my committee and providing valuable suggestions and feedback about my
work. Last but not least, I would like to thank Dr. Albert for all his support and guidance in my
journey and teaching me to be persistent.
In addition, I am also thankful to Dr. William Rasdorf and Mr. Roberto Nunez for providing me
with an excellent opportunity to work with them and teaching me the value of discipline and
dedication to one's work. I am grateful to Renee Howard, Jodie Gregoritsch, and Barbara
Simerson for their devotion, help, and efforts.
I am thankful to my parents Mr. MohammadReza Noghabaei and Mrs. Hajisoltani for their
unconditional love, sacrifice, and patience. I cannot thank them enough for the selfless sacrifices
they have made to give me a comfortable life and quality education. I am thankful to my brother
Ali for his support and inspiring me to strive for greater heights. I also thank my grandparents for
their selfless love and prayers.
My time at NC State would not have been as enjoyable as it was without my research mates and
friends, Yajie Liu, Rachel Son, Doyun Lee, Matt Ball, Khashayar Asadi, and Idris Jeelani.

v
Lastly, I would like to thank my friends Sajjad, and Amin have been a big part of my life. I am
grateful to them for always being there for me and sharing the most beautiful moments of my
life.

vi
TABLE OF CONTENTS
LIST OF TABLES ......................................................................................................................... ix
LIST OF FIGURES .........................................................................................................................x
CHAPTER 1: Introduction ..............................................................................................................1
1.1. Observed Problem ............................................................................................................ 1
1.2. Research Goals and Method Overview ............................................................................ 3
1.3. Dissertation Format .......................................................................................................... 4
CHAPTER 2: Feasibility Study to Identify Brain Activity and Eye-tracking Features for
Assessing Hazard Recognition Using Consumer-grade Wearables in an
Immersive Virtual Environment ................................................................................5
2.1. Abstract ............................................................................................................................ 5
2.2. Introduction ...................................................................................................................... 6
2.3. Background ...................................................................................................................... 9
VR in Hazard Recognition .................................................................................................... 12
EEG Sensors in Hazard Recognition .................................................................................... 12
Eye-Tracking for Identifying Visual Search Pattern in Hazard Recognition ....................... 13
2.4. Method ........................................................................................................................... 14
Hazard Simulation in VR ...................................................................................................... 14
Data Preprocessing................................................................................................................ 16
Feature Extraction and Selection .......................................................................................... 19
Data Synchronization ............................................................................................................ 23
Prediction Model ................................................................................................................... 23
2.5. Experimental Setup ........................................................................................................ 25
Subjects and Data Acquisition Process ................................................................................. 25
Device Calibration ................................................................................................................ 26
2.6. Experimental Results...................................................................................................... 27
Implications of Results Compared to Findings from Literature ........................................... 31
2.7. Discussion and Future Works ........................................................................................ 33
2.8. Conclusion ...................................................................................................................... 34
CHAPTER 3: Virtual Manipulation in Immersive Environments: Hand Motion Tracking
Technology and Snap-to-fit Function ......................................................................36
3.1. Abstract .......................................................................................................................... 36
3.2. Introduction .................................................................................................................... 37
3.3. Background .................................................................................................................... 41
3.4. Comparison of State-of-the-art VM Technologies......................................................... 46

vii
VM Hardware ....................................................................................................................... 46
Case Study ............................................................................................................................ 47
Findings................................................................................................................................. 48
3.5. Snap-to-fit Function ....................................................................................................... 50
Method .................................................................................................................................. 51
Experimental Setup ............................................................................................................... 55
Experimental Results ............................................................................................................ 58
3.6. Discussion and Future Works ........................................................................................ 62
3.7. Conclusion ...................................................................................................................... 63
CHAPTER 4: Automated Compatibility Checking of Prefabricated Components Using 3D
As-built Models and BIM ........................................................................................65
4.1. Abstract .......................................................................................................................... 65
4.2. Introduction .................................................................................................................... 66
4.3. Background .................................................................................................................... 68
Module Position Checking .................................................................................................... 71
Module Dimension Checking ............................................................................................... 71
Module Defect Checking ...................................................................................................... 71
Gaps in Knowledge and Study Contributions ....................................................................... 72
4.4. Method ........................................................................................................................... 73
Data Collection ..................................................................................................................... 74
Data Registration .................................................................................................................. 74
Noise Quantification, Cancellation, and Occlusion Mapping .............................................. 75
Compatibility Analysis ......................................................................................................... 77
4.5. Experimental Setup and Results ..................................................................................... 79
Data Collection ..................................................................................................................... 80
Data Registration .................................................................................................................. 81
Noise Quantification, Cancellation, and Occlusion Mapping .............................................. 82
Compatibility Analysis ......................................................................................................... 82
4.6. Discussion and Future Works ........................................................................................ 86
4.7. Conclusion ...................................................................................................................... 87
CHAPTER 5: Performance Monitoring of Modular Construction through a Virtually
Connected Project Site and Offsite Manufacturing Facilities .................................89
5.1. Abstract .......................................................................................................................... 89
5.2. Introduction .................................................................................................................... 90
5.3. System ............................................................................................................................ 90

viii
Point Cloud Generation......................................................................................................... 91
Camera Transformations ....................................................................................................... 92
Unity Framework .................................................................................................................. 92
Point Cloud Specifications .................................................................................................... 95
Compatibility Check ............................................................................................................. 96
Challenges and Limitations................................................................................................... 99
5.4. Conclusion .................................................................................................................... 100
CHAPTER 6: Conclusion and Future Works ..............................................................................101
6.1. Conclusion .................................................................................................................... 101
6.2. Future Research ............................................................................................................ 103
REFERENCES ............................................................................................................................105
APPENDIX ...............................................................................................................................137
8.1 APPENDIX I ................................................................................................................ 138
Data Reliability ................................................................................................................... 138
EEG Data Preprocessing ..................................................................................................... 140
Data Synchronization .......................................................................................................... 142
8.2 Synchronization Results ............................................................................................... 144

ix
LIST OF TABLES
Table 2-1. Overview of the related research ..................................................................................11
Table 2-2. Hazards list in the simulated virtual environment ........................................................15
Table 2-3. EEG signals extracted features .....................................................................................20
Table 2-4. Eye-tracking extracted features ....................................................................................22
Table 2-5. Selected feature from sequential forward feature selection in four scenarios ..............31
Table 3-1. An overview of the commercial AR/VR haptic and tracker technologies ...................44
Table 3-2. A summary of AR/VR technologies state of the art applications ................................45
Table 3-3. Comparison of manipulation systems ..........................................................................50
Table 3-4. Features for snap-to-fit function ...................................................................................54
Table 3-5. Vertex count of the objects in BIM and scan ...............................................................57
Table 3-6. Time performance of the snap-to-fit function for various segments counts and
objects in seconds. .......................................................................................................59
Table 3-7. Snap-to-fit function accuracy for various segment counts and objects. .......................59
Table 3-8. Time performance of the snap-to-fit function for object C for different occlusion
and BIM details with 10*10*10 segment count in seconds .........................................60
Table 3-9. Snap-to-fit function accuracy for object C for different occlusion and BIM details
with 10*10*10 segment count .....................................................................................60
Table 3-10. Snap-to-fit function accuracy for object C for various simplification levels of
BIM and scan for 10*10*10 segment count ................................................................61
Table 4-1 Summary of using laser scanner for construction applications. ....................................70
Table 4-2. Point count and face count of the point clouds in scan and BIM .................................81
Table 4-3. Registration error for each marker set on each model in millimeter. ...........................82
Table 4-4. Model noise specifications after artifact removal (before noise removal) ...................82
Table 4-5. Compatibility feature values for each element set and time performance. ..................85
Table 4-6. Scenarios that compatibility analysis was tested on. ....................................................85
Table 5-1. Point clouds specifications ...........................................................................................96

x
LIST OF FIGURES
Figure 1.1. Research summary ........................................................................................................ 4
Figure 2.1. Channel locations corresponding hazard recognition according to literature .............. 8
Figure 2.2. Method overview ........................................................................................................ 14
Figure 2.3. 3D simulated environment; (A) first-person view of the 3D simulated
environment; (B) hazard number five; (C) simulated site .......................................... 16
Figure 2.4. Data collection process; (A) HMD with eye tracker; (B) participant is wearing an
EEG sensor and HMD to identify hazards
(adopted from Noghabaei and Han 2020, © ASCE). ................................................. 17
Figure 2.5. Data annotation using fixed window approach .......................................................... 19
Figure 2.6. Greedy feature selection schematic ............................................................................ 23
Figure 2.7. Frequency of the number of participants in 24 studies that used Emotiv EEG
sensor Vs. the number of participants in this Study.................................................... 25
Figure 2.8. Classification accuracies for different algorithms and time intervals ........................ 28
Figure 2.9. ROC curve for different classification algorithms ..................................................... 29
Figure 2.10. Confusion matrix for Gaussian SVM for one-second interval ................................. 30
Figure 2.11. Feature selection; (A) sequential forward feature selection with eye-tracking
features; (B) sequential forward feature selection with EEG features; (C) sequential
forward feature selection with all EEG and eye-tracking features; (D) sequential
forward feature selection with selected features from part a and b. ........................... 30
Figure 2.12. Features selected from sequential forward feature selection vs. channels
correspond to hazard recognition according to the literature review. ......................... 32
Figure 2.13. The main future directions of this research .............................................................. 34
Figure 3.1. A taxonomy of AR/VR technologies by their I/O ...................................................... 42
Figure 3.2. Noitom Hi5 details; (A) Sensor placement on the finger; (B) Glove placement
over the hand; (C) HTC trackers mounted on the glove ............................................. 46
Figure 3.3. Leap Motion overview; (A) Leap Motion hardware; (B) Connecting Leap
Motion to HTC Vive ................................................................................................... 47
Figure 3.4. Camera placement on the Oculus Quest HMD. ......................................................... 47

xi
Figure 3.5. Objects for manipulation scenarios based on the relative size; (A) Screwdriver;
(B) Claw hammer; (C) Crowbar; (D) Power drill. ...................................................... 48
Figure 3.6. Defined gestures for grabbing the objects .................................................................. 48
Figure 3.7. Snap-to-fit function overview..................................................................................... 51
Figure 3.8. Segmentation process for BIM and scan models ....................................................... 52
Figure 3.9. Segmentation process for BIM and scan models ....................................................... 52
Figure 3.10. Snap-to-fit function pseudocode............................................................................... 55
Figure 3.11. Scanning objects process; (A) Artec Eva scanning a pipe on a rotary table;
(B) Artec Leo scanning a part on a rotary table; (C) Artec Leo overview ................. 56
Figure 3.12. Scan vs. BIM model of the used objects .................................................................. 56
Figure 3.13. Segmenting object C for different occlusions level ................................................. 57
Figure 3.14. Resizing scanned mesh using Fast Quadric Mesh Simplification with different
level of simplification [157], [158] ............................................................................. 58
Figure 3.15. Simulation of manipulation in VR. .......................................................................... 61
Figure 3.16. Simulation of manipulation in VR for virtually bringing and testing the parts
before the actual shipment of the parts. ...................................................................... 63
Figure 4.1 Shipping cycle between the manufacturing plant and project site .............................. 68
Figure 4.2 Method overview and steps ......................................................................................... 73
Figure 4.3. Flowchart of the compatibility analysis ..................................................................... 74
Figure 4.4. Generated point clouds with different levels of Gaussian noise for a sample pipe .... 75
Figure 4.5. Extraction of noise distribution based on scanned point cloud to BIM registration. . 76
Figure 4.6. Visualizing the features selected for compatibility analysis. ..................................... 78
Figure 4.7. Sample case studies for compatibility analysis .......................................................... 79
Figure 4.8. Scan vs. BIM/CAD model of the used objects ........................................................... 80
Figure 4.9. Scanning setup with Faro laser scanner ...................................................................... 80
Figure 4.10. Point cloud cross section for C1 ............................................................................... 83
Figure 4.11. Compatibility cross section for objects C1 and C2 .................................................. 83

xii
Figure 4.12. Cross section of each coupling system in each direction ......................................... 84
Figure 4.13. 2D occlusion map for object C1 in y direction......................................................... 84
Figure 4.14. Sample of complex mechanical systems .................................................................. 87
Figure 5.1. Framework overview .................................................................................................. 91
Figure 5.2. Interface sections ........................................................................................................ 94
Figure 5.3. Examples of image rendering ..................................................................................... 95
Figure 5.4. Examples of the point clouds generated using Pix4D pipeline .................................. 95
Figure 5.5. Procedure to switch into compatibility mode ............................................................. 96
Figure 5.6. Compatibility mode options ....................................................................................... 97
Figure 5.7. Module selection in compatibility mode .................................................................... 98
Figure 5.8. Visual inspection of an offsite module ....................................................................... 98
Figure 5.9. Fine-tuning the position of the off-site module for enhanced inspection ................... 99
Figure 8.1. Noise cancellation applied to 30 s of EEG data for all EEG channels
(A) raw signals; (B) filtered signals; (C) EEG channel locations. ............................ 141
Figure 8.2. Synchronization using messages and event markers ................................................ 143
Figure 8.3. Synchronization accuracy; (A) EEG and eye-tracking before synchronization;
(B) regression of eye-tracking and EEG by fixing first and last events; (C)
synchronization error histogram. .............................................................................. 145

1
1 CHAPTER 1: Introduction
1.1. Observed Problem
Over the past decade, the AEC industry has found a wide range of BIM applications [1]–[5].
Global reports in 2018 indicate that BIM is utilized heavily by AEC companies, and within one
year, more than 90% of the entire industry will completely utilize BIM in their projects [6]. In
this thesis, BIM is defined as the process of generating and involving a digital representation of a
building or construction and their characteristics. BIM is not just the production of 3D models
[7]. Therefore, it can be used for different functions, such as improving communication,
decision-making enhancement, and visualization. Furthermore, BIM can accelerate information
integration from design to construction [8]. BIM technology has improved and revolutionized the
way designers, engineers, and managers think about the buildings and enables them to predict
and solve problems that might occur during the life-cycle of a building. BIM technology has
enabled designers and engineers to detect clashes and simulate different construction scenarios
for more efficient decision making. It revolutionized the AEC industry in many different aspects,
such as technical aspects, knowledge management, standardization, and diversity management
[9].
However, BIM still has some inherent shortcomings. For instance, BIM does not provide robust
visualization for cluttered construction sites and the existing software packages provide limited
user experience (i.e., lack of interactive visualization using a keyboard and mouse) [10].
Moreover, investigations have shown that BIM has some limitations in real-time on-site
communication [11], [12]. Additionally, the stakeholders who are not familiar with BIM
solutions are not able to utilize its capabilities, such as improved communication through
visualization and immersion.

2
To address some of the inherent deficiencies of BIM and open a new technological advancement
for the AEC industry, researchers proposed the use of new technologies, such as Augmented
Reality (AR), Virtual Reality (VR), and reality capture. In this thesis, AR is referred to as a
physical environment, whose elements are augmented with and supported by virtual input, and
VR is referred to a simulated virtual environment, representing a physical environment.
Accordingly, Immersive Virtual Environments (IVEs) are VR/AR environments where user
interaction is supported within a virtual environment. AR/VR technologies can potentially
address these deficiencies and enhance BIM in several aspects, such as real-time on-site
communication [11]. AR/VR can also improve communication among stakeholders and provide
better visualization for engineers, designers, and other stakeholders, enabling one-to-one fully
immersive experience [13]. Furthermore, IVEs have the necessary potentials to achieve
knowledge synthesis to improve the design process [14]. Lastly, AR/VR have shown many
potentials for improving safety in construction [15], [16]. Many industries implemented AR/VR
in a successful way. For example, AR/VR has applications in manufacturing [17], [18], retail
[19], [20], mining [21], [22], education [23]–[25] and healthcare, especially for simulating
surgeries [26]–[28]. Recent studies indicate the benefits of AR/VR in the AEC industry by
demonstrating potential applications, such as safety training [15], [29], visualization [30], [31],
communication [10], and energy management [32]. Although research suggests AR/VR
technologies can be very effective, the AEC industry has been very slow in adopting these
technologies [33], [34].
Beside IVEs, reality capture technologies (i.e., laser scanner and unmanned aerial vehicles
(UAV)) can also improve how BIM is used as they provide information about the state of the
construction [35], [36]. UAV and lidar point clouds can capture the as-built state of the

3
construction [37] and help project managers and inspectors to remotely measure project metrics
and perform remote inspection [36], [38].
1.2. Research Goals and Method Overview
The overall goal of this research is to leverage the emerging AR/VR technologies to improve
construction safety, planning, and project controls. As such, the first sub-goal is to investigate
how biometric sensors and VR can be used for understanding cognitive behavior of construction
workers. This first study can lead to effective safety management and improving safety training
programs, which ultimately benefits the construction industry by reducing construction injuries.
The second sub-goal is to investigate the use of AR/VR and motion trackers for improved user
interaction in IVE for inspection and virtual assembly applications. The goal of this study is to
inspect scanned elements that have been built offsite in a VR environment. This technology will
have construction applications, such as development of training programs (e.g., visually guided
assembly that a user can follow in a virtual space) and inspection.
The last sub-goal is to inspect scanned elements that are manufactured in the offsite facility and
check its compatibility to the modules in the construction site remotely. This sub-goal completes
the previous sub-goal by checking the compatibility between two as-built models versus the past
study which was comparing the as-built model and as-planned model of the same component.
To achieve these goals, the research is divided into three chapters as illustrated by Figure 1.1.
Lastly, chapter 5 discusses the practical implications of this research and chapter 6 concludes this
thesis with future research directions.

4
Figure 1.1. Research summary
1.3. Dissertation Format
This dissertation is organized by sub-goals. Each chapter discusses each sub-goal and consists of
its own abstract, motivation and background, theoretical and practical contributions, research
methods, and, conclusions. Chapters 2, 3, and 4 of this dissertation presents the current research
that is conducted and published as journal papers. Chapter 5 introduces construction performance
modeling and simulation, which shows how this research helps construction industry in practice.
Ultimately, chapter 6 introduces future research directions.
5
2 CHAPTER 2: Feasibility Study to Identify Brain Activity and Eye-
tracking Features for Assessing Hazard Recognition Using Consumer-
grade Wearables in an Immersive Virtual Environment
2.1. Abstract
Hazard recognition is vital to achieving effective safety management. Unmanaged or
unrecognized hazards in construction sites can lead to unexpected accidents. Recent research has
identified cognitive failures among workers as being a principal factor associated with poor
hazard recognition levels. Therefore, understanding cognitive correlates of when individuals
recognize hazards versus when they fail to recognize hazards will be useful to combat the issue
of poor hazard recognition. Such efforts are now possible with recent advances in
electroencephalograph (EEG) and eye-tracking technologies. This chapter presents a feasibility
study that combines EEG and an eye-tracking together in an immersive virtual environment
(IVE) to predict when safety hazards will be successfully recognized during hazard recognition
efforts using machine learning techniques. Workers wear a Virtual Reality (VR) head-mounted
device (HMD) that is equipped with an eye-tracking sensor. Together with an EEG sensor, brain
activities and eye movement of the worker are recorded as they navigate in a simulated virtual
construction site and recognize safety hazards. Through an experiment and a feature extraction
and selection process, 13 best features out of 306 features from EEG and eye-tracking were
selected to train a machine learning model. The results show that EEG and eye-tracking together
can be leveraged to predict when individuals will recognize safety hazards. The developed IVE
can be potentially used to identify hazard types that are correlated with higher arousal and
valence, and evaluate the correlation between arousal, valence, and hazard recognition.

6
2.2. Introduction
Research studies indicate that low levels of hazard recognition and management in the
construction industry contributes to poor safety performance [39]. For example, efforts have
demonstrated that more than 57% of construction hazards can potentially remain unrecognized
by workers [21], [40], [41]. Therefore, various efforts have advocated the adoption of proper
safety training programs [42], [43] to enhance construction hazard recognition skill among
workers. Researchers have also suggested leveraging different technologies such as Virtual
Reality (VR) [44], brain-sensing [45], and eye-tracking [46]) to identify cognitive and
physiological behaviors of workers during hazard recognition tasks.
Furthermore, studies have illustrated that utilizing eye-tracking and VR technologies in
personalized safety training programs can significantly improve hazard recognition skills of
workers as eye-tracking provides important insights about workers’ visual search patterns and
VR provides higher spatial perception compared to traditional 2D videos [39]. Most eye-tracking
studies examined if there was a relationship between hazard recognition performance and the
search patterns that workers demonstrate during hazard recognition efforts [47]. However, the
use of eye-tracking in isolation provides limited insight into the mental processes associated with
effective hazard recognition, which can be addressed by brain-sensing (i.e., EEG).
EEG sensors can collect brainwave signals during visual hazard recognition tasks, allowing the
classification and identification of brain activities that are associated with superior hazard
recognition levels. This classification can help trainers provide more accurate and personalized
feedback to workers, which ultimately will lead to better safety performance [45]. Also,
researchers identified that workers experience emotional changes while they are working in a
hazardous environment [45]. These findings demonstrate that combining eye-tracking

7
technology with brain-sensing can potentially be used to predict the hazard recognition
performance of workers.
This chapter presents a feasibility study that combines a VR head-mounted device (HMD) with
an embedded eye-tracker and a consumer-grade EEG sensor (its reliability is discussed in II.
Background) for predicting workers’ ability to recognize safety hazards (e.g., whether or not a
worker detected hazards). Workers will wear this HMD and EEG sensor while performing a
hazard recognition task in an immersive virtual construction site. This platform allows
synchronous analyses of brain activity and eye movement of workers in an immersive virtual
environment (IVE). The recorded data from the eye-tracker and EEG sensor is analyzed and
classified using a machine learning technique that recognizes the pattern of brain activities and
eye movement. Through a greedy feature selection process, 13 out of 306 features of EEG and
eye-tracking were found to be the best features that can be used for the prediction of hazard
recognition. The findings of this feasibility study can lead to future safety training programs and
future research directions as will be discussed in the article. The main contributions of this
chapter are as follows:
1) Development of a framework that combines VR HMD, eye-tracking, and brainwaves
(EEG): To the authors’ best of knowledge, this study is the first attempt to combine eye-
tracking, EEG, and VR HMD (see Table 2-1).
2) Comprehensive literature review: This chapter summarizes 30 recent papers from 2012 to
2020 on the use of EEG, eye-tracking, VR HMD, and a combination of these
technologies (see Table 2-1) in addition to 20 papers that are reviewed and summarized
in the Background section.

8
3) Identification of best features (EEG & eye-tracking), that can be used to predicting
workers’ ability recognize hazard (e.g., whether or not a worker detected hazards)
through a greedy feature selection: The number of extracted features from EEG and eye-
tracking is large and long recording time can lead to very large datasets to be processed
for any machine learning methods. Therefore, 13 essential features were selected from
306 features through a greedy feature selection process without compensating for
accuracy.
4) Validation against neuroscience literature to ensure that the research findings are in
alignment with existing literature: According to literature, occipital lobe channels (e.g.,
O1 and O2) are correlated with a sense of danger [48]–[50]. Also, other channels, such as
FC5 and AF3, are correlated with visual perception [48]–[50]. Figure 2.1 shows these
areas of the brain by dashed lines (channels outside dashed lines area are not directly
corresponding to hazard detection). The research results agree with these findings from
the literature.
Figure 2.1. Channel locations corresponding hazard recognition according to literature

9
2.3. Background
This section focuses on studies of enabling technologies (EEG, eye-tracking, and VR HMD) for
the proposed work. Table 2-1 summarizes the area of the work, limitations, and enabling
technologies used. As can be seen in Table 2-1, this chapter is the first attempt to use a fusion of
EEG, eye-tracking, and VR HMD for safety improvement purposes. Table 2-1 shows 29 articles
from journals with high impact factors in the related field (13 from IEEE journals). 22 of them
used consumer-grade EEG devices (21 using the same EEG sensor in this chapter).
Studies have demonstrated the practicality of using consumer EEG devices in domains, such as
brain-computer interaction (BCI) and assessment of workload and human behavior [51]–[54].
For example, many studies focused on the analysis of steady-state visually evoked potentials
(SSVEP) and event-related potentials (ERP) [55]. SSVEP is a resonance phenomenon that can be
observed in the occipital and parietal lobes of the brain when a subject looks at a light source
flickering at a constant frequency. ERP is the brain response that is the direct result of a specific
sensory, cognitive, or motor event [53], [56], [57]. Accordingly, researchers have suggested the
examination of EEG signals can offer profound insights into human behavior [58]–[60]. These
classifications can be used to analyze brain activity during a physical task [61] and improving
BCI [62], [63]. Apart from such examinations, to broaden the analysis level of EEG signals,
researchers have proposed fusing EEG and eye-trackers [64]. Such studies have analyzed eye-
movement and brainwave patterns of subjects for assessing cognitive load during driving [65],
and assess human experience to evaluate architectural designs [66]. Also, a combination of EEG
and VR has been proposed the researchers to design detailed experiments [67]–[69].
Recent advancements in EEG analysis [70]–[72] and eye-tracking [73] have created new insights
for the construction industry and more specifically safety. To the authors’ best of knowledge, this

10
study is the first attempt to combine eye-tracking, EEG, and VR HMD in the same framework in
the construction domain. This study is the first study that combines all these technologies to
provide profound insights for construction safety.

11
Table 2-1. Overview of the related research
# Summary Limitations and
Recommendations
EEG
Device Key Features
EEG Eye-
tracker AR/VR Safety
[51] Analyzed the SSVEP responses
recorded with EEG in games
80% accuracy
achieved in controlling the game
Emotiv ✔
[52] 90% accuracy for controlling video
games using EEG - Emotiv ✔
[53] Developed SSVEP based BCI with
95% accuracy - Emotiv ✔
[61] Used EEG to analyze human's
behavior during physical activity
EEG can be used in outdoor
environments
Emotiv ✔
[74]
Studied how to learn the sensitivity
of neurometric application fidelity
to EEG data
- Emotiv ✔
[56] Classified P300 with 90% accuracy - Emotiv ✔
[58]
An approach to classifying
olfactory stimulus from the EEG
response
- Emotiv ✔
[54] Memory workload assessment - Emotiv ✔
[62] Control robotic arm with EEG - Emotiv ✔
[63] Improved BCI calibration - Emotiv ✔
[55]
The latency and peak amplitude of
N200 and P300 components were
found similar between consumer-level EEG and advanced EEG
devices
Consumer-level
EEG promoted to be accurate
Emotiv ✔
[59] Emotion recognition using EEG
and deep learning - Emotiv ✔
[60] EEG optimal feature selection - Emotiv ✔
[64] Measured the effect of color
priming using EEG - Emotiv ✔ ✔
[75] Combined EEG and eye-tracker for
safety research - BioSemi ✔ ✔ ✔
[69] Combined EEG and VR to classify
physical modality - Emotiv ✔ ✔
[76] Suggested using VR and EEG
together VR can act as a real
environment - ✔ ✔
[77] Improved cognition using an EEG
training in Unity3D
Combining VR and
EEG provides deeper experimental
insights
Emotiv ✔ ✔
[78] Suggested using VR and EEG for
art applications
BCI can be successfully used
with AR/VR
- ✔ ✔
[70] Suggested that SSVEP in 2D screen
acts similar to AR AR is suggested for SSVEP experiments
- ✔ ✔
[71] Used EEG for improving safety - Emotiv ✔ ✔
[72] Brainwave can be used to assess
mental workload
Suggested to monitor workers
physical activities
Emotiv ✔ ✔
[79] EEG sensors were used to monitor
construction workers' perceived risk EEG can be used in construction sites
Emotiv ✔ ✔
[21] automated and scale personalized
training using eye-tracker
VR can be
combined with eye-tracking
- ✔ ✔
[80] Evaluated of VR based training for
the mining industry - - ✔ ✔
This
chapter
Combining EEG, VR, and eye-
tracking for automated
personalized feedback generation
in construction safety training
- Emotiv ✔ ✔ ✔ ✔
12
VR in Hazard Recognition
Researchers have developed safety training platforms using VR to offer personalized feedback to
participants for improving safety training outcomes [81]. The outcomes indicate that safety
training programs that utilize VR technology provide high fidelity simulations for the workers. In
general, VR can present better spatial perception than conventional visualization methods such
as 2D screens [82]. Consequently, VR technology can help in improving the quality of training
[12], [83].
More particularly, researchers have presented a pilot study that utilizes VR that can enhance the
safety and occupational health of mining workers [84]. In this study, safety experts trained the
workers and tested different motion tracking systems, HMD, joysticks, and training scenarios.
The results illustrated that VR technology could be an effective platform for safety training and a
substitute for on-site training. By substituting VR training for on-site training, unnecessary
exposure of trainees to mining environment risks and dangers can be prevented. Also,
researchers have developed a VR training system for the mining industry and demonstrated that
increasing immersion using hand motion trackers could enhance the training systems [21].
Pedram et al. (2017) assessed the VR safety training systems and illustrated that these systems
have a significant positive learning experience. In addition, researchers in the field of
construction proposed the idea of fusing EEG and VR technologies to assess humans' behavior in
virtually-designed areas [66], [85]. Overall, research suggests that VR can be used as one of the
useful tools for improving current safety training programs.
EEG Sensors in Hazard Recognition
In addition to VR, many researchers focused on using EEG sensors and neurological sensors to
enhance construction safety using mental and physical workload assessment. Construction

13
researchers have often questioned the feasibility of adopting EEG sensors on construction sites
since EEG sensor devices are susceptible, and small movements can generate artifacts in the
obtained data [72]. To solve this problem, Jebelli et al. (2018) demonstrated that it is feasible to
use an EEG device on a construction site to monitor workers’ valance and arousal. Also,
researchers used EEG sensors for measuring construction workers' emotional state during
construction tasks [45]. Chen et al. (2016) developed a wearable EEG monitoring helmet and
illustrated that mental workload could be used as an essential indicator of workers' vulnerability
to hazards in a construction site. EEG sensors have the potentials to be used in construction;
however, due to the hardship of data collection and artifact removal process, this technology is
not fully utilized yet.
Eye-Tracking for Identifying Visual Search Pattern in Hazard Recognition
Visual search processes are prevalent in workplaces. For instance, law enforcement agents scan
traveler’s luggage at airport checkpoints [87], or a bridge supervisor evaluates channel
components to identify structural shortcomings [88]. To effectively analyze visual search
patterns, investigators have started utilizing eye-tracking technology that can monitor eye
movements during visual search processes. Eye-tracking technology was used to evaluate the
visual search patterns of construction workers during risk identification undertakings [89].
Comprehension of these links can be valuable in the determination of visual search shortcomings
connected with ineffective hazard identification performance. Furthermore, this knowledge can
be employed in the examination of the efficiency of strategic measures to enhance visual search
arrangements and construction risk recognition.

14
2.4. Method
The main objective of the presented method is to capture the patterns of workers’ brainwaves
and eye movement during hazard recognition task and classify whether or not a worker detect
hazards in a virtual platform. An eye-tracking enabled HMD and an EEG sensor are used to
collect eye movement and brain activity. This platform simulates a virtual construction site
where participants are asked to identify hazards. The participants press a button as they identify a
hazard. Meanwhile, eye movements and brain waves are collected. The platform uses the button
press as a trigger for synchronizing signals and to determine whether a participant was able to
detect a hazard or not. The research methods illustrated in Figure 2.2 and the structure of this
section follows the steps in the figure.
Figure 2.2. Method overview
Hazard Simulation in VR
The initial stage of the current study is to imitate a construction site in a VR environment using a
3D engine, Unity 3D that is widely used in the architectural, engineering, and construction
(AEC) industry for VR simulations [90] and also educational materials and neuroscientific
applications [69]. Ten hazards as shown in Table 2-2 are simulated in a virtual construction
environment. These hazards are responsible for roughly 80% of construction-related fatalities
[47], [91]. A detailed construction site was modeled based on real construction sites and hazards

15
were simulated to create a realistic virtual environment. Figure 2.3(A) demonstrates a first-
person view of the simulated site and Figure 2.3(B) shows a chemical hazard (Hazard 5). Lastly,
Figure 2.3(C) shows a view of the simulated area. The next step was data acquisition and
preprocessing as detailed in the following subsection.
Table 2-2. Hazards list in the simulated virtual environment
Hazard
id Hazard type Description
1 Fall hazard Unprotected object near the edge
2 Electrical
hazard Unprotected electric cables without proper conduit
3 Trip hazard Unprotected ladder
4 Fall hazard Unprotected barrel near the edge
5 Chemical
hazard
An unmarked barrel with unknown chemical fluid without
lid
6 Trip hazard Unprotected bricks on the ground
7 Electrical
hazard Unprotected junction box without proper protection
8 Chemical
hazard Unprotected igneous chemical fluids
9 Chemical
hazard
An unmarked bucket with unknown chemical fluid without
lid
10 Pressure
hazard Gas cylinder without proper restraints in the work zone

16
Figure 2.3. 3D simulated environment; (A) first-person view of the 3D simulated
environment; (B) hazard number five; (C) simulated site
Data Preprocessing
This section discusses data acquisition and preprocessing of the two sensors – brainwaves (EEG)
and eye-tracking. In the first two subsections, the process of artifact removal for the EEG signal
and the details of the eye-tracker are discussed. In the final and third subsection of this section,
EEG and eye-tracking data were labeled using triggers (when participants press the button).
EEG Data Preprocessing
EMOTIV EPOC+ [92] is used to acquire the EEG data stream. This device is a consumer-level
EEG device that is economical and accessible to the construction industry. Using a high-end
EEG device is not practical for the construction industry since it requires device manipulations
and more time to set up (i.e., putting gels on 32/64 EEG nodes in more advanced devices). The

17
reliability of this device, artifact removal procedure, and the data generated are detailed in the
Supplementary Data section of Appendix I.
Eye-tracking Data Preprocessing
To acquire eye-tracking data in VR, the HTC Vive Pro Eye VR headset is used (see Figure
2.4(A)). The reliability of this device and the data generated are detailed in the Discussion and
Future Works section. Raw eye-tracking data were acquired from a developed code within Unity
[93]. This code identifies the sighted object at each moment and records the data within the eye-
tracking data stream. This device has an accuracy of 0.5 degrees and 110 degrees trackable field
of view. This device can collect gaze origin, gaze direction, pupil position, and absolute pupil
size data with less than 10 ms of latency. It has ten infrared (IR) illuminators and an eye-tracking
sensor for each eye. Figure 2.4(B) shows a participant wearing an EEG sensor and HMD at the
same time, following the setup instructions provided by EMOTIV [94], [95]. Figure 2.4(B)
shows that the participant is pressing a button on the keyboard as he is identifying hazards.
Figure 2.4. Data collection process; (A) HMD with eye tracker; (B) participant is wearing
an EEG sensor and HMD to identify hazards (adopted from Noghabaei and Han 2020, ©
ASCE).

18
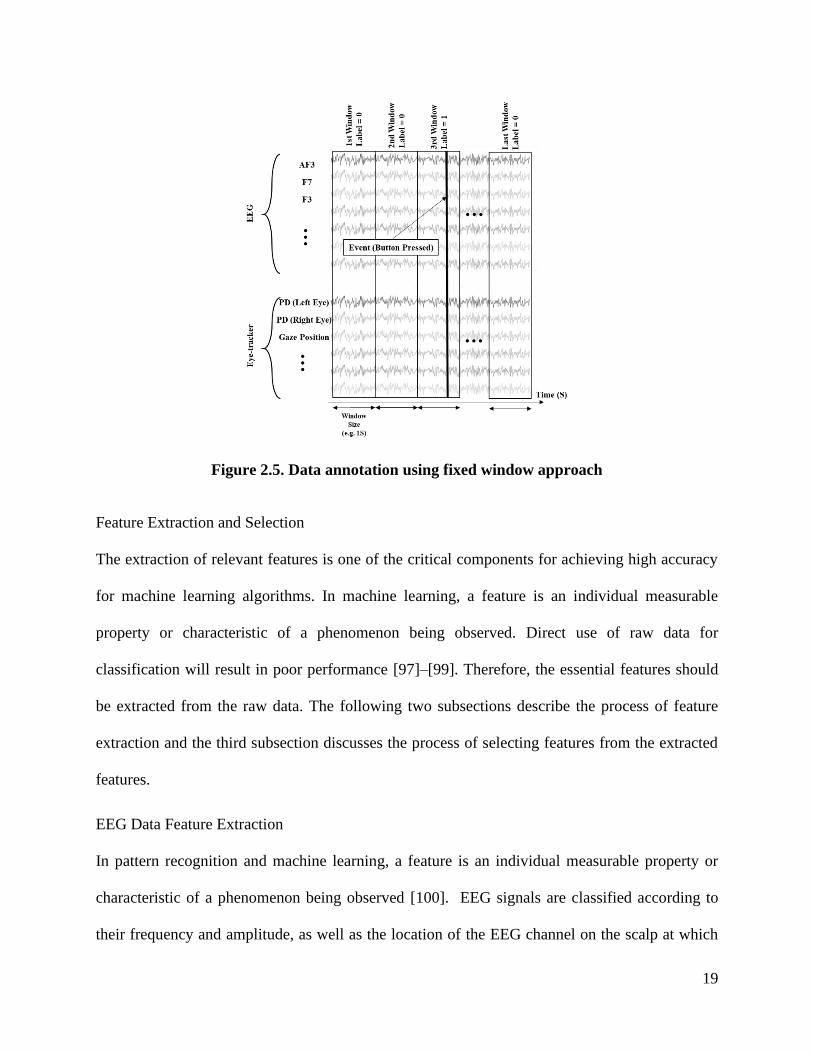
Data Labeling based on Triggers
Labeling is an essential step in training data for supervised learning. To label data, one method is
to partition the data into various windows and define a single continuous segment that spans an
entire action sequence data (i.e., fixed windowing approach). Features are then extracted
(detailed in the Feature Extraction and Selection section) from these windowed segments and
used in a machine-learning algorithm to classify a fixed-length testing segment (fixed window
size is shown in Figure 2.5). This method is commonly used for EEG signal annotation;
however, in this study, this method is applied to both eye-tracking and EEG signal streams for
data annotations. To label the data, the participants were asked to press a controller button as
they detect hazards. As soon as they pressed the button, a trigger is sent to the EEG device, and a
message is recorded in the eye-tracking data. These markers can be used for both signal
synchronization (of EEG and eye-tracking data) and data labeling. When the participants pressed
the button, the object at which the person was looking was marked in the data. If the person
detected a regular object as a hazard, the recording was not valid and was removed. However, if
the person detected the hazard correctly, the recordings were used for training. Figure 2.5
illustrates the process of labeling data in a fixed time interval (time interval or window size is a
fixed time duration that the features were extracted from the signals (Figure 2.5)).
19
Figure 2.5. Data annotation using fixed window approach
Feature Extraction and Selection
The extraction of relevant features is one of the critical components for achieving high accuracy
for machine learning algorithms. In machine learning, a feature is an individual measurable
property or characteristic of a phenomenon being observed. Direct use of raw data for
classification will result in poor performance [97]–[99]. Therefore, the essential features should
be extracted from the raw data. The following two subsections describe the process of feature
extraction and the third subsection discusses the process of selecting features from the extracted
features.
EEG Data Feature Extraction
In pattern recognition and machine learning, a feature is an individual measurable property or
characteristic of a phenomenon being observed [100]. EEG signals are classified according to
their frequency and amplitude, as well as the location of the EEG channel on the scalp at which

20
the data are recorded. EEG signal frequency refers to a repetitive rhythmic activity (in Hz). A
frequency band is an interval in the frequency domain, delimited by a lower and an upper
frequency. EEG signals can be classified in frequency ranges (Delta: 0.5–4 Hz, Theta: 4–7.5 Hz,
Alpha: 7.5–13 Hz, Low beta: 13–15 Hz, Beta: 15–20 Hz, High beta: 20–38 Hz, and Gamma: 38
and higher Hz). EEG signal bands with lower frequencies are related to more profound thoughts
(e.g., the Theta band for meditation [80]). Table 2-3 summarizes the features extracted from the
EEG data. The total number of extracted features from all channels of EEG signals is 296.
Table 2-3. EEG signals extracted features
Features Descriptions Equations
Maximum Maximum amplitude for channel j in
range of x to y 𝑀𝑎𝑥(𝐸𝐸𝐺𝑗
𝑥:𝑦)
Minimum Minimum amplitude for channel j in
range of x to y 𝑀𝑖𝑛(𝐸𝐸𝐺𝑗
𝑥:𝑦)
Mean value Average amplitude for channel j in
range of x to y
∑ 𝐸𝐸𝐺𝑗𝑖𝑦
𝑖=𝑥
𝑦 − 𝑥
Maximum of
the frequency
range
Maximum amplitude for channel j
with frequency range (delta, or ...)
within a specified period in the range
of x to y
𝑀𝑎𝑥(𝐸𝐸𝐺𝑗𝑥:𝑦
) ∀𝑓
∈ [α, β, γ, δ, θ] ∗
Minimum of
the frequency
range
Minimum amplitude for channel j with
frequency within a specified period in
the range of x to y
𝑀𝑖𝑛(𝐸𝐸𝐺𝑗𝑥:𝑦
) ∀𝑓
∈ [α, β, γ, δ, θ] ∗
Mean value of
frequency
range
Average amplitude for channel j with
frequency within a specified period in
the range of x to y
𝐴𝑣𝑔(𝐸𝐸𝐺𝑗𝑥:𝑦
) ∀𝑓
∈ [α, β, γ, δ, θ] ∗
Valence [101] Happiness level α(𝐹4)
β(𝐹4)−
α(𝐹3)
β(𝐹3)
Arousal [101] Excitement level α(𝐴𝐹3 + 𝐴𝐹4 + 𝐹3 + 𝐹4)
β(𝐴𝐹3 + 𝐴𝐹4 + 𝐹3 + 𝐹4)
* The frequency ranges of the waves: Delta: 0.5–4 Hz, Theta: 4–7.5 Hz, Alpha: 7.5–13 Hz, Low
beta: 13–15 Hz, Beta: 15–20 Hz, High beta: 20–38 Hz, and Gamma: 38 and higher Hz.
Eye-tracking Data Feature Extraction
When an individual participates in any visual search activity, two primary behavior is observed.
These two behaviors are known as saccades and fixations [73], [79], [102]. According to

21
literature, fixations are the positions where the pupil is stationary. These stationary positions
show the focusing attention or visual processing on a specific object, location, or stimulus in the
environment [102]. The rapid movements of the pupil between each two fixation points are
known as a saccade. During saccades, minimal data can be absorbed by individuals.
Since hazard recognition is a visual search activity, and it requires attention, it is expected that
saccades and fixations can be used as essential features for data classification purposes. To
extract features from eye-tracking data, the authors extracted the following features (based on
previous studies on eye-tracking for hazard recognition [73]) from raw eye-tracking data. Table
2-4 shows formulas for computing these features.
Fixation Count (FC): Hazard recognition task requires high levels of attention. When an
individual detects a hazard, many fixations should have happened before reporting the detection.
The number of these fixations within a period can be used as a feature. This feature is called FC.
Fixation Time (FT): FT relates to the attention level of an individual as it shows the total time
spent on a fixation point (e.g., a particular location, object, or stimulus).
Mean Fixation Duration (MFD): Average of fixation duration is one of the essential factors.
This factor is one of the most important factors among any visual search task [103]. A higher
level of mean fixation duration is associated with higher mental activity [103].
Saccade Velocity (SV): SV is correlated to low arousal and engagement level during a visual
search activity and this factor is also associated with fatigue level and lethargy [104].
Pupil Diameter (PD): pupillary response is a physiological response that changes the pupil size
with the oculomotor cranial nerve [105]. Studies illustrated that the pupil size of the eyes varies
based on the interest level of visual stimuli [106].

22
Table 2-4. Eye-tracking extracted features
Features Equations
FC 𝑁𝑢𝑚𝑏𝑒𝑟 𝑜𝑓 𝑓𝑖𝑥𝑎𝑡𝑖𝑜𝑛𝑠
FT ∑(𝐸(𝑓𝑖) − 𝑆(𝑓𝑖))
𝑛
𝑖=1
MFD 𝐹𝑇
𝐹𝐶
SV 𝐴𝑣𝑒𝑟𝑎𝑔𝑒 𝑛𝑢𝑚𝑏𝑒𝑟 𝑜𝑓 𝑝𝑖𝑥𝑒𝑙𝑠
𝑀𝑜𝑣𝑒𝑚𝑒𝑛𝑡 𝑡𝑖𝑚𝑒
PD N/A
Feature Selection
In this study, the high frequency of collected data from EEG (128 Hz) and eye-tracker (120 Hz)
and the high number of features per data point is generated from the raw data. There are 248 data
points (128 for EEG and 120 for eye-tracker) per second. A recording of the collected data per
person for a 30-minute training session will generate 446,400 data points for 306 features (296
for EEG + 10 for eye-tracking), each data point including 306 feature data. As more data from
more sessions with more people can lead to very large data, leading to expensive computation.
Therefore, a reduction in the input dimension is very important.
Moreover, the accuracy of the classification algorithms might be negatively affected without
feature selection [107]. Redundant attributes can mislead the classification algorithms by
introducing noise in the data [108]. The proposed method is a greedy forward selection for subset
selection (Figure 2.6). In this approach, a subset with fixed cardinality is extracted from the
feature set. After that, all other remaining features are added to each subset and are evaluated
separately. Finally, the feature with the best evaluation function is selected and added to the
subset with fixed cardinality. The greedy forward selection allows identifying the best feature at
each step. Therefore, it will provide valuable information about which features are more
important than the others. In this study, the accuracy of a nonlinear model was used as an
evaluation function since it was faster than other evaluation functions (i.e., mean square error). In
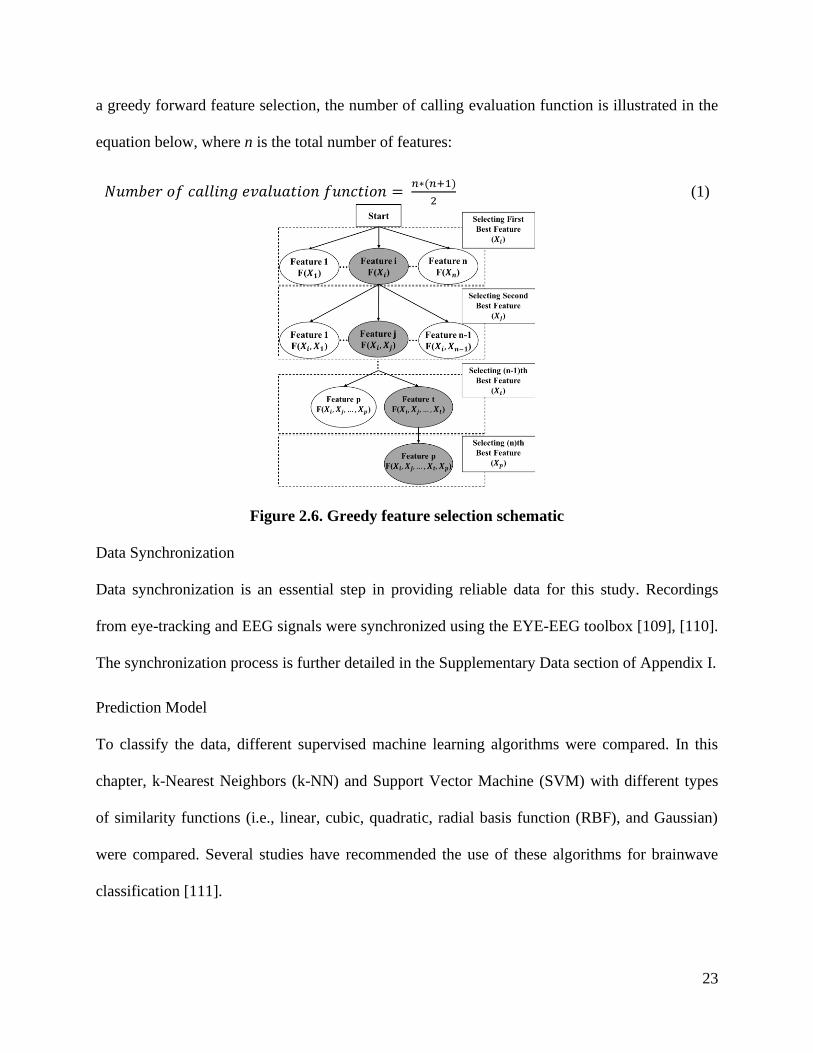
23
a greedy forward feature selection, the number of calling evaluation function is illustrated in the
equation below, where n is the total number of features:
𝑁𝑢𝑚𝑏𝑒𝑟 𝑜𝑓 𝑐𝑎𝑙𝑙𝑖𝑛𝑔 𝑒𝑣𝑎𝑙𝑢𝑎𝑡𝑖𝑜𝑛 𝑓𝑢𝑛𝑐𝑡𝑖𝑜𝑛 = 𝑛∗(𝑛+1)
2 (1)
Figure 2.6. Greedy feature selection schematic
Data Synchronization
Data synchronization is an essential step in providing reliable data for this study. Recordings
from eye-tracking and EEG signals were synchronized using the EYE-EEG toolbox [109], [110].
The synchronization process is further detailed in the Supplementary Data section of Appendix I.
Prediction Model
To classify the data, different supervised machine learning algorithms were compared. In this
chapter, k-Nearest Neighbors (k-NN) and Support Vector Machine (SVM) with different types
of similarity functions (i.e., linear, cubic, quadratic, radial basis function (RBF), and Gaussian)
were compared. Several studies have recommended the use of these algorithms for brainwave
classification [111].

24
k-NN is a memory-based algorithm, which utilizes the entire database for prediction based on a
similarity measure in the instance space [112]. Memory-based algorithms find a set of nearby
data points in the instance space with similar features, known as neighbors. To predict the label
of a new data point, a group of nearby neighbors referred to as the neighborhood is formed. k-
NN is based on the assumption that the nearby data points in the instance space have the same
class.
On the other hand, SVM is widely used in supervised machine learning and data mining [113].
SVM has been introduced as an appropriate classifier for neurological data class actions [114].
SVM creates hyperplanes that separate data points of a binary classification problem. SVM
applies an iterative learning process to converge into an optimal hyperplane that maximizes the
margin between data points of two classes. Besides, in machine learning (especially SVM),
kernel methods are commonly utilized [115]. Kernel methods are a class of algorithms for
pattern analysis. Kernel methods mean transforming data into another dimension that has a clear
dividing margin between classes of data. In this study, Gaussian and RBF kernels were tested as
they are well known for yielding more accurate classification, compared to other kernels.
In addition to k-NN and SVM, the authors tested the data with other classification methods, such
as Gaussian Discriminant Analysis (GDA), Hidden Markov Models (HMM), decision tree, and
logistic regression [116]–[119]. However, the preliminary results of the classification were
discouraging, therefore, not reported here. Lastly, 5-fold cross-validation was performed to
validate attained classification accuracies. In this study, the input of the machine learning
algorithms are the extracted features from eye-tracking and EEG data, and the output is whether
the hazard was detected by participants in the selected time window or not.

25
2.5. Experimental Setup
Subjects and Data Acquisition Process
According to studies examining EEG data, reliable inferences can be made in EEG experiments
with 10 to 20 participants [120]. Accordingly, 24 studies that similarly used the Emotiv EEG
sensor had an average of 14.2 participants as shown in Figure 2.7. The data in the current study
were collected from 30 participants. According to the two-sigma rule, the number of participants
in this study is more than 95% of similar studies.
Figure 2.7. Frequency of the number of participants in 24 studies that used Emotiv EEG
sensor Vs. the number of participants in this Study
To ensure that the participants are familiar with construction hazard recognition, a very brief
introduction to safety in construction was given to the participants. The introduction contained
information about what is considered a hazard. There was no history of mental disorder or any
eye-related problem in the participants. EEG and eye-tracking signals were obtained from the
participants. Each participant in this experiment had ten trials with a one-minute rest between
each trial, which is a standard protocol in brain-sensing experiments. To reduce errors related to
the sequence effect (also known as learning effect) [72], hazard locations are changed in each

26
trial. In this experiment, the learning effect means the affected brain signals due to previous trials
in the experiment. Also, each trial was limited to 30 seconds to make sure that the participants
are focusing on hazard recognition task during the experiment. Limiting experiment time to 30
seconds guarantees high synchronization accuracy. Also, the objective of this experiment was
not to make sure that the participants detect all of the hazards. In fact, the experiment was
designed in a way that participants focus on critical hazards rather than all the hazards to
properly capture the brain and pupillary responses of the subjects.
The participants were asked to attend the experimental session with washed and dried hair. They
were asked not to use any hair products (i.e., wax, gel, conditioner, and hair spray) as wet hair
and hair treatments will generate higher impedances. Before each experiment, all electrodes were
cleaned using a cloth. After cleaning, the electrode gel/conductive paste was applied to the
electrodes. Then, the HMD is placed on top of the EEG device. Before starting the experiment,
all experimental details (i.e., how to press keys, how to perform device calibration, and the
number of trials) were discussed with the participants. Figure 2.4(B) shows a participant
experimenting in a VR environment.
Device Calibration
Before performing the experiment, the eye-tracking device is calibrated by asking the
participants to look at the red dots in the VR simulation. The performed calibration method is
known as 5-point calibration and performed as instructed by the manufacturer of the eye-tracker
device [121]. Then, EEG calibration was performed as instructed by the manufacturer of the
EEG device.

27
2.6. Experimental Results
All features were extracted from preprocessed data with different window sizes, as discussed in
Figure 2.5. The extracted data directly used in classification algorithms and the accuracies are
reported. 5-fold cross-validation was performed, and the results of the selected algorithms were
compared. The classification accuracy for each algorithm is the true-positive rate plus the true-
negative rate. The summation of these two numbers from a confusion matrix provides the
classification accuracy for each algorithm. Figure 2.8 shows that the best window size for
achieving the highest accuracy is one second. Therefore, one second is selected for further data
analyses in this section. Since the accuracies of the selected algorithms are close to each other
(90% - 93%), further investigations are necessary to select the best algorithm. This finding fits
with previous research studies that identified the humans detect hazards as fast as 390 to 600 ms
after they see the hazard [122], [123]. To compare these algorithms (k-nearest neighbors (KNN),
gaussian support vector machine (SVM), and radial basis function (RBF) SVM), receiver
operating characteristic (ROC) charts for each algorithm has been drawn. Figure 2.9 shows the
ROC curve for the selected algorithms.
28
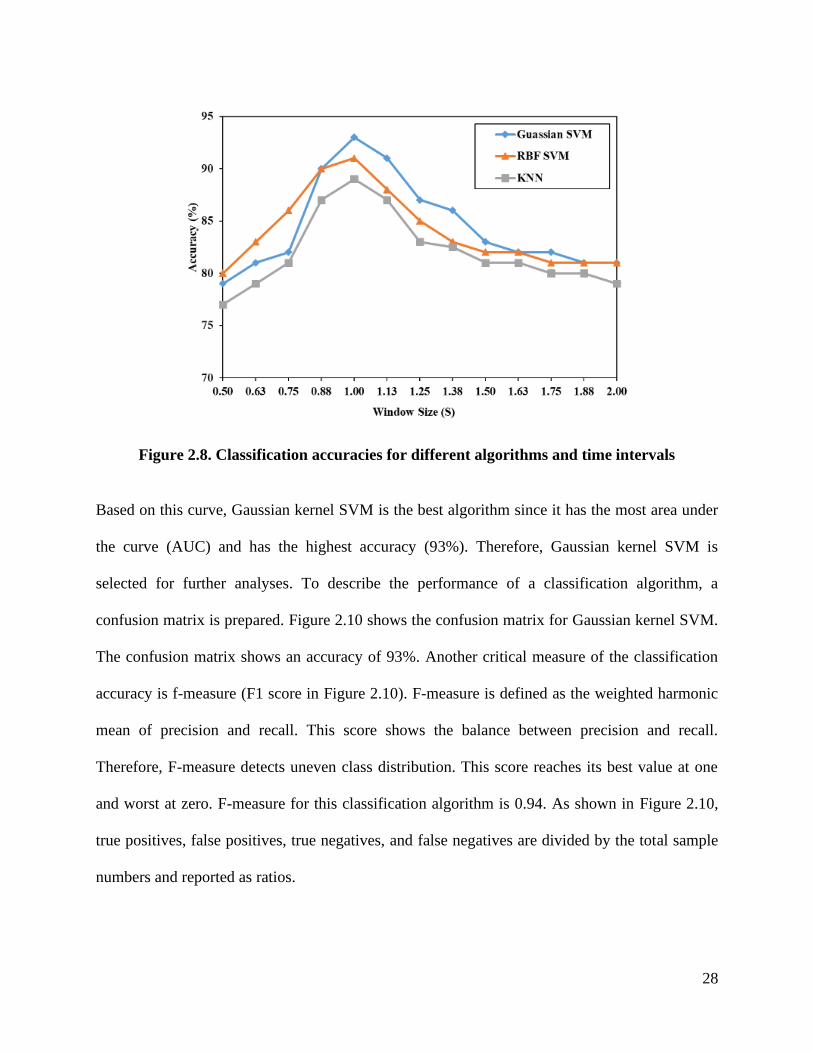
Figure 2.8. Classification accuracies for different algorithms and time intervals
Based on this curve, Gaussian kernel SVM is the best algorithm since it has the most area under
the curve (AUC) and has the highest accuracy (93%). Therefore, Gaussian kernel SVM is
selected for further analyses. To describe the performance of a classification algorithm, a
confusion matrix is prepared. Figure 2.10 shows the confusion matrix for Gaussian kernel SVM.
The confusion matrix shows an accuracy of 93%. Another critical measure of the classification
accuracy is f-measure (F1 score in Figure 2.10). F-measure is defined as the weighted harmonic
mean of precision and recall. This score shows the balance between precision and recall.
Therefore, F-measure detects uneven class distribution. This score reaches its best value at one
and worst at zero. F-measure for this classification algorithm is 0.94. As shown in Figure 2.10,
true positives, false positives, true negatives, and false negatives are divided by the total sample
numbers and reported as ratios.

29
Figure 2.9. ROC curve for different classification algorithms
To find the most important features based on the collected data, greedy sequential feature
selection is performed (discussed in Feature Selection section). The data is divided into four
groups of features: 1) eye-tracking; 2) EEG; 3) selection from the first two groups; and 4) both
EEG and eye-tracker. Then greedy feature selection was performed on all four groups.
Figure 2.11(A) shows the accuracy of the best features that were selected by greedy feature
selection for the first group (eye-tracking). This graph shows that it is possible to achieve 74%
accuracy in classification by using eye-tracking data only. According to this graph, the accuracy
reached a plateau after the first five features (second column of Table 2-5). Therefore, these five
features were selected from eye-tracking to be combined with the selected EEG features. Figure
2.11(B) shows the accuracy of 14 best features from EEG features. These 14 (second column of
Table 2-5) features reached about 82% accuracy while the overall accuracy reached a plateau of
around 83%. Figure 2.11(C) shows the sequential forward feature selection with five eye-
tracking and 14 EEG features (fourth column of Table 2-5) that were selected from the first two
groups.
Figure 2.11(D) shows the accuracy of the combination of best features from all EEG and eye-
tracking features. The accuracy of the combined features from EEG and eye-tracking plateaued

30
at around 93%, as shown in Figure 2.11(D). Figure 2.11(D) also shows an accuracy of 93% with
13 best features (last column of Table 2-5). These 13 best features can be used to reason about
participants' ability to recognize hazards as further discussed in the following section.
Figure 2.10. Confusion matrix for Gaussian SVM for one-second interval
Figure 2.11. Feature selection; (A) sequential forward feature selection with eye-tracking
features; (B) sequential forward feature selection with EEG features; (C) sequential
forward feature selection with all EEG and eye-tracking features; (D) sequential forward
feature selection with selected features from part a and b.
Hazard
Identified
Hazard Not
Identified
Hazard
Identified0.343 0.052
Hazard Not
Identified0.016 0.589
Accuracy
= 0.932
F1 Score =
0.941
Predicted
Condition
Precision
= 0.868
Recall = 0.956
True Condition

31
Table 2-5. Selected feature from sequential forward feature selection in four scenarios
Feature
No. Eye-tracking EEG Selected EEG and Eye-tracking EEG and Eye-tracking
1 FT average Max of FC5 channel in gamma
band FT average FT average
2 PD average for right
eye Min of AF3 channel PD average for right eye
Max of FC5 channel in gamma
band
s3 PD average for left eye Max of P8 channel PD average for left eye Min of F4 channel in delta band
4 PD max for right eye Max of AF3 channel Min of F8 channel in gamma
band PD average for right eye
5 PD max for left eye Max of F4 channel in delta
band
Min of O2 channel in theta
band Max of AF3 channel in delta band
6
Min of P7 channel PD max for left eye Max of T7 channel in alpha band
7 Max of FC5 channel in delta
band
Max of F4 channel in delta
band PD average for left eye
8 Max of T8 channel in gamma
band PD average for right eye Min of F4 channel in gamma band
9 Max of P7 channel in gamma
band Min of P7 channel Min of O2 channel
10 Min of O2 channel in theta
band
Max of FC5 channel in gamma
band Min of O1 channel in alpha band
11 Min of F8 channel in gamma
band Min of AF3 channel Min of F7 channel
12 Min of F4 channel in gamma
band
Max of FC5 channel in delta
band Max of FC5 channel in delta band
13 Max of F7 channel in theta
band
Min of O1 channel in alpha
band Min of P7 in high beta band
14 Min of O1 channel in alpha
band
Min of F4 channel in gamma
band
15
Max of AF3 channel
16 Max of T8 channel in gamma
band
17 Max of F7 channel in theta
band
18 Max of P7 channel in gamma
band
Implications of Results Compared to Findings from Literature
The findings of this research contribute to the safety literature and have important implications
for theory and practice. For instance, the results show that from the 13 best features, three
features from eye-tracking (PD and FT) and ten from EEG signal bands can be effectively used
to predict if safety hazards are recognized or not by workers.
The results show the average classification accuracy of 93% for visual hazard recognition. This
finding shows that using EEG and eye-tracking signals together are more sophisticated predictors
Eye-tracking Features EEG Features from AF3, FC5, O1, and O2 EEG Features

32
of whether someone is aware of the surrounding hazards, compared to the accuracies achieved
by EEG (83%) or eye-tracking (74%), independently. Therefore, while previous research efforts
have only used eye-tracking to assess hazard recognition, the current study demonstrates that the
integration of EEG along with eye-tracking offers additional information to analyze the hazard
recognition behavior of workers.
Moreover, the results show that brain activity in the occipital lobe is correlated with visual
hazard recognition. Accordingly, literature [48]–[50] shows that occipital lobe channels (e.g.,
O1 and O2) activities are correlated with a sense of danger. Moreover, other channels, such as
FC5 and AF3, are correlated with visual perception tasks according to neuroscience literature
[48]–[50]. Five out of the ten best EEG features were from these four channels (O1, O2, FC5,
and AF3). Figure 2.12 shows these features that were also part of the 13 best features in red and
yellow. The circles with dashed lines are the areas that are related to hazard perception according
to literature. These results demonstrate that the activation of certain channels during hazard
recognition efforts is indicative of hazard detection.
Figure 2.12. Features selected from sequential forward feature selection vs. channels
correspond to hazard recognition according to the literature review.

33
2.7. Discussion and Future Works
The findings of this research show the feasibility of using EEG and eye-tracking together for
detecting workers’ ability to recognize hazards, which can be potentially integrated into safety
training programs. To be used in practice, there are a number of research questions that need to
be addressed. For instance, human behaviors (i.e., lack of concentration and selective attention)
can affect hazard recognition. Developing training interventions that are mindful of these aspects
may potentially improve both workers' hazard recognition skills and safety performance.
Moreover, studying how brainwave and eye movement patterns are different between highly
skilled workers and workers with less experience needs to be also addressed before this study
can be used in practice. This comparison can provide essential insights into the way that skilled
workers perceive danger and provide important insights for safety researchers to create more
advanced safety training. Mainly, the future direction of this research can be split into three main
sections (Figure 2.13). The first direction is to check the correlation of arousal and valence that
are extracted from EEG signals to hazard recognition. This analysis can clarify what emotions
can be predictive of successful hazard recognition. Therefore, designing safety training programs
that intensify these emotions can potentially improve the outcome of these programs. Second,
identifying the hazard types and the corresponding emotions can similarly help to detect what
hazard types can generate intense emotions in the workers. For example, fall hazards might
produce a sense of fear in the worker which can ultimately reduce the vulnerability of these
hazards as they are more often identified. Lastly, analyzing how EEG cognitive load is correlated
with hazard recognition can provide important insights into the performance of each worker. For
example, the worker with a lower cognitive load might be more vulnerable to hazards compared
to a worker with a higher cognitive load.

34
Figure 2.13. The main future directions of this research
Finally, this study is a step toward automating personalized feedback generation using brainwave
and eye movement patterns, which can improve safety performance [81]. In practice, most
training sessions are held by an instructor who is not able to provide personalized feedback to
many workers. The presented approach in this chapter can be extended to automating prior work
on personalized safety training that provides personalized feedback to workers as part of a
training program [79]. For example, when workers allocate attention to a particular safety hazard
as captured using an eye-tracker but do not mentally process the hazard as captured by the
brainwaves, likely, the workers may not be aware of the risks associated with that hazard.
Trainers (if manual) and/or an automated system can use this information to identify particular
hazards and hazard types that workers are not mentally processing and provide feedback to
improve workers’ hazard recognition levels.
2.8. Conclusion
A combination of visual search and brain wave analyses provides valuable information for safety
trainers and educators. Through a feature selection process, this study identified 13 best EEG and
eye-tracking features that are related to hazard recognition. According to the findings of this
Future Directions
Checking the
correlation between
arousal, valence and
hazard recognition
Identifying the hazard
types that are correlated
with high arousal and
valence
Identifying EEG
cognitive load
correlation with hazard
recognition skills

35
study, high cognitive loads in an occipital lobe within the participants are correlated with a
successful visual hazard recognition task. This finding matches with neuroscience literature
which shows that occipital lobe channels (e.g., O1 and O2) activities are correlated with a sense
of danger [48]–[50]. Using eye-tracking and EEG in this study provides deeper insights into how
the worker’s brain and eye react during the visual search process. Analyzing both eye movement
and brainwaves in an integrated platform can lead to higher classification accuracy. This finding
shows that using EEG and eye-tracking signals together (93% accuracy) are more sophisticated
predictors of whether someone is aware of the surrounding hazards, compared to the accuracies
achieved by EEG (83%) or eye-tracking (74%), independently. The outcomes deliver three
significant directions for future studies. First, using this platform to checking the correlation
between arousal, valence, and hazard recognition performance. Second, the proposed platform
can help to identify the hazard types that are correlated with high arousal and valence. Lastly,
this work can be potentially extended to identify EEG cognitive load correlation with hazard
recognition skills for avoiding the workers to work during low mental cognitive load situations.

36
3 CHAPTER 3: Virtual Manipulation in Immersive Environments: Hand
Motion Tracking Technology and Snap-to-fit Function
3.1. Abstract
The architecture, engineering, and construction industry have increased the adoption of
augmented reality (AR) and virtual reality (VR) tools in recent years. This chapter addresses
virtual manipulation (VM) for AR/VR applications using motion tracker and haptic gloves in a
virtual environment for manipulating assembly systems. In this regard, the research proposes a
VR-based framework for assembling virtual elements and suggests a snap-to-fit function for
improving user interactions in VM. Furthermore, this study compares the state-of-art VM image-
based, infrared-based, and magnetic-based systems. The VM technologies are validated in a case
study where the performance of the systems was analyzed in different construction manipulation
scenarios. This study can effectively assist practitioners and researchers in adopting VM for
virtual assembly applications. The proposed VM benefits the AEC industry to increase the
adoption of AR/VR technologies.

37
3.2. Introduction
Researchers proposed the use of Augmented Reality (AR) and Virtual Reality (VR) to improve
the communication, efficiency, education, and training of the architecture, engineering, and
construction (AEC) industry [83]. AR/VR technologies were utilized by researchers in different
industries, such as manufacturing [17], [124], retail [19], [20], mining [21], [22], education [23]–
[25], and healthcare [27] over the past years. Similarly, the AEC industry also has utilized
AR/VR technologies over the past years [83]. Increasing the AR/VR utilization in the AEC
industry can potentially address deficiencies, such as lack of real-time and on-site
communication [11], lack of communication among stakeholders, and lack of visualization for
engineers and designers [13], [125]. AR/VR also exhibited possible applications in domains,
such as safety training [29], design [126], clash detection [127], compatibility check [30], [31],
improving stakeholders' communication [10], [82], [128], and energy management [32] over the
past decade.
Although many researchers studied the visualization aspect of AR/VR, one area that is under-
investigated is virtual object manipulation. With recent advances in hardware that allows
detection of hand movement while using VR head-mounted display (HMD), this chapter focuses
on virtual manipulation (VM) in AR/VR environments that can be used for virtual assembly (i.e.,
piping system). Assembly is defined as the process in which two or more objects are coupled and
joined together. The current practice for assembly training utilizes two-dimensional (2D)
drawings as the primary visualization means to guide workers. Researchers proposed and
experimented with an AR/VR system that was designed for assembly tasks that are normally
guided by reference to documentation [129]. The results revealed that the AR/VR system yielded
shorter assignment accomplishment periods, fewer assembly faults, and lower task burden [129],

38
[130]. The findings through a series of experiments for construction piping assembly revealed
that the utilization of AR/VR yielded to a 50% reduction of task completion time and a 50%
reduction in assembly errors [130], [131]. Findings also indicated that the AR/VR significantly
reduced (46%) the rework time and decreased the cost of correcting erroneous assembly by 66%.
The results also demonstrated that AR/VR could help improve the workers with lower spatial
cognitive abilities the most for assembly of pipe spools [132], [133]. Researchers presented a
study that compares the effectiveness of virtual training and physical training for teaching a
bimanual assembly task [134]. The results show that the performance of virtually trained
participants was promising [134].
Despite these benefits, user interaction with and in AR/VR platforms has been a challenge for the
development and full adoption of AR/VR in the AEC industry due to the dynamic nature of the
tasks compared to other industries, such as manufacturing [12], [83]. Technologies, such as
haptic gloves and hand motion tracking, along with AR/VR are rapidly being developed to
overcome this interaction deficiency [12], [33]. The interaction in the AR/VR environment using
hand motion tracking and haptic technologies are called VM [12]. A VM system consists of
hardware and software components. VM hardware comprises of the devices and methods
required for tracking body parts (e.g., hand or fingers) and haptic feedback in the AR/VR
environment. VM software contains the algorithms that perform grabbing, moving, and placing
of objects in the AR/VR environment. The development of AR/VR tools and applications for the
AEC industry requires considerable research and software development endeavors, including the
development of software development kits (SDK) and libraries that can simplify the
development efforts [83] . The development of these SDKs and libraries can lead to higher
adoption of VM systems and eventually improving the adoption of AR/VR technologies.

39
The following gaps in the knowledge in the AEC research and practice regarding the VM system
are identified (further detailed in Section 2).
Gaps in Knowledge:
1) Limited research in the AEC domain that utilizes VM systems despite vast potentials for
these technologies.
2) Lack of research that compares VM hardware for construction tasks and evaluates the
advantages and disadvantages of various VM hardware types, such as image-based,
infrared-based, or magnetic-based.
3) Limited functionality of VM systems to guide users with the placement of objects in the
AR/VR environments [135]. Therefore, researchers suggested the development of a snap-
to-fit function to fix the placement deficiencies in VM systems [135].
Study Contributions:
Limited research efforts on VM applications for the AEC industry indicate the need for
structured studies on hardware and software that will improve user interaction in AR/VR
environments. Therefore, this chapter presents advances in knowledge in both VM hardware and
software and set the basis for the future development of VM technologies. The specific
contributions are as follows:
1) Detailed review and comparison of currently available VM hardware. Literature review
of past research and identification of potential adoption of VM technologies in the AEC
industry (Section 2).

40
2) Detailed case study through a series of experiments comparing the three types of VM
hardware (image-based, infrared-based, and magnetic-based) for AEC applications
(Section 3).
3) Improve the placement process for VM through the development of a snap-to-fit function
(Section 4). This study focuses on improving the immersion level through solving
limitations of the advanced AR/VR interaction metaphors. Moreover, the placement of
different types of data type (as-built model vs BIM/CAD) was studied to have broader
applications in construction.
With these contributions, the presented method can be extended to the future development of
training programs (e.g., visually guided assembly that a user can follow in a virtual space) and
inspection (e.g., compatibility check of a scanned object with other components of a modular
component).

41
3.3. Background
The Background section examines the existing AR/VR technologies and their applications in the
AEC industry as well as other sectors such as manufacturing. Then it identifies gaps for
implementing AR/VR and VM in the AEC industry (listed previously as “Gaps in Knowledge”).
This section also discusses the potentials of AR/VR with a glimpse over VM technologies and
the benefits of adopting AR/VR technologies in the AEC industry.
AR/VR technologies have been rapidly recognized in construction engineering, education, and
training programs. AR/VR technologies are the visualization techniques referred to as the pure or
partial virtual presence of a user in a virtual environment [136]. AR/VR technologies nowadays
are attracting much attention to improve communications in professional work and collaborative
spaces [137]. The advantages of using AR/VR in education and training are associated with
AR/VR ability to empower users to interact with other users through virtual three-dimensional
(3D) environments. AR/VR's visual representation allows a higher level of interaction with
virtual elements compared to the conventional education and training methods, such as the
utilization of stagnant pictures or two dimensional (2D) drawings. An AR/VR framework
consists of hardware and software components.
The hardware incorporates a processor, display, sensors, and input/output (I/O) devices (a
taxonomy of AR/VR I/O hardware [138] is illustrated in Figure 1) . The AR/VR software
controls the I/O devices to analyze and respond to the user interacts. The software sends signals
to the system about the action of the user (e.g., movements of motion tracker gloves) and how
the hardware should respond to the user’s activities. The software provides appropriate
reactions/feedbacks back to the user through the output devices (e.g., haptic feedback) in real-
time.

42
The AR/VR system could be designed based on the level of immersion or required interactions.
The immersion level depends on various combinations of hardware and their configurations. For
example, gloves can act as input (e.g., sending hand position) in an AR/VR system and also act
as an output for haptic feedback in a scenario when hands collide an object in AR/VR
simulations (Figure 3.1). In this chapter, the authors classified AR/VR systems into low
immersion level (low-level) and high immersion level (high-level). Low immersion AR/VR is a
system that does not employ motion trackers or haptic feedback for interaction while high
immersion AR/VR utilizes motion trackers or haptic feedback.
Figure 3.1. A taxonomy of AR/VR technologies by their I/O
A low-level AR/VR system is always limited to certain types of pre-defined interactions through
controllers. Utilizing a high-level AR/VR system can enable users to explore and manipulate real
and virtual models using new interaction metaphors such as hand motion tracking or haptic
feedback systems [139]. Table 3-1demonstrates an overview of the commercial AR/VR haptic
and tracker technologies sorted by the enabling technology.
Studies indicate that using motion trackers and haptic feedback in AR/VR can significantly
improve the AR/VR realism level [140]. Researchers aimed to explore a new generation of
interaction metaphors to increase the speed in the design review process [141]. They presented a
framework that obtains user motion using a combination of video and Kinect (an infrared-based
The focus areas of this chapter

43
motion detection device developed by Microsoft) and visualizes the CAD/BIM models in AR
[141], [142]. They evaluated the feasibility and robustness of the interface and identified that this
framework requires significant improvements due to the low-accuracy of motion detection [141].
In addition to the low accuracy of motion detection, researchers suggested recruiting haptic
devices to improve user interactions in AR/VR training scenarios [143].
Studies investigated virtual bimanual haptic training and classified VM into three sections as
grabbing objects, moving objects, and finally placing objects [12]. The researchers separated the
object manipulation in an AR/VR environment to three sections of object grabbing, moving, and
placing. However, the researchers identified needs for improving the placement operation in VM
since the VM SDKs lack such operation. The researchers suggested the development of a snap-
to-fit function to address the limitations of object placement and enable users to place (snap) an
object into a target area or highlighted mesh [135].
Researchers developed a framework for the remote construction worker system to eliminate to
increase construction safety [144]. The results identified the gaps in human-machine interfaces
for remote-controlled construction robots and suggested the use of haptic gloves for improved
user interaction [145]. Researchers also indicated that haptic gloves and BIM-based systems
could boost the remote control of the cranes and excavators [146]–[149]. Studies suggested using
Leap Motion with VR to overcome problems associated with using Kinect and improve user
interaction [150]. Researchers ensured high accuracy using Leap Motion [151]. The results show
that the Leap Motion can provide users with exceptional interactive experiences [151]. Recent
studies advanced Leap Motion trough using tactile feedback and concluded that tactile feedback
could significantly improve user interaction in the domain of remote surgery [152]. Table 3-2
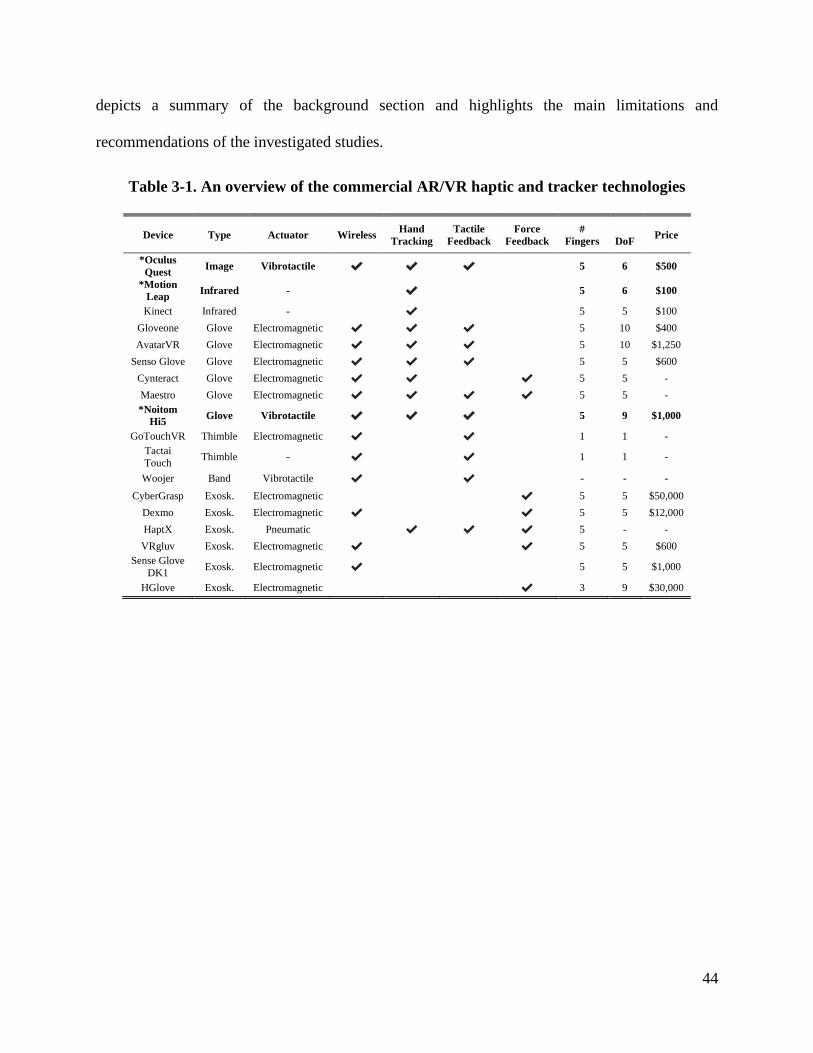
44
depicts a summary of the background section and highlights the main limitations and
recommendations of the investigated studies.
Table 3-1. An overview of the commercial AR/VR haptic and tracker technologies
Device Type Actuator Wireless Hand
Tracking
Tactile
Feedback
Force
Feedback
#
Fingers
DoF Price
*Oculus
Quest Image Vibrotactile ✔ ✔ ✔ 5 6 $500
*Motion
Leap Infrared - ✔ 5 6 $100
Kinect Infrared - ✔ 5 5 $100
Gloveone Glove Electromagnetic ✔ ✔ ✔ 5 10 $400
AvatarVR Glove Electromagnetic ✔ ✔ ✔ 5 10 $1,250
Senso Glove Glove Electromagnetic ✔ ✔ ✔ 5 5 $600
Cynteract Glove Electromagnetic ✔ ✔ ✔ 5 5 -
Maestro Glove Electromagnetic ✔ ✔ ✔ ✔ 5 5 -
*Noitom
Hi5 Glove Vibrotactile ✔ ✔ ✔ 5 9 $1,000
GoTouchVR Thimble Electromagnetic ✔ ✔ 1 1 -
Tactai
Touch Thimble - ✔ ✔ 1 1 -
Woojer Band Vibrotactile ✔ ✔ - - -
CyberGrasp Exosk. Electromagnetic ✔ 5 5 $50,000
Dexmo Exosk. Electromagnetic ✔ ✔ 5 5 $12,000
HaptX Exosk. Pneumatic ✔ ✔ ✔ 5 - -
VRgluv Exosk. Electromagnetic ✔ ✔ 5 5 $600
Sense Glove
DK1 Exosk. Electromagnetic ✔ 5 5 $1,000
HGlove Exosk. Electromagnetic ✔ 3 9 $30,000

45
Table 3-2. A summary of AR/VR technologies state of the art applications
Name Yea
r Area of work
Limitations and
recommendations
Manipulatio
n device Key features
VR AR Manipulatio
n Haptic
[153] 2020
VR to integrate
knowledge and improve
safety
VR usage for remote robot control
Virtoba V1 ✔ ✔
[154] 2019
VR experiment to study
the impact of reinforced
learning on fall risk
Lack of accurate motion tracking
Kinect ✔ ✔
[12] 2019 Virtual manipulation for
compatibility check
Lack of a snap-to-fit
function for object
placement in VM
Leap motion ✔ ✔
[152] 2019 A platform for haptic
manipulation
The platform requires
further accuracy
improvement
Leap motion ✔ ✔
[148] 2019 Haptic system for excavator control
Require more
sophisticated haptic
device
Custom device
✔ ✔
[151] 2019 Human-robot interaction
using tracking systems
Required a force
feedback system Leap motion ✔
[128] 2019 VR for real-time cost
estimation Limited user interactions
- ✔
[132] 2019 AR Manipulation and
training workers
Problems in
manipulation
Light
scanner ✔ ✔
[132] 2019 VR for assembly training Needed vibrotactile
feedback systems Oculus Quest ✔ ✔
[126] 2019 VR for design review VR simulations should
be more realistic HTC ✔ ✔
[34] 2019 AR for Lean construction
and project delivery
Limitations in using the
device Hololens ✔ ✔
[134] 2018 Virtual training for
bimanual assembly
Limited operations in
Oculus Touch Oculus Quest ✔ ✔
[139] 2018 AR and VR for off-site
and on-site training Needed a manipulation
system - ✔ ✔
[144] 2018 Robotic construction
worker system
Manipulation was not
accurate and efficient Kinect ✔ ✔
[142] 2018 Improving efficiency
through enhanced training Difficulties in engaging
users in AR. - ✔
[145] 2018 Human-machine
interaction for robots Suggested the use of
Haptic Gloves -
[137] 2018 VR for constructability
analysis
Difficult interaction in
4D VR. Controller ✔ ✔
[146] 2018 Operator assistant system Proposed use of haptic
gloves for crane control - ✔ ✔
[140] 2017 Full body avatar
development
Difficulties in action
calibration
Motion
tracker ✔ ✔
[150] 2016 Introducing the idea of
VR manipulation
Occlusion of motion
sensor Leap motion ✔ ✔
[133] 2015 AR/VR training for
industrial assembly tasks
Limited user
interactions - ✔ ✔
[135] 2015 Virtual training for
assembly
Absence of a snap-to-fit function for VM
training
5DT glove ✔ ✔ ✔
[130] 2014 Using AR for pipe
assembly AR limitations in object
detection - ✔
[131] 2014 AR for maintenance
instruction Limited AR interaction - ✔
[129] 2013 Assembly training in AR.
Difficulties in
interaction using QR
code
- ✔
[141] 2013 Improved interaction with
3D CAD
Difficulties in detecting
hand gestures Kinect ✔ ✔

46
3.4. Comparison of State-of-the-art VM Technologies
As discussed in 2. Background, AEC researchers did not fully adopt using haptic gloves and
hand motion trackers [12], [83], [96]. A detailed comparison of VM systems is not available for
the AEC community. To the best of the authors' knowledge, haptic gloves were not adopted in
any construction research paper. Therefore, before going into the development of the snap-to-fit
function, this section compares a state-of-the-art commercial and research level haptic gloves
and two different types of hand motion tracker devices for VM tasks. This case study compares
the tracking and haptic feedback accuracy of the three common setups to find the optimal setup
for the AEC industry and research.
VM Hardware
Three major VR motion trackers were selected for comparison in this section, and the technical
details, accuracy, and performance of these devices were compared through a series of
observations while manipulating standard construction objects and typical gestures.
1) Noitom Hi5 was selected as the state-of-the-art commercial haptic glove and magnetic-based
motion tracker [155]. Figure 3.2 shows an overview of the glove. Figure 3.2(A) shows sensor
placement over the fingers. Figure 3.2(B) and (C) show the essential parts of the gloves, such
as the HTC tracker position over the gloves.
Figure 3.2. Noitom Hi5 details; (A) Sensor placement on the finger; (B) Glove placement
over the hand; (C) HTC trackers mounted on the glove
2) Leap Motion was selected as the conventional infrared-based motion tracker first introduced
in 2012 (infrared depth-sensing using a stereo infrared camera) [156]. Figure 3.3(A) shows

47
the placement of infrared cameras and emitters over the Leap Motion. Figure 3.3(B) indicates
the arrangement of the Leap Motion over a VR HMD.
Figure 3.3. Leap Motion overview; (A) Leap Motion hardware; (B) Connecting Leap
Motion to HTC Vive
3) Oculus Quest was selected as an image-based commercial level VR system that has
integrated hand motion tracking technology using four peripheral cameras. Figure 3.4 shows
the placement of peripheral cameras over the VR HMD.
Figure 3.4. Camera placement on the Oculus Quest HMD.
Case Study
Four commonly used construction tools were selected to compare the manipulation systems for
dealing with different grabbing scenarios (see Figure 3.5). These tools were chosen in a way to
cover various dimensions from small to large. Lastly, these four tools were selected for one hand
and two hand manipulation scenarios. For instance, tool D in Figure 3.5 requires two-hand
manipulation.

48
Figure 3.5. Objects for manipulation scenarios based on the relative size; (A) Screwdriver;
(B) Claw hammer; (C) Crowbar; (D) Power drill.
In addition to the four tools, four one-handed and two-handed main gestures were defined for
grabbing scenarios, not necessarily for operating the four tools but grabbing and picking in
general. Figure 3.6 shows the gestures used in this section. In this case study, a PC with an Intel
Core i7-6700K, 64 GB of RAM, and Nvidia GTX 1080 was used.
Figure 3.6. Defined gestures for grabbing the objects
Findings
Table 3-3 summarizes the pros and cons of manipulating each object with the three manipulation
system. The overall findings of this section suggest that Noitom Hi5 had the best performance
and provided seamless manipulation and haptic experience both in large and small objects with
one-handed or two-handed gestures. The main limitation of Noitom Hi5 is calibration problems
and the effects of magnetic fields on the accuracy of motion trackers. The Noitom Hi5 gloves
quickly lose calibration in the presence of a small magnetic field from the phone or other devices
and require recalibration.

49
The second-best performance was achieved by Oculus Quest. Oculus Quest achieved great
accuracy and has the ability to track hands in the user’s peripheral vision since it has four
peripheral cameras mounted on HMD. The main limitation of this device is the lack of haptic
feedback. Lastly, Leap Motion achieved the lowest performance since the motion tracking was
extremely noisy and the trackers constantly show shaking in virtual simulated hands that are not
occurring on the tracked hand. Also, Leap Motion can only track the hands in a conical vision,
and it loses track if the hands move to the peripheral position.
After an object is grabbed using one of the VM technologies studied in this section, a user needs
to place it at the desired location. For AEC applications that use BIM or 3D CAD models, there
will be a pre-determined place to where a user should move the virtual object. The next section
presents a snap-to-fit function for virtual assembly that will lead to multiple applications in the
AEC domain.

50
Table 3-3. Comparison of manipulation systems
Objects Manipulation Systems
Noitom Hi5 (Magnetic-
Based) Oculus Quest (Image-Based)
Leap Motion (Infrared-
Based)
Screwdriver
Pros • Strong tracking in
gesture C and D
• Strong tracking in fine
movements in gesture C -
Cons • Calibration difficulties • Self-occlusion of hands • Extremely noisy especially
in gesture type A
Claw hammer
Pros • Strong tracking in all
four gestures • Strong tracking
• Self-occlusion of hands in
gesture A and B
Cons • Poor performance in the
presence of extrinsic
magnetic fields
• Self-occlusion of hands • Extremely noisy
Crowbar Pros • Strong tracking • Strong tracking
• Self-occlusion of hands in
gesture A and B
Cons • Calibration difficulties • Self-occlusion of hands • Noisy performance
Power drill
Pros • Strong tracking in
bimanual manipulations
• Strong tracking in gesture C
and D
• Excellent performance
with two hands in gesture B
Cons • Calibration difficulties • Self-occlusion of hands • Bimanual manipulation is
not working properly
Overall
• Tracks hands in any
position without limitation
• Gloves working only
with HTC Vive as Hi5
requires Vive trackers
• Problem with calibration
and magnetic fields
• Poor performance in the
presence of extrinsic
magnetic fields
• Limited API
• Tracks hands even in your
peripheral vision
• Strong tracking
• No haptic feedback
• Self-occlusion of hands
• Limited API
• Tracks hand only in your
conical vision
• Tracks hands even in your
peripheral vision
• Weak in bimanual
manipulations
• Extremely noisy
• Strong API
3.5. Snap-to-fit Function
The snap-to-fit function acts as a critical intervention for snapping virtually 3D models (both
mesh and point clouds) to a pre-determined location in real-time. An AEC application of this
concept in this chapter is the snapping of as-built models (3D scanned models) to as-planned
models (BIM/CAD), which can provide have extended applications for training,
inspection/quality assurance. This snap-to-fit function can be also applied to the snapping of as-
planned models onto as-planned or as-built models in the same way.
The development of this functionality is challenging since the scanned model with different
geometry, meshing, and occlusion rates have to snap into a BIM model accurately. Also, BIM
and scanned models have a large number of vertices and faces, which may be challenging for

51
real-time applications. This chapter addresses this limitation by introducing a function that can
perform snap-to-fit in real-time. This function was tested, validated, and evaluated through an
experiment.
Method
Figure 3.7 demonstrates the overall steps of the developed snap-to-fit function. In the first step,
the as-built and as-planned models have to be segmented. This process splits the mesh into small
segments (depending on the selected number of segments), as demonstrated in Figure 3.8.
Figure 3.7. Snap-to-fit function overview
After segmentation, the user grabs the as-built model and try to place it in the as-planned model.
During this process of manual alignment, the snap-to-fit function calculates a similarity rate,
which fixes the as-built model in the position as soon as the similarity rate reaches a certain
threshold. Finally, the snap-to-fit function evaluates the scanned model by providing an
occlusion rate and a similarity rate.

52
Figure 3.8. Segmentation process for BIM and scan models
Figure 3.9. Segmentation process for BIM and scan models
The snap-to-fit function operates based on the following mathematical definitions, operations,
and steps that compare segments in BIM and scan models. In this study a mesh 𝑀 is defined as a
triangulated planar surface that consists of three vertices (𝑉𝑖 , 𝑉𝑗 , 𝑉𝑘). Each vertex 𝑉 is created from
three values showing a 3D coordinate (i.e., x, y, z). Each face 𝐹 is created by connecting (𝑉𝑖 , 𝑉𝑗 , 𝑉𝑘).
The mesh is defined as 𝑀 (𝑉 , 𝐹 ). Consequently, the normal of a face in a mesh �⃗⃗� 𝐹𝑚 is defined as
follows:
∀ 𝐹𝑚 = {𝑉𝑖 , 𝑉𝑗 , 𝑉𝑘} ∈ 𝑀 (𝑉 , 𝐹 ) ∶ �⃗⃗� 𝐹𝑚=
(�⃗⃗� 𝑖−�⃗⃗� 𝑗)×(�⃗⃗� 𝑘−�⃗⃗� 𝑗)
|(�⃗⃗� 𝑖−�⃗⃗� 𝑗)×(�⃗⃗� 𝑘−�⃗⃗� 𝑗)| (1)

53
The highest point of a mesh in each direction is defined as follows:
∀ 𝑑𝑖𝑟 ∈ {𝑥, 𝑦, 𝑧} ∶ 𝑀𝑎𝑥𝑀(𝑉,𝐹)𝑑𝑖𝑟 = 𝑀𝑎𝑥 (𝑣𝑑𝑖𝑟 ∈ 𝑉𝑖 𝑖𝑛 𝑀 (𝑉 , 𝐹 )) (2)
Consequently, the lowest point of a mesh in each direction is defined as follows:
∀ 𝑑𝑖𝑟 ∈ {𝑥, 𝑦, 𝑧} ∶ 𝑀𝑖𝑛𝑀(𝑉,𝐹)𝑑𝑖𝑟 = 𝑀𝑖𝑛 (𝑣𝑑𝑖𝑟 ∈ 𝑉𝑖 𝑖𝑛 𝑀 (𝑉 , 𝐹 )) (3)
The delta value (the dimension of a mesh or mesh segment in each direction) of a mesh in each
direction is defined as follows:
∀ 𝑑𝑖𝑟 ∈ {𝑥, 𝑦, 𝑧} ∶ ∆𝑀(𝑉,𝐹)𝑑𝑖𝑟 = 𝑀𝑎𝑥𝑀(𝑉,𝐹)
𝑑𝑖𝑟 − 𝑀𝑖𝑛𝑀(𝑉,𝐹)𝑑𝑖𝑟 (4)
The upper and lower boundary of each segment is necessary to calculate and useful in the
process of segmentation. The lower boundary of a mesh in each direction of a segment is defined
as follows:
∀ 𝑑𝑖𝑟 ∈ {𝑥, 𝑦, 𝑧} ∧ ∀ 𝑎 ∈ {1,… , 𝑆𝑒𝑔𝑚𝑒𝑛𝑡_𝑐𝑜𝑢𝑛𝑡} ∶
𝐵𝑜𝑢𝑛𝑑𝑎𝑦𝑙𝑜𝑤𝑑𝑖𝑟 (𝑎) = 𝑀𝑖𝑛𝑀(𝑉,𝐹)
𝑑𝑖𝑟 + ∆𝑀(𝑉,𝐹)𝑑𝑖𝑟 ∗
𝑎−1
𝑆𝑒𝑔𝑚𝑒𝑛𝑡_𝑐𝑜𝑢𝑛𝑡 (5)
The upper boundary of a mesh in each direction of a segment is defined as follows:
∀ 𝑑𝑖𝑟 ∈ {𝑥, 𝑦, 𝑧} ∧ ∀ 𝑎 ∈ {1,… , 𝑆𝑒𝑔𝑚𝑒𝑛𝑡_𝑐𝑜𝑢𝑛𝑡} ∶
𝐵𝑜𝑢𝑛𝑑𝑎𝑦𝑢𝑝𝑑𝑖𝑟(𝑎) = 𝑀𝑖𝑛𝑀(𝑉,𝐹)
𝑑𝑖𝑟 + ∆𝑀(𝑉,𝐹)𝑑𝑖𝑟 ∗
𝑎
𝑆𝑒𝑔𝑚𝑒𝑛𝑡_𝑐𝑜𝑢𝑛𝑡 (6)
The following formulas express the mathematical process of segmenting a mesh:
∀ 𝑑𝑖𝑟 ∈ {𝑥, 𝑦, 𝑧} ∧ ∀ 𝑎 ∈ {1,… , 𝑆𝑒𝑔𝑚𝑒𝑛𝑡_𝑐𝑜𝑢𝑛𝑡} ∧ ∀ 𝑏 ∈ {1,… , 𝑆𝑒𝑔𝑚𝑒𝑛𝑡_𝑐𝑜𝑢𝑛𝑡} ∧ ∀ 𝑐 ∈ {1, … , 𝑆𝑒𝑔𝑚𝑒𝑛𝑡_𝑐𝑜𝑢𝑛𝑡} ∧
∀𝑑𝑖𝑟_𝑠𝑒𝑔 ∈ {𝑎, 𝑏, 𝑐} ∧ ∀ 𝑉𝑖 ∈ 𝑉 ∧
𝐵𝑜𝑢𝑛𝑑𝑎𝑦𝑙𝑜𝑤𝑑𝑖𝑟 (𝑑𝑖𝑟_𝑠𝑒𝑔) ≤ 𝑉𝑖
𝑑𝑖𝑟 ≤ 𝐵𝑜𝑢𝑛𝑑𝑎𝑦𝑢𝑝𝑑𝑖𝑟(𝑑𝑖𝑟_𝑠𝑒𝑔):
𝑆𝑒𝑔(𝑎,𝑏,𝑐)𝑀(𝑉,𝐹)
= 𝑀𝑖 (𝑉𝑖 , 𝐹𝑖 ) (7)
To compare the as-built and as-planned segments, the authors defined the three parameters in
each segment as summarized in Table 3-4.

54
Table 3-4. Features for snap-to-fit function
Parameters Formulas
Segment Surface (SS)
∑ |(𝑉𝑖 − 𝑉𝑗, ). (𝑉𝑘 − 𝑉𝑗)| 2⁄
𝐹𝑚={𝑉𝑖,𝑉𝑗,𝑉𝑘} ∈ 𝐹
Segment
Dimension (SD) ∀ 𝑑𝑖𝑟 ∈ {𝑥, 𝑦, 𝑧} ∶ 𝑀𝑎𝑥𝑀(𝑉,𝐹)
𝑑𝑖𝑟 − 𝑀𝑖𝑛𝑀(𝑉,𝐹)𝑑𝑖𝑟
Segment Aggregated
Normal (SAN)
∑ �⃗⃗� 𝐹𝑚∗ |(�⃗⃗� 𝑖 − �⃗⃗� 𝑗) . (�⃗⃗� 𝑘 − �⃗⃗� 𝑗)| 2⁄𝐹𝑚={𝑉𝑖,𝑉𝑗,𝑉𝑘} ∈ 𝐹
∑ |(�⃗⃗� 𝑖 − �⃗⃗� 𝑗) . (�⃗⃗� 𝑘 − �⃗⃗� 𝑗)| 2⁄𝐹𝑚={𝑉𝑖,𝑉𝑗,𝑉𝑘} ∈ 𝐹
The following formula (8) is defined to calculate the similarity ratio (SR). In this formula, the
values of each parameter for as-built and as-planned segments are compared and created a ratio
which is called SR.
𝑆𝑅(𝑀𝑎 (𝑉𝑎 , 𝐹𝑎), 𝑀𝑏 (𝑉𝑏 , 𝐹𝑏)) =
𝑆𝑆(𝑀𝑎 )
𝑆𝑆(𝑀𝑏 )
𝑠𝑔𝑛(𝑆𝑆(𝑀𝑏 )−𝑆𝑆(𝑀𝑎 ))∗ ∏
𝑆𝐷𝑑𝑖𝑟(𝑀𝑎 )
𝑆𝐷𝑑𝑖𝑟(𝑀𝑏)
𝑠𝑔𝑛(𝑆𝐷𝑑𝑖𝑟(𝑀𝑏)−𝑆𝐷𝑑𝑖𝑟(𝑀𝑎 ))
𝑑𝑖𝑟={𝑥,𝑦,𝑧} ∗ ∏𝑆𝐴𝑁𝑑𝑖𝑟(𝑀𝑎 )
𝑆𝐴𝑁𝑑𝑖𝑟(𝑀𝑏 )
𝑠𝑔𝑛(𝑆𝐴𝑁𝑑𝑖𝑟(𝑀𝑏 )−𝑆𝐴𝑁𝑑𝑖𝑟(𝑀𝑎 ))
𝑑𝑖𝑟={𝑥,𝑦,𝑧}
(8)
The following formula (9) further expands SR formula for all the segments and to aggregate the
total SR from SR between each segment pair.
𝑎, 𝑏, 𝑐 = {1,… , 𝑆𝑒𝑔𝑚𝑒𝑛𝑡_𝑐𝑜𝑢𝑛𝑡} ∧ ¬𝑖𝑠_𝑒𝑚𝑝𝑡𝑦(𝑆𝑒𝑔(𝑎,𝑏,𝑐)𝑀𝐵𝐼𝑀 ) ∧ 𝑖𝑠_𝑒𝑚𝑝𝑡𝑦(𝑆𝑒𝑔(𝑎,𝑏,𝑐)
𝑀𝑆𝑐𝑎𝑛 ):
𝑆𝑅(𝑀𝑆𝑐𝑎𝑛 (𝑉𝑠𝑐𝑎𝑛 , 𝐹𝑠𝑐𝑎𝑛), 𝑀𝐵𝐼𝑀 (𝑉𝐵𝐼𝑀 , 𝐹𝐵𝐼𝑀)) = ∏ 𝑆𝑅(𝑆𝑒𝑔(𝑎,𝑏,𝑐)
𝑀𝑆𝑐𝑎𝑛 , 𝑆𝑒𝑔(𝑎,𝑏,𝑐)
𝑀𝐵𝐼𝑀 )𝑎,𝑏,𝑐={1,…,𝑆𝑒𝑔𝑚𝑒𝑛𝑡_𝑐𝑜𝑢𝑛𝑡} (9)
Another necessary variable to calculate is occlusion rate (OR) which shows how many segments
in the scan is missing. The following formula calculates the OR.
𝑂𝑅 =∑ ¬𝑖𝑠_𝑒𝑚𝑝𝑡𝑦(𝑆𝑒𝑔
(𝑎,𝑏,𝑐)
𝑀𝐵𝐼𝑀 )∧𝑖𝑠_𝑒𝑚𝑝𝑡𝑦(𝑆𝑒𝑔(𝑎,𝑏,𝑐)
𝑀𝑆𝑐𝑎𝑛 )𝑎,𝑏,𝑐={1,…,𝑆𝑒𝑔𝑚𝑒𝑛𝑡_𝑐𝑜𝑢𝑛𝑡}
∑ ¬𝑖𝑠_𝑒𝑚𝑝𝑡𝑦(𝑆𝑒𝑔(𝑎,𝑏,𝑐)
𝑀𝐵𝐼𝑀 )𝑎,𝑏,𝑐={1,…,𝑆𝑒𝑔𝑚𝑒𝑛𝑡_𝑐𝑜𝑢𝑛𝑡}
(10)
Figure 3.10 shows pseudocode that illustrates the process of snap-to-fit function and explains
each step of the calculations. This algorithm was implemented in Unity 3D since this 3D engine
is able to perform these operations optimally and seamlessly handle user interactions in the VR
environment.

55
Figure 3.10. Snap-to-fit function pseudocode
Experimental Setup
This section describes an experiment that is designed to test and validate the performance of
snap-to-fit function both in terms of accuracy and time performance. Also, the robustness of the
algorithm is further discussed by examining it against various occlusions in scanned data (as-
built models). Six objects were selected, scanned, and tested in different scenarios.
To make 3D scanned models of the parts, the authors used the Artec Eva [157] and the Artec Leo
laser scanners [158]. These hand-held scanners can achieve an accuracy of up to 0.1 millimeters.

56
Any scanning device/technology that will meet the user’s requirement and produce a 3D point
cloud can be used for this method. Figure 3.11 shows the process of 3D scanning a pipe using the
two scanners. The pipe was placed on the rotary table while 3D hand-held scanner stays fixed to
generate a 3D scanned model. After scanning the parts, Artec Studio's automated process was
used to generate a 3D mesh.
Figure 3.11. Scanning objects process; (A) Artec Eva scanning a pipe on a rotary table; (B)
Artec Leo scanning a part on a rotary table; (C) Artec Leo overview
Six objects were selected and scanned to validate the snap-to-fit function. The BIM models of
the same objects were also acquired. Figure 3.12shows the pictures, scanned models, and BIM
models of the six objects.
Figure 3.12. Scan vs. BIM model of the used objects
Table 3-5 shows the number of vertices for the objects in Figure 3.12. The authors used the
default number of vertices. The number of vertices for BIM can be changed when exporting the

57
models using BIM software (xx in this case). Also, the number of vertices for BIM and scan
models can be down sampled using an algorithm as introduced later in this section
Table 3-5. Vertex count of the objects in BIM and scan
Object A B C D E F
Vertex
Count
BIM 43008 18432 80802 41088 36504 13260
Scan 125742 31943 82648 198402 44511 446350
Object C in Figure 3.12was manipulated with various types of occlusions to simulate occluding
scenarios that might occur during scanning and show the robustness of the proposed snap-to-fit
function. Figure 3.13 shows the four occlusion types that were used. The percentage of each scan
in Figure 3.13 shows the number of presented mesh faces relative to the original scan. This
number is later compared to the OR value (Equation 10) for validating accuracy.
Figure 12 shows the segmentation results for 5*5*5, 8*8*8, and 12*12*12 segments. Lastly,
Figure 3.13 shows various types of missing information from a low range (36%) to a high range
(86%) and missing interior or part of the object.
Figure 3.13. Segmenting object C for different occlusions level

58
Lastly, to improve the time performance of the snap-to-fit function, the accuracy of the snap-to-
fit function was tested and validated with various mesh densities. A fast quadratic mesh
simplification (FQMS) was used to reduce the mesh density (number of faces/vertices in each
mesh) [159]. Figure 3.14 shows applying FQMS with corresponding percentages for the scanned
model of Object A.
Figure 3.14. Resizing scanned mesh using Fast Quadric Mesh Simplification with different
level of simplification [160], [161]
Experimental Results
This section summarizes the results of the experiment. HTC Vive VR headset with Noitom Hi5
was used for hand motion tracking. This hardware enables users to interact with virtual objects in
an immersive virtual environment (IVE) using their hands. The result of this section was
generated using an Intel Core i7-6700K with 64 GB of RAM and an Nvidia GTX 1080 as the
graphic card. First, BIM models and scanned models are imported to the IVE. Then, both the VR
device and tracker gloves were connected through Unity 3D. In the developed IVE, users can
move, rotate, grab, manipulate, and connect virtual elements.
In this IVE, a user can place scanned models in the corresponding and highlighted BIM elements
with a snap-to-fit function as shown in Figure 3.15. If the SR reaches a selected threshold (θ) for

59
the 3D scan and its BIM model, the object will snap into the highlighted area. Otherwise, the part
will not snap due to unacceptable discrepancy, which is an indication that the scanned object is
not closely aligned and should not be placed.
The first section of the experiment validates the robustness and time performance of the snap-to-
fit function for various segment counts x and objects. The complete scans (1st column of Figure
3.12) were aligned with their BIM, and SR between them are computed. With this finding, the
appropriate threshold (θ) per segment count can be determined.
Table 3-6 shows the time performance. Table 3-7 shows the SR of the snap-to-fit function.
Although the number of points to be processed are the same for different segment counts,
increasing segment counts also increased the processing time. Increasing segment counts also
increased SR.
Table 3-6. Time performance of the snap-to-fit function for various segments counts and
objects in seconds.
Object A B C D E F
Segment
Count
(x)
7*7*7 0.90 0.24 0.74 0.64 0.36 0.90
8*8*8 1.02 0.38 0.88 0.49 0.46 0.87
9*9*9 1.29 0.52 1.09 0.65 0.73 0.75
10*10*10 1.47 0.92 1.64 1.03 1.11 1.36
Table 3-7. Snap-to-fit function accuracy for various segment counts and objects.
Object
A B C D E F
Segment
Count
(x)
7*7*7 81% 75% 80% 80% 71% 72%
8*8*8 86% 78% 82% 86% 74% 72%
9*9*9 86% 82% 81% 89% 77% 76%
10*10*10 92% 84% 82% 91% 84% 82%
The second section of the experiment checks the performance of the snap-to-fit algorithm for
occlusion types in Figure 3.14and various levels of simplification of BIM using FQMS with a

60
10*10*10 segment count. Table 3-8 shows the time performance of the algorithm, and Table 3-9
shows SR of the snap-to-fit function.
Table 3-8. Time performance of the snap-to-fit function for object C for different occlusion
and BIM details with 10*10*10 segment count in seconds
BIM Detail
8% 13% 25% 100%
Occlusion
Rate
(OR)
0% 1.54 1.68 1.73 1.69
36% 1.47 1.52 1.45 1.71
51% 1.40 1.36 1.33 1.64
53% 1.40 1.38 1.38 1.54
86% 0.87 0.96 0.90 0.94
A comparison of the time performance of the algorithm and SR shows that SR is robust to the
occlusions meaning increasing the OR does not decrease the SR significantly. Also, the time
performance of the algorithm and SR has a direct relation with BIM detail. The segmentation
process clusters the scan and BIM meshes to deal with occlusions and unscanned areas, e.g.,
inside a scanned pipe.
Table 3-9. Snap-to-fit function accuracy for object C for different occlusion and BIM
details with 10*10*10 segment count
BIM Detail 8% 13% 25% 100%
Occlusion
Rate
(OR)
0% 76% 76% 77% 82%
36% 77% 78% 78% 82%
51% 75% 75% 75% 80%
53% 75% 75% 76% 81%
86% 73% 73% 74% 76%
The last part of the experiment analyses the SR for various BIM and scan detail levels. In this
part of the experiment, 100% BIM detail had the same number of vertices as 100% scan detail.

61
This comparison was conducted to understand whether the difference in the number of vertices
in BIM and scans have impact on SR. Table 3-10 shows that SR has a higher correlation with
BIM detail.
Table 3-10. Snap-to-fit function accuracy for object C for various simplification levels of
BIM and scan for 10*10*10 segment count
BIM Detail
25% 50% 75% 100%
Scan
Detail
25% 74% 79% 82% 81%
50% 75% 79% 82% 82%
75% 75% 79% 82% 82%
100% 74% 80% 83% 82%
Lastly, Figure 3.15 shows the actual manipulation of a scanned object using the snap-to-fit
function in an IVE. In Figure 3.15, the scanned element is hovering the right side, and the
position of the BIM element is highlighted by green color. In Figure 3.15, the user grasped the
scanned model. The user's goal is to place the 3D scanned part in the highlighted area. In Figure
3.15, the user moves the part close to the highlighted area, and in Figure 3.15, the scanned model
snaps in the highlighted area in green.
Figure 3.15. Simulation of manipulation in VR.

62
3.6. Discussion and Future Works
The first part of this research investigates and compares three main motion tracking methods and
hardware (image-based, infrared-based, and magnetic-based). This study found out that
magnetic-based motion tracking is far more accurate compared to the image-based and infrared
method. However, the magnetic-based gloves is not stable in the presence of exterior magnetic
fields. For example, the presence of metals in the surrounding environment can adversely affect
the performance of the motion trackers. The findings outlined in Table 3-3 (pros and cons)
suggested that a hybrid approach that combines magnetic-based gloves with image-based motion
trackers can potentially solve this deficiency and improve the accuracy of the hand motion
trackers in the presence of the magnetic fields.
The second part of this chapter solves the placement issue in hand motion tracking systems
through the snap-to-fit function. Some of the possible extensions and improvements to this study
are documented as follows. The time performance of the snap-to-fit function can be further
improved by using GPU (graphical processing unit) processing since the snap-to-fit function is
inherently a parallel algorithm meaning it contains processes that are independent of each other.
Furthermore, combining the VM with a remote robotic arm can help the workers to perform
construction tasks remotely in hazardous environments. Lastly, the goal of this chapter was to
introduce a detailed comparison of the VM systems for construction tasks and proposing a snap-
to-fit function that can lead to applications in construction and operation and maintenance. For
instance, Figure 15 shows an example of how this research fits in practice and shows the process
of bringing elements virtually to the facility (could also be a construction site) and visually
inspect and check for compatibility issues before shipping a pre-fabricated element. During
construction, prefabricated components that arrive on job site will not have compatibility issues

63
after going through this process. Similarly, during operation and maintenance, any replacement
parts/components (e.g., old steam generator in a power plant) that will arrive at the facility with
quality assurance that there will not be any compatibility issue.
Figure 3.16. Simulation of manipulation in VR for virtually bringing and testing the parts
before the actual shipment of the parts.
3.7. Conclusion
Over the past few years, AR/VR technologies have received significant popularity in the AEC
industry, namely construction safety training, assembly training, construction design review, and
inspection. However, there are still numerous research questions to be investigated, such as
efficient AR/VR interaction hardware and software. To address this issue and improve the
AR/VR interaction, this chapter presents a detailed comparison of the state of the art image-
based, infrared-based, and magnetic-based VM systems. Also, the second part of this study
proposes a novel snap-to-fit function that assesses and performs the compatibility of as-built and
as-planned models in real-time. The results of this study show that the magnetic-based VM

64
system outperformed both image-based and infrared-based VM systems. Also, the results
demonstrated that a user could automatically check the compatibility of as-built and as-planned
models using the snap-to-fit function. Furthermore, the snap-to-fit function was validated in three
scenarios to various occlusion types and rates, the number of segment counts, and the as-built
and as-planned level of mesh detail. The results are promising, demonstrating the effectiveness
and robustness of the proposed snap-to-fit function for VM of the as-built elements and verified
the compatibility of the as-built and as-planned models.

65
4 CHAPTER 4: Automated Compatibility Checking of Prefabricated
Components Using 3D As-built Models and BIM
4.1. Abstract
There have been recent efforts to use reality capture technologies to perform remote quality
control in construction. However, there is a lack of research efforts in detecting construction
incompatibilities in modular construction using reality capture technologies. The construction
incompatibilities in modular construction often cause reworks and delays in the project schedule.
To address this issue, this chapter presents a general compatibility analysis method that propose
scanning the modules in manufacturing plant and construction site, and check module-to-module
compatibility remotely, prior to the shipment and installation. This study provides three sample
module-to-module compatibility scenarios to validate the proposed compatibility analysis. The
case study results show that the compatibility analysis method was able to identify the
compatibility issues with high accuracy. Lastly, the compatibility analysis method was validated
in terms of accuracy and time performance in six scenarios that was defined on the modules.

66
4.2. Introduction
The architecture, engineering, and construction (AEC) industry is among the largest industries in
the U.S., spending over $1.3 trillion in 2019 [162], [163]. In response to rising construction
demand and a severe shortage of skilled labor in the workforce [164], [165], developers and
contractors worldwide are now revisiting the concept of offsite construction, integrating new
technologies and manufacturing approaches, such as robotics and reality capture [166], [167].
Moving major parts of construction into large manufacturing plants introduced new
opportunities, such as global construction, allowing, parts of a module or building components
are produced from different countries where labor and material are cheaper and then shipped to
the construction site [168]–[170]. The Marriott company is finalizing its plans to construct its
latest New York City hotel in just 90 days by manufacturing and shipping modules from Poland
[171]. Moreover, they were able to reduce construction costs by $30 million, decreased project
time by six months. They were also able to cut down the required on-site labor by 70%, which
shows that modular construction can be one way to deal with labor shortage that is affecting the
construction industry in the U.S. [164], [165]. While speed and cost were the primary drivers
behind Marriott’s and many other companies’ use of offsite construction, this approach provides
other benefits. For instance, constructing modules under controlled environments allows quality
to be vastly improved because manufacturing is not affected by weather conditions. Unlike
construction sites that is constantly changing, there is no change in the environment and the
manufacturing facilities covers multiple construction projects without changing their locations,
allowing consistency in quality. Also, prefabrication can significantly reduce waste in the
construction process, limiting the overall environmental impact of construction [172], [173].

67
Despite these benefits, offsite manufacturing often introduces significant challenges that need to
be addressed. One of the challenges in modular construction is module mismatch, which often
causes delays for the whole project [174], [175]. Modules often need to be modified on-site to fix
the incompatibilities, which increase rework and introduce new challenges. If modules are not
repairable on-site, remanufacturing and shipping will lead to even greater delays and cost
overruns. To avoid rework and remanufacturing, researchers suggested using laser scanners and
BIM for quality assessment [176]. The researchers suggested registering the as-built point clouds
of the modules to the BIM and manually or automatically detect geometric defects [176]. Using
this approach, geometric defects can be identified at the manufacturing facility before shipment.
Researchers have applied this concept to various types of modules, such as piping spools [177],
precast concrete modules [178], [179], and industrial modules [176].
The main limitation of the current methods in detecting the geometric defects is that the modules
are investigated individually. However, the defects often occur in module-to-module
incompatibilities, especially when there is a discrepancy or error in the design model. For
example, a piping module may not be compatible with its connecting modules due to changing
site conditions even if each module meets the required geometric standards. To address this
limitation, this chapter presents a construction performance monitoring framework. In this
framework, modules in the manufacturing facilities and the main structure on the project site are
scanned as illustrated in Figure 4.1. The presented semi-automated compatibility assessment
method detects module-to-module incompatibilities prior to the shipment from the
manufacturing sites to the project site.

68
Figure 4.1 Shipping cycle between the manufacturing plant and project site
4.3. Background
The Background section provides summary of existing methods that are relevant to the presented
compatibility checking and quality assessment of as-built components and their applications in
the AEC industry. This section also discusses the potentials of more general compatibility
checking for the construction industry. The background section was categorized based on use
cases of reality capture technologies. Three following subsections in this section are going to
digest the state-of-the-art module quality assessment, are module position checking, module
dimension checking, module defect checking. Then, the las subsection identifies gaps for
implementing a generalized compatibility checking method and the study contributions (listed in
“Gaps in knowledge and study contributions”).
Over the past few years, reality capturing technologies have received significant popularity in the
AEC industry, namely construction progress and performance monitoring [180]–[182], assembly
training [183], construction quantity takeoff [184], [185], safety [186], and inspection [38],
[182], [187]. However, there are still numerous research questions to be investigated. Table 4-1
Summary of using laser scanner for construction applications. summarizes the use cases of
reality capture technology, emphasizing laser scanners in as-built module quality control. Table

69
4-1 identifies the use cases recognized by researchers and states the limitations and
recommendations suggested by each paper.

70
Table 4-1 Summary of using laser scanner for construction applications.
Nam
e Area of work Summary Limitations and recommendations
[188] Rebar diameter
measurement
Machine learning method to predict the
diameter of rebars using 3D point clouds
Challenges in the prediction of small
diameter rebars and the requirement for scan plans for improved predictions
[189] Bridge deformation
detection
Bridge deflection measurement using octree,
voxelization, and 3D point clouds
Low accuracy for measuring deflection
less than four millimeters
[190] Compliance checking in
pipe spool
Detection of deviations in pipe spool by
registration of 3D point clouds to BIM models
Registration deficiencies for symmetrical
objects
[176] Prefabricated MEP
module inspection
Inspection of MEP modules by automatic
registration of 3D point cloud to BIM
Deficiencies in measuring the thickness of the irregular shape elements such as
ventilation ducts
[191] Surface defect detection
in prefabricated
elements
Semi-automated surface defect detection using 3D point clouds and compliance verification
with BIM
Deficiencies with presented dimensionality reduction
and manual supervision requirements
[192] Extracting pipe spool Automated pipe spool detection in cluttered 3D
point clouds Requirement for methods that can quantify
noise in 3D point clouds
[193] Precast concrete
inspection
Quality assessment of precast concrete elements
by combining 3D point clouds and BIM
Restrictions on the uniformity of the
precast element thickness
[194] Precast concrete
inspection Dimensional quality assurance of full-scale
precast concrete elements Requirement for placement of the laser
scanner
[195] Precast concrete
inspection
Automated dimensional quality assessment
technique for precast concrete panels
Restrictions on the uniformity of the
precast element thickness
[196] Construction inspection
Metric quality assessment method to evaluate
whether a built element is within the required
tolerance
Method is restricted to the exterior dimension of elements
[197] Precast concrete
monitoring
Progress monitoring of precast concrete
elements using on-site cameras
Limited range and resolution of on-site
cameras
[198] Pipe radius
measurement Radius detection and estimation from 3D point
clouds using low-cost range cameras Impact of lighting condition has to be
measured
[199] Scaffolding detection Automated detection of scaffolding in 3D point
clouds for progress monitoring
Deficiencies in the 3D reconstruction of
scaffolding using SfM
[200] Rebar position
estimation Estimating the position of rebar in reinforced
precast concrete using machine learning
Lack of a method to detect quality issues
in the rebars and a general quality
assessment method
[192] Pipe spool recognition Automated method for extracting pipe spools
from cluttered 3D point cloud
Need for a method to quantify 3D point
cloud noise
[201] Quality assessment of
industrial assemblies
Automated discrepancy quantification of
construction components
Requirement for automated clutter
removal approach
[202] Pipe spool inspection Quantifying the discrepancies in the
construction assemblies Requirement for accurate and reliable
acquired 3D point clouds as inputs
[177] Pipe spool quality
assessment
Quality management system that can reduce
construction rework Low quality of 3D point clouds
[203]
Concrete steel
embedded plates quality
control
Control the position and dimension of steel plates using 3D point clouds
Requirement for further improvement for achieving full autonomy
[179] Rebar quality
assessment
Automated quality control for rebar size and
position
Requirement for better registration and
optimal laser scanner position
[204] Module quality
assessment Control element dimension in a prefabricated
module Requirement for clarification of tolerance
ranges
[205] Module quality
assessment
Analysis of the accumulation of dimensional
variability in construction assemblies Assumption that all components are rigid
[206] Element recognition Automated recognition of elements in the 3D
point cloud
Suggestion of using 3D point clouds for
automated quality assessment
[207] Element recognition
and quality assessment Automated recognition of elements and
dimension checking More comprehensive dimension checking
required
[178] Precast concrete
inspection Automated shear key dimension inspection Limitation in size of the concrete module
[208] Precast concrete
inspection
Estimation of the dimensions of full-scale
precast concrete bridge deck panels Hardship of data collection process
[209] Prefabricated quality
assessment Concrete staircase quality assessment The algorithm is limited to large modules
[210] Precast concrete
inspection
Assessment of dimension and flatness of
concrete module Laser scanner data can be noisy
[211] Automated coupling
steel beam location
Fully-automated method for locating
replaceable coupling steel beams
Recommended using multiple laser
scanners

71
Module Position Checking
Module misplacement has always been a challenge in construction and studies wanted to
avoid this by employing new technologies that can automatically detect the misplacement [202].
Researchers proposed using point clouds to detect module position mismatch based on scan-to-
BIM registrations in pipe spools [190], however this method works only on uncluttered point
clouds which was later addressed [192]. Beside point clouds, researchers suggested using video
surveillance to detect the position of precast concrete modules [197]. Also, researchers proposed
a technique that can accurately estimate rebar positions on reinforced precast concrete bridge
deck panels [200]. Researchers presents an algorithm for automated discrepancy quantification
of construction components [192], [201].
Module Dimension Checking
In addition to the modules position, module dimensions are another important factor.
Researchers proposed automated systems that uses scan-to-BIM registration to perform
dimensional quality assessment of precast concrete elements [193], [195]. Similar methods,
performed quality assessments on the concrete steel embedded plates [203]. Researchers
expanded the methods to measure rebar sizes [179] and module dimensions [204].
Module Defect Checking
Ultimately, researchers focused on detected module defects such as warping in precast
concrete modules [193] and deflection of the bridges for maintenance [189]. Also, the
researchers developed methods to automatically detect the squareness of shear keys in a precast
concrete module [178]. Lastly, researchers suggested geometric quality inspection technique to
detect defects for prefabricated MEP modules [176] and a framework for surface quality
assessment of precast concrete elements using edge extraction algorithms [193], [195].

72
Gaps in Knowledge and Study Contributions
Gaps: Previous research efforts are only focused on the quality assessment of a single module or
component based on the corresponding BIM model of the same module or component. Meaning
that, even if a module passes quality requirement compared to its design model, there still is a
risk of incompatibility with other connecting parts on the jobsite due to constant changing nature
of construction. The development of compatibility checking system between as-built modules is
challenging since checking the compatibility among 3D scanned models with different geometry,
meshing, and occlusion is inherently dynamic and can vary widely. Also, BIM and scanned
models have a large number of vertices and faces, which may be challenging for near real-time
applications. Moreover, researchers suggested a need for generalized quality assessment
methods that can be applied on various types of modules [200]. Lastly, researchers identified that
the noise and occlusions are two factors that can adversely affect the accuracy of the proposed
quality assessments methods [210].
Contributions: This chapter addresses these challenges by introducing a compatibility checking
method that can calculates the distance between two as-built models and quantifies the gap
between the two for precise compatibility. This method is a generalized method that would work
for different types and shapes of modular/fabricated components. This compatibility method was
tested and validated using three types of offsite manufactured modules.

73
4.4. Method
Figure 4.2 illustrates the overall steps of the developed compatibility checking method. The laser
scanning data from two modules that need to be assembled together is collected using a laser
scanner. An example for such modules can be two mechanical, electrical, and plumbing (MEP)
modules which need to be matched accurately. After data collection, the modules will be
registered to the BIM model. This operation is performed semi-automatically by method similar
to [212]. After registering each module to the corresponding BIM element, the noise of each
point cloud needs to be quantified and removed to make sure the collected point cloud passes the
requirement for compatibility checking. Lastly, a compatibility analysis has been done on both
modules to make sure the modules pass the compatibility requirements. Also, during the
compatibility analysis, the incompatible parts of each module will be highlighted to the user.
Figure 4.2 Method overview and steps
Figure 4.2 shows the overall workflow and provide more detail for each step that was mentioned
in Figure 4.3. The red boxes show the compatibility checking method, the main contributions of
this chapter. The output of this system is going to show whether the two modules are going to be
compatible (i.e., fit, joint, attached as designed) based on the quality threshold selected by the
user.

74
Figure 4.3. Flowchart of the compatibility analysis
Data Collection
This section describes the process of data collection. As-built modeling needs to be performed at
two different places – 1) where a module of interest is manufactured and 2) where this module is
shipped to and assembled. To generate the 3D as-built models of the module and its connecting
part (i.e., building component), a reliable reality capture technology should be used. For instance,
for larger module and building components, a terrestrial laser scanner can be used. For smaller
modules and/or models with very stringent quality requirements, a metrology-grade laser scanner
should be used. The 3D CAD/BIM models of two objects are also needed.
Data Registration
The registration process can use any existing registration method (i.e., automated [213], semi-
automated [214], [215], or manual). For this study, a semi-automated registration was performed
similar to [214], [215]. Six corresponding points (features or markers) were selected from both
BIM and the point cloud in a similar approach to. The corresponding points were used to solve

75
the least square registration problem of absolute orientation for seven degrees-of-freedom [216],
which returns a transformation matrix and a registration error. The transformation matrix is used
to perform a 3D linear transformation [217], [218]. In case of a high registration error, the
registration has to be iterated until the accuracy of the registration reaches below the user
requirement/threshold. Also, other methods can be used for registration including automated
registration using fiduciary markers and surveying coordinates
Noise Quantification, Cancellation, and Occlusion Mapping
In addition to registration, noise is also another essential factor that can affect the compatibility
checking process. Excessive noise can severely affect compatibility checking. Figure 4.4 shows a
sample point cloud that was affected by Gaussian noise with different levels of standard
deviation. It shows that high standard deviation can adversely affect the compatibility, meaning
that the noise cancellation must be applied. The standard deviation should be kept low in
accordance with user quality requirement to make compatibility checking feasible.
Figure 4.4. Generated point clouds with different levels of Gaussian noise for a sample pipe
Figure 4.5 illustrates the process to quantify noise based on point cloud-to-BIM registration.
After they are registered into the same coordinate system, the minimum distance between each

76
point in the point cloud to the BIM is calculated. These minimum distances form a probability
distribution which presents the distribution of noise in the point cloud as illustrated in Figure 4.5.
Figure 4.5. Extraction of noise distribution based on scanned point cloud to BIM
registration.
The noise quantification method operates based on the following mathematical
definitions, operations, and steps that compare BIM and scan models. A point cloud 𝑃𝐶 is defined
as a number of points that consists of (𝑉1, 𝑉2, … , 𝑉𝑛). Each point 𝑉 is created from three values for a
3D coordinate (i.e., x, y, z) and 𝑛 is the total number of points in point cloud 𝑃𝐶 . Similarly, a
CAD/BIM model consists of triangulated planar surfaces/meshes that consists of vertices. Each
face 𝐹 is created by connecting three vertices (𝑉𝑖 , 𝑉𝑗 , 𝑉𝑘). Therefore, a mesh is defined as 𝑀 (𝑉 , 𝐹 ).
Noise is defined as the distance between each point (𝑉𝑖) in the point cloud 𝑃𝐶 1 and the BIM (mesh
𝑀). First, noise mean and standard deviation is computed and the point cloud went through a
noise removal process. To remove any potential noise in the collected point clouds, the
Statistical Outlier Removal (SOR) method [219], [220] was applied. After the noise removal
process, noise mean and standard deviation was calculated another time to ensure that the noise
level is below the selected threshold by the user.

77
Compatibility Analysis
Compatibility of the two modules is checked at each cross section (the interval of the cross
sections can be determined by the users). Cross section planes are going to be in all directions
(i.e., x, y, z) and with selected offset, where a section plane and offset are selected by the users as
illustrated in the Figure 4.6. In other words, offset is the amount that the point cloud is clipped.
The cross section of a point cloud 𝑃𝐶 is defined as follows:
𝑐𝑟𝑜𝑠𝑠 𝑠𝑒𝑐𝑡𝑖𝑜𝑛 = 𝑣 , where 𝑠𝑒𝑐𝑡𝑖𝑜𝑛 − 𝑜𝑓𝑓𝑠𝑒𝑡 < 𝑣 < 𝑠𝑒𝑐𝑡𝑖𝑜𝑛 + 𝑜𝑓𝑓𝑠𝑒𝑡 (Eq 1)
, where v is a point in point cloud, section is the coordinate of section plane, and offset is
coordinate of offset planes as illustrated in Figure 4.6.
Ultimately, the module-to-module distance was checked for each cross section. If the
minimum distance between two modules in each cross section passed the upper and lower
thresholds, the modules are compatible. Otherwise, the modules are marked as incompatible. The
upper bound threshold is the maximum tolerable gap, and the minimum threshold is the
minimum tolerable gap. The lower value for the thresholds corresponds to tighter joint where
higher values of the thresholds correspond to having more gap between the elements. The
proposed compatibility assessment uses the minimum distance (MD) between two modules. The
module-to-module minimum distance (MD) between the two point clouds, 𝑃𝐶 1 and 𝑃𝐶 2, is
defined as follows:
𝑀𝐷 = min(|𝑉𝑖1 − 𝑉𝑗
2| ∶ 𝑖 ∈ {1: 𝑛1} , 𝑗 ∈ {1: 𝑛2}) (Eq 2)
, where 𝑉𝑖1 is a point in point cloud 𝑃𝐶 1 and 𝑉𝑗
2 is a point in point cloud 𝑃𝐶2. Also, 𝑛1 and 𝑛2 are the
number of points in 𝑃𝐶 1 and 𝑃𝐶2 respectively.

78
Figure 4.6. Visualizing the features selected for compatibility analysis.

79
4.5. Experimental Setup and Results
This section summarizes the experimental setup and results. To validate the generalized method,
three modules with different shapes were chosen. The first module is a piping system. This
system was selected as the compatibility of the piping system is a challenge for construction
industry. The distance between the pipes needs to pass inspection based on the construction
codes. During the inspection process, the gap between two pipes is measured and based on codes
and pipe diameter cannot exceed a certain threshold. The second module is a precast concrete
module. The rebars in such modules are often misplaced and require reworks to be fixed. The
third module is a window system. Incompatibility in window systems can cause waste of energy
and rework depending on the amount of gap. Figure 4.7 presents these three compatibility tasks.
Figure 4.7. Sample case studies for compatibility analysis
Two objects per module were selected and scanned. The CAD models of these objects
were also acquired. Figure 4.8 shows the pictures, scanned models, and BIM models of the six
objects. These objects were selected in a way that they can represent challenges (symmetricity,
self-occlusion while scanning, etc.) for the compatibility checking method. The result of the
experiment was generated using an Intel Core i7-6700K with 64 GB of RAM and an Nvidia
GTX 1080 as the graphic card.
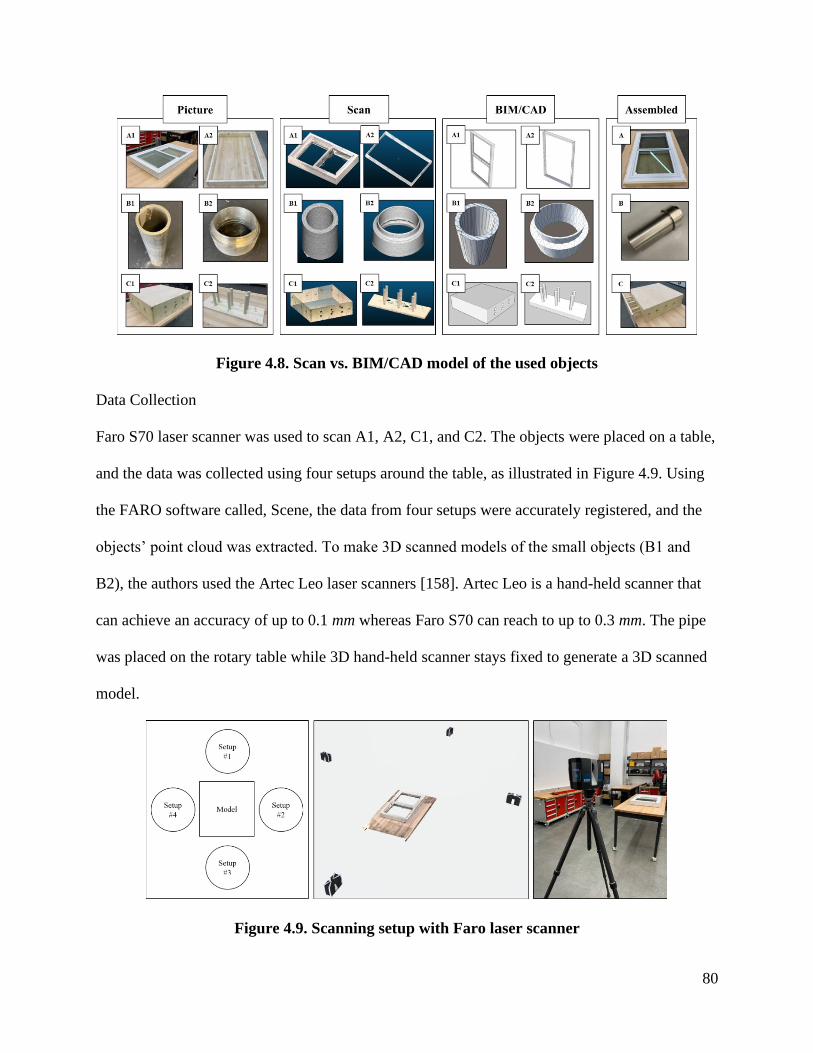
80
Figure 4.8. Scan vs. BIM/CAD model of the used objects
Data Collection
Faro S70 laser scanner was used to scan A1, A2, C1, and C2. The objects were placed on a table,
and the data was collected using four setups around the table, as illustrated in Figure 4.9. Using
the FARO software called, Scene, the data from four setups were accurately registered, and the
objects’ point cloud was extracted. To make 3D scanned models of the small objects (B1 and
B2), the authors used the Artec Leo laser scanners [158]. Artec Leo is a hand-held scanner that
can achieve an accuracy of up to 0.1 mm whereas Faro S70 can reach to up to 0.3 mm. The pipe
was placed on the rotary table while 3D hand-held scanner stays fixed to generate a 3D scanned
model.
Figure 4.9. Scanning setup with Faro laser scanner

81
For each setup, the resolution was set at 1/5, meaning the scan size was chosen as (8192 by 3413
Pt). Therefore, the number of collected points in each setup was 28.0 million points. With this
setting, the point-to-point distance will be 7.7 millimeters at a 10-meter distance. Also, the
quality was selected at 6x, meaning that each point was sample six times to make sure that the
point cloud is accurate and reliable. Lastly, the point clouds are cropped, and the objects’ point
clouds are separated from the surroundings. Table 4-2. Point count and face count of the point
clouds in scan and BIM depicts the number of points in the point cloud (point count) collected
from each element and the number of vertices (vertex count) for their corresponding BIM
models.
Table 4-2. Point count and face count of the point clouds in scan and BIM
Point cloud A1 A2 B1 B2 C1 C2
Face
count BIM 2,532 124 384 448 1,176 1,180
Point
count Scan 254,156 93,835 1,000,026 999,873 193,687 48,114
Data Registration
To register the collected point cloud to the BIM model, six markers were selected from both
BIM and point cloud. Using these points, the BIM model and the point cloud were registered as
described in Section 3.2. Data registration. Table 4-3 shows the error for each marker in the six
collected models in this section. The registration process was iteratively done to make sure that
the registration accuracy was kept under the selected threshold for the compatibility checking.
The results in Table 4-3 show an accuracy of 1-6 mm for registration of point clouds to the
corresponding BIM elements, verifying the manufacturer claim of millimeter accuracy of point
clouds.

82
Table 4-3. Registration error for each marker set on each model in millimeter.
Objects Markers
M1 M2 M3 M4 M5 M6
A1 3.1 2.3 1.1 1.8 2.6 3.4
A2 2.2 2.9 3.9 3.4 1.6 1.2
B1 1.8 3.2 5.3 3.2 1.3 1.7
B2 2.6 1.3 1.6 4.1 1.0 0.6
C1 1.6 2.7 4.0 2.5 0.8 4.9
C2 1.4 2.3 4.9 1.8 5.6 2.5
Noise Quantification, Cancellation, and Occlusion Mapping
This section presents the results of noise quantification and cancellation. Table 4-4 shows the
results of noise cancellation for each point clouds. Noise cancellation step ensures that the point
cloud noise is minimal, and the point clouds are ready for compatibility analysis.
Table 4-4. Model noise specifications after artifact removal (before noise removal)
Objects
A1 A2 B1 B2 C1 C2
Mean
(mm)
12 (58) 18 (76) 8 (16) 6 (22) 15 (34) 14 (31)
Sigma 31 (46) 27 (32) 22 (37) 17 (29) 17 (44) 11 (57)
Compatibility Analysis
The last part of the method is compatibility analysis. The first step of compatibility is to generate
a cross section for each module. The cross-section generation was introduced in the method
section. The two main parameters in generating the point cloud cross section are the position and
direction of the cross-section plane as well as the offset which is selected by the user. Figure 4.10
shows a sample cross section plane and offset for C1.

83
Figure 4.10. Point cloud cross section for C1
The Figure 4.11 shows the extracted cross sections of objects C1 and C2 in x, y, z
direction. The offset is selected as 20 mm. The cross sections will be used to measure minimum
distance between modules and generate occlusion maps that is detailed below.
Figure 4.11. Compatibility cross section for objects C1 and C2
Similarly for each compatibility scenario, cross sections can be generated in x, y, and z
directions. Figure 4.12 shows cross sections of the modules in each compatibility scenarios. In
each scenario, one module cross section was colored in red while the other module was in blue.

84
Figure 4.12. Cross section of each coupling system in each direction
Figure 4.13 shows the occlusion map of the C1 in y direction. The occlusion map
identifies and visualizes the parts of the model that were not scanned (i.e., due to self-occlusion
or site conditions). Therefore, the system does not detect any incompatibilities in the occluded
areas and the user will know the areas that are not checked. This is an inherent limitation of
visual sensors that rely on clear line-of-sight (i.e., terrestrial laser scanner).
Figure 4.13. 2D occlusion map for object C1 in y direction
Table 4-5 shows the results of the compatibility analysis and shows the value of each feature in
each compatibility scenario (A, B, and C). The results of the compatibility analysis can be
approved or rejected based on a user selected threshold. Lastly, the time performance of the
compatibility analysis is reported to assess the computational complexity of the proposed
algorithms. The time performance in scenario B was higher than the other two scenarios due to
the large number of points in the point cloud. The reason why it had significantly more number
of points (as illustrated in Table 4-2) in this object is that the modules in scenario B was scanned

85
using a high precision hand-held laser scanner as opposed to the terrestrial laser scanner for the
other two scenarios.
Table 4-5. Compatibility feature values for each element set and time performance.
Object set
A B C
MD (mm) 4 8 6
MD calculation time (s) 0.76 7.39 0.58
Cross section calculation time (s) 0.243 5.12 0.193
Ultimately, the objects were manipulated in six various scenarios (i.e., scaling one module in one
direction or introducing twist in one module) to test its performance against different as-built
deviations. The compatibility analysis was performed on all these scenarios. Table 4-6 shows
when the compatibility analysis algorithm accurately detected the incompatibilities with various
thresholds and through different compatibility scenarios. Also, Table 4-6 summarizes the type of
manipulation for each scenario (SC1 to 7), compatibility of the two parts, and a figure showing a
cross section per scenario. The compatibility scenarios were manually inspected and the
compatibility decisions were accurate. Lastly, the strength and the limitations of the
compatibility analysis was discussed in the Discussion and future works section.
Table 4-6. Scenarios that compatibility analysis was tested on.
Scenarios
SC1 SC2 SC3 SC4 SC5 SC6
A A B B C C
Thresholds
(mm)
A1 scaled down
1 cm in x and y
directions
A1 rotated 5
degrees in z
direction
B2 rotated 5
degrees in x
direction
B2 scaled
down 1 cm
in x
direction
C2 scaled up
5 cm in y
direction
C2 scaled
down 5cm in
y direction
5 – 10 Incompatible Incompatible Compatible Incompatible Compatible Compatible
10 – 15 Compatible Incompatible Incompatible Incompatible Incompatible Incompatible
15 - 20 Incompatible Incompatible Incompatible Compatible Incompatible Incompatible
Illustration

86
4.6. Discussion and Future Works
The proposed compatibility checking method can be used in several domains as follows. The
first domain can be permitting operations. For example, in the case of concrete pipe installation,
the gap between modules should not exceed a certain threshold based on local codes. The current
methods for performing such operations can be done only after the modules (e.g., pipes) have
been shipped and installed in place. Such procedure can often cause rework in cases where the
required threshold is not met. The second domain is where the modules does not fit in place
which can cause delays and rework to the project. For example, if the rebars do not fit in the
holes in precast concrete modules, the compatibility analysis can easily detect that.
One of the strengths of this method is that any scanning device/technology that meets the user’s
quality requirement can be used. On the other hand, the main limitation of the proposed system is
that the data collection process (i.e., use of terrestrial scanners) is often time consuming. In
future there is a need for devices that can scan components at a much faster rate. Also, noise can
adversely affect the accuracy of the proposed method. Therefore, there is a need for research
efforts that can minimize the amount of noise in the point cloud especially for metallic objects
(or any with reflective surfaces) as metal is one of the commonly used materials in the
construction. Lastly, the processing time of the compatibility analysis is directly correlated with
the number of points in the modules. Therefore, there is a need for methods that can sample point
clouds effectively and reduce the processing time especially for the point clouds that are
generated with high precision hand-held laser scanners.
Figure 4.14 shows an example of how this research fits in practice in complex construction
systems and shows how the process of bringing elements virtually to the facility (could also be a
construction site) and visually inspect and check for compatibility issues before shipping a

87
prefabricated element can be beneficial. During construction, prefabricated components that
arrive on a job site will not have compatibility issues after going through this process. Similarly,
during operation and maintenance, any replacement parts/components (e.g., old steam generator
in a power plant) that will arrive at the facility will not have any compatibility issues. Lastly, this
framework can be beneficial for change orders as any changes in site condition can be scanned
and compatibility with a new component/design can be assessed quickly. A user can simply
proof check the new component even without having access to BIM model or drawings.
Figure 4.14. Sample of complex mechanical systems
4.7. Conclusion
Over the past few years, reality capture technologies have received significant popularity in the
AEC industry, namely construction progress monitoring [180], assembly training [183],
construction quantity takeoff [184], safety [15], [186], and inspection [182]. However, there are
still numerous research questions to be investigated, such as efficient and general compatibility
checking of offsite components. To address this issue and improve the compatibility checking
process, this chapter presents a generalized method for compatibility checking of fabricated
components. The proposed method is a powerful tool in detecting geometric defects and
incompatibilities between modules in modular construction. This compatibility system is robust
to occlusions, noise, and can be applied on various types of point clouds that are captured using

88
different approaches and devices. The system was tested and validated in three different
scenarios and demonstrated the effectiveness and robustness of the proposed method for
compatibility analysis on the as-built elements and verified the compatibility of the as-built
models.

89
5 CHAPTER 5: Performance Monitoring of Modular Construction
through a Virtually Connected Project Site and Offsite Manufacturing
Facilities
5.1. Abstract
Cost overruns and schedule delays as a result of rework have made construction profit marginal.
Much of the research and development has focused on developing new systems to reduce costs
associated with rework. To support the construction industry in lowering fabrication and
construction costs, which will contribute to lowering the overnight construction costs, this
chapter presents the development of an innovative virtual environment to digitally manage
Quality Control (QC) inspections and construction progress and improve supply chain efficiency.
This innovative concept builds upon recent advances in building information modeling (BIM)
and reality capture that utilize the power of 3D laser scanners and camera-equipped drones for
3D image/video processing. We envision this construction performance modeling and simulation
(CPMS) environment will facilitate automated inspections of components and subsystems before
shipping. The presented solution will be embedded into the supply chain loop to ensure ongoing
quality control, simulation of weekly progress and work schedules, and timely decision support
throughout construction.

90
5.2. Introduction
High escalations in overnight construction costs and schedule delays related to rework have made
commercially unattractive. Much of the research and development has focused on developing new reactor
designs with accident tolerant fuels and passive safety systems intended to reduce operating and lifecycle
costs. To support the construction industry in lowering fabrication and construction costs, which
will contribute to lowering the overnight construction costs, this chapter presents monitoring
framework for modular construction that uses a virtual environment to digitally manage Quality
Control (QC) inspections and construction progress and improve supply chain efficiency. This
innovative concept builds upon recent advances in building information modeling (BIM) and
reality capture that utilize the power of 3D laser scanners and camera-equipped drones for 3D
image/video processing. The presented framework will model and simulate construction performance
in a virtual environment, hence denoted hereafter as Construction Performance Modeling and Simulation
(CPMS). CPMS will facilitate decision making through a virtually connected construction site and off-
site facilities. The presented solution will be embedded into the supply chain loop to ensure ongoing
quality control, simulation of weekly progress and work schedules, and timely decision support
throughout construction. The presented solution in this chapter can potentially integrate all the conducted
research in the previous chapters (chapter 2-4) and can be practically used within construction domain.
5.3. System
To initialize the development of virtual environment platform, we created a GitHub repository.
This repository consists of 1) a general ReadMe, which includes the overall guidelines of the
developed platform, 2) all of the developed programs at each stage, 3) all the BIM, images, and
point clouds that were used in this project, and 4) Kanban chart to show the progress of the
platform in detail. In addition to the GitHub repository, we completed the following steps to
develop the virtual environment platform. Figure 5.1 shows an overview of the required steps to

91
develop the framework. This framework has four main sections. The first section is the point
cloud generation. This section includes the process of generating a point cloud from finding
corresponding features from the recorded images in the construction site. The second section is
mesh generation. In this section, the process of converting the point cloud to mesh was
introduced. The third section is camera transformations, where the details of how transformation
matrixes from point cloud generation section were interpreted and converted in a format that is
readable for 3D engines. The final section which is the Unity framework, illustrates how the
framework works and introduces the framework functionalities.
Figure 5.1. Framework overview
Point Cloud Generation
The first step in point cloud generation is data collection. A drone was first flown around a
construction site to take pictures of the project at short time intervals to collect the data. The aim
is to capture images of as much of the project as possible in a flowing pattern around the
construction site. Taking pictures using this method increases the probability of creating a dense
point cloud with as few holes as possible. Once the captured images have been recorded, the
VisualSFM application is applied to the images to reconstruct the project as a point cloud.
VisualSFM is a 3D reconstruction application using structure from motion (SFM). VisualSFM

92
matches the features in the images using a scale-invariant feature transform (SIFT) feature
detection algorithm. VisualSFM performs a sparse reconstruction, bundle adjustment, and dense
reconstruction of the project depicted in the images. In this process, the reconstructed location of
each shared feature, each point in the resultant point cloud, and the camera intrinsic and extrinsic
properties for each image are determined and logged to a “bundle.out” file. This file is later
parsed to determine each camera’s location and viewing direction. After dense reconstruction,
the workspace information of the reconstruction is saved using an NVM format. This file will
later be used to import the SFM reconstruction environment to other applications.
Camera Transformations
The camera parameters were determined by VisualSFM and logged to a “bundle.out” file. A
Bundle file contains the estimated scene and camera geometry from the reconstruction. Each
camera entry includes the estimated camera intrinsic and extrinsic values. To read and parse the
data from the “bundle.out” file, a MATLAB script was written to parse the “bundle.out” file and
store the camera parameters in a structured array. The parameters are now in a for that can be
used to calculate the parameters we need to plot the images in Unity. Bundler’s manual contains
the formulas to calculate the viewing direction and position of a camera from its extrinsic
properties.
Unity Framework
Now that the camera parameters are stored in a CSV file, Unity C# scripts were written to plot
the images and to be able to move the field of view to each image. To plot the images, the CSV
file was read, and a game object was instantiated with the position and look at the direction of
each camera. The look at vector was then multiplied by the focal length of the camera and a scale
factor. The image position was found by adding this resultant vector to the camera’s position,

93
and another game object was instantiated. The Unity project now contained a game object for
each camera and image used for the reconstruction. To apply the image to the game object, a
Unity material was created for each of the images. In the plotter script, the corresponding
material was applied to the image game object. When an image number is selected from the
dropdown menu (see Unity framework section), the Unity camera is translated, and the look at
direction is transformed to the corresponding camera game object. This transformation will
display the image aligned with the point cloud or mesh. The developed framework has the
following main features.
• A real image can be selected from section 1 in Figure 5.2. The photos which were used in
VisualSFM were transferred and aligned with BIM and point clouds automatically using
MATLAB and unity scripts (further details can be found in the camera transformations
section). (box 1 in Figure 5.2)
• The BIM and image can be turned on and off for better visualization and improving the
user experience. (box 2 in Figure 5.2)
• The framework can switch between point clouds and meshes for better visualization (box
3 in Figure 5.2)
• A timeline was designed so the user can move the slider to the required time point. Each
time point will render the corresponding point cloud and the BIM model. Furthermore, at
each time point, BIM uses four colors on each element to show the schedule. The BIM
was color-coded into four primary colors. Opaque white color on BIM elements means
that the construction of the parts is completed. Transparent white color means the element
has not been constructed yet, and the construction time of that element has not reached

94
according to the schedule. Green means the element is under construction, and the
construction is ahead of schedule, and red means the element is under construction, but
the construction is behind schedule. (box 7 in Figure 5.2)
• To show how many points are rendered in each frame and the number of frames rendered
per second in a separate window (box 8 in Figure 5.2)
• This framework can show each BIM element and the related information (box 4,5, and 6
in Figure 5.2)
Figure 5.2. Interface sections
Figure 5.3 shows an overview of a user using the framework. In Figure 5.3(A), a user selects
image number 404 from the dropdown button on the top left of the picture. In Figure 5.3(B), the
user turns off the image toggle to see the mesh instead of the image. In Figure 5.3(C), the user
disables the BIM to see the mesh. Figure 5.3(D) shows how the user can change meshes to point
cloud, and Figure 5.3(E) and (F) show the point cloud alignment with the BIM and the images.

95
Figure 5.3. Examples of image rendering
Point Cloud Specifications
Figure 5.4. Examples of the point clouds generated using Pix4D pipeline
The details of the five models that were used in our framework described in Table 5-1. The
average rendered points are 5 million, and the average image used to generate the point clouds is

96
465 images. Furthermore, the average file size of the models is 223 MB. Figure 5.4 shows the
five point clouds.
Table 5-1. Point clouds specifications
Models Point number File size (KB) Image number
1 16,150,468 236,580 360
2 18,646,503 273,143 377
3 16,703,296 244,678 442
4 13,934,706 204,122 454
5 10,851,989 158,965 692
Average 15,257,392 223,498 465
Compatibility Check
We added compatibility check mode as a new feature to the framework. To enter this mode, we
added a button as demonstrated in Figure 5.5. By clicking on this button, the user will move to
the compatibility mode where the user can check the compatibility of manufactured modules in
manufacturing plants with the as-built and as-planned models before shipping the actual modules
to the construction site.
Figure 5.5. Procedure to switch into compatibility mode

97
Inside compatibility mode, the user can see three main components. The components are
demonstrated in Figure 5.6. The first component is shown in the top right corner of Figure 5.6.
This component is controlling the position and rotation of the module that is brought virtually to
the as-built model for compatibility checks. The second component is shown in the bottom right
corner of Figure 5.6. Using this window, the user can select the remote module and the
information of the module is going to be demonstrated according to the selection. The user can
bring the selected element to the as-built model for performing compatibility checks by clicking
on “virtually bring element.” Lastly, the component in the bottom left corner of Figure 5.6 is
responsible for showing the corresponding BIM element of the remote module that was selected
previously. Also, the user can move out of compatibility mode by clicking on “view mode.”
Figure 5.6. Compatibility mode options
Figure 5.7 shows the procedure for selecting the remote module. By selecting a module, the
framework automatically finds the corresponding as-planned component with the same ID and
shows the BIM element in the bottom left corner of the screen, as shown in Figure 5.7.

98
Figure 5.7. Module selection in compatibility mode
After the user selects the element and clicks on “virtually bring element” in Figure 5.6 and
Figure 5.7, the framework will automatically zoom to the position of the element in the model.
The framework brings the remote module and places it in the corresponding BIM element
position, as illustrated in Figure 5.8. This position is not necessarily accurate and depends on the
process of laser scanning. The position and rotation of the element can be modified using the
buttons on the top right corner of the screen in Figure 5.8.
Figure 5.8. Visual inspection of an offsite module

99
After fine-tuning the position and rotation of the remote module, the inspection process can be
done, as shown in Figure 5.9. The user can move and virtually inspect the joints and
compatibility of the scanned module with an as-built model, and after approval, the module can
be sent to the site.
Figure 5.9. Fine-tuning the position of the off-site module for enhanced inspection
Challenges and Limitations
The challenges and limitations for developing a point cloud viewer and compatibility checking
framework in Unity 3D can be classified into the following sections.
1) Different coordinate systems: Pix4D and 3D engines such as Unity use different
coordinate systems. One of the challenges of this framework was aligning the two
coordinate systems. This task can be challenging since the details of how the points
stored in the database had to be identified manually, and the proper conversion had to be
developed accordingly.

100
2) Point size: the current version of the viewer does not support changing the point size. To
address this limitation, proper shader must be developed and implemented in the project.
This task can be quite challenging since the developed shader has to be both efficient in
terms of required computations and error-prone to be used in the 3D engine.
3) A large number of BIM elements: the number of BIM elements can be quite large.
However, dropdown buttons in the user interface can show a limited number of options
without lowering the performance or frame per second (FPS). To address this
inefficiency, a solution has to be implemented to improve the efficiency of the dropdown
button.
5.4. Conclusion
This chapter presents a monitoring framework for modular construction. It presents major
components of the presented CPMS, including as-built modeling at the main project site and off-
site facilities, data captures through advances in robotics and computer vision, and virtual
environment that visualizes as-built models and as-planned BIM. The presented CPMS will
allow visualization of actual construction progress compared against plans (4D BIM). As 4D
BIM has embedded construction schedule, reasoning about the dependencies of construction
activities along with the compared progress will allow traveling back in time to identify root-
causes and forward in time to identify potential issues. CPMS has the potential to serve as a
monitoring and digital data management solution that can serve all stakeholders of the
construction, including owners, construction managers, general contractors, subcontractors, and
venders.

101
6 CHAPTER 6: Conclusion and Future Works
6.1. Conclusion
Over the past few years, AR/VR technologies have received significant popularity in the AEC
industry, specifically in construction safety training, assembly training, construction design
review, and inspection. However, there are still numerous research questions to be investigated,
such as efficient AR/VR interaction hardware and software, AR/VR fusion with physiological
sensors, and AR/VR usage for construction inspection. The focus of the first part of this research
is to provide a combination of visual search and brain wave analyses that offers safety trainers
valuable information. Through a feature selection process, the first study discovered 13 best EEG
and eye tracking features that are related to hazard recognition. It presented an approach for
extracting features from high-frequency EEG and eye-tracking data, and pointed out the
feasibility of analyzing these features, even though the data sets generated can be quite large.
The proposed system can be used for data collection in a simulated environment and potentially
make data collection easier. According to the study findings, high cognitive loads in an occipital
lobe within the brain correlate with successful visual hazard recognition. This conclusion
matches findings from the neuroscience literature showing that activity in occipital lobe channels
(e.g., O1 and O2) correlate with a sense of danger (Joseph 1990; Mesulam 2000; Walker et al.
2007). Eye tracking and EEG provide deep insights into how a worker’s brain and eye react
during visual search. Analyzing both eye movement and brain waves in an integrated platform
can lead to higher classification accuracy, showing that combined EEG and eye-tracking signals
(93% accuracy) are more sophisticated predictors of awareness of surrounding hazards when
compared with the accuracy achieved by EEG (83%) or that achieved by eye tracking (74%)
independently. These findings have important implications for construction research and

102
practice. Specifically, they can enhance current safety training programs (and ongoing research
efforts) by assessing worker biometrics in real time to provide personalized feedback. Several
lessons emerged from this study. For instance, combining EEG and eye-tracking sensors with
VR is an important breakthrough for safety researchers because they can simulate custom safety
scenarios and have a predictive measure of workers’ ability to recognize different hazard types.
The are three significant directions in which future studies may go. First, researchers might use
this platform to correlate arousal, valence, and hazard recognition performance. Second, they
may use the proposed platform in identifying hazard types that correlate with high arousal and
valence. And third, they can extend the platform to correlate EEG cognitive load with hazard
recognition skills to determine low mental cognitive load situations on the construction site.
The second part of this thesis focuses on improving the AR/VR interaction. The second study
presents a detailed comparison of the state-of-the-art image-based, infrared-based, and magnetic-
based VM systems. Also, the second part of this study proposes a novel snap-to-fit function that
assesses and performs the compatibility of as-built and as-planned models in real-time. The
results of this study show that the magnetic-based VM system outperformed both image based
and infrared-based VM systems. Also, the results demonstrated that a user could automatically
check the compatibility of as-built and as-planned models using the snap-to-fit function.
Furthermore, the snap-to-fit function was validated in three scenarios to various occlusion types
and rates, the number of segment counts, and the as-built and as-planned level of mesh detail.
The results are promising, demonstrating the effectiveness and robustness of the proposed snap-
to-fit function for VM of the as-built elements and verified the compatibility of the as-built and
as-planned models.

103
Ultimately, the last study extends the second study by proposing a new compatibility checking
method that can check the compatibility between as-built models. This method is useful in
scenarios where one construction module in built in the manufacturing facility and shipped to the
construction site. In such projects, as-built models of the module and construction site can be
captured, and compatibility of the modules can be investigated prior to the module shipment. The
compatibility method can ultimately avoid cost and schedule overruns as it can potentially
reduce rework.
6.2. Future Research
Although the AEC industry is far behind other industries such as healthcare and retail in
adopting AR/VR technologies in the research literature, the results of this study showed that
AEC industry is changing its previous path towards utilizing these technologies [83]. The
industry experts foresee strong growth in the use of AR/VR technologies over the next 5 to 10
years [83]. However, to address the limitations of AR/VR technologies, several deficiencies
needs to be addressed by future researchers. For instance, there is no robust approach for
transferring all BIM information along with cost data into a VR platform. Importing BIM models
into a 3D engine is a challenge because some of the building information (i.e., material library)
might be lost during the export and import process. Moreover, connecting several VR headsets to
enable a group meeting in a virtual space can enhance and improve communications among
stakeholders. These problems have to be solved in order to convince the AEC industry to spend
more money on the development and adoption in this area. Besides, with recent advancements in
mobile augmented reality and machine learning, it is expected that AR head-mounted displays
provide a better assistant to project teams during the construction phase (e.g., real-time safety

104
feedback, progress monitoring) or facility managers during the operation phase (e.g., sensor data
visualization, energy simulations) in comparison to VR tools.
In addition to AR/VR, in future, researchers should focus on producing high quality point clouds
for improved as-built inspection. Also, as the size of the as-built models generated by reality
capture technologies can be quite large, new methods are required to minimize the data size
while maintaining a high-quality point cloud that can be used for inspection. Furthermore, noise
can often introduce challenges for as-built point cloud inspection. Therefore, new methods are
required to remove or minimalize noise in the as-built point clouds.

105
7 REFERENCES
[1] M. Yalcinkaya and V. Singh, “Automation in Construction Patterns and trends in Building
Information Modeling ( BIM ) research : A Latent Semantic Analysis,” Autom. Constr.,
vol. 59, pp. 68–80, 2015, doi: 10.1016/j.autcon.2015.07.012.
[2] R. Volk, J. Stengel, and F. Schultmann, “Automation in Construction Building
Information Modeling ( BIM ) for existing buildings — Literature review and future
needs,” Autom. Constr., vol. 38, pp. 109–127, 2014, doi: 10.1016/j.autcon.2013.10.023.
[3] K. Asadi and K. Han, “Real-Time Image-to-BIM Registration Using Perspective
Alignment for Automated Construction Monitoring,” in Construction Research Congress,
Mar. 2018, vol. 2017-June, doi: 10.1061/9780784481264.038.
[4] K. Asadi et al., “Vision-based integrated mobile robotic system for real-time applications
in construction,” Autom. Constr., vol. 96, pp. 470–482, Dec. 2018, doi:
10.1016/J.AUTCON.2018.10.009.
[5] K. Asadi et al., “Vision-based Obstacle Removal System for Autonomous Ground
Vehicles Using a Robotic Arm,” in Computing in Civil Engineering 2019, Jun. 2019, pp.
328–335, doi: 10.1061/9780784482438.042.
[6] NBS Organization, “National BIM Report,” Natl. BIM Rep., pp. 1–28, 2018, doi:
10.1017/CBO9781107415324.004.
[7] H. Y. Chong, R. Lopez, J. Wang, X. Wang, and Z. Zhao, “Comparative Analysis on the
Adoption and Use of BIM in Road Infrastructure Projects,” J. Manag. Eng., vol. 32, no. 6,
Nov. 2016, doi: 10.1061/(ASCE)ME.1943-5479.0000460.
[8] L. Liao and E. Ai Lin Teo, “Organizational Change Perspective on People Management in
BIM Implementation in Building Projects,” J. Manag. Eng., vol. 34, no. 3, May 2018, doi:

106
10.1061/(ASCE)ME.1943-5479.0000604.
[9] A. Ghaffarianhoseini et al., “Building Information Modelling (BIM) uptake: Clear
benefits, understanding its implementation, risks and challenges,” Renew. Sustain. Energy
Rev., vol. 75, pp. 1046–1053, Aug. 2017, doi: 10.1016/J.RSER.2016.11.083.
[10] J. Du, Y. Shi, Z. Zou, and D. Zhao, “CoVR: Cloud-Based Multiuser Virtual Reality
Headset System for Project Communication of Remote Users,” J. Constr. Eng. Manag.,
vol. 144, no. 2, p. 04017109, Feb. 2018, doi: 10.1061/(ASCE)CO.1943-7862.0001426.
[11] X. Wang, P. E. D. Love, M. J. Kim, C. S. Park, C. P. Sing, and L. Hou, “A conceptual
framework for integrating building information modeling with augmented reality,” Autom.
Constr., vol. 34, pp. 37–44, 2013, doi: 10.1016/j.autcon.2012.10.012.
[12] M. Noghabaei, K. Asadi, and K. Han, “Virtual Manipulation in an Immersive Virtual
Environment: Simulation of Virtual Assembly,” Comput. Civ. Eng. Vis. Inf. Model.
Simul., pp. 95–102, Jun. 2019, doi: 10.1061/9780784482421.013.
[13] F. Biocca and M. R. Levy, Communication in the age of virtual reality. Routledge, 2013.
[14] C. S. Dossick, A. Anderson, R. Azari, J. Iorio, G. Neff, and J. E. Taylor, “Messy Talk in
Virtual Teams: Achieving Knowledge Synthesis through Shared Visualizations,” J.
Manag. Eng., vol. 31, no. 1, p. A4014003, Jan. 2015, doi: 10.1061/(ASCE)ME.1943-
5479.0000301.
[15] M. Noghabaei, K. Han, and A. Albert, “Feasibility Study to Identify Brain Activity and
Eye-Tracking Features for Assessing Hazard Recognition Using Consumer-Grade
Wearables in an Immersive Virtual Environment,” J. Constr. Eng. Manag., vol. 147, no.
9, p. 04021104, Jul. 2021, doi: 10.1061/(ASCE)CO.1943-7862.0002130.
[16] M. Noghabaei and K. Han, “Hazard recognition in an immersive virtual environment:

107
Framework for the simultaneous analysis of visual search and EEG patterns,” Constr. Res.
Congr., 2020, doi: https://doi.org/10.1061/9780784482865.099.
[17] L. P. Berg and J. M. Vance, “Industry use of virtual reality in product design and
manufacturing: a survey,” Virtual Real., vol. 21, no. 1, pp. 1–17, Mar. 2017, doi:
10.1007/s10055-016-0293-9.
[18] S. Choi, K. Jung, and S. Do Noh, “Virtual reality applications in manufacturing industries:
Past research, present findings, and future directions,” Concurr. Eng., vol. 23, no. 1, pp.
40–63, Mar. 2015, doi: 10.1177/1063293X14568814.
[19] S. G. Dacko, “Enabling smart retail settings via mobile augmented reality shopping apps,”
Technol. Forecast. Soc. Change, vol. 124, pp. 243–256, Nov. 2017, doi:
10.1016/J.TECHFORE.2016.09.032.
[20] F. Bonetti, G. Warnaby, and L. Quinn, “Augmented Reality and Virtual Reality in
Physical and Online Retailing: A Review, Synthesis and Research Agenda,” Springer,
Cham, 2018, pp. 119–132.
[21] H. Zhang, “Head-mounted display-based intuitive virtual reality training system for the
mining industry,” Int. J. Min. Sci. Technol., vol. 27, no. 4, pp. 717–722, Jul. 2017, doi:
10.1016/J.IJMST.2017.05.005.
[22] S. Pedram, P. Perez, S. Palmisano, and M. Farrelly, “Evaluating 360-Virtual Reality for
Mining Industry’s Safety Training,” Springer, Cham, 2017, pp. 555–561.
[23] Z. Merchant, E. T. Goetz, L. Cifuentes, W. Keeney-kennicutt, and J. Davis, “Computers &
Education Effectiveness of virtual reality-based instruction on students ’ learning
outcomes in K-12 and higher education : A meta-analysis,” Comput. Educ., vol. 70, pp.
29–40, 2014, doi: 10.1016/j.compedu.2013.07.033.

108
[24] M. Zhang, Z. Zhang, Y. Chang, E. Aziz, S. Esche, and C. Chassapis, “Recent
Developments in Game-Based Virtual Reality Educational Laboratories Using the
Microsoft Kinect,” Int. J. Emerg. Technol. Learn., vol. 13, no. 1, pp. 138–159, 2018, doi:
https://doi.org/10.3991/ijet.v13i01.7773.
[25] S. Greenwald et al., “Technology and applications for collaborative learning in virtual
reality,” 2017. https://uwe-repository.worktribe.com/output/886338 (accessed Dec. 03,
2020).
[26] W. S. Khor, B. Baker, K. Amin, A. Chan, K. Patel, and J. Wong, “Augmented and virtual
reality in surgery — the digital surgical environment : applications , limitations and legal
pitfalls,” vol. 4, no. 23, pp. 1–10, 2016, doi: 10.21037/atm.2016.12.23.
[27] S. de Ribaupierre, B. Kapralos, F. Haji, E. Stroulia, A. Dubrowski, and R. Eagleson,
“Healthcare training enhancement through virtual reality and serious games,” Virtual,
Augment. Real. Serious Games Healthc., pp. 9–27, 2014, doi: 10.1007/978-3-642-54816-
1_2.
[28] A. Atwal, A. Money, and M. Harvey, “Occupational therapists’ views on using a virtual
reality interior design application within the pre-discharge home visit process,” J. Med.
Internet Res., vol. 16, no. 12, 2014, doi: 10.2196/jmir.3723.
[29] X. Li, W. Yi, H. Chi, X. Wang, and A. P. C. Chan, “Automation in Construction A critical
review of virtual and augmented reality ( VR / AR ) applications in construction safety,”
Autom. Constr., vol. 86, no. July 2016, pp. 150–162, 2018, doi:
10.1016/j.autcon.2017.11.003.
[30] D. Paes, E. Arantes, and J. Irizarry, “Immersive environment for improving the
understanding of architectural 3D models: Comparing user spatial perception between

109
immersive and traditional virtual reality systems,” Autom. Constr., vol. 84, pp. 292–303,
Dec. 2017, doi: 10.1016/J.AUTCON.2017.09.016.
[31] J. Fogarty, J. McCormick, and S. El-Tawil, “Improving Student Understanding of
Complex Spatial Arrangements with Virtual Reality,” J. Prof. Issues Eng. Educ. Pract.,
vol. 144, no. 2, p. 04017013, Apr. 2018, doi: 10.1061/(ASCE)EI.1943-5541.0000349.
[32] S. Niu, W. Pan, and Y. Zhao, “A virtual reality integrated design approach to improving
occupancy information integrity for closing the building energy performance gap,”
Sustain. Cities Soc., vol. 27, pp. 275–286, 2016, doi: 10.1016/j.scs.2016.03.010.
[33] S. Alizadehsalehi, A. Hadavi, and J. C. Huang, “From BIM to extended reality in AEC
industry,” Autom. Constr., vol. 116, p. 103254, Aug. 2020, doi:
10.1016/j.autcon.2020.103254.
[34] S. Alizadehsalehi, A. Hadavi, and J. C. Huang, “BIM/MR-Lean Construction Project
Delivery Management System,” IEEE Technol. Eng. Manag. Conf., pp. 1–6, Jun. 2019,
doi: 10.1109/TEMSCON.2019.8813574.
[35] M. Kamari and Y. Ham, “Automated filtering big visual data from drones for enhanced
visual analytics in construction,” in Construction Research Congress 2018: Construction
Information Technology - Selected Papers from the Construction Research Congress
2018, 2018, vol. 2018-April, pp. 398–409, doi: 10.1061/9780784481264.039.
[36] Y. Ham and M. Kamari, “Automated content-based filtering for enhanced vision-based
documentation in construction toward exploiting big visual data from drones,” Autom.
Constr., vol. 105, p. 102831, Sep. 2019, doi: 10.1016/j.autcon.2019.102831.
[37] E. Z. Berglund et al., “Smart Infrastructure: A Vision for the Role of the Civil
Engineering Profession in Smart Cities,” J. Infrastruct. Syst., vol. 26, no. 2, Jun. 2020,

110
doi: 10.1061/(ASCE)IS.1943-555X.0000549.
[38] M. Farhadmanesh, C. Cross, A. H. Mashhadi, A. Rashidi, and J. Wempen, “Highway
Asset and Pavement Condition Management using Mobile Photogrammetry,” Transp. Res.
Rec. J. Transp. Res. Board, p. 036119812110018, Mar. 2021, doi:
10.1177/03611981211001855.
[39] I. Jeelani, K. Han, and A. Albert, “Development of Immersive Personalized Training
Environment for Construction Workers,” Comput. Civ. Eng. 2017, vol. 2017-June, pp.
407–415, Jun. 2017, doi: 10.1061/9780784480830.050.
[40] S. Bahn, “Workplace hazard identification and management: The case of an underground
mining operation,” Saf. Sci., vol. 57, 2013, doi: 10.1016/j.ssci.2013.01.010.
[41] A. Perlman, R. Sacks, and R. Barak, “Hazard recognition and risk perception in
construction,” Saf. Sci., vol. 64, pp. 22–31, Apr. 2014, doi: 10.1016/J.SSCI.2013.11.019.
[42] O. Rozenfeld, R. Sacks, Y. Rosenfeld, and H. Baum, “Construction Job Safety Analysis,”
Saf. Sci., vol. 48, no. 4, pp. 491–498, Apr. 2010, doi: 10.1016/J.SSCI.2009.12.017.
[43] H. Li, M. Lu, G. Chan, and M. Skitmore, “Proactive training system for safe and efficient
precast installation,” Autom. Constr., vol. 49, pp. 163–174, Jan. 2015, doi:
10.1016/J.AUTCON.2014.10.010.
[44] D. Zhao and J. Lucas, “Virtual reality simulation for construction safety promotion,” Int.
J. Inj. Contr. Saf. Promot., vol. 22, no. 1, pp. 57–67, Jan. 2015, doi:
10.1080/17457300.2013.861853.
[45] S. Hwang, H. Jebelli, B. Choi, M. Choi, and S. Lee, “Measuring Workers’ Emotional
State during Construction Tasks Using Wearable EEG,” J. Constr. Eng. Manag., vol. 144,
no. 7, p. 04018050, Jul. 2018, doi: 10.1061/(ASCE)CO.1943-7862.0001506.

111
[46] S. Hasanzadeh, B. Esmaeili, and M. D. Dodd, “Measuring the Impacts of Safety
Knowledge on Construction Workers’ Attentional Allocation and Hazard Detection Using
Remote Eye-Tracking Technology,” J. Manag. Eng., vol. 33, no. 5, pp. 1–17, 2017, doi:
10.1061/(ASCE)ME.1943-5479.0000526.
[47] I. Jeelani, A. Albert, R. Azevedo, and E. J. E. J. Jaselskis, “Development and Testing of a
Personalized Hazard-Recognition Training Intervention,” J. Constr. Eng. Manag., vol.
143, no. 5, p. 04016120, May 2017, doi: 10.1061/(ASCE)CO.1943-7862.0001256.
[48] J. E. Walker, G. P. Kozlowski, and R. Lawson, “A Modular Activation/Coherence
Approach to Evaluating Clinical/QEEG Correlations and for Guiding Neurofeedback
Training: Modular Insufficiencies, Modular Excesses, Disconnections, and
Hyperconnections,” J. Neurother., vol. 11, no. 1, pp. 25–44, Jun. 2007, doi:
10.1300/J184v11n01_03.
[49] M. Mesulam, Principles of behavioral and cognitive neurology. 2000.
[50] R. Joseph, Neuropsychology, neuropsychiatry, and behavioral neurology. 2013.
[51] N. Chumerin, N. V. Manyakov, M. Van Vliet, A. Robben, A. Combaz, and M. M. Van
Hulle, “Steady-state visual evoked potential-based computer gaming on a consumer-grade
EEG device,” IEEE Trans. Comput. Intell. AI Games, vol. 5, no. 2, pp. 100–110, 2013,
doi: 10.1109/TCIAIG.2012.2225623.
[52] M. Van Vliet, A. Robben, N. Chumerin, N. V. Manyakov, A. Combaz, and M. M. Van
Hulle, “Designing a brain-computer interface controlled video-game using consumer
grade EEG hardware,” 2012, doi: 10.1109/BRC.2012.6222186.
[53] Y. Liu et al., “Implementation of SSVEP based BCI with Emotiv EPOC,” in Proceedings
of IEEE International Conference on Virtual Environments, Human-Computer Interfaces,

112
and Measurement Systems,VECIMS, 2012, pp. 34–37, doi:
10.1109/VECIMS.2012.6273184.
[54] S. Wang, J. Gwizdka, and W. A. Chaovalitwongse, “Using Wireless EEG Signals to
Assess Memory Workload in the n-Back Task,” IEEE Trans. Human-Machine Syst., vol.
46, no. 3, pp. 424–435, Jun. 2016, doi: 10.1109/THMS.2015.2476818.
[55] M. P. Barham, G. M. Clark, M. J. Hayden, P. G. Enticott, R. Conduit, and J. A. G. Lum,
“Acquiring research-grade ERPs on a shoestring budget: A comparison of a modified
Emotiv and commercial SynAmps EEG system,” Psychophysiology, vol. 54, no. 9, pp.
1393–1404, Sep. 2017, doi: 10.1111/psyp.12888.
[56] A. S. Elsawy, S. Eldawlatly, M. Taher, and G. M. Aly, “Performance analysis of a
Principal Component Analysis ensemble classifier for Emotiv headset P300 spellers,” in
2014 36th Annual International Conference of the IEEE Engineering in Medicine and
Biology Society, EMBC 2014, Nov. 2014, pp. 5032–5035, doi:
10.1109/EMBC.2014.6944755.
[57] Y. P. Lin, Y. Wang, and T. P. Jung, “Assessing the feasibility of online SSVEP decoding
in human walking using a consumer EEG headset,” J. Neuroeng. Rehabil., vol. 11, no. 1,
p. 119, Aug. 2014, doi: 10.1186/1743-0003-11-119.
[58] A. Saha, A. Konar, A. Chatterjee, A. Ralescu, and A. K. Nagar, “EEG analysis for
olfactory perceptual-ability measurement using a recurrent neural classifier,” IEEE Trans.
Human-Machine Syst., vol. 44, no. 6, pp. 717–730, Dec. 2014, doi:
10.1109/THMS.2014.2344003.
[59] R. M. Mehmood, R. Du, and H. J. Lee, “Optimal feature selection and deep learning
ensembles method for emotion recognition from human brain EEG sensors,” IEEE

113
Access, vol. 5, pp. 14797–14806, 2017, doi: 10.1109/ACCESS.2017.2724555.
[60] M. H. Bhatti et al., “Soft Computing-Based EEG Classification by Optimal Feature
Selection and Neural Networks,” IEEE Trans. Ind. Informatics, vol. 15, no. 10, pp. 5747–
5754, Oct. 2019, doi: 10.1109/TII.2019.2925624.
[61] P. Aspinall, P. Mavros, R. Coyne, and J. Roe, “The urban brain: Analysing outdoor
physical activity with mobile EEG,” Br. J. Sports Med., vol. 49, no. 4, pp. 272–276, Feb.
2015, doi: 10.1136/bjsports-2012-091877.
[62] A. F. Perez Vidal, M. A. Oliver Salazar, and G. Salas Lopez, “Development of a Brain-
Computer Interface Based on Visual Stimuli for the Movement of a Robot Joints,” IEEE
Lat. Am. Trans., vol. 14, no. 2, pp. 477–484, Feb. 2016, doi: 10.1109/TLA.2016.7437182.
[63] D. Wu, “Online and Offline Domain Adaptation for Reducing BCI Calibration Effort,”
IEEE Trans. Human-Machine Syst., vol. 47, no. 4, pp. 550–563, Aug. 2017, doi:
10.1109/THMS.2016.2608931.
[64] A. J. Casson and E. V. Trimble, “Enabling Free Movement EEG Tasks by Eye Fixation
and Gyroscope Motion Correction: EEG Effects of Color Priming in Dress Shopping,”
IEEE Access, vol. 6, pp. 62975–62987, 2018, doi: 10.1109/ACCESS.2018.2877158.
[65] D. He, B. Donmez, C. C. Liu, and K. N. Plataniotis, “High Cognitive Load Assessment in
Drivers Through Wireless Electroencephalography and the Validation of a Modified N-
Back Task,” IEEE Trans. Human-Machine Syst., vol. 49, no. 4, pp. 362–371, Aug. 2019,
doi: 10.1109/THMS.2019.2917194.
[66] S. Ergan, A. Radwan, Z. Zou, H. Tseng, and X. Han, “Quantifying Human Experience in
Architectural Spaces with Integrated Virtual Reality and Body Sensor Networks,” J.
Comput. Civ. Eng., vol. 33, no. 2, p. 04018062, Mar. 2019, doi: 10.1061/(ASCE)CP.1943-

114
5487.0000812.
[67] R. N. Khushaba, C. Wise, S. Kodagoda, J. Louviere, B. E. Kahn, and C. Townsend,
“Consumer neuroscience: Assessing the brain response to marketing stimuli using
electroencephalogram (EEG) and eye tracking,” Expert Syst. Appl., vol. 40, no. 9, pp.
3803–3812, Jul. 2013, doi: 10.1016/J.ESWA.2012.12.095.
[68] A. S. Azevedo, J. Jorge, and P. Campos, “Combining EEG data with place and plausibility
responses as an approach to measuring presence in outdoor virtual environments,”
Presence Teleoperators Virtual Environ., vol. 23, no. 4, pp. 354–368, Nov. 2014, doi:
10.1162/PRES_a_00205.
[69] C. G. Coogan and B. He, “Brain-Computer Interface Control in a Virtual Reality
Environment and Applications for the Internet of Things,” IEEE Access, vol. 6, pp.
10840–10849, Feb. 2018, doi: 10.1109/ACCESS.2018.2809453.
[70] D. Wang, H. Li, and J. Chen, “Detecting and measuring construction workers’ vigilance
through hybrid kinematic-EEG signals,” Autom. Constr., vol. 100, pp. 11–23, Apr. 2019,
doi: 10.1016/J.AUTCON.2018.12.018.
[71] J. Chen, X. Song, and Z. Lin, “Revealing the ‘Invisible Gorilla’ in construction:
Estimating construction safety through mental workload assessment,” Autom. Constr., vol.
63, pp. 173–183, Mar. 2016, doi: 10.1016/J.AUTCON.2015.12.018.
[72] D. Wang, J. Chen, D. Zhao, F. Dai, C. Zheng, and X. Wu, “Monitoring workers’ attention
and vigilance in construction activities through a wireless and wearable
electroencephalography system,” Autom. Constr., vol. 82, pp. 122–137, Oct. 2017, doi:
10.1016/J.AUTCON.2017.02.001.
[73] I. Jeelani, A. Albert, K. Han, and R. Azevedo, “Are Visual Search Patterns Predictive of

115
Hazard Recognition Performance? Empirical Investigation Using Eye-Tracking
Technology,” J. Constr. Eng. Manag., vol. 145, no. 1, p. 04018115, Jan. 2019, doi:
10.1061/(ASCE)CO.1943-7862.0001589.
[74] Z. Ren, X. Qi, G. Zhou, and H. Wang, “Exploiting the data sensitivity of neurometric
fidelity for optimizing EEG sensing,” IEEE Internet Things J., vol. 1, no. 3, pp. 243–254,
Jun. 2014, doi: 10.1109/JIOT.2014.2322331.
[75] R. N. Khushaba, C. Wise, S. Kodagoda, J. Louviere, B. E. Kahn, and C. Townsend,
“Consumer neuroscience: Assessing the brain response to marketing stimuli using
electroencephalogram (EEG) and eye tracking,” Expert Syst. Appl., vol. 40, no. 9, pp.
3803–3812, Jul. 2013, doi: 10.1016/j.eswa.2012.12.095.
[76] Z. Huang, A. Javaid, V. K. Devabhaktuni, Y. Li, and X. Yang, “Development of
Cognitive Training Program with EEG Headset,” IEEE Access, vol. 7, pp. 126191–
126200, 2019, doi: 10.1109/ACCESS.2019.2937866.
[77] F. Putze, “Methods and Tools for Using BCI with Augmented and Virtual Reality,” in
Brain Art, Springer International Publishing, 2019, pp. 433–446.
[78] X. Zhao, C. Liu, Z. Xu, L. Zhang, and R. Zhang, “SSVEP Stimulus Layout Effect on
Accuracy of Brain-computer interfaces in Augmented Reality Glasses,” IEEE Access, pp.
1–1, Jan. 2020, doi: 10.1109/access.2019.2963442.
[79] I. Jeelani, K. Han, and A. Albert, “Automating and scaling personalized safety training
using eye-tracking data,” Autom. Constr., vol. 93, pp. 63–77, Sep. 2018, doi:
10.1016/J.AUTCON.2018.05.006.
[80] S. W. Savage, D. D. Potter, and B. W. Tatler, “Does preoccupation impair hazard
perception? A simultaneous EEG and Eye Tracking study,” Transp. Res. Part F Traffic
116
Psychol. Behav., vol. 17, pp. 52–62, Feb. 2013, doi: 10.1016/J.TRF.2012.10.002.
[81] H. Moore, R. Eiris, … M. G.-C. in, and U. 2019, “Hazard Identification Training Using
360-Degree Panorama vs. Virtual Reality Techniques: A Pilot Study,” Am. Soc. Civ. Eng.
…, 2019, Accessed: Aug. 14, 2019. [Online]. Available:
https://scholar.google.com/scholar?hl=en&as_sdt=0%2C34&q=Hazard+Identification+Tr
aining+Using+360-
Degree+Panorama+vs.+Virtual+Reality+Techniques%3A+A+Pilot+Study&btnG=.
[82] V. Balali, M. Noghabaei, A. Heydarian, and K. Han, “Improved Stakeholder
Communication and Visualizations: Real-Time Interaction and Cost Estimation within
Immersive Virtual Environments,” Constr. Res. Congr. 2018, pp. 522–530, 2018, doi:
10.1061/9780784481264.
[83] M. Noghabaei, A. Heydarian, V. Balali, and K. Han, “Trend Analysis on Adoption of
Virtual and Augmented Reality in the Architecture, Engineering, and Construction
Industry,” Data, vol. 5, no. 1, p. 26, Mar. 2020, doi: 10.3390/data5010026.
[84] A. Grabowski and J. Jankowski, “Virtual Reality-based pilot training for underground coal
miners,” Saf. Sci., vol. 72, pp. 310–314, 2015, doi: 10.1016/j.ssci.2014.09.017.
[85] Z. Zou, X. Yu, and S. Ergan, “Visualization (nD, VR, AR),” in Computing in Civil
Engineering 2019, Jun. 2019, pp. 169–176, doi: 10.1061/9780784482421.022.
[86] H. Jebelli, S. Hwang, and S. Lee, “EEG-based workers’ stress recognition at construction
sites,” Autom. Constr., vol. 93, pp. 315–324, Sep. 2018, doi:
10.1016/J.AUTCON.2018.05.027.
[87] A. T. Biggs and S. R. Mitroff, “Improving the Efficacy of Security Screening Tasks: A
Review of Visual Search Challenges and Ways to Mitigate Their Adverse Effects,” Appl.

117
Cogn. Psychol., vol. 29, no. 1, pp. 142–148, Jan. 2015, doi: 10.1002/acp.3083.
[88] A. C. Estes and D. M. Frangopol, “Updating Bridge Reliability Based on Bridge
Management Systems Visual Inspection Results,” J. Bridg. Eng., vol. 8, no. 6, pp. 374–
382, Nov. 2003, doi: 10.1061/(ASCE)1084-0702(2003)8:6(374).
[89] O. F. Alruwaythi, M. H. Sears, and P. M. Goodrum, “The Impact of Engineering
Information Formats on Craft Worker Eye Gaze Patterns,” in Computing in Civil
Engineering 2017, Jun. 2017, pp. 9–16, doi: 10.1061/9780784480847.002.
[90] “Unity3D,” 2020. https://unity3d.com/ (accessed Jul. 31, 2019).
[91] M. G. Helander, “Safety hazards and motivation for safe work in the construction
industry,” Int. J. Ind. Ergon., vol. 8, no. 3, pp. 205–223, Nov. 1991, doi: 10.1016/0169-
8141(91)90033-I.
[92] “EMOTIV EPOC+ - 14 Channel Wireless EEG Headset,” 2019.
https://www.emotiv.com/epoc/ (accessed Mar. 16, 2019).
[93] Tobii, “Tobii API,” 2019. https://vr.tobii.com/sdk/develop/unity/.
[94] EMOTIV, “Can I wear EPOC+ or INSIGHT with VR headsets?,” 2019.
https://www.emotiv.com/knowledge-base/can-i-wear-epoc-or-insight-with-vr-headsets/
(accessed Jul. 15, 2019).
[95] EMOTIV, “Research Project: EMOTIV VR - Emotiv,” 2019.
https://www.emotiv.com/news/research-project-emotive-vr/ (accessed Jul. 15, 2019).
[96] M. Noghabaei and K. Han, “Hazard recognition in an immersive virtual environment:
Framework for the simultaneous analysis of visual search and EEG patterns,”
Construction Research Congress, 2020.
https://arxiv.org/ftp/arxiv/papers/2003/2003.09494.pdf.

118
[97] T. Lan, D. Erdogmus, A. Adami, … S. M.-C., and U. 2007, “Channel selection and
feature projection for cognitive load estimation using ambulatory EEG,” hindawi.com,
2007, Accessed: Mar. 27, 2019. [Online]. Available:
https://www.hindawi.com/journals/cin/2007/074895/abs/.
[98] B. Sherafat, A. Rashidi, Y.-C. Lee, and C. R. Ahn, “Automated Activity Recognition of
Construction Equipment Using a Data Fusion Approach,” Jun. 2019, doi:
10.1061/9780784482438.001.
[99] Sherafat, Rashidi, Lee, and Ahn, “A Hybrid Kinematic-Acoustic System for Automated
Activity Detection of Construction Equipment,” Sensors, vol. 19, no. 19, p. 4286, Oct.
2019, doi: 10.3390/s19194286.
[100] C. Bishop, Pattern recognition and machine learning. 2006.
[101] H. Blaiech, M. Neji, A. Wali, and A. M. Alimi, “Emotion recognition by analysis of EEG
signals,” in 13th International Conference on Hybrid Intelligent Systems (HIS 2013), Dec.
2013, pp. 312–318, doi: 10.1109/HIS.2013.6920451.
[102] K. Holmqvist, M. Nyström, R. Andersson, R. Dewhurst, H. Jarodzka, and J. Van de
Weijer, Eye tracking: A comprehensive guide to methods and measures. OUP Oxford,
2011.
[103] F. Shic, B. Scassellati, and K. Chawarska, “The incomplete fixation measure,” in
Proceedings of the 2008 symposium on Eye tracking research & applications - ETRA ’08,
2008, p. 111, doi: 10.1145/1344471.1344500.
[104] L. L. Di Stasi et al., “Saccadic Eye Movement Metrics Reflect Surgical Residentsʼ
Fatigue,” Ann. Surg., vol. 259, no. 4, pp. 824–829, Apr. 2014, doi:
10.1097/SLA.0000000000000260.

119
[105] C. J. Ellis, “The pupillary light reflex in normal subjects.,” Br. J. Ophthalmol., vol. 65, no.
11, pp. 754–9, Nov. 1981, doi: 10.1136/BJO.65.11.754.
[106] E. H. HESS and J. M. POLT, “Pupil size as related to interest value of visual stimuli.,”
Science, vol. 132, no. 3423, pp. 349–50, Aug. 1960, doi:
10.1126/SCIENCE.132.3423.349.
[107] C. Chu, A.-L. Hsu, K.-H. Chou, P. Bandettini, and C. Lin, “Does feature selection
improve classification accuracy? Impact of sample size and feature selection on
classification using anatomical magnetic resonance images,” Neuroimage, vol. 60, no. 1,
pp. 59–70, Mar. 2012, doi: 10.1016/J.NEUROIMAGE.2011.11.066.
[108] B. Sherafat et al., “Automated Methods for Activity Recognition of Construction Workers
and Equipment: State-of-the-Art Review,” J. Constr. Eng. Manag., vol. 146, no. 6, p.
03120002, Jun. 2020, doi: 10.1061/(ASCE)CO.1943-7862.0001843.
[109] “EYE-EEG,” 2018. http://www2.hu-berlin.de/eyetracking-eeg.
[110] O. Dimigen, W. Sommer, A. Hohlfeld, A. M. Jacobs, and R. Kliegl, “Coregistration of
eye movements and EEG in natural reading: Analyses and review.,” J. Exp. Psychol. Gen.,
vol. 140, no. 4, pp. 552–572, 2011, doi: 10.1037/a0023885.
[111] J. Moon, Y. Kwon, J. Park, and W. C. Yoon, “Detecting user attention to video segments
using interval EEG features,” Expert Syst. Appl., vol. 115, pp. 578–592, Jan. 2019, doi:
10.1016/J.ESWA.2018.08.016.
[112] N. S. Altman, “An Introduction to Kernel and Nearest-Neighbor Nonparametric
Regression,” Am. Stat., vol. 46, no. 3, pp. 175–185, Aug. 1992, doi:
10.1080/00031305.1992.10475879.
[113] C. J. C. Burges, “A Tutorial on Support Vector Machines for Pattern Recognition,” Data

120
Min. Knowl. Discov., vol. 2, no. 2, pp. 121–167, 1998, doi: 10.1023/A:1009715923555.
[114] P. Rani, C. Liu, N. Sarkar, and E. Vanman, “An empirical study of machine learning
techniques for affect recognition in human–robot interaction,” Pattern Anal. Appl., vol. 9,
no. 1, pp. 58–69, May 2006, doi: 10.1007/s10044-006-0025-y.
[115] T. Hofmann, B. Schölkopf, A. S.-T. annals of Statistics, and U. 2008, “Kernel methods in
machine learning,” JSTOR, 2008, Accessed: Mar. 18, 2019. [Online]. Available:
https://www.jstor.org/stable/25464664.
[116] A. Erfani and M. Tavakolan, “Risk Evaluation Model of Wind Energy Investment
Projects Using Modified Fuzzy Group Decision-making and Monte Carlo Simulation:,”
https://doi.org/10.1177/0976747920963222, p. 097674792096322, Nov. 2020, doi:
10.1177/0976747920963222.
[117] A. Erfani, K. Zhang, and Q. Cui, “TAB Bid Irregularity: Data-Driven Model and Its
Application,” J. Manag. Eng., vol. 37, no. 5, p. 04021055, Jul. 2021, doi:
10.1061/(ASCE)ME.1943-5479.0000958.
[118] L. Li, A. Erfani, Y. Wang, and Q. Cui, “Anatomy into the battle of supporting or opposing
reopening amid the COVID-19 pandemic on Twitter: A temporal and spatial analysis,”
PLoS One, vol. 16, no. 7, p. e0254359, Jul. 2021, doi:
10.1371/JOURNAL.PONE.0254359.
[119] A. Erfani et al., “Heterogeneous or homogeneous? A modified decision-making approach
in renewable energy investment projects,” AIMS Energy 2021 3558, vol. 9, no. 3, pp. 558–
580, 2021, doi: 10.3934/ENERGY.2021027.
[120] A. Melnik et al., “Systems, Subjects, Sessions: To What Extent Do These Factors
Influence EEG Data?,” Front. Hum. Neurosci., vol. 11, p. 150, Mar. 2017, doi:

121
10.3389/fnhum.2017.00150.
[121] Tobii, “Tobii Pro VR Integration based on HTC Vive HMD,” 2020, Accessed: Mar. 16,
2019. [Online]. Available: https://www.tobiipro.com/product-listing/vr-integration/.
[122] Rob Matheson, “Study measures how fast humans react to road hazards | MIT News,”
2019.
[123] D. Crundall et al., “Some hazards are more attractive than others: Drivers of varying
experience respond differently to different types of hazard,” Accid. Anal. Prev., vol. 45,
pp. 600–609, Mar. 2012, doi: 10.1016/j.aap.2011.09.049.
[124] S. Choi, K. Jung, and S. Do Noh, “Virtual reality applications in manufacturing industries:
Past research, present findings, and future directions,” Concurr. Eng., vol. 23, no. 1, pp.
40–63, Mar. 2015, doi: 10.1177/1063293X14568814.
[125] A. Karji, A. Woldesenbet, and S. Rokooei, “Integration of Augmented Reality, Building
Information Modeling, and Image Processing in Construction Management: A Content
Analysis,” in AEI 2017: Resilience of the Integrated Building, 2017, pp. 983–992, doi:
10.1061/9780784480502.082.
[126] J. Wolfartsberger, “Analyzing the potential of Virtual Reality for engineering design
review,” Autom. Constr., vol. 104, pp. 27–37, Aug. 2019, doi:
10.1016/j.autcon.2019.03.018.
[127] N. Kayhani, H. Taghaddos, M. Noghabaee, and U. R. Hermann, “Utilization of Virtual
Reality Visualizations on Heavy Mobile Crane Planning for Modular Construction,”
ISARC 2018 - 35th Int. Symp. Autom. Robot. Constr. Int. AEC/FM, 2018, doi:
10.22260/ISARC2018/0170.
[128] V. Balali, A. Zalavadia, and A. Heydarian, “Real-Time Interaction and Cost Estimating

122
within Immersive Virtual Environments,” J. Constr. Eng. Manag., vol. 146, no. 2, p.
04019098, Feb. 2020, doi: 10.1061/(ASCE)CO.1943-7862.0001752.
[129] L. Hou, X. Wang, L. Bernold, and P. E. D. Love, “Using Animated Augmented Reality to
Cognitively Guide Assembly,” J. Comput. Civ. Eng., vol. 27, no. 5, pp. 439–451, Sep.
2013, doi: 10.1061/(ASCE)CP.1943-5487.0000184.
[130] L. Hou, X. Wang, and M. Truijens, “Using Augmented Reality to Facilitate Piping
Assembly: An Experiment-Based Evaluation,” J. Comput. Civ. Eng., vol. 29, no. 1, p.
05014007, Jan. 2015, doi: 10.1061/(ASCE)CP.1943-5487.0000344.
[131] M. Fiorentino, A. E. Uva, M. Gattullo, S. Debernardis, and G. Monno, “Augmented
reality on large screen for interactive maintenance instructions,” Comput. Ind., vol. 65, no.
2, pp. 270–278, Feb. 2014, doi: 10.1016/j.compind.2013.11.004.
[132] C. Kwiatek, M. Sharif, S. Li, C. Haas, and S. Walbridge, “Impact of augmented reality
and spatial cognition on assembly in construction,” Autom. Constr., vol. 108, Dec. 2019,
doi: 10.1016/j.autcon.2019.102935.
[133] N. Gavish et al., “Evaluating virtual reality and augmented reality training for industrial
maintenance and assembly tasks,” Interact. Learn. Environ., vol. 23, no. 6, pp. 778–798,
Nov. 2015, doi: 10.1080/10494820.2013.815221.
[134] M. Murcia-López and A. Steed, “A comparison of virtual and physical training transfer of
bimanual assembly tasks,” IEEE Trans. Vis. Comput. Graph., vol. 24, no. 4, pp. 1574–
1583, Apr. 2018, doi: 10.1109/TVCG.2018.2793638.
[135] P. Carlson, A. Peters, S. B. Gilbert, J. M. Vance, and A. Luse, “Virtual training: Learning
transfer of assembly tasks,” IEEE Trans. Vis. Comput. Graph., vol. 21, no. 6, pp. 770–
782, Jun. 2015, doi: 10.1109/TVCG.2015.2393871.

123
[136] I. Jeelani, K. Han, and A. Albert, “Development of virtual reality and stereo-panoramic
environments for construction safety training,” Eng. Constr. Archit. Manag., 2020, doi:
10.1108/ECAM-07-2019-0391.
[137] C. Boton, “Supporting constructability analysis meetings with Immersive Virtual Reality-
based collaborative BIM 4D simulation,” Autom. Constr., vol. 96, pp. 1–15, Dec. 2018,
doi: 10.1016/j.autcon.2018.08.020.
[138] X. Li, W. Yi, H.-L. Chi, X. Wang, and A. P. C. Chan, “A critical review of virtual and
augmented reality (VR/AR) applications in construction safety,” Autom. Constr., vol. 86,
pp. 150–162, Feb. 2018, doi: 10.1016/J.AUTCON.2017.11.003.
[139] L. Hou, H. L. Chi, W. Tarng, J. Chai, K. Panuwatwanich, and X. Wang, “A framework of
innovative learning for skill development in complex operational tasks,” Autom. Constr.,
vol. 83, pp. 29–40, Nov. 2017, doi: 10.1016/j.autcon.2017.07.001.
[140] B. Bodenheimer, S. Creem-Regehr, J. Stefanucci, E. Shemetova, and W. B. Thompson,
“Prism aftereffects for throwing with a self-avatar in an immersive virtual environment,”
IEEE Virtual Real., vol. 0, pp. 141–147, Apr. 2017, doi: 10.1109/VR.2017.7892241.
[141] M. Fiorentino, R. Radkowski, C. Stritzke, A. E. Uva, and G. Monno, “Design review of
CAD assemblies using bimanual natural interface,” Int. J. Interact. Des. Manuf., vol. 7,
no. 4, pp. 249–260, Nov. 2013, doi: 10.1007/s12008-012-0179-3.
[142] M. Chu, J. Matthews, and P. E. D. Love, “Integrating mobile Building Information
Modelling and Augmented Reality systems: An experimental study,” Autom. Constr., vol.
85, pp. 305–316, Jan. 2018, doi: 10.1016/j.autcon.2017.10.032.
[143] D. Y. De Moura and A. Sadagic, “The effects of stereopsis and immersion on bimanual
assembly tasks in a virtual reality system,” IEEE Conf. Virtual Real. 3D User Interfaces,

124
VR 2019, pp. 286–294, Mar. 2019, doi: 10.1109/VR.2019.8798112.
[144] M. Kurien, M. K. Kim, M. Kopsida, and I. Brilakis, “Real-time simulation of construction
workers using combined human body and hand tracking for robotic construction worker
system,” Autom. Constr., vol. 86, pp. 125–137, Feb. 2018, doi:
10.1016/j.autcon.2017.11.005.
[145] J. Czarnowski, A. Dąbrowski, M. Maciaś, J. Główka, and J. Wrona, “Technology gaps in
Human-Machine Interfaces for autonomous construction robots,” Autom. Constr., vol. 94,
pp. 179–190, Oct. 2018, doi: 10.1016/j.autcon.2018.06.014.
[146] Y. Fang, Y. K. Cho, F. Druso, and J. Seo, “Assessment of operator’s situation awareness
for smart operation of mobile cranes,” Autom. Constr., vol. 85, pp. 65–75, Jan. 2018, doi:
10.1016/j.autcon.2017.10.007.
[147] Q. H. Le, J. W. Lee, and S. Y. Yang, “Remote control of excavator using head tracking
and flexible monitoring method,” Autom. Constr., vol. 81, pp. 99–111, Sep. 2017, doi:
10.1016/j.autcon.2017.06.015.
[148] F. Morosi, M. Rossoni, and G. Caruso, “Coordinated control paradigm for hydraulic
excavator with haptic device,” Autom. Constr., vol. 105, Sep. 2019, doi:
10.1016/j.autcon.2019.102848.
[149] A. N. Tak, H. Taghaddos, A. Mousaei, A. Bolourani, and U. Hermann, “BIM-based 4D
mobile crane simulation and onsite operation management,” Autom. Constr., vol. 128, p.
103766, Aug. 2021, doi: 10.1016/J.AUTCON.2021.103766.
[150] T. Hilfert and M. König, “Low-cost virtual reality environment for engineering and
construction,” Vis. Eng., vol. 4, no. 1, p. 2, Dec. 2016, doi: 10.1186/s40327-015-0031-5.
[151] G. Du, G. Yao, C. Li, and P. X. Liu, “Natural Human Robot Interface Using Adaptive

125
Tracking System with the Unscented Kalman Filter,” IEEE Trans. Human-Machine Syst.,
2019, doi: 10.1109/THMS.2019.2947576.
[152] J. D’Abbraccio et al., “Haptic Glove and Platform with Gestural Control For
Neuromorphic Tactile Sensory Feedback In Medical Telepresence,” Sensors, vol. 19, no.
3, p. 641, Feb. 2019, doi: 10.3390/s19030641.
[153] V. Getuli, P. Capone, A. Bruttini, and S. Isaac, “BIM-based immersive Virtual Reality for
construction workspace planning: A safety-oriented approach,” Autom. Constr., vol. 114,
p. 103160, Jun. 2020, doi: 10.1016/j.autcon.2020.103160.
[154] Y. Shi, J. Du, C. R. Ahn, and E. Ragan, “Impact assessment of reinforced learning
methods on construction workers’ fall risk behavior using virtual reality,” Autom. Constr.,
vol. 104, pp. 197–214, Aug. 2019, doi: 10.1016/j.autcon.2019.04.015.
[155] Noitom, “Noitom Hi5 VR Glove,” 2020. https://hi5vrglove.com/ (accessed Jan. 24, 2020).
[156] L. Motion, “Leap Motion Controller,” 2020. https://www.ultraleap.com/product/leap-
motion-controller/ (accessed Jan. 24, 2020).
[157] “Artec Eva,” Artec, 2018. https://www.artec3d.com/portable-3d-scanners/artec-eva
(accessed Feb. 12, 2018).
[158] “Artec Leo 3D Scanner - The first scanner to offer automatic onboard processing,” 2020.
https://sourcegraphics.com/3d/scanners/artec/leo/ (accessed Mar. 02, 2020).
[159] “Fast Quadric Mesh Simplification,” 2020.
https://github.com/Whinarn/UnityMeshSimplifier (accessed Aug. 05, 2020).
[160] M. Garland and P. S. Heckbert, “Simplifying surfaces with color and texture using quadric
error metrics,” IEEE Vis., pp. 263–269, 1998, doi: 10.1109/visual.1998.745312.
[161] Christopher G. Healey, “3D Modeling and Parallel Mesh Simplification Intel Software,”

126
2015. https://software.intel.com/en-us/articles/3d-modeling-and-parallel-mesh-
simplification (accessed Jan. 24, 2020).
[162] United States Census Bureau, “CONSTRUCTION SPENDING,” Census.gov, 2020.
https://www.census.gov/construction/c30/pdf/release.pdf (accessed Jan. 20, 2020).
[163] M. Noghabaei, A. Heydarian, V. Balali, and K. Han, “Trend analysis on adoption of
virtual and augmented reality in the architecture, engineering, and construction industry,”
Data, vol. 5, no. 1, Mar. 2020, doi: 10.3390/data5010026.
[164] H. Karimi, T. R. B. Taylor, G. B. Dadi, P. M. Goodrum, and C. Srinivasan, “Impact of
Skilled Labor Availability on Construction Project Cost Performance,” J. Constr. Eng.
Manag., vol. 144, no. 7, p. 04018057, Jul. 2018, doi: 10.1061/(ASCE)CO.1943-
7862.0001512.
[165] S. Kim, S. Chang, and D. Castro-Lacouture, “Dynamic Modeling for Analyzing Impacts
of Skilled Labor Shortage on Construction Project Management,” J. Manag. Eng., vol. 36,
no. 1, p. 04019035, Jan. 2020, doi: 10.1061/(ASCE)ME.1943-5479.0000720.
[166] H. Li, C. Zhang, S. Song, S. Demirkesen, and R. Chang, “Improving tolerance control on
modular construction project with 3d laser scanning and bim: A case study of removable
floodwall project,” Appl. Sci., vol. 10, no. 23, pp. 1–21, Dec. 2020, doi:
10.3390/app10238680.
[167] Y. Yang, M. Pan, and W. Pan, “‘Co-evolution through interaction’ of innovative building
technologies: The case of modular integrated construction and robotics,” Autom. Constr.,
vol. 107, p. 102932, Nov. 2019, doi: 10.1016/j.autcon.2019.102932.
[168] A. Nekouvaght Tak, H. Taghaddos, A. Mousaei, and U. (Rick) Hermann, “Evaluating
industrial modularization strategies: Local vs. overseas fabrication,” Autom. Constr., vol.

127
114, p. 103175, Jun. 2020, doi: 10.1016/J.AUTCON.2020.103175.
[169] A. Mousaei, H. Taghaddos, A. N. Tak, S. Behzadipour, and U. Hermann, “Optimized
Mobile Crane Path Planning in Discretized Polar Space,” J. Constr. Eng. Manag., vol.
147, no. 5, p. 04021036, Mar. 2021, doi: 10.1061/(ASCE)CO.1943-7862.0002033.
[170] S. Pooladvand, H. Taghaddos, A. Eslami, A. N. Tak, and U. (Rick) Hermann, “Evaluating
Mobile Crane Lift Operations Using an Interactive Virtual Reality System,” J. Constr.
Eng. Manag., vol. 147, no. 11, p. 04021154, Sep. 2021, doi: 10.1061/(ASCE)CO.1943-
7862.0002177.
[171] J. Brenner, “The New Marriott In Manhattan Is The World’s Tallest Modular Hotel,”
Forbes, 2019. https://www.forbes.com/sites/juliabrenner/2019/11/22/the-new-marriott-in-
manhattan-is-the-worlds-tallest-modular-hotel/?sh=2b2b851741a1 (accessed Jul. 05,
2021).
[172] W. Lu and H. Yuan, “Investigating waste reduction potential in the upstream processes of
offshore prefabrication construction,” Renew. Sustain. Energy Rev., vol. 28, pp. 804–811,
Dec. 2013, doi: 10.1016/J.RSER.2013.08.048.
[173] Z. Li, G. Q. Shen, and M. Alshawi, “Measuring the impact of prefabrication on
construction waste reduction: An empirical study in China,” Resour. Conserv. Recycl.,
vol. 91, pp. 27–39, Sep. 2014, doi: 10.1016/J.RESCONREC.2014.07.013.
[174] Y. Shahtaheri, C. Rausch, J. West, C. Haas, and M. Nahangi, “Managing risk in modular
construction using dimensional and geometric tolerance strategies,” Autom. Constr., vol.
83, pp. 303–315, Nov. 2017, doi: 10.1016/j.autcon.2017.03.011.
[175] H. Hyun, H. Kim, H. S. Lee, M. Park, and J. Lee, “Integrated design process for modular
construction projects to reduce rework,” Sustain., vol. 12, no. 2, p. 530, Jan. 2020, doi:

128
10.3390/su12020530.
[176] J. Guo, Q. Wang, and J. H. Park, “Geometric quality inspection of prefabricated MEP
modules with 3D laser scanning,” Autom. Constr., vol. 111, p. 103053, Mar. 2020, doi:
10.1016/j.autcon.2019.103053.
[177] M. Safa, A. Shahi, M. Nahangi, C. Haas, and H. Noori, “Automating measurement
process to improve quality management for piping fabrication,” Structures, vol. 3, pp. 71–
80, Aug. 2015, doi: 10.1016/j.istruc.2015.03.003.
[178] Q. Wang, M. K. Kim, J. C. P. Cheng, and H. Sohn, “Automated quality assessment of
precast concrete elements with geometry irregularities using terrestrial laser scanning,”
Autom. Constr., vol. 68, pp. 170–182, Aug. 2016, doi: 10.1016/j.autcon.2016.03.014.
[179] M. K. Kim, J. P. P. Thedja, and Q. Wang, “Automated dimensional quality assessment for
formwork and rebar of reinforced concrete components using 3D point cloud data,”
Autom. Constr., vol. 112, p. 103077, Apr. 2020, doi: 10.1016/j.autcon.2020.103077.
[180] K. Asadi, H. Ramshankar, M. Noghabaee, and K. Han, “Real-time Image Localization and
Registration with BIM Using Perspective Alignment for Indoor Monitoring of
Construction,” J. Comput. Civ. Eng., 2019, doi: 10.1061/(ASCE)CP.1943-5487.0000847.
[181] M. Golparvar-Fard, J. Bohn, J. Teizer, S. Savarese, and F. Peña-Mora, “Evaluation of
image-based modeling and laser scanning accuracy for emerging automated performance
monitoring techniques,” Autom. Constr., vol. 20, no. 8, pp. 1143–1155, Dec. 2011, doi:
10.1016/J.AUTCON.2011.04.016.
[182] C. H. P. Nguyen and Y. Choi, “Comparison of point cloud data and 3D CAD data for on-
site dimensional inspection of industrial plant piping systems,” Autom. Constr., vol. 91,
pp. 44–52, Jul. 2018, doi: 10.1016/j.autcon.2018.03.008.

129
[183] M. Noghabaei and K. Han, “Object manipulation in immersive virtual environments:
Hand Motion tracking technology and snap-to-fit function,” Autom. Constr., vol. 124,
2021, doi: 10.1016/j.autcon.2021.103594.
[184] M. Kamari and Y. Ham, “Vision-based volumetric measurements via deep learning-based
point cloud segmentation for material management in jobsites,” Autom. Constr., vol. 121,
p. 103430, Jan. 2021, doi: 10.1016/j.autcon.2020.103430.
[185] B. AlizadehKharazi, A. Alvanchi, and H. Taghaddos, “A Novel Building Information
Modeling-based Method for Improving Cost and Energy Performance of the Building
Envelope,” Int. J. Eng., vol. 33, no. 11, pp. 2162–2173, Nov. 2020, doi:
10.5829/IJE.2020.33.11B.06.
[186] I. Jeelani, K. Asadi, H. Ramshankar, K. Han, and A. Albert, “Real-time vision-based
worker localization & hazard detection for construction,” Autom. Constr., vol. 121, p.
103448, Jan. 2021, doi: 10.1016/j.autcon.2020.103448.
[187] B. Alizadeh Kharazi and A. H. Behzadan, “Flood depth mapping in street photos with
image processing and deep neural networks,” Comput. Environ. Urban Syst., vol. 88, p.
101628, Jul. 2021, doi: 10.1016/J.COMPENVURBSYS.2021.101628.
[188] M. K. Kim, J. P. P. Thedja, H. L. Chi, and D. E. Lee, “Automated rebar diameter
classification using point cloud data based machine learning,” Autom. Constr., vol. 122, p.
103476, Feb. 2021, doi: 10.1016/j.autcon.2020.103476.
[189] G. Cha, S. Park, and T. Oh, “A Terrestrial LiDAR-Based Detection of Shape Deformation
for Maintenance of Bridge Structures,” J. Constr. Eng. Manag., vol. 145, no. 12, p.
04019075, Dec. 2019, doi: 10.1061/(asce)co.1943-7862.0001701.
[190] M. Nahangi and C. T. Haas, “Automated 3D compliance checking in pipe spool

130
fabrication,” in Advanced Engineering Informatics, Oct. 2014, vol. 28, no. 4, pp. 360–369,
doi: 10.1016/j.aei.2014.04.001.
[191] Z. Xu, R. Kang, and R. Lu, “3D Reconstruction and Measurement of Surface Defects in
Prefabricated Elements Using Point Clouds,” J. Comput. Civ. Eng., vol. 34, no. 5, p.
04020033, Sep. 2020, doi: 10.1061/(asce)cp.1943-5487.0000920.
[192] T. Czerniawski, M. Nahangi, C. Haas, and S. Walbridge, “Pipe spool recognition in
cluttered point clouds using a curvature-based shape descriptor,” Autom. Constr., vol. 71,
no. Part 2, pp. 346–358, Nov. 2016, doi: 10.1016/j.autcon.2016.08.011.
[193] M. K. Kim, J. C. P. Cheng, H. Sohn, and C. C. Chang, “A framework for dimensional and
surface quality assessment of precast concrete elements using BIM and 3D laser
scanning,” Autom. Constr., vol. 49, pp. 225–238, Jan. 2015, doi:
10.1016/j.autcon.2014.07.010.
[194] M. K. Kim, Q. Wang, J. W. Park, J. C. P. Cheng, H. Sohn, and C. C. Chang, “Automated
dimensional quality assurance of full-scale precast concrete elements using laser scanning
and BIM,” Autom. Constr., vol. 72, pp. 102–114, Dec. 2016, doi:
10.1016/j.autcon.2016.08.035.
[195] M. K. Kim, H. Sohn, and C. C. Chang, “Automated dimensional quality assessment of
precast concrete panels using terrestrial laser scanning,” Autom. Constr., vol. 45, pp. 163–
177, Sep. 2014, doi: 10.1016/j.autcon.2014.05.015.
[196] M. Bassier, S. Vincke, H. De Winter, and M. Vergauwen, “Drift Invariant Metric Quality
Control of Construction Sites Using BIM and Point Cloud Data,” ISPRS Int. J. Geo-
Information, vol. 9, no. 9, p. 545, Sep. 2020, doi: 10.3390/ijgi9090545.
[197] Z. Wang et al., “Vision-Based Framework for Automatic Progress Monitoring of Precast

131
Walls by Using Surveillance Videos during the Construction Phase,” J. Comput. Civ.
Eng., vol. 35, no. 1, p. 04020056, Jan. 2021, doi: 10.1061/(asce)cp.1943-5487.0000933.
[198] M. Nahangi, T. Czerniawski, C. T. Haas, and S. Walbridge, “Pipe radius estimation using
Kinect range cameras,” Autom. Constr., vol. 99, pp. 197–205, Mar. 2019, doi:
10.1016/j.autcon.2018.12.015.
[199] Y. Xu, S. Tuttas, L. Hoegner, and U. Stilla, “Reconstruction of scaffolds from a
photogrammetric point cloud of construction sites using a novel 3D local feature
descriptor,” Autom. Constr., vol. 85, pp. 76–95, Jan. 2018, doi:
10.1016/j.autcon.2017.09.014.
[200] Q. Wang, J. C. P. Cheng, and H. Sohn, “Automated Estimation of Reinforced Precast
Concrete Rebar Positions Using Colored Laser Scan Data,” Comput. Civ. Infrastruct.
Eng., vol. 32, no. 9, pp. 787–802, Sep. 2017, doi: 10.1111/mice.12293.
[201] M. Nahangi and C. T. Haas, “Skeleton-based discrepancy feedback for automated
realignment of industrial assemblies,” Autom. Constr., vol. 61, pp. 147–161, Jan. 2016,
doi: 10.1016/J.AUTCON.2015.10.014.
[202] M. Nahangi, J. Yeung, C. T. Haas, S. Walbridge, and J. West, “Automated assembly
discrepancy feedback using 3D imaging and forward kinematics,” Autom. Constr., vol. 56,
pp. 36–46, Aug. 2015, doi: 10.1016/j.autcon.2015.04.005.
[203] H. Alzraiee, R. Sprotte, and A. Leal Ruiz, “Quality Control for Concrete Steel Embed
Plates using LiDAR and Point Cloud Mapping,” Oct. 2020, Accessed: Jan. 11, 2021.
[Online]. Available:
http://www.iaarc.org/publications/2020_proceedings_of_the_37th_isarc/quality_control_f
or_concrete_steel_embed_plates_using_lidar_and_point_cloud_mapping.html.

132
[204] M. S. A. Enshassi, S. Walbridge, J. S. West, and C. T. Haas, “Dynamic and Proactive
Risk-Based Methodology for Managing Excessive Geometric Variability Issues in
Modular Construction Projects Using Bayesian Theory,” J. Constr. Eng. Manag., vol.
146, no. 2, p. 04019096, Feb. 2020, doi: 10.1061/(asce)co.1943-7862.0001747.
[205] C. Rausch, M. Nahangi, C. Haas, and J. West, “Kinematics chain based dimensional
variation analysis of construction assemblies using building information models and 3D
point clouds,” Autom. Constr., vol. 75, pp. 33–44, Mar. 2017, doi:
10.1016/j.autcon.2016.12.001.
[206] F. Bosche, C. T. Haas, and B. Akinci, “Automated Recognition of 3D CAD Objects in
Site Laser Scans for Project 3D Status Visualization and Performance Control,” J.
Comput. Civ. Eng., vol. 23, no. 6, pp. 311–318, Nov. 2009, doi: 10.1061/(asce)0887-
3801(2009)23:6(311).
[207] F. Bosché, “Automated recognition of 3D CAD model objects in laser scans and
calculation of as-built dimensions for dimensional compliance control in construction,”
Adv. Eng. Informatics, vol. 24, no. 1, pp. 107–118, Jan. 2010, doi:
10.1016/j.aei.2009.08.006.
[208] Q. Wang, H. Sohn, and J. C. P. Cheng, “Automatic As-Built BIM Creation of Precast
Concrete Bridge Deck Panels Using Laser Scan Data,” J. Comput. Civ. Eng., vol. 32, no.
3, p. 04018011, May 2018, doi: 10.1061/(asce)cp.1943-5487.0000754.
[209] D. Li, J. Liu, L. Feng, Y. Zhou, H. Qi, and Y. F. Chen, “Automatic modeling of
prefabricated components with laser‐scanned data for virtual trial assembly,” Comput.
Civ. Infrastruct. Eng., p. mice.12627, Oct. 2020, doi: 10.1111/mice.12627.
[210] Y. Tan, S. Li, and Q. Wang, “Automated geometric quality inspection of prefabricated

133
housing units using BIM and LiDAR,” Remote Sens., vol. 12, no. 15, p. 2492, Aug. 2020,
doi: 10.3390/RS12152492.
[211] X. Zhou, J. Liu, G. Cheng, D. Li, and Y. F. Chen, “Automated locating of replaceable
coupling steel beam using terrestrial laser scanning,” Autom. Constr., vol. 122, p. 103468,
Feb. 2021, doi: 10.1016/j.autcon.2020.103468.
[212] E. B. Anil, P. Tang, B. Akinci, and D. Huber, “Deviation analysis method for the
assessment of the quality of the as-is Building Information Models generated from point
cloud data,” Autom. Constr., vol. 35, pp. 507–516, Nov. 2013, doi:
10.1016/J.AUTCON.2013.06.003.
[213] M. Rumpler et al., “AUTOMATED END-TO-END WORKFLOW FOR PRECISE AND
GEO-ACCURATE RECONSTRUCTIONS USING FIDUCIAL MARKERS,” 2014.
[214] K. K. Han and M. Golparvar-Fard, “Appearance-based material classification for
monitoring of operation-level construction progress using 4D BIM and site photologs,”
Autom. Constr., vol. 53, pp. 44–57, May 2015, doi: 10.1016/J.AUTCON.2015.02.007.
[215] K. Han, J. Degol, and M. Golparvar-Fard, “Geometry- and Appearance-Based Reasoning
of Construction Progress Monitoring,” J. Constr. Eng. Manag., vol. 144, no. 2, p.
04017110, Feb. 2018, doi: 10.1061/(ASCE)CO.1943-7862.0001428.
[216] B. K. P. Horn, “Closed-form solution of absolute orientation using unit quaternions,” J.
Opt. Soc. Am. A, vol. 4, no. 4, pp. 629–642, 1987.
[217] D. Aiger, N. J. Mitra, and D. Cohen-Or, “4-points congruent sets for robust pairwise
surface registration,” in SIGGRAPH’08: International Conference on Computer Graphics
and Interactive Techniques, ACM SIGGRAPH 2008 Papers 2008, 2008, vol. 27, p. 1, doi:
10.1145/1399504.1360684.

134
[218] D. Girardeau-Montaut, “Cloudcompare-open source project,” OpenSource Proj., 2011.
[219] C. Compare, “SOR filter - CloudCompareWiki,” Cloud Compare, 2021.
https://www.cloudcompare.org/doc/wiki/index.php?title=SOR_filter (accessed May 02,
2021).
[220] H. Balta, J. Velagic, W. Bosschaerts, G. De Cubber, and B. Siciliano, “Fast Statistical
Outlier Removal Based Method for Large 3D Point Clouds of Outdoor Environments,”
IFAC-PapersOnLine, vol. 51, no. 22, pp. 348–353, Jan. 2018, doi:
10.1016/j.ifacol.2018.11.566.
[221] A. Patney et al., “Towards foveated rendering for gaze-tracked virtual reality,” ACM
Trans. Graph., vol. 35, no. 6, pp. 1–12, Nov. 2016, doi: 10.1145/2980179.2980246.
[222] J. Iskander, M. Hossny, and S. Nahavandi, “Using biomechanics to investigate the effect
of VR on eye vergence system,” Appl. Ergon., vol. 81, p. 102883, Nov. 2019, doi:
10.1016/J.APERGO.2019.102883.
[223] D. Wang, H. Li, and J. Chen, “Detecting and measuring construction workers’ vigilance
through hybrid kinematic-EEG signals,” Autom. Constr., vol. 100, pp. 11–23, Apr. 2019,
doi: 10.1016/J.AUTCON.2018.12.018.
[224] A. Aryal, A. Ghahramani, and B. Becerik-Gerber, “Monitoring fatigue in construction
workers using physiological measurements,” Autom. Constr., vol. 82, pp. 154–165, Oct.
2017, doi: 10.1016/J.AUTCON.2017.03.003.
[225] H. Jebelli, S. Hwang, and S. Lee, “Feasibility of Field Measurement of Construction
Workers’ Valence Using a Wearable EEG Device,” in Computing in Civil Engineering
2017, Jun. 2017, pp. 99–106, doi: 10.1061/9780784480830.013.
[226] R. Zerafa, T. Camilleri, O. Falzon, and K. P. Camilleri, “A comparison of a broad range of

135
EEG acquisition devices – is there any difference for SSVEP BCIs?,” Brain-Computer
Interfaces, vol. 5, no. 4, pp. 121–131, Oct. 2018, doi: 10.1080/2326263X.2018.1550710.
[227] H. Jebelli, M. M. Khalili, S. Hwang, and S. Lee, “A Supervised Learning-Based
Construction Workers’ Stress Recognition Using a Wearable Electroencephalography
(EEG) Device,” in Construction Research Congress 2018, Mar. 2018, pp. 40–50, doi:
10.1061/9780784481288.005.
[228] A. K. Singh, H.-T. Chen, J.-T. King, and C.-T. Lin, “Measuring Cognitive Conflict in
Virtual Reality with Feedback-Related Negativity,” Mar. 2017, Accessed: Jul. 15, 2019.
[Online]. Available: http://arxiv.org/abs/1703.05462.
[229] J. A. Urigüen and B. Garcia-Zapirain, “EEG artifact removal—state-of-the-art and
guidelines,” J. Neural Eng., vol. 12, no. 3, p. 031001, Jun. 2015, doi: 10.1088/1741-
2560/12/3/031001.
[230] M. Cohen, Analyzing neural time series data: theory and practice. 2014.
[231] G. Gratton, M. Coles, E. D.-E. and Clinical, and U. 1983, “A new method for off-line
removal of ocular artifact,” Elsevier, 1983, Accessed: Jan. 07, 2019. [Online]. Available:
https://www.sciencedirect.com/science/article/pii/0013469483901359.
[232] T. Jung, S. Makeig, C. Humphries, … T. L.-, and U. 2000, “Removing
electroencephalographic artifacts by blind source separation,” cambridge.org, 2000,
Accessed: Jan. 07, 2019. [Online]. Available:
https://www.cambridge.org/core/journals/psychophysiology/article/removing-
electroencephalographic-artifacts-by-blind-source-
separation/2548D35629CAE17E6956C2FFF1B6C8AB.
[233] M. Plöchl, J. P. Ossandón, and P. König, “Combining EEG and eye tracking:

136
identification, characterization, and correction of eye movement artifacts in
electroencephalographic data,” Front. Hum. Neurosci., vol. 6, 2012, doi:
10.3389/fnhum.2012.00278.
[234] A. Delorme, S. M.-J. of neuroscience Methods, and U. 2004, “EEGLAB: an open source
toolbox for analysis of single-trial EEG dynamics including independent component
analysis,” Elsevier, 2004, Accessed: Jan. 07, 2019. [Online]. Available:
https://www.sciencedirect.com/science/article/pii/S0165027003003479.
[235] H. Jebelli, S. Hwang, and S. Lee, “EEG Signal-Processing Framework to Obtain High-
Quality Brain Waves from an Off-the-Shelf Wearable EEG Device,” J. Comput. Civ.
Eng., vol. 32, no. 1, p. 04017070, Jan. 2018, doi: 10.1061/(ASCE)CP.1943-
5487.0000719.
[236] Microsoft, “Windows raw input API,” 2019. https://docs.microsoft.com/en-
us/windows/desktop/inputdev/raw-input (accessed Aug. 14, 2019).
[237] S. Meyberg, M. Werkle-Bergner, W. Sommer, and O. Dimigen, “Microsaccade-related
brain potentials signal the focus of visuospatial attention,” Neuroimage, vol. 104, pp. 79–
88, Jan. 2015, doi: 10.1016/J.NEUROIMAGE.2014.09.065.
[238] S. Meyberg, W. Sommer, and O. Dimigen, “How microsaccades relate to lateralized ERP
components of spatial attention: A co-registration study,” Neuropsychologia, vol. 99, pp.
64–80, May 2017, doi: 10.1016/J.NEUROPSYCHOLOGIA.2017.02.023.
[239] B. Kornrumpf and W. Sommer, “Modulation of the attentional span by foveal and
parafoveal task load: An ERP study using attentional probes,” Psychophysiology, vol. 52,
no. 9, pp. 1218–1227, Sep. 2015, doi: 10.1111/psyp.12448.

137
8 APPENDIX

138
8.1 APPENDIX I
Data Reliability
Data reliability in experiments that use devices, such as eye-tracking and EEG, have always been
an important concern. In this study, both devices were used. To ensure data reliability, the main
types of noises that can question the reliability of data should be investigated. The three main
types of data in this experiment are generated by: (1) an eye-tracking enabled VR HMD (Tobii
HTC VR), (2) an EEG device (EMOTIV EPOC+), and (3) data fusion of both devices (EEG and
eye-tracking).
Reliability of the VR eye-tracking device: This HMD was released in 2018 as the best eye-
tracking enabled VR headset produced through a collaboration between an eye-tracking
manufacturer (Tobii) that produces products for business and scientific professionals and a VR
HMD manufacturer (HTC). This device brings a higher-quality VR experience, using a
technique called “foveated rendering” [221]. Foveated rendering is a rendering method that uses
a VR HMD with an eye-tracker to reduce the rendering workload by significantly reducing the
image quality in the peripheral vision (the regions outside of the zone that is gazed by the fovea).
This technique provides a better sense of presence in this research. Moreover, Tobii produces the
highest quality eye-tracking in the market. In addition, the authors visually tested the accuracy of
gaze position in the eye-tracking section under data acquisition preprocessing section. The
accuracy can be considered similar to Tobii Eye-tracking Glasses Pro 2 that is a high-end eye-
tracker in the market. The reliability of the Tobii VR eye-tracker has been proven by Applied
Ergonomics community [222]. In addition, the authors compared the accuracy of this device with
another off-the-shelf VR eye-tracker, FOVE, and concluded that this device is generating more
robust data. Although manufactures of low-end VR eye-tracker (i.e., FOVE) claim comparable

139
specifications to that of Tobii’s (accuracies of FOVE and Tobii are claimed to be 1 and 0.5
degrees, respectively, and they both have 120 fps eye-tracking frequency), their performance are
not comparable according to our own experience, in addition to these manufacturers’ reputation
in the scientific domain. Furthermore, Tobii VR is a high-end device that is significantly more
expensive compared to other VR eye-trackers, such as FOVE ($10,000 for Tobii VR Vs. $500
for FOVE).
Reliability of EEG devices: the main concern regarding EEG studies is the reliability of the
acquired data. This concern can be addressed by using high-end EEG caps and performing the
experiments accurately. The EEG device in this study, EMOTIV EPOC+, has been widely used
in construction research [45], [71], [72], [86], [223]–[225]. Moreover, other researchers in
Cognitive Neuroscience and Brain-Computer Interfaces investigated the accuracy of this device
by comparing it to other available research-grade brain sensors [55], [226]. Results demonstrated
that EMOTIV provides high quality results in comparison to the other available brain sensors.
Reliability of both devices in a single platform: the last concern is when two devices were
used in a single platform. This can be separated into two sections – 1) interference of EEG
device with eye-tracking and 2) interference of eye-tracking with EEG data. To address the first
concern, the authors visually tested the eye-tracking with the EEG device. As long as the HMD
is fixed in its position, the accuracy remains the same (see the Eye-Tracking subsection under
Data Acquisition Preprocessing). On the other hand, the VR HMD cannot interfere with the EEG
data if the proper noise cancellation method is applied. Construction researchers acquired data
from EEG device while worker wore a construction helmet and moved in the crowded and noisy
construction environment [86], [225], [227]. The experiment environment in this study was by
far less noisy and the VR HMD is significantly easier to wear [86], [225], [227]. Therefore, the

140
acquired data in this experiment was valid and reliable. Finally, this type of platforms was
successfully tested and recommended by EMOTIV and researchers [94], [95], [228].
EEG Data Preprocessing
EEG devices were designed to measure brain activity, but these devices also record electrical
activities from external sources that are noise or artifacts [229]. EMOTIV EPOC+ [92] is used to
acquire the EEG data stream. The reliability of this device and the data generated are detailed in
the Discussion section. EEG devices were designed to measure brain activity, but these devices
also record electrical activities from external sources that are noise or artifacts [229]. Artifacts
should be removed since the recorded electrical activity is contaminated with artifacts and the
noise affect the analysis of the EEG signal. Some of the sources of artifacts are muscle
movements, line noise, or eye blinks [98], [230]. Artifacts can contaminate EEG signals by
introducing oscillations [72]. Minimizing noise is possible by filtering high-frequency bands.
Techniques, such as the regress-based approach [231] and independent component analysis
(ICA) [232], can remove these artifacts. Researchers suggested that ICA works better with
removing oculomotor artifacts [233]. ICA can separate EEG artifacts from the original EEG
[232]. Filtering noises can be accomplished by identifying EEG constituents in the data and
removing the components that are linked to artifacts to attain a clean signal. In this study, the
primary source of artifacts is oculomotor artifacts. Therefore, raw signals were filtered using
ICA and EEGLAB toolbox [234].

141
Figure 8.1. Noise cancellation applied to 30 s of EEG data for all EEG channels (A) raw
signals; (B) filtered signals; (C) EEG channel locations.
Generally, artifacts have different frequencies compared to brain waves [235]. Consequently,
filtering of the frequencies that are unattainable by EEG signals eliminates most of the artifacts.
Therefore, applying a bandpass filter with high and low cutoffs of 64 Hz and 0.5 Hz proved to
reduce artifacts significantly [235]. The higher frequency was chosen based on the EEG data
recording rate, which was Nyquist frequency at 128Hz Nyquist frequency is the highest
frequency that is measured in a sampled data without presenting aliasing. Essentially, this
frequency is equivalent to half of the sampling rate, which is 64 Hz for the EMOTIV brain-
sensor. Furthermore, the lower cutoff was selected according to the lowest brain potential
frequency (e.g., Delta waves: 0.5–4 Hz, Theta waves: 4–7.5 Hz, Alpha waves: 7.5–13 Hz, Low
beta waves: 13–15 Hz, Beta waves: 15–20 Hz, High beta waves: 20–38 Hz, and Gamma waves:
38–higher Hz) [86]. Therefore, a bandpass filter with high and low cutoffs of 64 Hz and 0.5 Hz,
respectively, was applied to the data to reduce noise further. Figure 8.1(A) demonstrates 30
seconds of raw data, and Figure 8.1 (B) shows the results of filtering 30 seconds of raw data.
Figure 8.1 (C) shows the channel locations of the EMOTIV EPOC+ from the top. Electrode

142
names begin with one or two letters indicating the general brain region or lobes where the
electrode is placed. For instance, F is frontal; C is central; P is parietal; O is occipital; T is
temporal; FP is pre-frontal; AF is between FP and F; FC is between F and C. Each electrode ends
with a number. Odd numbers are used in the left hemisphere and even numbers are used for the
right hemisphere. Larger numbers indicate greater distances from the brain midline.
Data Synchronization
One of the main challenges in this study is the synchronization of eye-tracking data with the
EEG recordings. EEG and eye-tracking data synchronization is challenging because of the high-
frequency and dissimilar sampling rates of the signals. According to the literature, three main
methods were suggested to synchronize eye-tracking and EEG signals [110]. The earliest method
is to utilize a shared trigger to send trigger pulses from the main processor (computer) to eye-
tracking and EEG devices mutually using a y-shaped wire that attaches the computer to both
devices. The advantage of this approach is that an identical signal is employed for
synchronization in both devices. However, this method is not practical because of hardware
restrictions. The next method is to inject condensed text strings in eye-tracking data when
triggers are sent to the EEG device. The text strings can be used to synchronize data. This
approach is hardware-independent and can still deliver high accuracy. The last method is to use
an analog output. In this method, eye-tracking data is inserted immediately into the EEG device.
Digital to analog converter card of the eye-tracker outputs the data as an analog signal. This
signal can be precisely inserted into the EEG device. Even though this method affords high-
quality synchronization, using analog converter card involves hardware manipulation, which is
restricted in most of EEG and eye-tracking hardware.

143
In the current research, messages and event markers were employed to synchronize the data as
shown in Figure 8.2. Recordings from eye-tracking and EEG signals were synchronized later
using the EYE-EEG toolbox [109], [110]. This toolbox uses conventional trigger pulses and
messages sent from the stimulation computer (running both Unity 3D and EMOTIV software) to
both EEG and eye-tracking hardware. A developed wrapper code that works based on Windows
raw input application programming interface (API) [236] transmits inputs to both Unity and
EMOTIV software once a button is pressed by participants,. This wrapper code hooks native
input events and permits receiving input events even when Unity application or the EMOTIV
software is working in the background. This code helps obtain the raw input events at the
identical timestamp by both Unity and EMOTIV, avoiding any latency problems. Subsequently,
Unity sends messages to the eye-tracking device, and EMOTIV software sends events markers to
the EEG device. These messages and event markers are recorded in the data stream. These
recordings are used by EYE-EEG to synchronize EEG data and eye-tracking data. This method
is a fundamental method, and it is commonly used for the synchronization of EEG and eye-
tracking data [237]–[239].
Figure 8.2. Synchronization using messages and event markers

144
8.2 Synchronization Results
Figure 8.3 represent the synchronization charts for a participant (This test applied to a participant
that did not participate in the experiment and the data generated from this participant was only
used to demonstrate synchronization accuracy). In the top chart, the eye-tracking data and the
events are demonstrated with vertical lines. Each line with color is relevant to one event (press of
a button). For instance, the yellow color is event 50 (space button), and the cyan color is event 99
(controller button). The purpose of event 50 is to synchronize the data. Once the signals were
synchronized using event 50, the accuracy of event 99 (hazard detection) was investigated.
Finally, EEG and eye-tracking events will be stored as a single shared events variable.
Initially, the first and the last events were matched together (Figure 8.3(A)). Then, the first and
last events are drawn in a chart (Figure 8.2(B)). The axes of this chart (Figure 8.3(B)) are EEG
latency in the sample and eye-tracking latency in timestamp (timestamp is variable generated
accurately measuring time in eye-tracking). After drawing the first and last events (marked with
blue circles), a line is drawn between these two points. All the events should be ideally on this
line; however, the event might be slightly off (one or two samples). This slight difference in
timestamp is called latency. The latencies for all events are drawn in Figure 8.3(C). Figure
8.3(C) demonstrates a synchronization error histogram (in samples). Zero error means the EEG
events and eye-tracking events perfectly matched after synchronization.

145
Figure 8.3. Synchronization accuracy; (A) EEG and eye-tracking before synchronization;
(B) regression of eye-tracking and EEG by fixing first and last events; (C) synchronization
error histogram.