CIN/BCIN Company/Bank Name Date of AGM FY-1 FY-2 FY-3 FY-4 ...
Upload
khangminh22Category
view
0download
0
FY 2016 -2017
www.concordnc.gov
Annual Operating Budget& Performance Plan

On December 10th, 2015, Concord held its first City Council meeting in the new City Hall building located at 35 Cabarrus Avenue, West. Photo Credit: LJ Weslowski, Light Capture Photography

Mission The City of Concord partners with our community to deliver excellent service, and
plans for the future while preserving, protecting, and enhancing the quality of life.
Core Values
Culture of Excellence: We respect members of the public and each other, and treat all with courtesy and dignity. We rely on teamwork to provide a seamless experience for all customers.
We uphold high ethical standards in our personal, professional, and organizational conduct. We continuously improve by promoting innovation and flexibility to best meet the needs of
customers with available resources. Accountability: We accept responsibility for our personal and organizational decisions and
actions, while delivering cost-effective and efficient services that are done right the first time.
Communication: We openly communicate with the public and each other by sharing information and soliciting feedback to achieve our goals.
Environment: We are concerned about our natural, historic, economic, and aesthetic resources and work to preserve and enhance them for future generations.
Safety: We use education, prevention, and enforcement methods to protect life and property in the community, and maintain our infrastructure and facilities to provide a safe environment in
which to live, work, shop, and play.
Trust: We realize the perception of our organization is dependent upon the public’s confidence in our commitment to our core values and to meeting the goals set collectively by the Mayor and
City Council.
Team Concord's Principles of Excellent Service Concern for the Individual Customer Focus Fair and Equitable Service
Professional Service Effective Communications Taking Ownership
Timeliness Teamwork Great Service Recovery

The Government Finance Officers Association of the United States and Canada (GFOA) presented a Distinguished Budget Presentation Award to the City of Concord, North Carolina for its annual budget for the fiscal year beginning July 1, 2015. In order to receive this award, a governmental unit must publish a budget document that meets program criteria as a policy document, as an operations guide, as a financial plan, and as a communications device. This award is valid for a period of one year only. We believe our current budget continues to conform to program requirements, and we are submitting it to GFOA to determine its eligibility for another award year.

TABLE OF CONTENTS Page Mission Statement and Core Values GFOA Distinguished Budget Presentation Award Table of Contents
INTRODUCTION Mayor and City Council 5 City Organizational Chart (with FTE) 6 Manager’s Budget Message 8 Guide to the Components of the Budget Document 24 Budget Process and Budget Calendar 26 What’s New or Changed (including Council changes to the Manager’s Rec. Budget) 28
History & Background of Concord 30 Mayor and City Council Goals and Objectives 31
Budget Ordinance 34
BUDGET SUMMARY Fund and Budget Unit Organizational Structure 37 Major Revenue Sources 39 Summary Tables and Charts 42 Fund Balances / Net Assets 47 Personnel Summary 48 Background on Customer Service Initiative 50 Background on Performance Measurement Efforts 51 External Agency Funding 52
GOVERNMENTAL FUND TYPES GENERAL FUND – Overview and Summary of Revenues and Expenditures 53 GENERAL GOVERNMENT – Overview and Summary of Expenditures 56 Governing Body 58 Public Service Administration 60
City Manager’s Office 62 Human Resources 65
Wellness Center 67 Finance 69
Tax Collection 71 Legal 73 Non-Departmental 75
PUBLIC SAFETY – Overview and Summary of Expenditures 76 Police 78 Code Enforcement 80
Emergency Communications 82 Radio Shop 84 Fire 86 Fire Prevention 89 Fire Training 91 Emergency Management 94
PUBLIC WORKS – Overview and Summary of Expenditures 96 Streets & Traffic 98
Powell Bill 100 Traffic Signals 102
Traffic Services 104 Solid Waste & Recycling 106
Cemeteries 108 Fleet Service 110
ECONOMIC DEVELOPMENT – Overview and Summary of Expenditures 112 Planning & Neighborhood Development 114
Transportation Planning 116

Economic Development 118 CULTURAL AND RECREATION – Overview and Summary of Expenditures 120
Parks and Recreation 122 Parks and Recreation and Aquatics 125
SPECIAL REVENUE FUNDS - Overview of Special Revenue Funds 127 MUNICIPAL SERVICE DISTRICT FUND – Summary of Revenues and Expenditures 128
Municipal Service District 129 HOUSING ASSISTANCE FUND – Summary of Revenues and Expenditures 130 Section 8 Voucher Program 131 HOME CONSORTIUM FUND – Summary of Revenues and Expenditures 133
Administration and Projects 135 ADDL. $5 VEHICLE TAX (TRANSIT) – Summary of Revenues and Expenditures 137 Addl. $5 Vehicle Tax (Transit) 138 COMMUNITY DEVELOPMENT BLOCK GRANT FUND (CDBG) – Summary of Revenues and Expenditures 139
Administration and Projects 141
PROPRIETARY FUND TYPES
ENTERPRISE FUNDS – OVERVIEW OF ENTERPRISE FUNDS 143 STORMWATER FUND – Summary of Revenues and Expenses 145 Stormwater Operations 147 ELECTRIC FUND – Summary of Revenues and Expenses 149
Administration 151 Purchased Power 153 Powerlines Maintenance 155
Tree Trimming 157 Electric Construction 159 Peak Shaving 161
Electric Engineering Services 163 Utility Locate Services 165
WATER RESOURCES FUND – Summary of Revenues and Expenses 167 Hillgrove & Coddle Creek Water Treatment Plants 169
Waterlines Operations & Maintenance 173 TRANSIT FUND – Summary of Revenues and Expenses 175
Transit Operations – Concord/Kannapolis Rider 177 WASTEWATER RESOURCES FUND – Summary of Revenues and Expenses 179
Wastewaterlines Operations & Maintenance 181 GOLF COURSE FUND – Summary of Revenues and Expenses 183
Golf Course Operations 185 AVIATION FUND – Summary of Revenues and Expenses 187 Aviation Operations 189 PUBLIC HOUSING FUND – Summary of Revenues and Expenses 191 Housing Operations 193
INTERNAL SERVICES FUND – Overview and Summary of Allocated Costs 195 Utilities Collections 197
Data Services 199 Billing 201 Customer Care 203 Engineering 205 Purchasing 207 Buildings and Grounds 209
DEBT SERVICE / CAPITAL IMPROVEMENT PLAN (CIP) 211
SUPPLEMENTAL INFORMATION Debt Management, Reserve, & CIP Policies 233 Authorized Position Detail, Salary Grades 241 Fees & Charges Schedule 250 City Profile & Glossary 289

In Concord, the Mayor and City Council serve part-time and are elected on a non-partisan basis. Under the council-manager form of government, the City Council acts as the legislative body in establishing policy and law and the City Manager handles the day-to-day management of the City organization. The Mayor is elected at-large to a four-year term, serves as the presiding officer at city council meetings, and is the official head of the city for ceremonial purposes. The seven City Council Members are elected at-large from districts for staggered four-year terms. The City Council appoints a professional City Manager, who serves as the Council’s chief advisor, and the City Manager appoints the employees of the City.
Mayor & City Council
MAYOR
J. Sco Padge
Term Expires: 12/17
padge [email protected]
DISTRICT 1
Samuel Leder
Term Expires: 12/19
DISTRICT 3
Ella Mae Small
Term Expires: 12/17
DISTRICT 2
W. Brian King
Term Expires: 12/19
DISTRICT 4
Mayor Pro‐Tem
Alfred M. Brown, Jr
Term Expires: 12/17
DISTRICT 5
W. Lamar Barrier
Term Expires: 12/17
DISTRICT 7
John Sweat, Jr.
Term Expires: 12/19
DISTRICT 6
Jennifer Parsley
Term Expires: 12/19
5

HOUSING14 FTE
Angela Graham704-920-6100
DATA SERVICES1 FTE
Bill Dusch (Contract)704-920-5293
PARKS AND RECREATION
22 FTEBob Dowless
704-920-5610
ELECTRIC SYSTEMS73 FTE
Bob Pate704-920-5301
SOLID WASTE AND RECYCLING
31.5 FTEBrian Moore
704-920-5351
WATER RESOURCES118 FTE
Christie Putnam704-920-5343
FLEET SERVICES14 FTE
Daniel Nuckolls704-920-5431
EMERGENCY MANGEMENT
2 FTEJim Sells
704-920-5528
TRANSPORTATION41 FTE
Joe Wilson704-920-5362
CITY CLERK
Kim Deason704-920-5205
RIDER TRANSIT5 FTE
L.J. Weslowski704-920-5878
ASSISTANTCITY MANAGER
Lloyd Payne704-920-5206
PLANNING AND NEIGH. DEV.
19 FTEMargaret Pearson
704-920-5151
DEPUTYCITY MANAGER
Merl Hamilton704-920-5330
FINANCE64 FTE
Pam Hinson704-920-5220
PUBLIC AFFAIRS
Peter Franzese704-920-5210
FIRE200.5 FTE
Ray Allen704-920-5516
HUMAN RESOURCES11 FTE
Rebecca Edwards704-920-5102
AVIATION40 FTE
Rick Cloutier704-920-5912
ENGINEERING24 FTE
Sue Hyde704-920-5401
BUILDINGS AND GROUNDS
50.3 FTESusan Sessler
704-920-5380
CITY ATTORNEY6 FTE
VaLerie Kolczynski704-920-5115
COMMUNICATIONS27 FTE
Vicki Callicutt704-920-5590
ROCKY RIVER GOLF CLUB
Contract Arrangement704-455-1200
Since 1965, the City of Concord has operated according to the Council-Managerform of government, where a professional City Manager serves at the pleasure ofthe City Council as chief executive of the organization. The City Manager isresponsible for all City personnel, with the exception of the City Attorney, who is alsoappointed by the City Council. The City Manager provides functional supervision forthe Legal Department.
CITY MANAGER6.5 FTE
Brian Hiatt704-920-5215
CITIZENS OF CONCORDREPRESENTED
BYMAYOR
ANDCITY COUNCIL
POLICE208.25 FTE
Gary Gacek704-920-5007
6

HOUSING14 FTE
Angela Graham704-920-6100
DATA SERVICES1 FTE
Bill Dusch (Contract)704-920-5293
PARKS AND RECREATION
22 FTEBob Dowless
704-920-5610
ELECTRIC SYSTEMS73 FTE
Bob Pate704-920-5301
SOLID WASTE AND RECYCLING
31.5 FTEBrian Moore
704-920-5351
WATER RESOURCES118 FTE
Christie Putnam704-920-5343
FLEET SERVICES14 FTE
Daniel Nuckolls704-920-5431
EMERGENCY MANGEMENT
2 FTEJim Sells
704-920-5528
TRANSPORTATION41 FTE
Joe Wilson704-920-5362
CITY CLERK
Kim Deason704-920-5205
RIDER TRANSIT5 FTE
L.J. Weslowski704-920-5878
ASSISTANTCITY MANAGER
Lloyd Payne704-920-5206
PLANNING AND NEIGH. DEV.
19 FTEMargaret Pearson
704-920-5151
DEPUTYCITY MANAGER
Merl Hamilton704-920-5330
FINANCE64 FTE
Pam Hinson704-920-5220
PUBLIC AFFAIRS
Peter Franzese704-920-5210
FIRE200.5 FTE
Ray Allen704-920-5516
HUMAN RESOURCES11 FTE
Rebecca Edwards704-920-5102
AVIATION40 FTE
Rick Cloutier704-920-5912
ENGINEERING24 FTE
Sue Hyde704-920-5401
BUILDINGS AND GROUNDS
50.3 FTESusan Sessler
704-920-5380
CITY ATTORNEY6 FTE
VaLerie Kolczynski704-920-5115
COMMUNICATIONS27 FTE
Vicki Callicutt704-920-5590
ROCKY RIVER GOLF CLUB
Contract Arrangement704-455-1200
Since 1965, the City of Concord has operated according to the Council-Managerform of government, where a professional City Manager serves at the pleasure ofthe City Council as chief executive of the organization. The City Manager isresponsible for all City personnel, with the exception of the City Attorney, who is alsoappointed by the City Council. The City Manager provides functional supervision forthe Legal Department.
CITY MANAGER7.5 FTE
Brian Hiatt704-920-5215
CITIZENS OF CONCORDREPRESENTED
BYMAYOR
ANDCITY COUNCIL
POLICE208.25 FTE
Gary Gacek704-920-5007
7

May 25, 2016 The Honorable J. Scott Padgett, Mayor Members of the City Council Concord, North Carolina Dear Mayor Padgett and Members of the City Council: Pursuant to Section 159-11 of the North Carolina General Statues, attached is the recommended FY 2016-17 Budget for your review and consideration. I want to thank the Mayor and Council for providing staff with specific direction to maintain basic City services as indicated in the FY 2016-17 Goals Statement. I used this document as a guide in making recommendations. I also want to thank Deputy Manager Merl Hamilton, Assistant City Manager Lloyd Payne, all department directors and their respective staffs, Finance Director Pam Hinson and, in particular, Budget and Performance Manager Robin Barham and Budget Analyst Lesley Reder for their assistance in preparing this proposal. The City-wide budget totals $230,157,100 for all funds, including utilities and special revenue funds. The recommended General Fund budget for FY 2016-17 totals $78,771,691 for City personnel, operations, capital improvements and debt service. Due to the need to implement Council’s aggressive goals for the community, the failure of the General Assembly to provide an alternate revenue source after eliminating the business license tax, increasing demands for service as part of a growing economy and the continued use of the ad valorem basis for distribution of sales taxes in Cabarrus County, I am recommending that the tax rate remain at 48¢ per $100 of valuation. As in past years, this proposed tax rate includes restricting the 2¢ budgeted for use in the Transportation Improvement Fund as mandated by City Council. Including an overall 8% increase in Concord’s assessed property values determined during the 2016 Cabarrus County revaluation process, the revenue neutral tax rate, using the formula provided in G.S. 159-11(e), is calculated at 45.94 cents for FY 2016-17. I am recommending no rate increases for the Stormwater, Water or Wastewater funds, despite a 5% increase in our wastewater treatment rates from WSAAC. No changes are recommended in electric rates at this time. As is the practice, if there is a need to consider a Purchased Power Adjustment, changes would be implemented in the September time frame. For the first time since before the Great Recession, we started the budget process with departments being asked to prepare a budget with up to, but no more than, a 2% operational increase. Many departments
0.000.050.100.150.200.250.300.350.400.450.500.550.60
2011 2012 2013* 2014 2015 2016 2017*
City Property Tax Rate(cents per $100 of valuation)
*indicates a revaluation year
8
did use this opportunity to address smaller but much needed operational items; however several departments did not request operating increases at all. As a separate review process, departments were able to identify additional needs beyond their current operations. Management considered the impact of these operational needs in an environment of a strengthening economy and growth, and recommended those new requests that will meet Council goals and/or have the greatest impact on direct service delivery to our citizens. The budget was balanced using conservative revenue projections. The growth in all sectors of the economy in Concord speaks well for the desirability of our community. We have been extremely conservative in expenditure growth over the past eight years, first due to the recession, then to the turmoil caused by the General Assembly’s elimination of the business license revenue and the debate on sales tax redistribution. With the growth, the City cannot maintain current services levels or meet Council goals without adding positions and increasing operational line items. My FY 2015-16 Message pointed out how the decrease in City positions per capita could not continue in light of the upturn in residential growth if the City is to maintain service levels. That is why there are such increases recommended. This recommendation assumes the General Assembly will not make changes to local government revenues that will impact the City of Concord. Per Council’s direction, the focus of this budget is maintaining essential services provided to our residents and businesses and fund the essential projects necessary to maintain and improve the quality of life in a growing community. To do this and to continue to make basic capital purchases, we are recommending the use of $2,985,540 from the City’s Capital Reserve Funds. RESERVES ARE NOT BEING USED TO FUND OPERATIONAL LINE ITEMS. The City Council is to be commended for continuing its past conservative practices, not only in projecting revenues, but also holding down expenditures and maintaining reserves to help meet essential needs. Operations continue to remain lean but these practices have enabled us to remain in a solid financial position. This could be undermined by past and future actions of the General Assembly. For FY 2016-17, the recommended Concord property tax rate continues to be among the lowest third of full-service North Carolina municipalities with populations greater than 40,000 and the lowest of those that do not charge solid waste and/or recycling fees. The property tax comparison chart on the next page summarizes the proposed property tax rates for these comparable cities. Most of the cities whose property tax rates are lower than Concord’s make extensive use of State authorized impact fees, and/or charge additional user fees for solid waste collection and/or disposal. Some of the lowest are cities in the Triangle, a region with rapid growth in sectors resulting in high property values and disposable income.
9

Due to increasing customer needs, several departments requested new positions or to “unfreeze” positions for FY 2016-17. Many of these are recommended. These include 28 new full-time positions, 1 part-time position, 6 unfrozen positions, and 2 positions moving from part-time to full-time status. The Council’s goal is to maintain a General Fund balance target between 30% and 35% of expenditures. The General Fund balance will continue to meet the Council goal. This stability in fund balance is possible only because our elected officials have been good stewards of the City’s revenues in the past. Regardless of its size, over reliance on fund balance in any one fiscal year is a dangerous practice in times of slow growth, particularly if used for ongoing operations. With this diligence, we have tried to avoid the practice of over reliance on fund balance or retained earnings, which would require us to eventually generate ongoing replacement revenue or new sources of funding. If we see more of the worst case revenue scenario coming from the General Assembly later this year, the Council will have difficult decisions to make regarding using reserves, raising revenues and/or cutting services. The overall budgetary principles on which this document is based are:
Basic City services are continued by recommending any increases needed to maintain current service levels.
Revenue projections are estimated with the assumptions outline earlier in this message. We have used the Mayor/City Council Goals Statement as our guide in recommending new
projects and services.
0.200.250.300.350.400.450.500.550.600.650.70
Car
y*
Ap
ex
Ral
eigh
Ash
evill
e
Co
nco
rd
Ch
arlo
tte
Wilm
ingt
on
Faye
ttev
ille
Gre
envi
lle
Ch
apel H
ill
Gas
ton
ia
Wils
on
Du
rham
Hic
kory
Bu
rlin
gto
n
Ro
cky
Mo
un
t
Kan
nap
olis
Gre
ensb
oro
Hig
h P
oin
t
Go
ldsb
oro
FY 2016‐17 Proposed Property Tax Rates for NC Full‐Service Cities Over 40,000 Pop.
(Cents per $100 Valuation)
Note:*Cary - extensive use of impact fees.
Cities in green apply a fee for solid waste (for some or all services) in addition to property tax.
0.48
10

EEXXPPEENNDDIITTUURREE HHIIGGHHLLIIGGHHTTSS BBYY FFUUNNDD While highlights of each operating fund are contained within the individual program summary pages located throughout this document, the expenditure highlights of major funds for the FY 2016-17 Recommended Budget are listed below: GENERAL FUND
Police – Addition of 4 Police Officer positions and 1 Sergeant position for Proactive Policing Unit (including equipment/supplies/vehicles) - $593,053.
Police – Addition of 4 Police Officer positions and 1 Sergeant position dedicated to Concord Regional Airport (including necessary equipment/supplies/vehicles) - $532,953.
Police – Evidence.com subscription for body-camera program - $147,500. Police – Supplies and equipment to outfit 16 bicycles for Police use (bicycles are being
purchased with Asset Forfeiture funds) - $14,720. Police – Purchase of 8 tablets/licenses, mounting and docking equipment for remainder of
SROs (ensures all SROs have tablets for computer/data access) - $62,240. Code Enforcement – Addition of 1 Code Enforcement Officer position to more efficiently
handle an increased workload/cases - $87,469. Emergency Communications – Addition of 1 Administrative Assistant position to assist with
false alarm and database management (offset with increased revenue from bringing the collection of fees in-house - effective October 1, 2016) - $42,374.
Fire – Replacement of an aerial platform ladder truck and associated equipment - $1,400,000. Fire – Addition of 3 Lieutenant and 3 Captain positions dedicated to Concord Regional Airport
(including necessary equipment/supplies) - $404,265. Fire – Increased maintenance needs at Fire Stations (renovation of kitchen at FS7, roof
replacement at FS3) - $100,000. Fire – Purchase of vehicle exhaust system for FS9 (FS7 and FS9 are the only stations now that
do not have it, however FS7 is eligible for a grant to purchase) - $58,000, Fire Prevention – Addition of 1 part-time Fire Marshal position to offset increases in plan
review workload - $24,192. Fire Prevention – Replacement of Fire Safety House (including carport) - $82,962. Emergency Management – Addition of an Assistant Emergency Management Manager to
assist with emergency response, developing plans, conducting risk assessments, etc. (including supplies/equipment/vehicle) - $118,625.
Emergency Management – Purchase of an Unmanned Aerial System for use primarily in public safety - $12,000.
Transportation – Addition of 1 Senior Equipment Operator position and 1 Equipment Operator position for utility cut patching (includes supplies/equipment/vehicle) - $134,106.
Transportation – Continuation of additional $30,000 for contracted sidewalk repair. Solid Waste and Recycling – Addition of residential recycling disposal costs (as defined in new
service contract with Sonoco; due to substantial decreases in the recycling market) - $120,000. Fleet Services – Reduction of $400,000 in city-wide fuel costs (due to lower prices) - $1.3
million. Fleet Services – Unfreezing and funding of Master Mechanic position to assist with workload
due to increased fleet size (includes supplies/equipment) - $55,026. Cemeteries – Continued maintenance funds for monument repair, landscaping, and sidewalks
at all three City-owned cemeteries - $28,000. Planning and Neighborhood Development – Addition of 1 Planner position to assist with
community development - $60,705.
11

Planning and Neighborhood Development – Increase in hours worked by Clearwater Studios Supervisor to become a full-time position (includes benefits) - $16,930.
Planning and Neighborhood Development – CVB Wayfinding Sign Fabrication project in the downtown area (Concord’s participation) - $42,000.
Economic Development – Enlist a Recruitment Consultant to target specialty retail - $30,000. Parks and Recreation – Install playground equipment at the Weddington Road Bark Park -
$35,000. Parks and Recreation – Replace windows/doors and HVAC units on west side of Academy
Recreation Center - $59,000. Parks and Recreation – Addition of funds needed to construct McEachern Greenway Cabarrus
Phase - $100,000. Parks and Recreation – Expand and make improvements to the Daniel Pharr building located
near Caldwell Park - $68,000. Parks and Recreation – Funding for design of Hector H Henry Greenway Airport phase
($52,500) and land/ROW acquisition associated with Hector H. Henry Greenway Riverwalk phase ($50,000).
Parks and Recreation – Use of Capital Reserve funds for construction of Hartsell Recreation Center renovations ($1,815,000), renovation of property on Burrage Road for future programming space ($309,540) and partial construction funding of McEachern Greenway Fink phase ($311,000). Remaining $1 million in construction funds for Fink phase is recommended for funding in the General Fund Parks and Recreation budget.
Parks and Recreation Aquatics – Resurface inside of the pool - $38,000. Public Services Administration – Replacement of Warehouse roof at the Brown Operations
Center -$275,000. City Manager’s Office – Updated process for Biennial Citizens Survey - $16,000. Human Resources – Addition of 1 HR Analyst position to assist with Benefits (and related
compliance) workload - $64,963. Finance – Upgrade of budgeting software to Questica product - $60,000. Non-departmental – Inclusion of funds for Mosquito Control Program administered by
Cabarrus Health Alliance - $12,000.
MUNICIPAL SERVICE DISTRICT FUND: A total of $89,000 is appropriated to the Concord Downtown Development Corporation for
use in the promotion and improvement of the City’s downtown district. The Revenue Neutral tax rate for the MSD is $.23 per $100, so no change is recommended in the tax rate.
STORMWATER FUND:
Provide funds for the replacement of culverts at Chelwood Dr and Hanover Circle – combined budget of $769,000.
Matching funds for the construction/completion of Army Corp of Engineer’s Stream Restoration project at the Academy and Stricker branch - $362,892.
ELECTRIC FUND:
FY17 Wholesale Purchase Power budget reflects 6.7% decrease from FY15-16 budget. Perform Solid State Relay Conversions at Substation M ($495,000) and Substation C
($935,000). Construction of Substation P near Hwy 601 and Hwy 49 - $2,500,000. Funds for HID to LED Lighting Replacement Program - $1,000,000.
12

WATER FUND: Water Treatment Plant Security Improvements- $100,000 Hillgrove Treatment Plant Design & Construction of Motor Control Center Lineup - $190,000 Coddle Creek Treatment Plant Settling Basin Improvements - $225,000 Coddle Creek Secondary Raw Waterline & Flow Meter- $1,190,000 (use of retained earnings) Upsizing of lines/extension of mains - $285,500 Waterline for Derita Road Widening - $125,000 George Liles Extension Waterline Phase 3 - $282,430 Creation of a reserve fund for future projects.
WASTEWATER FUND:
Accent Drive Outfall replacement - $590,000. Continue to invest in pipe lining for wastewater lines - $721,035. Engineering work associated with Wastewater Master Plan - $150,000. Reflects 5% increase in utilities paid to WSACC for the treatment of sewer – addtl. $318,323. Creation of a reserve fund for future projects.
PUBLIC TRANSIT FUND: Transition to TransDev as the provider of CK Rider services. First year for ADA Paratransit service. Expand access to and quality of customer service at the Rider Transit Center utilizing
additional staffing (increase of part-time position to full-time) - $17,459. GOLF COURSE FUND:
Budget reflects increased revenue/rounds associated with recent course and clubhouse improvements.
Course bunker restoration and irrigation repairs - $199,650. AVIATION FUND:
Expansion of commercial service with opening of new terminal and parking deck in August 2016, additional flights, destinations and potentially, a new carrier.
Addition of 11 dedicated Public Safety positions to Concord Regional Airport as directed by TSA or FAA (highlighted under General Fund section).
Addition of 6 positions (4 new, 2 unfrozen/funded) targeted at customer service, operations, and maintenance of the new facility, as well as the existing terminal - $235,097.
INTERNAL SERVICES FUND: The Internal Service amounts are charged back to user departments and are reflected in each department or fund’s recommended budget amount. Highlights include:
Engineering – Unfreeze and fund Engineering Manager position - $86,938. Building and Grounds – Addition of 1 Grounds Maintenance Worker (including equipment
and vehicle) associated with facility additions at FS11, Weddington Road Bark Park and Hector H Henry II Greenway - $91,681.
Data Services – Continue upgrade of City’s network infrastructure and capacity - $75,000. Data Services – Various server replacements across the City to ensure application and network
reliability, as well as data security – combined $172,000.
The budget is presented in a format that groups expenditures into major areas: personnel services, operations, capital outlay, debt service, and non-departmental allocations. This format is consistent with Council’s goal of developing a results-oriented budget with performance measures rather than just numbers not tied to specific goals and projects. This is an extension of the Mayor and Council’s annual process of formally setting goals to track results. There has been a refinement of many departmental
13

915.8 916.2 934.7 944.5 979.1
2013 2014 2015 2016 20170
200
400
600
800
1,000
1,200
Authorized FTE
performance measures. Staff is working to meet the objective of only using measures that are meaningful to the elected officials and citizens and which truly reflect value added services. Staff also proposes that Concord continue participation in the North Carolina Local Government Performance Measurement Project as it has proven to assist in benchmarking and performance improvement. The City Council adopted Fiscal Policies addressing Revenues, Capital Improvements, Accounting, Debt and Reserves. These policies have been updated annually as part of the Mayor/Council Goals and have been addressed in preparation of this budget. The five-year Capital Improvement Program is also updated and also presented herein for your review.
PPEERRSSOONNNNEELL HHIIGGHHLLIIGGHHTTSS Personnel expenditures include salaries, FICA, group insurance, retirement, 401K, longevity pay, merit pay, and other miscellaneous benefits for co-workers. Contract, legal, medical, and other outside professional services are not included under personnel. They are included under the Operations category. For FY 2016-2017, personnel expenditures account for $65,641,276 or 28% of the total budget. This year we are proposing funds for reasonable performance based merit increases. An overall average increase of 3.5% is recommended with merit increases to range from 3% to 4%, depending upon performance. The City will also continue with career development programs for many classifications. A total of 35.1 FTE in additional staffing is recommended for FY 2016-17. Twenty-eight new full-time positions and one new part-time positions are recommended for funding, while 6 current “frozen” positions are recommended to be funded and filled. In addition, 2 part-time positions are recommended for full-time status to better meet customer needs. The recommended positions are as follows: General Fund (23 full-time positions, 1 part-time, 1 part-time to full-time, and 1 frozen position) Human Resources:
1 - HR Analyst (Compliance and Benefits) Police:
4 – Police Officers 1 – Police Sergeant 4 – Police Officers (dedicated to Concord Regional Airport) 1 – Police Sergeant (dedicated to Concord Regional Airport)
Code Enforcement: 1 - Code Enforcement Officer
Emergency Communications: 1 – Administrative Assistant (effective October 2016)
Fire: 3 – Fire Lieutenants (dedicated to Concord Regional Airport) 3 – Fire Captains (dedicated to Concord Regional Airport) 1 – PT Assistant Fire Marshal
Emergency Management: 1 – Assistant Emergency Management Coordinator
14

Transportation/Streets: 1 – Senior Equipment Operator 1 – Equipment Operator
Fleet Services: 1 – Master Mechanic (unfrozen position)
Planning and Neighborhood Development: 1 – Planner 1 – Clearwater Studios Supervisor position to move from part-time to full-time (+12 hours)
Electric Fund (1 position unfrozen and filled):
1 – Electric Engineering Specialist
Water Fund (1 position unfrozen and filled): 1 – Utility Service Worker
Aviation (4 full-time positions, 2 positions unfrozen and filled): 2 - Customer Service Representative 1 – Custodian 1 – Aviation Service Worker 1 – Custodian (request to unfreeze) 1 – Senior Customer Service Representative (request to unfreeze)
Transit Fund (1 part-time position to full-time status) 1 – Customer Service Representative to move from part-time to full-time (+12 hours)
Internal Service Fund (1 full-time position, 1 position unfrozen and filled): 1 – Engineering: Engineering Manager (unfrozen position) 1 – Building and Grounds: Grounds Service Worker
A total of 979.1 full-time equivalent positions are recommended for funding. Due to changing priorities within departmental operations and efficiencies gained in recent years, 6 previously “frozen” positions have been evaluated and determined suitable for elimination. All were previously unfunded and unfilled: General Fund (4 full-time positions): Solid Waste:
2 – Equipment Operators 1 – Solid Waste Crew Supervisor
Parks and Recreation: 1 – Parks and Recreation Specialist
Aviation (1 full-time position):
1 – Accounting Supervisor Building and Grounds (1 part-time position):
1 – PT Custodian Our health care premiums and benefits were adjusted in anticipation of the new budget year. The City’s HRA health care plan continues to be used by most coworkers. Employees have the option of selecting this plan at a lower cost with the City paying most of the full cost for the individual. The alternate PPO based plan, which is similar to the plans used by most employers in the region, provides a “richer” level of
15

benefits at a higher cost for coverage and the coworker must pay most of the additional cost over that of the HRA for employee only and family plans. Both plans are self-funded and administered by Blue Cross/Blue Shield. Wellness efforts have been a priority, both for the benefit of our coworkers and to reduce costs. The City of Concord Wellness Center offers free health care services to all full-time City of Concord employees, along with retirees, spouses, and dependents who are enrolled in the City's self-funded insurance plan. The Wellness Center provides a basic level of routine medical care and health screenings. It is not intended to replace an individual's primary care physician, but rather to provide a convenient, no-cost access point for basic medical care. The Center is staffed by a licensed nurse practitioner and a medical office assistant with direct oversight by a licensed physician. A Wellness committee, comprised of co-workers, meets monthly to help create and promote wellness activities city-wide. The City has been working to provide equipment for coworkers to exercise on-site before or after work, or during lunch. An incentive has been offered to coworkers again this year for managing their health. Employees who completed a Health Risk Assessment and certified they do not use tobacco, or attended a tobacco cessation program if they do, receive a reduction in monthly health care premium costs. The Health Risk Assessment includes the completion of a questionnaire, biometric measures and a fasting blood draw. The City’s required contribution levels to the North Carolina Local Government Employees Retirement System will increase with FY 2016-17. The contribution per general employee increased to 7.25%, while contributions for law enforcement officers are at 8.0%. Actuarial projections point to continued modest increases in future fiscal years. The budget also maintains the City’s 401(k) contribution for coworkers at 3.5%. By State mandate, the city contributes 5% to accounts for sworn law enforcement officers. We also continue to monitor the impact of retiree health care benefits. The City provides health care benefits to eligible retirees up to the time they are Medicare eligible. As with other retiree benefits, these health care plans have gone through drastic changes over the years. Retiree healthcare subsidies started with large private employers, with governmental employers jumping in later as the struggle to compete with the salaries and benefits in the private sector became more pronounced. State governments, including North Carolina, jumped in next to cover teachers and other employees. The market has changed dramatically since then, but many state and local governments still provide retiree health care at some level. These benefits are costing the City more as baby boomers continue to retire. This is particularly true for public safety coworkers who tend to retire earlier than the general employee population, thus staying on the City’s plans for a longer period of time. This past year, the number of retirees receiving health care benefits from the City grew from 116 to 128.
Staff is recommending that Concord continue to allocate $100,000 to go into the State trust fund established for this purpose in order for the city to participate in the future if it decides to do so. In the meantime, staff will continue to monitor what other local governments are doing in response and evaluate the use of this trust.
KKEEYY RREECCOOMMMMEENNDDAATTIIOONNSS,, AACCCCOOMMPPLLIISSHHMMEENNTTSS AANNDDCCHHAALLLLEENNGGEESS FFOORR TTHHEE FFUUTTUURREE
THE NORTH CAROLINA GENERAL ASSEMBLY AND REVENUES
As noted, this budget recommendation assumes the General Assembly will not make, or threaten to make, changes to local government revenue sources as in previous fiscal years. The elimination of the Business License Tax two years ago resulted in the loss of over $1,000,000 to the City of Concord, equivalent to
16

over a penny on the property tax rate. Last year’s discussion of sales tax redistribution produced schemes that would have resulted in Concord eventually losing millions of dollars in revenues. The compromise solution finally adopted ended up redistributing all sales taxes on new services, but leaving the existing revenue alone. Hopefully any of the anticipated tweaks to these new taxes to eliminate some of the confusion that has been caused will not impact Concord’s revenues. Recall that sales taxes are distributed among Cabarrus local governments using the ad valorem basis. This is the distribution method Cabarrus County has chosen instead of the per capita basis. Using this method, the dollar amounts of ad valorem (property) taxes levied by the county and each municipality in the county in the preceding fiscal year are added. The proportion that each unit’s levy bears to the total levy of all units in the county determines the amount of local sales and use tax revenue that each local government receives. Thus, when one Cabarrus local government increases its tax rate and/or grows significantly more than another, it will impact the distribution of these sales taxes. Currently, Concord receives 21.53% of the local sales tax retuned. Concord’s portion has been on a downward trend over the last ten years, primarily due to changing tax rates among local governments. Since this is a revaluation year, the setting of the tax rate has a direct impact on the amount of sales tax the City will receive in future years. Since it appears most, if not all, of other Cabarrus local governments are recommending maintaining their current property tax rate, it is important that Concord do so too to avoid further decline in the proportion of sales tax received.
THE ECONOMY AND THE CHALLENGES OF GROWTH
The economy is strong and there are many opportunities to plant seeds for the future of better paying industrial and technology jobs, mixed-use office parks, and the continued redevelopment of Concord’s downtown. The next twelve months will be a year full of activity for City staff, City Council and residents of Concord. With the growth of our community comes the need to constantly plan for the future. These are exciting times as the City needs to prepare not only for the services and lifestyle for a very active baby boomer generation, but also for the younger generations that are staying in their hometown to live and raise families in the community they grew up in, or are moving here due to the quality of life. Over the past few months, the Planning and Neighborhood Development Department has been coordinating an update to the City’s Downtown Master Plan. This started with a comprehensive parking study and then proceeded to the next step with a market analysis that focused on the great potential that exists for continued development in the areas of residential, retail, dining and office uses. In March, contracted experts worked with our staff to solicit input from stake owners on future design aspects of downtown, using the information from the parking study and the market analysis to support ideas on how we can make Concord’s downtown even more appealing to people that would like to live, work and play in an urban environment. These ideas are being formally presented to City Council for prioritization of the elements of the plan. After that is completed, staff will be following-up quickly to engage help from a consultant to facilitate the updating of the City’s Land Use Plan. City Council has adopted this as one of its goals for Fiscal Year 2016-17. It presents a vision for the future, with long-range goals and objectives for all development activities. This includes guidance on how to make decisions on public and private land development proposals. In other words, it provides an outline of how we want the community to grow and look in future years. Like the Downtown Master Plan, there will be many opportunities for stakeholder input as we plan for the future.
17

DOWNTOWN DEVELOPMENT
With the completion of the New City Hall, Council is now determining the fate of the two vacated buildings on Union Street. The School of Government’s Development Finance Initiative; who also conducted the market analysis for the Downtown Master Plan, is completing studies of these two buildings that have focused on the best use of these sites and will also help with locating a private sector buyer and the financial assistance needed to support the redevelopment. 30 Market is slated to be demolished to make more room for a public plaza. Before that can happen, a building for the Traffic Management Center, currently located in the basement will need to be constructed. This will be at the Brown Operations Center unless other opportunities arise. Another need related to the demolition of 30 Market and construction of the Plaza is finding public parking to replace the adjacent parking lot. Cabarrus County is currently developing concepts for a new public parking deck that could be built on the current surface parking lot on Barbrick. The City is seriously considering partnering with the County to provide for general downtown parking needs and to replace the spaces lost in the Spring Street lot beside of 30 Market. The completion of the historic rehabilitation of Lofts 29 into apartments has been successful and is sparking interest in other downtown projects. The process leading to the rehabilitation of Hotel Concord is well underway, with the possibility of construction starting in early 2017.
WATER AND WASTEWATER NEEDS
Concord, Kannapolis and Albemarle completed the Albemarle water line in 2015. It is now delivering Yadkin River water treated at Albemarle water plants. While we now have a major new source of water, the City must continue to plan for water and wastewater infrastructure. A growing population a3We have taken a major step in bringing in more water with our partners in Kannapolis with the completion of the Albemarle water line; however, we continue to evaluate the condition of our existing water plants and lines to make improvements to protect our investment, meet higher environmental standards, and prepare for future needs. Staff is coordinating an update to our Water Master Plan and will do the same for the Waste Water Plan with the coming of the new fiscal year. In concert with Electric Systems, Water Resources has started implementation of advanced metering technology as part of the City’s efforts to develop a utility smart grid. It was determined earlier this year it would be more beneficial to go ahead and do a full implementation at the same time as the Electric Department. Both the City and its customers will be able to benefit greatly from this new technology. WSACC implemented another rate increase for the wholesale treatment of wastewater; however, the recommendation is to delay an increase to customers until FY 17-18. This budget also includes funds for capital improvements and maintenance of the wastewater system, particularly in areas of Concord where aging lines are more likely to lead to rainfall infiltration.
ELECTRIC SYSTEMS
The major project for FY 2016-17 is the continued implementation of the Smart Community effort. The implementation of new meters and related technology will improve our service response, systems reliability and will provide both the City and its customers with sophisticated tools to analyze and manage use. While the system is being deployed the City will actively educate customers about the meter
18

installations, communicate the benefits, roll out programs and aggressively engage customers to use these new tools. The City’s current contract to purchase power from Duke Energy is based on Duke Energy’s system average cost. Costs are tied to Duke’s expenditures and go up (or down) depending upon market conditions and infrastructure investment. Concord has entered into a contract with NTE, the builder and operator of a natural gas fired plant under construction in Kings Mountain. Under the terms of the agreement, the City of Concord will be provided with electric generation services by NTE using a portion of the capacity and energy generated by the facility for an initial term of 20 years. This will allow Concord to utilize this source when the Duke contract ends in 2019. The contract also provides for access to power produced from other types of generation if it is more cost effective to buy on the market.
AIR AND SURFACE TRANSPORTATION
Air transportation The growth of commercial air service at Concord Regional Airport (CRA) has had a dramatic impact on this budget. In order to prepare for more commercial flights, a new terminal for passengers and related parking is being constructed on the south end of the Airport. The new terminal is partially funded through a FAA grant matched by the City of Concord. The adjacent parking deck has been financed with passenger fees and parking fees eventually generating the revenue to cover the debt.
New personnel must be hired in advance of the new services, so the General Fund is recommended to help by providing supporting revenues for the public safety positions until the new commercial flights will generate the revenues to pay for these jobs. Four Police Officer positions and a Sergeant are being assigned to meet TSA requirements. There will be Federal reimbursement available for salaries for these jobs. Three Fire Captains and three Fire Lieutenant positions are also being added to provide for minimum staffing levels necessary to meet requirements for a commercial airport. Finally, funding for four new Aviation Department positions and two unfrozen positions are recommended to provide customer service and building maintenance services at the new facilities.
Commercial activity has already helped to solidify the airport’s position in qualifying for FAA funding for airports with commercial type operations. Concord Regional Airport intends to continue being a top General Aviation airport that helps to spur economic activity. The growth in commercial operations is intended to provide funds to help support that General Aviation infrastructure.
Surface transportation This budget maintains the Transportation Improvement Fund created by the City Council to fund transportation projects. These funds come from 2 cents of the property tax rate and are supplemented by dollars generated from local vehicle license fees. Many of the projects described will be at least partially funded through this source. The NE Subset sidewalk extension will be constructed in FY 2016-17 in the Burrage Road/Beverly Hills area. In addition, the design work for improvements to Brookwood Avenue continues along with the matching dollars for the traffic management grant and the funding set aside for the Virginia Street improvements. The Transportation Fund also includes all the dollars that have been set aside previously for participation with NCDOT on other projects. Staff has been able to develop a fully functional traffic management operation center on a very tight budget. As noted earlier, the traffic management center has been housed in the basement of 30 Market Street in the old Police Headquarters. Additional funds are included in this budget, partially out of the
19

Transportation Fund, to construct a new facility and supporting infrastructure on land at the Brown Operations Center if another location is not secured. The City is also ready to begin implementation of the Intelligent Transportation System grant that was received a few years ago. The ITS Grant Project provides for the signal system master plan to prepare us for future growth and expansion. It will involve the design and construction of dynamic message board signs for the Exit 49 area as well as provide funding for CCTV cameras, video servers, fiber and wireless communications infrastructure, laptop computers for signal technicians and the video wall for the New/relocated traffic management operation center. Projects impacting NCDOT facilities that are programmed with Concord’s participation: I-85 Widening Project, NC 73 to 29-601 Connector in Rowan County - The NCDOT, I-85 project from NC 73 to 29-601 Connector in Rowan County is underway. This includes significant improvements to the interchanges at Exits 58 (US 29) and 60 (Copperfield/Dale Earnhardt). The City of Concord and the City of Kannapolis are cooperating to include aesthetic improvements to the end of the bridges at these interchanges.
Exit 49- Three projects have been solidified as priorities in the I-85 – Exit 49 area. These include a “fly over” directly into the first entrance to Concord Mills Mall, pedestrian improvements along Bruton Smith Boulevard and the completion of the Derita Road widening project, including the bridge, from the Rocky River to the end of Concord Mills Boulevard. All of these projects now have been included for NCDOT funding and planning is underway. The City of Concord has pledged to provide 20% of the cost of these projects. Derita Road – Traffic congestion is choking this important corridor that serves the Airport, the growing industrial area, and Concord Mills. Concord was required to pick up the total cost to match the Federal funds for Phase 1 construction of this NCDOT Road going from Poplar Tent Road to the Rocky River Bridge. The match is estimated to be $3,036,763. However, as noted above NCDOT has now allocated funds to complete the rest of the project all the way to Concord Mills Boulevard. Design and permitting is completed and right-of-way acquisition for the Phase I portion has been underway. Construction was delayed to allow the full project to be bid at the same time so it will begin in 2017. George Liles Parkway Extension – Project continues with Blythe acting as contractor. The contractor has finished the between Weddington and Concord Parkway (US 29). The entire project to Roberta Road should be completed in 2017, including the interchange at US 29. Congestion Mitigation and Air Quality Project – Concord continues to work with NCDOT on a CMAQ road project to improve the intersection of Poplar Tent and US 29 (C-4918-A). This required a local match that has been budgeted using the Transportation Fund. The City will manage the project during construction. The construction will incorporate “superstreet” design. It has been delayed repeatedly due to the approval process but should begin by the end of 2016. Public Transit The Rider System will be changing contractors for the new fiscal year with Transdev North America talking over operations and maintenance from First Transit. No major changes are anticipated as Transdev is seeking to hire many of the existing personnel. The biggest obstacle for the future continues to be changes and/or decreases in Federal revenue. The Cabarrus County Transportation System and the Salisbury fixed-route bus system are now lumped in with the Rider System to compete for Federal Transit Administration funding. Rowan County may be included
20

in future fiscal years. This could result with the revenue “pie” being near the same with more systems getting funding from the same source. These changes could eventually have a dramatic impact on the ability to maintain the current level of service. Cabarrus County is looking to fund a study to analyze better coordination between the Rider and Cabarrus County systems, or even consolidation. Rider will participate with funding once details are finalized by the County. Conversations will continue to take place with Charlotte’s CATS system as to how to link riders in Concord with the Blue Line in the University area. The current express bus arrangement will likely be outmoded when the light rail line opens. However, there is not adequate parking for Concord residents to drive and park, generating the need to link by bus for riders going both ways.
PUBLIC SAFETY
With a growing city comes the need for new police personnel. In addition to the positions added at Concord Regional Airport, four Police Officer positions and one Sergeant are recommended to form a unit to supplement targeted efforts within the Police Districts. We anticipate staff will be evaluating the need for additional personnel in FY 2017-18. Fire Station 11 was completed on Weddington Road beside the Bark Par. It includes a ladder company and a Cabarrus County EMS unit. The budget recommendation includes many capital needs for the Department, including a platform ladder truck replacement. Staff continues to evaluate the need to construct other new stations, along with the associated staffing and equipment.
RECREATION AND OPEN SPACE
The Weddington Road Bark Park (for dogs) was completed in 2016, along with the Hector H. Henry, II Greenway section that runs from this park and connects to the sidewalk system near the Concord Convention Center. Playground equipment for the Park is included in the budget recommendation. Also included is money for planning for the extension of the greenway along the Rocky River both north and south from the Weddington Road Bark Park. Continued development of the McEachern Greenway is also a priority. The phase from Mickey McGee Park north to beyond Cabarrus Avenue is funded but construction has been held off until obstacles due to land acquisition are overcome. In order to save mobilization dollars, additional funds are recommended to extend this project under Cabarrus Avenue to use the Fink property already acquired. This was targeted to take place in a future phase but since the project is already designed the recommendation is to build it now. It is hoped that the project can be bid before the end of 2016. Another major project funded is for major renovations to the Hartsell Recreation Center. This will incorporate improvements similar to those already implemented at the Logan Multi-purpose Center and the Academy Center. Improvements to the Pharr building at Caldwell Park are also recommended. Finally, renovation of the home the City owns as part of the acquisition of property on Burrage Road will take place to provide meeting space for Recreation programs. As the community grows, so does the demand for recreation services and facilities. Another FY 2016-17 Council Goal is the updating of the Parks and Recreation Master Plan. Obviously more facilities are needed to meet the demands of a growing population, particularly in the Northwest portion of Concord. At the same time we must plan for the needs of an active aging population and those of kids and younger adults looking for more opportunities for recreation. This is another process where feedback from our residents will be an important component.
21

The Rocky River Golf Club continues to be one of the highest quality municipal golf courses in North Carolina. A small project to expand the clubhouse was completed and now gatherings of larger groups can be accommodated, resulting in increased revenue. The FY 2016-17 recommendation includes funds for the first phase of a project to rehabilitate the bunkers on the course.
TECHNOLOGY
Today’s customers demand that we keep up with technology as it impacts the way they interact with the City. With more and more people being technologically “savvy” and possessing smart devices, this creates a challenge to advance City technology to meet customer expectations. For example, customers now have technology in the hands as they can report service needs using a City app and their smart devices.
The implementation of the Accela software continues in partnership with Cabarrus County. The end user now has one source to go to when going through the development process. This technology should prove to very useful to developers and their engineers and architects, as well as small business people who may not have the money to spend on support staff for their development project(s). Finally, the City has worked hard over the years to develop a fiber optic system to link City facilities. This is a valuable asset. Tech Edge has added personnel better suited to oversee this system to make sure we are maximizing its use for the betterment of all departments and Concord as a whole.
CUSTOMER SERVICE AND CITIZEN COMMUNICATIONS
Citizen communications will continue to be varied. Direct mailings such as the “City Circular” newsletter, newspaper placements, the electronic newsletter, the City’s website, news releases, television, radio and other outlets will continue. However, we have also moved into new media such as blogs, Facebook, and RSS feeds, as citizens get their news from vastly different media outlets than a few years ago. The Connect CTY calling system continues to be a very valuable tool to notify groups during emergency situations and notify citizens of work that might impact their neighborhood, changes in City services and changes in schedules during holidays. The City continues its partnership with the school system by offering various opportunities to learn about City services. The City’s Civic Education program involving 3rd grade students attending participating elementary schools continues to expand. One of the best ways to teach the parents about local government is through their children. Also, the highly successful Youth Council will continue this year. Concord 101 and the Public Safety Academy are very well received by participants. These programs give residents an opportunity to learn more about their municipal government and to provide feedback on important local needs and issues. Funds are budgeted to continue these programs in the new fiscal year. As noted above, the Accela software has been implemented to provide a more seamless experience for those seeking to develop in our City. The Customer Care Center continues to be essential in providing a human contact for citizens who phone in service needs. Customer Care handled 118,385 calls in 2015, resulting in an average of 9,865 per month. Coworkers have expanded their ability to handle full transactions so fewer calls are being transferred to others for disposition. Also, the move to the New City Hall has allowed for the relocation of Customer Care Center staff and walk-in customer staff to the same floor, allowing for better coverage depending upon the workload.
22
EMPLOYEE COMPENSATION AND BENEFITS It is clear that many employers in the public and private sectors have been enhancing their compensation offers as we continue to see increased competition for certain types of coworkers. The City continues its efforts to be competitive in FY 2016-17; however, it is always a challenge for the public sector during periods of strong economic growth as we are competing with private sector employers who are willing to pay what it takes for particular jobs where there is a shortage in the labor market. The cost of retiree health insurance overall and the supplemental retirement benefits in the Police Department continue to rise as baby boomers retire. Police and Fire employees will generally draw the retiree health insurance longer as they tend to retire at younger ages. Finally, we are determining the impact of the Federal government’s final Fair Labor Standards Act overtime rule that was released in late May. This raises the salary threshold for overtime calculations from $23,660/year ($455/week) to $47,476/year ($913/week), thus increasing the cost for the City of Concord.
EXTERNAL AGENCY FUNDING
For FY 2016-17, external agencies requested $164,780 from the City of Concord. This compares to the $137,500 appropriated for such purposes in FY 2015-16. These agencies play an important role in ensuring a high quality of life in our community and, in some cases, providing a safety net for those in need. However, Concord must focus on its core mission of providing municipal services. While many of the services these agencies provide are vital, they are not considered municipal in nature in North Carolina. Community Development Block Grant funds can be used for human services and housing, but they are limited to a certain percentage of the grant amount. The recommendations call for funding requests from many of the agencies that received City support last year. $85,780 is recommended from the General Fund, a 27% increase from FY 2015-16. $42,000 is recommended from Community Development Block Grant monies, which represents a 20% decrease over FY 2015-16. $15,000 is recommended from the utilities funds. The individual agency funding recommendations are included within the budget of their associated functional areas as directed by Council.
CCOONNCCLLUUSSIIOONN
The FY 2016-17 budget proposal operationalizes the goals for the City of Concord established by the Mayor and City Council. The services, programs, and facility needs prioritized in the City Council Goals Statement were addressed. In addition, basic services have been maintained. While this budget is proposed by the City Manager, it is neither final nor is it necessarily a reflection of what will be approved by the City Council. The Mayor and City Council will review these recommendations to arrive at what it considers the proper expenditure of the available revenues for the upcoming year. Respectfully submitted,
W. Brian Hiatt City Manager
23

GUIDE TO THE COMPONENTS OF THE FY2016-17 OPERATING BUDGET DOCUMENT
The budget outlines the City's plan for achieving the goals, objectives, and service delivery levels desired by the Mayor and City Council. More specifically, the budget is a financial plan consisting of an estimate of proposed expenditures, the proposed means of financing, and the goals and objectives of the expenditures for a given time period, usually one year (July 1 - June 30). The major components of the budget document include: Introduction: The introduction’s largest component includes the Manager’s Message – an executive
summary of the recommended budget from the City Manager to the Mayor and City Council. It discusses the major budget items and changes and the City’s present and future financial condition. Other components of the introduction include a summary of the City’s budget process and calendar, a discussion of what is new or has changed, a brief history of the City, Mayor and Council goals and objectives, and the budget ordinance.
Budget Summary: The Budget Summary section begins with an outline of the City’s fund and cost
center structure and the City’s organizational chart. This section is then followed by discussion of major revenue assumptions and trends. After revenue assumptions are tables and charts that outline the City’s revenue and expenditure plan by fund, function, and department. The Budget Summary also includes a personnel summary, background on the City’s performance measurement and customer service efforts, and a listing of funded External Agencies.
General Fund (Fund 100): The General Fund accounts for resources traditionally associated with
government that are not required legally or by sound financial management to be accounted for in another fund. It is the city’s main operating fund. This section contains a summary of the General Fund, summaries of the General Fund’s five functions (General Government, Public Safety, Public Works, Economic Development, and Culture & Recreation), and a detailed breakdown of each department.
Special Revenue Funds: Funds that are used or required to account for specific revenues that are legally
restricted to expenditures for particular purposes. This section follows the layout of the General Fund. For the City of Concord, Special Revenue Funds include:
Municipal Service District Fund (Fund 201): This fund accounts for taxes levied on behalf of and
remitted to the Concord Downtown Development Corporation for use in the promotion and improvement of the City’s downtown area.
Housing Assistance Fund – Section 8 (Fund 210): This fund is used to account for federal grants
received to provide housing assistance payments for low-income families. Community Development Block Grant Fund (Fund 307): The CDBG fund accounts for federal
grants under the Community Development Block Grant program. Home Consortium Fund (Fund 257): This fund accounts for federal grants received to expand the
supply of decent, affordable housing for low and very low income families with emphasis on rental housing, build state and local capacity to carry out affordable housing programs, and provide for coordinated assistance to participants and the development of affordable low income housing.
24

Addl. $5 Vehicle Tax (Transit) (Fund 292): This fund accounts for revenues collected from the
Municipal Vehicle Tax for Public Transportation, which is levied on each motor vehicle resident within the City of Concord and licensed, or required to be licensed by the State of North Carolina.
Enterprise Funds: These funds account for operations that are financed and operated in a manner similar to private business enterprises, where the intent of the City Council is that the costs of providing goods or services to the general public on a continuing basis be financed or recovered primarily through user charges. For the City of Concord, those funds include:
Stormwater Fund (Fund 600): The Stormwater Fund accounts for monies associated with operating the City’s EPA Phase II Stormwater management program. The program’s purpose is to reduce erosion and run-off pollution associated with rain events.
Electric Fund (Fund 610): The Electric Fund accounts for all monies associated with operating the
City’s electric distribution system. Water Fund (Fund 620): This fund accounts for all monies associated with operating the City’s water
treatment and distribution system. Transit Fund (Fund 630): This fund accounts for all monies associated with operating the Rider -
Concord/Kannapolis Area Transit System fixed-route public transit system. Wastewater Fund (Fund 640): Wastewater Fund monies are designated for use in maintaining and
construction of the City’s wastewater collection system. Golf Course Fund (Fund 650): This fund accounts for monies used in operation of the City’s
municipal golf course. Aviation Fund (Fund 680): This fund accounts for monies associated with the operation of the City’s
regional airport. Public Housing Fund (Fund 690): This fund is used to account for the operations of the City’s public
housing department. Internal Services Fund (Fund 800): This fund accounts for the financing of goods or services provided
by one department or agency to other departments or agencies, or to other governmental units, on a cost reimbursement basis.
Debt Service / Capital Improvement Plan (CIP): The Debt Service section outlines the regulations
municipalities in North Carolina must follow when issuing debt, the types of debt financing used by the City of Concord, and a summary of the City’s current debt structure. The CIP section provides a brief summary of the City’s capital improvement projects approved in the FY17 budget process and those projects that are currently in-progress.
Supplemental Information: This section contains supplemental information regarding the City’s fiscal
and CIP policies, a listing of Authorized Positions, employee salary grades, the FY17 Fees and Charges Schedule, a City profile, and a glossary.
This document and additional budget and performance measurement information can be
obtained by visiting the City’s budget website:
http://www.concordnc.gov/Departments/Budget
25

BUDGET PROCESS The budget is the single most important document presented to the Mayor and City Council. The budget document outlines policy direction, but it also serves the citizens by providing an understanding of the City's operating fiscal programs. It reflects the City's commitment to maintaining necessary services, improving the quality of service, and keeping the impact of taxes to citizens at a minimum. The City operates under an annual budget ordinance adopted by the City Council in accordance with the provisions of N.C.G.S. 159 – known as the Local Government Budget and Fiscal Control Act. The City Manager is required to submit a balanced budget by June 1 and the Council must adopt the budget by July 1. The fiscal year encompasses the period between July 1 and June 30.
Procedures The City's budget process begins in November, at which time CIP instructions are explained and distributed to departments. All departments receive their operating budget forms and instructions in early January. Department Directors are responsible for estimating departmental expenditures. The Finance Director in conjunction with appropriate Department Directors determines revenues. When budgeting expenditures, the basic requirements are to request sufficient funding to adequately operate the department and to request funding at the lowest reasonable level in order to achieve departmental goals and objectives. The departmental requests are submitted to the Finance Department, then organized and analyzed. The budget reflects the service priorities of the Governing Body and Citizens of Concord. The service needs of the community are determined
by public hearings and feedback through the Mayor and City Council. The City Manager and Budget Staff then conduct a comprehensive review of service needs in light of departmental budget requests. After final service priorities are established and decided upon, a balanced funding plan is formulated. Through careful assessment of funding requirements and financing methods, a proposed budget document is organized into final format and submitted to the Mayor and City Council for their consideration and adoption. The Mayor and City Council review the recommended budget packet, including departmental performance objectives, thoroughly with the City Manager and Budget Staff during special work sessions. A copy of the proposed budget packet with recommended changes is also filed with the City Clerk for public inspection. A public hearing is scheduled prior to the formal adoption of the budget. Adoption of the budget by the City Council establishes the legal authority to incur expenditures in the ensuing fiscal year. All annual appropriations lapse at fiscal year end.
Budget Transfers & Amendments Even though the budget begins July 1, changes to revenues and expenditures can occur throughout the fiscal year. Under a budget transfer, monies are transferred, within the departmental budget, from one line-item revenue or expenditure to another line-item. This process requires the approval of the City Manager (or his/her designee if sum is under $10,000), and the City Manager may authorize any amount of money to be shifted within a cost center. The City Manager is also authorized to effect interdepartmental transfers within the same fund, not to exceed 10 percent of the appropriated monies for the department whose allocation is reduced. A budget amendment usually involves larger sums of
26

money and results in a significant change to the department’s overall revenue and/or expenditure level. Budget amendments require City Council approval. Budget transfers and amendments must adhere to balanced budget requirements and impose no additional tax levy liability on citizens.
Encumbrances
All monies at fiscal year end lapse and spending authority ceases, unless specific services or goods are encumbered. Encumbrances are a financial commitment or earmark for services, contracts, or goods that have not been delivered by June 30 – the end of the fiscal year. Encumbered monies are carried over into the new fiscal year’s budget. Outstanding encumbrances at fiscal year end do not constitute expenditures or liabilities.
Basis of Budgeting and Accounting In accordance with the North Carolina Budget and Fiscal Control Act, the budget is developed and adopted under the modified accrual basis of accounting. Under this format, revenues are recognized when measurable and available and obligations of the City are budgeted as expenditures. During the fiscal year, budgets are monitored and accounted for using the modified accrual basis. At fiscal year end, the City’s Comprehensive Annual Financial Report (CAFR) is prepared using Generally Accepted Accounting Principles, or GAAP. All governmental funds are reported using the modified accrual basis of accounting. Although the CAFR reports all proprietary funds using the full accrual basis of accounting, whereby revenues are recognized when earned and expenses recognized in the period incurred, for simplicity, the budget document reports all proprietary funds’ prior year actuals using the modified accrual method.
TASKSTART DATE
DUE DATE(S)
Mgt. & Budget Team discuss process and calendar 11/12/15 11/12/15
CIP Informational Meetings, CIPs due 12/12/15 1/1/16
CIP & Budget software training 12/2/15 2/2/15
Revenues estimated 12/1/2015 4/30/2015
Budget Kickoff: Packets distributed to Dept Directors 1/11/16 1/11/16
Council goals and objectives established at Mayor & City Council Planning Session
2/11/16 2/12/16
External agency budget requests accepted and hearing before Mayor & City Council
2/1/16 2/29/16;4/12/16
Budget Requests, Budget Document Pages, 5-Year Capital/Personnel Estimates due for Internal Service Depts. 2/12/16, for Operating Depts. 2/26/16
2/12/16 2/26/16
Departmental budget reviews 3/1/16 4/12/16
Fees & Charges Schedule emailed to Dept Directors; Updates due 3/23/16 4/15/16
City Manager's recommended budget compiled and presented to Mayor & City Council
04/01/16 05/25/15
Budget available for public viewing at City Clerk's Office 05/25/16 06/16
Mayor & City Council review budget and performance objectives, budgetworkshop held
05/25/16 06/16
Public Hearing conducted; budget & Capital Improvement Plan adopted by City Council
06/9/16 (hearing) 06/9/16
Evaluation of budget process 6/16 8/16
Legend: City Mgt., Budget Staff , Dept Directors & Staff City Mgt. & Budget Staff Internal Service Depts.
Budget Staff, Department Directors Finance & Budget Staff Budget Staff, Dept Dir. & Staff
Mayor, City Council, City Mgt., Dept. Directors, Budget Staff Mayor & City Council
External Agencies, Budget Staff, City Manager, Mayor & City Council
FY2017 OPERATING/CIP BUDGET & PERFORMANCE PLAN DEVELOPMENT CALENDAR
SEPT MAYNOVJULY OCTAUG JUNEDEC JAN FEB MARCH APRIL
27

WHAT’S NEW OR CHANGED FOR FY 2016-17 (INCLUDING CITY COUNCIL CHANGES TO THE MANAGER’S RECOMMENDED BUDGET)
The items below summarize City Council changes to the Manager’s Recommended Budget and any budget document changes/additions from the prior fiscal year’s document.
City Council Changes to the Manager’s Recommended Budget: The City Council made no changes to the Manager’s Recommended Budget.
New Funds and/or Budget Units: New fund numbers and budget units were assigned to HOME and Community Development Block Grant accounts and an updated budget unit number was assigned to the Rider Transit System. In
addition, the Risk Management budget unit was combined under Human Resources as it was integrated into that department.
Personnel Changes: A total of 35.1 FTE in additional staffing is recommended for FY 2016-17. Twenty-eight new full-time positions and one new part-time position are recommended for funding, while 6 current “frozen” positions are recommended to be funded and filled. In addition, 2 part-time positions are recommended for full-time status to better meet customer needs. Additional detail regarding the full and part-time positions can be found below:
Human Resources: A new Human Resources Analyst will split the duties of the current HR Analyst for compliance and benefits due to increased workload. The cost of this position (salary and associated equipment) is $64,963.
Police: A total of 10 new Police positions are included in the budget. Four Police Officers and one Sergeant will be assigned to Concord Regional Airport as a part of Federal requirements related to the increase in commercial passenger service. An additional four Police Officers and 1 Sergeant will be assigned to a flexible proactive policing unit to be dispatched where needed across the City. Approximately 80% of the salary and benefits for the policing unit based out of the Airport will be reimbursed through a federal program. The City’s salary, benefit, and equipment cost for these officers (excluding grant reimbursement) is $1,148,516.
Code Enforcement: A new Code Enforcement Officer will be added to the Code Enforcement budget in order to reduce the size of each Officer’s district to improve effectiveness. The cost of the Officer and related supplies/equipment is $87,469.
Emergency Communications: An Administrative Assistant will be added to the Emergency Communications department to assist with the workload for both Communications and Radio Shop to include processing of alarms and database management. Salary and benefits for this position are $33,021.
Fire and Fire Prevention: Three Fire Lieutenants and three Fire Captains will be added to meet the needs of the increased commercial service at Concord Regional Airport. The cost of these positions is $385,536. Fire will also add a Part-time Assistant Fire Marshall to increase departmental efficiency. Salary and benefits for this position are $24,192.
Emergency Management: One Assistant Emergency Management Coordinator will be added to train under the Emergency Management Coordinator. The cost of this position plus related equipment is $118,625.
28
Transportation - Streets: Two new positions have been added to assist with utility cut patching. A Senior Equipment Operator and an Equipment Operator will be added at a cost of $89,570 for salaries and benefits.
Fleet Services: Fleet Services will unfreeze and fill a Master Mechanic position to assist with the increased size of the City’s fleet at a cost of $54,718.
Planning & Neighborhood Development: To deal with an growth-related increase in workload, the Planning department will add a Planner, reclassify a Development Services Technician to a Planner, and increase the hours of the Clearwater Artist Studio Supervisor. The total cost to the department for these positions is $84,778.
Electric Engineering: An Electric Engineering Specialist will be unfrozen in the Electrical Engineering Department for a total cost of $50,841.
Water: A Utility Service Worker will be unfrozen and added to the Water department at a salary & benefits cost of $38,839.
Transit: CK Rider will increase the hours of a Part-Time Customer Service position to provide continuous customer service coverage at the Transit Center. Concord’s portion of salary and benefits is $8,730 (50%/50% split with Kannapolis).
Aviation: Aviation will add a total of six new positions for FY17 in order to staff the commercial passenger service terminal. A customer service team of one Senior Customer Service Representative and two Customer Service Representatives will be added, as well as two Custodians, and an Aviation Service Worker. The total cost of salary and benefits for these positions is $235,097.
Engineering: The Engineering department will unfreeze and fill an Engineering Manager position. The cost of salary and benefits for this position is $87,130.
Building & Grounds: Growth in the City’s Parks & Recreation and other municipal facilities has increased the Building & Grounds workload enough to add a Grounds Maintenance Worker. The cost of salary, benefits, and related equipment for a total cost of $86,373. A total of 5 full-time and 1 part-time positions will be eliminated for the FY 2016-17 fiscal year with a cost savings of $265,163. All positions being eliminated are vacant.
Changes to the Budget Document: The Mayor & City Council page has been updated to include a map of City Council districts.
29

HISTORY AND BACKGROUND OF THE CITY OF CONCORD Concord's history dates back more than 200 years. In the late 1700's, the German and Scotch-Irish settlements in the area disagreed over exactly where the County seat of the newly formed County of Cabarrus should be located. Eventually, a compromise was reached, and the new city was founded in 1796 on a 26-acre site purchased by John Means and Leonard Barbrick for $62.30. To reflect the spirit in which the issue was settled, the city was named Concord, meaning "harmony," and the main thoroughfare through downtown was labeled “Union Street”. Concord emerged as a major textile center for the country in the late 1800’s when John Odell, James Cannon, and Warren Coleman established mills. Although much of the City’s heritage centers on the textile industry, recent decades have witnessed an entrepreneurial spirit that has flourished the current economy with diversity and vitality. Major industries now include automotive racing, coffee, healthcare, manufacturing, educational institutions, retail sales and food distribution. In addition to increased economic diversity, significant population growth (30,843 in 1990, 50,564 in 2000, 79,066 in 2010, and 87,696 in 2016) has fueled Concord’s economic vitality and influence as a key economic component of the Southeast U.S. Concord continues looking toward the future with plans visioning far ahead to the year 2050. The ideals of sustainability guide these plans, as the growth of residential, commercial and industrial areas drive the need for improved infrastructural, recreational, and public safety systems. Citizens enjoy a multitude of options for dining, shopping, and entertainment, but have easy access to travel options if a trip is required. Concord is located conveniently along the I-85 corridor just minutes from Charlotte. U.S. routes 29 and 601, along with NC routes 49 and 73 serve drivers in, around, and out of town. The City is also home to Concord Regional Airport, and within a half-hour drive to Charlotte-Douglas International Airport. When you look at Concord today and see the wonderful mixture of progress and heritage, and the perfect blend of business, industry, and residential life, you can see that Concord still embodies the meaning of its name - "harmony."
30

FY 2016-2017 CITY COUNCIL GOALS On February 9 and 12, 2016, the Mayor and City Council held the annual planning session. The direction provided by
the Mayor and Council during the planning session has been developed into a statement of goals for the City of
Concord for FY 2016-2017. These goals guide budget development and implementation. In addition to this statement
of goals, the City has also developed a set of financial policies that are approved by City Council to guide the City in
the financial management of all funds. Although North Carolina local governmental units must adhere to the
requirements set forth in the North Carolina Local Government Budget and Fiscal Control Act, the financial policies
approved by City Council are often more stringent than State requirements to assure the City of Concord will continue
to function in a very fiscally sound manner.
The FY 2016-2017 goals are presented according to functional areas. During the year, monthly functional meetings
are held to monitor progress on these goals and to identify new issues that must be considered for long-range
planning. City Departments are evaluated on their performance in meeting these goals.
General Government Communicate legislative goals and agendas to representatives for both the Federal and State
legislative processes. Monitor the progress of the Cabarrus County revaluation process to determine the impact on the City
of Concord and its tax rate as soon as possible during the FY 2016-17 budget process. Develop and launch a formal process to divest the City of extraneous properties, with goals of making
the properties available to the private sector or otherwise highest possible use and eliminating unnecessary maintenance costs.
Continue to maintain a fund balance goal of 30 to 35 percent of General Fund expenditures and use fund balance only for non-recurring capital expenditures.
Continue to include a performance measurement component in the external agency process, requiring monitoring, and reporting of performance outcomes for funded agencies.
Continue to adhere to approved financial management policies that maintain the City’s financial strength and integrity including continuation of conservative revenue estimates that reflect economic conditions and the aggressive pursuit of revenues collections.
Continue to prepare the City’s annual budget document in compliance with criteria established to obtain the Government Finance Officers Association’s (GFOA) budget award and submit the document for review to the GFOA.
Continue to maintain a sound financial position that results in bond ratings that are at least as beneficial as current ratings.
Continue to update and re-adopt the Capital Improvement Program, detailing capital projects, estimated costs, and funding sources.
Continue to maintain accounting systems in compliance with the NC Local Government Budget and Fiscal Control Act.
Continue to prepare the Comprehensive Annual Financial Report (CAFR) in compliance with the required criteria in order to obtain the GFOA Certificate of Achievement for Excellence in Financial Reporting.
Continue to finance capital costs so that future growth can help pay for major capital needs and improvements, but continue to use pay-as-go method for most other capital purchases.
Continue to enhance partnership among management, directors, and Customer Service Advancement Team to serve our citizens and customers, apply best practices to enhance satisfaction levels, and focus on continuous improvement.
Continue to support the recognized neighborhood program and seek opportunities to enhance the quality of relationships, strengthen communications, and build capacity of neighborhood leaders.
31

Transportation Continue to routinely monitor projects and consider participation in additional projects to assure
Transportation Fund revenues are being used to fund highest priorities and funds are available for local matches to leverage additional projects with a focus on City infrastructure.
Continue, at a minimum, appropriating existing revenue amounts using 2-cents of the Ad Valorem tax and $5.00 of the Vehicle tax for the Transportation Fund.
Continue to maintain the $400,000 minimum balance in the Transportation Fund. Budget $150,000 annually within the Transportation Fund to implement priorities in the Pedestrian
Improvement Plan based on established policy. Continue efforts to secure funding for Congestion Mitigation Air Quality (CMAQ), Federal
Transportation, Community, and System Preservation Program (TCSP), Economic Enhancement, Highway Safety Improvement (HSIP), and small construction projects from the federal government and/or the NCDOT, and continue to coordinate associated local activities with NCDOT Division 10.
Continue to perform City of Concord infrastructure rehabilitation projects that do not fit within the routine maintenance and/or resurfacing programs and have historically been neglected.
Consider participation in Exit 49 economic development sustainability initiative. Establish priorities for future surface transportation fund projects for which construction dollars have
not been committed. With the projected continued growth of both population and traffic congestion and the growing need
for residents and visitors alike to move regionally, explore if there are the means to fund all day service between Concord and Charlotte via the proposed Rider Express.
Address identified public safety needs at Concord Regional Airport, including funding additional Fire Department and a portion of Police Department positions and equipment to support operations, meet FAA Part 139 standards, and meet TSA requirements.
Environment/Solid Waste and Recycling/Stormwater Continue emphasis on improving community appearance through regular street sweeping, litter pick-
up and removal of signs that violate City ordinance. Continue to pursue strategies to reduce fuel consumption, including diversification of fueling methods,
purchasing hybrid vehicles when possible, replacing aging light-duty vehicles with smaller more fuel-efficient vehicles, increasing fuel storage capacity and the use of blended fuels and target goals to reduce overall fuel consumption.
Continue the current practice of only maintaining stormwater systems on public rights of way, and seek alternate funding mechanisms and encourage private owners to do the same to address drainage issues on property outside of public rights of way.
Consider approval of the highest ranking projects on the integrated Stormwater project list during the Stormwater CIP and budget review process.
Direct staff to negotiate a contract with Waste Pro to collect commingled recycling from businesses in the Downtown area or elsewhere in Concord that would like to participate at a cost of $1.69/monthly per business for biweekly collection.
Streamline the business corrugated cardboard collection program, such that the City pays for one dumpster to be serviced weekly per business by the contractor and businesses arrange directly with the contractor for additional services.
Direct staff to negotiate a two-year contract renewal with Waste Pro for residential garbage, recycling, and bulky waste collection, including efficiency improvements for bulky waste such as every-other-week collection aligning with the recycling collection schedule.
Utilities Continue to educate the public and all system customers on the importance of water conservation. Continue to pursue strategies to promote water conservation, water re-use, and investigate
alternatives to reducing individual water use. Continue to work with WSACC to develop a plan to reuse water for irrigation and other permitted
purposes. Continue to enforce consistent rights-of-way protection policy to include notification of property
owners relative to existing obstructions, conflicts or structures within the utility right-of-way. Continue with the development of the water master plan and fund the wastewater master plan during
FY 2016-17. Continue to follow the RW Beck recommendations for the Electric System.
32

Allow the wholesale cost increases to be handled by the purchased power adjustment over the next few years that Duke has forecasted significant capital cost expenditures that will affect increases in the City’s demand cost.
Investigate ways to control/buffer these increases for customers through applying rate stabilization funds to the purchased power adjustment.
Continue to match Duke Energy’s avoided cost rate for purchase of renewable generation projects that attach to the City’s system.
Planning/Economic Development/Redevelopment Address and respond to current growth trends through a process to update the City’s land use plan
and small area plans, incorporating best land use practices and addressing demands and issues during this process.
Following the completion of the Land Use Plan update, consider expand community input into other areas through an overall strategic planning process.
Continue the process of updating the Downtown Master Plan, with remaining components to be completed including the market analysis and urban design phases. Proceed with identifying reuse and marketing opportunities for the City’s vacant buildings on Union Street South, with the assistance of the UNC Development Finance Initiative.
Incorporate the CVB’s unified wayfinding system design in the downtown master plan public strategies and investment component.
Continue to support the business recruitment and development efforts of the Concord Downtown Development Corporation (CDDC) in attracting new business and enhancing existing downtown businesses.
Continue to work closely with economic development partners in Cabarrus County to present a complete coordinated recruitment and retention effort.
Continue to regulate the design criteria for commercial development in accordance with the Concord Development Ordinance (CDO), with emphasis on low impact development.
Continue the close working relationship between various City Departments on zoning and ordinance issues, and continue to use the methods in place to weigh the positives versus the negatives of future annexations.
Incorporating feedback from City Council, finalize the sign ordinance draft for public input and review by the Planning and Zoning Commission, who will recommend an ordinance for adoption by City Council.
Public Safety Continue to explore opportunities to make Fire Station #1 on Church Street a museum if Fire Station
#1 is relocated to another location in the future. Continue support of an Urban Archery Season consistent with state and local law. Continue to maintain code enforcement penalties and fees, with annual monitoring of potential
changes in order to ensure that the penalties properly discourage code violations. Continue participating in the school resource officer program. Complete the purchase and deployment of the body worn cameras to every sworn officer. Recreation/Parks/Open Space By end of calendar year 2016, complete draft of Recreation Master Plan for consideration by City
Council. Continue development the Hector H. Henry, II and McEachern Greenways, making full use of
Carolina Thread Trail and Trust Funds money to acquire properties for future greenways if net cost to City is reduced.
Fund the renovation of Hartsell Recreation Center and improvements to the property on Burrage Road.
Support expanded programming on the greenways and cultural arts programming. Explore development of a large park to serve residents in northwest Concord, and consider
partnership options with Cabarrus County for this or other new park facilities and greenway connectivity opportunities.
Explore best practices and possible modifications for recreation facility use policies related to access and fee-waivers for 501(c) nonprofit organizations.
33

34

35

36

FUND AND BUDGET UNIT STRUCTURE (FY 2016-2017) Below outlines the organizational structure the city uses to account for (including accounting numbers) revenues and expenditures of city operations. Revenues are accounted at the fund level. Expenditures are accounted at the budget unit level (e.g. Governing Body, Tree Trimming, Purchasing, Police, etc.). GENERAL FUND FUND 100 – GENERAL FUND General Government
1. Governing Body – 4110 2. Public Services Admin. – 4115 3. City Manager’s Office – 4120 4. Human Resources – 4125 5. Wellness Center – 4126 6. Finance – 4130 7. Tax – 4140 8. Legal – 4150 9. Non-Departmental – 4190
Public Safety 10. Police – 4310 11. Code Enforcement – 4312 12. Emergency Communications – 4315 13. Radio Shop – 4330 14. Fire Operations – 4340 15. Fire Prevention – 4341 16. Fire Training – 4342 17. Emergency Management - 4343
Public Works 18. Streets & Traffic – 4510 19. Powell Bill – 4511 20. Traffic Signals – 4513 21. Traffic Services – 4514 22. Solid Waste & Recycling – 4520 23. Cemeteries – 4540 24. Fleet Services -- 4550
Economic Development 25. Planning & Neighborhood
Development – 4910 26. Transportation Planning – 4915 27. Economic Development – 4920
Cultural and Recreational 28. Parks and Recreation – 6120 29. Aquatics – 6121
SPECIAL REVENUE FUNDS FUND 201 – MUNICIPAL SERVICE DISTRICT FUND
1. Municipal Service District – 5000 FUND 210 – SECTION 8 VOUCHER PROGRAM FUND
1. Housing Vouchers Program – 1500
FUND 257 – HOME CONSORTIUM FUND
1. Administration – 2570 2. Projects 2016 – 2575
FUND 292 – ADDL. $5 VEHICLE TAX (TRANSIT) FUND
1. Addl. $5 Vehicle Tax – 8200 FUND 307 – COMMUNITY DEVELOPMENT
BLOCK GRANT (CDBG) FUND 1. Administration – 3070 2. Projects 2016 – 3075
ENTERPRISE FUNDS FUND 600 – STORMWATER FUND 1. Stormwater Operations – 7100 FUND 610 – ELECTRIC SYSTEMS FUND
1. Electric Administration – 7200 2. Purchased Power – 7210 3. Powerlines Maintenance – 7220 4. Tree Trimming – 7230 5. Electric Construction – 7240 6. Peak Shaving – 7241 7. Electric Engineering Services – 7250 8. Utility Locate Services – 7260
FUND 620 – WATER RESOURCES FUND
1. Hillgrove Treatment Plt. – 7330 2. Coddle Creek Treatment Plt. – 7331 3. Waterlines Oper. & Maint. – 7340
FUND 630 – PUBLIC TRANSIT FUND 1. Rider Transit System – 7613 FUND 640 – WASTEWATER RESOURCES FUND
1. Wastewaterlines Operations & Maintenance – 7420
FUND 650 – GOLF COURSE FUND
1. Rocky River Golf Club – 7501 FUND 680 – AVIATION FUND
1. Aviation Operations – 4530 FUND 690 – PUBLIC HOUSING FUND
1. Public Housing Operations – 1000
37

INTERNAL SERVICES FUND FUND 800 – INTERNAL SERVICES FUND
1. Utilities Collections – 4200 2. Data Services – 4210 3. Billing – 4215 4. Customer Care – 4220 5. Engineering - 4230 6. Purchasing – 4250 7. Buildings & Grounds – 4270
PROJECT FUNDS FUND 285 – GENERAL CAPITAL RESERVE PROJECTS
1. Capital Reserve Expenditures – 8150 FUND 420 – PARKS & RECREATION CAPITAL PROJECTS
2. Parks & Recreation Capital Projects – 8300
3. Hector H Henry II Greenway – 8311 4. McEachern Greenway – 8312 5. Parks – 8313
FUND 421 – WASTEWATER CAPITAL PROJECTS
1. Wastewater Projects – 8402 2. Quail Haven – 8403 3. Irish Buffalo/Zion Church Outfall –
8404 FUND 423 – TRANSPORTATION CAPITAL PROJECTS
1. Streets Projects – 8600 FUND 426 – FIRE & LIFE SAFETY PROJECTS
1. Fire & Life Safety Projects – 8670 FUND 429 – WATER CAPITAL PROJECTS
1. Water Projects – 8700 FUND 430 – GENERAL CAPITAL PROJECTS
1. BOC Capital Projects- 8800 2. Business & Neighborhood Service
Projects – 8801 3. Solid Waste Projects – 8802 4. Data Services Projects - 8803 5. General Fund Capital Projects – 8804
FUND 451 –AIRPORT PROJECTS
1. Airport Projects – 6300 FUND 473 – ELECTRIC PROJECTS
1. Electric Projects – 6949 FUND 474 – STORMWATER PROJECTS
1. Stormwater Master Plan – 7101 2. Stream Restoration Project – 7102 3. Stormwater Projects – 7103
FUND 475 – ROCKY RIVER GOLF COURSE PROJECTS
1. Golf Course – 7550
FIRST CONCORD/DEBT SERVICE FUNDS FUND 550 – 2010 LIMITED OBLIGATION
1. 2010 LOBS – 7020 FUND 552 – 2014 LOBS
1. 2014 LOBS First Concord – 6990
FUND 553– 2005 CERTIFICATES OF PARTICIPATION 1. Police Headqrtrs & Commun – 7000
FUND 569 – 160A-19 FINANCING AGREEMENT
1. Golf Course – 4600 2. Aviation – 4650
38
MAJOR REVENUE SOURCES General Fund: The General current Fund budget for the 2016-17 fiscal year totals $78,771,691 compared to the amended budget of $89,719,030 for FY 2015-16. Factoring out transfers, financing proceeds and appropriations from fund balance (non-operating revenue); there is a revenue increase of $6,630,139 (9%) when compared to the current amended budget. The increase in revenues for the City’s General Fund budget proposal is a result of a 7% growth in the City’s assessed values. This increase is the result of a reassessment of property values in Cabarrus County. The City’s tax rate of 0.48¢ per $100 will not change. Sales tax collections were estimated very conservatively in FY 2015-16 due to uncertainty in the state’s legislature rulings on this subject; therefore the 2016-17 budget includes an increase in expected revenue from this source in the amount of $1.8 million. The City has estimated revenues conservatively using information provided by the North Carolina League of Municipalities, historical and statistical trends, and other local factors. Again, this budget was prepared under the assumption that the City of Concord will receive all of its State shared revenues for the 2016-17 fiscal year.
Property Taxes: The budget is balanced with a property tax rate of $.48 per $100 valuation. This will yield $49,439,665 in total current and prior year ad valorem tax revenue based on an average real and personal property collection rate of 97.70%. The tax base used in this budget preparation represents a 7% increase in property values for a total valuation of $10,467,302,137 (including motor vehicles). One cent on the City’s tax rate produces $1,014,206 in revenue, after the City’s estimated collection rate is applied. This rate compares favorably to past City tax rates and remains one of the lowest in the state among medium to large size cities.
Sales Taxes: Local sales taxes levied by the City and County comprise 2.25% of the total 7.0% sales tax paid on retail sales in North Carolina. The local sales tax portion consists of a 1-cent tax that was first levied in 1971, a ½-cent tax levied in 1983, a ½-cent tax levied in 1986 and an additional ½-cent that was levied July 1, 2003. Effective October 1, 2008, the State took over one-quarter cent of the Article 44 local option sales tax and effective October 1, 2009 the state took over the remaining one-quarter cent of this local tax. The City will be completely reimbursed for the loss of this revenue with hold harmless payments. The State of North Carolina collects the sales taxes and distributes them to the local units. Local option sales taxes, telecommunications sales taxes and video programming sales taxes are estimated to be $15,933,959 for fiscal year 2016-17. This revenue source is expected to increase 2.75% when compared to the current year estimated collections. Sales tax allocations for Cabarrus County are based on proportional property tax levies. The City has projected no growth in local option sales tax allocations for FY 2016-17 when compared to FY 2015-16 budgeted collections. The City continues to apply a conservative approach when estimating this revenue source. Although sales continue to increase, the methods of distribution continue to be discussed at the State legislature. A conservative estimate ensures the City can react to any changes in revenue distribution methods. Legislation passed during the 2001 session repealed the utility franchise tax on telephone companies and replaced it with a sales tax on telecommunications of 6% of gross receipts (now 8%). As State and local tax rates change, the percentage of the net proceeds on which the municipal distribution is based also changes in order to keep municipality’s revenue share neutral. The rate is currently 18.7%. The estimated telecommunications sales tax included for FY 2016-17 is $480,405, which represents a 2% decline when compared to FY16 estimated collections. Much of the recent decline has been driven by a loss in revenue from landlines as consumers have increasingly opted to go solely wireless. The N.C. Department of Revenue distributes part of the state sales tax collected on video programming and telecommunication services to counties and cities. Local governments receive 23.6% of the sales tax collections from video programming service, an additional 7.7% of the existing telecommunications sales
39

tax and 37.1% of sales tax collections on satellite television service. The estimated video programming sales tax included in FY 2016-17 is $520,756, which represents a 2% decline in this revenue source when compared to FY16 estimates. The decrease in revenue is attributed to more consumers switching from traditional cable and satellite television services to Internet-based viewing services.
Electric Sales Tax & Piped Natural Gas Sales Tax: Effective July 1, 2014, the distribution method for the electricity sales tax changed as a result of the tax reform legislation passed during the General Assembly session in 2013. The general sales tax rate is now being applied to the sales of electricity, and 44 percent of the proceeds from the sales tax are returned to cities and towns. That percentage was chosen with the intent that it would be sufficient to hold municipalities harmless from the amount they were currently receiving in utility franchise tax distributions. The amount of electricity franchise tax municipalities received in Fiscal Year 2013-14 was intended to serve as a baseline for the amount they were to receive going forward. The City has projected Electric Sales Tax in FY2016-17 to be $4,602,337 which is based on actual estimated collections in FY2016. As with the electricity sales tax, the distribution method for the tax on piped natural gas was changed as part of the tax reform legislation passed during the General Assembly session in 2013. The general sales tax rate is now applied to the sale of piped natural gas, and 20 percent of the proceeds from the sales tax are returned to cities and towns. Similar to the electricity sales tax, that percentage was chosen with the intention that it would be sufficient to hold municipalities harmless from the amount they were currently receiving in piped natural gas distributions. The amount of piped natural gas excise tax municipalities received in Fiscal Year 2013-14 is intended to serve as a baseline for the amount they are to receive going forward. The FY2016-17 proposed budget of $363,700 is based on estimated collections for FY2016. These revenue sources are expected to increase 3% when compared to the current year’s estimated collections. Powell Bill Street Allocation: These funds represent redistribution by the State of a portion of the motor fuel taxes collected. The use of these funds is restricted to maintaining, repairing, constructing, reconstructing or widening any public street or thoroughfare within the City limits. Bridges, drainage, curb and gutter and other necessary appurtenances are also approved uses of these funds. One-quarter of distribution is based on the number of miles of local streets in the City and the remainder is distributed on a population basis. These funds are expected to provide $2,300,995 for FY 2016-17, which represents no growth when compared to current year estimates. This revenue source continues to remain flat as the State’s allocation per street mile does not increase; in some years, it is reduced. Fund Balance: The City’s unassigned General Fund balance was $50,118,453 as of June 30, 2015. It is anticipated that the City will meet our target goal of a 30-35% minimum General Fund unassigned fund balance at June 30, 2016. The City has transferred $12 million into the capital reserve fund for general fund in the current year; this transfer will reduce the unassigned fund balance by $12 million. Our ability to maintain a healthy fund balance in previous fiscal years was attributable to the economic vibrancy present in the City of Concord and increases in available cash for investments, collection percentage of property taxes, and conservative estimates on revenues. As the City experienced a slowing economy, our conservative policies and procedures were even more important. The proposed budget for FY 2016-17 does not include an appropriation from fund balance. The recommended budget does appropriate $2,985,540 from the General Capital Reserve fund balance for one time capital expenditures. In FY2007-08 the City created a General Fund Reserve to begin preparing for future projects and each year the City contributes available resources to this Capital Reserve Fund. Although these reserves (approximately $26,600,000) now reside in a separate fund from the General Fund and are no longer included in the City’s General Fund Balance, the amounts are still available for projects and capital designated by the City Council.
Special Revenue Funds: The Municipal Service District tax rate is $0.23 per $100 assessed valuation. Also, included in the Special Revenue Fund is the budget request for Community Development Block Grant
40

Funds, the H.O.M.E. Program, the $5 Vehicle Tax fund (Transit), and the Section 8 Housing Vouchers program. The special revenue funds total $5,451,994. Enterprise Funds: Stormwater, Electric, Water and Wastewater rates and charges will generate $124,775,000 in revenues.
Stormwater: The Stormwater Fund is comprised of $3,900,000 in operating revenue and $1,500 in non-operating revenues. No rate or fee increases are proposed for the Stormwater program. Rate revenue for FY 2017 is expected to increase 1% when compared to FY 2016 year-end estimates.
Electric Fund: The Electric Fund is comprised of $84,262,000 in operating revenues and $30,000 in non-operating revenues, with no appropriation from retained earnings. Electric revenues are estimated using the City’s rate model. The proposed budgeted revenue does not include a rate increase. The purchase power adjustment to rates will be evaluated during the year, but the FY 2017 budget proposal does not project increases in purchase power rate adjustments. FY 2017 rate revenue is anticipated to increase 2% when compared to FY 2016 year-end estimates. This growth is due to system expansion as residential and commercial development in the City is increasing. Water Fund: The Water Fund is comprised of $22,886,000 in operating revenue, non-operating revenue of $34,000, and an appropriation from retained earnings of $1,190,000 for one time capital project costs. There are no water rate increases included in the FY 2017 budget. Water rate revenue is projected to increase 5% when compared to FY 2016 year-end estimates. This increase is a result of the new agreement with Kannapolis regarding the purchase of additional water from the Albemarle connection and anticipated system growth resulting from development. Wastewater Funds: The Wastewater Fund is comprised of operating revenue of $16,572,000. There is no appropriation from retained earnings. There are no wastewater rate increases in the FY 2017 budget and the flat charge sewer rates were reduced to more adequately reflect the cost of that service. Wastewater revenues are expected to increase 2% based upon current residential and commercial development trends. Public Transit: The Public Transit budget is comprised of $275,000 in operating revenue, $2,476,907 in restricted intergovernmental revenue, and transfers of $731,184. In FY 2016-17, Concord’s General Fund contribution to the Transit system is $381,184, which includes our portion of the CATS 79x service. A $2.00 ADA Paratransit fare is proposed for the FY 2016-17 budget. Golf Course: The Golf Course Fund anticipates earned revenue for FY 2016-17 to remain stable when compared to the amended budget of the prior year. Total revenues are estimated at $2,618,427 which includes a transfer from the General Fund of $937,780 which is designated towards debt service. Aviation: The Aviation budget is comprised of $8,802,582 in operating revenue, $99,300 in non-operating revenue and a transfer of $777,175 from the General Fund. There is no appropriation from retained earnings. Fuel Sales have been budgeted with no material increases.
Internal Services Fund: The Internal Services Fund – comprised of Data Services, Customer Care, Utilities Collections, Billing, Engineering, Buildings and Grounds and Purchasing – totals $11,303,471. All costs within this fund are allocated among the Electric, Water, Wastewater, Stormwater, Aviation and General Funds based on percentages derived from a cost allocation method. All rates, fees, and charges are listed in the Schedule of Fees and Charges.
41

City Revenues
2013-2014 2014-2015 2015-2016 2015-2016 2016-2017 2016-2017
ActualRevenues
ActualRevenues
CouncilApproved*
ActualRevenues**
ManagerRecommended
CouncilApproved
By FundGeneral Fund 74,167,576$ 78,496,818$ 89,827,380$ 80,699,617$ 78,771,691$ 78,771,691$ Municipal Service District 99,007$ 104,399$ 113,475$ 107,027$ 89,000$ 89,000$ Home Consortium Fund 132,582$ 140,492$ 277,299$ 247,880$ 279,216$ 279,216$ Community DevelopmentBlock Grant (CDBG) Fund 288,600$ 137,148$ 492,545$ 90,441$ 470,745$ 470,745$ $5 Vehicle Tax for Public Transit 512,378$ 393,292$ 400,245$ 382,249$ 350,000$ 350,000$ Section 8 Voucher Program 4,514,998$ 4,295,194$ 4,829,256$ 4,064,997$ 4,263,033$ 4,263,033$ Stormwater Fund 3,936,574$ 4,016,619$ 3,874,095$ 4,052,360$ 3,924,500$ 3,924,500$ Electric Fund 81,511,937$ 81,533,075$ 90,358,939$ 82,776,282$ 84,292,000$ 84,292,000$ Water Fund 20,388,795$ 21,847,759$ 28,676,401$ 34,407,451$ 24,110,000$ 24,110,000$ Transit Fund 6,578,015$ 2,874,514$ 3,245,205$ 3,151,642$ 3,483,091$ 3,483,091$ Wastewater Fund 15,535,860$ 16,365,188$ 17,011,892$ 21,392,105$ 16,572,000$ 16,572,000$ Golf Course Fund 2,539,685$ 2,349,333$ 1,764,072$ 2,514,774$ 2,618,427$ 2,618,427$ Aviation Fund 11,100,573$ 9,977,766$ 9,804,261$ 8,235,962$ 9,679,057$ 9,679,057$
Public Housing 1,032,799$ 1,191,338$ 1,314,210$ 1,258,548$ 1,254,340$ 1,254,340$
TOTAL CITY REVENUES 222,339,379$ 223,722,935$ 251,989,275$ 243,381,335$ 230,157,100$ 230,157,100$
% budget change 1% 9% -9%* as amended **as of 8/11/2016
$50,000,000
$100,000,000
$150,000,000
$200,000,000
$250,000,000
$300,000,000
ActualRevenues
ActualRevenues
ActualRevenues**
CouncilApproved
2013-2014 2014-2015 2015-2016 2016-2017
Total City Revenue Trend Wastewater Fund
Aviation Fund
Golf Course Fund
Transit Fund
Water Fund
Public Housing
Electric Fund
Stormwater Fund
Section 8 Voucher Program
$5 Vehicle Tax for Public Transit
Community DevelopmentBlock Grant (CDBG) FundHome Consortium Fund
Municipal Service District
General Fund
General Fund34.2%
Municipal Service District0.04%
HOME Fund0.2%
Transportation Imp. Fund1.3%
CDBG Fund0.3%
$5 Vehicle Tax 0.1%
Stormwater Fund1.7%
Electric Fund36.6%
Water Fund10.5%
Transit Fund1.5%
Wastewater Fund7.2%
Golf Course Fund1.1% Aviation Fund
4.2% Public Housing0.5%
FY 2016-2017 City-wide Revenues (by Fund)
42

City Expenditures
2013-2014 2014-2015 2015-2016 2015-2016 2016-2017 2016-2017
Actual Expenses
Actual Expenses
CouncilApproved
Actual Expenses**
ManagerRecommended
CouncilApproved
By FundGeneral Fund 71,448,110$ 66,632,700$ 89,827,380$ 80,960,235$ 78,771,691$ 78,771,691$ Municipal Service District 99,007$ 104,399$ 113,475$ 107,027$ 89,000$ 89,000$ Home Consortium Fund 136,230$ 173,481$ 277,299$ 91$ 279,216$ 279,216$ Community Development Block Grant (CDBG) Fund 67,337$ 115,707$ 492,545$ 121,425$ 470,745$ 470,745$ $5 Vehicle Tax for Public Transit 512,378$ 393,292$ 400,245$ 382,248$ 350,000$ 350,000$ Section 8 Voucher Program 4,596,323$ 4,439,762$ 4,829,256$ 4,142,334$ 4,263,033$ 4,263,033$ Stormwater Fund 4,951,644$ 4,181,879$ 3,874,095$ 3,504,531$ 3,924,500$ 3,924,500$ Electric Fund 77,556,125$ 72,276,242$ 90,358,939$ 71,225,498$ 84,292,000$ 84,292,000$ Water Fund 20,486,213$ 16,941,493$ 28,676,401$ 33,598,090$ 24,110,000$ 24,110,000$ Transit Fund 8,424,176$ 2,950,147$ 5,861,045$ 2,977,702$ 3,483,091$ 3,483,091$ Wastewater Fund 14,782,971$ 13,945,885$ 17,011,892$ 18,881,397$ 16,572,000$ 16,572,000$ Golf Course Fund 2,577,867$ 2,382,769$ 2,703,992$ 2,514,775$ 2,618,427$ 2,618,427$ Aviation Fund 11,748,744$ 10,027,833$ 9,804,261$ 8,263,436$ 9,679,057$ 9,679,057$ Public Housing 1,663,512$ 1,738,432$ 1,314,210$ 1,282,818$ 1,254,340$ 1,254,340$
Internal Service Fund*** -$ -$ -$ -$ -$ -$
TOTAL CITY EXPENDITURES 219,050,637$ 196,304,021$ 255,545,035$ 227,961,607$ 230,157,100$ 230,157,100$ % budget change -10% 16% -10%* as amended **as of 8/11/2016
*** All Internal Service Expenditures are allocated to other City departments.
General Fund34.2%
Municipal Service District0.04%
HOME Fund0.2%
Transportation Improvement Fund
1%
CDBG Fund0.3%
Section 8 Voucher Program1.9%
Stormwater Fund1.7%
Electric Fund 36.6%
Water Fund10.5%
Transit Fund1.5%
Wastewater Fund7.2%
Golf Course Fund1.1% Aviation Fund
4.2%Public Housing
0.5%
FY 2016-2017 City-wide Expenditures (by Fund)
$50,000,000
$70,000,000
$90,000,000
$110,000,000
$130,000,000
$150,000,000
$170,000,000
$190,000,000
$210,000,000
$230,000,000
$250,000,000
ActualExpenses
ActualExpenses
ActualExpenses**
CouncilApproved
2013-2014 2014-2015 2015-2016 2016-2017
Total City Expenditure Trend Wastewater Fund
Aviation Fund
Golf Course Fund
Transit Fund
Water Fund
Public Housing
Electric Fund
Stormwater Fund
Section 8 Voucher Program
$5 Vehicle Tax for Public Transit
Community DevelopmentBlock Grant (CDBG) Fund
Home Consortium Fund
Municipal Service District
General Fund
43

General Fund
Revenues: General FundMunicipal Service
DistrictSection 8 Voucher
ProgramHOME Consortium CDBG $5 Vehicle Tax Stormwater
Ad Valorem Taxes 49,439,665$ 89,000$ -$ -$ -$ -$ -$ Sales Tax 15,949,919$ -$ -$ -$ -$ -$ -$ Licenses, Fees & Permits 926,000$ -$ -$ -$ -$ 350,000$ -$
Unrestricted Intergovernmental Revenue 6,003,172$ -$ -$ -$ -$ -$ -$
Restricted Intergovernmental Revenue 3,848,083$ -$ -$ 183,440$ 463,245$ -$ -$ Operating Revenue -$ -$ -$ -$ -$ 3,923,000$
Other/Non-Operating Revenue 2,604,852$ -$ 501,000$ 33,753$ 7,500$ -$ 1,500$ Investment Earnings -$ -$ -$ -$ -$ -$ -$
Retained Earnings Appropriated -$ -$ -$ -$ -$ -$ -$ Fund Balance Appropriated -$ -$ -$ -$ -$ -$ -$ HUD Contributions -$ -$ 3,762,033$ -$ -$ -$ -$ Transfers -$ -$ -$ 62,023$ -$ -$ -$
TOTAL REVENUE 78,771,691$ 89,000$ 4,263,033$ 279,216$ 470,745$ 350,000$ 3,924,500$
Personal Services* 42,580,996$ -$ 280,661$ 60,964$ 81,066$ -$ 1,270,597$ Operations 23,478,848$ 89,000$ 3,982,372$ 218,252$ 389,679$ -$ 626,680$ Capital Outlay 4,667,954$ -$ -$ -$ -$ -$ 257,000$ Debt Service 3,657,058$ -$ -$ -$ -$ -$ -$ Cost Allocations (1,354,318)$ -$ -$ -$ -$ -$ 633,760$ Transfers 5,741,153$ -$ -$ -$ -$ 350,000$ 1,136,463$
TOTAL EXPENDITURES 78,771,691$ 89,000$ 4,263,033$ 279,216$ 470,745$ 350,000$ 3,924,500$
*Note: Personal Service costs for the Internal Service Fund ($6,810,813) are captured in the Cost Allocations line above
Expenditures:
Special Revenue Funds
FY 2016-2017 Budget
$0
$25,000,000
$50,000,000
$75,000,000
$100,000,000
$125,000,000
$150,000,000
$175,000,000
$200,000,000
$225,000,000
$250,000,000
FY13 FY14 FY15 FY16 FY17
Budgeted RevenuesFY13-FY17
Retained Earnings Appropriated
Investment Earnings
Licenses, Fees & Permits
Unrestricted IntergovernmentalRevenue
Fund Balance Appropriated
HUD Contributions
Non-Operating Revenue
Restricted IntergovernmentalRevenue
Sales Tax
Ad Valorem Taxes
Operating Revenue
44
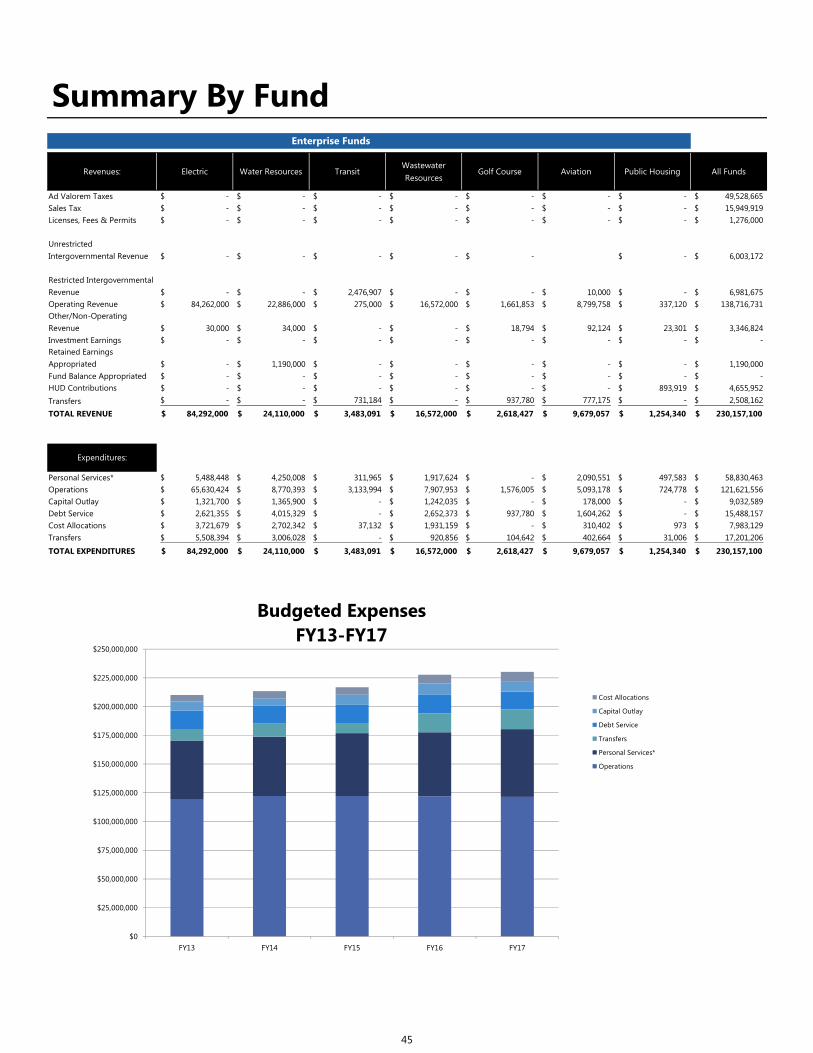
Revenues: Electric Water Resources TransitWastewater Resources
Golf Course Aviation Public Housing All Funds
Ad Valorem Taxes -$ -$ -$ -$ -$ -$ -$ 49,528,665$ Sales Tax -$ -$ -$ -$ -$ -$ -$ 15,949,919$ Licenses, Fees & Permits -$ -$ -$ -$ -$ -$ -$ 1,276,000$
Unrestricted Intergovernmental Revenue -$ -$ -$ -$ -$ -$ 6,003,172$
Restricted Intergovernmental Revenue -$ -$ 2,476,907$ -$ -$ 10,000$ -$ 6,981,675$ Operating Revenue 84,262,000$ 22,886,000$ 275,000$ 16,572,000$ 1,661,853$ 8,799,758$ 337,120$ 138,716,731$ Other/Non-Operating Revenue 30,000$ 34,000$ -$ -$ 18,794$ 92,124$ 23,301$ 3,346,824$ Investment Earnings -$ -$ -$ -$ -$ -$ -$ -$ Retained Earnings Appropriated -$ 1,190,000$ -$ -$ -$ -$ -$ 1,190,000$ Fund Balance Appropriated -$ -$ -$ -$ -$ -$ -$ -$ HUD Contributions -$ -$ -$ -$ -$ -$ 893,919$ 4,655,952$ Transfers -$ -$ 731,184$ -$ 937,780$ 777,175$ -$ 2,508,162$
TOTAL REVENUE 84,292,000$ 24,110,000$ 3,483,091$ 16,572,000$ 2,618,427$ 9,679,057$ 1,254,340$ 230,157,100$
Personal Services* 5,488,448$ 4,250,008$ 311,965$ 1,917,624$ -$ 2,090,551$ 497,583$ 58,830,463$ Operations 65,630,424$ 8,770,393$ 3,133,994$ 7,907,953$ 1,576,005$ 5,093,178$ 724,778$ 121,621,556$ Capital Outlay 1,321,700$ 1,365,900$ -$ 1,242,035$ -$ 178,000$ -$ 9,032,589$ Debt Service 2,621,355$ 4,015,329$ -$ 2,652,373$ 937,780$ 1,604,262$ -$ 15,488,157$ Cost Allocations 3,721,679$ 2,702,342$ 37,132$ 1,931,159$ -$ 310,402$ 973$ 7,983,129$ Transfers 5,508,394$ 3,006,028$ -$ 920,856$ 104,642$ 402,664$ 31,006$ 17,201,206$
TOTAL EXPENDITURES 84,292,000$ 24,110,000$ 3,483,091$ 16,572,000$ 2,618,427$ 9,679,057$ 1,254,340$ 230,157,100$
Enterprise Funds
Expenditures:
Summary By Fund
$0
$25,000,000
$50,000,000
$75,000,000
$100,000,000
$125,000,000
$150,000,000
$175,000,000
$200,000,000
$225,000,000
$250,000,000
FY13 FY14 FY15 FY16 FY17
Budgeted ExpensesFY13-FY17
Cost Allocations
Capital Outlay
Debt Service
Transfers
Personal Services*
Operations
45

Salaries70%
Overtime2%
Retirement8%
Health Insurance14%
Worker's Comp1%
FICA5%
FY 16 -17 Summary of Budgeted City-wide Compensation Expenditures*
($65,641,276)
*Includes compensation for Mayor & City Council Members
Personnel28%
Operations55%
Capital Outlay4%
Debt Service7%
Cost Allocations4%
Transfers2%
FY 16-17 Expenditures by Line-item Category(City total = $230,157,100)
46

Fund Balances 2012/13 2013/14 2014/15 2015/16* 2016/17**
General Fund 55,160,067$ 57,879,528$ 69,743,640$ 57,709,453$ 57,710,000$ 56.2% 52.7% 75.2% 59.7% TBD
Other Governmental Funds 31,634,171$ 35,917,593$ 37,314,689$ 49,314,689$ 49,400,000$ Totals 86,794,238$ 93,797,121$ 107,058,329$ 107,024,142$ 107,110,000$
Net PositionBusiness Type Activities - Enterprise Funds
Electric Fund 94,000,371$ 99,847,033$ 109,424,987$ 112,424,987$ 112,424,990$ Water Fund 90,882,515$ 95,653,439$ 99,219,520$ 93,219,520$ 94,000,000$ Wastewater Fund 58,986,048$ 67,199,198$ 72,736,722$ 72,136,725$ 72,150,000$ Aviation Fund 69,723,777$ 70,697,418$ 71,785,128$ 71,385,125$ 71,400,000$ Stormwater Fund 53,037,393$ 53,189,453$ 53,398,253$ 53,398,053$ 53,400,000$
Other Enterprise Funds 15,298,407$ 19,548,401$ 18,574,976$ 15,200,400$ 15,200,400$
Totals 381,928,511$ 406,134,942$ 425,139,586$ 417,764,810$ 418,575,390$
* unaudited, ** estimated
Amounts shown as fund balance for Governmental Funds represent a running total of monies over the years thatremain unspent after all budgeted expenditures have been made. For many years, the North Carolina LocalGovernment Commission has recommended that units retain an amount of available fund balance in the generalfund to at least 8% of the appropriations of the fund. The Concord City Council has a financial policy requiring anavailable fund balance between 30%-35% of its general fund operating budget. The reason for this policy is toavoid cash flow interruptions, to generate investment income, to eliminate the need for short-term borrowing, and to have a reserve available in case of sudden emergencies. In accordance with GASB, the City reports net position(total assets and deferred outflows of resources less total liabilities and deferred inflows of resources) inProprietary Funds as opposed to retained earnings (accumulated earnings of funds after all budget businessexpenses have been made). The significant change in General Fund balance associated with the FY 2015 figurebelow is due to the transfer of $12 million to Capital Reserve (per our policy) that was not made until FY 2016. Inother years, the transfer (if needed) occurs during each fiscal year.
Fund Balances / Net Position
Available Fund Balance %
$55,160,067 $57,879,528
$69,743,640
$57,709,453 $57,710,000
$31,634,171 $35,917,593 $37,314,689
$49,314,689 $49,400,000
$0
$7,500,000
$15,000,000
$22,500,000
$30,000,000
$37,500,000
$45,000,000
$52,500,000
$60,000,000
$67,500,000
$75,000,000
2012/13 2013/14 2014/15 2015/16* 2016/17**
Fund Balance
General Fund Other Governmental Funds
47

Budget UnitFY 2013-14
FTEFY 2014-15
FTEFY 2015-16
FTEFY 2016-17
FTE*
General GovernmentPublic Services Administration 1 1 1 1City Manager's Office 6 6 6 6.5Risk Management (combined with HR for FY17) 3 3 3 -Human Resources 7 7 7 11Finance 14 13.25 13.25 13Tax 4.5 4.5 3.5 3.5Legal 6 6 6 6Non-Departmental 0 0 0 0
Public SafetyPolice 180.25 189.25 190.25 200.25Code Enforcement 7 7 7 8Emergency Communications 22.5 22.5 22.5 23.5Radio Shop 2.5 3.5 3.5 3.5Fire 181 181 181 187Fire Prevention 6 9 9 9.5Fire Training 4 2 4 4Emergency Management 1 1 1 2
Public WorksStreets & Traffic 27 27 28 30Powell Bill (staff part of Streets & Traffic) 0 0 0 0Traffic Signals 5 6 6 6Traffic Services 5 5 5 5Solid Waste & Recycling 32 32 32 31.5Cemeteries 8 8 8 8Fleet Services 13 13 13 14
Economic DevelopmentPlanning & Neighborhood Development 14.5 14.5 14.7 16Transportation Planning (contract) 0 0 0 0Economic Development 1 1 1 1
Culture & RecreationParks & Recreation 21.25 21 22 22Parks & Recreation - Aquatics (seasonal staff) 0 0 0 0
Total FTE General Fund 572.5 583.5 587.7 612.25
OTHER FUNDSMunicipal Service District Fund 0 0 0 0HOME Consortium Fund 1 0.9 0.8 0.8Transportation Improvement Fund 0 0 0 0CDBG Fund 1 1.1 1.2 1.2Addl. $5 Vehicle Tax (Transit) Fund 0 0 0 0
GENERAL FUND
Personnel counts are calculated using the full-time-equivalent (FTE) method for all full-time and permanent part-time city employees(seasonal and temporary positions are not included). The FTE converts the hours worked by a position into a percentage of a full year'snumber of hours. For most city positions, 1 FTE equals 2,080 hours per year per position (based on a 40 hour work week and a 52 weekwork year). If a position works 1,040 hours per year, this translates into .5 FTE. Similarly, if a new full-time position has a Jan. 1 effectivedate (1/2 of the fiscal year), this translates into .5 FTE. In the case of Police Officer positions, 1 FTE equals 2,229.84 hours per year. A FireFighter FTE equals 2,920.96 hours per year.
Personnel Summary
48
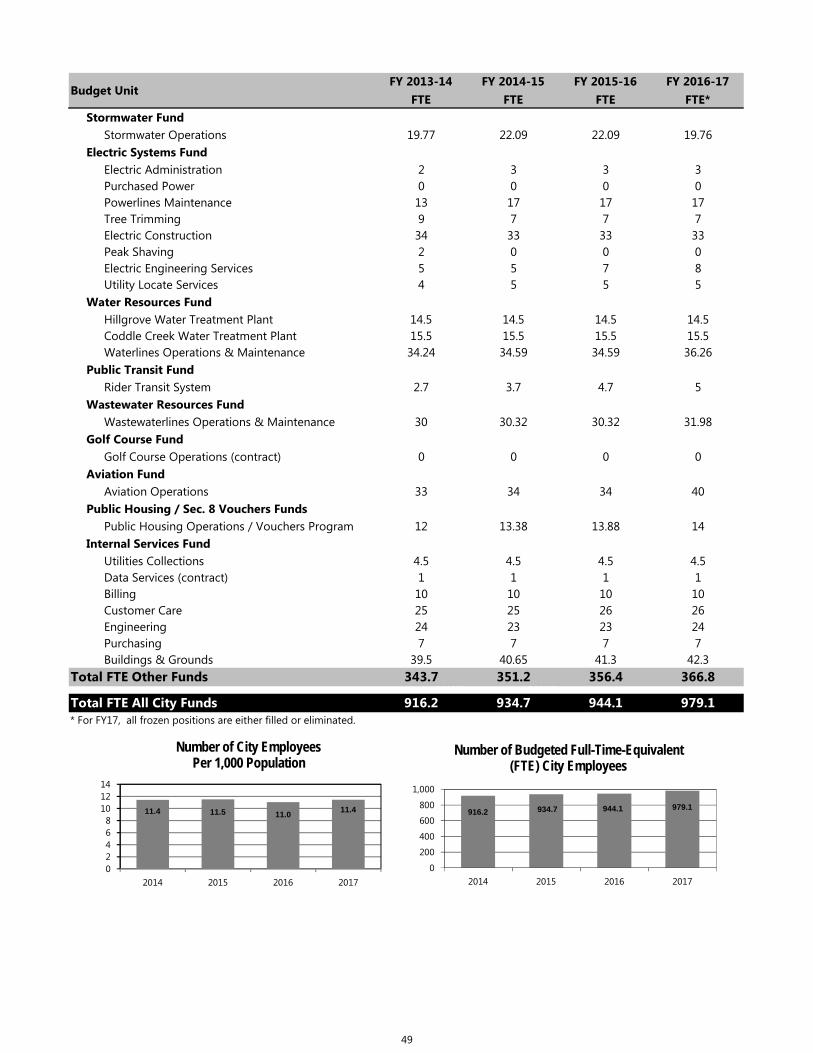
Budget UnitFY 2013-14
FTEFY 2014-15
FTEFY 2015-16
FTEFY 2016-17
FTE*Stormwater Fund
Stormwater Operations 19.77 22.09 22.09 19.76Electric Systems Fund
Electric Administration 2 3 3 3Purchased Power 0 0 0 0Powerlines Maintenance 13 17 17 17Tree Trimming 9 7 7 7Electric Construction 34 33 33 33Peak Shaving 2 0 0 0Electric Engineering Services 5 5 7 8Utility Locate Services 4 5 5 5
Water Resources FundHillgrove Water Treatment Plant 14.5 14.5 14.5 14.5Coddle Creek Water Treatment Plant 15.5 15.5 15.5 15.5Waterlines Operations & Maintenance 34.24 34.59 34.59 36.26
Public Transit FundRider Transit System 2.7 3.7 4.7 5
Wastewater Resources FundWastewaterlines Operations & Maintenance 30 30.32 30.32 31.98
Golf Course FundGolf Course Operations (contract) 0 0 0 0
Aviation FundAviation Operations 33 34 34 40
Public Housing / Sec. 8 Vouchers FundsPublic Housing Operations / Vouchers Program 12 13.38 13.88 14
Internal Services FundUtilities Collections 4.5 4.5 4.5 4.5Data Services (contract) 1 1 1 1Billing 10 10 10 10Customer Care 25 25 26 26Engineering 24 23 23 24Purchasing 7 7 7 7Buildings & Grounds 39.5 40.65 41.3 42.3
Total FTE Other Funds 343.7 351.2 356.4 366.82014 2014Total FTE All City Funds 916.2 934.7 944.1 979.1* For FY17, all frozen positions are either filled or eliminated.
11.4 11.5 11.011.4
02468
101214
2014 2015 2016 2017
Number of City Employees Per 1,000 Population
916.2 934.7 944.1 979.1
0
200
400
600
800
1,000
2014 2015 2016 2017
Number of Budgeted Full-Time-Equivalent (FTE) City Employees
49

CustomerServiceAdvancementTeam
Concord is committed to creating a culture of customer service and providing the best service possible to our citizens. Customer service is the responsibility of every coworker; and as such, each time coworkers interacts with an individual, answers a telephone, sends an e-mail, writes a letter, or attends a meeting, an impression is made on customers - whether they are citizens, visitors, or coworkers. The City hopes that TEAM CONCORD becomes the standard for how we work together to serve and interact with customers.
BACKGROUND Upon the direction of the City Council, a customer service team composed of a dedicated group of co-workers from each department was formed in September 2007. The group’s charge was to establish a shared definition of excellent customer service and to determine the best way to develop a culture of providing excellent customer service. Team members held frequent meetings and worked with a facilitator to develop a strategy. They adopted a motto – “Committed to excellent service” – established 9 key principles, a set of shared values and principles. Other accomplishments include the delivery of city wide customer service training and the developed of an employee recognition initiative. After several years of work and success in building a culture of excellent service, the team gained new members and adopted a new name – Customer Service Advancement Team. CSAT team members worked to further advance the customer service initiative and continued to build on the previous team’s success by identifying new ways to promote the desired culture. In 2015 the team expanded the employee recognition program. The new program titled High 5 for Excellent Service provides internal and external customers the ability to recognize instances when of co-workers providing excellent service. The Customer Service Advancement Team is comprised of co-workers from each city department. The members are appointed by the City Manager based on the recommendation from the respective Department Director. Team meetings are held at 9:00 a.m. on the 2nd Wednesday of each month. During these meetings, team members present updates to programs, and discuss ways to continue to promote the culture of excellent customer service for our organization. Customer Service Advancement Team members Katie Ashworth, Aviation Tony Black, Buildings and Grounds Stephanie Isbell, Communications Billy Robbins, Electric Systems Charity Langston, Engineering Leigh Ann Sells, Finance Pat Watkins, Fleet Services April Allen, Finance (Customer Service) Carson Carroll, Finance (Purchasing) Lee Readling, Fire Sonya Bost, Fire Wendy Skinner, Housing Chantel Thompson, Human Resources
Angela McLean, Parks & Recreation Angela Baldwin, Planning & Neighborhood Development Brian Hathcock, Police Robert Watson, Police (Code Enforcement) Desmond Miller, Solid Waste Michelle Hunt, Transit Brian Taylor, Transportation Mark Varnadore, Water Resources (Wastewater) Crystal Brown, Water Resources (Stormwater) Terry Paxton, Water Resources (Water) Staff Facilitator: Cherie Jzar, City Manager's Office
50

BACKGROUND ON THE CITY’S PERFORMANCE MEASUREMENT EFFORTS
The City of Concord is deeply committed to exploring new methods in providing cost efficient and quality services to citizens. In order to support these efforts, the City monitors its performance in a program commonly referred to as performance measurement. Performance measurement involves the regular collection of quantifiable information regarding the results of city services. It includes the measurement of the kind of job we are doing and includes the effects our efforts are having in our community. Together with benchmarking, performance measurement forms the nucleus for managing for results and productivity improvement. Performance information is designed to be a tool for use by the citizens of Concord, the City Council, city management, department directors, supervisors, and front-line employees. Why do local governments measure performance? There are a number of reasons, which include:1
1. To improve accountability 2. To enhance city planning and budgeting 3. To improve operational practices 4. To conduct performance evaluations/management by objectives/performance appraisals 5. To assist decision-making with regard to resource allocation, and 6. To enhance management decisions and contract monitoring
Elements of the City's performance measurement efforts include:
Striving Towards Excellence Program (STEP) STEP is the name given to the City's performance measurement program. North Carolina Local Government Performance Measurement Project
In 1999, the City of Concord joined the North Carolina Local Government Performance Measurement Project - coordinated by the University Of North Carolina Institute Of Government. The Project’s measures are standardized so city services can be compared across fourteen municipalities and best practices identified. The program tracks performance information on the following basic city services:
-Residential Refuse Collection -Police Services -Yard Waste/Leaf Collection -Asphalt Maintenance & Repair -Emergency Communications -Fleet Maintenance
-Fire Services -Human Resources -Household Recycling -Water Services -Building Inspections (provided by Cabarrus County) -Sewer -Parks & Recreation
This budget document does not attempt to list all performance measures associated with the NC Local Government Performance Measurement Project. Additional Project information can be obtained by contacting the City’s Finance Department or the UNC – Chapel Hill School of Government. In the spring of 2001, the City began an aggressive effort to incorporate the use of performance measures in all city departments. Most departments report performance information, which can be found on individual departmental pages later in this document. The implementation and enhancement of performance measurement is a continuous journey is reflected in budget documents.
1 Ammons, David N. (2001). Municipal Benchmarks: Assessing Local Performance and Establishing Community Standards (2nd ed.). Thousand Oaks, CA: Sage Publications.
51
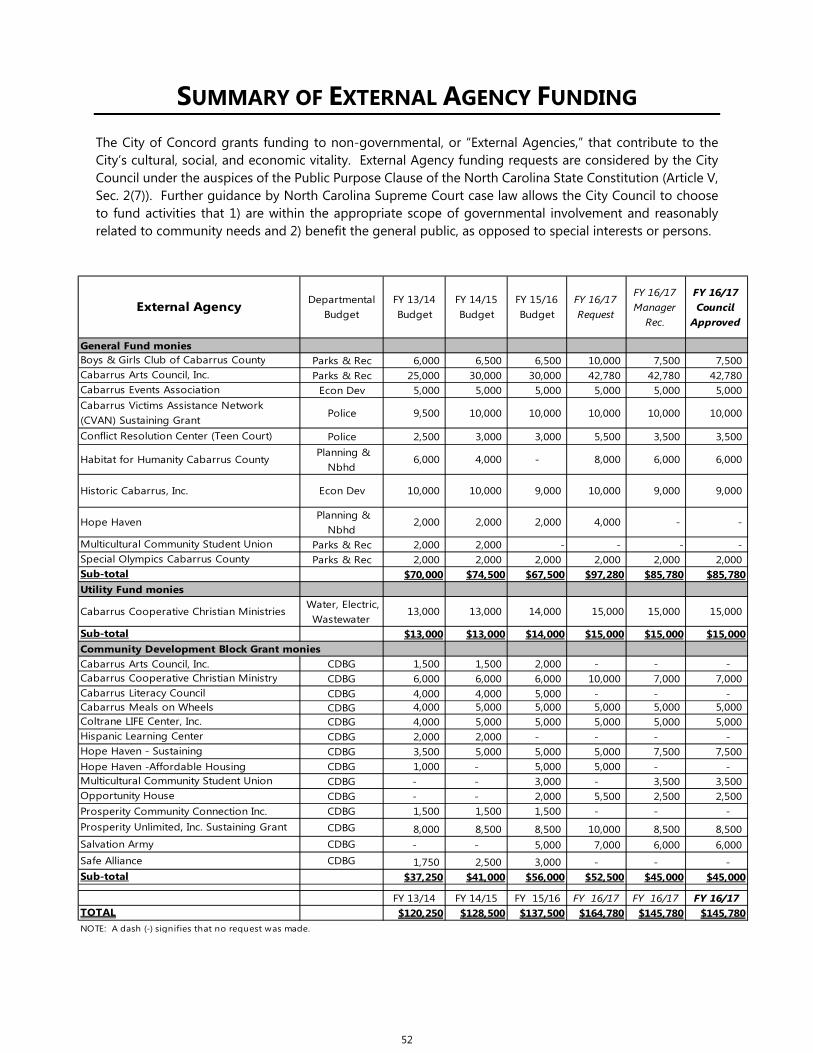
SUMMARY OF EXTERNAL AGENCY FUNDING The City of Concord grants funding to non-governmental, or “External Agencies,” that contribute to the City’s cultural, social, and economic vitality. External Agency funding requests are considered by the City Council under the auspices of the Public Purpose Clause of the North Carolina State Constitution (Article V, Sec. 2(7)). Further guidance by North Carolina Supreme Court case law allows the City Council to choose to fund activities that 1) are within the appropriate scope of governmental involvement and reasonably related to community needs and 2) benefit the general public, as opposed to special interests or persons.
DepartmentalBudget
FY 13/14 Budget
FY 14/15 Budget
FY 15/16 Budget
FY 16/17 Request
FY 16/17 Manager
Rec.
FY 16/17 Council
Approved
General Fund moniesParks & Rec 6,000 6,500 6,500 10,000 7,500 7,500 Parks & Rec 25,000 30,000 30,000 42,780 42,780 42,780
Econ Dev 5,000 5,000 5,000 5,000 5,000 5,000
Police 9,500 10,000 10,000 10,000 10,000 10,000
Police 2,500 3,000 3,000 5,500 3,500 3,500 Planning &
Nbhd 6,000 4,000 - 8,000 6,000 6,000
Econ Dev 10,000 10,000 9,000 10,000 9,000 9,000
Planning & Nbhd
2,000 2,000 2,000 4,000 - -
Parks & Rec 2,000 2,000 - - - -Parks & Rec 2,000 2,000 2,000 2,000 2,000 2,000
$70,000 $74,500 $67,500 $97,280 $85,780 $85,780Utility Fund monies
Cabarrus Cooperative Christian Ministries Water, Electric,
Wastewater 13,000 13,000 14,000 15,000 15,000 15,000
$13,000 $13,000 $14,000 $15,000 $15,000 $15,000Community Development Block Grant monies
CDBG 1,500 1,500 2,000 - - - CDBG 6,000 6,000 6,000 10,000 7,000 7,000 CDBG 4,000 4,000 5,000 - - - CDBG 4,000 5,000 5,000 5,000 5,000 5,000 CDBG 4,000 5,000 5,000 5,000 5,000 5,000 CDBG 2,000 2,000 - - - - CDBG 3,500 5,000 5,000 5,000 7,500 7,500 CDBG 1,000 - 5,000 5,000 - - CDBG - - 3,000 - 3,500 3,500 CDBG - - 2,000 5,500 2,500 2,500 CDBG 1,500 1,500 1,500 - - - CDBG 8,000 8,500 8,500 10,000 8,500 8,500 CDBG - - 5,000 7,000 6,000 6,000 CDBG 1,750 2,500 3,000 - - -
$37,250 $41,000 $56,000 $52,500 $45,000 $45,000
FY 13/14 FY 14/15 FY 15/16 FY 16/17 FY 16/17 FY 16/17$120,250 $128,500 $137,500 $164,780 $145,780 $145,780
Hope Haven -Affordable Housing
Conflict Resolution Center (Teen Court)
Cabarrus Events Association
Cabarrus Literacy Council
Multicultural Community Student Union
Cabarrus Arts Council, Inc.
Habitat for Humanity Cabarrus County
Hope Haven - Sustaining
Safe Alliance
NOTE: A dash (-) signifies that no request was made.
Prosperity Unlimited, Inc. Sustaining Grant
TOTAL
Sub-total
Sub-total
Hispanic Learning Center
Cabarrus Cooperative Christian Ministry
External Agency
Boys & Girls Club of Cabarrus CountyCabarrus Arts Council, Inc.
Cabarrus Victims Assistance Network (CVAN) Sustaining Grant
Hope Haven
Prosperity Community Connection Inc.
Historic Cabarrus, Inc.
Salvation Army
Cabarrus Meals on WheelsColtrane LIFE Center, Inc.
Special Olympics Cabarrus County
Opportunity House
Sub-total
Multicultural Community Student Union
52

GENERAL FUND OVERVIEW: The General Fund is a governmental fund used to account for all financial resources of the City, except those required to be accounted for in another fund. Revenues to support the General Fund are derived from sources such as property taxes, sales tax, franchise fees, and service fees. The General Fund is comprised of five functions: General Government, Public Safety, Public Works, Economic Development, and Cultural & Recreational. FUNCTIONAL AREAS:
General Government: General Government serves as the support function, assisting all City Departments in the conduct of their daily operations. General Government is comprised of the Governing Body, Public Services Administration, City Manager’s Office, Human Resources, the Wellness Center, Finance, Tax, Legal, and Non-Departmental.
Public Safety: Public Safety serves as the safety and security function, providing assistance to all City
residents with life and property protection. Public Safety is comprised of Police, Code Enforcement, Communications, Radio Shop, Fire, Fire Prevention, Fire Training, and Emergency Management.
Public Works: Public Works serves as the infrastructure function, providing basic services to both City departments and residents of Concord. Public Works is comprised of Streets & Traffic, Powell Bill, Traffic Signals, Traffic Services, Solid Waste & Recycling, Cemeteries, and Fleet Services.
Economic Development: Economic Development serves as the business and residential development, land-use planning, transportation planning, and development coordinator for the City of Concord. Economic Development is comprised of Planning and Neighborhood Development, Transportation Planning, and Economic Development.
Cultural & Recreational: Cultural & Recreational provides recreational opportunities to the citizens of
Concord through provision of recreational services, parks, and facilities. Cultural & Recreational is comprised of Parks & Recreation and Parks & Recreation – Aquatics.
53

General Fund RevenuesFund 100
2013-2014 2014-2015 2015-2016 2015-2016 2016-2017 2016-2017Actual
RevenuesActual
RevenuesCouncil
Approved*Actual
Revenues**Manager
RecommendedCouncil
Approved
Ad Valorem Taxes $ 46,099,790 $ 45,749,513 $ 46,291,851 $ 48,029,760 $ 49,439,665 $ 49,439,665
Sales Taxes 14,042,681$ 16,917,829$ 14,084,105$ 16,191,843$ 15,949,919$ 15,949,919$
Unrestricted Intergovernmental Revenue 3,685,351$ 4,482,455$ 4,381,541$ 5,715,996$ 6,003,172$ 6,003,172$ Restricted Intergovernmental Revenue 3,627,351$ 3,734,701$ 3,397,470$ 3,704,721$ 3,848,083$ 3,848,083$
Licenses 2,204,920$ 2,003,261$ 1,071,541$ 1,286,318$ 926,000$ 926,000$
Other General Revenue 3,634,643$ 3,600,976$ 2,856,703$ 3,482,921$ 2,604,852$ 2,604,852$
Investment Earnings 869,188$ 406,617$ 616,000$ 693,058$ -$ -$
Fund Balance Appropriated -$ 149,666$ 15,533,169$ -$ -$ -$ Transfers 3,652$ 1,451,800$ 1,595,000$ 1,595,000$ -$ -$
TOTAL REVENUES 74,167,576$ 78,496,818$ 89,827,380$ 80,699,617$ 78,771,691$ 78,771,691$
% budget change 12% 3% -12%
* as amended**as of 8/11/2016
Ad Valorem Taxes63%
Sales Taxes20%
Unrestricted Intergovernmental Revenue
8%
Restricted Intergovernmental Revenue
5%
Licenses1%
Other General Revenue3%
FY 16-17 General Fund Revenues(by source)
$‐
$10,000,000
$20,000,000
$30,000,000
$40,000,000
$50,000,000
$60,000,000
$70,000,000
$80,000,000
$90,000,000
ActualRevenues
ActualRevenues
ActualRevenues**
CouncilApproved
2013‐2014 2014‐2015 2015‐2016 2016‐2017
General Fund Revenue Trend Investment Earnings
Other General Revenue
UnrestrictedIntergovernmental Revenue
Fund Balance Appropriated
Licenses
RestrictedIntergovernmental Revenue
Sales Taxes
Ad Valorem Taxes
54

General Fund Expenditures
2013-2014 2014-2015 2015-2016 2015-2016 2016-2017 2016-2017Actual
ExpensesActual
ExpensesCouncil
ApprovedActual
Expenses**Manager
RecommendedCouncil
ApprovedBy FunctionGeneral Government 12,538,199$ 7,536,884$ 22,484,754$ 20,380,251$ 9,751,757$ 9,751,757$
Public Safety 35,925,592$ 37,479,391$ 40,372,356$ 38,453,733$ 43,005,221$ 43,005,221$
Public Works 14,571,265$ 13,360,124$ 17,441,902$ 13,861,420$ 15,649,175$ 15,649,175$
Economic Development 3,710,739$ 3,083,374$ 4,291,429$ 3,620,356$ 3,943,542$ 3,943,542$
Cultural & Recreational 4,702,315$ 5,172,927$ 5,236,939$ 4,644,475$ 6,421,996$ 6,421,996$
TOTAL EXPENDITURES 71,448,110$ 66,632,700$ 89,827,380$ 80,960,235$ 78,771,691$ 78,771,691$
% budget change 9% 21.5% -12%
* as amended**as of 8/11/2016
General Government12%
Public Safety 55%
Public Works20%
Economic Development5%
Cultural & Recreational8%
FY 16-17 General Fund Expenditures (by Function)
$‐
$10,000,000
$20,000,000
$30,000,000
$40,000,000
$50,000,000
$60,000,000
$70,000,000
$80,000,000
$90,000,000
ActualExpenses
ActualExpenses
ActualExpenses**
CouncilApproved
2013‐2014 2014‐2015 2015‐2016 2016‐2017
General Fund Expenditure Trend
Economic Development
Cultural & Recreational
General Government
Public Works
Public Safety
55

GENERAL GOVERNMENT OVERVIEW: General Government serves as the support function, assisting all City departments in the conduct of their daily operations. General Government is comprised of the Governing Body, Public Services Administration, the City Manager’s Office, Human Resources, the Wellness Center, Finance, Tax, Legal, and Non-Departmental. BUDGET UNITS:
Governing Body: The Governing Body consists of the Mayor and seven City Council members. It is responsible for the City’s legislative governance and general policy setting. For additional information, contact Kim Deason, City Clerk, at (704) 920-5205 or [email protected].
Public Services Administration: The Public Services Administration Department serves as the coordination and planning body for the City’s eight municipal service departments. For additional information, contact Lloyd Payne, Assistant City Manager, at (704) 920-5206 or [email protected].
City Manager’s Office: The City Manager’s Office serves as the leadership, coordination, planning, and information dissemination body for implementing City Council goals, objectives, and policies. For additional information, contact Kim Deason, City Clerk, at (704) 920-5205 or [email protected].
Human Resources: The Human Resources Department coordinates employment, personnel actions, benefit plans, risk management, wellness programs, and professional development of City employees. For additional information, contact Rebecca Edwards, Director of Human Resources, at (704) 920-5103 or [email protected].
Wellness Center: The Wellness Center is dedicated to improving the health and wellness of coworkers by diagnosing and treating illnesses/injuries and providing opportunities for employees to learn the skills necessary to optimize their health. For additional information, contact Rebecca Edwards, Director of Human Resources, at (704) 920-5103 or [email protected].
Finance: The Finance Department is responsible for managing all of the fiscal affairs of the City and
supporting the financial related operations of other City departments. For additional information contact Pam Hinson, Director of Finance, at (704) 920-5221 or [email protected].
Tax: The Tax Collection Division is responsible for the billing and collection of all current and delinquent property taxes and privilege licenses. For additional information, contact Rita Ellison, Tax Collector, at (704) 920-5265 or [email protected].
Legal: The Legal Department provides legal services to all City departments, the Mayor, City Council, and all City Boards and Commissions. For additional information, contact VaLerie Kolczynski, City Attorney, at (704) 920-5114 or kolczynv @concordnc.gov.
Non-Departmental: Non-Departmental accounts for expenditures which are unable or not required to be designated to a specific department. For additional information, contact Pam Hinson, Director of Finance, at (704) 920-5221 or [email protected].
56

General Government Expenditures2013-2014 2014-2015 2015-2016 2015-2016 2016-2017 2016-2017
ActualExpenditures
ActualExpenditures
CouncilApproved*
ActualExpenditures**
ManagerRecommended
CouncilApproved
Budget Unit (General Fund)Governing Body 151,963$ 184,885$ 234,841$ 247,669$ 213,390$ 213,390$ Public Services Administration 353,783$ 544,870$ 339,398$ 246,973$ 238,789$ 238,789$ City Manager's Office 426,776$ 478,343$ 655,361$ 656,451$ 646,556$ 646,556$ Human Resources 485,688$ 455,820$ 592,814$ 552,807$ 593,586$ 593,586$ Wellness Center 296,060$ 291,021$ 338,071$ 273,225$ 325,393$ 325,393$ Finance 521,822$ 574,616$ 675,708$ 623,316$ 610,383$ 610,383$ Tax 400,211$ 476,806$ 449,477$ 460,612$ 419,904$ 419,904$ Legal 279,153$ 282,405$ 368,847$ 407,653$ 328,405$ 328,405$ Non-Departmental 9,622,743$ 4,248,118$ 18,830,237$ 16,911,545$ 6,375,351$ 6,375,351$
Total Expenditures 12,538,199$ 7,536,884$ 22,484,754$ 20,380,251$ 9,751,757$ 9,751,757$ % budget change 70% -40% 170% -57%* as amended**as of 8/11/2016
Governing Body 2%
Wellness Center4%
Human Resources6% Tax
5%
City Manager's Office7%
Finance7%
Non‐Departmental69%
FY 16‐17 General Government Expenditures(by Budget Unit)
$0
$5,000,000
$10,000,000
$15,000,000
$20,000,000
$25,000,000
ActualExpenditures
ActualExpenditures
ActualExpenditures**
CouncilApproved
2013‐2014 2014‐2015 2015‐2016 2016‐2017
General Government Expenditure Trend Non-Departmental
Governing Body
Public ServicesAdministration
Legal
Wellness Center
Human Resources
Tax
City Manager's Office
Finance
57

GOVERNING BODY MISSION: The mission of the City of Concord is to partner with our community to deliver services, preserve, protect and enhance the quality of life of citizens, and plan for the future. The Governing Body is responsible for the City’s legislative governance and policy setting. PROGRAM LOCATOR:: Fund: General Fund Functional Area: General Government Department: Governing Body BUDGET & PERFORMANCE HIGHLIGHTS:
MAJOR SERVICE(S) PROVIDED: Set policy for operation of government and
establish goals and objectives guided by those policies.
Seek economic development through partnerships with other governments and private interests.
Set budget guidelines and adopt financial plan to provide all services and retain financial stability of the City.
FY 2015-16 MAJOR ACCOMPLISHMENTS: Continued maintaining a healthy fund balance and
capital reserves account while meeting necessary expenses on a pay-as-you-go basis.
Completed 85 percent of stated Council goals for the year by December 31, 2015.
Evaluated current and potential fee structures in Solid Waste, Planning, and Parks and Recreation.
Supported completion of the City Hall construction project and transition into the new building.
Supported development of reuse options for 26 and 66 Union Street S.
Supported response to current growth trends through a process to update the City's land use plan and small area plans.
FY 2016-17 MAJOR BUDGET CHANGES / NEW REQUESTS /
FOCUS AREAS: Continue maintaining fund balance and capital
reserves account while meeting necessary expenses on a pay-as-you-go basis.
Support a formal process to divest the City of extraneous properties.
Support completion of the Downtown Master Plan and reuse/marketing opportunities for the City's vacant properties on Union Street S.
Support completion of updates to the City's land use plan and small area plans.
STEPS / PROGRAMS BEING UNDERTAKEN TO ENHANCE
PERFORMANCE: N/A
$- $75,000
$150,000 $225,000 $300,000 $375,000 $450,000
13-14 14-15 15-16 16-17Budget
Total Expenditures
58
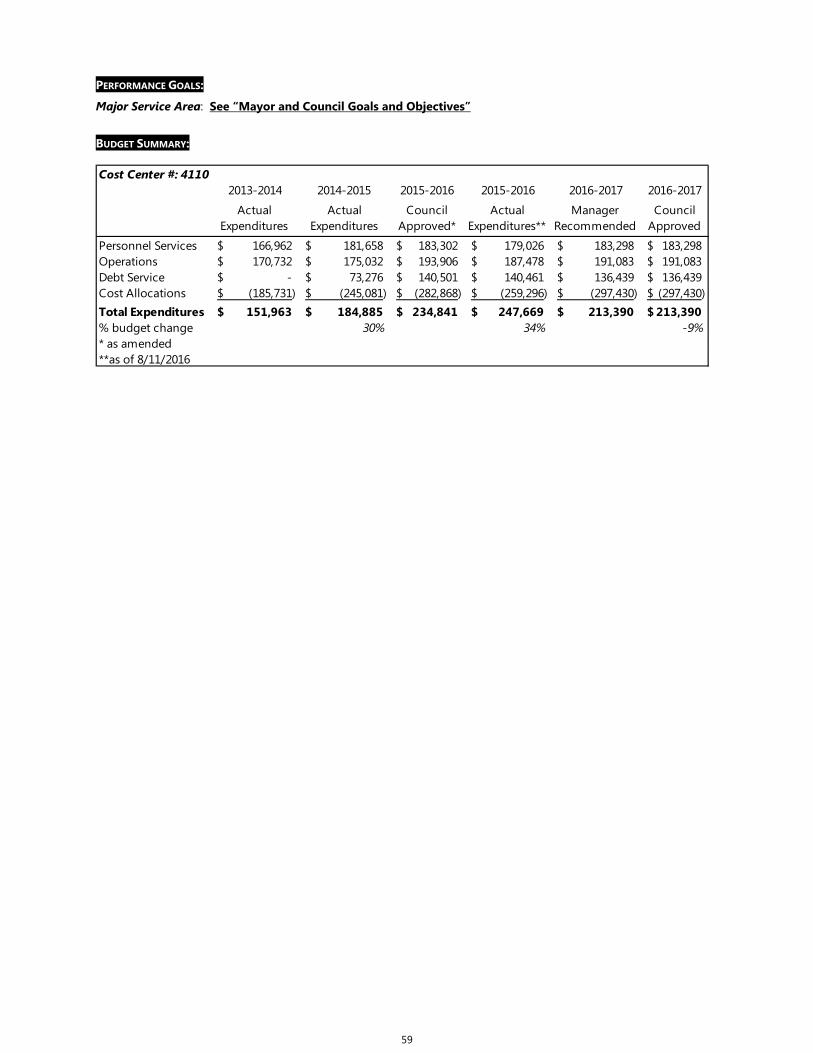
PERFORMANCE GOALS:
Major Service Area: See “Mayor and Council Goals and Objectives”
BUDGET SUMMARY:
Cost Center #: 41102013-2014 2014-2015 2015-2016 2015-2016 2016-2017 2016-2017
Actual Expenditures
Actual Expenditures
Council Approved*
Actual Expenditures**
ManagerRecommended
CouncilApproved
Personnel Services 166,962$ 181,658$ 183,302$ 179,026$ 183,298$ 183,298$ Operations 170,732$ 175,032$ 193,906$ 187,478$ 191,083$ 191,083$ Debt Service -$ 73,276$ 140,501$ 140,461$ 136,439$ 136,439$ Cost Allocations (185,731)$ (245,081)$ (282,868)$ (259,296)$ (297,430)$ (297,430)$ Total Expenditures 151,963$ 184,885$ 234,841$ 247,669$ 213,390$ 213,390$ % budget change 30% 34% -9%* as amended**as of 8/11/2016
59

PUBLIC SERVICE ADMINISTRATION MISSION: The Public Services Administration Department exists to provide effective leadership, coordinate services and promote new initiatives for the infrastructure/development departments with the desire to support and achieve the goals of the Mayor, City Council, and the City Manager. PROGRAM LOCATOR:: Fund: General Fund Functional Area: General Government Department: Public Service Administration BUDGET & PERFORMANCE HIGHLIGHTS: MAJOR SERVICE(S) PROVIDED: Support and direction for City utility,
infrastructure, and development services departments.
FY 2015-16 MAJOR ACCOMPLISHMENTS: Jointly funded MPA intern with the City of
Kannapolis for fourth year. Added energy saving lighting and HVAC controls. Conducted an external security assessment of
Brown Center campus.
FY 2016-17 MAJOR BUDGET CHANGES / NEW REQUESTS /
FOCUS AREAS: Continue to fund energy efficiency projects. Implement security improvements as identified in
the security assessment.
Enhance employee wellness by converting locker room into fitness/workout facility.
STEPS / PROGRAMS BEING UNDERTAKEN TO ENHANCE
PERFORMANCE: Conduct team building exercises for department
heads. Pursue change outs of lights, thermostats and
HVAC to reduce energy use. Encourage staff to print double-sided and
black/white to reduce waste.
$-
$100,000
$200,000
$300,000
$400,000
$500,000
$600,000
13-14 14-15 15-16 16-17
Total Expenditures
00.10.20.30.40.50.60.70.80.9
1
13-14 14-15 15-16 16-17
% of Performance Objectives Achieved by Infrastructure/Development
Departments
Actual Objective
60
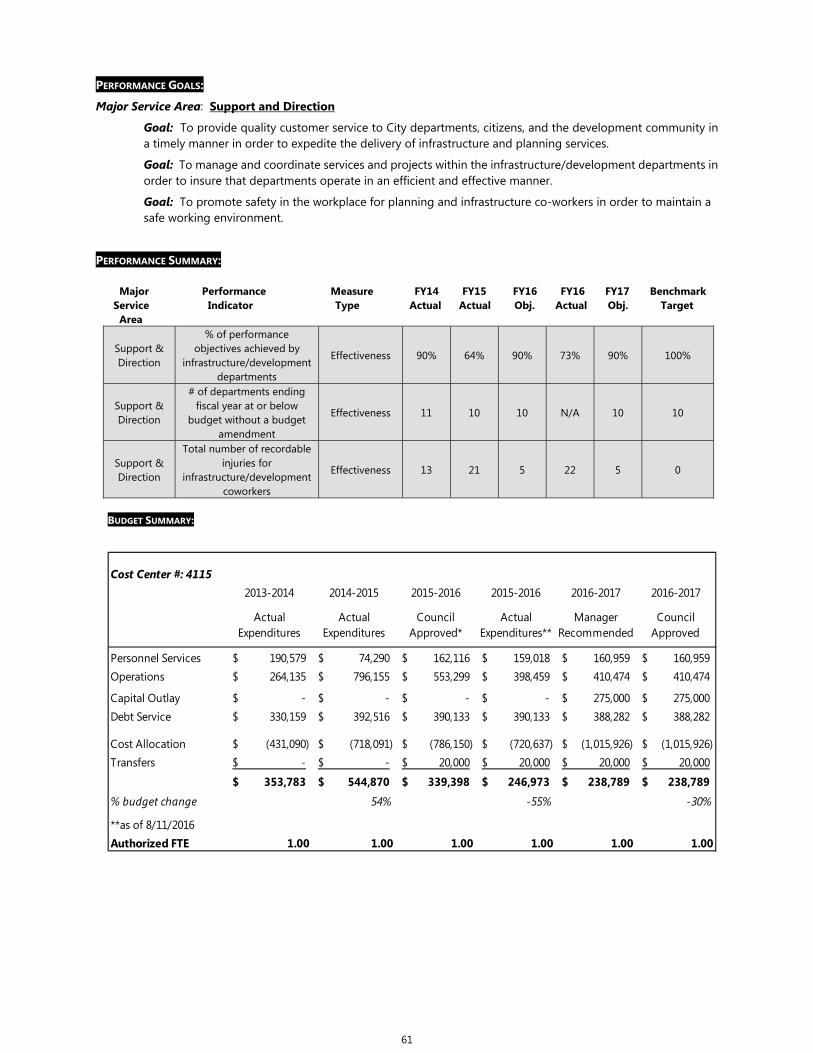
PERFORMANCE GOALS:
Major Service Area: Support and Direction
Goal: To provide quality customer service to City departments, citizens, and the development community in a timely manner in order to expedite the delivery of infrastructure and planning services.
Goal: To manage and coordinate services and projects within the infrastructure/development departments in order to insure that departments operate in an efficient and effective manner.
Goal: To promote safety in the workplace for planning and infrastructure co-workers in order to maintain a safe working environment.
PERFORMANCE SUMMARY: Major Performance Measure FY14 FY15 FY16 FY16 FY17 Benchmark Service Indicator Type Actual Actual Obj. Actual Obj. Target Area
Support & Direction
% of performance objectives achieved by
infrastructure/development departments
Effectiveness 90% 64% 90% 73% 90% 100%
Support & Direction
# of departments ending fiscal year at or below
budget without a budget amendment
Effectiveness 11 10 10 N/A 10 10
Support & Direction
Total number of recordable injuries for
infrastructure/development coworkers
Effectiveness 13 21 5 22 5 0
BUDGET SUMMARY:
Cost Center #: 41152013-2014 2014-2015 2015-2016 2015-2016 2016-2017 2016-2017
Actual Expenditures
Actual Expenditures
CouncilApproved*
Actual Expenditures**
ManagerRecommended
CouncilApproved
Personnel Services 190,579$ 74,290$ 162,116$ 159,018$ 160,959$ 160,959$ Operations 264,135$ 796,155$ 553,299$ 398,459$ 410,474$ 410,474$
Capital Outlay -$ -$ -$ -$ 275,000$ 275,000$ Debt Service 330,159$ 392,516$ 390,133$ 390,133$ 388,282$ 388,282$
Cost Allocation (431,090)$ (718,091)$ (786,150)$ (720,637)$ (1,015,926)$ (1,015,926)$ Transfers -$ -$ 20,000$ 20,000$ 20,000$ 20,000$
353,783$ 544,870$ 339,398$ 246,973$ 238,789$ 238,789$
% budget change 54% -55% -30%
**as of 8/11/2016Authorized FTE 1.00 1.00 1.00 1.00 1.00 1.00
61

CITY MANAGER’S OFFICE MISSION: The City Manager’s Office exists to ensure that City services are planned and delivered to all citizens in the most efficient, economical and effective manner and that our citizens are informed and aware of City government. PROGRAM LOCATOR:: Fund: General Fund Functional Area: General Government Department: City Manager’s Office BUDGET & PERFORMANCE HIGHLIGHTS:
0
0.2
0.4
0.6
0.8
1
13-14 14-15 15-16 16-17
% of Council Goals Accomplished
Actual Objective MAJOR SERVICE(S) PROVIDED: Present reports and recommendations in
assistance to the Mayor and City Council. Manage the delivery of City services through
coordination and direction of all City Departments. Assure that all Statutes and Ordinances are
followed in the public notice and conduct of City Council meetings.
Maintain complete and accurate records of the proceedings of City Council meetings.
Provide a comprehensive public affairs program in support of Council action and the activities of City departments, including environmental education and outreach opportunities such as Concord 101,
Civic Education, and Partnerships for Stronger Neighborhoods.
Coordinate the City’s Customer Service Initiative. FY 2015-16 MAJOR ACCOMPLISHMENTS: Executive support for the opening of City Hall. Guided the transition of the Police Department's
new Chief. Supported investment in technology to better
serve citizens and customers. Incorporated environmental education into the
Public Affairs team. FY 2016-17 MAJOR BUDGET CHANGES / NEW REQUESTS /
FOCUS AREAS: \ Continue Federal and State legislative advocacy. Improve communications through enhanced email
marketing, digital signage in City Hall, and streamlined internal and public event calendars.
Implementation of NWF Mayor's Monarch Pledge. Enhanced methods for determining citizen
satisfaction and employee engagement. STEPS / PROGRAMS BEING UNDERTAKEN TO ENHANCE
PERFORMANCE: Broaden reach of the third grade civic education
program and adjust curriculum to be more interactive.
Continue with monthly staff and functional meetings to review progress with departmental goals and responsibilities.
Continue to enhance partnership among management, directors, and the Customer Service Advancement team to serve citizens and customers, help departments apply best practices to enhance customer satisfaction.
Continue working with City departments to foster more sustainable, environmentally-friendly, and conservation-minded practices.
$- $100,000 $200,000 $300,000 $400,000 $500,000 $600,000 $700,000
13-14 14-15 15-16 16-17Budget
Total Expenditures
62

PERFORMANCE GOALS:
Major Service Area: Assistance to Mayor and City Council
Goal: To provide thorough information to Mayor and City Council in order to facilitate informed decision making concerning the City.
Major Service Area: Coordination of City Departments
Goal: To provide timely and accurate information to City departments for effective use of City resources.
Major Service Area: Customer Service
Goal: To provide promotions, leadership, and monitoring for the City’s initiative and commitment to provide excellent and continuously improving customer service.
Major Service Area: Public Affairs
Goal: To provide quality, comprehensive, and timely information to the public and City neighborhoods on major events/issues and projects in Concord; develop community outreach opportunities; create environmental stewardship within the community and organization; and foster clear communication and productive relationships between City government and citizens.
Major Service Area: Records
Goal: To provide accurate notification of public meetings, prepare and maintain all Statutes and Ordinances, and compile and disseminate City Council meeting minutes in a timely manner.
PERFORMANCE SUMMARY: Major Performance Measure FY14 FY15 FY16 FY16 FY17 Benchmark Service Area Indicator Type Actual Actual Obj. Actual Obj. Target
Assistance to Mayor and
Council
% of Council Members rating overall satisfaction with Admin. as “very” or
“somewhat” satisfied Effectiveness 100% 100% 100% 100% 100% 100%
Coordination City Depts.
% of City Departments rating overall satisfaction with Admin. as “very” or
“somewhat” satisfied Effectiveness 95% 95% 100% 91% 100% 100%
Coordination City Depts.
% of Council Goals accomplished Effectiveness 93% 93% 95% 90% 100% 100%
Records
% of draft regular meeting minutes ready for adoption by next month
Effectiveness 100% 100% 100% 100% 100% 100%
Public Affairs % of 3rd grade teachers rating overall
satisfaction with Civic Education Program as “very” or “somewhat”
Effectiveness 100% 100% 100% 100% 100% 100%
Public Affairs % of Concord 101 participants rating overall satisfaction with program as
“very” or “somewhat” satisfied Effectiveness 100% 100% 100% 100% 100% 100%
Coordination of City Depts.
% of citizens rating overall satisfaction with City services “very” or “somewhat”
Effectiveness NA 91% 91% NA 95% 100%
63

BUDGET SUMMARY:
Cost Center #: 41202013-2014 2014-2015 2015-2016 2015-2016 2016-2017 2016-2017
Actual Expenditures
Actual Expenditures
CouncilApproved*
Actual Expenditures**
ManagerRecommended
CouncilApproved
Personnel Services 693,402$ 728,698$ 728,487$ 731,852$ 768,862$ 768,862$ Operations 206,858$ 214,726$ 229,886$ 190,392$ 262,600$ 262,600$
Capital Outlay -$ -$ -$ -$ -$ -$ Debt Service -$ 74,923$ 143,617$ 143,617$ 139,505$ 139,505$ Cost Allocations (473,484)$ (540,004)$ (446,629)$ (409,410)$ (524,411)$ (524,411)$
Total Expenditures 426,776$ 478,343$ 655,361$ 656,451$ 646,556$ 646,556$
% budget change 25% 37% -1%
* as amended**as of 8/11/2016Authorized FTE 6.00 6.00 6.00 6.00 6.50 6.50
64

HUMAN RESOURCES MISSION: The Human Resources (HR) Department is responsible for managing the strategic and operational workforce-related activities of the City of Concord. The Human Resources Department performs with the highest level of confidentiality, professionalism, and integrity with a primary focus on decreasing liability and helping to make the City of Concord a preferred employer. Major areas of expertise include: policy development, federal and state employment law compliance, employee relations, manage general liability insurance, benefits administration, recruitment, worker’s compensation, position management, compensation, safety and risk management, performance management, as well as occupational health and wellness. PROGRAM LOCATOR:: Fund: General Fund Functional Area: General Government Department: Human Resources BUDGET & PERFORMANCE HIGHLIGHTS:
MAJOR SERVICE(S) PROVIDED:
o Federal and State Employment Law Compliance o Benefits Administration o Employee Relations o Worker’s Compensation
FY 2015-16 MAJOR ACCOMPLISHMENTS: Created and implemented ADA Title 1 engagement
process. Centralized FMLA and ADA processes to decrease liability for the City. Successfully integrated Safety and Risk into the
Human Resources department. Implemented CPR/First Aid Certification training
classes for coworkers. Launched the City's first wellness-
related challenges for coworker engagement. Implemented paperless prescriptions for Worker's
Compensation cases. Realized a decrease in the City's annual
unemployment tax by $55,000. Produced a Compensation Structure and Hiring
Guide which encompasses the aspects of the new compensation plan.
Successfully transitioned wellness center management to Carolinas HealthCare System.
Sponsored the City’s first National Safety Month initiative to support safe work and awareness in the workplace.
FY 2016-2017 MAJOR FOCUS AREAS: Continue the audit of policies and practices from
the lens of employment law compliancy and best practice methodology.
Research efficiencies and automation possibilities for multiple systems used within department by collaborating with IT and other relevant departments.
Coordinate a Job Safety Analysis study with departments to improve on-the-job safety.
Addition of a HR Analyst position to assist with leave and benefit compliance.
STEPS / PROGRAMS BEING UNDERTAKEN TO ENHANCE
PERFORMANCE: Prioritize continuous learning through formal HR
related training and internal cross training. Incorporate City Hall Fitness Center in wellness
activities to promote health and awareness and potentially reduce health care costs.
$-
$200,000
$400,000
$600,000
$800,000
13-14 14-15 15-16 16-17Budget
Total Expenditures
.
0%
2%
4%
6%
8%
10%
13-14 14-15 15-16 16-17
Turnover Rate
Actual Objective
65

PERFORMANCE GOALS:
Major Service Area: Federal and State Employment Law Compliance Goal: To ensure clear and objective development and administration of policies to ensure compliance with federal and state employment regulations, for the well-being of the City and its coworkers.
Major Service Area: Employee Relations Goal: To encourage and provide a thorough and streamlined grievance process in order to review issues fairly and expediently.
Major Service Area: Recruitment Goal: To provide strong position descriptions to attract qualified employees in order to fill existing openings to ensure appropriate staffing levels.
Major Service Area: Benefits Administration Goal: To provide high quality, diverse, and comprehensive benefits to eligible City coworkers.
Major Service Area: Worker’s Compensation
Goal: To ensure thorough review and correct processing of related claims.
PERFORMANCE SUMMARY: Major Performance Measure FY13 FY14 FY15 FY16 FY17 Benchmark Service Indicator Type Actual Actual Actual Actual Obj. Target Area
Compliance # of HR related trainings
attended by staff Workload N/A N/A N/A 46 20 20
Retention Turnover Rate Effectiveness 5.6% 8.5% 8% 9.2% <10% 10.2%
Recruitment Average # of days from open-
to-fill for full-time job vacancies
Effectiveness 53 unavailable <50 68 <70 70
Employee Relations
% of grievances resolved at department level
Effectiveness 80% unavailable 80% 20% 85% 80%
Safety and Training
% of employees receiving OSHA required annual
training courses Effectiveness N/A 69 85 85% 90 90
Safety and Training
# of departments receiving Department of Labor Safety
Award Effectiveness 28 32 30 28 26 26
BUDGET SUMMARY:
Cost Center #: 4125
2013-2014 2014-2015 2015-2016 2015-2016 2016-2017 2016-2017Actual
ExpendituresActual
ExpendituresCouncil
Approved*Actual
Expenditures**Manager
RecommendedCouncil
Approved
Personnel Services 704,660$ 621,514$ 726,622$ 736,378$ 855,714$ 855,714$ Operations 337,067$ 295,298$ 384,592$ 278,268$ 375,015$ 375,015$ Capital Outlay -$ 27,237$ -$ -$ -$ -$ Debt Service -$ 79,039$ 150,707$ 151,508$ 147,169$ 147,169$ Cost Allocations (556,039)$ (567,268)$ (669,107)$ (613,347)$ (784,312)$ (784,312)$
Total Expenditures 485,688$ 455,820$ 592,814$ 552,807$ 593,586$ 593,586$
% budget change 47% 21% 0%* as amended**as of 8/11/2016Authorized FTE 10.00 10.00 10.00 10.00 11.00 11.00
66

WELLNESS MISSION: To create an environment dedicated to improving the health and wellness of our coworkers by diagnosing and treating illnesses/injuries and providing opportunities for employees to learn the skills they need in order to optimize their health and well-being. The Wellness Center is committed to providing services that are easily accessible and confidential and to consistently provide all customers with professionalism, expertise and high quality customer service in the administration of services. PROGRAM LOCATOR:: Fund: General Fund Functional Area: General Government
Department: Human Resources Division: Wellness
BUDGET & PERFORMANCE HIGHLIGHTS:
$- $50,000
$100,000 $150,000 $200,000 $250,000 $300,000 $350,000
13-14 14-15 15-16 16-17Budget
Total Expenditures
0500
10001500200025003000
13-14 14-15 15-16 16-17
# of Patient Visits
Actual Objective MAJOR SERVICE(S) PROVIDED: Illness prevention and risk-reduction counseling Treatment of chronic and acute episodic injuries,
illnesses and accidents. Comprehensive physical examinations for:
o Annual requirements for positions which require them
o Pre-Employment for positions which require them
Immunizations Workers Compensation Services Drug Testing
FY 2015-16 MAJOR ACCOMPLISHMENTS: Performed Health Risk Assessments and biometric
screenings for approximately 750 participants. Conducted epinephrine auto-injector education
and QuitSmart smoking cessation trainings. Coordinated CHS Mobile Mammography on-site
unit in November and April. Organized and managed annual Wellness Fair for
employees. Assisted in the implementation of the City Hall
Fitness Center and provided equipment orientation for employees.
Partnered with the City’s EAP provider to offer a Stress Management Education Lunch and Learn.
Introduced a water drinking challenge to encourage better hydration choices and raise awareness of the importance of drinking non- sugar drinks, with employees consuming approximately 81,000 ounces of water over 31 days.
Conducted seminars to educate employees on how to better utilize the City of Concord Wellness Center Patient Portal.
FY 2016-17 MAJOR BUDGET CHANGES / NEW REQUESTS /
FOCUS AREAS: CONTINUE ENHANCED BY N Continue to seek enhancements to services
offered by contract providers. Provide oversight for the new City Hall Fitness
Center. \
STEPS / PROGRAMS BEING UNDERTAKEN TO ENHANCE
PERFORMANCE: Develop and promote additional wellness
initiatives to engage coworkers and potentially reduce health care costs.
o Nutrition o Weight loss o Diabetes management o Breast cancer awareness o Heart health o Cancer prevention o Stress management o Well man, woman, and child visits
67

PERFORMANCE GOALS:
Major Service Area: Education Goal: To provide information and support for coworkers to change their behaviors and adopt a new
wellness lifestyle by educating them regarding unhealthy habits and the benefits of healthy habits – for themselves and their families.
Major Service Area: Customer Service Goal: To enhance the level of customer service provided to coworkers by proving cost saving alternatives.
PERFORMANCE SUMMARY: Major Performance Measure FY14 FY15 FY16 FY16 FY17 Benchmark Service Indicator Type Actual Actual Obj. Actual Obj. Target Area
Education
Number of risk-reduction or patient education programs
(i.e., smoking cessation, weight management)
Workload 15 8 20 35 15 20
Health Number of Patient Visits Workload 1,655 2,500 2,000 1,996 2000 2,000
BUDGET SUMMARY:
Cost Center #: 41262013-2014 2014-2015 2015-2016 2015-2016 2016-2017 2016-2017
Actual Expenditures
Actual Expenditures
CouncilApproved
Actual Expenditures**
ManagerRecommended
CouncilApproved
Operations 474,455$ 464,149$ 507,819$ 428,825$ 489,149$ 489,149$ Cost Allocations (178,395)$ (173,128)$ (169,748)$ (155,600)$ (163,756)$ (163,756)$
Total Expenditures 296,060$ 291,021$ 338,071$ 273,225$ 325,393$ 325,393$
% budget change -2% -6% -4%* as amended**as of 8/11/2016Authorized FTE 0.00 0.00 0.00 0.00 0.00 0.00
68

FINANCE MISSION: The Finance Department exists to provide sound and innovative financial management in the areas of financial record keeping, accounting, payroll, accounts payable, and budgeting to the Mayor and City Council, City Management, City departments, regulatory agencies, vendors and U.S. financial markets with the desire to conduct ourselves according to the highest professional standards of financial planning and reporting. PROGRAM LOCATOR:: Fund: General Fund Functional Area: General Government Department: Finance BUDGET & PERFORMANCE HIGHLIGHTS:
$- $75,000
$150,000 $225,000 $300,000 $375,000 $450,000 $525,000 $600,000 $675,000
13-14 14-15 15-16 16-17Budget
Total Expenditures
0%
100%
13-14 14-15 15-16 16-17
Receipt of GFOA Certificate of Excellence in Financial Reporting and Distinguished Budget
Presentation Award (100% = Yes)
Financial Budget
MAJOR SERVICE(S) PROVIDED: Accounts Payable Processing Payroll Processing Accounting & Grants Budgeting & Performance Measurement Investments and Debt
FY 2015-16 MAJOR ACCOMPLISHMENTS: Received 14th consecutive Distinguished Budget
Presentation Award for the FY2016 budget document and applied for the 27th consecutive
Certificate of Achievement in Financial Reporting from GFOA for FY2015.
Continued to review/revise performance measures. Continued to monitor monthly cash balances to keep
banking fees at a minimum and earn maximum returns on investments.
Grant Accountants produced an instructional quarterly Grant Newsletter.
Issued debt for airport projects. Refunded revenue bonds for future savings on debt
service payments. Created an Electronic Records policy to coordinate
with record retention compliance.
FY 2016-17 MAJOR BUDGET CHANGES / NEW REQUESTS /
FOCUS AREAS: Increase user-friendliness of forms and procedures. Budget staff will explore efforts to better educate
citizens on how their tax dollars are used. Implement paperless Accounts Payable workflow
process and begin storing records electronically. Expand internal audit reviews. Continue building on the Cash Flow statement to
forecast cash needs and uses, primarily for investing and debt service functions.
Continue to look for ways to convert more check payments to electronic payment methods in order to further reduce costs.
Look for ways to increase utilization of functions available in FinancePlus software to streamline and/or improve processes.
Upgrade budget software to Questica product. STEPS / PROGRAMS BEING UNDERTAKEN TO ENHANCE
PERFORMANCE: Budget Staff uses the NC Benchmarking Project to
evaluate/improve departmental performance. Accounts Payable staff reviews monthly on-time
payment reports to identify problems and causes for late payments.
Payroll staff reviews monthly payroll accuracy reports. Efforts are made to reduce or eliminate potential for error on future payroll processes.
Accounting staff regularly reviews Generally Accepted Accounting Principles and procedures to ensure that the City is 100% in compliance with the highest accounting standards.
Accounting staff continues to search for grant funding.
69

PERFORMANCE GOALS:
Major Service Area: Accounting & Grants
Goal: To provide accurate financial information in a timely manner to the City Council, department directors, and external agencies in order to comply with local, state, and federal laws, and governmental accounting and regulatory requirements.
Major Service Area: Payroll
Goal: To provide accurate and timely payments to City employees in order to comply with the City’s compensation plan.
Major Service Area: Accounts Payable
Goal: To provide accurate and timely issuance of payments to vendors in order to maximize the City’s cash flow position.
Major Service Area: Budgeting & Performance Measurement
Goal: To provide timely and accurate budget and performance information to the Mayor and City Council, management, department directors, external agencies, and the general public in order to ensure the effective use of City resources.
PERFORMANCE SUMMARY:
Major Performance Measure FY14 FY15 FY16 FY16 FY17 Benchmark Service Area Indicator Type Actual Actual Obj. Mid-Yr. Obj. Target
Accounting Receipt of GFOA Certificate of
Excellence in Financial Reporting
Effectiveness Yes Yes Yes Yes Yes Yes
Accounting % of journal entries made as
corrections Effectiveness 4.3% 4.6% <10% 3.6% <10% 8%
Accounting % of external reporting
deadlines met Effectiveness 100% 100% 100% 100% 100% 100%
Payroll Payroll accuracy rate Effectiveness 99.7% 99.9% 99% 99.9% 99% 99%
Accounts Payable
% of vendors paid on-time Effectiveness 95.2% 93.6% 93% 94.8% 93% 95%
Accounts Payable
% of payments made electronically
Efficiency 48.7% 48.4% 55% 47.3% 55% 55%
Budgeting & Perf. Meas.
Receipt of GFOA Distinguished
Budget Presentation Award Effectiveness Yes Yes Yes Yes Yes Yes
BUDGET SUMMARY: Cost Center #: 4130
2013-2014 2014-2015 2015-2016 2015-2016 2016-2017 2016-2017
Actual Expenditures
Actual Expenditures
CouncilApproved*
Actual Expenditures**
ManagerRecommended
CouncilApproved
Personnel Services 982,427$ 999,026$ 1,012,572$ 1,007,019$ 1,020,458$ 1,020,458$ Operations 119,822$ 131,926$ 124,808$ 112,620$ 117,801$ 117,801$ Capital Outlay -$ 41,977$ 98,710$ -$ 60,000$ 60,000$ Debt Service -$ 108,679$ 208,324$ 208,324$ 202,358$ 202,358$ Cost Allocations (580,427)$ (706,992)$ (768,706)$ (704,647)$ (790,234)$ (790,234)$
Total Expenditures 521,822$ 574,616$ 675,708$ 623,316$ 610,383$ 610,383$ % budget change 10% 8% -10%* as amended**as of 8/11/2016Authorized FTE 14.00 14.00 14.00 13.25 13.00 13.00
70

TAX MISSION: The Tax Division exists to provide accurate and timely tax and license billings, processing of payments and enforcement of collections in order to provide the City with the resources for the delivery of quality public services and assist Council in ensuring a fair and equitable tax rate. PROGRAM LOCATOR:: Fund: General Fund Functional Area: General Government Department: Finance Division: Tax BUDGET & PERFORMANCE HIGHLIGHTS: MAJOR SERVICE(S) PROVIDED: Billing and Processing of Tax Bills Cemetery Record maintenance
FY 2015-16 MAJOR ACCOMPLISHMENTS: FY16 Property Tax Collection Rate 98% as of April
30, 2016. Began sending delinquent account to Datamax for
collection. Continue collection of Beer & Wine Licenses. Reduced customer wait times by cross training
other coworkers on property tax payments.
FY 2016-17 MAJOR BUDGET CHANGES / NEW REQUESTS /
FOCUS AREAS: Send new batch of delinquent Tax accounts to
Datamax for collection.
STEPS / PROGRAMS BEING UNDERTAKEN TO ENHANCE
PERFORMANCE: Actively pursuing all methods of tax collection
including attachment and garnishment of wages and bank accounts, Debt Set Off collection.
More thoroughly research returned mail to reroute to current owner/address.
Complete the conversion of Oakwood Cemetery records to electronic form.
$- $75,000
$150,000 $225,000 $300,000 $375,000 $450,000
13-14 14-15 15-16 16-17Budget
Total Expenditures
50%60%70%80%90%
100%
13-14 14-15 15-16 16-17
% of Taxes Collected
Actual Objective
71

PERFORMANCE GOALS:
Major Service Area: Billing and Processing of Tax Bills
Goal: To provide timely distribution of tax bills to property owners, which in turn will enable and encourage the property owners to pay their bills early. Employ all lawful means to collect all taxes due the City in accordance with North Carolina Laws.
Goal: To provide low cost Tax Division services in order to maximize use of resources required to service the City’s taxpayers.
PERFORMANCE SUMMARY: Major Performance Measure FY14 FY15 FY16 FY16 FY17 Benchmark Service Indicator Type Actual Actual Obj. Mid-Yr. Obj. Target Area
Billing & Processing of Tax Bills
Cost per taxpayer bill serviced*
Efficiency $13.76 $14.05 <$13 $9.68 $9.50 <$9
Billing & Processing of Tax Bills
% of taxes collected Effectiveness 97.19% 99.35% 98% 95.4% 99% 98%
* Calculation based on tax year, not fiscal year (ex. 2015 fiscal year uses 2014 tax year data.) BUDGET SUMMARY:
Cost Center #: 41402013-2014 2014-2015 2015-2016 2015-2016 2016-2017 2016-2017
Actual Expenditures
Actual Expenditures
CouncilApproved*
Actual Expenditures**
ManagerRecommended
CouncilApproved
Personnel Services 245,683$ 241,158$ 198,326$ 196,056$ 195,526$ 195,526$
Operations 135,191$ 216,897$ 218,470$ 232,186$ 186,376$ 186,376$ Debt Service -$ 11,527$ 21,472$ 22,095$ 21,462$ 21,462$
Cost Allocations 19,337$ 7,224$ 11,209$ 10,275$ 16,540$ 16,540$
Total Expenditures 400,211$ 476,806$ 449,477$ 460,612$ 419,904$ 419,904$
% budget change 16% -3% -7%
* as amended**as of 8/11/2016Authorized FTE 4.50 4.50 4.50 4.50 4.50 4.50
72

LEGAL
MISSION: The Legal Department exists to provide efficient and effective in-house legal counsel to all City departments, the City Manager’s Office, the Mayor, City Council, Planning and Zoning Commission, Zoning Board of Adjustment, and the Historic Commission with the desire to reduce the City’s potential liabilities and damages.
PROGRAM LOCATOR:: Fund: General Fund Functional Area: General Government Department: Legal BUDGET & PERFORMANCE HIGHLIGHTS: MAJOR SERVICE(S) PROVIDED:
Real Property- Research and acquire real property; handle disposition of surplus properties.
Contracts- Research and write contracts, deeds, leases, releases and other legal documents; review and certify as to form and legal acceptability of contracts prepared by others.
Debt Collection- Institute legal proceedings and file claims with courts to collect monies due the City for taxes, utilities, fees, etc.
Litigation- Research and prepare documents necessary for the defense of lawsuits against the City or its employees brought against them for conduct while in the line of duty.
City Code/Ordinances- Research and draft new ordinances and changes to City Code.
Education- Review legal periodicals and recent court decisions and advise City Management and staff of legal implications and potential impact on policies and procedures. Train staff and elected officials in proper legal procedures and changing laws.
Advise Policy Makers- Provide legal counsel to Policy
Makers, City Council, City Manager, Department Heads, City staff, Historic Preservation Commission, Planning & Zoning Commission, and Zoning Board of Adjustment.
FY 2015-16 MAJOR ACCOMPLISHMENTS: Albemarle-Concord-Kannapolis water line, easement
acquisitions, eminent domain actions. Planning & Zoning matters - BV Belk law suit. Greenway acquisitions, including 3 Mile Branch Greenway
and Hector H. Henry II Greenway. Economic Development - Heilig Meyers; Silverman Group;
Legacy Concord LLC utility upsize agreement; International Business Park – DOT MOU; Celgard payment; AC Controls; Walton Development Group Infrastructure Reimbursement agreement; CAT revision; Suncap; SmartPost.
Contracts, including: City Hall Construction Manager Preconstruction Contracts.
Research/assembling many public records requests. Approximately 56 title searches for code enforcement,
subdivision and utility projects; negotiated and acquired approximately 33 properties for City utilities and infrastructures.
Represented City in litigation matters, including code enforcement, personnel, workers compensation, civil rights cases, eminent domain, personal injury, collections, contracts and bankruptcies.
Reviewed approximately 190 contracts in an average of 1.2 days.
• Title project for Barber-Scotia property. • Property acquisition for northeast subset sidewalks. • Economic Development contract document revisions,
Habitat/CDBG contracts. • Over $40,000.00 in payments collected from responsible
insurance companies for damaged City property. FY 2016-17 MAJOR BUDGET CHANGES/NEW REQUESTS/ FOCUS AREAS • Stricker Branch & Logan Community storm water projects. • Assemble heirs’ property and city owned property data
base. • Sidewalks along Arbor Street, Palaside Drive, Miramar
Street and Burrage Road. STEPS/PROGRAMS BEING UNDERTAKEN TO ENHANCE PERFORMANCE UNDERTAKEN TO: • Staff to attend continuing education classes. • Keep City staff, elected officials, and appointed officers
informed & trained on legal procedures & changing laws. • Efficient review of contracts in a timely manner. • Cross-train staff for efficiency when absences occur. • Scan historic documents for general use. • Updating CDO and COD to conform with changes in GIS to
shorten and make more user-friendly.
0.00.51.01.52.02.53.03.54.0
13-14 14-15 15-16 16-17
Avg # of Days to Review Contracts
Actual Objective
$- $50,000
$100,000 $150,000 $200,000 $250,000 $300,000 $350,000 $400,000 $450,000
13-14 14-15 15-16 16-17Budget
Total Expenditures
73

PERFORMANCE GOALS: Major Service Area: Sound Legal Representation
Goal: To provide sound legal representation to the Mayor, City Council, and City Management in order to resolve all legal issues and obtain outcomes in the City’s favor.
Major Service Area: Real Property Goal: To check ownership and liens on all titles for acquisition, litigation and code enforcement purposes in order to ensure that the City obtains clear property titles, and in order to name the proper parties in litigation and code enforcement actions.
Major Service Area: Contracts Goal: To efficiently review, amend, and execute contracts in order to ensure that the City’s interests are properly addressed and that goods and services are procured in a timely manner.
Major Service Area: Debt Collection Goal: To collect as many past-due accounts as possible in order to ensure fundamental fairness to the taxpayers.
Major Service Area: City Code Goal: To have a modern, correct, clear, and legally defensible City code in order to protect the City’s interests and provide proper guidance on the legalities of City services.
Major Service Area: Education Goal: To train staff, elected officials, and appointed officers in proper legal procedures and changing laws in order to reduce and or eliminate potential liability and to ensure compliance with all applicable local, state, and federal laws and regulations.
Major Service Area: Advise Policy Makers Goal: To provide legal counseling to Council, Historic Properties Commission, Zoning Board of Adjustment, and Planning & Zoning Commission in order to make informed policies while reducing potential liabilities. Goal: To provide legal advice and support to the City Manager, department heads and staff in order to comply with all applicable laws, reduce liabilities, enforce the City’s ordinances and promote orderly growth and development of the City.
PERFORMANCE SUMMARY:
Major Performance Measure FY14 FY15 FY16 FY16 FY17 Benchmark Service Indicator Type Actual Actual Obj. Actual Obj. Target Area
Real Property # of title searches Workload 152 193 155 174 152 N/A
Contracts Avg. days turnaround time to
review written contracts Effectiveness 1.4 1 2 1 2 3
Education % of state mandated training
completed by Attorneys & staff
Effectiveness 100% 100% 100% 100% 100% 100%
Education Create, maintain, & update a bank of legal bulletins on the
City’s intranet Effectiveness Yes Yes Yes Yes Yes Yes
BUDGET SUMMARY: IS EFFECTED BY 24 TAX COLLECTION CASES FILED BUT NOT COMPLETED IN NOVEMBER & DECEMBER DUE O Cost Center #: 4150
2013-2014 2014-2015 2015-2016 2015-2016 2016-2017 2016-2017Actual
ExpendituresActual
ExpendituresCouncil
Approved*Actual
Expenditures**Manager
RecommendedCouncil
ApprovedPersonnel Services 485,951$ 477,104$ 542,998$ 540,333$ 536,004$ 536,004$
Operations 109,155$ 83,456$ 107,806$ 114,998$ 107,643$ 107,643$
Debt Service -$ 67,512$ 129,415$ 129,413$ 125,708$ 125,708$ Cost Allocations (315,953)$ (345,667)$ (411,372)$ (377,091)$ (440,950)$ (440,950)$
Total Expenditures 279,153$ 282,405$ 368,847$ 407,653$ 328,405$ 328,405$ % budget change 16% 44% -11%* as amended**as of 8/11/2016 5.00 6.00 6.00 6.00 6.00 6.00
74

NON-DEPARTMENTAL MISSION: The Non-departmental budget unit includes expenses which are unable to or not required to be assigned to a specific City department. PROGRAM LOCATOR:: Fund: General Fund Functional Area: General Government Department: Non-Departmental BUDGET & PERFORMANCE HIGHLIGHTS:
$-
$5,000,000
$10,000,000
$15,000,000
$20,000,000
13-14 14-15 15-16 16-17Budget
Total Expenditures
MAJOR SERVICE(S) PROVIDED: N/A
FY 2015-16 MAJOR ACCOMPLISHMENTS: Funded Concord’s share of Rider Transit System. Appropriated a transfer of $12 million to Capital
Reserve for future capital needs.
FY 2016-17 MAJOR BUDGET CHANGES/NEW
REQUESTS/FOCUS AREAS Continue Concord Express contract with CATS for
80x bus (funding transferred to Transit). Fund needed repairs and maintenance for City
facilities in preparation for planned sale or reuse. Resume funding for Cabarrus Health Alliance
Mosquito Control Program.
STEPS / PROGRAMS BEING UNDERTAKEN TO ENHANCE
PERFORMANCE: N/A
PERFORMANCE GOALS:
N/A
PERFORMANCE SUMMARY: N/A
Cost Center #: 41902013-2014 2014-2015 2015-2016 2015-2016 2016-2017 2016-2017
ActualExpenditures
ActualExpenditures
CouncilApproved*
ActualExpenditures**
ManagerRecommended
CouncilApproved
Personnel Services -$ -$ 500,000$ -$ 500,000$ 500,000$ Operations 1,492,613$ 1,154,928$ 1,758,166$ 1,286,396$ 2,096,688$ 2,096,688$ Capital Outlay 135,000$ 109,441$ 5,195$ -$ -$ -$ Debt Service 265,478$ 254,677$ 859,526$ 859,518$ 234,438$ 234,438$ Cost Allocations 724,359$ 754,246$ 1,110,180$ 981,915$ 1,084,999$ 1,084,999$ Transfers 7,005,293$ 1,974,826$ 14,597,170$ 13,783,716$ 2,459,226$ 2,459,226$
Total Expenditures 9,622,743$ 4,248,118$ 18,830,237$ 16,911,545$ 6,375,351$ 6,375,351$ % budget change -56% 298% -66%* as amended**as of 8/11/2016
75

PUBLIC SAFETY OVERVIEW: Public Safety serves as the safety and protection function, providing assistance to all City residents with life and property protection. Public Safety is comprised of Police, Code Enforcement, Emergency Communications, Radio Shop, Fire, Fire Prevention, Fire Training, and Emergency Management. BUDGET UNITS:
Police: The Police Department is responsible for the safety of citizens and charged with enforcing federal, state, and local laws. Additional information regarding the Police Department or Code Enforcement may be obtained by contacting Gary Gacek, Chief of Police, at (704) 920-5007 or via email at [email protected].
Code Enforcement: The Code Enforcement Unit is responsible for enhancing the quality of life in our
neighborhoods through the enforcement of minimum housing and zoning ordinances.
Emergency Communications: The Emergency Communications Department operates the City’s Emergency 911 Public Safety Answering Point and dispatches police, fire, and other City departments. Additional information regarding the Emergency Communications Department or the Radio Shop may be obtained by contacting Vicki Callicut, Director of Emergency Communications, at (704) 920-5590 or via email at [email protected].
Radio Shop: The Radio Shop provides installation and maintenance of communications equipment for
Concord, Kannapolis, and Cabarrus County governmental departments. It also provides maintenance of the telephone systems and other electronic equipment.
Fire: Fire is responsible for modern fire and rescue services as well as medical assistance response
to the customers and shareholders of the City of Concord. Additional information regarding the Fire Operations, Prevention, or Training Divisions may be obtained by contacting Ray Allen, Fire Chief, at (704) 920-5536 or via email at [email protected].
Fire Prevention: The Fire Prevention Division provides fire code enforcement and Investigations for the Citizens of and businesses within the City of Concord. Fire Training: The Fire Training Division provides a full range of personnel development for the Department.
Emergency Management: The Emergency Management Division provides planning and coordination
for natural and manmade emergencies or disasters for the citizens of the City of Concord. Additional information regarding Emergency Management may be obtained by contacting Jim Sells, Emergency Management Coordinator, at (704) 920-5528 or via email at [email protected].
76

Public Safety Expenditures2013-2014 2014-2015 2015-2016 2015-2016 2016-2017 2016-2017
ActualExpenditures
ActualExpenditures
CouncilApproved*
ActualExpenditures**
ManagerRecommended
CouncilApproved
Budget Unit (General Fund)Police 16,653,752$ 18,392,473$ 19,109,721$ 18,025,309$ 20,684,491$ 20,684,491$ Code Enforcement 1,048,516$ 596,409$ 721,749$ 623,241$ 808,018$ 808,018$ Emergency Communications 1,233,756$ 1,297,515$ 1,432,985$ 1,345,808$ 1,463,206$ 1,463,206$ Radio Shop 336,610$ 352,370$ 380,870$ 346,850$ 362,334$ 362,334$ Fire Operations 15,654,030$ 15,764,380$ 17,414,745$ 16,921,420$ 18,077,002$ 18,077,002$ Fire Prevention 482,977$ 638,521$ 714,599$ 707,952$ 835,402$ 835,402$ Fire Training 404,309$ 313,586$ 423,522$ 349,670$ 481,195$ 481,195$ Emergency Management 111,642$ 124,137$ 174,165$ 133,483$ 293,573$ 293,573$
Total Expenditures 35,925,592$ 37,479,391$ 40,372,356$ 38,453,733$ 43,005,221$ 43,005,221$ % budget change 4% 3% 7%* as amended** as of 8/11/2016
Police48.1%
Code Enforcement1.9%
Emergency Communications3.4%
Radio Shop0.8%
Fire Operations42.0%
Fire Prevention1.9%
Fire Training1.1%
Emergency Management0.7%
FY 16-17 Public Safety Expenditures (by Budget Unit)
$-
$5,000,000
$10,000,000
$15,000,000
$20,000,000
$25,000,000
$30,000,000
$35,000,000
$40,000,000
$45,000,000
$50,000,000
ActualExpenditures
ActualExpenditures
ActualExpenditures**
CouncilApproved
2013-2014 2014-2015 2015-2016 2016-2017
Public Safety Expenditure Trend EmergencyManagementFire Training
Fire Prevention
EmergencyCommunicationsRadio Shop
CodeEnforcementFire Operations
Police
77

POLICE
MISSION: Concord Police Department exists to maximize the quality of life of the citizens of the City and its visitors by combating crime and the fear of crime. We will uphold the law fairly and firmly by building community partnerships, solving problems, and being accountable. We will do all this with integrity, common sense, sound judgment, and respect for cultural diversity. PROGRAM LOCATOR: Fund: General Fund Functional Area: Public Safety Department: Police Division: Police BUDGET & PERFORMANCE HIGHLIGHTS:
MAJOR SERVICE(S) PROVIDED: Community Oriented Police Service
o Evidenced-Based Policing o Criminal Investigations o Crime Prevention
FY2015-2016 MAJOR ACCOMPLISHMENTS: Completed SRO staffing at elementary schools. Revised critical policies and procedures. Officers completed Fair and Impartial Policing
Training. 46% increase in self-initiated officer activity. Hired 16 new officers to fill vacant positions. Held (2) Public Listening Sessions on critical
policies.
FY 2016-17 MAJOR BUDGET CHANGES / NEW REQUESTS /
FOCUS AREAS: New request for additional sworn personnel to
enhance patrol field operations. New request for additional sworn personnel to
staff airport. New request to purchase (16) bicycles plus
equipment and uniforms to implement bicycle patrol to enhance police/community relationships.
New request for subscription to Evidence.com for body worn camera video storage.
Develop a 3-5 year strategic plan that will serve as a roadmap for future development and growth.
Re-organize department structure to increase effectiveness and efficiency in operations.
Geographically assign general detectives to patrol districts.
Traffic Unit to take data-driven approach to reduce motor vehicle crashes.
Reduction in Part 1 crime with emphasis on Part 1 violent crimes.
STEPS / PROGRAMS BEING UNDERTAKEN TO ENHANCE
PERFORMANCE: Effective communication strategies –
o Distribution of daily bulletins to share information about Part 1 crimes.
o Use of Intranet to store policies, memos and daily bulletins.
o Use of internal Special Events calendar to post upcoming city events that require police staffing.
o Use of surveys to gather input and feedback about chief’s progress, police vehicle graphics, patrol schedule, promotion process, and public safety academy.
Use of Asset Management Module to track vehicle/equipment.
Utilization of data to measure performance indicators at city, district, and team levels.
Community policing philosophy continues with emphasis on evidence-based policing, community partnerships, problem- solving, accountability and customer service.
0102030405060
13-14 14-15 15-16 16-17
Part I Crimes per 1,000 Population
ActualObjective
$-
$5,000,000
$10,000,000
$15,000,000
$20,000,000
$25,000,000
13-14 14-15 15-16 16-17Budget
Total Expenditures
78
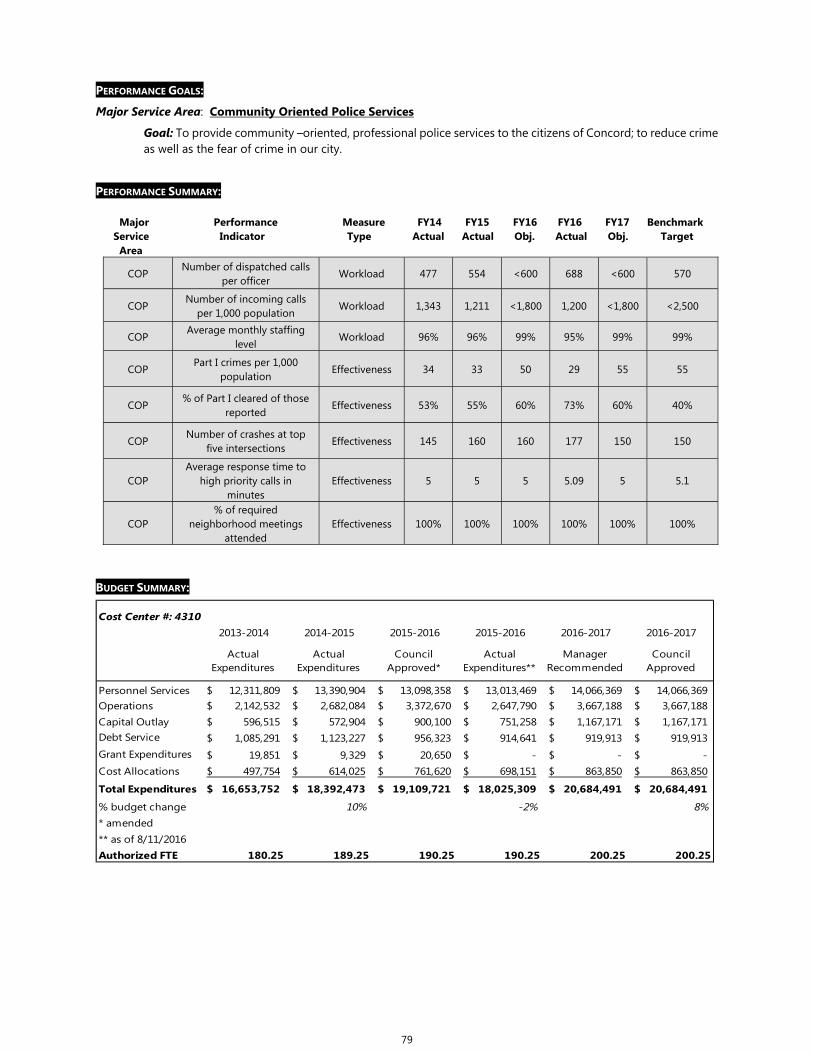
PERFORMANCE GOALS:
Major Service Area: Community Oriented Police Services
Goal: To provide community –oriented, professional police services to the citizens of Concord; to reduce crime as well as the fear of crime in our city.
PERFORMANCE SUMMARY: Major Performance Measure FY14 FY15 FY16 FY16 FY17 Benchmark Service Indicator Type Actual Actual Obj. Actual Obj. Target Area Actual
COP Number of dispatched calls
per officer Workload 477 554 <600 688 <600 570
COP Number of incoming calls
per 1,000 population Workload 1,343 1,211 <1,800 1,200 <1,800 <2,500
COP Average monthly staffing
level Workload 96% 96% 99% 95% 99% 99%
COP Part I crimes per 1,000
population Effectiveness 34 33 50 29 55 55
COP % of Part I cleared of those
reported Effectiveness 53% 55% 60% 73% 60% 40%
COP Number of crashes at top
five intersections Effectiveness 145 160 160 177 150 150
COP Average response time to
high priority calls in minutes
Effectiveness 5 5 5 5.09 5 5.1
COP % of required
neighborhood meetings attended
Effectiveness 100% 100% 100% 100% 100% 100%
BUDGET SUMMARY:
Cost Center #: 43102013-2014 2014-2015 2015-2016 2015-2016 2016-2017 2016-2017
Actual Expenditures
Actual Expenditures
CouncilApproved*
Actual Expenditures**
ManagerRecommended
CouncilApproved
Personnel Services 12,311,809$ 13,390,904$ 13,098,358$ 13,013,469$ 14,066,369$ 14,066,369$ Operations 2,142,532$ 2,682,084$ 3,372,670$ 2,647,790$ 3,667,188$ 3,667,188$ Capital Outlay 596,515$ 572,904$ 900,100$ 751,258$ 1,167,171$ 1,167,171$ Debt Service 1,085,291$ 1,123,227$ 956,323$ 914,641$ 919,913$ 919,913$ Grant Expenditures 19,851$ 9,329$ 20,650$ -$ -$ -$ Cost Allocations 497,754$ 614,025$ 761,620$ 698,151$ 863,850$ 863,850$
Total Expenditures 16,653,752$ 18,392,473$ 19,109,721$ 18,025,309$ 20,684,491$ 20,684,491$
% budget change 10% -2% 8%* amended** as of 8/11/2016 Authorized FTE 180.25 189.25 190.25 190.25 200.25 200.25
79

CODE ENFORCEMENT MISSION: The Code Enforcement Division of the Concord Police Department exists to maximize the quality of life for the citizens of the City and its visitors by protecting property and the natural, historic, and economic environment. Combat crime and the fear of crime while upholding the law fairly, firmly, and respectfully. Accomplishing this with teamwork, building community partnerships, solving problems, and being accountable to those we serve. We will do this with integrity, common sense, sound judgment, and respect for cultural diversity and high ethical standards. PROGRAM LOCATOR:: Fund: General Fund Functional Area: Public Safety Department: Police Division: Code Enforcement BUDGET & PERFORMANCE HIGHLIGHTS: MAJOR SERVICE(S) PROVIDED: Enforcement of codes related to disorder issues. Enforcement of established zoning codes. Enforcement of minimum housing codes.
FY 2015-16 MAJOR ACCOMPLISHMENTS: Demolition of 6 Substandard Structures. Removal of over 7,027 signs in 2015.
Implemented switch to Accela Software. FY 2016-17 MAJOR BUDGET CHANGES / NEW REQUESTS /
FOCUS AREAS: Request an additional Code Enforcement Officer
to reduce the size in area of our current districts. This officer will allow the division to keep up with the growth in population, the expansion of city boundaries, increase supervision of the officers in the field, and improve the effectiveness of our enforcement action.
The additional Code Enforcement Officer will also allow the division to implement a more proactive approach in neighborhoods. Doing so will not only bring about improvement, but reduce crime and the fear of crime while improving the quality of life throughout the city.
Officers will participate in education about and enforcement of the revised sign ordinance.
Officer will focus on the division’s statistics to direct where an emphasis of enforcement is needed the most and use targeted enforcement in those areas.
STEPS / PROGRAMS BEING UNDERTAKEN TO ENHANCE
PERFORMANCE: Continue the implementation of Accela for the
division. Continued improvement for the division in
consistency and efficiency of daily operations, while being able to track stats and work trends.
Review Code Enforcement processes to continue improvement or determine if they are as efficient and effective as allowed by law.
Use statistics and Code Officers’ knowledge of neighborhoods to determine areas that need more emphasis from enforcement to combat the fear of crime and be more efficient with our resources.
$- $125,000 $250,000 $375,000 $500,000 $625,000 $750,000 $875,000
$1,000,000 $1,125,000
13-14 14-15 15-16 16-17Budget
Total Expenditures
02468
10121416
13-14 14-15 15-16 16-17
# of Targeted Enforcement Assignments
Actual
80

PERFORMANCE GOALS:
Major Service Area: Code Enforcement Goal: To provide citizens comprehensive and consistent enforcement of zoning and City code regulations
to improve neighborhood appearance, quality of life, and reduce the fear of crime.
PERFORMANCE SUMMARY Major Performance Measure FY14 FY15 FY16 FY16 FY17 Benchmark Service Indicator Type Actual Actual Obj Actual Obj. Target Area Actual
Code Enforcement
# of targeted enforcement assignments by Code
Enforcement Workload 12 4 9 10 9 9
Code Enforcement
Avg # of cases per Code Enforcement Officer per
year Workload
New for
FY17
New for
FY17
New for
FY17
New for
FY17 315 340
Code Enforcement
Avg # of new cases per day per officer
Workload New for
FY17
New for
FY17
New for
FY17
New for
FY17 2 2.5
Code Enforcement
% of substandard housing violations resolved within 90
days Effectiveness 59% 58% 47% 39% 55% 55%
BUDGET SUMMARY:
Cost Center #: 43122013-2014 2014-2015 2015-2016 2015-2016 2016-2017 2016-2017
Actual Expenditures
Actual Expenditures
CouncilApproved*
Actual Expenditures**
ManagerRecommended
CouncilApproved
Personnel Services 497,368$ 489,199$ 503,779$ 504,508$ 555,527$ 555,527$ Operations 489,543$ 107,210$ 217,503$ 118,305$ 224,491$ 224,491$ Capital Outlay 61,605$ -$ -$ -$ 28,000$ 28,000$ Cost Allocation -$ -$ 467$ 428$ -$ -$
Total Expenditures 1,048,516$ 596,409$ 721,749$ 623,241$ 808,018$ 808,018$ % budget change -43% 4% 12%
* as amended** as of 8/11/2016 Authorized FTE 7.00 7.00 7.00 7.00 8.00 8.00
81

EMERGENCY COMMUNICATIONS MISSION: The Emergency Communications Department exists to provide, through partnerships with other departments, a high level of customer service to citizens in their time of need by quick and efficient handling of calls and providing information to responding departments. PROGRAM LOCATOR:: Fund: General Fund Functional Area: Public Safety Department: Emergency Communications BUDGET & PERFORMANCE HIGHLIGHTS: MAJOR SERVICE(S) PROVIDED: Call-taking Dispatching
FY 2015-16 MAJOR ACCOMPLISHMENTS: Replaced CAD server. Replaced aging switches in the server room with
updated POE switches. Supervisory staffed completed testing and
received Emergency Number Professionals (ENP) certification.
Reclassification of two internal positions to Senior Telecommunicator.
FY 2016-17 MAJOR BUDGET CHANGES / NEW REQUESTS /
FOCUS AREAS: Replacement of aging 24/7 ergoCentric seating
within Communication Center. Building improvements within Communications
Center for increased efficiency. Administrative position to assist with the workload
for both Communications and Radio Shop to include processing of alarms and database management.
Reclassification of two additional Senior Telecommunicators.
STEPS / PROGRAMS BEING UNDERTAKEN TO ENHANCE
PERFORMANCE: Continuing to monitor and analyze fire dispatch
practices to enhance response times and provide a higher level of customer service to responders.
Revising and updating current Standard Operating Guidelines.
Working closely with both City and County GIS to enhance AVL responses.
$0$250,000$500,000$750,000
$1,000,000$1,250,000$1,500,000$1,750,000
13-14 14-15 15-16 16-17Budget
Total Expenditures
80%
85%
90%
95%
100%
13-14 14-15 15-16 16-17
% of Emergency Calls Dispatched within 60 Seconds
Actual Objective
82

PERFORMANCE GOALS:
Major Service Area: Call-taking
Goal: To provide timely call-taking to the residents of Concord in order to reduce call building time and ensure the prompt responses to inquiries and requests for service.
Major Service Area: Dispatching
Goal: To provide the closest resources available to all emergency situations by tracking all personnel activity in order to reduce response time.
PERFORMANCE SUMMARY: Major Performance Measure FY14 FY15 FY16 FY16 FY17 Benchmark Service Indicator Type Actual Actual Obj. Actual Obj. Target Area
Call-taking
Avg. # of seconds from ring to answer
Effectiveness 4 Unavailable <5 4 <5 < 5
Call-taking % of initial call-taking entry for emergency calls within
30 seconds Effectiveness 93.5% 94.7% >90% 93.7% >90% > 90%
Call-taking Avg. # of calls answered per Telecommunicator
Workload 5,088 4690 <8,000 4,769 <8000 < 8,000
Dispatching % of emergency calls dispatched within 60
seconds Effectiveness 93% 92.8% >90% 90.6% >90% > 90%
Dispatching Cost per call answered Efficiency $11.29 Unavailable <$12 Unavailable <$12 < $12
BUDGET SUMMARY:
Cost Center #: 43152013-2014 2014-2015 2015-2016 2015-2016 2016-2017 2016-2017
Actual Expenditures
Actual Expenditures
CouncilApproved*
Actual Expenditures**
ManagerRecommended
CouncilApproved
Personnel Services 1,125,199$ 1,187,108$ 1,215,658$ 1,151,267$ 1,279,848$ 1,279,848$ Operations 96,595$ 96,719$ 126,774$ 113,975$ 147,234$ 147,234$ Capital Outlay -$ -$ 52,663$ 45,834$ -$ -$ Grant Expenditures -$ -$ -$ -$ -$ -$ Cost Allocations 11,962$ 13,688$ 37,890$ 34,732$ 36,124$ 36,124$
Total Expenditures 1,233,756$ 1,297,515$ 1,432,985$ 1,345,808$ 1,463,206$ 1,463,206$ % budget change -13% 4% 2%* as amended** as of 8/11/2016 Authorized FTE 22.50 22.50 22.50 22.50 23.50 23.50
83

RADIO SHOP MISSION: The Radio Shop exists to provide, through partnership with other governmental entities and departments, reliable and cost effective maintenance to the communications infrastructure that links our citizens, employees and services together. PROGRAM LOCATOR:: Fund: General Fund Functional Area: Public Safety Department: Radio Shop BUDGET & PERFORMANCE HIGHLIGHTS: MAJOR SERVICE(S) PROVIDED: Telephone System Radio System Vehicle Electronics/Lighting
FY 2015-16 MAJOR ACCOMPLISHMENTS: Completed data/telephone wiring installation for
New City Hall earning Productivity Improvement Award based on cost savings and efficiencies.
Completed data/telephone wiring installations for Fire Station #11.
Updated templates for all Police, Fire and Non-Public Safety Radios to remove previous radio system frequencies to prevent transmission failures.
Addition of AVL in new patrol vehicles to enhance officer safety and increase efficiency in dispatching the closest available unit.
Installation of emergency lighting, radios, and various hardware for forty-two vehicles replaced throughout the City of Concord vehicle fleet.
Installation of mounts and tablets in eighteen existing SRO vehicles.
FY 2016-17 MAJOR BUDGET CHANGES / NEW REQUESTS /
FOCUS AREAS: Relocation of Weddington Rd Tower. Installation of 60 gallon fuel storage tank at Erwin
St Tower to ensure generator will remain operational for 24 hour periods.
LED Lighting replacement for Radio Shop for increased efficiency.
Continue cross training of personnel to increase productivity.
STEPS / PROGRAMS BEING UNDERTAKEN TO ENHANCE
PERFORMANCE: Streamline ordering of anticipated lighting needs
prior to need arising. Annual tuning of radios to identify deficiencies and
reduce down time of equipment. Seeking alternatives sources for modifications at
Station #3 tower to optimize space and reduce loading.
$320,000$325,000$330,000$335,000$340,000$345,000$350,000$355,000$360,000$365,000
13-14 14-15 15-16 16-17Budget
Total Expenditures
0
25
50
75
100
125
150
13-14 14-15 15-16 16-17
Total Annual Telephone System Downtime (in minutes)
Actual Objective
84

PERFORMANCE GOALS:
Major Service Area: Telephone System
Goal: To provide timely and preventative maintenance service to the City’s telephone and voice mail systems in order to minimize down time or disruption to users.
Major Service Area: Radio System
Goal: To oversee preventative maintenance service to the countywide radio system and microwave backbone in order to minimize down time or disruption to users.
Major Service Area: Vehicle Systems
Goal: To provide timely installations of radios, emergency lighting, decals and other related equipment in the City fleet in order to have new vehicles ready to provide service to citizens.
PERFORMANCE SUMMARY: Major Performance Measure FY14 FY15 FY16 FY16 FY17 Benchmark Service Indicator Type Actual Actual Obj. Actual Obj. Target Area
Radio System
#of field radios maintained Workload 889 900 925 unavailable 925 900
Telephone System
Total annual telephone system downtime (in
minutes) Effectiveness 35 6.0 <5 unavailable <5 <5
Vehicle Systems
% of installations within the last 3 months not needing
corrections or repairs Effectiveness 100% 89% >95% unavailable >95% >95%
Note: Beginning in FY15, radio system maintenance has been contracted out to the City of Charlotte. BUDGET SUMMARY:
Cost Center # 43302013-2014 2014-2015 2015-2016 2015-2016 2016-2017 2016-2017
Actual Expenditures
Actual Expenditures
CouncilApproved
Actual Expenditures**
ManagerRecommended
CouncilApproved
Personnel Services 130,328$ 165,248$ 215,397$ 211,954$ 207,458$ 207,458$
Operations 61,417$ 98,716$ 100,083$ 72,356$ 91,976$ 91,976$ Capital Outlay 84,265$ 23,430$ -$ -$ -$ -$ Debt Service 60,600$ 64,976$ 65,390$ 62,540$ 62,900$ 62,900$
Total Expenditures 336,610$ 352,370$ 380,870$ 346,850$ 362,334$ 362,334$ % budget change 5% -2% -5%
* as amended** as of 8/11/2016 Authorized FTE 3.50 3.50 3.50 3.50 3.50 3.50
85

FIRE MISSION: The Concord Department of Fire & Life Safety exists to reduce the loss of life and property, and to prevent injury to all shareholders and customers of the City of Concord. The Department partners with each City department and the community to provide effective and efficient fire suppression, emergency medical care, life safety education, fire inspections, code enforcement, fire investigations, hazardous materials response, and specialized rescue while maintaining a high level of training and personnel development. PROGRAM LOCATOR:: Fund: General Fund Functional Area: Public Safety Department: Fire & Life Safety Division: Fire Operations BUDGET & PERFORMANCE HIGHLIGHTS: MAJOR SERVICE(S) PROVIDED:
Fire, Rescue and Medical Assistance Response Special Operations
o Hazardous Materials o Urban Search and Rescue o Aircraft Rescue-Firefighting Protection
FY 2015-16 MAJOR ACCOMPLISHMENTS: Continued to assess needs and plan for additional
fire & life safety services in the western and southern growth areas.
Continued to work on operational and capital needs to comply with the National Fire Protection Association Standard 1710: Standard for the Organization and Deployment of Fire Suppression Operations, Emergency Medical Operations, and Special Operations to the Public by a Career Fire Department.
Completed a Bathroom and Kitchen remodel at Fire Station 2, concrete replacement in the bay at Fire Station 7 and completed a Kitchen remodel at Fire station 3.
Fire Station 11 was completed and fully staffed as of September 2015.
Engine 5 was replaced and the new truck was placed in service in October of 2015.
Community CPR classes at no or minimal charge. FY 2016-17 MAJOR BUDGET CHANGES / NEW REQUESTS /
FOCUS AREAS: Continue various Fire Station Renovations. Continue to provide outstanding fire/rescue
services to the community. Continue to evaluate and improve the AVL
dispatch which will reduce response times. Vehicle exhaust removal system for all stations. Completion of concrete work at Fire Station 11. Addition of 3 Fire Captain and 3 Fire Lieutenant
positions dedicated to Concord Regional Airport as a result of its expansion.
STEPS / PROGRAMS BEING UNDERTAKEN TO ENHANCE
PERFORMANCE: Review of Redeployment Plan (this plan provides a
roadmap for distribution of fire companies in the future).
More emphasis on accountability at all levels of the Department.
Review of all programs and processes to improve operations.
Expand automatic aid policies with other local departments to provide the quickest response possible.
$-
$5,000,000
$10,000,000
$15,000,000
$20,000,000
13-14 14-15 15-16 16-17Budget
Total Expenditures
3.0
3.4
3.8
4.2
4.6
5.0
13-14 14-15 15-16 16-17
Average Travel Time to Priority 1 Calls (in minutes)
ActualObjective
86

PERFORMANCE GOALS:
Major Service Area: Fire, Rescue & Medical Assistance Response
Goal: To provide effective and timely response to fire/rescue/medical assistance incidents within the City in order to minimize loss of life and destruction of personal property.
Major Service Area: Special Operations
Goal: To provide effective response to escalated hazards resulting from Hazardous Material releases, Collapse/Trench rescues and other specialized response incidents in order to minimize loss of life, destruction of personal property, and harm to the environment.
PERFORMANCE SUMMARY: Major Performance Measure FY14 FY15 FY16 FY16 FY17 Benchmark Service Indicator Type Actual Actual Obj. Actual Obj. Target Area
Fire Percentage of fires confined to area(s) involved on arrival
Effectiveness 92.5% 84% 85% 92.5% 85% 90%
Fire Transmit an “all clear”
within 10 minutes Effectiveness 83% 87% 80% 96.4% 80% 90%
Fire Transmittal of “under
control” within 15 minutes Effectiveness 98% 97.5% 90% 96.9% 90% 90%
Fire / Special
Operations Property saved to loss ratio Effectiveness 99.5% 98.01 98% 88% 98% 98%
Fire / Special
Operations
Property protected to lost ratio
Effectiveness 99% 99% 99% 99% 99% 99%
Fire / Special
Operations
Average travel time to priority 1 calls (in minutes)
Effectiveness 4 4 <4 4 <4 <4
Fire / Special
Operations
Percentage of first unit arrivals within 4 minutes
(supp.) Effectiveness 78.4% 86.7% 85% 85% 85% 90%
Fire / Special
Operations
Percentage of first unit arrivals within 4 minutes
(EMS) Effectiveness 70.1% 83% 85% 76.8% 85% 90%
Fire / Special
Operations
Percentage for full assignment arrival within 8
minutes Effectiveness 88% 86% 85% 94% 85% 95%
Fire / Special
Operations
Percentage of turnouts of less than 60 seconds (7:00am
– 9:59pm) (0700-2200) Effectiveness 89.5% 90% 90% 87.7% 90% 90%
Fire / Special
Operations
Percentage of turnouts of less than 90 seconds
(10:00pm – 6:59am) (2201-0659) Effectiveness 91% 87.6% 90% 89.2% 90% 90%
87

BUDGET SUMMARY:
Cost Center #: 43402013-2014 2014-2015 2015-2016 2015-2016 2015-2016 2015-2016
Actual Expenditures
Actual Expenditures
CouncilApproved*
Actual Expenditures**
ManagerRecommended
CouncilApproved
Personnel Services 12,076,538$ 11,969,837$ 11,902,604$ 11,874,206$ 12,482,624$ 12,482,624$ Operations 1,974,630$ 1,869,679$ 2,430,155$ 2,397,142$ 2,306,175$ 2,306,175$ Capital Outlay 284,484$ 732,314$ 1,445,466$ 1,087,775$ 1,698,300$ 1,698,300$ Debt Service 734,511$ 640,302$ 617,642$ 617,635$ 596,472$ 596,472$ Cost Allocations 497,322$ 529,645$ 890,593$ 816,377$ 993,431$ 993,431$ Transfers 86,545$ 22,603$ 128,285$ 128,285$ -$ -$
Total Expenditures 15,654,030$ 15,764,380$ 17,414,745$ 16,921,420$ 18,077,002$ 18,077,002$
% budget change -1% 7% 4%
* as amended** as of 8/11/2016 Authorized FTE 181.00 181.00 181.00 181.00 187.00 187.00
88

FIRE PREVENTION MISSION: The Concord Department of Fire & Life Safety exists to reduce the loss of life and property, and to prevent injury to all shareholders and customers of the City of Concord. The Department partners with each City department and the community to provide effective and efficient fire suppression, emergency medical care, life safety education, fire inspections, code enforcement, fire investigations, hazardous materials response, and specialized rescue while maintaining a high level of training and personnel development. PROGRAM LOCATOR: Fund: General Fund Functional Area: Public Safety Department: Fire & Life Safety Division: Fire Prevention BUDGET & PERFORMANCE HIGHLIGHTS: MAJOR SERVICE(S) PROVIDED: Fire Inspections Fire Investigations Plan Review Code Enforcement
FY 2015-16 MAJOR ACCOMPLISHMENTS: Promoted a new Division Chief of Fire Prevention
to fill the vacant position.
Division personnel completed 6541 fire code related inspections.
Integrated the Fire Educators from the Training Division into the Fire Prevention Division.
Experienced a 9% increase in new construction plan reviews over previous year.
FY 2016-17 MAJOR BUDGET CHANGES / NEW REQUESTS /
FOCUS AREAS: Continue to provide advanced level inspection and
investigation service to the community. Promote a Deputy Fire Marshal to fill the vacancy
created by the promotion of the Division Chief. Promote an Assistant Fire Marshal to fill the
vacancy created by the promotion of the Deputy Fire Marshal.
Purchase a BullEX fire extinguisher trainer to provide clean, safe and cost effective extinguisher training.
Purchase a new Fire Safety House, allowing for training that meets the current needs of fire and life safety topics.
Hire a part time inspector to increase effectiveness in the division.
STEPS / PROGRAMS BEING UNDERTAKEN TO ENHANCE
PERFORMANCE: Processes to be updated to take advantage of
more efficient record entry by Fire Prevention Staff.
Continue to evaluate existing inspection districts and reallocate inspection occupancy assignments due to realignment of functions in Fire Prevention to enhance efficiency.
$0
$200,000
$400,000
$600,000
$800,000
$1,000,000
13-14 14-15 15-16 16-17Budget
Total Expenditures
0%
20%
40%
60%
80%
100%
13-14 14-15 15-16 16-17
% of Fire Code Violations Cleared within 90 Days
Actua lObjective
89

PERFORMANCE GOALS:
Major Service Area: Fire Inspections
Goal: To provide and maintain a fire inspection and code enforcement program that meets all local, state, and federal requirements in order to reduce the potential for future fires.
Major Service Area: Fire Investigations
Goal: To provide a system for fire cause determination in order to ensure timely indications of incendiary or malicious trends.
PERFORMANCE SUMMARY: Major Performance Measure FY14 FY15 FY16 FY16 FY17 Benchmark Service Indicator Type Actual Actual Obj. Actual Obj. Target Area
Fire Inspections
% of fire code violations cleared within 90 days
Effectiveness 70% 81.5% 95% 83.5% 95% 95%
Fire Inspections
% of level three occupancies inspected per
year Effectiveness 99% 68% 100% 75% 100% 100%
Fire Inspections
% of level two occupancies inspected per year
Effectiveness 100% 89.5% 100% 95% 100% 100%
Fire Inspections
% of level one occupancies inspected per three years
Effectiveness 93% 96.5% 100% 99% 100% 100%
Fire Invest. % of arson fires with cause
determined Effectiveness 79% 89% 80% 86% 80% 80%
BUDGET SUMMARY:
Cost Center #: 43412013-2014 2014-2015 2015-2016 2015-2016 2016-2017 2016-2017
Actual Expenditures
Actual Expenditures
CouncilApproved*
Actual Expenditures**
ManagerRecommended
CouncilApproved
Personnel Services 470,412$ 607,093$ 676,000$ 674,912$ 707,705$ 707,705$ Operations 12,565$ 31,428$ 38,599$ 33,040$ 44,735$ 44,735$
Capital Outlay -$ -$ -$ -$ 82,962$ 82,962$
Total Expenditures 482,977$ 638,521$ 714,599$ 707,952$ 835,402$ 835,402$
% budget change 38% 11% 17%* as amended** as of 8/11/2016 Authorized FTE 7.00 9.00 9.00 9.00 9.50 9.50
90

FIRE TRAINING & SAFETY MISSION: The Concord Department of Fire & Life Safety exists to reduce the loss of life and property, and to prevent injury to all shareholders and customers of the City of Concord. The Department partners with each City department and the community to provide effective and efficient fire suppression, emergency medical care, life safety education, fire inspections, code enforcement, fire investigations, hazardous materials response, and specialized rescue while maintaining a high level of training and personnel development. PROGRAM LOCATOR:: Fund: General Fund Functional Area: Public Safety Department: Fire & Life Safety Division: Training BUDGET & PERFORMANCE HIGHLIGHTS: MAJOR SERVICE(S) PROVIDED: Manage Department Safety Program. Manage Career Development Program,
Continuing Education Program, Recruit Training Program, and Specialized Training.
Present Life Safety Education Programs to the community.
FY 2015-16 MAJOR ACCOMPLISHMENTS: Complete review and update of the Fire House
reporting system. The will allow for more accurate reporting.
Annual ARFF burns completed in accordance with FAA 139 for Airport Personnel.
Provided OSFM certification classes to the members.
Revised Training Policies to coincide with recent changes to the NC Fire Suppression Rating Schedule to continue maintaining ISO Class 2.
Transitioned from classroom based Emergency Medical training to the use of Blackboard which is an online training tool.
Promoted a new Division Chief of Training. The new Shift Training officers went in service in
January 2015. CPAT was used for the new hire physical agility
process. FY 2016-17 MAJOR BUDGET CHANGES / NEW REQUESTS /
FOCUS AREAS: Complete assessment process for Captain,
Battalion Captain, Battalion Chief, Engineer and Engineer.
Continue to evaluate and improve the Regional hiring and training process.
Increase the number of personnel meeting the Performance measures during the physical skills test each year.
Place an emphasis on Cancer awareness and implement best practices after contact with products of combustion.
Transition from the current video conferencing training system to a web based system.
STEPS / PROGRAMS BEING UNDERTAKEN TO ENHANCE
PERFORMANCE: Increased efforts toward safety training to curtail
accidents and reduce injuries. Increased emphasis on wellness activities to
increase number of personnel reaching acceptable level of fitness.
Concerted effort toward specialty certification areas.
Certify all Chief Officers in the Blue Card incident command practices.
$0$50,000
$100,000$150,000$200,000$250,000$300,000$350,000$400,000$450,000$500,000
13-14 14-15 15-16 16-17Budget
Total Expenditure
0
2
4
6
8
10
12
13-14 14-15 15-16 16-17
# of Work-Related Injuries per 100 Firefighters
ActualObjective
91

PERFORMANCE GOALS:
Major Service Area: Safety
Goal: To provide and maintain a work environment that meets and exceeds all safety standards to include station safety, incident safety, employee health, apparatus, and equipment safety in order to ensure optimal physical fitness of Fire & Life Safety personnel.
Major Service Area: Training
Goal: To provide comprehensive continuing education, recruit training, and specialized training to ensure personnel are prepared for incident response.
Major Service Area: Life Safety Education
Goal: To provide educational programs to the community that stress total life safety in order to aid in the prevention of accidents and injuries.
PERFORMANCE SUMMARY: Major Performance Measure FY14 FY15 FY16 FY16 FY17 Benchmark Service Indicator Type Actual Actual Obj. Actual Obj. Target Area
Safety
% of department members scoring at or above 11 METS
on the annual fitness evaluation
Effectiveness 78% 78% 90% 75% 90% 90%
Safety
% of department members, 40 years or older completing 25
pushups or more on the annual fitness evaluation
Effectiveness 50.7% 60% 75% 44.8% 75% 75%
Safety
% of department members, under the age of 40
completing 30 pushups or more on the annual fitness
evaluation
Effectiveness 59% 63.5% 75% 48.5% 75% 75%
Safety
% of department personnel performing the static plank for at least 2 minutes during the
annual fitness evaluation
Effectiveness 61.5% 37.8% 75% 54.2% 70% 75%
Safety # of work-related injuries per 100 Firefighters Effectiveness 8 8 10 8.57 7 7
Safety # of vehicle and equipment accidents Effectiveness 6 7 10 20 10 7
Training % of personnel certified as
Hazardous Material Technicians
Effectiveness NA 52% 60% 50.5% 60% 60%
Training % of personnel certified as USAR Technicians Effectiveness 26% 29% 25% 13.5% 25% 25%
Training % of personnel compliant with FAA 139 ARFF Effectiveness 13% 12% 10% 14% 10% 25%
Life Safety Education
% of residential fires where the dwelling has no working
smoke alarms Effectiveness 21% 14.2% 21.4% 12.1% 0% 0%
Life Safety Education
% of fires where juveniles are involved in ignition Effectiveness 2.6% 0%
<2.5%
3.7% <2.5 <2.5%
92
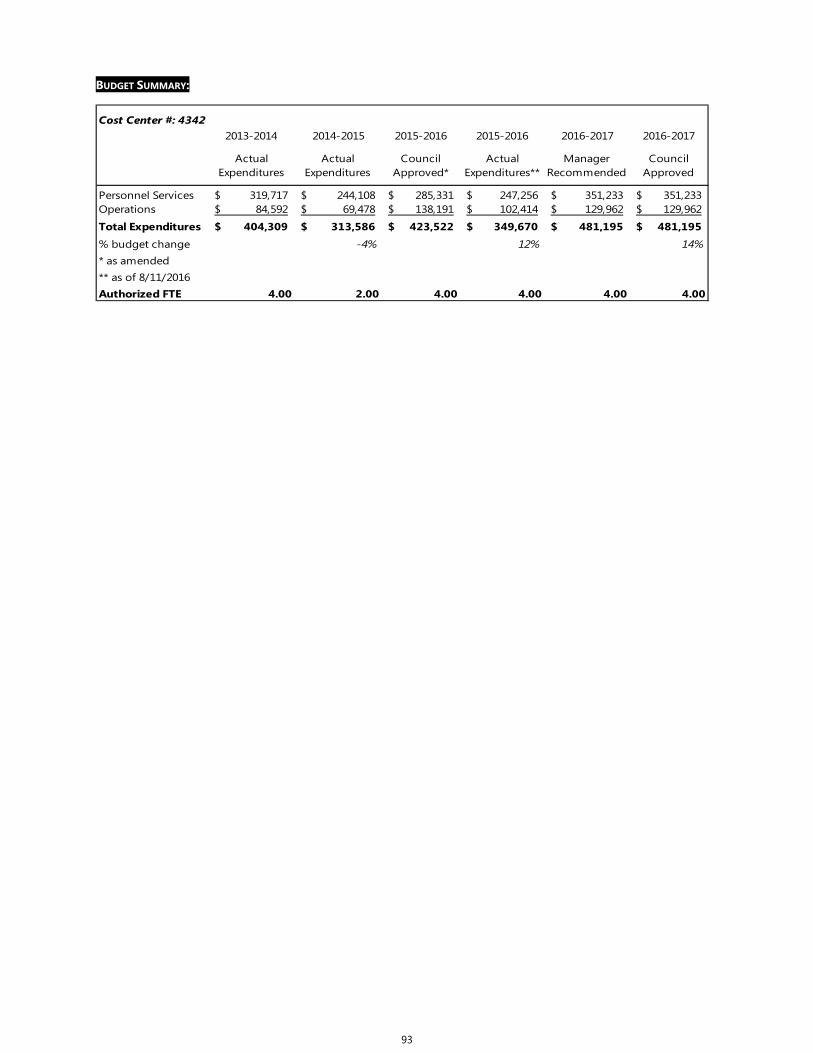
BUDGET SUMMARY:
Cost Center #: 43422013-2014 2014-2015 2015-2016 2015-2016 2016-2017 2016-2017
Actual Expenditures
Actual Expenditures
CouncilApproved*
Actual Expenditures**
ManagerRecommended
CouncilApproved
Personnel Services 319,717$ 244,108$ 285,331$ 247,256$ 351,233$ 351,233$ Operations 84,592$ 69,478$ 138,191$ 102,414$ 129,962$ 129,962$
Total Expenditures 404,309$ 313,586$ 423,522$ 349,670$ 481,195$ 481,195$
% budget change -4% 12% 14%* as amended** as of 8/11/2016 Authorized FTE 4.00 2.00 4.00 4.00 4.00 4.00
93

EMERGENCY MANAGEMENT
MISSION: The mission of the Emergency Management Division is to implement an Integrated Emergency Management framework using sound risk management principles that will improve the quality of life and minimize the effects of a disaster through mitigation, preparedness, response, and recovery services. PROGRAM LOCATOR: Fund: General Fund Functional Area: Public Safety Department: City Manager’s Office Division: Emergency Management BUDGET & PERFORMANCE HIGHLIGHTS: MAJOR SERVICE(S) PROVIDED: Emergency Management function for the City
including preparedness, response, recovery & mitigation
Environmental response, inspection & follow-up Emergency Management education Risk/Security Assessments
FY 2015-16 MAJOR ACCOMPLISHMENTS: Began a Cyber Security project for the municipal
information technology system. Completed an educational programs, including
risk assessment and public safety exercise project
for Cannon School for an active shooter incident. Worked with Concord Police Department to
develop and present an educational program on House of Worship Security.
Completed emergency preparedness and response exercises for Cyber Security, Concord Regional Airport, Cannon School, Winter Weather, and an Active Shooter incident in a mall.
Updated emergency plans for Lake Fisher, spill response, Concord Regional Airport, Winter Weather, Hazard Specific Annexes, new FEMA Rate Schedule and Debris Management.
Incorporated a response plan for UAS (Drones) into special events operations including a demonstration.
Coordinated planning and response for Hurricane Joaquin, Major events at CMS, Tree lighting ceremony, several winter storm events, flooding, hazardous materials, and severe weather.
Completed risk assessments for all City facilities including addressing the occupancy load in the Logan Center and assisting Building & Grounds and the Assistant City Manager with a security assessment and implementation plan for the Alfred M. Brown Center.
Invoiced $4,357 for hazardous materials response including a response with Immigration and Customs Enforcement on I-85.
FY 2016-17 MAJOR BUDGET CHANGES / NEW REQUESTS /
FOCUS AREAS: Develop a Cyber Security Program. Development a municipal Continuity of
Operations/Continuity of Government Plan.
STEPS / PROGRAMS BEING UNDERTAKEN TO ENHANCE
PERFORMANCE: Evaluating and implementing a Cyber Security
Program. Transitioning the municipal Emergency
Operations Center from Concord Fire Station #3 to City Hall.
Conducting an exercise series on active shooter response to a mall.
Continued implementation of a new response policy to improve the survivability of an active shooter incident.
Addition of an Emergency Management Coordinator Position.
Evaluate municipal preparedness for continuity of operations.
$- $50,000
$100,000 $150,000 $200,000 $250,000 $300,000 $350,000
13-14 14-15 15-16 16-17Budget
Total Expenditures
0%
20%
40%
60%
80%
100%
13-14 14-15 15-16 16-17
% of Schools Successfully Passing Annual Tornado Drills
Actual
Objective
94

PERFORMANCE GOALS:
Major Service Area: Emergency Management
Goal: To promote public protective actions and domestic preparedness through a comprehensive and effective emergency management program in order to mitigate against, prepare for, respond to, and quickly recover from the multi-hazards that may impact the residents of the City of Concord.
PERFORMANCE SUMMARY: Major Performance Measure FY14 FY15 FY16 FY16 FY17 Benchmark Service Indicator Type Actual Actual Obj. Actual Obj. Target Area
Emergency Mgt.
% of municipal building code/safety violations
corrected Effectiveness 75% 75% 100% 100% 100% 100%
Emergency
Mgt.
% of municipal buildings safety/code violations
corrected Effectiveness 75% 75% 100% 60% 80% 100%
Emergency Mgt.
% of invoiced responses recovered
Efficiency 75% 48% 50% 57.95% 75% 75%
Emergency Mgt.
% of City departments that have a Continuity of
Operations/Government Plan Efficiency
New for
FY15 25% 25% 45% 50% 100%
Emergency Mgt.
% of city facilities pasing annual safety drills (tornado,
lockdown, fire) Effectiveness
New for
FY17
New for
FY17
New for
FY17
New for
FY17 100% 100%
Emergency Mgt.
Number of joint departmental trainings and drills.
Workload New for
FY15 3 5 6 5 5
BUDGET SUMMARY:
Cost Center #: 43432013-2014 2014-2015 2015-2016 2015-2016 2016-2017 2016-2017
Actual Expenditures
Actual Expenditures
CouncilApproved*
Actual Expenditures**
ManagerRecommended
CouncilApproved
Personnel Services 104,863$ 111,350$ 117,074$ 115,552$ 191,866$ 191,866$ Operations 6,779$ 9,494$ 50,956$ 11,618$ 57,575$ 57,575$ Capital -$ -$ -$ -$ 38,000$ 38,000$
Debt Service -$ 3,293$ 6,135$ 6,313$ 6,132$ 6,132$
Total Expenditures 111,642$ 124,137$ 174,165$ 133,483$ 293,573$ 293,573$
% budget change -8% 8% 69%* as amended** as of 8/11/2016 Authorized FTE 1.00 1.00 1.00 1.00 2.00 2.00
95

PUBLIC WORKS OVERVIEW: Public Works serves as the General Fund’s infrastructure function, providing basic services to both City departments and residents of Concord. Public Works is comprised of Streets & Traffic, Powell Bill, Traffic Signals, Traffic Services, Solid Waste & Recycling, Cemeteries, and Fleet Services. DEPARTMENTS:
Streets & Traffic: The Streets & Traffic Division is responsible for the management of traffic and transportation engineering, project inspection, preventive maintenance, and repair of city streets with curb and gutter, sidewalk , and bridges. Additional information regarding the Streets & Traffic Division may be obtained by contacting Joseph K. Wilson III, P.E. Transportation Director, at (704) 920-5362 or via email at [email protected].
Powell Bill: Powell Bill funds originate from state-shared gasoline taxes based on a formula using
population and qualified road miles. The funds are restricted for use on maintenance of local streets, bridges, and sidewalks. Additional information regarding Powell Bill may be obtained by contacting Joseph K. Wilson III, P.E., Transportation Director, at (704) 920-5362 or via email at [email protected].
Traffic Signals: The Signal Division is responsible for the installation, maintenance, and operation of traffic
control signals, intersection control beacons, and school zone flashers owned by the City of Concord. Additional information regarding the Traffic Signal Division may be obtained by contacting Joseph K. Wilson III, P.E., Transportation Director, at (704) 920-5362 or via email at [email protected].
Traffic Services: Traffic Services is responsible for maintaining and installing all traffic-control signs,
markings, delineators, and warning devices on City streets. In addition, Traffic Services provides traffic control for special events / projects and fabricates specialty signs and decals for other City departments as a team service. Additional information regarding Traffic Services may be obtained by contacting Joseph K. Wilson III, P.E., Transportation Director, at (704) 920-5362 or via email at [email protected].
Solid Waste & Recycling: Solid Waste & Recycling Services provides a high level of solid waste
removal services and recycling to residents as well as commercial recycling to Concord businesses. The City contracts residential curbside refuse and recycling collection to Waste Pro, Inc. Commercial recycling is contracted with Signature Waste and Benfield Sanitation. Commercial refuse collection is privately contracted by each business. Additional information regarding Solid Waste & Recycling may be obtained by contacting Brian Moore, Director of Solid Waste & Recycling, at (704) 920-5351 or via email at [email protected].
Cemeteries: The Cemeteries Division of the Buildings & Grounds Maintenance Department provides burial
services and grounds care at the three city owned cemeteries: Rutherford, West Concord, and Oakwood. Additional information regarding the Cemeteries Division may be obtained by contacting Susan Sessler, Building & Grounds Director at (704) 920-3801 or via email at [email protected].
Fleet Services: Fleet Services provides mechanical support for all of the City’s fleet, which consists of more
than 800 vehicles and medium/heavy duty equipment. Additional information regarding Fleet Services may be obtained by contacting Daniel Nuckolls, Director of Fleet Services, at (704) 920-5431 or via email at [email protected].
96

Public Works Expenditures2013-2014 2014-2015 2015-2016 2015-2016 2016-2017 2016-2017
ActualExpenditures
ActualExpenditures
CouncilApproved*
ActualExpenditures**
ManagerRecommended
CouncilApproved
Budget Unit (General Fund)Streets & Traffic 4,479,406$ 4,162,000$ 5,612,180$ 4,693,941$ 6,023,077$ 6,023,077$ Powell Bill 2,387,575$ 1,248,872$ 3,261,077$ 1,499,893$ 1,245,103$ 1,245,103$ Traffic Signals 644,337$ 661,939$ 884,125$ 727,054$ 810,866$ 810,866$ Traffic Services 486,004$ 520,732$ 628,339$ 565,129$ 553,153$ 553,153$ Solid Waste & Recycling 5,906,582$ 5,921,634$ 6,449,447$ 5,830,867$ 6,421,736$ 6,421,736$ Cemeteries 492,452$ 511,709$ 559,188$ 518,774$ 595,240$ 595,240$ Fleet Services 174,909$ 333,238$ 47,546$ 25,762$ -$ -$
Total Expenditures 14,571,265$ 13,360,124$ 17,441,902$ 13,861,420$ 15,649,175$ 15,649,175$ % budget change -8% 4% -10%* as amended**as of 8/11/2016
Streets & Traffic38%
Powell Bill8%
Traffic Signals5%
Traffic Services4%
Solid Waste & Recycling41%
Cemeteries4%
FY 16-17 Public Works Expenditures (by Budget Unit)
$-
$2,000,000
$4,000,000
$6,000,000
$8,000,000
$10,000,000
$12,000,000
$14,000,000
$16,000,000
ActualExpenditures
ActualExpenditures
ActualExpenditures**
CouncilApproved
2013-2014 2014-2015 2015-2016 2016-2017
Public Works Expenditure Trend
Fleet Services
Cemeteries
Traffic Services
Traffic Signals
Powell Bill
Solid Waste &Recycling
Streets & Traffic
97

STREETS AND TRAFFIC MISSION: The Streets & Traffic Division exists to manage, inspect, perform maintenance, and enhance the safety and serviceability of the City of Concord’s Street, Bike and Pedestrian Systems for the benefit and welfare of the traveling public. PROGRAM LOCATOR:: Fund: General Fund Functional Area: Public Works Department: Transportation Division: Streets and Traffic BUDGET & PERFORMANCE HIGHLIGHTS:
MAJOR SERVICES (S) PROVIDED: Non-Powell Bill eligible Roadway Maintenance
and small Construction or Enhancement Projects. Emergency response and resolution of service area
street problems. Traffic Engineering, Technical Support, Contract
and Customer Services. Infrastructure Inspection and Quality Assurance.
FY 2015-16 MAJOR ACCOMPLISHMENTS: Provided $700,000 to repave/preserve additional
streets annually to improve the City’s average pavement rating.
Rehabilitated Burrage Rd and added sidewalk/ bicycle accommodations;
Rehabilitated Terminal Ct - US 29 to Cul-de-sac. Let construction of US 29 / Poplar Tent CMAQ
Superstreet intersection project; Completed construction of the NC 3/ US 601 CMAQ Project enhancements.
Constructed salt storage building for warehousing annual supplies of salt, salt and de-icing materials for winter weather operations.
Provided 50% funding to match 50% Powell Bill funding for replacing STR 001 director vehicle.; 47% funding to match 53% Powell Bill funding for replacing STR 639 tandem dump truck, STR 433 skid steer loader and STR 377 tractor.
Provided an additional $30,000 (Total $60,000) funding for contracted concrete repair services to supplement sidewalk maintenance by City forces; Provided private sector contracting for specialized, non-Powell Bill eligible maintenance operations to improve efficiency using available funding.
Continued citizen education efforts. FY 2016-17 MAJOR BUDGET CHANGES / NEW REQUESTS /
FOCUS AREAS: Add a patch crew, patch truck and equipment to
facilitate provision of utility cut patching without adversely affecting routine maintenance activities.
Provide 50% funding to match 50% Powell Bill funding for replacing STR 432 asphalt patch truck ; 43% funding to match 57% Powell Bill funding for replacing STR 637 emergency call truck, STR 430 crew truck and STR 100 contour mower.
Continue funding initiative to repave and preserve additional streets annually to improve the City’s average pavement rating.
Complete construction of US 29 / Poplar Tent CMAQ Superstreet intersection project; Let contract to build 4-Lane divided Derita Rd from Poplar Tent to Meck. Co. line.
Let contract to rehabilitate Virginia St from Corban Ave to Hillcrest Ave, and add sidewalk.
Complete Brookwood Ave enhancement design. Complete the construction of Miramar St sidewalk
and acquire right-of-way to facilitate construction of Sidewalk for the NE Subset Sidewalk CMAQ.
STEPS / PROGRAMS BEING UNDERTAKEN TO ENHANCE
PERFORMANCE: Continue to explore new methods to improve
operational procedures to achieve higher benefit cost ratios for all programs, services, and activities performed by the Street and Traffic Division.
Continue use of asset-resource management software to evaluate performance effectiveness to maximize effectiveness and efficiency of non- Powell Bill operations.
Continue to participate in UNC School of Government’s Benchmarking Project.
$- $750,000
$1,500,000 $2,250,000 $3,000,000 $3,750,000 $4,500,000 $5,250,000 $6,000,000 $6,750,000
13-14 14-15 15-16 16-17Budget
Total Expenditures
0%
20%
40%
60%
80%
100%
13-14 14-15 15-16 16-17
% of Utility Cuts & Other Non-Pothole Repair Requests Completed within
24 hrs of Being Logged
Actual Objective
98

PERFORMANCE GOALS:
Major Service Area: Roadway Maintenance and Construction Goal: To provide maintenance and small construction enhancements on all streets within the City of Concord to benefit citizens and the traveling public in order to facilitate the movement of people, goods, and services.
Major Service Area: Infrastructure Inspection and Quality Assurance
Goal: To provide a system of regular inspections and project quality control on a continuing, systematic basis to serve both internal and external customers and to ensure Council Goals are met within the limits of fiscal constraints.
Major Service Area: Traffic Engineering, Technical and Customer Services Goal: To investigate traffic inquiries, complaints, and service requests, apply technical expertise, and
administer departmental work plans to provide excellent service to both internal and external customers in order to ensure Council Goals are met and to provide for an adequate, safe local transportation system.
PERFORMANCE SUMMARY: Major Performance Measure FY14 FY15 FY16 FY16 FY17 Benchmark Service Indicator Type Actual Actual Obj. Actual Obj. Target Area
Traffic Eng., Tech. &
Customer Service
Average response / analysis time (in days) for traffic safety and speeding
complaints
Effectiveness 19 16 15 30 30 15
Roadway Maint. & Constr.
% of repairs to utility cuts and other non-pothole
repair customer requests completed within 24-hrs. of
being logged
Effectiveness 85% 70% 90% 76% 90% 95%
Traffic Eng., Tech. &
Customer Service
% of customer inquiries responded to within 24-hrs
Effectiveness 94% 95% 95% 95% 95% 97%
BUDGET SUMMARY:
Cost Center #: 45102013-2014 2014-2015 2015-2016 2015-2016 2016-2017 2016-2017
Actual Expenditures
Actual Expenditures
CouncilApproved*
Actual Expenditures**
ManagerRecommended
CouncilApproved
Personnel Services 798,554$ 687,556$ 897,075$ 838,208$ 1,804,070$ 1,804,070$ Operations 1,242,955$ 1,115,388$ 1,982,598$ 1,156,516$ 1,278,714$ 1,278,715$ Capital Outlay 185,116$ 89,215$ 213,050$ 215,350$ 249,754$ 249,754$ Debt Service 217,210$ 208,372$ 200,498$ 200,491$ 191,813$ 191,813$ Cost Allocations 269,006$ 244,069$ 426,989$ 391,406$ 470,316$ 470,316$ Transfers 1,766,565$ 1,817,400$ 1,891,970$ 1,891,970$ 2,028,410$ 2,028,410$
Total Expenditures 4,479,406$ 4,162,000$ 5,612,180$ 4,693,941$ 6,023,077$ 6,023,078$ % budget change 18% 10% 13% 7%
* as amended**as of 8/11/2016
Authorized FTE 27.00 27.00 28.00 28.00 30.00 30.00
99

POWELL BILL MISSION: Powell Bill funds are used to maintain and enhance City of Concord Street, Bike, and Pedestrian Systems for the benefit and welfare of the traveling public through the restricted local use of state-shared motor vehicle fuel taxes. PROGRAM LOCATOR:: Fund: General Fund Functional Area: Public Works Department: Transportation Division: Powell Bill BUDGET & PERFORMANCE HIGHLIGHTS: MAJOR SERVICE(S) PROVIDED: Roadway Infrastructure Maintenance Bridge Maintenance Right-of-Way and Sidewalk Maintenance
FY 2015-16 MAJOR ACCOMPLISHMENTS: Focused on reducing the current street repaving
cycle time by maximizing the number of lane miles resurfaced and / or preserved with available Powell Bill funds and to provide for regular street, sidewalk, right-of-way, and bridge maintenance.
Provided 50% funding to match 50% non-Powell Bill funding for replacing STR 001 director vehicle; Provided 53% funding to match 47% non-Powell Bill funding for replacing STR 639 tandem dump truck, STR 433 skid steer loader and STR 377 tractor.
Provided 100% funding to replace two (2) snow plows and one (1) v-type box spreaders for existing sprayers for winter weather operations.
Continued to provide funding of specialized Powell Bill eligible private sector contract services such as consulting engineering for bridge inspections, tree and limb removal, guardrail maintenance, railroad arm gear maintenance and installation of raised pavement markers and thermoplastic pavement markings on City streets.
FY 2016-17 MAJOR BUDGET CHANGES / NEW REQUESTS / FOCUS AREAS: Provide 50% funding to match 50% non-Powell Bill
funding for replacing STR 432 asphalt patch truck ;57% funding to match 43% non-Powell Bill funding for replacing STR 637 emergency call truck, STR 430 crew truck and STR 100 mower.
Provided 100% funding to replace one (1) snow plow and one (1) v-type box spreader for replacement of a dump truck in the Water Dept utilized for winter weather operations.
Continue to focus on reducing the current street repaving cycle time by maximizing the number of lane miles resurfaced and / or preserved with available Powell Bill funds and to provide regular street maintenance, sidewalk maintenance, bridge maintenance, and street right-of-way operations.
Continue to provide funding for specialized Powell Bill eligible private sector contract services such as consulting engineering for bridge inspections, tree and limb removal, guardrail maintenance, railroad arm gear maintenance and installation of raised pavement markers and thermoplastic pavement markings on City streets.
STEPS / PROGRAMS BEING UNDERTAKEN TO ENHANCE PERFORMANCE: Continue to explore new methods to improve
operational procedures to achieve higher benefit cost ratios for all programs, services, and activities performed under Powell Bill line items.
Continue to use of asset-resource management software to evaluate and maximize effectiveness and efficiency of Powell Bill operations.
Continue to participate in the UNC Institute of Government’s Benchmarking Project to measure service profiles against other NC cities of comparable population size.
Monitor and quickly identify potential expenditure problems and improve management of assets through the use of monthly budget and work plan review meetings.
$-
$500,000
$1,000,000
$1,500,000
$2,000,000
$2,500,000
$3,000,000
13-14 14-15 15-16 16-17Budget
Total Expenditures
0%20%40%60%80%
100%
13-14 14-15 15-16 16-17
% of City Lane Miles Rated 85% or Better
Actual Objective
100

PERFORMANCE GOALS:
Major Service Area: Roadway Maintenance and Enhancement Goal: To provide roadway maintenance and enhancement services on City streets for the traveling public in order to facilitate the movement of people, goods, and services at a safe, acceptable, and cost effective Level of Service (LOS).
Major Service Area: Bridge Maintenance and Upkeep Goal: To provide regular bridge maintenance on City bridges for the traveling public in order to keep this infrastructure in an acceptable condition.
Major Service Area: Right-of-Way Operations
Goal: To provide maintenance of City street rights-of-way for City citizens and the traveling public in order to provide clean, visually appealing, and safe roadways.
PERFORMANCE SUMMARY:: Major Performance Measure FY14 FY15 FY16 FY16 FY17 Benchmark Service Indicator Type Actual Actual Obj. Mid-Yr. Obj. Target Area
Roadway Maint. &
Construct.
Cost of asphalt maintenance per lane mile
Efficiency unavailable $382 $2,200 N/A $2,200 $2,400
Roadway Maint. &
Construct.
% of reported pot holes repaired within 24-hours
Effectiveness 95% 95% 95% 95% 95% 95%
Bridge Maint. & Upkeep
% of City bridges rated “not deficient” on a bi-annual basis
Effectiveness 93% NA 85% N/A 85% 100%
Roadway Maint. &
Construct.
% of lane miles rated 85% or better
Effectiveness 46% NA 68% N/A 68% 68%
Roadway Maint. &
Construct.
% of lane miles rated below 45%
Effectiveness 9% NA 1% N/A 1% 1%
Roadway Maint. &
Construct.
Average Pavement Rating % of Entire System (street-lane-
miles) Effectiveness 77% NA 84% N/A 84% 85%
ROW Maint. Ops
% of mowing routes rated monthly at satisfactory or
better during growing season Effectiveness 100% 100% 100% 100% 100% 100%
BUDGET SUMMARY: Cost Center #: 4511
2013-2014 2014-2015 2015-2016 2015-2016 2016-2017 2016-2017
Actual Expenditures
Actual Expenditures
CouncilApproved*
Actual Expenditures**
ManagerRecommended
CouncilApproved
Personnel Services 834,164$ 817,675$ 809,819$ 668,816$ 6,000$ 6,000$ Operations 1,378,384$ 179,111$ 2,277,308$ 662,035$ 866,336$ 866,336$ Capital Outlay 175,027$ 252,086$ 173,950$ 169,042$ 372,767$ 372,767$
Total Expenditures 2,387,575$ 1,248,872$ 3,261,077$ 1,499,893$ 1,245,103$ 1,245,103$
% budget change -31% 20% -62%
* as amended**as of 8/11/2016
Authorized FTE 0.00 0.00 0.00 0.00 0.00 0.00
Note: Powell Bill monies fund approximately 70% of Streets & Traffic Division field employees, however for budgetingpurposes, Transportation salaries are budgeted in 4510 Streets & Traffic and allocated back to 4511 during the year.
101

TRAFFIC SIGNALS MISSION: The Signal Division maintains, optimizes, and enhances traffic control signals, intersection control beacons, and school zone flashers owned by the City of Concord and the NCDOT for the benefit and welfare of the traveling public. Additionally, the Signal Division assists in maintenance of the City’s fiber optic communications network. PROGRAM LOCATOR:: Fund: General Fund Functional Area: Public Works Department: Transportation Division: Traffic Signals BUDGET & PERFORMANCE HIGHLIGHTS: MAJOR SERVICE(S) PROVIDED: Maintenance of 127 Traffic Control Signals, 6
Intersection Control Beacons, 22 School Zone Flashers, and 20 Intersection Pedestrian Signals.
Maintain and operate 44 PTZ Traffic Cameras & 53 Security Cameras
Signal diagnostic and optimization services. Assist the City’s fiber optic network. Emergency response and resolution of service area
signal problems.
FY 2015-16 MAJOR ACCOMPLISHMENTS: Completed year five (5) of five (5) Schedule C and
Schedule D maintenance operations on NCDOT signals in the Concord Area.
Filled Traffic Engineer position to fulfill staffing needs of Signal Division.
Continued Flashing Yellow Arrow (FYA) Upgrades in coordination with the NCDOT of designated signal assemblies in the Concord service area.
Continued funding to supplement NCDOT reimbursements for regular and routine signal maintenance on City and NCDOT area signals.
Constructed a new signal on Weddington Rd at Fire Station No. 11.
Integrated signals at George Liles Pkwy/US 29, Powder St/Cabarrus Ave and NC 73/Gold Hill Rd into the Centralized System.
Let TCSP grant contract to expand the signal network and add intelligent transportation system components & dynamic message board at exit 49.
Designed the new Traffic Management Center and maintenance facility to be constructed on land along US 601 at the BOC site.
Continued to mitigate traffic for special events in the City of Concord, including those downtown, at CMS and Concord Mills, through the centralized signal system.
FY 2016-17 MAJOR BUDGET CHANGES / NEW REQUESTS / FOCUS AREAS: Fill Staff Engineer position to achieve approved full
staffing. Let construction contract to build new Traffic
Management Center and maintenance facility. Initiate construction associated with the $1 Million
TSCP Grant for signal system interconnection along with providing additional traffic cameras and ITS infrastructure.
Continue funding to supplement NCDOT reimbursements for regular and routine signal maintenance on City and NCDOT area signals.
Continue Flashing Yellow Arrow (FYA) Upgrade Program in coordination with NCDOT at designated signals in the Concord Service Area.
STEPS / PROGRAMS BEING UNDERTAKEN TO ENHANCE PERFORMANCE: Expand integrated signal communication and
traffic management software to improve efficiency of operations at the Traffic Management Center.
Continue to explore new methods to improve operational procedures to achieve higher benefit cost ratios for all programs, services, and activities performed by the Traffic Signals Division.
Provide continuing education and training opportunities through NCDOT and IMSA courses.
Monitor and quickly identify potential expenditure problems and improve management of assets through the use of monthly budget and work plan review meetings.
$-
$500,000
$1,000,000
$1,500,000
$2,000,000
$2,500,000
$3,000,000
13-14 14-15 15-16 16-17Budget
Total Expenditures
0%20%40%60%80%
100%
13-14 14-15 15-16 16-17
% of City Lane Miles Rated 85% or Better
Actual Objective
102

PERFORMANCE GOALS:
Major Service Area: Signal, Beacon, and Flasher Maintenance
Goal: To provide programmed maintenance and emergency service to signals, beacons and flashers in order to ensure public confidence in the Concord area’s signalized traffic control system.
Major Service Area: Signal Optimization
Goal: To provide regular, scheduled maintenance service on non-coordinated system signals to the traveling public in order to meet or exceed NCDOT Schedule C standards.
Goal: To provide regular, scheduled optimization service on eight area coordinated system signals to the traveling public in order to meet or exceed NCDOT Schedule D standards.
PERFORMANCE SUMMARY: Major Performance Measure FY14 FY15 FY16 FY16 FY17 Benchmark Service Indicator Type Actual Actual Obj. Actual Obj. Target Area
Signal Emergency
Maint.
% on-site response to malfunctioning signals made within 2-hrs or
less
Effectiveness unavailable 100% 100% 100% 100% 100%
Signal Indication
Maint.
% of repairs to indication failures within
24-hrs or less Effectiveness unavailable 100% 100% 100% 100% 100%
Signal Preventative
Maint.
% of NCDOT signals checked on time to meet Schedule C requirement
(once/year)
Effectiveness 100% 100% 100% 100% 100% 100%
Signal Preventative
Maint.
% of NCDOT signals optimized on time to
Schedule D maintenance (once/year)
Effectiveness 52% 60% 66% 60% 100% 100%
BUDGET SUMMARY:
Cost Center #: 4513 2013-2014 2014-2015 2015-2016 2015-2016 2016-2017 2016-2017
Actual Expenditures
Actual Expenditures
CouncilApproved*
Actual Expenditures**
ManagerRecommended
CouncilApproved
Personnel Services 206,319$ 252,429$ 364,126$ 325,310$ 386,118$ 386,118$
Operations 386,528$ 388,032$ 470,341$ 345,380$ 373,687$ 373,687$ Capital Outlay 29,694$ 5,509$ 20,000$ 29,178$ 26,000$ 26,000$ Cost Allocations 21,796$ 15,969$ 29,658$ 27,186$ 25,061$ 25,061$ Transfers -$ -$ -$ -$ -$ -$
Total Expenditures 644,337$ 661,939$ 884,125$ 727,054$ 810,866$ 810,866$
% budget change 4% 10% -8%
* as amended**as of 8/11/2016
Authorized FTE 4.00 5.00 5.00 6.00 6.00 6.00
103

TRAFFIC SERVICES MISSION: Traffic Services exists to maintain, evaluate, and enhance traffic control signs, pavement markings, and traffic safety measures on the City of Concord’s Street, Bike, and Pedestrian Systems for the benefit and welfare of the traveling public. PROGRAM LOCATOR: Fund: General Fund Functional Area: Public Works Department: Transportation Division: Traffic Services BUDGET & PERFORMANCE HIGHLIGHTS: MAJOR SERVICE(S) PROVIDED: Maintenance of Traffic Control Signage and
Pavement Markings. Provide Traffic Services Technical Assistance as
related to Work Zone, Detour Routing, and Special Events signage.
Emergency response and resolution of service area signage problems.
Design and Install Custom Signs and Decals for Internal Customers and for Recognized Neighborhoods.
FY 2015-16 MAJOR ACCOMPLISHMENTS: Continued support of traffic and pedestrian
control associated with special events and activities in the City of Concord.
Continued retroreflective & spectroanalysis compliance testing for asset management control to comply with FHWA and MUTCD regulations.
Continue Regulatory, Warning Sign, and Raised Pavement Marker maintenance programs providing emphasis on maintaining current level of service (LOS).
Continued responsibilities associated with the decal striping of City of Concord vehicles and new Police vehicle designs.
FY 2016-17 MAJOR BUDGET CHANGES / NEW REQUESTS /
FOCUS AREAS: Continue support of traffic and pedestrian control
associated with special events and activities in the City of Concord.
Continue Regulatory and Warning Sign maintenance programs. Provide emphasis on maintaining current level of service (LOS) within approved funding allocation(s).
Continue Raised Pavement Marker Program on major City streets to provide positive guidance for drivers during low-light and inclement weather conditions.
Continue responsibilities associated with the decal striping of City of Concord vehicles.
STEPS / PROGRAMS BEING UNDERTAKEN TO ENHANCE
PERFORMANCE: Continue to explore new methods to improve
operational procedures to achieve cost savings for all programs, services, and activities performed by the Traffic Services Division.
Continue use of asset-resource management programs to provide prompt replacement of deficient or missing regulatory and warning signs and to evaluate performance effectiveness with regards to such.
Provide opportunities for career development programs to increase coworker proficiency thru IMSA and RCCC.
Monitor and quickly identify potential expenditure problems and improve management of assets through the use of monthly budget and work plan review meetings.
$- $100,000 $200,000 $300,000 $400,000 $500,000 $600,000 $700,000
13-14 14-15 15-16 16-17Budget
Total Expenditures
50%
60%
70%
80%
90%
100%
13-14 14-15 15-16 16-17
% of In-field Work Orders-Regulatory or Warning Sign Replacements within 72 hrs
Actual Objective
104

PERFORMANCE GOALS:
Major Service Area: Traffic Control Signage and Pavement Markings Goal: To maintain and provide traffic control signs and pavement markings for the traveling public in order to promote safety and the orderly movement of traffic.
Major Service Area: Traffic Services Technical Assistance
Goal: To provide technical assistance to internal customers in order to support their work operations where temporary traffic control set-ups or pavement markings are warranted.
Major Service Area: Custom Signs and Decals
Goal: To provide custom sign and decal services to internal customers and Recognized Neighborhoods in order to support emergency vehicle identification and recognition goals.
Goal: To provide signing of Zoning Public Hearing Notices for the City of Concord Development Services Department in order to meet time posting requirements under the North Carolina General Statues.
PERFORMANCE SUMMARY: Major Performance Measure FY14 FY15 FY16 FY16 FY17 Benchmark Service Area Indicator Type Actual Actual Obj. Actual Obj. Target
Traffic Control Signage & Pavement Markings
% of STOP sign knock downs responded to within
1 hour Effectiveness 100% 100% 100% 100% 100% 100%
Traffic Control Signage & Pavement Markings
% of in-field work orders for regulatory or warning sign replacements made within
72 hours
Effectiveness 100% 100% 100% 100% 100% 95%
Traffic Control Signage & Pavement Markings
% of programmed sign replacements made within
one week of scheduling Effectiveness 100% 100% 100% 100% 100% 100%
Traffic Services Tech.
Assistance
% of on-call assistance for utility emergency or incident
operations made within 2 hours
Effectiveness 100% 100% 100% 100% 100% 100%
Custom Signs & Decals
% of custom sign requests completed within 2 weeks
for internal customers Effectiveness 100% 100% 100% 100% 100% 100%
Custom Signs & Decals
% of rezoning/special use notice postings made
accurately within the legal time requirement
Effectiveness 100% 100% 100% 100% 100% 100%
BUDGET SUMMARY: Cost Center # 4514
2013-2014 2014-2015 2015-2016 2015-2016 2016-2017 2016-2017
Actual Expenditures
Actual Expenditures
CouncilApproved*
Actual Expenditures**
ManagerRecommended
CouncilApproved
Personnel Services 313,803$ 328,668$ 349,083$ 341,900$ 342,412$ 342,412$ Operations 120,602$ 115,822$ 224,398$ 170,456$ 174,216$ 174,216$ Capital Outlay 26,025$ 47,722$ 24,200$ 24,669$ -$ -$ Cost Allocations 25,574$ 28,520$ 30,658$ 28,104$ 36,525$ 36,525$ Transfer -$ -$ -$ -$ -$ -$
Total Expenditures 486,004$ 520,732$ 628,339$ 565,129$ 553,153$ 553,153$
% budget change 11% 9% -12%
* as amended**as of 8/11/2016
Authorized FTE 5.00 5.00 5.00 5.00 5.00 5.00
105

SOLID WASTE & RECYCLING
MISSION: The Solid Waste & Recycling department exists to provide residential garbage, recycling, yard waste collection and disposal, and provides businesses with waste reduction and recycling opportunities in order to protect and preserve public health and safety, and to protect and enhance the physical environment. PROGRAM LOCATOR: Fund: General Fund Functional Area: Public Works Department: Solid Waste & Recycling BUDGET & PERFORMANCE HIGHLIGHTS: MAJOR SERVICE(S) PROVIDED: Residential Garbage, Bulky, and Recycling Collection Commercial Cardboard, Office Paper, and
Commingled Recycling Collection Programs Yard Waste Collection White Goods, Metal, Tire, Electronic Waste and
Building Material Collection FY 2015-16 MAJOR ACCOMPLISHMENTS: Solid Waste Services strengthened the department’s
workforce with two new positions. The first position was a Project Manager. This
position provides direct support to the Director in key areas of solid waste.
The second position was a Compliance Inspector. This position gives SWS an opportunity to have an educational piece for internal and external customers, focusing on code enforcement.
FY 2016-17 MAJOR BUDGET CHANGES / NEW REQUESTS / FOCUS AREAS: Changes to the Downtown Recycling Pilot
Program will result in a $4,000 annual savings. Changes to the Business Cardboard Recycling
Program will result in a $61,474 annual savings. Adjust the current Bulky Waste collection schedule
to every-other week to improve collection efficiency and create a cost avoidance of $124,000 per year.
Continue to focus on public outreach programs to increase the curbside recycling participation rate and tons collected.
Work closely with contractors to educate citizens on ways to identify strategies for waste reduction and promote recycling towards achieving N.C.’s state-wide waste reduction goal.
Continue the verification policy and review process for back yard collection service. Citizens shall submit a physician’s affidavit stating a medical condition exists, which necessitates back yard service.
Continue to enforce solid waste codes and ensure that customers continue to comply.
Continue customer service focus with greater emphasis on team building, training, and increasing the visibility for coworkers.
STEPS / PROGRAMS BEING UNDERTAKEN TO ENHANCE PERFORMANCE: Continue automated waste and recycling
collection program and customer education efforts about changes in bulky waste service and pre-collection requirements.
Continue development of CityWorks and Mobile 311 to monitor weekly Yard Waste & Bulky Waste Collection Performance.
Develop appropriate performance measures for individual Yard Waste crews.
Continue to meet with individual crews to discuss performance measures and achievable goals.
Continue to utilize all practical methods including press releases, utility bill inserts, and ConnectCTY to notify citizens of the leaf collection schedule and any changes that might occur during the season.
Continue conducting customer satisfaction survey that will target recycling participation and other service areas in the City of Concord.
Promote recycling participation using web-site enhancements, direct mail, City Circular articles, and other practical outreach measures to grow recycling participation and annual tons of recyclables collected.
Join with recognized neighborhood volunteers to conduct neighborhood clean-up days to collect debris and litter for recycling or disposal.
$-
$2,000,000
$4,000,000
$6,000,000
$8,000,000
13-14 14-15 15-16 16-17Budget
Total Expenditures
0102030405060
13-14 14-15 15-16 16-17
Complaints per 1,000 Collection Points (Garbage & Bulky Waste)
Actual Objective
106

PERFORMANCE GOALS:
Major Service Area: Residential Garbage/Bulky/Recycling Collection
Goal: To provide residential garbage, bulky and recycling collection to city residents in order to maintain a safe and healthy living environment for present and future generations to live, grow, and work.
Major Service Area: Commercial Cardboard/Office Paper/Commingled Recycling Collection
Goal: To provide attractive commercial recycling programs to businesses in order to promote waste reduction and to provide cost reduction opportunities in the business community.
Major Service Area: Yard Waste Collection
Goal: To provide yard waste collection to City residents in order to keep neighborhoods clean and attractive.
Major Service Area: White Goods, Metal, Tire, & Building Material Collection
Goal: To provide white goods, tire, electronic waste and building material collection to City residents in order to provide residents a full range of Solid Waste & Recycling services and follow NC State laws regarding recycling white goods and tires.
PERFORMANCE SUMMARY:
Major Performance Measure FY14 FY15 FY16 FY16 FY17 Benchmark Service Area Indicator Type Actual Actual Obj. Actual Obj. Target
Residential Garbage
Collection Tons per 1,000 population Workload 286 283 277 293 275 275
Residential Garbage &
Bulky Collection
Contractor complaints per 1,000 collection points
Effectiveness 3 10 10 52 50 18
Residential Recycling Collection
% of customers participating in curb-side recycling program
Effectiveness 78% 83% 80% 76% 78% 50%
Residential Recycling Collection
Avg. pounds of recyclables collected per household per
year in curbside recycling program
Effectiveness 369 554 415 394 400 425
Commercial Recycling Collection
# of commercial cardboard recycling customers
Workload 421 413 350 397 395 425
Commercial Recycling Collection
# of commercial mixed paper recycling customers
Workload 207 210 209 176 180 219
Yard Waste Collection
Complaints per 10,000 Collection Points (city)
Effectiveness NA 12 20 78 75 26
Yard Waste Collection
Tons Collected per Collection FTE
Efficiency 361 255 300 345 320 NA
BUDGET SUMMARY:
Cost Center #: 45202013-2014 2014-2015 2014-2015 2015-2016 2016-2017 2016-2017
Actual Expenditures
Actual Expenditures
CouncilApproved*
Actual Expenditures**
ManagerRecommended
CouncilApproved
Personnel Services 1,648,873$ 1,694,037$ 1,760,549$ 1,737,466$ 1,777,410$ 1,777,410$
Operations 3,737,448$ 3,597,171$ 4,101,813$ 3,575,739$ 4,131,638$ 4,131,638$ Capital Outlay 171,928$ 368,293$ 357,000$ 306,751$ 350,000$ 350,000$ Cost Allocations 223,045$ 262,133$ 230,085$ 210,911$ 162,688$ 162,688$ Transfers 125,288$ -$ -$ -$ -$ -$
Total Expenditures 5,906,582$ 5,921,634$ 6,449,447$ 5,830,867$ 6,421,736$ 6,421,736$
% budget change 1% -2% -0.4%
* as amended**as of 8/11/2016
Authorized FTE 32.00 32.00 32.00 32.00 31.50 31.50
107

CEMETERIES MISSION: The Cemetery Division provides for the comprehensive and continuous operation and maintenance of the City cemeteries in an efficient, accurate, and professional manner. PROGRAM LOCATOR:: Fund: General Fund Functional Area: Public Works Department: Cemeteries BUDGET & PERFORMANCE HIGHLIGHTS:
$-
$100,000
$200,000
$300,000
$400,000
$500,000
$600,000
13-14 14-15 15-16 16-17Budget
Total Expenditures
0%
20%
40%
60%
80%
100%
13-14 14-15 15-16 16-17
% of Citizens/Funeral Homes Rating Cemetery Services as "Excellent" or "Good"
Actual Objective
MAJOR SERVICE(S) PROVIDED: Cemetery Operations.
FY 2015-16 MAJOR ACCOMPLISHMENTS: Continued to aggressively treat the fire ant
infestation. Painted the wrought iron fence at the main
entrance of Oakwood Cemetery. Began painting the chain link fence at Oakwood
Cemetery. Began repairing the sidewalks at Oakwood
Cemetery. Painted roof and interior of the stone building at
Oakwood Cemetery. Painted exterior & interior of Oakwood office.
Power washed wall & landscape front wall of Rutherford.
Removed dead trees at West Concord.
FY 2016-17 MAJOR BUDGET CHANGES / NEW REQUESTS /
FOCUS AREAS: Begin 3rd year cycle of new treatment regimen for
fire ants at West Concord, Rutherford & Oakwood. Continue painting & improvements to chain link
fence at Oakwood Cemetery. Continue sidewalk repair at Oakwood Cemetery. Continue landscape improvements. Continue dead wooding of trees at Oakwood
Cemetery & West Concord. Data connectivity to Oakwood office.
STEPS / PROGRAMS BEING UNDERTAKEN TO ENHANCE
PERFORMANCE: Monthly staff meetings designed to improve
customer service.
108

PERFORMANCE GOALS:
Major Service Area: Cemetery Operations
Goal: To provide efficient, accurate and professional burial services to cemetery customers.
Goal: To maintain the Cemetery grounds to the highest standards in order to meet or exceed visitor expectations.
PERFORMANCE SUMMARY: Major Performance Measure FY14 FY15 FY16 FY16 FY17 Benchmark Service Indicator Type Actual Actual Obj. Actual Obj. Target Area
Cemetery Operations
% of citizens/funeral homes rating Cemetery service as “Excellent” or
“Good”
Effectiveness 100% 100% 100% 100% 100% 100%
Cemetery Operations
% of citizens/funeral homes rating Cemetery
appearance as “Excellent” or “Good”
Effectiveness New New New New 80% 100%
Cemetery Operations
% of Cemetery work orders responded to within 24
hours Effectiveness 100% 100% 100% 100% 100% 100%
Cemetery Operations
% of Cemetery mowing completed on time
Effectiveness 100% 83% 93% 71% 93% 100%
BUDGET SUMMARY:
Cost Center #: 45402013-2014 2014-2015 2015-2016 2015-2016 2016-2017 2016-2017
Actual Expenditures
Actual Expenditures
CouncilApproved*
Actual Expenditures**
ManagerRecommended
CouncilApproved
Personnel Services 398,846$ 376,765$ 407,217$ 402,563$ 399,240$ 399,240$ Operations 84,876$ 106,788$ 151,737$ 115,996$ 143,234$ 143,234$ Capital Outlay 7,911$ 27,965$ -$ -$ 46,000$ 46,000$ Cost Allocations 819$ 191$ 234$ 215$ 6,766$ 6,766$
Total Expenditures 492,452$ 511,709$ 559,188$ 518,774$ 595,240$ 595,240$
% budget change 2% 1% 6%
* as amended**as of 8/11/2016
Authorized FTE 8.00 8.00 8.00 8.00 8.00 8.00
109

FLEET SERVICES MISSION: Fleet Services provides City departments with the most timely and cost-effective vehicle/equipment maintenance, repair, and fueling services. Our focus is to maintain a competitive advantage by providing the best value to our customers, which will in turn allow a greater level of service to City of Concord citizens. PROGRAM LOCATOR:: Fund: General Fund Functional Area: Public Works Department: Fleet Services BUDGET & PERFORMANCE HIGHLIGHTS:
MAJOR SERVICE(S) PROVIDED: Vehicle / Equipment Maintenance Fueling Services Vehicle / Equipment Specifications / Purchasing Vehicle / Equipment Disposal CDL 3rd Party Testing
FY 2015-16 MAJOR ACCOMPLISHMENTS: Fleet is recognized by the NC Benchmarking
Program as having one of the lowest cost fleets in North Carolina.
Re-certified ASE Blue Seal of Excellence Award for Fleet Services Shop.
Completed Fuel Management software upgrade.
Completed Diesel Exhaust Fluid dispenser project at the BOC Fuel Facility.
FY 2016-17 MAJOR BUDGET CHANGES / NEW REQUESTS /
FOCUS AREAS: Add an additional mechanic due to increased fleet
size (position was previously frozen). Add a 12-passenger van to pool fleet and transfer
15-passenger van from pool to Fire. Install manual manifold to BOC Fuel Facility to
accommodate emergency off-loading. Develop and implement CDL Training class to
comply with new DMV rules. STEPS / PROGRAMS BEING UNDERTAKEN TO ENHANCE
PERFORMANCE: Educate co-workers using the Journey through
Concord Program and the new Supervisor Training Program on how to use Fleet Services.
Focus mechanic training on specific sources of vehicle come-backs.
Continue emphasis on ASE Certifications for mechanics.
$2,400,000
$2,600,000
$2,800,000
$3,000,000
$3,200,000
$3,400,000
13-14 14-15 15-16 16-17Budget
Total Expenditures before Direct Billing
0%
20%
40%
60%
80%
100%
13-14 14-15 15-16 16-17
Hours Billed as % of Billable Hours
Actual Objective
110

PERFORMANCE GOALS:
Major Service Area: Maintenance
Goal: To provide high quality and timely vehicle maintenance for City departments in order to achieve maximum fleet availability and high customer satisfaction.
PERFORMANCE SUMMARY: Major Performance Measure FY14 FY15 FY16 FY16 FY17 Benchmark Service Indicator Type Actual Actual Obj. Actual Obj. Target Area
Maintenance
Hours billed as % of billable hours
Efficiency 63% 70% 70% 64% 70% 80%
Maintenance
% of work orders completed within 24
hours Effectiveness 98% 98% 98% 99% 99% 98%
Maintenance
% of work orders that require repeat repairs
within 30 days Effectiveness 0.3% 0.4% 0.4% 0.36% 0.4% 0.4%
Maintenance % of customers rating
overall service as “Excellent” or “Good”
Effectiveness 100% 98% 98% 98% 98% NA
Maintenance Fleet Availability Rate Effectiveness 98% 99% 99% 99% 99% NA
BUDGET SUMMARY:
Cost Center #: 45502013-2014 2014-2015 2015-2016 2015-2016 2016-2017 2016-2017
Actual Expenses
Actual Expenses
Council Approved*
Actual Expenses**
Manager Recommended
Council Approved
Personnel Services 885,634$ 1,003,298$ 877,831$ 872,920$ 949,977$ 949,977$
Operations 2,457,636$ 2,180,164$ 2,787,924$ 1,897,305$ 2,329,937$ 2,329,937$
Capital Outlay 12,449$ 34,876$ 20,000$ 18,095$ 32,000$ 32,000$
Direct Billing/Alloc (3,180,810)$ (2,885,100)$ (3,638,209)$ (2,762,558)$ (3,311,914)$ (3,311,914)$
Total Expenses 174,909$ 333,238$ 47,546$ 25,762$ -$ -$ % budget change -8.9% -4.2% -9%* as amended**as of 8/11/2016
Authorized FTE 13.00 13.00 13.00 13.00 14.00 14.00
111

ECONOMIC DEVELOPMENT OVERVIEW: Economic Development serves as the business and residential development, land use planning, transportation planning, and development coordinator for the City of Concord. Economic Development is comprised of Planning & Neighborhood Development, Transportation Planning, and Economic Development. DEPARTMENTS: Planning & Neighborhood Development: The Planning & Neighborhood Development Department exists
to provide courteous, effective and accurate planning, development and inspection services to the City of Concord residents and development community in order to build a thriving, prosperous, and safe community that enhances the quality of life for all residents of the City of Concord. Additional information regarding the Planning & Neighborhood Development Department may be obtained by contacting Margaret Pearson, Planning & Neighborhood Development Director, at (704) 920-5151 or via email at [email protected].
Transportation Planning: Transportation Planning is accomplished in a cooperative partnership with the
Cabarrus-Rowan Metropolitan Planning Organization (MPO). The MPO coordinates all transportation planning including highway, rail, bus, and aviation. The Business & Neighborhood Services Department serves as the Lead Planning Agency for the MPO. Additional information regarding Transportation Planning may be obtained by contacting Joseph K. Wilson III, P.E. Transportation Director, at (704) 920-5362 or via email at [email protected].
Economic Development: Economic Development administers local, state and federal funds to stabilize
neighborhoods, improve infrastructure, and create jobs through economic development opportunities. Additional information regarding Economic Development may be obtained by contacting Joseph Beasley, Economic Development Coordinator, at (704) 920-5128 or via email at [email protected].
112

Economic Development Expenditures2013-2014 2014-2015 2015-2016 2015-2016 2016-2017 2016-2017
ActualExpenditures
ActualExpenditures
CouncilApproved*
ActualExpenditures**
ManagerRecommended
CouncilApproved
By Department (General Fund)Planning & Neighborhood Development 2,318,192$ 2,129,807$ 2,653,553$ 2,449,230$ 2,503,944$ 2,503,944$ Transportation Planning 367,958$ 282,023$ 364,439$ 288,569$ 324,712$ 324,712$ Economic Development 1,024,589$ 671,544$ 1,273,437$ 882,557$ 1,114,886$ 1,114,886$
Total Expenditures 3,710,739$ 3,083,374$ 4,291,429$ 3,620,356$ 3,943,542$ 3,943,542$ * as amended -17% 17% -8%**as of 8/11/2016
Planning & Neighborhood Development
64%
Transportation Planning8%
Economic Development28%
FY 16-17 Economic Development Expenditures (by Budget Unit)
$‐
$500,000
$1,000,000
$1,500,000
$2,000,000
$2,500,000
$3,000,000
$3,500,000
$4,000,000
$4,500,000
ActualExpenditures
ActualExpenditures
ActualExpenditures**
CouncilApproved
2013‐2014 2014‐2015 2015‐2016 2016‐2017
Economic Development Expenditure Trend
EconomicDevelopment
TransportationPlanning
Planning &NeighborhoodDevelopment
113

PLANNING & NEIGHBORHOOD DEVELOPMENT MISSION: The Planning & Neighborhood Development Department exists to provide courteous, effective and accurate planning, development, and inspection services to the City of Concord residents and development community in order to build a thriving, prosperous, and safe community that enhances the quality of life for all residents of the City of Concord. PROGRAM LOCATOR:: Fund: General Fund Functional Area: Economic Development Department: Planning & Neighborhood Development BUDGET & PERFORMANCE HIGHLIGHTS: MAJOR SERVICE(S) PROVIDED:
Development Plan Review and Permitting Public Hearings: Planning and Zoning
Commission, Board of Adjustment and the Historic Preservation Commission
Downtown business assistance with data collection, site selection, plan reviews, incentives and other matters
CDBG/Home Program Long-range planning in partnership with citizens
FY 2015-16 MAJOR ACCOMPLISHMENTS: Completed the implementation of the new
software Accela for Plan Review. Completed the Clearwater Artist Studios structural
improvement in the lower level.
Submitted successful Action Plan and Caper Report to HUD. Met 1.5 CDBG spending ratios.
Renewed HUD agreement for the consortium as the lead agency.
Increased events at Clearwater. Conducted a planning and training session with
the Planning and Zoning Commission to provide guidance on quasi-judicial hearings, downtown masterplan and the Sign Ordinance.
Completed signage for the Downtown murals and establishment of an arts committee to further downtown mural locations, guidelines and installations.
Completed update to the Sign Ordinance. Completed Downtown Masterplan.
FY 2016-17 MAJOR BUDGET CHANGES / NEW REQUESTS / FOCUS AREAS: Continue to work with the County to utilize to the
full potential new software Accela for Plan Review. Continue to look for funding options for the
evolution of the Clearwater Artist Studio facility and Manager position, which will be a full-time position in FY16-17.
Implement Wayfinding Signage as approved by CVB and City Council.
Continue to generate informational service specific Website, newsletters and pamphlets for citizen/developer education and assistance.
Update the comprehensive Land Use Plan and revise the CDO to reflect the vision approved by the City Council.
Implement Downtown Masterplan. Addition of 1 Planner position for community
development. STEPS / PROGRAMS BEING UNDERTAKEN TO ENHANCE PERFORMANCE: Conduct weekly staff meetings to discuss all
upcoming projects including those that appear before various boards, commission and with regard to design, site plan layout, and other issues.
Continue to improve coordination with other departments to ensure that projects stay on track and problems are identified and solved early.
$-
$500,000
$1,000,000
$1,500,000
$2,000,000
$2,500,000
$3,000,000
13-14 14-15 15-16 16-17Budget
Total Expenditures
0%
20%
40%
60%
80%
100%
13-14 14-15 15-16 16-17
% of Customers "Very" or "Somewhat" Satisfied with Business Assistance
Actual Objective
114

PERFORMANCE GOALS: Major Service Area: Development Plan Review
Goal: To provide an accurate and timely review for the development community in order to reduce the time required for plan review.
Major Service Area: Downtown Business Assistance Goal: To provide accurate information and assistance in a timely manner to existing and prospective businesses in order to facilitate industrial diversification, capital investment and job creation.
Major Service Area: Permitting Goal: To provide accurate and timely issuance of development permits to developers and citizen in order to ensure compliance with local ordinances.
Major Service Area: Long-range Planning Goal: To provide timely and accurate information and plans for future development, in partnership with citizens, to the Mayor and City Council, management, department directors, developers, and the general public in order to ensure the effective use of City resources.
Major Service Area: Public Hearings Goal: To provide complete and accurate case information to various City boards in order to help the board members make well-educated decisions concerning zoning and development approvals.
PERFORMANCE SUMMARY: Major Performance Measure FY14 FY15 FY16 FY16 FY17 Benchmark Service Indicator Type Actual Actual Obj. Actual Obj. Target Area Actual
Dev. Plan Review
% of plans approved within 2 submittals
Effectiveness 83% 80% 90% 92.7% 90% 95%
Dev. Plan Review
# of plans submitted Workload 313 523 250 494 NA NA
Permitting
% of customers satisfied with permitting process
Effectiveness 85% 90% 90% Survey not
conducted 90% 95%
Public Hearings
% of board members rating overall satisfaction
with the agenda information completeness
as “Very Satisfied” or “Satisfied”
Effectiveness 97% 95% 100% 100% 100% 100%
Business Assistance
% of customers “very” or “somewhat” satisfied with
business assistance Effectiveness 100% 90% 90% 100% 90% 90%
BUDGET SUMMARY: Cost Center #: 4910
2013-2014 2014-2015 2015-2016 2015-2016 2016-2017 2016-2017
Actual Expenditures
Actual Expenditures
CouncilApproved*
Actual Expenditures**
ManagerRecommended
CouncilApproved
Personnel Services 1,117,863$ 1,166,132$ 1,195,997$ 1,170,849$ 1,303,656$ 1,303,656$ Operations 179,818$ 191,873$ 597,757$ 454,092$ 366,305$ 366,305$ Capital Outlay -$ 153,873$ -$ -$ -$ Debt Service -$ 145,728$ 271,468$ 279,329$ 271,344$ 271,344$ Cost Allocations 335,697$ 437,827$ 552,257$ 515,780$ 531,633$ 531,633$ Transfers 684,814$ 34,374$ 36,074$ 29,180$ 31,006$ 31,006$
Total Expenditures 2,318,192$ 2,129,807$ 2,653,553$ 2,449,230$ 2,503,944$ 2,503,944$
% budget change -8% 15% -6%
* as amended**as of 8/11/2016 Authorized FTE 14.50 14.50 14.70 14.70 16.00 16.00
115

TRANSPORTATION PLANNING MISSION: Transportation Planning is accomplished through local urban design efforts and a cooperative partnership with the Cabarrus-Rowan Metropolitan Planning Organization (CRMPO). CRMPO plans for regional transportation needs including highway, transit, air, bicycle, and pedestrian facilities within both Cabarrus and Rowan counties as well as connections to the greater Metrolina Area. Concord is the lead agency and Transportation Department staff serves as members and alternates to the CRMPO’s Technical Coordinating Committee. PROGRAM LOCATOR:: Fund: General Fund Functional Area: Economic Development Department: Transportation Division: Transportation Planning BUDGET & PERFORMANCE HIGHLIGHTS: MAJOR SERVICE(S) PROVIDED: Support for local urban design efforts MPO transportation planning Regional coordination on transportation issues in
the Charlotte metro area FY 2015-16 MAJOR ACCOMPLISHMENTS: Provided delegated staff and participated with
regional partners on issues of air quality, transportation planning, finance, and project delivery with the Technical Coordination Committee (TCC) of the CRMPO and the CRAFT Technical Committee.
Coordinated with City departments, consulting engineers, and NCDOT to finalize plans and secure rights-of-way for the CMAQ Poplar Tent Rd. / US Hwy. 29, the CMAQ NC Hwy. 3 / US Hwy. 601 Intersection Improvement Projects, the CMAQ NE Subset Sidewalk Extension Project & the Derita Rd. Widening prior to letting bids.
Facilitated the NCDOT prioritization process for the DRAFT FY16 TIP to include the addition of Concord Mills Flyover and Bruton Smith Pedestrian projects added in the TIP.
Facilitated completion of construction for the remaining section Derita Rd.
Revised & updated the City's Comprehensive Transportation Plan (CTP); Assisted the revision of the CRMPO Functional Classification Map/Listing.
Assisted in completing the draft Transportation Conformity Report for the Metrolina Region and 2040 MTP Report.
FY 2016-17 MAJOR BUDGET CHANGES / NEW REQUESTS /
FOCUS AREAS: Provide delegated staff support and identify
participating funds on transportation issues such as Exit 49 improvements as coordinated through the CRMPO.
Continue to assist in the latest update of the NCDOT’s Comprehensive Transportation Plan (CTP) for the CRMPO in coordination with the City's latest revision of its CTP.
Continue participation in the Regional Model maintenance, including updates to socioeconomic base year data, changes to the Model network(s).
Continue to work with City infrastructure departments, consulting engineers, the CRMPO and its contracted agents to complete construction of local approved projects on the State Transportation Improvement Plan (STIP).
STEPS / PROGRAMS BEING UNDERTAKEN TO ENHANCE
PERFORMANCE: Improve communication efforts between City and
fellow jurisdictions within the CRMPO. Improve staff involvement and support to CRAFT. Continue to support efforts and interagency
communications for ranking STIP Projects using data driven criteria.
Continue to coordinate and work within the CRMPO and with the NCDOT on the state's Comprehensive Transportation Plan (CTP) and the Regional Model for the metropolitan area.
$-
$100,000
$200,000
$300,000
$400,000
13-14 14-15 15-16 16-17Budget
Total Expenditures
0%
20%
40%
60%
80%
100%
13-14 14-15 15-16 16-17
% of TCC Meetings Attended
Actual Objective
116

PERFORMANCE GOALS
Major Service Area: MPO Transportation Planning Goal: To provide Concord citizens with active representation in the MPO transportation planning process through representation on the Technical Coordinating Committee in order to address issues to increase transportation choices, reduce road congestion, increase traffic flow and improve traffic safety.
Major Service Area: Regional Coordination Goal: To provide Concord citizens with regional representation to coordinate and cooperate with partners in the Charlotte metro area, as outlined and required by USDOT and NCDOT, and to provide a significant presence in any regional discussions about transportation planning and project/service delivery.
PERFORMANCE SUMMARY Major Performance Measure FY14 FY15 FY16 FY16 FY17 Benchmark Service Indicator Type Actual Actual Obj. Mid-Yr. Obj. Target Area
MPO Transportation
Planning
% of TCC meetings attended
Effectiveness 100% 100% 100% 100% 100% 100%
Regional Coordination
% of Regional Model Executive Committee meetings attended
Effectiveness 100% 100% 100% 100% 100% 100%
BUDGET SUMMARY
Cost Center #: 49152013-2014 2014-2015 2015-2016 2015-2016 2016-2017 2016-2017
Actual Expenditures
Actual Expenditures
CouncilApproved*
Actual Expenditures**
ManagerRecommended
CouncilApproved
Operations 367,958$ 282,023$ 364,439$ 288,569$ 324,712$ 324,712$
Total Expenditures 367,958$ 282,023$ 364,439$ 288,569$ 324,712$ 324,712$
% budget change -23% 2% -11%* as amended**as of 8/11/2016 Authorized FTE 0.00 0.00 0.00 0.00 0.00 0.00
117

ECONOMIC DEVELOPMENT MISSION: Economic Development administers local, state, and federal funds to stabilize neighborhoods, improve infrastructure, and create jobs through economic development opportunities. PROGRAM LOCATOR:: Fund: General Fund Functional Area: Economic Development Department: City Manager’s Office Division: Economic Development BUDGET & PERFORMANCE HIGHLIGHTS: MAJOR SERVICE(S) PROVIDED: Recruit, retain, and help expand businesses. Facilitate redevelopment to assist developers
through complex renovation / reuse projects.
FY 2015-16 MAJOR ACCOMPLISHMENTS: Assisted Beacon Partners and the Silverman Group
with the development of industrial parks. Continued close partnership with Cabarrus
Economic Development Corporation (EDC) and the Concord Downtown Development Corporation (CDDC).
Staff served on the Board of Directors, the Business Development Committee and the Design Division of CDDC.
Continued to work with EDC and Trinity Partners to attract prospective tenants to the 277,000 sf industrial spec building at International Crossing.
Completed the redevelopment of the Heilig Meyers building in Downtown for residential apartments.
Continue partnering with Carolina Courts to attract sports tournaments to Downtown.
Continue to work with the owners/developers of the International Business Park to promote available buildings and sites.
Continue to work with SunCap Development to develop a second 330,000 sf building in International Business Park that would be occupied by FedEx Ground.
Began work to jumpstart the rehabilitation of the historic downtown Concord Hotel.
FY 2016-17 MAJOR BUDGET CHANGES / NEW REQUESTS /
FOCUS AREAS: Maintain the strong partnership with the Cabarrus
County, CDDC and the EDC. Continue to work with CDDC to facilitate the
redevelopment of the historic Concord Hotel and Fifth Third properties.
Continue to assist private sector industrial developers to construct facilities that will attract quality companies to locate in Concord.
Continue to work with the property owners along the George Liles Parkway extension to develop the vacant land with high quality residential, office and commercial products.
Continue to assist developers with the City’s permit process
Work with owners of underutilized industrial property to redevelop and create jobs.
Partner with the EDC to implement a marketing plan that promotes the City and attracts quality industries and employers.
STEPS / PROGRAMS BEING UNDERTAKEN TO ENHANCE
PERFORMANCE: Continue the use of surveys to identify program
and priority changes that are needed, as well as to determine effectiveness of efforts to achieve customer satisfaction by surveying businesses.
Review economic development incentive grant programs to identify needed updates.
Actively market programs and opportunities to encourage investment from the private sector.
Continue to improve business webpage with redesign and up-to-date materials.
Maintain regular and open communication with EDC staff.
$-
$500,000
$1,000,000
$1,500,000
13-14 14-15 15-16 16-17Budget
Total Expenditures
0%
20%
40%
60%
80%
100%
13-14 14-15 15-16 16-17
% of Customers Rating Overall Satisfaction as "Very" or "Somewhat"
Actual Objective
118

PERFORMANCE GOALS:
Major Service Area: Redevelopment Facilitation
Goal: To provide enhanced investment and redevelopment opportunities within the developed and older areas of Concord in a timely manner that simplifies project complexity, reduces risk factors, attracts capital investment, and creates jobs.
Major Service Area: Investment Tracking
Goal: To provide accurate information in a timely manner to developers elected officials, and City management regarding public and private investment throughout the City of Concord.
PERFORMANCE SUMMARY: Major Performance Measure FY14 FY15 FY16 FY16 FY17 Benchmark Service Indicator Type Actual Actual Obj. Actual Obj. Target Area
Redevelop-ment
Facilitation
% of customers rating overall satisfaction as ‘Very’ or ‘Somewhat’
satisfied
Effectiveness 100% 100% 90% NA 90% 90%
Investment Tracking
Total public and private business investment in
the downtown area (Union St., Cabarrus
Ave., Church St.)
Effectiveness $9,518,075 $29,639,272 NA NA NA NA
Investment Tracking
Total public and private business investment in manufacturing, high tech, & Class A office
Effectiveness New for FY17
New for FY17
New for FY17
New for FY17 NA NA
Investment Tracking
Total public and private business investment in
other areas Effectiveness New for
FY17 New for
FY17 New for
FY17 New for
FY17 NA NA
BUDGET SUMMARY
Cost Center #: 49202013-2014 2014-2015 2015-2016 2015-2016 2016-2017 2016-2017
Actual Expenditures
Actual Expenditures**
CouncilApproved
Actual Expenditures**
ManagerRecommended
CouncilApproved
Personnel Services 88,720$ -$ 79,758$ 68,009$ 72,063$ 72,063$
Operations 935,050$ 671,544$ 768,679$ 389,548$ 1,042,823$ 1,042,823$ Cost Allocations 819$ -$ -$ -$ -$ -$
Capital Outlay -$ -$ 425,000$ 425,000$ -$ -$
Total Expenditures 1,024,589$ 671,544$ 1,273,437$ 882,557$ 1,114,886$ 1,114,886$
% budget change -80% 31% -12%
* as amended**as of 8/11/2016Authorized FTE 1.00 1.00 1.00 1.00 1.00 1.00
119

CULTURAL & RECREATIONAL OVERVIEW: Cultural & Recreational provides recreational opportunities to the citizens of Concord through the provision of recreational services, parks, and facilities. Cultural & Recreational is comprised of Parks & Recreation and Parks & Recreation- Aquatics. DEPARTMENTS:
Parks & Recreation: The Parks & Recreation Department provides recreation and leisure services for the citizens of Concord. The department currently operates seven city parks, three recreation centers, several miles of greenways and trails, and one aquatic center. Additional information regarding the Parks & Recreation Department may be obtained by contacting Bob Dowless, Director of Parks & Recreation, at (704) 920- 5600 or via email at [email protected].
Parks & Recreation- Aquatics: The Parks & Recreation Department- Aquatics operates the McInnis
Aquatics Center. Additional information may be obtained by contacting Bob Dowless, Director of Parks & Recreation, at (704) 920-5600 or via email at [email protected].
120

Cultural & Recreation Expenditures2013-2014 2014-2015 2015-2016 2015-2016 2016-2017 2016-2017
ActualExpenses
ActualExpenses
CouncilApproved*
ActualExpenses**
ManagerRecommended
CouncilApproved
Budget Unit (General Fund)Parks & Recreation 4,611,996$ 5,067,918$ 5,061,333$ 4,522,141$ 6,243,519$ 6,243,519$ Parks & Recreation - Aquatics 90,319$ 105,009$ 175,606$ 122,334$ 178,477$ 178,477$
Total Expenditures 4,702,315$ 5,172,927$ 5,236,939$ 4,644,475$ 6,421,996$ 6,421,996$ % budget change -13% 10% -10% 23%* as amended**as of 8/11/2016
Parks & Recreation97%
Parks & Recreation - Aquatics3%
FY 16-17 Cultural & Recreation Expenditures (by Budget Unit)
$-
$1,000,000
$2,000,000
$3,000,000
$4,000,000
$5,000,000
$6,000,000
$7,000,000
ActualExpenses
ActualExpenses
ActualExpenses**
CouncilApproved
2013-2014 2014-2015 2015-2016 2016-2017
Parks & Recreation Parks & Recreation - Aquatics
Cultural & Recreational Expenditure Trend
121

PARKS AND RECREATION MISSION: The Parks and Recreation Department exists to provide recreation services, parks, and facilities that enrich the lives of all residents and promote the opportunity for a healthy lifestyle. PROGRAM LOCATOR: Fund: General Fund Functional Area: Cultural and Recreational Department: Parks and Recreation BUDGET & PERFORMANCE HIGHLIGHTS: MAJOR SERVICE(S) PROVIDED: Facility Development Festivals, Events, Programs and Athletics Recreation Center Operations and Programming Facility Operations Customer Service
FY 2015-16 MAJOR ACCOMPLISHMENTS: Completed construction and began operations of
Hector H Henry II Greenway, Exit 49 Phase and Bark Park.
Continued work on construction documents for Hector H Henry II Greenway, Riverwalk Phase.
Completed construction documents for renovations of Hartsell Center.
Installed Control Link lighting controls at five ball fields.
Began updating the Parks Master Plan.
Purchased first phase of new weight equipment at Academy Recreation Center.
Utilize fiber optics and install security cameras at Dorton Park.
Replaced basketball goals at all 3 recreation centers.
FY 2016-17 MAJOR BUDGET CHANGES / NEW REQUESTS /
FOCUS AREAS: Begin renovations of Hartsell Recreation Center. Begin construction of McEachern Greenway,
Cabarrus Avenue Phase. Apply for PARTF grant for Hector H Henry
greenway and continue design. Acquire land for access into Riverwalk. Begin construction of McEachern, Fink Phase. Renovate windows and HVAC on west side of
Academy Recreation Center. Expand Daniel Pharr Building for additional
meeting space. Replace Webb Field scoreboard.
STEPS / PROGRAMS BEING UNDERTAKEN TO ENHANCE
PERFORMANCE: Emphasis on providing information about
greenways to the public. Emphasis on expanded capabilities of professional
staff to include Project Management, Park Operations, ADA, and Grant opportunities.
Emphasis on customer services to the public through technical means (Facebook and website development, the Operations Manuals).
Aggressively search for and evaluate new facility opportunities in high growth areas.
$- $1,000,000 $2,000,000 $3,000,000 $4,000,000 $5,000,000 $6,000,000 $7,000,000
13-14 14-15 15-16 16-17Budget
Total Expenditures
0%20%40%60%80%
100%
13-14 14-15 15-16 16-17
% of Program Participants Reporting being "Very" Satisfied with their Experience
Actual Objective
122

PERFORMANCE GOALS:
Major Service Area: Customer Service
Goal: Provide tools to communicate with the public, track responses and evaluate, implement change according to feedback, improve usage of existing facilities, improve other major service areas.
Major Service Area: Facility Development
Goal: To pursue park facility development, including long range visioning, partnerships, alternative funding, donations, evolving role of athletics, site control efforts, master planning, design and construction.
Major Service Area: Festivals, Events, Programs and Athletics
Goal: To provide basic, extended and special leisure/athletic programming to youth and adults that are cost effective and engaging in order to provide social, educational, athletic and mentally stimulating experiences.
Major Service Area: Recreation Center Operations and Programming
Goal: To operate recreation centers that are positive destination points for the residents of Concord. To market the recreation centers in order to provide programs and activities that are popular with the communities served.
Major Service Area: Facility Operations
Goal: To operate park facilities that are positive destination points in order to provide patrons with a safe leisure experience in a cost effective manner.
PERFORMANCE SUMMARY:4 Major Performance Measure FY14 FY15 FY16 FY16 FY17 Benchmark Service Indicator Type Actual Actual Obj. Actual Obj. Target Area
Facility Development
Number of donations, partnerships and funding
sources secured NA 8 4 8 4 8 10
Festivals, Events, Programs, Athletics
% cost recovery of extended adult programs
Efficiency 92% 100% 100% 105% 100% 90%
Festivals, Events, Programs, Athletics
% of program participants reporting being “very” satisfied
with their experience Effectiveness 95% 96% 98% 98% 99% 100%
Festivals, Events, Programs, Athletics
# of youth participating in youth programming
Workload 11,672 11,251 12,500 14,793 13,000 15,000
Festivals, Events, Programs, Athletics
% of volunteers, coaches and contract instructors reporting
being “very” satisfied with their experience
Effectiveness 97% 96% 98% 97% 98% 100%
Festivals, Events, Programs, Athletics
# of Youth Council Participant Volunteer Hours
Effectiveness New for
FY17
New for
FY17
New for
FY17
New for
FY17 900 NA
Recreation Center Op. & Programming
Total Attendance at Recreation Centers
Efficiency 81,093 85,663 83,000 87,165 85,000 80,000
Facility Operations
Dept’s revenue as % of operating expenditures
Effectiveness 12% 14.8% 16% 17% 16% 20%
Facility Operations
# of vandalism incidents Effectiveness 33 34 33 31 33 NA
Customer Service
Resident Outreach: # Amount of Organic Reach on Social
Media Effectiveness
New for
FY17
New for
FY17
New for
FY17
New for
FY17 80,000 NA
Customer Service Resident Outreach: % of on-
line registrations of total Effectiveness 23% 19.2% 25% 26% 25% 60%
123

BUDGET SUMMARY:
Cost Center #: 6120
2013-2014 2014-2015 2015-2016 2015-2016 2016-2017 2016-2017
Actual Expenditures
Actual Expenditures
CouncilApproved*
Actual Expenditures**
Manager Recommended
CouncilApproved
Personnel Services 1,200,962$ 1,219,460$ 1,343,695$ 1,246,525$ 1,383,746$ 1,383,746$
Operations 1,342,901$ 1,272,827$ 1,769,441$ 1,537,439$ 1,493,468$ 1,493,468$
Capital Outlay 73,780$ 601,311$ 100,000$ 25,346$ 204,000$ 204,000$
Debt Service 241,344$ 231,525$ 222,773$ 222,768$ 213,123$ 213,123$
Cost Allocations 1,676,504$ 1,737,785$ 1,624,347$ 1,488,986$ 1,746,682$ 1,746,682$
Transfers 76,505$ 5,010$ 1,077$ 1,077$ 1,202,500$ 1,202,500$
Total Expenditures 4,611,996$ 5,067,918$ 5,061,333$ 4,522,141$ 6,243,519$ 6,243,519$
% budget change -93% -79% 23%
* as amended**as of 8/11/2016Authorized FTE 22.25 21.00 22.00 22.00 22.00 22.00
124

PARKS AND RECREATION AQUATICS MISSION: The Parks and Recreation Department exists to provide recreation services, parks and facilities that enrich the lives of all residents and promote the opportunity for a healthy lifestyle. PROGRAM LOCATOR: Fund: General Fund Functional Area: Cultural and Recreational Department: Parks & Recreation Division: Aquatics BUDGET & PERFORMANCE HIGHLIGHTS: MAJOR SERVICE(S) PROVIDED: Pool Operations Pool Programs
FY 2015-16 MAJOR ACCOMPLISHMENTS:
Replaced the final ¼ of existing plaster-coated deck with brushed concrete that will last 15 years. This addresses safety and customer service concerns.
Improve customer satisfaction by further limiting the days/hours that large groups can come to the pool, which increases the time available for families to attend.
Added 2 new tables and 2 benches to improve customer area.
Replaced Main Drains for pool compliance. Installed new shelter in front of building.
FY 2016-17 MAJOR BUDGET CHANGES / NEW REQUESTS /
FOCUS AREAS: Resurface the inside of the pool.
STEPS / PROGRAMS BEING UNDERTAKEN TO ENHANCE
PERFORMANCE: Focused staff training to increase customer
satisfaction, including discussion of complaint resolution at staff meetings.
Increase staff training regarding safety awareness, and swim instruction.
Use of Operations Manual for improved customer service.
Improved availability of pool to the public for open swim times.
Increased collection of customer satisfaction surveys.
$-
$50,000
$100,000
$150,000
$200,000
13-14 14-15 15-16 16-17Budget
Total Expenditures
0%
20%
40%
60%
80%
100%
13-14 14-15 15-16 16-17
% of Pool Patrons Reporting Being "Somewhat" or "Very" Satisfied with their Experience
Actual Objective
125
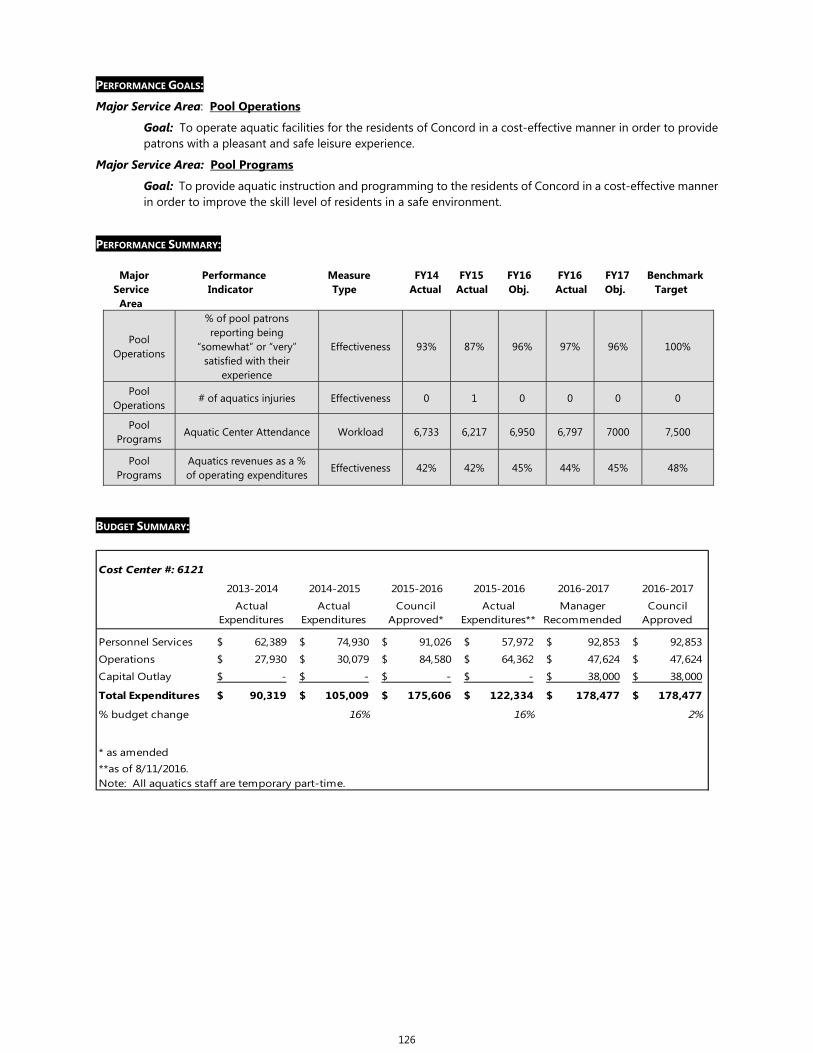
PERFORMANCE GOALS:
Major Service Area: Pool Operations
Goal: To operate aquatic facilities for the residents of Concord in a cost-effective manner in order to provide patrons with a pleasant and safe leisure experience.
Major Service Area: Pool Programs
Goal: To provide aquatic instruction and programming to the residents of Concord in a cost-effective manner in order to improve the skill level of residents in a safe environment.
PERFORMANCE SUMMARY: Major Performance Measure FY14 FY15 FY16 FY16 FY17 Benchmark Service Indicator Type Actual Actual Obj. Actual Obj. Target Area
Pool Operations
% of pool patrons reporting being
“somewhat” or “very” satisfied with their
experience
Effectiveness 93% 87% 96% 97% 96% 100%
Pool Operations
# of aquatics injuries Effectiveness 0 1 0 0 0 0
Pool Programs
Aquatic Center Attendance Workload 6,733 6,217 6,950 6,797 7000 7,500
Pool Programs
Aquatics revenues as a % of operating expenditures
Effectiveness 42% 42% 45% 44% 45% 48%
BUDGET SUMMARY:
Cost Center #: 6121
2013-2014 2014-2015 2015-2016 2015-2016 2016-2017 2016-2017
Actual Expenditures
Actual Expenditures
CouncilApproved*
Actual Expenditures**
Manager Recommended
CouncilApproved
Personnel Services 62,389$ 74,930$ 91,026$ 57,972$ 92,853$ 92,853$
Operations 27,930$ 30,079$ 84,580$ 64,362$ 47,624$ 47,624$
Capital Outlay -$ -$ -$ -$ 38,000$ 38,000$
Total Expenditures 90,319$ 105,009$ 175,606$ 122,334$ 178,477$ 178,477$
% budget change 16% 16% 2%
* as amended**as of 8/11/2016.Note: All aquatics staff are temporary part-time.
126

SPECIAL REVENUE FUNDS OVERVIEW: Special Revenue Funds are funds that are used or required to account for specific revenues that are legally restricted to expenditures for particular purposes. Special Revenue Funds include the Municipal Service District, HOME Consortium - Administration and Projects 2016, Community Development Block Grant (CDBG) – Administration and Projects 2016, Section 8 Housing Choice Voucher Program, and the Additional $5 Vehicle Tax for Public Transit. FUNDS:
Municipal Service District: The Municipal Service District serves as a pass-through agent for taxes levied on behalf of and remitted to the Concord Downtown Redevelopment Corporation for use in the promotion and improvement of the City’s downtown area. Additional information regarding the Municipal Service District may be obtained by contacting Pam Hinson, Director of Finance, at (704) 920-5220 or via email at [email protected].
Section 8 Housing Choice Voucher Program: The Section 8 Housing Choice Voucher Program is
responsible for assisting low-income families in finding affordable and decent housing in the private rental market. Additional information regarding the Voucher Program may be obtained by contacting Angela Graham, Director of Public Housing, at (704) 788-1139 or via email at [email protected].
Community Development Block Grant (CDBG) – Administration and Projects 2016: The CDBG –
Administration and Project Department is responsible for administering and outlining Federal community development monies designated for serving low to moderate-income areas of the City. Funds are granted through the U.S. Department of Housing and Urban Development. Additional information regarding Community Development Block Grants may be obtained by contacting Margaret Pearson, Planning & Neighborhood Development Director, at (704) 920-5151 or via email at [email protected].
HOME Consortium - Administration and Projects 2016: The Cabarrus, Iredell, and Rowan HOME
Consortium was established in 1996 as an entitlement area to receive HOME Investment Partnership funds through the U.S. Department of Housing and Urban Development. The HOME program allows participating jurisdictions to address affordable housing issues through renovations of existing homes and by constructing new units. The Consortium members include the counties of Cabarrus, Iredell, and Rowan, the towns of Davidson and Mooresville, and the cities of Concord, Kannapolis, Salisbury, and Statesville. The City of Concord serves as the lead entity. Additional information regarding the HOME Consortium Department may be obtained by contacting Margaret Pearson, Planning & Neighborhood Development Director, at (704) 920-5151 or via email at [email protected].
Additional $5 Vehicle Tax for Public Transit: The $5 Vehicle Tax for Public Transit Fund serves as a
pass-through agent for annual vehicle license taxes approved by the City of Concord under G.S. 105-561. The purpose of this tax is to raise revenue for capital and operating expenses associated with operation of the Concord-Kannapolis Rider Public Transit System. This special revenue fund accounts for the tax revenue and transfer of funds to the City’s Public Transit Fund. Additional information regarding the Additional $5 Vehicle Tax Fund for Public Transit may be obtained by contacting Pam Hinson, Director of Finance, at (704) 920-5220 or via email at [email protected].
127

Municipal Service District RevenueFund 201
2013-2014 2014-2015 2015-2016 2015-2016 2016-2017 2016-2017
Actual Revenues
Actual Revenues
CouncilApproved*
Actual Revenues**
Manager Recommended
Council Approved
Current Levy Collection 99,007$ 104,399$ 113,475$ 107,027$ 89,000$ 89,000$
Total Revenue 99,007$ 104,399$ 113,475$ 107,027$ 89,000$ 89,000$ % budget change 5.4% 2.5% -22%** as of 8/11/2016
Municipal Service District Expenditures
2013-2014 2014-2015 2015-2016 2015-2016 2016-2017 2016-2017
Actual Expenditures
Actual Expenditures
Council Approved*
Actual Expenditures**
Manager Recommended
Council Approved
Budget UnitConcord Downtown Development Corp. 99,007$ 104,399$ 113,475$ 107,027$ 89,000$ 89,000$
Total Expenditures 99,007$ 104,399$ 113,475$ 107,027$ 89,000$ 89,000$ % budget change 5.4% 2.5% -22%* as amended**as of 8/11/2016
$- $10,000 $20,000 $30,000 $40,000 $50,000 $60,000 $70,000 $80,000 $90,000
$100,000 $110,000
ActualRevenues
ActualRevenues
ActualRevenues**
ManagerRecommended
2013-2014 2014-2015 2015-2016 2016-2017
Municipal Service District Revenue Trend
$- $10,000 $20,000 $30,000 $40,000 $50,000 $60,000 $70,000 $80,000 $90,000
$100,000 $110,000 $120,000
ActualExpenditures
ActualExpenditures
ActualExpenditures**
CouncilApproved
2013-2014 2014-2015 2015-2016 2016-2017
Municipal Service District Expenditure Trend
128

MUNICIPAL SERVICE DISTRICT MISSION: N/A PROGRAM LOCATOR:: Fund: Municipal Service District Functional Area: Municipal Service District Department: Municipal Service District BUDGET & PERFORMANCE HIGHLIGHTS: MAJOR SERVICE(S) PROVIDED: Budget serves as a Special Revenue Fund pass
through agent for the Concord Downtown Development Corporation.
FY 2015-16 MAJOR ACCOMPLISHMENTS: N/A
BUDGET SUMMARY:
FY 2016-17 MAJOR BUDGET CHANGES / NEW REQUESTS /
FOCUS AREAS: Maintains a tax rate for the district of $0.23 per
$100 of valuation. STEPS / PROGRAMS BEING UNDERTAKEN TO ENHANCE
PERFORMANCE: N/A
PERFORMANCE GOALS:
Major Service Area: _____N/A______
Goal: N/A
PERFORMANCE SUMMARY: N/A
Cost Center #: 50002013-2014 2014-2015 2015-2016 2015-2016 2016-2017 2016-2017
Actual Expenditures
Actual Expenditures
CouncilApproved*
Actual Expenditures**
Manager Recommended
CouncilApproved
Operations 99,007$ 104,399$ 113,475$ 107,027$ 89,000$ 89,000$
Total Expenditures 99,007$ 104,399$ 113,475$ 107,027$ 89,000$ 89,000$
% budget change 5% 2.5% -22%
* as amended
**as of 8/11/2016
$- $10,000 $20,000 $30,000 $40,000 $50,000 $60,000 $70,000 $80,000 $90,000
$100,000 $110,000
13-14 14-15 15-16 16-17Budget
Total Expenditures
129

Section 8 Voucher Program RevenuesFund 210
2013-2014 2014-2015 2015-2016 2015-2016 2016-2017 2016-2017Actual
RevenuesActual
RevenuesCouncil
Approved*Actual
Revenues**Manager
RecommendedCouncil
Approved
Restricted Intergov't Revenues 4,514,998$ 4,295,194$ 3,768,256$ 4,062,657$ 3,762,033$ 3,762,033$ Other Revenues -$ -$ 1,061,000$ 2,340$ 501,000$ 501,000$
Total Revenue 4,514,998$ 4,295,194$ 4,829,256$ 4,064,997$ 4,263,033$ 4,263,033$ % budget change -7% -5% -12%* as amended**as of 8/11/2016
Section 8 Voucher Program Expenditures2013-2014 2014-2015 2015-2016 2015-2016 2016-2017 2016-2017
ActualExpenditures
ActualExpenditures
CouncilApproved*
Actual Expenditures**
Manager Recommended
CouncilApproved
Section 8 Voucher Program 4,596,323$ 4,439,762$ 4,829,256$ 4,142,334$ 4,263,033$ 4,263,033$
Total Expenditures 4,596,323$ 4,439,762$ 4,829,256$ 4,142,334$ 4,263,033$ 4,263,033$ % budget change -3% -7% -12%* as amended**as of 8/11/2016
$2,000,000
$2,500,000
$3,000,000
$3,500,000
$4,000,000
$4,500,000
$5,000,000
ActualRevenues
ActualRevenues
ActualRevenues**
CouncilApproved
2013-2014 2014-2015 2015-2016 2016-2017
Section 8 Revenue Trend
Restricted Intergov't Revenues Other Revenues
$2,000,000
$2,500,000
$3,000,000
$3,500,000
$4,000,000
$4,500,000
$5,000,000
ActualExpenditures
ActualExpenditures
ActualExpenditures**
CouncilApproved
2013-2014 2014-2015 2015-2016 2016-2017
Section 8 Voucher Program Expenditure Trend
130

SECTION 8 HOUSING CHOICE VOUCHER PROGRAM MISSION: The City of Concord Housing Department serves low-income families for whom conventional housing is unaffordable. Our mission is to provide these families with decent, safe, and sanitary housing while supporting their efforts to achieve economic independence and self-sufficiency. PROGRAM LOCATOR:: Fund: Voucher Program Functional Area: Voucher Program Department: Public Housing Division: Vouchers BUDGET & PERFORMANCE HIGHLIGHT MAJOR SERVICE(S) PROVIDED: Decent, safe, sanitary housing for clients Family self-sufficiency Accounting Education
FY 2015-16 MAJOR ACCOMPLISHMENTS:
The department was a finalist for the City’s Productivity Award for reducing the Portability
Receivable (funding owed to the Housing Department from other Housing Authorities throughout the United States) by 94%.
The Housing Department continues to educate Housing Choice Voucher Landlords by hosting a yearly Landlord Workshop. This informative program covers all phases of what both new and existing landlords need to know to comply with HUD rules and regulations.
Built and completed an open-market duplex on Shannon Drive to generate additional revenue for the program.
FY 2016-17 MAJOR BUDGET CHANGES / NEW REQUESTS /
FOCUS AREAS: Maintain a 98% lease-up of our Housing Choice
Voucher units to assist families in need of decent, safe, and sanitary housing.
Work closely with community partners to research, identify and align resources to assist families on the path to a life of economic independence.
Encourage self-sufficiency of participant families and assist in the expansion of family opportunities which address educational, socio-economic, recreational, and other human resource needs.
STEPS / PROGRAMS BEING UNDERTAKEN TO ENHANCE
PERFORMANCE: Provide decent, safe, and sanitary housing in good
repair – in compliance with program uniform physical condition standards – for very- low and low- income families.
Promote fair housing and the opportunity for very low-income and low-income families of all races, ethnicities, national origins, religions, ethnic backgrounds, and with all types of disabilities, to participate in the Housing Choice Voucher program and its services.
Attain and maintain a high level of standards and professionalism in day-to-day management of all program components.
Continue to provide education on policies and procedures through semiannual landlord workshops.
$-
$1,000,000
$2,000,000
$3,000,000
$4,000,000
$5,000,000
13-14 14-15 15-16 16-17Budget
Total Expenditures
0%
25%
50%
75%
100%
13-14 14-15 15-16 16-17
% Utilization of Units Under Lease
Actual Objective
131

PERFORMANCE GOALS:
Major Service Area: Decent, Safe, and Sanitary Housing
Goal: To provide high quality housing to residents/clients in order to obtain a safe and enjoyable living environment.
Major Service Area: Family Self-Sufficiency
Goal: To provide Family Self-Sufficiency support resources to our housing residents in order to promote the ultimate goal of homeownership.
Major Service Area: Accounting
Goal: To provide accurate financial information, in a timely manner, to the City of Concord and the Department of Housing and Urban Development in order to comply with local, state, and federal laws, and governmental accounting and regulatory requirements.
Major Service Area: Education
Goal: To improve on educating landlords/property owners in the Housing Choice Voucher Program through forums and workshops.
Major Service Area: Self-Sufficiency
Goal: To utilize our homeownership program and coordinator to continue to encourage all program participants of the benefits of Self-Sufficiency.
PERFORMANCE SUMMARY: Major Performance Measure FY14 FY15 FY16 FY16 FY17 Benchmark Service Indicator Type Actual Actual Obj. Actual Obj. Target Area
Decent, Safe, and Sanitary Housing
% Utilization of Units under lease based on Voucher
Funding Effectiveness 95% 90% 99% 110% 100% 98%
Family Self Sufficiency
# of participants in the FSS program
Effectiveness 25 24 25 25 25 25
Education % of New Landlords attending Landlord Forums/Workshops
Effectiveness 100% 100% 100% 100% 100% 100%
BUDGET SUMMARY: Cost Center #: 1500
2013-2014 2014-2015 2015-2016 2015-2016 2016-2017 2016-2017
Actual Expenditures
Actual Expenditures
CouncilApproved*
Actual Expenditures**
Manager Recommended
CouncilApproved
Administration 258,779$ 224,663$ 277,291$ 250,668$ 280,661$ 280,661$
Housing Assistance Pymts. 4,279,278$ 4,136,884$ 4,525,876$ 3,832,267$ 3,979,371$ 3,979,371$
Maintenance / Other Expen. 58,266$ 78,215$ 26,089$ 59,399$ 3,001$ 3,001$
Total Expenditures 4,596,323$ 4,439,762$ 4,829,256$ 4,142,334$ 4,263,033$ 4,263,033$
% budget change -3.4% -6.7% -12%* as amended**as of 8/11/2016Authorized FTE 4.50 4.70 4.58 4.58 5.40 5.40
132

HOME Consortium RevenuesFund 257
2013-2014 2014-2015 2015-2016 2015-2016 2016-2017 2016-2017
Actual Revenues
Actual Revenues**
CouncilApproved*
Actual Revenues
Manager Recommended
CouncilApproved
Restricted Intergov'tl Revenue -$ 77$ 173,225$ 91$ 183,440$ 183,440$ Other Revenue 83,099$ 86,372$ 48,331$ 193,272$ 33,753$ 33,753$ Transfers 49,483$ 54,043$ 55,743$ 54,517$ 62,023$ 62,023$
Total Revenue 132,582$ 140,492$ 277,299$ 247,880$ 279,216$ 279,216$ % budget change 6% 76% 1%* as amended**as of 8/11/2016
Restricted Intergov'tl Revenue66%
Other Revenue12%
Transfers22%
FY 16-17 HOME Consortium Revenues
$-
$50,000
$100,000
$150,000
$200,000
$250,000
$300,000
ActualRevenues
ActualRevenues**
ActualRevenues
CouncilApproved
2013-2014 2014-2015 2015-2016 2016-2017
HOME Revenue Trend
Transfers
Other Revenue
Restricted Intergov'tlRevenue
133

HOME Consortium Expenditures2013-2014 2014-2015 2015-2016 2015-2016 2016-2017 2016-2017
Actual Expenses
Actual Expenses
Council Approved*
Actual Expenses**
ManagerRecommended
Council Approved
Budget UnitAdministration 9,517$ 51,260$ 63,306$ 91$ 65,847$ 65,847$ Projects 126,713$ 122,221$ 213,993$ -$ 213,369$ 213,369$ Total Expenditures 136,230$ 173,481$ 277,299$ 91$ 279,216$ 279,216$ % budget change -18% -100% 1%* as amended**as of 8/11/2016
Administration24%
Projects 76%
FY 16-17 Home Consortium Expenditures
$-
$50,000
$100,000
$150,000
$200,000
$250,000
$300,000
ActualExpenses
ActualExpenses
ActualExpenses**
CouncilApproved
2013-2014 2014-2015 2015-2016 2016-2017
HOME Expenditure Trends
Administration
Projects
134

HOME CONSORTIUM ADMINISTRATION AND PROJECTS 2016
MISSION: The HOME Consortium exists to provide low and moderate-income citizens with major housing rehabilitation, new home construction, and homebuyer assistance to improve their quality of life and enhance the vitality, safety, and attractiveness of neighborhoods. PROGRAM LOCATOR:: Fund: HOME Consortium 2016 Functional Area: HOME 2016 Department: Planning & Nbhd Services Division: HOME Admin. & Projects 2016 BUDGET & PERFORMANCE HIGHLIGHTS: MAJOR SERVICE(S) PROVIDED: Lead Agency Administration of the Cabarrus / Iredell / Rowan HOME Consortium. Down Payment Assistance to Low and Moderate- Income Homebuyers. New Construction of Affordable Housing Units.
FY 2015-16 MAJOR ACCOMPLISHMENTS: Conducted HUD Training for HOME Consortium
members and 10 HOME Consortium monitoring visits.
Successful submittal of automated HOME Consortium Consolidation Action Plan and CAPER.
Completed new construction of 4 homes in LMI neighborhoods.
Completed new construction of 1 duplex in an LMI area for the Housing Department.
Assisted 2 families with down payment assistance for new home purchases.
Completed 2 whole-house rehabilitation projects. Achieved satisfactory ratings from HUD in all core
areas of program operations. FY 2016-17 MAJOR BUDGET CHANGES / NEW REQUESTS /
FOCUS AREAS: Complete construction of 4 new homes in LMI
communities. Complete 2 HOME whole-house rehabilitation
projects. Complete 1 HOME reconstruction project. Continue efforts to assist with multi-family tax
credit development and rehabilitation projects. Continue partnership with Habitat to build 2 new
homes. Continue assistance for families who need whole-
house rehabilitation repairs.
STEPS/PROGRAMS BEING UNDERTAKEN TO ENHANCE
PERFORMANCE: Enhance monitoring efforts of City financed tax
credit project in regards to HUD’s Affirmatively Furthering Fair Housing (AFFH) regulations.
Work in partnership with the Housing Department to provide housing counseling services to residents who participate in the Family Self Sufficiency Program.
Continue training sessions for HOME Consortium members to provide tools to administer HOME projects more efficiently and effectively.
Continue to provide training opportunities for staff to enhance their administrative skill sets.
$0
$50,000
$100,000
$150,000
$200,000
$250,000
$300,000
13-14 14-15 15-16 16-17Budget
HOME Total Expenditures
50%
60%
70%
80%
90%
100%
13-14 14-15 15-16 16-17
% of HOME Consortium Members and CHDOs in Full Compliance
Actual Objective
135
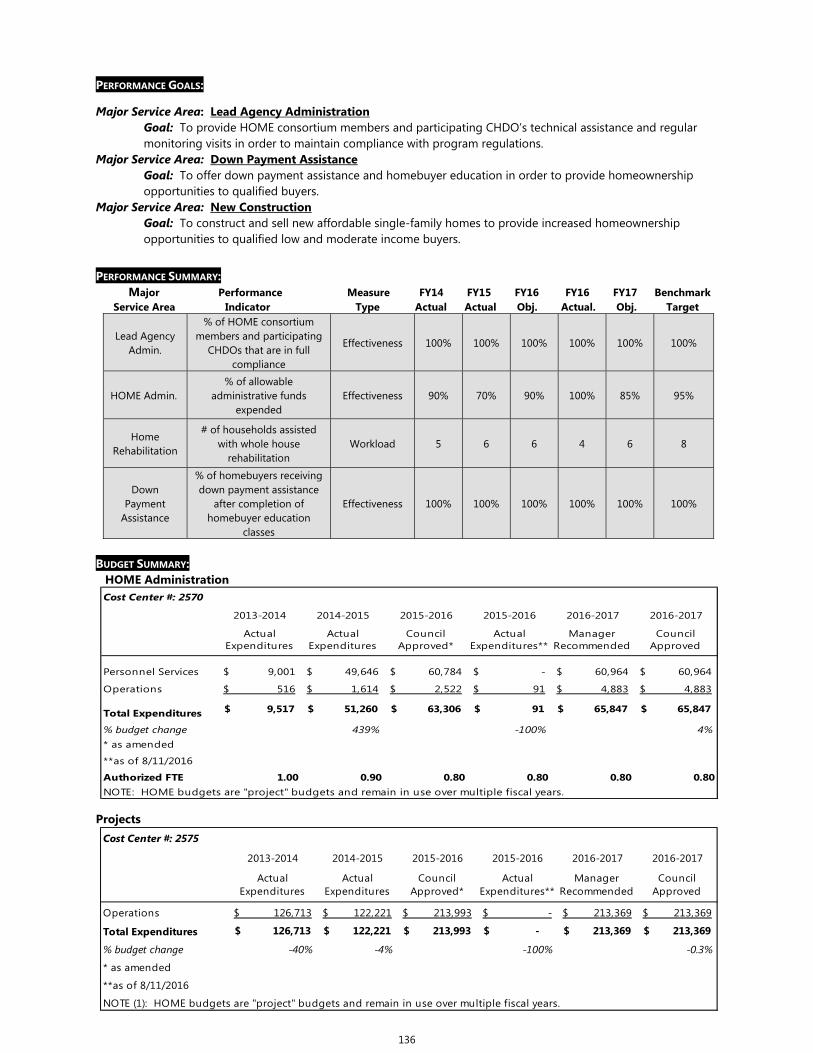
PERFORMANCE GOALS:
Major Service Area: Lead Agency Administration Goal: To provide HOME consortium members and participating CHDO’s technical assistance and regular monitoring visits in order to maintain compliance with program regulations.
Major Service Area: Down Payment Assistance Goal: To offer down payment assistance and homebuyer education in order to provide homeownership opportunities to qualified buyers.
Major Service Area: New Construction Goal: To construct and sell new affordable single-family homes to provide increased homeownership opportunities to qualified low and moderate income buyers.
PERFORMANCE SUMMARY: Major Performance Measure FY14 FY15 FY16 FY16 FY17 Benchmark Service Area Indicator Type Actual Actual Obj. Actual. Obj. Target
Lead Agency Admin.
% of HOME consortium members and participating
CHDOs that are in full compliance
Effectiveness 100% 100% 100% 100% 100% 100%
HOME Admin. % of allowable
administrative funds expended
Effectiveness 90% 70% 90% 100% 85% 95%
Home Rehabilitation
# of households assisted with whole house
rehabilitation Workload 5 6 6 4 6 8
Down Payment
Assistance
% of homebuyers receiving down payment assistance
after completion of homebuyer education
classes
Effectiveness 100% 100% 100% 100% 100% 100%
BUDGET SUMMARY: HOME Administration
Projects
Cost Center #: 2570
2013-2014 2014-2015 2015-2016 2015-2016 2016-2017 2016-2017
Actual Expenditures
Actual Expenditures
CouncilApproved*
Actual Expenditures**
Manager Recommended
CouncilApproved
Personnel Services 9,001$ 49,646$ 60,784$ -$ 60,964$ 60,964$
Operations 516$ 1,614$ 2,522$ 91$ 4,883$ 4,883$
Total Expenditures 9,517$ 51,260$ 63,306$ 91$ 65,847$ 65,847$
% budget change 439% -100% 4%* as amended
**as of 8/11/2016
Authorized FTE 1.00 0.90 0.80 0.80 0.80 0.80NOTE: HOME budgets are "project" budgets and remain in use over multiple fiscal years.
Cost Center #: 2575
2013-2014 2014-2015 2015-2016 2015-2016 2016-2017 2016-2017
Actual Expenditures
Actual Expenditures
CouncilApproved*
Actual Expenditures**
Manager Recommended
CouncilApproved
Operations 126,713$ 122,221$ 213,993$ -$ 213,369$ 213,369$
Total Expenditures 126,713$ 122,221$ 213,993$ -$ 213,369$ 213,369$
% budget change -40% -4% -100% -0.3%
* as amended
**as of 8/11/2016
NOTE (1): HOME budgets are "project" budgets and remain in use over multiple fiscal years.
136

Additional $5 Vehicle Tax (Transit) RevenueFund 292
2013-2014 2014-2015 2015-2016 2015-2016 2016-2017 2016-2017
Actual Revenues
Actual Revenues
CouncilApproved*
Actual Revenues**
Manager Recommended
CouncilApproved
Licenses 512,378$ 393,017$ 400,000$ 381,680$ 350,000$ 350,000$ Investment Earnings -$ 275$ 245$ 569$ -$ -$
Total Revenues 512,378$ 393,292$ 400,245$ 382,249$ 350,000$ 350,000$ % budget change -23% -3% -13%* as amended** as of 8/11/2016
Additional $5 Vehicle Tax (Transit) Expenditures2013-2014 2014-2015 2015-2016 2015-2016 2016-2017 2016-2017
Actual Expenditures
Actual Expenditures
CouncilApproved*
Actual Expenditures**
Manager Recommended
CouncilApproved
By DepartmentTransfer to Public Transit 512,378$ 393,292$ 400,245$ 382,248$ 350,000$ 350,000$
Total Expenditures 512,378$ 393,292$ 400,245$ 382,248$ 350,000$ 350,000$ % budget change -23% -3% -13%* as amended** as of 8/11/2016
$‐
$100,000
$200,000
$300,000
$400,000
$500,000
$600,000
ActualRevenues
ActualRevenues
ActualRevenues**
CouncilApproved
2013‐2014 2014‐2015 2015‐2016 2016‐2017
Additional $5 Vehicle Tax ‐Transit Revenue
Licenses
$‐
$100,000
$200,000
$300,000
$400,000
$500,000
$600,000
ActualExpenditures
ActualExpenditures
ActualExpenditures**
CouncilApproved
2013‐2014 2014‐2015 2015‐2016 2016‐2017
Additional $5 Vehicle Tax ‐Transit Expenditures
137

ADDITIONAL $5 VEHICLE TAX- TRANSIT MISSION: N/A PROGRAM LOCATOR:: Fund: Additional $5 Vehicle Tax - Transit Functional Area: Addl. $5 Vehicle Tax - Transit Department: Addl. $5 Vehicle Tax - Transit Division: N/A BUDGET & PERFORMANCE HIGHLIGHTS: MAJOR SERVICE(S) PROVIDED: Budget unit serves as a Special Revenue Fund pass
through agent for funding dedicated to Public Transit
FY 2015-16 MAJOR ACCOMPLISHMENTS:
N/A
FY 2016-17 MAJOR BUDGET CHANGES / NEW REQUESTS /
FOCUS AREAS: N/A
STEPS / PROGRAMS BEING UNDERTAKEN TO ENHANCE
PERFORMANCE: N/A
PERFORMANCE SUMMARY: N/A
PERFORMANCE GOALS:
Major Service Area: _ N/A____
Goal: N/A
BUDGET SUMMARY:
Cost Center #: 8200
2013-2014 2014-2015 2015-2016 2015-2016 2016-2017 2016-2017
Actual Expenses
Actual Expenses
CouncilApproved*
Actual Expenses**
Manager Recommended
CouncilApproved
Transfers 512,378$ 393,292$ 400,245$ 382,248$ 350,000$ 350,000$
Total Expenditures 512,378$ 393,292$ 400,245$ 382,248$ 350,000$ 350,000$
% budget change -23% -3% -13%
* as amended
**as of 8/11/2016
$0
$250,000
$500,000
$750,000
13-14 14-15 15-16 16-17Budget
Total Expenditures
138

Community Development Block Grant RevenuesFund 307
2013-2014 2014-2015 2015-2016 2015-2016 2016-2017 2016-2017
Actual Revenues
Actual Revenues
Council Approved*
Actual Revenues
Manager Recommended
Council Approved
Restricted Intergov'tl Revenue 268,324$ 113,219$ 476,545$ 84,173$ 463,245$ 463,245$ Other Revenue 20,276$ 23,929$ 16,000$ 6,268$ 7,500$ 7,500$ Total Revenue 288,600$ 137,148$ 492,545$ 90,441$ 470,745$ 470,745$ % budget change -3% -52% -34% -4%* as amended**as of 8/11/2016
Restricted Intergov'tl Revenue98%
Other Revenue2%
FY 16-17 CDBG Revenue
$-
$100,000
$200,000
$300,000
$400,000
$500,000
$600,000
ActualRevenues
ActualRevenues
ActualRevenues
CouncilApproved
2013-2014 2014-2015 2015-2016 2016-2017
CDBG Revenue Trend
Other Revenue
RestrictedIntergov'tl Revenue
139

Community Development Block Grant Expenditures2013-2014 2014-2015 2015-2016 2015-2016 2016-2017 2016-2017
Actual Expenses
Actual Expenses
CouncilApproved*
Actual Expenses**
ManagerRecommended
CouncilApproved
Budget UnitAdministration 67,337$ 72,560$ 98,509$ 73,425$ 94,149$ 94,149$ Projects -$ 43,147$ 394,036$ 48,000$ 376,596$ 376,596$ Total Expenditures 67,337$ 115,707$ 492,545$ 121,425$ 470,745$ 470,745$ % budget change -78% 72% 5% -4%* as amended**as of 8/11/2016
Administration19%
Projects81%
FY 16-17 CDBG Expenditures
$-
$100,000
$200,000
$300,000
$400,000
$500,000
$600,000
$700,000
ActualExpenses
ActualExpenses
ActualExpenses**
CouncilApproved
2013-2014 2014-2015 2015-2016 2016-2017
CDBG Expenditure Trend
Projects
Administration
140

COMMUNITY DEVELOPMENT BLOCK GRANT (CDBG) -
ADMINISTRATION AND PROJECTS 2016 MISSION: The CDBG program for the City of Concord exists to provide individual citizens, neighborhoods, non-profit organizations and other government agencies with neighborhood revitalization assistance, housing rehabilitation, new home construction, job creation, infrastructure improvements, code enforcement, and blight clearance to enhance the vitality, safety, and attractiveness of Concord's neighborhoods. PROGRAM LOCATOR:: Fund: Community Development Block Grant Functional Area: CDBG 2016 Department: Planning & NBHD Services Division: CDBG Admin. & Projects 2016 BUDGET & PERFORMANCE HIGHLIGHTS:
MAJOR SERVICE(S) PROVIDED: CDBG Administration and Sub-Recipient Program
Management Emergency Needs Program Assisting Low and
Moderate-Income Homeowners Provide funding for infrastructure needs (i.e.
sidewalks, road repairs) in LMI neighborhoods
FY 2015-16 MAJOR ACCOMPLISHMENTS: Completed automated submittal of Action Plan
and Consolidated Annual Performance Evaluation Report in HUD’s IDIS System.
Completed 9 emergency needs projects. Completed renovations to Clearwater Market and
structural improvements to the lower level space in the Operations Building.
Increased Clearwater special events revenue by 60%.
Conducted 11 monitoring visits of CDBG Subrecipients to assess service delivery and overall performance.
Acquired 4 lots to address slum and blight in LMI neighborhoods.
FY 2016-17 MAJOR BUDGET CHANGES / NEW REQUESTS
/FOCUS AREAS: Complete at least 1 major infrastructure
improvement project in an LMI area. Commence rehabilitation of property at Kerr
Street/Academy in Gibson Village Neighborhood. Continue clearance/code enforcement activities
to eliminate slum and blight in LMI neighborhoods.
Continue revitalization effort in Gibson Village neighborhood.
Continue with Clearwater lower-level renovations and creation of a pottery studio.
STEPS / PROGRAMS BEING UNDERTAKEN TO ENHANCE
PERFORMANCE: Continue to work with Transportation
Department to identify infrastructure (i.e. sidewalks, roads) needs in LMI communities.
Enhance program offerings (i.e. classes, artistic presentations at Clearwater.
Enhance partnership with Parks and Recreation Department to increase outdoor events along the greenway adjacent to Clearwater.
Continue efforts to work with local community agencies (subrecipients) to provide funding assistance for service programs and operations.
$0$100,000$200,000$300,000$400,000$500,000
13-14 14-15 15-16 16-17Budget
CDBG Total Expenditures
0%
25%
50%
75%
100%
13-14 14-15 15-16 16-17
% of Available Emergency Needs Funds Expended
Actual Objective
141

PERFORMANCE GOALS:
Major Service Area: CDBG Administration Goal: To provide on-going technical assistance, on-site monitoring visits and program support to CDBG sub-recipients in order to achieve full regulatory compliance through effective program administration.
Major Service Area: Emergency Needs Goal: To provide timely assistance to low and moderate-income homeowners with emergency repairs in order to achieve program objectives and expend grant funds in a timely manner.
PERFORMANCE SUMMARY: Major Performance Measure FY14 FY15 FY16 FY16 FY17 Benchmark Service Indicator Type Actual Actual Obj. Actual Obj. Target Area
CDBG Admin.
% of sub-recipients that are in full compliance
Effectiveness 100% 100% 100% 100% 100% 100%
Emergency Needs
% of available Emergency Needs funds expended
Effectiveness 50% 80% 80% 56% 85% 90%
CDBG Admin.
% of Allowable Administrate funds
expended Effectiveness 100% 100% 100% 100% 100% 100%
CDBG Admin.
# of households assisted with emergency needs
Workload 8 6 13 10 12 13
BUDGET SUMMARY:
CDBG Administration CDBG Projects
Cost Center #: 30702013-2014 2014-2015 2015-2016 2015-2016 2016-2017 2016-2017
Actual Expenditures
Actual Expenditures
CouncilApproved*
Actual Expenditures**
Manager Recommended
CouncilApproved
Personnel Services 67,337$ 72,560$ 80,735$ 73,425$ 81,066$ 81,066$
Operations 3,790$ 13,430$ 17,774$ 9,688$ 13,083$ 13,083$
Total Expenditures 71,127$ 85,990$ 98,509$ 83,113$ 94,149$ 94,149$
% budget change 41% -3% -4.4%* as amended**as of 8/11/2016Authorized FTE 1.10 1.00 1.20 1.20 1.20 1.20NOTE (1): CDBG budgets are "project" budgets and remain in use over multiple fiscal years. NOTE (2): An additional 0.8 FTE located in Home Consortium - Administration budget.
Cost Center #30752013-2014 2014-2015 2015-2016 2015-2016 2016-2017 2016-2017
Actual Expenditures
Actual Expenditures
CouncilApproved*
Actual Expenditures**
Manager Recommended
CouncilApproved
Operations -$ 43,147$ 394,036$ 48,000$ 376,596$ 376,596$ Total Expenditures -$ 43,147$ 394,036$ 48,000$ 376,596$ 376,596$ % budget change 11% -4%* as amended**as of 8/11/2016
142

ENTERPRISE FUNDS OVERVIEW OVERVIEW: Enterprise Funds provide services that are funded primarily through user charges. Enterprise Funds include Stormwater, Electric, Water, Transit, Wastewater, Golf Course, Aviation, and Public Housing. FUNDS & BUDGET UNITS:
Stormwater Fund: Stormwater provides inspection and maintenance of storm drains and ditches located within city-owned right-of-ways, and is responsible for implementation of the Environmental Projection Agency (EPA) Phase II Stormwater Management Program. Additional information regarding Stormwater may be obtained by contacting Christie Putnam, Director of Water Resources, at (704) 920-5343 or via email at [email protected].
Electric Fund: Electric Systems operates and maintains the City of Concord’s electric distribution system.
Additional information regarding any Electric Systems division may be obtained by contacting Bob Pate, Director of Electric Systems, at (704) 920-5301 or via email at [email protected].
Electric Systems Administration: Electric Systems Administration provides leadership, coordination of the maintenance and construction, and financial solvency of the City’s electric utility system.
Purchased Power: Purchased Power accounts for the purchase of wholesale power from Duke Power Co., Southeaster Power Administration, and BFI for retail sale in the City’s electrical distribution system.
Powerlines Maintenance: Powerlines Maintenance is responsible for provision of preventive maintenance and emergency repairs of power lines, substations, power delivery stations, peak shaving generation plants, electric metering, and SCADA operations.
Tree Trimming: Tree trimming is responsible for maintaining clearance of trees from power lines in order to minimize the interruption of electric service to customers.
Electric Construction: Electric Construction is responsible for construction of additions and extension of the electric system’s infrastructure as required to meet growing demands for electric services in the City’s Electric System service area.
Peak Shaving: Peak Shaving is the arrangement whereby the Electric System generates electricity during periods of time when customer demands for electricity are greatest. The power the City is required to produce during “peak” times is diminished by the amount of power that the City generates through peak shaving. Since purchased power is traditionally more expensive during “peak” power use times, utilization of peak shaving results in a monetary savings for the City.
Electric Engineering Services: Electric Engineering Services is responsible for all engineering and design functions for the construction, upgrade, and maintenance of the electric system infrastructure. The Division has both internal and external customers.
Utility Locate Services: Utility Locate Services is responsible for identifying and marking underground stormwater, water, electric, and wastewater lines.
Water Fund: Water Resources operates and maintains the City of Concord’s water system, providing safe
drinking water to the citizens of Concord. Additional information regarding any Water Resources division may be obtained by contacting Christie Putnam, Director of Water Resources, at (704) 920-5343 or via email at [email protected].
Hillgrove Water Treatment Plant: Hillgrove Water Treatment Plant provides up to 12,000,000
gallons per day (MGD) of treated drinking water.
143

Coddle Creek Water Treatment Plant: Coddle Creek Water Treatment Plant provides up to
12,000,000 gallons per day (MGD) of treated drinking water.
Waterlines Operations & Maintenance: Waterlines Operations & Maintenance is responsible for the efficient operation and maintenance of water lines and connections 24 hours a day.
Transit Fund: The Concord/Kannapolis Area Transit System - or Rider – is responsible for providing the
highest quality passenger transportation services for the citizens of Concord and Kannapolis. The Cities of Concord and Kannapolis partner to provide the Rider service with Concord serving as the lead agency. Additional information regarding Transit System may be contacting LJ Weslowski, Director of Transit, at (704) 920-5878 or via email at [email protected].
Wastewater Fund: Wastewater Resources is responsible for managing and maintaining the sewer
collection system and pump stations that provide service for over 30,000 customers. Additional information regarding Wastewater Resources may be obtained by contacting Christie Putnam, Director of Water Resources, at (704) 920-5343 or via email at [email protected].
Golf Course Fund: The Dan Maples designed Rocky River Golf Course at Concord is a full-service 18-hole
championship golf course open to all citizens. The City contracts course management to John Q. Hammonds. Additional information regarding Rocky River Golf Club at Concord may be obtained by contacting Merl Hamilton, Deputy City Manager, (704) 920-5201 or via email at [email protected].
Aviation Fund: The Aviation Department – Concord Regional Airport – is responsible for operating and
maintaining the City’s airport facilities for public use in accordance with federal, state, and local regulations, rules, policies, and ordinances. The airport also provides fuel and other aeronautical services and lease space on a long and short-term basis to tenants and transient individuals, firms, and agencies. Additional information regarding Concord Regional Airport may be obtained by contacting Rick Cloutier, Aviation Director, at (704) 920-5900 or via email at [email protected].
Public Housing Fund: Public Housing provides adequate, safe and sanitary housing for low-income
residents of the City of Concord while promoting economic independence. Additional information regarding the Public Housing Department may be obtained by contacting Angela Graham at (704) 788-1139 or via email at [email protected].
144
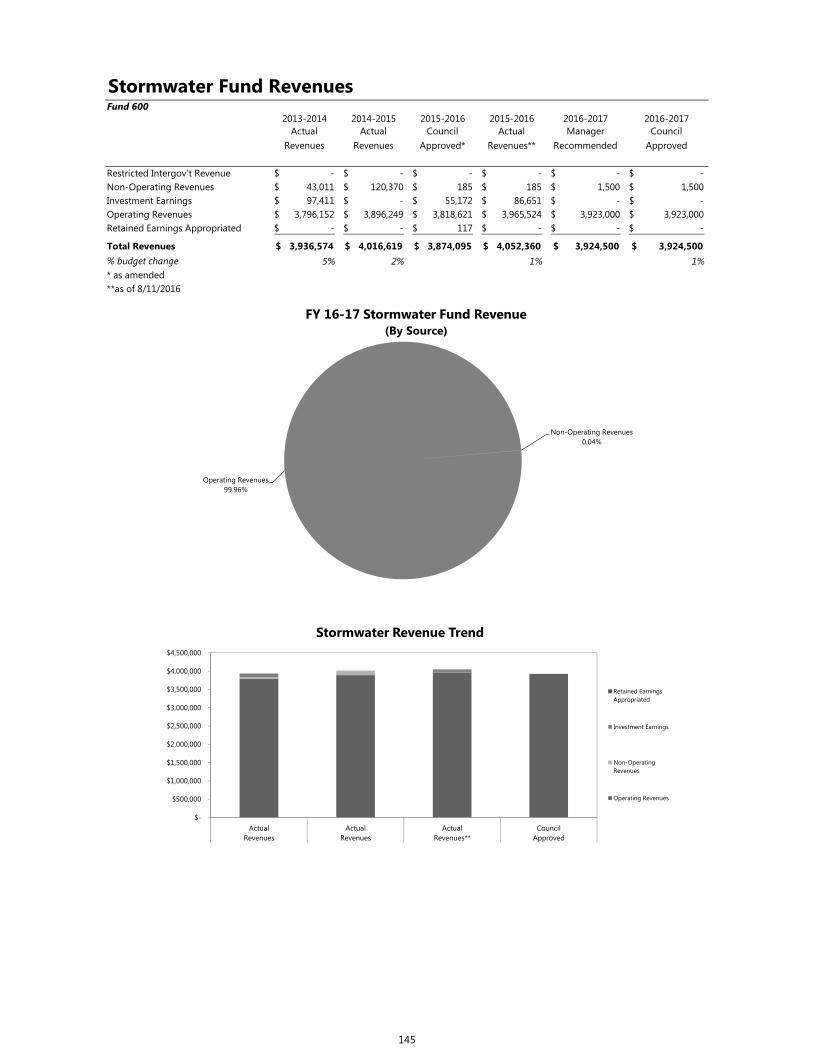
Stormwater Fund RevenuesFund 600
2013-2014 2014-2015 2015-2016 2015-2016 2016-2017 2016-2017Actual
RevenuesActual
RevenuesCouncil
Approved*Actual
Revenues**Manager
RecommendedCouncil
Approved
Restricted Intergov't Revenue -$ -$ -$ -$ -$ -$ Non-Operating Revenues 43,011$ 120,370$ 185$ 185$ 1,500$ 1,500$ Investment Earnings 97,411$ -$ 55,172$ 86,651$ -$ -$ Operating Revenues 3,796,152$ 3,896,249$ 3,818,621$ 3,965,524$ 3,923,000$ 3,923,000$ Retained Earnings Appropriated -$ -$ 117$ -$ -$ -$
Total Revenues 3,936,574$ 4,016,619$ 3,874,095$ 4,052,360$ 3,924,500$ 3,924,500$ % budget change 5% 2% 1% 1%* as amended**as of 8/11/2016
$-
$500,000
$1,000,000
$1,500,000
$2,000,000
$2,500,000
$3,000,000
$3,500,000
$4,000,000
$4,500,000
ActualRevenues
ActualRevenues
ActualRevenues**
CouncilApproved
Stormwater Revenue Trend
Retained EarningsAppropriated
Investment Earnings
Non-OperatingRevenues
Operating Revenues
Non-Operating Revenues0.04%
Operating Revenues99.96%
FY 16-17 Stormwater Fund Revenue(By Source)
145

Stormwater Fund Expenditures2013-2014 2014-2015 2015-2016 2015-2016 2015-2016 2016-2017
Actual Expenses
Actual Expenses
CouncilApproved
Actual Expenses**
ManagerRecommended
CouncilApproved
Stormwater Operations 4,951,644$ 4,181,879$ 3,874,095$ 3,504,531$ 3,924,500$ 3,924,500$
Total Expenditures 4,951,644$ 4,181,879$ 3,874,095$ 3,504,531$ 3,924,500$ 3,924,500$
% budget change -16% -16% 1%* as amended**as of August 11, 2015
$0
$1,000,000
$2,000,000
$3,000,000
$4,000,000
$5,000,000
$6,000,000
ActualExpenses
ActualExpenses
ActualExpenses**
CouncilApproved
2013-2014 2014-2015 2015-2016 2016-2017
Stormwater Expenditure Trend
146

STORMWATER OPERATIONS & MAINTENANCE MISSION: Stormwater Operations and Maintenance exists to provide timely response to customer inquiries concerning drainage, water quality, and stormwater utility; maintain the existing stormwater infrastructure within City maintained rights-of-way and easements; implement the NPDES Phase II Stormwater Permit requirements; and ensure new development meets or exceeds development standards in an effort to reduce potential losses to property owners during flooding rains and to reduce pollutants entering the streams and lakes. PROGRAM LOCATOR:: Fund: Stormwater Fund Functional Area: Utilities - Stormwater Department: Stormwater Operations & Maint. Division: N/A BUDGET & PERFORMANCE HIGHLIGHTS:
MAJOR SERVICE(S) PROVIDED: Respond to customer inquiries related to
drainage and stormwater quality in a timely manner.
Maintain drainage system within City maintained street rights-of-way.
Maintain compliance with the City of Concord’s NPDES Phase II stormwater permit.
Review development plans to ensure compliance with City ordinances that address floodplain
protection, water quality, and water quantity from stormwater runoff.
Provide scheduled street sweeping within City limits to enhance water quality.
FY 2015-16 MAJOR ACCOMPLISHMENTS: Began implementation of new technology for use
by stormwater crews. Began construction Treasure Dr. and Shamrock
culvert replacements. Completed final master planning project. Completed Springview Ct. culvert replacement
and drainage improvements. Completed Princess/ Crowell culvert replacement. Completed Rubens Road culvert replacement. Completed design for all four master plan
projects in Zemosa. Completed design of the Wyoming Drive culvert
replacements.
FY 2016-17 MAJOR BUDGET CHANGES / NEW REQUESTS /
FOCUS AREAS: Complete final project ranking analysis for all
master plan projects and update cost estimates. Continue to deploy technology in the field to
enhance customer service and efficiency. Begin Zemosa Acres and Country Acres culvert
replacement projects. Determine the boundaries of all existing
stormwater drainage basins and add this information to the GIS stormwater system map.
Continue to enhance the existing stormwater GIS system by improving field/office procedures and adding new technology where it is needed.
Construct a database from the compilation of various information that would increase the overall efficiency of the department.
STEPS / PROGRAMS BEING UNDERTAKEN TO ENHANCE
PERFORMANCE: Continue to monitor potential regulatory changes
to NPDES stormwater permit. Leverage GIS capabilities in the field/office to
help identify issues and solutions as well as improve database accuracy.
Continue to evaluate ditch maintenance program to maximize efficiencies.
50%60%70%80%90%
100%
13-14 14-15 15-16 16-17
% of Customer Service Requests Investigated & Responded to in <48hrs
Actual Objective
$-
$2,000,000
$4,000,000
$6,000,000
13-14 14-15 15-16 16-17Budget
Total Expenditures
147

PERFORMANCE GOALS:
Major Service Area: Customer Service
Goal: To respond to stormwater inquiries within 2 working days and schedule meetings with customers or initiate investigations to evaluate customer concerns and identify necessary corrective actions.
Major Service Area: Safety
Goal: Provide training and corrective actions to support a safe working environment for co-workers and the public.
Major Service Area: Maintain NPDES Phase II Compliance
Goal: To implement required NPDES Phase II Stormwater program elements in order to reduce pollution and erosion caused by stormwater runoff.
Major Service Area: Development Plan Review
Goal: To complete thorough review in a timely manner to support development while assuring compliance with City ordinances and required NPDES Phase II Stormwater program elements.
Major Service Area: Provide Scheduled Street Sweeping within City Limits to Enhance Water Quality
Goal: To complete established sweeping routes on schedule in order to reduce pollution from streets reaching streams and degrading water quality.
PERFORMANCE SUMMARY: Major Performance Measure FY14 FY15 FY16 FY16 FY17 Benchmark Service Area Indicator Type Actual Actual Obj. Actual Obj. Target
Street Sweeping
Total number of times streets swept per year
Workload 16 12 12 12 12 12
Customer Service
% service requests investigated & responded to within 2 working days
Effectiveness 98.1% 98% 100% 98.5% 100% 100%
NPDES Phase II
Total number of Phase II education events
Workload 29 43 30 34 30 30
NPDES Phase II
% of BMPs inspected per year
Workload 68% 35% 25% 70% 25% 25%
Development Plan Review
% of development plans reviewed by internal
deadline Effectiveness 100% 98% 100% 99% 100% 100%
Safety # of preventable
accidents Effectiveness 0 0 0 0 0 0
BUDGET SUMMARY: Cost Center #: 7100
2013-2014 2014-2015 2015-2016 2015-2016 2016-2017 2016-2017Actual
ExpensesActual
ExpensesCouncil
Approved*Actual
Expenses**Manager
RecommendedCouncil
Approved
Personnel Services 1,285,187$ 1,279,028$ 1,417,120$ 1,365,199$ 1,270,597$ 1,270,597$ Operations 338,813$ 306,201$ 634,865$ 383,672$ 626,680$ 626,680$ Capital Outlay -$ -$ -$ -$ 257,000$ 257,000$ Depreciation 1,687,943$ 1,667,017$ -$ -$ -$ -$ Debt Service -$ -$ -$ -$ -$ -$ Cost Allocations 463,535$ 399,473$ 478,032$ 411,582$ 633,760$ 633,760$ Transfers 1,176,166$ 530,160$ 1,344,078$ 1,344,078$ 1,136,463$ 1,136,463$
Total Expenditures 4,951,644$ 4,181,879$ 3,874,095$ 3,504,531$ 3,924,500$ 3,924,500$
% budget change 20% -16% -16% 1%* as amended **as of 8/11/2016Authorized FTE 19.77 22.09 22.09 22.09 19.73 19.73
148

Electric Systems RevenueFund 610
2013-2014 2014-2015 2015-2016 2015-2016 2016-2017 2016-2017
Actual Revenues
Actual Revenues
CouncilApproved*
Actual Revenues**
ManagerRecommended
CouncilApproved
Non-Operating Revenues 29,085$ 161$ 45,765$ 45,765$ 30,000$ 30,000$ Investment Earnings 729,661$ 414,513$ 405,000$ 643,379$ -$ -$ Operating Revenue 80,753,191$ 81,118,401$ 82,227,355$ 82,087,138$ 84,262,000$ 84,262,000$ Retained Earnings Appropriated -$ -$ 7,680,819$ -$ -$ -$ Transfers -$ -$ -$ -$ -$ -$
Total Revenues 81,511,937$ 81,533,075$ 90,358,939$ 82,776,282$ 84,292,000$ 84,292,000$ % budget change 0.03% 2% -7%* as amended**as of 8/11/2016
$50,000,000
$55,000,000
$60,000,000
$65,000,000
$70,000,000
$75,000,000
$80,000,000
$85,000,000
$90,000,000
ActualRevenues
ActualRevenues
ActualRevenues**
CouncilApproved
2013-2014 2014-2015 2015-2016 2016-2017
Electric Systems Revenue Trend
Transfers
Retained EarningsAppropriated
Non-OperatingRevenues
Operating Revenue
Operating Revenue100.0%
FY16-17 Electric Systems Revenues
149

Electric Systems Expenditures2013-2014 2014-2015 2015-2016 2015-2016 2016-2017 2016-2017
Actual Expenses
Actual Expenses
CouncilApproved*
Actual Expenses**
ManagerRecommended
CouncilApproved
Budget UnitElectric Administration 2,792,980$ 2,977,780$ 3,375,511$ 2,991,967$ 4,649,281$ 4,649,281$ Purchased Power 56,631,428$ 50,865,045$ 60,574,420$ 47,243,223$ 57,099,388$ 57,099,388$ Powerline Maintenance 4,270,044$ 3,995,384$ 9,324,672$ 8,689,645$ 6,094,205$ 6,094,205$ Tree Trimming 919,635$ 957,191$ 961,847$ 869,375$ 1,063,139$ 1,063,139$ Electric Construction 11,048,836$ 11,748,328$ 14,318,278$ 10,390,621$ 13,613,512$ 13,613,512$ Peak Shaving 1,193,175$ 939,496$ 710,177$ 161,399$ 691,633$ 691,633$ Electric Engineering 577,909$ 656,598$ 920,146$ 787,937$ 929,082$ 929,082$ Utility Locate Services 122,118$ 136,420$ 173,888$ 91,331$ 151,760$ 151,760$ Total Expenses 77,556,125$ 72,276,242$ 90,358,939$ 71,225,498$ 84,292,000$ 84,292,000$ % budget change -7% -1% -7%* as amended**as of 8/11/2016
Electric Administration6%
Purchased Power68%
Powerline Maintenance7%
Tree Trimming1%
Electric Construction16%
Peak Shaving1%
Electric Engineering 1.1%
Utility Locate Services0.2%
FY16-17 Electric Systems Expenditures
$-
$10,000,000
$20,000,000
$30,000,000
$40,000,000
$50,000,000
$60,000,000
$70,000,000
$80,000,000
$90,000,000
ActualExpenses
ActualExpenses
ActualExpenses**
CouncilApproved
2013-2014 2014-2015 2015-2016 2016-2017
Electric Systems Expenditure Trends
Utility Locate Services
Electric Engineering
Peak Shaving
Tree Trimming
Powerline Maintenance
Electric Administration
Electric Construction
Purchased Power
150

ELECTRIC SYSTEMS ADMINISTRATION MISSION: Electric Systems Administration exists to ensure that the City of Concord’s electric system operates in a manner that provides a reliable source of electric power to the City’s customers in a fiscally responsible manner that is safe for employees, customers, and the general public. PROGRAM LOCATOR:: Fund: Electric Fund Functional Area: Utilities-Electric Department: Electric Systems Division: Electric Administration BUDGET & PERFORMANCE HIGHLIGHTS:
MAJOR SERVICE(S) PROVIDED: Safety Electric System Management
FY 2015-16 MAJOR ACCOMPLISHMENTS: Continued the Peak Partner Program that notifies
our customers of time of forecasted peak electric demand. This voluntary program can help the City control its wholesale power cost and help reduce rate increases to our customers.
Continued the Key Accounts Program with our top 15 electric customers. Each account was visited to introduce the program and each account was assigned an electric staff member as a main point of contact for their electric questions and concerns.
Completed contractual negotiations and began implementation planning for Advanced Metering Infrastructure (AMI) deployment.
FY 2016-17 MAJOR BUDGET CHANGES / NEW REQUESTS /
FOCUS AREAS: Continuation of Legal and Engineering
funding. These funds are required to support possible audits and review of wholesale power rates, annual adjustments, system design, and SERC/NERC compliance as anticipated.
Continuation of a payment in lieu of taxes to the General Fund.
Continuation of a Rate Stabilization Fund and Reserves for future Electric needs.
Continue strategic planning and management of Advanced Metering Infrastructure (AMI) deployment.
Continue management of power supply contract and analysis for the most effective cost reduction options.
STEPS / PROGRAMS BEING UNDERTAKEN TO ENHANCE
PERFORMANCE: Bi-monthly staff meetings ensure clear
understanding of departmental objectives and individual roles.
Regular departmental safety meetings are held to ensure personnel are adequately trained and understand expectations regarding safe working practices.
Staff will monitor the contract with NTE to make sure all the obligation are meet by them by June 1, 2016 as outlined in the contract.
$-
$1,000,000
$2,000,000
$3,000,000
$4,000,000
$5,000,000
13-14 14-15 15-16 16-17Budget
Total Expenses
012345678
13-14 14-15 15-16 16-17
Average # of Reportable Incidents
Actual Objective
151

PERFORMANCE GOALS:
Major Service Area: Safety
Goal: To provide a safe work environment for employees in order to minimize safety risks.
BUDGET SUMMARY: Major Performance Measure FY14 FY15 FY16 FY16 FY17 Benchmark Service Indicator Type Actual Actual Obj. Actual Obj. Target Area
Safety Average # of reportable
incidents Effectiveness 1.67 7 2 6.7 2 5
BUDGET SUMMARY:
Cost Center #: 7200
2013-2014 2014-2015 2015-2016 2015-2016 2016-2017 2016-2017
ActualExpenses
ActualExpenses
CouncilApproved
ActualExpenses**
Manager Recommended
CouncilApproved
Personnel Services 290,763$ 318,352$ 304,456$ 318,885$ 305,799$ 305,799$
Operations 243,909$ 302,767$ 434,086$ 296,611$ 415,979$ 415,979$
Depreciation & Amortization 871$ 773$ -$ -$ -$ -$
Other Appropriations 145,350$ (75,744)$ -$ (88,306)$ 607,135$ 607,135$
Cost Allocations 1,563,493$ 1,872,625$ 2,066,310$ 1,894,118$ 2,349,109$ 2,349,109$ Transfers 548,594$ 559,007$ 570,659$ 570,659$ 971,259$ 971,259$
Total Expenses 2,792,980$ 2,977,780$ 3,375,511$ 2,991,967$ 4,649,281$ 4,649,281$
% budget change 7% 0% 38%* as amended
**as of 8/11/2016Authorized FTE 2.00 3.00 3.00 3.00 3.00 3.00
152

PURCHASED POWER MISSION: The Purchased Power Department exists to maintain a dependable, reliable and affordable source of electricity for resale to customers of the City of Concord’s Electric System. PROGRAM LOCATOR:: Fund: Electric Fund Functional Area: Utilities- Electric Department: Electric Systems Division: Purchased Power BUDGET & PERFORMANCE HIGHLIGHTS:
MAJOR SERVICE(S) PROVIDED: Purchase Wholesale Power:
o Monitor current contracts for the City’s purchase of wholesale power to ensure economic and operational integrity and reliability
o Monitor monthly wholesale power bills to ensure accuracy.
o Predict anticipated electric system peaks and determine load ratio share calculations that will be used for annual billing projections.
FY 2015-16 MAJOR ACCOMPLISHMENTS: Continued the offering of customer programs and
a new rate to help reduce the City’s wholesale demand cost.
Staff has used available peak shaving resources and will reduce purchased power expense by approximately $5 million during the current fiscal year.
Continued analysis of the new purchased power agreement to ensure a seamless transition on the start date of January 1, 2019.
FY 2016-17 MAJOR BUDGET CHANGES / NEW REQUESTS /
FOCUS AREAS: Continue analysis efforts on current rates
schedules to ensure fair and prudent cost to each rate class.
Continue to work with future power supplier NTE to enhance the City’s position in the power markets and ensure the best power supply options are exercised.
Continue to research programs designed to enhance peak demand reduction during heavy system loads.
STEPS / PROGRAMS BEING UNDERTAKEN TO ENHANCE
PERFORMANCE: Staff will review all invoices for purchased power
to ensure accuracy. Staff will formulate a plan, which responds to a
change in the yearly billing demand determination format in order to maximize the efficiency of peak shaving resources and capitalize on opportunities to reduce wholesale power costs.
$- $10,000,000 $20,000,000 $30,000,000 $40,000,000 $50,000,000 $60,000,000
13-14 14-15 15-16 16-17Budget
Total Expenses
0.01.02.03.04.05.06.07.0
13-14 14-15 15-16 16-17
Average Cost of Purchased Power in ¢
Actual Objective
153

PERFORMANCE GOALS:
Major Service Area: Purchase Wholesale Power
Goal: Ensure the accuracy of all payments for purchased power by reviewing and comparing metering data and bill calculations.
Goal: Predict annual system peak and load ratio share calculations that will minimize end impact of end of year true up process.
Major Service Area: Resource Management
Goal: To provide efficient utilization of resources in order to limit or reduce costs of electric system operation.
PERFORMANCE SUMMARY: Major Performance Measure FY14 FY15 FY16 FY16 FY17 Benchmark Service Indicator Type Actual Actual Obj. Actual Obj. Target Area
Purchase Wholesale
Power
Accuracy rate for purchased power
payments Workload 100% 100% 100% 100% 100% 100%
Resource Mngt.
Average cost of purchased power (in cents)
Effectiveness 7¢ 6.7¢ 7¢ 6.4¢ 7¢ 7¢
BUDGET SUMMARY:
Cost Center #: 72102013-2014 2014-2015 2015-2016 2015-2016 2016-2017 2016-2017
ActualExpenses
ActualExpenses**
CouncilApproved
ActualExpenses**
Manager Recommended
CouncilApproved
Operations 56,631,428$ 50,865,045$ 60,574,420$ 47,243,223$ 57,099,388$ 57,099,388$
Total Expenses 56,631,428$ 50,865,045$ 60,574,420$ 47,243,223$ 57,099,388$ 57,099,388$
% budget change 0% -10% -7% -6%* as amended**as of 8/11/2016Authorized FTE 0.00 0.00 0.00 0.00 0.00 0.00
154

MAINTENANCE POWER LINES MISSION: The Maintenance Power lines Division exists to ensure that all of the City’s electric customers receive safe and reliable electric service by maintaining, measuring, and monitoring the City’s power supply. PROGRAM LOCATOR:: Fund: Electric Fund Functional Area: Utilities- Electric Department: Electric Systems Division: Maintenance Power lines BUDGET & PERFORMANCE HIGHLIGHTS:
MAJOR SERVICE(S) PROVIDED: System Monitoring Electric Equipment Maintenance Testing/Installation
FY 2015-16 MAJOR ACCOMPLISHMENTS: Maintenance Power lines coworkers successfully
deployed to assist the Peak Shaving Division with operation of Generation facilities to reduce peak demand, thereby lowering the cost of purchase power.
Completed upgrading Substation A with a new power transformer and current design electronic relaying package.
Completed conversion of all remaining substations to a fiber optic communications platform.
Changed out residential electric meters as part of a change-out program to maintain a growing electrical system with new hardware and materials.
Began project to install new 44KV breakers and electronic relaying at Delivery Station 2.
Began implementing video surveillance system at all Substations.
Completed upgrading Substation B with new 12KV breakers and current design electronic relaying package.
FY 2016-17 MAJOR BUDGET CHANGES / NEW REQUESTS /
FOCUS AREAS: Continue to change out residential electric meters
as part of the change-out program and to maintain a growing electric system with new hardware and materials.
Complete implementation of video surveillance system at 3 substations.
Complete project to install new 44KV breakers and electronic relaying at Delivery Station 2.
Initiate advanced metering infrastructure on key accounts to better track energy consumption profiles.
Begin project to install animal protection fences at retail substation sites.
STEPS / PROGRAMS BEING UNDERTAKEN TO ENHANCE
PERFORMANCE: A routine preventive maintenance and emergency
repair program is maintained to ensure effectiveness of power lines, substations, power delivery stations, peak shaving generation plants, electric metering and SCADA operations.
Staff will continue to evaluate outage data to improve system reliability.
Staff is implementing the wireless Ethernet SCADA Communication Line Network. This will enable remote access of the SCADA servers and provide the ability to remotely monitor and control strategic system protective devices. This provides a more rapid response to power outages.
Staff will continue career development training. The SCADA department will work with GIS to
update and ensure a viable and reliable mapping database.
$-
$2,000,000
$4,000,000
$6,000,000
$8,000,000
$10,000,000
13-14 14-15 15-16 16-17Budget
Total Expenses
0
20
40
60
80
100
13-14 14-15 15-16 16-17
Average Duration of Power Outages(in minutes)
Actual
155

PERFORMANCE GOALS:
Major Service Area: System Monitoring
Goal: To provide timely response to power outages for business and residential customers in order to minimize power disruptions.
Major Service Area: Electric Equipment Maintenance
Goal: To provide system maintenance of electrical equipment in order to ensure constant flow of power.
Major Service Area: Testing/Installation Goal: To ensure the accuracy and integrity of all electric meter systems in order to maintain compliance
with State regulations and proper billing.
PERFORMANCE SUMMARY: Major Performance Measure FY14 FY15 FY16 FY16 FY17 Benchmark Service Indicator Type Actual Actual Obj. Actual Obj. Target Area
System Monitoring
System Average Interruption Duration Index
(SAIDI) (in minutes) Effectiveness N/A 34 40 49 40 110
System Monitoring
System Average Interruption Frequency
Index (SAIFI) (# of events) Effectiveness N/A .60 .61 1.03 .61 1.1
System Monitoring
Customer Average Interruption Duration Index
(CAIDI) (in minutes) Effectiveness N/A 55 66 47.5 66 80
Electric Equipment
Maint.
% of outages caused by mechanical failure
Effectiveness 3.21% 3.34% 3% 3.8% 3% 3%
Meter Testing /
Installation
# of watt-hr. meters tested/calibrated
Workload 2,945 2,452 3,000 3,993 3,000 NA
BUDGET SUMMARY:
Cost Center #: 72202013-2014 2014-2015 2015-2016 2015-2016 2016-2017 2016-2017
ActualExpenses
ActualExpenses
CouncilApproved
ActualExpenses**
Manager Recommended
CouncilApproved
Personnel Services 1,067,317$ 1,250,994$ 1,249,711$ 1,222,959$ 1,271,957$ 1,271,957$ Operations 338,011$ 505,316$ 865,156$ 438,357$ 658,137$ 658,137$ Capital Outlay -$ -$ 178,901$ -$ 182,000$ 182,000$ Depreciation & Amortization 1,130,901$ 1,152,705$ -$ -$ -$ -$ Cost Allocations 23,815$ 21,369$ 30,904$ 28,329$ 52,111$ 52,111$ Transfers 1,710,000$ 1,065,000$ 7,000,000$ 7,000,000$ 3,930,000$ 3,930,000$
Total Expenses 4,270,044$ 3,995,384$ 9,324,672$ 8,689,645$ 6,094,205$ 6,094,205$
% budget change 60% -6% 117% -35%* as amended**as of 8/11/2016
13.00 17.00 17.00 17.00 17.00 17.00
156

TREE TRIMMING MISSION: The City’s Tree Trimming Department exists to maintain clearance of trees and plant growth in power line rights-of-way and easements in a manner that provides more reliable electric service to the City’s electric customers. PROGRAM LOCATOR:: Fund: Electric Fund Functional Area: Utilities- Electric Department: Electric Systems Division: Tree Trimming BUDGET & PERFORMANCE HIGHLIGHTS:
MAJOR SERVICE(S) PROVIDED: Line Clearance Tree Trimming
FY 2015-16 MAJOR ACCOMPLISHMENTS: Reduced customer concerns with personal contact
or by leaving a door hanger prior to performing removal and/or trimming of customers’ trees.
Continued career development training for tree trimming personnel to enhance level of service and proficiency for customers.
Increased overall % of circuits trimmed with use of contract services and improved scheduling.
FY 2016-17 MAJOR BUDGET CHANGES / NEW REQUESTS /
FOCUS AREAS: Continue tree replacement program, which
encourages re-planting of low growing trees in order to minimize future maintenance of power line rights-of-way and improve reliability of electric service to customers.
Continue utilization of contract labor to augment in-house personnel in clearing power line rights-of-way. This will enhance the reliability of service provided to customers.
Continue to educate the public on the need for proper ROW clearance.
Improve our low growth line clearance preventative maintenance programs.
STEPS / PROGRAMS BEING UNDERTAKEN TO ENHANCE
PERFORMANCE: Contract labor will be utilized during peak growth
times to enhance levels of service. Career development training enhances the level of
service provided to customers by increasing the knowledge and proficiency of Tree Trimming personnel.
$-
$250,000
$500,000
$750,000
$1,000,000
$1,250,000
$1,500,000
13-14 14-15 15-16 16-17Budget
Total Expenses
.
0%
10%
20%
30%
40%
50%
13-14 14-15 15-16 16-17
% of Main Circuit Right-of-Way Trimmed/Maintained per Year
Actual
Objective
157

PERFORMANCE GOALS:
Major Service Area: Tree Trimming Goal: To provide timely notification to customers of tree trimming services scheduled near or on their property in order to heighten awareness of work crew activity and customer service.
Goal: To provide thorough tree trimming and timely response to customer tree maintenance in order to minimize potential or further damage to electrical infrastructures and property.
PERFORMANCE SUMMARY: Major Performance Measure FY14 FY15 FY16 FY16 FY17 Benchmark Service Indicator Type Actual Actual Obj. Actual Obj. Target Area
Tree Trimming
% of customers receiving personal or door hanger notification of service on their property within 24 hrs. of scheduled tree
trimming
Effectiveness 100% 100% 100% 100% 100% 100%
Tree Trimming
% of main circuit right-of-way trimmed/
maintained per year Effectiveness 36% 33% 33% 18% 33% 33%
Tree Trimming
% of power outages caused by trees and tree
limbs Effectiveness 12% 10% 10% 16% 10% 10%
BUDGET SUMMARY:
Cost Center #: 72302013-2014 2014-2015 2015-2016 2015-2016 2016-2017 2016-2017
ActualExpenses
ActualExpenses
CouncilApproved*
ActualExpenses**
Manager Recommended
CouncilApproved
Personnel Services 490,995$ 471,364$ 477,628$ 456,931$ 498,410$ 498,410$ Operations 405,610$ 460,219$ 471,575$ 407,729$ 491,744$ 491,744$ Capital Outlay -$ -$ 7,500$ -$ 69,700$ 69,700$ Depreciation & Amortization 17,032$ 19,914$ -$ -$ -$ -$ Cost Allocations 5,998$ 5,694$ 5,144$ 4,715$ 3,285$ 3,285$ Transfers -$ -$ -$ -$ -$ -$
Total Expenses 919,635$ 957,191$ 961,847$ 869,375$ 1,063,139$ 1,063,139$
% budget change 8% 13% -9% 11%* as amended**as of 8/11/2016
9.00 9.00 7.00 7.00 7.00 7.00
158

ELECTRIC CONSTRUCTION MISSION: The Electric Construction Department exists to extend, construct, and install major overhead and underground electric facilities for current and future City of Concord electric customers to meet the needs for electric system capacity. PROGRAM LOCATOR:: Fund: Electric Fund Functional Area: Utilities- Electric Department: Electric Systems Division: Electric Construction BUDGET & PERFORMANCE HIGHLIGHTS:
MAJOR SERVICE(S) PROVIDED: Electric Construction
o Underground Utility Construction o Overhead Utility Construction
FY 2015-16 MAJOR ACCOMPLISHMENTS: Began LED lighting conversion program across the
entire service area. Inspected wooden pole lines; replaced and
upgraded poles as required. Completed renovations to vaults in the downtown
underground system. Completed deployment of capacitors across the
Western grid circuits. Continued deployment of new fusing schemes
throughout the electric system.
Completed construction of primary duct bank system to feed additional loads in the north section of the International Business Park.
Began upgrades to aging infrastructure in the International Business Park.
FY 2016-17 MAJOR BUDGET CHANGES / NEW REQUESTS /
FOCUS AREAS: Continue to replace aging Bucket Trucks and
equipment as budget allows. Continue career development training of electric
maintenance and construction personnel in order to provide continuous improvement of employee proficiency and enhance their ability to provide the level of service our customers expect.
Continue to install new LED lighting across the service area.
Continue to inspect and remediate several wooden pole lines that comprise strategic distribution circuits. These pole lines exceed 30 years old and require documentation of their general condition and remediation of deterioration.
Continue International Business Park infrastructure upgrades.
Continue to maintain capacitor banks across the entire service area.
Continue to install fiber optic cable throughout the City for major and small projects.
STEPS / PROGRAMS BEING UNDERTAKEN TO ENHANCE
PERFORMANCE: Maintain a schedule for truck and equipment
replacement to ensure maximum availability to crews and ensure response to customers’ demands.
Utilize contract labor as a means of providing high levels of service in periods of increased service demand.
Regularly inspect wooden poles on the system to protect against disruptions in the system.
Provide career development training to increase the knowledge and performance of employees.
$- $2,500,000 $5,000,000 $7,500,000
$10,000,000 $12,500,000 $15,000,000 $17,500,000
13-14 14-15 15-16 16-17Budget
Total Expenses
75%
80%
85%
90%
95%
100%
13-14 14-15 15-16 16-17
% of Service Installations Completed within 10 Working Days
ActualObjective
159

PERFORMANCE GOALS:
Major Service Area: Electric Construction
Goal: To provide timely response to calls for service to ensure that citizens obtain proper electrical service
in a reasonable time period.
PERFORMANCE SUMMARY: Major Performance Measure FY14 FY15 FY16 FY16 FY17 Benchmark Service Indicator Type Actual Actual Obj. Actual Obj. Target Area
Electric Const.
% of service installations completed within 10
working days Effectiveness 99% 99% 99% 99% 99% 99%
Electric Const.
% of outdoor lights installed within 5 working
days Effectiveness 99% 95% 99% 97% 98% 99%
Electric Const.
% of street lights repaired within 2 working days
Effectiveness 99% 95% 99% 97% 98% 99%
BUDGET SUMMARY:
Cost Center #:72402013-2014 2014-2015 2015-2016 2015-2016 2016-2017 2016-2017
ActualExpenses
ActualExpenses
Council Approved*
ActualExpenses**
Manager Recommended
Council Approved
Personnel Services 2,590,393$ 2,672,629$ 2,525,164$ 2,476,593$ 2,489,710$ 2,489,710$ Operations 1,481,734$ 1,693,686$ 3,495,713$ 4,518,188$ 5,939,550$ 5,939,550$ Capital Outlay 316,045$ 444,181$ 2,890,867$ 705,483$ 1,034,000$ 1,034,000$ Depreciation & Amortization 2,818,886$ 2,816,671$ -$ 7,339$ -$ -$ Debt Service 1,045,219$ 982,649$ 2,959,374$ 1,078,909$ 2,621,355$ 2,621,355$ CIP Projects 1,305,228$ 1,622,409$ 858,327$ 147,678$ -$ -$ Cost Allocations 1,341,331$ 1,436,103$ 1,588,833$ 1,456,431$ 1,528,897$ 1,528,897$ Transfers 150,000$ 80,000$ -$ -$ -$ -$
Total Expenses 11,048,836$ 11,748,328$ 14,318,278$ 10,390,621$ 13,613,512$ 13,613,512$ % budget change -24% -19% -12% -5%
* as amended**as of 8/11/2016
Authorized FTE 34.00 34.00 34.00 33.00 33.00 33.00
160

PEAK SHAVING MISSION: The Peak Shaving Department exists to ensure the availability of its Peak Shaving generation resources in a manner that will reduce the City’s expense for purchased power. PROGRAM LOCATOR:: Fund: Electric Fund Functional Area: Utilities- Electric Department: Electric Systems Division: Peak Shaving BUDGET & PERFORMANCE HIGHLIGHTS:
MAJOR SERVICE(S) PROVIDED: Peak Shaving Generation
FY 2015-16 MAJOR ACCOMPLISHMENTS: Utilized peak shaving resources to reduce
approximately $4 million from the City’s purchased power expense.
Major preventative maintenance was performed to maintain peak shaving generator effectiveness.
Tested to determine compliance for reciprocating internal combustion engine (RICE) emissions standards.
Upgraded major fuel lines for diesel generation sites.
FY 2016-17 MAJOR BUDGET CHANGES / NEW REQUESTS /
FOCUS AREAS: Continue to utilize peak shaving resources to
reduce the City’s purchased power expense. Purchase critical replacement supplies to ensure
quick response to mechanical failures. Continue required testing of all phases of
mitigation equipment to reduce diesel exhaust emissions and to document compliance with Environmental Protection Agency standards.
STEPS / PROGRAMS BEING UNDERTAKEN TO ENHANCE
PERFORMANCE: Continue to perform engine maintenance as
scheduled to ensure efficient operation. Continue to monitor system loading through
SCADA. Continue to train generating personnel to handle
peak shaving efforts.
$-
$200,000
$400,000
$600,000
$800,000
$1,000,000
$1,200,000
$1,400,000
13-14 14-15 15-16 16-17Budget
Total Expenses
$0$550,000
$1,100,000$1,650,000$2,200,000$2,750,000$3,300,000$3,850,000$4,400,000$4,950,000
13-14 14-15 15-16 16-17
Net Savings Generated by Peak Shaving
ActualObjective
161

PERFORMANCE GOALS:
Major Service Area: Peak Shaving Goal: To provide efficient and reliable peak shaving units to the Purchased Power budget unit to reduce the City’s need to purchase power during peak usage times.
PERFORMANCE SUMMARY: Major Performance Measure FY14 FY15 FY16 FY16 FY17 Benchmark Service Indicator Type Actual Actual Obj. Actual Obj. Target Area
Peak Shaving
Average KW output per unit
Efficiency 1,575 1,600 1,600 1,600 1,600 1,600
Peak Shaving
Amount of net savings peak shavings generates
Effectiveness $4.5M $4.5M $4M $4.5M $4M $4M
BUDGET SUMMARY:
Cost Center #: 72412013-2014 2014-2015 2015-2016 2015-2016 2016-2017 2016-2017
Actual Expenses
Actual Expenses**
Council Approved*
Actual Expenses**
Manager Recommended
Council Approved
Personnel Services 21,672$ -$ -$ -$ -$ -$ Operations 948,039$ 880,329$ 710,177$ 161,399$ 691,633$ 691,633$ Capital Outlay -$ -$ -$ -$ -$ -$ Depreciation & Amortizatio 53,423$ 58,155$ -$ -$ -$ -$ Transfers 169,000$ -$ -$ -$ -$ -$ Cost Allocations 1,041$ 1,012$ -$ -$ -$ -$
Total Expenses 1,193,175$ 939,496$ 710,177$ 161,399$ 691,633$ 691,633$
% budget change 30% 2% -83% -3%* amended**as of 8/11/2016
2.00 0.00 0.00 0.00 0.00 0.00
162

ELECTRIC ENGINEERING SERVICES MISSION: To provide the highest level of service to both internal and external customers of the City’s electric service through engineering and design of new and existing services, along with electric systems data acquisition and use through sound engineering practices and GIS mapping technology. PROGRAM LOCATOR:: Fund: Electric Fund Functional Area: Utilities- Electric Department: Electric Systems Division: Electric Engineering Services BUDGET & PERFORMANCE HIGHLIGHTS:
MAJOR SERVICE(S) PROVIDED: Electric Engineering Planning and Design Electric Distribution System Protection (Safety) Compliance with NESC, NEC & other applicable
codes GIS Application Services (Maps & data) Compliance with SERC and NERC (Reliability)
FY 2015-16 MAJOR ACCOMPLISHMENTS: Continued to provided maps and data to
operation’s crews for ongoing electric system’s protection coordination (re-fusing) project. Acquire facility revisions, provided by operations crews, to update maps and database with actual changes and differences verified in field. Several different types of equipment are being verified.
Supported electrical design solutions for commercial and industrial loads by interacting with the customers, as well as our planning department, in order to provide the best results for each project. Supported electrical design solutions for electric infrastructure improvements.
Implemented a new mapping software and associated staking software which will enhance our ability to populate the engineering model.
Enhanced a computer processed engineering analysis model, for the City’s electric distribution system, using Milsoft’s Engineering Analysis Software. This is currently being used for a capacitor evaluation.
FY 2016-17 MAJOR BUDGET CHANGES / NEW REQUESTS /
FOCUS AREAS: Continue maintaining the accuracy and structure
of the data in the electric system geo-database. Continue implementation of an ArcFM ESRI
extension with the Milsoft WindMil Map. Incorporate new staking software with the interface capability within WindMil Map.
Develop financial reporting aspect of staking software to carefully track installed assets.
Continue researching the work-flow required for more accurate Work Order Management system.
Unfreeze and fund an Electric Engineering Specialist position dedicated to inventory of electric materials.
STEPS / PROGRAMS BEING UNDERTAKEN TO ENHANCE
PERFORMANCE: Continue training personnel by using cost effective
training courses. Database maintenance techniques will continue to
be refined as we strive to provide the highest integrity possible.
Manage our Residential Energy Audit, Heat Pump Rebate and Peak Partners Programs.
Manage our Key Accounts Program that provides a relationship between the Electric Systems and Key Accounts.
Establish an electronic interface capable of connecting the software used for work orders associated with electric design to the warehouse and accounting/bookkeeping departments.
$- $100,000 $200,000 $300,000 $400,000 $500,000 $600,000 $700,000 $800,000 $900,000
$1,000,000
13-14 14-15 15-16 16-17Budget
Total Expenses
0%
20%
40%
60%
80%
100%
13-14 14-15 15-16 16-17
% Developers Contacted within 48 hours of request through Plan Review Center
Actual
163

PERFORMANCE GOALS:
Major Service Area: Planning and Design
Goal: To provide prompt response to new customers to determine their needs and desires for electric service.
Major Service Area: GIS Application Service
Goal: To identify and address internal customer needs such as calculations and maps promptly in order to maintain construction and service schedules.
PERFORMANCE SUMMARY: Major Performance Measure FY14 FY15 FY16 FY16 FY17 Benchmark Service Indicator Type Actual Actual Obj. Actual Obj. Target Area
Planning and Design
% of Customers contacted within 24 hours of a
request through the Call Center or Electric Dispatch
Effectiveness N/A 100% 100% 100% 100% 100%
Planning and Design
% of Developers Contacted within 48 hours of a
request through the Plan Review Center
Effectiveness N/A 100% 100% 100% 100% 100%
GIS App. Service
% of Internal customer needs responded to within
24 hours. Effectiveness N/A 100% 100% 100% 100% 100%
GIS App. Service
% of Provision of mapping needs handled within 1
working day Effectiveness N/A 100% 100% 100% 100% 100%
BUDGET SUMMARY:
Cost Center #:72502013-2014 2014-2015 2015-2016 2015-2016 2016-2017 2016-2017
Actual Expenses
Actual Expenses**
Council Approved
Actual Expenses**
Manager Recommended
Council Approved
Personnel Services 380,535$ 426,915$ 556,249$ 519,531$ 600,861$ 600,861$
Operations 116,963$ 153,195$ 226,198$ 178,366$ 234,481$ 234,481$ Capital Outlay -$ -$ 45,795$ 5,795$ 6,000$ 6,000$ Depreciation & Amortizati 10,454$ 15,518$ -$ -$ -$ -$ Cost Allocations 69,957$ 60,970$ 91,904$ 84,245$ 87,740$ 87,740$
Total Expenses 577,909$ 656,598$ 920,146$ 787,937$ 929,082$ 929,082$ % budget change -10% 3% 44% 20% 1%* as amended** as of 8/11/2016Authorized FTE 5.00 5.00 7.00 7.00 8.00 8.00
164

UTILITY LOCATE SERVICES MISSION: The Utility Locate Service Division exists to ensure that all City utilities are accurately located in adequate time to comply with the N.C. Underground Damage Prevention Act. PROGRAM LOCATOR:: Fund: Electric Fund Functional Area: Utilities – Electric Department: Electric Systems Division: Utility Locate Services BUDGET & PERFORMANCE HIGHLIGHTS:
MAJOR SERVICE(S) PROVIDED: Utility Location services provided for Electric,
Water and Sewer infrastructure assets. All underground utilities are located upon request to prevent possible damage and service interruptions.
Services are provided through joint funding by Electric, Water and Sewer Departments.
FY 2015-16 MAJOR ACCOMPLISHMENTS: Improved base GIS Map accuracy levels by field
verification. Established a more productive system of assigned
area cross-training. Updated locating equipment for better efficiency
and accuracy.
FY 2016-17 MAJOR BUDGET CHANGES / NEW REQUESTS /
FOCUS AREAS: Budget provides equipment and tools required to
allow locators to locate all of the City’s utilities. Focus will be on improved coordination between
assigned areas to enhance response times. Investments will be made in new technologies to
reduce overhead and improve production with fewer employees.
STEPS / PROGRAMS BEING UNDERTAKEN TO ENHANCE
PERFORMANCE: Staff is researching available techniques, programs
and tech support in order to stay current with standard practices to protect the City’s utility investment.
Continue to train assigned personnel to handle locating tasks accurately and more efficiently.
$- $25,000 $50,000 $75,000
$100,000 $125,000 $150,000 $175,000
13-14 14-15 15-16 16-17Budget
Total Expenses
75%
80%
85%
90%
95%
100%
13-14 14-15 15-16 16-17
% of Locates Completed Within 48 Hrs
ActualObjective
165

PERFORMANCE GOALS:
Major Service Area: Utility Location Goal: To locate all utilities in compliance with the N.C. Underground Damage Prevention Act guidelines of accuracy and time requirements in order to prevent damage to underground water, wastewater, and electric infrastructure.
PERFORMANCE SUMMARY: Major Performance Measure FY14 FY15 FY16 FY16 FY17 Benchmark Service Indicator Type Actual Actual Obj. Actual Obj. Target Area
Utility Location
% of locates that are located within 24 inches
Effectiveness 99% 99% 99% 99% 99% 99%
Utility Location
% of locates that are located within 48 hours
Effectiveness 99% 99% 99% 97% 99% 99%
BUDGET SUMMARY:
Cost Center #:72602012-2013 2013-2014 2015-2016 2015-2016 2016-2017 2016-2017
Actual Expenses
Actual Expenses
Council Approved*
Actual Expenses**
Manager Recommended
Council Approved
Personnel Services 280,971$ 310,151$ 335,603$ 332,733$ 321,711$ 321,711$
Operations 66,376$ 78,370$ 99,564$ 60,507$ 99,512$ 99,512$ Capital Outlay -$ -$ 68,000$ -$ 30,000$ 30,000$ Depreciation & Amortization 4,633$ 8,062$ -$ -$ -$ -$ Cost Allocations (229,862)$ (260,163)$ (329,279)$ (301,909)$ (299,463)$ (299,463)$
Total Expenses 122,118$ 136,420$ 173,888$ 91,331$ 151,760$ 151,760$ % budget change 1% 13% -33.1% -13%
*as amended** as of 8/11/2016
5.00 4.00 4.00 5.00 5.00 5.00The Utility Locate Services budget is allocated across the Electric, Water, and Wastewater departments.
166

Water Resources RevenuesFund 620
2013-2014 2014-2015 2015-2016 2015-2016 2016-2017 2016-2017
ActualRevenues
ActualRevenues**
Council Approved*
ActualRevenues**
ManagerRecommended
Council Approved
Non-Operating Revenues 52,844$ 47,687$ 34,000$ 66,071$ 34,000$ 34,000$ Investment Earnings 547,096$ 320,050$ 340,000$ 471,521$ -$ -$
Operating Revenues - Utilities 19,788,855$ 21,480,022$ 21,405,903$ 22,898,637$ 22,886,000$ 22,886,000$
Retained Earnings Appropriated $ - $ - $ 6,896,498 $ - $ 1,190,000 $ 1,190,000 Financing Proceeds/Other Revenue -$ -$ -$ 10,971,222$ -$ -$
Total Revenues 20,388,795$ 21,847,759$ 28,676,401$ 34,407,451$ 24,110,000$ 24,110,000$ % budget change 13% 57% -16%* as amended**as of 8/11/2016
Non-Operating Revenues0.1%
Operating Revenues - Utilities95%
Retained Earnings Appropriated
5%
FY 17 Water Resources Revenues(by Source)
$-
$5,000,000
$10,000,000
$15,000,000
$20,000,000
$25,000,000
$30,000,000
$35,000,000
$40,000,000
ActualRevenues
ActualRevenues**
ActualRevenues**
CouncilApproved
2013-2014 2014-2015 2015-2016 2016-2017
Water Resources Revenue TrendFinancingProceeds/Other Revenue
RetainedEarningsAppropriated
InvestmentEarnings
Non-OperatingRevenues
OperatingRevenues -Utilities
167

Water Resources Expenditures2013-2014 2014-2015 2015-2016 2015-2016 2016-2017 2016-2017
Actual Expenses
ActualExpenses
CouncilApproved*
Actual Expenses**
ManagerRecommended
CouncilApproved
Budget UnitHillgrove Water Treatment Plant 2,698,464$ 2,835,797$ 3,714,920$ 2,082,515$ 3,319,940$ 3,319,940$ Coddle Creek Water Treatment Plant 3,057,182$ 3,334,573$ 6,230,919$ 4,072,178$ 7,556,222$ 7,556,222$
Waterlines Operation & Maintenance 14,730,567$ 10,771,123$ 18,730,562$ 27,443,397$ 13,233,838$ 13,233,838$
Total Expenses 20,486,213$ 16,941,493$ 28,676,401$ 33,598,090$ 24,110,000$ 24,110,000$ % budget change -17% 98% -16%
* as amended**as of 8/11/2016
Hillgrove WTP20%
Coddle Creek WTP24%
Waterlines Operations & Maint.56%
FY 17 Water Resources Expenditures(by Budget Unit)
$-
$5,000,000
$10,000,000
$15,000,000
$20,000,000
$25,000,000
$30,000,000
$35,000,000
$40,000,000
ActualExpenses
ActualExpenses
ActualExpenses**
CouncilApproved
2013-2014 2014-2015 2015-2016 2016-2017
Water Resources Expenditure Trend
Waterlines Operation &Maintenance
Coddle Creek WaterTreatment Plant
Hillgrove WaterTreatment Plant
168

HILLGROVE WATER PLANT MISSION: The Hillgrove Water Plant provides drinking water at the most economical rate, meeting all state and federal regulations for the customers of the City of Concord and Cabarrus County, and our neighboring municipalities Harrisburg, Kannapolis, and Midland. PROGRAM LOCATOR: Fund: Water Fund Functional Area: Utilities - Water Department: Water Resources Division: Hillgrove Water Plant BUDGET & PERFORMANCE HIGHLIGHTS: MAJOR SERVICE(S) PROVIDED: Water Treatment and Analysis
FY 2015-16 MAJOR ACCOMPLISHMENTS: Partial completion of outdated lab equipment
replacement. Purchased work order/inventory software
program & tablets for maintenance personnel. Partial top repair of a clear well. Media replacement for biological filtration study
for Disinfection By-Product (DBP) regulation. Completed installation of PAX Trihalomethane
Reduction System (TRS) in clearwell. Received NC Area Wide Optimization Award for
surpassing federal and state drinking water standards.
FY 2016-17 MAJOR BUDGET CHANGES / NEW REQUESTS /
FOCUS AREAS: Continue replacing outdated lab equipment for
compliance monitoring. Security improvements for water treatment plant
and remote sites. Install new motor control center for controlling
pumps. Complete biological filtration study for
Disinfection By-Product reduction. STEPS / PROGRAMS BEING UNDERTAKEN TO ENHANCE
PERFORMANCE: Attending training sessions to obtain knowledge
on new regulations and treatment processes. Attend training on OSHA safety programs. Plan for future upgrades and technology
enhancements that will address future regulations and provide high quality water for years to come.
$0
$1,000,000
$2,000,000
$3,000,000
$4,000,000
13-14 14-15 15-16 16-17Budget
Total Expenses
0%
20%
40%
60%
80%
100%
13-14 14-15 15-16 16-17
% Treated Water Meeting or Surpassing State and Federal Regulations
Actual Objective
169

PERFORMANCE GOALS:
Major Service Area: Water Treatment and Analysis
Goal: To comply with and exceed state and federal regulations in order to provide safe drinking water.
Goal: To provide efficient production of treated water in order to reduce the total treatment cost per 1,000 gallons.
Major Service Area: Safety
Goal: To provide a safe work environment for coworkers.
PERFORMANCE SUMMARY: Major Performance Measure FY14 FY15 FY16 FY16 FY17 Benchmark Service Indicator Type Actual Actual Obj. Actual Obj. Target Area
Water Treatment & Analysis
% of treated water meeting or surpassing State and
Federal Regulations Effectiveness 100% 100% 100% 100% 100% 100%
Water Treatment & Analysis
% of treated water turbidity at or below 0.30
NTU* Effectiveness 100% 100% 100% 99% 100% 100%
Water Treatment & Analysis
% of treated water turbidity at or below 0.20
NTU** Effectiveness 100% 100% 100% 99% 100% 100%
Water Treatment & Analysis
% of treated water turbidity at or below 0.10
NTU** Effectiveness 98% 100% 98% 95% 98% 87%
Water Treatment & Analysis
Gallons of water required to produce 1 finished
gallon of water Efficiency 1.02 1.01 1.03 1.01 1.03 1.03
Safety # of preventable accidents Effectiveness 0 0 0 0 0 0
*State and Federal Regulation is 95% **These are internally established limits that exceed State and Federal Regulations. BUDGET SUMMARY:
Cost Center #: 7330
2013-2014 2014-2015 2015-2016 2015-2016 2016-2017 2016-2017
ActualExpenses
ActualExpenses
CouncilApproved*
ActualExpenses**
Manager Recommended
CouncilApproved
Personnel Services 847,417$ 835,077$ 1,005,787$ 865,672$ 921,279$ 921,279$ Operations 1,053,682$ 1,171,671$ 2,080,686$ 1,201,309$ 2,091,623$ 2,091,623$ Capital Outlay -$ 611,500$ -$ 300,000$ 300,000$ Depreciation & Amortization 367,602$ 374,452$ -$ -$ -$ -$ Transfers 415,000$ 440,000$ -$ -$ -$ -$ Cost Allocations 14,763$ 14,597$ 16,947$ 15,534$ 7,038$ 7,038$
Total Expenses 2,698,464$ 2,835,797$ 3,714,920$ 2,082,515$ 3,319,940$ 3,319,940$
% budget change 8% -1% 6% -11%* as amended**as of 8/11/2016 Authorized FTE 14.50 14.50 14.50 14.50 14.50 14.50
170

CODDLE CREEK WATER PLANT MISSION: The Coddle Creek Water Treatment Plant provides safe, sufficient drinking water at the most economical rate, meeting all state and federal regulations for customers of the City of Concord, Cabarrus County, and our neighboring municipalities Harrisburg, Kannapolis and Midland. PROGRAM LOCATOR:: Fund: Water Fund Functional Area: Utilities - Water Department: Water Resources
Division: Coddle Creek Water Plant BUDGET & PERFORMANCE HIGHLIGHTS:
MAJOR SERVICE(S) PROVIDED:
Water Treatment and Analysis
FY 2015-16 MAJOR ACCOMPLISHMENTS: Changed out high service pump motor starters
for HSP pumps 2 and 4. Moved raw water actuator control above ground. Introduction of Albemarle water into City of
Concord distribution system. FY 2016-17 MAJOR BUDGET CHANGES / NEW REQUESTS /
FOCUS AREAS: Settling basin upgrades for water quality
enhancements. Security improvements at facility and remote
sites.
Sampling station installations in distribution system.
Raw water flow meter. Replace Programmable Logic Controller cabinets. Install new raw water line from reservoir to Plant.
STEPS / PROGRAMS BEING UNDERTAKEN TO ENHANCE
PERFORMANCE: Attend training sessions and seminars to stay
abreast of the newest regulations, treatment techniques and testing methods to meet these requirements.
Network with our peers in the industry and state and regulatory personnel.
Plan for future upgrades and technology enhancements that will address future regulations and provide high quality water for years to come.
Working to meet more stringent voluntary programs such as the Area Wide Optimization Program (AWOP).
$0$1,000,000$2,000,000$3,000,000$4,000,000$5,000,000$6,000,000$7,000,000
13-14 14-15 15-16 16-17Budget
Total Expenses
0%
20%
40%
60%
80%
100%
13-14 14-15 15-16 16-17
% Treated Water Meeting or Surpassing State and Federal Regulations
Actual Objective
171

PERFORMANCE GOALS:
Major Service Area: Water Treatment and Analysis Goal: To comply with and exceed State and Federal regulations in order to provide safe drinking water. Goal: To provide efficient production of treated water in order to reduce the total treatment cost per 1,000 gallons.
Major Service Area: Safety Goal: To provide a safe work environment for coworkers.
PERFORMANCE SUMMARY: Major Performance Measure FY14 FY15 FY16 FY16 FY17 Benchmark Service Indicator Type Actual Actual Obj. Actual Obj. Target Area
Water Treatment & Analysis
% of treated water meeting or surpassing State and
Federal regulations. Effectiveness 100% 100% 100% 100% 100% 100%
Water Treatment & Analysis
% of treated water turbidity at or below 0.30
NTU* Effectiveness 100% 100% 100% 100% 100% 100%
Water Treatment & Analysis
% of treated water turbidity at or below 0.20
NTU** Effectiveness 100% 99.6% 100% 100% 100% 100%
Water Treatment & Analysis
% of treated water turbidity at or below 0.10
NTU** Effectiveness 97.9% 94.8% 97.9% 97.3% 98% 98%
Water Treatment & Analysis
Gallons of water required to produce 1 finished
gallon of water Efficiency 1.026 1.02 1.026 1.026 1.03 1.03
Safety # of preventable accidents Effectiveness 0 0 0 0 0 0
*State and Federal regulation is 95%. **These are internally established limits that exceed State and Federal regulations. BUDGET SUMMARY: Cost Center #: 7331
2013-2014 2014-2015 2015-2016 2015-2016 2016-2017 2016-2017
ActualExpenses
ActualExpenses
CouncilApproved*
ActualExpenses**
Manager Recommended
CouncilApproved
Personnel Services 945,298$ 994,315$ 1,012,525$ 989,161$ 1,011,411$ 1,011,411$ Operations 1,837,361$ 1,759,525$ 5,019,658$ 3,017,970$ 4,680,368$ 4,680,368$ Capital Outlay -$ -$ 182,400$ 50,072$ 340,400$ 340,400$ Depreciation & Amortization 260,058$ 260,455$ -$ -$ -$ -$ Cost Allocations 14,465$ 14,278$ 16,336$ 14,975$ 9,043$ 9,043$ Transfers -$ 306,000$ -$ -$ 1,515,000$ 1,515,000$
Total Expenses 3,057,182$ 3,334,573$ 6,230,919$ 4,072,178$ 7,556,222$ 7,556,222$ % budget change -29% -1% 5% 21%* as amended**as of 8/11/2016Authorized FTE 15.50 15.50 15.50 15.50 15.50 15.50
172

WATERLINES OPERATIONS & MAINTENANCE MISSION: The Water Resources Department exists to provide quality drinking water, accountability, respect, continuous improvement, and trust to our customers including the planning of long-range water needs to meet future growth and demands on our water distribution system. PROGRAM LOCATOR:: Fund: Water Fund Functional Area: Utilities - Water Department: Water Resources Division: Waterlines Operations & Maint. BUDGET & PERFORMANCE HIGHLIGHTS: ET & PER MAJOR SERVICE(S) PROVIDED::
Maintenance New Construction Water Quality Water Meters
FY 2015-16 MAJOR ACCOMPLISHMENTS: Completed the Water System Model Update
project that will help develop the future Water System Master Plan.
Began the information gathering phase for the Water System Master Plan project.
Completed 10% leak detection project. Completed key field investigations and discussion
of design alternatives for the Downtown Water Line Phase 1 project.
Completed the construction of the pressure reducing and check valve vault project along Rocky River Road.
Completed the plan reviews of the I-85 Widening Phase 2 project.
Updated the Water System Management Plan. Began conversion to Advancing Metering
Infrastructure (AMI) system. Completed rehabilitation of Todd Street elevated
storage tank. Implemented tablets for water crews to improve
customer service and project/work tracking. Initiated a more robust customer notification
process for construction projects.
FY 2016-17 MAJOR BUDGET CHANGES / NEW REQUESTS /
FOCUS AREAS: Continue leak detection. Continue conversion to AMI. Begin programming changes recommended in the
Water System Master Plan project. Continue working with the Fire Department in
looking at areas in the existing water system that have low pressures and/or low flows.
STEPS / PROGRAMS BEING UNDERTAKEN TO ENHANCE
PERFORMANCE: Leak detection to facilitate repair of small leaks
before they become major water main breaks in roadways and under sidewalks.
Water Quality complaints are being reduced due to replacement of older water mains and installation of automatic flushing devices on dead end mains.
Continue to monitor potential regulatory changes to NPDES water distribution and treatment permits.
Continue to enhance the current water quality procedures.
Leverage GIS capabilities in the field/office to help identify issues and solutions as well as improve database accuracy.
$0
$5,000,000
$10,000,000
$15,000,000
$20,000,000
$25,000,000
$30,000,000
13-14 14-15 15-16 16-17Budget
Total Expenses
02468
101214
13-14 14-15 15-16 16-17
Average # of Days to Install 3/4" through 2" Water Service
Actual Objective
173

PERFORMANCE GOALS: Major Service Area: Maintenance
Goal: To conduct leak detection surveys on the 10% of the water distribution system annually in order to reduce the number of leaks and reduce un-accounted water loss. Major Service Area: New Construction Goal: To provide more efficient water service installations for residential, commercial, and industrial customers in order to help expedite the construction of development projects. Major Service Area: Water Quality Goal: To provide the highest quality of water to customers by meeting and exceeding both state and EPA
guidelines in order to ensure the safety and health of the water supply. Major Service Area: Water Meters
Goal: To install AMI water meter technology to increase the efficiency and accuracy in reading water meters. Major Service Area: Safety Goal: To provide a safe work environment for coworkers.
PERFORMANCE SUMMARY: Major Performance Measure FY14 FY15 FY16 FY16 FY17 Benchmark Service Indicator Type Actual Actual Obj. Actual Obj. Target Area
New Construc
-tion
Avg. # of days to install ¾” through 2” water
service Workload 13.5 12 8 10 8 8
Water Quality
# of customer complaints per 1,000 accounts
Effectiveness 4.8 6.3 1 6.3 1 1
Water Meters
% AMI Conversion Workload Revised for FY17
Revised for FY17
Revised for FY17
Revised for FY17
50% NA
Maint. % of System leak detection surveys
completed Effectiveness 10% 10% 10% 10% 10% 10%
Safety # of preventable
accidents Effectiveness 1 0 0 2 0 0
BUDGET SUMMARY: Cost Center #: 7340
2013-2014 2014-2015 2015-2016 2015-2016 2016-2017 2016-2017
ActualExpenses
ActualExpenses
CouncilApproved*
ActualExpenses**
Manager Recommended
CouncilApproved
Personnel Services 1,948,294$ 1,896,149$ 2,090,046$ 2,238,631$ 2,317,318$ 2,317,318$ Operations 1,325,524$ 1,349,871$ 2,134,462$ 1,264,931$ 1,998,402$ 1,998,402$
Capital Outlay (81,227)$ (89,268)$ 676,500$ 389,993$ 725,500$ 725,500$ Depreciation & Amortizati 3,177,797$ 3,188,266$ -$ (14,678)$ -$ -$ Debt Service 1,600,169$ 1,504,782$ 4,448,449$ 14,395,321$ 4,015,329$ 4,015,329$ CIP Projects -$ -$ -$ -$ -$ -$ Cost Allocations 2,217,698$ 2,497,021$ 2,542,858$ 2,330,952$ 2,686,261$ 2,686,261$ Non Operating Expense 136,326$ (70,512)$ -$ -$ -$ -$ Transfers 4,405,986$ 494,814$ 6,838,247$ 6,838,247$ 1,491,028$ 1,491,028$
Total Expenses 14,730,567$ 10,771,123$ 18,730,562$ 27,443,397$ 13,233,838$ 13,233,838$ % budget change 58% -27% 155% -29%* as amended**as of 8/11/2016
Authorized FTE 34.24 34.59 34.59 34.59 36.26 36.26
174

Transit System RevenueFund 630
2013-2014 2014-2015 2015-2016 2015-2016 2016-2017 2016-2017Actual
RevenuesActual
RevenuesCouncil
Approved*Actual
Revenues**Manager
RecommendedCouncil
Approved
Restricted Intergov't Revenue 5,096,508$ 2,033,171$ 2,413,879$ 1,944,304$ 2,476,907$ 2,476,907$
Operating Revenues 289,091$ 295,558$ 275,000$ 268,121$ 275,000$ 275,000$ Non-Operating Revenue 63,287$ -$ 34,874$ 17,332$ -$ -$ Transfer from Gen Fund 921,800$ 152,494$ 521,452$ 921,885$ 381,184$ 381,184$ Transfer from Addt'l $5 Vehicle 207,329$ 393,291$ -$ -$ 350,000$ 350,000$
Total Revenues 6,578,015$ 2,874,514$ 3,245,205$ 3,151,642$ 3,483,091$ 3,483,091$ % budget change -56% 10% 7%* as amended**as of 8/11/2016
Restricted Intergov't Revenue
71%
Operating Revenues8%
Transfer from Addt'l $5 Vehicle
10%
FY 16-17 Transit System Revenues(by Source)
$-
$1,000,000
$2,000,000
$3,000,000
$4,000,000
$5,000,000
$6,000,000
$7,000,000
ActualRevenues
ActualRevenues
ActualRevenues**
CouncilApproved
2013-2014 2014-2015 2015-2016 2016-2017
Transit Revenue Trend
Operating Revenues
Transfer from Addt'l $5Vehicle
Transfer from GenFund
Restricted Intergov'tRevenue
175

Transit System Expenses2013-2014 2014-2015 2015-2016 2015-2016 2016-2017 2016-2017
Actual Expenses
Actual Expenses
CouncilApproved*
Actual Expenses**
Manager Recommended
CouncilApproved
Transit - Rider 8,424,176$ 2,950,147$ 5,861,045$ 2,977,702$ 3,483,091$ 3,483,091$
Total Expenses 8,424,176$ 2,950,147$ 5,861,045$ 2,977,702$ 3,483,091$ 3,483,091$ % budget change -65% 1% -41%
* as amended**as of 8/11/2016
$-
$1,000,000
$2,000,000
$3,000,000
$4,000,000
$5,000,000
$6,000,000
$7,000,000
$8,000,000
$9,000,000
ActualExpenses
ActualExpenses
ActualExpenses**
CouncilApproved
2013-2014 2014-2015 2015-2016 2016-2017
Transit Expenditure Trend
176

PUBLIC TRANSIT SYSTEM
MISSION: To provide safe, dependable, and user-friendly transportation services to the citizens of Concord and Kannapolis with the desire to operate at the highest levels of rider satisfaction. PROGRAM LOCATOR:: Fund: Transit System Functional Area: Transit System Department: Transit FY17 - Rider BUDGET & PERFORMANCE HIGHLIGHTS: MAJOR SERVICE(S) PROVIDED: Fixed-route transit service to Concord and
Kannapolis
FY 2015-16 MAJOR ACCOMPLISHMENTS: Revised, strengthened and update Rider Transit
ADA Paratransit Program. Developed and distributed new ADA Paratransit
“How to Rider Guide” Revised and updated Rider Transit Service
Provider to include transition of ADA Paratransit service from County to Service Provider; successfully lead RFP process from development to selection of new Service Provider.
Completed procurements of new ADA Paratransit vehicles and ADA program management software.
Successfully complete first year of a multi-year partnership with Cabarrus Health Alliance and their REACH grant program.
Revised and updated the Rider Transit web site and completed a successfully billboard campaign; resulting in an increased use of the Rider web site and Facebook page.
Worked with CATS to develop and analyze several viable options for service between Rider and the new CATS Blue Line Extension.
Hosted the 2015 North Carolina Public Transportation Association annual Conference, Expo, Roadeo and Golf events; successfully secured Concord as the host location for 2016 and 2017.
Developed and filled two new staff positions: Transit Planner and Technology Coordinator, and Transit ADA Coordinator.
FY 2016-17 MAJOR BUDGET CHANGES / NEW REQUESTS / FOCUS AREAS: Continue implementation of Transit bus stop
amenities. Expand access to and quality of customer service
at the Rider Transit Center utilizing addition staffing.
Continue to develop understanding of new FTA FAST legislation while seeking new ways and means to fund transit operations and projects.
Successfully transition operations to new Service Provider, particularly the ADA Paratransit service.
Continue examination of advertising program options to generate additional program income for Rider.
Continue to prepare for and adjust to significant operational impacts due to local road construction projects.
STEPS / PROGRAMS BEING UNDERTAKEN TO ENHANCE PERFORMANCE: Continue to fully and creatively leverage our
Federal and State funding options available within MAP-21 the new FAST Act. Look for additional sources of funding.
Monitor development and growth utilization of the ADA Paratransit program and seek to control costs where possible.
Continue implementation of Transit Development Plan recommendations, specifically infrastructure & amenity improvement projects.
Continue improving Rider Transit’s marketing program and impact.
Continue efforts to improve communication & coordination between Rider & neighboring transit systems & services.
$-
$2,000,000
$4,000,000
$6,000,000
$8,000,000
$10,000,000
13-14 14-15 15-16 16-17Budget
Total Expenses
0
5
10
15
20
13-14 14-15 15-16 16-17
# of Passengers per Revenue Hour
Actual Objective
177

PERFORMANCE GOALS:
Major Service Area: Fixed-route and ADA Paratransit Transit Service
Goal: To provide safe, quality service to riders in order to attract new and retain existing riders, prevent
roadway injuries and property damage, keep costs low, and maintain bus trip and ADA Paratransit schedules.
PERFORMANCE SUMMARY: Major Performance Measure FY14 FY15 FY16 FY16 FY17 Benchmark Service Indicator Type Actual Actual Obj. Actual Obj. Target Area
BUDGET SUMMARY:
Fixed-route Transit
# of Riders Workload 465,335 472,555 500,000 426,622 440,000 500,000
Fixed-route Transit
# of passengers per revenue hour
Efficiency 13 13 14.30 12.06 13 15
Fixed-route Transit
% of fare box recovery Efficiency 9.88% 10.75% 9.5% 8.98% 9.5% 15%
Fixed-route Transit
# of preventable accidents per 100,000
bus miles Effectiveness .63 0 .60 0 .60 .60
Fixed-route Transit
# of rider complaints per 100,000 riders/trips
Effectiveness 10.75 8 10.5 7.16 10 10
Fixed-route Transit
Average satisfaction rating of overall service
Effectiveness 94.9% 94.1% 95% 94.62% 95% 95%
Fixed-route Transit
On-time Performance Effectiveness 69.85% 79.05% 83% 86.49% 85% 75%
Fixed-route Transit
Passenger requests for service inside the
service area Workload 346 383 300 356 300 200
Cost Center #: 76132013-2014 2014-2015 2015-2016 2015-2016 2016-2017 2016-2017
Actual Expenses
Actual Expenses
Council Approved*
Actual Expenses**
Manager Recommended
Council Approved
Personnel Services 145,658$ 157,656$ 282,702$ 233,384$ 311,965$ 311,965$ Operations 2,910,875$ 2,668,503$ 3,034,744$ 2,616,784$ 3,117,774$ 3,117,774$
Capital Outlay 5,006,932$ (1,072)$ 245,645$ -$ -$ -$ Grant Expenditures 316,650$ 73,639$ 2,151,597$ 12,667$ 16,220$ 16,220$ Cost Allocations 44,061$ 51,421$ 146,357$ 114,867$ 37,132$ 37,132$
Total Expenses 8,424,176$ 2,950,147$ 5,861,045$ 2,977,702$ 3,483,091$ 3,483,091$ % budget change 176% -65% 1% -41%
* as amended** as of 8/11/16Authorized FTE 2.70 3.70 4.70 4.70 5.00 5.00
178

Wastewater Resources RevenuesFund 640
2013-2014 2014-2015 2015-2016 2015-2016 2016-2017 2016-2017Actual
RevenuesActual
RevenuesCouncil
ApprovedActual
Revenues**Manager
RecommendedCouncil
Approved
Non-Operating Revenues 245,525$ 34,842$ 25,021$ 35,099$ -$ -$
Investment Earnings 214,790$ 162,412$ 200,000$ 250,312$ -$ -$ Operating Revenues 15,075,545$ 16,167,934$ 16,168,850$ 17,650,991$ 16,572,000$ 16,572,000$
Retained Earnings Appropriated -$ -$ 618,021$ 3,455,703$ -$ -$
Total Revenues 15,535,860$ 16,365,188$ 17,011,892$ 21,392,105$ 16,572,000$ 16,572,000$
% budget change 5% 31% -3%* as amended**as of 8/11/2016
Operating Revenues100%
FY 17 Wastewater Resources Revenue(by Source)
0
2,000,000
4,000,000
6,000,000
8,000,000
10,000,000
12,000,000
14,000,000
16,000,000
18,000,000
20,000,000
ActualRevenues
ActualRevenues
ActualRevenues**
CouncilApproved
2013-2014 2014-2015 2015-2016 2016-2017
Wastewater Revenue Trend
Investment Earnings
Non-OperatingRevenues
Operating Revenues
179

Wastewater Resources Expenditures2013-2014 2014-2015 2015-2016 2015-2016 2016-2017 2016-2017
Actual Expenses
Actual Expenses
CouncilApproved*
Actual Expenses**
Manager Recommended
CouncilApproved
Wastewaterlines Operations & Maint. 14,782,971$ 13,945,885$ 17,011,892$ 18,881,397$ 16,572,000$ 16,572,000$
Total Expenditures 14,782,971$ 13,945,885$ 17,011,892$ 18,881,397$ 16,572,000$ 16,572,000$
% budget change -6% 35% -3%
* as amended
** as of 8/11/2016
By Cost Center
$‐
$2,000,000
$4,000,000
$6,000,000
$8,000,000
$10,000,000
$12,000,000
$14,000,000
$16,000,000
$18,000,000
ActualExpenses
ActualExpenses
ActualExpenses**
CouncilApproved
2013-2014 2014-2015 2015-2016 2016-2017
Wastewater Expenditure Trend
180

WASTEWATERLINES OPERATIONS & MAINTENANCE MISSION: The Wastewater Resources Department exists to provide efficient and timely sanitary sewer collection service to residential, commercial, and industrial customers, while building the integrity of our system to enhance water quality and protect the environment for future generations. PROGRAM LOCATOR:: Fund: Wastewater Fund Functional Area: Utilities - Wastewater Department: Wastewaterlines Oper. & Maint. Division: N/A BUDGET & PERFORMANCE HIGHLIGHTS:
MAJOR SERVICE(S) PROVIDED:
Management and maintenance of a wastewater collection system with 540 miles of gravity sewer, 24 pump stations, and 14 miles of force main that serves over 31,000 customers, including: Rapid response to calls concerning potential
blockages and overflows Pipe and pump station wet well jetting/cleaning Routine pump station inspection Pipe inspection using closed circuit t.v. cameras Installation and repair of sewer service
connections Installation and repair of system pipes/manholes
Smoke testing Location of system components and defects
using GPS units Right-of-way maintenance Fats, oils, and grease control education
program Flow monitoring
FY 2015-16 MAJOR ACCOMPLISHMENTS: Completed the design for the Havencrest Sewer
Replacement project. Determined the final alignment for the Province
Green Pump Station Elimination project. Completed the plan reviews of the I-85 Widening
Phase 2 project. Revised sewer flow monitoring program
calculation/graphics procedures and studied drainage areas within Rocky River and Three Mile Branch basins.
Completed the overall evaluation of the Ruben Linker Pump Station and reviewing the preliminary design of the pump station renovation.
Completed first sewer lateral lining project. Initiated a more robust customer notification
process for construction projects. Continued to aggressively identify and resolve
inflow and infiltration issues.
FY 2016-17 MAJOR BUDGET CHANGES / NEW REQUESTS /
FOCUS AREAS: Begin sewer master planning process. Determine the boundaries of all existing sewer
drainage basins and add this information to the GIS sewer system map.
After evaluating results from the sewer flow monitoring program, determine areas of the sewer system that need additional inflow and infiltration testing.
STEPS / PROGRAMS BEING UNDERTAKEN TO ENHANCE
PERFORMANCE: Lining and manhole rehab programs to address
the oldest/most defective areas in the system. Using the latest technology to enhance our
performance to our customers. Continue to monitor potential regulatory changes
to NPDES sewer permit. Enhance right-of-way maintenance program
through new equipment and procedures.
$0
$4,000,000
$8,000,000
$12,000,000
$16,000,000
$20,000,000
13-14 14-15 15-16 16-17Budget
Total Expenses
50%
60%
70%
80%
90%
100%
13-14 14-15 15-16 16-17
% of Repairs Completed within 8 Working Days
Actual Objective
181

PERFORMANCE GOALS:
Major Service Area: Manage and Maintain Sewer System
Goal: To provide quality and cost efficient management and maintenance of the City’s sewer system in order to maximize resources and ensure the health and safety of the community.
Major Service Area: Safety
Goal: To provide training and corrective actions to support a safe working environment for co-workers and the public.
Major Service Area: Emergency Response Calls
Goal: To provide timely response to all emergency calls (line or service blockages) in order to quickly correct system disruptions and potential damage to the system and personal property.
Major Service Area: Jetting and Cleaning
Goal: To provide comprehensive jetting and cleaning of collection mains in order to prevent main blockage and main breaks.
PERFORMANCE SUMMARY:
Major Performance Measure FY14 FY15 FY16 FY16 FY17 Benchmark Service Indicator Type Actual Actual Obj Actual Obj. Target Area
Manage & Maintain Sewer
System
% of repairs completed within 8 working days
Workload 98% 95% 100% 89% 100% 80%
Manage & Maintain Sewer
System
Miles of high priority lines inspected
Efficiency 12 4 80 10 80 NA
Manage & Maintain Sewer
System
% of food service facilities inspected
annually Workload 88.4% 100% 100% 80% 100% NA
Safety # of preventable
accidents Effectiveness 1 2 0 2 0 0
Manage & Maintain Sewer
System # of reportable SSOs Effectiveness 11 2 0 5 0 0
Jetting & Cleaning
Miles of sewer main cleaned
Workload 94.9 53 53 88 54 NA
Manage & Maintain Sewer
System
Miles of right-of-way mowed annually
Efficiency 46 121 82 107 82 82
Emergency Response Calls
% of emergency call on-site evaluations within
120 minutes Efficiency 100% 100% 100% 100% 100% 100%
BUDGET SUMMARY
Cost Center #:7420
2013-2014 2014-2015 2015-2016 2015-2016 2016-2017 2016-2017
Actual Expenses
Actual Expenses
CouncilApproved*
Actual Expenses**
Manager Recommended
CouncilApproved
Personnel Services 1,545,251$ 1,604,658$ 1,834,543$ 1,613,025$ 1,917,624$ 1,917,624$ Operations 7,107,181$ 6,820,872$ 7,694,040$ 7,674,241$ 7,907,953$ 7,907,953$ Capital Outlay -$ -$ 1,516,200$ 944,530$ 1,242,035$ 1,242,035$ Depreciation & Amortizatio 2,830,755$ 3,002,656$ -$ 11,498$ -$ -$ Debt Service -$ -$ 2,796,226$ 5,952,957$ 2,652,373$ 2,652,373$ CIP Projects 88,745$ 69,133$ 11,117$ 80,302$ -$ -$ Cost Allocations 2,610,961$ 2,445,325$ 2,312,404$ 1,757,482$ 1,931,159$ 1,931,159$ Transfers 600,078$ 3,241$ 847,362$ 847,362$ 920,856$ 920,856$ Total Expenses 14,782,971$ 13,945,885$ 17,011,892$ 18,881,397$ 16,572,000$ 16,572,000$ % budget change -6% 35% -3%* as amended**as of 8/11/2016Authorized FTE 30.00 30.32 30.32 30.32 31.98 31.98
182

Rocky River Golf Course RevenuesFund 650
2013-2014 2014-2015 2015-2016 2015-2016 2016-2017 2016-2017
Actual Revenues
Actual Revenues
CouncilApproved*
Actual Revenues**
Manager Recommended
CouncilApproved
Non-Operating Revenues 1,536$ -$ 18,794$ 18,794$ Investment Earnings -$ -$ -$ -$
Operating Revenues 1,750,255$ 1,687,663$ 1,684,487$ 1,631,667$ 1,661,853$ 1,661,853$ Transfer from Retained Earnings -$ -$ 79,585$ -$ -$ -$ Transfer from Gen Fund 787,894$ 661,670$ 883,107$ 937,780$ 937,780$
Total Revenues 2,539,685$ 2,349,333$ 1,764,072$ 2,514,774$ 2,618,427$ 2,618,427$ % budget change -7% 7% 48%* as amended**as of 8/11/2016
Non-Operating Revenues1%
Operating Revenues 63%
Transfer from Gen Fund36%
FY 16-17 Golf Course Revenues(by source)
$-
$500,000
$1,000,000
$1,500,000
$2,000,000
$2,500,000
$3,000,000
ActualRevenues
ActualRevenues
ActualRevenues**
CouncilApproved
2013-2014 2014-2015 2015-2016 2016-2017
Golf Course Revenue Trend
Investment Earnings
Non-OperatingRevenues
Operating Revenues
Transfer from GenFund
183

Rocky River Golf Course Expenses
2013-2014 2014-2015 2015-2016 2015-2016 2016-2017 2016-2017
Actual Expenses
Actual Expenses
CouncilApproved
Actual Expenses**
Manager Recommended
CouncilApproved
Rocky River Golf Club at Concord 2,577,867$ 2,382,769$ 2,703,992$ 2,514,775$ 2,618,427$ 2,618,427$
Total Expenses 2,577,867$ 2,382,769$ 2,703,992$ 2,514,775$ 2,618,427$ 2,618,427$ % budget change -8% 6% -3%* as amended**as of 8/11/2016
$-
$500,000
$1,000,000
$1,500,000
$2,000,000
$2,500,000
$3,000,000
ActualExpenses
ActualExpenses
ActualExpenses**
CouncilApproved
2013-2014 2014-2015 2015-2016 2016-2017
Rocky River Golf Club at Concord Expenditure Trend
184

GOLF COURSE MISSION: The Golf Course is committed to excellence in offering a full service quality golf facility and consistently providing high quality course conditions and customer services. PROGRAM LOCATOR:: Fund: Golf Course Functional Area: Golf Course Department: Rocky River Golf Course Division: N/A BUDGET & PERFORMANCE HIGHLIGHTS:
MAJOR SERVICE(S) PROVIDED: Full Service Golf Facility:
o Full Service bar and grill, banquet facilities and associated catering services.
o Practice range with putting green and target greens.
o Complete instructional programs by PGA professionals in the form of clinics and individual golf lessons.
o Retail merchandising of golf-related apparel and equipment.
o Maintenance of Clubhouse landscaping and irrigation.
FY 2015-16 MAJOR ACCOMPLISHMENTS: Hosted Annual Mayor’s Tournament, Doug
Herbert BRAKES foundation and Habitat for Humanity outings with great results.
Increased ranking to #80 in NC Golf Panel’s “Top 100 courses” for 2016, continuing as one of very few public courses with that distinction.
Highest ranked public course in the entire Charlotte/Concord metro region.
Clubhouse expansion and renovation project completed in February 2016. This has already increased usage of the facility for private parties and banquets.
FY 2016-17 MAJOR BUDGET CHANGES / NEW REQUESTS /
FOCUS AREAS: Revenue driven by local play, and group events.
Also hosting bigger special events (weddings, etc). Bunker renovation project is the major CIP and will
continue to improve the quality of the facility. Continue to host large corporate and charity
outings to increase golf revenues. STEPS / PROGRAMS BEING UNDERTAKEN TO ENHANCE
PERFORMANCE: Continued teaching and lesson programs
promoted through social media. Promote youth golf and grow the game through
instructional programs. Promote golf to Cabarrus County Schools by
hosting high school golf teams, and working with middle schools to introduce the game.
Continue to encourage participation of corporate leagues on weekday evenings. Currently Wells Fargo and 2 other local companies host leagues.
$- $500,000
$1,000,000 $1,500,000 $2,000,000 $2,500,000 $3,000,000
13-14 14-15 15-16 16-17Budget
Total Expenses
0
10,000
20,000
30,000
40,000
13-14 14-15 15-16 16-17
# of Rounds Played (18-Hole Equivalent)
Actual Objective
185

PERFORMANCE GOALS:
Major Service Area: Full Service Golf Facility
Goal: To consistently provide a quality golf facility at an affordable rate with superlative customer service to both residents and non-residents of the City of Concord in order to provide the best possible golf experience and maximize both recreational use and revenue.
PERFORMANCE SUMMARY: Major Performance Measure FY14 FY15 FY16 FY16 FY17 Benchmark Service Indicator Type Actual Actual Obj. Actual Obj. Target Area
Full Service Golf Facility
# of rounds played (18-hole equivalent)
Workload 28,437 27,581 31,000 28,998 30,028 34,000
Full Service Golf Facility
# of pass-holder rounds played (18-hole equivalent)
Workload 2,904 3,660 3,500 3,794 3,453 5,000
Full Service Golf Facility
Average golf and food/beverage revenue per
18-hole round Efficiency $55.85 $54.02 $55.00 $56.27 $55.00 N/A
Full Service Golf Facility
Average operating cost per 18-hole round
Efficiency $48.65 $47.01 $47.50 $50.62 $50.00 N/A
BUDGET SUMMARY:
Cost Center #: 7500, 75012013-2014 2014-2015 2015-2016 2015-2016 2016-2017 2016-2017
Actual Expenses
Actual Expenses
CouncilApproved*
Actual Expenses**
Manager Recommended
CouncilApproved
Operations 1,526,935$ 1,493,002$ 1,645,968$ 1,574,859$ 1,576,005$ 1,576,005$
Capital Outlay 10,200$ -$ -$ -$ -$ -$
Depreciation & Amortization 38,182$ 33,435$ -$ -$ -$ -$
Debt Service 1,002,550$ 856,332$ 939,920$ 939,916$ 937,780$ 937,780$
Transfers -$ -$ 118,104$ -$ 104,642$ 104,642$
Total Expenses 2,577,867$ 2,382,769$ 2,703,992$ 2,514,775$ 2,618,427$ 2,618,427$
% budget change -8% 6% -3%* as amended**as of 8/11/2016
186

Aviation RevenueFund 680
2013-2014 2014-2015 2015-2016 2015-2016 2016-2017 2016-2017Actual
RevenuesActual
RevenuesCouncil
Approved*Actual
Revenues**Manager
RecommendedCouncil
Approved
Restricted Intergovt Revenue -$ 516,657$ 190,833$ 114,175$ 10,000$ 10,000$ Non-Operating Revenue 183,019$ 14,015$ 72,200$ 404,964$ 89,300$ 89,300$ Investment Earnings 69,167$ 41,723$ 40,000$ 60,684$ -$ -$ Operating Revenue 10,267,904$ 8,612,280$ 8,265,446$ 7,656,139$ 8,802,582$ 8,802,582$ Retained Earnings Appropriated -$ -$ 479,141$ -$ -$ -$ Transfers 580,483$ 793,091$ 756,641$ -$ 777,175$ 777,175$
Total Revenue 11,100,573$ 9,977,766$ 9,804,261$ 8,235,962$ 9,679,057$ 9,679,057$ % budget change -10% -17% -1%* as amended**as of 8/11/2016
Non‐Operating Revenue0.9%
Operating Revenues 90.9%
Transfers8%
FY 16-17 Aviation Revenues (by source)
$-
$2,000,000
$4,000,000
$6,000,000
$8,000,000
$10,000,000
$12,000,000
ActualRevenues
ActualRevenues
ActualRevenues**
ManagerRecommended
2013-2014 2014-2015 2015-2016 2016-2017
Aviation Revenue Trend (by Source)
RestrictedIntergovtRevenue
Transfers
Retained EarningsAppropriated
OperatingRevenue
InvestmentEarnings
Non‐OperatingRevenue
187

Aviation Expenditures2013-2014 2014-2015 2015-2016 2015-2016 2016-2017 2016-2017
Actual Expenses
Actual Expenses
CouncilApproved*
Actual Expenses**
Manager Recommended
CouncilApproved
Aviation Operations 11,748,744$ 10,027,833$ 9,804,261$ 8,263,436$ 9,679,057$ 9,679,057$
Total Expenses 11,748,744$ 10,027,833$ 9,804,261$ 8,263,436$ 9,679,057$ 9,679,057$ % budget change -14.6% -17.6% -1%* as amended**as of 8/11/2016
$-
$2,000,000
$4,000,000
$6,000,000
$8,000,000
$10,000,000
$12,000,000
$14,000,000
ActualExpenses
ActualExpenses
ActualExpenses**
CouncilApproved
2013-2014 2014-2015 2015-2016 2016-2017
Aviation Expenditure Trend
188

AVIATION
MISSION The Aviation Department’s mission is to provide services in a safe and secure manner, that exceed expectations for the corporate, business, and general aviation community with the desire to increase & support economic development for the City of Concord and the region. PROGRAM LOCATOR:: Fund: Aviation Functional Area: Transportation Department: Aviation Operations Division: N/A BUDGET & PERFORMANCE HIGHLIGHTS:
MAJOR SERVICE(S) PROVIDED: Airport Management, Operation, Development,
Community Outreach & Marketing Airport Facility Maintenance, Safety, & Security Aviation Fixed Base Operation (Aircraft Fueling &
Line Services, Hangar Rental, etc. 2014-15 S: Continued working with Federal Aviation
Administration to identify projects eligible under the Non-Primary Entitlement grant program.
FY 2015-16 MAJOR ACCOMPLISHMENTS: Allegiant Airlines expanded the commercial
service by adding weekly flights from Concord to Tampa / St. Pete and Fort Lauderdale with added additional flights from Concord to Orlando, increasing the number of commercial flights from Concord from 6-10 per week.
Processed over 112,060 passengers through the temporary commercial service building in calendar year 2015.
Continued expansion of NASCAR Race team Boeing 737 commercial charter flights with 32,500 passengers.
Promoted Concord Regional Airport at the National Business Aviation Association (NBAA) aviation trade show.
FY 2016-17 MAJOR BUDGET CHANGES / NEW REQUESTS /
FOCUS AREAS: N Continue to market Concord Regional Airport for
additional destinations to increase airline service. Provide a safe, secure environment for our staff,
customers, and vendors. Complete construction of the Commercial Service
Terminal and Parking Deck. Construction of perimeter fence. Master Plan update. Upgrade security cameras where needed. Implement enhanced security badging to meet
TSA requirements. Six additional Aviation staff positions requested to
meet increased customer service and operational needs.
STEPS / PROGRAMS BEING UNDERTAKEN TO ENHANCE
PERFORMANCE: Major focus on providing outstanding customer
service. Airport Administration staff proactively search for
federal and state grant funds for airport improvement projects.
Aviation Department will continue comparing itself to surrounding airports to be a benchmark with fuel prices and other services offered to keep our competitive edge.
Airport Administration maintains relationships with FAA, TSA, and other federal, state and local officials in order to strengthen General Aviation ties to the area.
Airport Administration continues to maintain the 139 Certification for Concord Regional Airport.
Maintain 100% compliance with Safety First PLST training for line personnel (FAA Requirement).
$0$2,000,000$4,000,000$6,000,000$8,000,000
$10,000,000$12,000,000$14,000,000
13-14 14-15 15-16 16-17Budget
Total Expenses
0
50
100
150
200
250
13-14 14-15 15-16 16-17
Number of Based Aircraft
Actual Objective
189

PERFORMANCE GOALS:
Major Service Area: Airport Management and Development
Goal: To operate and develop the City’s Airport in the most fiscally responsible way to ensure aeronautical and facility needs are met to support growth and the related economic development of the City, County, and region.
Major Service Area: Airport Facility Maintenance, Safety, & Security
Goal: To protect life and property at the airport by being proactive in maintaining the safest possible facilities, equipment, and staff that complies or exceeds federal, state and local safety and security regulations.
Major Service Area: Fixed Base Operations and Customer Service
Goal: To provide outstanding aviation services, amenities, customer service, to the visiting aviation users and based customers, realizing that the Concord Regional Airport is the first and last impression many people get of our City and community.
PERFORMANCE SUMMARY:
Major Performance Measure FY14 FY15 FY16 FY16 FY17 Benchmark Service Area Indicator Type Actual Actual Obj. Actual Obj. Target
Airport Mgmt. & Dev.
Number of based aircraft Workload 166 166 165 172 175 200
Airport Mgmt. & Dev.
# of general aviation departures
Workload 54,200 54,200 60,000 33,128 34,000 NA
Airport Mgmt. & Dev.
% of office space leased Effectiveness 93% 93% 90% 93% 95% 100%
Airport Mgmt. & Dev.
Monthly scheduled Airline Departure Load Factor
Effectiveness 89% 89% 90% 91% 90% 90%
Maint., Safety, & Security
# of 139 Inspection Discrepancies
Effectiveness 2 2 0 0 0 0
FBO % of airfield inspections
completed Effectiveness 100% 100% 100% 100% 100% 100%
BUDGET SUMMARY:
Cost Center #: 45302013-2014 2014-2015 2015-2016 2015-2016 2016-2017 2016-2017
Actual Expenses
Actual Expenses
CouncilApproved*
Actual Expenses**
Manager Recommended
CouncilApproved
Personnel Services 1,679,210$ 1,763,604$ 1,928,789$ 1,792,000$ 2,090,551 2,090,551$ Operations 7,261,973$ 5,573,679$ 5,497,155$ 4,182,456$ 5,093,178 5,093,178$ Capital Outlay -$ -$ 1,090,773$ 1,075,806$ 178,000 178,000$ Depreciation 1,592,393$ 1,661,375$ -$ -$ - -$ Debt Service 624,906$ 585,907$ 245,053$ 245,045$ 1,604,262 1,604,262$ Non Operating Exp 75,843$ (36,212)$ -$ -$ - -$ Cost Allocations 343,542$ 318,934$ 347,918$ 318,954$ 310,402 310,402$ Transfers 170,877$ 160,546$ 694,573$ 649,175$ 402,664 402,664$
Total Expenses 11,748,744$ 10,027,833$ 9,804,261$ 8,263,436$ 9,679,057$ 9,679,057$ % budget change -15% -18% -1%* as amended**as of 8/11/2016Authorized FTE 33.00 34.00 34.00 34.00 40.00 40.00
190

Public Housing RevenueFund 690
2013-2014 2014-2015 2015-2016 2015-2016 2016-2017 2016-2017Actual
RevenuesActual
RevenuesCouncil
Approved*Actual
Revenues**Manager
RecommendedCouncil
Approved
Other Revenue -$ (26,496)$ -$ -$ -$ -$ Retained Earnings -$ -$ 600$ -$ -$ -$ Rental Income 290,455$ 356,888$ 330,000$ 380,300$ 337,120$ 337,120$ Non-Rental Income 53,468$ 130,129$ 77,000$ 91,278$ 23,301$ 23,301$ HUD Contributions 688,876$ 730,817$ 906,610$ 786,970$ 893,919$ 893,919$ Total Revenue 1,032,799$ 1,191,338$ 1,314,210$ 1,258,548$ 1,254,340$ 1,254,340$ % budget change 15% 6% -4.56%* as amended** as of 8/11/2016
Rental Income27%
Non-Rental Income2%
HUD Contributions71%
FY 16-17 Public Housing Revenue(by source)
$-
$200,000
$400,000
$600,000
$800,000
$1,000,000
$1,200,000
$1,400,000
ActualRevenues
ActualRevenues
ActualRevenues**
CouncilApproved
2013‐2014 2014‐2015 2015‐2016 2016‐2017
Public Housing Revenue Trend
Non-RentalIncomeOther Revenue
Rental Income
HUDContributions
191

Public Housing Expenditures2013-2014 2014-2015 2015-2016 2015-2016 2016-2017 2016-2017
Actual Expenses
Actual Expenses
CouncilApproved*
Actual Expenses**
Manager Recommended
CouncilApproved
Public Housing Operations 1,663,512$ 1,738,432$ 1,314,210$ 1,282,818$ 1,254,340$ 1,254,340$ Total Expense 1,663,512$ 1,738,432$ 1,314,210$ 1,282,818$ 1,254,340$ 1,254,340$ % budget change 5% -26% -5%* as amended** as of 8/11/2016
$-
$200,000
$400,000
$600,000
$800,000
$1,000,000
$1,200,000
$1,400,000
$1,600,000
$1,800,000
$2,000,000
ActualExpenses
ActualExpenses
ActualExpenses**
CouncilApproved
2013-2014 2014-2015 2015-2016 2016-2017
Public Housing Expenditure Trend
192

PUBLIC HOUSING OPERATIONS MISSION: The City of Concord’s Housing Department serves low-income families for whom conventional housing is unaffordable. Our mission is to provide these families with decent, safe, and sanitary housing while supporting their efforts to achieve economic independence and self-sufficiency. PROGRAM LOCATOR: Fund: Public Housing Functional Area: Public Housing Department: Public Housing Operations BUDGET & PERFORMANCE HIGHLIGHTS
MAJOR SERVICE(S) PROVIDED: Decent, Safe, and Sanitary Housing for our
Residents Family Self-Sufficiency Accounting Task Tracking Staff Training Public Image
FY 2015-16 MAJOR ACCOMPLISHMENTS: Six (6) Public Housing residents graduated from
the Family Self-Sufficiency program with three (3) participants obtaining Homeownership.
National Night Out was a tremendous success this year with over 300 people attending.
Completed the Safety & Security Grant received from HUD. The grant was used for security lighting, new doors, and fencing in each of the Public Housing communities.
A job fair was hosted at the Neighborhood Networks Technology Center with over ten (10) agencies participating.
There were 16 graduates from advanced computer classes taught at the Technology Center. Participants learned Excel, Word, and PowerPoint.
Completed Phase 1 of new roofing for the Mary Chapman Homes community.
FY 2016-17 MAJOR BUDGET CHANGES / NEW REQUESTS /
FOCUS AREAS: Work closely with community partners to research,
identify and align resources to assist families on the path to a life of economic independence.
Maintain housing stock above quality requirements.
Begin Final Phase of new roofing for the Mary Chapman community.
Continue to explore new funding through grant opportunities being made available both locally, state, and nationally.
Work closely with community partners to research, identify, and align resources to assist families on the path to a life of economic independence.
STEPS / PROGRAMS BEING UNDERTAKEN TO ENHANCE
PERFORMANCE: Provide decent, safe, and sanitary housing in good
repair – in compliance with program uniform physical condition standards – for very- low and low- income families.
Promote fair housing and the opportunity for very low-income and low-income families of all races, ethnicities, national origins, religions, ethnic backgrounds, and with all types of disabilities, to participate in the public housing program and its services. Attain and maintain a high level of standards and professionalism in day-to-day management of all program components.
Attain and maintain a high level of standards and professionalism in day-to-day management of all program components.
$- $250,000 $500,000 $750,000
$1,000,000 $1,250,000 $1,500,000 $1,750,000 $2,000,000
13-14 14-15 15-16 16-17Budget
Total Expenditures
50%
60%
70%
80%
90%
100%
13-14 14-15 15-16 16-17
% of Leased Up Units
Actual Objective
193

PERFORMANCE GOALS:
Major Service Area: Decent, Safe, and Sanitary Housing
Goal: Provide high quality housing to residents/clients to obtain a safe and enjoyable living environment.
Major Service Area: Family Self-Sufficiency
Goal: Provide Family Self-Sufficiency support resources to our housing residents in order to promote the ultimate goal of homeownership.
Major Service Area: Accounting
Goal: Provide accurate financial information, in a timely manner, to the City of Concord and the Department of Housing and Urban Development to comply with local, state, and federal laws, and governmental accounting and regulatory requirements.
Major Service Area: Task Tracking
Goal: Continue and improve Task Tracking/Management by objectives which incorporates appropriate elements of PHAS, SEMAP, MASS, and similar existing measures.
Major Service Area: Staff Training
Goal: Encourage staff to complete training/certification programs relevant to their areas of responsibility.
Major Service Area: Public Image
Goal: Continue to improve our public image through enhanced communication, coordination and accountability with outside agencies, among the staff, and with our residents.
PERFORMANCE SUMMARY:
Major Performance Measure FY14 FY15 FY16 FY16 FY17 Benchmark Service Area Indicator Type Actual Actual Obj. Actual Obj. Target
Decent, Safe/ Sanitary Housing
% of leased up units Effectiveness 98% 99% 100% 99% 98% 100%
Family Self-Sufficiency
# of participants in the FSS program
Effectiveness 25 29 25 17 25 30
Task Tracking % of participants
recertified under program Effectiveness 100% 100% 100% 100% 100% 100%
Staff Training % of Staff Maintaining Training/Certification
Effectiveness 100% 100% 100% 100% 100% 100%
Public Image # of Participants Using Tech Center Monthly
Workload/ Demand
175 187 130 165 180 130
Decent, Safe, and Sanitary Housing
# of Days to Turnover Unit for Move-In
Effectiveness 10 48 10 49 15 15
Accounting % Tenant Accounts
Collected Effectiveness 98% 83% 98% 87% 95% 98%
BUDGET SUMMARY:
Cost Center #: 10002013-2014 2014-2015 2015-2016 2015-2016 2016-2017 2016-2017
Actual Expenses
Actual Expenses
CouncilApproved*
Actual Expenses**
Manager Recommended
CouncilApproved
Administration 363,558$ 468,929$ 509,031$ 496,949$ 497,583$ 497,583$ Operations 770,094$ 775,679$ 778,390$ 759,081$ 724,778$ 724,778$ Debt Service -$ 1,925$ 1,451$ 1,451$ 973$ 973$ Depreciation 480,134$ 485,407$ -$ -$ -$ -$ Non Operating Expenses 30,057$ (13,177)$ -$ -$ Transfers 19,669$ 19,669$ 25,338$ 25,337$ 31,006$ 31,006$
Total Expenditures 1,663,512$ 1,738,432$ 1,314,210$ 1,282,818$ 1,254,340$ 1,254,340$
% budget change 5% 29% -4.56%
* as amended**as of 8/11/2016Authorized FTE 7.50 9.30 9.30 9.30 8.60 8.60
194

INTERNAL SERVICES FUND OVERVIEW: Internal Services serves as a support function, assisting all City departments in their daily operations. Internal Services is comprised of Utilities Collections, Data Services, Billing, Customer Care, Engineering, Purchasing, and Buildings & Grounds Maintenance. BUDGET UNITS:
Utilities Collections: The Utilities Collections Department is responsible for the collection of all electric, water, sewer, and commercial solid waste payments made to the City. The Collection of utility deposits, reconnect fees, returned checks, and other miscellaneous revenues are also transacted in this department. Additional information regarding Utilities Collections may be obtained by contacting Rita Ellison, Tax Collector, at (704) 920-5265 or via email at [email protected].
Data Services: Data Services is responsible for the network design, engineering, procurement, installation, and
servicing of the computer infrastructure, hardware, and software for the City. The City contracts Data Services with Technologies Edge, Inc. Additional information regarding Data Services may be obtained by contacting Bill Dusch, at (704) 920-5293 or via email at [email protected].
Billing: Billing is responsible for all meter reading services, which includes electric, water, and wastewater. The
Department processes the readings and the billing of more than 44,000 customers. Additional information regarding Billing may be obtained by contacting Jackie Brown, Billing Manager, at (704) 920-5255 or via email at [email protected].
Customer Care: Customer Care is responsible for creating new customer utility accounts and answering customer
inquiries regarding their utility accounts. Additional information regarding Customer Service may be obtained by contacting Tammy Linn, Customer Service Manager, at (704) 920-5240 or via email at [email protected].
Engineering: The Engineering Department provides engineering, technical, and contract management assistance
to all City departments. Department’s responsibility to schedule, design, prepare specifications, acquire permits, secure rights-of-way, advertise, bid, and manage all capital improvement projects as directed and approved by the City Council and the City Manager. Other engineering responsibilities include plan review, obtaining and holding application permits and encroachment agreements, and observing the construction of new public infrastructure to ensure compliance with local, state, and federal regulations. Additional information regarding Engineering may be obtained by contacting Sue Hyde, Director of Engineering, at (704) 920-5425 or via email at [email protected].
Purchasing: Purchasing is responsible for the procurement and storage of goods and equipment for all City
departments. Additional information regarding Purchasing may be obtained by contacting Sid Talbert, Purchasing Officer, at (704) 920-5441 or via email at [email protected].
Building & Grounds Maintenance: Buildings & Grounds Maintenance supports the maintenance operations of
City departments. Primary responsibilities include ground maintenance, building maintenance, HVAC/Electrical, custodial, vacant lot mowing, street rights-of-way mowing, and Public Housing grounds maintenance. Additional information regarding Buildings & Grounds Maintenance may be obtained by contacting Susan Sessler, Building and Grounds Director, at (704) 920-5380 or via email at [email protected].
195

Internal Services Fund Allocated CostsFund 800
2013-2014 2014-2015 2015-2016 2015-2016 2016-2017 2016-2017
ActualAllocation
ActualAllocation
CouncilApproved
ActualAllocation**
ManagerRecommended*
CouncilApproved
Budget UnitUtilities Collections 271,510$ 381,480$ 342,510$ 313,295$ 348,974$ 348,974$ Data Services 1,762,132$ 1,900,563$ 2,545,762$ 2,140,211$ 2,505,601$ 2,505,601$ Billing 815,743$ 979,916$ 1,172,680$ 1,060,684$ 1,032,780$ 1,032,780$ Customer Care 1,431,568$ 1,371,999$ 1,673,945$ 1,525,710$ 1,767,394$ 1,767,394$ Engineering 1,725,306$ 1,599,192$ 1,967,270$ 1,801,878$ 2,033,991$ 2,033,991$ Purchasing 433,641$ 526,694$ 555,629$ 508,686$ 476,468$ 476,468$ Buildings & Grounds 2,574,712$ 2,684,692$ 3,074,207$ 2,799,399$ 3,138,263$ 3,138,263$
Total Allocated Costs to other City Departments
9,014,612$ 9,444,536$ 11,332,003$ 10,149,863$ 11,303,471$ 11,303,471$
% budget change 5% 7% -0.3%* as amended**as of 8/11/2016 Note: All Internal Service Department costs are allocated, or charged out, to other departments.
Utilities Collections3%
Data Services22%
Billing9%
Customer Care16%
Engineering18%
Purchasing4%
Buildings & Grounds28%
FY 16-17 Internal Services Fund (Allocated Costs)
$-
$2,000,000
$4,000,000
$6,000,000
$8,000,000
$10,000,000
$12,000,000
ActualAllocation
ActualAllocation
ActualAllocation**
CouncilApproved
2013-2014 2014-2015 2015-2016 2016-2017
Internal Services Expenditure TrendUtilities Collections
Purchasing
Billing
Customer Care
Data Services
Engineering
Buildings & Grounds
196

UTILITIES COLLECTIONS MISSION: The Collections Department exists to provide timely and accurate posting of utility payments for the citizens of Concord with the desire to uphold the highest level of customer service. PROGRAM LOCATOR:: Fund: Internal Services Functional Area: Internal Services Department: Utilities Collections Division: N/A BUDGET & PERFORMANCE HIGHLIGHTS:
$- $50,000
$100,000 $150,000 $200,000 $250,000 $300,000 $350,000 $400,000
13-14 14-15 15-16 16-17Budget
Total Allocation
75%
80%
85%
90%
95%
100%
13-14 14-15 15-16 16-17
% of Days Cashiers Not Out of Balance More than $1
ActualObjective
MAJOR SERVICE(S) PROVIDED: Utility Payment Processing
FY 2015-16 MAJOR ACCOMPLISHMENTS: Continued to focus on cross training so that
coworkers are able to assist any customer. Transitioned successfully to new City Hall location
with no lapse or decline in customer service. Collected $273,258 in delinquent utility revenue
via Debt Set Off and the Collection Agency as of April 30, 2016.
Credit Card RFP issued and awarded to offer customers a better online payment solution.
FY 2016-17 MAJOR BUDGET CHANGES / NEW REQUESTS /
FOCUS AREAS: Crosstrain on Tax Department functions and
Munis system. Encourage and promote eBill for utility customers
who are enrolled in eCARE. Implement a new policy and procedure that allows
for automatic refunding of utility deposits when customers become eligible.
STEPS / PROGRAMS BEING UNDERTAKEN TO ENHANCE
PERFORMANCE: Coworkers continue to research and correct their
own errors in an effort to identify problem areas. Coworkers will attend training classes and
teambuilding events as funding allows.
197

PERFORMANCE GOALS:
Major Service Area: Utility Payment Processing
Goal: To provide timely processing of utility payments in order to optimize cash flow position. Goal: To provide accurate posting of utility payments in order to maintain customer satisfaction and reduce corrections.
PERFORMANCE SUMMARY: Major Performance Measure FY14 FY15 FY16 FY16 FY17 Benchmark Service Indicator Type Actual Actual Obj. Actual Obj. Target Area
Utility Payment
Processing
% of days cashiers not out of balance more than $1
Effectiveness 97.2% 92% 98% 94% 98% 98%
Utility Payment
Processing
% of receipts processed and deposited within 24
hrs. Effectiveness 99% 99% 99% 99% 99% 99%
Utility Payment
Processing
# of monthly adjustments for incorrect postings
Effectiveness 4 4 5 5 5 5
BUDGET SUMMARY:
Cost Center #: 42002013-2014 2014-2015 2015-2016 2015-2016 2016-2017 2016-2017
Actual Expenses
Actual Expenses
Council Approved*
Actual Expenses**
Manager Recommended
Council Approved
Personnel Services 202,975$ 193,405$ 219,306$ 193,347$ 225,232$ 225,232$ Operations 98,359$ 90,393$ 95,597$ 93,776$ 96,148$ 96,148$ Depreciation -$ 1,542$ -$ -$ -$ -$ Debt Service -$ 14,820$ 27,607$ 28,408$ 27,594$ 27,594$ Non-Operating Exp 9,408$ -$ -$ -$ -$ -$ Cost Allocation (271,510)$ (381,480)$ (342,510)$ (313,295)$ (348,974)$ (348,974)$ Total Expenses 39,232$ (81,320)$ -$ 2,236$ -$ -$ % budget change 41% -18% 2%* as amended**as of 8/11/2016 Authorized FTE 4.50 4.50 3.50 3.50 3.50 3.50
198

DATA SERVICES MISSION: The Data Services Department exists to provide technology solutions and support to all City departments and employees in a timely and cost-effective manner with the desire to provide access to appropriate information and data required for conducting public business and communicating with citizens. PROGRAM LOCATOR:: Fund: Internal Services Functional Area: Internal Services Department: Data Services Division: N/A BUDGET & PERFORMANCE HIGHLIGHTS: MAJOR SERVICE(S) PROVIDED: Network Infrastructure: design, installation and
maintenance of City’s network and servers Computer Hardware and Software: procurement,
installation and maintenance Technology Project management and consulting
FY 2015-16 MAJOR ACCOMPLISHMENTS: Completed migration of Novell eDirectory to
Microsoft Active Directory. Replaced 10 Novell Servers with 4 Microsoft
Network Storage Servers. Moved 30 Servers and 110 Users into City Hall. Completed Phase III of Network Infrastructure
upgrade.
Installed GIS2 Server (virtual server). Began implementation of Evidence.com for Police
Body camera system. Upgraded Agenda Manager software. Installed Northstar Automation Platform. Replaced Fire Station 8 Wireless system. Replaced 42 Ricoh Copier/Printers/Scanners. Completed migration of Northstar from Informix
to SQL database in preparation of Advanced Meter Infrastructure Automation Platform (AMI).
Initiated AMI Project with Electric and Water. Coordinated process review of Northstar for
Collections, Billing, and Customer Service. Completed implementation of Accela Customer
Access portal. Increased City’s Internet connectivity to 100 Mbps
at 2 locations (City Hall and Brown Complex).
FY 2016-17 MAJOR BUDGET CHANGES / NEW REQUESTS /
FOCUS AREAS: Continue working with Billing, Electric and Water
on AMI Project. Complete process review of Northstar for
Collections, Billing and Customer Service. Install Network Monitoring system. Replace GIS1 Server. Install Phase IV network upgrade. Broaden tablet-based solutions in the field. Migrate Police Department to Microsoft Outlook. Complete Evidence.com implementation of cloud
storage solution for Police Body Cameras. Expand report-writing/data retrieval capabilities. Install new SQL Server. Create additional Web-based Internet forms for
easier to use customer utility applications. Install Northstar Report Writing and Disaster
Recovery server. Replace Laserfiche Servers and upgrade software. Implement new Email Protection system (spam,
virus, phishing attack prevention). Upgrade Fletcher Budget software to Questica. Provide Fiber Infrastructure support.
STEPS/PROGRAMS BEING UNDERTAKEN TO ENHANCE
PERFORMANCE: Preventive maintenance programs to provide for
high network availability. Allocate staff resources to meet increasing
demand for service requests. Customer satisfaction survey to provide direct
customer feedback. Certify additional staff in GIS and Cityworks. Technology Project Management and Consulting.
$- $250,000 $500,000 $750,000
$1,000,000 $1,250,000 $1,500,000 $1,750,000 $2,000,000 $2,250,000 $2,500,000 $2,750,000
13-14 14-15 15-16 16-17Budget
Total Allocation
75%
80%
85%
90%
95%
100%
13-14 14-15 15-16 16-17
% of Customers Rating Data Services Overall as "Excellent" or "Good"
Actual
199
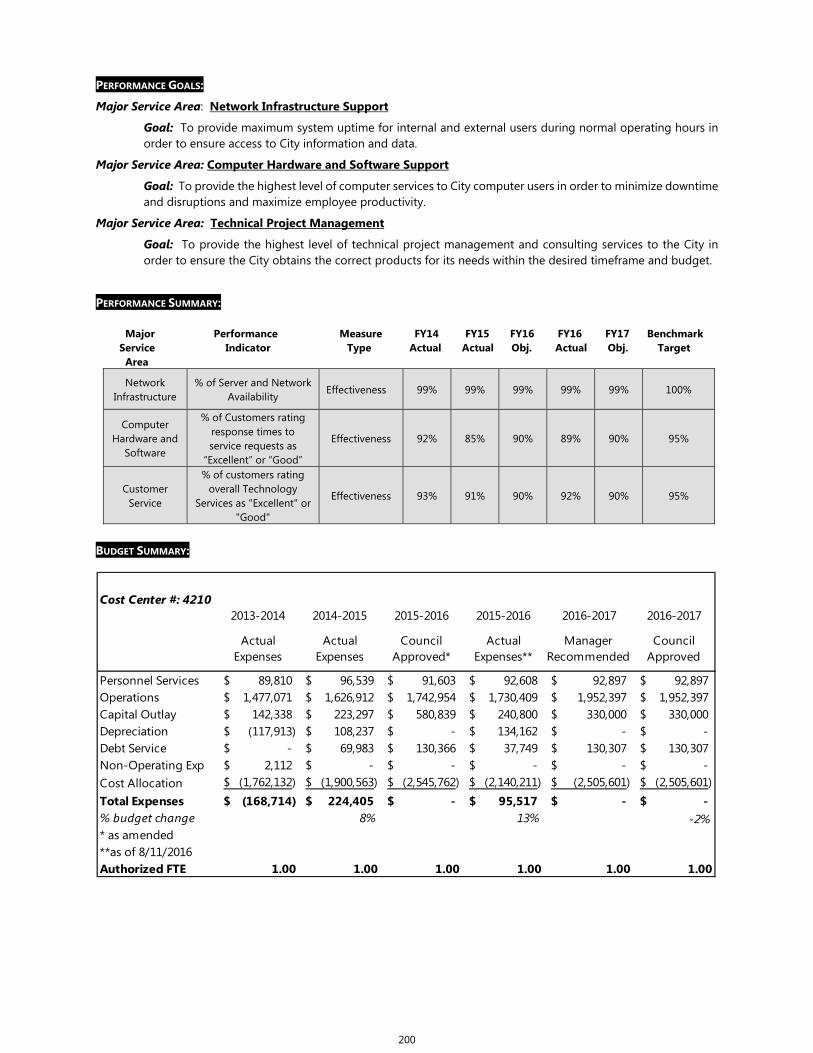
PERFORMANCE GOALS:
Major Service Area: Network Infrastructure Support
Goal: To provide maximum system uptime for internal and external users during normal operating hours in order to ensure access to City information and data.
Major Service Area: Computer Hardware and Software Support
Goal: To provide the highest level of computer services to City computer users in order to minimize downtime and disruptions and maximize employee productivity.
Major Service Area: Technical Project Management
Goal: To provide the highest level of technical project management and consulting services to the City in order to ensure the City obtains the correct products for its needs within the desired timeframe and budget.
PERFORMANCE SUMMARY: Major Performance Measure FY14 FY15 FY16 FY16 FY17 Benchmark Service Indicator Type Actual Actual Obj. Actual Obj. Target Area
Network Infrastructure
% of Server and Network Availability
Effectiveness 99% 99% 99% 99% 99% 100%
Computer Hardware and
Software
% of Customers rating response times to service requests as
“Excellent” or “Good”
Effectiveness 92% 85% 90% 89% 90% 95%
Customer Service
% of customers rating overall Technology
Services as "Excellent" or "Good"
Effectiveness 93% 91% 90% 92% 90% 95%
BUDGET SUMMARY:
Cost Center #: 42102013-2014 2014-2015 2015-2016 2015-2016 2016-2017 2016-2017
Actual Expenses
Actual Expenses
Council Approved*
Actual Expenses**
Manager Recommended
Council Approved
Personnel Services 89,810$ 96,539$ 91,603$ 92,608$ 92,897$ 92,897$ Operations 1,477,071$ 1,626,912$ 1,742,954$ 1,730,409$ 1,952,397$ 1,952,397$ Capital Outlay 142,338$ 223,297$ 580,839$ 240,800$ 330,000$ 330,000$ Depreciation (117,913)$ 108,237$ -$ 134,162$ -$ -$ Debt Service -$ 69,983$ 130,366$ 37,749$ 130,307$ 130,307$ Non-Operating Exp 2,112$ -$ -$ -$ -$ -$ Cost Allocation (1,762,132)$ (1,900,563)$ (2,545,762)$ (2,140,211)$ (2,505,601)$ (2,505,601)$ Total Expenses (168,714)$ 224,405$ -$ 95,517$ -$ -$ % budget change 8% 13% -2%* as amended**as of 8/11/2016 Authorized FTE 1.00 1.00 1.00 1.00 1.00 1.00
200

BILLING MISSION: The Billing Department exists to provide accurate and timely billing for all residential, commercial, industrial, institutional, storm water and municipal utility customers in order to provide the City’s Electric, Water, Wastewater, and Stormwater utilities with the necessary resources that are required to provide the highest possible level of service to the City. PROGRAM LOCATOR:: Fund: Internal Services Functional Area: Internal Services Department: Finance Division: Billing BUDGET & PERFORMANCE HIGHLIGHTS:
MAJOR SERVICE(S) PROVIDED: Meter Reading Billing
FY 2015-16 MAJOR ACCOMPLISHMENTS: Mailed 47,500 utility bills per month. Read 70,000 meters per month. The Department is now utilizing 4 Mobile Data
Collectors to read meters. This helps to ensure our utility customers meters are read as close to 30 days as possible.
Currently, over 1,880 e-Bill Customers enrolled. Continue to process and mail utility bills 100% on
time for the year.
Final Utility Bills have been outsourced. Midland Capital Recovery Fee and Capacity
Charges are now being charged. Replaced meter reading vehicle.
FY 2016-17 MAJOR BUDGET CHANGES / NEW REQUESTS /
FOCUS AREAS: Working with both Electric and Water
Departments to implement our AMI program for Smart Metering System.
Work with Tech Edge on the newest upgrade in NorthStar 6.4 to help integrate some of our financial and CIS applications.
STEPS / PROGRAMS BEING UNDERTAKEN TO ENHANCE
PERFORMANCE: Work with the Water Department on the Water
and Electric Departments meter change-out program.
Continue to attend conferences or meetings pertaining to our utility software in order to gain current updates which will help us better serve our utility customers.
Continue troubleshooting radio-read meters with the meter reading staff.
Work on the ability to decrease the number of misread meters which will ensure accurate billing.
Strive to continue mailing utility bills to customers on time.
Educate our customers on e-Billing, Pre-Authorized Payments and Budget Billing Programs.
Assist in the development of a streamlined customer account setup process where each department has a documented and fail-proof method of ensuring the proper billing measures are in place.
$-
$200,000
$400,000
$600,000
$800,000
$1,000,000
$1,200,000
13-14 14-15 15-16 16-17Budget
Total Allocation
0
100
200
300
400
500
600
13-14 14-15 15-16 16-17
Average # Meter Re-Reads per Month
Actual
201
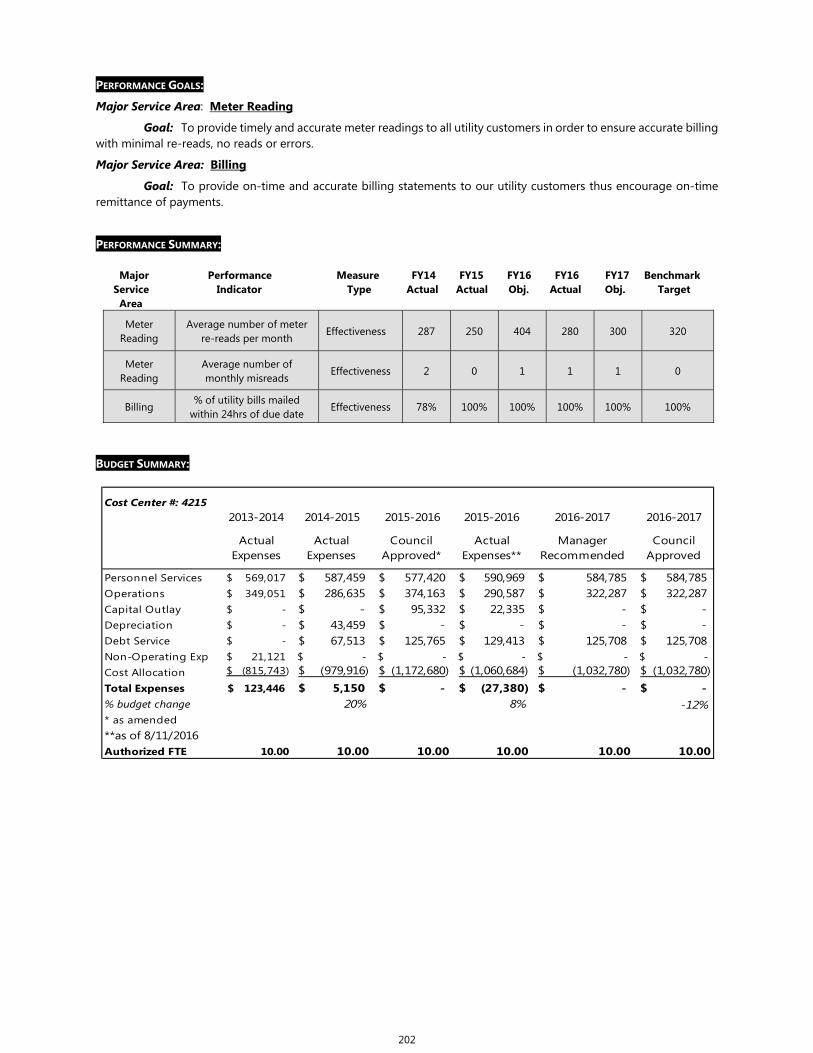
PERFORMANCE GOALS:
Major Service Area: Meter Reading
Goal: To provide timely and accurate meter readings to all utility customers in order to ensure accurate billing with minimal re-reads, no reads or errors.
Major Service Area: Billing
Goal: To provide on-time and accurate billing statements to our utility customers thus encourage on-time remittance of payments.
PERFORMANCE SUMMARY: Major Performance Measure FY14 FY15 FY16 FY16 FY17 Benchmark Service Indicator Type Actual Actual Obj. Actual Obj. Target Area
Meter Reading
Average number of meter re-reads per month
Effectiveness 287 250 404 280 300 320
Meter Reading
Average number of monthly misreads
Effectiveness 2 0 1 1 1 0
Billing % of utility bills mailed
within 24hrs of due date Effectiveness 78% 100% 100% 100% 100% 100%
BUDGET SUMMARY:
Cost Center #: 42152013-2014 2014-2015 2015-2016 2015-2016 2016-2017 2016-2017
Actual Expenses
Actual Expenses
Council Approved*
Actual Expenses**
Manager Recommended
Council Approved
Personnel Services 569,017$ 587,459$ 577,420$ 590,969$ 584,785$ 584,785$ Operations 349,051$ 286,635$ 374,163$ 290,587$ 322,287$ 322,287$ Capital Outlay -$ -$ 95,332$ 22,335$ -$ -$ Depreciation -$ 43,459$ -$ -$ -$ -$ Debt Service -$ 67,513$ 125,765$ 129,413$ 125,708$ 125,708$ Non-Operating Exp 21,121$ -$ -$ -$ -$ -$ Cost Allocation (815,743)$ (979,916)$ (1,172,680)$ (1,060,684)$ (1,032,780)$ (1,032,780)$ Total Expenses 123,446$ 5,150$ -$ (27,380)$ -$ -$ % budget change 20% 8% -12%* as amended**as of 8/11/2016 Authorized FTE 10.00 10.00 10.00 10.00 10.00 10.00
202

CUSTOMER CARE MISSION: The Customer Service Department exists to provide quality service to City Departments and Utility Customers. By providing timely and accurate information on existing and new accounts, we will continue to establish quality work, good communication, and trusting relationships. PROGRAM LOCATOR:: Fund: Internal Services Functional Area: Internal Services Department: Customer Care Division: N/A BUDGET & PERFORMANCE HIGHLIGHTS:
$- $250,000 $500,000 $750,000
$1,000,000 $1,250,000 $1,500,000 $1,750,000
13-14 14-15 15-16 16-17Budget
Total Allocation
MAJOR SERVICE(S) PROVIDED: Process Service Requests:
o Connect / Disconnect Utility Services o Install Electric and Water Meters o Disconnect Unpaid Accounts/Reconnect
After Payment Received o Leak Adjustments:
Research, Calculate, and Advise Customer
Research Customer Inquiries: o Issue Service Order / Contact Customer
When Completed
FY 2015-16 MAJOR ACCOMPLISHMENTS: Combined the Call Center staff with Walk-In staff
into one Budget unit listed under Customer Care. Improved existing Service Application process for
applications that are sent in electronically in order to reduce service delay and call times.
Documented internal processes that encompass all major duties performed by Walk-In staff in order for Call Center staff to be able to assist with duties if necessary and assist new employees.
Reduced the Call Center call abandoned rate to below 10% which surpassed the benchmarked goal.
FY 2016-17 MAJOR BUDGET CHANGES / NEW REQUESTS /
FOCUS AREAS: Cross-train Call Center staff with the Walk-In staff
in order for employees to have knowledge of all aspects of the Customer Care department
Develop and train all Customer Service staff on a formal call monitoring program to improve the quality of the phone calls and service delivery.
Implement electronic application to simplify the process and reduce the amount of time and steps required to establish new service.
Continue to incorporate Customer Service training; including sending staff to internal and external Customer Service classes/seminars.
STEPS / PROGRAMS BEING UNDERTAKEN TO ENHANCE
PERFORMANCE: Continue debt setoff process and the use of
collection agency in an effort to collect more revenue.
Will continue to scan and electronically save documents to conserve space and paper.
Run weekly reports on Call Center staff to provide individual call stats to monitor and improve the performance of each Customer Service specialist.
Develop a new payment agreement process to eliminate the ability to over-extend customer account balances and allow collection of revenue in a timely manner.
Install sound masking throughout the Customer Care department to enhance employee/ customer interaction as well as Call Center talk-time and privacy.
Implement walk-in Management process for the walk in group to assist customers timely.
NorthStar Utilization review of all current processes for quicker processes.
0
5
10
15
20
25
13-14 14-15 15-16 16-17
Average # of Customers Seen per Day per Customer Service Rep.
Actua lObjective
203

PERFORMANCE GOALS:
Major Service Area: Timeliness
Goal: To provide the timely processing of requests for service, answer customer questions and set up new service for customers in order to maintain the high level of service.
Major Service Area: Customer Service
Goal: To provide excellent service and information to residential and commercial customers while efficiently assisting a high number of customers daily.
PERFORMANCE SUMMARY:
Major Performance Measure FY14 FY15 FY16 FY16 FY17 Benchmark Service Indicator Type Actual Actual Obj. Actual Obj. Target Area
Walk-in Customers
Average # of customers seen per
day by each Customer Service
Representative
Workload 15 17 17 17 12 17
Illegal Meter
Usage
% of Meter
Tampering Charges Recovered
Effectiveness 22% 25% 25% 41.6% 25% 50%
Customer Service
Average #of tickets completed per day
per technician Efficiency unavailable 39.4 40 25 30 40
Customer Service
Percentage of total
calls abandoned Effectiveness 26% 24% 10% 13.5% 15% 10%
Customer Service
Percentage of total
calls answered Effectiveness unavailable 76% 90% 86.5% 85% 80%
Customer Service
Average number of
re-queued calls Effectiveness 13 132 50 52 50 >50
BUDGET SUMMARY:
Cost Center #: 4220
2013-2014 2014-2015 2015-2016 2015-2016 2016-2017 2016-2017
Actual Expenses
Actual Expenses
Council Approved*
Actual Expenses**
Manager Recommended
Council Approved
Personnel Services 1,228,688$ 1,261,269$ 1,313,082$ 1,292,252$ 1,403,314$ 1,403,314$ Operations 151,965$ 84,264$ 159,556$ 101,984$ 164,788$ 164,788$ Capital Outlay -$ 8,576$ 1,924$ -$ -$ -$ Depreciation 417$ 15,334$ -$ -$ -$ -$ Debt Service -$ 53,516$ 199,383$ 205,167$ 199,292$ 199,292$ Non Operating Exp 50,498$ -$ -$ -$ -$ Cost Allocation (1,431,568)$ (1,371,999)$ (1,673,945)$ (1,525,710)$ (1,767,394)$ (1,767,394)$ Total Expenses -$ 50,960$ -$ 73,693$ -$ -$ % budget change -5% 11% 6%* as amended**as of 8/11/2016 Authorized FTE 25.00 25.00 26.00 26.00 26.00 26.00
204

ENGINEERING MISSION: The Engineering Department provides quality, innovative, and cost–effective consulting engineering services in a timely manner to the various departments of the City of Concord for the preservation and continuous enhancement of the safety, health, and quality of life of our citizens, businesses, and guests. PROGRAM LOCATOR:: Fund: Internal Services Functional Area: Internal Services Department: Engineering BUDGET & PERFORMANCE HIGHLIGHTS:
MAJOR SERVICE(S) PROVIDED: Design Construction Inspection Surveying
FY 2015-16 MAJOR ACCOMPLISHMENTS: Designed and/or monitored the construction of
22,227 feet of wastewater collection system extension for an estimated value of $9.7 million.
Designed and/or monitored the construction of 20,545 feet of water distribution system extension for an estimated value of $1.9 million.
Monitored the construction of 6.62 miles of new roads, 12.51 miles of curb and gutter, and 12.34 miles of new sidewalk, for an estimated value of $20 million.
Design and monitored construction of the new 1.5 miles Hector H. Henry Greenway-Exit 49 and first City Dog Park on Weddington Road.
Construction management of the New City Hall. FY 2016-17 MAJOR BUDGET CHANGES / NEW REQUESTS /
FOCUS AREAS: Fill new position of Building Construction
Specialist. Request to unfreeze Engineering Manager
Position. STEPS / PROGRAMS BEING UNDERTAKEN TO ENHANCE
PERFORMANCE: Continue making improvements to the template
of Civil 3D so the Design and Survey branch of the department can use the software more efficiently.
Continue using the time tracking software to monitor effective use of staff time.
Construction inspectors continue using portable computer tablets to file reports and update as-built drawings to improve accuracy and reduce cost.
$-
$500,000
$1,000,000
$1,500,000
$2,000,000
$2,500,000
13-14 14-15 15-16 16-17Budget
Total Allocation
75%
80%
85%
90%
95%
100%
13-14 14-15 15-16 16-17
% Rating Overall Satisfaction with Engineering as "Very" or "Somewhat"
Satisfied
ActualObjective
205

PERFORMANCE GOALS:
Major Service Area: Design
Goal: To provide design services to City Departments and technical plan review services to developers in order to ensure that development and infrastructure meet City standards, adhere to good engineering practices, and are consistent with the goals of the City.
Major Service Area: Construction Inspection
Goal: To provide the best possible construction inspection service to City administration and City departments so projects can be executed according to City standards, in a timely manner, within budget, and technically correct.
Major Service Area: Surveying
Goal: To provide accurate and timely surveying information to all City departments in order to produce sound designs, comply with local, state, and federal laws, and optimize the use of City resources.
PERFORMANCE SUMMARY: Major Performance Measure FY14 FY15 FY16 FY16 FY17 Benchmark Service Indicator Type Actual Actual Obj. Actual Obj. Target Area
Surveying
% rating satisfaction with Survey Branch as “very” or “somewhat”
satisfied
Effectiveness 95% 100% 95% 97% 95% 95%
Design Average # of days to turnaround review of engineering drawings
Effectiveness 2 3 5 2 5 5
Design
% rating satisfaction with Design Branch as “very or “somewhat”
satisfied
Effectiveness 88% 95% 95% 97% 95% 95%
Construction Inspection
% of projects completed on time & within budget
Effectiveness 80% 100% 100% 95% 100% 100%
Construction Inspection
% rating satisfaction with Construction Branch as “very” or
“somewhat” satisfied
Effectiveness 90% 100% 95% 97% 95% 95%
Surveying / Design /
Construction Inspection
% rating overall satisfaction with
department as “very” or “somewhat” satisfied
Effectiveness
94% 100% 95% 100% 95% 95%
BUDGET SUMMARY:
Cost Center #: 42302013-2014 2014-2015 2015-2016 2015-2016 2016-2017 2016-2017
Actual Expenses
Actual Expenses
Council Approved*
Actual Expenses**
Manager Recommended
Council Approved
Personnel Services 1,392,390$ 1,478,220$ 1,694,186$ 1,435,623$ 1,827,749$ 1,827,749$ Operations 130,221$ 120,058$ 197,654$ 117,511$ 206,242$ 206,242$ Capital Outlay 5,196$ 7,245$ 75,430$ 71,860$ -$ -$ Depreciation -$ 14,857$ -$ -$ -$ -$ Non Operating Exp 50,498$ -$ -$ -$ -$ Cost Allocation (1,725,306)$ (1,599,192)$ (1,967,270)$ (1,801,878)$ (2,033,991)$ (2,033,991)$ Total Expenses (147,001)$ 21,188$ -$ (176,884)$ -$ -$ % budget change -7% 13% 3%* as amended**as of 8/11/2016 Authorized FTE 24.00 24.00 23.00 23.00 24.00 24.00
206

PURCHASING MISSION: The Purchasing Department exists to provide timely and accurate procurement and sound warehouse management for City departments with the desire to ensure that the goods and services required to deliver public services are available when needed and that the best possible prices for these goods and services are obtained. PROGRAM LOCATOR:: Fund: Internal Service Functional Area: Internal Services Department: Purchasing Division: N/A BUDGET & PERFORMANCE HIGHLIGHTS:
MAJOR SERVICE(S) PROVIDED: Procurement of Goods for Public Services
(including guiding departments in following State and local purchasing statutes)
Warehouse Management of Inventoried Goods
FY 2015-16 MAJOR ACCOMPLISHMENTS: Audited year end physical inventory with
acceptable results. Purchasing Manager instructed all City supervision
on purchasing procedures at training session. Non-wheeled surplus property for City sold on
Govdeals.com.
Audit of City owned cellular phones and usage. Purchasing Manager on selection committee for
architect and construction manager at risk for construction of new City Hall building.
Warehouse Supervisor and Warehouse Clerks reorganized non-inventory and inventory items in warehouse for improved service.
Two Purchasing Department coworkers completed Career Development for year.
Successful hiring of new Warehouse Clerk. Purchasing Technician conducted the year end
closing meeting for all departments of the City. Worked with Engineering to oversee the bidding
of furniture for the new City Hall.
FY 2016-17 MAJOR BUDGET CHANGES / NEW REQUESTS /
FOCUS AREAS: Continue to organize inventory and identify non-
moving inventory to utilize fully warehouse storage.
Continue to monitor uniform rental contract for the non-Electric coworker departments.
Work with Electric to implement the work order system for filling orders efficiently.
Train new hired Warehouse Clerks in inventory management.
STEPS / PROGRAMS BEING UNDERTAKEN TO ENHANCE
PERFORMANCE: Better analysis of managing inventory levels and
reorder points with bar code enhancements. Continue to identify surplus property and stagnant
inventory. Continue to email purchase orders to vendors for
faster turnaround time. Monitor the uniform and copier service contracts
for improving internal customer service. Update the Purchasing Policy for the City. Assist the various departments of the City in
complying with Purchasing General Statutes. Work on maximizing the existing warehouse space
for stored inventory.
$- $100,000 $200,000 $300,000 $400,000 $500,000 $600,000 $700,000
13-14 14-15 15-16 16-17Budget
Total Allocation
0
5
10
15
13-14 14-15 15-16 16-17
Average Number of Hours Required to Process a Purchase Order
Actual Objective
207

PERFORMANCE GOALS:
Major Service Area: Procurement
Goal: To provide timely processing of purchase orders and formal bids for departments in order to expedite procurement of needed supplies.
Major Service Area: Warehouse Management
Goal: To reduce the total wait time to fill an inventory order for the various City departments in order to expedite receipt of requested inventory.
Goal: To accurately account for the physical inventory stored in the warehouse and yard areas in order to adhere to all accounting standards and requirements.
PERFORMANCE SUMMARY: Major Performance Measure FY14 FY15 FY16 FY16 FY17 Benchmark Service Indicator Type Actual Actual Obj. Actual Obj. Target Area
Procurement Average number of hours
required to process a purchase order
Effectiveness 10 8 8 8 8 8
Warehouse Mgmt.
Order fill time in minutes for inventory items
requested by departments Effectiveness 10 10 7 8 7 <8
Warehouse Mgmt.
% variance of actual inventory dollars versus
reported accounting system value
Effectiveness 0.10% 0.10% 0.10% 0.12% 0.10% 0.25%
Purchasing/ Warehouse
Mgmt.
% of departments rating Purchasing services as “Excellent” or “Good”
Effectiveness 96% 95.8% 100% 95.8% 100% 100%
BUDGET SUMMARY:
Cost Center #: 42502013-2014 2014-2015 2015-2016 2015-2016 2016-2017 2016-2017
Actual Expenses
Actual Expenses
Council Approved*
Actual Expenses**
Manager Recommended
Council Approved
Personnel Services 424,219$ 458,235$ 445,128$ 433,683$ 420,713$ 420,713$ Operations 42,518$ 59,224$ 75,501$ 42,155$ 55,755$ 55,755$ Capital Outlay -$ -$ 35,000$ 28,396$ -$ -$ Depreciation -$ 16,904$ -$ -$ -$ -$ Non Operating Exp 14,786$ -$ -$ -$ -$ Cost Allocations (433,641)$ (526,694)$ (555,629)$ (508,686)$ (476,468)$ (476,468)$ Total Expenses 47,882$ 7,669$ -$ (4,452)$ -$ -$ % budget change 21% -3% -14%* as amended**as of 8/11/2016 Authorized FTE 7.00 7.00 7.00 7.00 7.00 7.00
208

BUILDINGS AND GROUNDS MISSION: The Building and Grounds Department is dedicated to efficiently maintaining a clean, safe, productive and energy-efficient work environment for City employees and the visiting public that exceeds their expectations in the area of general maintenance and repairs to City-owned buildings, parks, greenways and rights-of-way. PROGRAM LOCATOR:: Fund: Internal Services Functional Area: Internal Services Department: Buildings & Grounds BUDGET & PERFORMANCE HIGHLIGHTS:
MAJOR SERVICE(S) PROVIDED: Buildings Maintenance Grounds Maintenance
FY 2015-16 MAJOR ACCOMPLISHMENTS: Improved landscaped areas throughout the City
focusing on plant material that is sustainable in regards to the environment and in regards to required maintenance.
Implemented year 4 of tree banding to combat canker worms.
Staffed the Urban Forrester position. Assisted with move-in of new City Hall.
FY 2016-17 MAJOR BUDGET CHANGES / NEW REQUESTS /
FOCUS AREAS: Identify and improve landscaped areas
throughout the City, focusing on plant material that is sustainable in regards to the environment and in regards to required maintenance.
Prepare and implement year five tree banding to combat cankerworms.
Urban Forrester will establish priorities in maintaining and enhancing the City’s tree canopy.
Add adequate staff to maintain 2nd phase of Moss Creek, Dog Park, Fire Station 11 and adjacent greenway.
Establish maintenance protocols & procedures for new City Hall.
STEPS / PROGRAMS BEING UNDERTAKEN TO ENHANCE
PERFORMANCE: Continue collaborating with Parks and Recreation
concerning ongoing issues and projects. Continue monthly internal department staff
meetings. Using a portion of the monthly meeting to review
safety procedures while on the job.
$- $500,000
$1,000,000 $1,500,000 $2,000,000 $2,500,000 $3,000,000 $3,500,000
13-14 14-15 15-16 16-17Budget
Total Allocation
75%
80%
85%
90%
95%
100%
13-14 14-15 15-16 16-17
% of City employees rating satisfaction with custodial services as “very good” or “good”
ActualObjective
209

PERFORMANCE GOALS:
Major Service Area: Buildings Maintenance
Goal: To provide timely response to and completion (i.e. changing light bulbs, HVAC maintenance, electrical, and general repairs of buildings) of routine and emergency maintenance calls in order to ensure safe and productive working environments.
Goal: To provide quality custodial services to City employees/customers in order to provide a clean and safe working environment.
Major Service Area: Grounds Maintenance
Goal: To provide professional turf care and timely mowing service to the various departments and citizens in order to meet aesthetic and performance expectations of recreational turf areas.
Goal: To provide the highest level of public park facility maintenance in order to meet and/or exceed expectations of visitors.
PERFORMANCE SUMMARY: Major Performance Measure FY14 FY15 FY16 FY16 FY17 Benchmark Service Area Indicator Type Actual Actual Obj. Actual Obj. Target
Buildings % of HVAC requests
completed within 24 hours Effectiveness 93% 93% 96% 94% 96% 96%
Buildings % of electrical maintenance requests completed within
two days Effectiveness 97% 96% 98% 95% 98% 98%
Buildings % of routine building maintenance requests
completed within two days Effectiveness 93% 96% 100% 93% 96% 100%
Buildings %of health and safety
requests responded to & completed within 4 hours
Effectiveness 100% 100% 100% 90% 100% 100%
Buildings % of City employees rating custodial services as “very
good” or “good” Effectiveness 100% 99% 100% 96% 100% 100%
Grounds % of park/facility mowing
schedules completed on-time Effectiveness 90% 79% 90% 79% 90% 90%
Grounds
% of landscaped medians & assigned facilities
maintained/mowed according to schedule & on-time
Effectiveness New for
FY16 85% 90% 100% 100% 90%
Grounds % of graffiti/vandalism
responded to within 24 hours Effectiveness 100% 100% 100% 100% 100% 100%
BUDGET SUMMARY:
Cost Center #: 42702013-2014 2014-2015 2015-2016 2015-2016 2016-2017 2016-2017
Actual Expenses
Actual Expenses
Council Approved*
Actual Expenses**
Manager Recommended
Council Approved
Personnel Services 1,935,140$ 2,062,822$ 2,165,666$ 2,141,987$ 2,256,123$ 2,256,123$ Operations 512,384$ 510,717$ 710,761$ 480,341$ 751,140$ 751,140$ Capital Outlay -$ 52,554$ 139,000$ 115,823$ 131,000$ 131,000$ Depreciation 51,890$ 43,381$ -$ -$ -$ -$ Non Operating Exp 75,298$ -$ 58,780$ 58,780$ -$ -$ Cost Allocation (2,574,712)$ (2,684,692)$ (3,074,207)$ (2,799,399)$ (3,138,263)$ (3,138,263)$ Total Expenses -$ (15,218)$ -$ (2,468)$ -$ -$ % budget change 4% 4% 2%* as amended**as of 8/11/2016 Authorized FTE 39.00 40.65 41.30 41.30 42.30 42.30
210

Total Assessed Value
8% of total assessed value (Mandated by N.C.G.S. 159-55 (c ))
Outstanding G.O. Bonds $ - Notes Payable/Installment Notes $ 51,424,000
$ 51,424,000 Amount of bonded debt incurred:
For Electric, Water and/or Wastewater Purposes 65,160,460$
Legal Debt Margin:Debt Percentage of Assessed Value:
DEBT SERVICE BACKGROUNDIn North Carolina, the Local Government Commission in the State Treasurer’s Office oversees local government bondeddebt and assists cities and counties in all areas of fiscal management. This agency conducts bond sales and ensures thatlocal units have sufficient fiscal capacity to repay debt. The City is subject to the Local Government Bond Act of NorthCarolina, which limits the amount of net bonded debt the City may have outstanding to 8% of the appraised value ofproperty subject to taxation.
Like most municipalities, the City of Concord uses debt as a means to finance long-term capital projects and it is ourpolicy that the financing period shall not exceed the useful life of the project. General obligation bonds are collateralizedby the full faith, credit, and taxing power of the City. The revenues generated by the debt-financed asset or by theoperating system of which that asset is a part are used to secure Revenue Bonds. Installment purchase contracts andCertificates of Participation (COPS) are secured by a security interest in the asset. Principal and interest requirements areprovided by appropriation in the year in which they are due.
(13,736,460)$ 644,460,817$
Computation of Legal Debt Margin (June 30, 2016)
1.23%
DEBT SUMMARYThe City of Concord holds GO Bond ratings of Aa1 from Moody’s Investor Service, AA from Fitch IBCA, and AA fromStandard & Poors. All debt ratings indicate a strong financial position with moderate debt levels and above averageamortization.
Debt Service payments on General Obligation Bonds comprise 0% of all debt service requirements. Funds received fromthis method of financing were originally borrowed for public utility projects, new fire facilities, parks and recreationprojects and the terminal building at the Concord Regional Airport.
Debt Service payments on Revenue Bonds comprise 72% of all debt service requirements. Funds received from thismethod of financing were originally borrowed for public utility projects and the construction of the Alfred M. BrownOperations Center. Series 2002 bonds have been designated for water and electric infrastructure improvements. TheCity of Concord holds Revenue Bond ratings of Aa2 from Moody’s Investor Service, AA from Fitch IBCA, and AA- fromStandard & Poors. All debt ratings indicate a strong financial position with moderate debt levels and above averageamortization.
Debt Service payments on installment notes/purchase contracts, Limited Obligation Bonds and Certificates ofParticipation comprise 38% of debt service payments for FY17. Funds received from this method of financing wereoriginally borrowed for transportation projects, parks and recreations projects, fire facilities, a downtown parkingfacility, aviation projects and a municipal golf course.
9,513,065,968$
761,045,277$ Debt Limit:
Gross Debt:
211

Issue Year
SeriesAmount Issued
Principal as of 7/1/2016
Amount Retiring in
FY 17
Interest Expense in
FY 17
Outstanding 6/30/17
Revenue Bonds2016 Utilities Bonds Refunding, Series 2016 23,146,037 23,146,030 - 926,283 23,146,037 2012 Utilities Bonds Refunding, Series 2012 17,635,000 14,470,000 830,000 573,806 13,640,0002009 Utilities Systems Refunding, Series 2009B 40,925,000 26,240,000 3,660,000 1,085,819 22,580,0002009 Utilities Systems Refunding Series 2009 23,935,000 4,985,000 2,455,000 140,888 2,530,0002008 Utilities System, Series 2008 27,365,000 2,265,000 725,000 77,082 1,540,000
Total Revenue Bond Debt 133,006,037 71,106,030 7,670,000 2,803,878 63,436,037
Limited Obligation Bonds & Certificates of Participation2014 LOB Series 2014 34,130,000 31,970,000 2,165,000 1,288,612 29,805,0002010 LOB Series 2010 9,235,000 4,355,000 905,000 160,625 3,450,000
Sub-Total LOBS & COPS 43,365,000$ 36,325,000$ 3,070,000$ 1,449,237$ 33,255,000$
Capital Lease Debt
2015 Installment Note/Purchase (BNC, Airport) 5,759,000 5,759,000 350,000 139,368 5,409,000 2008 Installment Note/Purchase (Fire, Airport) 12,950,000 7,446,250 647,501 322,904 6,798,7492005 Installment Note/Purchase (BOA) 4,500,000 1,893,750 225,000 89,710 1,668,750
Sub-Total Capital Lease Debt 23,209,000$ 15,099,000$ 1,222,501$ 551,982$ 13,876,499$
Total Loans & Installment Notes/Purchases 66,574,000$ 51,424,000$ 4,292,501$ 2,001,219$ 47,131,499$
ALL DEBT 199,580,037$ 122,530,030$ 11,962,501$ 4,805,097$ 110,567,536$
16,767,598$
Outstanding Bonded Debt - Fiscal Year 2016-17
Total Principal Plus Interest to be Serviced in FY 2016-17
$‐
$20,000,000
$40,000,000
$60,000,000
$80,000,000
$100,000,000
$120,000,000
$140,000,000
$160,000,000
2011 2012 2013 2014 2015 2016 2017 2018 2019 2020
Total City Debt Principalby Financing Method
General Obligation Bond Debt Revenue Bond Debt Installment Debt
212

Governmental Business
Principal Interestto
Principal Interest Principal Interestto
Principal Interestto
Totals
2017-2021 1,310,645 263,434 29,679,355 10,828,615 10,301,900 5,749,721 5,348,100 422,560 1,904,392 6,573,282 72,382,004
2022-2026 573,895 33,722 18,416,105 5,298,005 7,945,000 3,548,156 0 0 1,604,926 5,529,229 42,949,038
2027-2031 0 0 9,765,000 2,616,685 8,425,000 1,757,631 0 0 423,043 2,550,463 25,537,822
2032-2036 0 0 7,300,000 848,475 4,310,000 303,119 0 0 0 0 12,761,594
Total 1,884,540 297,156 65,160,460 19,591,780 30,981,900 11,358,627 5,348,100 422,560 3,932,361 14,652,974 153,630,458
Schedule of Total Debt Requirements by Type
Other Lease Purchase & Installment Contracts(Principal & Interest)
Please note, in the tables that follow, Govermental types are those payable by General Fund and Business types are those payable by Enterprise Funds. The City retired all remaining General Obligation Bond debt in fiscal year 2011, so no General Obligation debt is listed in the charts below.
Revenue Bonds
Governmental Business BusinessGovernmental
Limited Obligation Bonds & Certificates of Participation
$0
$2,000,000
$4,000,000
$6,000,000
$8,000,000
$10,000,000
$12,000,000
$14,000,000
$16,000,000
$18,000,000
2017-2021 2022-2026 2027-2031 2032-2036
Limited Obligation Bonds & Certificates of Participation
Payable by General Fund Payable by Enterprise Funds
$0
$1,000,000
$2,000,000
$3,000,000
$4,000,000
$5,000,000
$6,000,000
$7,000,000
2017-2021 2022-2026 2027-2031 2032-2036
Other Lease Purchase & Installment Contracts
Payable by General Fund Payable by Enterprise Funds
$0
$5,000,000
$10,000,000
$15,000,000
$20,000,000
$25,000,000
$30,000,000
$35,000,000
$40,000,000
$45,000,000
2017-2021 2022-2026 2027-2031 2032-2036
Revenue Bond Debt Principal
Payable by General Fund Payable by Enterprise Funds
213

FY 2017-21 CAPITAL IMPROVEMENT PLAN (CIP) GUIDE
PURPOSE AND DEFINITIONS The purpose of the capital improvement plan (CIP) is to forecast and match major capital needs with projected revenues over a five (5)-year period. Capital planning is an important management tool that strengthens the linkages between community infrastructure needs and the financial capacity of the City.
The City defines a CIP as any expenditure of major value that recurs irregularly, results in the acquisition of a fixed asset, and has a useful life greater than one (1) year. Items included in the CIP include those which involve (1) acquisition, renovation, and/or construction of a single fixed asset greater than $100,000, (2) any land purchases not associated with or included in another CIP project, and (3) capital road maintenance or construction greater than $100,000 – excluding recurring or routine maintenance projects. HOW IS THE CIP DEVELOPED? The CIP is updated annually as part of the City’s budget process. After departments submit their CIP requests to the Budget Office, the City’s capital project recommendation committee reviews and evaluates the proposed projects based on Mayor and City Council goals, city infrastructure needs, the financial capacity of the city, and the impacts on the City’s operating budget.
Once the projects are evaluated, the committee recommends to the City Manager the selection and timing of capital projects in future fiscal years. First-year projects are incorporated into the City Manager’s recommended annual operating budget. Projects for which funding and expenditures cross multiple fiscal years are included in a separate Capital Project ordinance, which is approved by City Council when the budget is adopted in June. The Mayor and City Council are also presented the future, unappropriated, planning years for their consideration, review, and endorsement so that staff can proceed with planning and evaluation of potential capital projects.
CAPITAL IMPROVEMENT PLAN The capital improvement plan is simply that – a plan. As such, projects are subject to change based on new or shifting service needs, special financing opportunities, emergency needs, or other directives established by the Mayor and City Council. City priorities may change, therefore projects included in outward planning years are not guaranteed for funding.
OPERATING BUDGET IMPACTS Departmental budgets may be impacted by capital projects once they are completed and require maintenance/upkeep. Examples of these impacts include additional or reduced utilities, fuel costs, or staffing changes, which may not be realized until after projects are completed. When available, the impacts of capital projects on the annual operating budget are estimated and included in Section 4 for each project’s CIP. For many projects, the operating costs are captured in the department’s annual operating budget and no additional operating costs are listed. Most projects will not have an operating impact in the initial funding year, since this is typically the construction/installation phase and operating budgets are not impacted.
CONTACT INFORMATION For any questions regarding this document, please contact the Finance Department at (704) 920-5261 or (704) 920-5263 or visit the City’s budget website:
http://www.concordnc.gov/Departments/Finance/Budget/Capital-Improvement-Plan
214

Functional Area/ Budget Unit
Project NamePrimary Funding
SourcesTotal Budget
Impact
Non-Departmental4190
Operations Center Improvements -Upper Laydown Yard
Capital Reserve 490,000 490,000
Operations Center Improvements -Parking & Access Road
Capital Reserve 950,000 100,000 1,050,000
Operations Center Improvements -New Equipment Shelter
Capital Reserve 1,465,000 200,000 1,665,000
0 0 490,000 0 950,000 100,000 1,465,000 200,000 0 0 0 3,205,000
Fire Operations4340
Replacement of Aerial Ladder FD 203
Operating Revenue 1,400,000 1,400,000
Purchase of Replacement Pumper FD 111
Capital Reserve, Operating Revenue
680,000 680,000
Purchase of Replacement Pumpers FD 112 & FD 113
Capital Reserve, Operating Revenue
1,400,000 1,400,000
New Engine Company & Crew for Fire Station 11
Capital Reserve, Operating Revenue
734,250 943,087 1,677,337
Vehicle Exhaust System Operating Revenue 140,000 140,000 Land Acquisition for Fire Station
17Capital Reserve 350,000 350,000
Fire Apparatus Tanker Capital Reserve 465,000 465,000
Training Facility Capital Reserve 5,986,590 5,986,590
Emergency Management
4343
Replacement Mobile Command Unit
Capital Reserve 500,000 500,000
1,400,000 0 1,180,000 0 1,400,000 0 734,250 943,087 6,941,590 0 0 12,598,927
Solid Waste & Recycling
4520
Replacement Knuckleboom Truck SWR 436
Operating Revenue 140,000 140,000
Replacement Rearloader Garbage Truck SWR 437
Operating Revenue 170,000 170,000
Replacement Rearloader Garbage Truck SWR 432
Operating Revenue 170,000 170,000
Replacement Knuckleboom Truck SWR 445
Operating Revenue 145,000 145,000
Replacement Rolloff Truck SWR 428
Operating Revenue 200,000 200,000
Replacement Dump Truck
SWR443Operating Revenue 105,000 105,000
Replacement Dump Truck SWR438
Operating Revenue 105,000 105,000
Replacement Rearloader SWR449 Operating Revenue 185,000 185,000
Replacement Rearloader SWR446 Operating Revenue 180,000 180,000
Fleet Services 4550 Fleet Services Facility Debt Financing 780,000 11,920,000 12,700,000
310,000 0 315,000 0 980,000 0 12,025,000 0 285,000 0 185,000 14,100,000GENERAL FUND CIP TOTAL - EXPENSE 1,710,000 0 1,985,000 0 3,330,000 100,000 14,224,250 1,143,087 7,226,590 0 185,000 29,903,927GENERAL FUND-Revenue Sources & Totals
1,710,000 390,000 350,000 100,000 105,000 1,143,087 425,000 185,000 4,408,087780,000 11,920,000 12,700,000
1,595,000 2,200,000 2,199,250 6,801,590 12,795,840GENERAL FUND CIP TOTAL - REVENUE 1,710,000 0 1,985,000 0 3,330,000 100,000 14,224,250 1,143,087 7,226,590 0 185,000 29,903,927
McEachern Greenway8312
Cabarrus Avenue Development Transfer from Gen Fund 1,096,330 100,000 100,000
Hector H Henry II Greenway 8311
Airport PhaseTransfer from Gen Fund, Capital Reserve, Grants
28,000 52,500 1,365,000 103,110 1,520,610
Riverwalk Phase DevelopmentTransfer from Gen Fund,
Operating Revenue395,585 50,000 1,575,000 5,000 1,630,000
Parks & Rec Projects8300
Burrage Road House RenovationsTransfer from General Capital Reserve, Operating Revenue
309,540 26,987 336,527
Hartsell Recreation Center Renovations
Transfer from General Capital Reserve
110,550 1,815,000 45,362 1,860,362
Parks 8313 Northwest Park DevelopmentTransfer from Gen Fund,
Operating Revenue5,031 800,000 37,000 837,000
McEachern Greenway8312
Hospital Phase DevelopmentGrants, Transfer from General
Fund42,000 449,400 491,400
Fink Phase DevelopmentTransfer from Gen Fund, General Capital Reserve
1,311,000 103,110 1,414,110
Parks & Rec Projects8300
Webb Field RenovationsTransfer from Gen Fund,
Operating Revenue500,000 500,000
Hartsell Ballfield Complex Renovations
Transfer from Gen Fund 345,000 345,000
Park Lighting Project Transfer from Gen Fund 56,491 250,000 250,000 150,000 650,000
Coddle Creek Greenway Transfer from Gen Fund 445,000 3,055,000 3,500,000
Irish Buffalo Creek GreenwayTransfer from Gen Fund,
Grants340,000 1,660,000 2,000,000
GENERAL FUND - 100
Parks & Recreation Capital Projects
Public Safety
Public Safety CIP TotalPublic Works
Public Works CIP Total
PARKS & RECREATION CAPITAL PROJECTS FUND - 420
General Government
General Government CIP Total
Operating RevenueDebt FinancingCapital Reserve
Capital Improvement Plan (CIP)
FY 2017Budget
Impact on FY 2017
Operating Budget
FY 2018 Budget
Impact on FY 2018
Operating Budget
FY 2019 Budget
Impact on FY 2019
Operating Budget
FY 2020 Budget
Impact on FY 2020
Operating Budget
FY 2021 Budget
Impact on FY 2021
Operating Budget
Future (remainder of project)
Prior Year Funding
215

Functional Area/ Budget Unit
Project NamePrimary Funding
SourcesTotal Budget
Impact
FY 2017Budget
Impact on FY 2017
Operating Budget
FY 2018 Budget
Impact on FY 2018
Operating Budget
FY 2019 Budget
Impact on FY 2019
Operating Budget
FY 2020 Budget
Impact on FY 2020
Operating Budget
FY 2021 Budget
Impact on FY 2021
Operating Budget
Future (remainder of project)
Prior Year Funding
PARKS & RECREATION CAPITAL PROJECTS FUND CIP TOTAL - EXPENSE 172,072 3,638,040 26,987 4,877,000 148,472 699,400 42,000 150,000 103,110 785,000 0 4,715,000 15,185,009
Operating Revenue 26,987 148,472 42,000 103,110 320,569
State/Federal Funding 400,000 428,000 340,000 1,168,000
Transfer from General Fund 1,202,500 3,512,000 271,400 150,000 445,000 4,715,000 10,295,900
Capital Reserve 2,435,540 965,000 3,400,540
PARKS & RECREATION FUND CIP TOTAL - REVENUE 3,638,040 26,987 4,877,000 148,472 699,400 42,000 150,000 103,110 785,000 0 4,715,000 15,185,009
Street Projects8600
Traffic Management CenterTransfer from General Capital
Reserve, Vehicle Fees2,197,500 1,100,000 1,100,000
Infrastructure Projects - Pedestrian Improvement
SidewalksVehicle Fees 150,000 150,000 150,000 150,000 150,000 750,000
Concord Mills Blvd Flyover Vehicle Fees 1,500,000 1,500,000 Brookwood Ave NE Corridor
EnhancementVehicle Fees 2,602,400 1,798,800 1,798,800 3,597,600
Bruton Smith Blvd Pedestrian Improvements
Vehicle Fees 800,000 800,000
Realignment of Union Cemetery Rd
Vehicle Fees 2,000,000 3,000,000 5,000,000
Derita Road Construction Developer Contributions 3,780,000 75,000 75,000
TRANSPORTATION CAPITAL PROJECTS FUND CIP TOTAL - EXPENSE 0 2,825,000 0 4,748,800 0 4,948,800 0 150,000 0 150,000 0 0 12,822,600
550,000 550,0002,200,000 4,748,800 4,948,800 150,000 150,000 12,197,600
75,000 75,000TRANSPORTATION CAPITAL PROJECTS FUND CIP TOTAL - REVENUE 2,825,000 0 4,748,800 0 4,948,800 0 150,000 0 150,000 0 0 12,822,600
Fire & Life Safety Projects
Fire Station #10 Permanent Station
Transfer from General Capital Reserve
319,921 3,862,267 4,182,188
FIRE & LIFE SAFETY PROJECTS FUND CIP TOTAL - EXPENSE 0 0 319,921 0 3,862,267 0 0 0 0 0 0 4,182,188FIRE & LIFE SAFETY PROJECTS FUND-Revenue Sources & Totals
319,921 319,9213,862,267 3,862,267
FIRE & LIFE SAFETY PROJECTS FUND CIP TOTAL - REVENUE 0 0 319,921 0 3,862,267 0 0 0 0 0 0 4,182,188
General Projects8804
Les Myers Park Environmental/Remedial
InvestigationGrant 140,000 80,000 80,000
Fiber Network ExtensionTransfers from City
Departments600,000 216,000 150,000 150,000 150,000 666,000
GENERAL CAPITAL PROJECTS FUND CIP TOTAL - EXPENSE 740,000 296,000 0 150,000 0 150,000 0 150,000 0 0 0 0 746,000GENERAL CAPITAL PROJECTS FUND-Revenue Sources & Totals
216,000 150,000 150,000 150,000 666,00080,000 80,000
GENERAL CAPITAL PROJECTS FUND CIP TOTAL - REVENUE 0 296,000 0 150,000 0 150,000 0 150,000 0 0 0 0 746,000
Stream Restoration 7102
Stream Restoration Project Transfer from Stormwater 927,631 362,892 465,610 828,502
Stormwater Projects 7103
Chelwood Drive Culvert Replacement
Transfer from Stormwater 573,681 491,000 491,000
Hanover Circle Culvert Replacement
Transfer from Stormwater 278,000 149,000 427,000
Havencrest Court Culvert Replacement
Transfer from Stormwater 707,000 707,000
Kerr Street Culvert Replacement Transfer from Stormwater 413,000 413,000
Duval Street Culvert Replacement Transfer from Stormwater 685,000 685,000
Dylan Place Culvert Replacement Upper & Lower
Transfer from Stormwater 957,000 957,000
Farmwood Boulevard Culvert Replacement
Transfer from Stormwater 663,000 663,000
Bridlewood Drive Culvert Replacement
Transfer from Stormwater 1,022,000 1,022,000
Miramar Culvert Replacement Transfer from Stormwater 552,000 572,000 1,124,000 Glenwood Drive Culvert
ReplacementTransfer from Stormwater 718,000 718,000
STORMWATER PROJECTS FUND CIP TOTAL - EXPENSE 1,131,892 0 1,734,610 0 2,305,000 0 1,574,000 0 1,290,000 0 0 8,035,502STORMWATER PROJECTS FUND-Revenue Sources & Totals
1,131,892 1,734,610 2,305,000 1,574,000 1,290,000 8,035,502STORMWATER PROJECTS FUND CIP TOTAL - REVENUE 1,131,892 0 1,734,610 0 2,305,000 0 1,574,000 0 1,290,000 0 0 8,035,502
StormwaterFord F550 Truck w/Crane
Replacement SW 434Operating Revenue 100,000 100,000
Jet-Vac Truck Replacement SW 318
Operating Revenue 110,000 110,000Jet-Vac Truck Replacement
SW 318Operating Revenue 325,000 325,000
Dump Truck Replacement SW 401 Operating Revenue 100,000 100,000
Camera Truck Replacement SW 321
Operating Revenue 222,650 222,650
STORMWATER FUND CIP TOTAL - EXPENSE 210,000 0 325,000 0 100,000 0 222,650 0 0 0 0 857,650
210,000 325,000 100,000 222,650 857,650STORMWATER FUND CIP TOTAL - REVENUE 210,000 0 325,000 0 100,000 0 222,650 0 0 0 0 857,650
Transfers from City DepartmentsGrant
STORMWATER PROJECTS FUND - 474
GENERAL FUND CAPITAL PROJECTS FUND - 430
STORMWATER FUND-Revenue Sources & TotalsOperating Revenue
ELECTRIC PROJECT FUND - 473
PARKS & RECREATION CAPITAL PROJECTS FUND-Revenue Sources & Totals
TRANSPORTATION CAPITAL PROJECTS FUND - 423
TRANSPORTATION CAPITAL PROJECTS FUND-Revenue Sources & Totals
FIRE & LIFE SAFETY PROJECTS FUND - 426
STORMWATER FUND - 600
Capital ReserveTransfer from General Fund
Transfer from Stormwater
Transfer from Gen Fund Vehicle FeesDeveloper Contributions
Transfer from General Capital Reserve
216

Functional Area/ Budget Unit
Project NamePrimary Funding
SourcesTotal Budget
Impact
FY 2017Budget
Impact on FY 2017
Operating Budget
FY 2018 Budget
Impact on FY 2018
Operating Budget
FY 2019 Budget
Impact on FY 2019
Operating Budget
FY 2020 Budget
Impact on FY 2020
Operating Budget
FY 2021 Budget
Impact on FY 2021
Operating Budget
Future (remainder of project)
Prior Year Funding
Electric Projects6949
Solid State Relay Conversion for Sub M
Transfer from Electric 495,000 495,000
Solid State Relay Conversion for Sub C
Transfer from Electric 935,000 935,000
Solid State Relay Conversion for Delivery 3
Transfer from Electric 275,000 275,000
New Delivery #4 & 100 kV Interconnected - Phase 1
Revenue Bonds 7,701,912 7,701,912
Construction of 100 kV Sub at Delivery #4 - Phase 2
Revenue Bonds 5,351,651 5,351,651
Delivery #1 Replacement Revenue Bonds 2,000,000 2,000,000 100 kV Transmission System -
Close Western LoopRevenue Bonds 5,670,297 5,670,297
Construction of New Substation P -NC49/US601
Transfer from Electric 2,500,000 2,500,000
ELECTRIC PROJECT FUND CIP TOTAL - EXPENSE 3,930,000 0 275,000 0 7,701,912 0 7,670,297 0 5,351,651 0 0 24,928,860
3,930,000 275,000 4,205,0007,701,912 7,670,297 5,351,651 20,723,860
ELECTRIC PROJECT FUND CIP TOTAL - REVENUE 3,930,000 0 275,000 0 7,701,912 0 7,670,297 0 5,351,651 0 0 24,928,860
Electric Construction Replace E326 Bucket Truck Operating Revenue 250,000250,000
Replace E325 Bucket Truck Operating Revenue 215,000 215,000
Replace E227 Bucket Truck Operating Revenue 180,000 180,000
Bucket/Digger Derrick Utility Vehicles
Operating Revenue 170,000 170,000
Tree Trimming Replace E320 Bucket Truck Operating Revenue 275,000 275,000
Electric Construction Replace E302 Bucket Truck Operating Revenue 240,000 240,000
Tree Trimming Replacement of E305 Operating Revenue 275,000 275,000
ELECTRIC FUND CIP TOTAL - EXPENSE 815,000 0 0 0 790,000 0 0 0 0 0 0 1,605,000
815,000 0 790,000 1,605,000ELECTRIC FUND CIP TOTAL - REVENUE 815,000 0 0 0 790,000 0 0 0 0 0 0 1,605,000
Water Projects George Liles Boulevard Waterline
Phase 3Transfer from Water 1,195,191 282,430 300,000 582,430
Derita Road Widening Transfer from Water 500,000 125,000 625,000 750,000
Coddle Creek Settling Basin Upgrades
Transfer from Water 225,000 1,500,000 3,000,000 4,725,000
Security Improvements at Water Treatment Plants and Remote
SitesTransfer from Water 100,000 100,000
Sampling Stations for Distribution System
Transfer from Water 100,000 100,000
Raw Water Line & Flow Meter for Coddle Creek WTP
Retained Earnings Transfer from Water
1,190,000 1,190,000
Poplar Tent Road Water Main Extension
Transfer from Water 685,303 685,303
Highway 73 Water Main Connection to CMU
Transfer from Water 544,000 544,000
Highway 73 Water Line Kannapolis Parkway & Trinity
Church RdTransfer from Water 195,470 1,107,655 1,303,125
Concord Mills Blvd Left Turn Flyover
Transfer from Water 200,000 200,000
Proposed NC49 Water Tank Transfer from Water 500,000 4,000,000 4,500,000
WATER PROJECTS FUND CIP TOTAL - EXPENSE 1,695,191 2,022,430 0 2,620,470 0 4,307,655 0 500,000 0 5,229,303 0 0 14,679,858
2,022,430 2,620,470 4,307,655 500,000 5,229,303 14,679,858WATER PROJECTS FUND CIP TOTAL - REVENUE 2,022,430 0 2,620,470 0 4,307,655 0 500,000 0 5,229,303 0 0 14,679,858
PLC Cabinet Replacement at Coddle Creek WTP
Operating Revenue 150,000 150,000
MCC Lineup at Hillgrove WTP Operating Revenue 190,000 190,000
Coddle Creek WTP Switchgear Replacement
Operating Revenue 1,485,000 1,485,000
Hillgrove Settling Basin Improvements
Operating Revenue 100,000 2,200,000 2,300,000
Hillgrove WTP Rapid Mix Basin Rehabilitation
Operating Revenue 100,000 100,000
Upgrade Basin Valve Actuators at Hillgrove WTP
Operating Revenue 200,000 200,000
Coddle Creek WTP Biofilter Installation
Operating Revenue 228,000 228,000
Resurface Clearwell #2 at Hillgrove WTP
Operating Revenue 130,000 130,000
WATER FUND CIP TOTAL - EXPENSE 340,000 0 1,585,000 0 100,000 0 2,628,000 0 130,000 0 0 4,783,000
340,000 1,585,000 100,000 2,628,000 130,000 4,783,000WATER FUND CIP TOTAL - REVENUE 340,000 0 1,585,000 0 100,000 0 2,628,000 0 130,000 0 0 4,783,000
Rider Transit SystemTransit Operations & Maintenance
FacilityGrant Revenue, Other
Funding6,000,000 50,000 50,000 6,100,000
Operating Revenue
Transfer from Electric
WATER PROJECTS FUND-Revenue Sources & Totals
WATER FUND - 620
WATER FUND-Revenue Sources & Totals
PUBLIC TRANSIT- 630
ELECTRIC FUND-Revenue Sources & Totals
WATER PROJECTS FUND - 429
ELECTRIC FUND - 610
Debt Financing
Operating Revenue
Transfer from Water
ELECTRIC FUND-Revenue Sources & Totals
217

Functional Area/ Budget Unit
Project NamePrimary Funding
SourcesTotal Budget
Impact
FY 2017Budget
Impact on FY 2017
Operating Budget
FY 2018 Budget
Impact on FY 2018
Operating Budget
FY 2019 Budget
Impact on FY 2019
Operating Budget
FY 2020 Budget
Impact on FY 2020
Operating Budget
FY 2021 Budget
Impact on FY 2021
Operating Budget
Future (remainder of project)
Prior Year Funding
PUBLIC TRANSIT FUND CIP TOTAL - EXPENSE 0 0 0 0 6,000,000 0 0 50,000 0 50,000 0 6,100,000
50,000 50,000 100,0006,000,000 6,000,000
PUBLIC TRANSIT FUND CIP TOTAL - REVENUE 0 0 0 0 6,000,000 0 0 50,000 0 50,000 0 6,100,000
Wastewater Projects 8402
Accent Ave Outfall Transfer from Wastewater 590,000 590,000
Concord Mills Boulevard Left Turn Flyover
Transfer from Wastewater 100,000 100,000
WASTEWATER FUND CIP TOTAL - EXPENSE 590,000 0 0 0 100,000 0 0 0 0 0 0 690,000WASTEWATER FUND-Revenue Sources & Totals
590,000 100,000 690,000WASTEWATER FUND CIP TOTAL - REVENUE 590,000 0 0 0 100,000 0 0 0 0 0 0 690,000
Wastewater Operations 7420
Excavator Replacement S 659 Operating Revenue 120,000 120,000
Sewer Master Plan Operating Revenue 150,000 150,000
Jet-Vac Truck Replacement S657 Operating Revenue 325,000 325,000
Rapid Response Truck S661 Operating Revenue 148,550 148,550
WASTEWATER FUND CIP TOTAL - EXPENSE 270,000 0 325,000 0 148,550 0 0 0 0 0 0 743,550WASTEWATER FUND-Revenue Sources & Totals
270,000 325,000 148,550 743,550WASTEWATER FUND CIP TOTAL - REVENUE 270,000 0 325,000 0 148,550 0 0 0 0 0 0 743,550
Golf Course ProjectsIrrigation Repairs & Bunker
RestorationOperating Revenue 199,650 150,000 349,650
ROCKY RIVER GOLF PROJECTS FUND CIP TOTAL - EXPENSE 0 199,650 0 150,000 0 0 0 0 0 0 0 0 349,650
199,650 150,000 349,650 ROCKY RIVER GOLF PROJECTS FUND CIP TOTAL - REVENUE 199,650 0 150,000 0 0 0 0 0 0 0 0 349,650
Airport Projects6300
SDA Commercial Passenger Terminal Building Phase 2
Grant, Transfer from Aviation 7,382,000 8,000,000 15,382,000
Airport Perimeter Security FencingGrants, Transfer from
Aviation 1,749,625 1,749,625
Airport Fuel Farm Addition Transfer from Aviation 443,000 443,000
Runway 20 EMAS Grant, Transfer from Aviation 938,675 3,754,700 4,693,375
South Development Apron Expansion Phase 2
Grant, Transfer from Aviation 250,000 5,914,000 6,164,000
Ivy Cline Land Acquisition Grant, Transfer from Aviation 3,400,000 3,400,000
Airport Fire Station and Security Center
Grant, Transfer from Aviation 100,000 1,643,000 1,743,000
Airport Hangar Taxilane Rehabilitation
Grant, Transfer from Aviation 100,000 2,060,000 2,160,000
East Side Airport Land Acquisition Area
Grant, Transfer from Aviation 5,090,000 5,090,000
East Side Commercial Airline Terminal Area
Revenue Bonds, Grants, Transportation Funds, Transfer from Aviation
600,000 40,000,000 40,600,000
North Apron Expansion Phase 3 Grant, Transfer from Aviation 250,000 1,750,000 2,000,000
New Relocated Airport Control Tower
Grant, Transfer from Aviation 200,000 3,500,000 3,700,000
FBO Terminal Building Rehabilitation
Public-Private Partnership, Capital Reserve
580,000 12,800,000 13,380,000
Corporate Hangar Development Debt Financing 3,500,000 3,500,000
Myint Lane Airport Access Road Transfer from Aviation 700,000 700,000
Myint Lane Airport Apron Development
Grant, Transfer from Aviation 150,000 1,200,000 1,350,000
Airport Helipads Grant, Transfer from Aviation 410,000 410,000
North Internal Service Road Grant, Transfer from Aviation 325,000 1,824,300 2,149,300
Airport Land Acquisition - West Side
Grants, Transfer from Aviation
3,000,000 3,000,000
AIRPORT PROJECTS FUND CIP TOTAL - EXPENSE 1,749,625 0 14,628,675 0 16,826,000 0 70,710,000 0 1,200,000 0 6,500,000 111,614,300
1,574,663 13,060,358 15,245,965 22,979,500 1,080,000 2,850,000 56,790,486 87,481 562,659 500,018 2,615,250 60,000 75,000 3,900,408 87,481 1,005,658 500,017 3,315,250 60,000 75,000 5,043,406
2,000,000 2,000,000 23,000,000 3,500,000 26,500,000 10,400,000 10,400,000
580,000 6,400,000 6,980,000
Transfer from Wastewater
OtherState/Federal Funding
WASTEWATER PROJECTS FUND - 421
PUBLIC TRANSIT FUND-Revenue Sources & Totals
Operating Revenue
Operating Revenue
Local MatchDedicated Transportation Funds
Revenue BondsOther
Capital Reserve
WASTEWATER FUND - 640
ROCKY RIVER GOLF COURSE PROJECT FUND - 475
ROCKY RIVER GOLF PROJECTS FUND-Revenue Sources & Totals
Federal Grant State Grant
AIRPORT PROJECTS FUND - 451
AIRPORT PROJECTS FUND-Revenue Sources & Totals
218

Functional Area/ Budget Unit
Project NamePrimary Funding
SourcesTotal Budget
Impact
FY 2017Budget
Impact on FY 2017
Operating Budget
FY 2018 Budget
Impact on FY 2018
Operating Budget
FY 2019 Budget
Impact on FY 2019
Operating Budget
FY 2020 Budget
Impact on FY 2020
Operating Budget
FY 2021 Budget
Impact on FY 2021
Operating Budget
Future (remainder of project)
Prior Year Funding
AIRPORT PROJECTS FUND CIP TOTAL - REVENUE 1,749,625 0 14,628,675 0 16,826,000 0 70,710,000 0 1,200,000 0 6,500,000 111,614,300
Aviation Airport Master Plan Update Grant, Operating Revenue 300,000 300,000
AIRPORT FUND CIP TOTAL - EXPENSE 300,000 0 0 0 0 0 0 0 0 0 0 300,000
280,000 280,000 10,000 10,000 10,000 10,000
AIPORT FUND CIP TOTAL - REVENUE 300,000 0 0 0 0 0 0 0 0 0 0 300,000
2,607,263 20,027,637 26,987 33,724,476 148,472 51,369,584 142,000 97,979,197 1,296,197 21,362,544 50,000 11,400,000 237,527,094
Federal Grant State Grant
Local Match
AIPORT FUND - 680
AIPORT FUND-Revenue Sources & Totals
CITY OF CONCORD CIP PROJECT TOTAL
219

How to read the summary information: Department
$100,000 Project title and FY17 cost
Project description
Estimated year of completion
Total Capital Cost $1,196,330 Total cost of capital project
Total Operating Cost $0 Total impact on operating budget
Funding Source(s) Project's funding sources
$52,500 $50,000
Total Capital Cost $2,094,610 Total Capital Cost $2,020,585
Total Operating Cost $0 Total Operating Cost $0
Funding Source(s)
$337,027 Hartsell Recreation Center Renovation $1,815,000
$309,540 $1,815,000
Total Operating Cost $337,027 Total Operating Cost $45,362
$1,311,000 $150,000
Total Capital Cost $1,311,000 Ongoing
Total Operating Cost $103,110 Total Operating Cost $0
Funding Source(s)
$75,000 Traffic Management Center $1,100,000
Total Capital Cost $3,855,000 $3,152,532
Total Operating Cost $0 Total Operating Cost $0
Expected Completion: FY18
Streets & Transportation ProjectsPedestrian Improvement Project - Sidewalks
Construct new City sidewalks and associated infrastructure to expand theexisting pedestrian system.
Expected Completion: Ongoing
Total Capital Cost
Funding Source(s)
Total Capital Cost
Funding Source(s) Developer Contributions Funding Source(s) Capital Reserve, Vehicle Fees
Streets & Transportation Projects
Derita Road Widening
Construction and installation of City of Concord Traffic ManagementCenter and associated extension of fiber optic communicationnetwork(s)
Expected Completion: FY18 Expected Completion: FY18
Provide funding for roadway improvements on Derita Rd from PoplarTent to Concord Mills Blvd.
Parks & Recreation Capital ProjectsMcEachern Greenway - Fink Phase
Capital Reserve, Operating Revenue
Streets & Transportation Projects
Funding Source(s) Capital Reserve, Operating Revenues Funding Source(s) Capital Reserve, Operating Revenue
Transfer from Gen Fund / Vehicle Fees
Burrage Road House Renovations
Design & renovation of house at 946 Burrage Road to be used forprogramming space.
Renovations will address structural issues and update both the upperand lower levels.
Expected Completion: FY19 Expected Completion: FY16
Total Capital Cost Total Capital Cost
Design & construction of the greenway from Cabarrus Avenueupstream for approximately 4,500 linear feet.
Parks & Recreation Capital Projects Parks & Recreation Capital Projects
Transfer from General Fund
Parks & Recreation Capital Projects Parks & Recreation Capital Projects
Hector H. Henry II Greenway - Airport Phase Hector H. Henry Greenway- Riverwalk
1.3 mile segment from Derita Road to the Weddington Road Bark Park.1.1 mile segment from Weddington Road Bark Park to Riverwalkneighborhood.
CIP YEAR 1 APPROVED PROJECTS The boxes below provide summary detail for CIP projects scheduled for funding in year 1, or FY 2017, of the CIP. For additional description and cost information, please see each project's individual page in the City's FY 2017-2021 Capital Improvement Plan. Please note that this listing does not include vehicle or equipment purchases scheduled for FY2017.
Parks & Recreation Capital Projects
McEachern Greenway - Cab. Ave Phase
6/10 of 1 mile segment to begin at McGee Park and extend along Three Mile Branch to Cabarrus Ave NE.
Expected Completion: FY18
Expected Completion: FY20 Expected Completion: FY19
Capital Reserve Grants, Op Rev Funding Source(s) Transfer from General Fund
220

$1,500,000 $216,000
Total Capital Cost $1,500,000 Total Capital Cost $166,000
Total Operating Cost $0 Total Operating Cost $50,000
Funding Source(s)
$80,000 $278,000
Total Capital Cost $220,000 Total Capital Cost $278,000
Total Operating Cost $0 Total Operating Cost $0
Funding Source(s) Funding Source(s)
$362,892 Chelwood Drive Culvert Replacement $491,000
$2,028,502 $491,000
Total Operating Cost $0 Total Operating Cost $0
Solid State Relay Conversion - Substation M $495,000 $2,500,000
$495,000 Total Capital Cost $2,500,000
Total Operating Cost $0 Total Operating Cost $0
Funding Source(s) Transfer from Electric
$935,000 Raw Waterline & Flow Meter for CCWTP $1,190,000
Total Capital Cost $935,000 Total Capital Cost $1,190,000
Total Operating Cost $0 Total Operating Cost $0
Funding Source(s)
$282,430 Derita Road Widening $125,000
$1,777,621 $750,000
Total Operating Cost $0 Total Operating Cost $0
Expected Completion: FY17
This project is for the addition of a second raw water line from Lake Howell to Coddle Creek WTP.
Funding Source(s) Transfer from Water
Expected Completion: FY17
George Liles Blvd Waterline Phase 3
Provide a new 24" waterline from Weddington Road to Roberta Roadas part of the NCDOT Westside Bypass Project.
Provide for the relocation and upsizing of existing water lines alongDerita Road between Concord Mills Boulevard and Poplar Tent Road as aresult of the NCDOT widening the existing roadway section.
Expected Completion: FY19 Expected Completion: FY19
Electric ProjectsSolid State Relay Conversion - Substation CThis project will convert the current relay protection package atSubstation "C" to a new solid state package, and replace the 1969model year transformer.
Expected Completion: FY16
Transfer from Electric
Water Projects
Total Capital Cost Total Capital Cost
Funding Source(s) Transfer from Water Funding Source(s) Transfer from Water
Funding Source(s) Transfer from Electric
Water Projects
Water Projects
Funding Source(s) Transfer from Stormwater Funding Source(s) Transfer from Stormwater
Electric Projects Substation P ConstructionProvide an additional 44 KV substation that will be required to addressthe load growth in the City's SE quadrant.
Electric Projects
Conversion of current relay protection at Sub M to a new solid statepackage, including control house and SCADA equipment.
Expected Completion: FY17
Total Capital Cost
Stream Restoration Project
Construction of detention ponds and stream restoration work toimprove water quality in Stricker Branch.
Culvert replacement and upsizing under Chelwood Drive is to reduceflooding risk to neighborhood homes.
Expected Completion: FY18 Expected Completion: FY17
Total Capital Cost Total Capital Cost
Stormwater Projects Stormwater Projects
State Funding Grant Transfer from Stormwater
Les Myers Park Environmental Hanover Circle Culvert Replacement
Consulting Engineer and Shield Engineering, Inc. will to completeremedial investigation for landfill at Les Myers Park property.
Culvert replacement and upsizing under Hanover Circle to reduceflooding risk to neighborhood homes.
Expected Completion: FY17 Expected Completion: FY18
Expected Completion: FY18 Expected Completion: Ongoing
Vehicle Fees Funding Source(s) Fund Transfers
General Fund Capital Projects Stormwater Projects
Streets & Transportation Projects General Fund Capital Projects
Concord Mills Blvd Flyover Fiber Network Extension
The construction of the Concord Mills Fly Over addresses the CityCouncil goal to support Exit 49 economic development and congestionwith City participation.
Fiber network extension providing high bandwidth connectivity for data,video, telephone, SCADA needs for various city departments
221

$225,000 $100,000
Total Capital Cost $4,725,000 Total Capital Cost $100,000
Total Operating Cost $0 Total Operating Cost $0
Funding Source(s)
$100,000 PLC Cabinet Replacement $150,000
$100,000 $150,000
Total Operating Cost $0 Total Operating Cost $0
MCC Lineup at Hillgrove Water Treatment Plant $190,000 $590,000
$190,000 Total Capital Cost $590,000
Total Operating Cost $0 Total Operating Cost $0
Funding Source(s) Transfer from Wastewater
$199,650 $1,749,625
Total Capital Cost $349,650 $1,749,625
Total Operating Cost $0 Total Operating Cost $0
Funding Source(s) Capital Reserve
$300,000
$300,000
Total Operating Cost $0
Aviation FundAirport Master Plan
Update to the Aviation Master Plan.
Expected Completion: FY17
Total Capital Cost
Funding Source(s) Grant Revenue, Local Match
Funding Source(s) Grant Revenue, Local Match
Expected Completion: FY17
Airport ProjectsAirport Perimeter Security Fencing
The project consists of constructing an 8 foot chain link perimetersecurity fence around the other perimeter of the airport property. Thefence will include 3 strands of barbed wire.
Expected Completion: FY17
Total Capital Cost
Golf Course ProjectsIrrigation Repairs & Bunker Restoration
Restoration of golf course bunkers and irrigation system repairs.
Expected Completion: FY18
Total Capital Cost
Funding Source(s) Operating Revenue
Wastewater ProjectsAccent Avenue Outfall
Funding Source(s) Operating Revenue
Hillgrove Water Treatment Plant
Replacement of Motor Control Center lineup at Hillgrove WaterTreatment Plant.
Expected Completion: FY17
Outfall line to provide the availability of sewer service for propertyowners on Accent Avenue.
Funding Source(s) Transfer from Water
Coddle Creek Water Treatment Plant
Replacement of the main PLC cabinet for motor and other controls atCoddle Creek Water Treatment Plant
Expected Completion: FY17
Total Capital Cost
Sampling Stations for Distribution System
These are sample stations that are installed in the distribution systemfor sample collection purposes.
Expected Completion: FY17
Total Capital Cost
Expected Completion: FY20 Expected Completion: FY17
Transfer from Water Funding Source(s) Transfer from Water
Water Projects
Water Projects Water Projects
Coddle Creek Settling Basin Upgrades Security Improvements at WTPs & Remote Sites
This project is to design and construct settling basin upgrades at theCoddle Creek Water Treatment Plant and includes a pilot study.
This project is to fund security improvements at the water treatmentplants and the remote sites including water storage tanks and boosterpump stations.
222

How to read the summary information: Department or Project Fund
Project title
Project description
Fiscal years of project approval and completion
Ongoing Total cost of capital project
Total Operating Cost Ongoing Total 5-yr impact on operating budget
Project's funding sources
$1,200,000 Total Capital Cost $1,758,491
$0 Total Operating Cost $0Funding Source(s) P&R Capital Reserve, Operating Rev.
Approved: FY12
$2,205,000 Total Capital Cost $1,758,491
Total Operating Cost $98,200 Total Operating Cost $0
Funding Source(s) P&R Capital Reserve, Operating Rev.
Approved: FY12 Approved: FY07
$601,000 Total Capital Cost $3,500,000
Total Operating Cost $0 Total Operating Cost $0
Funding Source(s)
$7,121,500 $415,000
Total Operating Cost $0 Total Operating Cost $0
Funding Source(s)
Total Capital Cost
Parks & Recreation Aviation
Avigation Easement ("Air Rights") Acq.This is a planned acquisition of air rights over the Vulcan propertyadjacent to the Airport in the approach path of the newly extendedrunway.
Operating Revenue, Federal
Expected Completion: Undetermined
Electric Projects
Operating Revenues
Project will upgrade all legacy electromechanical relays to digital protection systems.
Expected Completion: FY17
IN-PROGRESS CIP PROJECTS DETAILThe boxes below provide summary detail of CIPs that were approved in prior fiscal years, did not receive additionalfunding in FY16, are currently in progress, and are not yet completed.
General Fund Capital Projects
Fiber Network Extension
Fiber network extension providing high bandwidth connectivity fordata, video, telephone and SCADA needs for various city departments.
Approved: FY14 Expected Completion: Ongoing
Total Capital Cost
Funding Source(s) Operating Revenues
Electric Projects Fund
Smart Meter/Smart GridThis project will replace all of the This project is to replace the existingAMR metering system for electric with newer technology that willenhance our operational efficiency andprovide better customer service for our customers.
Expected Completion: FY17
Total Capital Cost
Delivery 2 Upgrades
Approved: FY15
Funding Source(s)
MacEachern Greenway- Cabarrus Avenue
Harold B. McEachern Greenway Phase 3 is an approximately .6 mile segment that extends from McGee Park to Cabarrus Ave. This includes land acquisistion and construction.
Funding Source(s) Operating Revenue
Funding Source(s) P&R Capital Reserve, Operating Rev.
Hector H. Henry Greenway - Airport Phase
This is an approximately 1.5 mile segment that begins at Interstate 85and extends upstream to Derita Rd. This includes land acquisition,plan/design and construction of the greenway.
Expected Completion: FY20
Total Capital Cost
Park Lighting Replacement Ph. 1This project replaces existing field lights at Webb Field as well as fieldand tennis lights at Les Myers Park. This includes poles and lights onthe athletic fields but lights only on the tennis courts.
Expected Completion: On Hold
Operating Revenue
Approved: FY16
Approved: FY14 Expected Completion: FY17
Total Capital Cost
Total Operating Cost
Funding Source(s) Capital Reserves
Total Capital Cost
Parks & RecreationParks & Recreation
Parks & RecreationMacEachern Greenway- Cabarrus AvenueHarold B. McEachern Greenway Phase 3 is an approximately .6 mile segment that extends from McGee Park to Cabarrus Ave. This includes land acquisistion and construction.Approved: FY12 Expected Completion: FY17
Expected Completion: FY17Approved: FY12
Fire & Life SafetySCBA Equipment ReplacementThis project includes total replacement of the self-containedbreathing equipment. SCBA equipment was last replaced in 2001.
223

$550,854 Total Capital Cost $643,428
Total Operating Cost $0 Total Operating Cost $0
Stormwater Project Fund
Total Capital Cost $620,130 $269,539
Total Operating Cost $0 Total Operating Cost $0
Wastewater Projects Fund
$990,000 Total Capital Cost $500,000
Total Operating Cost $0 Total Operating Cost $0
Approved: FY14Total Capital Cost $5,000,000 $210,000
Total Operating Cost $0 Total Operating Cost $0
Approved: FY16
Total Capital Cost $300,000 $750,000
Total Operating Cost $0 Total Operating Cost $0
Approved: FY13
$1,675,000 $1,459,626
Total Operating Cost $0 Total Operating Cost $0
Shamrock Culvert Replacement
Wastewater Projects FundProvince Green Pump Station EliminationThis project includes installation of approximately 2,900LF of gravity sewer main and abandonment of a pump station to eliminate the Province Green pump station..
Expected Completion: FY17
Funding Source(s) Operating Revenue Funding Source(s) Operating Revenues
Expected Completion: TBD
Total Capital Cost
Funding Source(s) Operating Revenue
Laurel Park Pump Station EliminationThis project includes installation of approximately 1,200LF of gravity sewer and abandonment of a pump station to eliminate the Laurel Park pump station.
Expected Completion: FY18Approved: FY16Approved: FY16
Total Capital Cost
Funding Source(s) Operating Revenue
Approved: FY14
The water main relocation is associated with the replacement of the bridge over US Highway 29 at Rocky River.
Realign the existing 16" waterline from Poplar Tent Road to Rocky River as part of the NCDOT TIP project.
Expected Completion: FY17
This culvert replacement and upsizing under Shamrock Drive is to reduce flooding risk to neighborhood homes and replace aging infrastructure.
This culvert replacement and upsizing under Channing Circle to reduce flooding risk to neighborhood homes and replace aging infrastructure.
Funding Source(s) Operating Revenue
Expected Completion: TBD
Stormwater Project FundWyoming Drive Culvert Replacements
Stormwater Project Fund
Approved: FY15
Approved: FY15
This culvert replacement and upsizing under Wyoming Drive andWyoming Drive/Grand Canyon is to reduce flooding risk toneighborhood homes and replace aging infrastructure.
Stormwater Project FundChadbourne Ave Culvert ReplacementThis culvert replacement and upsizing under Chadborne Avenue is toreduce flooding risk to neighborhood homes and replace aginginfrastructure.
Expected Completion: TBD
Total Capital Cost
Expected Completion: TBD
Funding Source(s) Operating Revenue
Channing Circle Culvert Replacement
Approved: FY16
Waterlines Operations & Maintenance
Total Capital Cost
Funding Source(s) Operating Revenue
Water Projects FundAMI Meter ConversionThis project is a replacement of existing water meters with AMI (Advanced Metering Infrastructure) meters.
Waterlines Operations & Maintenance
Replace PLC Cabinets at Coddle Creek WTPReplace two existing PLC cabinets located in the filter galley. Projectionincludes replacement of remaining PLC every three years.
Expected Completion: FY17Approved: FY14
Derita Road Waterline Replacement
Funding Source(s) Operating Revenue
Approved: FY14 Expected Completion: FY18
Total Capital Cost
Hillgrove WTP - Byproduct Reduction
Expected Completion: FY18
Conduct full scale testing, design, & construction of a chlorine dioxide system,upgrade of the flash mixing basin, design/construction of piping modificationsand baffling in the clearwell, and design/construction of a powdered activatedcarbon feed.
Funding Source(s)
US29 Bridge 16" Watermain Replacement
Operating Revenue
Water Projects Fund
Operating Revenue
Total Capital Cost
Funding Source(s)
Approved: FY14 Expected Completion: Ongoing
Funding Source(s)
Waterlines Operations & Maintenance
Operating Revenue
Transportation Capital Projects
CMAQ Poplar Tent/US 29
Provide local funding match for Congestion Mitigation Air Quality funds used tomake roadway improvements at and near the intersection of Poplar Tent Rd. andUS Highway 29 using a Modified Superstreet design that will lessen congestion.
Expected Completion: FY17
Total Capital Cost
Funding Source(s) Transportation Fund, Grants
224

Approved: FY13$20,000,000 $150,000
Total Operating Cost $0 Total Operating Cost $0
$525,916 $600,000
Total Operating Cost $0 Total Operating Cost $0
Total Capital Cost
Expected Completion: FY17
Total Capital Cost
Funding Source(s) Trans Funds, CMAQ Grant
Transportation Capital ProjectsVirginia Street SE Segment ImprovementRe-construct the surface of Virginia St., SE from Corban Ave., SE toLouise Ave., SE, inside the platted public R/W and upgrade / renovatethe facility to meet minimum City of Concord street standards with aComplete Streets typical section.
Transportation Capital ProjectsDerita Road ImprovementsProvide funding for roadway improvements on Derita Rd from PoplarTent to Rocky River. Includes design, permitting, purchase of right-of-way, utility relocation, and construction of an improved roadwaysection with curb, gutter and sidewalks.
Expected Completion: FY17
Funding Source(s) NCDOT, Transportation Rsvs
Transportation Capital ProjectsNE Subset Sidewalk ExtensionProvide local funding match for CMAQ funds used to extendpedestrian facilities in the NE Quadrant of the City of Concord. Thisproject will lessen congestion and mitigate current vehicle emission
Approved: FY14 Expected Completion: TBD
Total Capital Cost
Funding Source(s) Transportation Funds
Approved: FY14
Transportation Capital ProjectsSidewalk Improvements - Miramar Ph. 2
Construct new City sidewalks and associated infrastructure to expandthe existing pedestrian system. Constructed in conjunction with the NESubset.
Approved: FY14 Expected Completion: FY17
Total Capital Cost
Funding Source(s) Transportation Funds
225

This page intentionally left blank.
226

CITY OF CONCORD, NC DEBT MANAGEMENT POLICY
Purpose The City of Concord (City) maintains conservative financial policies to assure strong financial health. One of the keys to sound financial management is the development of a debt policy, which includes methods for determining debt affordability. This need is recognized by bond rating agencies, and development of a debt policy is a recommended practice by the Government Finance Officers Association.
The objectives of a debt policy are as follows: establish conditions for the use of debt vs. pay-as-you-go, by providing guidelines for consistency
in decision making; create policies that minimize the City’s debt service and issuance costs; retain a high credit rating and maintaining full and complete financial disclosure and reporting, demonstrates a commitment to long term financial planning, aids in development of capital budgets, taking into account financial and economic resources as
well as infrastructure needs.
Capital Improvement Plan (CIP) A formal CIP is essential to intelligent planning of debt issuance and management, and therefore
commits the City to developing and maintaining a long-term plan that identifies and prioritizes potential capital investments, their costs and benefits, and potential funding sources for each item. The City will prepare and update annually a five-year capital improvement program (CIP) for consideration and adoption by City Council as part of the City’s budget process. First-year projects are incorporated in the City Manager’s recommended annual budget that is presented to City Council for adoption. The CIP will include possible debt issuance to fund future projects. The Finance Department is responsible for coordinating and analyzing the debt requirements, including timing of debt, analysis of outstanding debt, debt limitations and compliance, forecast of future debt obligations, and current revenue requirements.
The CIP is updated annually as part of the City’s regular budget process. After departments submit their CIP requests to the Finance Department, the City’s Capital Project Selection Committee reviews and evaluates the proposed projects based on Mayor and City Council service priorities, infrastructure needs, the financial capacity of the City and the impact the projects could have on the City’s operating budget.
Debt financing will be considered in conjunction with the approval by the City Council of the CIP. Additionally debt financing will be considered for large capital items that normally do not go through the CIP process but are included in departmental requests and not considered operating expenditures.
Legal and Regulatory Requirements Management responsibility for the City’s debt program is hereby delegated to the Finance Director, who will establish procedures for the operation of the debt program consistent with the Debt Policy and in full compliance with the North Carolina General Statutes, Local Government Finance Act. It will be the sole responsibility of the Finance Director to issue debt on behalf of the City. The Finance Director may assign another employee to assist in the duties of debt issuance, debt payments and other debt-related activities. The City Manager will direct the Finance Director in all debt issuance and the City Council will approve all debt agreements. Where applicable, debt issuances will be approved by the North Carolina Local Government Commission.
227

The City will provide on-going disclosure information to established national information repositories and maintain compliance with disclosure standards. When applicable, the City will receive an opinion acceptable to market from a law firm that any financing transactions complies with applicable law and all agreements in connection with any financing are legal, valid and binding obligation of the City. Guidelines for Debt Issuance
Evaluation of Market Conditions: High interest rates increase total debt issuance costs, so the City may consider debt issuance rather than pay-as-you-go when interest rates are lower. It is important that all market conditions are considered before issuance of debt; therefore this policy allows for flexibility when recommendations are made to the City Manager. Low interest rates are not always the supporting factor for issuing debt.
Debt should only be incurred for financing capital assets/projects that, because of their long-term nature or because of budgetary restraints, cannot be acquired from current budgeted resources.
Limitations on Debt Issuance: The City will evaluate the financial ratios as explained in the section titled, Debt Affordability - Limits on Debt Issued & Outstanding. The legal debt margin will also be reviewed before any new debt is proposed.
City Council Authority: Staff will follow all N.C. General Statutes regarding debt issuance. All debt issuance will be approved by City Council and all proceeds from debt issuance for the City of Concord shall be appropriated by City Council.
Permissible Debt Instruments: The City will follow the N.C. General Statues in regards to what type of debt a municipality is allowed to issue.
Pay-As-You-Go Alternative: Staff will use an objective, analytical approach to determine if the City will benefit from pay-as-you-go vs. debt financing. This process involves comparisons of generally accepted standards of affordability to current City values.
The City will follow all requirements set in the Fiscal Policy - Reserve Funds Policy when determining resources available for debt service and pay-as-you-go recommendations.
When the North Carolina Local Government Commission (LGC) is required to approve the debt issuance, a complete application should be filed four weeks prior to the LGC meeting date (first Tuesday of every month). When applicable, a letter should be submitted to the LGC Joint Legislative Committee in advance to ensure the debt issuance will be supported by the committee.
Arbitrage Requirements and Bond Issuance Bond Issuance & Arbitrage Requirements: If a credit rating is necessary for an issuance, the purpose of the debt issuance will support an investment grade credit rating. The City will comply with all applicable U.S. Internal Revenue Service and U.S. Treasury arbitrage requirements for bonded indebtedness. The City will maintain a system of record keeping and reporting to meet arbitrage rebate compliance requirements. Bond issues should be planned to minimize the frequency of issuance, thereby ensuring the lowest possible costs of issuance. When determining the size of a bond issue, consideration should be given to the need for construction, debt service and capitalized interest funds. Construction fund draw schedules shall be prepared, and projection of conservative earnings on unspent bond funds should be made in conjunction with planning of the City’s Capital Improvement Program. The decision to use bond proceeds to pay interest during construction for revenue-producing projects shall be made on a case by case basis and shall be based on an evaluation of the opportunity cost of funds and the availability of other sources of funds to pay interest costs. General obligation bonds will be amortized on a level principal basis to the extent practical, and revenue bonds will be amortized on a level debt service basis to the extent practical considering the forecasted available pledged revenues.
228

Restrictions on Debt Issuance The City will not issue long-term debt for operations. Debt will not be issued with a longer amortization period than the life of the asset it is financing. The size of the issue will be analyzed but the City should not use long-term debt for small issues
nor should large issues be financed with capital leases when unfavorable interest rates exist. Debt structures that result in significant principal payments at the back end of the debt life, instead
of equalized over the life of the debt should be avoided. Variable rate debt will not be issued without proper analysis and evaluation to determine that the
issuance is in the best interest of the City. Debt will not be issued when the limits on debt are exceeded or when the legal debt margin is not
met. The City will not enter into any debt agreement that is not approved by the N.C. General Statutes.
Requirements for Pay-As-You-Go The use of current resources and accumulated reserves to purchase capital items or to fund capital projects/improvements is used to keep the debt burden of the City low and because the net benefits derived from the asset are likely to be greater in the early years of the asset’s life. The City also maintains a reserve fund so that capital project items may be funded with cash upon recommendation of the City Manager and City Council approval. The City’s conservative financial policies enable the City to minimize the use of debt by increasing the use of cash to fund projects over time. The following should be evaluated when a recommendation for Pay-As-You-Go is being considered.
The City will strive to fund at least 10% of the project costs in the current year CIP with cash when the following apply: The asset/project life is less than 10 years. The amount of the asset/project is less than $5,000,000. The Fiscal Policy – Reserve Funds Policy is maintained.
Professional Services The City of Concord has authority, subject to review and approval by the Local Government Commission, to select and retain the financial consultants, underwriters and bond attorneys to be associated with the bond issue, and selection is made in accordance with G.S. 159-123(e).
Bond Counsel – When applicable, debt issued by the City will include a written opinion by bond counsel affirming that the City is authorized to issue the proposed debt. The opinion shall include confirmation that the City has met all city and state constitutional and statutory requirements necessary for issuance, a determination of the proposed debt’s federal income tax status and any other components necessary for the proposed debt.
Financial Advisor – A Financial Advisor(s) may be used to assist in the issuance of the City’s debt. The Financial Advisor will provide the City with objective advice and analysis on debt issuance. This includes, but is not limited to, monitoring market opportunities, structuring and pricing debt, and preparing official statements of disclosure.
Underwriters – An Underwriter(s) will be used for all debt issued in a negotiated or private placement sale method. The Underwriter is responsible for purchasing negotiated or private placement debt and reselling the debt to investors.
Constitutional and Statutory Limitations: Debt financing can include general obligation bonds, revenue bonds, certificates of participation, limited obligation bonds, lease/purchase agreements special obligation bonds or any other financing instrument
229

allowed under North Carolina statutes. The N. C. General Statutes, Chapter 159, Article 4. Local Government Bond Act establishes the authority to borrow money. The Statutes further defines the types of debt allowable, the purpose and the limitations of each. Debt Affordability - Limits on Debt Issued and Outstanding Debt Capacity-General Fund & Governmental Fund Types- the City considers the following factors:
Annual debt service should not exceed 15% of operating expenditures. This ratio reflects the City’s budgetary flexibility to change spending and respond to economic downturns.
Net general obligation debt per capita will not exceed $1000. All debt per capita will not exceed $3000. This ratio measures the burden of debt placed on the size of the population supporting the debt. This ratio is used to measure an issuer’s ability to repay the debt.
Total net bonded debt should not exceed 2% of assessed value. This ratio measures debt levels against property tax base. The tax base generates the revenue that will be the main source to repay the debt. Although the legal debt margin has a statuary limit of 8%, the City’s target is 2%.
The City will compare the measures above with other units of government with an electric system and that are similar in size.
No more than 60% of the five-year Capital Improvement Plan will be funded from long-term debt. Variable rate debt may not exceed 20% of the City’s total debt portfolio (includes all debt). The City will include a review of direct and overlapping debt in analyzing the financial condition of
the City in regards to debt issuance. This analysis is included in the City’s Comprehensive Annual Report (Statistical Section) each year.
Legal Debt Margin - Per the N.C. General Statutes, the City’s net bonded debt outstanding may not exceed 8% of the appraised value of property subject to taxation. Debt Capacity-Enterprise Funds - There are no specific debt limits for the city’s enterprise funds as utility rates are set as needed to fully cover total costs and debt service. The City will annually calculate debt coverage as required by the revenue bond rate covenant. Normal coverage is at least 1.2 but the revenue bond covenants should be reviewed to ensure coverage levels are satisfied. The standard ratio is calculated by dividing net available revenues by principal and interest requirements for the year. This measure shows the extent to which revenues are available to cover annual debt service requirements after operating costs have been paid. Refunding of Debt The City will refund debt when it is in the best financial interest of the City to do so. Debt Service Savings—When a refunding is undertaken to generate interest rate cost savings, the minimum aggregate present value savings will be 3% of the refunded bond principal amount. The present value savings will be net of all costs related to the financing. Restructuring—Refundings for restructuring purposes will be limited to restructuring to alleviate debt service during difficult budgetary years, achieve cost savings, mitigate irregular debt service payments, release reserve funds or remove unduly restrictive bond covenants. Arbitrage—The City shall take all necessary steps to optimize escrows and to avoid negative arbitrage in its refundings. Any resulting positive arbitrage will be rebated as necessary according to Federal guidelines.
230

Investor Relations, Disclosure and Communication The debt ratios outlined above will be computed annually and reported in the Comprehensive
Annual Financial Report, along with a computation of net tax-supported debt per capita. The City will maintain communication with bond rating agencies to keep them abreast of its
financial condition by providing them the City’s Comprehensive Annual Financial Report, Annual budget, and Capital Improvement Program. The City will seek to obtain the highest credit ratings on its debt issues.
The City will comply with all of its undertakings in accordance with Securities and Exchange Commission Rule 15c2-21.
NOTE: ALL NUMBERS FOR EVALUATION WILL BE OBTAINED FROM THE MOST CURRENT AUDITED FINANCIAL DOCUMENTS OF THE CITY. Glossary Advance Refunding. A refinancing transaction in which new (refunding) bonds are issued to repay (refund) outstanding bonds prior to the first call date. The proceeds of the refunding bonds are deposited in an escrow account, invested in government securities, and used to pay debt service (interest, principal and premium, if any) on the refunded bonds through the applicable call date. For accounting purposes, refunding obligations are not considered a part of an issuer’s debt. Arbitrage. The difference between the interest paid on the tax-exempt securities and the interest earned by investing the security proceeds in higher-yielding taxable securities. IRS regulations govern arbitrage on the proceeds from issuance of municipal securities. Bond Anticipation Notes (BANs). Notes which are paid from the proceeds of the issuance of long-term bonds. Typically issued for capital projects. Call Provisions. The terms of the bond giving the issuer the right to redeem all or a portion of a bond prior to its stated date of maturity at a specific price, usually at or above par. Capitalized Interest. A portion of the proceeds of a bond issue which is set aside to pay interest on the same bond issue for a specific period of time. Interest is commonly capitalized for the construction period of the project. Capital Lease. A lease obligation that has met the criteria to be categorized as a capital lease as opposed to an operating lease under generally accepted accounting principles. Capital leases are common in certain types of financing transactions involving the use of revenue bonds as opposed to general obligation bonds. Competitive Sale. A sale/auction of securities by an issuer in which underwriters or syndicates of underwriters submit sealed bids to purchase the securities. Contrast to a negotiated sale. Continuing Disclosure. The principle that accurate and complete information material to the transaction which potential investors would be likely to consider material in making investment decisions with respect to the securities be made available on an ongoing basis. Debt. Any obligations of the City for the payment of money issued pursuant to the North Carolina General Statutes, Local Government Bond Act. Debt Service Reserve Fund. The fund in which moneys are placed which may be used to pay debt service if pledged revenues are insufficient to satisfy the debt service requirements. Escrow. A fund established to hold moneys pledged and to be used to pay debt service on an outstanding issue. Expenses. Compensates senior managers for out-of-pocket expenses including: underwriter’s counsel, DTC charges, travel, syndicate expenses, dealer fees, overtime expenses, communication expenses, computer time and postage.
231

General Obligations. Bonds issued by the City secured by the City’s pledge of its full faith and credit and unlimited taxing power. Legal Debt Margin. The amount of federal obligation bonds and certain other interest bearing obligations (other than revenue bonds) that the City may have outstanding expressed as a percentage of the assessed value of real estate in the City as shown on the last preceding assessment for taxes. Negotiated Sale. A method of sale in which the issuer chooses one underwriter to negotiate terms pursuant to which such underwriter will purchase and market the bonds. Option Value. Option valuation is a methodology for evaluating the efficiency of a refunding. Option valuation calculates the maximum theoretical value of refunding a bond, then expresses the current refunding savings as a percentage of the maximum theoretical savings. Operating Expenditures. Operating expenditures are the basic expenditures that are needed for operations. Capital, transfers, and other non-operating items are not included in operating expenditures. Overlapping Debt. The percentage of county’s assessed value that is located in the city limits is used to compute overlapping debt. Pay-As-You-Go. An issuer elects to finance a project with existing cash flow as opposed to issuing debt obligations. Present Value. The current value of a future cash flow. Private Placement. The original placement of an issue with one or more investors as opposed to being publicly offered or sold. Rebate. A requirement imposed by Tax Reform Act of 1986 whereby the issuer of tax-exempt bonds must pay the IRS an amount equal to its profit earned from investment of tax-exempt bond proceeds at rates exceeding the tax-exempt borrowing rate. The tax-exempt borrowing rate (or “bond yield”) is calculated pursuant to the IRS code together with all income earned on the accumulated profit pending payment. Refunding. A transaction in which the City refinances an outstanding issue by issuing new (refunding) bonds and using the proceeds to immediately retire the old (refunded) bonds. Revenue Bonds. Bonds issued by the City secured by a specific revenue pledge of rates, rents or fees. Tax -Supported Debt. Debt that is expected to be repaid from the general fund tax revenues of the City. This includes general obligation bonds, appropriation-supported bonds, capital leases and in certain circumstances moral obligation bonds. For the purpose of this Debt Policy, net tax-supported debt includes general obligation debt for the City, certain bonded capital leases, and any moral obligation bonds for which the City has deposited funds to a debt service reserve fund as requested to replenish such reserve fund. Underwriter. A dealer that purchases new issues of municipal securities from the Issuer and resells them to investors. Underwriter’s Discount. The difference between the price at which bonds are bought by the Underwriter from the Issuer and the price at which they are reoffered to investors. Policy approved 8/1/2014 by City Manager and submitted to City Council for approval on 9/11/2014. In the future the policy will be reviewed and approved as part of the City’s budget document each year.
232

CITY OF CONCORD, NC FINANCIAL POLICY - RESERVE FUNDS
Purpose:
Reserve funds will be established and maintained to ensure the continued delivery of City services. The City desires to maintain a prudent level of financial reserves to guard its citizens against service disruption in the event of unexpected temporary revenue shortfalls or unpredicted one-time expenditures. The reserves have been accumulated to provide stability and flexibility, to respond to unexpected adversity and/or opportunities, and to stabilize fluctuations in operations’ cash flows and rates. Capital Reserve Funds are used to accumulate funds over time that will be used to complete capital projects, acquire major capital assets and support economic development projects.
General Fund Reserves:
Based upon GASB Statement 54, there may be up to five separate categories of fund balance, based on the extent to which the City is bound to honor constraints on the specific purposes for which amounts can be spent: nonspendable fund balance, restricted fund balance, committed fund balance, assigned fund balance, and unassigned fund balance. The total of the last three categories, which include only resources without a constraint on spending or for which the constraint on spending is imposed by the government itself, is termed unrestricted fund balance.
The City will maintain adequate reserves of General Fund balance to: Insulate General Fund programs and current service levels from large and unanticipated one-time
expenditure requirements, revenue reductions due to a change in state or federal legislation, adverse litigation or any similar unforeseen action.
Temporarily insulate General Fund programs and current service levels from slower revenue growth that typically occurs during an economic recession.
Maintain stable tax rates. Aid in long term financial and capital planning. Support economic development opportunities. Ensure creditworthiness or positive economic conditions to ensure the City maintains a high
favorable bond rating.
The City recommends the following General Fund balance levels: The City will maintain an unassigned General Fund balance minimum between 30% and 35% of
General Fund expenditures, which includes transfers. Unrestricted fund balance in the General Fund should be at a minimum no less than 3 months of
regular general fund operating expenditures. Operating expenditures would not include capital outlay or transfers.
The City will maintain a five year forecast to monitor projected fund balance levels.
233

Per the North Carolina Local Government Commission’s recommendations, the City will compare their unassigned General Fund Balance to the average unassigned General Fund Balance numbers for electric cities with our population average. This amount can be found on the annual Cash, Taxes and Fund Balance Available statistical reports published by the Department of State Treasurer’s office. The benchmark will be to not fall below 40% of our city group average.
The City recommends the following uses of General Fund balance reserves: Any amount greater than the unassigned General Fund balance target is deemed available for
transfer to the capital reserve account for future projects listed in the City’s Capital Improvement Plan, acquisition of major capital assets or to support future economic development projects. The City will evaluate each year to determine the amount available for transfer to the capital reserve fund. The City is not required to transfer the entire amount to the reserve fund. Staff will evaluate current economic conditions, the City’s forecast for the operating fund, the Capital Improvement Plan and any other relevant factors to determine an acceptable amount to be transferred. The City may elect to transfer no funds to the reserve. Any transfer to the capital reserve will be approved by City Council. The transfer will be determined after the previous year audit is complete and final numbers are available for review.
Reserves should only be used for specific circumstances: responding to extreme events or emergencies, unanticipated one time expenditure requirements, to offset unanticipated revenue fluctuations occurring within a fiscal year, and one time outlays that the City Manager may recommend to City Council.
All fund balance appropriations will be approved by City Council. These policies will be evaluated each year during the budget process to determine if amendments
to the policy are needed.
The City’s plan to replenish fund balance levels that fall below the policy guidelines: The City will strive to replenish fund balance levels within 3 years. The following will be used to replenish reserve levels when available: non-recurring revenues,
surplus of year-end revenues that exceed year-end expenditures, and departmental expenditure budget cuts.
Enterprise Fund Reserves – Electric, Water, Wastewater, Stormwater and Airport:
Enterprise funds distinguish between current and non-current assets and liabilities. The measure of working capital (i.e., current assets less current liabilities) indicates the relatively liquid portion of total enterprise fund capital, which constitutes a margin for meeting obligations. Working capital is a measure of available margin or buffer in enterprise funds. Enterprise funds should strive to maintain working capital equal to no less than 90 days of operating expenses.
The measure of liquidity helps to assess the ability of the City to sustain a strong financial position. The ratio of unrestricted cash and short term investments to current liabilities will be used to calculate the liquidity position in Enterprise Funds.
234

The City will maintain adequate reserves in Enterprise Funds to: Ensure stable services and fees. Aid in long term financial and capital planning. Ensure creditworthiness or positive economic conditions to ensure the City maintains a high
favorable bond rating. Insulate Enterprise Fund operations and current service levels from large and unanticipated one-
time expenditure requirements, a revenue reduction due to a change in state or federal legislation, adverse litigation or any similar unforeseen action.
Temporarily insulate the Enterprise Fund operations and current service levels from slower revenue growth that typically occurs during an economic recession.
The City recommends the following Enterprise Fund reserve levels: The City will maintain a liquidity ratio of more than one to one. The City will maintain 90-days’ worth of annual operating expenses. The City will maintain rate models to adequately forecast financial condition.
The City recommends the following uses of Enterprise Funds reserves:
Any amount greater than the working capital target is deemed available for transfer to the capital reserve account for future projects listed in the City’s Capital Improvement Plan, large capital asset purchases and economic development projects. The City will evaluate each year to determine the amount for transfer to the capital reserve fund. Staff will evaluate current economic conditions, the City’s forecast and any other relevant factor to determine an acceptable amount to be transferred. The City may elect to transfer no funds to the reserve. Any transfer to the capital reserve will be approved by City Council. The transfer will be determined after the previous year audit is complete and final numbers are available for review.
Reserves should only be used for specific circumstances: responding to extreme events or emergencies, unanticipated one time expenditure requirements, to offset unanticipated revenue fluctuations occurring within a fiscal year, and one time outlays that the City Manager may recommend to City Council.
Funds will not be available for reserve transfers if working capital targets are not met in the operating fund.
All retained earnings appropriations will be approved by City Council. These policies will be evaluated each year during the budget process to determine if amendments
to the policy are needed.
The City’s plan to replenish reserve levels that fall below the policy guidelines: The City will strive to replenish reserve levels within 3 years. The following will be used to replenish reserve levels when available: non-recurring revenues,
surplus of year-end revenues that exceed year-end expenditures, rate adjustments, and departmental expenditure budget cuts.
235

Capital Project Reserves:
The capital project reserve fund shall be established to maintain and accumulate funds from transfers from the projects related operating fund. This fund shall be maintained to protect the existing assets of the City and ensure public access to City facilities and information while promoting community wide economic development. This fund shall only be used to pay for non-routine and one-time expenditures/expenses, such as land, buildings, construction, large capital outlay, technology improvements, etc. Normally, the following guidelines may be applied to determine if an expenditure/expense is classified as a capital reserve item.
Construction & Maintenance – 10 year life Capital Asset or Vehicle – 10 year life Technology Improvements – 5 year life.
The City will maintain adequate capital project reserves to: Accumulate funds to acquire large capital assets and to fund various capital projects. Allows continued capital improvements during an economic recession or periods of revenue
declines. Allow for funding of preliminary activities associated with large projects, such as
engineering/planning activities. Aid in long term capital planning. Fund economic development opportunities.
The City recommends the following capital project reserve levels:
If a Capital Reserve Fund is funded, the City will set a goal to maintain capital reserves of at least 5% of the operating revenue in each operating fund that is associated with the capital project reserve fund. This will be calculated by using the most recent audited financial report.
The City will maintain a five year operating forecast/rate models to monitor projected reserve levels and to project future capital project funding needs.
Reserve levels may fall below the recommended target with City Manager recommendation. This situation could arise if the City has an unexpected project that will benefit the community. The project would require City Council approval.
The City recommends the following uses of capital project reserves: Acquisition of a major capital asset that recurs irregularly with an estimated useful life of greater
than one year. Normally, a major value is defined as greater than $100,000. Major improvement that increases the value of a capital asset $100,000, excluding reoccurring or
routine maintenance projects. Funding for large infrastructure projects that exceed $100,000. Economic development activities. Funding capital projects that will require longer than one year to complete. (Projects are approved
by City Council.) The City Manager may recommend an item to City Council that may be classified as a project and
funded from these reserves upon Council approval.
236

All reserve appropriations will be approved by City Council. These policies will be evaluated each year during the budget process to determine if amendments
to the policy are needed.
The City’s plan to replenish capital project reserve levels that fall below the policy guidelines: The City will strive to replenish capital reserve levels within 3 years. Capital reserves are funded by transfers from their related operating funds. Surpluses above the
reserve targets in each fund will be used to replenish reserve levels in the capital reserve fund.
Policy approved 6/17/2014 by City Manager and submitted to City Council for approval on 9/11/2014. In the future the policy will be reviewed and approved as part of the City’s budget document each year.
237

CAPITAL IMPROVEMENT PLAN, BUDGET, AND FINANCIAL POLICY
I. PREPARATION OF THE CAPITAL IMPROVEMENT PLAN (CIP):
A. The purpose of the capital improvement plan (CIP) is to forecast and match projected revenues and major capital needs over a five (5)-year period. Long-range capital planning is an important management tool, which strengthens the linkages between community infrastructure needs and the financial capacity of the City.
B. All proposals for capital investment shall go through the capital planning process. C. Definition of appropriate capital items for inclusion on the CIP:
1. Definition of a CIP capital expenditure – Expenditure of major value that recurs irregularly, results in the acquisition of a fixed asset, and has a useful life greater than one (1) year.
2. As a rule of thumb, items to be included in the CIP include those which: (a) Involve the acquisition, renovation, and/or construction of a single fixed asset
greater than $100,000 (b) involve any land purchases not associated with or included in another CIP project (c) involve capital road maintenance or construction greater than $100,000 – excluding
recurring or routine maintenance projects D. Difference between departmental capital outlay items (in operating budget) and capital project
outlay items (in CIP): 1. Departmental capital items shall not be submitted as part of the CIP. Departmental capital
items include: (a) equipment/tools, furniture, office equipment such as computers and fax machines,
minor remodeling, or other construction projects below $100,000 (such items should be outlined in the “Capital Outlay” section of the operating budget request).
(b) all vehicles/rolling stock/machinery below $100,000 2. However, any upcoming, or 1st year costs associated with a CIP request shall be entered in
the department’s operating budget request in order to ensure that 1st year CIP costs are noted and included in the Manager’s Recommended Budget.
E. Inclusion of expenditures for maintenance and/or staffing in the CIP: 1. All operating, maintenance, and personnel budget expenditures associated with the
purchase of a CIP item shall be included and noted in the annual operating budget. However, for reporting and future expenditure forecasting purposes, the estimated additional expenditures on operating, maintenance, and personnel shall be included on all CIP requests.
II. ORGANIZATIONAL ISSUES:
A. Departments are responsible for identifying, documenting, and justifying CIP requests. Departments are also responsible for obtaining project cost estimates and identifying appropriate revenue sources for the project (the Finance Dept. shall assist in identifying costs and appropriate revenue sources).
B. The City Manager, in conjunction with the Finance Director and Budget staff, shall be responsible for coordinating the CIP process and submission of the CIP to the Mayor and City Council.
C. A capital project selection committee shall be used to evaluate and recommend a ranking of proposed projects to the City Manager. This committee shall be comprised of:
238

City Manager, Deputy City Manager, Director of Planning & Neighborhood Development, Finance Director, Budget & Performance Manager, Budget Analyst, and Director of Engineering.
D. Council review, recommendation, and adoption of CIP: 1. The City Manager’s Recommended CIP shall be submitted to the Mayor and City Council for
their review and recommendation during the beginning stages of the annual budget process. NOTE: Governing Body recommendation of the CIP does not authorize money for any of the projects in the plan, but the recommendation by the Governing Body shall provide the City Manager direction to proceed with formulating the annual CIP and inclusion of first year CIP items in the City Manager’s Recommended City Budget.
2. A Capital Projects Ordinance will be adopted by City Council with the City’s Operating Budget establishing necessary project fund structures for CIP expenditures at the beginning of the fiscal year.
III. EVALUATION OF PROJECT MERIT:
A. Proposed CIP items will be evaluated and ranked according to merit. B. Projects should generally be foreseen ahead of the time (preferably 2+ years) of need to allow time
for planning long-term financing strategies or financing methods.
IV. FUNDING SOURCES: A. Debt will be considered for capital projects under the following circumstances:
1. The capital item is a long-living (useful life greater than one (1) year) asset. 2. The asset has a useful life expectancy that equals or exceeds the length of the debt
financing period.
B. The following types or combination of financing may be considered under the following circumstances:
1. Debt methods: (a) General Obligation Bonds (G.O. Bonds) – The capital item is used for a public facility
or equipment that is a public good and that has no revenue-producing capability (e.g. streets and municipal buildings or structures). Generally, G.O. Bonds are only used for major General Fund projects.
(b) 2/3 General Obligation Bonds – Without voter approval, G.O. Bonds may be issued annually on 2/3 of net G.O. debt reduction (principal retirement) in the prior year.
(c) Revenue Bonds -- The capital item is used for a non-public good in which a revenue stream is associated with the capital item (e.g. airport, water, wastewater, and electric system capital items).
(d) Special Obligation Bonds (S.O. Bonds) – S.O. Bonds may be used for solid waste management projects which can include equipment or facilities for construction of incinerators, land for recycling facilities, drainage collection and treatment systems for landfills, land and liners for landfills, monitoring wells, recycling equipment and facilities, and volume reduction equipment; can also be used for water/sewer projects
(e) Special Assessments – The capital item benefits only immediately adjacent property. Adjacent property owners pay the special assessments after the improvement is completed and its cost is known. Therefore, special assessments are not a method of capital financing, but rather a method of eventually paying for the improvements for which they are levied. Other sources of funds are needed to finance the improvements for which the assessments are later levied.
239

(f) Property Secured Debt – The capital item can be secured as collateral itself. Includes lease or installment purchase transactions and certificates of participation (COPS) or limited obligation bonds (LOBS).
2. Non-debt methods (Also referred to as Pay-as-you-go, or Pay-Go) (a) Current revenues – The capital item can be acquired through existing revenues. (b) Capital reserves – The capital item can be funded from City Council designated
taxes or revenue streams that are set aside in a separate fund. (c) Capital recovery, facility, or impact fees – Capital items may be financed from
charges to benefiting property owners for major infrastructure or facilities that benefit that property. Charges can be levied and collected before infrastructure is built.
(d) Fund Balance – The capital item can be funded with unassigned operating fund balances.
(e) Grants – Funding of the capital item was secured upon application of a governmental grant (examples might include CDBG or HOME grants, law enforcement grants, or EPA water quality grants.)
(f) Gifts – The capital item may be purchased or acquired with restricted or non-restricted donations by citizens or corporations.
C. Debt Limits
1. The City shall not exceed N.C.G.S. 159-55(c) limiting the amount of net bonded debt outstanding to 8% of appraised value of property subject to taxation, and
2. Annual G.O Bond debt service payments (principal and interest) shall not exceed 15% of the City’s General Fund operating budget.
D. Course of action in the event that the costs of a capital project are under or overestimated
1. Underestimated – (a) Review project scope and performance of contractor. (b) Analyze need for more funding – i.e. cost overruns, unforeseen circumstances, new legal requirements. (c) Execute budget transfers to obtain idle funds. (d) Close out PO’s to obtain additional funding from idle funds. (e) Develop and present options with recommended action to the Governing Body.
2. Overestimated – (a) Savings are reprogrammed in the next CIP. (b) Analyze reasons for overestimation.
240

Salary Grade
Full-time
Perm.Part-time
FTEFull-time
Perm.Part-time
FTEFull-time
Perm.Part-time
FTE
IV 1 1 1 1 1 1
1 1.00 1 1.00 1 1.00
S 1 1 1 1 1 1
V 1 1 1 1 1 1
112 1 1 1 1 1 1
109 1 1 1 1 1 1
109 1 1 1 1 1 1
106 - - - - 1 0.5
209 1 1 1 1 1 1
6 6.00 6 6.00 7 6.50
II 1 1 1 1 1 1
113 1 1 1 1 1 1
113 1 1 1 1 1 1
109 1 1 1 1 3 3
109 1 1 1 1 1 1
106 1 1 1 1 1 1
210 2 2 2 2 2 2
208 1 1 1 1 - -
209 1 1 1 1 1 1
10 10.00 10 10.00 11 11.00
III 1 1 1 1 1 1
114 1 1 1 1 1 1
113 1 1 1 1 1 1
113 1 1 1 1 1 1
110 1 1 1 1 1 1
109 - 0.25 - 0.25 - -
108 2 2 2 2 2 2
Accounting Technician II 207 1 1 1 1 1 1
Accounts Payable Technician 207 3 3 3 3 3 3
Payroll Technician 207 2 2 2 2 2 2
13 13.25 13 13.25 13 13.00
112 1 0.5 1 0.5 1 0.5
207 - - 1 1 1 1
207 1 1 - - - -
206 3 3 2 2 2 2
5 4.5 4 3.5 4 3.5
S 1 1 1 1 1 1
114 1 1 1 1 1 1
112 1 1 1 1 1 1
210 2 2 2 2 2 2
210 1 1 1 1 1 1
6 6.00 6 6.00 6 6.00
41 0 41 40 0 40 42 0 41
III 1 1 1 1 1 1
P6 1 1 1 1 1 1
P5 3 3 2 2 2 2
P4 7 7 8 8 8 8
P3 25 25 26 26 28 28
FY 2016-2017 Adopted Budget
Authorized PositionsBolded FY 2016-2017 figures represent new/unfrozen position requests or reclassified positions or other adjustments to the City's organizational structure.Changes made during the fiscal year by the City Council are not bolded.
Education Specialist (.5 FTE moved from Solid Waste & Recycling in FY16, split with Water & Stormwater)
FY 2015-2016Amended Budget
Position
FY 2014-2015Amended Budget
(Human Resources)
Deputy City Manager
Public Affairs & Project Manager
General Government
(Public Services Administration)
Assistant City Manager
(City Manager's Office)
City Manager
(Finance)
Finance Director
Deputy Finance Director
Finance Manager
Budget & Performance Manager
Budget Analyst
Human Resources Director
Human Resources Analyst (Benefits Specialist reclassified in FY16, 1 new for FY17)
HR Wellness Coordinator
Benefits Specialist (Reclassified to HR Analyst in FY16)
Safety, Health & Risk Manager
Safety, Health & Risk Coordinator
City Clerk
Community Outreach Coordinator
Senior Executive Assistant
Human Resources Supervisor
Assistant Human Resources Director
Deputy Tax Collector
Business License Officer (reclassified to Customer Service Specialist in Customer Care for FY16)
(Legal)
City Attorney
Deputy City Attorney
Accounting Supervisor (Position no longer shared with Housing for FY17)
Senior Accountant
(Tax)
Tax Collector/Collections Mgr. (split with Utility Collections)
Accounting Technician II
(Police)
Police Chief
Deputy Police Chief
Police Major
Police Captain
Police Sergeant (2 new Sergeants in FY17)
Assistant City Attorney
Paralegal
Legal Assistant
General Government Sub-total
Public Safety
Senior Executive Assistant (Reclassified from Senior Administrative Assistant in FY16)
241

Salary Grade
Full-time
Perm.Part-time
FTEFull-time
Perm.Part-time
FTEFull-time
Perm.Part-time
FTE
FY 2016-2017 Adopted Budget
FY 2015-2016Amended Budget
Position
FY 2014-2015Amended Budget
P2 68 67.25 62 61.25 62 61.25
P1 65 65 71 71 79 79
209 1 1 1 1 1 1
209 1 1 1 1 1 1
206 3 3 3 3 3 3
207 2 2 2 2 2 2
205 2 2 2 2 2 2
204 10 10 10 10 10 10
203 1 1 1 1 1 1
190 189.25 191 190.25 201 200.25
110 1 1 1 1 1 1
210 1 1 1 1 1 1
207 5 5 5 5 6 6
7 7.00 7 7.00 8 8.00
I 1 0.5 1 0.5 1 0.5
111 1 1 1 1 1 1
210 4 4 4 4 4 4
207 2 2 2 2 4 4
206 14 4 15 14 4 15 12 4 13
206 - - - - 1 1
22 4 22.50 22 4 22.50 23 4 23.50
I - 0.5 - 0.5 - 0.5
209 2 2 2 2 2 2
206 1 1 1 1 1 1
3 3.50 3 3.50 3 3.50
III 1 1 1 1 1 1
F8 2 2 2 2 2 2
F7 6 6 6 6 6 6
F6 39 39 39 39 42 42
F4 38 38 37 37 40 40
F4 1 1 1 1 1 1
F3 16 16 10 10 10 10
F2 36 36 38 38 33 33
F1 39 39 44 44 49 49
209 1 1 1 1 1 1
205 2 2 2 2 2 2
181 181 181 181 187 187
F7 1 1 1 1 1 1
F6 2 2 2 2 2 2
F5 6 6 6 6 6 1 6.5
9 9.00 9 9.00 9 9.50
F7 1 1 1 1 1 1
F6 1 1 3 3 3 3
2 2.00 4 4.00 4 4.00
113 1 1 1 1 1 1
111 - - - - 1 1
1.00 1.00 1.00 1.00 2.00 2.00
415 4 415.25 418 4 418.25 437 4 437.75
III 1 1 1 1 1 1
113 1 1 1 1 1 1
111 1 1 1 1 1 1
110 1 1 1 1 1 1
109 - - - - 1 1
211 2 2 2 2 1 1
Senior Administrative Assistant (new for FY17, October start date)
Assistant Emergency Management Coordinator (new for FY17)
Senior Telecommunicator (2 Telecommunicators reclassified to Sr. Telecomm in FY17)
Customer Service Representative (non-sworn)
Parking Enforcement Technician (non-sworn)
(Code Enforcement)
Code Enforcement Manager
Senior Code Enforcement Officer
Master Police Officer (.75 of MPO position budgeted to Parks and Rec)
Police Officer (includes SRO positions) (8 new Police Officers in FY17)
Senior Executive Assistant (non-sworn)
Senior Administrative Assistant (non-sworn)
Senior Customer Service Representative (non-sworn)
Police Crime Analyst (non-sworn)
(Radio Shop)
Communications Director (position split with Communications)
Senior Communications Technician
Communications Technician
Code Enforcement Officer (1 New Officer for FY17)
(Emergency Communications)
Communications Director (position split with Radio Shop)
911 Telecommunications Center Manager
911 Shift Supervisor
Telecommunicator (2 Telecommunicators reclassified to Senior Telecommunicators in FY17)
Logistics Officer
Firefighter
Senior Executive Assistant
Administrative Assistant
(Fire - Prevention)
(Fire)
Fire Chief
Deputy Fire Chief
Battalion Chief
Fire Captain (3 new Captains for FY17)
Senior Firefighter
Fire Lieutenant (3 new Lieutentants for FY17)
Fire Engineer
(Emergency Mgt. - reports to City Manager's Office)
Emergency Management Coordinator
Public Safety Sub-total
Public Works
Division Chief
Deputy Fire Marshal
Assistant Fire Marshal (1 new PT position added for FY17)
(Fire - Training)
Division Chief
Fire Captain
(Streets & Traffic)
Transportation Director
Engineering Manager
Streets Superintendent
Project Engineer
GIS Analyst (1 Position Reclassified to Staff Engineer in FY16)
Staff Engineer (1 Position Reclassified from GIS Analyst in FY16)
Administrative Assistant (non-sworn)
242

Salary Grade
Full-time
Perm.Part-time
FTEFull-time
Perm.Part-time
FTEFull-time
Perm.Part-time
FTE
FY 2016-2017 Adopted Budget
FY 2015-2016Amended Budget
Position
FY 2014-2015Amended Budget
210 4 4 4 4 4 4
208 1 1 1 1 1 1
208 1 1 1 1 1 1
207 5 5 6 6 7 7
205 5 5 5 5 6 6
204 5 5 5 5 5 5
27 27.00 28 28.00 30 30.00
112 1 1 1 1 1 1
109 1 1 1 1 1 1
211 1 1 1 1 1 1
209 3 3 3 3 3 3
6 6.00 6 6.00 6 6.00
109 1 1 1 1 1 1
208 2 2 2 2 2 2
206 2 2 2 2 2 2
5 5.00 5 5.00 5 5.00
I 1 1 1 1 1 1
109 1 1 1 1 1 1
109 1 1 1 1 1 1
106 1 0.5 1 0.5 - -
210 2 2 2 2 2 2
208 - 0.5 - 0.5 - 0.5
208 1 1 1 1 1 1
207 8 8 8 8 8 8
205 1 1 1 1 1 1
205 7 7 7 7 7 7
204 9 9 9 9 9 9
32 32.00 32 32.00 31 31.50
109 1 1 1 1 1 1
208 2 2 2 2 2 2
203 5 5 5 5 5 5
8 8.00 8 8.00 8 8.00
I 1 1 1 1 1 1
108 1 1 1 1 1 1
210 1 1 1 1 1 1
209 1 1 1 1 2 2
208 1 1 1 1 1 1
208 1 1 1 1 1 1
207 6 6 6 6 6 6
204 1 1 1 1 1 1
13 13.00 13 13.00 14 14.00
91 0 91.00 92 0 92.00 94 0 94.50
II 1 1 1 1 1 1
114 1 1 1 1 1 1
112 1 1 1 1 1 1
112 1 1 1 1 1 1
112 1 1 1 1 1 1
110 1 1 1 1 1 1
110 4 4 4 4 4 4
107 - - - - 2 2
209 1 1 1 1 1 1
207 - 1 0.5 - 1 0.7 1 1
206 1 1 1 1 1 1
Planner (1 new position for FY17, 1 reclass of Development Services Technician)
Construction Inspector
Streets Crew Supervisor
CAD Technician
Equipment Operator (1 new for FY17)
Streets Maintenance Worker
Senior Equipment Operator (1 new for FY17)
Transportation Coordinator
Sign Technician II
Sign Technician I
(Solid Waste & Recycling)
Solid Waste Services Director
(Traffic Signals)
Traffic Engineer
Staff Engineer
Signal Technician
(Traffic Services)
Traffic Signal Supervisor
Senior Customer Service Specialist
Equipment Operator
Solid Waste Worker
(Cemeteries - Buildings & Grounds)
Cemetery Crew Supervisor
Solid Waste Project Manager
Solid Waste Superintendent
Education Specialist (position moved to City Manager's Office)
Solid Waste Crew Supervisor
Executive Assistant (position split with Stormwater)
Solid Waste Compliance Inspector
Fleet Services Supervisor
Automotive Parts Supervisor
Master Mechanic (1 frozen Fleet Mechanic, reclassified to Master Mechanic for FY17)
Executive Assistant
Automotive Parts Clerk
Cemetery Maintenance Manager
Cemetery Maintenance Worker
(Fleet Services)
Fleet Services Director
Fleet Services Manager
Fleet Mechanic
Development Review Administrator
Planning & Development Manager
Community Development Manager
GIS Administrator
Senior Planner
Public Works Sub-total
Economic Development
(Planning & Neighborhood Development)
Planning & Community Development Director
Deputy Director of Planning & Community Development
Clearwater Artist Studio Supervisor (Position moved to full-time for FY17)
Senior Executive Assistant
Community Development Technician
Senior Equipment Operator
243

Salary Grade
Full-time
Perm.Part-time
FTEFull-time
Perm.Part-time
FTEFull-time
Perm.Part-time
FTE
FY 2016-2017 Adopted Budget
FY 2015-2016Amended Budget
Position
FY 2014-2015Amended Budget
204 2 2 2 2 1 1
14 1 14.50 14 1 14.70 16 16.00
111 1 1 1 1 1 1
1 1.00 1 1.00 1 1.00
15 1 15.50 15 1 15.70 17 0 17.00
II 1 1 1 1 1 1
114 1 1 1 1 1 1
109 2 2 2 2 2 2
P2 - 0.75 - 0.75 - 0.75
209 5 5 5 5 5 5
209 1 1 1 1 1 1
208 2 2 3 3 3 3
207 2 2 2 2 2 2
206 2 1.75 2 1.75 2 1.75
202 - 12 4.5 - 12 4.5 - 12 4.5
16 12 21 17 12 22.00 17 12 22.00
16 12 21.00 17 12 22.00 17 12 22.00
General Fund Sub-Total 578.0 17 583.50 582.0 17 587.70 607.0 16 612.25
110 - 0.1 - 0.2 - 0.2
109 1 1 1 1 1 1
1 0 1.10 1 0 1.20 1 0 1.20
1 0 1.10 1 0 1.20 1 0 1.20
110 1 0.9 1 0.8 1 0.8
1 0.90 1 0.80 1 0.80
1 0 0.90 1 0 0.80 1 0 0.80
III - 0.34 - 0.34 - 0.33
114 1 0.34 1 0.34 1 0.34
113 - 0.33 - 0.33 - 0.33
111 1 1 1 1 1 0.34
110 - 0.33 - 0.33 - 0.33
110 1 1 1 1 1 1
109 1 1 1 1 1 0.34
106 - 0.25 - 0.25 - 0.25
210 4 4 4 4 4 4
208 1 0.5 1 0.5 1 0.5
208 3 3 3 3 3 3
207 4 4 4 4 4 4
207 1 1 1 1 - -
205 2 2 2 2 2 2
204 3 3 3 3 3 3
22 22.09 22 22.09 21 19.76
22 0 22.09 22 0 22.09 21 0 19.76
III 1 1 1 1 1 1
114 1 1 1 1 1 1
208 1 1 1 1 1 1
3 3 3 3 3 3
Senior Equipment Operator
Economic Development Coordinator
Economic Development Sub-total
Parks & Recreation
Parks & Recreation Director
Deputy Parks & Recreation Director
Development Services Technician
(Economic Development)
Part-Time Rec Center Leader
Parks & Recreation Sub-total
Community Development Block Grant
Federal Program Coordinator (split with Home)
Parks & Recreation Coordinator
Master Police Officer/Park Ranger (other 0.25 FTE in Police)
Parks & Recreation Supervisor
Senior Executive Assistant
Parks & Recreation Specialist
Senior Administrative Assistant
Home Consortium
Federal Program Coordinator (split with CDBG)
Home Consortium Sub-total
Construction Coordinator
CDBG Sub-total
Staff Engineer (split with Water & Wastewater)
Water Resources Superintendent
Education Specialist (split with City Manager's Office & Water)
Water Crew Supervisor
Technical Equipment Operator
Stormwater
Water Resources Director (split with Water & Wastewater)
Deputy Water Resources Director (split with Water & Wastewater)
Engineering Manager (split with Water & Wastewater)
Project Engineer (split with Water & Wastewater)
Senior GIS Coordinator (split with Water & Wastewater)
Executive Assistant (split with Solid Waste)
Electric Systems Director
Deputy Electric Systems Director
Executive Assistant
Equipment Operator
Utility Services Worker
Stormwater Sub-total
Electric Systems
(Electric Administration)
GIS Technician (position moved to Wastewater and reclassified to a Utility Service Worker)
Parks & Recreation Assistant Supervisor
244
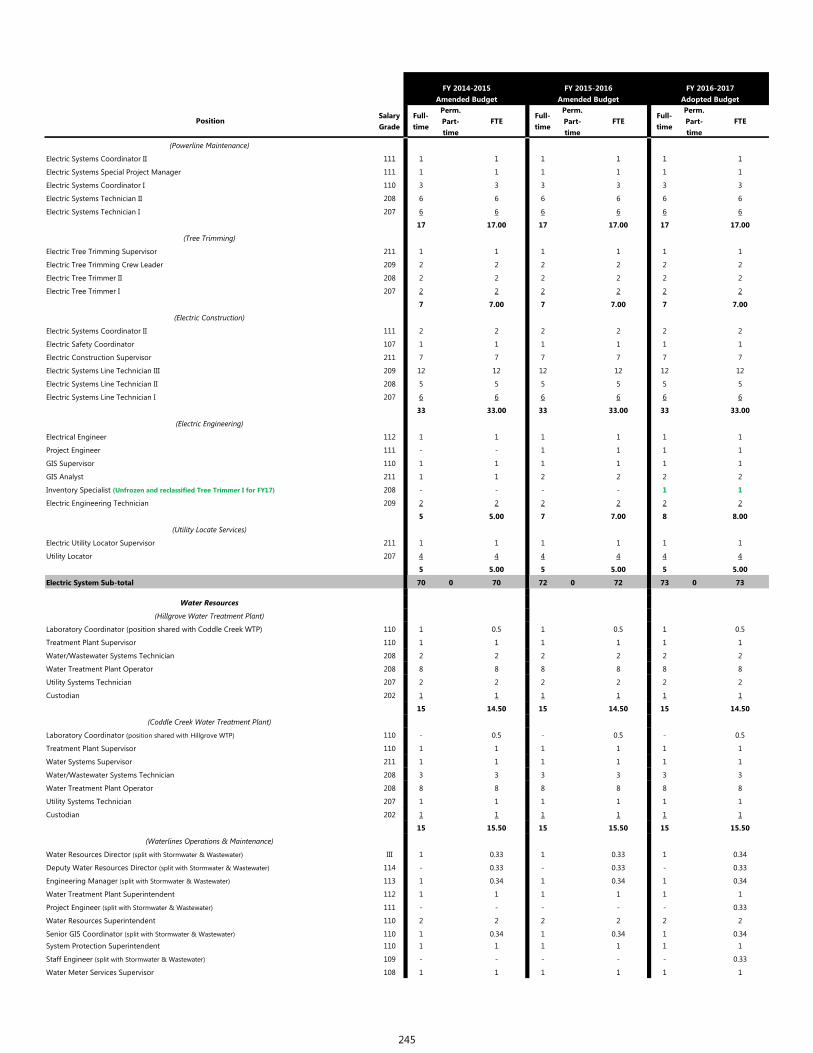
Salary Grade
Full-time
Perm.Part-time
FTEFull-time
Perm.Part-time
FTEFull-time
Perm.Part-time
FTE
FY 2016-2017 Adopted Budget
FY 2015-2016Amended Budget
Position
FY 2014-2015Amended Budget
111 1 1 1 1 1 1
111 1 1 1 1 1 1
110 3 3 3 3 3 3
208 6 6 6 6 6 6
207 6 6 6 6 6 6
17 17.00 17 17.00 17 17.00
211 1 1 1 1 1 1
209 2 2 2 2 2 2
208 2 2 2 2 2 2
207 2 2 2 2 2 2
7 7.00 7 7.00 7 7.00
111 2 2 2 2 2 2
107 1 1 1 1 1 1
211 7 7 7 7 7 7
209 12 12 12 12 12 12
208 5 5 5 5 5 5
207 6 6 6 6 6 6
33 33.00 33 33.00 33 33.00
112 1 1 1 1 1 1
111 - - 1 1 1 1
110 1 1 1 1 1 1
211 1 1 2 2 2 2
208 - - - - 1 1
209 2 2 2 2 2 2
5 5.00 7 7.00 8 8.00
211 1 1 1 1 1 1
207 4 4 4 4 4 4
5 5.00 5 5.00 5 5.00
70 0 70 72 0 72 73 0 73
110 1 0.5 1 0.5 1 0.5
110 1 1 1 1 1 1
208 2 2 2 2 2 2
208 8 8 8 8 8 8
207 2 2 2 2 2 2
202 1 1 1 1 1 1
15 14.50 15 14.50 15 14.50
110 - 0.5 - 0.5 - 0.5
110 1 1 1 1 1 1
211 1 1 1 1 1 1
208 3 3 3 3 3 3
208 8 8 8 8 8 8
207 1 1 1 1 1 1
202 1 1 1 1 1 1
15 15.50 15 15.50 15 15.50
III 1 0.33 1 0.33 1 0.34
114 - 0.33 - 0.33 - 0.33
113 1 0.34 1 0.34 1 0.34
112 1 1 1 1 1 1
111 - - - - - 0.33
110 2 2 2 2 2 2
110 1 0.34 1 0.34 1 0.34110 1 1 1 1 1 1
109 - - - - - 0.33
108 1 1 1 1 1 1
Inventory Specialist (Unfrozen and reclassified Tree Trimmer I for FY17)
Staff Engineer (split with Stormwater & Wastewater)
Water Treatment Plant Superintendent
Electric Systems Line Technician III
(Powerline Maintenance)
Electric Systems Coordinator II
Electric Tree Trimming Supervisor
Electric Tree Trimming Crew Leader
Electric Tree Trimmer I
(Electric Construction)
Electric Systems Special Project Manager
Electric Systems Coordinator I
Electric Systems Technician II
Electric Systems Technician I
(Tree Trimming)
Electric Tree Trimmer II
(Electric Engineering)
Electrical Engineer
Project Engineer
Electric Systems Coordinator II
Electric Construction Supervisor
Electric Systems Line Technician II
Electric Safety Coordinator
Electric Systems Line Technician I
Utility Locator
Electric System Sub-total
Water Resources
(Hillgrove Water Treatment Plant)
GIS Supervisor
GIS Analyst
Electric Engineering Technician
(Utility Locate Services)
Electric Utility Locator Supervisor
Custodian
(Coddle Creek Water Treatment Plant)
Project Engineer (split with Stormwater & Wastewater)
Laboratory Coordinator (position shared with Hillgrove WTP)
Treatment Plant Supervisor
Laboratory Coordinator (position shared with Coddle Creek WTP)
Treatment Plant Supervisor
Water/Wastewater Systems Technician
Water Treatment Plant Operator
Utility Systems Technician
(Waterlines Operations & Maintenance)
Water Resources Director (split with Stormwater & Wastewater)
Deputy Water Resources Director (split with Stormwater & Wastewater)
Engineering Manager (split with Stormwater & Wastewater)
Water Systems Supervisor
Water/Wastewater Systems Technician
Water Treatment Plant Operator
Utility Systems Technician
Custodian
Water Resources Superintendent
Senior GIS Coordinator (split with Stormwater & Wastewater)
Water Meter Services Supervisor
System Protection Superintendent
245

Salary Grade
Full-time
Perm.Part-time
FTEFull-time
Perm.Part-time
FTEFull-time
Perm.Part-time
FTE
FY 2016-2017 Adopted Budget
FY 2015-2016Amended Budget
Position
FY 2014-2015Amended Budget
106 - 0.25 - 0.25 - 0.25
210 5 5 5 5 5 5
208 - - - - 1 1208 1 1 1 1 1 1
208 1 1 1 1 1 1
207 1 1 1 1 1 1
207 4 4 4 4 4 4
207 4 4 4 4 3 3
205 1 1 1 1 1 1
205 4 4 4 4 4 4
204 7 7 7 7 8 8
36 34.59 36 34.59 37 36.26
66 0 64.59 66 0 64.59 67 0 66.26
III - 0.33 - 0.33 - 0.33
114 - 0.33 - 0.33 - 0.33
113 - 0.33 - 0.33 - 0.33
110 - 0.33 - 0.33 - 0.33
111 - - - - - 0.33
109 - - - - - 0.33
110 2 2 2 2 2 2
208 1 1 1 1 1 1
210 5 5 5 5 5 5
211 1 1 1 1 1 1
208 1 1 1 1 1 1
208 8 8 8 8 8 8
207 1 1 1 1 1 1
207 3 3 3 3 3 3
205 4 4 5 5 5 5
204 3 3 2 2 3 3
29 30.32 29 30.32 30 31.98
29 0 30.32 29 0 30.32 30 0 31.98
II 1 1 1 1 1 1
112 1 1 1 1 1 1
112 1 1 1 1 1 1
210 1 1 1 1 1 1
208 1 1 1 1 1 1
208 1 1 1 1 1 1
208 1 1 1 1 1 1
207 4 4 4 4 4 4
207 1 1 1 1 1 1
207 - - - - 1 1
206 1 1 1 1 1 1
205 15 15 15 15 16 16
204 6 6 6 6 8 8
202 - - - - 2 2
34 0 34.00 34 0 34.00 40 0 40.00
34 0 34.00 34 0 34.00 40 0 40.00
I 1 1 1 1 1 1
111 1 1 1 1 1 1
109 1 0.75 1 0.75 - -
210 1 1 1 1 1 1
209 - - - - 1 1
209 1 1 1 1 1 1
208 3 3 3 3 3 3
Accountant
System Protection Inspector
Project Engineer (split with Water & Stormwater)
Staff Engineer (split with Stormwater & Wastewater)
Senior Equipment Operator
Senior Equipment Operator
GIS Technician
Wastewater Resources
(Wastewaterlines Operation & Maintenance)
Senior Customer Service Specialist
Administrative Assistant
Equipment Operator
Utility Services Worker (1 position unfrozen for FY17)
Executive Assistant
Water Resources Sub-total
Utility Services Technician (1 position reclassified to System Protection Inspector for FY17)
Education Specialist (split with City Manager's Office & Stormwater)
Water Crew Supervisor
Water Crew Supervisor
W/WW Systems Supervisor
GIS Technician
W/WW Systems Technician
Technical Equipment Operator
Equipment Operator
Water Resources Director (split with Water & Stormwater)
Deputy Water Resources Director (split with Water & Stormwater)
Senior GIS Coordinator (split with Water & Stormwater)
Water Resources Superintendent
System Protection Inspector
Aviation Operations Manager
Utility Services Worker (1 new position - GIS Tech reclassified to Utility Service Worker for FY17)
Wastewater Resources Sub-total
Aviation (Concord Regional Airport)
Aviation Director
Housing Inspector/ Maintenance Supervisor
Building Maintenance Mechanic II
Aviation Sub-total
Housing Department (HUD Funded)
Housing Director
Housing Manager
Accounting Supervisor
Aviation Coordinator
Administrative & Properties Manager
Senior Executive Assistant
Engineering Manager (split with Water & Stormwater)
Aviation Service Worker (1 new position for FY17)
Custodian (1 new position for FY17, 1 position unfrozen & reclassified)
Airport Electrician
Airport Maintenance Mechanic
Aviation Supervisor
Aviation Service Worker Lead
Accounting Technician II
Executive Assistant
Customer Service Representative (2 new positions for FY17)
Senior Customer Service Representative (1 position unfrozen for FY17)
246

Salary Grade
Full-time
Perm.Part-time
FTEFull-time
Perm.Part-time
FTEFull-time
Perm.Part-time
FTE
FY 2016-2017 Adopted Budget
FY 2015-2016Amended Budget
Position
FY 2014-2015Amended Budget
207 - - - 1 0.5 - -
205 1 1 1 1 1 1
205 - 1 0.63 1 1 1 1
205 2 2 2 2 2 2
204 1 1 1 1 1 1
204 1 1 1 1 1 1
13 1 13.38 14 1 14.25 14 0 14.00
13 1 13.38 14 1 14.25 14 0 14.00
112 - 0.5 - 0.5 - 0.5
206 4 4 4 4 4 4
4 4.50 4 4.50 4 4.50
109 1 1 1 1 1 1
1 1.00 1 1.00 1 1.00
109 1 1 1 1 1 1
209 1 1 1 1 1 1
206 3 3 3 3 3 3
206 5 5 5 5 5 5
10 10.00 10 10.00 10 10.00
112 1 1 1 1 1 1
210 2 2 2 2 2 2
209 1 1 1 1 1 1
208 2 2 3 3 2 2
206 4 4 4 4 4 4
205 15 15 15 15 16 16
25 25.00 26 26.00 26 26.00
III 1 1 1 1 1 1
114 1 1 1 1 1 1
113 - - - - 1 1
111 2 2 2 2 2 2
111 1 1 1 1 1 1
111 1 1 1 1 1 1
109 1 1 1 1 1 1
107 1 1 1 1 1 1
210 1 1 1 1 1 1
209 1 1 1 1 1 1
209 1 1 1 1 1 1
208 4 4 4 4 4 4
208 1 1 1 1 1 1
208 1 1 1 1 1 1
208 2 2 2 2 2 2
207 2 2 2 2 2 2
206 1 1 1 1 1 1
205 1 1 1 1 1 1
23 23.00 23 23.00 24 24.00
111 1 1 1 1 1 1
210 1 1 1 1 1 1
207 2 2 2 2 2 2
203 3 3 3 3 3 3
7 7.00 7 7.00 7 7.00
I 1 1 1 1 1 1
109 1 1 1 1 1 1
109 1 1 1 1 1 1
109 1 1 1 1 1 1
Grounds Maintenance Manager
Customer Service Supervisor
Section 8 Housing Specialist
Accounts Payable Technician
Family Self-Sufficiency Specialist
(Utilities Collections)
Tax Collector/Collections Mgr. (split with Tax)
Accounting Technician I
(Data Services)
Customer Service Representative
Housing Department Sub-total
Internal Services
Engineering Director
Utility Billing Specialist
(Customer Care)
Customer Service Manager
Senior Meter Technician
Customer Service Specialist
GIS Coordinator
(Billing)
Utility Billing Manager
Senior Meter Technician
Meter Technician
Meter Technician
Senior Customer Service Specialist
(Engineering)
Warehouse Supervisor
Purchasing Technician
Right of Way Agent
Survey Technician II
CAD Technician
Executive Assistant
Senior Administrative Assistant
Survey Technician I
Warehouse Clerk
(Purchasing)
Purchasing Manager
Building Maintenance Manager
Senior Engineering Technician
Engineer Coordinator
Engineering Construction Supervisor
Assistant Surveyor Supervisor
Construction Inspector
Deputy City Engineer
Engineering Manager (position unfrozen for FY17)
Project Engineer
Engineering Construction Manager
Surveyor / Real Estate Manager
Building Construction Specialist
(Buildings & Grounds Maintenance)
Buildings and Grounds Director
Urban Forester
Resident Service Coordinator
Public Housing Specialist
247

Salary Grade
Full-time
Perm.Part-time
FTEFull-time
Perm.Part-time
FTEFull-time
Perm.Part-time
FTE
FY 2016-2017 Adopted Budget
FY 2015-2016Amended Budget
Position
FY 2014-2015Amended Budget
210 2 2 2 2 2 2
209 1 1 1 1 1 1
208 4 4 4 4 4 4
208 3 3 3 3 3 3
206 1 1 1 1 1 1
203 15 15 15 15 16 16
202 7 8 10.65 8 7 11.3 8 7 11.337 8 40.65 38 7 41.30 39 7 42.30
107 8 111.15 109 7 112.8 111 7 114.8
TOTAL FULL-TIME EMPLOYEES 924 934 970
TOTAL PERM. PART-TIME EMPLOYEES 27 26 23
TOTAL FTE 934.7 944.5 979.1
Maintenance Mechanic I
Internal Services Sub-total
Custodian
Grounds Crew Supervisor
Building Maintenance Supervisor
Maintenance Mechanic II
Custodian Supervisor
Grounds Maintenance Worker (1 new position for FY17)
2003 2004 2005 2006 2007 2008 2009 2010 2011 2012 2013 2014 2015 2016 2017
0
50,000
100,000
Concord Population Growth and Employees per 1,000 Population
248

Grade Min Mid Max Min Mid Max Min Mid Max
201 21,408.46 28,366.20 35,323.94 823.40 1,091.01 1,358.61 10.29 13.64 16.98 202 23,121.13 30,635.50 38,149.86 889.27 1,178.29 1,467.30 11.12 14.73 18.34 203 24,970.82 33,086.34 41,201.85 960.42 1,272.55 1,584.69 12.01 15.91 19.81 204 26,968.48 35,733.23 44,498.00 1,037.25 1,374.36 1,711.46 12.97 17.18 21.39 205 29,125.96 38,591.90 48,057.83 1,120.23 1,484.30 1,848.38 14.00 18.55 23.10 206 31,456.04 41,679.26 51,902.46 1,209.85 1,603.05 1,996.25 15.12 20.04 24.95 207 34,287.08 45,430.40 56,573.69 1,318.73 1,747.32 2,175.91 16.48 21.84 27.20 208 37,372.92 49,519.11 61,665.33 1,437.42 1,904.58 2,371.74 17.97 23.81 29.65 209 40,736.49 53,975.84 67,215.20 1,566.79 2,075.99 2,585.20 19.58 25.95 32.32 210 44,402.76 58,833.67 73,264.57 1,707.80 2,262.83 2,817.87 21.35 28.29 35.22 211 48,399.02 64,128.70 79,858.37 1,861.50 2,466.49 3,071.48 23.27 30.83 38.39 212 52,754.93 69,900.28 87,045.64 2,029.04 2,688.47 3,347.91 25.36 33.61 41.85
105 33,922.49 44,947.32 55,972.13 1,304.71 1,728.74 2,152.77 16.31 21.61 26.91 106 36,975.52 48,992.57 61,009.61 1,422.14 1,884.33 2,346.52 17.78 23.55 29.33 107 40,303.31 53,401.91 66,500.48 1,550.13 2,053.92 2,557.71 19.38 25.67 31.97 108 43,930.62 58,208.07 72,485.53 1,689.64 2,238.77 2,787.91 21.12 27.98 34.85 109 47,884.37 63,446.79 79,009.22 1,841.71 2,440.26 3,038.82 23.02 30.50 37.99 110 52,193.96 69,157.01 86,120.06 2,007.46 2,659.89 3,312.31 25.09 33.25 41.40 111 56,891.43 75,381.14 93,870.86 2,188.13 2,899.27 3,610.42 27.35 36.24 45.13 112 62,580.58 82,919.25 103,257.93 2,406.95 3,189.20 3,971.46 30.09 39.87 49.64 113 68,838.63 91,211.18 113,583.73 2,647.64 3,508.12 4,368.61 33.10 43.85 54.61 114 75,722.49 100,332.30 124,942.11 2,912.40 3,858.93 4,805.47 36.41 48.24 60.07
I 76,911.85 101,908.20 126,904.55 2,958.15 3,919.55 4,880.94 36.98 48.99 61.01 II 82,145.02 108,842.16 135,539.30 3,159.42 4,186.24 5,213.05 39.49 52.33 65.16 III 92,002.43 121,903.22 151,804.01 3,538.56 4,688.59 5,838.62 44.23 58.61 72.98 IV 103,042.72 136,531.61 170,020.49 3,963.18 5,251.22 6,539.25 49.54 65.64 81.74 V 110,255.71 146,088.82 181,921.93 4,240.60 5,618.80 6,997.00 53.01 70.24 87.46
F1 33,357.17 45,884.44 58,411.72 1,282.97 1,764.79 2,246.60 11.42 15.71 20.00 F2 38,484.96 48,785.40 59,085.83 1,480.19 1,876.36 2,272.53 13.18 16.70 20.23 F3 39,950.24 50,736.81 61,523.37 1,536.55 1,951.42 2,366.28 13.68 17.37 21.06 F4 41,490.53 53,431.63 65,372.74 1,595.79 2,055.06 2,514.34 14.20 18.29 22.38 F5 45,719.06 59,387.33 73,055.59 1,758.43 2,284.13 2,809.83 21.98 28.55 35.12 F6 51,232.59 67,979.18 84,725.77 1,970.48 2,614.58 3,258.68 24.63 32.68 40.73 F7 59,317.70 79,167.87 99,018.05 2,281.45 3,044.92 3,808.39 28.52 38.06 47.60 F8 68,403.57 90,626.80 112,850.03 2,630.91 3,485.65 4,340.39 32.89 43.57 54.25
P1 36,755.31 49,251.70 61,748.09 1,413.67 1,894.30 2,374.93 16.48 22.09 27.69 P2 41,896.84 53,491.25 65,085.67 1,611.42 2,057.36 2,503.30 18.79 23.99 29.19 P3 49,407.49 67,066.63 84,725.77 1,900.29 2,579.49 3,258.68 22.16 30.08 38.00 P4 53,619.46 73,936.60 94,253.76 2,062.29 2,843.72 3,625.14 25.78 35.55 45.31 P5 65,759.86 84,771.11 103,782.36 2,529.23 3,260.43 3,991.63 31.62 40.76 49.90 P6 68,805.24 94,342.98 119,880.75 2,646.36 3,628.58 4,610.80 33.08 45.36 57.63
City of Concord, NC COMPENSATION PLAN GRADE ASSIGNMENTS - 6/5/2017
Pay Structure - Annual Pay Structure - Bi-Weekly Pay Structure - Hourly
249

FY 2016-17 ADOPTED FEES, RATES AND CHARGES SCHEDULE (Effective July 1, 2016 unless otherwise noted, or first applicable billing cycle for Utilities;
Fees subject to change by Council.)
ADMINISTRATIVE
City Code $100.00 Bound Copy $ 75.00 Unbound Copy
$ 20.00 Renewal Subscription Consideration of Utility, Solid Waste or Other Franchise Ordinance $500.00
Laser Printer Copies / Photocopies 1-10 Copies Free 11 or more Copies $ 0.25 photo copy or page printed A special service charge may be required for extensive information technology or personnel required to respond to a public records request. Such charge shall be based on cost incurred by the City in generating the particular response in accordance with NCGS 132-6.2(b). Child Support Payroll Administration Fee $ 2.00 each Duplicate W-2’s $ 5.00 each Official Public Budget Document $ 50.00/book Attorney’s Fee $250.00/hr or reimbursement of contract actual cost Paralegal Fee $ 95.00 per hour Parking Deck Fee:
Level 1.5 $ 25.00/space/month Level 3 $ 15.00/space/month Level 4 $ 10.00/space/month Discount $ 1.00/space/month on all singly-purchased
blocks of 10 or more spaces ($5 late fee charged on all past due payments)
Parking Deck Permit (City Employees only) First parking permit free Replacement parking permit $10.00
Encroachment/Permit for Sidewalk Dining $175.00 Encroachment/Banner Attachment $15.00 per banner
Payment by Credit Card May be assessed by a third-party vendor a convenience fee for using this service.
Civil Penalty for Violating City Code, “(a)(1) Unless otherwise specifically provided, violation of any provision of this Code or any other city ordinance shall subject the offender to a civil penalty in the amount of $500.00 or as specified in the then current Fees, Rates and Charges Schedule adopted as part of the City of Concord Annual Operating Budget; except, that where the General Statutes of North Carolina provide specific remedies for violations of provisions of this Code adopted pursuant to such statutes, such remedies available to the city for enforcement of this Code shall be in addition to the remedies hereinafter stated; except, that where the General Statutes of North Carolina provide specific remedies for violations of provisions of this Code adopted pursuant to such statutes, such remedies available to the city for enforcement of this Code shall be in addition to the remedies hereinafter stated. (4) Except as otherwise specifically provided, each day's continuing violation of any provision of this Code or any other city ordinance shall be a separate and distinct offense. (f)(3) (3) Any willful failure to pay any civil penalty imposed within this Code is a misdemeanor under G.S. § 14-4 and punishable by a fine of $500.00 or 30 days in jail, or both.” Excerpts from Sec 1.6, Code of Ordinances of the City of Concord.
AVIATION
DAILY RATES
Category I Remain Over Night (RON): $15.00; Hangar In Common (HIC): $30.00; Landing: $12.00 All Cessna
100/200 Series Models, Tripacer, Colt, Comanche, Cherokee, Pacer, Musketeer, Bonanza, Mooney, Rockwell Commander, Lance, Arrow, Cirrus. Fuel purchase of 10 gallons will waive the RON.
Category II RON: $20.00; HIC: $40.00; Landing: $20.00 Cessna 310, 335, 336, 337, 401, 402, 411, 414, 421, - All
300's/400's, Aztec, Apache, Navajo, Twin Comanche, Duke, Baron, Duchess, Seminole, Seneca, Aerostar, Saratoga, Malibu. Fuel purchase of 25 gallons will waive the RON.
Category III RON: $25.00; HIC: $50.00; Landing: $50.00 Kingair, Twin Beech (D-18), Queenair, Aero/Grand
Commander, Cheyenne, Turbo-Commander, Conquest, MU-2, Metroliner, Merlin, Caravan, Jetstream, Avanti, Palatus. Fuel purchase of 50 gallons will waive the RON.
250

Category IV RON: 50.00; HIC: $90.00; Landing: $75.00; Ramp $50.00. Lear, Citation, Jet-Commander, Saber-liner,
Hansa, Lodestar, Westwind, Starship, Diamond, Beech Jet, Falcon 10, Astra, Premier, Beach 1900, Beachjet 400, Hawker 700, Hawker 800, Hawker 1000. Fuel purchase of 100 gallons will waive the RON/Ramp Fees.
Category V RON: $75.00; HIC: $150.00; Landing: $110.00; Ramp $75.00. Falcon 20, 50, 200, 900, G-I, II, III, IV, V,
Jetstar, DC-3, DH-8, Shorts 360, SAAB 340, Challenger, Twin Otter Challenger 601, Challenger 604, Regional Jet, EMB 120, ERJ 135, 145, Galaxy, ATR 42, Fokker 50. Fuel purchase of 200 gallons will waive the RON/Ramp Fees.
Category VI RON: $100.00; HIC: $175.00; Ramp $100.00. Landing: based on aircraft gross landing weight: ($2 per
1,000 LBS) DC-8, DC-9, 727, 737, BAC1-11, Convair 440, 640, 580, MD80, Global Express, Saab 2000. Fuel purchase of 300 gallons will waive the RON/Ramp Fees.
Helicopters RON: $25.00; HIC: $50.00; Landing: $20.00. Fuel purchase of 10 gallons will waive the RON.
Aircraft Registered and paying tax in the City of Concord, but not based at CRA will receive based tenant landing/ ramp fees and fuel discount. T-Hangar:
Single Engine $ 45.00/day Twin Engine - piston $ 50.00/day King Air 90 and 100 series $ 75.00/day
MONTHLY RATES
Open Tie-Down: Category I $ 65.00/month Category II $ 95.00/month Category III $130.00/month Category IV $180.00/month Category V $230.00/month Category VI Negotiated
T-Hangars: T-10 $255.00/month
T-40 $285.00/month T-50 $390.00/month
Hangar In Common Monthly Rate starting at $200.00 for a small single engine up to $1,500.00 for a Gulfstream V. All aircraft larger than a Gulfstream V will be at a negotiable rate.
HIC - Helicopter (Jet Ranger, Hughes 500, Astar) $300.00/month HIC - Helicopter (S-76, Bell 222) $375.00/month Terminal Office Space $1.55 month/sq foot HIC Office Space $1.50 month/sq foot Modular Building Office Space $1.50 month/sq foot Terminal Counter Space $200.00/month plus % of gross Terminal General Merchandise Negotiated Rate plus % of gross Mailbox Rental $ 20.00 Advertising Agency Fee Negotiated Lobby Advertising Negotiated
PRIVILEGE / OPERATING FEES: (ALL COMMERCIAL AERONAUTICAL OPERATORS MUST ALSO HAVE WRITTEN AGREEMENT WITH CITY)
Fixed Base Operation – Full service (excluding fueling) $2,000.00 /month Fixed Base Operation – Aircraft Airframe / Engine Maintenance $350.00/month Fixed Base Operation – Specialized Repair (ie Avionics) $350.00/month Fixed Base Operation – Aircraft Charter & Air Taxi $350.00/month Fixed Base Operation – Air Cargo $250.00/month Fixed Base Operation – Flight Training $325.00/month Fixed Base Operation – Ground Classroom or Sim. Training $325.00/month Fixed Base Operation – Banner Tow / Aerial Advertising $100.00 /day or $50 per banner Fixed Base Operation – Aircraft Management / Fractional $300.00 /month Fixed Base Operation – Pilot Check Ride $50.00 /month Fixed Base Operation – Aircraft Sales $300.00 /month Fixed Base Operation – Aircraft Cleaning $300.00/month Fixed Base Operation – Medical Services (Physicals) $100.00/month Fixed Base Operation – Pilot Services $300.00 /month Fixed Base Operation – Aircraft Rental $300.00 /month Fixed Base Operation – Aircraft Ground Services $300.00 /month Fixed Base Operation – Aircraft Line Services $300.00 /month
251

Fixed Base Operation – Aerial Photography $225.00/month Fixed Base Operation – Other Negotiated Non-Based Operations - (no based aircraft or office space lease) $400.00/ month minimum. Actual fee negotiated after
review of proposed operations. MISCELLANEOUS FEES
Commercial Aircraft Terminal Fee $300.00/operation Commercial Aircraft Ramp Fee $350.00/aircraft arrival Baggage Handling Fee $ 4.00/passenger ($200.00 Minimum Charge) Aircraft Tow $ 10.00 (Category I, II); $14.00 (Category III, IV); $20.00
(Category V) Exclusively Leased or Privately Owned Hangar Aircraft Tow $15.00 (Category I, II); $20.00 (Category III, IV); $25.00
(Category V) Auxiliary Power Unit $15.00 Engine Start Only; $10.00/ 15min. of
Continuous Use Wash Rack $10.00 single; $15.00 twin Self-Maintenance Hangar $5.00/hour (Reservations required-more than 24
continuous hours requires Aviation Director approval) Potable Water $20.00 Lavatory Service $60.00 T-Hangar Cleaning $75.00 Defueling Cart $15.00/day (No charge for first day use) Re-coring tenant locks on T-hangars $75.00 (when tenant loses keys) Extra keys $ 5.00 each for tenants Helicopter Platforms $75.00/month or $10.00/day Blimp Mooring $60.00/day Commercial Helicopter Shuttle $50.00/trip or $100.00/day per helicopter Terminal Conference Room Full room $200/day or $100/half day; includes
coffee service (can accommodate 24) Half room $100/day or $50/half day; includes
coffee service (can accommodate 12) Training room (Hangar A) $200.00/day or $100/half day (can
accommodate 50) Catering Delivery 10% surcharge added to retail price of catering
order Catering Pick-up 25% surcharge added to retail price of catering
order Set up fee and clean up fee $50.00 (set up); $50.00 (clean up) Hangar Rental Special Events $750.00/day Special Event Site Fee $500.00/day Video Conferencing $50.00/hour Xerox Copies $ 0.25/page Fax Service Local $1.00/page; long distance $2.00/page Notary Public $ 3.00 Audio/Visual $20.00/day Off-site Rent-a-car pick-up / drop-off $10.00 per car or $500.00/month (Companies must
submit activity report to City or $500.00 will be charged)
Limousine $10.00/load or $50.00/car/month Shuttle Bus $10.00/load or $50.00/bus/month Taxi Cab $10.00/load or $50.00 car/month Annual operating decal fee for all limousine taxicab shuttle companies (fee is for unscheduled carriers) $50.00 City Assistance $25.00/hr minimum (includes administrative
research and document preparation) Aircraft Debris Removal (Accident) $200.00 minimum fee + $75.00/hour Loss Revenue (Accident) TBD Outside Vendor Per event (percentage of gross or set fee) Office Janitorial Service $10.00/day or $100.00/month (vacuum, dust, and
trash disposal) Vacuum Rental $20.00 Fuel & Oil Per fuel policy of minimum margin as
set in budget Self-Fueling Flowage Fees Determined by an accounting study of Airport expenses Terminal Lots Parking First 2 hours free, then $4.00 per day/per vehicle in Uncovered Parking $5.00 per day/per vehicle in Covered Parking Rental Vehicle Facility Fee $1.00 per vehicle rental
252

BADGING/ SECURITY PROCESSING FEES
Initial Airport ID Badge fee $10.00 Airport ID Badge Renewal Fee $5.00 Lost or expired (beyond 60 day) Badge Replacement $25.00 Airport Proximity Access card fee $10.00 Security Threat Assessment (STA) & CHRC processing $50.00 initial SIDA Card STA annual processing fee $5.00 (due on badge anniversary date) AOA Vehicle Inspection / Decal fee $12.00 (Annually) Penalties for non-return of ID CARD:
i) A $250.00 fee will be charged per badge against any Employer / Sponsor who fails to collect a Concord Regional Airport SIDA card from employee or contractor that is no longer employed or working at the airport.
ii) A $25.00 fee will be charged per badge against any Employer / Sponsor who fails to collect a Concord Regional Airport ID (non-SIDA) card from an employee, aircraft owner, or contractor that is no longer employed or working at the airport
OTHER
1) Late Charge:
i) A late charge of 1 ½ percent is charged on all unpaid balances. A late fee applies if payment is not paid by the 26th day, in accordance with City of Concord Policy.
2) Security Deposits: i) All hangar rentals are required to deposit an amount equal to one month’s rental.
3) On Account (Monthly Fuel Billing): i) All Customers wishing to bill fuel on account must sign a “Guarantee of Payment” and complete a “City of Concord
Regional Airport Credit Application.” Only those customers having a satisfactory credit rating are allowed to bill fuel on account.
4) Partial Payment Application: i) Partial payments are applied first to the oldest invoices or any delinquent charges first, unless otherwise specified.
Customer is responsible for remaining past due amounts and is subject to any liens or lease termination per Aircraft Storage Permit.
5) Check Cashing: i) Checks are not accepted for accounts terminated due to non-payment and /or returned checks. ii) No third party checks will be cashed.
6) Returned Check Charge: i) There is a $25.00 service charge for returned checks. It is the City of Concord’s Policy to process Non-sufficient Funds
(NSF) checks twice before being returned from the bank. If the City receives two NSF checks in a sixty-day (60) period, accounts are placed on and marked “CASH-ONLY” for a one (1) year period. “CASH-ONLY” status is reviewed after one year.
7) Credit Card Processing Fee for customers using a non-preferred card will be 3% charge on total credit card receipts.
CEMETERIES OPENING AND CLOSING CHARGES*
Rutherford, West Concord and Oakwood Weekdays Arrival at the gravesite before 3:30 $525.00 Arrival at gravesite at or after 3:30 $625.00 No graveside services scheduled after 4:00 pm
Weekends/Holidays Arrival at the gravesite before 3:00 $800.00
Arrival at gravesite at or after 3:00 $900.00 No graveside services scheduled after 3:30 pm Cremains Section in West Concord Weekdays Arrival at the gravesite before 3:30 $350.00 Arrival at the gravesite at or after 3:30 $450.00 No graveside services scheduled after 4:00 pm Weekends/Holidays Arrival at the gravesite before 3:00 $425.00 Arrival at the gravesite at or after 3:00 $500.00 No graveside services scheduled after 3:30 pm Infant Site in Rutherford, West Concord and Oakwood (up to 3’) Weekdays Arrival at the gravesite before 3:30 $300.00 Arrival at the gravesite at or after 3:30 $400.00
253

No graveside services scheduled after 4:00 pm Weekends/Holidays
Arrival at the gravesite before 3:30 $450.00 Arrival at the gravesite at or after 3:30 $750.00 No graveside services scheduled after 4:00 pm Inurnment at Columbarium Weekdays $100.00 Weekends/Holidays $150.00
Installation of oversized burial vaults (such as Poly Vaults) that fit within the allowed excavation area for a single standard, non-oversized grave (but require excavation beyond that required for a standard burial vault) - additional preparation fee of $200.00. Installation of oversized burial vaults containing oversized coffins, with dimensions that exceed the standard excavation boundaries, require BOTH the purchase of a second lot AND an additional preparation fee of $200.00. LOT FEES**
West Concord - Cremains Section only: Total Current Endowment*** Resident $300.00 $99.98 $200.02 Non-Resident $400.00 $133.32 $266.68
Rutherford – Cemetery Lot Fee:
Resident Total Current Endowment*** 1 grave lot $350.00 $116.67 $233.33 Non-Resident 1 grave lot $500.00 $166.67 $333.33
Columbarium Niche: Resident $1,500.00 Non-Resident $1,800.00 Engrave Niche Cover $300.00 NOTE: Lots must be marked within a year from burial.
Infant grave price same as above. *No Interment or Entombment Services on Christmas Day, Thanksgiving Day, or Easter Sunday. Interments and Entombments for Christmas Eve and New Years Eve must arrive in the Cemetery by 1:00 p.m. **All burials utilizing an oversize coffin vault with dimensions that exceed the standard excavation boundaries must pay a fee equal to the cost of two (2) lots. ***Endowments are contributions toward the cost of lot mowing, as well as a fee for the one lot share of ordinary, general cemetery property upkeep.
CLEARWATER ARTIST STUDIOS CLEARWATER GALLERY (2,249 SQ FT)
Hourly Event Rental Rates 1 - 3 Hours $85.00/hour (2-hour minimum)
4 - 6 hours $80.00/hour 7 or more $75.00/hour Refundable Cleaning Deposit $175.00 Refundable Security Deposit $100.00 Artwork Exhibit Takedown Fee (optional) $200.00 CLEARWATER MARKET AND/OR GREENSPACE
Half-Day (4-6 hours) $250.00 Full Day (8-10 hours) $500.00
DEFINITIONS: Market = covered, outdoor “market” space + all paved parking areas. Greenspace = green space between greenway and buildings for events; plus green lot on Cedar/Kerr Street for parking (if needed) and all paved parking areas. No access to indoor spaces or restrooms. NOTE: If using BOTH the Market Space and Greenspace(s), fees double. Porta-Jon rental fee: $100/per (1 minimum required); Clearwater/City arranges.
FUTURE CAFÉ SPACE
Half-Day (1-4 hours) $25.00 Full Day (4-8 hours) $50.00
254

STUDIO LEASE RATES Up to 250 sq ft $5.50/sq ft per year 251-600 sq ft $5.25/sq ft per year 601-1,499 sq ft $5.00/sq ft per year 1,500+ sq ft $3.50/sq ft per year
ELECTRIC
This fee schedule contains all fee changes, revisions and additions that will become effective as of July 1, 2016. Please reference Chapter 59, Electric Systems and Services, Article II of the City’s Code of Ordinances; Concord Technical Standards Manual, Chapter 6; and Customer Service Policies and Procedures for specific requirements, availability, and eligibility.
REBATES OFFERED RESIDENTIAL HIGH EFFICIENCY HEAT PUMP REBATE PROGRAM: The City is offering a $400 rebate to residential customers who install new or replace an existing heating/air conditioning system with a high efficiency heat pump. For information on how to qualify for this rebate, contact the City’s Electric Department at 704-920-5303.
RIDERS TO THE ELECTRIC RATES The City Manager is authorized to approve periodic adjustments to the Purchase Power Adjustment, the Portfolio Standard Renewable Energy Rider, and the Renewable Energy Generation Rider when such adjustments are received from the City’s wholesale energy provider(s). PURCHASE POWER ADJUSTMENT RIDER
Availability: The City reserves the right to charge a Purchase Power Adjustment at such time as the average cost of purchased power to the City deviates from the base cost of purchased power used in the design of the City’s rate schedules and/or rider. This rider applies across all rate categories.
PORTFOLIO STANDARD RENEWABLE ENERGY RIDER (REPS) Availability:
Service supplied to the City’s retail customers is subject to a REPS monthly charge applied to each customer agreement for service on a residential, general service, or industrial service rate schedule. This charge is adjusted annually, pursuant to North Carolina General Statute 62-133.8 and North Carolina Utilities Commission Rate R8-67. This Rider is applicable to all rate categories with exception to agreements for the City’s outdoor lighting rate schedules OL, PL, or FL, and also shall not apply to electric service(s) that are auxiliary to another contract between the City and the customer. An auxiliary service is defined as a non-demand metered non-residential service for the same customer at the same location. The North Carolina Utilities Commission has ordered effective for service rendered on and after September 1, 2009 that a REPS Monthly Charge be included in the customers' bills. The current rates are as follows:
RESIDENTIAL SERVICE AGREEMENTS REPS Monthly Charge $0.69 GENERAL SERVICE AGREEMENTS REPS Monthly Charge $3.22 INDUSTRIAL SERVICE AGREEMENTS REPS Monthly Charge $17.06
EXTRA FACILITIES CHARGE RIDER:
Availability: This Rider is applicable to any electric service(s) requiring the installed cost of extra facilities necessary to provide electric services. A monthly “Extra Facilities” charge equal to 1.7% of the installed cost of extra facilities necessary for service, but not less than $25, shall be billed to the Customer in addition to the bill under the appropriate rate schedule and this Rider, when applicable.
ECONOMIC DEVELOPMENT RIDER:
Availability: This Rider is available only at the option and approval by the City Manager to nonresidential establishments receiving service from the City under Schedules 5-G, 6-GA, 7-I or TOU (as stated below). Customers must create a minimum new load of 300 kW with a load factor of 55% or greater at one delivery point.
Application of Credit:
Beginning with the Operational Date, a credit based on the percentages below will be applied to the total bill for the New Load contracted for under this Rider, calculated on the applicable rate schedule, including the Basic Facilities, Demand Charge, Energy Charge, or Minimum Bill excluding other applicable Riders, and excluding extra Facilities Charges.
255

Months 01 – 12 20% Months 13 – 24 15% Months 25 – 36 10% Months 37 – 48 5%
After Month 48 0% RENEWABLE ENERGY GENERATION RIDER Availability:
Residential or business customers who operate an approved renewable energy generating system, located and used at the Customer’s primary residence or business. The rated capacity of the generating system shall not exceed 20 kilowatts for a residential system or 2 megawatts for a non-residential system. This fee is applicable to all electric service of the same available type supplied at Customer’s premises at one point of delivery through a one kilowatt-hour meter. The types of services are alternating current, 60 hertz, single phase 2 or 3 wires, or three phase 3 or 4 wires, at City’s standard voltages.
RATES 1 (One of the following two Rate options shall apply:
Option A Administrative Charge $19.91 per month
Interconnected to the City’s System:
Capacity Credit Variable Rate All On-Peak Energy per On-Peak Month per kWh 1.96 ¢ All On-Peak Energy per Off-Peak Month per kWh 0.98 ¢
Energy Credit Variable Rate All On-Peak Energy per Month per kWh 3.95 ¢ All Off-Peak Energy per Month per kWh 3.01 ¢ Option B Administrative Charge $19.91 per month Interconnected to the City’s System:
Capacity Credit Variable Rate All On-Peak Energy per Summer Month per kWh 5.97 ¢ All On-Peak Energy per Non-Summer Month per kWh 2.31 ¢
Energy Credit Variable Rate All On-Peak Energy per Month per kWh 4.14 ¢ All Off-Peak Energy per Month per kWh 3.26 ¢
1 Unless otherwise specified in the City’s contract with the Customer, payment of credits under this Schedule do not convey to the City the right to renewable energy credits (REC’s) associated with the energy delivered to the City by the Customer.
Renewable Energy Generator Application Fees – these fees are applicable for anyone who wishes to interconnect renewable energy generating facilities to the City of Concord’s Electric System.
Small Inverter Process: a request to interconnect a certified inverter-based Generating Facility no larger than 20 kW for residential and no larger than 100kW for non-residential.
Residential $100.00 Non-residential $250.00
Fast Track Process – a request to interconnect a certified Generating Facility no larger than 2 MW, which meets the Fast Track Process criteria.
Generating Facilities larger than 20 kW but no larger than 100 kW $250.00 Generating Facilities larger than 100 kW but no larger than 2 MW $500.00
Study Process – a request to interconnect a certified Generating Facility that does not meet the criteria for the Fast Track Process or are larger than 2 MW. The City will provide an estimate of the Study Process fees once it receives and reviews a completed Interconnection Request form.
Study Deposit $1,000.00 Change in Ownership of a Renewable Generator
Application Fee (non-refundable) $50.00
256
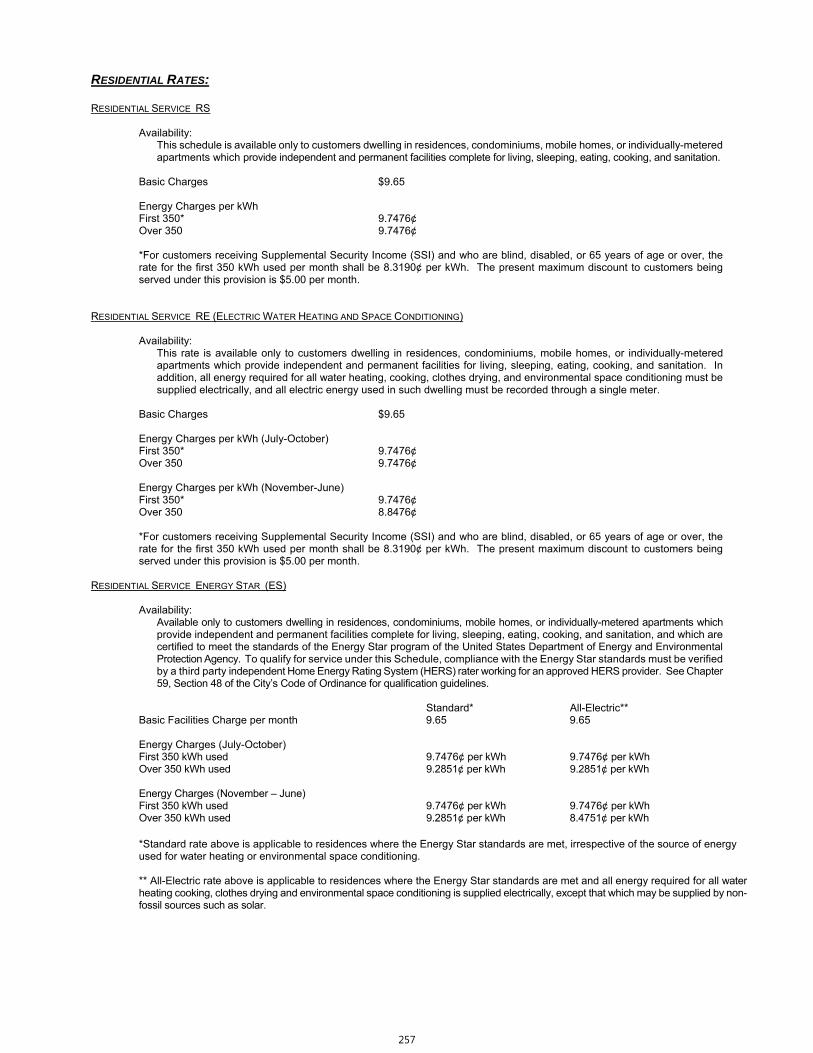
RESIDENTIAL RATES: RESIDENTIAL SERVICE RS
Availability: This schedule is available only to customers dwelling in residences, condominiums, mobile homes, or individually-metered apartments which provide independent and permanent facilities complete for living, sleeping, eating, cooking, and sanitation.
Basic Charges $9.65 Energy Charges per kWh First 350* 9.7476¢ Over 350 9.7476¢ *For customers receiving Supplemental Security Income (SSI) and who are blind, disabled, or 65 years of age or over, the rate for the first 350 kWh used per month shall be 8.3190¢ per kWh. The present maximum discount to customers being served under this provision is $5.00 per month.
RESIDENTIAL SERVICE RE (ELECTRIC WATER HEATING AND SPACE CONDITIONING) Availability:
This rate is available only to customers dwelling in residences, condominiums, mobile homes, or individually-metered apartments which provide independent and permanent facilities for living, sleeping, eating, cooking, and sanitation. In addition, all energy required for all water heating, cooking, clothes drying, and environmental space conditioning must be supplied electrically, and all electric energy used in such dwelling must be recorded through a single meter.
Basic Charges $9.65 Energy Charges per kWh (July-October) First 350* 9.7476¢ Over 350 9.7476¢ Energy Charges per kWh (November-June) First 350* 9.7476¢ Over 350 8.8476¢ *For customers receiving Supplemental Security Income (SSI) and who are blind, disabled, or 65 years of age or over, the rate for the first 350 kWh used per month shall be 8.3190¢ per kWh. The present maximum discount to customers being served under this provision is $5.00 per month.
RESIDENTIAL SERVICE ENERGY STAR (ES)
Availability: Available only to customers dwelling in residences, condominiums, mobile homes, or individually-metered apartments which provide independent and permanent facilities complete for living, sleeping, eating, cooking, and sanitation, and which are certified to meet the standards of the Energy Star program of the United States Department of Energy and Environmental Protection Agency. To qualify for service under this Schedule, compliance with the Energy Star standards must be verified by a third party independent Home Energy Rating System (HERS) rater working for an approved HERS provider. See Chapter 59, Section 48 of the City’s Code of Ordinance for qualification guidelines.
Standard* All-Electric** Basic Facilities Charge per month 9.65 9.65 Energy Charges (July-October) First 350 kWh used 9.7476¢ per kWh 9.7476¢ per kWh Over 350 kWh used 9.2851¢ per kWh 9.2851¢ per kWh Energy Charges (November – June) First 350 kWh used 9.7476¢ per kWh 9.7476¢ per kWh Over 350 kWh used 9.2851¢ per kWh 8.4751¢ per kWh
*Standard rate above is applicable to residences where the Energy Star standards are met, irrespective of the source of energy used for water heating or environmental space conditioning.
** All-Electric rate above is applicable to residences where the Energy Star standards are met and all energy required for all water heating cooking, clothes drying and environmental space conditioning is supplied electrically, except that which may be supplied by non-fossil sources such as solar.
257

OUTDOOR, STREET, AND TRAFFIC SIGNAL LIGHTING RATES:
OUTDOOR LIGHTING SERVICE (OL) – RENTAL
Availability: This monthly rental service is available to light outdoor areas, private streets, and private driveways by means of light emitting diode (LED) metal halide, sodium vapor, or other area lighting units only, as supplied by the City. This rental service is not available to light public, dedicated streets or highways.
HID Lighting Rate Rate Rate Existing New New Wood Pole Wooden Pole Wooden Pole Served Underground
100 watts (1) $8.42 $15.13 $19.90 150 watts (HPSV) (1) $10.14 $16.85 $21.62 175 watts (metal halide) (1) $10.70 N/A N/A 175 watts (Mercury Vapor) (1) $8.59 (1) $17.41 $22.18 250 watts (HPSV) (1) $11.80 $18.51 $23.28 250 watts (mercury vapor) (1) $11.80 (1) $18.51 $23.28 400 watts (HPSV) (1) $14.12 $20.83 $25.60 400 watts (mercury vapor) (1) $14.12 (1) $20.83 $25.60 400 watts (metal halide) (1) $17.46 $24.17 $28.94 1000 watts (mercury vapor) (1) $27.39 $34.10 $38.87 1000 watts (HPSV) (1) $29.66 $36.37 $41.14 1000 watts (metal halide) (1) $33.07 $39.78 $44.55
(1) These units are no longer available for repair, replacement or new installations. Rate applies to existing installations. At the time of failure, HID lighting fixtures will be replaced with the most comparable LED fixture. If the comparable LED fixture will result in a rate increase, the customer will have the option to discontinue service without penalty.
LED Lighting
Rate Rate Rate Existing New New Wood Pole Wooden Pole Wooden Pole Served Underground
50 watts (Area) $7.58 $14.29 $19.06 65 watts (Area) $8.52 $15.23 $20.00 75 watts (Area) $9.13 $15.84 $20.61 100 watts (Area) $9.96 $16.67 $21.37 160 watts (Area) $10.62 $17.33 $22.10 215 watts (Area) $13.09 $19.80 $24.57 315 watts (Area) $18.90 $25.67 $30.44
530 watts (Area) $31.30 $38.01 $42.78
FLOOD LIGHTING (FL) SERVICE
Availability: This monthly rental service is available to light outdoor areas, private streets, and private driveways by means of light emitting diode (LED) metal halide, sodium vapor, or other area lighting units only, as supplied by the City. This rental service is not available to light public, dedicated streets or highways.
HID Lighting Rate Rate Rate
Existing New New Wood Pole Wooden Pole Wooden Pole Served Underground
250w (HPSV)(1) $14.34 $21.05 $25.82 400w (HPSV) (1) $15.71 $22.42 $27.19 400w (Metal Halide) (1) $17.63 $24.34 $29.11
(1) These units are no longer available for repair, replacement, or new installations. Rate applies to existing installations. At the time of failure, HID lighting fixtures will be replaced with the most comparable LED lighting fixture. If the comparable LED fixture will result in a rate increase, the customer will have the option to discontinue service without penalty.
258

LED Lighting Rate Rate Rate Existing New New Wood Pole Wooden Pole Wooden Pole Served Underground
130w (LED) $14.34 $21.05 $25.82 240w (LED) $17.63 $24.34 $29.11
Special Conditions:
Rental fees include a 30-foot high Class 5 pole supplied by the City. Customers requesting a pole more than 30 feet high shall pay in advance the actual difference in cost between the 30-foot Class 5 pole and the pole requested. Luminaires installed remain the property of the City, which will maintain the luminaires.
Additional monthly charges for underground conductors (OL/FL Rate): 0-150 feet $0.35 150-250 feet $0.75 This fee will be added to the base rate. Additional monthly charges pertaining to Outdoor Lighting Rates:
Additional monthly charge of $5.70 for wooden pole without luminaire PUBLIC LIGHTING (PL) SERVICE RATE SCHEDULE
Availability: Available only for the purposes of lighting streets, highways, parks and other public places for municipal, county, state and federal governments at locations inside the municipal limits on the City’s distribution system. This schedule is not available for service to non-governmental entities. HID Lighting
Rate (PL Base) Rate Rate Existing New Wooden Pole New Wooden Pole (underground)
100 watts (1) $7.47 N/A N/A 150 watts (HPSV) (1) $9.20 N/A N/A 175 watts (metal halide) (1) $9.64 N/A N/A 175 watts (1) $7.63 N/A N/A 250 watts (mercury vapor)(1) $9.76 N/A N/A 250 watts (HPSV) (2) $10.86 $18.51 $23.28 400 watts (HPSV) (2) $13.20 $20.83 $25.60 400 watts (mercury vapor)(1) $10.09 N/A N/A 400 watts (metal halide) $16.17 $17.63 N/A 1000 watts (HPSV) (1) $26.40 N/A N/A 1000 watts (metal halide) (1) $29.93 N/A N/A
(1)These units are no longer available for repair, replacement or new installations. Rate applies to existing installations. At the time of failure, HID lighting fixtures will be replaced with the most comparable LED fixture. If the comparable LED fixture will result in a rate increase, the customer will have the option to discontinue service without penalty.
(2) Roadway use only
LED Lighting
Rate Rate Rate Existing New Wooden New Wooden Pole
Wood Pole Pole Served Underground
50 watts (Area) $6.72 $13.43 $18.20 65 watts (Area) $7.70 $14.41 $19.18 75 watts (Area) $8.44 $15.15 $19.92 100 watts (Area) $9.56 $16.27 $21.04 160 watts (Area) $10.13 $16.84 $21.61 215 watts (Area) $12.12 $18.83 $23.60 315 watts (Area) $17.75 $24.46 $29.23
530 watts (Area) $29.10 $35.81 $40.58
FLOOD LIGHTING (PL-FL) SERVICE
Availability: This monthly rental service is available to light outdoor areas, private streets, and private driveways by means of light emitting diode (LED) metal halide, sodium vapor, or other area lighting units only, as supplied by the City. This rental service is not available to light public, dedicated streets or highways.
259

HID Lighting Rate Rate Rate
Existing New New Wood Pole Wooden Pole Wooden Pole Served Underground
250w (HPSV) (1) $14.34 $21.05 $25.82 400w (HPSV) (1) $15.71 $22.42 $27.19 400w (Metal Halide) (1) $17.63 $24.34 $29.11
(1)These units are no longer available for repair, replacement or new installations. Rate applies to existing installations. At the time of failure, HID lighting fixtures will be replaced with the most comparable LED fixture. If the comparable LED fixture will result in a rate increase, the customer will have the option to discontinue service without penalty.
LED Lighting Rate Rate Rate Existing New New Wood Pole Wooden Pole Wooden Pole Served Underground
130w (LED) $14.34 $21.05 $25.82 240w (LED) $17.63 $24.34 $29.11
Special Conditions:
Rental fees include a 30-foot high Class 5 pole supplied by the City. Customers requesting a pole more than 30 feet high shall pay in advance the actual difference in cost between the 30-foot Class 5 pole and the pole requested. Luminaires installed remain the property of the City, which will maintain the luminaires.
Additional monthly charges for underground conductors (PL/FL Rate): 0-150 feet $0.35 150-250 feet $0.75 This fee will be added to the base rate. Additional monthly charges pertaining to Outdoor Lighting Rates: Wooden Pole without luminaire $5.70
Decorative Luminaires and/or poles:
The City has a defined selection of decorative luminaires and/or poles available. Decorative luminaires and/or poles can be installed upon customer request, at the City’s option, at the basic rates plus an extra monthly decorative adder charge equal to 1.4% of the installed cost difference between the luminaire and pole requested and the equivalent standard base rate luminaire and pole. The calculated monthly rate will be in effect for the life of the service.
Contract period and terms for all luminaires/pole installations:
a) Three years for all luminaires designated as standard by the City and bracket mounted on standard poles. b) Ten years for all luminaires designated as decorative by the City and for all standard luminaires mounted on
supports other than standards wooden poles. c) All luminaires, poles, apparatus and associated wiring remain the property of the City during the lifetime of the
contract and during any length of service after the contractual period. As defined in City ordinance, additional lights, cameras, wireless devices and other customer owned apparatus are not permitted on City owned poles. If lighting service is terminated either by the City or the customer, the City will remove all its facilities from the customer’s property and return the items to City inventories. City installed luminaires and/or polies are not available for sale to any customer, either during or at the discontinuance of lighting service.
PERSONNEL AND EQUIPMENT CHARGES/FEES Request for relocation of existing facilities or damage to existing facilities will be charged at the following rates:
a. All personnel will be billed at salary cost including 32% benefits and overhead. b. All equipment will be billed at prevailing FEMA rates in effect at the time of the work order completion. c. Engineering/Project Management costs for all jobs will be billed as a flat 10% of the project cost. d. Warehousing costs will be billed as a flat fee of 10% of all materials used in the project.
TRAFFIC SIGNAL SERVICE (TS)
Availability:
Available only to municipalities in which the City owns and operates the electric distribution system, and to county, state and federal authorities in areas served by the City, for the energy requirements of traffic and safety signal systems.
Basic Facilities charge $6.50 First 50 kWh 18.8151¢ per kWh Over 50 8.6328¢ per kWh
260

NON-RESIDENTIAL RATES: Unless otherwise noted under each rate schedule, all categories under Non-Residential Rates are subject to a Billing Demand, a Minimum Bill requirement and a Power Factor Correction charge as outlined below:
Billing Demand: The Billing Demand each month shall be the largest of the following: The maximum integrated thirty-minute demand in the previous 12 months including the month for which the bill is
rendered. Fifty percent (50%) of the contract demand 30 kilowatts (KW)
Minimum Bill: The minimum bill shall be the bill calculated on the applicable rate including the Basic Facilities Charge, Demand Charge and Energy Charge, but the bill shall not be less than the amount determined as shown below according to the type of minimum selected by the City. Some rate schedules have different Minimum Bills, as noted below.
Monthly - $1.90 per KW per month of Contract Demand If the customer's measured demand exceeds the contract demand, the City may, at any time establish the minimum based on the maximum integrated demand in the previous 12 months including the month for which the bill is rendered, instead of the Contract Demand.
Annual - $38.00 per KW per year of Contract Demand The City may choose the Annual Charge option if the customer's service is seasonal or erratic, or it may offer the customer a monthly minimum option. Unless otherwise specified in the contract, the billing procedure for annual minimums will be as follows:
For each month of the contract year when energy is used, a monthly bill will be calculated on the rate above. For each month of the contract year when no energy is used, no monthly amount will be billed. The bill for the last month of the contract year will be determined as follows: If the total of the charges for 12 months exceeds the annual minimum, the last bill of the contract year will
include only the charge for that month. If the total of the charges for 12 months is less than the annual minimum, the last bill of the contract year
will include an amount necessary to satisfy the annual minimum.
Power Factor Correction: When the average monthly power factor of the Customer's power requirements is less than 85 percent, the City may correct the integrated demand in kilowatts for that month by multiplying by 85 percent and dividing by the average power factor in percent for that month.
GENERAL SERVICE 5-G
Availability: Available to the contracting Customer(s) in a single enterprise, located entirely on a single, contiguous premise. This Schedule is not available to the individual customer that qualifies for a residential or industrial schedule, nor for auxiliary or breakdown service.
Basic Facilities Charge $18.20
Plus Demand Charge
First 30 kW of billing demand No charge For all over 30 kW of billing demand $3.77
Plus Energy Charge First 125 kWh per kW billing demand per month First 3000 12.0344¢ per kWh Next 87,000 7.4726¢ per kWh Over 90,000 7.2417¢ per kWh Next 275 kWh per kW billing demand per month First 6000 7.1607¢ per kWh Next 134,000 6.4328¢ per kWh Over 140,000 6.2018¢ per kWh All over 400 kWh per kW billing demand All kWh 6.0813¢ per kWh Rates subject to Billing Demand, Minimum Bill requirement, and Power Factor Correction as outlined above.
261

GENERAL SERVICE 5_GB (not available to new customers)
Basic facilities charge $19.28
Plus Energy Charge First 125 kWh per kW billing demand per month General Service First 3000 13.3265¢ per kWh Next 87,000 11.9719¢ per kWh Over 90,000 10.9120¢ per kWh Next 275 kWh per kW billing demand per month First 6000 9.1415¢ per kWh Next 134,000 7.7196¢ per kWh Over 140,000 6.7271¢ per kWh All over 400 kWh per kW billing demand All kWh 6.4722¢ per kWh
This rate is not subject to Billing Demand, however the Power Factor Correction applies as outlined above. The calculation of Minimum Bill for General Service 5-GB shall be the bill calculated on the applicable rate including the Basic Facilities Charge and Energy Charge, but the bill shall not be less than the Basic Facilities Charge.
GENERAL SERVICE, ALL ELECTRIC 6-GA Availability:
Available only to establishments in which environmental space conditioning is required and all energy for all such conditioning (heating and cooling) is supplied electrically through the same meter as all other electric energy used in the establishment. However, if any such establishment contains residential housekeeping units, all energy for all water heating and cooking for such units is also supplied electrically.
Basic facilities charge $18.20
Plus demand charge First 30 kW of billing demand per month No charge All over 30 kW billing demand per month $3.77/kW
Plus energy charge First 125 kWh per kW billing demand per month April-Nov December-March First 3,000 12.0344¢ per kWh 11.7112¢ per kWh Next 87,000 7.4726¢ per kWh 7.2846¢ per kWh Over 90,000 7.2417¢ per kWh 7.0607¢ per kWh Next 275 kWh per kW billing demand per month First 6,000 7.1607¢ per kWh 6.9821¢ per kWh Next 134,000 6.4328¢ per kWh 6.2758¢ per kWh Over 140,000 6.2018¢ per kWh 6.0517¢ per kWh Next 400 kWh per kW billing demand per month All kWh 6.0863¢ per kWh 5.9395¢ per kWh
This rate is subject to the Minimum Bill requirement and the Power Factor Correction as outlined above. The Billing Demand each month for this rate schedule shall be the largest of the following:
The maximum integrated thirty-minute demand measured during the month for which the bill is rendered Fifty percent (50%) of the maximum integrated thirty-minute demand in the previous 12 months including the month
for which the bill is rendered Fifty percent (50%) of the contract demand 15 Kilowatts (KW)
INDUSTRIAL SERVICE 7-I
Availability:
Available only to establishments classified as "Manufacturing Industries" by the North American Industrial Classification System (NAICS) Manual published by the Executive Office of the President, Office of Management and Budget, National Technical Information Service, U. S. Department of Commerce (most current edition).
Basic Facilities Charge $19.30
Plus demand charge
First 30 kW of billing demand per month No charge Over 30 kW billing demand per month $3.80 per kW
Plus energy charge
First 125 kWh per kW billing demand per month First 3,000 11.5251¢ per kWh
262

Next 87,000 7.0911¢ per kWh Over 90,000 6.9151¢ per kWh Next 275 kWh per kW billing demand per month First 140,000 6.0471¢ per kWh Over 140,000 5.8651¢ per kWh Over 400 kWh per kW billing demand per month All kWh 5.6751¢ per kWh
This rate is subject to the Minimum Bill requirement and the Power Factor Correction as outlined above. The Billing Demand each month for this rate schedule shall be as follows:
The Billing Demand each month shall be the largest of the following: The maximum integrated thirty-minute demand in the previous 12 months including the month for which the
bill is rendered Fifty percent (50%) of the Contract Demand 30 kilowatts (KW)
BUILDING CONSTRUCTION SERVICE 9-BC
Availability:
Available only as temporary service to builders for use in construction of buildings or other establishments, which will receive, upon completion, permanent electric service from the City. This Schedule is not available for permanent service to any building or other establishment, or for service to construction projects of types other than those described above. This Schedule is not available to owner-occupied dwellings. This Schedule is not available to rock crushers, asphalt plants, carnivals, fairs, or other non-permanent connections. Such service will be provided on the City's General Service Schedule.
Basic Facilities Charge $18.54 First 50 kWh per month 9.3905¢ per kWh Over 50 kWh per month 7.5070¢ per kWh This rate is not subject to Billing Demand or Power Factor Correction. The Minimum Bill requirement is $10.67 per month. Other Charges:
There will be no charge for connection and disconnection of the temporary service if the builder accepts delivery at a point where the City deems such delivery feasible; otherwise, there will be a charge as follows: Overhead service conductors, transformers and line extensions necessary to serve such requirements will be erected and dismantled at actual cost subject to credit for facilities which may remain in permanent service. The actual cost shall include payroll, transportation, and miscellaneous expense for both erection and dismantling of the temporary facilities, plus cost of material used, less the salvage value of the material removed.
TIME OF USE AND MISCELLANEOUS RATES: GENERAL SERVICE TOU
Availability:
This schedule is available only to non-residential Customers requiring electrical loads having a demand greater than or equal to 100kW during at least three months of a twelve-month period and an average annual load factor of at least 55%. Service under this Schedule should be used for a Customer with a single enterprise located entirely on a single, continuous premise.
Basic facilities charge $46.22
Demand Charge Summer Months Winter Months June-Sept. Oct.-May
On-Peak Demand Charge per month $13.29 per KW $8.67 per KW Economy Demand Charge $ 1.16 per KW $1.16 per KW
Energy Charge All On-Peak Energy per month 8.6719¢ per kWh 8.4153¢ per kWh All Off-Peak Energy per month 5.2081¢ per kWh 4.9515¢ per kWh
On-Peak and Off-Peak Hours Summer Months Winter Months June-Sept. Oct.-May On-Peak Period Hours 1:00 p.m. – 7:00 p.m. 6:00 a.m.–9:00 a.m. Monday-Friday Monday-Friday
263

Off-Peak Period Hours All other weekday hours and all Sunday and Saturday hours.
This rate is subject to Billing Demand, Minimum Bill and Power Factor Correction as outlined below. The Billing Demand each month for this rate schedule shall be calculated by combining the following two Billing Demands, Economy and On-Peak:
The On- Peak Billing Demand each month shall be the largest of the following: The maximum integrated thirty-minute demand measured during the on peak period during the month for which
the bill is rendered 15 kilowatts (KW)
The monthly Economy Demand shall be defined as the difference between the monthly off-peak demand and the monthly on-peak demand. The monthly Economy Demand shall not be less than zero.
Minimum Bill: The Minimum Bill shall be the bill calculated on the rate above, including the Basic Facilities Charge, Demand Charge and Energy Charge. Power Factor Correction: When the average monthly power factor of the Customer’s power requirements is less than 85 percent, the City may correct the integrated demand in kilowatts for that month by multiplying by 85 percent and dividing by the average power factor in percent for that month.
INDUSTRIAL SERVICE TOU
Availability: This schedule is available only to Industrial Customers requesting electric service having loads with a demand greater than or equal to 100kW during at least three months of a twelve-month period and an average annual load factor of at least 55%. Service under this Schedule should be used for a Customer with a single enterprise located entirely on a single, continuous premise.
Basic facilities charge $47.09
Summer Months Winter Months
Demand Charge June-Sept. Oct.-May On-Peak Demand Charge per month $12.95 per KW $8.24 per KW Economy Demand Charge $ 1.18 per KW $1.18 per KW
Energy Charge All On-Peak Energy per month 8.9654¢ per kWh 8.8235¢ per kWh All Off-Peak Energy per month 5.1312¢ per kWh 4.9891¢ per kWh
On-Peak and Off-Peak Hours Summer Months Winter Months
June-Sept. Oct.-May On-Peak Period Hours 1:00 p.m.–7:00 p.m. 6:00 a.m.–9:00 a.m. Monday-Friday Monday-Friday Off-Peak Period Hours All other weekday hours and all Sunday and Saturday hours.
This rate is subject to Billing Demand, Minimum Bill, and Power Factor Correction as outlined below. The Billing Demand each month for this rate schedule shall be calculated by combining the following two Billing Demands, Economy and On-peak:
The On- Peak Billing Demand each month shall be the largest of the following: The maximum integrated thirty-minute demand measured during the on peak period during the month for which
the bill is rendered 15 kilowatts (KW)
The monthly Economy Demand shall be defined as the difference between the monthly off-peak demand and the monthly on-peak demand. The monthly Economy Demand shall not be less than zero.
Minimum Bill: The Minimum Bill shall be the bill calculated on the rate above, including the Basic Facilities Charge, Demand Charge and Energy Charge. Power Factor Correction: When the average monthly power factor of the Customer’s power requirements is less than 85 percent, the City may correct the integrated demand in kilowatts for that month by multiplying by 85 percent and dividing by the average power factor in percent for that month.
264

LARGE GENERAL INDUSTRIAL SERVICE TOU
Availability: Available only to non-residential loads with a demand greater than or equal to 2000 kW during at least four months of a twelve-month period. Service under this Schedule should be used for a Customer with a single enterprise located entirely on a single, contiguous premise.
Basic facilities charge $46.22
Summer Months Winter Months
Plus Demand Charge June 1 -Sept.30 Oct 1 –May 31 On-Peak Demand Charge per month $52.81 per KW $0.00 per KW Economy Demand Charge $ 1.05 per KW $1.05 per KW
Energy Charge All Energy per month 2.9887¢ per kWh 2.9887¢ per kWh
On-Peak and Off-Peak Hours Summer Months Winter Months June 1 -Sept.30 Oct. 1 – May 31 On-Peak Period Hours 2:00 p.m.–6:00 p.m. None Monday-Friday
Off-Peak Period Hours All hours except the hours of 2 p.m. to 6 p.m. during June 1 – September 30, Monday through Friday. .
This rate is subject to Billing Demand, Minimum Bill, Power Factor Correction, Annual Demand Surcharge, and Rate Adjustment as outlined below. The Billing Demand each month for this rate schedule shall be calculated by combining the following two Billing Demands, Economy and On-peak:
The On- Peak Billing Demand each month shall be the largest of the following: The maximum integrated one hour demand measured during the on peak period during the month for which
the bill is rendered 15 kilowatts (KW)
The monthly Economy Demand shall be defined as the difference between the monthly off-peak demand and the monthly on-peak demand. The monthly Economy Demand shall not be less than zero. In the winter months where there is no peak demand charge, the charge for demand during these months will be at the economy demand rate.
Minimum Bill: The Minimum Bill shall be the bill calculated on the rate above, including the Basic Facilities Charge, Demand Charge and Energy Charge. Power Factor Correction: When the average monthly power factor of the Customer’s power requirements is less than 85 percent, the City may correct the integrated demand in kilowatts for that month by multiplying by 85 percent and dividing by the average power factor in percent for that month. Annual Demand Surcharge - When the customer KW demand at the Duke peak is higher than the average KW demand billed during the on Peak period, the annual demand surcharge will be applied to the customer’s bill. Rate Adjustment - This rate will be adjusted every January 1 to include increases or decreases in the City of Concord wholesale purchase power cost.
RESERVE CAPACITY RATE
Availability: Applicable for any Customer who wishes to sell energy produced by a qualifying renewable energy generator to a Utility other than the City of Concord. Customers who utilize any part of the City of Concord’s delivery system to wheel the Customer’s renewable energy must comply with the City of Concord’s Interconnection Policy and shall pay this Rate for Reserved Capacity on the City’s system. The Customer shall compensate the City of Concord each month for Reserved Capacity at the sum of the applicable charge set forth below.
Monthly Delivery: $1.15/KW of Reserved Capacity per month
UNDERGROUND INSTALLATION FEES:
SECONDARY SERVICES (UP TO 480V) Service to Mobile Home $299.68 Underground Secondary installed to a second service on the same lot $9.50 per ft. Change of Service from overhead to underground $9.50 per foot plus cost of early retirement of overhead facilities.
265

PRIMARY SERVICES (UP TO 12,470V) Single phase primary service installed to a single residential customer $12.10 per ft. Three phase primary service installed to a single residential customer $17.86 per ft.
COMMERCIAL AND INDUSTRIAL ENERGY ASSESSMENT PROGRAM Through a partnership with ElectriCities, the City of Concord can provide an energy assessment program for our commercial and industrial customers. Fees for each assessment will vary depending on the scope of work. Please contact the Electric Systems Department at 704-920-5303 for more information.
ELECTRIC METER TEST Test within 12-month period of any prior tests
and no abnormality detected $50.00 ELECTRIC METER BASE FEE
The City of Concord will only connect to electric meter enclosures that are furnished by the City of Concord. All descriptions and fees that are affected are listed below. Payments for meter enclosure will be made at 26 Union St., S. (Customer Service Department). All meter bases must be picked up from the Warehouse Department at the Alfred M. Brown Operations Center located at 850 Warren C. Coleman Blvd. (accompanied by a receipt).
200 amp single-phase overhead/underground $104.00 400 amp single-phase overhead/underground $201.00 200 amp poly-phase (3 phase) overhead/underground $134.00 400 amp poly-phase (3 phase) overhead/underground $254.00 200 amp single-phase underground mobile home pedestal $316.00
DOWNTOWN EVENT POWER SERVICE FEE
Organizations sponsoring events in the downtown area may use the electric service point(s) to power equipment. The fee covers the cost of power and labor to cut the service on and off. Payment should be submitted to the Chief of Police with the Parade/Demonstration/Assembly Permit Application. Use fee for downtown event service point(s) $ 40.00
For billing questions, contact Customer Service at 704-920-5200. For questions about rates, contact the Electric Department at 704-920-5320. ENGINEERING
Water permit application review $200.00 Wastewater permit application review $480.00 Driveway Permit Application Fee (Commercial Applications and Residential Additional Driveway or Relocation) $50.00
Master Utility Permit Agreement $250.00 FIRE DEPARTMENT REQUIRED CERTIFICATE OF COMPLIANCE
Certificate of Compliance 1- 20,000 SF $ 50.00 20,000-50,000 SF $100.00 50,000-70,000 SF $200.00
***** Space greater than 70,000 SF is calculated by total SF x .0025
Certificate of Compliance Re-inspections $ 50.00 Plans Review $ 50.00 + .025/SF Upfit review $ 50.00 + .025/SF Site Plan $ 50.00 Re-review fee (applied on 3rd submittal $ 50.00 & each resubmittal thereafter) Hydrant flow test (fee per hydrant) $150.00 Temporary Power Inspection $50.00
Load Merchandise Inspection $50.00 NOTES:
(1) For multi-tenant building, fees are per tenant. (2) For multiple building owned by the same owner(s)/developers, fees are assessed per building. (3) Individuals or companies that have not secured permits or Certificates of Compliance prior to beginning
work or occupying the structure shall be charged double the listed amount. (4) Re-inspections of the Sprinkler System, Fire Alarm System, or building for Certificate of Compliance will
result in an additional fee per inspection.
266

REQUIRED CONSTRUCTION PERMITS Permit Fee Test Fee
Automatic Fire Extinguishing Systems (Ansul/Sprinkler) $150.00 $150.00 ** Compressed Gases $150.00 $150.00 Fire Alarm & Detection Systems $150.00 $150.00 ** Fire Pumps $150.00 $150.00 Flammable & Combustible liquids $150.00 $150.00 Hazardous Materials $150.00 $150.00 Industrial Ovens $150.00 $150.00 Private Fire Hydrants $150.00 $150.00 Spraying or Dipping Operations $150.00 $150.00 Standpipe Systems $150.00 $150.00 Temporary Membrane Structures, Tents, Canopies $ 50.00 + .01/SF $ 0.00 NOTE: Any system installation prior to plan review and/or permit being issued will incur a double fee. ** Any structure over 70,000 SF x .002 + $150.00 (DOES NOT INCLUDE HOOD SYSTEM/ANSUL)
REQUIRED OPERATION PERMITS
Amusement Buildings $ 150.00 Carnivals, Fairs, and Outdoor Concerts $ 300.00 Covered Mall Buildings $ 150.00 Exhibits and Trade Shows $2,500.00/yr or $150.00/event Explosives (Blasting) $ 100.00/1-day or $300.00/90-days Liquids Use, Dispensing, Storage, Transportation $ 150.00 UGST/AGST Install, Alter, Remove, Abandon $ 250.00/site
Change in Liquid in Tanks $ 150.00 Manufacture or Process Liquids $ 150.00 Liquid Dispensing – AGST/UGST to Vehicles $ 150.00 Liquid Dispensing – Tanker to Vehicles $ 150.00 Fumigation and Insecticidal Fogging $ 300.00 Vehicles in Assembly Buildings $ 150.00 Private Fire Hydrants $ 150.00 Pyrotechnic Special Effects Material/Fireworks $ 300.00/day & site Spraying or Dipping $ 150.00 Tents & Canopies $ 50.00 + .01/SF
REQUIRED OTHER CHARGES/FEES
Dedicated Non-Emergency Services of Fire Personnel and Equipment: Appropriate personnel and apparatus necessary for a requested or required service will be determined by the Fire Chief. A written agreement of the supplemental service will be in place prior to CFD providing any services. Fire Personnel: Rank/Band Required for Duty (Hourly rate or portion of any hour, two-hour minimum charge) Firefighter $ 19.76/ hr per person Lieutenant/Engineer/Specialist $ 25.55/ hr per person Fire Captain $ 35.04/ hr per person Battalion Chief (Operations) $ 38.99/ hr per person Battalion Chief (Prevention/Emergency Management/Training) $ 54.54/ hr per person Assistant Fire Marshal $ 30.23/ hr per person Assistant Deputy Fire Marshal $ 42.44/ hr per person Deputy Chief $ 63.06/ hr per person Fire Chief $ 81.27/ hr per person Equipment: Ladder Truck (Aerial or Platform) $125.00 per hour Engine (Pumper) $ 95.00 per hour Hazardous Material Unit $ 95.00 per hour ARFF Unit $ 95.00 per hour Heavy Rescue $ 95.00 per hour Mobile Command Unit/Bus $ 30.00 per hour USAR Unit $ 30.00 per hour Light Vehicles (Cars/Pick-ups) $ 17.00//$27.00 per hour Trailers $ 10.25 per hour Mules/ATV $ 8.00 per hour Other Services: Environmental Site Assessment Research $25.00 per hour (one hour minimum) Fire Flow request/Special Request (fee per hydrant) $100.00/hydrant After Hours Inspection Review – Special Request $ 35.00/hr (minimum of 2 hours) After Hours Plan Review – Special Request $ 150.00/submittal Other inspections by request – Special Request $100.00 Re-inspections (3rd visit or additional inspections) $ 50.00
267

State License Inspection Fee $100.00 Daycare License Inspection Fee $ 75.00 Group Home License Inspection Fee (annually) $ 75.00 Foster License Inspection Fee (annually) $ 20.00 (2nd visit $50.00) Fire Incident Report Copy (s) $ 1.00 (per report) Complete Fire Incident Report Copy (s) on CD $ 25.00 (per CD) Community Rooms (Fire Stations 3, 7, 8, and 9) Rental fee $25.00/per hour City resident; $30.00/per hour (Non-
City resident) Community Rooms (refundable deposit/clean-up fee) $ 50.00 deposit
Charitable, non-profit, governmental – exempt, deposit/clean up fee $ 50.00 deposit Fire extinguisher recharge use for class Current Market Rate per Extinguisher Fire Extinguisher Program (Training Class) $ 50.00/On-site Class at Fire Station #3 Fire Extinguisher Program (Training Class) $ 75.00/Off-site Class at Requested Business
FINES BY VIOLATION
Knox Box $500.00/day (may be issued after 75 days and 3 written notices)
Burning without a Permit- Residential $50.00 (1st offense); $100.00 (2nd offense) (may be issued after one written notice)
Burning without a Permit- Commercial $500.00/stack or pile (1st offense); $1,000.00/stack or pile (2nd offense) (no notice required)
Code of Ordinances-Chapter 10 Violation $500.00/day (may be issued w/o notice, usual practice is after 75 days and three written notices)
Locked Exit / Exit Obstruction $500.00 (1st offense); $1,000.00 (2nd offense) (may be issued w/o notice, in usual practice, verbal and written warnings precede citation)
Fire Detection / Protection $250.00 (1st offense); $500.00/day for any recurring violation (may be issued w/o notice, in usual practice, verbal and written warnings precede citation)
NOTE: Assembly, Hazardous, Institutional Systems must be in service at all times or immediate fire watch provided or shut down and fine; All others a fire watch must be provided in a reasonable period of time and maintained.
Access During Construction $1,000.00/day (May be issued w/o notice, in usual
practice, verbal and written warnings precede citation.)
Occupancy without COC $1,000.00/day (May be issued w/o notice, in usual practice, verbal and written warnings precede citation.) (Issued immediately for new structures and after 45 days for existing, disconnection of utility service may be used in lieu of fines.)
General Violation $100.00 (Issued after 45 days and three written Notices - issued per item and not violation
False Alarm > 3 per 90 days $250.00 (May be issued w/o notice, in usual practice, issued on fourth violation within 90 days after one written notice on the third violation. Alarms in rapid succession are considered an individual occurrence.)
Fire Lane Parking Violations $100.00 (May be issued w/o notice when vehicle is not occupied.)
Key Box Maintenance $100.00 (May be issued w/o notice when Knox box is found to contain no key or incorrect key. In usual practice one written warning precedes citation.)
Overcrowding $500.00 (1st offense); $1,000.00 (2nd offense) (Issued at the time of violation after occupancy overcrowding conditions have been corrected. Third offense may constitute court proceedings. Offenses run calendar year.)
Permits Double Permit Fee (Charged for any permit for which work was done prior to permit being issued.)
Assault on a Fire Official The subjection of any authorized fire inspector to physical abuse during an inspection shall be fined $1,000.00 and/or a criminal offense of assault of $1,000.00 (If this charge is necessary leave the business/premises and notify Concord PD to respond to in initiate proceedings.)
Matters Not Provided For Any other violation of the fire code not specifically codified in Ch. 34 shall be fined $250.00 (the Bureau Chief shall be consulted prior to the levying of any fine using this as the reference.)
268

HAZARDOUS MATERIALS STORAGE FEES
Fee Solids (lbs) Liquids (gals) Gases (SCF) $ 50.00 < 501 < 56 < 201 $150.00 501-5,000 56-550 201-2000 $200.00 5,001-25,000 551-2,750 2,001-10,000 $250.00 25,001-50,000 2,751-5,500 10,0001-20,000 $300.00 50,001-75,000 5,501-10,000 20,001-40,000 $300.00/lb plus $0.01/addtl gal. or SCF > 75,000 > 10,000 > 40,000 NOTE: Excludes LPG/medical gases LPG (excluding LPG used only for heating and cooking) $150.00/tank Medical Gases $150.00/tank Radioactive Materials (any amount) $125.00
Hazardous Materials Reimbursement or Response fees are based on time and materials used per incident. Additional fees may be charged as recommended by the Emergency Management Coordinator.
FIRE INSPECTION PROGRAM TIME PERIODS AND PENALTIES 1st Inspection (Initial) $0.00 2nd Visit (After 30-days) Potential Civil Penalties 3rd Visit (After 30-days) Potential Civil Penalties 4th Visit (After 10-days) Civil Penalties & Fines Issued
5th Visit (After 10-days) Civil Penalties & Fines, plus Civil Action, Misdemeanor Charges
NOTE: Imminent danger/life safety violation citation will be issued at the time of inspection.
PARKS AND RECREATION RECREATION FEES
Adult: Open League Basketball (8 games) $375.00/team Other League Basketball (8 games) $375.00/team Over 40 League Basketball (8 games) $375.00/team Other League Softball (8 games) $375.00/team Open League Softball (8 games) $375.00/team Men’s Fall League Softball (8 games) $375.00/team Adult League Soccer (8 games) $375.00/team Women’s League Softball (8 games) $375.00/team Women’s League Basketball (8 games) $375.00/team Flag Football Co-Ed $375.00/team Couch to 5K $15.00/session Road Races Registration (5K & 10K) 5K $ 20.00; Early Registration $15.00 10K $ 20.00; Early Registration $15.00
Youth:
Youth Basketball $200.00/sponsor $35.00/child (City);
$55.00/child (All others) Youth Baseball/Softball (Spring/Fall) $225.00/sponsor
$35.00/child (City); $55.00/child (All others)
Youth Soccer $200.00/sponsor $35.00/child (City); $55.00/child (All others)
Karate (Ages 18 & Under) Free instruction – parents purchase uniforms Golf $ 40.00/Golf Club, plus $5.00 for driving range balls; $ 45.00/Rocky River, plus $4.50 for driving range
balls Tennis $ 15.00/hr for lessons
Various Programs:
Karate (monthly) $20.00/month (City); $25.00/month (All others) Fitness Classes-Various levels-Youth to Adult $ 3.00 to $90.00
Fitness - City Employees (any fitness class) $ 15.00/employee/session Fitness - Personal Trainer (individual rate) $35.00/hour (City); $40.00/hour (All Others)
Shag Lessons (4 weeks) $ 35.00 (City); $40.00 (All others) Pin Splitters $ 10.00 (City); $15.00 (All Others)
269

Summer Playground $375.00/(City); $530.00 (All others) per session Camp Spencer (1 week) $ 30.00 City; $35.00 (All others)
Trips $ 1.00 - $800.00/person/trip Identification Card First Card Free
Replacement Card $3.00/each
NOTE: Session = class period AQUATICS CENTER
Admission fees – Adults (18 and up) $ 2.50 Youth (17 and under) $ 1.50 Groups (1½ Hours of Use) $ 2.00/person (NOTE change from $1.00)
Swimming lessons $35.00 (City); $40.00 (All others) Individual Swimming Lessons (per ½ hour session) $15.00 (City); $20.00 (All others)
Parent/Child (2 yr and under) $15.00 (City); $20.00 (All others) Season Pass Family $75.00/pass (City); $100.00/pass (All others) Season Pass Individual $45.00/pass (City): $55.00/pass (All others)
Season Pass includes Privilege Pass and unlimited visits Privilege Badge- Individual (seasonal) $ 5.00/person (City); $10.00 (All others) Privilege Badge- Family (seasonal) $15.00/family (City); $30.00/family (All others) Water aerobics (6 weeks) $35.00 (City); $40.00 (All others) *Payment must be made at time of registration
The John F. McInnis Aquatic Center can be rented for private parties and special events. Option #1 Private Rentals (during closed hours), Fee is $75.00 for one hour and includes two lifeguards, which safely covers up to 50 guests. Additional lifeguards for numbers over 50 are $15.00 for each additional guard per hour; ratio of 1 guard to 25 patrons. Additional facility hours are $25.00 per hour/$50.00 Refundable Deposit. Option #2 Open Rentals (during regular operating hours) Fee is $25.00 and reserves tables, chairs and tent for your party. Regular admissions apply for the party and are payable at the time of entry; Ages 18+ up - $2.50/each; Ages 17 + under - $1.50/each/$50.00 Refundable Deposit.
RENTAL FEES Hourly Rate: City Residents Non City Residents
Meeting Room $10.00 $15.00 Gymnasium $50.00 $60.00 Recreation Center $100.00 $120.00 Community Buildings/Rooms $25.00 $30.00 Fire Station Community Rooms $25.00 $30.00 Picnic Shelters and Amphitheaters
$20.00/full day (City Residents) $25.00/half day or $35.00/full day (Non Residents) Half Day Time Periods are park opening to 2pm or 3pm to park closing Full Day Time Periods are park opening to park closing After Hours Staff Charge (All Facilities) is $15.00/staff person per hour (All users)
Fees are due in full when making reservation. Rentals will require a cleaning deposit of at least $50-$500.00 (as stated in policy). Police security could be required at some functions. Tennis Court reservations are available on a first come, first serve basis. These are available at no charge. However, reservations are recommended and should be made through the Athletic Office. Two Courts must be available to the public at all times.
$2.00/hr. for court reservations, for City residents, with or without lights. $3.00/hr. for court reservations for Non-city-residents, with or without lights.
Reservations for any league will be the same. Outdoor Basketball Courts – use is available on a first come; first serve basis. These are available at no charge. However, reservations are recommended to secure court and should be made through the Athletic Office.
$2.00/hr for court reservations for City residents, with or without lights. $3.00/hr for court reservations for Non-City residents, with or without lights.
Reservations for any league will be the same.
GREENWAY RENTAL FEE 6 Hour Rental Period for Road Races and Walks $350.00 plus $500.00 deposit
Event must be completed by 12 noon. Fee covers reservations of both McGee and Myers Park and all of their amenities. Also includes parking on the ball fields, mile markers, time clock and a Parks and Recreation Staff Liaison.
270

BALLFIELD RENTAL (Myers, McAllister, Gibson, WW Flowe, Hartsell, Caldwell & Webb) Weekdays/Weekends
Lights Only $20.00/hour (City); $25.00/hr (all others) Reserve Field (no lights/no lines) $15.00/hour (City); $20.00/hr (all others) Reserve field 1-hour -line off $35.00 (City); $40.00 (all others) Reserve field 1-hour -line off with one hour lights $55.00 (City); $65.00 (all others) Reserve field 2 hours -line off with two hour lights $90.00 (City); $110.00 (all others) Reserve for Tournaments** $150.00 per field Reserve for Spectator Event** $200.00 per field
NOTE: Rates the same regardless of weekday or weekend ** To reserve a field for either a Tournament or a Spectator Event requires a cleaning deposit ranging from $50.00 to $500.00, depending on the nature of the event and recommendation of the Parks & Recreation Director, and a 15% commission paid to the City of Concord from any revenues from the event.
SOCCER FIELD (Dorton, Caldwell Park, WW Flowe, Irvin Elementary) Reserve Field 1 hour – not lined off $20.00/hour (City); $25.00/hour (all others) Reserve Field 1 hour – lined off $65.00 (City); $70.00 (all others) Reserve Field 2 hours – lined off $120.00 (City); $140.00 (all others) NOTE: We do not have lighted soccer fields.
LAKE FISHER
Boat rental Fees: all rates per person Children under 12 FREE with a licensed paying fisherman Adults $5.00 (City); $10.00 (All others) Sr. Citizens (60+) $5.00 (City); $ 8.00 (All others) Youth 12-16 $5.00 (City); $ 8.00 (All others)
PLANNING AND NEIGHBORHOOD DEVELOPMENT APPLICATIONS FOR COMMISSIONS AND/OR COUNCIL REVIEW
Voluntary Annexation Petition $300.00 Text Amendment Fee $400.00 Vested rights certification $400.00 Appeal from a Final order, Decision or Interpretation $500.00 Certificate of Appropriateness $ 20.00 Variance and Appeals $500.00 Rezoning/Amendments to conditional district $600.00 Second Rezoning/Amendment in less than 12 months $800.00 Land use plan amendment $400.00 Conditional district $800.00 Special use permit $600.00 Historic District Map Amendment $350.00 Street, Alley or Right-of-way closing $300.00
Certification of Non-Conformity Adjustment $400.00 Re-advertisement Fee $300.00 PUBLICATIONS Historic Handbook & Guidelines $ 10.00 PERMITS NOTE – A 5% technology fee is added to each of the following permit fees: New Construction (Zoning Clearance Approval/Permit): Single Family $100.00 Multi-family (5 units or less) $100.00 + $10.00/unit Multi-family (more than 5 units) $300.00 or $0.04/sf whichever is greater Commercial $300.00 or $0.04/sf whichever is greater Industrial $75.00 for 1st acre impervious $500.00 for every additional impervious acre $100.00 for every acre pervious Grading/Paving/Land Disturbing Approval Permit: $200.00 less than 1 acre $400.00 1-5 acres $600.00 over 5 acres Flood Study Review Permit: $500.00 Additions, Accessory, Up fits (Zoning Clearance Approval/Permit): Residential $ 40.00 Commercial Addition/Accessory $100.00 or $0.03/sf whichever is greater Commercial Up fit $100.00
271

Industrial Addition/Accessory $225.00 or $0.03/sf whichever is greater Industrial Up fit $100.00
Certificate of Compliance (final approval/acceptance for all non-residential projects) $100.00 Temporary Permits: Temporary Construction Trailer $100.00
Temporary Use Permit $100.00 Temporary Power Compliance $ 50.00 (fire fee may apply) Sign Permits: Wall Mounted, Projecting, or Canopy $ 60.00 Temporary Sign/Banner $ 25.00 Ground Mounted $140.00 Outdoor Advertising $500.00 Change of Panel $ 40.00
Miscellaneous: Home Occupation Permit $ 50.00 Change of Use Permit $ 50.00
Architectural Review Permit (shopping centers) $ 50.00 Re-review (after 3 submittals) $ 50.00+$0.01/sf of site Zoning Verification Permit/ABC letter $ 50.00 Certificate of Non-Conformity Permit $100.00 Fine for Construction without a permit Double permit fee Permit Renewal $ 40.00
PLATS Subdivisions: Preliminary Plat (new submittals) less than 2 acres $100.00 2-10 acres $200.00 10-25 acres $300.00 over 25 acres $400.00 Preliminary Plat Extensions $100.00 Construction Plans less than 2 acres $175.00 2-10 acres $400.00 10-25 acres $500.00 over 25 acres each additional acre $ 50.00 Final Plat Review
less than 2 acres $ 80.00 2-10 acres $125.00 GIS FEES
Digital files: GIS Data on CD (ESRI format) $20.00
GIS layers (ESRI format) $ 5.00 Maps:
GIS Map – 11” X 17” or “18” X 24” $ 1.00 GIS Map – 24” wide $ 5.00 GIS Map – 30” wide $10.00 GIS Map – 36” wide $15.00
GIS Map – 42” wide $20.00 Folded road map $ 3.00 each
Printing: Subdivision Listing $ 3.00 each Street Listing $ 3.00 each GIS Miscellaneous: Custom Request $40.00/hr
NOTE: Prices include sales tax.
MISCELLANEOUS House plans for homes constructed by the City $50.00/set Land Use Plans $30.00
POLICE
Parking Fine Single Violation $10.00 1-5 Violations Annually $10.00 each
6-10 Violations Annually $20.00 each Over 10 Violations Annually $40.00 each Cruising Fine $50.00 Copy Fee $ 1.00
272

Fingerprinting fee (includes 1 card) $10.00 $ 5.00 each additional card
Application Processing Fee for City-Sponsored Festival, $50.00 Private Alcohol Sales
Downtown Event Power Service Fee Events requiring electric service subject to fee as published in Electric Department Miscellaneous Rates. Fee collected by Chief of Police at time of application for Parade/Demonstration/Assembly Permit.
Alarm Ordinance Fees Alarm Permit $ 10.00 per location Penalty for Failure to Obtain Permit $200.00 for each False Alarm Penalty for Prohibited Acts as defined by the Ordinance $200.00 per occurrence Penalty for Operating an Alarm without Permit $200.00
Civil Penalties for False Alarms within Permit Year Third, fourth, and fifth False Alarm $ 50.00 per occurrence Sixth and seventh False Alarm $100.00 per occurrence Eighth and ninth False Alarm $250.00 per occurrence Tenth and over False Alarm $500.00 per occurrence, revocation of Alarm Permit Reinstatement of a revoked Permit $100.00
Precious Metal Dealer Permit
SBI Processing prints $ 38.00 Concord Police Fingerprinting fee $ 10.00 Application/permit issuance fee $180.00 Employee Permit fee $ 3.00 Special Occasion Permit fee $180.00 Exemption Permit fee $ 5.00 Video Recording Public Record Request $15.00 per public/media request for video Secondary Employment Application Processing Employer – single event $5.00 per application Employer – continuous event* $50.00 each annual application
*Requests off-duty officer(s) on an annual basis, continuous either daily, weekly, or monthly. Secondary Employment Coordinator may waive fee for charitable organizations, churches, and non-profits.
CODE ENFORCEMENT
Vacant lot cleaning Actual Cost from Contractor
Civil Penalties: General code enforcement penalty $500.00 Code non-compliance penalty $175.00
Civil penalty for failure to respond or pay general code enforcement penalty within 15 days $100.00
Minimum Housing Fees:
Inspection Fees: Each inspection after first inspection $100.00 Each inspection following failure to remedy a violation after the issuance of a citation $325.00
Each additional inspection disclosing any violations
within the same 12 month period $625.00 Other Fees:
Property owner shall be charged for any additional costs incurred in prosecuting an enforcement action on the property including but not limited to any publication costs for legal notices.
Civil Penalty: Civil penalty, per violation per day, for each and every subsequent day that the dwelling unit remains in
violation and until such time as the responsible party schedules an inspection resulting in a finding that the violations are corrected. $200.00
273

ROCKY RIVER GOLF CLUB AT CONCORD* IN-SEASON RATES (APRIL 1 – NOVEMBER 28) DISCOUNTS NOT TO EXCEED $20.00 FROM PUBLISHED RATES, NO PROMOTIONAL RATE IS TO BE LESS THAN CONCORD RESIDENT RATE. INCREASES NOT TO EXCEED $5.00 FROM PUBLISHED RATES, AS MARKET CONDITIONS ALLOW. Mon-Thurs Friday Sat-Sun Cart Fee, included in all rates (except Walking/Juniors) $14.00 $14.00 $14.00 Eighteen Hole (Includes Cart) $49.00 $59.00 $69.00 Nine Hole (A) $29.00 $33.00 $37.00 Eighteen Hole – Concord Resident $42.00 $49.00 $59.00 Nine Hole (A) – Concord Resident $24.00 $27.00 $32.00 Twilight (B) $36.00 $44.00 $47.00 Senior (C)/College (D)/Public Service (E)/Ladies Day (Tues) $35.00 $39.00 N/A Juniors (F) $27.00 $30.00 $32.00 Junior Nine Hole (on Availability) $15.00 $16.00 $17.00 Walking (G) $37.00 $45.00 $55.00 Corporate League Play (H) $25.00 N/A N/A Replay Round (on Availability) $28.00 $28.00 $28.00 Replay Round – Nine Hole (on Availability) $20.00 $20.00 $20.00 WINTER RATES (NOVEMBER 29 – MARCH 31) DISCOUNTS NOT TO EXCEED $20.00 FROM PUBLISHED RATES, NO PROMOTIONAL RATE IS TO BE LESS THAN CONCORD RESIDENT RATE. INCREASES NOT TO EXCEED $5.00 FROM PUBLISHED RATES, AS MARKET CONDITIONS ALLOW. Mon-Thurs Friday Sat-Sun Cart Fee, included in all rates (except Walking/Juniors) $14.00 $14.00 $14.00 Eighteen Hole $44.00 $47.00 $52.00 Nine Hole (A) $25.00 $28.00 $33.00 Eighteen Hole – Concord Resident $34.00 $37.00 $42.00 Nine Hole (A) – Concord Resident $22.00 $24.00 $28.00 Twilight (B) $30.00 $35.00 $42.00 Senior (C)/College (D)/Public Service (E)/Ladies Day (Tues) $30.00 $30.00 $40.00 Juniors (F) $25.00 $25.00 $30.00 Junior Nine Hole (on Availability) $15.00 $15.00 $15.00 Walking (G) $32.00 $35.00 $40.00 Corporate League Play (H) $25.00 N/A N/A Replay Round (on Availability) $25.00 $25.00 $25.00 Replay Round – Nine Hole (on Availability) $15.00 $15.00 $15.00 (A) On availability, 9 Holes riding must be after 1pm on weekends (B) Twilight Rates apply: April through October after 2:00 PM. Concord residents receive $5 off. (C) Seniors ( 60+) Concord residents receive $3 off. (D) College (with proper ID) (E) Public Service (Active duty military, police, fire and ems personnel with proper ID) (F) Juniors (17 years and under with proper ID, Parent/Guardian required before 2pm). Carts not offered without a current license.
Concord residents receive $3 off. (G) Walking is permitted anytime Monday thru Thursday, and after 3:00 PM (In-Season) and after 1:30 PM (Winter) Fri thru Sun. (H) Corporate League play is permitted Tuesday thru Thursday after 3:00 PM and includes riding for nine holes only. GROUP / TOURNAMENT RATES Group Tournament rate range of $35 - $85 applies to all seasons.
Golf Course staff will set rate dependent upon prime play times, tournament sponsor (e.g. Charity-501c, Non-Charity or Corporate) and contracted performance (e.g. food, beverages and merchandise)
ANNUAL GOLF PLAN PROMOTIONS - (ANNUAL GOLF PLANS EXPIRE ONE YEAR FROM DATE OF PURCHASE AND ARE NON-REFUNDABLE) Eagle Plan: Individual & Family: Available to individual and spouse Non-Resident $2,500.00 Add spouse $1,000.00 Add dependent* $ 375.00 Resident $2,125.00 Add spouse $ 850.00 Add dependent* $ 575.00
Benefits: Unlimited complimentary green fees any time. Complimentary range balls (up to 1 large bag per day). Priority accesses to tee-times. Plan participants may
reserve tee times up to 10 days in advance. 10% discount on merchandise, except sale items. 10% discount on food purchases. Complimentary USGA Handicap Service.
274

Corporate – eligible Employees and Owners Non-resident Corporation - City of Concord First participant $1,800.00 Second participant (15% discount) $1,530.00 Third participant (20% discount) $1,440.00 Fourth participant (25% discount) $1,350.00 Fifth and all additional participants (30% discount) $1,260.00
Transfer fee $ 250.00 Resident Corporation - City of Concord First participant $1,500.00 Second participant (15% discount) $1,275.00 Third participant (20% discount) $1,200.00 Fourth participant (25% discount) $1,125.00 Fifth and all additional participants (30% discount) $1,050.00 Transfer fee $ 250.00
Birdie Plan: Individual & Family Non-Resident $1,900.00 Add spouse $ 800.00 Add dependent* $ 375.00 Resident $1,615.00 Add spouse $ 680.00 Add dependent* $ 375.00 Benefits: Unlimited complimentary green fees Monday – Friday. Complimentary range balls (up to 1 large bag per day)
Monday – Friday. Priority accesses to tee-times. Plan participants may
reserve tee times up to 10 days in advance. 10% discount on merchandise, except sale items. 10% discount on food purchases. Complimentary USGA Handicap Service.
Corporate – eligible Employees and Owners Non-resident Corporation - City of Concord First participant $1,400.00 Second participant (15% discount) $1,190.00 Third participant (20% discount) $1,120.00 Fourth participant (25% discount) $1,050.00 Fifth and all additional participants (30% discount) $ 980.00 Resident Corporation - City of Concord First participant $1,150.00 Second participant (15% discount) $ 975.00 Third participant (20% discount) $ 920.00 Fourth participant (25% discount) $ 860.00 Fifth and all additional participants (30% discount) $ 805.00 Transfer fee $ 250.00
Bogey Plan: Available to Seniors, age 60 years and older Driving Range Plans:Individual & Family Non-Resident $1,125.00 Add spouse $ 625.00 Add dependent* $ 375.00 Resident $ 960.00 Add spouse $ 525.00 Add dependent* $ 375.00 Benefits: Unlimited complimentary green fees Monday – Friday. Complimentary range balls (up to 1 large bag per day)
Monday – Thursday. Priority accesses to tee-times. Plan participants may
reserve tee times up to 10 days in advance.
Individual & Family Non-Resident $675.00 Add spouse & dependent* $275.00 Resident $500.00 Add spouse & dependent* $250.00 Junior (18& under) $350.00 Benefits: Unlimited complimentary range balls any time. 10% discount on merchandise, except sale items. 10% discount on food purchases.
10% discount on food purchases. Complimentary USGA Handicap Service. 10% discount on merchandise, except sale items. *Dependents are defined as son, stepson, daughter, stepdaughter of participant. Dependent must be under the age of twenty two and attending school on a full time basis, or serving full time active duty in the armed forces. Evidence of a full time student will be required for all high school graduates. SOLID WASTE AND RECYCLING
RESIDENTIAL GARBAGE, RECYCLING, AND BULKY COLLECTION Yard Waste Removal (vacant lots zoned residential): < 2 cubic yards No Charge ≥ 2 cubic yards $25.00/cubic yd, $150 minimum Residential Yard Waste Removal
275

(As allowed by City Ordinance) No Charge Second Chance (Scheduled fee-based loose-leaf collection available after loose-leaf season ends) $75.00 [See Note 1] Bulky Waste Collection (At multi-family housing, business, $50.00 for 1 to 5 items, or any portion thereof and residential properties exceeding collection limits) Residential Garbage Rollout Containers No Charge (1st container); $9.00/month/container for
each additional container (Residents with additional containers must recycle; maximum of 3 containers per residence)
Residential Recycling Rollout Containers No charge for 1st or 2nd container, 2nd container only available after January 1, 2012 with Solid Waste Director approval.
Roll-off Container Service Fee (including disposal) NOTE – Available to Residential Customers Only (No Contractors please) 15 CY (2 Ton limit) $110.00 (includes pickup and delivery) 20 CY (3 Ton limit) $110.00 (includes pickup and delivery) 30 CY (5 Ton limit) $110.00 (includes pickup and delivery) 40 CY (6 Ton limit) $110.00 (includes pickup and delivery) Rental charge $10.00 per day Lost or damaged rollout container replacement $70.00 per 95 gal cart (Beyond normal wear & tear) $65.00 per 65 gal cart CODE ENFORCEMENT REMOVAL FEES Yard Waste Removal/ Code Enforcement Collection (where fees apply) $25.00/cubic yd, $150 minimum [See Note 2] Special Load Collection/Code Enforcement Cleanup $35.00/cubic yd, $450 minimum [See Note 3] Basketball Goal Removal from Public Right-Of-Way $225.00 first offense; $450 each repeat offense Discarded TV’s and Computer Equipment, $25.00 per item; $150 minimum (as defined in Note 4 based on NCGS § 130A-309.91). White Goods & Scrap Metal removal $25.00 per item, $150 minimum (fee applies only when collection is not consistent with ordinance) Auto or truck tire removal $25.00 each, $150 minimum (fee applies only when collection is not consistent with ordinance) NOTE 1: Second Chance Loose-leaf Collection Program provides a limited number of scheduled appointments available to Customers for $75.00 to collect loose-leaves placed at the curb after the end of loose-leaf season. These appointments are available on a first-come, first-served basis. Everyone else who places loose leaves to the curb will be required to bag their leaves or be subject to Code Enforcement action with removal fees beginning at $150. NOTE 2: Yard Waste Removal (where fees apply)/Code Enforcement Collection Fee applies to yard waste placed at the curb un-bagged (grass clippings, leaves after loose leaf season has ended, etc.), improperly bagged yard waste (black bags), or trees, tree limbs, brush and other materials cut or deposited by a commercial tree service, arborist or forester that are not to be collected by the City. NOTE 3: Special Load Collection/Code Enforcement Cleanup Fee applies to bulky waste/building materials/large trash piles placed at the curb that do not follow City guidelines or that exceed established limits for curb placement and do not utilize a roll-off container. Examples are loose material (clothes, insulation or other building material, etc.) dropped at the curb, failure to bag material in clear bags, debris piles in excess of 4 cubic yards or total volume of materials exceeding 10 cubic yard size limit (10 rollout cart size pile), and placing material at the curb without scheduling or without using a roll-off container. These situations are subject to Code Enforcement Action. NOTE 4: COMPUTER EQUIPMENT. – Any desktop central processing unit, any laptop computer, the monitor or video display unit for a computer system, and the keyboard, mice, and other peripheral equipment. Computer equipment does include a printing device such as a printer, a scanner, a combination print-scanner-fax machine, or other device designed to produce hard paper copies from a computer. Computer Equipment does NOT include an automobile; a television; a household appliance; a large piece of commercial or industrial equipment, such as commercial medical equipment, that contains a cathode ray tube, a cathode ray tube device, a flat panel display, or similar video display device that is contained within, and is not separate from, the larger piece of equipment, or other medical devices as that term is defined under the federal Food, Drug, and Cosmetic Act. NOTE 5: Residents who place or leave their garbage containers and recycling containers on the street in violation of this policy shall receive a warning sticker for the first offense. Second or future violations will result in a twenty-five dollar ($25.00) citation
TELEVISION. – Any electronic device that contains a tuner that locks on to a selected carrier frequency and is capable of receiving and displaying of television or video programming via broadcast, cable, or satellite, including, without limitation, any direct view or projection television with a viewable screen of 9 inches or larger whose display technology is based on cathode ray tube (CRT), plasma, liquid crystal (LCD), digital light processing (DLP), liquid crystal on silicon (LCOS), silicon crystal reflective display (SXRD), light emitting diode (LED), or similar technology marketed and intended for use by a consumer primarily for personal purposes. The term does not include computer equipment.
276

COMMERCIAL WASTE
Effective March 1, 2001, this ordinance applies to all business, commercial, office, multi-family housing, industrial and institutional segments including schools, churches, day care centers, and non-profit organizations.
CITY COMMERCIAL ROLL OUT CUSTOMERS
Commercial Rollout Service $20.00/cart/month a. Service performed by Waste Pro. b. City to bill for carts on utility bills per city policy c. Roll out must be approved by Solid Waste Services Director d. Limit of (3) carts per building or number set by Solid Waste Services Director e. Only City carts may be used f. Residential recycling rollout cart service is available to customers subscribing to City-provided Commercial Garbage
Rollout Service. Limit one recycling cart per rollout subscription with Solid Waste Director’s approval. g. Rollout Container at curb after Collection Day $25.00 per 95 gallon cart
WE NO LONGER PICK UP OR MAINTAIN THE BICENTENNIAL LOT DUMPSTER
Qualifications for Commercial Rollout Cart Service: Commercial generators operating out of houses or storefront buildings may request rollout container service where dumpster service is not available or practical as determined by the Solid Waste Services Director. Each building is limited to minimum number of rollout containers required to meet the waste generated by the commercial occupants in the building(s). Commercial generators in “strip malls” are required to use dumpster service and are encouraged to partner with adjacent commercial generators for the service. Other dumpster exceptions granted by the Director shall receive the number of rollout containers necessary for the waste stream generated. The City-established fee for Commercial Roll Out container service shall apply and commercial generators will be billed by the City monthly as a part of the City utility bill and will be billed for the number of carts in their possession, not the number collected. Billing shall be in accordance with the City utility billing and collection policy. Only “City of Concord” rollout containers are emptied. These containers remain the property of the City of Concord. City operated public-housing facilities may utilize rollout containers and per General Statute section 160A-314 (a2) a reduced Public Housing billed by the City for such low income customers shall apply and is adjusted annually according to the Consumer Price Index (CPI). CORRUGATED CARDBOARD RECYCLING SERVICE
The City collects corrugated cardboard free of charge from commercial generators, irrespective of quantity generated. Small volume generators are required to flatten corrugated cardboard and store it in a location accessible to collection crews for weekly collection. Large volume generators (4 yards per week flattened or greater) will be provided an 8-yard container(s) specifically designed for corrugated collection and weekly collection service. Commercial generators generating in excess of 24 yards per week, flattened, may be required to purchase or rent compaction equipment to facilitate collection efficiency.
It is the commercial generator’s responsibility to ensure that contamination of the corrugated containers is kept to a minimum. Repeated contamination problems can result in removal of the container or termination of service. The City will communicate repeated contamination problems to affected generators.
Neither the City, nor its contract collector for corrugated cardboard are responsible for any damages to pavement, structures or obstructions encountered during such collection except due to gross negligence.
All corrugated cardboard collection service will be on a set schedule. The City cannot guarantee additional pick-ups on a call in basis.
OFFICE PAPER RECYCLING SERVICE
The City provides a roll out cart(s) free of charge to commercial generators for paper recycling. This container may not be used for any trash disposal. The containers remain the property of the City of Concord.
The City provides commercial generators with a list of acceptable office papers for the recycling program. Generally, all copier, letterhead, computer print out, envelopes, forms, manila folders, post it notes, etc. are acceptable. Paper clips and staples do not have to be removed. Unacceptable items include newspaper, magazines, paper bags, cups and plates, carbon paper and rubber bands.
Each commercial generator is responsible for collecting the acceptable office paper by whatever means it chooses and placing it in the rollout cart(s) for weekly collection. The City can assist in providing technical assistance on implementing this program. The containers must be placed in an agreed location accessible to collection crews.
DUMPSTER SERVICE
Commercial generators may contract directly with any waste hauler for service Except as otherwise provided herein, all commercial generators shall utilize dumpster service for their waste.
DUMPSTER SERVICE EXCEPTIONS
In the event a commercial generator cannot comply with dumpster service policies due to logistical items including but not limited to space or access limitations or other service-related factors, the Solid Waste Services Director or his delegate has the authority to grant exceptions for good cause shown. Such exceptions are subject to the limited rollout container policies below.
MULTI-FAMILY HOUSING SERVICE
Multifamily residence is defined by any apartment or group of apartments, townhomes, or condominiums, having six dwelling units or more. Developments including duplexes and/or other multiple dwelling units that take indirect
277

access from a public right –of-way and collectively exceed 5 dwelling units total are classified as a commercial multi-family development for waste disposal purposes regardless of the number of parcels occupied, the configuration of property or zoning lines, or the number of owners.
Single-family residence is defined by any detached dwellings designed, permitted and built as a single-family dwelling unit, mobile home, or duplex, triplex, or quadplex, apartment or group of apartments, or townhomes having less than six dwelling units, or any number of condominiums will be residentially serviced at no charge by the city and may use rollout carts.
Developments with 6 units (e.g. apartment complexes) are required to utilize dumpsters (unless an exception is granted) and pay for container rental and waste disposal. Complexes are required to provide one 8 cubic yard container per 25 units emptied twice per week. Alternatively, the owner may provide a recycling program equal to city residential curb-side recycling program with sufficient tenant participation to reduce waste production to justify once per week servicing of each dumpster.
Multi-family housing owners/managers may use any hauling firm. The Solid Waste Services Director or his/her delegate may grant dumpster exceptions in the event that logistical problems prevent dumpster service from occurring at any given multi-family housing location. Such exceptions shall be subject to the limited rollout container policy above.
The City will provide information regarding the location of recycling drop off centers to multi-family housing complexes as well as technical assistance in implementing a multi-family recycling program at the complex. The cost to implement and maintain a Multi-Family Housing recycling program will be entirely the expense of the Multi-Family Housing Complex’s owner/manager.
Multi-Family Housing Complexes are considered commercial operations for the purpose of waste disposal, and are responsible to arrange for and pay for disposal of all waste generated from these facilities. The City of Concord does not provide yard waste, bulky waste, building materials, or garbage collection or disposal or recycling services to these facilities.
Bulky item pick-up service may be requested at Multi-Family Housing who have large items, such as large household appliances (white goods) and old furniture that are too large to be placed in a commercial container. This service is provided for a fee for the collection of up to five items or any portion thereof. Collection of Bulky Items must be scheduled through the Customer Care Center and payment must be received in advance.
CONDOMINIUMS
Condominium service shall be considered residential service provided at no cost by the City
All new condominium complexes to be constructed in the City of Concord shall be designed and built to allow the use of dumpsters, providing one 8-cubic yard container per the equivalent of 25 2-bedroom units.
Existing condominium complexes shall utilize dumpsters wherever logistically practical as determined by the Solid Waste Services Director or his/her delegate. Complexes designed and built in a “townhouse” style with detached units may be serviced using roll out carts if deemed practical to do so by the Solid Waste Services Director.
The City of Concord will pay for residential rollout or dumpster waste removal at condominium complexes.
CITY-PROVIDED DUMPSTER SERVICES IN DOWNTOWN BUSINESS DISTRICT DOWNTOWN BUSINESS DISTRICT MIXED-USE DUMPSTER SERVICE (ACCESSED VIA ALLEY WESTSIDE OF PARKING DECK)
Category Minimum Under 2,000 Sq Ft Cost per 100 Sq Ft Over 2,000 Sq Ft Office $ 5.00 $1.00 Retail $ 5.00 $1.00 Arts, Entertainment & Recreation $ 5.00 $1.00
Apartment $ 5.00 $1.00 State/County Government $ 5.00 $1.00 Unclassified & Other $ 5.00 $1.00 Accommodation & Food Service $10.00 $3.00 Accommodation & Food Service w/ABC Permit $25.00 $3.00 Retail Home Improvement $10.00 $3.00
DOWNTOWN BUSINESS DISTRICT MIXED-USE DUMPSTER SERVICE (BICENTENNIAL PARKING LOT DUMPSTERS)
Category Minimum Under 2,000 Sq Ft Cost per 100 Sq Ft Over 2,000 Sq Ft* Office $ 7.30 $0.50* Retail $ 8.75 $0.50* Arts, Entertainment & Recreation $ 7.30 $0.50*
Apartment $ 7.30 $0.50* State/County Government $ 7.30 $0.50* Unclassified & Other $ 7.30 $0.50* Accommodation & Food Service $20.00 $0.50 Accommodation & Food Service w/ ABC Permit $35.00 $0.50
278

Retail Home Improvement $10.00 $0.50* *Maximum total cost for customers in non-Accommodation & Food Service categories shall be twice the minimum cost of the respective category.
SPECIAL DUMPSTER FEES APPLICABLE TO CITY-MAINTAINED DUMPSTERS IN DOWNTOWN BUSINESS DISTRICT Cleanup fee, for failing to place garbage and corrugated into dumpsters provided $150.00 per event Special event service fee when extra collections are required $50.00 per event
ADDITIONAL INFORMATION APPLICABLE TO DOWNTOWN BUSINESS DISTRICT
Businesses are charged a minimum monthly fee for up to 2,000 sq ft. of floor space plus an additional fee for every additional 100 sq ft of floor space over 2,000 square feet, based on the rates listed in the business classification table for each City-managed dumpster location.
Businesses that accommodate special events requiring extra collections are billed $50.00 per event/collection.
Anyone failing to place garbage or corrugated cardboard into the dumpsters provided will be charged a $150 cleanup fee.
Security cameras have been installed to monitor activity at the dumpsters to assure the area remains clean and only those businesses subscribing to this service are using the dumpster facility.
Use of the City dumpster facilities in the Downtown Business District is a fee-based service only. Unauthorized use of these facilities by non-paying businesses or illegal dumping by anyone will be prosecuted to the full extent allowed by law.
The City establishes solid waste service fees for use of the City managed dumpster facilities located in the Downtown Business District. These solid waste fees shall apply according to the business category, and the subscribing business will be billed monthly on their City utility bill. Service fee rate calculate will be based on both the business category and the square feet of occupancy. Billing shall be in accordance with the City utility billing and collection policy.
Where a property is not served by a dumpster facility maintained by the City of Concord, the Property Owner(s) must provide a screened dumpster location meeting established development standards and one or more dumpsters (a sufficient number to meet the waste generation of the property).
Where a business does not generate sufficient waste to justify a dumpster or where structural or other physical barriers exist preventing installation and servicing of a dumpster, commercial rollout container may be used and charged at the monthly rate listed above. Prior approval by the Solid Waste Services Director is required.
STORMWATER SERVICES One Equivalent Runoff Unit (ERU) is 3,120 square feet (sq. ft.) ERU Rate - $4.30 per month Single Family Residential – Including Mobile Homes With < 1,890 sq. ft. impervious area 0.6 * ERU Rate With 1,890 to 5,507 sq. ft. impervious area 1.0 * ERU Rate With > 5,507 sq. ft. impervious area 1.8 * ERU Rate Multi-Family Residential – Including Apartments, Condominiums, Townhomes 1.0 * ERU Rate per unit. Other Properties – 1 ERU rate per month for each 3,120 sq. ft. of impervious surface STORMWATER SERVICES
Construction of Stormwater Structures Time & Materials Other Stormwater Services See Water & Wastewater labor and equipment
schedule for pricing Street Debris Removal $400.00 + $150.00/hr after first hour Ditch Cleaning (applies to removal of yard waste or Other waste debris obstructing drainage; not for routine $125.00 minimum + $80/hr after first Ditch maintenance) hour or portion thereof
MAINTENANCE ASSESSMENTS
Assessments for the maintenance of stormwater control facilities may periodically be made pursuant to the Code of Ordinances § 60-88 and Concord Development Ordinance Article 4 based on actual City costs.
279

TAX TAX RATE Ad Valorem Tax Rate $0.4800/$100 Valuation Municipal Service District Tax Rate $0.2300/$100 Valuation
Both the Ad Valorem and Municipal Service District Tax Rate represent the Revenue Neutral rate resulting from the 2016 County-wide Revaluation.
MOTOR VEHICLES
A $10.00 General Municipal Vehicle Tax * is levied and a $5.00 Municipal Vehicle Tax for Public Transportation** is levied for a total license tax of $15.00 on every motor vehicle resident within the City of Concord and licensed or required to be licensed by the State of North Carolina.
Source: *G.S. 20-97(b) General Municipal Vehicle Tax $10.00 **G.S. 20-97(c) Municipal Vehicle Tax for Public Transportation $5.00 Note: These Municipal Vehicle Taxes are billed and collected by Cabarrus County.
Beer and Wine License
Businesses operating within the City of Concord that have obtained a North Carolina ABC permit to sell beer and/or wine are required to obtain a City Beer & Wine License annually. An annual Beer and Wine License is levied on each Business selling beer or wine for on-premises or off-premises consumption based on G.S 105-113.77 and G.S 105-113.79 and by the authority of N.C.G.S. 160A-211. Licenses expire on April 30 and must be renewed.
ABC Permit Tax On-premises malt beverage $15.00 Off-premises malt beverage $5.00 On-premises wine, fortified, unfortified, $15.00 or both Off-premises wine, fortified, unfortified, $10.00 or both Wholesale malt beverage $37.50 Wholesale wine (fortified and unfortified) $37.50 Wholesale malt beverage and wine $62.50 (fortified and unfortified) Tax on additional licenses:
The Tax stated above is the first license issued to a person. The tax for each additional license of the same type issued to that person for the same tax year is one hundred and ten percent (110%) of that base license tax; that increase will apply progressively for each additional license.
GARNISHMENT FEES Fee $60.00 Source: N.C. General Statues sections 105-368 and 7A-311 TRANSIT SYSTEM – Concord/Kannapolis Rider
Regular Fare1 $1.25/one-way trip ADA Paratransit Fare $2.00/one-way trip Senior Citizen Fare2 $0.60/one-way trip Disabled Fare2 $0.60/one-way trip Medicare Card Holders2 $0.60/one-way trip Student Fare2 $0.60/one-way trip Children (under 5) Free Transfers3 Free
1-Day Unlimited Ride Pass $4.00 1-Day Unlimited Ride Pass (Senior, Disabled, Student, Medicare)2 $2.00 7-Day Unlimited Ride Pass $12.00 7-Day Unlimited Ride Pass (Senior, Disabled, Student, Medicare)2 $6.00 10-Ride Electronic Fare Media $10.00 10-Ride Electronic Fare (Senior, Disabled, Medicare, Student) 2 $5.00 10 Tokens (Non-profit agencies) $8.00 31-Day Pass $40.00 31-Day Pass (Senior, Disabled, Student, Medicare) 2 $20.00 Smart Card (cashless version of Regular Fare)4 $1.25 per ride Smart Card (cashless fare for Senior, Disabled, Student, Medicare) 2 $0.60 per ride 1-Ride Pass 5 $1.00 (80% of Regular Fare rate per ride)
Credit/Debit Card Processing Fee $1.00
280

1All riders shall pay this fare unless the rider qualifies under the fare policy for one of the reduced fares as listed. 2Discounted fares require a reduced-Fare ID. 3Transfers can only be used at the Rider Transit Center, Kannapolis Train Station, NCRC/NC State Bldg. and DSS. 4Smart Card – minimum purchase to receive card is $25.00 (card may be reused with a minimum purchase of $10.00). 51-Ride Pass – minimum purchase of 100 passes; if less than 100 passes purchased, passes will be sold at regular fare rate if applicable.
TRANSPORTATION SIGNAL DIVISION
Design Review and Inspection Fee $5,000.00 Emergency Mobilization $2,000.00 Fiber Optic Make Ready Fee $ 175.00 Fiber Optic Splice Fee per fiber $ 75.00 Interference and Damage to City Property All cases will be judged on an individual basis and
cost recovery based on Cityworks Work Order. STREETS AND TRAFFIC
Right-of-Way Encroachment Permit Application Fee $100.00
Schedule of Street Cut Repair Charges: Size of Est. Asphalt Cost Street Cut Required 4 sq ft (minimum) 0.2 ton $138.00 8 sq ft 0.4 ton $151.00 12 sq ft 0.6 ton $163.00 16 sq ft 0.8 ton $176.00 20 sq ft 1.0 ton $313.00 24 sq ft 1.2 tons $326.00 28 sq ft 1.4 tons $339.00 32 sq ft 1.6 tons $351.00 36 sq ft 1.8 tons $363.00 40 sq ft 2.0 tons $377.00 44 sq ft 2.2 tons $389.00 48 sq ft 2.4 tons $526.00 50 sq ft 2.6 tons $539.00 > 50 sq ft N/A Time and Materials
*Crew Labor and Equipment Rate per hour $250.00 Schedule of Sidewalk and Concrete Street Repair Charges:
Size of Est. Concrete Cost Sidewalk or Street Cut Required
16 sq ft (minimum) 1/4 cubic yard $226.00 20 sq ft 1/4 cubic yard $226.00 21 – 50 sq ft 1/2 cubic yard $256.00 51 – 64 sq ft 3/4 cubic yard $282.00 65 – 80 sq ft 1 cubic yard $310.00
> 80 sq ft 1 ¼ cubic yards $634.00 1 ½ cubic yards $663.00 1 ¾ cubic yards $690.00 2 cubic yards $718.00 2 ¼ cubic yards $745.00 2 ½ cubic yards $773.00 2 ¾ cubic yards $800.00 3 cubic yards $1,126.00 > 3 cubic yards Time and Materials *Crew Labor and Equipment Rate per hour $250.00 Schedule of Curb and Gutter Charges – per ft. Installation of new curb and gutter including suitable base material $ 25.00 Schedule of new 4 inch Thick Sidewalk – per sq ft. Installation charges including grading and suitable base material $ 35.00 Schedule for seeding and mulching – per sq ft. Installation charges including preparing and raking area to be seeded $ 5.00
NOTE: Fees are based on normal costs and operational estimates. In the event that the City’s costs for materials increases by 33%, all repairs for private parties will be suspended until further action of the Council.
281

TRAFFIC SERVICES Signs:
10 ft channel post with anchor $ 50.00 Delineator Post w/base $100.00 Stop sign 30” $ 50.00 Yield sign $ 50.00 No Parking sign $ 20.00 Speed limit sign $ 50.00 Street marker assembly $200.00 Street intersection marker blades $ 75.00 Crime watch signs including installation and maintenance on Private roads $150.00 Crime watch signs including installation and maintenance on Public roads $ 60.00 Regulatory signs, exc. Stop & Yield $ 50.00 Warning sign $ 50.00 Information sign $ 25.00 Labor for each item above $ 40.00 Street Sign Toppers (per sign) $ 40.00
Pavement Markings:
4 inch line (per linear foot) $ 2.08 8 inch line (per linear foot) $ 4.16 24 inch stop bar (per linear foot) $ 12.48 Cross Walk (per linear foot of 24” bar) $ 12.48 8’ character (per letter) $190.00 10’ character (per letter) Cost of Special Order Symbol Railroad Crossing $625.00 Parking Space (parking lot – per linear foot) $ 2.08 Parking Space (parallel roadway – per linear foot) $ 2.08 Turn Arrow, Standard (Right or Left) $400.00 Straight Arrow, Standard $300.00 Combination Arrow, Standard $400.00
Traffic control services for non-profit special events, parades, emergency operations, etc. All cases will be judged on an individual basis and cost recovery based on Cityworks Work Order
Temporary traffic control (rental) for parades, block parties & special events:
Barricades, each per day $5.00 Detour signs, each per day $5.00 Traffic cones, each per day $0.50
Note: All City-owned vehicles and equipment used in a cost-reimbursement service not listed on this fee schedule will be charged to the customer at the current FEMA rate.
UTILITY BILLING AND COLLECTION (Including commercial waste collection billings of the City)
Late Fee A Utility late fee of 1 ½ percent will be charged on all unpaid balances. A late fee will apply if payment is not paid by the 26th day. Effective 7/7/00, new payment arrangements are subject to late fee. Prior payment arrangements are not subject to late fee unless not current.
Same Day Connection Fee A connection fee will be charged for same day service as follows: Monday – Friday 8:00am – 3:00pm No Charge Monday – Friday 3:01pm – 5:00pm $100.00 *No regular connection after hours, on weekends or holidays. NOTE: Same day service will only apply to residential customers applying for new service or transferring
service. Same day service is not available for meter sets. Non-Payment Administration Fee
An Administration fee will be charged as follows: Monday – Friday 8:00am – 4:00pm $50.00 Once a customer has been placed on the cutoff list, administrative fees apply regardless of whether the customer has been disconnected. Monday – Friday after 4:00pm, Weekends, and Holidays $100.00 Administration charge for meter tampering, when service has been disconnected at the point of connection between
282

the customer and the utility by an electric utility crew. $200.00 (anytime)
Security Deposits
Commercial and Industrial customers who provide a letter of credit at the initial application for service will not be required to pay a deposit. However, if a letter of credit is not provided, a deposit equal to one month's average bill is required. Disconnection for non-payment will require a deposit equal to two months average bill for reconnection of services.
Commercial customers whose past due balance is greater than $500.00 will be subject to the following: Past due > $500.00 Add $50.00 to above stated deposit schedule Past due > $1,000.00 Add $75.00 to above stated deposit schedule Past due > $2,000.00 Add $100.00 to above stated deposit schedule Residential customers who meet a satisfactory credit rating are not required to have a security deposit at time of
initial service. Disconnection for non-payment, returned checks, or bankruptcy will subject customer to deposit schedule for reconnection of service. A credit letter will be accepted in lieu of a deposit.
Residential customers who fail to meet a satisfactory credit rating will be required to deposit the following if the customer’s past due balance is less than $200.00: Water and/or sewer service only $ 75.00 Water, sewer and electric $150.00 Residential customers whose past due balance is greater than $200.00 will be subject to the following: Past due > $200.00 Add $25.00 to above stated deposit schedule Past due > $500.00 Add $50.00 to above stated deposit schedule
Past due > $1,000.00 Add $75.00 to above stated deposit schedule Past due > $2,000.00 Add $100.00 to above stated deposit schedule
Returned Check Charge There will be a $25.00 service charge for returned checks. Services are subject to disconnection for returned checks.
Partial Payment Application
Partial payments will be applied to services in the order of Stormwater, Commercial waste collection, Sewer, Water and Electricity. Customer is responsible for remaining past due amounts and is subject to disconnection without further notice.
Check Cashing:
Checks are not accepted for accounts disconnected due to non-payment and/or returned checks. No third party checks will be cashed.
Involuntary Discontinuance of Service – Water and Sewer
In order to protect the City’s water distribution and wastewater collection systems, to protect the consuming public, to prevent the dangerous and destructive practice of tampering with any water distribution or wastewater collection facilities of the City, the following penalties are hereby established:
(1) Penalty of $500.00 for altering, tampering with or removing or replacing a City water meter. A fee of
$500.00 for the jumping or by-passing of water meter. (2) All cases not covered by the specific situations as noted above, will be judged on an individual basis and
treated accordingly. (3) In addition to the fees set forth above, the offending party shall pay all costs incurred by the City by reason
of damage to its equipment. (4) In addition to the fees and costs provided in the above, such conduct described shall be subject to
immediate disconnection of City water and/or sewer service if the offending party is a water and/or sewer customer of the City.
(5) The penalties and costs herein provided shall be imposed by the Customer Service Manager, department(s) involved, or their designated agent.
(6) When it becomes necessary for the City to discontinue services for any of the reasons listed in Section 4, Discontinuing Services of the City’s Customer Service Policies and Procedures Manual, service will be restored after payment of (1) all past due bills due the City, (2) any deposit as required, and (3) any material and labor cost incurred by the City, according to the current Fee Schedule. No meters will be set in subdivision until all penalties and charges are paid.
(7) Any person upon whom penalty and/or cost is imposed shall have the right of appeal from the action taken by the Customer Service Manager directly to the Finance Director.
(8) Any person upon whom any penalty and/or cost are imposed shall have the right of appeal from the action taken by the Finance Director to the City Manager.
(9) If it is determined that a residential customer is a first time offender, the tampering charge may be reduced to $100 plus the damages, usage and reconnection fee.
283
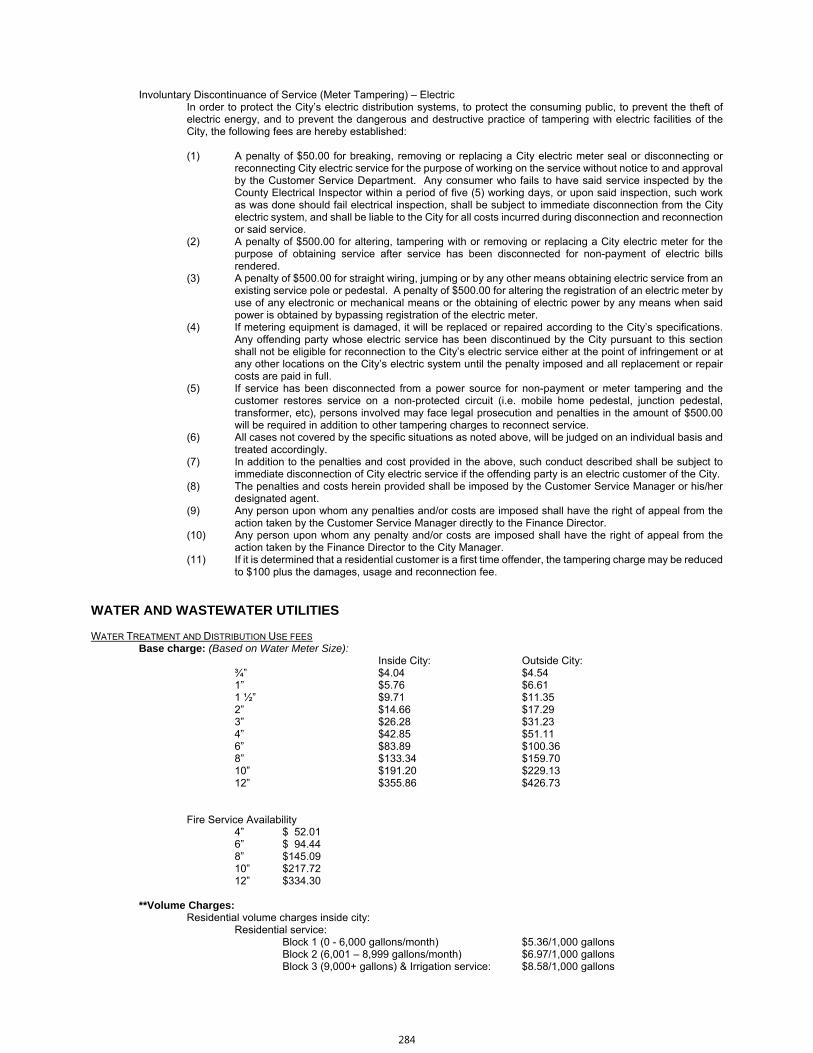
Involuntary Discontinuance of Service (Meter Tampering) – Electric
In order to protect the City’s electric distribution systems, to protect the consuming public, to prevent the theft of electric energy, and to prevent the dangerous and destructive practice of tampering with electric facilities of the City, the following fees are hereby established: (1) A penalty of $50.00 for breaking, removing or replacing a City electric meter seal or disconnecting or
reconnecting City electric service for the purpose of working on the service without notice to and approval by the Customer Service Department. Any consumer who fails to have said service inspected by the County Electrical Inspector within a period of five (5) working days, or upon said inspection, such work as was done should fail electrical inspection, shall be subject to immediate disconnection from the City electric system, and shall be liable to the City for all costs incurred during disconnection and reconnection or said service.
(2) A penalty of $500.00 for altering, tampering with or removing or replacing a City electric meter for the purpose of obtaining service after service has been disconnected for non-payment of electric bills rendered.
(3) A penalty of $500.00 for straight wiring, jumping or by any other means obtaining electric service from an existing service pole or pedestal. A penalty of $500.00 for altering the registration of an electric meter by use of any electronic or mechanical means or the obtaining of electric power by any means when said power is obtained by bypassing registration of the electric meter.
(4) If metering equipment is damaged, it will be replaced or repaired according to the City’s specifications. Any offending party whose electric service has been discontinued by the City pursuant to this section shall not be eligible for reconnection to the City’s electric service either at the point of infringement or at any other locations on the City’s electric system until the penalty imposed and all replacement or repair costs are paid in full.
(5) If service has been disconnected from a power source for non-payment or meter tampering and the customer restores service on a non-protected circuit (i.e. mobile home pedestal, junction pedestal, transformer, etc), persons involved may face legal prosecution and penalties in the amount of $500.00 will be required in addition to other tampering charges to reconnect service.
(6) All cases not covered by the specific situations as noted above, will be judged on an individual basis and treated accordingly.
(7) In addition to the penalties and cost provided in the above, such conduct described shall be subject to immediate disconnection of City electric service if the offending party is an electric customer of the City.
(8) The penalties and costs herein provided shall be imposed by the Customer Service Manager or his/her designated agent.
(9) Any person upon whom any penalties and/or costs are imposed shall have the right of appeal from the action taken by the Customer Service Manager directly to the Finance Director.
(10) Any person upon whom any penalty and/or costs are imposed shall have the right of appeal from the action taken by the Finance Director to the City Manager.
(11) If it is determined that a residential customer is a first time offender, the tampering charge may be reduced to $100 plus the damages, usage and reconnection fee.
WATER AND WASTEWATER UTILITIES WATER TREATMENT AND DISTRIBUTION USE FEES
Base charge: (Based on Water Meter Size): Inside City: Outside City:
¾” $4.04 $4.54 1” $5.76 $6.61 1 ½” $9.71 $11.35 2” $14.66 $17.29 3” $26.28 $31.23 4” $42.85 $51.11 6” $83.89 $100.36 8” $133.34 $159.70 10” $191.20 $229.13 12” $355.86 $426.73
Fire Service Availability
4” $ 52.01 6” $ 94.44 8” $145.09 10” $217.72 12” $334.30
**Volume Charges:
Residential volume charges inside city: Residential service: Block 1 (0 - 6,000 gallons/month) $5.36/1,000 gallons Block 2 (6,001 – 8,999 gallons/month) $6.97/1,000 gallons Block 3 (9,000+ gallons) & Irrigation service: $8.58/1,000 gallons
284

Residential volume charges outside city:
Residential service: Block 1 (0 - 6,000 gallons/month) $6.44/1,000 gallons Block 2 (6,001 – 8,999 gallons/month) $8.37/1,000 gallons Block 3 (9,000+ gallons) & Irrigation service $10.30/1,000 gallons
Commercial and institutional volume charges inside city:
Commercial/institutional service $5.41/1,000 gallons Commercial/institutional irrigation service $8.58/1,000 gallons
Commercial and institutional volume charges outside city: Commercial/institutional service $6.50/1,000 gallons
Commercial/institutional irrigation service $10.30 /1,000 gallons Industrial volume charge inside city: Industrial service $4.44/1,000 gallons Industrial irrigation service $8.58/1,000 gallons
Industrial volume charge outside city: Industrial service $4.88/1,000 gallons Industrial irrigation service $10.30/1,000 gallons Town of Harrisburg – Per Contract
Monthly Reserved Capacity Charges $22,388.00 O&M Rate $3.14/1000 gallons (Required base
amount purchased monthly is set per contract)
City of Kannapolis* $1.52/1,000 gallons (Base charges n/a) Fire hydrant volume charges $8.36/1,000 gallons Water tanker $8.36/1,000 gallons Water use permit for tank/tankers $50.00 annually *Per contract
IRRIGATION SERVICES: ALL Irrigation Services and Meter Charges (residential, commercial, institutional, and industrial) shall be charged the same as listed under the non-residential charges. DROUGHT SURCHARGE POLICY: During periods of extended and extreme drought when mandatory water usage restrictions are necessary, an additional 10% surcharge will be applied to Blocks 2 and 3 of the current residential service rate. FEES FOR VIOLATIONS OF MANDATORY WATER RESTRICTIONS
Residential First offense $ 100.00 Second and subsequent offense $ 300.00
Commercial/Institutional First offense $ 500.00 Second and subsequent offense $1,500.00
Industrial First offense $ 500.00 Second and subsequent offense $1,500.00 WATER CONNECTION CHARGES (Applicable to Residential, Commercial, Institutional and Industrial Customers).
Residential Charges: Residential charges are comprised of a capacity fee, installation fee, and meter fee. Residential charges do not apply to hotels, motels, resorts, and campgrounds; commercial charges shall apply to these facilities.
Capacity Fee: $1,089 per residential unit
A residential unit includes each dwelling separately owned, sold, or leased, regardless if the unit is metered individually or if the residential development is master-metered. For example, a residential unit includes, and a residential capacity fee applies to, each and every apartment unit, both units of a duplex, each single-family home, each mobile home, etc.
Installation and Meter Fee:
Installed by Concord Utilities on existing City owned water mains* Meter Size:
¾” $1,327 ($1,134 installation + $193 meter) 1” $1,656 ($1,261 installation + $395 meter)
2” $2,639 ($1,865 installation + $774 meter) Installed by others on water main extensions not yet owned by the City of Concord
Meter Size: ¾” $193 – purchased from City of Concord 1” $395 purchased from City of Concord 2” $774 purchased from City of Concord
285

Greater than 2” At cost – must be provided by applicant according to City specifications
Irrigation Services ALL Irrigation Services and Meter Charges (residential, commercial, institutional, and industrial) shall be charged the same as listed under the non-residential charges below.
Non-Residential Charges:
Installed by Concord Utilities on existing City owned water mains Meter Size*: Connection Charge:
¾” $2,416 ($1,089 capacity + $1,134 installation + $193 meter) 1” $3,507 ($1,851 capacity + $1,261 installation + $395 meter) 2” $8,411 ($5,772 capacity + $1,865 installation + $774 meter)
Installed by others on existing City owned water mains Meter Size*: Capacity Charge: (excludes installation and meter fee)
4” $ 18,186.00 6” $ 36,264.00 8” $ 58,044.00 10” $ 83,527.00 12” $156,054.00
Installed by others on water main extensions not yet owned by the City of Concord
Meter Size*: Connection Charge: (includes meter fee) ¾” $1,282 ($1,089 capacity + $193 meter) 1” $2,246 ($1,851 capacity + $395 meter) 2” $6,546 ($5,772 capacity + $774 meter)
Installed by others on water main extensions not yet owned by the City of Concord Meter Size*: Capacity Charge: (excludes meter fee)
4” $ 18,186.00 6” $ 36,264.00 8” $ 58,044.00 10” $ 83,527.00 12” $156,054.00
*Notes: Connections installed by others must be by licensed utility contractors approved by the Water Resources Director or
designee. All meters greater than 2” must meet City of Concord specifications and should be provided by the applicant. Dedicated fire protection connections are exempt from water connection charges however potable service connections off
the fire line are subject to connection charges. WATER SENSE TOILET REBATE/CREDIT (RESIDENTIAL SERVICE) $50.00 credit on Utility Bill per qualifying toilet
replacement (limit 3 per single family residential service). For more information, contact the Water Resources Dept. or visit their website.
NON-EMERGENCY, AFTER HOURS, WEEKEND/HOLIDAY CUT OFF/ON $100.00 (For Customers requesting service cut off/on for non-emergency plumbing repairs) MOVE EXISTING SERVICE TO ANOTHER LOCATION ON SAME PROPERTY At Cost (labor + equipment + materials) PURCHASE OF REPLACEMENT WELL WATER USAGE SIGNS $ 10.00 each (for signs in excess of annual
replacement) WATER METER TESTING FEES 5/8” – 1” $ 50.00 1 ½”-2” $ 125.00 PURCHASE OF RAIN BARREL FOR WATER CONSERVATION Actual cost (set by Purchasing), plus sales tax WASTEWATER COLLECTION SYSTEM USE FEES Base Charge: (Based on Water Meter Size):
Inside City Outside City ¾” $3.39 $3.80 1” $4.80 $5.49 1 ½” $8.02 $9.35 2” $12.05 $14.18 3” $21.51 $25.53
286

4” $34.99 $41.71 6” $68.40 $81.80 8” $108.65 $130.10 10” $155.74 $186.61
Volume Charges:
Inside City Water Customers of Concord Utilities $5.62/1000 gallons Flat-Rate Customers $27.56/month Outside City
Water Customers of Concord Utilities $6.74/1000 gallons Flat-Rate Customers $32.78/month WASTEWATER CONNECTION CHARGES (Applicable to Residential, Commercial and Institutional, and Industrial Customers
Residential Charges: Residential charges are comprised of a capacity fee and installation fee. Residential charges do not apply to hotels, motels, resorts, and campgrounds; commercial charges shall apply to these facilities.
Capacity Fee: $800 per residential unit A residential unit includes each dwelling separately owned, sold, or leased, regardless if the unit is metered individually or if the residential development is master-metered. For example, a residential unit includes, and a residential capacity fee applies to, each and every apartment unit, both units of a duplex, each single-family home, each mobile home, etc.
Installation Fee: $1,000 /4-inch service $1,800 /6-inch service
Non-Residential Charges:
Installed by Concord Utilities on existing City owned sewer mains Meter Size*: Connection Fee:
¾” $ 1,800.00 ($ 800 capacity + $1,000 installation) 1” $ 2,360.00 ($ 1,360 capacity + $1,000 installation) 2” $ 5,240.00 ($ 4,240 capacity + $1,000 installation) 4” $ 15,160.00 ($ 13,360 capacity + $1,800 installation) 6” $ 28,440.00 ($ 26,640 capacity + $1,800 installation) 8” $ 44,440.00 ($ 42,640 capacity + $1,800 installation) 10” $ 63,160.00 ($ 61,360 capacity + $1,800 installation) 12” $116,440.00 ($114,640 capacity + $1,800 installation)
Installed by others on sewer mains not yet owned by the City of Concord Meter Size*: Connection Fee (excludes installation fee):
¾” $ 800.00 1” $ 1,360.00 2” $ 4,240.00 4” $ 13,360.00 6” $ 26,640.00 8” $ 42,640.00 10” $ 61,360.00 12” $114,640.00
Move Existing Service to Another Location on Same Property At Cost (labor + equipment + materials) CONCORD UTILITIES EXTENSION AND MODIFICATION PERMIT FEES Water permit application review (See “ENGINEERING”)
Wastewater permit application review (See “ENGINEERING”) LABOR AND EQUIPMENT CHARGES T.V. Truck $150.00/hr, 2 hr. min. charge (incl. Operator)
Jet-Vac Truck $225.00/hr, 2 hr. min. charge (incl. Operator) Flusher/Sweeper $ 75.00/hr 1 ½ hr min Motor-Grader $ 40.00/hr Rapid Response Vehicle $100.00/hr, 2 hr. min. charge (incl. Operator) Crew Truck $ 20.00/hr Pick-up Truck $ 17.00/hr Tandem Dump $ 30.00/hr 5-10 Ton Dump Truck $ 26.00/hr 1-Ton Dump Truck $ 20.00/hr 10-Ton Trailer $ 10 .00/hr
287

5-ton Trailer $ 10.00/hr Landscape Trailer $ 10.00/hr Emergency Response Trailer $ 10.00/hr Shoring Trailer w/Shore Material $ 20.00/hr 50,000-Pound Class Track Hoe $ 88.00/hr 30,000-Pound Class Track Hoe $ 45.00/hr Front End Loader $ 44.00/hr Rubber Tire Backhoe $ 29.00/hr Mini Excavator $ 25.00/hr Drum Roller Trench Compactor $ 27.00/hr 185 Cubic Foot per Minute Air Compressor $ 60.00/hour Concrete Mixer $ 47.00/hr Argo All-Terrain Vehicle $ 12.00/hr, 2 hr. min. charge Core Machine:
4” to 6” core $175.00/each 8” to 10” core $250.00/each
Hand Whacker Tamp $ 5.00/hr Small Centrifugal & Diaphragm Pumps $ 5.00/hr Chainsaw $ 5.00/hr By-Pass Pump: 4” pump $ 15.00 $25.00/hr, 2 hr. min. charge 6” pump $ 19.00 $33.00/hr, 2 hr. min. charge
8” pump $ 25.00 $50.00/hr, 2 hr. min. charge Small Generator (>7,000 watts) $ 40.00/hr Large Generator (<7,000 watts) $ 20.00/hr Trip Charge $ 30.00* Smoke Machine $ 5.00/hr ¾”water meter $193.00 1” water meter $395.00 2” water meter $774.00 Sewer Service Trailer $ 15.00/hr Low-boy Tractor & Trailer $ 32.00/hr Hydroseeder $ 10.00/hr Straw Blower $ 6.00/hr Skid Steer $ 18.00/hr *Applicable when more than two (2) trips are made to the same location to install water meters and applicable to all after hours calls for turning water services off or on to accommodate customer repairs. All City owned vehicles and equipment used in a cost – reimbursement service not listed on this schedule will be charged to the customer at the current FEMA rate.
288

Date of Incorporation: 1796 Registered Voters Date of City Charter: 1798 July 1, 2016 54,582Form of Government: Council-Manager July 1, 2015 51,738Land Area: 61.35 square miles July 1, 2014 52,244Elevation: 704 feet above sea level July 1, 2013 50,302Population: 87,696 July 1, 2012 48,263
Climate Economy (Citywide) Average January Temperature Civilian Labor Force 44,172
High 51°/Low 28° Employed Residents 42,522Average July Temperature Unemployed Residents 1,650
High 90°/Low 68° Unemployment Rate 3.7%Record High: 107° (August 1983)Record Low: -5° (January 1985) TaxesAnnual Precipitation: 47.3 inches Sales Tax 7.00%
Property Tax Rate Per $100 valuation 48¢Transportation Cabarrus Co. Property Tax Rate per $100 70¢Major Highways
Interstate 85 City Bond Ratings GO/RevenueU.S. Routes 29 and 601 Fitch IBCA AA/AANC Routes 3, 49, and 73 Standard and Poor's AA/AA-
Rail Moody's Aa1/Aa2Southern Railway Company
Air Fire Protection (ISO Rating: 2)Charlotte Douglas International Airport - Stations 10approximately 25 miles from the City Center Firefighters and Officers (Op., Prevention, & Training) 197Concord Regional Airport Administrative Support 3
GroundConcord-Kannapolis Rider bus service Police ProtectionGreyhound and Trailways bus services Main Station 1Privately-owned taxicab service District Stations 4
Sworn Police Officers 185.25Non-Sworn Police Personnel 15
U.S. Census, 2014 ACS Survey Code Enforcement 8Residents
Population by Gender InfrastructureMale 47% Miles of power linesFemale 53% Overhead 740
Population by Race Underground 678White 64% Miles of water lines 708Black 19% Miles of wastewater lines 544Hispanic 12% Lane-miles of street 701.93Asian, AIAN, NHPI, Other, 2 or more Races 5.2% Paved (City maintained) 343.15
Age (Estimated) Paved (State Maintained) 91.5(Birth-19) 22.9% Paved (Interstate) 18.55(20-34) 18.7%(35-64) 40.2% Media(65+) 10.8% Television: Major Networks, Cable
Median Income 52,901$ Local Newspaper: Independent TribuneNumber of Households Social Media:
1990 11,670 Twitter: @ConcordNCgov2000 22,485 Facebook: ConcordNC2010 32,130 YouTube: ConcordNC1
Flickr: concordnc
CITY PROFILE(as of June 30, 2016 unless otherwise noted)
289

Public Recreation Top Taxpayers (FY 2015-16)Acreage 188 Concord Mills, LTD 2.49%Facilities (City-Owned) Celgard LLC 2.31%
Parks 8 Charlotte Motor Speedway 2.14%Playgrounds 14 DNP IMS America Corporation 0.89%Gymnasiums 3 Great Wolf Lodge 0.89%Basketball Courts 7 Windstream 0.62%Tennis Courts 14 Bootsmead Leaseco (ALEVO) 0.56%Playing Fields 22 S&D Coffee and Tea 0.54%Swimming Pools 1 JQH- Concord Development 0.54%Greenway/Trail Miles 7.5 Hendrick Motorsports, Inc. 0.52%
Utilities Top Water Customers (FY 2015-16)Telephone Town Of Harrisburg-S/A 9.44%
Windstream Communications City Of Kannapolis 5.04%Electric Corning, Inc 3.15%
City of Concord Perdue Farms, LLC 2.63%Duke Energy Corporation Linde, North America 1.64%
Gas Carolinas Healthcare System 1.29%Public Service Company Great Wolf Lodge, LLC 1.18%
Water Cabarrus County Schools 1.06%City of Concord Concord Mills, LLC 0.80%
Wastewater Bexley Village at Concord Mills 0.77%City of Concord
Top Wastewater Customers (FY 2015-16)Housing Perdue Farms 2.95%Average Home Sales Price $203,553 Great Wolf Lodge, LLC 1.61%Fair Market Rent of 1BR Apartment $745 Carolinas Healthcare Systems 1.48%Fair Market Rent of 2BR Apartment $864 Cabarrus County Schools 1.48%Fair Market Rent of 3BR Apartment $1,173 Town of Harrisburg 1.33%Public Housing Units 176 City of Kannapolis 1.24%Housing Choice Voucher Units 541 Concord Mills LLC 1.08%
Bexley Village at Concord Mills 0.93%Medical Facilities Beds Embassy Suites 0.82%Hospitals S&D Coffee and Tea 0.74%
CMC-NorthEast 457Nursing Homes Top Electric Customers (FY 2015-16)
Avante at Concord 120 Concord Mills LLC 3.11%Brian Center 90 Perdue Farms 3.09%Five Oaks Nursing Manor 184 LeGrand, Pass & Seymour 2.85%Gardens at Taylor Glen 48 S&D Coffee and Tea 2.66%Universal Health Care & Rehab 120 WSACC 2.59%
Celgard, LLC 2.23%Education City of Concord 2.10%Public Schools in City limits 14 Cabarrus County Schools 1.98%Long School Exceptional Children 1 Cabarrus Plastics 1.95%Parochial and Private 5 Wind Shear Inc 1.79%Higher Education Rowan-Cabarrus Community College Cabarrus College of Health Sciences
Shoe ShowKannapolis City SchoolsPharmaceutical Research Associates
Top Employers
CMC-NorthEast Medical CenterWal-Mart
Cabarrus County Schools City of Concord12345678United Heathcare Services
Cabarrus County GovernmentAmazon
CITY PROFILE (cont.)
290

GLOSSARY OF BUDGET & PERFORMANCE MEASUREMENT
TERMS & COMMON ACRONYMS Accrual Basis of Accounting (or Full Accrual): Accounting method for proprietary funds that recognizes revenues in the accounting period in which they are earned and become measurable. Expenses are recognized in the period incurred, if measurable. Ad Valorem Tax: A tax levied in proportion to the value of real property. Amortization: Paying the principal amount of a debt issue through periodic payments either directly to bondholders or to a sinking fund for later payment to bondholders. Amortization payments include interest and any payment on principal. Appropriation: Expenditure authority created by the City Council. Assessed Value: The value of real estate or personal property as determined by tax assessors and used as a basis for levying taxes. (Note: the County establishes Property values.) Assigned Fund Balance: Monies over the years that remain unspent after all budgeted expenditures have been made, but which are reserved for specific purposes. Authorized Bond: Bonds that have been legally approved but may or may not have been sold. Balanced Budget: Occurs when planned expenditures equal anticipated revenues. North Carolina state law requires the annual operating budget to be balanced. Base Budget: Those resources necessary to meet an established and existing service level. Basis of Accounting: The accounting method that determines when, for accounting purposes, expenditures, expenses, and revenues are recognized. The two bases of governmental accounting include accrual (or full accrual) and modified accrual. Benchmarking: The systematic process of searching for best practices, innovative ideas and highly effective operating procedures that lead to superior performance; The process of identifying the best-in-class and duplicating or surpassing their performance. Bond: A written promise to pay a specific amount of money with interest within a specific time period, usually long-term.
Bond Rating: A grade indicating a governmental unit’s investment qualities. Generally, the higher the bond rating, the less risk investors assume resulting in a more favorable interest rate and lower cost of financing capital projects for the governmental unit. The three main bond-rating agencies include: Standard and Poor’s, Moody’s, and Fitch. Budget: The budget translates organizational intentions into actions, allocating resources in support of organizational goals, objectives, and desired service levels. Budget Amendment: A legal procedure used by the City staff and the City Council to revise a budget appropriation. Budget Document: A formal document outlining the City’s financial plan for a fiscal year. Budget Message: A written overview of the proposed budget from the City Manager to the Mayor and City Council that discusses the major budget items and changes and the City’s present and future financial condition. Budget Ordinance: The official enactment by the City Council to establish legal authority for City officials to obligate and expend resources. Capital Improvement Program (CIP): A multi-year plan (5 years for the City) for the construction or acquisition of major capital items (over $100,000). The plan usually outlines spending needs, the financing source or sources expected, and the impact of the CIP on future annual operating budgets. Capital Outlay: An expenditure expected to have a useful life greater than one year or a total value of $5,000 or more resulting in the acquisition of or addition to a fixed asset. Examples of capital outlay expenditures include vehicles, mowing equipment, and buildings. The portion of the budget pertaining to the purchase of capital outlay items. Capital Project: A capital improvement that usually requires a major initial investment, and a significant and continuing financial commitment in the form of operating costs. Certificates of Participation (COPS): A security created as a part of a lease-purchase agreement. The lender, the holder of the certificate, owns a right to participate in periodic lease payments (interest and return of principal) as they are paid. City Council: A seven member governing board elected within districts for four-year terms by the citizens of Concord.
291

City Manager: An individual appointed at the discretion of the Mayor and City Council to serve as the chief administrative officer of the City. Committed Fund Balance: Used for specific purpose pursuant to constraints imposed by formal action of the government's highest level of decision-making authority Community Development Block Grant (CDBG): An entitlement grant from the U.S. Department of Housing and Urban Development (HUD) to assist low and moderate income persons of the City in targeted neighborhoods. This fund is required by federal regulations to account for the use of these funds. Cost Allocations: Portion of the budget pertaining to payments made to other departments for costs involved in supporting a primary service. Cost Center: An organizational budget / operating unit within each City department or division (e.g. Tree Trimming is a cost center within the Electric Systems department.). Debt Service: The portion of the budget pertaining to payment of principal and interest requirements on outstanding debts. Debt Service Funds: Funds used for the accumulation and disbursement of financial resources that will be used to make principal and interest payments on general long-term debt. Deficit: The amount by which expenditures exceed revenues during an accounting period. Department: A major administrative division of the City that has overall management responsibility for an operation within a function area. Depreciation: The process of estimating and recording the lost usefulness, expired useful life, or diminution of service from a fixed asset that cannot or will not be restored by repair and must be replaced. The cost of the fixed asset’s lost usefulness is the depreciation or the cost to the reserve to replace the item at the end of its useful life. Effectiveness Measure: A performance measure identifying quality or extent to which an organization is obtaining its objectives (ex. percentage of yard waste/leaf collection points serviced on time). Efficiency Measure: A performance measure identifying inputs used per unit of output, or unit costs (ex. cost per ton of yard waste/leaves collected). Encumbrance: A financial commitment or earmark for services, contracts, or goods that have not as yet been delivered by a specified time frame, usually the end of the fiscal year. Enterprise Fund: A fund that accounts for a governmental activities supported wholly or partially with user fees or charges and operated using business principles.
Expenditures: The measurement focus of governmental fund accounting identifying financial resources expended during a period for operations, capital outlay, and long-term debt principal retirement and interest. With the exception of long-term debt principal retirement expenditures, expenditures reflect the cost incurred to acquire goods and services. Expenses: The measurement focus of proprietary fund accounting identifying costs expired during a period, including depreciation and other allocations as in business accounting. Expenses reflect the cost of goods or services used. External Agency: A non-governmental agency, usually of nonprofit legal status, which may request public funds for use on programs benefiting social, cultural, or economic needs of the City. Fiscal Policy: The financial plan embracing the general goals and acceptable procedures for managing the City’s financial resources. Fiscal Year: A 12-month period of time, from July 1 through June 30, to which the annual budget applies. Fixed Asset: An asset of long-term character. For budgetary purposes, a fixed asset is defined as an item costing $5,000 or more with an expected life of more than one year. Fringe Benefits: For budgeting purposes fringe benefits include employer payments for social security, retirement, group health insurance, life insurance, dental insurance, workers compensation, and travel allowances. Fiduciary Funds: Funds used to separate, control, and track financial resources in which the government oversees as a third party, or on behalf of, another public entity. The four fiduciary fund types include: 1) Agency Fund, 2) Pension Trust, 3) Expendable Trust, and 4) Non-Expendable Trust. Full Cost Accounting: Type of accounting concerned with accumulating both direct and indirect costs for financial reporting and decision-making purposes. By using this accounting technique, the City is able to assess the complete total cost of providing a service and its associated benefits. Full-time Equivalent (FTE): An FTE converts the hours worked by a position into a percentage of a full year’s number of hours. Generally, one FTE equals 2080 hours per year per permanent position (based on a 40hr. work week and a 52 week work year; does not include temporary part-time staff). Function: A group of related programs crossing organizational (departmental) boundaries and aimed at accomplishing a similar broad goal or major service. Examples of functions within the City of Concord include Public Safety, Cultural and Recreational, and General Government. Fund: A fiscal and accounting entity that has a self-balancing set of accounts recording cash and other financial resources, as well as related liabilities and residual equity. These are segregated to carry on specific activities or objectives in
292
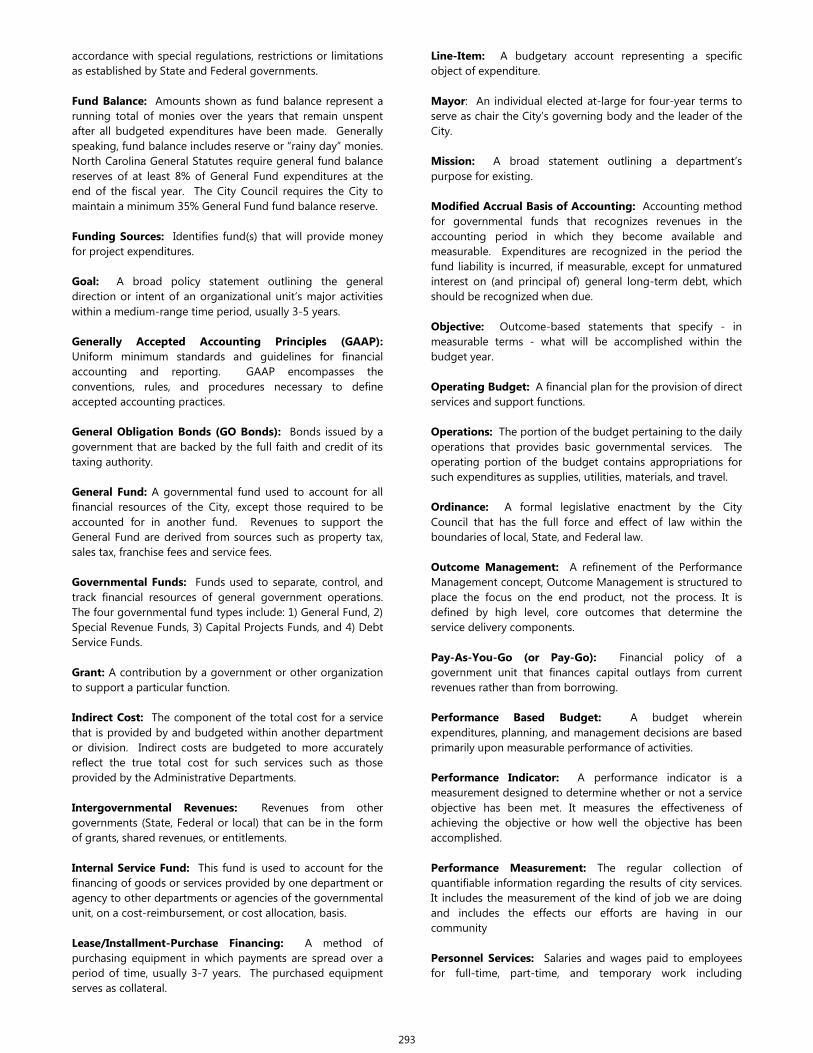
accordance with special regulations, restrictions or limitations as established by State and Federal governments. Fund Balance: Amounts shown as fund balance represent a running total of monies over the years that remain unspent after all budgeted expenditures have been made. Generally speaking, fund balance includes reserve or “rainy day” monies. North Carolina General Statutes require general fund balance reserves of at least 8% of General Fund expenditures at the end of the fiscal year. The City Council requires the City to maintain a minimum 35% General Fund fund balance reserve. Funding Sources: Identifies fund(s) that will provide money for project expenditures. Goal: A broad policy statement outlining the general direction or intent of an organizational unit’s major activities within a medium-range time period, usually 3-5 years. Generally Accepted Accounting Principles (GAAP): Uniform minimum standards and guidelines for financial accounting and reporting. GAAP encompasses the conventions, rules, and procedures necessary to define accepted accounting practices. General Obligation Bonds (GO Bonds): Bonds issued by a government that are backed by the full faith and credit of its taxing authority. General Fund: A governmental fund used to account for all financial resources of the City, except those required to be accounted for in another fund. Revenues to support the General Fund are derived from sources such as property tax, sales tax, franchise fees and service fees. Governmental Funds: Funds used to separate, control, and track financial resources of general government operations. The four governmental fund types include: 1) General Fund, 2) Special Revenue Funds, 3) Capital Projects Funds, and 4) Debt Service Funds. Grant: A contribution by a government or other organization to support a particular function. Indirect Cost: The component of the total cost for a service that is provided by and budgeted within another department or division. Indirect costs are budgeted to more accurately reflect the true total cost for such services such as those provided by the Administrative Departments. Intergovernmental Revenues: Revenues from other governments (State, Federal or local) that can be in the form of grants, shared revenues, or entitlements. Internal Service Fund: This fund is used to account for the financing of goods or services provided by one department or agency to other departments or agencies of the governmental unit, on a cost-reimbursement, or cost allocation, basis. Lease/Installment-Purchase Financing: A method of purchasing equipment in which payments are spread over a period of time, usually 3-7 years. The purchased equipment serves as collateral.
Line-Item: A budgetary account representing a specific object of expenditure. Mayor: An individual elected at-large for four-year terms to serve as chair the City’s governing body and the leader of the City. Mission: A broad statement outlining a department’s purpose for existing. Modified Accrual Basis of Accounting: Accounting method for governmental funds that recognizes revenues in the accounting period in which they become available and measurable. Expenditures are recognized in the period the fund liability is incurred, if measurable, except for unmatured interest on (and principal of) general long-term debt, which should be recognized when due. Objective: Outcome-based statements that specify - in measurable terms - what will be accomplished within the budget year. Operating Budget: A financial plan for the provision of direct services and support functions. Operations: The portion of the budget pertaining to the daily operations that provides basic governmental services. The operating portion of the budget contains appropriations for such expenditures as supplies, utilities, materials, and travel. Ordinance: A formal legislative enactment by the City Council that has the full force and effect of law within the boundaries of local, State, and Federal law. Outcome Management: A refinement of the Performance Management concept, Outcome Management is structured to place the focus on the end product, not the process. It is defined by high level, core outcomes that determine the service delivery components. Pay-As-You-Go (or Pay-Go): Financial policy of a government unit that finances capital outlays from current revenues rather than from borrowing. Performance Based Budget: A budget wherein expenditures, planning, and management decisions are based primarily upon measurable performance of activities. Performance Indicator: A performance indicator is a measurement designed to determine whether or not a service objective has been met. It measures the effectiveness of achieving the objective or how well the objective has been accomplished. Performance Measurement: The regular collection of quantifiable information regarding the results of city services. It includes the measurement of the kind of job we are doing and includes the effects our efforts are having in our community Personnel Services: Salaries and wages paid to employees for full-time, part-time, and temporary work including
293

overtime and similar compensation. Also included in this account group are fringe benefits paid for employees. Policy: A direction that must be followed to advance toward a goal. The direction can be a course of action or a guiding principle. Powell Bill Funds: Funding from state-shared gasoline taxes that are restricted for use on maintenance of local streets and roads. Productivity Measure: A performance measure combining efficiency and effectiveness measures into a single factor (ex. cost per ton of on-time yard waste/leaf collection) Program: A well-defined portion of the operating plan for which a distinct set of goals and outcomes may be developed. Proprietary Funds: Funds used to separate, control, and track financial resources of business-type activities carried out by a government. The two proprietary fund types include: 1) Enterprise Funds and 2) Internal Service Fund. Public Safety: A group of expenditure related to the provision and enforcement of law enforcement, fire, disaster protection, traffic safety, and communication. Reappraisal: The process of revaluing a jurisdiction’s real property in order to adjust the tax value to the market value. By North Carolina law, a revaluation must be conducted at a minimum of every eight years. Reserve: An account designated for a portion of the fund balance that is to be used for a specific purpose. Retained Earnings: Amounts shown as retained earnings represent accumulated earnings of proprietary funds after all budgeted business expenses have been made. Revenue: Funds the City receives as income. It includes tax payments, fees for services, grants, fines, forfeitures and interest income. Revenue Bonds: Bonds issued by a government that are backed by a specific revenue source – such as special assessments, water/sewer fees, and electric fees. Taxes: Compulsory charges levied by a government for the purpose of financing services performed for the common benefit of the people. This term does not include specific charges made against particular persons or property for current or permanent benefit, such as special assessments. This term, also, does not refer to user charges for enterprise type services (i.e. water, wastewater, electricity) or special or enhanced services or products benefiting a single party. See also “User Fees/Charges.” Tax Levy: The resultant product when the tax rate per one-hundred dollars valuation is multiplied by the total taxable valuation, or tax base. Special Revenue Fund: A fund used to account for the proceeds from specific revenue sources that are restricted or
committed to expenditure for specified purposes other than debt service or capital projects. Surplus: The amount by which revenues exceed expenditures. Unassigned Fund Balance/Undesignated Retained Earnings: The portion of a fund’s unspent monies, or reserves, that is not restricted for a specific purpose and is available for general appropriation. User Fee/Charge: The payment for direct receipt of a service by the party benefiting from the service. Working Capital: The result of Current Assets minus Current Liabilities which is considered a good measure of both an organization’s efficiency and its financial health. Workload Measure: A performance measure identifying how much or how many products or services were produced.
COMMON BUDGET & PERFORMANCE MEASUREMENT ACRONYMS
CDBG = Community Development Block Grant CIP = Capital Improvement Plan COPS = Certificates of Participation FTE = Full-time Equivalent FY = Fiscal Year GAAP = Generally Accepted Accounting Principles GASB = Governmental Accounting Standards Board GFOA = Government Finance Officers Association GO Bonds = General Obligation Bonds NCGS = North Carolina General Statute NCLGPMP = North Carolina Local Government Performance Measurement Project PIP = Pedestrian Improvement Plan PM = Performance Measurement UDO = Unified Development Ordinance WSACC = Water & Sewer Authority of Cabarrus County
294
Copyright © 2022 FDOKUMEN