NC DHSR: 2010 State Medical Facilities Plan - NC DHHS
416
N.C. Division of Health Service Regulation 2 0 1 0 DHSR N.C. Division of Health Service Regulation State Medical Facilities Plan North Carolina Department of Health and Human Services STATE HEALTH COORDINATING COUNCIL
-
Upload
khangminh22 -
Category
Documents
-
view
2 -
download
0
Transcript of NC DHSR: 2010 State Medical Facilities Plan - NC DHHS

N.C. Division of Health Service Regulation
2010 DHSR
N.C. Division of Health Service Regulation
State Medical
Facilities Plan
North Carolina Department of Health and Human Services
S TAT E H E A L T H C O O R D I N AT I N G C O U N C I L

NORTH CAROLINA 2010 STATE MEDICAL FACILITIES PLAN
Effective January 1, 2010 Prepared by the
North Carolina Department of Health and Human Services Division of Health Service Regulation
Medical Facilities Planning Section Under the direction of the
North Carolina State Health Coordinating Council For information contact the
North Carolina Division of Health Service Regulation 2714 Mail Service Center Raleigh, North Carolina 27699-2714 http://www.ncdhhs.gov/dhsr/ncsmfp/index.html (919) 855 - 3865 Telephone Number (919) 715 - 4413 FAX Number
The North Carolina Department of Health and Human Services does not discriminate on the basis of race, color, national origin, sex, religion, age or disability in employment or the provision of services.


TABLE OF CONTENTS
Background Chapter 1 Overview of the North Carolina 2010 State Medical Facilities Plan Chapter 2 Amendments and Revisions Chapter 3 Certificate of Need Review Categories and Schedule Chapter 4 Statement of Policies: Acute Care Hospitals Nursing Care Facilities Adult Care Homes Home Health Services End-Stage Renal Disease Dialysis Services Mental Health, Developmental Disabilities, and Substance Abuse (General) Psychiatric Inpatient Services Intermediate Care Facilities for the Mentally Retarded All Health Services
Acute Care Facilities and Services Chapter 5 Acute Care Hospital Beds Chapter 6 Operating Rooms Chapter 7 Other Acute Care Services Open Heart Surgery Services and Heart-Lung Bypass Machines Burn Intensive Care Services Transplantation Services Chapter 8 Inpatient Rehabilitation Services Technology and Equipment Chapter 9 Technology Lithotripsy Gamma Knife Radiation Oncology Services - Linear Accelerators Positron Emission Tomography Scanner Magnetic Resonance Imaging Cardiac Catheterization Equipment

Long-Term Care Facilities and Services Chapter 10 Nursing Care Facilities Chapter 11 Adult Care Homes Chapter 12 Home Health Services Chapter 13 Hospice Services Chapter 14 End-Stage Renal Disease Dialysis Facilities Chapter 15 Psychiatric Inpatient Services Chapter 16 Substance Abuse Inpatient And Residential Services (Chemical Dependency Treatment Beds) Chapter 17 Intermediate Care Facilities for the Mentally Retarded Appendices Appendix A: North Carolina Counties by Health Service Areas Appendix B: Partial Listing of Health Planning Acronyms Appendix C: List of Contiguous Counties Appendix D: North Carolina Certificate of Need Statute Appendix E: Regulation of Detoxification Services Provided in Hospitals Licensed under Article 5, Chapter 131E, of the General Statutes
DISCLAIMER The North Carolina 2010 State Medical Facilities Plan is subject to revision throughout the year. Notices containing updates and changes will be posted on the North Carolina Division of Health Service Regulation web page at http://www.ncdhhs.gov/dhsr/ncsmfp/index.html as they are approved. Check our web site periodically for updates.

Chapter 1:Overview of the 2010 State Medical Facilities Plan
CHAPTER 1 OVERVIEW OF THE NORTH CAROLINA 2010 STATE MEDICAL FACILITIES PLAN Purpose The North Carolina 2010 State Medical Facilities Plan (“Plan”) was developed by the North Carolina Department of Health and Human Services, Division of Health Service Regulation, under the direction of the North Carolina State Health Coordinating Council, (SHCC) pursuant to G.S. §131E-177. The major objective of the Plan is to provide individuals, institutions, state and local government agencies, and community leadership with policies and projections of need to guide local planning for specific health care facilities and services. Projections of need are provided for the following types of facilities and services:
acute care hospitals
operating rooms
inpatient rehabilitation facilities
technology services
nursing care facilities
adult care facilities
Medicare-certified home health agencies
end-stage renal disease dialysis facilities
hospice home care and hospice inpatient beds
psychiatric hospital units and specialty hospitals
substance abuse hospital units, specialty hospitals, and residential facilities
intermediate care facilities for people with mental retardation Chapters dealing with specific facility/service categories contain summaries of the supply and the utilization of each type of facility or service, a description of changes in the projection method and policies from the previous planning year, a description of the projection method, and other data relevant to the projections of need. The projections of need for the various facilities and services are used in conjunction with other statutes and rules in reviewing certificate of need applications for establishment, expansion, or conversion of health care facilities and services. All parties interested in health care facility and health services planning should consider this Plan a key resource.

Basic Principles Governing the Development of this Plan 1. Safety and Quality Basic Principle
The State of North Carolina recognizes the importance of systematic and ongoing improvement in the quality of health services. Citizens of North Carolina rightfully expect health services to be safe and efficacious. To warrant public trust in the regulation of health services, monitoring of safety and quality using established and independently verifiable metrics will be an integral part of the formulation and application of the North Carolina State Medical Facilities Plan.
Scientific quantification of quality and safety is rapidly evolving. Emerging measures of quality address both favorable clinical outcomes and patient satisfaction, while safety measures focus on the elimination of practices that contribute to avoidable injury or death and the adoption of practices that promote and ensure safety. The SHCC recognizes that while safety, clinical outcomes, and satisfaction may be conceptually separable, they are often interconnected in practice. The North Carolina State Medical Facilities Plan should maximize all three elements. Where practicalities require balancing of these elements, priority should be given to safety, followed by clinical outcomes, followed by satisfaction.
The appropriate measures for quality and safety should be specific to the type of facility or service regulated. Clinical outcome and safety measures should be evidence-based and objective. Patient satisfaction measures should be quantifiable. In all cases, metrics should be standardized and widely reported and preference should be given to those metrics reported on a national level. The SHCC recognizes that metrics meeting these criteria are currently better established for some services than for others. Furthermore, experience and research as well as regulation at the federal level will continue to identify new measures that may be incorporated into the standards applicable to quality and safety. As experience with the application of quality and safety metrics grows, the SHCC should regularly review policies and need methodologies and revise them as needed to address any persistent and significant deficiencies of safety and quality in a particular service area. 2. Access Basic Principle
Equitable access to timely, clinically appropriate and high quality health care for all the people of North Carolina is a foundation principle for the formulation and application of the North Carolina State Medical Facilities Plan. Barriers to access include, but are not limited to: geography, low income, limited or no insurance coverage, disability, age, race, ethnicity, culture, language, education and health literacy. Individuals whose access to needed health services is impeded by any of these barriers are medically underserved. The formulation and implementation of the North Carolina State Medical Facilities Plan seeks to reduce all of these types of barriers to timely and appropriate access. The first priority is to ameliorate economic barriers and the second priority is to mitigate time and distance barriers.
The impact of economic barriers is twofold. First, individuals without insurance, with insufficient insurance, or without sufficient funds to purchase their own health care will often

require public funding to support access to regulated services. Second, the preferential selection by providers of well-funded patients may undermine the advantages that can accrue to the public from market competition in health care. A competitive marketplace should favor providers that deliver the highest quality and best value care, but only in the circumstance that all competitors deliver like services to similar populations.
The SHCC assigns the highest priority to a methodology that favors providers delivering services to a patient population representative of all payer types in need of those services in the service area. Comparisons of value and quality are most likely to be valid when services are provided to like populations. Incentives for quality and process improvement, resource maximization, and innovation are most effective when providers deliver services to a similar and representative mixture of patients.
Access barriers of time and distance are especially critical to rural areas and small communities. However, urban populations can experience similar access barriers. The SHCC recognizes that some essential, but unprofitable, medical services may require support by revenues gained from profitable services or other sources. The SHCC also recognizes a trend to the delivery of some services in more accessible, less complex, and less costly settings. Whenever verifiable data for outcome, satisfaction, safety, and costs for the delivery of such services to representative patient populations justify, the SHCC will balance the advantages of such ambulatory facilities with the needs for financial support of medically necessary but unprofitable care.
The needs of rural and small communities that are distant from comprehensive urban medical facilities merit special consideration. In rural and small communities selective competition that disproportionately captures profitable services may threaten the viability of sole providers of comprehensive care and emergency services. For this reason methodologies that balance value, quality and access in urban and rural areas may differ quantitatively. The SHCC planning process will promote access to an appropriate spectrum of health services at a local level, whenever feasible under prevailing quality and value standards. 3. Value Basic Principle
The SHCC defines health care value as maximum health care benefit per dollar expended. Disparity between demand growth and funding constraints for health care services increases the need for affordability and value in health services. Maximizing the health benefit for the entire population of North Carolina that is achieved by expenditures for services regulated by the State Medical Facilities Plan will be a key principle in the formulation and implementation of SHCC recommendations for the State Medical Facilities Plan.
Measurement of the cost component of the value equation is often easier than measurement of benefit. Cost per unit of service is an appropriate metric when comparing providers of like services for like populations. The cost basis for some providers may be inflated by disproportionate care to indigent and underfunded patients. In such cases the SHCC encourages the adjustment of cost measures to reflect such disparity, but only to the extent such expenditures can be measured according to an established, state-wide standard that is uniformly reported and verifiable. Measurement of benefit is more challenging. Standardized safety and

quality measures, when available, can be important factors in achieving improved value in the provision of health services. Prevention, early detection and early intervention are important means for increasing the total population benefit for health expenditures. Development of new technology has the potential to add value by improving outcome and enhancing early detection. Capital costs of such new technology may be greater but justified by the added population benefit. At the same time overutilization of more costly and/or highly specialized, low-volume services without evidence-based medical indications may contribute to escalating health costs without commensurate population-based health benefit. The SHCC favors methodologies which encourage technological advances for proven and affordable benefit and appropriate utilization for evidence-based indications when available. The SHCC also recognizes the importance of primary care and health education in promoting affordable health care and best utilization of scarce and expensive health resources. Unfortunately technologically sophisticated and costly services that benefit small numbers of patients may be more readily pursued than simple and less costly detection and prevention measures that benefit the broader population. In the pursuit of maximum population-based health care value, the SHCC recognizes the potential adverse impact for growth of regulated services to supplant services of broad benefit to the larger population.
Long-term enhancement of health care value will result from a state medical facilities plan that promotes a balance of competition and collaboration and encourages innovation in health care delivery. The SHCC encourages the development of value-driven health care by promoting collaborative efforts to create common resources such as shared health databases, purchasing cooperatives, and shared information management, and by promoting coordinated services that reduce duplicative and conflicting care. The SHCC also recognizes the importance of balanced competition and market advantage in order to encourage innovation, in so far as those innovations improve safety, quality, access, and value in health care delivery. The State Health Planning Process Throughout the development of the North Carolina State Medical Facilities Plan there are opportunities for public review and comment. Sections of the Plan, including the policies and methods for projecting need, are developed with the assistance of committees of the North Carolina State Health Coordinating Council (Table 1A). The committees submit their recommendations to the Council for approval. A Proposed Plan is assembled and made available to the public. Public hearings on the Proposed Plan are held throughout the State during the summer. Comments and petitions received during this period are considered by the Council and, upon incorporation of all changes approved by the Council, a final draft of the Plan is presented to the Governor for review and approval. With the Governor’s approval, the State Medical Facilities Plan becomes the official document for health facility and health service planning in North Carolina for the specified calendar year.

Other Publications Information concerning publications or the availability of other data related to the health planning process may be obtained by contacting the North Carolina Division of Health Service Regulation, Medical Facilities Planning Section. North Carolina Division of Health Service Regulation Medical Facilities Planning Section 2714 Mail Service Center Raleigh, North Carolina 27699-2714 Telephone Number: (919) 855-3865 FAX Number: (919) 715-4413
NOTE
Determinations of need for services and facilities in this Plan do not imply an intent on the part of the North Carolina Department of Health and Human Services, Division of Medical Assistance to participate in the reimbursement of the cost of care of patients using services and facilities developed in response to this need.
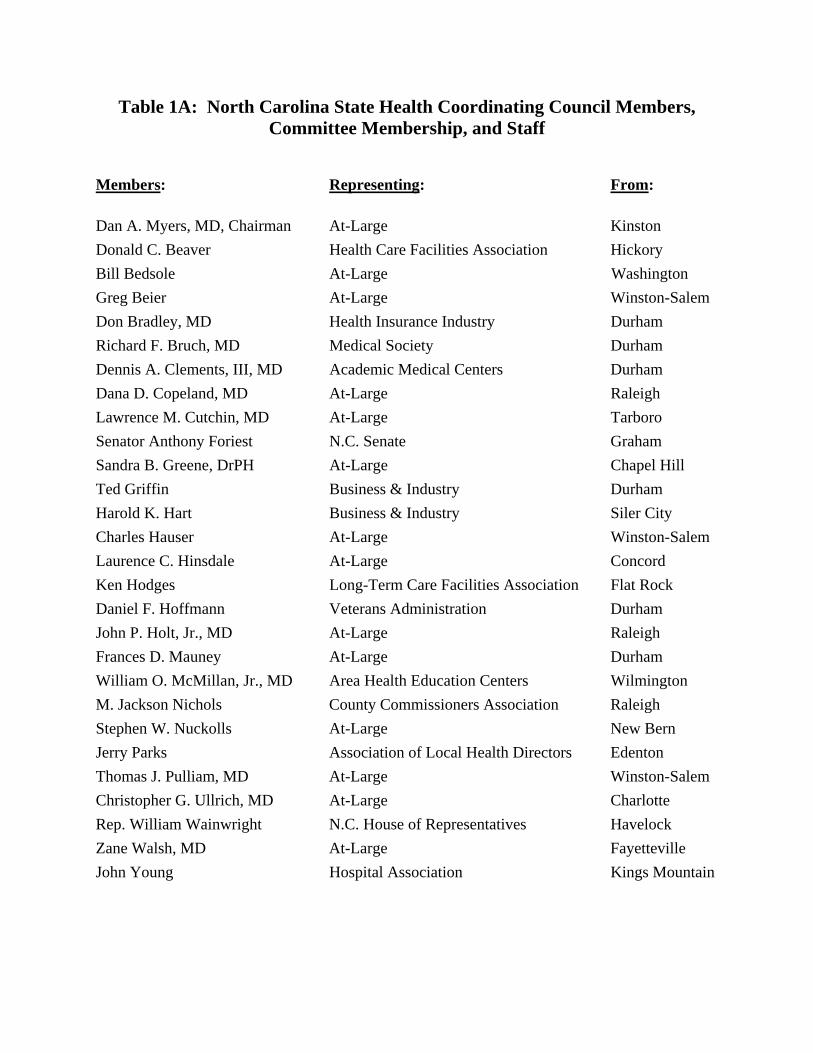
Table 1A: North Carolina State Health Coordinating Council Members, Committee Membership, and Staff
Members: Representing: From:
Dan A. Myers, MD, Chairman At-Large Kinston
Donald C. Beaver Health Care Facilities Association Hickory
Bill Bedsole At-Large Washington
Greg Beier At-Large Winston-Salem
Don Bradley, MD Health Insurance Industry Durham
Richard F. Bruch, MD Medical Society Durham
Dennis A. Clements, III, MD Academic Medical Centers Durham
Dana D. Copeland, MD At-Large Raleigh
Lawrence M. Cutchin, MD At-Large Tarboro
Senator Anthony Foriest N.C. Senate Graham
Sandra B. Greene, DrPH At-Large Chapel Hill
Ted Griffin Business & Industry Durham
Harold K. Hart Business & Industry Siler City
Charles Hauser At-Large Winston-Salem
Laurence C. Hinsdale At-Large Concord
Ken Hodges Long-Term Care Facilities Association Flat Rock
Daniel F. Hoffmann Veterans Administration Durham
John P. Holt, Jr., MD At-Large Raleigh
Frances D. Mauney At-Large Durham
William O. McMillan, Jr., MD Area Health Education Centers Wilmington
M. Jackson Nichols County Commissioners Association Raleigh
Stephen W. Nuckolls At-Large New Bern
Jerry Parks Association of Local Health Directors Edenton
Thomas J. Pulliam, MD At-Large Winston-Salem
Christopher G. Ullrich, MD At-Large Charlotte
Rep. William Wainwright N.C. House of Representatives Havelock
Zane Walsh, MD At-Large Fayetteville
John Young Hospital Association Kings Mountain

Committees and Staff Members Acute Care Services Committee (Planning for acute care beds, operating rooms, open heart surgery services, heart-lung bypass machines, burn intensive care services, transplantation services [bone marrow transplants and solid organ transplants], and inpatient rehabilitation services):
Sandra B. Greene, DrPH, (Chair); Dana D. Copeland, MD, (Vice Chair); Bill Bedsole; Greg Beier; Don Bradley, MD; Lawrence M. Cutchin, MD; Jack Nichols; Daniel F. Hoffmann; Zane Walsh, MD; John Young Staffed by: Victoria McClanahan Long-Term and Behavioral Health Committee (Planning for nursing care facilities, adult care homes, home health services, hospice services, end-stage renal disease dialysis facilities, psychiatric inpatient facilities, substance abuse inpatient and residential services (chemical dependency treatment beds), and intermediate care facilities for the mentally retarded:
Thomas J. Pulliam, MD, (Chair); Jerry Parks, (Vice Chair); Donald C. Beaver; Senator Anthony Foriest; Ted Griffin; Ken Hodges; John P. Holt, Jr., MD; Frances D. Mauney. Staffed by: Floyd Cogley, Victoria McClanahan and Carol G. Potter Technology and Equipment Committee Planning for lithotripsy, gamma knife, linear accelerators, positron emission tomography scanners, magnetic resonance imaging scanners, and cardiac catheterization/angioplasty equipment):
Christopher G. Ullrich, MD, (Chair); William O. McMillan, Jr., MD, (Vice Chair); Richard F. Bruch, MD; Dennis A. Clements III, MD; Harold K. Hart; Charles Hauser; Laurence C. Hinsdale; Stephen W. Nuckolls; Rep. William L. Wainwright Staffed by: Carol G. Potter Medical Facilities Planning Section Staff
Elizabeth K. Brown, Chief Floyd Cogley, Assistant Chief, Planner Victoria McClanahan, Planner Carol G. Potter, Planner Kelli Fisk, Administrative Assistant Division of Health Service Regulation
Jeff Horton, Acting Director

Chapter 2: Amendments and Revisions
CHAPTER 2 AMENDMENTS AND REVISIONS TO THE STATE MEDICAL FACILITIES PLAN
Amendment of Approved Plans After the North Carolina State Medical Facilities Plan has been signed by the Governor, it will be amended only as necessary to correct errors or to respond to statutory changes, amounts of legislative appropriations or judicial decisions. The North Carolina State Health Coordinating Council will conduct a public hearing on proposed amendments and will recommend changes it deems appropriate for the Governor's approval. NOTE: Need determinations as shown in this document may be increased or decreased during the year pursuant to Policy GEN-2 (See Chapter 4). Petitions to Revise the Next State Medical Facilities Plan Anyone who finds that the N.C. State Medical Facilities Plan policies or methodologies, or the results of their application, are inappropriate may petition for changes or revisions. Such petitions are of two general types: those requesting changes in basic policies and methodologies, and those requesting adjustments to the need projections. Petitions for Changes in Basic Policies and Methodologies People who wish to recommend changes that may have a statewide effect are asked to contact the Medical Facilities Planning Section staff as early in the year as possible, and to submit petitions no later than March 3, 2010. Changes with the potential for a statewide effect are the addition, deletion, and revision of policies or projection methodologies. These types of changes will need to be considered in the first four months of the calendar year as the "Proposed N.C. State Medical Facilities Plan" (explained below) is being developed. Instructions for Writing Petitions for Changes in Basic Policies and Methodologies
At a minimum, each written petition requesting a change in basic policies and methodologies used in the N.C. State Medical Failities Plan should contain: 1. Name, address, email address and phone number of petitioner. 2. Statement of the requested change, citing the policy or planning methodology
in the N.C. State Medical Facilities Plan for which the change is proposed.

3. Reasons for the proposed change to include: a. A statement of the adverse effects on the providers or consumers
of health services that are likely to ensue if the change is not made, and
b. A statement of alternatives to the proposed change that were
considered and found not feasible.
4. Evidence that the proposed change would not result in unnecessary duplication of health resources in the area.
5. Evidence that the requested change is consistent with the three Basic
Principles governing the development of the N.C. State Medical Facilities Plan: Safety and Quality, Access, and Value.
Each written petition must be clearly labeled “Petition” and one copy of each petition must be received by the North Carolina Division of Health Service Regulation’s Medical Facilities Planning Section by 5:00 p.m. on March 3, 2010. Petitions must be submitted by e-mail, fax, mail or hand delivery. E-Mail: [email protected] Fax: 919-715-4413 Mail: North Carolina Division of Health Service Regulation Medical Facilities Planning Section 2714 Mail Service Center Raleigh, NC 27699-2714 The office location and address for hand delivery and use of delivery services: 701 Barbour Drive Raleigh, N.C. 27603

Response to Petitions for Changes in Basic Policies and Methodologies
The process for response to such petitions is as follows:
1. Staff, in reviewing the proposed change, may request additional information and opinions from the petitioner or any other person or organization(s) who may be affected by the proposed change.
2. The petition and other information will be made available to the
members of the appropriate committee of the North Carolina State Health Coordinating Council.
3. The petition will be considered by the appropriate committee of the
North Carolina State Health Coordinating Council and the committee will make recommendations to the North Carolina State Health Coordinating Council regarding disposition of the petition.
4. The North Carolina State Health Coordinating Council will consider
the committee’s recommendations and make decisions regarding whether or not to incorporate the changes into the final N.C. State Medical Facilities Plan.
Petitioners will receive written notification of times and places of meetings at which their petitions will be discussed. Disposition of all petitions for changes in basic policies and methodologies in the N.C. State Medical Facilities Plan will be made no later than the final Council meeting of the calender year. Petitions for Adjustments to Need Determinations A Proposed N.C. State Medical Facilities Plan is adopted annually by the North Carolina State Health Coordinating Council, and is made available for review by interested parties during an annual "Public Review and Comment Period." During this period, regional public hearings are held to receive oral/written comments and written petitions. The Public Review and Comment Period for consideration of each Proposed N.C. State Medical Facilities Plan is determined annually and dates are available from the Medical Facilities Planning Section and published in the N.C. State Medical Facilities Plan, People who believe that unique or special attributes of a particular geographic area or institution give rise to resource requirements that differ from those provided by application of the standard planning procedures and policies may submit a written petition requesting an adjustment be made to the need determination given in the Proposed N.C. State Medical
Facilities Plan. These petitions should be delivered to the Medical Facilities Planning Section as early in the Public Review and Comment Period as possible, but no later than the last day of this period. Requirements for petitions to change need determinations in the Proposed N.C. State Medical Facilities Plan are given below. Instructions for Writing Petitions for Adjustments to Need Determinations At a minimum, each written petition requesting an adjustment to a need determination in the Proposed State Medical Facilities Plan should contain:
1. Name, address, email address and phone number of petitioner.
2. A statement of the requested adjustment, citing the provision or need determination in the Proposed State Medical Facilities Plan for which the adjustment is proposed.
3. Reasons for the proposed adjustment, including:
a. Statement of the adverse effects on the population of the affected area that are likely to ensue if the adjustment is not made, and
b. A statement of alternatives to the proposed adjustment that were considered and found not feasible.
4. Evidence that health service development permitted by the proposed adjustment would not result in unnecessary duplication of health resources in the area.
5. Evidence that the requested adjustment is consistent with the three Basic
Principles governing the development of the N.C State Medical Facilities Plan: Safety and Quality, Access and Value.
Petitioners should use the same service area definitions as provided in the program chapters of the Proposed N.C. State Medical Facilities Plan. Petitioners should also be aware that the Medical Facilities Planning staff, in reviewing the proposed adjustment, may request additional information and opinions from the petitioner or any other person and organization(s) who may be affected by the proposed adjustment. Each written petition must be clearly labeled “Petition” and one copy of each petition must be received by the Medical Facilities Planning Section by 5:00 p.m. on August 2, 2010. Petitions must be submitted by e-mail, fax, mail or hand delivery.

E-Mail: [email protected] Fax: 919-715-4413 Mail: North Carolina Division of Health Service Regulation Medical Facilities Planning Section 2714 Mail Service Center Raleigh, NC 27699-2714 The office location and address for hand delivery and use of delivery services: 701 Barbour Drive Raleigh, N.C. 27603 Response to Petitions for Adjustments to Need Determinations The process for response to these petitions by the North Carolina Division of Health Service Regulation and the North Carolina State Health Coordinating Council is as follows:
1. Preparation of an agency report. Staff may request additional
information from the petitioner. Notification that the Agency Report has been posted on the Division of Health Service Regulation web site will be sent to the petitioner on or about the day the report is posted.
2. Consideration of the petition and the agency report by the appropriate
committee of the North Carolina State Health Coordinating Council. 3. Committee submits its recommendations to the North Carolina State
Health Coordinating Council regarding disposition of the petition.
4. Consideration of the committee recommendations by the North Carolina State Health Coordinating Council and decisions regarding whether or not to incorporate the recommended adjustments in the final N.C. State Medical Facilities Plan to be forwarded to the Governor.
Petitioners will receive written notification of times and places of meetings at which their petitions will be discussed. Disposition of all petitions for adjustments to need determinations in the N.C. State Medical Facilities Plan will be made no later than the date of the final Council meeting of the calendar year.

Scheduled State Health Coordinating Council Meetings and Committee Meetings
Any changes to Council, Committee and Public Hearing meeting dates, times and locations will be posted on the meeting information web page at:
http://www.ncdhhs.gov/dhsr/mfp/meetings.html
North Carolina State Health Coordinating Council
March 3, 2010 Holiday Inn Brownstone Downtown 10:00 a.m. 1707 Hillsborough Street, Raleigh 919-828-0811
May 26, 2010 Holiday Inn Brownstone Downtown 10:00 a.m. 1707 Hillsborough Street, Raleigh 919-828-0811
October 6, 2010 Holiday Inn Brownstone Downtown 10:00 a.m. 1707 Hillsborough Street, Raleigh 919-828-0811
http://www.brownstonehotel.com/location.htm (The Council will conduct a Public Hearing on statewide issues related to development of the North Carolina Proposed 2011 State Medical Facilities Plan immediately following the business meeting on March 3, 2010.)

Acute Care Committee April 14, 2010 DHSR 10:00 a.m. 701 Barbour Drive Raleigh, NC Council Building Conference Room 201 May 5, 2010 DHSR 10:00 a.m. 701 Barbour Drive Raleigh, NC Council Building Conference Room 201 Sept. 15, 2010 DHSR 10:00 a.m. 701 Barbour Drive Raleigh, NC Council Building Conference Room 201
Long-Term and Behavioral Health Committee
May 14, 2010 DHSR 10:00 a.m. 701 Barbour Drive Raleigh, NC Council Building Conference Room 201 Sept. 24, 2010 DHSR 10:00 a.m. 701 Barbour Drive Raleigh, NC Council Building Conference Room 201

Technology and Equipment Committee
April 28, 2010 DHSR 10:00 a.m. 701 Barbour Drive Raleigh, NC Council Building Conference Room 201 May 12, 2010 DHSR 10:00 a.m. 701 Barbour Drive Raleigh, NC Council Building Conference Room 201 Sept. 8, 2010 DHSR 10:00 a.m. 701 Barbour Drive Raleigh, NC Council Building Conference Room 201

Deadlines for Petitions and Comments, and Public Hearing Schedule Any changes to Council, Committee and Public Hearing meeting dates, times and locations will be posted on the meeting web page: http://www.ncdhhs.gov/dhsr/mfp/meetings.html. The deadline for receipt by the Medical Facilities Planning Section (MFPS) of petitions, written comments and written comments on petitions and comments is 5:00 p.m. on dates listed below. March 3, 2010 The Council will conduct a Public Hearing on statewide issues related to
development of the North Carolina Proposed 2011 State Medical Facilities Plan (SMFP) immediately following the business meeting.
March 3, 2010 Deadline for receipt of petitions for changes in basic policies and methodologies and other written comments regarding the Proposed 2011 North Carolina State Medical Facilities Plan
March 24, 2010 Deadline for receipt by the MFPS of written comments about Acute Care Services related petitions and comments.
April 7, 2010 Deadline for receipt by the MFPS of written comments about Technology & Equipment related petitions and comments. April 23, 2010 Deadline for receipt by the MFPS of written comments about Long- Term and Behavioral Health related petitions and comments.
2010 Schedule for Public Hearings on the Proposed 2011 SMFP
(all hearings begin at 1:30 p.m.) July 16, 2010 Greensboro Greensboro Area Health Education Center July 21, 2010 Charlotte Carolinas College of Health Sciences July 23, 2010 Asheville Mountain Area Health Education Center July 27, 2010 Greenville Pitt County Office Bldg. July 30, 2010 Wilmington Coastal Area Health Education Center August 2, 2010 Raleigh To be determined
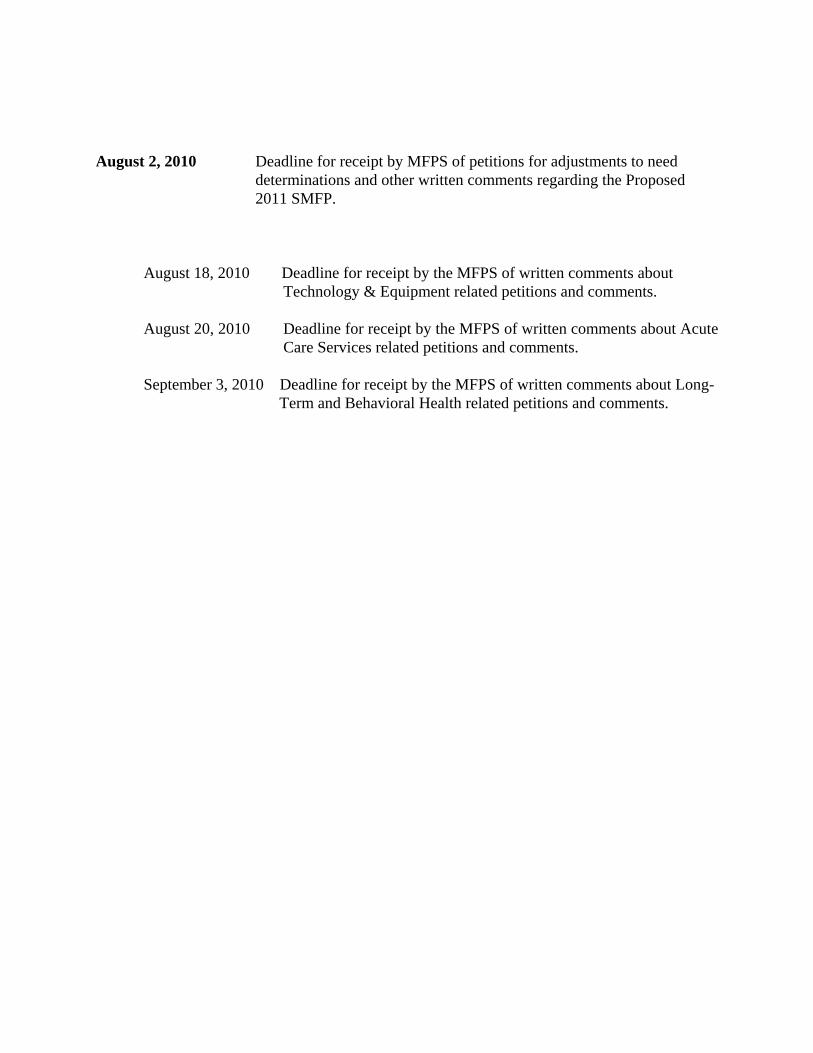
August 2, 2010 Deadline for receipt by MFPS of petitions for adjustments to need determinations and other written comments regarding the Proposed 2011 SMFP.
August 18, 2010 Deadline for receipt by the MFPS of written comments about Technology & Equipment related petitions and comments.
August 20, 2010 Deadline for receipt by the MFPS of written comments about Acute Care Services related petitions and comments.
September 3, 2010 Deadline for receipt by the MFPS of written comments about Long- Term and Behavioral Health related petitions and comments.

Chapter 3:Certificate of Need Review Categories and Schedule

CHAPTER 3 CERTIFICATE OF NEED REVIEW CATEGORIES AND SCHEDULE
Certificates of need are required prior to the development of new institutional health services identified as needed in the North Carolina State Medical Facilities Plan. The Certificate of Need Section shall determine the appropriate review category or categories in which an application shall be submitted pursuant to 10A NCAC 14C .0202. For proposals which include more than one category, an applicant must contact the Certificate of Need Section prior to submittal of the application for a determination regarding the appropriate review category or categories and the applicable review period in which the proposal must be submitted.
The categories are as follows:
Category A Proposals submitted by acute care hospitals, except those proposals included in
Categories B through M.
Category B Proposals to increase the number of nursing care or adult care home beds in a county
for which there is a need determination for additional beds; and proposals for new continuing care retirement communities applying for exemption under Policy NH-2 or Policy LTC-1.
Category C Proposals for new psychiatric facilities; psychiatric beds in existing health care
facilities; new intermediate care facilities for the mentally retarded (ICF/MR) and ICF/MR beds in existing health care facilities; new substance abuse and chemical dependency treatment facilities and substance abuse and chemical dependency treatment beds in existing health care facilities; and transfer of nursing care beds from state psychiatric hospitals to local communities pursuant to Policy NH-5, psychiatric beds from state psychatric hospitals to community facilities pursuant to Policy PSY-1, and ICF/MR beds from state developmental centers to community facilities pursuant to Chapter 858 of the 1983 Session Laws or Policy ICF/MR-2.
Category D Proposals for new dialysis stations in response to the “County Need” or “Facility
Need” methodologies; and relocation of existing certified dialysis stations to another county.
Category E Proposals for inpatient rehabilitation facilities; inpatient rehabilitation beds; and
licensed ambulatory surgical facilities, including single specialty ambulatory surgery demonstration projects; new operating rooms and relocation of existing operating rooms, as defined in G.S. 131E-176(18c) with the exception of the relocation of an entire existing licensed ambulatory surgical facility within the same county which is included in Category I.

Category F Proposals for new Medicare-certified home health agencies or offices; new hospices;
new hospice inpatient facility beds; and new hospice residential care facility beds. Category G Proposals for conversion of acute care beds to nursing care beds under Policy NH-1;
and proposals for the conversion of acute care beds to long-term care hospital beds. Category H Proposals for bone marrow transplantation services, burn intensive care services,
neonatal intensive care services, open heart surgery services, solid organ transplantation services, cardiac catheterization equipment, heart-lung bypass machines, gamma knives, lithotriptors, fixed site magnetic resonance imaging scanners, positron emission tomography scanners, linear accelerators, simulators, major medical equipment as defined in G.S. 131E-176(14f), and diagnostic centers as defined in G.S. 131E-176(7a).
Category I Proposals for: cost overruns; expansions of existing continuing care retirement
communities which are licensed by the Department of Insurance at the date the application is filed and are applying under Policy NH-2 or Policy LTC-1 for exemption from need determinations in Chapter 10: Nursing Care Facilities or Chapter 11: Adult Care Homes; relocation within the same county of an entire existing health service facility (excluding acute care hospitals); relocation within the same county of existing licensed nursing facility beds, existing licensed adult care home beds, or existing certified dialysis stations; transfer of continuing care retirement community beds pursuant to Policy NH-7; reallocation of beds or services pursuant to Policy Gen-1; Category A or Policy AC-3 projects submitted by Academic Medical Center Teaching Hospitals designated prior to January 1, 1990; acquisition of replacement equipment that does not result in an increase in the inventory of the equipment; and, any other project not included in Categories A through H or Categories J through M.
Category J Proposals for: demonstration projects; statewide MRI scanner need determinations;
and relocation of exisitng adult care home or nursing facility beds, pursuant to Policy NH-4, NH-6 or LTC-2, to a different county which does not have a need determination for additional beds; and any new institutional health service, as defined in N.C.G.S. 131E-176(16), that is proposed to be developed or offered in Hoke County, with the exception of proposals in Category D or I.

Category K Proposals for new or additional acute care beds in the acute care service area;
relocation of one or more existing licensed acute care beds to a different site within the same acute care service area, except proposals included in Category J; and new long term care hospital beds.
Category L Proposals for new mobile magnetic resonance imaging scanners. Category M Proposals for new or additional gastrointestinal endoscopy rooms as defined in G.S.
131E-176(7d) and relocation of exisiting gastrointestinal endoscopy rooms as set forth in G.S. 131E-176(16)u.
Review Dates
Table 3A shows the review schedule, by category, for certificate of need applications requiring review. However, a service, facility, or equipment for which a need determination is identified in the North Carolina State Medical Facilities Plan will have only one scheduled review date and one corresponding application filing deadline in the calendar year, even though the table shows multiple review dates for the broad category. In order to determine the designated filing deadline for a specific need determination in the North Carolina State Medical Facilities Plan, an applicant must refer to the applicable need determination table for that service in the related chapter in the Plan. Applications for certificates of need for new institutional health services not specified in other chapters of the Plan shall be reviewed pursuant to the following review schedule, with the exception that no reviews are scheduled if the need determination is zero. Need determinations for additional dialysis stations pursuant to the “county need” or “facility need” methodologies shall be reviewed in accordance with the provisions of Chapter 14. In order to give the Certificate of Need Section sufficient time to provide public notice of review and public notice of public hearings as required by G.S. 131E-185, the deadline for filing certificate of need applications is 5:30 p.m. on the 15th day of the month preceding the “CON Beginning Review Date.” In instances when the 15th day of the month falls on a weekend or holiday, the filing deadline is 5:30 p.m. on the next business day. The filing deadline is absolute and applications received after the deadline shall not be reviewed in that review period. Applicants are strongly encouraged to complete all materials at least one day prior to the filing deadline and to submit material early on the “Certificate of Need Application Due Date.”

Table 3A: 2010 Certificate of Need Review Schedule
CON Beginning Review Date
Health Service Area I, II, III
Health Service Area IV, V, VI
January 1, 2010 -- -- February 1, 2010 A, B, C, G, H, I -- March 1, 2010 -- A, B, C, E, G, H, I April 1, 2010 C, D, E, F, H, I, K(1), M(1) D May 1, 2010 J C, F, H, I, J, K(4), M(4) June 1, 2010 A, B, C, F, H, I July 1, 2010 -- A, B, C, E, H, I, K(5), M(5) August 1, 2010 B, C, E, F, H, I, K(2), M(2) -- September 1, 2010 -- B, C, E, F, H, I October 1, 2010 A, C, D, F, H, I D November 1, 2010 B, C, E, H, I, L, K(3), M(3) -- December 1, 2010 -- A, B, C, F, H, I, L, K(6), M(6)
(1) HSA I only. (2) HSA II only. (3) HSA III only. (4) HSA IV only. (5) HSA V only. (6) HSA VI only.
For further information about specific schedules, timetables, and certificate of need application forms, contact:
North Carolina Division of Health Service Regulation Certificate of Need Section 2704 Mail Service Center Raleigh, N.C. 27699-2704
Phone: (919) 855-3873

Chapter 4:Statement of Policies:
• Acute Care Hospitals
• Nursing Care Facilities
• Adult Care Homes
• Home Health Services
• End-Stage Renal Disease Dialysis Services
• Mental Health, Developmental Disabilities,
and Substance Abuse (General)
• Psychiatric Inpatient Services
• Intermediate Care Facilities for the Mentally Retarded
• All Health Services
CHAPTER 4 STATEMENT OF POLICIES Summary of Policy Changes for 2010
No substantive policy changes have been incorporated into the North Carolina 2010 State Medical Facilities Plan.
Throughout Chapter 4, references to dates have been advanced by one year, as appropriate. POLICIES APPLICABLE TO ACUTE CARE HOSPITALS (AC)
POLICY AC-1: USE OF LICENSED BED CAPACITY DATA FOR PLANNING PURPOSES For planning purposes the number of licensed beds shall be determined by the Division of Health Service Regulation in accordance with standards found in 10A NCAC 13B - Section .6200 and Section .3102 (d). Licensed bed capacity of each hospital is used for planning purposes. It is the hospital's responsibility to notify the Division of Health Service Regulation promptly when any of the space allocated to its licensed bed capacity is converted to another use, including purposes not directly related to health care. POLICY AC-3: EXEMPTION FROM PLAN PROVISIONS FOR CERTAIN ACADEMIC MEDICAL CENTER TEACHING HOSPITAL PROJECTS Projects for which certificates of need are sought by academic medical center teaching hospitals may qualify for exemption from the need determinations of this document. The Medical Facilities Planning Section shall designate as an Academic Medical Center Teaching Hospital any facility whose application for such designation demonstrates the following characteristics of the hospital: 1. Serves as a primary teaching site for a school of medicine and at least one other
health professional school, providing undergraduate, graduate and postgraduate education.
2. Houses extensive basic medical science and clinical research programs, patients and
equipment. 3. Serves the treatment needs of patients from a broad geographic area through
multiple medical specialties.

Exemption from the provisions of need determinations of the North Carolina State Medical Facilities Plan shall be granted to projects submitted by Academic Medical Center Teaching Hospitals designated prior to January 1, 1990 provided the projects comply with one of the following conditions: 1. Necessary to complement a specified and approved expansion of the number or
types of students, residents or faculty, as certified by the head of the relevant associated professional school; or
2. Necessary to accommodate patients, staff or equipment for a specified and
approved expansion of research activities, as certified by the head of the entity sponsoring the research; or
3. Necessary to accommodate changes in requirements of specialty education
accrediting bodies, as evidenced by copies of documents issued by such bodies. A project submitted by an Academic Medical Center Teaching Hospital under this Policy that meets one of the above conditions shall also demonstrate that the Academic Medical Center Teaching Hospital’s teaching or research need for the proposed project cannot be achieved effectively at any non-Academic Medical Center Teaching Hospital provider which currently offers the service for which the exemption is requested and which is within 20 miles of the Academic Medical Center Teaching Hospital. Any health service facility or health service facility bed that results from a project submitted under this Policy after January 1, 1999 shall be excluded from the inventory of that health service facility or health service facility beds in the North Carolina State Medical Facilities Plan. POLICY AC-4: RECONVERSION TO ACUTE CARE Facilities that have redistributed beds from acute care bed capacity to psychiatric, rehabilitation, nursing care, or long-term care hospital use, shall obtain a certificate of need to convert this capacity back to acute care. Applicants proposing to reconvert psychiatric, rehabilitation, nursing care, or long-term care hospital beds back to acute care beds shall demonstrate that the hospital’s average annual utilization of licensed acute care beds as calculated using the most recent Thomson Reuters Days of Care as provided to the Medical Facilities Planning Section by The Cecil G. Sheps Center, is equal to or greater than the target occupancies shown below, but shall not be evaluated against the acute care bed need determinations shown in Chapter 5 of the North Carolina State Medical Facilities Plan. In determining utilization rates and average daily census, only acute care bed “days of care” are counted.
Facility Average Daily Census Target Occupancy of
Licensed Acute Care Beds
1 – 99
66.7%
100 – 200
71.4%
Greater than 200
75.2%

POLICY AC-5: REPLACEMENT OF ACUTE CARE BED CAPACITY Proposals for either partial or total replacement of acute care beds (i.e., construction of new space for existing acute care beds) shall be evaluated against the utilization of the total number of acute care beds in the applicant’s hospital in relation to utilization targets found below. In determining utilization of acute care beds, only acute care bed “days of care” shall be counted. Any hospital proposing replacement of acute care beds must clearly demonstrate the need for maintaining the acute care bed capacity proposed within the application.
Facility Average Daily Census Target Occupancy of
Licensed Acute Care Beds
1 – 99
66.7%
100 – 200
71.4%
Greater than 200
75.2%
POLICY AC-6: HEART-LUNG BYPASS MACHINES FOR EMERGENCY COVERAGE To protect cardiac surgery patients, who may require emergency procedures while scheduled procedures are under way, a need is determined for one additional heart-lung bypass machine whenever a hospital is operating an open heart surgery program with only one heart-lung bypass machine. The additional machine is to be used to assure appropriate coverage for emergencies and in no instance shall this machine be scheduled for use at the same time as the machine used to support scheduled open heart surgery procedures. A certificate of need application for a machine acquired in accordance with this provision shall be exempt from compliance with the performance standards set forth in 10A NCAC 14C .1703(2).
POLICIES APPLICABLE TO NURSING CARE FACILITIES (NH)
POLICY NH-1: PROVISION OF HOSPITAL-BASED NURSING CARE A certificate of need may be issued to a hospital which is licensed under G.S. 131E, Article 5, and which meets the conditions set forth below and in 10A NCAC 14C .1100, to convert up to 10 beds from its licensed acute care bed capacity for use as hospital-based nursing care beds without regard to determinations of need in Chapter 10: Nursing Care Facilities, if the hospital: 1. is located in a county which was designated as non-metropolitan by the U. S. Office
of Management and Budget on January 1, 2010; and 2. on January 1, 2010, had a licensed acute care bed capacity of 150 beds or less. The certificate of need shall remain in force as long as the North Carolina Department of Health and Human Services determines that the hospital is meeting the conditions outlined in this policy.

"Hospital-based nursing care" is defined as nursing care provided to a patient who has been directly discharged from an acute care bed and cannot be immediately placed in a licensed nursing facility because of the unavailability of a bed appropriate for the individual's needs. Nursing care beds developed under this policy are intended to provide placement for residents only when placement in other nursing care beds is unavailable in the geographic area. Hospitals which develop nursing care beds under this policy shall discharge patients to other nursing facilities with available beds in the geographic area as soon as possible where appropriate and permissible under applicable law. Necessary documentation, including copies of physician referral forms (FL 2) on all patients in hospital-based nursing units, shall be made available for review upon request by duly authorized representatives of licensed nursing facilities. For purposes of this policy, beds in hospital-based nursing care shall be certified as a "distinct part" as defined by the Centers for Medicare and Medicaid Services. Nursing care beds in a "distinct part" shall be converted from the existing licensed acute care bed capacity of the hospital and shall not be reconverted to any other category or type of bed without a certificate of need. An application for a certificate of need for reconverting beds to acute care shall be evaluated against the hospital's service needs utilizing target occupancies shown in Policy AC-4, without regard to the acute care bed need shown in Chapter 5: Acute Care Hospital Beds. A certificate of need issued for a hospital-based nursing care unit shall remain in force as long as the following conditions are met: 1. the nursing care beds shall be certified for participation in the Title XVIII
(Medicare) and Title XIX (Medicaid) programs; 2. the hospital discharges residents to other nursing facilities in the geographic area
with available beds when such discharge is appropriate and permissible under applicable law;
3. patients admitted shall have been acutely ill inpatients of an acute hospital or its
satellites immediately preceding placement in the nursing care unit. The granting of beds for hospital-based nursing care shall not allow a hospital to convert additional beds without first obtaining a certificate of need. Where any hospital, or the parent corporation or entity of such hospital, any subsidiary corporation or entity of such hospital, or any corporation or entity related to or affiliated with such hospital by common ownership, control or management:
1. applies for and receives a certificate of need for nursing care bed need determinations in Chapter 10 of the North Carolina State Medical Facilities Plan, or
2. currently has nursing home beds licensed as a part of the hospital under G.S. 131E, Article 5, or
3. currently operates nursing care beds under the Federal Swing Bed Program (P.L. 96-499),

such hospital shall not be eligible to apply for a certificate of need for hospital-based nursing care beds under this policy. Hospitals designated by the State of North Carolina as Critical Access Hospitals pursuant to section 1820 (f) of the Social Security Act, as amended, which have not been allocated nursing care beds under provisions of G.S. 131E 175-190, may apply to develop beds under this policy. However, such hospitals shall not develop nursing care beds both to meet needs determined in Chapter 10 of the North Carolina State Medical Facilities Plan and this policy. Beds certified as a "distinct part" under this policy shall be counted in the inventory of existing nursing care beds and used in the calculation of unmet nursing care bed need for the general population of a planning area. Applications for certificates of need pursuant to this policy shall be accepted only for the February 1 review cycle for Health Service Areas I, II and III, and for the March 1 review cycle for Health Service Areas IV, V and VI. Nursing care beds awarded under this policy shall be deducted from need determinations for the county as shown in Chapter 10: Nursing Care Facilities. Continuation of this policy shall be reviewed and approved by the North Carolina Department of Health and Human Services annually. Certificates of need issued under policies analogous to this policy in the North Carolina State Medical Facilities Plans subsequent to the 1986 Plan are automatically amended to conform with the provisions of this policy at the effective date of this policy. The North Carolina Department of Health and Human Services shall monitor this program and ensure that patients affected by this policy are receiving services as indicated by their care plan, and that conditions under which the certificate of need was granted are being met. POLICY NH-2: PLAN EXEMPTION FOR CONTINUING CARE RETIREMENT COMMUNITIES Qualified continuing care retirement communities may include from the outset, or add or convert bed capacity for nursing care without regard to the nursing care bed need shown in Chapter 10: Nursing Care Facilities. To qualify for such exemption, applications for certificates of need shall show that the proposed nursing care bed capacity:
1. Will only be developed concurrently with, or subsequent to, construction on the same site of facilities for both of the following levels of care:
a. independent living accommodations (apartments and homes) for people who are able to carry out normal activities of daily living without assistance; such accommodations may be in the form of apartments, flats, houses, cottages, and rooms;
b. licensed adult care home beds for use by people who, because of age or disability require some personal services, incidental medical services, and room and board to assure their safety and comfort.

2. Will be used exclusively to meet the needs of people with whom the facility has continuing care contracts (in compliance with the North Carolina Department of Insurance statutes and rules) who have lived in a non-nursing unit of the continuing care retirement community for a period of at least 30 days. Exceptions shall be allowed when one spouse or sibling is admitted to the nursing unit at the time the other spouse or sibling moves into a non-nursing unit, or when the medical condition requiring nursing care was not known to exist or be imminent when the individual became a party to the continuing care contract.
3. Reflects the number of nursing care beds required to meet the current or projected needs of residents with whom the facility has an agreement to provide continuing care, after making use of all feasible alternatives to institutional nursing care.
4. Will not be certified for participation in the Medicaid program.
One half of the nursing care beds developed under this exemption shall be excluded from the inventory used to project nursing care bed need for the general population. Certificates of need issued under policies analogous to this policy in the North Carolina State Medical Facilities Plans subsequent to the 1985 State Medical Facilities Plan are automatically amended to conform with the provisions of this policy at the effective date of this policy. Certificates of need awarded pursuant to the provisions of Chapter 920, Session Laws 1983 or Chapter 445, Session Laws 1985 shall not be amended. POLICY NH-3: DETERMINATION OF NEED FOR ADDITIONAL NURSING CARE BEDS IN SINGLE PROVIDER COUNTIES When a nursing care facility with fewer than 80 nursing care beds is the only nursing care facility within a county, it may apply for a certificate of need for additional nursing care beds in order to bring the minimum number of nursing care beds available within the county to no more than 80 nursing care beds without regard to the nursing care bed need determination for that county as listed in Chapter 10: Nursing Care Facilities. POLICY NH-4: RELOCATION OF CERTAIN NURSING FACILITY BEDS A certificate of need to relocate existing licensed nursing facility beds to another county(ies) may be issued to a facility licensed as a nursing facility under G.S. Chapter 131E, Article 6, Part 1, provided that the conditions set forth below and in 10A NCAC 14C .1100 and the review criteria in G.S. 131E-183(a) are met. A facility applying for a certificate of need to relocate nursing facility beds shall demonstrate that: 1. it is a non-profit nursing facility supported by and directly affiliated with a
particular religion and that it is the only nursing facility in North Carolina supported by and affiliated with that religion;
2. the primary purpose for the nursing facility’s existence is to provide long-term care
to followers of the specified religion in an environment which emphasizes religious customs, ceremonies, and practices;

3. relocation of the nursing facility beds to one or more sites is necessary to more effectively provide nursing care to followers of the specified religion in an environment which emphasizes religious customs, ceremonies, and practices;
4. the nursing facility is expected to serve followers of the specified religion from a
multi-county area; and 5. the needs of the population presently served shall be met adequately pursuant to
G.S. 131E-183. Exemption from the need determinations in Chapter 10: Nursing Care Facilities shall be granted to a nursing facility for purposes of relocating existing licensed nursing care beds to another county provided that it complies with all of the criteria listed in Subparts 1 through 5 above. Any certificate of need issued under this policy shall be subject to the following conditions: 1. the nursing facility shall relocate beds in at least two stages over a period of at least
six months or such shorter period of time as is necessary to transfer residents desiring to transfer to the new facility and otherwise make discharge arrangements acceptable to residents not desiring to transfer to the new facility; and
2. the nursing facility shall provide a letter to the Licensure and Certification Section,
on or before the date that the first group of beds are relocated, irrevocably committing the facility to relocate all of the nursing facility beds for which it has a certificate of need to relocate; and
3. subsequent to providing the letter to the Licensure and Certification Section
described in Subsection 2 above, the nursing facility shall accept no new patients in the beds which are being relocated, except new patients who, prior to admission, indicate their desire to transfer to the facility’s new location(s).
POLICY NH-5: TRANSFER OF NURSING FACILITY BEDS FROM STATE PSYCHIATRIC HOSPITAL NURSING FACILITIES TO COMMUNITY FACILITIES Beds in state psychiatric hospitals that are certified as nursing facility beds may be relocated to licensed nursing facilities. However, before nursing facility beds are transferred out of the state psychiatric hospitals, services shall be available in the community. State psychiatric hospital nursing facility beds that are relocated to licensed nursing facilities shall be closed within 90 days following the date the transferred beds become operational in the community.
Licensed nursing facilities proposing to operate transferred nursing facility beds shall commit to serve the type of residents who are normally placed in nursing facility beds at the state psychiatric hospitals. To help ensure that relocated nursing facility beds will serve those people who would have been served by state psychiatric hospitals in nursing facility beds, a certificate of need application to transfer nursing facility beds from a state hospital shall include a written memorandum of agreement between the director of the applicable state psychiatric hospital; the director of the North Carolina Division of State Operated Healthcare Facilities; the secretary of

the North Carolina Department of Health and Human Services; and the person submitting the proposal.
This policy does not allow the development of new nursing care beds. Nursing care beds transferred from state psychiatric hospitals to the community pursuant to Policy NH-5 shall be excluded from the inventory. POLICY NH-6: RELOCATION OF NURSING FACILITY BEDS Relocations of existing licensed nursing facility beds are allowed only within the host county and to contiguous counties currently served by the facility, except as provided in Policies NH-4, NH-5 and NH-7. Certificate of need applicants proposing to relocate licensed nursing facility beds to contiguous counties shall:
1. demonstrate that the proposal shall not result in a deficit in the number of licensed
nursing facility beds in the county that would be losing nursing facility beds as a result of the proposed project, as reflected in the North Carolina State Medical Facilities Plan in effect at the time the certificate of need review begins, and
2. demonstrate that the proposal shall not result in a surplus of licensed nursing
facility beds in the county that would gain nursing facility beds as a result of the proposed project, as reflected in the North Carolina State Medical Facilities Plan in effect at the time the certificate of need review begins.
POLICY NH-7: TRANSFER OF CONTINUING CARE RETIREMENT COMMUNITY BEDS A certificate of need to relocate existing licensed nursing beds to another county or counties may be issued to a facility licensed as a nursing facility under G.S. Chapter 131E, Article 6, Part 1 without regard to the nursing care bed need shown in Chapter 10, provided that the following conditions are met:
1. Any certificate of need application filed pursuant to this policy must satisfy:
a. the regulatory review criteria in 10A NCAC 14C.1100, except the performance standards in 10A NCAC 14C.1102(a) and (b); and
b. the review criteria in G.S. 131E-183(a). 2. The nursing facility receiving the beds (“the receiving facility”) must: a. be part of a not-for-profit continuing care retirement community (CCRC);
b. be part of a CCRC which is affiliated through ownership, governance, or leasehold with a not-for-profit organization which provides long-term care to residents;
c. provide CCRC services to residents from multiple counties in addition to the
county in which the facility is located; and
d. use the transferred beds exclusively to meet the needs of people either eligible for Medicaid or eligible for Medicaid within 45 days of admission to the nursing facility bed with whom the facility has continuing care contracts (in compliance with the North Carolina Department of Insurance statutes and rules) who have lived in a non-nursing unit of the continuing care retirement community for a period of at least 30 days.
3. The nursing facility transferring the beds (“the transferring facility”) must be a
CCRC affiliated through ownership, governance or leasehold with the same not-for-profit organization as the receiving facility.
4. The transferred beds shall not have been originally approved through the certificate
of need process on or after January 1, 1976 and shall have been eligible prior to January 1, 1976 to be certified for Medicaid.
5. No more than five beds may be transferred to any single nursing facility pursuant to
this policy during any consecutive three-year period.
6. Certificate of need applicants proposing to relocate licensed nursing facility beds under this policy shall demonstrate that the proposal will not result in a deficit in the number of licensed nursing facility beds in the county that would be losing nursing facility beds as a result of the proposed project, as reflected in the North Carolina State Medical Facilities Plan in effect at the time the certificate of need review begins.
7. Nursing facility beds relocated under this policy shall be counted in the planning
inventory of the receiving county.
POLICY NH-8: INNOVATIONS IN NURSING FACILITY DESIGN Certificate of need applicants proposing new nursing facilities, replacement nursing facilities, and projects associated with the expansion and/or renovation of existing nursing facilities shall pursue innovative approaches in care practices, work place practices and environmental design that address quality of care and quality of life needs of the residents. These plans could include innovative design elements that encourage less institutional, more home-like settings, privacy, autonomy, and resident choice, among others.

POLICIES APPLICABLE TO ADULT CARE HOMES POLICY LTC-1: PLAN EXEMPTION FOR CONTINUING CARE RETIREMENT COMMUNITIES – Adult Care Home Beds Qualified continuing care retirement communities may include from the outset, or add or convert bed capacity for adult care without regard to the adult care home bed need shown in Chapter 11: Adult Care Homes. To qualify for such exemption, applications for certificates of need shall show that the proposed adult care home bed capacity:
1. Will only be developed concurrently with, or subsequent to, construction on the same site of independent living accommodations (apartments and homes) for people who are able to carry out normal activities of daily living without assistance; such accommodations may be in the form of apartments, flats, houses, cottages, and rooms.
2. Will provide for the provision of nursing services, medical services, or other health related services as required for licensure by the North Carolina Department of Insurance.
3. Will be used exclusively to meet the needs of people with whom the facility has continuing care contracts (in compliance with the North Carolina Department of Insurance statutes and rules) who have lived in a non-nursing or adult care unit of the continuing care retirement community for a period of at least 30 days. Exceptions shall be allowed when one spouse or sibling is admitted to the adult care home unit at the time the other spouse or sibling moves into a non-nursing or adult care unit, or when the medical condition requiring nursing or adult care home care was not known to exist or be imminent when the individual became a party to the continuing care contract.
4. Reflects the number of adult care home beds required to meet the current or projected needs of residents with whom the facility has an agreement to provide continuing care, after making use of all feasible alternatives to institutional adult care home care.
5. Will not participate in the Medicaid program or serve State-County Special Assistance recipients.
One half of the adult care home beds developed under this exemption shall be excluded from the inventory used to project adult care home bed need for the general population. Certificates of need issued under policies analogous to this policy in the North Carolina State Medical Facilities Plans subsequent to the North Carolina 2002 State Medical Facilities Plan are automatically amended to conform with the provisions of this policy at the effective date of this policy.

POLICY LTC-2: RELOCATION OF ADULT CARE HOME BEDS Relocations of existing licensed adult care home beds are allowed only within the host county and to contiguous counties currently served by the facility. Certificate of need applicants proposing to relocate licensed adult care home beds to contiguous counties shall: 1. Demonstrate that the proposal shall not result in a deficit in the number of licensed
adult care home beds in the county that would be losing adult care home beds as a result of the proposed project, as reflected in the North Carolina State Medical Facilities Plan in effect at the time the certificate of need review begins, and
2. Demonstrate that the proposal shall not result in a surplus of licensed adult care
home beds in the county that would gain adult care home beds as a result of the proposed project, as reflected in the North Carolina State Medical Facilities Plan in effect at the time the certificate of need review begins.
POLICIES APPLICABLE TO HOME HEALTH SERVICES (HH) POLICY HH-3: NEED DETERMINATION FOR MEDICARE-CERTIFIED HOME AGENCY IN A COUNTY When a county has no Medicare-certified home health agency office physically located within the county’s borders, and the county has a population of more than 20,000 people; or, if the county has a population of less than 20,000 people and there is not an existing Medicare-certified home health agency office located in a North Carolina county within 20 miles, need for a new Medicare-certified home health agency office in the county is thereby established through this policy. The “need determination” shall be reflected in the next annual North Carolina State Medical Facilities Plan that is published following determination that a county meets the criteria indicated above. (Population is based on population estimates/projections from the North Carolina Office of State Budget and Management for the plan year in which the need determination would be made excluding active duty military for any county with more than 500 active duty military personnel. The measurement of 20 miles will be in a straight line from the closest point on the county line of the county in which an existing agency office is located to the county seat of the county in which there is no agency.) POLICIES RELATED TO END-STAGE RENAL DISEASE
DIALYSIS SERVICES (ESRD)
POLICY ESRD-2: RELOCATION OF DIALYSIS STATIONS Relocations of existing dialysis stations are allowed only within the host county and to contiguous counties currently served by the facility. Certificate of need applicants proposing to relocate dialysis stations to contiguous counties shall:

1. demonstrate that the proposal shall not result in a deficit in the number of dialysis stations in the county that would be losing stations as a result of the proposed project, as reflected in the most recent North Carolina Semiannual Dialysis Report, and
2. demonstrate that the proposal shall not result in a surplus of dialysis stations in the county that would gain stations as a result of the proposed project, as reflected in the most recent North Carolina Semiannual Dialysis Report.
GENERAL POLICY APPLICABLE TO ALL MENTAL HEALTH, DEVELOPMENTAL DISABILITIES AND SUBSTANCE ABUSE FACILITIES (MH)
POLICY MH-1: LINKAGES BETWEEN TREATMENT SETTINGS An applicant for a certificate of need for psychiatric, substance abuse, or Intermediate Care Facilities for the Mentally Retarded beds shall document that the affected local management entity has been contacted and invited to comment on the proposed services. POLICIES APPLICABLE TO PSYCHIATRIC INPATIENT SERVICES FACILITIES (PSY)
POLICY PSY-1: TRANSFER OF BEDS FROM STATE PSYCHIATRIC HOSPITALS TO COMMUNITY FACILITIES Beds in the state psychiatric hospitals used to serve short-term psychiatric patients may be relocated to community facilities through the certificate of need process. However, before beds are transferred out of the state psychiatric hospitals, services and programs shall be available in the community. State psychiatric hospital beds that are relocated to community facilities shall be closed within 90 days following the date the transferred beds become operational in the community. Facilities proposing to operate transferred beds shall submit an application to the Certificate of Need Section of the North Carolina Department of Health and Human Services and commit to serve the type of short-term patients normally placed at the state psychiatric hospitals. To help ensure that relocated beds will serve those people who would have been served by the state psychiatric hospitals, a proposal to transfer beds from a state hospital shall include a written memorandum of agreement between the local management entity serving the county where the beds are to be located, the secretary of the North Carolina Department of Health and Human Services, and the person submitting the proposal.

POLICIES APPLICABLE TO INTERMEDIATE CARE FACILITIES FOR THE MENTALLY RETARDED (ICF/MR)
POLICY ICF/MR-1: TRANSFER OF ICF/MR BEDS FROM STATE OPERATED
DEVELOPMENTAL CENTERS TO COMMUNITY FACILITIES FOR MEDICALLY FRAGILE CHILDREN
Intermediate Care Facilities for the Mentally Retarded (ICF/MR) beds in state operated developmental centers may be relocated to community facilities through the certificate of need process for the establishment of community ICF/MR facilities to serve children ages birth through six years who have severe to profound developmental disabilities and are medically fragile. This policy allows for the relocation or transfer of beds only and does not provide for transfer of residents with the beds. State operated developmental center ICF/MR beds that are relocated to community facilities shall be closed upon licensure of the transferred beds.
Facilities proposing to operate transferred beds shall submit an application to the Certificate of Need Section demonstrating a commitment to serve children ages birth through six years who have severe to profound developmental disabilities and are medically fragile. To help ensure the relocated beds will serve these residents such proposal shall include a written agreement with the following representatives: director of the local management entity serving the county where the group home is to be located; the director of the applicable state operated developmental center; the director of the North Carolina Division of State Operated Healthcare Facilities; the secretary of the North Carolina Department of Health and Human Services and the operator of the group home. POLICY ICF/MR-2: TRANSFER OF ICF/MR BEDS FROM STATE OPERATED
DEVELOPMENTAL CENTERS TO COMMUNITY FACILITIES FOR INDIVIDUALS WHO CURRENTLY OCCUPY THE BEDS
Existing certified Intermediate Care Facilities for the Mentally Retarded (ICF/MR) beds in state operated developmental centers may be transferred through the certificate of need process to establish ICF/MR group homes in the community to serve people with complex behavioral challenges and/or medical conditions for whom a community ICF/MR placement is appropriate, as determined by the individual’s treatment team and with the individual/guardian being in favor of the placement. This policy requires the transfer of the individuals who currently occupy the ICF/MR beds in the developmental center to the community facility when the beds are transferred. The beds in the state operated developmental center shall be closed upon certification of the transferred ICF/MR beds in the community facility. Providers proposing to develop transferred ICF/MR beds, as those beds are described in this policy, shall submit an application to the Certificate of Need Section that demonstrates their clinical experience in treating individuals with complex behavioral challenges or medical conditions in a residential ICF/MR setting. To ensure the transferred beds will be used to serve these individuals, a written agreement between the following parties shall be obtained prior to development of the group home: director of the local management entity serving the county where the group home is to be located, the director of the applicable developmental center, the director of the North Carolina

Division of State Operated Healthcare Facilities, the secretary of the North Carolina Department of Health and Human Services and the operator of the group home.
POLICIES APPLICABLE TO ALL HEALTH SERVICES (GEN)
The policy statements below apply to all health services including acute care (hospitals, ambulatory surgical facilities, operating rooms, rehabilitation facilities, and technology); long-term care (nursing homes, adult care homes, Medicare-certified home health agencies, end-stage renal disease services and hospice services); mental health (psychiatric facilities, substance abuse facilities, and ICF/MR) and services and equipment including bone marrow transplantation services, burn intensive care services, neonatal intensive care services, open heart surgery services, solid organ transplantation services, cardiac catheterization equipment, heart-lung bypass machines, gamma knives, linear accelerators, lithotriptors, magnetic resonance imaging scanners, positron emission tomography scanners, simulators, major medical equipment as defined in G.S. 131E-176(14f), and diagnostic centers as defined in G.S. 131E-176(7a). POLICY GEN-1: REALLOCATIONS 1. Reallocations shall be made only to the extent that the methodologies used in this
Plan to make need determinations indicate that need exists after the inventories are revised and the need determinations are recalculated.
2. Beds or services which are reallocated once in accordance with this policy shall not
be reallocated again. Rather, the Medical Facilities Planning Section shall make any necessary changes in the next annual North Carolina State Medical Facilities Plan.
3. Dialysis stations that are withdrawn, relinquished, not applied for, decertified,
denied, appealed, or pending the expiration of the 30-day appeal period shall not be reallocated. Instead, any necessary redetermination of need shall be made in the next scheduled publication of the North Carolina Semiannual Dialysis Report.
4. Appeals of Certificate of Need Decisions on Applications Need determinations of beds or services for which the Certificate of Need Section
decision to approve or deny the application has been appealed shall not be reallocated until the appeal is resolved.
a. Appeals resolved prior to August 17: If such an appeal is resolved in the calendar year prior to August 17, the beds
or services shall not be reallocated by the Certificate of Need Section; rather the Medical Facilities Planning Section shall make the necessary changes in the next annual North Carolina State Medical Facilities Plan, except for dialysis stations which shall be processed pursuant to Item (3).

b. Appeals resolved on or after August 17: If such an appeal is resolved on or after August 17 in the calendar year, the
beds or services, except for dialysis stations, shall be made available for a review period to be determined by the Certificate of Need Section, but beginning no earlier than 60 days from the date that the appeal is resolved. Notice shall be mailed by the Certificate of Need Section to all people on the mailing list for the North Carolina State Medical Facilities Plan, no less than 45 days prior to the due date for receipt of new applications.
5. Withdrawals and Relinquishments Except for dialysis stations, a need determination for which a certificate of need is
issued, but is subsequently withdrawn or relinquished, is available for a review period to be determined by the Certificate of Need Section, but beginning no earlier than 60 days from:
a. the last date on which an appeal of the notice of intent to withdraw the certificate could be filed if no appeal is filed,
b. the date on which an appeal of the withdrawal is finally resolved against the holder, or
c. the date that the Certificate of Need Section receives from the holder of the certificate of need notice that the certificate has been voluntarily relinquished.
Notice of the scheduled review period for the reallocated services or beds shall be
mailed by the Certificate of Need Section to all people on the mailing list for the North Carolina State Medical Facilities Plan, no less than 45 days prior to the due date for submittal of the new applications.
6. Need Determinations for which No Applications are Received a. Services or beds with scheduled review in the calendar year on or before
September 1: The Certificate of Need Section shall not reallocate the services or beds in this category for which no applications were received, because the Medical Facilities Planning Section will have sufficient time to make any necessary changes in the determinations of need for these services or beds in the next annual North Carolina State Medical Facilities Plan, except for dialysis stations.
b. Services or beds with scheduled review in the calendar year after September
1: Except for dialysis stations, a need determination in this category for which no application has been received by the last due date for submittal of applications shall be available to be applied for in the second Category I review period in the next calendar year for the applicable Health Service Area. Notice of the scheduled review period for the reallocated beds or services shall be mailed by the Certificate of Need Section to all people on the mailing list for the North Carolina State Medical Facilities Plan, no less than 45 days prior to the due date for submittal of new applications.

7. Need Determinations not Awarded because Application Disapproved a. Disapproval in the calendar year prior to August 17: Need determinations or portions of such need for which applications were
submitted but disapproved by the Certificate of Need Section before August 17, shall not be reallocated by the Certificate of Need Section. Instead the Medical Facilities Planning Section shall make the necessary changes in the next annual North Carolina State Medical Facilities Plan if no appeal is filed, except for dialysis stations.
b. Disapproval in the calendar year on or after August 17: Need determinations or portions of such need for which applications were
submitted but disapproved by the Certificate of Need Section on or after August 17, shall be reallocated by the Certificate of Need Section, except for dialysis stations. A need in this category shall be available for a review period to be determined by the Certificate of Need Section but beginning no earlier than 95 days from the date the application was disapproved, if no appeal is filed. Notice of the scheduled review period for the reallocation shall be mailed by the Certificate of Need Section to all people on the mailing list for the North Carolina State Medical Facilities Plan no less than 80 days prior to the due date for submittal of the new applications.
8. Reallocation of Decertified Intermediate Care Facilities for the Mentally Retarded
(ICF/MR) Beds If an ICF/MR facility’s Medicaid certification is relinquished or revoked, the
ICF/MR beds in the facility may be reallocated by the North Carolina Department of Health and Human Services, Division of Health Service Regulation, Medical Facilities Planning Section after consideration of recommendations from the North Carolina Division of Mental Health, Developmental Disabilities, and Substance Abuse Services. The North Carolina Department of Health and Human Services, Division of Health Service Regulation, Certificate of Need Section shall schedule reviews of applications for any reallocated beds pursuant to Section (5) of this policy.
POLICY GEN-2: CHANGES IN NEED DETERMINATIONS 1. The need determinations adopted in this document or in the Dialysis Reports shall
be revised continuously throughout the calendar year to reflect all changes in the inventories of:
a. the health services listed at G.S. 131E-176 (16)f; b. health service facilities; c. health service facility beds; d. dialysis stations; e. the equipment listed at G.S. 131E-176 (16)f1; f. mobile medical equipment; and g. operating rooms as defined in Chapter 6;

as those changes are reported to the Medical Facilities Planning Section. However, need determinations in this document shall not be reduced if the relevant inventory is adjusted upward 60 days or less prior to the applicable “Certificate of Need Application Due Date.”
2. Inventories shall be updated to reflect:
a. decertification of Medicare-certified home health agencies or offices, ICF/MR and dialysis stations;
b. delicensure of health service facilities and health service facility beds; c. demolition, destruction, or decommissioning of equipment as listed at G.S.
131E-176(16)f1 and s; d. elimination or reduction of a health service as listed at G.S. 131E-176(16)f; e. addition or reduction in operating rooms as defined in Chapter 6; f. psychiatric beds licensed pursuant to G.S. 131E-184(c); g. certificates of need awarded, relinquished, or withdrawn, subsequent to the
preparation of the inventories in the North Carolina State Medical Facilities Plan;
h. corrections of errors in the inventory as reported to the Medical Facilities Planning Section.
3. Any person who is interested in applying for a new institutional health service for
which a need determination is made in this document may obtain information about updated inventories and need determinations from the Medical Facilities Planning Section.
4. Need determinations resulting from changes in inventory shall be available for a
review period to be determined by the Certificate of Need Section, but beginning no earlier than 60 days from the date of the action identified in Subsection (2), except for dialysis stations which shall be determined by the Medical Facilities Planning Section and published in the next North Carolina Semiannual Dialysis Report. Notice of the scheduled review period for the need determination shall be mailed by the Certificate of Need Section to all people on the mailing list for the North Carolina State Medical Facilities Plan no less than 45 days prior to the due date for submittal of the new applications.
POLICY GEN-3: BASIC PRINICPLES A certificate of need applicant applying to develop or offer a new institutional health service for which there is a need determination in the North Carolina State Medical Facilities Plan shall demonstrate how the project will promote safety and quality in the delivery of health care services while promoting equitable access and maximizing healthcare value for resources expended. A certificate of need applicant shall document its plans for providing access to services for patients with limited financial resources and demonstrate the availability of capacity to provide these services. A certificate of need applicant shall also document how its projected volumes incorporate these concepts in meeting the need identified in the State Medical Facilities Plan as well as addressing the needs of all residents in the proposed service area.

Chapter 5:Acute Care Hospital Beds

CHAPTER 5 ACUTE CARE HOSPITAL BEDS Summary of Bed Supply and Utilization
Data reported on the “2009 Hospital License Renewal Applications” indicated that there are 114 licensed acute care hospitals and 20,510 licensed acute care beds in North Carolina. Data provided by Thomson Reuters indicated that 4,515,839 days of care were provided to patients in those hospitals during 2008, which represents an average annual occupancy rate of 60.16 percent These numbers exclude beds in service for substance abuse, psychiatry, rehabilitation, hospice, and long-term care. In addition, across the state acute care bed capacity is expected to increase in certain markets by 756 pending beds and to decrease in other markets by 404 beds, for a net increase of 352 beds. It is important to note that not all licensed beds were in service throughout the year. Some beds were permanently idled, while others were temporarily taken out of service due to staff shortages or to accommodate renovation projects. Changes from the Previous Plan
One substantive change from the previous Plan has been incorporated into the 2010 North Carolina State Medical Facilities Plan. For the 2010 North Carolina State Medical Facilities Plan, Hoke County was assigned to Moore and Cumberland counties, creating a Cumberland Hoke Multi-county Acute Care Bed Service Area and a Moore Hoke Multi-county Acute Care Bed Service Area.
The inventory has been updated and references to dates have been advanced by one year as appropriate. Basic Principles A. Acute Care Hospital Goals 1. To facilitate continuing improvement in the State’s acute care services. Advances in
medical practice frequently entail the development of new services, new facilities or both. The policy of the State is to encourage their development when cost effective and essential to assure reasonable accessibility to services.
2. To expand the availability of appropriate, adequate acute care service to the people
of North Carolina. Our improving highways and transportation systems have brought acute care services within reasonable geographic reach of all North Carolinians, but not within financial reach. Despite the expansion of the State’s Medicaid Program, in 2004 17.5 percent of North Carolinians under the age of 65 were uninsured for a full year, according to a study by the Cecil G. Sheps Center for Health Services Research, at the University of North Carolina at Chapel Hill.
3. To protect the resource that the State’s acute care hospitals represent. The acute
care hospitals are the providers of essential health care services, the State’s third largest

employer, the largest single investment of public funds in many communities, magnets for physicians deciding where to practice, and building blocks in the economic development of their communities. North Carolina must safeguard the future of its hospitals.
Even so, it is not the State’s policy to guarantee the survival and continued operation of
all the State’s hospitals, or even any one of them. In a dynamic, fast-changing environment, which is moving away from inpatient hospital services, the survival and future activities of hospitals will be a function of many factors beyond the realm of State policy.
The State can, however, facilitate the survival of its hospitals and promote the
development of needed health care services, acute and non-acute, by encouraging hospitals to convert unused acute care inpatient facilities to new purposes, to collaborate with other health care providers, and to develop health care delivery networks.
4. To encourage the substitution of less expensive for more expensive services
whenever feasible and appropriate. The State supports continued and expanded use of programs which have demonstrated their capacity to reduce both the number and length of hospital admissions, including:
a. Development of health care delivery networks; b. Increased use of ambulatory surgery; c. Outpatient diagnostic studies; d. Preadmission testing; e. Preadmission certification; f. Programs to reduce admission and readmission rates; g. Timely scheduling of admissions; h. Effective utilization review; i. Discharge planning; j. Appropriate use of alternative services such as home health services, hospice, adult care homes, nursing homes; and k. Initiating new, or maximizing existing, preventive health services. 5. To assure that substantial capital expenditures for the construction or renovation of
health care facilities are based on demonstrated need. 6. To assure that applicants proposing to expand or replace acute care beds should
provide careful analysis of what they have done to promote cost-effective alternatives to inpatient care and to reduce average length of stay.
B. Use of Swing Beds The North Carolina Department of Health and Human Services supports the use of "swing beds" in providing long-term nursing care services in rural acute care hospitals.
Section 1883 of the Social Security Act provides that certain small rural hospitals may use their inpatient facilities to furnish skilled nursing facility (SNF) services to Medicare and Medicaid beneficiaries and intermediate care facility (ICF) services to Medicaid beneficiaries. Hospitals wishing to receive swing bed certification for Medicare patients must meet the eligibility criteria outlined in the law which include:
1. Have a certificate of need, or a letter from the Certificate of Need Section indicating that no certificate of need review is required to provide "swing bed" services; and
2. Have a current valid Medicare provider agreement; and
3. Be located in an area of the State not designated as "urbanized" by the most recent
official census; and
4. Have fewer than 100 hospital beds, excluding beds for newborns and beds in intensive
type inpatient units; and
5. Not have in effect a 24-hour nursing waiver granted under 42 CFR 488.54(c); and
6. Not have had a swing bed approval terminated within the two years previous to application; and
7. Meet the Swing Bed Conditions of Participation (see 42 CFR 482.66) on Resident
Rights; Admission, Transfer, and Discharge Rights; Resident Behavior and Facility Practices; Patient Activities; Social Services; Discharge Planning; Specialized Rehabilitative Services; and Dental Services.
A certificate of need is not required if capital expenditures associated with the swing bed service do not exceed $2 million, and there is no change in bed capacity. Sources of Data
Inventory of Acute Care Beds: The inventory of hospital facilities is maintained through the hospitals' response to a state law that requires each facility to notify the North Carolina Department of Health and Human Services and receive appropriate approvals before construction, alterations or additions to existing buildings or any changes in bed capacities. Bed counts are revised in the state's inventory as changes are reported and approved.
Days of Care and Patient Origin Data for the Bed Need Methodology: The data source for annual Days of Care used in the methodology is Thomson Reuters, a collector of hospital patient discharge information. The general acute care days of care by facility and data on patient’s county of residence were provided by the Sheps Center, based

on the Thomson Reuters data. (Note: The determination of whether a patient record was categorized as an “acute care/general discharge” was determined by the revenue code(s) for accommodation type, as submitted to Thomson Reuters by facilities on the UB-92 form. Included in Column F, "Thomson Reuters 2008 Acute Care Days" are records with revenue codes signifying an acute care/general accommodation type. Likewise, any records that are coded as substance abuse, psychiatric, or rehabilitation discharges are excluded from these figures.)
Basic Assumptions of the Methodology
Target occupancies of hospitals should encourage efficiency of operation, and vary with average daily census:
Average Daily Census Target Occupancy of
Licensed Acute Care Beds 1 - 99 66.7 %
100 - 200 71.4 % Greater than 200 75.2 %
In determining utilization rates and average daily census, only acute care bed “days of
care” are counted.
If a hospital has received approval to increase or decrease acute care bed capacity, this change is incorporated into the anticipated bed capacity regardless of the licensure status of the beds.
Application of the Methodology Step 1 The Acute Care Bed Service Area is a single county, except where there is no hospital located within the county in which case the county or counties without a hospital are combined in a multi-county grouping with a county that has a hospital. Multi-county groupings are determined based on the county in which the hospital or hospitals that provide the largest number of inpatient days of care to the residents of the county which has no hospital, except as described in the following sentences. In response to a petition submitted to the State Health Coordinating Council, Hoke County was assigned to Moore and Cumberland Counties for the 2010 North Carolina State Medical Facilities Plan. This created a Cumberland Hoke Multi-county Acute Care Bed Service Area, in addition to the existing Moore Hoke Multi-county Acute Care Bed Service Area. Data to determine patient’s county of residence (based on the Thomson Reuters data) that is used to establish the multi-county groupings were provided by the Sheps Center. (Note: An acute care bed’s service area is the acute care bed planning area in which the bed is located. The acute care bed planning areas are the single and multi-county groupings shown in Figure 5.1.)

Step 2 (Columns D and E) Determine the number of acute care beds in the inventory by totaling: (Column D) (a) the number of licensed acute care beds at each hospital; (Column E) (b) the number of acute care beds for which certificates of need have been issued, but for which
changes in the license have not yet been made (i.e., additions, reductions, and relocations); and
(c) the number of acute care beds for which a need determination in the North Carolina State Medical Facilities Plan is pending review or appeal.
Step 3 (Column F) Determine the total number of acute inpatient days of care provided by each hospital based on the data contained in the above referenced report for Federal Fiscal Year 2008. (Please see note in “Sources of Data” regarding identification of general acute days of care.) Step 4 (Column G) Calculate the projected inpatient days of care in Federal Fiscal Year 2014 as follows: (a) Determine the total annual number of inpatient days of care provided to North Carolina
residents in North Carolina acute care hospitals during each of the last four federal fiscal years based on data provided by the Sheps Center.
(b) Calculate the difference in the number of inpatient days of care provided from year to year.
(c) For each of the last three years, divide the calculated difference in inpatient days by the total number of inpatient days provided during the previous year to determine the percentage change from the previous year. (Example: (YR 2006 – YR 2005) / YR 2005; etc.)
(d) Total the annual percentages of change and divide by three to determine the average annual
historical percentage change for the State. (Note: The average annual statewide percent of change is 0 .02% per year, a multiplier of 1.0002.)
(e) Calculate the compounded statewide growth factor projected for the next six years, by using
the average annual historical percentage change (from (d) above) in the first year and compounding the change each year thereafter at the same rate. (Example: YR1@ 1.0002; YR2 @ 1.0002 x 1.0002 = 1.0004; YR3 @ 1.0004 x 1.0002 = 1.0006; etc.)
(f) For each hospital, multiply the acute inpatient days of care from Column E by the
compounded statewide growth factor to project the number of acute inpatient days of care to be provided in Federal Fiscal Year 2014 at each hospital.

Step 5 (Column H) Calculate the projected midnight average daily census for each hospital in Federal Fiscal Year 2014, by dividing the projected number of acute inpatient days of care provided at the hospital (from Column G) by 365 days. Step 6 (Column I) Multiply each hospital's projected midnight average daily census from Step 5 (Column H) by the appropriate target occupancy factor below:
Average Daily Census less than 100 = 1.50 Average Daily Census 100-200 = 1.40 Average Daily Census greater than 200 = 1.33 Step 7 (Column J) Determine the surplus or deficit of beds for each hospital by subtracting the inventory of beds in Step 2 (Column D plus Column E) from the number of beds generated in Step 6 (Column I). (Note: Deficits will appear as positive numbers; surpluses, as negative numbers.)
Step 8 (Column K) The number of acute care beds needed in a service area is determined as follows: (a) If two or more hospitals in the same service area are under common ownership, total the
surpluses and deficits of beds for those hospitals to determine the surplus or deficit of beds for each owner of multiple hospitals in the service area.
(b) When the deficit of total acute care beds in the service area for an owner (regardless of number of hospitals owned) equals or exceeds 20 beds or 10% of the inventory of acute care beds for that owner, the deficits of all owners in the service area will be summed to determine the number of acute care beds needed in the service area.
Qualified Applicants Any qualified applicant may apply for a certificate of need to acquire the needed acute care beds. A person is a qualified applicant if he or she proposes to operate the additional acute care beds in a hospital that will provide:
(1) a 24-hour emergency services department, (2) inpatient medical services to both surgical and non-surgical patients, and (3) if proposing a new licensed hospital, medical and surgical services on a daily basis within at
least five of the major diagnostic categories as recognized by the Centers for Medicare and Medicaid Services (CMS), as follows: MDC 1: Diseases and disorders of the nervous system MDC 2: Diseases and disorders of the eye MDC 3: Diseases and disorders of the ear, nose, mouth and throat

MDC 4: Diseases and disorders of the respiratory system MDC 5: Diseases and disorders of the circulatory system MDC 6: Diseases and disorders of the digestive system MDC 7: Diseases and disorders of the hepatobiliary system and pancreas MDC 8: Diseases and disorders of the musculoskeletal system and connective tissue MDC 9: Diseases and disorders of the skin, subcutaneous tissue and breast MDC 10: Endocrine, nutritional and metabolic diseases and disorders MDC 11: Diseases and disorders of the kidney and urinary tract MDC 12: Diseases and disorders of the male reproductive system MDC 13: Diseases and disorders of the female reproductive system MDC 14: Pregnancy, childbirth and the puerperium MDC 15: Newborns/other neonates with conditions originating in the perinatal period MDC 16: Diseases and disorders of the blood and blood-forming organs and
immunological disorders MDC 17: Myeloproliferative diseases and disorders and poorly differentiated neoplasms MDC 18: Infectious and parasitic diseases MDC 19: Mental diseases and disorders MDC 20: Alcohol/drug use and alcohol/drug-induced organic mental disorders MDC 21: Injury, poisoning and toxic effects of drugs MDC 22: Burns MDC 23: Factors influencing health status and other contacts with health services MDC 24: Multiple significant trauma MDC 25: Human immunodeficiency virus infections

Hospital Multi-County Service Area Color Code
Murphy Medical Center Cherokee, Clay and Graham
Mission Hospitals Buncombe, Madison and Yancey
First Health Moore Regional Moore and Hoke
Cape Fear Valley Medical Center Cumberland and Hoke
University of North Carolina Hospital Orange and Caswell
Maria Parham Hospital Vance and Warren
Our Community Hospital and Halifax Regional Medical Center Halifax and Northampton
Pitt County Memorial Hospital Pitt and Greene
Craven Regional Medical Center Craven, Jones and Pamlico
Pungo District Hospital Corporation and Beaufort County Hospital Beaufort and Hyde
Roanoke-Chowan Hospital Hertford and Gates
Chowan Hospital Chowan and Tyrell
Albemarle Hospital Pasquotank, Camden, Currituck and Perquimans
CHEROKEE
SWAIN
JACKSONGRAHAM
CHATHAM
POLK
BUNCOM
BEMAD
ISON
ASHE
WATAUGA WILKES YADKIN
DAVIE
ROWAN
STOKES
FORSYTH
GUILFORD
ROCKINGHAMCASWELL
RANDOLPHDAV
IDSON
COLUMBUS
ONSLOW
MOORE
HOKE
LEE
HARNETT
SCOTLA
ND
BLADEN
SAMPSON DUPLIN
WILSON
WAYNELENOIR
GREENE
CARTERET
UNION ANSON
CABARRUS
STANLY
RICHMOND
CRAVEN
JONES
PITT BEAUFORT
WASHING
TON
TYRRELL
DAREMARTIN
EDGECOMBE
BERTIE
GATESNORTHAMPTON
HERTFORDWARREN
FRANKLIN
WAKE
PERSON
VANCE
MCDOWELL BURKE
CALDWELL
MITCHELL
YANCEY
LINCOLN
GASTON
RUTHERFORD
CLEVELAND
MACONCLAY TRA
NSYLVA
NIA
AVERY
CATAWBA
HYDE
BRUNSWICK
MON
TGOM
ERY
ALEXAND
ER
ALLEGHANY
HENDERSON
CURRITUCK
PASQUOTANK
PERQUIM.
CAMDEN
CHOWAN
PAMLICO
NEWHANOVER
SURRY
IREDELL
HAYWOOD
GRA
NVILLE
HALIFAX
NASH
JOHNSTON
DURH
AM
ORA
NGE
ALA
MANCE
CUMBERLAND
ROBESON
PENDER
MEC
KLEN
BURG
MOORE
HOKE
HOKE
CUMBERLAND
Shaded counties are multi-county acute care bed service areas, consisting of a county with one or more hospitals and a nearby county or counties without an acute care hospital. Counties without acute care hospitals were grouped with the county where a plurality of residents were served.Source: 2001 (HCIA) Solucient data except Moore Hoke & Cumberland Hoke.
At least one licensed facility with an operating room located in the county
Figure 5.1: Acute Care Bed Service Areas

Table 5A: Acute Care Bed Need Projections(2008 Utilization Data from Thomson as compiled by the Cecil B. Sheps Center for Health Services Research)
A B C D E F G H I J K
License Number Facility Name County
Licensed Acute Care
Beds
Adjustments for CONs/
Previous Need
Thomson Reuters
2008 Acute Care Days
6 Years Growth Using .02%
Growth Rate
2014 Projected Average Daily Census (ADC)
2014 Beds Adjusted for Target
Occupancy
Projected 2014 Deficit or
Surplus ("-" )2014 Need
Determination
H0272Alamance Regional Medical Center Alamance 182 0 45,843 45,898 126 176 -6 0
H0274 Alexander Hospital Alexander 25 0 0 0 0 0 -25 0H0108 Alleghany Memorial Hospital Alleghany 41 0 2,785 2,788 8 11 -30 0H0082 Anson Community Hospital Anson 52 0 4,152 4,157 11 17 -35 0H0099 Ashe Memorial Hospital Ashe 76 0 5,182 5,188 14 21 -55 0
H0037Charles A. Cannon, Jr. Memorial Hospital Avery 30 0 6,433 6,441 18 26 -4 0
H0268 Bertie Memorial Hospital Bertie 6 0 1,578 1,580 4 6 0 0
H0154Cape Fear Valley - Bladen County Hospital Bladen 48 0 3,794 3,799 10 16 -32 0
H0036 Mission Hospitals Buncombe 673 0 186,888 187,112 513 682 9 0
2010 Buncombe County SMFP Adjusted Need Determination Buncombe 9
H0031Carolinas Medical Center - NorthEast Cabarrus 447 0 105,542 105,669 290 385 -62 0
H0061 Caldwell Memorial Hospital Caldwell 110 0 17,505 17,526 48 72 -38 0H0222 Carteret General Hospital Carteret 135 0 27,483 27,516 75 113 -22 0H0007 Chatham Hospital Chatham 25 0 3,341 3,345 9 14 -11 0H0239 Murphy Medical Center Cherokee 57 0 8,473 8,483 23 35 -22 0H0063 Chowan Hospital Chowan 49 0 6,988 6,996 19 29 -20 0H0045 Columbus County Hospital Columbus 154 0 22,882 22,909 63 94 -60 0H0201 CarolinaEast Medical Canter Craven 270 37 77,706 77,799 213 283 -24 0
H0213Cape Fear Valley Medical Center Cumberland 487 44 145,017 145,191 398 529 -2 0
H0273 The Outer Banks Hospital Dare 21 0 3,634 3,638 10 15 -6 0H0171 Davie County Hospital Davie 81 -31 1,420 1,422 4 6 -44 0H0166 Duplin General Hospital Duplin 61 0 9,460 9,471 26 39 -22 0H0258 Heritage Hospital Edgecombe 101 0 15,631 15,650 43 64 -37 0
H0261Franklin Regional Medical Center Franklin 70 0 11,342 11,356 31 47 -23 0
H0105 Gaston Memorial Hospital Gaston 372 0 81,162 81,259 223 296 -76 0H0098 Granville Medical Center Granville 62 0 8,077 8,087 22 33 -29 0
Counties with one hospital shown first, followed by counties with more than one hospital.
In response to a petition, Buncombe County Need Determination was adjusted to 9 acute care beds.
Projections bsed on Growth Factor at .02% per year for the next 6 years. Target Occupancy Factors: ADC<100=150%, ADC 100-200=140%, ADC>200=133%.(ADC=Average Daily Census)

Table 5A: Acute Care Bed Need Projections(2008 Utilization Data from Thomson as compiled by the Cecil B. Sheps Center for Health Services Research)
A B C D E F G H I J K
License Number Facility Name County
Licensed Acute Care
Beds
Adjustments for CONs/
Previous Need
Thomson Reuters
2008 Acute Care Days
6 Years Growth Using .02%
Growth Rate
2014 Projected Average Daily Census (ADC)
2014 Beds Adjusted for Target
Occupancy
Projected 2014 Deficit or
Surplus ("-" )2014 Need
Determination
Counties with one hospital shown first, followed by counties with more than one hospital.
H0025Haywood Regional Medical Center Haywood 153 0 15,721 15,740 43 65 -88 0
H0001 Roanoke-Chowan Hospital Hertford 86 0 14,323 14,340 39 59 -27 0H0087 Harris Regional Hospital Jackson 86 0 18,293 18,315 50 75 -11 0H0151 Johnston Memorial Hospital Johnston 157 22 38,113 38,159 105 146 -33 0H0243 Central Carolina Hospital Lee 127 0 19,687 19,711 54 81 -46 0H0043 Lenoir Memorial Hospital Lenoir 218 0 46,226 46,281 127 178 -40 0
H0225Carolinas Medical Center - Lincoln Lincoln 101 0 15,253 15,271 42 63 -38 0
H0078 Martin General Hospital Martin 49 0 7,965 7,975 22 33 -16 0H0097 The McDowell Hospital McDowell 65 0 6,525 6,533 18 27 -38 0H0169 Blue Ridge Regional Hospital Mitchell 46 0 6,568 6,576 18 27 -19 0
H0003FirstHealth Montgomery Memorial Hospital Montgomery 37 0 1,835 1,837 5 8 -29 0
H0100FirstHealth Moore Regional Hospital Moore 297 23 73,264 73,352 201 267 -53 0
H0228 Nash General Hospital Nash 270 0 56,687 56,755 155 218 -52 0
H0221New Hanover Regional Medical Center New Hanover 647 0 139,482 139,649 383 509 -138 0
H0048 Onslow Memorial Hospital Onslow 162 0 33,350 33,390 91 137 -25 0
H0157University of North Carolina Hospitals Orange 651 42 199,848 200,088 548 729 36 36
H0054 Albemarle Hospital Pasquotank 182 0 27,437 27,470 75 113 -69 0H0115 Pender Memorial Hospital Pender 43 0 2,985 2,989 8 12 -31 0H0066 Person Memorial Hospital Person 50 0 9,717 9,729 27 40 -10 0H0104 Pitt County Memorial Hospital Pitt 734 0 197,218 197,455 541 719 -15 0H0079 St. Luke's Hospital Polk 45 0 3,521 3,525 10 14 -31 0H0013 Randolph Hospital Randolph 145 0 26,549 26,581 73 109 -36 0
H0064Southeastern Regional Medical Center Robeson 292 0 60,085 60,157 165 231 -61 0
H0040 Rowan Regional Medical Center Rowan 223 0 34,559 34,600 95 142 -81 0H0039 Rutherford Hospital Rutherford 129 0 17,431 17,452 48 72 -57 0
Projections bsed on Growth Factor at .02% per year for the next 6 years. Target Occupancy Factors: ADC<100=150%, ADC 100-200=140%, ADC>200=133%.(ADC=Average Daily Census)

Table 5A: Acute Care Bed Need Projections(2008 Utilization Data from Thomson as compiled by the Cecil B. Sheps Center for Health Services Research)
A B C D E F G H I J K
License Number Facility Name County
Licensed Acute Care
Beds
Adjustments for CONs/
Previous Need
Thomson Reuters
2008 Acute Care Days
6 Years Growth Using .02%
Growth Rate
2014 Projected Average Daily Census (ADC)
2014 Beds Adjusted for Target
Occupancy
Projected 2014 Deficit or
Surplus ("-" )2014 Need
Determination
Counties with one hospital shown first, followed by counties with more than one hospital.
H0067Sampson Regional Medical Center Sampson 116 0 8,054 8,064 22 33 -83 0
H0107 Scotland Memorial Hospital Scotland 97 21 24,706 24,736 68 102 -16 0
H0008 Stanly Regional Medical Center Stanly 97 0 14,101 14,118 39 58 -39 0
H0165Stokes-Reynolds Memorial Hospital Stokes 53 0 842 843 2 3 -50 0
H0069 Swain County Hospital Swain 48 0 1,607 1,609 4 7 -41 0
H0111Transylvania Community Hospital Transylvania 42 0 5,829 5,836 16 24 -18 0
H0050Carolinas Medical Center - Union Union 157 0 40,362 40,410 111 155 -2 02010 Union County SMFP Adjusted Need Determination Union 25
H0267 Maria Parham Hospital Vance 91 0 19,892 19,916 55 82 -9 0H0006 Washington County Hospital Washington 49 -37 1,849 1,851 5 8 -4 0H0257 Wayne Memorial Hospital Wayne 255 0 60,022 60,094 165 230 -25 0
H0153 Wilkes Regional Medical Center Wilkes 120 0 16,184 16,203 44 67 -53 0H0210 Wilson Medical Center Wilson 294 -96 34,631 34,673 95 142 -56 0H0155 Hoots Memorial Hospital Yadkin 22 0 1,100 1,101 3 5 -17 0
In response to a petition, Union County Need Determination was adjusted to 25 acute care beds.
Projections bsed on Growth Factor at .02% per year for the next 6 years. Target Occupancy Factors: ADC<100=150%, ADC 100-200=140%, ADC>200=133%.(ADC=Average Daily Census)
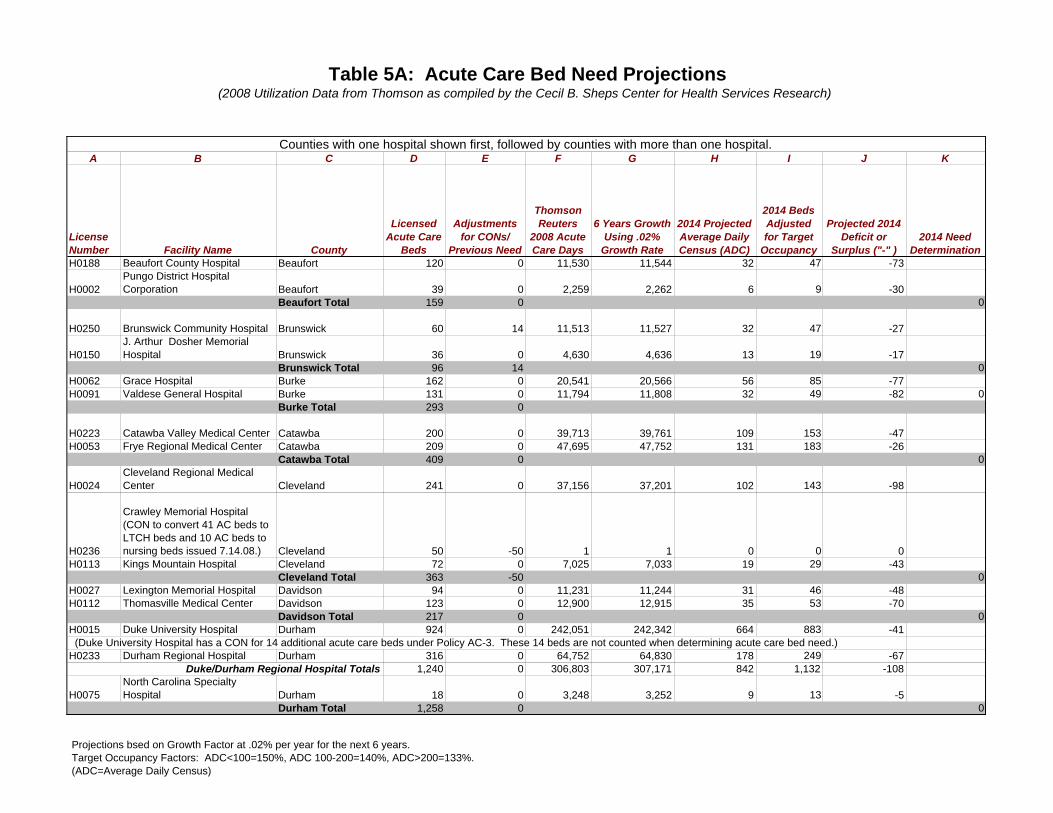
Table 5A: Acute Care Bed Need Projections(2008 Utilization Data from Thomson as compiled by the Cecil B. Sheps Center for Health Services Research)
A B C D E F G H I J K
License Number Facility Name County
Licensed Acute Care
Beds
Adjustments for CONs/
Previous Need
Thomson Reuters
2008 Acute Care Days
6 Years Growth Using .02%
Growth Rate
2014 Projected Average Daily Census (ADC)
2014 Beds Adjusted for Target
Occupancy
Projected 2014 Deficit or
Surplus ("-" )2014 Need
Determination
Counties with one hospital shown first, followed by counties with more than one hospital.
H0188 Beaufort County Hospital Beaufort 120 0 11,530 11,544 32 47 -73
H0002Pungo District Hospital Corporation Beaufort 39 0 2,259 2,262 6 9 -30
Beaufort Total 159 0 0
H0250 Brunswick Community Hospital Brunswick 60 14 11,513 11,527 32 47 -27
H0150J. Arthur Dosher Memorial Hospital Brunswick 36 0 4,630 4,636 13 19 -17
Brunswick Total 96 14 0H0062 Grace Hospital Burke 162 0 20,541 20,566 56 85 -77H0091 Valdese General Hospital Burke 131 0 11,794 11,808 32 49 -82 0
Burke Total 293 0
H0223 Catawba Valley Medical Center Catawba 200 0 39,713 39,761 109 153 -47H0053 Frye Regional Medical Center Catawba 209 0 47,695 47,752 131 183 -26
Catawba Total 409 0 0
H0024Cleveland Regional Medical Center Cleveland 241 0 37,156 37,201 102 143 -98
H0236
Crawley Memorial Hospital(CON to convert 41 AC beds to LTCH beds and 10 AC beds to nursing beds issued 7.14.08.) Cleveland 50 -50 1 1 0 0 0
H0113 Kings Mountain Hospital Cleveland 72 0 7,025 7,033 19 29 -43Cleveland Total 363 -50 0
H0027 Lexington Memorial Hospital Davidson 94 0 11,231 11,244 31 46 -48H0112 Thomasville Medical Center Davidson 123 0 12,900 12,915 35 53 -70
Davidson Total 217 0 0H0015 Duke University Hospital Durham 924 0 242,051 242,342 664 883 -41 (Duke University Hospital has a CON for 14 additional acute care beds under Policy AC-3. These 14 beds are not counted when determining acute care bed need.)H0233 Durham Regional Hospital Durham 316 0 64,752 64,830 178 249 -67
1,240 0 306,803 307,171 842 1,132 -108
H0075North Carolina Specialty Hospital Durham 18 0 3,248 3,252 9 13 -5
Durham Total 1,258 0 0
Duke/Durham Regional Hospital Totals
Projections bsed on Growth Factor at .02% per year for the next 6 years. Target Occupancy Factors: ADC<100=150%, ADC 100-200=140%, ADC>200=133%.(ADC=Average Daily Census)

Table 5A: Acute Care Bed Need Projections(2008 Utilization Data from Thomson as compiled by the Cecil B. Sheps Center for Health Services Research)
A B C D E F G H I J K
License Number Facility Name County
Licensed Acute Care
Beds
Adjustments for CONs/
Previous Need
Thomson Reuters
2008 Acute Care Days
6 Years Growth Using .02%
Growth Rate
2014 Projected Average Daily Census (ADC)
2014 Beds Adjusted for Target
Occupancy
Projected 2014 Deficit or
Surplus ("-" )2014 Need
Determination
Counties with one hospital shown first, followed by counties with more than one hospital.
H0209 Forsyth Medical Center Forsyth 751 62 210,295 210,547 577 767 -46H0229 Medical Park Hospital Forsyth 22 -10 4,906 4,912 13 20 8
773 52 215,201 215,459 590 787 -38
H0011 North Carolina Baptist Hospitals Forsyth 789 13 218,907 219,170 600 799 -3Forsyth Total 1,562 65 0
H0052High Point Regional Health System Guilford 291 16 67,906 67,988 186 261 -46
H0159 Moses Cone Health System Guilford 759 18 192,429 192,660 528 702 -75Guilford Total 1,050 34 0
H0230 Halifax Regional Medical Center Halifax 186 0 33,056 33,096 91 136 -50H0004 Our Community Hospital Halifax 20 0 52 52 0 0 -20
Halifax Total 206 0 0
H0224Betsy Johnson Regional Hospital Harnett 101 0 27,358 27,391 75 113 12
Harnett Health System Central Campus
Harnett Health System Central Campus Harnett 0 50 0 0 0 0 -50
101 50 27,358 27,391 75 113 -38
H0080Good Hope Hospital (closed effective 4/11/06) Harnett 0 34 0 0 0 0 -34
Harnett Total 101 84 0
H0161Margaret R. Pardee Memorial Hospital Henderson 193 0 24,580 24,610 67 101 -92
H0019 Park Ridge Hospital Henderson 62 0 14,135 14,152 39 58 -4Henderson Total 255 0 0
H0248 Davis Regional Medical Center Iredell 120 -18 16,476 16,496 45 68 -34
H0259Lake Norman Regional Medical Center Iredell 105 18 27,321 27,354 75 112 -11
225 0 43,797 43,850 120 180 -45H0164 Iredell Memorial Hospital Iredell 199 0 40,708 40,757 112 156 -43
Iredell Total 424 0 0H0034 Angel Medical Center Macon 59 0 5,607 5,614 15 23 -36H0193 Highlands-Cashiers Hospital Macon 24 0 919 920 3 4 -20
Macon Total 83 0 0
Betsy Johnson/Harnett Health System Totals
Davis Regional/Lake Norman Regional Medical Center Totals
Forsyth/Medical Park Hospital Totals
Projections bsed on Growth Factor at .02% per year for the next 6 years. Target Occupancy Factors: ADC<100=150%, ADC 100-200=140%, ADC>200=133%.(ADC=Average Daily Census)

Table 5A: Acute Care Bed Need Projections(2008 Utilization Data from Thomson as compiled by the Cecil B. Sheps Center for Health Services Research)
A B C D E F G H I J K
License Number Facility Name County
Licensed Acute Care
Beds
Adjustments for CONs/
Previous Need
Thomson Reuters
2008 Acute Care Days
6 Years Growth Using .02%
Growth Rate
2014 Projected Average Daily Census (ADC)
2014 Beds Adjusted for Target
Occupancy
Projected 2014 Deficit or
Surplus ("-" )2014 Need
Determination
Counties with one hospital shown first, followed by counties with more than one hospital.
H0042Carolinas Medical Center - Mercy & Pineville Mecklenburg 294 36 61,844 61,918 170 237 -93
H0255Carolinas Medical Center - University Mecklenburg 130 -36 21,979 22,005 60 90 -4
H0071Carolinas Medical Center / Center for Mental Health Mecklenburg 795 0 233,864 234,145 641 853 58
1,219 0 317,687 318,068 871 1,181 -38H0010 Presbyterian Hospital Mecklenburg 463 76 154,618 154,804 424 564 25
H0282Presbyterian Hospital Huntersville Mecklenburg 60 15 17,081 17,102 47 70 -5
H0270 Presbyterian Hospital Matthews Mecklenburg 102 12 30,779 30,816 84 127 13
Presbyterian Hospital Mint Hill Presbyterian Hospital Mint Hill Mecklenburg 0 50 Utilization for reporting period shown below with H0251. -50
H0251Presbyterian Orthopaedic Hospital Mecklenburg 140 -126 12,803 12,818 35 53 39
765 27 215,281 215,539 591 814 22
2009 Mecklenburg SMFP Need Determination
2009 Mecklenburg SMFP Need Determination Mecklenburg 20 0 0
Mecklenburg Total 1,984 47 0
H0158FirstHealth Richmond Memorial Hospital Richmond 99 0 12,731 12,746 35 52 -47 0
H0265Sandhills Regional Medical Center (see note below) Richmond 54 6 11,962 11,976 33 49 -11
Note: Sandhills Regional Medical Center's 2008 Acute Care Days have not been verified as correct - service area need determination not affected. Richmond Total 153 6 0
H0023 Annie Penn Hospital Rockingham 110 0 13,555 13,571 37 56 -54H0072 Morehead Memorial Hospital Rockingham 108 0 23,357 23,385 64 96 -12
Rockingham Total 218 0 0
H0049Hugh Chatham Memorial Hospital Surry 81 0 18,817 18,840 52 77 -4
H0184Northern Hospital of Surry County Surry 100 0 15,719 15,738 43 65 -35
Surry Total 181 0 0
Carolinas Medical Center Totals
Presbyterian Hospital Totals
Projections bsed on Growth Factor at .02% per year for the next 6 years. Target Occupancy Factors: ADC<100=150%, ADC 100-200=140%, ADC>200=133%.(ADC=Average Daily Census)

Table 5A: Acute Care Bed Need Projections(2008 Utilization Data from Thomson as compiled by the Cecil B. Sheps Center for Health Services Research)
A B C D E F G H I J K
License Number Facility Name County
Licensed Acute Care
Beds
Adjustments for CONs/
Previous Need
Thomson Reuters
2008 Acute Care Days
6 Years Growth Using .02%
Growth Rate
2014 Projected Average Daily Census (ADC)
2014 Beds Adjusted for Target
Occupancy
Projected 2014 Deficit or
Surplus ("-" )2014 Need
Determination
Counties with one hospital shown first, followed by counties with more than one hospital.
H0238 Duke Health Raleigh Hospital Wake 186 0 25,269 25,299 69 104 -82H0065 Rex Hospital Wake 425 8 106,947 107,075 293 390 -43H0276 WakeMed Cary Hospital Wake 156 0 38,542 38,588 106 148 -8H0199 WakeMed Raleigh Campus Wake 515 113 177,318 177,531 486 647 19
671 113 215,860 216,119 592 795 11
2009 Wake SMFP Need Determination (neonatal beds only)
Remainder of 2009 SMFP Wake Need Determination (neonatal beds only) Wake 6 0 0
Wake Total 1,282 127 0H0160 Blowing Rock Hospital Watauga 28 0 622 623 2 3 -25H0077 Watauga Medical Center Watauga 117 0 21,199 21,224 58 87 -30
Watauga Total 145Grand Total All Hospitals 20,510 352 70
WakeMed Totals
Projections bsed on Growth Factor at .02% per year for the next 6 years. Target Occupancy Factors: ADC<100=150%, ADC 100-200=140%, ADC>200=133%.(ADC=Average Daily Census)
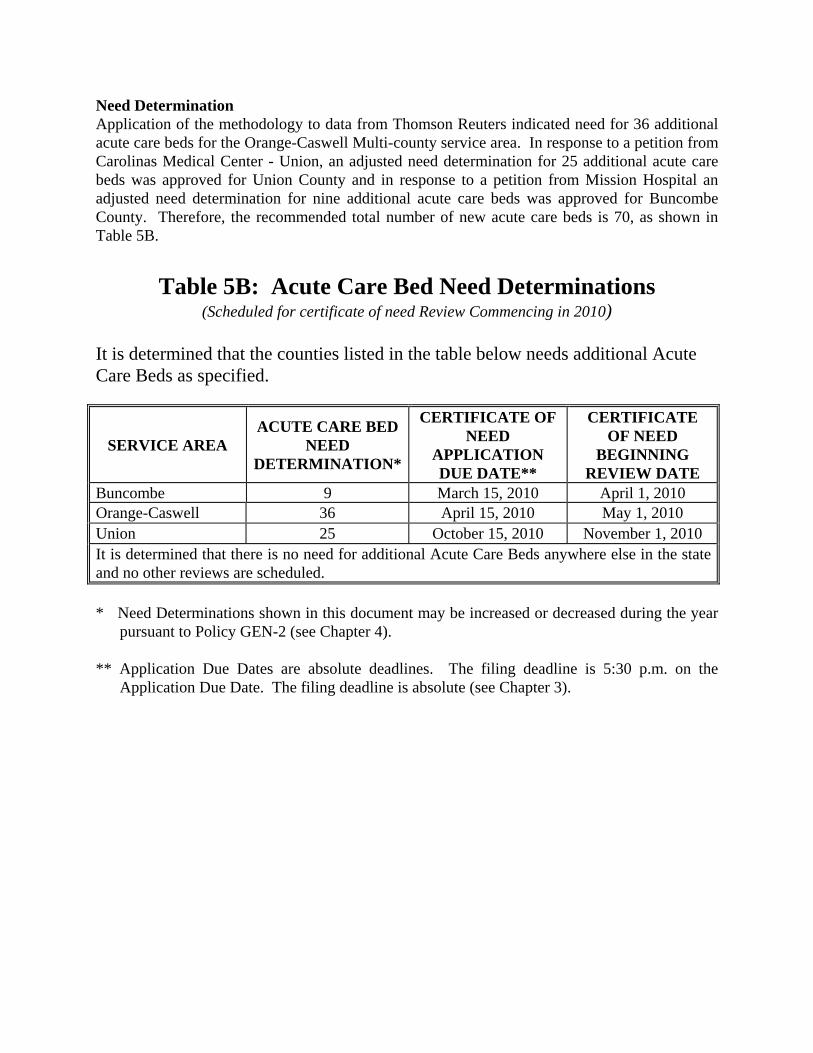
Need Determination Application of the methodology to data from Thomson Reuters indicated need for 36 additional acute care beds for the Orange-Caswell Multi-county service area. In response to a petition from Carolinas Medical Center - Union, an adjusted need determination for 25 additional acute care beds was approved for Union County and in response to a petition from Mission Hospital an adjusted need determination for nine additional acute care beds was approved for Buncombe County. Therefore, the recommended total number of new acute care beds is 70, as shown in Table 5B.
Table 5B: Acute Care Bed Need Determinations
(Scheduled for certificate of need Review Commencing in 2010)
It is determined that the counties listed in the table below needs additional Acute Care Beds as specified.
SERVICE AREA ACUTE CARE BED
NEED DETERMINATION*
CERTIFICATE OF NEED
APPLICATION DUE DATE**
CERTIFICATE OF NEED
BEGINNING REVIEW DATE
Buncombe 9 March 15, 2010 April 1, 2010 Orange-Caswell 36 April 15, 2010 May 1, 2010 Union 25 October 15, 2010 November 1, 2010 It is determined that there is no need for additional Acute Care Beds anywhere else in the state and no other reviews are scheduled. * Need Determinations shown in this document may be increased or decreased during the year
pursuant to Policy GEN-2 (see Chapter 4). ** Application Due Dates are absolute deadlines. The filing deadline is 5:30 p.m. on the
Application Due Date. The filing deadline is absolute (see Chapter 3).

Inventory of Long-Term Care Hospital Beds As a result of the August 2005 change in the Certificate of Need Statute which made “long- term care hospital beds” a separate category of health service facility beds, the bed days associated with long-term care hospitals have been removed from the acute care bed need determinations. Table 5C, based on 2008 data from the 2009 Hospital License Renewal Applications, shows long-term care hospital inventory data.
Table 5C: Long-Term Care Hospital (LTCH) Bed Inventory
LICENSE # FACILITY NAME COUNTY
LICENSED LTCH BEDS
ADJUSTMENTS FOR CONS AND PREVIOUS NEED
H0279 Asheville Specialty Hospital Buncombe 34 0
H0278 Carolinas Select Specialty Hospital Mecklenburg 40 0
H0236 Crawley Memorial Hospital Cleveland 0 41
H0275 Highsmith-Rainey Memorial Hospital Cumberland 66 0
H0073 Kindred Hospital-Greensboro Guilford 101 0
H0242 LifeCare Hospital of North Carolina Nash 50 0
H0280 Select Specialty Hospital -Durham Durham 30 0
H0284 Select Specialty Hospital -Greensboro Guilford 30 0
H0277 Select Specialty Hospital -Winston-Salem Forsyth 42 0

Chapter 6:Operating Rooms

CHAPTER 6 OPERATING ROOMS
Summary of Operating Room Inventory and Utilization
In the Fall of 2009, the combined inventory of operating rooms in hospitals and ambulatory surgical facilities consisted of 155 dedicated inpatient surgery rooms (including 84 dedicated C-Section rooms), 284 dedicated ambulatory surgery rooms and 861 shared operating rooms. Data from the 2009 Hospital and Ambulatory Surgical Facility License Renewal Applications indicated that of the total reported surgical cases, (excluding C-Section cases), 71 percent of the cases were ambulatory cases and 29 percent of the cases were inpatient cases. Changes from the Previous Plan
One substantive change to the Operating Room Need Methodology has been incorporated into the 2010 North Carolina State Medical Facilities Plan. For the 2010 North Carolina State Medical Facilities Plan, Hoke County was assigned to Moore and Cumberland counties, creating a Cumberland Hoke Multi-county Operating Room Service Area and a Moore Hoke Multi-county Operating Room Service Area. Step 3 of the Operating Room Need Projection methodology has been revised to reflect this service area change.
The inventory and case data have been updated and references to dates have been advanced by one year, as appropriate. Sources of Data
Data on the number of cases and procedures for the 2010 North Carolina State Medical Facilities Plan were taken from the “2009 Hospital License Renewal Applications” and the “2009 Ambulatory Surgical Facility License Renewal Applications” as submitted to the Licensure and Certification Section of the Division of Health Service Regulation. (Note: While utilization data are reported on the annual license renewal applications for dedicated C-Section rooms, utilization data must be collected separately for the excluded Trauma Center and Burn Intensive Care Unit operating rooms described in Step 4 j of the “Methodology for Projecting Operating Room Need”. For the 2010 Plan, the only service area with a projected deficit that also has a designated trauma OR is Wake County. Therefore, the number of WakeMed trauma cases was collected and then subtracted from the total Wake County cases on Table 6B used to project need for additional ORs. Trauma cases from other designated Trauma Centers/Burn Intensive Care Units were not collected. Excluding cases for Service Areas with projected surpluses would only increase the size of the projected surplus.)
Inventory data for the 2010 Plan were compiled by staff based on License Renewal Applications, supplemented with data from the most recent licenses issued by the Licensure and Certification Section and with project approval letters from the Certificate of Need Section.
Population data by county for 2008 and 2012 were obtained from the North Carolina
Office of State Budget and Management.

Methodology for Projecting Operating Room Need The following narrative describes the assumptions and methodology used in determining the operating room inventory and in projecting need for additional operating room capacity. The objective of the methodology is to arrive at a reasonable assessment of the adequacy of current resources for performing surgery, compared with an estimate of need for additional capacity. Step 1 – Delineation of Service Areas (Column A) Each county is a separate Operating Room Service Area except where there is no licensed facility with an operating room located within the county, in which case the county or counties without a licensed facility providing operating rooms are combined in a multi-county grouping with a county that has at least one licensed facility with an operating room. Multi-county groupings were determined based on surgical patient origin data from the Hospital and the Ambulatory Surgical Facility License Renewal Applications, supplemented by surgical patient origin data from Blue Cross and Blue Shield. Counties without a facility providing operating rooms were grouped with the contiguous county, whenever possible, which served the largest reported number of surgical patients, except as described in the following sentences. In 2006, in response to an adjusted need determination petition, the State Health Coordinating Council added Swain County to the Jackson-Graham Multi-County Operating Room Service Area. This created a Multi-county Operating Room Service Area including two counties with operating rooms and one county without operating rooms. Additionally, in response to a petition submitted to the State Health Coordinating Council, Hoke County was assigned to Moore and Cumberland Counties for the 2010 North Carolina State Medical Facilities Plan. This created a Cumberland Hoke Multi-county Operating Room Service Area in addition to the existing Moore Hoke Multi-county Operating Room Service Area. (Note: An operating room’s service area is the operating room planning area in which the operating room is located. The operating room planning areas are the single and multi-county groupings shown in Figure 6.1. For the 2010 Plan, the State Health Coordinating Council has identified three additional operating room service areas specifically for the Single Specialty Ambulatory Surgery Facility Demonstration Project, which is described in Table 6D. Step 2 – Estimate the Total Surgery Hours for the Previous Year (Columns B through H) Estimate the total number of surgery hours performed during the previous fiscal year based on reported cases by type from Annual License Renewal Applications, as follows: (a) Sum the number of inpatient surgical cases reported in the Inpatient Cases column of the
“Surgical Cases by Specialty Area” table on the annual Hospital License Renewal Applications for all licensed facilities within the OR Service Area. (NOTE: Cases performed in Dedicated C-Section Rooms; cases reported as “Trauma Cases” by Level I or II Trauma Centers; and cases reported by designated “Burn Intensive Care Units” are excluded for purposes of these need projections.) Multiply the total number of inpatient cases by three hours to estimate the number of hours utilized for inpatient cases. (Column B * Column C = Column D)
(b) Sum the number of ambulatory surgical cases reported in the Ambulatory Cases column of
the “Surgical Cases by Specialty Area” table on the annual Hospital License Renewal Applications and the number of Surgical Cases reported on the annual Ambulatory Surgical Facility License Renewal Applications for all licensed facilities within the OR Service Area.

Multiply the total number of ambulatory cases by 1.5 hours to estimate the number of hours utilized for ambulatory cases. (Column E * Column F = Column G)
(c) Sum the totals from Step 2 (a) and (b) to determine the “Total Estimated Hours” reported
during the previous fiscal year. (Column D + Column G = Column H) Step 3 – Project Future OR Requirements based on Growth of OR Hours (Columns I through L) (d) For purposes of these need projections, the number of surgical hours is anticipated to
increase or decrease in direct proportion to the change in the general population of the OR Service Area. A “Growth Factor,” based on each service area’s projected population change between the “data year” (2008) and the “target year” for need projections (2012) is calculated based on population figures from the North Carolina Office of State Budget and Management. (Column I: Growth Factor = 2012 Service Area Population minus 2008 Service Area Population, then divided by the 2008 Service Area Population.)
For the 2010 SMFP, when determining need for operating rooms, Hoke County’s population growth was assigned as follows: Cumberland County was assigned the proportion of Hoke County’s population growth
equal to the proportion of Hoke County residents receiving surgical services in Cumberland County;
Moore County was assigned the proportion of Hoke County’s population growth equal to the proportion of Hoke County residents receiving surgical services in Moore County
Surgical patient origin data for 2008 from the 2009 License Renewal Applications was used to determine the proportion of Hoke County residents receiving services in Cumberland and Moore Counties.
The table below shows how the Cumberland Hoke and the Moore Hoke Multi-county Service Areas’ growth rates were calculated for the 2010 SMFP.
County July 2008 Projected
Population July 2012 Projected
Population Change Change Rate
Cumberland 316,945 329,653 12,708 4.01%Hoke 44,442 49,082 4,640 10.44%Moore 85,293 91,667 6,374 7.47%Cumberland 316,945 329,653 12,708 4.01%
Hoke 20,319
(20,319 =45.72% of 44,442) 22,440
(22,440=45.72% of 49,082) 2,121 10.44%Cumberland Hoke Total 337,264 352,093 14,829 4.40%Moore 85,293 91,667 6,374 7.47%
Hoke 17,990
(17,990=40.48% of 44,442)19,868
(19,868=40.48% of 49,082) 1,878 10.44%Moore Hoke Total 103,283 111,535 8,252 7.99% (e) Multiply the “Total Estimated Hours” for the most recent fiscal year by the “Growth Factor”
for each OR Service Area, then add the product to the Total Estimated Hours to determine the “Projected Surgical Hours Anticipated in 2011.” ([Column H * Column I] + Column H = Column J)
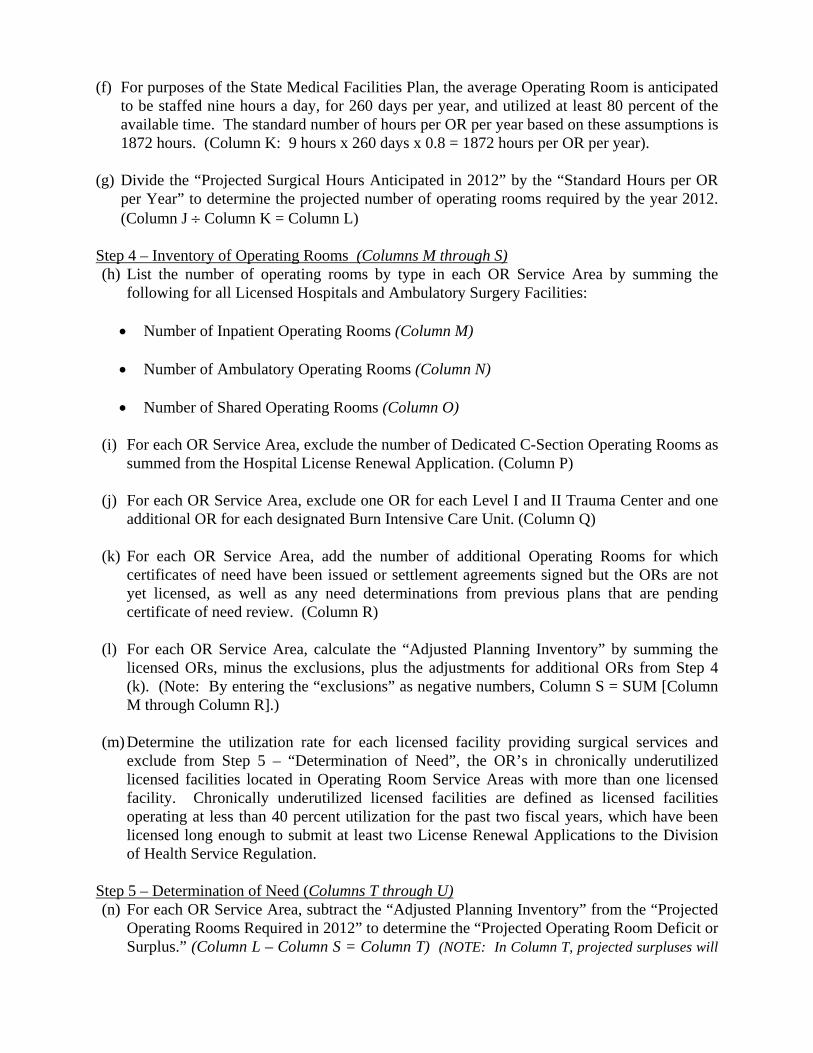
(f) For purposes of the State Medical Facilities Plan, the average Operating Room is anticipated to be staffed nine hours a day, for 260 days per year, and utilized at least 80 percent of the available time. The standard number of hours per OR per year based on these assumptions is 1872 hours. (Column K: 9 hours x 260 days x 0.8 = 1872 hours per OR per year).
(g) Divide the “Projected Surgical Hours Anticipated in 2012” by the “Standard Hours per OR
per Year” to determine the projected number of operating rooms required by the year 2012. (Column J Column K = Column L)
Step 4 – Inventory of Operating Rooms (Columns M through S) (h) List the number of operating rooms by type in each OR Service Area by summing the
following for all Licensed Hospitals and Ambulatory Surgery Facilities: Number of Inpatient Operating Rooms (Column M)
Number of Ambulatory Operating Rooms (Column N)
Number of Shared Operating Rooms (Column O)
(i) For each OR Service Area, exclude the number of Dedicated C-Section Operating Rooms as
summed from the Hospital License Renewal Application. (Column P) (j) For each OR Service Area, exclude one OR for each Level I and II Trauma Center and one
additional OR for each designated Burn Intensive Care Unit. (Column Q) (k) For each OR Service Area, add the number of additional Operating Rooms for which
certificates of need have been issued or settlement agreements signed but the ORs are not yet licensed, as well as any need determinations from previous plans that are pending certificate of need review. (Column R)
(l) For each OR Service Area, calculate the “Adjusted Planning Inventory” by summing the
licensed ORs, minus the exclusions, plus the adjustments for additional ORs from Step 4 (k). (Note: By entering the “exclusions” as negative numbers, Column S = SUM [Column M through Column R].)
(m) Determine the utilization rate for each licensed facility providing surgical services and
exclude from Step 5 – “Determination of Need”, the OR’s in chronically underutilized licensed facilities located in Operating Room Service Areas with more than one licensed facility. Chronically underutilized licensed facilities are defined as licensed facilities operating at less than 40 percent utilization for the past two fiscal years, which have been licensed long enough to submit at least two License Renewal Applications to the Division of Health Service Regulation.
Step 5 – Determination of Need (Columns T through U) (n) For each OR Service Area, subtract the “Adjusted Planning Inventory” from the “Projected
Operating Rooms Required in 2012” to determine the “Projected Operating Room Deficit or Surplus.” (Column L – Column S = Column T) (NOTE: In Column T, projected surpluses will

appear as negative numbers indicating that there are more Operating Rooms in the Adjusted Planning Inventory than the methodology projects will be needed by 2012.)
(o) For each OR Service Area with more than 10 operating rooms and a projected deficit of
0.50 or greater, the “Operating Room Need Determination” is equal to the “Projected Operating Room Deficit” rounded to the next whole number. (In this step, fractions of 0.50 or greater are rounded to the next highest whole number.) For each OR Service Area with more than 10 operating rooms and a projected deficit that is less than 0.50 or in which there is a projected surplus, the Operating Room Need Determination is zero. (Column U)
For each OR Service Area with six to 10 operating rooms and a projected deficit of .30 or greater, the “Operating Room Need Determination” is equal to the “Projected Operating Room Deficit” rounded to the next whole number. (In this step, fractions of .30 or greater are rounded to the next highest whole number.) For each OR Service Area with six to 10 operating rooms and a projected deficit that is less than 0.30 or in which there is a projected surplus, the Operating Room Need Determination is zero. (Column U) For each OR Service Area with five or fewer operating rooms and a projected deficit of .20 or greater, the “Operating Room Need Determination” is equal to the “Projected Operating Room Deficit” rounded to the next whole number. (In this step, fractions of .20 or greater are rounded to the next highest whole number.) For each OR Service Area with five or fewer operating rooms and a projected deficit that is less than 0.20 or in which there is a projected surplus, the Operating Room Need Determination is zero. (Column U)
NOTE: “Dedicated C-Section Operating Rooms” and associated cases are excluded from the calculation of need for additional “operating rooms” by the standard methodology; therefore, hospitals proposing to add a new operating room for use as a “Dedicated C-Section Operating Room” shall apply for a certificate of need, without regard to the need determinations in Chapter 6 of this Plan. There are no other operating room exclusions for which this protocol is applicable. A “Dedicated C-Section Operating Room” shall only be used to perform Cesarean Sections and other procedures performed on the patient in the same visit to the C-Section Operating Room, such that a patient receiving another procedure at the same time as the Cesarean Section would not need to be moved to a different operating room for the second procedure.

CHEROKEE
SWAIN
JACKSONGRAHAM
CHATHAM
POLK
BUNCOM
BEMAD
ISON
ASHE
WATAUGA WILKES YADKIN
DAVIE
ROWAN
STOKES
FORSYTH
GUILFORD
ROCKINGHAMCASWELL
RANDOLPHDAV
IDSON
COLUMBUS
ONSLOW
MOORE
HOKE
LEE
HARNETT
SCOTLA
ND
BLADEN
SAMPSON DUPLIN
WILSON
WAYNELENOIR
GREENE
CARTERET
UNION ANSON
CABARRUS
STANLY
RICHMOND
CRAVEN
JONES
PITT BEAUFORT
WASHING
TON
TYRRELL
DAREMARTIN
EDGECOMBE
BERTIE
GATESNORTHAMPTON
HERTFORDWARREN
FRANKLIN
WAKE
PERSON
VANCE
MCDOWELL BURKE
CALDWELL
MITCHELL
YANCEY
LINCOLN
GASTON
RUTHERFORD
CLEVELAND
MACONCLAY TRA
NSYLVA
NIA
AVERY
CATAWBA
HYDE
BRUNSWICK
MON
TGOM
ERY
ALEXAND
ER
ALLEGHANY
HENDERSON
CURRITUCK
PASQUOTANK
PERQUIM.
CAMDEN
CHOWAN
PAMLICO
NEWHANOVER
SURRY
IREDELL
HAYWOOD
GRA
NVILLE
HALIFAX
NASH
JOHNSTON
DURH
AM
ORA
NGE
ALA
MANCE
CUMBERLAND
ROBESON
PENDER
MEC
KLEN
BURG
MOORE
HOKE
HOKE
CUMBERLAND
Shaded counties are multi-county operating room service areas consisting of a county with one or more licensed facilities with operating rooms and a county or counties with no licensed facilities with operating rooms. Counties with no licensed facilities with operating rooms were grouped with the nearest county where a plurality of residents were served. At least one licensed facility with an operating room located in the county
Figure 6.1: Operating Room Service Areas
Hospital Multi-County Service Area Color Code
Murphy Medical Center Cherokee and Clay
Harris Regional Hospital and Swain County Hospital Jackson, Graham and Swain
Mission Hospitals Buncombe, Madison and Yancey
First Health Moore Regional Moore and Hoke
Cape Fear Valley Medical Center Cumberland and Hoke
Alamance Regional Hospital Alamance and Caswell
Maria Parham Hospital Vance and Warren
Our Community Hospital and Halifax Regional Medical Center Halifax and Northampton
Pitt County Memorial Hospital Pitt and Greene
Craven Regional Medical Center Craven, Jones and Pamlico
Pungo District Hospital Corporation and Beaufort County Hospital Beaufort and Hyde
Chowan Hospital Chowan and Tyrell
Albemarle Hospital Pasquotank, Camden, Currituck

Table 6A: Operating Room Inventory (Combined Data for Hospitals and Ambulatory Surgical Facilities)Case Data for 10/01/07 through 9/30/08 as reported on the 2009 Hospital and Ambulatory Surgical Facility License Renewal Applications.
Lic # Facility Name County
Inpatient Cases
(Dedicated C-Section OR
Cases Excluded)Ambulatory
CasesInpatient
ORsAmbulatory
ORsShared
ORs
Excluded C-Section
ORs
Excluded Trauma/Burn
ORsCON
Adjustments
CON Adjustments for Dedicated C-Section OR
H0274 Alexander Hospital Alexander 0 0 0 0 2 0 0 0 0H0108 Alleghany Memorial Hospital Alleghany 27 239 0 0 2 0 0 0 0H0082 Anson Community Hospital Anson 65 636 0 0 2 0 0 0 0H0099 Ashe Memorial Hospital Ashe 275 425 0 0 2 0 0 0 0
H0037Charles A. Cannon, Jr. Memorial Hospital Avery 143 290 0 0 2 0 0 0 0
H0268 Bertie Memorial Hospital Bertie 17 846 0 0 2 0 0 0 0
H0154Cape Fear Valley - Bladen County Hospital Bladen 274 436 0 0 2 0 0 0 0
H0061 Caldwell Memorial Hospital Caldwell 1,292 3,041 1 3 4 -1 0 0 0H0007 Chatham Hospital Chatham 66 221 0 0 2 0 0 0 0H0239 Murphy Medical Center Cherokee 469 2,348 0 0 4 0 0 0 0H0063 Chowan Hospital Chowan 579 1,217 0 0 3 0 0 0 0
H0045Columbus Regional Healthcare System Columbus 1,453 3,418 1 0 4 -1 0 1 0
H0201 CarolinaEast Medical Center Craven 3,809 8,352 3 6 9 -1 0 0 0H0171 Davie County Hospital Davie 6 48 0 0 2 0 0 0 0H0166 Duplin General Hospital Duplin 740 1,236 0 0 3 0 0 0 0H0258 Heritage Hospital Edgecombe 736 1,295 1 0 5 -1 0 0 0H0098 Granville Medical Center Granville 545 1,951 0 0 3 0 0 0 0
H0230Halifax Regional Medical Center Halifax 1,510 2,683 0 0 6 0 0 0 0
H0025Haywood Regional Medical Center Haywood 1,325 2,027 0 0 7 0 0 0 0
H0001 Roanoke-Chowan Hospital Hertford 809 1,696 1 0 5 -1 0 0 0H0087 Harris Regional Hospital Jackson 1,222 4,399 0 0 6 0 0 0 0H0043 Lenoir Memorial Hospital Lenoir 1,933 3,077 1 0 9 -1 0 0 0
H0225Carolinas Medical Center - Lincoln Lincoln 699 1,788 0 0 4 0 0 0 1
H0078 Martin General Hospital Martin 293 813 0 0 2 0 0 0 0H0097 The McDowell Hospital McDowell 522 1,558 1 0 3 -1 0 0 0
H0169 Blue Ridge Regional Hospital Mitchell 389 790 0 0 3 0 0 0 0
H0003FirstHealth Montgomery Memorial Hospital Montgomery 138 408 0 0 2 0 0 0 0
H0228 Nash General Hospital Nash 2,318 7,275 1 0 13 -1 0 0 0H0048 Onslow Memorial Hospital Onslow 1,309 3,177 1 4 5 -1 0 0 0H0054 Albemarle Hospital Pasquotank 1,323 4,501 2 0 8 -2 0 0 0H0115 Pender Memorial Hospital Pender 63 293 0 0 2 0 0 0 0H0066 Person Memorial Hospital Person 699 1,744 1 0 4 -1 0 0 0H0079 St. Luke's Hospital Polk 282 1,066 0 0 3 0 0 0 0
Counties with one facility shown first, followed by counties with more than one facility.
OR = Operating Room

Table 6A: Operating Room Inventory (Combined Data for Hospitals and Ambulatory Surgical Facilities)Case Data for 10/01/07 through 9/30/08 as reported on the 2009 Hospital and Ambulatory Surgical Facility License Renewal Applications.
Lic # Facility Name County
Inpatient Cases
(Dedicated C-Section OR
Cases Excluded)Ambulatory
CasesInpatient
ORsAmbulatory
ORsShared
ORs
Excluded C-Section
ORs
Excluded Trauma/Burn
ORsCON
Adjustments
CON Adjustments for Dedicated C-Section OR
Counties with one facility shown first, followed by counties with more than one facility.
H0064Southeastern Regional Medical Center Robeson 2,148 4,520 1 0 9 0 0 0 0
H0040Rowan Regional Medical Center Rowan 2,215 6,243 2 3 8 -2 0 0 0
H0039 Rutherford Hospital Rutherford 1,414 2,047 0 0 5 0 0 0 0
H0067Sampson Regional Medical Center Sampson 780 1,684 0 0 8 0 0 0 0
H0107 Scotland Memorial Hospital Scotland 1,077 2,842 1 0 5 -1 0 0 0
H0008Stanly Regional Medical Center Stanly 629 2,349 1 0 5 -1 0 0 0
H0165Stokes-Reynolds Memorial Hospital Stokes 4 573 0 2 2 0 0 0 0
H0069 Swain County Hospital Swain 0 99 0 0 1 0 0 0 0
H0111Transylvania Community Hospital Transylvania 395 1,934 0 0 4 0 0 0 0
H0267 Maria Parham Medical Center Vance 702 1,878 0 0 5 0 0 0 0H0006 Washington County Hospital Washington 15 376 0 0 2 0 0 0 0H0155 Hoots Memorial Hospital Yadkin 1 297 0 0 2 0 0 0 0
OR = Operating Room

Table 6A: Operating Room Inventory (Combined Data for Hospitals and Ambulatory Surgical Facilities)Case Data for 10/01/07 through 9/30/08 as reported on the 2009 Hospital and Ambulatory Surgical Facility License Renewal Applications.
Lic # Facility Name County
Inpatient Cases
(Dedicated C-Section OR
Cases Excluded)Ambulatory
CasesInpatient
ORsAmbulatory
ORsShared
ORs
Excluded C-Section
ORs
Excluded Trauma/Burn
ORsCON
Adjustments
CON Adjustments for Dedicated C-Section OR
Counties with one facility shown first, followed by counties with more than one facility.
H0272Alamance Regional Medical Center Alamance 1,958 7,136 2 0 9 -2 0 -2 0
AS0114Mebane Ambulatory Surgical Facility Alamance 0 60 0 3 0 0 0 0 0
Alamance Total 1,958 7,196 2 3 9 -2 0 -2 0H0188 Beaufort County Hospital Beaufort 745 2,261 1 0 5 -1 0 0 0
H0002Pungo District Hospital Corporation Beaufort 17 32 0 0 2 0 0 0 0
Beaufort Total 762 2,293 1 0 7 -1 0 0 0
H0250Brunswick Community Hospital Brunswick 702 2,572 1 0 3 -1 0 1 0
H0150J. Arthur Dosher Memorial Hospital Brunswick 376 1,421 0 0 2 0 0 0 0
Brunswick Total 1,078 3,993 1 0 5 -1 0 1 0
AS0065Asheville Eye Surgery Center (Licensed 3/2004) Buncombe 0 3,666 0 1 0 0 0 0 0
AS0004 FEMCARE Buncombe 0 1,020 0 2 0 0 0 0 0H0036 Mission Hospitals Buncombe 13,146 20,962 21 13 9 -2 -1 4 0
AS0038Orthopaedic Surgery Center of Asheville Buncombe 0 2,537 0 3 0 0 0 0 0
Buncombe Total 13,146 28,185 21 19 9 -2 -1 4 0H0062 Grace Hospital Burke 1,034 2,786 1 0 5 -1 0 0 0
AS0040Surgery Center of Morganton Eye Physicians, P.A. Burke 0 2,166 0 2 0 0 0 0 0
H0091 Valdese General Hospital Burke 518 1,963 0 0 4 0 0 0 0Burke Total 1,552 6,915 1 2 9 -1 0 0 0
AS0019 Eye Surgery And Laser Clinic Cabarrus 0 2,393 0 2 0 0 0 0 0
AS0070Gateway Ambulatory Surgery Center (new 2006) Cabarrus 0 5,735 0 4 0 0 0 0 0
H0031Carolinas Medical Center - NorthEast Cabarrus 5,713 6,536 4 0 17 -2 0 0 0
Cabarrus Total 5,713 14,664 4 6 17 -2 0 0 0H0222 Carteret General Hospital Carteret 1,865 1,978 1 0 5 -1 0 0 0AS0061 Carteret Surgery Center Carteret 0 1,675 0 2 0 0 0 0 0
Carteret Total 1,865 3,653 1 2 5 -1 0 0 0
OR = Operating Room

Table 6A: Operating Room Inventory (Combined Data for Hospitals and Ambulatory Surgical Facilities)Case Data for 10/01/07 through 9/30/08 as reported on the 2009 Hospital and Ambulatory Surgical Facility License Renewal Applications.
Lic # Facility Name County
Inpatient Cases
(Dedicated C-Section OR
Cases Excluded)Ambulatory
CasesInpatient
ORsAmbulatory
ORsShared
ORs
Excluded C-Section
ORs
Excluded Trauma/Burn
ORsCON
Adjustments
CON Adjustments for Dedicated C-Section OR
Counties with one facility shown first, followed by counties with more than one facility.
H0223Catawba Valley Medical Center Catawba 3,108 6,700 1 0 12 -1 0 0 0
H0053 Frye Regional Medical Center Catawba 3,187 6,424 2 4 15 0 0 0 0
AS0036
Graystone Eye Surgery Center (X HealthSouth Surgery Center) Catawba 0 4,166 0 1 0 0 0 0 0
AS0101 Viewmont Surgery Center Catawba 0 1,929 0 3 0 0 0 0 0Catawba Total 6,295 19,219 3 8 27 -1 0 0 0
AS0062Cleveland Ambulatory Services Cleveland 0 1,672 0 4 0 0 0 0 0
H0024Cleveland Regional Medical Center Cleveland 2,382 3,347 1 0 6 -1 0 0 0
AS0049 Eye Surgery Center of Shelby Cleveland 0 1,743 0 2 0 0 0 0 0H0113 Kings Mountain Hospital Cleveland 151 960 0 0 2 0 0 0 0
Cleveland Total 2,533 7,722 1 6 8 -1 0 0 0
H0213Cape Fear Valley Medical Center Cumberland 6,498 6,210 5 0 13 -3 0 1 0
AS0006Fayetteville Ambulatory Surgery Center Cumberland 0 14,547 0 11 0 0 0 0 0
H0275Highsmith-Rainey Memorial Hospital Cumberland 156 2,844 0 0 4 0 0 0 0
Cumberland Total 6,654 23,601 5 11 17 -3 0 1 0AS0053 RMS Surgery Center Dare 0 652 0 2 0 0 0 0 0H0273 The Outer Banks Hospital Dare 348 1,009 1 0 2 -1 0 0 0
Dare Total 348 1,661 1 2 2 -1 0 0 0H0027 Lexington Memorial Hospital Davidson 904 2,339 0 0 4 0 0 0 0H0112 Thomasville Medical Center Davidson 605 2,592 1 0 5 -1 0 0 0
Davidson Total 1,509 4,931 1 0 9 -1 0 0 0
OR = Operating Room

Table 6A: Operating Room Inventory (Combined Data for Hospitals and Ambulatory Surgical Facilities)Case Data for 10/01/07 through 9/30/08 as reported on the 2009 Hospital and Ambulatory Surgical Facility License Renewal Applications.
Lic # Facility Name County
Inpatient Cases
(Dedicated C-Section OR
Cases Excluded)Ambulatory
CasesInpatient
ORsAmbulatory
ORsShared
ORs
Excluded C-Section
ORs
Excluded Trauma/Burn
ORsCON
Adjustments
CON Adjustments for Dedicated C-Section OR
Counties with one facility shown first, followed by counties with more than one facility.
H0015 Duke University Hospital Durham 16,166 19,055 4 9 32 0 -1 4 0 (In addition to a CON Adjustment for 4 ORs, Duke University Hospital has a CON for 16 additional ORs under Policy AC-3. These 16 ORs are not counted when determining OR need.)
H0233 Durham Regional Hospital Durham 4,276 3,238 3 0 12 -2 0 0 0
AS0041James E. Davis Ambulatory Surgical Center Durham 0 5,299 0 8 0 0 0 0 0
H0075North Carolina Specialty Hospital Durham 1,276 5,600 0 0 4 0 0 0 0
Durham Total 21,718 33,192 7 17 48 -2 -1 4 0H0209 Forsyth Medical Center Forsyth 10,361 12,676 5 6 19 -2 0 10 0H0229 Medical Park Hospital Forsyth 1,085 10,531 0 0 13 0 0 -6 0
H0011North Carolina Baptist Hospitals Forsyth 13,251 17,999 4 0 36 0 -2 0 0
AS0021Plastic Surgery Center Of North Carolina Forsyth 0 411 0 3 0 0 0 0 0
Forsyth Total 24,697 41,617 9 9 68 -2 -2 4 0
H0261Franklin Regional Medical Center Franklin 923 1,422 0 0 3 0 0 0 0
2009 Franklin SMFP Need Determination
2009 Franklin SMFP Need Determination Franklin 0 0 0 0 0 0 0 1
Franklin Total 923 1,422 0 0 3 0 0 1 0AS0037 CaroMont Specialty Surgery Gaston 0 4,073 0 6 0 0 0 0 0H0105 Gaston Memorial Hospital Gaston 4,055 10,160 5 8 9 -4 0 0 0
Gaston Total 4,055 14,233 5 14 9 -4 0 0 0AS0015 Carolina Birth Center Guilford 0 545 0 1 0 0 0 0 0
AS0009HEALTHSOUTH Greensboro Specialty Surgical Center Guilford 0 1,888 0 3 0 0 0 0 0
AS0018HEALTHSOUTH Surgical Center of Greensboro Guilford 0 13,984 0 13 0 0 0 0 0
H0052High Point Regional Health System Guilford 3,621 3,935 3 0 9 -1 0 -1 0
AS0047 High Point Surgery Center Guilford 0 4,888 0 6 0 0 0 0 0
H0073 Kindred Hospital - Greensboro Guilford 929 46 0 0 1 0 0 0 0H0159 Moses Cone Health System Guilford 13,723 20,083 4 13 37 0 -1 -2 0
Triad Neurosurgery Triad Neurosurgery Guilford 0 0 0 0 0 0 0 2 0AS0063 Piedmont Surgical Center Guilford 0 1,012 0 2 0 0 0 0 0
Premier Surgery Center Premier Surgery Center Guilford 0 0 0 0 0 0 0 2 0AS0033 Surgical Eye Center Guilford 0 3,019 0 4 0 0 0 0 0
Guilford Total 18,273 49,400 7 42 47 -1 -1 1 0
OR = Operating Room

Table 6A: Operating Room Inventory (Combined Data for Hospitals and Ambulatory Surgical Facilities)Case Data for 10/01/07 through 9/30/08 as reported on the 2009 Hospital and Ambulatory Surgical Facility License Renewal Applications.
Lic # Facility Name County
Inpatient Cases
(Dedicated C-Section OR
Cases Excluded)Ambulatory
CasesInpatient
ORsAmbulatory
ORsShared
ORs
Excluded C-Section
ORs
Excluded Trauma/Burn
ORsCON
Adjustments
CON Adjustments for Dedicated C-Section OR
Counties with one facility shown first, followed by counties with more than one facility.
H0224Betsy Johnson Regional Hospital Harnett 1,236 2,928 0 0 4 0 0 0 0
Good Hope Hospital (closed effective
4/11/2006)
Good Hope Hospital (closed effective 4/11/2006) Harnett 0 0 0 0 0 0 0 3
Harnett Health System - Central Campus
Harnett Health System - Central Campus Harnett 0 0 0 0 0 0 0 3
Harnett Total 1,236 2,928 0 0 4 0 0 6 0
H0161Margaret R. Pardee Memorial Hospital Henderson 1,897 5,135 0 0 10 0 0 0 0
H0019 Park Ridge Hospital Henderson 1,302 4,974 0 0 6 0 0 0 1Henderson Total 3,199 10,109 0 0 16 0 0 0 1
H0248Davis Regional Medical Center Iredell 778 2,310 1 0 5 -1 0 0 0
AS0042Iredell Head Neck and Ear Ambulatory Surgery Center Iredell 0 601 0 1 0 0 0 0 0
H0164 Iredell Memorial Hospital Iredell 2,307 3,897 1 0 10 -1 0 0 0AS0050 Iredell Surgical Center Iredell 0 1,640 0 4 0 0 0 0 0
H0259Lake Norman Regional Medical Center Iredell 2,032 2,766 1 0 7 -1 0 0 0
AS0001The Surgical Center at Lake Norman Iredell 0 2,273 0 2 0 0 0 0 0
Iredell Total 5,117 13,487 3 7 22 -3 0 0 0H0151 Johnston Memorial Hospital Johnston 2,191 3,885 1 2 5 -1 0 0 1
2009 Johnston SMFP Need Determination
2009 Johnston SMFP Need Determination Johnston 0 0 0 0 0 0 0 1
Johnston Total 2,191 3,885 1 2 5 -1 0 1 1
Central Carolina Ambulatory Surgery Center
Central Carolina Ambulatory Surgery Center Lee 0 0 0 0 0 0 0 2
H0243 Central Carolina Hospital Lee 891 2,577 1 0 5 -1 0 0 0Lee Total 891 2,577 1 0 5 -1 0 2 0
H0034 Angel Medical Center Macon 203 1,445 1 0 4 -1 0 0 0H0193 Highlands-Cashiers Hospital Macon 46 347 0 0 2 0 0 0 0
Macon Total 249 1,792 1 0 6 -1 0 0 0
OR = Operating Room

Table 6A: Operating Room Inventory (Combined Data for Hospitals and Ambulatory Surgical Facilities)Case Data for 10/01/07 through 9/30/08 as reported on the 2009 Hospital and Ambulatory Surgical Facility License Renewal Applications.
Lic # Facility Name County
Inpatient Cases
(Dedicated C-Section OR
Cases Excluded)Ambulatory
CasesInpatient
ORsAmbulatory
ORsShared
ORs
Excluded C-Section
ORs
Excluded Trauma/Burn
ORsCON
Adjustments
CON Adjustments for Dedicated C-Section OR
Counties with one facility shown first, followed by counties with more than one facility.
AS0058Carolina Surgery Center - Wendover (x Edgehill) * Mecklenburg 0 1,182 0 2 0 0 0 0 0
H0071Carolina Medical Center / Center for Mental Health Mecklenburg 15,885 13,572 10 11 22 -4 -1 4 0
H0042Carolinas Medical Center - Mercy and Pineville Mecklenburg 3,597 10,029 3 0 18 -2 0 6 0
H0255Carolinas Medical Center - University Mecklenburg 1,058 6,997 1 4 9 -1 0 -2 0
AS0064Carolinas Surgery Center - Randolph Mecklenburg 0 5,022 0 8 0 0 0 -8 0
AS0026
Charlotte Surgery Center(X HealthSouth Surgery Center of Charlotte) Mecklenburg 0 7,081 0 7 0 0 0 0 0
H0010 Presbyterian Hospital Mecklenburg 5,993 19,052 6 3 26 -3 0 3 0
H0282Presbyterian Hospital Huntersville Mecklenburg 961 4,173 1 0 4 -1 0 0 0
H0270Presbyterian Hospital Matthews Mecklenburg 1,249 4,971 2 0 8 -2 0 0 0
Presbyterian Hospital Mint Hill Presbyterian Hospital Mint Hill Mecklenburg 0 0 0 0 0 0 0 4 1
H0251Presbyterian Orthopaedic Hospital Mecklenburg 3,206 4,171 0 0 12 0 0 -9 0
Presbyterian Same Day Surgery Center
Huntersville
Presbyterian Same Day Surgery Center Huntersville Mecklenburg 0 0 0 0 0 0 0 2
AS0098Same Day Surgery Center at Ballantyne Mecklenburg 0 632 0 3 0 0 0 -1 0
AS0068 South Park Surgery Center Mecklenburg 0 9,664 0 6 0 0 0 0 0Mecklenburg Total 31,949 86,546 23 44 99 -13 -1 -1 1
OR = Operating Room

Table 6A: Operating Room Inventory (Combined Data for Hospitals and Ambulatory Surgical Facilities)Case Data for 10/01/07 through 9/30/08 as reported on the 2009 Hospital and Ambulatory Surgical Facility License Renewal Applications.
Lic # Facility Name County
Inpatient Cases
(Dedicated C-Section OR
Cases Excluded)Ambulatory
CasesInpatient
ORsAmbulatory
ORsShared
ORs
Excluded C-Section
ORs
Excluded Trauma/Burn
ORsCON
Adjustments
CON Adjustments for Dedicated C-Section OR
Counties with one facility shown first, followed by counties with more than one facility.
H0100FirstHealth Moore Reg. Hosp. and Pinehurst Treatment Moore 5,616 4,453 2 4 10 0 0 2 0
AS0022
The Eye Surgery Center of the Carolinas(X HealthSouth Surgery Center of Southern Pines) Moore 0 9,520 0 3 0 0 0 0 0
AS0069 Surgery Center of Pinehurst Moore 0 4,757 0 6 0 0 0 0 0Moore Total 5,616 18,730 2 13 10 0 0 2 0
AS0103Atlantic Surgicenter (Licensed Effective 11/15/07) New Hanover 0 961 0 4 0 0 0 0 0
H0221New Hanover Regional Medical Center New Hanover 9,800 18,698 5 5 20 -3 -1 2 0
Same Day Surgery Center New Hanover
Same Day Surgery Center New Hanover New Hanover 0 0 0 0 0 0 0 2
AS0055 Wilmington SurgCare New Hanover 0 9,791 0 7 0 0 0 0 0
New Hanover Total 9,800 29,450 5 16 20 -3 -1 4 0AS0010 Chapel Hill Surgical Center Orange 0 849 0 3 0 0 0 0 0
H0157University of North Carolina Hospitals Orange 11,006 13,970 6 4 29 -3 -2 4 0
Orange Total 11,006 14,819 6 7 29 -3 -2 4 0
H0104 Pitt County Memorial Hospital Pitt 10,705 9,095 7 0 22 -4 -1 4 0
AS0012SurgiCenter of Eastern Carolina Pitt 0 11,292 0 8 0 0 0 2 0
Pitt Total 10,705 20,387 7 8 22 -4 -1 6 0H0013 Randolph Hospital Randolph 1,288 3,471 1 0 5 -1 0 0 0
2009 Randolph SMFP Need Determination
2009 Randolph SMFP Need Determination Randolph 0 0 0 0 0 0 0 2
Randolph Total 1,288 3,471 1 0 5 -1 0 2 0
H0158FirstHealth Richmond Memorial Hospital Richmond 447 923 1 0 3 -1 0 0 0
H0265Sandhills Regional Medical Center Richmond 681 1,169 0 0 3 0 0 0 0
Richmond Total 1,128 2,092 1 0 6 -1 0 0 0H0023 Annie Penn Hospital Rockingham 580 1,706 0 0 4 0 0 0 0H0072 Morehead Memorial Hospital Rockingham 1,065 2,111 1 0 5 -1 0 0 0
Rockingham Total 1,645 3,817 1 0 9 -1 0 0 0
OR = Operating Room
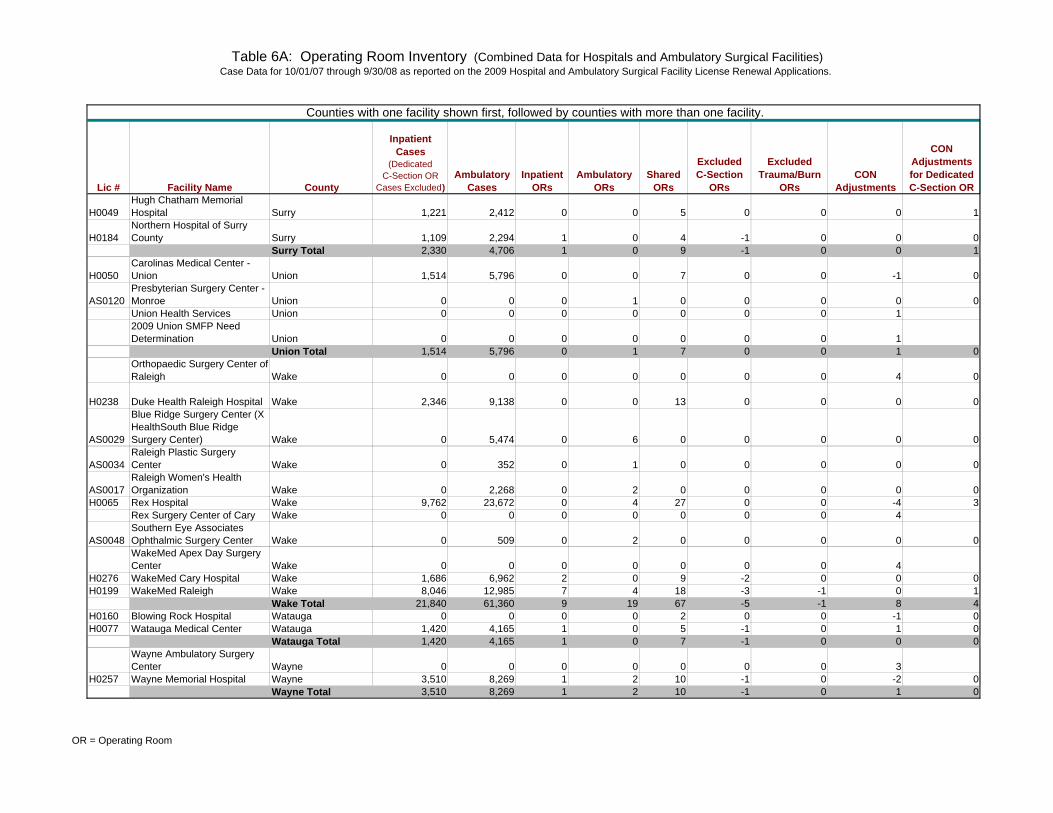
Table 6A: Operating Room Inventory (Combined Data for Hospitals and Ambulatory Surgical Facilities)Case Data for 10/01/07 through 9/30/08 as reported on the 2009 Hospital and Ambulatory Surgical Facility License Renewal Applications.
Lic # Facility Name County
Inpatient Cases
(Dedicated C-Section OR
Cases Excluded)Ambulatory
CasesInpatient
ORsAmbulatory
ORsShared
ORs
Excluded C-Section
ORs
Excluded Trauma/Burn
ORsCON
Adjustments
CON Adjustments for Dedicated C-Section OR
Counties with one facility shown first, followed by counties with more than one facility.
H0049Hugh Chatham Memorial Hospital Surry 1,221 2,412 0 0 5 0 0 0 1
H0184Northern Hospital of Surry County Surry 1,109 2,294 1 0 4 -1 0 0 0
Surry Total 2,330 4,706 1 0 9 -1 0 0 1
H0050Carolinas Medical Center - Union Union 1,514 5,796 0 0 7 0 0 -1 0
AS0120Presbyterian Surgery Center - Monroe Union 0 0 0 1 0 0 0 0 0
Union Health Services Union Health Services Union 0 0 0 0 0 0 0 1
2009 Union SMFP Need Determination
2009 Union SMFP Need Determination Union 0 0 0 0 0 0 0 1
Union Total 1,514 5,796 0 1 7 0 0 1 0
Orthopaedic Surgery Center of Raleigh
Orthopaedic Surgery Center of Raleigh Wake 0 0 0 0 0 0 0 4 0
H0238 Duke Health Raleigh Hospital Wake 2,346 9,138 0 0 13 0 0 0 0
AS0029
Blue Ridge Surgery Center (X HealthSouth Blue Ridge Surgery Center) Wake 0 5,474 0 6 0 0 0 0 0
AS0034Raleigh Plastic Surgery Center Wake 0 352 0 1 0 0 0 0 0
AS0017Raleigh Women's Health Organization Wake 0 2,268 0 2 0 0 0 0 0
H0065 Rex Hospital Wake 9,762 23,672 0 4 27 0 0 -4 3Rex Surgery Center of Cary Rex Surgery Center of Cary Wake 0 0 0 0 0 0 0 4
AS0048Southern Eye Associates Ophthalmic Surgery Center Wake 0 509 0 2 0 0 0 0 0
WakeMed Apex Day Surgery Center
WakeMed Apex Day Surgery Center Wake 0 0 0 0 0 0 0 4
H0276 WakeMed Cary Hospital Wake 1,686 6,962 2 0 9 -2 0 0 0H0199 WakeMed Raleigh Wake 8,046 12,985 7 4 18 -3 -1 0 1
Wake Total 21,840 61,360 9 19 67 -5 -1 8 4H0160 Blowing Rock Hospital Watauga 0 0 0 0 2 0 0 -1 0H0077 Watauga Medical Center Watauga 1,420 4,165 1 0 5 -1 0 1 0
Watauga Total 1,420 4,165 1 0 7 -1 0 0 0
Wayne Ambulatory Surgery Center
Wayne Ambulatory Surgery Center Wayne 0 0 0 0 0 0 0 3
H0257 Wayne Memorial Hospital Wayne 3,510 8,269 1 2 10 -1 0 -2 0Wayne Total 3,510 8,269 1 2 10 -1 0 1 0
OR = Operating Room

Table 6A: Operating Room Inventory (Combined Data for Hospitals and Ambulatory Surgical Facilities)Case Data for 10/01/07 through 9/30/08 as reported on the 2009 Hospital and Ambulatory Surgical Facility License Renewal Applications.
Lic # Facility Name County
Inpatient Cases
(Dedicated C-Section OR
Cases Excluded)Ambulatory
CasesInpatient
ORsAmbulatory
ORsShared
ORs
Excluded C-Section
ORs
Excluded Trauma/Burn
ORsCON
Adjustments
CON Adjustments for Dedicated C-Section OR
Counties with one facility shown first, followed by counties with more than one facility.
H0153Wilkes Regional Medical Center Wilkes 1,005 1,933 1 0 4 -1 0 0 0
AS0046
Wilkes Regional Medical Center Ambulatory Surgery Facility Wilkes 0 442 0 1 0 0 0 0 0
Wilkes Total 1,005 2,375 1 1 4 -1 0 0 0
AS0005
Eastern Regional Surgical Center(X HealthSouth Surgecenter of Wilson) Wilson 0 1,320 0 4 0 0 0 0 0
H0210 Wilson Medical Center Wilson 1,759 3,184 1 0 9 -1 0 0 0AS0007 Wilson OB-GYN Wilson 0 450 0 1 0 0 0 0 0
Wilson Total 1,759 4,954 1 5 9 -1 0 0 0Grand Total 267,187 657,748 155 284 861 -84 -11 51 9
Lic # Facility Name County
H0002Pungo District Hospital Corporation Beaufort
AS0062Cleveland Ambulatory Services Cleveland
AS0021Plastic Surgery Center Of North Carolina Forsyth
AS0050 Iredell Surgical Center IredellH0193 Highlands-Cashiers Hospital Macon
AS0098Same Day Surgery Center at Ballantyne Mecklenburg
AS0010 Chapel Hill Surgical Center OrangeH0069 Swain County Hospital Swain
AS0034Raleigh Plastic Surgery Center Wake
AS0048Southern Eye Associates Ophthalmic Surgery Center Wake
H0160 Blowing Rock Hospital Watauga
AS0005
Eastern Regional Surgical Center(X HealthSouth Surgecenter of Wilson) Wilson
AS0007 Wilson OB-GYN Wilson
Underutilized Facilities: Excluded from Need Determinations
OR = Operating Room

Table 6B: Projected Operating Room Need for 2012
A B C D E F G H I J K L
Operating Room Service Areas (Multi-County Groupings and Single Counties. Multi-County Groupings First, Followed by Single Counties.)
2008 Inpatient
Cases(without
exclusions)
Inpatient Case Time Standard (3 Hours)
Estimated Inpatient
Hours
2008 Ambulatory
Cases
Ambulatory Case Time Standard (1.5 Hours)
Estimated Ambulatory
Hours
Total Estimated
Hours(D+G)
Growth Factor
2008-2012(Population
Change Rate)
Projected Surgical Hours: 2012
Standard Hours per
OR per Year
(9/260/80%)
Projected ORs
Needed in 2012
Alamance 1,958 3.0 5,874 7,196 1.5 10,794 16,668 9.23% 18,206.56 1872 9.73
Caswell 0 3.0 0 0 1.5 0 0 -1.31% 0.00 1872 0.00
Alamance Caswell Total 1,958 3.0 5,874 7,196 1.5 10,794 16,668 7.78% 17,964.39 1872 9.60
Beaufort 745 3.0 2,235 2,261 1.5 3,392 5,627 1.55% 5,713.80 1872 3.05
Hyde 0 3.0 0 0 1.5 0 0 -2.58% 0.00 1872 0.00
Beaufort Hyde Total 745 3.0 2,235 2,261 1.5 3,392 5,627 1.11% 5,689.23 1872 3.04
Buncombe 13,146 3.0 39,438 28,185 1.5 42,278 81,716 5.34% 86,081.04 1872 45.98
Madison 0 3.0 0 0 1.5 0 0 -1.49% 0.00 1872 0.00
Yancey 0 3.0 0 0 1.5 0 0 3.37% 0.00 1872 0.00
Buncombe Madison YanceyTotal 13,146 3.0 39,438 28,185 1.5 42,278 81,716 4.60% 85,477.25 1872 45.66
Cherokee 469 3.0 1,407 2,348 1.5 3,522 4,929 5.27% 5,188.76 1872 2.77
Clay 0 3.0 0 0 1.5 0 0 8.10% 0.00 1872 0.00
Cherokee Clay Total 469 3.0 1,407 2,348 1.5 3,522 4,929 6.05% 5,227.43 1872 2.79
Chowan 579 3.0 1,737 1,217 1.5 1,826 3,563 1.08% 3,600.82 1872 1.92
Tyrrell 0 3.0 0 0 1.5 0 0 0.77% 0.00 1872 0.00
Chowan Tyrell Total 579 3.0 1,737 1,217 1.5 1,826 3,563 1.01% 3,598.37 1872 1.92
Craven 3,809 3.0 11,427 8,352 1.5 12,528 23,955 2.95% 24,662.38 1872 13.17
Jones 0 3.0 0 0 1.5 0 0 0.26% 0.00 1872 0.00
Pamlico 0 3.0 0 0 1.5 0 0 -0.36% 0.00 1872 0.00
Craven Jones Pamlico Total 3,809 3.0 11,427 8,352 1.5 12,528 23,955 2.37% 24,523.00 1872 13.10
Cumberland 6,654 3.0 19,962 23,601 1.5 35,402 55,364 4.01% 57,583.32 1872 30.76
Hoke 0 3.0 0 0 1.5 0 0 10.44% 0.00 1872 0.00
Cumberland Hoke Total 6,654 3.0 19,962 23,601 1.5 35,402 55,364 4.40% 57,797.82 1872 30.87
Halifax 1,510 3.0 4,530 2,683 1.5 4,025 8,555 -0.60% 8,503.38 1872 4.54
Northampton 0 3.0 0 0 1.5 0 0 -0.74% 0.00 1872 0.00
Halifax Northampton Total 1,510 3.0 4,530 2,683 1.5 4,025 8,555 -0.64% 8,500.05 1872 4.54
Jackson 1,222 3.0 3,666 4,399 1.5 6,599 10,265 5.98% 10,878.46 1872 5.81
Graham 0 3.0 0 0 1.5 0 0 2.29% 0.00 1872 0.00
Swain 0 3.0 0 0 1.5 0 0 4.64% 0.00 1872 0.00
Jackson Graham Swain Total 1,222 3.0 3,666 4,399 1.5 6,599 10,265 5.16% 10,794.00 1872 5.77
Moore 5,616 3.0 16,848 18,730 1.5 28,095 44,943 7.47% 48,301.62 1872 25.80
Hoke 0 3.0 0 0 1.5 0 0 10.44% 0.00 1872 0.00
Moore Hoke Total 5,616 3.0 16,848 18,730 1.5 28,095 44,943 7.99% 48,533.92 1872 25.93
Pasquotank 1,323 3.0 3,969 4,501 1.5 6,752 10,721 1.31% 10,860.83 1872 5.80
Camden 0 3.0 0 0 1.5 0 0 4.63% 0.00 1872 0.00
Currituck 0 3.0 0 0 1.5 0 0 -2.63% 0.00 1872 0.00
Gates 0 3.0 0 0 1.5 0 0 4.22% 0.00 1872 0.00
Perquimans 0 3.0 0 0 1.5 0 0 8.32% 0.00 1872 0.00
Pasquotank Camden Currituck Gates PerquimansTotal 1,323 3.0 3,969 4,501 1.5 6,752 10,721 1.96% 10,930.18 1872 5.84
Pitt 10,705 3.0 32,115 20,387 1.5 30,581 62,696 9.63% 68,735.92 1872 36.72
Greene 0 3.0 0 0 1.5 0 0 2.82% 0.00 1872 0.00
Pitt GreeneTotal 10,705 3.0 32,115 20,387 1.5 30,581 62,696 8.82% 68,223.38 1872 36.44
Vance 702 3.0 2,106 1,878 1.5 2,817 4,923 0.29% 4,937.26 1872 2.64
Warren 0 3.0 0 0 1.5 0 0 -0.34% 0.00 1872 0.00
Vance WarrenTotal 702 3.0 2,106 1,878 1.5 2817 4,923 0.09% 4927.50 1872 2.63

Table 6B: Projected Operating Room Need for 2012
A
Operating Room Service Areas (Multi-County Groupings and Single Counties. Multi-County Groupings First, Followed by Single Counties.)Alamance
Caswell
Alamance Caswell TotalBeaufort
Hyde
Beaufort Hyde TotalBuncombe
Madison
Yancey
Buncombe Madison YanceyTotalCherokee
Clay
Cherokee Clay TotalChowan
Tyrrell
Chowan Tyrell TotalCraven
Jones
Pamlico
Craven Jones Pamlico TotalCumberland
Hoke
Cumberland Hoke TotalHalifax
Northampton
Halifax Northampton TotalJackson
Graham
Swain
Jackson Graham Swain TotalMoore
Hoke
Moore Hoke Total Pasquotank
Camden
Currituck
Gates
Perquimans
Pasquotank Camden Currituck Gates PerquimansTotalPitt
Greene
Pitt GreeneTotalVance
Warren
Vance WarrenTotal
M N O P Q R S T U
Number of Inpatient Operating
Rooms
Number of Ambulatory Operating
Rooms
Number of Shared
Operating Rooms
Excluded Dedicated C-Section
Rooms
Exclusion of One
Operating Room for
each Level I and II Trauma
Center and Burn Unit
Adjustments: CONs Issued,
Settlement Agreements,
Previous Need
Adjusted Planning Inventory
Projected Operating
Room Deficit or Surplus
(Surplus shows as a "-")
Projected Need for
New Operating
Rooms2 3 9 -2 0 -2 10 -0.27
0 0 0 0 0 0 0 0.00
2 3 9 -2 0 -2 10 -0.40 0
1 0 5 -1 0 0 5 -1.95
0 0 0 0 0 0 0 0.00
1 0 5 -1 0 0 5 -1.96 0
21 19 9 -2 -1 4 50 -4.02
0 0 0 0 0 0 0 0.00
0 0 0 0 0 0 0 0.00
21 19 9 -2 -1 4 50 -4.34 0
0 0 4 0 0 0 4 -1.23
0 0 0 0 0 0 0 0.00
0 0 4 0 0 0 4 -1.21 0
0 0 3 0 0 0 3 -1.08
0 0 0 0 0 0 0 0.00
0 0 3 0 0 0 3 -1.08 0
3 6 9 -1 0 0 17 -3.83
0 0 0 0 0 0 0 0.00
0 0 0 0 0 0 0 0.00
3 6 9 -1 0 0 17 -3.90 0
5 11 17 -3 0 1 31 -0.24
0 0 0 0 0 0 0 0.00
5 11 17 -3 0 1 31 -0.13 0
0 0 6 0 0 0 6 -1.46
0 0 0 0 0 0 0 0.00
0 0 6 0 0 0 6 -1.46 0
0 0 6 0 0 0 6 -0.19
0 0 0 0 0 0 0 0.00
0 0 0 0 0 0 0 0.00
0 0 6 0 0 0 6 -0.23 0
2 13 10 0 0 2 27 -1.20
0 0 0 0 0 0 0 0.00
2 13 10 0 0 2 27 -1.07 0
2 0 8 -2 0 0 8 -2.20
0 0 0 0 0 0 0 0.00
0 0 0 0 0 0 0 0.00
0 0 0 0 0 0 0 0.00
0 0 0 0 0 0 0 0.00
2 0 8 -2 0 0 8 -2.16 0
7 8 22 -4 -1 6 38 -1.28
0 0 0 0 0 0 0 0.00
7 8 22 -4 -1 6 38 -1.56 0
0 0 5 0 0 0 5 -2.36
0 0 0 0 0 0 0 0.00
0 0 5 0 0 0 5 -2.37 0

Table 6B: Projected Operating Room Need for 2012
A B C D E F G H I J K L
Operating Room Service Areas (Multi-County Groupings and Single Counties. Multi-County Groupings First, Followed by Single Counties.)
2008 Inpatient
Cases(without
exclusions)
Inpatient Case Time Standard (3 Hours)
Estimated Inpatient
Hours
2008 Ambulatory
Cases
Ambulatory Case Time Standard (1.5 Hours)
Estimated Ambulatory
Hours
Total Estimated
Hours(D+G)
Growth Factor
2008-2012(Population
Change Rate)
Projected Surgical Hours: 2012
Standard Hours per
OR per Year
(9/260/80%)
Projected ORs
Needed in 2012
Alexander 0 3.0 0 0 1.5 0 0 3.31% 0.00 1872 0.00
Alleghany 27 3.0 81 239 1.5 359 440 3.02% 452.75 1872 0.24
Anson 65 3.0 195 636 1.5 954 1,149 -0.52% 1,142.98 1872 0.61
Ashe 275 3.0 825 425 1.5 638 1,463 3.09% 1,507.67 1872 0.81
Avery 143 3.0 429 290 1.5 435 864 -0.05% 863.58 1872 0.46
Bertie 17 3.0 51 846 1.5 1,269 1,320 0.65% 1,328.55 1872 0.71
Bladen 274 3.0 822 436 1.5 654 1,476 0.25% 1,479.62 1872 0.79
Brunswick 1,078 3.0 3,234 3,993 1.5 5,990 9,224 14.42% 10,553.09 1872 5.64
Burke 1,552 3.0 4,656 6,915 1.5 10,373 15,029 4.76% 15,744.46 1872 8.41
Cabarrus 5,713 3.0 17,139 14,664 1.5 21,996 39,135 15.39% 45,158.81 1872 24.12
Caldwell 1,292 3.0 3,876 3,041 1.5 4,562 8,438 3.71% 8,750.17 1872 4.67
Carteret 1,865 3.0 5,595 3,653 1.5 5,480 11,075 1.71% 11,263.80 1872 6.02
Catawba 6,295 3.0 18,885 19,219 1.5 28,829 47,714 5.42% 50,300.35 1872 26.87
Chatham 66 3.0 198 221 1.5 332 530 10.35% 584.32 1872 0.31
Cleveland 2,533 3.0 7,599 6,050 1.5 9,075 16,674 3.46% 17,250.55 1872 9.22
Columbus 1,453 3.0 4,359 3,418 1.5 5,127 9,486 2.52% 9,724.89 1872 5.19
Dare 348 3.0 1,044 1,661 1.5 2,492 3,536 -4.37% 3,380.85 1872 1.81
Davidson 1,509 3.0 4,527 4,931 1.5 7,397 11,924 6.22% 12,664.89 1872 6.77
Davie 6 3.0 18 48 1.5 72 90 6.89% 96.20 1872 0.05
Duplin 740 3.0 2,220 1,236 1.5 1,854 4,074 3.97% 4,235.69 1872 2.26
Durham 21,718 3.0 65,154 33,192 1.5 49,788 114,942 10.79% 127,339.47 1872 68.02
Edgecombe 736 3.0 2,208 1,295 1.5 1,943 4,151 -0.65% 4,123.42 1872 2.20
Forsyth 24,697 3.0 74,091 41,206 1.5 61,809 135,900 6.73% 145,043.78 1872 77.48
Franklin 923 3.0 2,769 1,422 1.5 2,133 4,902 7.50% 5,269.62 1872 2.81
Gaston 4,055 3.0 12,165 14,233 1.5 21,350 33,515 8.82% 36,470.60 1872 19.48
Granville 545 3.0 1,635 1,951 1.5 2,927 4,562 4.06% 4,746.62 1872 2.54
Guilford 18,273 3.0 54,819 49,400 1.5 74,100 128,919 7.17% 138,156.14 1872 73.80
Harnett 1,236 3.0 3,708 2,928 1.5 4,392 8,100 12.19% 9,087.28 1872 4.85
Haywood 1,325 3.0 3,975 2,027 1.5 3,041 7,016 1.98% 7,154.16 1872 3.82
Henderson 3,199 3.0 9,597 10,109 1.5 15,164 24,761 6.82% 26,450.38 1872 14.13
Hertford 809 3.0 2,427 1,696 1.5 2,544 4,971 -0.23% 4,959.67 1872 2.65
Iredell 5,117 3.0 15,351 11,847 1.5 17,771 33,122 10.96% 36,751.63 1872 19.63
Johnston 2,191 3.0 6,573 3,885 1.5 5,828 12,401 14.87% 14,244.09 1872 7.61
Lee 891 3.0 2,673 2,577 1.5 3,866 6,539 8.33% 7,083.19 1872 3.78
Lenoir 1,933 3.0 5,799 3,077 1.5 4,616 10,415 -0.40% 10,373.05 1872 5.54
Lincoln 699 3.0 2,097 1,788 1.5 2,682 4,779 10.85% 5,297.72 1872 2.83
Macon 203 3.0 609 1,445 1.5 2,168 2,777 4.93% 2,913.50 1872 1.56
Martin 293 3.0 879 813 1.5 1,220 2,099 5.27% 2,209.10 1872 1.18
McDowell 522 3.0 1,566 1,558 1.5 2,337 3,903 7.17% 4,182.74 1872 2.23
Mecklenburg 31,949 3.0 95,847 85,914 1.5 128,871 224,718 7.77% 242,175.17 1872 129.37
Mitchell 389 3.0 1,167 790 1.5 1,185 2,352 0.62% 2,366.52 1872 1.26
Montgomery 138 3.0 414 408 1.5 612 1,026 1.75% 1,043.92 1872 0.56
Nash 2,318 3.0 6,954 7,275 1.5 10,913 17,867 5.29% 18,811.34 1872 10.05
New Hanover 9,800 3.0 29,400 29,450 1.5 44,175 73,575 5.48% 77,607.34 1872 41.46
Onslow 1,309 3.0 3,927 3,177 1.5 4,766 8,693 6.84% 9,287.35 1872 4.96
Orange 11,006 3.0 33,018 13,970 1.5 20,955 53,973 5.68% 57,040.62 1872 30.47
Pender 63 3.0 189 293 1.5 440 629 12.78% 708.79 1872 0.38
Person 699 3.0 2,097 1,744 1.5 2,616 4,713 1.09% 4,764.39 1872 2.55
Polk 282 3.0 846 1,066 1.5 1,599 2,445 0.82% 2,464.96 1872 1.32
Randolph 1,288 3.0 3,864 3,471 1.5 5,207 9,071 5.41% 9,560.94 1872 5.11
Richmond 1,128 3.0 3,384 2,092 1.5 3,138 6,522 0.86% 6,578.38 1872 3.51
Robeson 2,148 3.0 6,444 4,520 1.5 6,780 13,224 3.90% 13,739.10 1872 7.34
Rockingham 1,645 3.0 4,935 3,817 1.5 5,726 10,661 0.74% 10,739.32 1872 5.74
Rowan 2,215 3.0 6,645 6,243 1.5 9,365 16,010 6.77% 17,093.63 1872 9.13
Rutherford 1,414 3.0 4,242 2,047 1.5 3,071 7,313 4.58% 7,647.51 1872 4.09

Table 6B: Projected Operating Room Need for 2012
A
Operating Room Service Areas (Multi-County Groupings and Single Counties. Multi-County Groupings First, Followed by Single Counties.)Alexander
Alleghany
Anson
Ashe
Avery
Bertie
Bladen
Brunswick
Burke
Cabarrus
Caldwell
Carteret
Catawba
Chatham
Cleveland
Columbus
Dare
Davidson
Davie
Duplin
Durham
Edgecombe
Forsyth
Franklin
Gaston
Granville
Guilford
Harnett
Haywood
Henderson
Hertford
Iredell
Johnston
Lee
Lenoir
Lincoln
Macon
Martin
McDowell
Mecklenburg
Mitchell
Montgomery
Nash
New Hanover
Onslow
Orange
Pender
Person
Polk
Randolph
Richmond
Robeson
Rockingham
Rowan
Rutherford
M N O P Q R S T U
Number of Inpatient Operating
Rooms
Number of Ambulatory Operating
Rooms
Number of Shared
Operating Rooms
Excluded Dedicated C-Section
Rooms
Exclusion of One
Operating Room for
each Level I and II Trauma
Center and Burn Unit
Adjustments: CONs Issued,
Settlement Agreements,
Previous Need
Adjusted Planning Inventory
Projected Operating
Room Deficit or Surplus
(Surplus shows as a "-")
Projected Need for
New Operating
Rooms0 0 2 0 0 0 2 -2.00 0
0 0 2 0 0 0 2 -1.76 0
0 0 2 0 0 0 2 -1.39 0
0 0 2 0 0 0 2 -1.19 0
0 0 2 0 0 0 2 -1.54 0
0 0 2 0 0 0 2 -1.29 0
0 0 2 0 0 0 2 -1.21 0
1 0 5 -1 0 1 6 -0.36 0
1 2 9 -1 0 0 11 -2.59 0
4 6 17 -2 0 0 25 -0.88 0
1 3 4 -1 0 0 7 -2.33 0
1 2 5 -1 0 0 7 -0.98 0
3 8 27 -1 0 0 37 -10.13 0
0 0 2 0 0 0 2 -1.69 0
1 2 8 -1 0 0 10 -0.78 0
1 0 4 -1 0 1 5 0.19 0
1 2 2 -1 0 0 4 -2.19 0
1 0 9 -1 0 0 9 -2.23 0
0 0 2 0 0 0 2 -1.95 0
0 0 3 0 0 0 3 -0.74 0
7 17 48 -2 -1 4 73 -4.98 0
1 0 5 -1 0 0 5 -2.80 0
9 6 68 -2 -2 4 83 -5.52 0
0 0 3 0 0 1 4 -1.19 0
5 14 9 -4 0 0 24 -4.52 0
0 0 3 0 0 0 3 -0.46 0
7 42 47 -1 -1 1 95 -21.20 0
0 0 4 0 0 6 10 -5.15 0
0 0 7 0 0 0 7 -3.18 0
0 0 16 0 0 0 16 -1.87 0
1 0 5 -1 0 0 5 -2.35 0
3 3 22 -3 0 0 25 -5.37 0
1 2 5 -1 0 1 8 -0.39 0
1 0 5 -1 0 2 7 -3.22 0
1 0 9 -1 0 0 9 -3.46 0
0 0 4 0 0 0 4 -1.17 0
1 0 4 -1 0 0 4 -2.44 0
0 0 2 0 0 0 2 -0.82 0
1 0 3 -1 0 0 3 -0.77 0
23 41 99 -13 -1 0 149 -19.63 0
0 0 3 0 0 0 3 -1.74 0
0 0 2 0 0 0 2 -1.44 0
1 0 13 -1 0 0 13 -2.95 0
5 16 20 -3 -1 4 41 0.46 0
1 4 5 -1 0 0 9 -4.04 0
6 4 29 -3 -2 4 38 -7.53 0
0 0 2 0 0 0 2 -1.62 0
1 0 4 -1 0 0 4 -1.45 0
0 0 3 0 0 0 3 -1.68 0
1 0 5 -1 0 2 7 -1.89 0
1 0 6 -1 0 0 6 -2.49 0
1 0 9 0 0 0 10 -2.66 0
1 0 9 -1 0 0 9 -3.26 0
2 3 8 -2 0 0 11 -1.87 0
0 0 5 0 0 0 5 -0.91 0
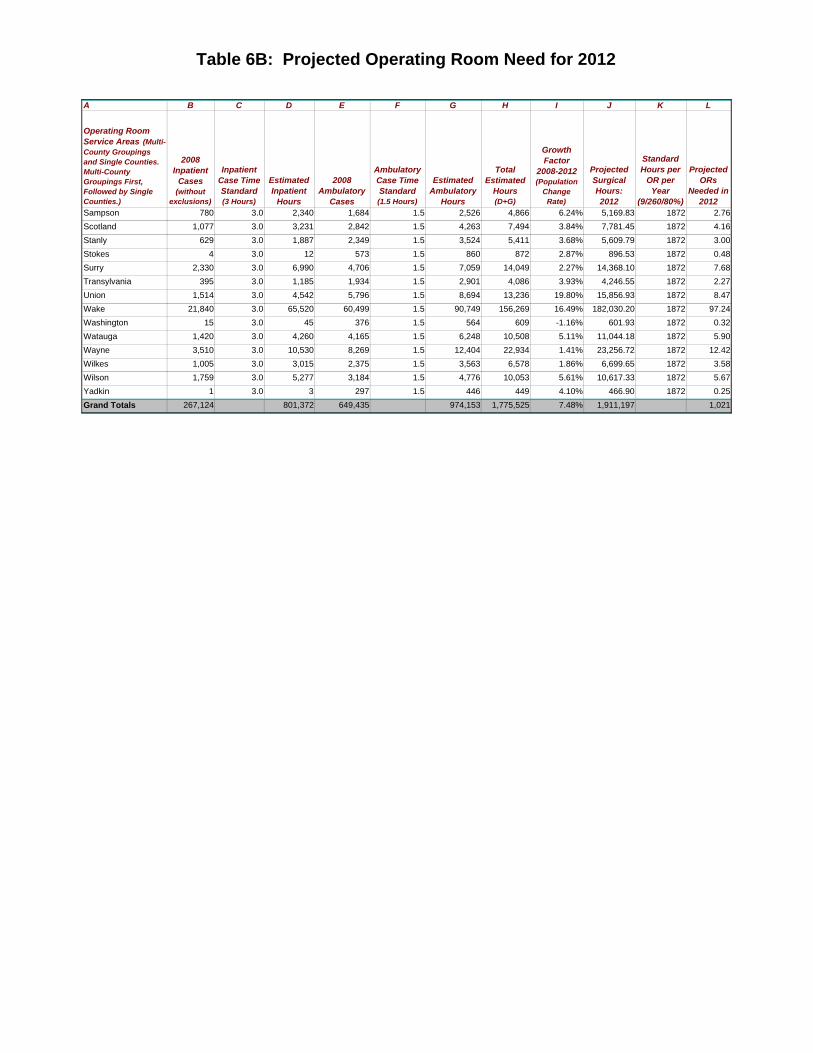
Table 6B: Projected Operating Room Need for 2012
A B C D E F G H I J K L
Operating Room Service Areas (Multi-County Groupings and Single Counties. Multi-County Groupings First, Followed by Single Counties.)
2008 Inpatient
Cases(without
exclusions)
Inpatient Case Time Standard (3 Hours)
Estimated Inpatient
Hours
2008 Ambulatory
Cases
Ambulatory Case Time Standard (1.5 Hours)
Estimated Ambulatory
Hours
Total Estimated
Hours(D+G)
Growth Factor
2008-2012(Population
Change Rate)
Projected Surgical Hours: 2012
Standard Hours per
OR per Year
(9/260/80%)
Projected ORs
Needed in 2012
Sampson 780 3.0 2,340 1,684 1.5 2,526 4,866 6.24% 5,169.83 1872 2.76
Scotland 1,077 3.0 3,231 2,842 1.5 4,263 7,494 3.84% 7,781.45 1872 4.16
Stanly 629 3.0 1,887 2,349 1.5 3,524 5,411 3.68% 5,609.79 1872 3.00
Stokes 4 3.0 12 573 1.5 860 872 2.87% 896.53 1872 0.48
Surry 2,330 3.0 6,990 4,706 1.5 7,059 14,049 2.27% 14,368.10 1872 7.68
Transylvania 395 3.0 1,185 1,934 1.5 2,901 4,086 3.93% 4,246.55 1872 2.27
Union 1,514 3.0 4,542 5,796 1.5 8,694 13,236 19.80% 15,856.93 1872 8.47
Wake 21,840 3.0 65,520 60,499 1.5 90,749 156,269 16.49% 182,030.20 1872 97.24
Washington 15 3.0 45 376 1.5 564 609 -1.16% 601.93 1872 0.32
Watauga 1,420 3.0 4,260 4,165 1.5 6,248 10,508 5.11% 11,044.18 1872 5.90
Wayne 3,510 3.0 10,530 8,269 1.5 12,404 22,934 1.41% 23,256.72 1872 12.42
Wilkes 1,005 3.0 3,015 2,375 1.5 3,563 6,578 1.86% 6,699.65 1872 3.58
Wilson 1,759 3.0 5,277 3,184 1.5 4,776 10,053 5.61% 10,617.33 1872 5.67
Yadkin 1 3.0 3 297 1.5 446 449 4.10% 466.90 1872 0.25
Grand Totals 267,124 801,372 649,435 974,153 1,775,525 7.48% 1,911,197 1,021

Table 6B: Projected Operating Room Need for 2012
A
Operating Room Service Areas (Multi-County Groupings and Single Counties. Multi-County Groupings First, Followed by Single Counties.)Sampson
Scotland
Stanly
Stokes
Surry
Transylvania
Union
Wake
Washington
Watauga
Wayne
Wilkes
Wilson
Yadkin
Grand Totals
M N O P Q R S T U
Number of Inpatient Operating
Rooms
Number of Ambulatory Operating
Rooms
Number of Shared
Operating Rooms
Excluded Dedicated C-Section
Rooms
Exclusion of One
Operating Room for
each Level I and II Trauma
Center and Burn Unit
Adjustments: CONs Issued,
Settlement Agreements,
Previous Need
Adjusted Planning Inventory
Projected Operating
Room Deficit or Surplus
(Surplus shows as a "-")
Projected Need for
New Operating
Rooms0 0 8 0 0 0 8 -5.24 0
1 0 5 -1 0 0 5 -0.84 0
1 0 5 -1 0 0 5 -2.00 0
0 2 2 0 0 0 4 -3.52 0
1 0 9 -1 0 0 9 -1.32 0
0 0 4 0 0 0 4 -1.73 0
0 1 7 0 0 1 9 -0.53 0
9 16 67 -5 -1 8 94 3.24 3
0 0 2 0 0 0 2 -1.68 0
1 0 5 -1 0 1 6 -0.10 0
1 2 10 -1 0 1 13 -0.58 0
1 1 4 -1 0 0 5 -1.42 0
1 0 9 -1 0 0 9 -3.33 0
0 0 2 0 0 0 2 -1.75 0
155 259 854 -84 -11 53 1226 -205 3

Need Determination Application of the methodology indicated need for three additional operating rooms in one operating room service area. In addition, the North Carolina State Health Coordinating Council has determined that there is a need for a Single Specialty Ambulatory Surgery Demonstration Project, consisting of three facilities with two operating rooms each. Therefore, there is a need determination for one facility to be located in each of the following areas: Charlotte Area (Mecklenburg, Cabarrus, Union counties), Triad Area (Guilford, Forsyth counties), Triangle Area (Wake, Durham, Orange counties). The demonstration project facilities must meet the criteria described in Table 6D. It is determined that there is no need for any additional Operating Rooms anywhere else in the state and no other reviews are scheduled. “Operating room” is defined in G.S. 131E-76(9) as “…a room used for the performance of surgical procedures requiring one or more incisions and that is required to comply with all applicable licensure codes and standards for an operating room.”
Table 6C: Operating Room Need Determinations (Scheduled for certificate of need Review Commencing in 2010)
It is determined that the counties listed in the table below need additional Operating Rooms as specified.
OPERATING ROOM SERVICE AREA
OPERATING ROOM NEED
DETERMINATION*
CERTIFICATE OF NEED
APPLICATION DUE DATE**
CERTIFICATE OF NEED
BEGINNING REVIEW DATE
Wake 3 February 15, 2010 March 1, 2010 Charlotte Area (Mecklenburg, Cabarrus, Union counties)
2 (Pursuant to the Single
Specialty Ambulatory Surgery Facility Demonstration Project)
July 15, 2010 August 1, 2010
Triad Area (Guilford, Forsyth counties)
2 (Pursuant to the Single
Specialty Ambulatory Surgery Facility Demonstration Project)
March 15, 2010 April 1, 2010
Triangle Area (Wake, Durham, Orange counties)
2 (Pursuant to the Single
Specialty Ambulatory Surgery Facility Demonstration Project)
November 15, 2010 December 1, 2010
It is determined that there is no need for additional Operating Rooms anywhere else in the state and no other reviews are scheduled.
* Need Determinations shown in this document may be increased or decreased during the year pursuant to Policy GEN-2 (see Chapter 4).
** Application Due Dates are absolute deadlines. The filing deadline is 5:30 p.m. on the
Application Due Date. The filing deadline is absolute (see Chapter 3).

Table 6D: Single Specialty Ambulatory Surgery Facility Demonstration Project
CRITERIA CRITERIA BASIC PRINCIPLE AND
RATIONALE Establish a special need determination for three new separately licensed single specialty ambulatory surgical facilities with two operating rooms each, such that there is a need identified for one new ambulatory surgical facility in each of the three following service areas: Mecklenburg, Cabarrus, Union counties (Charlotte Area) Guilford, Forsyth counties (Triad) Wake, Durham, Orange counties (Triangle)
Value At least one county in each of the groups of counties has a current population greater than or equal to 200,000 and more than 50 total ambulatory/shared operating rooms and at least 1 separately licensed Ambulatory Surgery Center. Locating facilities in high population areas with a large number of operating rooms and existing ambulatory surgery providers prevents the facilities from harming hospitals in rural areas, which need revenue from surgical services to offset losses from other necessary services such as emergency department services.
In choosing among competing demonstration project facilities, priority will be given to facilities that are owned wholly or in part by physicians.
Value Giving priority to demonstration project facilities owned wholly or in part by physicians is an innovative idea with the potential to improve safety, quality, access and value. Implementing this innovation through a demonstration project enables the State Health Coordinating Council to monitor and evaluate the innovation’s impact.
Each demonstration project facility shall provide care to the indigent population, as described below:
The percentage of the facility’s total collected revenue that is attributed to self-pay and Medicaid revenue shall be at least seven percent, which shall be calculated as follows: The Medicare allowable amount for self-pay and Medicaid surgical cases minus all revenue collected from self-pay and Medicaid cases divided by the total collected revenues for all surgical cases performed in the facility.
Following are examples of the calculation of self pay and Medicaid revenue:
If Medicare allows $300 for a surgical procedure and a self-pay patient pays the facility $0, then $300 is considered self-pay revenue. If Medicare allows $300 for a surgical procedure and a self-pay patient pays the facility $50, then $250 is considered self-pay revenue.
Access Requiring service to indigent patients promotes equitable access to the services provided by the demonstration project facilities.

CRITERIA CRITERIA BASIC PRINCIPLE AND RATIONALE
If Medicare allows $300 for a surgical procedure and Medicaid pays the facility $225, then $75 is considered Medicaid revenue.
Demonstration project facilities shall report utilization and payment data to the statewide data processor as required by G.S. 131E-214.2. The Agency will monitor compliance with indigent care requirements by analyzing payment data submitted by the facilities. Demonstration project facilities shall complete a “Surgical Safety Checklist (adapted for use in the US)” before each surgery is performed. Note: “Surgical Safety Checklist is based on the WHO Surgical Safety Checklist developed by: World Health Organization” Each demonstration project facility shall develop a system to measure and report patient outcomes to the Agency for the purpose of monitoring the quality of care provided in the facility. If patient outcome measures are available for a facility’s particular surgical specialty, the facility shall identify those measures and may use them for reporting patient outcomes. If patient outcome measures are not available, the facility shall develop its own patient outcome measures that will be reported to the Agency. Demonstration project facilities shall submit annual reports to the Agency regarding the results of patient outcome measures. Examples of patient outcome measures include: wound infection rate, post-operative infections, post-procedure complications, readmission, and medication errors.
Safety and Quality Implementing a system for measuring and reporting quality promotes identification and correction of quality of care issues and overall improvement in the quality of care provided.
Demonstration project facilities are encouraged to develop systems that will enhance communication and ease data collection, for example, electronic medical records that support interoperability with other providers.
Safety and Quality, Access, Value Electronic medical records improve the collection of quality and access to care data and collecting data is the first step in monitoring and improving quality of care and access. Interoperability facilitates communication among providers, enhancing care coordination.
Demonstration project facilities are encouraged to provide open access to physicians.
Access Services will be accessible to a greater number of surgical patients if the facility has an open access policy for physicians.

CRITERIA CRITERIA BASIC PRINCIPLE AND RATIONALE
Physicians affiliated with the demonstration project facilities are required to establish or maintain hospital staff privileges with at least one hospital and to begin or continue meeting Emergency Department coverage responsibilities with at least one hospital, with the following caveat: This requirement has to be available to the physicians and not denied based upon charges that physicians are engaging in competitive behavior by providing services at a facility that is perceived to be in competition with the hospital if it so happens that the CON is issued to an organization other than the hospital. Additionally, physicians affiliated with the demonstration project facilities are required to provide annually to the Agency data related to meeting their hospital staff privilege and Emergency Department coverage responsibilities. Specific data to be reported, such as number of nights on call, will be determined by the Agency.
Safety and Quality Encouraging physicians to establish or maintain hospital staff privileges and to begin or continue meeting Emergency Department coverage responsibilities helps prevent a decrease in the quality of the overall healthcare system resulting from lack of resources.
Facilities shall obtain a license no later than two years from the date of issuance of the certificate of need, unless this requirement is changed in a subsequent State Medical Facilities Plan.
Access and Value Timely project completion increases access to services and enhances project value.
The Single Specialty Ambulatory Surgery Work Group values the collective wisdom of the North Carolina Hospital Association and the North Carolina Medical Society and requests that the two organizations work together to assist the demonstration project facilities in developing quality measures and increasing access to the underserved.
Safety and Quality, Access and Value Collaboration between the North Carolina Hospital Association and the North Carolina Medical Society in an effort to develop quality measures and increase access to the underserved promotes all three Basic Principles.
Facilities will provide annual reports to the Agency showing the facility’s compliance with the demonstration project criteria in the State Medical Facilities Plan. The Agency may specify the reporting requirements and reporting format. The Agency will perform an evaluation of each facility at the end of the first calendar year the facility is in operation and will perform an annual evaluation of each facility thereafter. The Agency may require corrective action if the Agency determines that a facility is not meeting or is not making good progress toward meeting the demonstration project criteria.
Safety and Quality, Access, Value Timely monitoring enables the Agency to determine if facilities are meeting criteria and to take corrective action if facilities fail to meet criteria. This ensures that all three Basic Principles are met by the demonstration project facilities.

CRITERIA CRITERIA BASIC PRINCIPLE AND RATIONALE
The Agency will evaluate each facility after each facility has been in operation for five years. If the Agency determines that the facilities are meeting or exceeding all criteria, the work group encourages the State Health Coordinating Council to consider allowing expansion of single specialty ambulatory surgical facilities beyond the original three demonstration sites. The Agency may require corrective action if the Agency determines that a facility is not meeting or is not making good progress toward meeting the demonstration project criteria. If the Agency determines that a facility is not in compliance with any one of the demonstration project criteria, the Department, in accordance with G.S. 131E-190, “may bring an action in Wake County Superior Court or the superior court of any county in which the certificate of need is to be utilized for injunctive relief, temporary or permanent, requiring the recipient, or its successor, to materially comply with the representations in its application. The Department may also bring an action in Wake County Superior Court or the superior court of any county in which the certificate of need is to be utilized to enforce the provisions of this subsection and G.S. 131E-181(b) and the rules adopted in accordance with this subsection and G.S. 131E-181(b).”

Inventory of Endoscopy Rooms in Licensed Facilities With the change in legislation which occurred in August 2005 (Session Law 2005-346), endoscopy rooms in licensed facilities are no longer defined as “operating rooms”. For information purposes only, a listing of endoscopy procedure rooms in licensed facilities is provided in Table 6E based on data from the 2009 Hospital and the 2009 Ambulatory Surgery Facility License Renewal Applications. The Review Schedule for endoscopy rooms in licensed facilities can be found in Chapter 3.

Table 6E: Endoscopy Room Inventory (Case and Procedure Data for 10/01/07 through 9/30/08 as reported on the 2009 Hospital and Ambulatory Surgical Facility License Renewal Applications)
License Number Facility Name County
Endoscopy Rooms
Adjustment for CONs
Endoscopy Cases
Endoscopy Procedures
H0274 Alexander Hospital Alexander 1 0 0 0H0082 Anson Community Hospital Anson 1 0 300 140
H0099Ashe Memorial Hospital(facility did not report procedures) Ashe 1 0 939 0
H0037 Charles A. Cannon, Jr. Memorial Hospital Avery 1 0 518 518H0188 Beaufort County Hospital Beaufort 1 0 1,933 2,058H0061 Caldwell Memorial Hospital Caldwell 2 0 1,760 1,936H0007 Chatham Hospital Chatham 1 0 499 547H0239 Murphy Medical Center Cherokee 2 0 1,557 1,962H0063 Chowan Hospital Chowan 1 0 517 585H0045 Columbus Regional Healthcare System Columbus 2 1 2,613 3,770H0273 The Outer Banks Hospital Dare 2 0 323 323H0171 Davie County Hospital Davie 1 0 323 383H0261 Franklin Regional Medical Center Franklin 1 0 592 794
H0098Granville Medical Center(facility does not track procedures) Granville 1 0 718 0
H0230 Halifax Regional Medical Center Halifax 1 0 519 519H0224 Betsy Johnson Regional Hospital Harnett 2 0 2,875 5,607H0025 Haywood Regional Medical Center Haywood 3 0 1,791 2,137H0001 Roanoke-Chowan Hospital Hertford 1 0 1,230 1,611H0087 Harris Regional Hospital Jackson 1 0 2,203 2,848H0151 Johnston Memorial Hospital Johnston 2 0 3,453 4,138H0225 Lincoln Medical Center Lincoln 2 0 1,402 1,402H0078 Martin General Hospital Martin 1 0 390 529H0169 Spruce Pine Community Hospital Mitchell 1 0 942 1,072H0157 University of North Carolina Hospitals Orange 9 0 11,368 12,508H0054 Albemarle Hospital Pasquotank 3 0 3,059 3,059H0115 Pender Memorial Hospital Pender 1 0 400 409H0040 Rowan Regional Medical Center Rowan 4 0 3,777 4,433H0039 Rutherford Hospital Rutherford 2 0 2,683 2,683H0107 Scotland Memorial Hospital Scotland 2 0 2,249 2,548
H0008Stanly Regional Medical Center(facility does not track procedures) Stanly 2 0 1,238 0
H0165 Stokes-Reynolds Memorial Hospital Stokes 1 0 280 368H0069 Swain County Hospital Swain 1 0 191 197H0111 Transylvania Community Hospital Transylvania 2 0 1,417 1,620H0267 Maria Parham Hospital Vance 2 0 4,101 6,382H0153 Wilkes Regional Medical Center Wilkes 2 0 1,825 1,911H0155 Hoots Memorial Hospital Yadkin 1 0 158 177
Counties with one facility shown first, followed by counties with more than one facility.

Table 6E: Endoscopy Room Inventory (Case and Procedure Data for 10/01/07 through 9/30/08 as reported on the 2009 Hospital and Ambulatory Surgical Facility License Renewal Applications)
License Number Facility Name County
Endoscopy Rooms
Adjustment for CONs
Endoscopy Cases
Endoscopy Procedures
Counties with one facility shown first, followed by counties with more than one facility.
H0272 Alamance Regional Medical Center Alamance 4 0 7,356 9,833Pioneer SurgeryPioneer Surgery Center Alamance 0 1 0 0
Alamance Total 4 1 7,356 9,833H0250 Brunswick Community Hospital Brunswick 2 0 1,898 1,907H0150 J. Arthur Dosher Memorial Hospital Brunswick 2 0 1,308 1,308
Brunswick Total 4 0 3,206 3,215H0036 Mission Hospitals Buncombe 6 0 7,064 8,942AS0051 The Endoscopy Center Buncombe 5 0 10,448 14,370
Buncombe Total 11 0 17,512 23,312Blue Ridge Hea Blue Ridge HealthCare Surgery Center Burke 0 1 0 0
Carolina Digestive Care Carolina Digestive Care Burke 0 2 0 0H0062 Grace Hospital Burke 1 -1 435 435H0091 Valdese General Hospital Burke 2 0 797 824
Burke Total 3 2 1,232 1,259H0031 CMC-NorthEast Cabarrus 4 2 7,007 9,394AS0070 Gateway Ambulatory Surgery Center Cabarrus 2 0 3,037 4,354
AS0104Northeast Digestive Health Center (licensed 11.16.07) Cabarrus 3 0 2,725 3,057
Cabarrus Total 9 2 12,769 16,805H0222 Carteret General Hospital Carteret 2 0 971 1,144AS0061 Carteret Surgery Center Carteret 1 0 1,790 2,179
Carteret Total 3 0 2,761 3,323H0223 Catawba Valley Medical Center Catawba 3 0 1,986 2,389H0053 Frye Regional Medical Center Catawba 2 0 1,978 2,016AS0077 Gastroenterology Associates of Hickory Catawba 3 0 5,134 6,229
Catawba Total 8 0 9,098 10,634AS0062 Cleveland Ambulatory Services Cleveland 4 0 3,381 4,292H0024 Cleveland Regional Medical Center Cleveland 4 0 2,312 3,868H0113 Kings Mountain Hospital Cleveland 1 0 396 450
Cleveland Total 9 0 6,089 8,610AS0078 CCHC Endoscopy Center Craven 3 0 4,202 4,770H0201 CarolinaEast Medical Center Craven 2 0 1,628 1,837AS0096 Eastern Carolina Internal Medicine Craven 3 0 3,588 4,098
Craven Total 8 0 9,418 10,705
AS0123Cape Fear Center for Digestive Diseases(licensed 11.9.09) Cumberland 2 0 0 0
H0213 Cape Fear Valley Medical Center Cumberland 4 0 2,931 3,158AS0006 Fayetteville Ambulatory Surgery Center Cumberland 3 0 3,246 3,246AS0071 Fayetteville Gastroenterology Associates Cumberland 4 0 8,475 9,161H0275 Highsmith-Rainey Memorial Hospital Cumberland 3 0 3,192 3,526
Cumberland Total 16 0 17,844 19,091H0027 Lexington Memorial Hospital Davidson 2 0 1,636 1,739

Table 6E: Endoscopy Room Inventory (Case and Procedure Data for 10/01/07 through 9/30/08 as reported on the 2009 Hospital and Ambulatory Surgical Facility License Renewal Applications)
License Number Facility Name County
Endoscopy Rooms
Adjustment for CONs
Endoscopy Cases
Endoscopy Procedures
Counties with one facility shown first, followed by counties with more than one facility.
H0112 Thomasville Medical Center Davidson 1 1 1,248 1,541Davidson Total 3 1 2,884 3,280
H0015 Duke University Hospital Durham 14 -4 13,379 19,666H0233 Durham Regional Hospital Durham 4 0 3,337 3,521AS0085 Triangle Endoscopy Center Durham 4 0 4,317 5,284
Durham Total 22 -4 21,033 28,471AS0099 Digestive Health Endoscopy Center Forsyth 2 2 6,260 7,687H0209 Forsyth Medical Center Forsyth 8 -4 7,728 15,761NCBH OutpatienNCBH Outpatient Endoscopy Center Forsyth 0 2 0 0H0011 North Carolina Baptist Hospitals Forsyth 12 -2 11,016 19,285
AS0044Piedmont Endoscopy Center (facility does not track cases) Forsyth 4 0 0 7,595
AS0074 Salem Gastroenterology Associates Forsyth 4 0 7,409 8,290Forsyth Total 30 -2 32,413 58,618
H0258 Heritage Hospital Edgecombe 2 0 1,254 1,254Tarboro Clinic Tarboro Clinic Edgecombe 0 1 0 0
Edgecombe Total 2 1CaroMont EndosCaroMont Endoscopy Center Gaston 0 2 0 0H0105 Gaston Memorial Hospital Gaston 8 -2 9,873 11,912
Gaston Total 8 0 9,873 11,912AS0076 Bethany Medical Endoscopy Group Guilford 2 0 1,626 1,626AS0075 Eagle Endoscopy Center Guilford 4 0 5,774 6,351AS0052 Greensboro Center For Digestive Diseases Guilford 3 0 6,958 7,690AS0113 Guilford Endoscopy Center Guilford 2 0 107 134AS0009 HEALTHSOUTH Greensboro Specialty Surgical Center Guilford 0 2 0 0AS0059 High Point Endoscopy Center Guilford 3 1 6,459 8,942H0052 High Point Regional Health System Guilford 3 -1 2,517 3,166H0159 Moses Cone Health System Guilford 8 0 7,080 8,371
Guilford Total 25 2 30,521 36,280
AS0106Carolina Mountain Gastroenterology Endoscopy Center (licensed 10.27.06) Henderson 2 0 3,541 3,646
H0161 Margaret R. Pardee Memorial Hospital Henderson 3 0 3,891 4,562H0019 Park Ridge Hospital Henderson 1 0 762 970
Henderson Total 6 0 8,194 9,178H0248 Davis Regional Medical Center Iredell 2 0 1,531 1,599H0164 Iredell Memorial Hospital Iredell 3 0 3,389 3,747H0259 Lake Norman Regional Medical Center Iredell 3 0 4,332 4,332Piedmont HealthPiedmont HealthCare Endoscopy Center Iredell 0 3 0 0
Iredell Total 8 3 9,252 9,678H0243 Central Carolina Hospital Lee 2 -2 882 2,052AS0094 Mid Carolina Gastroenterology Associates Lee 2 0 2,528 2,856
Lee Total 4 -2 3,410 4,908

Table 6E: Endoscopy Room Inventory (Case and Procedure Data for 10/01/07 through 9/30/08 as reported on the 2009 Hospital and Ambulatory Surgical Facility License Renewal Applications)
License Number Facility Name County
Endoscopy Rooms
Adjustment for CONs
Endoscopy Cases
Endoscopy Procedures
Counties with one facility shown first, followed by counties with more than one facility.
AS0122 Kinston Medical Specialists (licensed 7.29.09) Lenoir 2 0 0 0H0043 Lenoir Memorial Hospital Lenoir 2 0 2,280 2,563AS0121 Park Endoscopy Center (licensed 2.16.09) Lenoir 2 0 0 0
Lenoir Total 6 0 2,280 2,563H0034 Angel Medical Center Macon 2 0 932 944H0193 Highlands-Cashiers Hospital, Inc. Macon 2 0 356 356AS0097 Western Carolina Digestive Consultants Macon 1 0 1,170 1,549
Macon Total 5 0 2,458 2,849AS0088 Carolina Endoscopy Center - Pineville Mecklenburg 2 0 1,325 1,720
AS0108Carolinas Endoscopy Center - Huntersville (licensed 10.24.07) Mecklenburg 2 0 276 349
AS0081Carolinas Gastroenterology Center - Ballantyne (licensed 12.13.06) Mecklenburg 4 0 1,172 1,465
AS0080Carolinas Gastroenterology Center - Medical Center Plaza (licensed 12.12.06) Mecklenburg 2 0 1,335 1,668
H0042 Carolinas Medical Center - Mercy and Pineville Mecklenburg 5 0 3,854 4,283H0255 Carolinas Medical Center - University Mecklenburg 1 0 4,985 5,781H0071 Carolinas Medical Center / Center for Mental Health Mecklenburg 8 -1 11,511 12,101
AS0110
Charlotte Gastroenterology & Hepatology (John J. Delaney Drive) (licensed 12.17.07) Mecklenburg 2 0 4,183 4,183
AS0109Charlotte Gastroenterology & Hepatology (Randolph Road) (licensed 12.17.07) Mecklenburg 4 0 4,212 4,212
AS0092 Endoscopy Services Center - Billingsley Road Mecklenburg 2 0 5,112 6,320AS0089 Endoscopy Services Center - University Mecklenburg 2 0 1,062 1,339AS0084 Presbyterian Endoscopy Center of Huntersville Mecklenburg 2 0 941 941H0010 Presbyterian Hospital Mecklenburg 9 -3 7,742 7,993H0282 Presbyterian Hospital Huntersville Mecklenburg 3 0 2,214 2,236H0270 Presbyterian Hospital Matthews Mecklenburg 4 -1 4,769 3,367Presbyterian HoPresbyterian Hospital Mint Hill Mecklenburg 0 1 0 0AS0098 Presbyterian SameDay Surgery Center at Ballantyne Mecklenburg 1 0 526 526
Mecklenburg Total 53 -4 55,219 58,484H0100 FirstHealth Moore Regional Hospital Moore 3 -2 3,864 3,864AS0073 Pinehurst Medical Clinic Endoscopy Center Moore 2 3 3,772 3,722
Moore Total 5 1 7,636 7,586
AS0105Boice-Willis Clinic Endoscopy Center (licensed 4.18.06) Nash 2 0 2,174 2,389
H0228 Nash General Hospital Nash 4 0 6,105 7,582Nash Total 6 0 8,279 9,971
AS0100 Hanover Medical Specialists New Hanover 2 0 4,932 4,932H0221 New Hanover Regional Medical Center New Hanover 7 -2 9,046 9,346

Table 6E: Endoscopy Room Inventory (Case and Procedure Data for 10/01/07 through 9/30/08 as reported on the 2009 Hospital and Ambulatory Surgical Facility License Renewal Applications)
License Number Facility Name County
Endoscopy Rooms
Adjustment for CONs
Endoscopy Cases
Endoscopy Procedures
Counties with one facility shown first, followed by counties with more than one facility.
AS0091 Wilmington Gastroenterology New Hanover 4 0 8,191 8,499AS0045 Wilmington Health Associates New Hanover 3 0 2,285 3,042AS0055 Wilmington SurgCare New Hanover 3 0 682 908
New Hanover Total 19 -2 25,136 26,727AS0079 East Carolina Gastroenterology Center Onslow 1 0 1,284 1,284H0048 Onslow Memorial Hospital Onslow 3 0 2,319 2,444
Onslow Total 4 0 3,603 3,728AS0086 Atlantic Gastroenterology Endoscopy Center Pitt 2 0 3,542 3,678AS0118 Carolina Digestive Diseases (licensed 1.8.09) Pitt 2 0 0 0AS0119 East Carolina Endoscopy Center (licensed 1.22.09) Pitt 3 0 0 0AS0117 Gastroenterology East Pitt 2 1 3,900 4,250H0104 Pitt County Memorial Hospital Pitt 5 -3 6,996 8,553AS0060 Quadrangle Endoscopy Center Pitt 6 0 5,509 6,122
Pitt Total 20 -2 19,947 22,603
AS0054Asheboro Endoscopy Center(procedure data not provided) Randolph 1 0 1,145 1,471
H0013 Randolph Hospital Randolph 2 0 2,998 4,155Randolph Total 3 0 4,143 5,626
H0158 FirstHealth Richmond Memorial Hospital Richmond 2 0 300 332AS0083 Marlboro GI Endoscopy Center Richmond 2 0 890 890H0265 Sandhills Regional Medical Center Richmond 2 0 239 239
Richmond Total 6 0 1,429 1,461
AS0107Southeastern Gastroenterology Endoscopy Center (licensed 9.5.06) Robeson 1 0 0 0
H0064 Southeastern Regional Medical Center Robeson 5 0 3,605 3,735Robeson Total 6 0 3,605 3,735
H0023 Annie Penn Hospital Rockingham 2 0 2,503 3,167H0072 Morehead Memorial Hospital Rockingham 2 0 1,833 1,833
Rockingham Total 4 0 4,336 5,000
H0184Northern Hospital of Surry County(facility does not track cases) Surry 2 0 0 2,475
AS0087 Tri County Gastroenterology Surry 3 0 2,665 2,655Surry Total 5 0 2,665 5,130
AS0090 Carolina Endoscopy Center - Monroe Union 2 0 1,907 2,504H0050 Union Regional Medical Center Union 2 0 3,246 3,891
Union Total 4 0 5,153 6,395
AS0072 Center for Digestive Diseases and Cary Endoscopy Center Wake 3 0 2,788 2,788AS0115 Duke GI at Brier Creek (licensed 6.20.08) Wake 2 0 2,038 2,051H0238 Duke Health Raleigh Hospital Wake 3 0 2,139 2,876AS0116 GastroIntestinal Healthcare (licensed 5.27.08) Wake 2 0 3,035 3,050Kurt G. Vernon, Kurt G. Vernon, M.D. Wake 0 1 0 0
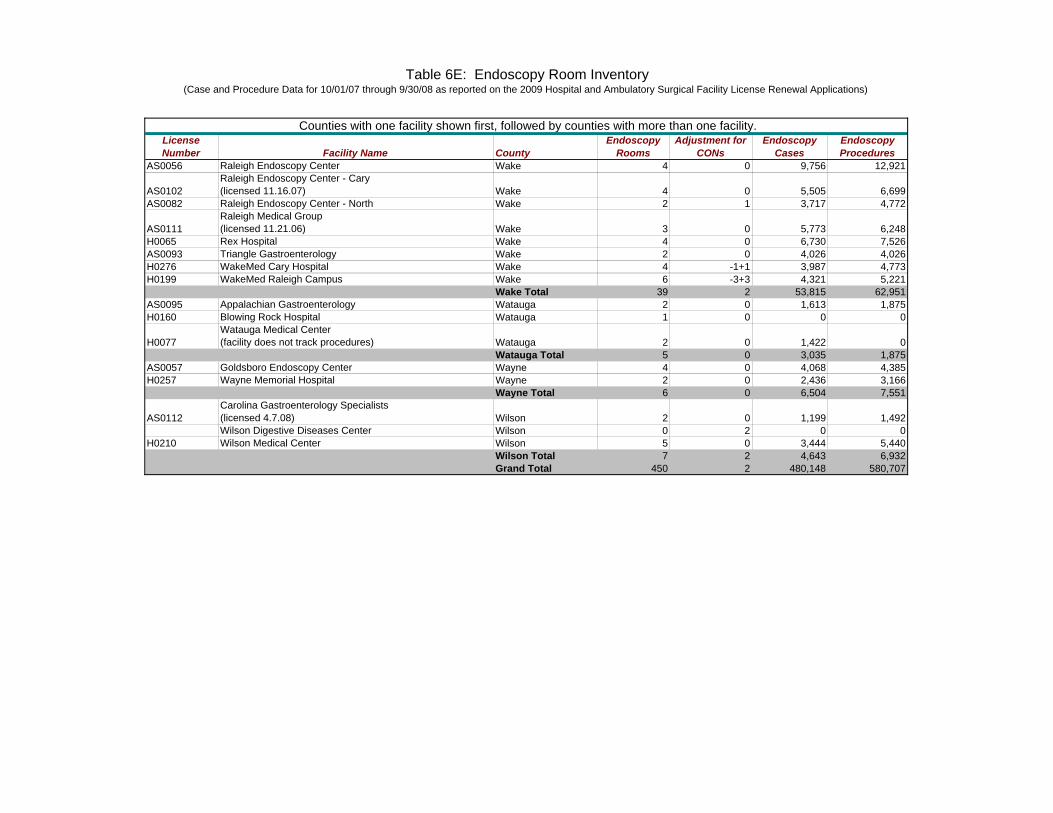
Table 6E: Endoscopy Room Inventory (Case and Procedure Data for 10/01/07 through 9/30/08 as reported on the 2009 Hospital and Ambulatory Surgical Facility License Renewal Applications)
License Number Facility Name County
Endoscopy Rooms
Adjustment for CONs
Endoscopy Cases
Endoscopy Procedures
Counties with one facility shown first, followed by counties with more than one facility.
AS0056 Raleigh Endoscopy Center Wake 4 0 9,756 12,921
AS0102Raleigh Endoscopy Center - Cary (licensed 11.16.07) Wake 4 0 5,505 6,699
AS0082 Raleigh Endoscopy Center - North Wake 2 1 3,717 4,772
AS0111Raleigh Medical Group (licensed 11.21.06) Wake 3 0 5,773 6,248
H0065 Rex Hospital Wake 4 0 6,730 7,526AS0093 Triangle Gastroenterology Wake 2 0 4,026 4,026H0276 WakeMed Cary Hospital Wake 4 -1+1 3,987 4,773H0199 WakeMed Raleigh Campus Wake 6 -3+3 4,321 5,221
Wake Total 39 2 53,815 62,951AS0095 Appalachian Gastroenterology Watauga 2 0 1,613 1,875H0160 Blowing Rock Hospital Watauga 1 0 0 0
H0077Watauga Medical Center(facility does not track procedures) Watauga 2 0 1,422 0
Watauga Total 5 0 3,035 1,875AS0057 Goldsboro Endoscopy Center Wayne 4 0 4,068 4,385H0257 Wayne Memorial Hospital Wayne 2 0 2,436 3,166
Wayne Total 6 0 6,504 7,551
AS0112Carolina Gastroenterology Specialists (licensed 4.7.08) Wilson 2 0 1,199 1,492
Wilson DigestiveWilson Digestive Diseases Center Wilson 0 2 0 0H0210 Wilson Medical Center Wilson 5 0 3,444 5,440
Wilson Total 7 2 4,643 6,932Grand Total 450 2 480,148 580,707

Chapter 7:Other Acute Care Services
• Open Heart Surgery Services
• Heart-Lung Bypass Machines
• Burn Intensive Care Services
• Transplantation Services

CHAPTER 7 OTHER ACUTE CARE SERVICES Summary of Service Supply and Utilization
During FY 2007-08, 22 hospitals provided Open Heart Surgery Services. The reported data indicate a statewide average annual utilization rate of 35.4 percent for the 72 Heart-Lung Bypass Machines in the total planning inventory (excluding emergency backup machines).
There are two Burn Intensive Care Services located in North Carolina with a total of 29
Burn Intensive Care Unit Beds. The reported days of care indicated an overall average annual occupancy rate of 79.3 percent in FY 2007-08. There are five hospitals approved to offer both Allogeneic and Autologous Bone Marrow Transplants, plus one hospital approved to offer only Autologous Bone Marrow Transplants. These facilities reported a total of 444 transplants performed during FY 2007-08. The Solid Organ Transplantation Services located at the five Academic Medical Center Teaching Hospitals reported a total of 817 transplants performed during FY 2007-2008. Changes from the Previous Plan
No substantive changes in basic principles and methodologies applied in the 2009 North Carolina State Medical Facilities Plan have been incorporated into the 2010 North Carolina State Medical Facilities Plan. Throughout the chapter, data have been revised to reflect services provided during FY 2007-2008, and dates have been advanced by one year, where appropriate. Open Heart Surgery Services and Heart-Lung Bypass Machines Definitions “Open heart surgery services,” as defined in G.S. 131E-176(18b), “means the provision of surgical procedures that utilize a heart-lung bypass machine during surgery to correct cardiac and coronary artery disease or defects.” “Heart-lung bypass machine,” as defined in G.S. 131E-176(10a), “means the equipment used to perform extra-corporeal circulation and oxygenation during surgical procedures.” Facility Inventory - Service Volume As the following Tables 7A and 7B indicate, there were 22 open-heart surgery programs in North Carolina in 2008, with a total planning inventory of 72 heart-lung bypass machines. Data reported for 2008 indicate that these 72 machines were utilized at an average annual rate of 35.4 percent, a slight decrease from the previous year’s utilization at 35.7 percent of capacity. In addition, seven programs have “back-up” heart-lung bypass machines, which by law can only be used for emergency back-up of their other heart-lung machines. Total open-heart surgery procedures for 1994-2008 are shown on the following graph and the reported numbers of procedures for years ending 9/30/94 through 9/30/08 appear in the following Table 7A.

0
2000
4000
6000
8000
10000
12000
14000
Adult Open Heart Surgery Procedures: 1994-2008(Procedures Utilizing Heart-Lung Bypass Machines)
Total Procdures 11168 12342 13161 13498 13365 13151 13210 12870 12259 12041 11128 10817 10459 9449 9136
1994 1995 1996 1997 1998 1999 2000 2001 2002 2003 2004 2005 2006 2007 2008

Table 7A: Open-Heart Surgery Procedures(Procedures Utilizing Heart-Lung Bypass Machines)
Adults
Facility 1994 1995 1996 1997 1998 1999 2000 2001 2002 2003 2004 2005 2006 2007 2008Cape Fear Valley Medical Center 225 243 283 317 326 327 387 388 356 448 458 432 352 301 299Carolinas Medical Center Mercy/Pineville 357 396 388 425 283 290 272 246 231 199 134 150 104 92 62Carolinas Medical Center/Center for Mental Health 1068 1118 1281 1242 1280 1143 997 941 875 719 710 631 615 640 457CMC-NorthEast 178 292 318 271 193 248 297 340 307 361 375 286 296 257 227Craven Regional Medical Center 102 140 126 139 244 184 193 215 240 222 238 255 255 219 209Duke University Hospital 1318 1367 1477 1490 1578 1494 1555 1565 1428 1229 995 914 947 852 829Durham Regional Hospital 179 179 170 170 175 198 204 173 178 170 168 166 142 119 87FirstHealth Moore Regional Hospital 233 282 269 291 294 366 340 393 355 429 316 387 319 369 406Forsyth Memorial Hospital 661 722 769 836 763 703 792 675 688 717 609 747 598 657 634Frye Regional Medical Center 470 621 614 598 557 359 408 315 271 281 388 374 344 224 206Gaston Memorial Hospital 30 217 316 313 309 309 248 202 246 183 190High Point Regional Health System 375 342 309 301 295 315 302 339 273 293 295 313 281 194 208Memorial Mission Hospital and Asheville Surgery Center 822 983 1077 1200 1185 1186 1161 1193 1053 1064 1084 1025 1105 1067 992Moses Cone Health System 690 852 1016 1030 1029 1005 935 894 889 829 883 849 860 578 596New Hanover Regional Medical Center 501 587 643 694 646 709 684 689 709 794 691 476 497 529 522North Carolina Baptist Hospital 682 637 767 726 674 677 660 564 666 625 563 521 534 511 496Pitt County Memorial Hospital 969 1012 1069 1091 1098 1102 1208 1147 1111 1096 933 938 1042 805 865Presbyterian Hospital 783 865 845 848 753 760 633 609 564 551 412 401 306 301 321Rex Hospital 399 454 431 479 550 516 526 448 416 419 369 357 359 334 313Southeastern Regional Medical Center 15 58 71University of North Carolina Hospitals 264 276 284 291 289 304 297 282 268 246 283 361 311 265 238WakeMed 892 974 1025 1059 1123 1048 1043 1141 1072 1040 976 1032 931 894 908Total Procedures 11168 12342 13161 13498 13365 13151 13210 12870 12259 12041 11128 10817 10459 9449 9136
Open Heart Surgery Services and Heart-Lung Bypass Machine Need Determination The capacity of a heart-lung bypass machine has been defined as 400 adult equivalent open heart surgical procedures per year. For purposes of determining capacity, one open-heart surgical procedure is defined to be the single utilization of a heart-lung bypass machine for open-heart surgery by a patient in a surgical operating room. Research indicates that one heart-lung bypass machine can be utilized for two scheduled open-heart surgical procedures per day. Because of additional time often incurred during procedures on patients age 14 and under, one procedure is valued at two adult equivalent open-heart surgical procedures. The following Table 7B displays 2008 heart-lung bypass machine capacity and utilization as reported on the 2009 Hospital License Renewal Applications on file with the Division of Health Service Regulation:

Table 7B: Heart-Lung Bypass Machine Capacity and Volume
License # HospitalCurrent
Inventory
CON Issued / Pending
Development
Total Planning Inventory
Backup Machines
2008 Procedures (Weighted)
Hospital Procedure Capacity
(Number of Machines X 400)
Percent Utilization
of CapacityEquipment
Deficit
Pending Review or
Appeal NeedH0213 Cape Fear Valley Medical Center 2 0 2 1 299 800 37.4% 0 0 0
H0042
Carolinas Medical Center Mercy/Pineville(One of the two machines in the Total Planning Inventory is to be used for backup only following completion of CON project F-7979-07.) 3 -1 2 0 62 800 7.8% 0 0 0
H0071 Carolinas Medical Center/Center for Mental Health 6 0 6 0 853 2400 35.5% 0 0 0H0031 Carolinas Medical Center - NorthEast 2 0 2 1 227 800 28.4% 0 0 0H0201 Craven Regional Medical Center 2 0 2 0 209 800 26.1% 0 0 0H0015 Duke University Hospital 7 0 7 0 1061 2800 37.9% 0 0 0H0233 Durham Regional Hospital 2 0 2 0 87 800 10.9% 0 0 0H0100 FirstHealth Moore Regional 2 0 2 1 406 800 50.8% 0 0 0H0209 Forsyth Memorial Hospital 3 0 3 0 634 1200 52.8% 0 0 0H0053 Frye Regional Medical Center 2 0 2 1 206 800 25.8% 0 0 0H0105 Gaston Memorial 2 0 2 1 190 800 23.8% 0 0 0H0052 High Point Regional Hospital 2 0 2 0 208 800 26.0% 0 0 0H0036 Memorial Mission Hospital 6 0 6 0 992 2400 41.3% 0 0 0H0159 Moses Cone Hospital 4 0 4 0 596 1600 37.3% 0 0 0H0221 New Hanover Regional Medical Center 3 0 3 0 522 1200 43.5% 0 0 0H0011 North Carolina Baptist Hospital 4 0 4 0 634 1600 39.6% 0 0 0H0104 Pitt County Memorial Hospital 5 0 5 0 935 2000 46.8% 0 0 0H0010 Presbyterian Hospital 3 0 3 1 321 1200 26.8% 0 0 0H0065 Rex Hospital 3 0 3 0 313 1200 26.1% 0 0 0H0064 Southeastern Regional 1 0 1 1 71 400 17.8% 0 0 0H0157 University of North Carolina Hospitals 4 0 4 0 462 1600 28.9% 0 0 0H0199 WakeMed 5 0 5 0 908 2000 45.4% 0 0 0
T O T A L 73 -1 72 7 10196 28800 35.4% 0 0 0
2008 procedures (weighted) equal adult procedures plus pediatric procedures X 2 for: Carolinas Medical Center/Center for Mental Health, Duke, North Carolina Baptist, Pitt County, and UNC Hospitals.
35.4% utilization based on 72 machines.

Need Determination for Open Heart Surgery Services It is determined that there is no need for additional open-heart surgery services anywhere in the state and no reviews are scheduled. Heart-Lung Bypass Machine Need Determination Methodology A need exists for an additional heart-lung bypass machine when the utilization of a provider’s existing and approved equipment is at or above 80 percent of capacity based on the number of open heart surgery procedures reported in the 2009 licensure application on file with the Division of Health Service Regulation, and after the equipment allocated in previous State Medical Facilities Plans which is pending review or appeal is subtracted from the equipment deficit. Any person may apply for a certificate of need to purchase an additional heart-lung bypass machine for which a need is determined, provided the heart-lung bypass machine will be located in the same county as the provider whose utilization was at or above 80 percent of capacity based on the number of open heart surgery procedures reported in the 2009 licensure application on file with the Division of Health Service Regulation. (Note: A heart-lung bypass machine’s service area is the heart-lung bypass machine planning area in which the heart-lung bypass machine is located. The heart-lung bypass machine planning areas are the single and multi-county groupings shown in Figure 5.1.) Need Determination for Heart-Lung Bypass Machines Application of the standard methodology indicates no need for additional heart-lung bypass machines anywhere in the state and no reviews are scheduled.
Burn Intensive Care Services
Definition “Burn intensive care services,” as defined in G.S. 131E-176(2b), are “services provided in a unit designed to care for patients who have been severely burned.” Facility Inventory - Service Volume There are two designated burn intensive care services in North Carolina. A 21-bed unit is located at UNC Hospitals in Chapel Hill, and an eight-bed unit is located in Winston-Salem at North Carolina Baptist Hospital. The percent utilization of burn intensive care services for 2004-2008 is shown on the following graph. The reported numbers of licensed beds, census days of care, and average annual occupancy rates for the years ending 9/30/04, 9/30/05, 9/30/06, 9/30/07 and 9/30/08 are shown in the following Table 7C.

Table 7C: Burn Intensive Care ServicesDays of care utilized by severely burned patients (DRGs 504-511) in the designated burn intensive care units.
2003-2004 2004-2005 2005-2006 2006-2007 2007-2008Facility Beds Total Days Total Days Total Days Total Days Total DaysUniversity of North Carolina Hospitals 21 3594 3030 4089 5074 6273North Carolina Baptist Hospital 8 2185 2255 2358 2268 2142TOTAL 29 5779 5285 6447 7342 8415
2003-2004 2004-2005 2005-2006 2006-2007 2007-2008
Facility BedsPercent
UtilizationPercent
UtilizationPercent
UtilizationPercent
UtilizationPercent
UtilizationUniversity of North Carolina Hospitals 21 46.8% 39.5% 53.3% 66.2% 81.6%North Carolina Baptist Hospital 8 74.6% 77.2% 80.8% 77.7% 73.2%TOTAL 29 54.4% 49.9% 60.9% 69.4% 79.3%
54.4%49.9%
60.9%
69.4%
79.3%
0%
10%
20%
30%
40%
50%
60%
70%
80%
90%
100%
2003-2004 2004-2005 2005-2006 2006-2007 2007-2008
Percent Utilization Burn Intensive Care Services2004-2008

Burn Intensive Care Services Need Determination Methodology The need for new burn intensive care services is demonstrated when the existing burn intensive care services in the State report an overall average annual occupancy rate of at least 80 percent during the two fiscal years prior to development of the Proposed North Carolina State Medical Facilities Plan. The determination of need for additional services in 2010 is calculated by dividing the total number of bed days utilized in 2007 by severely burned patients (7,342 days) in the two units by the total number of burn intensive care unit beds (29 beds) in these units multiplied by 365 days (10,585 days). This procedure is repeated for the bed days utilized in 2008 by severely burned patients (8,415 days), except that the total number of beds (29) is multiplied by 366 days (10,614).
Percent Occupancy (average annual occupancy rate) for 2007 = 69.4% [7,342 days of care/10,585 days (29 beds x 365 days)]
Percent Occupancy (average annual occupancy rate) for 2008 = 79.3%
[8,415 days of care/10,614 days (29 beds x 366 days)] Need Determination It is determined that no need exists for additional Burn Intensive Care Services anywhere in the state and no reviews are scheduled. Transplantation Services Bone Marrow Transplantation Services Definition “Bone Marrow Transplantation Services,” as defined in G.S. 131E-176(2a), “means the process of infusing bone marrow into people with diseases to stimulate the production of blood cells.” Bone marrow transplants may be autologous (using a patient’s own marrow, drawn early in the course of the disease), or syngeneic (using marrow from an identical twin) or allogeneic (using marrow from a relative other than an identical twin, or from an unrelated donor). For allogeneic marrow transplants, the transplant service must have the ability to ascertain that a donor’s human leucocyte antigens (HLA) correspond to those of the transplant patient. Allogeneic-transplant patients are also more difficult to manage postoperatively than patients receiving autologous bone marrow transplants. Facility Inventory-Service Volume There are five Bone Marrow Transplantation Services operational in North Carolina located at Carolinas Medical Center, Duke University Hospital, North Carolina Baptist Hospital, Pitt County Memorial Hospital, and University of North Carolina Hospitals. Total bone marrow transplants for 2005-2008 are shown on the following graph. The reported numbers of transplants for the years ending 9/30/05, 9/30/06, 9/30/07 and 9/30/08 are shown in the following Table 7D.

426420 421
444
0
50
100
150
200
250
300
350
400
450
2004-2005 2005-2006 2006-2007 2007-2008
Total Bone Marrow Transplants: 2004 - 2007

Table 7D: Bone Marrow Transplants
Allogeneic Bone Marrow Transplants2004-2005 2005-2006 2006-2007 2007-2008
Carolinas Medical Center/Center for Mental Health 0 0 0 0Duke University Hospital 129 167 115 139North Carolina Baptist Hospital 24 12 11 51Pitt County Memorial Hospital 1 0 0 0University of North Carolina Hospitals 34 36 37 35TOTAL 188 215 163 225
Autologous Bone Marrow Transplants2004-2005 2005-2006 2006-2007 2007-2008
Carolinas Medical Center/Center for Mental Health 8 11 5 8Duke University Hospital 116 98 149 104North Carolina Baptist Hospital 52 37 35 24Pitt County Memorial Hospital 6 0 0 0University of North Carolina Hospitals 56 59 69 83TOTAL 238 205 258 219
Total Bone Marrow Transplants2004-2005 2005-2006 2006-2007 2007-2008
Carolinas Medical Center/Center for Mental Health 8 11 5 8Duke University Hospital 245 265 264 243North Carolina Baptist Hospital 76 49 46 75Pitt County Memorial Hospital 7 0 0 0University of North Carolina Hospitals 90 95 106 118TOTAL 426 420 421 444

Bone Marrow Transplantation Service Need Determination Methodology The need for a new Bone Marrow Transplantation Service is demonstrated when each of the existing services has performed at least 20 allogeneic transplants during the fiscal year prior to development of the current Proposed North Carolina State Medical Facilities Plan. Need Determination Based on the number of transplants performed at each of the five reporting facilities for the year ending September 30, 2008, it is determined that there is no need for additional Bone Marrow Transplantation Services anywhere in the state. Additionally, allogeneic bone marrow transplants shall be provided only in facilities having the capability of doing HLA matching and of management of patients having solid organ transplants. At their present stage of development, it is determined that allogeneic bone marrow transplantation services shall be limited to Academic Medical Center Teaching Hospitals. Solid Organ Transplantation Services Definition “Solid Organ Transplantation Services,” as defined in G.S. 131E-176(24b), “means the provision of surgical procedures and the interrelated medical services that accompany the surgery to remove an organ from a patient and surgically implant an organ from a donor.” Facility Inventory - Service Volume There are five Solid Organ Transplantation Services in North Carolina located at the five Academic Medical Center Teaching Hospitals. The reported numbers of transplants performed at these five centers for the year ending September 30, 2008 are presented on the following graph and in Table 7E.
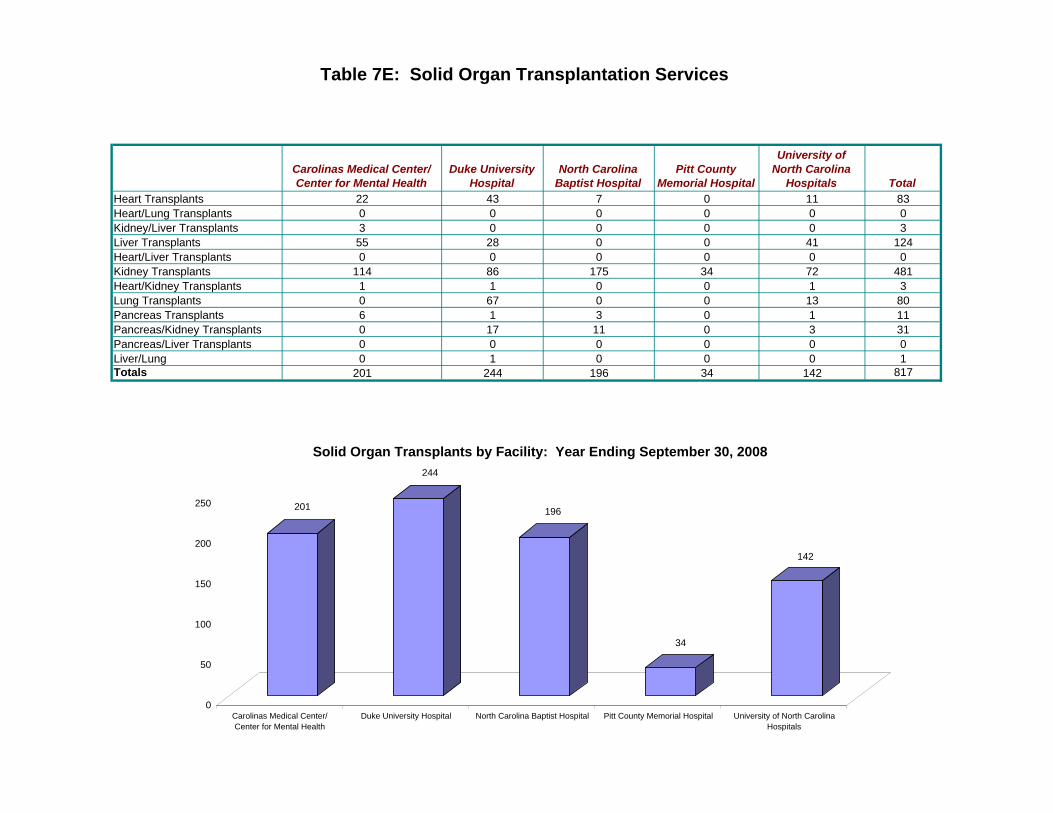
Table 7E: Solid Organ Transplantation Services
Carolinas Medical Center/Center for Mental Health
Duke University Hospital
North Carolina Baptist Hospital
Pitt County Memorial Hospital
University of North Carolina
Hospitals TotalHeart Transplants 22 43 7 0 11 83Heart/Lung Transplants 0 0 0 0 0 0Kidney/Liver Transplants 3 0 0 0 0 3Liver Transplants 55 28 0 0 41 124Heart/Liver Transplants 0 0 0 0 0 0Kidney Transplants 114 86 175 34 72 481Heart/Kidney Transplants 1 1 0 0 1 3Lung Transplants 0 67 0 0 13 80Pancreas Transplants 6 1 3 0 1 11Pancreas/Kidney Transplants 0 17 11 0 3 31Pancreas/Liver Transplants 0 0 0 0 0 0Liver/Lung 0 1 0 0 0 1Totals 201 244 196 34 142 817
201
244
196
34
142
0
50
100
150
200
250
Carolinas Medical Center/Center for Mental Health
Duke University Hospital North Carolina Baptist Hospital Pitt County Memorial Hospital University of North CarolinaHospitals
Solid Organ Transplants by Facility: Year Ending September 30, 2008
Solid Organ Transplantation Service Need Determination Methodology The offering of a solid organ (heart, heart/lung, kidney, liver, pancreas) transplant service is an organized, interrelated medical, diagnostic, therapeutic and/or rehabilitative activity that is integral to the prevention of disease or to the clinical management of a sick, injured, or disabled person. In addition to the costs directly associated with transplant surgery, hospitals experience significant costs prior to and following the transplant procedure. A principal aspect of this cost is the immunological subspecialty skills and laboratory support required to assure immunosuppression levels that are sufficient to prevent graft rejection but which are not so great as to cause unnecessary hazards to the life of the patient. The average cost of care per patient in such programs elsewhere has been found to be inversely related to the volume of transplant procedures performed in a facility. The scarcity of donor organs demands that the available organ resources be used as skillfully as possible. Such skills currently are found in transplant services of academic medical center teaching hospitals. Solid organ transplant services shall be limited to academic medical center teaching hospitals at this stage of the development of this service and availability of solid organs. Need Determination Current volumes of procedures performed in existing solid organ transplant services in North Carolina are not sufficient to require that additional solid organ transplant services be developed. It is determined that there is no need for additional solid organ transplant services anywhere in the state. The introduction of a new solid organ transplantation program in a facility which already is performing other types of solid organ transplantation is not considered a new health service unless such addition requires a capital expenditure of $2 million or more.
Chapter 8: Inpatient Rehabilitation Services

CHAPTER 8 INPATIENT REHABILITATION SERVICES Summary of Bed Supply and Utilization In the Fall of 2009, there were 981 inpatient rehabilitation beds in 26 facilities strategically located throughout North Carolina. From an historical perspective, although the “Days of Care” decreased between 2001 and 2002, the Average Annual Utilization Rate increased slightly due to a parallel decrease in the Total Planning Inventory. The “Days of Care” continued to decline in 2003, with the Average Annual Utilization Rate decreasing from 62.9 percent in 2002 to 60.6 percent in 2003. During data year 2004, the Average Annual Utilization Rate increased to 62.3 percent. For data year 2005, the Average Annual Utilization Rate decreased to 59.1 percent, for data year 2006, the rate increased slightly to 59.5 percent, for data year 2007 the rate decreased slightly to 59.2 percent, and for data year 2008 the rate increased slightly to 59.7 percent. Of the 26 facilities providing services during the reporting period, 12 facilities indicated increased utilization and 14 facilities indicated decreased utilization. Changes from Previous Plans No substantive changes in the inpatient rehabilitation principles or methodology have been incorporated into the 2010 North Carolina State Medical Facilities Plan. As in the 2009 State Medical Facilities Plan, the inpatient rehabilitation bed need determination methodology is based on historic utilization of beds over a two-year period. Basic Principles The scope of services covered in this section of the North Carolina State Medical Facilities Plan is limited to rehabilitation services provided to physically disabled people. Physical rehabilitation services exclude mental health and substance abuse rehabilitation services, but include those mental health services needed by individuals primarily suffering from physical injury or disease, and rehabilitation services provided to people who are cognitively disabled as a result of physical injury or disease. The combination of component services required to meet the needs of the individual is provided using an interdisciplinary approach and continues as long as, within a reasonable period of time, significant and observable improvement toward established goals is taking place. Where necessary, these services are provided through a spectrum of care using a system of case management. Inpatient rehabilitation beds include comprehensive (general), spinal cord, brain injury and pediatric beds. Inpatient rehabilitation facilities units/beds should be located in general acute care or rehabilitation hospitals or in nursing facilities to ensure that there is available medical backup for medical emergencies.

Basic Assumptions of the Method The Health Service Areas (HSAs) remain logical planning areas for inpatient
rehabilitation beds even though many patients elect to enter rehabilitation facilities outside the region in which they reside.
The bed need determination methodology is based upon the historic average annual
utilization of inpatient rehabilitation beds. Source of Data
Annual Hospital Licensure Applications – The numbers of inpatient rehabilitation bed days of care were compiled from the 2008 and 2009 Hospital License Renewal Applications as submitted to the Division of Health Service Regulation of the North Carolina Department of Health and Human Services. Inpatient Rehabilitation Bed Need Projection Methodology Need for additional inpatient rehabilitation beds in any of the six Health Service Areas is determined when the total number of existing and certificate of need approved inpatient rehabilitation beds in a Health Service Area report an overall average, annual occupancy rate of 80 percent or higher during the two fiscal years prior to development of the North Carolina State Medical Facilities Plan. The determination of need (based on average annual occupancy rate) for additional inpatient rehabilitation beds or facilities in a Health Service Area for Plan Year 2010 is calculated by dividing the total number of rehabilitation bed days of care reported in FY 2006-2007 in all units in the HSA by the total number of licensed and certificate of need approved rehabilitation beds in these units multiplied by 365 days and the total number of rehabilitation bed days of care reported in FY 2007-2008 in all units in the HSA by the total number of licensed and certificate of need approved rehabilitation beds in these units multiplied by 366 days.

Table 8A: Inventory and Utilization of Inpatient Rehabilitation Beds
HSA Facility Current
CON Issued / Pending
Development
Pending Review or
Appeal
Total Planning Inventory 2006-2007 2007-2008 2007 2008
Beds Needed
I Catawba Valley Medical Center 20 0 0 20 1,526 1,644 20.9% 22.5%I Care Partners Rehabilitation Hospital 80 0 0 80 16,980 17,001 58.2% 58.1%I Frye Regional Medical Center 29 0 0 29 2,769 2,276 26.2% 21.4%I Total 129 0 0 129 21,275 20,921 45.2% 44.3% 0II High Point Regional 16 0 0 16 4,005 4,481 68.6% 76.5%II Hugh Chatham Memorial Hospital 12 0 0 12 2,154 1,987 49.2% 45.2%II North Carolina Baptist Hospital 39 0 0 39 6,724 6,038 47.2% 42.3%II Whitaker Rehabilitation Center 68 0 0 68 13,408 12,652 54.0% 50.8%II Moses Cone Memorial Hospital 49 0 0 49 8,333 8,300 46.6% 46.3%II Total 184 0 0 184 34,624 33,458 51.6% 49.7% 0III Rowan Regional Medical Center 10 0 0 10 2,665 2,058 73.0% 56.2%III Stanly Regional Medical Center 10 -10 0 0 743 778 20.4% 21.3%1
III Carolinas Rehabilitation Hospital 119 -30 0 89 40,315 32,113 64.2%2 73.7%3
III CMC-Levine Children's Hospital 13 0 0 13 0 2,127 0.0% 44.7%III Carolinas Rehabilitation Hospital Mount Holly 40 0 0 40 0 8,489 0.0% 58.0%III Carolinas Rehabilitation - NorthEast 0 40 0 40 0 0 0.0% 0.0%
III2009 Adjusted Need Determination (see row below for note from 2009 SMFP) 0 10 0 10 0 0 0.0% 0.0%
III Total 192 10 0 202 43,723 45,565 62.4% 61.6% 0IV Durham Regional Hospital 30 0 0 30 6,758 6,382 61.7% 58.1%IV University of North Carolina Hospitals 30 0 0 30 9,084 9,046 83.0% 82.4%IV WakeMed 84 0 0 84 24,006 27,728 78.3% 90.2%IV Maria Parham Hospital 11 0 0 11 2,588 2,612 64.5% 64.9%IV Total 155 0 0 155 42,436 45,768 75.0% 80.7% 0V FirstHealth Moore Regional Hospital 25 0 0 25 5,929 5,870 65.0% 64.2%V New Hanover Regional Medical Center 60 0 0 60 10,904 10,557 49.8% 48.1%V Scotland Memorial Hospital 7 0 0 7 1,322 1,323 51.7% 51.6%V Southeastern Regional Rehabilitation Center 78 0 0 78 18,813 19,696 66.1% 69.0%V Total 170 0 0 170 36,968 37,446 59.6% 60.2% 0VI Nash General Hospital 23 0 0 23 7,140 6,915 85.1% 82.1%VI Lenoir Memorial Hospital 17 0 0 17 2,554 2,187 41.2% 35.1%VI Heritage Hospital 16 0 0 16 3,112 3,276 53.3% 55.9%VI Pitt Hospital Regional Rehabilitation Center 75 0 0 75 16,657 17,560 60.8% 64.0%VI Craven Regional Medical Center 20 0 0 20 3,393 3,342 46.5% 45.7%VI Total 151 0 0 151 32,856 33,280 59.6% 60.2% 0Grand Total 981 10 0 991 211,882 216,438 59.2% 59.7% 0
Inventory Days of CareAverage Annual Utilization Rate
Ten inpatient rehabilitation beds to be awarded to an existing acute care hospital in Rowan County, as a result of the removal of the inpatient rehabilitation facility beds from a unit at a Rowan County hospital in 2008. To avoid any confusion over the status of inpatient rehabilitation facility beds in Rowan County, I have concluded that any successful applicant for a CON to develop these ten beds shall be required as a condition of its approval to withdraw any other pending application or litigation concerning the right to develop or offer such beds in Rowan County.
1 Utilization rate based on 10 beds in service during reporting period.2 Utilization rate based on 172 beds in service during reporting period. 3 Utilization rate based on 119 beds in service during reporting period.

Need Determination Using the standard methodology, it is determined that there is no need for additional
inpatient rehabilitation beds in any Health Service Area in the State.

Chapter 9:Technology
• Lithotripsy
• Gamma Knife
• Radiation Oncology Services – Linear Accelerators
• Positron Emission Tomography Scanner
• Magnetic Resonance Imaging
• Cardiac Catheterization Equipment

CHAPTER 9 TECHNOLOGY AND EQUIPMENT Summary of Service Supply and Utilization The number of lithotripsy procedures reported on lithotripters registered in North Carolina for 2007-2008 was 11,784. There were 14 lithotripsy units operated by eight providers.
The present gamma knife located at Wake Forest University Baptist Medical Center in Health Service Area (HSA) II serves the western portion of the state (HSAs I, II, and III). During 2007-2008, 286 gamma knife procedures were reported. Pitt County Memorial Hospital received a certificate of need pursuant to a need determination in the North Carolina 2003 State Medical Facilities Plan for one gamma knife to serve the eastern portion of the state (HSAs IV, V and VI). Pitt began offering service as of October 2005, and reported 115 gamma knife procedures provided during 2007-2008. The two gamma knives assure that the western and eastern portions of the state have equal access to gamma knife services. Linear accelerators provided 587,798 Equivalent Simple Treatment Visit procedures that are counted for need determination purposes in 2007-2008. The average number of procedures statewide per linear accelerator is 5,067. There are 115 linear accelerators in North Carolina that are operational, have a certificate of need, or for which there is a prior year need determination. Twenty hospitals reported a total of 32,303 procedures for fixed Positron Emission Tomography (PET) Scanners that were operational in the reporting period. Twenty-three sites reported 5,815 procedures in total for mobile PET service. In 1983, there were only two magnetic resonance imaging (MRI) scanners programs in North Carolina, performing a total of 531 procedures. In 2007-2008, fixed and mobile scanners were reported as providing 814,048 procedures. A total of 44 hospitals provided fixed Cardiac Catheterization services during fiscal year 2007-08. Also, during fiscal year 2007-2008, mobile Cardiac Catheterization services were reported at 20 hospitals and cardiac diagnostic centers across the state. Changes from the Previous Plan Language clarifying service areas and steps in methodologies is included in the North Carolina 2010 State Medical Facilities Plan in the Lithotripsy, Gamma Knife, Linear Accelerators, PET Scanners and Cardiac Catheterization Equipment sections. In the MRI section, in addition to language about methodology steps, the following has been added, “There is no need for any additional mobile MRI scanners anywhere in the state.” In response to a petition submitted to the State Health Coordinating Council, Hoke County was assigned to Moore and Cumberland counties for the North Carolina 2010 State Medical Facilities Plan. This added Cumberland/Hoke multi-county Cardiac Catheterization Equipment and MRI service areas to the existing Moore/Hoke multi-county Cardiac Catheterization Equipment and MRI service areas. No other substantive changes in basic principles and methodologies were recommended.

Lithotripsy Introduction Lithotripsy is defined as the pulverization of urinary stones by means of a lithotripter. Extracorporeal lithotripsy is lithotripsy that occurs outside the body. Extracorporeal shock wave lithotripsy (ESWL) is the non-invasive procedure with which this section will concern itself. A lithotripter is a device that uses shock waves to pulverize urinary stones, which can then be expelled in the urine. An emitter is placed in contact with the patient's abdomen and the shock waves are focused on the stone, which is shattered by the force. A lithotripter’s service area is the lithotripter planning area in which the lithotripter is located. The lithotripter planning area is the entire state. Lithotripter Utilization Lithotripter utilization can be reasonably estimated by the incidence of urinary stone disease. Urinary stone disease, or urolithiasis, is a disease in which urinary tract stones or calculi are formed. The annual incidence of urinary stone disease is approximately 16 per 10,000 population1. Not all cases of urinary stone disease would be appropriately treated by lithotripsy. It has been estimated that 85 to 90 percent of kidney stone patients, when surgery is indicated, can be treated successfully by ESWL treatment. The annual treatment capacity of a lithotripter has been estimated at between 1,000 and 1,500 cases. North Carolina Utilization The number of lithotripsy procedures reported in North Carolina for the period of 2007-2008 was 11,784 procedures. There were 14 lithotripsy units operated by eight providers. Procedures were provided by a fixed unit at one hospital, and by 13 mobile units operated by seven providers. There was one need determination for a lithotripter in Mecklenburg County in the North Carolina 2007 State Medical Facilities Plan and the certificate of need was awarded to The Stone Institute. Given the 14 lithotripsy units, the average number of procedures per lithotripter for the 2007-2008 fiscal year is 842. Access Due to the mobility of lithotripter services, and the subsequent number of sites from which the service is provided, it may be concluded that geographic access is available to the maximum economically feasible extent. North Carolina's Need Determination Methodology North Carolina uses a methodology based on the incidence of urinary stone disease. The need is linked to the estimate of urinary stone disease cases and is based on the assumption that 90 percent could be treated by ESWL.
1 Pahiri, J.J. & Razack, A.A. (2001) “Chapter 9: Nephrolithiasis”. In Clinical Manual of Urology, by Philip M. Hanno, Alan J. Wein, S. Bruce Malkowicz. McGraw-Hill Professional Publisher.
The standard methodology used for determining need for lithotripters is calculated as follows: Step 1. Divide the July 1, 2010 estimated population of the state, available from the North
Carolina Office of State Budget and Management, by 10,000 and multiply the result by 16, which is the incidence of urinary stone disease per 10,000 population.
Step 2. Multiply the result from Step 1 by 90 percent to get the number of patients in the state who have the potential to be treated by lithotripsy in one year.
Step 3. Divide the result of Step 2 by 1,000, which is the low range of the annual treatment capacity of a lithotripter, and round to the nearest whole number.
Step 4. Sum the number of existing lithotripters in the state, lithotripters not yet operational but for which a certificate of need has been awarded, and lithotripter need determinations from previous years for which a certificate of need has yet to be awarded.
Step 5. Subtract the result of Step 4 from the result of Step 3 to calculate the number of additional lithotripters needed in the state.
North Carolina’s Need With an annual treatment capacity of a lithotripter being estimated at between 1,000 and 1,500 cases, the maximum number of lithotripters needed in the state would be 14, based on 13,785 estimated cases and 1,000 procedures per lithotripter. There are 14 lithotripters in the state, and the methodology indicates a maximum need of 14 lithotripters in the state. As a result, it is determined that there is no need for additional lithotripters anywhere in the state. Lithotripsy Services in North Carolina The eight providers that offer lithotripsy services in North Carolina are listed on the following pages.

Table 9A: Mobile Lithotripsy Providers and Locations Served(From 2008 data as reported on the 2009 Lithotripsy Registration and Inventory Form for Mobile Equipment)
Provider: Carolina Lithotripsy, LTD, 2014 Litho Place, Fayetteville, NC 28304-
Facility and Location Procedures
Machines 2;
Areas Generally Served:
Purchased or Replaced: 10/2000, 11/2001
Eastern North Carolina
Beaufort County Hospital, Washington, NC 49
CarolinaEast Medical Center, New Bern, NC 63
Carteret General Hospital, Morehead City, NC 45
Carteret Surgery Center, Morehead City, NC 9
Columbus County Hospital, Whiteville, NC 118
Dosher Memorial Hospital, Southport, NC 49
Duke Raleigh Hospital, Raleigh, NC 198
Halifax Memorial Hospital, Roanoke Rapids, NC 42
Highsmith Rainey, Fayetteville, NC 198
Johnston Memorial Hospital, Smithfield, NC 95
Lenoir Memorial Hospital, Kinston, NC 53
Moore Regional Hospital, Pinehurst, NC 151
New Hanover Regional Medical Center, Wilmington, NC 238
Onslow Memorial Hospital, Jacksonville, NC 17
Pitt County Memorial Hospital, Greenville, NC 86
Rex Healthcare, Raleigh, NC 136
Richmond Memorial Hospital, Rockingham, NC 27
Southeastern Regional, Lumberton, NC 75
WakeMed, Raleigh, NC 54
Wayne Memorial Hospital, Goldsboro, NC 17
Wilson Memorial Hospital, Wilson, NC 72
Total Procedures: 1,792
Average Number of Procedures per Lithotripter: 896

Table 9A: Mobile Lithotripsy Providers and Locations Served(From 2008 data as reported on the 2009 Lithotripsy Registration and Inventory Form for Mobile Equipment)
Provider: Carolinas Mobile Lithotripsy Service, 810 Fairgrove Church Road, Hickory, NC 28602-
Facility and Location Procedures
Machines 2;
Areas Generally Served:
Purchased or Replaced: 3/2002, 3/2002
Western and Central North Carolina
Catawba Valley Medical Center, Hickory, NC 146
Frye Regional Medical Center, Hickory, NC 109
Grace Blue Ridge Health Care, Morganton, NC 35
Harris Regional Medical Center, Sylva, NC 124
Haywood Regional Medical Center, Clyde, NC 105
Murphy Medical Center, Murphy, NC 65
Rutherford Hospital, Rutherford, NC 81
Scotland Memorial Hospital, Laurinburg, NC 141
The McDowell Hospital, Marion, NC 11
Valdese Blue Ridge Health Care, Morganton, NC 47
Total Procedures: 864
Average Number of Procedures per Lithotripter: 432
Provider: Fayetteville Lithotripters Limited Partnership- Virginia I, 9825 Spectrum Drive, Bldg 3, Austin, TX 78717-
Facility and Location Procedures
Machines 1;
Areas Generally Served:
Purchased or Replaced: 2/2003; 7/1990 initial
Eastern North Carolina and Virginia
Albemarle Hospital, Elizabeth City, NC 18
Chowan Hospital, Edenton, NC 57
Roanoke-Chowan Hospital, Ahoskie, NC 16
Community Memorial Healthcare, South Hill, VA 26
Harborview Medical Center, Suffolk, VA 62
Louise Obici Memorial Hospital, Suffolk, VA 57
Mary Immaculate Hospital, Suffolk, VA 107
Mary Washington Hospital, Fredericksburg, VA 260
Rappahannock General Hospital, Fredericksburg, VA 260
Riverside Regional Medical Center, Kilmarnock, VA 41
Riverside Tappahannock Hospital, Tappahannock, VA 17
Riverside Walter Reed Hospital, Gloucester, VA 44
Southside Community Hospital, Newport News, VA 81
Southside Regional Medical Center, Petersburg, VA 89
Total Procedures: 1,135
Average Number of Procedures per Lithotripter: 1,135

Table 9A: Mobile Lithotripsy Providers and Locations Served(From 2008 data as reported on the 2009 Lithotripsy Registration and Inventory Form for Mobile Equipment)
Provider: Fayetteville Lithotripters Limited Partnership-South Carolina II, 9825 Spectrum Drive, Bldg 3, Austin, TX 78717-
Facility and Location Procedures
Machines 1;
Areas Generally Served:
Purchased or Replaced: 9/2002; 8/1989 initial
Western North Carolina and South Carolina
Duke University Ambulatory Surgery Center, Durham, NC 15
Heritage Hospital, Tarboro, NC 7
Margaret Pardee Hospital, Hendersonville, NC 77
Park Ridge Hospital, Fletcher, NC 37
Transylvania Community Hospital, Brevard, NC 13
Abbeville Area Medical Center, Abbeville, SC 13
Laurens County Healthcare, Clinton, SC 4
Oconee Memorial Hospital, Sececa, SC 31
Self Regional Healthcare, Greenwood, SC 39
St. Francis Hospital, Greenville, SC 221
Total Procedures: 457
Average Number of Procedures per Lithotripter: 457

Table 9A: Mobile Lithotripsy Providers and Locations Served(From 2008 data as reported on the 2009 Lithotripsy Registration and Inventory Form for Mobile Equipment)
Provider: Piedmont Stone Center, PLLC, 1907 South Hawthorne Road, Winston-Salem, NC 27103-
Facility and Location Procedures
Machines 4;
Areas Generally Served:
Purchased or Replaced: 3/2002, 4/2003, 4/2003, 9/89, 4/90, 2/95 initial
Western and Central North Carolina and Virginia
Alamance Regional Medical Center, Burlington, NC 228
Annie Penn Memorial Hospital, Reidsville, NC 30
Caldwell Memorial Hospital, Lenoir, NC 49
Davis Regional Medical Center, Statesville, NC 26
High Point Regional Health System, High Point, NC 462
Iredell Memorial Hospital, Statesville, NC 130
Lexington Memorial Hospital, Lexington, NC 171
Maria Parham Hospital, Henderson, NC 111
Morehead Memorial Hospital, Eden, NC 215
Northern Hospital of Surry County, Mount Airy, NC 67
Piedmont Stone Center, PLLC, Winston-Salem, NC 738
Randolph Hospital, Asheboro, NC 123
Rowan Regional Medical Center, Salisbury, NC 179
Wake Forest University Baptist Medical Center, Winston-Salem, NC 20
Watauga Medical Center, Boone, NC 192
Wesley Long Hospital, Greensboro, NC 425
Wilkes Regional Medical Center, North Wilkesboro, NC 93
Lynchburg General Hospital, Lynchburg, VA 191
Martha Jefferson Hospital, Charlottesville, VA 171
Piedmont Day Surgery Center, Danville, VA 51
Twin County Regional Hospital, Galax, VA 61
Urology Associates of New River Valley, Christiansburg, VA 108
Wythe County Community General, Wytheville, VA 29
Total Procedures: 3,870
Average Number of Procedures per Lithotripter: 968

Table 9A: Mobile Lithotripsy Providers and Locations Served(From 2008 data as reported on the 2009 Lithotripsy Registration and Inventory Form for Mobile Equipment)
Provider: Stone Institute of the Carolinas, LLC, 705 Griffith St., Suite 205, PO Box 4509, Davidson, NC 28036-
Facility and Location Procedures
Machines 2;
Areas Generally Served:
Purchased or Replaced: 10/2006; 01/2001, 1991
Western and Central North Carolina
Carolinas Medical Center, Charlotte, NC 355
Cleveland Regional Medical Center, Shelby, NC 137
CMC-Northeast Medical Center, Concord, NC 252
CMC-Pineville, Charlotte, NC 0
CMC-University, Charlotte, NC 176
Gaston Memorial Hospital, Gastonia, NC 181
Lake Norman Regional Medical Center, Mooresville, NC 120
Lincoln Medical Center, Lincolnton, NC 60
Presbyterian Orthopaedic Hospital, Charlotte, NC 353
Stanly Memorial Hospital, Albemarle, NC 45
Union Regional Medical Center, Monroe, NC 130
Piedmont Medical Center, Rock Hill, SC 254
Springs Memorial Hospital, Lancaster, SC 12
Total Procedures: 2,075
Average Number of Procedures per Lithotripter: 1,038
Provider: Triangle Lithotrispy Corp., 7003 Chadwick Dr #321, Brentwood, TN 37027-
Facility and Location Procedures
Machines 1;
Areas Generally Served:
Purchased or Replaced: 10/2002, 6/90
East Central North Carolina
Central Carolina Medical Center, Sanford, NC 100
Durham Ambulatory Surgical Center, Durham, NC 143
Durham Regional Hospital, Durham, NC 136
Franklin Regional, Louisburg, NC 28
Nash Day, Rocky Mount, NC 115
Rex Hospital, Raleigh, NC 366
Wake Med, Raleigh, NC 244
Wayne Memorial, Goldsboro, NC 95
Total Procedures: 1,227
Average Number of Procedures per Lithotripter: 1,227
Total Mobile Procedures for State: 11,420

Table 9B: Fixed Lithotripsy Providers and Locations Served(From 2008 data as reported on the 2009 Hospital License Renewal Application)
Provider: Mission Hospitals, Inc., 509 Biltmore Ave, Asheville, NC 28801-
Machines: 1 Purchased or Replaced: 8/2000
Facility and Location Procedures
Area Served:
Average Number of Procedures per Lithotripter:
St. Joseph's-Mission, Asheville, NC 364
Total Number of Procedures: 364
364
Table 9C: Mobile and Fixed Lithotripsy(Total Procedures/Units Reported)
Total Procedures Reported
11,784
Units Reported
14
Average Procedures Per Unit
842

Gamma Knife Definition "Gamma Knife,” as defined in General Statute § 131E-176(7c), means “equipment which emits photon beams from a stationary radioactive cobalt source to treat lesions deep within the brain and is one type of stereotactic radiosurgery.”
Two types of equipment, both using photon beams, are available for performing this kind
of radiosurgery. In one type, beams from a linear accelerator are focused from a device that rotates around the patient. The other type of equipment, gamma knife, emits 201 beams from stationary radioactive cobalt sources.
Facility Inventory-Service Volume Gamma knife fixed and movable equipment capital costs exceed $3,500,000. There is one gamma knife that was approved for acquisition pursuant to Policy AC-3 of the North Carolina 1998 State Medical Facilities Plan. The approved unit is located at Wake Forest University Baptist Medical Center, and became operational effective September 1, 1999. During 2007-2008, as reported in the 2009 Hospital Licensure Renewal Application, which reflects 2008 data, 286 gamma knife procedures were reported. Pitt County Memorial Hospital received a certificate of need pursuant to a need determination in the North Carolina 2003 State Medical Facilities Plan for one gamma knife to serve the eastern portion of the state (HSAs IV, V and VI). Pitt County Memorial Hospital began offering service as of October 2005. During 2007-2008, 115 gamma knife procedures were reported. Gamma Knife Need Determination Methodology
A gamma knife’s service area is the gamma knife planning region in which the gamma knife is located. There are two gamma knife planning regions, the west region (HSAs I, II, and III as described in Appendix A) and the east region (HSAs IV, V, and VI as described in Appendix A). The gamma knife located at Wake Forest University Baptist Medical Center in HSA II serves the western portion of the state (HSAs I, II, and III). The gamma knife located at Pitt County Memorial Hospital in HSA VI serves the eastern portion of the state (HSAs IV, V and VI). The two gamma knives assure that the western and eastern portions of the state have equal access to gamma knife services.
There is adequate capacity and geographical accessibility for gamma knife services in the
state.
Need Determination It is determined that there is no need for an additional gamma knife anywhere in the state.

Linear Accelerators Introduction The methodology incorporates a geographic accessibility criterion (a population base of 120,000), a criterion aimed at assuring efficient use of megavoltage radiation facilities (when Equivalent Simple Treatment Visit (ESTV) procedures divided by 6,750 minus the number of present linear accelerators equals .25+), and a patient origin criterion that indicates when a service area has 45 percent or more of the patients coming from outside the service area. A need determination is generated when two of the three criteria are met within a service area. Counties are the basic units for the formation of linear accelerator service areas, based on proximity, utilization patterns, and patient origin data. A small percentage of the population lives some distance from a linear accelerator, but the sparsity of population in and around these areas does not provide the population required to support a linear accelerator. The statewide average number of procedures per accelerator as shown in Table 9E is 5,067. Assessment -- Linear Accelerators Radiation therapy (megavoltage radiation) is used in the treatment of about half of all cancers. Its users seek to destroy cancer cells with ionizing radiation while limiting damage to non-cancerous tissue. Linear accelerators are now the instruments of choice because most are capable of producing either electron or photon beams at variable energy levels.
In the 2009 Hospital Licensure Renewal Applications, which reflect 2008 data, there are
14 linear accelerators in nine different locations in North Carolina reported as being operational and providing stereotactic radiosurgery treatment: Carolinas Medical Center (115 procedures); Carolinas Medical Center - NorthEast (240 CyberKnife procedures); Duke University Hospital (272 procedures on two linear accelerators); Memorial Mission Hospital (339 CyberKnife procedures); Brody School of Medicine at East Carolina University (25 procedures on two linear accelerators); University of North Carolina Hospitals (381 procedures on four linear accelerators, including one CyberKnife); Wake Forest University Baptist Medical Center (10 procedures); Forsyth Memorial Hospital (73 procedures); and North Carolina Radiation Therapy Management Services in Asheville (five procedures). In recent years, radiation therapy has been offered increasingly in comprehensive oncology programs where medical oncologists and hematologists also offer chemotherapy. Most such programs are associated with general hospitals, but some are freestanding. Some programs offering only radiation therapy, or only chemotherapy, may refer to themselves as oncology centers. A new radiation oncology facility, with necessary equipment, usually costs about $2,000,000.
In addition to a linear accelerator, every radiation oncology program uses a treatment
simulator to aid in treatment planning, a computer for calculating dosages, and devices for cutting blocks to protect non-targeted areas from radiation. One simulator, which is the most expensive of these additional items ($200,000 - $400,000), can serve a facility with three linear
accelerators or serve multiple facilities with up to four linear accelerators total. The specialized staff who operate and maintain this equipment, including a required radiation physicist, are more efficiently utilized in facilities with more than one linear accelerator. There are 71 hospitals and freestanding oncology treatment centers statewide in North Carolina with 115 linear accelerators that are operational, have a certificate of need in hand, or for which there is a prior year need determination. The utilization methodology used calls for data gathering that is uniform. There are radiation treatments of varying complexity, and the concept of ESTV is used. ESTVs are recommended by the American College of Radiology. In addition, ESTVs were recommended as part of the comments during public hearings when the original methodology was developed. The data gathering survey that the Medical Facilities Planning Section sends out to providers has changed the manner in which procedures are counted. This survey asks for procedures by CPT codes and shows the equivalent ESTVs. Hospitals and free-standing centers have responded well in giving procedures that can be translated into ESTV totals. Basic Assumptions of the Methodology A linear accelerator’s service area is the linear accelerator planning area in which the linear accelerator is located. Linear accelerator planning areas are the 27 multi-county groupings defined in Table 9G. In determining whether an additional linear accelerator is needed in a service area, three principal questions must be addressed:
1. Are the linear accelerators in a linear accelerator service area performing greater than 6,750 procedures (ESTVs) per accelerator per year?
2. Is the population that lives in a linear accelerator service area sufficiently great to support
the addition of another accelerator (population per accelerator greater than 120,000 - a figure suggested by the Inter-Society Council for Radiation Oncology)?
3. Does the patient origin data show that more than 45 percent of the patients come from
outside the service area? Patient origin data is requested in order to establish service areas, and the vast majority of facilities have responded with patient origin data. To examine the second and third questions, linear accelerator service areas are delineated, including in each area the counties that are closest to a linear accelerator. Two exceptions were employed in applying this method:
a. Where patient origin data indicate a county's primary use of a linear accelerator that is not the closest, the county is aligned with the linear accelerator county where most or a plurality of its citizens go for linear accelerator services. Example: Alleghany to Forsyth

b. When a linear accelerator county has a population too small to support it, that county is combined with an adjacent county to which a sizable percentage of patients go for linear accelerator services, according to the base county's patient origin data. Example: Haywood - Buncombe
Data regarding each of the linear accelerator service areas of North Carolina were organized so as to examine each of the questions noted above. Methodology for Determining Need
The methodology incorporates a geographic accessibility criterion (population base of 120,000), a criterion aimed at assuring efficient use of megavoltage radiation facilities (when ESTV procedures divided by 6,750 minus the number of present linear accelerators equals .25+), and a patient origin criterion (when a service area has more than 45 percent of the patients coming from outside the service area). A need determination is generated when two of the three criteria are met within a service area.
The standard methodology used for determining need for linear accelerators is calculated
as follows:
Criterion 1:
Step 1. Using the 2009 North Carolina population estimate obtained from the North Carolina Office of State Budget and Management, sum the population estimates for counties that comprise each linear accelerator service area to determine the population for linear accelerator service areas.
Step 2. For each linear accelerator service area, sum the number of operational linear accelerators acquired in accordance with G.S. 131E-175, et. seq., the number of approved linear accelerators not yet operational but for which a certificate of need has been awarded, and the linear accelerator need determinations from previous years.
Step 3. Divide the service area population by the result of Step 2 to determine the population residing in the service area per linear accelerator. If the result is greater than or equal to 120,000 per linear accelerator, Criterion 1 is satisfied.
Criterion 2:
Step 4. Using patient origin data reported on the 2009 Hospital License Renewal Applications and Linear Accelerator Registration and Inventory Forms for linear accelerators, for each service area, count the number of patients who were served on linear accelerators located in the service area, and who reside in a county outside the service area.
Step 5. For each service area, divide the results of Step 4 by the total number of patients served on linear accelerators located in the service area. If more than 45 percent of total patients served on linear accelerators located in a service area reside outside the service area, then Criterion 2 is satisfied.

Criterion 3:
Step 6. For each linear accelerator service area, sum the number of ESTV procedures performed on the linear accelerators located in the service area as reported in each provider’s 2009 Hospital License Renewal Application or Linear Accelerator Registration and Inventory Form.
Step 7. Divide the results of Step 6 by the number of linear accelerators in the service area which are counted in Step 2 to determine the average number of ESTV procedures performed per linear accelerator in each linear accelerator service area.
Step 8. Divide the results of Step 7 by 6,750 ESTV procedures.
Step 9. Subtract the number of linear accelerators in the service area counted in Step 2 from the results of Step 8. If the difference is greater than or equal to positive 0.25, Criterion 3 is satisfied.
Step 10. If any two of the above three criteria are satisfied in a linear accelerator service area, a need is determined for one additional linear accelerator in that service area.
Criterion 4:
Step 11. Regardless of the results of Steps 1-10 above, if a county has a population of 120,000 or more and there is not a linear accelerator counted in Step 2 for that county, a need is determined for one linear accelerator for that county. As a result, the county becomes a separate, new linear accelerator service area.
Linear Accelerator Need Determination
It was suggested by some radiation oncologists in 2006 that CPT Code 77427, weekly radiation therapy management, not be counted in the totals of freestanding radiation oncology centers. The advice was accepted in 2006 for the North Carolina 2007 State Medical Facilities Plan, and procedure counts for CPT Code 77427 were removed from the totals. Procedure counts for CPT Code 77427 also have been removed from Table 9E in this North Carolina 2010 State Medical Facilities Plan.
In the North Carolina 2008 State Medical Facilities Plan, in response to a petitioner's request for an adjustment to the need determination for linear accelerators, there was an adjusted need determination for one linear accelerator in Linear Accelerator Service Area 18. The need determination did not specify certain configurations or specifications. As Table 9F indicates, there are two service areas where the threshold equals .25+; however, there is no need determination for Service Areas 17 and 19 because these service areas do not meet the criterion of a population base of 120,000 per linear accelerator. In response to a petition, there was included in the North Carolina 2009 State Medical Facilities Plan a statewide need determination for one dedicated linear accelerator that shall be part of a demonstration project for a model multidisciplinary prostate health center focused on the treatment of prostate cancer, particularly in African American men.
Through the standard need determination methodology, it is determined that there is no
need for an additional linear accelerator anywhere in the state.

Table 9D: Linear Accelerator Treatment Data - Hospital and Free-Standing
CPT
Description
ESTVs/ Procedures Under ACR
Simple Treatment Delivery: 77401 Radiation treatment delivery 1.00 77402 Radiation treatment delivery (<=5 MeV) 1.00 77403 Radiation treatment delivery (6-10 MeV) 1.00 77404 Radiation treatment delivery (11-19 MeV) 1.00 77406 Radiation treatment delivery (>=20 MeV) 1.00 Intermediate Treatment Delivery: 77407 Radiation treatment delivery (<=5 MeV) 1.00 77408 Radiation treatment delivery (6-10 MeV) 1.00 77409 Radiation treatment delivery (11-19 MeV) 1.00 77411 Radiation treatment delivery (>=20 MeV) 1.00
Complex Treatment Delivery:
77412 Radiation treatment delivery (<=5 MeV) 1.00 77413 Radiation treatment delivery (6-10 MeV) 1.00 77414 Radiation treatment delivery (11-19 MeV) 1.00 77416 Radiation treatment delivery (>= 20 MeV) 1.00
Other CPT Codes
77417 Additional field check radiographs .50 77418 Intensity modulated radiation treatment (IMRT) delivery 1.00 77432 Stereotactic radiosurgery treatment mgmt.
Linear Accelerator 3.00
77432 Stereotactic radiosurgery Treatment mgmt. Gamma Knife
3.00
Total body irradiation 2.50 Hemibody irradiation 2.00 Intraoperative radiation therapy (conducted by bringing
the anesthetized patient down to the linac) 10.00
Neutron and proton radiation therapy 2.00 Limb salvage irradiation 1.00 Pediatric Patient under anesthesia 1.50

Facility NameService Area # County
Number of Linear
Accelerators
Number of Procedures (ESTVs)
10/1/2007-9/30/2008
Average # of Procedures per
UnitMurphy Medical Center 1 Cherokee 1* 2,343 2,343Harris Regional Hospital, Inc. 1 Jackson 1 4,693 4,693
NC Radiation Therapy - Franklin 1 Macon 1 1,530 1,530
Mission Hospitals (S) (b) 2 Buncombe 3 20,668 6,889NC Radiation Therapy - Asheville 2 Buncombe 2 8,639 4,320NC Radiation Therapy - Clyde 2 Haywood 1 4,489 4,489NC Radiation Therapy - Marion 2 McDowell 1 3,838 3,838Watauga Hospital 3 Watauga 1 4,005 4,005Margaret Pardee Mem. Hospital 4 Henderson 1 7,879 7,879NC Radiation Therapy - Brevard 4 Transylvania 1 1,453 1,453NC Rad.Therapy - Hendersonville 4 Henderson 1 1,258 1,258Catawba Valley Medical Center 5 Catawba 2 14,405 7,202Frye Regional Medical Center 5 Catawba 1 NA NAGrace Hospital, Inc. 5 Burke 1 NR NRValdese General 5 Burke 1 4,004 4,004Caldwell Memorial Hospital, Inc. 5 Caldwell 1 2,762 2,762Cleveland Regional 6 Cleveland 1 7,343 7,343Gaston Memorial Hospital (h) 6 Gaston 3 13,531 4,510Lincoln Radiation Oncology Associates (s) 6 Lincoln
will be transferred NR NR
NC Radiation Therapy - Forest City 6 Rutherford 1 2,464 2,464
Pineville Radiation Therapy Center (n) 7 Mecklenburg 1 NA NACarolinas Medical Center (S) 7 Mecklenburg 3** 18,619 6,206CMC-Union Reg. Medical Center ( i ) 7 Union 1 8,125 8,125Matthews Radiation Oncology 7 Mecklenburg 1 12,704 12,704Presbyterian Hospital 7 Mecklenburg 4 12,341 3,085University Radiation Oncology 7 Mecklenburg 1 6,956 6,956Iredell Memorial 8 Iredell 2 5,862 2,931Lake Norman Radiation Oncology Center 8 Iredell 1 8,617 8,617Rowan Regional Medical Center 8 Rowan 1 5,785 5,785CMC-NorthEast Medical Center 9 Cabarrus 2 13,712 6,856Stanly Regional Medical Center 9 Stanly 1 3,846 3,846Forsyth Memorial Hospital 10 Forsyth 4 26,944 6,736Hugh Chatham Memorial Hospital (d) 10 Surry 1 5,260 5,260N. C. Baptist Hospitals (S) 10 Forsyth 4 17,688 4,422
Cancer Center of Davidson County (o) 11 Davidson 1 NA NAHigh Point Regional Health System 12 Guilford 2 10,090 5,045Morehead Memorial Hospital 12 Rockingham 1 4,474 4,474Moses Cone Health System 12 Guilford 4 26,998 6,749Randolph Cancer Center (m) 13 Randolph 1 NA NAUNC Hospitals (S) 14 Orange 4 22,414 5,603Alamance Regional Medical Center (j) 15 Alamance 2 9,700 4,850Duke University Hospital (S) 16 Durham 5 37,245 7,449Durham Regional Hospital 16 Durham 1 2,766 2,766Maria Parham Hospital (e) 16 Vance 1 5,773 5,773FirstHealth Moore Regional 17 Moore 2 19,550 9,775Scotland Memorial Hospital ( l ) 17 Scotland 1 4,917 4,917
Table 9E: Hospital and Free-Standing Linear Accelerators and Radiation Oncology Procedures

Facility NameService Area # County
Number of Linear
Accelerators
Number of Procedures (ESTVs)
10/1/2007-9/30/2008
Average # of Procedures per
Unit
Table 9E: Hospital and Free-Standing Linear Accelerators and Radiation Oncology Procedures
Cape Fear Valley Medical Center (a) 18 Cumberland 5 21,340 4,268Southeastern Regional Medical Center ( v ) 18 Robeson 1 6,705 6,705Sampson Regional Medical Center 18 Sampson 1 2,365 2,365New Hanover Radiation Oncology 19 New Hanover 2 23,613 11,807New Hanover Regional Med Center 19 New Hanover 1 7,186 7,186South Atlantic Radiation Oncology, LLC ( c ) 19 Brunswick 1 3,694 3,694Raleigh Hematology Oncology Associates/Cancer Centers of NC (u) 20 Wake 2 11,277 5,639Duke Health Raleigh Hospital 20 Wake 1 7,566 7,566Rex Hospital 20 Wake 4 16,970 4,242
Wake Radiology / Oncology Services 20 Wake 1 6,216 6,216Rex Healthcare (Smithfield Radiation Oncology) 21 Johnston 1 3,706 3,706Johnston Memorial Hospital Authority (t) 21 Johnston 1 NR NRLenoir Memorial 22 Lenoir 1 6,911 6,911
Goldsboro Radiation Therapy Services dba Wayne Radiation Oncology Center 22 Wayne 1 5,955 5,955Carteret General Hospital (g) 23 Carteret 1 4,162 4,162CarolinaEast Medical Center 23 Craven 2 12,771 6,386Onslow Radiation Oncology, LLC 24 Onslow 1 NR NRNash Day Hospital 25 Nash 2 8,183 4,091Roanoke Valley Cancer Center 25 Halifax 1 3,844 3,844Wilson Medical Center 25 Wilson 1 4,526 4,526Beaufort County Hospital 26 Beaufort 1 3,470 3,470Ahoskie Cancer Center 26 Hertford 1 2,048 2,048NC Radiation Therapy Management Services (prev Carolina Radiation Medicine, P.A.) (f) (S) 26 Pitt 1 7,668 7,668ECU Brody School of Medicine (S) 26 Pitt 3 14,929 4,976Albemarle Hospital 27 Pasquotank 1 4,696 4,696Alliance Oncology dba Outer Banks Cancer Center 27 Dare 1 2,323 2,323
TOTALS (72 Facilities) 116 587,798 5,067
(b) Mission Hospitals received a CON in September 2004 to initiate CyberKnife linac service; operational in October 2005.
(c) South Atlantic Radiation Oncology received a CON in August 2005 to initiate linac service; operation effective May 2007.
(d) Hugh Chatham Memorial Hospital became operational in March 2000 with a leased linac from NC Baptist Hospitals.
(e) Maria Parham Hospital received a CON in July 2001 to lease and install one linac.
(f) Carolina Radiation Medicine, P.A. became operational in July 1998.
(g) Carteret General Hospital received a no review in June 1999 to replace a linear accelerator and purchase a simulator.
(h) Gaston Memorial Hospital received a CON in August 1999 to add one linac.
* Murphy Medical Center stopped operating, and decommissioned, this linear accelerator on May 20, 2009.** CMC will move one linear accelerator to CMC-Union per CON F-007525-06(a) Cape Fear Valley Health System received a CON in May 2004 for the fourth linac, and a CON on 12/18/2009 for the fifth linac, which will be a CyberKnife.

Facility NameService Area # County
Number of Linear
Accelerators
Number of Procedures (ESTVs)
10/1/2007-9/30/2008
Average # of Procedures per
Unit
Table 9E: Hospital and Free-Standing Linear Accelerators and Radiation Oncology Procedures
footnotes, continued:
( i ) Union Regional Medical Center received a CON in April 2000 to acquire one linac.
( j ) Alamance Regional Medical Center received a CON in August 2002 to add one linac.
(k) Forsyth Medical Center received a CON in August 2002 to add one linac; operational in October 2004.
( l ) Scotland Memorial Hospital became operational in August 2003.
(m) Randolph Cancer Center received a CON in June 2006 to initiate linac service.
(n) Pineville Radiation Therapy Center received a CON in June 2007 to initiate linac service.
(o) Cancer Center of Davidson County, LLC received a CON in July 2007 to initiate linac service.
(p) East Carolina University Brody School of Medicine (Pitt Memorial) received a CON in December 2007 to replace an
existing linear accelerator with a CyberKnife linear accelerator.
(q) UNC Hospitals received a CON in October 2006 to replace an existing linear accelerator with a CyberKnife linear accelerator.
(r) Carolinas Medical Center - NorthEast received a CON in February 2006 to acquire a CyberKnife linear accelerator.
NA - Not Applicable, not in operation for appropriate time frame.
NR - No report
S - Has at least one Linear Accelerator configured for Stereotactic Radiosurgery
( v ) Southeastern Regional Medical Center received CON #N-004919-93 on 2/2/94.
( u ) Raleigh Hematology Oncology Associates, PC d/b/a Cancer Centers of NC received CON #J-007941-07 in July 2009 for a second linear accelerator.
( t ) Johnston Memorial Hospital Authority received CON # J-8188-08 on 2/24/09.
(s) Lincoln Radiation Oncology Associates received CON 10/27/08 to acquire existing linear accelerator through ownership transfer from Gaston Memorial Hospital, replace the linear accelerator and relocate to Lincoln Radiation Oncology Center.

Table 9F: Linear Accelerator Service Areas and Calculations
Area 27 157,818 2 78,909 1.77% 7,019 3,510 -0.96 *
Totals 9,397,397 115*** 81,716 587,798 5,111 -27.92 0
* Service Area does not have 120,000 base population per accelerator** Area 14 has more than 45% of its patients coming from outside its service area*** Does not include the linear accelerator decommissioned by Murphy Medical Center on May 20, 2009.
Service Area 2009 Accelerators Population Percentage of 2007-2008 Procedures ESTV ProceduresCivilian within Service Patients from ESTV Per Divided by 6,750
Population Area Per Outside the Procedures Accelerator Minus #Accelerator Service Area of Accelerators
Area 1 133,777 2 66,889 3.70% 8,566 4,283 -0.73 *
Area 2 390,739 7 55,820 21.32% 37,634 5,376 -1.42 *
Area 3 90,427 1 90,427 6.29% 4,005 4,005 -0.41 *
Area 4 156,733 3 52,244 12.93% 10,589 3,530 -1.43 *
Area 5 363,074 6 60,512 15.29% 21,170 3,528 -2.86 *
Area 6 442,271 5 88,454 3.07% 23,337 4,667 -1.54 *
Area 7 1,146,032 11 104,185 12.09% 58,743 5,340 -2.30 *
Area 8 297,958 4 74,490 25.79% 20,263 5,066 -1.00 *
Area 9 235,292 3 78,431 27.14% 17,558 5,853 -0.40 *
Area 10 629,269 9 69,919 27.19% 49,891 5,543 -1.61 *
Area 11 158,855 1
Area 12 567,337 7 81,048 24.22% 41,561 5,937 -0.84 *
Area 13 141,696 1
Area 14** 192,495 4 48,124 74.64% 22,414 5,603 -0.68 *
Area 15 170,348 2 85,174 7.08% 9,700 4,850 -0.56 *
Area 16 422,621 7 60,374 27.96% 45,784 6,541 -0.22 *
Area 17* 303,465 3 101,155 16.61% 24,467 8,156 0.62 *
Area 18 545,707 7 77,958 14.09% 30,409 4,344 -2.49 *
Area 19* 415,820 4 103,955 12.94% 34,492 8,623 1.11 *
Area 20 1,068,619 8 133,577 16.10% 42,028 5,254 -1.77
Area 21 167,849 2 83,925 39.77% 3,706 1,853 -1.45
Area 22 227,753 2 113,877 12.21% 12,866 6,433 -0.09 *
Area 23 186,014 3 62,005 22.27% 16,933 5,644 -0.49 *
Area 24 173,460 1
Area 25 300,550 4 75,138 7.57% 16,552 4,138 -1.55 *
Area 26 311,418 6 51,903 2.86% 28,115 4,686 -1.83 *
NeedDeter-
mination

Area County 2009Total
Population1 Cherokee 27,958
Clay 10,800Graham 8,206Jackson 37,731Macon 34,808Swain 14,274
TOTAL 133,7772 Buncombe 232,718
Haywood 57,666Madison 20,778
McDowell 44,709Mitchell 15,948Yancey 18,920
TOTAL 390,7393 Ashe 26,560
Avery 18,395Watauga 45,472
TOTAL 90,4274 Henderson 106,214
Polk 19,099Transylvania 31,420
TOTAL 156,7335 Alexander 37,372
Burke 88,460Caldwell 80,052Catawba 157,190
TOTAL 363,0746 Rutherford 62,842
Cleveland 97,104Gaston 206,538Lincoln 75,787
TOTAL 442,2717 Mecklenburg 919,372
Anson 24,994Union 201,666
TOTAL 1,146,0328 Iredell 159,443
Rowan 138,515TOTAL 297,958
9 Cabarrus 175,821Stanly 59,471
TOTAL 235,29210 Forsyth 349,449
Davie 42,171Stokes 46,596Surry 73,876
Wilkes 67,509Alleghany 11,256
Yadkin 38,412TOTAL 629,269
Table 9G: Linear Accelerator Service Areas

Area County 2009Total
Population
Table 9G: Linear Accelerator Service Areas
11 Davidson 158,85512 Guilford 475,826
Rockingham 91,511TOTAL 567,337
13 Randolph 141,69614 Chatham 61,869
Orange 130,626TOTAL 192,495
15 Alamance 146,889Caswell 23,459
TOTAL 170,34816 Durham 263,857
Granville 57,127Person 38,145Vance 43,641Warren 19,851
TOTAL 422,62117 Moore 86,942
Hoke 46,099Lee 58,606
Montgomery 27,852Scotland 37,038
Richmond 46,928TOTAL 303,465
18 Cumberland 315,955Bladen 32,531
Robeson 131,368Sampson 65,853
TOTAL 545,70719 New Hanover 199,351
Brunswick 108,419Columbus 54,267
Pender 53,783TOTAL 415,820
20 Wake 898,818Franklin 58,858Harnett 110,943
TOTAL 1,068,61921 Johnston 167,84922 Lenoir 57,255
Duplin 54,359Wayne 116,139
TOTAL 227,75323 Craven 98,212
Carteret 64,428Jones 10,411
Pamlico 12,963TOTAL 186,014
24 Onslow 173,460
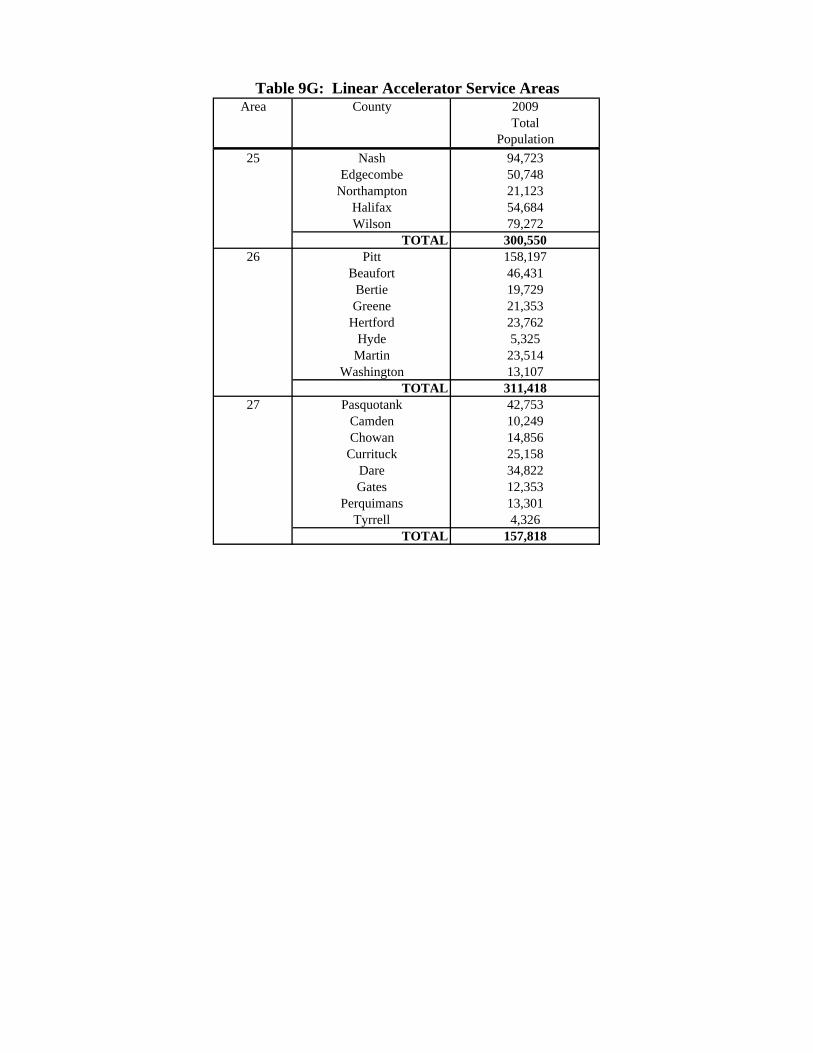
Area County 2009Total
Population
Table 9G: Linear Accelerator Service Areas
25 Nash 94,723Edgecombe 50,748
Northampton 21,123Halifax 54,684Wilson 79,272
TOTAL 300,55026 Pitt 158,197
Beaufort 46,431Bertie 19,729Greene 21,353
Hertford 23,762Hyde 5,325
Martin 23,514Washington 13,107
TOTAL 311,41827 Pasquotank 42,753
Camden 10,249Chowan 14,856
Currituck 25,158Dare 34,822Gates 12,353
Perquimans 13,301Tyrrell 4,326
TOTAL 157,818

Linear AcceleratorHSA Service Area Provider Units
Statewide 2009 Adjusted Need Determination 1
Table 9H:Linear Accelerator Inventory for Demonstration Project
There was included in the North Carolina 2009 State Medical Facilities Plan a statewide need determination for one dedicated linear accelerator that shall be part of a demonstration project for a model multidisciplinary prostate health center focused on the treatment of prostate cancer, particularly in African American men.

Positron Emission Tomography Scanner Definition Positron Emission Tomography (PET) Scanner as defined in General Statute § 131E-176(19a), means “Equipment that utilizes a computerized radiographic technique that employs radioactive substances to examine the metabolic activity of various body structures.” From its introduction in the mid-1980s until the last few years, PET scanning was used more in research than clinical practice. Early clinical applications focused on the heart and the brain. Now, the clinical use of PET scanning is increasing rapidly, and new applications involve the diagnosis of cancer. At North Carolina’s most active PET facilities, the diagnosis of cancer accounts for well over 80 percent of clinical studies. A PET scanner is a device with multiple radiation detectors designed to detect the two simultaneous photons emitted from the body after a positron annihilation. Positron annihilation occurs after a positron (a sub-atomic particle) is emitted from certain radioactive substances. Such events are recorded over the course of a scan and subsequently reconstructed via computerized techniques into images. These images represent the cross-sectional distribution of the radioactive (positron-emitting) tracer in the body. By measuring the distributions of certain radiotracers in the body some time after they have been administered, PET can be used both to diagnose physical abnormalities and to study body functions in normal subjects. PET differs from other nuclear medicine both in the type of radiation emitted and in the type of scanner required to detect it. The radioactive tracers used in PET imaging may be produced on-site with a cyclotron (or generator, for some tracers) and appropriate chemistry labs, or may be ordered from commercial distributors, even though all PET tracers are relatively short-lived (110 minutes is the longest half-life). Therefore, the capital costs associated with developing the equipment capable of PET scanning can range from a few hundred thousand dollars (for the gamma camera being upgraded with coincident circuitry to perform PET scans) to less than one million dollars (for a low-end scanner) to several million dollars for a high-end scanner, a cyclotron, and associated chemistry capabilities.
Coincidence cameras are “built” by adding electronic circuitry to gamma cameras. The coincident circuitry makes it a PET system. The coincidence camera is nuclear medicine equipment that is designed, built or modified to detect only the single photon emitted from nuclear events other than positron annihilation. This hybrid machine is used as a gamma camera 90-95 percent of the time to perform non-PET imaging; thus, coincidence cameras are non-dedicated PET scanners. The first PET scanners were dedicated machines performing only that service, supported by cyclotrons on-site. However, PET scanners also include hybrid machines, performing a variety of nuclear medicine studies and supported by new tracer production facilities housing cyclotrons in stand-alone facilities.

All these machines are PET scanners as defined in G.S. § 131E-176(19a), but they vary widely in their capabilities. The less expensive hybrid devices are capable of disclosing the presence of lesions as small as 1.5 to 2 centimeters, while the better dedicated scanners can disclose lesions as small as 0.5 to 1 centimeter. Because they can provide definitive studies for many patients and because they cost less, hybrid devices have quickly found a market. In fact, there are now over 85 dedicated scanners and more than 200 hybrid devices in the country. The leading impetus to hybridization is the fact that the technology is rapidly improving. As a result, less expensive devices are now better than their predecessors and higher-end dedicated scanners are being adapted to include computed tomography (CT) scanners, which will give them the capacity to perform, more accurately, the range of studies now performed on hybrid machines. Additionally, mobile PET scanners are available, and the number in operation in the United States is growing. Dedicated PET scanners are scanners used exclusively for PET imaging. Dedicated PET scanners can be fixed or mobile. Mobile PET scanner means a dedicated PET scanner and its transporting equipment that is moved to provide services at two or more host facilities. The rapid improvements in the equipment are being driven both by the rate of technological advances and by the steady growth in the number of clinical studies for which the Centers for Medicare and Medicaid Services (CMS) authorizes reimbursement. Among oncologists, oncologic surgeons, and radiation oncologists, PET is already recognized as essential to the diagnosis and treatment of patients with melanoma, colorectal cancer, lung cancer and lymphoma. CMS has approved reimbursement for studies for patients with solitary pulmonary nodules, carcinoma of the lung (non-small cell), melanoma, colorectal cancer, lymphoma, head and neck tumors, esophageal cancer, breast cancer, refractory seizures, perfusion of the heart, and questions concerning myocardial viability. Facility Inventory-Service Volume There are 27 approved or operational fixed dedicated PET scanners in North Carolina. Duke University Hospital acquired a cyclotron generated fixed dedicated PET scanner in 1985. During the following years, North Carolina Baptist Hospitals, Carolinas Medical Center and University of North Carolina (UNC) Hospitals also acquired a cyclotron generated fixed dedicated PET scanner each. Pitt County Memorial Hospital, Rex Hospital, Mission Hospitals, New Hanover Regional Medical Center, Catawba Valley / Frye Regional (joint ownership), Cape Fear Valley Medical Center, First Health Moore, Forsyth Medical Center, Moses Cone Health System, Gaston Memorial Hospital, Carolinas Medical Center - NorthEast, CarolinaEast Medical Center (previously Craven Regional Medical Center), The Presbyterian Hospital, High Point Regional and Wake PET Services were approved for each entity to acquire one fixed dedicated PET scanner. Duke University Hospital, Carolinas Medical Center and UNC Hospitals were also approved to acquire a second fixed dedicated PET scanner. There were three additional need determinations in the North Carolina 2006 State Medical Facilities Plan, one each in HSAs II, III, and VI. Alamance Regional Medical Center, Iredell Memorial Hospital, and Nash General Hospital were approved in 2007 to acquire fixed dedicated PET/CT scanners. The reported number of procedures performed on these fixed dedicated PET scanners for the years ending 9/30/2005, 9/30/2006, 9/30/2007 and 9/30/2008 are reflected in Table 9I.
Table 9I is followed by Tables 9J(1) and 9J(2), which reflect the reported number of procedures performed on mobile dedicated PET scanners for the years ending 9/30/2005, 9/30/2006, 9/30/2007 and 9/30/2008. Fixed Dedicated PET Scanner Need Methodology A fixed PET scanner's service area is the Health Service Area (HSA) in which the scanner is located. The HSAs are the six multi-county groupings as defined in Appendix A. A mobile PET scanner's service area is the planning region in which the scanner is located. There are two mobile PET scanner planning regions, the west region (HSAs I, II, and III as described in Appendix A) and the east region (HSAs IV, V, and VI as described in Appendix A).
One additional fixed dedicated PET scanner is needed for each existing fixed dedicated
PET scanner that was utilized at or above 80 percent of capacity during the 12-month period reflected in the owner’s 2009 Hospital Licensure Renewal Application on file with the North Carolina Division of Health Service Regulation.1 The North Carolina State Health Coordinating Council approved a change in the annual capacity for fixed dedicated PET scanners from 2,600 to 3,000 procedures. For the purposes of this determination, the annual capacity of a fixed dedicated PET scanner is 3,000 (3,000 X .80 = 2,400) procedures.
The standard methodology used to determine need for fixed PET scanners is calculated as
follows:
Methodology Part 1:
Step 1. Determine the planning inventory of all fixed PET scanners in the state, to include existing fixed PET scanners in operation, approved fixed PET scanners for which a certificate of need was issued but is pending development, and fixed PET scanners for which no certificate of need has been issued, because the decision on a need determination in a previous year is under review or appeal.
Step 2. For each facility at which a PET scanner is operated, determine the total number of procedures performed on all fixed PET scanners located at each facility as reported for the 12-month period reflected in the Hospital License Renewal Application or Registration and Inventory of Equipment on file with the North Carolina Division of Health Service Regulation.
Step 3. Multiply the number of fixed PET scanners at each facility by 3,000 procedures to determine the PET scanner capacity at each facility.
Step 4. Divide the total number of PET scanner procedures performed at each facility, as determined in Step 2, by the capacity calculated in Step 3. Multiply the results by 100 to convert the numbers to a utilization percentage.
1 The need generated by this part of the methodology may be met by any applicant, and not just the owner or operator of the scanner that has achieved the target utilization.

Step 5. A need is determined for an additional fixed PET scanner if the utilization percentage is 80 percent or greater at a facility, except as provided in Step 8 for both parts of the methodology combined.
Methodology Part 2:
Step 6. Identify each major cancer treatment facility, program or provider in the state, i.e., providers that operate two linear accelerators and performed over 12,500 ESTV procedures in the 12-month period reflected on the Hospital License Renewal Application or Equipment Registration and Inventory Form.
Step 7. A need is determined for one additional fixed PET scanner if a major cancer treatment facility, program or provider identified in Step 6 is hospital-based and does not own or operate a fixed dedicated PET scanner, except as provided in Step 8 for both parts of the methodology combined.2
Step 8. The maximum need determination for a single HSA in any one year will be no more than two additional fixed PET scanners regardless of the numbers generated individually by each part of the methodology.
Need Determinations The first part of the methodology indicates that there is no need for additional fixed dedicated PET scanners anywhere in the state. The second part of the methodology indicates that there is no need for any additional fixed dedicated PET scanners anywhere in the state. There is no need for any additional mobile dedicated PET scanners anywhere in the state.
2 The need generated by this part of the methodology may be met by any applicant, and not just a major cancer treatment facility, program, or provider that does not own or operate a fixed dedicated PET scanner.

Utilization Rate
Center 2004- 2005- 2006- 2007- HSA r 2008 Procedures/ 2005 2006 2007 2008 3000 as Capacity
Mission Hospitals (f) 875 1,003 1,607 1,674 I 1 53.57%Catawba Valley/ Frye Reg. (j) 848 1,258 1,574 1,597 I 1 52.47%N.C. Baptist Hospitals 1,266 1,477 1,919 2,011 II 1 67.03%Moses Cone Health System (o) 1,352 1,760 1,955 2,161 II 1 72.03%Forsyth Medical Center (p) 1,579 2,417 2,983 3,208 II 2 53.47%
High Point Regional ( r ) 356 574 785 1,101 II 1 36.70%
Alamance Reg. Medical Ctr. (u) 374 480 37 II 1 1.23%mobile procedures,
too
Carolinas Med Center (a), (k) 3,049 3,635 3,654 3,510 III 2 58.50%
CMC-Union (w) III 1 0.00%mobile procedures
onlyGaston Memorial Hospital/CIS Summit (m) 700 846 984 870 III 1 29.00%
CMC-NorthEast Medical Center (n) 481 615 818 868 III 1 28.93%
The Presbyterian Hospital (q) 1,544 1,988 2,173 2,062 III 1 68.73%
Iredell Memorial Hospital (t) NA 306 III 1 10.20%
Duke Univ. Hospital (d) 3,091 3,596 3,858 3,924 IV 2 65.40%
UNC Hospitals (b) 1,144 1,386 1,878 1,553 IV 2 25.88%
Rex Hospital (e) 1,544 1,913 2,139 1,704 IV 1 56.80%Wake PET Services, Wake Radiology Oncology, Wake Radiology (s) NA NA NA IV 1 0.00%
New Hanover Reg. Med. (g) 582 755 895 1,020 V 1 34.00%
Cape Fear Valley Medical Ctr. (h) 1,218 2,069 2,268 1,672 V 1 55.73%
First Imaging of the Carolinas ( i ) 529 550 865 1,036 V 1 34.53%
Pitt Co. Memorial ( c ) 393 832 981 1,120 VI 1 37.33%
CarolinaEast Medical Center ( l ) 719 831 852 869 VI 1 28.97%
Nash General Hospital (v) 336 421 0 VI 1 0.00%mobile procedures
onlyTOTAL 21,270 28,215 33,089 32,303 27 0
NA Not Applicable for time period ending September 30, 2008.
(a) Approved for additional scanner in November 2001. ( l ) Approved for scanner in October 2003.(b) Approved for scanner in June 2000 and additional (m) Approved for scanner in December 2003. scanner under Policy AC-3 in November 2005. (n) Approved for scanner in December 2003.(c) Approved for scanner in August 2001. (o) Operational in October 2004.(d) Approved for additional scanner under Policy AC-3 (p) Approved for scanners in June 2004 in September 2002. and November 2008.(e) Approved for scanner in September 2002. (q) Approved for scanner in June 2004.(f) Approved for scanner in January 2003. (r) Approved for scanner in January 2005.(g) Operational in October 2004. (s) Approved for scanner in November 2005.
(t) Approved for scanner in January 2007.( i )Approved for scanner in August 2003. (u) Approved for scanner in April 2007.( j )Approved for scanner in July 2003. (v) Approved for scanner in May 2007.(k) Approved for replacement of 1 scanner in June 2003. (w) Approved for scanner in April 2009.
Table 9I: PET Scanner Utilization of Existing Fixed Dedicated Scanners
(h) Approved for scanner in August 2003. Different method used for counting procedures in 2008.
Inve
ntor
y
ProceduresNeed
Determination by Criteria - 80% of Present Capacity
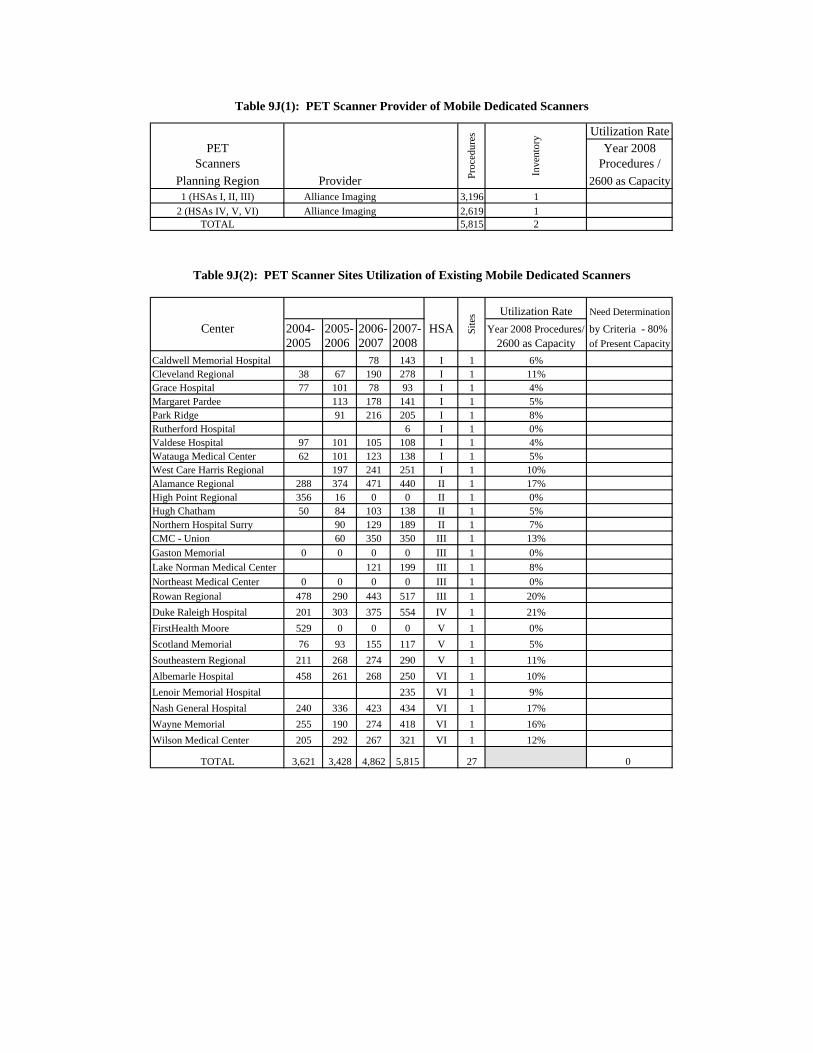
Utilization RatePET
Scanners Year 2008
Procedures /
Planning Region Provider 2600 as Capacity1 (HSAs I, II, III) Alliance Imaging 3,196 1
2 (HSAs IV, V, VI) Alliance Imaging 2,619 1TOTAL 5,815 2
Utilization Rate Need Determination
Center 2004- 2005- 2006- 2007- HSA Year 2008 Procedures/ by Criteria - 80% 2005 2006 2007 2008 2600 as Capacity of Present Capacity
Caldwell Memorial Hospital 78 143 I 1 6%Cleveland Regional 38 67 190 278 I 1 11%Grace Hospital 77 101 78 93 I 1 4%Margaret Pardee 113 178 141 I 1 5%Park Ridge 91 216 205 I 1 8%Rutherford Hospital 6 I 1 0%Valdese Hospital 97 101 105 108 I 1 4%Watauga Medical Center 62 101 123 138 I 1 5%West Care Harris Regional 197 241 251 I 1 10%Alamance Regional 288 374 471 440 II 1 17%High Point Regional 356 16 0 0 II 1 0%Hugh Chatham 50 84 103 138 II 1 5%Northern Hospital Surry 90 129 189 II 1 7%CMC - Union 60 350 350 III 1 13%
Gaston Memorial 0 0 0 0 III 1 0%
Lake Norman Medical Center 121 199 III 1 8%
Northeast Medical Center 0 0 0 0 III 1 0%
Rowan Regional 478 290 443 517 III 1 20%
Duke Raleigh Hospital 201 303 375 554 IV 1 21%
FirstHealth Moore 529 0 0 0 V 1 0%
Scotland Memorial 76 93 155 117 V 1 5%
Southeastern Regional 211 268 274 290 V 1 11%
Albemarle Hospital 458 261 268 250 VI 1 10%
Lenoir Memorial Hospital 235 VI 1 9%
Nash General Hospital 240 336 423 434 VI 1 17%
Wayne Memorial 255 190 274 418 VI 1 16%
Wilson Medical Center 205 292 267 321 VI 1 12%
TOTAL 3,621 3,428 4,862 5,815 27 0
Table 9J(1): PET Scanner Provider of Mobile Dedicated Scanners
Sit
es
Inve
ntor
y
Pro
cedu
res
Table 9J(2): PET Scanner Sites Utilization of Existing Mobile Dedicated Scanners

Magnetic Resonance Imaging Introduction Magnetic Resonance Imaging (MRI) technology is mobile and apparently is financially feasible at relatively small-volume mobile sites. Geographic accessibility is a significant planning issue, and it is important to assure that the rural areas of the state have the opportunity to access this important technology through both fixed and mobile scanners, as it has become the standard of care.
The methodology that is used allows the addition of a fixed MRI scanner at a fixed site within the same MRI service area. The Technology Nuclei of atoms in various structures of the human body resonate differentially when exposed to a strong magnetic field. MRI devices register these differences in response as images for use in making diagnoses. Use of MRI technology has grown rapidly because it does not expose patients to ionizing radiation, and because of the quality of images it obtains. In 1983, there were only two MRI programs in North Carolina, performing a total of 531 procedures. In 2007-2008, fixed and mobile scanners were reported as providing 814,048 procedures.
An MRI procedure is defined as a single discrete MRI study of one patient (single CPT coded procedure). An MRI study means one or more scans relative to a single diagnosis or symptom.
An MRI procedure is a single MRI procedure performed on one defined body part during one visit. Each MRI procedure must be directly linked to a single billable CPT code associated with an MRI procedure. For example, an MRI brain scan with and without contrast is a single procedure with a single CPT code.
For reporting verification, each reporting site will provide the number of scans performed annually for all CPT codes by volume on Hospital License Renewal Applications and Registration and Inventory of Medical Equipment Forms for Fixed (Non-Hospital) and Mobile MRI Providers. Assessment
Mobile MRI Because of the availability of mobile units, it appears that MRI technology is accessible within a reasonable distance and travel time to all of the population of North Carolina. Several mobile sites in operation all of 2007-2008 reported fewer than 200 procedures.
Mobile MRI scanner means an MRI scanner and transporting equipment that is moved at least weekly to provide services at two or more host facilities.
Some sites that initiated MRI service with mobile units have installed fixed scanners as
volumes increased. Because of the need to house a unit in a specially constructed building or area of a building, the cost of each such new fixed facility may exceed $2,000,000.

Fixed MRI Units Fixed MRI scanner means an MRI scanner that is not a mobile MRI scanner. The principal capital expenditure issue with respect to fixed MRI units is the volume of procedures, which warrants the acquisition of an additional magnet. Definition of an MRI Service Area A fixed MRI Service Area is the same as an Acute Care Bed Service Area as defined in Chapter 5, Acute Care Beds, and contained in Figure 5.1. The fixed MRI service area is a single county, except where there is no hospital located within the county, in which case, the county or counties without a hospital are combined in a multi-county grouping with a county that has a hospital. Multi-county groupings are determined based on the county in which the hospital or hospitals are located that provide the largest number of inpatient days of care to the residents of the county that has no hospital, except as described in the following sentence. In response to a petition submitted to the State Health Coordinating Council, Hoke County was assigned to Moore and Cumberland counties for the North Carolina 2010 State Medical Facilities Plan. This created a Cumberland/Hoke multi-county MRI service area, in addition to the existing Moore/Hoke multi-county MRI service area. A fixed MRI scanner’s service area is the MRI service area in which the scanner is located. Basic Assumptions of the Methodology
1. Facilities that currently offer mobile MRI services, but have received the transmittal of a certificate of need for a fixed MRI scanner are included in the inventory as a fixed MRI scanner in Table 9K.
2. A placeholder of one MRI scanner is placed in Table 9K for each new fixed MRI scanner for which a certificate of need has been issued even if the scanner is not operational. All procedures performed by a single licensed entity are counted as performed at a single site, even if MRI services are provided at more than one site.
3. The need determination for any one Service Area under the methodology for Fixed MRI Scanner Utilization shall not exceed one MRI scanner per year, unless there is an adjusted need determination approved for a specific MRI Service Area.
4. A facility that offers MRI services on a full-time basis pursuant to a service agreement with an MRI provider is not precluded from applying for a need determination in the North Carolina 2010 State Medical Facilities Plan to replace the existing contracted service with a fixed MRI scanner under the applicant’s ownership and control. It is consistent with the purposes of the Certificate of Need law and the State Medical Facilities Plan for a facility to acquire and operate an MRI scanner to replace such a contracted service, if the acquisition and operation of the facility’s own MRI scanner will allow the facility to reduce the cost of providing the MRI service at that facility.

Methodology for Determining Need The methodology includes need thresholds arranged in tiers based on the number of
scanners, weighting of procedures based on complexity, and a component addressing MRI service areas that have no fixed MRIs, but have mobile MRI scanners serving the area. The methodology for determining need is based on fixed and mobile procedures performed at hospitals and freestanding facilities with fixed MRI scanners and procedures performed on mobile MRI scanners at mobile sites in the MRI service areas. In addition, equivalent values for mobile scanners in MRI service areas are found in the column labeled Fixed Equivalent in Table 9K.
MRI Tiered Planning Thresholds
Acute Care Bed Service Area Fixed Scanners
Inpatient and Contrast Adjusted Thresholds
Planning
Threshold 4 and over 4,8051 70.0% 3 4,4622 65.0% 2 4,1183 60.0% 1 3,7754 55.0% 0 1,7165 25.0%
The above tiering is based on the assumption that the time necessary to complete 1.0 MRI procedure (a basic outpatient procedure without contrast) is 30 minutes, or an average throughput of two procedures per hour on an MRI scanner. Capacity of a single MRI scanner is defined as that of an MRI scanner being available and staffed for use at least 66 hours per week, and 52 weeks per year. The resulting capacity of a fixed MRI scanner is defined below:
Annual Maximum Capacity of a Single Fixed MRI Scanner = 66 hours per week x 52 weeks x 2 procedures per hour = 6,864 procedures annually
This definition of capacity represents 100 percent of the procedure volume the equipment
is capable of completing, given perfect scheduling, no machine or room downtime, no cancellations, no patient transportation problems, no staffing or physician delays and no MRI procedures outside the norm. Procedure totals are from the 2009 Hospital Licensure Renewal Application or the 2009 MRI Registration and Inventory of Medical Equipment Form as submitted to the North Carolina Division of Health Service Regulation concerning equipment registration and inventory, and number of procedures.
1 6,864 X 70% = 4,805 2 6,864 X 65% = 4,462 3 6,864 X 60% = 4,118 4 6,864 X 55% = 3,775 5 6,864 X 25% = 1,716

The table below indicates the weighting values assigned to the procedure type: Weighting System
PROCEDURE TYPE
BASE
WEIGHT
INPATIENT
WEIGHT
CONTRAST
WEIGHT
PROCEDURE TIME
MINUTES Outpatient/No Contrast/Sedation
1.0 0.0 0.0 30
Outpatient/With Contrast/Sedation
1.0 0.0 .4 (Add 12 minutes)
42
Inpatient/No Contrast/Sedation
1.0 .4 (Add 12 minutes)
0.0 42
Inpatient/With Contrast/Sedation
1.0 .4 (Add 12 minutes)
.4 (Add 12 minutes)
54
Procedures with contrast include those with sedation as reported in the annual Hospital
Licensure Renewal Application and the annual Registration and Inventory of Medical Equipment for Fixed and Mobile MRIs.
Need Determination
The standard methodology used to determine need for fixed MRI scanners is calculated as follows:
Step 1. Determine the number of clinical fixed and mobile MRI scanners in each MRI service area by site to include: existing fixed or mobile MRI scanners in operation, approved fixed or mobile MRI scanners for which a certificate of need was issued but is pending development, and fixed MRI scanners for which no certificate of need has been issued because the decision regarding a need determination in a previous year is under review or appeal. The inventory shall exclude: MRI scanners used for research only, non-clinical MRI scanners, and MRI scanners awarded based on need determinations for a dedicated purpose or demonstration project.
Step 2. Convert the number of fixed and mobile MRI scanners to fixed equivalent magnets as follows:
(a) For each existing fixed MRI scanner, assign a value of one fixed equivalent magnet; (b) For each approved fixed MRI scanner, assign a value of one fixed equivalent magnet, even though the site may be receiving mobile services temporarily until the fixed scanner is operational. [Note: The mobile services are not listed separately from the approved fixed MRI scanner if the mobile unit will no longer be used when the fixed MRI scanner is operational.] (c) For each existing mobile MRI scanner site, calculate the fixed equivalent for each mobile site by dividing the number of MRI scans performed at each site by the threshold for the MRI service area, with the exception that the fixed equivalent shall be no greater than one; and (d) For each approved mobile MRI scanner site, at which services have not started, calculate the days to be operated at the site as a fraction of the total days of service to be provided by the approved mobile MRI scanner. [For example, if a certificate of need has

been awarded to a provider to serve six different sites in the state for one day per week at each site, the fixed equivalent for each approved site in the state is 0.17 (1/6=0.1666). If the mobile is approved to serve two sites for three days per week at each site, the fixed equivalent for each site is 0.50 (3/6=0.50).]
Step 3. Sum the number of fixed equivalent magnets for each MRI service area.
Step 4. Determine the total number of MRI scans performed at each site regardless of whether the MRI scanner is fixed or mobile, as reported in the 2009 Hospital License Renewal Applications or 2009 MRI Registration and Inventory Forms.
Step 5. Of the total number of MRI scans performed, determine the number of MRI scans performed by type (i.e., inpatient, outpatient, with contrast or sedation, no contrast or sedation) as reported in the 2009 Hospital License Renewal Applications or 2009 MRI Registration and Inventory Forms.
Step 6. For each site, multiply the number of inpatient MRI scans by 0.40 to calculate the inpatient adjustment.
Step 7. For each site, multiply the number of contrast or sedation scans by 0.40 to calculate the contrast adjustment.
Step 8. For each site, sum the total number of MRI scans performed (Step 4), the inpatient adjustment (Step 6), and the contrast adjustment (Step 7) to calculate the total number of adjusted MRI procedures for each site.
Step 9. For each service area, sum the number of adjusted total MRI procedures for all sites in the MRI service area.
Step 10. Calculate the average number of adjusted total MRI procedures per MRI scanner in the service area by dividing the adjusted total procedures for the service area (Step 9) by the sum of fixed equivalent magnets in the service area (Step 3).
Step 11. Determine the utilization threshold for the service area based only on the number of existing, approved and pending fixed MRI scanners located in the service area as identified in Step 1:
4+ fixed MRI scanners – 4,805 threshold 3 fixed MRI scanners – 4,462 threshold 2 fixed MRI scanners – 4,118 threshold 1 fixed MRI scanner – 3,775 threshold 0 fixed MRI scanners – 1,716 threshold
Step 12. Compare the area average procedures per fixed equivalent magnet (Step 10) with the threshold for the MRI service area (Step 11). If the area average procedure per magnet is greater than or equal to the service area threshold, a need is determined for one additional MRI scanner in the service area.
The tables reflect the MRI service areas. The standard methodology resulted in a need
determination in Table 9K for one additional fixed MRI scanner each in Wake and Forsyth counties. The standard methodology further indicated a need for a fixed MRI scanner in Rutherford County. However, this need determination was removed from the North Carolina 2010 State Medical Facilities Plan in response to a petition submitted to the State Health Coordinating Council. There is no need for any additional fixed MRI scanners anywhere else in the state. There is no need for any additional mobile MRI scanners anywhere in the state.

Tables
The following tables are included in this section of the chapter: Table 9K, MRI Procedures by MRI Service Areas – All Fixed and Mobile Procedures – Totals with Tiered & % Mobile Equivalents; Table 9L (1), Inventory of MRI Scanners for Cardiovascular Clinical Research Use Pursuant to Policy AC-3 in the North Carolina 2001 State Medical Facilities Plan; Table 9L (2), Inventory of Dedicated Breast MRI Scanners Pursuant to Adjusted Need Determination in the North Carolina 2002 State Medical Facilities Plan and the North Carolina 2006 State Medical Facilities Plan; Table 9L (3) Inventory of Dedicated Pediatric MRI Scanner Pursuant to Adjusted Need Determination in the North Carolina 2005 State Medical Facilities Plan; Table 9L (4) Inventory of Demonstration Project for a Fixed Extremity MRI Scanner Pursuant to Adjusted Need Determination in the North Carolina 2006 State Medical Facilities Plan; Table 9L (5), Inventory of MRI Scanners Dedicated for Radiation Oncology and Use in Operating Room Suite; Table 9L (6): Inventory of Fixed Multi-Position MRI Scanners Dedicated For Two Demonstration Projects; and Table 9M, Fixed MRI Scanners Need Determination.

Service Type
Service Site (Provider/Owner)
CON # Total MRI Scans
Inpt Contrast
Inpt No Contrast
Outpt Contrast
Outpt No Contrast
Service Area Adjusted Total
Area Avg Procs Threshold
MRI Need
Table 9K: MRI by MRI Service Areas - All Fixed and Mobile Procedures - TOTALS with Tiered and % Mobile EquivalentsFixed
MagnetFixed Equiv
Hospital Fixed
G-006214-00 6,442 5815341,9343,393Alamance Alamance Regional Medical Center, Inc
7,8942 2.00
Mobile G-007053-04 0 0000Alamance Alamance Regional Medical Center
00 1.00
Mobile Grandfathered 175 0055122Alamance Atlantic Diagnostic-Burlington (Alliance Imaging Inc.)
1990 0.04
Mobile Grandfathered 25 00421Alamance Atlantic Diagnostic-Burlington (Alliance Imaging Inc.)
270 0.01
Mobile Grandfathered 27 00918Alamance Atlantic Diagnostic-Burlington (Alliance Imaging Inc.)
310 0.01
Mobile Temp. unit removed 12/07
47 00938Alamance Atlantic Diagnostic-Burlington (Alliance Imaging Inc.)
510 0.01
Mobile Grandfathered 720 03160557Alamance Atlantic Diagnostic-Burlington (Alliance Imaging Inc.)
7850 0.17
Alamance 7,436 8,9862 4,1183.24 2,773 0Mobile E-007059-04 0 0000Alexander Alexander County Public Health
Dept. (Frye Regional Medical Center)
00 0.10
Alexander 0 00 1,7160.10 0 0No Service Site
Alleghany 1,716 0Mobile F-006868-03 92 022466Anson Anson Community Hospital
(Carolinas Imaging Services)1020 0.05
Anson 92 1020 1,7160.05 102 0Hospital
FixedD-008162-08 0 0000Ashe Ashe Memorial Hospital, Inc 01 1.00
Mobile Grandfathered 776 1828224506Ashe Ashe Memorial Hospital Inc. (Alliance Imaging Inc.)
8910 0.19
Mobile G-006271-00 270 111172176Ashe Ashe Memorial Hospital Inc. (Alliance Imaging Inc.)
3120 0.07
Ashe 1,046 1,2031 3,7751.26 955 0Mobile G-006271-00 181 1932139Avery Charles A. Cannon Memorial
Hospital (Alliance Imaging Inc.)1980 0.11
Mobile Grandfathered 397 22191283Avery Charles A. Cannon Memorial Hospital (Alliance Imaging Inc.)
4430 0.23
Avery 578 6420 1,7160.34 642 0Hospital
FixedQ-005992-99 2,413 114845581,657Beaufort Beaufort County Hospital
Association, Inc 2,7611 1.00

Service Type
Service Site (Provider/Owner)
CON # Total MRI Scans
Inpt Contrast
Inpt No Contrast
Outpt Contrast
Outpt No Contrast
Service Area Adjusted Total
Area Avg Procs Threshold
MRI Need
Table 9K: MRI by MRI Service Areas - All Fixed and Mobile Procedures - TOTALS with Tiered and % Mobile EquivalentsFixed
MagnetFixed Equiv
Mobile Q-006884-03 316 91747243Beaufort Pungo District Hospital (Alliance Imaging & University Health Systems)
3490 0.08
Beaufort/Hyde 2,729 3,1101 3,7751.08 2,879 0Mobile Q-006884-03 377 81141317Bertie Bertie Memorial Hospital
(Alliance Imaging & University Health Systems)
4040 0.22
Bertie 377 4040 1,7160.22 404 0Mobile J-007013-04 441 61069356Bladen Bladen County Hospital
(WakeMed Health and Hospitals)4770 0.26
Bladen 441 4770 1,7160.26 477 0Hospital
FixedO-006658-02 2,451 1142125331,592Brunswick Brunswick Community Hospital,
LLC 2,8401 1.00
Mobile Grandfathered 13 0049Brunswick Arthur Dosher Memorial Hospital (Alliance Imaging Inc.)
150 0.00
Mobile O-007001-04 1,117 3228343714Brunswick Arthur Dosher Memorial Hospital (Alliance Imaging Inc.)
1,2910 0.30
Mobile Grandfathered 10 0028Brunswick Arthur Dosher Memorial Hospital (Alliance Imaging Inc.)
110 0.00
Mobile Grandfathered 10 0082Brunswick Atlantic Radiology Associates (Alliance Imaging Inc.)
130 0.00
Brunswick 3,601 4,1701 3,7751.30 3,208 0Hospital
FixedB-006869-03 6,777 1,1121,8311,2682,572Buncombe Memorial Mission Hospital 8,9122 2.00
Hospital Fixed
B-006215-00 2,862 652818419973Buncombe St. Joseph Hospital 3,8781 1.00
Freestand-ing Fixed
B-004178-90 10,284 003,9906,294Buncombe Asheville MRI [procedures for both units reported here]
11,8801 1.00
Freestand-ing Fixed
B-006446-01 0 0000Buncombe Asheville MRI [procedures reported on other unit]
01 1.00
Freestand-ing Fixed
B-006440-01 3,305 003182,987Buncombe Asheville Open MRI, Inc 3,4321 1.00
Freestand-ing Fixed
B-005492-96 6,587 009625,625Buncombe Asheville Open MRI, Inc 6,9721 1.00
Freestand-ing Fixed
B-006643-02 1,549 00581,491Buncombe Asheville Orthopaedic Assoc P.A. (Insight Health Corp)
1,5721 1.00
Freestand-ing Fixed
B-005583-97 2,907 001,3851,522Buncombe Mountain Neurosurgical and Spine Center, P.A.
3,4611 1.00
Freestand-ing Fixed
B-006444-01 613 0079534Buncombe Skyland MRI 6451 1.00

Service Type
Service Site (Provider/Owner)
CON # Total MRI Scans
Inpt Contrast
Inpt No Contrast
Outpt Contrast
Outpt No Contrast
Service Area Adjusted Total
Area Avg Procs Threshold
MRI Need
Table 9K: MRI by MRI Service Areas - All Fixed and Mobile Procedures - TOTALS with Tiered and % Mobile EquivalentsFixed
MagnetFixed Equiv
Mobile Grandfathered 236 0017219Buncombe Park Ridge Hospital (Alliance Imaging Inc.)
2430 0.05
Mobile Temp. unit removed 12/07
50 00050Buncombe Park Ridge Hospital (Alliance Imaging Inc.)
500 0.01
Mobile Grandfathered 72 00567Buncombe Park Ridge Hospital (Alliance Imaging Inc.)
740 0.01
Mobile Grandfathered 30 00624Buncombe Park Ridge Hospital (Alliance Imaging Inc.)
320 0.01
Mobile F-005723-97 246 000246Buncombe Southeastern Sports Medicine (Insight Health Corp)
2460 0.05
Mobile 36 003636Buncombe Southern Sports Medicine (Insight Health Corp)
860 0.01
B-M-Y 35,554 41,48410 4,80510.14 4,091 0Hospital
FixedE-006961-03 3,304 605803042,360Burke Grace Hospital, Inc. 3,7061 1.00
Hospital Fixed
E-007203-05 2,580 1402922241,924Burke Valdese General Hospital, Inc. 2,8981 1.00
Mobile E-007066-04 2,101 006911,410Burke Blue Ridge Radiology Associates 2,3770 0.51
Mobile Grandfathered 667 0453610Burke Carolina Orthopaedic Specialists (Alliance Imaging Inc.)
6900 0.16
Mobile Grandfathered 14 00113Burke Carolina Orthopaedic Specialists (Alliance Imaging Inc.)
140 0.00
Mobile E-008230-08 0 0000Burke Carolina Orthopaedic Specialists-Morganton (Carolina Orthopaedic Specialists)
00 0.16
Burke 8,666 9,6862 4,1182.83 3,422 0Hospital
FixedF-005933-98; F-006629-02; F-007086-04
21,979 3,8232,5766,5379,043Cabarrus CMC-NorthEast, Inc. 28,6834 4.00
Freestand-ing Fixed
F-007088-04 1,644 004861,158Cabarrus Access Medical Imaging, PLLC 1,8381 1.00
Freestand-ing Fixed
F-005916-98 2,159 003691,790Cabarrus Cabarrus Diagnostic Imaging 2,3071 1.00
Freestand-ing Fixed
F-007859-07 0 0000Cabarrus Southern Piedmont Imaging, LLC 01 1.00
Mobile F-006734-02 193 0057136Cabarrus Carolina NeuroSurgery & Spine Associates
2160 0.04
Mobile Grandfathered 48 001236Cabarrus CMC-Northeast Medical Center (Alliance Imaging Inc.)
530 0.01

Service Type
Service Site (Provider/Owner)
CON # Total MRI Scans
Inpt Contrast
Inpt No Contrast
Outpt Contrast
Outpt No Contrast
Service Area Adjusted Total
Area Avg Procs Threshold
MRI Need
Table 9K: MRI by MRI Service Areas - All Fixed and Mobile Procedures - TOTALS with Tiered and % Mobile EquivalentsFixed
MagnetFixed Equiv
Mobile Grandfathered 85 002065Cabarrus CMC-Northeast Medical Center (Alliance Imaging Inc.)
930 0.02
Mobile 979 00388591Cabarrus Northeast Orthopedics, PA (Insight Health Corp)
1,1340 0.20
Cabarrus 27,087 34,3237 4,8057.27 4,721 0Hospital
FixedE-007222-05 2,969 863476971,839Caldwell Caldwell Memorial Hospital, Inc. 3,4551 1.00
Mobile Grandfathered 1,381 011031,277Caldwell Carolina Orthopaedic Specialists (Alliance Imaging Inc.)
1,4230 0.37
Mobile E-008230-08 0 0000Caldwell Carolina Orthopaedic Specialists-Lenoir (Carolina Orthopaedic Specialists)
00 0.31
Caldwell 4,350 4,8781 3,7751.68 2,904 0Hospital
FixedP-005282-95 2,937 3392729161,410Carteret Carteret County General Hospital
Corporation 3,6831 1.00
Freestand-ing Fixed
P-008049-08 0 0000Carteret Carteret General Hospital and Seashore Imaging, LLC
01 1.00
Mobile Grandfathered 131 0027104Carteret Atlantic Diagnostic-Morehead (Alliance Imaging Inc.)
1420 0.03
Mobile Grandfathered 11 0029Carteret Atlantic Diagnostic-Morehead (Alliance Imaging Inc.)
120 0.00
Mobile Grandfathered 959 00151808Carteret Atlantic Diagnostic-Morehead (Alliance Imaging Inc.)
1,0190 0.23
Mobile Grandfathered 147 0021126Carteret Atlantic Diagnostic-Morehead (Alliance Imaging Inc.)
1550 0.04
Mobile Grandfathered 613 0076537Carteret Atlantic Diagnostic-Morehead (Alliance Imaging Inc.)
6430 0.15
Mobile O-006434-01 362 0076286Carteret Atlantic Diagnostic-Morehead (Cape Fear Diagnostic Imaging)
3920 0.09
Mobile J-007013-04 225 0068157Carteret Carteret County Hospital (WakeMed Health and Hospitals)
2520 0.05
Carteret 5,385 6,3002 4,1182.59 2,432 0Hospital
FixedE-007270-05 8,151 1,0874703,4461,491Catawba Catawba Valley Medical Center 8,9302 2.00
Hospital Fixed
E-004812-93; E-005922-98
4,526 7865391,1892,012Catawba Frye Regional Medical Center 5,8462 2.00
Mobile Grandfathered 1,544 021531,389Catawba Carolina Orthopaedic Specialists (Alliance Imaging Inc.)
1,6060 0.32

Service Type
Service Site (Provider/Owner)
CON # Total MRI Scans
Inpt Contrast
Inpt No Contrast
Outpt Contrast
Outpt No Contrast
Service Area Adjusted Total
Area Avg Procs Threshold
MRI Need
Table 9K: MRI by MRI Service Areas - All Fixed and Mobile Procedures - TOTALS with Tiered and % Mobile EquivalentsFixed
MagnetFixed Equiv
Mobile Grandfathered 736 00102634Catawba Carolina Orthopaedic Specialists (Alliance Imaging Inc.)
7770 0.15
Mobile G-007038-04 16 00412Catawba Carolina Orthopaedic Specialists (Alliance Imaging Inc.)
180 0.00
Mobile E-008230-08 0 0000Catawba Carolina Orthopaedic Specialists-Hickory (Carolina Orthopaedic Specialists)
00 0.38
Mobile E-008230-08 0 0000Catawba Carolina Orthopaedic Specialists-Newton (Carolina Orthopaedic Specialists)
00 0.15
Mobile E-007059-04 3,044 001,0312,013Catawba FryeCare (Frye Regional Medical Center)
3,4560 0.63
Mobile Temp. unit removed 12/07
177 0022155Catawba Hickory Orthopaedic Center (Alliance Imaging Inc.)
1860 0.04
Mobile Grandfathered 117 0015102Catawba Hickory Orthopaedic Center (Alliance Imaging Inc.)
1230 0.02
Mobile Grandfathered 297 0042255Catawba Hickory Orthopaedic Center (Alliance Imaging Inc.)
3140 0.06
Mobile G-007038-04 832 0084748Catawba Hickory Orthopaedic Center (Alliance Imaging Inc.)
8660 0.17
Catawba 19,440 22,1214 4,8055.92 3,737 0Mobile Grandfathered 217 71548147Chatham Chatham Hospital (Alliance
Imaging Inc.)2480 0.13
Mobile Grandfathered 226 12340162Chatham Chatham Hospital (Alliance Imaging Inc.)
2520 0.13
Chatham 443 5000 1,7160.26 500 0Hospital
FixedA-006767-03 1,728 25504961,157Cherokee Murphy Medical Center, Inc. 1,9661 1.00
C-G-C 1,728 1,9661 3,7751.00 1,966 0Hospital
FixedR-008168-08 0 0000Chowan Chowan Hospital (East Carolina
Health) 01 1.00
Mobile Q-006884-03 1,196 5086227833Chowan Chowan Hospital (Alliance Imaging & University Health Systems)
1,3610 0.32
Chowan/Tyrell 1,196 1,3611 3,7751.32 1,031 0Hospital
FixedC-005725-97 4,789 3092871,6272,566Cleveland Cleveland Regional Medical
Center 5,8021 1.00
Hospital Fixed
C-006915-03 1,166 5654336720Cleveland Kings Mountain Hospital 1,3671 1.00
Mobile F-007987-07 0 0000Cleveland OrthoCarolina P.A. 00 0.25

Service Type
Service Site (Provider/Owner)
CON # Total MRI Scans
Inpt Contrast
Inpt No Contrast
Outpt Contrast
Outpt No Contrast
Service Area Adjusted Total
Area Avg Procs Threshold
MRI Need
Table 9K: MRI by MRI Service Areas - All Fixed and Mobile Procedures - TOTALS with Tiered and % Mobile EquivalentsFixed
MagnetFixed Equiv
Mobile Grandfathered 794 000794Cleveland Miller Orthopedic-Shelby (Alliance Imaging Inc.)
7940 0.19
Cleveland 6,749 7,9632 4,1182.44 3,263 0Hospital
FixedO-006426-01 2,326 031902,007Columbus Columbus Regional Healthcare
System 2,4541 1.00
Mobile Grandfathered 32 00428Columbus Atlantic Radiology Associates (Alliance Imaging Inc.)
340 0.01
Mobile Grandfathered 362 0076286Columbus Atlantic Radiology Associates (Alliance Imaging Inc.)
3920 0.10
Mobile Grandfathered 105 002778Columbus Atlantic Radiology Associates (Alliance Imaging Inc.)
1160 0.03
Mobile Grandfathered 17 00512Columbus Atlantic Radiology Associates-Goldsboro Orthopaedics (Alliance Imaging Inc.)
190 0.00
Mobile O-007340-05 309 000309Columbus Columbus Orthopedics (Waccamaw Ultrasound & Diagnostics, Inc)
3090 0.08
Mobile O-007340-05 996 00100896Columbus Waccamaw Imaging (Waccamaw Ultrasound & Diagnostics, Inc)
1,0360 0.26
Mobile Grandfathered 133 0013120Columbus Waccamaw Imaging, Inc. (Alliance Imaging Inc.)
1380 0.04
Mobile O-007340-05 294 000294Columbus Whiteville Medical (Waccamaw Ultrasound & Diagnostics, Inc)
2940 0.08
Columbus 4,574 4,7921 3,7751.60 2,995 0Hospital
FixedP-005760-97 6,104 9021,3921,4612,349Craven CarolinaEast Medical Center
(Craven Reg Med Auth) 7,9672 2.00
Freestand-ing Fixed
P-006764-03 5,547 002,1053,442Craven Coastal Carolina Health Care, P.A.
6,3891 1.00
Freestand-ing Fixed
P-008108-08 0 0000Craven Coastal Carolina Health Care, P.A.
01 1.00
Mobile Q-006884-03 599 11172425Jones Eastern Carolina Internal Medicine (Alliance Imaging & University Health Systems)
6690 0.12
Mobile Grandfathered 211 0069142Jones Eastern Carolina Internal Medicine (Alliance Imaging Inc.)
2390 0.04
Mobile Grandfathered 57 001344Jones Eastern Carolina Internal Medicine (Alliance Imaging Inc.)
620 0.01
C-J-P 12,518 15,3264 4,8054.17 3,675 0Hospital
FixedM-006603-02 7,386 1,7671,9212,3951,303Cumberland Cape Fear Valley Medical Center 10,5262 2.00

Service Type
Service Site (Provider/Owner)
CON # Total MRI Scans
Inpt Contrast
Inpt No Contrast
Outpt Contrast
Outpt No Contrast
Service Area Adjusted Total
Area Avg Procs Threshold
MRI Need
Table 9K: MRI by MRI Service Areas - All Fixed and Mobile Procedures - TOTALS with Tiered and % Mobile EquivalentsFixed
MagnetFixed Equiv
Hospital Fixed
1,123 06836281Cumberland Highsmith-Rainey Specialty Hospital
1,4601 1.00
Freestand-ing Fixed
M-007924-07 0 0000Cumberland Carolina Imaging of Fayetteville 01 1.00
Freestand-ing Fixed
M-005899-98 6,587 009975,590Cumberland Carolina Imaging of Fayetteville 6,9861 1.00
Freestand-ing Fixed
Grandfathered 5,429 001,1294,300Cumberland Diagnostic Health of Fayetteville (National Imaging Affiliates of Fayetteville, Inc.)
5,8811 1.00
Freestand-ing Fixed
M-005905-98 1,558 003041,254Cumberland Diagnostic Health of Fayetteville (Open MRI of Fayetteville)
1,6801 1.00
Mobile Grandfathered 47 00443Cumberland Atlantic Radiology Associates-Fayetteville (Alliance Imaging Inc.)
490 0.01
Mobile Grandfathered 122 0019103Cumberland Atlantic Radiology Associates-Fayetteville (Alliance Imaging Inc.)
1300 0.03
Mobile Grandfathered 12 00111Cumberland Atlantic Radiology Associates-Fayetteville (Alliance Imaging Inc.)
120 0.00
Mobile Grandfathered 273 0051222Cumberland Atlantic Radiology Associates-Fayetteville (Alliance Imaging Inc.)
2930 0.06
Mobile O-006665-02 3,290 008432,447Cumberland Carolina Imaging of Fayetteville (Cape Fear Mobile Imaging)
3,6270 0.68
Mobile 1,082 00281801Cumberland Carolina Imaging of Fayetteville (King's Medical Company)
1,1940 0.23
Mobile 1,240 00272968Cumberland Cross Creek Imaging (Insight Health Corp)
1,3490 0.26
Mobile F-005723-97 88 001672Cumberland Cross Creek Imaging (Insight Health Corp)
940 0.02
Mobile 38 001325Cumberland Cross Creek Imaging (Insight Health Corp)
430 0.01
Mobile Grandfathered 11 0029Cumberland Cross Creek Imaging, LLC (Alliance Imaging Inc.)
120 0.00
Mobile Grandfathered 28 00523Cumberland Cross Creek Imaging, LLC (Alliance Imaging Inc.)
300 0.01
Mobile Grandfathered 15 00411Cumberland Cross Creek Imaging, LLC (Alliance Imaging Inc.)
170 0.00
Mobile Grandfathered 16 00610Cumberland Cross Creek Imaging, LLC (Alliance Imaging Inc.)
180 0.00
Cumberland/Hoke 28,345 33,4017 4,8058.31 4,019 0
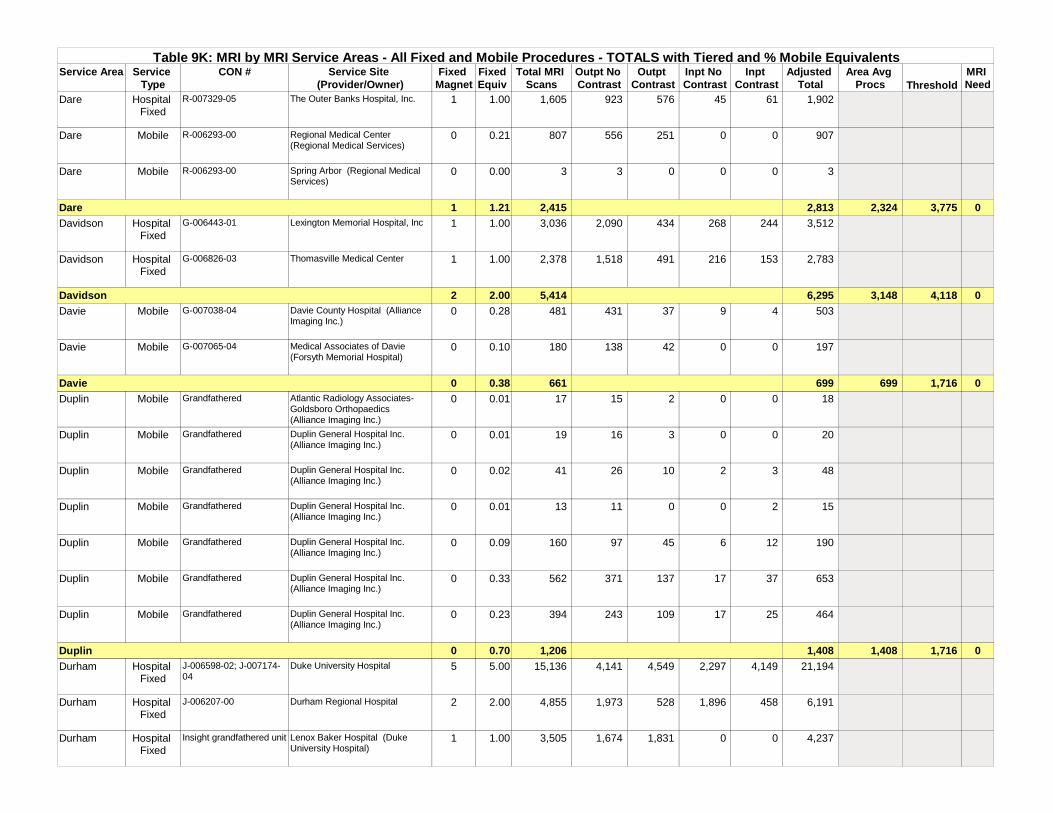
Service Type
Service Site (Provider/Owner)
CON # Total MRI Scans
Inpt Contrast
Inpt No Contrast
Outpt Contrast
Outpt No Contrast
Service Area Adjusted Total
Area Avg Procs Threshold
MRI Need
Table 9K: MRI by MRI Service Areas - All Fixed and Mobile Procedures - TOTALS with Tiered and % Mobile EquivalentsFixed
MagnetFixed Equiv
Hospital Fixed
R-007329-05 1,605 6145576923Dare The Outer Banks Hospital, Inc. 1,9021 1.00
Mobile R-006293-00 807 00251556Dare Regional Medical Center (Regional Medical Services)
9070 0.21
Mobile R-006293-00 3 0003Dare Spring Arbor (Regional Medical Services)
30 0.00
Dare 2,415 2,8131 3,7751.21 2,324 0Hospital
FixedG-006443-01 3,036 2442684342,090Davidson Lexington Memorial Hospital, Inc 3,5121 1.00
Hospital Fixed
G-006826-03 2,378 1532164911,518Davidson Thomasville Medical Center 2,7831 1.00
Davidson 5,414 6,2952 4,1182.00 3,148 0Mobile G-007038-04 481 4937431Davie Davie County Hospital (Alliance
Imaging Inc.)5030 0.28
Mobile G-007065-04 180 0042138Davie Medical Associates of Davie (Forsyth Memorial Hospital)
1970 0.10
Davie 661 6990 1,7160.38 699 0Mobile Grandfathered 17 00215Duplin Atlantic Radiology Associates-
Goldsboro Orthopaedics (Alliance Imaging Inc.)
180 0.01
Mobile Grandfathered 19 00316Duplin Duplin General Hospital Inc. (Alliance Imaging Inc.)
200 0.01
Mobile Grandfathered 41 321026Duplin Duplin General Hospital Inc. (Alliance Imaging Inc.)
480 0.02
Mobile Grandfathered 13 20011Duplin Duplin General Hospital Inc. (Alliance Imaging Inc.)
150 0.01
Mobile Grandfathered 160 1264597Duplin Duplin General Hospital Inc. (Alliance Imaging Inc.)
1900 0.09
Mobile Grandfathered 562 3717137371Duplin Duplin General Hospital Inc. (Alliance Imaging Inc.)
6530 0.33
Mobile Grandfathered 394 2517109243Duplin Duplin General Hospital Inc. (Alliance Imaging Inc.)
4640 0.23
Duplin 1,206 1,4080 1,7160.70 1,408 0Hospital
FixedJ-006598-02; J-007174-04
15,136 4,1492,2974,5494,141Durham Duke University Hospital 21,1945 5.00
Hospital Fixed
J-006207-00 4,855 4581,8965281,973Durham Durham Regional Hospital 6,1912 2.00
Hospital Fixed
Insight grandfathered unit 3,505 001,8311,674Durham Lenox Baker Hospital (Duke University Hospital)
4,2371 1.00

Service Type
Service Site (Provider/Owner)
CON # Total MRI Scans
Inpt Contrast
Inpt No Contrast
Outpt Contrast
Outpt No Contrast
Service Area Adjusted Total
Area Avg Procs Threshold
MRI Need
Table 9K: MRI by MRI Service Areas - All Fixed and Mobile Procedures - TOTALS with Tiered and % Mobile EquivalentsFixed
MagnetFixed Equiv
Hospital Fixed
J-007174-04 3,484 001,8201,664Durham Lenox Baker Hospital (Duke University Hospital)
4,2121 1.00
Hospital Fixed
J-006598-02 3,653 001,9081,745Durham Lenox Baker Hospital (Duke University Hospital)
4,4161 1.00
Hospital Fixed
J-006108-99 2,324 001,2211,103Durham Lenox Baker Hospital (Duke University Hospital)
2,8121 1.00
Hospital Fixed
Alliance grandfathered unit
3,856 002,0141,842Durham Lenox Baker Hospital (Duke University Hospital)
4,6621 1.00
Freestand-ing Fixed
J-006760-03 3,856 001,1712,685Durham Durham Diagnostic Imaging, LLC 4,3241 1.00
Freestand-ing Fixed
J-007031-04 6,285 003535,932Durham Triangle Orthopaedic Associates, P.A.
6,4261 1.00
Mobile Grandfathered 2 0002Durham Atlantic Diagnostic-Durham (Alliance Imaging Inc.)
20 0.00
Mobile Grandfathered 190 0042148Durham Atlantic Diagnostic-Durham (Alliance Imaging Inc.)
2070 0.04
Mobile Grandfathered 473 12103367Durham Atlantic Diagnostic-Durham (Alliance Imaging Inc.)
5160 0.10
Mobile M-006605-02 796 00235591Durham Durham Diagnostic Imaging-South Park Dr (Mobile Imaging of NC)
9200 0.17
Mobile M-006605-02 409 00150259Durham Regional Neurosurgery (Mobile Imaging of NC)
4690 0.09
Mobile Grandfathered 564 002562Durham Triangle Orthopedic (Alliance Imaging Inc.)
5650 0.12
Durham 49,388 61,15314 4,80514.52 4,212 0Hospital
FixedL-008327-09 0 0000Edgecombe East Carolina Health-Heritage,
Inc. 01 1.00
Mobile Q-006884-03 856 129156122449Edgecombe Heritage Hospital (Alliance Imaging & University Health Systems)
1,0700 0.23
Mobile Grandfathered 811 8894119510Edgecombe Heritage Hospital (Alliance Imaging Inc.)
9670 0.21
Edgecombe 1,667 2,0371 3,7751.44 1,415 0Hospital
FixedG-004293-91; G-006588-02; G-007919-07
12,747 7,0182,7092,022998Forsyth Forsyth Memorial Hospital, Inc. 20,2543 3.00
Hospital Fixed
G-007083-04 21,896 4,4041,6169,9825,894Forsyth North Carolina Baptist Hospital 30,0585 5.00
Freestand-ing Fixed
G-007780-07 0 0000Forsyth NCBH Outpatient Imaging, LLC 01 1.00

Service Type
Service Site (Provider/Owner)
CON # Total MRI Scans
Inpt Contrast
Inpt No Contrast
Outpt Contrast
Outpt No Contrast
Service Area Adjusted Total
Area Avg Procs Threshold
MRI Need
Table 9K: MRI by MRI Service Areas - All Fixed and Mobile Procedures - TOTALS with Tiered and % Mobile EquivalentsFixed
MagnetFixed Equiv
Freestand-ing Fixed
6,203 001,5814,622Forsyth Excel Imaging Maplewood 6,8351 1.00
Freestand-ing Fixed
G-007387-05 1,551 003951,156Forsyth Excel Imaging Maplewood [moved from Salem; operational 6/23/2008]
1,7091 1.00
Freestand-ing Fixed
4,145 009103,235Forsyth Excel Imaging Salem MRI 4,5091 1.00
Freestand-ing Fixed
G-007387-05 3,391 007442,647Forsyth Excel Imaging Salem MRI [operated 10/1/2007-6/13/2008; moved to Maplewood]
3,6890 0.00
Freestand-ing Fixed
Grandfathered 5,259 001,2094,050Forsyth Piedmont Imaging, Inc 5,7431 1.00
Freestand-ing Fixed
G-006893-03 5,904 001,4544,450Forsyth Piedmont Imaging, Inc 6,4861 1.00
Freestand-ing Fixed
G-008196-08 0 0000Forsyth Piedmont Imaging, LLC 01 1.00
Mobile G-007065-04 1,357 0001,357Forsyth Central Triad Imaging (Forsyth Memorial Hospital)
1,3570 0.28
Mobile 2,516 004812,035Forsyth Excel Imaging (Insight Health Corp)
2,7080 0.52
Mobile F-005723-97 307 0067247Forsyth Excel Imaging- Kernersville (Insight Health Corp)
3410 0.06
Mobile 57 00948Forsyth Excel Imaging-Kernersville (Insight Health Corp)
610 0.01
Mobile Grandfathered 51 00843Forsyth Greensboro Imaging @ Kernersville (Alliance Imaging Inc.)
540 0.01
Mobile G-007723-06 180 0034146Forsyth Kernersville Clinic (Orthopaedic Specialists of the Carolinas PA)
1940 0.04
Mobile G-007723-06 2,771 002112,560Forsyth Orthopaedic Specialists of the Carolinas PA
2,8550 0.58
Mobile G-007038-04 782 0064718Forsyth Orthopedic Specialists of the Carolinas (Alliance Imaging Inc.)
8080 0.16
Mobile G-007065-04 1,340 0001,340Forsyth Winston-Salem Healthcare (Forsyth Memorial Hospital)
1,3400 0.28
0 0000Forsyth 2009 SMFP Need Determination 01 1.00
Forsyth 70,457 89,00016 4,80517.94 4,961 1Hospital
FixedK-007501-06 1,899 92412400995Franklin Franklin Regional Medical Center 2,2971 1.00
Franklin 1,899 2,2971 3,7751.00 2,297 0

Service Type
Service Site (Provider/Owner)
CON # Total MRI Scans
Inpt Contrast
Inpt No Contrast
Outpt Contrast
Outpt No Contrast
Service Area Adjusted Total
Area Avg Procs Threshold
MRI Need
Table 9K: MRI by MRI Service Areas - All Fixed and Mobile Procedures - TOTALS with Tiered and % Mobile EquivalentsFixed
MagnetFixed Equiv
Hospital Fixed
F-005577-97 7,532 2,2081,6012,1991,524Gaston Gaston Memorial Hospital 10,8181 1.00
Hospital Fixed
F-006620-02 4,558 101,7332,824Gaston Gaston Memorial Hospital, CaroMont Imaging Services, Belmont
5,2521 1.00
Hospital Fixed
F-006622-02 3,895 001,2882,607Gaston Gaston Memorial Hospital, CaroMont Imaging Services, Summit
4,4101 1.00
Hospital Fixed
2,734 009071,827Gaston Gaston Memorial Hospital-The Diagnostic Center
3,0971 1.00
Mobile F-008000-07 0 0000Gaston MRI Specialists of The Carolinas, LLC
00 1.00
Mobile Grandfathered 1,029 00221808Gaston Mecklenburg Diagnostic-Gastonia (Alliance Imaging Inc.)
1,1170 0.21
Mobile Grandfathered 961 00226735Gaston Mecklenburg Diagnostics-Cox (Alliance Imaging Inc.)
1,0510 0.20
Gaston 20,709 25,7464 4,8055.41 4,759 0Hospital
FixedK-007190-04 1,782 35792531,301Granville Granville Health System 1,8291 1.00
Granville 1,782 1,8291 4,1181.00 1,829 0Hospital
FixedG-005924-98 5,201 5281,4947322,447Guilford High Point Regional Health
System 6,5142 2.00
Hospital Fixed
G-006299-00 7,964 1,7012,9781,5041,781Guilford The Moses H. Cone Memorial Operating Corporation
11,1182 2.00
Hospital Fixed
3,164 3355371,2291,063Guilford Wesley Long Community Hospital
4,1381 1.00
Freestand-ing Fixed
G-007269-05 3,689 001,1942,495Guilford Cornerstone Health Care, PA 4,1671 1.00
Freestand-ing Fixed
G-006952-03 5,980 003,6532,327Guilford Diagnostic Radiology & Imaging, LLC
7,4411 1.00
Freestand-ing Fixed
5,988 003,4062,582Guilford Diagnostic Radiology & Imaging, LLC
7,3501 1.00
Freestand-ing Fixed
2,969 007042,265Guilford Southeastern Radiology P.A. 3,2511 1.00
Freestand-ing Fixed
Grandfathered 5,286 001,0054,281Guilford Triad Imaging, Inc-Henry St. (Triad Imaging, Inc-MedQuest)
5,6881 1.00
Mobile 2,779 008031,976Guilford Cornerstone Healthcare, PA (Insight Health Corp)
3,1000 0.58
Mobile Grandfathered 3,654 003213,333Guilford Greensboro Orthopaedic Center (Alliance Imaging Inc.)
3,7820 0.76

Service Type
Service Site (Provider/Owner)
CON # Total MRI Scans
Inpt Contrast
Inpt No Contrast
Outpt Contrast
Outpt No Contrast
Service Area Adjusted Total
Area Avg Procs Threshold
MRI Need
Table 9K: MRI by MRI Service Areas - All Fixed and Mobile Procedures - TOTALS with Tiered and % Mobile EquivalentsFixed
MagnetFixed Equiv
Mobile Grandfathered 872 0064808Guilford Greensboro Orthopaedic Center (Alliance Imaging Inc.)
8980 0.18
Mobile 1,111 00554557Guilford Guilford Neurologic Assoiciates (King's Medical Company)
1,3330 0.23
Mobile G-007064-04 1,198 12264931Guilford High Point Regional Health System
1,3050 0.25
Mobile G-007064-04 544 00147397Guilford Johnson Neurological Clinic (High Point Regional Health System)
6030 0.11
Mobile Grandfathered 1,256 001231,133Guilford SE Orthopaedic Specialists, P.A. (Alliance Imaging Inc.)
1,3050 0.26
Mobile G-006271-00 3,176 003302,846Guilford SE Orthopaedic Specialists, P.A. (Alliance Imaging Inc.)
3,3080 0.66
Mobile Grandfathered 561 0032529Guilford SE Orthopaedic Specialists, P.A. (Alliance Imaging Inc.)
5740 0.12
Mobile 683 00178505Guilford Triad Imaging, Inc (King's Medical Company)
7540 0.14
Mobile Grandfathered 138 004593Guilford Vanguard Brain & Spine Specialists (Alliance Imaging Inc.)
1560 0.03
Mobile G-006271-00 164 000164Guilford Vanguard Brain & Spine Specialists (Alliance Imaging Inc.)
1640 0.03
Mobile G-006271-00 90 002565Guilford Vanguard Brain & Spine Specialists (Alliance Imaging Inc.)
1000 0.02
Mobile Grandfathered 6 0006Guilford Vanguard Brain & Spine Specialists (Alliance Imaging Inc.)
60 0.00
0 0000Guilford 2009 SMFP Need Determination 01 1.00
Guilford 56,473 67,05511 4,80514.37 4,666 0Hospital
FixedL-007257-05 2,349 1762254721,476Halifax Halifax Regional Medical Center,
Inc. 2,7691 1.00
Halifax/Northampton 2,349 2,7691 3,7751.00 2,769 0Hospital
FixedM-006712-02 3,248 2882028291,929Harnett Betsy Johnson Regional Hospital 3,8911 1.00
Mobile M-006605-02 1,124 00181943Harnett Carolina Regional Radiology (Mobile Imaging of NC)
1,1960 0.27
Mobile 225 000225Harnett Oudeh Medical Plaza (Insight Health Corp)
2250 0.05
0 0000Harnett 2009 SMFP Need Determination 01 1.00

Service Type
Service Site (Provider/Owner)
CON # Total MRI Scans
Inpt Contrast
Inpt No Contrast
Outpt Contrast
Outpt No Contrast
Service Area Adjusted Total
Area Avg Procs Threshold
MRI Need
Table 9K: MRI by MRI Service Areas - All Fixed and Mobile Procedures - TOTALS with Tiered and % Mobile EquivalentsFixed
MagnetFixed Equiv
Harnett 4,597 5,3122 4,1182.32 2,290 0Hospital
FixedA-005060-94; A-007807-07
3,551 1202881,2691,874Haywood Haywood Regional Medical Center
4,2702 2.00
Haywood 3,551 4,2702 4,1182.00 2,135 0Hospital
FixedB-006004-99 6,337 2163261,8233,972Henderson Margaret R. Pardee Memorial
Hospital 7,3692 2.00
Hospital Fixed
B-006012-99; B-007384-05
2,684 1452055061,828Henderson Park Ridge Hospital 3,0841 1.00
Mobile G-006271-00 144 0038106Henderson Laurel Park Medical Centre (Alliance Imaging Inc.)
1590 0.03
Mobile Grandfathered 10 0037Henderson Laurel Park Medical Centre-Fletcher (Alliance Imaging Inc.)
110 0.00
Mobile Grandfathered 88 001870Henderson Laurel Park Medical Centre-Hendersonville (Alliance Imaging Inc.)
950 0.02
Henderson 9,263 10,7193 4,4623.05 3,515 0Hospital
FixedQ-007213-05 2,259 2122214301,396Hertford Roanoke-Chowan Hospital 2,6891 1.00
Hertford/Gates 2,259 2,6891 3,7751.00 2,689 0Hospital
FixedF-006728-02 2,653 1713606821,440Iredell Davis Regional Medical Center 3,2071 1.00
Hospital Fixed
F-005340-96 4,067 7995209941,754Iredell Iredell Memorial Hospital 5,3121 1.00
Hospital Fixed
F-005815-98; F-006591-02
4,052 1704551,2262,201Iredell Lake Norman Regional Medical Center
4,8602 2.00
Freestand-ing Fixed
F-006957-03 3,483 006862,797Iredell Piedmont Healthcare, P.A. 3,7571 1.00
Mobile 255 000255Iredell Carolina Specialty Care (Insight Health Corp)
2550 0.05
Mobile Grandfathered 1,776 003031,473Iredell Mecklenburg Diagnostic Imaging (Alliance Imaging Inc.)
1,8970 0.37
Mobile Grandfathered 365 000365Iredell Northshore Orthopedic and Sport (Alliance Imaging Inc.)
3650 0.08
Mobile Grandfathered 489 0068421Iredell Piedmont Healthcare (Alliance Imaging Inc.)
5160 0.10
Mobile Grandfathered 9 0027Iredell Piedmont HealthCare PA (Alliance Imaging Inc.)
100 0.00
Iredell 17,149 20,1795 4,8055.60 3,603 0
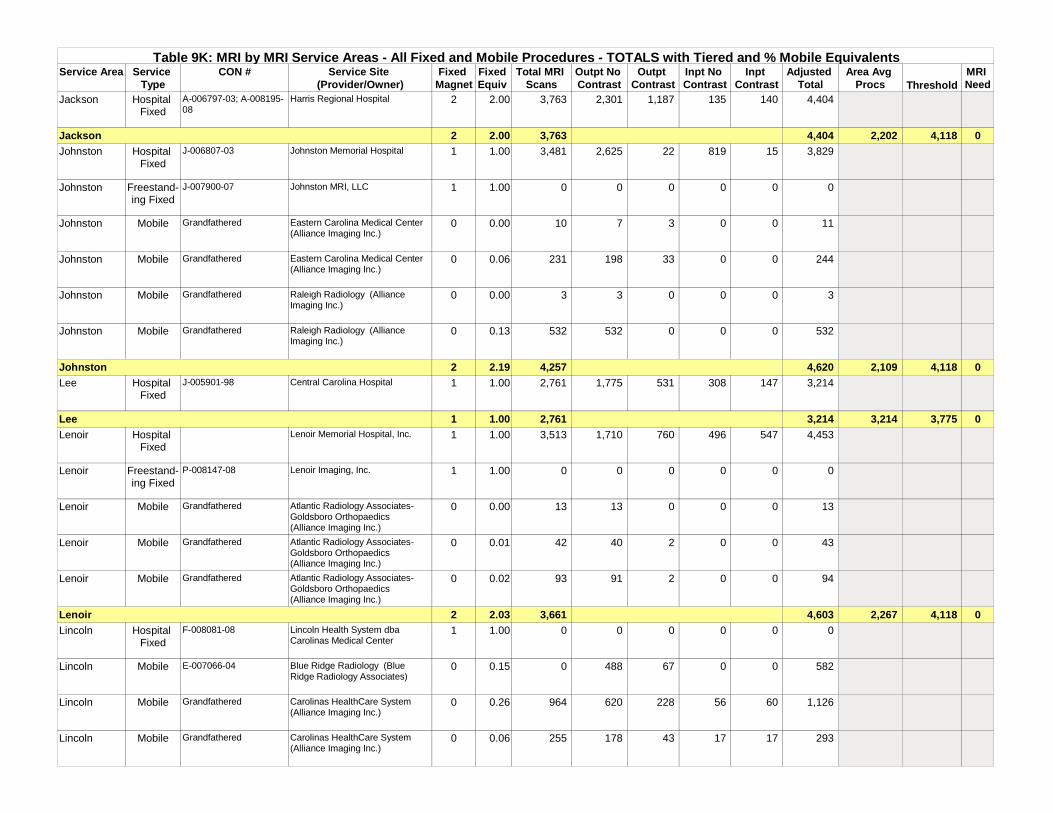
Service Type
Service Site (Provider/Owner)
CON # Total MRI Scans
Inpt Contrast
Inpt No Contrast
Outpt Contrast
Outpt No Contrast
Service Area Adjusted Total
Area Avg Procs Threshold
MRI Need
Table 9K: MRI by MRI Service Areas - All Fixed and Mobile Procedures - TOTALS with Tiered and % Mobile EquivalentsFixed
MagnetFixed Equiv
Hospital Fixed
A-006797-03; A-008195-08
3,763 1401351,1872,301Jackson Harris Regional Hospital 4,4042 2.00
Jackson 3,763 4,4042 4,1182.00 2,202 0Hospital
FixedJ-006807-03 3,481 15819222,625Johnston Johnston Memorial Hospital 3,8291 1.00
Freestand-ing Fixed
J-007900-07 0 0000Johnston Johnston MRI, LLC 01 1.00
Mobile Grandfathered 10 0037Johnston Eastern Carolina Medical Center (Alliance Imaging Inc.)
110 0.00
Mobile Grandfathered 231 0033198Johnston Eastern Carolina Medical Center (Alliance Imaging Inc.)
2440 0.06
Mobile Grandfathered 3 0003Johnston Raleigh Radiology (Alliance Imaging Inc.)
30 0.00
Mobile Grandfathered 532 000532Johnston Raleigh Radiology (Alliance Imaging Inc.)
5320 0.13
Johnston 4,257 4,6202 4,1182.19 2,109 0Hospital
FixedJ-005901-98 2,761 1473085311,775Lee Central Carolina Hospital 3,2141 1.00
Lee 2,761 3,2141 3,7751.00 3,214 0Hospital
Fixed3,513 5474967601,710Lenoir Lenoir Memorial Hospital, Inc. 4,4531 1.00
Freestand-ing Fixed
P-008147-08 0 0000Lenoir Lenoir Imaging, Inc. 01 1.00
Mobile Grandfathered 13 00013Lenoir Atlantic Radiology Associates-Goldsboro Orthopaedics (Alliance Imaging Inc.)
130 0.00
Mobile Grandfathered 42 00240Lenoir Atlantic Radiology Associates-Goldsboro Orthopaedics (Alliance Imaging Inc.)
430 0.01
Mobile Grandfathered 93 00291Lenoir Atlantic Radiology Associates-Goldsboro Orthopaedics (Alliance Imaging Inc.)
940 0.02
Lenoir 3,661 4,6032 4,1182.03 2,267 0Hospital
FixedF-008081-08 0 0000Lincoln Lincoln Health System dba
Carolinas Medical Center 01 1.00
Mobile E-007066-04 0 0067488Lincoln Blue Ridge Radiology (Blue Ridge Radiology Associates)
5820 0.15
Mobile Grandfathered 964 6056228620Lincoln Carolinas HealthCare System (Alliance Imaging Inc.)
1,1260 0.26
Mobile Grandfathered 255 171743178Lincoln Carolinas HealthCare System (Alliance Imaging Inc.)
2930 0.06

Service Type
Service Site (Provider/Owner)
CON # Total MRI Scans
Inpt Contrast
Inpt No Contrast
Outpt Contrast
Outpt No Contrast
Service Area Adjusted Total
Area Avg Procs Threshold
MRI Need
Table 9K: MRI by MRI Service Areas - All Fixed and Mobile Procedures - TOTALS with Tiered and % Mobile EquivalentsFixed
MagnetFixed Equiv
Mobile F-006868-03 1,033 6172255512Lincoln CMC-Lincoln (Carolinas Imaging Services)
1,0800 0.24
Lincoln 2,252 3,0801 3,7751.71 1,801 0Hospital
FixedA-006828-03 1,601 42271,013519Macon Angel Medical Center, Inc 2,0511 1.00
Hospital Fixed
A-007197-05 409 09116284Macon Highlands-Cashiers Hospital, Inc. 4591 1.00
Mobile Grandfathered 149 005693Macon WestCare Health System-Franklin (Alliance Imaging Inc.)
1710 0.04
Mobile G-006271-00 30 00030Macon WestCare Health System-Franklin (Alliance Imaging Inc.)
300 0.01
Macon 2,189 2,7112 4,1182.05 1,322 0Mobile Grandfathered 544 0041503Martin Martin General Hospital (Alliance
Imaging Inc.)5600 0.32
Martin 544 5600 1,7160.32 560 0Hospital
FixedC-007304-05 1,763 22563371,348McDowell The McDowell Hospital, Inc. 1,9381 1.00
McDowell 1,763 1,9381 3,7751.00 1,938 0Hospital
FixedF-005918-98; F-006493-01
11,734 2,6282,1864,2322,688Mecklenburg Carolinas Medical Center 16,4043 3.00
Hospital Fixed
F-006830-03 10,901 1,0439313,4485,479Mecklenburg Carolinas Medical Center Mercy/Pineville
13,4872 2.00
Hospital Fixed
F-005919-98 5,121 5023321,7102,577Mecklenburg Carolinas Medical Center-University
6,3391 1.00
Hospital Fixed
F-005580-97 4,509 1534221,2422,692Mecklenburg Presbyterian Hospital Huntersville [moved from Randolph Radiology 11/2007]
5,2971 1.00
Hospital Fixed
F-006379-01 6,684 4668862,3602,972Mecklenburg Presbyterian Hospital Matthews 8,3551 1.00
Hospital Fixed
F-005575-97 3,398 29391,1112,219Mecklenburg Presbyterian Orthopaedic Hospital, LLC
3,8811 1.00
Hospital Fixed
F-006499-01 8,650 1,6932,4342,5521,971Mecklenburg The Presbyterian Hospital 11,9992 2.00
Freestand-ing Fixed
F-005918-98 603 00221384Mecklenburg Carolinas Imaging Services [moved from Charlotte Radiology 7/2008 per 1/2008 dec. ruling]
6931 1.00
Freestand-ing Fixed
F-007167-04 664 00185479Mecklenburg Carolinas Imaging Services [moved to CIS Ballantyne 7/2008]
7380 0.00
Freestand-ing Fixed
F-007167-04 469 00118351Mecklenburg Carolinas Imaging Services [moved from CIS Huntersville 7/2008]
5161 1.00

Service Type
Service Site (Provider/Owner)
CON # Total MRI Scans
Inpt Contrast
Inpt No Contrast
Outpt Contrast
Outpt No Contrast
Service Area Adjusted Total
Area Avg Procs Threshold
MRI Need
Table 9K: MRI by MRI Service Areas - All Fixed and Mobile Procedures - TOTALS with Tiered and % Mobile EquivalentsFixed
MagnetFixed Equiv
Freestand-ing Fixed
Grandfathered 2,325 005951,744Mecklenburg Charlotte Radiology P.A. [unit will be moved to CMC]
2,5771 1.00
Freestand-ing Fixed
F-005918-98 1,550 003961,162Mecklenburg Charlotte Radiology P.A. [moved to CIS 7/2008 per 1/2008 dec. ruling]
1,7160 0.00
Freestand-ing Fixed
F-007068-04 1,761 003491,412Mecklenburg Mecklenburg Diagnostic Imaging 1,9011 1.00
Freestand-ing Fixed
F-005748-97 2,890 007052,185Mecklenburg Mecklenburg Diagnostic Imaging 3,1721 1.00
Freestand-ing Fixed
F-006698-02 8,242 008247,419Mecklenburg OrthoCarolina P.A. 8,5731 1.00
Freestand-ing Fixed
F-002332-85 2,425 001,470955Mecklenburg Presbyterian Imaging Center-Mint Museum (Presbyterian Imaging Centers)
3,0131 1.00
Freestand-ing Fixed
F-005580-97 121 002794Mecklenburg Randolph Radiology Imaging [10/07 only; moved to PHH] (Carolinas Integrated Healthcare)
1320 0.00
Mobile F-007040-04 0 0000Mecklenburg Carolinas Imaging Services 00 1.00
Mobile F-007987-07 0 0000Mecklenburg OrthoCarolina P.A. 00 0.75
Mobile F-006626-02 78 00573Mecklenburg Carolina Bone and Joint (Jacksonville Diagnostic Imaging (prev IAC Mobile))
800 0.02
Mobile F-006734-02 3,849 001,3142,535Mecklenburg Carolina NeuroSurgery & Spine Assoc-Baldwin Ave (Carolina NeuroSurgery & Spine
4,3750 0.80
Mobile F-006734-02 1,082 00187895Mecklenburg Carolina NeuroSurgery & Spine Assoc-Ballantyne (Carolina NeuroSurgery & Spine
1,1570 0.23
Mobile Grandfathered 1,024 00402622Mecklenburg Carolinas Physician Network, Inc (Alliance Imaging Inc.)
1,1850 0.21
Mobile F-006868-03 287 0086205Mecklenburg CIS NorthCross (Carolinas Imaging Services)
3250 0.06
Mobile Grandfathered 2,218 001692,049Mecklenburg Miller Orthopaedic Clinic, Inc. (Alliance Imaging Inc.)
2,2860 0.46
Mobile Grandfathered 1,628 0001,628Mecklenburg Miller Orthopedic-Ballantyne (Alliance Imaging Inc.)
1,6280 0.34
Mobile Grandfathered 1,547 0001,547Mecklenburg Miller Orthopedics-Huntersville (Alliance Imaging Inc.)
1,5470 0.32
Mobile Grandfathered 30 00030Mecklenburg OrthoCarolina, P.A. (Alliance Imaging Inc.)
300 0.01
Mobile Grandfathered 118 000118Mecklenburg OrthoCarolina, P.A. (Alliance Imaging Inc.)
1180 0.02

Service Type
Service Site (Provider/Owner)
CON # Total MRI Scans
Inpt Contrast
Inpt No Contrast
Outpt Contrast
Outpt No Contrast
Service Area Adjusted Total
Area Avg Procs Threshold
MRI Need
Table 9K: MRI by MRI Service Areas - All Fixed and Mobile Procedures - TOTALS with Tiered and % Mobile EquivalentsFixed
MagnetFixed Equiv
Mobile Grandfathered 384 000384Mecklenburg Oweida Orthopaedic Associates (Alliance Imaging Inc.)
3840 0.08
Mobile Grandfathered 327 000327Mecklenburg Perry & Barrons Orthopaedics (Alliance Imaging Inc.)
3270 0.07
Mobile F-005723-97 319 155579170Mecklenburg Presbyterian Hospital Huntersville (Insight Health Corp)
3850 0.07
Mobile 18 00216Mecklenburg Presbyterian Hospital Huntersville (Insight Health Corp)
190 0.00
Mobile F-006626-02 1,113 00880233Mecklenburg Presbyterian Imaging Center-Ballantyne (Jacksonville Diagnostic Imaging (prev IAC
1,4650 0.23
Mobile F-006626-02 20 00614Mecklenburg Presbyterian Imaging Center-University (Jacksonville Diagnostic Imaging (prev IAC
220 0.00
Mobile 144 0036108Mecklenburg Presbyterian Medical Plaza (Insight Health Corp)
1580 0.03
Mobile F-005723-97 980 00330650Mecklenburg Presbyterian Medical Plaza (Insight Health Corp)
1,1120 0.20
Mobile Grandfathered 461 000461Mecklenburg Total Spine Specialist (Alliance Imaging Inc.)
4610 0.10
Mobile F-007164-04 851 00399452Mecklenburg University Imaging (Presbyterian Mobile Imaging)
1,0110 0.18
Mecklenburg 88,525 106,86718 4,80523.18 4,610 0Hospital
FixedD-006866-03 1,075 2325303724Mitchell Blue Ridge Regional Hospital, Inc 1,2251 1.00
Mitchell 1,075 1,2251 3,7751.00 1,225 0Mobile H-006104-99 358 3257296Montgomery FH Montgomery Memorial
Hospital (FirstHealth of the Carolinas)
3840 0.21
Montgomery 358 3840 1,7160.21 384 0Hospital
FixedH-005602-97; H-007097-04
11,470 9011,3083,1976,064Moore FirstHealth of the Carolinas, Inc. 13,9933 3.00
Freestand-ing Fixed
H-006845-03 4,331 009553,376Moore Pinehurst Surgical Clinic, PA (Alliance Imaging & Pinehurst Surgical Clinic)
4,7131 1.00
Mobile O-006665-02 1,113 00125988Moore Triad Imaging dba Southern Pines Diagnostic Imaging (Cape Fear Mobile Imaging)
1,1630 0.23
Mobile 1,278 00839439Moore Triad Imaging dba Southern Pines Diagnostic Imaging (King's Medical Company)
1,6140 0.27
0 0000Moore 2009 SMFP Need Determination 01 1.00
Moore/Hoke 18,192 21,4825 4,8055.50 3,906 0

Service Type
Service Site (Provider/Owner)
CON # Total MRI Scans
Inpt Contrast
Inpt No Contrast
Outpt Contrast
Outpt No Contrast
Service Area Adjusted Total
Area Avg Procs Threshold
MRI Need
Table 9K: MRI by MRI Service Areas - All Fixed and Mobile Procedures - TOTALS with Tiered and % Mobile EquivalentsFixed
MagnetFixed Equiv
Hospital Fixed
L-005908-98 5,688 5466061,5093,027Nash Nash Hospitals, Inc. 6,9712 2.00
Freestand-ing Fixed
L-007499-06 0 0000Nash Nash Imaging, Inc 01 1.00
Mobile Grandfathered 849 00255594Nash Boice-Willis Clinic, P.A. (Alliance Imaging Inc.)
9510 0.19
Mobile Grandfathered 277 000277Nash Carolina Regional Orthopaedics (Alliance Imaging Inc.)
2770 0.06
Nash 6,814 8,1993 4,4623.25 2,523 0Hospital
FixedO-006212-00 13,656 2,1351,6744,5955,252New Hanover New Hanover Regional Medical
Center 17,8724 4.00
Freestand-ing Fixed
O-007259-05 3,097 001362,961New Hanover Atlantic Orthopedics, PA 3,1511 1.00
Mobile Grandfathered 766 01251514New Hanover Atlantic Diagnostic-17th Street (Alliance Imaging Inc.)
8670 0.16
Mobile Grandfathered 126 004878New Hanover Atlantic Diagnostic-Landfall (Alliance Imaging Inc.)
1450 0.03
Mobile Grandfathered 7 0043New Hanover Atlantic Diagnostic-Landfall (Alliance Imaging Inc.)
90 0.00
Mobile Grandfathered 61 001645New Hanover Atlantic Diagnostic-Landfall (Alliance Imaging Inc.)
670 0.01
Mobile Grandfathered 585 26188389New Hanover Atlantic Diagnostic-Landfall (Alliance Imaging Inc.)
6640 0.12
Mobile O-006434-01 2,643 006072,036New Hanover Cape Fear Diagnostic Imaging 2,8860 0.55
Mobile O-007254-05 413 00173240New Hanover Delaney Radiologists (Market St) (Porter's Neck Imaging, LLC)
4820 0.09
Mobile O-007254-05 2,290 001,0231,267New Hanover Delaney Radiologists (Medical Center Dr) (Porter's Neck Imaging, LLC)
2,6990 0.48
Mobile O-007001-04 1,028 00411617New Hanover Delaney Radiology (Alliance Imaging Inc.)
1,1920 0.21
Mobile O-007001-04 912 00326586New Hanover Delaney Radiology (Alliance Imaging Inc.)
1,0420 0.19
Mobile O-007001-04 298 00113185New Hanover Delaney Radiology (Alliance Imaging Inc.)
3430 0.06
Mobile Grandfathered 2,017 3017988982New Hanover WHA Medical Clinic PLLC (Alliance Imaging Inc.)
2,4430 0.42

Service Type
Service Site (Provider/Owner)
CON # Total MRI Scans
Inpt Contrast
Inpt No Contrast
Outpt Contrast
Outpt No Contrast
Service Area Adjusted Total
Area Avg Procs Threshold
MRI Need
Table 9K: MRI by MRI Service Areas - All Fixed and Mobile Procedures - TOTALS with Tiered and % Mobile EquivalentsFixed
MagnetFixed Equiv
Mobile O-007001-04 441 000441New Hanover Wilmington Orthopaedic Group (Alliance Imaging Inc.)
4410 0.09
Mobile Grandfathered 139 000139New Hanover Wilmington Orthopaedic Group (Alliance Imaging Inc.)
1390 0.03
New Hanover 28,479 34,4435 4,8057.44 4,629 0Hospital
Fixed2,795 3282021,0121,253Onslow Onslow Memorial Hospital, Inc. 3,5431 1.00
Freestand-ing Fixed
P-007324-05 4,222 006963,526Onslow Jacksonville Diagnostic Imaging 4,5001 1.00
Mobile O-006434-01 610 00102508Onslow Jacksonville Diagnostic Imaging (Cape Fear Diagnostic Imaging)
6510 0.14
0 0000Onslow 2009 SMFP Need Determination 01 1.00
Onslow 7,627 8,6943 4,4623.14 2,769 0Hospital
FixedJ-005900-98; J-007028-04; J-007301-05; J-008136-08
26,111 5,5322,85012,6955,034Orange University of North Carolina Hospitals
36,7557 7.00
Freestand-ing Fixed
Grandfathered 1,804 005551,249Orange Wake Radiology-Chapel Hill (Wake Radiology Diagnostic Imaging)
2,0261 1.00
0 0000Orange 2009 SMFP Need Determination 01 1.00
Orange/Caswell 27,915 38,7819 4,8059.00 4,309 0Hospital
FixedR-007623-06 3,558 2082511,0062,093Pasquotank Albemarle Hospital 4,2272 2.00
C-C-P-P 3,558 4,2272 4,1182.00 2,114 0Mobile Grandfathered 42 05532Pender Pender Memorial Hospital
(Alliance Imaging Inc.)460 0.02
Mobile Grandfathered 71 031850Pender Pender Memorial Hospital (Alliance Imaging Inc.)
790 0.04
Mobile Grandfathered 211 0050161Pender Pender Memorial Hospital (Alliance Imaging Inc.)
2310 0.12
Mobile Grandfathered 38 041024Pender Pender Memorial Hospital (Alliance Imaging Inc.)
440 0.02
Pender 362 4000 1,7160.20 400 0Mobile Grandfathered 104 553559Person Person County Memorial
Hospital (Alliance Imaging Inc.)1240 0.06
Mobile Grandfathered 18 02511Person Person County Memorial Hospital (Alliance Imaging Inc.)
210 0.01

Service Type
Service Site (Provider/Owner)
CON # Total MRI Scans
Inpt Contrast
Inpt No Contrast
Outpt Contrast
Outpt No Contrast
Service Area Adjusted Total
Area Avg Procs Threshold
MRI Need
Table 9K: MRI by MRI Service Areas - All Fixed and Mobile Procedures - TOTALS with Tiered and % Mobile EquivalentsFixed
MagnetFixed Equiv
Mobile Grandfathered 190 9838135Person Person County Memorial Hospital (Alliance Imaging Inc.)
2160 0.11
Mobile Grandfathered 819 3017225547Person Person County Memorial Hospital (Alliance Imaging Inc.)
9400 0.48
Mobile Grandfathered 47 211628Person Person County Memorial Hospital (Alliance Imaging Inc.)
550 0.03
Person 1,178 1,3560 1,7160.69 1,356 0Hospital
FixedQ-005898-98; Q-006709-02; Q-007658-06
8,843 2,9642,4161,8261,637Pitt Pitt County Memorial Hospital, Inc.
12,9113 3.00
Freestand-ing Fixed
6,444 001,2685,176Pitt East Carolina Neurology dba MRI of Eastern Carolina
6,9511 1.00
Freestand-ing Fixed
Q-006854-03 3,833 001,4492,384Pitt Greenville MRI LLC 4,4131 1.00
Freestand-ing Fixed
5,307 001,9263,381Pitt Greenville MRI LLC 6,0771 1.00
Freestand-ing Fixed
Grandfathered 2,296 007601,536Pitt Physicians East PA (King's Medical Company)
2,6001 1.00
Mobile Grandfathered 619 0037582Pitt Orthopaedics East, Inc. (Alliance Imaging Inc.)
6340 0.13
Mobile Grandfathered 504 0033471Pitt Orthopaedics East, Inc. (Alliance Imaging Inc.)
5170 0.10
Mobile Grandfathered 106 013102Pitt Orthopaedics East, Inc. (Alliance Imaging Inc.)
1080 0.02
Pitt/Greene 27,952 34,2117 4,8057.25 4,719 0Mobile 61 101248Polk St. Luke's Hospital (Insight
Health Corp)670 0.04
Mobile F-005723-97 730 65205514Polk St. Luke's Hospital (Insight Health Corp)
8190 0.43
Polk 791 8850 1,7160.47 885 0Hospital
FixedG-006817-03 3,200 3022061,0611,631Randolph Randolph Hospital, Inc. 3,9481 1.00
Mobile Grandfathered 1,127 021211,004Randolph Asheboro Imaging (Alliance Imaging Inc.)
1,1760 0.27
Mobile Grandfathered 91 00883Randolph Asheboro Imaging (Alliance Imaging Inc.)
940 0.02
0 0000Randolph 2009 SMFP Need Determination 01 1.00
Randolph 4,418 5,2192 4,1182.29 2,279 0

Service Type
Service Site (Provider/Owner)
CON # Total MRI Scans
Inpt Contrast
Inpt No Contrast
Outpt Contrast
Outpt No Contrast
Service Area Adjusted Total
Area Avg Procs Threshold
MRI Need
Table 9K: MRI by MRI Service Areas - All Fixed and Mobile Procedures - TOTALS with Tiered and % Mobile EquivalentsFixed
MagnetFixed Equiv
Hospital Fixed
H-008193-08 0 0000Richmond Sandhills Regional Medical Center
01 1.00
Mobile H-006104-99 1,284 2952957246Richmond FH Richmond Memorial Hospital (FirstHealth of the Carolinas)
1,7110 0.34
Mobile 24 01814Richmond Sandhills Regional Medical Center (Insight Health Corp)
270 0.01
Mobile J-007008-04 609 611144448Richmond Sandhills Regional Medical Center (Insight Health Corp)
6760 0.16
Mobile 247 2540200Richmond Sandhills Regional Medical Center (Insight Health Corp)
2670 0.07
Mobile F-005723-97 23 0449Richmond Sandhills Regional Medical Center (Insight Health Corp)
200 0.00
Mobile 23 001310Richmond Sandhills Regional Medical Center (Insight Health Corp)
280 0.01
Richmond 2,210 2,7281 3,7751.59 1,716 0Hospital
FixedN-005496-96; N-006606-02
6,306 2461,6415753,844Robeson Southeastern Regional Medical Center
7,3892 2.00
Mobile 568 000568Robeson Allen Orthopedic (Waccamaw Ultrasound & Diagnostics, Inc)
5680 0.14
Mobile Grandfathered 36 00036Robeson Atlantic Diagnostic-Pembroke (Alliance Imaging Inc.)
360 0.01
Mobile Grandfathered 91 00091Robeson Waccamaw Imaging (Allen Ortho) (Alliance Imaging Inc.)
910 0.02
Robeson 7,001 8,0842 4,1182.17 3,725 0Hospital
FixedG-006691-02 2,829 112892792,250Rockingham Annie Penn Hospital 3,0651 1.00
Hospital Fixed
G-006297-00 2,755 1382766211,720Rockingham Morehead Memorial Hospital 3,2241 1.00
Mobile 161 0014147Rockingham Reidsville Imaging, LLC (Insight Health Corp)
1670 0.04
Mobile 547 0049498Rockingham Reidsville Imaging, LLC (Insight Health Corp)
5670 0.13
Rockingham 6,292 7,0222 4,1182.17 3,236 0Hospital
FixedF-005829-98; F-006919-03
12,066 2698122,4548,531Rowan Rowan Regional Medical Center, Inc.
13,5883 3.00
Mobile Grandfathered 1,147 0001,147Rowan Romedical Care, Inc. (Alliance Imaging Inc.)
1,1470 0.24

Service Type
Service Site (Provider/Owner)
CON # Total MRI Scans
Inpt Contrast
Inpt No Contrast
Outpt Contrast
Outpt No Contrast
Service Area Adjusted Total
Area Avg Procs Threshold
MRI Need
Table 9K: MRI by MRI Service Areas - All Fixed and Mobile Procedures - TOTALS with Tiered and % Mobile EquivalentsFixed
MagnetFixed Equiv
Mobile Grandfathered 150 000150Rowan Romedical Care, Inc. (Alliance Imaging Inc.)
1500 0.03
0 0000Rowan 2009 SMFP Need Determination 01 1.00
Rowan 13,363 14,8854 4,8054.27 3,486 0Hospital
FixedC-006229-00; C-007298-05
3,337 2611987582,120Rutherford Rutherford Hospital, Inc. 3,9281 1.00
Rutherford 3,337 3,9281 3,7751.00 3,928 0 *Hospital
FixedM-007218-05 1,804 20474291,308Sampson Sampson Regional Medical
Center, Inc. 2,0101 1.00
Mobile Grandfathered 56 00947Sampson Atlantic Radiology Associates-Fayetteville (Alliance Imaging Inc.)
600 0.01
Mobile Grandfathered 10 00010Sampson Atlantic Radiology Associates-Fayetteville (Alliance Imaging Inc.)
100 0.00
Mobile Grandfathered 96 00987Sampson Atlantic Radiology Associates-Fayetteville (Alliance Imaging Inc.)
1000 0.02
Mobile Grandfathered 47 001334Sampson Atlantic Radiology Associates-Roseboro (Alliance Imaging Inc.)
520 0.01
Mobile Grandfathered 129 0023106Sampson Atlantic Radiology Associates-Roseboro (Alliance Imaging Inc.)
1380 0.03
Mobile Grandfathered 3 0003Sampson Clinton Medical Clinic (Alliance Imaging Inc.)
30 0.00
Mobile Grandfathered 463 0046417Sampson Clinton Medical Clinic (Alliance Imaging Inc.)
4810 0.11
Mobile Grandfathered 76 001066Sampson Clinton Medical Clinic (Alliance Imaging Inc.)
800 0.02
Mobile Grandfathered 164 71025122Sampson Sampson Regional Medical Center (Alliance Imaging Inc.)
1840 0.04
Mobile J-007013-04 71 531053Sampson Sampson Regional Medical Center (WakeMed Health and Hospitals)
800 0.02
Sampson 2,919 3,1981 4,1181.26 2,538 0Hospital
FixedN-007805-07 3,027 1964186561,757Scotland Scotland Memorial Hospital, Inc. 3,6132 2.00
Mobile J-007008-04 1,445 002371,208Scotland Scotland Imaging (Insight Health Corp)
1,5400 0.35
Scotland 4,472 5,1532 4,1182.35 2,193 0Hospital
FixedF-007461-06 3,023 942696032,057Stanly Stanly Regional Medical Center 3,4471 1.00

Service Type
Service Site (Provider/Owner)
CON # Total MRI Scans
Inpt Contrast
Inpt No Contrast
Outpt Contrast
Outpt No Contrast
Service Area Adjusted Total
Area Avg Procs Threshold
MRI Need
Table 9K: MRI by MRI Service Areas - All Fixed and Mobile Procedures - TOTALS with Tiered and % Mobile EquivalentsFixed
MagnetFixed Equiv
Stanly 3,023 3,4471 3,7751.00 3,447 0Mobile G-007065-04 365 000365Stokes Mountainview Medical (Forsyth
Memorial Hospital)3650 0.21
Stokes 365 3650 1,7160.21 365 0Hospital
FixedG-006792-03 3,361 493343542,624Surry Hugh Chatham Memorial
Hospital, Inc. 3,6751 1.00
Hospital Fixed
G-006569-02; G-008115-08
3,886 792999392,569Surry Northern Hospital Surry County 4,4442 2.00
Surry 7,247 8,1203 4,4623.00 2,707 0Mobile Grandfathered 112 112783Swain WestCare Health System-Swain
(Alliance Imaging Inc.)1240 0.07
Mobile G-006271-00 32 01724Swain WestCare Health System-Swain (Alliance Imaging Inc.)
350 0.02
Swain 144 1590 1,7160.09 159 0Hospital
FixedB-007019-04 2,342 271396181,558Transylvania Transylvania Community
Hospital, Inc. 2,6661 1.00
Transylvania 2,342 2,6661 3,7751.00 2,666 0Hospital
FixedF-005920-98 4,886 3181,0648482,656Union CMC-Union Regional Medical
Center 5,9051 1.00
Freestand-ing Fixed
657 00112545Union Union Medical Services LLC 7021 1.00
Mobile Grandfathered 202 0050152Union Mecklenburg Diagnostic-Monroe (Alliance Imaging Inc.)
2220 0.05
Mobile Grandfathered 165 0045120Union Mecklenburg Diagnostic-Monroe (Alliance Imaging Inc.)
1830 0.04
Mobile Grandfathered 1,501 002911,210Union Mecklenburg Diagnostic-Monroe (Alliance Imaging Inc.)
1,6170 0.36
Mobile F-007164-04 251 0070181Union Southern Piedmont Primary Care (Presbyterian Mobile Imaging)
2790 0.06
Union 7,662 8,9082 4,1182.51 3,549 0Hospital
FixedK-006527-01; K-007839-07
3,849 1947087022,245Vance Maria Parham Medical Center, Inc.
4,5682 2.00
Mobile M-006605-02 215 000215Vance Henderson (Mobile Imaging of NC)
2150 0.05
Vance/Warren 4,064 4,7832 4,1182.05 2,333 0Hospital
Fixed4,071 3993661,6891,617Wake Duke Raleigh Hospital 5,2121 1.00

Service Type
Service Site (Provider/Owner)
CON # Total MRI Scans
Inpt Contrast
Inpt No Contrast
Outpt Contrast
Outpt No Contrast
Service Area Adjusted Total
Area Avg Procs Threshold
MRI Need
Table 9K: MRI by MRI Service Areas - All Fixed and Mobile Procedures - TOTALS with Tiered and % Mobile EquivalentsFixed
MagnetFixed Equiv
Hospital Fixed
J-006932-03 10,974 9681,8703,6504,486Wake Rex Hospital, Inc.-Consolidated 13,9563 3.00
Hospital Fixed
J-006368-01 10,338 1,5062,2491,7674,816Wake WakeMed 13,1492 2.00
Hospital Fixed
J-007119-04 4,449 3725761,0842,417Wake WakeMed Cary Hospital 5,4111 1.00
Freestand-ing Fixed
Grandfathered 4,946 001,8993,047Wake Raleigh MRI, LLC (Wake Radiology Imaging)
5,7061 1.00
Freestand-ing Fixed
J-005783-97 4,896 001,6743,222Wake Raleigh MRI, LLC (Wake Radiology Imaging)
5,5661 1.00
Freestand-ing Fixed
2,047 007671,280Wake Raleigh Neurology Associates [1/1/2008-7/31/2008, mobile during move]
2,3540 0.00
Freestand-ing Fixed
1,147 00386761Wake Raleigh Neurology Associates [8/1/2008-9/30/2008, after move to new location]
1,3011 1.00
Freestand-ing Fixed
1,347 00391956Wake Raleigh Neurology Associates [10/1/2007-12/31/2007, before move to new location]
1,5030 0.00
Freestand-ing Fixed
J-007289-05 6,379 001,4224,957Wake Raleigh Radiology at Cedarhurst (Pinnacle Health Services of NC)
6,9481 1.00
Mobile J-007008-04 1,193 00581,135Wake Carolina Rehab & Surgical Associates (Insight Health Corp)
1,2160 0.25
Mobile Grandfathered 187 0068119Wake Cary Diagnostic Radiology (Alliance Imaging Inc.)
2140 0.04
Mobile Grandfathered 330 0068262Wake Cary Diagnostic Radiology (Alliance Imaging Inc.)
3570 0.07
Mobile Grandfathered 84 002262Wake Cary Diagnostic Radiology (Alliance Imaging Inc.)
930 0.02
Mobile Grandfathered 24 001410Wake Cary Diagnostic Radiology (Alliance Imaging Inc.)
300 0.00
Mobile J-007013-04 120 476904Wake Dorothea Dix Hospital (WakeMed Health and Hospitals)
1850 0.02
Mobile J-007012-04 432 00133299Wake Raleigh MRI Center (Wake Radiology Diagnostic Imaging- Mobile)
4850 0.09
Mobile Grandfathered 464 00178286Wake Raleigh Neurology Imaging, PLLC (Alliance Imaging Inc.)
5350 0.10
Mobile Grandfathered 41 001922Wake Raleigh Neurology Imaging, PLLC (Alliance Imaging Inc.)
490 0.01
Mobile Grandfathered 68 001949Wake Raleigh Neurology Imaging, PLLC (Alliance Imaging Inc.)
760 0.01

Service Type
Service Site (Provider/Owner)
CON # Total MRI Scans
Inpt Contrast
Inpt No Contrast
Outpt Contrast
Outpt No Contrast
Service Area Adjusted Total
Area Avg Procs Threshold
MRI Need
Table 9K: MRI by MRI Service Areas - All Fixed and Mobile Procedures - TOTALS with Tiered and % Mobile EquivalentsFixed
MagnetFixed Equiv
Mobile Grandfathered 847 006841Wake Raleigh Orthopaedic Clinic (Alliance Imaging Inc.)
8490 0.18
Mobile J-007757-06 1,446 00351,411Wake Raleigh Orthopaedic Clinic 1,4600 0.30
Mobile J-007757-06 240 000240Wake Raleigh Orthopaedic Clinic 2400 0.05
Mobile J-007757-06 166 000166Wake Raleigh Orthopaedic Clinic 1660 0.03
Mobile Grandfathered 1,309 02421,240Wake Raleigh Radiology (Alliance Imaging Inc.)
1,3020 0.27
Mobile Grandfathered 3 0003Wake Raleigh Radiology (Alliance Imaging Inc.)
30 0.00
Mobile Grandfathered 110 002783Wake Raleigh Radiology (Alliance Imaging Inc.)
1210 0.02
Mobile Grandfathered 1,010 0268940Wake Raleigh Radiology (Alliance Imaging Inc.)
1,0380 0.21
Mobile Grandfathered 150 0029121Wake Raleigh Radiology, LLC (Alliance Imaging Inc.)
1620 0.03
Mobile Grandfathered 11 0038Wake Raleigh Radiology, LLC (Alliance Imaging Inc.)
120 0.00
Mobile Grandfathered 7 0007Wake Raleigh Radiology, LLC (Alliance Imaging Inc.)
70 0.00
Mobile Grandfathered 430 0099331Wake Raleigh Radiology, LLC (Alliance Imaging Inc.)
4700 0.09
Mobile Grandfathered 142 0037105Wake Raleigh Radiology, LLC (Alliance Imaging Inc.)
1570 0.03
Mobile J-007284-05 0 0000Wake Rex Family Practice of Wakefield (Rex Hospital, Inc)
00 0.57
Mobile J-007284-05 558 13282272Wake Rex Hospital, Inc. (Rex Hospital, Inc)
6730 0.12
Mobile J-007284-05 0 0000Wake Rex Knightdale (Rex Hospital, Inc)
00 0.14
Mobile Grandfathered 203 0044159Wake Southeastern Imaging Consultant (Alliance Imaging Inc.)
2210 0.04
Mobile Grandfathered 605 00218387Wake Southeastern Imaging Consultant (Alliance Imaging Inc.)
6920 0.13
Mobile 61 002140Wake Superior Diagnostic Imaging, Inc (Insight Health Corp)
690 0.01

Service Type
Service Site (Provider/Owner)
CON # Total MRI Scans
Inpt Contrast
Inpt No Contrast
Outpt Contrast
Outpt No Contrast
Service Area Adjusted Total
Area Avg Procs Threshold
MRI Need
Table 9K: MRI by MRI Service Areas - All Fixed and Mobile Procedures - TOTALS with Tiered and % Mobile EquivalentsFixed
MagnetFixed Equiv
Mobile J-007008-04 247 0048199Wake Superior Diagnostic Imaging, Inc Carolina Radiology (Insight Health Corp)
2660 0.05
Mobile Grandfathered 60 00060Wake Triangle Orthopedic (Alliance Imaging Inc.)
600 0.01
Mobile Grandfathered 16 00016Wake Triangle Orthopedic (Alliance Imaging Inc.)
160 0.00
Mobile Grandfathered 12 00012Wake Triangle Orthopedic (Alliance Imaging Inc.)
120 0.00
Mobile Grandfathered 82 00082Wake Triangle Orthopedic (Alliance Imaging Inc.)
820 0.02
Mobile Grandfathered 24 00024Wake Triangle Orthopedic (Alliance Imaging Inc.)
240 0.00
Mobile Temp. unit removed 12/07
101 000101Wake Triangle Orthopedic (Alliance Imaging Inc.)
1010 0.02
Mobile Grandfathered 853 000853Wake Triangle Orthopedic (Alliance Imaging Inc.)
8530 0.18
Mobile J-007012-04 152 0026126Wake Wake Radiology (Wake Radiology Diagnostic Imaging- Mobile)
1620 0.03
Mobile J-007012-04 2,396 005801,816Wake Wake Radiology (Wake Radiology Diagnostic Imaging- Mobile)
2,6280 0.50
Mobile Grandfathered 92 001874Wake Wake Radiology-Garner (Alliance Imaging Inc.)
990 0.02
Mobile Grandfathered 87 002067Wake Wake Radiology-Garner (Alliance Imaging Inc.)
950 0.02
Mobile Grandfathered 12 00210Wake Wake Radiology-Garner (Alliance Imaging Inc.)
130 0.00
Mobile Grandfathered 109 003178Wake Wake Radiology-Garner (Alliance Imaging Inc.)
1210 0.02
Mobile Grandfathered 66 001848Wake Wake Radiology-Garner (Alliance Imaging Inc.)
730 0.01
Mobile J-007013-04 748 00218530Wake WakeMed North Healthplex (WakeMed Health and Hospitals)
8350 0.16
Wake 65,892 77,42811 4,80514.87 5,207 1Mobile Grandfathered 48 00543Washington Washington County Hospital
(Alliance Imaging Inc.)500 0.03
Mobile Grandfathered 281 31625237Washington Washington County Hospital (Alliance Imaging Inc.)
3000 0.16
Washington 329 3500 1,7160.19 350 0

Service Type
Service Site (Provider/Owner)
CON # Total MRI Scans
Inpt Contrast
Inpt No Contrast
Outpt Contrast
Outpt No Contrast
Service Area Adjusted Total
Area Avg Procs Threshold
MRI Need
Table 9K: MRI by MRI Service Areas - All Fixed and Mobile Procedures - TOTALS with Tiered and % Mobile EquivalentsFixed
MagnetFixed Equiv
Hospital Fixed
D-006652-02 4,128 1832771,3502,318Watauga Watauga Medical Center, Inc. 4,9252 2.00
Watauga 4,128 4,9252 4,8052.00 2,463 0Hospital
FixedP-006889-03; P-007447-05
6,121 1515286884,754Wayne Wayne Memorial Hosptial, Inc. 6,7282 2.00
Mobile Grandfathered 1,534 00301,504Wayne Atlantic Radiology Associates-Goldsboro Orthopaedics (Alliance Imaging Inc.)
1,5460 0.37
Mobile Grandfathered 15 00213Wayne Atlantic Radiology Associates-Goldsboro Orthopaedics (Alliance Imaging Inc.)
160 0.00
Mobile Grandfathered 29 00029Wayne Atlantic Radiology Associates-Goldsboro Orthopaedics (Alliance Imaging Inc.)
290 0.01
Mobile Grandfathered 117 0015102Wayne Atlantic Radiology Associates-Goldsboro Orthopaedics (Alliance Imaging Inc.)
1230 0.03
Wayne 7,816 8,4422 4,1182.41 3,503 0Hospital
FixedD-005911-98 2,727 292832312,184Wilkes Wilkes Regional Medical Center 2,9561 1.00
Wilkes 2,727 2,9561 3,7751.00 2,956 0Hospital
Fixed3,861 3594391,5861,477Wilson Wilson Medical Center 4,9581 1.00
Hospital Fixed
L-007624-06 0 0000Wilson WilMed Imaging Services, LLC 01 1.00
Freestand-ing Fixed
2,531 006781,853Wilson Regional MRI of Wilson 2,8021 1.00
Mobile Grandfathered 131 005081Wilson Atlantic Radiology Associates-Fayetteville (Alliance Imaging Inc.)
1510 0.03
Wilson 6,523 7,9113 4,4623.03 2,611 0Mobile G-007038-04 184 11013160Yadkin Hoots Memorial Hospital
(Alliance Imaging Inc.)1940 0.11
Yadkin 184 1940 1,7160.11 194 0
814,048258.52219Total Total of Need Determinations 2
Theshold 4+ Fixed Scanners = 4,805 3 Fixed Scanners = 4,462 2 Fixed Scanners = 4,118 1 Fixed Scanner = 3,775 0 Fixed Scanners = 1,716
* There is an adjusted need determination for no additional fixed MRI scanners in Rutherford County.

ServiceArea County Provider
Durham Duke University Hospital
ServiceArea County Provider MRI Scanners
Mecklenburg Charlotte Radiology Breast Center 1
Forsyth Breast Clinic MRI, LLC 1
ServiceArea County Provider MRI Scanners
Mecklenburg Carolinas Medical Center 1
Table 9L(1): Inventory of MRI Scanners for Cardiovascular Clinical Research Use Pursuant to Policy AC-3 in the 2001 North Carolina State Medical Facilities Plan
Adjusted Need Determinations in the 2002 and 2006 North Carolina State Medical Facilities Plans
Table 9L(2): Inventory of Dedicated Breast MRI Scanners Pursuant to
MRI Scanners
2
A Certificate of Need (J-006511-01) was issued on April 30, 2002 to Duke University Hospital. The Certificate of Need states that Duke University Health Systems, Inc. shall, pursuant to Policy AC-3 in the 2001 SMFP, convert a research only MRI scanner to clinical research use and acquire a second MRI scanner for clinical research use by the Cardiovascular and Magnetic Resonance Center. These MRI scanners shall only be used for cardiovascular purposes and shall not be counted in the inventory of fixed MRI scanners.
A Certificate of Need (F-006725-02) was issued on September 24, 2003 to Charlotte Radiology, P.A. The certificate of need states that Charlotte Radiology, P.A., d/b/a Charlotte Radiology Breast Center, shall acquire a dedicated breast MRI scanner.
These MRI scanners shall be used exclusively in mammographic studies and shall not be counted in the inventory of fixed MRI scanners. These MRI scanners shall not be used for general diagnostic purposes, and the projected costs for procedures to patients and payors shall be lower than the costs associated with conventional MRI procedures.
A Certificate of Need (G-007601-06) was issued on November 27, 2006 to Breast MRI Clinic, LLC. The certificate of need states that the center shall acquire a dedicated breast MRI scanner.
Table 9L(3): Inventory of Dedicated Pediatric MRI Scanner Pursuant to Adjusted Need Determination in the
2005 North Carolina State Medical Facilities Plan
A Certificate of Need (F-007219-05) was issued on August 23, 2005 to Carolinas Medical Center to locate a dedicated pediatric MRI scanner in Levine Children's Hospital. This MRI scanner shall be used exclusively in pediatric studies and shall not be counted in the inventory of fixed MRI scanners. This MRI scanner shall not be used for adult patients, and the projected costs for procedures to patients andpayors shall be lower than the costs associated with conventional MRI procedures.

ServiceArea County Provider MRI Scanners
Wake Bone & Joint Surgery Clinic, LLP 1
ServiceArea County Provider MRI Scanners
Durham Duke University Hospital one MRI scanner in operating room suite
Durham Duke University Hospital one MRI scanner dedicated for radiation oncology
Forsyth Wake Forest University Baptist Hospital one MRI scanner dedicated for radiation oncology
ServiceArea County Provider MRI Scanners
I, II, III MecklenburgCarolina Neurosurgery & Spine Associates,
P.A.1
IV, V, VI Durham Triangle Orthopaedic Associates 1
Table 9L (6): Inventory of Fixed Multi-Position MRI Scanners DedicatedFor Two Demonstration Projects (One Scanner Per Project)
The 2008 North Carolina State Medical Facilities Plan included an adjusted need determination for two demonstration projects with one multi-position MRI scanner per project. One demonstration project of one multi-position MRI scanner shall be located in the western portion of the state (HSAs I, II, and III). One demonstration project of one multi-position MRI scanner shall be located in the eastern portion of the state (HSAs IV, V and VI). These MRI scanners shall be used exclusively in the demonstration projects, shall not be counted in the inventory of fixed MRI scanners, and shall not be later replaced with conventional MRI scanners. Certificates of Need were issued on 10/28/2008 to Triangle Orthopaedic Associates, PA. (J-008107-08), and to Carolina Neurosurgery & Spine Associates, P.A. on 3/9/2009 (F-008106-08).
For Radiation Oncology and Use in Operating Room Suite
Two MRI scanners, one at Duke University Hospital and one at Wake Forest University Baptist Hospital, shall be used exclusively for radiation oncology and shall not be counted in the inventory of fixed MRI scanners. These MRI scanners shall not be used for conventional MRI procedures. One MRI scanner, at Duke University Hospital, shall be used in an operating room suite and shall not be used for clinical diagnostic purposes.
Scanner Pursuant to Adjusted Need Determination in the 2006 North Carolina State Medical Facilities Plan
A Certificate of Need (J-007605-06) was issued on March 28, 2007 to The Bone and Joint Surgery Clinic, LLP to locate a demonstration project for a fixed extremity MRI scanner. The fixed Extremity MRI scanner shall not be counted in the regular inventory of MRI scanners and shall not be used for whole body procedures. In addition, the demonstration project shall be conducted as an organized research study to determine the convenience, cost effectiveness and improved access provided by an fixed Extremity MRI scanner. The project shall include a comparative analysis of “total dollars received per procedure” performed on extremity MRI scanners and “total dollars received per procedure” for similar procedures performed on fixed whole body MRI scanners. The purpose of this aspect of the study is to demonstrate any cost savings to the patient or third party payer of the extremity MRI scanner. A mechanism to ensure cost savings must be included in thdemonstration project. The recipient of the CON must provide annual reports demonstrating cost savings for a three-year reporting period from the date of installation.
e
Table 9L(5): Inventory of MRI Scanners Dedicated
Table 9L(4): Inventory of Demonstration Project for a Fixed Extremity MRI

(Scheduled for Certificate of Need Review during 2010)
Fixed MRIScanners CON CON
MRI Need Application BeginningHSA Service Area Determination* Due Date** Review Date
IV Wake 1 June 15, 2010 July 1, 2010
II Forsyth 1 July 15, 2010 August 1, 2010
TOTAL 2
Table 9M: Fixed MRI Scanners Need Determination
* Need determinations as shown in this document may be increased or decreased during the year pursuant to Policy GEN-2 (See Chapter 4).
It is determined that there is no need for any additional fixed MRI scanners anywhere else in the state.
It is determined that the service areas listed in the tables below need additional Fixed MRI Scanners as specified:
** Application Due Dates are absolute deadlines. The filing deadline is 5:30 p.m. on the Application Due Date. The filing deadline is absolute (See Chapter 3).
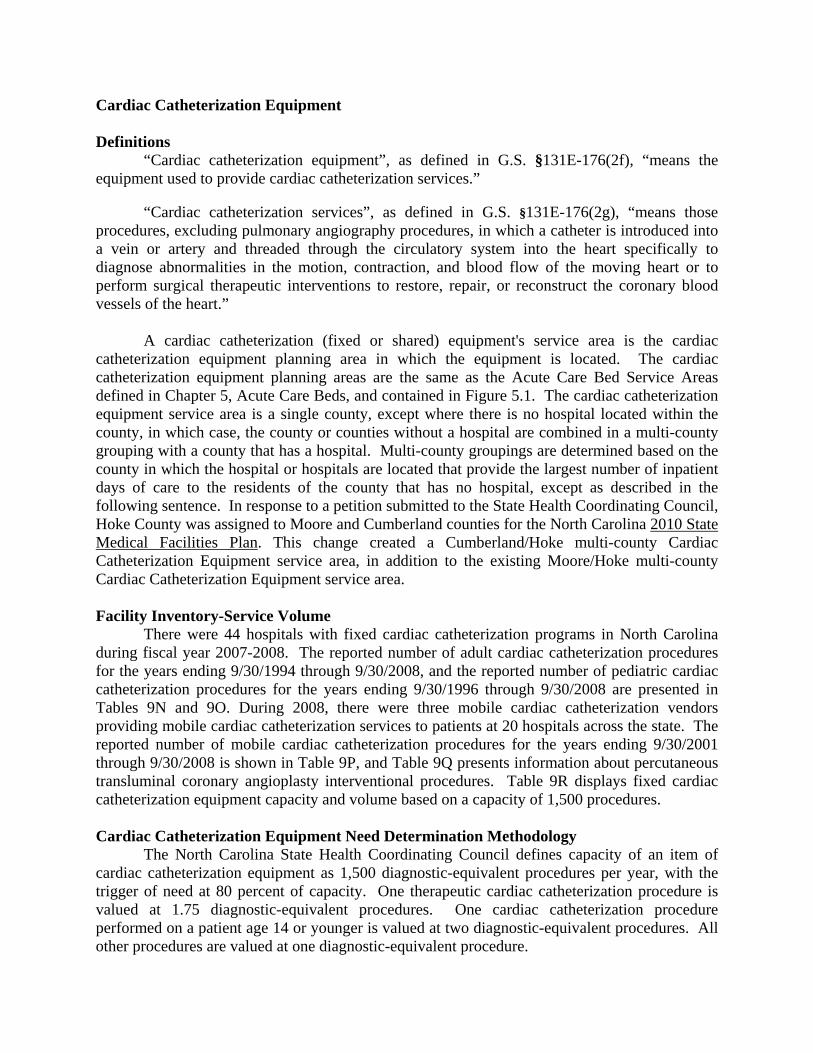
Cardiac Catheterization Equipment Definitions “Cardiac catheterization equipment”, as defined in G.S. §131E-176(2f), “means the equipment used to provide cardiac catheterization services.”
“Cardiac catheterization services”, as defined in G.S. §131E-176(2g), “means those procedures, excluding pulmonary angiography procedures, in which a catheter is introduced into a vein or artery and threaded through the circulatory system into the heart specifically to diagnose abnormalities in the motion, contraction, and blood flow of the moving heart or to perform surgical therapeutic interventions to restore, repair, or reconstruct the coronary blood vessels of the heart.”
A cardiac catheterization (fixed or shared) equipment's service area is the cardiac catheterization equipment planning area in which the equipment is located. The cardiac catheterization equipment planning areas are the same as the Acute Care Bed Service Areas defined in Chapter 5, Acute Care Beds, and contained in Figure 5.1. The cardiac catheterization equipment service area is a single county, except where there is no hospital located within the county, in which case, the county or counties without a hospital are combined in a multi-county grouping with a county that has a hospital. Multi-county groupings are determined based on the county in which the hospital or hospitals are located that provide the largest number of inpatient days of care to the residents of the county that has no hospital, except as described in the following sentence. In response to a petition submitted to the State Health Coordinating Council, Hoke County was assigned to Moore and Cumberland counties for the North Carolina 2010 State Medical Facilities Plan. This change created a Cumberland/Hoke multi-county Cardiac Catheterization Equipment service area, in addition to the existing Moore/Hoke multi-county Cardiac Catheterization Equipment service area.
Facility Inventory-Service Volume There were 44 hospitals with fixed cardiac catheterization programs in North Carolina during fiscal year 2007-2008. The reported number of adult cardiac catheterization procedures for the years ending 9/30/1994 through 9/30/2008, and the reported number of pediatric cardiac catheterization procedures for the years ending 9/30/1996 through 9/30/2008 are presented in Tables 9N and 9O. During 2008, there were three mobile cardiac catheterization vendors providing mobile cardiac catheterization services to patients at 20 hospitals across the state. The reported number of mobile cardiac catheterization procedures for the years ending 9/30/2001 through 9/30/2008 is shown in Table 9P, and Table 9Q presents information about percutaneous transluminal coronary angioplasty interventional procedures. Table 9R displays fixed cardiac catheterization equipment capacity and volume based on a capacity of 1,500 procedures. Cardiac Catheterization Equipment Need Determination Methodology The North Carolina State Health Coordinating Council defines capacity of an item of cardiac catheterization equipment as 1,500 diagnostic-equivalent procedures per year, with the trigger of need at 80 percent of capacity. One therapeutic cardiac catheterization procedure is valued at 1.75 diagnostic-equivalent procedures. One cardiac catheterization procedure performed on a patient age 14 or younger is valued at two diagnostic-equivalent procedures. All other procedures are valued at one diagnostic-equivalent procedure.

The standard methodologies used to determine need for additional fixed cardiac catheterization equipment are calculated as follows:
Methodology 1:
Step 1. Determine the planning inventory for each facility that has fixed cardiac catheterization equipment, immediately prior to publication of the annual State Medical Facilities Plan, to include: existing equipment in operation, approved equipment for which a certificate of need was issued but is pending development, and pending equipment for which no certificate of need has been issued, because the decision on a need determination in a previous year is under review or appeal. For each cardiac catheterization equipment service area, calculate the total number of existing, approved and pending units of cardiac catheterization equipment located in the cardiac catheterization equipment service area.
Step 2. Determine the number of adult and pediatric diagnostic and interventional procedures performed at each facility as reported for the 12-month period reflected in the 2009 Hospital License Renewal Application or the 2009 Registration and Inventory of Cardiac Catheterization Equipment.
Step 3. For each facility, calculate the total weighted (diagnostic-equivalent) cardiac catheterization procedures by multiplying adult diagnostic procedures by 1.0, interventional cardiac catheterization procedures by 1.75, and pediatric procedures performed on patients age 14 or younger by 2.00.
Step 4. For each facility, determine the number of units of fixed cardiac catheterization equipment required for the number of procedures performed by dividing the number of weighted (diagnostic-equivalent) cardiac catheterization procedures performed at each facility by 1,200 procedures (i.e., 80 percent of capacity, which is 1,500 procedures). (NOTE: Round the result to the nearest hundredth.)
Step 5. Sum the number of units of fixed cardiac catheterization equipment required for all facilities in the same cardiac catheterization equipment service area as calculated in Step 4. (NOTE: The sum is rounded to the nearest whole number.)
Step 6. Subtract the number of units of fixed cardiac catheterization equipment required in each cardiac catheterization equipment service area from the total planning inventory for each cardiac catheterization equipment service area. The difference is the number of units of fixed cardiac catheterization equipment needed.
Methodology 2:
For cardiac catheterization equipment service areas in which a unit of fixed cardiac catheterization equipment is not located, need exists for one shared fixed cardiac catheterization equipment (i.e. fixed equipment that is used to perform both cardiac catheterization procedures and angiography procedures) when:
a. The number of cardiac catheterization procedures as defined in 10A NCAC 14C .1601(5) performed at any mobile site in the cardiac catheterization equipment service area exceeds 240 (300 procedures X 80 percent) procedures per year for each eight hours per week the mobile equipment is operated at that site during the

12-month period reflected in the 2009 Hospital License Renewal Application or the 2009 Registration and Inventory of Cardiac Catheterization Equipment on file with the North Carolina Division of Health Service Regulation; and
b. No other fixed or mobile cardiac catheterization service is provided within the same cardiac catheterization equipment service area.
There is adequate capacity and geographical accessibility for cardiac catheterization equipment in the state, and therefore there is no need for any additional mobile cardiac catheterization equipment. Need Determination It is determined that there is no need for any additional fixed cardiac catheterization equipment anywhere in the state and no certificate of need reviews will be scheduled. It is determined that there is no need for additional units of shared fixed cardiac catheterization equipment anywhere in the state and no certificate of need reviews will be scheduled. It is determined that there is no need for additional units of mobile cardiac catheterization equipment anywhere in the state and no reviews will be scheduled. It is further determined that fixed cardiac catheterization equipment and services shall only be approved for development on hospital sites. It is further determined that mobile cardiac catheterization equipment and services shall only be approved for development on hospital sites.

Facility 1994 1995 1996 1997 1998 1999 2000 2001 2002 2003 2004 2005 2006 2007 2008Alamance Regional -- -- 690 828 931 994 1,226 1,126 920 892 919 920 897 887 947Albemarle Hospital -- -- -- -- 645 1,244 703 1,078 1,110 787 674 630 756 1,104 948
Caldwell Memorialsee
mobile 587Cape Fear Valley 546 581 741 1,102 1,127 1,254 504 1,313 1,490 2,048 2,356 2,584 2,426 1,150 1,606Cardiac Diag Ctr.-Wake -- -- -- 600 569 472 548 365 317 -- -- -- -- -- --Carolinas Med. Ctr. 5,555 4,510 4,284 4,331 4,334 4,335 5,152 5,400 5,260 4,681 4,032 3,824 4,166 4,105 4,299Catawba Valley 398 343 359 398 470 478 624 624 596 503 493 498 443 461 408Cleveland Regional 670 146 390 418 556 615 561 579 629 700 417 597 457 425 390CMC - Mercy 1,503 1,400 1,472 1,675 1,607 2,283 1,840 1,813 1,489 1,651 1,331 1,388 1,195 1,428 1,026CMC-University -- -- -- -- -- -- -- -- -- -- -- 245 205 207 222CMC - Union 98 350 484 469 570 760 687 822 705 723 753 788 779 619 413CarolinaEast Med. Ctr. 604 975 1,199 1,220 1,360 1,353 1,576 1,504 1,588 1,368 1,565 1,629 1,526 1,421 1,329Davis Medical 215 216 251 241 348 412 421 448 405 342 370 446 363 328 295Duke Raleigh Hospital -- -- -- -- -- -- -- -- -- -- -- 1288 202 325 244Duke University 3,615 4,939 3,154 4,075 4,558 4,025 4,759 4,949 5,239 5,513 5,574 6,825 5,337 3,700 4,220Durham Regional 765 582 755 823 904 937 724 551 823 835 873 1096 1019 735 637Forsyth Medical Center 2,291 2,499 2,659 2,753 2,253 2,614 3,090 4,046 5,024 6,092 6,075 5,429 3,310 3,435 2,811Frye Regional 1,329 1,938 1,855 1,963 1,996 2,063 2,348 2,643 2,489 2,664 2,624 2,736 3,078 3,125 3,226Gaston Memorial -- -- -- 629 1,129 1,602 2,010 2,104 1,959 1,775 2,145 2,224 2,388 2,147 2,243
Grace Hospitalsee
mobile 427
Greensboro Heart Centersee
mobile 464Haywood Regional -- -- -- 110 176 140 169 263 213 239 167 301 208 286 151High Point Regional 1,127 1,451 1,413 1,550 1,960 1,946 1,985 1,860 2,070 2,123 2,181 2,032 1,997 1,929 5,158Iredell Memorial 426 453 480 614 668 507 579 686 704 708 762 569 743 466 445Johnston Memorial -- -- -- -- -- -- -- -- -- -- -- 1057 1032 864 826Lake Norman Regional -- -- -- -- -- -- -- -- -- -- -- 204 211 178 156Lenoir Memorial 346 382 460 539 542 596 533 580 616 650 366 555 408 471 430Margaret R. Pardee Memorial
see mobile 179
Mission Hospitals 2,794 3,106 3,590 3,638 3,838 3,739 3,811 4,136 3,669 3,322 4,348 4,210 4,316 4,405 3,557
Table 9N: Adult Diagnostic Fixed Cardiac Catheterization Procedures* by Facility and Aggregate Cardiac Catheterization Totals

Facility 1994 1995 1996 1997 1998 1999 2000 2001 2002 2003 2004 2005 2006 2007 2008
Table 9N: Adult Diagnostic Fixed Cardiac Catheterization Procedures* by Facility and Aggregate Cardiac Catheterization Totals
FirstHealth Moore 1,257 1,622 1,763 1,990 2,490 2,660 2,618 2,683 2,873 2,906 3,457 3,490 3,490 3,294 3,364Moses Cone Health** 4,443 4,633 4,754 4,223 4,927 5,167 5,264 5,603 5,643 6,855 7,238 5,937 3,000 2,945 2,964N. C. Baptist 2,667 3,525 2,543 2,898 2,779 2,679 2,548 2,295 2,103 2,134 2,076 2,004 1,782 1,790 1,652Nash General 494 670 851 892 916 1,112 1,045 1,356 1,507 1,627 1,216 1,155 1,015 967 882New Hanover Reg. 1,807 2,164 2,491 2,590 2,666 2,682 3,209 3,373 3,380 3,583 3,867 3,943 2,669 2,719 2,728CMC-NorthEast 1,077 1,243 1,426 1,067 955 1,037 1,206 1,391 1,284 1,533 1,629 1,574 1,008 963 797Onslow Memorial 29 340 463 238 432 629 636 706 459 372 270 118 95 104 29Pitt County 3,485 3,912 3,990 3,506 3,279 2,990 3,095 3,080 4,636 4,912 5,081 4,033 3,301 3,467 2,428Presbyterian Hospital 3,095 3,322 3,492 3,516 3,537 3,200 2,229 2,359 2,568 2,562 2,137 2,248 2,168 1,810 1,534Presbyterian-Matthews -- -- -- -- -- -- -- 531 515 528 468 461 500 457 415
Randolph Hospitalsee
mobile 76Rex Hospital 1,625 1,690 1,912 2,078 2,365 2,416 3,141 3,254 2,846 2,207 2,041 1,923 2,086 1,966 1,901Rowan Reg. Med. Ctr. 415 563 546 529 667 644 676 617 725 776 437 425 328 362 436
Rutherford Hospitalsee
mobile 81Southeastern Reg. 751 777 908 951 930 916 1,017 1,073 915 796 972 827 652 957 830Stanly Memorial 192 249 272 255 264 234 235 170 288 312 251 144 138 57 19UNC Hospitals 1,594 1,258 1,740 1,794 1,682 1,703 2,084 2,075 1,510 1,328 1,673 2,114 2,168 1,995 1,899WakeMed 3,508 3,835 4,409 4,190 4,400 4,356 3,920 4,344 4,353 4,775 5,082 5,420 5,536 5,262 5,410WakeMed Cary -- -- -- -- -- -- -- -- -- -- -- 498 401 406 384Watauga Medical Ctr. 93 148Wayne Memorial -- 290 321 269 310 318 321 512 558 558 528 529 413 346 293Wilkes Regional -- -- -- -- 179 166 161 69 97 78 107 70 46 34 5
Wilmington Heart Centersee
mobile 1,227Wilson Medical 365 435 519 536 483 466 455 502 553 678 606 653 571 464 396Sub-Total Fixed Adult 49,086 53,819 56,636 59,498 64,002 65,744 67,710 72,883 74,128 76,136 77,161 79,641 68,829 64,659 67,542 Pediatric 488 645 730 630 580 557 543 634 634 734 594 664 760 676 640Sub-Total Fixed Adult/Ped. 49,574 54,464 57,366 60,128 64,617 66,301 68,253 73,517 74,762 76,870 77,755 80,305 69,589 65,335 68,182Mobile Units 3,583 3,346 3,477 3,672 3,140 3,432 5,172 4,779 4,406 4,291 5,048 4,357 4,967 5,318 1,527Grand Total 53,157 57,810 60,843 63,800 67,757 69,733 73,425 78,296 79,168 81,161 82,803 84,662 74,556 70,653 69,709
Source: North Carolina Division of Health Service Regulation Annual Hospital License Renewal Applications*Includes inpatient and outpatient procedures
**Wesley Long Community Hospital's data through 1997 reported under Moses Cone Health

Facility 1996 1997 1998 1999 2000 2001 2002 2003 2004 2005 2006 2007 2008
Cape Fear Valley -- -- -- -- -- -- -- -- -- -- -- -- --
Carolinas Medical Center 286 150 153 120 98 149 100 166 163 155 160 169 189
Duke Univ. Hospital 181 176 180 195 174 161 95 142 88 149 247 187 198
Mission Hospitals 1 30 38 13 1 1 -- -- --
N. C. Baptist 74 111 100 93 97 97 96 88 80 60 64 93 83
Pitt County Memorial 24 35 19 14 18 27 39 49 44 37 46 26 28
Presbyterian 1 -- -- -- -- -- -- -- -- -- -- -- --
UNC Hospitals 164 158 128 135 155 170 266 276 218 262 243 201 142
WakeMed -- -- -- -- -- -- -- -- -- -- -- -- --
TOTALS 730 630 580 557 543 634 634 734 594 664 760 676 640
Source: N.C. Division of Health Service Regulation Annual Hospital License Renewal Application.
Table 9O: Pediatric Diagnostic Catheterization Procedures *
* Until 1995, Pediatric Procedures were defined as those procedures performed on cardiac patients ages 5 and younger. Beginning in 1996 the Hospital License Renewal Application requested Hospitals to report pediatric information based on cardiac patients 14 and younger.

Hospital 2001 2002 2003 2004 2005 2006 2007 2008
Betsy Johnson Regional Hospital 72 120 92 24 -- --Caldwell Memorial 38 248 336 322 318 577 616 see fixedCardiac Diagnostic Center-Wake -- 317 -- -- -- -- -- --Central Carolina 140 147 113 113 207 104 33 51Chatham Hospital -- -- 12 50 39 -- -- --Chowan Hospital -- 37 15 15 -- -- -- --Columbus County 110 117 128 260 122 128 131 81Duke Raleigh Hospital -- -- 176 278 -- -- -- see fixedDurham Regional 228 -- -- -- -- -- -- --FirstHealth Moore Regional 412 265 220 596 612 -- 551 see fixedFirstHealth Richmond Memorial 90 54 69 412 311 196 163 169Franklin Regional Medical Center -- -- -- -- -- -- -- --Frye Regional -- -- 6 6 -- -- -- --Good Hope Hospital -- 46 63 101 37 2 -- --Greensboro Heart Center -- 396 402 455 455 457 see fixedGrace Hospital 381 412 460 405 498 579 430 see fixedHalifax Regional -- -- -- -- 92 55 -- 84Hugh Chatham Memorial 47 46 27 25 30 61 72 54Johnston Memorial 864 744 -- -- -- -- -- --Lake Norman Regional 386 268 -- -- -- -- -- --Lexington Memorial Hospital 60 1 -- -- -- -- -- --Lincoln Medical Center -- -- -- -- 20 20 -- --Maria Parham 75 66 130 130 120 121 100 87New Hanover Regional 88 170 -- -- 130 0 -- --Northern Hospital of Surry Co. 242 189 77 65 88 74 59 49Pardee Memorial Hospital -- 11 54 42 15 204 134 see fixedPark Ridge 52 36 44 18 -- -- -- --Powell Medical Clinic - Sampson Reg. -- -- 37 37 89 92 87 63Presbyterian Hospital-Matthews -- -- -- -- -- -- -- see fixedPresbyterian Hospital-Huntersville -- -- -- -- 32 120 77 140Randolph Hospital 208 148 135 75 145 515 81 see fixed
Table 9P: Mobile Cardiac Catheterization Procedures

Hospital 2001 2002 2003 2004 2005 2006 2007 2008
Table 9P: Mobile Cardiac Catheterization Procedures
Rex Hospital 682 273 -- -- -- -- 54 --Roanoke-Chowan 109 92 97 67 -- -- -- --Rowan Regional 37 -- -- -- -- -- -- --Rutherford Hospital 125 156 68 68 195 66 38 see fixedRegional Medical Center - Kitty Hawk -- -- 81 82 88 0 -- --Sandhills Regional Medical Center -- -- 47 41 117 118 116 37Scotland Memorial 62 161 243 243 429 427 424 387Southeastern Cardiology -Robeson 52 401 237Thomasville Medical Center 68 89 62 70 72 51 58 88University of NC Hospitals -- 29 80 80 -- -- -- --Valdese General 118 120 117 78 3 0 -- --Watauga 157 164 153 15 -- -- -- --Wilmington Heart Center -- -- 1 1 1 926 1,143 see fixedWilmington HC - Brunswick -- -- 772 831 -- -- -- -- TOTAL 4,779 4,406 4,291 5,048 4,357 4,967 5,225 1,527

Hospital 1999 2000 2001 2002 2003 2004 2005 2006 2007 2008Alamance Regional 100 155 143 103 99 123 163 140 120 201Albemarle Hospital -- -- -- -- -- 63 31 -- -- --
Cape Fear Valley Medical Center 304 332 339 415 437 659 747 613 417 1,262
Carolinas Medical Center 1,733 1,655 1,724 1,784 2,509 1,999 1,791 1,847 1,817 1,756
CMC Mercy-Pineville 785 940 698 660 633 634 554 516 529 175Catawba Valley Medical Center 3 64 98 61 92 79 92 86 119 85
CarolinaEast Medical Center 466 587 532 567 510 570 586 501 570 504
Duke Raleigh Hospital -- -- -- -- -- -- -- -- 18 10
Duke University Hospital 1,708 1,689 1,594 1,655 1,871 1,724 1,845 1,618 1,498 1,840
Durham Regional Hospital 288 296 374 375 364 217 78 293 237 281
First Health Moore Regional 1,025 1,127 1,207 1,284 1,422 1,671 1,759 1,880 1,845 1,439
Forsyth Medical Center 672 814 1,787 2,246 2,838 2,632 1,860 1,627 1,593 1,652
Frye Regional Medical Center 815 837 836 970 1107 1057 1061 1300 1487 1,289
Gaston Memorial 449 630 613 1,170 990 1,233 778 837 719 832
High Point Regional Hospital 801 823 1,426 1,547 1,638 1,762 1,060 856 998 852
Mission Hospitals 778 944 1,166 1,237 1,211 1,326 1,376 1,482 1,347 1,489
Moses Cone 1,629 1,816 1,789 1,808 1,944 1,855 1,712 1,850 1,546 1,303
N. C. Baptist Hospital 1,673 1,875 1,598 1,600 1,389 1,383 1,407 1,380 1,105 1,066New Hanover Reg. Med. Center 1,190 1,251 1,242 1,318 1,217 1,571 1,846 1,889 1,983 2,110CMC-Northeast Medical Center 328 340 433 411 629 597 686 719 631 705
Pitt County Memorial 1,635 1,642 1,637 1,838 2,101 2,124 1,807 1,481 1,611 1,398
Presbyterian Hospital 1,500 1,490 1,696 1,758 1,850 1,917 1,864 1,541 1,400 1,361
Presbyterian Hosp-Matthews -- -- -- -- -- -- 3 -- -- 60
Rex Hospital 799 930 1,181 984 1,215 1,237 1,128 1,102 960 980
Rowan Reg. Med. Center -- -- -- -- -- -- -- -- 26 60Southeastern Regional Medical Center -- -- -- -- -- -- -- -- 132 219
UNC Hospitals 276 301 327 488 536 549 674 632 733 836
WakeMed 2,050 2,474 2,685 3,011 3,427 3,787 3,751 3,521 3,654 3,944
WakeMed Cary -- -- -- -- -- 2 0 2 7 5
TOTAL 21,007 23,012 25,125 27,290 30,029 30,771 28,659 27,713 27,102 27,714
Table 9Q: Percutaneous Transluminal Coronary Angioplasty (PTCA) Interventional Procedures *
Source: Division of Health Service Regulation Annual License Renewal Application (Note: Two additional procedures were reported by Presbyterian Hospital-Huntersville through its mobile vendor, MedCath. One additional procedure was reported in 2001 by Columbus County Hospital through its Mobile Vendor, Duke University Hospital.)
* The total number of PTCA procedures hospitals reported beginning with the 1999 Hospital License Renewal Application includes procedures coded ICD 36.06 -- Insertion of coronary artery stent(s).

Cardiac Catheterization
Equipment Service Areas
FacilityCurrent
Inventory
CON Issued/ Pending
Development
Pending Review or
Appeal
Total Planning Inventory
Footnote
2008 Procedures (Weighted
Totals)
Machines Required based on 80% utilization
Total No. of Additional Machines
Required by Facility
No. of Machines Needed
Alamance Alamance Regional 1 1 b 1,299 1.08 0Pending Review/ Appeal 0TOTAL 1 1 0
Buncombe Mission Hospitals 5 1 6 a 6,163 5.14 0Pending Review/ Appeal 0TOTAL 6 5 0
Burke Grace Hospital 1 1 c 427 0.36 0Pending Review/ Appeal 0TOTAL 1 0 0
Cabarrus CMC-NorthEast 2 2 b 2,031 1.69 0Pending Review/ Appeal 0 0TOTAL 2 2 0
Caldwell Caldwell Memorial 1 1 c 587 0.49 0Pending Review/ Appeal 0TOTAL 1 0 0
Catawba Catawba Valley 1 1 b 557 0.46 0Frye Regional 3 1 4 b 5,482 4.57 1Pending Review/ Appeal 0TOTAL 5 5 0
Cleveland Cleveland Regional 1 1 c 390 0.33 0Pending Review/ Appeal 0 0TOTAL 1 0 0
CarolinaEast Med. Center 2 2 b 2,211 1.84 0Pending Review/ Appeal 0 0TOTAL 2 2 0
Cape Fear Valley 2 1 3 b 3,818 3.18 0Pending Review/ Appeal 0 0TOTAL 3 3 0
Craven/Jones/ Pamlico
Table 9R: Fixed Cardiac Catheterization Equipment, Capacity and Volume
Cumberland/ Hoke

Cardiac Catheterization
Equipment Service Areas
FacilityCurrent
Inventory
CON Issued/ Pending
Development
Pending Review or
Appeal
Total Planning Inventory
Footnote
2008 Procedures (Weighted
Totals)
Machines Required based on 80% utilization
Total No. of Additional Machines
Required by Facility
No. of Machines Needed
Table 9R: Fixed Cardiac Catheterization Equipment, Capacity and Volume
Durham Duke 7 7 a 8,055 6.71 0Durham Regional 2 0 0 2 b 1,129 0.94 0Pending Review/ Appeal 0 0TOTAL 9 8 0
Forsyth Forsyth Memorial Hospital 6 2 8 b 5,702 4.75 0N. C. Baptist 5 0 5 a 3,601 3.00 0Pending Review/ Appeal 0TOTAL 13 8 0
Gaston Gaston Memorial 3 1 4 b 3,699 3.08 0Pending Review/ Appeal 0 0TOTAL 4 3 0
Guilford High Point Regional 4 0 4 b 8,443 7.04 3Moses Cone 7 2 9 b 5,244 4.37 0Greensboro Heart Center 1 1 c 464 0.39 0Pending Review/ Appeal 0 0TOTAL 14 12 0
Halifax Halifax Regional 1 1 NR 0Pending Review/ Appeal 0 0TOTAL 1 0 0
Haywood Haywood Regional 1 1 c 151 0.13 0Pending Review/ Appeal 0 0TOTAL 1 0 0
HendersonMargaret R. Pardee Memorial Hospital 1 1 c 179 0.15 0Pending Review/ Appeal 0TOTAL 1 0 0
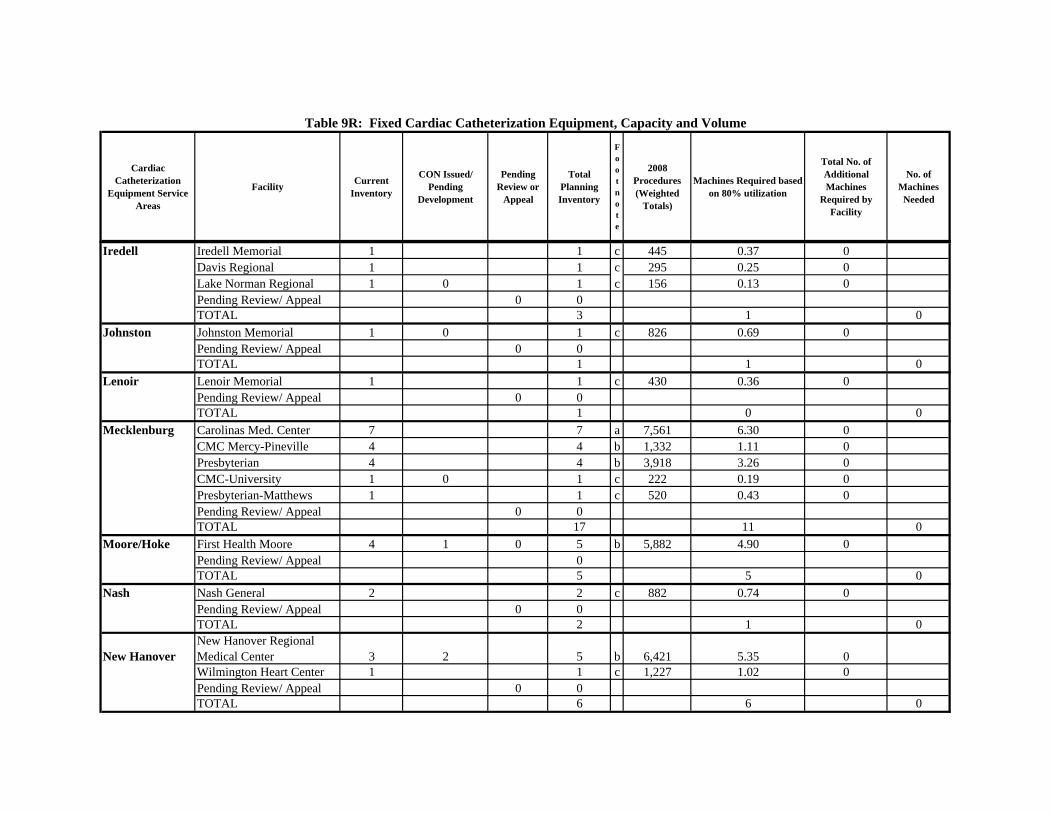
Cardiac Catheterization
Equipment Service Areas
FacilityCurrent
Inventory
CON Issued/ Pending
Development
Pending Review or
Appeal
Total Planning Inventory
Footnote
2008 Procedures (Weighted
Totals)
Machines Required based on 80% utilization
Total No. of Additional Machines
Required by Facility
No. of Machines Needed
Table 9R: Fixed Cardiac Catheterization Equipment, Capacity and Volume
Iredell Iredell Memorial 1 1 c 445 0.37 0Davis Regional 1 1 c 295 0.25 0Lake Norman Regional 1 0 1 c 156 0.13 0Pending Review/ Appeal 0 0TOTAL 3 1 0
Johnston Johnston Memorial 1 0 1 c 826 0.69 0Pending Review/ Appeal 0 0TOTAL 1 1 0
Lenoir Lenoir Memorial 1 1 c 430 0.36 0Pending Review/ Appeal 0 0TOTAL 1 0 0
Mecklenburg Carolinas Med. Center 7 7 a 7,561 6.30 0CMC Mercy-Pineville 4 4 b 1,332 1.11 0Presbyterian 4 4 b 3,918 3.26 0CMC-University 1 0 1 c 222 0.19 0Presbyterian-Matthews 1 1 c 520 0.43 0Pending Review/ Appeal 0 0TOTAL 17 11 0
Moore/Hoke First Health Moore 4 1 0 5 b 5,882 4.90 0Pending Review/ Appeal 0TOTAL 5 5 0
Nash Nash General 2 2 c 882 0.74 0Pending Review/ Appeal 0 0TOTAL 2 1 0
New HanoverNew Hanover Regional Medical Center 3 2 5 b 6,421 5.35 0Wilmington Heart Center 1 1 c 1,227 1.02 0Pending Review/ Appeal 0 0TOTAL 6 6 0
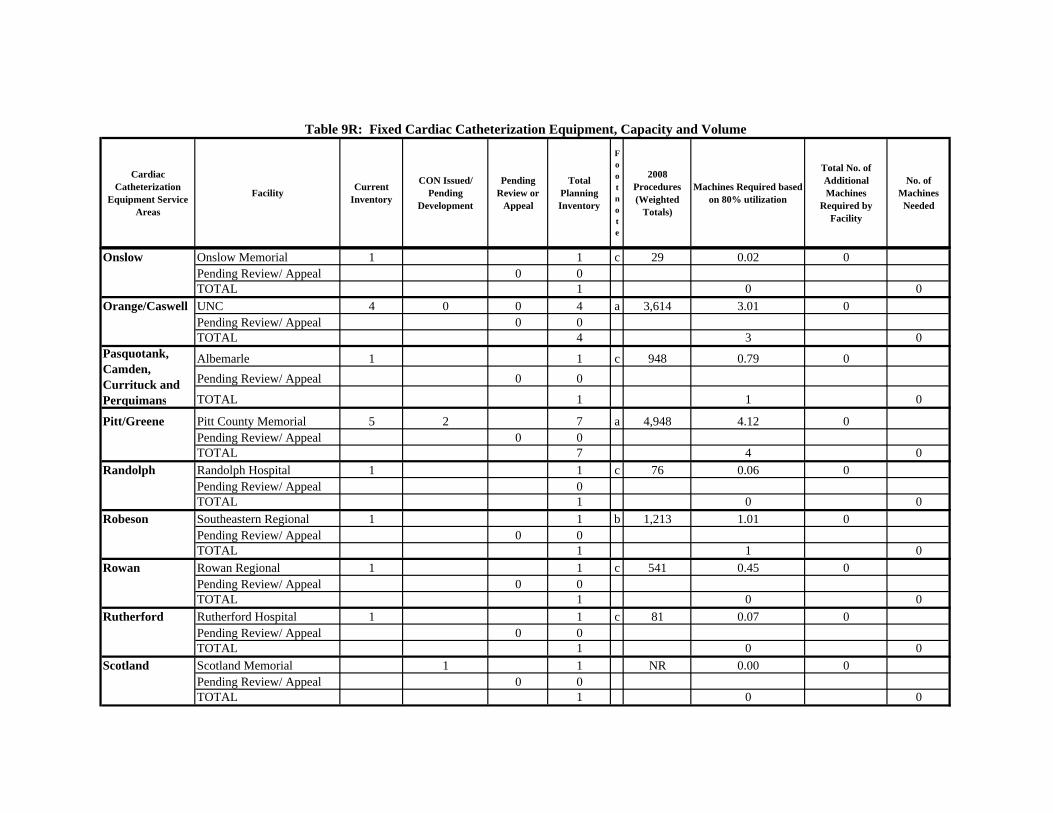
Cardiac Catheterization
Equipment Service Areas
FacilityCurrent
Inventory
CON Issued/ Pending
Development
Pending Review or
Appeal
Total Planning Inventory
Footnote
2008 Procedures (Weighted
Totals)
Machines Required based on 80% utilization
Total No. of Additional Machines
Required by Facility
No. of Machines Needed
Table 9R: Fixed Cardiac Catheterization Equipment, Capacity and Volume
Onslow Onslow Memorial 1 1 c 29 0.02 0Pending Review/ Appeal 0 0TOTAL 1 0 0
Orange/Caswell UNC 4 0 0 4 a 3,614 3.01 0Pending Review/ Appeal 0 0TOTAL 4 3 0
Albemarle 1 1 c 948 0.79 0
Pending Review/ Appeal 0 0
TOTAL 1 1 0
Pitt/Greene Pitt County Memorial 5 2 7 a 4,948 4.12 0Pending Review/ Appeal 0 0TOTAL 7 4 0
Randolph Randolph Hospital 1 1 c 76 0.06 0Pending Review/ Appeal 0TOTAL 1 0 0
Robeson Southeastern Regional 1 1 b 1,213 1.01 0Pending Review/ Appeal 0 0TOTAL 1 1 0
Rowan Rowan Regional 1 1 c 541 0.45 0Pending Review/ Appeal 0 0TOTAL 1 0 0
Rutherford Rutherford Hospital 1 1 c 81 0.07 0Pending Review/ Appeal 0 0TOTAL 1 0 0
Scotland Scotland Memorial 1 1 NR 0.00 0Pending Review/ Appeal 0 0TOTAL 1 0 0
Pasquotank, Camden, Currituck and Perquimans

Cardiac Catheterization
Equipment Service Areas
FacilityCurrent
Inventory
CON Issued/ Pending
Development
Pending Review or
Appeal
Total Planning Inventory
Footnote
2008 Procedures (Weighted
Totals)
Machines Required based on 80% utilization
Total No. of Additional Machines
Required by Facility
No. of Machines Needed
Table 9R: Fixed Cardiac Catheterization Equipment, Capacity and Volume
Stanly Stanly Reg. Medical Center 1 1 c 19 0.02 0Pending Review/ Appeal 0 0TOTAL 1 0 0
Union CMC-Union 1 1 c 413 0.34 0Pending Review/ Appeal 0 0TOTAL 1 0 0
Wake Rex 3 1 4 b 3,581 2.98 0WakeMed 9 1 10 b 12,312 10.26 0WakeMed Cary Hospital 1 1 c 393 0.33 0
Duke Raleigh Hospital 2 0 2 c 1,154 0.96 0Pending Review/ Appeal 0 0TOTAL 17 15 0
Watauga Watauga Medical Center 1 1 c 148 0.12 0Pending Review/ Appeal 0 0TOTAL 1 0 0
Wayne Wayne Memorial 1 1 c 293 0.24 0Pending Review/ Appeal 0 0TOTAL 1 0 0
Wilkes Wilkes Regional 1 1 c 5 0.00 0Pending Review/ Appeal 0 0TOTAL 1 0 0
Wilson Wilson Medical Center 1 1 c 396 0.33 0Pending Review/ Appeal 0 0TOTAL 1 0 0
NORTH CAROLINA TOTALS 124 17 0 141 119,910 99 0
a Adult procedures plus angioplasty x 1.75 plus pediatric procedures x 2.b Adult procedures plus angioplasty x 1.75.c Adult procedures.

Days/Week Procedure ProceduresFacility On Site Capacity Reported in 2008
Central Carolina 1.00 300 51
Columbus County 1.25 375 81
FirstHealth Richmond Memorial 2.00 600 169
Halifax Regional 1.25 375 84
Hugh Chatham Memorial 0.50 150 54
Maria Parham Hospital 1.25 375 87
Northern Hospital of Surry County 0.50 150 49
Presbyterian Hospital - Huntersville 1.00 300 140
Sampson Regional 1.25 375 63
Sandhills Regional Medical Center 1.00 300 37
Scotland Memorial 2.00 600 387
Southeastern Cardiology - Robeson 2.00 600 237
Thomasville Medical Center 1.00 300 88
N. C. TOTAL: 13 16.00 4,800 1,527
Table 9S: Mobile Cardiac Catheterization Capacity and Volume

Chapter 10:Nursing Care Facilities

CHAPTER 10 NURSING CARE FACILITIES Summary of Bed Supply and Utilization
In the fall of 2009, the nursing care bed inventory included 42,431 licensed beds in nursing homes and 1,884 licensed beds in hospitals for a total of 44,315 licensed nursing care beds (not including nursing care beds in state-operated and special care facilities). An additional 988 nursing care beds had received approval from the Certificate of Need (CON) Section, but were not yet licensed. Previous need determinations for which certificates of need have not been issued (including applications currently under review, denied or appealed) were anticipated to add 20 more nursing care beds. The "total inventory" (excluding state-operated and special care facilities) of nursing care beds (licensed + CON approved + previously allocated) was 45,323.
Exclusions from the inventory have been retained for specialty care units (beds in units
designated exclusively for people with head injuries or ventilator dependency), for out-of-area placements in non-profit religious or fraternal facilities, for one-half of the qualified nursing care beds in continuing care retirement communities (Policy NH-2 beds), and for beds transferred from State Psychiatric Hospitals (Policy NH-5 beds). For the North Carolina 2010 State Medical Facilities Plan, the excluded beds total 1,516, resulting in an adjusted "planning inventory" of 43,807 nursing care beds. Changes from the Previous Plan
There have been no substantial changes in application of the nursing care bed need methodology from that used in the North Carolina 2009 State Medical Facilities Plan. References to dates in the methodology and in the policies have been advanced by one year, as appropriate. Basic Assumptions of the Method
1. The principal determinant of nursing home use is the age of the population; the higher the age, the higher the use.
2. Any advantages to patients that may arise from competition will be
fostered by policies which lead to the establishment of new provider institutions. Consequently, whenever feasible, allocations of 90 additional beds or more should be made. It is recognized, however, that such allocations do not always result in new entities.
3. Counties whose deficits represent a high proportion (10 percent or
greater) of their total needs (deficit index) and who have an occupancy of licensed beds in the county, excluding continuing care retirement communities, that is 90 percent or greater based on utilization data reported on 2009 License Renewal Applications, should receive need determinations, even though such increments may be of insufficient size to encourage establishment of new facilities.
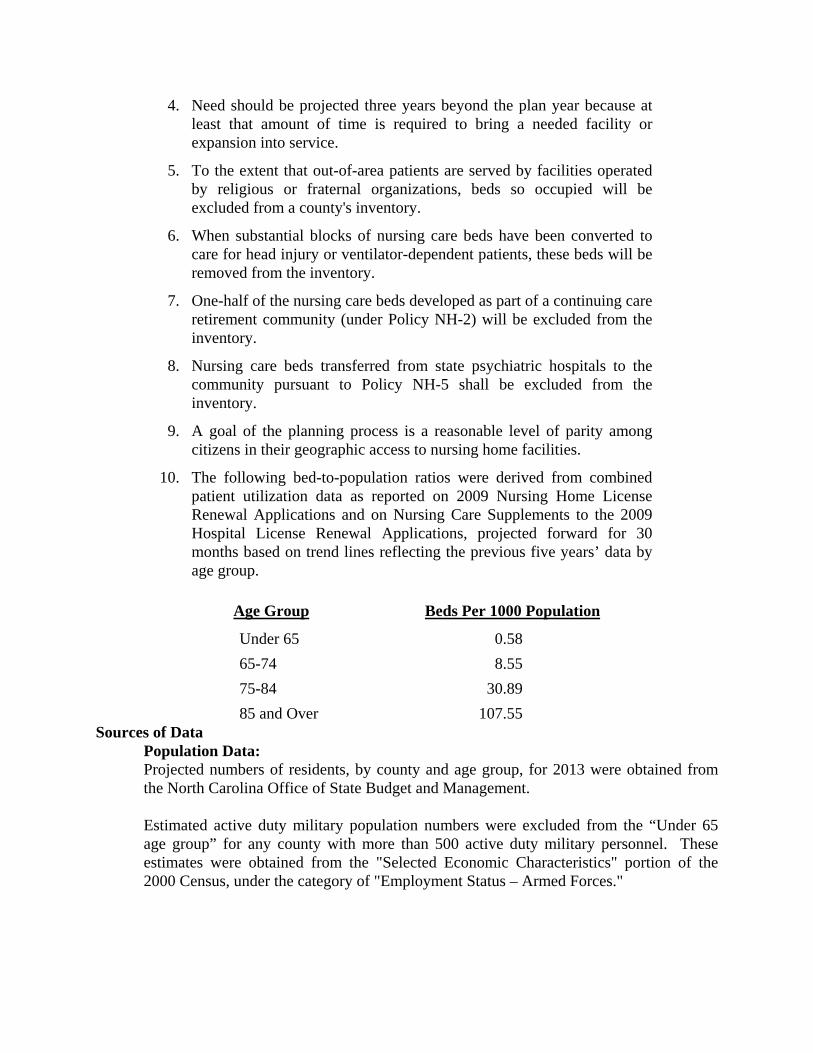
4. Need should be projected three years beyond the plan year because at least that amount of time is required to bring a needed facility or expansion into service.
5. To the extent that out-of-area patients are served by facilities operated
by religious or fraternal organizations, beds so occupied will be excluded from a county's inventory.
6. When substantial blocks of nursing care beds have been converted to
care for head injury or ventilator-dependent patients, these beds will be removed from the inventory.
7. One-half of the nursing care beds developed as part of a continuing care
retirement community (under Policy NH-2) will be excluded from the inventory.
8. Nursing care beds transferred from state psychiatric hospitals to the
community pursuant to Policy NH-5 shall be excluded from the inventory.
9. A goal of the planning process is a reasonable level of parity among
citizens in their geographic access to nursing home facilities.
10. The following bed-to-population ratios were derived from combined patient utilization data as reported on 2009 Nursing Home License Renewal Applications and on Nursing Care Supplements to the 2009 Hospital License Renewal Applications, projected forward for 30 months based on trend lines reflecting the previous five years’ data by age group.
Age Group Beds Per 1000 Population
Under 65 0.58
65-74 8.55
75-84 30.89
85 and Over 107.55 Sources of Data
Population Data: Projected numbers of residents, by county and age group, for 2013 were obtained from the North Carolina Office of State Budget and Management. Estimated active duty military population numbers were excluded from the “Under 65 age group” for any county with more than 500 active duty military personnel. These estimates were obtained from the "Selected Economic Characteristics" portion of the 2000 Census, under the category of "Employment Status – Armed Forces."

Utilization Data: Data on utilization of nursing facilities by age groups were compiled from the "2009 Renewal Applications for License to Operate a Nursing Home," combined with data from the “Nursing Care Facility/Unit Beds 2009 Annual Data Supplement to Hospital License Applications,” as submitted to the North Carolina Department of Health and Human Services, Division of Health Service Regulation.
Application of the Method
The steps in applying the projection method are as follows:
Step 1: Multiply the adopted age-specific use rates (see "Assumptions") by each county's corresponding projected age-specific civilian population (in thousands) for the target year (2013).
Step 2: For each county, add the products of the age-specific projections of beds in Step 1.
The sum is the county’s projected bed utilization. Step 3: For each county, the “planning inventory” is determined based on licensed beds
adjusted for: CON-Approved/License Pending beds, beds available in prior Plans that have not been CON approved, and, exclusions from the county's inventory, if any. For each county, the projected bed utilization derived in Step 2 is subtracted from the “planning inventory.” The result is the county's surplus or deficit.
Step 4: a. For a county with a deficit of 71 to 90 beds, if the average occupancy of
licensed beds in the county, excluding continuing care retirement communities, is 90 percent or greater based on utilization data reported on 2009 Renewal Applications, the need determination is 90 beds.
b. For a county with a deficit of 91 or more beds, if the average occupancy
of licensed beds in the county, excluding continuing care retirement communities, is 90 percent or greater based on utilization data reported on 2009 Renewal Applications, the need determination is the amount of the deficit rounded* to 10.
c. If any other county’s deficit is 10 percent or more of its total projected
bed need, and the average occupancy of licensed beds in the county, excluding continuing care retirement communities, is 90 percent or greater based on utilization data reported on 2009 Renewal Applications, the need determination is the amount of the deficit rounded* to 10.
*For purposes of rounding need determinations, numbers greater than
10 and ending in one to four would round to the next lower number divisible by 10, and numbers ending in five to nine would round to the next higher number divisible by 10.
(A nursing care bed’s service area is the nursing care bed planning area in which the bed is located. Each of the 100 counties in the State is a separate nursing care bed planning area.)

Table 10A: Inventory of Nursing Home and Hospital Nursing Care Beds (Fall 2009)
INVENTORY Sum of TOTALCOUNTY Licensed Nursing Beds Licensed Nursing Beds TOTAL CON Approved / License Pending Available TOTAL Exclu- Planning
Facility Name in Nursing Homes in Hospitals Licensed Beds Nursing Home Hospital in SMFP Available sions Inventory
Alamance Alamance Health Care Center 180 0 180 180 0 180Edgewood Place at the Village at Brookwood 105 0 105 105 12 93Liberty Commons Nursing & Rehab Center 90 0 90 90 0 90Presbyterian Home of Hawfields 117 0 117 117 5 112Rehab. & Healthcare Center of Alamance 120 0 120 120 0 120Twin Lakes Community 100 0 100 100 20 80Twin Lakes - Memory Care Center 16 0 16 16 4 12White Oak Manor-Burlington 160 0 160 160 0 160
TOTALS 888 0 888 0 0 0 888 41 847
Alexander Valley Nursing Center 183 0 183 183 12 171 TOTALS 183 0 183 0 0 0 183 12 171
Alleghany Alleghany Care & Rehab. Center 90 0 90 90 0 90 TOTALS 90 0 90 0 0 0 90 0 90
Anson Anson Community Hospital 0 95 95 95 0 95Heritage Hills Living Center, LLC 66 0 66 66 0 66
TOTALS 66 95 161 0 0 0 161 0 161
Ashe AMH Seagraves Care Center 0 60 60 60 0 60Margate Health & Rehab Center 150 0 150 150 0 150
TOTALS 150 60 210 0 0 0 210 0 210
Avery Cannon Memorial Hospital 0 10 10 10 0 10Life Care Center of Banner Elk 118 0 118 118 0 118
TOTALS 118 10 128 0 0 0 128 0 128
Beaufort Britthaven of Washington 140 0 140 140 0 140Pungo District Hospital 0 10 10 10 10 0Ridgewood Manor 150 0 150 150 0 150
TOTALS 290 10 300 0 0 0 300 10 290
Bertie Brian Center Health & Rehab/Windsor 82 0 82 82 0 82Three Rivers Health and Rehab 60 0 60 60 0 60
TOTALS 142 0 142 0 0 0 142 0 142
Bladen Cape Fear Valley - Bladen County Hospital 0 10 10 10 0 10Elizabethtown Nursing Center, Inc. 94 0 94 94 0 94Poplar Heights Care & Rehab. Center 90 0 90 90 0 90
TOTALS 184 10 194 0 0 0 194 0 194
Brunswick Autumn at Brunswick Plantation 0 0 0 100 100 0 100Autumn Care of Shallotte 130 0 130 -30 100 0 100Brunswick Cove Nursing Center 175 0 175 175 0 175J. Arthur Dosher Hospital 0 50 50 50 0 50Ocean Trail Convalescent Center, Inc. 99 0 99 99 0 99Universal Health Care 0 0 0 90 90 0 90
TOTALS 404 50 454 160 0 0 614 0 614

Table 10A: Inventory of Nursing Home and Hospital Nursing Care Beds (Fall 2009)
INVENTORY Sum of TOTALCOUNTY Licensed Nursing Beds Licensed Nursing Beds TOTAL CON Approved / License Pending Available TOTAL Exclu- Planning
Facility Name in Nursing Homes in Hospitals Licensed Beds Nursing Home Hospital in SMFP Available sions Inventory
Buncombe Asheville Health Care Center 106 0 106 106 0 106Aston Park Health Care Center, Inc. 120 0 120 120 0 120Black Mountain Neuro-Medical Treatment Ctr* 0 0 71* 71* 0 0Brian Center Health & Rehab/Weaverville 122 0 122 122 0 122Brooks-Howell Home 58 0 58 58 58 0Courtyard Rehabilitation and Nursing Center 120 0 120 120 0 120Deerfield Episcopal Retirement Community 48 0 48 14 62 31 31Emerald Ridge Rehab. & Care Center 100 0 100 100 0 100Flesher's Fairview Health Care Center 106 0 106 106 0 106Givens Health Center 58 0 58 58 2 56Golden LivingCenter - Asheville 77 0 77 77 0 77Grace Healthcare of Asheville 120 0 120 120 0 120Highland Farms Retirement Community 60 0 60 60 0 60Mountain Ridge Wellness Center 97 0 97 97 0 97Pisgah Manor Health Care Center 118 0 118 118 6 112Rickman Nursing Care Center 100 0 100 100 20 80The Laurels of GreenTree Ridge 98 0 98 98 0 98The Laurels of Summit Ridge 60 0 60 60 0 60The Oaks at Sweeten Creek Healthcare 100 0 100 100 0 100
TOTALS 1668 0 1668 14 0 0 1682 117 1565Burke Autumn Care of Drexel 100 0 100 100 0 100
Britthaven of Morganton 121 0 121 121 0 121Carolina Rehab Center of Burke 90 0 90 90 0 90College Pines Nursing Center 100 0 100 100 0 100Grace Heights Health and Rehab Center 120 0 120 120 0 120Grace Ridge 25 0 25 25 13 12
TOTALS 556 0 556 0 0 0 556 13 543Cabarrus Avante at Concord 120 0 120 120 0 120
Brian Center Health and Retirement 90 0 90 90 0 90Five Oaks Manor 160 0 160 160 0 160Gardens of Taylor Glen Retirement Comm. 24 0 24 24 17 7The Oaks at Town Center 70 0 70 70 0 70Transitional Health Services of Kannapolis 107 0 107 107 0 107Universal Health Care and Rehab Center 120 0 120 120 0 120
TOTALS 691 0 691 0 0 0 691 17 674
Caldwell Camelot Manor Nursing Care Fac., Inc. 120 0 120 120 0 120Gateway Rehabilitation and Healthcare 100 0 100 100 0 100Lenoir Healthcare Center 120 0 120 120 0 120Shaire Nursing Center 60 0 60 60 0 60
TOTALS 400 0 400 0 0 0 400 0 400
* State Veterans Nursing Homes, Hospitals, Mental Retardation Centers and Special Care Centers are not counted in the "County" and "State" Totals.

Table 10A: Inventory of Nursing Home and Hospital Nursing Care Beds (Fall 2009)
INVENTORY Sum of TOTALCOUNTY Licensed Nursing Beds Licensed Nursing Beds TOTAL CON Approved / License Pending Available TOTAL Exclu- Planning
Facility Name in Nursing Homes in Hospitals Licensed Beds Nursing Home Hospital in SMFP Available sions Inventory
Camden N/A (Beds located in Currituck (15) and Pasquotank (25)) -40 40 TOTALS 0 0 0 0 -40 40
Carteret Britthaven of Newport 64 0 64 64 0 64Crystal Bluffs Rehabilitation and Healthcare 92 0 92 92 0 92Harborview Health Care Center 122 0 122 122 0 122Snug Harbor on Nelson Bay 42 0 42 42 0 42Taylor Extended Care 104 0 104 104 0 104
TOTALS 424 0 424 0 0 0 424 0 424
Caswell Brian Center Health & Rehabilitation/ Yanceyville 157 157 157 0 157
TOTALS 157 0 157 0 0 0 157 0 157
Catawba Abernethy Laurels 174 0 174 174 12 162Brian Center Health & Rehabilitation/ Hickory East 150 0 150 150 0 150Brian Center Hlth/Rehab/Hickory Viewmount 104 0 104 104 0 104Conover Nursing and Rehab Center 90 0 90 90 0 90Frye Regional Medical Center 0 17 17 17 0 17Lutheran Home - Hickory 104 0 104 104 1 103Lutheran Home/Hickory West 120 0 120 120 5 115
TOTALS 742 17 759 0 0 0 759 18 741
Chatham Carolina Meadows Health Center 90 0 90 90 45 45Galloway Ridge (The Arbor) 17 0 17 23 40 20 20Siler City Care & Rehab. Center 150 0 150 150 0 150The Laurels of Chatham 140 0 140 140 0 140
TOTALS 397 0 397 23 0 0 420 65 355
Cherokee Murphy Medical Center 0 134 134 134 0 134Valley View Care & Rehabilitation Center 76 0 76 76 0 76
TOTALS 76 134 210 0 0 0 210 0 210
Chowan Britthaven of Edenton 130 0 130 130 0 130Chowan Hospital 0 40 40 40 0 40
TOTALS 130 40 170 0 0 0 170 0 170
Clay Clay County Care Center 90 0 90 90 0 90 TOTALS 90 0 90 0 0 90 0 90

Table 10A: Inventory of Nursing Home and Hospital Nursing Care Beds (Fall 2009)
INVENTORY Sum of TOTALCOUNTY Licensed Nursing Beds Licensed Nursing Beds TOTAL CON Approved / License Pending Available TOTAL Exclu- Planning
Facility Name in Nursing Homes in Hospitals Licensed Beds Nursing Home Hospital in SMFP Available sions Inventory
Cleveland Cleveland Pines Nursing Center 120 0 120 120 0 120Crawley Memorial Hospital 0 10 10 10 10 0Kings Mountain Hospital 0 10 10 10 0 10Peak Resources - Shelby 100 0 100 100 0 100White Oak Manor/Kings Mountain 154 0 154 154 0 154White Oak Manor/Shelby 160 0 160 160 0 160
TOTALS 534 20 554 0 0 0 554 10 544
Columbus Liberty Commons Nursing and Rehab Ctr. 107 0 107 107 0 107Premier Living and Rehab Center 127 0 127 127 0 127Shoreland Health Care & Retirement Center 89 0 89 89 0 89
TOTALS 323 0 323 0 0 0 323 0 323
Craven Bayview Nursing and Rehabilitation 60 0 60 60 0 60Britthaven of Havelock 70 0 70 70 0 70Britthaven of New Bern 105 0 105 105 0 105Two Rivers Healthcare - Trent Campus 116 0 116 116 0 116Two Rivers Healthcare - Neuse Campus 110 0 110 110 0 110
TOTALS 461 0 461 0 0 0 461 0 461Cumberland Autumn Care of Cumberland 0 0 0 90 90 0 90
Bethesda Health Care Facility 85 0 85 85 0 85Cambellton Health Care Center 120 0 120 120 0 120Carolina Hlth. Care Ctr. Of Cumberland Co. 136 0 136 136 0 136Golden Years Nursing Home 58 0 58 58 0 58Haymount Rehab and Nursing Center 98 0 98 98 0 98Highland House Rehab and Healthcare 106 0 106 106 0 106North Carolina State Veterans Nursing Home * 0 0 150* 150* 0 0The Rehab. and Hlth. Care Ctr./Village Green 170 0 170 170 0 170Whispering Pines Nursing & Rehab Center 86 0 86 86 0 86Woodlands Assisted Living and Rehab 80 0 80 80 0 80
TOTALS 939 0 939 90 0 0 1029 0 1029(15/Camden)
Currituck Sentara Nursing Center-Currituck 100 0 100 100 15 85 TOTALS 100 0 100 0 0 100 15 85
Dare Britthaven of Outer Banks 126 126 126 0 126 TOTALS 126 0 126 0 0 0 126 0 126
* State Veterans Nursing Homes, Hospitals, Mental Retardation Centers and Special Care Centers are not counted in the "County" and "State" Totals.
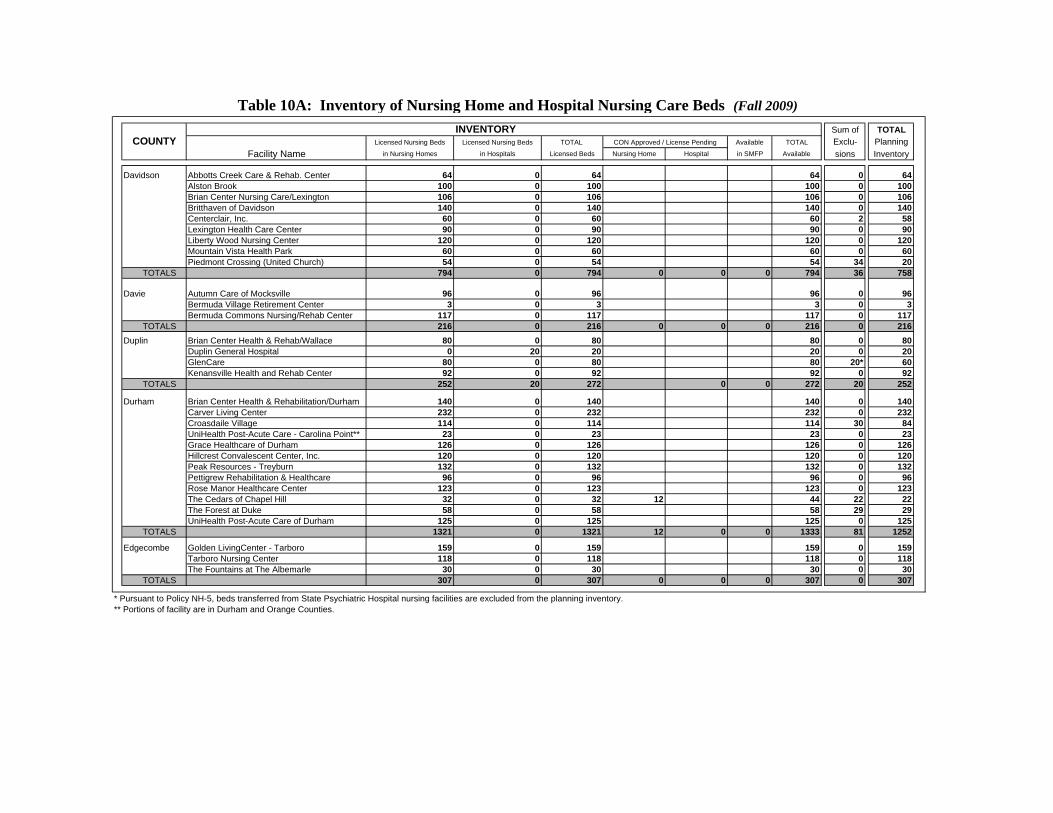
Table 10A: Inventory of Nursing Home and Hospital Nursing Care Beds (Fall 2009)
INVENTORY Sum of TOTALCOUNTY Licensed Nursing Beds Licensed Nursing Beds TOTAL CON Approved / License Pending Available TOTAL Exclu- Planning
Facility Name in Nursing Homes in Hospitals Licensed Beds Nursing Home Hospital in SMFP Available sions Inventory
Davidson Abbotts Creek Care & Rehab. Center 64 0 64 64 0 64Alston Brook 100 0 100 100 0 100Brian Center Nursing Care/Lexington 106 0 106 106 0 106Britthaven of Davidson 140 0 140 140 0 140Centerclair, Inc. 60 0 60 60 2 58Lexington Health Care Center 90 0 90 90 0 90Liberty Wood Nursing Center 120 0 120 120 0 120Mountain Vista Health Park 60 0 60 60 0 60Piedmont Crossing (United Church) 54 0 54 54 34 20
TOTALS 794 0 794 0 0 0 794 36 758
Davie Autumn Care of Mocksville 96 0 96 96 0 96Bermuda Village Retirement Center 3 0 3 3 0 3Bermuda Commons Nursing/Rehab Center 117 0 117 117 0 117
TOTALS 216 0 216 0 0 0 216 0 216Duplin Brian Center Health & Rehab/Wallace 80 0 80 80 0 80
Duplin General Hospital 0 20 20 20 0 20GlenCare 80 0 80 80 20* 60Kenansville Health and Rehab Center 92 0 92 92 0 92
TOTALS 252 20 272 0 0 272 20 252
Durham Brian Center Health & Rehabilitation/Durham 140 0 140 140 0 140Carver Living Center 232 0 232 232 0 232Croasdaile Village 114 0 114 114 30 84UniHealth Post-Acute Care - Carolina Point** 23 0 23 23 0 23Grace Healthcare of Durham 126 0 126 126 0 126Hillcrest Convalescent Center, Inc. 120 0 120 120 0 120Peak Resources - Treyburn 132 0 132 132 0 132Pettigrew Rehabilitation & Healthcare 96 0 96 96 0 96Rose Manor Healthcare Center 123 0 123 123 0 123The Cedars of Chapel Hill 32 0 32 12 44 22 22The Forest at Duke 58 0 58 58 29 29UniHealth Post-Acute Care of Durham 125 0 125 125 0 125
TOTALS 1321 0 1321 12 0 0 1333 81 1252
Edgecombe Golden LivingCenter - Tarboro 159 0 159 159 0 159Tarboro Nursing Center 118 0 118 118 0 118The Fountains at The Albemarle 30 0 30 30 0 30
TOTALS 307 0 307 0 0 0 307 0 307
* Pursuant to Policy NH-5, beds transferred from State Psychiatric Hospital nursing facilities are excluded from the planning inventory.** Portions of facility are in Durham and Orange Counties.

Table 10A: Inventory of Nursing Home and Hospital Nursing Care Beds (Fall 2009)
INVENTORY Sum of TOTALCOUNTY Licensed Nursing Beds Licensed Nursing Beds TOTAL CON Approved / License Pending Available TOTAL Exclu- Planning
Facility Name in Nursing Homes in Hospitals Licensed Beds Nursing Home Hospital in SMFP Available sions Inventory
Forsyth Arbor Acres United Methodist Retire. Comm. 53 0 53 12 65 59 6Baptist Retirement Homes of NC 85 0 85 85 18 67Brian Ctr. Health & Retire./Winston Salem 40 0 40 40 0 40Britthaven of Kernersville 92 0 92 92 0 92Clemmons Nursing and Rehab Center 120 0 120 120 0 120Forsyth Medical Center Skilled Nursing Unit 0 20 20 20 0 20Grace Healthcare of Winston-Salem 230 0 230 230 0 230Heritage Healthcare of High-Point 100 0 100 100 0 100Lutheran Home/Winston-Salem 217 0 217 -100 117 13 104Lutheran Home/Forsyth County 0 0 0 100 100 0 100Oak Forest Health and Rehabilitation 170 0 170 170 18 152Salemtowne 84 0 84 84 43 41Silas Creek Manor 94 0 94 94 0 94Springwood Care Center of Forsyth 200 0 200 200 0 200The Oaks at Forsyth 151 0 151 151 0 151
TOTALS 1636 20 1656 12 0 0 1668 151 1517
Franklin Britthaven of Louisburg 166 0 166 166 0 166Louisburg Nursing Center 92 0 92 92 0 92
TOTALS 258 0 258 0 0 0 258 0 258
Gaston Alexandria Place 60 0 60 60 0 60Belaire Health Care Center 80 0 80 80 0 80Brian Center Health & Rehab./Gastonia 162 0 162 162 0 162Carolina Care Center 107 0 107 107 0 107Courtland Terrace 77 0 77 77 0 77Covenant Village, Inc. 38 0 38 38 19 19MeadowWood Nursing Center 50 0 50 50 0 50Peak Resources - Cherryville 54 0 54 54 0 54Peak Resources - Gastonia 120 0 120 120 0 120Rehab. & Health Center of Gastonia 118 0 118 118 0 118Stanley Total Living Center, Inc. 106 0 106 106 22 84
TOTALS 972 0 972 0 0 0 972 41 931
Gates Down East Health and Rehabilitation 70 0 70 70 0 70 TOTALS 70 0 70 0 0 0 70 0 70
Graham Britthaven of Graham 80 0 80 80 0 80 TOTALS 80 0 80 0 0 0 80 0 80

Table 10A: Inventory of Nursing Home and Hospital Nursing Care Beds (Fall 2009)
INVENTORY Sum of TOTALCOUNTY Licensed Nursing Beds Licensed Nursing Beds TOTAL CON Approved / License Pending Available TOTAL Exclu- Planning
Facility Name in Nursing Homes in Hospitals Licensed Beds Nursing Home Hospital in SMFP Available sions Inventory
Granville Granville Medical Center/Brantwood 0 80 80 80 0 80Universal Health Care Oxford 160 0 160 160 0 160
TOTALS 160 80 240 0 0 0 240 0 240
Greene Britthaven of Snow Hill 115 0 115 115 0 115 TOTALS 115 0 115 0 0 0 115 0 115
Guilford Adams Farm Living and Rehab 120 0 120 120 0 120Ashton Place Health & Rehab 134 0 134 134 0 134Blumenthal Jewish Nursing/Rehab Center 134 0 134 134 0 134Britthaven of Guilford 120 0 120 120 0 120Camden Place Health & Rehab 135 0 135 135 0 135Carolina Commons Healthcare & Rehab. Ctr. 210 0 210 210 0 210Clapp's Nursing Center, Inc. 118 0 118 118 0 118Countryside Manor 60 0 60 60 0 60Evergreens Senior Healthcare System 57 0 57 -57 0 0 0Friends Home at Guilford 69 0 69 69 19 50Friends Homes West 40 0 40 40 20 20Golden LivingCenter - Greensboro 105 0 105 105 0 105Golden LivingCenter - Starmount 126 0 126 126 0 126Guilford Health Care Center 110 0 110 110 0 110Heartland Living and Rehab 107 0 107 107 0 107High Point Regional Health System 0 30 30 30 0 30Kindred Hospital - Greensboro 0 23 23 23 0 23Maryfield Nursing Home 125 0 125 125 11 114Masonic & Eastern Star Home of NC 88 0 88 88 46 42Moses Cone Health System Hospital 0 19 19 19 0 19Presbyterian Home of High Point 65 0 65 65 10 55River Landing at Sandy Ridge 60 0 60 60 21 39Triad Care & Rehab. Center 199 0 199 199 0 199The Evergreens, Inc. (High Point) 93 0 93 -93 0 0 0The Shannon Gray Rehab & Recovery Place 0 0 0 150 150 0 150Wellspring Ret. Community 60 0 60 60 40 20Westchester Manor at Providence Place 129 0 129 129 0 129
TOTALS 2464 72 2536 0 0 0 2536 167 2369
Halifax Britthaven of Enfield 63 0 63 63 0 63Guardian Care of Scotland Neck 62 0 62 62 0 62Guardian Care of Roanoke Rapids 110 0 110 110 0 110Liberty Commons Nursing/Rehab of Halifax 50 0 50 50 0 50Our Community Hospital 0 60 60 60 0 60
TOTALS 285 60 345 0 0 0 345 0 345

Table 10A: Inventory of Nursing Home and Hospital Nursing Care Beds (Fall 2009)
INVENTORY Sum of TOTALCOUNTY Licensed Nursing Beds Licensed Nursing Beds TOTAL CON Approved / License Pending Available TOTAL Exclu- Planning
Facility Name in Nursing Homes in Hospitals Licensed Beds Nursing Home Hospital in SMFP Available sions Inventory
Harnett Britthaven of Harnett 100 0 100 100 0 100Dunn Rehab. and Nursing Center 100 0 100 100 0 100Magnolia Living Center, LLC 96 0 96 96 0 96Universal Health Care Lillington 129 0 129 129 0 129
TOTALS 425 0 425 0 0 0 425 0 425
Haywood Autumn Care of Waynesville 90 0 90 90 0 90Brian Center Health & Rehab/Waynesville 90 0 90 90 0 90Canton Health Care Center 114 0 114 114 0 114Haywood Regional Medical Center 0 20 20 -20 0 0 0Smoky Mountain HealthCare/Rehab Ctr. 50 0 50 50 0 50Silver Bluff 111 0 111 20 131 0 131
TOTALS 455 20 475 0 0 0 475 0 475
Henderson Beystone Health & Rehab 50 0 50 50 0 50Brian Center Health & Rehabilitation 120 0 120 120 0 120Carolina Village, Inc. 58 0 58 58 29 29Golden LivingCenter - Hendersonville 150 0 150 150 0 150Hendersonville Health and Rehabilitation 130 0 130 130 0 130Life Care Ctr. of Hendersonville,Inc 80 0 80 80 0 80Mountain Home Health & Rehab 134 0 134 134 0 134The Laurels of Hendersonville 100 0 100 100 0 100Universal Health Care/Fletcher 90 0 90 90 0 90
TOTALS 912 0 912 0 0 0 912 29 883
Hertford Guardian Care of Ahoskie 151 0 151 151 0 151 TOTALS 151 0 151 0 0 0 151 0 151
Hoke Autumn Care of Raeford 132 0 132 132 0 132McCain Correctional Hospital * 0 0 38* 38* 0 0
TOTALS 132 0 132 0 0 0 132 0 132Hyde Cross Creek Health Care 80 0 80 80 0 80 TOTALS 80 0 80 0 0 0 80 0 80Iredell Autumn Care of Statesville 90 0 90 90 0 90
Brian Center Health & Retirement/ Mooresville 131 0 131 131 0 131Brian Center Health & Rehab/ Statesville 147 0 147 147 0 147Davis Regional Medical Center 0 13 13 13 0 13Iredell Memorial Hospital 0 48 48 48 0 48Maple Leaf Health Care 94 0 94 94 0 94Mooresville Center 130 0 130 130 0 130
TOTALS 592 61 653 0 0 0 653 0 653
* State Veterans Nursing Homes, Hospitals, Mental Retardation Centers and Special Care Centers are not counted in the "County" and "State" Totals.

Table 10A: Inventory of Nursing Home and Hospital Nursing Care Beds (Fall 2009)
INVENTORY Sum of TOTALCOUNTY Licensed Nursing Beds Licensed Nursing Beds TOTAL CON Approved / License Pending Available TOTAL Exclu- Planning
Facility Name in Nursing Homes in Hospitals Licensed Beds Nursing Home Hospital in SMFP Available sions Inventory
Jackson Mountain Trace Nursing Center 106 0 106 106 0 106Skyland Care Center, Inc. 94 0 94 94 0 94
TOTALS 200 0 200 0 0 0 200 0 200
Johnston Brian Center Health & Ret./Clayton 90 0 90 90 0 90Britthaven of Smithfield 200 0 200 5 205 0 205Liberty Commons Nursing and Rehab 100 0 100 100 0 100Smithfield Manor, Inc. 160 0 160 160 0 160
TOTALS 550 0 550 5 0 0 555 0 555
Jones Brookstone Living Center 80 0 80 80 0 80 TOTALS 80 0 80 0 0 0 80 0 80Lee Lee County Nursing & Rehab Center 83 0 83 83 0 83
Liberty Commons Nursing/Rehab Lee Co. 80 0 80 80 0 80Sanford Health and Rehab 131 0 131 131 0 131
TOTALS 294 0 294 0 0 0 294 0 294
Lenoir Britthaven of Kinston 175 0 175 175 0 175Kinston Rehabilitation and Healthcare Center 106 0 106 106 0 106Lenoir Memorial Hospital 0 26 26 26 0 26
TOTALS 281 26 307 0 0 0 307 0 307
Lincoln Brian Center Health & Retirement/ Lincolnton 117 0 117 117 0 117Cardinal Healthcare and Rehab Center 63 0 63 63 0 63Lincoln Nursing Center 120 0 120 120 0 120
TOTALS 300 0 300 0 0 0 300 0 300
Macon Britthaven of Franklin 200 0 200 200 0 200Highlands-Cashiers Hospital/Eckerd Center 0 84 84 84 0 84
TOTALS 200 84 284 0 0 284 0 284
Madison Elderberry Health Care 80 0 80 80 0 80Madison Manor Rehab and Nursing Center 100 0 100 100 0 100
TOTALS 180 0 180 0 0 0 180 0 180
Martin Williamston Rehab and Healthcare Center 154 0 154 154 0 154 TOTALS 154 0 154 0 0 0 154 0 154
McDowell Autumn Care of Marion 110 0 110 110 0 110Sunrise Rehabilitation and Care 140 0 140 20 160 0 160
TOTALS 250 0 250 20 0 0 270 0 270

Table 10A: Inventory of Nursing Home and Hospital Nursing Care Beds (Fall 2009)
INVENTORY Sum of TOTALCOUNTY Licensed Nursing Beds Licensed Nursing Beds TOTAL CON Approved / License Pending Available TOTAL Exclu- Planning
Facility Name in Nursing Homes in Hospitals Licensed Beds Nursing Home Hospital in SMFP Available sions Inventory
Mecklenburg Asbury Care Center 100 0 100 100 61 39Autumn Care of Mecklenburg 0 0 0 102 102 0 102Avante at Charlotte 100 0 100 100 0 100Brian Center Health & Rehab./Charlotte 120 0 120 120 0 120Brian Center Nursing Care/Shamrock 100 0 100 100 0 100Britthaven of Charlotte 207 0 207 207 0 207Britthaven of Mecklenburg 0 0 0 120 120 0 120Carrington Place 166 0 166 166 0 166Charlotte Health Care Center 120 0 120 60 180 0 180Churchill Commons Nursing & Rehab Center 0 0 0 120 120 0 120Golden LivingCenter - Charlotte 120 0 120 120 0 120Golden LivingCenter - Dartmouth 133 0 133 133 0 133Hunter Woods Nursing & Rehab. Center 120 0 120 120 0 120Huntersville Oaks 168 0 168 168 0 168Liberty Nursing & Rehab. Center 289 0 289 -289 0 0 0Mecklenburg Health Care Center 100 0 100 100 0 100Old Knox Commons/Village of Mecklenburg 114 0 114 114 0 114Peak Resources- Charlotte 142 0 142 142 0 142Pineville Rehabilitation and Living Center 106 0 106 106 0 106Presbyterian Orthopaedic Hospital 0 16 16 16 0 16Royal Park Rehab & Nursing Center 0 0 0 169 169 0 169Sardis Oaks 124 0 124 124 0 124Saturn Nursing and Rehabilitation Center 120 0 120 120 0 120Sharon Towers 96 0 96 96 80 16Southminster 60 0 60 60 60 0The Carriage Club of Charlotte 42 0 42 42 21 21The Pines at Davidson 51 0 51 51 46 5The Stewart Health Center 36 0 36 20 56 28 28White Oak Manor/Charlotte 180 0 180 180 0 180WillowBrooke Court/ Plantation Estates 80 0 80 80 40 40Wilora Lake Healthcare Center 70 0 70 70 0 70
TOTALS 3064 16 3080 302 0 0 3382 336 3046Mitchell Brian Center Health & Rehab/Spruce Pine 127 0 127 127 0 127 TOTALS 127 0 127 0 0 0 127 0 127Montgomery Autumn Care of Biscoe 141 0 141 141 0 141 TOTALS 141 0 141 0 0 0 141 0 141Moore Kingswood Nursing Center 90 0 90 90 0 90
Manor Care Health Services/ Pinehurst 120 0 120 120 0 120Methodist Retirement/Quail Haven Village 60 0 60 60 14 46Peak Resources - Pinelake 90 0 90 90 0 90Penick Village 50 0 50 50 17 33Pinehurst Healthcare and Rehab Center 144 0 144 144 0 144St. Joseph of The Pines-Health Center 176 0 176 176 0 176
TOTALS 730 0 730 0 0 0 730 31 699
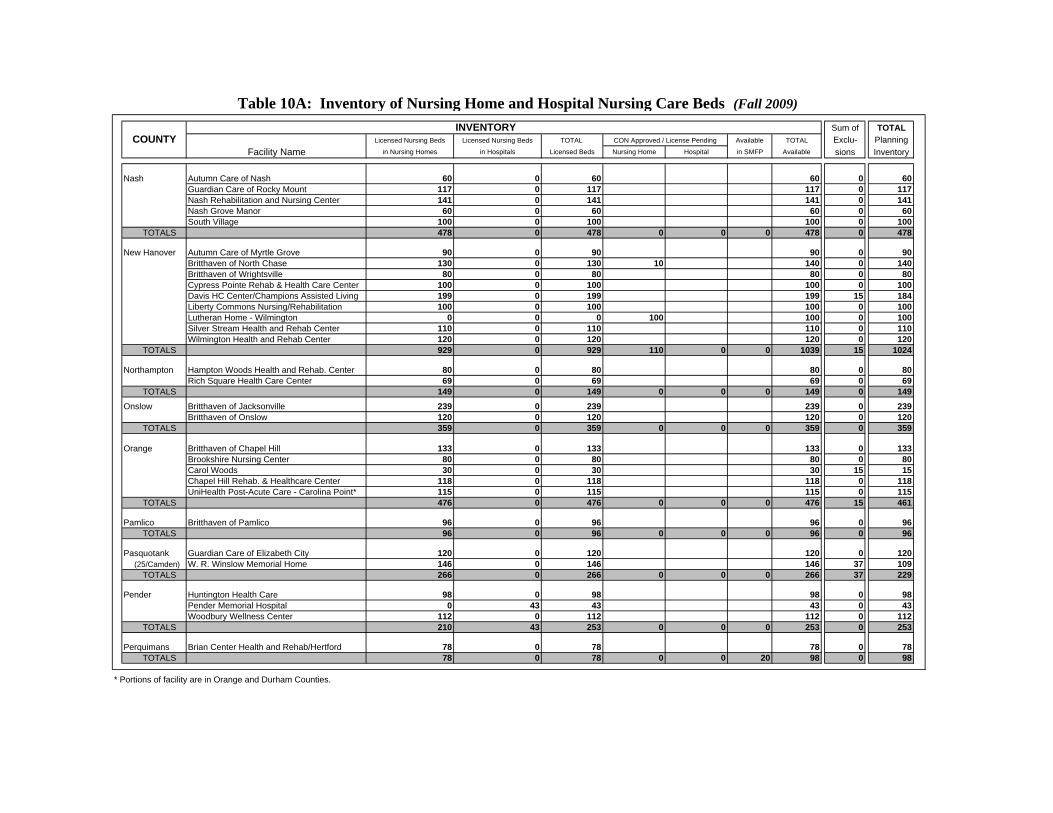
Table 10A: Inventory of Nursing Home and Hospital Nursing Care Beds (Fall 2009)
INVENTORY Sum of TOTALCOUNTY Licensed Nursing Beds Licensed Nursing Beds TOTAL CON Approved / License Pending Available TOTAL Exclu- Planning
Facility Name in Nursing Homes in Hospitals Licensed Beds Nursing Home Hospital in SMFP Available sions Inventory
Nash Autumn Care of Nash 60 0 60 60 0 60Guardian Care of Rocky Mount 117 0 117 117 0 117Nash Rehabilitation and Nursing Center 141 0 141 141 0 141Nash Grove Manor 60 0 60 60 0 60South Village 100 0 100 100 0 100
TOTALS 478 0 478 0 0 0 478 0 478
New Hanover Autumn Care of Myrtle Grove 90 0 90 90 0 90Britthaven of North Chase 130 0 130 10 140 0 140Britthaven of Wrightsville 80 0 80 80 0 80Cypress Pointe Rehab & Health Care Center 100 0 100 100 0 100Davis HC Center/Champions Assisted Living 199 0 199 199 15 184Liberty Commons Nursing/Rehabilitation 100 0 100 100 0 100Lutheran Home - Wilmington 0 0 0 100 100 0 100Silver Stream Health and Rehab Center 110 0 110 110 0 110Wilmington Health and Rehab Center 120 0 120 120 0 120
TOTALS 929 0 929 110 0 0 1039 15 1024
Northampton Hampton Woods Health and Rehab. Center 80 0 80 80 0 80Rich Square Health Care Center 69 0 69 69 0 69
TOTALS 149 0 149 0 0 0 149 0 149Onslow Britthaven of Jacksonville 239 0 239 239 0 239
Britthaven of Onslow 120 0 120 120 0 120 TOTALS 359 0 359 0 0 0 359 0 359
Orange Britthaven of Chapel Hill 133 0 133 133 0 133Brookshire Nursing Center 80 0 80 80 0 80Carol Woods 30 0 30 30 15 15Chapel Hill Rehab. & Healthcare Center 118 0 118 118 0 118UniHealth Post-Acute Care - Carolina Point* 115 0 115 115 0 115
TOTALS 476 0 476 0 0 0 476 15 461
Pamlico Britthaven of Pamlico 96 0 96 96 0 96 TOTALS 96 0 96 0 0 0 96 0 96
Pasquotank Guardian Care of Elizabeth City 120 0 120 120 0 120 (25/Camden) W. R. Winslow Memorial Home 146 0 146 146 37 109 TOTALS 266 0 266 0 0 0 266 37 229
Pender Huntington Health Care 98 0 98 98 0 98Pender Memorial Hospital 0 43 43 43 0 43Woodbury Wellness Center 112 0 112 112 0 112
TOTALS 210 43 253 0 0 0 253 0 253
Perquimans Brian Center Health and Rehab/Hertford 78 0 78 78 0 78 TOTALS 78 0 78 0 0 20 98 0 98
* Portions of facility are in Orange and Durham Counties.

Table 10A: Inventory of Nursing Home and Hospital Nursing Care Beds (Fall 2009)
INVENTORY Sum of TOTALCOUNTY Licensed Nursing Beds Licensed Nursing Beds TOTAL CON Approved / License Pending Available TOTAL Exclu- Planning
Facility Name in Nursing Homes in Hospitals Licensed Beds Nursing Home Hospital in SMFP Available sions Inventory
Person Person Memorial Hospital 0 60 60 60 0 60Roxboro Nursing Center 140 0 140 140 0 140
TOTALS 140 60 200 0 0 0 200 0 200
Pitt Britthaven of Ayden 82 0 82 82 0 82Cypress Glen Retirement Community 30 0 30 30 15 15Golden LivingCenter - Greenville 152 0 152 152 0 152Greenfield Place 130 0 130 130 0 130Heritage Healthcare of Farmville 56 0 56 56 0 56Universal Health Care Greenville 120 0 120 120 0 120
TOTALS 570 0 570 0 0 0 570 15 555
Polk Autumn Care of Saluda 99 0 99 99 0 99WillowBrooke Court Skilled Care Center 52 0 52 52 26 26White Oak Manor/Tryon 70 0 70 70 0 70
TOTALS 221 0 221 0 0 0 221 26 195
Randolph Clapp's Convales. Nursing Home,Inc. 96 0 96 96 0 96Randolph Health and Rehab Center 238 0 238 238 0 238The GrayBrier Nursing & Retirement Center 128 0 128 128 0 128Universal Health Care/Ramseur 90 0 90 90 0 90Westwood Health and Rehabilitation 68 0 68 68 0 68Woodland Hill Care & Rehab. Center 100 0 100 100 0 100
TOTALS 720 0 720 0 0 0 720 0 720
Richmond Britthaven of Hamlet 105 0 105 105 0 105FirstHealth Richmond Memorial Hospital 0 51 51 51 0 51Rockingham Manor 120 0 120 120 0 120
TOTALS 225 51 276 0 0 0 276 0 276
Robeson GlenFlora 52 0 52 52 0 52Golden LivingCenter - Lumberton 122 0 122 122 0 122Linkhaw Place 90 0 90 90 0 90Pembroke Care & Rehab. Center 84 0 84 84 0 84Wesley Pines Retirement Community 62 0 62 62 4 58WoodHaven Nursing and Alzheimer's Care Center 0 115 115 115 0 115
TOTALS 410 115 525 0 0 0 525 4 521
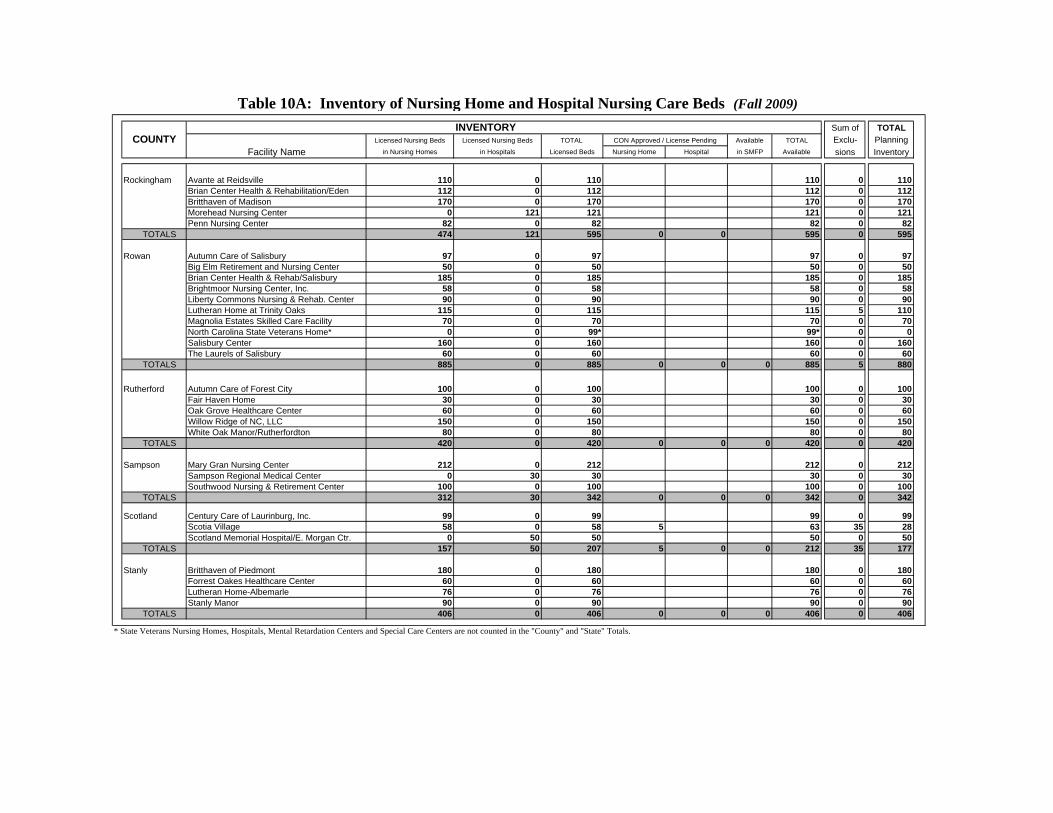
Table 10A: Inventory of Nursing Home and Hospital Nursing Care Beds (Fall 2009)
INVENTORY Sum of TOTALCOUNTY Licensed Nursing Beds Licensed Nursing Beds TOTAL CON Approved / License Pending Available TOTAL Exclu- Planning
Facility Name in Nursing Homes in Hospitals Licensed Beds Nursing Home Hospital in SMFP Available sions Inventory
Rockingham Avante at Reidsville 110 0 110 110 0 110Brian Center Health & Rehabilitation/Eden 112 0 112 112 0 112Britthaven of Madison 170 0 170 170 0 170Morehead Nursing Center 0 121 121 121 0 121Penn Nursing Center 82 0 82 82 0 82
TOTALS 474 121 595 0 0 595 0 595
Rowan Autumn Care of Salisbury 97 0 97 97 0 97Big Elm Retirement and Nursing Center 50 0 50 50 0 50Brian Center Health & Rehab/Salisbury 185 0 185 185 0 185Brightmoor Nursing Center, Inc. 58 0 58 58 0 58Liberty Commons Nursing & Rehab. Center 90 0 90 90 0 90Lutheran Home at Trinity Oaks 115 0 115 115 5 110Magnolia Estates Skilled Care Facility 70 0 70 70 0 70North Carolina State Veterans Home* 0 0 99* 99* 0 0Salisbury Center 160 0 160 160 0 160The Laurels of Salisbury 60 0 60 60 0 60
TOTALS 885 0 885 0 0 0 885 5 880
Rutherford Autumn Care of Forest City 100 0 100 100 0 100Fair Haven Home 30 0 30 30 0 30Oak Grove Healthcare Center 60 0 60 60 0 60Willow Ridge of NC, LLC 150 0 150 150 0 150White Oak Manor/Rutherfordton 80 0 80 80 0 80
TOTALS 420 0 420 0 0 0 420 0 420
Sampson Mary Gran Nursing Center 212 0 212 212 0 212Sampson Regional Medical Center 0 30 30 30 0 30Southwood Nursing & Retirement Center 100 0 100 100 0 100
TOTALS 312 30 342 0 0 0 342 0 342
Scotland Century Care of Laurinburg, Inc. 99 0 99 99 0 99Scotia Village 58 0 58 5 63 35 28Scotland Memorial Hospital/E. Morgan Ctr. 0 50 50 50 0 50
TOTALS 157 50 207 5 0 0 212 35 177
Stanly Britthaven of Piedmont 180 0 180 180 0 180Forrest Oakes Healthcare Center 60 0 60 60 0 60Lutheran Home-Albemarle 76 0 76 76 0 76Stanly Manor 90 0 90 90 0 90
TOTALS 406 0 406 0 0 0 406 0 406
* State Veterans Nursing Homes, Hospitals, Mental Retardation Centers and Special Care Centers are not counted in the "County" and "State" Totals.

Table 10A: Inventory of Nursing Home and Hospital Nursing Care Beds (Fall 2009)
INVENTORY Sum of TOTALCOUNTY Licensed Nursing Beds Licensed Nursing Beds TOTAL CON Approved / License Pending Available TOTAL Exclu- Planning
Facility Name in Nursing Homes in Hospitals Licensed Beds Nursing Home Hospital in SMFP Available sions Inventory
Stokes Stokes-Reynolds Memorial Hospital 0 40 40 40 0 40Universal Health Care/King 96 0 96 96 0 96Village Care of King 96 0 96 96 0 96Walnut Cove Health and Rehab Center 90 0 90 90 0 90
TOTALS 282 40 322 0 0 0 322 0 322
Surry Central Continuing Care, Inc. 120 0 120 120 0 120Golden LivingCenter - Surry Community 120 0 120 120 0 120Heritage Healthcare of Elkin 100 0 100 100 0 100Hugh Chatham Nursing Center 0 99 99 99 0 99Northern Hospital of Surry County 0 33 33 33 0 33
TOTALS 340 132 472 0 0 0 472 0 472
Swain Mountain View Manor Nursing Center 120 0 120 120 0 120 TOTALS 120 0 120 0 0 0 120 0 120
Transylvania Brian Center Health & Rehabilitation/ Brevard 147 0 147 147 0 147The Oaks of Brevard 110 0 110 110 0 110Transylvania Regional Hospital 0 10 10 10 0 10
TOTALS 257 10 267 0 0 0 267 0 267
Tyrrell N/A (Tyrrell County has 30 beds located in Washington County) -30 30 TOTALS 0 -30 30
Union Autumn Care of Marshville 110 0 110 110 0 110Brian Center Health & Retirement/Monroe 60 0 60 60 0 60Jesse Helms Nursing Center 0 70 70 70 0 70Lake Park Nursing and Rehab Center 120 0 120 120 0 120Rehabilitation & Nursing Center of Monroe 147 0 147 147 0 147The Heritage of Union County 0 0 0 90 90 0 90White Oak Manor 0 0 0 100 100 0 100
TOTALS 437 70 507 190 0 0 697 0 697
Vance Britthaven of Henderson 92 0 92 92 0 92Guardian Care of Henderson 80 0 80 80 0 80Senior Citizens Home 60 0 60 60 0 60
TOTALS 232 0 232 0 0 0 232 0 232

Table 10A: Inventory of Nursing Home and Hospital Nursing Care Beds (Fall 2009)
INVENTORY Sum of TOTALCOUNTY Licensed Nursing Beds Licensed Nursing Beds TOTAL CON Approved / License Pending Available TOTAL Exclu- Planning
Facility Name in Nursing Homes in Hospitals Licensed Beds Nursing Home Hospital in SMFP Available sions Inventory
Wake Blue Ridge Health Care Center 134 0 134 134 20 114Capital Nursing and Rehab. Center 125 0 125 125 0 125Cary Health & Rehabilitation Center 120 0 120 120 0 120City of Oaks Health & Rehab Center 180 0 180 180 0 180Dan E. & Mary Louise Stewart Health Care Ctr. of Springmoor Life & Ret.Community 173 0 173 173 87 86Glenaire 65 0 65 6 71 26 45Guardian Care of Zebulon 60 0 60 60 0 60Hillside Nur. Ctr. of Wake Forest 130 0 130 130 0 130Litchford Falls Healthcare & Rehab. Ctr. 90 0 90 90 0 90Mayview Convalescent Center 139 0 139 139 0 139Raleigh Rehabilitation & Healthcare Center 174 0 174 174 0 174Rex Rehab and Nursing Care Center 0 120 120 120 0 120Rex Rehab/Nursing Care Center of Apex 107 0 107 107 0 107Searstone 0 0 0 24 24 12 12Sunnybrook Healthcare/Rehab Specialists 114 0 114 114 0 114The Cardinal at North Hills Healthcare 0 0 0 15 15 8 7The Cypress of Raleigh 36 0 36 36 18 18The Laurels of Forest Glenn 120 0 120 120 0 120The Oaks of Carolina 150 0 150 150 0 150Universal Health Care/ North Raleigh 112 0 112 112 0 112Universal Health Care Fuquay-Varina 49 0 49 49 0 49WakeMed - Zebulon/Wendell 0 19 19 19 0 19WakeMed - Fuquay-Varina 0 36 36 36 0 36Wellington Healthcare and Rehabilitation 80 0 80 80 0 80Windsor Point Continuing Care Ret. Comm. 45 0 45 45 23 22
TOTALS 2203 175 2378 45 0 0 2423 194 2229Warren Warren Hills, Personal Care & Nursing Facility 140 0 140 140 0 140 TOTALS 140 0 140 0 0 0 140 0 140Washington Plumblee Nursing Center 114 0 114 114 30 84 TOTALS 114 0 114 0 0 0 114 30 84Watauga Blowing Rock Hospital 0 72 72 72 0 72
Glenbridge Health & Rehabilitation 124 0 124 124 0 124 TOTALS 124 72 196 0 0 0 196 0 196Wayne Brian Center Health & Rehab./Goldsboro 130 0 130 130 0 130
Britthaven of Goldsboro 200 0 200 200 0 200Cherry Hospital * 0 0 154* -20* 134* 0 0Mount Olive Care & Rehab. Center 150 0 150 150 0 150
TOTALS 480 0 480 0 0 0 480 0 480
* State Veterans Nursing Homes, Hospitals, Mental Retardation Centers and Special Care Centers are not counted in the "County" and "State" Totals.

Table 10A: Inventory of Nursing Home and Hospital Nursing Care Beds (Fall 2009)
INVENTORY Sum of TOTALCOUNTY Licensed Nursing Beds Licensed Nursing Beds TOTAL CON Approved / License Pending Available TOTAL Exclu- Planning
Facility Name in Nursing Homes in Hospitals Licensed Beds Nursing Home Hospital in SMFP Available sions Inventory
Wilkes Avante at Wilkesboro 120 0 120 120 0 120Britthaven of Wilkesboro, Inc. 176 0 176 176 0 176Wilkes Regional Medical Center 0 10 10 10 0 10Wilkes Senior Village 111 0 111 111 0 111
TOTALS 407 10 417 0 0 0 417 0 417
Wilson Avante at Wilson, Inc. 110 0 110 110 0 110Brian Center Health & Ret./Wilson 99 0 99 99 0 99Britthaven of Wilson 95 0 95 95 0 95Longleaf Neuro-Medical Treatment Center* 0 0 248* 248* 0 0Wilmed Nursing Care Center 90 0 90 90 0 90
TOTALS 394 0 394 0 0 0 394 0 394
Yadkin Willowbrook Rehabilitation and Care Center 76 0 76 76 0 76Yadkin Nursing Care Center 147 0 147 147 0 147
TOTALS 223 0 223 0 0 0 223 0 223
Yancey Brookside Rehabilitation and Care 140 0 140 140 0 140 TOTALS 140 0 140 0 0 0 140 0 140
GRAND TOTALS 42,431 1,884 44,315 988 0 20 45,323 1,516 43,807
* State Veterans Nursing Homes, Hospitals, Mental Retardation Centers and Special Care Centers are not counted in the "County" and "State" Totals.

Table 10B: Nursing Bed Need Projections for 2013 (2010 Plan)
Projected 2013 Population Projected 2013 Bed Utilization Projected Bed Licensed Plus Exclu- Planning Surplus/ Deficit Occupancy New Beds County Under Age 65* Age 65-74 Age 75-84 Age 85 up <65 65-74 75-84 85+ Utilization Sum Prev. Allocations sions Inventory "-" = Deficit Index Rate </>90 Needed
Alamance 140,200 12,878 6,805 2,982 81 110 210 321 722 888 41 847 125 0Alexander 32,483 3,643 1,728 570 19 31 53 61 165 183 12 171 6 0Alleghany 9,037 1,331 830 295 5 11 26 32 74 90 0 90 16 0Anson 21,309 2,197 1,123 586 12 19 35 63 129 161 0 161 32 0Ashe 21,925 3,005 1,718 706 13 26 53 76 167 210 0 210 43 0
Avery 15,135 1,851 1,062 410 9 16 33 44 102 128 0 128 26 0Beaufort 38,931 4,949 2,660 1,004 23 42 82 108 255 300 10 290 35 0Bertie 16,959 1,722 1,074 463 10 15 33 50 108 142 0 142 34 0Bladen 27,176 2,952 1,570 575 16 25 48 62 151 194 0 194 43 0Brunswick 100,209 12,257 6,941 2,010 58 105 214 216 594 614 0 614 20 0
Buncombe 203,927 22,146 11,594 5,370 118 189 358 578 1,243 1,682 117 1,565 322 0Burke 79,427 8,713 4,683 1,768 46 74 145 190 455 556 13 543 88 0Cabarrus 179,201 14,835 6,705 2,501 104 127 207 269 707 691 17 674 -33 5% 0Caldwell 70,314 7,938 4,111 1,393 41 68 127 150 385 400 0 400 15 0Camden** 8,590 938 480 166 5 8 15 18 46 **40 -40 40 -6 12% NA 10
Carteret* 50,818 7,350 4,327 1,620 29 63 134 174 400 424 0 424 24 0Caswell 18,986 2,329 1,174 487 11 20 36 52 120 157 0 157 37 0Catawba 142,014 14,055 6,859 2,545 82 120 212 274 688 759 18 741 53 0Chatham 58,395 5,908 3,030 1,442 34 51 94 155 333 420 65 355 22 0Cherokee 22,525 3,345 1,993 774 13 29 62 83 186 210 0 210 24 0
Chowan 12,172 1,383 909 425 7 12 28 46 93 170 0 170 77 0Clay 8,758 1,369 819 387 5 12 25 42 84 90 0 90 6 0Cleveland 86,583 9,103 4,595 1,765 50 78 142 190 460 554 10 544 84 0Columbus 47,992 4,967 2,643 889 28 42 82 96 248 323 0 323 75 0Craven* 80,385 7,377 4,749 1,765 47 63 147 190 446 461 0 461 15 0
Cumberland* 264,896 18,263 9,543 3,031 154 156 295 326 931 1,029 0 1,029 98 0Currituck 19,087 2,186 1,088 355 11 19 34 38 102 100 15 85 -17 16% <90% 0Dare 25,684 3,435 2,097 748 15 29 65 80 189 126 0 126 -63 34% <90% 0Davidson 145,599 15,320 7,613 2,844 84 131 235 306 756 794 36 758 2 0Davie 37,519 4,114 2,063 811 22 35 64 87 208 216 0 216 8 0
Duplin 48,564 4,206 2,422 862 28 36 75 93 232 272 20 252 20 0Durham 264,353 18,865 8,381 3,989 153 161 259 429 1,003 1,333 81 1,252 249 0Edgecombe 44,199 4,104 2,240 895 26 35 69 96 226 307 0 307 81 0Forsyth 321,529 29,435 15,153 6,582 186 252 468 708 1,614 1,668 151 1,517 -97 6% <90% 0Franklin 55,376 4,910 2,243 809 32 42 69 87 230 258 0 258 28 0
* Projections for under age 65 were adjusted to exclude active duty military personnel.
"Combined" Ratios for Beds per 1000 0.58 Beds/1000 Under Age 65 ** The Camden County nursing beds are located in Currituck County (15 beds) andPopulation; Projected-forward 30 Months: 8.55 Beds/1000 Age 65-74 Pasquotank County (25 beds).
30.89 Beds/1000 Age 75-84107.55Beds/1000 Age 85 up NA Not Applicable. No licensed beds in County.
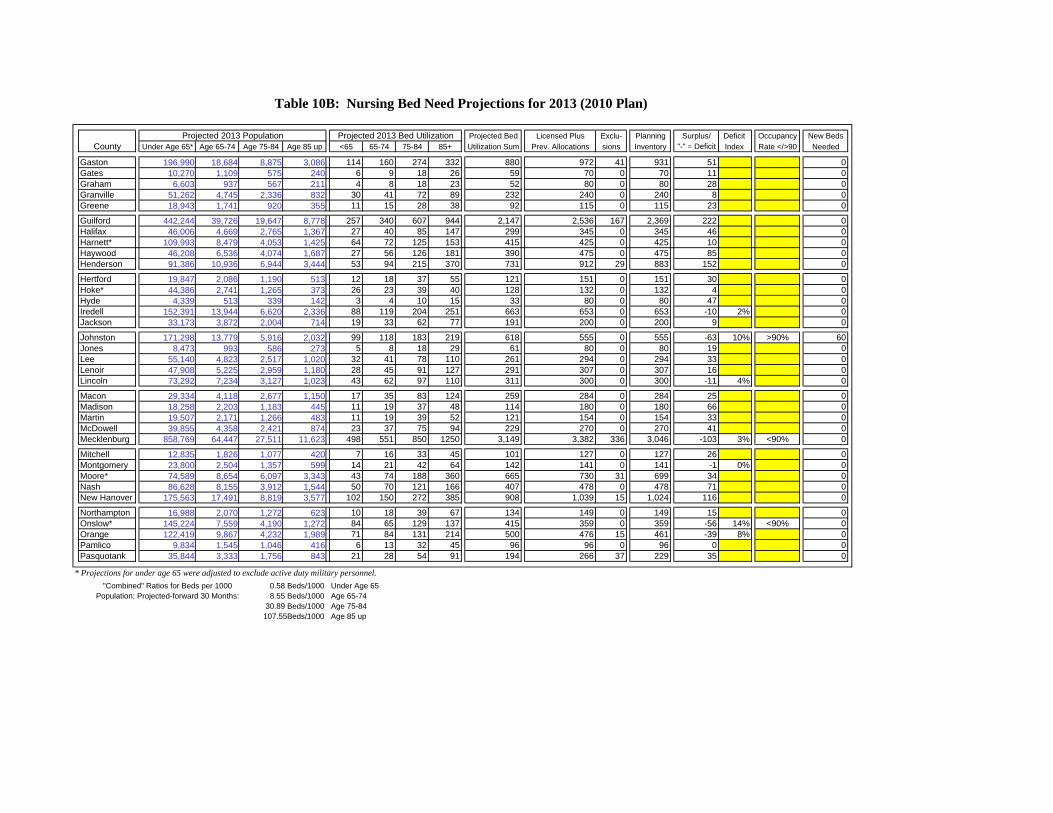
Table 10B: Nursing Bed Need Projections for 2013 (2010 Plan)
Projected 2013 Population Projected 2013 Bed Utilization Projected Bed Licensed Plus Exclu- Planning Surplus/ Deficit Occupancy New BedsCounty Under Age 65* Age 65-74 Age 75-84 Age 85 up <65 65-74 75-84 85+ Utilization Sum Prev. Allocations sions Inventory "-" = Deficit Index Rate </>90 Needed
Gaston 196,990 18,684 8,875 3,086 114 160 274 332 880 972 41 931 51 0Gates 10,270 1,109 575 240 6 9 18 26 59 70 0 70 11 0Graham 6,603 937 567 211 4 8 18 23 52 80 0 80 28 0Granville 51,262 4,745 2,336 832 30 41 72 89 232 240 0 240 8 0Greene 18,943 1,741 920 355 11 15 28 38 92 115 0 115 23 0
Guilford 442,244 39,726 19,647 8,778 257 340 607 944 2,147 2,536 167 2,369 222 0Halifax 46,006 4,669 2,765 1,367 27 40 85 147 299 345 0 345 46 0Harnett* 109,993 8,479 4,053 1,425 64 72 125 153 415 425 0 425 10 0Haywood 46,208 6,536 4,074 1,687 27 56 126 181 390 475 0 475 85 0Henderson 91,386 10,936 6,944 3,444 53 94 215 370 731 912 29 883 152 0
Hertford 19,847 2,086 1,190 513 12 18 37 55 121 151 0 151 30 0Hoke* 44,386 2,741 1,265 373 26 23 39 40 128 132 0 132 4 0Hyde 4,339 513 339 142 3 4 10 15 33 80 0 80 47 0Iredell 152,391 13,944 6,620 2,336 88 119 204 251 663 653 0 653 -10 2% 0Jackson 33,173 3,872 2,004 714 19 33 62 77 191 200 0 200 9 0
Johnston 171,298 13,779 5,916 2,032 99 118 183 219 618 555 0 555 -63 10% >90% 60Jones 8,473 993 586 273 5 8 18 29 61 80 0 80 19 0Lee 55,140 4,823 2,517 1,020 32 41 78 110 261 294 0 294 33 0Lenoir 47,908 5,225 2,959 1,180 28 45 91 127 291 307 0 307 16 0Lincoln 73,292 7,234 3,127 1,023 43 62 97 110 311 300 0 300 -11 4% 0
Macon 29,334 4,118 2,677 1,150 17 35 83 124 259 284 0 284 25 0Madison 18,258 2,203 1,183 445 11 19 37 48 114 180 0 180 66 0Martin 19,507 2,171 1,266 483 11 19 39 52 121 154 0 154 33 0McDowell 39,855 4,358 2,421 874 23 37 75 94 229 270 0 270 41 0Mecklenburg 858,769 64,447 27,511 11,623 498 551 850 1250 3,149 3,382 336 3,046 -103 3% <90% 0
Mitchell 12,835 1,826 1,077 420 7 16 33 45 101 127 0 127 26 0Montgomery 23,800 2,504 1,357 599 14 21 42 64 142 141 0 141 -1 0% 0Moore* 74,589 8,654 6,097 3,343 43 74 188 360 665 730 31 699 34 0Nash 86,628 8,155 3,912 1,544 50 70 121 166 407 478 0 478 71 0New Hanover 175,563 17,491 8,819 3,577 102 150 272 385 908 1,039 15 1,024 116 0
Northampton 16,988 2,070 1,272 623 10 18 39 67 134 149 0 149 15 0Onslow* 145,224 7,559 4,190 1,272 84 65 129 137 415 359 0 359 -56 14% <90% 0Orange 122,419 9,867 4,232 1,989 71 84 131 214 500 476 15 461 -39 8% 0Pamlico 9,834 1,545 1,046 416 6 13 32 45 96 96 0 96 0 0Pasquotank 35,844 3,333 1,756 843 21 28 54 91 194 266 37 229 35 0
* Projections for under age 65 were adjusted to exclude active duty military personnel.
"Combined" Ratios for Beds per 1000 0.58 Beds/1000 Under Age 65Population; Projected-forward 30 Months: 8.55 Beds/1000 Age 65-74
30.89 Beds/1000 Age 75-84107.55Beds/1000 Age 85 up

Table 10B: Nursing Bed Need Projections for 2013 (2010 Plan)
Projected 2013 Population Projected 2013 Bed Utilization Projected Bed Licensed Plus Exclu- Planning Surplus/ Deficit Occupancy New BedsCounty Under Age 65* Age 65-74 Age 75-84 Age 85 up <65 65-74 75-84 85+ Utilization Sum Prev. Allocations sions Inventory "-" = Deficit Index Rate </>90 Needed
Pender 50,726 5,490 2,849 1,022 29 47 88 110 274 253 0 253 -21 8% 0Perquimans 11,525 1,474 892 376 7 13 28 40 87 98 0 98 11 0Person 32,203 3,340 1,790 681 19 29 55 73 176 200 0 200 24 0Pitt 156,334 10,883 5,131 2,000 91 93 158 215 557 570 15 555 -2 0% 0Polk 14,958 2,122 1,371 725 9 18 42 78 147 221 26 195 48 0
Randolph 128,693 13,151 6,323 2,310 75 112 195 248 631 720 0 720 89 0Richmond 40,502 3,942 2,072 800 23 34 64 86 207 276 0 276 69 0Robeson 121,471 9,306 4,327 1,585 70 80 134 170 454 525 4 521 67 0Rockingham 77,200 8,662 4,712 1,894 45 74 146 204 468 595 0 595 127 0Rowan 128,731 12,291 6,385 2,866 75 105 197 308 685 885 5 880 195 0
Rutherford 56,360 6,226 3,333 1,296 33 53 103 139 328 420 0 420 92 0Sampson 61,008 5,442 2,929 1,081 35 47 90 116 289 342 0 342 53 0Scotland 33,796 3,130 1,408 526 20 27 43 57 146 212 35 177 31 0Stanly 52,619 5,548 2,996 1,263 31 47 93 136 306 406 0 406 100 0Stokes 40,854 4,593 2,126 708 24 39 66 76 205 322 0 322 117 0
Surry 62,925 7,014 3,918 1,618 36 60 121 174 392 472 0 472 80 0Swain 12,478 1,383 710 219 7 12 22 24 65 120 0 120 55 0Transylvania 25,006 3,722 2,551 1,187 15 32 79 128 253 267 0 267 14 0Tyrrell *** 3,547 368 267 141 2 3 8 15 29 **30 -30 30 1 0Union 213,278 16,438 6,732 2,006 124 141 208 216 688 697 0 697 9 0
Vance 37,773 3,396 1,789 696 22 29 55 75 181 232 0 232 51 0Wake* 936,409 68,574 26,955 10,100 543 586 833 1086 3,048 2,423 194 2,229 -819 27% <90% 0Warren 15,898 1,971 1,315 650 9 17 41 70 137 140 0 140 3 0Washington 10,630 1,284 762 317 6 11 24 34 75 114 30 84 9 0Watauga 41,292 3,994 2,067 868 24 34 64 93 215 196 0 196 -19 9% 0
Wayne* 98,575 8,776 4,926 1,785 57 75 152 192 476 480 0 480 4 0Wilkes 57,036 6,823 3,695 1,318 33 58 114 142 347 417 0 417 70 0Wilson 72,788 6,769 3,519 1,423 42 58 109 153 362 394 0 394 32 0Yadkin 33,717 3,672 2,027 717 20 31 63 77 191 223 0 223 32 0Yancey 15,426 2,095 1,286 574 9 18 40 62 128 140 0 140 12 0
NC Totals * 8,663,614 788,331 394,283 156,808 5,025 6,740 12,179 16,865 40,809 45,323 1,516 43,807 70
* Projections for under age 65 were adjusted to exclude active duty military personnel.
"Combined" Ratios for Beds per 1000 0.58 Beds/1000 Under Age 65 *** The Tyrrell County nursing beds are located in Washington County (30).Population; Projected-forward 30 Months: 8.55 Beds/1000 Age 65-74
30.89 Beds/1000 Age 75-84107.55Beds/1000 Age 85 up

County HSA Number of New CON CON Nursing Care Application Beginning
Beds Needed * Due Date** Review Date
Johnston IV 60 June 15, 2010 July 1, 2010
Camden VI 10 February 15, 2010 March 1, 2010
Perquimans*** VI 20 June 15, 2010 July 1, 2010
* Need determinations as shown in this document may be increased or decreased during the yearpursuant to Policy GEN-2 (See Chapter 4).
** Application Due Dates are absolute deadlines. The filing deadline is 5:30 p.m. on the Application
A 20 bed need determination identified based on the 2008 Plan has been reallocated for Perquimans
County using the 2009 Plan methodology.
***
Table 10C: Nursing Care Bed Need Determinations
Due Date. The filing deadline is absolute ( See Chapter 3).
It is determined that the counties listed in the table below need additional nursing care beds as specified:
It is determined that there is no need for additional nursing care beds anywhere else in the State and no other reviews are scheduled.
(Scheduled for Certificate of Need Review Commencing in 2010)

Chapter 11:Adult Care Homes

CHAPTER 11 ADULT CARE HOMES Summary of Bed Supply and Utilization
An Adult Care Home is defined as a facility with seven or more beds licensed under G.S. 131D-2 or Chapter 131E of the General Statutes. These statutory citations refer to licensure of adult care homes, nursing homes and hospitals.
Prior to enactment of legislation (Senate Bill 937) in 2001 to regulate the development of Adult Care Homes under the Certificate of Need law, legislation ratified in 1997 (S. L. 1997-443) placed a statewide moratorium on the development of new adult care home beds. However, the 1997 legislation allowed for the development of additional adult care home beds under defined circumstances. Such beds were referred to as “exempt” or “pipeline” beds. More than 10,000 beds were identified as “exempt” or “pipeline” beds in the North Carolina 2002 State Medical Facilities Plan. Senate Bill 937, however, provides dates by which defined conditions must be met in order for these unlicensed exempt or pipeline beds to continue to be authorized for development. In addition, some other beds remain eligible to be developed pursuant to settlements of contested cases. These “settlement” beds are also subject to conditions set out in the terms of the controlling settlement agreements. The planning inventory of adult care home beds included in the North Carolina 2010 State Medical Facilities Plan is subject to change based on whether or not conditions have been met to allow for development of the “exempt”, “pipeline” or settlement beds that have been included in this inventory. Changes in the inventory of “exempt” or “pipeline” beds following publication of the North Carolina 2010 State Medical Facilities Plan will be addressed in the 2011 or subsequent Plans. Changes in inventory may also be made as a result of litigation.
In the fall of 2009, the adult care home inventory included 41,547 licensed beds in adult
care homes, nursing homes and hospitals. An additional 1,622 beds had not, as yet, been licensed. These 1,622 “License Pending” beds had either been exempted from the moratorium on the development of additional adult care home beds, or had been determined to be in the pipeline for development prior to the moratorium, or had been set out in the terms of settlement agreements, or had received approval from the Certificate of Need (CON) Section but were not yet licensed. In addition, previous need determinations for which certificates of need have not been issued were anticipated to add 50 more adult care home beds. The "total inventory" of adult care home beds (licensed + license pending + previously allocated) was 43,219. Exclusions for one-half of the adult care home beds in continuing care retirement communities (Policy LTC beds) accounted for 1,095 excluded beds resulting in an adjusted “planning inventory” of 42,124 adult care home beds.
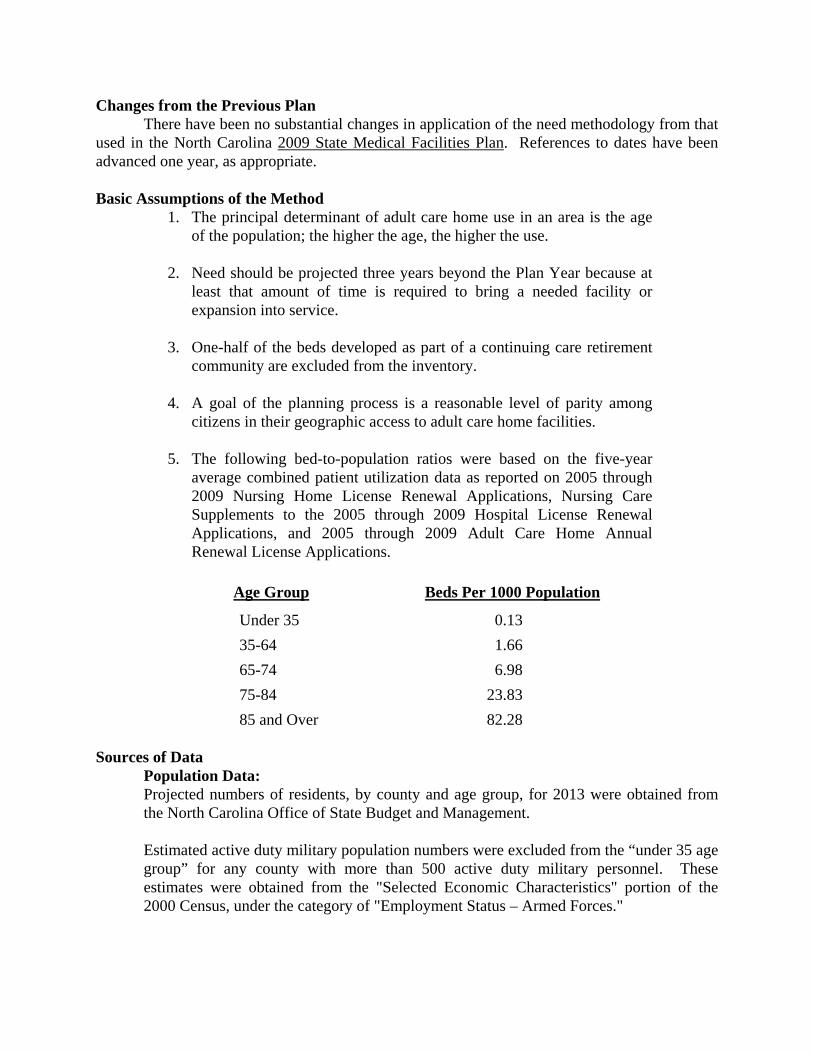
Changes from the Previous Plan There have been no substantial changes in application of the need methodology from that
used in the North Carolina 2009 State Medical Facilities Plan. References to dates have been advanced one year, as appropriate. Basic Assumptions of the Method
1. The principal determinant of adult care home use in an area is the age of the population; the higher the age, the higher the use.
2. Need should be projected three years beyond the Plan Year because at
least that amount of time is required to bring a needed facility or expansion into service.
3. One-half of the beds developed as part of a continuing care retirement
community are excluded from the inventory. 4. A goal of the planning process is a reasonable level of parity among
citizens in their geographic access to adult care home facilities. 5. The following bed-to-population ratios were based on the five-year
average combined patient utilization data as reported on 2005 through 2009 Nursing Home License Renewal Applications, Nursing Care Supplements to the 2005 through 2009 Hospital License Renewal Applications, and 2005 through 2009 Adult Care Home Annual Renewal License Applications.
Age Group Beds Per 1000 Population
Under 35 0.13
35-64 1.66
65-74 6.98
75-84 23.83
85 and Over 82.28
Sources of Data Population Data: Projected numbers of residents, by county and age group, for 2013 were obtained from the North Carolina Office of State Budget and Management. Estimated active duty military population numbers were excluded from the “under 35 age group” for any county with more than 500 active duty military personnel. These estimates were obtained from the "Selected Economic Characteristics" portion of the 2000 Census, under the category of "Employment Status – Armed Forces."

Utilization Data: Data on utilization by age groups were compiled from the 2005 through 2009 "Renewal Applications for License to Operate a Nursing Home" combined with data from the 2005 through 2009 “Nursing Care Facility/Unit Beds Annual Data Supplement to Hospital License Applications,” combined with data from the 2005 through 2009 “Adult Care Home Annual Renewal License Applications,” as submitted to the North Carolina Department of Health and Human Services, Division of Health Service Regulation.
Application of the Method The steps in applying the projection method are as follows: Step 1: Multiply the adopted age-specific use rates (see under "Assumptions") by each
county’s corresponding projected age-specific civilian population (in thousands) for the target year (2013).
Step 2: For each county, add the products of the age-specific projections of beds in Step 1.
The sum is the county’s projected bed utilization. Step 3: For each county, the “planning inventory” is determined based on licensed beds
adjusted for: license pending beds; beds available in prior Plans that have not been CON approved; and, exclusions from the county’s inventory, if any.
Step 4: For each county, the projected bed utilization derived in Step 2 is subtracted from
the “planning inventory” derived in Step 3. The result is the county’s surplus or deficit.
Step 5: If any county’s deficit is 10 percent to 50 percent of its total projected bed need,
and the average occupancy of licensed beds in the county, excluding continuing care retirement communities, is 85 percent or greater based on utilization data reported on 2009 Renewal Applications, the need determination is the amount of the deficit rounded to 10. If any county’s deficit is 50 percent or more of its total projected bed need, the need determination is the amount of the deficit rounded to 10. For purposes of rounding need determinations, numbers greater than 10 and ending in one to four would round to the next lower number divisible by 10, and numbers ending in five to nine would round to the next higher number divisible by 10.
(An adult care home bed’s service area is the adult care home bed planning area in which the bed is located. Each of the 100 counties in the state is a separate adult care home planning area.)

COUNTY
Facility NameLic. Beds in
Nursing Homes
Lic. Beds in Hospitals
Adult Care Homes
Total Licensed Beds CON ACH
(Exempt)ACH
(Pipeline)
Available SMFP
Total Available
Sum of Exclusions
TOTAL Planning Inventory
License PendingINVENTORY
Table 11A: Inventory of Adult Care Home Bed (Fall 2009)
Totals
Alamance A Vision Come True 0 0 12 12 0 0 0 0 12 0 12
Alamance Manor Assisted Living 0 0 0 0 125 0 0 0 125 0 125
Blakey Hall Assisted Living 0 0 72 72 0 0 0 0 72 0 72
Burlington Care Center 0 0 12 12 0 0 0 0 12 0 12
Burlington Manor 0 0 84 84 0 0 0 0 84 0 84
Clare Bridge at Burlington Manor dba Discovery 0 0 52 52 0 0 0 0 52 0 52
Dogwood Forest Adult Care Home/Megrea Bldg 0 0 12 12 0 0 0 0 12 0 12
Dogwood Forest/Nicole Building 0 0 42 42 0 0 0 0 42 0 42
Dogwood Forest-Alexandria/Adelaide 0 0 40 40 0 0 0 0 40 0 40
Edgewood Place at the Village at Brookwood 24 0 0 24 0 0 0 0 24 12 12
Elon Village Home 0 0 12 12 0 0 0 0 12 0 12
Golden Years Assisted Living 0 0 12 12 0 0 0 0 12 0 12
Golden Years Assisted Living II 0 0 12 12 0 0 0 0 12 0 12
Homeplace of Burlington 0 0 67 67 0 0 0 0 67 0 67
Liberty Commons 48 0 0 48 0 0 0 0 48 0 48
Pleasant Grove Retirement Home 0 0 12 12 0 0 0 0 12 0 12
Southern Seasons Retirement Home 0 0 12 12 0 0 0 0 12 0 12
Springview - Brock Building 0 0 12 12 0 0 0 0 12 0 12
Springview - Crouse Building 0 0 12 12 0 0 0 0 12 0 12
Springview - Ross Building 0 0 12 12 0 0 0 0 12 0 12
Springview - Stewart Building 0 0 12 12 0 0 0 0 12 0 12
The Oaks of Alamance 0 0 69 69 0 0 0 0 69 0 69
Twin Lakes Memory Care Center 16 0 0 16 0 0 0 0 16 8 8
Totals 88 0 570 658 125 0 0 0 783 20 763Alexander 2009 SMFP 0 0 0 0 0 0 0 10 10 0 10
A New Outlook of Taylorsville 0 0 34 34 0 0 0 0 34 0 34
Alexander Assisted Living 0 0 32 32 0 0 0 0 32 0 32
Taylorsville House 0 0 60 60 0 0 0 0 60 0 60
Totals 0 0 126 126 0 0 0 10 136 0 136Alleghany 2009 SMFP 0 0 0 0 0 0 0 40 40 0 40
Alleghany Care & Rehab. Center 22 0 0 22 0 0 0 0 22 0 22
Totals 22 0 0 22 0 0 0 40 62 0 62
Anson Heritage Hills Living Center 53 0 0 53 0 0 0 0 53 0 53
Meadowview Terrace of Wadesboro 0 0 60 60 0 0 0 0 60 0 60
Totals 53 0 60 113 0 0 0 0 113 0 113Ashe Ashe Assisted Living 0 0 55 55 0 0 0 0 55 0 55
Jefferson Care Center 0 0 21 21 0 0 0 0 21 0 21
The Villages of Ashe Traditional Living, Inc. 0 0 60 60 0 0 0 0 60 0 60
Totals 0 0 136 136 0 0 0 0 136 0 136Avery Cranberry House 0 0 60 60 0 0 0 0 60 0 60
The Heritage of Sugar Mountain 0 0 40 40 0 0 0 0 40 0 40
Totals 0 0 100 100 0 0 0 0 100 0 100

COUNTY
Facility NameLic. Beds in
Nursing Homes
Lic. Beds in Hospitals
Adult Care Homes
Total Licensed Beds CON ACH
(Exempt)ACH
(Pipeline)
Available SMFP
Total Available
Sum of Exclusions
TOTAL Planning Inventory
License PendingINVENTORY
Table 11A: Inventory of Adult Care Home Bed (Fall 2009)
Beaufort A. G. Dunston Manor 0 0 0 0 50 0 0 0 50 0 50
Autumnfield of Belhaven 0 0 64 64 0 0 0 0 64 0 64
Britthaven of Washington 10 0 0 10 0 0 0 0 10 0 10
Clara Manor 0 0 20 20 0 0 0 0 20 0 20
Pantego Rest Home 0 0 30 30 0 0 0 0 30 0 30
Washington Manor 0 0 9 9 0 0 0 0 9 0 9
Willow Manor 0 0 34 34 0 0 0 0 34 0 34
Totals 10 0 157 167 50 0 0 0 217 0 217Bertie Southern Touch Assisted Living 0 0 25 25 0 0 0 0 25 0 25
Three Rivers Health and Rehab. 20 0 0 20 0 0 0 0 20 0 20
Windsor House 0 0 60 60 0 0 0 0 60 0 60
Totals 20 0 85 105 0 0 0 0 105 0 105Bladen Cape Fear Manor 0 0 60 60 0 0 0 0 60 0 60
Glencare of Bladenboro 0 0 60 60 0 0 0 0 60 0 60
Poplar Heights Care and Rehab. Center 30 0 0 30 0 0 0 0 30 0 30
Totals 30 0 120 150 0 0 0 0 150 0 150Brunswick Autumn Care of Shallotte 10 0 0 10 0 0 0 0 10 0 10
Brunswick Cove Nursing Center 40 0 0 40 0 0 0 0 40 0 40
Carillon Assisted Living of Southport 0 0 96 96 0 0 0 0 96 0 96
Corinthian Place, Inc 0 0 78 78 0 22 0 0 100 0 100
J. Arthur Dosher Hospital 0 14 0 14 0 0 0 0 14 0 14
Ocean Trail Convalescent Center, Inc. 17 0 0 17 0 0 0 0 17 0 17
Shallotte Assisted Living 0 0 80 80 0 0 0 0 80 0 80
Totals 67 14 254 335 0 22 0 0 357 0 357

COUNTY
Facility NameLic. Beds in
Nursing Homes
Lic. Beds in Hospitals
Adult Care Homes
Total Licensed Beds CON ACH
(Exempt)ACH
(Pipeline)
Available SMFP
Total Available
Sum of Exclusions
TOTAL Planning Inventory
License PendingINVENTORY
Table 11A: Inventory of Adult Care Home Bed (Fall 2009)
Buncombe Arbor Terrace of Asheville 0 0 70 70 0 0 0 0 70 0 70
Asheville Manor 0 0 79 79 0 0 0 0 79 0 79
Aston Park Health Care Center, Inc. 23 0 0 23 0 0 0 0 23 0 23
Becky's Rest Home #1 0 0 15 15 0 0 0 0 15 0 15
Becky's Rest Home #2 0 0 15 15 0 0 0 0 15 0 15
Brian Center Health & Rehab/Weaverville 16 0 0 16 0 0 0 0 16 0 16
Candler Living Center, LLC 0 0 29 29 0 0 0 0 29 0 29
Canterbury Hills Adult Care Home 0 0 99 99 0 0 0 0 99 0 99
Chunn's Cove of Asheville, LLC d/b/a Chunn's 0 0 68 68 0 0 0 0 68 0 68
Clare Bridge of Asheville 0 0 38 38 0 0 0 0 38 0 38
Crescent View 0 0 24 24 0 0 0 0 24 0 24
Davis & Davis Associates - (DBA) Chase Samari 0 0 54 54 0 0 0 0 54 0 54
Deerfield Episcopal Retirement Community 42 0 0 42 20 0 0 0 62 31 31
Emerald Ridge Rehab. & Care Center 20 0 0 20 0 0 0 0 20 0 20
Flesher's Fairview Health Care Center 14 0 0 14 0 0 0 0 14 0 14
Flesher's Fairview Rest Home, Inc. 0 0 64 64 0 0 0 0 64 0 64
Givens Health Center 26 0 0 26 0 0 0 0 26 13 13
Heather Glen at Ardenwoods 0 0 60 60 0 0 0 0 60 30 30
Highland Farms, Inc. 30 0 0 30 0 0 0 0 30 15 15
Hominy Valley Retirement Center 0 0 30 30 0 0 0 0 30 0 30
Marjorie McCune Memorial Center 0 0 64 64 0 0 0 0 64 0 64
Richard A. Wood, Jr. Assisted Living Center 0 0 56 56 0 0 0 0 56 0 56
Richmond Hill Rest Home #1 0 0 12 12 0 0 0 0 12 0 12
Richmond Hill Rest Home #2 0 0 12 12 0 0 0 0 12 0 12
Richmond Hill Rest Home #3 0 0 12 12 0 0 0 0 12 0 12
Richmond Hill Rest Home #4 0 0 12 12 0 0 0 0 12 0 12
Richmond Hill Rest Home #5 0 0 12 12 0 0 0 0 12 0 12
Rickman Nursing Care Center 50 0 0 50 0 0 0 0 50 0 50
Shadybrook Assisted Living 0 0 49 49 0 0 0 0 49 0 49
The Laurels of Summit Ridge 63 0 0 63 0 0 0 0 63 0 63
The Oaks at Sweeten Creek Healthcare 20 0 0 20 0 0 0 0 20 0 20
Windwood Rest Home 0 0 12 12 0 0 0 0 12 0 12
Totals 304 0 886 1190 20 0 0 0 1210 89 1121Burke Autumn Care of Drexel 20 0 0 20 0 0 0 0 20 0 20
Burke Long Term Care 0 0 24 24 0 0 0 0 24 0 24
Cambridge House 0 0 60 60 0 0 0 0 60 0 60
Grace Ridge 47 0 0 47 0 0 0 0 47 24 23
High Country Home Care, Inc. dba Jonas Ridge 0 0 57 57 0 0 0 0 57 0 57
Longview Assisted Living 0 0 63 63 0 0 0 0 63 0 63
McAlpine Adult Care 0 0 60 60 0 0 0 0 60 0 60
Morganton Long Term Care Facility 0 0 20 20 0 0 0 0 20 0 20
Morganton Long Term Care, Southview Facility 0 0 64 64 0 0 0 0 64 0 64
Totals 67 0 348 415 0 0 0 0 415 24 391

COUNTY
Facility NameLic. Beds in
Nursing Homes
Lic. Beds in Hospitals
Adult Care Homes
Total Licensed Beds CON ACH
(Exempt)ACH
(Pipeline)
Available SMFP
Total Available
Sum of Exclusions
TOTAL Planning Inventory
License PendingINVENTORY
Table 11A: Inventory of Adult Care Home Bed (Fall 2009)
Cabarrus Carebridge Assisted Living Community 0 0 74 74 0 0 0 0 74 0 74
Caremoor Retirement Center, Inc. 0 0 30 30 0 0 0 0 30 0 30
Carillon Assisted Living of Harrisburg 0 0 96 96 0 0 0 0 96 0 96
Concord House 0 0 48 48 0 0 0 0 48 0 48
Concord Living Center, LLC 0 0 40 40 0 0 0 0 40 0 40
Concord Place 0 0 112 112 0 0 0 0 112 0 112
First Assembly Living Center 0 0 180 180 0 0 0 0 180 0 180
Five Oaks Manor 24 0 0 24 0 0 0 0 24 0 24
Gardens of Taylor Glen 24 0 0 24 0 0 0 0 24 12 12
Horizon Bay AL at Concord 0 0 60 60 0 0 0 0 60 0 60
Kannapolis Village 0 0 60 60 0 0 0 0 60 0 60
Morningside of Concord 0 0 105 105 0 0 0 0 105 0 105
Senior Housing Resources 0 0 0 0 81 0 0 0 81 0 81
St. Andrews Center 0 0 25 25 -25 0 0 0 0 0 0
St. Andrews Living Center 0 0 56 56 -56 0 0 0 0 0 0
Transitional Health Services of Kannapolis 10 0 0 10 0 0 0 0 10 0 10
Totals 58 0 886 944 0 0 0 0 944 12 932Caldwell Camelot Manor DBA Brockford Inn, Inc. 0 0 62 62 0 0 0 0 62 0 62
Carolina Oaks Enhanced Care Center 0 0 60 60 0 0 0 0 60 0 60
Gateway Nursing Center 18 0 0 18 0 0 0 0 18 0 18
Grandview Villa Assisted Living 0 0 40 40 0 0 0 0 40 0 40
Lenoir Park 0 0 82 82 0 0 0 0 82 0 82
The Shaire Center 0 0 82 82 0 0 0 0 82 0 82
Totals 18 0 326 344 0 0 0 0 344 0 344Camden Needham Adult Care Home 0 0 24 24 0 0 0 0 24 0 24
Totals 0 0 24 24 0 0 0 0 24 0 24Carteret Carolina House of Morehead City 0 0 72 72 0 0 0 0 72 0 72
Carteret Manor Assisted Living 0 0 0 0 110 0 0 0 110 0 110
Snug Harbor on Nelson Bay 40 0 0 40 10 0 0 0 50 0 50
Somerset Court of Newport 0 0 64 64 0 0 0 0 64 0 64
The Heritage of Newport 0 0 62 62 0 0 0 0 62 0 62
Totals 40 0 198 238 120 0 0 0 358 0 358Caswell Blackwell's Rest Home 0 0 40 40 0 0 0 0 40 0 40
Caswell House 0 0 100 100 0 0 0 0 100 0 100
Dogwood Forest #2 0 0 12 12 0 0 0 0 12 0 12
G. Anthony Rucker Rest Home 0 0 12 12 0 0 0 0 12 0 12
Jefferson Care Home 0 0 12 12 0 0 0 0 12 0 12
Poole's Rest Home 0 0 19 19 0 0 0 0 19 0 19
The Ronald David Home 0 0 12 12 0 0 0 0 12 0 12
Totals 0 0 207 207 0 0 0 0 207 0 207

COUNTY
Facility NameLic. Beds in
Nursing Homes
Lic. Beds in Hospitals
Adult Care Homes
Total Licensed Beds CON ACH
(Exempt)ACH
(Pipeline)
Available SMFP
Total Available
Sum of Exclusions
TOTAL Planning Inventory
License PendingINVENTORY
Table 11A: Inventory of Adult Care Home Bed (Fall 2009)
Catawba Abernethy Laurels (United Church) 18 0 0 18 0 0 0 0 18 9 9
Austin Adult Care Home 0 0 30 30 0 0 0 0 30 0 30
Brian Center Health & Rehab/Hickory East 20 0 0 20 0 0 0 0 20 0 20
Carillon Assisted Living of Newton 0 0 96 96 0 0 0 0 96 0 96
Catawba Valley Living at Rock Barn 0 0 80 80 0 0 0 0 80 0 80
Heritage Care of Conover 0 0 60 60 0 0 0 0 60 0 60
Hickory Manor 0 0 88 88 0 0 0 0 88 0 88
Lutheran Home/Hickory 100 0 0 100 0 0 0 0 100 0 100
Piedmont Village at Newton 0 0 40 40 0 0 0 0 40 0 40
Spring Arbor of Hickory 0 0 66 66 0 0 0 0 66 0 66
Sterling House of Hickory 0 0 60 60 0 0 0 0 60 0 60
The Alberta House 0 0 20 20 0 0 0 0 20 0 20
Walden House 0 0 56 56 0 0 0 0 56 0 56
Totals 138 0 596 734 0 0 0 0 734 9 725Chatham Cambridge Hills of Pittsboro 0 0 90 90 0 0 0 0 90 0 90
Careview Rest Home 0 0 20 20 0 0 0 0 20 0 20
Carolina Meadows 0 0 95 95 0 0 0 0 95 48 47
Conventry House of Siler City 0 0 52 52 0 0 0 0 52 0 52
Gallaway Ridge (The Arbor) 23 0 0 23 28 0 0 0 51 26 25
Hill Forest Rest Home 0 0 40 40 0 0 0 0 40 0 40
Pittsboro Christian Village, Inc 0 0 40 40 0 0 0 0 40 20 20
Totals 23 0 337 360 28 0 0 0 388 94 294Cherokee Carolina Care Home #1 0 0 12 12 0 0 0 0 12 0 12
Carolina Care Home #2 0 0 12 12 0 0 0 0 12 0 12
Murphy House 0 0 0 0 70 0 0 0 70 0 70
Totals 0 0 24 24 70 0 0 0 94 0 94Chowan Britthaven of Edenton 30 0 0 30 0 0 0 0 30 0 30
Edenton House 0 0 60 60 0 0 0 0 60 0 60
Edenton Prime Time Retirement Village 0 0 60 60 0 0 0 0 60 0 60
Totals 30 0 120 150 0 0 0 0 150 0 150Clay Clay County Care Center 10 0 0 10 0 0 0 0 10 0 10
Hayesville House 0 0 60 60 0 0 0 0 60 0 60
Totals 10 0 60 70 0 0 0 0 70 0 70Cleveland Carillon Assisted Living of Shelby 0 0 96 96 0 0 0 0 96 0 96
Golden Years Rest Home 0 0 12 12 0 0 0 0 12 0 12
Kings Mountain Care Center, Inc. 0 0 20 20 0 0 0 0 20 0 20
Luximbhe-Ne Home 0 0 0 0 0 0 23 0 23 0 23
Openview Retirement Home 0 0 24 24 0 0 0 0 24 0 24
Shelby Manor 0 0 74 74 0 0 0 0 74 0 74
Somerset Court of Shelby 0 0 72 72 0 0 0 0 72 0 72
Sterling House of Shelby 0 0 60 60 0 0 0 0 60 0 60
Summit Place of Kings Mountain 0 0 65 65 0 0 0 0 65 0 65
Totals 0 0 423 423 0 0 23 0 446 0 446

COUNTY
Facility NameLic. Beds in
Nursing Homes
Lic. Beds in Hospitals
Adult Care Homes
Total Licensed Beds CON ACH
(Exempt)ACH
(Pipeline)
Available SMFP
Total Available
Sum of Exclusions
TOTAL Planning Inventory
License PendingINVENTORY
Table 11A: Inventory of Adult Care Home Bed (Fall 2009)
Columbus Lake Pointe Assisted Living 0 0 80 80 0 0 0 0 80 0 80
Liberty Commons 40 0 0 40 0 0 0 0 40 0 40
Premier Living and Rehab Center 15 0 0 15 0 0 0 0 15 0 15
Shoreland Health Care & Retirement Center 10 0 0 10 0 0 0 0 10 0 10
Water Brooke Assisted Living 0 0 80 80 0 0 0 0 80 0 80
Totals 65 0 160 225 0 0 0 0 225 0 225
Craven Bayview Nursing and Rehab Center 20 0 0 20 0 0 0 0 20 0 20
Britthaven of New Bern 18 0 0 18 0 0 0 0 18 0 18
Carebridge Assisted Living Community 0 0 108 108 0 0 0 0 108 0 108
Croatan Village 0 0 72 72 0 0 0 0 72 0 72
Good Shepherd Home for the Aged 0 0 54 54 0 0 0 0 54 0 54
Homeplace of New Bern 0 0 60 60 0 0 0 0 60 0 60
Riverstone 0 0 64 64 0 0 0 0 64 0 64
Sterling House of New Bern 0 0 60 60 0 0 0 0 60 0 60
The Courtyards at Berne Village 0 0 55 55 0 0 0 0 55 0 55
The Courtyards at Berne Village Memory Care 0 0 25 25 0 0 0 0 25 0 25
Water Oak Manor 0 0 100 100 0 0 0 0 100 0 100
Totals 38 0 598 636 0 0 0 0 636 0 636Cumberland Carillon Assisted Living of Fayetteville 0 0 96 96 0 0 0 0 96 0 96
Carolina Inn at Village Green 0 0 100 100 0 0 0 0 100 0 100
Cedar Creek Assisted Living, LLC 0 0 163 163 0 0 0 0 163 0 163
Countryside Villa 0 0 80 80 0 0 0 0 80 0 80
Fayetteville Manor 0 0 60 60 0 0 0 0 60 0 60
Happy Valley Retirement Center 0 0 29 29 0 0 0 0 29 0 29
Haymount Rehab & Nursing Center 22 0 0 22 0 0 0 0 22 0 22
Heritage Suites 0 0 62 62 0 0 0 0 62 0 62
Highland House Rehabilitation and Healthcare 53 0 0 53 0 0 0 0 53 0 53
Hope Mills Retirement Center 0 0 64 64 0 0 0 0 64 0 64
Hope Rest Home 0 0 20 20 0 0 0 0 20 0 20
Mann Street Residental Care Facility 0 0 36 36 0 0 0 0 36 0 36
Nubbing Hill Health Care, Inc dba Eastover Gar 0 0 32 32 0 44 0 0 76 0 76
Pine Valley Adult Care Home 0 0 40 40 0 0 0 0 40 0 40
Valley Pines Adult Care 0 0 23 23 0 0 0 0 23 0 23
Woodlands Assisted Living and Rehab 20 0 0 20 0 0 0 0 20 0 20
Totals 95 0 805 900 0 44 0 0 944 0 944Currituck Currituck House 0 0 0 0 90 0 0 0 90 0 90
Totals 0 0 0 0 90 0 0 0 90 0 90Dare Britthaven of Outer Banks 18 0 0 18 0 0 0 0 18 0 18
Spring Arbor of the Outer Banks 0 0 72 72 30 0 0 0 102 0 102
Totals 18 0 72 90 30 0 0 0 120 0 120

COUNTY
Facility NameLic. Beds in
Nursing Homes
Lic. Beds in Hospitals
Adult Care Homes
Total Licensed Beds CON ACH
(Exempt)ACH
(Pipeline)
Available SMFP
Total Available
Sum of Exclusions
TOTAL Planning Inventory
License PendingINVENTORY
Table 11A: Inventory of Adult Care Home Bed (Fall 2009)
Davidson Abbotts Creek Care & Rehab. Center 22 0 0 22 0 0 0 0 22 0 22
Britthaven of Davidson 14 0 0 14 0 0 0 0 14 0 14
Brookstone Retirement Center, LLC 0 0 115 115 0 0 0 0 115 0 115
Carolina House of Lexington 0 0 76 76 0 0 0 0 76 0 76
Golden Age, Inc. 0 0 0 0 14 0 0 0 14 0 14
Hilltop Living Center 0 0 96 96 -16 0 0 0 80 0 80
Landmark Estates 0 0 0 0 55 0 0 0 55 0 55
Lexington Health Care Center 10 0 0 10 0 0 0 0 10 0 10
Mallard Ridge Assisted Living 0 0 100 100 0 0 0 0 100 0 100
Mountain Vista Health Park 60 0 0 60 0 0 0 0 60 0 60
Piedmont Crossing (United Church) 40 0 0 40 0 0 0 0 40 20 20
Southland Homes, Inc./Landmark Estates 0 0 29 29 -29 0 0 0 0 0 0
The Oaks of Thomasville 0 0 62 62 0 0 0 0 62 0 62
Totals 146 0 478 624 24 0 0 0 648 20 628Davie Autumn Care of Mocksville 12 0 0 12 0 0 0 0 12 0 12
Bermuda Commons Nursing/Rehab 10 0 0 10 0 0 0 0 10 0 10
Bermuda Village Retirement Center 21 0 0 21 0 0 0 0 21 0 21
Davie Place Residential Care 0 0 69 69 0 0 0 0 69 0 69
Somerset Court of Mocksville 0 0 60 60 0 0 0 0 60 0 60
The Heritage of Cedar Rock 0 0 40 40 0 0 0 0 40 0 40
Totals 43 0 169 212 0 0 0 0 212 0 212Duplin Autumn Village, Inc. 0 0 88 88 0 0 0 0 88 0 88
DaySpring Assisted Living 0 0 80 80 0 0 0 0 80 0 80
GlenCare 26 0 0 26 4 0 0 0 30 0 30
Golden Care 0 0 30 30 0 0 0 0 30 0 30
Rosemary Rest Home 0 0 45 45 0 0 0 0 45 0 45
Wallace Gardens 0 0 64 64 0 0 0 0 64 0 64
Windham Hall, Inc. 0 0 80 80 0 0 0 0 80 0 80
Totals 26 0 387 413 4 0 0 0 417 0 417

COUNTY
Facility NameLic. Beds in
Nursing Homes
Lic. Beds in Hospitals
Adult Care Homes
Total Licensed Beds CON ACH
(Exempt)ACH
(Pipeline)
Available SMFP
Total Available
Sum of Exclusions
TOTAL Planning Inventory
License PendingINVENTORY
Table 11A: Inventory of Adult Care Home Bed (Fall 2009)
Durham Alta Walk Assisted Living 0 0 20 20 0 0 0 0 20 0 20
Carolina Assisted Living, LLC d/b/a Seasons @ 0 0 51 51 0 0 0 0 51 0 51
Carolina House of Durham 0 0 119 119 0 0 0 0 119 0 119
Carver Living Center 20 0 0 20 0 0 0 0 20 0 20
Clare Bridge of Chapel Hill 0 0 38 38 0 0 0 0 38 0 38
Croasdaile Village 0 0 30 30 0 0 0 0 30 15 15
Durham Ridge Assisted Living 0 0 142 142 0 0 0 0 142 0 142
Eden Spring Living Center 0 0 19 19 0 0 0 0 19 0 19
Ellison's Rest Home #1 0 0 29 29 0 0 0 0 29 0 29
Eno Pointe Assisted Living 0 0 147 147 0 0 0 0 147 0 147
Hillcrest Convalescent Center, Inc. 34 0 0 34 0 0 0 0 34 0 34
KC Care Management, Inc. d/b/a Camellia Gard 0 0 81 81 0 0 0 0 81 0 81
South Point Manor 0 0 29 29 0 0 0 0 29 0 29
Spring Arbor of Durham 0 0 60 60 0 0 0 0 60 0 60
The Forest at Duke 34 0 0 34 0 0 0 0 34 17 17
Wynwood of Chapel Hill 0 0 70 70 0 0 0 0 70 0 70
Totals 88 0 835 923 0 0 0 0 923 32 891Edgecombe Britthaven of Tarboro 0 0 130 130 0 0 0 0 130 0 130
Heritage Care of Rocky Mount 0 0 126 126 0 0 0 0 126 0 126
The Fountains at The Albemarle 56 0 0 56 0 0 0 0 56 0 56
Totals 56 0 256 312 0 0 0 0 312 0 312

COUNTY
Facility NameLic. Beds in
Nursing Homes
Lic. Beds in Hospitals
Adult Care Homes
Total Licensed Beds CON ACH
(Exempt)ACH
(Pipeline)
Available SMFP
Total Available
Sum of Exclusions
TOTAL Planning Inventory
License PendingINVENTORY
Table 11A: Inventory of Adult Care Home Bed (Fall 2009)
Forsyth Arbor Acres United Methodist Retirement Comm 84 0 0 84 18 0 0 0 102 51 51
Baptist Retirement Homes of NC 36 0 0 36 0 0 0 0 36 18 18
Blumenthal Jewish Home 0 0 0 0 36 0 0 0 36 0 36
Brian Center Health & Retirement 40 0 0 40 0 0 0 0 40 0 40
Brighton Gardens of Winston-Salem 0 0 115 115 0 0 0 0 115 0 115
Brookstone Terrace 0 0 20 20 0 0 0 0 20 0 20
Brookstone/Winston-Salem 0 0 20 20 0 0 0 0 20 0 20
C.R.T. - Golden Lamb Rest Home 0 0 40 40 0 0 0 0 40 0 40
Clare Bridge of Winston-Salem 0 0 38 38 0 0 0 0 38 0 38
Clemmons Village 0 0 60 60 0 0 0 0 60 0 60
Clemmons Village II 0 0 66 66 0 0 0 0 66 0 66
Creekside Manor 0 0 60 60 0 0 0 0 60 0 60
Danby House 0 0 100 100 0 0 0 0 100 0 100
Diversified Health Group 0 0 0 0 0 85 0 0 85 0 85
Forest Heights Senior Living Community 0 0 125 125 0 0 0 0 125 0 125
Forsyth Village 0 0 60 60 0 0 0 0 60 0 60
Heritage Woods 0 0 29 29 0 0 0 0 29 0 29
Homestead Hills Retirement Limited Partnership 0 0 66 66 0 0 0 0 66 0 66
Kerner Ridge Assisted Living 0 0 66 66 0 0 0 0 66 0 66
LSA Elms at Tanglewood, Inc dba Elms at Tangl 0 0 104 104 0 0 0 0 104 0 104
Magnolia Creek Assisted Living 0 0 117 117 0 0 0 0 117 0 117
Reynolda Park 0 0 72 72 0 0 0 0 72 0 72
Reynolds House 0 0 121 121 0 0 0 0 121 0 121
Salem Terrace 0 0 142 142 0 0 0 0 142 0 142
Salemtowne 46 0 0 46 0 0 0 0 46 23 23
Shuler Health Care Inc./Crane Villa 0 0 12 12 0 0 0 0 12 0 12
Shuler Health Care Inc./Phillips Villa 0 0 12 12 0 0 0 0 12 0 12
Shuler Health Care Inc./Pierce Villa 0 0 12 12 0 0 0 0 12 0 12
Shuler Health Care Inc./Record Villa 0 0 12 12 0 0 0 0 12 0 12
Shuler Health Care Inc./Storey Villa 0 0 12 12 0 0 0 0 12 0 12
Somerset Court at University Place 0 0 60 60 0 25 0 0 85 0 85
Southfork 0 0 78 78 0 0 0 0 78 0 78
The Bradford Village of Kernersville - East, LLC 0 0 59 59 0 0 0 0 59 0 59
The Bradford Village of Kernersville - West, LLC 0 0 62 62 0 0 0 0 62 0 62
The Crest of Clemmons 0 0 96 96 0 0 0 0 96 0 96
Vienna Village, Inc. 0 0 90 90 0 0 0 0 90 0 90
Totals 206 0 1926 2132 54 110 0 0 2296 92 2204Franklin Britthaven of Louisburg 10 0 0 10 0 0 0 0 10 0 10
Carebridge Assisted Living 0 0 60 60 0 0 0 0 60 0 60
Louisburg Gardens 0 0 56 56 0 0 0 0 56 0 56
Louisburg Manor 0 0 60 60 0 0 0 0 60 0 60
Zollieville Rest Home #2, Inc dba Zollieville Rest 0 0 54 54 0 0 0 0 54 0 54
Totals 10 0 230 240 0 0 0 0 240 0 240

COUNTY
Facility NameLic. Beds in
Nursing Homes
Lic. Beds in Hospitals
Adult Care Homes
Total Licensed Beds CON ACH
(Exempt)ACH
(Pipeline)
Available SMFP
Total Available
Sum of Exclusions
TOTAL Planning Inventory
License PendingINVENTORY
Table 11A: Inventory of Adult Care Home Bed (Fall 2009)
Gaston Abingdon Place of Gastonia 0 0 86 86 0 0 0 0 86 0 86
Alexandria Place 40 0 0 40 0 0 0 0 40 0 40
Belaire Health Care Center 20 0 0 20 0 0 0 0 20 0 20
Carillon Assisted Living of Cramer Mountain 0 0 128 128 0 0 0 0 128 0 128
Carolina Care Center 12 0 0 12 0 0 0 0 12 0 12
Country Time Inn 0 0 62 62 0 0 0 0 62 0 62
Courtland Terrace 19 0 0 19 0 0 0 0 19 0 19
Covenant Village, Inc. 42 0 0 42 0 0 0 0 42 21 21
Delta Healthcare Management LLC DBA Heritag 0 0 86 86 0 0 0 0 86 0 86
Gaston Manor 0 0 78 78 0 0 0 0 78 0 78
Gaston Place 0 0 89 89 0 0 0 0 89 0 89
Morningside of Gastonia 0 0 105 105 0 0 0 0 105 0 105
Peak Resources of Cherryville 57 0 0 57 0 0 0 0 57 0 57
Rosewood Assisted Living 0 0 48 48 0 0 0 0 48 0 48
Somerset Court of Cherryville 0 0 60 60 0 0 0 0 60 0 60
Stanley Total Living Center, Inc. 24 0 0 24 0 0 0 0 24 12 12
Terrace Ridge 0 0 74 74 0 42 0 0 116 0 116
Wellington House 0 0 48 48 0 0 0 0 48 0 48
Woodlawn Haven 0 0 80 80 0 0 0 0 80 0 80
Totals 214 0 944 1158 0 42 0 0 1200 33 1167
Gates Down East Health and Rehabilitation Center 10 0 0 10 0 0 0 0 10 0 10
Totals 10 0 0 10 0 0 0 0 10 0 10Graham Britthaven of Graham 23 0 0 23 0 0 0 0 23 0 23
Totals 23 0 0 23 0 0 0 0 23 0 23Granville Granville House 0 0 60 60 0 0 0 0 60 0 60
Heritage Meadows Long Term Care Facility 0 0 80 80 0 0 0 0 80 0 80
Pine Gardens Adult Care 0 0 31 31 0 0 0 0 31 0 31
Toney Rest Home Inc. 0 0 60 60 0 0 0 0 60 0 60
Universal Health Care Oxford 20 0 0 20 0 0 0 0 20 0 20
Totals 20 0 231 251 0 0 0 0 251 0 251Greene Britthaven of Snow Hill 17 0 0 17 0 0 0 0 17 0 17
Glen Care of Snow Hill 0 0 40 40 0 0 0 0 40 0 40
Totals 17 0 40 57 0 0 0 0 57 0 57

COUNTY
Facility NameLic. Beds in
Nursing Homes
Lic. Beds in Hospitals
Adult Care Homes
Total Licensed Beds CON ACH
(Exempt)ACH
(Pipeline)
Available SMFP
Total Available
Sum of Exclusions
TOTAL Planning Inventory
License PendingINVENTORY
Table 11A: Inventory of Adult Care Home Bed (Fall 2009)
Guilford Abbotswood at Irving Park Assisted Living 0 0 28 28 0 0 0 0 28 0 28
Adams Farm Living and Rehab 20 0 0 20 0 0 0 0 20 0 20
Arbor Care Assisted Living 0 0 92 92 0 0 0 0 92 0 92
Bell House 0 0 22 22 18 0 0 0 40 0 40
Blumenthal Jewish Nursing and Rehab Ctr. 20 0 0 20 0 0 0 0 20 0 20
Brighton Gardens of Greensboro 0 0 125 125 0 0 0 0 125 0 125
Carolina Commons Healthcare & Rehab. Ctr. 40 0 0 40 0 0 0 0 40 0 40
Carrage House Senior Living Community 0 0 108 108 0 0 0 0 108 0 108
Clapp's Assisted Living 0 0 30 30 0 0 0 0 30 0 30
Clare Bridge at High Point Place 0 0 65 65 0 0 0 0 65 0 65
Countryside Manor 16 0 0 16 0 0 0 0 16 0 16
Elm Villa, LLC 0 0 44 44 0 0 0 0 44 0 44
Friends Home at Guilford 60 0 0 60 0 0 0 0 60 30 30
Friends Homes West 40 0 0 40 0 0 0 0 40 20 20
Greensboro Living Center 0 0 114 114 0 0 0 0 114 0 114
Greensboro Manor 0 0 81 81 0 0 0 0 81 0 81
Greensboro Place on Lawndale 0 0 118 118 0 0 0 0 118 0 118
Greensboro Retirement Center 0 0 64 64 0 0 0 0 64 0 64
Heartland Living and Rehab 37 0 0 37 0 0 0 0 37 0 37
High Point Manor on Hartley 0 0 82 82 0 0 0 0 82 0 82
High Point Place 0 0 102 102 0 0 0 0 102 0 102
Lawson's Adult Enrichment Center 0 0 18 18 0 0 0 0 18 0 18
Long's Rest Home for Aged 0 0 12 12 0 0 0 0 12 0 12
Loyalton of Greensboro 0 0 70 70 0 0 0 0 70 0 70
Maryfield Nursing Home 36 0 0 36 0 0 0 0 36 18 18
Masonic & Eastern Star Home of NC 12 0 0 12 0 0 0 0 12 6 6
Morningview in Greensboro 0 0 105 105 0 0 0 0 105 0 105
Oak Hill Rest Home 0 0 60 60 0 0 0 0 60 0 60
Piedmont Christian Home, Inc. " 0 0 93 93 0 0 0 0 93 0 93
Presbyterian Home of High Point 10 0 0 10 0 0 0 0 10 5 5
Riverlanding at Sandy Ridge 56 0 0 56 0 0 0 0 56 28 28
Serenity Care Rest Home 0 0 29 29 0 0 0 0 29 0 29
Skeet Club Manor 0 0 79 79 0 0 0 0 79 0 79
Southland Homes, Inc./Oakview Assisted Living 0 0 10 10 -10 0 0 0 0 0 0
Spring Arbor of Greensboro 0 0 100 100 0 0 0 0 100 0 100
St. Gales Estates, Inc. 0 0 60 60 0 0 0 0 60 0 60
The Arboretum at Heritage Greens 0 0 48 48 0 0 0 0 48 0 48
The Evergreens, Inc. (High Point) 27 0 0 27 -27 0 0 0 0 0 0
Verra Springs at Heritage Greens 0 0 45 45 0 0 0 0 45 0 45
Well-Spring Retirement Community 72 0 0 72 0 0 0 0 72 36 36
Wesleyan Arms Retirement Center 0 0 69 69 0 21 0 0 90 0 90
Woodland Place - Greensboro 0 0 96 96 0 0 0 0 96 0 96
Totals 446 0 1969 2415 -19 21 0 0 2417 143 2274

COUNTY
Facility NameLic. Beds in
Nursing Homes
Lic. Beds in Hospitals
Adult Care Homes
Total Licensed Beds CON ACH
(Exempt)ACH
(Pipeline)
Available SMFP
Total Available
Sum of Exclusions
TOTAL Planning Inventory
License PendingINVENTORY
Table 11A: Inventory of Adult Care Home Bed (Fall 2009)
Halifax Carolina Rest Home 0 0 40 40 0 0 0 0 40 0 40
Liberty Commons Nursing/Rehab 25 0 0 25 0 0 0 0 25 0 25
Our Community Hospital 0 20 0 20 0 0 0 0 20 0 20
Woodhaven Rest Home #1 0 0 0 0 60 0 0 0 60 0 60
Woodhaven Rest Home #2 0 0 60 60 0 0 0 0 60 0 60
Totals 25 20 100 145 60 0 0 0 205 0 205
Harnett Brookfield Retirement Center 0 0 105 105 0 0 0 0 105 0 105
Core Family Care, Inc. 0 0 36 36 0 0 0 0 36 0 36
Dunn Rehab and Nursing Center 8 0 0 8 0 0 0 0 8 0 8
Harnett Manor 106 0 0 106 0 0 0 0 106 0 106
Johnson Better Care Facility, Inc. 0 0 50 50 0 0 0 0 50 0 50
Oak Hill Living Center 0 0 122 122 0 0 0 0 122 0 122
Pinecrest Gardens 0 0 60 60 0 0 0 0 60 0 60
Primrose Villa IV 0 0 12 12 0 0 0 0 12 0 12
Primrose Villa Retirement Home II 0 0 12 12 0 0 0 0 12 0 12
Primrose Villa Retirement III 0 0 12 12 0 0 0 0 12 0 12
Senior Citizens Village 0 0 65 65 0 0 0 0 65 0 65
Senter's Rest Home 0 0 50 50 0 0 0 0 50 0 50
Stage Coach Manor 0 0 40 40 0 0 0 0 40 0 40
Unprecedented Care 0 0 12 12 0 0 0 0 12 0 12
Totals 114 0 576 690 0 0 0 0 690 0 690Haywood Ann Davis Rest Home 0 0 10 10 0 0 0 0 10 0 10
Autumn Care of Waynesville 10 0 0 10 0 0 0 0 10 0 10
Chestnut Park Rest Home #1 0 0 10 10 0 0 0 0 10 0 10
Chestnut Park Retirement Center 0 0 20 20 0 0 0 0 20 0 20
Community Care of Haywood #1 0 0 20 20 0 0 0 0 20 0 20
Haywood House 0 0 0 0 50 0 0 0 50 0 50
Haywood Lodge and Retirement Center 0 0 68 68 0 0 0 0 68 0 68
Hospitalily Retreat 0 0 20 20 0 0 0 0 20 0 20
McCracken Rest Home 0 0 22 22 0 0 0 0 22 0 22
Mountain Hart Retirement, LLC 0 0 20 20 0 0 0 0 20 0 20
Pigeon Valley Rest Home 0 0 29 29 0 0 0 0 29 0 29
Queen Retirement Home 0 0 20 20 0 0 0 0 20 0 20
Richland Community Care #2 0 0 11 11 0 0 0 0 11 0 11
Silver Bluff 13 0 0 13 0 0 0 0 13 0 13
Totals 23 0 250 273 50 0 0 0 323 0 323

COUNTY
Facility NameLic. Beds in
Nursing Homes
Lic. Beds in Hospitals
Adult Care Homes
Total Licensed Beds CON ACH
(Exempt)ACH
(Pipeline)
Available SMFP
Total Available
Sum of Exclusions
TOTAL Planning Inventory
License PendingINVENTORY
Table 11A: Inventory of Adult Care Home Bed (Fall 2009)
Henderson Blue Ridge Retirement 0 0 43 43 0 0 0 0 43 0 43
Cardinal Care Center-Hendersonville 0 0 60 60 0 0 0 0 60 0 60
Carillon Assisted Living Of Hendersonville 0 0 96 96 0 0 0 0 96 0 96
Carolina Village, Inc. 0 0 60 60 0 0 0 0 60 30 30
Cherry Springs Village 0 0 60 60 0 0 0 0 60 0 60
Country Meadow Rest Home 0 0 15 15 0 0 0 0 15 0 15
Druid Hills Living Center #2 0 0 30 30 0 0 0 0 30 0 30
Druid Hills Living Center #1 0 0 10 10 0 0 0 0 10 0 10
Henderson's Assisted Living 0 0 26 26 0 0 0 0 26 0 26
Heritage Lodge 0 0 24 24 0 0 0 0 24 0 24
McCullough's Rest Home 0 0 13 13 0 0 0 0 13 0 13
Mountain View Assisted Living 0 0 27 27 0 0 0 0 27 0 27
Spring Arbor of Hendersonville II, LP 0 0 61 61 0 0 0 0 61 0 61
Spring Arbor West 0 0 48 48 0 0 0 0 48 0 48
The Laurels of Hendersonville 20 0 0 20 0 0 0 0 20 0 20
Totals 20 0 573 593 0 0 0 0 593 30 563Hertford Ahoskie House 0 0 60 60 0 0 0 0 60 0 60
Pinewood Manor 0 0 92 92 0 0 0 0 92 0 92
Twin Oaks Adult Home 0 0 21 21 0 0 0 0 21 0 21
Totals 0 0 173 173 0 0 0 0 173 0 173
Hoke Autumn Care of Raeford 8 0 0 8 0 0 0 0 8 0 8
Open Arms Retirement Center 0 0 90 90 0 0 0 0 90 0 90
Raeford Manor 0 0 75 75 0 0 0 0 75 0 75
Totals 8 0 165 173 0 0 0 0 173 0 173Iredell Aurora of Statesville 0 0 80 80 0 0 0 0 80 0 80
Autumn Care of Statesville 10 0 0 10 0 0 0 0 10 0 10
Brian Center Health & Rehab/Statesville 20 0 0 20 0 0 0 0 20 0 20
Crown Colony at Mooresville 0 0 60 60 0 0 0 0 60 0 60
Heritage Place Adult Living Center 0 0 40 40 0 0 0 0 40 0 40
Jurney's Assisted Living 0 0 60 60 0 0 0 0 60 0 60
Maple Leaf Health Care 8 0 0 8 0 0 0 0 8 0 8
Mooresville Center 30 0 0 30 0 0 0 0 30 0 30
Rosewood Assisted Living 0 0 54 54 0 0 0 0 54 0 54
Southland Homes, Inc./Olin Village 0 0 64 64 0 0 0 0 64 0 64
Statesville Manor on East Broad 0 0 58 58 0 0 0 0 58 0 58
Statesville Place on Peachtree 0 0 87 87 0 0 0 0 87 0 87
Summit Place of Mooresville 0 0 60 60 0 0 0 0 60 0 60
The Churchill Senior Living Community 0 0 120 120 0 0 0 0 120 0 120
The Clare Bridge at Statesville Place 0 0 40 40 0 0 0 0 40 0 40
The Gardens of Statesville 0 0 67 67 0 0 0 0 67 0 67
Totals 68 0 790 858 0 0 0 0 858 0 858Jackson Morningstar of Jackson, LLC d/b/a Morningstar 0 0 55 55 0 0 0 0 55 0 55
Skyland House 0 0 0 0 90 0 0 0 90 0 90
Totals 0 0 55 55 90 0 0 0 145 0 145

COUNTY
Facility NameLic. Beds in
Nursing Homes
Lic. Beds in Hospitals
Adult Care Homes
Total Licensed Beds CON ACH
(Exempt)ACH
(Pipeline)
Available SMFP
Total Available
Sum of Exclusions
TOTAL Planning Inventory
License PendingINVENTORY
Table 11A: Inventory of Adult Care Home Bed (Fall 2009)
Johnston Autumn Home Care of Johnston County, Inc. I 0 0 12 12 0 0 0 0 12 0 12
Autumn Home Care of Johnston County, Inc. II 0 0 12 12 0 0 0 0 12 0 12
Autumn Home Care of Johnston County, Inc. III 0 0 12 12 0 0 0 0 12 0 12
Autumn Wind Assisted Living 0 0 20 20 0 0 0 0 20 0 20
Cardinal Care Assisted Living Village, LLC #3 0 0 12 12 0 0 0 0 12 0 12
Cardinal Care Assisted Living Village, LLC # 1 0 0 12 12 0 0 0 0 12 0 12
Cardinal Care Assisted Living Village, LLC #2 0 0 12 12 0 0 0 0 12 0 12
Cardinal Care Assisted Living Village, LLC #4 0 0 12 12 0 0 0 0 12 0 12
Cardinal Care Assisted Living Village, LLC #5 0 0 12 12 0 0 0 0 12 0 12
Cardinal Care Assisted Living Village, LLC #6 0 0 12 12 0 0 0 0 12 0 12
Carolina House of Smithfield 0 0 74 74 0 0 0 0 74 0 74
Classic Care Homes 0 0 12 12 0 0 0 0 12 0 12
Classic Care Homes 103 0 0 12 12 0 0 0 0 12 0 12
Classic Care Homes 105 0 0 12 12 0 0 0 0 12 0 12
Clayton House 0 0 60 60 0 0 0 0 60 0 60
Four Oaks Assisted Living 0 0 120 120 0 0 0 0 120 0 120
Liberty Commons Nursing and Rehab 60 0 0 60 0 0 0 0 60 0 60
McLamb's Rest Home 0 0 12 12 0 0 0 0 12 0 12
McLamb's Rest Home #2 0 0 12 12 0 0 0 0 12 0 12
Meadowview Assisted Living Center 0 0 60 60 0 0 0 0 60 0 60
Progressive Care 0 0 12 12 0 0 0 0 12 0 12
Smithfield House East 0 0 77 77 0 0 0 0 77 0 77
Smithfield House West 0 0 60 60 0 0 0 0 60 0 60
Smithfield Manor, Inc. 20 0 0 20 0 0 0 0 20 0 20
Totals 80 0 651 731 0 0 0 0 731 0 731Jones Brookstone Living Center 20 0 0 20 0 0 0 0 20 0 20
Totals 20 0 0 20 0 0 0 0 20 0 20Lee AN & FC's Residential Care 0 0 20 20 0 0 0 0 20 0 20
Ashewood Estates Retirement Center 0 0 85 85 0 0 0 0 85 0 85
Oakhaven Home 0 0 40 40 0 0 0 0 40 0 40
Oakhaven II 0 0 12 12 0 0 0 0 12 0 12
Parkview Retirement Center, Inc. 0 0 116 116 0 0 0 0 116 0 116
Victorian 0 0 50 50 0 0 0 0 50 0 50
Totals 0 0 323 323 0 0 0 0 323 0 323
Lenoir GlenCare Assisted Living, Inc. d/b/a Glen Care 0 0 94 94 0 0 0 0 94 0 94
GlenCare of Kinston 0 0 63 63 0 0 0 0 63 0 63
Kinston Assisted Living 0 0 60 60 0 0 0 0 60 0 60
Spring Arbor of Kinston 0 0 86 86 0 0 0 0 86 0 86
Trinity Manor 0 0 33 33 0 0 0 0 33 0 33
Totals 0 0 336 336 0 0 0 0 336 0 336

COUNTY
Facility NameLic. Beds in
Nursing Homes
Lic. Beds in Hospitals
Adult Care Homes
Total Licensed Beds CON ACH
(Exempt)ACH
(Pipeline)
Available SMFP
Total Available
Sum of Exclusions
TOTAL Planning Inventory
License PendingINVENTORY
Table 11A: Inventory of Adult Care Home Bed (Fall 2009)
Lincoln Amazing Grace Rest Home 0 0 20 20 0 0 0 0 20 0 20
Boger City Rest Home 0 0 52 52 0 0 0 0 52 0 52
Brian Center Health & Retirement 23 0 0 23 0 0 0 0 23 0 23
Cardinal Healthcare and Rehab 20 0 0 20 0 0 0 0 20 0 20
Carillon Assisted Living of Lincolnton 0 0 96 96 0 0 0 0 96 0 96
Heath House 0 0 60 60 0 0 0 0 60 0 60
Lakewood Care Center, Inc. 0 0 60 60 0 0 0 0 60 0 60
North Brook Rest Home, Inc 0 0 12 12 0 0 0 0 12 0 12
Wexford House 0 0 60 60 0 0 0 0 60 0 60
Totals 43 0 360 403 0 0 0 0 403 0 403Macon Britthaven of Franklin 0 0 0 0 10 0 0 0 10 0 10
Chestnut Hill of Highlands 0 0 26 26 0 0 0 0 26 0 26
Franklin House 0 0 0 0 70 0 0 0 70 0 70
Grandview Manor Care Center 0 0 52 52 30 0 0 0 82 0 82
Totals 0 0 78 78 110 0 0 0 188 0 188Madison Elderberry Health Care 20 0 0 20 0 0 0 0 20 0 20
Mars Hill Retirement Community 0 0 69 69 0 0 0 0 69 0 69
Totals 20 0 69 89 0 0 0 0 89 0 89Martin The Hamilton Baptist Home 0 0 30 30 0 0 0 0 30 0 30
Vintage Inn 0 0 122 122 0 0 0 0 122 0 122
Williamston House 0 0 60 60 0 0 0 0 60 0 60
Totals 0 0 212 212 0 0 0 0 212 0 212McDowell Autumn Care of Marion 15 0 0 15 0 0 0 0 15 0 15
Cedarbrook Residential Center 0 0 80 80 0 0 0 0 80 0 80
Houston House, Inc. 0 0 30 30 0 0 0 0 30 0 30
Lake James Lodge 0 0 60 60 0 0 0 0 60 0 60
McDowell Assisted Living, LLC 0 0 54 54 0 0 0 0 54 0 54
McDowell House, Inc. 0 0 25 25 0 0 0 0 25 0 25
Rose Hill Retirement Community 0 0 87 87 0 0 0 0 87 0 87
Totals 15 0 336 351 0 0 0 0 351 0 351

COUNTY
Facility NameLic. Beds in
Nursing Homes
Lic. Beds in Hospitals
Adult Care Homes
Total Licensed Beds CON ACH
(Exempt)ACH
(Pipeline)
Available SMFP
Total Available
Sum of Exclusions
TOTAL Planning Inventory
License PendingINVENTORY
Table 11A: Inventory of Adult Care Home Bed (Fall 2009)
Mecklenburg Atria Merrywood 0 0 20 20 0 0 0 0 20 0 20
Brighton Gardens of Charlotte 0 0 125 125 0 0 0 0 125 0 125
Britthaven of Charlotte 10 0 0 10 0 0 0 0 10 0 10
Brookdale Place South Charlotte 0 0 51 51 0 0 0 0 51 0 51
Carmel Hills 0 0 38 38 0 0 0 0 38 19 19
Carriage Club of Charlotte (Coach House) 0 0 108 108 0 0 0 0 108 54 54
Carrington Place 10 0 0 10 0 0 0 0 10 0 10
Charlotte Manor 0 0 40 40 0 0 0 0 40 0 40
Charlotte Square 0 0 125 125 0 0 0 0 125 0 125
Cuthbertson Village at Aldersgate 0 0 45 45 0 0 0 0 45 23 22
East Towne 0 0 120 120 0 0 0 0 120 0 120
Elmcroft of Little Avenue 0 0 62 62 0 0 0 0 62 0 62
Helton Manor West, Inc. 0 0 120 120 0 0 0 0 120 0 120
Hunter Village 0 0 68 68 0 0 0 0 68 0 68
Hunter Woods Nursing & Rehab. Center 10 0 0 10 0 0 0 0 10 0 10
Lawyers Glen Retirement Living Center 0 0 82 82 0 0 0 0 82 0 82
Lee's Living Center 0 0 48 48 0 0 0 0 48 0 48
Legacy Heights Senior Living Community 0 0 122 122 0 0 0 0 122 0 122
Parker Terrace 0 0 53 53 0 0 0 0 53 27 26
Pineville Rehab and Living Center 10 0 0 10 0 0 0 0 10 0 10
Preston House 0 0 40 40 0 0 0 0 40 0 40
Regency Retirement Village 0 0 119 119 0 0 0 0 119 0 119
Saturn Nursing and Rehabilitation Center 20 0 0 20 0 0 0 0 20 0 20
Sharon Towers 40 0 0 40 0 0 0 0 40 20 20
Slay's Rest Home 0 0 12 12 0 0 0 0 12 0 12
Southminster 40 0 0 40 0 0 0 0 40 20 20
Summit Place of Southpark 0 0 120 120 0 0 0 0 120 0 120
Sunrise Eastover Assisted Living, LLC 0 0 104 104 0 0 0 0 104 0 104
Sunrise on Providence 0 0 95 95 0 0 0 0 95 0 95
The Arbors at Carriage Club of Charlotte 0 0 34 34 0 0 0 0 34 17 17
The Court at South Park 0 0 56 56 0 0 0 0 56 0 56
The Cove at Wilora Lake Lodge 0 0 50 50 0 0 0 0 50 0 50
The Haven in Highland Creek 0 0 60 60 0 0 0 0 60 0 60
The Haven in the Village at Carolina Place 0 0 60 60 0 0 0 0 60 0 60
The Laurels in Highland Creek 0 0 105 105 0 0 0 0 105 0 105
The Laurels in the Village at Carolina Place 0 0 104 104 0 0 0 0 104 0 104
The Little Flower Assisted Living Residence 0 0 49 49 0 0 0 0 49 0 49
The Parc at Sharon Amity 0 0 64 64 0 0 0 0 64 0 64
The Pines at Davidson 30 0 0 30 0 0 0 0 30 15 15
Weddington Park 0 0 83 83 0 0 0 0 83 0 83
Willow Ridge Assisted Living 0 0 52 52 0 0 0 0 52 0 52
WillowBrooke Court/Plantation Estates 60 0 0 60 0 0 0 0 60 30 30
Wilora Lake Health Care Center 20 0 0 20 0 0 0 0 20 0 20
Totals 250 0 2434 2684 0 0 0 0 2684 225 2459

COUNTY
Facility NameLic. Beds in
Nursing Homes
Lic. Beds in Hospitals
Adult Care Homes
Total Licensed Beds CON ACH
(Exempt)ACH
(Pipeline)
Available SMFP
Total Available
Sum of Exclusions
TOTAL Planning Inventory
License PendingINVENTORY
Table 11A: Inventory of Adult Care Home Bed (Fall 2009)
Mitchell Brian Center Health & Rehab/Spruce Pines 10 0 0 10 0 0 0 0 10 0 10
Mitchell House 0 0 0 0 80 0 0 0 80 0 80
Totals 10 0 0 10 80 0 0 0 90 0 90Montgomery Autumn Care of Biscoe 10 0 0 10 0 0 0 0 10 0 10
Brookstone Haven of Star 0 0 54 54 0 0 0 0 54 0 54
Poplar Springs 0 0 12 12 0 0 0 0 12 0 12
Sandy Ridge Assisted Living 0 0 104 104 0 0 0 0 104 0 104
Tillery Chase Adult Care Home 0 0 60 60 0 0 0 0 60 0 60
Totals 10 0 230 240 0 0 0 0 240 0 240Moore Carolina House of Pinehurst 0 0 76 76 0 0 0 0 76 0 76
Elmcroft of Southern Pines 0 0 94 94 0 0 0 0 94 0 94
Fox Hollow Senior Living Community 0 0 85 85 0 0 0 0 85 0 85
KingsWood Nursing Center 10 0 0 10 0 0 0 0 10 0 10
Magnolia Gardens 0 0 110 110 0 0 0 0 110 0 110
Peak Resources - Pinelake 20 0 0 20 0 0 0 0 20 0 20
Penick Village 29 0 0 29 0 0 0 0 29 15 14
Pinehurst Healthcare and Rehab Center 15 0 0 15 0 0 0 0 15 0 15
Seven Lakes Assisted Living 0 0 60 60 0 0 0 0 60 0 60
Southern Pines Manor 0 0 10 10 0 0 0 0 10 0 10
St. Joseph of the Pines Belle Meade 0 0 50 50 0 0 0 0 50 25 25
Tara Plantation of Carthage 0 0 80 80 0 0 0 0 80 0 80
Totals 74 0 565 639 0 0 0 0 639 40 599Nash Autumn Care of Nash 20 0 0 20 0 0 0 0 20 0 20
Brekenridge Retirement Center 0 0 64 64 0 0 0 0 64 0 64
Hunter Hills Senior Village 0 0 64 64 0 0 0 0 64 0 64
Nash Grove Manor 122 0 0 122 0 0 0 0 122 0 122
Nash Rehab & Nursing Center 9 0 0 9 0 0 0 0 9 0 9
Somerset Court of Rocky Mount 0 0 60 60 0 0 0 0 60 0 60
South Village 15 0 0 15 0 0 0 0 15 0 15
Spring Arbor of Rocky Mount 0 0 84 84 0 0 0 0 84 0 84
Sterling House of Rocky Mount 0 0 60 60 0 0 0 0 60 0 60
Trinity Retirement Villas #1 0 0 12 12 0 0 0 0 12 0 12
Trinity Retirement Villas #2 0 0 12 12 0 0 0 0 12 0 12
Totals 166 0 356 522 0 0 0 0 522 0 522

COUNTY
Facility NameLic. Beds in
Nursing Homes
Lic. Beds in Hospitals
Adult Care Homes
Total Licensed Beds CON ACH
(Exempt)ACH
(Pipeline)
Available SMFP
Total Available
Sum of Exclusions
TOTAL Planning Inventory
License PendingINVENTORY
Table 11A: Inventory of Adult Care Home Bed (Fall 2009)
New Hanover Autumn Care of Myrtle Grove 20 0 0 20 0 0 0 0 20 0 20
Champions Assisted Living 0 0 148 148 0 0 0 0 148 0 148
Clare Bridge of Wilmington 0 0 38 38 0 0 0 0 38 0 38
Diversicare of New Hanover 0 0 61 61 -61 0 0 0 0 0 0
Fannie Norwood Memorial Home 0 0 16 16 0 0 0 0 16 0 16
GlenCare of Wilmington 0 0 64 64 0 0 0 0 64 0 64
Hermitage House Rest Home 0 0 84 84 0 0 0 0 84 0 84
Liberty Commons Nursing Wilmington 40 0 0 40 0 0 0 0 40 0 40
New Hanover House 0 0 0 0 61 0 0 0 61 0 61
Oakdale Heights Wilmington 0 0 101 101 0 0 0 0 101 0 101
Port South Village/Carmen D. Villa 0 0 12 12 0 0 0 0 12 0 12
Port South Village/Catherine S. Villa 0 0 12 12 0 0 0 0 12 0 12
Port South Village/Crystal L. Villa 0 0 12 12 0 0 0 0 12 0 12
Port South Village/Lorraine B. Villa 0 0 12 12 0 0 0 0 12 0 12
Port South Village/Tara L. Villa 0 0 12 12 0 0 0 0 12 0 12
Port South Village/Teresa C. Villa 0 0 12 12 0 0 0 0 12 0 12
Sherwood Manor Rest Home 0 0 40 40 0 0 0 0 40 0 40
Spring Arbor of Wilmington 0 0 66 66 0 0 0 0 66 0 66
The Commons at Brightmore 0 0 201 201 0 0 0 0 201 0 201
The Kempton at Brightmore 0 0 136 136 0 0 0 0 136 0 136
Wilmington Health and Rehabilitation Center 30 0 0 30 0 0 0 0 30 0 30
Totals 90 0 1027 1117 0 0 0 0 1117 0 1117Northampton Hampton Manor 0 0 82 82 0 0 0 0 82 0 82
Pine Forest Rest, Inc 0 0 24 24 0 0 0 0 24 0 24
Rich Square Villa 0 0 38 38 0 0 0 0 38 0 38
Rich Square Manor 0 0 32 32 0 0 0 0 32 0 32
St. Mary's Assisted Living Facility of Pleasant Hi 0 0 66 66 0 0 0 0 66 0 66
Totals 0 0 242 242 0 0 0 0 242 0 242Onslow Britthaven of Jacksonville 7 0 0 7 0 0 0 0 7 0 7
Carebridge Assisted Living Community 0 0 160 160 0 0 0 0 160 0 160
GlenCare AL , Inc. d/b/a GlenCare of Holly Ridg 0 0 40 40 0 0 0 0 40 0 40
Liberty Commons Assisted Living 0 0 79 79 0 0 0 0 79 0 79
Lighthouse Village 0 0 80 80 0 0 0 0 80 0 80
The Arc Community 0 0 32 32 0 0 0 0 32 0 32
The Heritage of Richlands 0 0 40 40 0 0 0 0 40 0 40
Totals 7 0 431 438 0 0 0 0 438 0 438

COUNTY
Facility NameLic. Beds in
Nursing Homes
Lic. Beds in Hospitals
Adult Care Homes
Total Licensed Beds CON ACH
(Exempt)ACH
(Pipeline)
Available SMFP
Total Available
Sum of Exclusions
TOTAL Planning Inventory
License PendingINVENTORY
Table 11A: Inventory of Adult Care Home Bed (Fall 2009)
Orange Britthaven of Chapel Hill 7 0 0 7 0 0 0 0 7 0 7
Brookshire Nursing Center 20 0 0 20 0 0 0 0 20 0 20
Carillon Assisted Living of Hillsborough 0 0 96 96 0 0 0 0 96 0 96
Carol Woods Retirement Community Bldg 7 65 0 12 77 0 0 0 0 77 39 38
Carolina House of Chapel Hill 0 0 64 64 0 0 0 0 64 0 64
Crescent Green of Carrboro 0 0 120 120 0 0 0 0 120 0 120
The Carol Woods Retirement Community - Build 0 0 12 12 0 0 0 0 12 6 6
The Stratford 0 0 77 77 0 0 0 0 77 0 77
Villines Rest Home, Inc 0 0 17 17 0 0 0 0 17 0 17
Totals 92 0 398 490 0 0 0 0 490 45 445Pamlico Britthaven of Pamlico 8 0 0 8 0 0 0 0 8 0 8
The Gardens of Pamlico 0 0 40 40 0 0 0 0 40 0 40
Totals 8 0 40 48 0 0 0 0 48 0 48Pasquotank Carolina House of Elizabeth City 0 0 76 76 0 0 0 0 76 0 76
Heritage Care of Elizabeth City 0 0 60 60 0 0 0 0 60 0 60
Waterbrooke of Elizabeth City 0 0 130 130 0 0 0 0 130 0 130
Totals 0 0 266 266 0 0 0 0 266 0 266Pender DaySpring Assisted Living of Burgaw 0 0 60 60 0 0 0 0 60 0 60
Huntington Health Care 23 0 0 23 0 0 0 0 23 0 23
Pen-Du Rest Home 0 0 19 19 0 0 0 0 19 0 19
Stone Bridge at Woodbury 0 0 0 0 100 0 0 0 100 0 100
Totals 23 0 79 102 100 0 0 0 202 0 202Perquimans Country Oaks 0 0 24 24 0 0 0 0 24 0 24
South Haven Manor 0 0 24 24 0 0 0 0 24 0 24
Totals 0 0 48 48 0 0 0 0 48 0 48Person Cambridge Hills Assisted Living, Inc. 0 0 120 120 0 0 0 0 120 0 120
Maple Heights Assisted Living 0 0 34 34 0 0 0 0 34 0 34
The Canterbury House 0 0 60 60 0 0 0 0 60 0 60
Totals 0 0 214 214 0 0 0 0 214 0 214Pitt Carolina House of Greenville 0 0 76 76 0 0 0 0 76 0 76
Cypress Glen Retirement Community Memory C 30 0 12 42 0 0 0 0 42 21 21
Dixon House 0 0 80 80 0 0 0 0 80 0 80
Greenfield Place 20 0 0 20 0 0 0 0 20 0 20
Oak Haven Assisted Living 0 0 54 54 0 0 0 0 54 0 54
Red Oak Assisted Living 0 0 62 62 0 0 0 0 62 0 62
Southern Living Assisted Care 0 0 120 120 0 0 0 0 120 0 120
Spring Arbor of Greenville 0 0 66 66 0 0 0 0 66 0 66
Sterling House of Greenville 0 0 60 60 0 0 0 0 60 0 60
Winterville Manor 0 0 29 29 0 0 0 0 29 0 29
Totals 50 0 559 609 0 0 0 0 609 21 588

COUNTY
Facility NameLic. Beds in
Nursing Homes
Lic. Beds in Hospitals
Adult Care Homes
Total Licensed Beds CON ACH
(Exempt)ACH
(Pipeline)
Available SMFP
Total Available
Sum of Exclusions
TOTAL Planning Inventory
License PendingINVENTORY
Table 11A: Inventory of Adult Care Home Bed (Fall 2009)
Polk K D Support Services dba Kellys Care # 5 0 0 14 14 0 0 0 0 14 0 14
Laurelwoods 0 0 60 60 0 0 0 0 60 0 60
Ridgerest 0 0 12 12 0 0 0 0 12 0 12
White Oak Manor/Tryon 30 0 0 30 0 0 0 0 30 15 15
WillowBrooke Court Skilled Care Center 44 0 0 44 0 0 0 0 44 22 22
Totals 74 0 86 160 0 0 0 0 160 37 123
Randolph Brookstone Haven 0 0 120 120 0 0 0 0 120 0 120
Carillon Assisted Living of Asheboro 0 0 96 96 0 0 0 0 96 0 96
Carolina House of Asheboro 0 0 76 76 0 0 0 0 76 0 76
Country Manor 0 0 9 9 0 0 0 0 9 0 9
Cross Road Retirement Community 0 0 152 152 0 0 0 0 152 0 152
North Pointe 0 0 67 67 0 0 0 0 67 0 67
North Pointe Assisted Living of Archdale 0 0 56 56 0 0 0 0 56 0 56
The GrayBrier Nursing & Retirement Center 14 0 0 14 0 0 0 0 14 0 14
Triad Telcare Inc. dba Country Club 0 0 12 12 0 0 0 0 12 0 12
Westwood Health and Rehabilitation Center 20 0 0 20 0 0 0 0 20 0 20
Totals 34 0 588 622 0 0 0 0 622 0 622Richmond Britthaven of Hamlet 10 0 0 10 0 0 0 0 10 0 10
Fisher Adult Care, Inc. 0 0 12 12 0 0 0 0 12 0 12
New Hope Adult Care 0 0 17 17 0 0 0 0 17 0 17
Somerset Court of Hamlet 0 0 60 60 0 0 0 0 60 0 60
The Hermitage Retirement Center of Rockingha 0 0 120 120 0 0 0 0 120 0 120
Totals 10 0 209 219 0 0 0 0 219 0 219Robeson Covenant Care 0 0 30 30 0 0 0 0 30 0 30
GlenFlora 20 0 0 20 0 0 0 0 20 0 20
Green Manor Rest Home 0 0 82 82 0 0 0 0 82 0 82
Greenbrier of Fairmont 0 0 100 100 0 0 0 0 100 0 100
Greystone Manor 0 0 81 81 0 0 0 0 81 0 81
Hermitage Retirement Center 0 0 104 104 0 0 0 0 104 0 104
J & S Care Inc. # 2 d/b/a Morning Star AL # 2 0 0 12 12 0 0 0 0 12 0 12
J & S Care Inc. # 3 d/b/a Morning Star AL # 3 0 0 12 12 0 0 0 0 12 0 12
J & S Care Inc. # 4 d/b/a Morning Star AL # 4 0 0 12 12 0 0 0 0 12 0 12
Low-Lock's 0 0 0 0 0 40 0 0 40 0 40
Morning Star Assisted Living 0 0 10 10 0 0 0 0 10 0 10
Spring Village Rest Home 0 0 11 11 0 0 0 0 11 0 11
St. Mary's Assisted Living Facility of Red Spring 0 0 63 63 0 0 0 0 63 0 63
Wesley Pines Retirement Community 42 0 0 42 0 0 0 0 42 21 21
Totals 62 0 517 579 0 40 0 0 619 21 598

COUNTY
Facility NameLic. Beds in
Nursing Homes
Lic. Beds in Hospitals
Adult Care Homes
Total Licensed Beds CON ACH
(Exempt)ACH
(Pipeline)
Available SMFP
Total Available
Sum of Exclusions
TOTAL Planning Inventory
License PendingINVENTORY
Table 11A: Inventory of Adult Care Home Bed (Fall 2009)
Rockingham Carolina House of Reidsville 0 0 76 76 0 0 0 0 76 0 76
Eden Estates 0 0 82 82 0 0 0 0 82 0 82
Highgrove Long Term Care Center,Inc 0 0 62 62 0 0 0 0 62 0 62
Moyer's Rest Home 0 0 18 18 0 0 0 0 18 0 18
North Pointe of Mayodan 0 0 70 70 0 0 0 0 70 0 70
Penn Nursing Center 10 0 0 10 0 0 0 0 10 0 10
Pine Forrest Home for the Aged 0 0 58 58 0 0 0 0 58 0 58
Reidsville House 0 0 43 43 0 0 0 0 43 0 43
Totals 10 0 409 419 0 0 0 0 419 0 419Rowan Best of Care Rest Assisted Living 0 0 25 25 0 0 0 0 25 0 25
Bethamy Retirement Center 0 0 43 43 0 0 0 0 43 0 43
Big Elm Retirement and Nursing Centers 96 0 0 96 0 0 0 0 96 0 96
Brightmoor Nursing Center 43 0 0 43 0 0 0 0 43 0 43
Britthaven of Kannapolis, Inc. 0 0 106 106 0 0 0 0 106 0 106
Carillon Assisted Living of Salisbury 0 0 128 128 0 0 0 0 128 0 128
China Grove Retirement Center 0 0 28 28 0 0 0 0 28 0 28
Harris Enterprises of NC, Inc. d/b/a Deal Care In 0 0 21 21 0 0 0 0 21 0 21
Heritage Center, LLC 0 0 34 34 0 0 0 0 34 0 34
Lutheran Home at Trinity Oaks 25 0 0 25 0 0 0 0 25 13 12
Salisbury Center 20 0 0 20 0 0 0 0 20 0 20
Salisbury Gardens 0 0 88 88 0 0 0 0 88 0 88
The Laurels of Salisbury 20 0 0 20 0 0 0 0 20 0 20
The Meadows of Rockwell Retirement Center 0 0 120 120 0 0 0 0 120 0 120
Trinity Oaks Continuing Care Retirement Comm 0 0 20 20 0 0 0 0 20 10 10
Varanda Residential Care 0 0 89 89 0 0 0 0 89 0 89
Totals 204 0 702 906 0 0 0 0 906 23 883Rutherford Autumn Care of Forest City 28 0 0 28 0 0 0 0 28 0 28
Carolina House of Forest City 0 0 76 76 0 0 0 0 76 0 76
Colonial Manor Rest Home 0 0 34 34 0 0 0 0 34 0 34
Fair Haven Home 37 0 0 37 0 0 0 0 37 0 37
Haven-N-Hills Living Center 0 0 46 46 0 0 0 0 46 0 46
Henderson Care Center 0 0 86 86 0 0 0 0 86 0 86
Hillcrest Adult Care Facility, Inc. 0 0 44 44 0 0 0 0 44 0 44
Holly Springs Senior Citizens Home 0 0 32 32 0 0 0 0 32 0 32
Oak Grove Healthcare Center 20 0 0 20 0 0 0 0 20 0 20
Oakland Living Center, Inc. 0 0 40 40 0 0 0 0 40 0 40
Restwell Home 0 0 20 20 0 0 0 0 20 0 20
Southern Manor Retirement Home, Inc. 0 0 25 25 0 0 0 0 25 0 25
Sunnyside Retirement Home 0 0 34 34 0 0 0 0 34 0 34
White Oak Manor/Rutherfordton 15 0 0 15 0 0 0 0 15 0 15
Totals 100 0 437 537 0 0 0 0 537 0 537
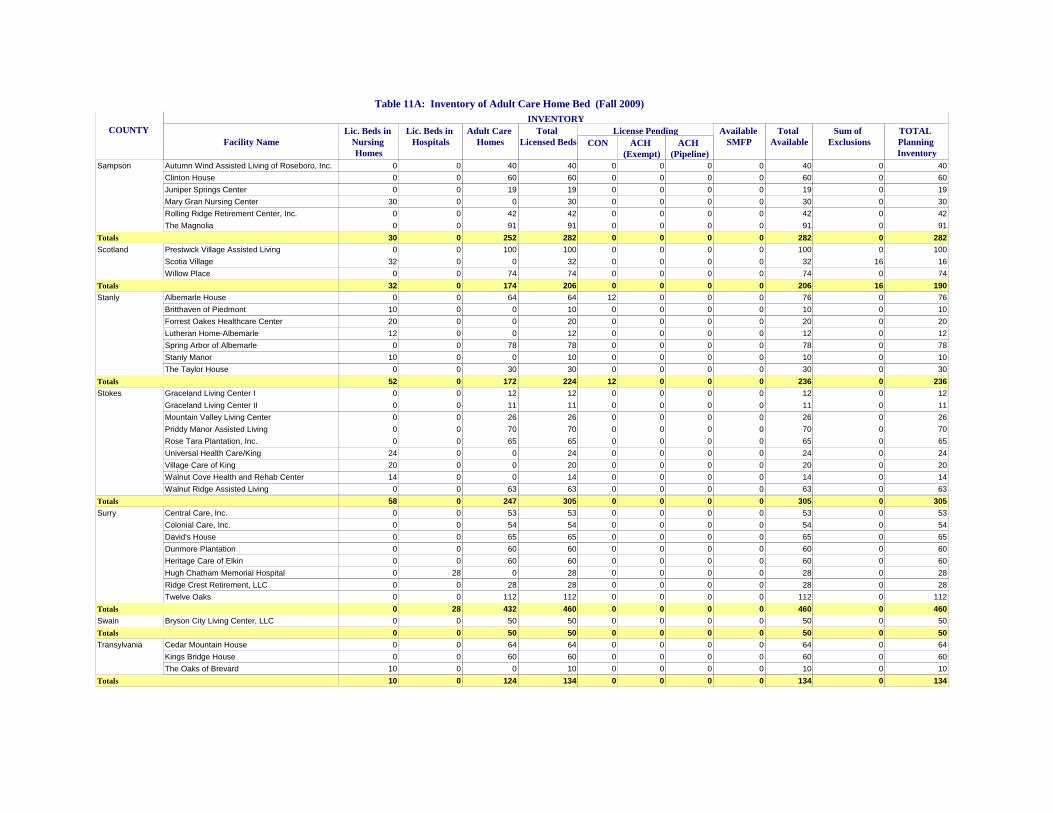
COUNTY
Facility NameLic. Beds in
Nursing Homes
Lic. Beds in Hospitals
Adult Care Homes
Total Licensed Beds CON ACH
(Exempt)ACH
(Pipeline)
Available SMFP
Total Available
Sum of Exclusions
TOTAL Planning Inventory
License PendingINVENTORY
Table 11A: Inventory of Adult Care Home Bed (Fall 2009)
Sampson Autumn Wind Assisted Living of Roseboro, Inc. 0 0 40 40 0 0 0 0 40 0 40
Clinton House 0 0 60 60 0 0 0 0 60 0 60
Juniper Springs Center 0 0 19 19 0 0 0 0 19 0 19
Mary Gran Nursing Center 30 0 0 30 0 0 0 0 30 0 30
Rolling Ridge Retirement Center, Inc. 0 0 42 42 0 0 0 0 42 0 42
The Magnolia 0 0 91 91 0 0 0 0 91 0 91
Totals 30 0 252 282 0 0 0 0 282 0 282Scotland Prestwick Village Assisted Living 0 0 100 100 0 0 0 0 100 0 100
Scotia Village 32 0 0 32 0 0 0 0 32 16 16
Willow Place 0 0 74 74 0 0 0 0 74 0 74
Totals 32 0 174 206 0 0 0 0 206 16 190Stanly Albemarle House 0 0 64 64 12 0 0 0 76 0 76
Britthaven of Piedmont 10 0 0 10 0 0 0 0 10 0 10
Forrest Oakes Healthcare Center 20 0 0 20 0 0 0 0 20 0 20
Lutheran Home-Albemarle 12 0 0 12 0 0 0 0 12 0 12
Spring Arbor of Albemarle 0 0 78 78 0 0 0 0 78 0 78
Stanly Manor 10 0 0 10 0 0 0 0 10 0 10
The Taylor House 0 0 30 30 0 0 0 0 30 0 30
Totals 52 0 172 224 12 0 0 0 236 0 236Stokes Graceland Living Center I 0 0 12 12 0 0 0 0 12 0 12
Graceland Living Center II 0 0 11 11 0 0 0 0 11 0 11
Mountain Valley Living Center 0 0 26 26 0 0 0 0 26 0 26
Priddy Manor Assisted Living 0 0 70 70 0 0 0 0 70 0 70
Rose Tara Plantation, Inc. 0 0 65 65 0 0 0 0 65 0 65
Universal Health Care/King 24 0 0 24 0 0 0 0 24 0 24
Village Care of King 20 0 0 20 0 0 0 0 20 0 20
Walnut Cove Health and Rehab Center 14 0 0 14 0 0 0 0 14 0 14
Walnut Ridge Assisted Living 0 0 63 63 0 0 0 0 63 0 63
Totals 58 0 247 305 0 0 0 0 305 0 305Surry Central Care, Inc. 0 0 53 53 0 0 0 0 53 0 53
Colonial Care, Inc. 0 0 54 54 0 0 0 0 54 0 54
David's House 0 0 65 65 0 0 0 0 65 0 65
Dunmore Plantation 0 0 60 60 0 0 0 0 60 0 60
Heritage Care of Elkin 0 0 60 60 0 0 0 0 60 0 60
Hugh Chatham Memorial Hospital 0 28 0 28 0 0 0 0 28 0 28
Ridge Crest Retirement, LLC 0 0 28 28 0 0 0 0 28 0 28
Twelve Oaks 0 0 112 112 0 0 0 0 112 0 112
Totals 0 28 432 460 0 0 0 0 460 0 460Swain Bryson City Living Center, LLC 0 0 50 50 0 0 0 0 50 0 50
Totals 0 0 50 50 0 0 0 0 50 0 50Transylvania Cedar Mountain House 0 0 64 64 0 0 0 0 64 0 64
Kings Bridge House 0 0 60 60 0 0 0 0 60 0 60
The Oaks of Brevard 10 0 0 10 0 0 0 0 10 0 10
Totals 10 0 124 134 0 0 0 0 134 0 134

COUNTY
Facility NameLic. Beds in
Nursing Homes
Lic. Beds in Hospitals
Adult Care Homes
Total Licensed Beds CON ACH
(Exempt)ACH
(Pipeline)
Available SMFP
Total Available
Sum of Exclusions
TOTAL Planning Inventory
License PendingINVENTORY
Table 11A: Inventory of Adult Care Home Bed (Fall 2009)
Union Autumn Care of Marshville 10 0 0 10 0 0 0 0 10 0 10
Brian Center Health & Retirement/Monroe 12 0 0 12 0 0 0 0 12 0 12
Carillon Assisted Living at Indian Trail 0 0 96 96 0 0 0 0 96 0 96
Clare Bridge at Monroe Square 0 0 65 65 0 0 0 0 65 0 65
Elizabethan Gardens 0 0 100 100 0 0 0 0 100 0 100
Hillcrest Church Rest Home 0 0 20 20 0 0 0 0 20 0 20
Monroe Manor Rest & Retirement Home, Inc. 0 0 12 12 0 0 0 0 12 0 12
Monroe Manor Rest & Retirement II, Inc. 0 0 12 12 0 0 0 0 12 0 12
Monroe Square Assisted Living Facility 0 0 102 102 0 0 0 0 102 0 102
Union Park 0 0 87 87 0 0 0 0 87 0 87
Woodridge Assisted Living Facility 0 0 80 80 0 0 0 0 80 0 80
Totals 22 0 574 596 0 0 0 0 596 0 596Vance Britthaven of Henderson 23 0 0 23 0 0 0 0 23 0 23
Green-Bullock Assisted Living Center, LLC 0 0 129 129 0 0 0 0 129 0 129
Senior Citizen's Home 54 0 0 54 0 0 0 0 54 0 54
Woodlawn Retirement Home 0 0 12 12 0 0 0 0 12 0 12
Totals 77 0 141 218 0 0 0 0 218 0 218

COUNTY
Facility NameLic. Beds in
Nursing Homes
Lic. Beds in Hospitals
Adult Care Homes
Total Licensed Beds CON ACH
(Exempt)ACH
(Pipeline)
Available SMFP
Total Available
Sum of Exclusions
TOTAL Planning Inventory
License PendingINVENTORY
Table 11A: Inventory of Adult Care Home Bed (Fall 2009)
Wake Aversboro Assisted Living of Garner, LLC 0 0 126 126 0 0 0 0 126 0 126
Brighton Gardens of Raleigh 0 0 115 115 0 0 0 0 115 0 115
Brookridge Assisted Living, Inc 0 0 55 55 0 0 0 0 55 0 55
Carolina House of Cary 0 0 80 80 0 0 0 0 80 0 80
Carolina House of Wake Forest 0 0 70 70 0 0 0 0 70 0 70
Cary Health & Rehabilitation Center 30 0 0 30 0 0 0 0 30 0 30
Chatham Creek Assisted Living 0 0 80 80 0 0 0 0 80 0 80
Clare Bridge of Cary 0 0 50 50 0 0 0 0 50 0 50
Coventry House of Zebulon 0 0 60 60 0 0 0 0 60 0 60
Dan E. & Mary Louise Stewart Health Center 18 0 0 18 0 0 0 0 18 9 9
Diversified Health Group, LLC II 0 0 0 0 0 85 0 0 85 0 85
Elmcroft of Northridge 0 0 161 161 0 0 0 0 161 0 161
Falls River Court Memory Care Community 0 0 38 38 0 0 0 0 38 0 38
Falls River Village Assisted Living Community 0 0 60 60 0 0 0 0 60 0 60
Glenaire 15 0 0 15 -6 0 0 0 9 5 4
HeartFields at Cary 0 0 97 97 0 0 0 0 97 0 97
Hillside Nursing Center of Wake Forest 20 0 0 20 0 0 0 0 20 0 20
James Rest Home 0 0 40 40 0 0 0 0 40 0 40
Lawndale Manor 0 0 62 62 0 0 0 0 62 0 62
Lee's Long Term Care Facility, Inc. 0 0 65 65 0 0 0 0 65 0 65
Litchford Falls Healthcare & Rehab. Ctr. 24 0 0 24 0 0 0 0 24 0 24
Magnolia Glen 0 0 66 66 0 0 0 0 66 0 66
Morningside of Raleigh 0 0 110 110 0 0 0 0 110 0 110
Phoenix Assisted Care, LLC 0 0 120 120 0 0 0 0 120 0 120
Searstone 0 0 0 0 8 0 0 0 8 4 4
Spring Arbor of Apex LTD Partnership 0 0 76 76 0 0 0 0 76 0 76
Spring Arbor of Raleigh 0 0 80 80 0 0 0 0 80 0 80
Sunrise Asst Lvg at North Hills 0 0 160 160 0 0 0 0 160 0 160
Sunrise of Cary 0 0 85 85 0 0 0 0 85 0 85
Sunrise of Raleigh 0 0 100 100 0 0 0 0 100 0 100
The Cardinal @ North Hills 0 0 0 0 45 0 0 0 45 23 22
The Covington 0 0 120 120 0 0 0 0 120 0 120
The Laurels of Forest Glenn 20 0 0 20 0 0 0 0 20 0 20
The Oliver House 0 0 100 100 0 0 0 0 100 0 100
Universal Health Care Fuquay Varina 31 0 0 31 0 0 0 0 31 0 31
Universal Healthcare North Raleigh 20 0 0 20 0 0 0 0 20 0 20
Wake Assisted Living 0 0 60 60 0 0 0 0 60 0 60
Wake Forest Care Center, Inc. 0 0 80 80 0 0 0 0 80 0 80
Wellington Nursing and Rehab Center 20 0 0 20 0 0 0 0 20 0 20
Windsor Point CCRC 55 0 0 55 0 0 0 0 55 28 27
Woodland Terrace 0 0 84 84 0 0 0 0 84 0 84
Zebulon House 0 0 60 60 0 0 0 0 60 0 60
Totals 253 0 2460 2713 47 85 0 0 2845 69 2776

COUNTY
Facility NameLic. Beds in
Nursing Homes
Lic. Beds in Hospitals
Adult Care Homes
Total Licensed Beds CON ACH
(Exempt)ACH
(Pipeline)
Available SMFP
Total Available
Sum of Exclusions
TOTAL Planning Inventory
License PendingINVENTORY
Table 11A: Inventory of Adult Care Home Bed (Fall 2009)
Warren Boyd's Rest Home #2 0 0 10 10 0 0 0 0 10 0 10
Floyd B. McKissick, Sr. Assisted Living Ctr. 0 0 40 40 0 0 0 0 40 0 40
Magnolia Gardens of Warrenton 0 0 86 86 0 0 0 0 86 0 86
Warren Hills, A Personal Care & Nursing Facilit 20 0 0 20 0 0 0 0 20 0 20
Totals 20 0 136 156 0 0 0 0 156 0 156Washington Cypress Manor 0 0 40 40 0 0 0 0 40 0 40
Plumblee Nursing Center 9 0 0 9 0 0 0 0 9 0 9
Totals 9 0 40 49 0 0 0 0 49 0 49Watauga Deerfield Ridge Assisted Living 0 0 96 96 0 0 0 0 96 0 96
Glenbridge Health & Rehab. 20 0 0 20 0 0 0 0 20 0 20
Mountain Care Facilities, Inc. 0 0 60 60 0 0 0 0 60 0 60
Totals 20 0 156 176 0 0 0 0 176 0 176Wayne Britthaven of LaGrange 0 0 37 37 0 0 0 0 37 0 37
Countryside Living, Inc. 0 0 40 40 0 0 0 0 40 0 40
Fremont Rest Center 0 0 50 50 0 0 0 0 50 0 50
Glen Care of Mount Olive 0 0 104 104 0 0 0 0 104 0 104
Goldsboro Assisted Living & Alzheimer's Care 0 0 56 56 0 0 0 0 56 0 56
Renu Life Extended, Inc. 0 0 37 37 0 0 0 0 37 0 37
Somerset Court of Goldsboro 0 0 60 60 0 0 0 0 60 0 60
Sterling House of Goldsboro 0 0 60 60 0 0 0 0 60 0 60
Sutton's Retirement Center, Inc 0 0 40 40 0 0 0 0 40 0 40
The Pines at Goldsboro 0 0 104 104 0 0 0 0 104 0 104
Wayne County Rest Villa No. 1 0 0 12 12 0 0 0 0 12 0 12
Wayne County Rest Villa No. 2 0 0 12 12 0 0 0 0 12 0 12
Woodard Care, Inc. 0 0 80 80 0 0 0 0 80 0 80
Woodard's Retirement Village 0 0 60 60 0 0 0 0 60 0 60
Totals 0 0 752 752 0 0 0 0 752 0 752Wilkes Britthaven of Wilkesboro 10 0 0 10 0 0 0 0 10 0 10
Rose Glen Manor 0 0 0 0 60 0 0 0 60 0 60
The Village of Wilkes Traditional Living 0 0 72 72 30 0 0 0 102 0 102
Wilkes Senior Village 19 0 0 19 0 0 0 0 19 0 19
Wilkesboro Living Center 0 0 99 99 0 0 0 0 99 0 99
Totals 29 0 171 200 90 0 0 0 290 0 290Wilson Applewood Assisted Living LLC 0 0 60 60 0 0 0 0 60 0 60
Brian Center Health & Rehab/Wilson 12 0 0 12 0 0 0 0 12 0 12
Britthaven of Wilson 30 0 0 30 0 0 0 0 30 0 30
Parkwood Village 0 0 70 70 0 0 0 0 70 0 70
Spring Arbor of Wilson 0 0 72 72 0 0 0 0 72 0 72
Wilson Assisted Living 0 0 88 88 0 0 0 0 88 0 88
Wilson House 0 0 136 136 0 0 0 0 136 0 136
Totals 42 0 426 468 0 0 0 0 468 0 468

COUNTY
Facility NameLic. Beds in
Nursing Homes
Lic. Beds in Hospitals
Adult Care Homes
Total Licensed Beds CON ACH
(Exempt)ACH
(Pipeline)
Available SMFP
Total Available
Sum of Exclusions
TOTAL Planning Inventory
License PendingINVENTORY
Table 11A: Inventory of Adult Care Home Bed (Fall 2009)
Yadkin Johnson Enterprises of Shelby Inc. d/b/aPiedmo 0 0 50 50 0 0 0 0 50 0 50
Pinebrook Residential Center #1 0 0 54 54 0 0 0 0 54 0 54
Pinebrook Residential Center #2 0 0 65 65 0 0 0 0 65 0 65
The Magnolias Over Yadkin 0 0 20 20 0 0 0 0 20 0 20
Totals 0 0 189 189 0 0 0 0 189 0 189Yancey Mountain Manor Assisted Living, LLC 0 0 29 29 0 0 0 0 29 0 29
Yancy House 0 0 70 70 0 0 0 0 70 0 70
Totals 0 0 99 99 0 0 0 0 99 0 99
4863Grand Total 62Grand Total 36622Grand Total 41547Grand Total 1235Grand Total 364Grand Total 23Grand Total 50 43219 1095 42124
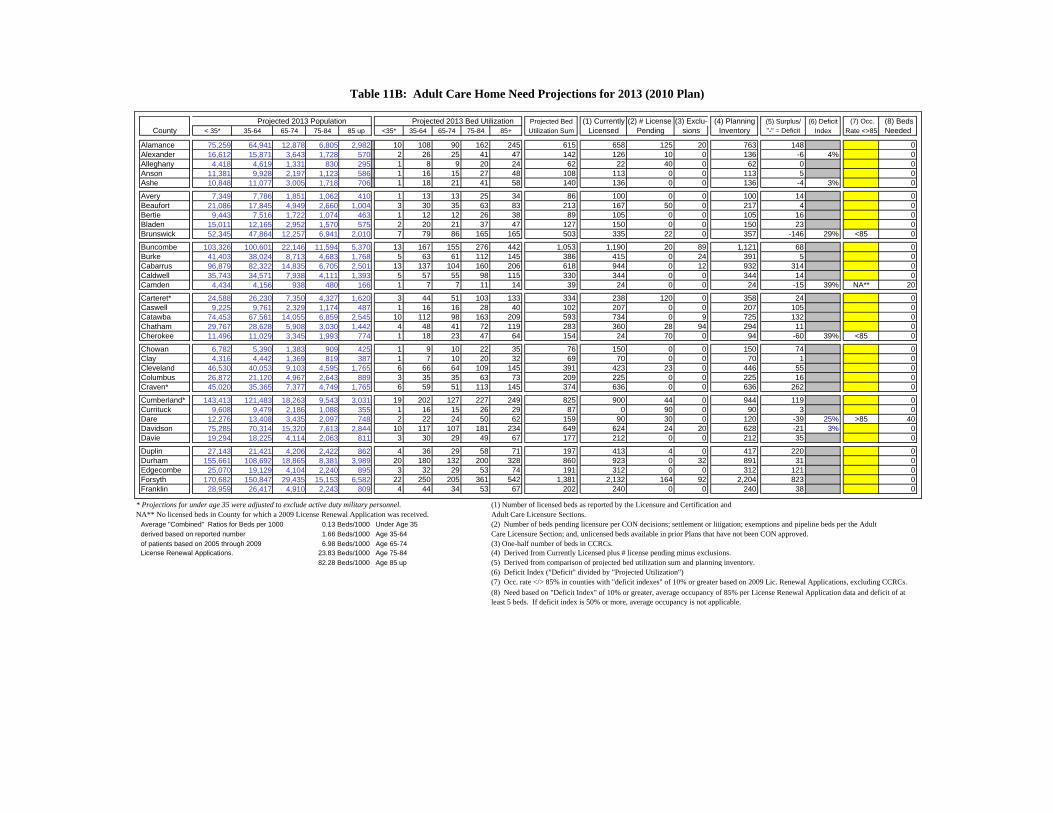
Table 11B: Adult Care Home Need Projections for 2013 (2010 Plan)
Projected 2013 Population Projected 2013 Bed Utilization Projected Bed (1) Currently (2) # License (3) Exclu- (4) Planning (5) Surplus/ (6) Deficit (7) Occ. (8) BedsCounty < 35* 35-64 65-74 75-84 85 up <35* 35-64 65-74 75-84 85+ Utilization Sum Licensed Pending sions Inventory "-" = Deficit Index Rate <>85 Needed
Alamance 75,259 64,941 12,878 6,805 2,982 10 108 90 162 245 615 658 125 20 763 148 0Alexander 16,612 15,871 3,643 1,728 570 2 26 25 41 47 142 126 10 0 136 -6 4% 0Alleghany 4,418 4,619 1,331 830 295 1 8 9 20 24 62 22 40 0 62 0 0Anson 11,381 9,928 2,197 1,123 586 1 16 15 27 48 108 113 0 0 113 5 0Ashe 10,848 11,077 3,005 1,718 706 1 18 21 41 58 140 136 0 0 136 -4 3% 0
Avery 7,349 7,786 1,851 1,062 410 1 13 13 25 34 86 100 0 0 100 14 0Beaufort 21,086 17,845 4,949 2,660 1,004 3 30 35 63 83 213 167 50 0 217 4 0Bertie 9,443 7,516 1,722 1,074 463 1 12 12 26 38 89 105 0 0 105 16 0Bladen 15,011 12,165 2,952 1,570 575 2 20 21 37 47 127 150 0 0 150 23 0Brunswick 52,345 47,864 12,257 6,941 2,010 7 79 86 165 165 503 335 22 0 357 -146 29% <85 0
Buncombe 103,326 100,601 22,146 11,594 5,370 13 167 155 276 442 1,053 1,190 20 89 1,121 68 0Burke 41,403 38,024 8,713 4,683 1,768 5 63 61 112 145 386 415 0 24 391 5 0Cabarrus 96,879 82,322 14,835 6,705 2,501 13 137 104 160 206 618 944 0 12 932 314 0Caldwell 35,743 34,571 7,938 4,111 1,393 5 57 55 98 115 330 344 0 0 344 14 0Camden 4,434 4,156 938 480 166 1 7 7 11 14 39 24 0 0 24 -15 39% NA** 20
Carteret* 24,588 26,230 7,350 4,327 1,620 3 44 51 103 133 334 238 120 0 358 24 0Caswell 9,225 9,761 2,329 1,174 487 1 16 16 28 40 102 207 0 0 207 105 0Catawba 74,453 67,561 14,055 6,859 2,545 10 112 98 163 209 593 734 0 9 725 132 0Chatham 29,767 28,628 5,908 3,030 1,442 4 48 41 72 119 283 360 28 94 294 11 0Cherokee 11,496 11,029 3,345 1,993 774 1 18 23 47 64 154 24 70 0 94 -60 39% <85 0
Chowan 6,782 5,390 1,383 909 425 1 9 10 22 35 76 150 0 0 150 74 0Clay 4,316 4,442 1,369 819 387 1 7 10 20 32 69 70 0 0 70 1 0Cleveland 46,530 40,053 9,103 4,595 1,765 6 66 64 109 145 391 423 23 0 446 55 0Columbus 26,872 21,120 4,967 2,643 889 3 35 35 63 73 209 225 0 0 225 16 0Craven* 45,020 35,365 7,377 4,749 1,765 6 59 51 113 145 374 636 0 0 636 262 0
Cumberland* 143,413 121,483 18,263 9,543 3,031 19 202 127 227 249 825 900 44 0 944 119 0Currituck 9,608 9,479 2,186 1,088 355 1 16 15 26 29 87 0 90 0 90 3 0Dare 12,276 13,408 3,435 2,097 748 2 22 24 50 62 159 90 30 0 120 -39 25% >85 40Davidson 75,285 70,314 15,320 7,613 2,844 10 117 107 181 234 649 624 24 20 628 -21 3% 0Davie 19,294 18,225 4,114 2,063 811 3 30 29 49 67 177 212 0 0 212 35 0
Duplin 27,143 21,421 4,206 2,422 862 4 36 29 58 71 197 413 4 0 417 220 0Durham 155,661 108,692 18,865 8,381 3,989 20 180 132 200 328 860 923 0 32 891 31 0Edgecombe 25,070 19,129 4,104 2,240 895 3 32 29 53 74 191 312 0 0 312 121 0Forsyth 170,682 150,847 29,435 15,153 6,582 22 250 205 361 542 1,381 2,132 164 92 2,204 823 0Franklin 28,959 26,417 4,910 2,243 809 4 44 34 53 67 202 240 0 0 240 38 0
* Projections for under age 35 were adjusted to exclude active duty military personnel. (1) Number of licensed beds as reported by the Licensure and Certification and NA** No licensed beds in County for which a 2009 License Renewal Application was received. Adult Care Licensure Sections.
Average "Combined" Ratios for Beds per 1000 0.13 Beds/1000 Under Age 35
derived based on reported number 1.66 Beds/1000 Age 35-64
of patients based on 2005 through 2009 6.98 Beds/1000 Age 65-74 (3) One-half number of beds in CCRCs. License Renewal Applications. 23.83 Beds/1000 Age 75-84 (4) Derived from Currently Licensed plus # license pending minus exclusions.
82.28 Beds/1000 Age 85 up (5) Derived from comparison of projected bed utilization sum and planning inventory.(6) Deficit Index ("Deficit" divided by "Projected Utilization") (7) Occ. rate </> 85% in counties with "deficit indexes" of 10% or greater based on 2009 Lic. Renewal Applications, excluding CCRCs.
(2) Number of beds pending licensure per CON decisions; settlement or litigation; exemptions and pipeline beds per the Adult Care Licensure Section; and, unlicensed beds available in prior Plans that have not been CON approved.
(8) Need based on "Deficit Index" of 10% or greater, average occupancy of 85% per License Renewal Application data and deficit of at least 5 beds. If deficit index is 50% or more, average occupancy is not applicable.

Table 11B: Adult Care Home Need Projections for 2013 (2010 Plan)
Projected 2013 Population Projected 2013 Bed Utilization Projected Bed (1) Currently (2) # License (3) Exclu- (4) Planning (5) Surplus/ (6) Deficit (7) Occ. (8) BedsCounty < 35* 35-64 65-74 75-84 85 up <35* 35-64 65-74 75-84 85+ Utilization Sum Licensed Pending sions Inventory "-" = Deficit Index Rate <>85 Needed
Gaston 103,875 93,115 18,684 8,875 3,086 14 155 130 211 254 764 1,158 42 33 1,167 403 0Gates 5,407 4,863 1,109 575 240 1 8 8 14 20 50 10 0 0 10 -40 80% NA 40Graham 3,551 3,052 937 567 211 0 5 7 14 17 43 23 0 0 23 -20 46% <85 0Granville 25,738 25,524 4,745 2,336 832 3 42 33 56 68 203 251 0 0 251 48 0Greene 9,840 9,103 1,741 920 355 1 15 12 22 29 80 57 0 0 57 -23 28% <85 0
Guilford 233,467 208,777 39,726 19,647 8,778 30 347 277 468 722 1,845 2,415 2 143 2,274 429 0Halifax 25,583 20,423 4,669 2,765 1,367 3 34 33 66 112 248 145 60 0 205 -43 17% <85 0Harnett* 59,575 50,418 8,479 4,053 1,425 8 84 59 97 117 364 690 0 0 690 326 0Haywood 22,947 23,261 6,536 4,074 1,687 3 39 46 97 139 323 273 50 0 323 0 0Henderson 47,672 43,714 10,936 6,944 3,444 6 73 76 165 283 604 593 0 30 563 -41 7% 0
Hertford 11,188 8,659 2,086 1,190 513 1 14 15 28 42 101 173 0 0 173 72 0Hoke* 24,802 19,584 2,741 1,265 373 3 33 19 30 31 116 173 0 0 173 57 0Hyde 1,983 2,356 513 339 142 0 4 4 8 12 28 0 0 0 0 -28 100% ** 30Iredell 80,880 71,511 13,944 6,620 2,336 11 119 97 158 192 577 858 0 0 858 281 0Jackson 18,914 14,259 3,872 2,004 714 2 24 27 48 59 160 55 90 0 145 -15 9% 0
Johnston 91,213 80,085 13,779 5,916 2,032 12 133 96 141 167 549 731 0 0 731 182 0Jones 4,432 4,041 993 586 273 1 7 7 14 22 51 20 0 0 20 -31 61% NA 30Lee 30,800 24,340 4,823 2,517 1,020 4 40 34 60 84 222 323 0 0 323 101 0Lenoir 26,412 21,496 5,225 2,959 1,180 3 36 36 71 97 243 336 0 0 336 93 0Lincoln 38,181 35,111 7,234 3,127 1,023 5 58 50 75 84 272 403 0 0 403 131 0
Macon 15,435 13,899 4,118 2,677 1,150 2 23 29 64 95 212 78 110 0 188 -24 11% <85 0Madison 9,414 8,844 2,203 1,183 445 1 15 15 28 37 96 89 0 0 89 -7 7% 0Martin 10,793 8,714 2,171 1,266 483 1 14 15 30 40 101 212 0 0 212 111 0McDowell 20,236 19,619 4,358 2,421 874 3 33 30 58 72 195 351 0 0 351 156 0Mecklenburg 450,089 408,680 64,447 27,511 11,623 59 678 450 656 956 2,799 2,684 0 225 2,459 -340 12% >85 3400Mitchell 6,421 6,414 1,826 1,077 420 1 11 13 26 35 84 10 80 0 90 6 0Montgomery 12,997 10,803 2,504 1,357 599 2 18 17 32 49 119 240 0 0 240 121 0Moore* 39,674 34,915 8,654 6,097 3,343 5 58 60 145 275 544 639 0 40 599 55 0Nash 46,238 40,390 8,155 3,912 1,544 6 67 57 93 127 350 522 0 0 522 172 0New Hanover 91,535 84,028 17,491 8,819 3,577 12 139 122 210 294 778 1,117 0 0 1,117 339 0
Northampton 9,166 7,822 2,070 1,272 623 1 13 14 30 51 110 242 0 0 242 132 0Onslow* 88,074 57,150 7,559 4,190 1,272 11 95 53 100 105 364 438 0 0 438 74 0Orange 66,772 55,647 9,867 4,232 1,989 9 92 69 101 164 434 490 0 45 445 11 0Pamlico 4,779 5,055 1,545 1,046 416 1 8 11 25 34 79 48 0 0 48 -31 39% <85 0Pasquotank 20,110 15,734 3,333 1,756 843 3 26 23 42 69 163 266 0 0 266 103 0
* Projections for under age 35 were adjusted to exclude active duty military personnel. (1) Number of licensed beds as reported by the Licensure and Certification and Adult Care Licensure Sections.
Average "Combined" Ratios for Beds per 1000 0.13 Beds/1000 Under Age 35
derived based on reported number 1.66 Beds/1000 Age 35-64
of patients based on 2005 through 2009 6.98 Beds/1000 Age 65-74 (3) One-half number of beds in CCRCs. License Renewal Applications. 23.83 Beds/1000 Age 75-84 (4) Derived from Currently Licensed plus # license pending minus exclusions.
82.28 Beds/1000 Age 85 up (5) Derived from comparison of projected bed utilization sum and planning inventory.(6) Deficit Index ("Deficit" divided by "Projected Utilization") (7) Occ. rate </> 85% in counties with "deficit indexes" of 10% or greater based on 2009 Lic. Renewal Applications, excluding CCRCs.
Care Licensure Section; and, unlicensed beds available in prior Plans that have not been CON approved.
(8) Need based on "Deficit Index" of 10% or greater, average occupancy of 85% per License Renewal Application data and deficit of at least 5 beds. If deficit index is 50% or more, average occupancy is not applicable.
(2) Number of beds pending licensure per CON decisions; settlement or litigation; exemptions and pipeline beds per the Adult ** Not Applicable. No licensed beds in County.

Table 11B: Adult Care Home Need Projections for 2013 (2010 Plan)
Projected 2013 Population Projected 2013 Bed Utilization Projected Bed (1) Currently (2) # License (3) Exclu- (4) Planning (5) Surplus/ (6) Deficit (7) Occ. (8) BedsCounty < 35* 35-64 65-74 75-84 85 up <35* 35-64 65-74 75-84 85+ Utilization Sum Licensed Pending sions Inventory "-" = Deficit Index Rate <>85 Needed
Pender 26,001 24,725 5,490 2,849 1,022 3 41 38 68 84 235 102 100 0 202 -33 14% <85 0Perquimans 6,186 5,339 1,474 892 376 1 9 10 21 31 72 48 0 0 48 -24 33% <85 0Person 16,540 15,663 3,340 1,790 681 2 26 23 43 56 150 214 0 0 214 64 0Pitt 91,790 64,544 10,883 5,131 2,000 12 107 76 122 165 482 609 0 21 588 106 0Polk 7,392 7,566 2,122 1,371 725 1 13 15 33 60 121 160 0 37 123 2 0
Randolph 67,465 61,228 13,151 6,323 2,310 9 102 92 151 190 543 622 0 0 622 79 0Richmond 23,018 17,484 3,942 2,072 800 3 29 28 49 66 175 219 0 0 219 44 0Robeson 71,611 49,860 9,306 4,327 1,585 9 83 65 103 130 391 579 40 21 598 207 0Rockingham 39,435 37,765 8,662 4,712 1,894 5 63 60 112 156 396 419 0 0 419 23 0Rowan 68,545 60,186 12,291 6,385 2,866 9 100 86 152 236 583 906 0 23 883 300 0
Rutherford 29,841 26,519 6,226 3,333 1,296 4 44 43 79 107 277 537 0 0 537 260 0Sampson 33,399 27,609 5,442 2,929 1,081 4 46 38 70 89 247 282 0 0 282 35 0Scotland 19,284 14,512 3,130 1,408 526 3 24 22 34 43 125 206 0 16 190 65 0Stanly 28,133 24,486 5,548 2,996 1,263 4 41 39 71 104 258 224 12 0 236 -22 9% 0Stokes 20,248 20,606 4,593 2,126 708 3 34 32 51 58 178 305 0 0 305 127 0
Surry 32,942 29,983 7,014 3,918 1,618 4 50 49 93 133 330 460 0 0 460 130 0Swain 6,926 5,552 1,383 710 219 1 9 10 17 18 55 50 0 0 50 -5 9% 0Transylvania 13,112 11,894 3,722 2,551 1,187 2 20 26 61 98 206 134 0 0 134 -72 35% <85 0Tyrrell 1,774 1,773 368 267 141 0 3 3 6 12 24 0 0 0 0 -24 100% ** 20Union 116,875 96,403 16,438 6,732 2,006 15 160 115 160 165 615 596 0 0 596 -19 3% 0
Vance 21,706 16,067 3,396 1,789 696 3 27 24 43 57 153 218 0 0 218 65 0Wake* 500,979 435,430 68,574 26,955 10,100 65 723 479 642 831 2,740 2,713 132 69 2,776 36 0Warren 8,358 7,540 1,971 1,315 650 1 13 14 31 53 112 156 0 0 156 44 0Washington 6,073 4,557 1,284 762 317 1 8 9 18 26 62 49 0 0 49 -13 20% >85 10Watauga 24,553 16,739 3,994 2,067 868 3 28 28 49 71 180 176 0 0 176 -4 2% 0
Wayne* 53,551 45,024 8,776 4,926 1,785 7 75 61 117 147 407 752 0 0 752 345 0Wilkes 28,985 28,051 6,823 3,695 1,318 4 47 48 88 108 294 200 90 0 290 -4 2% 0Wilson 39,850 32,938 6,769 3,519 1,423 5 55 47 84 117 308 468 0 0 468 160 0Yadkin 17,589 16,128 3,672 2,027 717 2 27 26 48 59 162 189 0 0 189 27 0Yancey 7,741 7,685 2,095 1,286 574 1 13 15 31 47 106 99 0 0 99 -7 7% 0
NC Totals * 4,640,072 4,023,542 788,331 394,283 156,808 603 6,679 5,503 9,396 12,902 35,083 41,547 1,672 1,095 42,124 530
* Projections for under age 35 were adjusted to exclude active duty military personnel. (1) Number of licensed beds as reported by the Licensure and Certification and Adult Care Licensure Sections.
Average "Combined" Ratios for Beds per 1000 0.13 Beds/1000 Under Age 35
derived based on reported number 1.66 Beds/1000 Age 35-64
of patients based on 2005 through 2009 6.98 Beds/1000 Age 65-74 (3) One-half number of beds in CCRCs. License Renewal Applications. 23.83 Beds/1000 Age 75-84 (4) Derived from Currently Licensed plus # license pending minus exclusions.
82.28 Beds/1000 Age 85 up (5) Derived from comparison of projected bed utilization sum and planning inventory.(6) Deficit Index ("Deficit" divided by "Projected Utilization") (7) Occ. rate </> 85% in counties with "deficit indexes" of 10% or greater based on 2009 Lic. Renewal Applications, excluding CCRCs.
** Not Applicable. No licensed beds in County.(2) Number of beds pending licensure per CON decisions; settlement or litigation; exemptions and pipeline beds per the Adult Care Licensure Section; and, unlicensed beds available in prior Plans that have not been CON approved.
(8) Need based on "Deficit Index" of 10% or greater, average occupancy of 85% per License Renewal Application data and deficit of at least 5 beds. If deficit index is 50% or more, average occupancy is not applicable.

County HSA Number of New CON CON Adult Care Home Application Beginning
Beds Needed * Due Date** Review Date
Mecklenburg III 340 May 17, 2010 June 1, 2010
Camden VI 20 February 15, 2010 March 1, 2010
Dare VI 40 February 15, 2010 March 1, 2010
Gates VI 40 February 15, 2010 March 1, 2010
Hyde VI 30 June 15, 2010 July 1, 2010
Jones VI 30 February 15, 2010 March 1, 2010
Tyrrell VI 20 June 15, 2010 July 1, 2010
Washington VI 10 June 15, 2010 July 1, 2010
* Need determinations as shown in this document may be increased or decreased during the yearpursuant to Policy GEN-2 (See Chapter 4).** Application Due Dates are absolute deadlines. The filing deadline is 5:30 p.m. on the Application
Table 11C: Adult Care Home Bed Need Determinations
Due Date. The filing deadline is absolute ( See Chapter 3)
It is determined that the counties listed in the table below need additional Adult Care Home beds as specified:
(Scheduled for Certificate of Need Review commencing in 2010)
It is determined that there is no need for additional Adult Care Home beds anywhere else in the State and no other reviews are scheduled.

Chapter 12:Home Health Services

CHAPTER 12 HOME HEALTH SERVICES Summary of Medicare-certified Home Health Agency Supply and Utilization
In the fall of 2009, the North Carolina Division of Health Service Regulation reported 214 Medicare-certified home health agencies in North Carolina.
Data from the “Home Health Agency 2009 Annual Data Supplements” indicated a total
of 195,242 home health patients were served during 2008 (FY 2007-2008). This represents a 1.08 percent increase in the reported number of patients from 2007. Compared to 2007 data, the average “State Use Rates per 1000 Population” increased in three age groups and decreased in one age group, as follows:
Age Group 2007 Use Rate 2008 Use Rate Under Age 18 3.32 3.12
Ages 18-64 10.03 10.67
Ages 65-74 60.72 64.12
Ages 75 & Over 161.57 169.40 Changes from the Previous Plan No substantive changes have been made in the home health policy, assumptions or methodology. For the North Carolina 2010 State Medical Facilities Plan references to dates have been advanced one year. Basic Assumptions of the Method
Assumptions underlying the projection of need for new Medicare-certified home health agencies or offices are as follows:
1. The target for projections should be one year beyond the Plan year, to allow time for completion of the certificate of need review cycles and for staffing of new agencies or offices.
2. Data aggregation and projections should be accomplished by four age groups (Under Age 18, Ages 18-64, Ages 65-74, and Ages 75 and Over) to allow more definitive examination of trends in services to children and to senior adults.
3. Current age-specific use rates are the most valid basis for projection of future “need.”
4. Because previous year’s data are used as the basis for projections, the average annual rate of change in “number of patients served” should be calculated over the previous three years for each age group in each Council of Governments

(COG) region and applied to current reported total number of patients served from each county within each COG region, to project changes in the capacity of existing agencies to serve people from each county by the target year.
5. Likewise, the average annual rate of change in “use rates per 1000 population” should be calculated over the previous three years for each age group in each Council of Governments region and applied to current “use rates per 1000 population” for each county within each COG region to project changes in the number of potential people needing home health services by the target year.
6. A new agency or office is needed if the projected unmet need in a single county is
275 patients or more.
7. When the need for additional agencies or offices is determined by the standard methodology or policy in the State Medical Facilities Plan, the three annual Plans following certification of the agencies or offices based on that need (during the time when the new agencies or offices are being established and are developing their services) should count the greater of 275 patients for each new agency office or the actual number of patients served by the new agency office as part of the total people served.
8. The North Carolina State Health Coordinating Council encourages home health
applicants to:
a. provide an expanded scope of services (including nursing, physical therapy, speech therapy, and home health aide service); b. provide the widest range of treatments within a given service;
c. have the ability to offer services on a seven days per week basis as required to meet patient needs; and,
d. address special needs populations. Sources of Data
Population: County population projections by age group for 2011 were obtained from the North Carolina Office of State Budget and Management. Estimated active duty military population numbers were excluded from the 18-64 age group for any county with more than 500 active duty military personnel. These estimates were obtained from the “Selected Economic Characteristics” portion of the 2000 Census, under the category of “Employment Status – Armed Forces.”
Utilization: Patient origin data were compiled from “Home Health Agency 2009 Annual Data Supplement(s) to License Application” as submitted by Medicare-certified home health agencies to the North Carolina Department of Health and Human Services, Division of Health Service Regulation.

Application of the Standard Methodology
Steps in applying the projection method are as follows:
Step 1: For each COG region, for each age group, calculate the “Average Annual Rate of Change in Number of Home Health Patients” over the previous three years.
Step 2: For each COG region, for each age group, calculate the “Average
Annual Rate of Change in Use Rates per 1000 Population” over the previous three years.
Step 3: For each county, for each age group, total the number of home health
patients served in 2008 as reported from agencies’ “Home Health Agency 2009 Annual Data Supplement(s) to License Application.”
Step 4: For each county, multiply the “Average Annual Rate of Change in Number of Home Health Patients” for each age group from the affiliated COG region, times the number of patients for each age group from Step 3.
Step 5: Multiply the product from Step 4 by three (to advance by three years),
and add that product to the base figure from Step 3 for each age group. The result is the anticipated number of patients who might be served by existing agencies in 2011 for each age group.
Step 6: For each county, for each age group, divide the number of patients
served in 2008 by the county’s population (in 1000’s for each age group). This produces use rates per 1000 population for the county.
Step 7: Multiply the “Average Annual Rate of Change in Use Rate per 1000
Population” for each age group from the affiliated COG region times the county use rates per 1000 population for each age group from Step 6.
Step 8: Multiply the product from Step 7 by three (to advance by three years),
and add that product to the base figure from Step 6 for each age group. The result is the anticipated use rate per 1000 population in 2011 for each age group.
Step 9: For each age group, multiply the anticipated use rate per 1000
population for 2011 times the projected 2011 population. The result is the potential number of home health patients in 2011.
Step 10: In counties for which additional home health agency office need
determinations were made by the standard methodology or policy (see

the seventh “Basic Assumption”), determine the difference between 275 and the number of patients actually served by each new agency in the county for which a need determination was made. If a new agency office served more than 275 clients, the agency’s reported number of patients is not adjusted. If a new agency office served fewer than 275 clients, an adjustment “placeholder” equal to the difference between the reported number of home health patients and 275 is used.
Step 11: For each county, sum the anticipated number of patients who may be
served in 2011 (from Step 5) across all four age groups and the adjustment placeholder (from Step 10), if applicable. The result is an “Adjusted Potential Total People Served” for each county for 2011.
Step 12: For each county, sum the potential number of home health patients in
2011 (from Step 9) across all four age groups. The result is the “Projected Utilization in 2011.”
Step 13: For each county, subtract the “Projected Utilization in 2011” from the
“Adjusted Potential Total People Served.” The remainder is the projected additional number of home health patients who will need home health services in 2011 (unmet need shows as a negative number of patients, i.e., a “patient deficit”).
Step 14: For each county, need for one new Medicare-certified agency office is
determined for each projected deficit of 275 patients. (A Medicare-certified home health agency office’s service area is the Medicare-certified home health agency office planning area in which the office is located. Each of the 100 counties in the state is a separate Medicare-certified home health agency office planning area.)
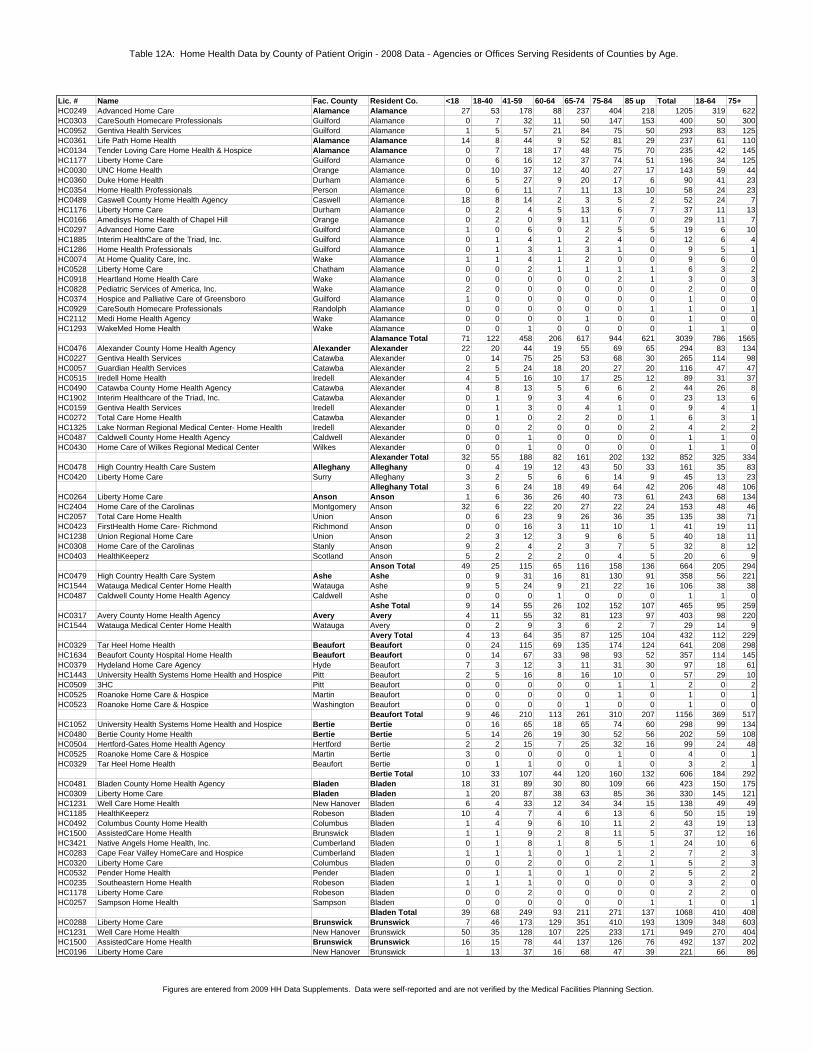
Table 12A: Home Health Data by County of Patient Origin - 2008 Data - Agencies or Offices Serving Residents of Counties by Age.
Lic. # Name Fac. County Resident Co. <18 18-40 41-59 60-64 65-74 75-84 85 up Total 18-64 75+HC0249 Advanced Home Care Alamance Alamance 27 53 178 88 237 404 218 1205 319 622HC0303 CareSouth Homecare Professionals Guilford Alamance 0 7 32 11 50 147 153 400 50 300HC0952 Gentiva Health Services Guilford Alamance 1 5 57 21 84 75 50 293 83 125HC0361 Life Path Home Health Alamance Alamance 14 8 44 9 52 81 29 237 61 110HC0134 Tender Loving Care Home Health & Hospice Alamance Alamance 0 7 18 17 48 75 70 235 42 145HC1177 Liberty Home Care Guilford Alamance 0 6 16 12 37 74 51 196 34 125HC0030 UNC Home Health Orange Alamance 0 10 37 12 40 27 17 143 59 44HC0360 Duke Home Health Durham Alamance 6 5 27 9 20 17 6 90 41 23HC0354 Home Health Professionals Person Alamance 0 6 11 7 11 13 10 58 24 23HC0489 Caswell County Home Health Agency Caswell Alamance 18 8 14 2 3 5 2 52 24 7HC1176 Liberty Home Care Durham Alamance 0 2 4 5 13 6 7 37 11 13HC0166 Amedisys Home Health of Chapel Hill Orange Alamance 0 2 0 9 11 7 0 29 11 7HC0297 Advanced Home Care Guilford Alamance 1 0 6 0 2 5 5 19 6 10HC1885 Interim HealthCare of the Triad, Inc. Guilford Alamance 0 1 4 1 2 4 0 12 6 4HC1286 Home Health Professionals Guilford Alamance 0 1 3 1 3 1 0 9 5 1HC0074 At Home Quality Care, Inc. Wake Alamance 1 1 4 1 2 0 0 9 6 0HC0528 Liberty Home Care Chatham Alamance 0 0 2 1 1 1 1 6 3 2HC0918 Heartland Home Health Care Wake Alamance 0 0 0 0 0 2 1 3 0 3HC0828 Pediatric Services of America, Inc. Wake Alamance 2 0 0 0 0 0 0 2 0 0HC0374 Hospice and Palliative Care of Greensboro Guilford Alamance 1 0 0 0 0 0 0 1 0 0HC0929 CareSouth Homecare Professionals Randolph Alamance 0 0 0 0 0 0 1 1 0 1HC2112 Medi Home Health Agency Wake Alamance 0 0 0 0 1 0 0 1 0 0HC1293 WakeMed Home Health Wake Alamance 0 0 1 0 0 0 0 1 1 0
Alamance Total 71 122 458 206 617 944 621 3039 786 1565HC0476 Alexander County Home Health Agency Alexander Alexander 22 20 44 19 55 69 65 294 83 134HC0227 Gentiva Health Services Catawba Alexander 0 14 75 25 53 68 30 265 114 98HC0057 Guardian Health Services Catawba Alexander 2 5 24 18 20 27 20 116 47 47HC0515 Iredell Home Health Iredell Alexander 4 5 16 10 17 25 12 89 31 37HC0490 Catawba County Home Health Agency Catawba Alexander 4 8 13 5 6 6 2 44 26 8HC1902 Interim Healthcare of the Triad, Inc. Catawba Alexander 0 1 9 3 4 6 0 23 13 6HC0159 Gentiva Health Services Iredell Alexander 0 1 3 0 4 1 0 9 4 1HC0272 Total Care Home Health Catawba Alexander 0 1 0 2 2 0 1 6 3 1HC1325 Lake Norman Regional Medical Center- Home Health Iredell Alexander 0 0 2 0 0 0 2 4 2 2HC0487 Caldwell County Home Health Agency Caldwell Alexander 0 0 1 0 0 0 0 1 1 0HC0430 Home Care of Wilkes Regional Medical Center Wilkes Alexander 0 0 1 0 0 0 0 1 1 0
Alexander Total 32 55 188 82 161 202 132 852 325 334HC0478 High Country Health Care Sustem Alleghany Alleghany 0 4 19 12 43 50 33 161 35 83HC0420 Liberty Home Care Surry Alleghany 3 2 5 6 6 14 9 45 13 23
Alleghany Total 3 6 24 18 49 64 42 206 48 106HC0264 Liberty Home Care Anson Anson 1 6 36 26 40 73 61 243 68 134HC2404 Home Care of the Carolinas Montgomery Anson 32 6 22 20 27 22 24 153 48 46HC2057 Total Care Home Health Union Anson 0 6 23 9 26 36 35 135 38 71HC0423 FirstHealth Home Care- Richmond Richmond Anson 0 0 16 3 11 10 1 41 19 11HC1238 Union Regional Home Care Union Anson 2 3 12 3 9 6 5 40 18 11HC0308 Home Care of the Carolinas Stanly Anson 9 2 4 2 3 7 5 32 8 12HC0403 HealthKeeperz Scotland Anson 5 2 2 2 0 4 5 20 6 9
Anson Total 49 25 115 65 116 158 136 664 205 294HC0479 High Country Health Care System Ashe Ashe 0 9 31 16 81 130 91 358 56 221HC1544 Watauga Medical Center Home Health Watauga Ashe 9 5 24 9 21 22 16 106 38 38HC0487 Caldwell County Home Health Agency Caldwell Ashe 0 0 0 1 0 0 0 1 1 0
Ashe Total 9 14 55 26 102 152 107 465 95 259HC0317 Avery County Home Health Agency Avery Avery 4 11 55 32 81 123 97 403 98 220HC1544 Watauga Medical Center Home Health Watauga Avery 0 2 9 3 6 2 7 29 14 9
Avery Total 4 13 64 35 87 125 104 432 112 229HC0329 Tar Heel Home Health Beaufort Beaufort 0 24 115 69 135 174 124 641 208 298HC1634 Beaufort County Hospital Home Health Beaufort Beaufort 0 14 67 33 98 93 52 357 114 145HC0379 Hydeland Home Care Agency Hyde Beaufort 7 3 12 3 11 31 30 97 18 61HC1443 University Health Systems Home Health and Hospice Pitt Beaufort 2 5 16 8 16 10 0 57 29 10HC0509 3HC Pitt Beaufort 0 0 0 0 0 1 1 2 0 2HC0525 Roanoke Home Care & Hospice Martin Beaufort 0 0 0 0 0 1 0 1 0 1HC0523 Roanoke Home Care & Hospice Washington Beaufort 0 0 0 0 1 0 0 1 0 0
Beaufort Total 9 46 210 113 261 310 207 1156 369 517HC1052 University Health Systems Home Health and Hospice Bertie Bertie 0 16 65 18 65 74 60 298 99 134HC0480 Bertie County Home Health Bertie Bertie 5 14 26 19 30 52 56 202 59 108HC0504 Hertford-Gates Home Health Agency Hertford Bertie 2 2 15 7 25 32 16 99 24 48HC0525 Roanoke Home Care & Hospice Martin Bertie 3 0 0 0 0 1 0 4 0 1HC0329 Tar Heel Home Health Beaufort Bertie 0 1 1 0 0 1 0 3 2 1
Bertie Total 10 33 107 44 120 160 132 606 184 292HC0481 Bladen County Home Health Agency Bladen Bladen 18 31 89 30 80 109 66 423 150 175HC0309 Liberty Home Care Bladen Bladen 1 20 87 38 63 85 36 330 145 121HC1231 Well Care Home Health New Hanover Bladen 6 4 33 12 34 34 15 138 49 49HC1185 HealthKeeperz Robeson Bladen 10 4 7 4 6 13 6 50 15 19HC0492 Columbus County Home Health Columbus Bladen 1 4 9 6 10 11 2 43 19 13HC1500 AssistedCare Home Health Brunswick Bladen 1 1 9 2 8 11 5 37 12 16HC3421 Native Angels Home Health, Inc. Cumberland Bladen 0 1 8 1 8 5 1 24 10 6HC0283 Cape Fear Valley HomeCare and Hospice Cumberland Bladen 1 1 1 0 1 1 2 7 2 3HC0320 Liberty Home Care Columbus Bladen 0 0 2 0 0 2 1 5 2 3HC0532 Pender Home Health Pender Bladen 0 1 1 0 1 0 2 5 2 2HC0235 Southeastern Home Health Robeson Bladen 1 1 1 0 0 0 0 3 2 0HC1178 Liberty Home Care Robeson Bladen 0 0 2 0 0 0 0 2 2 0HC0257 Sampson Home Health Sampson Bladen 0 0 0 0 0 0 1 1 0 1
Bladen Total 39 68 249 93 211 271 137 1068 410 408HC0288 Liberty Home Care Brunswick Brunswick 7 46 173 129 351 410 193 1309 348 603HC1231 Well Care Home Health New Hanover Brunswick 50 35 128 107 225 233 171 949 270 404HC1500 AssistedCare Home Health Brunswick Brunswick 16 15 78 44 137 126 76 492 137 202HC0196 Liberty Home Care New Hanover Brunswick 1 13 37 16 68 47 39 221 66 86
Figures are entered from 2009 HH Data Supplements. Data were self-reported and are not verified by the Medical Facilities Planning Section.

Table 12A: Home Health Data by County of Patient Origin - 2008 Data - Agencies or Offices Serving Residents of Counties by Age.
Lic. # Name Fac. County Resident Co. <18 18-40 41-59 60-64 65-74 75-84 85 up Total 18-64 75+HC0532 Pender Home Health Pender Brunswick 0 4 10 5 9 12 7 47 19 19HC0492 Columbus County Home Health Columbus Brunswick 0 0 1 0 0 0 0 1 1 0HC0320 Liberty Home Care Columbus Brunswick 0 0 1 0 0 0 0 1 1 0HC1178 Liberty Home Care Robeson Brunswick 0 1 0 0 0 0 0 1 1 0
Brunswick Total 74 114 428 301 790 828 486 3021 843 1314HC0114 CarePartners Home Health Services Buncombe Buncombe 83 139 576 274 700 976 651 3399 989 1627HC2114 Tar Heel Home Health Buncombe Buncombe 0 85 202 83 251 277 166 1064 370 443HC0911 Park Ridge Home Health Henderson Buncombe 1 26 101 29 62 72 86 377 156 158HC0440 CarePartners Home Health Services Henderson Buncombe 0 11 26 17 59 76 95 284 54 171HC0279 CarePartners Home Health Services Haywood Buncombe 0 1 31 7 22 36 18 115 39 54HC0419 Madison Home Care & Hospice Madison Buncombe 0 1 10 7 6 6 7 37 18 13HC0201 Pardee Home Care Henderson Buncombe 0 2 2 2 0 2 1 9 6 3
Buncombe Total 84 265 948 419 1100 1445 1024 5285 1632 2469HC0105 Blue Ridge Home Care Burke Burke 6 88 251 123 299 392 265 1424 462 657HC0272 Total Care Home Health Catawba Burke 0 16 67 27 64 93 35 302 110 128HC0057 Guardian Health Services Catawba Burke 21 7 51 29 62 85 34 289 87 119HC0490 Catawba County Home Health Agency Catawba Burke 13 2 10 4 8 5 0 42 16 5HC1902 Interim Healthcare of the Triad, Inc. Catawba Burke 3 3 17 8 3 1 3 38 28 4HC0227 Gentiva Health Services Catawba Burke 0 1 15 4 4 0 0 24 20 0HC0487 Caldwell County Home Health Agency Caldwell Burke 0 1 8 1 1 1 0 12 10 1HC0042 Cleveland Home Health Agency, Inc. Cleveland Burke 0 0 0 0 0 2 1 3 0 3
Burke Total 43 118 419 196 441 579 338 2134 733 917HC0281 Advanced Home Care Cabarrus Cabarrus 38 105 382 195 394 416 196 1726 682 612HC0270 Gentiva Health Services Rowan Cabarrus 0 32 148 70 185 265 228 928 250 493HC0486 Cabarrus Health Alliance/Home Health Cabarrus Cabarrus 66 32 85 44 149 229 276 881 161 505HC0308 Home Care of the Carolinas Stanly Cabarrus 7 3 12 6 11 10 6 55 21 16HC1038 CMC-Home Care Mecklenburg Cabarrus 15 6 15 2 2 2 1 43 23 3HC0357 Home Health Professionals Rowan Cabarrus 0 1 6 2 4 5 1 19 9 6HC0171 Advanced Home Care Mecklenburg Cabarrus 1 0 4 2 3 3 0 13 6 3HC1325 Lake Norman Regional Medical Center- Home Health Iredell Cabarrus 0 0 5 0 0 3 3 11 5 6HC0355 Home Health Professionals Mecklenburg Cabarrus 0 0 0 2 1 3 0 6 2 3HC3694 Liberty Home Care and Hospice Mecklenburg Cabarrus 0 0 3 0 0 3 0 6 3 3HC0399 Rowan Regional Home Health & Hospice Rowan Cabarrus 0 0 1 0 2 2 1 6 1 3HC0369 Hospice & Palliative Care Charlotte Region Mecklenburg Cabarrus 4 0 0 0 0 0 0 4 0 0HC0787 Gentiva Health Services Mecklenburg Cabarrus 0 0 0 0 0 2 1 3 0 3
Cabarrus Total 131 179 661 323 751 943 713 3701 1163 1656HC0057 Guardian Health Services Catawba Caldwell 37 40 129 127 218 254 107 912 296 361HC0487 Caldwell County Home Health Agency Caldwell Caldwell 21 41 114 50 136 176 156 694 205 332HC0227 Gentiva Health Services Catawba Caldwell 0 20 116 47 127 129 64 503 183 193HC0272 Total Care Home Health Catawba Caldwell 0 2 5 5 20 40 53 125 12 93HC0490 Catawba County Home Health Agency Catawba Caldwell 6 9 15 13 17 22 14 96 37 36HC0105 Blue Ridge Home Care Burke Caldwell 2 9 22 8 16 29 9 95 39 38HC1902 Interim Healthcare of the Triad, Inc. Catawba Caldwell 2 3 11 5 3 4 0 28 19 4HC0476 Alexander County Home Health Agency Alexander Caldwell 0 0 1 0 1 5 0 7 1 5HC0430 Home Care of Wilkes Regional Medical Center Wilkes Caldwell 0 0 0 0 0 1 1 2 0 2HC1544 Watauga Medical Center Home Health Watauga Caldwell 0 0 0 0 1 0 0 1 0 0
Caldwell Total 68 124 413 255 539 660 404 2463 792 1064HC0473 Albemarle Home Care Camden Camden 4 11 18 4 23 23 24 107 33 47HC1071 Sentara Home Care Services Pasquotank Camden 4 1 10 5 7 4 2 33 16 6HC0475 Albemarle Home Care Currituck Camden 0 2 0 0 0 0 0 2 2 0HC0472 Albemarle Home Care Perquimans Camden 0 1 0 0 0 0 0 1 1 0
Camden Total 8 15 28 9 30 27 26 143 52 53HC0488 Carteret Home Health Services Carteret Carteret 17 25 89 47 152 214 104 648 161 318HC0073 Tar Heel Home Health Carteret Carteret 0 23 119 32 132 161 143 610 174 304HC1353 Liberty Home Care Carteret Carteret 4 6 80 41 110 97 74 412 127 171HC0165 Home Care Craven Regional Medical Authority Craven Carteret 0 1 4 5 15 3 1 29 10 4HC0506 3HC Jones Carteret 0 0 4 0 0 0 1 5 4 1HC1209 Continuum Home Care and Hospice Onslow Carteret 0 1 2 0 1 1 0 5 3 1HC0316 Liberty Home Care Onslow Carteret 0 0 1 0 1 1 2 5 1 3HC0431 Tar Heel Home Health Jones Carteret 0 0 0 0 0 0 1 1 0 1
Carteret Total 21 56 299 125 411 477 326 1715 480 803HC0489 Caswell County Home Health Agency Caswell Caswell 11 9 85 35 85 111 66 402 129 177HC0249 Advanced Home Care Alamance Caswell 2 3 12 6 6 18 4 51 21 22HC0217 Advanced Home Care Rockingham Caswell 1 4 9 7 7 10 6 44 20 16HC0354 Home Health Professionals Person Caswell 0 0 7 1 3 7 9 27 8 16HC0134 Tender Loving Care Home Health & Hospice Alamance Caswell 0 2 4 2 4 5 2 19 8 7HC0361 Life Path Home Health Alamance Caswell 0 0 0 0 3 4 2 9 0 6HC0533 Home Health and Hospice of Person County Person Caswell 1 1 2 1 1 0 0 6 4 0HC0303 CareSouth Homecare Professionals Guilford Caswell 0 0 1 0 3 0 0 4 1 0HC0297 Advanced Home Care Guilford Caswell 0 1 1 0 1 0 0 3 2 0HC0360 Duke Home Health Durham Caswell 0 0 0 0 0 1 0 1 0 1
Caswell Total 15 20 121 52 113 156 89 566 193 245HC0057 Guardian Health Services Catawba Catawba 36 49 142 70 260 281 149 987 261 430HC0490 Catawba County Home Health Agency Catawba Catawba 70 89 166 81 168 195 164 933 336 359HC0272 Total Care Home Health Catawba Catawba 0 32 115 48 177 258 213 843 195 471HC0227 Gentiva Health Services Catawba Catawba 0 49 183 74 170 196 126 798 306 322HC1902 Interim Healthcare of the Triad, Inc. Catawba Catawba 9 13 44 25 26 33 19 169 82 52HC1325 Lake Norman Regional Medical Center- Home Health Iredell Catawba 2 5 17 12 13 17 6 72 34 23HC0105 Blue Ridge Home Care Burke Catawba 1 4 5 8 12 11 5 46 17 16HC0515 Iredell Home Health Iredell Catawba 1 3 2 3 8 7 4 28 8 11HC0135 Carolinas Medical Center Lincoln Home Health Lincoln Catawba 0 0 4 1 0 1 2 8 5 3HC0906 Advanced Home Care Gaston Catawba 0 1 1 2 1 0 0 5 4 0HC0159 Gentiva Health Services Iredell Catawba 0 0 2 0 0 2 1 5 2 3HC0356 Home Health Professionals Gaston Catawba 0 0 0 0 0 3 0 3 0 3HC0476 Alexander County Home Health Agency Alexander Catawba 1 0 0 0 0 1 0 2 0 1HC0487 Caldwell County Home Health Agency Caldwell Catawba 0 0 0 1 0 0 0 1 1 0
Figures are entered from 2009 HH Data Supplements. Data were self-reported and are not verified by the Medical Facilities Planning Section.

Table 12A: Home Health Data by County of Patient Origin - 2008 Data - Agencies or Offices Serving Residents of Counties by Age.
Lic. # Name Fac. County Resident Co. <18 18-40 41-59 60-64 65-74 75-84 85 up Total 18-64 75+Catawba Total 120 245 681 325 835 1005 689 3900 1251 1694
HC0528 Liberty Home Care Chatham Chatham 3 10 30 25 69 79 66 282 65 145HC2803 UNC Home Health Chatham Chatham 0 12 40 22 43 77 62 256 74 139HC0166 Amedisys Home Health of Chapel Hill Orange Chatham 0 7 5 9 55 36 0 112 21 36HC0929 CareSouth Homecare Professionals Randolph Chatham 0 1 5 0 11 14 14 45 6 28HC0552 Home Health of Randolph Hospital Randolph Chatham 4 2 4 2 4 14 11 41 8 25HC0918 Heartland Home Health Care Wake Chatham 0 2 5 2 5 8 11 33 9 19HC0360 Duke Home Health Durham Chatham 2 0 2 3 3 7 6 23 5 13HC0030 UNC Home Health Orange Chatham 0 1 8 0 4 5 4 22 9 9HC0074 At Home Quality Care, Inc. Wake Chatham 0 3 2 1 2 3 0 11 6 3HC0426 Liberty Home Care Lee Chatham 0 0 1 0 5 2 2 10 1 4HC0361 Life Path Home Health Alamance Chatham 1 0 0 0 1 1 2 5 0 3HC1176 Liberty Home Care Durham Chatham 0 0 0 0 1 3 1 5 0 4HC0397 Hospice of Randolph County, Inc. Randolph Chatham 3 0 1 0 0 0 0 4 1 0HC2562 Liberty Home Care Wake Chatham 0 0 1 0 1 0 0 2 1 0HC0124 Liberty Home Care Davidson Chatham 0 0 1 0 0 0 0 1 1 0HC0332 FirstHealth Home Care Moore Chatham 0 1 0 0 0 0 0 1 1 0
Chatham Total 13 39 105 64 204 249 179 853 208 428HC0275 Good Shepherd Home Health and Hospice Agency, Inc. Cherokee Cherokee 3 8 90 51 123 169 118 562 149 287HC0104 Mountain Home Nursing Service, Inc. Clay Cherokee 1 1 7 6 42 41 47 145 14 88HC0298 Angel Home Health and Hospice Swain Cherokee 0 0 0 3 2 3 0 8 3 3
Cherokee Total 4 9 97 60 167 213 165 715 166 378HC0474 Albemarle Home Care Chowan Chowan 4 10 40 16 42 73 65 250 66 138HC1052 University Health Systems Home Health and Hospice Bertie Chowan 0 0 5 2 7 19 12 45 7 31HC1071 Sentara Home Care Services Pasquotank Chowan 2 1 4 7 6 2 0 22 12 2HC0472 Albemarle Home Care Perquimans Chowan 0 1 2 1 0 0 2 6 4 2
Chowan Total 6 12 51 26 55 94 79 323 89 173HC0318 Good Shepherd Home Health and Hospice Agency, Inc. Clay Clay 1 0 21 18 33 34 48 155 39 82HC0104 Mountain Home Nursing Service, Inc. Clay Clay 0 2 7 0 25 37 38 109 9 75
Clay Total 1 2 28 18 58 71 86 264 48 157HC0042 Cleveland Home Health Agency, Inc. Cleveland Cleveland 75 79 257 108 323 379 249 1470 444 628HC0221 Total Care Home Health Cleveland Cleveland 1 45 155 80 219 253 213 966 280 466HC1903 Interim HealthCare of the Triad, Inc. Gaston Cleveland 14 22 47 18 35 33 22 191 87 55HC0906 Advanced Home Care Gaston Cleveland 14 4 44 13 25 13 5 118 61 18HC0353 Emerald Care, Inc. Gaston Cleveland 1 3 7 11 7 8 15 52 21 23HC0227 Gentiva Health Services Catawba Cleveland 0 2 18 8 2 0 0 30 28 0HC0356 Home Health Professionals Gaston Cleveland 0 4 10 6 3 3 1 27 20 4HC0135 Carolinas Medical Center Lincoln Home Health Lincoln Cleveland 0 2 2 1 1 1 0 7 5 1HC0186 Carolina Home Care Rutherford Cleveland 2 1 2 0 1 0 1 7 3 1HC0057 Guardian Health Services Catawba Cleveland 0 0 0 0 0 1 0 1 0 1HC0159 Gentiva Health Services Iredell Cleveland 0 0 1 0 0 0 0 1 1 0
Cleveland Total 107 162 543 245 616 691 506 2870 950 1197HC0492 Columbus County Home Health Columbus Columbus 31 97 276 119 280 248 173 1224 492 421HC0320 Liberty Home Care Columbus Columbus 7 29 161 94 228 271 118 908 284 389HC1231 Well Care Home Health New Hanover Columbus 7 20 79 37 88 72 40 343 136 112HC1185 HealthKeeperz Robeson Columbus 19 5 28 7 21 15 5 100 40 20HC1500 AssistedCare Home Health Brunswick Columbus 1 4 12 7 14 18 8 64 23 26HC0309 Liberty Home Care Bladen Columbus 0 0 2 2 6 5 2 17 4 7HC0532 Pender Home Health Pender Columbus 0 1 2 1 2 4 1 11 4 5HC3421 Native Angels Home Health, Inc. Cumberland Columbus 0 0 2 0 0 0 0 2 2 0HC0196 Liberty Home Care New Hanover Columbus 0 0 1 0 0 1 0 2 1 1HC0288 Liberty Home Care Brunswick Columbus 0 0 1 0 0 0 0 1 1 0
Columbus Total 65 156 564 267 639 634 347 2672 987 981HC0165 Home Care Craven Regional Medical Authority Craven Craven 6 37 89 62 218 258 117 787 188 375HC0431 Tar Heel Home Health Jones Craven 0 17 82 63 114 158 118 552 162 276HC0493 Craven County Health Dept. Home Health-Hospice Agency Craven Craven 8 23 90 33 91 104 69 418 146 173HC0316 Liberty Home Care Onslow Craven 0 6 47 25 14 5 4 101 78 9HC1353 Liberty Home Care Carteret Craven 0 4 20 10 10 11 6 61 34 17HC0506 3HC Jones Craven 1 6 20 3 4 10 5 49 29 15HC0428 Tar Heel Home Health Lenoir Craven 0 0 5 3 5 10 6 29 8 16HC0073 Tar Heel Home Health Carteret Craven 0 2 5 1 3 9 1 21 8 10HC1443 University Health Systems Home Health and Hospice Pitt Craven 0 2 0 0 3 6 2 13 2 8HC0328 Tar Heel Home Health Pitt Craven 0 0 0 0 2 1 2 5 0 3HC0195 3HC Lenoir Craven 0 0 0 0 1 2 1 4 0 3HC1634 Beaufort County Hospital Home Health Beaufort Craven 0 0 0 0 1 0 0 1 0 0HC0329 Tar Heel Home Health Beaufort Craven 0 0 0 0 0 0 1 1 0 1HC0168 Greene Regional Home Health Greene Craven 0 0 0 0 0 1 0 1 0 1
Craven Total 15 97 358 200 466 575 332 2043 655 907HC0283 Cape Fear Valley HomeCare and Hospice Cumberland Cumberland 337 191 366 100 222 181 110 1507 657 291HC0274 Liberty Home Care Cumberland Cumberland 0 33 193 96 253 358 173 1106 322 531HC0359 HealthKeeperz Cumberland Cumberland 35 58 212 89 238 289 159 1080 359 448HC0255 3HC Sampson Cumberland 29 46 134 65 134 126 76 610 245 202HC0292 Amedisys Home Health of Fayetteville Cumberland Cumberland 0 12 26 15 49 74 43 219 53 117HC3421 Native Angels Home Health, Inc. Cumberland Cumberland 1 0 14 7 17 35 17 91 21 52HC0125 Liberty Home Care Harnett Cumberland 0 3 4 4 11 9 6 37 11 15HC0277 Liberty Home Care Hoke Cumberland 1 1 1 0 0 3 0 6 2 3HC0507 3HC Johnston Cumberland 0 1 0 0 1 1 0 3 1 1HC0309 Liberty Home Care Bladen Cumberland 0 0 1 0 0 0 0 1 1 0HC0352 Liberty Home care Robeson Cumberland 0 0 0 0 1 0 0 1 0 0HC0918 Heartland Home Health Care Wake Cumberland 0 0 0 0 1 0 0 1 0 0
Cumberland Total 403 345 951 376 927 1076 584 4662 1672 1660HC0475 Albemarle Home Care Currituck Currituck 7 12 40 20 49 64 35 227 72 99HC1071 Sentara Home Care Services Pasquotank Currituck 19 4 47 20 30 39 11 170 71 50HC0494 Dare Home Health and Hospice Dare Currituck 0 0 1 0 2 1 1 5 1 2
Currituck Total 26 16 88 40 81 104 47 402 144 151HC0494 Dare Home Health and Hospice Dare Dare 3 15 53 26 65 82 55 299 94 137
Figures are entered from 2009 HH Data Supplements. Data were self-reported and are not verified by the Medical Facilities Planning Section.

Table 12A: Home Health Data by County of Patient Origin - 2008 Data - Agencies or Offices Serving Residents of Counties by Age.
Lic. # Name Fac. County Resident Co. <18 18-40 41-59 60-64 65-74 75-84 85 up Total 18-64 75+HC1071 Sentara Home Care Services Pasquotank Dare 5 18 42 19 31 27 22 164 79 49HC0475 Albemarle Home Care Currituck Dare 0 2 6 6 13 14 5 46 14 19
Dare Total 8 35 101 51 109 123 82 509 187 205HC0521 Piedmont Home Care Davidson Davidson 50 13 95 49 148 167 118 640 157 285HC0297 Advanced Home Care Guilford Davidson 33 38 119 59 134 138 76 597 216 214HC1104 CareSouth Homecare Professionals Davidson Davidson 0 41 107 38 103 170 97 556 186 267HC0358 Home Health Professionals Davidson Davidson 9 28 93 46 87 103 86 452 167 189HC0567 Gentiva Health Services Forsyth Davidson 0 18 54 32 73 96 65 338 104 161HC0495 Amedisys Home Health of Lexington Davidson Davidson 0 6 53 26 78 70 52 285 85 122HC0499 Advanced Home Care Forsyth Davidson 24 15 60 20 63 61 17 260 95 78HC1131 Gentiva Health Services Forsyth Davidson 1 18 45 12 26 24 10 136 75 34HC0124 Liberty Home Care Davidson Davidson 0 4 20 8 16 27 12 87 32 39HC0231 Gentiva Health Services Forsyth Davidson 0 0 2 1 3 20 25 51 3 45HC0265 Gentiva Health Services Rowan Davidson 0 6 17 7 3 10 3 46 30 13HC0869 Advanced Home Care Rowan Davidson 0 2 8 3 11 6 2 32 13 8HC1286 Home Health Professionals Guilford Davidson 0 2 7 7 5 6 2 29 16 8HC0552 Home Health of Randolph Hospital Randolph Davidson 4 3 5 1 2 4 5 24 9 9HC1210 Gentiva Health Services Forsyth Davidson 0 0 0 0 5 11 7 23 0 18HC1885 Interim HealthCare of the Triad, Inc. Guilford Davidson 5 0 8 3 2 3 1 22 11 4HC0395 Care Connection Guilford Davidson 5 1 3 2 7 0 1 19 6 1HC0399 Rowan Regional Home Health & Hospice Rowan Davidson 1 1 5 1 1 3 0 12 7 3HC1886 Interim HealthCare of the Triad Inc. Forsyth Davidson 3 0 4 0 2 2 0 11 4 2HC0409 Hospice & Palliative CareCenter Forsyth Davidson 2 0 0 3 2 2 0 9 3 2HC0929 CareSouth Homecare Professionals Randolph Davidson 0 1 2 0 0 3 0 6 3 3HC0308 Home Care of the Carolinas Stanly Davidson 2 1 0 0 1 1 1 6 1 2HC0953 Gentiva Health Services Randolph Davidson 0 1 0 0 0 1 2 4 1 3
Davidson Total 139 199 707 318 772 928 582 3645 1224 1510HC0496 Davie County Home Health Agency Davie Davie 12 14 49 34 104 200 148 561 97 348HC0499 Advanced Home Care Forsyth Davie 16 9 31 16 40 30 18 160 56 48HC0567 Gentiva Health Services Forsyth Davie 0 2 15 12 43 40 13 125 29 53HC0170 Gentiva Health Services Iredell Davie 0 2 24 7 18 35 30 116 33 65HC1131 Gentiva Health Services Forsyth Davie 0 2 16 8 11 15 13 65 26 28HC0357 Home Health Professionals Rowan Davie 0 2 3 4 12 0 0 21 9 0HC0515 Iredell Home Health Iredell Davie 2 2 3 1 4 2 1 15 6 3HC0399 Rowan Regional Home Health & Hospice Rowan Davie 1 0 2 3 0 1 1 8 5 2HC0005 Home Health Professionals Forsyth Davie 0 0 0 0 3 1 1 5 0 2HC0409 Hospice & Palliative CareCenter Forsyth Davie 1 0 1 1 1 1 0 5 2 1HC0231 Gentiva Health Services Forsyth Davie 0 0 1 0 0 1 1 3 1 2HC1104 CareSouth Homecare Professionals Davidson Davie 0 0 1 0 0 0 1 2 1 1HC0358 Home Health Professionals Davidson Davie 0 0 0 0 2 0 0 2 0 0HC0521 Piedmont Home Care Davidson Davie 1 0 0 0 0 0 0 1 0 0HC1304 Amedisys Home Health of Winston Salem Forsyth Davie 0 0 1 0 0 0 0 1 1 0HC0297 Advanced Home Care Guilford Davie 0 0 0 0 0 1 0 1 0 1HC0159 Gentiva Health Services Iredell Davie 0 0 0 0 0 1 0 1 0 1
Davie Total 33 33 147 86 238 328 227 1092 266 555HC0053 Carolina East Home Care & Hospice Inc. Duplin Duplin 28 32 114 42 136 136 84 572 188 220HC1565 Tar Heel Home Health Lenoir Duplin 5 6 79 34 103 126 90 443 119 216HC0532 Pender Home Health Pender Duplin 3 8 26 13 49 61 45 205 47 106HC1241 Liberty Home Care Pender Duplin 0 3 22 6 20 19 12 82 31 31HC0255 3HC Sampson Duplin 2 8 13 4 15 24 10 76 25 34HC1231 Well Care Home Health New Hanover Duplin 4 6 13 4 11 13 3 54 23 16HC0257 Sampson Home Health Sampson Duplin 0 0 3 0 8 3 2 16 3 5HC1209 Continuum Home Care and Hospice Onslow Duplin 0 1 1 0 0 2 1 5 2 3HC0316 Liberty Home Care Onslow Duplin 0 0 0 0 2 3 0 5 0 3HC0195 3HC Lenoir Duplin 0 1 1 1 0 0 0 3 3 0HC1500 AssistedCare Home Health Brunswick Duplin 0 0 0 0 1 0 0 1 0 0HC0074 At Home Quality Care, Inc. Wake Duplin 0 0 0 0 1 0 0 1 0 0HC0228 3HC Wayne Duplin 0 0 0 0 0 1 0 1 0 1
Duplin Total 42 65 272 104 346 388 247 1464 441 635HC0360 Duke Home Health Durham Durham 110 105 283 122 274 298 196 1388 510 494HC1176 Liberty Home Care Durham Durham 1 37 138 82 126 174 158 716 257 332HC0918 Heartland Home Health Care Wake Durham 0 14 91 37 90 134 121 487 142 255HC0339 Intrepid USA Healthcare Services Wake Durham 2 5 40 41 62 158 136 444 86 294HC2111 Tar Heel Home Health Durham Durham 1 8 44 20 82 99 87 341 72 186HC0166 Amedisys Home Health of Chapel Hill Orange Durham 0 17 9 6 66 163 6 267 32 169HC0145 Tender Loving Care Home Health & Hospice Durham Durham 0 4 20 6 28 44 33 135 30 77HC0327 Visiting Nurse Service of Durham Durham Durham 0 12 20 10 17 26 40 125 42 66HC0030 UNC Home Health Orange Durham 1 16 30 13 26 20 14 120 59 34HC2112 Medi Home Health Agency Wake Durham 0 7 15 8 31 33 18 112 30 51HC0507 3HC Johnston Durham 19 13 20 8 17 17 5 99 41 22HC0074 At Home Quality Care, Inc. Wake Durham 1 23 21 6 13 7 4 75 50 11HC0354 Home Health Professionals Person Durham 2 3 8 5 15 15 17 65 16 32HC0828 Pediatric Services of America, Inc. Wake Durham 14 0 0 0 0 0 0 14 0 0HC1437 Professional Nursing Service and Home Health Wake Durham 2 0 0 0 0 0 0 2 0 0HC2562 Liberty Home Care Wake Durham 0 0 0 0 0 1 0 1 0 1
Durham Total 153 264 739 364 847 1189 835 4391 1367 2024HC0498 Edgecombe Homecare & Hospice Edgecombe Edgecombe 24 31 155 65 132 177 106 690 251 283HC0497 Tar Heel Home Health Nash Edgecombe 1 13 66 28 103 93 67 371 107 160HC1443 University Health Systems Home Health and Hospice Pitt Edgecombe 1 3 19 4 28 28 14 97 26 42HC0508 3HC Wilson Edgecombe 1 5 18 5 12 6 2 49 28 8HC0343 Wilson County Home Health Wilson Edgecombe 1 2 14 3 2 2 0 24 19 2HC0328 Tar Heel Home Health Pitt Edgecombe 0 0 0 1 1 2 1 5 1 3HC0509 3HC Pitt Edgecombe 0 0 1 0 0 0 0 1 1 0
Edgecombe Total 28 54 273 106 278 308 190 1237 433 498HC0499 Advanced Home Care Forsyth Forsyth 159 111 324 145 348 558 293 1938 580 851HC0567 Gentiva Health Services Forsyth Forsyth 0 67 249 101 402 498 292 1609 417 790
Figures are entered from 2009 HH Data Supplements. Data were self-reported and are not verified by the Medical Facilities Planning Section.

Table 12A: Home Health Data by County of Patient Origin - 2008 Data - Agencies or Offices Serving Residents of Counties by Age.
Lic. # Name Fac. County Resident Co. <18 18-40 41-59 60-64 65-74 75-84 85 up Total 18-64 75+HC0231 Gentiva Health Services Forsyth Forsyth 0 29 141 53 130 270 356 979 223 626HC1131 Gentiva Health Services Forsyth Forsyth 5 81 238 82 174 219 139 938 401 358HC1210 Gentiva Health Services Forsyth Forsyth 0 29 82 66 136 239 263 815 177 502HC0005 Home Health Professionals Forsyth Forsyth 31 54 81 40 91 156 146 599 175 302HC1885 Interim HealthCare of the Triad, Inc. Guilford Forsyth 93 30 61 19 72 84 57 416 110 141HC1304 Amedisys Home Health of Winston Salem Forsyth Forsyth 0 8 47 22 45 118 146 386 77 264HC0297 Advanced Home Care Guilford Forsyth 34 29 59 24 71 99 50 366 112 149HC1104 CareSouth Homecare Professionals Davidson Forsyth 0 14 47 15 45 63 70 254 76 133HC0409 Hospice & Palliative CareCenter Forsyth Forsyth 26 2 23 3 18 11 6 89 28 17HC1699 Gentiva Health Services Stokes Forsyth 0 5 6 1 9 5 7 33 12 12HC0124 Liberty Home Care Davidson Forsyth 0 4 4 2 0 8 0 18 10 8HC1886 Interim HealthCare of the Triad Inc. Forsyth Forsyth 0 6 2 5 0 0 0 13 13 0HC1286 Home Health Professionals Guilford Forsyth 1 0 3 1 4 2 2 13 4 4HC0521 Piedmont Home Care Davidson Forsyth 0 1 3 1 3 1 1 10 5 2HC0358 Home Health Professionals Davidson Forsyth 0 0 1 0 1 0 1 3 1 1HC0395 Care Connection Guilford Forsyth 1 0 0 0 0 1 0 2 0 1HC1177 Liberty Home Care Guilford Forsyth 0 0 1 1 0 0 0 2 2 0HC0420 Liberty Home Care Surry Forsyth 1 0 0 0 1 0 0 2 0 0HC0281 Advanced Home Care Cabarrus Forsyth 0 0 1 0 0 0 0 1 1 0HC0496 Davie County Home Health Agency Davie Forsyth 0 0 0 1 0 0 0 1 1 0HC0952 Gentiva Health Services Guilford Forsyth 0 0 1 0 0 0 0 1 1 0
Forsyth Total 351 470 1374 582 1550 2332 1829 8488 2426 4161HC0215 Tar Heel Home Health Franklin Franklin 2 33 105 34 130 162 96 562 172 258HC0500 Franklin County Home Health Agency Franklin Franklin 23 25 117 31 91 141 92 520 173 233HC0918 Heartland Home Health Care Wake Franklin 0 6 15 9 13 19 10 72 30 29HC2112 Medi Home Health Agency Wake Franklin 0 2 7 4 10 17 16 56 13 33HC1293 WakeMed Home Health Wake Franklin 0 8 13 4 10 10 4 49 25 14HC0339 Intrepid USA Healthcare Services Wake Franklin 0 1 4 2 12 7 5 31 7 12HC2562 Liberty Home Care Wake Franklin 1 2 6 5 11 5 1 31 13 6HC0422 Rex Home Services Wake Franklin 0 0 5 2 4 9 5 25 7 14HC0360 Duke Home Health Durham Franklin 0 2 6 3 5 6 2 24 11 8HC0145 Tender Loving Care Home Health & Hospice Durham Franklin 0 0 8 2 3 6 2 21 10 8HC0823 Maria Parham Regional Home Health Vance Franklin 1 2 0 0 0 1 0 4 2 1HC0074 At Home Quality Care, Inc. Wake Franklin 1 1 2 0 0 0 0 4 3 0HC0497 Tar Heel Home Health Nash Franklin 0 0 0 0 2 0 0 2 0 0HC0501 Granville-Vance Home Health Agency Vance Franklin 2 0 0 0 0 0 0 2 0 0HC1176 Liberty Home Care Durham Franklin 0 0 0 0 0 0 1 1 0 1HC0031 Horizons Home Care Wake Franklin 0 0 0 0 1 0 0 1 0 0HC0828 Pediatric Services of America, Inc. Wake Franklin 1 0 0 0 0 0 0 1 0 0HC1437 Professional Nursing Service and Home Health Wake Franklin 1 0 0 0 0 0 0 1 0 0
Franklin Total 32 82 288 96 292 383 234 1407 466 617HC0906 Advanced Home Care Gaston Gaston 222 108 457 235 367 412 164 1965 800 576HC0268 Total Care Home Health Gaston Gaston 0 46 205 97 331 413 269 1361 348 682HC0353 Emerald Care, Inc. Gaston Gaston 5 27 127 78 253 396 345 1231 232 741HC1903 Interim HealthCare of the Triad, Inc. Gaston Gaston 66 69 180 77 95 91 50 628 326 141HC0356 Home Health Professionals Gaston Gaston 19 36 87 55 92 96 61 446 178 157HC0042 Cleveland Home Health Agency, Inc. Cleveland Gaston 18 20 32 18 31 33 14 166 70 47HC0135 Carolinas Medical Center Lincoln Home Health Lincoln Gaston 12 10 27 5 9 9 4 76 42 13HC1038 CMC-Home Care Mecklenburg Gaston 12 5 9 3 3 2 0 34 17 2HC0787 Gentiva Health Services Mecklenburg Gaston 0 2 14 5 5 2 0 28 21 2HC1325 Lake Norman Regional Medical Center- Home Health Iredell Gaston 0 1 2 0 6 1 1 11 3 2HC0227 Gentiva Health Services Catawba Gaston 0 0 3 6 1 0 0 10 9 0HC0171 Advanced Home Care Mecklenburg Gaston 0 0 0 0 0 2 4 6 0 6HC0369 Hospice & Palliative Care Charlotte Region Mecklenburg Gaston 6 0 0 0 0 0 0 6 0 0HC3694 Liberty Home Care and Hospice Mecklenburg Gaston 0 0 0 0 1 0 0 1 0 0
Gaston Total 360 324 1143 579 1194 1457 912 5969 2046 2369HC1062 Hertford-Gates Home Health Agency Gates Gates 2 5 15 9 31 30 21 113 29 51HC1071 Sentara Home Care Services Pasquotank Gates 0 10 28 17 22 12 10 99 55 22HC0472 Albemarle Home Care Perquimans Gates 4 7 7 5 20 21 8 72 19 29
Gates Total 6 22 50 31 73 63 39 284 103 102HC0157 WestCare Home Health and Hospice Services Jackson Graham 1 4 24 6 25 33 16 109 34 49HC0298 Angel Home Health and Hospice Swain Graham 2 4 15 10 12 23 21 87 29 44
Graham Total 3 8 39 16 37 56 37 196 63 93HC0501 Granville-Vance Home Health Agency Vance Granville 7 26 62 24 80 120 62 381 112 182HC0360 Duke Home Health Durham Granville 0 9 44 20 36 17 9 135 73 26HC0339 Intrepid USA Healthcare Services Wake Granville 0 0 5 13 37 35 38 128 18 73HC0145 Tender Loving Care Home Health & Hospice Durham Granville 0 0 4 4 16 26 11 61 8 37HC0215 Tar Heel Home Health Franklin Granville 0 2 13 6 12 19 8 60 21 27HC0918 Heartland Home Health Care Wake Granville 0 1 8 3 12 13 9 46 12 22HC1176 Liberty Home Care Durham Granville 0 5 14 2 7 3 1 32 21 4HC0823 Maria Parham Regional Home Health Vance Granville 1 4 3 0 10 8 5 31 7 13HC2111 Tar Heel Home Health Durham Granville 0 1 3 2 6 4 6 22 6 10HC2112 Medi Home Health Agency Wake Granville 0 0 6 1 4 2 1 14 7 3HC0354 Home Health Professionals Person Granville 1 1 1 3 1 1 0 8 5 1HC0074 At Home Quality Care, Inc. Wake Granville 1 0 2 0 1 0 1 5 2 1HC0533 Home Health and Hospice of Person County Person Granville 0 0 1 0 0 1 0 2 1 1HC0134 Tender Loving Care Home Health & Hospice Alamance Granville 0 0 0 0 1 0 0 1 0 0HC1437 Professional Nursing Service and Home Health Wake Granville 1 0 0 0 0 0 0 1 0 0
Granville Total 11 49 166 78 223 249 151 927 293 400HC0168 Greene Regional Home Health Greene Greene 6 17 36 18 60 77 63 277 71 140HC0428 Tar Heel Home Health Lenoir Greene 0 5 14 2 12 19 3 55 21 22HC0195 3HC Lenoir Greene 1 4 7 4 6 10 5 37 15 15HC1443 University Health Systems Home Health and Hospice Pitt Greene 0 4 7 1 3 10 1 26 12 11HC0328 Tar Heel Home Health Pitt Greene 0 0 1 0 1 1 3 6 1 4HC0343 Wilson County Home Health Wilson Greene 1 0 2 0 0 0 0 3 2 0HC0228 3HC Wayne Greene 0 0 0 0 1 0 0 1 0 0
Figures are entered from 2009 HH Data Supplements. Data were self-reported and are not verified by the Medical Facilities Planning Section.

Table 12A: Home Health Data by County of Patient Origin - 2008 Data - Agencies or Offices Serving Residents of Counties by Age.
Lic. # Name Fac. County Resident Co. <18 18-40 41-59 60-64 65-74 75-84 85 up Total 18-64 75+HC1299 Tar Heel Home Health Wayne Greene 0 0 0 0 1 0 0 1 0 0
Greene Total 8 30 67 25 84 117 75 406 122 192HC0297 Advanced Home Care Guilford Guilford 353 354 1078 440 964 1254 723 5166 1872 1977HC0952 Gentiva Health Services Guilford Guilford 14 91 278 114 372 470 332 1671 483 802HC0303 CareSouth Homecare Professionals Guilford Guilford 0 40 145 45 172 249 225 876 230 474HC1286 Home Health Professionals Guilford Guilford 38 54 74 35 92 219 286 798 163 505HC1210 Gentiva Health Services Forsyth Guilford 0 5 42 11 50 153 151 412 58 304HC1885 Interim HealthCare of the Triad, Inc. Guilford Guilford 61 36 64 25 57 65 56 364 125 121HC1177 Liberty Home Care Guilford Guilford 0 11 58 23 52 61 44 249 92 105HC1131 Gentiva Health Services Forsyth Guilford 0 11 38 4 21 17 8 99 53 25HC0231 Gentiva Health Services Forsyth Guilford 0 0 3 5 13 25 30 76 8 55HC0567 Gentiva Health Services Forsyth Guilford 0 8 16 7 12 11 7 61 31 18HC0953 Gentiva Health Services Randolph Guilford 0 1 12 6 18 5 7 49 19 12HC0395 Care Connection Guilford Guilford 13 3 4 4 4 12 3 43 11 15HC0374 Hospice and Palliative Care of Greensboro Guilford Guilford 38 3 0 0 0 0 0 41 3 0HC0124 Liberty Home Care Davidson Guilford 2 2 1 5 3 7 6 26 8 13HC1304 Amedisys Home Health of Winston Salem Forsyth Guilford 0 1 4 0 4 6 0 15 5 6HC1886 Interim HealthCare of the Triad Inc. Forsyth Guilford 2 3 2 2 0 3 2 14 7 5HC0134 Tender Loving Care Home Health & Hospice Alamance Guilford 0 0 2 4 3 2 1 12 6 3HC0217 Advanced Home Care Rockingham Guilford 0 3 0 1 2 0 6 12 4 6HC0552 Home Health of Randolph Hospital Randolph Guilford 6 1 1 1 1 0 1 11 3 1HC0249 Advanced Home Care Alamance Guilford 0 0 2 1 3 1 3 10 3 4HC0361 Life Path Home Health Alamance Guilford 0 0 0 0 2 3 5 10 0 8HC0521 Piedmont Home Care Davidson Guilford 1 1 4 1 1 0 0 8 6 0HC0499 Advanced Home Care Forsyth Guilford 1 1 0 1 1 3 0 7 2 3HC0409 Hospice & Palliative CareCenter Forsyth Guilford 6 0 0 0 1 0 0 7 0 0HC1104 CareSouth Homecare Professionals Davidson Guilford 0 0 2 0 1 1 1 5 2 2HC0171 Advanced Home Care Mecklenburg Guilford 0 0 0 0 2 1 1 4 0 2HC0495 Amedisys Home Health of Lexington Davidson Guilford 0 0 0 0 0 1 1 2 0 2HC0281 Advanced Home Care Cabarrus Guilford 0 1 0 0 0 0 0 1 1 0HC0489 Caswell County Home Health Agency Caswell Guilford 0 0 0 0 1 0 0 1 0 0HC0929 CareSouth Homecare Professionals Randolph Guilford 0 0 0 0 0 1 0 1 0 1
Guilford Total 535 630 1830 735 1852 2570 1899 10051 3195 4469HC0765 Home Health and Hospice of Halifax Halifax Halifax 18 35 125 67 162 182 163 752 227 345HC0497 Tar Heel Home Health Nash Halifax 0 9 90 42 98 160 105 504 141 265
Halifax Total 18 44 215 109 260 342 268 1256 368 610HC0503 Harnett County Home Health Agency Harnett Harnett 6 40 179 69 163 229 152 838 288 381HC0125 Liberty Home Care Harnett Harnett 1 23 108 47 158 194 129 660 178 323HC0255 3HC Sampson Harnett 4 21 85 35 75 58 37 315 141 95HC0299 Tar Heel Home Health Wake Harnett 0 1 24 14 31 44 26 140 39 70HC0283 Cape Fear Valley HomeCare and Hospice Cumberland Harnett 12 7 13 4 8 6 0 50 24 6HC0257 Sampson Home Health Sampson Harnett 7 1 9 5 7 6 2 37 15 8HC0339 Intrepid USA Healthcare Services Wake Harnett 0 0 1 4 10 11 3 29 5 14HC0422 Rex Home Services Wake Harnett 0 1 3 2 2 9 5 22 6 14HC0426 Liberty Home Care Lee Harnett 1 0 2 5 2 5 3 18 7 8HC0918 Heartland Home Health Care Wake Harnett 0 0 2 3 5 5 1 16 5 6HC1293 WakeMed Home Health Wake Harnett 0 0 6 2 1 1 3 13 8 4HC0359 HealthKeeperz Cumberland Harnett 0 3 2 2 2 3 0 12 7 3HC0383 Johnston Memorial Home Care and Hospice Johnston Harnett 0 0 3 3 3 1 0 10 6 1HC2112 Medi Home Health Agency Wake Harnett 0 2 2 1 3 2 0 10 5 2HC0292 Amedisys Home Health of Fayetteville Cumberland Harnett 0 0 4 0 1 3 0 8 4 3HC0332 FirstHealth Home Care Moore Harnett 3 0 3 0 0 1 0 7 3 1HC0166 Amedisys Home Health of Chapel Hill Orange Harnett 0 1 1 0 1 2 0 5 2 2HC0507 3HC Johnston Harnett 0 1 2 0 0 1 0 4 3 1HC0074 At Home Quality Care, Inc. Wake Harnett 1 2 0 0 1 0 0 4 2 0HC0002 Liberty Home Care Moore Harnett 0 0 1 0 0 1 0 2 1 1HC0031 Horizons Home Care Wake Harnett 0 0 1 0 0 1 0 2 1 1HC2562 Liberty Home Care Wake Harnett 0 0 0 0 1 1 0 2 0 1HC1437 Professional Nursing Service and Home Health Wake Harnett 0 0 1 1 0 0 0 2 2 0HC0274 Liberty Home Care Cumberland Harnett 0 0 0 0 0 0 1 1 0 1HC0195 3HC Lenoir Harnett 0 0 1 0 0 0 0 1 1 0
Harnett Total 35 103 453 197 474 584 362 2208 753 946HC0109 Home Care Services of Haywood Regional Medical Center Haywood Haywood 20 21 72 36 134 196 142 621 129 338HC0279 CarePartners Home Health Services Haywood Haywood 4 22 110 56 125 136 83 536 188 219HC2114 Tar Heel Home Health Buncombe Haywood 0 2 12 11 13 13 5 56 25 18HC0157 WestCare Home Health and Hospice Services Jackson Haywood 7 1 8 2 5 4 1 28 11 5HC0114 CarePartners Home Health Services Buncombe Haywood 8 0 0 0 0 0 0 8 0 0
Haywood Total 39 46 202 105 277 349 231 1249 353 580HC0201 Pardee Home Care Henderson Henderson 1 30 124 58 250 350 251 1064 212 601HC0440 CarePartners Home Health Services Henderson Henderson 3 25 137 80 142 162 120 669 242 282HC0911 Park Ridge Home Health Henderson Henderson 1 11 53 35 86 135 101 422 99 236HC2114 Tar Heel Home Health Buncombe Henderson 0 3 26 19 73 82 64 267 48 146HC0114 CarePartners Home Health Services Buncombe Henderson 33 1 6 7 8 6 2 63 14 8HC0067 TRH-Home Care Transylvania Henderson 0 0 1 1 5 7 5 19 2 12HC0279 CarePartners Home Health Services Haywood Henderson 0 0 1 0 0 0 0 1 1 0
Henderson Total 38 70 348 200 564 742 543 2505 618 1285HC0504 Hertford-Gates Home Health Agency Hertford Hertford 12 46 93 47 119 156 125 598 186 281HC1052 University Health Systems Home Health and Hospice Bertie Hertford 0 7 17 9 18 29 20 100 33 49HC0480 Bertie County Home Health Bertie Hertford 0 0 0 0 0 1 0 1 0 1
Hertford Total 12 53 110 56 137 186 145 699 219 331HC0277 Liberty Home Care Hoke Hoke 3 25 122 33 136 181 128 628 180 309HC0403 HealthKeeperz Scotland Hoke 7 7 26 9 14 12 5 80 42 17HC0283 Cape Fear Valley HomeCare and Hospice Cumberland Hoke 16 9 17 5 11 7 0 65 31 7HC0332 FirstHealth Home Care Moore Hoke 5 4 23 9 7 4 1 53 36 5HC3421 Native Angels Home Health, Inc. Cumberland Hoke 0 0 1 0 2 0 0 3 1 0HC0352 Liberty Home care Robeson Hoke 0 0 1 0 0 1 0 2 1 1
Figures are entered from 2009 HH Data Supplements. Data were self-reported and are not verified by the Medical Facilities Planning Section.

Table 12A: Home Health Data by County of Patient Origin - 2008 Data - Agencies or Offices Serving Residents of Counties by Age.
Lic. # Name Fac. County Resident Co. <18 18-40 41-59 60-64 65-74 75-84 85 up Total 18-64 75+HC0292 Amedisys Home Health of Fayetteville Cumberland Hoke 0 0 0 0 1 0 0 1 0 0HC0002 Liberty Home Care Moore Hoke 0 0 1 0 0 0 0 1 1 0HC0423 FirstHealth Home Care- Richmond Richmond Hoke 0 0 0 0 0 0 1 1 0 1HC0235 Southeastern Home Health Robeson Hoke 0 0 0 0 0 1 0 1 0 1
Hoke Total 31 45 191 56 171 206 135 835 292 341HC0379 Hydeland Home Care Agency Hyde Hyde 3 3 6 7 15 14 15 63 16 29
Hyde Total 3 3 6 7 15 14 15 63 16 29HC0515 Iredell Home Health Iredell Iredell 109 109 239 111 238 371 283 1460 459 654HC1325 Lake Norman Regional Medical Center- Home Health Iredell Iredell 3 33 138 82 159 208 119 742 253 327HC0170 Gentiva Health Services Iredell Iredell 1 37 112 41 134 203 190 718 190 393HC0159 Gentiva Health Services Iredell Iredell 0 15 94 57 152 168 128 614 166 296HC0869 Advanced Home Care Rowan Iredell 5 10 21 13 11 24 8 92 44 32HC1901 Interim HealthCare of the Triad, Inc. Mecklenburg Iredell 3 9 13 7 11 2 1 46 29 3HC0357 Home Health Professionals Rowan Iredell 1 0 4 5 0 2 2 14 9 4HC1902 Interim Healthcare of the Triad, Inc. Catawba Iredell 0 2 2 4 0 1 0 9 8 1HC0490 Catawba County Home Health Agency Catawba Iredell 0 3 3 1 0 0 0 7 7 0HC1038 CMC-Home Care Mecklenburg Iredell 5 0 0 0 0 1 1 7 0 2HC0369 Hospice & Palliative Care Charlotte Region Mecklenburg Iredell 7 0 0 0 0 0 0 7 0 0HC0057 Guardian Health Services Catawba Iredell 1 0 2 1 1 1 0 6 3 1HC0476 Alexander County Home Health Agency Alexander Iredell 1 0 0 0 1 1 2 5 0 3HC0171 Advanced Home Care Mecklenburg Iredell 0 0 0 0 1 1 0 2 0 1HC0496 Davie County Home Health Agency Davie Iredell 0 0 0 0 0 1 0 1 0 1HC0430 Home Care of Wilkes Regional Medical Center Wilkes Iredell 0 0 0 0 1 0 0 1 0 0
Iredell Total 136 218 628 322 709 984 734 3731 1168 1718HC0157 WestCare Home Health and Hospice Services Jackson Jackson 24 20 59 46 110 107 105 471 125 212HC0298 Angel Home Health and Hospice Swain Jackson 3 1 7 7 3 1 2 24 15 3HC0067 TRH-Home Care Transylvania Jackson 0 0 1 1 1 2 0 5 2 2HC0324 Angel Home Health & Hospice Macon Jackson 0 0 0 0 1 0 0 1 0 0
Jackson Total 27 21 67 54 115 110 107 501 142 217HC0507 3HC Johnston Johnston 17 54 214 95 197 226 152 955 363 378HC0383 Johnston Memorial Home Care and Hospice Johnston Johnston 3 43 152 93 190 190 131 802 288 321HC1299 Tar Heel Home Health Wayne Johnston 0 7 35 24 63 76 39 244 66 115HC0299 Tar Heel Home Health Wake Johnston 0 4 26 15 67 59 38 209 45 97HC0125 Liberty Home Care Harnett Johnston 0 5 28 15 49 48 29 174 48 77HC0339 Intrepid USA Healthcare Services Wake Johnston 0 3 15 25 35 21 32 131 43 53HC0422 Rex Home Services Wake Johnston 0 4 28 12 32 21 15 112 44 36HC0918 Heartland Home Health Care Wake Johnston 0 6 20 9 22 24 10 91 35 34HC1293 WakeMed Home Health Wake Johnston 0 8 22 16 17 18 8 89 46 26HC2112 Medi Home Health Agency Wake Johnston 0 4 9 12 20 29 10 84 25 39HC0343 Wilson County Home Health Wilson Johnston 5 3 10 7 20 9 8 62 20 17HC2562 Liberty Home Care Wake Johnston 0 1 8 7 6 10 4 36 16 14HC0166 Amedisys Home Health of Chapel Hill Orange Johnston 0 1 0 2 9 15 4 31 3 19HC0255 3HC Sampson Johnston 1 2 2 4 0 1 0 10 8 1HC0497 Tar Heel Home Health Nash Johnston 0 0 1 1 1 2 3 8 2 5HC1437 Professional Nursing Service and Home Health Wake Johnston 3 1 3 0 1 0 0 8 4 0HC0283 Cape Fear Valley HomeCare and Hospice Cumberland Johnston 1 0 1 0 1 2 1 6 1 3HC0074 At Home Quality Care, Inc. Wake Johnston 1 1 2 0 2 0 0 6 3 0HC0228 3HC Wayne Johnston 0 0 0 0 1 1 4 6 0 5HC0508 3HC Wilson Johnston 0 0 1 1 0 0 0 2 2 0HC0292 Amedisys Home Health of Fayetteville Cumberland Johnston 0 0 0 1 0 0 0 1 1 0HC0145 Tender Loving Care Home Health & Hospice Durham Johnston 0 0 1 0 0 0 0 1 1 0HC0031 Horizons Home Care Wake Johnston 0 0 0 0 0 1 0 1 0 1HC0828 Pediatric Services of America, Inc. Wake Johnston 1 0 0 0 0 0 0 1 0 0
Johnston Total 32 147 578 339 733 753 488 3070 1064 1241HC0431 Tar Heel Home Health Jones Jones 0 0 17 14 36 47 57 171 31 104HC0506 3HC Jones Jones 1 2 10 4 17 15 8 57 16 23HC0165 Home Care Craven Regional Medical Authority Craven Jones 0 1 3 4 7 13 1 29 8 14HC0316 Liberty Home Care Onslow Jones 0 0 7 5 6 6 2 26 12 8HC0428 Tar Heel Home Health Lenoir Jones 0 0 1 0 2 3 7 13 1 10HC1209 Continuum Home Care and Hospice Onslow Jones 1 0 1 0 2 3 0 7 1 3HC0195 3HC Lenoir Jones 0 1 2 0 1 0 0 4 3 0HC0493 Craven County Health Dept. Home Health-Hospice Agency Craven Jones 0 0 0 0 1 0 0 1 0 0HC0053 Carolina East Home Care & Hospice Inc. Duplin Jones 0 0 0 0 0 1 0 1 0 1
Jones Total 2 4 41 27 72 88 75 309 72 163HC0426 Liberty Home Care Lee Lee 1 22 96 53 137 204 143 656 171 347HC0332 FirstHealth Home Care Moore Lee 10 19 47 23 50 61 29 239 89 90HC0918 Heartland Home Health Care Wake Lee 0 2 2 0 6 20 33 63 4 53HC0283 Cape Fear Valley HomeCare and Hospice Cumberland Lee 8 5 9 2 5 4 7 40 16 11HC0359 HealthKeeperz Cumberland Lee 1 4 1 1 8 2 0 17 6 2HC0166 Amedisys Home Health of Chapel Hill Orange Lee 0 0 0 0 4 7 0 11 0 7HC0125 Liberty Home Care Harnett Lee 0 0 0 1 3 0 0 4 1 0HC0828 Pediatric Services of America, Inc. Wake Lee 3 0 0 0 0 0 0 3 0 0HC0528 Liberty Home Care Chatham Lee 0 0 1 1 0 0 0 2 2 0HC0074 At Home Quality Care, Inc. Wake Lee 1 0 0 1 0 0 0 2 1 0HC0292 Amedisys Home Health of Fayetteville Cumberland Lee 0 0 1 0 0 0 0 1 1 0
Lee Total 24 52 157 82 213 298 212 1038 291 510HC0428 Tar Heel Home Health Lenoir Lenoir 6 29 167 90 285 383 293 1253 286 676HC0195 3HC Lenoir Lenoir 12 28 96 43 103 134 60 476 167 194HC1565 Tar Heel Home Health Lenoir Lenoir 3 3 10 5 29 32 17 99 18 49HC0168 Greene Regional Home Health Greene Lenoir 2 8 9 3 11 13 11 57 20 24HC1443 University Health Systems Home Health and Hospice Pitt Lenoir 1 5 13 5 10 6 2 42 23 8HC0053 Carolina East Home Care & Hospice Inc. Duplin Lenoir 0 0 0 2 2 2 1 7 2 3HC1209 Continuum Home Care and Hospice Onslow Lenoir 0 1 0 1 1 2 2 7 2 4HC0228 3HC Wayne Lenoir 1 1 0 0 2 3 0 7 1 3HC1299 Tar Heel Home Health Wayne Lenoir 0 0 1 1 1 1 1 5 2 2HC0507 3HC Johnston Lenoir 0 0 2 0 0 1 0 3 2 1
Figures are entered from 2009 HH Data Supplements. Data were self-reported and are not verified by the Medical Facilities Planning Section.

Table 12A: Home Health Data by County of Patient Origin - 2008 Data - Agencies or Offices Serving Residents of Counties by Age.
Lic. # Name Fac. County Resident Co. <18 18-40 41-59 60-64 65-74 75-84 85 up Total 18-64 75+HC0506 3HC Jones Lenoir 0 0 1 0 1 1 0 3 1 1HC0509 3HC Pitt Lenoir 0 0 0 0 1 0 1 2 0 1HC0431 Tar Heel Home Health Jones Lenoir 0 0 0 0 0 1 0 1 0 1HC1231 Well Care Home Health New Hanover Lenoir 0 0 0 0 1 0 0 1 0 0HC0328 Tar Heel Home Health Pitt Lenoir 0 0 0 0 1 0 0 1 0 0HC0255 3HC Sampson Lenoir 0 0 0 1 0 0 0 1 1 0
Lenoir Total 25 75 299 151 448 579 388 1965 525 967HC0268 Total Care Home Health Gaston Lincoln 1 8 60 35 103 155 110 472 103 265HC0135 Carolinas Medical Center Lincoln Home Health Lincoln Lincoln 18 39 98 38 68 103 57 421 175 160HC0391 Lincoln County Home Health Agency Lincoln Lincoln 11 20 48 29 87 118 70 383 97 188HC0906 Advanced Home Care Gaston Lincoln 16 12 43 29 41 45 16 202 84 61HC0356 Home Health Professionals Gaston Lincoln 1 11 31 10 21 30 21 125 52 51HC1903 Interim HealthCare of the Triad, Inc. Gaston Lincoln 11 13 26 15 3 9 3 80 54 12HC1325 Lake Norman Regional Medical Center- Home Health Iredell Lincoln 1 1 13 11 21 16 12 75 25 28HC0159 Gentiva Health Services Iredell Lincoln 0 1 2 6 18 26 16 69 9 42HC0353 Emerald Care, Inc. Gaston Lincoln 0 1 2 4 9 13 11 40 7 24HC0057 Guardian Health Services Catawba Lincoln 0 2 6 2 7 6 3 26 10 9HC0227 Gentiva Health Services Catawba Lincoln 0 0 13 0 3 2 0 18 13 2HC0042 Cleveland Home Health Agency, Inc. Cleveland Lincoln 2 1 4 1 5 3 1 17 6 4HC0490 Catawba County Home Health Agency Catawba Lincoln 3 2 3 0 2 4 1 15 5 5HC1902 Interim Healthcare of the Triad, Inc. Catawba Lincoln 0 0 1 0 4 0 0 5 1 0HC0515 Iredell Home Health Iredell Lincoln 0 0 1 0 2 0 0 3 1 0HC1038 CMC-Home Care Mecklenburg Lincoln 2 0 0 0 0 1 0 3 0 1HC0369 Hospice & Palliative Care Charlotte Region Mecklenburg Lincoln 2 0 0 0 0 0 0 2 0 0
Lincoln Total 68 111 351 180 394 531 321 1956 642 852HC0324 Angel Home Health & Hospice Macon Macon 6 21 72 41 117 163 131 551 134 294HC0157 WestCare Home Health and Hospice Services Jackson Macon 13 1 18 10 45 44 16 147 29 60HC0298 Angel Home Health and Hospice Swain Macon 1 0 1 0 0 2 1 5 1 3
Macon Total 20 22 91 51 162 209 148 703 164 357HC0419 Madison Home Care & Hospice Madison Madison 0 14 35 17 57 74 60 257 66 134HC0114 CarePartners Home Health Services Buncombe Madison 8 11 52 24 45 61 33 234 87 94HC2114 Tar Heel Home Health Buncombe Madison 0 2 5 2 3 8 5 25 9 13HC0279 CarePartners Home Health Services Haywood Madison 0 0 1 0 0 2 1 4 1 3
Madison Total 8 27 93 43 105 145 99 520 163 244HC0525 Roanoke Home Care & Hospice Martin Martin 27 23 66 30 132 162 150 590 119 312HC0329 Tar Heel Home Health Beaufort Martin 0 11 25 12 37 35 20 140 48 55HC1052 University Health Systems Home Health and Hospice Bertie Martin 1 6 29 11 13 21 7 88 46 28HC0509 3HC Pitt Martin 2 0 2 1 7 5 6 23 3 11HC1634 Beaufort County Hospital Home Health Beaufort Martin 0 0 2 3 5 4 1 15 5 5HC0328 Tar Heel Home Health Pitt Martin 0 0 0 0 0 3 2 5 0 5HC0523 Roanoke Home Care & Hospice Washington Martin 0 0 1 0 0 0 0 1 1 0
Martin Total 30 40 125 57 194 230 186 862 222 416HC0435 McDowell Home Health Agency McDowell McDowell 30 79 183 90 168 209 142 901 352 351HC0105 Blue Ridge Home Care Burke McDowell 8 10 42 19 46 59 27 211 71 86HC2114 Tar Heel Home Health Buncombe McDowell 0 2 5 3 8 6 1 25 10 7HC0186 Carolina Home Care Rutherford McDowell 3 0 2 2 1 2 0 10 4 2
McDowell Total 41 91 232 114 223 276 170 1147 437 446HC1038 CMC-Home Care Mecklenburg Mecklenburg 587 501 952 368 603 693 430 4134 1821 1123HC0171 Advanced Home Care Mecklenburg Mecklenburg 16 166 465 200 486 654 444 2431 831 1098HC0787 Gentiva Health Services Mecklenburg Mecklenburg 0 62 363 199 661 667 350 2302 624 1017HC1901 Interim HealthCare of the Triad, Inc. Mecklenburg Mecklenburg 242 203 325 150 255 220 132 1527 678 352HC0097 Total Care Home Health Mecklenburg Mecklenburg 0 17 74 38 141 427 625 1322 129 1052HC0138 Total Care Home Health Mecklenburg Mecklenburg 5 50 168 78 169 218 171 859 296 389HC0355 Home Health Professionals Mecklenburg Mecklenburg 0 26 102 49 90 122 95 484 177 217HC1325 Lake Norman Regional Medical Center- Home Health Iredell Mecklenburg 1 7 26 19 29 44 26 152 52 70HC0281 Advanced Home Care Cabarrus Mecklenburg 5 10 16 12 19 34 17 113 38 51HC0356 Home Health Professionals Gaston Mecklenburg 0 11 37 16 20 9 6 99 64 15HC3694 Liberty Home Care and Hospice Mecklenburg Mecklenburg 0 0 16 4 18 33 13 84 20 46HC0369 Hospice & Palliative Care Charlotte Region Mecklenburg Mecklenburg 51 0 0 0 0 0 0 51 0 0HC0353 Emerald Care, Inc. Gaston Mecklenburg 0 0 1 0 7 10 20 38 1 30HC0264 Liberty Home Care Anson Mecklenburg 0 0 7 2 3 8 5 25 9 13HC0906 Advanced Home Care Gaston Mecklenburg 1 1 3 3 1 1 2 12 7 3HC0515 Iredell Home Health Iredell Mecklenburg 0 0 4 0 0 1 1 6 4 2HC0486 Cabarrus Health Alliance/Home Health Cabarrus Mecklenburg 1 1 0 0 0 1 0 3 1 1HC0352 Liberty Home care Robeson Mecklenburg 0 0 0 0 0 0 1 1 0 1HC0308 Home Care of the Carolinas Stanly Mecklenburg 0 0 1 0 0 0 0 1 1 0
Mecklenburg Total 909 1055 2560 1138 2502 3142 2338 13644 4753 5480HC0319 Mitchell County Home Health Agency Mitchell Mitchell 10 16 49 44 90 145 84 438 109 229HC0114 CarePartners Home Health Services Buncombe Mitchell 0 0 0 0 0 1 0 1 0 1
Mitchell Total 10 16 49 44 90 146 84 439 109 230HC2404 Home Care of the Carolinas Montgomery Montgomery 35 18 61 43 90 105 88 440 122 193HC0423 FirstHealth Home Care- Richmond Richmond Montgomery 0 18 35 17 30 52 22 174 70 74HC0552 Home Health of Randolph Hospital Randolph Montgomery 2 8 16 7 8 9 4 54 31 13HC0953 Gentiva Health Services Randolph Montgomery 0 5 24 4 8 5 5 51 33 10HC0332 FirstHealth Home Care Moore Montgomery 13 1 12 1 5 10 6 48 14 16HC0002 Liberty Home Care Moore Montgomery 0 0 5 4 6 6 3 24 9 9HC0403 HealthKeeperz Scotland Montgomery 4 2 3 2 2 1 0 14 7 1HC0929 CareSouth Homecare Professionals Randolph Montgomery 0 0 2 1 1 5 4 13 3 9HC0308 Home Care of the Carolinas Stanly Montgomery 5 1 0 0 3 1 0 10 1 1HC0124 Liberty Home Care Davidson Montgomery 0 1 0 0 1 0 0 2 1 0HC0397 Hospice of Randolph County, Inc. Randolph Montgomery 1 0 0 0 1 0 0 2 0 0
Montgomery Total 60 54 158 79 155 194 132 832 291 326HC0332 FirstHealth Home Care Moore Moore 86 32 186 90 248 353 188 1183 308 541HC0002 Liberty Home Care Moore Moore 0 16 63 30 94 130 117 450 109 247HC0403 HealthKeeperz Scotland Moore 15 16 30 17 40 49 43 210 63 92HC2404 Home Care of the Carolinas Montgomery Moore 19 2 1 0 2 4 3 31 3 7
Figures are entered from 2009 HH Data Supplements. Data were self-reported and are not verified by the Medical Facilities Planning Section.

Table 12A: Home Health Data by County of Patient Origin - 2008 Data - Agencies or Offices Serving Residents of Counties by Age.
Lic. # Name Fac. County Resident Co. <18 18-40 41-59 60-64 65-74 75-84 85 up Total 18-64 75+HC0125 Liberty Home Care Harnett Moore 0 0 0 5 4 16 4 29 5 20HC0426 Liberty Home Care Lee Moore 1 1 4 4 3 7 2 22 9 9HC0283 Cape Fear Valley HomeCare and Hospice Cumberland Moore 4 2 4 1 3 2 4 20 7 6HC0423 FirstHealth Home Care- Richmond Richmond Moore 0 1 3 2 5 2 7 20 6 9HC0929 CareSouth Homecare Professionals Randolph Moore 0 0 2 3 1 3 3 12 5 6HC0277 Liberty Home Care Hoke Moore 1 1 0 0 0 2 1 5 1 3HC0552 Home Health of Randolph Hospital Randolph Moore 0 0 1 0 0 0 1 2 1 1HC3694 Liberty Home Care and Hospice Mecklenburg Moore 0 0 0 0 0 1 0 1 0 1HC0397 Hospice of Randolph County, Inc. Randolph Moore 1 0 0 0 0 0 0 1 0 0
Moore Total 127 71 294 152 400 569 373 1986 517 942HC0520 Nash County Home Health Agency Nash Nash 22 47 154 75 185 267 213 963 276 480HC0497 Tar Heel Home Health Nash Nash 0 19 95 53 171 238 185 761 167 423HC0508 3HC Wilson Nash 11 21 54 15 32 21 10 164 90 31HC0343 Wilson County Home Health Wilson Nash 11 3 14 6 17 16 7 74 23 23HC0918 Heartland Home Health Care Wake Nash 0 0 2 1 2 1 2 8 3 3HC0074 At Home Quality Care, Inc. Wake Nash 0 0 3 1 1 0 0 5 4 0HC2562 Liberty Home Care Wake Nash 0 0 3 1 0 1 0 5 4 1HC0500 Franklin County Home Health Agency Franklin Nash 0 0 0 2 1 1 0 4 2 1HC2112 Medi Home Health Agency Wake Nash 0 0 0 0 0 1 1 2 0 2HC0255 3HC Sampson Nash 0 0 0 1 0 0 0 1 1 0HC1437 Professional Nursing Service and Home Health Wake Nash 1 0 0 0 0 0 0 1 0 0HC0341 Warren County Home Health Agency Warren Nash 0 0 0 0 0 1 0 1 0 1
Nash Total 45 90 325 155 409 547 418 1989 570 965HC0196 Liberty Home Care New Hanover New Hanover 5 49 246 158 365 497 405 1725 453 902HC1231 Well Care Home Health New Hanover New Hanover 89 93 305 135 325 427 323 1697 533 750HC1500 AssistedCare Home Health Brunswick New Hanover 20 35 109 54 141 210 153 722 198 363HC0532 Pender Home Health Pender New Hanover 7 30 65 38 76 82 59 357 133 141HC1241 Liberty Home Care Pender New Hanover 1 0 0 0 1 4 0 6 0 4
New Hanover Total 122 207 725 385 908 1220 940 4507 1317 2160HC0530 Northampton Co. Home Health Agency Northampton Northampton 0 30 88 41 126 175 133 593 159 308HC0504 Hertford-Gates Home Health Agency Hertford Northampton 1 1 1 1 3 3 2 12 3 5HC1052 University Health Systems Home Health and Hospice Bertie Northampton 0 0 0 1 2 3 2 8 1 5HC0497 Tar Heel Home Health Nash Northampton 0 0 1 0 0 1 3 5 1 4HC0341 Warren County Home Health Agency Warren Northampton 0 0 0 0 0 2 1 3 0 3
Northampton Total 1 31 90 43 131 184 141 621 164 325HC0316 Liberty Home Care Onslow Onslow 11 37 142 70 186 177 85 708 249 262HC0531 Onslow County Home Health and Hospice Onslow Onslow 50 60 97 38 83 113 63 504 195 176HC1209 Continuum Home Care and Hospice Onslow Onslow 9 30 68 29 109 113 60 418 127 173HC0431 Tar Heel Home Health Jones Onslow 0 13 43 25 56 100 70 307 81 170HC0506 3HC Jones Onslow 7 15 33 11 36 34 21 157 59 55HC1231 Well Care Home Health New Hanover Onslow 10 15 35 19 37 22 17 155 69 39HC1353 Liberty Home Care Carteret Onslow 0 1 4 6 6 11 2 30 11 13HC0053 Carolina East Home Care & Hospice Inc. Duplin Onslow 0 1 3 0 0 4 5 13 4 9HC0532 Pender Home Health Pender Onslow 0 0 4 2 5 0 2 13 6 2HC0073 Tar Heel Home Health Carteret Onslow 0 1 0 1 1 4 2 9 2 6HC1241 Liberty Home Care Pender Onslow 0 0 0 3 2 0 1 6 3 1HC1500 AssistedCare Home Health Brunswick Onslow 0 0 0 0 0 1 1 2 0 2
Onslow Total 87 173 429 204 521 579 329 2322 806 908HC0030 UNC Home Health Orange Orange 1 16 71 43 108 129 119 487 130 248HC1176 Liberty Home Care Durham Orange 0 11 51 30 62 64 48 266 92 112HC0166 Amedisys Home Health of Chapel Hill Orange Orange 0 5 2 6 96 123 18 250 13 141HC0360 Duke Home Health Durham Orange 20 17 48 21 39 50 27 222 86 77HC2111 Tar Heel Home Health Durham Orange 0 0 10 6 16 24 21 77 16 45HC0134 Tender Loving Care Home Health & Hospice Alamance Orange 0 0 8 3 7 28 19 65 11 47HC0918 Heartland Home Health Care Wake Orange 0 1 11 6 12 14 13 57 18 27HC0249 Advanced Home Care Alamance Orange 0 3 7 3 8 12 6 39 13 18HC0354 Home Health Professionals Person Orange 7 3 4 2 6 6 7 35 9 13HC2803 UNC Home Health Chatham Orange 0 0 9 2 7 6 1 25 11 7HC0074 At Home Quality Care, Inc. Wake Orange 1 1 10 0 5 6 2 25 11 8HC2112 Medi Home Health Agency Wake Orange 0 3 1 0 8 5 3 20 4 8HC0361 Life Path Home Health Alamance Orange 2 0 0 0 2 8 5 17 0 13HC0145 Tender Loving Care Home Health & Hospice Durham Orange 0 0 1 0 1 4 5 11 1 9HC0828 Pediatric Services of America, Inc. Wake Orange 7 0 0 0 0 0 0 7 0 0HC0489 Caswell County Home Health Agency Caswell Orange 0 0 1 1 0 1 0 3 2 1HC0507 3HC Johnston Orange 1 0 0 0 0 0 0 1 0 0HC0533 Home Health and Hospice of Person County Person Orange 0 0 0 1 0 0 0 1 1 0HC0339 Intrepid USA Healthcare Services Wake Orange 0 0 0 0 0 0 1 1 0 1HC1437 Professional Nursing Service and Home Health Wake Orange 0 0 0 0 1 0 0 1 0 0
Orange Total 39 60 234 124 378 480 295 1610 418 775HC0165 Home Care Craven Regional Medical Authority Craven Pamlico 0 2 11 8 37 53 17 128 21 70HC0431 Tar Heel Home Health Jones Pamlico 1 6 15 9 21 16 20 88 30 36HC1634 Beaufort County Hospital Home Health Beaufort Pamlico 0 1 3 1 0 4 1 10 5 5HC0493 Craven County Health Dept. Home Health-Hospice Agency Craven Pamlico 0 0 1 0 0 0 0 1 1 0
Pamlico Total 1 9 30 18 58 73 38 227 57 111HC0471 Albemarle Home Care Pasquotank Pasquotank 12 34 98 54 109 141 130 578 186 271HC1071 Sentara Home Care Services Pasquotank Pasquotank 14 17 37 13 18 15 6 120 67 21
Pasquotank Total 26 51 135 67 127 156 136 698 253 292HC0532 Pender Home Health Pender Pender 15 33 114 68 162 148 92 632 215 240HC1241 Liberty Home Care Pender Pender 0 12 41 27 83 69 27 259 80 96HC1231 Well Care Home Health New Hanover Pender 21 15 37 15 54 63 42 247 67 105HC1500 AssistedCare Home Health Brunswick Pender 3 0 2 4 13 14 8 44 6 22HC0316 Liberty Home Care Onslow Pender 0 0 4 0 5 2 1 12 4 3HC1209 Continuum Home Care and Hospice Onslow Pender 0 0 2 0 4 0 2 8 2 2HC0053 Carolina East Home Care & Hospice Inc. Duplin Pender 0 0 0 2 2 2 1 7 2 3HC1565 Tar Heel Home Health Lenoir Pender 2 0 0 0 2 0 0 4 0 0HC0196 Liberty Home Care New Hanover Pender 0 0 1 0 2 0 0 3 1 0
Figures are entered from 2009 HH Data Supplements. Data were self-reported and are not verified by the Medical Facilities Planning Section.
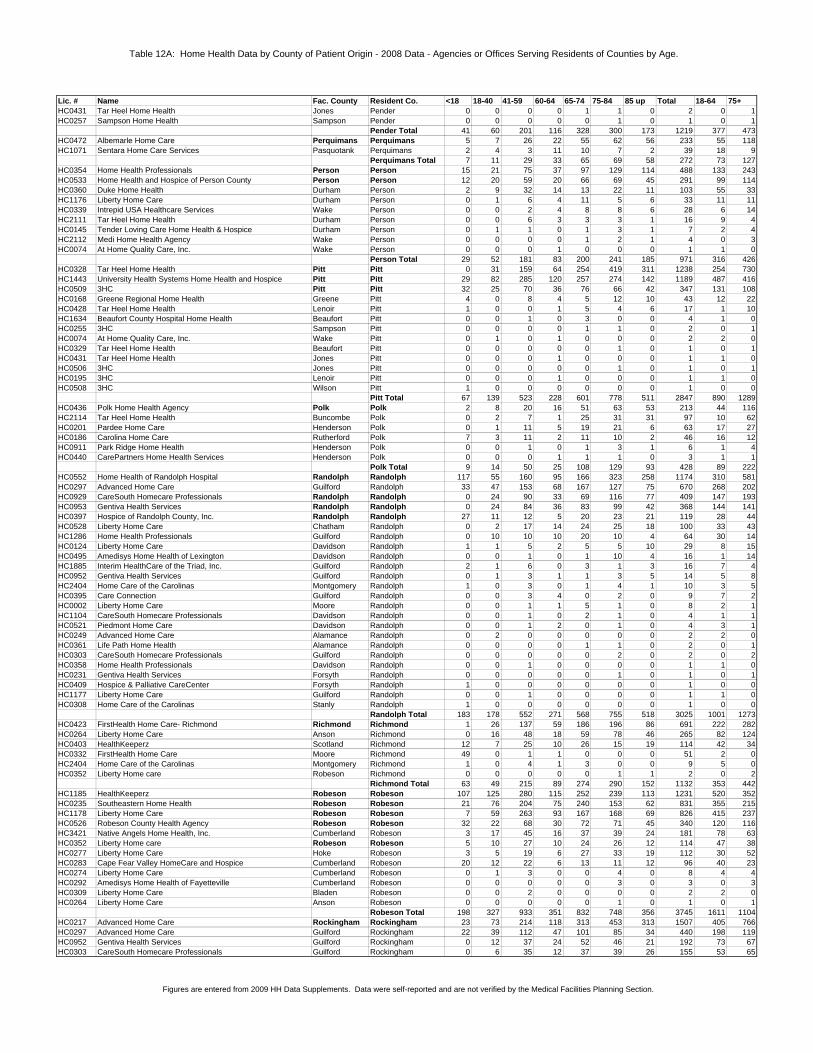
Table 12A: Home Health Data by County of Patient Origin - 2008 Data - Agencies or Offices Serving Residents of Counties by Age.
Lic. # Name Fac. County Resident Co. <18 18-40 41-59 60-64 65-74 75-84 85 up Total 18-64 75+HC0431 Tar Heel Home Health Jones Pender 0 0 0 0 1 1 0 2 0 1HC0257 Sampson Home Health Sampson Pender 0 0 0 0 0 1 0 1 0 1
Pender Total 41 60 201 116 328 300 173 1219 377 473HC0472 Albemarle Home Care Perquimans Perquimans 5 7 26 22 55 62 56 233 55 118HC1071 Sentara Home Care Services Pasquotank Perquimans 2 4 3 11 10 7 2 39 18 9
Perquimans Total 7 11 29 33 65 69 58 272 73 127HC0354 Home Health Professionals Person Person 15 21 75 37 97 129 114 488 133 243HC0533 Home Health and Hospice of Person County Person Person 12 20 59 20 66 69 45 291 99 114HC0360 Duke Home Health Durham Person 2 9 32 14 13 22 11 103 55 33HC1176 Liberty Home Care Durham Person 0 1 6 4 11 5 6 33 11 11HC0339 Intrepid USA Healthcare Services Wake Person 0 0 2 4 8 8 6 28 6 14HC2111 Tar Heel Home Health Durham Person 0 0 6 3 3 3 1 16 9 4HC0145 Tender Loving Care Home Health & Hospice Durham Person 0 1 1 0 1 3 1 7 2 4HC2112 Medi Home Health Agency Wake Person 0 0 0 0 1 2 1 4 0 3HC0074 At Home Quality Care, Inc. Wake Person 0 0 0 1 0 0 0 1 1 0
Person Total 29 52 181 83 200 241 185 971 316 426HC0328 Tar Heel Home Health Pitt Pitt 0 31 159 64 254 419 311 1238 254 730HC1443 University Health Systems Home Health and Hospice Pitt Pitt 29 82 285 120 257 274 142 1189 487 416HC0509 3HC Pitt Pitt 32 25 70 36 76 66 42 347 131 108HC0168 Greene Regional Home Health Greene Pitt 4 0 8 4 5 12 10 43 12 22HC0428 Tar Heel Home Health Lenoir Pitt 1 0 0 1 5 4 6 17 1 10HC1634 Beaufort County Hospital Home Health Beaufort Pitt 0 0 1 0 3 0 0 4 1 0HC0255 3HC Sampson Pitt 0 0 0 0 1 1 0 2 0 1HC0074 At Home Quality Care, Inc. Wake Pitt 0 1 0 1 0 0 0 2 2 0HC0329 Tar Heel Home Health Beaufort Pitt 0 0 0 0 0 1 0 1 0 1HC0431 Tar Heel Home Health Jones Pitt 0 0 0 1 0 0 0 1 1 0HC0506 3HC Jones Pitt 0 0 0 0 0 1 0 1 0 1HC0195 3HC Lenoir Pitt 0 0 0 1 0 0 0 1 1 0HC0508 3HC Wilson Pitt 1 0 0 0 0 0 0 1 0 0
Pitt Total 67 139 523 228 601 778 511 2847 890 1289HC0436 Polk Home Health Agency Polk Polk 2 8 20 16 51 63 53 213 44 116HC2114 Tar Heel Home Health Buncombe Polk 0 2 7 1 25 31 31 97 10 62HC0201 Pardee Home Care Henderson Polk 0 1 11 5 19 21 6 63 17 27HC0186 Carolina Home Care Rutherford Polk 7 3 11 2 11 10 2 46 16 12HC0911 Park Ridge Home Health Henderson Polk 0 0 1 0 1 3 1 6 1 4HC0440 CarePartners Home Health Services Henderson Polk 0 0 0 1 1 1 0 3 1 1
Polk Total 9 14 50 25 108 129 93 428 89 222HC0552 Home Health of Randolph Hospital Randolph Randolph 117 55 160 95 166 323 258 1174 310 581HC0297 Advanced Home Care Guilford Randolph 33 47 153 68 167 127 75 670 268 202HC0929 CareSouth Homecare Professionals Randolph Randolph 0 24 90 33 69 116 77 409 147 193HC0953 Gentiva Health Services Randolph Randolph 0 24 84 36 83 99 42 368 144 141HC0397 Hospice of Randolph County, Inc. Randolph Randolph 27 11 12 5 20 23 21 119 28 44HC0528 Liberty Home Care Chatham Randolph 0 2 17 14 24 25 18 100 33 43HC1286 Home Health Professionals Guilford Randolph 0 10 10 10 20 10 4 64 30 14HC0124 Liberty Home Care Davidson Randolph 1 1 5 2 5 5 10 29 8 15HC0495 Amedisys Home Health of Lexington Davidson Randolph 0 0 1 0 1 10 4 16 1 14HC1885 Interim HealthCare of the Triad, Inc. Guilford Randolph 2 1 6 0 3 1 3 16 7 4HC0952 Gentiva Health Services Guilford Randolph 0 1 3 1 1 3 5 14 5 8HC2404 Home Care of the Carolinas Montgomery Randolph 1 0 3 0 1 4 1 10 3 5HC0395 Care Connection Guilford Randolph 0 0 3 4 0 2 0 9 7 2HC0002 Liberty Home Care Moore Randolph 0 0 1 1 5 1 0 8 2 1HC1104 CareSouth Homecare Professionals Davidson Randolph 0 0 1 0 2 1 0 4 1 1HC0521 Piedmont Home Care Davidson Randolph 0 0 1 2 0 1 0 4 3 1HC0249 Advanced Home Care Alamance Randolph 0 2 0 0 0 0 0 2 2 0HC0361 Life Path Home Health Alamance Randolph 0 0 0 0 1 1 0 2 0 1HC0303 CareSouth Homecare Professionals Guilford Randolph 0 0 0 0 0 2 0 2 0 2HC0358 Home Health Professionals Davidson Randolph 0 0 1 0 0 0 0 1 1 0HC0231 Gentiva Health Services Forsyth Randolph 0 0 0 0 0 1 0 1 0 1HC0409 Hospice & Palliative CareCenter Forsyth Randolph 1 0 0 0 0 0 0 1 0 0HC1177 Liberty Home Care Guilford Randolph 0 0 1 0 0 0 0 1 1 0HC0308 Home Care of the Carolinas Stanly Randolph 1 0 0 0 0 0 0 1 0 0
Randolph Total 183 178 552 271 568 755 518 3025 1001 1273HC0423 FirstHealth Home Care- Richmond Richmond Richmond 1 26 137 59 186 196 86 691 222 282HC0264 Liberty Home Care Anson Richmond 0 16 48 18 59 78 46 265 82 124HC0403 HealthKeeperz Scotland Richmond 12 7 25 10 26 15 19 114 42 34HC0332 FirstHealth Home Care Moore Richmond 49 0 1 1 0 0 0 51 2 0HC2404 Home Care of the Carolinas Montgomery Richmond 1 0 4 1 3 0 0 9 5 0HC0352 Liberty Home care Robeson Richmond 0 0 0 0 0 1 1 2 0 2
Richmond Total 63 49 215 89 274 290 152 1132 353 442HC1185 HealthKeeperz Robeson Robeson 107 125 280 115 252 239 113 1231 520 352HC0235 Southeastern Home Health Robeson Robeson 21 76 204 75 240 153 62 831 355 215HC1178 Liberty Home Care Robeson Robeson 7 59 263 93 167 168 69 826 415 237HC0526 Robeson County Health Agency Robeson Robeson 32 22 68 30 72 71 45 340 120 116HC3421 Native Angels Home Health, Inc. Cumberland Robeson 3 17 45 16 37 39 24 181 78 63HC0352 Liberty Home care Robeson Robeson 5 10 27 10 24 26 12 114 47 38HC0277 Liberty Home Care Hoke Robeson 3 5 19 6 27 33 19 112 30 52HC0283 Cape Fear Valley HomeCare and Hospice Cumberland Robeson 20 12 22 6 13 11 12 96 40 23HC0274 Liberty Home Care Cumberland Robeson 0 1 3 0 0 4 0 8 4 4HC0292 Amedisys Home Health of Fayetteville Cumberland Robeson 0 0 0 0 0 3 0 3 0 3HC0309 Liberty Home Care Bladen Robeson 0 0 2 0 0 0 0 2 2 0HC0264 Liberty Home Care Anson Robeson 0 0 0 0 0 1 0 1 0 1
Robeson Total 198 327 933 351 832 748 356 3745 1611 1104HC0217 Advanced Home Care Rockingham Rockingham 23 73 214 118 313 453 313 1507 405 766HC0297 Advanced Home Care Guilford Rockingham 22 39 112 47 101 85 34 440 198 119HC0952 Gentiva Health Services Guilford Rockingham 0 12 37 24 52 46 21 192 73 67HC0303 CareSouth Homecare Professionals Guilford Rockingham 0 6 35 12 37 39 26 155 53 65
Figures are entered from 2009 HH Data Supplements. Data were self-reported and are not verified by the Medical Facilities Planning Section.

Table 12A: Home Health Data by County of Patient Origin - 2008 Data - Agencies or Offices Serving Residents of Counties by Age.
Lic. # Name Fac. County Resident Co. <18 18-40 41-59 60-64 65-74 75-84 85 up Total 18-64 75+HC1885 Interim HealthCare of the Triad, Inc. Guilford Rockingham 1 4 18 2 6 8 5 44 24 13HC1177 Liberty Home Care Guilford Rockingham 0 0 3 3 1 4 5 16 6 9HC0489 Caswell County Home Health Agency Caswell Rockingham 3 0 2 0 0 0 1 6 2 1HC0567 Gentiva Health Services Forsyth Rockingham 0 0 0 1 0 0 0 1 1 0HC0005 Home Health Professionals Forsyth Rockingham 0 0 0 0 0 1 0 1 0 1
Rockingham Total 49 134 421 207 510 636 405 2362 762 1041HC0399 Rowan Regional Home Health & Hospice Rowan Rowan 86 35 153 61 148 204 138 825 249 342HC0265 Gentiva Health Services Rowan Rowan 4 24 101 50 148 186 220 733 175 406HC0357 Home Health Professionals Rowan Rowan 3 24 126 68 178 199 109 707 218 308HC0869 Advanced Home Care Rowan Rowan 17 48 166 67 164 149 65 676 281 214HC0486 Cabarrus Health Alliance/Home Health Cabarrus Rowan 16 15 42 24 42 64 58 261 81 122HC0270 Gentiva Health Services Rowan Rowan 0 6 51 24 61 62 40 244 81 102HC0308 Home Care of the Carolinas Stanly Rowan 6 2 3 0 5 3 6 25 5 9HC1325 Lake Norman Regional Medical Center- Home Health Iredell Rowan 0 0 7 1 5 8 3 24 8 11HC0515 Iredell Home Health Iredell Rowan 3 2 3 2 2 1 6 19 7 7HC0521 Piedmont Home Care Davidson Rowan 2 0 1 0 2 0 0 5 1 0HC0171 Advanced Home Care Mecklenburg Rowan 0 1 0 0 2 0 1 4 1 1HC0495 Amedisys Home Health of Lexington Davidson Rowan 0 0 0 0 2 0 1 3 0 1HC1104 CareSouth Homecare Professionals Davidson Rowan 0 1 0 1 0 0 1 3 2 1HC0124 Liberty Home Care Davidson Rowan 0 0 0 0 1 0 2 3 0 2HC0409 Hospice & Palliative CareCenter Forsyth Rowan 1 1 0 0 1 0 0 3 1 0HC0496 Davie County Home Health Agency Davie Rowan 0 0 0 0 1 0 1 2 0 1HC3694 Liberty Home Care and Hospice Mecklenburg Rowan 0 0 0 0 1 0 0 1 0 0
Rowan Total 138 159 653 298 763 876 651 3538 1110 1527HC0186 Carolina Home Care Rutherford Rutherford 26 56 286 105 297 253 110 1133 447 363HC0445 Rutherford Home Health Care Rutherford Rutherford 16 20 68 28 67 83 100 382 116 183HC0221 Total Care Home Health Cleveland Rutherford 0 23 63 18 76 80 62 322 104 142HC0042 Cleveland Home Health Agency, Inc. Cleveland Rutherford 2 5 31 8 25 19 4 94 44 23HC0201 Pardee Home Care Henderson Rutherford 0 0 1 0 3 1 0 5 1 1
Rutherford Total 44 104 449 159 468 436 276 1936 712 712HC0257 Sampson Home Health Sampson Sampson 55 35 134 55 194 258 142 873 224 400HC0255 3HC Sampson Sampson 9 18 93 44 99 114 55 432 155 169HC0125 Liberty Home Care Harnett Sampson 0 1 10 18 19 17 12 77 29 29HC0274 Liberty Home Care Cumberland Sampson 1 3 19 15 20 13 5 76 37 18HC1565 Tar Heel Home Health Lenoir Sampson 0 1 11 9 16 16 7 60 21 23HC0283 Cape Fear Valley HomeCare and Hospice Cumberland Sampson 8 4 8 2 5 4 7 38 14 11HC0309 Liberty Home Care Bladen Sampson 0 2 6 1 5 3 0 17 9 3HC0053 Carolina East Home Care & Hospice Inc. Duplin Sampson 0 1 4 1 0 1 1 8 6 2HC1231 Well Care Home Health New Hanover Sampson 0 0 2 1 3 1 1 8 3 2HC1241 Liberty Home Care Pender Sampson 0 0 3 1 1 3 0 8 4 3HC0359 HealthKeeperz Cumberland Sampson 0 0 1 0 0 2 0 3 1 2HC0532 Pender Home Health Pender Sampson 0 0 0 1 1 0 1 3 1 1HC0228 3HC Wayne Sampson 0 0 2 0 1 0 0 3 2 0HC0507 3HC Johnston Sampson 0 0 0 0 1 0 1 2 0 1HC0195 3HC Lenoir Sampson 0 0 1 0 0 0 1 2 1 1HC0508 3HC Wilson Sampson 0 0 0 0 2 0 0 2 0 0HC0292 Amedisys Home Health of Fayetteville Cumberland Sampson 0 0 0 0 0 1 0 1 0 1HC0426 Liberty Home Care Lee Sampson 0 0 0 0 1 0 0 1 0 0HC1299 Tar Heel Home Health Wayne Sampson 0 0 0 0 0 1 0 1 0 1
Sampson Total 73 65 294 148 368 434 233 1615 507 667HC0403 HealthKeeperz Scotland Scotland 50 49 147 55 138 176 121 736 251 297HC0352 Liberty Home care Robeson Scotland 2 12 76 26 49 59 32 256 114 91HC0423 FirstHealth Home Care- Richmond Richmond Scotland 0 14 31 20 31 22 9 127 65 31HC3421 Native Angels Home Health, Inc. Cumberland Scotland 0 2 6 2 9 4 0 23 10 4HC0283 Cape Fear Valley HomeCare and Hospice Cumberland Scotland 2 1 2 0 1 2 2 10 3 4HC0332 FirstHealth Home Care Moore Scotland 7 0 0 0 0 1 0 8 0 1HC0277 Liberty Home Care Hoke Scotland 0 1 0 0 0 2 2 5 1 4HC1178 Liberty Home Care Robeson Scotland 0 1 1 0 0 0 0 2 2 0HC0264 Liberty Home Care Anson Scotland 0 0 1 0 0 0 0 1 1 0HC0309 Liberty Home Care Bladen Scotland 0 0 1 0 0 0 0 1 1 0
Scotland Total 61 80 265 103 228 266 166 1169 448 432HC0308 Home Care of the Carolinas Stanly Stanly 60 47 118 62 173 248 169 877 227 417HC0281 Advanced Home Care Cabarrus Stanly 6 12 63 35 67 51 6 240 110 57HC0514 Stanly County Home Health Agency Stanly Stanly 26 15 25 24 52 40 28 210 64 68HC0270 Gentiva Health Services Rowan Stanly 0 3 27 16 41 42 11 140 46 53HC0486 Cabarrus Health Alliance/Home Health Cabarrus Stanly 1 1 1 2 0 1 2 8 4 3HC2404 Home Care of the Carolinas Montgomery Stanly 2 0 0 0 0 1 1 4 0 2HC0399 Rowan Regional Home Health & Hospice Rowan Stanly 0 0 1 0 1 1 1 4 1 2HC0171 Advanced Home Care Mecklenburg Stanly 0 0 0 2 0 0 0 2 2 0HC1038 CMC-Home Care Mecklenburg Stanly 2 0 0 0 0 0 0 2 0 0HC2057 Total Care Home Health Union Stanly 0 0 0 0 2 0 0 2 0 0HC1325 Lake Norman Regional Medical Center- Home Health Iredell Stanly 0 0 0 0 1 0 0 1 0 0HC0423 FirstHealth Home Care- Richmond Richmond Stanly 0 0 0 0 0 0 1 1 0 1HC1238 Union Regional Home Care Union Stanly 0 0 0 0 0 0 1 1 0 1
Stanly Total 97 78 235 141 337 384 220 1492 454 604HC1699 Gentiva Health Services Stokes Stokes 0 23 93 44 111 184 171 626 160 355HC0499 Advanced Home Care Forsyth Stokes 13 11 45 28 46 44 11 198 84 55HC0517 Stokes County HHA Stokes Stokes 2 15 36 12 53 57 11 186 63 68HC0567 Gentiva Health Services Forsyth Stokes 0 1 11 13 38 38 27 128 25 65HC1131 Gentiva Health Services Forsyth Stokes 0 3 12 4 20 19 10 68 19 29HC0420 Liberty Home Care Surry Stokes 10 3 12 4 4 6 6 45 19 12HC0005 Home Health Professionals Forsyth Stokes 3 2 1 1 3 9 4 23 4 13HC1886 Interim HealthCare of the Triad Inc. Forsyth Stokes 5 2 3 2 2 3 1 18 7 4HC0217 Advanced Home Care Rockingham Stokes 0 0 2 1 4 3 3 13 3 6HC0409 Hospice & Palliative CareCenter Forsyth Stokes 4 0 0 1 1 0 2 8 1 2HC1304 Amedisys Home Health of Winston Salem Forsyth Stokes 0 0 3 0 1 0 2 6 3 2
Figures are entered from 2009 HH Data Supplements. Data were self-reported and are not verified by the Medical Facilities Planning Section.

Table 12A: Home Health Data by County of Patient Origin - 2008 Data - Agencies or Offices Serving Residents of Counties by Age.
Lic. # Name Fac. County Resident Co. <18 18-40 41-59 60-64 65-74 75-84 85 up Total 18-64 75+HC0297 Advanced Home Care Guilford Stokes 0 1 0 1 0 1 0 3 2 1
Stokes Total 37 61 218 111 283 364 248 1322 390 612HC0420 Liberty Home Care Surry Surry 75 50 127 64 177 242 160 895 241 402HC0296 Surry County Home Health Agency Surry Surry 8 23 65 43 113 158 151 561 131 309HC1699 Gentiva Health Services Stokes Surry 0 10 46 32 64 95 91 338 88 186HC0346 Yadkin Valley Home Health Yadkin Surry 2 5 28 16 52 85 77 265 49 162HC0499 Advanced Home Care Forsyth Surry 9 6 33 18 22 28 8 124 57 36HC0252 Gentiva Health Services Wilkes Surry 0 3 16 14 32 32 24 121 33 56HC0567 Gentiva Health Services Forsyth Surry 0 0 2 1 12 17 3 35 3 20HC1131 Gentiva Health Services Forsyth Surry 0 2 5 3 4 5 4 23 10 9HC1886 Interim HealthCare of the Triad Inc. Forsyth Surry 1 0 0 3 3 1 1 9 3 2HC0297 Advanced Home Care Guilford Surry 0 1 0 0 0 1 0 2 1 1HC0005 Home Health Professionals Forsyth Surry 0 0 0 0 0 1 0 1 0 1HC0409 Hospice & Palliative CareCenter Forsyth Surry 0 0 0 1 0 0 0 1 1 0HC0430 Home Care of Wilkes Regional Medical Center Wilkes Surry 0 0 0 0 1 0 0 1 0 0
Surry Total 95 100 322 195 480 665 519 2376 617 1184HC0157 WestCare Home Health and Hospice Services Jackson Swain 8 5 27 13 30 39 28 150 45 67HC0298 Angel Home Health and Hospice Swain Swain 1 9 26 13 15 36 28 128 48 64
Swain Total 9 14 53 26 45 75 56 278 93 131HC0067 TRH-Home Care Transylvania Transylvania 20 22 93 49 164 246 221 815 164 467HC0440 CarePartners Home Health Services Henderson Transylvania 1 4 13 6 7 6 0 37 23 6HC0201 Pardee Home Care Henderson Transylvania 0 1 4 4 15 7 2 33 9 9HC0911 Park Ridge Home Health Henderson Transylvania 1 0 0 0 0 0 3 4 0 3HC0114 CarePartners Home Health Services Buncombe Transylvania 2 0 0 0 0 0 0 2 0 0
Transylvania Total 24 27 110 59 186 259 226 891 196 485HC0524 Roanoke Home Care & Hospice Tyrrell Tyrrell 2 2 7 6 18 29 23 87 15 52HC0523 Roanoke Home Care & Hospice Washington Tyrrell 1 0 0 0 1 0 1 3 0 1
Tyrrell Total 3 2 7 6 19 29 24 90 15 53HC1238 Union Regional Home Care Union Union 53 70 289 71 178 189 168 1018 430 357HC2057 Total Care Home Health Union Union 1 13 100 43 208 257 226 848 156 483HC0171 Advanced Home Care Mecklenburg Union 2 18 72 37 76 91 45 341 127 136HC1901 Interim HealthCare of the Triad, Inc. Mecklenburg Union 14 20 25 11 15 8 0 93 56 8HC0787 Gentiva Health Services Mecklenburg Union 0 0 15 4 12 9 2 42 19 11HC1038 CMC-Home Care Mecklenburg Union 9 2 1 1 3 1 1 18 4 2HC0355 Home Health Professionals Mecklenburg Union 0 0 3 4 3 2 1 13 7 3HC0308 Home Care of the Carolinas Stanly Union 2 1 1 0 4 1 3 12 2 4HC0369 Hospice & Palliative Care Charlotte Region Mecklenburg Union 11 0 0 0 0 0 0 11 0 0HC2404 Home Care of the Carolinas Montgomery Union 0 0 0 0 1 1 0 2 0 1HC0264 Liberty Home Care Anson Union 0 0 0 0 0 1 0 1 0 1HC0281 Advanced Home Care Cabarrus Union 0 1 0 0 0 0 0 1 1 0
Union Total 92 125 506 171 500 560 446 2400 802 1006HC0823 Maria Parham Regional Home Health Vance Vance 2 21 95 32 81 98 80 409 148 178HC0501 Granville-Vance Home Health Agency Vance Vance 5 20 52 25 55 41 28 226 97 69HC0215 Tar Heel Home Health Franklin Vance 2 15 42 24 38 40 22 183 81 62HC0339 Intrepid USA Healthcare Services Wake Vance 0 0 9 16 29 26 34 114 25 60HC0360 Duke Home Health Durham Vance 1 5 15 7 13 4 2 47 27 6HC0145 Tender Loving Care Home Health & Hospice Durham Vance 0 2 3 1 4 3 3 16 6 6HC0500 Franklin County Home Health Agency Franklin Vance 0 0 5 0 0 5 0 10 5 5HC0918 Heartland Home Health Care Wake Vance 0 0 3 0 1 1 0 5 3 1HC0074 At Home Quality Care, Inc. Wake Vance 0 2 0 0 1 0 0 3 2 0HC2112 Medi Home Health Agency Wake Vance 0 0 0 0 0 1 0 1 0 1
Vance Total 10 65 224 105 222 219 169 1014 394 388HC0422 Rex Home Services Wake Wake 2 75 372 203 533 713 483 2381 650 1196HC1293 WakeMed Home Health Wake Wake 22 252 587 214 439 515 272 2301 1053 787HC0339 Intrepid USA Healthcare Services Wake Wake 6 35 138 114 177 246 478 1194 287 724HC2562 Liberty Home Care Wake Wake 1 37 206 105 199 320 307 1175 348 627HC0299 Tar Heel Home Health Wake Wake 4 20 143 92 176 321 256 1012 255 577HC0918 Heartland Home Health Care Wake Wake 0 38 189 89 190 254 178 938 316 432HC0166 Amedisys Home Health of Chapel Hill Orange Wake 0 20 38 69 186 254 89 656 127 343HC0360 Duke Home Health Durham Wake 26 27 118 53 102 108 54 488 198 162HC0145 Tender Loving Care Home Health & Hospice Durham Wake 0 1 34 11 63 154 177 440 46 331HC2112 Medi Home Health Agency Wake Wake 0 8 44 27 95 148 100 422 79 248HC0074 At Home Quality Care, Inc. Wake Wake 9 28 64 28 61 75 56 321 120 131HC0507 3HC Johnston Wake 62 24 45 18 62 62 27 300 87 89HC0215 Tar Heel Home Health Franklin Wake 0 2 9 3 21 28 24 87 14 52HC0031 Horizons Home Care Wake Wake 4 1 9 2 8 15 17 56 12 32HC1437 Professional Nursing Service and Home Health Wake Wake 9 7 6 5 4 9 4 44 18 13HC0828 Pediatric Services of America, Inc. Wake Wake 33 0 0 0 0 0 0 33 0 0HC0383 Johnston Memorial Home Care and Hospice Johnston Wake 0 0 6 1 3 4 3 17 7 7HC0125 Liberty Home Care Harnett Wake 0 0 1 2 5 1 6 15 3 7HC0528 Liberty Home Care Chatham Wake 0 0 0 0 2 3 0 5 0 3HC1176 Liberty Home Care Durham Wake 0 0 1 0 1 2 0 4 1 2HC0500 Franklin County Home Health Agency Franklin Wake 0 0 0 0 0 3 1 4 0 4HC0426 Liberty Home Care Lee Wake 0 0 1 0 1 2 0 4 1 2HC0255 3HC Sampson Wake 2 0 0 0 1 0 0 3 0 0HC0228 3HC Wayne Wake 0 1 0 0 0 1 0 2 1 1HC0509 3HC Pitt Wake 1 0 0 0 0 0 0 1 0 0HC0508 3HC Wilson Wake 0 0 0 0 1 0 0 1 0 0
Wake Total 181 576 2011 1036 2330 3238 2532 11904 3623 5770HC0341 Warren County Home Health Agency Warren Warren 6 13 33 31 59 109 81 332 77 190HC0215 Tar Heel Home Health Franklin Warren 2 2 19 13 25 35 19 115 34 54HC0823 Maria Parham Regional Home Health Vance Warren 1 10 18 4 15 30 15 93 32 45HC0145 Tender Loving Care Home Health & Hospice Durham Warren 0 0 0 0 4 1 1 6 0 2HC0501 Granville-Vance Home Health Agency Vance Warren 1 0 0 0 1 2 0 4 0 2HC0765 Home Health and Hospice of Halifax Halifax Warren 0 0 0 0 0 1 0 1 0 1HC0497 Tar Heel Home Health Nash Warren 0 0 0 0 0 1 0 1 0 1
Figures are entered from 2009 HH Data Supplements. Data were self-reported and are not verified by the Medical Facilities Planning Section.

Table 12A: Home Health Data by County of Patient Origin - 2008 Data - Agencies or Offices Serving Residents of Counties by Age.
Lic. # Name Fac. County Resident Co. <18 18-40 41-59 60-64 65-74 75-84 85 up Total 18-64 75+HC1293 WakeMed Home Health Wake Warren 0 0 0 1 0 0 0 1 1 0
Warren Total 10 25 70 49 104 179 116 553 144 295HC0523 Roanoke Home Care & Hospice Washington Washington 13 10 36 18 42 70 37 226 64 107HC0329 Tar Heel Home Health Beaufort Washington 0 5 7 2 4 8 12 38 14 20HC1052 University Health Systems Home Health and Hospice Bertie Washington 0 3 5 3 4 4 0 19 11 4HC1634 Beaufort County Hospital Home Health Beaufort Washington 0 0 3 3 1 1 0 8 6 1HC0525 Roanoke Home Care & Hospice Martin Washington 0 0 0 1 0 0 0 1 1 0
Washington Total 13 18 51 27 51 83 49 292 96 132HC1544 Watauga Medical Center Home Health Watauga Watauga 8 17 69 37 85 118 88 422 123 206HC0477 High Country Health Care System Watauga Watauga 0 5 10 12 39 43 49 158 27 92HC0487 Caldwell County Home Health Agency Caldwell Watauga 0 1 1 0 1 0 0 3 2 0
Watauga Total 8 23 80 49 125 161 137 583 152 298HC1299 Tar Heel Home Health Wayne Wayne 32 54 200 112 335 461 271 1465 366 732HC0228 3HC Wayne Wayne 24 49 193 89 225 208 128 916 331 336HC0053 Carolina East Home Care & Hospice Inc. Duplin Wayne 5 4 19 12 15 20 13 88 35 33HC1437 Professional Nursing Service and Home Health Wake Wayne 4 2 2 1 8 6 8 31 5 14HC0168 Greene Regional Home Health Greene Wayne 2 3 5 1 2 3 0 16 9 3HC0507 3HC Johnston Wayne 0 1 0 1 3 0 0 5 2 0HC0428 Tar Heel Home Health Lenoir Wayne 0 0 2 0 1 1 1 5 2 2HC0255 3HC Sampson Wayne 0 1 1 0 2 1 0 5 2 1HC0343 Wilson County Home Health Wilson Wayne 1 1 1 0 2 0 0 5 2 0HC0195 3HC Lenoir Wayne 0 0 1 0 1 0 1 3 1 1HC0508 3HC Wilson Wayne 0 1 1 0 0 0 0 2 2 0HC1209 Continuum Home Care and Hospice Onslow Wayne 0 0 1 0 0 0 0 1 1 0HC0509 3HC Pitt Wayne 0 0 0 0 0 0 1 1 0 1HC0257 Sampson Home Health Sampson Wayne 0 0 0 0 0 0 1 1 0 1
Wayne Total 68 116 426 216 594 700 424 2544 758 1124HC0252 Gentiva Health Services Wilkes Wilkes 3 31 120 66 164 208 148 740 217 356HC0430 Home Care of Wilkes Regional Medical Center Wilkes Wilkes 22 31 114 56 138 175 132 668 201 307HC0346 Yadkin Valley Home Health Yadkin Wilkes 1 3 19 22 49 70 50 214 44 120HC0227 Gentiva Health Services Catawba Wilkes 0 3 26 15 7 4 4 59 44 8HC0515 Iredell Home Health Iredell Wilkes 1 2 4 3 0 4 6 20 9 10HC0476 Alexander County Home Health Agency Alexander Wilkes 1 0 4 2 3 0 0 10 6 0HC0420 Liberty Home Care Surry Wilkes 3 1 2 1 1 0 0 8 4 0HC0487 Caldwell County Home Health Agency Caldwell Wilkes 1 0 0 0 1 1 0 3 0 1HC1544 Watauga Medical Center Home Health Watauga Wilkes 0 0 0 1 0 0 0 1 1 0
Wilkes Total 32 71 289 166 363 462 340 1723 526 802HC0343 Wilson County Home Health Wilson Wilson 44 94 253 108 252 342 238 1331 455 580HC0328 Tar Heel Home Health Pitt Wilson 0 11 44 20 89 140 109 413 75 249HC0508 3HC Wilson Wilson 8 18 113 30 94 74 52 389 161 126HC1443 University Health Systems Home Health and Hospice Pitt Wilson 0 2 4 0 2 2 2 12 6 4HC0497 Tar Heel Home Health Nash Wilson 0 0 1 0 2 3 1 7 1 4HC0168 Greene Regional Home Health Greene Wilson 2 0 0 0 0 1 1 4 0 2HC0074 At Home Quality Care, Inc. Wake Wilson 0 0 0 0 2 0 0 2 0 0HC0507 3HC Johnston Wilson 0 0 0 0 1 0 0 1 0 0HC0506 3HC Jones Wilson 0 0 0 0 0 0 1 1 0 1HC0255 3HC Sampson Wilson 0 0 0 0 0 1 0 1 0 1HC1299 Tar Heel Home Health Wayne Wilson 0 0 0 0 0 1 0 1 0 1
Wilson Total 54 125 415 158 442 564 404 2162 698 968HC0346 Yadkin Valley Home Health Yadkin Yadkin 12 18 63 30 93 115 124 455 111 239HC0252 Gentiva Health Services Wilkes Yadkin 0 21 87 24 44 38 10 224 132 48HC0499 Advanced Home Care Forsyth Yadkin 17 7 27 15 38 33 13 150 49 46HC0567 Gentiva Health Services Forsyth Yadkin 0 0 22 6 25 21 11 85 28 32HC0420 Liberty Home Care Surry Yadkin 19 2 5 5 4 5 3 43 12 8HC1131 Gentiva Health Services Forsyth Yadkin 0 4 9 4 8 7 0 32 17 7HC0005 Home Health Professionals Forsyth Yadkin 3 2 2 1 4 5 4 21 5 9HC0515 Iredell Home Health Iredell Yadkin 0 0 4 1 2 4 0 11 5 4HC0227 Gentiva Health Services Catawba Yadkin 0 1 2 1 0 0 0 4 4 0HC1886 Interim HealthCare of the Triad Inc. Forsyth Yadkin 1 0 1 1 1 0 0 4 2 0HC1699 Gentiva Health Services Stokes Yadkin 0 0 0 2 0 1 1 4 2 2HC0496 Davie County Home Health Agency Davie Yadkin 0 0 1 0 0 1 1 3 1 2HC0409 Hospice & Palliative CareCenter Forsyth Yadkin 0 0 1 0 0 1 0 2 1 1HC0231 Gentiva Health Services Forsyth Yadkin 0 0 0 0 0 1 0 1 0 1HC0159 Gentiva Health Services Iredell Yadkin 0 0 0 0 0 1 0 1 0 1
Yadkin Total 52 55 224 90 219 233 167 1040 369 400HC0323 Yancey County Home Health Agency Yancey Yancey 4 18 44 17 77 116 77 353 79 193HC0114 CarePartners Home Health Services Buncombe Yancey 3 6 30 12 40 58 26 175 48 84HC0419 Madison Home Care & Hospice Madison Yancey 0 0 3 3 2 2 3 13 6 5
Yancey Total 7 24 77 32 119 176 106 541 133 282Grand Total 6909 10487 34749 16461 40519 50929 35188 195242 61697 86117
Figures are entered from 2009 HH Data Supplements. Data were self-reported and are not verified by the Medical Facilities Planning Section.

Table 12B: Average Annual Rates of Change in "Patients" and "Use Rates per 1000 Population"
Under Age 18 Average Average
H.H. Use H.H. Use H.H. Use Annual Rate Annual Rate
COUNTY Patients Estimated Rate Patients Estimated Rate Patients Estimated Rate of Change of Change in
in 2006 for in 2007 for in 2008 for in Number "Use Rates
2006 Population 2006 2007 Population 2007 2008 Population 2008 of Patients per 1000"
Cherokee 12 5,359 2.24 7 5,355 1.31 4 5,222 0.77 -42% -42%Clay 6 1,808 3.32 1 1,799 0.56 1 1,748 0.57 -42% -40%Graham 8 1,782 4.49 3 1,785 1.68 3 1,762 1.70 -31% -31%Haywood 58 11,246 5.16 34 11,238 3.03 39 11,134 3.50 -13% -13%Jackson 31 6,754 4.59 24 6,896 3.48 27 6,949 3.89 -5% -6%Macon 28 6,453 4.34 15 6,602 2.27 20 6,742 2.97 -7% -9%Swain 25 3,352 7.46 17 3,309 5.14 9 3,319 2.71 -40% -39%
Region A Totals 168 36,754 4.57 101 36,984 2.73 103 36,876 2.79 -19% -19%Buncombe 361 47,320 7.63 249 48,087 5.18 84 48,474 1.73 -49% -49%
Henderson 107 21,068 5.08 84 21,551 3.90 38 21,934 1.73 -38% -39%Madison 25 4,222 5.92 23 4,204 5.47 8 4,224 1.89 -37% -36%Transylvania 33 5,693 5.80 31 5,724 5.42 24 5,734 4.19 -14% -15%
Region B Totals 526 78,303 6.72 387 79,566 4.86 154 80,366 1.92 -43% -44%Cleveland 127 23,395 5.43 107 23,273 4.60 107 23,170 4.62 -8% -7%McDowell 46 9,662 4.76 50 9,708 5.15 41 9,717 4.22 -5% -5%Polk 8 3,668 2.18 10 3,602 2.78 9 3,550 2.54 8% 9%Rutherford 38 14,588 2.60 41 14,540 2.82 44 14,584 3.02 8% 8%
Region C Totals 219 51,313 4.27 208 51,123 4.07 201 51,021 3.94 -4% -4%Alleghany 2 2,077 0.96 1 2,087 0.48 3 2,058 1.46 75% 77%Ashe 14 4,971 2.82 8 5,041 1.59 9 5,101 1.76 -15% -16%Avery 6 3,399 1.77 3 3,384 0.89 4 3,383 1.18 -8% -8%Mitchell 24 3,153 7.61 20 3,117 6.42 10 3,102 3.22 -33% -33%Watauga 9 6,580 1.37 7 6,670 1.05 8 6,757 1.18 -4% -5%Wilkes 23 14,778 1.56 35 14,890 2.35 32 14,906 2.15 22% 21%Yancey 22 3,684 5.97 12 3,693 3.25 7 3,674 1.91 -44% -43%
Region D Totals 100 38,642 2.59 86 38,882 2.21 73 38,981 1.87 -15% -15%Alexander 57 8,352 6.82 30 8,358 3.59 32 8,366 3.83 -20% -20%Burke 50 19,912 2.51 51 19,724 2.59 43 19,769 2.18 -7% -6%Caldwell 85 18,004 4.72 69 17,944 3.85 68 17,935 3.79 -10% -10%Catawba 156 36,147 4.32 144 36,579 3.94 120 36,836 3.26 -12% -13%
Region E Totals 348 82,415 4.22 294 82,605 3.56 263 82,906 3.17 -13% -13%Anson 23 6,111 3.76 48 6,061 7.92 49 5,983 8.19 55% 57%Cabarrus 103 39,985 2.58 127 41,776 3.04 131 43,220 3.03 13% 9%Gaston 424 47,575 8.91 346 48,444 7.14 360 49,183 7.32 -7% -9%Iredell 141 36,005 3.92 144 36,871 3.91 136 37,361 3.64 -2% -4%Lincoln 44 16,830 2.61 62 17,006 3.65 68 17,246 3.94 25% 24%Mecklenburg 858 215,698 3.98 876 224,098 3.91 909 228,229 3.98 3% 0%Rowan 151 31,645 4.77 131 31,893 4.11 138 32,142 4.29 -4% -5%Stanly 76 13,857 5.48 71 13,760 5.16 97 13,693 7.08 15% 16%Union 122 45,970 2.65 106 48,300 2.19 92 49,945 1.84 -13% -17%
Region F Totals 1,942 453,676 4.28 1,911 468,209 4.08 1,980 477,002 4.15 1% -1%Alamance 52 32,915 1.58 66 33,591 1.96 71 34,206 2.08 17% 15%Caswell 9 4,999 1.80 18 4,885 3.68 15 4,719 3.18 42% 45%Davidson 131 36,071 3.63 153 36,097 4.24 139 36,413 3.82 4% 3%Guilford 573 107,034 5.35 569 108,826 5.23 535 110,277 4.85 -3% -5%Montgomery 24 6,774 3.54 57 6,830 8.35 60 6,822 8.80 71% 70%Randolph 196 33,323 5.88 218 33,352 6.54 183 33,433 5.47 -2% -3%Rockingham 43 20,671 2.08 40 20,549 1.95 49 20,445 2.40 8% 8%
Region G Totals 1,028 241,787 4.25 1,121 244,130 4.59 1,052 246,315 4.27 1% 1%Davie 41 9,077 4.52 45 9,122 4.93 33 9,113 3.62 -8% -9%Forsyth 434 80,787 5.37 402 82,453 4.88 351 83,738 4.19 -10% -12%Stokes 55 10,403 5.29 55 10,247 5.37 37 10,147 3.65 -16% -15%Surry 80 16,907 4.73 98 16,889 5.80 95 16,824 5.65 10% 10%Yadkin 79 8,867 8.91 62 8,872 6.99 52 8,893 5.85 -19% -19%
Region I Totals 689 126,041 5.47 662 127,583 5.19 568 128,715 4.41 -9% -10%Chatham 10 12,877 0.78 8 13,122 0.61 13 13,530 0.96 21% 18%Durham 179 61,215 2.92 157 63,212 2.48 153 65,754 2.33 -7% -11%Johnston 64 39,547 1.62 44 40,957 1.07 32 42,220 0.76 -29% -32%Lee 16 14,201 1.13 28 14,492 1.93 24 14,760 1.63 30% 28%Moore* 58 17,549 3.31 100 17,896 5.59 127 18,099 7.02 50% 47%Orange 34 24,229 1.40 36 24,271 1.48 39 24,435 1.60 7% 7%Wake* 170 200,511 0.85 179 209,179 0.86 181 216,713 0.84 3% -1%
Region J Totals 531 370,129 1.43 552 383,129 1.44 569 395,511 1.44 4% 0%
(Sorted by Councils of Governments (COG) Regions -- Each Age Group covers two pages)

Table 12B: Average Annual Rates of Change in "Patients" and "Use Rates per 1000 Population"
Under Age 18 Average Average
H.H. Use H.H. Use H.H. Use Annual Rate Annual Rate
COUNTY Patients Estimated Rate Patients Estimated Rate Patients Estimated Rate of Change of Change in
in 2006 for in 2007 for in 2008 for in Number "Use Rates
2006 Population 2006 2007 Population 2007 2008 Population 2008 of Patients per 1000"
Franklin 49 13,250 3.70 39 13,430 2.90 32 13,634 2.35 -19% -20%Granville 15 12,071 1.24 9 12,438 0.72 11 12,381 0.89 -9% -9%Person 36 8,669 4.15 30 8,628 3.48 29 8,499 3.41 -10% -9%Vance 28 11,861 2.36 20 11,813 1.69 10 11,734 0.85 -39% -39%Warren 8 4,167 1.92 4 4,105 0.97 10 3,989 2.51 50% 54%
Region K Totals 136 50,018 2.72 102 50,414 2.02 92 50,237 1.83 -17% -18%Edgecombe 36 13,453 2.68 31 13,241 2.34 28 13,217 2.12 -12% -11%Halifax 26 13,614 1.91 22 13,396 1.64 18 13,136 1.37 -17% -15%Nash 44 22,592 1.95 35 22,637 1.55 45 22,731 1.98 4% 4%Northampton 7 4,766 1.47 4 4,671 0.86 1 4,550 0.22 -59% -58%Wilson 46 19,204 2.40 56 19,332 2.90 54 19,531 2.76 9% 8%
Region L Totals 159 73,629 2.16 148 73,277 2.02 146 73,165 2.00 -4% -4%Cumberland* 435 88,803 4.90 372 89,222 4.17 403 90,633 4.45 -3% -4%Harnett* 37 27,033 1.37 33 27,662 1.19 35 28,287 1.24 -2% -5%Sampson 86 16,276 5.28 75 16,407 4.57 73 16,551 4.41 -8% -9%
Region M Totals 558 132,112 4.22 480 133,291 3.60 511 135,471 3.77 -4% -5%Bladen 38 7,915 4.80 32 7,879 4.06 39 7,831 4.98 3% 4%Hoke* 43 12,446 3.45 27 12,779 2.11 31 13,164 2.35 -11% -14%Richmond 47 11,705 4.02 78 11,732 6.65 63 11,720 5.38 23% 23%Robeson 183 36,246 5.05 204 36,511 5.59 198 36,667 5.40 4% 4%Scotland 67 9,604 6.98 62 9,575 6.48 61 9,559 6.38 -5% -4%
Region N Totals 378 77,916 4.85 403 78,476 5.14 392 78,941 4.97 2% 1%Brunswick 57 19,630 2.90 78 20,550 3.80 74 21,138 3.50 16% 11%Columbus 60 13,357 4.49 58 13,342 4.35 65 13,385 4.86 4% 4%New Hanover 124 39,548 3.14 103 40,239 2.56 122 40,649 3.00 1% -1%Pender 33 10,482 3.15 35 10,829 3.23 41 11,007 3.72 12% 9%
Region O Totals 274 83,017 3.30 274 84,960 3.23 302 86,179 3.50 5% 3%Carteret* 17 12,221 1.39 25 12,024 2.08 21 11,936 1.76 16% 17%Craven* 20 25,103 0.80 24 25,421 0.94 15 25,952 0.58 -9% -10%Duplin 48 13,618 3.52 38 13,743 2.77 42 13,865 3.03 -5% -6%Greene 4 4,900 0.82 7 4,962 1.41 8 4,911 1.63 45% 44%Jones 2 2,272 0.88 4 2,224 1.80 2 2,144 0.93 25% 28%Lenoir 34 14,125 2.41 29 13,996 2.07 25 13,932 1.79 -14% -14%Onslow* 83 46,425 1.79 81 47,910 1.69 87 50,306 1.73 2% -2%Pamlico 1 2,390 0.42 1 2,329 0.43 1 2,267 0.44 0% 3%Wayne* 99 29,458 3.36 84 29,474 2.85 68 29,596 2.30 -17% -17%
Region P Totals 308 150,512 2.05 293 152,083 1.93 269 154,909 1.74 -7% -8%Beaufort 24 10,596 2.27 26 10,535 2.47 9 10,639 0.85 -29% -28%Bertie 7 4,603 1.52 15 4,769 3.15 10 4,739 2.11 40% 37%Hertford 8 5,372 1.49 7 5,324 1.31 12 5,245 2.29 29% 31%Martin 40 5,768 6.93 29 5,628 5.15 30 5,583 5.37 -12% -11%Pitt 92 35,055 2.62 65 35,878 1.81 67 36,818 1.82 -13% -15%
Region Q Totals 171 61,394 2.79 142 62,134 2.29 128 63,024 2.03 -13% -15%Camden 7 2,032 3.44 8 2,041 3.92 8 2,005 3.99 7% 8%Chowan 5 3,371 1.48 4 3,363 1.19 6 3,359 1.79 15% 15%Currituck 8 5,227 1.53 13 5,138 2.53 26 4,915 5.29 81% 87%Dare 10 7,175 1.39 10 7,010 1.43 8 6,805 1.18 -10% -8%Gates 10 2,676 3.74 3 2,654 1.13 6 2,490 2.41 15% 22%Hyde 1 1,068 0.94 4 1,046 3.82 3 1,057 2.84 138% 141%Pasquotank 19 9,511 2.00 23 9,650 2.38 26 9,591 2.71 17% 17%Perquimans 5 2,536 1.97 7 2,575 2.72 7 2,574 2.72 20% 19%Tyrrell 4 850 4.71 2 863 2.32 3 872 3.44 0% -1%Washington 13 3,235 4.02 10 3,197 3.13 13 3,151 4.13 3% 5%
Region R Totals 82 37,681 2.18 84 37,537 2.24 106 36,819 2.88 14% 16%
NC Totals 7,617 2,145,339 3.55 7,248 2,184,383 3.32 6,909 2,216,438 3.12 -5% -6%
* Adjustments for "Active Duty Military Personnel" have been applied to the "Age 18-64" population projections for these counties.
Note: For Pamlico County - 2007 Patients - a value of 1 was entered to replace a 0 to allow for calculation of rates of change.
(Sorted by Councils of Governments (COG) Regions -- Each Age Group covers two pages)

Table 12B: Average Annual Rates of Change in "Patients" and "Use Rates per 1000 Population"
AGES 18 - 64 Average Average
H.H. Use H.H. Use H.H. Use Annual Rate Annual Rate
COUNTY Patients Estimated Rate Patients Estimated Rate Patients Estimated Rate of Change of Change in
in 2006 for in 2007 for in 2008 for in Number "Use Rates
2006 Population 2006 2007 Population 2007 2008 Population 2008 of Patients per 1000"
Cherokee 96 15,964 6.01 155 16,130 9.61 166 16,073 10.33 34% 34%Clay 103 6,159 16.72 41 6,286 6.52 48 6,292 7.63 -22% -22%Graham 53 4,754 11.15 28 4,777 5.86 63 4,726 13.33 39% 40%Haywood 305 34,044 8.96 283 34,390 8.23 353 34,502 10.23 9% 8%Jackson 124 24,600 5.04 152 24,443 6.22 142 24,441 5.81 8% 8%Macon 162 19,318 8.39 190 19,695 9.65 164 20,092 8.16 2% 0%Swain 77 8,515 9.04 71 8,456 8.40 93 8,573 10.85 12% 11%
Region A Totals 920 113,354 8.12 920 114,177 8.06 1,029 114,699 8.97 6% 5%Buncombe 1407 140,522 10.01 1485 143,052 10.38 1,632 144,831 11.27 8% 6%Henderson 633 58,562 10.81 608 60,169 10.10 618 61,630 10.03 -1% -4%Madison 121 12,769 9.48 123 12,877 9.55 163 13,146 12.40 17% 15%Transylvania 152 17,772 8.55 161 17,991 8.95 196 18,197 10.77 14% 12%
Region B Totals 2,313 229,625 10.07 2,377 234,089 10.15 2,609 237,804 10.97 6% 4%Cleveland 889 59,448 14.95 746 60,030 12.43 950 60,944 15.59 6% 4%McDowell 441 27,260 16.18 589 27,570 21.36 437 27,985 15.62 4% 3%Polk 92 11,066 8.31 105 11,205 9.37 89 11,283 7.89 -1% -2%Rutherford 604 38,045 15.88 574 38,218 15.02 712 38,823 18.34 10% 8%
Region C Totals 2,026 135,819 14.92 2,014 137,023 14.70 2,188 139,035 15.74 4% 3%Alleghany 55 6,684 8.23 55 6,732 8.17 48 6,739 7.12 -6% -7%Ashe 122 15,891 7.68 104 16,034 6.49 95 16,269 5.84 -12% -13%Avery 128 11,928 10.73 109 11,986 9.09 112 12,002 9.33 -6% -6%Mitchell 107 9,710 11.02 114 9,765 11.67 109 9,836 11.08 1% 0%Watauga 147 32,023 4.59 160 32,364 4.94 152 32,759 4.64 2% 1%Wilkes 514 41,547 12.37 547 41,754 13.10 526 41,805 12.58 1% 1%Yancey 105 11,017 9.53 109 11,241 9.70 133 11,287 11.78 13% 12%
Region D Totals 1,178 128,800 9.15 1,198 129,876 9.22 1,175 130,697 8.99 0% -1%Alexander 246 23,091 10.65 274 23,330 11.74 325 23,552 13.80 15% 14%Burke 680 55,158 12.33 727 55,369 13.13 733 56,029 13.08 4% 3%Caldwell 628 49,481 12.69 619 49,699 12.45 792 50,186 15.78 13% 12%Catawba 1144 95,127 12.03 1240 96,750 12.82 1,251 98,009 12.76 5% 3%
Region E Totals 2,698 222,857 12.11 2,860 225,148 12.70 3,101 227,776 13.61 7% 6%Anson 222 15,570 14.26 205 15,640 13.11 205 15,735 13.03 -4% -4%Cabarrus 764 98,852 7.73 948 103,786 9.13 1,163 108,039 10.76 23% 18%Gaston 1,910 123,598 15.45 1,679 126,646 13.26 2,046 129,773 15.77 5% 2%Iredell 1,003 91,330 10.98 966 94,852 10.18 1,168 97,838 11.94 9% 5%Lincoln 531 45,451 11.68 514 46,684 11.01 642 48,093 13.35 11% 8%Mecklenburg 3,996 540,170 7.40 4,115 558,926 7.36 4,753 568,290 8.36 9% 7%Rowan 1,044 83,798 12.46 1,242 85,435 14.54 1,110 87,247 12.72 4% 2%Stanly 379 36,279 10.45 351 36,628 9.58 454 37,154 12.22 11% 10%Union 618 108,604 5.69 650 116,530 5.58 802 123,103 6.51 14% 7%
Region F Totals 10,467 1,143,652 9.15 10,670 1,185,127 9.00 12,343 1,215,272 10.16 9% 6%Alamance 752 87,170 8.63 812 89,554 9.07 786 91,883 8.55 2% 0%Caswell 140 15,085 9.28 193 15,146 12.74 193 15,091 12.79 19% 19%Davidson 992 97,429 10.18 1117 98,474 11.34 1,224 100,424 12.19 11% 9%Guilford 2,780 288,704 9.63 2,832 294,769 9.61 3,195 300,599 10.63 7% 5%Montgomery 198 16,604 11.92 221 16,676 13.25 291 16,713 17.41 22% 21%Randolph 773 86,795 8.91 811 87,616 9.26 1,001 89,100 11.23 14% 13%Rockingham 743 56,661 13.11 708 56,898 12.44 762 57,107 13.34 1% 1%
Region G Totals 6,378 648,448 9.84 6,694 659,133 10.16 7,452 670,917 11.11 8% 6%Davie 242 24,925 9.71 272 25,466 10.68 266 25,966 10.24 5% 3%Forsyth 2316 208,438 11.11 2240 212,350 10.55 2,426 216,033 11.23 3% 1%Stokes 336 29,699 11.31 382 29,796 12.82 390 30,200 12.91 8% 7%Surry 608 44,307 13.72 558 44,618 12.51 617 44,948 13.73 1% 0%Yadkin 330 23,072 14.30 343 23,213 14.78 369 23,491 15.71 6% 5%
Region I Totals 3,832 330,441 11.60 3,795 335,443 11.31 4,068 340,638 11.94 3% 2%Chatham 197 36,239 5.44 211 37,259 5.66 208 38,606 5.39 3% 0%Durham 1293 162,971 7.93 1418 166,316 8.53 1,367 169,595 8.06 3% 1%Johnston 888 96,010 9.25 889 99,948 8.89 1,064 103,822 10.25 10% 6%Lee 294 34,002 8.65 280 34,665 8.08 291 35,436 8.21 0% -2%Moore* 483 46,703 10.34 468 48,078 9.73 517 49,266 10.49 4% 1%Orange 446 88,436 5.04 471 90,681 5.19 418 92,356 4.53 -3% -5%Wake* 2,983 526,234 5.67 3,253 551,416 5.90 3,623 573,690 6.32 10% 6%
Region J Totals 6,584 990,595 6.65 6,990 1,028,363 6.80 7,488 1,062,771 7.05 7% 3%
(Sorted by Councils of Governments (COG) Regions -- Each Age Group covers two pages)

Table 12B: Average Annual Rates of Change in "Patients" and "Use Rates per 1000 Population"
AGES 18 - 64 Average Average
H.H. Use H.H. Use H.H. Use Annual Rate Annual Rate
COUNTY Patients Estimated Rate Patients Estimated Rate Patients Estimated Rate of Change of Change in
in 2006 for in 2007 for in 2008 for in Number "Use Rates
2006 Population 2006 2007 Population 2007 2008 Population 2008 of Patients per 1000"
Franklin 409 35,682 11.46 483 36,550 13.21 466 37,727 12.35 7% 4%Granville 271 35,206 7.70 293 36,575 8.01 293 37,107 7.90 4% 1%Person 231 23,449 9.85 290 23,720 12.23 316 23,717 13.32 17% 17%Vance 356 26,208 13.58 338 26,228 12.89 394 26,255 15.01 6% 6%Warren 149 12,080 12.33 166 12,121 13.70 144 12,193 11.81 -1% -1%
Region K Totals 1,416 132,625 10.68 1,570 135,194 11.61 1,613 136,999 11.77 7% 5%Edgecombe 452 31,931 14.16 476 31,741 15.00 433 31,782 13.62 -2% -2%Halifax 406 33,325 12.18 450 33,369 13.49 368 33,575 10.96 -4% -4%Nash 593 57,748 10.27 530 58,555 9.05 570 59,483 9.58 -2% -3%Northampton 166 12,727 13.04 175 12,707 13.77 164 12,722 12.89 0% 0%Wilson 682 47,696 14.30 724 48,242 15.01 698 48,968 14.25 1% 0%
Region L Totals 2,299 183,427 12.53 2,355 184,614 12.76 2,233 186,530 11.97 -1% -2%Cumberland* 2025 158,767 12.75 1483 161,043 9.21 1,672 162,648 10.28 -7% -8%Harnett* 638 62,897 10.14 580 64,986 8.92 753 67,386 11.17 10% 7%Sampson 507 39,206 12.93 508 39,624 12.82 507 40,404 12.55 0% -1%
Region M Totals 3,170 260,870 12.15 2,571 265,653 9.68 2,932 270,438 10.84 -2% -4%Bladen 331 19,782 16.73 386 19,606 19.69 410 19,646 20.87 11% 12%Hoke* 323 24,336 13.27 264 25,149 10.50 292 26,240 11.13 -4% -7%Richmond 404 28,256 14.30 348 28,482 12.22 353 28,687 12.31 -6% -7%Robeson 1569 78,561 19.97 1574 79,338 19.84 1,611 80,220 20.08 1% 0%Scotland 492 22,720 21.65 482 22,860 21.08 448 23,107 19.39 -5% -5%
Region N Totals 3,119 173,655 17.96 3,054 175,435 17.41 3,114 177,900 17.50 0% -1%Brunswick 777 58,346 13.32 837 61,467 13.62 843 63,757 13.22 4% 0%Columbus 959 33,191 28.89 896 33,267 26.93 987 33,550 29.42 2% 1%New Hanover 1186 122,840 9.65 1264 124,720 10.13 1,317 126,218 10.43 5% 4%Pender 414 30,692 13.49 374 32,099 11.65 377 33,162 11.37 -4% -8%
Region O Totals 3,336 245,069 13.61 3,371 251,553 13.40 3,524 256,687 13.73 3% 0%Carteret* 405 38,961 10.40 453 38,746 11.69 480 38,880 12.35 9% 9%Craven* 555 50,996 10.88 583 50,742 11.49 655 51,602 12.69 9% 8%Duplin 382 32,015 11.93 384 32,322 11.88 441 32,663 13.50 8% 7%Greene 116 13,145 8.82 111 13,445 8.26 122 13,622 8.96 3% 1%Jones 65 6,275 10.36 57 6,370 8.95 72 6,456 11.15 7% 6%Lenoir 434 34,949 12.42 451 34,768 12.97 525 34,782 15.09 10% 10%Onslow* 686 76,081 9.02 795 77,406 10.27 806 81,817 9.85 9% 5%Pamlico 72 7,863 9.16 29 7,808 3.71 57 7,804 7.30 18% 19%Wayne* 674 67,539 9.98 782 67,849 11.53 758 68,306 11.10 6% 6%
Region P Totals 3,389 327,824 10.34 3,645 329,456 11.06 3,916 335,932 11.66 7% 6%Beaufort 338 27,895 12.12 347 27,784 12.49 369 28,165 13.10 5% 4%Bertie 187 11,465 16.31 174 12,066 14.42 184 12,204 15.08 -1% -4%Hertford 208 14,737 14.11 214 14,773 14.49 219 14,825 14.77 3% 2%Martin 227 14,606 15.54 209 14,442 14.47 222 14,513 15.30 -1% -1%Pitt 804 98,387 8.17 874 101,366 8.62 890 103,915 8.56 5% 2%
Region Q Totals 1,764 167,090 10.56 1,818 170,431 10.67 1,884 173,622 10.85 3% 1%Camden 63 5,981 10.53 51 6,173 8.26 52 6,296 8.26 -9% -11%Chowan 65 8,553 7.60 78 8,626 9.04 89 8,652 10.29 17% 16%Currituck 139 15,211 9.14 142 15,487 9.17 144 15,425 9.34 2% 1%Dare 169 22,156 7.63 149 21,774 6.84 187 21,446 8.72 7% 9%Gates 85 7,235 11.75 86 7,462 11.53 103 7,381 13.95 10% 10%Hyde 17 3,447 4.93 14 3,429 4.08 16 3,486 4.59 -2% -2%Pasquotank 211 25,222 8.37 226 25,915 8.72 253 26,223 9.65 10% 7%Perquimans 55 7,397 7.44 90 7,663 11.74 73 7,806 9.35 22% 19%Tyrrell 19 2,632 7.22 16 2,682 5.97 15 2,686 5.58 -11% -12%Washington 103 7,854 13.11 107 7,794 13.73 96 7,805 12.30 -3% -3%
Region R Totals 926 105,688 8.76 959 107,005 8.96 1,028 107,206 9.59 5% 5%
NC Totals 55,815 5,539,839 10.08 56,861 5,667,720 10.03 61,697 5,784,923 10.67 5% 3%
* Adjustments for "Active Duty Military Personnel" have been applied to the "Age 18-64" population projections for these counties.
(Sorted by Councils of Governments (COG) Regions -- Each Age Group covers two pages)

Table 12B: Average Annual Rates of Change in "Patients" and "Use Rates per 1000 Population"
AGES 65 - 74 Average Average
H.H. Use H.H. Use H.H. Use Annual Rate Annual Rate
COUNTY Patients Estimated Rate Patients Estimated Rate Patients Estimated Rate of Change of Change in
in 2006 for in 2007 for in 2008 for in Number "Use Rates
2006 Population 2006 2007 Population 2007 2008 Population 2008 of Patients per 1000"
Cherokee 81 2,931 27.64 168 3,012 55.78 167 3,084 54.15 53% 49%Clay 106 1,085 97.70 48 1,107 43.36 58 1,137 51.01 -17% -19%Graham 46 844 54.50 12 862 13.92 37 894 41.39 67% 61%Haywood 272 5,859 46.42 291 5,929 49.08 277 6,020 46.01 1% 0%Jackson 96 2,978 32.24 110 3,061 35.94 115 3,200 35.94 10% 6%Macon 165 3,637 45.37 163 3,684 44.25 162 3,728 43.45 -1% -2%Swain 72 1,158 62.18 50 1,168 42.81 45 1,198 37.56 -20% -22%
Region A Totals 838 18,492 45.32 842 18,823 44.73 861 19,261 44.70 1% -1%Buncombe 942 16,787 56.11 1045 17,358 60.20 1,100 18,007 61.09 8% 4%Henderson 445 9,412 47.28 490 9,539 51.37 564 9,730 57.97 13% 11%Madison 107 1,808 59.18 116 1,835 63.22 105 1,901 55.23 -1% -3%Transylvania 185 3,434 53.87 154 3,512 43.85 186 3,553 52.35 2% 0%3,394 3,394Region B Totals 1,679 31,441 53.40 1,805 32,244 55.98 1,955 33,191 58.90 8% 5%Cleveland 548 7,178 76.34 447 7,388 60.50 616 7,616 80.88 10% 6%McDowell 253 3,639 69.52 305 3,772 80.86 223 3,891 57.31 -3% -6%Polk 90 1,889 47.64 91 1,913 47.57 108 1,941 55.64 10% 8%Rutherford 372 5,232 71.10 357 5,323 67.07 468 5,477 85.45 14% 11%
Region C Totals 1,263 17,938 70.41 1,200 18,396 65.23 1,415 18,925 74.77 6% 4%Alleghany 50 1,205 41.49 64 1,221 52.42 49 1,230 39.84 2% 1%Ashe 110 2,525 43.56 112 2,590 43.24 102 2,668 38.23 -4% -6%Avery 97 1,556 62.34 90 1,599 56.29 87 1,660 52.41 -5% -8%Mitchell 83 1,573 52.77 89 1,589 56.01 90 1,631 55.18 4% 2%Watauga 111 2,934 37.83 108 3,072 35.16 125 3,207 38.98 7% 2%Wilkes 343 5,637 60.85 341 5,802 58.77 363 5,971 60.79 3% 0%Yancey 81 1,806 44.85 81 1,836 44.12 119 1,877 63.40 23% 21%
Region D Totals 875 17,236 50.77 885 17,709 49.97 935 18,244 51.25 3% 0%Alexander 147 2,744 53.57 162 2,865 56.54 161 2,965 54.30 5% 1%Burke 484 7,074 68.42 483 7,245 66.67 441 7,486 58.91 -4% -7%Caldwell 431 6,465 66.67 425 6,653 63.88 539 6,868 78.48 13% 9%Catawba 675 10,524 64.14 779 10,880 71.60 835 11,324 73.74 11% 7%
Region E Totals 1,737 26,807 64.80 1,849 27,643 66.89 1,976 28,643 68.99 7% 3%Anson 133 1,753 75.87 123 1,805 68.14 116 1,871 62.00 -7% -10%Cabarrus 587 9,647 60.85 668 10,233 65.28 751 10,896 68.92 13% 6%Gaston 1,174 13,693 85.74 1,032 14,116 73.11 1,194 14,701 81.22 2% -2%Iredell 627 9,963 62.93 634 10,446 60.69 709 10,990 64.51 6% 1%Lincoln 350 4,916 71.20 297 5,160 57.56 394 5,496 71.69 9% 3%Mecklenburg 2,221 40,491 54.85 2,287 43,471 52.61 2,502 46,316 54.02 6% -1%Rowan 734 9,307 78.87 570 9,549 59.69 763 9,973 76.51 6% 2%Stanly 279 4,450 62.70 296 4,543 65.16 337 4,731 71.23 10% 7%Union 445 9,599 46.36 467 10,496 44.49 500 11,418 43.79 6% -3%
Region F Totals 6,550 103,819 63.09 6,374 109,819 58.04 7,266 116,392 62.43 6% 0%Alamance 609 9,655 63.08 523 10,006 52.27 617 10,381 59.44 2% -2%Caswell 100 1,847 54.14 130 1,917 67.81 113 2,017 56.02 8% 4%Davidson 638 11,546 55.26 759 11,960 63.46 772 12,483 61.84 10% 6%Guilford 1,637 28,166 58.12 1,687 29,349 57.48 1,852 30,918 59.90 6% 2%Montgomery 129 2,043 63.14 132 2,092 63.10 155 2,203 70.36 10% 6%Randolph 482 9,705 49.67 504 10,010 50.35 568 10,441 54.40 9% 5%Rockingham 477 7,317 65.19 480 7,422 64.67 510 7,628 66.86 3% 1%
Region G Totals 4,072 70,279 57.94 4,215 72,756 57.93 4,587 76,071 60.30 6% 2%Davie 178 3,099 57.44 187 3,210 58.26 238 3,336 71.34 16% 12%Forsyth 1415 21,927 64.53 1386 22,556 61.45 1,550 23,411 66.21 5% 1%Stokes 232 3,433 67.58 254 3,536 71.83 283 3,746 75.55 10% 6%Surry 416 5,874 70.82 377 5,970 63.15 480 6,153 78.01 9% 6%Yadkin 215 3,094 69.49 207 3,128 66.18 219 3,226 67.89 1% -1%
Region I Totals 2,456 37,427 65.62 2,411 38,400 62.79 2,770 39,872 69.47 7% 3%Chatham 161 4,185 38.47 172 4,318 39.83 204 4,547 44.86 13% 8%Durham 742 12,148 61.08 898 12,741 70.48 847 13,586 62.34 8% 2%Johnston 484 8,867 54.58 590 9,431 62.56 733 10,061 72.86 23% 16%Lee 198 3,715 53.30 213 3,819 55.77 213 3,993 53.34 4% 0%Moore* 402 7,907 50.84 387 7,911 48.92 400 8,010 49.94 0% -1%Orange 280 6,128 45.69 316 6,446 49.02 378 6,915 54.66 16% 9%Wake* 1,897 37,267 50.90 2,024 40,479 50.00 2,330 44,466 52.40 11% 2%
Region J Totals 4,164 80,217 51.91 4,600 85,145 54.03 5,105 91,578 55.74 11% 4%
(Sorted by Councils of Governments (COG) Regions -- Each Age Group covers two pages)

Table 12B: Average Annual Rates of Change in "Patients" and "Use Rates per 1000 Population"
AGES 65 - 74 Average Average
H.H. Use H.H. Use H.H. Use Annual Rate Annual Rate
COUNTY Patients Estimated Rate Patients Estimated Rate Patients Estimated Rate of Change of Change in
in 2006 for in 2007 for in 2008 for in Number "Use Rates
2006 Population 2006 2007 Population 2007 2008 Population 2008 of Patients per 1000"
Franklin 281 3,464 81.12 285 3,643 78.23 292 3,846 75.92 2% -3%Granville 188 3,608 52.11 211 3,742 56.39 223 3,889 57.34 9% 5%Person 140 2,781 50.34 176 2,827 62.26 200 2,898 69.01 20% 17%Vance 231 2,941 78.54 219 2,946 74.34 222 3,004 73.90 -2% -3%Warren 106 1,853 57.20 133 1,874 70.97 104 1,876 55.44 2% 1%
Region K Totals 946 14,647 64.59 1,024 15,032 68.12 1,041 15,513 67.11 5% 2%Edgecombe 279 3,587 77.78 282 3,590 78.55 278 3,628 76.63 0% -1%Halifax 287 4,215 68.09 300 4,242 70.72 260 4,279 60.76 -4% -5%Nash 390 6,007 64.92 362 6,172 58.65 409 6,430 63.61 3% -1%Northampton 128 1,904 67.23 125 1,904 65.65 131 1,933 67.77 1% 0%Wilson 384 5,373 71.47 440 5,483 80.25 442 5,678 77.84 8% 5%
Region L Totals 1,468 21,086 69.62 1,509 21,391 70.54 1,520 21,948 69.25 2% 0%Cumberland* 1019 15,151 67.26 862 15,322 56.26 927 15,733 58.92 -4% -6%Harnett* 350 6,059 57.77 405 6,317 64.11 474 6,646 71.32 16% 11%Sampson 316 4,476 70.60 341 4,550 74.95 368 4,698 78.33 8% 5%2,571 2,571Region M Totals 1,685 25,686 65.60 1,608 26,189 61.40 1,769 27,077 65.33 3% 0%Bladen 176 2,528 69.62 207 2,572 80.48 211 2,590 81.47 10% 8%Hoke* 200 1,985 100.76 170 2,061 82.48 171 2,163 79.06 -7% -11%Richmond 274 3,388 80.87 256 3,444 74.33 274 3,511 78.04 0% -2%Robeson 739 7,327 100.86 714 7,575 94.26 832 7,797 106.71 7% 3%Scotland 229 2,350 97.45 226 2,430 93.00 228 2,536 89.91 0% -4%8,545 8,545Region N Totals 1,618 17,578 92.05 1,573 18,082 86.99 1,716 18,597 92.27 3% 0%Brunswick 640 10,010 63.94 753 10,423 72.24 790 10,846 72.84 11% 7%Columbus 578 4,335 133.33 564 4,361 129.33 639 4,424 144.44 5% 4%New Hanover 821 12,965 63.32 864 13,474 64.12 908 14,086 64.46 5% 1%Pender 261 4,038 64.64 244 4,201 58.08 328 4,393 74.66 14% 9%
Region O Totals 2,300 31,348 73.37 2,425 32,459 74.71 2,665 33,749 78.97 8% 4%Carteret* 338 6,284 53.79 346 6,376 54.27 411 6,574 62.52 11% 8%Craven* 351 6,810 51.54 395 6,739 58.61 466 6,765 68.88 15% 16%Duplin 301 3,706 81.22 297 3,756 79.07 346 3,821 90.55 8% 6%Greene 70 1,401 49.96 89 1,454 61.21 84 1,490 56.38 11% 7%Jones 61 860 70.93 61 872 69.95 72 877 82.10 9% 8%Lenoir 301 4,661 64.58 339 4,650 72.90 448 4,704 95.24 22% 22%Onslow* 456 6,523 69.91 518 6,578 78.75 521 6,810 76.51 7% 5%Pamlico 51 1,477 34.53 26 1,495 17.39 58 1,514 38.31 37% 35%Wayne* 561 7,807 71.86 569 7,833 72.64 594 7,947 74.75 3% 2%
Region P Totals 2,490 39,529 62.99 2,640 39,753 66.41 3,000 40,502 74.07 10% 8%Beaufort 244 4,121 59.21 237 4,184 56.64 261 4,289 60.85 4% 2%Bertie 135 1,562 86.43 118 1,598 73.84 120 1,604 74.81 -5% -7%Hertford 153 1,843 83.02 146 1,855 78.71 137 1,896 72.26 -5% -7%Martin 157 2,011 78.07 166 1,999 83.04 194 2,002 96.90 11% 12%Pitt 565 7,674 73.63 545 7,946 68.59 601 8,322 72.22 3% -1%
Region Q Totals 1,254 17,211 72.86 1,212 17,582 68.93 1,313 18,113 72.49 2% 0%Camden 21 721 29.13 30 759 39.53 30 805 37.27 21% 15%Chowan 44 1,320 33.33 47 1,335 35.21 55 1,350 40.74 12% 11%Currituck 77 1,738 44.30 71 1,815 39.12 81 1,893 42.79 3% -1%Dare 89 3,022 29.45 105 3,061 34.30 109 3,124 34.89 11% 9%Gates 61 887 68.77 59 928 63.58 73 949 76.92 10% 7%Hyde 22 499 44.09 22 501 43.91 15 499 30.06 -16% -16%Pasquotank 86 2,563 33.55 111 2,639 42.06 127 2,738 46.38 22% 18%Perquimans 51 1,276 39.97 62 1,318 47.04 65 1,377 47.20 13% 9%Tyrrell 26 350 74.29 18 355 50.70 19 357 53.22 -13% -13%Washington 62 1,124 55.16 54 1,149 47.00 51 1,180 43.22 -9% -11%
Region R Totals 539 13,500 39.93 579 13,860 41.77 625 14,272 43.79 8% 5%
NC Totals 35,934 584,241 61.51 36,751 605,283 60.72 40,519 631,948 64.12 6% 2%
* Adjustments for "Active Duty Military Personnel" have been applied to the "Age 18-64" population projections for these counties.
(Sorted by Councils of Governments (COG) Regions -- Each Age Group covers two pages)

Table 12B: Average Annual Rates of Change in "Patients" and "Use Rates per 1000 Population"
AGES 75 and Over Average Average
H.H. Use H.H. Use H.H. Use Annual Rate Annual Rate
COUNTY Patients Estimated Rate Patients Estimated Rate Patients Estimated Rate of Change of Change in
in 2006 for in 2007 for in 2008 for in Number "Use Rates
2006 Population 2006 2007 Population 2007 2008 Population 2008 of Patients per 1000"
Cherokee 248 2,430 102.06 377 2,458 153.38 378 2,490 151.81 26% 25%Clay 306 1,079 283.60 127 1,103 115.14 157 1,133 138.57 -17% -20%Graham 97 690 140.58 39 696 56.03 93 705 131.91 39% 38%Haywood 562 5,288 106.28 638 5,389 118.39 580 5,464 106.15 2% 1%Jackson 230 2,282 100.79 189 2,335 80.94 217 2,408 90.12 -2% -4%Macon 393 3,536 111.14 354 3,577 98.97 357 3,663 97.46 -5% -6%Swain 144 914 157.55 123 908 135.46 131 892 146.86 -4% -3%
Region A Totals 1,980 16,219 122.08 1,847 16,466 112.17 1,913 16,755 114.17 -2% -3%Buncombe 2,354 16,470 142.93 2,477 16,560 149.58 2,469 16,602 148.72 2% 2%Henderson 1,290 10,517 122.66 1,326 10,555 125.63 1,285 10,561 121.67 0% 0%Madison 273 1,517 179.96 252 1,532 164.49 244 1,543 158.13 -5% -6%Transylvania 501 3,365 148.89 497 3,454 143.89 485 3,514 138.02 -2% -4%
Region B Totals 4,418 31,869 138.63 4,552 32,101 141.80 4,483 32,220 139.14 1% 0%Cleveland 1277 6,194 206.17 984 6,187 159.04 1,197 6,223 192.35 -1% -1%McDowell 419 2,932 142.91 359 2,941 122.07 446 2,977 149.82 5% 4%Polk 204 2,283 89.36 216 2,248 96.09 222 2,212 100.36 4% 6%Rutherford 806 4,785 168.44 889 4,708 188.83 712 4,679 152.17 -5% -4%
Region C Totals 2,706 16,194 167.10 2,448 16,084 152.20 2,577 16,091 160.15 -2% -2%Alleghany 99 980 101.02 119 1,011 117.71 106 1,048 101.15 5% 1%Ashe 249 2,243 111.01 241 2,271 106.12 259 2,287 113.25 2% 1%Avery 234 1,331 175.81 209 1,362 153.45 229 1,384 165.46 -1% -2%Mitchell 226 1,448 156.08 239 1,449 164.94 230 1,465 157.00 1% 0%Watauga 300 2,458 122.05 295 2,512 117.44 298 2,602 114.53 0% -3%Wilkes 808 4,493 179.84 857 4,551 188.31 802 4,628 173.29 0% -2%Yancey 228 1,687 135.15 233 1,717 135.70 282 1,758 160.41 12% 9%
Region D Totals 2,144 14,640 146.45 2,193 14,873 147.45 2,206 15,172 145.40 1% 0%Alexander 299 1,947 153.57 324 2,001 161.92 334 2,074 161.04 6% 2%Burke 1040 5,828 178.45 934 5,903 158.22 917 5,990 153.09 -6% -7%Caldwell 855 4,853 176.18 956 4,941 193.48 1,064 5,049 210.73 12% 9%Catawba 1418 8,560 165.65 1626 8,682 187.28 1,694 8,803 192.43 9% 8%
Region E Totals 3,612 21,188 170.47 3,840 21,527 178.38 4,009 21,916 182.93 5% 4%Anson 360 1,833 196.40 314 1,796 174.83 294 1,779 165.26 -10% -8%Cabarrus 1,390 7,963 174.56 1,567 8,115 193.10 1,656 8,293 199.69 9% 7%Gaston 2,563 11,164 229.58 2,040 11,275 180.93 2,369 11,357 208.59 -2% -3%Iredell 1,557 7,675 202.87 1,550 7,813 198.39 1,718 7,980 215.29 5% 3%Lincoln 811 3,575 226.85 671 3,647 183.99 852 3,717 229.22 5% 3%Mecklenburg 5,031 32,369 155.43 5,177 33,358 155.20 5,480 34,338 159.59 4% 1%Rowan 1,711 9,180 186.38 1,640 9,212 178.03 1,527 9,183 166.29 -6% -6%Stanly 571 4,093 139.51 570 4,129 138.05 604 4,150 145.54 3% 2%Union 926 5,994 154.49 969 6,326 153.18 1,006 6,676 150.69 4% -1%
Region F Totals 14,920 83,846 177.95 14,498 85,671 169.23 15,506 87,473 177.27 2% 0%Alamance 1,404 9,438 148.76 1,486 9,483 156.70 1,565 9,555 163.79 6% 5%Caswell 168 1,498 112.15 213 1,512 140.87 245 1,529 160.24 21% 20%Davidson 1,424 9,319 152.81 1,561 9,398 166.10 1,510 9,577 157.67 3% 2%Guilford 3,844 25,821 148.87 4,084 26,255 155.55 4,469 26,645 167.72 8% 6%Montgomery 290 1,835 158.04 329 1,881 174.91 326 1,918 169.97 6% 4%Randolph 1,098 7,759 141.51 1,198 7,892 151.80 1,273 8,028 158.57 8% 6%Rockingham 1,034 6,561 157.60 987 6,524 151.29 1,041 6,520 159.66 0% 1%
Region G Totals 9,262 62,231 148.83 9,858 62,945 156.61 10,429 63,772 163.54 6% 5%Davie 483 2,470 195.55 523 2,508 208.53 555 2,565 216.37 7% 5%Forsyth 3,470 19,902 174.35 3,544 20,253 174.99 4,161 20,604 201.95 10% 8%Stokes 484 2,525 191.68 604 2,541 237.70 612 2,556 239.44 13% 12%Surry 1,079 5,475 197.08 967 5,462 177.04 1,184 5,467 216.57 6% 6%Yadkin 433 2,475 174.95 396 2,521 157.08 400 2,562 156.13 -4% -5%
Region I Totals 5,949 32,847 181.11 6,034 33,285 181.28 6,912 33,754 204.78 8% 7%Chatham 512 4,109 124.60 443 4,158 106.54 428 4,212 101.61 -8% -10%Durham 1,734 11,334 152.99 1,962 11,404 172.04 2,024 11,536 175.45 8% 7%Johnston 924 6,286 146.99 949 6,463 146.84 1,241 6,673 185.97 17% 13%Lee 447 3,228 138.48 403 3,271 123.20 510 3,322 153.52 8% 7%Moore* 936 9,118 102.65 945 9,271 101.93 942 9,368 100.56 0% -1%Orange 735 5,370 136.87 815 5,484 148.61 775 5,613 138.07 3% 1%Wake* 5,081 26,411 192.38 5,262 27,680 190.10 5,770 29,049 198.63 7% 2%
Region J Totals 10,369 65,856 157.45 10,779 67,731 159.14 11,690 69,773 167.54 6% 3%
(Sorted by Councils of Governments (COG) Regions -- Each Age Group covers two pages)

Table 12B: Average Annual Rates of Change in "Patients" and "Use Rates per 1000 Population"
AGES 75 and Over Average Average
H.H. Use H.H. Use H.H. Use Annual Rate Annual Rate
COUNTY Patients Estimated Rate Patients Estimated Rate Patients Estimated Rate of Change of Change in
in 2006 for in 2007 for in 2008 for in Number "Use Rates
2006 Population 2006 2007 Population 2007 2008 Population 2008 of Patients per 1000"
Franklin 541 2,617 206.73 550 2,654 207.23 617 2,704 228.18 7% 5%Granville 367 2,735 134.19 412 2,817 146.25 400 2,877 139.03 5% 2%Person 349 2,371 147.20 405 2,381 170.10 426 2,396 177.80 11% 10%Vance 328 2,457 133.50 344 2,479 138.77 388 2,504 154.95 9% 8%Warren 311 1,783 174.43 307 1,822 168.50 295 1,858 158.77 -3% -5%
Region K Totals 1,896 11,963 158.49 2,018 12,153 166.05 2,126 12,339 172.30 6% 4%Edgecombe 524 3,194 164.06 538 3,170 169.72 498 3,184 156.41 -2% -2%Halifax 688 4,225 162.84 713 4,220 168.96 610 4,228 144.28 -5% -5%Nash 836 5,283 158.24 838 5,313 157.73 965 5,355 180.21 8% 7%Northampton 283 1,897 149.18 296 1,903 155.54 325 1,927 168.66 7% 6%Wilson 838 4,671 179.40 919 4,686 196.12 968 4,757 203.49 7% 7%
Region L Totals 3,169 19,270 164.45 3,304 19,292 171.26 3,366 19,451 173.05 3% 3%Cumberland* 1,609 10,682 150.63 1,422 10,992 129.37 1,660 11,354 146.20 3% -1%Harnett* 789 4,692 168.16 843 4,795 175.81 946 4,923 192.16 10% 7%Sampson 587 3,660 160.38 646 3,700 174.59 667 3,755 177.63 7% 5%
Region M Totals 2,985 19,034 156.82 2,911 19,487 149.38 3,273 20,032 163.39 5% 2%Bladen 378 2,088 181.03 395 2,086 189.36 408 2,117 192.73 4% 3%Hoke* 394 1,285 306.61 335 1,329 252.07 341 1,397 244.09 -7% -10%Richmond 496 2,953 167.96 451 2,937 153.56 442 2,935 150.60 -6% -5%Robeson 1,179 5,631 209.38 1,117 5,633 198.30 1,104 5,657 195.16 -3% -3%Scotland 450 1,885 238.73 416 1,886 220.57 432 1,870 231.02 -2% -1%
Region N Totals 2,897 13,842 209.29 2,714 13,871 195.66 2,727 13,976 195.12 -3% -3%Brunswick 1,107 6,364 173.95 1,169 6,730 173.70 1,314 7,136 184.14 9% 3%Columbus 1,011 3,393 297.97 935 3,375 277.04 981 3,399 288.61 -1% -1%New Hanover 2,010 10,840 185.42 2,005 11,072 181.09 2,160 11,326 190.71 4% 1%Pender 445 3,042 146.29 422 3,149 134.01 473 3,272 144.56 3% 0%10Region O Totals 4,573 23,639 193.45 4,531 24,326 186.26 4,928 25,133 196.08 4% 1%Carteret* 702 5,145 136.44 746 5,313 140.41 803 5,442 147.56 7% 4%Craven* 740 6,104 121.23 758 6,227 121.73 907 6,350 142.83 11% 9%Duplin 605 3,026 199.93 554 3,045 181.94 635 3,093 205.30 3% 2%Greene 158 1,146 137.87 174 1,164 149.48 192 1,187 161.75 10% 8%Jones 105 806 130.27 133 814 163.39 163 817 199.51 25% 24%Lenoir 752 4,085 184.09 791 4,100 192.93 967 4,117 234.88 14% 13%Onslow* 704 4,363 161.36 809 4,518 179.06 908 4,697 193.31 14% 9%Pamlico 136 1,227 110.84 25 1,271 19.67 111 1,311 84.67 131% 124%Wayne* 1157 6,173 187.43 1185 6,291 188.36 1,124 6,388 175.95 -1% -3%
Region P Totals 5,059 32,075 157.72 5,175 32,743 158.05 5,810 33,402 173.94 7% 5%Beaufort 511 3,374 151.45 529 3,419 154.72 517 3,507 147.42 1% -1%Bertie 260 1,491 174.38 280 1,499 186.79 292 1,525 191.48 6% 5%Hertford 335 1,696 197.52 376 1,716 219.11 331 1,731 191.22 0% -1%Martin 397 1,763 225.18 381 1,765 215.86 416 1,775 234.37 3% 2%Pitt 1,070 6,343 168.69 1,081 6,432 168.07 1,289 6,552 196.73 10% 8%
Region Q Totals 2,573 14,667 175.43 2,647 14,831 178.48 2,845 15,090 188.54 5% 4%Camden 40 500 80.00 40 517 77.37 53 551 96.19 16% 11%Chowan 131 1,320 99.24 158 1,316 120.06 173 1,327 130.37 15% 15%Currituck 154 1,159 132.87 157 1,200 130.83 151 1,253 120.51 -1% -5%Dare 189 2,201 85.87 207 2,336 88.61 205 2,437 84.12 4% -1%Gates 112 732 153.01 101 745 135.57 102 764 133.51 -4% -6%Hyde 41 451 90.91 34 460 73.91 29 470 61.70 -16% -18%Pasquotank 260 2,554 101.80 295 2,580 114.34 292 2,626 111.20 6% 5%Perquimans 107 1,107 96.66 105 1,145 91.70 127 1,167 108.83 10% 7%Tyrrell 45 354 127.12 53 365 145.21 53 366 144.81 9% 7%Washington 142 1,022 138.94 139 1,028 135.21 132 1,040 126.92 -4% -4%
Region R Totals 1,221 11,400 107.11 1,289 11,692 110.25 1,317 12,001 109.74 4% 1%
NC Totals 79,733 490,780 162.46 80,638 499,078 161.57 86,117 508,350 169.40 4% 2%
* Adjustments for "Active Duty Military Personnel" have been applied to the "Age 18-64" population projections for these counties.
(Sorted by Councils of Governments (COG) Regions -- Each Age Group covers two pages)

2010 Plan
Under Age 18H.H. COG's Anticipated Geographic Unit's COG's Anticipated Potential
COUNTY Patients Avg. Annual Rate # of Patients Use Rate Avg. Annual Rate Use Rate Projected Home Health
in of Change in Receiving Service per 1000 of Change in per 1000 2011 Patients
2008 # Pats. Served in 2011 in 2008 Use Rate by 2011 Population in 2011
Cherokee 4 -19% 2 0.77 -19% 0.33 5,289 2Clay 1 -19% 0 0.57 -19% 0.25 1,793 0Graham 3 -19% 1 1.70 -19% 0.73 1,796 1Haywood 39 -19% 17 3.50 -19% 1.51 10,954 16Jackson 27 -19% 12 3.89 -19% 1.67 7,261 12Macon 20 -19% 9 2.97 -19% 1.28 7,144 9Swain 9 -19% 4 2.71 -19% 1.17 3,420 4
Region A Totals 103 -19% 44 2.79 -19% 1.20 37,657 45Buncombe 84 -43% -24 1.73 -44% -0.55 49,760 -28Henderson 38 -43% -11 1.73 -44% -0.55 23,050 -13Madison 8 -43% -2 1.89 -44% -0.61 4,241 -3Transylvania 24 -43% -7 4.19 -44% -1.34 5,818 -8
Region B Totals 154 -43% -45 1.92 -44% -0.61 82,869 -51Cleveland 107 -4% 94 4.62 -4% 4.06 22,828 93McDowell 41 -4% 36 4.22 -4% 3.71 9,934 37Polk 9 -4% 8 2.54 -4% 2.23 3,435 8Rutherford 44 -4% 39 3.02 -4% 2.65 14,638 39
Region C Totals 201 -4% 177 3.94 -4% 3.47 50,835 176Alleghany 3 -15% 2 1.46 -15% 0.80 2,025 2Ashe 9 -15% 5 1.76 -15% 0.97 5,172 5Avery 4 -15% 2 1.18 -15% 0.65 3,230 2Mitchell 10 -15% 6 3.22 -15% 1.77 3,056 5Watauga 8 -15% 4 1.18 -15% 0.65 7,001 5Wilkes 32 -15% 18 2.15 -15% 1.18 14,850 18Yancey 7 -15% 4 1.91 -15% 1.05 3,643 4
Region D Totals 73 -15% 40 1.87 -15% 1.03 38,977 40Alexander 32 -13% 20 3.83 -13% 2.33 8,292 19Burke 43 -13% 26 2.18 -13% 1.33 19,854 26Caldwell 68 -13% 41 3.79 -13% 2.31 17,889 41Catawba 120 -13% 73 3.26 -13% 1.99 37,518 75
Region E Totals 263 -13% 160 3.17 -13% 1.94 83,553 162Anson 49 1% 50 8.19 -1% 7.94 5,763 46Cabarrus 131 1% 135 3.03 -1% 2.94 47,407 139Gaston 360 1% 371 7.32 -1% 7.10 51,321 364Iredell 136 1% 140 3.64 -1% 3.53 38,914 137Lincoln 68 1% 70 3.94 -1% 3.82 17,946 69Mecklenburg 909 1% 936 3.98 -1% 3.86 238,669 922Rowan 138 1% 142 4.29 -1% 4.16 32,997 137Stanly 97 1% 100 7.08 -1% 6.87 13,607 93Union 92 1% 95 1.84 -1% 1.79 55,289 99
Region F Totals 1,980 1% 2,039 4.15 -1% 4.03 501,913 2,021Alamance 71 1% 73 2.08 1% 2.14 36,011 77Caswell 15 1% 15 3.18 1% 3.27 4,360 14Davidson 139 1% 143 3.82 1% 3.93 36,998 145Guilford 535 1% 551 4.85 1% 5.00 113,896 569Montgomery 60 1% 62 8.80 1% 9.06 6,873 62Randolph 183 1% 188 5.47 1% 5.64 33,964 191Rockingham 49 1% 50 2.40 1% 2.47 20,052 49
Region G Totals 1,052 1% 1,084 4.27 1% 4.40 252,154 1,109Davie 33 -9% 24 3.62 -10% 2.53 9,131 23Forsyth 351 -9% 256 4.19 -10% 2.93 87,059 255Stokes 37 -9% 27 3.65 -10% 2.55 9,847 25Surry 95 -9% 69 5.65 -10% 3.95 16,732 66Yadkin 52 -9% 38 5.85 -10% 4.09 8,955 37
Region I Totals 568 -9% 415 4.41 -10% 3.09 131,724 407Chatham 13 4% 15 0.96 0% 0.96 14,405 14Durham 153 4% 171 2.33 0% 2.33 72,024 168Johnston 32 4% 36 0.76 0% 0.76 45,746 35Lee 24 4% 27 1.63 0% 1.63 15,666 25Moore* 127 4% 142 7.02 0% 7.02 19,014 133Orange 39 4% 44 1.60 0% 1.60 24,627 39Wake* 181 4% 203 0.84 0% 0.84 238,464 199
Region J Totals 569 4% 637 1.44 0% 1.44 429,946 619
Table 12C: 2011 Need Projections for Medicare-certified Home Health Agencies or Offices

2010 Plan
Under Age 18H.H. COG's Anticipated Geographic Unit's COG's Anticipated Potential
COUNTY Patients Avg. Annual Rate # of Patients Use Rate Avg. Annual Rate Use Rate Projected Home Health
in of Change in Receiving Service per 1000 of Change in per 1000 2011 Patients
2008 # Pats. Served in 2010 in 2008 Use Rate by 2010 Population in 2010
Franklin 32 -17% 16 2.35 -18% 1.08 13,924 15Granville 11 -17% 5 0.89 -18% 0.41 12,110 5Person 29 -17% 14 3.41 -18% 1.57 8,340 13Vance 10 -17% 5 0.85 -18% 0.39 11,533 5Warren 10 -17% 5 2.51 -18% 1.15 3,835 4
Region K Totals 92 -17% 45 1.83 -18% 0.84 49,742 42Edgecombe 28 -4% 25 2.12 -4% 1.86 12,976 24Halifax 18 -4% 16 1.37 -4% 1.21 12,629 15Nash 45 -4% 40 1.98 -4% 1.74 22,964 40Northampton 1 -4% 1 0.22 -4% 0.19 4,376 1Wilson 54 -4% 48 2.76 -4% 2.43 20,066 49
Region L Totals 146 -4% 128 2.00 -4% 1.76 73,011 128Cumberland* 403 -4% 355 4.45 -5% 3.78 92,857 351Harnett* 35 -4% 31 1.24 -5% 1.05 29,874 31Sampson 73 -4% 64 4.41 -5% 3.75 17,019 64
Region M Totals 511 -4% 450 3.77 -5% 3.21 139,750 448Bladen 39 2% 41 4.98 1% 5.13 7,769 40Hoke* 31 2% 33 2.35 1% 2.43 13,971 34Richmond 63 2% 67 5.38 1% 5.54 11,605 64Robeson 198 2% 210 5.40 1% 5.56 37,186 207Scotland 61 2% 65 6.38 1% 6.57 9,501 62
Region N Totals 392 2% 416 4.97 1% 5.11 80,032 409Brunswick 74 5% 85 3.50 3% 3.82 22,960 88Columbus 65 5% 75 4.86 3% 5.29 13,517 72New Hanover 122 5% 140 3.00 3% 3.27 41,914 137Pender 41 5% 47 3.72 3% 4.06 11,592 47
Region O Totals 302 5% 347 3.50 3% 3.82 89,983 344Carteret* 21 -7% 17 1.76 -8% 1.34 11,850 16Craven* 15 -7% 12 0.58 -8% 0.44 26,962 12Duplin 42 -7% 33 3.03 -8% 2.30 14,230 33Greene 8 -7% 6 1.63 -8% 1.24 4,828 6Jones 2 -7% 2 0.93 -8% 0.71 1,977 1Lenoir 25 -7% 20 1.79 -8% 1.36 13,736 19Onslow* 87 -7% 69 1.73 -8% 1.31 54,930 72Pamlico 1 -7% 1 0.44 -8% 0.34 2,182 1Wayn* 68 -7% 54 2.30 -8% 1.75 29,857 52
Region P Totals 269 -7% 213 1.74 -8% 1.32 160,552 212Beaufort 9 -13% 5 0.85 -15% 0.47 10,637 5Bertie 10 -13% 6 2.11 -15% 1.16 4,623 5Hertford 12 -13% 7 2.29 -15% 1.26 5,097 6Martin 30 -13% 18 5.37 -15% 2.96 5,384 16Pitt 67 -13% 41 1.82 -15% 1.00 39,233 39
Region Q Totals 128 -13% 78 2.03 -15% 1.12 64,974 73Camden 8 14% 11 3.99 16% 5.91 1,964 12Chowan 6 14% 9 1.79 16% 2.64 3,327 9Currituck 26 14% 37 5.29 16% 7.83 4,457 35Dare 8 14% 11 1.18 16% 1.74 6,469 11Gates 6 14% 9 2.41 16% 3.57 2,350 8Hyde 3 14% 4 2.84 16% 4.20 987 4Pasquotank 26 14% 37 2.71 16% 4.01 9,484 38Perquimans 7 14% 10 2.72 16% 4.02 2,706 11Tyrrell 3 14% 4 3.44 16% 5.09 863 4Washington 13 14% 18 4.13 16% 6.11 3,072 19
Region R Totals 106 14% 151 2.88 16% 4.26 35,679 152
NC Totals 6,909 -5% 5,873 3.12 -6% 2.56 2,303,351 5,888
* Adjustments for "Active Duty Military Personnel" have been applied to the "Age 18-64" population projections for these counties.
Table 12C: 2011 Need Projections for Medicare-certified Home Health Agencies or Offices
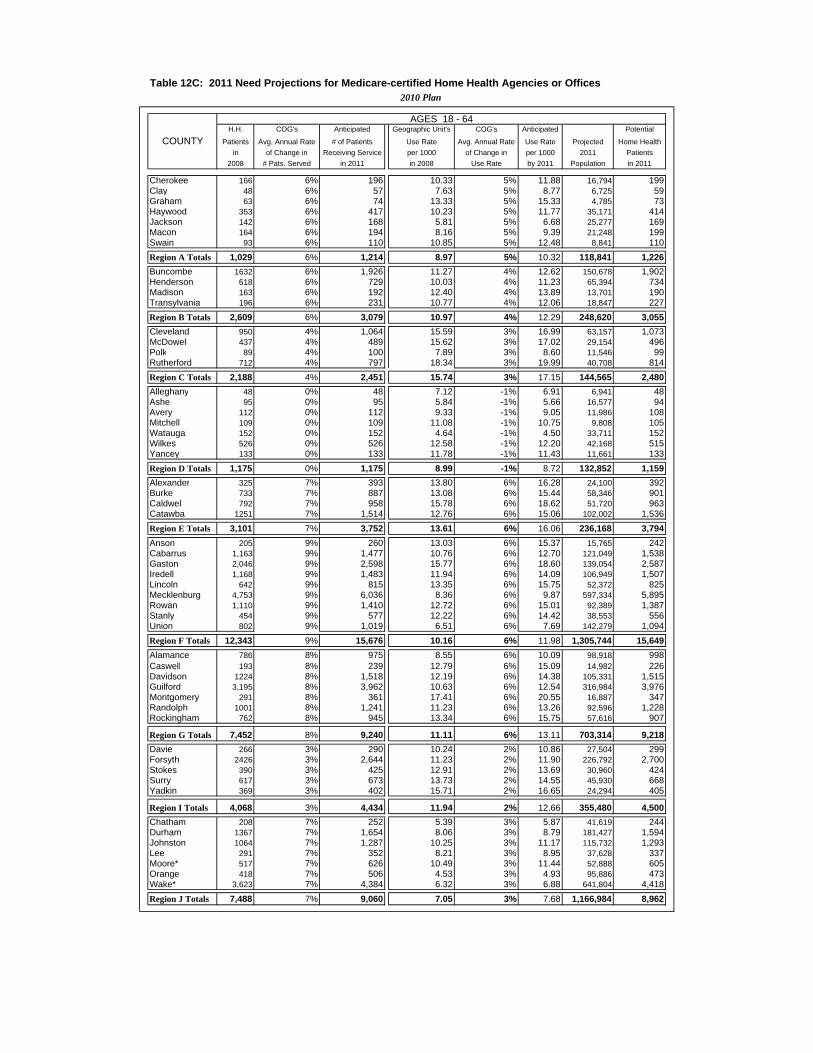
2010 Plan
AGES 18 - 64H.H. COG's Anticipated Geographic Unit's COG's Anticipated Potential
COUNTY Patients Avg. Annual Rate # of Patients Use Rate Avg. Annual Rate Use Rate Projected Home Health
in of Change in Receiving Service per 1000 of Change in per 1000 2011 Patients
2008 # Pats. Served in 2011 in 2008 Use Rate by 2011 Population in 2011
Cherokee 166 6% 196 10.33 5% 11.88 16,794 199Clay 48 6% 57 7.63 5% 8.77 6,725 59Graham 63 6% 74 13.33 5% 15.33 4,785 73Haywood 353 6% 417 10.23 5% 11.77 35,171 414Jackson 142 6% 168 5.81 5% 6.68 25,277 169Macon 164 6% 194 8.16 5% 9.39 21,248 199Swain 93 6% 110 10.85 5% 12.48 8,841 110
Region A Totals 1,029 6% 1,214 8.97 5% 10.32 118,841 1,226Buncombe 1632 6% 1,926 11.27 4% 12.62 150,678 1,902Henderson 618 6% 729 10.03 4% 11.23 65,394 734Madison 163 6% 192 12.40 4% 13.89 13,701 190Transylvania 196 6% 231 10.77 4% 12.06 18,847 227
Region B Totals 2,609 6% 3,079 10.97 4% 12.29 248,620 3,055Cleveland 950 4% 1,064 15.59 3% 16.99 63,157 1,073McDowell 437 4% 489 15.62 3% 17.02 29,154 496Polk 89 4% 100 7.89 3% 8.60 11,546 99Rutherford 712 4% 797 18.34 3% 19.99 40,708 814
Region C Totals 2,188 4% 2,451 15.74 3% 17.15 144,565 2,480Alleghany 48 0% 48 7.12 -1% 6.91 6,941 48Ashe 95 0% 95 5.84 -1% 5.66 16,577 94Avery 112 0% 112 9.33 -1% 9.05 11,986 108Mitchell 109 0% 109 11.08 -1% 10.75 9,808 105Watauga 152 0% 152 4.64 -1% 4.50 33,711 152Wilkes 526 0% 526 12.58 -1% 12.20 42,168 515Yancey 133 0% 133 11.78 -1% 11.43 11,661 133
Region D Totals 1,175 0% 1,175 8.99 -1% 8.72 132,852 1,159Alexander 325 7% 393 13.80 6% 16.28 24,100 392Burke 733 7% 887 13.08 6% 15.44 58,346 901Caldwell 792 7% 958 15.78 6% 18.62 51,720 963Catawba 1251 7% 1,514 12.76 6% 15.06 102,002 1,536
Region E Totals 3,101 7% 3,752 13.61 6% 16.06 236,168 3,794Anson 205 9% 260 13.03 6% 15.37 15,765 242Cabarrus 1,163 9% 1,477 10.76 6% 12.70 121,049 1,538Gaston 2,046 9% 2,598 15.77 6% 18.60 139,054 2,587Iredell 1,168 9% 1,483 11.94 6% 14.09 106,949 1,507Lincoln 642 9% 815 13.35 6% 15.75 52,372 825Mecklenburg 4,753 9% 6,036 8.36 6% 9.87 597,334 5,895Rowan 1,110 9% 1,410 12.72 6% 15.01 92,389 1,387Stanly 454 9% 577 12.22 6% 14.42 38,553 556Union 802 9% 1,019 6.51 6% 7.69 142,279 1,094
Region F Totals 12,343 9% 15,676 10.16 6% 11.98 1,305,744 15,649Alamance 786 8% 975 8.55 6% 10.09 98,918 998Caswell 193 8% 239 12.79 6% 15.09 14,982 226Davidson 1224 8% 1,518 12.19 6% 14.38 105,331 1,515Guilford 3,195 8% 3,962 10.63 6% 12.54 316,984 3,976Montgomery 291 8% 361 17.41 6% 20.55 16,887 347Randolph 1001 8% 1,241 11.23 6% 13.26 92,596 1,228Rockingham 762 8% 945 13.34 6% 15.75 57,616 907
Region G Totals 7,452 8% 9,240 11.11 6% 13.11 703,314 9,218Davie 266 3% 290 10.24 2% 10.86 27,504 299Forsyth 2426 3% 2,644 11.23 2% 11.90 226,792 2,700Stokes 390 3% 425 12.91 2% 13.69 30,960 424Surry 617 3% 673 13.73 2% 14.55 45,930 668Yadkin 369 3% 402 15.71 2% 16.65 24,294 405
Region I Totals 4,068 3% 4,434 11.94 2% 12.66 355,480 4,500Chatham 208 7% 252 5.39 3% 5.87 41,619 244Durham 1367 7% 1,654 8.06 3% 8.79 181,427 1,594Johnston 1064 7% 1,287 10.25 3% 11.17 115,732 1,293Lee 291 7% 352 8.21 3% 8.95 37,628 337Moore* 517 7% 626 10.49 3% 11.44 52,888 605Orange 418 7% 506 4.53 3% 4.93 95,886 473Wake* 3,623 7% 4,384 6.32 3% 6.88 641,804 4,418
Region J Totals 7,488 7% 9,060 7.05 3% 7.68 1,166,984 8,962
Table 12C: 2011 Need Projections for Medicare-certified Home Health Agencies or Offices

2010 Plan
AGES 18 - 64H.H. COG's Anticipated Geographic Unit's COG's Anticipated Potential
COUNTY Patients Avg. Annual Rate # of Patients Use Rate Avg. Annual Rate Use Rate Projected Home Health
in of Change in Receiving Service per 1000 of Change in per 1000 2011 Patients
2008 # Pats. Served in 2010 in 2008 Use Rate by 2010 Population in 2010
Franklin 466 7% 564 12.35 5% 14.20 39,970 568Granville 293 7% 355 7.90 5% 9.08 38,409 349Person 316 7% 382 13.32 5% 15.32 23,962 367Vance 394 7% 477 15.01 5% 17.26 26,385 455Warren 144 7% 174 11.81 5% 13.58 12,206 166
Region K Totals 1,613 7% 1,952 11.77 5% 13.54 140,932 1,908Edgecombe 433 -1% 420 13.62 -2% 12.81 31,596 405Halifax 368 -1% 357 10.96 -2% 10.30 33,778 348Nash 570 -1% 553 9.58 -2% 9.01 62,135 560Northampton 164 -1% 159 12.89 -2% 12.12 12,714 154Wilson 698 -1% 677 14.25 -2% 13.40 51,157 685
Region L Totals 2,233 -1% 2,166 11.97 -2% 11.25 191,380 2,154Cumberland* 1672 -2% 1,572 10.28 -4% 9.05 168,405 1,523Harnett* 753 -2% 708 11.17 -4% 9.83 74,610 734Sampson 507 -2% 477 12.55 -4% 11.04 42,503 469
Region M Totals 2,932 -2% 2,756 10.84 -4% 9.54 285,518 2,724Bladen 410 0% 410 20.87 -1% 20.24 19,568 396Hoke* 292 0% 292 11.13 -1% 10.79 28,511 308Richmond 353 0% 353 12.31 -1% 11.94 28,998 346Robeson 1611 0% 1,611 20.08 -1% 19.48 82,733 1,612Scotland 448 0% 448 19.39 -1% 18.81 23,911 450
Region N Totals 3,114 0% 3,114 17.50 -1% 16.98 183,721 3,119Brunswick 843 3% 919 13.22 0% 13.22 71,197 941Columbus 987 3% 1,076 29.42 0% 29.42 34,113 1,004New Hanover 1317 3% 1,436 10.43 0% 10.43 130,539 1,362Pender 377 3% 411 11.37 0% 11.37 36,607 416
Region O Totals 3,524 3% 3,841 13.73 0% 13.73 272,456 3,740Carteret* 480 7% 581 12.35 6% 14.57 39,183 571Craven* 655 7% 793 12.69 6% 14.98 52,489 786Duplin 441 7% 534 13.50 6% 15.93 33,659 536Greene 122 7% 148 8.96 6% 10.57 13,994 148Jones 72 7% 87 11.15 6% 13.16 6,583 87Lenoir 525 7% 635 15.09 6% 17.81 34,602 616Onslow* 806 7% 975 9.85 6% 11.62 84,898 987Pamlico 57 7% 69 7.30 6% 8.62 7,793 67Wayne* 758 7% 917 11.10 6% 13.09 68,909 902
Region P Totals 3,916 7% 4,738 11.66 6% 13.76 342,110 4,706Beaufort 369 3% 402 13.10 1% 13.49 28,286 382Bertie 184 3% 201 15.08 1% 15.53 12,400 193Hertford 219 3% 239 14.77 1% 15.22 14,839 226Martin 222 3% 242 15.30 1% 15.76 14,416 227Pitt 890 3% 970 8.56 1% 8.82 111,243 981
Region Q Totals 1,884 3% 2,054 10.85 1% 11.18 181,184 2,025Camden 52 5% 60 8.26 5% 9.50 6,566 62Chowan 89 5% 102 10.29 5% 11.83 8,797 104Currituck 144 5% 166 9.34 5% 10.74 15,186 163Dare 187 5% 215 8.72 5% 10.03 20,289 203Gates 103 5% 118 13.95 5% 16.05 7,763 125Hyde 16 5% 18 4.59 5% 5.28 3,442 18Pasquotank 253 5% 291 9.65 5% 11.10 26,480 294Perquimans 73 5% 84 9.35 5% 10.75 8,383 90Tyrrell 15 5% 17 5.58 5% 6.42 2,691 17Washington 96 5% 110 12.30 5% 14.14 7,692 109
Region R Totals 1,028 5% 1,182 9.59 5% 11.03 107,289 1,183
NC Totals 61,697 5% 70,952 10.67 3% 11.63 6,117,158 71,112
* Adjustments for "Active Duty Military Personnel" have been applied to the "Age 18-64" population projections for these counties.
Table 12C: 2011 Need Projections for Medicare-certified Home Health Agencies or Offices

2010 Plan
AGES 65 - 74H.H. COG's Anticipated Geographic Unit's COG's Anticipated Potential
COUNTY Patients Avg. Annual Rate # of Patients Use Rate Avg. Annual Rate Use Rate Projected Home Health
in of Change in Receiving Service per 1000 of Change in per 1000 2011 Patients
2008 # Pats. Served in 2011 in 2008 Use Rate by 2011 Population in 2011
Cherokee 167 1% 172 54.15 -1% 52.53 3,182 167Clay 58 1% 60 51.01 -1% 49.48 1,257 62Graham 37 1% 38 41.39 -1% 40.15 883 35Haywood 277 1% 285 46.01 -1% 44.63 6,237 278Jackson 115 1% 118 35.94 -1% 34.86 3,525 123Macon 162 1% 167 43.45 -1% 42.15 3,913 165Swain 45 1% 46 37.56 -1% 36.44 1,287 47
Region A Totals 861 1% 887 44.70 -1% 43.36 20,284 880Buncombe 1100 8% 1,364 61.09 5% 70.25 19,832 1,393Henderson 564 8% 699 57.97 5% 66.66 10,200 680Madison 105 8% 130 55.23 5% 63.52 2,050 130Transylvania 186 8% 231 52.35 5% 60.20 3,639 219
Region B Totals 1,955 8% 2,424 58.90 5% 67.74 35,721 2,420Cleveland 616 6% 727 80.88 4% 90.59 8,296 752McDowell 223 6% 263 57.31 4% 64.19 4,075 262Polk 108 6% 127 55.64 4% 62.32 1,987 124Rutherford 468 6% 552 85.45 4% 95.70 5,749 550
Region C Totals 1,415 6% 1,670 74.77 4% 83.74 20,107 1,684Alleghany 49 3% 53 39.84 0% 39.84 1,260 50Ashe 102 3% 111 38.23 0% 38.23 2,812 108Avery 87 3% 95 52.41 0% 52.41 1,725 90Mitchell 90 3% 98 55.18 0% 55.18 1,748 96Watauga 125 3% 136 38.98 0% 38.98 3,563 139Wilkes 363 3% 396 60.79 0% 60.79 6,361 387Yancey 119 3% 130 63.40 0% 63.40 1,947 123
Region D Totals 935 3% 1,019 51.25 0% 51.25 19,416 995Alexander 161 7% 195 54.30 3% 59.19 3,321 197Burke 441 7% 534 58.91 3% 64.21 7,983 513Caldwell 539 7% 652 78.48 3% 85.54 7,322 626Catawba 835 7% 1,010 73.74 3% 80.37 12,545 1,008
Region E Totals 1,976 7% 2,391 68.99 3% 75.20 31,171 2,344Anson 116 6% 137 62.00 0% 62.00 2,006 124Cabarrus 751 6% 886 68.92 0% 68.92 12,870 887Gaston 1,194 6% 1,409 81.22 0% 81.22 16,399 1,332Iredell 709 6% 837 64.51 0% 64.51 12,424 802Lincoln 394 6% 465 71.69 0% 71.69 6,352 455Mecklenburg 2,502 6% 2,952 54.02 0% 54.02 55,203 2,982Rowan 763 6% 900 76.51 0% 76.51 10,989 841Stanly 337 6% 398 71.23 0% 71.23 5,014 357Union 500 6% 590 43.79 0% 43.79 14,123 618
Region F Totals 7,266 6% 8,574 62.43 0% 62.43 135,380 8,451Alamance 617 6% 728 59.44 2% 63.00 11,477 723Caswell 113 6% 133 56.02 2% 59.39 2,161 128Davidson 772 6% 911 61.84 2% 65.55 13,756 902Guilford 1,852 6% 2,185 59.90 2% 63.49 35,028 2,224Montgomery 155 6% 183 70.36 2% 74.58 2,319 173Randolph 568 6% 670 54.40 2% 57.66 11,748 677Rockingham 510 6% 602 66.86 2% 70.87 8,021 568
Region G Totals 4,587 6% 5,413 60.30 2% 63.92 84,510 5,402Davie 238 7% 288 71.34 3% 77.76 3,724 290Forsyth 1550 7% 1,876 66.21 3% 72.17 25,973 1,874Stokes 283 7% 342 75.55 3% 82.35 4,182 344Surry 480 7% 581 78.01 3% 85.03 6,526 555Yadkin 219 7% 265 67.89 3% 74.00 3,438 254
Region I Totals 2,770 7% 3,352 69.47 3% 75.72 43,843 3,320Chatham 204 11% 271 44.86 4% 50.25 5,217 262Durham 847 11% 1,127 62.34 4% 69.82 16,115 1,125Johnston 733 11% 975 72.86 4% 81.60 12,092 987Lee 213 11% 283 53.34 4% 59.74 4,373 261Moore* 400 11% 532 49.94 4% 55.93 8,151 456Orange 378 11% 503 54.66 4% 61.22 8,378 513Wake* 2,330 11% 3,099 52.40 4% 58.69 57,139 3,353
Region J Totals 5,105 11% 6,790 55.74 4% 62.43 111,465 6,959
Table 12C: 2011 Need Projections for Medicare-certified Home Health Agencies or Offices

2010 Plan
AGES 65 - 74H.H. COG's Anticipated Geographic Unit's COG's Anticipated Potential
COUNTY Patients Avg. Annual Rate # of Patients Use Rate Avg. Annual Rate Use Rate Projected Home Health
in of Change in Receiving Service per 1000 of Change in per 1000 2011 Patients
2008 # Pats. Served in 2010 in 2008 Use Rate by 2010 Population in 2010
Franklin 292 5% 336 75.92 2% 80.48 4,390 353Granville 223 5% 256 57.34 2% 60.78 4,325 263Person 200 5% 230 69.01 2% 73.15 3,087 226Vance 222 5% 255 73.90 2% 78.34 3,171 248Warren 104 5% 120 55.44 2% 58.76 1,866 110
Region K Totals 1,041 5% 1,197 67.11 2% 71.13 16,839 1,198Edgecombe 278 2% 295 76.63 0% 76.63 3,810 292Halifax 260 2% 276 60.76 0% 60.76 4,389 267Nash 409 2% 434 63.61 0% 63.61 7,190 457Northampton 131 2% 139 67.77 0% 67.77 2,006 136Wilson 442 2% 469 77.84 0% 77.84 6,118 476
Region L Totals 1,520 2% 1,611 69.25 0% 69.25 23,513 1,628Cumberland* 927 3% 1,010 58.92 0% 58.92 16,703 984Harnett* 474 3% 517 71.32 0% 71.32 7,528 537Sampson 368 3% 401 78.33 0% 78.33 5,052 396
Region M Totals 1,769 3% 1,928 65.33 0% 65.33 29,283 1,913Bladen 211 3% 230 81.47 0% 81.47 2,762 225Hoke* 171 3% 186 79.06 0% 79.06 2,419 191Richmond 274 3% 299 78.04 0% 78.04 3,670 286Robeson 832 3% 907 106.71 0% 106.71 8,400 896Scotland 228 3% 249 89.91 0% 89.91 2,825 254
Region N Totals 1,716 3% 1,870 92.27 0% 92.27 20,076 1,852Brunswick 790 8% 980 72.84 4% 81.58 11,539 941Columbus 639 8% 792 144.44 4% 161.77 4,649 752New Hanover 908 8% 1,126 64.46 4% 72.20 15,770 1,139Pender 328 8% 407 74.66 4% 83.62 4,997 418
Region O Totals 2,665 8% 3,305 78.97 4% 88.44 36,955 3,268Carteret* 411 10% 534 62.52 8% 77.52 6,893 534Craven* 466 10% 606 68.88 8% 85.42 6,885 588Duplin 346 10% 450 90.55 8% 112.28 3,934 442Greene 84 10% 109 56.38 8% 69.91 1,571 110Jones 72 10% 94 82.10 8% 101.80 909 93Lenoir 448 10% 582 95.24 8% 118.10 4,840 572Onslow* 521 10% 677 76.51 8% 94.87 7,029 667Pamlico 58 10% 75 38.31 8% 47.50 1,462 69Wayne* 594 10% 772 74.75 8% 92.68 8,224 762
Region P Totals 3,000 10% 3,900 74.07 8% 91.85 41,747 3,834Beaufort 261 2% 277 60.85 0% 60.85 4,576 278Bertie 120 2% 127 74.81 0% 74.81 1,624 121Hertford 137 2% 145 72.26 0% 72.26 1,997 144Martin 194 2% 206 96.90 0% 96.90 2,039 198Pitt 601 2% 637 72.22 0% 72.22 9,462 683
Region Q Totals 1,313 2% 1,392 72.49 0% 72.49 19,698 1,428Camden 30 8% 37 37.27 5% 42.86 879 38Chowan 55 8% 68 40.74 5% 46.85 1,348 63Currituck 81 8% 100 42.79 5% 49.21 2,042 100Dare 109 8% 135 34.89 5% 40.12 3,276 131Gates 73 8% 91 76.92 5% 88.46 1,043 92Hyde 15 8% 19 30.06 5% 34.57 498 17Pasquotank 127 8% 157 46.38 5% 53.34 3,072 164Perquimans 65 8% 81 47.20 5% 54.28 1,421 77Tyrrell 19 8% 24 53.22 5% 61.20 355 22Washington 51 8% 63 43.22 5% 49.70 1,230 61
Region R Totals 625 8% 775 43.79 5% 50.36 15,164 764
NC Totals 40,519 6% 47,812 64.12 2% 67.96 705,172 47,927
* Adjustments for "Active Duty Military Personnel" have been applied to the "Age 18-64" population projections for these counties.
Table 12C: 2011 Need Projections for Medicare-certified Home Health Agencies or Offices

2010 Plan
AGES 75 and OverH.H. COG's Anticipated Geographic Unit's COG's Anticipated Potential
COUNTY Patients Avg. Annual Rate # of Patients Use Rate Avg. Annual Rate Use Rate Projected Home Health
in of Change in Receiving Service per 1000 of Change in per 1000 2011 Patients
2008 # Pats. Served in 2011 in 2008 Use Rate by 2011 Population in 2011
Cherokee 378 -2% 355 151.81 -3% 138.14 2,666 368Clay 157 -2% 148 138.57 -3% 126.10 1,180 149Graham 93 -2% 87 131.91 -3% 120.04 762 91Haywood 580 -2% 545 106.15 -3% 96.60 5,622 543Jackson 217 -2% 204 90.12 -3% 82.01 2,593 213Macon 357 -2% 336 97.46 -3% 88.69 3,769 334Swain 131 -2% 123 146.86 -3% 133.64 920 123
Region A Totals 1,913 -2% 1,798 114.17 -3% 103.90 17,512 1,819Buncombe 2,469 1% 2,543 148.72 0% 148.72 16,834 2,504Henderson 1,285 1% 1,324 121.67 0% 121.67 10,529 1,281Madison 244 1% 251 158.13 0% 158.13 1,594 252Transylvania 485 1% 500 138.02 0% 138.02 3,646 503
Region B Totals 4,483 1% 4,617 139.14 0% 139.14 32,603 4,536Cleveland 1197 -2% 1,125 192.35 -2% 180.81 6,300 1,139McDowell 446 -2% 419 149.82 -2% 140.83 3,165 446Polk 222 -2% 209 100.36 -2% 94.34 2,136 202Rutherford 712 -2% 669 152.17 -2% 143.04 4,641 664
Region C Totals 2,577 -2% 2,422 160.15 -2% 150.54 16,242 2,445Alleghany 106 1% 109 101.15 0% 101.15 1,098 111Ashe 259 1% 267 113.25 0% 113.25 2,361 267Avery 229 1% 236 165.46 0% 165.46 1,439 238Mitchell 230 1% 237 157.00 0% 157.00 1,492 234Watauga 298 1% 307 114.53 0% 114.53 2,786 319Wilkes 802 1% 826 173.29 0% 173.29 4,868 844Yancey 282 1% 290 160.41 0% 160.41 1,816 291
Region D Totals 2,206 1% 2,272 145.40 0% 145.40 15,860 2,306Alexander 334 5% 384 161.04 4% 180.37 2,202 397Burke 917 5% 1,055 153.09 4% 171.46 6,281 1,077Caldwell 1064 5% 1,224 210.73 4% 236.02 5,319 1,255Catawba 1694 5% 1,948 192.43 4% 215.53 9,209 1,985
Region E Totals 4,009 5% 4,610 182.93 4% 204.88 23,011 4,714Anson 294 2% 312 165.26 0% 165.26 1,726 285Cabarrus 1,656 2% 1,755 199.69 0% 199.69 8,798 1,757Gaston 2,369 2% 2,511 208.59 0% 208.59 11,789 2,459Iredell 1,718 2% 1,821 215.29 0% 215.29 8,556 1,842Lincoln 852 2% 903 229.22 0% 229.22 3,944 904Mecklenburg 5,480 2% 5,809 159.59 0% 159.59 37,079 5,917Rowan 1,527 2% 1,619 166.29 0% 166.29 9,206 1,531Stanly 604 2% 640 145.54 0% 145.54 4,229 615Union 1,006 2% 1,066 150.69 0% 150.69 7,839 1,181
Region F Totals 15,506 2% 16,436 177.27 0% 177.27 93,166 16,515Alamance 1,565 6% 1,847 163.79 5% 188.36 9,734 1,833Caswell 245 6% 289 160.24 5% 184.27 1,625 299Davidson 1,510 6% 1,782 157.67 5% 181.32 10,090 1,830Guilford 4,469 6% 5,273 167.72 5% 192.88 27,705 5,344Montgomery 326 6% 385 169.97 5% 195.46 1,940 379Randolph 1,273 6% 1,502 158.57 5% 182.36 8,432 1,538Rockingham 1,041 6% 1,228 159.66 5% 183.61 6,574 1,207
Region G Totals 10,429 6% 12,306 163.54 5% 187.20 66,100 12,374Davie 555 8% 688 216.37 7% 261.81 2,738 717Forsyth 4,161 8% 5,160 201.95 7% 244.36 21,310 5,207Stokes 612 8% 759 239.44 7% 289.72 2,692 780Surry 1,184 8% 1,468 216.57 7% 262.05 5,454 1,429Yadkin 400 8% 496 156.13 7% 188.91 2,654 501
Region I Totals 6,912 8% 8,571 204.78 7% 247.78 34,848 8,635Chatham 428 6% 505 101.61 3% 110.76 4,383 485Durham 2,024 6% 2,388 175.45 3% 191.24 11,975 2,290Johnston 1,241 6% 1,464 185.97 3% 202.71 7,355 1,491Lee 510 6% 602 153.52 3% 167.34 3,438 575Moore* 942 6% 1,112 100.56 3% 109.61 9,488 1,040Orange 775 6% 915 138.07 3% 150.50 5,940 894Wake* 5,770 6% 6,809 198.63 3% 216.51 33,451 7,242
Region J Totals 11,690 6% 13,794 167.54 3% 182.62 76,030 13,885
Table 12C: 2011 Need Projections for Medicare-certified Home Health Agencies or Offices
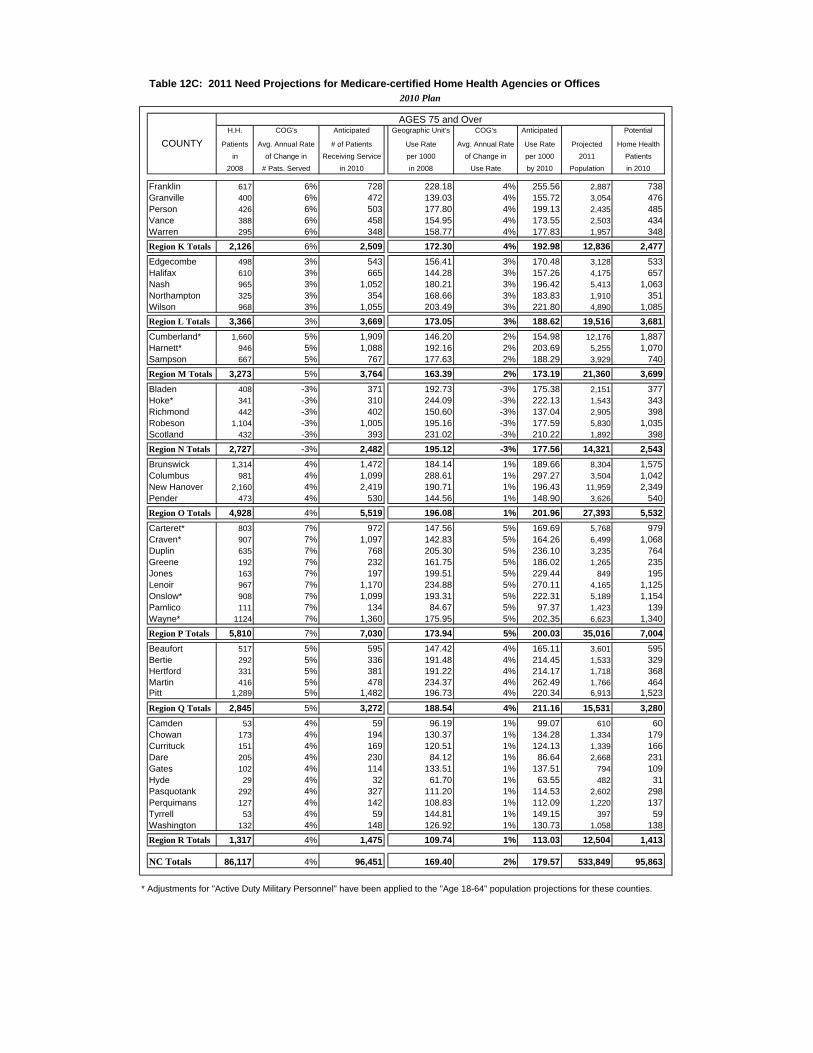
2010 Plan
AGES 75 and OverH.H. COG's Anticipated Geographic Unit's COG's Anticipated Potential
COUNTY Patients Avg. Annual Rate # of Patients Use Rate Avg. Annual Rate Use Rate Projected Home Health
in of Change in Receiving Service per 1000 of Change in per 1000 2011 Patients
2008 # Pats. Served in 2010 in 2008 Use Rate by 2010 Population in 2010
Franklin 617 6% 728 228.18 4% 255.56 2,887 738Granville 400 6% 472 139.03 4% 155.72 3,054 476Person 426 6% 503 177.80 4% 199.13 2,435 485Vance 388 6% 458 154.95 4% 173.55 2,503 434Warren 295 6% 348 158.77 4% 177.83 1,957 348
Region K Totals 2,126 6% 2,509 172.30 4% 192.98 12,836 2,477Edgecombe 498 3% 543 156.41 3% 170.48 3,128 533Halifax 610 3% 665 144.28 3% 157.26 4,175 657Nash 965 3% 1,052 180.21 3% 196.42 5,413 1,063Northampton 325 3% 354 168.66 3% 183.83 1,910 351Wilson 968 3% 1,055 203.49 3% 221.80 4,890 1,085
Region L Totals 3,366 3% 3,669 173.05 3% 188.62 19,516 3,681Cumberland* 1,660 5% 1,909 146.20 2% 154.98 12,176 1,887Harnett* 946 5% 1,088 192.16 2% 203.69 5,255 1,070Sampson 667 5% 767 177.63 2% 188.29 3,929 740
Region M Totals 3,273 5% 3,764 163.39 2% 173.19 21,360 3,699Bladen 408 -3% 371 192.73 -3% 175.38 2,151 377Hoke* 341 -3% 310 244.09 -3% 222.13 1,543 343Richmond 442 -3% 402 150.60 -3% 137.04 2,905 398Robeson 1,104 -3% 1,005 195.16 -3% 177.59 5,830 1,035Scotland 432 -3% 393 231.02 -3% 210.22 1,892 398
Region N Totals 2,727 -3% 2,482 195.12 -3% 177.56 14,321 2,543Brunswick 1,314 4% 1,472 184.14 1% 189.66 8,304 1,575Columbus 981 4% 1,099 288.61 1% 297.27 3,504 1,042New Hanover 2,160 4% 2,419 190.71 1% 196.43 11,959 2,349Pender 473 4% 530 144.56 1% 148.90 3,626 540
Region O Totals 4,928 4% 5,519 196.08 1% 201.96 27,393 5,532Carteret* 803 7% 972 147.56 5% 169.69 5,768 979Craven* 907 7% 1,097 142.83 5% 164.26 6,499 1,068Duplin 635 7% 768 205.30 5% 236.10 3,235 764Greene 192 7% 232 161.75 5% 186.02 1,265 235Jones 163 7% 197 199.51 5% 229.44 849 195Lenoir 967 7% 1,170 234.88 5% 270.11 4,165 1,125Onslow* 908 7% 1,099 193.31 5% 222.31 5,189 1,154Pamlico 111 7% 134 84.67 5% 97.37 1,423 139Wayne* 1124 7% 1,360 175.95 5% 202.35 6,623 1,340
Region P Totals 5,810 7% 7,030 173.94 5% 200.03 35,016 7,004Beaufort 517 5% 595 147.42 4% 165.11 3,601 595Bertie 292 5% 336 191.48 4% 214.45 1,533 329Hertford 331 5% 381 191.22 4% 214.17 1,718 368Martin 416 5% 478 234.37 4% 262.49 1,766 464Pitt 1,289 5% 1,482 196.73 4% 220.34 6,913 1,523
Region Q Totals 2,845 5% 3,272 188.54 4% 211.16 15,531 3,280Camden 53 4% 59 96.19 1% 99.07 610 60Chowan 173 4% 194 130.37 1% 134.28 1,334 179Currituck 151 4% 169 120.51 1% 124.13 1,339 166Dare 205 4% 230 84.12 1% 86.64 2,668 231Gates 102 4% 114 133.51 1% 137.51 794 109Hyde 29 4% 32 61.70 1% 63.55 482 31Pasquotank 292 4% 327 111.20 1% 114.53 2,602 298Perquimans 127 4% 142 108.83 1% 112.09 1,220 137Tyrrell 53 4% 59 144.81 1% 149.15 397 59Washington 132 4% 148 126.92 1% 130.73 1,058 138
Region R Totals 1,317 4% 1,475 109.74 1% 113.03 12,504 1,413
NC Totals 86,117 4% 96,451 169.40 2% 179.57 533,849 95,863
* Adjustments for "Active Duty Military Personnel" have been applied to the "Age 18-64" population projections for these counties.
Table 12C: 2011 Need Projections for Medicare-certified Home Health Agencies or Offices

2010 Plan
Placeholder TOTALS Need
Adjustment Adjusted Projected Surplus for New
COUNTY for Agencies Potential Total Utilization or Deficit Agencies
Under People in ("-" = or
Development Served 2011 Deficit)** Offices
Cherokee 0 725 737 -12 0Clay 0 264 270 -6 0Graham 0 201 202 0 0Haywood 0 1,264 1,252 12 0Jackson 0 502 517 -15 0Macon 0 705 708 -3 0Swain 0 283 284 -1 0
Region A Totals 0 3,944 3,970 -27Buncombe 0 5,808 5,771 38 0Henderson 0 2,741 2,683 58 0Madison 0 572 570 2 0Transylvania 0 955 942 13 0
Region B Totals 0 10,076 9,960 116Cleveland 0 3,010 3,056 -46 0McDowell 0 1,208 1,240 -32 0Polk 0 444 432 11 0Rutherford 0 2,058 2,067 -9 0
Region C Totals 0 6,720 6,785 -65Alleghany 0 212 211 1 0Ashe 0 478 474 4 0Avery 0 445 439 6 0Mitchell 0 450 442 8 0Watauga 0 600 614 -15 0Wilkes 0 1,765 1,762 3 0Yancey 0 557 552 5 0
Region D Totals 0 4,506 4,500 7Alexander 0 992 1,005 -14 0Burke 0 2,501 2,517 -15 0Caldwell 0 2,876 2,886 -11 0Catawba 0 4,545 4,604 -59 0
Region E Totals 0 10,914 11,014 -100Anson 0 759 698 62 0Cabarrus 0 4,253 4,321 -67 0Gaston 0 6,889 6,742 147 0Iredell 0 4,281 4,288 -6 0Lincoln 0 2,253 2,253 0 0Mecklenburg 191 15,925 15,717 208 0Rowan 0 4,071 3,896 175 0Stanly 0 1,714 1,622 92 0Union 0 2,770 2,992 -223 0
Region F Totals 191 42,916 42,636 280Alamance 0 3,623 3,632 -9 0Caswell 0 677 668 9 0Davidson 0 4,354 4,392 -38 0Guilford 0 11,972 12,113 -141 0Montgomery 0 990 961 29 0Randolph 0 3,602 3,634 -32 0Rockingham 0 2,826 2,732 93 0
Region G Totals 0 28,043 28,103 -60Davie 0 1,290 1,328 -38 0Forsyth 0 9,936 10,037 -101 0Stokes 0 1,553 1,573 -20 0Surry 0 2,791 2,719 72 0Yadkin 0 1,201 1,197 4 0
Region I Totals 0 16,771 16,861 -90Chatham 0 1,043 1,006 37 0Durham 0 5,340 5,177 163 0Johnston 0 3,763 3,805 -43 0Lee 0 1,264 1,199 65 0Moore* 0 2,411 2,234 177 0Orange 0 1,967 1,919 47 0Wake* 275 14,769 15,213 -444 1
Region J Totals 275 30,557 30,425 132
Table 12C: 2011 Need Projections for Medicare-certified Home Health Agencies or Offices
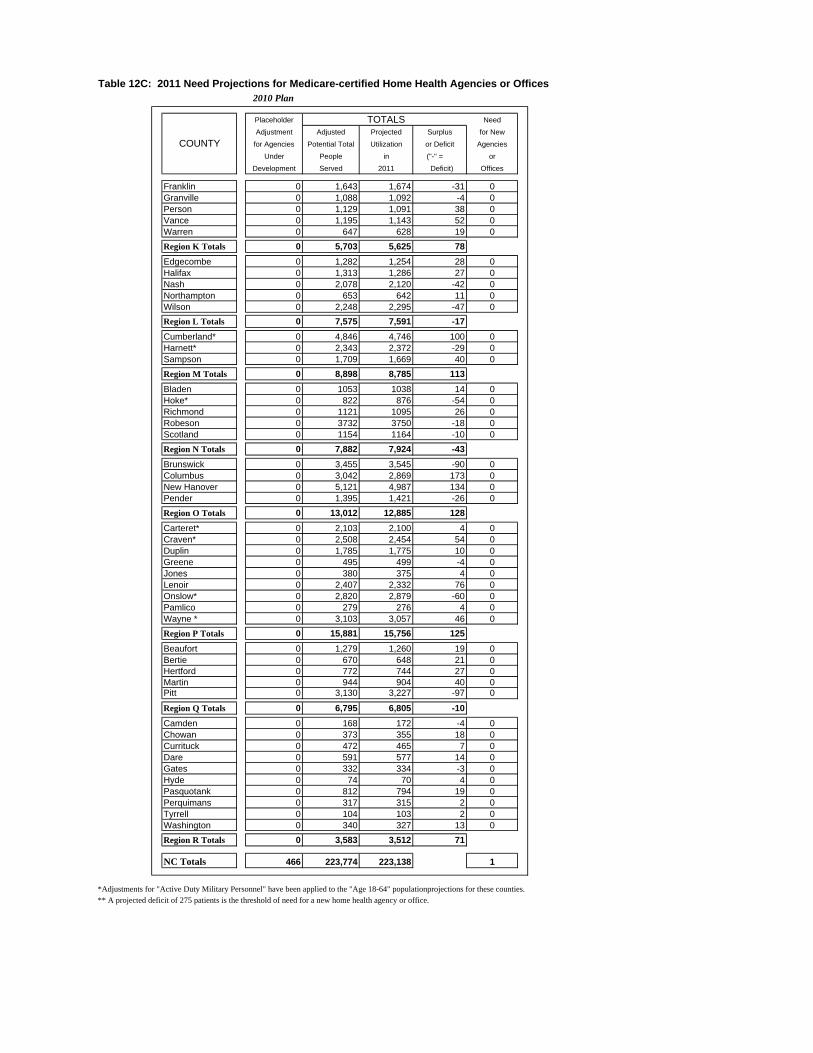
2010 Plan
Placeholder TOTALS Need
Adjustment Adjusted Projected Surplus for New
COUNTY for Agencies Potential Total Utilization or Deficit Agencies
Under People in ("-" = or
Development Served 2011 Deficit) Offices
Franklin 0 1,643 1,674 -31 0Granville 0 1,088 1,092 -4 0Person 0 1,129 1,091 38 0Vance 0 1,195 1,143 52 0Warren 0 647 628 19 0
Region K Totals 0 5,703 5,625 78Edgecombe 0 1,282 1,254 28 0Halifax 0 1,313 1,286 27 0Nash 0 2,078 2,120 -42 0Northampton 0 653 642 11 0Wilson 0 2,248 2,295 -47 0
Region L Totals 0 7,575 7,591 -17Cumberland* 0 4,846 4,746 100 0Harnett* 0 2,343 2,372 -29 0Sampson 0 1,709 1,669 40 0
Region M Totals 0 8,898 8,785 113Bladen 0 1053 1038 14 0Hoke* 0 822 876 -54 0Richmond 0 1121 1095 26 0Robeson 0 3732 3750 -18 0Scotland 0 1154 1164 -10 0
Region N Totals 0 7,882 7,924 -43Brunswick 0 3,455 3,545 -90 0Columbus 0 3,042 2,869 173 0New Hanover 0 5,121 4,987 134 0Pender 0 1,395 1,421 -26 0
Region O Totals 0 13,012 12,885 128Carteret* 0 2,103 2,100 4 0Craven* 0 2,508 2,454 54 0Duplin 0 1,785 1,775 10 0Greene 0 495 499 -4 0Jones 0 380 375 4 0Lenoir 0 2,407 2,332 76 0Onslow* 0 2,820 2,879 -60 0Pamlico 0 279 276 4 0Wayne * 0 3,103 3,057 46 0
Region P Totals 0 15,881 15,756 125Beaufort 0 1,279 1,260 19 0Bertie 0 670 648 21 0Hertford 0 772 744 27 0Martin 0 944 904 40 0Pitt 0 3,130 3,227 -97 0
Region Q Totals 0 6,795 6,805 -10Camden 0 168 172 -4 0Chowan 0 373 355 18 0Currituck 0 472 465 7 0Dare 0 591 577 14 0Gates 0 332 334 -3 0Hyde 0 74 70 4 0Pasquotank 0 812 794 19 0Perquimans 0 317 315 2 0Tyrrell 0 104 103 2 0Washington 0 340 327 13 0
Region R Totals 0 3,583 3,512 71
NC Totals 466 223,774 223,138 1
*Adjustments for "Active Duty Military Personnel" have been applied to the "Age 18-64" populationprojections for these counties.** A projected deficit of 275 patients is the threshold of need for a new home health agency or office.
Table 12C: 2011 Need Projections for Medicare-certified Home Health Agencies or Offices
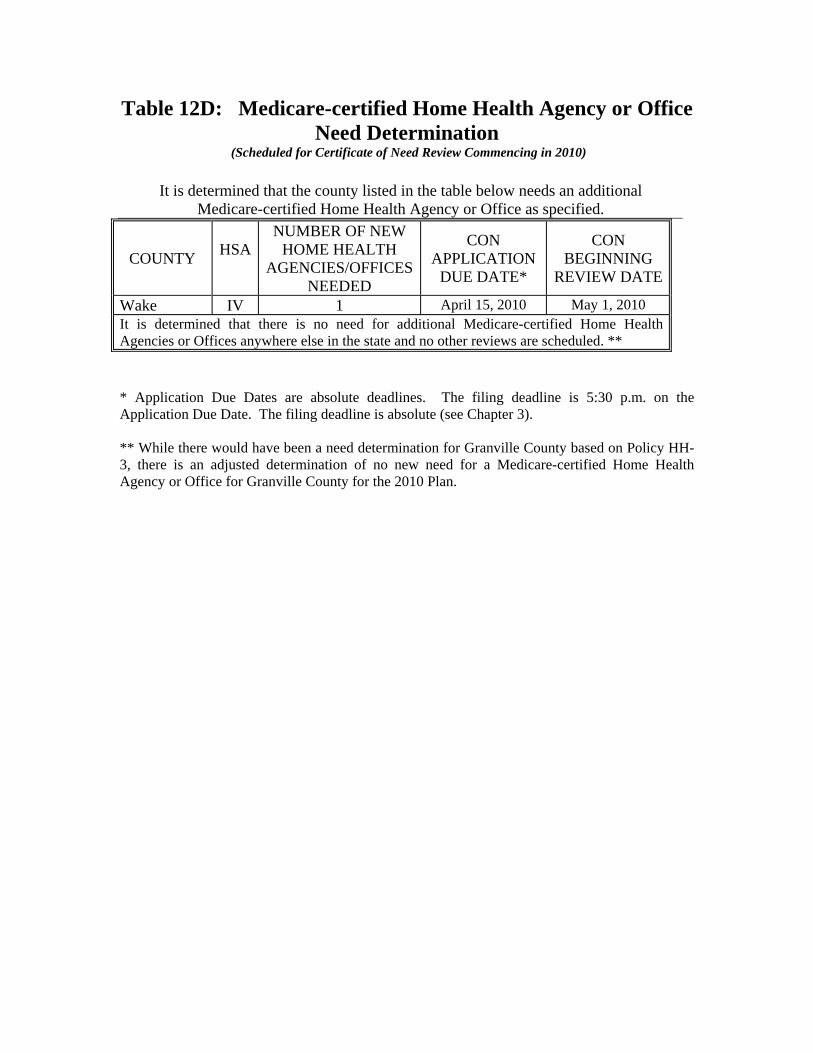
Table 12D: Medicare-certified Home Health Agency or Office Need Determination
(Scheduled for Certificate of Need Review Commencing in 2010)
It is determined that the county listed in the table below needs an additional Medicare-certified Home Health Agency or Office as specified.
COUNTY
HSA
NUMBER OF NEW HOME HEALTH
AGENCIES/OFFICES NEEDED
CON APPLICATION
DUE DATE*
CON BEGINNING
REVIEW DATE
Wake IV 1 April 15, 2010 May 1, 2010 It is determined that there is no need for additional Medicare-certified Home Health Agencies or Offices anywhere else in the state and no other reviews are scheduled. **
* Application Due Dates are absolute deadlines. The filing deadline is 5:30 p.m. on the Application Due Date. The filing deadline is absolute (see Chapter 3). ** While there would have been a need determination for Granville County based on Policy HH-3, there is an adjusted determination of no new need for a Medicare-certified Home Health Agency or Office for Granville County for the 2010 Plan.

Chapter 13:Hospice Services

CHAPTER 13 HOSPICE SERVICES Summary of Hospice Services and Supply
In the fall of 2009, there were 263 hospice facilities (including hospice home care facilities and hospice inpatient and residential facilities) listed as being separately licensed in North Carolina according to the North Carolina Division of Health Service Regulation.
According to the hospice licensure law, as passed by the N.C. General Assembly in 1984,
a hospice must provide home care services to terminally ill patients with a life expectancy generally not to exceed six months and their families, with provision for inpatient care or hospice residential care, as long as hospice inpatient is provided directly or through a contractual agreement. Data reported on the 2009 Licensure Renewal Applications indicate that more than 39,000 hospice patients were served in 2007-2008.
There are 29 hospice inpatient facilities (comprising 256 beds) located in North Carolina,
providing acute symptom control and pain management for hospice patients. Of the 29 facilities, 27 are free-standing hospice inpatient units located in Alamance, Buncombe, Cabarrus, Caldwell, Catawba, Cleveland, Cumberland, Davidson, Duplin, Durham, Forsyth, Gaston, Guilford, Harnett, Henderson, Iredell, Mecklenburg, New Hanover, Orange, Pitt, Robeson, Rockingham, Rutherford, Scotland, Surry and Wayne counties. Two hospitals have hospice inpatient units as a part of the hospital, located in Mecklenburg and Wake counties. Hospice inpatient facilities located in Beaufort, Brunswick, Burke, Caldwell, Catawba, Cleveland, Columbus, Gaston, Haywood, Johnston, Moore, Nash, Randolph, Richmond, Robeson, Rowan, Union, and Wake counties will add a total of 123 beds. Further, additions to facilities in Forsyth, Harnett, Robeson, Scotland and Wayne counties will add 25 beds.
There are 21 hospice residential facilities (comprising 151 beds) currently providing
residential hospice care for patients who have frail and elderly caregivers or who live alone. These facilities are located in Alamance, Buncombe, Burke, Cabarrus, Catawba, Cleveland, Davidson, Duplin, Forsyth, Gaston, Guilford, Iredell, Mecklenburg, Richmond, Rockingham, Rutherford, Scotland, Surry, Union, and Wayne counties. The hospice residential facilities being developed in Caldwell, Cleveland, Gaston, Johnston, Nash, Randolph, Rowan, Union and Wake counties will add a total of 53 beds. Further, an addition to the Wayne County facility will add six beds. Changes from the Previous Plan
In 2008, based on the recommendation of its Long-Term and Behavioral Health Committee, the State Health Coordinating Council authorized the formation of a Hospice Methodologies Task Force to make recommendations for the 2010 State Medical Facilities Plan.
An 11-member Task Force was formed and met four times. Represented on the group were members of the Council as well as hospice entities and a member of the general public. Serving as resource people were the president and chief executive officer of the Carolinas Center for Hospice and End of Life Care, the president of Health Planning Source and representatives of the Division of Medical Assistance, and the Division of Health Service Regulation’s Certificate of

Need, and Acute and Home Care Licensure and Certification sections. The meetings were open to and attended by members of the public.
The Task Force presented its recommendations to the Long-Term and Behavioral Health Committee. The Committee accepted the recommendations which were subsequently approved by the Council for inclusion in the 2010 Plan. Hospice Home Care Offices:
The hospice home care methodology has been modified to utilize the two-year trailing average growth rate in the number of deaths served and in the percent of deaths served. No need determinations are considered for counties with three or more hospice home care offices (excludes hospice inpatient and residential only facilities) per 100,000 population, as the data showed that counties in the state with a penetration rate of 40 percent or higher had three or fewer hospice home care offices located in the county and reporting service provision. The threshold for a need determination has been changed to a deficit of 90 or greater deaths, which represented the approximate number of deaths served at three hospice offices per 100,000 and a statewide median penetration rate (8.5 deaths per 1,000 [statewide death rate] x 100 = 850 deaths per 100,000 x 29.5 percent of deaths served = 251 deaths served by hospice/3 hospice agencies = approx. 90). The placeholder for new hospice offices has been changed to the new threshold of 90 in order to maintain consistency. Hospice Inpatient Beds:
The hospice inpatient bed methodology has been modified to utilize projected hospice days of care calculated by multiplying projected hospice admissions by the lower of the statewide median average length of stay or the actual average length of stay for each county. This selection reduces the inclusion of days of care that may not be appropriate for an inpatient facility. Projected hospice admissions are determined by the application of the two-year trailing average growth rate in the number of admissions served to current admissions. Inpatient days as a percent of total days of care are determined to be approximately six percent based on statewide inpatient days as a percent of total days of care.
For the North Carolina 2010 State Medical Facilities Plan (SMFP), references to dates have been advanced by one year. The Task Force also recommended reviewing the hospice methodologies for the 2012 SMFP in order to determine the effect of all of these changes. Further, with regard to data reporting, The Carolinas Center for Hospice and End of Life Care and the Association for Home & Hospice Care of North Carolina will follow up with the Division of Health Service Regulation’s Acute and Home Care Licensure Section. Basic Assumptions of the Method
Hospice Home Care Offices: 1. County mortality (death) rates for the most recent years (2003-2007) are used as the
basis for hospice patient need projection. The five-year death rate for 2003-2007 is used as an indicator of deaths from all sites in each county and is not affected by changes in actual deaths from year to year.
2. Because previous years’ data are used as the basis for projections, the two-year trailing average growth rate in statewide number of deaths served should be

calculated over the previous three years and applied to the current reported number of deaths served to project changes in the capacity of existing agencies to serve deaths from each county by the target year. Hospice deaths served will not be projected to exceed 60 percent of total deaths.
3. Median projected hospice deaths is projected by applying a projected statewide median percent of deaths served by hospice to projected deaths in each county. Projected statewide median percent of deaths served should be calculated by applying the two-year trailing average growth rate in the statewide median percent of deaths served over the previous three years to the current statewide median percent of deaths served.
4. An additional hospice is indicated if: 1) the county’s deficit is 90 or more, and 2) the number of licensed hospice home care offices located in the county per 100,000 population is three or less.
Hospice Inpatient Beds:
1. Because previous years’ data are used as the basis for projections, the two-year trailing average growth rate in statewide hospice admissions should be calculated over the previous three years and applied to the current reported number of hospice admissions to project total hospice admissions.
2. Total projected admissions and the lower of the statewide median average length of stay per admission and each county’s average length of stay per admission are used as the basis for projecting estimated inpatient days for each county.
3. Six percent of total estimated days of care in each county is used as a basis for estimating days of care in licensed inpatient hospice facility beds.
Hospice Residential Beds: Rules for hospice residential beds were adopted by the Medical Care Commission in 1991.
This category of beds does not have a methodology to project need and no need methodology has been recommended for the North Carolina 2010 State Medical Facilities Plan.
Sources of Data Population: Estimates and projections of population were obtained from the North Carolina Office of
State Budget and Management. Estimated active duty military population numbers were excluded for any county with
more than 500 active duty military personnel. These estimates were obtained from the “Selected Economic Characteristics” portion of the 2000 Census, under the category of
yment Status – Armed Forces.” “Emplo Number of Deaths and Death Rates: Deaths and death rates are from “Selected Vital Statistics for 2007 and 2003-2007, Vol. 1”
published by the North Carolina Department of Health and Human Services, State Center for Health Statistics.

Utilization and Licensed Offices: Total reported hospice patient deaths, admissions, days of care and licensed offices by
county were compiled from the “2009 Annual Data Supplement to Licensure Application” as submitted to the North Carolina Department of Health and Human Services, Division of Health Service Regulation by existing licensed hospices and by home care agencies and health departments who meet the requirements of the rules for hospice licensure.
Application of the Standard Methodology The steps in applying the projection methods are as follows: H
ospice Home Care Offices:
Step 1: The 2003-2007 death rate/1000 population is entered. Step 2: The estimated 2011 population of each county is entered with adjustments for the
counties with more than 500 active duty military personnel. Step 3: Projected 2011 deaths for each county is calculated by multiplying the county death
rate (Step 1) by the 2011 estimated population (Step 2) divided by 1000. Step 4: The total number of reported hospice patient deaths, by county of patient residence,
from annual data supplements to licensure applications is entered. Step 5: The “Two-Year Trailing Average Growth Rate in Statewide Number of Deaths
Served” over the previous three years is calculated.
Year Statewide # Deaths Served Growth 2006 22,653 2007 24,897 9.9% 2008 26,353 5.8%
Two-Year Trailing Average Growth Rate 7.9% Step 6a: 2011 number of hospice deaths served at two-year trailing average growth rate is
calculated by multiplying the number of reported hospice deaths (Step 4) by the statewide two-year trailing average growth rate for deaths served for three years (Step 5) (# of reported deaths x 107.9% x 107.9% x 107.9% ).
Step 6b: 2011 number of hospice deaths served limited to 60 percent is calculated by
multiplying the projected 2011 deaths for each county (Step 2) by 60 percent. Step 6c: Projected 2011 number of hospice deaths served is determined to be the lower of:
(a) Projected 2011 number of hospice deaths served at two-year trailing average growth rate (Step 6a), or; (b) Projected 2011 number of hospice deaths served limited to 60 percent (Step 6b).

Step 7: The “Two-Year Trailing Average Growth Rate in Statewide Median Percent of
Deaths Served” over the previous three years is calculated.
Year Median Percent of Deaths Served Growth 2006 27.02% 2007 29.50% 9.2% 2008 29.70% 0.7% Two Year Trailing Average Growth Rate 4.9%
Step 8: The projected median statewide percent of deaths served is calculated by multiplying
the current statewide median percent of deaths served by the statewide two-year trailing average growth rate for median percent of deaths served (Step 7) for three years (statewide median percent of deaths served x 104.9% x 104.9% x 104.9%).
Step 9: Median projected 2011 hospice deaths is calculated by multiplying projected 2011
deaths (Step 3) by the projected statewide median percent of deaths served (Step 8). Step 10: In counties for which additional hospice home care office need determinations were
made, determine the difference between 90 and the number of hospice patient deaths reported by each new office in the county for which a need determination was made. If a new office reports more than 90 hospice patient deaths in the county for which a need determination was made, the office’s reported number of hospice patient deaths is not adjusted for that county. If a new office reported fewer than 90 hospice patient deaths in the county for which a need determination was made, an adjustment “placeholder” equal to the difference between the reported number of hospice patient deaths and 90 is used. The adjustment “placeholder” is made through the third annual Plan following either: a) issuance of the certificate of need if the approved applicant had a hospice home care office in the county prior to the issuance of the certificate; or, b) certification of the new office that received the certificate of need in the county for which a need determination was made if the approved applicant did not have an existing hospice home care office in the county prior to the issuance of the certificate.
Step 11: Project the number of patients in need (deficit or surplus) by subtracting the median
projected 2011 hospice deaths (Step 9) for each county from the projected 2011 number of hospice deaths served (Step 6c) plus any adjustment (Step 10).
Step 12: The number of licensed hospice home care offices located in each county from
annual data supplements to licensure applications is entered. Step 13: The number of licensed hospice home care offices per 100,000 population for each
county is calculated by dividing the number of licensed hospice offices (Step 12) by the 2011 estimated population (Step 2) divided by 100,000.

Step 14: A need determination would be made for a county if both of the following are true:
(a) The county’s deficit (Step 11) is 90 or more, and; (b) The county’s number of licensed hospice home care offices per 100,000 population (Step 13) is three or less.
A hospice office’s service area is the hospice planning area in which the hospice office is located. Each of the 100 counties in the state is a separate hospice planning area. Hospice Inpatient Beds: Step 1: The total number of reported hospice admissions, by county of patient residence,
from annual data supplements to licensure applications is entered. Step 2: The total number of days of care, by county of patient residence, from annual data
supplements to licensure applications is entered. Step 3: The average length of stay per admission (ALOS) is calculated by dividing total days
of care (Step 2) by total admissions (Step 1). Step 4: The “Two-Year Trailing Average Growth Rate in Statewide Number of Admissions”
over the previous three years is calculated.
Year Statewide Hospice Admissions Growth 2006 28,666 2007 30,907 7.8% 2008 32,509 5.2% Two-Year Trailing Average Growth Rate 6.5%
Step 5: Total 2013 admissions is calculated for each county by multiplying the total
admissions (Step 1) by the statewide two-year trailing average growth rate for hospice admissions (Step 4) for five years (total admissions x 106.5% x 106.5% x 106.5% x 106.5% x 106.5%).
Step 6a: 2013 days of care at the county ALOS is calculated by multiplying the total 2013
admissions (Step 5) by the ALOS per admission for each county (Step 3). Step 6b: 2013 days of care at the statewide ALOS is calculated by multiplying the total 2013
admissions (Step 5) by the statewide median ALOS per admission.

Step 6c: Projected 2013 days of care for inpatient estimates is determined to be the lower of:
(a) 2013 days of care at the county ALOS (Step 6a), or; (b) 2013 days of care at the statewide ALOS (Step 6b).
Step 7: Projected 2013 inpatient days is calculated for each county by multiplying the
projected 2013 days of care for inpatient estimates (Step 6c) by 6 percent. Step 8: Projected inpatient hospice beds is calculated by dividing 2013 projected inpatient
days (Step 7) by 365 days and then dividing by 0.85 to adjust for a targeted 85 percent occupancy.
Step 9: Adjust the projected inpatient hospice beds (Step 8) by the number of licensed
hospice beds in each county, certificate of need approved/licensure pending beds, and beds available in previous Plans.
Step 10: Calculate occupancy rates of existing hospice inpatient facilities based on 2009
annual data supplements to licensure application. Step 11: Adjust projected beds in Step 9 for occupancy rates of existing facilities in counties
(Step 10) that are not at 85 percent occupancy. Indicate for such counties either zero or the deficit indicated in Step 9, whichever is greater. Further adjustments are made for CON approved closures.
Step 12: For single counties with a projected deficit of six or more hospice inpatient beds,
applications for single county Hospice Inpatient Units will be considered. The single county need equals the projected deficit. (Note: Adjusted single county need determinations were approved for three beds in Alexander County, five beds in Buncombe County and six beds in Macon County.) (A hospice inpatient facility bed’s service area is the hospice inpatient facility bed planning area in which the bed is located. Each of the 100 counties in the state is a separate hospice inpatient facility bed planning area.)
The Long-Term and Behavioral Health Committee and the State Health Coordinating Council will consider petitions for adjusted need determinations that are filed in accordance with provisions outlined in Chapter 2 of the State Medical Facilities Plan. Applicants for certificate of need are encouraged to contact the Certificate of Need Section to arrange pre-application conference prior to submission of application.

Table 13A: Hospice Data by County of Patient Origin - 2008 Data
Lic. # Facility Cnty Facility Name Days of Care DeathsAdmissions
Agencies or Offices serving residents of Alamance
HC0361 Alamance Hospice and Palliative Care Center of Alamance-Caswe 52384 577654
HOS0021 Durham Duke Hospice 1069 47
HOS0370 Chatham UNC Hospice 134 55
HOS2997 Orange Community Home Care & Hospice 410 23
HOS3049 Alamance Liberty Home Care and Hospice 2446 815
Totals for Alamance 56,443 596684
Agencies or Offices serving residents of Alexander
HC0362 Alexander Hospice and Home Care of Alexander County, Inc. 3638 4551
HOS0367 Catawba Palliative Care Center & Hospice of Catawba Valley, In 4499 5452
HOS0387 Iredell Hospice of Iredell County, Inc 2930 3844
Totals for Alexander 11,067 137147
Agencies or Offices serving residents of Alleghany
HC0409 Forsyth Hospice & Palliative CareCenter 23 23
HC1498 Yadkin Mountain Valley Hospice and Palliative Care 2 11
HOS0404 Surry Mountain Valley Hospice and Palliative Care 89 12
HOS1001 Surry Mountain Valley Hospice and Palliative Care 8 11
HOS1123 Alleghany High Country Health Care System 3003 2328
Totals for Alleghany 3,125 2835
Agencies or Offices serving residents of Anson
HC0369 Mecklenburg Hospice & Palliative Care of Charlotte Region 5 33
HC1869 Anson Anson Community Hospice, Inc. 2003 1822
HOS0402 Stanly Hospice of Stanly County, Inc 274 12
HOS0405 Union Hospice of Union County, Inc 1734 2027
HOS3064 Anson Liberty Home Care and Hospice 257 66
Totals for Anson 4,273 4860
Agencies or Offices serving residents of Ashe
HC0409 Forsyth Hospice & Palliative CareCenter 15 22
HOS1124 Ashe High Country Health Care System 5857 6795
Totals for Ashe 5,872 6997
Agencies or Offices serving residents of Avery
HOS0113 Buncombe CarePartners Hospice & Palliative Care Services 43 23
HOS0185 Caldwell Caldwell Hospice and Palliative Care, Inc 13 11
HOS0363 Avery Hospice and Palliative Care of Avery County, Inc 3368 3652
HOS0832 Mitchell The Hospice & Palliative Care Center of Mitchell Coun 9 01
HOS1581 Guilford Hospice of the Piedmont, Inc 4 11
Totals for Avery 3,437 4058
Figures were taken from the 2009 Hospice Data Supplements. Data were self-reported and are not verified by the Medical Facilities Planning Section.

Lic. # Facility Cnty Facility Name Days of Care DeathsAdmissions
Agencies or Offices serving residents of Beaufort
HOS0331 Pitt AseraCare Hospice 9740 4654
HOS1711 Pitt University Health Systems Home Health and Hospice 718 1613
HOS2516 Beaufort Community Home Care & Hospice 9795 7293
HOS3008 Martin Community Home Care & Hospice 16 01
HOS3302 Hyde Community Home Care & Hospice 169 22
HOS3347 Craven United Hospice of Coastal Carolina 30 11
Totals for Beaufort 20,468 137164
Agencies or Offices serving residents of Bertie
HOS0425 Hertford University Health Systems Home Health and Hospice 3100 3940
HOS3008 Martin Community Home Care & Hospice 659 69
Totals for Bertie 3,759 4549
Agencies or Offices serving residents of Bladen
HC0283 Cumberland Cape Fear Valley Home Health & Hospice 196 45
HC1331 Cumberland Community Home Care & Hospice 79 11
HC2307 Bladen Advantage Hospice & Home Care 2334 614
HC2362 Columbus Advantage Hospice & Home Care 395 13
HC2452 Robeson Advantage Hospice & Home Care 868 04
HC2968 Sampson Advantage Hospice & Home Care 310 00
HOS0415 Bladen Lower Cape Fear Hospice, Inc 8143 5979
HOS1599 Robeson Southeastern Hospice 395 78
HOS1945 Bladen Community Home Care & Hospice 5199 2848
HOS2003 Bladen Liberty Home Care and Hospice 37 22
HOS2007 Columbus Liberty Home Care and Hospice 503 22
HOS2861 Robeson Native Angels Hospice 981 511
Totals for Bladen 19,440 115177
Agencies or Offices serving residents of Brunswick
HOS0414 Brunswick Lower Cape Fear Hospice, Inc 28441 289372
HOS2006 Brunswick Liberty Home Care and Hospice 7154 4064
HOS2008 New Hanover Liberty Home Care and Hospice 0 00
HOS3010 Brunswick Community Home Care & Hospice 1765 1021
HOS3159 Duplin Advantage Hospice & Home Care 10 00
Totals for Brunswick 37,370 339457
Agencies or Offices serving residents of Buncombe
HC0419 Madison Madison Home Care & Hospice 208 13
HOS0113 Buncombe CarePartners Hospice & Palliative Care Services 74792 913995
HOS0386 Henderson Four Seasons Hospice & Palliative Care 1337 2126
Totals for Buncombe 76,337 9351,024
Agencies or Offices serving residents of Burke
Figures were taken from the 2009 Hospice Data Supplements. Data were self-reported and are not verified by the Medical Facilities Planning Section.
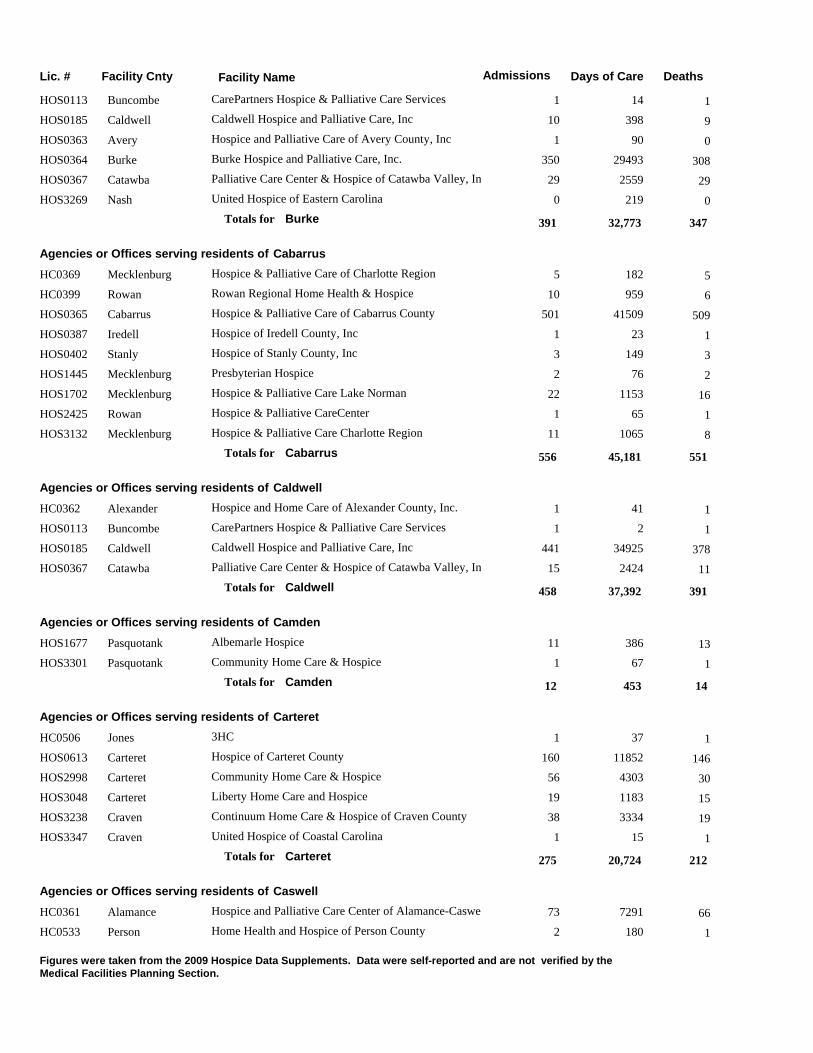
Lic. # Facility Cnty Facility Name Days of Care DeathsAdmissions
HOS0113 Buncombe CarePartners Hospice & Palliative Care Services 14 11
HOS0185 Caldwell Caldwell Hospice and Palliative Care, Inc 398 910
HOS0363 Avery Hospice and Palliative Care of Avery County, Inc 90 01
HOS0364 Burke Burke Hospice and Palliative Care, Inc. 29493 308350
HOS0367 Catawba Palliative Care Center & Hospice of Catawba Valley, In 2559 2929
HOS3269 Nash United Hospice of Eastern Carolina 219 00
Totals for Burke 32,773 347391
Agencies or Offices serving residents of Cabarrus
HC0369 Mecklenburg Hospice & Palliative Care of Charlotte Region 182 55
HC0399 Rowan Rowan Regional Home Health & Hospice 959 610
HOS0365 Cabarrus Hospice & Palliative Care of Cabarrus County 41509 509501
HOS0387 Iredell Hospice of Iredell County, Inc 23 11
HOS0402 Stanly Hospice of Stanly County, Inc 149 33
HOS1445 Mecklenburg Presbyterian Hospice 76 22
HOS1702 Mecklenburg Hospice & Palliative Care Lake Norman 1153 1622
HOS2425 Rowan Hospice & Palliative CareCenter 65 11
HOS3132 Mecklenburg Hospice & Palliative Care Charlotte Region 1065 811
Totals for Cabarrus 45,181 551556
Agencies or Offices serving residents of Caldwell
HC0362 Alexander Hospice and Home Care of Alexander County, Inc. 41 11
HOS0113 Buncombe CarePartners Hospice & Palliative Care Services 2 11
HOS0185 Caldwell Caldwell Hospice and Palliative Care, Inc 34925 378441
HOS0367 Catawba Palliative Care Center & Hospice of Catawba Valley, In 2424 1115
Totals for Caldwell 37,392 391458
Agencies or Offices serving residents of Camden
HOS1677 Pasquotank Albemarle Hospice 386 1311
HOS3301 Pasquotank Community Home Care & Hospice 67 11
Totals for Camden 453 1412
Agencies or Offices serving residents of Carteret
HC0506 Jones 3HC 37 11
HOS0613 Carteret Hospice of Carteret County 11852 146160
HOS2998 Carteret Community Home Care & Hospice 4303 3056
HOS3048 Carteret Liberty Home Care and Hospice 1183 1519
HOS3238 Craven Continuum Home Care & Hospice of Craven County 3334 1938
HOS3347 Craven United Hospice of Coastal Carolina 15 11
Totals for Carteret 20,724 212275
Agencies or Offices serving residents of Caswell
HC0361 Alamance Hospice and Palliative Care Center of Alamance-Caswe 7291 6673
HC0533 Person Home Health and Hospice of Person County 180 12
Figures were taken from the 2009 Hospice Data Supplements. Data were self-reported and are not verified by the Medical Facilities Planning Section.

Lic. # Facility Cnty Facility Name Days of Care DeathsAdmissions
HOS2958 Durham Community Home Care & Hospice 167 02
HOS2997 Orange Community Home Care & Hospice 41 22
Totals for Caswell 7,679 6979
Agencies or Offices serving residents of Catawba
HC0362 Alexander Hospice and Home Care of Alexander County, Inc. 43 12
HC0369 Mecklenburg Hospice & Palliative Care of Charlotte Region 2 11
HOS0185 Caldwell Caldwell Hospice and Palliative Care, Inc 199 54
HOS0364 Burke Burke Hospice and Palliative Care, Inc. 19 56
HOS0367 Catawba Palliative Care Center & Hospice of Catawba Valley, In 61072 727773
HOS0387 Iredell Hospice of Iredell County, Inc 117 55
HOS0389 Lincoln Hospice & Palliative Care of Lincoln County, Inc 894 79
HOS1338 Iredell Hospice of Iredell County, Inc 345 78
HOS1702 Mecklenburg Hospice & Palliative Care Lake Norman 170 21
Totals for Catawba 62,861 760809
Agencies or Offices serving residents of Chatham
HC0361 Alamance Hospice and Palliative Care Center of Alamance-Caswe 268 22
HC0369 Mecklenburg Hospice & Palliative Care of Charlotte Region 11 11
HC0374 Guilford Hospice and Palliative Care of Greensboro 0 00
HC0397 Randolph Hospice of Randolph County, Inc. 19 22
HOS0021 Durham Duke Hospice 122 66
HOS0370 Chatham UNC Hospice 7541 82113
HOS2281 Wake Heartland Home Health Care and Hospice 159 13
HOS2983 Chatham Community Home Care & Hospice 7978 5369
HOS3135 Chatham Hospice of Wake County, Inc 47 22
HOS3147 Wake Tender Loving Care Home Health & Hospice 4 11
HOS3149 Chatham Liberty Home Care and Hospice 1254 611
HOS3346 Johnston United Hospice of Eastern Carolina, Smithfield 832 11
Totals for Chatham 18,235 157211
Agencies or Offices serving residents of Cherokee
HC0275 Cherokee Good Shepherd Home Health and Hospice Agency, Inc 2975 6080
HOS0113 Buncombe CarePartners Hospice & Palliative Care Services 30 22
Totals for Cherokee 3,005 6282
Agencies or Offices serving residents of Chowan
HOS0425 Hertford University Health Systems Home Health and Hospice 1206 1116
HOS1677 Pasquotank Albemarle Hospice 937 1816
HOS3301 Pasquotank Community Home Care & Hospice 116 34
Totals for Chowan 2,259 3236
Agencies or Offices serving residents of Clay
HC0318 Clay Good Shepherd Home Health and Hospice Agency, Inc 675 1522
Figures were taken from the 2009 Hospice Data Supplements. Data were self-reported and are not verified by the Medical Facilities Planning Section.

Lic. # Facility Cnty Facility Name Days of Care DeathsAdmissions
HOS0113 Buncombe CarePartners Hospice & Palliative Care Services 22 22
Totals for Clay 697 1724
Agencies or Offices serving residents of Cleveland
HC0812 Gaston Hospice of Gaston County, Inc. 1090 1314
HOS0367 Catawba Palliative Care Center & Hospice of Catawba Valley, In 83 22
HOS0371 Cleveland Hospice & Palliative Care Cleveland County 36715 457583
HOS0389 Lincoln Hospice & Palliative Care of Lincoln County, Inc 380 11
HOS0400 Rutherford Hospice of Rutherford County, Inc 602 56
HOS1581 Guilford Hospice of the Piedmont, Inc 7 11
Totals for Cleveland 38,877 479607
Agencies or Offices serving residents of Columbus
HC2362 Columbus Advantage Hospice & Home Care 12654 42109
HOS0417 Columbus Lower Cape Fear Hospice, Inc 12384 98134
HOS1599 Robeson Southeastern Hospice 8 11
HOS2007 Columbus Liberty Home Care and Hospice 6234 5063
HOS2861 Robeson Native Angels Hospice 2216 415
HOS3011 Columbus Community Home Care & Hospice 8624 1536
Totals for Columbus 42,120 210358
Agencies or Offices serving residents of Craven
HC0195 Lenoir 3HC 6 11
HC0493 Craven Craven County Health Dept. Home Health-Hospice Ag 6617 88126
HC0506 Jones 3HC 426 78
HOS0331 Pitt AseraCare Hospice 366 01
HOS1711 Pitt University Health Systems Home Health and Hospice 62 32
HOS2302 Craven Community Home Care & Hospice 17073 58109
HOS2984 Lenoir Community Home Care & Hospice 253 24
HOS2998 Carteret Community Home Care & Hospice 167 21
HOS3048 Carteret Liberty Home Care and Hospice 518 37
HOS3104 Wayne Advantage Hospice & Home Care 378 12
HOS3159 Duplin Advantage Hospice & Home Care 252 02
HOS3238 Craven Continuum Home Care & Hospice of Craven County 3558 1217
HOS3347 Craven United Hospice of Coastal Carolina 8286 5183
Totals for Craven 37,962 228363
Agencies or Offices serving residents of Cumberland
HC0255 Sampson 3HC 2307 1326
HC0283 Cumberland Cape Fear Valley Home Health & Hospice 16677 290337
HC0359 Cumberland HealthKeeperz, Inc. 2306 3252
HC0507 Johnston 3HC 0 11
HC1265 Cumberland 3HC 72 23
HC1331 Cumberland Community Home Care & Hospice 29780 148218
Figures were taken from the 2009 Hospice Data Supplements. Data were self-reported and are not verified by the Medical Facilities Planning Section.

Lic. # Facility Cnty Facility Name Days of Care DeathsAdmissions
HC1844 Sampson Community Home Care & Hospice 8 01
HC2306 Cumberland Advantage Hospice & Home Care 7927 4463
HC2968 Sampson Advantage Hospice & Home Care 73 01
HOS2004 Cumberland Liberty Home Care and Hospice 5968 5183
HOS2048 Harnett Community Home Care & Hospice 598 00
HOS2060 Robeson Community Home Care & Hospice 60 00
HOS2290 Hoke Liberty Home Care and Hospice 0 00
HOS2861 Robeson Native Angels Hospice 4557 616
HOS3007 Richmond Community Home Care & Hospice 78 11
HOS3067 Harnett Liberty Home Care and Hospice 369 23
HOS3346 Johnston United Hospice of Eastern Carolina, Smithfield 3731 1340
HOS3412 Cumberland Carrol S. Roberson Hospice Center 1683 110173
Totals for Cumberland 76,194 7131,018
Agencies or Offices serving residents of Currituck
HOS1677 Pasquotank Albemarle Hospice 2322 3239
HOS3301 Pasquotank Community Home Care & Hospice 2218 2024
Totals for Currituck 4,540 5263
Agencies or Offices serving residents of Dare
HC0494 Dare Dare Home Health and Hospice 2187 4048
HOS1677 Pasquotank Albemarle Hospice 96 1514
HOS3301 Pasquotank Community Home Care & Hospice 12 10
HOS3302 Hyde Community Home Care & Hospice 158 24
Totals for Dare 2,453 5866
Agencies or Offices serving residents of Davidson
HC0374 Guilford Hospice and Palliative Care of Greensboro 8 11
HC0409 Forsyth Hospice & Palliative CareCenter 6269 6271
HOS0372 Davidson Hospice of Davidson County, Inc 20111 206270
HOS1581 Guilford Hospice of the Piedmont, Inc 5980 107118
HOS2425 Rowan Hospice & Palliative CareCenter 1200 1214
HOS3051 Davidson Liberty Home Care and Hospice 1717 516
HOS3075 Randolph Community Home Care & Hospice 40 01
Totals for Davidson 35,325 393491
Agencies or Offices serving residents of Davie
HC0399 Rowan Rowan Regional Home Health & Hospice 168 11
HC0409 Forsyth Hospice & Palliative CareCenter 2397 3434
HOS0387 Iredell Hospice of Iredell County, Inc 898 35
HOS0404 Surry Mountain Valley Hospice and Palliative Care 1 11
HOS2425 Rowan Hospice & Palliative CareCenter 131 12
HOS3051 Davidson Liberty Home Care and Hospice 3 11
HOS3084 Davie Hospice & Palliative CareCenter 7526 8595
Figures were taken from the 2009 Hospice Data Supplements. Data were self-reported and are not verified by the Medical Facilities Planning Section.

Lic. # Facility Cnty Facility Name Days of Care DeathsAdmissions
Totals for Davie 11,124 126139
Agencies or Offices serving residents of Duplin
HC0053 Duplin Carolina East Home Care & Hospice, Inc 11182 6688
HC0228 Wayne 3HC 88 02
HC0255 Sampson 3HC 1213 614
HC1209 Onslow Continuum Home Care and Hospice 219 00
HC1844 Sampson Community Home Care & Hospice 1105 010
HC2361 Wayne Community Home Care & Hospice 35 11
HOS1302 Wayne Carolina East Home Care & Hospice, Inc. 1126 76
HOS2008 New Hanover Liberty Home Care and Hospice 160 00
HOS2984 Lenoir Community Home Care & Hospice 208 04
HOS2995 Duplin Community Home Care & Hospice 1432 614
HOS3006 Onslow Community Home Care & Hospice 52 11
HOS3052 Pender Lower Cape Fear Hospice and Life Care Center 1627 2125
HOS3054 Sampson Liberty Home Care and Hospice 425 13
HOS3159 Duplin Advantage Hospice & Home Care 6376 1546
HOS3345 Pitt United Hospice of Eastern Carolina, Farmville 421 14
Totals for Duplin 25,669 125218
Agencies or Offices serving residents of Durham
HC0361 Alamance Hospice and Palliative Care Center of Alamance-Caswe 33 11
HC0507 Johnston 3HC 1 00
HC0533 Person Home Health and Hospice of Person County 10 11
HOS0021 Durham Duke Hospice 25638 300344
HOS0370 Chatham UNC Hospice 1929 2829
HOS2125 Wake Duke Hospice 31 22
HOS2281 Wake Heartland Home Health Care and Hospice 9305 89158
HOS2958 Durham Community Home Care & Hospice 3512 1724
HOS3095 Wake Advantage Hospice & Home Care 1308 55
HOS3126 Durham Hospice of Wake County, Inc 355 57
HOS3147 Wake Tender Loving Care Home Health & Hospice 143 12
HOS3269 Nash United Hospice of Eastern Carolina 1999 2331
HOS3304 Durham Liberty Home Care and Hospice 136 02
Totals for Durham 44,400 472606
Agencies or Offices serving residents of Edgecombe
HC0393 Nash Hospice and Palliative Care of Nash General Hospital 2213 2427
HC0498 Edgecombe Edgecombe HomeCare & Hospice 3501 4659
HOS0331 Pitt AseraCare Hospice 3952 2123
HOS0408 Wilson WilMed Hospice 202 12
HOS2985 Edgecombe Community Home Care & Hospice 3729 3250
HOS2996 Pitt Community Home Care & Hospice 50 01
HOS3138 Wilson Advantage Hospice & Home Care 172 01
Figures were taken from the 2009 Hospice Data Supplements. Data were self-reported and are not verified by the Medical Facilities Planning Section.

Lic. # Facility Cnty Facility Name Days of Care DeathsAdmissions
HOS3269 Nash United Hospice of Eastern Carolina 832 33
HOS3292 Edgecombe University Health Systems Home Health and Hospice 1381 915
Totals for Edgecombe 16,032 136181
Agencies or Offices serving residents of Forsyth
HC0374 Guilford Hospice and Palliative Care of Greensboro 40 43
HC0409 Forsyth Hospice & Palliative CareCenter 79056 10261131
HC1498 Yadkin Mountain Valley Hospice and Palliative Care 16 01
HOS0372 Davidson Hospice of Davidson County, Inc 444 22
HOS0387 Iredell Hospice of Iredell County, Inc 8 11
HOS0404 Surry Mountain Valley Hospice and Palliative Care 124 22
HOS1581 Guilford Hospice of the Piedmont, Inc 806 1515
HOS3075 Randolph Community Home Care & Hospice 4377 1545
HOS3084 Davie Hospice & Palliative CareCenter 61 01
HOS3295 Stokes Hospice & Palliative CareCenter 2908 2324
Totals for Forsyth 87,840 1,0881,225
Agencies or Offices serving residents of Franklin
HC0078 Franklin Tender Loving Care Home Health & Hospice 6116 611
HC0393 Nash Hospice and Palliative Care of Nash General Hospital 10 11
HOS0021 Durham Duke Hospice 216 24
HOS2125 Wake Duke Hospice 82 24
HOS2135 Johnston Community Home Care & Hospice 58 01
HOS2281 Wake Heartland Home Health Care and Hospice 872 915
HOS3005 Franklin Community Home Care & Hospice 4480 3450
HOS3058 Wake Liberty Home Care and Hospice 30 12
HOS3125 Franklin Hospice of Wake County, Inc 1833 3233
HOS3269 Nash United Hospice of Eastern Carolina 135 15
Totals for Franklin 13,832 88126
Agencies or Offices serving residents of Gaston
HC0369 Mecklenburg Hospice & Palliative Care of Charlotte Region 840 36
HC0374 Guilford Hospice and Palliative Care of Greensboro 0 00
HC0812 Gaston Hospice of Gaston County, Inc. 55560 771851
HOS0371 Cleveland Hospice & Palliative Care Cleveland County 2426 2432
HOS0389 Lincoln Hospice & Palliative Care of Lincoln County, Inc 2055 3136
HOS1445 Mecklenburg Presbyterian Hospice 909 77
HOS3132 Mecklenburg Hospice & Palliative Care Charlotte Region 763 89
Totals for Gaston 62,553 844941
Agencies or Offices serving residents of Gates
HOS0425 Hertford University Health Systems Home Health and Hospice 298 66
HOS1677 Pasquotank Albemarle Hospice 45 109
HOS3301 Pasquotank Community Home Care & Hospice 890 69
Figures were taken from the 2009 Hospice Data Supplements. Data were self-reported and are not verified by the Medical Facilities Planning Section.

Lic. # Facility Cnty Facility Name Days of Care DeathsAdmissions
Totals for Gates 1,233 2224
Agencies or Offices serving residents of Graham
HC0157 Jackson WestCare Home Health and Hospice Services 290 610
HC0298 Swain Angel Home Health & Hospice 377 78
HOS0113 Buncombe CarePartners Hospice & Palliative Care Services 7 22
Totals for Graham 674 1520
Agencies or Offices serving residents of Granville
HC0078 Franklin Tender Loving Care Home Health & Hospice 583 1717
HC0533 Person Home Health and Hospice of Person County 1 11
HOS0021 Durham Duke Hospice 2123 2527
HOS2125 Wake Duke Hospice 69 11
HOS2281 Wake Heartland Home Health Care and Hospice 787 717
HOS2561 Vance Community Home Care & Hospice 2249 3642
HOS3133 Granville Hospice of Wake County, Inc 382 23
HOS3269 Nash United Hospice of Eastern Carolina 167 46
Totals for Granville 6,361 93114
Agencies or Offices serving residents of Greene
HC0195 Lenoir 3HC 833 77
HC0228 Wayne 3HC 0 11
HC2575 Johnston Advantage Hospice & Home Care 20 02
HOS0331 Pitt AseraCare Hospice 373 11
HOS1711 Pitt University Health Systems Home Health and Hospice 193 98
HOS2241 Wilson Community Home Care & Hospice 2516 1821
HOS2984 Lenoir Community Home Care & Hospice 530 25
HOS3104 Wayne Advantage Hospice & Home Care 22 00
HOS3261 Lenoir Continuum Home Care & Hospice of Lenior County 140 01
HOS3345 Pitt United Hospice of Eastern Carolina, Farmville 735 56
Totals for Greene 5,362 4352
Agencies or Offices serving residents of Guilford
HC0361 Alamance Hospice and Palliative Care Center of Alamance-Caswe 683 1417
HC0374 Guilford Hospice and Palliative Care of Greensboro 62760 608710
HC0409 Forsyth Hospice & Palliative CareCenter 1035 1111
HOS0372 Davidson Hospice of Davidson County, Inc 378 22
HOS1581 Guilford Hospice of the Piedmont, Inc 22418 330362
HOS3049 Alamance Liberty Home Care and Hospice 3469 730
HOS3051 Davidson Liberty Home Care and Hospice 305 10
HOS3075 Randolph Community Home Care & Hospice 2869 1112
HOS3148 Guilford Hospice and Palliative Care of Greensboro 37974 243296
HOS3295 Stokes Hospice & Palliative CareCenter 164 22
Figures were taken from the 2009 Hospice Data Supplements. Data were self-reported and are not verified by the Medical Facilities Planning Section.

Lic. # Facility Cnty Facility Name Days of Care DeathsAdmissions
Totals for Guilford 132,055 1,2291,442
Agencies or Offices serving residents of Halifax
HC0393 Nash Hospice and Palliative Care of Nash General Hospital 272 59
HC0765 Halifax Home Health and Hospice of Halifax 5550 5570
HOS0425 Hertford University Health Systems Home Health and Hospice 2 11
HOS2424 Nash Community Home Care & Hospice 17 11
HOS2985 Edgecombe Community Home Care & Hospice 181 22
HOS3009 Halifax Community Home Care & Hospice 4135 4046
HOS3269 Nash United Hospice of Eastern Carolina 1132 1916
Totals for Halifax 11,289 123145
Agencies or Offices serving residents of Harnett
HC0255 Sampson 3HC 1241 515
HC0283 Cumberland Cape Fear Valley Home Health & Hospice 1783 1217
HC0359 Cumberland HealthKeeperz, Inc. 230 23
HC0507 Johnston 3HC 184 01
HC1331 Cumberland Community Home Care & Hospice 21 11
HC2324 Harnett Advantage Hospice & Home Care 3941 1429
HC2361 Wayne Community Home Care & Hospice 3 10
HC2575 Johnston Advantage Hospice & Home Care 1646 89
HOS0370 Chatham UNC Hospice 231 12
HOS0375 Harnett Hospice of Harnett County, Inc 10438 50102
HOS2034 Lee Community Home Care & Hospice 3467 1528
HOS2048 Harnett Community Home Care & Hospice 11988 5973
HOS2135 Johnston Community Home Care & Hospice 401 47
HOS2281 Wake Heartland Home Health Care and Hospice 39 12
HOS2958 Durham Community Home Care & Hospice 210 01
HOS2983 Chatham Community Home Care & Hospice 558 23
HOS3005 Franklin Community Home Care & Hospice 239 11
HOS3067 Harnett Liberty Home Care and Hospice 4039 2760
HOS3086 Lee Liberty Home Care and Hospice 19 00
HOS3134 Harnett Hospice of Wake County, Inc 1595 2427
HOS3346 Johnston United Hospice of Eastern Carolina, Smithfield 106 01
HOS3690 Harnett E. Carlton Powell Hospice Center 1651 96197
Totals for Harnett 44,030 323579
Agencies or Offices serving residents of Haywood
HC0109 Haywood Home Care Services of Haywood Regional Medical Ce 16657 210260
HC0157 Jackson WestCare Home Health and Hospice Services 48 22
HOS0113 Buncombe CarePartners Hospice & Palliative Care Services 238 1922
Totals for Haywood 16,943 231284
Agencies or Offices serving residents of Henderson
Figures were taken from the 2009 Hospice Data Supplements. Data were self-reported and are not verified by the Medical Facilities Planning Section.

Lic. # Facility Cnty Facility Name Days of Care DeathsAdmissions
HOS0113 Buncombe CarePartners Hospice & Palliative Care Services 617 68
HOS0386 Henderson Four Seasons Hospice & Palliative Care 71368 758832
HOS3269 Nash United Hospice of Eastern Carolina 217 01
Totals for Henderson 72,202 764841
Agencies or Offices serving residents of Hertford
HOS0425 Hertford University Health Systems Home Health and Hospice 4787 8282
HOS3008 Martin Community Home Care & Hospice 224 22
HOS3009 Halifax Community Home Care & Hospice 13 01
Totals for Hertford 5,024 8485
Agencies or Offices serving residents of Hoke
HC0283 Cumberland Cape Fear Valley Home Health & Hospice 4018 712
HC0427 Moore First Health Hospice & Palliative Care 8 11
HC1331 Cumberland Community Home Care & Hospice 1733 711
HC2306 Cumberland Advantage Hospice & Home Care 343 01
HC2452 Robeson Advantage Hospice & Home Care 293 01
HOS2060 Robeson Community Home Care & Hospice 71 01
HOS2290 Hoke Liberty Home Care and Hospice 8660 6278
HOS2861 Robeson Native Angels Hospice 831 00
HOS3031 Scotland Hospice of Scotland County 13 11
HOS3066 Robeson Liberty Home Care and Hospice 184 01
HOS3346 Johnston United Hospice of Eastern Carolina, Smithfield 69 01
Totals for Hoke 16,223 78108
Agencies or Offices serving residents of Hyde
HOS3302 Hyde Community Home Care & Hospice 9591 4255
Totals for Hyde 9,591 4255
Agencies or Offices serving residents of Iredell
HC0362 Alexander Hospice and Home Care of Alexander County, Inc. 19 11
HC0369 Mecklenburg Hospice & Palliative Care of Charlotte Region 18 66
HC0399 Rowan Rowan Regional Home Health & Hospice 33 11
HC1498 Yadkin Mountain Valley Hospice and Palliative Care 56 01
HOS0367 Catawba Palliative Care Center & Hospice of Catawba Valley, In 471 23
HOS0387 Iredell Hospice of Iredell County, Inc 20923 333366
HOS0389 Lincoln Hospice & Palliative Care of Lincoln County, Inc 24 11
HOS0407 Wilkes Hospice of Wilkes Regional Medical Center 8 11
HOS1338 Iredell Hospice of Iredell County, Inc 12008 167175
HOS1445 Mecklenburg Presbyterian Hospice 16 00
HOS1702 Mecklenburg Hospice & Palliative Care Lake Norman 4503 4348
HOS2425 Rowan Hospice & Palliative CareCenter 55 11
HOS3132 Mecklenburg Hospice & Palliative Care Charlotte Region 24 01
Figures were taken from the 2009 Hospice Data Supplements. Data were self-reported and are not verified by the Medical Facilities Planning Section.

Lic. # Facility Cnty Facility Name Days of Care DeathsAdmissions
Totals for Iredell 38,158 556605
Agencies or Offices serving residents of Jackson
HC0157 Jackson WestCare Home Health and Hospice Services 8598 112117
HC0298 Swain Angel Home Health & Hospice 145 03
HC0324 Macon Angel Home Health & Hospice 97 67
HOS0113 Buncombe CarePartners Hospice & Palliative Care Services 3 11
HOS0390 Macon Highlands-Cashiers Hospice 279 57
Totals for Jackson 9,122 124135
Agencies or Offices serving residents of Johnston
HC0228 Wayne 3HC 346 22
HC0255 Sampson 3HC 80 00
HC0383 Johnston Johnston Memorial Home Care and Hospice 4776 5373
HC0507 Johnston 3HC 6923 55100
HC2324 Harnett Advantage Hospice & Home Care 298 42
HC2361 Wayne Community Home Care & Hospice 7 11
HC2575 Johnston Advantage Hospice & Home Care 5007 2951
HOS0375 Harnett Hospice of Harnett County, Inc 371 12
HOS0408 Wilson WilMed Hospice 5963 1528
HOS2048 Harnett Community Home Care & Hospice 109 11
HOS2135 Johnston Community Home Care & Hospice 4091 3056
HOS2281 Wake Heartland Home Health Care and Hospice 1577 1329
HOS3058 Wake Liberty Home Care and Hospice 49 22
HOS3067 Harnett Liberty Home Care and Hospice 3200 1420
HOS3069 Johnston Liberty Home Care and Hospice 4 11
HOS3124 Johnston Hospice of Wake County, Inc 2481 4548
HOS3147 Wake Tender Loving Care Home Health & Hospice 54 11
HOS3269 Nash United Hospice of Eastern Carolina 1 01
HOS3346 Johnston United Hospice of Eastern Carolina, Smithfield 1153 47
Totals for Johnston 36,490 271425
Agencies or Offices serving residents of Jones
HC0053 Duplin Carolina East Home Care & Hospice, Inc 233 22
HC0195 Lenoir 3HC 56 00
HC0228 Wayne 3HC 0 11
HC0493 Craven Craven County Health Dept. Home Health-Hospice Ag 18 22
HC0506 Jones 3HC 819 1114
HC1209 Onslow Continuum Home Care and Hospice 447 02
HOS1711 Pitt University Health Systems Home Health and Hospice 10 11
HOS2005 Onslow Liberty Home Care and Hospice 156 11
HOS2302 Craven Community Home Care & Hospice 810 35
HOS2984 Lenoir Community Home Care & Hospice 167 02
HOS2995 Duplin Community Home Care & Hospice 288 00
Figures were taken from the 2009 Hospice Data Supplements. Data were self-reported and are not verified by the Medical Facilities Planning Section.

Lic. # Facility Cnty Facility Name Days of Care DeathsAdmissions
HOS3006 Onslow Community Home Care & Hospice 188 21
HOS3159 Duplin Advantage Hospice & Home Care 1286 67
HOS3238 Craven Continuum Home Care & Hospice of Craven County 646 15
HOS3347 Craven United Hospice of Coastal Carolina 178 16
Totals for Jones 5,302 3149
Agencies or Offices serving residents of Lee
HC0283 Cumberland Cape Fear Valley Home Health & Hospice 97 11
HC0359 Cumberland HealthKeeperz, Inc. 2 11
HC0427 Moore First Health Hospice & Palliative Care 6 11
HOS0370 Chatham UNC Hospice 337 58
HOS0375 Harnett Hospice of Harnett County, Inc 5 11
HOS2034 Lee Community Home Care & Hospice 17974 109144
HOS2281 Wake Heartland Home Health Care and Hospice 205 27
HOS2290 Hoke Liberty Home Care and Hospice 64 12
HOS3086 Lee Liberty Home Care and Hospice 3672 3458
HOS3346 Johnston United Hospice of Eastern Carolina, Smithfield 45 12
Totals for Lee 22,407 156225
Agencies or Offices serving residents of Lenoir
HC0195 Lenoir 3HC 7029 5493
HC0228 Wayne 3HC 1 78
HC0508 Wilson 3HC 16 00
HC2361 Wayne Community Home Care & Hospice 4 11
HOS0331 Pitt AseraCare Hospice 314 12
HOS1302 Wayne Carolina East Home Care & Hospice, Inc. 932 717
HOS1711 Pitt University Health Systems Home Health and Hospice 241 79
HOS2984 Lenoir Community Home Care & Hospice 4070 2535
HOS3104 Wayne Advantage Hospice & Home Care 74 02
HOS3159 Duplin Advantage Hospice & Home Care 101 01
HOS3261 Lenoir Continuum Home Care & Hospice of Lenior County 2652 1231
HOS3345 Pitt United Hospice of Eastern Carolina, Farmville 1871 1517
Totals for Lenoir 17,305 129216
Agencies or Offices serving residents of Lincoln
HC0369 Mecklenburg Hospice & Palliative Care of Charlotte Region 20 33
HC0812 Gaston Hospice of Gaston County, Inc. 644 1419
HOS0185 Caldwell Caldwell Hospice and Palliative Care, Inc 39 11
HOS0367 Catawba Palliative Care Center & Hospice of Catawba Valley, In 3072 1426
HOS0371 Cleveland Hospice & Palliative Care Cleveland County 637 25
HOS0389 Lincoln Hospice & Palliative Care of Lincoln County, Inc 17165 180204
HOS1445 Mecklenburg Presbyterian Hospice 21 01
HOS3132 Mecklenburg Hospice & Palliative Care Charlotte Region 101 22
Figures were taken from the 2009 Hospice Data Supplements. Data were self-reported and are not verified by the Medical Facilities Planning Section.

Lic. # Facility Cnty Facility Name Days of Care DeathsAdmissions
Totals for Lincoln 21,699 216261
Agencies or Offices serving residents of Macon
HC0157 Jackson WestCare Home Health and Hospice Services 1390 1216
HC0324 Macon Angel Home Health & Hospice 7253 84103
HOS0113 Buncombe CarePartners Hospice & Palliative Care Services 25 23
HOS0390 Macon Highlands-Cashiers Hospice 1209 1720
Totals for Macon 9,877 115142
Agencies or Offices serving residents of Madison
HC0419 Madison Madison Home Care & Hospice 3219 5363
HOS0113 Buncombe CarePartners Hospice & Palliative Care Services 1044 3234
Totals for Madison 4,263 8597
Agencies or Offices serving residents of Martin
HC0498 Edgecombe Edgecombe HomeCare & Hospice 320 10
HC0509 Pitt 3HC 92 12
HC0525 Martin Roanoke Home Care & Hospice 623 1519
HOS0331 Pitt AseraCare Hospice 526 88
HOS1711 Pitt University Health Systems Home Health and Hospice 373 810
HOS3008 Martin Community Home Care & Hospice 4572 4254
Totals for Martin 6,506 7593
Agencies or Offices serving residents of McDowell
HOS0113 Buncombe CarePartners Hospice & Palliative Care Services 173 1315
HOS0364 Burke Burke Hospice and Palliative Care, Inc. 95 13
HOS0400 Rutherford Hospice of Rutherford County, Inc 1513 1020
HOS1153 McDowell Hospice of McDowell County, Inc 9610 100129
Totals for McDowell 11,391 124167
Agencies or Offices serving residents of Mecklenburg
HC0369 Mecklenburg Hospice & Palliative Care of Charlotte Region 2153 122128
HC0812 Gaston Hospice of Gaston County, Inc. 386 43
HOS0365 Cabarrus Hospice & Palliative Care of Cabarrus County 346 109
HOS0387 Iredell Hospice of Iredell County, Inc 90 55
HOS0389 Lincoln Hospice & Palliative Care of Lincoln County, Inc 227 23
HOS0405 Union Hospice of Union County, Inc 1595 1118
HOS1338 Iredell Hospice of Iredell County, Inc 664 1517
HOS1445 Mecklenburg Presbyterian Hospice 25662 547699
HOS1702 Mecklenburg Hospice & Palliative Care Lake Norman 17166 180213
HOS3116 Union Community Home Care & Hospice 4157 1226
HOS3132 Mecklenburg Hospice & Palliative Care Charlotte Region 117947 10591202
Totals for Mecklenburg 170,393 1,9672,323
Figures were taken from the 2009 Hospice Data Supplements. Data were self-reported and are not verified by the Medical Facilities Planning Section.

Lic. # Facility Cnty Facility Name Days of Care DeathsAdmissions
Agencies or Offices serving residents of Mitchell
HOS0113 Buncombe CarePartners Hospice & Palliative Care Services 7 11
HOS0363 Avery Hospice and Palliative Care of Avery County, Inc 132 03
HOS0832 Mitchell The Hospice & Palliative Care Center of Mitchell Coun 12465 7278
HOS1153 McDowell Hospice of McDowell County, Inc 2 01
Totals for Mitchell 12,606 7383
Agencies or Offices serving residents of Montgomery
HC0397 Randolph Hospice of Randolph County, Inc. 86 21
HC0427 Moore First Health Hospice & Palliative Care 4284 4347
HOS0402 Stanly Hospice of Stanly County, Inc 1619 1120
HOS3199 Montgomery Community Home Care & Hospice 2695 522
Totals for Montgomery 8,684 6190
Agencies or Offices serving residents of Moore
HC0283 Cumberland Cape Fear Valley Home Health & Hospice 118 11
HC0359 Cumberland HealthKeeperz, Inc. 7 11
HC0397 Randolph Hospice of Randolph County, Inc. 38 14
HC0427 Moore First Health Hospice & Palliative Care 32455 276325
HC2351 Moore Community Home Care & Hospice 6294 5368
HOS2034 Lee Community Home Care & Hospice 146 212
HOS3050 Moore Liberty Home Care and Hospice 2067 519
HOS3086 Lee Liberty Home Care and Hospice 185 45
HOS3346 Johnston United Hospice of Eastern Carolina, Smithfield 67 12
Totals for Moore 41,377 344437
Agencies or Offices serving residents of Nash
HC0393 Nash Hospice and Palliative Care of Nash General Hospital 6527 135134
HC0508 Wilson 3HC 804 814
HC2575 Johnston Advantage Hospice & Home Care 12 01
HOS0408 Wilson WilMed Hospice 486 12
HOS1711 Pitt University Health Systems Home Health and Hospice 35 11
HOS2281 Wake Heartland Home Health Care and Hospice 53 12
HOS2424 Nash Community Home Care & Hospice 7824 5578
HOS2985 Edgecombe Community Home Care & Hospice 398 33
HOS3005 Franklin Community Home Care & Hospice 85 02
HOS3138 Wilson Advantage Hospice & Home Care 263 11
HOS3269 Nash United Hospice of Eastern Carolina 3186 1320
HOS3292 Edgecombe University Health Systems Home Health and Hospice 24 11
Totals for Nash 19,697 219259
Agencies or Offices serving residents of New Hanover
HOS0416 New Hanover Lower Cape Fear Hospice, Inc 56705 670771
HOS2008 New Hanover Liberty Home Care and Hospice 5772 4357
Figures were taken from the 2009 Hospice Data Supplements. Data were self-reported and are not verified by the Medical Facilities Planning Section.

Lic. # Facility Cnty Facility Name Days of Care DeathsAdmissions
HOS3010 Brunswick Community Home Care & Hospice 1616 1219
Totals for New Hanover 64,093 725847
Agencies or Offices serving residents of Northhampton
HC0765 Halifax Home Health and Hospice of Halifax 15 22
HOS0425 Hertford University Health Systems Home Health and Hospice 1188 2630
HOS3009 Halifax Community Home Care & Hospice 2860 1820
HOS3269 Nash United Hospice of Eastern Carolina 52 12
Totals for Northhampton 4,115 4754
Agencies or Offices serving residents of Onslow
HC0053 Duplin Carolina East Home Care & Hospice, Inc 136 22
HC0228 Wayne 3HC 0 11
HC0506 Jones 3HC 1091 1622
HC0531 Onslow Onslow County Home Health And Hospice 4091 4151
HC1209 Onslow Continuum Home Care and Hospice 4741 7290
HOS0416 New Hanover Lower Cape Fear Hospice, Inc 114 1213
HOS2005 Onslow Liberty Home Care and Hospice 2067 1933
HOS2998 Carteret Community Home Care & Hospice 85 11
HOS3006 Onslow Community Home Care & Hospice 3281 1634
HOS3159 Duplin Advantage Hospice & Home Care 7 11
HOS3238 Craven Continuum Home Care & Hospice of Craven County 517 58
HOS3347 Craven United Hospice of Coastal Carolina 347 89
Totals for Onslow 16,477 194265
Agencies or Offices serving residents of Orange
HC0255 Sampson 3HC 43 01
HC0361 Alamance Hospice and Palliative Care Center of Alamance-Caswe 834 1922
HC0507 Johnston 3HC 25 00
HOS0021 Durham Duke Hospice 11562 212234
HOS0370 Chatham UNC Hospice 6443 96114
HOS2281 Wake Heartland Home Health Care and Hospice 3241 427
HOS2958 Durham Community Home Care & Hospice 737 59
HOS2997 Orange Community Home Care & Hospice 1470 1218
HOS3049 Alamance Liberty Home Care and Hospice 57 01
HOS3147 Wake Tender Loving Care Home Health & Hospice 13 11
HOS3269 Nash United Hospice of Eastern Carolina 210 22
HOS3304 Durham Liberty Home Care and Hospice 14 11
Totals for Orange 24,649 352430
Agencies or Offices serving residents of Pamlico
HC0493 Craven Craven County Health Dept. Home Health-Hospice Ag 181 11
HOS0394 Pamlico Hospice of Pamilco County, Inc 1002 1518
HOS2302 Craven Community Home Care & Hospice 1194 45
Figures were taken from the 2009 Hospice Data Supplements. Data were self-reported and are not verified by the Medical Facilities Planning Section.

Lic. # Facility Cnty Facility Name Days of Care DeathsAdmissions
HOS3347 Craven United Hospice of Coastal Carolina 111 55
Totals for Pamlico 2,488 2529
Agencies or Offices serving residents of Pasquotank
HOS1677 Pasquotank Albemarle Hospice 4543 7474
HOS3301 Pasquotank Community Home Care & Hospice 3581 2533
Totals for Pasquotank 8,124 99107
Agencies or Offices serving residents of Pender
HC0053 Duplin Carolina East Home Care & Hospice, Inc 303 43
HOS2005 Onslow Liberty Home Care and Hospice 6 11
HOS2008 New Hanover Liberty Home Care and Hospice 148 34
HOS2995 Duplin Community Home Care & Hospice 116 11
HOS3006 Onslow Community Home Care & Hospice 17 11
HOS3010 Brunswick Community Home Care & Hospice 185 35
HOS3052 Pender Lower Cape Fear Hospice and Life Care Center 13686 164185
HOS3059 Pender Liberty Home Care and Hospice 56 12
HOS3159 Duplin Advantage Hospice & Home Care 1302 18
Totals for Pender 15,819 179210
Agencies or Offices serving residents of Perquimans
HOS0425 Hertford University Health Systems Home Health and Hospice 125 22
HOS1677 Pasquotank Albemarle Hospice 1476 2432
HOS3301 Pasquotank Community Home Care & Hospice 281 76
Totals for Perquimans 1,882 3340
Agencies or Offices serving residents of Person
HC0533 Person Home Health and Hospice of Person County 7609 8197
HOS0021 Durham Duke Hospice 1446 1115
HOS0405 Union Hospice of Union County, Inc 21 11
HOS2561 Vance Community Home Care & Hospice 69 11
HOS2958 Durham Community Home Care & Hospice 152 34
HOS3269 Nash United Hospice of Eastern Carolina 329 14
Totals for Person 9,626 98122
Agencies or Offices serving residents of Pitt
HC0228 Wayne 3HC 0 23
HC0508 Wilson 3HC 42 00
HC0509 Pitt 3HC 3609 2738
HC2575 Johnston Advantage Hospice & Home Care 71 01
HOS0331 Pitt AseraCare Hospice 4686 3640
HOS0425 Hertford University Health Systems Home Health and Hospice 89 21
HOS1711 Pitt University Health Systems Home Health and Hospice 11458 144142
HOS2516 Beaufort Community Home Care & Hospice 12 11
Figures were taken from the 2009 Hospice Data Supplements. Data were self-reported and are not verified by the Medical Facilities Planning Section.

Lic. # Facility Cnty Facility Name Days of Care DeathsAdmissions
HOS2984 Lenoir Community Home Care & Hospice 133 12
HOS2996 Pitt Community Home Care & Hospice 11957 64100
HOS3008 Martin Community Home Care & Hospice 78 10
HOS3009 Halifax Community Home Care & Hospice 26 01
HOS3138 Wilson Advantage Hospice & Home Care 297 12
HOS3292 Edgecombe University Health Systems Home Health and Hospice 38 22
HOS3345 Pitt United Hospice of Eastern Carolina, Farmville 8372 4664
HOS3346 Johnston United Hospice of Eastern Carolina, Smithfield 366 00
Totals for Pitt 41,234 327397
Agencies or Offices serving residents of Polk
HOS0113 Buncombe CarePartners Hospice & Palliative Care Services 3 11
HOS0386 Henderson Four Seasons Hospice & Palliative Care 49 33
HOS0396 Polk Hospice of the Carolina Foothills, Inc 17788 184202
HOS0400 Rutherford Hospice of Rutherford County, Inc 214 12
Totals for Polk 18,054 189208
Agencies or Offices serving residents of Randolph
HC0361 Alamance Hospice and Palliative Care Center of Alamance-Caswe 146 21
HC0374 Guilford Hospice and Palliative Care of Greensboro 187 78
HC0397 Randolph Hospice of Randolph County, Inc. 32450 360411
HC0409 Forsyth Hospice & Palliative CareCenter 30 23
HC0427 Moore First Health Hospice & Palliative Care 366 00
HOS0372 Davidson Hospice of Davidson County, Inc 770 44
HOS0387 Iredell Hospice of Iredell County, Inc 139 01
HOS1581 Guilford Hospice of the Piedmont, Inc 4696 8895
HOS2006 Brunswick Liberty Home Care and Hospice 79 01
HOS2983 Chatham Community Home Care & Hospice 207 11
HOS3051 Davidson Liberty Home Care and Hospice 303 11
HOS3075 Randolph Community Home Care & Hospice 8030 2441
Totals for Randolph 47,403 489567
Agencies or Offices serving residents of Richmond
HC0424 Richmond Richmond County Hospice, Inc. 16786 118154
HC0427 Moore First Health Hospice & Palliative Care 366 00
HOS2861 Robeson Native Angels Hospice 40 01
HOS3007 Richmond Community Home Care & Hospice 9222 1735
HOS3031 Scotland Hospice of Scotland County 5687 1732
HOS3064 Anson Liberty Home Care and Hospice 1179 67
Totals for Richmond 33,280 158229
Agencies or Offices serving residents of Robeson
HC0283 Cumberland Cape Fear Valley Home Health & Hospice 2641 58
HC0359 Cumberland HealthKeeperz, Inc. 1526 1124
Figures were taken from the 2009 Hospice Data Supplements. Data were self-reported and are not verified by the Medical Facilities Planning Section.

Lic. # Facility Cnty Facility Name Days of Care DeathsAdmissions
HC1331 Cumberland Community Home Care & Hospice 110 22
HC2452 Robeson Advantage Hospice & Home Care 19567 5298
HOS0417 Columbus Lower Cape Fear Hospice, Inc 8 11
HOS1581 Guilford Hospice of the Piedmont, Inc 18 11
HOS1599 Robeson Southeastern Hospice 8134 167210
HOS2004 Cumberland Liberty Home Care and Hospice 77 11
HOS2060 Robeson Community Home Care & Hospice 18002 55111
HOS2290 Hoke Liberty Home Care and Hospice 1317 1923
HOS2861 Robeson Native Angels Hospice 35380 56127
HOS3031 Scotland Hospice of Scotland County 3839 920
HOS3066 Robeson Liberty Home Care and Hospice 11729 3289
Totals for Robeson 102,348 411715
Agencies or Offices serving residents of Rockingham
HC0361 Alamance Hospice and Palliative Care Center of Alamance-Caswe 324 02
HC0374 Guilford Hospice and Palliative Care of Greensboro 326 66
HOS0398 Rockingham Hospice of Rockingham County, Inc 17022 259271
HOS3075 Randolph Community Home Care & Hospice 109 11
HOS3295 Stokes Hospice & Palliative CareCenter 145 12
Totals for Rockingham 17,926 267282
Agencies or Offices serving residents of Rowan
HC0369 Mecklenburg Hospice & Palliative Care of Charlotte Region 24 22
HC0399 Rowan Rowan Regional Home Health & Hospice 21383 248336
HC0409 Forsyth Hospice & Palliative CareCenter 1081 2415
HOS0185 Caldwell Caldwell Hospice and Palliative Care, Inc 7 11
HOS0365 Cabarrus Hospice & Palliative Care of Cabarrus County 2457 2729
HOS0387 Iredell Hospice of Iredell County, Inc 647 109
HOS0402 Stanly Hospice of Stanly County, Inc 197 22
HOS1338 Iredell Hospice of Iredell County, Inc 467 55
HOS1702 Mecklenburg Hospice & Palliative Care Lake Norman 10 11
HOS2425 Rowan Hospice & Palliative CareCenter 7325 7789
HOS3051 Davidson Liberty Home Care and Hospice 24 11
Totals for Rowan 33,622 398490
Agencies or Offices serving residents of Rutherford
HC0369 Mecklenburg Hospice & Palliative Care of Charlotte Region 3 11
HOS0113 Buncombe CarePartners Hospice & Palliative Care Services 18 11
HOS0371 Cleveland Hospice & Palliative Care Cleveland County 548 36
HOS0386 Henderson Four Seasons Hospice & Palliative Care 43 21
HOS0396 Polk Hospice of the Carolina Foothills, Inc 28 01
HOS0400 Rutherford Hospice of Rutherford County, Inc 54452 412465
Totals for Rutherford 55,092 419475
Figures were taken from the 2009 Hospice Data Supplements. Data were self-reported and are not verified by the Medical Facilities Planning Section.

Lic. # Facility Cnty Facility Name Days of Care DeathsAdmissions
Agencies or Offices serving residents of Sampson
HC0053 Duplin Carolina East Home Care & Hospice, Inc 74 01
HC0228 Wayne 3HC 3 22
HC0255 Sampson 3HC 4746 2653
HC0283 Cumberland Cape Fear Valley Home Health & Hospice 2106 1315
HC0359 Cumberland HealthKeeperz, Inc. 24 22
HC1331 Cumberland Community Home Care & Hospice 24 11
HC1844 Sampson Community Home Care & Hospice 10720 4392
HC2324 Harnett Advantage Hospice & Home Care 119 00
HC2968 Sampson Advantage Hospice & Home Care 9307 1857
HOS0375 Harnett Hospice of Harnett County, Inc 237 12
HOS0415 Bladen Lower Cape Fear Hospice, Inc 264 22
HOS1945 Bladen Community Home Care & Hospice 198 01
HOS2004 Cumberland Liberty Home Care and Hospice 9 11
HOS2048 Harnett Community Home Care & Hospice 214 21
HOS2995 Duplin Community Home Care & Hospice 170 11
HOS3054 Sampson Liberty Home Care and Hospice 6803 4357
HOS3067 Harnett Liberty Home Care and Hospice 300 13
HOS3346 Johnston United Hospice of Eastern Carolina, Smithfield 261 01
Totals for Sampson 35,579 156292
Agencies or Offices serving residents of Scotland
HC0359 Cumberland HealthKeeperz, Inc. 529 29
HC0424 Richmond Richmond County Hospice, Inc. 346 21
HC2452 Robeson Advantage Hospice & Home Care 795 25
HOS2060 Robeson Community Home Care & Hospice 3 00
HOS2290 Hoke Liberty Home Care and Hospice 479 34
HOS2861 Robeson Native Angels Hospice 2883 413
HOS3007 Richmond Community Home Care & Hospice 684 33
HOS3031 Scotland Hospice of Scotland County 15348 187206
HOS3064 Anson Liberty Home Care and Hospice 557 02
Totals for Scotland 21,624 203243
Agencies or Offices serving residents of Stanly
HC0369 Mecklenburg Hospice & Palliative Care of Charlotte Region 3 11
HOS0365 Cabarrus Hospice & Palliative Care of Cabarrus County 365 75
HOS0402 Stanly Hospice of Stanly County, Inc 13635 216234
HOS0405 Union Hospice of Union County, Inc 68 01
HOS3132 Mecklenburg Hospice & Palliative Care Charlotte Region 15 11
Totals for Stanly 14,086 225242
Agencies or Offices serving residents of Stokes
HC0409 Forsyth Hospice & Palliative CareCenter 5338 5051
Figures were taken from the 2009 Hospice Data Supplements. Data were self-reported and are not verified by the Medical Facilities Planning Section.

Lic. # Facility Cnty Facility Name Days of Care DeathsAdmissions
HOS0404 Surry Mountain Valley Hospice and Palliative Care 1157 1213
HOS0554 Stokes Hospice of Stokes County 11138 5464
HOS1001 Surry Mountain Valley Hospice and Palliative Care 6 01
HOS3295 Stokes Hospice & Palliative CareCenter 7880 6267
Totals for Stokes 25,519 178196
Agencies or Offices serving residents of Surry
HC0409 Forsyth Hospice & Palliative CareCenter 625 1112
HC1498 Yadkin Mountain Valley Hospice and Palliative Care 527 84
HOS0404 Surry Mountain Valley Hospice and Palliative Care 41463 248335
HOS0554 Stokes Hospice of Stokes County 376 11
HOS1001 Surry Mountain Valley Hospice and Palliative Care 8040 7087
HOS3295 Stokes Hospice & Palliative CareCenter 886 77
Totals for Surry 51,917 345446
Agencies or Offices serving residents of Swain
HC0157 Jackson WestCare Home Health and Hospice Services 1699 2532
HC0298 Swain Angel Home Health & Hospice 2669 1921
HOS0113 Buncombe CarePartners Hospice & Palliative Care Services 2 11
Totals for Swain 4,370 4554
Agencies or Offices serving residents of Transylvania
HC0067 Transylvania Home Care - TCH 10460 119151
HOS0113 Buncombe CarePartners Hospice & Palliative Care Services 39 77
HOS0386 Henderson Four Seasons Hospice & Palliative Care 395 46
Totals for Transylvania 10,894 130164
Agencies or Offices serving residents of Tyrrell
HC0524 Tyrrell Roanoke Home Care & Hospice 148 54
Totals for Tyrrell 148 54
Agencies or Offices serving residents of Union
HC0369 Mecklenburg Hospice & Palliative Care of Charlotte Region 598 3034
HOS0387 Iredell Hospice of Iredell County, Inc 9 11
HOS0405 Union Hospice of Union County, Inc 12809 169194
HOS1445 Mecklenburg Presbyterian Hospice 1819 1827
HOS3116 Union Community Home Care & Hospice 2221 1022
HOS3132 Mecklenburg Hospice & Palliative Care Charlotte Region 8005 109120
Totals for Union 25,461 337398
Agencies or Offices serving residents of Vance
HC0078 Franklin Tender Loving Care Home Health & Hospice 203 44
HOS0021 Durham Duke Hospice 420 69
HOS2281 Wake Heartland Home Health Care and Hospice 927 57
Figures were taken from the 2009 Hospice Data Supplements. Data were self-reported and are not verified by the Medical Facilities Planning Section.

Lic. # Facility Cnty Facility Name Days of Care DeathsAdmissions
HOS2561 Vance Community Home Care & Hospice 7139 6072
HOS3269 Nash United Hospice of Eastern Carolina 864 310
Totals for Vance 9,553 78102
Agencies or Offices serving residents of Wake
HC0078 Franklin Tender Loving Care Home Health & Hospice 15 11
HC0228 Wayne 3HC 0 22
HC0255 Sampson 3HC 23 00
HC0383 Johnston Johnston Memorial Home Care and Hospice 109 02
HC0409 Forsyth Hospice & Palliative CareCenter 7 11
HC0507 Johnston 3HC 1195 911
HC0508 Wilson 3HC 13 11
HC1306 Wake Home Health and Hospice Care, Inc. 42 12
HC2575 Johnston Advantage Hospice & Home Care 164 23
HOS0021 Durham Duke Hospice 1871 2217
HOS0370 Chatham UNC Hospice 10 11
HOS0375 Harnett Hospice of Harnett County, Inc 137 10
HOS1595 Wake Hospice of Wake County, Inc 72550 9951154
HOS2125 Wake Duke Hospice 8355 102117
HOS2135 Johnston Community Home Care & Hospice 103 01
HOS2223 Wake Community Home Care & Hospice 7819 5775
HOS2281 Wake Heartland Home Health Care and Hospice 41583 237425
HOS3005 Franklin Community Home Care & Hospice 303 36
HOS3058 Wake Liberty Home Care and Hospice 5825 4775
HOS3067 Harnett Liberty Home Care and Hospice 25 22
HOS3095 Wake Advantage Hospice & Home Care 1759 913
HOS3147 Wake Tender Loving Care Home Health & Hospice 6112 1620
HOS3269 Nash United Hospice of Eastern Carolina 3987 2740
HOS3346 Johnston United Hospice of Eastern Carolina, Smithfield 1 01
Totals for Wake 152,008 1,5361,970
Agencies or Offices serving residents of Warren
HC0078 Franklin Tender Loving Care Home Health & Hospice 27 22
HOS2561 Vance Community Home Care & Hospice 83 25
HOS3005 Franklin Community Home Care & Hospice 267 69
HOS3009 Halifax Community Home Care & Hospice 40 01
HOS3269 Nash United Hospice of Eastern Carolina 150 34
Totals for Warren 567 1321
Agencies or Offices serving residents of Washington
HC0523 Washington Roanoke Home Care & Hospice 599 109
HOS0331 Pitt AseraCare Hospice 74 11
HOS0425 Hertford University Health Systems Home Health and Hospice 53 12
HOS3008 Martin Community Home Care & Hospice 1051 1111
Figures were taken from the 2009 Hospice Data Supplements. Data were self-reported and are not verified by the Medical Facilities Planning Section.

Lic. # Facility Cnty Facility Name Days of Care DeathsAdmissions
Totals for Washington 1,777 2323
Agencies or Offices serving residents of Watauga
HOS0363 Avery Hospice and Palliative Care of Avery County, Inc 228 16
HOS1122 Watauga High Country Health Care System 5893 5468
Totals for Watauga 6,121 5574
Agencies or Offices serving residents of Wayne
HC0053 Duplin Carolina East Home Care & Hospice, Inc 38 01
HC0195 Lenoir 3HC 464 12
HC0228 Wayne 3HC 14907 294351
HC0255 Sampson 3HC 1410 13
HC0506 Jones 3HC 269 00
HC0507 Johnston 3HC 139 11
HC0508 Wilson 3HC 173 00
HC0509 Pitt 3HC 142 11
HC2361 Wayne Community Home Care & Hospice 9321 5186
HC2575 Johnston Advantage Hospice & Home Care 1933 1123
HOS1302 Wayne Carolina East Home Care & Hospice, Inc. 721 45
HOS3104 Wayne Advantage Hospice & Home Care 1662 612
HOS3159 Duplin Advantage Hospice & Home Care 81 01
HOS3261 Lenoir Continuum Home Care & Hospice of Lenior County 528 23
HOS3346 Johnston United Hospice of Eastern Carolina, Smithfield 157 26
Totals for Wayne 31,945 374495
Agencies or Offices serving residents of Wilkes
HC0369 Mecklenburg Hospice & Palliative Care of Charlotte Region 4 11
HC0409 Forsyth Hospice & Palliative CareCenter 385 57
HOS0185 Caldwell Caldwell Hospice and Palliative Care, Inc 232 21
HOS0387 Iredell Hospice of Iredell County, Inc 45 35
HOS0404 Surry Mountain Valley Hospice and Palliative Care 55 22
HOS0407 Wilkes Hospice of Wilkes Regional Medical Center 8362 103120
HOS1001 Surry Mountain Valley Hospice and Palliative Care 2003 2230
Totals for Wilkes 11,086 138166
Agencies or Offices serving residents of Wilson
HC0228 Wayne 3HC 27 22
HC0393 Nash Hospice and Palliative Care of Nash General Hospital 391 35
HC0498 Edgecombe Edgecombe HomeCare & Hospice 26 11
HC0508 Wilson 3HC 2067 1628
HC2575 Johnston Advantage Hospice & Home Care 3183 59
HOS0331 Pitt AseraCare Hospice 3 11
HOS0408 Wilson WilMed Hospice 6561 5665
HOS1711 Pitt University Health Systems Home Health and Hospice 68 01
Figures were taken from the 2009 Hospice Data Supplements. Data were self-reported and are not verified by the Medical Facilities Planning Section.

Lic. # Facility Cnty Facility Name Days of Care DeathsAdmissions
HOS2241 Wilson Community Home Care & Hospice 7499 7783
HOS3138 Wilson Advantage Hospice & Home Care 2266 718
HOS3269 Nash United Hospice of Eastern Carolina 835 35
HOS3292 Edgecombe University Health Systems Home Health and Hospice 337 33
Totals for Wilson 23,263 174221
Agencies or Offices serving residents of Yadkin
HC0409 Forsyth Hospice & Palliative CareCenter 2288 3130
HC1498 Yadkin Mountain Valley Hospice and Palliative Care 7665 6993
HOS0387 Iredell Hospice of Iredell County, Inc 27 45
HOS0404 Surry Mountain Valley Hospice and Palliative Care 14 01
HOS1001 Surry Mountain Valley Hospice and Palliative Care 1498 1113
HOS3084 Davie Hospice & Palliative CareCenter 1003 1213
Totals for Yadkin 12,495 127155
Agencies or Offices serving residents of Yancey
HOS0113 Buncombe CarePartners Hospice & Palliative Care Services 180 911
HOS1027 Yancey Hospice of Yancey County 16446 86122
Totals for Yancey 16,626 95133
Grand Total 2,679,306 26,35332,509
Figures were taken from the 2009 Hospice Data Supplements. Data were self-reported and are not verified by the Medical Facilities Planning Section.

Table 13B: Year 2011 Hospice Home Care Office Need Projections for 2010 Plan Column A Column B Column C Column D Column E Column F Column G Column H Column I Column J Column K Column L Column M Column N
2003-2007 Death
Rate/1000 Population
2011 Population (excluding military)
Projected 2011 Deaths
2008 Reported # of Hospice
Patient Deaths
2011 # of Hospice DeathsServed at Two Year
Trailing Average Growth Rate
2011 # of Hospice DeathsServed Limited to 60%
Projected 2011 # of Hospice Deaths
Served
Median Projected 2011 Hospice Deaths
Place- holder for New Hospice Office
Projected Number of Additional Patients in
Need Surplus (Deficit)
Licensed Home Care Offices in County
Lic. Home Care Offices in Cty per 100,000
Additional Hospice Office
Need
Source or Formula =>Deaths - NC
Vital Statistics
Office of State Budget and
ManagementCol. B x
(Col.C/1000)2008 Lic. Data Supplements
Col. E x 3 Yrs Growth at 7.9% annually Col. D x 60%
Lower # of Deaths between Col. F and Col.
G
Col. D x Proj. Statewide Median Percent Deaths Served (34.3%)
Col. H + Col. J - Col. I
2008 Lic. Data Supplement
Col. L / (Col. C / 100,000)
If Col. M <= 3 and Col. K <= -90
North Carolina 8.5 9,659,530 82,106 26,353 33,084 49,264 33,084 28,171 180 5,093 240 3.6 0
Alamance 9.7 156,140 1,515 596 748 909 748 520 229 4 2.6
Alexander 8.7 37,915 330 137 172 198 172 113 59 1 2.6
Alleghany 12.2 11,324 138 28 35 83 35 47 (12) 1 8.8
Anson 11 25,260 278 48 60 167 60 95 (35) 3 11.9
Ashe 11.7 26,922 315 69 87 189 87 108 (21) 1 3.7
Avery 10.6 18,380 195 40 50 117 50 67 (17) 1 5.4
Beaufort 11.6 47,100 546 137 172 328 172 187 (15) 2 4.2
Bertie 12.1 20,180 244 45 56 147 56 84 (27) 0 0.0
Bladen 11.9 32,250 384 115 144 230 144 132 13 4 12.4
Brunswick 9.6 114,000 1,094 339 426 657 426 375 50 4 3.5
Buncombe 10.1 237,104 2,395 935 1,174 1,437 1,174 822 352 1 0.4
Burke 9.7 92,464 897 347 436 538 436 308 128 1 1.1
Cabarrus 8.2 190,124 1,559 551 692 935 692 535 157 2 1.1
Caldwell 10 82,250 823 391 491 494 491 282 209 1 1.2
Camden 7.9 10,019 79 14 18 47 18 27 (10) 0 0.0
Carteret* 11 63,694 701 212 266 420 266 240 26 4 6.3
Caswell 10.1 23,128 234 69 87 140 87 80 6 0 0.0
Catawba 9 161,274 1,451 760 954 871 871 498 373 1 0.6
Chatham 9.1 65,624 597 157 197 358 197 205 (8) 4 6.1
Cherokee 12.1 27,931 338 62 78 203 78 116 90 52 1 3.6
Chowan 12.5 14,806 185 32 40 111 40 64 (23) 1 6.8
Clay 11.8 10,955 129 17 21 78 21 44 (23) 1 9.1
Cleveland 10.5 100,581 1,056 479 601 634 601 362 239 1 1.0
Columbus 11.8 55,783 658 210 264 395 264 226 38 4 7.2
Craven* 9.7 92,835 900 228 286 540 286 309 (23) 4 4.3
Cumberland* 6.7 290,141 1,944 713 895 1,166 895 667 228 8 2.8
Currituck 8 23,024 184 52 65 111 65 63 2 0 0.0
Dare 7.6 32,702 249 58 73 149 73 85 (12) 2 6.1
Davidson 9.5 166,175 1,579 393 493 947 493 542 (48) 3 1.8
Davie 8.9 43,097 384 126 158 230 158 132 27 2 4.6
Duplin 9.9 55,058 545 125 157 327 157 187 (30) 4 7.3
Durham 6.9 281,541 1,943 472 593 1,166 593 667 (74) 6 2.1
Edgecombe 11.2 51,510 577 136 171 346 171 198 (27) 3 5.8

Table 13B: Year 2011 Hospice Home Care Office Need Projections for 2010 Plan Column A Column B Column C Column D Column E Column F Column G Column H Column I Column J Column K Column L Column M Column N
2003-2007 Death
Rate/1000 Population
2011 Population (excluding military)
Projected 2011 Deaths
2008 Reported # of Hospice
Patient Deaths
2011 # of Hospice DeathsServed at Two Year
Trailing Average Growth Rate
2011 # of Hospice DeathsServed Limited to 60%
Projected 2011 # of Hospice Deaths
Served
Median Projected 2011 Hospice Deaths
Place- holder for New Hospice Office
Projected Number of Additional Patients in
Need Surplus (Deficit)
Licensed Home Care Offices in County
Lic. Home Care Offices in Cty per 100,000
Additional Hospice Office
Need
Source or Formula =>Deaths - NC
Vital Statistics
Office of State Budget and
ManagementCol. B x
(Col.C/1000)2008 Lic. Data Supplements
Col. E x 3 Yrs Growth at 7.9% annually Col. D x 60%
Lower # of Deaths between Col. F and Col.
G
Col. D x Proj. Statewide Median Percent Deaths Served (34.3%)
Col. H + Col. J - Col. I
2008 Lic. Data Supplement
Col. L / (Col. C / 100,000)
If Col. M <= 3 and Col. K <= -90
Forsyth 8.6 361,134 3,106 1088 1,366 1,863 1,366 1,066 300 2 0.6
Franklin 8.4 61,171 514 88 110 308 110 176 (66) 4 6.5
Gaston 10 218,563 2,186 844 1,060 1,311 1,060 750 310 1 0.5
Gates 10.3 11,950 123 22 28 74 28 42 (15) 0 0.0
Graham 11.8 8,226 97 15 19 58 19 33 (14) 1 12.2
Granville 8.8 57,898 510 93 117 306 117 175 (58) 2 3.5
Greene 9.2 21,658 199 43 54 120 54 68 (14) 1 4.6
Guilford 8.1 493,613 3,998 1229 1,543 2,399 1,543 1,372 171 4 0.8
Halifax 11.6 54,971 638 123 154 383 154 219 (64) 3 5.5
Harnett* 7.7 117,267 903 323 405 542 405 310 96 7 6.0
Haywood 11.9 57,984 690 231 290 414 290 237 53 1 1.7
Henderson 12.6 109,173 1,376 764 959 825 825 472 353 1 0.9
Hertford 12.1 23,651 286 84 105 172 105 98 7 1 4.2
Hoke* 6.6 46,444 307 78 98 184 98 105 (7) 2 4.3
Hyde 12.1 5,409 65 42 53 39 39 22 17 1 18.5
Iredell 8.6 166,843 1,435 556 698 861 698 492 206 3 1.8
Jackson 9 38,656 348 124 156 209 156 119 36 1 2.6
Johnston 7.1 180,925 1,285 271 340 771 340 441 (101) 8 4.4
Jones 10.6 10,318 109 31 39 66 39 38 1 1 9.7
Lee 9.2 61,105 562 156 196 337 196 193 3 2 3.3
Lenoir 11.9 57,343 682 129 162 409 162 234 (72) 3 5.2
Lincoln 8.8 80,614 709 216 271 426 271 243 28 1 1.2
Macon 12.8 36,074 462 115 144 277 144 158 (14) 3 8.3
Madison 11.2 21,586 242 85 107 145 107 83 24 1 4.6
Martin 13.1 23,605 309 75 94 186 94 106 (12) 3 12.7
McDowell 10.1 46,328 468 124 156 281 156 161 (5) 1 2.2
Mecklenburg 6 928,285 5,570 1967 2,469 3,342 2,469 1,911 558 6 0.6
Mitchell 12.6 16,104 203 73 92 122 92 70 22 1 6.2
Montgomery 10 28,019 280 61 77 168 77 96 (20) 1 3.6
Moore* 11.7 89,541 1,048 344 432 629 432 359 72 3 3.4
Nash 9.9 97,702 967 219 275 580 275 332 (57) 4 4.1
New Hanover 8.3 200,182 1,662 725 910 997 910 570 340 3 1.5
Northampton 13.3 21,006 279 47 59 168 59 96 (37) 1 4.8
Onslow* 5.1 152,046 775 194 244 465 244 266 (23) 4 2.6
Orange 5.7 134,831 769 352 442 461 442 264 178 3 2.2
Pamlico 11.2 12,860 144 25 31 86 31 49 (18) 2 15.6
Pasquotank 9.4 41,638 391 99 124 235 124 134 (10) 2 4.8

Table 13B: Year 2011 Hospice Home Care Office Need Projections for 2010 Plan Column A Column B Column C Column D Column E Column F Column G Column H Column I Column J Column K Column L Column M Column N
2003-2007 Death
Rate/1000 Population
2011 Population (excluding military)
Projected 2011 Deaths
2008 Reported # of Hospice
Patient Deaths
2011 # of Hospice DeathsServed at Two Year
Trailing Average Growth Rate
2011 # of Hospice DeathsServed Limited to 60%
Projected 2011 # of Hospice Deaths
Served
Median Projected 2011 Hospice Deaths
Place- holder for New Hospice Office
Projected Number of Additional Patients in
Need Surplus (Deficit)
Licensed Home Care Offices in County
Lic. Home Care Offices in Cty per 100,000
Additional Hospice Office
Need
Source or Formula =>Deaths - NC
Vital Statistics
Office of State Budget and
ManagementCol. B x
(Col.C/1000)2008 Lic. Data Supplements
Col. E x 3 Yrs Growth at 7.9% annually Col. D x 60%
Lower # of Deaths between Col. F and Col.
G
Col. D x Proj. Statewide Median Percent Deaths Served (34.3%)
Col. H + Col. J - Col. I
2008 Lic. Data Supplement
Col. L / (Col. C / 100,000)
If Col. M <= 3 and Col. K <= -90
Pender 8.7 56,822 494 179 225 297 225 170 55 4 7.0
Perquimans 11.8 13,730 162 33 41 97 41 56 (14) 0 0.0
Person 10.6 37,824 401 98 123 241 123 138 (15) 1 2.6
Pitt 7.5 166,851 1,251 327 411 751 411 429 (19) 7 4.2
Polk 14.8 19,104 283 189 237 170 170 97 73 1 5.2
Randolph 8.7 146,740 1,277 489 614 766 614 438 176 2 1.4
Richmond 11.1 47,178 524 158 198 314 198 180 19 2 4.2
Robeson 9.3 134,149 1,248 411 516 749 516 428 88 6 4.5
Rockingham 11.6 92,263 1,070 267 335 642 335 367 (32) 2 2.2
Rowan 9.9 145,581 1,441 398 500 865 500 495 5 3 2.1
Rutherford 12.4 65,736 815 419 526 489 489 280 209 1 1.5
Sampson 9.7 68,503 664 156 196 399 196 228 (32) 4 5.8
Scotland 10.2 38,129 389 203 255 233 233 133 100 1 2.6
Stanly 10.1 61,403 620 225 282 372 282 213 70 2 3.3
Stokes 9.6 47,681 458 178 223 275 223 157 66 2 4.2
Surry 11 74,642 821 345 433 493 433 282 151 3 4.0
Swain 13 14,468 188 45 56 113 56 65 (8) 1 6.9
Transylvania 12 31,950 383 130 163 230 163 132 32 1 3.1
Tyrrell 8.1 4,306 35 5 6 21 6 12 (6) 1 23.2
Union 5.9 219,530 1,295 337 423 777 423 444 (21) 5 2.3
Vance 10.8 43,592 471 78 98 282 98 162 (64) 2 4.6
Wake* 4.9 970,858 4,757 1536 1,928 2,854 1,928 1,632 296 9 0.9
Warren 11.5 19,864 228 13 16 137 16 78 (62) 0 0.0
Washington 11.4 13,052 149 23 29 89 29 51 (22) 2 15.3
Watauga 6.8 47,061 320 55 69 192 69 110 (41) 1 2.1
Wayne* 9.3 113,613 1,057 374 470 634 470 363 107 5 4.4
Wilkes 10.1 68,247 689 138 173 414 173 237 90 27 2 2.9
Wilson 10.1 82,231 831 174 218 498 218 285 (67) 5 6.1
Yadkin 10.1 39,341 397 127 159 238 159 136 23 1 2.5
Yancey 11.2 19,067 214 95 119 128 119 73 46 1 5.2
*population projections were adjusted to exclude active duty military personnel.

Table 13C: Year 2013 Hospice Inpatient Bed Need Projections for the 2010 Plan Column A Column B Column C Column D Column E Column F Column G Column H Column I Column J Column K Column L Column M Column N Column O
County
Total Admissions (2008 data)
Total Days of Care
(2008 Data)ALOS per Admission
Total 2013 Admissions
2013 Days of Care at
County ALOS
2013 Days of Care at
Statewide ALOS
Projected 2013 Days of
Care for Inpatient
Estimates
Projected Inpatient
Days
Projected Total
Inpatient Beds
Currently Licensed
Beds
CON Appv'd/Lic. Pending/
Prev. Need Determ.
Adjusted Projected
Beds
Existing Facility
Occupancy Rate
Deficit/(Surplus) Adjusted for
facilities not at 85% occupancy
(Col. N)
Source or Formula =>
2009 Lic. Data Supplement
2009 Lic. Data Supplement Col. C / Col. B
Col.B x 5 Yrs Growth at 6.5%
annually Col. D x Col .E
Col. E x Statewide Median ALOS per Admission (77.2)
Lower # of Days of Care between Col. F and Col.
G Col. H * 6%(Col. I/365) /
85%Licensure Inventory
Col. J - (Col. K + Col. L)
2009 Lic. Data Supplement
Alamance 684 56,443 82.5 937 77,333 72,359 72,359 4,342 14 8 6 (0) 92.17% (0)Alexander 147 11,067 75.3 201 15,163 15,551 15,163 910 3 3 3Alleghany 35 3,125 89.3 48 4,282 3,703 3,703 222 1 1 1Anson 60 4,273 71.2 82 5,855 6,347 5,855 351 1 1 1Ashe 97 5,872 60.5 133 8,045 10,261 8,045 483 2 2 2Avery 58 3,437 59.3 79 4,709 6,136 4,709 283 1 1 1Beaufort 164 20,468 124.8 225 28,044 17,349 17,349 1,041 3 6 (3) (3)Bertie 49 3,759 76.7 67 5,150 5,184 5,150 309 1 1 1Bladen 177 19,440 109.8 243 26,635 18,725 18,725 1,123 4 4 4Brunswick 457 37,370 81.8 626 51,201 48,345 48,345 2,901 9 7 2 2Buncombe 1,024 76,337 74.5 1,403 104,591 108,327 104,591 6,275 20 15 5 100.00% 5Burke 391 32,773 83.8 536 44,903 41,363 41,363 2,482 8 8 (0) (0)Cabarrus 556 45,181 81.3 762 61,903 58,818 58,818 3,529 11 6 8 (3) 54.50% (3)Caldwell 458 37,392 81.6 628 51,231 48,451 48,451 2,907 9 6 3 0 90.16% 0Camden 12 453 37.8 16 621 1,269 621 37 0 0 0Carteret 275 20,724 75.4 377 28,394 29,092 28,394 1,704 5 5 5Caswell 79 7,679 97.2 108 10,521 8,357 8,357 501 2 2 2Catawba 809 62,861 77.7 1,108 86,127 85,583 85,583 5,135 17 11 6 (0) 100.00% (0)Chatham 211 18,235 86.4 289 24,984 22,321 22,321 1,339 4 4 4Cherokee 82 3,005 36.6 112 4,117 8,675 4,117 247 1 1 1Chowan 36 2,259 62.8 49 3,095 3,808 3,095 186 1 1 1Clay 24 697 29.0 33 955 2,539 955 57 0 0 0Cleveland 607 38,877 64.0 832 53,266 64,213 53,266 3,196 10 5 4 1 99.51% 1Columbus 358 42,120 117.7 491 57,709 37,872 37,872 2,272 7 6 1 1Craven 363 37,962 104.6 497 52,012 38,401 38,401 2,304 7 7 7Cumberland 1,018 76,194 74.8 1,395 104,395 107,692 104,395 6,264 20 8 12 57.48% 0Currituck 63 4,540 72.1 86 6,220 6,665 6,220 373 1 1 1Dare 66 2,453 37.2 90 3,361 6,982 3,361 202 1 1 1Davidson 491 35,325 71.9 673 48,399 51,942 48,399 2,904 9 8 1 1Davie 139 11,124 80.0 190 15,241 14,705 14,705 882 3 3 3Duplin 218 25,669 117.7 299 35,170 23,062 23,062 1,384 4 3 1 1Durham 606 44,400 73.3 830 60,833 64,108 60,833 3,650 12 12 (0) (0)Edgecombe 181 16,032 88.6 248 21,966 19,148 19,148 1,149 4 4 4Forsyth 1,225 87,840 71.7 1,678 120,351 129,591 120,351 7,221 23 20 10 (7) 100.00% (7)Franklin 126 13,832 109.8 173 18,951 13,329 13,329 800 3 3 3Gaston 941 62,553 66.5 1,289 85,705 99,547 85,705 5,142 17 6 7 4 32.66% 0

Table 13C: Year 2013 Hospice Inpatient Bed Need Projections for the 2010 Plan Column A Column B Column C Column D Column E Column F Column G Column H Column I Column J Column K Column L Column M Column N Column O
County
Total Admissions (2008 data)
Total Days of Care
(2008 Data)ALOS per Admission
Total 2013 Admissions
2013 Days of Care at
County ALOS
2013 Days of Care at
Statewide ALOS
Projected 2013 Days of
Care for Inpatient
Estimates
Projected Inpatient
Days
Projected Total
Inpatient Beds
Currently Licensed
Beds
CON Appv'd/Lic. Pending/
Prev. Need Determ.
Adjusted Projected
Beds
Existing Facility
Occupancy Rate
Deficit/(Surplus) Adjusted for
facilities not at 85% occupancy
(Col. N)
Source or Formula =>
2009 Lic. Data Supplement
2009 Lic. Data Supplement Col. C / Col. B
Col.B x 5 Yrs Growth at 6.5%
annually Col. D x Col .E
Col. E x Statewide Median ALOS per Admission (77.2)
Lower # of Days of Care between Col. F and Col.
G Col. H * 6%(Col. I/365) /
85%Licensure Inventory
Col. J - (Col. K + Col. L)
2009 Lic. Data Supplement
Gates 24 1,233 51.4 33 1,689 2,539 1,689 101 0 0 0Graham 20 674 33.7 27 923 2,116 923 55 0 0 0Granville 114 6,361 55.8 156 8,715 12,060 8,715 523 2 2 2Greene 52 5,362 103.1 71 7,347 5,501 5,501 330 1 1 1Guilford 1,442 132,055 91.6 1,976 180,931 152,547 152,547 9,153 30 14 16 80.82% 0Halifax 145 11,289 77.9 199 15,467 15,339 15,339 920 3 3 3Harnett 579 44,030 76.0 793 60,326 61,251 60,326 3,620 12 7 1 4 58.43% 0Haywood 284 16,943 59.7 389 23,214 30,044 23,214 1,393 4 6 (2) (2)Henderson 841 72,202 85.9 1,152 98,925 88,968 88,968 5,338 17 19 (2) 80.19% (2)Hertford 85 5,024 59.1 116 6,883 8,992 6,883 413 1 1 1Hoke 108 16,223 150.2 148 22,227 11,425 11,425 686 2 2 2Hyde 55 9,591 174.4 75 13,141 5,818 5,818 349 1 1 1Iredell 605 38,158 63.1 829 52,281 64,002 52,281 3,137 10 9 1 92.92% 1Jackson 135 9,122 67.6 185 12,498 14,281 12,498 750 2 2 2Johnston 425 36,490 85.9 582 49,996 44,960 44,960 2,698 9 12 (3) (3)Jones 49 5,302 108.2 67 7,264 5,184 5,184 311 1 1 1Lee 225 22,407 99.6 308 30,700 23,802 23,802 1,428 5 5 5Lenoir 216 17,305 80.1 296 23,710 22,850 22,850 1,371 4 4 4Lincoln 261 21,699 83.1 358 29,730 27,611 27,611 1,657 5 5 5McDowell 167 11,391 68.2 229 15,607 17,667 15,607 936 3 3 3Macon 142 9,877 69.6 195 13,533 15,022 13,533 812 3 3 3Madison 97 4,263 43.9 133 5,841 10,261 5,841 350 1 1 1Martin 93 6,506 70.0 127 8,914 9,838 8,914 535 2 2 2Mecklenburg 2,323 170,393 73.4 3,183 233,458 245,746 233,458 14,007 45 19 26 69.99% 0Mitchell 83 12,606 151.9 114 17,272 8,780 8,780 527 2 2 2Montgomery 90 8,684 96.5 123 11,898 9,521 9,521 571 2 2 2Moore 437 41,377 94.7 599 56,691 46,229 46,229 2,774 9 11 (2) (2)Nash 259 19,697 76.1 355 26,987 27,399 26,987 1,619 5 6 (1) (1)New Hanover 847 64,093 75.7 1,160 87,815 89,603 87,815 5,269 17 12 5 98.72% 5Northhampton 54 4,115 76.2 74 5,638 5,713 5,638 338 1 1 1Onslow 265 16,477 62.2 363 22,575 28,034 22,575 1,355 4 4 4Orange 430 24,649 57.3 589 33,772 45,489 33,772 2,026 7 6 1 100.00% 1Pamlico 29 2,488 85.8 40 3,409 3,068 3,068 184 1 1 1Pasquotank 107 8,124 75.9 147 11,131 11,319 11,131 668 2 2 2Pender 210 15,819 75.3 288 21,674 22,216 21,674 1,300 4 4 4Perquimans 40 1,882 47.1 55 2,579 4,232 2,579 155 0 0 0

Table 13C: Year 2013 Hospice Inpatient Bed Need Projections for the 2010 Plan Column A Column B Column C Column D Column E Column F Column G Column H Column I Column J Column K Column L Column M Column N Column O
County
Total Admissions (2008 data)
Total Days of Care
(2008 Data)ALOS per Admission
Total 2013 Admissions
2013 Days of Care at
County ALOS
2013 Days of Care at
Statewide ALOS
Projected 2013 Days of
Care for Inpatient
Estimates
Projected Inpatient
Days
Projected Total
Inpatient Beds
Currently Licensed
Beds
CON Appv'd/Lic. Pending/
Prev. Need Determ.
Adjusted Projected
Beds
Existing Facility
Occupancy Rate
Deficit/(Surplus) Adjusted for
facilities not at 85% occupancy
(Col. N)
Source or Formula =>
2009 Lic. Data Supplement
2009 Lic. Data Supplement Col. C / Col. B
Col.B x 5 Yrs Growth at 6.5%
annually Col. D x Col .E
Col. E x Statewide Median ALOS per Admission (77.2)
Lower # of Days of Care between Col. F and Col.
G Col. H * 6%(Col. I/365) /
85%Licensure Inventory
Col. J - (Col. K + Col. L)
2009 Lic. Data Supplement
Person 122 9,626 78.9 167 13,189 12,906 12,906 774 2 2 2Pitt 397 41,234 103.9 544 56,495 41,998 41,998 2,520 8 8 0 0.00% 0Polk 208 18,054 86.8 285 24,736 22,004 22,004 1,320 4 4 4Randolph 567 47,403 83.6 777 64,948 59,982 59,982 3,599 12 6 6 6Richmond 229 33,280 145.3 314 45,597 24,226 24,226 1,454 5 6 (1) (1)Robeson 715 102,348 143.1 980 140,229 75,639 75,639 4,538 15 12 14 (11) 44.81% (11)Rockingham 282 17,926 63.6 386 24,561 29,832 24,561 1,474 5 3 2 56.41% 0Rowan 490 33,622 68.6 671 46,066 51,836 46,066 2,764 9 7 2 2Rutherford 475 55,092 116.0 651 75,482 50,249 50,249 3,015 10 10 (0) 98.29% (0)Sampson 292 35,579 121.8 400 48,747 30,890 30,890 1,853 6 6 6Scotland 243 21,624 89.0 333 29,627 25,707 25,707 1,542 5 4 2 (1) (1)Stanly 242 14,086 58.2 332 19,299 25,601 19,299 1,158 4 4 4Stokes 196 25,519 130.2 269 34,964 20,734 20,734 1,244 4 6 (2) (2)Surry 446 51,917 116.4 611 71,132 47,182 47,182 2,831 9 13 (4) (4)Swain 54 4,370 80.9 74 5,987 5,713 5,713 343 1 1 1Transylvania 164 10,894 66.4 225 14,926 17,349 14,926 896 3 3 3Tyrrell 4 148 37.0 5 203 423 203 12 0 0 0Union 398 25,461 64.0 545 34,885 42,104 34,885 2,093 7 6 1 1Vance 102 9,553 93.7 140 13,089 10,790 10,790 647 2 2 2Wake 1,970 152,008 77.2 2,699 208,269 208,403 208,269 12,496 40 6 18 16 82.38% 0Warren 21 567 27.0 29 777 2,222 777 47 0 0 0Washington 23 1,777 77.3 32 2,435 2,433 2,433 146 0 0 0Watauga 74 6,121 82.7 101 8,386 7,828 7,828 470 2 2 2Wayne 495 31,945 64.5 678 43,768 52,365 43,768 2,626 8 6 6 (4) 100.00% (4)Wilkes 166 11,086 66.8 227 15,189 17,561 15,189 911 3 3 3Wilson 221 23,263 105.3 303 31,873 23,379 23,379 1,403 5 5 5Yadkin 155 12,495 80.6 212 17,120 16,397 16,397 984 3 3 3Yancey 133 16,626 125.0 182 22,780 14,070 14,070 844 3 3 3Total 32,509 2,679,306 77.2 44,541 3,439,070 3,439,070 3,439,070 206,344 665 256 178 84.13%

Hospice Inpatient Facilities: (2010 Plan)
County Facility
Number of Licensed
Beds
Number of Beds CON Approved/
Lic. Pending
Days of Care Per 2009 Data Supplement
Occ. Rate For
Reporting Period
Alamance Hospice of Alamance / Hospice Home 8 2024 92.17% *
Beaufort Pamlico/Tar Hospice House 6 NA NA
Brunswick Brunswick County Hospice Care Center 7 NA NA
Buncombe Carepartners Hospice and Palliative Care/ Solace 15 6061 100.00%
Burke Burke Palliative Care Center 8 445 NA
Cabarrus Hospice/Palliative Care of Cabarrus County 6 412 54.5% *
Caldwell Caldwell Hospice and Palliative Care/ Kirkwood 6 -2 1980 90.16%
Caldwell Caldwell Hospice and Palliative Care/ Hospice House 5 NA NA
Catawba Catawba Valley Hospice House 11 1954 100.00%
Catawba Sherrills Ford Hospice House 6 NA NA
Cleveland Hospice/Palliative Care Cleveland County / Wendover 5 1821 99.51%
Cleveland Hospice of Cleveland County/Kings Mountain 4 NA NA
Columbus Columbus County / Hospice Care Center 6 NA NA
Cumberland Carroll S. Roberson Center 8 1683 57.48%
Davidson Henry Etta and Bruce Hinkle Hospice House 8 NA NA
Duplin Carolina East Hospice Care Center 3 NA NA
Durham Duke Hospice, Hoke Family Pavilion 12 NA NA
Forsyth Kate B. Reynolds Hospice Home 20 10 7565 100.00%
Gaston Robin Johnson House - Gaston Hospice 6 629 32.66% *
Gaston Gaston Hospice House - Mount Holly 7 NA NA
Guilford Hospice/Palliative Care of Greensboro/ Beacon Place 8 2169 74.08%
Guilford Hospice Home at High Point 6 1972 89.80%
Harnett E. Carlton Powell Hospice House 7 1 1497 58.43%
Henderson Four Seasons Hospice and Palliative Care 19 3522 80.19%
Haywood Home Care Services of Haywood Regional Medical Ctr. 6 NA NA
Iredell Hospice of Iredell County/Gordon Hospice House 9 1812 92.92% *
Johnston Johnston Memorial Hospital 12 NA NA
Mecklenburg Presbyterian Hospital / Harris Hospital Unit 8 2355 80.43%
Mecklenburg Levine and Dickson Hospice House 11 1434 57.68% *
Moore First Health Hospice/Palliative Care 11 NA NA
Nash Nash Regional Hospice House 6 NA NA
New Hanover Lower Cape Fear Hospice / Hospice Care Center 12 4336 98.72%
Orange Duke Hospice at the Meadowlands 6 2419 100.00%
Pitt University Health Systems Inpatient Hospice 8 0 0.00%
Randolph Hospice of Randolph County 6 NA NA
Richmond Hospice Haven of Richmond County 6 NA NA
Robeson Southeastern Regional Medical Center 12 6 1968 44.81%
Robeson Native Angles Hospice 8 NA NA
Rockingham Hospice of Rockingham County 3 484 56.41% *
Rowan Rowan Regional Medical Center 7 NA NA
Rutherford Hospice of Rutherford County / Hospice Home 10 1439 98.29% *
Scotland Hospice of Scotland County/Hospice House 4 2 NA NA
Surry Hospice of Surry County 13 NA NA
Union Hospice of Union County 6 NA NA
Wake Rex Hospital 6 1809 82.38%
Wake Hospice of Wake County 8 NA NA
Wayne 3HC/Kitty Askins Hospice Center 6 6 2216 100.00%
Total 256 148 54006 84.13% ** Adjusted for beds open during the data reporting year or for part of data reporting year.

Hospice Residential Facilities:
Counties Name of Facility
Number of Licensed
Beds
Number of Beds CON Approved/ License Pending
Alamance Hospice of Alamance County - Hospice Home 8Buncombe CarePartners Hospice/Palliative Care - Solace 12Burke Burke Palliative Care Center - Shytle House 6Cabarrus Hospice/Palliative Care - Cabarrus - Hospice House 6Caldwell Caldwell Hospice/Palliative Care
Kirkwood 2 Hospice Home 7
Catawba Hospice of Catawba Valley - Catawba Valley Hospice House 10Cleveland Hospice/Palliative Care - Cleveland - Wendover 9
Hospice of Cleveland County - Kings Mountain 4Davidson Hospice of Davidson County 4Duplin Carolina East Hospice Center 3Forsyth Kate B. Reynolds Hospice Home 10Gaston Hospice of Gaston County - Robin Johnson House 6Gaston Gaston Hospice House - Mount Holly 5Guilford Hospice/Palliative Care - Greensboro - Beacon Place 6Guilford Hospice Home at High Point 8Iredell Hospice of Iredell County - Gordon Hospice Home 6Johnston Johnston Memorial Hospital Authority 6Mecklenburg NewSouth Health Care - Levine and Dickson Hospice House 5Nash Nash Regional Hospice House 6Randolph Hospice of Randolph County 4Richmond Richmond Co. Hospice Residential Facility - Hospice Haven 6Rockingham Hospice of Rockingham County 5Rowan Rowan Regional Medical Center 7Rutherford Hospice of Rutherford County - Hospice Home 8Scotland Hospice of Scotland County - Hospice House 6Surry Hospice of Surry County 7Union Hospice of Union County 14 6Wake Hospice of Wake County 6Wayne 3HC - Kitty Askins Hospice Center 6 6
151 59

Inventory of Hospice Residential Beds
OperationalCounty CON Award Facility
1 Alamance 82 Alexander 3 Alleghany4 Anson5 Ashe
6 Avery7 Beaufort8 Bertie9 Bladen
10 Brunswick
11 Buncombe 1212 Burke 613 Cabarrus 614 Caldwell 915 Camden
16 Carteret17 Caswell
18 Catawba 1019 Chatham20 Cherokee
21 Chowan22 Clay
23 Cleveland 4 924 Columbus25 Craven
26 Cumberland27 Currituck28 Dare
29 Davidson 430 Davie
31 Duplin 332 Durham33 Edgecombe
34 Forsyth 1035 Franklin
36 Gaston 5 637 Gates38 Graham39 Granville40 Greene
41 Guilford 1442 Halifax
43 Harnett44 Haywood45 Henderson
46 Hertford47 Hoke48 Hyde
49 Iredell 650 Jackson
51 Johnston 652 Jones53 Lee54 Lenoir55 Lincoln

Inventory of Hospice Residential Beds
OperationalCounty CON Award Facility
56 McDowell57 Macon58 Madison59 Martin
60 Mecklenburg 5
61 Mitchell62 Montgomery63 Moore64 Nash 665 New Hanover
66 Northampton67 Onslow68 Orange69 Pamlico70 Pasquotank
71 Pender72 Perquimans73 Person74 Pitt75 Polk
76 Randolph 477 Richmond 678 Robeson79 Rockingham 580 Rowan 7
81 Rutherford 882 Sampson
83 Scotland 684 Stanly85 Stokes
86 Surry 787 Swain88 Transylvania89 Tyrrell
90 Union 6 14
91 Vance92 Wake 693 Warren94 Washington95 Watauga
96 Wayne 6 697 Wilkes98 Wilson99 Yadkin
100 Yancey
T O T A L 59 151
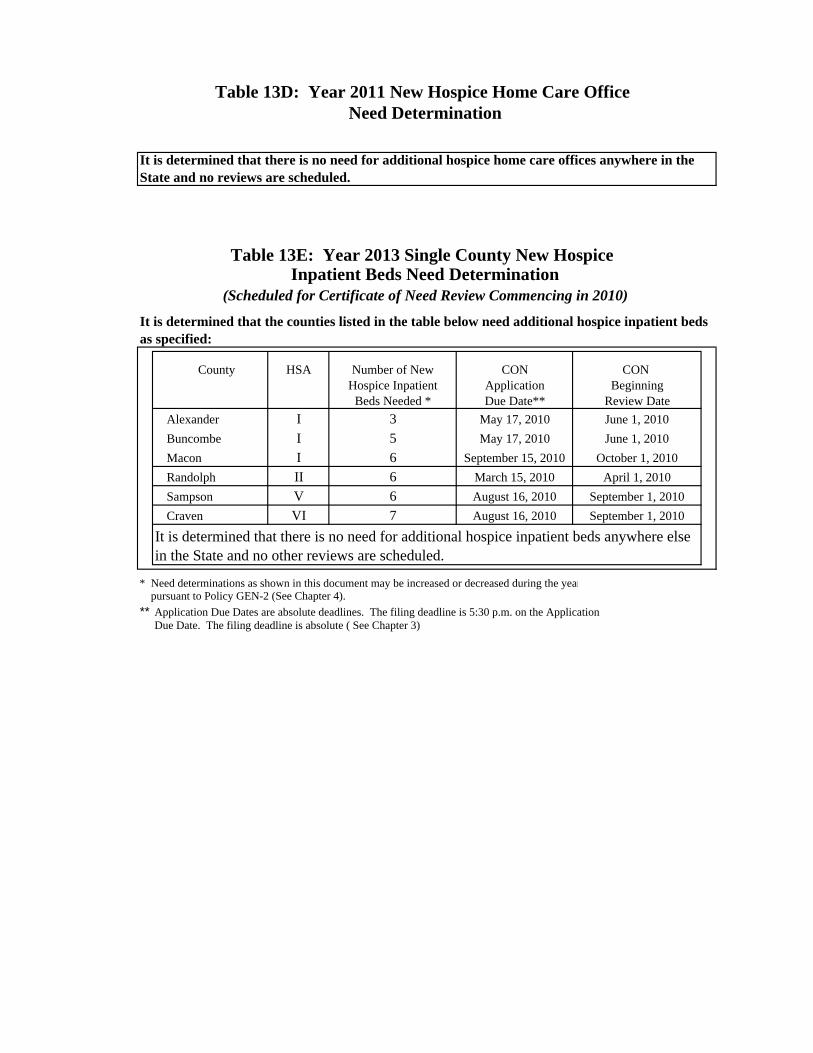
Table 13E: Year 2013 Single County New Hospice Inpatient Beds Need Determination
(Scheduled for Certificate of Need Review Commencing in 2010)
County HSA Number of New CON CON Hospice Inpatient Application Beginning
Beds Needed * Due Date** Review Date
Alexander I 3 May 17, 2010 June 1, 2010
Buncombe I 5 May 17, 2010 June 1, 2010
Macon I 6 September 15, 2010 October 1, 2010
Randolph II 6 March 15, 2010 April 1, 2010
Sampson V 6 August 16, 2010 September 1, 2010
Craven VI 7 August 16, 2010 September 1, 2010
* Need determinations as shown in this document may be increased or decreased during the year pursuant to Policy GEN-2 (See Chapter 4).
**
It is determined that there is no need for additional hospice inpatient beds anywhere else in the State and no other reviews are scheduled.
Application Due Dates are absolute deadlines. The filing deadline is 5:30 p.m. on the ApplicationDue Date. The filing deadline is absolute ( See Chapter 3)
Table 13D: Year 2011 New Hospice Home Care Office Need Determination
It is determined that there is no need for additional hospice home care offices anywhere in the State and no reviews are scheduled.
It is determined that the counties listed in the table below need additional hospice inpatient beds as specified:
Chapter 14:End-Stage Renal Disease Dialysis Facilities

CHAPTER 14 END-STAGE RENAL DISEASE DIALYSIS FACILITIES Summary of Dialysis Station Supply and Utilization
Inventories of dialysis facilities and current utilization rates are presented twice a year in “Semiannual Dialysis Reports” required by this chapter. According to the “July 2009 North Carolina Semiannual Dialysis Report,” there were 161 End-Stage Renal Disease (ESRD) dialysis facilities certified and operating in North Carolina (i.e., facilities reporting patient data via the Southeastern Kidney Council), providing a total of 3,895 dialysis stations. Certificates of need (CONs) had been issued for an additional 215 dialysis stations, but the stations were not yet certified. Another 60 dialysis stations had been requested, but had not completed the CON review and appeals process. The number of facilities per county ranged from 0 to 13.
Utilization data are based on reported numbers of patients obtained from the
Southeastern Kidney Council and the Mid-Atlantic Renal Coalition. Of the 161 certified facilities operational on December 31, 2008, 80 were at or above 80 percent utilization (i.e., operating with at least 3.2 patients per station). Changes from the Previous Plan
No substantive changes in the dialysis policy or in the dialysis need methodology have been incorporated into the 2010 North Carolina State Medical Facilities Plan. Dates have been advanced by one year, as needed to represent the period for the 2010 Plan.
Basic Principles The principles underlying projection of need for additional dialysis stations are as follows:
1. Increases in the number of facilities or stations should be done to meet the specific need for either a new facility or an expansion.
2. New facilities must have a projected need for at least 10 stations (or 32 patients at
3.2 patients per station) to be cost effective and to assure quality of care.
3. The Medical Facilities Planning Section will maintain a list of existing facilities and stations, utilization rates and projected need by county that is up-dated semiannually. Updated projections will be available two times a year on a published schedule. Existing or potential providers interested in expanding in any area of the state may contact the Medical Facilities Planning Section for projected need in the area of interest. (Note: A dialysis station’s service area is the dialysis station planning area in which the dialysis station is located. Except for the Cherokee-Clay-Graham Multi-county Planning Area and the Avery-Mitchell-Yancey Multi-county Planning Area, each of the 94 remaining counties is a separate dialysis station planning area.)

4. Updates of the projections may target counties that have developed sufficient need
to warrant consideration for facility expansion or for establishment of a new facility. Actual numbers are not published in the Plan so they can be updated as appropriate by the Medical Facilities Planning Section.
5. Home patients will not be included in the determination of need for new stations.
Home patients include those that receive hemodialysis or peritoneal dialysis in their home.
6. No existing facility may expand unless its utilization is 80 percent or greater. Any
facility at 80 percent utilization or greater may apply to expand. 7. Facilities reporting no patients through the Southeastern Kidney Council for four
consecutive Semiannual Dialysis Reports, beginning from March 1997, will be excluded from future inventories.
8. Quality of Care:
All facilities should comply with Medicare and Medicaid regulations relating to the delivery and certification of ESRD services and with relevant North Carolina statutory provisions. An applicant already involved in the provision of end-stage renal disease services should provide evidence that care of high quality has been provided in the past. The following are considered indicators of quality of care and existing providers proposing to expand their operations should include in their applications data which include, but are not limited to, the following:
a. utilization rates b. morbidity and mortality rates c. numbers of patients who are home trained and patients on home dialysis d. number of patients receiving transplants e. number of patients currently on the transplant waiting list f. hospital admission rates g. conversion rates for patients who have acquired hepatitis or AIDS 9. Availability of Manpower and Ancillary/Support Services:
The applicant should show evidence of the availability of qualified staff and other health manpower and management for the provision of quality ESRD services as well as the availability of a safe and adequate water supply, provision for treatment of wastewater discharge and a standing electrical service with backup capabilities.
10. Patient Access to In-Center ESRD Services:
As a means of making ESRD services more accessible to patients, one of the goals of the North Carolina Department of Health and Human Services is to minimize patient travel time to and from the center.

Therefore,
a. End-stage renal disease treatment should be provided in North Carolina such that patients who require renal dialysis are able to be served in a facility no farther than 30 miles from the patients’ homes.
b. In areas where it is apparent that patients are currently traveling more than 30 miles for in-center dialysis, favorable consideration should be given to proposed new facilities which would serve patients who are farthest away from existing, operational or approved facilities.
11. Transplantation Services:
Transplantation services should be available to, and a priority for, all ESRD patients whose conditions make them suitable candidates for this treatment. New enrollees should meet with and have access to a transplantation representative to provide patient education and evaluation for transplantation.
12. Availability of Dialysis Care:
The North Carolina State Health Coordinating Council encourages applicants for dialysis stations to provide or arrange for:
a. Home training and backup for patients suitable for home dialysis in the ESRD
dialysis facility or in a facility that is a reasonable distance from the patient’s residence;
b. ESRD dialysis service availability at times that do not interfere with ESRD
patients’ work schedules; c. Services in rural, remote areas.
Sources of Data
Inventory Data: Data on the current number of dialysis facilities and stations shall be obtained from the Certificate of Need Section and from the Licensure and Certification Section, Division of Health Service Regulation, North Carolina Department of Health and Human Services. Dialysis Patient Data: Data on the dialysis population by county and by facility as of June 30, 2009 and as of December 31, 2009 shall be provided by the Centers for Medicare and Medicaid Services (CMS) through the Southeastern Kidney Council, Inc. (SEKC) and the Mid-Atlantic Renal Coalition.
Method for Projecting New Dialysis Station Need The Medical Facilities Planning Section shall determine need for new dialysis stations two times each calendar year, and shall make a report of such determinations available to all who request it. This report shall be called the North Carolina Semiannual Dialysis Report

(SDR). Relocations of existing dialysis stations within a county shall be reviewed independently (see Chapter 3, Category I). The Semiannual Dialysis Reports will use facility, station and active patient data as of June 30, 2009 for the “January 2010 SDR” and as of December 31, 2009 for the “July 2010 SDR.” A new five-year trend line will be established in the “July 2010 SDR,” based on validated data as reported to CMS for the time period ending December 31, 2009 . Need for new dialysis stations shall be determined as follows: (1) County Need (for the January 2010 SDR – Using the trend line ending with December 31, 2008 data) (A) The average annual rate (percent) of change in total number of dialysis patients
resident in each county from the end of 2004 to the end of 2008 is multiplied by the county’s June 30, 2009 total number of patients in the SDR, and the product is added to each county's most recent total number of patients reported in the SDR. The sum is the county's projected total June 30, 2010 patients.
(B) The percent of each county's total patients who were home dialysis patients on June
30, 2009 is multiplied by the county's projected total June 30, 2010 patients, and the product is subtracted from the county's projected total June 30, 2010 patients. The remainder is the county's projected June 30, 2010 in-center dialysis patients.
(C) The projected number of each county's June 30, 2010 in-center patients is divided by
3.2. The quotient is the projection of the county's June 30, 2010 in-center dialysis stations.
(D) From each county's projected number of June 30, 2010 in-center stations is
subtracted the county's number of stations certified for Medicare, CON-approved and awaiting certification, awaiting resolution of CON appeals, and the number represented by need determinations in previous State Medical Facilities Plans or Semiannual Dialysis Reports for which CON decisions have not been made. The remainder is the county's June 30, 2010 projected station surplus or deficit.
(E) If a county's June 30, 2010 projected station deficit is 10 or greater and the January
SDR shows that utilization of each dialysis facility in the county is 80 percent or greater, the June 30, 2010 county station need determination is the same as the June 30, 2010 projected station deficit. If a county's June 30, 2010 projected station deficit is less than 10 or if the utilization of any dialysis facility in the county is less than 80 percent, the county’s June 30, 2010 station need determination is zero.
(2) County Need (for the July 2010 SDR – Using a new trend line based on 12/31/2009 data) (A) The average annual rate (percent) of change in total number of dialysis patients
resident in each county from the end of 2005 to the end of 2009 is multiplied by the county's December 31, 2009 total number of patients in the SDR, and the product is
added to each county's most recent total number of patients reported in the SDR. The sum is the county's projected total December 31, 2010 patients.
(B) The percent of each county's total patients who were home dialysis patients on
December 31, 2009 is multiplied by the county's projected total December 31, 2010 patients, and the product is subtracted from the county's projected total December 31, 2010 patients. The remainder is the county's projected December 31, 2010 in-center dialysis patients.
(C) The projected number of each county's December 31, 2010 in-center patients is
divided by 3.2. The quotient is the projection of the county's December 31, 2010 in-center dialysis stations.
(D) From each county's projected number of December 31, 2010 in-center stations is
subtracted the county's number of stations certified for Medicare, CON-approved and awaiting certification, awaiting resolution of CON appeals, and the number represented by need determinations in previous State Medical Facilities Plans or Semiannual Dialysis Reports for which CON decisions have not been made. The remainder is the county's December 31, 2010 projected station surplus or deficit.
(E) If a county's December 31, 2010 projected station deficit is 10 or greater and the
July SDR shows that utilization of each dialysis facility in the county is 80 percent or greater, the December 31, 2010 county station need determination is the same as the December 31, 2010 projected station deficit. If a county's December 31, 2010 projected station deficit is less than 10 or if the utilization of any dialysis facility in the county is less than 80 percent, the county’s December 31, 2010 station need determination is zero.
(3) Facility Need
A dialysis facility located in a county for which the result of the County Need methodology is zero in the current Semiannual Dialysis Report is determined to need additional stations to the extent that:
(A) Its utilization, reported in the current SDR, is 3.2 patients per station or greater. (B) Such need, calculated as follows, is reported in an application for a CON: (i) The facility's number of in-center dialysis patients reported in the previous
Dialysis Report (SDR1) is subtracted from the number of in-center dialysis patients reported in the current SDR (SDR2). The difference is multiplied by 2 to project the net in-center change for one year. Divide the projected net in-center change for the year by the number of in-center patients from SDR1 to determine the projected annual growth rate.
(ii) The quotient from (3)(B)(i) is divided by 12.

(iii) The quotient from (3)(B)(ii) is multiplied by six (the number of months from
June 30, 2009 until December 31, 2009 ) for the January 4, 2010 SDR and by 12 (the number of months from December 31, 2009 until December 31, 2010) for the July 1, 2010 SDR.
(iv) The product from (3)(B)(iii) is multiplied by the number of the facility's in-
center patients reported in the current SDR and that product is added to such reported number of in-center patients.
(v) The sum from (3)(B)(iv) is divided by 3.2, and from the quotient is subtracted
the facility's current number of certified stations as recorded in the current SDR and the number of pending new stations for which a CON has been issued. The remainder is the number of stations needed.
(C) The facility may apply to expand to meet the need established in (3)(B)(v), up to a
maximum of 10 stations. [NOTE: "Rounding" to the nearest whole number is allowed only in Step 1(C), Step 2(C) and Step 3(B)(v). In these instances, fractions of 0.5000 or greater shall be rounded to the next highest whole number.]
Unless specific “adjusted need determinations” are recommended by the North Carolina State Health Coordinating Council, an application for a CON for additional dialysis stations can be considered consistent with the need determinations of this Plan only if it demonstrates a need by utilizing one of the methods of determining need outlined in this chapter. Timeline The schedule for publication of the North Carolina Semiannual Dialysis Reports and for receipt of CON applications based on each issue of that report in shall be as follows: Data for Due Dates for Publication Application Due Dates Beginning Period Ending SEKC Report of SDR for CON Applications Review Dates
June 30, 2009 Nov. 9, 2009 January 4, 2010 March 15, 2010 April 1, 2010 Dec. 31, 2009 May 10, 2010 July 1, 2010 September 15, 2010 October 1, 2010
Please be advised that 5:30 p.m. on the specified Application Due Date is the filing deadline for any CON application in response to these dialysis reports. The filing deadline is absolute.

Chapter 15:Psychiatric Inpatient Services

CHAPTER 15 PSYCHIATRIC INPATIENT SERVICES Background Information Certificates of need are required prior to the development of inpatient psychiatric beds identified as needed in the North Carolina 2010 State Medical Facilities Plan. In addition, community hospitals wishing to transfer beds from state psychiatric facilities must obtain a certificate of need prior to establishing these beds pursuant to Policy PSY-1. Further, community hospitals may develop psychiatric beds by converting acute care beds to psychiatric beds through a contract with the North Carolina Division of Mental Health, Developmental Disabilities, and Substance Abuse Services and/or one or more of the local management entities (Area Mental Health, Developmental Disabilities, and Substance Abuse Authorities) in accordance with G.S. §131E-184. If the hospital has executed such a contract, the conversion will be exempt from certificate of need requirements. Basic Principles Services for people who are mentally ill should be organized in such a way that a continuum of care is available. Because needs of people with mental illness vary greatly, they require access to a wide array of services including outpatient treatment, housing resources, day treatment services, residential treatment services and hospitalization. For most individuals in acute distress, admission to a community-based facility is preferable to admission to a regional, state operated facility because community-based treatment provides greater potential for reintegration into the community. The role of state facilities is to complement and supplement the community mental health system. State facilities should be the treatment setting of last resort and should provide services that cannot be economically provided in the community. Development of community programs may be accomplished through establishing appropriate treatment programs and support services in the community to avoid institutionalization of individuals in acute distress, and relocating people from state facilities to community programs to the extent appropriate services are developed in the community. Inpatient psychiatric treatment of children and adolescents (which is more extensive than stabilization) shall occur in units which are separate and distinct from both adult psychiatric units and general pediatric units. In order to maximize efficiency and ensure the availability of a continuum of care, psychiatric beds for children and adolescents shall be developed in conjunction with outpatient treatment programs. Changes from the Previous Plan No substantive changes in basic principles and methodologies have been incorporated into the North Carolina 2010 State Medical Facilities Plan. Throughout the chapter, data have been revised to reflect services provided during FY 2007-2008, and dates have been advanced by one year, where appropriate. The base year is changed to 2008 and the base year utilization data is applied to Year 2012 population estimates.

Summary of Bed Supply and Utilization Psychiatric inpatient services are provided by four state-owned regional hospitals, three licensed freestanding specialty hospitals and by 42 general acute care hospitals with designated psychiatric units. The non-state hospitals have 1,682 licensed beds and provided a total of 327,624 days of care during the 12-month period ending September 30, 2008 – 15 percent of which were provided to patients younger than 18 years of age. Methodology for Determining Psychiatric Bed Need The methodology used to project need for psychiatric beds focuses on short-term psychiatric beds only, i.e., those beds used primarily by patients with lengths of stay of 60 days or fewer. The methodology is based on Year 2008 utilization data obtained from Thomson Reuters, a collector of hospital patient discharge information. The data was gathered from all acute care hospitals and specialty psychiatric hospitals. State hospital data are excluded because these hospitals are not subject to the certificate of need law. The data include discharges, days of care, and average lengths of stay for all psychiatric patients by their county of residence and age group. ICD-9-CM diagnosis codes used in the survey were 290, 293-302, and 306-314. Basic Assumptions of the Methodology
1. A psychiatric inpatient bed’s service area is the catchment area for the local management entity for mental health, developmental disabilities, and substance abuse services in which the bed is located. The counties comprising each of the 24 local management entity catchment areas for mental health, developmental disabilities, and substance abuse services are listed in Table 15B.
2. Children and adolescents require psychiatric treatment in units that are
programmatically and physically distinct from adult patient units. 3. Short-term psychiatric beds in the state psychiatric hospitals being used by
residents of each psychiatric planning area program may be relocated to community facilities in accordance with Policy PSY-1. Relocation of these beds will not result in a net change in the number of existing beds or the need for additional beds.
4. Optimum occupancy of freestanding psychiatric hospitals and designated
psychiatric units in acute care hospitals is considered to be 75 percent.
5. Bed need is projected two years in advance because that amount of time may be required to bring a needed facility or expansion into service. Need in the North Carolina 2010 State Medical Facilities Plan is projected for Year 2012.
Sources of Data Inventory Data: North Carolina Department of Health and Human Services, Division of Health Service
Regulation, Mental Health Licensure and Certification Section; Acute and Home Care Licensure Section; and the Certificate of Need Section.

Population Data: North Carolina Office of State Budget and Management
Utilization Data:
Thomson Reuters collected data for the period from October 2007 through September 2008 from the providers of psychiatric inpatient services, and the Cecil G. Sheps Center distilled the data down to the individual counties.
Application of the Methodology Each step explained below is applied to the 24 local management entities to arrive at bed surpluses/deficits in each local management entity. Part 1: Determining Projected Patient Days of Care and Bed Need for Children and
Adolescents Step 1: The estimated Year 2012 days of care for children/adolescents is determined by
taking the actual 2008 days of care for the age group birth through 17, multiplying that number by the projected Year 2012 child/adolescent population and then dividing by the Year 2008 child/adolescent population.
Step 2: The projected Year 2012 days of care is then adjusted downward by 20 percent to
take into account the projected continued decrease in utilization by this age group. Step 3: The adjusted Year 2012 days of care is divided by 365 and then by 75 percent to
arrive at the child/adolescent bed need in Year 2012, assuming 75 percent occupancy.
Step 4: The number of existing child/adolescent beds in the planning inventory is then
subtracted from the bed need (from Step 3) in order to arrive at the Year 2012 unmet bed need for children and adolescents.
Part 2: Determining Projected Patient Days of Care and Bed Need for Adults Step 1: The estimated Year 2012 days of care for adults is determined by taking the
actual Year 2008 days of care for the age group 18 and over, multiplying that number by the projected Year 2012 adult population and then dividing by the Year 2008 adult population.
Step 2: The projected Year 2012 days of care is divided by 365 and then divided by 75
percent to arrive at the adult bed need in Year 2012, assuming 75 percent occupancy.

Step 3. The number of existing adult beds in the planning inventory is then subtracted from the bed need (from Step 2) in order to arrive at the Year 2012 unmet bed need for adults.
Need Determination Adult Psychiatric Inpatient Beds
Utilizing the standard methodology, it is determined that there is need for additional adult psychiatric inpatient beds in the following local management entity areas:
Smoky Mountain: Alexander, Alleghany, Ashe, Avery, Caldwell, Cherokee, Clay, Graham, Haywood, Jackson, McDowell, Macon, Swain, Watauga, and Wilkes counties
Pathways: Cleveland, Gaston, and Lincoln counties Mecklenburg County Crossroads: Surry, Iredell, and Yadkin counties Five County: Vance, Granville, Franklin, Warren, and Halifax counties Johnston County Onslow-Carteret counties Albemarle: Camden, Chowan, Currituck, Dare, Hyde, Martin, Pasquotank, Perquimans,
Tyrrell, and Washington counties In response to a petition submitted to the State Health Coordinating Council, the North
Carolina 2010 State Medical Facilities Plan includes an adjusted need determination for seven additional adult psychiatric inpatient beds for Davidson County in the Piedmont local management entity. It is determined that there is no need for additional adult psychiatric inpatient beds anywhere else in the state.
Child/Adolescent Psychiatric Inpatient Beds Utilizing the standard methodology, it is determined that there is need for additional
child/adolescent psychiatric inpatient beds in the following local management entity areas: Smoky Mountain: Alexander, Alleghany, Ashe, Avery, Caldwell, Cherokee, Clay,
Graham, Haywood, Jackson, McDowell, Macon, Swain, Watauga, and Wilkes counties Piedmont: Cabarrus, Davidson, Rowan, Stanly, and Union counties Crossroads: Surry, Iredell, and Yadkin counties Durham County Five County: Vance, Granville, Franklin, Warren, and Halifax counties Sandhills: Anson, Harnett, Hoke, Lee, Montgomery, Moore, Randolph, and Richmond
counties Southeastern Regional: Robeson, Bladen, Columbus, and Scotland counties Cumberland County Johnston County Southeastern Center: New Hanover, Brunswick, and Pender counties Beacon Center: Edgecombe, Nash, Wilson, and Greene counties East Carolina Behavioral Health: Beaufort, Bertie, Craven, Gates, Hertford, Jones,
Pamlico, Pitt, and Northampton counties Albemarle: Camden, Chowan, Currituck, Dare, Hyde, Martin, Pasquotank, Perquimans,
Tyrrell, and Washington counties

Eastpointe: Duplin, Lenoir, Sampson, and Wayne counties It is determined that there is no need for additional child/adolescent psychiatric inpatient
beds anywhere else in the state.
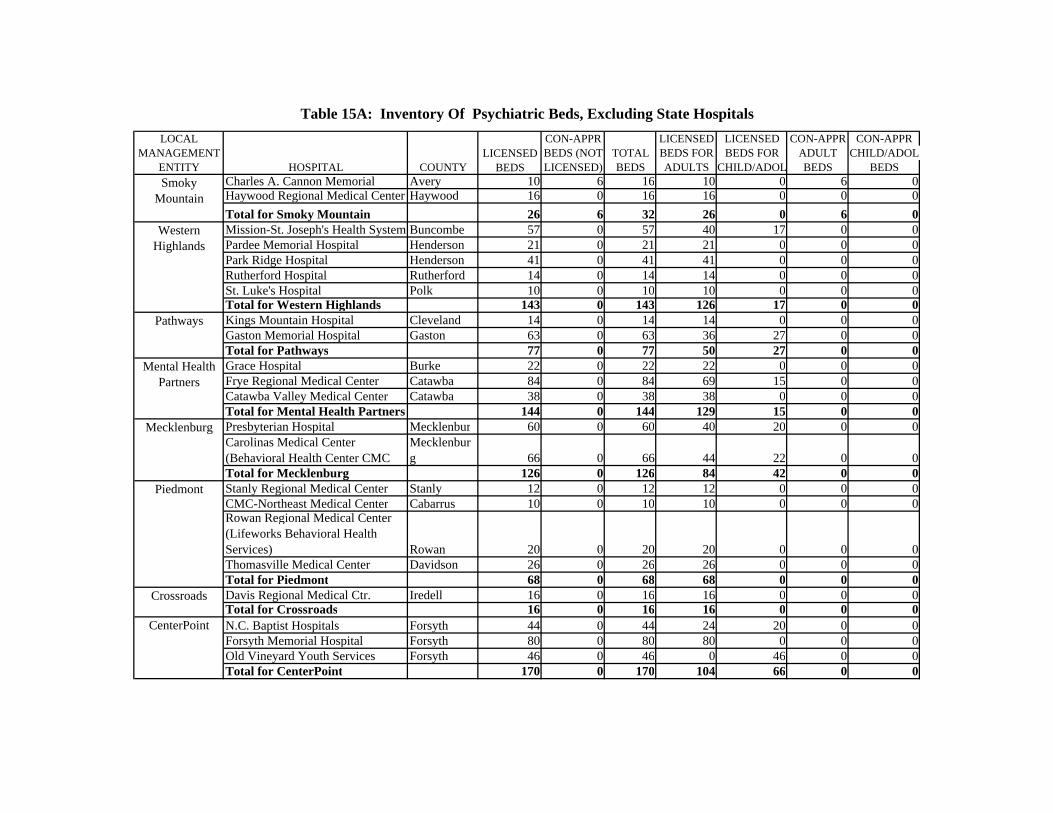
CON-APPR LICENSED LICENSED CON-APPR CON-APPRBEDS (NOT BEDS FOR BEDS FOR ADULT CHILD/ADOLLICENSED) ADULTS CHILD/ADOL BEDS BEDS
Charles A. Cannon Memorial Avery 10 6 16 10 0 6 0Haywood Regional Medical Center Haywood 16 0 16 16 0 0 0
Total for Smoky Mountain 26 6 32 26 0 6 0Mission-St. Joseph's Health System Buncombe 57 0 57 40 17 0 0Pardee Memorial Hospital Henderson 21 0 21 21 0 0 0Park Ridge Hospital Henderson 41 0 41 41 0 0 0Rutherford Hospital Rutherford 14 0 14 14 0 0 0St. Luke's Hospital Polk 10 0 10 10 0 0 0Total for Western Highlands 143 0 143 126 17 0 0Kings Mountain Hospital Cleveland 14 0 14 14 0 0 0Gaston Memorial Hospital Gaston 63 0 63 36 27 0 0Total for Pathways 77 0 77 50 27 0 0Grace Hospital Burke 22 0 22 22 0 0 0Frye Regional Medical Center Catawba 84 0 84 69 15 0 0Catawba Valley Medical Center Catawba 38 0 38 38 0 0 0Total for Mental Health Partners 144 0 144 129 15 0 0Presbyterian Hospital Mecklenbur 60 0 60 40 20 0 0Carolinas Medical Center (Behavioral Health Center CMC
Mecklenburg 66 0 66 44 22 0 0
Total for Mecklenburg 126 0 126 84 42 0 0Stanly Regional Medical Center Stanly 12 0 12 12 0 0 0CMC-Northeast Medical Center Cabarrus 10 0 10 10 0 0 0Rowan Regional Medical Center (Lifeworks Behavioral Health Services) Rowan 20 0 20 20 0 0 0Thomasville Medical Center Davidson 26 0 26 26 0 0 0Total for Piedmont 68 0 68 68 0 0 0Davis Regional Medical Ctr. Iredell 16 0 16 16 0 0 0Total for Crossroads 16 0 16 16 0 0 0N.C. Baptist Hospitals Forsyth 44 0 44 24 20 0 0Forsyth Memorial Hospital Forsyth 80 0 80 80 0 0 0Old Vineyard Youth Services Forsyth 46 0 46 0 46 0 0Total for CenterPoint 170 0 170 104 66 0 0
Table 15A: Inventory Of Psychiatric Beds, Excluding State Hospitals
Smoky Mountain
Western Highlands
Pathways
Mental Health Partners
Mecklenburg
Piedmont
Crossroads
CenterPoint
LOCAL MANAGEMENT
ENTITYTOTAL BEDS
LICENSED BEDSCOUNTYHOSPITAL

CON-APPR LICENSED LICENSED CON-APPR CON-APPRBEDS (NOT BEDS FOR BEDS FOR ADULT CHILD/ADOLLICENSED) ADULTS CHILD/ADOL BEDS BEDS
Table 15A: Inventory Of Psychiatric Beds, Excluding State Hospitals
LOCAL MANAGEMENT
ENTITYTOTAL BEDS
LICENSED BEDSCOUNTYHOSPITAL
Alamance Regional Medical Ctr. Alamance 44 0 44 36 8 0 0Total for A - C 44 0 44 36 8 0 0High Point Regional Guilford 24 0 24 24 0 0 0Moses Cone Health System (Behavioral Health Center) Guilford 80 0 80 50 30 0 0Total for Guilford 104 0 104 74 30 0 0UNC Hospitals Orange 76 0 76 58 18 0 0Total for OPC 76 0 76 58 18 0 0Durham Regional Hospital Durham 23 0 23 23 0 0 0Duke University Medical Center Durham 19 0 19 19 0 0 0Total for Durham 42 0 42 42 0 0 0
Five County Halifax Regional Medical Center Halifax 20 0 20 20 0 0 0Total for Five County 20 0 20 20 0 0 0Sandhills Regional Medical Center Richmond 10 0 10 10 0 0 0gHospital Moore 36 0 36 36 0 0 0Good Hope Hospital Harnett 0 16 16 0 0 16 0Central Carolina Hospital Lee 10 0 10 10 0 0 0Total for Sandhills 56 16 72 56 0 16 0Southeastern Regional Medical Center Robeson 33 0 33 33 0 0 0Total for Southeastern Regional 33 0 33 33 0 0 0
Cape Fear Valley Medical Center Cumberland 28 0 28 28 0 0 0Total for Cumberland 28 0 28 28 0 0 0Johnston Memorial Hospital Johnston 20 0 20 20 0 0 0Total for Johnston 20 0 20 20 0 0 0Holly Hill Hospital Wake 124 0 124 62 62 0 0Total for Wake 124 0 124 62 62 0 0New Hanover Regional Medical Center
New Hanover 62 0 62 62 0 0 0
Total for Southeastern Center 62 0 62 62 0 0 0Brynn Marr Behavorial Health System Onslow 30 0 30 4 26 0 0Total for Onslow-Carteret 30 0 30 4 26 0 0
Southeastern Regional
Cumberland
A - C
Guilford
OPC
Durham
Johnston
Wake
Southeastern Center
Onslow-Carteret
Sandhills

CON-APPR LICENSED LICENSED CON-APPR CON-APPRBEDS (NOT BEDS FOR BEDS FOR ADULT CHILD/ADOLLICENSED) ADULTS CHILD/ADOL BEDS BEDS
Table 15A: Inventory Of Psychiatric Beds, Excluding State Hospitals
LOCAL MANAGEMENT
ENTITYTOTAL BEDS
LICENSED BEDSCOUNTYHOSPITAL
Wilson Memorial Hospital Wilson 23 0 23 23 0 0 0Nash General Hospital Nash 44 0 44 44 0 0 0Total for Beacon Center 67 0 67 67 0 0 0CarolinaEast Medical Center Craven 23 0 23 23 0 0 0Roanoke-Chowan Hospital Hertford 28 0 28 28 0 0 0Pitt County Memorial Hospital Pitt 52 0 52 52 0 0 0Beaufort County Hospital Beaufort 22 0 22 22 0 0 0Total for East Carolina Beh. 125 0 125 125 0 0 0No Facility 0 0 0 0 0 0 0Total for Albemarle 0 0 0 0 0 0 0Duplin General Hospital Duplin 20 0 20 20 0 0 0Wayne Memorial Hospital Wayne 61 0 61 61 0 0 0Total for Eastpointe 81 0 81 81 0 0 0 STATE TOTALS 1,682 22 1,704 1,371 311 22 0
Beacon Center
East Carolina Behavioral
Health
Eastpointe
Albemarle

A B C D E F G H I
Local Management Entity (LME)2008 <18
Days of Care2008 <18
Population
2012 <18 Population Projected
2012: <18 Projected Days
of Care (B x D)÷C
2012 Adjusted Days of Care (E-
20%E)
<18 Number of Beds Needed (F ÷
365)
<18 Total Beds needed
(G/75%)
Psychiatric Bed Inventory
Child/Adolescent
Child/Adolescent Bed Need (Surplus/Deficit (I-H) (Deficits are Shown as
Minuses)
Smoky Mountain: Alexander, Alleghany, Ashe, Avery, Caldwell, Cherokee, Clay, Graham, Haywood, Jackson, McDowell, Macon, Swain, Watauga, Wilkes 2,291 105,099 106,720 2,326 1,861 5 7 0
2009 SMFP Need Determination for 4 Child/Adol Beds 4 -3
Western Highlands: Buncombe, Henderson, Madison, Mitchell, Polk, Rutherford, Transylvania, Yancey 2,959 105,276 108,752 3,057 2,445 7 9 17 8
Pathways: Cleveland, Gaston, Lincoln 1,758 89,599 93,297 1,831 1,464 4 5 27 22
Mental Health Partners: Catawba, Burke 941 56,605 57,706 959 767 2 3 15 12
Mecklenburg 6,936 228,229 242,227 7,361 5,889 16 22 42 20
Piedmont: Cabarrus, Davidson, Rowan, Stanly, Union 3,543 175,413 190,481 3,847 3,078 8 11 0
2009 SMFP Need Determination for 10 Child/Adol Beds 10 -1
Crossroads: Surry, Iredell, Yadkin 895 63,078 65,234 926 740 2 3 0
2009 SMFP Need Determination for 3 Child/Adol Beds 3 0
CenterPoint: Forsyth, Stokes, Davie, Rockingham 2,452 123,443 127,160 2,526 2,021 6 7 66 59
A - C: Alamance, Caswell 804 38,925 41,001 847 678 2 2 8 6
Guilford 2,088 110,277 115,318 2,183 1,747 5 6 30 24
OPC: Orange, Person, Chatham 1,822 46,464 47,788 1,874 1,499 4 5 18 13
Durham 1,639 65,754 73,988 1,844 1,475 4 5 0
2009 SMFP Need Determination for 4 Child/Adol Beds 4 -1
Five County: Vance, Granville, Franklin, Warren, Halifax 1,306 54,874 54,044 1,286 1,029 3 4 0 -4
Sandhills: Anson, Harnett, Hoke, Lee, Montgomery, Moore, Randolph, Richmond 2,379 132,268 138,465 2,490 1,992 5 7 0
2009 SMFP Need Determination for 8 Child/Adol Beds 8 1
Southeastern Regional: Robeson, Bladen, Columbus, Scotland 1,029 67,442 68,346 1,043 834 2 3 0
2009 SMFP Need Determination for 3 Child/Adol Beds 3 0
Cumberland 1,201 90,633 93,694 1,242 993 3 4 0 -4
Johnston 1,148 42,220 46,966 1,277 1,022 3 4 0 -4
Wake 5,900 216,713 245,637 6,687 5,350 15 20 62 42
Southeastern Center: New Hanover, Brunswick, Pender 1,662 72,794 77,802 1,776 1,421 4 5 0
2009 SMFP Need Determination for 6 Child/Adol Beds 6 1
Onslow - Carteret 1,323 62,242 68,522 1,456 1,165 3 4 26 22
Beacon Center: Edgecombe, Nash, Wilson, Greene 1,276 60,390 61,183 1,293 1,034 3 4 0
2009 SMFP Need Determination for 4 Child/Adol Beds 4 0
East Carolina Behavioral Health: Beaufort, Bertie, Craven, Gates, Hertford, Jones, Pamlico, Pitt, Northampton 1,734 94,844 98,722 1,805 1,444 4 5 0
2009 SMFP Need Determination for 6 Child/Adol Beds 6 1
Albemarle: Camden, Chowan, Currituck, Dare, Hyde, Martin, Pasquotank, Perquimans, Tyrrell, Washington 564 39,912 38,589 545 436 1 2 0
2009 SMFP Need Determination for 2 Child/Adol Beds 2 0
Eastpointe: Duplin, Lenoir, Sampson, Wayne 1,452 73,944 75,220 1,477 1,182 3 4 0
2009 SMFP Need Determination for 5 Child/Adol Beds 5 1
CHILD/ADOLESCENT STATE TOTALS 49,102 2,216,438 2,336,862 51,960 41,568 114 152 366
Table 15B: 2012 Projections of Psychiatric Bed Need By Local Management Entity (LME)Part 1. Projection of Child/Adolescent Psychiatric Bed Need for 2012

K L M N O P Q
LOCAL MANAGEMENT ENTITY (LME)
2008 18+ Days of
Care2008
18+ Population
2012 18+
Population Projected
2012: 18+ Projected Days of Care (K x M)÷L
Number of Beds Adults
Total Adult Beds Needed
(O ÷ 75%)Adult Bed Inventory
Adult Bed (Surplus/Deficit)
(Q-P)(Deficits are shown as
Minuses)
Smoky Mountain: Alexander, Alleghany, Ashe, Avery, Caldwell, Cherokee, Clay, Graham, Haywood, Jackson, McDowell, Macon, Swain, Watauga, Wilkes 14,479 412,521 431,023 15,128 41 55 32
2009 SMFP Need Determination for 13 Adult Beds 13 -10
Western Highlands: Buncombe, Henderson, Madison, Mitchell, Polk, Rutherford, Transylvania, Yancey 25,309 395,484 417,310 26,706 73 98 126 28
Pathways: Cleveland, Gaston, Lincoln 14,057 287,920 313,784 15,320 42 56 50
2009 SMFP Need Determination for 7 Adult Beds 7 1
Mental Health Partners: Catawba, Burke 13,232 187,641 199,195 14,047 38 51 129 78
Mecklenburg 21,450 648,944 703,089 23,240 64 85 84 -1
Piedmont: Cabarrus, Davidson, Rowan, Stanly, Union 15,837 543,347 613,826 17,891 49 65 68 3
Crossroads: Surry, Iredell, Yadkin 7,304 202,655 220,629 7,952 22 29 16
2007 SMFP Need Determination for 12 Adult Beds 12 -1
CenterPoint: Forsyth, Stokes, Davie, Rockingham 15,141 399,672 423,927 16,060 44 59 104 45
A - C: Alamance, Caswell 4,764 130,456 141,554 5,169 14 19 36 17
Guilford 13,278 358,162 386,685 14,335 39 52 74 22
OPC: Orange, Person, Chatham 7,175 181,260 193,999 7,679 21 28 58 30
Durham 6,188 194,717 214,577 6,819 19 25 42 17
Five County: Vance, Granville, Franklin, Warren, Halifax 8,774 177,922 185,106 9,128 25 33 20 -13
Sandhills: Anson, Harnett, Hoke, Lee, Montgomery, Moore, Randolph, Richmond 14,598 405,516 436,869 15,727 43 57 72 15
Southeastern Regional: Robeson, Bladen, Columbus, Scotland 7,724 186,913 193,966 8,015 22 29 33 4
Cumberland 5,112 226,312 235,959 5,330 15 19 28 9
Johnston 5,990 120,556 140,010 6,957 19 25 20 -5
Wake 17,751 647,869 761,476 20,864 57 76 62
2009 SMFP Need Determination for 16 Adult Beds 16 2
Southeastern Center: New Hanover, Brunswick, Pender 9,643 274,196 301,178 10,592 29 39 62 23
Onslow - Carteret 6,402 177,307 184,158 6,649 18 24 4
2009 SMFP Need Determination for 18 Adult Beds (12 of which were applied for) 18 -2
Beacon Center: Edgecombe, Nash, Wilson, Greene 8,505 185,564 194,433 8,911 24 33 67 34
East Carolina Behavioral Health: Beaufort, Bertie, Craven, Gates, Hertford, Jones, Pamlico, Pitt, Northampton 20,615 304,804 319,918 21,637 59 79 125 46
Albemarle: Camden, Chowan, Currituck, Dare, Hyde, Martin, Pasquotank, Perquimans, Tyrrell, Washington 3,867 142,675 143,503 3,889 11 14 0
2009 SMFP Need Determination for 17 Adult Beds 17 3
Eastpointe: Duplin, Lenoir, Sampson, Wayne 11,327 218,165 224,496 11,656 32 43 81 38
ADULT STATE TOTALS 278,522 7,010,578 7,580,670 299,702 821 1,095 1,476
Table 15B: 2012 Projections of Psychiatric Bed Need By Local Management Entity (LME)Part 2. Projection of Adult Psychiatric Bed Need for 2012

HSA Local Management Entity (LME) and Counties
Adult Psychiatric Bed Need
Determination*CON Application
Due Date**CON Beginning
Review Date
I
Smoky Mountain: Alexander, Alleghany, Ashe, Avery, Caldwell, Cherokee, Clay, Graham,
Haywood, Jackson, McDowell, Macon, Swain, Watauga, Wilkes
23 1 March 15, 2010 April 1, 2010
I, III Pathways: Cleveland, Gaston, Lincoln 7 2 May 17, 2010 June 1, 2010
III Mecklenburg 1 March 15, 2010 April 1, 2010
II, III Crossroads: Surry, Iredell, Yadkin 1 March 15, 2010 April 1, 2010
II Piedmont: Davidson County only 7 March 15, 2010 April 1, 2010
IV, VIFive County: Vance, Granville, Franklin, Warren,
Halifax13 April 15, 2010 May 1, 2010
IV Johnston 5 June 15, 2010 July 1, 2010
VI Onslow-Carteret 8 2 August 16, 2010 September 1, 2010
VIAlbemarle: Camden, Chowan, Currituck, Dare, Hyde, Martin, Pasquotank, Perquimans, Tyrrell,
Washington17 3 April 15, 2010 May 1, 2010
2 - Revisions in need determinations were due to updates in inventory (Policy GEN-2).
Table 15C (1): 2012 Need Determination For Adult Psychiatric Inpatient Beds
*Need determinations as shown in this document may be increased or decreased during the year pursuant to Policy GEN-2 (See Chapter 4).
It is determined that there is no need for additional Adult Psychiatric Inpatient Beds anywhere else in the state.
3 - Need determinations identified based on the 2009 SMFP have been reallocated using the 2009 methodology, and, if applicable, added to 2010 need determinations (Policy GEN-1).
** Application Due Dates are absolute deadlines. The filing deadline is 5:30 p.m. on the Application Due Date. The filing deadline is absolute (See Chapter 3).
1 - Revisions in need determinations were due to reallocations as a result of no applications being filed for 2009 SMFP need determinations, and updates in inventory (Policies GEN-1 and GEN-2).
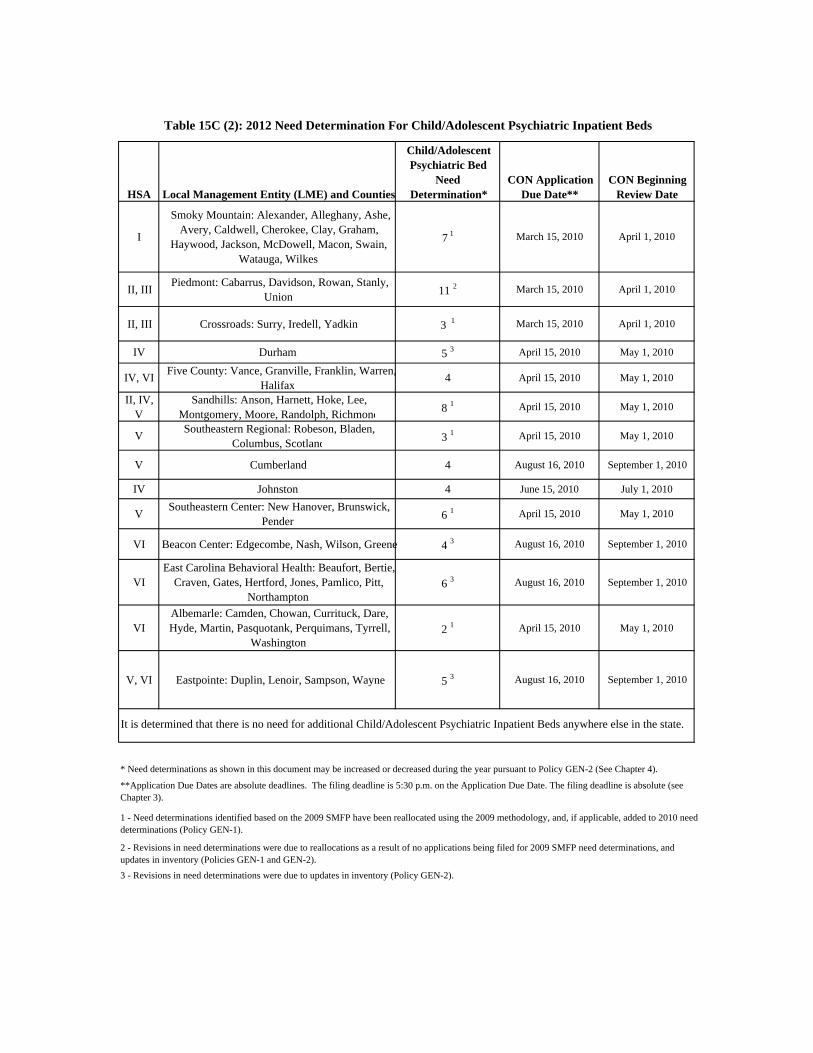
HSA Local Management Entity (LME) and Counties
Child/Adolescent Psychiatric Bed
Need Determination*
CON Application Due Date**
CON Beginning Review Date
I
Smoky Mountain: Alexander, Alleghany, Ashe, Avery, Caldwell, Cherokee, Clay, Graham,
Haywood, Jackson, McDowell, Macon, Swain, Watauga, Wilkes
7 1 March 15, 2010 April 1, 2010
II, IIIPiedmont: Cabarrus, Davidson, Rowan, Stanly,
Union11 2 March 15, 2010 April 1, 2010
II, III Crossroads: Surry, Iredell, Yadkin 3 1 March 15, 2010 April 1, 2010
IV Durham 5 3 April 15, 2010 May 1, 2010
IV, VIFive County: Vance, Granville, Franklin, Warren,
Halifax4 April 15, 2010 May 1, 2010
II, IV, V
Sandhills: Anson, Harnett, Hoke, Lee, Montgomery, Moore, Randolph, Richmond
8 1 April 15, 2010 May 1, 2010
VSoutheastern Regional: Robeson, Bladen,
Columbus, Scotland3 1 April 15, 2010 May 1, 2010
V Cumberland 4 August 16, 2010 September 1, 2010
IV Johnston 4 June 15, 2010 July 1, 2010
VSoutheastern Center: New Hanover, Brunswick,
Pender6 1 April 15, 2010 May 1, 2010
VI Beacon Center: Edgecombe, Nash, Wilson, Greene 4 3 August 16, 2010 September 1, 2010
VIEast Carolina Behavioral Health: Beaufort, Bertie,
Craven, Gates, Hertford, Jones, Pamlico, Pitt, Northampton
6 3 August 16, 2010 September 1, 2010
VIAlbemarle: Camden, Chowan, Currituck, Dare, Hyde, Martin, Pasquotank, Perquimans, Tyrrell,
Washington2 1 April 15, 2010 May 1, 2010
V, VI Eastpointe: Duplin, Lenoir, Sampson, Wayne 5 3 August 16, 2010 September 1, 2010
3 - Revisions in need determinations were due to updates in inventory (Policy GEN-2).
Table 15C (2): 2012 Need Determination For Child/Adolescent Psychiatric Inpatient Beds
It is determined that there is no need for additional Child/Adolescent Psychiatric Inpatient Beds anywhere else in the state.
* Need determinations as shown in this document may be increased or decreased during the year pursuant to Policy GEN-2 (See Chapter 4).
**Application Due Dates are absolute deadlines. The filing deadline is 5:30 p.m. on the Application Due Date. The filing deadline is absolute (see Chapter 3).
1 - Need determinations identified based on the 2009 SMFP have been reallocated using the 2009 methodology, and, if applicable, added to 2010 need determinations (Policy GEN-1).
2 - Revisions in need determinations were due to reallocations as a result of no applications being filed for 2009 SMFP need determinations, and updates in inventory (Policies GEN-1 and GEN-2).

Chapter 16:Substance Abuse Inpatient and Residential Services(Chemical Dependency Treatment Beds)

CHAPTER 16 SUBSTANCE ABUSE INPATIENT AND RESIDENTIAL SERVICES (CHEMICAL DEPENDENCY TREATMENT BEDS)
Summary of Bed Supply and Utilization Three state-owned Alcohol and Drug Abuse Treatment Centers (ADATCs) provide Chemical Dependency (Substance Abuse) detoxification and treatment services with a total of 188 beds (located in Black Mountain, Buncombe County; Butner, Granville County; and Greenville, Pitt County). The non-state facilities which also provide these services include 16 specialty and acute hospitals and 15 residential treatment centers. Changes from the Previous Plan No substantive changes in basic principles and methodologies have been recommended for the North Carolina 2010 State Medical Facilities Plan. Throughout the chapter, data have been revised to reflect services provided during fiscal year 2007-2008, and dates have been advanced by one year, where appropriate. The base year is changed to 2008 and the base year utilization data is applied to Year 2012 population estimates. Basic Principles Services for people who are substance abusers should be organized in such a way that a continuum of care is available. Because their needs vary greatly, substance abusers require access to a wide array of services including outpatient treatment, housing resources, day treatment services, residential treatment services and hospitalization. For most individuals in acute distress, admission to a community-based facility is preferable to admission to a regional, state-operated facility because community-based treatment provides greater potential for reintegration into the community. The role of state facilities is to complement and supplement the community mental health system. State facilities should be the treatment setting of last resort and should provide services that cannot be economically provided in the community. Development of community programs may be accomplished through establishing appropriate treatment programs and support services in the community. This avoids institutionalization of individuals in acute distress and allows relocating people from state facilities to community programs to the extent appropriate services are developed in the community. Adolescents should receive substance abuse treatment services that are distinct from services provided to adults.
It is essential that a continuum of services be available for the treatment of substance abuse. Physical withdrawal from addicting substance(s) is accomplished through detoxification services. Hospitalization shall be considered the most restrictive form of therapeutic intervention or treatment and shall be used only when this level of 24-hour care and supervision is required to meet the patient's health care needs. Following detoxification, the individual should receive addiction-related services addressing his/her physical, emotional, psychological and social needs.

Also, individuals should have access to a continuum of appropriate services including periodic, day/night and residential/inpatient services. Support services (e.g., Alcoholics and Narcotics Anonymous, vocational rehabilitation) that help the individual remain in control of his/her life and prevent the possibility of relapse should also be available.
The 2003 Session of the General Assembly of North Carolina approved Session Law 2003-390, House Bill 815, which stated that it was:
“An act to amend the definition of chemical dependency treatment facility to provide that social setting detoxification facilities and medical detoxification facilities are not chemical dependency treatment facilities for the purposes of Certificate of Need requirements and to amend the definition of chemical dependency treatment bed to provide that beds licensed for detoxification are not chemical dependency treatment beds for the purposes of Certificate of Need requirements; and to provide that social setting detoxification facilities and medical detoxification facilities shall not deny admission or treatment to an individual on the basis of the individual's inability to pay.”
In response to House Bill 815, the detoxification-only beds for residential facilities were
removed from the inventory in this chapter. Licenses for acute care hospitals were revised to change the existing licensed medical detoxification beds to licensed chemical dependency/ substance abuse treatment beds. See DFS Advisory in Appendix E. Basic Assumptions of the Methodology
1. Children and adolescents require treatment in units that are programmatically and physically distinct from adult patient units.
2. Target occupancy of substance abuse treatment units in hospitals and residential
facilities is considered to be 85 percent.
3. Bed need is projected two years in advance because that amount of time may be required to bring a needed facility or expansion into service. Need in the North Carolina 2010 State Medical Facilities Plan is projected for Year 2012.
Sources of Data
Number of Licensed Beds in Hospitals and Residential Facilities: North Carolina Department of Health and Human Services, Division of Health Service Regulation, Mental Health Licensure Section; Acute Care and Home Care Licensure Section.
Number of beds with Certificate of Need approval but not yet licensed: North
Carolina Department of Health and Human Services, Division of Health Service Regulation, Certificate of Need Section.
Number of Beds in State-Owned Facilities: North Carolina Department of Health and Human Services, Division of Mental Health,
Developmental Disabilities and Substance Abuse Services.

Population Data: North Carolina Office of State Budget and Management.
Utilization Data: Thomson Reuters collected data for the period from October 2007 through September 2008 from hospital providers, and the Cecil G. Sheps Center distilled the data down to the individual counties.
Methodology for Determining Chemical Dependency (Substance Abuse) Treatment Bed Need The methodology is based on 2008 hospital utilization data obtained from Thomson Reuters, a collector of hospital patient discharge information. Data reflecting utilization of chemical dependency (substance abuse) residential treatment facilities in 2008 were derived from the “2009 Substance Abuse Residential Facilities Data Collection Form” as submitted to the North Carolina Division of Health Service Regulation. The data that are collected and calculated include the number of discharges, days of care, and average lengths of stay for all substance abuse patients by their county of residence and age group, for a one-year time period. Application of the Methodology A chemical dependency treatment bed’s service area is the mental health planning region in which the bed is located (i.e., Western, North Central, South Central, Eastern). The local management entities comprising the four mental health planning regions are listed in Table 16B. The counties comprising each of the 24 local management entity catchment areas for mental health, developmental disabilities, and substance abuse services are listed in Table 15B. Each step explained below is applied individually to the 24 mental health local management entities, and then bed surpluses/deficits in the local management entities are combined to arrive at the total surpluses/deficits for the four mental health planning regions. Treatment utilization data from acute care and specialty hospitals and from residential treatment facilities were incorporated into the methodology. Part 1: Determining Projected Patient Days of Care and Total Bed Need
Step 1: The estimated Year 2012 days of care for all age groups is determined by taking the actual Year 2008 days of care, multiplying that number by the projected Year 2012 population and then dividing by the Year 2008 population.
Step 2: The Year 2012 days of care is divided by 365 and then by 85 percent to arrive at
the total bed need in Year 2012, assuming an 85 percent occupancy. Eighty-five percent has been determined to be the target occupancy rate for chemical dependency (substance abuse) treatment beds in hospitals and residential treatment facilities.

Part 2: Determining Projected Unmet Bed Need for Children and Adolescents and for Adults Step 1. The number of existing beds in the planning inventory is then subtracted from the
total bed need (from Part 1, Step 2) in order to arrive at the Year 2012 unmet bed need for all age groups (“total bed surplus/deficit”).
Step 2: Nine percent of the total bed need is subtracted as the estimated Year 2012 bed
need for children and adolescents, based on utilization patterns reflected in past data (nine percent of the days of stay were for children and adolescents).
Step 3. The child/adolescent planning inventory is subtracted from the child/adolescent
bed need (from Part 2, Step 2) to arrive at the Year 2012 child/adolescent unmet bed need.
Step 4. The adult bed need is then calculated by subtracting the child/adolescent bed
“surplus/deficit” from the total bed “surplus/deficit.” Need Determination for Adult Chemical Dependency (Substance Abuse) Treatment Beds (for Review in 2010)
Through the standard methodology, there is a need determination for three adult chemical dependency (substance abuse) treatment beds for the South Central Mental Health Planning Region. However, the need determination shall be initially limited for development of only residential chemical dependency treatment beds and not hospital-based inpatient chemical dependency treatment beds. If no certificate of need applications are received for the need determination in the scheduled review period, the need determination shall be reallocated in accordance with Policy GEN-1 and revised to permit development of either residential or hospital-based chemical dependency treatment beds. It is determined that there is no need for any additional adult chemical dependency (substance abuse) treatment beds (inpatient or residential) anywhere else in the state. The need determination is indicated in Table 16C. Need Determination for Child/Adolescent Chemical Dependency (Substance Abuse) Treatment Beds (for Review in 2010)
Through the standard methodology, there is a need determination for two child/adolescent chemical dependency (substance abuse) treatment beds for the South Central Mental Health Planning Region. However, the need determination shall be initially limited for development of only residential chemical dependency treatment beds and not hospital-based inpatient chemical dependency treatment beds. If no certificate of need applications are received for the need determination in the scheduled review period, the need determination shall be reallocated in accordance with Policy GEN-1 and revised to permit development of either residential or hospital-based chemical dependency treatment beds. It is determined that there is no need for any additional child/adolescent chemical dependency (substance abuse) treatment beds (residential or inpatient) anywhere else in the state. The need determination is indicated in Table 16D.

LME FACILITY NAME TYPE HSA COUNTY DETOX/TREATMENT BEDS: DETOX/TREATMENT BEDS:
TOTAL TOTAL ADULT ADOLESCENTALL TOTAL LIC. CON APPR TOTAL LIC. CON APPR TOTAL LIC. CON APPR TOTAL LIC. CON APPR BEDS
BEDS APPR. BEDS NOT YET APPR. BEDS NOT YET APPR. BEDS NOT YET APPR. + BEDS NOT YET UNDER +LIC. LICENSED +LIC. LICENSED +LIC. LICENSED LIC.+REW. LICENSED REVIEW
Robert Swain Recovery Center R I Buncombe 22 22 22 0 16 16 0 6 6 0 0 0 0 0Transylvania Community Hospital H I Transylvania 40 40 40 0 40 40 0 0 0 0 0 0 0 0Pavillon International R I Polk 46 46 46 0 46 46 0 0 0 0 0 0 0 0TOTAL FOR WESTERN HIGHLANDS 108 108 108 0 102 102 0 6 6 0 0 0 0 0Kings Mountain Hospital H I Cleveland 6 6 6 0 6 6 0 0 0 0 0 0 0 0The Recovery Center R I Gaston 6 6 6 0 6 6 0 0 0 0 0 0 0 0TOTAL FOR PATHWAYS 12 12 12 0 12 12 0 0 0 0 0 0 0 0Frye Regional Med. Ctr. H I Catawba 16 16 16 0 16 16 0 0 0 0 0 0 0 0TOTAL FOR MENTAL HEALTH PARTNERS 16 16 16 0 16 16 0 0 0 0 0 0 0 0McLeod Addictive Disease Center R III Mecklenburg 36 36 36 0 36 36 0 0 0 0 0 0 0 0Mercy Hospital H III Mecklenburg 11 11 11 0 11 11 0 0 0 0 0 0 0 0Mecklenburg County SAS Center R III Mecklenburg 32 32 32 0 32 32 0 0 0 0 0 0 0 0TOTAL FOR MECKLENBURG 79 79 79 0 79 79 0 0 0 0 0 0 0 0
Behavioral Health Center-First Step, Carolinas Medical Center-Union R III Union 16 16 16 0 16 16 0 0 0 0 0 0 0 0Rowan Regional Medical Center H III Rowan 15 15 15 0 15 15 0 0 0 0 0 0 0 0Path of Hope, Men's Division R II Davidson 12 12 12 0 12 12 0 0 0 0 0 0 0 0Path of Hope, Women's Division R II Davidson 6 6 6 0 6 6 0 0 0 0 0 0 0 0TOTAL FOR PIEDMONT 49 49 49 0 49 49 0 0 0 0 0 0 0 0Hope Valley, Inc. (Women) R II Surry 8 8 8 0 8 8 0 0 0 0 0 0 0 0Hope Valley, Inc. (Men) R II Surry 22 22 22 0 22 22 0 0 0 0 0 0 0 0TOTAL FOR CROSSROADS 30 30 30 0 30 30 0 0 0 0 0 0 0 0Old Vineyard Youth Services H II Forsyth 8 8 8 0 0 0 0 8 8 0 0 0 0 0
Addiction Recovery Care Association R II Forsyth 36 36 36 0 36 36 0 0 0 0 0 0 0 0TOTAL FOR CENTERPOINT 44 44 44 0 36 36 0 8 8 0 0 0 0 0Alamance Regional Medical Center H II Alamance 12 12 12 0 0 0 0 12 12 0 0 0 0 0TOTAL FOR A-C 12 12 12 0 0 0 0 12 12 0 0 0 0 0High Point Regional Hospital H II Guilford 23 23 23 23 23 0 0 0 0 0 0 0 0Fellowship Hall H II Guilford 60 54 48 6 54 48 6 0 0 0 6 0 6 0The Guilford County Substance Abuse Treatment Center R II Guilford 40 40 40 0 40 40 0 0 0 0 0 0 0 0TOTAL FOR GUILFORD 123 117 111 6 117 111 6 0 0 0 6 0 6 0
FirstHealth Moore Regional Hospital H V Moore 14 14 14 0 14 14 0 0 0 0 0 0 0 0Samaritan Colony R V Richmond 12 12 12 0 12 12 0 0 0 0 0 0 0 0TOTAL FOR SANDHILLS 26 26 26 0 26 26 0 0 0 0 0 0 0 0
South-eastern Regional
TOTAL FOR SOUTHEASTERN REGIONAL 0 0 0 0 0 0 0 0 0 0 0 0 0 0Cape Fear Valley Medical Center H V Cumberland 4 0 0 0 0 0 0 0 0 0 4 4 0 0TOTAL FOR CUMBERLAND 4 0 0 0 0 0 0 0 0 0 4 4 0 0Day-by-Day Treatment Center R IV Johnston 17 17 17 0 17 17 0 0 0 0 0 0 0 0TOTAL FOR JOHNSTON 17 17 17 0 17 17 0 0 0 0 0 0 0 0
DETOX ONLY BEDSDETOX/TREATMENT BEDS:
Table 16A: Inventory of Chemical Dependency (Substance Abuse) Beds, Excluding State Facilities
Western Highlands
Pathways
Mental Health Partners
Mecklen-burg
Piedmont
Crossroads
Center-Point
A-C
Guilford
Sandhills
Cumber-land
Johnston

LME FACILITY NAME TYPE HSA COUNTY DETOX/TREATMENT BEDS: DETOX/TREATMENT BEDS:
TOTAL TOTAL ADULT ADOLESCENTALL TOTAL LIC. CON APPR TOTAL LIC. CON APPR TOTAL LIC. CON APPR TOTAL LIC. CON APPR BEDS
BEDS APPR. BEDS NOT YET APPR. BEDS NOT YET APPR. BEDS NOT YET APPR. + BEDS NOT YET UNDER +LIC. LICENSED +LIC. LICENSED +LIC. LICENSED LIC.+REW. LICENSED REVIEW
DETOX ONLY BEDSDETOX/TREATMENT BEDS:
Table 16A: Inventory of Chemical Dependency (Substance Abuse) Beds, Excluding State Facilities
Holly Hill Hospital H IV Wake 28 28 28 0 20 20 0 8 8 0 0 0 0 0Wake Co. Alcoholism Treatment Center H IV Wake 34 26 26 0 26 26 0 0 0 0 8 8 0 0TOTAL FOR WAKE 62 54 54 0 46 46 0 8 8 0 8 8 0 0Wilmington Treatment Center H V New Hanover 44 44 44 0 44 44 0 0 0 0 0 0 0 0TOTAL FOR SOUTHEASTERN CENTER 44 44 44 0 44 44 0 0 0 0 0 0 0 0
Brynn Marr Behavorial Health System H VI Onslow 12 8 8 0 4 4 0 4 4 0 4 4 0 0TOTAL FOR ONSLOW-CARTERET 12 8 8 0 4 4 0 4 4 0 4 4 0 0Mary Frances Center R VI Edgecombe 66 66 66 0 46 46 0 20 20 0 0 0 0 0Nash General Hospital H VI Nash 16 12 12 12 12 0 0 0 0 4 4 0 0TOTAL FOR BEACON CENTER 82 78 78 0 58 58 0 20 20 0 4 4 0 0STATE TOTALS 720 694 688 6 636 630 6 58 58 0 26 20 6 0
South-eastern Center
Onslow-Carteret
Beacon Center
Wake

A B C D E F G H I J K L M N OTOTAL BED CHILD/ADOL. ADULT
SURPLUS/DEFICIT BED NEED BED NEED
(H - G) CHILD/ CHILD/ (SURPLUS/ (SURPLUS/
ADOL. ADOL. DEFICIT) DEFICIT)
BED NEED BED (K - J) (I-L)
(B x D) ÷ C (E ÷ 365) (F ÷ 85%) (G x9%) INVENTORY ADULT
Smoky Mountain 3,737 517,620 537,743 3,882 11 13 0 -13 1 0 -1 -12Western Highlands 4,849 500,760 526,062 5,094 14 16 108 92 1 6 5 87Pathways 3,478 377,519 407,081 3,750 10 12 12 0 1 0 -1 1
Mental Health Partners 2,888 244,246 256,901 3,038 8 10 16 6 1 0 -1 7Mecklenburg 25,023 877,173 945,316 26,967 74 87 79 -8 8 19 11 -19Piedmont 13,208 718,760 804,307 14,780 40 48 49 1 4 0 -4 5
WESTERN REGION 53,183 3,236,078 3,477,410 57,511 158 185 264 79 12 25 8 69 NONE NONE
Crossroads 2,745 265,733 285,863 2,953 8 10 30 20 1 0 -1 21CenterPoint 8,352 523,115 551,087 8,799 24 28 44 16 3 8 5 11A - C 1,147 169,381 182,555 1,236 3 4 12 8 0 12 12 -4Guilford 13,734 468,439 502,003 14,718 40 47 123 76 4 0 -4 80OPC 2,032 227,724 241,787 2,157 6 7 0 -7 1 0 -1 -6Durham 1,196 260,471 288,565 1,325 4 4 0 -4 0 0 0 -4
Five County 1,958 232,796 239,150 2,011 6 6 0 -6 1 0 -1 -5
NORTH CENTRAL REGION 31,164 2,147,659 2,291,010 33,200 91 201 209 102 10 20 10 93 NONE NONE
Sandhills 10,241 537,784 575,334 10,956 30 35 26 -9 3 0 -3 -6
Southeastern Regional 2,962 254,355 262,312 3,055 8 10 0 -10 1 0 -1 -9Cumberland 1,471 316,945 329,653 1,530 4 5 4 -1 0 0 0 -1Johnston 3,390 162,776 186,976 3,894 11 13 17 4 1 0 -1 5Wake 13,549 864,582 1,007,113 15,783 43 51 62 11 5 8 3 8
SOUTH CENTRAL REGION 31,613 2,136,442 2,361,388 35,217 96 114 109 -5 10 8 -2 -3 2 3
Southeastern Center 2,703 346,990 378,980 2,952 8 10 44 34 1 0 -1 35Onslow - Carteret 767 239,549 252,680 809 2 3 12 9 0 4 4 5
Beacon Center 2,300 245,954 255,616 2,390 7 8 82 74 1 20 19 55
East Carolina Behavioral Health 1,665 399,648 418,640 1,744 5 6 0 -6 1 0 -1 -5Albemarle 500 182,587 182,092 499 1 2 0 -2 0 0 0 -2Eastpointe 1,101 292,109 299,716 1,130 3 4 0 -4 0 0 0 -4
EASTERN REGION 9,036 1,706,837 1,787,724 9,524 26 31 138 107 3 24 21 84 NONE NONE
Need Determination
NUMBER OF BEDS
TOTAL BEDS
NEEDED TOTAL BED INVENTORY
Table 16B: 2012 Projection of Chemical Dependency (Substance Abuse) Treatment Bed Need By Mental Health Planning Region
2010 Treatment Bed
(Deficits are Shown as Minuses)DAYS OF
CARE 2008
LOCAL MANAGEMENT
ENTITIES AND REGIONS
2008 POPULATION
PROJECTED 2012 POPULATION
2012 PROJECTED
DAYS OF CARE CHILD/
ADOL(Deficits are
Shown as Minuses)
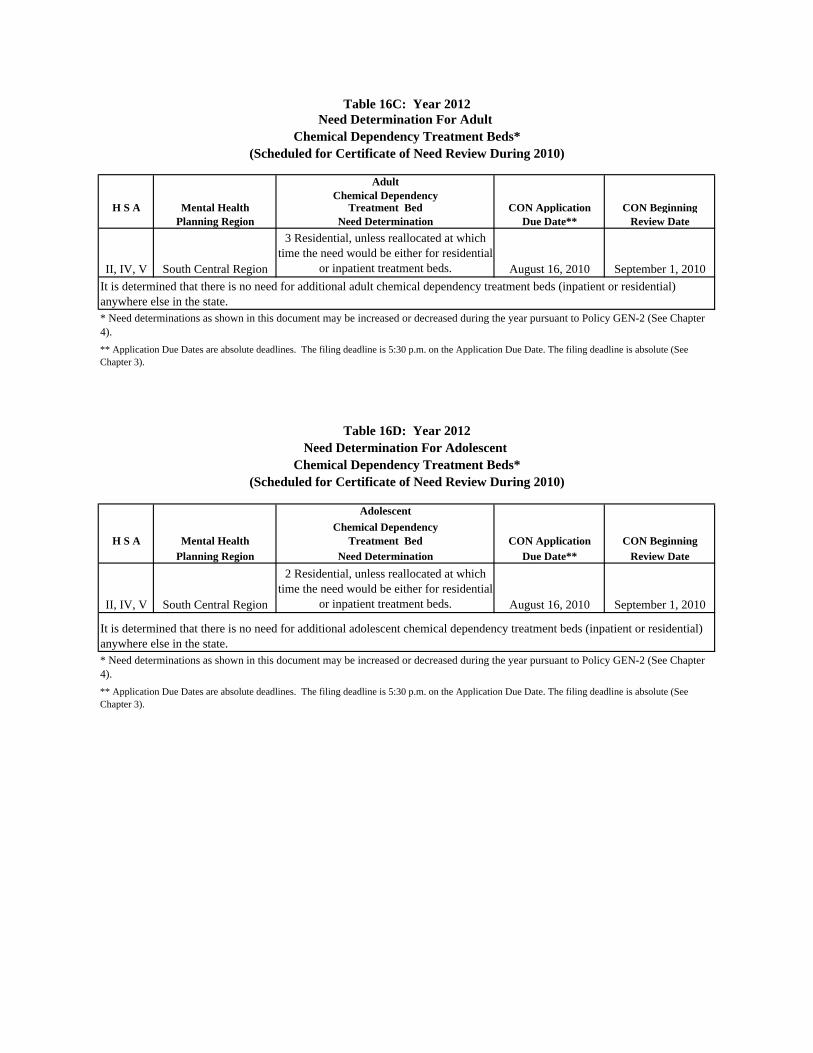
AdultChemical Dependency
H S A Mental Health Treatment Bed CON Application CON BeginningPlanning Region Need Determination Due Date** Review Date
II, IV, V South Central Region
3 Residential, unless reallocated at which time the need would be either for residential
or inpatient treatment beds. August 16, 2010 September 1, 2010
Adolescent
Chemical DependencyH S A Mental Health Treatment Bed CON Application CON Beginning
Planning Region Need Determination Due Date** Review Date
II, IV, V South Central Region
2 Residential, unless reallocated at which time the need would be either for residential
or inpatient treatment beds. August 16, 2010 September 1, 2010
* Need determinations as shown in this document may be increased or decreased during the year pursuant to Policy GEN-2 (See Chapter 4).
** Application Due Dates are absolute deadlines. The filing deadline is 5:30 p.m. on the Application Due Date. The filing deadline is absolute (See Chapter 3).
Table 16D: Year 2012Need Determination For Adolescent
Chemical Dependency Treatment Beds*(Scheduled for Certificate of Need Review During 2010)
It is determined that there is no need for additional adolescent chemical dependency treatment beds (inpatient or residential) anywhere else in the state.
It is determined that there is no need for additional adult chemical dependency treatment beds (inpatient or residential) anywhere else in the state.* Need determinations as shown in this document may be increased or decreased during the year pursuant to Policy GEN-2 (See Chapter 4).
** Application Due Dates are absolute deadlines. The filing deadline is 5:30 p.m. on the Application Due Date. The filing deadline is absolute (See Chapter 3).
Table 16C: Year 2012Need Determination For Adult
Chemical Dependency Treatment Beds*(Scheduled for Certificate of Need Review During 2010)

Chapter 17:Intermediate Care Facilities for the Mentally Retarded

CHAPTER 17 INTERMEDIATE CARE FACILITIES FOR THE MENTALLY RETARDED Background Information Area mental health, developmental disabilities, and substance abuse authorities (G.S. 122C-117(a)(2)) have responsibility by law to ensure provision of services to people in need within their catchment areas. A certificate of need application for a new or expanded Intermediate Care Facility for the Mentally Retarded (ICF/MR) should contain written comments from the Local Management Entity (LME) of the area authority relative to its endorsement of the project and involvement in the development of a client admission/discharge agreement. The LMEs shall serve as the portals of entry and exit for the admission and discharge of clients in ICF/MR facilities (G.S. 122C-115.4) within the applicable Mental Health, Developmental Disabilities, and Substance Abuses Services (MH/DD/SAS) catchment areas. This involvement is essential to ensure that only clients in need of the intensive array of services provided in an ICF/MR program are admitted and served as close as possible to their own homes, and ensured coordination with services outside the facility. The North Carolina Department of Health and Human Services is committed to the integration of people with mental retardation/developmental disabilities into community living to the fullest extent possible. Community-based alternatives are encouraged, particularly through the transfer of ICF/MR beds from state developmental centers. Other alternatives may include small, community-based non-ICF/MR residential options as well as other sites through the Medicaid Waiver Community Alternatives Program (CAP)-MR/DD Program. Facilities proposing to transfer ICF/MR beds from state developmental centers to communities shall demonstrate that they are committed to serving the same type of residents normally served in state developmental centers. To ensure that relocated beds will serve those people, any certificate of need application for beds allocated under the above policy must meet the requirements of Chapter 858 of the 1983 Session Laws. The application for transferred beds shall include a written agreement by the applicant with the following representatives which outlines the operational aspects of the bed transfers: director of the LME serving the county where the program is to be located; the director of the applicable state developmental center; the director of the North Carolina Division of State Operated Healthcare Facilities; and the Secretary of the North Carolina Department of Health and Human Services.
Alternatively, notwithstanding the requirements of Chapter 858 of the 1983 Session Laws, facilities proposing to operate transferred beds shall submit an application to the Certificate of Need Section demonstrating a commitment to serve children ages birth through six years who have severe to profound developmental disabilities and are medically fragile. To help ensure the relocated beds will serve these residents, such proposal shall include a written agreement with the following representatives: director of the LME serving the county where the program is to be located; the director of the applicable state developmental center; the director of the North Carolina Division of State Operated Healthcare Facilities; and the secretary of the North Carolina Department of Health and Human Services.

Also, in Chapter 4 of the North Carolina 2010 State Medical Facilities Plan there is a
corresponding policy titled: POLICY ICF/MR-1: TRANSFER OF ICF/MR BEDS FROM STATE OPERATED DEVELOPMENTAL CENTERS TO COMMUNITY FACILITIES FOR MEDICALLY FRAGILE CHILDREN. The policy allows for a certificate of need for a project that utilizes existing ICF-MR beds (currently certified in state operated facilities) by transferring these beds to community facilities without the transfer of clients.
In addition, there is a policy titled: POLICY ICF/MR-2: TRANSFER OF ICF/MR BEDS
FROM STATE OPERATED DEVELOPMENTAL CENTERS TO COMMUNITY FACILITIES FOR INDIVIDUALS WHO CURRENTLY OCCUPY THE BEDS. The policy allows existing certified ICF/MR beds in state operated developmental centers to be transferred through the certificate of need process to establish ICF/MR group homes in the community to serve people with complex behavioral challenges and/or medical conditions for whom a community ICF/MR placement is appropriate, as determined by the individual’s treatment team and with the individual/guardian being in favor of the placement.
Basic Principles People with conditions other than mental retardation (such as autism, cerebral palsy, epilepsy or related conditions) may be appropriate for placement in an ICF/MR setting if they are in need of the services the program is certified to provide. In the development of services for this population, the full continuum of services should be explored to determine the most appropriate level of care for their needs. Services for people who are developmentally disabled should be organized in such a way that a continuum of care is available. For most individuals, admission to a community-based facility is preferable to admission to a regional, state operated facility because community-based treatment provides greater potential for reintegration into the community. The role of state facilities is to complement and supplement the community mental health system. State facilities should be the treatment setting of last resort and should provide services that cannot be economically provided in the community. Development of community programs may be accomplished through establishing appropriate treatment programs and support services in the community to avoid institutionalization of individuals with developmental disabilities, and relocating people from state facilities to community programs to the extent appropriate services are developed in the community. Summary of ICF/MR Bed Supply and Utilization Intermediate Care Facilities for people who are Mentally Retarded or otherwise developmentally disabled is a category of group home care designated by the federal-state Medicaid program. A total of 5,252 certified ICF/MR beds are in operation. This total includes three demonstration projects and their 60 beds, and four state facilities and their 2,451 beds. The beds located in state facilities are excluded from the regular bed inventory because such facilities are not subject to the state’s certificate of need law.

Other States' ICF/MR Bed Totals The agency has surveyed the southeastern states that cover ICF/MR beds under their certificate of need statutes. The research found: In the state of Tennessee, the legislature has capped the number of beds at 668. If the ratio of beds to population is calculated, it is the following:
5,368,198 668 = 8,036 people per bed If North Carolina used the above methodology and used the same year population, it
would be the following: 7,425,183 8,036 = 924 beds instead of 5,252 beds
In the state of Kentucky, the number of beds is capped at 1,208. There are not any plans to increase the number of beds. If the ratio of beds to population is calculated, it is the following:
3,908,124 1,208 = 3,235 people per bed
If North Carolina used the above methodology and used the same year population, it would be the following:
7,425,183 3,235 = 2,295 beds instead of 5,252 beds
In the state of South Carolina, the number of beds is 2,714. There are not any plans to increase the number of beds. If the ratio of beds to population is calculated, it is the following:
3,760,181 2,714 = 1,385 people per bed
If North Carolina used the above methodology and used the same year population, it would be the following:
7,425,183 1,385 = 5,361 beds instead of 5,252 beds In the state of Virginia, the number of beds is 2,090. There are not any plans to increase the number of beds. If the ratio of beds to population is calculated, it is the following:
6,733,996 2,090 = 3,222 people per bed
If North Carolina used the above methodology and used the same year population, it would be the following: 7,425,183 3,222 = 2,305 beds instead of 5,252 beds

Comparison of North Carolina to Other States and Need Determination Methodology If North Carolina used any of the individual state's ratios above or need methodologies
(except for South Carolina's), the need for ICF/MR beds would indicate that the present number of 5,252 beds providing service in the state is an adequate number of beds.
If North Carolina used the average of the ratios for people per bed from the above four
states, the need for ICF/MR beds would equal to 1,870 beds:
7,425,183 3,970 = 1,870 beds instead of 5,252 beds In the publication State of Tennessee's Health Guidelines for Growth, it is stated that
"the population-based estimate of the total need for ICF/MR facilities is .05 percent of the general population. This estimate is based on the estimate for all mental retardation of 1 percent. Of the 1 percent estimate, 5 percent of those are estimated to meet level 1 criteria and be appropriate for ICF/MR services."
If North Carolina used the .05 percent of its general Year 2009 population, the need for ICF/MR beds would equal to 4,699 beds:
9,398,080 x .01 = 93,981 x .05 = 4,699 beds instead of 5,252 beds
The North Carolina Division of Health Service Regulation’s basic position continues to be that additional ICF/MR beds in North Carolina are in conflict with the experience and practice of surrounding states that indicate that North Carolina has a more than adequate number of ICF/MR beds in comparison to other southeastern states. Need Determination for ICF/MR Beds
The service area for an ICF/MR bed is the catchment area for the LME for mental health, developmental disabilities, and substance abuse services in which the bed is located. LME catchment areas for mental health, developmental disabilities, and substance abuse services are listed in Table 17A: Inventory of ICF/MR Facilities and Beds. Regarding need determination for ICF/MR beds, through the standard methodology, it is determined that there is no need for additional ICF/MR beds anywhere in the state.
In accordance with the policy titled: POLICY ICF/MR-2: TRANSFER OF ICF/MR
BEDS FROM STATE OPERATED DEVELOPMENTAL CENTERS TO COMMUNITY FACILITIES FOR INDIVIDUALS WHO CURRENTLY OCCUPY THE BEDS, a proposal was submitted by the North Carolina Division of MH/DD/SAS to facilitate the downsizing of the state operated developmental centers.
The proposal indicated that the North Carolina Division of MH/DD/SAS will transfer existing adult certified ICF/MR beds in state operated developmental centers through the certificate of need process to establish ICF/MR group homes in the community to serve people with complex behavioral challenges and /or medical conditions for whom a community ICF/MR placement is appropriate, as determined by the individual’s treatment team and with the individual/guardian being in favor of the placement.

The State Health Coordinating Council approved the proposal from the North Carolina
Division of MH/DD/SAS to transfer 36 existing adult certified ICF/MR beds in state operated developmental centers through the certificate of need process to establish beds in Buncombe, Guilford, Mecklenburg, Wake, New Hanover and Pitt counties. The North Carolina 2008 State Medical Facilities Plan included a need determination for the transfer of the 36 beds. Sources of Data
ICF/MR Beds Operational: North Carolina Department of Health and Human Services, Division of Health Service
Regulation, Certification Section. ICF/MR Beds Available: North Carolina Department of Health and Human Services, Division of Health Service
Regulation, Certificate of Need Section.

County Child Adult
Macon 2959/4171 6 346469 6
Macon 4289 6 34603N 6Haywood 2651 5 346374 5Jackson 3878 6 346012 6
Jackson 1618/5046 6 346324 6Alleghany 2074/6400 5 346317 5Ashe 3482/3586 6 346130 6 *Ashe 3481/3587 6 346130 6 *Ashe 3480/3588 6 346150 6 *Wilkes 5728/6349 6 346365 6Wilkes 5729/6350 6 346085 6Watauga 5731/6347 6 346528 6Watauga 2661 15 346549 15Wilkes 3827 6 34601B 6Wilkes 2657 12 346512 12 **Wilkes 5732/6348 6 346510 6Wilkes 3486/5473 6 34604E 6Alexander 4023 6 34600A 6
Alexander 4007 6 34605T 6
Alexander 4452 6 34610B 6 ***
Caldwell 4026 6 34601E 6
Caldwell 4004 6 34606H 6
Caldwell 4453 6 34610Z 6 **
Caldwell 4455 6 34611J 6 **
McDowell 4025 6 346077 6
0 0 163 163
Buncombe 4888/2294 32 346434 32Buncombe 4850/2628 11 346413 11
Buncombe 3478/4175 6 346595 6Buncombe 6 34610T 6Buncombe 5059 6 6Buncombe 5330/2958 6 346410 6
Buncombe 4309 6 34604M 6
Buncombe 3880 6 346449 6
Buncombe 4855 5 34609W 5
Buncombe 3881 6 346322 6Henderson 4773/2622 6 346402 6
Henderson 3996 6 34601U 6
Henderson 4758/4759 8 34609V 8
Madison 2294 32 346438 32
Rutherford 4003 6 34603Y 6Rutherford 4006 6 34604X 6
Transylvania 2956/3997 6 34604E 6
TOTAL WESTERN HIGHLANDS 0 0 160 160
Smoky Mountain (Counties: Alexander,
Alleghany, Ashe, Avery, Caldwell, Cherokee, Clay,
Graham, Haywood, Jackson, McDowell,
Macon, Swain, Watauga, Wilkes)
Western Highlands (Counties: Buncombe,
Henderson, Madison, Mitchell, Polk,
Rutherford, Transylvania,
Yancey)
Certif. Vendor Number
TOTAL BEDS
(Appr. + Cert.)
TOTAL SMOKY MOUNTAIN
Macon ICF/MR Group Home #1(Second Street, Franklin)Macon ICF/MR Group Home #2(Iotla St., Franklin)Haywood County G. H. (Oak Park Dr.)Webster Children Group Home
VOCA-College StreetVOCA-Kimsey Care Center I
Smoky Mountain ICF/MR Group Home (11 Dills St.)New River Cottage, Inc (82 Davis Lane)Ridgecrest I (West Jefferson)Ridgecrest II (West Jefferson)
VOCA-Apple Valley Care Center II
Blue Ridge Home, Swannanoa (91 Poplar Circle)
CON Project Number
Total Beds
Certif.
Wildcat Group HomeWestern Health Care (Lakewood)Lewis Fork I and II (Ferguson)VOCA-Wellborn
Thomas Street Home (Jefferson)VOCA-Blairfield Court
Irene Wortham Group Home (1 Rose St.)Irene Wortham Residential Center (16 Azalea St.)Dogwood Group Home (2 Rose St.)RHA (122 New Stock Road- Weaverville)Chiles Ave. Group Home (22 Chiles Ave.)Kenmore St. Group Home/Autistic Children (1 Kenmore St.)Pisgah Group Home (28 Pisgah View Ave-Asheville)Montford Group Home - Autistic (406 Montford Ave.)Ora Street Group Home For Autistic (95 Ora St., Asheville)Country Cove Group HomePinebrook ICF/MR Family Care Ctr.(Erkwood Drive)Rayside ICF/MR (617 & 619 Ray Street-Hendersonville)Ctr Mental Retardation of Madison (199 Wall Road)VOCA Woodland Group Home, Woodland Dr.VOCA Corp., Rollins Road, Forest CityForest Bend Group Home (S. Oak St., Brevard)
Litle River Group Home (Taylorsville)VOCA Second St. G. Home (111 Second St.)Ellendale Group Home (4165 NC Hwy 127, Taylorsville)Comserv/Creekside G. H.(723 Hillsfarm Rd.)VOCA Laurel G. Home/Children (Laurel St., Granite Falls)
Playmore Group Home (Rt.7, Box 230)Comserve/Lenoir II (Lower Creek Group Home) Comserve/Laurelwood Group Home (Lonon Ave., Marion)
Approved, Not Yet
CertifiedLocal
Management Entity (LME) Name of Provider
Table 17A: Inventory of ICF/MR Facilities and Beds
*Bed count includes one Thomas S. bed; **Bed count includes two Thomas S. beds; ***Bed count includes three Thomas S. beds; ****Bed count includes five Thomas S. beds; *****Bed count includes six Thomas S. beds
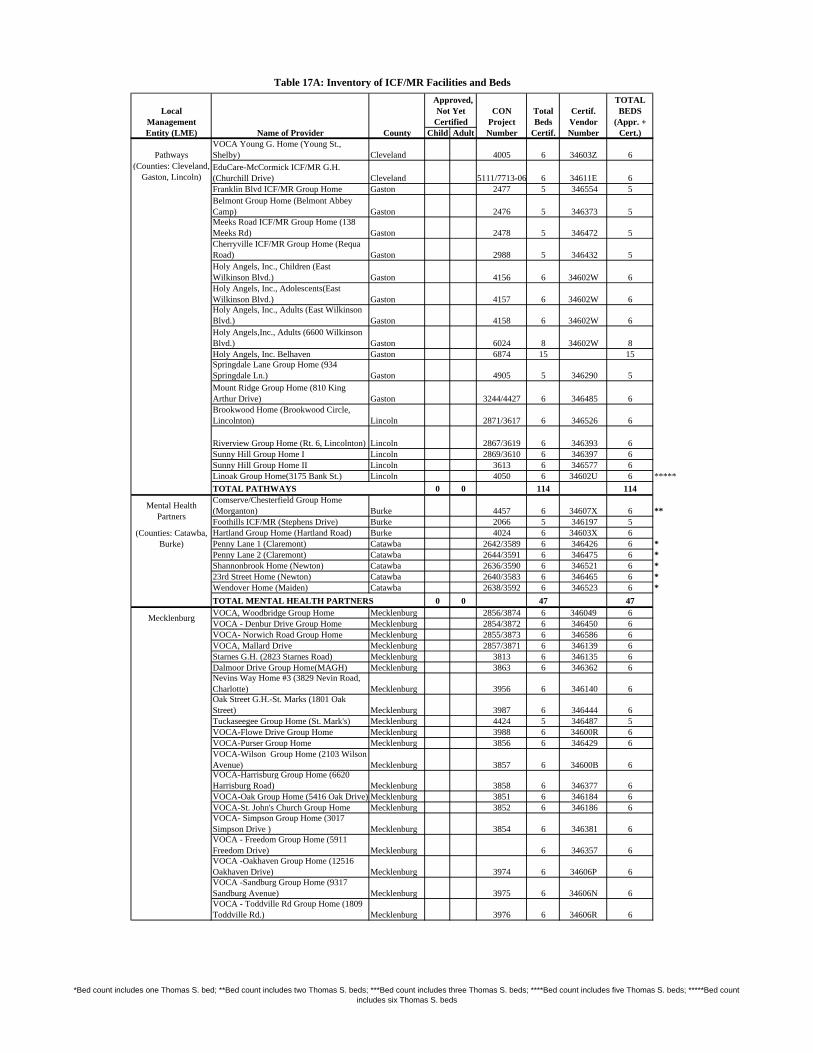
County Child Adult
Certif. Vendor Number
TOTAL BEDS
(Appr. + Cert.)
CON Project Number
Total Beds
Certif.
Approved, Not Yet
CertifiedLocal
Management Entity (LME) Name of Provider
Table 17A: Inventory of ICF/MR Facilities and Beds
Pathways Cleveland 4005 6 34603Z 6
Cleveland 5111/7713-06 6 34611E 6Gaston 2477 5 346554 5
Gaston 2476 5 346373 5
Gaston 2478 5 346472 5
Gaston 2988 5 346432 5
Gaston 4156 6 34602W 6
Gaston 4157 6 34602W 6
Gaston 4158 6 34602W 6
Gaston 6024 8 34602W 8Gaston 6874 15 15
Gaston 4905 5 346290 5
Gaston 3244/4427 6 346485 6
Lincoln 2871/3617 6 346526 6
Lincoln 2867/3619 6 346393 6Lincoln 2869/3610 6 346397 6Lincoln 3613 6 346577 6Lincoln 4050 6 34602U 6 *****
TOTAL PATHWAYS 0 0 114 114
Burke 4457 6 34607X 6 **Burke 2066 5 346197 5
Hartland Group Home (Hartland Road) Burke 4024 6 34603X 6Penny Lane 1 (Claremont) Catawba 2642/3589 6 346426 6 *Penny Lane 2 (Claremont) Catawba 2644/3591 6 346475 6 *Shannonbrook Home (Newton) Catawba 2636/3590 6 346521 6 *23rd Street Home (Newton) Catawba 2640/3583 6 346465 6 *Wendover Home (Maiden) Catawba 2638/3592 6 346523 6 *
TOTAL MENTAL HEALTH PARTNERS 0 0 47 47VOCA, Woodbridge Group Home Mecklenburg 2856/3874 6 346049 6VOCA - Denbur Drive Group Home Mecklenburg 2854/3872 6 346450 6VOCA- Norwich Road Group Home Mecklenburg 2855/3873 6 346586 6VOCA, Mallard Drive Mecklenburg 2857/3871 6 346139 6Starnes G.H. (2823 Starnes Road) Mecklenburg 3813 6 346135 6Dalmoor Drive Group Home(MAGH) Mecklenburg 3863 6 346362 6
Mecklenburg 3956 6 346140 6
Mecklenburg 3987 6 346444 6Tuckaseegee Group Home (St. Mark's) Mecklenburg 4424 5 346487 5VOCA-Flowe Drive Group Home Mecklenburg 3988 6 34600R 6VOCA-Purser Group Home Mecklenburg 3856 6 346429 6
Mecklenburg 3857 6 34600B 6
Mecklenburg 3858 6 346377 6VOCA-Oak Group Home (5416 Oak Drive) Mecklenburg 3851 6 346184 6VOCA-St. John's Church Group Home Mecklenburg 3852 6 346186 6
Mecklenburg 3854 6 346381 6
Mecklenburg 6 346357 6
Mecklenburg 3974 6 34606P 6
Mecklenburg 3975 6 34606N 6
Mecklenburg 3976 6 34606R 6
(Counties: Cleveland, Gaston, Lincoln)
(Counties: Catawba, Burke)
Mecklenburg
Mental Health Partners
Comserve/Chesterfield Group Home (Morganton)Foothills ICF/MR (Stephens Drive)
VOCA Young G. Home (Young St., Shelby)
EduCare-McCormick ICF/MR G.H. (Churchill Drive)Franklin Blvd ICF/MR Group HomeBelmont Group Home (Belmont Abbey Camp)
Holy Angels,Inc., Adults (6600 Wilkinson Blvd.)Holy Angels, Inc. BelhavenSpringdale Lane Group Home (934 Springdale Ln.)
Meeks Road ICF/MR Group Home (138 Meeks Rd)Cherryville ICF/MR Group Home (Requa Road)Holy Angels, Inc., Children (East Wilkinson Blvd.)Holy Angels, Inc., Adolescents(East Wilkinson Blvd.)
Sunny Hill Group Home II Linoak Group Home(3175 Bank St.)
Mount Ridge Group Home (810 King Arthur Drive)Brookwood Home (Brookwood Circle, Lincolnton)
Riverview Group Home (Rt. 6, Lincolnton)Sunny Hill Group Home I
Holy Angels, Inc., Adults (East Wilkinson Blvd.)
Nevins Way Home #3 (3829 Nevin Road, Charlotte)Oak Street G.H.-St. Marks (1801 Oak Street)
VOCA-Wilson Group Home (2103 Wilson Avenue)VOCA-Harrisburg Group Home (6620 Harrisburg Road)
VOCA- Simpson Group Home (3017 Simpson Drive )VOCA - Freedom Group Home (5911 Freedom Drive)VOCA -Oakhaven Group Home (12516 Oakhaven Drive)VOCA -Sandburg Group Home (9317 Sandburg Avenue)VOCA - Toddville Rd Group Home (1809 Toddville Rd.)
*Bed count includes one Thomas S. bed; **Bed count includes two Thomas S. beds; ***Bed count includes three Thomas S. beds; ****Bed count includes five Thomas S. beds; *****Bed count includes six Thomas S. beds

County Child Adult
Certif. Vendor Number
TOTAL BEDS
(Appr. + Cert.)
CON Project Number
Total Beds
Certif.
Approved, Not Yet
CertifiedLocal
Management Entity (LME) Name of Provider
Table 17A: Inventory of ICF/MR Facilities and Beds
Mecklenburg 4159 6 34602B 6
Mecklenburg 3457/4422 5 346352 5
Mecklenburg 4754 6 34608H 6
Mecklenburg 4753 6 34609P 6
Mecklenburg 4752 6 34609E 6
Mecklenburg 4837/7678-06 6 34610F 6
Mecklenburg 4425 6 34609A 6
Mecklenburg 4841 6 34609J 6
Mecklenburg 4842 6 34608X 6
Mecklenburg 4843/7714-06 6 34609Y 6
TOTAL MECKLENBURG 0 0 178 178Howell's Child Care Center (Clear Creek) Cabarrus 120 346336 120
Cabarrus 10 346203 10Michigan Street Home (Kannapolis) Cabarrus 5 346305 5
Cabarrus 2473 5 346560 5Wilhelm Place Home Cabarrus 2474 5 346188 5
Davidson 3280 6 346346316 6Scotthurst Foundation - #2 Davidson 5841/5450 6 6
Stanly 2853 6 346392 6
Stanly 3877 6 346481 6
Stanly 2847 5 346415 5
Stanly 2658 6 346500 6
Stanly 3456/3815 6 346165 6
Union 2475 6 346493 6Karen Lane Home (Karen Lane, Monroe) Union 4152 6 34602Y 6
Union 4153 6 34602X 6Laura Springs Road Home (Salisbury) Rowan 2493/3614 6 346517 6Myron Place Home (Salisbury) Rowan 2491/3612 6 346518 6Rockwell Homes #1 and #2 (Rockwell) Rowan 2495/2497 12 346350 12
Rowan 4049 6 34607A 6 *****Smith Street Home (Cleveland) Rowan 2499/3615 6 346519 6TOTAL PIEDMONT 0 0 240 240Yadkin I (Rt. 2, Hamptonville) Yadkin 3301/3597 6 346126 6 *Yadkin II (Rt. 1, Hamptonville) Yadkin 3302/3596 6 346178 6 *Yadkin III (Rt. 1, Hamptonville) Yadkin 3303/3595 6 346178 6 *
Surry 4604 6 34608M 6
Surry 4605 6 34609B 6
Iredell 2481/3608 6 346513 6
Iredell 2483/3618 6 346514 6Fan Joy #1 (Rt. 7) Iredell 2487/3606 6 346367 6 *****Fan Joy #2 (Rt. 15) Iredell 2488/3607 6 346515 6
Iredell 2489/3609 6 346419 6
Iredell 4051 6 34602V 6
Iredell 4052 6 34606Z 6 *****TOTAL CROSSROADS 0 0 72 72
Piedmont(Counties: Cabarrus, Davidson, Rowan,
Stanly, Union)
(Counties: Iredell, Surry, Yadkin)
Crossroads
Marie Smith Home for Autistic Children (1921 Palmetto Dr.)Moss Springs Group Home #2, (1615 B Moss Sprgs. Rd.)Moss Springs Group Home #1, (1617 Moss Springs Rd.)Robert Thompson Group Home (1920 Woodhaven Dr.)
Bost Children's Center (Highway 200, Concord)
Christy Wood's Group Home (Mount Olive Road)
Scotthurst Foundation - Rock Creek (174 Scotthurst Drive)
Mantle Court Group Home (4319 Mantle Court)Bon Rea Drive Group Home (St. Mark's Center)
Educare-Heathcroft Group Home (3046 Heathcroft Court)
Educare Group Home (1812 McLean Road)
Howell's Center for Adults (7621 Monroe Rd., Charlotte)Howell's Center for Adults (5927 Lakeview Drive, Charlotte)Howell's Center for Adults (1710 Burtonwood Ct., Charlotte)Rowan Way Group Home (5343 Robinhood Road, Charlotte) Replace at 5917 Rowan Way
ARC of Surry Co. (Sydnor St. Group Home)ARC of Surry Co. (Park Drive Group Home)
A Jack Wall Group Home for Autistic (Moss Springs Rd.)Piedmont Dev. Ser. - Meadowview Home (Bobwhite Circle)
Ridgefield Home (730 Ficher Ridge Dr., Monroe)
Stone Ridge, (Union Heights Blvd. Salisbury)
Ravendale Drive G.H. (1123 Ravendale Drive)Educare- Leaves Group Home (7106 Leaves Lane)
Mecklenburg, continued
Bonnie Lane Home (Bonnie Lane, Statesville)Dal-Wan Heights Home (Sharon Drive, Statesville)
Oakdale Home (Mocksville Hwy., Statesville)Procomm/Hollingsworth Home (Hollingswood Dr.)Pinewood Home (2101 Beauty St., Statesville)
*Bed count includes one Thomas S. bed; **Bed count includes two Thomas S. beds; ***Bed count includes three Thomas S. beds; ****Bed count includes five Thomas S. beds; *****Bed count includes six Thomas S. beds
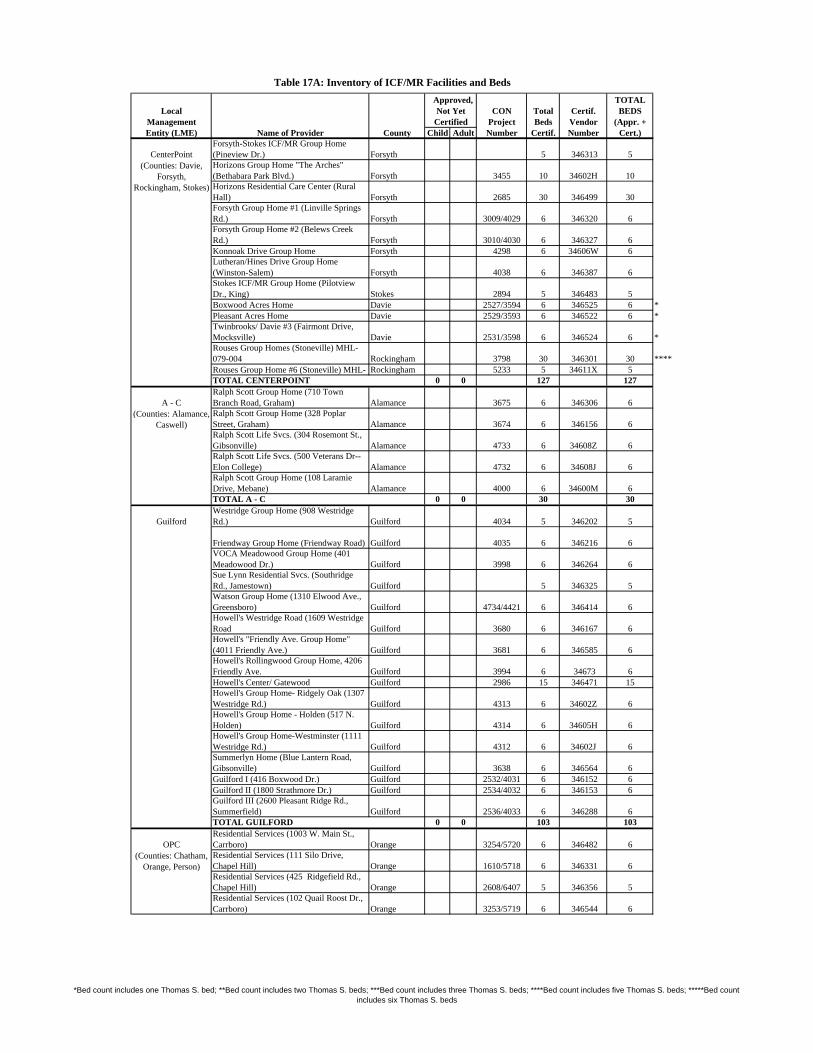
County Child Adult
Certif. Vendor Number
TOTAL BEDS
(Appr. + Cert.)
CON Project Number
Total Beds
Certif.
Approved, Not Yet
CertifiedLocal
Management Entity (LME) Name of Provider
Table 17A: Inventory of ICF/MR Facilities and Beds
CenterPoint Forsyth 5 346313 5
Forsyth 3455 10 34602H 10
Forsyth 2685 30 346499 30
Forsyth 3009/4029 6 346320 6
Forsyth 3010/4030 6 346327 6Konnoak Drive Group Home Forsyth 4298 6 34606W 6
Forsyth 4038 6 346387 6
Stokes 2894 5 346483 5Boxwood Acres Home Davie 2527/3594 6 346525 6 *Pleasant Acres Home Davie 2529/3593 6 346522 6 *
Davie 2531/3598 6 346524 6 *
Rockingham 3798 30 346301 30 ****Rockingham 5233 5 34611X 5
TOTAL CENTERPOINT 0 0 127 127
A - C Alamance 3675 6 346306 6
Alamance 3674 6 346156 6
Alamance 4733 6 34608Z 6
Alamance 4732 6 34608J 6
Alamance 4000 6 34600M 6TOTAL A - C 0 0 30 30
Guilford Guilford 4034 5 346202 5
Guilford 4035 6 346216 6
Guilford 3998 6 346264 6
Guilford 5 346325 5
Guilford 4734/4421 6 346414 6
Guilford 3680 6 346167 6
Guilford 3681 6 346585 6
Guilford 3994 6 34673 6Howell's Center/ Gatewood Guilford 2986 15 346471 15
Guilford 4313 6 34602Z 6
Guilford 4314 6 34605H 6
Guilford 4312 6 34602J 6
Guilford 3638 6 346564 6Guilford I (416 Boxwood Dr.) Guilford 2532/4031 6 346152 6Guilford II (1800 Strathmore Dr.) Guilford 2534/4032 6 346153 6
Guilford 2536/4033 6 346288 6TOTAL GUILFORD 0 0 103 103
OPC Orange 3254/5720 6 346482 6
Orange 1610/5718 6 346331 6
Orange 2608/6407 5 346356 5
Orange 3253/5719 6 346544 6
(Counties: Chatham, Orange, Person)
(Counties: Davie, Forsyth,
Rockingham, Stokes)
Forsyth-Stokes ICF/MR Group Home (Pineview Dr.)Horizons Group Home "The Arches" (Bethabara Park Blvd.)
Sue Lynn Residential Svcs. (Southridge Rd., Jamestown)
Horizons Residential Care Center (Rural Hall)Forsyth Group Home #1 (Linville Springs Rd.)Forsyth Group Home #2 (Belews Creek Rd.)
Lutheran/Hines Drive Group Home (Winston-Salem)Stokes ICF/MR Group Home (Pilotview Dr., King)
Twinbrooks/ Davie #3 (Fairmont Drive, Mocksville) Rouses Group Homes (Stoneville) MHL-079-004Rouses Group Home #6 (Stoneville) MHL-
Ralph Scott Group Home (710 Town Branch Road, Graham)Ralph Scott Group Home (328 Poplar Street, Graham)Ralph Scott Life Svcs. (304 Rosemont St., Gibsonville)Ralph Scott Life Svcs. (500 Veterans Dr--Elon College)Ralph Scott Group Home (108 Laramie Drive, Mebane)
Westridge Group Home (908 Westridge Rd.)
Friendway Group Home (Friendway Road)VOCA Meadowood Group Home (401 Meadowood Dr.)
Watson Group Home (1310 Elwood Ave., Greensboro)Howell's Westridge Road (1609 Westridge RoadHowell's "Friendly Ave. Group Home" (4011 Friendly Ave.)Howell's Rollingwood Group Home, 4206 Friendly Ave.
Howell's Group Home- Ridgely Oak (1307 Westridge Rd.)Howell's Group Home - Holden (517 N. Holden) Howell's Group Home-Westminster (1111 Westridge Rd.)Summerlyn Home (Blue Lantern Road, Gibsonville)
Guilford III (2600 Pleasant Ridge Rd., Summerfield)
Residential Services (1003 W. Main St., Carrboro) Residential Services (111 Silo Drive, Chapel Hill)Residential Services (425 Ridgefield Rd., Chapel Hill)Residential Services (102 Quail Roost Dr., Carrboro)
(Counties: Alamance, Caswell)
*Bed count includes one Thomas S. bed; **Bed count includes two Thomas S. beds; ***Bed count includes three Thomas S. beds; ****Bed count includes five Thomas S. beds; *****Bed count includes six Thomas S. beds

County Child Adult
Certif. Vendor Number
TOTAL BEDS
(Appr. + Cert.)
CON Project Number
Total Beds
Certif.
Approved, Not Yet
CertifiedLocal
Management Entity (LME) Name of Provider
Table 17A: Inventory of ICF/MR Facilities and Beds
OPC, continuedOrange 3821 6 34603P 6
Orange 5026 6 34610U 6
Person 4576 6 34607W 6Cates Street ICF/MR Group Home Person 3960 6 346144 6TOTAL OPC 0 0 47 47
Durham Durham 3601 5 346333 5
Durham 3992 6 34602T 6Keywest Center, Athens Avenue Durham 3601 6 346548 6Chandler Road Group Home (RHA) Durham 2594 6 346508 6 *
Durham 2596/4054 6 346218 6Mineral Springs I (RHA) Durham 2598 6 346132 6 *Mineral Springs II (RHA) Durham 2600 6 346132 6 *
Durham 2602/4057 6 346112 6 **SCI-Triangle House I (Tyonek Dr.) Durham 3819 6 346234 6SCI- Triangle House II (Tyonek Dr.) Durham 3820 6 346243 6VOCA - Otis Group Home Durham 3848 6 346355 6VOCA - Obie Group Home Durham 3849 6 346532 6
Durham 3850 6 346001 6TOTAL DURHAM 0 0 77 77
Five County Granville 1077 5 346229 5
Granville 3250/4059 6 346536 6 *
Granville 3249/4050 6 346555 6
Granville 3251/4060 6 346574 6 **
Halifax 4303 6 34605G 6
Halifax 4305 6 34605G 6
Halifax 3700 6 346196 6
Halifax 3702 6 346323 6
Halifax 5116 6 34612A 6Life, Inc. (214 McFarland, Enfield) Child Halifax 5117 6 34611Z 6TOTAL FIVE COUNTY 0 0 59 59
Sandhills Anson 3654 6 346395 6Old Farm Road Home (Raeford) Hoke 2618 6 346375 6 *Ashley Heights Home (Aberdeen) Hoke 2616 6 346403 6 *
Montgomery 4851 6 34609X 6
Montgomery 3655 6 346412 6Sherwood Park Home (Aberdeen) Moore 1921 15 346520 15
Moore 4188 6 34604J 6
Moore 4187 6 34604W 6
Moore 3657 6 346340 6
Randolph 4744 6 34608F 6
Randolph 4743 6 34608T 6
Richmond 5 346332 5
Richmond 3658 6 346491 6
Richmond 4857 9 34611G 9
(Counties: Franklin, Granville, Halifax,
Vance, Warren)
(Counties: Anson, Harnett, Hoke, Lee,
Montgomery, Moore, Randolph, Richmond)
Hoffman Group Home (Lifeskills,Rt. 1, Hoffman)Pence Place (295 Airport Road, Rockingham)
Magnolia Drive Home (Lifeskills, Aberdeen)
Brookwood (313 E. Brookwood - Liberty)Timberlea G.H. (5691 Mack Lineberry Rd. - Climax)Sandhills ICF/MR Group Home (142 Mallard Lane)
Montgomery Co. G.H. (205 E. 1st Ave., Mt. Gilead)Myrtlewood Group Home - Lifeskills (Mt. Gilead)
Moore Co. Adult Autistic Hm. (Devonshire Trail, Aberdeen)Moore Co. Grp. Hm.-Autistic Adol. (Southern Pines)
Residential Services, 901 Shady Lawn Dr., Chapel HillResidential Services (802 Christopher Road)Frank St. Group Home-Adults (719 Frank St.)
Durham ICF/MR Group Home (Seven Oaks Rd.)Durham Autistic Adults (5004 Kenwood Rd.)
Lynn Road Group Home (RHA) (515 Lynn Rd.)
Holloway Street Group Home (RHA) (1409 Holloway)
VOCA -Gentry Group Home (Gentry Drive)
Granville County G.H. (5509 Dorsey Road, Oxford)Dove Road Home (102 Dove Rd., Creedmoor)Stem Road Home (702 Stem Rd., Creedmoor)
Lakeview Children's Group Home (102 Midway Lane)Life, Inc. (117 S. King Street, Halifax) Child
Park Avenue Home (105 Park Ave., Creedmoor)SCI Roanoke House (103 Clearfield Dr., Roanoke Rapids) SCI Roanoke House (105 Clearfield Dr., Roanoke Rapids)Idlewood (103 Wood Glen Road) for children
Ansonville Group Home (Rt. 1, Box 126-D, Ansonville)
*Bed count includes one Thomas S. bed; **Bed count includes two Thomas S. beds; ***Bed count includes three Thomas S. beds; ****Bed count includes five Thomas S. beds; *****Bed count includes six Thomas S. beds

County Child Adult
Certif. Vendor Number
TOTAL BEDS
(Appr. + Cert.)
CON Project Number
Total Beds
Certif.
Approved, Not Yet
CertifiedLocal
Management Entity (LME) Name of Provider
Table 17A: Inventory of ICF/MR Facilities and Beds
Harnett 3625/2122 6 346341 6 *
Harnett 3628/2122 6 346345 6 *Erwin #2 (West "B" Street, Erwin) Harnett 3635/2122 6 346342 6 *
Lee 2060 15 346361 15VOCA/ 6th St.Group Home (Sanford) Lee 3961 6 34604R 6VOCA/ Hickory II Group Home (Sanford) Lee 3964 6 34604P 6Pine Ridge (7003 Arthur Maddox Road) Lee 4671 6 34608G 6 *****
Lee 2571 10 346407 10TOTAL SANDHILLS 0 0 156 156
Bladen 3659 6 34601X 6Midlake Residential (Hwy 211 East) Bladen 4316 6 34603M 6Riverside Residential (Brooks and Elm St.) Columbus 4315 6 34603J 6 *Strawberry House (303 N. Howard St.) Columbus 3651 6 34601Y 6Corbel Residential (Creek Road-Orrum) Robeson 4673 6 34609H 6 *****
Robeson 3653 6 34602M 6
Robeson 3306/3630 6 346479 6 *Wakulla #1 Robeson 3307/3633 6 346529 6 *Wakulla #2 Robeson 3308/3632 6 346529 6Scotland Forest (Maxton) Scotland 3309/3626 6 346561 6 *
Scotland 3310/3627 6 346563 6 *
Scotland 3311/3629 6 346565 6TOTAL SOUTHEASTERN REGIONAL 0 0 72 72My Place (Hogan Street, Fayetteville) Cumberland 2819/3642 6 346442 6 *
Cumberland Thomas S. - Decatur (7559 Decatur Dr.) Cumberland 3914 6 34602E 6 *****Hope Mills (Newton Street, Hope Mills) Cumberland 2938 6 346448 6
Cumberland 3915 6 346050 6 *****
Cumberland 3639 6 346578 6
Cumberland 3284 5 346591 5
Cumberland 2940/3809 6 346584 62001 Southern Ave. (Fayetteville) Cumberland 2627/5833 6 346447 6 *
Cumberland 4460 6 34604Z 6
Cumberland 4310 6 34607U 6
Cumberland 3304/4027 12 346594 12TOTAL CUMBERLAND 0 0 71 71
Johnston Johnston 3621 6 346527 6
Johnston 3620 6 346511 6
Johnston 3962 6 34605R 6
Johnston 3963 6 34605U 6Country Manor Home (Rt. 1, Box 420) Johnston 3622 6 346516 6TOTAL JOHNSTON 0 0 30 30Blanch Drive (Raleigh) Wake 2568/4431 6 346421 6Dartmouth Group Home (Raleigh) Wake 2566/3986 6 346476 6Forest Creek Group Home (Raleigh) Wake 2567/3985 6 346477 6
Wake 2563/4432 6 346380 6
Wake 22 7614-06 22
Wake 2564/4433 6 346390 6
Wake 2565/4434 6 346385 6
Wake 2620 20 346504 20
(Counties: Bladen, Columbus, Robeson,
Scotland)
Sandhills, continued
Wake
Rolling Meadows Group Home (Rolling Meadows Dr., Raleigh)Swift Drive Group Home (Swift Dr., Raleigh)Tammy Lynn Center/Children (739 Chappell Dr.)
VOCA Greenwood Group Home (Smithfield)VOCA Laurelwood Group Home (Laurelwood Dr., Smithfield)
Georgia Court Group Home (Georgia Court, Cary)Hilltop Home (Raleigh) Transferred Beds from O'Berry Center
Holiday's Place Group Home (Quail Meadow Rd)Strickland Bridge, A&B (934 Strickland Bridge Rd.)
Canterbury Road Home (Canterbury Rd., Smithfield)RHAHeath Avenue Home (E. Heath Ave., Smithfield)RHA
Extra Special Care (Kilmory Street, Fayetteville) "No Place Like Home" (Rt. 24, Fayetteville)
Wilmington Rd. Group Home (Fayetteville)
Northside Grp. Hm.-for Autistic Adults (3301 Barksdale Dr.)
Eastbrook Group Home (110 Eastbrook Dr.)
Lee Forest G. H (1209 Pelham Drive, Laurinburg)College Park G.H. (1900 Lake Drive, Laurinburg)
Thomas S. - Kinlaw (Kinlaw Road, Fayetteville)
Skill Creations of Sanford (Hawkins Ave., Sanford)
T L C Home, Inc. (Hawkins Ave., Sanford)
LifeSkills-Northridge Group Home (Rt.1, Mitchell Ford Rd.)
Westside Residential Program (Rt. 1, Creek Rd.)
Erwin Avenue Home (Erwin Ave., Erwin)RHALillington Group Home (Rt. 1, Lillington)RHA
Southeastern Regional
*Bed count includes one Thomas S. bed; **Bed count includes two Thomas S. beds; ***Bed count includes three Thomas S. beds; ****Bed count includes five Thomas S. beds; *****Bed count includes six Thomas S. beds

County Child Adult
Certif. Vendor Number
TOTAL BEDS
(Appr. + Cert.)
CON Project Number
Total Beds
Certif.
Approved, Not Yet
CertifiedLocal
Management Entity (LME) Name of Provider
Table 17A: Inventory of ICF/MR Facilities and Beds
Wake 1761 10 346335 10
Wake 3861 6 34600G 6
Wake 3859 6 34600J 6
Wake 3864 6 34600H 6
Wake 3860 6 34600W 6
Wake 3989 6 34602G 6Educare-Electra Drive Group Home Wake 4435 6 34605A 6
Wake 4437 6 34603F 6
Wake 4438 6 34606V 6
Wake 4436 6 34606U 6
Wake 3966 6 34605M 6
Wake 4061 6 34605J 6 *****
Wake 4062 6 34605W 6 *****
Wake 3967 6 34605N 6TOTAL WAKE 22 0 144 166Lockwood St. Group Home, Supply Brunswick 3649 6 34601W 6Folly St. Group Home, Supply Brunswick 3650 6 34601V 6Robin Hood G.H. (1507 Robin Hood Rd.) New Hanover 4020 6 34602N 6
New Hanover 4021 6 34602A 6
New Hanover 3686/2614 6 346452 6
New Hanover 3687/2614 6 346453 6
New Hanover 3662/3663 12 346250 12
New Hanover 4767 6 34608W 6Myrtle Grove Group Home New Hanover 3688/2614 6 346249 6TOTAL SOUTHEASTERN CENTER 0 0 60 60
Onslow-Carteret Onslow 3291/5597 6 346496 6
Onslow 6025-99 8 346346496 8
Onslow 3672/4603 6 346249 6Sand Ridge I (199 Cinnamon Dr.) Onslow 3673/4600 6 346249 6Sand Ridge IV (194 Cinnamon Dr.) Onslow 4602 6 346249 6
Onslow 4586 6 34605Y 6Sand Ridge II (197 Cinnamon Dr.) Onslow 3673/4601 6 346249 6Life Inc. (Grey Fox Run, Newport) Carteret 4320 6 34606F 6Life Inc. (Nine Foot Road, Newport) Carteret 4319 6 34606G 6TOTAL ONSLOW-CARTERET 0 0 56 56
Beacon Center Wilson 4321 6 34603H 6
Wilson 4322 6 34603U 6
Wilson 3724 6 346312 6 *****
Wilson 4679 6 34610M 6 *****
Wilson 2166/2172 15 346416 15
Edgecombe 2165/2171 15 346401 15
Nash 3665 6 346133 6
Nash 4608 6 34606M 6
Nash 3664/3897 6 346065 6 *TOTAL BEACON CENTER 0 0 72 72
SCI - Nash House II (Hawthorne Rd., Rocky Mount)
Skill Creations of Wilson (264 Hwy at Butterfield Lane)Skill Creations of Tarboro (W. Blvd., Tarboro)SCI - Nash House I (Kinchen Dr., Rocky Mount)Life Inc. - Green Tea Lane Group Home (1320 Green Tea Lane)
Life Inc./Raven Ridge G.H. (4105 Raven Ridge Drive)Life Inc./McKeel Loop G.H. (5910 Farmwood Loop Rd)NOVA-IC, Inc., Wilson G.H.#3 (7233 Great Swamp Loop)Nova-IC Inc.Wilson Grp Home #8 (7225 Great Swamp Loop)
Carobell - Queen's Pond (561 Queen's Creek Rd., Hubert)Carobell - Virginia Franks (561 Queen's Creek Rd., Hubert)
Sand Ridge III (195 Cinnamon Dr., Hubert)
Country View Residential (Firetower Rd., Richlands)
Echo Farms Group Home (Dorchester Place, Wilmington)Greenville Loop Group Home (Wilmington)SCI - Coastal House I and II (Lake Shore Dr., Wilmington)Life, Inc. (103 Cherokee Trail, Wilmington)
VOCA Mason Group Home (306 N. Mason St., Apex)
Southeastern Center
Robert E. Lee G.H./Cape Fear (1519 Robert E. Lee Dr.)
Rockwood Drive G. Home (4409 Rockwood Dr.)VOCA - Olive St. G. Home (Olive St., Apex)Avent Ferry Rd. G. Home (904 Avent Ferry, Holly Springs)Trotters Bluff G. Home (912 Avent Ferry, Holly Springs)
VOCA-Creekway (424 Creekway Drive, Fuquay Varina)Dickens Dr. G.H. (113 Dickens Dr.) (Autistic)
Stonegate Drive G.Home (8609 Stonegate Dr.)
Tammy Lynn Center/Adults Residential (737 Chappell Dr.)VOCA - Hickory Group Home (Hickory Ave., Holly Springs)VOCA - Country Group Home (Country Lane, Holly Springs) Jade Tree Group Home (Jade Tree Lane, Raleigh)
Helmsdale G.H.-Educare (1317 Helmsdale Dr., Cary)
Wake, continued
(Counties: Brunswick, New Hanover, Pender)
(Counties: Edgecombe, Greene,
Nash, Wilson)
*Bed count includes one Thomas S. bed; **Bed count includes two Thomas S. beds; ***Bed count includes three Thomas S. beds; ****Bed count includes five Thomas S. beds; *****Bed count includes six Thomas S. beds

County Child Adult
Certif. Vendor Number
TOTAL BEDS
(Appr. + Cert.)
CON Project Number
Total Beds
Certif.
Approved, Not Yet
CertifiedLocal
Management Entity (LME) Name of Provider
Table 17A: Inventory of ICF/MR Facilities and Beds
Craven 125 346279 125
Craven 4324/3099 6 346459 6
Craven 4325/3097 6 346440 6
Craven 4323/3098 6 346441 6
Craven 5386/3689 6 346194 6
Craven 3690 5 346427 5
Craven 4893 6 34610J 6
Pitt 4318 6 346304 6
Pitt 3095 6 346530 6
Pitt 3096/5832 6 346541 6
Pitt 2161/2167 15 346425 15SCI East (468 Cooper St., Winterville) Pitt 4307 6 34603T 6Howell Center-Greenville (500 Sean Drive) Pitt 4306 6 34603T 6
Pitt 5115 6 34610W 6
Pitt 5114 6 34610V 6
Hertford 4761 6 34PEND 6
Beaufort 3677 6 346393 6
Beaufort 3676 6 346226 6
Beaufort 5036 6 34610A 6
Beaufort 5035 6 34610Y 6
Beaufort 4967 6 34611A 6TOTAL EAST CAROLINA BEHAVIORAL HEALTH 0 0 253 253
Albemarle Washington 4966 6 6
Washington 4964 6 6
Martin 4965 6 34610G 6
Chowan 4768 6 34607P 6
Chowan 5037 6 34610N 6
Chowan 5038 6 34610P 6
Chowan 5039 6 34610R 6TOTAL ALBEMARLE 0 0 42 42Skill Creations of Kenansville (Stokes St.) Duplin 2169 15 346370 15
Eastpointe Duplin 3728 6 346058 6 *****SCI-Duplin Home (101 Orville St.) Duplin 4304 6 34602P 6
Lenoir 113 346034 113Howell's Child Care / (100 Howell Drive) Lenoir 12 346259 12
Lenoir 3726 6 346289 6 *****
Lenoir 1654 5 346321 5
Lenoir 4677 6 34608V 6 *****
Lenoir 2164/2170 15 346386 15
Sampson 2082 15 346347 15 *Howell's Child Care / Walnut Creek Wayne 37 346193 37
Wayne 4327 6 346319 6
Howell's Child Care / Bear Creek (LaGrange)
NOVA-IC, Inc. - Lenoir Co. Group (405 W. Washington)Our Homes, Inc., Roseanne (900 Roseanne Dr., Kinston)NOVA-IC, Inc. - Lenoir Co. Group (407 W. Washington)
Life, Inc.(Coke Avenue G. H.- 255 Coke Avenue Edenton)Life, Inc.(Chowan G.H.- 249 Coke Avenue-Edenton)Life, Inc. (Albemarle G.H. 243 Coke Avenue-Edenton)
Duplin County Group Home (Rt. 1, Mt. Olive)
Skill Creations of Kinston (Doctor's Dr., Kinston)Skill Creations of Clinton (Forest Trail, Clinton)
Life Inc. -William St. Grp. Home (N. William St., Goldsboro)
Life Inc./ Wilson St. GH (1116 Wilson St. Ext., Plymouth)Life Inc./Old Roper GH (206 A Old Roper Rd. Plymouth )Life Inc./Twin Acres GH (2767 Wildcat Rd-- Williamston)Life Inc. (Luke Street G.H. 697 Luke St.-Edenton)
Life Inc./Edgewood (506 Edgewood Dr., Chocowinity)Life, Inc./Slatestone Road G.H. (332 Slatestone Road)Life,Inc/Beaufort Heights GH (103 Circle Street)Life Inc./Minute Man GH (588 Minute Man Lane)
Howell's King George G.H. (323 King George Road)Howell's Forest Hills G.H. (1913 Forest Hills Drive)Roanoke Place (704 Carolina Ave., Ahoskie)Life, Inc./Dixon Road Group Home (Chocowinity)
Pitt Co. Hm. for MR Autistic Persons (Fairway Dr., Grifton)Pitt County Group Home #2 (S. Edge Road, Ayden)Pitt County Group Home #3 (401 N. Pitt St., Grifton)Skill Creations of Greenville (W. 5th St., Greenville)
Life, Inc./Oakdale (907 Oakdale, New Bern)Craven County Children's Home (3000 Brices Creek Rd)ARC/HDS Craven #2 Group Home (2401 Dogwood Dr)Craven Co Children's Group Home #2 (3010 Brices Crk Rd)
Howell's Child Care, Riverbend (140 Pirate's Rd., New Bern)Life, Inc./Cherry Lane G.H. (1104 Cherry Lane,New Bern)Life, Inc./Lavenham G.H. (3700 Lavenham Rd, New Bern)
East Carolina Behavioral Health
(Counties: Beaufort, Bertie, Craven, Gates,
Hertford, Jones, Pamlico, Pitt, Northampton)
(Counties: Camden, Chowan, Currituck, Dare, Hyde, Martin,
Pasquotank, Perquimans, Tyrrell,
Washington)
(Counties: Duplin, Lenoir, Sampson,
Wayne)
*Bed count includes one Thomas S. bed; **Bed count includes two Thomas S. beds; ***Bed count includes three Thomas S. beds; ****Bed count includes five Thomas S. beds; *****Bed count includes six Thomas S. beds
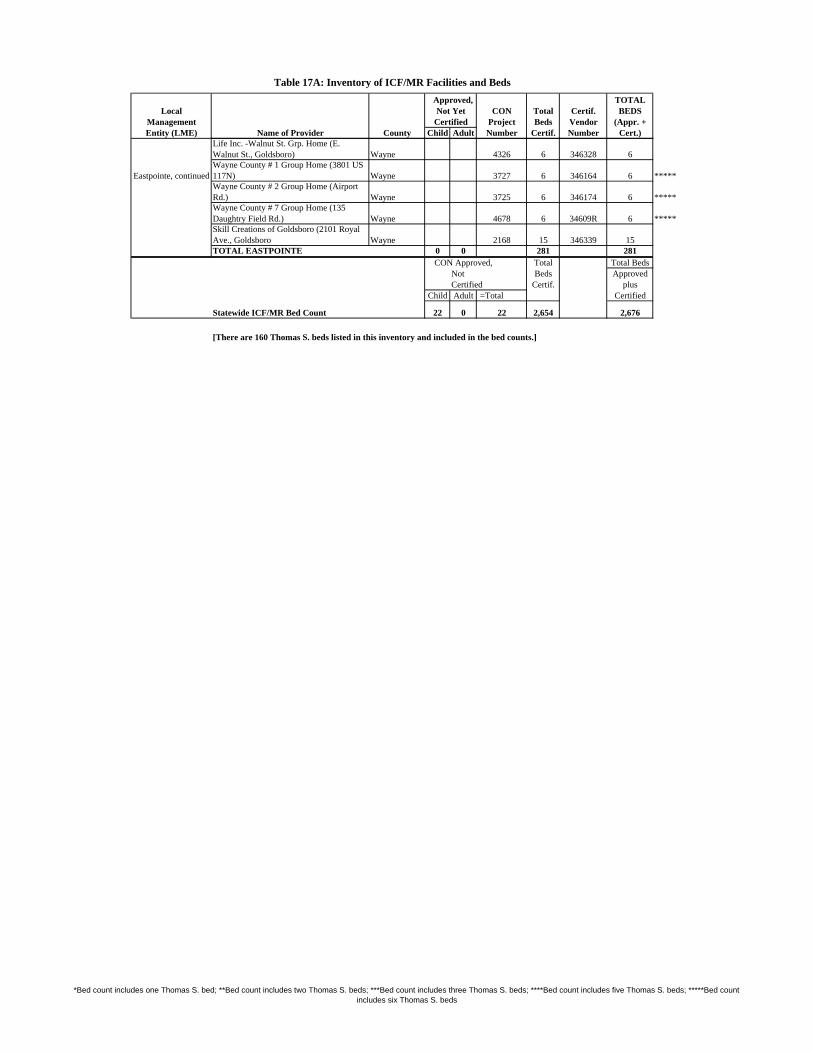
County Child Adult
Certif. Vendor Number
TOTAL BEDS
(Appr. + Cert.)
CON Project Number
Total Beds
Certif.
Approved, Not Yet
CertifiedLocal
Management Entity (LME) Name of Provider
Table 17A: Inventory of ICF/MR Facilities and Beds
Wayne 4326 6 346328 6
Wayne 3727 6 346164 6 *****
Wayne 3725 6 346174 6 *****
Wayne 4678 6 34609R 6 *****
Wayne 2168 15 346339 15TOTAL EASTPOINTE 0 0 281 281
CON Approved, Total Total Beds Not Beds Approved
Certified Certif. plusChild Adult =Total Certified
Statewide ICF/MR Bed Count 22 0 22 2,654 2,676
[There are 160 Thomas S. beds listed in this inventory and included in the bed counts.]
Wayne County # 1 Group Home (3801 US 117N)Wayne County # 2 Group Home (Airport Rd.)Wayne County # 7 Group Home (135 Daughtry Field Rd.) Skill Creations of Goldsboro (2101 Royal Ave., Goldsboro
Life Inc. -Walnut St. Grp. Home (E. Walnut St., Goldsboro)
Eastpointe, continued
*Bed count includes one Thomas S. bed; **Bed count includes two Thomas S. beds; ***Bed count includes three Thomas S. beds; ****Bed count includes five Thomas S. beds; *****Bed count includes six Thomas S. beds

Local Thomas S. CON CertificationManagement County Provider Beds In Project VendorEntity (LME) Facility Number Number
Ashe Ridgecrest I (West Jefferson) 1 3482/3586 346130Ashe Ridgecrest II (West Jefferson) 1 3481/3587 346130Ashe Thomas Street Home (Jefferson) 1 3480/3588 346150Wilkes Lewis Fork I and II (Ferguson) 2 2657 346512Alexander Comserve / Ellendale Group Home Taylorsville 3 4452 34610BCaldwell Comserve/Lenoir I 2 4453Caldwell Comserve/Lenoir II 2 4455
Pathways Lincoln Linoak G.H. (3175 Bank St.) 6 4050 34602UBurke Comserve / Chesterfield Group Home Morganton 2 4457 34607XCatawba Penny Lane 1 (Claremont) 1 2642/3589 346426Catawba Penny Lane 2 (Claremont) 1 2644/3591 346475Catawba Shannonbrook Home (Newton) 1 2636/3590 346521Catawba 23rd St. Home (Newton) 1 2640/3583 346465Catawba Wendover Home (Maiden) 1 2638/3592 346523
Piedmont Rowan Procomm/Pinelane 6 4049 34607AIredell Procomm/Hollingsworth Home (Hollingsworth Dr.) 6 4051 34602V
Crossroads Iredell Procomm/Sharon 6 4052 34606ZYadkin Yadkin I (Rt. 2, Hamptonville) 1 3301/3597 346126Yadkin Yadkin II (Rt. 1, Hamptonville) 1 3302/3596 346178Yadkin Yadkin III (Rt. 1, Hamptonville) 1 3303/3595 346178Davie Boxwood Acres Home 1 2527/3594 346525Davie Pleasant Acres Home 1 2529/3593 346522Davie Twin Brooks/Davie #3 (Mocksville) 1 2531/3598 346524Rockingham Rouses Group Home (Stoneville) 5 3798 346301Durham Chandler Road Group Home (RHA) 1 2594/4053 346508
Durham Durham Mineral Springs I (RHA) 1 2598/4055 346132Durham Mineral Springs Home II (RHA) 1 2600/4056 346132Durham Holloway Street G.H. RHA (1409 Holloway) 2 2602/4057 346112
Five County Granville Dove Road Home (Creedmore) 1 3250/4059 346536Granville Park Avenue Home 2 3251/4060 346574Hoke Old Farm Road (Raeford) 1 2618 346375
Sandhills Hoke Ashley Heights Home (Aberdeen) 1 2616 346403Harnett Erwin Ave. Group Home (Erwin) 1 3625/2122 346341Harnett Lillington Group Home (Rt. 1, Lillington) 1 3628/2122 346345Harnett Erwin # 2 ICF/MR G.H. (W. "B" St., Erwin) 1 3635/2122 346342Lee Lee I Group Home 6 4671 34608GColumbus Columbus Group Home (Whiteville) 1 4315 34603JColumbus PC Contract/Columbus GH III (Whiteville) 6 4673 34609HRobeson East Brook Group Home 1 3306/3630 346479Robeson Wakulla #1 1 3307/3633 346529Scotland Scotland Forest (Maxton) 1 3309/3626 346561Scotland Lee Forest Group Home (Laurinburg) 1 3310/3627 346563Cumberland Peterkin/My Place (Hogan St., Fayetteville) 1 2819/3642 346442
Cumberland Cumberland Peterkin-Thomas S. (7559 Decatur) 6 3914 34602ECumberland Peterkin-Thomas S. (Kinlaw Road, Fayetteville) 6 3915 346050Cumberland CMHC / 2001 Southern Avenue (Fayetteville) 1 2627 346447
Wake Wake Procomm/Capt. Healthcare (Lot 2, Avent Ferry Rd.) 6 4061 34605JWake Procomm/Capt. Healthcare (Lot 4, Avent Ferry Rd.) 6 4062 34605W
Beacon Center Wilson NOVA-IC Inc. 6 4679Wilson NOVA-IC Inc. / Wilson Co. Group Home (Rt. 2, Lucama) 6 3724 346312Nash SCI Nash House II (Hawthorne Road) 1 3664/3897 346065Wayne Wayne Co. Group Home #1 (Rt. 8, Box 136) 6 3727 346164
Eastpointe Wayne NOVA-IC Inc. 6 4678 34609RWayne Wayne Co. Group Home #2 (Rt. 8, Box 135) 6 3725 346174Lenoir NOVA-IC Inc. 6 4677 34608VLenoir Lenoir Co. Group Home (LaGrange) 6 3726 346289Sampson Skill Creations of Clinton (Forest Trail, Clinton) 1 2082 346347Duplin Duplin Co. Group Home (Rt. 1, Mt. Olive) 6 3728 346058STATE TOTAL 160
Note: All 160 beds are part of the inventory in Table 17A.
Table 17B: Thomas S. Bed Inventory
Smoky Mountain
Mental Health Partners
Southeastern Regional
Centerpoint

Local Management Number of Reason for
Facility Name HSA Entity (LME) Certified Beds ExclusionJ. Iverson Riddle
Developmental Center I Mental Health Partners 493 State Facility
Murdoch Center II Five County 660 State Facility
O'Berry Center IV Eastpointe 485 State Facility
Caswell Center IV Eastpointe 813 State Facility
2,451
Carolina Living & Learning II Orange-Person-Chatham 15 Demonstration Project
Group Homes for the Autistic III Piedmont 15 Demonstration Project
Howell's A&B IV East Carolina Behavioral 30 Demonstration Project
60Total Excluded Beds 2,511
Table 17C: Beds Excluded from ICF/MR Inventory
State Facility Total
Demonstration Project Total

Appendix A:North Carolina Counties by Health Service Area Appendix B: Partial Listing of Health Planning Acronyms Appendix C: List of Contiguous Counties Appendix D: North Carolina’s Certificate of Need Statute Appendix E: Regulation of Detoxification Services Provided in Hospitals Licensed under Article 5, Chapter 131E, of the General Statutes
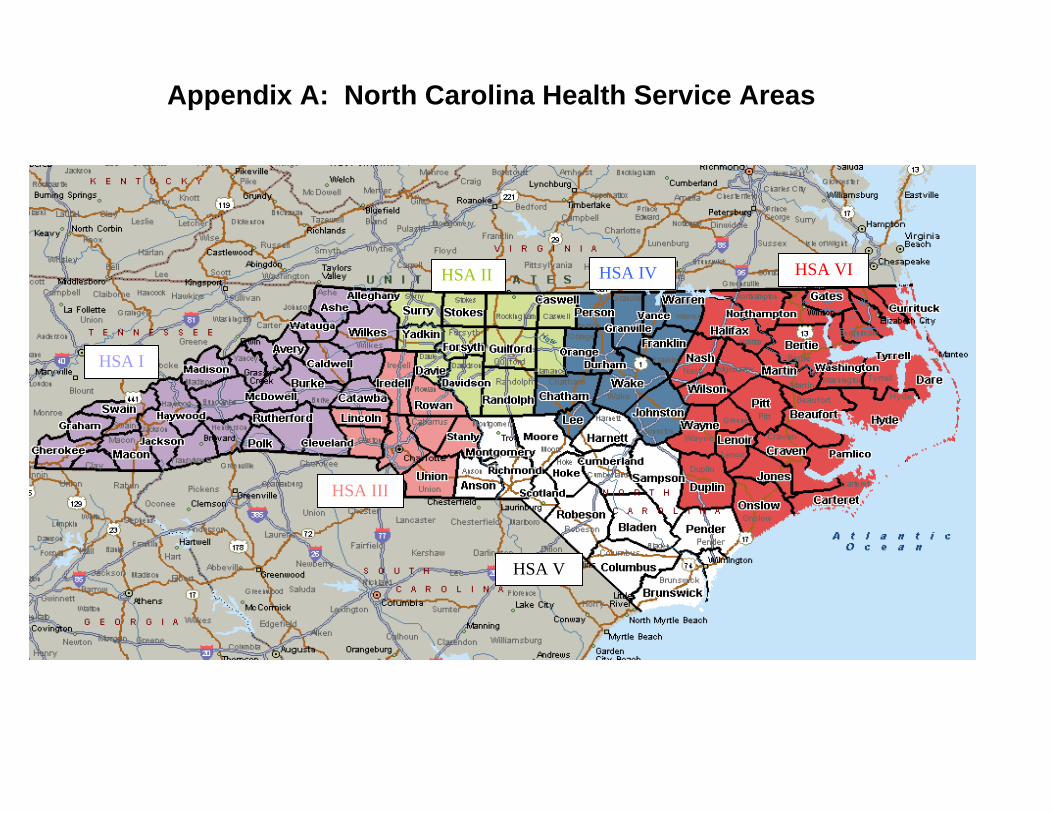
Appendix A: North Carolina Health Service Areas
HSA I
HSA IVHSA II
HSA V
HSA III
HSA VI

Appendix B: Medical Facilities Planning Acronyms/Terms
Statute 131 E – 175 et. seq. – Certificate of Need Law Acronym / Term Refers to / Meaning
AC Acute Care ACH Adult Care Home ACS Acute Care Services AIDS Acquired Immune Deficiency Syndrome APA Administrative Procedures Act ASC Ambulatory Surgery Center CAP MR/DD Community Alternatives Program for Mentally Retarded/Developmentally Disabled Persons (same as CAP/MR Waiver Program) CCRC Continuing Care Retirement Community CD Chemical Dependency CMS Centers for Medicare and Medicaid Services (Federal Agency) COG Council of Governments CON Certificate of Need CON Section Certificate of Need Section (A section within DHSR that reviews applications and
awards Certificates of Need) CPT Current Procedural Terminology (code set maintained by the American Medical
Association) C-Section Cesarean Section DD Developmental Disability DFS Division of Facility Services which has now become the DHSR DHSR Division of Health Service Regulation DHHS Department of Health and Human Services DMA Division of Medical Assistance DMH/DD/SAS Division of Mental Health, Developmental Disabilities and Substance Abuse Services DRG Diagnosis Related Group DSM III R Diagnostic and Statistical Manual of Mental Disorders (revised) Endo Endoscopy ESRD End-Stage Renal Disease ESTV Equivalent Simple Treatment Visits ESWL Extracorporeal Shock Wave Lithotripsy GS General Statute(s) HCUP Healthcare Cost and Utilization Project HIV+ Infection with Human Immunodeficiency Virus HH Home Health HSA Health Service Area HUD Housing and Urban Development (Federal Agency) ICD International Classification of Diseases ICF/MR Intermediate Care Facility for the Mentally Retarded ICU Intensive Care Unit IP Inpatient LME Local Management Entity LRA License Renewal Application

LTC Long-Term Care LTCH Long Term Care Hospital MARC Mid-Atlantic Renal Coalition MDC Major Diagnostic Category MFP Section Medical Facilities Planning Section (A section within DHSR that assists with preparation of the State Medical Facilities Plan) MH Mental Health MRI Magnetic Resonance Imaging Scanner NCAC North Carolina Administrative Code (also known as: Rules) NH Nursing Home and Nursing Care Facilities OP Outpatient OR Operating Room PET Positron Emission Tomography Scanner Plan North Carolina State Medical Facilities Plan PSY Psychiatric QAV Quality, Access and Value SA Substance Abuse SDR Semiannual Dialysis Report (prepared by the Medical Facilities Planning Section) SEKC Southeastern Kidney Council (Federal contract agency which collects dialysis data) SHCC State Health Coordinating Council (Official Title: North Carolina State Health Coordinating Council) SMFP State Medical Facilities Plan

Appendix C: List of "Contiguous Counties"
For purposes of the State Medical Facilities Plan, the Medical Facilities Planning Section defines contiguousgroupings in relation to a base county and includes any North Carolina county that touches that base county.
ALAMANCE ALEXANDER ALLEGHANY ANSON ASHE AVERYCaswell Caldwell Ashe Montgomery Alleghany BurkeChatham Catawba Surry Richmond Watauga CaldwellGuilford Iredell Wilkes Stanly Wilkes McDowellOrange Wilkes Union MitchellRandolph WataugaRockingham
BEAUFORT BERTIE BLADEN BRUNSWICK BUNCOMBE BURKECraven Chowan Columbus Columbus Haywood AveryHyde Halifax Cumberland New Hanover Henderson CaldwellMartin Hertford Pender Pender Madison CatawbaPamlico Martin Robeson McDowell ClevelandPitt Northampton Sampson Rutherford LincolnWashington Washington Yancey McDowell
Rutherford
CABARRUS CALDWELL CAMDEN CARTERET CASWELL CATAWBAIredell Alexander Currituck Craven Alamance AlexanderMecklenburg Avery Gates Jones Orange BurkeRowan Burke Pasquotank Onslow Person CaldwellStanly Catawba Rockingham Cleveland Union Watauga Iredell
Wilkes Lincoln
CHATHAM CHEROKEE CHOWAN CLAY CLEVELAND COLUMBUSAlamance Clay Bertie Cherokee Burke BladenDurham Graham Gates Macon Catawba BrunswickHarnett Macon Hertford Gaston PenderLee Perquimans Lincoln RobesonMoore RutherfordOrangeRandolphWake
CRAVEN CUMBERLAND CURRITUCK DARE DAVIDSON DAVIEBeaufort Bladen Camden Currituck Davie DavidsonCarteret Harnett Dare Hyde Forsyth ForsythJones Hoke Tyrrell Guilford IredellLenoir Moore Montgomery RowanPamlico Robeson Randolph YadkinPitt Sampson Rowan
Stanly

DUPLIN DURHAM EDGECOMBE FORSYTH FRANKLIN GASTONJones Chatham Halifax Davidson Granville ClevelandLenoir Granville Martin Davie Halifax LincolnOnslow Orange Nash Guilford Johnston MecklenburgPender Person Pitt Rockingham NashSampson Wake Wilson Stokes VanceWayne Surry Wake
Yadkin Warren
GATES GRAHAM GRANVILLE GREENE GUILFORD HALIFAXCamden Cherokee Durham Lenoir Alamance BertieChowan Macon Franklin Pitt Davidson EdgecombeHertford Swain Person Wayne Forsyth FranklinPasquotank Vance Wilson Randolph MartinPerquimans Wake Rockingham Nash
Stokes NorthamptonWarren
HARNETT HAYWOOD HENDERSON HERTFORD HOKE HYDEChatham Buncombe Buncombe Bertie Cumberland BeaufortCumberland Henderson Haywood Chowan Harnett DareHoke Jackson Polk Gates Moore TyrrellJohnston Madison Rutherford Northampton Richmond WashingtonLee Swain Transylvania RobesonMoore Transylvania ScotlandSampson Wake
IREDELL JACKSON JOHNSTON JONES LEE LENOIRAlexander Haywood Franklin Carteret Chatham CravenCabarrus Macon Harnett Craven Harnett DuplinCatawba Swain Nash Duplin Moore GreeneDavie Transylvania Sampson Lenoir JonesLincoln Wake Onslow PittMecklenburg Wayne WayneRowan WilsonWilkesYadkin
LINCOLN McDOWELL MACON MADISON MARTIN MECKLENBURGBurke Avery Cherokee Buncombe Beaufort CabarrusCatawba Buncombe Clay Haywood Bertie GastonCleveland Burke Graham Yancey Edgecombe LincolnGaston Mitchell Jackson Halifax IredellIredell Rutherford Swain Pitt UnionMecklenburg Yancey Washington

MITCHELL MONTGOMERY MOORE NASH NEW HANOVER NORTHAMPTONAvery Anson Chatham Edgecombe Brunswick BertieMcDowell Davidson Cumberland Franklin Pender HalifaxYancey Moore Harnett Halifax Hertford
Randolph Hoke Johnston WarrenRichmond Lee WakeRowan Montgomery WarrenStanly Randolph Wilson
RichmondScotland
ONSLOW ORANGE PAMLICO PASQUOTANK PENDER PERQUIMANSCarteret Alamance Beaufort Camden Bladen ChowanDuplin Caswell Craven Gates Brunswick GatesJones Chatham Perquimans Columbus PasquotankPender Durham Duplin
Person New HanoverOnslowSampson
PERSON PITT POLK RANDOLPH RICHMOND ROBESONCaswell Beaufort Henderson Alamance Anson BladenDurham Craven Rutherford Chatham Hoke ColumbusGranville Edgecombe Davidson Montogomery CumberlandOrange Greene Guilford Moore Hoke
Lenoir Montgomery Scotland ScotlandMartin Moore StanlyWilson
ROCKINGHAM ROWAN RUTHERFORD SAMPSON SCOTLAND STANLYAlamance Cabarrus Buncombe Bladen Hoke AnsonCaswell Davidson Burke Cumberland Moore CabarrusForsyth Davie Cleveland Duplin Richmond DavidsonGuilford Iredell Henderson Harnett Robeson MontgomeryStokes Montgomery McDowell Johnston Richmond
Stanly Polk Pender RowanWayne Union
STOKES SURRY SWAIN TRANSYLVANIA TYRRELL UNIONForsyth Alleghany Graham Haywood Dare AnsonGuilford Forsyth Haywood Henderson Hyde CabarrusRockingham Stokes Jackson Jackson Washington MecklenburgSurry Wilkes Macon StanlyYadkin Yadkin

VANCE WAKE WARREN WASHINGTON WATAUGA WAYNEFranklin Chatham Franklin Beaufort Ashe DuplinGranville Durham Halifax Bertie Avery GreeneWarren Franklin Nash Hyde Caldwell Johnston
Granville Northampton Martin Wilkes LenoirHarnett Vance Tyrrell Sampson Johnston WilsonNash
WILKES WILSON YADKIN YANCEYAlexander Edgecombe Davie BuncombeAlleghany Greene Forsyth MadisonAshe Johnston Iredell McDowellCaldwell Nash Stokes MitchellIredell Pitt SurrySurry Wayne WilkesWataugaYadkin

Article 9
Certificate of Need
§ 131E-175. Findings of fact.
The General Assembly of North Carolina makes the following findings: (1) That the financing of health care, particularly the reimbursement of health services
rendered by health service facilities, limits the effect of free market competition and government regulation is therefore necessary to control costs, utilization, and distribution of new health service facilities and the bed complements of these health service facilities.
(2) That the increasing cost of health care services offered through health service facilities threatens the health and welfare of the citizens of this State in that citizens need assurance of economical and readily available health care.
(3) That, if left to the market place to allocate health service facilities and health care services, geographical maldistribution of these facilities and services would occur and, further, less than equal access to all population groups, especially those that have traditionally been medically underserved, would result.
(3a) That access to health care services and health care facilities is critical to the welfare of rural North Carolinians, and to the continued viability of rural communities, and that the needs of rural North Carolinians should be considered in the certificate of need review process.
(4) That the proliferation of unnecessary health service facilities results in costly duplication and underuse of facilities, with the availability of excess capacity leading to unnecessary use of expensive resources and overutilization of health care services.
(5) Repealed. (6) That excess capacity of health service facilities places an enormous economic burden
on the public who pay for the construction and operation of these facilities as patients, health insurance subscribers, health plan contributors, and taxpayers.
(7) That the general welfare and protection of lives, health, and property of the people of this State require that new institutional health services to be offered within this State be subject to review and evaluation as to need, cost of service, accessibility to services, quality of care, feasibility, and other criteria as determined by provisions of this Article or by the North Carolina Department of Health and Human Services pursuant to provisions of this Article prior to such services being offered or developed in order that only appropriate and needed institutional health services are made available in the area to be served.
(8) That because persons who have received exemptions under Section 11.9(a) of S.L. 2000-67, as amended, and under Section 11.69(b) of S.L. 1997-443, as amended by Section 12.16C(a) of S.L. 1998-212, and as amended by Section 1 of S.L. 1999-135, have had sufficient time to complete development plans and initiate construction of beds in adult care homes.
(9) That because with the enactment of this legislation, beds allowed under the exemptions noted above and pending development will count in the inventory of adult care home beds available to provide care to residents in the State Medical Facilities Plan.
(10) That because State and county expenditures provide support for nearly three-quarters of the residents in adult care homes through the State County Special Assistance program, and excess bed capacity increases costs per resident day, it is in the public interest to promote efficiencies in delivering care in those facilities by controlling and directing their growth in an effort to prevent underutilization and higher costs and provide appropriate geographical distribution.

(11) That physicians providing gastrointestinal endoscopy services in unlicensed settings should be given an opportunity to obtain a license to provide those services to ensure the safety of patients and the provision of quality care.
(12) That demand for gastrointestinal endoscopy services is increasing at a substantially faster rate than the general population given the procedure is recognized as a highly effective means to diagnose and prevent cancer.
§ 131E-176. Definitions.
As used in this Article, unless the context clearly requires otherwise, the following terms have the meanings specified:
(1) "Adult care home" means a facility with seven or more beds licensed under G.S. 131D-2 or Chapter 131E of the General Statutes that provides residential care for aged or disabled persons whose principal need is a home which provides the supervision and personal care appropriate to their age and disability and for whom medical care is only occasional or incidental.
(1a) "Air ambulance" means aircraft used to provide air transport of sick or injured persons between destinations within the State.
(1b) "Ambulatory surgical facility" means a facility designed for the provision of a specialty ambulatory surgical program or a multispecialty ambulatory surgical program. An ambulatory surgical facility serves patients who require local, regional or general anesthesia and a period of post-operative observation. An ambulatory surgical facility may only admit patients for a period of less than 24 hours and must provide at least one designated operating room or gastrointestinal endoscopy room, as defined in Article 5 Part 1 and Article 6, Part 4 of this Chapter, and at least one designated recovery room, have available the necessary equipment and trained personnel to handle emergencies, provide adequate quality assurance and assessment by an evaluation and review committee, and maintain adequate medical records for each patient. An ambulatory surgical facility may be operated as a part of a physician or dentist's office, provided the facility is licensed under G.S. Chapter 131E, Article 6, Part D, but the performance of incidental, limited ambulatory surgical procedures which do not constitute an ambulatory surgical program as defined in subdivision (1c) of this section and which are performed in a physician's or dentist's office does not make that office an ambulatory surgical facility.
(1c) "Ambulatory surgical program" means a formal program for providing on a same-day basis those surgical procedures which require local, regional or general anesthesia and a period of post-operative observation to patients whose admission for more than 24 hours is determined, prior to surgery or gastrointestinal endoscopy, to be medically unnecessary.
(2) "Bed capacity" means space used exclusively for inpatient care, including space designed or remodeled for licensed inpatient beds even though temporarily not used for such purposes. The number of beds to be counted in any patient room shall be the maximum number for which adequate square footage is provided as established by rules of the Department except that single beds in single rooms are counted even if the room contains inadequate square footage. The term "bed capacity" also refers to the number of dialysis stations in kidney disease treatment centers, including freestanding dialysis units.
(2a) "Bone marrow transplantation services" means the process of infusing bone marrow into persons with diseases to stimulate the production of blood cells.
(2b) "Burn intensive care services" means services provided in a unit designed to care for patients who have been severely burned.

(2c) "Campus" means the adjacent grounds and buildings, or grounds and buildings not separated by more than a public right-of-way, of a health service facility and related health care entities.
(2d) "Capital expenditure" means an expenditure for a project, including but not limited to the cost of construction, engineering, and equipment which under generally accepted accounting principles is not properly chargeable as an expense of operation and maintenance. Capital expenditure includes, in addition, the fair market value of an acquisition made by donation, lease, or comparable arrangement by which a person obtains equipment, the expenditure for which would have been considered a capital expenditure under this Article if the person had acquired it by purchase.
(2e) Repealed. 8-26-05 (2f) "Cardiac catheterization equipment" means the equipment used to provide cardiac
catheterization services. (2g) “Cardiac catherization services” means those procedures, excluding pulmonary
angiography procedures, in which a catheter is introduced into a vein or artery and threaded through the circulatory system into the heart specifically to diagnose abnormalities in the motion, contraction, and blood flow of the moving heart or to perform surgical therapeutic interventions to restore, repair, or reconstruct the coronary blood vessels of the heart.
(3) "Certificate of need" means a written order which affords the person so designated as the legal proponent of the proposed project the opportunity to proceed with the development of such project.
(4) Repealed. (5) "Change in bed capacity" means (i) any relocation of health service facility beds, or
dialysis stations from one licensed facility or campus to another, or (ii) any redistribution of health service facility bed capacity among the categories of health service facility bed as defined in G.S. 131E-176(9c), or (iii) any increase in the number of health service facility beds, or dialysis stations in kidney disease treatment centers, including freestanding dialysis units.
(5a) "Chemical dependency treatment facility" means a public or private facility, or unit in a facility, which is engaged in providing 24-hour a day treatment for chemical dependency or substance abuse. This treatment may include detoxification, administration of a therapeutic regimen for the treatment of chemically dependent or substance abusing persons and related services. The facility or unit may be: a. A unit within a general hospital or an attached or freestanding unit of a general
hospital licensed under Article 5, Chapter 131E, of the General Statutes, b. A unit within a psychiatric hospital or an attached or freestanding unit of a
psychiatric hospital licensed under Article 1A of General Statutes Chapter 122 or Article 2 of General Statutes Chapter 122C,
c. A freestanding facility specializing in treatment of persons who are substance abusers or chemically dependent licensed under Article 1A of General Statutes Chapter 122 or Article 2 of General Statutes Chapter 122C; and may be identified as "chemical dependency, substance abuse, alcoholism, or drug abuse treatment units," "residential chemical dependency, substance abuse, alcoholism or drug abuse facilities," or by other names if the purpose is to provide treatment of chemically dependent or substance abusing persons, but shall not include social setting detoxification facilities, medical detoxification facilities, halfway houses or recovery farms.
(5b) "Chemical dependency treatment beds" means beds that are licensed for the inpatient treatment of chemical dependency. Residential treatment beds for the treatment of chemical dependency or substance abuse are chemical dependency treatment beds. Chemical dependency treatment beds shall not include beds licensed for detoxification.
(6) "Department" means the North Carolina Department of Health and Human Services.

(7) To "develop" when used in connection with health services, means to undertake those activities which will result in the offering of institutional health service or the incurring of a financial obligation in relation to the offering of such a service.
(7a) "Diagnostic center" means a freestanding facility, program, or provider, including but not limited to, physicians' offices, clinical laboratories, radiology centers, and mobile diagnostic programs, in which the total cost of all the medical diagnostic equipment utilized by the facility which cost ten thousand dollars ($10,000) or more exceeds five hundred thousand dollars ($500,000). In determining whether the medical diagnostic equipment in a diagnostic center costs more than five hundred thousand dollars ($500,000), the costs of the equipment, studies, surveys, designs, plans, working drawings, specifications, construction, installation, and other activities essential to acquiring and making operational the equipment shall be included. The capital expenditure for the equipment shall be deemed to be the fair market value of the equipment or the cost of the equipment, whichever is greater.
(7b) "Expedited review" means the status given to an application's review process when the applicant petitions for the review and the Department approves the request based on findings that all of the following are met: a. The review is not competitive. b. The proposed capital expenditure is less than five million dollars ($5,000,000). c. A request for a public hearing is not received within the time frame defined in G.S.
131E-185. d. The agency has not determined that a public hearing is in the public interest.
(7c) "Gamma knife" means equipment which emits photon beams from a stationary radioactive cobalt source to treat lesions deep within the brain and is one type of stereotactic radiosurgery.
(7d) “Gastrointestinal endoscopy room” means a room used for the performance of procedures that require the insertion of a flexible endoscope into a gastrointestinal orifice to visualize the gastrointestinal lining and adjacent organs for diagnostic or therapeutic purposes.
(8),(9) Repealed. (9a) "Health service" means an organized, interrelated medical, diagnostic, therapeutic,
and/or rehabilitative activity that is integral to the prevention of disease or the clinical management of a sick, injured, or disabled person. "Health service" does not include administrative and other activities that are not integral to clinical management.
(9b) "Health service facility" means a hospital; long-term care hospital; psychiatric facility; rehabilitation facility; nursing home facility; adult care home; kidney disease treatment center, including freestanding hemodialysis units; intermediate care facility for the mentally retarded; home health agency office; chemical dependency treatment facility; diagnostic center; hospice office, hospice inpatient facility, hospice residential care facility; and ambulatory surgical facility.
(9c) "Health service facility bed" means a bed licensed for use in a health service facility in the categories of (i) acute care beds; (ii) psychiatric beds; (iii) rehabilitation beds; (iv) nursing home beds; (v) intermediate care beds for the mentally retarded; (vi) chemical dependency treatment beds; (vii) hospice inpatient facility beds; (viii) hospice residential care facility beds; (ix) adult care home beds; and (x) long-term care hospital beds.
(10) "Health maintenance organization (HMO)" means a public or private organization which has received its certificate of authority under Article 67 of Chapter 58 of the General Statutes and which either is a qualified health maintenance organization under Section 1310(d) of the Public Health Service Act or: a. Provides or otherwise makes available to enrolled participants health care services,
including at least the following basic health care services: usual physician services,

hospitalization, laboratory, X ray, emergency and preventive services, and out-of-area coverage;
b. Is compensated, except for copayments, for the provision of the basic health care services listed above to enrolled participants by a payment which is paid on a periodic basis without regard to the date the health care services are provided and which is fixed without regard to the frequency, extent, or kind of health service actually provided; and
c. Provides physicians' services primarily (i) directly through physicians who are either employees or partners of such organizations, or (ii) through arrangements with individual physicians or one or more groups of physicians organized on a group practice or individual practice basis.
(10a) "Heart-lung bypass machine" means the equipment used to perform extra-corporeal circulation and oxygenation during surgical procedures.
(11) Repealed (12) "Home health agency" means a private organization or public agency, whether owned
or operated by one or more persons or legal entities, which furnishes or offers to furnish home health services. "Home health services" means items and services furnished to an individual by a home health agency, or by others under arrangements with such others made by the agency, on a visiting basis, and except for paragraph e. of this subdivision, in a place of temporary or permanent residence used as the individual's home as follows: a. Part-time or intermittent nursing care provided by or under the supervision of a
registered nurse; b. Physical, occupational or speech therapy; c. Medical social services, home health aid services, and other therapeutic services; d. Medical supplies, other than drugs and biologicals and the use of medical
appliances; e. Any of the foregoing items and services which are provided on an outpatient basis
under arrangements made by the home health agency at a hospital or nursing home facility or rehabilitation center and the furnishing of which involves the use of equipment of such a nature that the items and services cannot readily be made available to the individual in his home, or which are furnished at such facility while he is there to receive any such item or service, but not including transportation of the individual in connection with any such item or service.
(13) "Hospital" means a public or private institution which is primarily engaged in providing to inpatients, by or under supervision of physicians, diagnostic services and therapeutic services for medical diagnosis, treatment, and care of injured, disabled, or sick persons, or rehabilitation services for the rehabilitation of injured, disabled, or sick persons. The term includes all facilities licensed pursuant to G.S. 131E-77 of the General Statutes, except long-term care hospitals.
(13a) "Hospice" means any coordinated program of home care with provision for inpatient care for terminally ill patients and their families. This care is provided by a medically directed interdisciplinary team, directly or through an agreement under the direction of an identifiable hospice administration. A hospice program of care provides palliative and supportive medical and other health services to meet the physical, psychological, social, spiritual and special needs of patients and their families, which are experienced during the final stages of terminal illness and during dying and bereavement.
(13b) "Hospice inpatient facility" means a freestanding licensed hospice facility or a designated inpatient unit in an existing health service facility which provides palliative and supportive medical and other health services to meet the physical, psychological, social, spiritual, and special needs of terminally ill patients and their families in an inpatient setting. For purposes of this Article only, a hospital which has a contractual agreement with a licensed hospice to provide inpatient services to a hospice patient as

defined in G.S. 131E-201(4) and provides those services in a licensed acute care bed is not a hospice inpatient facility and is not subject to the requirements in G.S. 131E-176(5)(ii) for hospice inpatient beds.
(13c) "Hospice residential care facility" means a freestanding licensed hospice facility which provides palliative and supportive medical and other health services to meet the physical, psychological, social, spiritual, and special needs of terminally ill patients and their families in a group residential setting.
(14) Repealed. (14a) "Intermediate care facility for the mentally retarded" means facilities licensed pursuant
to Article 2 of Chapter 122C of the General Statutes for the purpose of providing health and habilitative services based on the developmental model and principles of normalization for persons with mental retardation, autism, cerebral palsy, epilepsy or related conditions.
(14b) Repealed. (14c) Reserved for future codification. (14d) Repealed. (14e) “Kidney disease treatment center” means a facility that is certified as an end-stage
renal disease facility by the Centers for Medicare and Medicaid Services, Department of Health and Human Services, pursuant to 42 C.F.R. § 405.
(14f) Reserved for future codification. (14g) “Linear accelerator” means a machine used to produce ionizing radiation in excess of
1,000,000 electron volts in the form of a beam of electrons or photons to treat cancer patients.
(14h) Reserved for future codification. (14i) "Lithotriptor" means extra-corporeal shock wave technology used to treat persons with
kidney stones and gallstones. (14j) Reserved for future codification. (14k) “Long-term care hospital” means a hospital that has been classified and designated as a
long-term care hospital by the Centers for Medicare and Medicaid Services, Department of Health and Human Services, pursuant to 42 C.F.R. § 412.
(14l) Reserved for future codification. (14m) "Magnetic resonance imaging scanner" means medical imaging equipment that uses
nuclear magnetic resonance. (14n) Reserved for future codification. (14o) "Major medical equipment" means a single unit or single system of components with
related functions which is used to provide medical and other health services and which costs more than seven hundred fifty thousand dollars ($750,000). In determining whether the major medical equipment costs more than seven hundred fifty thousand dollars ($750,000), the costs of the equipment, studies, surveys, designs, plans, working drawings, specifications, construction, installation, and other activities essential to acquiring and making operational the major medical equipment shall be included. The capital expenditure for the equipment shall be deemed to be the fair market value of the equipment or the cost of the equipment, whichever is greater. Major medical equipment does not include replacement equipment as defined in this section.
(15) Repealed. (15a) "Multispecialty ambulatory surgical program" means a formal program for providing
on a same-day basis surgical procedures for at least three of the following specialty areas: gynecology, otolaryngology, plastic surgery, general surgery, ophthalmology, orthopedic, or oral surgery.
(15b) "Neonatal intensive care services" means those services provided by a health service facility to high-risk newborn infants who require constant nursing care, including but not limited to continuous cardiopulmonary and other supportive care.

(16) "New institutional health services" means any of the following: a. The construction, development, or other establishment of a new health service
facility. b. Except as otherwise provided in G.S. 131E-184(e), the obligation by any person of
a capital expenditure exceeding two million dollars ($2,000,000) to develop or expand a health service or a health service facility, or which relates to the provision of a health service. The cost of any studies, surveys, designs, plans, working drawings, specifications, and other activities, including staff effort and consulting and other services, essential to the acquisition, improvement, expansion, or replacement of any plant or equipment with respect to which an expenditure is made shall be included in determining if the expenditure exceeds two million dollars ($2,000,000).
c. Any change in bed capacity as defined in G.S. 131E-176(5). d. The offering of dialysis services or home health services by or on behalf of a
health service facility if those services were not offered within the previous 12 months by or on behalf of the facility.
e. A change in a project that was subject to certificate of need review and for which a certificate of need was issued, if the change is proposed during the development of the project or within one year after the project was completed. For purposes of this subdivision, a change in a project is a change of more than fifteen percent (15%) of the approved capital expenditure amount or the addition of a health service that is to be located in the facility, or portion thereof, that was constructed or developed in the project.
f. The development or offering of a health service as listed in this subdivision by or on behalf of any person: 1. Bone marrow transplantation services. 2. Burn intensive care services. 2a. Cardiac catheterization services, except cardiac catheterization services
provided on equipment furnished by a person authorized to operate such equipment in North Carolina pursuant to either a certificate of need issued for mobile cardiac catheterization equipment or a settlement agreement executed by the Department for provision of cardiac catheterization services.
3. Neonatal intensive care services. 4. Open-heart surgery services. 5. Solid organ transplantation services.
f1. The acquisition by purchase, donation, lease, transfer, or comparable arrangement of any of the following equipment by or on behalf of any person: 1. Air ambulance. 2. Repealed. 3. Cardiac catheterization equipment. 4. Gamma knife. 5. Heart-lung bypass machine. 5a. Linear accelerator. 6. Lithotriptor. 7. Magnetic resonance imaging scanner. 8. Positron emission tomography scanner. 9. Simulator.
g.to k. Repealed. l. The purchase, lease, or acquisition of any health service facility, or portion thereof,
or a controlling interest in the health service facility or portion thereof, if the health service facility was developed under a certificate of need issued pursuant to G.S. 131E-180.

m. Any conversion of nonhealth service facility beds to health service facility beds. n. The construction, development or other establishment of a hospice, hospice
inpatient facility, or hospice residential care facility; o. The opening of an additional office by an existing home health agency or hospice
within its service area as defined by rules adopted by the Department; or the opening of any office by an existing home health agency or hospice outside its service area as defined by rules adopted by the Department.
p. The acquisition by purchase, donation, lease, transfer, or comparable arrangement by any person of major medical equipment.
q. The relocation of a health service facility from one service area to another. r. The conversion of a specialty ambulatory surgical program to a multispecialty
ambulatory surgical program or the addition of a specialty to a specialty ambulatory surgical program.
s. The furnishing of mobile medical equipment to any person to provide health services in North Carolina, which was not in use in North Carolina prior to the adoption of this provision, if such equipment would otherwise be subject to review in accordance with G.S. 131E-176(16)(f1.) or G.S. 131E-176(16)(p) if it had been acquired in North Carolina.
t. Repealed. u. The construction, development, establishment, increase in the number, or
relocation of an operating room or gastrointestinal endoscopy room in a licensed health service facility, other than the relocation of an operating room or gastrointestinal endoscopy room within the same building or on the same grounds or to grounds not separated by more than a public right-of-way adjacent to the grounds where the operating room is or gastrointestinal endoscopy room is currently located.
v. The change in designation, in a licensed health service facility, of an operating room to a gastrointestinal endoscopy room or change in designation of a gastrointestinal endoscopy room to an operating room that results in a different number of each type of room than is reflected on the health service facility’s license in effect as of January 1, 2005.
(17) "North Carolina State Health Coordinating Council" means the Council that prepares, with the Department of Health and Human Services, the State Medical Facilities Plan.
(17a) "Nursing care" means: a. Skilled nursing care and related services for residents who require medical or
nursing care; b. Rehabilitation services for the rehabilitation of injured, disabled, or sick persons;
or c. Health-related care and services provided on a regular basis to individuals who
because of their mental or physical condition require care and services above the level of room and board, which can be made available to them only through institutional facilities.
These are services which are not primarily for the care and treatment of mental diseases.
(17b) "Nursing home facility" means a health service facility whose bed complement of health service facility beds is composed principally of nursing home facility beds.
(18) To "offer," when used in connection with health services, means that the person holds himself out as capable of providing, or as having the means for the provision of, specified health services.
(18a) Repealed. 8-26-05 (18b) "Open-heart surgery services" means the provision of surgical procedures that utilize a
heart-lung bypass machine during surgery to correct cardiac and coronary artery disease or defects.

(18c) “Operating room” means a room used for the performance of surgical procedures requiring one or more incisions and that is required to comply with all applicable licensure codes and standards for an operating room.
(19) "Person" means an individual, a trust or estate, a partnership, a corporation, including associations, joint stock companies, and insurance companies; the State, or a political subdivision or agency or instrumentality of the State.
(19a) "Positron emission tomography scanner" means equipment that utilizes a computerized radiographic technique that employs radioactive substances to examine the metabolic activity of various body structures.
(20) "Project" or "capital expenditure project" means a proposal to undertake a capital expenditure that results in the offering of a new institutional health service as defined by this Article. A project, or capital expenditure project, or proposed project may refer to the project from its earliest planning stages up through the point at which the specified new institutional health service may be offered. In the case of facility construction, the point at which the new institutional health service may be offered must take place after the facility is capable of being fully licensed and operated for its intended use, and at that time it shall be considered a health service facility.
(21) "Psychiatric facility" means a public or private facility licensed pursuant to Article 2 of Chapter 122C of the General Statutes and which is primarily engaged in providing to inpatients, by or under the supervision of a physician, psychiatric services for the diagnosis and treatment of mentally ill persons.
(22) "Rehabilitation facility" means a public or private inpatient facility which is operated for the primary purpose of assisting in the rehabilitation of disabled persons through an integrated program of medical and other services which are provided under competent, professional supervision.
(22a) "Replacement equipment" means equipment that costs less than two million dollars ($2,000,000) and is purchased for the sole purpose of replacing comparable medical equipment currently in use which will be sold or otherwise disposed of when replaced. In determining whether the replacement equipment costs less than two million dollars ($2,000,000), the costs of equipment, studies, surveys, designs, plans, working drawings, specifications, construction, installation, and other activities essential to acquiring and making operational the replacement equipment shall be included. The capital expenditure for the equipment shall be deemed to be the fair market value of the equipment or the cost of the equipment, whichever is greater.
(23) Repealed. (24) Repealed. (24a) "Service area" means the area of the State, as defined in the State Medical Facilities
Plan or in rules adopted by the Department, which receives services from a health service facility.
(24b) “Simulator” means a machine that produces high quality diagnostic radiographs and precisely reproduces the geometric relationships of megavoltage radiation therapy equipment to the patient.
(24c) Reserved for future codification. (24d) "Solid organ transplantation services" means the provision of surgical procedures and
the interrelated medical services that accompany the surgery to remove an organ from a patient and surgically implant an organ from a donor.
(24e) Reserved for future codification. (24f) "Specialty ambulatory surgical program" means a formal program for providing on a
same-day basis surgical procedures for only the specialty areas identified on the ambulatory surgical facility's 1993 Application for Licensure as an Ambulatory Surgical Center and authorized by its certificate of need.
(25) "State Medical Facilities Plan" means the plan prepared by the Department of Health and Human Services and the North Carolina State Health Coordinating Council, and
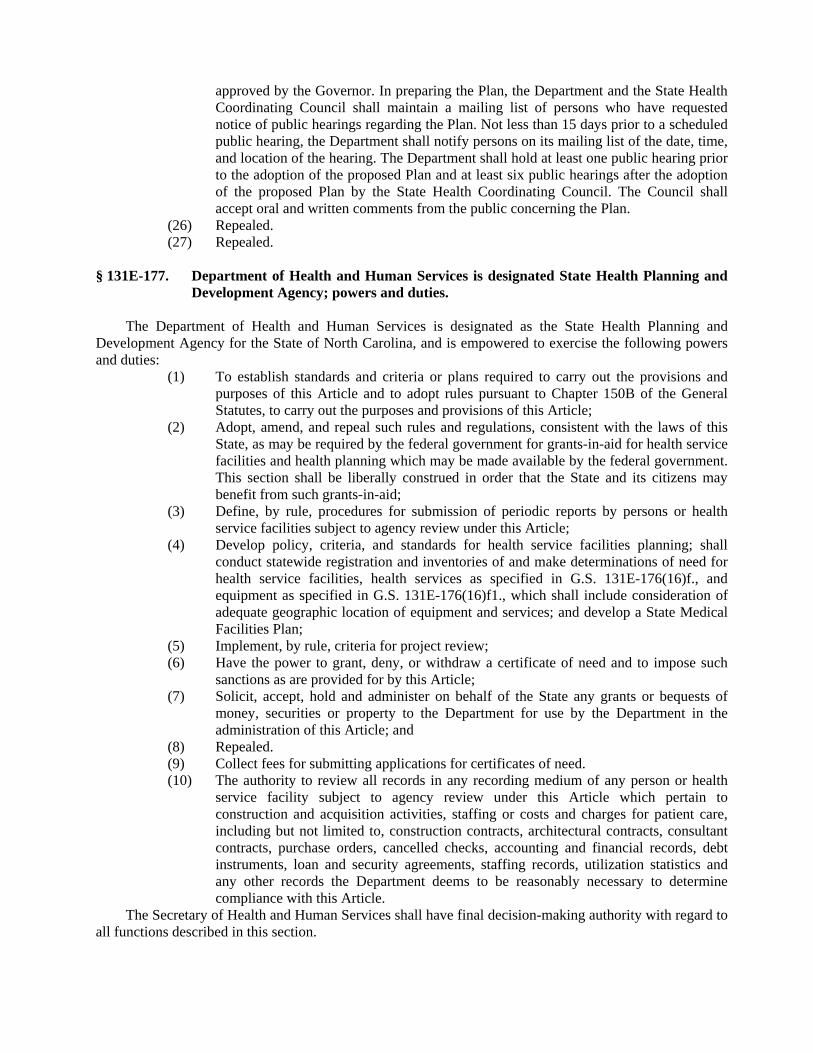
approved by the Governor. In preparing the Plan, the Department and the State Health Coordinating Council shall maintain a mailing list of persons who have requested notice of public hearings regarding the Plan. Not less than 15 days prior to a scheduled public hearing, the Department shall notify persons on its mailing list of the date, time, and location of the hearing. The Department shall hold at least one public hearing prior to the adoption of the proposed Plan and at least six public hearings after the adoption of the proposed Plan by the State Health Coordinating Council. The Council shall accept oral and written comments from the public concerning the Plan.
(26) Repealed. (27) Repealed.
§ 131E-177. Department of Health and Human Services is designated State Health Planning and
Development Agency; powers and duties.
The Department of Health and Human Services is designated as the State Health Planning and Development Agency for the State of North Carolina, and is empowered to exercise the following powers and duties:
(1) To establish standards and criteria or plans required to carry out the provisions and purposes of this Article and to adopt rules pursuant to Chapter 150B of the General Statutes, to carry out the purposes and provisions of this Article;
(2) Adopt, amend, and repeal such rules and regulations, consistent with the laws of this State, as may be required by the federal government for grants-in-aid for health service facilities and health planning which may be made available by the federal government. This section shall be liberally construed in order that the State and its citizens may benefit from such grants-in-aid;
(3) Define, by rule, procedures for submission of periodic reports by persons or health service facilities subject to agency review under this Article;
(4) Develop policy, criteria, and standards for health service facilities planning; shall conduct statewide registration and inventories of and make determinations of need for health service facilities, health services as specified in G.S. 131E-176(16)f., and equipment as specified in G.S. 131E-176(16)f1., which shall include consideration of adequate geographic location of equipment and services; and develop a State Medical Facilities Plan;
(5) Implement, by rule, criteria for project review; (6) Have the power to grant, deny, or withdraw a certificate of need and to impose such
sanctions as are provided for by this Article; (7) Solicit, accept, hold and administer on behalf of the State any grants or bequests of
money, securities or property to the Department for use by the Department in the administration of this Article; and
(8) Repealed. (9) Collect fees for submitting applications for certificates of need. (10) The authority to review all records in any recording medium of any person or health
service facility subject to agency review under this Article which pertain to construction and acquisition activities, staffing or costs and charges for patient care, including but not limited to, construction contracts, architectural contracts, consultant contracts, purchase orders, cancelled checks, accounting and financial records, debt instruments, loan and security agreements, staffing records, utilization statistics and any other records the Department deems to be reasonably necessary to determine compliance with this Article.
The Secretary of Health and Human Services shall have final decision-making authority with regard to all functions described in this section.

§ 131E-178. Activities requiring certificate of need.
(a) No person shall offer or develop a new institutional health service without first obtaining a certificate of need from the Department; provided, however, no person who provides gastrointestinal endoscopy procedures in one or more gastrointestinal endoscopy rooms located in a nonlicensed setting, shall be required to obtain a certificate of need to license that setting as an ambulatory surgical facility with the existing number of gastrointestinal endoscopy rooms, provided that:
(1) The license application is postmarked for delivery to the Division of Health Service Regulation by December 31, 2006;
(2) The applicant verifies, by affidavit submitted to the Division of Health Service Regulation within 60 days of the effective date of this act, that the facility is in operation as of the effective date of this act or that the completed application for the building permit for the facility was submitted by the effective date of this act;
(3) The facility has been accredited by The Accreditation Association for Ambulatory Health Care, The Joint Commission on Accreditation of Healthcare Organizations, or The American Association for Accreditation of Ambulatory Surgical Facilities by the time the license application is postmarked for delivery to the Division of Health Service Regulation of the Department; and
(4) The license application includes a commitment and plan for serving indigent and medically underserved populations.
All other persons proposing to obtain a license to establish an ambulatory surgical facility for the provision of gastrointestinal endoscopy procedures shall be required to obtain a certificate of need. The annual State Medical Facilities Plan shall not include policies or need determinations that limit the number of gastrointestinal endoscopy rooms that may be approved.
(b) No person shall make an acquisition by donation, lease, transfer, or comparable arrangement without first obtaining a certificate of need from the Department, if the acquisition would have been a new institutional health service if it had been made by purchase. In determining whether an acquisition would have been a new institutional health service, the capital expenditure for the asset shall be deemed to be the fair market value of the asset or the cost of the asset, whichever is greater.
(c) No person shall incur an obligation for a capital expenditure which is a new institutional health service without first obtaining a certificate of need from the Department. An obligation for a capital expenditure is incurred when:
(1) An enforceable contract, excepting contracts which are expressly contingent upon issuance of a certificate of need, is entered into by a person for the construction, acquisition, lease or financing of a capital asset;
(2) A person takes formal action to commit funds for a construction project undertaken as his own contractor; or
(3) In the case of donated property, the date on which the gift is completed. (d) Where the estimated cost of a proposed capital expenditure, including the fair market value
of equipment acquired by purchase, lease, transfer, or other comparable arrangement, is certified by a licensed architect or engineer to be equal to or less than the expenditure minimum for capital expenditure for new institutional health services, such expenditure shall be deemed not to exceed the amount for new institutional health services regardless of the actual amount expended, provided that the following conditions are met:
(1) The certified estimated cost is prepared in writing 60 days or more before the obligation for the capital expenditure is incurred. Certified cost estimates shall be available for inspection at the facility and sent to the Department upon its request.
(2) The facility on whose behalf the expenditure was made notifies the Department in writing within 30 days of the date on which such expenditure is made if the expenditure exceeds the expenditure minimum for capital expenditures. The notice shall include a copy of the certified cost estimate.
(e) The Department may grant certificates of need which permit capital expenditures only for predevelopment activities. Predevelopment activities include the preparation of architectural designs, plans,

working drawings, or specifications, the preparation of studies and surveys, and the acquisition of a potential site. § 131E-179. Research activities.
(a) Notwithstanding any other provisions of this Article, a health service facility may offer new institutional health services to be used solely for research, or incur the obligation of a capital expenditure solely for research, without a certificate of need, if the Department grants an exemption. The Department shall grant an exemption if the health service facility files a notice of intent with the Department in accordance with rules promulgated by the Department and if the Department finds that the offering or obligation will not:
(1) Affect the charges of the health service facility for the provision of medical or other patient care services other than services which are included in the research;
(2) Substantially change the bed capacity of the facility; or (3) Substantially change the medical or other patient care services of the facility.
(b) After a health service facility has received an exemption pursuant to subsection (a) of this section, it shall not offer the new institutional health services, or use a facility acquired through the capital expenditure, in a manner which affects the charges of the facility for the provision of medical or other patient care services, other than the services which are included in the research and shall not charge patients for the use of the service for which an exemption has been granted, without first obtaining a certificate of need from the Department; provided, however, that any facility or service acquired or developed under the exemption provided by this section shall not be subject to the foregoing restrictions on its use if the facility or service could otherwise be offered or developed without a certificate of need.
(c) Any of the activities described in subsection (a) of this section shall be deemed to be solely for research even if they include patient care provided on an occasional and irregular basis and not as a part of the research program. § 131E-180. Repealed. 8-26-05 § 131E-181. Nature of certificate of need.
(a) A certificate of need shall be valid only for the defined scope, physical location, and person named in the application. A certificate of need shall not be transferred or assigned except as provided in G.S. 131E-189(c).
(b) A recipient of a certificate of need, or any person who may subsequently acquire, in any manner whatsoever permitted by law, the service for which that certificate of need was issued, is required to materially comply with the representations made in its application for that certificate of need. The Department shall require any recipient of a certificate of need, or its successor, whose service is in operation to submit to the Department evidence that the recipient, or its successor, is in material compliance with the representations made in its application for the certificate of need which granted the recipient the right to operate that service. In determining whether the recipient of a certificate of need, or its successor, is operating a service which materially differs from the representations made in its application for that certificate of need, the Department shall consider cost increases to the recipient, or its successor, including, but not limited to, the following:
(1) Any increase in the consumer price index; (2) Any increased cost incurred because of Government requirements, including federal,
State, or any political subdivision thereof; and (3) Any increase in cost due to professional fees or the purchase of services and supplies.
(c) Whenever a certificate of need is issued more than 12 months after the application for the certificate of need began review, the Department shall adjust the capital expenditure amount proposed by increasing it to reflect any inflation in the Department of Commerce's Construction Cost Index that has occurred since the date when the application began review; and the Department shall use this recalculated capital expenditure amount in the certificate of need issued for the project.

(d) A project authorized by a certificate of need is complete when the health service or the health service facility for which the certificate of need was issued is licensed and certified and is in material compliance with the representations made in the certificate of need application. § 131E-182. Application.
(a) The Department in its rules shall establish schedules for submission and review of completed applications. The schedules shall provide that applications for similar proposals in the same service area will be reviewed together. However, there shall not be a review schedule prior to February 1, 2006, for submission and review of certificate of need applications that propose an increase in the number of licensed gastrointestinal endoscopy rooms. An applicant for a certificate of need to establish a licensed gastrointestinal endoscopy room shall show that it is performing or reasonably projects to perform at least 1,500 gastrointestinal endoscopy procedures per gastrointestinal endoscopy room per year.
(b) An application for a certificate of need shall be made on forms provided by the Department. The application forms, which may vary according to the type of proposal, shall require such information as the Department, by its rules deems necessary to conduct the review. An applicant shall be required to furnish only that information necessary to determine whether the proposed new institutional health service is consistent with the review criteria implemented under G.S. 131E-183 and with duly adopted standards, plans and criteria.
(c) An application fee is imposed on an applicant for a certificate of need. An applicant must submit the fee with the application. The fee is not refundable, regardless of whether a certificate of need is issued. Fees collected under this section shall be credited to the General Fund as nontax revenue. The application fee is five thousand dollars ($5,000) plus an amount equal to three-tenths of one percent (.3%) of the amount of the capital expenditure proposed in the application that exceeds one million dollars ($1,000,000). In no event may the fee exceed fifty thousand dollars ($50,000). § 131E-183. Review criteria.
(a) The Department shall review all applications utilizing the criteria outlined in this subsection and shall determine that an application is either consistent with or not in conflict with these criteria before a certificate of need for the proposed project shall be issued.
(1) The proposed project shall be consistent with applicable policies and need determinations in the State Medical Facilities Plan, the need determination of which constitutes a determinative limitation on the provision of any health service, health service facility, health service facility beds, dialysis stations, operating rooms, or home health offices that may be approved.
(2) Repealed. (3) The applicant shall identify the population to be served by the proposed project, and
shall demonstrate the need that this population has for the services proposed, and the extent to which all residents of the area, and, in particular, low income persons, racial and ethnic minorities, women, handicapped persons, the elderly, and other underserved groups are likely to have access to the services proposed.
(3a) In the case of a reduction or elimination of a service, including the relocation of a facility or a service, the applicant shall demonstrate that the needs of the population presently served will be met adequately by the proposed relocation or by alternative arrangements, and the effect of the reduction, elimination or relocation of the service on the ability of low income persons, racial and ethnic minorities, women, handicapped persons, and other underserved groups and the elderly to obtain needed health care.
(4) Where alternative methods of meeting the needs for the proposed project exist, the applicant shall demonstrate that the least costly or most effective alternative has been proposed.
(5) Financial and operational projections for the project shall demonstrate the availability of funds for capital and operating needs as well as the immediate and long-term

financial feasibility of the proposal, based upon reasonable projections of the costs of and charges for providing health services by the person proposing the service.
(6) The applicant shall demonstrate that the proposed project will not result in unnecessary duplication of existing or approved health service capabilities or facilities.
(7) The applicant shall show evidence of the availability of resources, including health manpower and management personnel, for the provision of the services proposed to be provided.
(8) The applicant shall demonstrate that the provider of the proposed services will make available, or otherwise make arrangements for, the provision of the necessary ancillary and support services. The applicant shall also demonstrate that the proposed service will be coordinated with the existing health care system.
(9) An applicant proposing to provide a substantial portion of the project's services to individuals not residing in the health service area in which the project is located, or in adjacent health service areas, shall document the special needs and circumstances that warrant service to these individuals.
(10) When applicable, the applicant shall show that the special needs of health maintenance organizations will be fulfilled by the project. Specifically, the applicant shall show that the project accommodates: a. The needs of enrolled members and reasonably anticipated new members of the
HMO for the health service to be provided by the organization; and b. The availability of new health services from non-HMO providers or other HMOs
in a reasonable and cost-effective manner which is consistent with the basic method of operation of the HMO. In assessing the availability of these health services from these providers, the applicant shall consider only whether the services from these providers: 1. Would be available under a contract of at least five years' duration; 2. Would be available and conveniently accessible through physicians and
other health professionals associated with the HMO; 3. Would cost no more than if the services were provided by the HMO; and 4. Would be available in a manner which is administratively feasible to the
HMO. (11) Repealed (12) Applications involving construction shall demonstrate that the cost, design, and
means of construction proposed represent the most reasonable alternative, and that the construction project will not unduly increase the costs of providing health services by the person proposing the construction project or the costs and charges to the public of providing health services by other persons, and that applicable energy saving features have been incorporated into the construction plans.
(13) The applicant shall demonstrate the contribution of the proposed service in meeting the health-related needs of the elderly and of members of medically underserved groups, such as medically indigent or low income persons, Medicaid and Medicare recipients, racial and ethnic minorities, women, and handicapped persons, which have traditionally experienced difficulties in obtaining equal access to the proposed services, particularly those needs identified in the State Health Plan as deserving of priority. For the purpose of determining the extent to which the proposed service will be accessible, the applicant shall show: a. The extent to which medically underserved populations currently use the
applicant's existing services in comparison to the percentage of the population in the applicant's service area which is medically underserved;
b. Its past performance in meeting its obligation, if any, under any applicable regulations requiring provision of uncompensated care, community service, or access by minorities and handicapped persons to programs receiving federal

assistance, including the existence of any civil rights access complaints against the applicant;
c. That the elderly and the medically underserved groups identified in this subdivision will be served by the applicant's proposed services and the extent to which each of these groups is expected to utilize the proposed services; and
d. That the applicant offers a range of means by which a person will have access to its services. Examples of a range of means are outpatient services, admission by house staff, and admission by personal physicians.
(14) The applicant shall demonstrate that the proposed health services accommodate the clinical needs of health professional training programs in the area, as applicable.
(15) through (18) Repealed. (18a) The applicant shall demonstrate the expected effects of the proposed services on
competition in the proposed service area, including how any enhanced competition will have a positive impact upon the cost effectiveness, quality, and access to the services proposed; and in the case of applications for services where competition between providers will not have a favorable impact on cost effectiveness, quality, and access to the services proposed, the applicant shall demonstrate that its application is for a service on which competition will not have a favorable impact.
(19) Repealed. (20) An applicant already involved in the provision of health services shall provide
evidence that quality care has been provided in the past. (21) Repealed.
(b) The Department is authorized to adopt rules for the review of particular types of applications that will be used in addition to those criteria outlined in subsection (a) of this section and may vary according to the purpose for which a particular review is being conducted or the type of health service reviewed. No such rule adopted by the Department shall require an academic medical center teaching hospital, as defined by the State Medical Facilities Plan, to demonstrate that any facility or service at another hospital is being appropriately utilized in order for that academic medical center teaching hospital to be approved for the issuance of a certificate of need to develop any similar facility or service.
(c) Repealed. § 131E-184. Exemptions from review.
(a) Except as provided in subsection (b), the Department shall exempt from certificate of need review a new institutional health service if it receives prior written notice from the entity proposing the new institutional health service, which notice includes an explanation of why the new institutional health service is required, for any of the following:
(1) To eliminate or prevent imminent safety hazards as defined in federal, State, or local fire, building, or life safety codes or regulations.
(1a) To comply with State licensure standards. (1b) To comply with accreditation or certification standards which must be met to receive
reimbursement under Title XVIII of the Social Security Act or payments under a State plan for medical assistance approved under Title XIX of that act.
(2) Repealed. (3) To provide data processing equipment. (4) To provide parking, heating or cooling systems, elevators, or other basic plant or
mechanical improvements, unless these activities are integral portions of a project that involves the construction of a new health service facility or portion thereof and that is subject to certificate of need review.
(5) To replace or repair facilities destroyed or damaged by accident or natural disaster. (6) To provide any nonhealth service facility or service. (7) To provide replacement equipment.

(8) To acquire an existing health service facility, including equipment owned by the health service facility at the time of acquisition.
(9) To develop or acquire a physician office building regardless of cost, unless a new institutional health service other than defined in G.S. 131E-176(16)b. is offered or developed in the building.
(b) Those portions of a proposed project which are not proposed for one or more of the purposes under subsection (a) of this section are subject to certificate of need review, if these non-exempt portions of the project are new institutional health services under G.S. 131E-176(16).
(c) The Department shall exempt from certificate of need review any conversion of existing acute care beds to psychiatric beds provided:
(1) The hospital proposing the conversion has executed a contract with the Department's Division of Mental Health, Developmental Disabilities, and Substance Abuse Services and/or one or more of the Area Mental Health, Developmental Disabilities, and Substance Abuse Authorities to provide psychiatric beds to patients referred by the contracting agency or agencies; and
(2) The total number of beds to be converted shall not be more than twice the number of beds for which the contract pursuant to subdivision (1) of this subsection shall provide.
(d) In accordance with, and subject to the limitations of G.S. 148-19.1, the Department shall exempt from certificate of need review the construction and operation of a new chemical dependency or substance abuse facility for the purpose of providing inpatient chemical dependency or substance abuse services solely to inmates of the Department of Correction. If an inpatient chemical dependency or substance abuse facility provides services both to inmates of the Department of Correction and to members of the general public, only the portion of the facility that serves inmates shall be exempt from certificate of need review.
(e) The Department shall exempt from certificate of need review a capital expenditure that exceeds the two million dollar ($2,000,000) threshold set forth in G.S. 131E-176(l6)b. if all of the following conditions are met:
(1) The proposed capital expenditure would: a. Be used solely for the purpose of renovating, replacing on the same
site, or expanding an existing: 1. Nursing home facility,
2. Adult care home facility, or 3. Intermediate care facility for the mentally retarded; and
b. Not result in a change in bed capacity, as defined in G.S. l3lE-l76(5), or the addition of a health service facility or any other new institutional health service other than that allowed in G.S. 131E-176(l6)b.
(2) The entity proposing to incur the capital expenditure provides prior written notice to the Department, which notice includes documentation that demonstrates that the proposed capital expenditure would be used for one or more of the following purposes: a. Conversion of semiprivate resident rooms to private rooms. b. Providing innovative, homelike residential dining spaces, such as cafes,
kitchenettes, or private dining areas to accommodate residents and their families or visitors.
c. Renovating, replacing, or expanding residential living or common areas to improve the quality of life of residents.
§ 131E-185. Review process.
(a) Repealed. (a1) Except as provided in subsection (c) of this section, there shall be a time limit of 90 days
for review of the applications, beginning on the day established by rule as the day on which applications for the particular service in the service area shall begin review.

(1) Any person may file written comments and exhibits concerning a proposal under review with the Department, not later than 30 days after the date on which the application begins review. These written comments may include: a. Facts relating to the service area proposed in the application; b. Facts relating to the representations made by the applicant in its application, and its
ability to perform or fulfill the representations made; c. Discussion and argument regarding whether, in light of the material contained in
the application and other relevant factual material, the application complies with relevant review criteria, plans, and standards.
(2) No more than 20 days from the conclusion of the written comment period, the Department shall ensure that a public hearing is conducted at a place within the appropriate service area if one or more of the following circumstances apply; the review to be conducted is competitive; the proponent proposes to spend five million dollars ($5,000,000) or more; a written request for a public hearing is received before the end of the written comment period from an affected party as defined in G.S. 131E-188(c); or the agency determines that a hearing is in the public interest. At such public hearing oral arguments may be made regarding the application or applications under review; and this public hearing shall include the following: a. An opportunity for the proponent of each application under review to respond to
the written comments submitted to the Department about its application; b. An opportunity for any person, except one of the proponents, to comment on the
applications under review; c. An opportunity for a representative of the Department, or such other person or
persons who are designated by the Department to conduct the hearing, to question each proponent of applications under review with regard to the contents of the application;
The Department shall maintain a recording of any required public hearing on an application until such time as the Department's final decision is issued, or until a final agency decision is issued pursuant to a contested case hearing, whichever is later; and any person may submit a written synopsis or verbatim statement that contains the oral presentation made at the hearing.
(3) The Department may contract or make arrangements with a person or persons located within each service area for the conduct of such public hearings as may be necessary. The Department shall publish, in each service area, notice of the contracts that it executes for the conduct of those hearings.
(4) Within 15 days from the beginning of the review of an application or applications proposing the same service within the same service area, the Department shall publish notice of the deadline for receipt of written comments, of the time and place scheduled for the public hearing regarding the application or applications under review, and of the name and address of the person or agency that will preside.
(5) The Department shall maintain all written comments submitted to it during the written comment stage and any written submissions received at the public hearing as part of the Department's file respecting each application or group of applications under review by it. The application, written comments, and public hearing comments, together with all documents that the Department used in arriving at its decision, from whatever source, and any documents that reflect or set out the Department's final analysis of the application or applications under review, shall constitute the Department's record for the application or applications under review.
(a2) When an expedited review has been approved by the Department, no public hearing shall be held. The Department may contact the applicant and request additional or clarifying information, amendments to, or substitutions for portions of the application. The Department may negotiate conditions to be imposed on the certificate of need with the applicant.
(b) Repealed.

(c) The Department may extend the review period for a period not to exceed 60 days and provide notice of such extension to all applicants. For expedited reviews, the Department may extend the review period only if it has requested additional substantive information from the applicant. § 131E-186. Decision.
(a) Within the prescribed time limits in G.S. 131E-185, the Department shall issue a decision to "approve," "approve with conditions," or "deny," an application for a new institutional health service. Approvals involving new or expanded nursing care or intermediate care for the mentally retarded bed capacity shall include a condition that specifies the earliest possible date the new institutional health service may be certified for participation in the Medicaid program. The date shall be set far enough in advance to allow the Department to identify funds to pay for care in the new or expanded facility in its existing Medicaid budget or to include these funds in its State Medicaid budget request for the year in which Medicaid certification is expected.
(b) Within five business days after it makes a decision on an application, the Department shall provide written notice of all the findings and conclusions upon which it based its decision, including the criteria used by the Department in making its decision, to the applicant. § 131E-187. Issuance of a certificate of need.
(a) Deleted. See Session Law 2009-373; SB 804. (b) Deleted. See Session Law 2009-373; SB 804. (c) The Department shall issue a certificate of need in accordance with the time line requirements
of this section but only after all applicable conditions of approval that can be satisfied before issuance of the certificate of need have been met. The Department shall issue a certificate of need within:
(1) Thirty-five days of the date of the decision referenced in G.S. 131E-186, when no request for a contested case hearing has been filed in accordance with G.S. 131E-188.
(2) Five business days after it receives a file-stamped copy of the notice of voluntary dismissal, unless the voluntary dismissal is a stipulation of dismissal without prejudice.
(3) Thirty-five days of the date of the written notice of the final agency decision affirming or approving the issuance, unless a notice of appeal to the North Carolina Court of Appeals is timely filed.
(4) Twenty days after a mandate is issued by the North Carolina Court of Appeals affirming the issuance of a certificate of need, unless a notice of appeal or petition for discretionary review to the North Carolina Supreme Court is timely filed.
(5) Five business days after the North Carolina Supreme Court issues a mandate affirming the issuance of a certificate of need or an order declining to certify the case for discretionary review if the order declining to certify the case disposes of the appeal in its entirety.
§ 131E-188. Administrative and judicial review.
(a) After a decision of the Department to issue, deny or withdraw a certificate of need or exemption or to issue a certificate of need pursuant to a settlement agreement with an applicant to the extent permitted by law, any affected person, as defined in subsection (c) of this section, shall be entitled to a contested case hearing under Article 3 of Chapter 150B of the General Statutes. A petition for a contested case shall be filed within 30 days after the Department makes its decision. When a petition is filed, the Department shall send notification of the petition to the proponent of each application that was reviewed with the application for a certificate of need that is the subject of the petition. Any affected person shall be entitled to intervene in a contested case.
A contested case shall be conducted in accordance with the following timetable: (1) An administrative law judge or a hearing officer, as appropriate, shall be assigned within 15 days
after a petition is filed.

(2) The parties shall complete discovery within 90 days after the assignment of the administrative law judge or hearing officer.
(3) The hearing at which sworn testimony is taken and evidence is presented shall be held within 45 days after the end of the discovery period.
(4) The administrative law judge or hearing officer shall make his recommended decision within 75 days after the hearing.
(5) The Department shall make its final decision within 30 days of receiving the official record of the case from the Office of Administrative Hearings.
The administrative law judge or hearing officer assigned to a case may extend the deadlines in subdivisions (2) through (4) so long as the administrative law judge or hearing officer makes his recommended decision in the case within 270 days after the petition is filed. The Department may extend the deadline in subdivision (5) for up to 30 days by giving all parties written notice of the extension.
(a1) On or before the date of filing a petition for a contested case hearing on the approval of an applicant for a certificate of need, the petitioner shall deposit a bond with the clerk of superior court where the new institutional health service that is the subject of the petition is proposed to be located. The bond shall be secured by cash or its equivalent in an amount equal to five percent (5%) of the cost of the proposed new institutional health service that is the subject of the petition, but may not be less than five thousand dollars ($5,000) and may not exceed fifty thousand dollars ($50,000). A petitioner who received approval for a certificate of need and is contesting only a condition in the certificate is not required to file a bond under this subsection. The applicant who received approval for the new institutional health service that is the subject of the petition may bring an action against a bond filed under this subsection in the superior court of the county where the bond was filed. Upon finding that the petition for a contested case was frivolous or filed to delay the applicant, the court may award the applicant part or all of the bond filed under this subsection. At the conclusion of the contested case, if the court does not find that the petition for a contested case was frivolous or filed to delay the applicant, the petitioner shall be entitled to the return of the bond deposited with the superior court upon demonstrating to the clerk of superior court where the bond was filed that the contested case hearing is concluded.
(b) Any affected person who was a party in a contested case hearing shall be entitled to judicial review of all or any portion of any final decision of the Department in the following manner. The appeal shall be to the Court of Appeals as provided in G.S. 7A-29(a). The procedure for the appeal shall be as provided by the rules of appellate procedure. The appeal of the final decision of the Department shall be taken within 30 days of the receipt of the written notice of final decision, and notice of appeal shall be filed with the Division of Health Service Regulation, Department of Health and Human Services and served on all other affected persons who were parties to the contested hearing.
(b1) Before filing an appeal of a final decision by the Department granting a certificate of need, the affected person shall deposit a bond with the Clerk of the Court of Appeals. (1) The bond shall be secured by cash or its equivalent in an amount equal to five percent (5%)
of the cost of the proposed new institutional health service that is the subject of the appeal, but may not be less than five thousand dollars ($5,000) and may not exceed fifty thousand dollars ($50,000); provided that the applicant who received approval of the certificate of need may petition the Court of Appeals for a higher bond amount for the payment of such costs and damages as may be awarded pursuant to subdivision (2) of this subsection. This amount shall be determined by the Court in its discretion, not to exceed three hundred thousand dollars ($300,000). A holder of a certificate of need who is appealing only a condition in the certificate is not required to file a bond under this subsection.
(2) If the Court of Appeals finds that the appeal was frivolous or filed to delay the applicant, the court shall remand the case to the superior court of the county where a bond was filed for the contested case hearing on the certificate of need. The superior court may award the holder of the certificate of need part or all of the bond. The court shall award the holder of the certificate of need reasonable attorney fees and costs incurred in the appeal to the Court of Appeals. If the Court of Appeals does not find that the appeal was frivolous or filed to delay the applicant and does not remand the case to superior court for a possible award of

all or part of the bond to the holder of the certificate of need, the person originally filing the bond shall be entitled to a return of the bond.
(c) The term "affected persons" includes: the applicant; any individual residing within the service area or the geographic area served or to be served by the applicant; any individual who regularly uses health service facilities within that geographic area or the service area; any person who provides services, similar to the services under review, to individuals residing within the service area or the geographic area proposed to be served by the applicant; any person who, prior to receipt by the agency of the proposal being reviewed, has provided written notice to the agency of an intention to provide similar services in the future to individuals residing within the service area or the geographic area to be served by the applicant; third party payers who reimburse health service facilities for services in the service area in which the project is proposed to be located; and any agency which establishes rates for health service facilities or HMOs located in the service area in which the project is proposed to be located. § 131E-189. Withdrawal of a certificate of need.
(a) The Department shall specify in each certificate of need the time the holder has to make the service or equipment available or to complete the project and the timetable to be followed. The timetable shall be the one proposed by the holder of the certificate of need unless the Department specifies a different timetable in its decision letter. The holder of the certificate shall submit such periodic reports on his progress in meeting the timetable as may be required by the Department. If no progress report is provided or, after reviewing the progress, the Department determines that the holder of the certificate is not meeting the timetable and the holder cannot demonstrate that it is making good faith efforts to meet the timetable, the Department may withdraw the certificate. If the Department determines that the holder of the certificate is making a good faith effort to meet the timetable, the Department may, at the request of the holder, extend the timetable for a specified period.
(b) The Department may withdraw any certificate of need, if the holder of the certificate fails to develop the service in a manner consistent with the representations made in the application or with any condition or conditions the Department placed on the certificate of need.
(c) The Department may immediately withdraw any certificate of need if the holder of the certificate, before completion of the project or operation of the facility, transfers ownership or control of the facility, the project, or the certificate of need. Any transfer after that time will be subject to the requirement that the service be provided consistent with the representations made in the application and any applicable conditions the Department placed on the certificate of need. Transfers resulting from death or personal illness or other good cause, as determined by the Department, shall not result in withdrawal if the Department receives prior written notice of the transfer and finds good cause. Transfers resulting from death shall not result in withdrawal. § 131E-190. Enforcement and sanctions.
(a) Only those new institutional health services which are found by the Department to be needed as provided in this Article and granted certificates of need shall be offered or developed within the State.
(b) No formal commitments made for financing, construction, or acquisition regarding the offering or development of a new institutional health service shall be made by any person unless a certificate of need for such service or activities has been granted.
(c) Repealed. (d) If any person proceeds to offer or develop a new institutional health service without having first
obtained a certificate of need for such services, the penalty for such violation of this Article and rules hereunder may include the withholding of federal and State funds under Titles V, XVIII, and XIX of the Social Security Act for reimbursement of capital and operating expenses related to the provision of the new institutional health service.
(e) The Department may revoke or suspend the license of any person who proceeds to offer or develop a new institutional health service without having first obtained a certificate of need for such services.

(f) The Department may assess a civil penalty of not more than twenty thousand dollars ($20,000) against any person who knowingly offers or develops any new institutional health service within the meaning of this Article without a certificate of need issued under this Article and the rules pertaining thereto, or in violation of the terms or conditions of such a certificate, whenever it determines a violation has occurred and each time the service is provided in violation of this provision. In determining the amount of the penalty the Department shall consider the degree and extent of harm caused by the violation and the cost of rectifying the damage. A person who is assessed a penalty shall be notified of the penalty by registered or certified mail. The notice shall state the reasons for the penalty. If a person fails to pay a penalty, the Department shall refer the matter to the Attorney General for collection. For the purpose of this subsection, the word "person" shall not include an individual in his capacity as an officer, director, or employee of a person as otherwise defined in this Article.
(g) No agency of the State or any of its political subdivisions may appropriate or grant funds or financially assist in any way a person, applicant, or facility which is or whose project is in violation of this Article.
(h) If any person proceeds to offer or develop a new institutional health service without having first obtained a certificate of need for such services, the Secretary of Health and Human Services or any person aggrieved, as defined by G.S. 150B-2(6), may bring a civil action for injunctive relief, temporary or permanent, against the person offering, developing or operating any new institutional health service. The action may be brought in the superior court of any county in which the health service facility is located or in the superior court of Wake County.
(i) If the Department determines that the recipient of a certificate of need, or its successor, is operating a service which materially differs from the representations made in its application for that certificate of need, the Department may bring an action in Wake County Superior Court or the superior court of any county in which the certificate of need is to be utilized for injunctive relief, temporary or permanent, requiring the recipient, or its successor, to materially comply with the representations in its application. The Department may also bring an action in Wake County Superior Court or the superior court of any county in which the certificate of need is to be utilized to enforce the provisions of this subsection and G.S. 131E-181(b) and the rules adopted in accordance with this subsection and G.S. 131E-181(b).


S t a t e M e d i c a l F a c i l i t i e s P l a n