CHAPTER 1 - NC State Repository
134
ABSTRACT JOSHI, BAL KRISHNA. Molecular Tagging of Resistance Genes to Septoria Leaf Spot and Late Blight in Tomato (Solanum lycopersicum L.). (Under the direction of Dr. Dilip R. Panthee.) Septoria leaf spot caused by Septoria lycopersici Speg. and late blight caused by Phytopthora infestans (Mont.) de Bary are two important foliar diseases of tomato (Solanum lycopersicum L.). Identification of DNA markers linked to these diseases is a prerequisite for accelerating resistance breeding through marker-assisted selection (MAS). The objectives of the present study were to investigate the inheritance pattern of septoria leaf spot resistance and identify molecular markers linked to septoria leaf spot and late blight resistance in tomato. Two tomato inbred lines, NC 85L-1W(2007), resistant to late blight and susceptible to septoria leaf spot, and NC 839-2(2007)-1, resistant to septoria leaf spot and susceptible to late blight were crossed to produce an F 1 progeny. A total of 250 F 2 plants, and 10 plants of each parents and F 1 were grown in field plots at the Mountain Horticultural Crops Research and Extension Center (MHCREC), Mills River, NC in the summer of 2009. Severity of these two diseases was scored from the same population in different time intervals under natural inoculums using a scale of 0 to 5, where 0 = no disease and 5 = complete development of disease on a plant. Different levels of infestation of both pathogens were observed in the plant population which indicated that, inoculum pressure was enough to screen the population. DNA was extracted from 2-3 week old plants. Both parental lines were screened with a total of 379 molecular markers that included 157 simple sequence repeats (SSR), two conserved ortholog sets (COS), 23 M-13 tailing SSRs, and 197 randomly amplified polymorphic DNA (RAPD) markers. Two DNA bulks, identified as the resistant bulk (RB) and susceptible bulk (SB) were prepared from eight resistant and eight susceptible F 2 individuals. Transgressive-segregants among the F 2 population
-
Upload
khangminh22 -
Category
Documents
-
view
1 -
download
0
Transcript of CHAPTER 1 - NC State Repository

ABSTRACT
JOSHI, BAL KRISHNA. Molecular Tagging of Resistance Genes to Septoria Leaf Spot and Late Blight in Tomato (Solanum lycopersicum L.). (Under the direction of Dr. Dilip R. Panthee.)
Septoria leaf spot caused by Septoria lycopersici Speg. and late blight caused by
Phytopthora infestans (Mont.) de Bary are two important foliar diseases of tomato
(Solanum lycopersicum L.). Identification of DNA markers linked to these diseases is a
prerequisite for accelerating resistance breeding through marker-assisted selection
(MAS). The objectives of the present study were to investigate the inheritance pattern
of septoria leaf spot resistance and identify molecular markers linked to septoria leaf
spot and late blight resistance in tomato. Two tomato inbred lines, NC 85L-1W(2007),
resistant to late blight and susceptible to septoria leaf spot, and NC 839-2(2007)-1,
resistant to septoria leaf spot and susceptible to late blight were crossed to produce an
F1 progeny. A total of 250 F2 plants, and 10 plants of each parents and F1 were grown in
field plots at the Mountain Horticultural Crops Research and Extension Center
(MHCREC), Mills River, NC in the summer of 2009. Severity of these two diseases was
scored from the same population in different time intervals under natural inoculums
using a scale of 0 to 5, where 0 = no disease and 5 = complete development of disease
on a plant. Different levels of infestation of both pathogens were observed in the plant
population which indicated that, inoculum pressure was enough to screen the
population. DNA was extracted from 2-3 week old plants. Both parental lines were
screened with a total of 379 molecular markers that included 157 simple sequence
repeats (SSR), two conserved ortholog sets (COS), 23 M-13 tailing SSRs, and 197
randomly amplified polymorphic DNA (RAPD) markers. Two DNA bulks, identified as
the resistant bulk (RB) and susceptible bulk (SB) were prepared from eight resistant and
eight susceptible F2 individuals. Transgressive-segregants among the F2 population

were found only for susceptibility of septoria leaf spot. The segregation ratio of
resistant and susceptible plants for resistance to septoria leaf spot fit the expected
ratio of 3:1 (2 = 3.014, P = 0.083) indicating that the inheritance of resistance was
based on a single dominant gene. While none of the SSR and COS were found to be
polymorphic between parents, a total of 34 RAPD primers (17.26%) were polymorphic,
of which 11 primers (32.35%) were polymorphic between resistant and susceptible
bulks of septoria leaf spot, however, six were found unlinked. Five RAPD primers were
identified linked to septoria disease reaction, of which two were linked to the
susceptible and three were linked to the resistance loci.
Transgressive segregation for resistance and susceptibility to late blight was also
observed in this study. Out of the 34 RAPD markers screened, 16 (47%) produced
polymorphic bands between resistant and susceptible bulks of late blight lines. Four
RAPD primers were identified as linked markers, two with susceptible and two with
resistance loci. Because of the low reproducibility of RAPD, these markers will be
converted to sequence characterized amplified region (SCAR) markers. These markers
will be evaluated for their utility in a marker-assisted selection (MAS) program in
tomato for septoria leaf spot and late blight. A total of 9 RAPD markers have been
identified linked to these two traits using the F2 population through a BSA technique.

Molecular Tagging of Resistance Genes to Septoria Leaf Spot and Late Blight in Tomato (Solanum lycopersicum L.)
by Bal Krishna Joshi
A thesis submitted to the Graduate Faculty of North Carolina State University
in partial fulfillment of the requirements for the degree of
Master of Science
Horticultural Science
Raleigh, North Carolina
2011
APPROVED BY:
___________________________ ____________________________
Bryon Sosinski Frank J. Louws
___________________________ _____________________________
G. Craig Yencho Consuelo Arellano
______________________________
Dilip R. Panthee Committee Chair

ii
BIOGRAPHY
I was born in 26 June 1967 at Samibhanjyang, Lamjung, Nepal. After
completion of School Leaving Certificate, I joined the Institute of Agriculture and
Animal Science (IAAS) at Rampur, Chitwan and earned a Bachelor in Science (Ag) with
Plant Breeding elective in 1992.
After graduation, I worked for the Unitarian Service Committee-Canada-Nepal
(USCCN) for 5 years as an Agriculture and Livestock Development Coordinator until I
joined the IAAS for studies toward a Master degree with a major in plant breeding.
After my Master degree in 2000, I joined the Nepal Agricultural Research Council
(NARC), Kathmandu. I also served as an editorial member for the Nepal Agriculture
Research Journal and some proceedings. During this time, I also taught plant breeding
to undergraduate students of the Himalayan College of Agricultural Sciences and
Technology, Purbanchal University in 2007 and 2008.
I received the national level scientific award in 2007, and I have published
more than 30 research papers, the details of which are available at
http://sites.google.com/site/jafgaubase). In 2009, I enrolled at North Carolina State
University, USA, to pursue a Master of Science in Horticulture under the guidance of
Dr. Dilip R. Panthee.

iii
ACKNOWLEDGMENTS
I would like to express my sincere thanks to the following who encouraged me
in my scientific pursuits.
To Dr. Dilip R. Panthee, advisor, for the invaluable guidance,
encouragement and fruitful discussions. Thank you for giving me the
opportunity to gain knowledge in the field of plant breeding and the
experience gathered from your lab.
To other advisory committee members, Dr. C. Arellano, Dr. G.C.
Yencho, Dr. F.J. Louws and Dr. B. Sosinski, for their guidance and suggestions
gained during the progress of my academic and research work.
To Candice Anderson for her support during field work and Dr.
Mahfuzur Rahman (Department of Plant Pathology) for his support in
pathological works.
To all my family members, relatives and friends that have helped,
supported and always encouraged me.
Finally, to Ganga (my wife) and Benjika (daughter), for providing me moral
support, for their continuous love and encouragement, and for their patience and
understanding.
iv
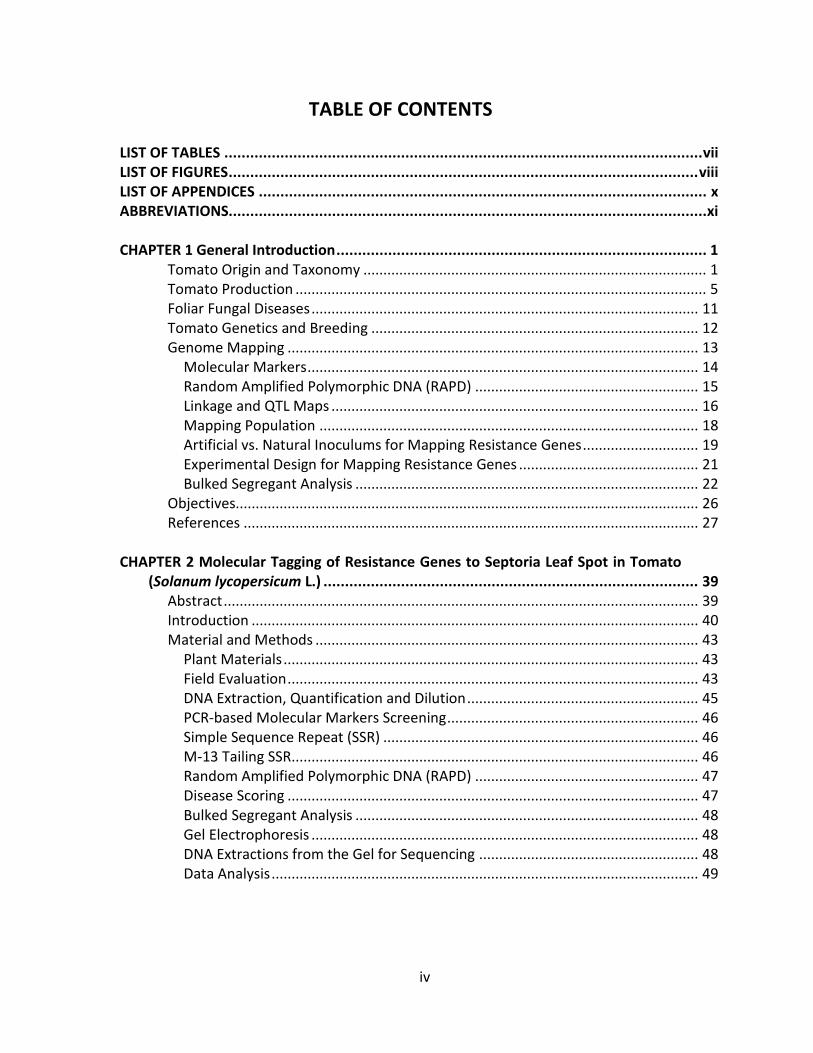
TABLE OF CONTENTS
LIST OF TABLES ............................................................................................................... vii LIST OF FIGURES ............................................................................................................. viii LIST OF APPENDICES ........................................................................................................ x ABBREVIATIONS............................................................................................................... xi CHAPTER 1 General Introduction ...................................................................................... 1
Tomato Origin and Taxonomy ...................................................................................... 1 Tomato Production ....................................................................................................... 5 Foliar Fungal Diseases ................................................................................................. 11 Tomato Genetics and Breeding .................................................................................. 12 Genome Mapping ....................................................................................................... 13
Molecular Markers .................................................................................................. 14 Random Amplified Polymorphic DNA (RAPD) ........................................................ 15 Linkage and QTL Maps ............................................................................................ 16 Mapping Population ............................................................................................... 18 Artificial vs. Natural Inoculums for Mapping Resistance Genes ............................. 19 Experimental Design for Mapping Resistance Genes ............................................. 21 Bulked Segregant Analysis ...................................................................................... 22
Objectives.................................................................................................................... 26 References .................................................................................................................. 27
CHAPTER 2 Molecular Tagging of Resistance Genes to Septoria Leaf Spot in Tomato
(Solanum lycopersicum L.) ....................................................................................... 39 Abstract ....................................................................................................................... 39 Introduction ................................................................................................................ 40 Material and Methods ................................................................................................ 43
Plant Materials ........................................................................................................ 43 Field Evaluation ....................................................................................................... 43 DNA Extraction, Quantification and Dilution .......................................................... 45 PCR-based Molecular Markers Screening ............................................................... 46 Simple Sequence Repeat (SSR) ............................................................................... 46 M-13 Tailing SSR ...................................................................................................... 46 Random Amplified Polymorphic DNA (RAPD) ........................................................ 47 Disease Scoring ....................................................................................................... 47 Bulked Segregant Analysis ...................................................................................... 48 Gel Electrophoresis ................................................................................................. 48 DNA Extractions from the Gel for Sequencing ....................................................... 48 Data Analysis ........................................................................................................... 49

v
Results ......................................................................................................................... 49 Segregation of Resistance ....................................................................................... 49 RAPD Markers ......................................................................................................... 50 RAPD Markers and Bulked Segregant Analysis ....................................................... 52
Discussion.................................................................................................................... 62 References .................................................................................................................. 65
CHAPTER 3 Molecular Tagging of Resistance Genes to Late Blight in Tomato .................. 68
Abstract ....................................................................................................................... 68 Introduction ................................................................................................................ 69 Material and Methods ................................................................................................ 72
Plant Materials ........................................................................................................ 72 Field Evaluation ....................................................................................................... 74 DNA Extraction, Quantification and Dilution .......................................................... 74 PCR-based Markers Screening ................................................................................ 75 SSR ........................................................................................................................... 75 Bulked Segergant Analysis ...................................................................................... 76 Gel Electrophoresis ................................................................................................. 77 DNA Extractions from the Gel for Sequencing ....................................................... 77 Data Scoring and Analysis ....................................................................................... 77
Results ......................................................................................................................... 78 RAPD Markers ......................................................................................................... 79 RAPD Markers and Bulked Segregant Analysis ....................................................... 79
Discussion.................................................................................................................... 89 References .................................................................................................................. 92
CHAPTER 4 Isolation and Culture of Septoria lycopersici Speg. from Septoria Leaf
Spot affected Tomato Leaves................................................................................... 95 Introduction ................................................................................................................ 95 Symptoms ................................................................................................................... 96 Host Pathogen Interaction .......................................................................................... 96 Resistance Breeding .................................................................................................... 97 Material and Methods ................................................................................................ 98
Plant Materials ........................................................................................................ 98 Clinical Test and Spore Identification ..................................................................... 98 Incubation, Isolation and Culture ........................................................................... 98 Sterilization and Aseptic Technique........................................................................ 99 Culture Media ......................................................................................................... 99 Subculture and Storage ......................................................................................... 101
Results and Discussion .............................................................................................. 101 Clinical Test and Spore Identification ................................................................... 101

vi
Isolation and Culture Techniques ......................................................................... 103 Colony Growth and Characters ............................................................................. 103 Subculture and Storage ......................................................................................... 103 Culture Media ....................................................................................................... 105 Conclusion ............................................................................................................. 105
References ................................................................................................................ 106 APPENDICES ................................................................................................................. 109

vii
LIST OF TABLES
Table 1. Wild relatives of tomato (http://tgrc.ucdavis.edu/key.aspx) .................................. 4
Table 2. Disease resistance genes and their linkage group in 12 chromosomes of tomato .................................................................................................................... 17
Table 3. Mapping population, marker types and number of QTLs detected for disease resistance and fruit quality traits in tomato ............................................. 20
Table 4. Use of bulked segregant analysis (BSA) to identify traits of interest in different crop species............................................................................................. 24
Table 5. Parental description along with their pedigrees and coefficient of parentage ..... 44
Table 6. Segregation ratio of resistant and susceptible progenies to septoria leaf spot observed in the F2 population of tomato derived from NC 085 x NC 839, 2009 ........................................................................................................................ 53
Table 7. RAPD primers polymorphic between resistant and susceptible parents of tomato to septoria leaf spot .................................................................................. 54
Table 8. Polymorphic RAPD markers and their size between resistance and susceptible bulks of tomato to septoria leaf spot ................................................. 55
Table 9. Polymorphic bands of RAPD markers linked to either resistance or susceptible genes of tomato for septoria leaf spot ............................................... 56
Table 10. Specific marker bands linked to either resistance or susceptible genes to septoria leaf spot (SLS) of tomato .......................................................................... 57
Table 11. Informative RAPD markers associated to tomato genes in relation to reaction with septoria leaf spot ............................................................................. 58
Table 12. Parental description along with their pedigrees and coefficient of parentage ..... 73
Table 13. RAPD primers polymorphic between resistant and susceptible parents of the NC 08135 F2 population of tomato screened for late blight resistance .......... 81
Table 14. Polymorphic RAPD markers and band size between late blight resistant and susceptible bulks of tomato ................................................................................... 82
Table 15. Polymorphic bands of RAPD markers linked to genes in tomato conferring resistance or susceptibility to late blight ............................................................... 83
Table 16. Specific marker bands linked to genes for resistance or susceptibility to late blight of tomato ..................................................................................................... 84
Table 17. Informative RAPD markers associated with susceptible or resistance genes to late blight of tomato .......................................................................................... 85

viii
LIST OF FIGURES
Figure 1. Top 15 countries in term of total harvested area for tomato production in the world, 2009. ....................................................................................................... 6
Figure 2. Total tomato production in million mt of top 15 countries in the world, 2009. ......................................................................................................................... 7
Figure 3. Top 22 countries in term of tomato productivity (ton/ha) in the world, 2009. ...... 8
Figure 4. Total harvested areas (ha), productivity and farm value of tomato in USA over two decades. .................................................................................................... 9
Figure 5. Tomato export and import volume (ton) in USA from 2000 to 2007. ................... 10
Figure 6. General description of bulked segregant analysis (BSA) technique. ..................... 23
Figure 7. Frequency distribution of 234 F2 individuals derived from NC-085L-1W(2007) x NC-839-2(2007)-1 based on the score of severity of septoria leaf spot in tomato, Mills River, 2009. .......................................................................... 51
Figure 8. Electrophoresis pattern of DNA fragments generated by RAPD markers (A. MRTOMR-031, B. MRTOMR-121). Polymorphic band (i.e., linked to susceptible) between parents, and between resistant and susceptible bulks are indicated by arrow. .......................................................................................... 59
Figure 9. Electrophoresis pattern of DNA fragments generated by RAPD marker (A. MRTOMR-022, B. MRTOMR-117 and C. MRTOMR-118). Polymorphic band (i.e., linked to resistance) between parents and between resistant and susceptible bulks are indicated by arrow. ............................................................. 60
Figure 10. RAPD marker (A. MRTOMR-130) showing polymorphic band (indicated by arrow) only to parents, i.e., band with unlinked loci and RAPD marker (MRTOMR-146) showing band (indicated by arrow) only in two bulks. ............... 61
Figure 11. Electrophoretic pattern of DNA fragments generated by RAPD marker (A. MRTOMR-026, B. MRTOMR-046). Polymorphic band (i.e., linked to susceptible) between parents and between resistant and susceptible bulks are indicated by arrow. .......................................................................................... 86
Figure 12. Electrophoretic pattern of DNA fragments generated by RAPD markers (A. MRTOMR-031, B. MRTOMR-038). Polymorphic band (i.e., linked to resistance) between parents and between resistant and susceptible bulks are indicated by arrow. .......................................................................................... 87

ix
Figure 13. A. RAPD marker (MRTOMR-040) showing polymorphic band (indicated by arrow) only to parents, i.e., band with unlinked loci. B. RAPD marker (MRTOMR-022) showing band (indicated by arrow) only in two bulks. ............... 88
Figure 14. Tomato leaves infected with septoria leaf spot (Septoria lycopersici) (A), extrusion of white mass of spore from pycnidia (B), and enlarged extrusion of spore (C). .......................................................................................................... 100
Figure 15. Blue stained thread like spore with septa of septoria (A) and enlarged spore (B). ........................................................................................................................ 102
Figure 16. White button like initial growth of septoria (A), fully grown colony (B) and colony in slant media for storage at 4oC (C). ........................................................ 104

x
LIST OF APPENDICES
Appendix 1. Monthly weather conditions during tomato growing period (shaded area) in Mills River, North Carolina, 2009 ................................................................. 109
Appendix 2. Parents [NC 85L-1W(2007) x NC 839-2(2007)] and their F1 (NC 08135) ......... 110
Appendix 3. Samples of tomato plant infected by two foliar diseases, late blight and septoria leaf spot ............................................................................................. 111
Appendix 4. List of SSR, RAPD and other markers used to screen parents......................... 112
Appendix 5. DNA extraction protocol from tomato fresh leaves ....................................... 115
Appendix 6. Extraction of DNA bands from agarose gels ................................................... 116
Appendix 7. SSR profiles of parental lines showing monomorphic based on agarose gel, polyacryalamide gel and capillary electrophoresis .................................. 118
Appendix 8. Chemicals and reagents for DNA extraction and PCR ..................................... 119
xi
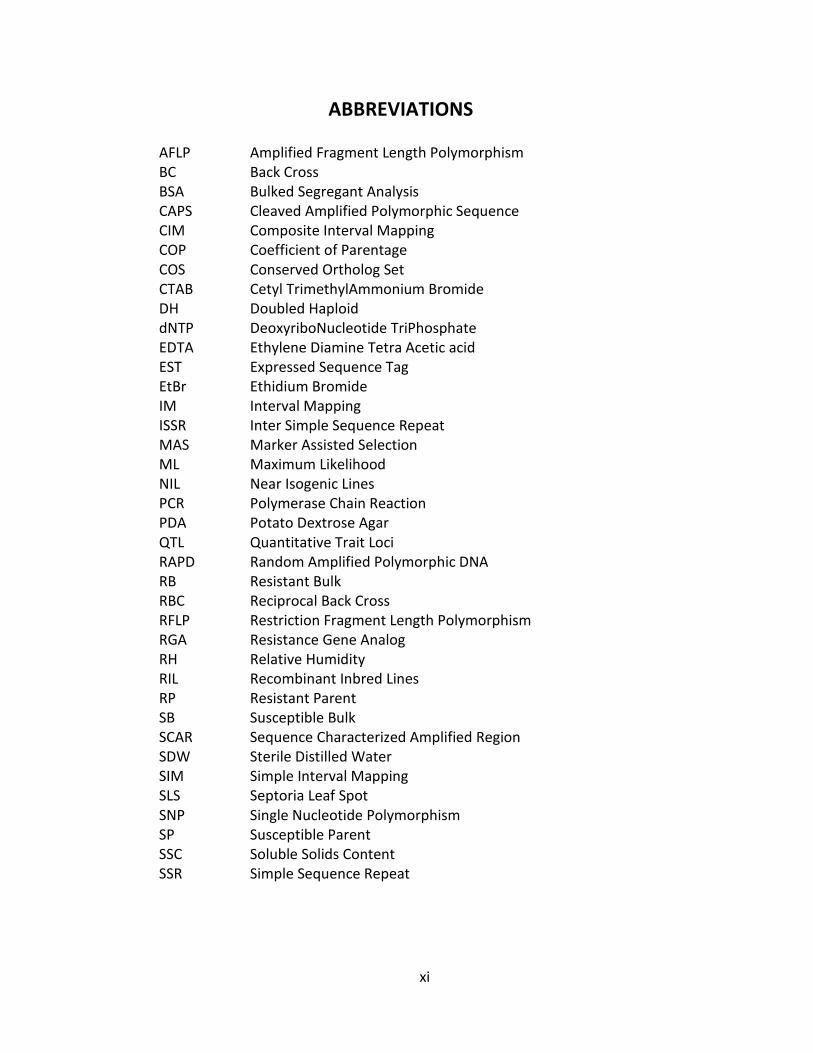
ABBREVIATIONS
AFLP Amplified Fragment Length Polymorphism BC Back Cross BSA Bulked Segregant Analysis CAPS Cleaved Amplified Polymorphic Sequence CIM Composite Interval Mapping COP Coefficient of Parentage COS Conserved Ortholog Set CTAB Cetyl TrimethylAmmonium Bromide DH Doubled Haploid dNTP DeoxyriboNucleotide TriPhosphate EDTA Ethylene Diamine Tetra Acetic acid EST Expressed Sequence Tag EtBr Ethidium Bromide IM Interval Mapping ISSR Inter Simple Sequence Repeat MAS Marker Assisted Selection ML Maximum Likelihood NIL Near Isogenic Lines PCR Polymerase Chain Reaction PDA Potato Dextrose Agar QTL Quantitative Trait Loci RAPD Random Amplified Polymorphic DNA RB Resistant Bulk RBC Reciprocal Back Cross RFLP Restriction Fragment Length Polymorphism RGA Resistance Gene Analog RH Relative Humidity RIL Recombinant Inbred Lines RP Resistant Parent SB Susceptible Bulk SCAR Sequence Characterized Amplified Region SDW Sterile Distilled Water SIM Simple Interval Mapping SLS Septoria Leaf Spot SNP Single Nucleotide Polymorphism SP Susceptible Parent SSC Soluble Solids Content SSR Simple Sequence Repeat

xii
Ta Annealing Temperature TAE Tris-Acetate-EDTA TBE Tris-Boric-EDTA TE Tris-EDTA Tm Melting Temperature ToMV Tomato Mosaic Virus TSWV Tomato Spotted Wilt Virus TYLCV Tomato Yellow Leaf Curl Virus

1
CHAPTER 1
General Introduction
Tomato (Solanum lycopersicum L., 2n = 24) is an herbaceous, usually sprawling plant
in the Solanaceae or nightshade family that is typically cultivated for its fruits for human
consumption. It is a perishable vegetable occupying a large volume in the international
trade. Literature shows that tomato was first used for culinary purposes in Southern
Europe (Ray, 1673; Miller, 1752) and it is an important crop rich in vitamins, minerals and
antioxidants (Rick, 1980; Vinson et al., 1998; Nguyen and Schwartz, 1999; Willcox et al.,
2003). High levels of dietary lycopene available in tomato have been found useful in
reducing cancer risk (Giovannucci, 2002).
TOMATO ORIGIN AND TAXONOMY
Linnaeus (1753) reported Solanum lycopersicum in America calidiore (a citation of
the type). The wild relatives of Solanum lycopersicum are distributed in South America,
along the coast and high Andes from central Ecuador, through Peru to northern Chile and in
the Galapagos Islands (Muller, 1940; Luckwill, 1943; Rick, 1973; Taylor, 1986; Jorgensen and
Léon-Yánez, 1999; Darwin et al., 2003; Peralta et al., 2005).
Early botanists recognized tomato as Solanum pomiferum (Sabine, 1820; Luckwill,
1943). Anguillara (1561, cited by Peralta and Spooner, 2007) named tomato as
Lycopersicon, which means ‘wolf peach’. Tournefort (1694) classified cultivated tomato in
the genus Lycopersicon, which was further described by Miller (1754). Linnaeus (1753)
described the species as Solanum lycopersicum. Miller (1754) reconsidered Tournefort’s
classification and grouped tomato into the genus Lycopersicon. Classical and modern
authors (Muller, 1940; Luckwill, 1943; Hawkes, 1990; Rick et al., 1990) have treated tomato
as Lycopersicon. Now, tomato is assigned to the genus Solanum based on the phylogenetic
relationship using molecular data (Spooner et al., 1993; Peralta and Spooner, 2001; Peralta
et al., 2005).

2
Rick et al. (1990), and Peralta and Spooner (2001) reported that the closest species
of cultivated tomato (Solanum lycopersicum, formerly Lycopersicon esculentum) is Solanum
pimpinellifolium (Jusl.) Mill. (formerly Lycopersicon pimpinellifolium). Key distinguishing
characters between these two species are fruit size and leaf margin. The fruit diameter of
Solanum lycopersicum is more than 1.5 cm with serrated leaf margin; whereas, fruit
diameter of Solanum pimpinellifolium is less than 1.5 cm with undulated or entire leaf
margin.
There are many subspecies of Solanum lycopersicum and they are typically
characterized by the shape, size and color of the fruit. For example, Solanum lycopersicum
var. cerasiforme (Dunal) Alef. which has typically small fruit (fruit diameter 1.5-2.5 cm with
2-loculed) is called Cherry tomato (Rick et al., 1990; Rick and Holle, 1990; Spooner et al.,
1993). S. lycopersicum var. pyriforme (Dunal) Alef. has pear shaped fruit usually <3.8 cm in
length and is called Pear tomato. S. lycopersicum var. grandifolium is called potato-leaved
tomato and it has large and entire with few secondary leaves. Tomato with upright and
erect, very compact plants is the characteristics of S. lycopersicum var. validium. S.
lycopersicum var. lycopersicum are the common garden tomatoes, and they vary in their
overall growth habit, fruit quality and fruit characteristics.
Taxonomical classification
Order: Solanales
Family: Solanaceae
Subfamily: Solanoideae
Tribe: Solaneae
Genus: Solanum L.
Subgenus: Lycopersicon (Mill.) Seithe
Species: Solanum lycopersicum L.

3
Synonyms
Lycopersicon galenii Mill.
Lycopersicon esculentum Mill.
Solanum spurium J.F.Gmel.
Solanum luridum Salisb.
Solanum pomiferum Cav.
Solanum humboldtii Willd.
Lycopersicon pyruforme Dunal
Lycopersicon humboldtii (Willd.) Dunal
Lycopersicon cerasiforme Dunal.
Lycopersicon lycopersicum (L.) H. Karst.
(Sources: http://www.uniprot.org/taxonomy/4081,
http://www.ncbi.nlm.nih.gov/guide/taxonomy/, http://plants.usda.gov/classification.html,
Jan. 2011)

4
Table 1. Wild relatives of tomato (http://tgrc.ucdavis.edu/key.aspx)
SN Old nomenclature New nomenclature
1. L. pimpinellifolium Solanum pimpinellifolium
2. L. cheesmanii Solanum cheesmaniae
3. L. cheesmanii f. minor Solanum galapagense
4. L. parviflorum Solanum neorickii
5. L. chmielewskii Solanum chmielewskii
6. L. chilense Solanum chilense
7. L. peruvianum Solanum peruvianum
8. L. pennellii Solanum pennellii
9. L. hirsutum Solanum habrochaites
10. S. lycopersicoides Solanum lycopersicoides
11. S. sitiens Solanum sitiens
12. S. juglandifolium Solanum juglandifolium
13. S. ochranthum Solanum ochranthum
SN = Serial number.

5
TOMATO PRODUCTION
Tomato is a tropical vegetable and used both as fresh and processed form
worldwide. Tomato is second among vegetables in the world after potato in term of
production with a total production of 136.2 million mt in 2008 (http://faostat.fao.org).
Among the countries, China is the top producer growing in 35% of the total world’s tomato
harvested area. Other top countries in descending order are USA, India, Turkey, Egypt, Italy
and Iran (Figure 1). The leading countries in terms of total production are China (34.1
million mt), USA (14.1 million mt), India (11.1 million mt), Turkey (10.7 million mt) and Egypt
(10 million mt) (Figure 2). The productivity of the Netherlands is the highest followed by
Belgium, Ukraine, Denmark, Ireland, Iceland, Norway and Sweden (Figure 3). USA ranked
21st for tomato productivity in the world.
Among the leading vegetables in USA, tomato ranks second with a production of
14.1 million tons in 2009. Economically, tomato is the third most important vegetable (with
a total farm value of $2.1 B) in US after potato ($2.6 B) and lettuce ($2.16 B)
(http://www.nass.usda.gov/Publications/index.asp). As a source of vitamins and minerals in
the US diet, it ranks first (Rick, 1980) among vegetables and fruits. The trend of tomato
harvested areas, productivity and farm value over decades are given in Figure 4. The
productivity is increasing over the years, but total harvested areas have remained almost
same. The farm value of tomato has fluctuated over the years. The import volume of
tomato in USA is almost four times more than export volume (Figure 5).

6
Figure 1. Top 15 countries in term of total harvested area for tomato production in the world, 2009.
(Source: FAOSTAT, 2010).
China35%
India14%Turkey
7%
Egypt6%
USA4%
Iran4%
Italy3%
Russian Fed.3%
Ukraine2%
Cuba2%
Brazil2%
Spain1%
Uzbekistan1%
Cameroon1% Iraq
1%Others (76)
14%

7
Figure 2. Total tomato production in million mt of top 15 countries in the world, 2009.
(Source: FAOSTAT, 2010).
China, 34.1
USA, 14.1
India, 11.1
Turkey, 10.7
Egypt, 10.0
Italy, 6.4
Iran, 5.9
Spain, 4.7
Brazil, 4.2Russian
Federation, 2.2
Uzbekistan, 2.1
Ukraine, 2.0
Greece, 1.4
Portugal, 1.3
Morocco, 1.3 Others (76), 18.3

8
Figure 3. Top 22 countries in term of tomato productivity (ton/ha) in the world, 2009.
(Source: FAOSTAT, 2010.)
48
0.0
42
5.5
41
0.6
40
0.0
40
0.0
37
0.3
34
1.3
33
8.0
33
6.7
24
1.4
22
3.3
16
7.2
16
1.1
12
3.5
10
4.9
88
.3
84
.2
83
.3
83
.0
82
.3
80
.6
80
.2
50
.6
0.0
100.0
200.0
300.0
400.0
500.0
600.0
Net
her
lan
ds
Bel
giu
m
Ukr
ain
e
Den
mar
k
Irel
and
Icel
and
No
rway
Swed
en
Fin
lan
d
Au
stri
a
Ger
man
y
Swit
zerl
and
Fran
ce
New
Zea
lan
d
UA
E
Cyp
rus
Isra
el
Pale
stin
e
Luxe
mb
ou
rg
Hu
nga
ry
USA
Port
uga
l
Wo
rld
Yiel
d, t
/ha

9
Figure 4. Total harvested areas (ha), productivity and farm value of tomato in USA over two decades.
(Source: http://usda.mannlib.cornell.edu/MannUsda/viewDocumentInfo.do?documentID=1210)
0.00
0.05
0.10
0.15
0.20
0.25
0
50
100
150
200
250
Farm
val
ue,
$/k
g
Tota
l are
a, x
10
00
ha;
Yie
ld, t
/ha Area, x1000 ha (Y = 187.16 - 1200x)
Farm value, $/kg (Y = 0.15 + 0.002X)
Yield, t/ha (Y = 55.71 + 1.03x)

10
Figure 5. Tomato export and import volume (ton) in USA from 2000 to 2007.
(Source: http://usda.mannlib.cornell.edu/MannUsda/viewDocumentInfo.do?documentID=1210)
0
200,000
400,000
600,000
800,000
1,000,000
1,200,000
2000 2001 2002 2003 2004 2005 2006 2007
Exp
ort
/ im
po
rt, t
Export volume, t Import volume, t

11
FOLIAR FUNGAL DISEASES
Over 200 diseases, caused by pathogenic fungi, bacteria, viruses and nematodes are
reported in tomato (Lukyanenko, 1991); hence, a major concern in tomato production is
disease management. Two approaches have been adopted for disease management - non-
breeding (e.g., use of fungicides) and breeding (use of resistance genes). The contribution of
plant breeding toward the development of resistance is considered the best in tomato crop
improvement. Resistance (R) genes have been identified for more than 30 tomato
pathogens especially in wild species of tomato (Foolad et al., 2008). Among the long list of
the diseases in tomato, two foliar diseases, septoria leaf spot (SLS) and late blight (LB), are
economically important and attention to the development of the durable resistance to
these pathogens is needed.
Septoria leaf spot (Septoria lycopersici Speg.) is one of the most devastating foliar
diseases in humid regions, particularly during the periods of rainfall, frequent dew or
overhead irrigation (Andrus and Reynard, 1945; Delahaut and Stevenson, 2004). It may
cause complete defoliation leading to a significant crop loss under favorable environment
conditions for disease development. Tomatoes may often be infected with pathogens of
septoria leaf spot and early blight (Altenaria solani) simultaneously. The fungus overwinters
in plant debris, on seed, or on weeds such as nightshade, jimsonweed, ground cherry and
horse-nettle (Delahaut and Stevenson, 2004). Spores of the fungi may be splashed or blown
onto tomato leaves. Spores of septoria can survive up to 3 years in infested debris.
Late blight (Phytopthora infestans (Mont.) de Bary) is generally recognized from the
leaflet margins having purple, dark brown or black water-soaked lesions with a pale
yellowish-green border. It can infect leaves, stems and fruits. Spores overwinter in the field
in plant debris and can survive even under harsh conditions, becoming inoculum for next
year’s crop (Gavino et al., 2000). The structure called sporangia produces the spores and the
optimum temperature for sporangia germination is above 21oC. The rapid asexual
reproduction of this pathogen can damage a tomato field quickly and sexual reproduction

12
enables it to develop new races through recombination or mutation. Therefore, a resistance
mechanism in the host plant can quickly be overcome by late blight.
TOMATO GENETICS AND BREEDING
Tomato is a diploid crop species with 2n=2x=24 chromosomes. It is autogamous in
nature with a genome size of 950 Mbp. Reshuffling of genes through recombination is the
principal way of developing improved genotypes in most breeding programs. Genetic
diversity is necessary to develop new varieties through hybridization. Diversity in terms of
its use and production environments of tomato is high. However, the genetic base of
cultivated tomato is narrow, which is the foundation of many breeding programs (Bai and
Lindhout 2007). It is estimated that the genomes of tomato cultivars contain 5% of the
genetic variation of their wild relatives (Miller and Tanksley 1990). This has been further
supported as less polymorphisms are typically detected with molecular markers within the
cultivated tomato gene pool (Garcia-Martinez et al. 2006; Park et al. 2004; Villand et al.
1998). A high level of polymorphism was found among the Solanum genus using SSR
markers (Alvarez et al., 2001). However, there is limited information on diversity at the
varietal level using DNA markers. Major factors in reducing variation in tomato are self-
pollination, founder effects, bottlenecks, and both artificial and natural selection (Rick 1958;
Rick and Fobes 1975).
Wild Cherry tomato (Solanum lycopersicum var. cerasiforme) is the ancestor of
cultivated tomato (Peralta and Spooner, 2007). Use of wild species in developing tomato
breeding lines has increased the genetic base to some extent. Rick (1973), and Williams and
St. Clair (1993) reported that germplasm base of cultivated tomato has been broadened
using other Solanum species. Existence of 12 wild species of tomato (Bai and Lindhout,
2007) has provided great scope to broaden the genetic base by gene introgression, which
can be exploited to widen the genetic base of tomato. However, the effect of recombination

13
on levels of polymorphism in Solanum is much weaker than in other well-studied species
(Baudry et al., 2001).
Around the world, more than 75,000 accessions of tomato are conserved in gene
banks of more than 120 countries (Robertson and Labate, 2007). The largest collections are
managed by: The United States Department of Agriculture (USDA), Geneva, NY; The Asian
Vegetable Research and Development Center (AVRDC), Tainan, Taiwan, and the Tomato
Genetic Resources Center (TGRC) located in the Department of Vegetable Center at the
University of California. These are the important sources of diversity in tomato breeding
programs and many mutants are available. Several varieties of tomato have been developed
through conventional breeding, even though it takes many years, especially to develop the
homozygous lines. The main steps in conventional breeding are selection of parents,
hybridization, selection and generation advancement, and evaluation. Selection based on
the phenotypic markers depends on the environment and genotypes. In case of a self-
pollinated crop, selection is effective only after getting complete homozygosity, which takes
almost 6 years. On the other hand, molecular markers if available can be applied at any crop
stage of early generation. It is also effective to identify the homozygote as well as
heterozygote plants. Molecular marker-assisted breeding in tomato, however, has still not
been widely used, either due to limited number of useful markers or availability of allele-
specificity.
GENOME MAPPING
The International Solanaceae Genome Project (SOL) has started sequencing the
genome of tomato (http://solgenomics.net/). Ten countries (China, France, India, Italy,
Japan, Korea, the Netherlands, Spain, United Kingdom, and the United States) are involved
in the project (Mueller et al., 2005). Tomato is a model plant for the study of a number of
economically important traits including fruit development and plant defense (Li et al., 2001;
Tanksley, 2004). In 2009, a whole genome shotgun approach was initiated for the tomato

14
genome and draft sequences are already available (http://solgenomics.net/genomes/
Solanum_lycopersicum/index.pl). This sequence data will be very useful for further
understanding the genetics of different traits.
Molecular Markers
Availability of polymorphic molecular markers is a pre-requisite for developing
genetic maps and molecular breeding. The number of markers is also very important for the
construction of a saturated molecular linkage map. After the invention of molecular
markers, which are many in numbers, it is now possible to develop saturated maps and to
select the genotype directly. Limitations of association with morphological and biochemical
markers are overcome by employing molecular markers. Molecular markers are useful for
accelerating breeding process by improving precision and making selection more efficient.
Markers linked to the gene(s) of interest help to select plants genotypically. Identification of
marker along with the development of linkage map is the prerequisite for initiating MAS in a
breeding program. Even quantitative traits can be dissected using molecular markers.
Individual quantitative trait loci (QTL) can be characterized and transferred with the help of
molecular markers.
The genetic marker should be polymorphic, co-dominant, non-epistatic and
insensitive to environment to be used in MAS. There are a number of marker types used in
plant breeding. Morphological markers are mostly few and depend on genotype-
environment interaction. Isozyme is a protein based marker that has also limitation in use
due to low level of polymorphism. The first DNA based marker is restriction fragment length
polymorphism (RFLP) (Botstein et al., 1980). RFLP involves fragmenting a sample of DNA by
restriction enzyme and then hybridization with a probe. It has been widely used on genome
mapping. It needs a large sample of DNA and the process is cumbersome. Alternatively, PCR
based markers, e.g., random amplified polymorphic DNA (RAPD), simple sequence repeat
(SSR), single nucleotide polymorphism (SNP) are now considered more useful and simple.
RAPD markers are usually decamer-based primers that amplify the random segments of

15
genomic DNA (Williams et al., 1990). SSR are repeating sequences of DNA and generally
they are neutral and co-dominant (Hearne et al., 1992). SNP is the variation in DNA due to
single nucleotide polymorphism in the genome (Wang et al., 1998) and abundant. RAPD is
dominant whereas SSR, RFLP, sequence characterized amplified region (SCAR), cleaved
amplified polymorphic sequence (CAPS) and SNP are co-dominant markers.
There are a number of linkage maps developed on tomato genome and different
markers have been identified (Table 2) suitable to select genotype with the traits of
interest. For example, RAPD markers linked to disease resistance genes have been identified
by screening nearly-isogenic lines (Klein-Lankhorst et al., 1991; Martin et al., 1991). De
Giovanni et al. (2004) identified RAPD marker linked to the ol-2 gene, which is resistance to
powdery mildew, using bulked segregant analysis (BSA) to an F2. The distance between
marker and ol-2 gene was also estimated through linkage analysis. Stevens et al. (1995) and
Chagué et al. (1996) have identified RAPD markers linked to the Sw-5 gene. Czech et al.
(2003) have used MAS for developing tomato spotted wilt virus (TSWV) resistant tomato
using polymerase chain reaction (PCR) based markers, SCAR 421.
Random Amplified Polymorphic DNA (RAPD)
Selection of markers depends on the types of objectives and target crop species. SSR
and SNP are generally crop specific and these are not available for many crop species. On
the other hand, without prior knowledge on the sequences of target genome, RAPD can be
used. RAPD is a PCR based multi-locus molecular marker system and is dominant in nature.
This type of marker was first described by Williams et al. (1990). Usually decamer primers
are used to amplify the homologous sites of the target genome. Polymorphisms are
detected as presence or absence of bands. RAPD markers, although old, are considered still
useful for developing genetic maps and analyzing populations (Michelmore et al., 1991).
These markers have been used widely in many species because of their application without
prior sequence information. However, RAPD is very sensitive to reaction conditions and
dominant in nature.
16
RAPD markers have been used in tomato for developing linkage maps (Grandillo and
Tanksley, 1996; Saliba-Colombani et al., 2000), tagging resistant genes (Table 4) and
diversity analysis (Villand et al 1998). They were also found very useful to discriminate
potato cultivars (Sosinski and Douches, 1996) and can be used in tomato for the same
purpose. Villand et al. (1998) used 41 RAPD primers which generated 98 polymorphic RAPD
markers to estimate relationships among 96 accessions of tomato collected from a wide
geographic range.
Linkage and QTL Maps
A linkage map is a map of markers as well as genes on chromosome based on
recombination. A linkage map is the prerequisite for MAS and gene cloning. A linkage map
of tomato with 153 morphological and physiological markers was developed in 1968 (cited
in Foolad 2007). Tanksley and Mutschler (1990) developed and added isozyme markers in
an already available morphological map. A dense map was developed in 1991 using 1030
RFLP markers and some morphological markers (Tanksley et al., 1992). Haanstra et al.
(1999) constructed an integrated map from 1078 amplified fragment length polymorphism
(AFLP) and 67 RFLP using an F2 population of S. lycopersicun x S. pennellii. After the
invention of PCR based markers, many quantitative traits have been mapped in tomato
genome (Table 3). The availability of complete DNA sequences and SNP markers will
enhance the molecular based breeding of tomato.
QTLs are responsible for the majority of important crop characteristics, including
regulation of fruit development and ripening. Advanced backcross breeding was initially
used to genetically isolate a QTL that plays a major role in fruit mass variation between
cultivated tomato and small fruited wild species S. pennellii (Alpert et al., 1995). QTLs were
detected for a number of traits, e.g., resistance to tomato yellow leaf curl virus (TYLCV),
early blight in inter-specific populations (Zamir et al., 1994; Foolad et al., 2002) of tomato.

17
Table 2. Disease resistance genes and their linkage group in 12 chromosomes of tomato
SN Trait Gene Linked markers Gene location
Reference
1 Bacterial canker
Rcm1.0 TG059 1 Sandbrink et al., 1995
Rcm7.0 TG061, TG174, TG210A
7 Sandbrink et al., 1995
2 Bacterial wilt Rrs4.0/Bw-4 TG268 4 Thoquet et al., 1996
Rrs6.0/Bw-1 TG118, CP18 6 Thoquet et al 1996
3 Fusarium wilt I, I-1, I-2, I-2C, I-3
CT226, TG572, P7-43DF3/R1
7, 11 Bournival et al., 1990; Sarfatti et al., 1991; Ori et al., 1997; Simons et al., 1998; Hemming et al., 2004
4 Late blight Ph-1, Ph-2, Ph-3 CP105, TG233, TG591
7, 9, 10 Pierce, 1971; Moreau et al., 1998; Chunwongse et al., 2002
5 Powdery mildew
Ol-1, Ol-2 TG20, SCAU31500, SCAF10, SCAG11
4, 6 Huang et al., 2000; De Giovanni et al., 2004
6 Verticillium wilt
Ve GP39 9 Diwan et al., 1999
7 ToMV Tm-1, Tm-2 TG101, TG79 2, 9 Young and Tanksley, 1989; Levesque et al., 1990
8 TSWV Sw-5 SCAR-421, SCR-2 9 Chagué et al., 1996; Stevens et al., 1996
9 TYLCV Ty-3, Ty-3a FLUW25, P6-25 6 Ji et al., 2008
SN = Serial number. TSWV = Tomato spotted wilt virus. TYLCV = Tomato yellow leaf curl virus. ToMV = Tomato
mosaic virus.
18
Mapping Population
Commonly used mapping populations are F2, backcross (BC), recombinant inbred
lines (RIL), near isogenic lines (NIL) and doubled haploids (DH) lines. In case of asexual crops
an F1 population is used. DH is developed by chromosome doubling of haploid cell, e.g.,
microspores or macrospores. BC progeny is generated by crossing F1 with one of its parents.
RILs are obtained by successive self-pollination of F2 individuals. NILs are the lines that have
the same genotypes except in one locus and it is generally developed through backcross. An
F2 population is the earliest segregating generation available for mapping genes from the
crosses of self-pollinated crop species and F1 population for non-fixed parents and provides
the greatest genetic window around the locus (Michelmore et al., 1991). All the possible
genotypes can be deduced from the parental genotypes. Findings from the F2 population
can be further verified using advanced generations. The heterozygous genotypes along with
two homozygous in F2 population allow estimates of the degree of dominance for loci linked
to markers. The F2 populations of tomato have been commonly used to map QTL for a
number of traits in tomato (Table 3), for example, acylsugars (Mutschler et al., 1996),
eleven quantitative traits (days to first true leaf, days to first flower, plant height, total
number of flower buds, number of internodes on the primary stem, total number of
internodes, number of well-developed branches, total fresh weight and total dry weight of
the aerial portion of the plant, diameter of the stem at the first internode and leaflet
width/length ratio) (DeVicente and Tanksley, 1993), fruit quality traits (Paterson et al.,
1991), soluble solid (Osborn et al., 1987; Tanksley and Hewitt, 1988), salt tolerance (Breto et
al., 1994; Foolad et al., 1997), fruit morphology (Van der Knaap and Tanksley, 2003) and
fruit size (Lippman and Tanksley, 2001).
Genotypic variation within cultivated tomato is reported to be low. Linkage map and
QTL detection have been based on inter-specific crosses in tomato (Paterson et al., 1991;
DeVicente and Tanksley, 1993; Mutschler et al., 1996; Fulton et al., 1997; Bai et al., 2003;
Van der Knaap and Tanksley, 2003). Advancement of molecular markers systems such as

19
SNP is abundant and might be useful to study the intra-specific population of tomato.
Polymorphism is generally high and easy to detect in the population generated from inter-
specific crosses. However, several limitations are associated with such a population. For
example, limitations include low fertility, segregation distortions, linkage drag between
desirable and undesirable traits, and non-direct use for the creation of new crop varieties
(Tanksley and Nelson, 1996). Linkage maps have also been constructed based on
intraspecific crosses in tomato using morphological, RFLP, RAPD and AFLP markers (Saliba-
Colombani et al., 2000). Causse et al. (2001) used intra-specific populations of tomato to
map QTLs for fruit quality traits and detected one to five QTLs per trait. Choice of parental
lines, segregating population and markers are determining factors for construction of
genetic map. If polymorphic markers are available, intra specific crosses offer valuable and
useful information to further advance the molecular breeding.
Artificial vs. Natural Inoculums for Mapping Resistance Genes
Artificial inoculation is a common method for studying host-pathogen interactions.
Genes as well as QTLs are mapped in a host by creating artificial disease pressure. However,
because of the cost and time involved in the artificial inoculation, natural infestation might
equally be considered suitable for mapping QTLs. Use of hot spots for specific disease and
spreader rows help to increase the disease pressure and are cost effective ways of
resistance breeding. Additionally, predictability of the favorable environment for a certain
disease can be utilized to study the host-pathogen interaction in natural condition. For
example, two QTLs for glume botch resistance in wheat were identified using composite
interval mapping from naturally inoculated populations (Schnurbusch et al., 2003). One of
these QTLs explained 31.2% of the observed phenotypic variation for the resistance within
the population. Aphid resistance in barley under natural infestation was studied and
detected a single QTL consistently over two years explaining at least 22% of total
phenotypic variation (Moharramipour et al., 1997). Natural infestation was also used by
Spaner et al. (1998) in barley and by Frei et al. (2005) in common bean.

20
Table 3. Mapping population, marker types and number of QTLs detected for disease resistance and fruit quality traits in tomato
Population Traits analyzed
Marker QTL Variation, % References
Source Type Size Number Types Detection method
Detected, n
R2
t R2
i
S. esculentum/ S. parrifolium
F2 104 Powdery mildew
318 AFLP IM 3 68 Bai et al., 2003
S. esculentum/ S. cheesmanii
F2, F3 350 Fruit wt, SSC, pH
71 RFLP ML 7-13 44-72 4-42 Paterson et al., 1991
S. esculentum/ S. pimpinellifolium
F2 160 Fruit size and shape
93 RFLP Regression 3, 7 30, 46 13-17, 7-19
Van der Knaap and Tanksley, 2003
S. esculentum/ S. pennellii
F2 234 Acylsugar 150 RFLP IM 5 Mutschler et al., 1996
S. esculentum/S. esculentum var. cerasiforme
RIL 144 Organoleptic traits
103 RFLP, RAPD, AFLP
SIM, CIM 1-5 9-45 Causse et al., 2001; Saliba-Colombani et al., 2001
S. esc/ S. hirsutum
BC, RBC
213, 133
Late blight 104, 98 RFLP IM 2-6 >20, 22 19-27 Brouwer and St. Clair, 2004
S. esc/ S. hirsutum
BC1 145 Early blight 141, 23 RFLP, RGAs
SIM, CIM 10 >57 8-26 Foolad et al., 2002
S. esc/ S. chilense BC1S1 50 TYLCV 61 RFLP ANOVA 3 Zamir et al., 1994 S. esculentum/ S. cheesmanii
F8 RIL 97 Fruit wt, SSC, seed wt, color
132 RFLP ANOVA 7-13 4-42 Goldman et al., 1995
S. esc./ S hirsutum
BC1F5 Fruit color ANOVA 13 15-89 Kabelka et al., 2004
S. esc/ S. pimpinellifolium
BC1 119 Lycopene content
151 RFLP IM 1-7 39-75 4-33 Chen et al., 1999
S. esc/ S. pimpinellifolium
BC2F6 170 22 quality traits
126 RFLP Regression 71 4-17 Doganlar et al., 2002
QTL = Quantitative trait loci. BC = Backcross. RIL = Recombinant inbred lines. SSC = Soluble solids content. wt = weight. TYLCV = Tomato yellow curl leaf virus. IM = Interval mapping. ML = Maximum likelihood. SIM = Simple interval mapping. CIM = Composite interval mapping. RBC = Reciprocal backcross. esc = esculentum. R
2t = Percentage of total variation for all the components of the trait. R
2i = Percentage of individual variation for all the
components of the trait.

21
Experimental Design for Mapping Resistance Genes
Genotypes of parents and their progenies for the traits of interest along with
phenotypic measurement of quantitative traits are necessary to construct linkage map and
to detect QTL. Randomized planting of male and female parents, F1, and F2 either in field or
glasshouse have been used to map tomato QTLs (Osborn et al., 1987; Tanksley and Hewitt,
1988; Paterson et al., 1991; DeVicente and Tanksley, 1993; Breto et al., 1994; Alpert et al.,
1995; Mutschler et al., 1996; Foolad et al., 1997; Saliba-Colombani et al., 2000; Causse et
al., 2001; Lippman and Tanksley, 2001; Van der Knaap and Tanksley, 2003).
Replication is necessary and commonly used to estimate the error variance and to
improve the significance of experimental results. However, for linkage and QTL analysis
based on the F2 population, replication is not necessarily considered important (DeVienne
and Causse, 2003). The number of different individuals in different genotypic classes serves
the basis for such type of analysis. Here, power of QTL detection and precision of QTL
location depends more on the population size rather than on marker density (Darvasi et al.,
1993; Liu, 1998). For example, to determine whether two gene pairs are linked or assorting
randomly, the conventional method is to compare the number of individuals observed in
each phenotypic class with those expected on the basis of independent assortment, and
then to test the deviation between these values by chi-square test. An F2 is the most
conveniently illustrative population for QTL mapping on a marker by marker basis
(DeVienne and Causse, 2003), because it is the only generation in which the three possible
genotypes of one locus are present. We can construct a linkage map where there is an
association between a marker and the trait. With the experiment of randomizing few
individuals of male and female parents, F1 and F2 individuals, QTLs have been mapped in
tomato for number of different traits, for examples powdery mildew resistance from 104 F2
individuals (Bai et al., 2003), salt tolerance from 206 F2 plants (Breto et al., 1994), different
quantitative traits from 432 F2 plants, 32 female plants, 18 male plants and 33 F1 plants.

22
Furthermore, individual plants from BC1 population without replication have also been used
for QTL analysis (Alpert et al., 1995).
Bulked Segregant Analysis
Tagging of a particular segment of chromosome by molecular marker is the
prerequisite of marker-assisted breeding. Earlier, use of near isogenic lines (NIL) was the
common means of identifying the gene of interest. NIL are not available for most of the
target regions and it takes a long time to develop. Alternatively, Michelmore et al. (1991)
developed a very rapid and simple PCR-based method to identify the gene of interest called
bulked segregant analysis (BSA) and identified RAPD markers linked to a disease resistance
gene in lettuce. For BSA, any kinds of mapping populations, e.g., RIL, BC, F2 and DH that are
segregating for a trait of interest, can be used (Table 4, Figure 6).
In BSA, two extreme phenotypes, i.e., low and high (or susceptible and resistant) of a
particular trait from a segregating population, are compared using bulk DNA from these two
extremes. DNA from individuals similar to trait of interest are bulked and assumed that the
bulks are homozygous for the target interval and heterozygous for the rest of the interval as
shown in Figure 6 (Giovannoni et al., 1991; Michelmore et al., 1991; Quarrie et al., 1999).
DNA markers are then used to screen the parents and bulks. If polymorphism is found
between bulks, this marker (polymorphic band) is expected to be associated with gene of
interest.
RAPD marker is not considered suitable for MAS mainly due to its dominant nature,
multiple loci amplification and low reproducibility, and sensitivity to reaction conditions.
However, many disease resistance genes have been identified in tomato using RAPD (Table
4). Once RAPD markers linked to resistance genes are detected, they can be converted into
co-dominant markers, for example, CAPS or SCAR, which are more reliable than RAPD.
There may be potential to use BSA for identifying gene conferring multiple disease
resistance (MDR) in a faster way. Zwonitzer et al. (2010) used RIL to see the evidence of
MDR in maize following the conventional QTL mapping strategy.

23
Figure 6. General description of bulked segregant analysis (BSA) technique.
After developing segregating population for trait of interest from crossing inbreds, two bulks are prepared from two extremes. These bulks and parents are then screened by markers to identify the polymorphic ones. P = Parent. B = Bulk. RIL = Recombinant inbred lines. BC = Back cross. DH = Double haploid. R = Resistance. S = Susceptible. Bar is a chromosome representation of each individual that contains a target region. The two lines across the bars indicate homozygote interval.
X
P1 P2
F1

24
Table 4. Use of bulked segregant analysis (BSA) to identify traits of interest in different crop species
SN Marker Bulked size
Crop Population Traits studied Reference
Type Total used
Polymorphic between
Parents Bulks
1. RFLP, RAPD
100 RAPD
- 3 RAPD 14-20 Lettuce F2 Resistance to downy mildew Michelmore et al. 1991
2. RAPD 600 254 4 100, 64
Tomato F4 QTL Resistance to TYLCV Chagué et al., 1997
3. RAPD 200 - 14 7-8 Tomato F7 (RIL) Flower number, fruit number, fruit setting percentage, yield, fruit weight
Lin et al., 2006
4. RAPD 382 117 6 67, 33 Tomato F2 Resistance to TSWV Chagué et al., 1996
5. RAPD 271 28 5 - Tomato F2 Resistance to TSWV Śmiech et al., 2000
6. RAPD 200 3 7-14 Tomato F2 Pedicel abscission and fruit ripening
Giovannoni et al., 1991
7. SNP 1536 27 9, 8 Soybean F2 Resistance to soybean rust Hyten et al., 2009
8. SSR 540 - - 5 Wheat DH Resistance to stripe rust Lan et al., 2010
9. RAPD 222 63 4 14 Corn F2 Resistance to northern leaf blight
Khampila et al., 2008
10. RAPD 200 7 3 8 Tomato F2 Male sterility Staniaszek et al., 2000
11. AFLP 256 13 2 10 Tomato F2 Resistance to bacterial wilt Miao et al., 2009
12. RAPD and ISSR
10 and 6
2 and 1 10 Tomato F2 Heat tolerance Kamel et al., 2010

25
SN Marker Bulked size
Crop Population Traits studied Reference
Type Total used
Polymorphic between
Parents Bulks
13. RAPD 13 5-6 Apple F1 Scab and powdery mildew resistance, ideotype
Sestras et al., 2009
14. RAPD 164 19 2 14, 3 Wheat F2 Stripe rust resistance Chague et al., 1999
15. RAPD 700 - 7 5 Barley DH Rhynchosporium secalis resistance
Barua et al., 1993
16. SSR 48 1 8 Wheat NIL Male sterility Cao et al., 2009
17. SSR 109 4 10 Maize F2 Drought tolerance Gemenet et al., 2010
18. SSR 293 2 20 Rice RIL Drought tolerance Venuprasad et al., 2009
19. RAPD and AFLP
213 and 26
47 1 and 1 10, 9 Tomato F2 Powdery mildew resistance De Giovanni et al., 2004
20. AFLP 128 1 5 Tomato F2 Late blight resistance Moreau et al., 1998
21. SSR 109 60 5 9 Wheat F3 Powdery mildew resistance Chantret et al., 2000
22. AFLP 42000 3 10 Tomato F2 Resistance to Cladosporium fulvum
Thomas et al., 1995
SN = Serial number. DH = Doubled haploid. RIL = Recombinant inbred lines. NIL = Near isogenic lines. TYLCV = Tomato yellow leaf curl virus. TSWV = Tomato spotted wild virus. QTL = Quantitative trait loci. Bulked size means number of individuals used.
Table 4. Continued

26
BSA has been an important technique to identify the DNA markers linked to trait of
interest. Availability of markers is very important to accelerate the breeding process. To
implement the MAS in tomato resistance breeding, it is necessary to tag the molecular
markers linked to resistance genes. This study focused on the identification of markers
through BSA technique with the following specific objectives.
OBJECTIVES
The main objective of this study is the development of reliable molecular markers
that are tightly linked to septoria leaf spot and late blight resistance genes in tomato. The
specific objectives were to:
1. determine the inheritance pattern of septoria leaf spot in a tomato population
derived from intra-species crosses; and
2. identify the molecular markers linked to septoria leaf spot and late blight
resistance genes.

27
REFERENCES
Alpert, K.B., S. Grandillo, and S.D. Tanksley. 1995. fw 2.2: A major QTL controlling fruit weight is common to both red-and green-fruited tomato species. Theor. Appl. Genet. 91:994-1000.
Alvarez, A.E., C.C.M. Van de Wiel, M.J.M. Smulders, and B. Vosman. 2001. Use of
microsatellites to evaluate genetic diversity and species relationships in the genus Lycopersicon. Theor. Appl. Genet. 103:1283-1292.
Andrus, C.F., and G.B. Reynard. 1945. Resistance to septoria leaf spot and its inheritance in
tomatoes. Phytopathology 35:16-24. Bai, Y., and P. Lindhout. 2007. Domestication and breeding of tomatoes: What have we
gained and what can we gain in the future? Ann. Bot. 100:1085-1094. Bai, Y., C.C. Huang, R. van der Hulst, F. Meijer-Dekens, G. Bonnema, and P. Lindhout. 2003.
QTLs for tomato powdery mildew resistance (Oidium lycopersici) in Lycopersicon parviflorum G1. 1601 co-localize with two qualitative powdery mildew resistance genes. Mol. Plant-Microbe Interact. 16:169-176.
Barua, U.M., K.J. Chalmers, C.A. Hackett, W.T.B. Thomas, W. Powell, and R. Waugh. 1993.
Identification of RAPD markers linked to a Rhynchosporium secalis resistance locus in barley using near-isogenic lines and bulked segregant analysis. Heredity (London) 71:177-177.
Baudry, E., C. Kerdelhue, H. Innan, and W. Stephan. 2001. Species and recombination
effects on DNA variability in the tomato genus. Genetics 158:1725-1735. Botstein, D., R.L. White, M. Skolnick, and R.W. Davis. 1980. Construction of a genetic linkage
map in man using restriction fragment length polymorphisms. Am. J. Hum. Genet. 32:314-331.
Bournival, B.L., C.E. Vallejos, and J.W. Scott. 1990. Genetic analysis of resistances to races 1 and 2 of Fusarium oxysporum f. sp. lycopersici from the wild tomato Lycopersicon pennellii. Theor. Appl. Genet. 79:641-645.
Breto, M.P., M.J. A ins, and E.A. Carbonell. 1994. Salt tolerance in Lycopersicon species. III.
Detection of quantitative trait loci by means of molecular markers. Theor. Appl. Genet. 88:395-401.

28
Brouwer, D.J., and D.A. St. Clair. 2004. Fine mapping of three quantitative trait loci for late blight resistance in tomato using near isogenic lines (NILs) and sub-NILs. Theor. Appl. Genet. 108:628-638.
Cao, W., D.J. Somers, and G. Fedak. 2009. A molecular marker closely linked to the region of
Rht-D1c and Ms2 genes in common wheat (Triticum aestivum). Genome 52:95-99. Causse, M., V. Saliba-Colombani, I. Lesschaeve, and M. Buret. 2001. Genetic analysis of
organoleptic quality in fresh market tomato. 2. Mapping QTLs for sensory attributes. Theor. Appl. Genet. 102:273-283.
Chague, V., T. Fahima, A. Dahan, G.L. Sun, A.B. Korol, Y.I. Ronin, A. Grama, M.S. Röder, and
E. Nevo. 1999. Isolation of microsatellite and RAPD markers flanking the Yr15 gene of wheat using NILs and bulked segregant analysis. Genome 42:1050-1056.
Chagué, V., J.C. Mercier, M. Guenard, A. De Courcel, and F. Vedel. 1997. Identification of
RAPD markers linked to a locus involved in quantitative resistance to TYLCV in tomato by bulked segregant analysis. Theor. Appl. Genet. 95:671-677.
Chagué, V., J.C. Mercier, M. Guénard, A. Courcel, and F. Vedel. 1996. Identification and
mapping on chromosome 9 of RAPD markers linked to Sw-5 in tomato by bulked segregant analysis. Theor. Appl. Genet. 92:1045-1051.
Chantret, N., P. Sourdille, M. Röder, M. Tavaud, M. Bernard, and G. Doussinault. 2000.
Location and mapping of the powdery mildew resistance gene MlRE and detection of a resistance QTL by bulked segregant analysis (BSA) with microsatellites in wheat. Theor. Appl. Genet. 100:1217-1224.
Chen, F.Q., M.R. Foolad, J. Hyman, D.A. St. Clair, and R.B. Beelaman. 1999. Mapping of QTLs
for lycopene and other fruit traits in a Lycopersicon esculentum × L. pimpinellifolium cross and comparison of QTLs across tomato species. Mol. Breed. 5:283-299.
Chunwongse, J., C. Chunwongse, L. Black, and P. Hanson. 2002. Molecular mapping of the
Ph-3 gene for late blight resistance in tomato. J. Hort. Sci. Biotechnol. 77:281-286. Czech, A.S., M. Szklarczyk, Z. Gajewski, E. Zukowska, B. Michalik, T. Kobylko, and K. Strzalka.
2003. Selection of tomato plants resistant to a local Polish isolate of tomato spotted wilt virus (TSWV). J. Appl. Genet. 44:473-480.
Darvasi, A., A. Weinreb, V. Minke, J.I. Weller, and M. Soller. 1993. Detecting marker-QTL
linkage and estimating QTL gene effect and map location using a saturated genetic

29
map. Genetics 134:943-951. Darwin, S.C., S. Knapp, and I.E. Peralta. 2003. Tomatoes in the Galápagos Islands:
Morphology of native and introduced species of Solanum section Lycopersicon (Solanaceae). Syst. Biodiv. 1:29-54.
De Giovanni, C., P. Dell'Orco, A. Bruno, F. Ciccarese, C. Lotti, and L. Ricciardi. 2004.
Identification of PCR-based markers (RAPD, AFLP) linked to a novel powdery mildew resistance gene (ol-2) in tomato. Plant Sci. 166:41-48.
Delahaut, K., and W. Stevenson. 2004. Tomato disorders: Early blight and septoria leaf spot.
The University of Wisconsin. A2606:R-0504. DeVicente, M.C., and S.D. Tanksley. 1993. QTL analysis of transgressive segregation in an
interspecific tomato cross. Genetics 134:585-596. DeVienne, D., and M. Causse. 2003. Mapping and characterising quantitative trait loci. p.
89-124. In deVienne, D. (ed.), Molecular markers in plant genetics and biotechnology. Science Publisher, USA.
Diwan, N., R. Fluhr, Y. Eshed, D. Zamir, and S.D. Tanksley. 1999. Mapping of Ve in tomato: A
gene conferring resistance to the broad-spectrum pathogen, Verticillium dahliae race 1. Theor. Appl. Genet. 98:315-319.
Doganlar, S., A. Frary, H.M. Ku, and S.D. Tanksley. 2002. Mapping quantitative trait loci in
inbred backcross lines of Lycopersicon pimpinellifolium (LA1589). Genome 45:1189-1202.
FAOSTAT. 2010. Food and Agriculture Organization of the United Nations. Available at
http://faostat.fao.org/site/339/default.aspx (verified 25 June 2010). Foolad, M.R. 2007. Genome mapping and molecular breeding of tomato. Intl. J. Plant
Genomics 2007:1-52. Foolad, M., H. Merk, and H. Ashrafi. 2008. Genetics, genomics and breeding of late blight
and early blight resistance in tomato. Crit. Rev. Plant Sci. 27:75-107. Foolad, M., L. Zhang, A.A. Khan, D. Nino-Liu, and G. Lin. 2002. Identification of QTLs for early
blight (Alternaria solani) resistance in tomato using backcross populations of a Lycopersicon esculentum × L. hirsutum cross. Theor. Appl. Genet. 104:945-958.

30
Foolad, M.R., T. Stoltz, C. Dervinis, R.L. Rodriguez, and R.A. Jones. 1997. Mapping QTLs conferring salt tolerance during germination in tomato by selective genotyping. Mol. Breed. 3:269-277.
Frei, A., M.W. Blair, C. Cardona, S.E. Beebe, H. Gu, and S. Dorn. 2005. QTL mapping of
resistance to thrips palmi karny in common bean. Crop Sci. 45:379-387. Fulton, T.M., T. Beck-Bunn, D. Emmatty, Y. Eshed, J. Lopez, V. Petiard, J. Uhlig, D. Zamir, and
S.D. Tanksley. 1997. QTL analysis of an advanced backcross of Lycopersicon peruvianum to the cultivated tomato and comparisons with QTLs found in other wild species. Theor. Appl. Genet. 95:881-894.
Garcia-Martinez, S., L. Andreani, M. Garcia-Gusano, F. Geuna, and J.J. Ruiz. 2005. Evolution
of amplified length polymorphism and simple sequence repeats for tomato germplasm fingerprinting: Utility for grouping closely related traditional cultivars. Genome 49:648-656.
Gavino, P.D., C.D. Smart, R.W. Sandrock, J.S. Miller, P.B. Hamm, T.Y. Lee, R.M. Davis, and W.E. Fry. 2000. Implications of sexual reproduction for Phytophthora infestans in the United States: Generation of an aggressive lineage. Plant Disease 84:731-735.
Gemenet, D.C., F.N. Wachira, R.S. Pathak, and S.W. Munyiri. 2010. Identification of
molecular markers linked to drought tolerance using bulked segregant analysis in Kenyan maize (Zea mays L.) landraces. J. Anim. Plant Sci. 9:1122-1134.
Giovannoni, J.J., R.A. Wing, M.W. Ganal, and S.D. Tanksley. 1991. Isolation of molecular
markers from specific chromosomal intervals using DNA pools from existing mapping populations. Nucleic Acid Res. 19:6553-6558.
Giovannucci, E. 2002. A review of epidemiologic studies of tomatoes, lycopene, and
prostate cancer. Exp. Biol. Med. 227:852-859. Goldman, I.L., I. Paran, and D. Zamir. 1995. Quantitative trait locus analysis of a
recombinant inbred line population derived from a Lycopersicon esculentum x Lycopersicon cheesmanii cross. Theor. Appl. Genet. 90:925-932.
Grandillo, S., and S.D. Tanksley. 1996. Genetic analysis of RFLPs, GATA microsatellites and
RAPDs in a cross between L. esculentum and L. pimpinellifolium. Theor. Appl. Genet. 92(8):957–965.
Haanstra, J.P.W., C. Wye, H. Verbakel, F. Meijer-Dekens, P. Van den Berg, P. Odinot, A.W.

31
Van Heusden, S. Tanksley, P. Lindhout, and J. Peleman. 1999. An integrated high-density RFLP-AFLP map of tomato based on two Lycopersicon esculentum × L. pennellii F2 populations. Theor. Appl. Genet. 99:254-271.
Hawkes, J.G. 1990. The potato: Evolution, biodiversity and genetic resources. Belhaven
Press, London. Hemming, M.N., S. Basuki, D.J. McGrath, B.J. Carroll, and D.A. Jones. 2004. Fine mapping of
the tomato I-3 gene for fusarium wilt resistance and elimination of a co-segregating resistance gene analogue as a candidate for I-3. Theor. Appl. Genet. 109:409-418.
Hearne, C.M., S. Ghosh, and J.A. Todd. 1992. Microsatellites for linkage analysis of genetic
traits. Trends in Genetics 8:288-294. Huang, C.C., Y.Y. Cui, C.R. Weng, P. Zabel, and P. Lindhout. 2000. Development of diagnostic
PCR markers closely linked to the tomato powdery mildew resistance gene Ol-1 on chromosome 6 of tomato. Theor. Appl. Genet. 101:918-924.
Hyten, D.L., J.R. Smith, R.D. Frederick, M.L. Tucker, Q. Song, and P.B. Cregan. 2009. Bulked
segregant analysis using the GoldenGate assay to locate the Rpp3 locus that confers resistance to soybean rust in soybean. Crop Sci. 49:265-271.
Ji, Y., M.S. Salus, B. Van Betteray, J. Smeets, K.S. Jensen, C.T. Martin, L. Mejia, J.W. Scott,
M.J. Havey, and D.P. Maxwell. 2008. Co-dominant SCAR markers for detection of the Ty-3 and Ty-3a loci from Solanum chilense at 25 cM of chromosome 6 of tomato. Tomato Genet. Coop. 57:25-29.
Jorgensen, P.M., and S. Léon-Yánez. 1999. Catalogue of the vascular plants of Ecuador.
Monogr. Syst. Bot. Missouri Bot. Gard. 75:iviii. Kabelka, E., W. Yang, and D.M. Francis. 2004. Improved tomato fruit color within an inbred
backcross line derived from Lycopersicon esculentum and L. hirsutum involves the interaction of loci. J. Am. Soc. Hort. Sci. 129:250-257.
Kamel, M.A., S.S. Soliman, A.E. Mandour, and M.S.S. Ahmed. 2010. Genetic evaluation and
molecular markers for heat tolerance in tomato (Lycopersicon esculentum Mill.). J. Am. Sci. 6:364-374.
Khampila, J., K. Lertrat, W. Saksirirat, J. Sanitchon, N. Muangsan, and P. Theerakulpisut.
2008. Identification of RAPD and SCAR markers linked to northern leaf blight resistance in waxy corn (Zea mays var. ceratina). Euphytica 164:615-625.
32
Klein-Lankhorst, R.M., A. Vermunt, R. Weide, T. Liharska, and P. Zabel. 1991. Isolation of molecular markers for tomato (L. esculentum) using random amplified polymorphic DNA (RAPD). Theor. Appl. Genet. 83:108-114.
Lan, C., S. Liang, X. Zhou, G. Zhou, Q. Lu, X. Xia, and Z. He. 2010. Identification of genomic
regions controlling adult-plant stripe rust resistance in Chinese landrace Pingyuan 50 through bulked segregant analysis. Phytopathology 100:313-318.
Levesque, H., F. Vedel, C. Mathieu, and A.G.L. Courcel. 1990. Identification of a short rDNA
spacer sequence highly specific of a tomato line containing Tm-1 gene introgressed from Lycopersicon hirsutum. Theor. Appl. Genet. 80:602-608.
Li, L., C. Li, and G.A. Howe. 2001. Genetic analysis of wound signaling in tomato. Evidence
for a dual role of jasmonic acid in defense and female fertility. Plant Physiol. 127:1414-1417.
Lin, K.H., H.F. Lo, S.P. Lee, C.G. Kuo, J.T. Chen, and W.L. Yeh. 2006. RAPD markers for the
identification of yield traits in tomatoes under heat stress via bulked segregant analysis. Hereditas 143:142-154.
Linnaeus, C. 1753. Sp. Pl. 1st ed. Holmiae, Stockholm. Lippman, Z., and S.D. Tanksley. 2001. Dissecting the genetic pathway to extreme fruit size in
tomato using a cross between the small-fruited wild species Lycopersicon pimpinellifolium and L. esculentum var. Giant Heirloom. Genetics 158:413-422.
Liu, B.H. 1998. Statistical genomics: Linkage, mapping, and QTL analysis. CRC Press, Boca
Raton.
Luckwill, L.C. 1943. The genus Lycopersicon: An historical, biological, and taxonomical survey of the wild and cultivated tomatoes. Aberdeen Univ. Stud. 120:1-44.
Lukyanenko, A.N. 1991. Disease resistance in tomato. p. 99–119. In Kalloo, G. (ed.), Genetic
improvement of tomato. Springer-Verlag, Berlin Heidelberg. Martin, G.B., J.G.K. Williams, and S.D. Tanksley. 1991. Rapid identification of markers linked
to a Pseudomonas resistance gene in tomato by using random primers and near-isogenic lines. Proc. Natl. Acad. Sci. 88:2336-2340.
Miao, L., S. Shou, J. Cai, F. Jiang, Z. Zhu, and H. Li. 2009. Identification of two AFLP markers
linked to bacterial wilt resistance in tomato and conversion to SCAR markers. Mol.

33
Biol. Rep. 36:479-486. Michelmore, R.W., I. Paran, and R.V. Kesseli. 1991. Identification of markers linked to
disease-resistance genes by bulked segregant analysis: A rapid method to detect markers in specific genomic regions by using segregating populations. Proc. Natl. Acad. Sci. 88:9828-9832.
Miller, J.C., and S.D. Tanksley. 1990. RFLP analysis of phylogenetic relationships and genetic
variation in the genus Lycopersicon. Theor. Appl. Genet. 80:437-448.
Miller, P. 1752. The Gardeners Dictionary. 6th ed. John and Francis Rivington, London. Miller, P. 1754. The Gardeners Dictionary. 4th ed. John and Francis Rivington, London. Moharramipour, S., H. Tsumuki, K. Sato, and H. Yoshida. 1997. Mapping resistance to cereal
aphids in barley. Theor. Appl. Genet. 94:592-596. Moreau, P., P. Thoquet, J. Olivier, H. Laterrot, and N. Grimsley. 1998. Genetic mapping of
Ph-2, a single locus controlling partial resistance to Phytophthora infestans in tomato. Mol. Plant-Microbe Interact. 11:259-269.
Mueller, L.A., T.H. Solow, N. Taylor, B. Skwarecki, R. Buels, J. Binns, C. Lin, M.H. Wright, R.
Ahrens, Y. Wang, V. Herbst, E.R. Keyder, N. Menda, D. Zamir, and S.D. Tanksley. 2005. The SOL genomics network: A comparative resource for Solanaceae biology and beyond. Plant Physiol. 138:1310-1317.
Mueller, L.A., S.D. Tanksley, J.J. Giovannoni, J. Van Eck, S. Stack, D. Choi, B.D. Kim, M. Chen,
Z. Cheng, C. Li, and others. 2005. The tomato sequencing project, the first cornerstone of the International Solanaceae Project (SOL). Comparative and Functional Genomics 6:153-158.
Muller, C.H. 1940. A revision of the genus Lycopersicon. US Dept. of Agriculture. Mutschler, M.A., R.W. Doerge, S.C. Liu, J.P. Kuai, B.E. Liedl, and J.A. Shapiro. 1996. QTL
analysis of pest resistance in the wild tomato Lycopersicon pennellii: QTLs controlling acylsugar level and composition. Theor. Appl. Genet. 92:709-718.
Nguyen, M.L., and S.J. Schwartz. 1999. Lycopene: Chemical and biological properties. Food
Technol. (USA) 53:38-45. Ori, N., Y. Eshed, I. Paran, G. Presting, D. Aviv, S. Tanksley, D. Zamir, and R. Fluhr. 1997. The

34
I2C family from the wilt disease resistance locus I2 belongs to the nucleotide binding, leucine-rich repeat superfamily of plant resistance genes. The Plant Cell Online 9:521-532.
Osborn, T.C., D.C. Alexander, and J.F. Fobes. 1987. Identification of restriction fragment
length polymorphisms linked to genes controlling soluble solids content in tomato fruit. Theor. Appl. Genet. 73:350-356.
Park, Y.H., M.A.L. West, and D.A. St. Clair. 2004. Evaluation of AFLPs for germplasm
fingerprinting and assessment of genetic diversity in cultivars of tomato (Lycopersicon esculentum L.). Genome 47:510-518.
Paterson, A.H., S. Damon, J.D. Hewitt, D. Zamir, H.D. Rabinowitch, S.E. Lincoln, E.S. Lander, and S.D. Tanksley. 1991. Mendelian factors underlying quantitative traits in tomato: Comparison across species, generations, and environments. Genetics 127:181-197.
Peralta, I.E., S. Knapp, D.M. Spooner, and T.G. Lammers. 2005. New species of wild
tomatoes (Solanum section Lycopersicon: Solanaceae) from Northern Peru. Syst. Bot. 30:424-434.
Peralta, I.E., and D.M. Spooner. 2001. GBSSI gene phylogeny of wild tomatoes (Solanum L.
section Lycopersicon [Mill.] Wettst. subsection Lycopersicon). Am. J. Bot. 88:1888-1902.
Peralta, I.E., and D.M. Spooner. 2007. History, origin and early cultivation of tomato
(Solanaceae). p. 1-24. In Rajdan, M.K., Mattoo, A.K. (eds.), Genetic improvement of Solanaceous crops. Vol. 2: Tomato. Science Publishers, New Hampshire.
Pierce, L.C. 1971. Linkage test with Ph conditioning resistance to race 0. Tomato. Genet.
Coop. Rep. 21:30. Quarrie, S.A., V. Lazic-Jancic, D. Kovacevic, A. Steed, and S. Pekic. 1999. Bulk segregant
analysis with molecular markers and its use for improving drought resistance in maize. J. Exp. Botany 50:1299-1306.
Ray, J. 1673. Observations topographical, moral and physiological; made in a journey
through part of the Low-countries, Germany, Italy and France. John Martyn, London:499p.
Rick, C.M. 1973. Potential genetic resources in tomato species: Clues from observations in
native habitats. Plenum Press, New York.
35
Rick, C.M. 1980. Tomato. p. 669-680. In Hybridization of crop plants. Amer. Soc. Agron./Crop Sci. Soc. Amer., Madison, Wis.
Rick, C.M., and M. Holle. 1990. Andean Lycopersicon esculentum var. cerasiforme: Genetic
variation and its evolutionary significance. Econ. Bot. 44:69-78. Rick, C.M., H. Laterrot, and J. Philouze. 1990. A revised key for the Lycopersicon species.
Tomato Genet. Coop. Rep. 40:31.
Rick, C.M. 1958. The role of natural hybridization in the derivation of cultivated tomatoes of
western South America. Econ. Bot. 12:346-367.
Rick, C.M., and J.F. Fobes. 1975. Allozyme variation in the cultivated tomato and closely related species. Bulletin of the Torrey Botanical Club 102:376-384.
Robertson, L., and J. Labate. 2007. Genetic resources of tomato (Lycopersicon esculentum Mill.) and wild relatives. p. 25-75. In Rajdan, M.K., Mattoo, A.K. (eds.), Genetic improvement of Solanaceous crops. Vol. 2: Tomato. Science Publishers, New Hampshire.
Sabine, J. 1820. On the love apple or tomato. Trans. Royal Hort. Soc. London 3:342-354. Saliba-Colombani, V., M. Causse, L. Gervais, and J. Philouze. 2000. Efficiency of RFLP, RAPD,
and AFLP markers for the construction of an intraspecific map of the tomato genome. Genome 43:29-40.
Saliba-Colombani, V., M. Causse, D. Langlois, J. Philouze, and M. Buret. 2001. Genetic
analysis of organoleptic quality in fresh market tomato. 1. Mapping QTLs for physical and chemical traits. Theor. Appl. Genet. 102:259-272.
Sandbrink, J.M., J.W. Ooijen, C.C. Purimahua, M. Vrielink, R. Verkerk, P. Zabel, and P.
Lindhout. 1995. Localization of genes for bacterial canker resistance in Lycopersicon peruvianum using RFLPs. Theor. Appl. Genet. 90:444-450.
Sarfatti, M., M. Abu-Abied, J. Katan, and D. Zamir. 1991. RFLP mapping of I1, a new locus in
tomato conferring resistance against Fusarium oxysporum f. sp. lycopersici race 1. Theor. Appl. Genet. 82:22-26.
Schnurbusch, T., S. Paillard, D. Fossati, M. Messmer, G. Schachermayr, M. Winzeler, and B.
Keller. 2003. Detection of QTLs for Stagonospora glume blotch resistance in Swiss winter wheat. Theor. Appl. Genet. 107:1226-1234.

36
Sestras, R., D. Pamfil, M. Aardelean, C. Botez, A. Sestras, I. Mitre, C. Dan, and L. Mihalte. 2009. Use of phenotypic and MAS selection based on bulk segregant analysis to reveal the genetic variability induced by artificial hybridization in apple. Not. Bot. Hort. Agrobot. Cluj 37:273-277.
Simons, G., J. Groenendijk, J. Wijbrandi, M. Reijans, J. Groenen, P. Diergaarde, T. Van der
Lee, M. Bleeker, J. Onstenk, and M. de Both. 1998. Dissection of the Fusarium I2 gene cluster in tomato reveals six homologs and one active gene copy. The Plant Cell Online 10:1055-1068.
Smiech, M., Z. Rusinowski, S. Malepszy, and K. Niemirowicz-Szczytt. 2000. New RAPD
markers of tomato spotted wilt virus (TSWV) resistance in Lycopersicon esculentum Mill. Acta Physiologiae Plantarum 22:299-303.
Sosinski, B., and D.S. Douches. 1996. Using polymerase chain reaction-based DNA
amplification to fingerprint north American potato cultivars. HORTSCIENCE 31:130-133.
Spaner, D., L.P. Shugar, T.M. Choo, I. Falak, K.G. Briggs, W.G. Legge, D.E. Falk, S.E. Ullrich,
N.A. Tinker, and B.J. Steffenson. 1998. Mapping of disease resistance loci in barley on the basis of visual assessment of naturally occurring symptoms. Crop Sci. 38:843-850.
Spooner, D.M., G.J. Anderson, and R.K. Jansen. 1993. Chloroplast DNA evidence for the
interrelationships of tomtoes, potatoes, and pepinos (Solanaceae). Am. J. Bot. 80:676-688.
Staniaszek, M., W. Marczewski, H. Habdas, and H. Potaczek. 2000. Identification of RAPD
markers linked to the ps gene and their usefulness for purity determination of breeding lines and F1 tomato hybrids. Acta Physiol. Plant 22:303-306.
Stevens, M.R., D.K. Heiny, P.D. Griffiths, J.W. Scott, and D.D. Rhoads. 1996. Identification of
co-dominant RAPD markers tightly linked to the tomato spotted wilt virus (TSWV) resistance gene Sw-5. Tomato Genet. Coop. Rep. 46:27-28.
Stevens, M.R., E.M. Lamb, and D.D. Rhoads. 1995. Mapping the Sw-5 locus for tomato
spotted wilt virus resistance in tomatoes using RAPD and RFLP analyses. Theor. Appl. Genet. 90:451-456.
Tanksley, S.D. 2004. The genetic, developmental, and molecular bases of fruit size and
shape variation in tomato. The Plant Cell Online 16(suppl. 1):S181.

37
Tanksley, S.D., M.W. Ganal, J.P. Prince, M.C. De-Vicente, M.W. Bonierbale, P. Broun, T.M. Fulton, J.J. Giovannoni, S. Grandillo, and G.B. Martin. 1992. High density molecular linkage maps of the tomato and potato genomes. Genetics 132:1141-1160.
Tanksley, S.D., and J. Hewitt. 1988. Use of molecular markers in breeding for soluble solids
content in tomato—A re-examination. Theor. Appl. Genet. 75:811-823. Tanksley, S.D., and J.C. Nelson. 1996. Advanced backcross QTL analysis: A method for the
simultaneous discovery and transfer of valuable QTLs from unadapted germplasm into elite breeding lines. Theor. Appl. Genet. 92:191-203.
Taylor, I.B. 1986. Biosystematics of the tomato. p. 1-34. In Ahterton, J.G., Rudich, J. (eds.),
The tomato crop: A scientific basis for improvement. Chapman and Hall, London. Thomas, C.M., P. Vos, M. Zabeau, D.A. Jones, K.A. Norcott, B.P. Chadwick, and J.D. Jones.
1995. Identification of amplified restriction fragment polymorphism (AFLP) markers tightly linked to the tomato Cf-9 gene for resistance to Cladosporium fulvum. The Plant Journal 8:785-794.
Thoquet, P., J. Olivier, C. Sperisen, P. Rogowsky, P. Prior, G. Anaïs, B. Mangin, B. Bazin, R.
Nazer, and N. Grimsley. 1996. Polygenic resistance of tomato plants to bacterial wilt in the French West Indies. Mol. Plant-Microbe Interact. 9:837-842.
Tournefort, J.P.D. 1694. Elements de Botanique. 1’Imprimerie Royale, Paris. Van der Knaap, E., and S.D. Tanksley. 2003. The making of a bell pepper-shaped tomato
fruit: Identification of loci controlling fruit morphology in Yellow Stuffer tomato. Theor. Appl. Genet. 107:139-147.
Venuprasad, R., C.O. Dalid, M. Del Valle, D. Zhao, M. Espiritu, M.T. Sta Cruz, M. Amante, A.
Kumar, and G.N. Atlin. 2009. Identification and characterization of large-effect quantitative trait loci for grain yield under lowland drought stress in rice using bulk-segregant analysis. Theor. Appl. Genet. 120:177-190.
Villand, J., P.W. Skroch, T. Lai, P. Hanson, C.G. Kuo, and J. Nienhuis. 1998. Genetic variation
among tomato accessions from primary and secondary centers of diversity. Crop Sci. 38:1339-1347.
Vinson, J.A., Y. Hao, X. Su, and L. Zubik. 1998. Phenol antioxidant quantity and quality in
foods: Vegetables. J. Agric. Food Chem. 46:3630-3634.

38
Wang, D.G., J.-B. Fan, C.-J. Siao, A. Berno, P. Young, R. Sapolsky, G. Ghandour, N. Perkins, E. Winchester, J. Spencer, L. Kruglyak, L. Stein, L. Hsie, T. Topaloglou, E. Hubbell, E. Robinson, M. Mittmann, M.S. Morris, N. Shen, D. Kilburn, J. Rioux, C. Nusbaum, S. Rozen, T.J. Hudson, R. Lipshutz, M. Chee, and E.S. Lander. 1998. Large-scale identiication, mapping, and genotyping of single-nucleotide polymorphisms in the human gGenome. Science 280:1077-1082.
Willcox, J.K., G.L. Catignani, and S. Lazarus. 2003. Tomatoes and cardiovascular health. Crit. Rev. Food Sci. Nutr. 43:1-18.
Williams, C., and D. St. Clair. 1993. Phenetic relationships and levels of variability detected
by restriction fragment length polymorphism and random amplified polymorphic DNA analysis of cultivated and wild accessions of Lycopersicon escuentum. Genome 36:619-630.
Williams, J.G., A.R. Kubelik, K.J. Livak, J.A. Rafalski, and S.V. Tingey. 1990. DNA
polymorphisms amplified by arbitrary primers are useful as genetic markers. Nucleic Acid Res. 18:6531-6535.
Young, N.D., and S.D. Tanksley. 1989. RFLP analysis of the size of chromosomal segments
retained around the Tm-2 locus of tomato during backcross breeding. Theor. Appl. Genet. 77:353-359.
Zamir, D., I. Ekstein-Michelson, Y. Zakay, N. Navot, M. Zeidan, M. Sarfatti, Y. Eshed, E. Harel,
T. Pleban, and H. Van-Oss. 1994. Mapping and introgression of a tomato yellow leaf curl virus tolerance gene, TY-1. Theor. Appl. Genet. 88:141-146.
Zwonitzer, J.C., N.D. Coles, M.D. Krakowsky, C. Arellano, J.B. Holland, M.D. McMullen, R.C.
Pratt, and P.J. Balint-Kurti. 2010. Mapping resistance quantitative trait loci for three foliar diseases in a maize recombinant inbred line population-Evidence for multiple disease resistance? Phytopathology 100:72-79.

39
CHAPTER 2
Molecular Tagging of Resistance Genes to Septoria Leaf Spot in
Tomato (Solanum lycopersicum L.)
ABSTRACT
Molecular marker linked to the resistance loci is necessary to accelerate the
resistance breeding process through marker assisted selection (MAS). We studied the
inheritance of resistance to Septoria lycopersici and identified RAPD markers linked to
septoria leaf spot resistance in tomato using an F2 population and bulked segregant
analysis. Two tomato inbred lines, NC 85L-1W(2007), susceptible to septoria leaf spot
pathogen, and NC 839-2(2007)-1, resistant to septoria leaf spot pathogen, were crossed to
produce an F1. A total of 250 F2 plants, and 10 plants each of P1, P2 and F1 were grown in
research plots at the Mountain Horticultural Crops Research and Extension Center, Mills
River, NC, in the summer of 2009. Disease severity was scored under natural inoculums
using a scale of 0 to 5, where 0 = no disease and 5 = complete development of disease on
the plant. DNA was extracted from 2-3 weeks old plants. The parental lines were screened
with a total of 379 molecular markers including 157 SSR, two conserved ortholog set (COS),
23 M-13 tailing SSR and 197 RAPD primers. Two DNA bulk samples, identified as resistant
bulk (RB) and susceptible bulk (SB), were prepared from the F2 individuals. The RB sample
consisted of 8 individuals with a disease score of 0 and the SB sample contained 8
individuals with a score of 4 to 4.5. Transgressive segregants among the F2 population were
found only for susceptibility. The segregation ratio of resistant and susceptible plants fit a
3:1 ratio (2 = 3.014, P = 0.083) indicating that the inheritance of resistance to septoria was
based on a single dominant gene in the present study. Only 34 RAPD primers (17.26%) were
found polymorphic between parents. Eleven RAPD primers (32.35%) showed polymorphism
between resistant and susceptible bulks. Five RAPD primers were identified linked to
septoria disease reactions. Among the five identified primers, two were linked to

40
susceptible and three were linked to resistance. Subject to verification in an independent
population, these markers may be useful for MAS of septoria leaf spot resistance in tomato.
INTRODUCTION
Tomato (Solanum lycopersicum L.) is one of the most important vegetable crops
worldwide. Among the foliar diseases of tomato, septoria leaf spot (Septoria lycopersici
Speg.) is one of the most devastating diseases. It may cause complete defoliation leading to
a significant crop loss under favorable environmental conditions, particularly in humid
regions during periods of high rainfall, frequent dew, or over-head irrigation (Andrus and
Reynard, 1945; Delahaut and Stevenson, 2004). Septoria occurs worldwide but it is
particularly important in Canada and United States (Ferrandino and Elmer, 1992; Poysa and
Tu, 1993).
Although fungicides are effective at controlling septoria, breeding for resistant
varieties is a priority due to the cost involved in applying fungicides and environmental
hazards associated with their use. However, with the use of fungicides, this disease has
received less attention from breeders in the past (Locke, 1949; Barksdale and Stoner, 1978).
It has been reported that resistance to septoria is controlled by a single dominant
gene (Barksdale and Stoner, 1978). The resistance in PI422397 is moderate and associated
with small fruit size and late in maturity (Poysa and Tu, 1993). The majority of the resistant
lines belong to the wild species, e.g., S. peruvianum, S. gladnulosum and S. pimpinellifolium.
The highest degree of resistance was found in S. habrachaites (Andrus and Reynard, 1945;
Locke, 1949).
Twenty-two accessions out of 700, mostly from S. habrachaites and S. peruvianum,
had a score of 2.0 and 3.9 (when scored using a 0 to 9 scale, where 0 = no disease and 9 =
severe disease) indicating that they were more resistant than PI422397 (Poysa and Tu,
1993). Useful levels of resistance have also been found in S. pennelli, S. pimpinellifolium, S.
chilense, and S. lycopersicum var. cerasiforme (Poysa and Tu, 1993). Breeding lines of

41
interspecific crosses with S. habrachaites accessions had high levels of resistance. But, these
interspecific lines had one or more undesirable horticultural traits such as indeterminate
growth habit, late maturity or low yield.
Many resistant varieties of tomato have been developed through the introgression
of resistant genes either from cultivated or from wild species of tomato. More than 8 years
is necessary to develop resistant varieties through conventional breeding, i.e., using
morphological markers or relying on phenotypic data. Molecular markers have emerged as
a very useful tool for breeders to select the desirable genotypes at any crop stage.
Molecular markers are useful for accelerating breeding process by improving precision and
making selection more efficient. Markers linked to the gene(s) of interest can be used to
select plants genotypically that are genetically similar to the recurrent parent possessing
the desired horticultural traits. However, due to lack of molecular markers linked to
septoria leaf spot of tomato, marker assisted selection (MAS) has not been initiated in
septoria resistance breeding. Identification of markers is a prerequisite for MAS.
Earlier, use of near isogenic lines (NIL) has been the common means of identifying
genes of interest. NILs are not available for most of the target regions and it takes a long
time to develop NIL. Alternatively, Michelmore et al. (1991) developed a very rapid and
simple PCR based method to identify the gene of interest called bulked segregant analysis
(BSA) and identified random amplified polymorphic DNA (RAPD) markers linked to a disease
resistance gene in lettuce. For BSA, any kind of mapping population e.g., recombinant
inbred lines (RIL), backcross (BC), F2 or double haploid (DH) that are segregating for a trait of
interest can be used.
In BSA, two extreme phenotypes, i.e., low and high (susceptible and resistant in case
of resistance breeding) of a particular trait from a segregating population are compared
using bulk DNA from these two extremes. DNA from individuals similar to the trait of
interest are pooled and assumed that the bulks are homozygous for the target interval and
heterozygote for the rest of the interval (Giovannoni et al., 1991; Michelmore et al., 1991;

42
Quarrie et al., 1999). DNA markers are then used to screen the parents and bulks. If
polymorphisms are found between bulks, this marker (polymorphic band) is expected to be
associated with the gene of interest.
Many disease resistance genes have been identified in tomato using RAPD following
the BSA approach. Once identified, these markers can be converted into co-dominant
markers, for example, cleaved amplified polymorphic sequence (CAPS) or sequence
characterized amplified region (SCAR), which are more reliable than RAPDs. SCAR being a
co-dominant marker can be applied in MAS. De Giovanni et al. (2004) identified a RAPD
marker linked to the ol-2 gene conferring resistance to powdery mildew using BSA from an
F2 population. A single RAPD marker, OPU31500 with 1500 bp in size was detected in the
susceptible bulk and converted to a CAPS marker. The distance between the marker and the
ol-2 gene was also estimated through linkage analysis. Stevens et al. (1995) and Chagué et
al. (1996) also identified RAPD markers linked to the Sw-5 gene that conferred resistance to
tomato spotted wilt virus (TSWV). Linkage analysis mapped this marker within a distance of
10.5 cM from Sw-5. This RAPD marker was later converted into a SCAR marker. Śmiech et al.
(2000) used BSA in an F2 segregating population and found five primers that distinguished
resistant and susceptible bulks.
DNA markers, though prerequisite for MAS, are not available for septoria leaf spot
(SLS) resistance breeding in tomato. Information is also lacking on the linkage group of the
resistance gene to septoria leaf spot. In such situations, BSA could be of valuable approach
to tag the resistance gene without constructing linkage map.
In this study, we used the BSA technique to identify RAPD markers linked to septoria
leaf spot resistance in tomato using an F2 population consisting of 8 resistant and 8
susceptible lines. An F2 population is the earliest segregating generation available for
mapping genes from the crosses between inbreds and provides the greatest genetic
window around the locus (Michelmore et al., 1991).

43
MATERIAL AND METHODS
Plant Materials
Two tomato inbred lines, NC 85L-1W(2007) (referred onward as NC 85L) and NC
839-2(2007)-1 (referred here onward as NC 839) were crossed to produce F1 in greenhouse.
NC 85L, used as a female, is susceptible to septoria leaf spot (susceptible parent, SP) and NC
839, used as male, is resistant to septoria leaf spot (resistant parent, RP). The F1 plants were
selfed to produce F2 seeds. A total of 250 F2 plants, and 10 plants each of SP, RP and F1 were
grown in this study. Among F2 plants, nine were blinds (seedlings without meristem) and
data in six plants were missing. Therefore, we used 234 F2 plants in this study. The fruit of
NC 85L was a mini roma type with dark red fruit color. It was developed by crossing a male
sterile line, NC 051(x)-18, with a normal inbred line, NC 05108-2-166. The resistant line, NC
839 was a grape tomato with light red fruit color (Table 5). It was a product of two inbred
lines, NC 0661 and NC 6109-1-196. The number of lines involved (i.e., crossing frequency) in
developing NC 839 was higher than NC 85L.
Field Evaluation
A total of 280 plants consisting of 10 plants of each parent and F1 and 250 F2 plants
were planted in the R16 Research Plot of the Mountain Horticultural Crops Research and
Extension Center (MHCREC), Mills River, NC, during the summer of 2009. This research plot
is a hotspot for septoria leaf spot and natural inoculum was abundant in the summer of
2009. Weather conditions of the tomato growing season are given in Appendix 1, and were
favorable for disease development. Plants were evaluated for septoria leaf spot infection
from natural inoculums using a scale of 0 to 5, where 0 = no disease and 5 = complete
development of disease on the plant. Late blight infection was also scored from the same
population. The experimental site was located at an altitude of 630 m (2067’) above sea
level with latitude of 35.42721o and longitude of -82.55888o (http://www.nc-
climate.ncsu.edu/cronos/?station=FLET).

44
Table 5. Parental description along with their pedigrees and coefficient of parentage
Parent Maturity Fruit type, shape, color
Disease reaction
Pedigree Common pedigree
COP
NC 85L-1W(2007)
Early Mini roma type, dark red
Late blight resistance
051(x)-
18//0463/9722(x)-
18
0179(x)-1-18-4, 215E-
1(93), 9722(x)-18, 051, 03220,
L3707
0.227 NC 839-2(2007)-1
Average Grape type, light red
Septoria leaf spot resistance
051(x)-18//CB25(x)-18-3/9722(x)-18/0464
COP = Coefficient of parentage.

45
Seeding was done on June 1, 2009, in 30.5 x 45.5 cm (12 x 18”) trays containing peat
moss and vermiculite. Trays were kept in the greenhouse with an average day temperature
of 21.1oC (70oF). Twelve day old seedlings were transplanted into a 50-cell tray size of 12.7 x
24.4 cm (5 x 10”). Six week old seedlings were then transplanted in the field having loam
soil with a row to row distance of 1.5 m (5’) and 45 cm (18”) plant to plant. The bed was
raised and covered with black plastic. Other recommended cultural practices were followed
as described in the Southeastern US 2010 Vegetable Crop Handbook
(http://www.ncsu.edu/ enterprises/tomatoes/2010/04/07/2010-southeastern-us-
vegetable-crop-handbook/).
DNA Extraction, Quantification and Dilution
DNA was extracted from all samples following the method of Fulton et al. (1995). A
detailed procedure of DNA extraction is given in Appendix 5. Briefly, approximately 100 mg
of young leaves from 2-3 week old tomato seedlings were collected from the greenhouse in
1.5 ml Eppendorf tubes. The tubes were then dipped into liquid nitrogen and samples were
ground using a glass rod. After adding 200 µl microprep buffer (see Appendix 5), samples
were incubated in a 65oC water bath for about 60 min and filled with chloroform/isoamyl
(24:1) solution. Samples were then centrifuged at 10,000 rpm for 5 minutes. The aqueous
phase was pipetted off into a new micro-centrifuge tubes and 2/3rd to 1 times the volume of
cold isopropanol was added to precipitate the DNA. After centrifuging this sample at 10,000
rpm for 5 minutes, the DNA pellet was separated and washed with 70% ethanol. The dry
DNA pellet was resuspended in 100 µl of 1x TE buffer and stored at -20oC. Concentrations of
DNA, which were estimated using spectrophotometer (NanoDrop 1000, Thermo Scientific,
DE USA) ranged from 109 to 4621 ng/µl in all samples. Working solutions of DNA samples
with a concentration of 20 ng/µl were prepared from original DNA samples in 1x TE buffer.
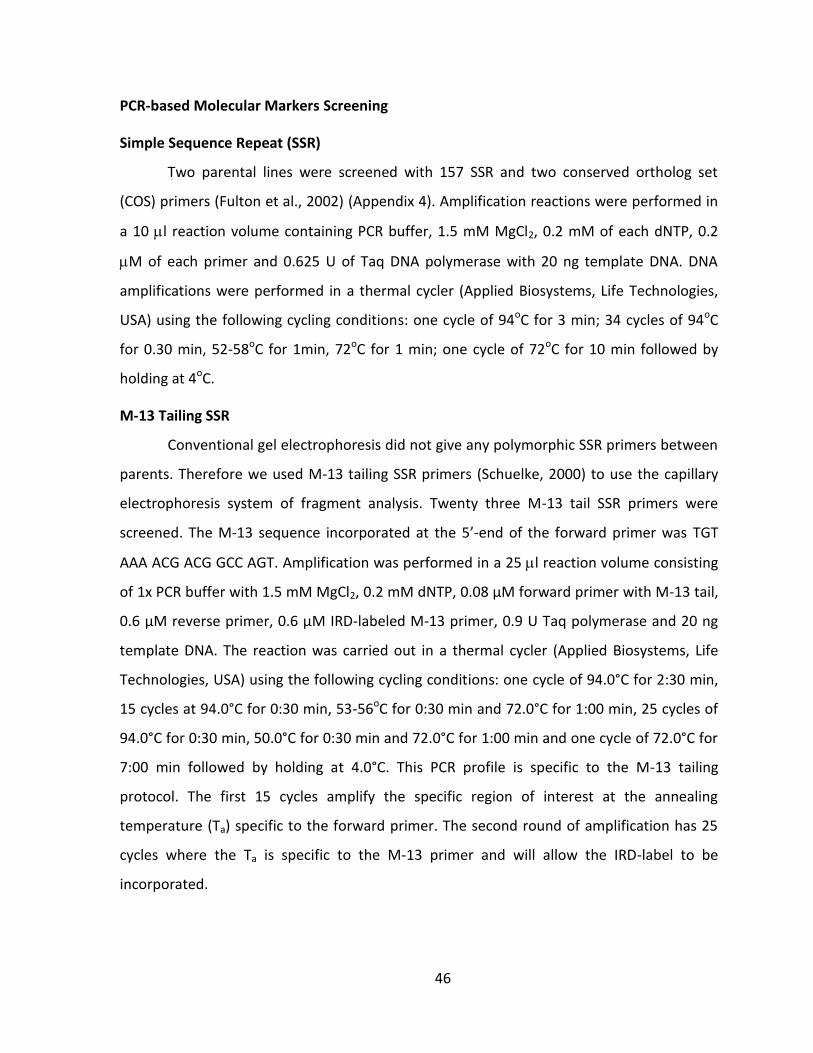
46
PCR-based Molecular Markers Screening
Simple Sequence Repeat (SSR)
Two parental lines were screened with 157 SSR and two conserved ortholog set
(COS) primers (Fulton et al., 2002) (Appendix 4). Amplification reactions were performed in
a 10 l reaction volume containing PCR buffer, 1.5 mM MgCl2, 0.2 mM of each dNTP, 0.2
M of each primer and 0.625 U of Taq DNA polymerase with 20 ng template DNA. DNA
amplifications were performed in a thermal cycler (Applied Biosystems, Life Technologies,
USA) using the following cycling conditions: one cycle of 94oC for 3 min; 34 cycles of 94oC
for 0.30 min, 52-58oC for 1min, 72oC for 1 min; one cycle of 72oC for 10 min followed by
holding at 4oC.
M-13 Tailing SSR
Conventional gel electrophoresis did not give any polymorphic SSR primers between
parents. Therefore we used M-13 tailing SSR primers (Schuelke, 2000) to use the capillary
electrophoresis system of fragment analysis. Twenty three M-13 tail SSR primers were
screened. The M-13 sequence incorporated at the 5’-end of the forward primer was TGT
AAA ACG ACG GCC AGT. Amplification was performed in a 25 l reaction volume consisting
of 1x PCR buffer with 1.5 mM MgCl2, 0.2 mM dNTP, 0.08 µM forward primer with M-13 tail,
0.6 µM reverse primer, 0.6 µM IRD-labeled M-13 primer, 0.9 U Taq polymerase and 20 ng
template DNA. The reaction was carried out in a thermal cycler (Applied Biosystems, Life
Technologies, USA) using the following cycling conditions: one cycle of 94.0°C for 2:30 min,
15 cycles at 94.0°C for 0:30 min, 53-56oC for 0:30 min and 72.0°C for 1:00 min, 25 cycles of
94.0°C for 0:30 min, 50.0°C for 0:30 min and 72.0°C for 1:00 min and one cycle of 72.0°C for
7:00 min followed by holding at 4.0°C. This PCR profile is specific to the M-13 tailing
protocol. The first 15 cycles amplify the specific region of interest at the annealing
temperature (Ta) specific to the forward primer. The second round of amplification has 25
cycles where the Ta is specific to the M-13 primer and will allow the IRD-label to be
incorporated.

47
An ABI plate was set up by adding 9.5 µl formamide /LIZ mix in 1 µl PCR product. Mix
of LIZ standard and formamide was at the concentration of 1/200 by volume. The plate was
denatured at 95oC for 5 min. DNA fragment analysis was done by capillary electrophoresis
using an ABI 3730 DNA Analyzer (Applied Biosystems, Life Technologies, USA). Data were
analyzed using GeneMarker Software V1.91 (SoftGenetics, USA). Electropherogram was
then compared between parents to detect any polymorphisms.
Random Amplified Polymorphic DNA (RAPD)
A total of 197 10-mer RAPD primers (Appendix 4) were screened using 20 ng DNA
template of two parental lines. Primers polymorphic to parental lines were then used to
screen resistant bulk and susceptible bulk samples. Amplification reactions were performed
in 10 l reaction volumes containing 1x buffer (10 mM Tris-HCl pH 8.3, 50 mM KCl, 1.5 mM
MgCl2), 200 M of each dNTP, 0.2 M primer and 1 U Taq polymerase. About 15 l mineral
oil was overlaid on the reaction mixture. DNA amplifications were performed in a thermal
cycler (Eppendorf, New York) using the following cycling condition: one cycle of 92oC for 3
min; 45 cycles of 92oC for 0.30 min, 42oC for 1 min and 72oC for 0.30 min; one cycle of 72oC
for 8 min followed by holding at 4oC.
Disease Scoring
Disease severity was scored at 77 days after seeding (August 17, 2009). Individual
disease rating scores were based on visual assessment of symptom severity. The following
scoring criteria was developed based on Winstead and Kelman (1952), Tu and Poysa (1990),
Danesh et al. (1994) and used in this study. Severity of disease was scored at a scale of 0 to
5 with 0.5 increment, as 0 = no disease symptoms, 0.5 = Less than 10% leaf area with
symptoms, 1 = 10-20% leaf area with symptoms, 1.5 = 20-30% leaf area with symptoms, 2 =
30-40% leaf area with symptoms, 2.5 = 40-50% leaf area with symptoms, 3= 50-60% leaf
area with symptoms, 3.5 = 60-70% leaf area with symptoms, 4 = 70-80% leaf area with
symptoms, 4.5 = 80-90% leaf area with symptoms, and 5 = 90-100% leaf area with
symptoms.

48
For the inheritance study, we grouped all segregating plants into two, one resistance
group with score from 0 to 2 and second, susceptible group with score from 2.5 to 5.
Bulked Segregant Analysis
Bulked segregant analysis (BSA) was performed following the method of Michelmore
et al. (1991). Two DNA bulks, called resistant bulk (RB) and susceptible bulk (SB) were
prepared from F2 individuals. The RB consisted of 8 individuals with disease a score of 0 and
SB contained 8 individuals with a score of 4 and 4.5. These two DNA bulks were prepared by
pooling equal amounts of DNA (50 µl) from each individual. Non-correlation of disease score
value of each bulk with total soluble solid indicated that, these bulks were from the two
extremes of disease severity. PCR was run with polymorphic primers between parents on
the bulks and parental DNA samples using the same reaction conditions as described above.
PCR was repeated for at least two times for those primers that were polymorphic between
bulks.
Gel Electrophoresis
All RAPD and SSR PCR products were analyzed in 2% agarose gels containing 0.1 g/ml
ethidium bromide in 1x TBE buffer (40 mM Tris-borate, pH 8.0, 1 mM EDTA) with a 100-bp
ladder. Electrophoresis was run at 135 V for 2 hours. Gels were rinsed with water to
enhance contrast and photographed under UV light. Polymorphism between parents by SSR
primers was not found in agarose gel. Therefore, some PCR products with SSR primers were
separated in 8% PAGE and stained with 0.5 µg/ml solution of ethidium bromide. Stained
gels were photographed under UV light. RAPD fragments were scored as 1 for presence and
0 for absence. Band size was estimated based on a 100-bp DNA ladder.
DNA Extractions from the Gel for Sequencing
Polymorphic RAPD bands between parents and bulks were extracted from the 2%
agarose gel following the protocol of GenElute™ Gel Extraction Kit (Sigma) (Appendix 6).
These DNA are being sequenced for converting useful RAPD primers into SCAR or CAPS
markers.

49
Data Analysis
Scores of parental lines and F1 were averaged. Frequency of different score
categories was estimated for F2 populations using SPSS v.17.0 (IBM, Corporation, New York,
USA) for segregation analysis and frequency distribution. Skewness was estimated using
SPSS v.17.0. Frequency data were analyzed by 2 to test the goodness of fit at an expected
ratio of 3R: 1S lines using SAS v.9.1 (SAS Institute Inc., Cary, NC). Simple statistics based on
the RAPD bands were calculated using MS Excel 2007.
The pedigrees of these two lines were traced back to estimate the coefficient of
parentage (COP). The COP was estimated between parents on the assumption that all
ancestors and parental lines are homozygous and a line derived from a cross obtains one-
half of its genes from each parent. The computer software KIN (Tinker and Mather, 1993)
was used to calculate the COP.
RESULTS
Segregation of Resistance
Severity of septoria leaf spot (SLS) infestation was assessed on 234 individual plants
at 77 days after planting, based on the percentage of total leaf area infected. The
distribution of disease reaction was highly right-skewed (Figure 7). Only 234 plants out of
250 were scored for SLS either because some of the plants were blinds (with no meristem)
or dead or mal-formed because of other factors. In tomato, blind plants are those seedlings
that do not produce meristem and after few weeks such plants die. No symptoms were
observed in the resistant parents, but the susceptible parents had intermediate levels of
reaction (score from 1.5 to 3) against the septoria pathogen. Comparing the scores of F2
individuals with their parents, it was clear that transgressive segregants were found only
towards susceptibility. This indicated that, the susceptible parent had also some
contribution to resistance. Based on the distribution of F2 individuals, we found clearly two
distinct groups, resistance and susceptible plants which allowed us to apply bulked
50
segregant analysis (BSA) to identify the linked markers. The distribution was right-skewed;
however, there were enough individual plants for BSA using the two extremes.
About fifty percent of the F1 plants had a disease score of 0 indicating that resistance
to the septoria pathogen was incomplete dominant. Among 234 F2 individuals, 164 were
resistant and 70 (score greater than 2) were susceptible. The segregation ratio of resistant
and susceptible plants fit the expected ratio of 3:1 (2 = 3.014, P = 0.083) for a single gene
(Table 6), which indicates that the inheritance of resistance to septoria was based on a
single dominant gene in the present study.
Two parents were phenotypically contrasting mainly for fruit type and color (Table
5). Fruit quality and shape of NC 839 are superior to NC 85L. Pedigree analysis of these
parents showed that six parents were common. The coefficient of parentage between them
was 0.23 indicating some dissimilarity between them. Variation was found between these
parents in morphology and pedigree. However, we could not find any polymorphic SSR
markers between them. We screened 180 SSR and two COS primers. Most of them were
monomorphic and some of them did not amplify the genomic DNA of these parents
(Appendix 7). Three systems of fragment analyses including agarose gel, polyacrylamide,
and capillary gel electrophoresis did not detect any polymorphism, indicating lack of
polymorphic SSR markers in these two lines.
RAPD Markers
Out of 197 RAPD primers used to screen parental lines, 34 RAPD primers (17.26%)
were polymorphic (Table 7). A total of 176 bands with a maximum fragment size of 1500 bp
and minimum fragment size of 100 bp were amplified using 34 primers. Among these
fragments, 84 were polymorphic between parents. The average number of bands per
polymorphic RAPD primer was 4 and ranged from 2 to 8 bands. The number of polymorphic
bands ranged from 1 to 4 with an average of 2. All 34 polymorphic RAPD primers were used
to screen the resistant and susceptible bulks.
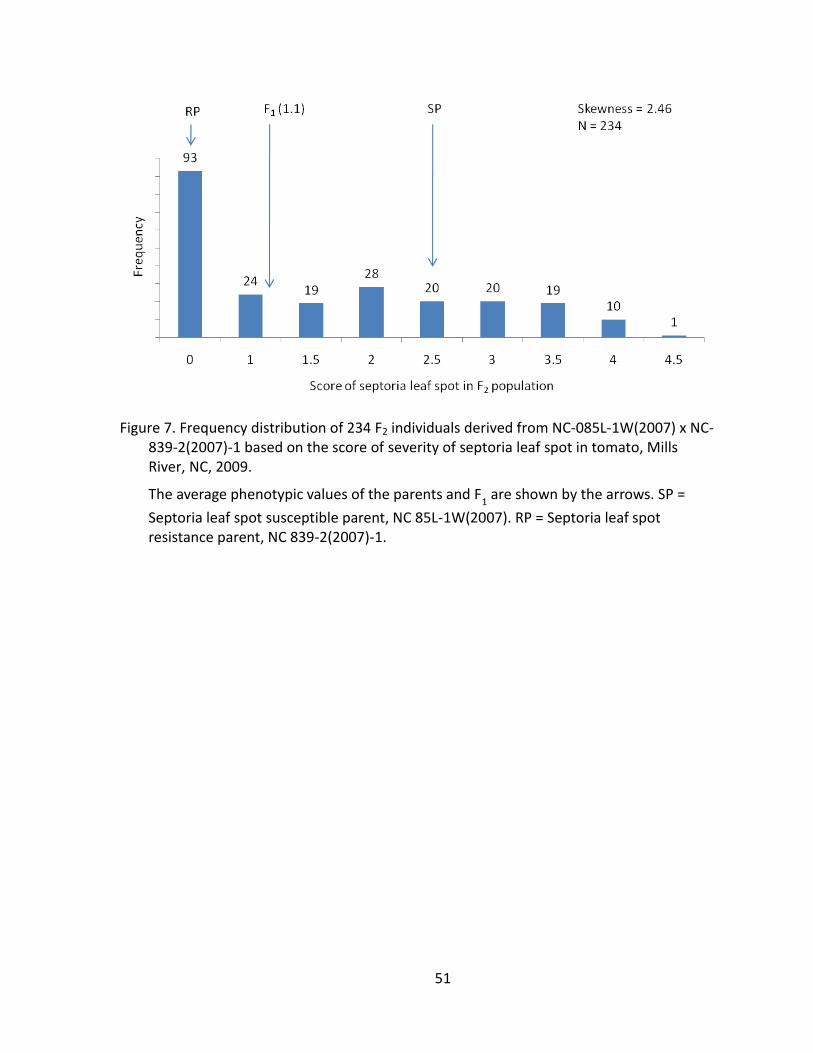
51
Figure 7. Frequency distribution of 234 F2 individuals derived from NC-085L-1W(2007) x NC-839-2(2007)-1 based on the score of severity of septoria leaf spot in tomato, Mills River, NC, 2009.
The average phenotypic values of the parents and F1 are shown by the arrows. SP =
Septoria leaf spot susceptible parent, NC 85L-1W(2007). RP = Septoria leaf spot resistance parent, NC 839-2(2007)-1.

52
RAPD Markers and Bulked Segregant Analysis
Among the 34 polymorphic RAPD primers observed between parents, only 11 RAPD
primers (32.35%) showed polymorphism between resistant and susceptible bulks (Table 8).
A total of 87 bands were amplified by 34 RAPD primers. Among these bands, 34 and 20
bands were polymorphic between parents and between bulks, respectively. The size of
bands ranged from 2000 to 150 bp. The average number of bands was seven per primer
among total amplified bands and the average number of polymorphic bands between
parents and between bulks was three and two, respectively. Five primers that distinguished
parents as well as bulks were identified linked to septoria disease reaction (Table 9). One
band of each of two primers, namely MRTOMR-121 and MRTOMR-031 (Figure 8) was found
only in the susceptible parent NC 085L and susceptible bulk. Similarly, one band of each of 3
RAPD primers was amplified only in the resistant parent NC 839 and resistant bulk.
Therefore, among five identified primers, two were linked to susceptible and three were
linked to resistance. Amplified bands size linked to susceptible were 380 and 600 bp of
RAPD primers MRTOMR-121 and MRTOMR-031, respectively (Table 10). Three RAPD
primers linked to resistance were MRTOMR-022, MRTOMR-117 and MRTOMR-121 (Figure
9). The size of linked bands of these primers ranged from 1000 to 600 bp.
Useful RAPD primers related to disease reaction are listed in Table 11. Six primers
were found to be unlinked to the loci (Figure 10). These primers distinguished only parents
and not bulks, therefore, stated as unlinked markers. Some of the amplified bands were
only found in bulks but not in either parent (Figure 10). This may be due to recombinants in
the F2 population.

53
Table 6. Segregation ratio of resistant and susceptible progenies to septoria leaf spot observed in the F2 population of tomato derived from NC 085 x NC 839, 2009
Cross Resistant (0-2 scale)
Susceptible (2.5-5 scale)
Total Expected ratio (R:S)
2 P-
value
NC 085L-1W(2007)/ NC 839-2(2007)-1
164 70 234 3:1 3.014 0.083

54
Table 7. RAPD primers polymorphic between resistant and susceptible parents of tomato to septoria leaf spot
Primer
Sequence
% GC Amplified bands
Band size, bp
Polymorphic band
% polymorphic
Tm
Max Min
MRTOMR-001 ATCGAGCACT 50 2 450 400 1 50 30
MRTOMR-003 AAGGGGCTGC 70 5 600 150 1 20 34
MRTOMR-014 CCGTCTCCAG 70 7 600 150 3 43 34
MRTOMR-022 CAGGGCCAGC 80 8 1000 100 6 75 36
MRTOMR-023 GGACCACGAA 60 3 650 100 2 67 32
MRTOMR-026 TAGGCACCGT 60 5 1000 300 3 60 32
MRTOMR-027 ACCTGATGCA 50 3 650 200 3 100 30
MRTOMR-029 CGCCATACGG 70 2 900 650 2 100 34
MRTOMR-031 GGGACGTCGC 80 5 600 200 2 40 36
MRTOMR-033 CGCTCGCGGC 90 5 1000 150 2 40 38
MRTOMR-038 TACCTTCGCC 60 6 1100 150 3 50 32
MRTOMR-039 CAGCACCACC 70 7 650 100 3 43 34
MRTOMR-040 ACAGTCCGCG 70 3 500 180 1 33 34
MRTOMR-046 CCATGCGCTA 60 5 600 100 4 80 32
MRTOMR-063 ACGAGTGACC 60 6 550 100 2 33 32
MRTOMR-078 GTGCCATGTG 60 4 700 200 1 25 32
MRTOMR-100 GAC GGC CCC A 80 7 1500 200 3 43 45
MRTOMR-110 ATG ACG ACC T 50 3 800 400 1 33 31
MRTOMR-112 CAT ACA CCT C 50 4 1500 650 2 50 25
MRTOMR-117 CCG AAC AAT C 50 6 950 300 5 83 28
MRTOMR-118 TGC TTG GGG G 70 4 1500 500 3 75 39
MRTOMR-121 GGC GTC GTA A 60 3 1100 550 2 67 36
MRTOMR-128 AGA CCC GGT C 70 3 600 300 1 33 38
MRTOMR-130 AGG TCT CTC G 60 3 700 250 1 33 32
MRTOMR-133 TTC AGC CAC A 50 3 900 300 2 67 32
MRTOMR-140 TGC CAA CGC C 70 5 800 250 1 20 42
MRTOMR-141 CAT TGG TGC T 50 2 900 450 1 50 31
MRTOMR-142 TTG CGC TTG T 50 2 800 400 1 50 37
MRTOMR-146 CGT TAC CGG G 70 5 2000 450 2 40 35
MRTOMR-161 TGT CTC CCT G 60 5 1500 700 1 20 32
MRTOMR-171 GAG GCCAGC G 80 4 700 200 1 25 43
MRTOMR-178 GCC ATC CGA A 60 2 800 650 1 50 35
MRTOMR-181 CAT GCG CTC C 70 3 800 400 1 33 39
OPK6 CACCTTTCCC 60 4 1000 600 1 25 31
P#72 GAGCACGGGA 70 4 600 250 1 25 39
bp = base pair. Tm = Melting temperature.

55
Table 8. Polymorphic RAPD markers and their size between resistance and susceptible bulks of tomato to septoria leaf spot
Primer
Amplified
bands
Size, bp Polymorphic % polymorphic
Max Min Between parents
Between bulks
Between parents
Between bulks
MRTOMR-022 8 1000 150 5 1 63 13
MRTOMR-031 6 1100 280 2 1 33 17
MRTOMR-038 5 800 500 3 1 60 20
MRTOMR-100 8 1500 350 4 1 50 13
MRTOMR-112 7 1500 300 1 3 14 43
MRTOMR-117 5 950 550 1 1 20 20
MRTOMR-118 9 1500 350 3 1 33 11
MRTOMR-121 8 1100 380 3 5 38 63
MRTOMR-130 4 700 250 1 25 0
MRTOMR-146 8 2000 450 4 1 50 13
MRTOMR-161 5 1500 700 1 2 20 40

56
Table 9. Polymorphic bands of RAPD markers linked to either resistance or susceptible genes of tomato for septoria leaf spot
Marker PBN Size, bp SP RP RB SB Marker type
MRTOMR-022
1 1000 0 1 1 0 P
2 800 0 1 0 0 -
3 600 1 0 1 1 -
7 250 1 0 1 1 -
8 150 1 0 1 1 -
MRTOMR-031 1 1100 0 1 1 1 -
3 600 1 0 0 1 N
MRTOMR-117 2 850 0 1 1 0 P
MRTOMR-118
3 800 1 0 0 0 -
4 750 0 1 0 0 -
6 600 0 1 1 0 P
MRTOMR-121
1 1100 0 0 0 1 -
3 900 1 1 0 0 -
4 850 1 1 0 1 -
6 650 1 1 1 0 -
7 420 1 0 0 0 -
8 380 1 0 0 1 N
PBN = Polymorphic band number. RP = Resistant parent. SP = Susceptible parent. RB = Resistant bulk. SB = Susceptible bulk. P = Positive. N = Negative.
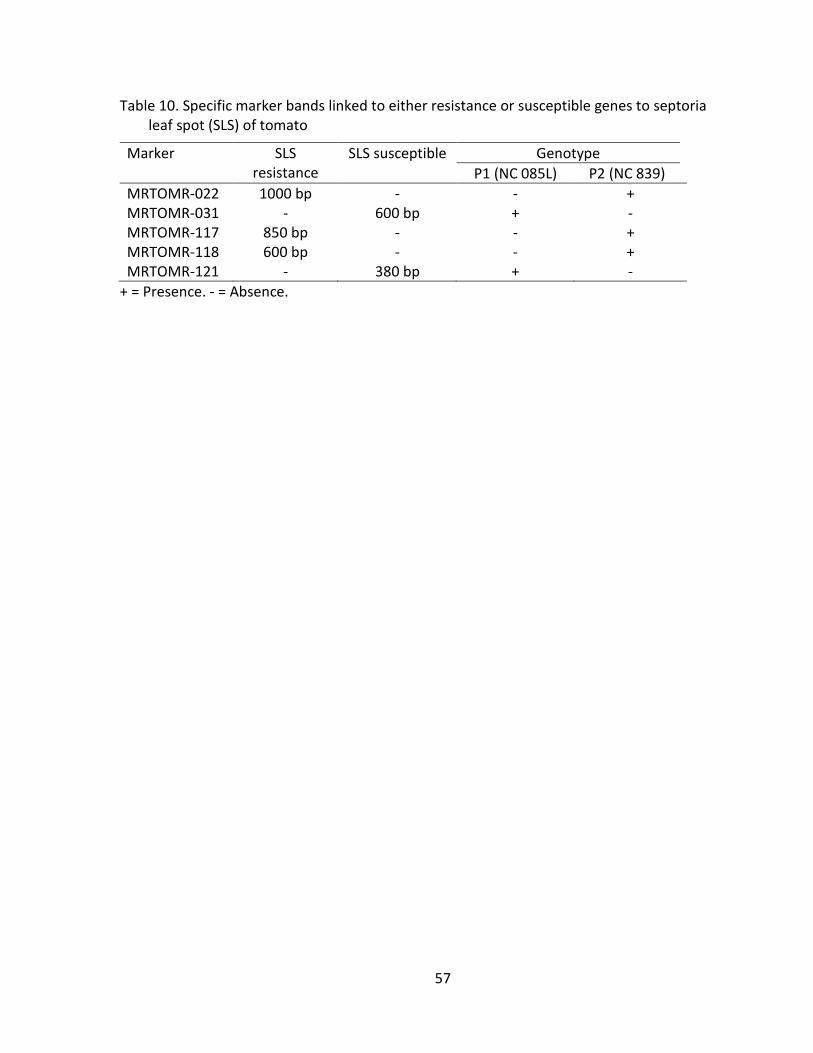
57
Table 10. Specific marker bands linked to either resistance or susceptible genes to septoria leaf spot (SLS) of tomato
Marker SLS resistance
SLS susceptible Genotype
P1 (NC 085L) P2 (NC 839)
MRTOMR-022 1000 bp - - + MRTOMR-031 - 600 bp + - MRTOMR-117 850 bp - - + MRTOMR-118 600 bp - - + MRTOMR-121 - 380 bp + -
+ = Presence. - = Absence.

58
Table 11. Informative RAPD markers associated to tomato genes in relation to reaction with septoria leaf spot
Linked to susceptible
Linked to resistant
Unlinked to reaction segment
With bands only in bulks
MRTOMR-031, MRTOMR-121
MRTOMR-022, MRTOMR-117, MRTOMR-142
MRTOMR-022, MRTOMR-031, MRTOMR-038, MRTOMR-100, MRTOMR-112, MRTOMR-130
MRTOMR-022, MRTOMR-121, MRTOMR-146, MRTOMR-161

59
Figure 8. Electrophoresis pattern of DNA fragments generated by RAPD markers (A. MRTOMR-031, B. MRTOMR-121). Polymorphic band (i.e., linked to susceptible) between parents, and between resistant and susceptible bulks are indicated by arrow.
SP = Susceptible parent, NC 085L. RP = Resistant parent, NC 839. RB = Resistant bulk. SP = Susceptible bulk. M = Marker.
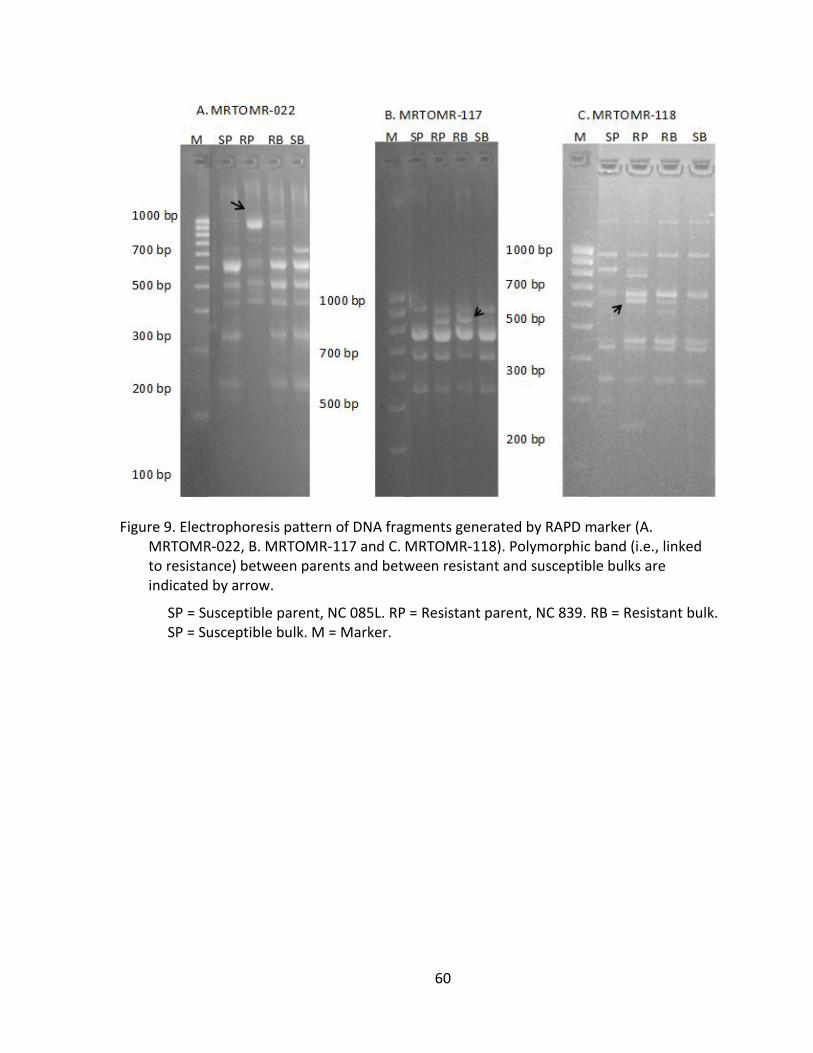
60
Figure 9. Electrophoresis pattern of DNA fragments generated by RAPD marker (A. MRTOMR-022, B. MRTOMR-117 and C. MRTOMR-118). Polymorphic band (i.e., linked to resistance) between parents and between resistant and susceptible bulks are indicated by arrow.
SP = Susceptible parent, NC 085L. RP = Resistant parent, NC 839. RB = Resistant bulk. SP = Susceptible bulk. M = Marker.

61
Figure 10. RAPD marker (A. MRTOMR-130) showing polymorphic band (indicated by arrow) only to parents, i.e., band with unlinked loci and RAPD marker (MRTOMR-146) showing band (indicated by arrow) only in two bulks.
SP = Susceptible parent, NC 085L. RP = Resistant parent, NC 839. RB = Resistant bulk. SP = Susceptible bulk. M = Marker
A. B.
62
DISCUSSION
Resistance to septoria leaf spot in the present study was hypothesized to be
controlled by a single incomplete dominant gene. Resistance has previously been reported
to have conferred by dominant gene, denoted by Se (Andrus and Reynard, 1945) as well as
recessive gene based on field observations in past studies (Wright and Lincoln, 1940). The
differences found in the inheritance of resistance in this experiment might be due to use of
different genotypes in different environment or different sources of resistance. The
susceptible parent we used in this study did not appear completely susceptible suggesting
that it might have some degree of resistance
Screening the F2 population with 197 RAPD primers, we identified three RAPD
markers linked to the resistance and two RAPD markers linked to the susceptibility. Through
the bulking of the extreme individuals from F2 population we were able to rapidly tag the
markers associated with chromosomal segments or alleles that have a role in the reaction of
tomato to septoria leaf spot. Using the BSA technique and 8 individuals in each bulk, five
primers gave different band sizes that were found useful for considering as markers in
septoria resistance breeding. Bands of two of these markers were only present in the
susceptible parent and susceptible bulk, and bands of the other three markers were present
only in the resistant parent and bulk. Therefore, these bands were considered associated
with the susceptible alleles or resistant alleles.
The tagging of resistance genes using BSA is very fast and facilitates screening for
new alleles of resistance for a particular disease. This is important because a resistant gene
once tagged may not be effective for a long time either because of recombination in the
host genome or mutation in pathogen.
The two parental lines used in this study were closely related to each other and SSR
screening proved this findings. However, using RAPDs we were able to distinguish these
parents at the molecular level. RAPDs are multilocus-based markers; therefore all primers

63
we identified here might be from the overlapping regions of a chromosome. For example,
MRTOMR-022 produced a 1000 bp band and MRTOMR-118 a 600 bp band. The band
produced by MRTOMR-118 might be the part of the band generated by MRTOMR-022. A
number of disadvantages are associated with RAPDs, including the fact that they anneal in
multiple sites, are dominant, and their sensitivity to reaction conditions may limit their use
directly in MAS. Therefore, candidate RAPD markers are generally converted to SCAR or
CAPS which produce the co-dominant banding pattern, and are much more useful for MAS.
BSA has been used in a number of crop species to tag a number of traits including
quantitative traits. After identifying useful markers by BSA in tomato, MAS is now possible
to apply during the selection of resistance to verticillium wilt, tomato spotted wilt virus,
root knot nematode, powdery mildew, and fusarium wilt. De Giovanni et al. (2004)
identified a RAPD marker linked to the ol-2 gene which confers resistance to powdery
mildew. A single RAPD marker, OPU31500 with 1500 bp in size was detected in the
susceptible bulk and converted to a CAPS marker. The distance between the marker and the
ol-2 gene was also estimated through linkage analysis. Stevens et al. (1995) and Chagué et
al. (1996) have identified RAPD markers linked to the Sw-5 gene for resistance to tomato
spotted wilt virus (TSWV). Among the four RAPD markers linked to the gene of interest, two
were tightly linked to the Sw-5 gene. Linkage analysis mapped this marker within a distance
of 10.5 cM from Sw-5. This RAPD marker was later converted into a SCAR marker. Czech et
al. (2003) have used MAS for developing TSWV resistant tomato using PCR markers. A single
PCR band of 0.94 kb indicated the resistance genotype and the susceptible genotype
showed an additional band of 0.9 kb. Smiech et al. (2000) found five primers that
distinguished resistant and susceptible bulks. A PCR-based co-dominant marker, tightly
linked to Mi has also been developed (Williamson et al., 1994).
We used disease scores that were based on natural infestation. Different levels of
infestation were observed in the plant population, and positive and negative controls,
which indicated that inoculum pressure was enough to screen the population. Spaner et al.

64
(1998) mapped loci affecting resistance to powdery mildew, leaf rust, stem rust, scald and
net blotch in barley using field-scored data of disease severity under natural infestation.
Natural infestation was also used by Frei et al. (2005) to identify QTLs resistance to thrips in
common bean. Use of natural inoculum saves cost and time. Screening of target
populations in conducive environments can be more successful in the long run to get the
durable resistance genotype. However, pressure of natural inoculum might not always be
enough to screen the lines. In such conditions, artificial inoculum is necessary and it can be
considered useful to verify the field data information. The technique we used here to isolate
and culture the septoria pathogen (Chapter 4) will be practically applicable in a septoria
screening program.
Use of hot spot for specific disease help to increase the disease pressure and are a
cost effective way of resistance breeding and is particularly useful in horizontal resistance
breeding. Horizontal resistance system is generally considered suitable for long term
cultivation of resistance variety. We tagged R gene for septoria leaf spot resistance based
on the segregating population that were naturally infested in this study.
We identified seven potential RADP markers associated with resistance to the
septoria infection. Four primers produced positive bands in resistant genotypes and these
primers could be very useful in MAS. Because of low reproducibility of RAPD, we plan to
convert these potential RAPD primers to SCAR and to find the tightly linked one, so that
MAS can be applied using a single marker. MAS is cost effective and more precise, because
it does not need to have a pathological evaluation and plants can be genotyped at any crop
stage. Identified markers linked to resistance will also have a potential role for gene
pyramiding (Hittalmani et al., 2000). SCAR markers may soon be available and facilitate the
septoria resistance breeding program in tomato. To our knowledge, there are no other
molecular markers reported associated with septoria leaf spot. RAPD identified in this study
will be novel, which may be useful for speeding up the tomato breeding program aiming to
improve septoria leaf spot resistance.

65
REFERENCES
Andrus, C.F., and G.B. Reynard. 1945. Resistance to septoria leaf spot and its inheritance in tomatoes. Phytopathology 35:16-24.
Barksdale, T.H., and A.K. Stoner. 1978. Resistance in tomato to Septoria lycopersici. Plant Dis. Rep. 62:844-847.
Chagué, V., J.C. Mercier, M. Guénard, A. Courcel, and F. Vedel. 1996. Identification and mapping on chromosome 9 of RAPD markers linked to Sw-5 in tomato by bulked segregant analysis. Theor. Appl. Genet. 92:1045-1051.
Czech, A.S., M. Szklarczyk, Z. Gajewski, E. Zukowska, B. Michalik, T. Kobylko, and K. Strzalka. 2003. Selection of tomato plants resistant to a local Polish isolate of tomato spotted wilt virus (TSWV). J. Appl. Genet. 44:473-480.
Danesh, D., S. Aarons, G.E. McGill, and N.D. Young. 1994. Genetic dissection of oligogenic resistance to bacterial wilt in tomato. Mol. Plant-Microbe Interact. 7:464-471.
De Giovanni, C., P. Dell’Orco, A. Bruno, F. Ciccarese, C. Lotti, and L. Ricciardi. 2004. Identification of PCR-based markers (RAPD, AFLP) linked to a novel powdery mildew resistance gene (ol-2) in tomato. Plant Sci. 166:41-48.
Delahaut, K., and W. Stevenson. 2004. Tomato disorders: Early blight and septoria leaf spot. The University of Wisconsin. A2606:R-0504.
Ferrandino, F.J., and W.H. Elmer. 1992. Reduction in tomato yield due to septoria leaf spot. Plant Disease 76:208-211.
Frei, A., M.W. Blair, C. Cardona, S.E. Beebe, H. Gu, and S. Dorn. 2005. QTL mapping of resistance to Thrips palmi Karny in common bean. Crop Sci. 45:379-387.
Fulton, T.M., J. Chunwongse, and S.D. Tanksley. 1995. Microprep protocol for extraction of DNA from tomato and other herbaceous plants. Plant Mol. Biol. Rep. 13:207-209.
Fulton, T.M., R. Van der Hoeven, N.T. Eannetta, and S.D. Tanksley. 2002. Identification, analysis, and utilization of conserved ortholog set markers for comparative genomics in higher plants. The Plant Cell Online 14:1457-1467.
Giovannoni, J.J., R.A. Wing, M.W. Ganal, and S.D. Tanksley. 1991. Isolation of molecular markers from specific chromosomal intervals using DNA pools from existing mapping populations. Nucleic Acid Res. 19:6553-6558.

66
Hittalmani, S., A. Parco, T.V. Mew, R.S. Zeigler, and N. Huang. 2000. Fine mapping and DNA marker-assisted pyramiding of the three major genes for blast resistance in rice. Theor. Appl. Genet. 100:1121-1128.
Locke, S.B. 1949. Resistance to early blight and septoria leaf spot in the genus Lycopersicon. Phytopathology 39:829-836.
Michelmore, R.W., I. Paran, and R.V. Kesseli. 1991. Identification of markers linked to disease-resistance genes by bulked segregant analysis: A rapid method to detect markers in specific genomic regions by using segregating populations. Proc. Natl. Acad. Sci. 88:9828-9832.
Poysa, V., and J.C. Tu. 1993. Response of cultivars and breeding lines of Lycopersicon spp. to Septoria lycopersici. Can. Plant Dis. Surv. 73:9-13.
Quarrie, S.A., V. Lazic-Jancic, D. Kovacevic, A. Steed, and S. Pekic. 1999. Bulk segregant analysis with molecular markers and its use for improving drought resistance in maize. J. Exp. Botany 50:1299-1306.
Schuelke, M. 2000. An economic method for the fluorescent labeling of PCR fragments. Nature Biotechnology 18:233–234.
Smiech, M., Z. Rusinowski, S. Malepszy, and K. Niemirowicz-Szczytt. 2000. New RAPD markers of tomato spotted wilt virus (TSWV) resistance in Lycopersicon esculentum Mill. Acta Physiologiae Plantarum 22:299-303.
Spaner, D., L.P. Shugar, T.M. Choo, I. Falak, K.G. Briggs, W.G. Legge, D.E. Falk, S.E. Ullrich, N.A. Tinker, and B.J. Steffenson. 1998. Mapping of disease resistance loci in barley on the basis of visual assessment of naturally occurring symptoms. Crop Sci. 38:843-850.
Stevens, M.R., E.M. Lamb, and D.D. Rhoads. 1995. Mapping the Sw-5 locus for tomato spotted wilt virus resistance in tomatoes using RAPD and RFLP analyses. Theor. Appl. Genet. 90:451-456.
Tinker, N.A., and D.E. Mather. 1993. KIN: Software for computing kinship coefficients. J. Hered. 84:238.
Tu, J.C., and V. Poysa. 1990. A brushing method of inoculation for screening tomato seedlings for resistance to Septoria lycopersici. Plant Dis. 74:294-297.
67
Williamson, V.M., J.Y. Ho, F.F. Wu, N. Miller, and I. Kaloshian. 1994. A PCR-based marker tightly linked to the nematode resistance gene, Mi, in tomato. Theor. Appl. Genet. 87:757-763.
Winstead, N.N., and A. Kelman. 1952. Inoculation technique for evaluating resistance to Pseudomonas solanacearum. Phytopathology 42:628-634.
Wright, V., and R.E. Lincoln. 1940. Resistance to defoliation diseases of tomato. Purdue Agric. Exp. Stn. Annu. Rep. 53:42-43.

68
CHAPTER 3
Molecular Tagging of Resistance Genes to Late Blight in Tomato
ABSTRACT
A prerequisite for marker assisted selection (MAS) is the development of markers
that is either tightly linked or in a known gene. We used the bulked segregant analysis (BSA)
to identify RAPD markers linked to late blight resistance in tomato using an F2 population.
Two tomato inbred lines, NC 85L-1W(2007) and NC 839-2(2007)-1 were crossed to produce
an F1. NC 85L-1W(2007) was resistant to late blight (resistant parent, RP) and NC 839-
2(2007)-1 was susceptible to late blight (susceptible parent, SP). A total of 250 F2 plants, and
10 plants each of the RP, SP and F1 materials were grown at the Mountain Horticultural
Crops Research and Extension Center (MHCREC), Mills River, NC, in 2009. Disease severity
was scored on 85 day old plants using a scale of 0 to 5. DNA was extracted from 2-3 week
old plants of all individual F2 plants, parents and F1. The parental lines were screened with
157 SSR and two conserved ortholog set (COS) primers, 23 M-13 tailing SSR primers and 197
10-mer RAPD primers. Two DNA bulk samples, called resistant bulk (RB) and susceptible
bulk (SB) were prepared from 16 F2 individuals. We observed transgressive segregation for
late blight resistance in this population. Only 34 RAPD primers (17.26%) were found to be
polymorphic between parents. Sixteen RAPD primers (47%) out of 34 produced polymorphic
bands between the resistant and susceptible bulks of late blight. Four RAPD primers,
namely MRTOMR-026, MRTOMR-031, MRTOMR-038 and MRTOMR-046 were identified as
linked markers to loci related to the late blight disease reaction. Two were linked to
susceptibility and two to resistance. Due to the low reproducibility of RAPDs, it is necessary
to convert these to SCARs and verify the tightly linked markers with late blight resistance
loci, so that MAS can be applied using a single marker.

69
INTRODUCTION
Tomato (Solanum lycopersicum L.) is a tropical vegetable used in fresh and
processed forms. It is the second most consumed vegetables after potato in the world
(FAOSTAT, 2010). Economically, tomato is the third most important vegetable in US after
potato and lettuce. In terms of a source of vitamins and minerals in the US diet, it ranks first
(Rick, 1980) among vegetables and fruits. Breeding efforts have been focused mainly on
fruit yield and foliar diseases. The most important foliar disease of tomato is late blight
(Panthee and Chen, 2010) caused by Phytopthora infestans (Mont.) de Bary, which can
destroy a tomato field within a few days of occurrence (Fry and Goodwin, 1997) in a
conducive environment for pathogen development. The most conducive environment for
disease development is wet and cloudy conditions with cool temperatures. The airborne
nature of late blight results in wide spread distribution in to a large area quickly. Davis et al.
(2000) reported that late blight is the eighth most important disease of tomato in term of
crop loss per acre in USA.
Advances have been made on resistance breeding to combat late blight in tomato.
Foolad et al. (2008) extensively reviewed late blight resistance in tomato. Both vertical and
horizontal resistances have been reported. A single dominant resistance gene to late blight
is commonly found in wild tomato species. Four race specific R genes, Ph-1, Ph-2, Ph-3 and
Ph-5 conferring resistance to late blight have been identified in S. pimpinellifolium. Ph-1 is a
complete dominant gene and it has been mapped to the distal end of chromosome 7
(Foolad et al., 2008). LA-3707, a selection of S. pimpinellifolium from the Asian Vegetable
Research and Development Center (AVRDC, Taiwan), contributed the Ph-3 gene, and
Richter's wild tomato was the source of a partial dominant gene, Ph-2 (Gardner and
Panthee, 2010b). The Ph-2 gene was mapped to chromosome 10. The Ph-3 gene, a partially
dominant gene, is considered to be more durable than Ph-1 and Ph-2. The newly identified
R gene, Ph-5, was found to be superior to all other R genes for late blight (Foolad et al.,
2008). Quantitative trait loci (QTLs) have also been identified from backcross populations
70
developed by crossing cultivated tomato with wild tomatoes. QTLs for late blight are
located in almost all 12 chromosomes (Brouwer et al., 2004), although the number of QTLs
were not specified.
A few resistant varieties of tomato have been developed through the introgression
of resistant genes, either from cultivated or from wild species of tomato (Panthee and
Gardner, 2010; Gardner and Panthee, 2010a). However, these varieties may not be
adaptable to all tomato growing regions and the resistance may not be long lasting.
Therefore, working towards the development of new resistant varieties continuously is
required. More than 8 years are required to develop a resistant variety through
conventional breeding (e.g., using phenotypic selection). Molecular markers are useful for
accelerating breeding work with more precise and efficient selection of desirable genotypes
at any crop stage. Markers linked to the gene(s) of interest help to select plants
genotypically that are genetically similar to the recurrent parent possessing the desired
trait. However, due to the unavailability of PCR-based molecular markers tightly linked to
late blight resistance, marker assisted selection (MAS) has not been adapted routinely
breeding programs.
Earlier, use of near isogenic lines (NIL) was the common means of identifying genes
of interest. NIL are not available for most of the target regions and takes a long time to
develop. Alternatively, Michelmore et al. (1991) developed a very rapid and simple PCR-
based method to identify the markers linked to gene of interest called bulked segregant
analysis (BSA) and identified RAPD markers linked to a downy mildew disease resistance
gene (Dm5/8) in lettuce. For BSA, any kind of mapping population e.g., recombinant inbred
lines (RIL), backcross (BC), F2 or double haploid (DH) that are segregating for a trait of
interest can be used. For dominant marker, e.g., RAPD, the F2 population is considered best,
because of the doubled number of segregating loci in F2 than in the BC (Mackay and
Caligari, 2000).

71
In BSA, two contrasting traits (e.g., resistance and susceptible) from a segregating
population are compared using bulk DNA from these two extremes. DNA from individuals
similar to traits of interest are bulked and assumed that the bulks are homozygous for the
target interval and heterozygote for the rest of the interval (Giovannoni et al., 1991;
Michelmore et al., 1991; Quarrie et al., 1999). DNA markers are then used to screen the
parents and bulks. If polymorphism is found between bulks, this marker (polymorphic band)
is expected to be associated with the gene of interest.
Different types of markers linked to disease resistance genes, e.g., Ph-3, ol-2 have
been identified in tomato using random amplified polymorphic DNA (RAPD) following the
BSA approach (Stevens et al., 1995; Chagué et al., 1996; De Giovanni et al., 2004). Once it is
identified, this marker is then converted into co-dominant markers, for example cleaved
amplified polymorphic sequence (CAPS), sequence characterized amplified region (SCAR)
which are more reproducible than RAPDs. Chunwongse et al. (2002) identified the amplified
fragment length polymorphism (AFLP) markers linked to Ph-3 using BSA. De Giovanni et al.
(2004) identified a RAPD marker linked to the ol-2 gene conferring resistance to powdery
mildew using BSA in an F2 population segregating for the ol-2 gene. A single RAPD marker,
OPU31500 with 1500 bp in size was detected in the susceptible bulk and was converted to a
CAPS marker. Stevens et al. (1995) and Chagué et al. (1996) also identified RAPD markers
linked to the Sw-5 gene, resistance to tomato spotted wilt virus (TSWV). Linkage analysis
mapped this marker within a distance of 10.5 cM from Sw-5. This RAPD marker was later
converted into SCAR marker. Śmiech et al. (2000) used BSA in F2 segregating population and
found five primers that distinguished resistant and susceptible bulks of TSWV.
In this study, we used the BSA method to identify RAPD markers linked to late blight
resistance in tomato using an F2 population. An F2 population is the earliest segregating
generation available for mapping genes from the crosses and provides the greatest genetic
window around the locus (Michelmore et al., 1991). We tagged R gene based on a
segregating population exposed to natural infestation. Uses of hot spot for specific disease

72
to screen the population are cost effective way of resistance breeding and particularly
useful in horizontal resistance breeding. Horizontal resistance system is generally
considered suitable for long term cultivation of resistance variety. Spaner et al. (1998)
mapped loci affecting resistance to powdery mildew, leaf rust, stem rust, scald and net
blotch in barley using field-scored data of disease severity under natural infestation
conditions.
MATERIAL AND METHODS
Plant Materials
Two tomato inbred lines, NC 85L-1W(2007) (referred onward as NC 85L) and NC
839-2(2007)-1 (referred onward as NC 839), were crossed to produce F1 in the greenhouse.
The NC 85L, used as a female, is resistant to late blight (resistant parent, RP) and NC 839,
used as male, is susceptible to late blight (susceptible parent, SP). The F1 plants were selfed
to obtain F2 seeds. A total of 250 F2 plants, and 10 plants each of RP, SP and F1 were
evaluated in this study. Nine F2 plants were blinds (seedling without meristem); therefore,
we used 241 F2 plants. The fruit of NC 85L was a mini roma type with dark red fruit color
(Table 12) whereas the fruit of NC 839 was a grape type with light red fruit color. The NC
85L selection was made for late blight and early blight resistance selected at Waynesville,
NC, and the NC 839 selection was made at Mills River, NC, for outstanding fruit and plant
type. The resistance source of late blight in NC 85L traces back to the L-3707 and Ritcher’s
wild tomato (S. pimpinellifolium).

73
Table 12. Parental description along with their pedigrees and coefficient of parentage
Parent Maturity Fruit type, shape, color
Disease reaction
Pedigree Common pedigree
COP
NC 85L-1W(2007)
Early Mini roma type, dark red
Late blight resistance
051(x)-
18//0463/97
22(x)-18
0179(x)-1-18-4, 215E-
1(93), 9722(x)-18, 051, 03220,
L3707
0.227 NC 839-2(2007)-1
Average Grape type, light red
Septoria leaf spot resistance
051(x)-18//CB25(x)-18-3/9722(x)-18/0464
COP = Coefficient of parentage.

74
Field Evaluation
A total of 280 plants, consisting of 10 plants of each parent and F1, and 250 F2 plants
were planted in R16 research plot of Mountain Horticultural Crops Research and Extension
Center (MHCREC), Mills River, NC, in the summer of 2009. This research plot is a hot-spot
for late blight and natural inoculum was observed at high pressure for screening the late
blight segregating population in the summer of 2009. All these plants were evaluated for
resistance to late blight using natural inoculum. The experimental site was in Mills River,
Henderson, North Carolina, located at an altitude of 630 m above sea level and latitude of
35.42721o and longitude of -82.55888o (http://www.nc-climate.ncsu.edu/cronos/
?station=FLET).
Seeding was done on June 1, 2009, in trays of size 30.5 x 45.7 cm containing peat
moss and vermiculite. Trays were kept in the greenhouse with an average temperature of
21.1oC. Twelve day old seedlings were transplanted in a 50-cell tray size of 12.5 x 24.4 cm.
Six week old seedlings were then transplanted in the field having loam type of soil at a row
to row distance of 1.5 m and plant to plant distance of 45 cm. The bed was raised and
covered with black plastic. Other recommended cultural practices were followed as
described in Southeastern US 2010 Vegetable Crop Handbook (http://www.ncsu.edu/
enterprises/tomatoes/2010/04/07/2010-southeastern-us-vegetable-crop-handbook/).
DNA Extraction, Quantification and Dilution
DNA was extracted from all individual F2 plants, parents and F1 following the method
of Fulton et al. (1995). Step by step procedure of DNA extraction is given in Appendix 5.
Approximately 100 mg of young leaves from 2-3 week old tomato seedlings were collected
from the greenhouse in 1.5 ml Eppendorf tube. This tube was then dipped into liquid
nitrogen and samples were ground with a glass rod. After adding 200 µl microprep buffer,
sample was incubated at 65oC water bath for about 60 min and filled with chloroform/
isoamyl (24:1) solution. Sample was then centrifuged at 10,000 rpm for 5 minutes. The
aqueous phase was pipetted off into new micro-centrifuge tubes and 2/3rd to 1 times the

75
volume of cold isopropanol was added to precipitate DNA. After centrifuging this sample at
10,000 rpm for 5 minutes, the DNA pellet was separated and washed by 70% ethanol. The
dry DNA pellet was resuspended in 100 µl of 1x TE buffer and stored at -20oC.
Concentrations of DNA in all samples were estimated using spectrophotometer (NANO Drop
1000, Thermo Scientific, USA). Working solutions of DNA samples with a concentration of 20
ng/ µl were prepared from original DNA samples in 1x TE buffer.
PCR-based Markers Screening
SSR
Two parental lines were screened with 157 SSR and two conserved ortholog set
(COS) primers (Fulton et al., 2002) (Appendix 4). Amplification reactions were performed in
a 10 l reaction volume containing PCR buffer, 1.5 mM MgCl2, 0.2 mM of each dNTP, 0.2
M of each primer and 0.625 U of Taq DNA polymerase with 20 ng template DNA. DNA
amplifications were performed in a thermal cycler (Applied Biosystems, Life Technologies,
USA) using the following cycling conditions: one cycle of 94oC for 3 min; 34 cycles of 94oC
for 0.30 min, 52-58oC for 1 min, 72oC for 1 min; one cycle of 72oC for 10 min followed by
holding at 4oC.
M-13 Tailing SSR
Conventional gel electrophoresis did not give any polymorphic SSR markers between
parents. Therefore we used M-13 tailing SSR primers (Schuelke, 2000) to use the capillary
electrophoresis system of fragment analysis. Twenty three M-13 tail SSR primers were
screened (Appendix 4). M-13 sequence incorporated at beginning of forward primer was
TGT AAA ACG ACG GCC AGT. Amplification was performed in a 25 l reaction volume
consisting of 1x PCR buffer with 1.5 mM MgCl2, 0.2 mM dNTP, 0.08 µM forward primer with
M-13 tail, 0.6 µM reverse primer, 0.6 µM IRD-labeled M-13 primer, 0.9 U Taq polymerase
and 20 ng template DNA. The reaction was carried out in a thermal cycler (Life
Technologies, USA) using the following cycling conditions: one cycle of 94.0°C for 2:30 min,

76
15 cycles of 94.0°C for 0:30 min, 53-56oC for 0:30 min and 72.0°C for 1:00 min, 25 cycles of
94.0°C for 0:30 min, 50.0°C for 0:30 min and 72.0°C for 1:00 min and one cycle of 72.0°C for
7:00 min followed by holding at 4.0°C. This PCR profile is specific to the M-13 tailing
protocol. The first 15 cycles amplify the specific region of interest at the annealing
temperature (Ta) specific to the forward primer. The second round of amplification has 25
cycles where the Ta is specific to the M-13 primer and will allow the IRD-label to be
incorporated.
An ABI plate was set up by adding 9.5 µl formamide /LIZ mix in 1 µl PCR product. Mix
of LIZ standard and formamide was at the concentration of 1/200 by volume. The plate was
denatured at 95oC for 5 min. DNA fragment analysis was done by capillary electrophoresis
using an ABI 3730 DNA Analyzer (Life Technologies, USA). Data were analyzed using
GeneMarker Software V1.91 (SoftGenetics, USA). Electropherogram was then compared
between parents to detect any polymorphisms.
RAPD
A total of 197 10-mer RAPD primers (Appendix 4) were screened using 20 ng DNA
template of two parental lines. Primers polymorphic to parental lines were then used to
screen resistant and susceptible bulk samples. Amplification reactions were performed in 10
l reaction volumes containing 1x buffer (10 mM Tris-HCl pH 8.3, 50 mM KCl, 1.5 mM
MgCl2), 200 M of each dNTP, 0.2 M primer and 1 U Taq polymerase. About 15 l mineral
oil was overlaid on the reaction mixture. DNA amplifications were performed in thermal
cycler (Eppendorf) using the following cycling condition: one cycle of 92oC for 3 min; 45
cycles of 92oC for 0.30 min, 42oC for 1 min and 72oC for 0.30 min; one cycle of 72oC for 8
min followed by holding at 4oC.
Bulked Segergant Analysis
Bulked segregant analysis was done following the method of Michelmore et al.
(1991). Two DNA bulks, called resistant bulk (RB) and susceptible bulk (SB) were prepared

77
from F2 individuals. RB consisted of 8 individuals with a disease score of 0 and SB consisted
of 8 individuals with a score of 4.5 and 5. The DNA was extracted separately from each
individual of F2 population. Later, DNA bulk was prepared by pooling equal amounts of DNA
(50 l) of each of eight resistant and eight susceptible F2 plants. Non-correlation of disease
score value of each bulk with total soluble solid indicated that these bulks were from the
two extremes of disease severity. PCR was run with polymorphic primer between parents
on the bulks and parental DNA samples using the same reaction conditions as described
above. PCR was repeated for those primers that were polymorphic between bulks.
Gel Electrophoresis
All RAPD and SSR PCR products were analyzed in 2% agarose gels containing 0.1 g/ml
ethidium bromide in 1x TBE buffer (40 mM Tris-borate, pH 8.0, 1 mM EDTA) with a 100-bp
ladder. Electrophoresis was run at 135 V for 2 hours. Gels were rinsed with water to
enhance contrast and photographed under UV light. Polymorphism between parents by SSR
primers was not found in agarose gel, therefore, some PCR products of SSR primers were
separated on 8% PAGE and stained in ethidium bromide. Stained gels were photographed
under UV light. RAPD fragments were scored as 1 for presence and 0 for absence. Band size
was estimated based on a 100-bp ladder (Bioline USA Inc, MA, USA). Simple statistics based
on the DNA bands were calculated using MS Excel 2007.
DNA Extractions from the Gel for Sequencing
Polymorphic RAPD bands between parents and bulks were extracted from the 2%
agarose gel following the Protocol of GenElute™ Gel Extraction Kit (Appendix 6). These DNA
are being sequenced for converting useful RAPD primers to SCAR or CAPS.
Data Scoring and Analysis
Disease severity was scored at 85 days after seeding (August 25, 2009). Individual
disease rating scores were based on visual assessment of symptom severity. The following
scoring criteria was developed based on Winstead and Kelman (1952), Tu and Poysa (1990),
Danesh et al. (1994) and used in this study. Severity of disease was scored at a scale of 0 to

78
5 with 0.5 increment, as 0 = no disease symptoms, 0.5 = Less than 10% leaf area with
symptoms, 1 = 10-20% leaf area with symptoms, 1.5 = 20-30% leaf area with symptoms, 2 =
30-40% leaf area with symptoms, 2.5 = 40-50% leaf area with symptoms, 3= 50-60% leaf
area with symptoms, 3.5 = 60-70% leaf area with symptoms, 4 = 70-80% leaf area with
symptoms, 4.5 = 80-90% leaf area with symptoms, and 5 = 90-100% leaf area with
symptoms.
Scores of parental lines and F1 were averaged to see the transgressive segregants.
The pedigrees of these two lines were traced back to estimate the coefficient of parentage
(COP). COP was estimated between parents on the assumption that all ancestors and
parental lines are homozygous and a line derived from a cross obtains one-half of its genes
from each parent. The computer software KIN (Tinker and Mather, 1993) was used to
calculate the coefficient of parentage (COP).
RESULTS
The percentage of leaf area infected by the late blight pathogen was assessed 85
days after seeding. The average score of the resistant parent was 1.1 and that of the
susceptible parent was 4.2. We observed transgressive segregation towards resistance as
well as susceptible. The average score of F1 was 3.5, indicating that expression of resistance
was incomplete. Some of F1 individuals had disease severity levels similar to the susceptible
parent.
Pedigree analysis of the parents in the study showed that they had six parents in
common. The coefficient of parentage between them was 0.23 indicating some dissimilarity
between them. Variation was found between these lines for morphology and pedigree;
however, we could not find any polymorphic SSR markers. We screened 180 SSR and two
COS markers. Most of them exhibited monomorphic banding patterns and some of them
did not amplify the genomic DNA of these parents (Appendix 7). Three systems of fragment
analyses including agarose gel, polyacrylamide gel and capillary gel electrophoresis were

79
tried but none were able to detect any polymorphisms, indicating close similarity between
these parents for SSR.
RAPD Markers
Out of 197 RAPD primers used to screen parental lines, 34 RAPD primers (17.26%)
were found polymorphic (Table 13). A total of 176 bands with maximum band size of 1500
bp and minimum band size of 100 bp were amplified using 34 primers. Among these bands,
84 were found polymorphic between parents. The average number of bands per
polymorphic RAPD primer was 4, ranging from 2 to 8 bands. The number of polymorphic
bands ranged from 1 to 4 with an average of 2. All these 34 polymorphic RAPD primers were
used to screen the resistant and susceptible bulks.
RAPD Markers and Bulked Segregant Analysis
Sixteen RAPD primers (47%) out of 34 gave polymorphic bands between late blight
resistant and susceptible bulks of an F2 population (Table 14). A total of 105 RAPD bands
were observed among four DNA samples consisting of two parents and two bulks samples.
The total number of polymorphic bands observed between parents and between bulks was
35 and 23, respectively. On average, each primer amplified 7 bands. The average number of
polymorphic bands per primer observed for the parental lines was 2 and for bulks 1. The
largest band size was of 2000 bp and smallest was of 100 bp. The polymorphism shown by
MRTOMR-046 was the largest among four samples.
The bands generated by MRTOMR-147 were mostly polymorphic between parents
but none of these bands could distinguish the bulks. Four RAPD primers, namely MRTOMR-
026, MRTOMR-031, MRTOMR-038 and MRTOMR-046 were identified as linked markers to
loci related to disease reaction (Table 15). Among those, two were linked to the
susceptibility (Figure 11) and two to resistance (Figure 12). The band sizes of 1100 bp
amplified by MRTOMR-026 and 800 bp amplified by MRTOMR-046 were found only in
susceptible parent, i.e., NC 839 and susceptible bulk. Two other primers, MRTOMR-031 and

80
MRTOMR-038 produced band sizes of 550 bp and 1100 bp, respectively that were only in
the resistant parent i.e., NC 085L and resistant bulk (Table 16).
The useful RAPD primers related to disease reaction are listed in Table 17. Eleven
primers were found to have bands that were unlinked to the loci. These primers
distinguished only parents and not bulks, and were therefore defined as unlinked markers
(Figure 13A). The amplified bands of eight RAPD primers were only found in bulks but not in
either parent (Figure 13B). This may be due to recombination in the F2 population.
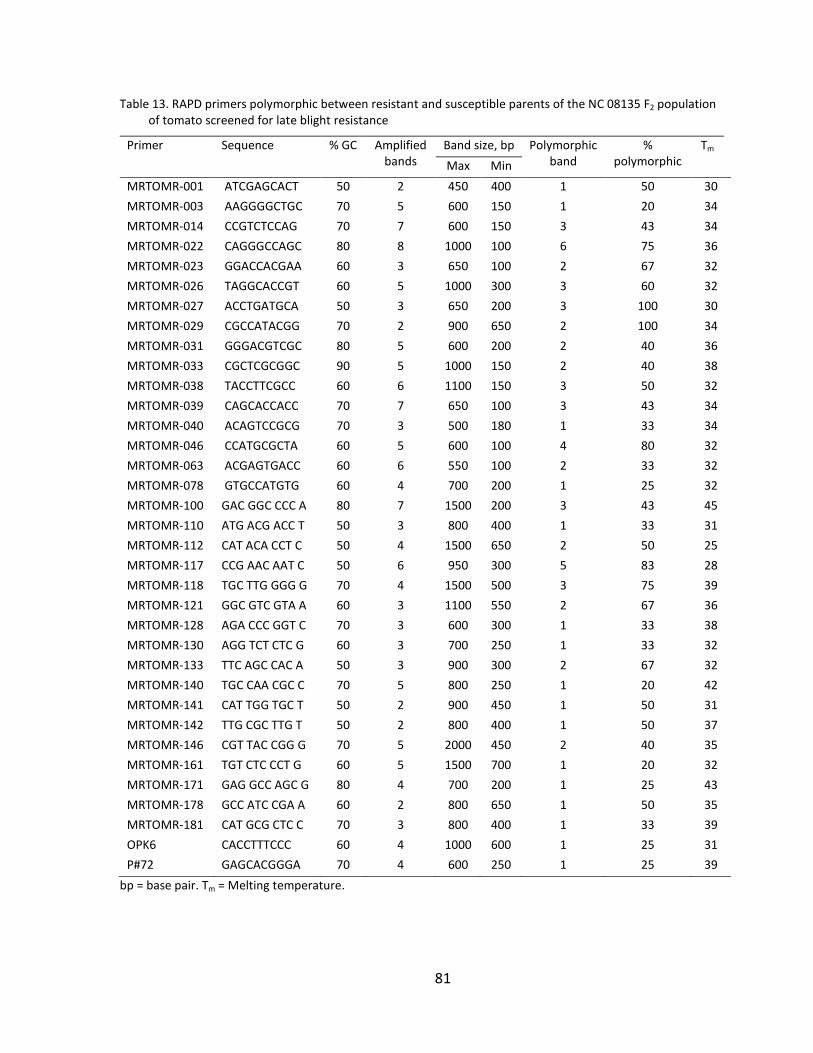
81
Table 13. RAPD primers polymorphic between resistant and susceptible parents of the NC 08135 F2 population of tomato screened for late blight resistance
Primer Sequence % GC Amplified bands
Band size, bp Polymorphic band
% polymorphic
Tm
Max Min
MRTOMR-001 ATCGAGCACT 50 2 450 400 1 50 30
MRTOMR-003 AAGGGGCTGC 70 5 600 150 1 20 34
MRTOMR-014 CCGTCTCCAG 70 7 600 150 3 43 34
MRTOMR-022 CAGGGCCAGC 80 8 1000 100 6 75 36
MRTOMR-023 GGACCACGAA 60 3 650 100 2 67 32
MRTOMR-026 TAGGCACCGT 60 5 1000 300 3 60 32
MRTOMR-027 ACCTGATGCA 50 3 650 200 3 100 30
MRTOMR-029 CGCCATACGG 70 2 900 650 2 100 34
MRTOMR-031 GGGACGTCGC 80 5 600 200 2 40 36
MRTOMR-033 CGCTCGCGGC 90 5 1000 150 2 40 38
MRTOMR-038 TACCTTCGCC 60 6 1100 150 3 50 32
MRTOMR-039 CAGCACCACC 70 7 650 100 3 43 34
MRTOMR-040 ACAGTCCGCG 70 3 500 180 1 33 34
MRTOMR-046 CCATGCGCTA 60 5 600 100 4 80 32
MRTOMR-063 ACGAGTGACC 60 6 550 100 2 33 32
MRTOMR-078 GTGCCATGTG 60 4 700 200 1 25 32
MRTOMR-100 GAC GGC CCC A 80 7 1500 200 3 43 45
MRTOMR-110 ATG ACG ACC T 50 3 800 400 1 33 31
MRTOMR-112 CAT ACA CCT C 50 4 1500 650 2 50 25
MRTOMR-117 CCG AAC AAT C 50 6 950 300 5 83 28
MRTOMR-118 TGC TTG GGG G 70 4 1500 500 3 75 39
MRTOMR-121 GGC GTC GTA A 60 3 1100 550 2 67 36
MRTOMR-128 AGA CCC GGT C 70 3 600 300 1 33 38
MRTOMR-130 AGG TCT CTC G 60 3 700 250 1 33 32
MRTOMR-133 TTC AGC CAC A 50 3 900 300 2 67 32
MRTOMR-140 TGC CAA CGC C 70 5 800 250 1 20 42
MRTOMR-141 CAT TGG TGC T 50 2 900 450 1 50 31
MRTOMR-142 TTG CGC TTG T 50 2 800 400 1 50 37
MRTOMR-146 CGT TAC CGG G 70 5 2000 450 2 40 35
MRTOMR-161 TGT CTC CCT G 60 5 1500 700 1 20 32
MRTOMR-171 GAG GCC AGC G 80 4 700 200 1 25 43
MRTOMR-178 GCC ATC CGA A 60 2 800 650 1 50 35
MRTOMR-181 CAT GCG CTC C 70 3 800 400 1 33 39
OPK6 CACCTTTCCC 60 4 1000 600 1 25 31
P#72 GAGCACGGGA 70 4 600 250 1 25 39
bp = base pair. Tm = Melting temperature.

82
Table 14. Polymorphic RAPD markers and band size between late blight resistant and susceptible bulks of tomato
Primer
Amplified
bands
Size, bp Polymorphic % polymorphic
Max Min Between parents
Between bulks
Between parents
Between bulks
MRTOMR-014 7 1500 300 3 2 43 29 MRTOMR-022 7 1200 300 1 0 14 0 MRTOMR-026 7 1500 250 1 2 14 29 MRTOMR-031 7 2000 450 3 1 43 14 MRTOMR-038 4 1500 300 2 1 50 25 MRTOMR-040 10 1600 280 4 5 40 50 MRTOMR-046 9 2000 100 6 5 67 56
MRTOMR-050 4 1000 400 1 0 25 0 MRTOMR-063 11 1500 150 2 1 18 9 MRTOMR-076 6 1500 350 1 2 17 33 MRTOMR-110 6 1200 180 1 0 17 0 MRTOMR-112 5 1200 300 1 0 20 0 MRTOMR-121 6 100 380 2 0 33 0 MRTOMR-130 4 750 200 1 0 25 0 MRTOMR-146 9 1500 250 4 4 44 44 MRTOMR-147 3 900 500 2 0 67 0

83
Table 15. Polymorphic bands of RAPD markers linked to genes in tomato conferring resistance or susceptibility to late blight
Name PBN Size, bp RP SP RB SB Marker type
MRTOMR-026 2 1100 0 1 0 1 N
5 500 0 0 1 0 -
MRTOMR-031 3 1200 1 0 0 0 -
6 550 1 0 1 0 P
MRTOMR-038 2 1100 1 0 1 0 P
3 750 0 1 1 1 -
MRTOMR-046
1 2000 0 1 0 0 -
2 1200 0 1 0 0 -
3 800 0 1 0 1 N
4 650 0 1 1 0 -
5 600 0 1 1 0 -
6 550 1 0 0 0 -
7 380 1 0 0 0 -
8 350 0 1 1 0 -
PBN = Polymorphic band number. RP = Resistant parent. SP = Susceptible parent. RB = Resistant bulk. SB = Susceptible bulk. P = Positive. N = Negative.

84
Table 16. Specific marker bands linked to genes for resistance or susceptibility to late blight of tomato
Marker LB resistance
LB susceptible
Genotype
P1 (NC 085LW) P2 (NC 839-2)
MRTOMR-026 - 1100 bp - + MRTOMR-031 550 bp - + - MRTOMR-038 1100 bp - + - MRTOMR-046 - 800 bp - +
+ = Presence. - = Absence.

85
Table 17. Informative RAPD markers associated with susceptible or resistance genes to late blight of tomato
Linked to susceptible
Linked to resistant
Unlinked With bands only in bulks
MRTOMR-026, MRTOMR-046,
MRTOMR-031, MRTOMR-038
MRTOMR-014, MRTOMR-022, MRTOMR-026 MRTOMR-031, MRTOMR-040, MRTOMR-046, MRTOMR-050, MRTOMR-112, MRTOMR-121, MRTOMR-130, MRTOMR-147
MRTOMR-014, MRTOMR-022, MRTOMR-040, MRTOMR-046, MRTOMR-076, MRTOMR-112, MRTOMR-121, MRTOMR-146

86
Figure 11. Electrophoretic pattern of DNA fragments generated by RAPD marker (A. MRTOMR-026, B. MRTOMR-046). Polymorphic band (i.e., linked to susceptible) between parents and between resistant and susceptible bulks are indicated by arrow.
RP = Resistant parent, NC 085L. SP = Susceptible parent, NC 839. RB = Resistant bulk. SP = Susceptible bulk. M = Marker.

87
Figure 12. Electrophoretic pattern of DNA fragments generated by RAPD markers (A. MRTOMR-031, B. MRTOMR-038). Polymorphic band (i.e., linked to resistance) between parents and between resistant and susceptible bulks are indicated by arrow.
RP = Resistant parent, NC 085L. SP = Susceptible parent, NC 839. RB = Resistant bulk. SP = Susceptible bulk. M = Marker.

88
Figure 13. A. RAPD marker (MRTOMR-040) showing polymorphic band (indicated by arrow)
only to parents, i.e., band with unlinked loci. B. RAPD marker (MRTOMR-022) showing band (indicated by arrow) only in two bulks.
RP = Resistant parent, NC 085L. SP = Susceptible parent, NC 839. RB = Resistant bulk. SP = Susceptible bulk. M = Marker.
A. B.

89
DISCUSSION
Among the Ph genes, resistant to late blight in tomato, Ph-2 and Ph-3 are partially
dominant genes (Foolad et al., 2008). In our study, the resistant parent, NC 85L, also has Ph-
2 and Ph-3, derived from L-3707 and Ritcher’s wild tomato, respectively. The expressions of
Ph-2 has been reported to be dependent on environmental conditions, crop physiological
stage and pathogen isolate (Moreau et al., 1998). Ph-3, though superior to
Ph-2, would not exhibit complete resistance to some isolates (Foolad et al., 2008).
Based on the screening of two bulks with 197 RAPD primers, we identified two RAPD
markers linked to a putative resistance allele and two RAPD markers linked to the
susceptible allele. Through the bulking of two extreme phenotypes of F2 populations we
were able to rapidly tag the markers associated with the chromosomal segment that has a
role on reaction to the late blight pathogen. With the BSA technique consisting of 8
individuals in each bulk, four primers gave different band sizes that were found to be linked
to late blight resistance. There are some reports of markers identified in relation to late
blight resistance in tomato (Chunwongse et al., 2002; Qiu et al., 2009). Chunwongse et al.
(2002) identified AFLP markers linked to the Ph-3 gene using BSA and Qiu et al. (2009)
identified one RAPD marker which was at distance of 5.8 cM from the target region of late
blight resistance.
The probability of declaring an unlinked polymorphic marker linked to a gene is
related to the size of the bulk and may be other factors. Both types of population and the
markers should be considered during preparing the bulks (Michelmore et al., 1991). If there
is small size of bulks, the frequency of false positives will increase. Michelmore et al. (1991)
suggested that a few individuals per bulk are enough to identify the linked markers. The
probability of finding an independent marker linked to the gene with bulk size of n is
reported to be 2(1/4)n[1-(1/4)n]. We used 8 individuals and based on this formula, the
proportion of false positives is about 3 x 10⁻⁵, which is very low.

90
In principle, BSA and NIL are effectively equivalent, and the many advantages of BSA
over NIL are discussed by Michelmore et al. (1991). Tagging of resistance gene using BSA is
very fast which facilitates the screening of new alleles for resistance to a particular
pathogen. This is important because resistant genes once tagged may not be effective for a
long time either because of recombination in the host genome or mutation in the pathogen.
The BSA approach is also considered useful to fill the gaps in the maps.
The two parental lines used in this study are closely related to each other and SSR
screening showed similar results. However, we found RAPD markers able to distinguish
these parents at the molecular level. RAPD is a multilocus-marker, therefore; all primers we
identified here might be from the overlap regions of the chromosome. For example,
MRTOMR-026 produced polymorphic band size of 1100 bp between bulks and MRTOMR-
046 800 bp band. The band produced by MRTOMR-046 might be the part of the band
generated by MRTOMR-026. These linkages should be verified by mapping the markers.
Sequence of amplified region will help if they were from the same region and can blast to
see the similarity and location in chromosome. A number of disadvantages associated with
RAPD, for example, including annealing in multiple sites, dominant in nature, sensitive to
reaction conditions may limit its use directly in MAS. Therefore, candidate RAPD markers
are generally converted to SCAR or CAPS which produce the co-dominant banding pattern
and are much more useful for MAS.
BSA has been used in a number of crop species to tag a number of traits including
quantitative traits. After identifying useful markers by BSA in tomato, MAS is now possible
to apply during the selection of resistance to verticillium wilt, tomato spotted wilt virus,
root knot nematode, powdery mildew, and fusarium wilt. De Giovanni et al. (2004)
identified a RAPD marker linked to the ol-2 gene, which confers resistance to powdery
mildew. A single RAPD marker, OPU31500 with 1500 bp in size was detected in the
susceptible bulk and converted to a CAPS marker. The distance between the marker and the
ol-2 gene was also estimated through linkage analysis. Stevens et al. (1995) and Chagué et

91
al. (1996) have identified RAPD markers linked to the Sw-5 gene for resistance to tomato
spotted wilt virus (TSWV). Among the four RAPD markers linked to the gene of interest, two
were tightly linked to the Sw-5 gene. Linkage analysis mapped this marker within a distance
of 10.5 cM from Sw-5. This RAPD marker was later converted into a SCAR marker. Czech et
al. (2003) have used MAS for developing TSWV resistant tomato using PCR markers. Smiech
et al. (2000) used BSA in an F2 segregating population and found five primers that
distinguished resistant and susceptible bulks.
We used disease scores that were based on natural infestation. Different levels of
infestation rate were observed in an F2 population indicating that inoculum pressure was
enough to screen the population. Use of natural inoculums saves cost and time. Screening
of a target population in a target environment can be more successful in the long run to get
the durable resistant genotype. Infestation from a natural population has been used in a
number of crop species. For example, two QTLs for glume botch resistance in wheat were
identified using composite interval mapping from naturally inoculated population
(Schnurbusch et al., 2003). Spaner et al. (1998) mapped loci affecting resistance to powdery
mildew, leaf rust, stem rust, scald and net blotch in barley using field-scored data of disease
severity under natural infestation. Natural infestation was also used by Frei et al. (2005) to
identify QTLs resistance to thrips in common bean.
We identified four potential RAPD primers associated with resistance to the late
blight in tomato. Two primers yielded a DNA band in late blight resistant genotypes and
these primers could be very useful in MAS. Because of low reproducibility of RAPD, these
markers need to be converted to tightly-linked SCAR markers, so that MAS can be applied
using a single marker. MAS is cost effective and more precise, because it does not need to
have a pathological evaluation and can genotype at any growth stage. Further, linkage
analysis is also necessary to identify the tightly linked marker.

92
REFERENCES
Brouwer, D.J., E.S. Jones, and D.A.S. Clair. 2004. QTL analysis of quantitative resistance to Phytophthora infestans (late blight) in tomato and comparisons with potato. Genome 47:475-492.
Chagué, V., J.C. Mercier, M. Guénard, A. Courcel, and F. Vedel. 1996. Identification and mapping on chromosome 9 of RAPD markers linked to Sw-5 in tomato by bulked segregant analysis. Theor. Appl. Genet. 92:1045-1051.
Chunwongse, J., C. Chunwongse, L. Black, and P. Hanson. 2002. Molecular mapping of the Ph-3 gene for late blight resistance in tomato. J. Hort. Sci. Biotechnol. 77:281-286.
Czech, A.S., M. Szklarczyk, Z. Gajewski, E. Zukowska, B. Michalik, T. Kobylko, and K. Strzalka. 2003. Selection of tomato plants resistant to a local Polish isolate of tomato spotted wilt virus (TSWV). J. Appl. Genet. 44:473-480.
Danesh, D., S. Aarons, G.E. McGill, and N.D. Young. 1994. Genetic dissection of oligogenic resistance to bacterial wilt in tomato. Mol. Plant-Microbe Interact. 7:464-471.
Davis, R.M., G. Hamilton, W.T. Lanini, T.H. Spreen, and C. Osteen. 2000. The importance of pesticides and other pest management practices in U.S. tomato production. USDA, NAPIAR.
De Giovanni, C., P. Dell’Orco, A. Bruno, F. Ciccarese, C. Lotti, and L. Ricciardi. 2004. Identification of PCR-based markers (RAPD, AFLP) linked to a novel powdery mildew resistance gene (ol-2) in tomato. Plant Sci. 166:41-48.
FAOSTAT. 2010. Food and Agriculture Organization of the United Nations. Available at http://faostat.fao.org/site/339/default.aspx (verified 25 June 2010).
Foolad, M., H. Merk, and H. Ashrafi. 2008. Genetics, genomics and breeding of late blight and early blight resistance in tomato. Crit. Rev. Plant Sci. 27:75-107.
Frei, A., M.W. Blair, C. Cardona, S.E. Beebe, H. Gu, and S. Dorn. 2005. QTL mapping of resistance to thrips palmi Karny in common bean. Crop Sci. 45:379-387.
Fry, W.E., and S.B. Goodwin. 1997. Resurgence of the Irish potato famine fungus. Bioscience 47:363-371.
Fulton, T.M., R. Van der Hoeven, N.T. Eannetta, and S.D. Tanksley. 2002. Identification, analysis, and utilization of conserved ortholog set markers for comparative genomics in higher plants. The Plant Cell Online 14:1457-1467.
93
Fulton, T.M., J. Chunwongse, and S.D. Tanksley. 1995. Microprep protocol for extraction of DNA from tomato and other herbaceous plants. Plant Mol. Biol. Rep. 13:207-209.
Gardner, R.G., and D.R. Panthee. 2010a. Plum Regal fresh-market plum tomato hybrid and its parents, NC 25P and NC 30P. HortScience 45:824-825.
Gardner, R.G., and D.R. Panthee. 2010b. NC 1 CELBR and NC 2 CELBR: Early blight and late blight-resistant fresh market tomato breeding lines. HortScience 45:975-976.
Giovannoni, J.J., R.A. Wing, M.W. Ganal, and S.D. Tanksley. 1991. Isolation of molecular markers from specific chromosomal intervals using DNA pools from existing mapping populations. Nucleic Acid Res. 19:6553-6558.
Mackay, I.J., and P.D.S. Caligari. 2000. Efficiencies of F2 and backcross generations for bulked segregant analysis using dominant markers. Crop Sci. 40:626-630.
Michelmore, R.W., I. Paran, and R.V. Kesseli. 1991. Identification of markers linked to disease-resistance genes by bulked segregant analysis: A rapid method to detect markers in specific genomic regions by using segregating populations. Proc. Natl. Acad. Sci. 88:9828-9832.
Moreau, P., P. Thoquet, J. Olivier, H. Laterrot, and N. Grimsley. 1998. Genetic mapping of Ph-2, a single locus controlling partial resistance to Phytophthora infestans in tomato. Mol. Plant-Microbe Interact. 11:259–269.
Panthee, D.R., and F. Chen. 2010. Genomics of fungal disease resistance in tomato. Current Genomics 11:30-39.
Panthee, D.R., and R.G. Gardner. 2010. Mountain Merit: A late blight-resistant large-fruited tomato hybrid. HortScience 45:1547–1548.
Qiu, Y.P., H.T. Li, Z. Zhang, and Q.D. Zou. 2009. RAPD marker of the resistant gene Ph-3 for tomato late blight. Acta Horticulturae Sinica 36:1227-1232Available at (verified 29 March 2011).
Quarrie, S.A., V. Lazic-Jancic, D. Kovacevic, A. Steed, and S. Pekic. 1999. Bulk segregant analysis with molecular markers and its use for improving drought resistance in maize. J. Exp. Botany 50:1299-1306.
Rick, C.M. 1980. Tomato. p. 669-680. In Hybridization of crop plants. Amer. Soc. Agron./Crop Sci. Soc. Amer., Madison, Wis.

94
Schnurbusch, T., S. Paillard, D. Fossati, M. Messmer, G. Schachermayr, M. Winzeler, and B. Keller. 2003. Detection of QTLs for Stagonospora glume blotch resistance in Swiss winter wheat. Theor. Appl. Genet. 107:1226-1234.
Schuelke, M. 2000. An economic method for the fluorescent labeling of PCR fragments. Nature Biotechnology 18:233–234.
Smiech, M., Z. Rusinowski, S. Malepszy, and K. Niemirowicz-Szczytt. 2000. New RAPD markers of tomato spotted wilt virus (TSWV) resistance in Lycopersicon esculentum Mill. Acta Physiologiae Plantarum 22:299-303.
Spaner, D., L.P. Shugar, T.M. Choo, I. Falak, K.G. Briggs, W.G. Legge, D.E. Falk, S.E. Ullrich, N.A. Tinker, and B.J. Steffenson. 1998. Mapping of disease resistance loci in barley on the basis of visual assessment of naturally occurring symptoms. Crop Sci. 38:843-850.
Stevens, M.R., E.M. Lamb, and D.D. Rhoads. 1995. Mapping the Sw-5 locus for tomato spotted wilt virus resistance in tomatoes using RAPD and RFLP analyses. Theor. Appl. Genet. 90:451-456.
Tinker, N.A., and D.E. Mather. 1993. KIN: Software for computing kinship coefficients. J. Hered. 84:238.
Tu, J.C., and V. Poysa. 1990. A brushing method of inoculation for screening tomato seedlings for resistance to Septoria lycopersici. Plant Dis. 74:294-297.
Winstead, N.N., and A. Kelman. 1952. Inoculation technique for evaluating resistance to Pseudomonas solanacearum. Phytopathology 42:628-634.

95
CHAPTER 4
Isolation and Culture of Septoria lycopersici Speg. from Septoria
Leaf Spot affected Tomato Leaves
INTRODUCTION
Septoria leaf spot (Septoria lycopersici Speg.) is one of the most devastating foliar
diseases of tomato, particularly in humid regions during the periods of rainfall, frequent
dew or over-head irrigation. It may cause complete defoliation leading to a significant crop
loss under favorable environment conditions for disease development (Andrus and
Reynard, 1945). The temperature range for sporulation varies from 15° to 27°C (59° to
80.5°F) with 25°C (77°F) being optimal. Free moisture is necessary for spore infection
through stomata; therefore, a long-lasting dew and rainy days favor disease development
(Delahaut and Stevenson, 2004); http://pubs.ext.vt.edu/450/450-711/450-711.html).
Septoria occurs worldwide and effective fungicides are available to control septoria leaf
spot. However, due to the cost involved in fungicides and environmental concern associated
with fungicides, breeding for resistant variety is the priority in many breeding programs.
With the use of fungicides this disease has got less attention from the breeder (Locke, 1949)
in the past,
Tomatoes may often be infected with septoria leaf spot (SLS) and early blight
(Altemaria solani) simultaneously (http://vegetablemdonline.ppath.cornell.edu/ factsheets/
Tomato_Septoria.htm). Septoria leaf spot is easily distinguished from early blight by the
uniform, small size spots and the lack of concentric rings in the spots. Septoria overwinter in
plant debris, on seed, or on weeds such as nightshade, jimsonweed, ground cherry and
horse-nettle (Delahaut and Stevenson, 2004) and can survive up to 3 years. It is also
reported as a soil borne fungal disease of tomato (Wyenandt et al., 2008). Wind and rain
then spread spores to adjacent healthy leaves and plants. Spores of this fungus on debris

96
splash or blow on tomato leaves and start the disease cycle. Initial infection can be seen on
lower leaves, and progresses upward.
SYMPTOMS
Susceptible plant shows small, water-soaked round spots, about 3.2 mm in
diameter, with a thin dark brown border and tan or a light center containing several small
dark pycnidia (Figure 14). Yellow haloes often surround the spots, and severely infected
leaves die and drop off. As the spots mature, they enlarge to diameter of about 6.4 mm and
may coalesce. In the center of the spots are many dark brown, pimple-like structures called
pycnidia, fruiting bodies of the fungus. The structures are large enough to be seen with the
unaided eye or with the aid of a hand lens. Spots may also appear on stems, calyxes, and
blossoms, but rarely on fruit. Heavily infected leaves will turn yellow, dry up, and drop off.
This defoliation will result in sun-scalding of the fruit. Resistant type lesions are smaller and
often resemble a dark rust colored fleck. Pycnidia, if present, are fewer, smaller and more
difficult to detect than on a susceptible type lesion (Ferrandino and Elmer, 1992; Delahaut
and Stevenson, 2004) .
HOST PATHOGEN INTERACTION
Main infection route of S. lycopersici is through stomata but it may also occur by
direct penetration of epidermal cells (Sohi and Sokhi, 1972). The enzyme tomatinase,
produced by septoria pathogen, degrades -tomatine. The -tomatine is steroidal,
glycoalkaloid saponin and has antimicrobial activity (Martin-Hernandez et al., 2000).
Tomatinase-minus mutants are more sensitive to -tomatine than the wild-type strain.
However, they can grow in the presence of 1 mM -tomatine, suggesting that non-
degradative mechanisms of tolerance are also important. Some fungal pathogens of tomato
are found to be more resistant to -tomatine (Melton et al., 1998). The necrotrophic
tomato pathogen Septoria lycopersici produces an extracellular tomatinase enzyme that
detoxifies -tomatine (Arneson and Durbin, 1967; 1968). The tomatine content which is

97
determined by the segregation of two codominant alleles of a single gene (Juvik and
Stevens, 1982) is correlated with disease resistance in tomato. Variation is reported in -
tomatine content in tomato species and accessions (Juvik et al., 1982). Cultivated tomato
species produce lower amount of tomatine than wild species S. pimpinellifolium. The
young leaves are rich in -tomatine (Roddick, 1974).
RESISTANCE BREEDING
Development of host-plant resistance is considered the most effective and
economical means to control diseases. Breeding efforts were not a priority due to effective
control of the disease by fungicides (Barksdale and Stoner, 1978). However, with the
severity of the problem, now it has been realized that breeding for septoria leaf spot
resistance is important. Resistance has been reported to have single dominant gene action
and is denoted by Se (Andrus and Reynard, 1945). However, recessive gene action has also
been reported based on the field observation in a different study (Wright and Lincoln,
1940).
Due to cost involved in disease management, environmental hazards and likelihood
of resistance development in the pathogen population from sole reliance on fungicides,
breeding resistant varieties is a priority in tomato breeding programs including at NCSU.
Screening germplasms for resistance under artificial inoculation is the most reliable option
to create optimum disease pressure and maintaining consistency over several screening
cycles. Artificial preparation of inoculums is also necessary to verify the markers identified
using naturally infested population. Isolation and culture of inoculum is thus the most
important first step to ensure the use of pathogen for artificial inoculation. However, an
established protocol for isolation and maintenance of S. lycopersici inoculum is lacking at
present. The objective of this experiment was to find a superior and reliable isolation and
inoculum multiplication protocol for Septoria lycopersici.

98
MATERIAL AND METHODS
Plant materials
Tomato leaves infected with septoria leaf spot were collected from research plots at
Mountain Horticultural Crops Research and Extension Center (MHCREC), Mills River, and
tomato growers’ field at Mills River (near MHCREC) in the summer of 2009.
Clinical Test and Spore Identification
Infected leaf samples were taken to the Plant Pathology lab of NCSU and evaluated
for disease symptoms visually and then using following three methods:
1. Using dissecting microscope: The lesions from an infected part of the leaf were
observed directly under dissecting microscope. The symptoms of SLS, as described
above, could be easily observed. Pycnidia, the fruiting bodies of SLS, were observed
and characterized.
2. Using compound microscope: Slide mount of spores was prepared in a drop of
water, first with a needle and then using blue staining solution (lactophenol cotton
blue). Shape and length of spores were measured. Pycnidia mounted in a drop of
water oozed conidia in large numbers.
3. Observing with naked eye after incubation: Infected leaves were incubated for 24
hours at room temperature using moist paper and observed with naked eye.
Incubation, Isolation and Culture
After visual examination, leaves were kept in a moist chamber over night at room
temperature to promote extrusion of spores from the pycnidia (Figure 14). After incubation
of disease leaf sample for 24 hours, the following four different approaches were used to
isolate the spores:
1. Sterile water was dropped on the spot of non-sterilized leaves and spores were
streaked out in the media with the help of wire loop.

99
2. Under the dissecting microscope, spores were directly transferred with the help of
needle by touching first infected leaf area and then the media.
3. A small piece of media was taken and touched to the infected leaf area and
replaced in the petri dishes.
4. Leaf samples were sterilized and macerated. Then quadrant-streak technique
(http://archive.microbelibrary.org/asmonly/details_print.asp?id=2808&lang=) was used to
drop spore from macerated sample onto media with a platinum wire loop.
A single colony was selected and re-streaked on media. Pure culture was obtained
by transferring either a hypha tip or streaked out the spore solution in the media following
the bacterial streaking technique.
Sterilization and Aseptic Technique
All operations including media transfer, isolation, and sub culture were performed in
a laminar flow hood. Media was sterilized with a pressure-temperature sterilizing system
(121oC, 15 psi for 20 min) and antibiotics were sterilized by filtration. Metal tools were
sterilized in flame and working area with 75% ethyl alcohol. Surface sterilizing technique
was followed to sterilize the leaf samples. Samples were dipped briefly in 70% alcohol and
soaked in 10% bleach solution followed by rinsing in sterile distilled water.
Culture Media
We used 3.9% Potato Dextrose Agar (PDA) media supplemented with Ampicillin @50
μg/mL. We dried the media by keeping in the laminar hood for a longer time, about one
hour, before initiating culture to enhance sporulation of septoria (Pritchard and Porte,
1921). Media was stored in refrigerator for future use.

100
Figure 14. Tomato leaves infected with septoria leaf spot (Septoria lycopersici) (A), extrusion of white mass of spore from pycnidia (B), and enlarged extrusion of spore (C).

101
Subculture and Storage
Each colony was examined for the shape and length of spores to determine the right
pathogen on a slide containing sterile distilled water (SDW) with cover slip under the
microscope. Small pieces of colony were transferred to fresh media every three weeks. The
colonies were maintained by routine transfer on fresh media. Colonies were transferred to
tubes having slant PDA media and kept at room temperature for 3 weeks for long term
storage. The fully grown colony was stored at 4oC.
RESULTS AND DISCUSSION
Clinical Test and Spore Identification
Before isolation and culture, it is very important to identify the pathogen and
associated pathogens with the target one. We used the following methods for diagnosis and
spore identification of septoria leaf spot of tomato.
1. Using dissecting microscope: Pycnidia, the fruiting bodies of SLS were seen
protruding from the center of leaf spot (Figure 14). Pycnidia were like pimple
structures with dark on the bottom and white on the top. Pycnidia were black,
globose to subglobose, ostiolate, 100-150 μm diameter.
2. Using compound microscope: Long and thread like shape of spores were observed.
Spores were blue after staining with lactophenol cotton blue. Pycnidia mounted in a
drop of water oozed conidia in large numbers. Spore (conidia) was hyaline and
needle like, typically long thread (14-100 µm) with 2-6 septa and tapered on the
both side (Figure 15).
3. Observing with naked eye after incubation: Several white dots were observed on
the center of SLS after 24 hours incubation at room temperature (Figure 14).
Incubation promoted extrusion of spores from the pycnidia.

102
Figure 15. Blue stained thread like spore with septa of septoria (A) and enlarged spore (B).

103
Isolation and Culture Techniques
We used four methods for transferring isolates from the leaves. Among these
methods, direct transfer of pycnidia with the help of a dissecting microscope was successful
and found more effective. After 24 hours of incubation, infected leaf areas were observed
under the dissecting microscope in the laminar hood. The pycnidia were seen clearly and
these pycnidia were then transferred with the help of sterilized needle in PDA media. The
other three methods, water aided spore transfer, media aided spore transfer and macerated
sample-streaked out, were not found effective to isolate and culture septoria pathogens.
After transferring, spores were incubated at room temperature for 1-2 weeks.
Colony Growth and Characters
Spore growth was observed after 2 weeks. Spores were long threads with many
septa and tapered both end. Growth of the spores was very slow, and its growth on the
media look like small button white mass (Figure 16). At the initial growth stage, they were
white but later turned black. The colony was very compact and hard (Figure 16). Few white
spots were also observed in old colony.
Subculture and Storage
Pure culture was obtained by transferring a very tip portion of the colony to media.
We stored the single colony that can be used for further study. Pure culture is necessary to
get the genetically similar population that is necessary to study the host-pathogen specific
reaction. Colonies were verified observing long thread like spores under microscope and
sub-cultured. Colony growth was maintained by routine transfer on PDA media. The colony
of S. lycopersici was stored simply using slanted PDA media in tube at 4oC.

104
Figure 16. White button like initial growth of septoria (A), fully grown colony (B) and colony in slant media for storage at 4oC (C).
105
For inoculums preparation, the stored colony can be recovered by inoculating blocks
of mycelium onto PDA and incubating in the dark at 22oC for about 14 days. Optimal
conditions (Tu and Poysa, 1990) for inoculation are 1. Inoculums concentration of 106
spores/ ml, 2. Temperature at 24°C, 3. Moisture period of 48 hours and 4. A photoperiod of
14 hours. Literature showed that there are five different methods of inoculation, namely
Spraying (Barksdale and Stoner, 1978), Spraying aided by spreader row (Poysa and Tu,
1993), Dipping (Andrus and Reynard, 1945), Brushing method (Tu and Poysa, 1990) and
Detached leaf test (Martin-Hernandez et al., 2000).
Culture Media
Spores were successfully cultured in PDA media. Use of cooked bean pod was also
reported to be effective. Andrus and Reynard (1945) used cooked bean pod to culture, in
which spores were sporulated copiously for screening and inheritance study of S. lycopersici
resistance. The green bean pod was cooked and put into the tubes for S. lycopersici culture.
Development of pycnidia is favored by dry air and hindered by moist air in tomato plants.
Therefore, media was dried just by keeping it a longer time, about one hour on the laminar
hood before culturing. Importance of dry media is supported by the findings of Pritchard
and Porte (1921) who found variation in sporulation in culture media. Pycnidia were readily
developed from the drier areas in the corn meal culture. Moist areas produced only after
the medium becomes somewhat dry.
Conclusion
A spore of SLS is thread-like, long with septa which can be directly isolated and
cultured in selective PDA media. Colony growth is very slow and it is white at the initial
growth stage and later it turns black in color and becomes compact and hard. Inoculums can
be prepared from the stored colony to use in the tomato resistance breeding program. We
hope this technique of isolation and culture of septoria will be useful in resistance breeding.
We are planning to use the technique for artificial inoculation of septoria pathogen to verify
the identified RAPD markers in Chapter 2.
106
REFERENCES
Andrus, C.F., and G.B. Reynard. 1945. Resistance to septoria leaf spot and its inheritance in tomatoes. Phytopathology 35:16-24.
Arneson, P.A., and R.D. Durbin. 1967. Hydrolysis of tomatine by Septoria lycopersici: A detoxification mechanism. Phytopathology 57:1358-1360.
Arneson, P.A., and R.D. Durbin. 1968. The sensitivity of fungi to alpha-tomatine. Phytopathology 58:536-537.
Barksdale, T.H., and A.K. Stoner. 1978. Resistance in tomato to Septoria lycopersici. Plant Dis. Rep. 62:844-847.
Delahaut, K., and W. Stevenson. 2004. Tomato disorders: Early blight and septoria leaf spot. The University of Wisconsin. A2606:R-0504.
Ferrandino, F.J., and W.H. Elmer. 1992. Reduction in tomato yield due to septoria leaf spot. Plant Disease 76:208-211.
Juvik, J.A., and M.A. Stevens. 1982. Inheritance of foliar alpha-tomatine content in tomatoes. J. Am. Soc. Hort. Sci. 107:1061-1065.
Juvik, J.A., M.A. Stevens, and C.M. Rick. 1982. Survey of the genus Lycopersicon for variability in alpha-tomatine content. HortScience 17:764-766.
Locke, S.B. 1949. Resistance to early blight and septoria leaf spot in the genus Lycopersicon. Phytopathology 39:829-836.
Martin-Hernandez, A.M., M. Dufresne, V. Hugouvieux, R. Melton, and A. Osbourn. 2000. Effects of targeted replacement of the tomatinase gene on the interaction of Septoria lycopersici with tomato plants. Mol. Plant-Microbe Interact. 13:1301-1311.
Melton, R.E., L.M. Flegg, J.K.M. Brown, R.P. Oliver, M.J. Daniels, and A.E. Osbourn. 1998. Heterologous expression of Septoria lycopersici tomatinase in Cladosporium fulvum: Effects on compatible and incompatible interactions with tomato seedlings. Mol. Plant-Microbe Interact. 11:228-236.
Poysa, V., and J.C. Tu. 1993. Response of cultivars and breeding lines of Lycopersicon spp. to Septoria lycopersici. Can. Plant Dis. Surv. 73:9-13.
Pritchard, F.J., and W.S. Porte. 1921. Relation of horse nettle (Solanum carolinese) to leaf spot of tomato (Septoria lycopersici). J. Agric. Res. XXI:501-506.

107
Roddick, J.G. 1974. The steroidal glycoalkaloid alpha-tomatine. Phytochemistry 13:9-25.
Sohi, H.S., and S.S. Sokhi. 1972. Morphological, physiological and pathological studies in Septoria lycopersici. Indian Phytopathol. 26:666-673.
Tu, J.C., and V. Poysa. 1990. A brushing method of inoculation for screening tomato seedlings for resistance to Septoria lycopersici. Plant Dis. 74:294-297.
Wright, V., and R.E. Lincoln. 1940. Resistance to defoliation diseases of tomato. Purdue Agric. Exp. Stn. Annu. Rep. 53:42-43.
Wyenandt, C.A., L.H. Rhodes, R.M. Riedel, and M.A. Bennett. 2008. Cover crop mulch and fungicide program affect development of septoria leaf spot and marketable yield in processing tomato production. HortScience 43:807-810.

108
APPENDICES

109
APPENDICES
Appendix 1. Monthly weather conditions during tomato growing period (shaded area) in Mills River, North Carolina, 2009
Min = Minimum temperature (°C). Max = Maximum temperature (°C). RH= Relative humidity (%).
Seeding: 1 Jun Last harvest: 18 Sep
0
50
100
150
200
250
0
10
20
30
40
50
60
70
80
90
Jan Feb Mar Apr May June Jul Aug Sep Oct Nov Dec
RH
, % a
nd r
ainf
all,
mm
Tem
pera
ture
, oC
Rainfall, mm Max
Min RH, %

110
Appendix 2. Parents [NC 85L-1W(2007) x NC 839-2(2007)] and their F1 (NC 08135)
x
Late blight resistance Septoria leaf spot resistance
F1 08135)

111
Appendix 3. Samples of tomato plant infected by two foliar diseases, late blight and septoria leaf spot
Symptom of septoria leaf spot Symptom of late blight
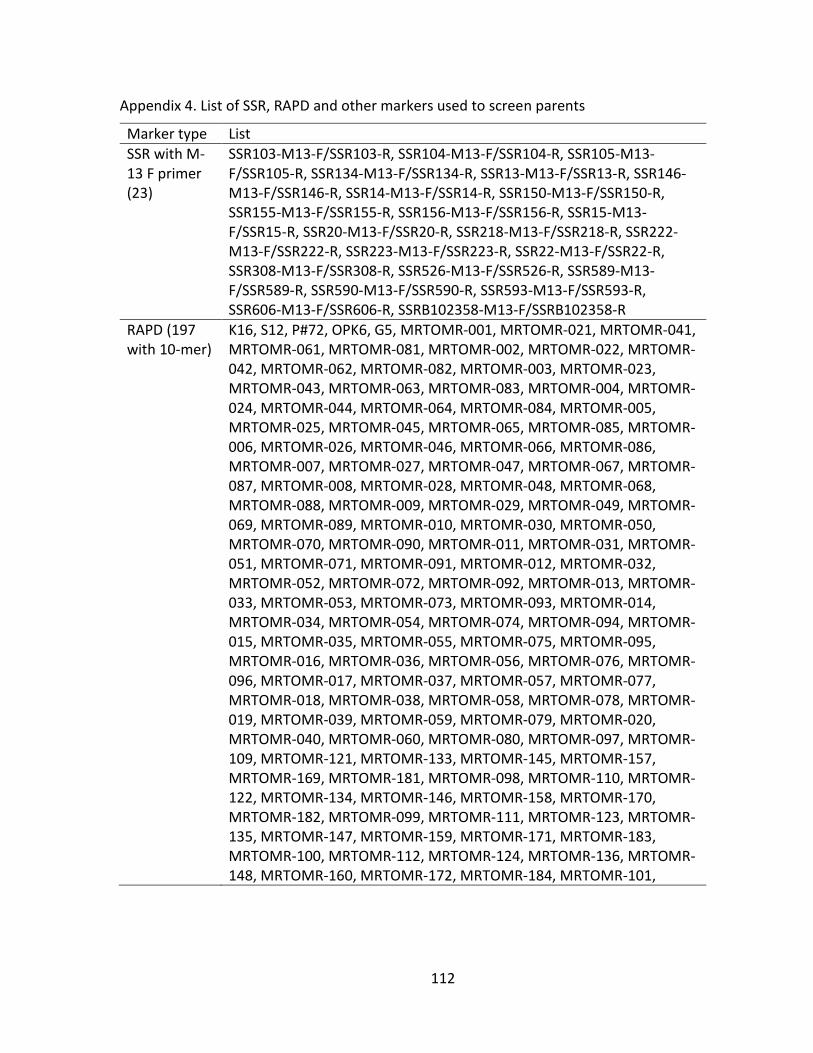
112
Appendix 4. List of SSR, RAPD and other markers used to screen parents
Marker type List
SSR with M-13 F primer (23)
SSR103-M13-F/SSR103-R, SSR104-M13-F/SSR104-R, SSR105-M13-F/SSR105-R, SSR134-M13-F/SSR134-R, SSR13-M13-F/SSR13-R, SSR146-M13-F/SSR146-R, SSR14-M13-F/SSR14-R, SSR150-M13-F/SSR150-R, SSR155-M13-F/SSR155-R, SSR156-M13-F/SSR156-R, SSR15-M13-F/SSR15-R, SSR20-M13-F/SSR20-R, SSR218-M13-F/SSR218-R, SSR222-M13-F/SSR222-R, SSR223-M13-F/SSR223-R, SSR22-M13-F/SSR22-R, SSR308-M13-F/SSR308-R, SSR526-M13-F/SSR526-R, SSR589-M13-F/SSR589-R, SSR590-M13-F/SSR590-R, SSR593-M13-F/SSR593-R, SSR606-M13-F/SSR606-R, SSRB102358-M13-F/SSRB102358-R
RAPD (197 with 10-mer)
K16, S12, P#72, OPK6, G5, MRTOMR-001, MRTOMR-021, MRTOMR-041, MRTOMR-061, MRTOMR-081, MRTOMR-002, MRTOMR-022, MRTOMR-042, MRTOMR-062, MRTOMR-082, MRTOMR-003, MRTOMR-023, MRTOMR-043, MRTOMR-063, MRTOMR-083, MRTOMR-004, MRTOMR-024, MRTOMR-044, MRTOMR-064, MRTOMR-084, MRTOMR-005, MRTOMR-025, MRTOMR-045, MRTOMR-065, MRTOMR-085, MRTOMR-006, MRTOMR-026, MRTOMR-046, MRTOMR-066, MRTOMR-086, MRTOMR-007, MRTOMR-027, MRTOMR-047, MRTOMR-067, MRTOMR-087, MRTOMR-008, MRTOMR-028, MRTOMR-048, MRTOMR-068, MRTOMR-088, MRTOMR-009, MRTOMR-029, MRTOMR-049, MRTOMR-069, MRTOMR-089, MRTOMR-010, MRTOMR-030, MRTOMR-050, MRTOMR-070, MRTOMR-090, MRTOMR-011, MRTOMR-031, MRTOMR-051, MRTOMR-071, MRTOMR-091, MRTOMR-012, MRTOMR-032, MRTOMR-052, MRTOMR-072, MRTOMR-092, MRTOMR-013, MRTOMR-033, MRTOMR-053, MRTOMR-073, MRTOMR-093, MRTOMR-014, MRTOMR-034, MRTOMR-054, MRTOMR-074, MRTOMR-094, MRTOMR-015, MRTOMR-035, MRTOMR-055, MRTOMR-075, MRTOMR-095, MRTOMR-016, MRTOMR-036, MRTOMR-056, MRTOMR-076, MRTOMR-096, MRTOMR-017, MRTOMR-037, MRTOMR-057, MRTOMR-077, MRTOMR-018, MRTOMR-038, MRTOMR-058, MRTOMR-078, MRTOMR-019, MRTOMR-039, MRTOMR-059, MRTOMR-079, MRTOMR-020, MRTOMR-040, MRTOMR-060, MRTOMR-080, MRTOMR-097, MRTOMR-109, MRTOMR-121, MRTOMR-133, MRTOMR-145, MRTOMR-157, MRTOMR-169, MRTOMR-181, MRTOMR-098, MRTOMR-110, MRTOMR-122, MRTOMR-134, MRTOMR-146, MRTOMR-158, MRTOMR-170, MRTOMR-182, MRTOMR-099, MRTOMR-111, MRTOMR-123, MRTOMR-135, MRTOMR-147, MRTOMR-159, MRTOMR-171, MRTOMR-183, MRTOMR-100, MRTOMR-112, MRTOMR-124, MRTOMR-136, MRTOMR-148, MRTOMR-160, MRTOMR-172, MRTOMR-184, MRTOMR-101,

113
Marker type List
MRTOMR-113, MRTOMR-125, MRTOMR-137, MRTOMR-149, MRTOMR-161, MRTOMR-173, MRTOMR-185, MRTOMR-102, MRTOMR-114, MRTOMR-126, MRTOMR-138, MRTOMR-150, MRTOMR-162, MRTOMR-174, MRTOMR-186, MRTOMR-103, MRTOMR-115, MRTOMR-127, MRTOMR-139, MRTOMR-151, MRTOMR-163, MRTOMR-175, MRTOMR-187, MRTOMR-104, MRTOMR-116, MRTOMR-128, MRTOMR-140, MRTOMR-152, MRTOMR-164, MRTOMR-176, MRTOMR-188, MRTOMR-105, MRTOMR-117, MRTOMR-129, MRTOMR-141, MRTOMR-153, MRTOMR-165, MRTOMR-177, MRTOMR-189, MRTOMR-106, MRTOMR-118, MRTOMR-130, MRTOMR-142, MRTOMR-154, MRTOMR-166, MRTOMR-178, MRTOMR-190, MRTOMR-107, MRTOMR-119, MRTOMR-131, MRTOMR-143, MRTOMR-155, MRTOMR-167, MRTOMR-179, MRTOMR-191, MRTOMR-108, MRTOMR-120, MRTOMR-132, MRTOMR-144, MRTOMR-156, MRTOMR-168, MRTOMR-180, MRTOMR-192
SSR and COS (159)
SSRB60800-F/SSRB60800-R, SSR150-F/SSR150-R, SSR155-F/SSR155-R, SSR156-F/SSR156-R, SSR159-F/SSR159-R, SSR15-F/SSR15-R, SSR162-F/SSR162-R, SSR188-F/SSR188-R, SSR192-F/SSR192-R, SSR19-F/SSR19-R, SSR201-F/SSR201-R, SSR20-F/SSR20-R, SSR214-F/SSR214-R, SSR218-F/SSR218-R, SSR222-F/SSR222-R, SSR223-F/SSR223-R, SSR22-F/SSR22-R, SSR231-F/SSR231-R, SSR237-F/SSR237-R, SSR241-F/SSR241-R, SSR244-F/SSR244-R, SSR248-F/SSR248-R, SSR266-F/SSR266-R, SSR26-F/SSR26-R, SSR270-F/SSR270-R, SSR276-F/SSR276-R, SSR27-F/SSR27-R, SSR285-F/SSR285-R, SSR286-F/SSR286-R, SSR287-F/SSR287-R, SSR288-F/SSR288-R, SSR28-F/SSR28-R, SSR290-F/SSR290-R, SSR293-F/SSR293-R, SSR295-F/SSR295-R, SSR296-F/SSR296-R, SSR29-F/SSR29-R, SSR300-F/SSR300-R, SSR301-F/SSR301-R, SSR304-F/SSR304-R, SSR306-F/SSR306-R, SSR308-F/SSR308-R, SSR310-F/SSR310-R, SSR316-F/SSR316-R, SSR318-F/SSR318-R, SSR31-F/SSR31-R, SSR320-F/SSR320-R, SSR325-F/SSR325-R, SSR326-F/SSR326-R, SSR327-F/SSR327-R, SSR32-F/SSR32-R, SSR330-F/SSR330-R, SSR331-F/SSR331-R, SSR333-F/SSR333-R, SSR335-F/SSR335-R, SSR336-F/SSR336-R, SSR340-F/SSR340-R, SSR341-F/SSR341-R, SSR344-F/SSR344-R, SSR345-F/SSR345-R, SSR346-F/SSR346-R, SSR349-F/SSR349-R, SSR34-F/SSR34-R, SSR350-F/SSR350-R, SSR356-F/SSR356-R, SSR360-F/SSR360-R, SSR37-F/SSR37-R, SSR383-F/SSR383-R, SSR38-F/SSR38-R, SSR40-F/SSR40-R, SSR42-F/SSR42-R, SSR43-F/SSR43-R, SSR448-F/SSR448-R, SSR44-F/SSR44-R, SSR450-F/SSR450-R, SSR45-F/SSR45-R, SSR46-F/SSR46-R, SSR478-F/SSR478-R, SSR479-F/SSR479-R, SSR47-F/SSR47-R, SSR48-F/SSR48-R, SSR49-F/SSR49-R, SSR4-F/SSR4-R, SSR50-F/SSR50-R, SSR51-F/SSR51-R, SSR526-F/SSR526-R, SSR52-F/SSR52-R, SSR555-F/SSR555-R, SSR557-F/SSR557-R, SSR565-F/SSR565-R, SSR572-F/SSR572-
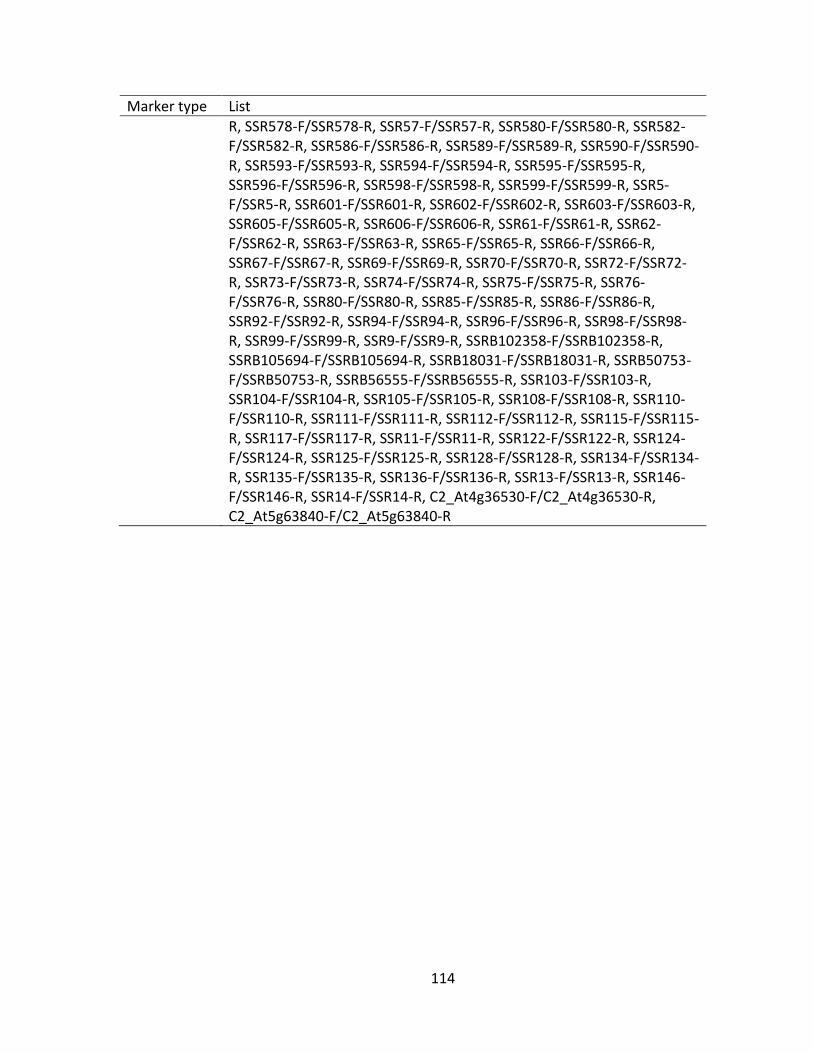
114
Marker type List
R, SSR578-F/SSR578-R, SSR57-F/SSR57-R, SSR580-F/SSR580-R, SSR582-F/SSR582-R, SSR586-F/SSR586-R, SSR589-F/SSR589-R, SSR590-F/SSR590-R, SSR593-F/SSR593-R, SSR594-F/SSR594-R, SSR595-F/SSR595-R, SSR596-F/SSR596-R, SSR598-F/SSR598-R, SSR599-F/SSR599-R, SSR5-F/SSR5-R, SSR601-F/SSR601-R, SSR602-F/SSR602-R, SSR603-F/SSR603-R, SSR605-F/SSR605-R, SSR606-F/SSR606-R, SSR61-F/SSR61-R, SSR62-F/SSR62-R, SSR63-F/SSR63-R, SSR65-F/SSR65-R, SSR66-F/SSR66-R, SSR67-F/SSR67-R, SSR69-F/SSR69-R, SSR70-F/SSR70-R, SSR72-F/SSR72-R, SSR73-F/SSR73-R, SSR74-F/SSR74-R, SSR75-F/SSR75-R, SSR76-F/SSR76-R, SSR80-F/SSR80-R, SSR85-F/SSR85-R, SSR86-F/SSR86-R, SSR92-F/SSR92-R, SSR94-F/SSR94-R, SSR96-F/SSR96-R, SSR98-F/SSR98-R, SSR99-F/SSR99-R, SSR9-F/SSR9-R, SSRB102358-F/SSRB102358-R, SSRB105694-F/SSRB105694-R, SSRB18031-F/SSRB18031-R, SSRB50753-F/SSRB50753-R, SSRB56555-F/SSRB56555-R, SSR103-F/SSR103-R, SSR104-F/SSR104-R, SSR105-F/SSR105-R, SSR108-F/SSR108-R, SSR110-F/SSR110-R, SSR111-F/SSR111-R, SSR112-F/SSR112-R, SSR115-F/SSR115-R, SSR117-F/SSR117-R, SSR11-F/SSR11-R, SSR122-F/SSR122-R, SSR124-F/SSR124-R, SSR125-F/SSR125-R, SSR128-F/SSR128-R, SSR134-F/SSR134-R, SSR135-F/SSR135-R, SSR136-F/SSR136-R, SSR13-F/SSR13-R, SSR146-F/SSR146-R, SSR14-F/SSR14-R, C2_At4g36530-F/C2_At4g36530-R, C2_At5g63840-F/C2_At5g63840-R

115
Appendix 5. DNA extraction protocol from tomato fresh leaves
(Fulton et al., 1995).
1. Collect 50-100 mg (approximately 4-8 new leaflets, up to 1.5 cm long) from a 1-3 week old tomato seedling(1) and nestle loosely in the bottom of a 1.5 ml Eppendorf tube (2).
2. Prepare fresh microprep buffer (see recipe below), keep at room temperature. 3. Add 200 µl of buffer and grind tissue with power drill and plastic bit (rinsing pestle
with water between samples); add another 550 µl of buffer and either vortex lightly or shake entire rack by hand.
4. Incubate in 65oC water bath for 30-120 minutes. 5. Fill the tube with chloroform/ isoamyl (24:1). Mix well. This can be done by vortexing
each tube or sandwiching tubes between two racks and vigorously inverting or shaking up and down 50-100 times.
6. Keep sample in ice for about 15-30’. 7. Centrifuge tubes at 10,000 rpm for 5 minutes. 8. Pipette off aqueous phase into new microfuge tubes (can repeat from step 5). Add
2/3-1 times the volume of cold isopropanol (or 70% ethyl alcohol) to each tube. Invert tubes until DNA precipitates.
9. Keep in fridge for 1 hour or overnight. 10. Immediately spin at 10,000 rpm for 5 minutes (no more), pour off isopropanol and
wash pellet with 70% ethanol (3). 11. Can keep over night to dry. 12. Dry pellet by leaving tubes upside down on paper towels for approximately 1 hour or
placing on sides in seed dryer for 15 minutes (longer if necessary). 13. Resuspend DNA in 50-150 µl of TE buffer.
Solutions for microprep buffer
DNA Extraction Buffer: 0.35 M Sorbitol, 0.1 M Tris-base, 5 mM EDTA; pH 7.5
Nuclei Lysis Buffer: 0.2 M Tris, 0.05 M EDTA, 2 M NaCl, 2% CTAB
Sarkosyl 5% Microprep buffer: 2.5 parts DNA extraction buffer, 2.5 parts nuclei lysis buffer, 1.0 part 5% Sarkosyl. Add 0.3-0.5 g Sodium Bisulfite/100 ml buffer immediately before use (can be increased to avoid color in final product).

116
Appendix 6. Extraction of DNA bands from agarose gels
Protocol of GenElute™ Gel Extraction Kit (Product Code NA1111) provided by Sigma (USA)
Preparation Instructions
1. Wash Solution: Dilute the entire 12 ml of the Wash Solution Concentrate G with 48 ml of 95-100% ethanol prior to initial use. After each use, tightly cap the diluted Wash Solution to prevent the evaporation of ethanol.
2. Gel Solubilization Solution: The Gel Solubilization Solution will precipitate out of solution if stored at temperatures less than 18-25°C. Check to ensure that this solution is completely dissolved and that no crystals are present. If crystals are present, incubate at 37-50°C with periodic mixing until the crystals dissolve (approximately 5 minutes).
3. Agarose Gel Electrophoresis: Use fresh electrophoresis running buffer. Electrophoresis buffer, which has been used repeatedly, will reduce the DNA recovery efficiency. Minimize examination of ethidium bromide-stained gels with an UV trans-illuminator. If possible, use a trans-illuminator equipped with a long-wavelength (302 nm) UV light source, as this will minimize the damaging effects of UV light on nucleic acids.
4. Elution Solution: If purifying plasmid DNA or large linear DNA fragments (>3 Kb) preheat the Elution Solution to 65°C prior to use.
Spin Procedure for Agarose Gels
All centrifugations (spins) are performed at 12,000 to 16,000 x g.
1. Excise band. Excise the DNA fragment of interest from the agarose gel with a clean, sharp scalpel or razor blade. Trim away excess gel to minimize the amount of agarose.
2. Weigh gel. Weigh the gel slice in a tared colorless tube. 3. Solubilize gel. Add 3 gel volumes of the Gel Solubilization Solution to the gel slice. In
other words, for every 100 mg of agarose gel, add 300 μl of Gel Solubilization Solution. Incubate the gel mixture at 50-60°C for 10 minutes, or until the gel slice is completely dissolved. Vortex briefly every 2-3 minutes during incubation to help dissolves the gel.
4. Prepare binding column. Preparation of the binding column can be completed while the agarose is being solubilized in step 3. Place the GenElute Binding Column G into one of the provided 2 ml collection tubes. Add 500 μl of the Column Preparation Solution to each binding column. Centrifuge for 1 minute. Discard flow-through liquid.
5. Check the color of the mixture. Once the gel slice is completely dissolved (step 3) make sure the color of the mixture is yellow (similar to fresh Gel Solubilization Solution with no gel slice) prior to proceeding to the following step. If the color of the mixture is red, add 10 μl of the 3 M Sodium Acetate Buffer, pH 5.2, and mix. The color should now be
117
yellow. If not, add the 3 M Sodium Acetate Buffer, pH 5.2, in 10 μl increments until the mixture is yellow.
6. Add isopropanol. Add 1 gel volume of 100% isopropanol and mix until homogenous. For a gel with an agarose concentration greater than 2%, use 2 gel volumes of 100% isopropanol.
7. Bind DNA. Load the solubilized gel solution mixture from step 6 into the binding column that is assembled in a 2 ml collection tube. It is normal to see an occasional color change from yellow to red once the sample is applied to the binding column. If the volume of the gel mixture is >700 μl, load the sample onto the column in 700 μl portions. Centrifuge for 1 minute after loading the column each time. Discard the flow-through liquid.
8. Wash column. Add 700 μl of Wash Solution (diluted from Wash Solution Concentrate G as described under Preparation Instructions) to the binding column. Centrifuge for 1 minute. Remove the binding column from the collection tube and discard the flow-through liquid. Place the binding column back into the collection tube and centrifuge again for 1 minute without any additional wash solution to remove excess ethanol. Residual Wash Solution will not be completely removed unless the flow-through is discarded before the final centrifugation.
9. Elute DNA. Transfer the binding column to a fresh collection tube. Add 50 μl of Elution Solution to the center of the membrane and incubate for 1 minute. Centrifuge for 1 minute. For efficient recovery of intact plasmid DNA, preheat the elution solution to 65°C prior to adding it to the membrane. Eluting at 65°C improves plasmid DNA recoveries by 2 to 3-fold. Yields of large linear DNA fragments (>3 Kb) can also be increased by up to 20% by preheating the elution solution to 65°C.
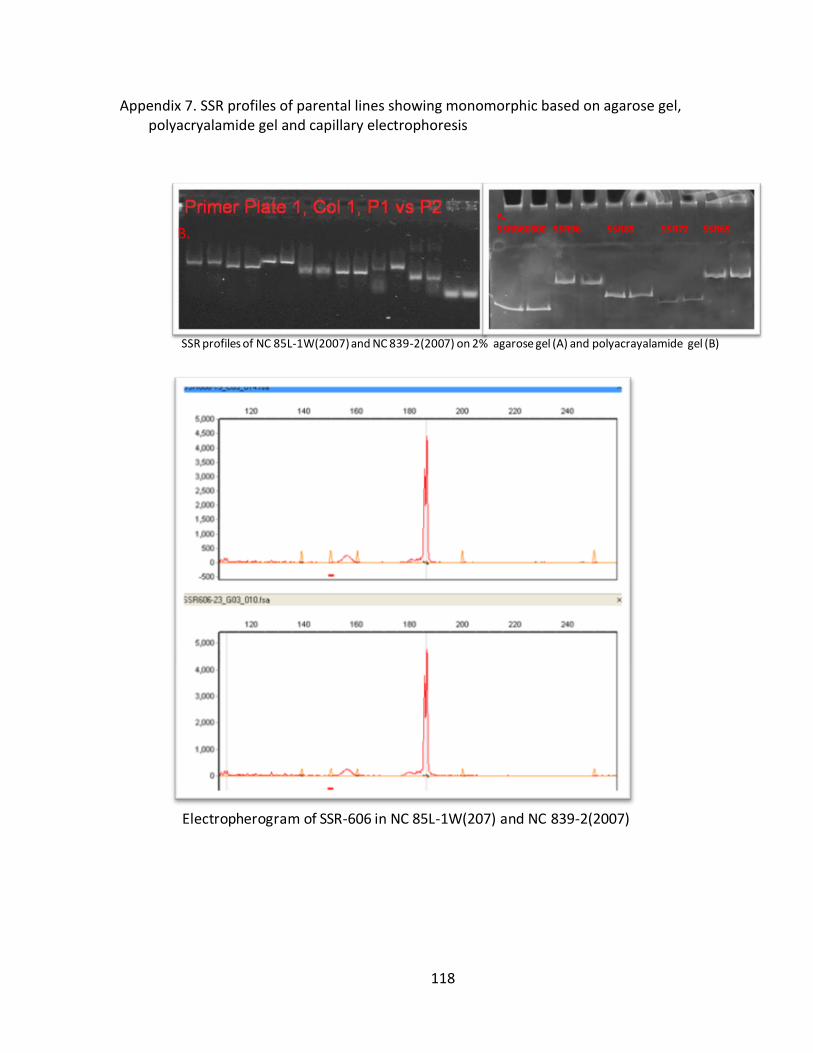
118
Appendix 7. SSR profiles of parental lines showing monomorphic based on agarose gel, polyacryalamide gel and capillary electrophoresis
SSR profiles of NC 85L-1W(2007) and NC 839-2(2007) on 2% agarose gel (A) and polyacrayalamide gel (B)
A.SSRB60800 SSR96 SSR85 SSR72 SSR65 B.
Electropherogram of SSR-606 in NC 85L-1W(207) and NC 839-2(2007)

119
Appendix 8. Chemicals and reagents for DNA extraction and PCR
Liquid nitrogen Sarkosyl 5% Sodium bisulfate 0.35M Sorbitol: Dissolve 63.76 g (0.35 x 182.17) of Sorbitol in one liter of water 25mM MgCl2 MgCl2.6H2O 0.50825 g Extra pure water 100 ml Mix using hot stirrer and autoclave 0.5M EDTA pH7.5
EDTA (Na2EDTA.2H2O) 46.5 g Extra pure water 200 ml NaOH 5 g Adjust pH and add extra pure water to make 250 ml volume and autoclave
2M Tris HCl pH 7.5 Trizma base 24.22 g Extra pure water 70 ml HCl as per needed Add extra pure water to make final volume of 100 ml and autoclave
100x TE: 121 g of Tris and 37.2 g Na2EDTA.H2O in 800 ml water, adjust pH 8.0 with HCl, make up to 1 liter and autoclave
5M NaCl: 292 g of NaCl in 750 ml water and make up to 1 liter with water and autoclave 50x TAE buffer
Trizma base (Tris) 242 g Acetic acid 57.1 ml 0.5M EDTA pH8.0 100 ml Extra pure water 700 ml Make a volume of 1 l and autoclave
50x TBE: 270 g of Tris (base), 138 g boric acid in 500 ml water. Add 100 ml 0.5M EDTA and make up to 1 liter. Store this solution in glass bottles at room temperature and discard any batches that develop a precipitate
Loading buffer 0.5% Xylene cyanol 0.05 g 0.5% Bromo phenol blue 0.05 g Glycerol 40 ml Extra pure water 40 ml Mix using stirrer and autoclave
10 mg/ml Ethidium Bromide (EtBr) Add 1 g of ethidium bromide to 100 ml of ultrapure H2O Stir on a magnetic stirrer for several hours to ensure that the dye has dissolved Wrap the container in aluminum foil or transfer the solution to a dark bottle and store at room temperature

120
10 mM dNTP mix (dATP, dTTP, dCTP, dGTP) Mix equal amounts of dATP, dTTP, dCTP and dGTP (each with a concentration of 100 mM) in a 1.5-ml centrifuge tube. This solution has a concentration of 100 mM total dNTPs and 25 mM each dNTP. Take 100 µl of this solution and add 900 µl of sterile ultrapure H2O. Store at –20oC
10x CTAB solution (10% CTAB, 0.7M NaCl) Mix 340 ml of autoclaved distilled water and add 40 g of CTAB. After dissolving completely add 16.46 g of NaCl and then fill it up to 400 ml with water. Autoclave
Chl/Iso (Chloroform:Isoamyalcohol = 24:1 v/v) Do not autoclave. Avoid this chemical in contact with skin